UNITED STATES
SECURITIES AND EXCHANGE COMMISSION
Washington, D.C. 20549
FORM N-CSR
CERTIFIED SHAREHOLDER REPORT OF REGISTERED
MANAGEMENT INVESTMENT COMPANIES
Investment Company Act file number811-21777
John Hancock Funds III
(Exact name of registrant as specified in charter)
200 Berkeley Street, Boston, Massachusetts 02116
(Address of principal executive offices) (Zip code)
Salvatore Schiavone
Treasurer
200 Berkeley Street
Boston, Massachusetts 02116
(Name and address of agent for service)
Registrant's telephone number, including area code:617-663-4497
| Date of fiscal year end: | March 31 |
| Date of reporting period: | March 31, 2019 |
ITEM 1. REPORTS TO STOCKHOLDERS.
John Hancock
Disciplined Value Mid Cap Fund
Annual report 3/31/19
Beginning on January 1, 2021, as permitted by regulations adopted by the Securities and Exchange Commission, paper copies of the Fund's shareholder reports like this one will no longer be sent by mail, unless you specifically request paper copies of the reports from the Fund or from your financial intermediary. Instead, the reports will be made available on a website, and you will be notified by mail each time a report is posted and provided with a website link to access the report.
If you already elected to receive shareholder reports electronically, you will not be affected by this change, and you do not need to take any action. You may elect to receive shareholder reports and other communications electronically by calling John Hancock Investment Management at 800-225-5291 (Class A and Class C shares) or 888-972-8696 (Class I, Class R2, Class R4, Class R6, and Class ADV) or by contacting your financial intermediary.
You may elect to receive all reports in paper, free of charge, at any time. You can inform John Hancock Investment Management or your financial intermediary that you wish to continue receiving paper copies of your shareholder reports by following the instructions listed above. Your election to receive reports in paper will apply to all funds held with John Hancock Investment Management or your financial intermediary.


A message to shareholders
Dear shareholder,
Market volatility was the big story in the latter half of 2018, as stocks sank in the fourth quarter, hurt by fears of slowing economic growth, mounting trade tensions between the United States and China, and a pullback in oil prices. Many of those fears were quelled in the beginning of 2019, as favorable earnings reports, progress with the China trade dispute, and signals from the U.S. Federal Reserve that interest-rate hikes were on hold sparked a market rebound.
Despite the positive economic news that has garnered headlines lately, we at John Hancock Investment Management believe that the bull market—which just celebrated its 10th anniversary on March 9—appears to be in the later innings. Whether or not these gains are sustained, it's clear we're in a late-cycle market.
Your best resource in unpredictable and volatile markets is your financial advisor, who can help position your portfolio so that it's sufficiently diversified to meet your long-term objectives and to withstand the inevitable turbulence along the way.
On behalf of everyone at John Hancock Investment Management, I'd like to take this opportunity to welcome new shareholders and thank existing shareholders for the continued trust you've placed in us.
Sincerely,

Andrew G. Arnott
President and CEO,
John Hancock Investment Management
Head of Wealth and Asset Management,
United States and Europe
This commentary reflects the CEO's views, which are subject to change at any time. Investing involves risks, including the potential loss of principal. Diversification does not guarantee a profit or eliminate the risk of a loss. It is not possible to invest directly in an index. For more up-to-date information, please visit our website at jhinvestments.com.
John Hancock
Disciplined Value Mid Cap Fund
Table of contents
| 2 | Your fund at a glance | |
| 4 | Discussion of fund performance | |
| 6 | A look at performance | |
| 8 | Your expenses | |
| 10 | Fund's investments | |
| 16 | Financial statements | |
| 20 | Financial highlights | |
| 27 | Notes to financial statements | |
| 35 | Report of independent registered public accounting firm | |
| 36 | Tax information | |
| 37 | Trustees and Officers | |
| 41 | More information |
INVESTMENT OBJECTIVE
The fund seeks long-term growth of capital with current income as a secondary objective.
AVERAGE ANNUAL TOTAL RETURNS AS OF 3/31/19 (%)
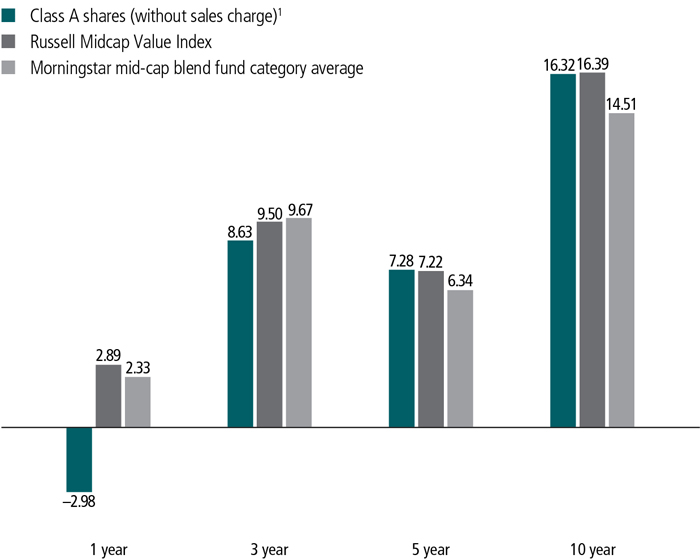
The Russell Midcap Value Index is an unmanaged index that measures the performance of those Russell Midcap Index companies with lower price-to-book ratios and lower forecasted growth values.
It is not possible to invest directly in an index. Index figures do not reflect expenses or sales charges, which would result in lower returns.
Figures from Morningstar, Inc. include reinvested distributions and do not take into account sales charges. Actual load-adjusted performance is lower.
| 1 | After the close of business on 7-9-10, holders of Investor shares of the former Robeco Boston Partners Mid Cap Value Fund (the predecessor fund) became owners of an equal number of full and fractional Class A shares of John Hancock Disciplined Value Mid Cap Fund, which were first offered on 7-12-10. Returns shown prior to Class A shares' commencement dates are those of the predecessor fund's Investor shares. |
The past performance shown here reflects reinvested distributions and the beneficial effect of any expense reductions, and does not guarantee future results. Performance of the other share classes will vary based on the difference in the fees and expenses of those classes. Shares will fluctuate in value and, when redeemed, may be worth more or less than their original cost. Current month-end performance may be lower or higher than the performance cited, and can be found at jhinvestments.com or by calling 800-225-5291. For further information on the fund's objectives, risks, and strategy, see the fund's prospectus.
PERFORMANCE HIGHLIGHTS OVER THE LAST TWELVE MONTHS
Mid-cap value stocks posted a gain
Despite a sharp sell-off in late 2018, the index generated a positive return thanks to its rally in the final three months of the period.
The fund underperformed the index
Weak stock selection in the information technology and healthcare sectors was the primary reason for the fund's shortfall.
Value stocks experienced poor relative performance
Although the value style outperformed somewhat in the downturn, it lagged in the full period due to investors' continued preference for faster-growing companies.
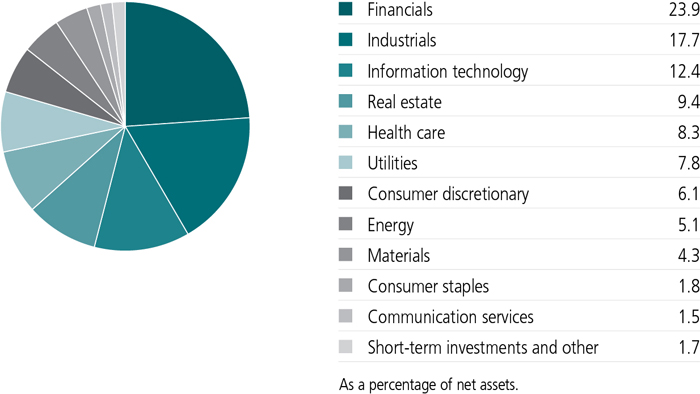
SECTOR COMPOSITION AS OF 3/31/19 (%)
A note about risks
The fund may be subject to various risks as described in the fund's prospectus. For more information, please refer to the "Principal risks" section of the prospectus.
After performing reasonably well through the first six months of the period, U.S. equities gave back ground in the fourth calendar quarter amid escalating fears about rising interest rates, the global growth outlook, and the United States' trade dispute with China. The sell-off reached its low point with a dramatic downturn on December 24, 2018, but the markets subsequently regained their footing and went on to produce a strong, protracted advance in the final three months of the period. The primary spark for the rally came from an abrupt shift toward more accommodative monetary policies by the U.S. Federal Reserve and other major world central banks. The value style trailed growth by a wide margin, weighing on the relative performance of higher-quality, undervalued companies.
What factors affected the fund's performance?
Stock selection and sector allocations both played a role in the fund's underperformance. With regard to the former, portfolio holdings in information technology, energy, healthcare, and industrials lagged their sector peers, offsetting a stronger showing in consumer staples. TE Connectivity, Ltd. was the largest detractor in technology. The company, which designs sensor equipment for use in industrial and automotive applications, experienced negative trends in earnings
TOP 10 HOLDINGS AS OF 3/31/19 (%)
| Discover Financial Services | 2.2 |
| Alleghany Corp. | 1.9 |
| Pinnacle West Capital Corp. | 1.8 |
| AMETEK, Inc. | 1.7 |
| Boston Properties, Inc. | 1.7 |
| Xcel Energy, Inc. | 1.7 |
| Aon PLC | 1.6 |
| TE Connectivity, Ltd. | 1.4 |
| TD Ameritrade Holding Corp. | 1.4 |
| Reinsurance Group of America, Inc. | 1.4 |
| TOTAL | 16.8 |
| As a percentage of net assets. | |
| Cash and cash equivalents are not included. | |
estimates and profit margins due to weaker-than-expected global auto production. A position in the pharmaceutical distribution company McKesson Corp. weighed on relative performance at a time in which biotechnology and mega-cap pharmaceutical stocks were the key drivers of the sector's return. East West Bancorp, Inc., whose links to China's economy caused it to be adversely affected by trade uncertainty, was the most significant detractor at the individual stock level.
The refining company Andeavor—which was acquired by Marathon Petroleum Corp.—was the leading individual contributor. We tendered the fund's shares on the offer. Holdings in the regulated utilities Pinnacle West Capital Corp., Entergy Corp., and Xcel Energy, Inc. also appreciated as investors were attracted to the companies' stable and predictable earnings and dividend streams.
In terms of overall portfolio activity, we made gradual changes at a stock-by-stock level as opportunities presented themselves. We made the largest additions in the healthcare and consumer discretionary sectors, while we reduced the fund's weightings in information technology and energy.As always, we maintained a focus on investing in companies with attractive valuations, sound fundamentals, and catalysts for improving business momentum. Although this approach didn't feed through to returns in the past 12 months, we believe these three factors provide a strong foundation for longer-term performance.
MANAGED BY
 | Steven L. Pollack, CFA On the fund since 2000 Investing since 1984 |
 | Joseph F. Feeney, Jr., CFA On the fund since 2010 Investing since 1985 |
![]()
TOTAL RETURNS FOR THE PERIOD ENDED MARCH 31, 2019
| Average annual total returns (%) with maximum sales charge | Cumulative total returns (%) with maximum sales charge | ||||||
| 1-year | 5-year | 10-year | 5-year | 10-year | |||
| Class A1 | -7.85 | 6.18 | 15.73 | 34.98 | 330.93 | ||
| Class C1 | -4.57 | 6.47 | 15.65 | 36.82 | 327.88 | ||
| Class I1,2 | -2.79 | 7.55 | 16.63 | 43.90 | 365.50 | ||
| Class R21,2 | -3.14 | 7.13 | 16.21 | 41.09 | 349.21 | ||
| Class R41,2 | -2.90 | 7.39 | 16.38 | 42.82 | 355.80 | ||
| Class R61,2 | -2.66 | 7.65 | 16.63 | 44.60 | 365.71 | ||
| Class ADV1,2 | -2.98 | 7.25 | 16.29 | 41.87 | 352.23 | ||
| Index† | 2.89 | 7.22 | 16.39 | 41.69 | 356.26 | ||
Performance figures assume all distributions are reinvested. Figures reflect maximum sales charges on Class A shares of 5% and the applicable contingent deferred sales charge (CDSC) on Class C shares. Class C shares sold within one year of purchase are subject to a 1% CDSC. Sales charges are not applicable to Class I, Class R2, Class R4, Class R6, and Class ADV shares.
The expense ratios of the fund, both net (including any fee waivers and/or expense limitations) and gross (excluding any fee waivers and/or expense limitations), are set forth according to the most recent publicly available prospectuses for the fund and may differ from those disclosed in the Financial highlights tables in this report. Net expenses reflect contractual expense limitations in effect until June 30, 2020 and are subject to change. Had the contractual fee waivers and expense limitations not been in place, gross expenses would apply. The expense ratios are as follows:
| Class A | Class C | Class I | Class R2 | Class R4 | Class R6 | Class ADV | |
| Gross (%) | 1.11 | 1.86 | 0.86 | 1.27 | 1.12 | 0.77 | 1.11 |
| Net (%) | 1.10 | 1.85 | 0.85 | 1.26 | 1.01 | 0.76 | 1.10 |
Please refer to the most recent prospectus and annual or semiannual report for more information on expenses and any expense limitation arrangements for each class.
The returns reflect past results and should not be considered indicative of future performance. The return and principal value of an investment will fluctuate so that shares, when redeemed, may be worth more or less than their original cost. Due to market volatility and other factors, the fund's current performance may be higher or lower than the performance shown. For current to the most recent month-end performance data, please call 800-225-5291 or visit the fund's website at jhinvestments.com.
The performance table above and the chart on the next page do not reflect the deduction of taxes that a shareholder would pay on fund distributions or the redemption of fund shares. The fund's performance results reflect any applicable fee waivers or expense reductions, without which the expenses would increase and results would have been less favorable.
| † | Index is the Russell Midcap Value Index. |
See the following page for footnotes.
This chart and table show what happened to a hypothetical $10,000 investment in John Hancock Disciplined Value Mid Cap Fund for the share classes and periods indicated, assuming all distributions were reinvested. For comparison, we've shown the same investment in the Russell Midcap Value Index.
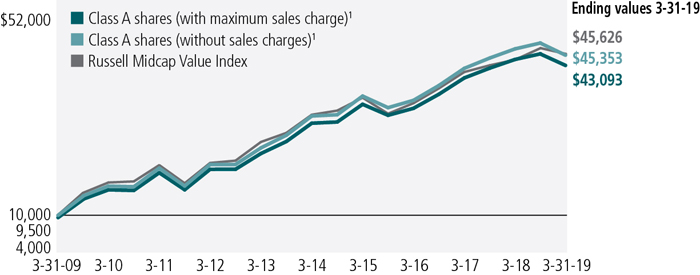
| Start date | With maximum sales charge ($) | Without sales charge ($) | Index ($) | |
| Class C1,3 | 3-31-09 | 42,788 | 42,788 | 45,626 |
| Class I1,2 | 3-31-09 | 46,550 | 46,550 | 45,626 |
| Class R21,2 | 3-31-09 | 44,921 | 44,921 | 45,626 |
| Class R41,2 | 3-31-09 | 45,580 | 45,580 | 45,626 |
| Class R61,2 | 3-31-09 | 46,571 | 46,571 | 45,626 |
| Class ADV1,2 | 3-31-09 | 45,223 | 45,223 | 45,626 |
The Russell Midcap Value Index is an unmanaged index that measures the performance of those Russell Midcap companies with lower price-to-book ratios and lower forecasted growth values.
It is not possible to invest directly in an index. Index figures do not reflect expenses or sales charges, which would result in lower returns.
Footnotes related to performance pages
| 1 | Class A, Class C, Class R2, Class R4, and Class R6 shares were first offered on 7-12-10, 8-15-11, 3-1-12, 7-2-13, and 9-1-11, respectively; Class I and Class ADV shares were first offered on 7-12-10. Investor shares and Institutional shares of Robeco Boston Partners Mid Cap Value Fund (the predecessor fund) were first offered on 6-2-97. Returns shown prior to Class A and Class ADV shares' commencement dates are those of the predecessor fund's Investor shares. Returns shown prior to Class I shares' commencement date are those of the predecessor fund's Institutional shares. Returns shown prior to Class C, Class R2, Class R4, and Class R6 shares' commencement dates are those of the predecessor fund's Investor shares (prior to 7-12-10) and the fund's Class A shares (from 7-12-10), that have not been adjusted for class-specific expenses; otherwise, returns would vary. |
| 2 | For certain types of investors, as described in the fund's prospectuses. |
| 3 | The contingent deferred sales charge is not applicable. |
| Your expenses |

| 8 | JOHN HANCOCK DISCIPLINED VALUE MID CAP FUND | ANNUAL REPORT |
| Account value on 10-1-2018 | Ending value on 3-31-2019 | Expenses paid during period ended 3-31-20191 | Annualized expense ratio | ||
| Class A | Actual expenses/actual returns | $1,000.00 | $944.00 | $5.38 | 1.11% |
| Hypothetical example | 1,000.00 | 1,019.40 | 5.59 | 1.11% | |
| Class C | Actual expenses/actual returns | 1,000.00 | 940.60 | 9.00 | 1.86% |
| Hypothetical example | 1,000.00 | 1,015.70 | 9.35 | 1.86% | |
| Class I | Actual expenses/actual returns | 1,000.00 | 944.80 | 4.27 | 0.88% |
| Hypothetical example | 1,000.00 | 1,020.50 | 4.43 | 0.88% | |
| Class R2 | Actual expenses/actual returns | 1,000.00 | 943.30 | 6.15 | 1.27% |
| Hypothetical example | 1,000.00 | 1,018.60 | 6.39 | 1.27% | |
| Class R4 | Actual expenses/actual returns | 1,000.00 | 944.60 | 4.90 | 1.01% |
| Hypothetical example | 1,000.00 | 1,019.90 | 5.09 | 1.01% | |
| Class R6 | Actual expenses/actual returns | 1,000.00 | 945.70 | 3.69 | 0.76% |
| Hypothetical example | 1,000.00 | 1,021.10 | 3.83 | 0.76% | |
| Class ADV | Actual expenses/actual returns | 1,000.00 | 943.90 | 5.38 | 1.11% |
| Hypothetical example | 1,000.00 | 1,019.40 | 5.59 | 1.11% |
| 1 | Expenses are equal to the annualized expense ratio, multiplied by the average account value over the period, multiplied by 182/365 (to reflect the one-half year period). |
| ANNUAL REPORT | JOHN HANCOCK DISCIPLINED VALUE MID CAP FUND | 9 |
| Fund’s investments |
| Shares | Value | ||||
| Common stocks 98.3% | $12,134,201,621 | ||||
| (Cost $9,803,658,074) | |||||
| Communication services 1.5% | 184,129,520 | ||||
| Entertainment 0.9% | |||||
| Activision Blizzard, Inc. | 1,044,081 | 47,537,008 | |||
| NetEase, Inc., ADR | 245,414 | 59,255,210 | |||
| Media 0.6% | |||||
| Liberty Global PLC, Series C (A) | 1,817,304 | 43,996,930 | |||
| Omnicom Group, Inc. | 456,780 | 33,340,372 | |||
| Consumer discretionary 6.1% | 757,045,049 | ||||
| Auto components 1.2% | |||||
| BorgWarner, Inc. | 1,217,250 | 46,754,573 | |||
| Gentex Corp. | 1,895,307 | 39,194,949 | |||
| Lear Corp. | 472,656 | 64,144,146 | |||
| Hotels, restaurants and leisure 1.1% | |||||
| Wyndham Destinations, Inc. | 1,313,325 | 53,176,529 | |||
| Wyndham Hotels & Resorts, Inc. | 1,786,812 | 89,322,732 | |||
| Internet and direct marketing retail 2.0% | |||||
| eBay, Inc. | 3,536,471 | 131,344,533 | |||
| Expedia Group, Inc. | 965,521 | 114,896,999 | |||
| Leisure products 0.5% | |||||
| Hasbro, Inc. | 703,818 | 59,838,606 | |||
| Multiline retail 0.8% | |||||
| Dollar Tree, Inc. (A) | 619,114 | 65,031,735 | |||
| Nordstrom, Inc. (B) | 701,488 | 31,132,037 | |||
| Specialty retail 0.5% | |||||
| Ross Stores, Inc. | 668,187 | 62,208,210 | |||
| Consumer staples 1.8% | 220,369,950 | ||||
| Beverages 0.8% | |||||
| Coca-Cola European Partners PLC (New York Stock Exchange) | 1,871,929 | 96,853,606 | |||
| Food products 1.0% | |||||
| Nomad Foods, Ltd. (A) | 3,838,988 | 78,507,305 | |||
| Tyson Foods, Inc., Class A | 648,265 | 45,009,039 | |||
| Energy 5.1% | 630,715,813 | ||||
| Energy equipment and services 0.5% | |||||
| Apergy Corp. (A) | 1,529,248 | 62,790,923 | |||
| Oil, gas and consumable fuels 4.6% | |||||
| Canadian Natural Resources, Ltd. | 1,637,181 | 45,022,478 | |||
| Cimarex Energy Company | 1,434,925 | 100,301,258 | |||
| 10 | JOHN HANCOCK DISCIPLINED VALUE MID CAP FUND | ANNUAL REPORT | SEE NOTES TO FINANCIAL STATEMENTS |
| Shares | Value | ||||
| Energy (continued) | |||||
| Oil, gas and consumable fuels (continued) | |||||
| Diamondback Energy, Inc. | 1,067,018 | $108,334,338 | |||
| Marathon Oil Corp. | 2,575,248 | 43,032,394 | |||
| Marathon Petroleum Corp. | 1,124,795 | 67,318,981 | |||
| Noble Energy, Inc. | 4,024,787 | 99,532,983 | |||
| Pioneer Natural Resources Company | 685,464 | 104,382,458 | |||
| Financials 23.9% | 2,954,781,591 | ||||
| Banks 6.4% | |||||
| East West Bancorp, Inc. | 2,763,914 | 132,584,955 | |||
| Fifth Third Bancorp | 5,007,988 | 126,301,457 | |||
| Huntington Bancshares, Inc. | 11,867,803 | 150,483,742 | |||
| KeyCorp | 7,506,491 | 118,227,233 | |||
| Regions Financial Corp. | 7,063,742 | 99,951,949 | |||
| SunTrust Banks, Inc. | 2,727,254 | 161,589,800 | |||
| Capital markets 3.8% | |||||
| E*TRADE Financial Corp. | 2,569,685 | 119,310,475 | |||
| Moody's Corp. | 375,784 | 68,050,725 | |||
| Raymond James Financial, Inc. | 852,456 | 68,545,987 | |||
| State Street Corp. | 631,379 | 41,551,052 | |||
| TD Ameritrade Holding Corp. | 3,497,817 | 174,855,872 | |||
| Consumer finance 3.3% | |||||
| Discover Financial Services | 3,815,579 | 271,516,599 | |||
| Navient Corp. | 3,233,068 | 37,406,597 | |||
| SLM Corp. | 5,218,724 | 51,717,555 | |||
| Synchrony Financial | 1,411,116 | 45,014,600 | |||
| Insurance 10.4% | |||||
| Aflac, Inc. | 923,102 | 46,155,100 | |||
| Alleghany Corp. (A) | 385,129 | 235,853,000 | |||
| Aon PLC | 1,180,655 | 201,537,809 | |||
| Everest Re Group, Ltd. | 562,791 | 121,540,344 | |||
| Loews Corp. | 1,388,336 | 66,542,944 | |||
| Marsh & McLennan Companies, Inc. | 811,467 | 76,196,751 | |||
| Reinsurance Group of America, Inc. | 1,181,920 | 167,809,002 | |||
| The Allstate Corp. | 1,342,525 | 126,439,005 | |||
| The Travelers Companies, Inc. | 603,088 | 82,719,550 | |||
| Torchmark Corp. | 607,555 | 49,789,132 | |||
| W.R. Berkley Corp. | 1,334,872 | 113,090,356 | |||
| Health care 8.3% | 1,018,423,036 | ||||
| Health care equipment and supplies 1.3% | |||||
| Boston Scientific Corp. (A) | 1,464,618 | 56,212,039 | |||
| Zimmer Biomet Holdings, Inc. | 809,815 | 103,413,376 | |||
| SEE NOTES TO FINANCIAL STATEMENTS | ANNUAL REPORT | JOHN HANCOCK DISCIPLINED VALUE MID CAP FUND | 11 |
| Shares | Value | ||||
| Health care (continued) | |||||
| Health care providers and services 4.7% | |||||
| AmerisourceBergen Corp. | 995,047 | $79,126,137 | |||
| Centene Corp. (A) | 1,545,683 | 82,075,767 | |||
| DaVita, Inc. (A) | 767,370 | 41,660,517 | |||
| Henry Schein, Inc. (A) | 720,267 | 43,295,249 | |||
| Humana, Inc. | 81,415 | 21,656,390 | |||
| Laboratory Corp. of America Holdings (A) | 702,662 | 107,493,233 | |||
| McKesson Corp. | 961,857 | 112,594,980 | |||
| Universal Health Services, Inc., Class B | 635,422 | 85,000,401 | |||
| Life sciences tools and services 1.8% | |||||
| ICON PLC (A) | 754,571 | 103,059,307 | |||
| IQVIA Holdings, Inc. (A) | 829,605 | 119,338,679 | |||
| Pharmaceuticals 0.5% | |||||
| Jazz Pharmaceuticals PLC (A) | 444,190 | 63,496,961 | |||
| Industrials 17.7% | 2,181,523,530 | ||||
| Aerospace and defense 3.1% | |||||
| Curtiss-Wright Corp. | 744,673 | 84,401,238 | |||
| Harris Corp. | 960,000 | 153,321,600 | |||
| Huntington Ingalls Industries, Inc. | 329,885 | 68,352,172 | |||
| Spirit AeroSystems Holdings, Inc., Class A | 407,755 | 37,321,815 | |||
| Textron, Inc. | 703,756 | 35,652,279 | |||
| Airlines 1.7% | |||||
| Delta Air Lines, Inc. | 2,000,690 | 103,335,639 | |||
| Southwest Airlines Company | 2,066,232 | 107,258,103 | |||
| Building products 1.0% | |||||
| Masco Corp. | 1,851,440 | 72,780,106 | |||
| Owens Corning | 1,031,864 | 48,621,432 | |||
| Commercial services and supplies 0.6% | |||||
| KAR Auction Services, Inc. | 1,482,017 | 76,042,292 | |||
| Electrical equipment 3.0% | |||||
| AMETEK, Inc. | 2,567,879 | 213,056,921 | |||
| Eaton Corp. PLC | 1,430,680 | 115,255,581 | |||
| EnerSys | 651,416 | 42,446,267 | |||
| Machinery 5.1% | |||||
| Cummins, Inc. | 254,210 | 40,132,133 | |||
| Dover Corp. | 1,726,692 | 161,963,710 | |||
| ITT, Inc. | 1,286,072 | 74,592,176 | |||
| PACCAR, Inc. | 882,403 | 60,126,940 | |||
| Parker-Hannifin Corp. | 956,808 | 164,207,389 | |||
| The Timken Company | 1,012,392 | 44,160,539 | |||
| WABCO Holdings, Inc. (A) | 604,790 | 79,729,466 | |||
| 12 | JOHN HANCOCK DISCIPLINED VALUE MID CAP FUND | ANNUAL REPORT | SEE NOTES TO FINANCIAL STATEMENTS |
| Shares | Value | ||||
| Industrials (continued) | |||||
| Professional services 1.5% | |||||
| ManpowerGroup, Inc. | 720,879 | $59,609,485 | |||
| Robert Half International, Inc. | 1,976,299 | 128,775,643 | |||
| Road and rail 0.4% | |||||
| Kansas City Southern | 443,662 | 51,455,919 | |||
| Trading companies and distributors 1.3% | |||||
| Air Lease Corp. | 890,774 | 30,598,087 | |||
| HD Supply Holdings, Inc. (A) | 2,152,240 | 93,299,604 | |||
| WESCO International, Inc. (A) | 660,762 | 35,026,994 | |||
| Information technology 12.4% | 1,529,325,208 | ||||
| Electronic equipment, instruments and components 2.3% | |||||
| Arrow Electronics, Inc. (A) | 824,187 | 63,511,850 | |||
| Flex, Ltd. (A) | 3,872,154 | 38,721,540 | |||
| TE Connectivity, Ltd. | 2,210,998 | 178,538,089 | |||
| IT services 4.7% | |||||
| Alliance Data Systems Corp. | 350,083 | 61,257,523 | |||
| Amdocs, Ltd. | 782,054 | 42,316,942 | |||
| Cognizant Technology Solutions Corp., Class A | 420,136 | 30,438,853 | |||
| Fidelity National Information Services, Inc. | 1,442,812 | 163,182,037 | |||
| First Data Corp., Class A (A) | 2,969,657 | 78,012,889 | |||
| Global Payments, Inc. | 647,393 | 88,382,092 | |||
| Leidos Holdings, Inc. | 1,884,154 | 120,755,430 | |||
| Semiconductors and semiconductor equipment 2.2% | |||||
| KLA-Tencor Corp. | 460,773 | 55,020,904 | |||
| Marvell Technology Group, Ltd. | 5,623,279 | 111,847,019 | |||
| Qorvo, Inc. (A) | 1,247,564 | 89,487,766 | |||
| Versum Materials, Inc. | 382,268 | 19,231,903 | |||
| Software 0.6% | |||||
| CDK Global, Inc. | 1,264,204 | 74,360,479 | |||
| Technology hardware, storage and peripherals 2.6% | |||||
| Hewlett Packard Enterprise Company | 4,072,034 | 62,831,485 | |||
| HP, Inc. | 4,442,694 | 86,321,544 | |||
| NetApp, Inc. | 754,888 | 52,343,934 | |||
| Western Digital Corp. | 542,173 | 26,056,834 | |||
| Xerox Corp. | 2,711,260 | 86,706,095 | |||
| Materials 4.3% | 532,108,199 | ||||
| Chemicals 2.7% | |||||
| FMC Corp. | 1,294,625 | 99,453,093 | |||
| Nutrien, Ltd. (B) | 2,181,298 | 115,085,282 | |||
| The Mosaic Company | 3,004,142 | 82,043,118 | |||
| Trinseo SA | 697,454 | 31,594,666 | |||
| SEE NOTES TO FINANCIAL STATEMENTS | ANNUAL REPORT | JOHN HANCOCK DISCIPLINED VALUE MID CAP FUND | 13 |
| Shares | Value | ||||
| Materials (continued) | |||||
| Containers and packaging 1.6% | |||||
| Avery Dennison Corp. | 927,324 | $104,787,612 | |||
| Berry Global Group, Inc. (A) | 194,263 | 10,464,948 | |||
| Crown Holdings, Inc. (A) | 649,904 | 35,465,261 | |||
| Graphic Packaging Holding Company | 4,213,319 | 53,214,219 | |||
| Real estate 9.4% | 1,159,837,152 | ||||
| Equity real estate investment trusts 9.4% | |||||
| American Homes 4 Rent, Class A | 2,033,718 | 46,206,073 | |||
| Boston Properties, Inc. | 1,584,930 | 212,190,428 | |||
| Douglas Emmett, Inc. | 3,338,154 | 134,928,185 | |||
| Duke Realty Corp. | 3,637,405 | 111,231,845 | |||
| Equity Residential | 2,069,740 | 155,892,817 | |||
| Kilroy Realty Corp. | 776,213 | 58,961,139 | |||
| Prologis, Inc. | 1,415,887 | 101,873,070 | |||
| Regency Centers Corp. | 1,886,743 | 127,336,285 | |||
| Retail Properties of America, Inc., Class A | 3,719,265 | 45,337,840 | |||
| SL Green Realty Corp. | 1,844,745 | 165,879,470 | |||
| Utilities 7.8% | 965,942,573 | ||||
| Electric utilities 6.2% | |||||
| Alliant Energy Corp. | 714,235 | 33,661,896 | |||
| American Electric Power Company, Inc. | 649,161 | 54,367,234 | |||
| Edison International | 829,574 | 51,367,222 | |||
| Entergy Corp. | 1,399,064 | 133,792,490 | |||
| Evergy, Inc. | 1,137,227 | 66,016,027 | |||
| Pinnacle West Capital Corp. | 2,261,647 | 216,168,220 | |||
| Xcel Energy, Inc. | 3,676,069 | 206,631,838 | |||
| Independent power and renewable electricity producers 0.5% | |||||
| Vistra Energy Corp. | 2,314,211 | 60,238,912 | |||
| Multi-utilities 1.1% | |||||
| DTE Energy Company | 1,151,986 | 143,698,734 | |||
| Yield (%) | Shares | Value | |||
| Securities lending collateral 0.0% | $6,143,864 | ||||
| (Cost $6,143,803) | |||||
| John Hancock Collateral Trust (C) | 2.6031(D) | 613,969 | 6,143,864 | ||
| Short-term investments 1.4% | $168,952,278 | ||||
| (Cost $168,952,278) | |||||
| Money market funds 1.4% | 168,952,278 | ||||
| State Street Institutional U.S. Government Money Market Fund, Premier Class | 2.3851(D) | 168,952,278 | 168,952,278 | ||
| 14 | JOHN HANCOCK DISCIPLINED VALUE MID CAP FUND | ANNUAL REPORT | SEE NOTES TO FINANCIAL STATEMENTS |
| Total investments (Cost $9,978,754,155) 99.7% | $12,309,297,763 | ||||
| Other assets and liabilities, net 0.3% | 40,325,138 | ||||
| Total net assets 100.0% | $12,349,622,901 | ||||
| The percentage shown for each investment category is the total value of the category as a percentage of the net assets of the fund. | |
| Security Abbreviations and Legend | |
| ADR | American Depositary Receipt |
| (A) | Non-income producing security. |
| (B) | All or a portion of this security is on loan as of 3-31-19. |
| (C) | Investment is an affiliate of the fund, the advisor and/or subadvisor. This security represents the investment of cash collateral received for securities lending. |
| (D) | The rate shown is the annualized seven-day yield as of 3-31-19. |
| SEE NOTES TO FINANCIAL STATEMENTS | ANNUAL REPORT | JOHN HANCOCK DISCIPLINED VALUE MID CAP FUND | 15 |
| Financial statements |
| Assets | |
| Unaffiliated investments, at value (Cost $9,972,610,352) including $5,841,186 of securities loaned | $12,303,153,899 |
| Affiliated investments, at value (Cost $6,143,803) | 6,143,864 |
| Total investments, at value (Cost $9,978,754,155) | 12,309,297,763 |
| Cash | 7,802,905 |
| Dividends and interest receivable | 22,303,459 |
| Receivable for fund shares sold | 21,588,313 |
| Receivable for investments sold | 78,661,365 |
| Receivable for securities lending income | 4,785 |
| Receivable for interfund lending | 4,927,209 |
| Other assets | 491,690 |
| Total assets | 12,445,077,489 |
| Liabilities | |
| Payable for investments purchased | 55,190,507 |
| Payable for fund shares repurchased | 30,735,452 |
| Payable upon return of securities loaned | 6,144,514 |
| Payable to affiliates | |
| Accounting and legal services fees | 472,854 |
| Transfer agent fees | 1,002,903 |
| Distribution and service fees | 71,770 |
| Other liabilities and accrued expenses | 1,836,588 |
| Total liabilities | 95,454,588 |
| Net assets | $12,349,622,901 |
| Net assets consist of | |
| Paid-in capital | $10,104,801,958 |
| Total distributable earnings (loss) | 2,244,820,943 |
| Net assets | $12,349,622,901 |
| 16 | JOHN HANCOCK Disciplined Value Mid Cap Fund | ANNUAL REPORT | SEE NOTES TO FINANCIAL STATEMENTS |
| Net asset value per share | |
| Based on net asset value and shares outstanding - the fund has an unlimited number of shares authorized with no par value | |
| Class A ($1,184,064,071 ÷ 62,063,063 shares)1 | $19.08 |
| Class C ($181,586,085 ÷ 9,492,167 shares)1 | $19.13 |
| Class I ($7,783,894,250 ÷ 390,884,191 shares) | $19.91 |
| Class R2 ($130,910,426 ÷ 6,595,876 shares) | $19.85 |
| Class R4 ($74,422,596 ÷ 3,740,311 shares) | $19.90 |
| Class R6 ($2,994,157,162 ÷ 150,440,095 shares) | $19.90 |
| Class ADV ($588,311 ÷ 30,915 shares) | $19.03 |
| Maximum offering price per share | |
| Class A (net asset value per share ÷ 95%)2 | $20.08 |
| 1 | Redemption price per share is equal to net asset value less any applicable contingent deferred sales charge. |
| 2 | On single retail sales of less than $50,000. On sales of $50,000 or more and on group sales the offering price is reduced. |
| SEE NOTES TO FINANCIAL STATEMENTS | ANNUAL REPORT | JOHN HANCOCK Disciplined Value Mid Cap Fund | 17 |
| Investment income | |
| Dividends | $227,193,093 |
| Interest | 4,950,403 |
| Securities lending | 437,684 |
| Less foreign taxes withheld | (577,344) |
| Total investment income | 232,003,836 |
| Expenses | |
| Investment management fees | 97,402,683 |
| Distribution and service fees | 6,859,183 |
| Accounting and legal services fees | 2,129,303 |
| Transfer agent fees | 13,404,790 |
| Trustees' fees | 210,799 |
| Custodian fees | 1,592,855 |
| State registration fees | 292,347 |
| Printing and postage | 849,037 |
| Professional fees | 295,034 |
| Other | 360,255 |
| Total expenses | 123,396,286 |
| Less expense reductions | (1,184,668) |
| Net expenses | 122,211,618 |
| Net investment income | 109,792,218 |
| Realized and unrealized gain (loss) | |
| Net realized gain (loss) on | |
| Unaffiliated investments and foreign currency transactions | 475,258,537 |
| Affiliated investments | (6,179) |
| 475,252,358 | |
| Change in net unrealized appreciation (depreciation) of | |
| Unaffiliated investments and translation of assets and liabilities in foreign currencies | (1,083,555,870) |
| Affiliated investments | 61 |
| (1,083,555,809) | |
| Net realized and unrealized loss | (608,303,451) |
| Decrease in net assets from operations | $(498,511,233) |
| 18 | JOHN HANCOCK Disciplined Value Mid Cap Fund | ANNUAL REPORT | SEE NOTES TO FINANCIAL STATEMENTS |
| Year ended 3-31-19 | Year ended 3-31-18 | |
| Increase (decrease) in net assets | ||
| From operations | ||
| Net investment income | $109,792,218 | $77,453,476 |
| Net realized gain | 475,252,358 | 1,350,826,526 |
| Change in net unrealized appreciation (depreciation) | (1,083,555,809) | (11,855,518) |
| Increase (decrease) in net assets resulting from operations | (498,511,233) | 1,416,424,484 |
| Distributions to shareholders | ||
| From net investment income and net realized gain | ||
| Class A | (144,723,293) | — |
| Class C | (22,813,889) | — |
| Class I | (917,596,549) | — |
| Class R2 | (15,192,670) | — |
| Class R4 | (9,323,306) | — |
| Class R6 | (316,546,525) | — |
| Class ADV | (186,668) | — |
| From net investment income | ||
| Class A | — | (4,461,222) |
| Class I | — | (48,973,205) |
| Class R2 | — | (250,599) |
| Class R4 | — | (354,995) |
| Class R6 | — | (15,013,808) |
| Class ADV | — | (5,803) |
| From net realized gain | ||
| Class A | — | (97,539,583) |
| Class C | — | (17,063,920) |
| Class I | — | (559,171,001) |
| Class R2 | — | (11,603,133) |
| Class R4 | — | (5,741,382) |
| Class R6 | — | (147,101,314) |
| Class ADV | — | (126,872) |
| Total distributions | (1,426,382,900) | (907,406,837) |
| From fund share transactions | (384,273,493) | 143,075,583 |
| Total increase (decrease) | (2,309,167,626) | 652,093,230 |
| Net assets | ||
| Beginning of year | 14,658,790,527 | 14,006,697,297 |
| End of year1 | $12,349,622,901 | $14,658,790,527 |
| 1 | Net assets - End of year includes undistributed net investment income of $20,012,522 at March 31, 2018. The SEC eliminated the requirement to disclose undistributed net investment income in the current reporting period. |
| SEE NOTES TO FINANCIAL STATEMENTS | ANNUAL REPORT | JOHN HANCOCK Disciplined Value Mid Cap Fund | 19 |
| Financial highlights |
| CLASS A SHARES Period ended | 3-31-19 | 3-31-18 | 3-31-17 | 3-31-16 | 3-31-15 |
| Per share operating performance | |||||
| Net asset value, beginning of period | $22.35 | $21.61 | $18.49 | $20.19 | $18.23 |
| Net investment income1 | 0.12 | 0.07 | 0.10 | 0.13 | 0.05 |
| Net realized and unrealized gain (loss) on investments | (1.01) | 2.11 | 3.57 | (0.63) | 2.42 |
| Total from investment operations | (0.89) | 2.18 | 3.67 | (0.50) | 2.47 |
| Less distributions | |||||
| From net investment income | (0.13) | (0.06) | (0.14) | (0.07) | (0.06) |
| From net realized gain | (2.25) | (1.38) | (0.41) | (1.13) | (0.45) |
| Total distributions | (2.38) | (1.44) | (0.55) | (1.20) | (0.51) |
| Net asset value, end of period | $19.08 | $22.35 | $21.61 | $18.49 | $20.19 |
| Total return (%)2,3 | (2.98) | 10.15 | 19.96 | (2.59) | 13.78 |
| Ratios and supplemental data | |||||
| Net assets, end of period (in millions) | $1,184 | $1,547 | $2,088 | $1,971 | $2,148 |
| Ratios (as a percentage of average net assets): | |||||
| Expenses before reductions | 1.11 | 1.11 | 1.12 | 1.13 | 1.13 |
| Expenses including reductions | 1.10 | 1.10 | 1.12 | 1.12 | 1.13 |
| Net investment income | 0.58 | 0.30 | 0.48 | 0.70 | 0.28 |
| Portfolio turnover (%) | 53 | 53 | 50 | 47 | 35 |
| 1 | Based on average daily shares outstanding. |
| 2 | Total returns would have been lower had certain expenses not been reduced during the applicable periods. |
| 3 | Does not reflect the effect of sales charges, if any. |
| 20 | JOHN HANCOCK Disciplined Value Mid Cap Fund | ANNUAL REPORT | SEE NOTES TO FINANCIAL STATEMENTS |
| CLASS C SHARES Period ended | 3-31-19 | 3-31-18 | 3-31-17 | 3-31-16 | 3-31-15 |
| Per share operating performance | |||||
| Net asset value, beginning of period | $22.42 | $21.77 | $18.65 | $20.43 | $18.53 |
| Net investment loss1 | (0.04) | (0.10) | (0.05) | (0.01) | (0.08) |
| Net realized and unrealized gain (loss) on investments | (1.00) | 2.13 | 3.58 | (0.64) | 2.43 |
| Total from investment operations | (1.04) | 2.03 | 3.53 | (0.65) | 2.35 |
| Less distributions | |||||
| From net realized gain | (2.25) | (1.38) | (0.41) | (1.13) | (0.45) |
| Net asset value, end of period | $19.13 | $22.42 | $21.77 | $18.65 | $20.43 |
| Total return (%)2,3 | (3.72) | 9.35 | 18.99 | (3.27) | 12.90 |
| Ratios and supplemental data | |||||
| Net assets, end of period (in millions) | $182 | $278 | $319 | $329 | $366 |
| Ratios (as a percentage of average net assets): | |||||
| Expenses before reductions | 1.86 | 1.86 | 1.87 | 1.88 | 1.89 |
| Expenses including reductions | 1.85 | 1.85 | 1.87 | 1.87 | 1.88 |
| Net investment loss | (0.19) | (0.43) | (0.27) | (0.06) | (0.42) |
| Portfolio turnover (%) | 53 | 53 | 50 | 47 | 35 |
| 1 | Based on average daily shares outstanding. |
| 2 | Total returns would have been lower had certain expenses not been reduced during the applicable periods. |
| 3 | Does not reflect the effect of sales charges, if any. |
| SEE NOTES TO FINANCIAL STATEMENTS | ANNUAL REPORT | JOHN HANCOCK Disciplined Value Mid Cap Fund | 21 |
| CLASS I SHARES Period ended | 3-31-19 | 3-31-18 | 3-31-17 | 3-31-16 | 3-31-15 |
| Per share operating performance | |||||
| Net asset value, beginning of period | $23.22 | $22.39 | $19.14 | $20.86 | $18.81 |
| Net investment income1 | 0.18 | 0.14 | 0.16 | 0.20 | 0.12 |
| Net realized and unrealized gain (loss) on investments | (1.06) | 2.19 | 3.69 | (0.67) | 2.49 |
| Total from investment operations | (0.88) | 2.33 | 3.85 | (0.47) | 2.61 |
| Less distributions | |||||
| From net investment income | (0.18) | (0.12) | (0.19) | (0.12) | (0.11) |
| From net realized gain | (2.25) | (1.38) | (0.41) | (1.13) | (0.45) |
| Total distributions | (2.43) | (1.50) | (0.60) | (1.25) | (0.56) |
| Net asset value, end of period | $19.91 | $23.22 | $22.39 | $19.14 | $20.86 |
| Total return (%)2 | (2.79) | 10.46 | 20.25 | (2.35) | 14.13 |
| Ratios and supplemental data | |||||
| Net assets, end of period (in millions) | $7,784 | $9,799 | $9,512 | $7,802 | $7,116 |
| Ratios (as a percentage of average net assets): | |||||
| Expenses before reductions | 0.88 | 0.86 | 0.86 | 0.87 | 0.87 |
| Expenses including reductions | 0.87 | 0.85 | 0.86 | 0.86 | 0.86 |
| Net investment income | 0.82 | 0.58 | 0.75 | 0.99 | 0.63 |
| Portfolio turnover (%) | 53 | 53 | 50 | 47 | 35 |
| 1 | Based on average daily shares outstanding. |
| 2 | Total returns would have been lower had certain expenses not been reduced during the applicable periods. |
| 22 | JOHN HANCOCK Disciplined Value Mid Cap Fund | ANNUAL REPORT | SEE NOTES TO FINANCIAL STATEMENTS |
| CLASS R2 SHARES Period ended | 3-31-19 | 3-31-18 | 3-31-17 | 3-31-16 | 3-31-15 |
| Per share operating performance | |||||
| Net asset value, beginning of period | $23.14 | $22.32 | $19.09 | $20.81 | $18.77 |
| Net investment income1 | 0.09 | 0.04 | 0.07 | 0.11 | 0.04 |
| Net realized and unrealized gain (loss) on investments | (1.04) | 2.19 | 3.68 | (0.66) | 2.48 |
| Total from investment operations | (0.95) | 2.23 | 3.75 | (0.55) | 2.52 |
| Less distributions | |||||
| From net investment income | (0.09) | (0.03) | (0.11) | (0.04) | (0.03) |
| From net realized gain | (2.25) | (1.38) | (0.41) | (1.13) | (0.45) |
| Total distributions | (2.34) | (1.41) | (0.52) | (1.17) | (0.48) |
| Net asset value, end of period | $19.85 | $23.14 | $22.32 | $19.09 | $20.81 |
| Total return (%)2 | (3.14) | 10.03 | 19.76 | (2.74) | 13.66 |
| Ratios and supplemental data | |||||
| Net assets, end of period (in millions) | $131 | $188 | $216 | $234 | $250 |
| Ratios (as a percentage of average net assets): | |||||
| Expenses before reductions | 1.27 | 1.26 | 1.27 | 1.27 | 1.29 |
| Expenses including reductions | 1.26 | 1.25 | 1.26 | 1.27 | 1.28 |
| Net investment income | 0.41 | 0.17 | 0.35 | 0.56 | 0.19 |
| Portfolio turnover (%) | 53 | 53 | 50 | 47 | 35 |
| 1 | Based on average daily shares outstanding. |
| 2 | Total returns would have been lower had certain expenses not been reduced during the applicable periods. |
| SEE NOTES TO FINANCIAL STATEMENTS | ANNUAL REPORT | JOHN HANCOCK Disciplined Value Mid Cap Fund | 23 |
| CLASS R4 SHARES Period ended | 3-31-19 | 3-31-18 | 3-31-17 | 3-31-16 | 3-31-15 |
| Per share operating performance | |||||
| Net asset value, beginning of period | $23.20 | $22.38 | $19.13 | $20.85 | $18.81 |
| Net investment income1 | 0.15 | 0.09 | 0.12 | 0.16 | 0.10 |
| Net realized and unrealized gain (loss) on investments | (1.05) | 2.20 | 3.70 | (0.66) | 2.47 |
| Total from investment operations | (0.90) | 2.29 | 3.82 | (0.50) | 2.57 |
| Less distributions | |||||
| From net investment income | (0.15) | (0.09) | (0.16) | (0.09) | (0.08) |
| From net realized gain | (2.25) | (1.38) | (0.41) | (1.13) | (0.45) |
| Total distributions | (2.40) | (1.47) | (0.57) | (1.22) | (0.53) |
| Net asset value, end of period | $19.90 | $23.20 | $22.38 | $19.13 | $20.85 |
| Total return (%)2 | (2.90) | 10.26 | 20.09 | (2.50) | 13.93 |
| Ratios and supplemental data | |||||
| Net assets, end of period (in millions) | $74 | $97 | $95 | $104 | $118 |
| Ratios (as a percentage of average net assets): | |||||
| Expenses before reductions | 1.12 | 1.12 | 1.11 | 1.12 | 1.15 |
| Expenses including reductions | 1.01 | 1.01 | 1.00 | 1.02 | 1.04 |
| Net investment income | 0.68 | 0.42 | 0.60 | 0.81 | 0.49 |
| Portfolio turnover (%) | 53 | 53 | 50 | 47 | 35 |
| 1 | Based on average daily shares outstanding. |
| 2 | Total returns would have been lower had certain expenses not been reduced during the applicable periods. |
| 24 | JOHN HANCOCK Disciplined Value Mid Cap Fund | ANNUAL REPORT | SEE NOTES TO FINANCIAL STATEMENTS |
| CLASS R6 SHARES Period ended | 3-31-19 | 3-31-18 | 3-31-17 | 3-31-16 | 3-31-15 |
| Per share operating performance | |||||
| Net asset value, beginning of period | $23.21 | $22.38 | $19.13 | $20.85 | $18.81 |
| Net investment income1 | 0.21 | 0.17 | 0.18 | 0.22 | 0.14 |
| Net realized and unrealized gain (loss) on investments | (1.07) | 2.18 | 3.69 | (0.67) | 2.48 |
| Total from investment operations | (0.86) | 2.35 | 3.87 | (0.45) | 2.62 |
| Less distributions | |||||
| From net investment income | (0.20) | (0.14) | (0.21) | (0.14) | (0.13) |
| From net realized gain | (2.25) | (1.38) | (0.41) | (1.13) | (0.45) |
| Total distributions | (2.45) | (1.52) | (0.62) | (1.27) | (0.58) |
| Net asset value, end of period | $19.90 | $23.21 | $22.38 | $19.13 | $20.85 |
| Total return (%)2 | (2.66) | 10.56 | 20.35 | (2.25) | 14.21 |
| Ratios and supplemental data | |||||
| Net assets, end of period (in millions) | $2,994 | $2,748 | $1,774 | $1,053 | $807 |
| Ratios (as a percentage of average net assets): | |||||
| Expenses before reductions | 0.77 | 0.77 | 0.77 | 0.77 | 0.78 |
| Expenses including reductions | 0.76 | 0.76 | 0.76 | 0.76 | 0.77 |
| Net investment income | 0.96 | 0.71 | 0.86 | 1.13 | 0.73 |
| Portfolio turnover (%) | 53 | 53 | 50 | 47 | 35 |
| 1 | Based on average daily shares outstanding. |
| 2 | Total returns would have been lower had certain expenses not been reduced during the applicable periods. |
| SEE NOTES TO FINANCIAL STATEMENTS | ANNUAL REPORT | JOHN HANCOCK Disciplined Value Mid Cap Fund | 25 |
| CLASS ADV SHARES Period ended | 3-31-19 | 3-31-18 | 3-31-17 | 3-31-16 | 3-31-15 |
| Per share operating performance | |||||
| Net asset value, beginning of period | $22.30 | $21.56 | $18.46 | $20.15 | $18.20 |
| Net investment income1 | 0.11 | 0.07 | 0.11 | 0.12 | 0.04 |
| Net realized and unrealized gain (loss) on investments | (1.00) | 2.11 | 3.54 | (0.63) | 2.40 |
| Total from investment operations | (0.89) | 2.18 | 3.65 | (0.51) | 2.44 |
| Less distributions | |||||
| From net investment income | (0.13) | (0.06) | (0.14) | (0.05) | (0.04) |
| From net realized gain | (2.25) | (1.38) | (0.41) | (1.13) | (0.45) |
| Total distributions | (2.38) | (1.44) | (0.55) | (1.18) | (0.49) |
| Net asset value, end of period | $19.03 | $22.30 | $21.56 | $18.46 | $20.15 |
| Total return (%)2 | (2.98) | 10.17 | 19.88 | (2.59) | 13.67 |
| Ratios and supplemental data | |||||
| Net assets, end of period (in millions) | $1 | $2 | $2 | $1 | $1 |
| Ratios (as a percentage of average net assets): | |||||
| Expenses before reductions | 1.11 | 1.11 | 1.13 | 1.42 | 3.12 |
| Expenses including reductions | 1.10 | 1.10 | 1.12 | 1.16 | 1.25 |
| Net investment income | 0.49 | 0.32 | 0.55 | 0.63 | 0.21 |
| Portfolio turnover (%) | 53 | 53 | 50 | 47 | 35 |
| 1 | Based on average daily shares outstanding. |
| 2 | Total returns would have been lower had certain expenses not been reduced during the applicable periods. |
| 26 | JOHN HANCOCK Disciplined Value Mid Cap Fund | ANNUAL REPORT | SEE NOTES TO FINANCIAL STATEMENTS |
Note 1 — Organization
John Hancock Disciplined Value Mid Cap Fund (the fund) is a series of John Hancock Funds III (the Trust), an open-end management investment company organized as a Massachusetts business trust and registered under the Investment Company Act of 1940, as amended (the 1940 Act). The investment objective of the fund is to seek long-term growth of capital with current income as a secondary objective.
The fund may offer multiple classes of shares. The shares currently offered by the fund are detailed in the Statement of assets and liabilities. Class A and Class C are offered to all investors. Class I shares are offered to institutions and certain investors. Class R2 and Class R4 shares are only available to certain retirement and 529 plans. Class R6 shares are available only to certain retirement plans, institutions and other investors. Class ADV shares are available only to investors who acquired Class A shares as a result of the reorganization of the Robeco Boston Partners Mid Cap Value Fund into the fund. Class C shares convert to Class A shares ten years after purchase (certain exclusions may apply). Shareholders of each class have exclusive voting rights to matters that affect that class. The distribution and service fees, if any, and transfer agent fees for each class may differ.
Effective March 11, 2019, all classes of shares offered by the fund are reopened to new investors.
Note 2 — Significant accounting policies
The financial statements have been prepared in conformity with accounting principles generally accepted in the United States of America (US GAAP), which require management to make certain estimates and assumptions as of the date of the financial statements. Actual results could differ from those estimates and those differences could be significant. The fund qualifies as an investment company under Topic 946 of Accounting Standards Codification of US GAAP.
Events or transactions occurring after the end of the fiscal period through the date that the financial statements were issued have been evaluated in the preparation of the financial statements. The following summarizes the significant accounting policies of the fund:
Security valuation.Investments are stated at value as of the scheduled close of regular trading on the New York Stock Exchange (NYSE), normally at 4:00 p.m., Eastern Time. In case of emergency or other disruption resulting in the NYSE not opening for trading or the NYSE closing at a time other than the regularly scheduled close, the net asset value (NAV) may be determined as of the regularly scheduled close of the NYSE pursuant to the fund's Valuation Policies and Procedures.
In order to value the securities, the fund uses the following valuation techniques: Equity securities held by the fund are typically valued at the last sale price or official closing price on the exchange or principal market where the security trades. In the event there were no sales during the day or closing prices are not available, the securities are valued using the last available bid price. Investments by the fund in open-end mutual funds, including John Hancock Collateral Trust (JHCT), are valued at their respective NAVs each business day.
In certain instances, the Pricing Committee may determine to value equity securities using prices obtained from another exchange or market if trading on the exchange or market on which prices are typically obtained did not open for trading as scheduled, or if trading closed earlier than scheduled, and trading occurred as normal on another exchange or market. Other portfolio securities and assets, for which reliable market quotations are not readily available, are valued at fair value as determined in good faith by the fund's Pricing Committee following procedures established by the Board of Trustees. The frequency with which these fair valuation procedures are used cannot be predicted and fair value of securities may differ significantly from the value that would have been used had a ready market for such securities existed.
The fund uses a three-tier hierarchy to prioritize the pricing assumptions, referred to as inputs, used in valuation techniques to measure fair value. Level 1 includes securities valued using quoted prices in active markets for identical securities. Level 2 includes securities valued using other significant observable inputs. Observable inputs may include quoted prices for similar securities, interest rates, prepayment speeds and credit risk. Prices for securities valued using these inputs are received from independent pricing vendors and brokers and are based on an evaluation of the inputs described. Level 3 includes securities valued using significant unobservable inputs when market prices are not readily available or reliable, including the fund's own assumptions in determining the fair value of investments. Factors used in determining value may include market or issuer specific events or trends, changes in interest rates and credit quality. The inputs or methodology used for valuing securities are not necessarily an indication of the risks associated with investing in those securities. Changes in valuation techniques and related inputs may result in transfers into or out of an assigned level within the disclosure hierarchy.
As of March 31, 2019, all investments are categorized as Level 1 under the hierarchy described above.
Security transactions and related investment income. Investment security transactions are accounted for on a trade date plus one basis for daily NAV calculations. However, for financial reporting purposes, investment transactions are reported on trade date. Interest income is accrued as earned. Dividend income is recorded on the ex-date, except for dividends of foreign securities where the dividend may not be known until after the ex-date. In those cases, dividend income, net of withholding taxes, is recorded when the fund becomes aware of the dividends. Non-cash dividends, if any, are recorded at the fair market value of the securities received. Gains and losses on securities sold are determined on the basis of identified cost and may include proceeds from litigation.
Real estate investment trusts. The fund may invest in real estate investment trusts (REITs). Distributions from REITs may be recorded as income and subsequently characterized by the REIT at the end of the fiscal year as a reduction of cost of investments and/or as a realized gain. As a result, the fund will estimate the components of distributions from these securities. Such estimates are revised when the actual components of the distributions are known.
Securities lending. The fund may lend its securities to earn additional income. The fund receives cash collateral from the borrower in an amount not less than the market value of the loaned securities. The fund will invest its collateral in JHCT, an affiliate of the fund, which has a floating NAV and is registered with the Securities and Exchange Commission (SEC) as an investment company. JHCT invests in short-term money market investments. The fund will receive the benefit of any gains and bear any losses generated by JHCT with respect to the cash collateral.
The fund has the right to recall loaned securities on demand. If a borrower fails to return loaned securities when due, then the lending agent is responsible and indemnifies the fund for the lent securities. The lending agent uses the collateral received from the borrower to purchase replacement securities of the same issue, type, class and series of the loaned securities. If the value of the collateral is less than the purchase cost of replacement securities, the lending agent is responsible for satisfying the shortfall but only to the extent that the shortfall is not due to any decrease in the value of JHCT.
Although the risk of the loss of the securities lent is mitigated by receiving collateral from the borrower and through lending agent indemnification, the fund could experience a delay in recovering securities or could experience a lower than expected return if the borrower fails to return the securities on a timely basis. The fund receives compensation for lending its securities by retaining a portion of the return on the investment of the collateral and compensation from fees earned from borrowers of the securities. Securities lending income received by the fund is net of fees retained by the securities lending agent. Net income received from JHCT is a component of securities lending income as recorded on the Statement of operations.
Obligations to repay collateral received by the fund are shown on the Statement of assets and liabilities as Payable upon return of securities loaned and are secured by the loaned securities. As of March 31, 2019, the fund loaned common stocks valued at $5,841,186 and received $6,144,514 of cash collateral.
Foreign taxes. The fund may be subject to withholding tax on income, capital gains or repatriation taxes imposed by certain countries, a portion of which may be recoverable. Foreign taxes are accrued based upon the fund's understanding of the tax rules and rates that exist in the foreign markets in which it invests. Taxes are accrued based on gains realized by the fund as a result of certain foreign security sales. In certain circumstances, estimated taxes are accrued based on unrealized appreciation of such securities. Investment income is recorded net of foreign withholding taxes.
Line of credit. The fund may have the ability to borrow from banks for temporary or emergency purposes, including meeting redemption requests that otherwise might require the untimely sale of securities. Pursuant to the fund's custodian agreement, the custodian may loan money to the fund to make properly authorized payments. The fund is obligated to repay the custodian for any overdraft, including any related costs or expenses. The custodian may have a lien, security interest or security entitlement in any fund property that is not otherwise segregated or pledged, to the extent of any overdraft, and to the maximum extent permitted by law.
The fund and other affiliated funds have entered into a syndicated line of credit agreement with Citibank, N.A. as the administrative agent that enables them to participate in a $750 million unsecured committed line of credit. Excluding commitments designated for a certain fund and subject to the needs of all other affiliated funds, the fund can borrow up to an aggregate commitment amount of $500 million, subject to asset coverage and other limitations as specified in the agreement. A commitment fee payable at the end of each calendar quarter, based on the average daily unused portion of the line of credit, is charged to each participating fund based on a combination of fixed and asset based allocations and is reflected in Other expenses on the Statement of operations. Commitment fees for the year ended March 31, 2019 were $32,108.
Expenses. Within the John Hancock group of funds complex, expenses that are directly attributable to an individual fund are allocated to such fund. Expenses that are not readily attributable to a specific fund are allocated among all funds in an equitable manner, taking into consideration, among other things, the nature and type of expense and the fund's relative net assets. Expense estimates are accrued in the period to which they relate and adjustments are made when actual amounts are known.
Class allocations. Income, common expenses and realized and unrealized gains (losses) are determined at the fund level and allocated daily to each class of shares based on the net assets of the class. Class-specific expenses, such as distribution and service fees, if any, and transfer agent fees, for all classes, are charged daily at the class level based on the net assets of each class and the specific expense rates applicable to each class.
Federal income taxes. The fund intends to continue to qualify as a regulated investment company by complying with the applicable provisions of the Internal Revenue Code and will not be subject to federal income tax on taxable income that is distributed to shareholders. Therefore, no federal income tax provision is required.
As of March 31, 2019, the fund had no uncertain tax positions that would require financial statement recognition, derecognition or disclosure. The fund's federal tax returns are subject to examination by the Internal Revenue Service for a period of three years.
Distribution of income and gains. Distributions to shareholders from net investment income and net realized gains, if any, are recorded on the ex-date. The fund generally declares and pays dividends and capital gain distributions, if any, annually.
The tax character of distributions for the years ended March 31, 2019 and 2018 was as follows:
| March 31, 2019 | March 31, 2018 | |
| Ordinary Income | $151,378,321 | $84,356,038 |
| Long-Term Capital Gain | 1,275,004,579 | 823,050,799 |
| Total | $1,426,382,900 | $907,406,837 |
Distributions paid by the fund with respect to each class of shares are calculated in the same manner, at the same time and in the same amount, except for the effect of class level expenses that may be applied differently to each class. As of March 31, 2019, the components of distributable earnings on a tax basis consisted of $24,801,729 of undistributed ordinary income and $12,701,438 of undistributed long-term capital gains.
Such distributions and distributable earnings, on a tax basis, are determined in conformity with income tax regulations, which may differ from US GAAP. Distributions in excess of tax basis earnings and profits, if any, are reported in the fund's financial statements as a return of capital.
Capital accounts within the financial statements are adjusted for permanent book-tax differences. These adjustments have no impact on net assets or the results of operations. Temporary book-tax differences, if any, will reverse in a subsequent period. Book-tax differences are primarily attributable to wash sale loss deferrals and treatment of a portion of the proceeds from redemptions as distributions for tax purposes.
Note 3 — Guarantees and indemnifications
Under the Trust's organizational documents, its Officers and Trustees are indemnified against certain liabilities arising out of the performance of their duties to the Trust, including the fund. Additionally, in the normal course of business, the fund enters into contracts with service providers that contain general indemnification clauses. The fund's maximum exposure under these arrangements is unknown, as this would involve future claims that may be made against the fund that have not yet occurred. The risk of material loss from such claims is considered remote.
Note 4 — Fees and transactions with affiliates
John Hancock Advisers, LLC (the Advisor) serves as investment advisor for the fund. John Hancock Funds, LLC (the Distributor), an affiliate of the Advisor, serves as principal underwriter of the fund. The Advisor and the Distributor are indirect, wholly owned subsidiaries of Manulife Financial Corporation.
Management fee. The fund has an investment management agreement with the Advisor under which the fund pays a daily management fee to the Advisor equivalent on an annual basis to the sum of: (a) 0.800% of the first $500 million of the fund's average daily net assets; (b) 0.775% of the next $500 million of the fund's average daily net assets; (c) 0.750% of the next $500 million of the fund's average daily net assets; (d) 0.725% of the next $1 billion of the fund's average daily net assets; and (e) 0.700% of the fund's average daily net assets in excess of $2.5 billion. The Advisor has a subadvisory agreement with Boston Partners Global Investors, Inc., an indirect, wholly owned subsidiary of Orix Corporation of Japan. The fund is not responsible for payment of the subadvisory fees.
The Advisor has contractually agreed to waive a portion of its management fee and/or reimburse expenses for certain funds of the John Hancock group of funds complex, including the fund (the participating portfolios). This waiver is based upon aggregate net assets of all the participating portfolios. The amount of the reimbursement is calculated daily and allocated among all the participating portfolios in proportion to the daily net assets of each fund. During the year ended March 31, 2019, this waiver amounted to 0.01% of the fund's average net assets. This agreement expires on June 30, 2020, unless renewed by mutual agreement of the fund and the Advisor based upon a determination that this is appropriate under the circumstances at that time.
For the year ended March 31, 2019, these expense reductions amounted to the following:
| Class | Expense reduction | Class | Expense reduction | |
| Class A | $109,416 | Class R4 | $7,083 | |
| Class C | 18,636 | Class R6 | 230,678 | |
| Class I | 717,390 | Class ADV | 134 | |
| Class R2 | 12,736 | Total | $1,096,073 |
Expenses waived or reimbursed in the current fiscal period are not subject to recapture in future fiscal periods.
The investment management fees, including the impact of the waivers and reimbursements as described above, incurred for the year ended March 31, 2019 were equivalent to a net annual effective rate of 0.70% of the fund's average daily net assets.
Accounting and legal services. Pursuant to a service agreement, the fund reimburses the Advisor for all expenses associated with providing the administrative, financial, legal, compliance, accounting and recordkeeping services to the fund, including the preparation of all tax returns, periodic reports to shareholders and regulatory reports, among other services. These expenses are allocated to each share class based on its relative net assets at the time the expense was incurred. These accounting and legal services fees incurred for the year ended March 31, 2019 amounted to an annual rate of 0.02% of the fund's average daily net assets.
Distribution and service plans. The fund has a distribution agreement with the Distributor. The fund has adopted distribution and service plans with respect to Class A, Class C, Class R2, Class R4 and Class ADV shares pursuant to Rule 12b-1 under the 1940 Act, to pay the Distributor for services provided as the distributor of shares of the fund. In addition, under a service plan for Class R2 and Class R4 shares, the fund pays for certain other services. The fund may pay up to the following contractual rates of distribution and service fees under these arrangements, expressed as an annual percentage of average daily net assets for each class of the fund's shares.
| Class | Rule 12b-1 fee | Service fee | Class | Rule 12b-1 fee | Service fee | |
| Class A | 0.30% | — | Class R4 | 0.25% | 0.10% | |
| Class C | 1.00% | — | Class ADV | 0.25% | — | |
| Class R2 | 0.25% | 0.25% |
Class A shares are currently charged 0.25% for Rule 12b-1 fees.
The fund's Distributor has contractually agreed to waive 0.10% of Rule12b-1 fees for Class R4 shares. The current waiver agreement expires on July 31, 2020, unless renewed by mutual agreement of the fund and the Distributor based upon a determination that this is appropriate under the circumstances at the time. This contractual waiver amounted to $88,595 for Class R4 shares for the year ended March 31, 2019.
Sales charges. Class A shares are assessed up-front sales charges, which resulted in payments to the Distributor amounting to $334,408 for the year ended March 31, 2019. Of this amount, $41,414 was retained and used for printing prospectuses, advertising, sales literature and other purposes, $292,525 was paid as sales commissions to broker-dealers and $469 was paid as sales commissions to sales personnel of Signator Investors, Inc., which had been a broker-dealer affiliate of the Advisor through November 2, 2018.
Class A and Class C shares may be subject to contingent deferred sales charges (CDSCs). Certain Class A shares that are acquired through purchases of $1 million or more and are redeemed within one year of purchase are subject to a 1.00% sales charge. Class C shares that are redeemed within one year of purchase are subject to a 1.00% CDSC.
CDSCs are applied to the lesser of the current market value at the time of redemption or the original purchase cost of the shares being redeemed. Proceeds from CDSCs are used to compensate the Distributor for providing distribution-related services in connection with the sale of these shares. During the year ended March 31, 2019, CDSCs received by the Distributor amounted to $1,069 and $6,029 for Class A and Class C shares, respectively.
Transfer agent fees. The John Hancock group of funds has a complex-wide transfer agent agreement with John Hancock Signature Services, Inc. (Signature Services), an affiliate of the Advisor. The transfer agent fees paid to Signature Services are determined based on the cost to Signature Services (Signature Services Cost) of providing recordkeeping services. It also includes out-of-pocket expenses, including payments made to third-parties for recordkeeping services provided to their clients who invest in one or more John Hancock funds. In addition, Signature Services Cost may be reduced by certain fees that Signature Services receives in connection with retirement and small accounts. Signature Services Cost is calculated monthly and allocated, as applicable, to five categories of share classes: Retail Share and Institutional Share Classes of Non-Municipal Bond Funds, Class R6 Shares, Retirement Share Classes and Municipal Bond Share Classes. Within each of these categories, the applicable costs are allocated to the affected John Hancock affiliated funds and/or classes, based on the relative average daily net assets.
Class level expenses. Class level expenses for the year ended March 31, 2019 were:
| Class | Distribution and service fees | Transfer agent fees |
| Class A | $3,421,724 | $1,503,716 |
| Class C | 2,326,853 | 255,325 |
| Class I | — | 11,225,387 |
| Class R2 | 796,373 | 20,952 |
| Class R4 | 310,082 | 11,664 |
| Class R6 | — | 385,933 |
| Class ADV | 4,151 | 1,813 |
| Total | $6,859,183 | $13,404,790 |
Trustee expenses.The fund compensates each Trustee who is not an employee of the Advisor or its affiliates. The costs of paying Trustee compensation and expenses are allocated to the fund based on its net assets relative to other funds within the John Hancock group of funds complex.
Interfund lending program. Pursuant to an Exemptive Order issued by the SEC, the fund, along with certain other funds advised by the Advisor or its affiliates, may participate in an interfund lending program. This program provides an alternative credit facility allowing the funds to borrow from, or lend money to, other participating affiliated funds. Any open loans at period end are presented under the caption Receivable for interfund lending in the Statement of assets and liabilities. The fund's activity in this program during the period for which loans were outstanding was as follows:
| Borrower or lender | Weighted average loan balance | Days outstanding | Weighted average interest rate | Interest income |
| Lender | $10,117,882 | 6 | 2.250% | $3,794 |
Note 5 — Fund share transactions
Transactions in fund shares for the fund for the years ended March 31, 2019 and 2018 were as follows:
| Year ended 3-31-19 | Year ended 3-31-18 | |||||||||||||||||||||||||
| Shares | Amount | Shares | Amount | |||||||||||||||||||||||
| Class A shares | ||||||||||||||||||||||||||
| Sold | 9,600,767 | $196,392,115 | 11,235,851 | $250,783,397 | ||||||||||||||||||||||
| Distributions reinvested | 7,176,446 | 124,941,934 | 3,987,112 | 88,792,985 | ||||||||||||||||||||||
| Repurchased | (23,945,531 | ) | (486,398,627 | ) | (42,639,114 | ) | (955,514,561 | ) | ||||||||||||||||||
| Net decrease | (7,168,318 | ) | $(165,064,578 | ) | (27,416,151 | ) | $(615,938,179 | ) | ||||||||||||||||||
| Class C shares | ||||||||||||||||||||||||||
| Sold | 535,694 | $10,538,379 | 468,051 | $10,479,110 | ||||||||||||||||||||||
| Distributions reinvested | 1,097,981 | 19,203,695 | 643,421 | 14,406,199 | ||||||||||||||||||||||
| Repurchased | (4,549,113 | ) | (92,210,346 | ) | (3,339,879 | ) | (74,955,162 | ) | ||||||||||||||||||
| Net decrease | (2,915,438 | ) | $(62,468,272 | ) | (2,228,407 | ) | $(50,069,853 | ) | ||||||||||||||||||
| Class I shares | ||||||||||||||||||||||||||
| Sold | 96,199,367 | $2,043,980,260 | 100,579,986 | $2,335,529,208 | ||||||||||||||||||||||
| Distributions reinvested | 42,216,483 | 766,651,337 | 22,467,686 | 519,452,895 | ||||||||||||||||||||||
| Repurchased | (169,569,857 | ) | (3,552,367,272 | ) | (125,787,847 | ) | (2,934,539,252 | ) | ||||||||||||||||||
| Net decrease | (31,154,007 | ) | $(741,735,675 | ) | (2,740,175 | ) | $(79,557,149 | ) | ||||||||||||||||||
| Class R2 shares | ||||||||||||||||||||||||||
| Sold | 1,473,157 | $30,719,374 | 1,729,337 | $40,010,051 | ||||||||||||||||||||||
| Distributions reinvested | 678,989 | 12,303,280 | 415,562 | 9,582,855 | ||||||||||||||||||||||
| Repurchased | (3,661,304 | ) | (79,802,365 | ) | (3,708,925 | ) | (86,242,670 | ) | ||||||||||||||||||
| Net decrease | (1,509,158 | ) | $(36,779,711 | ) | (1,564,026 | ) | $(36,649,764 | ) | ||||||||||||||||||
| Class R4 shares | ||||||||||||||||||||||||||
| Sold | 878,937 | $19,103,976 | 1,094,641 | $25,429,018 | ||||||||||||||||||||||
| Distributions reinvested | 513,681 | 9,323,305 | 263,798 | 6,096,377 | ||||||||||||||||||||||
| Repurchased | (1,849,341 | ) | (38,431,474 | ) | (1,425,921 | ) | (33,310,046 | ) | ||||||||||||||||||
| Net decrease | (456,723 | ) | $(10,004,193 | ) | (67,482 | ) | $(1,784,651 | ) | ||||||||||||||||||
| Class R6 shares | ||||||||||||||||||||||||||
| Sold | 48,812,674 | $1,040,348,591 | 53,459,571 | $1,263,250,283 | ||||||||||||||||||||||
| Distributions reinvested | 16,526,815 | 299,796,417 | 6,815,858 | 157,514,495 | ||||||||||||||||||||||
| Repurchased | (33,281,169 | ) | (707,145,429 | ) | (21,142,024 | ) | (493,583,155 | ) | ||||||||||||||||||
| Net increase | 32,058,320 | $632,999,579 | 39,133,405 | $927,181,623 | ||||||||||||||||||||||
| Class ADV shares | ||||||||||||||||||||||||||
| Sold | 1,749 | $38,161 | 1,177 | $25,991 | ||||||||||||||||||||||
| Distributions reinvested | 10,753 | 186,669 | 5,971 | 132,675 | ||||||||||||||||||||||
| Repurchased | (76,260 | ) | (1,445,473 | ) | (11,864 | ) | (265,110 | ) | ||||||||||||||||||
| Net decrease | (63,758 | ) | $(1,220,643 | ) | (4,716 | ) | $(106,444 | ) | ||||||||||||||||||
| Total net increase (decrease) | (11,209,082 | ) | $(384,273,493 | ) | 5,112,448 | $143,075,583 | ||||||||||||||||||||
Note 6 — Purchase and sale of securities
Purchases and sales of securities, other than short-term investments, amounted to $7,057,799,076 and $8,619,143,191, respectively, for the year ended March 31, 2019.
Note 7 — Investment in affiliated underlying funds
The fund may invest in affiliated underlying funds that are managed by the Advisor and its affiliates. Information regarding the fund's purchases and sales of the affiliated underlying funds as well as income and capital gains earned, if any, during the period is as follows:
| Dividends and distributions | ||||||||||||||||||||||||||||||||||||||
| Fund | Beginning share amount | Shares purchased | Shares sold | Ending share amount | Income distributions received | Capital gain distributions received | Realized gain (loss) | Change in unrealized appreciation (depreciation) | Ending value | |||||||||||||||||||||||||||||
| John Hancock Collateral Trust* | 615,609 | 81,394,724 | (81,396,364 | ) | 613,969 | — | — | ($6,179 | ) | $61 | $6,143,864 | |||||||||||||||||||||||||||
| *Refer to the Securities lending note within Note 2 for details regarding this investment. | ||||||||||||||||||||||||||||||||||||||
REPORT OF INDEPENDENT REGISTERED PUBLIC ACCOUNTING FIRM
To the Board of Trustees of John Hancock Funds III and Shareholders of John Hancock Disciplined Value Mid Cap Fund
Opinion on the Financial Statements
We have audited the accompanying statement of assets and liabilities, including the Fund's investments, of John Hancock Disciplined Value Mid Cap Fund (one of the funds constituting John Hancock Funds III, referred to hereafter as the "Fund") as of March 31, 2019, the related statement of operations for the year ended March 31, 2019, the statements of changes in net assets for each of the two years in the period ended March 31, 2019, including the related notes, and the financial highlights for each of the five years in the period ended March 31, 2019 (collectively referred to as the "financial statements"). In our opinion, the financial statements present fairly, in all material respects, the financial position of the Fund as of March 31, 2019, the results of its operations for the year then ended, the changes in its net assets for each of the two years in the period ended March 31, 2019 and the financial highlights for each of the five years in the period ended March 31, 2019 in conformity with accounting principles generally accepted in the United States of America.
Basis for Opinion
These financial statements are the responsibility of the Fund's management. Our responsibility is to express an opinion on the Fund's financial statements based on our audits. We are a public accounting firm registered with the Public Company Accounting Oversight Board (United States) ("PCAOB") and are required to be independent with respect to the Fund in accordance with the U.S. federal securities laws and the applicable rules and regulations of the Securities and Exchange Commission and the PCAOB.
We conducted our audits of these financial statements in accordance with the standards of the PCAOB. Those standards require that we plan and perform the audit to obtain reasonable assurance about whether the financial statements are free of material misstatement, whether due to error or fraud.
Our audits included performing procedures to assess the risks of material misstatement of the financial statements, whether due to error or fraud, and performing procedures that respond to those risks. Such procedures included examining, on a test basis, evidence regarding the amounts and disclosures in the financial statements. Our audits also included evaluating the accounting principles used and significant estimates made by management, as well as evaluating the overall presentation of the financial statements. Our procedures included confirmation of securities owned as of March 31, 2019 by correspondence with the custodian, transfer agents, and brokers; when replies were not received from brokers, we performed other auditing procedures. We believe that our audits provide a reasonable basis for our opinion.
/s/ PricewaterhouseCoopers LLP
Boston, Massachusetts
May 16, 2019
We have served as the auditor of one or more investment companies in the John Hancock group of funds since 1988.
Unaudited
For federal income tax purposes, the following information is furnished with respect to the distributions of the fund, if any, paid during its taxable year ended March 31, 2019.
The fund reports the maximum amount allowable of its net taxable income as eligible for the corporate dividends-received deduction.
The fund reports the maximum amount allowable of its net taxable income as qualified dividend income as provided in the Jobs and Growth Tax Relief Reconciliation Act of 2003.
The fund paid $1,314,432,434 in capital gain dividends.
Eligible shareholders will be mailed a 2019 Form 1099-DIV in early 2020. This will reflect the tax character of all distributions paid in calendar year 2019.
Please consult a tax advisor regarding the tax consequences of your investment in the fund.
This chart provides information about the Trustees and Officers who oversee your John Hancock fund. Officers elected by the Trustees manage the day-to-day operations of the fund and execute policies formulated by the Trustees.
Independent Trustees
| Name, year of birth Position(s) held with Trust Principal occupation(s) and other directorships during past 5 years | Trustee of the Trust since1 | Number of John Hancock funds overseen by Trustee |
| Hassell H. McClellan, Born: 1945 | 2012 | 215 |
| Trustee and Chairperson of the Board Director/Trustee, Virtus Funds (since 2008); Director, The Barnes Group (since 2010); Associate Professor, The Wallace E. Carroll School of Management, Boston College (retired 2013). Trustee (since 2005) and Chairperson of the Board (since 2017) of various trusts within the John Hancock Fund Complex. | ||
| Charles L. Bardelis,2 Born: 1941 | 2012 | 215 |
| Trustee Director, Island Commuter Corp. (marine transport). Trustee of various trusts within the John Hancock Fund Complex (since 1988). | ||
| James R. Boyle,Born: 1959 | 2015 | 215 |
| Trustee Chief Executive Officer, Foresters Financial (since 2018); Chairman and Chief Executive Officer, Zillion Group, Inc. (formerly HealthFleet, Inc.) (healthcare) (2014-2018); Executive Vice President and Chief Executive Officer, U.S. Life Insurance Division of Genworth Financial, Inc. (insurance) (January 2014-July 2014); Senior Executive Vice President, Manulife Financial, President and Chief Executive Officer, John Hancock (1999-2012); Chairman and Director, John Hancock Advisers, LLC, John Hancock Funds, LLC, and John Hancock Investment Management Services, LLC (2005-2010). Trustee of various trusts within the John Hancock Fund Complex (2005-2014 and since 2015). | ||
| Peter S. Burgess,2 Born: 1942 | 2012 | 215 |
| Trustee Consultant (financial, accounting, and auditing matters) (since 1999); Certified Public Accountant; Partner, Arthur Andersen (independent public accounting firm) (prior to 1999); Director, Lincoln Educational Services Corporation (since 2004); Director, Symetra Financial Corporation (2010-2016); Director, PMA Capital Corporation (2004-2010). Trustee of various trusts within the John Hancock Fund Complex (since 2005). | ||
| William H. Cunningham, Born: 1944 | 2006 | 215 |
| Trustee Professor, University of Texas, Austin, Texas (since 1971); former Chancellor, University of Texas System and former President of the University of Texas, Austin, Texas; Chairman (since 2009) and Director (since 2006), Lincoln National Corporation (insurance); Director, Southwest Airlines (since 2000); former Director, LIN Television (2009-2014). Trustee of various trusts within the John Hancock Fund Complex (since 1986). | ||
| Grace K. Fey, Born: 1946 | 2012 | 215 |
| Trustee Chief Executive Officer, Grace Fey Advisors (since 2007); Director and Executive Vice President, Frontier Capital Management Company (1988-2007); Director, Fiduciary Trust (since 2009). Trustee of various trusts within the John Hancock Fund Complex (since 2008). | ||
Independent Trustees (continued)
| Name, year of birth Position(s) held with Trust Principal occupation(s) and other directorships during past 5 years | Trustee of the Trust since1 | Number of John Hancock funds overseen by Trustee |
| Theron S. Hoffman,2 Born: 1947 | 2012 | 215 |
| Trustee Chief Executive Officer, T. Hoffman Associates, LLC (consulting firm) (since 2003); Director, The Todd Organization (consulting firm) (2003-2010); President, Westport Resources Management (investment management consulting firm) (2006-2008); Board Member, Senior Managing Director, Partner, and Operating Head, Putnam Investments (2000-2003); Executive Vice President, The Thomson Corp. (financial and legal information publishing) (1997-2000). Trustee of various trusts within the John Hancock Fund Complex (since 2008). | ||
| Deborah C. Jackson, Born: 1952 | 2008 | 215 |
| Trustee President, Cambridge College, Cambridge, Massachusetts (since 2011); Board of Directors, National Association of Corporate Directors/New England (since 2015); Board of Directors, Association of Independent Colleges and Universities of Massachusetts (since 2014); Chief Executive Officer, American Red Cross of Massachusetts Bay (2002-2011); Board of Directors of Eastern Bank Corporation (since 2001); Board of Directors of Eastern Bank Charitable Foundation (since 2001); Board of Directors of American Student Assistance Corporation (1996-2009); Board of Directors of Boston Stock Exchange (2002-2008); Board of Directors of Harvard Pilgrim Healthcare (health benefits company) (2007-2011). Trustee of various trusts within the John Hancock Fund Complex (since 2008). | ||
| James M. Oates, Born: 1946 | 2012 | 215 |
Trustee | ||
| Steven R. Pruchansky, Born: 1944 | 2006 | 215 |
| Trustee and Vice Chairperson of the Board Managing Director, Pru Realty (since 2017); Chairman and Chief Executive Officer, Greenscapes of Southwest Florida, Inc. (since 2000); Director and President, Greenscapes of Southwest Florida, Inc. (until 2000); Member, Board of Advisors, First American Bank (until 2010); Managing Director, Jon James, LLC (real estate) (since 2000); Partner, Right Funding, LLC (2014-2017); Director, First Signature Bank & Trust Company (until 1991); Director, Mast Realty Trust (until 1994); President, Maxwell Building Corp. (until 1991). Trustee (since 1992), Chairperson of the Board (2011-2012), and Vice Chairperson of the Board (since 2012) of various trusts within the John Hancock Fund Complex. | ||
| Gregory A. Russo, Born: 1949 | 2008 | 215 |
| Trustee Director and Audit Committee Chairman (since 2012), and Member, Audit Committee and Finance Committee (since 2011), NCH Healthcare System, Inc. (holding company for multi-entity healthcare system); Director and Member (since 2012) and Finance Committee Chairman (since 2014), The Moorings, Inc. (nonprofit continuing care community); Vice Chairman, Risk & Regulatory Matters, KPMG LLP (KPMG) (2002-2006); Vice Chairman, Industrial Markets, KPMG (1998-2002); Chairman and Treasurer, Westchester County, New York, Chamber of Commerce (1986-1992); Director, Treasurer, and Chairman of Audit and Finance Committees, Putnam Hospital Center (1989-1995); Director and Chairman of Fundraising Campaign, United Way of Westchester and Putnam Counties, New York (1990-1995). Trustee of various trusts within the John Hancock Fund Complex (since 2008). | ||
Non-Independent Trustees3
| Name, year of birth Position(s) held with Trust Principal occupation(s) and other directorships during past 5 years | Trustee of the Trust since1 | Number of John Hancock funds overseen by Trustee |
| Andrew G. Arnott, Born: 1971 | 2017 | 215 |
| President and Non-Independent Trustee Head of Wealth and Asset Management, United States and Europe, for John Hancock and Manulife (since 2018); Executive Vice President, John Hancock Financial Services (since 2009, including prior positions); Director and Executive Vice President, John Hancock Advisers, LLC (since 2005, including prior positions); Director and Executive Vice President, John Hancock Investment Management Services, LLC (since 2006, including prior positions); President, John Hancock Funds, LLC (since 2004, including prior positions); President of various trusts within the John Hancock Fund Complex (since 2007, including prior positions). | ||
| Marianne Harrison, Born: 1963 | 2018 | 215 |
| Non-Independent Trustee President and CEO, John Hancock (since 2017); President and CEO, Manulife Canadian Division (2013-2017); Member, Board of Directors, American Council of Life Insurers (ACLI) (since 2018); Member, Board of Directors, Communitech, an industry-led innovation center that fosters technology companies in Canada (since 2017); Member, Board of Directors, Manulife Assurance Canada (since 2015); Board Member, St. Mary's General Hospital Foundation (since 2014); Member, Board of Directors, Manulife Bank of Canada (since 2013); Member, Standing Committee of the Canadian Life & Health Assurance Association (since 2013); Member, Board of Directors, John Hancock USA, John Hancock Life & Health, John Hancock New York (2012-2013). Trustee of various trusts within the John Hancock Fund Complex (since 2018). | ||
Principal officers who are not Trustees
| Name, year of birth Position(s) held with Trust Principal occupation(s) during past 5 years | Officer of the Trust since |
| Francis V. Knox, Jr.,Born: 1947 | 2006 |
| Chief Compliance Officer Vice President, John Hancock Financial Services (since 2005); Chief Compliance Officer, various trusts within the John Hancock Fund Complex, John Hancock Advisers, LLC, and John Hancock Investment Management Services, LLC (since 2005). | |
| Charles A. Rizzo, Born: 1957 | 2007 |
| Chief Financial Officer Vice President, John Hancock Financial Services (since 2008); Senior Vice President, John Hancock Advisers, LLC and John Hancock Investment Management Services, LLC (since 2008); Chief Financial Officer of various trusts within the John Hancock Fund Complex (since 2007). | |
| Salvatore Schiavone, Born: 1965 | 2010 |
| Treasurer Assistant Vice President, John Hancock Financial Services (since 2007); Vice President, John Hancock Advisers, LLC and John Hancock Investment Management Services, LLC (since 2007); Treasurer of various trusts within the John Hancock Fund Complex (since 2007, including prior positions). | |
Principal officers who are notTrustees (continued)
| Name, year of birth Position(s) held with Trust Principal occupation(s) during past 5 years | Officer of the Trust since | |
| Christopher (Kit) Sechler,Born: 1973 | 2018 | |
| Chief Legal Officer and Secretary Vice President and Deputy Chief Counsel, John Hancock Investments (since 2015); Assistant Vice President and Senior Counsel (2009-2015), John Hancock Investments; Chief Legal Officer and Secretary of various trusts within the John Hancock Fund Complex (since 2018); Assistant Secretary of John Hancock Advisers, LLC and John Hancock Investment Management Services, LLC (since 2009). | ||
The business address for all Trustees and Officers is 200 Berkeley Street, Boston, Massachusetts 02116-5023.
The Statement of Additional Information of the fund includes additional information about members of the Board of Trustees of the Trust and is available without charge, upon request, by calling 800-225-5291.
| 1 | Each Trustee holds office until his or her successor is elected and qualified, or until the Trustee's death, retirement, resignation, or removal. Mr. Boyle has served as Trustee at various times prior to the date listed in the table. |
| 2 | Member of the Audit Committee. |
| 3 | The Trustee is a Non-Independent Trustee due to current or former positions with the Advisor and certain affiliates. |
Trustees Hassell H. McClellan,Chairperson Officers Andrew G. Arnott Francis V. Knox, Jr. Charles A. Rizzo Salvatore Schiavone Christopher (Kit) Sechler** | Investment advisor John Hancock Advisers, LLC Subadvisor Boston Partners Global Investors, Inc. Portfolio Managers Joseph F. Feeney, Jr., CFA Principal distributor John Hancock Funds, LLC Custodian State Street Bank and Trust Company Transfer agent John Hancock Signature Services, Inc. Legal counsel K&L Gates LLP Independent registered public accounting firm PricewaterhouseCoopers LLP |
* Member of the Audit Committee
† Non-Independent Trustee
#Effective 6-19-18
**Effective 9-13-18
The fund's proxy voting policies and procedures, as well as the fund proxy voting record for the most recent twelve-month period ended June 30, are available free of charge on the Securities and Exchange Commission (SEC) website at sec.gov or on our website.
All of the fund's holdings as of the end of the third month of every fiscal quarter are filed with the SEC on Form N-PORT within 60 days of the end of the fiscal quarter. The fund's Form N-PORT filings are available on our website and the SEC's website, sec.gov.
We make this information on your fund, as well asmonthly portfolio holdings, and other fund details available on our website at jhinvestments.com or by calling 800-225-5291.
| You can also contact us: | |||
| 800-225-5291 jhinvestments.com | Regular mail: John Hancock Signature Services, Inc. | Express mail: John Hancock Signature Services, Inc. | |
John Hancock family of funds
DOMESTIC EQUITY FUNDS Blue Chip Growth Classic Value Disciplined Value Disciplined Value Mid Cap Equity Income Financial Industries Fundamental All Cap Core Fundamental Large Cap Core Fundamental Large Cap Value New Opportunities Regional Bank Small Cap Core Small Cap Growth Small Cap Value U.S. Global Leaders Growth U.S. Quality Growth Value Equity GLOBAL AND INTERNATIONAL EQUITY FUNDS Disciplined Value International Emerging Markets Emerging Markets Equity Fundamental Global Franchise Global Equity Global Shareholder Yield Global Thematic Opportunities Greater China Opportunities International Dynamic Growth International Growth International Small Company | INCOME FUNDS Bond California Tax-Free Income Emerging Markets Debt Floating Rate Income Government Income High Yield High Yield Municipal Bond Income Investment Grade Bond Money Market Short Duration Credit Opportunities Spectrum Income Strategic Income Opportunities Tax-Free Bond ALTERNATIVE AND SPECIALTY FUNDS Absolute Return Currency Alternative Asset Allocation Disciplined Alternative Yield Global Absolute Return Strategies Global Conservative Absolute Return Global Focused Strategies Infrastructure Seaport Long/Short |
A fund's investment objectives, risks, charges, and expenses should be considered carefully before investing. The prospectus contains this and other important information about the fund. To obtain a prospectus, contact your financial professional, call John Hancock Investments at 800-225-5291, or visit our website at jhinvestments.com. Please read the prospectus carefully before investing or sending money.
ASSET ALLOCATION Balanced Income Allocation Multi-Index Lifetime Portfolios Multi-Index Preservation Portfolios Multimanager Lifestyle Portfolios Multimanager Lifetime Portfolios Retirement Income 2040 EXCHANGE-TRADED FUNDS John Hancock Multifactor Consumer Discretionary ETF John Hancock Multifactor Consumer Staples ETF John Hancock Multifactor Developed International ETF John Hancock Multifactor Emerging Markets ETF John Hancock Multifactor Energy ETF John Hancock Multifactor Financials ETF John Hancock Multifactor Healthcare ETF John Hancock Multifactor Industrials ETF John Hancock Multifactor Large Cap ETF John Hancock Multifactor Materials ETF John Hancock Multifactor Media and John Hancock Multifactor Mid Cap ETF John Hancock Multifactor Small Cap ETF John Hancock Multifactor Technology ETF John Hancock Multifactor Utilities ETF | ENVIRONMENTAL, SOCIAL, AND ESG All Cap Core ESG Core Bond ESG International Equity ESG Large Cap Core CLOSED-END FUNDS Financial Opportunities Hedged Equity & Income Income Securities Trust Investors Trust Preferred Income Preferred Income II Preferred Income III Premium Dividend Tax-Advantaged Dividend Income Tax-Advantaged Global Shareholder Yield |
John Hancock Multifactor ETF shares are bought and sold at market price (not NAV), and are not individually redeemed
from the fund. Brokerage commissions will reduce returns.
John Hancock ETFs are distributed by Foreside Fund Services, LLC, and are subadvised by Dimensional Fund Advisors LP.
Foreside is not affiliated with John Hancock Funds, LLC or Dimensional Fund Advisors LP.
Dimensional Fund Advisors LP receives compensation from John Hancock in connection with licensing rights to the
John Hancock Dimensional indexes. Dimensional Fund Advisors LP does not sponsor, endorse, or sell, and makes no
representation as to the advisability of investing in, John Hancock Multifactor ETFs.
John Hancock Investment Management
A trusted brand
John Hancock Investment Management is a premier asset manager
representing one of America's most trusted brands, with a heritage of
financial stewardship dating back to 1862. Helping our shareholders
pursue their financial goals is at the core of everything we do. It's why
we support the role of professional financial advice and operate with
the highest standards of conduct and integrity.
A better way to invest
We serve investors globally through a unique multimanager approach:
We search the world to find proven portfolio teams with specialized
expertise for every strategy we offer, then we apply robust investment
oversight to ensure they continue to meet our uncompromising
standards and serve the best interests of our shareholders.
Results for investors
Our unique approach to asset management enables us to provide
a diverse set of investments backed by some of the world's best
managers, along with strong risk-adjusted returns across asset classes.
![]()
John Hancock Funds, LLC n Member FINRA, SIPC
200 Berkeley Street n Boston, MA 02116-5010 n 800-225-5291 n jhinvestments.com
This report is for the information of the shareholders of John Hancock Disciplined Value Mid Cap Fund. It is not authorized for distribution to prospective investors unless preceded or accompanied by a prospectus.
| MF802039 | 363A 3/19 5/19 |
John Hancock
Disciplined Value Fund
Annual report 3/31/19
Beginning on January 1, 2021, as permitted by regulations adopted by the Securities and Exchange Commission, paper copies of the Fund's shareholder reports like this one will no longer be sent by mail, unless you specifically request paper copies of the reports from the Fund or from your financial intermediary. Instead, the reports will be made available on a website, and you will be notified by mail each time a report is posted and provided with a website link to access the report.
If you already elected to receive shareholder reports electronically, you will not be affected by this change, and you do not need to take any action. You may elect to receive shareholder reports and other communications electronically by calling John Hancock Investment Management at 800-225-5291 (Class A, Class B and Class C shares) or 888-972-8696 (Class I, Class I2, Class R1, Class R2, Class R3, Class R4, Class R5, Class R6 and Class NAV) or by contacting your financial intermediary.
You may elect to receive all reports in paper, free of charge, at any time. You can inform John Hancock Investment Management or your financial intermediary that you wish to continue receiving paper copies of your shareholder reports by following the instructions listed above. Your election to receive reports in paper will apply to all funds held with John Hancock Investment Management or your financial intermediary.
A message to shareholders
Dear shareholder,
Market volatility was the big story in the latter half of 2018, as stocks sank in the fourth quarter, hurt by fears of slowing economic growth, mounting trade tensions between the United States and China, and a pullback in oil prices. Many of those fears were quelled in the beginning of 2019, as favorable earnings reports, progress with the China trade dispute, and signals from the U.S. Federal Reserve that interest-rate hikes were on hold sparked a market rebound.
Despite the positive economic news that has garnered headlines lately, we at John Hancock Investment Management believe that the bull market—which just celebrated its 10th anniversary on March 9—appears to be in the later innings. Whether or not these gains are sustained, it's clear we're in a late-cycle market.
Your best resource in unpredictable and volatile markets is your financial advisor, who can help position your portfolio so that it's sufficiently diversified to meet your long-term objectives and to withstand the inevitable turbulence along the way.
On behalf of everyone at John Hancock Investment Management, I'd like to take this opportunity to welcome new shareholders and thank existing shareholders for the continued trust you've placed in us.
Sincerely,
Andrew G. Arnott
President and CEO,
John Hancock Investment Management
Head of Wealth and Asset Management,
United States and Europe
This commentary reflects the CEO's views, which are subject to change at any time. Investing involves risks, including the potential loss of principal. Diversification does not guarantee a profit or eliminate the risk of a loss. It is not possible to invest directly in an index. For more up-to-date information, please visit our website at jhinvestments.com.
John Hancock
Disciplined Value Fund
Table of contents
| 2 | Your fund at a glance | |
| 4 | Discussion of fund performance | |
| 6 | A look at performance | |
| 8 | Your expenses | |
| 10 | Fund's investments | |
| 14 | Financial statements | |
| 19 | Financial highlights | |
| 31 | Notes to financial statements | |
| 40 | Report of independent registered public accounting firm | |
| 41 | Tax information | |
| 42 | Trustees and Officers | |
| 46 | More information |
INVESTMENT OBJECTIVE
The fund seeks to provide long-term growth of capital primarily through investment in equity securities. Current income is a secondary objective.
AVERAGE ANNUAL TOTAL RETURNS AS OF 3/31/19 (%)
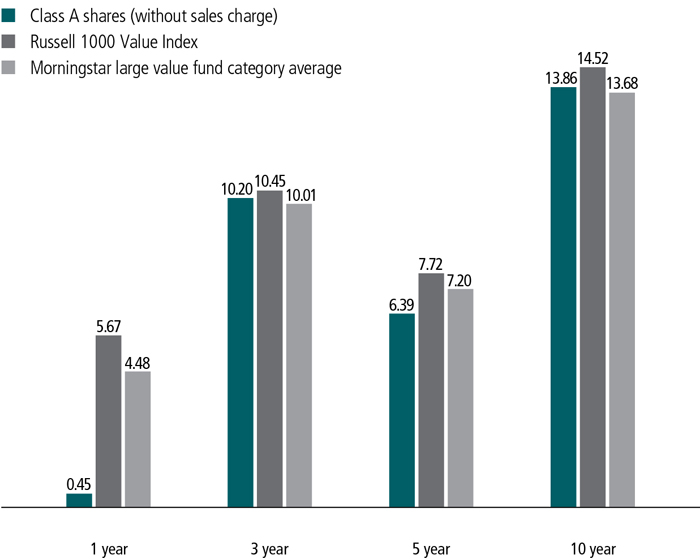
The Russell 1000 Value Index is an unmanaged index containing those securities in the Russell 1000 Index with a lower price-to-book ratio and less-than-average growth orientation.
It is not possible to invest directly in an index. Index figures do not reflect expenses or sales charges, which would result in lower returns.
Figures from Morningstar, Inc. include reinvested distributions and do not take into account sales charges. Actual load-adjusted performance is lower.
The past performance shown here reflects reinvested distributions and the beneficial effect of any expense reductions, and does not guarantee future results. Performance of the other share classes will vary based on the difference in the fees and expenses of those classes. Shares will fluctuate in value and, when redeemed, may be worth more or less than their original cost. Current month-end performance may be lower or higher than the performance cited, and can be found at jhinvestments.com or by calling 800-225-5291. For further information on the fund's objectives, risks, and strategy, see the fund's prospectus.
PERFORMANCE HIGHLIGHTS OVER THE LAST TWELVE MONTHS
The Russell 1000 Value Index finished in positive territory
Despite a sharp sell-off in late 2018, the fund's benchmark posted a gain thanks to its rally in the final three months of the period.
Value stocks experienced weak relative performance
Although the value style outperformed somewhat in the downturn, it lagged in the full period due to investors' continued preference for faster-growing companies.
The fund underperformed the index
Stock selection in the healthcare and materials sectors was the primary reason for the fund's shortfall.
SECTOR COMPOSITION AS OF 3/31/19 (%)
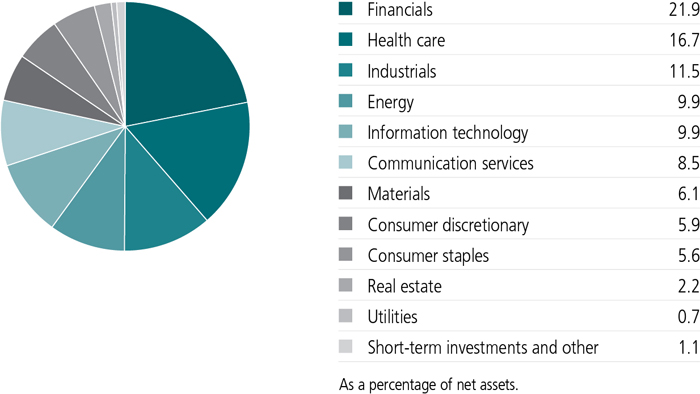
A note about risks
The fund may be subject to various risks as described in the fund's prospectus. For more information, please refer to the "Principal risks" section of the prospectus.
After performing very well in the first six months of the period, U.S. equities fell sharply in the fourth quarter of 2018 in reaction to rising trade tensions between the United States and China and expectations that the U.S. Federal Reserve would continue to raise interest rates. Both of these concerns began to fade in early 2019, allowing the index to regain its earlier losses and close the 12-month period in positive territory. The value style trailed growth by a wide margin, weighing on the relative performance of higher-quality, undervalued companies.
What factors affected the fund's performance?
The fund's underperformance of its benchmark, the Russell 1000 Value Index, was a result of both stock selection and sector allocations. With regard to selection, the largest performance deficits occurred in the healthcare and materials sectors. Cigna Corp., which recently completed its acquisition of Express Scripts Company, was a large detractor in healthcare. Cigna's contract with the health insurance provider Anthem was discontinued nine months earlier than expected, pressuring the company's earnings outlook. Positions in the pharmaceutical distribution companies CVS Health Corp. and McKesson Corp. also weighed on relative performance at a time in which biotechnology and mega-cap pharmaceutical stocks
| TOP 10 HOLDINGS AS OF 3/31/19 (%) | COUNTRY COMPOSITION AS OF 3/31/19 (%) | |||
| Cisco Systems, Inc. | 4.3 | United States | 85.6 | |
| Johnson & Johnson | 4.3 | Switzerland | 2.9 | |
| Berkshire Hathaway, Inc., Class B | 4.2 | Canada | 2.5 | |
| Comcast Corp., Class A | 3.5 | Netherlands | 2.5 | |
| Bank of America Corp. | 3.3 | Ireland | 2.4 | |
| The Procter & Gamble Company | 2.9 | United Kingdom | 2.4 | |
| Chevron Corp. | 2.8 | Other countries | 1.7 | |
| Citigroup, Inc. | 2.7 | TOTAL | 100.0 | |
| Verizon Communications, Inc. | 2.5 | |||
| Pfizer, Inc. | 2.3 | |||
| TOTAL | 32.8 | |||
| As a percentage of net assets. | As a percentage of net assets. | |||
| Cash and cash equivalents are not included. | ||||
were the key drivers of the sector's return. Weakness in WestRock Company, a producer of corrugated packaging products whose shares came under pressure from the uncertainty surrounding trade policy, was a large detractor in materials.
Stock selection in energy had a mixed effect on results. On the positive side, the refining company Andeavor—which was acquired by Marathon Petroleum Corp.—was the leading individual contributor in both the sector and the fund as a whole. We tendered the fund's shares on the offer. Marathon itself was a key detractor, however, as were the smaller exploration companies Cimarex Energy Company and EQT Corp.
Stock selection in communications services and financials added value thanks to an underweight in AT&T Corp. and a position in American Express Company, respectively. Outside of these two sectors, key contributors included the technology stocks Cisco Systems, Inc. and NetApp, Inc.
In terms of overall portfolio activity, we made gradual changes at a stock-by-stock level as opportunities presented themselves. We made the largest additions in the consumer staples and industrials sectors, while we reduced the fund's weightings in financials and information technology.
MANAGED BY
 | Mark E. Donovan, CFA On the fund since 2008 and its predecessor since 1997 Investing since 1981 |
 | David J. Pyle, CFA On the fund since 2008 and its predecessor since 1997 Investing since 1995 |
 | Stephanie T. McGirr On the fund since 2018 Investing since 2002 |
 | David T. Cohen, CFA On the fund since 2018 Investing since 2005 |
![]()
TOTAL RETURNS FOR THE PERIOD ENDED MARCH 31, 2019
| Average annual total returns (%) with maximum sales charge | Cumulative total returns (%) with maximum sales charge | ||||||||
| 1-year | 5-year | 10-year | Since inception | 5-year | 10-year | Since inception | |||
| Class A | -4.58 | 5.30 | 13.28 | — | 29.47 | 247.85 | — | ||
| Class B | -4.90 | 5.26 | 12.93 | — | 29.21 | 237.39 | — | ||
| Class C | -1.26 | 5.59 | 12.97 | — | 31.26 | 238.56 | — | ||
| Class I1 | 0.64 | 6.66 | 14.19 | — | 38.05 | 276.88 | — | ||
| Class I21 | 0.64 | 6.65 | 14.20 | — | 37.96 | 277.18 | — | ||
| Class R11 | 0.01 | 5.95 | 13.41 | — | 33.53 | 251.83 | — | ||
| Class R21 | 0.24 | 6.23 | 13.74 | — | 35.30 | 262.20 | — | ||
| Class R31 | 0.08 | 6.06 | 13.51 | — | 34.21 | 255.23 | — | ||
| Class R41 | 0.52 | 6.49 | 13.94 | — | 36.95 | 268.84 | — | ||
| Class R51 | 0.75 | 6.73 | 14.23 | — | 38.47 | 278.28 | — | ||
| Class R61 | 0.76 | 6.77 | 14.18 | — | 38.75 | 276.60 | — | ||
| Class NAV1,2 | 0.77 | 6.78 | — | 12.83 | 38.84 | — | 227.93 | ||
| Index 1† | 5.67 | 7.72 | 14.52 | — | 45.04 | 288.03 | — | ||
| Index 2† | 9.50 | 10.91 | 15.92 | — | 67.81 | 338.09 | — | ||
Performance figures assume all distributions have been reinvested. Figures reflect maximum sales charge on Class A shares of 5%, and the applicable contingent deferred sales charge (CDSC) on Class B and Class C shares. The Class B shares' CDSC declines annually between years 1 to 6 according to the following schedule: 5%, 4%, 3%, 3%, 2%, and 1%. No sales charge will be assessed after the sixth year. Class C shares sold within one year of purchase are subject to a 1% CDSC. Sales charges are not applicable to Class I, Class I2, Class R1, Class R2, Class R3, Class R4, Class R5, Class R6, and Class NAV shares.
The expense ratios of the fund, both net (including any fee waivers and/or expense limitations) and gross (excluding any fee waivers and/or expense limitations), are set forth according to the most recent publicly available prospectuses for the fund and may differ from those disclosed in the Financial highlights tables in this report. Net expenses reflect contractual expense limitations in effect until June 30, 2020 and are subject to change. Had the contractual fee waivers and expense limitations not been in place, gross expenses would apply. The expense ratios are as follows:
| Class A | Class B | Class C | Class I | Class I2 | Class R1 | Class R2 | Class R3 | Class R4 | Class R5 | Class R6 | Class NAV | |
| Gross (%) | 1.06 | 1.81 | 1.81 | 0.81 | 0.81 | 1.46 | 1.21 | 1.36 | 1.06 | 0.76 | 0.71 | 0.70 |
| Net (%) | 1.05 | 1.80 | 1.80 | 0.80 | 0.80 | 1.45 | 1.20 | 1.35 | 0.95 | 0.75 | 0.70 | 0.69 |
Please refer to the most recent prospectus and annual or semiannual report for more information on expenses and any expense limitation arrangements for each class.
The returns reflect past results and should not be considered indicative of future performance. The return and principal value of an investment will fluctuate so that shares, when redeemed, may be worth more or less than their original cost. Due to market volatility and other factors, the fund's current performance may be higher or lower than the performance shown. For current to the most recent month-end performance data, please call 800-225-5291 or visit the fund's website at jhinvestments.com.
The performance table above and the chart on the next page do not reflect the deduction of taxes that a shareholder would pay on fund distributions or the redemption of fund shares. The fund's performance results reflect any applicable fee waivers or expense reductions, without which the expenses would increase and results would have been less favorable.
| † | Index 1 is the Russell 1000 Value Index; Index 2 is the S&P 500 Index. |
See the following page for footnotes.
This chart and table show what happened to a hypothetical $10,000 investment in John Hancock Disciplined Value Fund for the share classes and periods indicated, assuming all distributions were reinvested. For comparison, we've shown the same investment in two separate indexes.
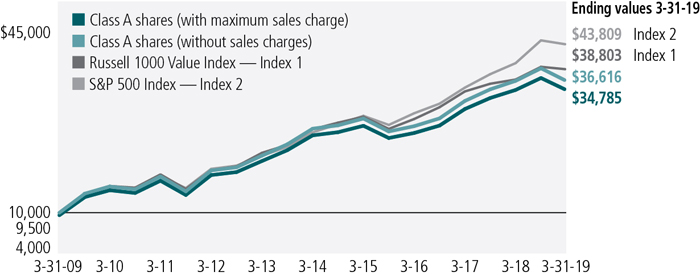
| Start date | With maximum sales charge ($) | Without sales charge ($) | Index 1 ($) | Index 2 ($) | |
| Class B3 | 3-31-09 | 33,739 | 33,739 | 38,803 | 43,809 |
| Class C3 | 3-31-09 | 33,856 | 33,856 | 38,803 | 43,809 |
| Class I1 | 3-31-09 | 37,688 | 37,688 | 38,803 | 43,809 |
| Class I21 | 3-31-09 | 37,718 | 37,718 | 38,803 | 43,809 |
| Class R11 | 3-31-09 | 35,183 | 35,183 | 38,803 | 43,809 |
| Class R21 | 3-31-09 | 36,220 | 36,220 | 38,803 | 43,809 |
| Class R31 | 3-31-09 | 35,523 | 35,523 | 38,803 | 43,809 |
| Class R41 | 3-31-09 | 36,884 | 36,884 | 38,803 | 43,809 |
| Class R51 | 3-31-09 | 37,828 | 37,828 | 38,803 | 43,809 |
| Class R61 | 3-31-09 | 37,660 | 37,660 | 38,803 | 43,809 |
| Class NAV1 | 5-29-09 | 32,793 | 32,793 | 33,425 | 38,379 |
The Russell 1000 Value Index is an unmanaged index containing those securities in the Russell 1000 Index with a lower price-to-book ratio and less-than-average growth orientation.
The S&P 500 Index is an unmanaged index that includes 500 widely traded common stocks.
It is not possible to invest directly in an index. Index figures do not reflect expenses or sales charges, which would result in lower returns.
Footnotes related to performance pages
| 1 | For certain types of investors, as described in the fund's prospectuses. |
| 2 | From 5-29-09. |
| 3 | The contingent deferred sales charge is not applicable. |
| Your expenses |

| 8 | JOHN HANCOCK DISCIPLINED VALUE FUND | ANNUAL REPORT |
| Account value on 10-1-2018 | Ending value on 3-31-2019 | Expenses paid during period ended 3-31-20191 | Annualized expense ratio | ||
| Class A | Actual expenses/actual returns | $1,000.00 | $939.50 | $5.08 | 1.05% |
| Hypothetical example | 1,000.00 | 1,019.70 | 5.29 | 1.05% | |
| Class B | Actual expenses/actual returns | 1,000.00 | 935.80 | 8.69 | 1.80% |
| Hypothetical example | 1,000.00 | 1,016.00 | 9.05 | 1.80% | |
| Class C | Actual expenses/actual returns | 1,000.00 | 935.40 | 8.69 | 1.80% |
| Hypothetical example | 1,000.00 | 1,016.00 | 9.05 | 1.80% | |
| Class I | Actual expenses/actual returns | 1,000.00 | 940.20 | 3.97 | 0.82% |
| Hypothetical example | 1,000.00 | 1,020.80 | 4.13 | 0.82% | |
| Class I2 | Actual expenses/actual returns | 1,000.00 | 940.20 | 3.97 | 0.82% |
| Hypothetical example | 1,000.00 | 1,020.80 | 4.13 | 0.82% | |
| Class R1 | Actual expenses/actual returns | 1,000.00 | 937.50 | 7.00 | 1.45% |
| Hypothetical example | 1,000.00 | 1,017.70 | 7.29 | 1.45% | |
| Class R2 | Actual expenses/actual returns | 1,000.00 | 938.50 | 5.85 | 1.21% |
| Hypothetical example | 1,000.00 | 1,018.90 | 6.09 | 1.21% | |
| Class R3 | Actual expenses/actual returns | 1,000.00 | 937.70 | 6.57 | 1.36% |
| Hypothetical example | 1,000.00 | 1,018.20 | 6.84 | 1.36% | |
| Class R4 | Actual expenses/actual returns | 1,000.00 | 939.50 | 4.59 | 0.95% |
| Hypothetical example | 1,000.00 | 1,020.20 | 4.78 | 0.95% | |
| Class R5 | Actual expenses/actual returns | 1,000.00 | 940.90 | 3.68 | 0.76% |
| Hypothetical example | 1,000.00 | 1,021.10 | 3.83 | 0.76% | |
| Class R6 | Actual expenses/actual returns | 1,000.00 | 941.00 | 3.44 | 0.71% |
| Hypothetical example | 1,000.00 | 1,021.40 | 3.58 | 0.71% | |
| Class NAV | Actual expenses/actual returns | 1,000.00 | 941.10 | 3.34 | 0.69% |
| Hypothetical example | 1,000.00 | 1,021.50 | 3.48 | 0.69% |
| 1 | Expenses are equal to the annualized expense ratio, multiplied by the average account value over the period, multiplied by 182/365 (to reflect the one-half year period). |
| ANNUAL REPORT | JOHN HANCOCK DISCIPLINED VALUE FUND | 9 |
| Fund’s investments |
| Shares | Value | ||||
| Common stocks 98.9% | $14,740,435,625 | ||||
| (Cost $13,014,179,781) | |||||
| Communication services 8.5% | 1,269,783,423 | ||||
| Diversified telecommunication services 2.5% | |||||
| Verizon Communications, Inc. | 6,413,559 | 379,233,744 | |||
| Interactive media and services 1.8% | |||||
| Alphabet, Inc., Class A (A) | 226,856 | 266,984,558 | |||
| Media 4.2% | |||||
| Comcast Corp., Class A | 13,118,316 | 524,470,274 | |||
| Liberty Global PLC, Series C (A) | 4,093,137 | 99,094,847 | |||
| Consumer discretionary 5.9% | 885,835,686 | ||||
| Hotels, restaurants and leisure 1.6% | |||||
| Las Vegas Sands Corp. | 1,875,040 | 114,302,438 | |||
| Wyndham Destinations, Inc. | 1,611,244 | 65,239,270 | |||
| Wyndham Hotels & Resorts, Inc. | 1,292,922 | 64,633,171 | |||
| Household durables 0.3% | |||||
| Toll Brothers, Inc. | 1,043,335 | 37,768,727 | |||
| Internet and direct marketing retail 1.5% | |||||
| Booking Holdings, Inc. (A) | 64,552 | 112,637,430 | |||
| eBay, Inc. | 3,013,861 | 111,934,798 | |||
| Multiline retail 0.9% | |||||
| Target Corp. | 1,672,426 | 134,228,911 | |||
| Specialty retail 1.6% | |||||
| AutoZone, Inc. (A) | 85,698 | 87,765,036 | |||
| Lowe's Companies, Inc. | 1,437,160 | 157,325,905 | |||
| Consumer staples 5.6% | 830,959,290 | ||||
| Beverages 1.1% | |||||
| Coca-Cola European Partners PLC (New York Stock Exchange) | 2,022,336 | 104,635,665 | |||
| Molson Coors Brewing Company, Class B | 1,020,320 | 60,862,088 | |||
| Food products 1.5% | |||||
| Mondelez International, Inc., Class A | 3,160,139 | 157,754,139 | |||
| Tyson Foods, Inc., Class A | 998,348 | 69,315,302 | |||
| Household products 3.0% | |||||
| The Procter & Gamble Company | 4,213,283 | 438,392,096 | |||
| Energy 9.9% | 1,479,646,497 | ||||
| Energy equipment and services 0.3% | |||||
| Apergy Corp. (A) | 1,230,345 | 50,517,966 | |||
| Oil, gas and consumable fuels 9.6% | |||||
| Canadian Natural Resources, Ltd. | 3,657,206 | 100,573,165 | |||
| 10 | JOHN HANCOCK DISCIPLINED VALUE FUND | ANNUAL REPORT | SEE NOTES TO FINANCIAL STATEMENTS |
| Shares | Value | ||||
| Energy (continued) | |||||
| Oil, gas and consumable fuels (continued) | |||||
| Chevron Corp. | 3,382,334 | $416,635,902 | |||
| Cimarex Energy Company | 1,442,551 | 100,834,315 | |||
| ConocoPhillips | 3,171,619 | 211,673,852 | |||
| Noble Energy, Inc. | 7,223,365 | 178,633,816 | |||
| Petroleo Brasileiro SA, ADR | 2,763,521 | 43,995,254 | |||
| Pioneer Natural Resources Company | 539,780 | 82,197,698 | |||
| Royal Dutch Shell PLC, ADR, Class A | 4,706,575 | 294,584,529 | |||
| Financials 21.9% | 3,270,738,046 | ||||
| Banks 9.0% | |||||
| Bank of America Corp. | 17,986,662 | 496,252,005 | |||
| BB&T Corp. | 1,179,511 | 54,882,647 | |||
| Citigroup, Inc. | 6,539,751 | 406,903,307 | |||
| SunTrust Banks, Inc. | 924,133 | 54,754,880 | |||
| Wells Fargo & Company | 6,760,460 | 326,665,427 | |||
| Consumer finance 1.8% | |||||
| American Express Company | 883,073 | 96,519,879 | |||
| Discover Financial Services | 2,420,461 | 172,240,005 | |||
| Diversified financial services 4.1% | |||||
| Berkshire Hathaway, Inc., Class B (A) | 3,097,779 | 622,312,823 | |||
| Insurance 7.0% | |||||
| American International Group, Inc. | 6,090,366 | 262,251,160 | |||
| Aon PLC | 900,139 | 153,653,727 | |||
| Chubb, Ltd. | 1,646,393 | 230,626,731 | |||
| Everest Re Group, Ltd. | 482,947 | 104,297,234 | |||
| The Allstate Corp. | 3,072,608 | 289,378,221 | |||
| Health care 16.7% | 2,496,462,549 | ||||
| Biotechnology 0.9% | |||||
| Biogen, Inc. (A) | 160,013 | 37,823,873 | |||
| Gilead Sciences, Inc. | 1,517,240 | 98,635,772 | |||
| Health care equipment and supplies 1.8% | |||||
| Medtronic PLC | 2,992,451 | 272,552,437 | |||
| Health care providers and services 5.7% | |||||
| Anthem, Inc. | 498,707 | 143,118,935 | |||
| Cigna Corp. | 1,815,671 | 291,996,210 | |||
| CVS Health Corp. | 2,972,737 | 160,319,706 | |||
| McKesson Corp. | 680,091 | 79,611,452 | |||
| Quest Diagnostics, Inc. | 1,404,140 | 126,260,269 | |||
| UnitedHealth Group, Inc. | 213,514 | 52,793,472 | |||
| Pharmaceuticals 8.3% | |||||
| Johnson & Johnson | 4,534,973 | 633,943,876 | |||
| SEE NOTES TO FINANCIAL STATEMENTS | ANNUAL REPORT | JOHN HANCOCK DISCIPLINED VALUE FUND | 11 |
| Shares | Value | ||||
| Health care (continued) | |||||
| Pharmaceuticals (continued) | |||||
| Novartis AG, ADR | 2,121,906 | $204,000,043 | |||
| Novo Nordisk A/S, ADR | 1,110,631 | 58,097,108 | |||
| Pfizer, Inc. | 7,942,298 | 337,309,396 | |||
| Industrials 11.5% | 1,713,235,873 | ||||
| Aerospace and defense 3.2% | |||||
| The Boeing Company | 413,389 | 157,674,832 | |||
| United Technologies Corp. | 2,505,705 | 322,960,317 | |||
| Air freight and logistics 0.8% | |||||
| United Parcel Service, Inc., Class B | 1,101,402 | 123,070,659 | |||
| Airlines 2.6% | |||||
| Delta Air Lines, Inc. | 4,200,937 | 216,978,396 | |||
| Southwest Airlines Company | 3,127,056 | 162,325,477 | |||
| Building products 0.5% | |||||
| Owens Corning | 1,627,986 | 76,710,700 | |||
| Electrical equipment 1.3% | |||||
| Eaton Corp. PLC | 2,399,177 | 193,277,699 | |||
| Machinery 1.0% | |||||
| Dover Corp. | 1,550,074 | 145,396,941 | |||
| Road and rail 2.1% | |||||
| Kansas City Southern | 807,158 | 93,614,185 | |||
| Union Pacific Corp. | 1,323,126 | 221,226,667 | |||
| Information technology 9.9% | 1,469,109,168 | ||||
| Communications equipment 4.3% | |||||
| Cisco Systems, Inc. | 11,764,391 | 635,159,473 | |||
| IT services 1.6% | |||||
| DXC Technology Company | 3,618,339 | 232,695,381 | |||
| Semiconductors and semiconductor equipment 0.5% | |||||
| NXP Semiconductors NV | 826,835 | 73,083,946 | |||
| Software 2.3% | |||||
| Microsoft Corp. | 1,061,873 | 125,237,302 | |||
| Oracle Corp. | 4,150,030 | 222,898,111 | |||
| Technology hardware, storage and peripherals 1.2% | |||||
| Hewlett Packard Enterprise Company | 6,618,209 | 102,118,965 | |||
| HP, Inc. | 4,010,087 | 77,915,990 | |||
| Materials 6.1% | 901,357,461 | ||||
| Chemicals 4.7% | |||||
| DowDuPont, Inc. | 5,902,024 | 314,636,899 | |||
| FMC Corp. | 1,434,785 | 110,220,184 | |||
| Nutrien, Ltd. (B) | 3,711,095 | 195,797,372 | |||
| 12 | JOHN HANCOCK DISCIPLINED VALUE FUND | ANNUAL REPORT | SEE NOTES TO FINANCIAL STATEMENTS |
| Shares | Value | ||||
| Materials (continued) | |||||
| Chemicals (continued) | |||||
| The Mosaic Company | 2,819,461 | $76,999,480 | |||
| Construction materials 0.9% | |||||
| Cemex SAB de CV, ADR (A) | 10,114,257 | 46,930,152 | |||
| CRH PLC, ADR | 2,555,928 | 79,233,768 | |||
| Metals and mining 0.5% | |||||
| Barrick Gold Corp. | 5,655,697 | 77,539,606 | |||
| Real estate 2.2% | 323,365,408 | ||||
| Equity real estate investment trusts 2.2% | |||||
| Equity Residential | 1,270,634 | 95,704,153 | |||
| Essex Property Trust, Inc. | 283,645 | 82,041,480 | |||
| SL Green Realty Corp. | 1,619,437 | 145,619,775 | |||
| Utilities 0.7% | 99,942,224 | ||||
| Electric utilities 0.7% | |||||
| Edison International | 1,614,054 | 99,942,224 | |||
| Yield (%) | Shares | Value | |||
| Securities lending collateral 0.4% | $66,309,596 | ||||
| (Cost $66,309,940) | |||||
| John Hancock Collateral Trust (C) | 2.6031(D) | 6,626,454 | 66,309,596 | ||
| Short-term investments 0.9% | $137,094,775 | ||||
| (Cost $137,094,775) | |||||
| Money market funds 0.9% | 137,094,775 | ||||
| State Street Institutional U.S. Government Money Market Fund, Premier Class | 2.3851(D) | 137,094,775 | 137,094,775 | ||
| Total investments (Cost $13,217,584,496) 100.2% | $14,943,839,996 | ||||
| Other assets and liabilities, net (0.2%) | (35,126,669) | ||||
| Total net assets 100.0% | $14,908,713,327 | ||||
| The percentage shown for each investment category is the total value of the category as a percentage of the net assets of the fund. | |
| Security Abbreviations and Legend | |
| ADR | American Depositary Receipt |
| (A) | Non-income producing security. |
| (B) | All or a portion of this security is on loan as of 3-31-19. |
| (C) | Investment is an affiliate of the fund, the advisor and/or subadvisor. This security represents the investment of cash collateral received for securities lending. |
| (D) | The rate shown is the annualized seven-day yield as of 3-31-19. |
| SEE NOTES TO FINANCIAL STATEMENTS | ANNUAL REPORT | JOHN HANCOCK DISCIPLINED VALUE FUND | 13 |
| Financial statements |
| Assets | |
| Unaffiliated investments, at value (Cost $13,151,274,556) including $64,987,484 of securities loaned | $14,877,530,400 |
| Affiliated investments, at value (Cost $66,309,940) | 66,309,596 |
| Total investments, at value (Cost $13,217,584,496) | 14,943,839,996 |
| Dividends and interest receivable | 20,607,327 |
| Receivable for fund shares sold | 21,126,428 |
| Receivable for investments sold | 72,748,254 |
| Receivable for securities lending income | 5,112 |
| Other assets | 633,844 |
| Total assets | 15,058,960,961 |
| Liabilities | |
| Payable for investments purchased | 66,531,997 |
| Payable for fund shares repurchased | 13,860,327 |
| Payable upon return of securities loaned | 66,309,940 |
| Payable to affiliates | |
| Accounting and legal services fees | 589,763 |
| Transfer agent fees | 987,217 |
| Distribution and service fees | 91,514 |
| Other liabilities and accrued expenses | 1,876,876 |
| Total liabilities | 150,247,634 |
| Net assets | $14,908,713,327 |
| Net assets consist of | |
| Paid-in capital | $12,663,234,506 |
| Total distributable earnings (loss) | 2,245,478,821 |
| Net assets | $14,908,713,327 |
| 14 | JOHN HANCOCK Disciplined Value Fund | ANNUAL REPORT | SEE NOTES TO FINANCIAL STATEMENTS |
| Net asset value per share | |
| Based on net asset value and shares outstanding - the fund has an unlimited number of shares authorized with no par value | |
| Class A ($1,091,926,667 ÷ 53,910,266 shares)1 | $20.25 |
| Class B ($5,512,371 ÷ 291,279 shares)1 | $18.92 |
| Class C ($234,989,665 ÷ 12,378,182 shares)1 | $18.98 |
| Class I ($7,398,773,080 ÷ 377,848,573 shares) | $19.58 |
| Class I2 ($50,112,352 ÷ 2,559,146 shares) | $19.58 |
| Class R1 ($16,128,682 ÷ 824,607 shares) | $19.56 |
| Class R2 ($101,905,004 ÷ 5,207,541 shares) | $19.57 |
| Class R3 ($12,286,696 ÷ 628,382 shares) | $19.55 |
| Class R4 ($142,532,677 ÷ 7,275,077 shares) | $19.59 |
| Class R5 ($165,551,135 ÷ 8,439,440 shares) | $19.62 |
| Class R6 ($4,584,269,342 ÷ 233,758,485 shares) | $19.61 |
| Class NAV ($1,104,725,656 ÷ 56,312,432 shares) | $19.62 |
| Maximum offering price per share | |
| Class A (net asset value per share ÷ 95%)2 | $21.32 |
| 1 | Redemption price per share is equal to net asset value less any applicable contingent deferred sales charge. |
| 2 | On single retail sales of less than $50,000. On sales of $50,000 or more and on group sales the offering price is reduced. |
| SEE NOTES TO FINANCIAL STATEMENTS | ANNUAL REPORT | JOHN HANCOCK Disciplined Value Fund | 15 |
| Investment income | |
| Dividends | $339,528,077 |
| Interest | 6,619,127 |
| Securities lending | 169,828 |
| Less foreign taxes withheld | (4,653,000) |
| Total investment income | 341,664,032 |
| Expenses | |
| Investment management fees | 99,905,356 |
| Distribution and service fees | 7,247,813 |
| Accounting and legal services fees | 2,401,556 |
| Transfer agent fees | 11,624,189 |
| Trustees' fees | 227,244 |
| Custodian fees | 1,683,747 |
| State registration fees | 392,667 |
| Printing and postage | 964,108 |
| Professional fees | 305,690 |
| Other | 382,541 |
| Total expenses | 125,134,911 |
| Less expense reductions | (1,404,696) |
| Net expenses | 123,730,215 |
| Net investment income | 217,933,817 |
| Realized and unrealized gain (loss) | |
| Net realized gain (loss) on | |
| Unaffiliated investments | 1,084,857,250 |
| Affiliated investments | 30,654 |
| 1,084,887,904 | |
| Change in net unrealized appreciation (depreciation) of | |
| Unaffiliated investments and translation of assets and liabilities in foreign currencies | (1,233,960,211) |
| Affiliated investments | 10,447 |
| (1,233,949,764) | |
| Net realized and unrealized loss | (149,061,860) |
| Increase in net assets from operations | $68,871,957 |
| 16 | JOHN HANCOCK Disciplined Value Fund | ANNUAL REPORT | SEE NOTES TO FINANCIAL STATEMENTS |
| Year ended 3-31-19 | Year ended 3-31-18 | |
| Increase (decrease) in net assets | ||
| From operations | ||
| Net investment income | $217,933,817 | $169,345,890 |
| Net realized gain | 1,084,887,904 | 1,210,958,852 |
| Change in net unrealized appreciation (depreciation) | (1,233,949,764) | 371,940,135 |
| Increase in net assets resulting from operations | 68,871,957 | 1,752,244,877 |
| Distributions to shareholders | ||
| From net investment income and net realized gain | ||
| Class A | (96,773,159) | — |
| Class B | (565,315) | — |
| Class C | (19,995,932) | — |
| Class I | (656,997,874) | — |
| Class I2 | (4,341,818) | — |
| Class R1 | (1,460,119) | — |
| Class R2 | (8,904,584) | — |
| Class R3 | (1,150,321) | — |
| Class R4 | (13,999,852) | — |
| Class R5 | (16,429,256) | — |
| Class R6 | (412,557,295) | — |
| Class NAV | (98,778,716) | — |
| From net investment income | ||
| Class A | — | (10,489,229) |
| Class B | — | (12,417) |
| Class C | — | (330,820) |
| Class I | — | (72,170,802) |
| Class I2 | — | (617,693) |
| Class R1 | — | (101,408) |
| Class R2 | — | (929,710) |
| Class R3 | — | (87,705) |
| Class R4 | — | (2,085,673) |
| Class R5 | — | (2,319,657) |
| Class R6 | — | (51,259,792) |
| Class NAV | — | (14,229,834) |
| From net realized gain | ||
| Class A | — | (58,300,473) |
| Class B | — | (490,339) |
| Class C | — | (13,067,228) |
| Class I | — | (309,060,194) |
| Class I2 | — | (2,645,177) |
| SEE NOTES TO FINANCIAL STATEMENTS | ANNUAL REPORT | JOHN HANCOCK Disciplined Value Fund | 17 |
| Year ended 3-31-19 | Year ended 3-31-18 | |
| Class R1 | — | $(1,040,482) |
| Class R2 | — | (6,239,501) |
| Class R3 | — | (742,753) |
| Class R4 | — | (10,400,536) |
| Class R5 | — | (9,594,792) |
| Class R6 | — | (203,358,352) |
| Class NAV | — | (55,543,200) |
| Total distributions | (1,331,954,241) | (825,117,767) |
| From fund share transactions | 1,172,354,452 | (268,015,446) |
| Total increase (decrease) | (90,727,832) | 659,111,664 |
| Net assets | ||
| Beginning of year | 14,999,441,159 | 14,340,329,495 |
| End of year1 | $14,908,713,327 | $14,999,441,159 |
| 1 | Net assets - End of year includes undistributed net investment income of $43,143,711 at March 31, 2018. The SEC eliminated the requirement to disclose undistributed net investment income in the current reporting period. |
| 18 | JOHN HANCOCK Disciplined Value Fund | ANNUAL REPORT | SEE NOTES TO FINANCIAL STATEMENTS |
| Financial highlights |
| CLASS A SHARES Period ended | 3-31-19 | 3-31-18 | 3-31-17 | 3-31-16 | 3-31-15 |
| Per share operating performance | |||||
| Net asset value, beginning of period | $22.11 | $20.71 | $17.64 | $19.44 | $18.94 |
| Net investment income1 | 0.26 | 0.20 | 0.18 | 0.16 | 0.20 |
| Net realized and unrealized gain (loss) on investments | (0.28) | 2.39 | 3.08 | (1.18) | 1.19 |
| Total from investment operations | (0.02) | 2.59 | 3.26 | (1.02) | 1.39 |
| Less distributions | |||||
| From net investment income | (0.23) | (0.18) | (0.19) | (0.19) | (0.10) |
| From net realized gain | (1.61) | (1.01) | — | (0.59) | (0.79) |
| Total distributions | (1.84) | (1.19) | (0.19) | (0.78) | (0.89) |
| Net asset value, end of period | $20.25 | $22.11 | $20.71 | $17.64 | $19.44 |
| Total return (%)2,3 | 0.45 | 12.42 | 18.50 | (5.29) | 7.53 |
| Ratios and supplemental data | |||||
| Net assets, end of period (in millions) | $1,092 | $1,289 | $1,449 | $2,375 | $2,705 |
| Ratios (as a percentage of average net assets): | |||||
| Expenses before reductions | 1.06 | 1.06 | 1.07 | 1.08 | 1.08 |
| Expenses including reductions | 1.05 | 1.05 | 1.06 | 1.07 | 1.08 |
| Net investment income | 1.18 | 0.92 | 0.96 | 0.87 | 1.04 |
| Portfolio turnover (%) | 69 | 45 | 65 | 61 | 44 |
| 1 | Based on average daily shares outstanding. |
| 2 | Total returns would have been lower had certain expenses not been reduced during the applicable periods. |
| 3 | Does not reflect the effect of sales charges, if any. |
| SEE NOTES TO FINANCIAL STATEMENTS | ANNUAL REPORT | JOHN HANCOCK Disciplined Value Fund | 19 |
| CLASS B SHARES Period ended | 3-31-19 | 3-31-18 | 3-31-17 | 3-31-16 | 3-31-15 |
| Per share operating performance | |||||
| Net asset value, beginning of period | $20.76 | $19.52 | $16.64 | $18.38 | $18.00 |
| Net investment income1 | 0.09 | 0.03 | 0.03 | 0.02 | 0.04 |
| Net realized and unrealized gain (loss) on investments | (0.26) | 2.24 | 2.91 | (1.12) | 1.13 |
| Total from investment operations | (0.17) | 2.27 | 2.94 | (1.10) | 1.17 |
| Less distributions | |||||
| From net investment income | (0.06) | (0.02) | (0.06) | (0.05) | — |
| From net realized gain | (1.61) | (1.01) | — | (0.59) | (0.79) |
| Total distributions | (1.67) | (1.03) | (0.06) | (0.64) | (0.79) |
| Net asset value, end of period | $18.92 | $20.76 | $19.52 | $16.64 | $18.38 |
| Total return (%)2,3 | (0.34) | 11.61 | 17.66 | (6.02) | 6.68 |
| Ratios and supplemental data | |||||
| Net assets, end of period (in millions) | $6 | $9 | $13 | $14 | $19 |
| Ratios (as a percentage of average net assets): | |||||
| Expenses before reductions | 1.81 | 1.81 | 1.82 | 1.85 | 1.91 |
| Expenses including reductions | 1.80 | 1.80 | 1.81 | 1.84 | 1.90 |
| Net investment income | 0.42 | 0.16 | 0.18 | 0.09 | 0.20 |
| Portfolio turnover (%) | 69 | 45 | 65 | 61 | 44 |
| 1 | Based on average daily shares outstanding. |
| 2 | Total returns would have been lower had certain expenses not been reduced during the applicable periods. |
| 3 | Does not reflect the effect of sales charges, if any. |
| 20 | JOHN HANCOCK Disciplined Value Fund | ANNUAL REPORT | SEE NOTES TO FINANCIAL STATEMENTS |
| CLASS C SHARES Period ended | 3-31-19 | 3-31-18 | 3-31-17 | 3-31-16 | 3-31-15 |
| Per share operating performance | |||||
| Net asset value, beginning of period | $20.82 | $19.57 | $16.69 | $18.43 | $18.03 |
| Net investment income1 | 0.09 | 0.03 | 0.03 | 0.02 | 0.07 |
| Net realized and unrealized gain (loss) on investments | (0.26) | 2.25 | 2.91 | (1.12) | 1.12 |
| Total from investment operations | (0.17) | 2.28 | 2.94 | (1.10) | 1.19 |
| Less distributions | |||||
| From net investment income | (0.06) | (0.02) | (0.06) | (0.05) | — |
| From net realized gain | (1.61) | (1.01) | — | (0.59) | (0.79) |
| Total distributions | (1.67) | (1.03) | (0.06) | (0.64) | (0.79) |
| Net asset value, end of period | $18.98 | $20.82 | $19.57 | $16.69 | $18.43 |
| Total return (%)2,3 | (0.35) | 11.58 | 17.61 | (6.00) | 6.78 |
| Ratios and supplemental data | |||||
| Net assets, end of period (in millions) | $235 | $275 | $293 | $309 | $302 |
| Ratios (as a percentage of average net assets): | |||||
| Expenses before reductions | 1.81 | 1.81 | 1.82 | 1.83 | 1.84 |
| Expenses including reductions | 1.80 | 1.80 | 1.81 | 1.82 | 1.83 |
| Net investment income | 0.43 | 0.16 | 0.18 | 0.12 | 0.35 |
| Portfolio turnover (%) | 69 | 45 | 65 | 61 | 44 |
| 1 | Based on average daily shares outstanding. |
| 2 | Total returns would have been lower had certain expenses not been reduced during the applicable periods. |
| 3 | Does not reflect the effect of sales charges, if any. |
| SEE NOTES TO FINANCIAL STATEMENTS | ANNUAL REPORT | JOHN HANCOCK Disciplined Value Fund | 21 |
| CLASS I SHARES Period ended | 3-31-19 | 3-31-18 | 3-31-17 | 3-31-16 | 3-31-15 |
| Per share operating performance | |||||
| Net asset value, beginning of period | $21.45 | $20.12 | $17.14 | $18.91 | $18.44 |
| Net investment income1 | 0.30 | 0.25 | 0.22 | 0.20 | 0.25 |
| Net realized and unrealized gain (loss) on investments | (0.27) | 2.32 | 3.00 | (1.14) | 1.16 |
| Total from investment operations | 0.03 | 2.57 | 3.22 | (0.94) | 1.41 |
| Less distributions | |||||
| From net investment income | (0.29) | (0.23) | (0.24) | (0.24) | (0.15) |
| From net realized gain | (1.61) | (1.01) | — | (0.59) | (0.79) |
| Total distributions | (1.90) | (1.24) | (0.24) | (0.83) | (0.94) |
| Net asset value, end of period | $19.58 | $21.45 | $20.12 | $17.14 | $18.91 |
| Total return (%)2 | 0.64 | 12.71 | 18.80 | (5.02) | 7.86 |
| Ratios and supplemental data | |||||
| Net assets, end of period (in millions) | $7,399 | $6,988 | $7,540 | $6,730 | $7,026 |
| Ratios (as a percentage of average net assets): | |||||
| Expenses before reductions | 0.82 | 0.81 | 0.81 | 0.81 | 0.81 |
| Expenses including reductions | 0.81 | 0.80 | 0.80 | 0.80 | 0.81 |
| Net investment income | 1.43 | 1.17 | 1.18 | 1.13 | 1.34 |
| Portfolio turnover (%) | 69 | 45 | 65 | 61 | 44 |
| 1 | Based on average daily shares outstanding. |
| 2 | Total returns would have been lower had certain expenses not been reduced during the applicable periods. |
| 22 | JOHN HANCOCK Disciplined Value Fund | ANNUAL REPORT | SEE NOTES TO FINANCIAL STATEMENTS |
| CLASS I2 SHARES Period ended | 3-31-19 | 3-31-18 | 3-31-17 | 3-31-16 | 3-31-15 |
| Per share operating performance | |||||
| Net asset value, beginning of period | $21.45 | $20.12 | $17.14 | $18.92 | $18.45 |
| Net investment income1 | 0.30 | 0.25 | 0.22 | 0.20 | 0.24 |
| Net realized and unrealized gain (loss) on investments | (0.27) | 2.32 | 3.00 | (1.15) | 1.17 |
| Total from investment operations | 0.03 | 2.57 | 3.22 | (0.95) | 1.41 |
| Less distributions | |||||
| From net investment income | (0.29) | (0.23) | (0.24) | (0.24) | (0.15) |
| From net realized gain | (1.61) | (1.01) | — | (0.59) | (0.79) |
| Total distributions | (1.90) | (1.24) | (0.24) | (0.83) | (0.94) |
| Net asset value, end of period | $19.58 | $21.45 | $20.12 | $17.14 | $18.92 |
| Total return (%)2 | 0.64 | 12.71 | 18.80 | (5.07) | 7.85 |
| Ratios and supplemental data | |||||
| Net assets, end of period (in millions) | $50 | $54 | $54 | $49 | $89 |
| Ratios (as a percentage of average net assets): | |||||
| Expenses before reductions | 0.82 | 0.81 | 0.81 | 0.82 | 0.84 |
| Expenses including reductions | 0.81 | 0.80 | 0.80 | 0.81 | 0.83 |
| Net investment income | 1.43 | 1.16 | 1.18 | 1.11 | 1.28 |
| Portfolio turnover (%) | 69 | 45 | 65 | 61 | 44 |
| 1 | Based on average daily shares outstanding. |
| 2 | Total returns would have been lower had certain expenses not been reduced during the applicable periods. |
| SEE NOTES TO FINANCIAL STATEMENTS | ANNUAL REPORT | JOHN HANCOCK Disciplined Value Fund | 23 |
| CLASS R1 SHARES Period ended | 3-31-19 | 3-31-18 | 3-31-17 | 3-31-16 | 3-31-15 |
| Per share operating performance | |||||
| Net asset value, beginning of period | $21.41 | $20.09 | $17.13 | $18.90 | $18.43 |
| Net investment income1 | 0.16 | 0.11 | 0.10 | 0.09 | 0.12 |
| Net realized and unrealized gain (loss) on investments | (0.26) | 2.32 | 2.98 | (1.15) | 1.15 |
| Total from investment operations | (0.10) | 2.43 | 3.08 | (1.06) | 1.27 |
| Less distributions | |||||
| From net investment income | (0.14) | (0.10) | (0.12) | (0.12) | (0.01) |
| From net realized gain | (1.61) | (1.01) | — | (0.59) | (0.79) |
| Total distributions | (1.75) | (1.11) | (0.12) | (0.71) | (0.80) |
| Net asset value, end of period | $19.56 | $21.41 | $20.09 | $17.13 | $18.90 |
| Total return (%)2 | 0.01 | 11.99 | 18.00 | (5.66) | 7.09 |
| Ratios and supplemental data | |||||
| Net assets, end of period (in millions) | $16 | $21 | $27 | $26 | $22 |
| Ratios (as a percentage of average net assets): | |||||
| Expenses before reductions | 1.46 | 1.46 | 1.47 | 1.48 | 1.54 |
| Expenses including reductions | 1.45 | 1.45 | 1.46 | 1.47 | 1.53 |
| Net investment income | 0.77 | 0.52 | 0.53 | 0.48 | 0.63 |
| Portfolio turnover (%) | 69 | 45 | 65 | 61 | 44 |
| 1 | Based on average daily shares outstanding. |
| 2 | Total returns would have been lower had certain expenses not been reduced during the applicable periods. |
| 24 | JOHN HANCOCK Disciplined Value Fund | ANNUAL REPORT | SEE NOTES TO FINANCIAL STATEMENTS |
| CLASS R2 SHARES Period ended | 3-31-19 | 3-31-18 | 3-31-17 | 3-31-16 | 3-31-15 |
| Per share operating performance | |||||
| Net asset value, beginning of period | $21.43 | $20.10 | $17.13 | $18.90 | $18.44 |
| Net investment income1 | 0.22 | 0.16 | 0.14 | 0.13 | 0.19 |
| Net realized and unrealized gain (loss) on investments | (0.27) | 2.33 | 2.99 | (1.14) | 1.14 |
| Total from investment operations | (0.05) | 2.49 | 3.13 | (1.01) | 1.33 |
| Less distributions | |||||
| From net investment income | (0.20) | (0.15) | (0.16) | (0.17) | (0.08) |
| From net realized gain | (1.61) | (1.01) | — | (0.59) | (0.79) |
| Total distributions | (1.81) | (1.16) | (0.16) | (0.76) | (0.87) |
| Net asset value, end of period | $19.57 | $21.43 | $20.10 | $17.13 | $18.90 |
| Total return (%)2 | 0.24 | 12.30 | 18.32 | (5.42) | 7.39 |
| Ratios and supplemental data | |||||
| Net assets, end of period (in millions) | $102 | $135 | $135 | $136 | $120 |
| Ratios (as a percentage of average net assets): | |||||
| Expenses before reductions | 1.21 | 1.21 | 1.21 | 1.22 | 1.25 |
| Expenses including reductions | 1.20 | 1.20 | 1.21 | 1.21 | 1.24 |
| Net investment income | 1.02 | 0.76 | 0.78 | 0.74 | 0.99 |
| Portfolio turnover (%) | 69 | 45 | 65 | 61 | 44 |
| 1 | Based on average daily shares outstanding. |
| 2 | Total returns would have been lower had certain expenses not been reduced during the applicable periods. |
| SEE NOTES TO FINANCIAL STATEMENTS | ANNUAL REPORT | JOHN HANCOCK Disciplined Value Fund | 25 |
| CLASS R3 SHARES Period ended | 3-31-19 | 3-31-18 | 3-31-17 | 3-31-16 | 3-31-15 |
| Per share operating performance | |||||
| Net asset value, beginning of period | $21.41 | $20.09 | $17.12 | $18.89 | $18.43 |
| Net investment income1 | 0.18 | 0.13 | 0.12 | 0.10 | 0.14 |
| Net realized and unrealized gain (loss) on investments | (0.27) | 2.32 | 2.99 | (1.14) | 1.15 |
| Total from investment operations | (0.09) | 2.45 | 3.11 | (1.04) | 1.29 |
| Less distributions | |||||
| From net investment income | (0.16) | (0.12) | (0.14) | (0.14) | (0.04) |
| From net realized gain | (1.61) | (1.01) | — | (0.59) | (0.79) |
| Total distributions | (1.77) | (1.13) | (0.14) | (0.73) | (0.83) |
| Net asset value, end of period | $19.55 | $21.41 | $20.09 | $17.12 | $18.89 |
| Total return (%)2 | 0.08 | 12.10 | 18.17 | (5.57) | 7.20 |
| Ratios and supplemental data | |||||
| Net assets, end of period (in millions) | $12 | $16 | $22 | $30 | $28 |
| Ratios (as a percentage of average net assets): | |||||
| Expenses before reductions | 1.36 | 1.35 | 1.36 | 1.37 | 1.43 |
| Expenses including reductions | 1.35 | 1.34 | 1.35 | 1.37 | 1.42 |
| Net investment income | 0.86 | 0.63 | 0.66 | 0.57 | 0.73 |
| Portfolio turnover (%) | 69 | 45 | 65 | 61 | 44 |
| 1 | Based on average daily shares outstanding. |
| 2 | Total returns would have been lower had certain expenses not been reduced during the applicable periods. |
| 26 | JOHN HANCOCK Disciplined Value Fund | ANNUAL REPORT | SEE NOTES TO FINANCIAL STATEMENTS |
| CLASS R4 SHARES Period ended | 3-31-19 | 3-31-18 | 3-31-17 | 3-31-16 | 3-31-15 |
| Per share operating performance | |||||
| Net asset value, beginning of period | $21.45 | $20.12 | $17.14 | $18.92 | $18.45 |
| Net investment income1 | 0.27 | 0.22 | 0.19 | 0.18 | 0.25 |
| Net realized and unrealized gain (loss) on investments | (0.27) | 2.32 | 3.00 | (1.16) | 1.12 |
| Total from investment operations | — | 2.54 | 3.19 | (0.98) | 1.37 |
| Less distributions | |||||
| From net investment income | (0.25) | (0.20) | (0.21) | (0.21) | (0.11) |
| From net realized gain | (1.61) | (1.01) | — | (0.59) | (0.79) |
| Total distributions | (1.86) | (1.21) | (0.21) | (0.80) | (0.90) |
| Net asset value, end of period | $19.59 | $21.45 | $20.12 | $17.14 | $18.92 |
| Total return (%)2 | 0.52 | 12.54 | 18.63 | (5.22) | 7.67 |
| Ratios and supplemental data | |||||
| Net assets, end of period (in millions) | $143 | $231 | $286 | $268 | $228 |
| Ratios (as a percentage of average net assets): | |||||
| Expenses before reductions | 1.06 | 1.06 | 1.07 | 1.06 | 1.08 |
| Expenses including reductions | 0.95 | 0.95 | 0.96 | 0.96 | 0.97 |
| Net investment income | 1.26 | 1.02 | 1.03 | 1.00 | 1.31 |
| Portfolio turnover (%) | 69 | 45 | 65 | 61 | 44 |
| 1 | Based on average daily shares outstanding. |
| 2 | Total returns would have been lower had certain expenses not been reduced during the applicable periods. |
| SEE NOTES TO FINANCIAL STATEMENTS | ANNUAL REPORT | JOHN HANCOCK Disciplined Value Fund | 27 |
| CLASS R5 SHARES Period ended | 3-31-19 | 3-31-18 | 3-31-17 | 3-31-16 | 3-31-15 |
| Per share operating performance | |||||
| Net asset value, beginning of period | $21.48 | $20.15 | $17.16 | $18.94 | $18.47 |
| Net investment income1 | 0.31 | 0.26 | 0.23 | 0.21 | 0.24 |
| Net realized and unrealized gain (loss) on investments | (0.26) | 2.32 | 3.00 | (1.15) | 1.19 |
| Total from investment operations | 0.05 | 2.58 | 3.23 | (0.94) | 1.43 |
| Less distributions | |||||
| From net investment income | (0.30) | (0.24) | (0.24) | (0.25) | (0.17) |
| From net realized gain | (1.61) | (1.01) | — | (0.59) | (0.79) |
| Total distributions | (1.91) | (1.25) | (0.24) | (0.84) | (0.96) |
| Net asset value, end of period | $19.62 | $21.48 | $20.15 | $17.16 | $18.94 |
| Total return (%)2 | 0.75 | 12.73 | 18.88 | (5.02) | 7.98 |
| Ratios and supplemental data | |||||
| Net assets, end of period (in millions) | $166 | $198 | $200 | $275 | $376 |
| Ratios (as a percentage of average net assets): | |||||
| Expenses before reductions | 0.76 | 0.76 | 0.76 | 0.77 | 0.73 |
| Expenses including reductions | 0.75 | 0.75 | 0.75 | 0.76 | 0.72 |
| Net investment income | 1.48 | 1.22 | 1.27 | 1.16 | 1.27 |
| Portfolio turnover (%) | 69 | 45 | 65 | 61 | 44 |
| 1 | Based on average daily shares outstanding. |
| 2 | Total returns would have been lower had certain expenses not been reduced during the applicable periods. |
| 28 | JOHN HANCOCK Disciplined Value Fund | ANNUAL REPORT | SEE NOTES TO FINANCIAL STATEMENTS |
| CLASS R6 SHARES Period ended | 3-31-19 | 3-31-18 | 3-31-17 | 3-31-16 | 3-31-15 |
| Per share operating performance | |||||
| Net asset value, beginning of period | $21.48 | $20.14 | $17.16 | $18.94 | $18.47 |
| Net investment income1 | 0.32 | 0.27 | 0.24 | 0.23 | 0.31 |
| Net realized and unrealized gain (loss) on investments | (0.27) | 2.33 | 3.00 | (1.15) | 1.12 |
| Total from investment operations | 0.05 | 2.60 | 3.24 | (0.92) | 1.43 |
| Less distributions | |||||
| From net investment income | (0.31) | (0.25) | (0.26) | (0.27) | (0.17) |
| From net realized gain | (1.61) | (1.01) | — | (0.59) | (0.79) |
| Total distributions | (1.92) | (1.26) | (0.26) | (0.86) | (0.96) |
| Net asset value, end of period | $19.61 | $21.48 | $20.14 | $17.16 | $18.94 |
| Total return (%)2 | 0.76 | 12.84 | 18.97 | (5.00) | 7.99 |
| Ratios and supplemental data | |||||
| Net assets, end of period (in millions) | $4,584 | $4,564 | $3,077 | $2,024 | $1,444 |
| Ratios (as a percentage of average net assets): | |||||
| Expenses before reductions | 0.71 | 0.71 | 0.72 | 0.72 | 0.72 |
| Expenses including reductions | 0.70 | 0.70 | 0.69 | 0.69 | 0.69 |
| Net investment income | 1.54 | 1.25 | 1.27 | 1.26 | 1.63 |
| Portfolio turnover (%) | 69 | 45 | 65 | 61 | 44 |
| 1 | Based on average daily shares outstanding. |
| 2 | Total returns would have been lower had certain expenses not been reduced during the applicable periods. |
| SEE NOTES TO FINANCIAL STATEMENTS | ANNUAL REPORT | JOHN HANCOCK Disciplined Value Fund | 29 |
| CLASS NAV SHARES Period ended | 3-31-19 | 3-31-18 | 3-31-17 | 3-31-16 | 3-31-15 |
| Per share operating performance | |||||
| Net asset value, beginning of period | $21.49 | $20.15 | $17.16 | $18.94 | $18.47 |
| Net investment income1 | 0.33 | 0.27 | 0.24 | 0.23 | 0.27 |
| Net realized and unrealized gain (loss) on investments | (0.28) | 2.34 | 3.01 | (1.15) | 1.16 |
| Total from investment operations | 0.05 | 2.61 | 3.25 | (0.92) | 1.43 |
| Less distributions | |||||
| From net investment income | (0.31) | (0.26) | (0.26) | (0.27) | (0.17) |
| From net realized gain | (1.61) | (1.01) | — | (0.59) | (0.79) |
| Total distributions | (1.92) | (1.27) | (0.26) | (0.86) | (0.96) |
| Net asset value, end of period | $19.62 | $21.49 | $20.15 | $17.16 | $18.94 |
| Total return (%)2 | 0.77 | 12.85 | 18.95 | (4.95) | 7.98 |
| Ratios and supplemental data | |||||
| Net assets, end of period (in millions) | $1,105 | $1,219 | $1,245 | $750 | $844 |
| Ratios (as a percentage of average net assets): | |||||
| Expenses before reductions | 0.70 | 0.70 | 0.70 | 0.70 | 0.69 |
| Expenses including reductions | 0.69 | 0.69 | 0.69 | 0.69 | 0.69 |
| Net investment income | 1.54 | 1.28 | 1.27 | 1.25 | 1.45 |
| Portfolio turnover (%) | 69 | 45 | 65 | 61 | 44 |
| 1 | Based on average daily shares outstanding. |
| 2 | Total returns would have been lower had certain expenses not been reduced during the applicable periods. |
| 30 | JOHN HANCOCK Disciplined Value Fund | ANNUAL REPORT | SEE NOTES TO FINANCIAL STATEMENTS |
Note 1 — Organization
John Hancock Disciplined Value Fund (the fund) is a series of John Hancock Funds III (the Trust), an open-end management investment company organized as a Massachusetts business trust and registered under the Investment Company Act of 1940, as amended (the 1940 Act). The investment objective of the fund is to seek to provide long-term growth of capital primarily through investment in equity securities. Current income is a secondary objective.
The fund may offer multiple classes of shares. The shares currently offered by the fund are detailed in the Statement of assets and liabilities. Class A and Class C shares are offered to all investors. Class I shares are offered to institutions and certain investors. Class B and Class I2 shares are closed to new investors. Class R1, Class R2, Class R3, Class R4 and Class R5 shares are available only to certain retirement and 529 plans. Class R6 shares are only available to certain retirement plans, institutions and other investors. Class NAV shares are offered to John Hancock affiliated funds of funds, retirement plans for employees of John Hancock and/or Manulife Financial Corporation (MFC), and certain 529 plans. Class B shares convert to Class A shares eight years after purchase. Class C shares convert to Class A shares ten years after purchase (certain exclusions may apply). Shareholders of each class have exclusive voting rights to matters that affect that class. The distribution and service fees, if any, and transfer agent fees for each class may differ.
Note 2 — Significant accounting policies
The financial statements have been prepared in conformity with accounting principles generally accepted in the United States of America (US GAAP), which require management to make certain estimates and assumptions as of the date of the financial statements. Actual results could differ from those estimates and those differences could be significant. The fund qualifies as an investment company under Topic 946 of Accounting Standards Codification of US GAAP.
Events or transactions occurring after the end of the fiscal period through the date that the financial statements were issued have been evaluated in the preparation of the financial statements. The following summarizes the significant accounting policies of the fund:
Security valuation.Investments are stated at value as of the scheduled close of regular trading on the New York Stock Exchange (NYSE), normally at 4:00 p.m., Eastern Time. In case of emergency or other disruption resulting in the NYSE not opening for trading or the NYSE closing at a time other than the regularly scheduled close, the net asset value (NAV) may be determined as of the regularly scheduled close of the NYSE pursuant to the fund's Valuation Policies and Procedures.
In order to value the securities, the fund uses the following valuation techniques: Equity securities, including exchange-traded funds, held by the fund are typically valued at the last sale price or official closing price on the exchange or principal market where the security trades. In the event there were no sales during the day or closing prices are not available, the securities are valued using the last available bid price. Investments by the fund in open-end management investment companies, including John Hancock Collateral Trust (JHCT), are valued at their respective NAVs each business day.
In certain instances, the Pricing Committee may determine to value equity securities using prices obtained from another exchange or market if trading on the exchange or market on which prices are typically obtained did not open for trading as scheduled, or if trading closed earlier than scheduled, and trading occurred as normal on another exchange or market.
Other portfolio securities and assets, for which reliable market quotations are not readily available, are valued at fair value as determined in good faith by the fund's Pricing Committee following procedures established by the Board of
Trustees. The frequency with which these fair valuation procedures are used cannot be predicted and fair value of securities may differ significantly from the value that would have been used had a ready market for such securities existed.
The fund uses a three-tier hierarchy to prioritize the pricing assumptions, referred to as inputs, used in valuation techniques to measure fair value. Level 1 includes securities valued using quoted prices in active markets for identical securities. Level 2 includes securities valued using other significant observable inputs. Observable inputs may include quoted prices for similar securities, interest rates, prepayment speeds and credit risk. Prices for securities valued using these inputs are received from independent pricing vendors and brokers and are based on an evaluation of the inputs described. Level 3 includes securities valued using significant unobservable inputs when market prices are not readily available or reliable, including the fund's own assumptions in determining the fair value of investments. Factors used in determining value may include market or issuer specific events or trends, changes in interest rates and credit quality. The inputs or methodology used for valuing securities are not necessarily an indication of the risks associated with investing in those securities. Changes in valuation techniques and related inputs may result in transfers into or out of an assigned level within the disclosure hierarchy.
As of March 31, 2019, all investments are categorized as Level 1 under the hierarchy described above.
Security transactions and related investment income. Investment security transactions are accounted for on a trade date plus one basis for daily NAV calculations. However, for financial reporting purposes, investment transactions are reported on trade date. Interest income is accrued as earned. Dividend income is recorded on the ex-date, except for dividends of foreign securities where the dividend may not be known until after the ex-date. In those cases, dividend income, net of withholding taxes, is recorded when the fund becomes aware of the dividends. Non-cash dividends, if any, are recorded at the fair market value of the securities received. Gains and losses on securities sold are determined on the basis of identified cost and may include proceeds from litigation.
Securities lending. The fund may lend its securities to earn additional income. The fund receives cash collateral from the borrower in an amount not less than the market value of the loaned securities. The fund will invest its collateral in JHCT, an affiliate of the fund, which has a floating NAV and is registered with the Securities and Exchange Commission (SEC) as an investment company. JHCT invests in short-term money market investments. The fund will receive the benefit of any gains and bear any losses generated by JHCT with respect to the cash collateral.
The fund has the right to recall loaned securities on demand. If a borrower fails to return loaned securities when due, then the lending agent is responsible and indemnifies the fund for the lent securities. The lending agent uses the collateral received from the borrower to purchase replacement securities of the same issue, type, class and series of the loaned securities. If the value of the collateral is less than the purchase cost of replacement securities, the lending agent is responsible for satisfying the shortfall but only to the extent that the shortfall is not due to any decrease in the value of JHCT.
Although the risk of the loss of the securities lent is mitigated by receiving collateral from the borrower and through lending agent indemnification, the fund could experience a delay in recovering securities or could experience a lower than expected return if the borrower fails to return the securities on a timely basis. The fund receives compensation for lending its securities by retaining a portion of the return on the investment of the collateral and compensation from fees earned from borrowers of the securities. Securities lending income received by the fund is net of fees retained by the securities lending agent. Net income received from JHCT is a component of securities lending income as recorded on the Statement of operations.
Obligations to repay collateral received by the fund are shown on the Statement of assets and liabilities as Payable upon return of securities loaned and are secured by the loaned securities. As of March 31, 2019, the fund loaned common stocks valued at $64,987,484 and received $66,309,940 of cash collateral.
Foreign taxes. The fund may be subject to withholding tax on income, capital gains or repatriation taxes imposed by certain countries, a portion of which may be recoverable. Foreign taxes are accrued based upon the fund's understanding of the tax rules and rates that exist in the foreign markets in which it invests. Taxes are accrued based on gains realized by the fund as a result of certain foreign security sales. In certain circumstances, estimated taxes are accrued based on unrealized appreciation of such securities. Investment income is recorded net of foreign withholding taxes, less any amounts reclaimable.
Line of credit.The fund may have the ability to borrow from banks for temporary or emergency purposes, including meeting redemption requests that otherwise might require the untimely sale of securities. Pursuant to the fund's custodian agreement, the custodian may loan money to the fund to make properly authorized payments. The fund is obligated to repay the custodian for any overdraft, including any related costs or expenses. The custodian may have a lien, security interest or security entitlement in any fund property that is not otherwise segregated or pledged, to the extent of any overdraft, and to the maximum extent permitted by law.
The fund and other affiliated funds have entered into a syndicated line of credit agreement with Citibank, N.A. as the administrative agent that enables them to participate in a $750 million unsecured committed line of credit. Excluding commitments designated for a certain fund and subject to the needs of all other affiliated funds, the fund can borrow up to an aggregate commitment amount of $500 million, subject to asset coverage and other limitations as specified in the agreement. A commitment fee payable at the end of each calendar quarter, based on the average daily unused portion of the line of credit, is charged to each participating fund based on a combination of fixed and asset based allocations and is reflected in Other expenses on the Statement of operations. Commitment fees for the year ended March 31, 2019 were $34,990.
Expenses. Within the John Hancock group of funds complex, expenses that are directly attributable to an individual fund are allocated to such fund. Expenses that are not readily attributable to a specific fund are allocated among all funds in an equitable manner, taking into consideration, among other things, the nature and type of expense and the fund's relative net assets. Expense estimates are accrued in the period to which they relate and adjustments are made when actual amounts are known.
Class allocations. Income, common expenses and realized and unrealized gains (losses) are determined at the fund level and allocated daily to each class of shares based on the net assets of the class. Class-specific expenses, such as distribution and service fees, if any, and transfer agent fees, for all classes, are charged daily at the class level based on the net assets of each class and the specific expense rates applicable to each class.
Federal income taxes. The fund intends to continue to qualify as a regulated investment company by complying with the applicable provisions of the Internal Revenue Code and will not be subject to federal income tax on taxable income that is distributed to shareholders. Therefore, no federal income tax provision is required.
As of March 31, 2019, the fund had no uncertain tax positions that would require financial statement recognition, derecognition or disclosure. The fund's federal tax returns are subject to examination by the Internal Revenue Service for a period of three years.
Distribution of income and gains. Distributions to shareholders from net investment income and net realized gains, if any, are recorded on the ex-date. The fund generally declares and pays dividends and capital gain distributions, if any, annually.
The tax character of distributions for the years ended March 31, 2019 and 2018 was as follows:
| March 31, 2019 | March 31, 2018 | |
| Ordinary Income | $207,942,145 | $154,634,740 |
| Long-Term Capital Gain | 1,124,012,096 | 670,483,027 |
| Total | $1,331,954,241 | $825,117,767 |
Distributions paid by the fund with respect to each class of shares are calculated in the same manner, at the same time and in the same amount, except for the effect of class level expenses that may be applied differently to each class. As of March 31, 2019, the components of distributable earnings on a tax basis consisted of $61,036,427 of undistributed ordinary income and $501,347,147 of undistributed long-term capital gains.
Such distributions and distributable earnings, on a tax basis, are determined in conformity with income tax regulations, which may differ from US GAAP. Distributions in excess of tax basis earnings and profits, if any, are reported in the fund's financial statements as a return of capital.
Capital accounts within the financial statements are adjusted for permanent book-tax differences. These adjustments have no impact on net assets or the results of operations. Temporary book-tax differences, if any, will reverse in a subsequent period. Book-tax differences are primarily attributable to wash sale loss deferrals and treatment of a portion of the proceeds from redemptions as distributions for tax purposes.
Note 3 — Guarantees and indemnifications
Under the Trust's organizational documents, its Officers and Trustees are indemnified against certain liabilities arising out of the performance of their duties to the Trust, including the fund. Additionally, in the normal course of business, the fund enters into contracts with service providers that contain general indemnification clauses. The fund's maximum exposure under these arrangements is unknown, as this would involve future claims that may be made against the fund that have not yet occurred. The risk of material loss from such claims is considered remote.
Note 4 — Fees and transactions with affiliates
John Hancock Advisers, LLC (the Advisor) serves as investment advisor for the fund. John Hancock Funds, LLC (the Distributor), an affiliate of the Advisor, serves as principal underwriter of the fund. The Advisor and the Distributor are indirect, wholly owned subsidiaries of MFC.
Management fee. The fund has an investment management agreement with the Advisor under which the fund pays a daily management fee to the Advisor equivalent on an annual basis to the sum of: (a) 0.750% of the first $500 million of the fund's average daily net assets; (b) 0.725% of the next $500 million of the fund's average daily net assets; (c) 0.700% of the next $500 million of the fund's average daily net assets; (d) 0.675% of the next $1 billion of the fund's average daily net assets; (e) 0.650% of the next $10 billion of the fund's average daily net assets; and (f) 0.625% of the fund's average daily net assets in excess of $12.5 billion. The Advisor has a subadvisory agreement with Boston Partners Global Investors, Inc., an indirect, wholly owned subsidiary of Orix Corporation of Japan. The fund is not responsible for payment of the subadvisory fees.
The Advisor has contractually agreed to waive a portion of its management fee and/or reimburse expenses for certain funds of the John Hancock group of funds complex, including the fund (the participating portfolios). This waiver is based upon aggregate net assets of all the participating portfolios. The amount of the reimbursement is calculated daily and allocated among all the participating portfolios in proportion to the daily net assets of each fund. During the year ended March 31, 2019, this waiver amounted to 0.01% of the fund's average net assets. This agreement expires
on June 30, 2020, unless renewed by mutual agreement of the fund and the Advisor based upon a determination that this is appropriate under the circumstances at that time.
Prior to July 1, 2018, the Advisor has contractually agreed to waive all or a portion of its management fee and/or reimburse or pay operating expenses to the extent necessary to maintain total operating expenses at 0.85% for Class I2 shares, excluding certain expenses such as taxes, brokerage commissions, interest expense, litigation and indemnification expenses and other extraordinary expenses not incurred in the ordinary course of the fund's business, acquired fund fees and expenses paid indirectly and short dividend expense.
For the year ended March 31, 2019, these expense reductions amounted to the following:
| Class | Expense reduction | Class | Expense reduction | |
| Class A | $95,365 | Class R3 | $1,203 | |
| Class B | 612 | Class R4 | 15,245 | |
| Class C | 20,516 | Class R5 | 15,125 | |
| Class I | 585,451 | Class R6 | 373,346 | |
| Class I2 | 4,025 | Class NAV | 92,401 | |
| Class R1 | 1,550 | Total | $1,214,444 | |
| Class R2 | 9,605 |
Expenses waived or reimbursed in the current fiscal period are not subject to recapture in future fiscal periods.
The investment management fees, including the impact of waiver and reimbursements as described above, incurred for the year ended March 31, 2019 were equivalent to a net annual effective rate of 0.65% of the fund's average daily net assets.
Accounting and legal services. Pursuant to a service agreement, the fund reimburses the Advisor for all expenses associated with providing the administrative, financial, legal, compliance, accounting and recordkeeping services to the fund, including the preparation of all tax returns, periodic reports to shareholders and regulatory reports, among other services. These expenses are allocated to each share class based on its relative net assets at the time the expense was incurred. These accounting and legal services fees incurred for the year ended March 31, 2019 amounted to an annual rate of 0.02% of the fund's average daily net assets.
Distribution and service plans. The fund has a distribution agreement with the Distributor. The fund has adopted distribution and service plans with respect to Class A, Class B, Class C, Class R1, Class R2, Class R3 and Class R4 pursuant to Rule 12b-1 under the 1940 Act, to pay the Distributor for services provided as the distributor of shares of the fund. In addition, under a service plan for Class R1, Class R2, Class R3, Class R4 and Class R5, the fund pays for certain other services. The fund may pay up to the following contractual rates of distribution and service fees under these arrangements, expressed as an annual percentage of average daily net assets for each class of the fund's shares.
| Class | Rule 12b-1 fee | Service fee | Class | Rule 12b-1 fee | Service fee | |
| Class A | 0.30% | — | Class R2 | 0.25% | 0.25% | |
| Class B | 1.00% | — | Class R3 | 0.50% | 0.15% | |
| Class C | 1.00% | — | Class R4 | 0.25% | 0.10% | |
| Class R1 | 0.50% | 0.25% | Class R5 | — | 0.05% |
Class A shares are currently charged 0.25% for Rule 12b-1 fees.
The fund's Distributor has contractually agreed to waive 0.10% of Rule12b-1 fees for Class R4 shares. The current waiver agreement expires on July 31, 2020, unless renewed by mutual agreement of the fund and the Distributor
based upon a determination that this is appropriate under the circumstances at the time. This contractual waiver amounted to $190,252 for Class R4 shares for the year ended March 31, 2019.
Sales charges. Class A shares are assessed up-front sales charges, which resulted in payments to the Distributor amounting to $1,420,317 for the year ended March 31, 2019. Of this amount, $230,368 was retained and used for printing prospectuses, advertising, sales literature and other purposes, $1,180,190 was paid as sales commissions to broker-dealers and $9,759 was paid as sales commissions to sales personnel of Signator Investors, Inc., which had been a broker-dealer affiliate of the Advisor through November 2, 2018.
Class A, Class B and Class C shares may be subject to contingent deferred sales charges (CDSCs). Certain Class A shares that are acquired through purchases of $1 million or more and are redeemed within one year of purchase are subject to a 1.00% sales charge. Class B shares that are redeemed within six years of purchase are subject to CDSCs, at declining rates, beginning at 5.00%. Class C shares that are redeemed within one year of purchase are subject to a 1.00% CDSC. CDSCs are applied to the lesser of the current market value at the time of redemption or the original purchase cost of the shares being redeemed. Proceeds from CDSCs are used to compensate the Distributor for providing distribution-related services in connection with the sale of these shares. During the year ended March 31, 2019, CDSCs received by the Distributor amounted to $9,595, $847 and $22,881 for Class A, Class B and Class C shares, respectively.
Transfer agent fees. The John Hancock group of funds has a complex-wide transfer agent agreement with John Hancock Signature Services, Inc. (Signature Services), an affiliate of the Advisor. The transfer agent fees paid to Signature Services are determined based on the cost to Signature Services (Signature Services Cost) of providing recordkeeping services. It also includes out-of-pocket expenses, including payments made to third-parties for recordkeeping services provided to their clients who invest in one or more John Hancock funds. In addition, Signature Services Cost may be reduced by certain fees that Signature Services receives in connection with retirement and small accounts. Signature Services Cost is calculated monthly and allocated, as applicable, to five categories of share classes: Retail Share and Institutional Share Classes of Non-Municipal Bond Funds, Class R6 Shares, Retirement Share Classes and Municipal Bond Share Classes. Within each of these categories, the applicable costs are allocated to the affected John Hancock affiliated funds and/or classes, based on the relative average daily net assets.
Class level expenses. Class level expenses for the year ended March 31, 2019 were:
| Class | Distribution and service fees | Transfer agent fees |
| Class A | $2,991,876 | $1,316,386 |
| Class B | 76,525 | 8,394 |
| Class C | 2,575,121 | 283,313 |
| Class I | — | 9,259,678 |
| Class I2 | — | 63,438 |
| Class R1 | 145,540 | 2,557 |
| Class R2 | 600,676 | 15,820 |
| Class R3 | 98,046 | 1,981 |
| Class R4 | 665,881 | 24,929 |
| Class R5 | 94,148 | 25,153 |
| Class R6 | — | 622,540 |
| Total | $7,247,813 | $11,624,189 |
Trustee expenses.The fund compensates each Trustee who is not an employee of the Advisor or its affiliates. The costs of paying Trustee compensation and expenses are allocated to the fund based on its net assets relative to other funds within the John Hancock group of funds complex.
Interfund lending program. Pursuant to an Exemptive Order issued by the SEC, the fund, along with certain other funds advised by the Advisor or its affiliates, may participate in an interfund lending program. This program provides an alternative credit facility allowing the funds to borrow from, or lend money to, other participating affiliated funds. At period end, no interfund loans were outstanding. The fund's activity in this program during the period for which loans were outstanding was as follows:
| Borrower or lender | Weighted average loan balance | Days outstanding | Weighted average interest rate | Interest income |
| Lender | $14,208,724 | 6 | 2.139% | $5,066 |
Note 5 — Fund share transactions
Transactions in fund shares for the years ended March 31, 2019 and 2018 were as follows:
| Year ended 3-31-19 | Year ended 3-31-18 | |||||||||||||||||||||||||
| Shares | Amount | Shares | Amount | |||||||||||||||||||||||
| Class A shares | ||||||||||||||||||||||||||
| Sold | 9,569,929 | $207,425,723 | 10,973,065 | $241,480,220 | ||||||||||||||||||||||
| Distributions reinvested | 4,960,098 | 94,985,868 | 3,011,965 | 67,377,662 | ||||||||||||||||||||||
| Repurchased | (18,918,870 | ) | (406,531,010 | ) | (25,654,811 | ) | (568,429,293 | ) | ||||||||||||||||||
| Net decrease | (4,388,843 | ) | $(104,119,419 | ) | (11,669,781 | ) | $(259,571,411 | ) | ||||||||||||||||||
| Class B shares | ||||||||||||||||||||||||||
| Sold | 11,891 | $237,117 | 16,805 | $353,704 | ||||||||||||||||||||||
| Distributions reinvested | 28,822 | 516,784 | 22,214 | 467,613 | ||||||||||||||||||||||
| Repurchased | (205,780 | ) | (4,153,192 | ) | (225,602 | ) | (4,635,062 | ) | ||||||||||||||||||
| Net decrease | (165,067 | ) | $(3,399,291 | ) | (186,583 | ) | $(3,813,745 | ) | ||||||||||||||||||
| Class C shares | ||||||||||||||||||||||||||
| Sold | 1,904,627 | $37,952,720 | 1,511,123 | $31,416,419 | ||||||||||||||||||||||
| Distributions reinvested | 1,016,186 | 18,281,188 | 578,627 | 12,214,821 | ||||||||||||||||||||||
| Repurchased | (3,767,579 | ) | (76,202,010 | ) | (3,816,343 | ) | (78,646,192 | ) | ||||||||||||||||||
| Net decrease | (846,766 | ) | $(19,968,102 | ) | (1,726,593 | ) | $(35,014,952 | ) | ||||||||||||||||||
| Class I shares | ||||||||||||||||||||||||||
| Sold | 111,952,595 | $2,334,678,792 | 92,274,463 | $1,981,049,277 | ||||||||||||||||||||||
| Distributions reinvested | 29,864,095 | 552,485,754 | 15,102,029 | 327,563,002 | ||||||||||||||||||||||
| Repurchased | (89,707,048 | ) | (1,831,894,283 | ) | (156,390,264 | ) | (3,346,189,465 | ) | ||||||||||||||||||
| Net increase (decrease) | 52,109,642 | $1,055,270,263 | (49,013,772 | ) | $(1,037,577,186 | ) | ||||||||||||||||||||
| Class I2 shares | ||||||||||||||||||||||||||
| Sold | 116,398 | $2,415,486 | 65,839 | $1,390,004 | ||||||||||||||||||||||
| Distributions reinvested | 234,229 | 4,333,235 | 150,160 | 3,256,976 | ||||||||||||||||||||||
| Repurchased | (320,123 | ) | (6,990,181 | ) | (357,450 | ) | (7,805,895 | ) | ||||||||||||||||||
| Net increase (decrease) | 30,504 | $(241,460 | ) | (141,451 | ) | $(3,158,915 | ) | |||||||||||||||||||
| Year ended 3-31-19 | Year ended 3-31-18 | |||||||||||||||||||||||||
| Shares | Amount | Shares | Amount | |||||||||||||||||||||||
| Class R1 shares | ||||||||||||||||||||||||||
| Sold | 269,688 | $5,592,580 | 246,467 | $5,240,651 | ||||||||||||||||||||||
| Distributions reinvested | 47,717 | 883,243 | 28,587 | 620,061 | ||||||||||||||||||||||
| Repurchased | (483,663 | ) | (10,113,192 | ) | (636,210 | ) | (13,683,427 | ) | ||||||||||||||||||
| Net decrease | (166,258 | ) | $(3,637,369 | ) | (361,156 | ) | $(7,822,715 | ) | ||||||||||||||||||
| Class R2 shares | ||||||||||||||||||||||||||
| Sold | 919,555 | $18,862,900 | 1,051,606 | $22,447,026 | ||||||||||||||||||||||
| Distributions reinvested | 362,873 | 6,716,771 | 249,395 | 5,409,378 | ||||||||||||||||||||||
| Repurchased | (2,370,440 | ) | (50,415,063 | ) | (1,736,841 | ) | (37,158,770 | ) | ||||||||||||||||||
| Net decrease | (1,088,012 | ) | $(24,835,392 | ) | (435,840 | ) | $(9,302,366 | ) | ||||||||||||||||||
| Class R3 shares | ||||||||||||||||||||||||||
| Sold | 90,292 | $1,868,437 | 155,826 | $3,325,836 | ||||||||||||||||||||||
| Distributions reinvested | 62,178 | 1,150,285 | 38,322 | 830,435 | ||||||||||||||||||||||
| Repurchased | (294,238 | ) | (6,083,846 | ) | (532,390 | ) | (11,226,104 | ) | ||||||||||||||||||
| Net decrease | (141,768 | ) | $(3,065,124 | ) | (338,242 | ) | $(7,069,833 | ) | ||||||||||||||||||
| Class R4 shares | ||||||||||||||||||||||||||
| Sold | 1,274,605 | $27,157,069 | 1,866,517 | $39,964,628 | ||||||||||||||||||||||
| Distributions reinvested | 755,931 | 13,999,851 | 575,401 | 12,486,208 | ||||||||||||||||||||||
| Repurchased | (5,504,672 | ) | (117,568,717 | ) | (5,898,214 | ) | (125,068,187 | ) | ||||||||||||||||||
| Net decrease | (3,474,136 | ) | $(76,411,797 | ) | (3,456,296 | ) | $(72,617,351 | ) | ||||||||||||||||||
| Class R5 shares | ||||||||||||||||||||||||||
| Sold | 994,259 | $20,610,888 | 2,193,508 | $47,435,860 | ||||||||||||||||||||||
| Distributions reinvested | 886,630 | 16,429,257 | 548,547 | 11,914,449 | ||||||||||||||||||||||
| Repurchased | (2,638,461 | ) | (54,438,870 | ) | (3,483,426 | ) | (75,192,002 | ) | ||||||||||||||||||
| Net decrease | (757,572 | ) | $(17,398,725 | ) | (741,371 | ) | $(15,841,693 | ) | ||||||||||||||||||
| Class R6 shares | ||||||||||||||||||||||||||
| Sold | 45,397,477 | $956,142,171 | 84,664,767 | $1,831,004,704 | ||||||||||||||||||||||
| Distributions reinvested | 22,117,614 | 409,618,214 | 11,292,223 | 245,154,164 | ||||||||||||||||||||||
| Repurchased | (46,226,115 | ) | (964,352,069 | ) | (36,244,284 | ) | (782,537,323 | ) | ||||||||||||||||||
| Net increase | 21,288,976 | $401,408,316 | 59,712,706 | $1,293,621,545 | ||||||||||||||||||||||
| Class NAV shares | ||||||||||||||||||||||||||
| Sold | 2,989,409 | $61,144,563 | 1,555,054 | $33,747,759 | ||||||||||||||||||||||
| Distributions reinvested | 5,330,746 | 98,778,716 | 3,212,386 | 69,773,034 | ||||||||||||||||||||||
| Repurchased | (8,731,977 | ) | (191,170,727 | ) | (9,836,981 | ) | (213,367,617 | ) | ||||||||||||||||||
| Net decrease | (411,822 | ) | $(31,247,448 | ) | (5,069,541 | ) | $(109,846,824 | ) | ||||||||||||||||||
| Total net increase (decrease) | 61,988,878 | $1,172,354,452 | (13,427,920 | ) | $(268,015,446 | ) | ||||||||||||||||||||
Affiliates of the fund owned 85% of shares of Class NAV on March 31, 2019. Such concentration of shareholders' capital could have a material effect on the fund if such shareholders redeem from the fund.
Note 6 — Purchase and sale of securities
Purchases and sales of securities, other than short-term securities, amounted to $10,715,367,017 and $10,333,938,951, respectively, for the year ended March 31, 2019.
Note 7 — Industry or sector risk
The fund may invest a large percentage of its assets in one or more particular industries or sectors of the economy. If a large percentage of the fund's assets are economically tied to a single or small number of industries or sectors of the economy, the fund will be less diversified than a more broadly diversified fund, and it may cause the fund to underperform if that industry or sector underperforms. In addition, focusing on a particular industry or sector may make the fund's NAV more volatile. Further, a fund that invests in particular industries or sectors is particularly susceptible to the impact of market, economic, regulatory and other factors affecting those industries or sectors.
Note 8 — Investment by affiliated funds
Certain investors in the fund are affiliated funds that are managed by the Advisor and its affiliates. The affiliated funds do not invest in the fund for the purpose of exercising management or control; however, this investment may represent a significant portion of the fund's net assets. At March 31, 2019, funds within the John Hancock group of funds complex held 6.3% of the fund's net assets.At March 31, 2019, there were no affiliated funds with an ownership of 5% or more of the fund's net assets.
Note 9 — Investment in affiliated underlying funds
The fund may invest in affiliated underlying funds that are managed by the Advisor and its affiliates. Information regarding the fund's purchases and sales of the affiliated underlying funds as well as income and capital gains earned, if any, during the period is as follows:
| Dividends and distributions | ||||||||||||||||||||||||||||||||||||||
| Fund | Beginning share amount | Shares purchased | Shares sold | Ending share amount | Income distributions received | Capital gain distributions received | Realized gain (loss) | Change in unrealized appreciation (depreciation) | Ending value | |||||||||||||||||||||||||||||
| John Hancock Collateral Trust* | 10,584,961 | 89,653,947 | (93,612,454 | ) | 6,626,454 | — | — | $30,654 | $10,447 | $66,309,596 | ||||||||||||||||||||||||||||
| *Refer to the Securities lending note within Note 2 for details regarding this investment. | ||||||||||||||||||||||||||||||||||||||
REPORT OF INDEPENDENT REGISTERED PUBLIC ACCOUNTING FIRM
To the Board of Trustees of John Hancock Funds III and Shareholders of John Hancock Disciplined Value Fund
Opinion on the Financial Statements
We have audited the accompanying statement of assets and liabilities, including the Fund's investments, of John Hancock Disciplined Value Fund (one of the funds constituting John Hancock Funds III, referred to hereafter as the "Fund") as of March 31, 2019, the related statement of operations for the year ended March 31, 2019, the statements of changes in net assets for each of the two years in the period ended March 31, 2019, including the related notes, and the financial highlights for each of the five years in the period ended March 31, 2019 (collectively referred to as the "financial statements"). In our opinion, the financial statements present fairly, in all material respects, the financial position of the Fund as of March 31, 2019, the results of its operations for the year then ended, the changes in its net assets for each of the two years in the period ended March 31, 2019 and the financial highlights for each of the five years in the period ended March 31, 2019 in conformity with accounting principles generally accepted in the United States of America.
Basis for Opinion
These financial statements are the responsibility of the Fund's management. Our responsibility is to express an opinion on the Fund's financial statements based on our audits. We are a public accounting firm registered with the Public Company Accounting Oversight Board (United States) ("PCAOB") and are required to be independent with respect to the Fund in accordance with the U.S. federal securities laws and the applicable rules and regulations of the Securities and Exchange Commission and the PCAOB.
We conducted our audits of these financial statements in accordance with the standards of the PCAOB. Those standards require that we plan and perform the audit to obtain reasonable assurance about whether the financial statements are free of material misstatement, whether due to error or fraud.
Our audits included performing procedures to assess the risks of material misstatement of the financial statements, whether due to error or fraud, and performing procedures that respond to those risks. Such procedures included examining, on a test basis, evidence regarding the amounts and disclosures in the financial statements. Our audits also included evaluating the accounting principles used and significant estimates made by management, as well as evaluating the overall presentation of the financial statements. Our procedures included confirmation of securities owned as of March 31, 2019 by correspondence with the custodian, transfer agents, and brokers; when replies were not received from brokers, we performed other auditing procedures. We believe that our audits provide a reasonable basis for our opinion.
/s/ PricewaterhouseCoopers LLP
Boston, Massachusetts
May 16, 2019
We have served as the auditor of one or more investment companies in the John Hancock group of funds since 1988.
Unaudited
For federal income tax purposes, the following information is furnished with respect to the distributions of the fund, if any, paid during its taxable year ended March 31, 2019.
The fund reports the maximum amount allowable of its net taxable income as eligible for the corporate dividends-received deduction.
The fund reports the maximum amount allowable of its net taxable income as qualified dividend income as provided in the Jobs and Growth Tax Relief Reconciliation Act of 2003.
The fund paid $1,175,151,913 in long term capital gain dividends.
Eligible shareholders will be mailed a 2019 Form 1099-DIV in early 2020. This will reflect the tax character of all distributions paid in calendar year 2019.
Please consult a tax advisor regarding the tax consequences of your investment in the fund.
This chart provides information about the Trustees and Officers who oversee your John Hancock fund. Officers elected by the Trustees manage the day-to-day operations of the fund and execute policies formulated by the Trustees.
Independent Trustees
| Name, year of birth Position(s) held with Trust Principal occupation(s) and other directorships during past 5 years | Trustee of the Trust since1 | Number of John Hancock funds overseen by Trustee |
| Hassell H. McClellan, Born: 1945 | 2012 | 215 |
| Trustee and Chairperson of the Board Director/Trustee, Virtus Funds (since 2008); Director, The Barnes Group (since 2010); Associate Professor, The Wallace E. Carroll School of Management, Boston College (retired 2013). Trustee (since 2005) and Chairperson of the Board (since 2017) of various trusts within the John Hancock Fund Complex. | ||
| Charles L. Bardelis,2 Born: 1941 | 2012 | 215 |
| Trustee Director, Island Commuter Corp. (marine transport). Trustee of various trusts within the John Hancock Fund Complex (since 1988). | ||
| James R. Boyle,Born: 1959 | 2015 | 215 |
| Trustee Chief Executive Officer, Foresters Financial (since 2018); Chairman and Chief Executive Officer, Zillion Group, Inc. (formerly HealthFleet, Inc.) (healthcare) (2014-2018); Executive Vice President and Chief Executive Officer, U.S. Life Insurance Division of Genworth Financial, Inc. (insurance) (January 2014-July 2014); Senior Executive Vice President, Manulife Financial, President and Chief Executive Officer, John Hancock (1999-2012); Chairman and Director, John Hancock Advisers, LLC, John Hancock Funds, LLC, and John Hancock Investment Management Services, LLC (2005-2010). Trustee of various trusts within the John Hancock Fund Complex (2005-2014 and since 2015). | ||
| Peter S. Burgess,2 Born: 1942 | 2012 | 215 |
| Trustee Consultant (financial, accounting, and auditing matters) (since 1999); Certified Public Accountant; Partner, Arthur Andersen (independent public accounting firm) (prior to 1999); Director, Lincoln Educational Services Corporation (since 2004); Director, Symetra Financial Corporation (2010-2016); Director, PMA Capital Corporation (2004-2010). Trustee of various trusts within the John Hancock Fund Complex (since 2005). | ||
| William H. Cunningham, Born: 1944 | 2006 | 215 |
| Trustee Professor, University of Texas, Austin, Texas (since 1971); former Chancellor, University of Texas System and former President of the University of Texas, Austin, Texas; Chairman (since 2009) and Director (since 2006), Lincoln National Corporation (insurance); Director, Southwest Airlines (since 2000); former Director, LIN Television (2009-2014). Trustee of various trusts within the John Hancock Fund Complex (since 1986). | ||
| Grace K. Fey, Born: 1946 | 2012 | 215 |
| Trustee Chief Executive Officer, Grace Fey Advisors (since 2007); Director and Executive Vice President, Frontier Capital Management Company (1988-2007); Director, Fiduciary Trust (since 2009). Trustee of various trusts within the John Hancock Fund Complex (since 2008). | ||
Independent Trustees (continued)
| Name, year of birth Position(s) held with Trust Principal occupation(s) and other directorships during past 5 years | Trustee of the Trust since1 | Number of John Hancock funds overseen by Trustee |
| Theron S. Hoffman,2 Born: 1947 | 2012 | 215 |
| Trustee Chief Executive Officer, T. Hoffman Associates, LLC (consulting firm) (since 2003); Director, The Todd Organization (consulting firm) (2003-2010); President, Westport Resources Management (investment management consulting firm) (2006-2008); Board Member, Senior Managing Director, Partner, and Operating Head, Putnam Investments (2000-2003); Executive Vice President, The Thomson Corp. (financial and legal information publishing) (1997-2000). Trustee of various trusts within the John Hancock Fund Complex (since 2008). | ||
| Deborah C. Jackson, Born: 1952 | 2008 | 215 |
| Trustee President, Cambridge College, Cambridge, Massachusetts (since 2011); Board of Directors, National Association of Corporate Directors/New England (since 2015); Board of Directors, Association of Independent Colleges and Universities of Massachusetts (since 2014); Chief Executive Officer, American Red Cross of Massachusetts Bay (2002-2011); Board of Directors of Eastern Bank Corporation (since 2001); Board of Directors of Eastern Bank Charitable Foundation (since 2001); Board of Directors of American Student Assistance Corporation (1996-2009); Board of Directors of Boston Stock Exchange (2002-2008); Board of Directors of Harvard Pilgrim Healthcare (health benefits company) (2007-2011). Trustee of various trusts within the John Hancock Fund Complex (since 2008). | ||
| James M. Oates, Born: 1946 | 2012 | 215 |
Trustee | ||
| Steven R. Pruchansky, Born: 1944 | 2006 | 215 |
| Trustee and Vice Chairperson of the Board Managing Director, Pru Realty (since 2017); Chairman and Chief Executive Officer, Greenscapes of Southwest Florida, Inc. (since 2000); Director and President, Greenscapes of Southwest Florida, Inc. (until 2000); Member, Board of Advisors, First American Bank (until 2010); Managing Director, Jon James, LLC (real estate) (since 2000); Partner, Right Funding, LLC (2014-2017); Director, First Signature Bank & Trust Company (until 1991); Director, Mast Realty Trust (until 1994); President, Maxwell Building Corp. (until 1991). Trustee (since 1992), Chairperson of the Board (2011-2012), and Vice Chairperson of the Board (since 2012) of various trusts within the John Hancock Fund Complex. | ||
| Gregory A. Russo, Born: 1949 | 2008 | 215 |
| Trustee Director and Audit Committee Chairman (since 2012), and Member, Audit Committee and Finance Committee (since 2011), NCH Healthcare System, Inc. (holding company for multi-entity healthcare system); Director and Member (since 2012) and Finance Committee Chairman (since 2014), The Moorings, Inc. (nonprofit continuing care community); Vice Chairman, Risk & Regulatory Matters, KPMG LLP (KPMG) (2002-2006); Vice Chairman, Industrial Markets, KPMG (1998-2002); Chairman and Treasurer, Westchester County, New York, Chamber of Commerce (1986-1992); Director, Treasurer, and Chairman of Audit and Finance Committees, Putnam Hospital Center (1989-1995); Director and Chairman of Fundraising Campaign, United Way of Westchester and Putnam Counties, New York (1990-1995). Trustee of various trusts within the John Hancock Fund Complex (since 2008). | ||
Non-Independent Trustees3
| Name, year of birth Position(s) held with Trust Principal occupation(s) and other directorships during past 5 years | Trustee of the Trust since1 | Number of John Hancock funds overseen by Trustee |
| Andrew G. Arnott, Born: 1971 | 2017 | 215 |
| President and Non-Independent Trustee Head of Wealth and Asset Management, United States and Europe, for John Hancock and Manulife (since 2018); Executive Vice President, John Hancock Financial Services (since 2009, including prior positions); Director and Executive Vice President, John Hancock Advisers, LLC (since 2005, including prior positions); Director and Executive Vice President, John Hancock Investment Management Services, LLC (since 2006, including prior positions); President, John Hancock Funds, LLC (since 2004, including prior positions); President of various trusts within the John Hancock Fund Complex (since 2007, including prior positions). | ||
| Marianne Harrison, Born: 1963 | 2018 | 215 |
| Non-Independent Trustee President and CEO, John Hancock (since 2017); President and CEO, Manulife Canadian Division (2013-2017); Member, Board of Directors, American Council of Life Insurers (ACLI) (since 2018); Member, Board of Directors, Communitech, an industry-led innovation center that fosters technology companies in Canada (since 2017); Member, Board of Directors, Manulife Assurance Canada (since 2015); Board Member, St. Mary's General Hospital Foundation (since 2014); Member, Board of Directors, Manulife Bank of Canada (since 2013); Member, Standing Committee of the Canadian Life & Health Assurance Association (since 2013); Member, Board of Directors, John Hancock USA, John Hancock Life & Health, John Hancock New York (2012-2013). Trustee of various trusts within the John Hancock Fund Complex (since 2018). | ||
Principal officers who are not Trustees
| Name, year of birth Position(s) held with Trust Principal occupation(s) during past 5 years | Officer of the Trust since |
| Francis V. Knox, Jr.,Born: 1947 | 2006 |
| Chief Compliance Officer Vice President, John Hancock Financial Services (since 2005); Chief Compliance Officer, various trusts within the John Hancock Fund Complex, John Hancock Advisers, LLC, and John Hancock Investment Management Services, LLC (since 2005). | |
| Charles A. Rizzo, Born: 1957 | 2007 |
| Chief Financial Officer Vice President, John Hancock Financial Services (since 2008); Senior Vice President, John Hancock Advisers, LLC and John Hancock Investment Management Services, LLC (since 2008); Chief Financial Officer of various trusts within the John Hancock Fund Complex (since 2007). | |
| Salvatore Schiavone, Born: 1965 | 2010 |
| Treasurer Assistant Vice President, John Hancock Financial Services (since 2007); Vice President, John Hancock Advisers, LLC and John Hancock Investment Management Services, LLC (since 2007); Treasurer of various trusts within the John Hancock Fund Complex (since 2007, including prior positions). | |
Principal officers who are notTrustees (continued)
| Name, year of birth Position(s) held with Trust Principal occupation(s) during past 5 years | Officer of the Trust since | |
| Christopher (Kit) Sechler,Born: 1973 | 2018 | |
| Chief Legal Officer and Secretary Vice President and Deputy Chief Counsel, John Hancock Investments (since 2015); Assistant Vice President and Senior Counsel (2009-2015), John Hancock Investments; Chief Legal Officer and Secretary of various trusts within the John Hancock Fund Complex (since 2018); Assistant Secretary of John Hancock Advisers, LLC and John Hancock Investment Management Services, LLC (since 2009). | ||
The business address for all Trustees and Officers is 200 Berkeley Street, Boston, Massachusetts 02116-5023.
The Statement of Additional Information of the fund includes additional information about members of the Board of Trustees of the Trust and is available without charge, upon request, by calling 800-225-5291.
| 1 | Each Trustee holds office until his or her successor is elected and qualified, or until the Trustee's death, retirement, resignation, or removal. Mr. Boyle has served as Trustee at various times prior to the date listed in the table. |
| 2 | Member of the Audit Committee. |
| 3 | The Trustee is a Non-Independent Trustee due to current or former positions with the Advisor and certain affiliates. |
Trustees Hassell H. McClellan,Chairperson Officers Andrew G. Arnott Francis V. Knox, Jr. Charles A. Rizzo Salvatore Schiavone Christopher (Kit) Sechler** | Investment advisor John Hancock Advisers, LLC Subadvisor Boston Partners Global Investors, Inc. Portfolio Managers David T. Cohen, CFA Principal distributor John Hancock Funds, LLC Custodian State Street Bank and Trust Company Transfer agent John Hancock Signature Services, Inc. Legal counsel K&L Gates LLP Independent registered public accounting firm PricewaterhouseCoopers LLP |
* Member of the Audit Committee
† Non-Independent Trustee
#Effective 6-19-18
**Effective 9-13-18
The fund's proxy voting policies and procedures, as well as the fund proxy voting record for the most recent twelve-month period ended June 30, are available free of charge on the Securities and Exchange Commission (SEC) website at sec.gov or on our website.
All of the fund's holdings as of the end of the third month of every fiscal quarter are filed with the SEC on Form N-PORT within 60 days of the end of the fiscal quarter. The fund's Form N-PORT filings are available on our website and the SEC's website, sec.gov.
We make this information on your fund, as well asmonthly portfolio holdings, and other fund details available on our website at jhinvestments.com or by calling 800-225-5291.
| You can also contact us: | |||
| 800-225-5291 jhinvestments.com | Regular mail: John Hancock Signature Services, Inc. | Express mail: John Hancock Signature Services, Inc. | |
John Hancock family of funds
DOMESTIC EQUITY FUNDS Blue Chip Growth Classic Value Disciplined Value Disciplined Value Mid Cap Equity Income Financial Industries Fundamental All Cap Core Fundamental Large Cap Core Fundamental Large Cap Value New Opportunities Regional Bank Small Cap Core Small Cap Growth Small Cap Value U.S. Global Leaders Growth U.S. Quality Growth Value Equity GLOBAL AND INTERNATIONAL EQUITY FUNDS Disciplined Value International Emerging Markets Emerging Markets Equity Fundamental Global Franchise Global Equity Global Shareholder Yield Global Thematic Opportunities Greater China Opportunities International Dynamic Growth International Growth International Small Company | INCOME FUNDS Bond California Tax-Free Income Emerging Markets Debt Floating Rate Income Government Income High Yield High Yield Municipal Bond Income Investment Grade Bond Money Market Short Duration Credit Opportunities Spectrum Income Strategic Income Opportunities Tax-Free Bond ALTERNATIVE AND SPECIALTY FUNDS Absolute Return Currency Alternative Asset Allocation Disciplined Alternative Yield Global Absolute Return Strategies Global Conservative Absolute Return Global Focused Strategies Infrastructure Seaport Long/Short |
A fund's investment objectives, risks, charges, and expenses should be considered carefully before investing. The prospectus contains this and other important information about the fund. To obtain a prospectus, contact your financial professional, call John Hancock Investments at 800-225-5291, or visit our website at jhinvestments.com. Please read the prospectus carefully before investing or sending money.
ASSET ALLOCATION Balanced Income Allocation Multi-Index Lifetime Portfolios Multi-Index Preservation Portfolios Multimanager Lifestyle Portfolios Multimanager Lifetime Portfolios Retirement Income 2040 EXCHANGE-TRADED FUNDS John Hancock Multifactor Consumer Discretionary ETF John Hancock Multifactor Consumer Staples ETF John Hancock Multifactor Developed International ETF John Hancock Multifactor Emerging Markets ETF John Hancock Multifactor Energy ETF John Hancock Multifactor Financials ETF John Hancock Multifactor Healthcare ETF John Hancock Multifactor Industrials ETF John Hancock Multifactor Large Cap ETF John Hancock Multifactor Materials ETF John Hancock Multifactor Media and John Hancock Multifactor Mid Cap ETF John Hancock Multifactor Small Cap ETF John Hancock Multifactor Technology ETF John Hancock Multifactor Utilities ETF | ENVIRONMENTAL, SOCIAL, AND ESG All Cap Core ESG Core Bond ESG International Equity ESG Large Cap Core CLOSED-END FUNDS Financial Opportunities Hedged Equity & Income Income Securities Trust Investors Trust Preferred Income Preferred Income II Preferred Income III Premium Dividend Tax-Advantaged Dividend Income Tax-Advantaged Global Shareholder Yield |
John Hancock Multifactor ETF shares are bought and sold at market price (not NAV), and are not individually redeemed
from the fund. Brokerage commissions will reduce returns.
John Hancock ETFs are distributed by Foreside Fund Services, LLC, and are subadvised by Dimensional Fund Advisors LP.
Foreside is not affiliated with John Hancock Funds, LLC or Dimensional Fund Advisors LP.
Dimensional Fund Advisors LP receives compensation from John Hancock in connection with licensing rights to the
John Hancock Dimensional indexes. Dimensional Fund Advisors LP does not sponsor, endorse, or sell, and makes no
representation as to the advisability of investing in, John Hancock Multifactor ETFs.
John Hancock Investment Management
A trusted brand
John Hancock Investment Management is a premier asset manager
representing one of America's most trusted brands, with a heritage of
financial stewardship dating back to 1862. Helping our shareholders
pursue their financial goals is at the core of everything we do. It's why
we support the role of professional financial advice and operate with
the highest standards of conduct and integrity.
A better way to invest
We serve investors globally through a unique multimanager approach:
We search the world to find proven portfolio teams with specialized
expertise for every strategy we offer, then we apply robust investment
oversight to ensure they continue to meet our uncompromising
standards and serve the best interests of our shareholders.
Results for investors
Our unique approach to asset management enables us to provide
a diverse set of investments backed by some of the world's best
managers, along with strong risk-adjusted returns across asset classes.
![]()
John Hancock Funds, LLC n Member FINRA, SIPC
200 Berkeley Street n Boston, MA 02116-5010 n 800-225-5291 n jhinvestments.com
This report is for the information of the shareholders of John Hancock Disciplined Value Fund. It is not authorized for distribution to prospective investors unless preceded or accompanied by a prospectus.
| MF802034 | 340A 3/19 5/19 |
John Hancock
Global Shareholder Yield Fund
Annual report 3/31/19
Beginning on January 1, 2021, as permitted by regulations adopted by the Securities and Exchange Commission, paper copies of the Fund's shareholder reports like this one will no longer be sent by mail, unless you specifically request paper copies of the reports from the Fund or from your financial intermediary. Instead, the reports will be made available on a website, and you will be notified by mail each time a report is posted and provided with a website link to access the report.
If you already elected to receive shareholder reports electronically, you will not be affected by this change, and you do not need to take any action. You may elect to receive shareholder reports and other communications electronically by calling John Hancock Investment Management at 800-225-5291 (Class A, Class B and Class C shares) or 888-972-8696 (Class I, Class R2, Class R6, and Class NAV) or by contacting your financial intermediary.
You may elect to receive all reports in paper, free of charge, at any time. You can inform John Hancock Investment Management or your financial intermediary that you wish to continue receiving paper copies of your shareholder reports by following the instructions listed above. Your election to receive reports in paper will apply to all funds held with John Hancock Investment Management or your financial intermediary.

A message to shareholders
Dear shareholder,
Market volatility was the big story in the latter half of 2018, as stocks sank in the fourth quarter, hurt by fears of slowing global economic growth, mounting trade tensions between the United States and China, and a pullback in oil prices. Many of those fears were quelled in the beginning of 2019, as favorable earnings reports, progress with the China trade dispute, and signals from the U.S. Federal Reserve that interest-rate hikes were on hold sparked a market rebound.
At the same time, monetary and fiscal stimulus was being employed across Europe, Japan, and China, and the result was that the first quarter of 2019 was the best quarterly performance in global equities since 2010.
Your best resource in unpredictable and volatile markets is your financial advisor, who can help position your portfolio so that it's sufficiently diversified to meet your long-term objectives and to withstand the inevitable turbulence along the way.
On behalf of everyone at John Hancock Investment Management, I'd like to take this opportunity to welcome new shareholders and thank existing shareholders for the continued trust you've placed in us.
Sincerely,
Andrew G. Arnott
President and CEO,
John Hancock Investment Management
Head of Wealth and Asset Management,
United States and Europe
This commentary reflects the CEO's views, which are subject to change at any time. Investing involves risks, including the potential loss of principal. Diversification does not guarantee a profit or eliminate the risk of a loss. It is not possible to invest directly in an index. For more up-to-date information, please visit our website at jhinvestments.com.
John Hancock
Global Shareholder Yield Fund
Table of contents
| 2 | Your fund at a glance | |
| 4 | Discussion of fund performance | |
| 6 | A look at performance | |
| 8 | Your expenses | |
| 10 | Fund's investments | |
| 14 | Financial statements | |
| 18 | Financial highlights | |
| 25 | Notes to financial statements | |
| 35 | Report of independent registered public accounting firm | |
| 36 | Tax information | |
| 37 | Trustees and Officers | |
| 41 | More information |
INVESTMENT OBJECTIVE
The fund seeks to provide a high level of income as its primary objective. Capital appreciation is a secondary investment objective.
AVERAGE ANNUAL TOTAL RETURNS AS OF 3/31/19 (%)
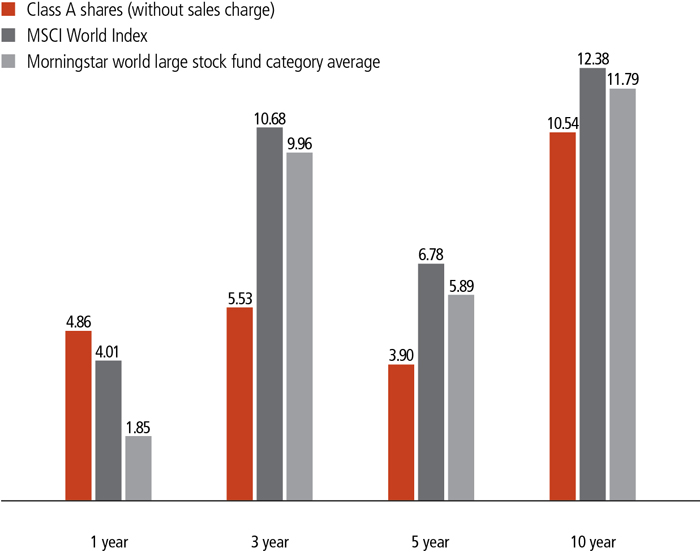
The MSCI World Index is a free float-adjusted market capitalization weighted index that is designed to measure the equity market performance of developed markets.
It is not possible to invest directly in an index. Index figures do not reflect expenses or sales charges, which would result in lower returns.
Figures from Morningstar, Inc. include reinvested distributions and do not take into account sales charges. Actual load-adjusted performance is lower.
The past performance shown here reflects reinvested distributions and the beneficial effect of any expense reductions, and does not guarantee future results. Performance of the other share classes will vary based on the difference in the fees and expenses of those classes. Shares will fluctuate in value and, when redeemed, may be worth more or less than their original cost. Current month-end performance may be lower or higher than the performance cited, and can be found at jhinvestments.com or by calling 800-225-5291. For further information on the fund's objectives, risks, and strategy, see the fund's prospectus.
PERFORMANCE HIGHLIGHTS OVER THE LAST TWELVE MONTHS
Economic fundamentals lifted global equities
Most global developed-market stocks posted positive returns, lifted by strong earnings growth; within global equities, U.S. stocks outperformed developed-market stocks outside the United States.
The fund outpaced its benchmark index
The fund outperformed its benchmark, the MSCI World Index, owing in part to its overall positioning in the utilities, financials, and energy sectors.
Positioning in selected sectors hindered relative performance
The fund's underweight in the information technology sector and stock picking in consumer discretionary and consumer staples had a negative impact.
SECTOR COMPOSITION AS OF 3/31/19 (%)
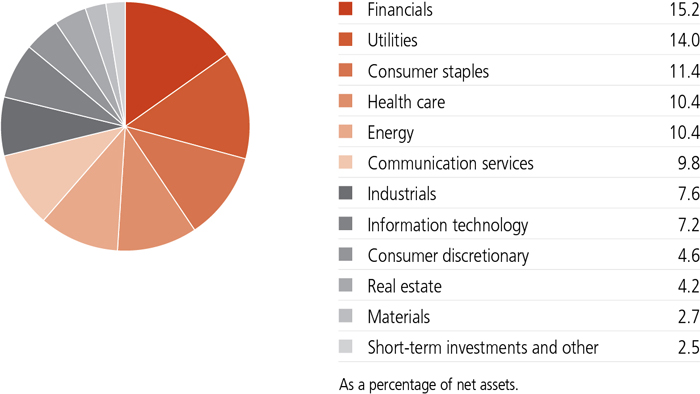
A note about risks
The fund may be subject to various risks as described in the fund's prospectus. For more information, please refer to the "Principal risks" section of the prospectus.
What were the main drivers of global equity market performance during the 12 months ended March 31, 2019?
Most global stocks, as measured by the fund's benchmark, the MSCI World Index, posted positive returns. U.S. equities generally outperformed; gains were more modest in developed markets outside the United States. At the sector level, the best results came from utilities and real estate; performance was weakest in financials and materials.
Market performance was volatile during the latter half of the period, as stocks fell sharply in December before recovering in January and extending their upward momentum into February and March. U.S. corporate earnings growth was strong, aided by cuts to corporate tax rates and a robust domestic economy; however, the earnings outlook weakened late in the period, as the positive impact from tax cuts began to diminish. In Europe, quarterly profits climbed, but lagged the strong growth seen in the United States.
In the market environment described above, how did the fund perform?
The fund outperformed the benchmark, owing in part to its overall positioning in the utilities, financials, and energy sectors. In utilities, the fund's overweight was a positive factor, as the sector outperformed; a contribution from stock picking in
| TOP 10 HOLDINGS AS OF 3/31/19 (%) | TOP 10 COUNTRIES AS OF 3/31/19 (%) | |||
| Muenchener Rueckversicherungs- Gesellschaft AG | 1.7 | United States | 48.8 | |
| United Kingdom | 12.7 | |||
| Allianz SE | 1.7 | France | 7.4 | |
| AXA SA | 1.7 | Germany | 7.1 | |
| BCE, Inc. | 1.7 | Canada | 6.1 | |
| Duke Energy Corp. | 1.7 | Italy | 3.6 | |
| Verizon Communications, Inc. | 1.7 | Switzerland | 3.2 | |
| Welltower, Inc. | 1.6 | Australia | 1.8 | |
| TOTAL SA | 1.5 | Netherlands | 1.5 | |
| Entergy Corp. | 1.5 | Spain | 1.3 | |
| GlaxoSmithKline PLC | 1.5 | TOTAL | 93.5 | |
| TOTAL | 16.3 | |||
| As a percentage of net assets. | As a percentage of net assets. | |||
| Cash and cash equivalents are not included. | Cash and cash equivalents are not included. | |||
utilities added further value. In financials and energy, stock selection contributed to relative performance.
On the negative side, relative performance was hindered by the fund's lower relative exposure to information technology, one of the strongest-performing sectors of the period. However, stock selection in the sector added value, helping to somewhat mitigate the negative impact from the fund's underweight. Stock picking in consumer staples and consumer discretionary also detracted.
What were the key drivers of relative performance at the individual security level?
Among the positions that had the most positive impact on relative performance were real estate investment trust Welltower, Inc. (U.S.), telecommunications company Verizon Communications, Inc. (U.S.), and pharmaceutical firm Merck & Company, Inc.
The position that had the most significant negative impact was Vodafone Group PLC (U.K.), a provider of telecommunication services. Other positions that significantly weighed on relative performance were commercial property firm Unibail-Rodamco-Westfield (France) and automotive company Daimler AG (Germany). We sold the fund's position in Daimler during the period.
MANAGED BY
 | William W. Priest, CFA On the fund since inception Investing since 1965 |
 | John Tobin, Ph.D., CFA On the fund since 2014 Investing since 1981 |
 | Kera Van Valen, CFA On the fund since 2014 Investing since 2001 |
 | Michael A. Welhoelter, CFA On the fund since inception Investing since 1986 |
![]()
TOTAL RETURNS FOR THE PERIOD ENDED MARCH 31, 2019
| Average annual total returns (%) with maximum sales charge | Cumulative total returns (%) with maximum sales charge | SEC 30-day yield (%) subsidized | SEC 30-day yield (%) unsubsidized1 | ||||||||
| 1-year | 5-year | 10-year | 5-year | 10-year | as of 3-31-19 | as of 3-31-19 | |||||
| Class A | -0.42 | 2.83 | 9.98 | 14.98 | 158.85 | 2.58 | 2.40 | ||||
| Class B | -0.80 | 2.82 | 9.73 | 14.94 | 153.13 | 1.94 | 1.81 | ||||
| Class C | 3.07 | 3.16 | 9.75 | 16.82 | 153.49 | 1.96 | 1.82 | ||||
| Class I2 | 5.10 | 4.20 | 10.93 | 22.85 | 182.14 | 2.97 | 2.83 | ||||
| Class R22,3 | 4.68 | 3.77 | 10.44 | 20.33 | 170.00 | 2.48 | 2.36 | ||||
| Class R62,3 | 5.31 | 4.33 | 10.89 | 23.60 | 181.11 | 3.06 | 2.92 | ||||
| Class NAV2 | 5.30 | 4.34 | 11.05 | 23.66 | 185.16 | 3.06 | 2.94 | ||||
| Index† | 4.01 | 6.78 | 12.38 | 38.80 | 221.33 | — | — | ||||
Performance figures assume all distributions have been reinvested. Figures reflect maximum sales charges on Class A shares of 5%, and the applicable contingent deferred sales charge (CDSC) on Class B and Class C shares. The Class B shares' CDSC declines annually between years 1 to 6 according to the following schedule: 5%, 4%, 3%, 3%, 2%, and 1%. No sales charge will be assessed after the sixth year. Class C shares sold within one year of purchase are subject to a 1% CDSC. Sales charges are not applicable to Class I, Class R2, Class R6, and Class NAV shares.
The expense ratios of the fund, both net (including any fee waivers and/or expense limitations) and gross (excluding any fee waivers and/or expense limitations), are set forth according to the most recent publicly available prospectuses for the fund and may differ from those disclosed in the Financial highlights tables in this report. Net expenses reflect contractual expense limitations in effect until June 30, 2020 and are subject to change. Had the contractual fee waivers and expense limitations not been in place, gross expenses would apply. The expense ratios are as follows:
| Class A | Class B | Class C | Class I | Class R2 | Class R6 | Class NAV | |
| Gross (%) | 1.27 | 1.97 | 1.97 | 0.97 | 1.37 | 0.87 | 0.86 |
| Net (%) | 1.09 | 1.84 | 1.84 | 0.84 | 1.24 | 0.74 | 0.85 |
Please refer to the most recent prospectus and annual or semiannual report for more information on expenses and any expense limitation arrangements for each class.
The returns reflect past results and should not be considered indicative of future performance. The return and principal value of an investment will fluctuate so that shares, when redeemed, may be worth more or less than their original cost. Due to market volatility and other factors, the fund's current performance may be higher or lower than the performance shown. For current to the most recent month-end performance data, please call 800-225-5291 or visit the fund's website at jhinvestments.com.
The performance table above and the chart on the next page do not reflect the deduction of taxes that a shareholder would pay on fund distributions or the redemption of fund shares. The fund's performance results reflect any applicable fee waivers or expense reductions, without which the expenses would increase and results would have been less favorable.
| † | Index is the MSCI World Index. |
See the following page for footnotes.
This chart and table show what happened to a hypothetical $10,000 investment in John Hancock Global Shareholder Yield Fund for the share classes and periods indicated, assuming all distributions were reinvested. For comparison, we've shown the same investment in the MSCI World Index.
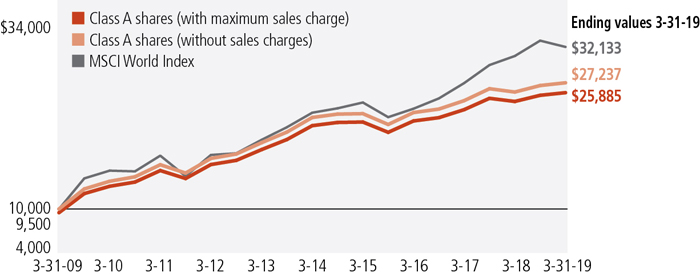
| Start date | With maximum sales charge ($) | Without sales charge ($) | Index ($) | |
| Class B4 | 3-31-09 | 25,313 | 25,313 | 32,133 |
| Class C4 | 3-31-09 | 25,349 | 25,349 | 32,133 |
| Class I2 | 3-31-09 | 28,214 | 28,214 | 32,133 |
| Class R22,3 | 3-31-09 | 27,000 | 27,000 | 32,133 |
| Class R62,3 | 3-31-09 | 28,111 | 28,111 | 32,133 |
| Class NAV2 | 3-31-09 | 28,516 | 28,516 | 32,133 |
The MSCI World Index s a free float-adjusted market capitalization weighted index that is designed to measure the equity market performance of developed markets.
It is not possible to invest directly in an index. Index figures do not reflect expenses or sales charges, which would result in lower returns.
Footnotes related to performance pages
| 1 | Unsubsidized yield reflects what the yield would have been without the effect of reimbursements and waivers. |
| 2 | For certain types of investors, as described in the fund's prospectuses. |
| 3 | Class R2 and Class R6 shares were first offered 3-1-12 and 9-1-11, respectively. The returns prior to these dates are those of Class A shares that have not been adjusted for class-specific expenses; otherwise, returns would vary. |
| 4 | The contingent deferred sales charge is not applicable. |
| Your expenses |

| 8 | JOHN HANCOCK GLOBAL SHAREHOLDER YIELD FUND | ANNUAL REPORT |
| Account value on 10-1-2018 | Ending value on 3-31-2019 | Expenses paid during period ended 3-31-20191 | Annualized expense ratio | ||
| Class A | Actual expenses/actual returns | $1,000.00 | $1,014.00 | $5.47 | 1.09% |
| Hypothetical example | 1,000.00 | 1,019.50 | 5.49 | 1.09% | |
| Class B | Actual expenses/actual returns | 1,000.00 | 1,011.10 | 9.23 | 1.84% |
| Hypothetical example | 1,000.00 | 1,015.80 | 9.25 | 1.84% | |
| Class C | Actual expenses/actual returns | 1,000.00 | 1,010.20 | 9.22 | 1.84% |
| Hypothetical example | 1,000.00 | 1,015.80 | 9.25 | 1.84% | |
| Class I | Actual expenses/actual returns | 1,000.00 | 1,015.20 | 4.22 | 0.84% |
| Hypothetical example | 1,000.00 | 1,020.70 | 4.23 | 0.84% | |
| Class R2 | Actual expenses/actual returns | 1,000.00 | 1,013.20 | 6.02 | 1.20% |
| Hypothetical example | 1,000.00 | 1,018.90 | 6.04 | 1.20% | |
| Class R6 | Actual expenses/actual returns | 1,000.00 | 1,016.70 | 3.72 | 0.74% |
| Hypothetical example | 1,000.00 | 1,021.20 | 3.73 | 0.74% | |
| Class NAV | Actual expenses/actual returns | 1,000.00 | 1,016.70 | 3.67 | 0.73% |
| Hypothetical example | 1,000.00 | 1,021.30 | 3.68 | 0.73% |
| 1 | Expenses are equal to the annualized expense ratio, multiplied by the average account value over the period, multiplied by 182/365 (to reflect the one-half year period). |
| ANNUAL REPORT | JOHN HANCOCK GLOBAL SHAREHOLDER YIELD FUND | 9 |
| Fund’s investments |
| Shares | Value | ||||
| Common stocks 97.5% | $1,985,992,016 | ||||
| (Cost $1,704,868,106) | |||||
| Australia 1.8% | 36,113,517 | ||||
| Commonwealth Bank of Australia (A) | 210,860 | 10,583,941 | |||
| Macquarie Group, Ltd. | 128,590 | 11,842,641 | |||
| Westpac Banking Corp. | 742,505 | 13,686,935 | |||
| Canada 6.1% | 124,739,872 | ||||
| BCE, Inc. | 786,001 | 34,902,009 | |||
| Nutrien, Ltd. (A) | 313,179 | 16,523,324 | |||
| Pembina Pipeline Corp. | 543,318 | 19,958,454 | |||
| Rogers Communications, Inc., Class B | 357,329 | 19,217,447 | |||
| Royal Bank of Canada | 185,270 | 13,977,567 | |||
| TELUS Corp. (A) | 544,728 | 20,161,071 | |||
| France 7.4% | 151,576,214 | ||||
| AXA SA | 1,395,827 | 35,106,463 | |||
| Cie Generale des Etablissements Michelin SCA | 155,151 | 18,330,263 | |||
| Sanofi | 229,046 | 20,253,296 | |||
| SCOR SE | 273,773 | 11,660,641 | |||
| TOTAL SA | 556,533 | 30,970,830 | |||
| Unibail-Rodamco-Westfield (A) | 114,072 | 18,706,427 | |||
| Vinci SA | 170,071 | 16,548,294 | |||
| Germany 7.1% | 143,816,191 | ||||
| Allianz SE | 158,318 | 35,280,956 | |||
| BASF SE | 212,243 | 15,652,319 | |||
| Deutsche Post AG | 506,756 | 16,491,413 | |||
| Deutsche Telekom AG | 1,791,277 | 29,758,960 | |||
| Muenchener Rueckversicherungs-Gesellschaft AG | 150,022 | 35,554,541 | |||
| Siemens AG | 103,010 | 11,078,002 | |||
| Italy 3.6% | 74,069,356 | ||||
| Assicurazioni Generali SpA | 1,089,561 | 20,201,137 | |||
| Snam SpA | 5,699,300 | 29,318,098 | |||
| Terna Rete Elettrica Nazionale SpA | 3,868,081 | 24,550,121 | |||
| Japan 0.5% | 10,930,154 | ||||
| Takeda Pharmaceutical Company, Ltd. | 266,900 | 10,930,154 | |||
| Netherlands 1.5% | 30,246,618 | ||||
| Royal Dutch Shell PLC, ADR, Class A | 483,250 | 30,246,618 | |||
| Norway 0.8% | 15,375,991 | ||||
| Orkla ASA | 2,002,138 | 15,375,991 |
| 10 | JOHN HANCOCK GLOBAL SHAREHOLDER YIELD FUND | ANNUAL REPORT | SEE NOTES TO FINANCIAL STATEMENTS |
| Shares | Value | ||||
| Singapore 1.0% | $20,175,192 | ||||
| Singapore Exchange, Ltd. | 1,926,751 | 10,415,363 | |||
| Singapore Telecommunications, Ltd. | 4,371,283 | 9,759,829 | |||
| South Korea 0.5% | 10,154,143 | ||||
| Samsung Electronics Company, Ltd., GDR (B) | 10,330 | 10,154,143 | |||
| Spain 1.3% | 26,993,913 | ||||
| Naturgy Energy Group SA | 476,337 | 13,332,480 | |||
| Red Electrica Corp. SA | 640,877 | 13,661,433 | |||
| Sweden 0.6% | 11,846,645 | ||||
| Svenska Handelsbanken AB, A Shares (A) | 1,122,054 | 11,846,645 | |||
| Switzerland 3.2% | 65,002,030 | ||||
| Nestle SA | 163,849 | 15,623,070 | |||
| Novartis AG | 262,020 | 25,185,241 | |||
| Roche Holding AG | 87,800 | 24,193,719 | |||
| Taiwan 0.6% | 11,270,349 | ||||
| Taiwan Semiconductor Manufacturing Company, Ltd., ADR | 275,155 | 11,270,349 | |||
| United Kingdom 12.7% | 258,612,783 | ||||
| AstraZeneca PLC, ADR | 707,938 | 28,621,933 | |||
| BAE Systems PLC | 3,010,812 | 18,925,354 | |||
| British American Tobacco PLC | 503,991 | 21,025,518 | |||
| British American Tobacco PLC, ADR | 194,959 | 8,133,689 | |||
| GlaxoSmithKline PLC | 1,482,246 | 30,795,003 | |||
| Imperial Brands PLC | 878,009 | 30,034,369 | |||
| Lloyds Banking Group PLC | 19,749,685 | 16,000,842 | |||
| Micro Focus International PLC | 734,209 | 19,089,104 | |||
| National Grid PLC | 2,371,317 | 26,322,533 | |||
| SSE PLC | 838,602 | 12,974,771 | |||
| Unilever PLC | 403,746 | 23,240,792 | |||
| Vodafone Group PLC | 12,868,025 | 23,448,875 | |||
| United States 48.8% | 995,069,048 | ||||
| 3M Company | 52,542 | 10,917,177 | |||
| AbbVie, Inc. | 187,354 | 15,098,859 | |||
| Altria Group, Inc. | 527,497 | 30,294,153 | |||
| Ameren Corp. | 207,403 | 15,254,491 | |||
| American Electric Power Company, Inc. | 209,477 | 17,543,699 | |||
| Arthur J. Gallagher & Company | 136,195 | 10,636,830 | |||
| AT&T, Inc. | 905,663 | 28,401,590 | |||
| BB&T Corp. | 228,144 | 10,615,540 | |||
| BlackRock, Inc. | 26,962 | 11,522,750 | |||
| Broadcom, Inc. | 38,024 | 11,434,197 | |||
| Chevron Corp. | 125,133 | 15,413,883 |
| SEE NOTES TO FINANCIAL STATEMENTS | ANNUAL REPORT | JOHN HANCOCK GLOBAL SHAREHOLDER YIELD FUND | 11 |
| Shares | Value | ||||
| United States (continued) | |||||
| Cisco Systems, Inc. | 505,374 | $27,285,142 | |||
| CME Group, Inc. | 62,912 | 10,354,057 | |||
| Dominion Energy, Inc. | 318,019 | 24,379,337 | |||
| DowDuPont, Inc. | 210,963 | 11,246,438 | |||
| Duke Energy Corp. | 386,462 | 34,781,580 | |||
| Eaton Corp. PLC | 301,426 | 24,282,879 | |||
| Emerson Electric Company | 247,501 | 16,946,393 | |||
| Entergy Corp. | 322,858 | 30,874,911 | |||
| Enterprise Products Partners LP | 872,478 | 25,389,110 | |||
| Exxon Mobil Corp. | 288,982 | 23,349,746 | |||
| FirstEnergy Corp. | 734,209 | 30,550,436 | |||
| Hanesbrands, Inc. | 716,234 | 12,806,264 | |||
| IBM Corp. | 100,245 | 14,144,570 | |||
| Intel Corp. | 275,847 | 14,812,984 | |||
| Iron Mountain, Inc. | 627,742 | 22,259,731 | |||
| Johnson & Johnson | 102,319 | 14,303,173 | |||
| Kimberly-Clark Corp. | 144,491 | 17,902,435 | |||
| Las Vegas Sands Corp. | 343,820 | 20,959,267 | |||
| Leggett & Platt, Inc. | 338,759 | 14,302,405 | |||
| Lockheed Martin Corp. | 49,085 | 14,733,354 | |||
| LyondellBasell Industries NV, Class A | 145,182 | 12,206,903 | |||
| Magellan Midstream Partners LP (A) | 246,810 | 14,964,090 | |||
| McDonald's Corp. | 81,578 | 15,491,662 | |||
| Merck & Company, Inc. | 185,280 | 15,409,738 | |||
| MetLife, Inc. | 434,165 | 18,482,404 | |||
| Microsoft Corp. | 146,565 | 17,285,876 | |||
| Occidental Petroleum Corp. | 333,920 | 22,105,504 | |||
| People's United Financial, Inc. | 680,284 | 11,183,869 | |||
| PepsiCo, Inc. | 127,899 | 15,674,022 | |||
| Pfizer, Inc. | 637,421 | 27,071,270 | |||
| Philip Morris International, Inc. | 291,748 | 25,787,606 | |||
| PPL Corp. | 682,358 | 21,658,043 | |||
| Public Storage | 56,690 | 12,345,948 | |||
| Target Corp. | 151,404 | 12,151,685 | |||
| Texas Instruments, Inc. | 204,638 | 21,705,953 | |||
| The Coca-Cola Company | 282,069 | 13,217,753 | |||
| The Procter & Gamble Company | 149,330 | 15,537,787 | |||
| United Parcel Service, Inc., Class B | 121,676 | 13,596,076 | |||
| Verizon Communications, Inc. | 584,878 | 34,583,836 | |||
| Watsco, Inc. | 80,625 | 11,546,306 | |||
| WEC Energy Group, Inc. | 214,317 | 16,948,188 | |||
| Wells Fargo & Company | 208,095 | 10,055,150 | |||
| Welltower, Inc. | 428,634 | 33,261,998 |
| 12 | JOHN HANCOCK GLOBAL SHAREHOLDER YIELD FUND | ANNUAL REPORT | SEE NOTES TO FINANCIAL STATEMENTS |
| Yield (%) | Shares | Value | |||
| Securities lending collateral 1.4% | $28,542,057 | ||||
| (Cost $28,541,483) | |||||
| John Hancock Collateral Trust (C) | 2.6031(D) | 2,852,238 | 28,542,057 | ||
| Total investments (Cost $1,733,409,589) 98.9% | $2,014,534,073 | ||||
| Other assets and liabilities, net 1.1% | 23,212,841 | ||||
| Total net assets 100.0% | $2,037,746,914 | ||||
| The percentage shown for each investment category is the total value of the category as a percentage of the net assets of the fund. | |
| Security Abbreviations and Legend | |
| ADR | American Depositary Receipt |
| GDR | Global Depositary Receipt |
| (A) | All or a portion of this security is on loan as of 3-31-19. |
| (B) | These securities are exempt from registration under Rule 144A of the Securities Act of 1933. Such securities may be resold, normally to qualified institutional buyers, in transactions exempt from registration. |
| (C) | Investment is an affiliate of the fund, the advisor and/or subadvisor. This security represents the investment of cash collateral received for securities lending. |
| (D) | The rate shown is the annualized seven-day yield as of 3-31-19. |
| SEE NOTES TO FINANCIAL STATEMENTS | ANNUAL REPORT | JOHN HANCOCK GLOBAL SHAREHOLDER YIELD FUND | 13 |
| Financial statements |
| Assets | |
| Unaffiliated investments, at value (Cost $1,704,868,106) including $27,312,825 of securities loaned | $1,985,992,016 |
| Affiliated investments, at value (Cost $28,541,483) | 28,542,057 |
| Total investments, at value (Cost $1,733,409,589) | 2,014,534,073 |
| Cash | 9,944,009 |
| Foreign currency, at value (Cost $1,574,741) | 1,573,236 |
| Dividends and interest receivable | 10,287,156 |
| Receivable for fund shares sold | 2,149,725 |
| Receivable for investments sold | 44,686,493 |
| Receivable for securities lending income | 59,262 |
| Receivable from affiliates | 25,081 |
| Other assets | 176,453 |
| Total assets | 2,083,435,488 |
| Liabilities | |
| Payable for investments purchased | 10,896,249 |
| Payable for fund shares repurchased | 5,662,515 |
| Payable upon return of securities loaned | 28,597,695 |
| Payable to affiliates | |
| Accounting and legal services fees | 76,237 |
| Transfer agent fees | 130,554 |
| Distribution and service fees | 358 |
| Other liabilities and accrued expenses | 324,966 |
| Total liabilities | 45,688,574 |
| Net assets | $2,037,746,914 |
| Net assets consist of | |
| Paid-in capital | $1,747,871,617 |
| Total distributable earnings (loss) | 289,875,297 |
| Net assets | $2,037,746,914 |
| 14 | JOHN HANCOCK Global Shareholder Yield Fund | ANNUAL REPORT | SEE NOTES TO FINANCIAL STATEMENTS |
| Net asset value per share | |
| Based on net asset value and shares outstanding - the fund has an unlimited number of shares authorized with no par value | |
| Class A ($333,905,928 ÷ 30,266,990 shares)1 | $11.03 |
| Class B ($3,704,054 ÷ 335,235 shares)1 | $11.05 |
| Class C ($75,493,217 ÷ 6,831,834 shares)1 | $11.05 |
| Class I ($814,693,547 ÷ 73,573,019 shares) | $11.07 |
| Class R2 ($793,209 ÷ 71,577 shares) | $11.08 |
| Class R6 ($351,267,693 ÷ 31,770,270 shares) | $11.06 |
| Class NAV ($457,889,266 ÷ 41,382,105 shares) | $11.06 |
| Maximum offering price per share | |
| Class A (net asset value per share ÷ 95%)2 | $11.61 |
| 1 | Redemption price per share is equal to net asset value less any applicable contingent deferred sales charge. |
| 2 | On single retail sales of less than $50,000. On sales of $50,000 or more and on group sales the offering price is reduced. |
| SEE NOTES TO FINANCIAL STATEMENTS | ANNUAL REPORT | JOHN HANCOCK Global Shareholder Yield Fund | 15 |
| Investment income | |
| Dividends | $96,805,248 |
| Securities lending | 743,825 |
| Interest | 615,739 |
| Less foreign taxes withheld | (5,038,375) |
| Total investment income | 93,126,437 |
| Expenses | |
| Investment management fees | 17,371,681 |
| Distribution and service fees | 1,953,820 |
| Accounting and legal services fees | 335,481 |
| Transfer agent fees | 1,579,140 |
| Trustees' fees | 33,467 |
| Custodian fees | 506,686 |
| State registration fees | 152,074 |
| Printing and postage | 210,438 |
| Professional fees | 94,645 |
| Other | 78,804 |
| Total expenses | 22,316,236 |
| Less expense reductions | (3,205,410) |
| Net expenses | 19,110,826 |
| Net investment income | 74,015,611 |
| Realized and unrealized gain (loss) | |
| Net realized gain (loss) on | |
| Unaffiliated investments and foreign currency transactions | 27,995,204 |
| Affiliated investments | (6,963) |
| 27,988,241 | |
| Change in net unrealized appreciation (depreciation) of | |
| Unaffiliated investments and translation of assets and liabilities in foreign currencies | (350,299) |
| Affiliated investments | 7,036 |
| (343,263) | |
| Net realized and unrealized gain | 27,644,978 |
| Increase in net assets from operations | $101,660,589 |
| 16 | JOHN HANCOCK Global Shareholder Yield Fund | ANNUAL REPORT | SEE NOTES TO FINANCIAL STATEMENTS |
| Year ended 3-31-19 | Period ended 3-31-181 | Year ended 2-28-18 | |
| Increase (decrease) in net assets | |||
| From operations | |||
| Net investment income | $74,015,611 | $7,947,861 | $72,570,124 |
| Net realized gain | 27,988,241 | 3,578,053 | 127,547,873 |
| Change in net unrealized appreciation (depreciation) | (343,263) | (34,329,113) | (15,042,837) |
| Increase (decrease) in net assets resulting from operations | 101,660,589 | (22,803,199) | 185,075,160 |
| Distributions to shareholders | |||
| From net investment income and net realized gain | |||
| Class A | (18,749,401) | — | — |
| Class B | (251,126) | — | — |
| Class C | (4,077,675) | — | — |
| Class I | (47,923,352) | — | — |
| Class R2 | (56,799) | — | — |
| Class R6 | (24,556,365) | — | — |
| Class NAV | (27,887,901) | — | — |
| From net investment income | |||
| Class A | — | (1,642,129) | (10,646,620) |
| Class B | — | (18,828) | (193,095) |
| Class C | — | (298,338) | (2,491,298) |
| Class I | — | (4,719,273) | (37,696,763) |
| Class R2 | — | (4,972) | (31,069) |
| Class R6 | — | (2,671,430) | (3,176,809) |
| Class NAV | — | (2,862,863) | (16,626,561) |
| Total distributions | (123,502,619) | (12,217,833) | (70,862,215) |
| From fund share transactions | (272,070,100) | 2,305,846 | (49,203,839) |
| Total increase (decrease) | (293,912,130) | (32,715,186) | 65,009,106 |
| Net assets | |||
| Beginning of year | 2,331,659,044 | 2,364,374,230 | 2,299,365,124 |
| End of year2 | $2,037,746,914 | $2,331,659,044 | $2,364,374,230 |
| 1 | For the one-month period ended 3-31-18. The fund changed its fiscal year end from February 28 to March 31. |
| 2 | Net assets - End of year includes undistributed net investment income of $2,015,467 and $6,274,718, at March 31, 2018 and February 28, 2018, respectively. The SEC eliminated the requirement to disclose undistributed net investment income in the current reporting period. |
| SEE NOTES TO FINANCIAL STATEMENTS | ANNUAL REPORT | JOHN HANCOCK Global Shareholder Yield Fund | 17 |
| Financial highlights |
| CLASS A SHARES Period ended | 3-31-19 | 3-31-181 | 2-28-18 | 2-28-17 | 2-29-16 | 2-28-15 |
| Per share operating performance | ||||||
| Net asset value, beginning of period | $11.14 | $11.31 | $10.78 | $9.89 | $11.78 | $11.74 |
| Net investment income2 | 0.35 | 0.04 | 0.32 | 0.27 | 0.33 | 0.36 |
| Net realized and unrealized gain (loss) on investments | 0.16 | (0.16) | 0.53 | 0.92 | (1.42) | 0.55 |
| Total from investment operations | 0.51 | (0.12) | 0.85 | 1.19 | (1.09) | 0.91 |
| Less distributions | ||||||
| From net investment income | (0.35) | (0.05) | (0.32) | (0.30) | (0.32) | (0.44) |
| From net realized gain | (0.27) | — | — | — | (0.48) | (0.43) |
| Total distributions | (0.62) | (0.05) | (0.32) | (0.30) | (0.80) | (0.87) |
| Net asset value, end of period | $11.03 | $11.14 | $11.31 | $10.78 | $9.89 | $11.78 |
| Total return (%)3,4 | 4.86 | (1.03)5 | 7.87 | 12.21 | (9.38) | 8.10 |
| Ratios and supplemental data | ||||||
| Net assets, end of period (in millions) | $334 | $348 | $355 | $381 | $470 | $580 |
| Ratios (as a percentage of average net assets): | ||||||
| Expenses before reductions | 1.28 | 1.306 | 1.27 | 1.29 | 1.29 | 1.33 |
| Expenses including reductions | 1.09 | 1.096 | 1.09 | 1.26 | 1.28 | 1.32 |
| Net investment income | 3.18 | 3.786 | 2.85 | 2.62 | 3.03 | 2.99 |
| Portfolio turnover (%) | 16 | 2 | 19 | 25 | 33 | 23 |
| 1 | For the one-month period ended 3-31-18. The fund changed its fiscal year end from February 28 to March 31. |
| 2 | Based on average daily shares outstanding. |
| 3 | Total returns would have been lower had certain expenses not been reduced during the applicable periods. |
| 4 | Does not reflect the effect of sales charges, if any. |
| 5 | Not annualized. |
| 6 | Annualized. |
| 18 | JOHN HANCOCK Global Shareholder Yield Fund | ANNUAL REPORT | SEE NOTES TO FINANCIAL STATEMENTS |
| CLASS B SHARES Period ended | 3-31-19 | 3-31-181 | 2-28-18 | 2-28-17 | 2-29-16 | 2-28-15 |
| Per share operating performance | ||||||
| Net asset value, beginning of period | $11.15 | $11.30 | $10.78 | $9.89 | $11.78 | $11.74 |
| Net investment income2 | 0.27 | 0.03 | 0.25 | 0.20 | 0.25 | 0.27 |
| Net realized and unrealized gain (loss) on investments | 0.17 | (0.15) | 0.50 | 0.92 | (1.42) | 0.55 |
| Total from investment operations | 0.44 | (0.12) | 0.75 | 1.12 | (1.17) | 0.82 |
| Less distributions | ||||||
| From net investment income | (0.27) | (0.03) | (0.23) | (0.23) | (0.24) | (0.35) |
| From net realized gain | (0.27) | — | — | — | (0.48) | (0.43) |
| Total distributions | (0.54) | (0.03) | (0.23) | (0.23) | (0.72) | (0.78) |
| Net asset value, end of period | $11.05 | $11.15 | $11.30 | $10.78 | $9.89 | $11.78 |
| Total return (%)3,4 | 4.16 | (1.05)5 | 6.98 | 11.42 | (10.10) | 7.26 |
| Ratios and supplemental data | ||||||
| Net assets, end of period (in millions) | $4 | $7 | $7 | $11 | $12 | $17 |
| Ratios (as a percentage of average net assets): | ||||||
| Expenses before reductions | 1.97 | 2.006 | 1.97 | 1.99 | 2.02 | 2.10 |
| Expenses including reductions | 1.84 | 1.846 | 1.84 | 1.97 | 2.02 | 2.10 |
| Net investment income | 2.49 | 3.036 | 2.19 | 1.94 | 2.31 | 2.24 |
| Portfolio turnover (%) | 16 | 2 | 19 | 25 | 33 | 23 |
| 1 | For the one-month period ended 3-31-18. The fund changed its fiscal year end from February 28 to March 31. |
| 2 | Based on average daily shares outstanding. |
| 3 | Total returns would have been lower had certain expenses not been reduced during the applicable periods. |
| 4 | Does not reflect the effect of sales charges, if any. |
| 5 | Not annualized. |
| 6 | Annualized. |
| SEE NOTES TO FINANCIAL STATEMENTS | ANNUAL REPORT | JOHN HANCOCK Global Shareholder Yield Fund | 19 |
| CLASS C SHARES Period ended | 3-31-19 | 3-31-181 | 2-28-18 | 2-28-17 | 2-29-16 | 2-28-15 |
| Per share operating performance | ||||||
| Net asset value, beginning of period | $11.16 | $11.31 | $10.78 | $9.90 | $11.79 | $11.74 |
| Net investment income2 | 0.27 | 0.03 | 0.24 | 0.20 | 0.25 | 0.27 |
| Net realized and unrealized gain (loss) on investments | 0.16 | (0.15) | 0.52 | 0.91 | (1.41) | 0.56 |
| Total from investment operations | 0.43 | (0.12) | 0.76 | 1.11 | (1.16) | 0.83 |
| Less distributions | ||||||
| From net investment income | (0.27) | (0.03) | (0.23) | (0.23) | (0.25) | (0.35) |
| From net realized gain | (0.27) | — | — | — | (0.48) | (0.43) |
| Total distributions | (0.54) | (0.03) | (0.23) | (0.23) | (0.73) | (0.78) |
| Net asset value, end of period | $11.05 | $11.16 | $11.31 | $10.78 | $9.90 | $11.79 |
| Total return (%)3,4 | 4.06 | (1.05)5 | 6.98 | 11.41 | (10.02) | 7.42 |
| Ratios and supplemental data | ||||||
| Net assets, end of period (in millions) | $75 | $107 | $110 | $126 | $133 | $168 |
| Ratios (as a percentage of average net assets): | ||||||
| Expenses before reductions | 1.97 | 2.006 | 1.97 | 1.99 | 1.99 | 2.03 |
| Expenses including reductions | 1.84 | 1.846 | 1.84 | 1.97 | 1.98 | 2.02 |
| Net investment income | 2.49 | 3.036 | 2.11 | 1.92 | 2.33 | 2.24 |
| Portfolio turnover (%) | 16 | 2 | 19 | 25 | 33 | 23 |
| 1 | For the one-month period ended 3-31-18. The fund changed its fiscal year end from February 28 to March 31. |
| 2 | Based on average daily shares outstanding. |
| 3 | Total returns would have been lower had certain expenses not been reduced during the applicable periods. |
| 4 | Does not reflect the effect of sales charges, if any. |
| 5 | Not annualized. |
| 6 | Annualized. |
| 20 | JOHN HANCOCK Global Shareholder Yield Fund | ANNUAL REPORT | SEE NOTES TO FINANCIAL STATEMENTS |
| CLASS I SHARES Period ended | 3-31-19 | 3-31-181 | 2-28-18 | 2-28-17 | 2-29-16 | 2-28-15 |
| Per share operating performance | ||||||
| Net asset value, beginning of period | $11.18 | $11.35 | $10.82 | $9.93 | $11.83 | $11.78 |
| Net investment income2 | 0.38 | 0.04 | 0.36 | 0.31 | 0.37 | 0.39 |
| Net realized and unrealized gain (loss) on investments | 0.16 | (0.15) | 0.51 | 0.91 | (1.43) | 0.56 |
| Total from investment operations | 0.54 | (0.11) | 0.87 | 1.22 | (1.06) | 0.95 |
| Less distributions | ||||||
| From net investment income | (0.38) | (0.06) | (0.34) | (0.33) | (0.36) | (0.47) |
| From net realized gain | (0.27) | — | — | — | (0.48) | (0.43) |
| Total distributions | (0.65) | (0.06) | (0.34) | (0.33) | (0.84) | (0.90) |
| Net asset value, end of period | $11.07 | $11.18 | $11.35 | $10.82 | $9.93 | $11.83 |
| Total return (%)3 | 5.10 | (0.96)4 | 8.10 | 12.51 | (9.13) | 8.50 |
| Ratios and supplemental data | ||||||
| Net assets, end of period (in millions) | $815 | $881 | $894 | $1,245 | $957 | $1,242 |
| Ratios (as a percentage of average net assets): | ||||||
| Expenses before reductions | 0.99 | 1.005 | 0.97 | 0.97 | 0.97 | 1.01 |
| Expenses including reductions | 0.84 | 0.845 | 0.84 | 0.95 | 0.97 | 1.00 |
| Net investment income | 3.44 | 4.035 | 3.12 | 2.91 | 3.37 | 3.24 |
| Portfolio turnover (%) | 16 | 2 | 19 | 25 | 33 | 23 |
| 1 | For the one-month period ended 3-31-18. The fund changed its fiscal year end from February 28 to March 31. |
| 2 | Based on average daily shares outstanding. |
| 3 | Total returns would have been lower had certain expenses not been reduced during the applicable periods. |
| 4 | Not annualized. |
| 5 | Annualized. |
| SEE NOTES TO FINANCIAL STATEMENTS | ANNUAL REPORT | JOHN HANCOCK Global Shareholder Yield Fund | 21 |
| CLASS R2 SHARES Period ended | 3-31-19 | 3-31-181 | 2-28-18 | 2-28-17 | 2-29-16 | 2-28-15 |
| Per share operating performance | ||||||
| Net asset value, beginning of period | $11.19 | $11.35 | $10.82 | $9.93 | $11.82 | $11.78 |
| Net investment income2 | 0.33 | 0.03 | 0.30 | 0.26 | 0.32 | 0.31 |
| Net realized and unrealized gain (loss) on investments | 0.16 | (0.14) | 0.53 | 0.92 | (1.43) | 0.58 |
| Total from investment operations | 0.49 | (0.11) | 0.83 | 1.18 | (1.11) | 0.89 |
| Less distributions | ||||||
| From net investment income | (0.33) | (0.05) | (0.30) | (0.29) | (0.30) | (0.42) |
| From net realized gain | (0.27) | — | — | — | (0.48) | (0.43) |
| Total distributions | (0.60) | (0.05) | (0.30) | (0.29) | (0.78) | (0.85) |
| Net asset value, end of period | $11.08 | $11.19 | $11.35 | $10.82 | $9.93 | $11.82 |
| Total return (%)3 | 4.68 | (0.98)4 | 7.68 | 12.04 | (9.51) | 7.93 |
| Ratios and supplemental data | ||||||
| Net assets, end of period (in millions) | $1 | $1 | $1 | $1 | $1 | $1 |
| Ratios (as a percentage of average net assets): | ||||||
| Expenses before reductions | 1.36 | 1.385 | 1.37 | 1.36 | 1.86 | 3.22 |
| Expenses including reductions | 1.22 | 1.245 | 1.24 | 1.34 | 1.43 | 1.47 |
| Net investment income | 3.02 | 3.625 | 2.62 | 2.50 | 2.92 | 2.66 |
| Portfolio turnover (%) | 16 | 2 | 19 | 25 | 33 | 23 |
| 1 | For the one-month period ended 3-31-18. The fund changed its fiscal year end from February 28 to March 31. |
| 2 | Based on average daily shares outstanding. |
| 3 | Total returns would have been lower had certain expenses not been reduced during the applicable periods. |
| 4 | Not annualized. |
| 5 | Annualized. |
| 22 | JOHN HANCOCK Global Shareholder Yield Fund | ANNUAL REPORT | SEE NOTES TO FINANCIAL STATEMENTS |
| CLASS R6 SHARES Period ended | 3-31-19 | 3-31-181 | 2-28-18 | 2-28-17 | 2-29-16 | 2-28-15 |
| Per share operating performance | ||||||
| Net asset value, beginning of period | $11.16 | $11.34 | $10.81 | $9.92 | $11.81 | $11.77 |
| Net investment income2 | 0.39 | 0.04 | 0.31 | 0.30 | 0.38 | 0.39 |
| Net realized and unrealized gain (loss) on investments | 0.17 | (0.16) | 0.57 | 0.93 | (1.42) | 0.57 |
| Total from investment operations | 0.56 | (0.12) | 0.88 | 1.23 | (1.04) | 0.96 |
| Less distributions | ||||||
| From net investment income | (0.39) | (0.06) | (0.35) | (0.34) | (0.37) | (0.49) |
| From net realized gain | (0.27) | — | — | — | (0.48) | (0.43) |
| Total distributions | (0.66) | (0.06) | (0.35) | (0.34) | (0.85) | (0.92) |
| Net asset value, end of period | $11.06 | $11.16 | $11.34 | $10.81 | $9.92 | $11.81 |
| Total return (%)3 | 5.31 | (1.03)4 | 8.22 | 12.66 | (8.94) | 8.56 |
| Ratios and supplemental data | ||||||
| Net assets, end of period (in millions) | $351 | $477 | $483 | $2 | $1 | $—5 |
| Ratios (as a percentage of average net assets): | ||||||
| Expenses before reductions | 0.88 | 0.896 | 0.87 | 0.87 | 1.45 | 6.51 |
| Expenses including reductions | 0.74 | 0.746 | 0.74 | 0.85 | 0.85 | 0.87 |
| Net investment income | 3.57 | 4.136 | 2.61 | 2.85 | 3.48 | 3.32 |
| Portfolio turnover (%) | 16 | 2 | 19 | 25 | 33 | 23 |
| 1 | For the one-month period ended 3-31-18. The fund changed its fiscal year end from February 28 to March 31. |
| 2 | Based on average daily shares outstanding. |
| 3 | Total returns would have been lower had certain expenses not been reduced during the applicable periods. |
| 4 | Not annualized. |
| 5 | Less than $500,000. |
| 6 | Annualized. |
| SEE NOTES TO FINANCIAL STATEMENTS | ANNUAL REPORT | JOHN HANCOCK Global Shareholder Yield Fund | 23 |
| CLASS NAV SHARES Period ended | 3-31-19 | 3-31-181 | 2-28-18 | 2-28-17 | 2-29-16 | 2-28-15 |
| Per share operating performance | ||||||
| Net asset value, beginning of period | $11.17 | $11.34 | $10.81 | $9.92 | $11.82 | $11.78 |
| Net investment income2 | 0.39 | 0.04 | 0.36 | 0.32 | 0.37 | 0.41 |
| Net realized and unrealized gain (loss) on investments | 0.16 | (0.15) | 0.52 | 0.91 | (1.42) | 0.55 |
| Total from investment operations | 0.55 | (0.11) | 0.88 | 1.23 | (1.05) | 0.96 |
| Less distributions | ||||||
| From net investment income | (0.39) | (0.06) | (0.35) | (0.34) | (0.37) | (0.49) |
| From net realized gain | (0.27) | — | — | — | (0.48) | (0.43) |
| Total distributions | (0.66) | (0.06) | (0.35) | (0.34) | (0.85) | (0.92) |
| Net asset value, end of period | $11.06 | $11.17 | $11.34 | $10.81 | $9.92 | $11.82 |
| Total return (%)3 | 5.30 | (0.94)4 | 8.11 | 12.76 | (9.03) | 8.57 |
| Ratios and supplemental data | ||||||
| Net assets, end of period (in millions) | $458 | $511 | $514 | $535 | $554 | $696 |
| Ratios (as a percentage of average net assets): | ||||||
| Expenses before reductions | 0.87 | 0.885 | 0.86 | 0.86 | 0.86 | 0.88 |
| Expenses including reductions | 0.74 | 0.745 | 0.74 | 0.85 | 0.85 | 0.87 |
| Net investment income | 3.54 | 4.135 | 3.19 | 3.03 | 3.45 | 3.42 |
| Portfolio turnover (%) | 16 | 2 | 19 | 25 | 33 | 23 |
| 1 | For the one-month period ended 3-31-18. The fund changed its fiscal year end from February 28 to March 31. |
| 2 | Based on average daily shares outstanding. |
| 3 | Total returns would have been lower had certain expenses not been reduced during the applicable periods. |
| 4 | Not annualized. |
| 5 | Annualized. |
| 24 | JOHN HANCOCK Global Shareholder Yield Fund | ANNUAL REPORT | SEE NOTES TO FINANCIAL STATEMENTS |
Note 1 — Organization
John Hancock Global Shareholder Yield Fund (the fund) is a series of John Hancock Funds III (the Trust), an open-end management investment company organized as a Massachusetts business trust and registered under the Investment Company Act of 1940, as amended (the 1940 Act). The investment objective of the fund is to seek to provide a high level of income. Capital appreciation is a secondary investment objective.
The fund may offer multiple classes of shares. The shares currently offered by the fund are detailed in the Statement of assets and liabilities. Class A and Class C shares are offered to all investors. Class B shares are closed to new investors. Class I shares are offered to institutions and certain investors. Class R2 shares are available only to certain retirement and 529 plans. Class R6 shares are only available to certain retirement plans, institutions and other investors. Class NAV shares are offered to John Hancock affiliated funds of funds, retirement plans for employees of John Hancock and/or Manulife Financial Corporation (MFC), and certain 529 plans. Class B shares convert to Class A shares eight years after purchase. Class C shares convert to Class A shares ten years after purchase (certain exclusions may apply). Shareholders of each class have exclusive voting rights to matters that affect that class. The distribution and service fees, if any, and transfer agent fees for each class may differ.
Note 2 — Significant accounting policies
The financial statements have been prepared in conformity with accounting principles generally accepted in the United States of America (US GAAP), which require management to make certain estimates and assumptions as of the date of the financial statements. Actual results could differ from those estimates and those differences could be significant. The fundqualifies as an investment company under Topic 946 of Accounting Standards Codification of US GAAP.
Events or transactions occurring after the end of the fiscal period through the date that the financial statements were issued have been evaluated in the preparation of the financial statements. The following summarizes the significant accounting policies of the fund:
Security valuation.Investments are stated at value as of the scheduled close of regular trading on the New York Stock Exchange (NYSE), normally at 4:00 p.m., Eastern Time. In case of emergency or other disruption resulting in the NYSE not opening for trading or the NYSE closing at a time other than the regularly scheduled close, the net asset value (NAV) may be determined as of the regularly scheduled close of the NYSE pursuant to the fund's Valuation Policies and Procedures.
In order to value the securities, the fund uses the following valuation techniques: Equity securities held by the fund are typically valued at the last sale price or official closing price on the exchange or principal market where the security trades. In the event there were no sales during the day or closing prices are not available, the securities are valued using the last available bid price. Investments by the fund in open-end mutual funds, including John Hancock Collateral Trust (JHCT), are valued at their respective NAVs each business day. Foreign securities and currencies are valued in U.S. dollars based on foreign currency exchange rates supplied by an independent pricing vendor.
In certain instances, the Pricing Committee may determine to value equity securities using prices obtained from another exchange or market if trading on the exchange or market on which prices are typically obtained did not open for trading as scheduled, or if trading closed earlier than scheduled, and trading occurred as normal on another exchange or market.
Other portfolio securities and assets, for which reliable market quotations are not readily available, are valued at fair value as determined in good faith by the fund's Pricing Committee following procedures established by the Board of Trustees. The frequency with which these fair valuation procedures are used cannot be predicted and fair value of
securities may differ significantly from the value that would have been used had a ready market for such securities existed. Trading in foreign securities may be completed before the scheduled daily close of trading on the NYSE. Significant events at the issuer or market level may affect the values of securities between the time when the valuation of the securities is generally determined and the close of the NYSE. If a significant event occurs, these securities may be fair valued, as determined in good faith by the fund's Pricing Committee, following procedures established by the Board of Trustees. The fund uses fair value adjustment factors provided by an independent pricing vendor to value certain foreign securities in order to adjust for events that may occur between the close of foreign exchanges or markets and the close of the NYSE.
The fund uses a three-tier hierarchy to prioritize the pricing assumptions, referred to as inputs, used in valuation techniques to measure fair value. Level 1 includes securities valued using quoted prices in active markets for identical securities. Level 2 includes securities valued using other significant observable inputs. Observable inputs may include quoted prices for similar securities, interest rates, prepayment speeds and credit risk. Prices for securities valued using these inputs are received from independent pricing vendors and brokers and are based on an evaluation of the inputs described. Level 3 includes securities valued using significant unobservable inputs when market prices are not readily available or reliable, including the fund's own assumptions in determining the fair value of investments. Factors used in determining value may include market or issuer specific events or trends, changes in interest rates and credit quality. The inputs or methodology used for valuing securities are not necessarily an indication of the risks associated with investing in those securities. Changes in valuation techniques and related inputs may result in transfers into or out of an assigned level within the disclosure hierarchy.
The following is a summary of the values by input classification of the fund's investments as of March 31, 2019, by major security category or type:
| Total value at 3-31-19 | Level 1 quoted price | Level 2 significant observable inputs | Level 3 significant unobservable inputs | ||||||||||||||
| Investments in securities: | |||||||||||||||||
| Assets | |||||||||||||||||
| Common stocks | |||||||||||||||||
| Australia | $36,113,517 | — | $36,113,517 | — | |||||||||||||
| Canada | 124,739,872 | $124,739,872 | — | — | |||||||||||||
| France | 151,576,214 | — | 151,576,214 | — | |||||||||||||
| Germany | 143,816,191 | — | 143,816,191 | — | |||||||||||||
| Italy | 74,069,356 | — | 74,069,356 | — | |||||||||||||
| Japan | 10,930,154 | — | 10,930,154 | — | |||||||||||||
| Netherlands | 30,246,618 | 30,246,618 | — | — | |||||||||||||
| Norway | 15,375,991 | — | 15,375,991 | — | |||||||||||||
| Singapore | 20,175,192 | — | 20,175,192 | — | |||||||||||||
| South Korea | 10,154,143 | — | 10,154,143 | — | |||||||||||||
| Spain | 26,993,913 | — | 26,993,913 | — | |||||||||||||
| Sweden | 11,846,645 | — | 11,846,645 | — | |||||||||||||
| Switzerland | 65,002,030 | — | 65,002,030 | — | |||||||||||||
| Taiwan | 11,270,349 | 11,270,349 | — | — | |||||||||||||
| United Kingdom | 258,612,783 | 36,755,622 | 221,857,161 | — | |||||||||||||
| Total value at 3-31-19 | Level 1 quoted price | Level 2 significant observable inputs | Level 3 significant unobservable inputs | ||||||||||||||
| United States | 995,069,048 | $995,069,048 | — | — | |||||||||||||
| Securities lending collateral | 28,542,057 | 28,542,057 | — | — | |||||||||||||
| Total investments in securities | $2,014,534,073 | $1,226,623,566 | $787,910,507 | — | |||||||||||||
Security transactions and related investment income. Investment security transactions are accounted for on a trade date plus one basis for daily NAV calculations. However, for financial reporting purposes, investment transactions are reported on trade date. Interest income is accrued as earned. Dividend income is recorded on the ex-date, except for dividends of foreign securities where the dividend may not be known until after the ex-date. In those cases, dividend income, net of withholding taxes, is recorded when the fund becomes aware of the dividends. Non-cash dividends, if any, are recorded at the fair market value of the securities received. Gains and losses on securities sold are determined on the basis of identified cost and may include proceeds from litigation.
Securities lending. The fund may lend its securities to earn additional income. The fund receives cash collateral from the borrower in an amount not less than the market value of the loaned securities. The fund will invest its collateral in JHCT, an affiliate of the fund, which has a floating NAV and is registered with the Securities and Exchange Commission (SEC) as an investment company. JHCT invests in short-term money market investments. The fund will receive the benefit of any gains and bear any losses generated by JHCT with respect to the cash collateral.
The fund has the right to recall loaned securities on demand. If a borrower fails to return loaned securities when due, then the lending agent is responsible and indemnifies the fund for the lent securities. The lending agent uses the collateral received from the borrower to purchase replacement securities of the same issue, type, class and series of the loaned securities. If the value of the collateral is less than the purchase cost of replacement securities, the lending agent is responsible for satisfying the shortfall but only to the extent that the shortfall is not due to any decrease in the value of JHCT.
Although the risk of the loss of the securities lent is mitigated by receiving collateral from the borrower and through lending agent indemnification, the fund could experience a delay in recovering securities or could experience a lower than expected return if the borrower fails to return the securities on a timely basis. The fund receives compensation for lending its securities by retaining a portion of the return on the investment of the collateral and compensation from fees earned from borrowers of the securities. Securities lending income received by the fund is net of fees retained by the securities lending agent. Net income received from JHCT is a component of securities lending income as recorded on the Statement of operations.
Obligations to repay collateral received by the fund are shown on the Statement of assets and liabilities as Payable upon return of securities loaned and are secured by the loaned securities. As of March 31, 2019, the fund loaned common stocks valued at $27,312,825 and received $28,597,695 of cash collateral.
Foreign investing. Assets, including investments, and liabilities denominated in foreign currencies are translated into U.S. dollar values each day at the prevailing exchange rate. Purchases and sales of securities, income and expenses are translated into U.S. dollars at the prevailing exchange rate on the date of the transaction. The effect of changes in foreign currency exchange rates on the value of securities is reflected as a component of the realized and unrealized gains (losses) on investments. Foreign investments are subject to a decline in the value of a foreign currency versus the U.S. dollar, which reduces the dollar value of securities denominated in that currency.
Funds that invest internationally generally carry more risk than funds that invest strictly in U.S. securities. These risks are heightened for investments in emerging markets. Risks can result from differences in economic and political conditions, regulations, market practices (including higher transaction costs), accounting standards and other factors.
Foreign taxes. The fund may be subject to withholding tax on income, capital gains or repatriation taxes imposed by certain countries, a portion of which may be recoverable. Foreign taxes are accrued based upon the fund's understanding of the tax rules and rates that exist in the foreign markets in which it invests. Taxes are accrued based on gains realized by the fund as a result of certain foreign security sales. In certain circumstances, estimated taxes are accrued based on unrealized appreciation of such securities. Investment income is recorded net of foreign withholding taxes.
Line of credit.The fund may have the ability to borrow from banks for temporary or emergency purposes, including meeting redemption requests that otherwise might require the untimely sale of securities. Pursuant to the fund's custodian agreement, the custodian may loan money to the fund to make properly authorized payments. The fund is obligated to repay the custodian for any overdraft, including any related costs or expenses. The custodian may have a lien, security interest or security entitlement in any fund property that is not otherwise segregated or pledged, to the extent of any overdraft, and to the maximum extent permitted by law.
The fund and other affiliated funds have entered into a syndicated line of credit agreement with Citibank, N.A. as the administrative agent that enables them to participate in a $750 million unsecured committed line of credit. Excluding commitments designated for a certain fund and subject to the needs of all other affiliated funds, the fund can borrow up to an aggregate commitment amount of $500 million, subject to asset coverage and other limitations as specified in the agreement. A commitment fee payable at the end of each calendar quarter, based on the average daily unused portion of the line of credit, is charged to each participating fund based on a combination of fixed and asset based allocations and is reflected in Other expenses on the Statement of operations. For the year ended March 31, 2019, the fund had no borrowings under the line of credit. Commitment fees for the year ended March 31, 2019 were $6,821.
Expenses. Within the John Hancock group of funds complex, expenses that are directly attributable to an individual fund are allocated to such fund. Expenses that are not readily attributable to a specific fund are allocated among all funds in an equitable manner, taking into consideration, among other things, the nature and type of expense and the fund's relative net assets. Expense estimates are accrued in the period to which they relate and adjustments are made when actual amounts are known.
Class allocations. Income, common expenses and realized and unrealized gains (losses) are determined at the fund level and allocated daily to each class of shares based on the net assets of the class. Class-specific expenses, such as distribution and service fees, if any, and transfer agent fees, for all classes, are charged daily at the class level based on the net assets of each class and the specific expense rates applicable to each class.
Federal income taxes. The fund intends to continue to qualify as a regulated investment company by complying with the applicable provisions of the Internal Revenue Code and will not be subject to federal income tax on taxable income that is distributed to shareholders. Therefore, no federal income tax provision is required.
As of March 31, 2019, the fund had no uncertain tax positions that would require financial statement recognition, derecognition or disclosure. The fund's federal tax returns are subject to examination by the Internal Revenue Service for a period of three years.
Distribution of income and gains. Distributions to shareholders from net investment income and net realized gains, if any, are recorded on the ex-date. The fund typically declares and pays dividends quarterly. Capital gain distributions, if any, are typically distributed annually.
The tax character of distributions for the year ended March 31, 2019 and for the period ended March 31, 2018 and for the year ended February 28, 2018 was as follows:
| March 31, 2019 | March 31, 20181 | February 28, 2018 | |
| Ordinary income | $72,791,029 | $12,217,833 | $70,862,215 |
| Long-term capital gains | 50,711,590 | — | — |
| Total | $123,502,619 | $12,217,833 | $70,862,215 |
| 1 For the one-month period ended 3-31-18. The fund changed its fiscal year end from February 28 to March 31. | |||
Distributions paid by the fund with respect to each class of shares are calculated in the same manner, at the same time and in the same amount, except for the effect of class level expenses that may be applied differently to each class. As of March 31, 2019, the components of distributable earnings on a tax basis consisted of $1,248,670 of undistributed ordinary income and $11,720,636 of undistributed long-term capital gains, respectively.
Such distributions and distributable earnings, on a tax basis, are determined in conformity with income tax regulations, which may differ from US GAAP. Distributions in excess of tax basis earnings and profits, if any, are reported in the fund's financial statements as a return of capital.
Capital accounts within the financial statements are adjusted for permanent book-tax differences. These adjustments have no impact on net assets or the results of operations. Temporary book-tax differences, if any, will reverse in a subsequent period. Book-tax differences are primarily attributable to partnerships, treating a portion of the proceeds from redemptions as distributions for tax purposes, and wash sale loss deferrals.
Note 3 — Guarantees and indemnifications
Under the Trust's organizational documents, its Officers and Trustees are indemnified against certain liabilities arising out of the performance of their duties to the Trust, including the fund. Additionally, in the normal course of business, the fund enters into contracts with service providers that contain general indemnification clauses. The fund's maximum exposure under these arrangements is unknown, as this would involve future claims that may be made against the fund that have not yet occurred. The risk of material loss from such claims is considered remote.
Note 4 — Fees and transactions with affiliates
John Hancock Advisers, LLC (the Advisor) serves as investment advisor for the fund. John Hancock Distributors, LLC (the Distributor), an affiliate of the Advisor, serves as principal underwriter of the fund. The Advisor and the Distributor are indirect, wholly owned subsidiaries of MFC.
Management fee. The fund has an investment management agreement with the Advisor under which the fund pays a daily management fee to the Advisor equivalent on an annual basis to the sum of 0.800%. The Advisor has a subadvisory agreement with Epoch Investment Partners, Inc. The fund is not responsible for payment of the subadvisory fees.
The Advisor has contractually agreed to waive a portion of its management fee and/or reimburse expenses for certain funds of the John Hancock group of funds complex, including the fund (the participating portfolios). This waiver is based upon aggregate net assets of all the participating portfolios. The amount of the reimbursement is calculated daily and allocated among all the participating portfolios in proportion to the daily net assets of each fund. During the year ended March 31, 2019, this waiver amounted to 0.01% of the fund's average net assets. This agreement expires on June 30, 2020, unless renewed by mutual agreement of the fund and the Advisor based upon a determination that this is appropriate under the circumstances at that time.
The Advisor contractually agrees to reduce its management fee or, if necessary, make payment to the applicable class in an amount equal to the amount by which expenses of Class A, Class B, Class C, Class I, Class R2, and Class R6 shares, as applicable, exceed 1.09%, 1.84%, 1.84%, 0.84%, 1.24%, and 0.74%, respectively, of average net assets attributable to the applicable class. For purposes of this agreement, "expenses of Class A, Class B, Class C, Class I, Class R2, and Class R6 shares" means all class expenses (including fund expenses attributable to the class), excluding taxes, brokerage commissions, interest expense, litigation and indemnification expenses and other extraordinary expenses not incurred in the ordinary course of the fund's business, acquired fund fees and expenses paid indirectly, and short dividend expense. This agreement expires on July 31, 2020, unless renewed by mutual agreement of the fund and the Advisor based on upon a determination that this is appropriate under the circumstances at that time.
The Advisor has voluntarily agreed to reduce its management fee for the fund, or if necessary, make payment to the fund, in an amount equal to the amount by which the fund's expenses exceed 0.74% of average net assets, on an annualized basis. Expenses means all the expenses of the fund, excluding taxes, brokerage commissions, interest expense, litigation and indemnification expenses and other extraordinary expenses not incurred in the ordinary course of the fund's business, advisory fees, class-specific expenses, borrowing costs, prime brokerage fees, acquired fund fees and expenses paid indirectly, and short dividend expense. This voluntary expense reduction will continue in effect until terminated at any time by the Advisor on notice to the fund.
For the year ended March 31, 2019, the expense reductions described above amounted to the following:
| Class | Expense reduction | Class | Expense reduction | |
| Class A | $628,258 | Class R2 | $1,422 | |
| Class B | 7,128 | Class R6 | 578,620 | |
| Class C | 117,556 | Class NAV | 613,644 | |
| Class I | 1,258,782 | Total | $3,205,410 |
Expenses waived or reimbursed in the current fiscal period are not subject to recapture in future fiscal periods.
The investment management fees, including the impact of the waivers and reimbursements as described above, incurred for the year ended March 31, 2019 were equivalent to a net annual effective rate of 0.65% of the fund's average daily net assets.
Accounting and legal services. Pursuant to a service agreement, the fund reimburses the Advisor for all expenses associated with providing the administrative, financial, legal, compliance, accounting and recordkeeping services to the fund, including the preparation of all tax returns, periodic reports to shareholders and regulatory reports, among other services. These expenses are allocated to each share class based on its relative net assets at the time the expense was incurred. These accounting and legal services fees incurred for the year ended March 31, 2019 amounted to an annual rate of 0.02% of the fund's average daily net assets.
Distribution and service plans. The fund has a distribution agreement with the Distributor. The fund has adopted distribution and service plans with respect to Class A, Class B, Class C, and Class R2 shares pursuant to Rule 12b-1 under the 1940 Act, to pay the Distributor for services provided as the distributor of shares of the fund. In addition, under a service plan for Class R2 shares, the fund pays for certain other services. The fund may pay up to the following contractual rates of distribution and service fees under these arrangements, expressed as an annual percentage of average daily net assets for each class of the fund's shares.
| Class | Rule 12b-1 fee | Service fee | Class | Rule 12b-1 fee | Service fee | |||||||||||||||
| Class A | 0.30% | — | Class C | 1.00% | — |
| Class | Rule 12b-1 fee | Service fee | Class | Rule 12b-1 fee | Service fee | |||||||||||||||
| Class B | 1.00% | — | Class R2 | 0.25% | 0.25% |
Sales charges. Class A shares are assessed up-front sales charges, which resulted in payments to the Distributor amounting to $483,040 for the year ended March 31, 2019. Of this amount, $83,441 was retained and used for printing prospectuses, advertising, sales literature and other purposes, $397,636 was paid as sales commissions to broker-dealers and $1,963 was paid as sales commissions to sales personnel of Signator Investors, Inc., which had been a broker-dealer affiliate of the Advisor through November 2, 2018.
Class A, Class B and Class C shares may be subject to contingent deferred sales charges (CDSCs). Certain Class A shares that are acquired through purchases of $1 million or more and are redeemed within one year of purchase are subject to a 1.00% sales charge. Class B shares that are redeemed within six years of purchase are subject to CDSCs, at declining rates, beginning at 5.00%. Class C shares that are redeemed within one year of purchase are subject to a 1.00% CDSC. CDSCs are applied to the lesser of the current market value at the time of redemption or the original purchase cost of the shares being redeemed. Proceeds from CDSCs are used to compensate the Distributor for providing distribution-related services in connection with the sale of these shares. During the year ended March 31, 2019, CDSCs received by the Distributor amounted to $10,012, $2,263, and $3,454 for Class A, Class B and Class C shares, respectively.
Transfer agent fees. The John Hancock group of funds has a complex-wide transfer agent agreement with John Hancock Signature Services, Inc. (Signature Services), an affiliate of the Advisor. The transfer agent fees paid to Signature Services are determined based on the cost to Signature Services (Signature Services Cost) of providing recordkeeping services. It also includes out-of-pocket expenses, including payments made to third-parties for recordkeeping services provided to their clients who invest in one or more John Hancock funds. In addition, Signature Services Cost may be reduced by certain fees that Signature Services receives in connection with retirement and small accounts. Signature Services Cost is calculated monthly and allocated, as applicable, to five categories of share classes: Retail Share and Institutional Share Classes of Non-Municipal Bond Funds, Class R6 Shares, Retirement Share Classes and Municipal Bond Share Classes. Within each of these categories, the applicable costs are allocated to the affected John Hancock affiliated funds and/or classes, based on the relative average daily net assets.
Class level expenses. Class level expenses for the year ended March 31, 2019 were:
| Class | Distribution and service fees | Transfer agent fees |
| Class A | $1,015,847 | $372,869 |
| Class B | 53,687 | 5,888 |
| Class C | 879,178 | 96,543 |
| Class I | — | 1,048,241 |
| Class R2 | 5,108 | 141 |
| Class R6 | — | 55,458 |
| Total | $1,953,820 | $1,579,140 |
Trustee expenses.The fund compensates each Trustee who is not an employee of the Advisor or its affiliates. The costs of paying Trustee compensation and expenses are allocated to the fund based on its net assets relative to other funds within the John Hancock group of funds complex.
Interfund lending program. Pursuant to an Exemptive Order issued by the SEC, the fund, along with certain other funds advised by the Advisor or its affiliates, may participate in an interfund lending program. This program provides
an alternative credit facility allowing the funds to borrow from, or lend money to, other participating affiliated funds. At period end, no interfund loans were outstanding. Interest expense is included in Other expenses on the Statement of operations. The fund's activity in this program during the period for which loans were outstanding was as follows:
| Borrower or lender | Weighted average loan balance | Days outstanding | Weighted average interest rate | Interest expense |
| Borrower | $18,644,791 | 1 | 2.350% | $1,217 |
Note 5 — Fund share transactions
Transactions in fund shares for the year ended March 31, 2019 and for the period ended March 31, 2018 and for the year ended February 28, 2018 were as follows:
| Year ended 3-31-19 | Period ended 3-31-181 | Year ended 2-28-18 | ||||||||||||||||||||||||||||||||||||
| Shares | Amount | Shares | Amount | Shares | Amount | |||||||||||||||||||||||||||||||||
| Class A shares | ||||||||||||||||||||||||||||||||||||||
| Sold | 5,161,275 | $56,794,764 | 328,635 | $3,690,424 | 4,887,570 | $55,317,402 | ||||||||||||||||||||||||||||||||
| Distributions reinvested | 1,729,739 | 18,423,338 | 146,351 | 1,612,789 | 924,739 | 10,462,524 | ||||||||||||||||||||||||||||||||
| Repurchased | (7,845,691 | ) | (86,052,357 | ) | (654,733 | ) | (7,383,805 | ) | (9,765,823 | ) | (110,840,941 | ) | ||||||||||||||||||||||||||
| Net decrease | (954,677 | ) | $(10,834,255 | ) | (179,747 | ) | $(2,080,592 | ) | (3,953,514 | ) | $(45,061,015 | ) | ||||||||||||||||||||||||||
| Class B shares | ||||||||||||||||||||||||||||||||||||||
| Sold | 4,751 | $53,547 | 234 | $2,590 | 8,773 | $100,317 | ||||||||||||||||||||||||||||||||
| Distributions reinvested | 18,486 | 196,711 | 1,379 | 15,210 | 13,227 | 149,606 | ||||||||||||||||||||||||||||||||
| Repurchased | (290,776 | ) | (3,181,473 | ) | (21,632 | ) | (244,352 | ) | (378,607 | ) | (4,328,572 | ) | ||||||||||||||||||||||||||
| Net decrease | (267,539 | ) | $(2,931,215 | ) | (20,019 | ) | $(226,552 | ) | (356,607 | ) | $(4,078,649 | ) | ||||||||||||||||||||||||||
| Class C shares | ||||||||||||||||||||||||||||||||||||||
| Sold | 274,532 | $3,029,238 | 48,700 | $550,543 | 766,239 | $8,681,591 | ||||||||||||||||||||||||||||||||
| Distributions reinvested | 368,049 | 3,918,414 | 26,090 | 288,029 | 211,666 | 2,396,367 | ||||||||||||||||||||||||||||||||
| Repurchased | (3,370,446 | ) | (37,274,570 | ) | (261,635 | ) | (2,942,356 | ) | (2,888,788 | ) | (32,746,743 | ) | ||||||||||||||||||||||||||
| Net decrease | (2,727,865 | ) | $(30,326,918 | ) | (186,845 | ) | $(2,103,784 | ) | (1,910,883 | ) | $(21,668,785 | ) | ||||||||||||||||||||||||||
| Class I shares | ||||||||||||||||||||||||||||||||||||||
| Sold | 12,921,368 | $142,302,285 | 1,293,551 | $14,608,777 | 29,000,429 | $328,965,528 | ||||||||||||||||||||||||||||||||
| Distributions reinvested | 4,441,626 | 47,545,936 | 421,098 | 4,657,346 | 3,290,903 | 37,305,368 | ||||||||||||||||||||||||||||||||
| Repurchased | (22,619,195 | ) | (249,211,116 | ) | (1,685,660 | ) | (19,015,316 | ) | (68,523,697 | ) | (789,962,651 | ) | ||||||||||||||||||||||||||
| Net increase (decrease) | (5,256,201 | ) | $(59,362,895 | ) | 28,989 | $250,807 | (36,232,365 | ) | $(423,691,755 | ) | ||||||||||||||||||||||||||||
| Year ended 3-31-19 | Period ended 3-31-181 | Year ended 2-28-18 | ||||||||||||||||||||||||||||||||||||
| Shares | Amount | Shares | Amount | Shares | Amount | |||||||||||||||||||||||||||||||||
| Class R2 shares | ||||||||||||||||||||||||||||||||||||||
| Sold | 11,527 | $127,833 | 3,814 | $42,501 | 19,164 | $218,403 | ||||||||||||||||||||||||||||||||
| Distributions reinvested | 5,270 | 56,283 | 443 | 4,906 | 2,709 | 30,823 | ||||||||||||||||||||||||||||||||
| Repurchased | (48,362 | ) | (535,315 | ) | (1,441 | ) | (16,412 | ) | (21,441 | ) | (250,223 | ) | ||||||||||||||||||||||||||
| Net increase (decrease) | (31,565 | ) | $(351,199 | ) | 2,816 | $30,995 | 432 | $(997 | ) | |||||||||||||||||||||||||||||
| Class R6 shares | ||||||||||||||||||||||||||||||||||||||
| Sold | 6,476,957 | $71,621,251 | 853,833 | $9,621,634 | 45,525,783 | $528,602,558 | ||||||||||||||||||||||||||||||||
| Distributions reinvested | 2,295,625 | 24,540,724 | 241,967 | 2,671,316 | 270,948 | 3,176,809 | ||||||||||||||||||||||||||||||||
| Repurchased | (19,726,348 | ) | (215,104,129 | ) | (965,286 | ) | (10,893,128 | ) | (3,342,342 | ) | (39,222,455 | ) | ||||||||||||||||||||||||||
| Net increase (decrease) | (10,953,766 | ) | $(118,942,154 | ) | 130,514 | $1,399,822 | 42,454,389 | $492,556,912 | ||||||||||||||||||||||||||||||
| Class NAV shares | ||||||||||||||||||||||||||||||||||||||
| Sold | 352,106 | $3,936,930 | 241,335 | $2,725,544 | 883,085 | $10,113,962 | ||||||||||||||||||||||||||||||||
| Distributions reinvested | 2,605,631 | 27,887,901 | 259,083 | 2,862,863 | 1,465,285 | 16,626,561 | ||||||||||||||||||||||||||||||||
| Repurchased | (7,312,294 | ) | (81,146,295 | ) | (49,262 | ) | (553,257 | ) | (6,494,055 | ) | (74,000,073 | ) | ||||||||||||||||||||||||||
| Net increase (decrease) | (4,354,557 | ) | $(49,321,464 | ) | 451,156 | $5,035,150 | (4,145,685 | ) | $(47,259,550 | ) | ||||||||||||||||||||||||||||
| Total net increase (decrease) | (24,546,170 | ) | $(272,070,100 | ) | 226,864 | $2,305,846 | (4,144,233 | ) | $(49,203,839 | ) | ||||||||||||||||||||||||||||
1 For the one-month period ended 3-31-18. The fund changed its fiscal year end from February 28 to March 31.
Affiliates of the fund owned 100% of shares of Class NAV, on March 31, 2019. Such concentration of shareholders' capital could have a material effect on the fund if such shareholders redeem from the fund.
Note 6 — Purchase and sale of securities
Purchases and sales of securities, other than short-term securities, amounted to $336,974,614 and $658,788,734 for the year ended March 31, 2019.
Note 7 — Investment by affiliated funds
Certain investors in the fund are affiliated funds that are managed by the Advisor and its affiliates. The affiliated funds do not invest in the fund for the purpose of exercising management or control; however, this investment may represent a significant portion of the fund's net assets. At March 31, 2019, funds within the John Hancock group of funds complex held 22.3% of the fund's net assets. The following funds had an affiliate ownership of 5% or more of the fund's net assets:
| Fund | Affiliated concentration | ||||
| John Hancock Funds II Multimanager Lifestyle Growth Portfolio | 7.1% |
| Fund | Affiliated concentration | ||||
| John Hancock Funds II Multimanager Lifestyle Balanced Portfolio | 6.8% |
Note 8 — Investment in affiliated underlying funds
The fund may invest in affiliated underlying funds that are managed by the Advisor and its affiliates. Information regarding the fund's purchases and sales of the affiliated underlying funds as well as income and capital gains earned, if any, during the period is as follows:
| Dividends and distributions | ||||||||||||||||||||||||||||||||||||||
| Fund | Beginning share amount | Shares purchased | Shares sold | Ending share amount | Income distributions received | Capital gain distributions received | Realized gain (loss) | Change in unrealized appreciation (depreciation) | Ending value | |||||||||||||||||||||||||||||
| John Hancock Collateral Trust* | 1,729,540 | 135,725,879 | (134,603,181 | ) | 2,852,238 | — | — | ($6,963 | ) | $7,036 | $28,542,057 | |||||||||||||||||||||||||||
| *Refer to the Securities lending note within Note 2 for details regarding this investment. | ||||||||||||||||||||||||||||||||||||||
REPORT OF INDEPENDENT REGISTERED PUBLIC ACCOUNTING FIRM
To the Board of Trustees of John Hancock Funds III and Shareholders of John Hancock Global Shareholder Yield Fund
Opinion on the Financial Statements
We have audited the accompanying statement of assets and liabilities, including the Fund's investments, of John Hancock Global Shareholder Yield Fund (one of the funds constituting John Hancock Funds III, referred to hereafter as the "Fund") as of March 31, 2019, the related statement of operations for the year ended March 31, 2019, the statements of changes in net assets for the year ended March 31, 2019, for the period from March 1, 2018 to March 31, 2018 and for the year ended February 28, 2018, including the related notes, and the financial highlights for each of the periods indicated therein (collectively referred to as the "financial statements"). In our opinion, the financial statements present fairly, in all material respects, the financial position of the Fund as of March 31, 2019, the results of its operations for the year then ended, the changes in its net assets for the year ended March 31, 2019, for the period from March 1, 2018 to March 31, 2018 and for the year ended February 28, 2018 and the financial highlights for each of the periods indicated therein in conformity with accounting principles generally accepted in the United States of America.
Basis for Opinion
These financial statements are the responsibility of the Fund's management. Our responsibility is to express an opinion on the Fund's financial statements based on our audits. We are a public accounting firm registered with the Public Company Accounting Oversight Board (United States) ("PCAOB") and are required to be independent with respect to the Fund in accordance with the U.S. federal securities laws and the applicable rules and regulations of the Securities and Exchange Commission and the PCAOB.
We conducted our audits of these financial statements in accordance with the standards of the PCAOB. Those standards require that we plan and perform the audit to obtain reasonable assurance about whether the financial statements are free of material misstatement, whether due to error or fraud.
Our audits included performing procedures to assess the risks of material misstatement of the financial statements, whether due to error or fraud, and performing procedures that respond to those risks. Such procedures included examining, on a test basis, evidence regarding the amounts and disclosures in the financial statements. Our audits also included evaluating the accounting principles used and significant estimates made by management, as well as evaluating the overall presentation of the financial statements. Our procedures included confirmation of securities owned as of March 31, 2019 by correspondence with the custodian, transfer agent, and brokers; when replies were not received from brokers, we performed other auditing procedures. We believe that our audits provide a reasonable basis for our opinion.
/s/ PricewaterhouseCoopers LLP
Boston, Massachusetts
May 16, 2019
We have served as the auditor of one or more investment companies in the John Hancock group of funds since 1988.
Unaudited
For federal income tax purposes, the following information is furnished with respect to the distributions of the fund, if any, paid during its taxable year ended March 31, 2019.
The fund reports the maximum amount allowable of its net taxable income as eligible for the corporate dividends-received deduction.
The fund reports the maximum amount allowable of its net taxable income as qualified dividend income as provided in the Jobs and Growth Tax Relief Reconciliation Act of 2003.
The fund paid $52,149,359 in long term capital gain dividends.
Eligible shareholders will be mailed a 2019 Form 1099-DIV in early 2020. This will reflect the tax character of all distributions paid in calendar year 2019.
Please consult a tax advisor regarding the tax consequences of your investment in the fund.
This chart provides information about the Trustees and Officers who oversee your John Hancock fund. Officers elected by the Trustees manage the day-to-day operations of the fund and execute policies formulated by the Trustees.
Independent Trustees
| Name, year of birth Position(s) held with Trust Principal occupation(s) and other directorships during past 5 years | Trustee of the Trust since1 | Number of John Hancock funds overseen by Trustee |
| Hassell H. McClellan, Born: 1945 | 2012 | 215 |
| Trustee and Chairperson of the Board Director/Trustee, Virtus Funds (since 2008); Director, The Barnes Group (since 2010); Associate Professor, The Wallace E. Carroll School of Management, Boston College (retired 2013). Trustee (since 2005) and Chairperson of the Board (since 2017) of various trusts within the John Hancock Fund Complex. | ||
| Charles L. Bardelis,2 Born: 1941 | 2012 | 215 |
| Trustee Director, Island Commuter Corp. (marine transport). Trustee of various trusts within the John Hancock Fund Complex (since 1988). | ||
| James R. Boyle,Born: 1959 | 2015 | 215 |
| Trustee Chief Executive Officer, Foresters Financial (since 2018); Chairman and Chief Executive Officer, Zillion Group, Inc. (formerly HealthFleet, Inc.) (healthcare) (2014-2018); Executive Vice President and Chief Executive Officer, U.S. Life Insurance Division of Genworth Financial, Inc. (insurance) (January 2014-July 2014); Senior Executive Vice President, Manulife Financial, President and Chief Executive Officer, John Hancock (1999-2012); Chairman and Director, John Hancock Advisers, LLC, John Hancock Funds, LLC, and John Hancock Investment Management Services, LLC (2005-2010). Trustee of various trusts within the John Hancock Fund Complex (2005-2014 and since 2015). | ||
| Peter S. Burgess,2 Born: 1942 | 2012 | 215 |
| Trustee Consultant (financial, accounting, and auditing matters) (since 1999); Certified Public Accountant; Partner, Arthur Andersen (independent public accounting firm) (prior to 1999); Director, Lincoln Educational Services Corporation (since 2004); Director, Symetra Financial Corporation (2010-2016); Director, PMA Capital Corporation (2004-2010). Trustee of various trusts within the John Hancock Fund Complex (since 2005). | ||
| William H. Cunningham, Born: 1944 | 2006 | 215 |
| Trustee Professor, University of Texas, Austin, Texas (since 1971); former Chancellor, University of Texas System and former President of the University of Texas, Austin, Texas; Chairman (since 2009) and Director (since 2006), Lincoln National Corporation (insurance); Director, Southwest Airlines (since 2000); former Director, LIN Television (2009-2014). Trustee of various trusts within the John Hancock Fund Complex (since 1986). | ||
| Grace K. Fey, Born: 1946 | 2012 | 215 |
| Trustee Chief Executive Officer, Grace Fey Advisors (since 2007); Director and Executive Vice President, Frontier Capital Management Company (1988-2007); Director, Fiduciary Trust (since 2009). Trustee of various trusts within the John Hancock Fund Complex (since 2008). | ||
Independent Trustees (continued)
| Name, year of birth Position(s) held with Trust Principal occupation(s) and other directorships during past 5 years | Trustee of the Trust since1 | Number of John Hancock funds overseen by Trustee |
| Theron S. Hoffman,2 Born: 1947 | 2012 | 215 |
| Trustee Chief Executive Officer, T. Hoffman Associates, LLC (consulting firm) (since 2003); Director, The Todd Organization (consulting firm) (2003-2010); President, Westport Resources Management (investment management consulting firm) (2006-2008); Board Member, Senior Managing Director, Partner, and Operating Head, Putnam Investments (2000-2003); Executive Vice President, The Thomson Corp. (financial and legal information publishing) (1997-2000). Trustee of various trusts within the John Hancock Fund Complex (since 2008). | ||
| Deborah C. Jackson, Born: 1952 | 2008 | 215 |
| Trustee President, Cambridge College, Cambridge, Massachusetts (since 2011); Board of Directors, National Association of Corporate Directors/New England (since 2015); Board of Directors, Association of Independent Colleges and Universities of Massachusetts (since 2014); Chief Executive Officer, American Red Cross of Massachusetts Bay (2002-2011); Board of Directors of Eastern Bank Corporation (since 2001); Board of Directors of Eastern Bank Charitable Foundation (since 2001); Board of Directors of American Student Assistance Corporation (1996-2009); Board of Directors of Boston Stock Exchange (2002-2008); Board of Directors of Harvard Pilgrim Healthcare (health benefits company) (2007-2011). Trustee of various trusts within the John Hancock Fund Complex (since 2008). | ||
| James M. Oates, Born: 1946 | 2012 | 215 |
Trustee | ||
| Steven R. Pruchansky, Born: 1944 | 2006 | 215 |
| Trustee and Vice Chairperson of the Board Managing Director, Pru Realty (since 2017); Chairman and Chief Executive Officer, Greenscapes of Southwest Florida, Inc. (since 2000); Director and President, Greenscapes of Southwest Florida, Inc. (until 2000); Member, Board of Advisors, First American Bank (until 2010); Managing Director, Jon James, LLC (real estate) (since 2000); Partner, Right Funding, LLC (2014-2017); Director, First Signature Bank & Trust Company (until 1991); Director, Mast Realty Trust (until 1994); President, Maxwell Building Corp. (until 1991). Trustee (since 1992), Chairperson of the Board (2011-2012), and Vice Chairperson of the Board (since 2012) of various trusts within the John Hancock Fund Complex. | ||
| Gregory A. Russo, Born: 1949 | 2008 | 215 |
| Trustee Director and Audit Committee Chairman (since 2012), and Member, Audit Committee and Finance Committee (since 2011), NCH Healthcare System, Inc. (holding company for multi-entity healthcare system); Director and Member (since 2012) and Finance Committee Chairman (since 2014), The Moorings, Inc. (nonprofit continuing care community); Vice Chairman, Risk & Regulatory Matters, KPMG LLP (KPMG) (2002-2006); Vice Chairman, Industrial Markets, KPMG (1998-2002); Chairman and Treasurer, Westchester County, New York, Chamber of Commerce (1986-1992); Director, Treasurer, and Chairman of Audit and Finance Committees, Putnam Hospital Center (1989-1995); Director and Chairman of Fundraising Campaign, United Way of Westchester and Putnam Counties, New York (1990-1995). Trustee of various trusts within the John Hancock Fund Complex (since 2008). | ||
Non-Independent Trustees3
| Name, year of birth Position(s) held with Trust Principal occupation(s) and other directorships during past 5 years | Trustee of the Trust since1 | Number of John Hancock funds overseen by Trustee |
| Andrew G. Arnott, Born: 1971 | 2017 | 215 |
| President and Non-Independent Trustee Head of Wealth and Asset Management, United States and Europe, for John Hancock and Manulife (since 2018); Executive Vice President, John Hancock Financial Services (since 2009, including prior positions); Director and Executive Vice President, John Hancock Advisers, LLC (since 2005, including prior positions); Director and Executive Vice President, John Hancock Investment Management Services, LLC (since 2006, including prior positions); President, John Hancock Funds, LLC (since 2004, including prior positions); President of various trusts within the John Hancock Fund Complex (since 2007, including prior positions). | ||
| Marianne Harrison, Born: 1963 | 2018 | 215 |
| Non-Independent Trustee President and CEO, John Hancock (since 2017); President and CEO, Manulife Canadian Division (2013-2017); Member, Board of Directors, American Council of Life Insurers (ACLI) (since 2018); Member, Board of Directors, Communitech, an industry-led innovation center that fosters technology companies in Canada (since 2017); Member, Board of Directors, Manulife Assurance Canada (since 2015); Board Member, St. Mary's General Hospital Foundation (since 2014); Member, Board of Directors, Manulife Bank of Canada (since 2013); Member, Standing Committee of the Canadian Life & Health Assurance Association (since 2013); Member, Board of Directors, John Hancock USA, John Hancock Life & Health, John Hancock New York (2012-2013). Trustee of various trusts within the John Hancock Fund Complex (since 2018). | ||
Principal officers who are not Trustees
| Name, year of birth Position(s) held with Trust Principal occupation(s) during past 5 years | Officer of the Trust since |
| Francis V. Knox, Jr.,Born: 1947 | 2006 |
| Chief Compliance Officer Vice President, John Hancock Financial Services (since 2005); Chief Compliance Officer, various trusts within the John Hancock Fund Complex, John Hancock Advisers, LLC, and John Hancock Investment Management Services, LLC (since 2005). | |
| Charles A. Rizzo, Born: 1957 | 2007 |
| Chief Financial Officer Vice President, John Hancock Financial Services (since 2008); Senior Vice President, John Hancock Advisers, LLC and John Hancock Investment Management Services, LLC (since 2008); Chief Financial Officer of various trusts within the John Hancock Fund Complex (since 2007). | |
| Salvatore Schiavone, Born: 1965 | 2010 |
| Treasurer Assistant Vice President, John Hancock Financial Services (since 2007); Vice President, John Hancock Advisers, LLC and John Hancock Investment Management Services, LLC (since 2007); Treasurer of various trusts within the John Hancock Fund Complex (since 2007, including prior positions). | |
Principal officers who are notTrustees (continued)
| Name, year of birth Position(s) held with Trust Principal occupation(s) during past 5 years | Officer of the Trust since | |
| Christopher (Kit) Sechler,Born: 1973 | 2018 | |
| Chief Legal Officer and Secretary Vice President and Deputy Chief Counsel, John Hancock Investments (since 2015); Assistant Vice President and Senior Counsel (2009-2015), John Hancock Investments; Chief Legal Officer and Secretary of various trusts within the John Hancock Fund Complex (since 2018); Assistant Secretary of John Hancock Advisers, LLC and John Hancock Investment Management Services, LLC (since 2009). | ||
The business address for all Trustees and Officers is 200 Berkeley Street, Boston, Massachusetts 02116-5023.
The Statement of Additional Information of the fund includes additional information about members of the Board of Trustees of the Trust and is available without charge, upon request, by calling 800-225-5291.
| 1 | Each Trustee holds office until his or her successor is elected and qualified, or until the Trustee's death, retirement, resignation, or removal. Mr. Boyle has served as Trustee at various times prior to the date listed in the table. |
| 2 | Member of the Audit Committee. |
| 3 | The Trustee is a Non-Independent Trustee due to current or former positions with the Advisor and certain affiliates. |
Trustees Hassell H. McClellan,Chairperson Officers Andrew G. Arnott Francis V. Knox, Jr. Charles A. Rizzo Salvatore Schiavone Christopher (Kit) Sechler** | Investment advisor John Hancock Advisers, LLC Subadvisor Epoch Investment Partners, Inc. Portfolio Managers William W. Priest, CFA Principal distributor John Hancock Funds, LLC Custodian Citibank, N.A. Transfer agent John Hancock Signature Services, Inc. Legal counsel K&L Gates LLP Independent registered public accounting firm PricewaterhouseCoopers LLP |
* Member of the Audit Committee
† Non-Independent Trustee
#Effective 6-19-18
**Effective 9-13-18
The fund's proxy voting policies and procedures, as well as the fund proxy voting record for the most recent twelve-month period ended June 30, are available free of charge on the Securities and Exchange Commission (SEC) website at sec.gov or on our website.
All of the fund's holdings as of the end of the third month of every fiscal quarter are filed with the SEC on Form N-PORT within 60 days of the end of the fiscal quarter. The fund's Form N-PORT filings are available on our website and the SEC's website, sec.gov.
We make this information on your fund, as well asmonthly portfolio holdings, and other fund details available on our website at jhinvestments.com or by calling 800-225-5291.
| You can also contact us: | |||
| 800-225-5291 jhinvestments.com | Regular mail: John Hancock Signature Services, Inc. | Express mail: John Hancock Signature Services, Inc. | |
John Hancock family of funds
DOMESTIC EQUITY FUNDS Blue Chip Growth Classic Value Disciplined Value Disciplined Value Mid Cap Equity Income Financial Industries Fundamental All Cap Core Fundamental Large Cap Core Fundamental Large Cap Value New Opportunities Regional Bank Small Cap Core Small Cap Growth Small Cap Value U.S. Global Leaders Growth U.S. Quality Growth Value Equity GLOBAL AND INTERNATIONAL EQUITY FUNDS Disciplined Value International Emerging Markets Emerging Markets Equity Fundamental Global Franchise Global Equity Global Shareholder Yield Global Thematic Opportunities Greater China Opportunities International Dynamic Growth International Growth International Small Company | INCOME FUNDS Bond California Tax-Free Income Emerging Markets Debt Floating Rate Income Government Income High Yield High Yield Municipal Bond Income Investment Grade Bond Money Market Short Duration Credit Opportunities Spectrum Income Strategic Income Opportunities Tax-Free Bond ALTERNATIVE AND SPECIALTY FUNDS Absolute Return Currency Alternative Asset Allocation Disciplined Alternative Yield Global Absolute Return Strategies Global Conservative Absolute Return Global Focused Strategies Infrastructure Seaport Long/Short |
A fund's investment objectives, risks, charges, and expenses should be considered carefully before investing. The prospectus contains this and other important information about the fund. To obtain a prospectus, contact your financial professional, call John Hancock Investments at 800-225-5291, or visit our website at jhinvestments.com. Please read the prospectus carefully before investing or sending money.
ASSET ALLOCATION Balanced Income Allocation Multi-Index Lifetime Portfolios Multi-Index Preservation Portfolios Multimanager Lifestyle Portfolios Multimanager Lifetime Portfolios Retirement Income 2040 EXCHANGE-TRADED FUNDS John Hancock Multifactor Consumer Discretionary ETF John Hancock Multifactor Consumer Staples ETF John Hancock Multifactor Developed International ETF John Hancock Multifactor Emerging Markets ETF John Hancock Multifactor Energy ETF John Hancock Multifactor Financials ETF John Hancock Multifactor Healthcare ETF John Hancock Multifactor Industrials ETF John Hancock Multifactor Large Cap ETF John Hancock Multifactor Materials ETF John Hancock Multifactor Media and John Hancock Multifactor Mid Cap ETF John Hancock Multifactor Small Cap ETF John Hancock Multifactor Technology ETF John Hancock Multifactor Utilities ETF | ENVIRONMENTAL, SOCIAL, AND ESG All Cap Core ESG Core Bond ESG International Equity ESG Large Cap Core CLOSED-END FUNDS Financial Opportunities Hedged Equity & Income Income Securities Trust Investors Trust Preferred Income Preferred Income II Preferred Income III Premium Dividend Tax-Advantaged Dividend Income Tax-Advantaged Global Shareholder Yield |
John Hancock Multifactor ETF shares are bought and sold at market price (not NAV), and are not individually redeemed
from the fund. Brokerage commissions will reduce returns.
John Hancock ETFs are distributed by Foreside Fund Services, LLC, and are subadvised by Dimensional Fund Advisors LP.
Foreside is not affiliated with John Hancock Funds, LLC or Dimensional Fund Advisors LP.
Dimensional Fund Advisors LP receives compensation from John Hancock in connection with licensing rights to the
John Hancock Dimensional indexes. Dimensional Fund Advisors LP does not sponsor, endorse, or sell, and makes no
representation as to the advisability of investing in, John Hancock Multifactor ETFs.
John Hancock Investment Management
A trusted brand
John Hancock Investment Management is a premier asset manager
representing one of America's most trusted brands, with a heritage of
financial stewardship dating back to 1862. Helping our shareholders
pursue their financial goals is at the core of everything we do. It's why
we support the role of professional financial advice and operate with
the highest standards of conduct and integrity.
A better way to invest
We serve investors globally through a unique multimanager approach:
We search the world to find proven portfolio teams with specialized
expertise for every strategy we offer, then we apply robust investment
oversight to ensure they continue to meet our uncompromising
standards and serve the best interests of our shareholders.
Results for investors
Our unique approach to asset management enables us to provide
a diverse set of investments backed by some of the world's best
managers, along with strong risk-adjusted returns across asset classes.
![]()
John Hancock Funds, LLC n Member FINRA, SIPC
200 Berkeley Street n Boston, MA 02116-5010 n 800-225-5291 n jhinvestments.com
This report is for the information of the shareholders of John Hancock Global Shareholder Yield Fund. It is not authorized for distribution to prospective investors unless preceded or accompanied by a prospectus.
| MF802053 | 320A 3/19 5/19 |
John Hancock
International Growth Fund
Annual report 3/31/19
Beginning on January 1, 2021, as permitted by regulations adopted by the Securities and Exchange Commission, paper copies of the Fund's shareholder reports like this one will no longer be sent by mail, unless you specifically request paper copies of the reports from the Fund or from your financial intermediary. Instead, the reports will be made available on a website, and you will be notified by mail each time a report is posted and provided with a website link to access the report.
If you already elected to receive shareholder reports electronically, you will not be affected by this change, and you do not need to take any action. You may elect to receive shareholder reports and other communications electronically by calling John Hancock Investment Management at 800-225-5291 (Class A, Class B and Class C shares) or 888-972-8696 (Class I, Class R2, Class R4, Class R6, Class 1, and Class NAV) or by contacting your financial intermediary.
You may elect to receive all reports in paper, free of charge, at any time. You can inform John Hancock Investment Management or your financial intermediary that you wish to continue receiving paper copies of your shareholder reports by following the instructions listed above. Your election to receive reports in paper will apply to all funds held with John Hancock Investment Management or your financial intermediary.
A message to shareholders
Dear shareholder,
Market volatility was the big story in the latter half of 2018, as stocks sank in the fourth quarter, hurt by fears of slowing global economic growth, mounting trade tensions between the United States and China, and a pullback in oil prices. Many of those fears were quelled in the beginning of 2019, as favorable earnings reports, progress with the China trade dispute, and signals from the U.S. Federal Reserve that interest-rate hikes were on hold sparked a market rebound.
At the same time, monetary and fiscal stimulus was being employed across Europe, Japan, and China, and the result was that the first quarter of 2019 was the best quarterly performance in global equities since 2010.
Your best resource in unpredictable and volatile markets is your financial advisor, who can help position your portfolio so that it's sufficiently diversified to meet your long-term objectives and to withstand the inevitable turbulence along the way.
On behalf of everyone at John Hancock Investment Management, I'd like to take this opportunity to welcome new shareholders and thank existing shareholders for the continued trust you've placed in us.
Sincerely,
Andrew G. Arnott
President and CEO,
John Hancock Investment Management
Head of Wealth and Asset Management,
United States and Europe
This commentary reflects the CEO's views, which are subject to change at any time. Investing involves risks, including the potential loss of principal. Diversification does not guarantee a profit or eliminate the risk of a loss. It is not possible to invest directly in an index. For more up-to-date information, please visit our website at jhinvestments.com.
John Hancock
International Growth Fund
Table of contents
| 2 | Your fund at a glance | |
| 4 | Discussion of fund performance | |
| 6 | A look at performance | |
| 8 | Your expenses | |
| 10 | Fund's investments | |
| 13 | Financial statements | |
| 17 | Financial highlights | |
| 26 | Notes to financial statements | |
| 37 | Report of independent registered public accounting firm | |
| 38 | Tax information | |
| 39 | Trustees and Officers | |
| 43 | More information |
INVESTMENT OBJECTIVE
The fund seeks high total return primarily through capital appreciation.
AVERAGE ANNUAL TOTAL RETURNS AS OF 3/31/19 (%)
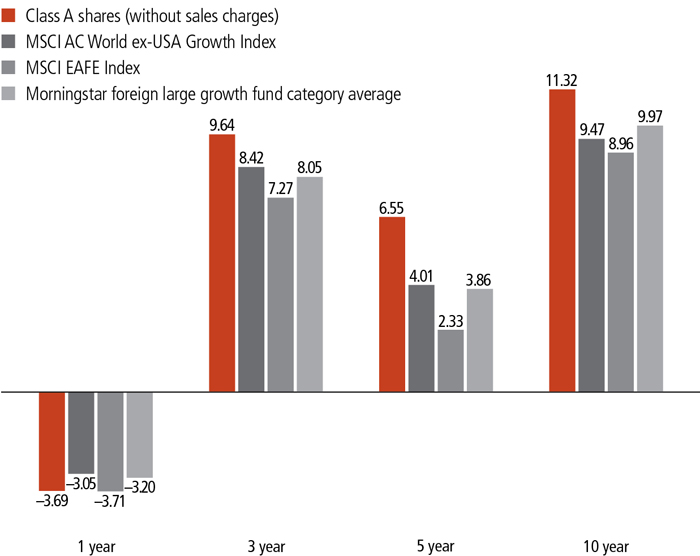
The MSCI AC World ex-USA Growth Index is a free float-adjusted market capitalization index that is designed to measure the equity performance of growth-oriented stocks in developed (excluding the U.S.) and emerging markets.
The MSCI EAFE Index is a free float-adjusted market capitalization index that is designed to measure the equity market performance of developed markets, excluding the U.S. and Canada.
It is not possible to invest directly in an index. Index figures do not reflect expenses or sales charges, which would result in lower returns.
Figures from Morningstar, Inc. include reinvested distributions and do not take into account sales charges. Actual load-adjusted performance is lower.
The past performance shown here reflects reinvested distributions and the beneficial effect of any expense reductions, and does not guarantee future results. Performance of the other share classes will vary based on the difference in the fees and expenses of those classes. Shares will fluctuate in value and, when redeemed, may be worth more or less than their original cost. Current month-end performance may be lower or higher than the performance cited, and can be found at jhinvestments.com or by calling 800-225-5291. For further information on the fund's objectives, risks, and strategy, see the fund's prospectus.
PERFORMANCE HIGHLIGHTS OVER THE LAST TWELVE MONTHS
Fund posted a loss for the period and underperformed its benchmark index
The fund returned a loss for the period, lagging its benchmark, the MSCI AC World ex-USA Growth Index.
Drivers of relative performance
Stock selection in communication services and information technology were negatives for relative performance, while selection in industrials, consumer discretionary, and healthcare was positive.
Certain sector weightings affected results
An overweight in the lagging information technology sector and an underweight in the outperforming communication services group detracted.
SECTOR COMPOSITION AS OF 3/31/19 (%)
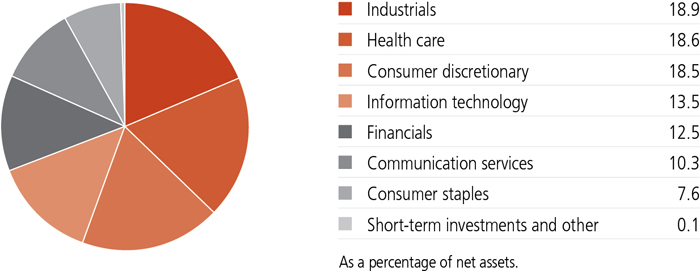
A note about risks
The fund may be subject to various risks as described in the fund's prospectus. For more information, please refer to the "Principal risks" section of the prospectus.
The fund posted a loss for the reporting period, underperforming its benchmark, the MSCI AC World ex-USA Growth Index, which also lost ground. Security selection in the information technology and communication services hurt, while selection in the industrials, consumer discretionary, and healthcare sectors were small relative positives. In terms of sector allocation, an overweight in the lagging information technology sector and underweight in the outperforming communication services category detracted.
Which equity positions detracted the most from relative performance?
The fund's top individual detractor was Tencent Holdings, Ltd., China's leading internet media company. Shares of Tencent dropped following a disappointing earnings report stemming from weakness in the company's mobile games business. Chinese pharmaceutical company CSPC Pharmaceutical Group, Ltd. also detracted, as the Chinese government announced a new drug-procurement policy involving a more drastic than expected pricing cut.
Which stocks contributed?
The fund's top individual contributor was Safran SA. Shares of this French
| TOP 10 HOLDINGS AS OF 3/31/19 (%) | TOP 10 COUNTRIES AS OF 3/31/19 (%) | |||
| Tencent Holdings, Ltd. | 4.2 | China | 17.6 | |
| Alibaba Group Holding, Ltd., ADR | 4.1 | United Kingdom | 14.6 | |
| Nestle SA | 3.8 | Switzerland | 11.7 | |
| Taiwan Semiconductor Manufacturing Company, Ltd. | 3.7 | France | 11.0 | |
| Japan | 8.0 | |||
| AIA Group, Ltd. | 3.0 | Netherlands | 7.7 | |
| Roche Holding AG | 2.8 | Ireland | 4.7 | |
| Canadian National Railway Company | 2.3 | Germany | 3.8 | |
| AstraZeneca PLC | 2.3 | Taiwan | 3.7 | |
| Safran SA | 2.3 | Hong Kong | 3.0 | |
| Keyence Corp. | 2.2 | TOTAL | 85.8 | |
| TOTAL | 30.7 | |||
| As a percentage of net assets. | As a percentage of net assets. | |||
| Cash and cash equivalents are not included. | Cash and cash equivalents are not included. | |||
multinational aircraft-engine and aerospace-components company rose after the company reported better-than-expected quarterly earnings and raised financial guidance. Throughout the period, Safran continued to rank attractively in our process for high organic revenue growth, valuation upside and quality. Other contributors were Wolters Kluwer NV, a Netherlands-based provider of information services for various industries, and Edenred, a French provider of prepaid corporate services.
At period end, how were you positioning the fund?
From a regional perspective, we continue to develop a more favorable view of emerging markets, as interest rates have declined while trade tensions ease. We continue to see long-term secular tailwinds for domestically oriented Chinese companies able to benefit from China's emerging middle class and growing services economy.
Meanwhile, Brexit continues to present challenges for the United Kingdom. Accordingly, in this market we are focusing on multinational companies with global revenue exposure while avoiding companies focused on the domestic U.K. market.
In light of more optimistic signs about the global economy, we have moved to equal weights in our investment model's quality, growth, valuation upside, and capital return factors. This has meant increased focus on more cyclical companies that we believe offer higher growth potential and some sales of higher-quality, dividend-paying companies.
MANAGED BY
 | John A. Boselli, CFA On the fund since 2014 Investing since 1996 |
![]()
TOTAL RETURNS FOR THE PERIOD ENDED MARCH 31, 2019
| Average annual total returns (%) with maximum sales charge | Cumulative total returns (%) with maximum sales charge | ||||||
| 1-year | 5-year | 10-year | 5-year | 10-year | |||
| Class A | -8.50 | 5.46 | 10.75 | 30.48 | 177.63 | ||
| Class B | -9.06 | 5.45 | 10.50 | 30.40 | 171.49 | ||
| Class C | -5.31 | 5.79 | 10.50 | 32.53 | 171.44 | ||
| Class I1 | -3.45 | 6.88 | 11.71 | 39.46 | 202.68 | ||
| Class R21,2 | -3.81 | 6.46 | 11.27 | 36.72 | 190.98 | ||
| Class R41,2 | -3.53 | 6.67 | 11.39 | 38.12 | 193.95 | ||
| Class R61,2 | -3.32 | 6.92 | 11.51 | 39.72 | 197.35 | ||
| Class 11 | -3.32 | 6.96 | 11.78 | 40.02 | 204.64 | ||
| Class NAV1,2 | -3.27 | 6.89 | 11.50 | 39.55 | 197.00 | ||
| Index 1† | -3.05 | 4.01 | 9.47 | 21.75 | 147.24 | ||
| Index2† | -3.71 | 2.33 | 8.96 | 12.19 | 135.80 | ||
Performance figures assume all distributions have been reinvested. Figures reflect maximum sales charges on Class A shares of 5%, and the applicable contingent deferred sales charge (CDSC) on Class B and Class C shares. The Class B shares' CDSC declines annually between years 1 to 6 according to the following schedule: 5%, 4%, 3%, 3%, 2%, and 1%. No sales charge will be assessed after the sixth year. Class C shares sold within one year of purchase are subject to a 1% CDSC. Sales charges are not applicable to Class I, Class R2, Class R4, Class R6, Class 1, and Class NAV shares.
The expense ratios of the fund, both net (including any fee waivers and/or expense limitations) and gross (excluding any fee waivers and/or expense limitations), are set forth according to the most recent publicly available prospectuses for the fund and may differ from those disclosed in the Financial highlights tables in this report. Net expenses reflect contractual fee waivers and expense limitations in effect until June 30, 2020 and are subject to change. Had the contractual fee waivers and expense limitations not been in place, gross expenses would apply. The expense ratios are as follows:
| Class A | Class B | Class C | Class I | Class R2 | Class R4 | Class R6 | Class 1 | Class NAV | |
| Gross (%) | 1.29 | 1.99 | 1.99 | 0.99 | 1.40 | 1.25 | 0.90 | 0.93 | 0.88 |
| Net (%) | 1.28 | 1.98 | 1.98 | 0.98 | 1.39 | 1.14 | 0.89 | 0.92 | 0.87 |
Please refer to the most recent prospectuses and annual or semiannual report for more information on expenses and any expense limitation arrangements for each class.
The returns reflect past results and should not be considered indicative of future performance. The return and principal value of an investment will fluctuate so that shares, when redeemed, may be worth more or less than their original cost. Due to market volatility and other factors, the fund's current performance may be higher or lower than the performance shown. For current to the most recent month-end performance data, please call 800-225-5291 or visit the fund's website at jhinvestments.com.
The performance table above and the chart on the next page do not reflect the deduction of taxes that a shareholder would pay on fund distributions or the redemption of fund shares. The fund's performance results reflect any applicable fee waivers or expense reductions, without which the expenses would increase and results would have been less favorable.
| † | Index 1 is the MSCI AC World ex-USA Growth Index; Index 2 is the MSCI EAFE Index. |
See the following page for footnotes.
This chart and table show what happened to a hypothetical $10,000 investment in John Hancock International Growth Fund for the share classes and periods indicated, assuming all distributions were reinvested. For comparison, we've shown the same investment in two separate indexes.
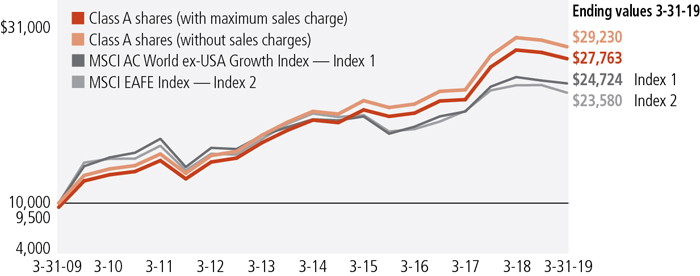
| Start date | With maximum sales charge ($) | Without sales charge ($) | Index 1 ($) | Index 2 ($) | |
| Class B3 | 3-31-09 | 27,149 | 27,149 | 24,724 | 23,580 |
| Class C3 | 3-31-09 | 27,144 | 27,144 | 24,724 | 23,580 |
| Class I1 | 3-31-09 | 30,268 | 30,268 | 24,724 | 23,580 |
| Class R21,2 | 3-31-09 | 29,098 | 29,098 | 24,724 | 23,580 |
| Class R41,2 | 3-31-09 | 29,395 | 29,395 | 24,724 | 23,580 |
| Class R61,2 | 3-31-09 | 29,735 | 29,735 | 24,724 | 23,580 |
| Class 11 | 3-31-09 | 30,464 | 30,464 | 24,724 | 23,580 |
| Class NAV1,2 | 3-31-09 | 29,700 | 29,700 | 24,724 | 23,580 |
The MSCI AC World ex-USA Growth Index is a free float-adjusted market capitalization index that is designed to measure the equity performance of growth-oriented stocks in developed (excluding the U.S.) and emerging markets.
The MSCI EAFE Index is a free float-adjusted market capitalization index that is designed to measure the equity market performance of developed markets, excluding the U.S. and Canada.
It is not possible to invest directly in an index. Index figures do not reflect expenses or sales charges, which would result in lower returns.
Footnotes related to performance pages
| 1 | For certain types of investors, as described in the fund's prospectuses. |
| 2 | Class R2, Class R4, and Class R6 shares were first offered on 3-27-15. Class NAV shares were first offered on 6-2-15. The returns prior to these dates are those of Class A shares that have not been adjusted for class-specific expenses; otherwise, returns would vary. |
| 3 | The contingent deferred sales charge is not applicable. |
| Your expenses |

| 8 | JOHN HANCOCK INTERNATIONAL GROWTH FUND | ANNUAL REPORT |
| Account value on 10-1-2018 | Ending value on 3-31-2019 | Expenses paid during period ended 3-31-20191 | Annualized expense ratio | ||
| Class A | Actual expenses/actual returns | $1,000.00 | $973.00 | $6.35 | 1.29% |
| Hypothetical example | 1,000.00 | 1,018.50 | 6.49 | 1.29% | |
| Class B | Actual expenses/actual returns | 1,000.00 | 969.50 | 9.77 | 1.99% |
| Hypothetical example | 1,000.00 | 1,015.00 | 10.00 | 1.99% | |
| Class C | Actual expenses/actual returns | 1,000.00 | 969.40 | 9.77 | 1.99% |
| Hypothetical example | 1,000.00 | 1,015.00 | 10.00 | 1.99% | |
| Class I | Actual expenses/actual returns | 1,000.00 | 974.00 | 4.97 | 1.01% |
| Hypothetical example | 1,000.00 | 1,019.90 | 5.09 | 1.01% | |
| Class R2 | Actual expenses/actual returns | 1,000.00 | 972.50 | 6.88 | 1.40% |
| Hypothetical example | 1,000.00 | 1,018.00 | 7.04 | 1.40% | |
| Class R4 | Actual expenses/actual returns | 1,000.00 | 973.90 | 5.61 | 1.14% |
| Hypothetical example | 1,000.00 | 1,019.20 | 5.74 | 1.14% | |
| Class R6 | Actual expenses/actual returns | 1,000.00 | 975.00 | 4.38 | 0.89% |
| Hypothetical example | 1,000.00 | 1,020.50 | 4.48 | 0.89% | |
| Class 1 | Actual expenses/actual returns | 1,000.00 | 975.00 | 4.53 | 0.92% |
| Hypothetical example | 1,000.00 | 1,020.30 | 4.63 | 0.92% | |
| Class NAV | Actual expenses/actual returns | 1,000.00 | 975.20 | 4.28 | 0.87% |
| Hypothetical example | 1,000.00 | 1,020.60 | 4.38 | 0.87% |
| 1 | Expenses are equal to the annualized expense ratio, multiplied by the average account value over the period, multiplied by 182/365 (to reflect the one-half year period). |
| ANNUAL REPORT | JOHN HANCOCK INTERNATIONAL GROWTH FUND | 9 |
| Fund’s investments |
| Shares | Value | ||||
| Common stocks 99.9% | $9,428,450,036 | ||||
| (Cost $8,091,946,929) | |||||
| Australia 1.1% | 106,913,373 | ||||
| Qantas Airways, Ltd. | 26,569,308 | 106,913,373 | |||
| Canada 2.3% | 221,836,372 | ||||
| Canadian National Railway Company | 2,478,066 | 221,836,372 | |||
| China 17.6% | 1,657,242,296 | ||||
| Alibaba Group Holding, Ltd., ADR (A) | 2,125,815 | 387,854,946 | |||
| China Merchants Bank Company, Ltd., H Shares | 19,970,500 | 97,291,023 | |||
| China Tower Corp., Ltd., H Shares (A)(B) | 617,334,642 | 143,394,297 | |||
| Hangzhou Hikvision Digital Technology Company, Ltd., Class A | 17,863,441 | 93,029,769 | |||
| Midea Group Company, Ltd., Class A | 15,654,900 | 113,474,999 | |||
| Ping An Insurance Group Company of China, Ltd., H Shares | 13,060,892 | 147,042,377 | |||
| Shenzhou International Group Holdings, Ltd. | 10,655,700 | 143,161,636 | |||
| TAL Education Group, ADR (A) | 3,639,816 | 131,324,561 | |||
| Tencent Holdings, Ltd. | 8,712,500 | 400,668,688 | |||
| France 11.0% | 1,040,049,748 | ||||
| Airbus SE (C) | 1,555,111 | 206,109,561 | |||
| Alstom SA | 2,336,568 | 101,318,543 | |||
| Edenred | 2,919,407 | 132,952,001 | |||
| Kering SA | 321,430 | 184,373,886 | |||
| LVMH Moet Hennessy Louis Vuitton SE | 542,201 | 199,711,860 | |||
| Safran SA | 1,572,900 | 215,583,897 | |||
| Germany 3.8% | 356,436,238 | ||||
| adidas AG | 636,649 | 154,847,370 | |||
| Infineon Technologies AG | 5,385,491 | 106,915,528 | |||
| Siemens Healthineers AG (B) | 2,267,597 | 94,673,340 | |||
| Hong Kong 3.0% | 280,970,797 | ||||
| AIA Group, Ltd. | 28,097,725 | 280,970,797 | |||
| India 1.7% | 163,503,338 | ||||
| HDFC Bank, Ltd. | 4,878,947 | 163,503,338 | |||
| Indonesia 2.1% | 198,208,507 | ||||
| Bank Mandiri Persero Tbk PT (A) | 186,374,400 | 97,798,847 | |||
| Telekomunikasi Indonesia Persero Tbk PT | 363,263,500 | 100,409,660 | |||
| Ireland 4.7% | 441,894,762 | ||||
| Accenture PLC, Class A | 928,210 | 163,383,524 | |||
| ICON PLC (A) | 1,031,904 | 140,937,448 | |||
| Medtronic PLC | 1,510,472 | 137,573,790 |
| 10 | JOHN HANCOCK INTERNATIONAL GROWTH FUND | ANNUAL REPORT | SEE NOTES TO FINANCIAL STATEMENTS |
| Shares | Value | ||||
| Japan 8.0% | $756,023,568 | ||||
| Bandai Namco Holdings, Inc. | 2,636,300 | 123,776,817 | |||
| Hoya Corp. | 2,933,700 | 194,320,270 | |||
| Keyence Corp. | 339,300 | 212,128,675 | |||
| Nexon Company, Ltd. (A) | 6,190,900 | 97,360,070 | |||
| Sony Corp. | 3,042,019 | 128,437,736 | |||
| Netherlands 7.7% | 727,558,038 | ||||
| ASML Holding NV | 1,042,988 | 196,030,231 | |||
| Koninklijke Philips NV | 4,596,748 | 187,812,865 | |||
| QIAGEN NV (A) | 4,548,100 | 184,617,983 | |||
| Wolters Kluwer NV | 2,335,212 | 159,096,959 | |||
| Singapore 1.3% | 122,612,759 | ||||
| DBS Group Holdings, Ltd. | 6,568,466 | 122,612,759 | |||
| South Korea 1.1% | 101,412,503 | ||||
| NCSoft Corp. | 231,967 | 101,412,503 | |||
| Spain 1.4% | 127,717,376 | ||||
| Cellnex Telecom SA (A)(B)(C) | 4,350,346 | 127,717,376 | |||
| Sweden 2.1% | 198,915,567 | ||||
| Alfa Laval AB | 4,371,051 | 100,451,180 | |||
| Epiroc AB, Class A (A) | 9,749,282 | 98,464,387 | |||
| Switzerland 11.7% | 1,100,370,558 | ||||
| Nestle SA | 3,771,644 | 359,627,808 | |||
| Novartis AG | 2,085,217 | 200,430,092 | |||
| Partners Group Holding AG | 172,771 | 125,684,445 | |||
| Roche Holding AG | 959,979 | 264,526,899 | |||
| Temenos AG (A) | 1,017,392 | 150,101,314 | |||
| Taiwan 3.7% | 350,174,666 | ||||
| Taiwan Semiconductor Manufacturing Company, Ltd. | 43,722,323 | 350,174,666 | |||
| United Kingdom 14.6% | 1,377,865,685 | ||||
| Aon PLC | 842,620 | 143,835,234 | |||
| AstraZeneca PLC | 2,723,779 | 217,417,055 | |||
| Compass Group PLC | 7,618,982 | 179,263,457 | |||
| Diageo PLC | 5,002,350 | 204,707,475 | |||
| Experian PLC | 6,318,620 | 171,016,675 | |||
| IHS Markit, Ltd. (A) | 3,147,183 | 171,143,812 | |||
| Reckitt Benckiser Group PLC | 1,793,684 | 149,275,866 | |||
| Smith & Nephew PLC | 7,110,379 | 141,206,111 | |||
| United States 1.0% | 98,743,885 | ||||
| Waste Connections, Inc. | 1,114,779 | 98,743,885 |
| SEE NOTES TO FINANCIAL STATEMENTS | ANNUAL REPORT | JOHN HANCOCK INTERNATIONAL GROWTH FUND | 11 |
| Yield (%) | Shares | Value | |||
| Securities lending collateral 0.4% | $35,310,762 | ||||
| (Cost $35,310,576) | |||||
| John Hancock Collateral Trust (D) | 2.6031(E) | 3,528,641 | 35,310,762 | ||
| Par value^ | Value | ||||
| Short-term investments 0.1% | $15,000,000 | ||||
| (Cost $15,000,000) | |||||
| Repurchase agreement 0.1% | 15,000,000 | ||||
| Bank of America Corp. Tri-Party Repurchase Agreement dated 3-29-19 at 2.550% to be repurchased at $13,002,763 on 4-1-19, collateralized by $13,021,664 Government National Mortgage Association, 3.730% due 12-20-68 (valued at $13,260,001, including interest) | 13,000,000 | 13,000,000 | |||
| Societe Generale Tri-Party Repurchase Agreement dated 3-29-19 at 2.550% to be repurchased at $2,000,425 on 4-1-19, collateralized by $1,968,948 Federal National Mortgage Association, 4.000% due 2-1-48 (valued at $2,040,000, including interest) | 2,000,000 | 2,000,000 | |||
| Total investments (Cost $8,142,257,505) 100.4% | $9,478,760,798 | ||||
| Other assets and liabilities, net (0.4%) | (37,670,386) | ||||
| Total net assets 100.0% | $9,441,090,412 | ||||
| The percentage shown for each investment category is the total value of the category as a percentage of the net assets of the fund. | |
| ^All par values are denominated in U.S. dollars unless otherwise indicated. | |
| Security Abbreviations and Legend | |
| ADR | American Depositary Receipt |
| (A) | Non-income producing security. |
| (B) | These securities are exempt from registration under Rule 144A of the Securities Act of 1933. Such securities may be resold, normally to qualified institutional buyers, in transactions exempt from registration. |
| (C) | All or a portion of this security is on loan as of 3-31-19. |
| (D) | Investment is an affiliate of the fund, the advisor and/or subadvisor. This security represents the investment of cash collateral received for securities lending. |
| (E) | The rate shown is the annualized seven-day yield as of 3-31-19. |
| 12 | JOHN HANCOCK INTERNATIONAL GROWTH FUND | ANNUAL REPORT | SEE NOTES TO FINANCIAL STATEMENTS |
| Financial statements |
| Assets | |
| Unaffiliated investments, at value (Cost $8,106,946,929) including $33,342,517 of securities loaned | $9,443,450,036 |
| Affiliated investments, at value (Cost $35,310,576) | 35,310,762 |
| Total investments, at value (Cost $8,142,257,505) | 9,478,760,798 |
| Cash | 52,685 |
| Foreign currency, at value (Cost $2,853,121) | 2,852,423 |
| Dividends and interest receivable | 13,804,912 |
| Receivable for fund shares sold | 11,435,514 |
| Receivable for investments sold | 13,726,657 |
| Receivable for securities lending income | 38,090 |
| Other assets | 501,324 |
| Total assets | 9,521,172,403 |
| Liabilities | |
| Foreign capital gains tax payable | 1,725,954 |
| Payable for investments purchased | 4,727,212 |
| Payable for fund shares repurchased | 35,998,427 |
| Payable upon return of securities loaned | 35,309,493 |
| Payable to affiliates | |
| Accounting and legal services fees | 355,617 |
| Transfer agent fees | 692,439 |
| Distribution and service fees | 18,032 |
| Other liabilities and accrued expenses | 1,254,817 |
| Total liabilities | 80,081,991 |
| Net assets | $9,441,090,412 |
| Net assets consist of | |
| Paid-in capital | $8,491,227,292 |
| Total distributable earnings (loss) | 949,863,120 |
| Net assets | $9,441,090,412 |
| SEE NOTES TO FINANCIAL STATEMENTS | ANNUAL REPORT | JOHN HANCOCK International Growth Fund | 13 |
| Net asset value per share | |
| Based on net asset value and shares outstanding - the fund has an unlimited number of shares authorized with no par value | |
| Class A ($608,780,914 ÷ 22,723,844 shares)1 | $26.79 |
| Class B ($964,039 ÷ 36,614 shares)1 | $26.33 |
| Class C ($262,824,052 ÷ 10,003,137 shares)1 | $26.27 |
| Class I ($5,575,912,781 ÷ 207,709,885 shares) | $26.84 |
| Class R2 ($42,852,338 ÷ 1,597,676 shares) | $26.82 |
| Class R4 ($7,963,395 ÷ 296,749 shares) | $26.84 |
| Class R6 ($1,835,568,744 ÷ 68,338,807 shares) | $26.86 |
| Class 1 ($78,366,815 ÷ 2,921,200 shares) | $26.83 |
| Class NAV ($1,027,857,334 ÷ 38,317,997 shares) | $26.82 |
| Maximum offering price per share | |
| Class A (net asset value per share ÷ 95%)2 | $28.20 |
| 1 | Redemption price per share is equal to net asset value less any applicable contingent deferred sales charge. |
| 2 | On single retail sales of less than $50,000. On sales of $50,000 or more and on group sales the offering price is reduced. |
| 14 | JOHN HANCOCK International Growth Fund | ANNUAL REPORT | SEE NOTES TO FINANCIAL STATEMENTS |
| Investment income | |
| Dividends | $189,144,718 |
| Non-cash dividends | 12,828,997 |
| Interest | 3,237,476 |
| Securities lending | 1,251,222 |
| Less foreign taxes withheld | (19,171,817) |
| Total investment income | 187,290,596 |
| Expenses | |
| Investment management fees | 79,646,309 |
| Distribution and service fees | 5,452,773 |
| Accounting and legal services fees | 1,525,628 |
| Transfer agent fees | 8,633,616 |
| Trustees' fees | 150,535 |
| Custodian fees | 2,746,628 |
| State registration fees | 410,361 |
| Printing and postage | 805,249 |
| Professional fees | 250,407 |
| Other | 633,772 |
| Total expenses | 100,255,278 |
| Less expense reductions | (794,466) |
| Net expenses | 99,460,812 |
| Net investment income | 87,829,784 |
| Realized and unrealized gain (loss) | |
| Net realized gain (loss) on | |
| Unaffiliated investments and foreign currency transactions | (327,464,297) |
| Affiliated investments | 60,265 |
| (327,404,032) | |
| Change in net unrealized appreciation (depreciation) of | |
| Unaffiliated investments and translation of assets and liabilities in foreign currencies | (203,442,957) |
| Affiliated investments | 4,575 |
| (203,438,382) | |
| Net realized and unrealized loss | (530,842,414) |
| Decrease in net assets from operations | $(443,012,630) |
| SEE NOTES TO FINANCIAL STATEMENTS | ANNUAL REPORT | JOHN HANCOCK International Growth Fund | 15 |
| Year ended 3-31-19 | Period ended 3-31-181 | Year ended 2-28-18 | |
| Increase (decrease) in net assets | |||
| From operations | |||
| Net investment income | $87,829,784 | $7,960,716 | $41,090,688 |
| Net realized gain (loss) | (327,404,032) | 21,459,463 | 325,432,390 |
| Change in net unrealized appreciation (depreciation) | (203,438,382) | 3,082,465 | 1,246,537,998 |
| Increase (decrease) in net assets resulting from operations | (443,012,630) | 32,502,644 | 1,613,061,076 |
| Distributions to shareholders | |||
| From net investment income and net realized gain | |||
| Class A | (14,660,561) | — | — |
| Class B | (20,861) | — | — |
| Class C | (4,998,651) | — | — |
| Class I | (144,368,088) | — | — |
| Class R2 | (906,042) | — | — |
| Class R4 | (191,219) | — | — |
| Class R6 | (49,853,759) | — | — |
| Class 1 | (2,141,203) | — | — |
| Class NAV | (28,574,370) | — | — |
| From net investment income | |||
| Class A | — | — | (1,662,236) |
| Class I | — | — | (21,874,556) |
| Class R2 | — | — | (22,327) |
| Class R4 | — | — | (25,088) |
| Class R6 | — | — | (8,042,919) |
| Class 1 | — | — | (438,430) |
| Class NAV | — | — | (6,809,529) |
| Total distributions | (245,714,754) | — | (38,875,085) |
| From fund share transactions | 245,618,755 | 301,253,138 | 4,074,516,879 |
| Total increase (decrease) | (443,108,629) | 333,755,782 | 5,648,702,870 |
| Net assets | |||
| Beginning of year | 9,884,199,041 | 9,550,443,259 | 3,901,740,389 |
| End of year2 | $9,441,090,412 | $9,884,199,041 | $9,550,443,259 |
| 1 | For the one-month period ended 3-31-18. The fund changed its fiscal year end from February 28 to March 31. |
| 2 | Net assets - End of year includes undistributed net investment income of $8,537,054 and $0, at March 31, 2018 and February 28, 2018, respectively. The SEC eliminated the requirement to disclose undistributed net investment income in the current reporting period. |
| 16 | JOHN HANCOCK International Growth Fund | ANNUAL REPORT | SEE NOTES TO FINANCIAL STATEMENTS |
| Financial highlights |
| CLASS A SHARES Period ended | 3-31-19 | 3-31-181 | 2-28-18 | 2-28-17 | 2-29-16 | 2-28-15 |
| Per share operating performance | ||||||
| Net asset value, beginning of period | $28.52 | $28.43 | $21.69 | $19.90 | $21.64 | $24.60 |
| Net investment income2 | 0.19 | 0.02 | 0.11 | 0.17 | 0.10 | 0.24 |
| Net realized and unrealized gain (loss) on investments | (1.31) | 0.07 | 6.69 | 1.75 | (1.81) | 0.83 |
| Total from investment operations | (1.12) | 0.09 | 6.80 | 1.92 | (1.71) | 1.07 |
| Less distributions | ||||||
| From net investment income | (0.15) | — | (0.06) | (0.13) | (0.03) | (0.47) |
| From net realized gain | (0.46) | — | — | — | — | (3.56) |
| Total distributions | (0.61) | — | (0.06) | (0.13) | (0.03) | (4.03) |
| Net asset value, end of period | $26.79 | $28.52 | $28.43 | $21.69 | $19.90 | $21.64 |
| Total return (%)3,4 | (3.69) | 0.325 | 31.38 | 9.62 | (7.86) | 5.91 |
| Ratios and supplemental data | ||||||
| Net assets, end of period (in millions) | $609 | $827 | $803 | $427 | $615 | $140 |
| Ratios (as a percentage of average net assets): | ||||||
| Expenses before reductions | 1.28 | 1.296 | 1.29 | 1.32 | 1.38 | 1.53 |
| Expenses including reductions | 1.28 | 1.286 | 1.28 | 1.32 | 1.37 | 1.52 |
| Net investment income | 0.72 | 0.696 | 0.41 | 0.79 | 0.48 | 1.02 |
| Portfolio turnover (%) | 98 | 4 | 65 | 94 | 82 | 204 |
| 1 | For the one-month period ended 3-31-18. The fund changed its fiscal year end from February 28 to March 31. |
| 2 | Based on average daily shares outstanding. |
| 3 | Total returns would have been lower had certain expenses not been reduced during the applicable periods. |
| 4 | Does not reflect the effect of sales charges, if any. |
| 5 | Not annualized. |
| 6 | Annualized. |
| SEE NOTES TO FINANCIAL STATEMENTS | ANNUAL REPORT | JOHN HANCOCK International Growth Fund | 17 |
| CLASS B SHARES Period ended | 3-31-19 | 3-31-181 | 2-28-18 | 2-28-17 | 2-29-16 | 2-28-15 |
| Per share operating performance | ||||||
| Net asset value, beginning of period | $28.06 | $27.99 | $21.45 | $19.70 | $21.55 | $24.50 |
| Net investment income (loss)2 | 0.02 | —3 | (0.04) | 0.04 | 0.02 | —3 |
| Net realized and unrealized gain (loss) on investments | (1.29) | 0.07 | 6.58 | 1.71 | (1.87) | 0.88 |
| Total from investment operations | (1.27) | 0.07 | 6.54 | 1.75 | (1.85) | 0.88 |
| Less distributions | ||||||
| From net investment income | — | — | — | — | — | (0.27) |
| From net realized gain | (0.46) | — | — | — | — | (3.56) |
| Total distributions | (0.46) | — | — | — | — | (3.83) |
| Net asset value, end of period | $26.33 | $28.06 | $27.99 | $21.45 | $19.70 | $21.55 |
| Total return (%)4,5 | (4.36) | 0.256 | 30.49 | 8.88 | (8.58) | 5.07 |
| Ratios and supplemental data | ||||||
| Net assets, end of period (in millions) | $1 | $2 | $2 | $2 | $2 | $2 |
| Ratios (as a percentage of average net assets): | ||||||
| Expenses before reductions | 1.98 | 1.997 | 1.99 | 2.03 | 2.32 | 3.18 |
| Expenses including reductions | 1.98 | 1.987 | 1.98 | 2.02 | 2.12 | 2.34 |
| Net investment income (loss) | 0.08 | (0.01)7 | (0.15) | 0.19 | 0.07 | —8 |
| Portfolio turnover (%) | 98 | 4 | 65 | 94 | 82 | 204 |
| 1 | For the one-month period ended 3-31-18. The fund changed its fiscal year end from February 28 to March 31. |
| 2 | Based on average daily shares outstanding. |
| 3 | Less than $0.005 per share. |
| 4 | Total returns would have been lower had certain expenses not been reduced during the applicable periods. |
| 5 | Does not reflect the effect of sales charges, if any. |
| 6 | Not annualized. |
| 7 | Annualized. |
| 8 | Less than 0.005%. |
| 18 | JOHN HANCOCK International Growth Fund | ANNUAL REPORT | SEE NOTES TO FINANCIAL STATEMENTS |
| CLASS C SHARES Period ended | 3-31-19 | 3-31-181 | 2-28-18 | 2-28-17 | 2-29-16 | 2-28-15 |
| Per share operating performance | ||||||
| Net asset value, beginning of period | $28.00 | $27.93 | $21.40 | $19.66 | $21.49 | $24.45 |
| Net investment income (loss)2 | —3 | —3 | (0.09) | 0.01 | (0.07) | (0.03) |
| Net realized and unrealized gain (loss) on investments | (1.27) | 0.07 | 6.62 | 1.73 | (1.76) | 0.92 |
| Total from investment operations | (1.27) | 0.07 | 6.53 | 1.74 | (1.83) | 0.89 |
| Less distributions | ||||||
| From net investment income | — | — | — | — | — | (0.29) |
| From net realized gain | (0.46) | — | — | — | — | (3.56) |
| Total distributions | (0.46) | — | — | — | — | (3.85) |
| Net asset value, end of period | $26.27 | $28.00 | $27.93 | $21.40 | $19.66 | $21.49 |
| Total return (%)4,5 | (4.37) | 0.256 | 30.51 | 8.85 | (8.52) | 5.11 |
| Ratios and supplemental data | ||||||
| Net assets, end of period (in millions) | $263 | $349 | $333 | $145 | $113 | $13 |
| Ratios (as a percentage of average net assets): | ||||||
| Expenses before reductions | 1.98 | 1.997 | 1.99 | 2.03 | 2.08 | 2.40 |
| Expenses including reductions | 1.98 | 1.987 | 1.98 | 2.02 | 2.07 | 2.30 |
| Net investment income (loss) | (0.01) | (0.01)7 | (0.33) | 0.03 | (0.33) | (0.11) |
| Portfolio turnover (%) | 98 | 4 | 65 | 94 | 82 | 204 |
| 1 | For the one-month period ended 3-31-18. The fund changed its fiscal year end from February 28 to March 31. |
| 2 | Based on average daily shares outstanding. |
| 3 | Less than $0.005 per share. |
| 4 | Total returns would have been lower had certain expenses not been reduced during the applicable periods. |
| 5 | Does not reflect the effect of sales charges, if any. |
| 6 | Not annualized. |
| 7 | Annualized. |
| SEE NOTES TO FINANCIAL STATEMENTS | ANNUAL REPORT | JOHN HANCOCK International Growth Fund | 19 |
| CLASS I SHARES Period ended | 3-31-19 | 3-31-181 | 2-28-18 | 2-28-17 | 2-29-16 | 2-28-15 |
| Per share operating performance | ||||||
| Net asset value, beginning of period | $28.59 | $28.49 | $21.72 | $19.94 | $21.67 | $24.62 |
| Net investment income2 | 0.24 | 0.02 | 0.18 | 0.20 | 0.16 | 0.35 |
| Net realized and unrealized gain (loss) on investments | (1.30) | 0.08 | 6.72 | 1.77 | (1.80) | 0.81 |
| Total from investment operations | (1.06) | 0.10 | 6.90 | 1.97 | (1.64) | 1.16 |
| Less distributions | ||||||
| From net investment income | (0.23) | — | (0.13) | (0.19) | (0.09) | (0.55) |
| From net realized gain | (0.46) | — | — | — | — | (3.56) |
| Total distributions | (0.69) | — | (0.13) | (0.19) | (0.09) | (4.11) |
| Net asset value, end of period | $26.84 | $28.59 | $28.49 | $21.72 | $19.94 | $21.67 |
| Total return (%)3 | (3.45) | 0.354 | 31.82 | 9.96 | (7.59) | 6.33 |
| Ratios and supplemental data | ||||||
| Net assets, end of period (in millions) | $5,576 | $5,631 | $5,424 | $2,380 | $1,168 | $152 |
| Ratios (as a percentage of average net assets): | ||||||
| Expenses before reductions | 1.00 | 1.005 | 0.99 | 1.02 | 1.06 | 1.19 |
| Expenses including reductions | 0.99 | 0.995 | 0.98 | 1.01 | 1.06 | 1.18 |
| Net investment income | 0.89 | 0.985 | 0.70 | 0.94 | 0.73 | 1.46 |
| Portfolio turnover (%) | 98 | 4 | 65 | 94 | 82 | 204 |
| 1 | For the one-month period ended 3-31-18. The fund changed its fiscal year end from February 28 to March 31. |
| 2 | Based on average daily shares outstanding. |
| 3 | Total returns would have been lower had certain expenses not been reduced during the applicable periods. |
| 4 | Not annualized. |
| 5 | Annualized. |
| 20 | JOHN HANCOCK International Growth Fund | ANNUAL REPORT | SEE NOTES TO FINANCIAL STATEMENTS |
| CLASS R2 SHARES Period ended | 3-31-19 | 3-31-181 | 2-28-18 | 2-28-17 | 2-29-162 |
| Per share operating performance | |||||
| Net asset value, beginning of period | $28.55 | $28.45 | $21.71 | $19.92 | $21.46 |
| Net investment income (loss)3 | 0.15 | 0.02 | 0.13 | (0.02) | 0.02 |
| Net realized and unrealized gain (loss) on investments | (1.30) | 0.08 | 6.65 | 1.91 | (1.56) |
| Total from investment operations | (1.15) | 0.10 | 6.78 | 1.89 | (1.54) |
| Less distributions | |||||
| From net investment income | (0.12) | — | (0.04) | (0.10) | — |
| From net realized gain | (0.46) | — | — | — | — |
| Total distributions | (0.58) | — | (0.04) | (0.10) | — |
| Net asset value, end of period | $26.82 | $28.55 | $28.45 | $21.71 | $19.92 |
| Total return (%)4 | (3.81) | 0.355 | 31.23 | 9.54 | (7.18)5 |
| Ratios and supplemental data | |||||
| Net assets, end of period (in millions) | $43 | $43 | $37 | $12 | $1 |
| Ratios (as a percentage of average net assets): | |||||
| Expenses before reductions | 1.38 | 1.326 | 1.40 | 1.42 | 1.906 |
| Expenses including reductions | 1.37 | 1.316 | 1.39 | 1.42 | 1.526 |
| Net investment income (loss) | 0.54 | 0.716 | 0.49 | (0.08) | 0.116 |
| Portfolio turnover (%) | 98 | 4 | 65 | 94 | 827 |
| 1 | For the one-month period ended 3-31-18. The fund changed its fiscal year end from February 28 to March 31. |
| 2 | The inception date for Class R2 shares is 3-27-15. |
| 3 | Based on average daily shares outstanding. |
| 4 | Total returns would have been lower had certain expenses not been reduced during the applicable periods. |
| 5 | Not annualized. |
| 6 | Annualized. |
| 7 | Portfolio turnover is shown for the period from 3-1-15 to 2-29-16. |
| SEE NOTES TO FINANCIAL STATEMENTS | ANNUAL REPORT | JOHN HANCOCK International Growth Fund | 21 |
| CLASS R4 SHARES Period ended | 3-31-19 | 3-31-181 | 2-28-18 | 2-28-17 | 2-29-162 |
| Per share operating performance | |||||
| Net asset value, beginning of period | $28.57 | $28.48 | $21.72 | $19.94 | $21.46 |
| Net investment income3 | 0.22 | 0.02 | 0.17 | 0.19 | 0.05 |
| Net realized and unrealized gain (loss) on investments | (1.30) | 0.07 | 6.69 | 1.75 | (1.54) |
| Total from investment operations | (1.08) | 0.09 | 6.86 | 1.94 | (1.49) |
| Less distributions | |||||
| From net investment income | (0.19) | — | (0.10) | (0.16) | (0.03) |
| From net realized gain | (0.46) | — | — | — | — |
| Total distributions | (0.65) | — | (0.10) | (0.16) | (0.03) |
| Net asset value, end of period | $26.84 | $28.57 | $28.48 | $21.72 | $19.94 |
| Total return (%)4 | (3.53) | 0.325 | 31.60 | 9.81 | (6.95)5 |
| Ratios and supplemental data | |||||
| Net assets, end of period (in millions) | $8 | $8 | $9 | $5 | $3 |
| Ratios (as a percentage of average net assets): | |||||
| Expenses before reductions | 1.24 | 1.256 | 1.24 | 1.25 | 1.666 |
| Expenses including reductions | 1.13 | 1.146 | 1.13 | 1.14 | 1.246 |
| Net investment income | 0.80 | 0.836 | 0.64 | 0.88 | 0.246 |
| Portfolio turnover (%) | 98 | 4 | 65 | 94 | 827 |
| 1 | For the one-month period ended 3-31-18. The fund changed its fiscal year end from February 28 to March 31. |
| 2 | The inception date for Class R4 shares is 3-27-15. |
| 3 | Based on average daily shares outstanding. |
| 4 | Total returns would have been lower had certain expenses not been reduced during the applicable periods. |
| 5 | Not annualized. |
| 6 | Annualized. |
| 7 | Portfolio turnover is shown for the period from 3-1-15 to 2-29-16. |
| 22 | JOHN HANCOCK International Growth Fund | ANNUAL REPORT | SEE NOTES TO FINANCIAL STATEMENTS |
| CLASS R6 SHARES Period ended | 3-31-19 | 3-31-181 | 2-28-18 | 2-28-17 | 2-29-162 |
| Per share operating performance | |||||
| Net asset value, beginning of period | $28.61 | $28.50 | $21.73 | $19.95 | $21.46 |
| Net investment income3 | 0.27 | 0.03 | 0.05 | 0.20 | 0.12 |
| Net realized and unrealized gain (loss) on investments | (1.30) | 0.08 | 6.88 | 1.79 | (1.53) |
| Total from investment operations | (1.03) | 0.11 | 6.93 | 1.99 | (1.41) |
| Less distributions | |||||
| From net investment income | (0.26) | — | (0.16) | (0.21) | (0.10) |
| From net realized gain | (0.46) | — | — | — | — |
| Total distributions | (0.72) | — | (0.16) | (0.21) | (0.10) |
| Net asset value, end of period | $26.86 | $28.61 | $28.50 | $21.73 | $19.95 |
| Total return (%)4 | (3.32) | 0.395 | 31.91 | 10.08 | (6.59)5 |
| Ratios and supplemental data | |||||
| Net assets, end of period (in millions) | $1,836 | $1,795 | $1,702 | $18 | $2 |
| Ratios (as a percentage of average net assets): | |||||
| Expenses before reductions | 0.89 | 0.896 | 0.90 | 0.93 | 1.376 |
| Expenses including reductions | 0.88 | 0.886 | 0.89 | 0.90 | 0.956 |
| Net investment income | 1.01 | 1.096 | 0.16 | 0.95 | 0.606 |
| Portfolio turnover (%) | 98 | 4 | 65 | 94 | 827 |
| 1 | For the one-month period ended 3-31-18. The fund changed its fiscal year end from February 28 to March 31. |
| 2 | The inception date for Class R6 shares is 3-27-15. |
| 3 | Based on average daily shares outstanding. |
| 4 | Total returns would have been lower had certain expenses not been reduced during the applicable periods. |
| 5 | Not annualized. |
| 6 | Annualized. |
| 7 | Portfolio turnover is shown for the period from 3-1-15 to 2-29-16. |
| SEE NOTES TO FINANCIAL STATEMENTS | ANNUAL REPORT | JOHN HANCOCK International Growth Fund | 23 |
| CLASS 1 SHARES Period ended | 3-31-19 | 3-31-181 | 2-28-18 | 2-28-17 | 2-29-16 | 2-28-15 |
| Per share operating performance | ||||||
| Net asset value, beginning of period | $28.57 | $28.47 | $21.71 | $19.93 | $21.65 | $24.61 |
| Net investment income2 | 0.28 | 0.03 | 0.21 | 0.23 | 0.23 | 0.28 |
| Net realized and unrealized gain (loss) on investments | (1.30) | 0.07 | 6.70 | 1.76 | (1.84) | 0.90 |
| Total from investment operations | (1.02) | 0.10 | 6.91 | 1.99 | (1.61) | 1.18 |
| Less distributions | ||||||
| From net investment income | (0.26) | — | (0.15) | (0.21) | (0.11) | (0.58) |
| From net realized gain | (0.46) | — | — | — | — | (3.56) |
| Total distributions | (0.72) | — | (0.15) | (0.21) | (0.11) | (4.14) |
| Net asset value, end of period | $26.83 | $28.57 | $28.47 | $21.71 | $19.93 | $21.65 |
| Total return (%)3 | (3.32) | 0.354 | 31.86 | 10.04 | (7.49) | 6.39 |
| Ratios and supplemental data | ||||||
| Net assets, end of period (in millions) | $78 | $93 | $91 | $50 | $39 | $20 |
| Ratios (as a percentage of average net assets): | ||||||
| Expenses before reductions | 0.92 | 0.925 | 0.93 | 0.95 | 1.00 | 1.10 |
| Expenses including reductions | 0.92 | 0.925 | 0.92 | 0.94 | 0.99 | 1.09 |
| Net investment income | 1.05 | 1.065 | 0.79 | 1.09 | 1.06 | 1.18 |
| Portfolio turnover (%) | 98 | 4 | 65 | 94 | 82 | 204 |
| 1 | For the one-month period ended 3-31-18. The fund changed its fiscal year end from February 28 to March 31. |
| 2 | Based on average daily shares outstanding. |
| 3 | Total returns would have been lower had certain expenses not been reduced during the applicable periods. |
| 4 | Not annualized. |
| 5 | Annualized. |
| 24 | JOHN HANCOCK International Growth Fund | ANNUAL REPORT | SEE NOTES TO FINANCIAL STATEMENTS |
| CLASS NAV SHARES Period ended | 3-31-19 | 3-31-181 | 2-28-18 | 2-28-17 | 2-29-162 |
| Per share operating performance | |||||
| Net asset value, beginning of period | $28.57 | $28.47 | $21.71 | $19.93 | $22.66 |
| Net investment income3 | 0.29 | 0.03 | 0.23 | 0.19 | 0.11 |
| Net realized and unrealized gain (loss) on investments | (1.31) | 0.07 | 6.69 | 1.81 | (2.72) |
| Total from investment operations | (1.02) | 0.10 | 6.92 | 2.00 | (2.61) |
| Less distributions | |||||
| From net investment income | (0.27) | — | (0.16) | (0.22) | (0.12) |
| From net realized gain | (0.46) | — | — | — | — |
| Total distributions | (0.73) | — | (0.16) | (0.22) | (0.12) |
| Net asset value, end of period | $26.82 | $28.57 | $28.47 | $21.71 | $19.93 |
| Total return (%)4 | (3.27) | 0.355 | 31.91 | 10.10 | (11.57)5 |
| Ratios and supplemental data | |||||
| Net assets, end of period (in millions) | $1,028 | $1,136 | $1,151 | $864 | $86 |
| Ratios (as a percentage of average net assets): | |||||
| Expenses before reductions | 0.87 | 0.876 | 0.88 | 0.91 | 0.946 |
| Expenses including reductions | 0.87 | 0.876 | 0.87 | 0.90 | 0.936 |
| Net investment income | 1.06 | 1.106 | 0.89 | 0.91 | 0.696 |
| Portfolio turnover (%) | 98 | 4 | 65 | 94 | 827 |
| 1 | For the one-month period ended 3-31-18. The fund changed its fiscal year end from February 28 to March 31. |
| 2 | The inception date for Class NAV shares is 6-2-15. |
| 3 | Based on average daily shares outstanding. |
| 4 | Total returns would have been lower had certain expenses not been reduced during the applicable periods. |
| 5 | Not annualized. |
| 6 | Annualized. |
| 7 | The portfolio turnover is shown for the period from 3-1-15 to 2-29-16. |
| SEE NOTES TO FINANCIAL STATEMENTS | ANNUAL REPORT | JOHN HANCOCK International Growth Fund | 25 |
Note 1 — Organization
John Hancock International Growth Fund (the fund) is a series of John Hancock Funds III (the Trust), an open-end management investment company organized as a Massachusetts business trust and registered under the Investment Company Act of 1940, as amended (the 1940 Act). The investment objective of the fund is to seek high total return primarily through capital appreciation.
The fund may offer multiple classes of shares. The shares currently offered by the fund are detailed in the Statement of assets and liabilities. Class A and Class C are offered to all investors. Class B shares are closed to new investors. Class I shares are offered to institutions and certain investors. Class R2 and R4 shares are available only to certain retirement and 529 plans. Class R6 shares are only available to certain retirement plans, institutions and other investors. Class 1 shares are offered only to certain affiliates of Manulife Financial Corporation (MFC).Class NAV shares are offered to John Hancock affiliated funds of funds, retirement plans for employees of John Hancock and/or MFC, and certain 529 plans. Class B shares convert to Class A shares eight years after purchase. Class C shares convert to Class A shares ten years after purchase (certain exclusions may apply). Shareholders of each class have exclusive voting rights to matters that affect that class. The distribution and service fees, if any, and transfer agent fees for each class may differ.
The fund is closed to new investors, except as provided in the fund's prospectus.
Note 2 — Significant accounting policies
The financial statements have been prepared in conformity with accounting principles generally accepted in the United States of America (US GAAP), which require management to make certain estimates and assumptions as of the date of the financial statements. Actual results could differ from those estimates and those differences could be significant. The fund qualifies as an investment company under Topic 946 of Accounting Standards Codification of US GAAP.
Events or transactions occurring after the end of the fiscal period through the date that the financial statements were issued have been evaluated in the preparation of the financial statements. The following summarizes the significant accounting policies of the fund:
Security valuation.Investments are stated at value as of the scheduled close of regular trading on the New York Stock Exchange (NYSE), normally at 4:00 p.m., Eastern Time. In case of emergency or other disruption resulting in the NYSE not opening for trading or the NYSE closing at a time other than the regularly scheduled close, the net asset value (NAV) may be determined as of the regularly scheduled close of the NYSE pursuant to the fund's Valuation Policies and Procedures.
In order to value the securities, the fund uses the following valuation techniques: Equity securities held by the fund are typically valued at the last sale price or official closing price on the exchange or principal market where the security trades. In the event there were no sales during the day or closing prices are not available, the securities are valued using the last available bid price. Investments by the fund in open-end mutual funds, including John Hancock Collateral Trust (JHCT), are valued at their respective NAVs each business day. Foreign securities and currencies are valued in U.S. dollars based on foreign currency exchange rates supplied by an independent pricing vendor.
In certain instances, the Pricing Committee may determine to value equity securities using prices obtained from another exchange or market if trading on the exchange or market on which prices are typically obtained did not open for trading as scheduled, or if trading closed earlier than scheduled, and trading occurred as normal on another exchange or market.
Other portfolio securities and assets, for which reliable market quotations are not readily available, are valued at fair value as determined in good faith by the fund's Pricing Committee following procedures established by the Board of Trustees. The frequency with which these fair valuation procedures are used cannot be predicted and fair value of
securities may differ significantly from the value that would have been used had a ready market for such securities existed. Trading in foreign securities may be completed before the scheduled daily close of trading on the NYSE. Significant events at the issuer or market level may affect the values of securities between the time when the valuation of the securities is generally determined and the close of the NYSE. If a significant event occurs, these securities may be fair valued, as determined in good faith by the fund's Pricing Committee, following procedures established by the Board of Trustees. The fund uses fair value adjustment factors provided by an independent pricing vendor to value certain foreign securities in order to adjust for events that may occur between the close of foreign exchanges or markets and the close of the NYSE.
The fund uses a three-tier hierarchy to prioritize the pricing assumptions, referred to as inputs, used in valuation techniques to measure fair value. Level 1 includes securities valued using quoted prices in active markets for identical securities. Level 2 includes securities valued using other significant observable inputs. Observable inputs may include quoted prices for similar securities, interest rates, prepayment speeds and credit risk. Prices for securities valued using these inputs are received from independent pricing vendors and brokers and are based on an evaluation of the inputs described. Level 3 includes securities valued using significant unobservable inputs when market prices are not readily available or reliable, including the fund's own assumptions in determining the fair value of investments. Factors used in determining value may include market or issuer specific events or trends, changes in interest rates and credit quality. The inputs or methodology used for valuing securities are not necessarily an indication of the risks associated with investing in those securities. Changes in valuation techniques and related inputs may result in transfers into or out of an assigned level within the disclosure hierarchy.
The following is a summary of the values by input classification of the fund's investments as of March 31, 2019, by major security category or type:
| Total value at 3-31-19 | Level 1 quoted price | Level 2 significant observable inputs | Level 3 significant unobservable inputs | ||||||||||||||
| Investments in securities: | |||||||||||||||||
| Assets | |||||||||||||||||
| Common stocks | |||||||||||||||||
| Australia | $106,913,373 | — | $106,913,373 | — | |||||||||||||
| Canada | 221,836,372 | $221,836,372 | — | — | |||||||||||||
| China | 1,657,242,296 | 519,179,507 | 1,138,062,789 | — | |||||||||||||
| France | 1,040,049,748 | — | 1,040,049,748 | — | |||||||||||||
| Germany | 356,436,238 | — | 356,436,238 | — | |||||||||||||
| Hong Kong | 280,970,797 | — | 280,970,797 | — | |||||||||||||
| India | 163,503,338 | — | 163,503,338 | — | |||||||||||||
| Indonesia | 198,208,507 | — | 198,208,507 | — | |||||||||||||
| Ireland | 441,894,762 | 441,894,762 | — | — | |||||||||||||
| Japan | 756,023,568 | — | 756,023,568 | — | |||||||||||||
| Netherlands | 727,558,038 | — | 727,558,038 | — | |||||||||||||
| Singapore | 122,612,759 | — | 122,612,759 | — | |||||||||||||
| South Korea | 101,412,503 | — | 101,412,503 | — | |||||||||||||
| Spain | 127,717,376 | — | 127,717,376 | — | |||||||||||||
| Sweden | 198,915,567 | — | 198,915,567 | — | |||||||||||||
| Switzerland | 1,100,370,558 | — | 1,100,370,558 | — | |||||||||||||
| Total value at 3-31-19 | Level 1 quoted price | Level 2 significant observable inputs | Level 3 significant unobservable inputs | ||||||||||||||
| Taiwan | 350,174,666 | — | $350,174,666 | — | |||||||||||||
| United Kingdom | 1,377,865,685 | $314,979,046 | 1,062,886,639 | — | |||||||||||||
| United States | 98,743,885 | 98,743,885 | — | — | |||||||||||||
| Securities lending collateral | 35,310,762 | 35,310,762 | — | — | |||||||||||||
| Short-term investments | 15,000,000 | — | 15,000,000 | — | |||||||||||||
| Total investments in securities | $9,478,760,798 | $1,631,944,334 | $7,846,816,464 | — | |||||||||||||
Repurchase agreements.The fund may enter into repurchase agreements. When the fund enters into a repurchase agreement, it receives collateral that is held in a segregated account by the fund's custodian, or for tri-party repurchase agreements, collateral is held at a third-party custodian bank in a segregated account for the benefit of the fund. The collateral amount is marked-to-market and monitored on a daily basis to ensure that the collateral held is in an amount not less than the principal amount of the repurchase agreement plus any accrued interest. Collateral received by the fund for repurchase agreements is disclosed in the Fund's investments as part of the caption related to the repurchase agreement.
Repurchase agreements are typically governed by the terms and conditions of the Master Repurchase Agreement and/or Global Master Repurchase Agreement (collectively, MRA). Upon an event of default, the non-defaulting party may close out all transactions traded under the MRA and net amounts owed. Absent an event of default, assets and liabilities resulting from repurchase agreements are not offset in the Statement of assets and liabilities. In the event of a default by the counterparty, realization of the collateral proceeds could be delayed, during which time the collateral value may decline or the counterparty may have insufficient assets to pay back claims resulting from close-out of the transactions.
Security transactions and related investment income. Investment security transactions are accounted for on a trade date plus one basis for daily NAV calculations. However, for financial reporting purposes, investment transactions are reported on trade date. Interest income is accrued as earned. Dividend income is recorded on the ex-date, except for dividends of foreign securities where the dividend may not be known until after the ex-date. In those cases, dividend income, net of withholding taxes, is recorded when the fund becomes aware of the dividends. Non-cash dividends, if any, are recorded at the fair market value of the securities received. Gains and losses on securities sold are determined on the basis of identified cost and may include proceeds from litigation.
Securities lending. The fund may lend its securities to earn additional income. The fund receives cash collateral from the borrower in an amount not less than the market value of the loaned securities. The fund will invest its collateral in JHCT, an affiliate of the fund, which has a floating NAV and is registered with the Securities and Exchange Commission (SEC) as an investment company. JHCT invests in short-term money market investments. The fund will receive the benefit of any gains and bear any losses generated by JHCT with respect to the cash collateral.
The fund has the right to recall loaned securities on demand. If a borrower fails to return loaned securities when due, then the lending agent is responsible and indemnifies the fund for the lent securities. The lending agent uses the collateral received from the borrower to purchase replacement securities of the same issue, type, class and series of the loaned securities. If the value of the collateral is less than the purchase cost of replacement securities, the lending agent is responsible for satisfying the shortfall but only to the extent that the shortfall is not due to any decrease in the value of JHCT.
Although the risk of the loss of the securities lent is mitigated by receiving collateral from the borrower and through lending agent indemnification, the fund could experience a delay in recovering securities or could experience a lower
than expected return if the borrower fails to return the securities on a timely basis. The fund receives compensation for lending its securities by retaining a portion of the return on the investment of the collateral and compensation from fees earned from borrowers of the securities. Securities lending income received by the fund is net of fees retained by the securities lending agent. Net income received from JHCT is a component of securities lending income as recorded on the Statement of operations.
Obligations to repay collateral received by the fund are shown on the Statement of assets and liabilities as Payable upon return of securities loaned and are secured by the loaned securities. As of March 31, 2019, the fund loaned common stocks valued at $33,342,517 and received $35,309,493 of cash collateral.
Foreign investing. Assets, including investments, and liabilities denominated in foreign currencies are translated into U.S. dollar values each day at the prevailing exchange rate. Purchases and sales of securities, income and expenses are translated into U.S. dollars at the prevailing exchange rate on the date of the transaction. The effect of changes in foreign currency exchange rates on the value of securities is reflected as a component of the realized and unrealized gains (losses) on investments. Foreign investments are subject to a decline in the value of a foreign currency versus the U.S. dollar, which reduces the dollar value of securities denominated in that currency.
Funds that invest internationally generally carry more risk than funds that invest strictly in U.S. securities. These risks are heightened for investments in emerging markets. Risks can result from differences in economic and political conditions, regulations, market practices (including higher transaction costs), accounting standards and other factors.
Foreign taxes. The fund may be subject to withholding tax on income, capital gains or repatriation taxes imposed by certain countries, a portion of which may be recoverable. Foreign taxes are accrued based upon the fund's understanding of the tax rules and rates that exist in the foreign markets in which it invests. Taxes are accrued based on gains realized by the fund as a result of certain foreign security sales. In certain circumstances, estimated taxes are accrued based on unrealized appreciation of such securities. Investment income is recorded net of foreign withholding taxes.
Line of credit.The fund may have the ability to borrow from banks for temporary or emergency purposes, including meeting redemption requests that otherwise might require the untimely sale of securities. Pursuant to the fund's custodian agreement, the custodian may loan money to the fund to make properly authorized payments. The fund is obligated to repay the custodian for any overdraft, including any related costs or expenses. The custodian may have a lien, security interest or security entitlement in any fund property that is not otherwise segregated or pledged, to the extent of any overdraft, and to the maximum extent permitted by law.
The fund and other affiliated funds have entered into a syndicated line of credit agreement with Citibank, N.A. as the administrative agent that enables them to participate in a $750 million unsecured committed line of credit. Excluding commitments designated for a certain fund and subject to the needs of all other affiliated funds, the fund can borrow up to an aggregate commitment amount of $500 million, subject to asset coverage and other limitations as specified in the agreement. A commitment fee payable at the end of each calendar quarter, based on the average daily unused portion of the line of credit, is charged to each participating fund based on a combination of fixed and asset based allocations and is reflected in Other expenses on the Statement of operations. Commitment fees for the year ended March 31, 2019 were $23,952.
Expenses. Within the John Hancock group of funds complex, expenses that are directly attributable to an individual fund are allocated to such fund. Expenses that are not readily attributable to a specific fund are allocated among all funds in an equitable manner, taking into consideration, among other things, the nature and type of expense and the fund's relative net assets. Expense estimates are accrued in the period to which they relate and adjustments are made when actual amounts are known.
Class allocations. Income, common expenses and realized and unrealized gains (losses) are determined at the fund level and allocated daily to each class of shares based on the net assets of the class. Class-specific expenses, such as distribution and service fees, if any, and transfer agent fees, for all classes, are charged daily at the class level based on the net assets of each class and the specific expense rates applicable to each class.
Federal income taxes. The fund intends to continue to qualify as a regulated investment company by complying with the applicable provisions of the Internal Revenue Code and will not be subject to federal income tax on taxable income that is distributed to shareholders. Therefore, no federal income tax provision is required.
Net capital losses of $381,177,985 that are the result of security transactions occurring after October 31, 2018, are treated as occurring on April 1, 2019, the first day of the fund's next taxable year.
As of March 31, 2019, the fund had no uncertain tax positions that would require financial statement recognition, derecognition or disclosure. The fund's federal tax returns are subject to examination by the Internal Revenue Service for a period of three years.
Distribution of income and gains. Distributions to shareholders from net investment income and net realized gains, if any, are recorded on the ex-date. The fund typically declares and pays dividends and capital gain distributions, if any, at least annually.
The tax character of distributions for the year ended March 31, 2019, for the period ended March 31, 2018 and for the year ended February 28, 2018 was as follows:
| March 31, 2019 | March 31, 20181 | February 28, 2018 | |
| Ordinary Income | $86,299,307 | — | $38,875,085 |
| Long-Term Capital Gain | 159,415,447 | — | — |
| Total | $245,714,754 | — | $38,875,085 |
1 For the one-month period ended 3-31-18. The fund changed its fiscal year end from February 28 to March 31.
Distributions paid by the fund with respect to each class of shares are calculated in the same manner, at the same time and in the same amount, except for the effect of class level expenses that may be applied differently to each class. As of March 31, 2019, the components of distributable earnings on a tax basis consisted of $11,649,253 of undistributed ordinary income.
Such distributions and distributable earnings, on a tax basis, are determined in conformity with income tax regulations, which may differ from US GAAP. Distributions in excess of tax basis earnings and profits, if any, are reported in the fund's financial statements as a return of capital.
Capital accounts within the financial statements are adjusted for permanent book-tax differences. These adjustments have no impact on net assets or the results of operations. Temporary book-tax differences, if any, will reverse in a subsequent period. Book-tax differences are primarily attributable to wash sale loss deferrals and treating a portion of the proceeds from redemptions as distributions for tax purposes.
Note 3 — Guarantees and indemnifications
Under the Trust's organizational documents, its Officers and Trustees are indemnified against certain liabilities arising out of the performance of their duties to the Trust, including the fund. Additionally, in the normal course of business, the fund enters into contracts with service providers that contain general indemnification clauses. The fund's maximum exposure under these arrangements is unknown, as this would involve future claims that may be made against the fund that have not yet occurred. The risk of material loss from such claims is considered remote.
Note 4 — Fees and transactions with affiliates
John Hancock Advisers, LLC (the Advisor) serves as investment advisor for the fund. John Hancock Funds, LLC (the Distributor), an affiliate of the Advisor, serves as principal underwriter of the fund. The Advisor and the Distributor are indirect, wholly owned subsidiaries of MFC.
Management fee. The fund has an investment management agreement with the Advisor under which the fund pays a daily management fee to the Advisor, equivalent on an annual basis to the sum of (a) 0.900% of the first $500 million of the fund's aggregate average daily net assets (together with the assets of any other applicable fund identified in the advisory agreement); (b) 0.850% of the next $500 million of the fund's aggregate average daily net assets, and (c) 0.800% of the fund's aggregate average daily net assets in excess of $1 billion. The Advisor has a subadvisory agreement with Wellington Management Company LLP. The fund is not responsible for payment of the subadvisory fees.
The Advisor has contractually agreed to waive a portion of its management fee and/or reimburse expenses for certain funds of the John Hancock group of funds complex, including the fund (the participating portfolios). This waiver is based upon aggregate net assets of all the participating portfolios. The amount of the reimbursement is calculated daily and allocated among all the participating portfolios in proportion to the daily net assets of each fund. During the year ended March 31, 2019, this waiver amounted to 0.01% of the fund's average net assets. This agreement expires on June 30, 2020, unless renewed by mutual agreement of the fund and the Advisor based upon a determination that this is appropriate under the circumstances at that time.
Prior to July 1, 2018, the Advisor had contractually agreed to waive fees and/or reimburse certain expenses for each share class of the fund. This agreement excludes taxes, brokerage commissions, interest expense, litigation and indemnification expenses and other extraordinary expenses not incurred in the ordinary course of the fund's business, acquired fees and expenses paid indirectly and short dividend expense. The fee waivers and/or reimbursements were such that these expenses did not exceed 1.35%, 2.05%, 2.05%, 1.05%, 1.45%, and 1.20% of average net assets for Class A, Class B, Class C, Class I, Class R2, and Class R4 shares, respectively.
For the year ended March 31, 2019, the expense reductions described above amounted to the following:
| Class | Expense reductions | Class | Expense reductions | |
| Class A | $56,141 | Class R4 | $636 | |
| Class B | 106 | Class R6 | 147,768 | |
| Class C | 24,462 | Class 1 | 6,878 | |
| Class I | 462,061 | Class NAV | 85,131 | |
| Class R2 | 3,304 | Total | $786,487 |
Expenses waived or reimbursed in the current fiscal period are not subject to recapture in future fiscal periods.
The investment management fees, including the impact of the waivers and reimbursements as described above, incurred for the year ended March 31, 2019 were equivalent to a net annual effective rate of 0.80% of the fund's average daily net assets.
Accounting and legal services. Pursuant to a service agreement, the fund reimburses the Advisor for all expenses associated with providing the administrative, financial, legal, compliance, accounting and recordkeeping services to the fund, including the preparation of all tax returns, periodic reports to shareholders and regulatory reports, among other services. These expenses are allocated to each share class based on its relative net assets at the time the expense was incurred. These accounting and legal services fees incurred for the year ended March 31, 2019 amounted to an annual rate of 0.02% of the fund's average daily net assets.
Distribution and service plans. The fund has a distribution agreement with the Distributor. The fund has adopted distribution and service plans with respect to Class A, Class B, Class C, Class R2, Class R4 and Class 1 shares pursuant to Rule 12b-1 under the 1940 Act, to pay the Distributor for services provided as the distributor of shares of the fund. In addition, under a service plan for Class R2 and Class R4 shares, the fund pays for certain other services. The fund may pay up to the following contractual rates of distribution and service fees under these arrangements, expressed as an annual percentage of average daily net assets for each class of the fund's shares:
| Class | Rule 12b-1 fee | Service fee | Class | Rule 12b-1 fee | Service fee | |
| Class A | 0.30% | — | Class R2 | 0.25% | 0.25% | |
| Class B | 1.00% | — | Class R4 | 0.25% | 0.10% | |
| Class C | 1.00% | — | Class 1 | 0.05% | — |
The fund's Distributor has contractually agreed to waive 0.10% of Rule12b-1 fees for Class R4 shares. The current waiver agreement expires on July 31, 2020, unless renewed by mutual agreement of the fund and the Distributor based upon a determination that this is appropriate under the circumstances at the time. This contractual waiver amounted to $7,979 for Class R4 shares for the year ended March 31, 2019.
Sales charges. Class A shares are assessed up-front sales charges, which resulted in payments to the Distributor amounting to $321,125 for the year ended March 31, 2019. Of this amount, $53,993 was retained and used for printing prospectuses, advertising, sales literature and other purposes, $265,979 was paid as sales commissions to broker-dealers and $1,153 was paid as sales commissions to sales personnel of Signator Investors, Inc., which had been a broker-dealer affiliate of the Advisor through November 2, 2018.
Class A, Class B and Class C shares may be subject to contingent deferred sales charges (CDSCs). Certain Class A shares that are acquired through purchases of $1 million or more and are redeemed within one year of purchase are subject to a 1.00% sales charge. Class B shares that are redeemed within six years of purchase are subject to CDSCs, at declining rates, beginning at 5.00%. Class C shares that are redeemed within one year of purchase are subject to a 1.00% CDSC. CDSCs are applied to the lesser of the current market value at the time of redemption or the original purchase cost of the shares being redeemed. Proceeds from CDSCs are used to compensate the Distributor for providing distribution-related services in connection with the sale of these shares. During the year ended March 31, 2019, CDSCs received by the Distributor amounted to $20,011, $135 and $73,876 for Class A, Class B and Class C shares, respectively.
Transfer agent fees. The John Hancock group of funds has a complex-wide transfer agent agreement with John Hancock Signature Services, Inc. (Signature Services), an affiliate of the Advisor. The transfer agent fees paid to Signature Services are determined based on the cost to Signature Services (Signature Services Cost) of providing recordkeeping services. It also includes out-of-pocket expenses, including payments made to third-parties for recordkeeping services provided to their clients who invest in one or more John Hancock funds. In addition, Signature Services Cost may be reduced by certain fees that Signature Services receives in connection with retirement and small accounts. Signature Services Cost is calculated monthly and allocated, as applicable, to five categories of share classes: Retail Share and Institutional Share Classes of Non-Municipal Bond Funds, Class R6 Shares, Retirement Share Classes and Municipal Bond Share Classes. Within each of these categories, the applicable costs are allocated to the affected John Hancock affiliated funds and/or classes, based on the relative average daily net assets.
Class level expenses. Class level expenses for the year ended March 31, 2019 were:
| Class | Distribution and service fees | Transfer agent fees | ||||||
| Class A | $2,104,942 | $770,224 | ||||||
| Class B | 13,216 | 1,448 |
| Class | Distribution and service fees | Transfer agent fees | ||||||
| Class C | $3,059,851 | $336,067 | ||||||
| Class I | — | 7,273,293 | ||||||
| Class R2 | 203,857 | 5,510 | ||||||
| Class R4 | 27,883 | 1,056 | ||||||
| Class R6 | — | 246,018 | ||||||
| Class 1 | 43,024 | — | ||||||
| Total | $5,452,773 | $8,633,616 |
Trustee expenses.The fund compensates each Trustee who is not an employee of the Advisor or its affiliates. The costs of paying Trustee compensation and expenses are allocated to the fund based on its net assets relative to other funds within the John Hancock group of funds complex.
Interfund lending program. Pursuant to an Exemptive Order issued by the SEC, the fund, along with certain other funds advised by the Advisor or its affiliates, may participate in an interfund lending program. This program provides an alternative credit facility allowing the funds to borrow from, or lend money to, other participating affiliated funds. At period end, no interfund loans were outstanding. Interest expense is included in Other expenses on the Statement of operations. The fund's activity in this program during the period for which loans were outstanding was as follows:
| Borrower or lender | Weighted average loan balance | Days outstanding | Weighted average interest rate | Interest Expense |
| Borrower | $10,479,285 | 11 | 2.126% | $6,808 |
Note 5 — Fund share transactions
Transactions in fund shares for the year ended March 31, 2019, for the period ended March 31, 2018 and for the year ended February 28, 2018 were as follows:
| Year ended 3-31-19 | Period ended 3-31-181 | Year ended 2-28-18 | ||||||||||||||||||||||||||||||||||||
| Shares | Amount | Shares | Amount | Shares | Amount | |||||||||||||||||||||||||||||||||
| Class A shares | ||||||||||||||||||||||||||||||||||||||
| Sold | 3,934,860 | $107,881,677 | 1,369,375 | $39,331,187 | 16,827,952 | $435,490,087 | ||||||||||||||||||||||||||||||||
| Distributions reinvested | 588,267 | 14,212,523 | — | — | 59,193 | 1,614,645 | ||||||||||||||||||||||||||||||||
| Repurchased | (10,780,632 | ) | (288,739,157 | ) | (616,943 | ) | (17,750,693 | ) | (8,333,545 | ) | (215,492,018 | ) | ||||||||||||||||||||||||||
| Net increase (decrease) | (6,257,505 | ) | $(166,644,957 | ) | 752,432 | $21,580,494 | 8,553,600 | $221,612,714 | ||||||||||||||||||||||||||||||
| Class B shares | ||||||||||||||||||||||||||||||||||||||
| Sold | 1,025 | $27,679 | 1,430 | $40,577 | 23,039 | $598,399 | ||||||||||||||||||||||||||||||||
| Distributions reinvested | 735 | 17,482 | — | — | — | — | ||||||||||||||||||||||||||||||||
| Repurchased | (27,519 | ) | (722,736 | ) | (2,470 | ) | (70,580 | ) | (29,951 | ) | (766,342 | ) | ||||||||||||||||||||||||||
| Net decrease | (25,759 | ) | $(677,575 | ) | (1,040 | ) | $(30,003 | ) | (6,912 | ) | $(167,943 | ) | ||||||||||||||||||||||||||
| Year ended 3-31-19 | Period ended 3-31-181 | Year ended 2-28-18 | ||||||||||||||||||||||||||||||||||||
| Shares | Amount | Shares | Amount | Shares | Amount | |||||||||||||||||||||||||||||||||
| Class C shares | ||||||||||||||||||||||||||||||||||||||
| Sold | 924,629 | $24,604,117 | 631,118 | $17,797,977 | 6,925,342 | $179,456,288 | ||||||||||||||||||||||||||||||||
| Distributions reinvested | 197,102 | 4,679,208 | — | — | — | — | ||||||||||||||||||||||||||||||||
| Repurchased | (3,565,527 | ) | (92,001,072 | ) | (121,827 | ) | (3,433,949 | ) | (1,766,592 | ) | (44,720,499 | ) | ||||||||||||||||||||||||||
| Net increase (decrease) | (2,443,796 | ) | $(62,717,747 | ) | 509,291 | $14,364,028 | 5,158,750 | $134,735,789 | ||||||||||||||||||||||||||||||
| Class I shares | ||||||||||||||||||||||||||||||||||||||
| Sold | 95,608,369 | $2,596,657,426 | 12,147,309 | $349,823,313 | 147,491,547 | $3,830,388,336 | ||||||||||||||||||||||||||||||||
| Distributions reinvested | 5,206,727 | 125,950,713 | — | — | 688,414 | 18,793,707 | ||||||||||||||||||||||||||||||||
| Repurchased | (90,103,831 | ) | (2,356,584,416 | ) | (5,561,623 | ) | (161,104,653 | ) | (67,338,886 | ) | (1,796,486,369 | ) | ||||||||||||||||||||||||||
| Net increase | 10,711,265 | $366,023,723 | 6,585,686 | $188,718,660 | 80,841,075 | $2,052,695,674 | ||||||||||||||||||||||||||||||||
| Class R2 shares | ||||||||||||||||||||||||||||||||||||||
| Sold | 441,295 | $11,837,910 | 251,550 | $7,258,324 | 966,184 | $26,281,352 | ||||||||||||||||||||||||||||||||
| Distributions reinvested | 33,567 | 812,332 | — | — | 609 | 16,628 | ||||||||||||||||||||||||||||||||
| Repurchased | (370,850 | ) | (10,005,761 | ) | (49,793 | ) | (1,422,538 | ) | (227,564 | ) | (5,989,130 | ) | ||||||||||||||||||||||||||
| Net increase | 104,012 | $2,644,481 | 201,757 | $5,835,786 | 739,229 | $20,308,850 | ||||||||||||||||||||||||||||||||
| Class R4 shares | ||||||||||||||||||||||||||||||||||||||
| Sold | 69,035 | $1,861,755 | 3,850 | $110,237 | 233,097 | $5,973,541 | ||||||||||||||||||||||||||||||||
| Distributions reinvested | 7,905 | 191,219 | — | — | 919 | 25,088 | ||||||||||||||||||||||||||||||||
| Repurchased | (74,859 | ) | (2,008,808 | ) | (10,385 | ) | (301,353 | ) | (154,003 | ) | (3,958,215 | ) | ||||||||||||||||||||||||||
| Net increase (decrease) | 2,081 | $44,166 | (6,535 | ) | $(191,116 | ) | 80,013 | $2,040,414 | ||||||||||||||||||||||||||||||
| Class R6 shares | ||||||||||||||||||||||||||||||||||||||
| Sold | 17,610,134 | $484,165,158 | 3,650,068 | $104,895,931 | 61,414,212 | $1,676,296,468 | ||||||||||||||||||||||||||||||||
| Distributions reinvested | 2,047,381 | 49,546,630 | — | — | 294,022 | 8,032,680 | ||||||||||||||||||||||||||||||||
| Repurchased | (14,078,112 | ) | (373,109,601 | ) | (593,470 | ) | (17,082,438 | ) | (2,835,726 | ) | (79,251,533 | ) | ||||||||||||||||||||||||||
| Net increase | 5,579,403 | $160,602,187 | 3,056,598 | $87,813,493 | 58,872,508 | $1,605,077,615 | ||||||||||||||||||||||||||||||||
| Year ended 3-31-19 | Period ended 3-31-181 | Year ended 2-28-18 | ||||||||||||||||||||||||||||||||||||
| Shares | Amount | Shares | Amount | Shares | Amount | |||||||||||||||||||||||||||||||||
| Class 1 shares | ||||||||||||||||||||||||||||||||||||||
| Sold | 394,196 | $10,902,977 | 91,868 | $2,655,806 | 1,143,563 | $30,003,926 | ||||||||||||||||||||||||||||||||
| Distributions reinvested | 88,589 | 2,141,203 | — | — | 16,066 | 438,430 | ||||||||||||||||||||||||||||||||
| Repurchased | (833,044 | ) | (22,291,454 | ) | (9,903 | ) | (279,084 | ) | (269,432 | ) | (6,916,625 | ) | ||||||||||||||||||||||||||
| Net increase (decrease) | (350,259 | ) | $(9,247,274 | ) | 81,965 | $2,376,722 | 890,197 | $23,525,731 | ||||||||||||||||||||||||||||||
| Class NAV shares | ||||||||||||||||||||||||||||||||||||||
| Sold | 1,905,823 | $49,201,008 | 28,046 | $807,458 | 10,273,748 | $264,034,315 | ||||||||||||||||||||||||||||||||
| Distributions reinvested | 1,182,714 | 28,574,370 | — | — | 249,616 | 6,809,529 | ||||||||||||||||||||||||||||||||
| Repurchased | (4,532,900 | ) | (122,183,627 | ) | (688,191 | ) | (20,022,384 | ) | (9,896,358 | ) | (256,155,809 | ) | ||||||||||||||||||||||||||
| Net increase (decrease) | (1,444,363 | ) | $(44,408,249 | ) | (660,145 | ) | $(19,214,926 | ) | 627,006 | $14,688,035 | ||||||||||||||||||||||||||||
| Total net increase | 5,875,079 | $245,618,755 | 10,520,009 | $301,253,138 | 155,755,466 | $4,074,516,879 | ||||||||||||||||||||||||||||||||
1 For the one-month period ended 3-31-18. The fund changed its fiscal year end from February 28 to March 31.
Affiliates of the fund owned 100% and 90% of shares of Class 1 and Class NAV, respectively, on March 31, 2019. Such concentration of shareholders' capital could have a material effect on the fund if such shareholders redeem from the fund.
Note 6 — Purchase and sale of securities
Purchases and sales of securities, other than short-term investments, amounted to $9,760,720,295 and $9,533,036,986, respectively, for the year ended March 31, 2019.
Note 7 — Investment by affiliated funds
Certain investors in the fund are affiliated funds that are managed by the Advisor and its affiliates. The affiliated funds do not invest in the fund for the purpose of exercising management or control; however, this investment may represent a significant portion of the fund's net assets. At March 31, 2019, funds within the John Hancock group of funds complex held 9.8% of the fund's net assets. At March 31, 2019, there were no affiliated funds with an ownership of 5% or more of the fund's net assets.
Note 8 — Investment in affiliated underlying funds
The fund may invest in affiliated underlying funds that are managed by the Advisor and its affiliates. Information regarding the fund's purchases and sales of the affiliated underlying funds as well as income and capital gains earned, if any, during the period is as follows:
| Dividends and distributions | ||||||||||||||||||||||||||||||||||||||
| Fund | Beginning share amount | Shares purchased | Shares sold | Ending share amount | Income distributions received | Capital gain distributions received | Realized gain (loss) | Change in unrealized appreciation (depreciation) | Ending value | |||||||||||||||||||||||||||||
| John Hancock Collateral Trust* | 3,554,324 | 252,326,462 | (252,352,145 | ) | 3,528,641 | — | — | $60,265 | $4,575 | $35,310,762 | ||||||||||||||||||||||||||||
| *Refer to the Securities lending note within Note 2 for details regarding this investment. | ||||||||||||||||||||||||||||||||||||||
REPORT OF INDEPENDENT REGISTERED PUBLIC ACCOUNTING FIRM
To the Board of Trustees of John Hancock Funds III and Shareholders of John Hancock International Growth Fund
Opinion on the Financial Statements
We have audited the accompanying statement of assets and liabilities, including the Fund's investments, of John Hancock International Growth Fund (one of the funds constituting John Hancock Funds III, referred to hereafter as the "Fund") as of March 31, 2019, the related statement of operations for the year ended March 31, 2019, the statements of changes in net assets for the year ended March 31, 2019, for the period from March 1, 2018 to March 31, 2018 and for the year ended February 28, 2018, including the related notes, and the financial highlights for each of the periods indicated therein (collectively referred to as the "financial statements"). In our opinion, the financial statements present fairly, in all material respects, the financial position of the Fund as of March 31, 2019, the results of its operations for the year then ended, the changes in its net assets for the year ended March 31, 2019, for the period from March 1, 2018 to March 31, 2018 and for the year ended February 28, 2018 and the financial highlights for each of the periods indicated therein in conformity with accounting principles generally accepted in the United States of America.
Basis for Opinion
These financial statements are the responsibility of the Fund's management. Our responsibility is to express an opinion on the Fund's financial statements based on our audits. We are a public accounting firm registered with the Public Company Accounting Oversight Board (United States) ("PCAOB") and are required to be independent with respect to the Fund in accordance with the U.S. federal securities laws and the applicable rules and regulations of the Securities and Exchange Commission and the PCAOB.
We conducted our audits of these financial statements in accordance with the standards of the PCAOB. Those standards require that we plan and perform the audit to obtain reasonable assurance about whether the financial statements are free of material misstatement, whether due to error or fraud.
Our audits included performing procedures to assess the risks of material misstatement of the financial statements, whether due to error or fraud, and performing procedures that respond to those risks. Such procedures included examining, on a test basis, evidence regarding the amounts and disclosures in the financial statements. Our audits also included evaluating the accounting principles used and significant estimates made by management, as well as evaluating the overall presentation of the financial statements. Our procedures included confirmation of securities owned as of March 31, 2019 by correspondence with the custodian, transfer agent, and brokers; when replies were not received from brokers, we performed other auditing procedures. We believe that our audits provide a reasonable basis for our opinion.
/s/ PricewaterhouseCoopers LLP
Boston, Massachusetts
May 16, 2019
We have served as the auditor of one or more investment companies in the John Hancock group of funds since 1988.
Unaudited
For federal income tax purposes, the following information is furnished with respect to the distributions of the fund, if any, paid during its taxable year ended March 31, 2019.
The fund reports the maximum amount allowable of its net taxable income as eligible for the corporate dividends-received deduction.
The fund reports the maximum amount allowable of its net taxable income as qualified dividend income as provided in the Jobs and Growth Tax Relief Reconciliation Act of 2003.
Income derived from foreign sources was $165,877,784. The fund intends to pass through foreign tax credits of $13,247,881.
The fund paid $176,030,911 in long term capital gain dividends.
Eligible shareholders will be mailed a 2019 Form 1099-DIV in early 2020. This will reflect the tax character of all distributions paid in calendar year 2019.
Please consult a tax advisor regarding the tax consequences of your investment in the fund.
This chart provides information about the Trustees and Officers who oversee your John Hancock fund. Officers elected by the Trustees manage the day-to-day operations of the fund and execute policies formulated by the Trustees.
Independent Trustees
| Name, year of birth Position(s) held with Trust Principal occupation(s) and other directorships during past 5 years | Trustee of the Trust since1 | Number of John Hancock funds overseen by Trustee |
| Hassell H. McClellan, Born: 1945 | 2012 | 215 |
| Trustee and Chairperson of the Board Director/Trustee, Virtus Funds (since 2008); Director, The Barnes Group (since 2010); Associate Professor, The Wallace E. Carroll School of Management, Boston College (retired 2013). Trustee (since 2005) and Chairperson of the Board (since 2017) of various trusts within the John Hancock Fund Complex. | ||
| Charles L. Bardelis,2 Born: 1941 | 2012 | 215 |
| Trustee Director, Island Commuter Corp. (marine transport). Trustee of various trusts within the John Hancock Fund Complex (since 1988). | ||
| James R. Boyle,Born: 1959 | 2015 | 215 |
| Trustee Chief Executive Officer, Foresters Financial (since 2018); Chairman and Chief Executive Officer, Zillion Group, Inc. (formerly HealthFleet, Inc.) (healthcare) (2014-2018); Executive Vice President and Chief Executive Officer, U.S. Life Insurance Division of Genworth Financial, Inc. (insurance) (January 2014-July 2014); Senior Executive Vice President, Manulife Financial, President and Chief Executive Officer, John Hancock (1999-2012); Chairman and Director, John Hancock Advisers, LLC, John Hancock Funds, LLC, and John Hancock Investment Management Services, LLC (2005-2010). Trustee of various trusts within the John Hancock Fund Complex (2005-2014 and since 2015). | ||
| Peter S. Burgess,2 Born: 1942 | 2012 | 215 |
| Trustee Consultant (financial, accounting, and auditing matters) (since 1999); Certified Public Accountant; Partner, Arthur Andersen (independent public accounting firm) (prior to 1999); Director, Lincoln Educational Services Corporation (since 2004); Director, Symetra Financial Corporation (2010-2016); Director, PMA Capital Corporation (2004-2010). Trustee of various trusts within the John Hancock Fund Complex (since 2005). | ||
| William H. Cunningham, Born: 1944 | 2006 | 215 |
| Trustee Professor, University of Texas, Austin, Texas (since 1971); former Chancellor, University of Texas System and former President of the University of Texas, Austin, Texas; Chairman (since 2009) and Director (since 2006), Lincoln National Corporation (insurance); Director, Southwest Airlines (since 2000); former Director, LIN Television (2009-2014). Trustee of various trusts within the John Hancock Fund Complex (since 1986). | ||
| Grace K. Fey, Born: 1946 | 2012 | 215 |
| Trustee Chief Executive Officer, Grace Fey Advisors (since 2007); Director and Executive Vice President, Frontier Capital Management Company (1988-2007); Director, Fiduciary Trust (since 2009). Trustee of various trusts within the John Hancock Fund Complex (since 2008). | ||
Independent Trustees (continued)
| Name, year of birth Position(s) held with Trust Principal occupation(s) and other directorships during past 5 years | Trustee of the Trust since1 | Number of John Hancock funds overseen by Trustee |
| Theron S. Hoffman,2 Born: 1947 | 2012 | 215 |
| Trustee Chief Executive Officer, T. Hoffman Associates, LLC (consulting firm) (since 2003); Director, The Todd Organization (consulting firm) (2003-2010); President, Westport Resources Management (investment management consulting firm) (2006-2008); Board Member, Senior Managing Director, Partner, and Operating Head, Putnam Investments (2000-2003); Executive Vice President, The Thomson Corp. (financial and legal information publishing) (1997-2000). Trustee of various trusts within the John Hancock Fund Complex (since 2008). | ||
| Deborah C. Jackson, Born: 1952 | 2008 | 215 |
| Trustee President, Cambridge College, Cambridge, Massachusetts (since 2011); Board of Directors, National Association of Corporate Directors/New England (since 2015); Board of Directors, Association of Independent Colleges and Universities of Massachusetts (since 2014); Chief Executive Officer, American Red Cross of Massachusetts Bay (2002-2011); Board of Directors of Eastern Bank Corporation (since 2001); Board of Directors of Eastern Bank Charitable Foundation (since 2001); Board of Directors of American Student Assistance Corporation (1996-2009); Board of Directors of Boston Stock Exchange (2002-2008); Board of Directors of Harvard Pilgrim Healthcare (health benefits company) (2007-2011). Trustee of various trusts within the John Hancock Fund Complex (since 2008). | ||
| James M. Oates, Born: 1946 | 2012 | 215 |
Trustee | ||
| Steven R. Pruchansky, Born: 1944 | 2006 | 215 |
| Trustee and Vice Chairperson of the Board Managing Director, Pru Realty (since 2017); Chairman and Chief Executive Officer, Greenscapes of Southwest Florida, Inc. (since 2000); Director and President, Greenscapes of Southwest Florida, Inc. (until 2000); Member, Board of Advisors, First American Bank (until 2010); Managing Director, Jon James, LLC (real estate) (since 2000); Partner, Right Funding, LLC (2014-2017); Director, First Signature Bank & Trust Company (until 1991); Director, Mast Realty Trust (until 1994); President, Maxwell Building Corp. (until 1991). Trustee (since 1992), Chairperson of the Board (2011-2012), and Vice Chairperson of the Board (since 2012) of various trusts within the John Hancock Fund Complex. | ||
| Gregory A. Russo, Born: 1949 | 2008 | 215 |
| Trustee Director and Audit Committee Chairman (since 2012), and Member, Audit Committee and Finance Committee (since 2011), NCH Healthcare System, Inc. (holding company for multi-entity healthcare system); Director and Member (since 2012) and Finance Committee Chairman (since 2014), The Moorings, Inc. (nonprofit continuing care community); Vice Chairman, Risk & Regulatory Matters, KPMG LLP (KPMG) (2002-2006); Vice Chairman, Industrial Markets, KPMG (1998-2002); Chairman and Treasurer, Westchester County, New York, Chamber of Commerce (1986-1992); Director, Treasurer, and Chairman of Audit and Finance Committees, Putnam Hospital Center (1989-1995); Director and Chairman of Fundraising Campaign, United Way of Westchester and Putnam Counties, New York (1990-1995). Trustee of various trusts within the John Hancock Fund Complex (since 2008). | ||
Non-Independent Trustees3
| Name, year of birth Position(s) held with Trust Principal occupation(s) and other directorships during past 5 years | Trustee of the Trust since1 | Number of John Hancock funds overseen by Trustee |
| Andrew G. Arnott, Born: 1971 | 2017 | 215 |
| President and Non-Independent Trustee Head of Wealth and Asset Management, United States and Europe, for John Hancock and Manulife (since 2018); Executive Vice President, John Hancock Financial Services (since 2009, including prior positions); Director and Executive Vice President, John Hancock Advisers, LLC (since 2005, including prior positions); Director and Executive Vice President, John Hancock Investment Management Services, LLC (since 2006, including prior positions); President, John Hancock Funds, LLC (since 2004, including prior positions); President of various trusts within the John Hancock Fund Complex (since 2007, including prior positions). | ||
| Marianne Harrison, Born: 1963 | 2018 | 215 |
| Non-Independent Trustee President and CEO, John Hancock (since 2017); President and CEO, Manulife Canadian Division (2013-2017); Member, Board of Directors, American Council of Life Insurers (ACLI) (since 2018); Member, Board of Directors, Communitech, an industry-led innovation center that fosters technology companies in Canada (since 2017); Member, Board of Directors, Manulife Assurance Canada (since 2015); Board Member, St. Mary's General Hospital Foundation (since 2014); Member, Board of Directors, Manulife Bank of Canada (since 2013); Member, Standing Committee of the Canadian Life & Health Assurance Association (since 2013); Member, Board of Directors, John Hancock USA, John Hancock Life & Health, John Hancock New York (2012-2013). Trustee of various trusts within the John Hancock Fund Complex (since 2018). | ||
Principal officers who are not Trustees
| Name, year of birth Position(s) held with Trust Principal occupation(s) during past 5 years | Officer of the Trust since |
| Francis V. Knox, Jr.,Born: 1947 | 2006 |
| Chief Compliance Officer Vice President, John Hancock Financial Services (since 2005); Chief Compliance Officer, various trusts within the John Hancock Fund Complex, John Hancock Advisers, LLC, and John Hancock Investment Management Services, LLC (since 2005). | |
| Charles A. Rizzo, Born: 1957 | 2007 |
| Chief Financial Officer Vice President, John Hancock Financial Services (since 2008); Senior Vice President, John Hancock Advisers, LLC and John Hancock Investment Management Services, LLC (since 2008); Chief Financial Officer of various trusts within the John Hancock Fund Complex (since 2007). | |
| Salvatore Schiavone, Born: 1965 | 2010 |
| Treasurer Assistant Vice President, John Hancock Financial Services (since 2007); Vice President, John Hancock Advisers, LLC and John Hancock Investment Management Services, LLC (since 2007); Treasurer of various trusts within the John Hancock Fund Complex (since 2007, including prior positions). | |
Principal officers who are notTrustees (continued)
| Name, year of birth Position(s) held with Trust Principal occupation(s) during past 5 years | Officer of the Trust since | |
| Christopher (Kit) Sechler,Born: 1973 | 2018 | |
| Chief Legal Officer and Secretary Vice President and Deputy Chief Counsel, John Hancock Investments (since 2015); Assistant Vice President and Senior Counsel (2009-2015), John Hancock Investments; Chief Legal Officer and Secretary of various trusts within the John Hancock Fund Complex (since 2018); Assistant Secretary of John Hancock Advisers, LLC and John Hancock Investment Management Services, LLC (since 2009). | ||
The business address for all Trustees and Officers is 200 Berkeley Street, Boston, Massachusetts 02116-5023.
The Statement of Additional Information of the fund includes additional information about members of the Board of Trustees of the Trust and is available without charge, upon request, by calling 800-225-5291.
| 1 | Each Trustee holds office until his or her successor is elected and qualified, or until the Trustee's death, retirement, resignation, or removal. Mr. Boyle has served as Trustee at various times prior to the date listed in the table. |
| 2 | Member of the Audit Committee. |
| 3 | The Trustee is a Non-Independent Trustee due to current or former positions with the Advisor and certain affiliates. |
Trustees Hassell H. McClellan,Chairperson Officers Andrew G. Arnott Francis V. Knox, Jr. Charles A. Rizzo Salvatore Schiavone Christopher (Kit) Sechler** | Investment advisor John Hancock Advisers, LLC Subadvisor Wellington Management Company LLP Portfolio Manager John A. Boselli, CFA Principal distributor John Hancock Funds, LLC Custodian Citibank. N.A. Transfer agent John Hancock Signature Services, Inc. Legal counsel K&L Gates LLP Independent registered public accounting firm PricewaterhouseCoopers LLP |
* Member of the Audit Committee
† Non-Independent Trustee
#Effective 6-19-18
**Effective 9-13-18
The fund's proxy voting policies and procedures, as well as the fund proxy voting record for the most recent twelve-month period ended June 30, are available free of charge on the Securities and Exchange Commission (SEC) website at sec.gov or on our website.
All of the fund's holdings as of the end of the third month of every fiscal quarter are filed with the SEC on Form N-PORT within 60 days of the end of the fiscal quarter. The fund's Form N-PORT filings are available on our website and the SEC's website, sec.gov.
We make this information on your fund, as well asmonthly portfolio holdings, and other fund details available on our website at jhinvestments.com or by calling 800-225-5291.
| You can also contact us: | |||
| 800-225-5291 jhinvestments.com | Regular mail: John Hancock Signature Services, Inc. | Express mail: John Hancock Signature Services, Inc. | |
John Hancock family of funds
DOMESTIC EQUITY FUNDS Blue Chip Growth Classic Value Disciplined Value Disciplined Value Mid Cap Equity Income Financial Industries Fundamental All Cap Core Fundamental Large Cap Core Fundamental Large Cap Value New Opportunities Regional Bank Small Cap Core Small Cap Growth Small Cap Value U.S. Global Leaders Growth U.S. Quality Growth Value Equity GLOBAL AND INTERNATIONAL EQUITY FUNDS Disciplined Value International Emerging Markets Emerging Markets Equity Fundamental Global Franchise Global Equity Global Shareholder Yield Global Thematic Opportunities Greater China Opportunities International Dynamic Growth International Growth International Small Company | INCOME FUNDS Bond California Tax-Free Income Emerging Markets Debt Floating Rate Income Government Income High Yield High Yield Municipal Bond Income Investment Grade Bond Money Market Short Duration Credit Opportunities Spectrum Income Strategic Income Opportunities Tax-Free Bond ALTERNATIVE AND SPECIALTY FUNDS Absolute Return Currency Alternative Asset Allocation Disciplined Alternative Yield Global Absolute Return Strategies Global Conservative Absolute Return Global Focused Strategies Infrastructure Seaport Long/Short |
A fund's investment objectives, risks, charges, and expenses should be considered carefully before investing. The prospectus contains this and other important information about the fund. To obtain a prospectus, contact your financial professional, call John Hancock Investments at 800-225-5291, or visit our website at jhinvestments.com. Please read the prospectus carefully before investing or sending money.
ASSET ALLOCATION Balanced Income Allocation Multi-Index Lifetime Portfolios Multi-Index Preservation Portfolios Multimanager Lifestyle Portfolios Multimanager Lifetime Portfolios Retirement Income 2040 EXCHANGE-TRADED FUNDS John Hancock Multifactor Consumer Discretionary ETF John Hancock Multifactor Consumer Staples ETF John Hancock Multifactor Developed International ETF John Hancock Multifactor Emerging Markets ETF John Hancock Multifactor Energy ETF John Hancock Multifactor Financials ETF John Hancock Multifactor Healthcare ETF John Hancock Multifactor Industrials ETF John Hancock Multifactor Large Cap ETF John Hancock Multifactor Materials ETF John Hancock Multifactor Media and John Hancock Multifactor Mid Cap ETF John Hancock Multifactor Small Cap ETF John Hancock Multifactor Technology ETF John Hancock Multifactor Utilities ETF | ENVIRONMENTAL, SOCIAL, AND ESG All Cap Core ESG Core Bond ESG International Equity ESG Large Cap Core CLOSED-END FUNDS Financial Opportunities Hedged Equity & Income Income Securities Trust Investors Trust Preferred Income Preferred Income II Preferred Income III Premium Dividend Tax-Advantaged Dividend Income Tax-Advantaged Global Shareholder Yield |
John Hancock Multifactor ETF shares are bought and sold at market price (not NAV), and are not individually redeemed
from the fund. Brokerage commissions will reduce returns.
John Hancock ETFs are distributed by Foreside Fund Services, LLC, and are subadvised by Dimensional Fund Advisors LP.
Foreside is not affiliated with John Hancock Funds, LLC or Dimensional Fund Advisors LP.
Dimensional Fund Advisors LP receives compensation from John Hancock in connection with licensing rights to the
John Hancock Dimensional indexes. Dimensional Fund Advisors LP does not sponsor, endorse, or sell, and makes no
representation as to the advisability of investing in, John Hancock Multifactor ETFs.
John Hancock Investment Management
A trusted brand
John Hancock Investment Management is a premier asset manager
representing one of America's most trusted brands, with a heritage of
financial stewardship dating back to 1862. Helping our shareholders
pursue their financial goals is at the core of everything we do. It's why
we support the role of professional financial advice and operate with
the highest standards of conduct and integrity.
A better way to invest
We serve investors globally through a unique multimanager approach:
We search the world to find proven portfolio teams with specialized
expertise for every strategy we offer, then we apply robust investment
oversight to ensure they continue to meet our uncompromising
standards and serve the best interests of our shareholders.
Results for investors
Our unique approach to asset management enables us to provide
a diverse set of investments backed by some of the world's best
managers, along with strong risk-adjusted returns across asset classes.
![]()
John Hancock Funds, LLC n Member FINRA, SIPC
200 Berkeley Street n Boston, MA 02116-5010 n 800-225-5291 n jhinvestments.com
This report is for the information of the shareholders of John Hancock International Growth Fund. It is not authorized for distribution to prospective investors unless preceded or accompanied by a prospectus.
| MF802058 | 87A 3/19 5/19 |
John Hancock
U.S. Quality Growth Fund
Formerly John Hancock Strategic Growth Fund
Annual report 3/31/19
Beginning on January 1, 2021, as permitted by regulations adopted by the Securities and Exchange Commission, paper copies of the Fund's shareholder reports like this one will no longer be sent by mail, unless you specifically request paper copies of the reports from the Fund or from your financial intermediary. Instead, the reports will be made available on a website, and you will be notified by mail each time a report is posted and provided with a website link to access the report.
If you already elected to receive shareholder reports electronically, you will not be affected by this change, and you do not need to take any action. You may elect to receive shareholder reports and other communications electronically by calling John Hancock Investment Management at 800-225-5291 (Class A and Class C shares) or 888-972-8696 (Class I, Class R2, Class R4, Class R6 and Class NAV) or by contacting your financial intermediary.
You may elect to receive all reports in paper, free of charge, at any time. You can inform John Hancock Investment Management or your financial intermediary that you wish to continue receiving paper copies of your shareholder reports by following the instructions listed above. Your election to receive reports in paper will apply to all funds held with John Hancock Investment Management or your financial intermediary.
A message to shareholders
Dear shareholder,
Market volatility was the big story in the latter half of 2018, as stocks sank in the fourth quarter, hurt by fears of slowing economic growth, mounting trade tensions between the United States and China, and a pullback in oil prices. Many of those fears were quelled in the beginning of 2019, as favorable earnings reports, progress with the China trade dispute, and signals from the U.S. Federal Reserve that interest-rate hikes were on hold sparked a market rebound.
Despite the positive economic news that has garnered headlines lately, we at John Hancock Investment Management believe that the bull market—which just celebrated its 10th anniversary on March 9—appears to be in the later innings. Whether or not these gains are sustained, it's clear we're in a late-cycle market.
Your best resource in unpredictable and volatile markets is your financial advisor, who can help position your portfolio so that it's sufficiently diversified to meet your long-term objectives and to withstand the inevitable turbulence along the way.
On behalf of everyone at John Hancock Investment Management, I'd like to take this opportunity to welcome new shareholders and thank existing shareholders for the continued trust you've placed in us.
Sincerely,
Andrew G. Arnott
President and CEO,
John Hancock Investment Management
Head of Wealth and Asset Management,
United States and Europe
This commentary reflects the CEO's views, which are subject to change at any time. Investing involves risks, including the potential loss of principal. Diversification does not guarantee a profit or eliminate the risk of a loss. It is not possible to invest directly in an index. For more up-to-date information, please visit our website at jhinvestments.com.
John Hancock
U.S. Quality Growth Fund
Table of contents
| 2 | Your fund at a glance | |
| 4 | Discussion of fund performance | |
| 6 | A look at performance | |
| 8 | Your expenses | |
| 10 | Fund's investments | |
| 13 | Financial statements | |
| 16 | Financial highlights | |
| 23 | Notes to financial statements | |
| 33 | Report of independent registered public accounting firm | |
| 34 | Tax information | |
| 35 | Trustees and Officers | |
| 39 | More information |
INVESTMENT OBJECTIVE
The fund seeks long-term capital appreciation.
AVERAGE ANNUAL TOTAL RETURNS AS OF 3/31/19 (%)
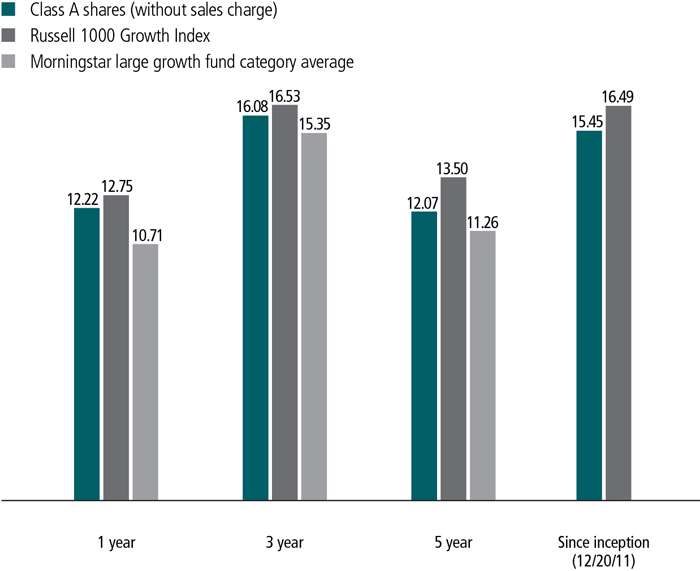
The Russell 1000 Growth Index is an unmanaged index that measures the performance of the small-cap growth segment of the U.S. equity universe. It includes those Russell 1000 Index companies with higher price-to-book ratios and higher forecasted growth values.
It is not possible to invest directly in an index. Index figures do not reflect expenses or sales charges, which would result in lower returns.
Figures from Morningstar, Inc. include reinvested distributions and do not take into account sales charges. Actual load-adjusted performance is lower. Since-inception returns for the Morningstar fund category average are not available.
The past performance shown here reflects reinvested distributions and the beneficial effect of any expense reductions, and does not guarantee future results. Performance of the other share classes will vary based on the difference in the fees and expenses of those classes. Shares will fluctuate in value and, when redeemed, may be worth more or less than their original cost. Current month-end performance may be lower or higher than the performance cited, and can be found at jhinvestments.com or by calling 800-225-5291. For further information on the fund's objectives, risks, and strategy, see the fund's prospectus.
PERFORMANCE HIGHLIGHTS OVER THE LAST TWELVE MONTHS
Fund underperformed its benchmark index
The fund modestly trailed its benchmark, the Russell 1000 Growth Index, for the period.
Drivers of relative performance
Stock picking in the consumer discretionary sector was a negative performance factor, while security selection in information technology added value.
Sector allocation hampered results
A slight overweight in the lagging industrials sector hampered results.
SECTOR COMPOSITION AS OF 3/31/19 (%)
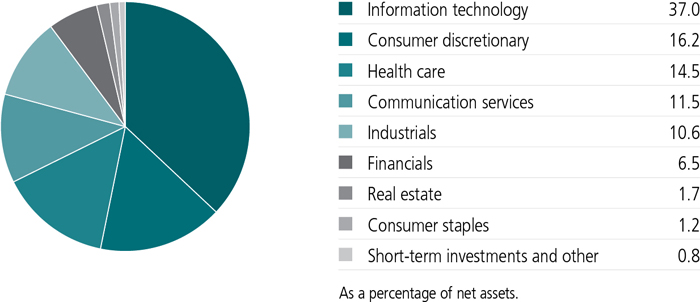
A note about risks
The fund may be subject to various risks as described in the fund's prospectus. For more information, please refer to the "Principal risks" section of the prospectus.
Note: Effective September 28, 2018, Wellington Management Company LLP replaced John Hancock Asset Management as the subadvisor for the fund. This interview was conducted with the new management team at Wellington; however, the report covers the full period. Effective November 12, 2018, the fund's name was changed from John Hancock Strategic Growth Fund to John Hancock U.S. Quality Growth Fund.
How did the fund perform during the 12 months ended March 31, 2019?
For the full period, the fund's Class A shares gained 12.22%, excluding sales charges, which underperformed the 12.75% return for its benchmark, the Russell 1000 Growth Index. Sector allocation largely drove the fund's relative result. Stock picking was strongest in information technology and healthcare, with the favorable impact offset by weak selection in consumer discretionary. In terms of sector allocation, a slight overweight in the lagging industrials sector further detracted.
Which stocks detracted?
A top detractor was Humana, Inc., a managed-care company primarily focused on the Medicare Advantage market. Humana's shares sold off as investors became more concerned about the potential negative financial impact of Medicare for All, a proposal that has been widely discussed in the run-up of the 2020 presidential election. As of period end, however, we believe the sell-off is an overreaction, as the
TOP 10 HOLDINGS AS OF 3/31/19 (%)
| Microsoft Corp. | 7.2 |
| Amazon.com, Inc. | 6.4 |
| Alphabet, Inc., Class A | 6.2 |
| Facebook, Inc., Class A | 4.3 |
| Visa, Inc., Class A | 3.2 |
| Mastercard, Inc., Class A | 2.8 |
| UnitedHealth Group, Inc. | 2.7 |
| The Home Depot, Inc. | 2.7 |
| The Boeing Company | 2.6 |
| Adobe, Inc. | 2.0 |
| TOTAL | 40.1 |
| As a percentage of net assets. | |
| Cash and cash equivalents are not included. | |
company's business fundamentals remain robust. Other relative detractors included Polaris Industries, Inc., a maker of snowmobiles and all-terrain vehicles, and trucking company Knight-Swift Transportation Holdings Inc.
Which equity positions contributed the most?
The fund benefited from a position in digital-payments company PayPal, Inc. PayPal has been benefiting from secular tailwinds, as e-commerce continues to grow as a percentage of retail sales. PayPal has also been partnering with major financial institutions and other technology platforms to become the dominant provider for online-commerce payments. According to our analysis, PayPal ranks highly in our investment process for its revenue growth with good valuation upside, better-than-average quality and good capital return to shareholders. In health care, the fund further benefited from an out-of-benchmark position in health insurer Anthem.
How were you positioning the fund as of the end of the period?
On a sector basis, the fund is overweight in information technology, as we believe companies in this category provide the best combination of growth and valuation upside in our stock-ranking process. The fund remained underweighted in consumer staples, where we saw less-attractive valuation upside. We have moved to equal weights in our investment model's quality, growth, valuation upside, and capital return factors. This has meant increased focus on cyclical companies that we believe offer higher growth potential and some sales of higher-quality, dividend-paying companies.
MANAGED BY
| | John A. Boselli, CFA On the fund since 2018 Investing since 1996 |
![]()
TOTAL RETURNS FOR THE PERIOD ENDED MARCH 31, 2019
| Average annual total returns (%) with maximum sales charge | Cumulative total returns (%) with maximum sales charge | ||||||
| 1-year | 5-year | Since inception1 | 5-year | Since inception1 | |||
| Class A | 6.61 | 10.93 | 14.64 | 67.94 | 170.51 | ||
| Class C2 | 10.54 | 11.30 | 14.91 | 70.83 | 175.17 | ||
| Class I3 | 12.55 | 12.39 | 15.81 | 79.29 | 191.29 | ||
| Class R22,3 | 12.13 | 11.97 | 15.39 | 76.02 | 183.53 | ||
| Class R42,3 | 12.36 | 12.18 | 15.53 | 77.68 | 186.20 | ||
| Class R62,3 | 12.68 | 12.43 | 15.71 | 79.61 | 189.31 | ||
| Class NAV3 | 12.69 | 12.56 | 15.99 | 80.65 | 194.47 | ||
| Index† | 12.75 | 13.50 | 16.49 | 88.34 | 203.90 | ||
Performance figures assume all distributions are reinvested. Figures reflect the maximum sales charge on Class A shares of 5% and the applicable contingent deferred sales charge (CDSC) on Class C shares. Class C shares sold within one year of purchase are subject to a 1% CDSC. Sales charges are not applicable to Class I, Class R2, Class R4, Class R6, and Class NAV shares.
The expense ratios of the fund, both net (including any fee waivers or expense limitations) and gross (excluding any fee waivers or expense limitations), are set forth according to the most recent publicly available prospectuses for the fund and may differ from those disclosed in the Financial highlights tables in this report. Net expenses reflect contractual expense limitations in effect until June 30, 2020 and are subject to change. Had the contractual fee waivers and expense limitations not been in place, gross expenses would apply. The expense ratios are as follows:
| Class A | Class C | Class I | Class R2 | Class R4 | Class R6 | Class NAV | |
| Gross (%) | 1.02 | 1.77 | 0.76 | 1.17 | 1.02 | 0.67 | 0.66 |
| Net (%) | 1.01 | 1.76 | 0.75 | 1.16 | 0.91 | 0.66 | 0.65 |
Please refer to the most recent prospectus and annual or semiannual report for more information on expenses and any expense limitation arrangements for each class.
The returns reflect past results and should not be considered indicative of future performance. The return and principal value of an investment will fluctuate so that shares, when redeemed, may be worth more or less than their original cost. Due to market volatility and other factors, the fund's current performance may be higher or lower than the performance shown. For current to the most recent month-end performance data, please call 800-225-5291 or visit the fund's website at jhinvestments.com.
The performance table above and the chart on the next page do not reflect the deduction of taxes that a shareholder would pay on fund distributions or the redemption of fund shares. The fund's performance results reflect any applicable fee waivers or expense reductions, without which the expenses would increase and results would have been less favorable.
| † | Index is the Russell 1000 Growth Index. |
See the following page for footnotes.
This chart and table show what happened to a hypothetical $10,000 investment in John Hancock U.S. Quality Growth Fund for the share classes and periods indicated, assuming all distributions were reinvested. For comparison, we've shown the same investment in the Russell 1000 Growth Index.
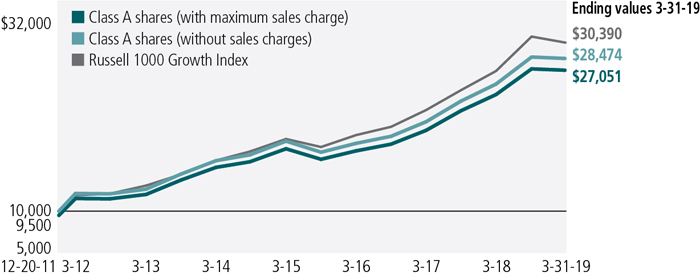
| Start date | With maximum sales charge ($) | Without sales charge ($) | Index ($) | |
| Class C2,4 | 12-20-11 | 27,517 | 27,517 | 30,390 |
| Class I3 | 12-20-11 | 29,129 | 29,129 | 30,390 |
| Class R22,3 | 12-20-11 | 28,353 | 28,353 | 30,390 |
| Class R42,3 | 12-20-11 | 28,620 | 28,620 | 30,390 |
| Class R62,3 | 12-20-11 | 28,931 | 28,931 | 30,390 |
| Class NAV3 | 12-20-11 | 29,447 | 29,447 | 30,390 |
The Russell 1000 Growth Index is an unmanaged index that measures the performance of the small-cap growth segment of the U.S. equity universe. It includes those Russell 1000 companies with higher price-to-book ratios and higher forecasted growth values.
It is not possible to invest directly in an index. Index figures do not reflect expenses or sales charges, which would result in lower returns.
Footnotes related to performance pages
| 1 | From 12-20-11. |
| 2 | Class C shares were first offered on 8-28-14; Class R2, Class R4, and Class R6 shares were first offered on 3-27-15. Returns prior to these dates are those of Class A shares that have not been adjusted for class-specific expenses; otherwise, returns would vary. |
| 3 | For certain types of investors, as described in the fund's prospectuses. |
| 4 | The contingent deferred sales charge is not applicable. |
| Your expenses |
| 8 | JOHN HANCOCK U.S. QUALITY GROWTH FUND | ANNUAL REPORT |
| Account value on 10-1-2018 | Ending value on 3-31-2019 | Expenses paid during period ended 3-31-20191 | Annualized expense ratio | ||
| Class A | Actual expenses/actual returns | $1,000.00 | $994.10 | $5.22 | 1.05% |
| Hypothetical example | 1,000.00 | 1,019.70 | 5.29 | 1.05% | |
| Class C | Actual expenses/actual returns | 1,000.00 | 990.00 | 8.93 | 1.80% |
| Hypothetical example | 1,000.00 | 1,016.00 | 9.05 | 1.80% | |
| Class I | Actual expenses/actual returns | 1,000.00 | 995.10 | 4.08 | 0.82% |
| Hypothetical example | 1,000.00 | 1,020.80 | 4.13 | 0.82% | |
| Class R2 | Actual expenses/actual returns | 1,000.00 | 993.50 | 5.96 | 1.20% |
| Hypothetical example | 1,000.00 | 1,018.90 | 6.04 | 1.20% | |
| Class R4 | Actual expenses/actual returns | 1,000.00 | 994.20 | 4.72 | 0.95% |
| Hypothetical example | 1,000.00 | 1,020.20 | 4.78 | 0.95% | |
| Class R6 | Actual expenses/actual returns | 1,000.00 | 996.00 | 3.48 | 0.70% |
| Hypothetical example | 1,000.00 | 1,021.40 | 3.53 | 0.70% | |
| Class NAV | Actual expenses/actual returns | 1,000.00 | 996.20 | 3.33 | 0.67% |
| Hypothetical example | 1,000.00 | 1,021.60 | 3.38 | 0.67% |
| 1 | Expenses are equal to the annualized expense ratio, multiplied by the average account value over the period, multiplied by 182/365 (to reflect the one-half year period). |
| ANNUAL REPORT | JOHN HANCOCK U.S. QUALITY GROWTH FUND | 9 |
| Fund’s investments |
| Shares | Value | ||||
| Common stocks 99.2% | $543,955,441 | ||||
| (Cost $453,578,487) | |||||
| Communication services 11.5% | 63,328,076 | ||||
| Interactive media and services 10.5% | |||||
| Alphabet, Inc., Class A (A) | 28,962 | 34,085,088 | |||
| Facebook, Inc., Class A (A) | 142,017 | 23,672,814 | |||
| Media 1.0% | |||||
| Comcast Corp., Class A | 139,324 | 5,570,174 | |||
| Consumer discretionary 16.2% | 88,803,952 | ||||
| Hotels, restaurants and leisure 1.1% | |||||
| Domino's Pizza, Inc. | 23,368 | 6,031,281 | |||
| Internet and direct marketing retail 8.0% | |||||
| Amazon.com, Inc. (A) | 19,643 | 34,979,272 | |||
| Booking Holdings, Inc. (A) | 4,950 | 8,637,305 | |||
| Specialty retail 5.3% | |||||
| Ross Stores, Inc. | 70,379 | 6,552,285 | |||
| The Home Depot, Inc. | 76,043 | 14,591,891 | |||
| The TJX Companies, Inc. | 153,469 | 8,166,085 | |||
| Textiles, apparel and luxury goods 1.8% | |||||
| NIKE, Inc., Class B | 116,920 | 9,845,833 | |||
| Consumer staples 1.2% | 6,719,728 | ||||
| Food and staples retailing 1.2% | |||||
| Sysco Corp. | 100,655 | 6,719,728 | |||
| Financials 6.5% | 35,602,604 | ||||
| Capital markets 3.8% | |||||
| Intercontinental Exchange, Inc. | 83,608 | 6,365,913 | |||
| S&P Global, Inc. | 39,695 | 8,357,782 | |||
| TD Ameritrade Holding Corp. | 125,363 | 6,266,896 | |||
| Consumer finance 1.4% | |||||
| American Express Company | 69,167 | 7,559,953 | |||
| Insurance 1.3% | |||||
| The Progressive Corp. | 97,823 | 7,052,060 | |||
| Health care 14.5% | 79,756,220 | ||||
| Health care equipment and supplies 4.6% | |||||
| Abbott Laboratories | 78,440 | 6,270,494 | |||
| Baxter International, Inc. | 74,343 | 6,044,829 | |||
| Edwards Lifesciences Corp. (A) | 39,943 | 7,642,294 | |||
| Medtronic PLC | 60,223 | 5,485,111 | |||
| 10 | JOHN HANCOCK U.S. QUALITY GROWTH FUND | ANNUAL REPORT | SEE NOTES TO FINANCIAL STATEMENTS |
| Shares | Value | ||||
| Health care (continued) | |||||
| Health care providers and services 6.1% | |||||
| Anthem, Inc. | 18,193 | $5,221,027 | |||
| Humana, Inc. | 25,006 | 6,651,596 | |||
| UnitedHealth Group, Inc. | 60,968 | 15,074,948 | |||
| WellCare Health Plans, Inc. (A) | 24,626 | 6,642,864 | |||
| Life sciences tools and services 2.2% | |||||
| Agilent Technologies, Inc. | 75,508 | 6,069,333 | |||
| Thermo Fisher Scientific, Inc. | 22,246 | 6,089,175 | |||
| Pharmaceuticals 1.6% | |||||
| Eli Lilly & Company | 66,003 | 8,564,549 | |||
| Industrials 10.6% | 57,902,024 | ||||
| Aerospace and defense 5.3% | |||||
| Harris Corp. | 39,958 | 6,381,692 | |||
| Lockheed Martin Corp. | 26,825 | 8,051,792 | |||
| The Boeing Company | 37,705 | 14,381,441 | |||
| Professional services 2.2% | |||||
| IHS Markit, Ltd. (A) | 105,473 | 5,735,622 | |||
| TransUnion | 95,515 | 6,384,223 | |||
| Road and rail 3.1% | |||||
| Norfolk Southern Corp. | 32,657 | 6,103,267 | |||
| Union Pacific Corp. | 64,976 | 10,863,987 | |||
| Information technology 37.0% | 202,596,388 | ||||
| Communications equipment 1.1% | |||||
| Cisco Systems, Inc. | 106,327 | 5,740,595 | |||
| Electronic equipment, instruments and components 1.3% | |||||
| CDW Corp. | 73,627 | 7,095,434 | |||
| IT services 18.0% | |||||
| Accenture PLC, Class A | 61,194 | 10,771,368 | |||
| Automatic Data Processing, Inc. | 55,982 | 8,942,565 | |||
| EPAM Systems, Inc. (A) | 37,679 | 6,372,649 | |||
| Ex-Sigma LLC (A)(B)(C) | 510 | 574,898 | |||
| FleetCor Technologies, Inc. (A) | 30,875 | 7,613,466 | |||
| Global Payments, Inc. | 57,860 | 7,899,047 | |||
| Mastercard, Inc., Class A | 64,440 | 15,172,398 | |||
| PayPal Holdings, Inc. (A) | 102,889 | 10,683,994 | |||
| Total System Services, Inc. | 68,748 | 6,531,747 | |||
| VeriSign, Inc. (A) | 36,097 | 6,553,771 | |||
| Visa, Inc., Class A | 112,161 | 17,518,427 | |||
| Semiconductors and semiconductor equipment 1.5% | |||||
| KLA-Tencor Corp. | 70,725 | 8,445,272 | |||
| SEE NOTES TO FINANCIAL STATEMENTS | ANNUAL REPORT | JOHN HANCOCK U.S. QUALITY GROWTH FUND | 11 |
| Shares | Value | ||||
| Information technology (continued) | |||||
| Software 13.9% | |||||
| Adobe, Inc. (A) | 41,949 | $11,178,989 | |||
| Fortinet, Inc. (A) | 67,190 | 5,641,944 | |||
| Intuit, Inc. | 36,535 | 9,550,614 | |||
| Microsoft Corp. | 336,677 | 39,707,686 | |||
| salesforce.com, Inc. (A) | 63,202 | 10,009,301 | |||
| Technology hardware, storage and peripherals 1.2% | |||||
| NetApp, Inc. | 95,071 | 6,592,223 | |||
| Real estate 1.7% | 9,246,449 | ||||
| Equity real estate investment trusts 1.7% | |||||
| American Tower Corp. | 46,922 | 9,246,449 | |||
| Yield (%) | Shares | Value | |||
| Short-term investments 0.5% | $2,655,180 | ||||
| (Cost $2,655,180) | |||||
| Money market funds 0.5% | 2,655,180 | ||||
| State Street Institutional U.S. Government Money Market Fund, Premier Class | 2.3851(D) | 2,655,180 | 2,655,180 | ||
| Total investments (Cost $456,233,667) 99.7% | $546,610,621 | ||||
| Other assets and liabilities, net 0.3% | 1,587,881 | ||||
| Total net assets 100.0% | $548,198,502 | ||||
| The percentage shown for each investment category is the total value of the category as a percentage of the net assets of the fund. | |
| Security Abbreviations and Legend | |
| (A) | Non-income producing security. |
| (B) | Direct placement securities are restricted as to resale, and the fund has limited rights to registration under the Securities Act of 1933. For more information on this security refer to the Notes to financial statements. |
| (C) | Security is valued using significant unobservable inputs and is classified as Level 3 in the fair value hierarchy. |
| (D) | The rate shown is the annualized seven-day yield as of 3-31-19. |
| 12 | JOHN HANCOCK U.S. QUALITY GROWTH FUND | ANNUAL REPORT | SEE NOTES TO FINANCIAL STATEMENTS |
| Financial statements |
| Assets | |
| Unaffiliated investments, at value (Cost $456,233,667) | $546,610,621 |
| Dividends and interest receivable | 149,543 |
| Receivable for fund shares sold | 1,661,608 |
| Receivable for securities lending income | 67,205 |
| Other assets | 120,177 |
| Total assets | 548,609,154 |
| Liabilities | |
| Payable for fund shares repurchased | 116,865 |
| Payable to affiliates | |
| Accounting and legal services fees | 29,778 |
| Transfer agent fees | 51,005 |
| Distribution and service fees | 506 |
| Trustees' fees | 75 |
| Other liabilities and accrued expenses | 212,423 |
| Total liabilities | 410,652 |
| Net assets | $548,198,502 |
| Net assets consist of | |
| Paid-in capital | $461,692,917 |
| Total distributable earnings (loss) | 86,505,585 |
| Net assets | $548,198,502 |
| Net asset value per share | |
| Based on net asset value and shares outstanding - the fund has an unlimited number of shares authorized with no par value | |
| Class A ($404,324,762 ÷ 24,907,817 shares)1 | $16.23 |
| Class C ($11,671,577 ÷ 734,861 shares)1 | $15.88 |
| Class I ($115,325,650 ÷ 7,049,224 shares) | $16.36 |
| Class R2 ($930,054 ÷ 56,721 shares) | $16.40 |
| Class R4 ($823,642 ÷ 50,242 shares) | $16.39 |
| Class R6 ($15,073,221 ÷ 919,763 shares) | $16.39 |
| Class NAV ($49,596 ÷ 3,028 shares) | $16.38 |
| Maximum offering price per share | |
| Class A (net asset value per share ÷ 95%)2 | $17.08 |
| 1 | Redemption price per share is equal to net asset value less any applicable contingent deferred sales charge. |
| 2 | On single retail sales of less than $50,000. On sales of $50,000 or more and on group sales the offering price is reduced. |
| SEE NOTES TO FINANCIAL STATEMENTS | ANNUAL REPORT | JOHN HANCOCK U.S. Quality Growth Fund | 13 |
| Investment income | |
| Dividends | $10,585,775 |
| Interest | 581,207 |
| Securities lending | 118,471 |
| Total investment income | 11,285,453 |
| Expenses | |
| Investment management fees | 7,843,422 |
| Distribution and service fees | 1,097,320 |
| Accounting and legal services fees | 177,625 |
| Transfer agent fees | 508,914 |
| Trustees' fees | 22,975 |
| Custodian fees | 141,603 |
| State registration fees | 117,977 |
| Printing and postage | 107,245 |
| Professional fees | 219,868 |
| Other | 57,911 |
| Total expenses | 10,294,860 |
| Less expense reductions | (97,626) |
| Net expenses | 10,197,234 |
| Net investment income | 1,088,219 |
| Realized and unrealized gain (loss) | |
| Net realized gain (loss) on | |
| Unaffiliated investments | 281,745,834 |
| Affiliated investments | 9,839 |
| Futures contracts | (4,319,716) |
| Redemptions in kind | 445,650,527 |
| 723,086,484 | |
| Change in net unrealized appreciation (depreciation) of | |
| Unaffiliated investments | (485,934,293) |
| Affiliated investments | 1,811 |
| (485,932,482) | |
| Net realized and unrealized gain | 237,154,002 |
| Increase in net assets from operations | $238,242,221 |
| 14 | JOHN HANCOCK U.S. Quality Growth Fund | ANNUAL REPORT | SEE NOTES TO FINANCIAL STATEMENTS |
| Year ended 3-31-19 | Year ended 3-31-18 | |
| Increase (decrease) in net assets | ||
| From operations | ||
| Net investment income | $1,088,219 | $6,154,329 |
| Net realized gain | 723,086,484 | 319,093,606 |
| Change in net unrealized appreciation (depreciation) | (485,932,482) | 69,918,355 |
| Increase in net assets resulting from operations | 238,242,221 | 395,166,290 |
| Distributions to shareholders | ||
| From net investment income and net realized gain | ||
| Class A | (83,061,817) | — |
| Class C | (1,692,850) | — |
| Class I | (5,130,366) | — |
| Class R2 | (174,632) | — |
| Class R4 | (156,581) | — |
| Class R6 | (1,983,279) | — |
| Class NAV | (267,256,660) | — |
| From net investment income | ||
| Class A | — | (639,234) |
| Class I | — | (59,195) |
| Class R2 | — | (575) |
| Class R4 | — | (828) |
| Class R6 | — | (41,600) |
| Class NAV | — | (7,398,368) |
| From net realized gain | ||
| Class A | — | (48,412,616) |
| Class C | — | (2,323,098) |
| Class I | — | (1,898,081) |
| Class R2 | — | (98,002) |
| Class R4 | — | (33,305) |
| Class R6 | — | (1,091,224) |
| Class NAV | — | (187,258,888) |
| Total distributions | (359,456,185) | (249,255,014) |
| From fund share transactions | (1,167,772,986) | (279,918,632) |
| Total decrease | (1,288,986,950) | (134,007,356) |
| Net assets | ||
| Beginning of year | 1,837,185,452 | 1,971,192,808 |
| End of year1 | $548,198,502 | $1,837,185,452 |
| 1 | Net assets - End of year includes undistributed net investment income of $0 at March 31, 2018. The SEC eliminated the requirement to disclose undistributed net investment income in the current reporting period. |
| SEE NOTES TO FINANCIAL STATEMENTS | ANNUAL REPORT | JOHN HANCOCK U.S. Quality Growth Fund | 15 |
| Financial highlights |
| CLASS A SHARES Period ended | 3-31-19 | 3-31-18 | 3-31-17 | 3-31-16 | 3-31-15 |
| Per share operating performance | |||||
| Net asset value, beginning of period | $17.94 | $16.89 | $15.33 | $16.44 | $15.50 |
| Net investment income (loss)1 | (0.01) | 0.01 | 0.04 | 0.03 | 0.03 |
| Net realized and unrealized gain (loss) on investments | 2.22 | 3.62 | 2.12 | (0.24) | 2.14 |
| Total from investment operations | 2.21 | 3.63 | 2.16 | (0.21) | 2.17 |
| Less distributions | |||||
| From net investment income | (0.03) | (0.03) | (0.04) | (0.05) | — |
| From net realized gain | (3.89) | (2.55) | (0.56) | (0.85) | (1.23) |
| Total distributions | (3.92) | (2.58) | (0.60) | (0.90) | (1.23) |
| Net asset value, end of period | $16.23 | $17.94 | $16.89 | $15.33 | $16.44 |
| Total return (%)2,3 | 12.22 | 21.91 | 14.34 | (1.45) | 14.68 |
| Ratios and supplemental data | |||||
| Net assets, end of period (in millions) | $404 | $379 | $343 | $18 | $18 |
| Ratios (as a percentage of average net assets): | |||||
| Expenses before reductions | 1.10 | 1.10 | 1.11 | 1.19 | 1.33 |
| Expenses including reductions | 1.09 | 1.09 | 1.10 | 1.18 | 1.30 |
| Net investment income (loss) | (0.07) | 0.03 | 0.27 | 0.20 | 0.16 |
| Portfolio turnover (%) | 884 | 83 | 94 | 90 | 109 |
| 1 | Based on average daily shares outstanding. |
| 2 | Total returns would have been lower had certain expenses not been reduced during the applicable periods. |
| 3 | Does not reflect the effect of sales charges, if any. |
| 4 | Excludes in-kind transactions. |
| 16 | JOHN HANCOCK U.S. Quality Growth Fund | ANNUAL REPORT | SEE NOTES TO FINANCIAL STATEMENTS |
| CLASS C SHARES Period ended | 3-31-19 | 3-31-18 | 3-31-17 | 3-31-16 | 3-31-151 |
| Per share operating performance | |||||
| Net asset value, beginning of period | $17.71 | $16.80 | $15.32 | $16.51 | $16.49 |
| Net investment loss2 | (0.14) | (0.13) | (0.08) | (0.09) | (0.04) |
| Net realized and unrealized gain (loss) on investments | 2.20 | 3.59 | 2.12 | (0.25) | 1.29 |
| Total from investment operations | 2.06 | 3.46 | 2.04 | (0.34) | 1.25 |
| Less distributions | |||||
| From net realized gain | (3.89) | (2.55) | (0.56) | (0.85) | (1.23) |
| Net asset value, end of period | $15.88 | $17.71 | $16.80 | $15.32 | $16.51 |
| Total return (%)3,4 | 11.44 | 20.95 | 13.53 | (2.24) | 8.205 |
| Ratios and supplemental data | |||||
| Net assets, end of period (in millions) | $12 | $18 | $17 | $1 | $1 |
| Ratios (as a percentage of average net assets): | |||||
| Expenses before reductions | 1.85 | 1.85 | 1.86 | 2.50 | 7.036 |
| Expenses including reductions | 1.84 | 1.84 | 1.85 | 1.94 | 2.056 |
| Net investment loss | (0.85) | (0.72) | (0.48) | (0.54) | (0.42)6 |
| Portfolio turnover (%) | 887 | 83 | 94 | 90 | 1098 |
| 1 | The inception date for Class C shares is 8-28-14. |
| 2 | Based on average daily shares outstanding. |
| 3 | Total returns would have been lower had certain expenses not been reduced during the applicable periods. |
| 4 | Does not reflect the effect of sales charges, if any. |
| 5 | Not annualized. |
| 6 | Annualized. |
| 7 | Excludes in-kind transactions. |
| 8 | Portfolio turnover is shown for the period from 4-1-14 to 3-31-15. |
| SEE NOTES TO FINANCIAL STATEMENTS | ANNUAL REPORT | JOHN HANCOCK U.S. Quality Growth Fund | 17 |
| CLASS I SHARES Period ended | 3-31-19 | 3-31-18 | 3-31-17 | 3-31-16 | 3-31-15 |
| Per share operating performance | |||||
| Net asset value, beginning of period | $18.05 | $16.98 | $15.41 | $16.53 | $15.58 |
| Net investment income1 | 0.04 | 0.06 | 0.08 | 0.08 | 0.10 |
| Net realized and unrealized gain (loss) on investments | 2.23 | 3.64 | 2.13 | (0.24) | 2.14 |
| Total from investment operations | 2.27 | 3.70 | 2.21 | (0.16) | 2.24 |
| Less distributions | |||||
| From net investment income | (0.07) | (0.08) | (0.08) | (0.11) | (0.06) |
| From net realized gain | (3.89) | (2.55) | (0.56) | (0.85) | (1.23) |
| Total distributions | (3.96) | (2.63) | (0.64) | (0.96) | (1.29) |
| Net asset value, end of period | $16.36 | $18.05 | $16.98 | $15.41 | $16.53 |
| Total return (%)2 | 12.55 | 22.12 | 14.70 | (1.17) | 15.07 |
| Ratios and supplemental data | |||||
| Net assets, end of period (in millions) | $115 | $20 | $17 | $10 | $12 |
| Ratios (as a percentage of average net assets): | |||||
| Expenses before reductions | 0.87 | 0.84 | 0.85 | 0.90 | 1.50 |
| Expenses including reductions | 0.86 | 0.83 | 0.84 | 0.88 | 0.94 |
| Net investment income | 0.25 | 0.31 | 0.47 | 0.50 | 0.62 |
| Portfolio turnover (%) | 883 | 83 | 94 | 90 | 109 |
| 1 | Based on average daily shares outstanding. |
| 2 | Total returns would have been lower had certain expenses not been reduced during the applicable periods. |
| 3 | Excludes in-kind transactions. |
| 18 | JOHN HANCOCK U.S. Quality Growth Fund | ANNUAL REPORT | SEE NOTES TO FINANCIAL STATEMENTS |
| CLASS R2 SHARES Period ended | 3-31-19 | 3-31-18 | 3-31-17 | 3-31-16 | 3-31-151 |
| Per share operating performance | |||||
| Net asset value, beginning of period | $18.08 | $17.02 | $15.44 | $16.55 | $16.50 |
| Net investment income (loss)2 | (0.04) | (0.02) | 0.03 | 0.01 | —3 |
| Net realized and unrealized gain (loss) on investments | 2.25 | 3.64 | 2.14 | (0.25) | 0.05 |
| Total from investment operations | 2.21 | 3.62 | 2.17 | (0.24) | 0.05 |
| Less distributions | |||||
| From net investment income | —3 | (0.01) | (0.03) | (0.02) | — |
| From net realized gain | (3.89) | (2.55) | (0.56) | (0.85) | — |
| Total distributions | (3.89) | (2.56) | (0.59) | (0.87) | — |
| Net asset value, end of period | $16.40 | $18.08 | $17.02 | $15.44 | $16.55 |
| Total return (%)4 | 12.13 | 21.68 | 14.30 | (1.63) | 0.305 |
| Ratios and supplemental data | |||||
| Net assets, end of period (in millions) | $1 | $1 | $1 | $—6 | $—6 |
| Ratios (as a percentage of average net assets): | |||||
| Expenses before reductions | 1.25 | 1.22 | 1.18 | 4.73 | 15.097 |
| Expenses including reductions | 1.25 | 1.21 | 1.17 | 1.32 | 13.967 |
| Net investment income (loss) | (0.22) | (0.11) | 0.19 | 0.06 | —7,8 |
| Portfolio turnover (%) | 889 | 83 | 94 | 90 | 10910 |
| 1 | The inception date for Class R2 shares is 3-27-15. |
| 2 | Based on average daily shares outstanding. |
| 3 | Less than $0.005 per share. |
| 4 | Total returns would have been lower had certain expenses not been reduced during the applicable periods. |
| 5 | Not annualized. |
| 6 | Less than $500,000. |
| 7 | Annualized. |
| 8 | Less than 0.005%. |
| 9 | Excludes in-kind transactions. |
| 10 | Portfolio turnover is shown for the period from 4-1-14 to 3-31-15. |
| SEE NOTES TO FINANCIAL STATEMENTS | ANNUAL REPORT | JOHN HANCOCK U.S. Quality Growth Fund | 19 |
| CLASS R4 SHARES Period ended | 3-31-19 | 3-31-18 | 3-31-17 | 3-31-16 | 3-31-151 |
| Per share operating performance | |||||
| Net asset value, beginning of period | $18.08 | $17.01 | $15.43 | $16.55 | $16.50 |
| Net investment income2 | 0.01 | 0.03 | 0.07 | 0.04 | —3 |
| Net realized and unrealized gain (loss) on investments | 2.24 | 3.65 | 2.14 | (0.25) | 0.05 |
| Total from investment operations | 2.25 | 3.68 | 2.21 | (0.21) | 0.05 |
| Less distributions | |||||
| From net investment income | (0.05) | (0.06) | (0.07) | (0.06) | — |
| From net realized gain | (3.89) | (2.55) | (0.56) | (0.85) | — |
| Total distributions | (3.94) | (2.61) | (0.63) | (0.91) | — |
| Net asset value, end of period | $16.39 | $18.08 | $17.01 | $15.43 | $16.55 |
| Total return (%)4 | 12.36 | 22.05 | 14.60 | (1.47) | 0.305 |
| Ratios and supplemental data | |||||
| Net assets, end of period (in millions) | $1 | $1 | $—6 | $—6 | $—6 |
| Ratios (as a percentage of average net assets): | |||||
| Expenses before reductions | 1.10 | 1.06 | 1.02 | 4.73 | 15.097 |
| Expenses including reductions | 1.00 | 0.95 | 0.91 | 1.13 | 1.187 |
| Net investment income | 0.03 | 0.18 | 0.44 | 0.25 | 0.187 |
| Portfolio turnover (%) | 888 | 83 | 94 | 90 | 1099 |
| 1 | The inception date for Class R4 shares is 3-27-15. |
| 2 | Based on average daily shares outstanding. |
| 3 | Less than $0.005 per share. |
| 4 | Total returns would have been lower had certain expenses not been reduced during the applicable periods. |
| 5 | Not annualized. |
| 6 | Less than $500,000. |
| 7 | Annualized. |
| 8 | Excludes in-kind transactions. |
| 9 | Portfolio turnover is shown for the period from 4-1-14 to 3-31-15. |
| 20 | JOHN HANCOCK U.S. Quality Growth Fund | ANNUAL REPORT | SEE NOTES TO FINANCIAL STATEMENTS |
| CLASS R6 SHARES Period ended | 3-31-19 | 3-31-18 | 3-31-17 | 3-31-16 | 3-31-151 |
| Per share operating performance | |||||
| Net asset value, beginning of period | $18.08 | $17.01 | $15.42 | $16.55 | $16.50 |
| Net investment income2 | 0.05 | 0.05 | 0.09 | 0.10 | —3 |
| Net realized and unrealized gain (loss) on investments | 2.24 | 3.67 | 2.16 | (0.25) | 0.05 |
| Total from investment operations | 2.29 | 3.72 | 2.25 | (0.15) | 0.05 |
| Less distributions | |||||
| From net investment income | (0.09) | (0.10) | (0.10) | (0.13) | — |
| From net realized gain | (3.89) | (2.55) | (0.56) | (0.85) | — |
| Total distributions | (3.98) | (2.65) | (0.66) | (0.98) | — |
| Net asset value, end of period | $16.39 | $18.08 | $17.01 | $15.42 | $16.55 |
| Total return (%)4 | 12.68 | 22.26 | 14.87 | (1.09) | 0.305 |
| Ratios and supplemental data | |||||
| Net assets, end of period (in millions) | $15 | $9 | $1 | $—6 | $—6 |
| Ratios (as a percentage of average net assets): | |||||
| Expenses before reductions | 0.75 | 0.75 | 0.75 | 4.75 | 15.917 |
| Expenses including reductions | 0.74 | 0.74 | 0.73 | 0.73 | 0.817 |
| Net investment income | 0.29 | 0.25 | 0.50 | 0.65 | 0.637 |
| Portfolio turnover (%) | 888 | 83 | 94 | 90 | 1099 |
| 1 | The inception date for Class R6 shares is 3-27-15. |
| 2 | Based on average daily shares outstanding. |
| 3 | Less than $0.005 per share. |
| 4 | Total returns would have been lower had certain expenses not been reduced during the applicable periods. |
| 5 | Not annualized. |
| 6 | Less than $500,000. |
| 7 | Annualized. |
| 8 | Excludes in-kind transactions. |
| 9 | Portfolio turnover is shown for the period from 4-1-14 to 3-31-15. |
| SEE NOTES TO FINANCIAL STATEMENTS | ANNUAL REPORT | JOHN HANCOCK U.S. Quality Growth Fund | 21 |
| CLASS NAV SHARES Period ended | 3-31-19 | 3-31-18 | 3-31-17 | 3-31-16 | 3-31-15 |
| Per share operating performance | |||||
| Net asset value, beginning of period | $18.07 | $17.00 | $15.42 | $16.55 | $15.58 |
| Net investment income1 | 0.03 | 0.07 | 0.10 | 0.10 | 0.12 |
| Net realized and unrealized gain (loss) on investments | 2.26 | 3.65 | 2.14 | (0.25) | 2.17 |
| Total from investment operations | 2.29 | 3.72 | 2.24 | (0.15) | 2.29 |
| Less distributions | |||||
| From net investment income | (0.09) | (0.10) | (0.10) | (0.13) | (0.09) |
| From net realized gain | (3.89) | (2.55) | (0.56) | (0.85) | (1.23) |
| Total distributions | (3.98) | (2.65) | (0.66) | (0.98) | (1.32) |
| Net asset value, end of period | $16.38 | $18.07 | $17.00 | $15.42 | $16.55 |
| Total return (%)2 | 12.69 | 22.30 | 14.81 | (1.09) | 15.43 |
| Ratios and supplemental data | |||||
| Net assets, end of period (in millions) | $—3 | $1,410 | $1,592 | $1,666 | $2,078 |
| Ratios (as a percentage of average net assets): | |||||
| Expenses before reductions | 0.74 | 0.73 | 0.73 | 0.74 | 0.72 |
| Expenses including reductions | 0.73 | 0.73 | 0.73 | 0.74 | 0.72 |
| Net investment income | 0.18 | 0.40 | 0.61 | 0.64 | 0.72 |
| Portfolio turnover (%) | 884 | 83 | 94 | 90 | 109 |
| 1 | Based on average daily shares outstanding. |
| 2 | Total returns would have been lower had certain expenses not been reduced during the applicable periods. |
| 3 | Less than $500,000. |
| 4 | Excludes in-kind transactions. |
| 22 | JOHN HANCOCK U.S. Quality Growth Fund | ANNUAL REPORT | SEE NOTES TO FINANCIAL STATEMENTS |
Note 1 — Organization
John Hancock U.S. Quality Growth Fund (formerly, John Hancock Strategic Growth Fund) (the fund) is a series of John Hancock Funds III (the Trust), an open-end management investment company organized as a Massachusetts business trust and registered under the Investment Company Act of 1940, as amended (the 1940 Act). The investment objective of the fund is to seek long-term capital appreciation.
The fund may offer multiple classes of shares. The shares currently offered are detailed in the Statement of assets and liabilities. Class A and Class C shares are offered to all investors. Class I shares are offered to institutions and certain investors. Class R2 and Class R4 shares are available only to certain retirement and 529 plans. Class R6 shares are available only to certain retirement plans, institutions and other investors. Class NAV shares are offered to John Hancock affiliated funds of funds, retirement plans for employees of John Hancock and/or Manulife Financial Corporation (MFC), and certain 529 plans. Class C shares convert to Class A shares ten years after purchase (certain exclusions may apply). Shareholders of each class have exclusive voting rights to matters that affect that class. The distribution and service fees, if any, and transfer agent fees for each class may differ.
On September 13, 2018, the Board of Trustees voted to recommend that shareholders approve the reorganization of John Hancock Funds II U.S. Growth Fund into the fund. Following approval by U.S. Growth Fund's shareholders on March 15, 2019, the reorganization occurred as of the close of business on April 12, 2019, which resulted in an increase in net assets of approximately $230 million.
Note 2 — Significant accounting policies
The financial statements have been prepared in conformity with accounting principles generally accepted in the United States of America (US GAAP), which require management to make certain estimates and assumptions as of the date of the financial statements. Actual results could differ from those estimates and those differences could be significant. The fund qualifies as an investment company under Topic 946 of Accounting Standards Codification of US GAAP.
Events or transactions occurring after the end of the fiscal period through the date that the financial statements were issued have been evaluated in the preparation of the financial statements. The following summarizes the significant accounting policies of the fund:
Security valuation.Investments are stated at value as of the scheduled close of regular trading on the New York Stock Exchange (NYSE), normally at 4:00 p.m., Eastern Time. In case of emergency or other disruption resulting in the NYSE not opening for trading or the NYSE closing at a time other than the regularly scheduled close, the net asset value (NAV) may be determined as of the regularly scheduled close of the NYSE pursuant to the fund's Valuation Policies and Procedures.
In order to value the securities, the fund uses the following valuation techniques: Equity securities held by the fund are typically valued at the last sale price or official closing price on the exchange or principal market where the security trades. In the event there were no sales during the day or closing prices are not available, the securities are valued using the last available bid price. Investments by the fund in open-end management investment companies are valued at their respective NAVs each business day.
In certain instances, the Pricing Committee may determine to value equity securities using prices obtained from another exchange or market if trading on the exchange or market on which prices are typically obtained did not open for trading as scheduled, or if trading closed earlier than scheduled, and trading occurred as normal on another exchange or market. Other portfolio securities and assets, for which reliable market quotations are not readily available, are valued at fair value as determined in good faith by the fund's Pricing Committee following procedures established by the Board of Trustees. The frequency with which these fair valuation procedures are used cannot be
predicted and fair value of securities may differ significantly from the value that would have been used had a ready market for such securities existed.
The fund uses a three-tier hierarchy to prioritize the pricing assumptions, referred to as inputs, used in valuation techniques to measure fair value. Level 1 includes securities valued using quoted prices in active markets for identical securities. Level 2 includes securities valued using other significant observable inputs. Observable inputs may include quoted prices for similar securities, interest rates, prepayment speeds and credit risk. Prices for securities valued using these inputs are received from independent pricing vendors and brokers and are based on an evaluation of the inputs described. Level 3 includes securities valued using significant unobservable inputs when market prices are not readily available or reliable, including the fund's own assumptions in determining the fair value of investments. Factors used in determining value may include market or issuer specific events or trends, changes in interest rates and credit quality. The inputs or methodology used for valuing securities are not necessarily an indication of the risks associated with investing in those securities. Changes in valuation techniques and related inputs may result in transfers into or out of an assigned level within the disclosure hierarchy.
The following is a summary of the values by input classification of the fund's investments as of March 31, 2019, by major security category or type:
| Total value at 3-31-19 | Level 1 quoted price | Level 2 significant observable inputs | Level 3 significant unobservable inputs | ||
| Investments in securities: | |||||
| Assets | |||||
| Common stocks | |||||
| Communication services | $63,328,076 | $63,328,076 | — | — | |
| Consumer discretionary | 88,803,952 | 88,803,952 | — | — | |
| Consumer staples | 6,719,728 | 6,719,728 | — | — | |
| Financials | 35,602,604 | 35,602,604 | — | — | |
| Health care | 79,756,220 | 79,756,220 | — | — | |
| Industrials | 57,902,024 | 57,902,024 | — | — | |
| Information technology | 202,596,388 | 202,021,490 | — | $574,898 | |
| Real estate | 9,246,449 | 9,246,449 | — | — | |
| Short-term investments | 2,655,180 | 2,655,180 | — | — | |
| Total investments in securities | $546,610,621 | $546,035,723 | — | $574,898 | |
Security transactions and related investment income. Investment security transactions are accounted for on a trade date plus one basis for daily NAV calculations. However, for financial reporting purposes, investment transactions are reported on trade date. Interest income is accrued as earned. Dividend income is recorded on the ex-date, except for dividends of foreign securities where the dividend may not be known until after the ex-date. In those cases, dividend income, net of withholding taxes, is recorded when the fund becomes aware of the dividends. Non-cash dividends, if any, are recorded at the fair market value of the securities received. Gains and losses on securities sold are determined on the basis of identified cost and may include proceeds from litigation.
Securities lending.The fund may lend its securities to earn additional income. The fund receives cash collateral from the borrower in an amount not less than the market value of the loaned securities. The fund will invest its collateral in John Hancock Collateral Trust (JHCT), an affiliate of the fund, which has a floating NAV and is registered with the Securities and Exchange Commission (SEC) as an investment company. JHCT invests in short-term money market
investments. The fund will receive the benefit of any gains and bear any losses generated by JHCT with respect to the cash collateral.
The fund has the right to recall loaned securities on demand. If a borrower fails to return loaned securities when due, then the lending agent is responsible and indemnifies the fund for the lent securities. The lending agent uses the collateral received from the borrower to purchase replacement securities of the same issue, type, class and series of the loaned securities. If the value of the collateral is less than the purchase cost of replacement securities, the lending agent is responsible for satisfying the shortfall but only to the extent that the shortfall is not due to any decrease in the value of JHCT.
Although the risk of the loss of the securities lent is mitigated by receiving collateral from the borrower and through lending agent indemnification, the fund could experience a delay in recovering securities or could experience a lower than expected return if the borrower fails to return the securities on a timely basis. The fund receives compensation for lending its securities by retaining a portion of the return on the investment of the collateral and compensation from fees earned from borrowers of the securities. Securities lending income received by the fund is net of fees retained by the securities lending agent. Net income received from JHCT is a component of securities lending income as recorded on the Statement of operations. As of March 31, 2019, there were no securities on loan.
Line of credit.The fund may have the ability to borrow from banks for temporary or emergency purposes, including meeting redemption requests that otherwise might require the untimely sale of securities. Pursuant to the fund's custodian agreement, the custodian may loan money to the fund to make properly authorized payments. The fund is obligated to repay the custodian for any overdraft, including any related costs or expenses. The custodian may have a lien, security interest or security entitlement in any fund property that is not otherwise segregated or pledged, to the extent of any overdraft, and to the maximum extent permitted by law.
The fund and other affiliated funds have entered into a syndicated line of credit agreement with Citibank, N.A. as the administrative agent that enables them to participate in a $750 million unsecured committed line of credit. Excluding commitments designated for a certain fund and subject to the needs of all other affiliated funds, the fund can borrow up to an aggregate commitment amount of $500 million, subject to asset coverage and other limitations as specified in the agreement. A commitment fee payable at the end of each calendar quarter, based on the average daily unused portion of the line of credit, is charged to each participating fund based on a combination of fixed and asset based allocations and is reflected in Other expenses on the Statement of operations. For the year ended March 31, 2019, the fund had no borrowings under the line of credit. Commitment fees for the year ended March 31, 2019 were $5,006.
Expenses. Within the John Hancock group of funds complex, expenses that are directly attributable to an individual fund are allocated to such fund. Expenses that are not readily attributable to a specific fund are allocated among all funds in an equitable manner, taking into consideration, among other things, the nature and type of expense and the fund's relative net assets. Expense estimates are accrued in the period to which they relate and adjustments are made when actual amounts are known.
Class allocations. Income, common expenses and realized and unrealized gains (losses) are determined at the fund level and allocated daily to each class of shares based on the net assets of the class. Class-specific expenses, such as distribution and service fees, if any, and transfer agent fees, for all classes, are charged daily at the class level based on the net assets of each class and the specific expense rates applicable to each class.
Federal income taxes. The fund intends to continue to qualify as a regulated investment company by complying with the applicable provisions of the Internal Revenue Code and will not be subject to federal income tax on taxable income that is distributed to shareholders. Therefore, no federal income tax provision is required.
Net capital losses of $2,640,989 that are a result of security transactions occurring after October 31, 2018, are treated as occurring on April 1, 2019, the first day of the fund's next taxable year.
As of March 31, 2019, the fund had no uncertain tax positions that would require financial statement recognition, derecognition or disclosure. The fund's federal tax returns are subject to examination by the Internal Revenue Service for a period of three years.
Distribution of income and gains. Distributions to shareholders from net investment income and net realized gains, if any, are recorded on the ex-date. The fund generally declares and pays dividends and capital gain distributions, if any, annually.
The tax character of distributions for the years ended March 31, 2019 and 2018 was as follows:
| March 31, 2019 | March 31, 2018 | |
| Ordinary Income | $83,257,183 | $101,174,268 |
| Long term capital gains | 276,199,002 | 148,080,746 |
| Total | $359,456,185 | $249,255,014 |
Distributions paid by the fund with respect to each class of shares are calculated in the same manner, at the same time and in the same amount, except for the effect of class level expenses that may be applied differently to each class. As of March 31, 2019, the components of distributable earnings on a tax basis consisted of $108,696 of undistributed ordinary income.
Such distributions and distributable earnings, on a tax basis, are determined in conformity with income tax regulations, which may differ from US GAAP. Distributions in excess of tax earnings and profits, if any, are reported in the fund's financial statements as a return of capital.
Capital accounts within the financial statements are adjusted for permanent book-tax differences. These adjustments have no impact on net assets or the results of operations. Temporary book-tax differences, if any, will reverse in a subsequent period. Book-tax differences are primarily attributable to wash sale loss deferrals, redemption in kind, and treatment of a portion of the proceeds from redemptions as distributions for tax purposes.
Note 3 — Derivative instruments
The fund may invest in derivatives in order to meet its investment objective. Derivatives include a variety of different instruments that may be traded in the over-the-counter (OTC) market, on a regulated exchange or through a clearing facility. The risks in using derivatives vary depending upon the structure of the instruments, including the use of leverage, optionality, the liquidity or lack of liquidity of the contract, the creditworthiness of the counterparty or clearing organization and the volatility of the position. Some derivatives involve risks that are potentially greater than the risks associated with investing directly in the referenced securities or other referenced underlying instrument. Specifically, the fund is exposed to the risk that the counterparty to an OTC derivatives contract will be unable or unwilling to make timely settlement payments or otherwise honor its obligations. OTC derivatives transactions typically can only be closed out with the other party to the transaction.
Futures are traded on an exchange. Exchange-traded transactions generally present less counterparty risk to a fund than OTC transactions. The exchange stands between the fund and the broker to the contract and therefore, credit risk is generally limited to the failure of the exchange or clearinghouse and the clearing member. Margin requirements for exchange-traded derivatives are set by the broker or applicable clearinghouse.
Futures. A futures contract is a contractual agreement to buy or sell a particular currency or financial instrument at a pre-determined price in the future. Risks related to the use of futures contracts include possible illiquidity of the
futures markets, contract prices that can be highly volatile and imperfectly correlated to movements in the underlying financial instrument and potential losses in excess of the amounts recognized on the Statement of assets and liabilities. Use of long futures contracts subjects the fund to the risk of loss up to the notional value of the futures contracts. Use of short futures contracts subjects the fund to unlimited risk of loss.
Upon entering into a futures contract, the fund is required to deposit initial margin with the broker in the form of cash or securities. The amount of required margin is generally based on a percentage of the contract value; this amount is the initial margin for the trade. The margin deposit must then be maintained at the established level over the life of the contract. Futures margin receivable / payable is included on the Statement of assets and liabilities. Futures contracts are marked-to-market daily and an appropriate payable or receivable for the change in value (variation margin) and unrealized gain or loss is recorded by the fund. When the contract is closed, the fund records a realized gain or loss equal to the difference between the value of the contract at the time it was opened and the value at the time it was closed.
During the year ended March 31, 2019, the fund used futures contracts as a substitute for securities purchased. The fund held futures contracts with notional values ranging up to $431.4 million as measured at each quarter end. There were no open futures contracts as of March 31, 2019.
Effect of derivative instruments on the Statement of operations
The table below summarizes the net realized gain (loss) included in the net increase (decrease) in net assets from operations, classified by derivative instrument and risk category, for the year ended March 31, 2019:
| Statement of operations location - net realized gain (loss) on: | |||||
| Risk | Futures contracts | ||||
| Equity | ($4,319,716 | ) | |||
Note 4 — Guarantees and indemnifications
Under the Trust's organizational documents, its Officers and Trustees are indemnified against certain liabilities arising out of the performance of their duties to the Trust, including the fund. Additionally, in the normal course of business, the fund enters into contracts with service providers that contain general indemnification clauses. The fund's maximum exposure under these arrangements is unknown, as this would involve future claims that may be made against the fund that have not yet occurred. The risk of material loss from such claims is considered remote.
Note 5 — Fees and transactions with affiliates
John Hancock Advisers, LLC (the Advisor) serves as investment advisor for the fund. John Hancock Funds, LLC (the Distributor), an affiliate of the Advisor, serves as principal underwriter of the fund. The Advisor and the Distributor are indirect, wholly owned subsidiaries of MFC.
Management fee. The fund has an investment management agreement with the Advisor under which the fund pays a daily management fee to the Advisor equivalent on an annual basis to the sum of: (a) 0.600% of the first $500 million of the fund's aggregate net assets; (b) 0.550% of the next $1.0 billion of the fund's aggregate net assets; and (c) 0.530% of the fund's aggregate net assets in excess of $1.5 billion. Aggregate net assets include the net assets of the fund and JHF II U.S. Growth Fund. The advisor has a subadvisory agreement with Wellington Management Company LLP. Prior to September 28, 2018, John Hancock Asset Management, a division of Manulife Asset Management (US) LLC, an indirectly owned subsidiary of MFC and an affiliate of the Advisor, served as the fund's subadvisor. The fund is not responsible for payment of the subadvisory fees.
Prior to September 28, 2018, the fund had an investment management agreement with the Advisor under which the fund paid a daily management fee to the Advisor equivalent on an annual basis to the sum of: (a) 0.725% of the first $500 million of the fund's average daily net assets; (b) 0.700% of the next $500 million of the fund's average daily net assets; (c) 0.675% of the next $500 million of the fund's average daily net assets; and (d) 0.650% of the fund's average daily net assets in excess of $1.5 billion.
The Advisor has contractually agreed to waive a portion of its management fee and/or reimburse expenses for certain funds of the John Hancock group of funds complex, including the fund (the participating portfolios). This waiver is based upon aggregate net assets of all the participating portfolios. The amount of the reimbursement is calculated daily and allocated among all the participating portfolios in proportion to the daily net assets of each fund. During the year ended March 31, 2019, this waiver amounted to 0.01% of the fund's average net assets. This agreement expires on June 30, 2020, unless renewed by mutual agreement of the fund and the Advisor based upon a determination that this is appropriate under the circumstances at that time.
For the year ended March 31, 2019, these expense reductions amounted to the following:
| Class | Expense reduction | Class | Expense reduction | |
| Class A | $32,167 | Class R4 | $61 | |
| Class C | 817 | Class R6 | 823 | |
| Class I | 3,656 | Class NAV | 59,277 | |
| Class R2 | 70 | Total | $96,871 |
Expenses waived or reimbursed in the current fiscal period are not subject to recapture in future fiscal periods.
The investment management fees, including the impact of waiver and reimbursements as described above, incurred for the year ended March 31, 2019 were equivalent to a net annual effective rate of 0.66% of the fund's average daily net assets.
Accounting and legal services. Pursuant to a service agreement, the fund reimburses the Advisor for all expenses associated with providing the administrative, financial, legal, compliance, accounting and recordkeeping services to the fund, including the preparation of all tax returns, periodic reports to shareholders and regulatory reports, among other services. These expenses are allocated to each share class based on its relative net assets at the time the expense was incurred. These accounting and legal services fees incurred for the year ended March 31, 2019 amounted to an annual rate of 0.02% of the fund's average daily net assets.
Distribution and service plans. The fund has a distribution agreement with the Distributor. The fund has adopted distribution and service plans with respect to Class A, Class C, Class R2 and Class R4 shares pursuant to Rule 12b-1 under the 1940 Act, to pay the Distributor for services provided as the distributor of shares of the fund. In addition, under a service plan for Class R2 and Class R4 shares, the fund pays for certain other services. The fund may pay up to the following contractual rates of distribution and service fees under these arrangements, expressed as an annual percentage of average daily net assets for each class of the fund's shares.
| Class | Rule 12b-1 fee | Service fees | Class | Rule 12b-1 fee | Service fees | |
| Class A | 0.30% | — | Class R2 | 0.25% | 0.25% | |
| Class C | 1.00% | — | Class R4 | 0.25% | 0.10% |
Currently only 0.25% is charged to Class A shares for Rule 12b-1 fees.
The fund's Distributor has contractually agreed to waive 0.10% of Rule12b-1 fees for Class R4 shares. The current waiver agreement expires on July 31, 2020, unless renewed by mutual agreement of the fund and the Distributor
based upon a determination that this is appropriate under the circumstances at the time. This contractual waiver amounted to $755 for Class R4 shares for the year ended March 31, 2019.
Sales charges. Class A shares are assessed up-front sales charges, which resulted in payments to the Distributor amounting to $227,012 for the year ended March 31,2019. Of this amount, $36,502 was retained and used for printing prospectuses, advertising, sales literature and other purposes, $174,354 was paid as sales commissions to broker-dealers and $16,156 was paid as sales commissions to sales personnel of Signator Investors, Inc., which had been a broker-dealer affiliate of the Advisor through November 2, 2018.
Class A and Class C shares may be subject to contingent deferred sales charges (CDSCs). Certain Class A shares that are acquired through purchases of $1 million or more and are redeemed within one year of purchase are subject to a 1.00% sales charge. Class C shares that are redeemed within one year of purchase are subject to a 1.00% CDSC. CDSCs are applied to the lesser of the current market value at the time of redemption or the original purchase cost of the shares being redeemed. Proceeds from CDSCs are used to compensate the Distributor for providing distribution-related services in connection with the sale of these shares. During the year ended March 31,2019, CDSCs received by the Distributor amounted to $532 and $659 for Class A and Class C shares, respectively.
Transfer agent fees. The John Hancock group of funds has a complex-wide transfer agent agreement with John Hancock Signature Services, Inc. (Signature Services), an affiliate of the Advisor. The transfer agent fees paid to Signature Services are determined based on the cost to Signature Services (Signature Services Cost) of providing recordkeeping services. It also includes out-of-pocket expenses, including payments made to third-parties for recordkeeping services provided to their clients who invest in one or more John Hancock funds. In addition, Signature Services Cost may be reduced by certain fees that Signature Services receives in connection with retirement and small accounts. Signature Services Cost is calculated monthly and allocated, as applicable, to five categories of share classes: Retail Share and Institutional Share Classes of Non-Municipal Bond Funds, Class R6 Shares, Retirement Share Classes and Municipal Bond Share Classes. Within each of these categories, the applicable costs are allocated to the affected John Hancock affiliated funds and/or classes, based on the relative average daily net assets.
Class level expenses. Class level expenses for the year ended March 31, 2019 were:
| Class | Distribution and service fees | Transfer agent fees |
| Class A | $989,246 | $435,995 |
| Class C | 101,093 | 11,096 |
| Class I | — | 60,239 |
| Class R2 | 4,329 | 115 |
| Class R4 | 2,652 | 100 |
| Class R6 | — | 1,369 |
| Total | $1,097,320 | $508,914 |
Trustee expenses.The fund compensates each Trustee who is not an employee of the Advisor or its affiliates. The costs of paying Trustee compensation and expenses are allocated to the fund based on its net assets relative to other funds within the John Hancock group of funds complex.
Interfund lending program. Pursuant to an Exemptive Order issued by the SEC, the fund, along with certain other funds advised by the Advisor or its affiliates, may participate in an interfund lending program. This program provides an alternative credit facility allowing the funds to borrow from, or lend money to, other participating affiliated funds.
At period end, no interfund loans were outstanding. The fund's activity in this program during the period for which loans were outstanding was as follows:
| Borrower or lender | Weighted average loan balance | Days outstanding | Weighted average interest rate | Interest income |
| Lender | $1,853,364 | 5 | 2.170% | $559 |
Note 6 — Fund share transactions
Transactions in fund shares for the years ended March 31, 2019 and 2018 were as follows:
| Year ended 3-31-19 | Year ended 3-31-18 | |||||||||||||||||||||||||
| Shares | Amount | Shares | Amount | |||||||||||||||||||||||
| Class A shares | ||||||||||||||||||||||||||
| Sold | 2,190,898 | $37,187,427 | 1,039,343 | $19,029,957 | ||||||||||||||||||||||
| Distributions reinvested | 4,951,957 | 80,912,745 | 2,710,777 | 47,547,047 | ||||||||||||||||||||||
| Repurchased | (3,373,280 | ) | (55,260,901 | ) | (2,937,346 | ) | (53,736,643 | ) | ||||||||||||||||||
| Net increase | 3,769,575 | $62,839,271 | 812,774 | $12,840,361 | ||||||||||||||||||||||
| Class C shares | ||||||||||||||||||||||||||
| Sold | 374,821 | $5,572,801 | 50,898 | $915,997 | ||||||||||||||||||||||
| Distributions reinvested | 91,024 | 1,459,117 | 122,678 | 2,129,676 | ||||||||||||||||||||||
| Repurchased | (724,672 | ) | (13,006,185 | ) | (173,793 | ) | (3,143,990 | ) | ||||||||||||||||||
| Net decrease | (258,827 | ) | $(5,974,267 | ) | (217 | ) | $(98,317 | ) | ||||||||||||||||||
| Class I shares | ||||||||||||||||||||||||||
| Sold | 6,662,479 | $101,675,911 | 673,531 | $12,351,454 | ||||||||||||||||||||||
| Distributions reinvested | 308,435 | 5,047,263 | 107,940 | 1,904,068 | ||||||||||||||||||||||
| Repurchased | (1,031,980 | ) | (16,000,869 | ) | (668,515 | ) | (12,591,106 | ) | ||||||||||||||||||
| Net increase | 5,938,934 | $90,722,305 | 112,956 | $1,664,416 | ||||||||||||||||||||||
| Class R2 shares | ||||||||||||||||||||||||||
| Sold | 5,407 | $89,857 | 3,784 | $70,322 | ||||||||||||||||||||||
| Distributions reinvested | 10,401 | 171,599 | 5,477 | 96,893 | ||||||||||||||||||||||
| Repurchased | (3,345 | ) | (57,599 | ) | (24,349 | ) | (437,248 | ) | ||||||||||||||||||
| Net increase (decrease) | 12,463 | $203,857 | (15,088 | ) | $(270,033 | ) | ||||||||||||||||||||
| Class R4 shares | ||||||||||||||||||||||||||
| Sold | 4,965 | $89,513 | 41,193 | $764,704 | ||||||||||||||||||||||
| Distributions reinvested | 9,493 | 156,581 | 1,562 | 27,614 | ||||||||||||||||||||||
| Repurchased | (5,284 | ) | (96,119 | ) | (16,615 | ) | (326,060 | ) | ||||||||||||||||||
| Net increase | 9,174 | $149,975 | 26,140 | $466,258 | ||||||||||||||||||||||
| Class R6 shares | ||||||||||||||||||||||||||
| Sold | 502,744 | $7,838,421 | 455,630 | $8,785,087 | ||||||||||||||||||||||
| Distributions reinvested | 120,357 | 1,983,279 | 64,110 | 1,132,824 | ||||||||||||||||||||||
| Repurchased | (212,973 | ) | (3,444,592 | ) | (67,149 | ) | (1,256,900 | ) | ||||||||||||||||||
| Net increase | 410,128 | $6,377,108 | 452,591 | $8,661,011 | ||||||||||||||||||||||
| Year ended 3-31-19 | Year ended 3-31-18 | |||||||||||||||||||||||||
| Shares | Amount | Shares | Amount | |||||||||||||||||||||||
| Class NAV shares | ||||||||||||||||||||||||||
| Sold | 441,456 | $7,977,037 | 1,264,023 | $22,615,331 | ||||||||||||||||||||||
| Distributions reinvested | 16,148,421 | 267,256,374 | 11,022,495 | 194,657,256 | ||||||||||||||||||||||
| Repurchased | (94,579,725 | ) | (1,597,324,646 | ) | (27,937,248 | ) | (520,454,915 | ) | ||||||||||||||||||
| Net decrease | (77,989,848 | ) | $(1,322,091,235 | ) | (15,650,730 | ) | $(303,182,328 | ) | ||||||||||||||||||
| Total net decrease | (68,108,401 | ) | $(1,167,772,986 | ) | (14,261,574 | ) | $(279,918,632 | ) | ||||||||||||||||||
Affiliates of the fund owned 100% of shares of Class NAV on March 31, 2019. Such concentration of shareholders' capital could have a material effect on the fund if such shareholders redeem from the fund.
On September 27, 2018, there was a redemption in kind from Class NAV of $996,040,781, which represented approximately 66% of the fund on that date. For purposes of US GAAP, this transaction was treated as a sale of securities and the resulting gains and losses were recognized based on the market value of the securities on the date of the transfer. For tax purposes, no gains or losses were recognized. Net realized gain resulting from such redemption in kind is shown on the Statement of operations.
Note 7 — Purchase and sale of securities
Purchases and sales of securities, other than short-term investments and redemptions in kind, amounted to $956,972,715 and $1,391,936,231, respectively, for the year ended March 31, 2019.
Note 8 — Investment in affiliated underlying funds
The fund may invest in affiliated underlying funds that are managed by the Advisor and its affiliates. Information regarding the fund's purchases and sales of the affiliated underlying funds as well as income and capital gains earned, if any, during the period is as follows:
| Dividends and distributions | ||||||||||||||||||||||||||||||||||||||
| Fund | Beginning share amount | Shares purchased | Shares sold | Ending share amount | Income distributions received | Capital gain distributions received | Realized gain (loss) | Change in unrealized appreciation (depreciation) | Ending value | |||||||||||||||||||||||||||||
| John Hancock Collateral Trust* | 1,207,975 | 28,997,145 | (30,205,120 | ) | — | — | — | $9,839 | $1,811 | — | ||||||||||||||||||||||||||||
| *Refer to the Securities lending note within Note 2 for details regarding this investment. | ||||||||||||||||||||||||||||||||||||||
Note 9 — Industry or sector risk
The fund may invest a large percentage of its assets in one or more particular industries or sectors of the economy. If a large percentage of the fund's assets are economically tied to a single or small number of industries or sectors of the economy, the fund will be less diversified than a more broadly diversified fund, and it may cause the fund to underperform if that industry or sector underperforms. In addition, focusing on a particular industry or sector may make the fund's NAV more volatile. Further, a fund that invests in particular industries or sectors is particularly susceptible to the impact of market, economic, regulatory and other factors affecting those industries or sectors.
Note 10 — Direct placement securities
The fund may hold private placement securities which are restricted as to resale and the fund has limited rights to registration under the Securities Act of 1933. The following table summarizes the direct placement securities held at March 31, 2019.
| Issuer, description | Acquisition date | Acquisition cost | Beginning share amount | Ending share amount | Value as a percentage of fund's net assets | Value as of 3-31-19 |
| Ex-Sigma LLC | 10-31-14 | $4,726,919 | 510 | 510 | 0.10% | $574,898 |
REPORT OF INDEPENDENT REGISTERED PUBLIC ACCOUNTING FIRM
To the Board of Trustees of John Hancock Funds III and Shareholders of John Hancock U.S. Quality Growth Fund
Opinion on the Financial Statements
We have audited the accompanying statement of assets and liabilities, including the Fund's investments, of John Hancock U.S. Quality Growth Fund (one of the funds constituting John Hancock Funds III, referred to hereafter as the "Fund") as of March 31, 2019, the related statement of operations for the year ended March 31, 2019, the statements of changes in net assets for each of the two years in the period ended March 31, 2019, including the related notes, and the financial highlights for each of the periods indicated therein (collectively referred to as the "financial statements"). In our opinion, the financial statements present fairly, in all material respects, the financial position of the Fund as of March 31, 2019, the results of its operations for the year then ended, the changes in its net assets for each of the two years in the period ended March 31, 2019 and the financial highlights for each of the periods indicated therein in conformity with accounting principles generally accepted in the United States of America.
Basis for Opinion
These financial statements are the responsibility of the Fund's management. Our responsibility is to express an opinion on the Fund's financial statements based on our audits. We are a public accounting firm registered with the Public Company Accounting Oversight Board (United States) ("PCAOB") and are required to be independent with respect to the Fund in accordance with the U.S. federal securities laws and the applicable rules and regulations of the Securities and Exchange Commission and the PCAOB.
We conducted our audits of these financial statements in accordance with the standards of the PCAOB. Those standards require that we plan and perform the audit to obtain reasonable assurance about whether the financial statements are free of material misstatement, whether due to error or fraud.
Our audits included performing procedures to assess the risks of material misstatement of the financial statements, whether due to error or fraud, and performing procedures that respond to those risks. Such procedures included examining, on a test basis, evidence regarding the amounts and disclosures in the financial statements. Our audits also included evaluating the accounting principles used and significant estimates made by management, as well as evaluating the overall presentation of the financial statements. Our procedures included confirmation of securities owned as of March 31, 2019 by correspondence with the custodian and transfer agent. We believe that our audits provide a reasonable basis for our opinion.
/s/ PricewaterhouseCoopers LLP
Boston, Massachusetts
May 16, 2019
We have served as the auditor of one or more investment companies in the John Hancock group of funds since 1988.
Unaudited
For federal income tax purposes, the following information is furnished with respect to the distributions of the fund, if any, paid during its taxable year ended March 31, 2019.
The fund reports the maximum amount allowable of its net taxable income as eligible for the corporate dividends-received deduction.
The fund reports the maximum amount allowable of its net taxable income as qualified dividend income as provided in the Jobs and Growth Tax Relief Reconciliation Act of 2003.
The fund paid $327,053,658 in long term capital gain dividends.
Eligible shareholders will be mailed a 2019 Form 1099-DIV in early 2020. This will reflect the tax character of all distributions paid in calendar year 2019.
Please consult a tax advisor regarding the tax consequences of your investment in the fund.
This chart provides information about the Trustees and Officers who oversee your John Hancock fund. Officers elected by the Trustees manage the day-to-day operations of the fund and execute policies formulated by the Trustees.
Independent Trustees
| Name, year of birth Position(s) held with Trust Principal occupation(s) and other directorships during past 5 years | Trustee of the Trust since1 | Number of John Hancock funds overseen by Trustee |
| Hassell H. McClellan, Born: 1945 | 2012 | 215 |
| Trustee and Chairperson of the Board Director/Trustee, Virtus Funds (since 2008); Director, The Barnes Group (since 2010); Associate Professor, The Wallace E. Carroll School of Management, Boston College (retired 2013). Trustee (since 2005) and Chairperson of the Board (since 2017) of various trusts within the John Hancock Fund Complex. | ||
| Charles L. Bardelis,2 Born: 1941 | 2012 | 215 |
| Trustee Director, Island Commuter Corp. (marine transport). Trustee of various trusts within the John Hancock Fund Complex (since 1988). | ||
| James R. Boyle,Born: 1959 | 2015 | 215 |
| Trustee Chief Executive Officer, Foresters Financial (since 2018); Chairman and Chief Executive Officer, Zillion Group, Inc. (formerly HealthFleet, Inc.) (healthcare) (2014-2018); Executive Vice President and Chief Executive Officer, U.S. Life Insurance Division of Genworth Financial, Inc. (insurance) (January 2014-July 2014); Senior Executive Vice President, Manulife Financial, President and Chief Executive Officer, John Hancock (1999-2012); Chairman and Director, John Hancock Advisers, LLC, John Hancock Funds, LLC, and John Hancock Investment Management Services, LLC (2005-2010). Trustee of various trusts within the John Hancock Fund Complex (2005-2014 and since 2015). | ||
| Peter S. Burgess,2 Born: 1942 | 2012 | 215 |
| Trustee Consultant (financial, accounting, and auditing matters) (since 1999); Certified Public Accountant; Partner, Arthur Andersen (independent public accounting firm) (prior to 1999); Director, Lincoln Educational Services Corporation (since 2004); Director, Symetra Financial Corporation (2010-2016); Director, PMA Capital Corporation (2004-2010). Trustee of various trusts within the John Hancock Fund Complex (since 2005). | ||
| William H. Cunningham, Born: 1944 | 2006 | 215 |
| Trustee Professor, University of Texas, Austin, Texas (since 1971); former Chancellor, University of Texas System and former President of the University of Texas, Austin, Texas; Chairman (since 2009) and Director (since 2006), Lincoln National Corporation (insurance); Director, Southwest Airlines (since 2000); former Director, LIN Television (2009-2014). Trustee of various trusts within the John Hancock Fund Complex (since 1986). | ||
| Grace K. Fey, Born: 1946 | 2012 | 215 |
| Trustee Chief Executive Officer, Grace Fey Advisors (since 2007); Director and Executive Vice President, Frontier Capital Management Company (1988-2007); Director, Fiduciary Trust (since 2009). Trustee of various trusts within the John Hancock Fund Complex (since 2008). | ||
Independent Trustees (continued)
| Name, year of birth Position(s) held with Trust Principal occupation(s) and other directorships during past 5 years | Trustee of the Trust since1 | Number of John Hancock funds overseen by Trustee |
| Theron S. Hoffman,2 Born: 1947 | 2012 | 215 |
| Trustee Chief Executive Officer, T. Hoffman Associates, LLC (consulting firm) (since 2003); Director, The Todd Organization (consulting firm) (2003-2010); President, Westport Resources Management (investment management consulting firm) (2006-2008); Board Member, Senior Managing Director, Partner, and Operating Head, Putnam Investments (2000-2003); Executive Vice President, The Thomson Corp. (financial and legal information publishing) (1997-2000). Trustee of various trusts within the John Hancock Fund Complex (since 2008). | ||
| Deborah C. Jackson, Born: 1952 | 2008 | 215 |
| Trustee President, Cambridge College, Cambridge, Massachusetts (since 2011); Board of Directors, National Association of Corporate Directors/New England (since 2015); Board of Directors, Association of Independent Colleges and Universities of Massachusetts (since 2014); Chief Executive Officer, American Red Cross of Massachusetts Bay (2002-2011); Board of Directors of Eastern Bank Corporation (since 2001); Board of Directors of Eastern Bank Charitable Foundation (since 2001); Board of Directors of American Student Assistance Corporation (1996-2009); Board of Directors of Boston Stock Exchange (2002-2008); Board of Directors of Harvard Pilgrim Healthcare (health benefits company) (2007-2011). Trustee of various trusts within the John Hancock Fund Complex (since 2008). | ||
| James M. Oates, Born: 1946 | 2012 | 215 |
Trustee | ||
| Steven R. Pruchansky, Born: 1944 | 2006 | 215 |
| Trustee and Vice Chairperson of the Board Managing Director, Pru Realty (since 2017); Chairman and Chief Executive Officer, Greenscapes of Southwest Florida, Inc. (since 2000); Director and President, Greenscapes of Southwest Florida, Inc. (until 2000); Member, Board of Advisors, First American Bank (until 2010); Managing Director, Jon James, LLC (real estate) (since 2000); Partner, Right Funding, LLC (2014-2017); Director, First Signature Bank & Trust Company (until 1991); Director, Mast Realty Trust (until 1994); President, Maxwell Building Corp. (until 1991). Trustee (since 1992), Chairperson of the Board (2011-2012), and Vice Chairperson of the Board (since 2012) of various trusts within the John Hancock Fund Complex. | ||
| Gregory A. Russo, Born: 1949 | 2008 | 215 |
| Trustee Director and Audit Committee Chairman (since 2012), and Member, Audit Committee and Finance Committee (since 2011), NCH Healthcare System, Inc. (holding company for multi-entity healthcare system); Director and Member (since 2012) and Finance Committee Chairman (since 2014), The Moorings, Inc. (nonprofit continuing care community); Vice Chairman, Risk & Regulatory Matters, KPMG LLP (KPMG) (2002-2006); Vice Chairman, Industrial Markets, KPMG (1998-2002); Chairman and Treasurer, Westchester County, New York, Chamber of Commerce (1986-1992); Director, Treasurer, and Chairman of Audit and Finance Committees, Putnam Hospital Center (1989-1995); Director and Chairman of Fundraising Campaign, United Way of Westchester and Putnam Counties, New York (1990-1995). Trustee of various trusts within the John Hancock Fund Complex (since 2008). | ||
Non-Independent Trustees3
| Name, year of birth Position(s) held with Trust Principal occupation(s) and other directorships during past 5 years | Trustee of the Trust since1 | Number of John Hancock funds overseen by Trustee |
| Andrew G. Arnott, Born: 1971 | 2017 | 215 |
| President and Non-Independent Trustee Head of Wealth and Asset Management, United States and Europe, for John Hancock and Manulife (since 2018); Executive Vice President, John Hancock Financial Services (since 2009, including prior positions); Director and Executive Vice President, John Hancock Advisers, LLC (since 2005, including prior positions); Director and Executive Vice President, John Hancock Investment Management Services, LLC (since 2006, including prior positions); President, John Hancock Funds, LLC (since 2004, including prior positions); President of various trusts within the John Hancock Fund Complex (since 2007, including prior positions). | ||
| Marianne Harrison, Born: 1963 | 2018 | 215 |
| Non-Independent Trustee President and CEO, John Hancock (since 2017); President and CEO, Manulife Canadian Division (2013-2017); Member, Board of Directors, American Council of Life Insurers (ACLI) (since 2018); Member, Board of Directors, Communitech, an industry-led innovation center that fosters technology companies in Canada (since 2017); Member, Board of Directors, Manulife Assurance Canada (since 2015); Board Member, St. Mary's General Hospital Foundation (since 2014); Member, Board of Directors, Manulife Bank of Canada (since 2013); Member, Standing Committee of the Canadian Life & Health Assurance Association (since 2013); Member, Board of Directors, John Hancock USA, John Hancock Life & Health, John Hancock New York (2012-2013). Trustee of various trusts within the John Hancock Fund Complex (since 2018). | ||
Principal officers who are not Trustees
| Name, year of birth Position(s) held with Trust Principal occupation(s) during past 5 years | Officer of the Trust since |
| Francis V. Knox, Jr.,Born: 1947 | 2006 |
| Chief Compliance Officer Vice President, John Hancock Financial Services (since 2005); Chief Compliance Officer, various trusts within the John Hancock Fund Complex, John Hancock Advisers, LLC, and John Hancock Investment Management Services, LLC (since 2005). | |
| Charles A. Rizzo, Born: 1957 | 2007 |
| Chief Financial Officer Vice President, John Hancock Financial Services (since 2008); Senior Vice President, John Hancock Advisers, LLC and John Hancock Investment Management Services, LLC (since 2008); Chief Financial Officer of various trusts within the John Hancock Fund Complex (since 2007). | |
| Salvatore Schiavone, Born: 1965 | 2010 |
| Treasurer Assistant Vice President, John Hancock Financial Services (since 2007); Vice President, John Hancock Advisers, LLC and John Hancock Investment Management Services, LLC (since 2007); Treasurer of various trusts within the John Hancock Fund Complex (since 2007, including prior positions). | |
Principal officers who are notTrustees (continued)
| Name, year of birth Position(s) held with Trust Principal occupation(s) during past 5 years | Officer of the Trust since | |
| Christopher (Kit) Sechler,Born: 1973 | 2018 | |
| Chief Legal Officer and Secretary Vice President and Deputy Chief Counsel, John Hancock Investments (since 2015); Assistant Vice President and Senior Counsel (2009-2015), John Hancock Investments; Chief Legal Officer and Secretary of various trusts within the John Hancock Fund Complex (since 2018); Assistant Secretary of John Hancock Advisers, LLC and John Hancock Investment Management Services, LLC (since 2009). | ||
The business address for all Trustees and Officers is 200 Berkeley Street, Boston, Massachusetts 02116-5023.
The Statement of Additional Information of the fund includes additional information about members of the Board of Trustees of the Trust and is available without charge, upon request, by calling 800-225-5291.
| 1 | Each Trustee holds office until his or her successor is elected and qualified, or until the Trustee's death, retirement, resignation, or removal. Mr. Boyle has served as Trustee at various times prior to the date listed in the table. |
| 2 | Member of the Audit Committee. |
| 3 | The Trustee is a Non-Independent Trustee due to current or former positions with the Advisor and certain affiliates. |
Trustees Hassell H. McClellan,Chairperson Officers Andrew G. Arnott Francis V. Knox, Jr. Charles A. Rizzo Salvatore Schiavone Christopher (Kit) Sechler** | Investment advisor John Hancock Advisers, LLC Subadvisor Wellington Management Company LLP Portfolio Manager John A. Boselli, CFA Principal distributor John Hancock Funds, LLC Custodian State Street Bank and Trust Company Transfer agent John Hancock Signature Services, Inc. Legal counsel K&L Gates LLP Independent registered public accounting firm PricewaterhouseCoopers LLP |
* Member of the Audit Committee
† Non-Independent Trustee
#Effective 6-19-18
**Effective 9-13-18
The fund's proxy voting policies and procedures, as well as the fund proxy voting record for the most recent twelve-month period ended June 30, are available free of charge on the Securities and Exchange Commission (SEC) website at sec.gov or on our website.
All of the fund's holdings as of the end of the third month of every fiscal quarter are filed with the SEC on Form N-PORT within 60 days of the end of the fiscal quarter. The fund's Form N-PORT filings are available on our website and the SEC's website, sec.gov.
We make this information on your fund, as well asmonthly portfolio holdings, and other fund details available on our website at jhinvestments.com or by calling 800-225-5291.
| You can also contact us: | |||
| 800-225-5291 jhinvestments.com | Regular mail: John Hancock Signature Services, Inc. | Express mail: John Hancock Signature Services, Inc. | |
John Hancock family of funds
DOMESTIC EQUITY FUNDS Blue Chip Growth Classic Value Disciplined Value Disciplined Value Mid Cap Equity Income Financial Industries Fundamental All Cap Core Fundamental Large Cap Core Fundamental Large Cap Value New Opportunities Regional Bank Small Cap Core Small Cap Growth Small Cap Value U.S. Global Leaders Growth U.S. Quality Growth Value Equity GLOBAL AND INTERNATIONAL EQUITY FUNDS Disciplined Value International Emerging Markets Emerging Markets Equity Fundamental Global Franchise Global Equity Global Shareholder Yield Global Thematic Opportunities Greater China Opportunities International Dynamic Growth International Growth International Small Company | INCOME FUNDS Bond California Tax-Free Income Emerging Markets Debt Floating Rate Income Government Income High Yield High Yield Municipal Bond Income Investment Grade Bond Money Market Short Duration Credit Opportunities Spectrum Income Strategic Income Opportunities Tax-Free Bond ALTERNATIVE AND SPECIALTY FUNDS Absolute Return Currency Alternative Asset Allocation Disciplined Alternative Yield Global Absolute Return Strategies Global Conservative Absolute Return Global Focused Strategies Infrastructure Seaport Long/Short |
A fund's investment objectives, risks, charges, and expenses should be considered carefully before investing. The prospectus contains this and other important information about the fund. To obtain a prospectus, contact your financial professional, call John Hancock Investments at 800-225-5291, or visit our website at jhinvestments.com. Please read the prospectus carefully before investing or sending money.
ASSET ALLOCATION Balanced Income Allocation Multi-Index Lifetime Portfolios Multi-Index Preservation Portfolios Multimanager Lifestyle Portfolios Multimanager Lifetime Portfolios Retirement Income 2040 EXCHANGE-TRADED FUNDS John Hancock Multifactor Consumer Discretionary ETF John Hancock Multifactor Consumer Staples ETF John Hancock Multifactor Developed International ETF John Hancock Multifactor Emerging Markets ETF John Hancock Multifactor Energy ETF John Hancock Multifactor Financials ETF John Hancock Multifactor Healthcare ETF John Hancock Multifactor Industrials ETF John Hancock Multifactor Large Cap ETF John Hancock Multifactor Materials ETF John Hancock Multifactor Media and John Hancock Multifactor Mid Cap ETF John Hancock Multifactor Small Cap ETF John Hancock Multifactor Technology ETF John Hancock Multifactor Utilities ETF | ENVIRONMENTAL, SOCIAL, AND ESG All Cap Core ESG Core Bond ESG International Equity ESG Large Cap Core CLOSED-END FUNDS Financial Opportunities Hedged Equity & Income Income Securities Trust Investors Trust Preferred Income Preferred Income II Preferred Income III Premium Dividend Tax-Advantaged Dividend Income Tax-Advantaged Global Shareholder Yield |
John Hancock Multifactor ETF shares are bought and sold at market price (not NAV), and are not individually redeemed
from the fund. Brokerage commissions will reduce returns.
John Hancock ETFs are distributed by Foreside Fund Services, LLC, and are subadvised by Dimensional Fund Advisors LP.
Foreside is not affiliated with John Hancock Funds, LLC or Dimensional Fund Advisors LP.
Dimensional Fund Advisors LP receives compensation from John Hancock in connection with licensing rights to the
John Hancock Dimensional indexes. Dimensional Fund Advisors LP does not sponsor, endorse, or sell, and makes no
representation as to the advisability of investing in, John Hancock Multifactor ETFs.
John Hancock Investment Management
A trusted brand
John Hancock Investment Management is a premier asset manager
representing one of America's most trusted brands, with a heritage of
financial stewardship dating back to 1862. Helping our shareholders
pursue their financial goals is at the core of everything we do. It's why
we support the role of professional financial advice and operate with
the highest standards of conduct and integrity.
A better way to invest
We serve investors globally through a unique multimanager approach:
We search the world to find proven portfolio teams with specialized
expertise for every strategy we offer, then we apply robust investment
oversight to ensure they continue to meet our uncompromising
standards and serve the best interests of our shareholders.
Results for investors
Our unique approach to asset management enables us to provide
a diverse set of investments backed by some of the world's best
managers, along with strong risk-adjusted returns across asset classes.
![]()
John Hancock Funds, LLC n Member FINRA, SIPC
200 Berkeley Street n Boston, MA 02116-5010 n 800-225-5291 n jhinvestments.com
This report is for the information of the shareholders of John Hancock U.S. Quality Growth Fund. It is not authorized for distribution to prospective investors unless preceded or accompanied by a prospectus.
| MF802064 | 393A 3/19 5/19 |
ITEM 2. CODE OF ETHICS.
As of the end of the year, March 31, 2019, the registrant has adopted a code of ethics, as defined in Item 2 of Form N-CSR, that applies to its Chief Executive Officer, Chief Financial Officer and Treasurer (respectively, the principal executive officer, the principal financial officer and the principal accounting officer, the “Covered Officers”). A copy of the code of ethics is filed as an exhibit to this Form N-CSR.
ITEM 3. AUDIT COMMITTEE FINANCIAL EXPERT.
Peter S. Burgess is the audit committee financial expert and is “independent”, pursuant to general instructions on Form N-CSR Item 3.
ITEM 4. PRINCIPAL ACCOUNTANT FEES AND SERVICES.
(a) Audit Fees
The aggregate fees billed for professional services rendered by the principal accountant for the audits of the registrant’s annual financial statements or services that are normally provided by the accountant in connection with statutory and regulatory filings or engagements amounted to the following for the fiscal years ended March 31, 2019 and 2018. These fees were billed to the registrant and were approved by the registrant’s audit committee.
| Fund | March 31, 2019 | March 31, 2018 | ||
| Disciplined Value Fund | $ | 37,595 | $ | 37,595 |
| Disciplined Value Mid Cap Fund | 51,292 | 48,292 | ||
| Global Shareholder Yield* | 38,144 | 48,530 | ||
| International Growth* | 50,277 | 62,684 | ||
| U.S. Quality Growth Fund | ||||
| (formerly known as Strategic | ||||
| Growth Fund) | 38,812 | 41,312 | ||
| Total | $ | 216,120 | $ | 238,413 |
| * | Year-end changed from February 28 to March 31 in 2018. March 31, 2018 amounts include fees for the year ended February 28, 2018 and for the one month ended March 31, 2018. |
(b) Audit-Related Services
Audit-related fees for assurance and related services by the principal accountant are billed to the registrant or to the registrant’s investment adviser (not including any sub-adviser whose role is primarily portfolio management and is subcontracted with or overseen by another investment adviser), and any entity controlling, controlled by, or under common control with the adviser ("control affiliates") that provides ongoing services to the registrant. The nature of the services provided was affiliated service provider internal controls reviews and merger related fees. Amounts billed to the registrant were as follows:
| Fund | March 31, 2019 | March 31, 2018 | ||
| Disciplined Value Fund | $ | 571 | $ | 540 |
| Disciplined Value Mid Cap Fund | 571 | 540 | ||
| Global Shareholder Yield* | 571 | 540 | ||
| International Growth* | 571 | 540 | ||
| U.S. Quality Growth Fund | 7,571 | 540 | ||
| (formerly known as Strategic | ||||
| Growth Fund) | ||||
| Total | $ | 9,855 | $ | 2,700 |
| * | Year-end changed from February 28 to March 31 in 2018. March 31, 2018 amounts include fees for the year ended February 28, 2018 and for the one month ended March 31, 2018. |
Amounts billed to control affiliates were $113,000 and $110,200 for the fiscal years ended March 31, 2019 and 2018, respectively.
(c) Tax Fees
The aggregate fees billed for professional services rendered by the principal accountant for tax compliance, tax advice and tax planning (“tax fees”) amounted to the following for the fiscal years ended March 31, 2019 and 2018. The nature of the services comprising the tax fees was the review of the registrant’s tax returns and tax distribution requirements. These fees were billed to the registrant and were approved by the registrant’s audit committee.
| Fund | March 31, 2019 | March 31, 2018 | ||
| Disciplined Value Fund | $ | 3,725 | $ | 3,725 |
| Disciplined Value Mid Cap Fund | 3,725 | 3,725 | ||
| Global Shareholder Yield* | 3,725 | 3,725 | ||
| International Growth* | 4,275 | 4,275 | ||
| U.S. Quality Growth Fund | 9,225 | 3,725 | ||
| (formerly known as Strategic | ||||
| Growth Fund) | ||||
| Total | $ | 24,675 | $ | 19,175 |
| * | Year-end changed from February 28 to March 31 in 2018. March 31, 2018 amounts include fees for the year ended February 28, 2018 and for the one month ended March 31, 2018. |
(d) All Other Fees
The nature of the services comprising all other fees is advisory services provided to the investment manager. Other fees amounted to the following for the fiscal years ended March 31, 2019 and 2018:
| Fund | March 31, 2018 | March 31, 2018 | ||
| Disciplined Value Fund | $ | 102 | $ | 221 |
| Disciplined Value Mid Cap Fund | 102 | 221 | ||
| Global Shareholder Yield* | 102 | 1,036 | ||
| International Growth* | 102 | 1,036 | ||
| U.S. Quality Growth Fund | 102 | 221 | ||
| (formerly known as Strategic | ||||
| Growth Fund) | ||||
| Total | $ | 510 | $ | 2,735 |
| * | Year-end changed from February 28 to March 31 in 2018. March 31, 2018 amounts include fees for the year ended February 28, 2018 and for the one month ended March 31, 2018. |
(e)(1) Audit Committee Pre-Approval Policies and Procedures:
The trust’s Audit Committee must pre-approve all audit and non-audit services provided by the independent registered public accounting firm (the “Auditor”) relating to the operations or financial reporting of the funds. Prior to the commencement of any audit or non-audit services to a fund, the Audit Committee reviews the services to determine whether they are appropriate and permissible under applicable law.
The trust’s Audit Committee has adopted policies and procedures to, among other purposes, provide a framework for the Committee’s consideration of audit-related and non-audit services by the Auditor. The policies and procedures require that any audit-related and non-audit service provided by the Auditor and any non-audit service provided by the Auditor to a fund service provider that relates directly to the operations and financial reporting of a fund are subject to approval by the Audit Committee before such service is provided. Audit-related services provided by the Auditor that are expected to exceed $25,000 per year/per fund are subject to specific pre-approval by the Audit Committee. Tax services provided by the Auditor that are expected to exceed $30,000 per year/per fund are subject to specific pre-approval by the Audit Committee.
All audit services, as well as the audit-related and non-audit services that are expected to exceed the amounts stated above, must be approved in advance of provision of the service by formal resolution of the Audit Committee. At the regularly scheduled Audit Committee meetings, the Committee reviews a report summarizing the services, including fees, provided by the Auditor.
(e)(2) Services approved pursuant to paragraph (c)(7)(i)(C) of Rule 2-01 of Regulation S-X:
Audit-Related Fees, Tax Fees and All Other Fees:
There were no amounts that were approved by the Audit Committee pursuant to the de minimis exception under Rule 2-01 of Regulation S-X.
(f) According to the registrant’s principal accountant for the fiscal year ended March 31, 2019, the percentage of hours spent on the audit of the registrant's financial statements for the most recent fiscal year that were attributed to work performed by persons who were not full-time, permanent employees of principal accountant was less than 50%.
(g) The aggregate non-audit fees billed by the registrant’s principal accountant for non-audit services rendered to the registrant and rendered to the registrant's control affiliates were $889,301 for the fiscal year ended March 31, 2019 and $7,692,718 for the fiscal year ended March 31, 2018.
(h) The audit committee of the registrant has considered the non-audit services provided by the registrant’s principal accountant to the control affiliates and has determined that the services that were not pre-approved are compatible with maintaining the principal accountant’s independence.
ITEM 5. AUDIT COMMITTEE OF LISTED REGISTRANTS.
The registrant has a separately-designated standing audit committee comprised of independent trustees. The members of the audit committee are as follows:
Peter S. Burgess
Charles L. Bardelis
Theron S. Hoffman
ITEM 6. SCHEDULE OF INVESTMENTS.
ITEM 7. DISCLOSURE OF PROXY VOTING POLICIES AND PROCEDURES FOR CLOSED-END MANAGEMENT INVESTMENT COMPANIES.
Not applicable.
ITEM 8. PORTFOLIO MANAGERS OF CLOSED-END MANAGEMENT INVESTMENT COMPANIES.
Not applicable.
ITEM 9. PURCHASES OF EQUITY SECURITIES BY CLOSED-END MANAGEMENT INVESTMENT COMPANY AND AFFILIATED PURCHASERS.
Not applicable.
ITEM 10. SUBMISSION OF MATTERS TO A VOTE OF SECURITY HOLDERS.
The registrant has adopted procedures by which shareholders may recommend nominees to the registrant's Board of Trustees. A copy of the procedures is filed as an exhibit to this Form N-CSR. See attached “John Hancock Funds – Nominating, Governance and Administration Committee Charter”.
ITEM 11. CONTROLS AND PROCEDURES.
(a) Based upon their evaluation of the registrant's disclosure controls and procedures as conducted within 90 days of the filing date of this Form N-CSR, the registrant's principal executive officer and principal financial officer have concluded that those disclosure controls and procedures provide reasonable assurance that the material information required to be disclosed by the registrant on this report is recorded, processed, summarized and reported within the time periods specified in the Securities and Exchange Commission's rules and forms.
(b) There were no changes in the registrant's internal control over financial reporting that occurred during the second fiscal quarter of the period covered by this report that have materially affected, or are reasonably likely to materially affect, the registrant's internal control over financial reporting.
ITEM 12. DISCLOSURE OF SECURITIES LENDING ACTIVITIES FOR CLOSED-END MANAGEMENT INVESTMENT COMPANIES.: Not applicable.
ITEM 13. EXHIBITS.
(a)(1) Code of Ethics for Covered Officers is attached.
(a)(2) Separate certifications for the registrant's principal executive officer and principal financial officer, as required by Section 302 of the Sarbanes-Oxley Act of 2002 and Rule 30a-2(a) under the Investment Company Act of 1940, are attached.
(b)(1) Separate certifications for the registrant's principal executive officer and principal financial officer, as required by 18 U.S.C. Section 1350, as adopted pursuant to Section 906 of the Sarbanes-Oxley Act of 2002, and Rule 30a-2(b) under the Investment Company Act of 1940, are attached. The certifications furnished pursuant to this paragraph are not deemed to be "filed" for purposes of Section 18 of the Securities Exchange Act of 1934, or otherwise subject to the liability of that section. Such certifications are not deemed to be incorporated by reference into any filing under the Securities Act of 1933 or the Securities Exchange Act of 1934, except to the extent that the Registrant specifically incorporates them by reference.
(c)(1) Submission of Matters to a Vote of Security Holders is attached. See attached “John Hancock Funds – Nominating, Governance and Administration Committee Charter”.
SIGNATURES
Pursuant to the requirements of the Securities Exchange Act of 1934 and the Investment Company Act of 1940, the registrant has duly caused this report to be signed on its behalf by the undersigned, thereunto duly authorized.
John Hancock Funds III
| By: | /s/ Andrew Arnott |
| Andrew Arnott | |
| President | |
| Date: | May 16, 2019 |
Pursuant to the requirements of the Securities Exchange Act of 1934 and the Investment Company Act of 1940, this report has been signed below by the following persons on behalf of the registrant and in the capacities and on the dates indicated.
| By: | /s/ Andrew Arnott |
| Andrew Arnott President | |
| Date: | May 16, 2019 |
| By: | /s/ Charles A. Rizzo |
| Charles A. Rizzo Chief Financial Officer | |
| Date: | May 16, 2019 |