UNITED STATES
SECURITIES AND EXCHANGE COMMISSION
Washington, D.C. 20549
FORM N-CSR
CERTIFIED SHAREHOLDER REPORT OF REGISTERED
MANAGEMENT INVESTMENT COMPANIES
Investment Company Act file number 811-21777
John Hancock Funds III
(Exact name of registrant as specified in charter)
601 Congress Street, Boston, Massachusetts 02210
(Address of principal executive offices) (Zip code)
Salvatore Schiavone
Treasurer
601 Congress Street
Boston, Massachusetts 02210
(Name and address of agent for service)
Registrant's telephone number, including area code: 617-663-4497
| Date of fiscal year end: | March 31 |
| Date of reporting period: | March 31, 2018 |
ITEM 1. REPORTS TO STOCKHOLDERS.
John Hancock
International Growth Fund
Annual report 2/28/18 (and one month 3/31/18)


A message to shareholders
Dear shareholder,
The markets spent much of 2017 on an upward trajectory, fueled by broad-based expansion of economic growth, supportive monetary policy, and benign inflation. Global equities rose throughout most of the period and outperformed U.S. equities. As the global economy continued to gain momentum, central banks began to normalize their long-standing accommodative monetary policies with the U.S. Federal Reserve leading this charge.
However, two significant developments materialized in early 2018 that bear watching. The first was a pronounced and sudden correction in most international equity indexes, with stocks selling off 10% from their peaks before stabilizing. The second is that the growth prospects in developed international markets, which had been quite promising, cooled. While many indicators remain positive, the likelihood of continued volatility remains higher now than a year ago.
While the global equity markets delivered positive results for the overall period, it's important for investors to be cognizant of the downside risks. Your best resource in unpredictable markets is your financial advisor, who can help position your portfolio so that it's sufficiently diversified to meet your long-term objectives and to withstand the inevitable turbulence along the way.
On behalf of everyone at John Hancock Investments, I'd like to take this opportunity to welcome new shareholders and to thank existing shareholders for the continued trust you've placed in us.
Sincerely,

Andrew G. Arnott
President and CEO,
John Hancock Investments
Head of Wealth and Asset Management,
United States and Europe
This commentary reflects the CEO's views, which are subject to change at any time. Investing involves risks, including the potential loss of principal. Diversification does not guarantee investment returns and does not eliminate risk of loss. For more up-to-date information, please visit our website at jhinvestments.com.
John Hancock
International Growth Fund
Table of contents
| 2 | Your fund at a glance | |
| 6 | Discussion of fund performance | |
| 11 | A look at performance | |
| 15 | Your expenses | |
| 18 | Fund's investments | |
| 26 | Financial statements | |
| 30 | Financial highlights | |
| 39 | Notes to financial statements | |
| 49 | Report of independent registered public accounting firm | |
| 50 | Tax information | |
| 51 | Trustees and Officers | |
| 55 | More information |
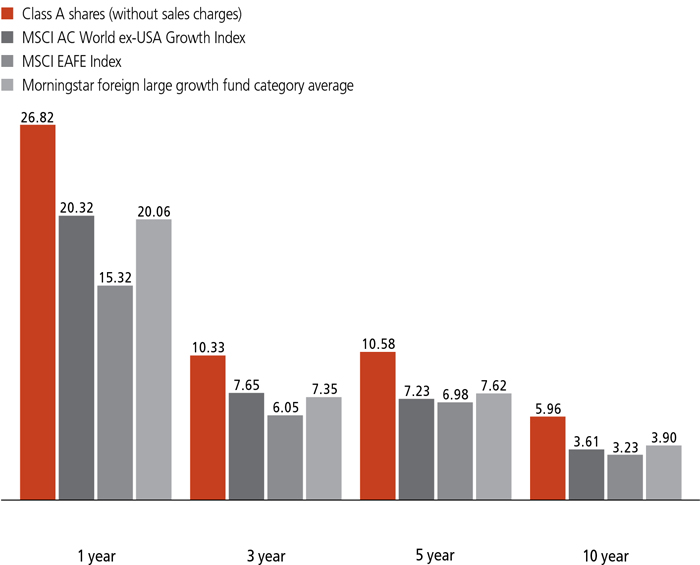
AVERAGE ANNUAL TOTAL RETURNS AS OF 2/28/18 (%)
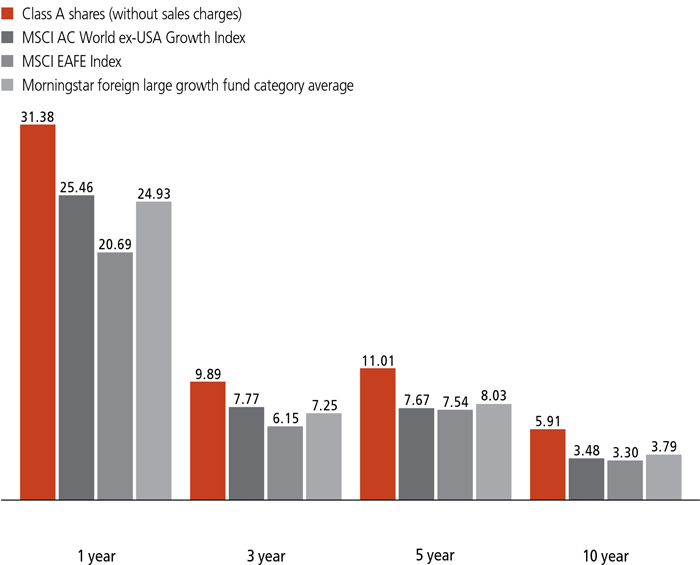
The MSCI AC World ex-USA Growth Index (gross of foreign withholding tax on dividends) is a free float-adjusted market capitalization index that is designed to measure the equity performance of growth-oriented stocks in developed (excluding the U.S.) and emerging markets.
The MSCI EAFE Index (gross of foreign withholding tax on dividends) is a free float-adjusted market capitalization index that is designed to measure the equity market performance of developed markets, excluding the U.S. and Canada.
It is not possible to invest directly in an index. Index figures do not reflect expenses or sales charges, which would result in lower returns.
Figures from Morningstar, Inc. include reinvested distributions and do not take into account sales charges. Actual load-adjusted performance is lower.
The past performance shown here reflects reinvested distributions and the beneficial effect of any expense reductions, and does not guarantee future results. Performance of the other share classes will vary based on the difference in the fees and expenses of those classes. Shares will fluctuate in value and, when redeemed, may be worth more or less than their original cost. Current month-end performance may be lower or higher than the performance cited, and can be found at jhinvestments.com or by calling 800-225-5291. For further information on the fund's objectives, risks, and strategy, see the fund's prospectus.
PERFORMANCE HIGHLIGHTS
A strong economic climate supported equities
Most developed-market stocks outside the United States posted strong gains as economic conditions strengthened in key markets, although market volatility increased substantially toward the end of the period as some economies showed signs of slowing.
The fund outperformed relative to the benchmark
The fund posted a positive overall return, outperforming its benchmark, the MSCI AC World ex-USA Growth Index, as a result of a positive impact from stock selection and sector allocation effects.
An overweight in information technology was a positive factor
In the information technology sector, an overweight position and security selection contributed significantly to relative performance.
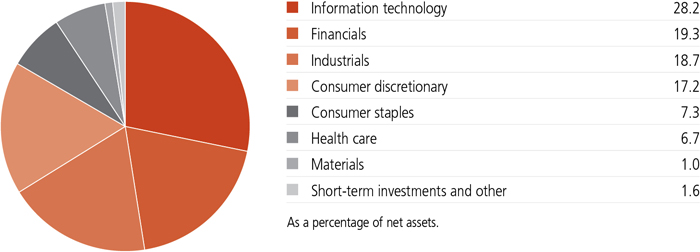
SECTOR COMPOSITION AS OF 3/31/18 (%)
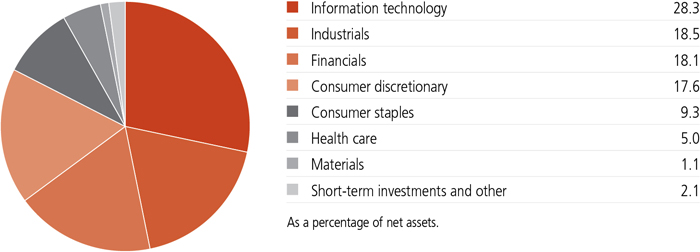
SECTOR COMPOSITION AS OF 2/28/18 (%)
A note about risks
Foreign investing, especially in emerging markets, has additional risks, such as currency and market volatility and political and social instability. Growth stocks may be subject to greater price fluctuations because their prices tend to place greater emphasis on earnings expectations. The value of a company's equity securities is subject to changes in the company's financial condition and overall market and economic conditions. Derivatives transactions, including hedging and other strategic transactions, may increase a fund's volatility and could produce disproportionate losses, potentially more than the fund's principal investment. A fund focused in one sector or that holds a limited number of securities may fluctuate more than a fund that invests in a wider variety of sectors. A higher portfolio turnover rate may indicate higher transaction costs and may result in higher taxes when fund shares are held in a taxable account. Please see the fund's prospectus for additional risks.

John A. Boselli, CFA
Portfolio Manager
Wellington Management Company LLP
Why does this discussion cover two periods?
The fund has changed its fiscal year for reporting purposes, moving from a period ending at the close of February each year to a schedule concluding at the close of March. This discussion covers a 12-month period plus an additional one-month period.
Can you describe the market environment during the period and the factors that drove the return for the fund's benchmark, the MSCI AC World ex-USA Growth Index?
Global equities rose throughout most of the period, as measured by the benchmark, and they outperformed U.S. equities, as measured by the broad-based S&P 500 Index. During the second and third quarters of calendar year 2017, broad-based expansion of economic growth, supportive monetary policy, and benign inflation helped drive equity markets higher. In September, eurozone business confidence reached the highest level in a decade, supported by solid employment and manufacturing growth and a reacceleration in the services sector. The U.S. economy continued on an upward trajectory, and signs of rising inflation increased investors' expectations of further monetary policy tightening.
As the global economy continued to gain momentum, central banks began to normalize their long-standing accommodative monetary policies. During the fourth quarter of the calendar year, political concerns dominated headlines globally, while economic data across most major economies remained largely positive. The U.S. Federal Reserve raised the benchmark federal funds rate four times during the period. In January 2018, the U.S. House of Representatives passed a short-term spending bill to reopen the government after a three-day shutdown, and U.S. companies began to respond to new tax laws. In February, the index posted its first monthly loss since November 2016. A sharp correction in global markets, accompanied by a spike in volatility, appeared to be triggered by an accumulation of data that reflected a shift in investors' perceptions about future market risks, notably inflation.
As the first quarter of calendar year 2018 came to a close, global equities declined for the second consecutive month. Concerns about a potential trade war between the U.S. and China intensified
TOP 10 HOLDINGS AS OF 3/31/18 (%)
| Tencent Holdings, Ltd. | 3.9 |
| Alibaba Group Holding, Ltd., ADR | 3.3 |
| Taiwan Semiconductor Manufacturing Company, Ltd. | 3.2 |
| Samsung Electronics Company, Ltd. | 2.7 |
| Unilever NV | 2.5 |
| Airbus SE | 2.3 |
| LVMH Moet Hennessy Louis Vuitton SE | 2.1 |
| Safran SA | 2.1 |
| ASML Holding NV | 2.1 |
| Keyence Corp. | 2.0 |
| TOTAL | 26.2 |
| As a percentage of net assets. | |
| Cash and cash equivalents are not included. | |
TOP 10 HOLDINGS AS OF 2/28/18 (%)
| Tencent Holdings, Ltd. | 4.0 |
| Alibaba Group Holding, Ltd., ADR | 3.3 |
| Taiwan Semiconductor Manufacturing Company, Ltd. | 3.1 |
| Samsung Electronics Company, Ltd. | 2.5 |
| Airbus SE | 2.4 |
| Unilever NV | 2.3 |
| Safran SA | 2.2 |
| British American Tobacco PLC | 2.1 |
| LVMH Moet Hennessy Louis Vuitton SE | 2.1 |
| ASML Holding NV | 2.0 |
| TOTAL | 26.0 |
| As a percentage of net assets. | |
| Cash and cash equivalents are not included. | |
The fund outperformed relative to its benchmark. What key factors had the most significant impact on this result?
TOP 10 COUNTRIES AS OF 3/31/18 (%)
| China | 12.7 |
| United Kingdom | 12.4 |
| France | 12.1 |
| Japan | 8.4 |
| Switzerland | 8.0 |
| Netherlands | 6.0 |
| Hong Kong | 5.1 |
| United States | 4.8 |
| Australia | 3.8 |
| India | 3.8 |
| TOTAL | 77.1 |
| As a percentage of net assets. | |
| Cash and cash equivalents are not included. |
TOP 10 COUNTRIES AS OF 2/28/18 (%)
| United Kingdom | 14.3 |
| China | 14.1 |
| France | 12.1 |
| Japan | 8.7 |
| Switzerland | 8.1 |
| United States | 5.3 |
| Netherlands | 4.5 |
| Australia | 4.1 |
| India | 3.7 |
| Ireland | 3.5 |
| TOTAL | 78.4 |
| As a percentage of net assets. | |
| Cash and cash equivalents are not included. |
underperformed the broader market, so the fund's underweights in those sectors had a positive impact on relative performance.
Which positions had the biggest positive impact on the fund's relative results?
The top contributor was Tencent Holdings, Ltd., a China-based internet media company. Its shares outperformed as the company's revenue growth accelerated in 2017, exceeding analysts' estimates. Tencent continued to rank highly in our process, as we viewed the stock as having a combination of high organic revenue growth, high free cash flow margins, and high valuation upside to our estimate of fair value.
Other positions that significantly contributed to relative performance were Alibaba Group Holding, Ltd., a China-based internet and e-commerce company, and Nexon Company, Ltd., a Japanese developer of online and mobile games.
Which equity positions had the biggest negative impact on the fund's performance?
The most significant detractor was the fund's position in Allergan PLC, a multinational pharmaceutical company producing branded and generic drugs headquartered in Ireland. While Allergan reported strong earnings, its stock declined due to investor concerns over competitive pressures for some of its key products. We sold the fund's position in Allergan. Another key detractor was British American Tobacco PLC, a U.K.-based multinational manufacturer and distributor of tobacco products. Its shares came under pressure after the company reported weaker-than-expected revenue growth. We sold the fund's position in British American, as a structural shift toward next-generation products was negatively impacting competitive dynamics across the industry. A position in China-based internet technology company NetEase, Inc. also had a negative impact. We sold the position, as earnings revisions turned negative.
How was the fund positioned at the end of the period?
From a sector perspective, information technology remained a large overweight, as we believe these companies provide the best combination of growth and valuation upside potential in our stock-ranking process. In financials, the fund also had an overweight position, as banks and insurers were benefiting from a strong economic cycle and more favorable regulatory environment. The fund remained underweight in consumer staples and healthcare, which had less attractive valuation upside potential in our view, and in energy and materials as these sectors are often too capital intensive to rank attractively for quality.
From a geographic perspective, the fund was overweight in emerging markets—particularly China and India—and in continental Europe, where we see the potential for strong economic growth. In China, we see long-term secular tailwinds for domestically oriented companies, which we believe
benefit from China's emerging middle class and growing services economy. In Taiwan and South Korea, the fund held positions in exporters exposed to accelerating demand globally, including certain semiconductor companies. The fund was underweight in Japan, as the stocks of high quality growth companies in Japan tended to be relatively expensive, in our view, with a lower relative rank in our process.
MANAGED BY
| | John A. Boselli, CFA On the fund since 2014 Investing since 1996 |
![]()
TOTAL RETURNS FOR THE PERIOD ENDED MARCH 31, 2018
| Average annual total returns (%) with maximum sales charge | Cumulative total returns (%) with maximum sales charge | ||||||
| 1-year | 5-year | 10-year | 5-year | 10-year | |||
| Class A | 20.46 | 9.45 | 5.42 | 57.07 | 69.53 | ||
| Class B | 20.94 | 9.50 | 5.18 | 57.44 | 65.69 | ||
| Class C | 24.96 | 9.79 | 5.18 | 59.51 | 65.70 | ||
| Class I1 | 27.24 | 10.95 | 6.36 | 68.16 | 85.24 | ||
| Class R21,2 | 26.73 | 10.51 | 5.93 | 64.83 | 77.86 | ||
| Class R41,2 | 27.04 | 10.67 | 6.00 | 66.03 | 79.16 | ||
| Class R61,2 | 27.38 | 10.88 | 6.10 | 67.59 | 80.84 | ||
| Class 11 | 27.28 | 11.03 | 6.42 | 68.70 | 86.27 | ||
| Class NAV1,2 | 27.33 | 10.84 | 6.08 | 67.30 | 80.52 | ||
| Index 1† | 20.32 | 7.23 | 3.61 | 41.77 | 42.60 | ||
| Index 2† | 15.32 | 6.98 | 3.23 | 40.13 | 37.37 | ||
TOTAL RETURNS FOR THE PERIOD ENDED FEBRUARY 28, 2018
| Average annual total returns (%) with maximum sales charge | Cumulative total returns (%) with maximum sales charge | ||||||
| 1-year | 5-year | 10-year | 5-year | 10-year | |||
| Class A | 24.82 | 9.88 | 5.37 | 60.14 | 68.71 | ||
| Class B | 25.49 | 9.92 | 5.13 | 60.49 | 64.92 | ||
| Class C | 29.51 | 10.22 | 5.13 | 62.64 | 64.92 | ||
| Class I1 | 31.82 | 11.37 | 6.31 | 71.34 | 84.35 | ||
| Class R21,2 | 31.23 | 10.93 | 5.87 | 67.95 | 76.92 | ||
| Class R41,2 | 31.60 | 11.10 | 5.95 | 69.24 | 78.28 | ||
| Class R61,2 | 31.91 | 11.29 | 6.04 | 70.71 | 79.83 | ||
| Class 11 | 31.86 | 11.45 | 6.37 | 71.98 | 85.37 | ||
| Class NAV1,2 | 31.91 | 11.26 | 6.03 | 70.47 | 79.58 | ||
| Index 1† | 25.46 | 7.67 | 3.48 | 44.70 | 40.74 | ||
| Index 2† | 20.69 | 7.54 | 3.30 | 43.81 | 38.35 | ||
Performance figures assume all distributions have been reinvested. Figures reflect maximum sales charges on Class A shares of 5%, and the applicable contingent deferred sales charge (CDSC) on Class B and Class C shares. The Class B shares' CDSC declines annually between years 1 to 6 according to the following schedule: 5%, 4%, 3%, 3%, 2%, and 1%. No sales charge will be assessed after the sixth year. Class C shares sold within one year of purchase are subject to a 1% CDSC. Sales charges are not applicable to Class I, Class R2, Class R4, Class R6, Class 1, and Class NAV shares.
The expense ratios of the fund, both net (including any fee waivers and/or expense limitations) and gross (excluding any fee waivers and/or expense limitations), are set forth according to the most recent publicly available prospectuses for the fund and may differ from those disclosed in the Financial highlights tables in this report. Net expenses reflect contractual fee waivers and expense limitations in effect until June 30, 2018 and are subject to change. Had the contractual fee waivers and expense limitations not been in place, gross expenses would apply. The expense ratios are as follows:
| Class A | Class B | Class C | Class I | Class R2 | Class R4 | Class R6 | Class 1 | Class NAV | |
| Gross (%) | 1.33 | 2.03 | 2.03 | 1.02 | 1.43 | 1.28 | 0.93 | 0.96 | 0.91 |
| Net (%) | 1.33 | 2.03 | 2.03 | 1.02 | 1.43 | 1.18 | 0.93 | 0.96 | 0.91 |
Please refer to the most recent prospectus and annual or semiannual report for more information on expenses and any expense limitation arrangements for each class.
The returns reflect past results and should not be considered indicative of future performance. The return and principal value of an investment will fluctuate so that shares, when redeemed, may be worth more or less than their original cost. Due to market volatility and other factors, the fund's current performance may be higher or lower than the performance shown. For current to the most recent month-end performance data, please call 800-225-5291 or visit the fund's website at jhinvestments.com.
The performance table above and the chart on the next page do not reflect the deduction of taxes that a shareholder would pay on fund distributions or the redemption of fund shares. The fund's performance results reflect any applicable fee waivers or expense reductions, without which the expenses would increase and results would have been less favorable.
| † | Index 1 is the MSCI AC World ex-USA Growth Index; Index 2 is the MSCI EAFE Index. |
See page 13 for footnotes.
This chart and table show what happened to a hypothetical $10,000 investment in John Hancock International Growth Fund for the share classes and periods indicated, assuming all distributions were reinvested. For comparison, we've shown the same investment in two separate indexes.
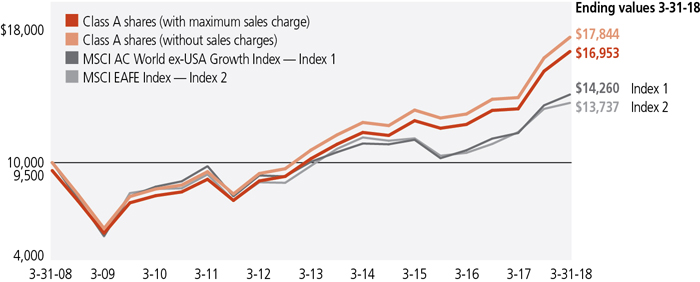
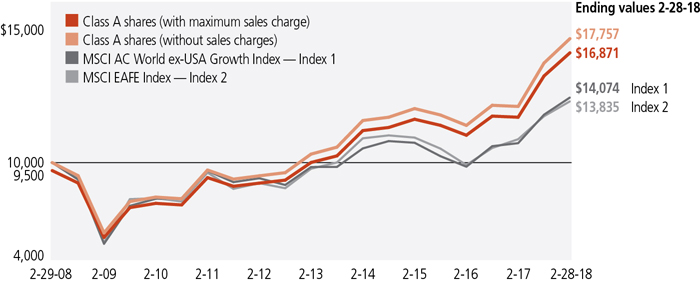
| Start date | With maximum sales charge ($) | Without sales charge ($) | Index 1 ($) | Index 2 ($) | |
| Class B3 | 2-29-08 | 16,492 | 16,492 | 14,074 | 13,835 |
| Class C3 | 2-29-08 | 16,492 | 16,492 | 14,074 | 13,835 |
| Class I1 | 2-29-08 | 18,435 | 18,435 | 14,074 | 13,835 |
| Class R21,2 | 2-29-08 | 18,537 | 18,537 | 14,074 | 13,835 |
| Class R41,2 | 2-29-08 | 17,692 | 17,692 | 14,074 | 13,835 |
| Class R61,2 | 2-29-08 | 17,828 | 17,828 | 14,074 | 13,835 |
| Class 11 | 2-29-08 | 17,983 | 17,983 | 14,074 | 13,835 |
| Class NAV1,2 | 2-29-08 | 17,958 | 17,958 | 14,074 | 13,835 |
The MSCI AC World ex-USA Growth Index (gross of foreign withholding tax on dividends) is a free float-adjusted market capitalization index that is designed to measure the equity performance of growth-oriented stocks in developed (excluding the U.S.) and emerging markets.
The MSCI EAFE Index (gross of foreign withholding tax on dividends) is a free float-adjusted market capitalization index that is designed to measure the equity market performance of developed markets, excluding the U.S. and Canada.
It is not possible to invest directly in an index. Index figures do not reflect expenses or sales charges, which would result in lower returns.
Footnotes related to performance pages
| 1 | For certain types of investors, as described in the fund's prospectuses. |
| 2 | Class R2, Class R4, and Class R6 shares were first offered on 3-27-15. Class NAV shares were first offered on 6-2-15. The returns prior to these dates are those of Class A shares that have not been adjusted for class-specific expenses; otherwise, returns would vary. |
| 3 | The contingent deferred sales charge is not applicable. |
These examples are intended to help you understand your ongoing operating expenses of investing in the fund so you can compare these costs with the ongoing costs of investing in other mutual funds.
Understanding fund expenses
As a shareholder of the fund, you incur two types of costs:
| • | Transaction costs, which include sales charges (loads) on purchases or redemptions (varies by share class), minimum account fee charge, etc. |
| • | Ongoing operating expenses, including management fees, distribution and service fees (if applicable), and other fund expenses. |
We are presenting only your ongoing operating expenses here.
Actual expenses/actual returns
The first line of each share class in the tables on the following page is intended to provide information about the fund's actual ongoing operating expenses, and is based on the fund's actual return. It assumes an account value of $1,000.00 on October 1, 2017 and September 1, 2017, with the same investment held until March 31, 2018 and February 28, 2018, respectively.
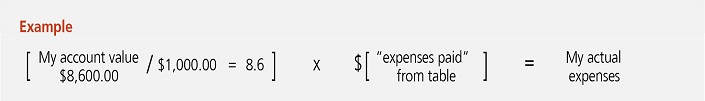
Together with the value of your account, you may use this information to estimate the operating expenses that you paid over the period. Simply divide your account value at March 31, 2018 and February 28, 2018, by $1,000.00, then multiply it by the "expenses paid" for your share class from the table. For example, for an account value of $8,600.00, the operating expenses should be calculated as follows:
Hypothetical example for comparison purposes
The second line of each share class in the tables on the following page allows you to compare the fund's ongoing operating expenses with those of any other fund. It provides an example of the fund's hypothetical account values and hypothetical expenses based on each class's actual expense ratio and an assumed 5% annualized return before expenses (which is not the fund's actual return). It assumes an account value of $1,000.00 on October 1, 2017 and September 1, 2017, with the same investment held until March 31, 2018 and February 28, 2018, respectively. Look in any other fund shareholder report to find its hypothetical example and you will be able to compare these expenses. Please remember that these hypothetical account values and expenses may not be used to estimate the actual ending account balance or expenses you paid for the period.
Remember, these examples do not include any transaction costs, therefore, these examples will not help you to determine the relative total costs of owning different funds. If transaction costs were included, your expenses would have been higher. See the prospectuses for details regarding transaction costs.
SHAREHOLDER EXPENSE EXAMPLE CHART
| Account value on 10-1-2017 | Ending value on 3-31-2018 | Expenses paid during period ended 3-31-20181 | Annualized expense ratio | ||
| Class A | Actual expenses/actual returns | $1,000.00 | $1,078.30 | $6.63 | 1.28% |
| Hypothetical example for comparison purposes | 1,000.00 | 1,018.50 | 6.44 | 1.28% | |
| Class B | Actual expenses/actual returns | 1,000.00 | 1,074.30 | 10.24 | 1.98% |
| Hypothetical example for comparison purposes | 1,000.00 | 1,015.10 | 9.95 | 1.98% | |
| Class C | Actual expenses/actual returns | 1,000.00 | 1,074.40 | 10.24 | 1.98% |
| Hypothetical example for comparison purposes | 1,000.00 | 1,015.10 | 9.95 | 1.98% | |
| Class I | Actual expenses/actual returns | 1,000.00 | 1,080.10 | 5.13 | 0.99% |
| Hypothetical example for comparison purposes | 1,000.00 | 1,020.00 | 4.99 | 0.99% | |
| Class R2 | Actual expenses/actual returns | 1,000.00 | 1,078.10 | 7.15 | 1.38% |
| Hypothetical example for comparison purposes | 1,000.00 | 1,018.10 | 6.94 | 1.38% | |
| Class R4 | Actual expenses/actual returns | 1,000.00 | 1,079.20 | 5.91 | 1.14% |
| Hypothetical example for comparison purposes | 1,000.00 | 1,019.20 | 5.74 | 1.14% | |
| Class R6 | Actual expenses/actual returns | 1,000.00 | 1,080.60 | 4.56 | 0.88% |
| Hypothetical example for comparison purposes | 1,000.00 | 1,020.50 | 4.43 | 0.88% | |
| Class 1 | Actual expenses/actual returns | 1,000.00 | 1,080.40 | 4.77 | 0.92% |
| Hypothetical example for comparison purposes | 1,000.00 | 1,020.30 | 4.63 | 0.92% | |
| Class NAV | Actual expenses/actual returns | 1,000.00 | 1,080.40 | 4.51 | 0.87% |
| Hypothetical example for comparison purposes | 1,000.00 | 1,020.60 | 4.38 | 0.87% | |
| 1 | Expenses are equal to the annualized expense ratio, multiplied by the average account value over the period, multiplied by 182/365 (to reflect the one-half period). |
| Account value on 9-1-2017 | Ending value on 2-28-2018 | Expenses paid during period ended 2-28-20181 | Annualized expense ratio | ||
| Class A | Actual expenses/actual returns | $1,000.00 | $1,093.90 | $6.65 | 1.28% |
| Hypothetical example for comparison purposes | 1,000.00 | 1,018.40 | 6.41 | 1.28% | |
| Class B | Actual expenses/actual returns | 1,000.00 | 1,090.00 | 10.26 | 1.98% |
| Hypothetical example for comparison purposes | 1,000.00 | 1,015.00 | 9.89 | 1.98% | |
| Class C | Actual expenses/actual returns | 1,000.00 | 1,090.20 | 10.26 | 1.98% |
| Hypothetical example for comparison purposes | 1,000.00 | 1,015.00 | 9.89 | 1.98% | |
| Class I | Actual expenses/actual returns | 1,000.00 | 1,095.70 | 5.09 | 0.98% |
| Hypothetical example for comparison purposes | 1,000.00 | 1,019.90 | 4.91 | 0.98% | |
| Class R2 | Actual expenses/actual returns | 1,000.00 | 1,092.80 | 7.26 | 1.40% |
| Hypothetical example for comparison purposes | 1,000.00 | 1,017.90 | 7.00 | 1.40% | |
| Class R4 | Actual expenses/actual returns | 1,000.00 | 1,094.70 | 5.92 | 1.14% |
| Hypothetical example for comparison purposes | 1,000.00 | 1,019.10 | 5.71 | 1.14% | |
| Class R6 | Actual expenses/actual returns | 1,000.00 | 1,095.80 | 4.68 | 0.90% |
| Hypothetical example for comparison purposes | 1,000.00 | 1,020.30 | 4.51 | 0.90% | |
| Class 1 | Actual expenses/actual returns | 1,000.00 | 1,095.60 | 4.78 | 0.92% |
| Hypothetical example for comparison purposes | 1,000.00 | 1,020.20 | 4.61 | 0.92% | |
| Class NAV | Actual expenses/actual returns | 1,000.00 | 1,096.00 | 4.52 | 0.87% |
| Hypothetical example for comparison purposes | 1,000.00 | 1,020.50 | 4.36 | 0.87% | |
| 1 | Expenses are equal to the annualized expense ratio, multiplied by the average account value over the period, multiplied by 181/365 (to reflect the one-half year period). |
| Fund’s investments |
| Shares | Value | ||||
| Common stocks 96.9% | $9,578,369,448 | ||||
| (Cost $8,052,402,661) | |||||
| Australia 3.8% | 371,323,078 | ||||
| Aristocrat Leisure, Ltd. | 5,839,063 | 109,018,317 | |||
| Qantas Airways, Ltd. | 23,543,036 | 106,215,531 | |||
| Treasury Wine Estates, Ltd. | 11,946,917 | 156,089,230 | |||
| Brazil 1.5% | 148,255,656 | ||||
| Ambev SA | 20,334,800 | 148,255,656 | |||
| Canada 1.0% | 101,124,001 | ||||
| Magna International, Inc. | 1,795,275 | 101,124,001 | |||
| China 12.7% | 1,259,748,523 | ||||
| Alibaba Group Holding, Ltd., ADR (A) | 1,757,397 | 322,552,648 | |||
| New Oriental Education & Technology Group, Inc., ADR | 1,209,642 | 106,025,121 | |||
| Ping An Insurance Group Company of China, Ltd., H Shares | 10,379,827 | 107,023,051 | |||
| Sunny Optical Technology Group Company, Ltd. | 6,740,850 | 126,487,371 | |||
| TAL Education Group, ADR | 2,901,297 | 107,609,106 | |||
| Tencent Holdings, Ltd. | 7,258,924 | 389,655,916 | |||
| Weibo Corp., ADR (A)(B) | 839,847 | 100,395,310 | |||
| Denmark 1.1% | 105,109,453 | ||||
| DSV A/S | 1,331,370 | 105,109,453 | |||
| France 12.1% | 1,192,165,011 | ||||
| Airbus SE | 1,970,202 | 228,066,351 | |||
| Alstom SA | 3,085,631 | 139,169,661 | |||
| Edenred | 4,163,838 | 144,829,067 | |||
| Kering SA | 300,755 | 144,247,428 | |||
| Legrand SA | 1,569,052 | 123,109,042 | |||
| LVMH Moet Hennessy Louis Vuitton SE | 673,433 | 207,534,221 | |||
| Safran SA | 1,933,569 | 205,209,241 | |||
| Germany 1.2% | 121,810,217 | ||||
| United Internet AG | 1,933,167 | 121,810,217 | |||
| Hong Kong 5.1% | 499,094,036 | ||||
| AIA Group, Ltd. | 22,665,000 | 193,755,796 | |||
| Melco Resorts & Entertainment, Ltd., ADR | 5,665,209 | 164,177,757 | |||
| Sino Biopharmaceutical, Ltd. | 71,028,000 | 141,160,483 | |||
| India 3.8% | 371,205,982 | ||||
| HDFC Bank, Ltd. | 3,772,733 | 112,170,111 | |||
| IndusInd Bank, Ltd. | 4,904,592 | 136,307,670 | |||
| Maruti Suzuki India, Ltd. | 899,038 | 122,728,201 | |||
| Indonesia 1.2% | 123,239,457 | ||||
| Bank Central Asia Tbk PT | 72,545,567 | 123,239,457 |
| 18 | JOHN HANCOCK INTERNATIONAL GROWTH FUND | ANNUAL REPORT | SEE NOTES TO FINANCIAL STATEMENTS |
| Shares | Value | ||||
| Ireland 3.6% | $359,380,813 | ||||
| Accenture PLC, Class A | 800,381 | 122,858,484 | |||
| ICON PLC (A) | 1,188,851 | 140,450,857 | |||
| Medtronic PLC | 1,197,600 | 96,071,472 | |||
| Italy 1.2% | 118,356,659 | ||||
| Moncler SpA | 3,109,881 | 118,356,659 | |||
| Japan 8.4% | 829,045,752 | ||||
| Keyence Corp. | 320,108 | 199,958,061 | |||
| Nexon Company, Ltd. (A) | 10,173,200 | 172,473,253 | |||
| SMC Corp. | 385,070 | 156,646,123 | |||
| Sony Corp. | 3,349,300 | 164,786,606 | |||
| Tokyo Electron, Ltd. | 730,747 | 135,181,709 | |||
| Luxembourg 1.0% | 94,239,934 | ||||
| B&M European Value Retail SA | 17,168,010 | 94,239,934 | |||
| Netherlands 6.0% | 589,969,668 | ||||
| ASML Holding NV | 1,024,161 | 203,084,801 | |||
| ING Groep NV | 6,589,668 | 111,202,133 | |||
| Koninklijke Philips NV | 3,492,549 | 133,736,871 | |||
| Wolters Kluwer NV | 2,668,911 | 141,945,863 | |||
| Norway 1.1% | 109,627,976 | ||||
| DNB ASA | 5,565,653 | 109,627,976 | |||
| Singapore 1.5% | 148,678,118 | ||||
| DBS Group Holdings, Ltd. | 7,038,900 | 148,678,118 | |||
| South Korea 2.7% | 264,447,057 | ||||
| Samsung Electronics Company, Ltd. | 113,182 | 264,447,057 | |||
| Sweden 1.2% | 122,486,585 | ||||
| Atlas Copco AB, A Shares | 2,820,205 | 122,486,585 | |||
| Switzerland 8.0% | 794,843,747 | ||||
| ABB, Ltd. | 5,514,004 | 131,113,093 | |||
| Cie Financiere Richemont SA | 1,539,517 | 138,343,871 | |||
| Julius Baer Group, Ltd. (A) | 2,446,435 | 150,557,261 | |||
| Partners Group Holding AG | 194,708 | 144,887,005 | |||
| Temenos Group AG (A) | 833,418 | 99,934,573 | |||
| UBS Group AG (A) | 7,378,880 | 130,007,944 | |||
| Taiwan 3.2% | 315,887,742 | ||||
| Taiwan Semiconductor Manufacturing Company, Ltd. | 37,294,008 | 315,887,742 | |||
| United Kingdom 12.4% | 1,230,104,983 | ||||
| Aon PLC | 794,571 | 111,502,148 | |||
| AstraZeneca PLC | 2,155,301 | 148,157,718 | |||
| Compass Group PLC | 6,069,068 | 123,923,724 | |||
| Diageo PLC | 5,048,075 | 170,724,046 |
| SEE NOTES TO FINANCIAL STATEMENTS | ANNUAL REPORT | JOHN HANCOCK INTERNATIONAL GROWTH FUND | 19 |
| Shares | Value | ||||
| United Kingdom (continued) | |||||
| IHS Markit, Ltd. (A) | 3,028,415 | $146,090,740 | |||
| Prudential PLC | 7,239,730 | 180,910,888 | |||
| Rio Tinto PLC | 2,061,226 | 104,594,713 | |||
| Unilever NV | 4,326,315 | 244,201,006 | |||
| United States 3.1% | 308,225,000 | ||||
| Amdocs, Ltd. | 1,675,088 | 111,761,871 | |||
| Broadcom, Ltd. | 433,155 | 102,072,976 | |||
| Sensata Technologies Holding PLC (A) | 1,821,149 | 94,390,153 | |||
| Preferred securities 1.5% | $148,474,102 | ||||
| (Cost $136,472,417) | |||||
| Brazil 1.5% | 148,474,102 | ||||
| Itau Unibanco Holding SA | 9,553,300 | 148,474,102 | |||
| Yield (%) | Shares | Value | |||
| Securities lending collateral 0.4% | $35,549,634 | ||||
| (Cost $35,554,023) | |||||
| John Hancock Collateral Trust (C) | 1.8276(D) | 3,554,324 | 35,549,634 | ||
| Par value^ | Value | ||||
| Short-term investments 1.4% | $138,700,000 | ||||
| (Cost $138,700,000) | |||||
| Repurchase agreement 1.4% | 138,700,000 | ||||
| Bank of America Corp. dated 3-29-18 at 1.800% to be repurchased at $59,011,800 on 4-2-18, collateralized by $59,975,019 Government National Mortgage Association, 4.000% - 4.500% due 8-20-44 to 10-20-44 (valued at $60,180,000, including interest) | 59,000,000 | 59,000,000 | |||
| Societe Generale dated 3-29-18 at 1.760% to be repurchased at $79,715,586 on 4-2-18, collateralized by $39,760,683 Federal Home Loan Mortgage Corp., 1.400% - 4.000% due 8-28-19 to 7-1-47 (valued at $39,607,934, including interest), $15,149,214 Federal National Mortgage Association, 1.000% - 3.185% due 4-30-18 to 7-1-35 (valued at $15,202,682, including interest), $200 U.S. Treasury Bills, 0.000% due 8-16-18 (valued at $199, including interest), $1,943,900 U.S. Treasury Bonds, 4.625% due 2-15-40 (valued at $2,482,975, including interest), $8,196,000 U.S. Treasury Notes, 0.750% due 8-31-18 (valued at $8,160,520, including interest), and $15,795,000 Federal Home Loan Bank, 3.000% due 9-11-26 (valued at $15,839,700, including interest) | 79,700,000 | 79,700,000 | |||
| Total investments (Cost $8,363,129,101) 100.2% | $9,901,093,184 | ||||
| Other assets and liabilities, net (0.2%) | (16,894,143) | ||||
| Total net assets 100.0% | $9,884,199,041 | ||||
| The percentage shown for each investment category is the total value of the category as a percentage of the net assets of the fund. | |
| ^All par values are denominated in U.S. dollars unless otherwise indicated. |
| 20 | JOHN HANCOCK INTERNATIONAL GROWTH FUND | ANNUAL REPORT | SEE NOTES TO FINANCIAL STATEMENTS |
| Security Abbreviations and Legend | |
| ADR | American Depositary Receipt |
| (A) | Non-income producing security. |
| (B) | A portion of this security is on loan as of 3-31-18. |
| (C) | Investment is an affiliate of the fund, the advisor and/or subadvisor. This security represents the investment of cash collateral received for securities lending. |
| (D) | The rate shown is the annualized seven-day yield as of 3-31-18. |
| SEE NOTES TO FINANCIAL STATEMENTS | ANNUAL REPORT | JOHN HANCOCK INTERNATIONAL GROWTH FUND | 21 |
| Fund’s investments |
| Shares | Value | ||||
| Common stocks 96.4% | $9,207,799,346 | ||||
| (Cost $7,684,610,219) | |||||
| Australia 4.1% | 387,480,080 | ||||
| Aristocrat Leisure, Ltd. | 5,471,096 | 104,007,031 | |||
| Qantas Airways, Ltd. | 22,669,985 | 103,192,074 | |||
| Treasury Wine Estates, Ltd. | 13,345,693 | 180,280,975 | |||
| Brazil 1.4% | 129,991,684 | ||||
| Ambev SA | 19,185,000 | 129,991,684 | |||
| Canada 1.0% | 92,964,058 | ||||
| Magna International, Inc. | 1,689,681 | 92,964,058 | |||
| China 14.1% | 1,348,051,900 | ||||
| Alibaba Group Holding, Ltd., ADR (A) | 1,704,122 | 317,205,270 | |||
| New Oriental Education & Technology Group, Inc., ADR | 1,514,575 | 138,417,009 | |||
| Ping An Insurance Group Company of China, Ltd., H Shares | 15,720,827 | 165,592,271 | |||
| Sunny Optical Technology Group Company, Ltd. | 7,446,050 | 121,787,479 | |||
| TAL Education Group, ADR | 3,318,654 | 125,312,375 | |||
| Tencent Holdings, Ltd. | 7,020,724 | 384,093,426 | |||
| Weibo Corp., ADR (A)(B) | 744,196 | 95,644,070 | |||
| Denmark 1.1% | 101,150,916 | ||||
| DSV A/S | 1,291,441 | 101,150,916 | |||
| France 12.1% | 1,155,397,185 | ||||
| Airbus SE | 1,930,387 | 231,063,173 | |||
| Alstom SA | 2,891,191 | 121,705,518 | |||
| Edenred | 3,985,711 | 139,842,521 | |||
| Kering SA | 300,755 | 141,135,446 | |||
| Legrand SA | 1,470,184 | 115,260,009 | |||
| LVMH Moet Hennessy Louis Vuitton SE | 659,824 | 197,351,916 | |||
| Safran SA | 1,894,494 | 209,038,602 | |||
| Germany 1.3% | 122,788,107 | ||||
| United Internet AG | 1,811,350 | 122,788,107 | |||
| Hong Kong 2.9% | 278,966,188 | ||||
| Melco Resorts & Entertainment, Ltd., ADR | 5,550,722 | 152,367,319 | |||
| Sino Biopharmaceutical, Ltd. | 67,566,000 | 126,598,869 | |||
| India 3.7% | 350,847,752 | ||||
| HDFC Bank, Ltd. | 3,772,733 | 110,975,249 | |||
| IndusInd Bank, Ltd. | 4,759,677 | 122,044,634 | |||
| Maruti Suzuki India, Ltd. | 871,206 | 117,827,869 | |||
| Indonesia 1.2% | 114,398,700 | ||||
| Bank Central Asia Tbk PT | 67,974,667 | 114,398,700 |
| 22 | JOHN HANCOCK INTERNATIONAL GROWTH FUND | ANNUAL REPORT | SEE NOTES TO FINANCIAL STATEMENTS |
| Shares | Value | ||||
| Ireland 3.5% | $333,089,885 | ||||
| Accenture PLC, Class A | 749,949 | 120,749,288 | |||
| ICON PLC (A) | 1,121,630 | 127,091,895 | |||
| Medtronic PLC | 1,067,076 | 85,248,702 | |||
| Italy 1.1% | 100,964,604 | ||||
| Moncler SpA | 2,909,306 | 100,964,604 | |||
| Japan 8.7% | 831,995,568 | ||||
| Keyence Corp. | 313,608 | 189,921,182 | |||
| Nexon Company, Ltd. (A) | 4,983,800 | 179,578,481 | |||
| SMC Corp. | 377,270 | 157,237,456 | |||
| Sony Corp. | 3,281,600 | 165,360,351 | |||
| Tokyo Electron, Ltd. | 715,947 | 139,898,098 | |||
| Luxembourg 1.0% | 93,526,865 | ||||
| B&M European Value Retail SA | 16,531,366 | 93,526,865 | |||
| Netherlands 4.5% | 432,567,025 | ||||
| ASML Holding NV | 1,003,464 | 195,699,714 | |||
| ING Groep NV | 6,174,399 | 108,348,546 | |||
| Wolters Kluwer NV | 2,537,186 | 128,518,765 | |||
| Norway 1.0% | 99,983,608 | ||||
| DNB ASA | 5,097,215 | 99,983,608 | |||
| Singapore 1.5% | 148,215,559 | ||||
| DBS Group Holdings, Ltd. | 6,896,700 | 148,215,559 | |||
| South Korea 2.5% | 240,982,492 | ||||
| Samsung Electronics Company, Ltd. | 110,895 | 240,982,492 | |||
| Sweden 1.2% | 112,403,712 | ||||
| Atlas Copco AB, A Shares | 2,642,479 | 112,403,712 | |||
| Switzerland 8.1% | 773,394,116 | ||||
| ABB, Ltd. | 4,976,929 | 120,435,496 | |||
| Cie Financiere Richemont SA | 1,484,162 | 130,146,987 | |||
| Julius Baer Group, Ltd. (A) | 2,396,996 | 155,692,158 | |||
| Partners Group Holding AG | 194,708 | 141,120,758 | |||
| Temenos Group AG (A) | 784,398 | 91,197,411 | |||
| UBS Group AG (A) | 7,113,570 | 134,801,306 | |||
| Taiwan 3.1% | 300,407,563 | ||||
| Taiwan Semiconductor Manufacturing Company, Ltd. | 36,178,008 | 300,407,563 | |||
| United Kingdom 14.3% | 1,366,671,251 | ||||
| Aon PLC | 744,497 | 104,467,819 | |||
| AstraZeneca PLC | 2,076,060 | 135,883,697 | |||
| British American Tobacco PLC | 3,419,578 | 201,833,341 | |||
| Compass Group PLC | 5,702,266 | 121,146,613 | |||
| Diageo PLC | 4,720,759 | 160,179,140 |
| SEE NOTES TO FINANCIAL STATEMENTS | ANNUAL REPORT | JOHN HANCOCK INTERNATIONAL GROWTH FUND | 23 |
| Shares | Value | ||||
| United Kingdom (continued) | |||||
| IHS Markit, Ltd. (A) | 2,919,492 | $137,362,099 | |||
| Prudential PLC | 7,093,424 | 177,741,527 | |||
| Rio Tinto PLC | 2,061,226 | 110,492,251 | |||
| Unilever NV | 4,157,054 | 217,564,764 | |||
| United States 3.0% | 291,560,528 | ||||
| Amdocs, Ltd. | 1,534,097 | 100,928,242 | |||
| Broadcom, Ltd. | 405,861 | 100,028,502 | |||
| Sensata Technologies Holding NV (A) | 1,714,033 | 90,603,784 | |||
| Preferred securities 1.5% | $145,236,033 | ||||
| (Cost $133,346,659) | |||||
| Brazil 1.5% | 145,236,033 | ||||
| Itau Unibanco Holding SA | 9,360,200 | 145,236,033 | |||
| Yield (%) | Shares | Value | |||
| Securities lending collateral 0.1% | $13,691,573 | ||||
| (Cost $13,691,973) | |||||
| John Hancock Collateral Trust (C) | 1.5822(D) | 1,368,718 | 13,691,573 | ||
| Par value^ | Value | ||||
| Short-term investments 1.6% | $147,700,000 | ||||
| (Cost $147,700,000) | |||||
| Repurchase agreement 1.6% | 147,700,000 | ||||
| Repurchase Agreement with Bank of America Corp. dated 2-28-18 at 1.390% to be repurchased at $68,402,641 on 3-1-18, collateralized by $67,445,188 Government National Mortgage Association, 3.500% - 6.000% due 10-15-36 to 1-20-48 (valued at $69,768,001, including interest) | 68,400,000 | 68,400,000 | |||
| Repurchase Agreement with Societe Generale dated 2-28-18 at 1.360% to be repurchased at $79,302,996 on 3-1-18, collateralized by $11,859,869 Federal Home Loan Mortgage Corp., 1.250% - 5.967% due 8-28-19 to 7-1-47 (valued at $12,236,664, including interest), $19,455,599 Federal National Mortgage Association, 3.000% - 4.000% due 11-1-25 to 4-1-47 (valued at $19,248,951, including interest), $2,998,998 Government National Mortgage Association, 2.625% - 4.500% due 5-20-28 to 4-20-47 (valued at $3,022,067, including interest), $7,717,600 U.S. Treasury Bonds, 3.125% due 8-15-44 (valued at $7,663,555, including interest), $40,289,100 U.S. Treasury Notes, 1.500% - 1.875% due 1-31-22 to 8-15-22 (valued at $38,704,729, including interest), and $10,000 Federal Home Loan Bank, 3.000% due 9-11-26 (valued at $10,055, including interest) | 79,300,000 | 79,300,000 | |||
| Total investments (Cost $7,979,348,851) 99.6% | $9,514,426,952 | ||||
| Other assets and liabilities, net 0.4% | 36,016,307 | ||||
| Total net assets 100.0% | $9,550,443,259 | ||||
| The percentage shown for each investment category is the total value of the category as a percentage of the net assets of the fund. | |
| ^All par values are denominated in U.S. dollars unless otherwise indicated. |
| 24 | JOHN HANCOCK INTERNATIONAL GROWTH FUND | ANNUAL REPORT | SEE NOTES TO FINANCIAL STATEMENTS |
| Security Abbreviations and Legend | |
| ADR | American Depositary Receipt |
| (A) | Non-income producing security. |
| (B) | A portion of this security is on loan as of 2-28-18. |
| (C) | Investment is an affiliate of the fund, the advisor and/or subadvisor. This security represents the investment of cash collateral received for securities lending. |
| (D) | The rate shown is the annualized seven-day yield as of 2-28-18. |
| SEE NOTES TO FINANCIAL STATEMENTS | ANNUAL REPORT | JOHN HANCOCK INTERNATIONAL GROWTH FUND | 25 |
Financial statements
STATEMENTS OF ASSETS AND LIABILITIES
| 3-31-181 | 2-28-18 | ||||||||||||||||||||||||||||||||||||||||||||
| Assets | |||||||||||||||||||||||||||||||||||||||||||||
| Unaffiliated investments, at value | $9,865,543,550 | $9,500,735,379 | |||||||||||||||||||||||||||||||||||||||||||
| Affiliated investments, at value | 35,549,634 | 13,691,573 | |||||||||||||||||||||||||||||||||||||||||||
| Total investments, at value | 9,901,093,184 | 9,514,426,952 | |||||||||||||||||||||||||||||||||||||||||||
| Cash | 6,232 | 15,168 | |||||||||||||||||||||||||||||||||||||||||||
| Foreign currency, at value | 1,555,160 | 7,427,276 | |||||||||||||||||||||||||||||||||||||||||||
| Receivable for fund shares sold | 25,926,525 | 59,435,959 | |||||||||||||||||||||||||||||||||||||||||||
| Dividends and interest receivable | 17,285,924 | 15,962,127 | |||||||||||||||||||||||||||||||||||||||||||
| Receivable for securities lending income | 17,351 | 37,306 | |||||||||||||||||||||||||||||||||||||||||||
| Other receivables and prepaid expenses | 500,621 | 462,613 | |||||||||||||||||||||||||||||||||||||||||||
| Total assets | 9,946,384,997 | 9,597,767,401 | |||||||||||||||||||||||||||||||||||||||||||
| Liabilities | |||||||||||||||||||||||||||||||||||||||||||||
| Payable for investments purchased | 5,596,579 | 23,335,521 | |||||||||||||||||||||||||||||||||||||||||||
| Payable for fund shares repurchased | 18,418,162 | 8,243,344 | |||||||||||||||||||||||||||||||||||||||||||
| Payable upon return of securities loaned | 35,562,575 | 13,733,181 | |||||||||||||||||||||||||||||||||||||||||||
| Payable to affiliates | |||||||||||||||||||||||||||||||||||||||||||||
| Accounting and legal services fees | 436,341 | 274,781 | |||||||||||||||||||||||||||||||||||||||||||
| Transfer agent fees | 651,526 | 555,394 | |||||||||||||||||||||||||||||||||||||||||||
| Distribution and service fees | 8,986 | 6,396 | |||||||||||||||||||||||||||||||||||||||||||
| Trustees' fees | 3,404 | 9,961 | |||||||||||||||||||||||||||||||||||||||||||
| Other liabilities and accrued expenses | 1,508,383 | 1,165,564 | |||||||||||||||||||||||||||||||||||||||||||
| Total liabilities | 62,185,956 | 47,324,142 | |||||||||||||||||||||||||||||||||||||||||||
| Net assets | $9,884,199,041 | $9,550,443,259 | |||||||||||||||||||||||||||||||||||||||||||
| Net assets consist of | |||||||||||||||||||||||||||||||||||||||||||||
| Paid-in capital | $8,228,885,065 | $7,927,631,927 | |||||||||||||||||||||||||||||||||||||||||||
| Undistributed net investment income | 8,537,054 | — | |||||||||||||||||||||||||||||||||||||||||||
| Accumulated net realized gain (loss) on investments and foreign currency transactions | 108,631,963 | 87,748,838 | |||||||||||||||||||||||||||||||||||||||||||
| Net unrealized appreciation (depreciation) on investments and translation of assets and liabilities in foreign currencies | 1,538,144,959 | 1,535,062,494 | |||||||||||||||||||||||||||||||||||||||||||
| Net assets | $9,884,199,041 | $9,550,443,259 | |||||||||||||||||||||||||||||||||||||||||||
| Unaffiliated investments, at cost | $8,327,575,078 | $7,965,656,878 | |||||||||||||||||||||||||||||||||||||||||||
| Affiliated investments, at cost | $35,554,023 | $13,691,973 | |||||||||||||||||||||||||||||||||||||||||||
| Foreign currency, at cost | $1,555,161 | $7,427,276 | |||||||||||||||||||||||||||||||||||||||||||
| Securities loaned, unaffiliated investments, at value | $34,813,574 | $13,453,925 | |||||||||||||||||||||||||||||||||||||||||||
STATEMENTS OF ASSETS AND LIABILITIES (continued)
| Net asset value per share | |||||||||||||||||||||||||||
| Based on net asset value and shares outstanding - The fund has an unlimited number of shares authorized with no par value | |||||||||||||||||||||||||||
| Class A2 | |||||||||||||||||||||||||||
| Net assets | $826,612,131 | $802,535,674 | |||||||||||||||||||||||||
| Shares outstanding | 28,981,349 | 28,228,917 | |||||||||||||||||||||||||
| Net asset value and redemption price per share | $28.52 | $28.43 | |||||||||||||||||||||||||
| Class B2 | |||||||||||||||||||||||||||
| Net assets | $1,750,303 | $1,774,766 | |||||||||||||||||||||||||
| Shares outstanding | 62,373 | 63,413 | |||||||||||||||||||||||||
| Net asset value, offering price and redemption price per share | $28.06 | $27.99 | |||||||||||||||||||||||||
| Class C2 | |||||||||||||||||||||||||||
| Net assets | $348,546,949 | $333,395,865 | |||||||||||||||||||||||||
| Shares outstanding | 12,446,933 | 11,937,642 | |||||||||||||||||||||||||
| Net asset value, offering price and redemption price per share | $28.00 | $27.93 | |||||||||||||||||||||||||
| Class I | |||||||||||||||||||||||||||
| Net assets | $5,631,292,885 | $5,423,988,543 | |||||||||||||||||||||||||
| Shares outstanding | 196,998,620 | 190,412,934 | |||||||||||||||||||||||||
| Net asset value, offering price and redemption price per share | $28.59 | $28.49 | |||||||||||||||||||||||||
| Class R2 | |||||||||||||||||||||||||||
| Net assets | $42,637,356 | $36,759,992 | |||||||||||||||||||||||||
| Shares outstanding | 1,493,664 | 1,291,907 | |||||||||||||||||||||||||
| Net asset value, offering price and redemption price per share | $28.55 | $28.45 | |||||||||||||||||||||||||
| Class R4 | |||||||||||||||||||||||||||
| Net assets | $8,419,177 | $8,576,898 | |||||||||||||||||||||||||
| Shares outstanding | 294,668 | 301,203 | |||||||||||||||||||||||||
| Net asset value, offering price and redemption price per share | $28.57 | $28.48 | |||||||||||||||||||||||||
| Class R6 | |||||||||||||||||||||||||||
| Net assets | $1,795,332,453 | $1,701,764,519 | |||||||||||||||||||||||||
| Shares outstanding | 62,759,404 | 59,702,806 | |||||||||||||||||||||||||
| Net asset value, offering price and redemption price per share | $28.61 | $28.50 | |||||||||||||||||||||||||
| Class 1 | |||||||||||||||||||||||||||
| Net assets | $93,476,651 | $90,810,643 | |||||||||||||||||||||||||
| Shares outstanding | 3,271,459 | 3,189,494 | |||||||||||||||||||||||||
| Net asset value, offering price and redemption price per share | $28.57 | $28.47 | |||||||||||||||||||||||||
| Class NAV | |||||||||||||||||||||||||||
| Net assets | $1,136,131,136 | $1,150,836,359 | |||||||||||||||||||||||||
| Shares outstanding | 39,762,360 | 40,422,505 | |||||||||||||||||||||||||
| Net asset value, offering price and redemption price per share | $28.57 | $28.47 | |||||||||||||||||||||||||
| Maximum offering price per share | |||||||||||||||||||||||||||
| Class A (net assets value per share ÷ 95%)3 | $30.02 | $29.93 | |||||||||||||||||||||||||
| 1 | The fund changed its fiscal year end from February 28 to March 31. | |||||||||||||||||||||||||
| 2 | Redemption price per share is equal to net asset value less any applicable contingent deferred sales charge. | |||||||||||||||||||||||||
| 3 | On single retail sales of less than $50,000. On sales of $50,000 or more and on group sales the offering price is reduced. | |||||||||||||||||||||||||
STATEMENTS OF OPERATIONS
| Period ended 3-31-181 | Year ended 2-28-18 | |||||||||||||||||||||||||||||||||||||||||
| Investment income | ||||||||||||||||||||||||||||||||||||||||||
| Dividends | $18,016,029 | $115,063,791 | ||||||||||||||||||||||||||||||||||||||||
| Interest | 234,369 | 1,777,998 | ||||||||||||||||||||||||||||||||||||||||
| Securities lending | 13,882 | 780,349 | ||||||||||||||||||||||||||||||||||||||||
| Less foreign taxes withheld | (1,863,333 | ) | (9,280,288 | ) | ||||||||||||||||||||||||||||||||||||||
| Total investment income | 16,400,947 | 108,341,850 | ||||||||||||||||||||||||||||||||||||||||
| Expenses | ||||||||||||||||||||||||||||||||||||||||||
| Investment management fees | 6,721,540 | 53,592,925 | ||||||||||||||||||||||||||||||||||||||||
| Distribution and service fees | 523,636 | 4,315,772 | ||||||||||||||||||||||||||||||||||||||||
| Accounting and legal services fees | 162,949 | 975,445 | ||||||||||||||||||||||||||||||||||||||||
| Transfer agent fees | 706,318 | 5,338,834 | ||||||||||||||||||||||||||||||||||||||||
| Trustees' fees | 8,816 | 94,186 | ||||||||||||||||||||||||||||||||||||||||
| State registration fees | 34,439 | 337,118 | ||||||||||||||||||||||||||||||||||||||||
| Printing and postage | 94,067 | 470,408 | ||||||||||||||||||||||||||||||||||||||||
| Professional fees | 20,168 | 153,945 | ||||||||||||||||||||||||||||||||||||||||
| Custodian fees | 233,156 | 2,414,215 | ||||||||||||||||||||||||||||||||||||||||
| Other | 6,643 | 116,176 | ||||||||||||||||||||||||||||||||||||||||
| Total expenses | 8,511,732 | 67,809,024 | ||||||||||||||||||||||||||||||||||||||||
| Less expense reductions | (71,501 | ) | (557,862 | ) | ||||||||||||||||||||||||||||||||||||||
| Net expenses | 8,440,231 | 67,251,162 | ||||||||||||||||||||||||||||||||||||||||
| Net investment income | 7,960,716 | 41,090,688 | ||||||||||||||||||||||||||||||||||||||||
| Realized and unrealized gain (loss) | ||||||||||||||||||||||||||||||||||||||||||
| Net realized gain (loss) on | ||||||||||||||||||||||||||||||||||||||||||
| Unaffiliated investments and foreign currency transactions | 21,471,616 | 325,477,080 | ||||||||||||||||||||||||||||||||||||||||
| Affiliated investments | (12,153 | ) | (44,690 | ) | ||||||||||||||||||||||||||||||||||||||
| 21,459,463 | 325,432,390 | |||||||||||||||||||||||||||||||||||||||||
| Change in net unrealized appreciation (depreciation) of | ||||||||||||||||||||||||||||||||||||||||||
| Unaffiliated investments and translation of assets and liabilities in foreign currencies | 3,086,454 | 1,246,540,771 | ||||||||||||||||||||||||||||||||||||||||
| Affiliated investments | (3,989 | ) | (2,773 | ) | ||||||||||||||||||||||||||||||||||||||
| 3,082,465 | 1,246,537,998 | |||||||||||||||||||||||||||||||||||||||||
| Net realized and unrealized gain | 24,541,928 | 1,571,970,388 | ||||||||||||||||||||||||||||||||||||||||
| Increase in net assets from operations | $32,502,644 | $1,613,061,076 | ||||||||||||||||||||||||||||||||||||||||
| 1 | For the one-month period ended 3-31-18. The fund changed its fiscal year end from February 28 to March 31. | |||||||||||||||||||||||||||||||
STATEMENTS OF CHANGES IN NET ASSETS
| Period ended 3-31-181 | Year ended 2-28-18 | Year ended 2-28-17 | |||||||||||||||||||||||||||||||||||||||||||||||||||||||||||||||||||
| Increase (decrease) in net assets | |||||||||||||||||||||||||||||||||||||||||||||||||||||||||||||||||||||
| From operations | |||||||||||||||||||||||||||||||||||||||||||||||||||||||||||||||||||||
| Net investment income | $7,960,716 | $41,090,688 | $23,250,804 | ||||||||||||||||||||||||||||||||||||||||||||||||||||||||||||||||||
| Net realized gain (loss) | 21,459,463 | 325,432,390 | (148,412,441 | ) | |||||||||||||||||||||||||||||||||||||||||||||||||||||||||||||||||
| Change in net unrealized appreciation (depreciation) | 3,082,465 | 1,246,537,998 | 353,314,086 | ||||||||||||||||||||||||||||||||||||||||||||||||||||||||||||||||||
| Increase in net assets resulting from operations | 32,502,644 | 1,613,061,076 | 228,152,449 | ||||||||||||||||||||||||||||||||||||||||||||||||||||||||||||||||||
| Distributions to shareholders | |||||||||||||||||||||||||||||||||||||||||||||||||||||||||||||||||||||
| From net investment income | |||||||||||||||||||||||||||||||||||||||||||||||||||||||||||||||||||||
| Class A | — | (1,662,236 | ) | (4,015,960 | ) | ||||||||||||||||||||||||||||||||||||||||||||||||||||||||||||||||
| Class I | — | (21,874,556 | ) | (16,927,587 | ) | ||||||||||||||||||||||||||||||||||||||||||||||||||||||||||||||||
| Class R2 | — | (22,327 | ) | (51,219 | ) | ||||||||||||||||||||||||||||||||||||||||||||||||||||||||||||||||
| Class R4 | — | (25,088 | ) | (21,812 | ) | ||||||||||||||||||||||||||||||||||||||||||||||||||||||||||||||||
| Class R6 | — | (8,042,919 | ) | (402,651 | ) | ||||||||||||||||||||||||||||||||||||||||||||||||||||||||||||||||
| Class 1 | — | (438,430 | ) | (457,163 | ) | ||||||||||||||||||||||||||||||||||||||||||||||||||||||||||||||||
| Class NAV | — | (6,809,529 | ) | (2,999,617 | ) | ||||||||||||||||||||||||||||||||||||||||||||||||||||||||||||||||
| Total distributions | — | (38,875,085 | ) | (24,876,009 | ) | ||||||||||||||||||||||||||||||||||||||||||||||||||||||||||||||||
| From fund share transactions | 301,253,138 | 4,074,516,879 | 1,668,056,731 | ||||||||||||||||||||||||||||||||||||||||||||||||||||||||||||||||||
| Total increase | 333,755,782 | 5,648,702,870 | 1,871,333,171 | ||||||||||||||||||||||||||||||||||||||||||||||||||||||||||||||||||
| Net assets | |||||||||||||||||||||||||||||||||||||||||||||||||||||||||||||||||||||
| Beginning of period | 9,550,443,259 | 3,901,740,389 | 2,030,407,218 | ||||||||||||||||||||||||||||||||||||||||||||||||||||||||||||||||||
| End of period | $9,884,199,041 | $9,550,443,259 | $3,901,740,389 | ||||||||||||||||||||||||||||||||||||||||||||||||||||||||||||||||||
| Undistributed (accumulated distributions in excess of) net investment income | $8,537,054 | — | ($1,461,881 | ) | |||||||||||||||||||||||||||||||||||||||||||||||||||||||||||||||||
| 1 | For the one-month period ended 3-31-18. The fund changed its fiscal year end from February 28 to March 31. | |||||||||||||||||||||||||||||||||||||||||||||||||||||||||||||||||||||||||
Financial highlights
| Class A Shares Period ended | 3-31-18 | 1 | 2-28-18 | 2-28-17 | 2-29-16 | 2-28-15 | 2-28-14 | |||||||||||||||||||||||||||||||||||||||||||||||||||||||||||||||||||||||||||||||||||||||||||||||||||||||||||||||
| Per share operating performance | ||||||||||||||||||||||||||||||||||||||||||||||||||||||||||||||||||||||||||||||||||||||||||||||||||||||||||||||||||||||
| Net asset value, beginning of period | $28.43 | $21.69 | $19.90 | $21.64 | $24.60 | $21.28 | ||||||||||||||||||||||||||||||||||||||||||||||||||||||||||||||||||||||||||||||||||||||||||||||||||||||||||||||||
| Net investment income2 | 0.02 | 0.11 | 0.17 | 0.10 | 0.24 | 0.25 | ||||||||||||||||||||||||||||||||||||||||||||||||||||||||||||||||||||||||||||||||||||||||||||||||||||||||||||||||
| Net realized and unrealized gain (loss) on investments | 0.07 | 6.69 | 1.75 | (1.81 | ) | 0.83 | 3.94 | |||||||||||||||||||||||||||||||||||||||||||||||||||||||||||||||||||||||||||||||||||||||||||||||||||||||||||||||
| Total from investment operations | 0.09 | 6.80 | 1.92 | (1.71 | ) | 1.07 | 4.19 | |||||||||||||||||||||||||||||||||||||||||||||||||||||||||||||||||||||||||||||||||||||||||||||||||||||||||||||||
| Less distributions | ||||||||||||||||||||||||||||||||||||||||||||||||||||||||||||||||||||||||||||||||||||||||||||||||||||||||||||||||||||||
| From net investment income | — | (0.06 | ) | (0.13 | ) | (0.03 | ) | (0.47 | ) | (0.15 | ) | |||||||||||||||||||||||||||||||||||||||||||||||||||||||||||||||||||||||||||||||||||||||||||||||||||||||||||
| From net realized gain | — | — | — | — | (3.56 | ) | (0.72 | ) | ||||||||||||||||||||||||||||||||||||||||||||||||||||||||||||||||||||||||||||||||||||||||||||||||||||||||||||||
| Total distributions | — | (0.06 | ) | (0.13 | ) | (0.03 | ) | (4.03 | ) | (0.87 | ) | |||||||||||||||||||||||||||||||||||||||||||||||||||||||||||||||||||||||||||||||||||||||||||||||||||||||||||
| Net asset value, end of period | $28.52 | $28.43 | $21.69 | $19.90 | $21.64 | $24.60 | ||||||||||||||||||||||||||||||||||||||||||||||||||||||||||||||||||||||||||||||||||||||||||||||||||||||||||||||||
| Total return (%)3,4 | 0.32 | 5 | 31.38 | 9.62 | (7.86 | ) | 5.91 | 19.95 | ||||||||||||||||||||||||||||||||||||||||||||||||||||||||||||||||||||||||||||||||||||||||||||||||||||||||||||||
| Ratios and supplemental data | ||||||||||||||||||||||||||||||||||||||||||||||||||||||||||||||||||||||||||||||||||||||||||||||||||||||||||||||||||||||
| Net assets, end of period (in millions) | $827 | $803 | $427 | $615 | $140 | $130 | ||||||||||||||||||||||||||||||||||||||||||||||||||||||||||||||||||||||||||||||||||||||||||||||||||||||||||||||||
| Ratios (as a percentage of average net assets): | ||||||||||||||||||||||||||||||||||||||||||||||||||||||||||||||||||||||||||||||||||||||||||||||||||||||||||||||||||||||
| Expenses before reductions | 1.29 | 6 | 1.29 | 1.32 | 1.38 | 1.53 | 1.56 | |||||||||||||||||||||||||||||||||||||||||||||||||||||||||||||||||||||||||||||||||||||||||||||||||||||||||||||||
| Expenses including reductions | 1.28 | 6 | 1.28 | 1.32 | 1.37 | 1.52 | 1.55 | |||||||||||||||||||||||||||||||||||||||||||||||||||||||||||||||||||||||||||||||||||||||||||||||||||||||||||||||
| Net investment income | 0.69 | 6 | 0.41 | 0.79 | 0.48 | 1.02 | 1.09 | |||||||||||||||||||||||||||||||||||||||||||||||||||||||||||||||||||||||||||||||||||||||||||||||||||||||||||||||
| Portfolio turnover (%) | 4 | 65 | 94 | 82 | 204 | 42 | ||||||||||||||||||||||||||||||||||||||||||||||||||||||||||||||||||||||||||||||||||||||||||||||||||||||||||||||||
| 1 | For the one-month period ended 3-31-18. The fund changed its fiscal year end from February 28 to March 31. | ||||||||||||||||||||||||||||||||||||||||||||||||||||||||||||||||||||||||||||||||||
| 2 | Based on average daily shares outstanding. | ||||||||||||||||||||||||||||||||||||||||||||||||||||||||||||||||||||||||||||||||||
| 3 | Does not reflect the effect of sales charges, if any. | ||||||||||||||||||||||||||||||||||||||||||||||||||||||||||||||||||||||||||||||||||
| 4 | Total returns would have been lower had certain expenses not been reduced during the applicable periods. | ||||||||||||||||||||||||||||||||||||||||||||||||||||||||||||||||||||||||||||||||||
| 5 | Not annualized. | ||||||||||||||||||||||||||||||||||||||||||||||||||||||||||||||||||||||||||||||||||
| 6 | Annualized. | ||||||||||||||||||||||||||||||||||||||||||||||||||||||||||||||||||||||||||||||||||
| Class B Shares Period ended | 3-31-18 | 1 | 2-28-18 | 2-28-17 | 2-29-16 | 2-28-15 | 2-28-14 | |||||||||||||||||||||||||||||||||||||||||||||||||||||||||||||||||||||||||||||||||||||||||||||||||||||||||||||||
| Per share operating performance | ||||||||||||||||||||||||||||||||||||||||||||||||||||||||||||||||||||||||||||||||||||||||||||||||||||||||||||||||||||||
| Net asset value, beginning of period | $27.99 | $21.45 | $19.70 | $21.55 | $24.50 | $21.22 | ||||||||||||||||||||||||||||||||||||||||||||||||||||||||||||||||||||||||||||||||||||||||||||||||||||||||||||||||
| Net investment income (loss)2 | — | 3 | (0.04 | ) | 0.04 | 0.02 | — | 3 | 0.10 | |||||||||||||||||||||||||||||||||||||||||||||||||||||||||||||||||||||||||||||||||||||||||||||||||||||||||||||
| Net realized and unrealized gain (loss) on investments | 0.07 | 6.58 | 1.71 | (1.87 | ) | 0.88 | 3.90 | |||||||||||||||||||||||||||||||||||||||||||||||||||||||||||||||||||||||||||||||||||||||||||||||||||||||||||||||
| Total from investment operations | 0.07 | 6.54 | 1.75 | (1.85 | ) | 0.88 | 4.00 | |||||||||||||||||||||||||||||||||||||||||||||||||||||||||||||||||||||||||||||||||||||||||||||||||||||||||||||||
| Less distributions | ||||||||||||||||||||||||||||||||||||||||||||||||||||||||||||||||||||||||||||||||||||||||||||||||||||||||||||||||||||||
| From net investment income | — | — | — | — | (0.27 | ) | — | |||||||||||||||||||||||||||||||||||||||||||||||||||||||||||||||||||||||||||||||||||||||||||||||||||||||||||||||
| From net realized gain | — | — | — | — | (3.56 | ) | (0.72 | ) | ||||||||||||||||||||||||||||||||||||||||||||||||||||||||||||||||||||||||||||||||||||||||||||||||||||||||||||||
| Total distributions | — | — | — | — | (3.83 | ) | (0.72 | ) | ||||||||||||||||||||||||||||||||||||||||||||||||||||||||||||||||||||||||||||||||||||||||||||||||||||||||||||||
| Net asset value, end of period | $28.06 | $27.99 | $21.45 | $19.70 | $21.55 | $24.50 | ||||||||||||||||||||||||||||||||||||||||||||||||||||||||||||||||||||||||||||||||||||||||||||||||||||||||||||||||
| Total return (%)4,5 | 0.25 | 6 | 30.49 | 8.88 | (8.58 | ) | 5.07 | 19.07 | ||||||||||||||||||||||||||||||||||||||||||||||||||||||||||||||||||||||||||||||||||||||||||||||||||||||||||||||
| Ratios and supplemental data | ||||||||||||||||||||||||||||||||||||||||||||||||||||||||||||||||||||||||||||||||||||||||||||||||||||||||||||||||||||||
| Net assets, end of period (in millions) | $2 | $2 | $2 | $2 | $2 | $2 | ||||||||||||||||||||||||||||||||||||||||||||||||||||||||||||||||||||||||||||||||||||||||||||||||||||||||||||||||
| Ratios (as a percentage of average net assets): | ||||||||||||||||||||||||||||||||||||||||||||||||||||||||||||||||||||||||||||||||||||||||||||||||||||||||||||||||||||||
| Expenses before reductions | 1.99 | 7 | 1.99 | 2.03 | 2.32 | 3.18 | 3.29 | |||||||||||||||||||||||||||||||||||||||||||||||||||||||||||||||||||||||||||||||||||||||||||||||||||||||||||||||
| Expenses including reductions | 1.98 | 7 | 1.98 | 2.02 | 2.12 | 2.34 | 2.30 | |||||||||||||||||||||||||||||||||||||||||||||||||||||||||||||||||||||||||||||||||||||||||||||||||||||||||||||||
| Net investment income (loss) | (0.01 | ) 7 | (0.15 | ) | 0.19 | 0.07 | — | 8 | 0.46 | |||||||||||||||||||||||||||||||||||||||||||||||||||||||||||||||||||||||||||||||||||||||||||||||||||||||||||||
| Portfolio turnover (%) | 4 | 65 | 94 | 82 | 204 | 42 | ||||||||||||||||||||||||||||||||||||||||||||||||||||||||||||||||||||||||||||||||||||||||||||||||||||||||||||||||
| 1 | For the one-month period ended 3-31-18. The fund changed its fiscal year end from February 28 to March 31. | ||||||||||||||||||||||||||||||||||||||||||||||||||||||||||||||||||||||||||||||||||
| 2 | Based on average daily shares outstanding. | ||||||||||||||||||||||||||||||||||||||||||||||||||||||||||||||||||||||||||||||||||
| 3 | Less than $0.005 per share. | ||||||||||||||||||||||||||||||||||||||||||||||||||||||||||||||||||||||||||||||||||
| 4 | Does not reflect the effect of sales charges, if any. | ||||||||||||||||||||||||||||||||||||||||||||||||||||||||||||||||||||||||||||||||||
| 5 | Total returns would have been lower had certain expenses not been reduced during the applicable periods. | ||||||||||||||||||||||||||||||||||||||||||||||||||||||||||||||||||||||||||||||||||
| 6 | Not annualized. | ||||||||||||||||||||||||||||||||||||||||||||||||||||||||||||||||||||||||||||||||||
| 7 | Annualized. | ||||||||||||||||||||||||||||||||||||||||||||||||||||||||||||||||||||||||||||||||||
| 8 | Less than 0.005%. | ||||||||||||||||||||||||||||||||||||||||||||||||||||||||||||||||||||||||||||||||||
| Class C Shares Period ended | 3-31-18 | 1 | 2-28-18 | 2-28-17 | 2-29-16 | 2-28-15 | 2-28-14 | |||||||||||||||||||||||||||||||||||||||||||||||||||||||||||||||||||||||||||||||||||||||||||||||||||||||||||||||
| Per share operating performance | ||||||||||||||||||||||||||||||||||||||||||||||||||||||||||||||||||||||||||||||||||||||||||||||||||||||||||||||||||||||
| Net asset value, beginning of period | $27.93 | $21.40 | $19.66 | $21.49 | $24.45 | $21.18 | ||||||||||||||||||||||||||||||||||||||||||||||||||||||||||||||||||||||||||||||||||||||||||||||||||||||||||||||||
| Net investment income (loss)2 | — | 3 | (0.09 | ) | 0.01 | (0.07 | ) | (0.03 | ) | 0.07 | ||||||||||||||||||||||||||||||||||||||||||||||||||||||||||||||||||||||||||||||||||||||||||||||||||||||||||||
| Net realized and unrealized gain (loss) on investments | 0.07 | 6.62 | 1.73 | (1.76 | ) | 0.92 | 3.92 | |||||||||||||||||||||||||||||||||||||||||||||||||||||||||||||||||||||||||||||||||||||||||||||||||||||||||||||||
| Total from investment operations | 0.07 | 6.53 | 1.74 | (1.83 | ) | 0.89 | 3.99 | |||||||||||||||||||||||||||||||||||||||||||||||||||||||||||||||||||||||||||||||||||||||||||||||||||||||||||||||
| Less distributions | ||||||||||||||||||||||||||||||||||||||||||||||||||||||||||||||||||||||||||||||||||||||||||||||||||||||||||||||||||||||
| From net investment income | — | — | — | — | (0.29 | ) | — | |||||||||||||||||||||||||||||||||||||||||||||||||||||||||||||||||||||||||||||||||||||||||||||||||||||||||||||||
| From net realized gain | — | — | — | — | (3.56 | ) | (0.72 | ) | ||||||||||||||||||||||||||||||||||||||||||||||||||||||||||||||||||||||||||||||||||||||||||||||||||||||||||||||
| Total distributions | — | — | — | — | (3.85 | ) | (0.72 | ) | ||||||||||||||||||||||||||||||||||||||||||||||||||||||||||||||||||||||||||||||||||||||||||||||||||||||||||||||
| Net asset value, end of period | $28.00 | $27.93 | $21.40 | $19.66 | $21.49 | $24.45 | ||||||||||||||||||||||||||||||||||||||||||||||||||||||||||||||||||||||||||||||||||||||||||||||||||||||||||||||||
| Total return (%)4,5 | 0.25 | 6 | 30.51 | 8.85 | (8.52 | ) | 5.11 | 19.05 | ||||||||||||||||||||||||||||||||||||||||||||||||||||||||||||||||||||||||||||||||||||||||||||||||||||||||||||||
| Ratios and supplemental data | ||||||||||||||||||||||||||||||||||||||||||||||||||||||||||||||||||||||||||||||||||||||||||||||||||||||||||||||||||||||
| Net assets, end of period (in millions) | $349 | $333 | $145 | $113 | $13 | $7 | ||||||||||||||||||||||||||||||||||||||||||||||||||||||||||||||||||||||||||||||||||||||||||||||||||||||||||||||||
| Ratios (as a percentage of average net assets): | ||||||||||||||||||||||||||||||||||||||||||||||||||||||||||||||||||||||||||||||||||||||||||||||||||||||||||||||||||||||
| Expenses before reductions | 1.99 | 7 | 1.99 | 2.03 | 2.08 | 2.40 | 2.62 | |||||||||||||||||||||||||||||||||||||||||||||||||||||||||||||||||||||||||||||||||||||||||||||||||||||||||||||||
| Expenses including reductions | 1.98 | 7 | 1.98 | 2.02 | 2.07 | 2.30 | 2.30 | |||||||||||||||||||||||||||||||||||||||||||||||||||||||||||||||||||||||||||||||||||||||||||||||||||||||||||||||
| Net investment income (loss)7 | (0.01 | ) 7 | (0.33 | ) | 0.03 | (0.33 | ) | (0.11 | ) | 0.32 | ||||||||||||||||||||||||||||||||||||||||||||||||||||||||||||||||||||||||||||||||||||||||||||||||||||||||||||
| Portfolio turnover (%) | 4 | 65 | 94 | 82 | 204 | 42 | ||||||||||||||||||||||||||||||||||||||||||||||||||||||||||||||||||||||||||||||||||||||||||||||||||||||||||||||||
| 1 | For the one-month period ended 3-31-18. The fund changed its fiscal year end from February 28 to March 31. | ||||||||||||||||||||||||||||||||||||||||||||||||||||||||||||||||||||||||||||||||||
| 2 | Based on average daily shares outstanding. | ||||||||||||||||||||||||||||||||||||||||||||||||||||||||||||||||||||||||||||||||||
| 3 | Less than $0.005 per share. | ||||||||||||||||||||||||||||||||||||||||||||||||||||||||||||||||||||||||||||||||||
| 4 | Does not reflect the effect of sales charges, if any. | ||||||||||||||||||||||||||||||||||||||||||||||||||||||||||||||||||||||||||||||||||
| 5 | Total returns would have been lower had certain expenses not been reduced during the applicable periods. | ||||||||||||||||||||||||||||||||||||||||||||||||||||||||||||||||||||||||||||||||||
| 6 | Not annualized. | ||||||||||||||||||||||||||||||||||||||||||||||||||||||||||||||||||||||||||||||||||
| 7 | Annualized. | ||||||||||||||||||||||||||||||||||||||||||||||||||||||||||||||||||||||||||||||||||
| Class I Shares Period ended | 3-31-18 | 1 | 2-28-18 | 2-28-17 | 2-29-16 | 2-28-15 | 2-28-14 | |||||||||||||||||||||||||||||||||||||||||||||||||||||||||||||||||||||||||||||||||||||||||||||||||||||||||||||||
| Per share operating performance | ||||||||||||||||||||||||||||||||||||||||||||||||||||||||||||||||||||||||||||||||||||||||||||||||||||||||||||||||||||||
| Net asset value, beginning of period | $28.49 | $21.72 | $19.94 | $21.67 | $24.62 | $21.31 | ||||||||||||||||||||||||||||||||||||||||||||||||||||||||||||||||||||||||||||||||||||||||||||||||||||||||||||||||
| Net investment income2 | 0.02 | 0.18 | 0.20 | 0.16 | 0.35 | 0.31 | ||||||||||||||||||||||||||||||||||||||||||||||||||||||||||||||||||||||||||||||||||||||||||||||||||||||||||||||||
| Net realized and unrealized gain (loss) on investments | 0.08 | 6.72 | 1.77 | (1.80 | ) | 0.81 | 3.95 | |||||||||||||||||||||||||||||||||||||||||||||||||||||||||||||||||||||||||||||||||||||||||||||||||||||||||||||||
| Total from investment operations | 0.10 | 6.90 | 1.97 | (1.64 | ) | 1.16 | 4.26 | |||||||||||||||||||||||||||||||||||||||||||||||||||||||||||||||||||||||||||||||||||||||||||||||||||||||||||||||
| Less distributions | ||||||||||||||||||||||||||||||||||||||||||||||||||||||||||||||||||||||||||||||||||||||||||||||||||||||||||||||||||||||
| From net investment income | — | (0.13 | ) | (0.19 | ) | (0.09 | ) | (0.55 | ) | (0.23 | ) | |||||||||||||||||||||||||||||||||||||||||||||||||||||||||||||||||||||||||||||||||||||||||||||||||||||||||||
| From net realized gain | — | — | — | — | (3.56 | ) | (0.72 | ) | ||||||||||||||||||||||||||||||||||||||||||||||||||||||||||||||||||||||||||||||||||||||||||||||||||||||||||||||
| Total distributions | — | (0.13 | ) | (0.19 | ) | (0.09 | ) | (4.11 | ) | (0.95 | ) | |||||||||||||||||||||||||||||||||||||||||||||||||||||||||||||||||||||||||||||||||||||||||||||||||||||||||||
| Net asset value, end of period | $28.59 | $28.49 | $21.72 | $19.94 | $21.67 | $24.62 | ||||||||||||||||||||||||||||||||||||||||||||||||||||||||||||||||||||||||||||||||||||||||||||||||||||||||||||||||
| Total return (%)3 | 0.35 | 4 | 31.82 | 9.96 | (7.59 | ) | 6.33 | 20.31 | ||||||||||||||||||||||||||||||||||||||||||||||||||||||||||||||||||||||||||||||||||||||||||||||||||||||||||||||
| Ratios and supplemental data | ||||||||||||||||||||||||||||||||||||||||||||||||||||||||||||||||||||||||||||||||||||||||||||||||||||||||||||||||||||||
| Net assets, end of period (in millions) | $5,631 | $5,424 | $2,380 | $1,168 | $152 | $290 | ||||||||||||||||||||||||||||||||||||||||||||||||||||||||||||||||||||||||||||||||||||||||||||||||||||||||||||||||
| Ratios (as a percentage of average net assets): | ||||||||||||||||||||||||||||||||||||||||||||||||||||||||||||||||||||||||||||||||||||||||||||||||||||||||||||||||||||||
| Expenses before reductions | 1.00 | 5 | 0.99 | 1.02 | 1.06 | 1.19 | 1.21 | |||||||||||||||||||||||||||||||||||||||||||||||||||||||||||||||||||||||||||||||||||||||||||||||||||||||||||||||
| Expenses including reductions | 0.99 | 5 | 0.98 | 1.01 | 1.06 | 1.18 | 1.21 | |||||||||||||||||||||||||||||||||||||||||||||||||||||||||||||||||||||||||||||||||||||||||||||||||||||||||||||||
| Net investment income | 0.98 | 5 | 0.70 | 0.94 | 0.73 | 1.46 | 1.33 | |||||||||||||||||||||||||||||||||||||||||||||||||||||||||||||||||||||||||||||||||||||||||||||||||||||||||||||||
| Portfolio turnover (%) | 4 | 65 | 94 | 82 | 204 | 42 | ||||||||||||||||||||||||||||||||||||||||||||||||||||||||||||||||||||||||||||||||||||||||||||||||||||||||||||||||
| 1 | For the one-month period ended 3-31-18. The fund changed its fiscal year end from February 28 to March 31. | ||||||||||||||||||||||||||||||||||||||||||||||||||||||||||||||||||||||||||||||||||
| 2 | Based on average daily shares outstanding. | ||||||||||||||||||||||||||||||||||||||||||||||||||||||||||||||||||||||||||||||||||
| 3 | Total returns would have been lower had certain expenses not been reduced during the applicable periods. | ||||||||||||||||||||||||||||||||||||||||||||||||||||||||||||||||||||||||||||||||||
| 4 | Not annualized. | ||||||||||||||||||||||||||||||||||||||||||||||||||||||||||||||||||||||||||||||||||
| 5 | Annualized. | ||||||||||||||||||||||||||||||||||||||||||||||||||||||||||||||||||||||||||||||||||
| Class R2 Shares Period ended | 3-31-18 | 1 | 2-28-18 | 2-28-17 | 2-29-16 | 2 | ||||||||||||||||||||||||||||||||||||||||||||||||||||||||||||||||||||||||||||||||||
| Per share operating performance | ||||||||||||||||||||||||||||||||||||||||||||||||||||||||||||||||||||||||||||||||||||||||
| Net asset value, beginning of period | $28.45 | $21.71 | $19.92 | $21.46 | ||||||||||||||||||||||||||||||||||||||||||||||||||||||||||||||||||||||||||||||||||||
| Net investment income (loss)3 | 0.02 | 0.13 | (0.02 | ) | 0.02 | |||||||||||||||||||||||||||||||||||||||||||||||||||||||||||||||||||||||||||||||||||
| Net realized and unrealized gain (loss) on investments | 0.08 | 6.65 | 1.91 | (1.56 | ) | |||||||||||||||||||||||||||||||||||||||||||||||||||||||||||||||||||||||||||||||||||
| Total from investment operations | 0.10 | 6.78 | 1.89 | (1.54 | ) | |||||||||||||||||||||||||||||||||||||||||||||||||||||||||||||||||||||||||||||||||||
| Less distributions | ||||||||||||||||||||||||||||||||||||||||||||||||||||||||||||||||||||||||||||||||||||||||
| From net investment income | — | (0.04 | ) | (0.10 | ) | — | ||||||||||||||||||||||||||||||||||||||||||||||||||||||||||||||||||||||||||||||||||
| Total distributions | — | (0.04 | ) | (0.10 | ) | — | ||||||||||||||||||||||||||||||||||||||||||||||||||||||||||||||||||||||||||||||||||
| Net asset value, end of period | $28.55 | $28.45 | $21.71 | $19.92 | ||||||||||||||||||||||||||||||||||||||||||||||||||||||||||||||||||||||||||||||||||||
| Total return (%)4 | 0.35 | 5 | 31.23 | 9.54 | (7.18 | ) 5 | ||||||||||||||||||||||||||||||||||||||||||||||||||||||||||||||||||||||||||||||||||
| Ratios and supplemental data | ||||||||||||||||||||||||||||||||||||||||||||||||||||||||||||||||||||||||||||||||||||||||
| Net assets, end of period (in millions) | $43 | $37 | $12 | $1 | ||||||||||||||||||||||||||||||||||||||||||||||||||||||||||||||||||||||||||||||||||||
| Ratios (as a percentage of average net assets): | ||||||||||||||||||||||||||||||||||||||||||||||||||||||||||||||||||||||||||||||||||||||||
| Expenses before reductions | 1.32 | 6 | 1.40 | 1.42 | 1.90 | 6 | ||||||||||||||||||||||||||||||||||||||||||||||||||||||||||||||||||||||||||||||||||
| Expenses including reductions | 1.31 | 6 | 1.39 | 1.42 | 1.52 | 6 | ||||||||||||||||||||||||||||||||||||||||||||||||||||||||||||||||||||||||||||||||||
| Net investment income (loss) | 0.71 | 6 | 0.49 | (0.08 | ) | 0.11 | 6 | |||||||||||||||||||||||||||||||||||||||||||||||||||||||||||||||||||||||||||||||||
| Portfolio turnover (%) | 4 | 65 | 94 | 82 | 7 | |||||||||||||||||||||||||||||||||||||||||||||||||||||||||||||||||||||||||||||||||||
| 1 | For the one-month period ended 3-31-18. The fund changed its fiscal year end from February 28 to March 31. | ||||||||||||||||||||||||||||||||||||||||||||||||||||||||||||||||||||||||||||||||||
| 2 | The inception date for Class R2 shares is 3-27-15. | ||||||||||||||||||||||||||||||||||||||||||||||||||||||||||||||||||||||||||||||||||
| 3 | Based on average daily shares outstanding. | ||||||||||||||||||||||||||||||||||||||||||||||||||||||||||||||||||||||||||||||||||
| 4 | Total returns would have been lower had certain expenses not been reduced during the applicable periods. | ||||||||||||||||||||||||||||||||||||||||||||||||||||||||||||||||||||||||||||||||||
| 5 | Not annualized. | ||||||||||||||||||||||||||||||||||||||||||||||||||||||||||||||||||||||||||||||||||
| 6 | Annualized. | ||||||||||||||||||||||||||||||||||||||||||||||||||||||||||||||||||||||||||||||||||
| 7 | The portfolio turnover is shown for the period from 3-1-15 to 2-29-16. | ||||||||||||||||||||||||||||||||||||||||||||||||||||||||||||||||||||||||||||||||||
| Class R4 Shares Period ended | 3-31-18 | 1 | 2-28-18 | 2-28-17 | 2-29-16 | 2 | ||||||||||||||||||||||||||||||||||||||||||||||||||||||||||||||||||||||||||||||||||
| Per share operating performance | ||||||||||||||||||||||||||||||||||||||||||||||||||||||||||||||||||||||||||||||||||||||||
| Net asset value, beginning of period | $28.48 | $21.72 | $19.94 | $21.46 | ||||||||||||||||||||||||||||||||||||||||||||||||||||||||||||||||||||||||||||||||||||
| Net investment income3 | 0.02 | 0.17 | 0.19 | 0.05 | ||||||||||||||||||||||||||||||||||||||||||||||||||||||||||||||||||||||||||||||||||||
| Net realized and unrealized gain (loss) on investments | 0.07 | 6.69 | 1.75 | (1.54 | ) | |||||||||||||||||||||||||||||||||||||||||||||||||||||||||||||||||||||||||||||||||||
| Total from investment operations | 0.09 | 6.86 | 1.94 | (1.49 | ) | |||||||||||||||||||||||||||||||||||||||||||||||||||||||||||||||||||||||||||||||||||
| Less distributions | ||||||||||||||||||||||||||||||||||||||||||||||||||||||||||||||||||||||||||||||||||||||||
| From net investment income | — | (0.10 | ) | (0.16 | ) | (0.03 | ) | |||||||||||||||||||||||||||||||||||||||||||||||||||||||||||||||||||||||||||||||||
| Total distributions | — | (0.10 | ) | (0.16 | ) | (0.03 | ) | |||||||||||||||||||||||||||||||||||||||||||||||||||||||||||||||||||||||||||||||||
| Net asset value, end of period | $28.57 | $28.48 | $21.72 | $19.94 | ||||||||||||||||||||||||||||||||||||||||||||||||||||||||||||||||||||||||||||||||||||
| Total return (%)4 | 0.32 | 5 | 31.60 | 9.81 | (6.95 | ) 5 | ||||||||||||||||||||||||||||||||||||||||||||||||||||||||||||||||||||||||||||||||||
| Ratios and supplemental data | ||||||||||||||||||||||||||||||||||||||||||||||||||||||||||||||||||||||||||||||||||||||||
| Net assets, end of period (in millions) | $8 | $9 | $5 | $3 | ||||||||||||||||||||||||||||||||||||||||||||||||||||||||||||||||||||||||||||||||||||
| Ratios (as a percentage of average net assets): | ||||||||||||||||||||||||||||||||||||||||||||||||||||||||||||||||||||||||||||||||||||||||
| Expenses before reductions | 1.25 | 6 | �� | 1.24 | 1.25 | 1.66 | 6 | |||||||||||||||||||||||||||||||||||||||||||||||||||||||||||||||||||||||||||||||||
| Expenses including reductions | 1.14 | 6 | 1.13 | 1.14 | 1.24 | 6 | ||||||||||||||||||||||||||||||||||||||||||||||||||||||||||||||||||||||||||||||||||
| Net investment income | 0.83 | 6 | 0.64 | 0.88 | 0.24 | 6 | ||||||||||||||||||||||||||||||||||||||||||||||||||||||||||||||||||||||||||||||||||
| Portfolio turnover (%) | 4 | 65 | 94 | 82 | 7 | |||||||||||||||||||||||||||||||||||||||||||||||||||||||||||||||||||||||||||||||||||
| 1 | For the one-month period ended 3-31-18. The fund changed its fiscal year end from February 28 to March 31. | ||||||||||||||||||||||||||||||||||||||||||||||||||||||||||||||||||||||||||||||||||
| 2 | The inception date for Class R4 shares is 3-27-15. | ||||||||||||||||||||||||||||||||||||||||||||||||||||||||||||||||||||||||||||||||||
| 3 | Based on average daily shares outstanding. | ||||||||||||||||||||||||||||||||||||||||||||||||||||||||||||||||||||||||||||||||||
| 4 | Total returns would have been lower had certain expenses not been reduced during the applicable periods. | ||||||||||||||||||||||||||||||||||||||||||||||||||||||||||||||||||||||||||||||||||
| 5 | Not annualized. | ||||||||||||||||||||||||||||||||||||||||||||||||||||||||||||||||||||||||||||||||||
| 6 | Annualized. | ||||||||||||||||||||||||||||||||||||||||||||||||||||||||||||||||||||||||||||||||||
| 7 | The portfolio turnover is shown for the period from 3-1-15 to 2-29-16. | ||||||||||||||||||||||||||||||||||||||||||||||||||||||||||||||||||||||||||||||||||
| Class R6 Shares Period ended | 3-31-18 | 1 | 2-28-18 | 2-28-17 | 2-29-16 | 2 | ||||||||||||||||||||||||||||||||||||||||||||||||||||||||||||||||||||||||||||||||||
| Per share operating performance | ||||||||||||||||||||||||||||||||||||||||||||||||||||||||||||||||||||||||||||||||||||||||
| Net asset value, beginning of period | $28.50 | $21.73 | $19.95 | $21.46 | ||||||||||||||||||||||||||||||||||||||||||||||||||||||||||||||||||||||||||||||||||||
| Net investment income3 | 0.03 | 0.05 | 0.20 | 0.12 | ||||||||||||||||||||||||||||||||||||||||||||||||||||||||||||||||||||||||||||||||||||
| Net realized and unrealized gain (loss) on investments | 0.08 | 6.88 | 1.79 | (1.53 | ) | |||||||||||||||||||||||||||||||||||||||||||||||||||||||||||||||||||||||||||||||||||
| Total from investment operations | 0.11 | 6.93 | 1.99 | (1.41 | ) | |||||||||||||||||||||||||||||||||||||||||||||||||||||||||||||||||||||||||||||||||||
| Less distributions | ||||||||||||||||||||||||||||||||||||||||||||||||||||||||||||||||||||||||||||||||||||||||
| From net investment income | — | (0.16 | ) | (0.21 | ) | (0.10 | ) | |||||||||||||||||||||||||||||||||||||||||||||||||||||||||||||||||||||||||||||||||
| Total distributions | — | (0.16 | ) | (0.21 | ) | (0.10 | ) | |||||||||||||||||||||||||||||||||||||||||||||||||||||||||||||||||||||||||||||||||
| Net asset value, end of period | $28.61 | $28.50 | $21.73 | $19.95 | ||||||||||||||||||||||||||||||||||||||||||||||||||||||||||||||||||||||||||||||||||||
| Total return (%)4 | 0.39 | 5 | 31.91 | 10.08 | (6.59 | ) 5 | ||||||||||||||||||||||||||||||||||||||||||||||||||||||||||||||||||||||||||||||||||
| Ratios and supplemental data | ||||||||||||||||||||||||||||||||||||||||||||||||||||||||||||||||||||||||||||||||||||||||
| Net assets, end of period (in millions) | $1,795 | $1,702 | $18 | $2 | ||||||||||||||||||||||||||||||||||||||||||||||||||||||||||||||||||||||||||||||||||||
| Ratios (as a percentage of average net assets): | ||||||||||||||||||||||||||||||||||||||||||||||||||||||||||||||||||||||||||||||||||||||||
| Expenses before reductions | 0.89 | 6 | 0.90 | 0.93 | 1.37 | 6 | ||||||||||||||||||||||||||||||||||||||||||||||||||||||||||||||||||||||||||||||||||
| Expenses including reductions | 0.88 | 6 | 0.89 | 0.90 | 0.95 | 6 | ||||||||||||||||||||||||||||||||||||||||||||||||||||||||||||||||||||||||||||||||||
| Net investment income | 1.09 | 6 | 0.16 | 0.95 | 0.60 | 6 | ||||||||||||||||||||||||||||||||||||||||||||||||||||||||||||||||||||||||||||||||||
| Portfolio turnover (%) | 4 | 65 | 94 | 82 | 7 | |||||||||||||||||||||||||||||||||||||||||||||||||||||||||||||||||||||||||||||||||||
| 1 | For the one-month period ended 3-31-18. The fund changed its fiscal year end from February 28 to March 31. | ||||||||||||||||||||||||||||||||||||||||||||||||||||||||||||||||||||||||||||||||||
| 2 | The inception date for Class R6 shares is 3-27-15. | ||||||||||||||||||||||||||||||||||||||||||||||||||||||||||||||||||||||||||||||||||
| 3 | Based on average daily shares outstanding. | ||||||||||||||||||||||||||||||||||||||||||||||||||||||||||||||||||||||||||||||||||
| 4 | Total returns would have been lower had certain expenses not been reduced during the applicable periods. | ||||||||||||||||||||||||||||||||||||||||||||||||||||||||||||||||||||||||||||||||||
| 5 | Not annualized. | ||||||||||||||||||||||||||||||||||||||||||||||||||||||||||||||||||||||||||||||||||
| 6 | Annualized. | ||||||||||||||||||||||||||||||||||||||||||||||||||||||||||||||||||||||||||||||||||
| 7 | The portfolio turnover is shown for the period from 3-1-15 to 2-29-16. | ||||||||||||||||||||||||||||||||||||||||||||||||||||||||||||||||||||||||||||||||||
| Class 1 Shares Period ended | 3-31-18 | 1 | 2-28-18 | 2-28-17 | 2-29-16 | 2-28-15 | 2-28-14 | |||||||||||||||||||||||||||||||||||||||||||||||||||||||||||||||||||||||||||||||||||||||||||||||||||||||||||||||
| Per share operating performance | ||||||||||||||||||||||||||||||||||||||||||||||||||||||||||||||||||||||||||||||||||||||||||||||||||||||||||||||||||||||
| Net asset value, beginning of period | $28.47 | $21.71 | $19.93 | $21.65 | $24.61 | $21.30 | ||||||||||||||||||||||||||||||||||||||||||||||||||||||||||||||||||||||||||||||||||||||||||||||||||||||||||||||||
| Net investment income2 | 0.03 | 0.21 | 0.23 | 0.23 | 0.28 | 0.37 | ||||||||||||||||||||||||||||||||||||||||||||||||||||||||||||||||||||||||||||||||||||||||||||||||||||||||||||||||
| Net realized and unrealized gain (loss) on investments | 0.07 | 6.70 | 1.76 | (1.84 | ) | 0.90 | 3.92 | |||||||||||||||||||||||||||||||||||||||||||||||||||||||||||||||||||||||||||||||||||||||||||||||||||||||||||||||
| Total from investment operations | 0.10 | 6.91 | 1.99 | (1.61 | ) | 1.18 | 4.29 | |||||||||||||||||||||||||||||||||||||||||||||||||||||||||||||||||||||||||||||||||||||||||||||||||||||||||||||||
| Less distributions | ||||||||||||||||||||||||||||||||||||||||||||||||||||||||||||||||||||||||||||||||||||||||||||||||||||||||||||||||||||||
| From net investment income | — | (0.15 | ) | (0.21 | ) | (0.11 | ) | (0.58 | ) | (0.26 | ) | |||||||||||||||||||||||||||||||||||||||||||||||||||||||||||||||||||||||||||||||||||||||||||||||||||||||||||
| From net realized gain | — | — | — | — | (3.56 | ) | (0.72 | ) | ||||||||||||||||||||||||||||||||||||||||||||||||||||||||||||||||||||||||||||||||||||||||||||||||||||||||||||||
| Total distributions | — | (0.15 | ) | (0.21 | ) | (0.11 | ) | (4.14 | ) | (0.98 | ) | |||||||||||||||||||||||||||||||||||||||||||||||||||||||||||||||||||||||||||||||||||||||||||||||||||||||||||
| Net asset value, end of period | $28.57 | $28.47 | $21.71 | $19.93 | $21.65 | $24.61 | ||||||||||||||||||||||||||||||||||||||||||||||||||||||||||||||||||||||||||||||||||||||||||||||||||||||||||||||||
| Total return (%)3 | 0.35 | 4 | 31.86 | 10.04 | (7.49 | ) | 6.39 | 20.43 | ||||||||||||||||||||||||||||||||||||||||||||||||||||||||||||||||||||||||||||||||||||||||||||||||||||||||||||||
| Ratios and supplemental data | ||||||||||||||||||||||||||||||||||||||||||||||||||||||||||||||||||||||||||||||||||||||||||||||||||||||||||||||||||||||
| Net assets, end of period (in millions) | $93 | $91 | $50 | $39 | $20 | $16 | ||||||||||||||||||||||||||||||||||||||||||||||||||||||||||||||||||||||||||||||||||||||||||||||||||||||||||||||||
| Ratios (as a percentage of average net assets): | ||||||||||||||||||||||||||||||||||||||||||||||||||||||||||||||||||||||||||||||||||||||||||||||||||||||||||||||||||||||
| Expenses before reductions | 0.92 | 5 | 0.93 | 0.95 | 1.00 | 1.10 | 1.12 | |||||||||||||||||||||||||||||||||||||||||||||||||||||||||||||||||||||||||||||||||||||||||||||||||||||||||||||||
| Expenses including reductions | 0.92 | 5 | 0.92 | 0.94 | 0.99 | 1.09 | 1.12 | |||||||||||||||||||||||||||||||||||||||||||||||||||||||||||||||||||||||||||||||||||||||||||||||||||||||||||||||
| Net investment income | 1.06 | 5 | 0.79 | 1.09 | 1.06 | 1.18 | 1.59 | |||||||||||||||||||||||||||||||||||||||||||||||||||||||||||||||||||||||||||||||||||||||||||||||||||||||||||||||
| Portfolio turnover (%) | 4 | 65 | 94 | 82 | 204 | 42 | ||||||||||||||||||||||||||||||||||||||||||||||||||||||||||||||||||||||||||||||||||||||||||||||||||||||||||||||||
| 1 | For the one-month period ended 3-31-18. The fund changed its fiscal year end from February 28 to March 31. | ||||||||||||||||||||||||||||||||||||||||||||||||||||||||||||||||||||||||||||||||||
| 2 | Based on average daily shares outstanding. | ||||||||||||||||||||||||||||||||||||||||||||||||||||||||||||||||||||||||||||||||||
| 3 | Total returns would have been lower had certain expenses not been reduced during the applicable periods. | ||||||||||||||||||||||||||||||||||||||||||||||||||||||||||||||||||||||||||||||||||
| 4 | Not annualized. | ||||||||||||||||||||||||||||||||||||||||||||||||||||||||||||||||||||||||||||||||||
| 5 | Annualized. | ||||||||||||||||||||||||||||||||||||||||||||||||||||||||||||||||||||||||||||||||||
| Class NAV Shares Period ended | 3-31-18 | 1 | 2-28-18 | 2-28-17 | 2-29-16 | 2 | ||||||||||||||||||||||||||||||||||||||||||||||||||||||||||||||||||||||||||||||||||
| Per share operating performance | ||||||||||||||||||||||||||||||||||||||||||||||||||||||||||||||||||||||||||||||||||||||||
| Net asset value, beginning of period | $28.47 | $21.71 | $19.93 | $22.66 | ||||||||||||||||||||||||||||||||||||||||||||||||||||||||||||||||||||||||||||||||||||
| Net investment income3 | 0.03 | 0.23 | 0.19 | 0.11 | ||||||||||||||||||||||||||||||||||||||||||||||||||||||||||||||||||||||||||||||||||||
| Net realized and unrealized gain (loss) on investments | 0.07 | 6.69 | 1.81 | (2.72 | ) | |||||||||||||||||||||||||||||||||||||||||||||||||||||||||||||||||||||||||||||||||||
| Total from investment operations | 0.10 | 6.92 | 2.00 | (2.61 | ) | |||||||||||||||||||||||||||||||||||||||||||||||||||||||||||||||||||||||||||||||||||
| Less distributions | ||||||||||||||||||||||||||||||||||||||||||||||||||||||||||||||||||||||||||||||||||||||||
| From net investment income | — | (0.16 | ) | (0.22 | ) | (0.12 | ) | |||||||||||||||||||||||||||||||||||||||||||||||||||||||||||||||||||||||||||||||||
| Total distributions | — | (0.16 | ) | (0.22 | ) | (0.12 | ) | |||||||||||||||||||||||||||||||||||||||||||||||||||||||||||||||||||||||||||||||||
| Net asset value, end of period | $28.57 | $28.47 | $21.71 | $19.93 | ||||||||||||||||||||||||||||||||||||||||||||||||||||||||||||||||||||||||||||||||||||
| Total return (%)4 | 0.35 | 5 | 31.91 | 10.10 | (11.57 | ) 5 | ||||||||||||||||||||||||||||||||||||||||||||||||||||||||||||||||||||||||||||||||||
| Ratios and supplemental data | ||||||||||||||||||||||||||||||||||||||||||||||||||||||||||||||||||||||||||||||||||||||||
| Net assets, end of period (in millions) | $1,136 | $1,151 | $864 | $86 | ||||||||||||||||||||||||||||||||||||||||||||||||||||||||||||||||||||||||||||||||||||
| Ratios (as a percentage of average net assets): | ||||||||||||||||||||||||||||||||||||||||||||||||||||||||||||||||||||||||||||||||||||||||
| Expenses before reductions | 0.87 | 6 | 0.88 | 0.91 | 0.94 | 6 | ||||||||||||||||||||||||||||||||||||||||||||||||||||||||||||||||||||||||||||||||||
| Expenses including reductions | 0.87 | 6 | 0.87 | 0.90 | 0.93 | 6 | ||||||||||||||||||||||||||||||||||||||||||||||||||||||||||||||||||||||||||||||||||
| Net investment income | 1.10 | 6 | 0.89 | 0.91 | 0.69 | 6 | ||||||||||||||||||||||||||||||||||||||||||||||||||||||||||||||||||||||||||||||||||
| Portfolio turnover (%) | 4 | 65 | 94 | 82 | 7 | |||||||||||||||||||||||||||||||||||||||||||||||||||||||||||||||||||||||||||||||||||
| 1 | For the one-month period ended 3-31-18. The fund changed its fiscal year end from February 28 to March 31. | ||||||||||||||||||||||||||||||||||||||||||||||||||||||||||||||||||||||||||||||||||
| 2 | The inception date for Class NAV shares is 6-2-15. | ||||||||||||||||||||||||||||||||||||||||||||||||||||||||||||||||||||||||||||||||||
| 3 | Based on average daily shares outstanding. | ||||||||||||||||||||||||||||||||||||||||||||||||||||||||||||||||||||||||||||||||||
| 4 | Total returns would have been lower had certain expenses not been reduced during the applicable periods. | ||||||||||||||||||||||||||||||||||||||||||||||||||||||||||||||||||||||||||||||||||
| 5 | Not annualized. | ||||||||||||||||||||||||||||||||||||||||||||||||||||||||||||||||||||||||||||||||||
| 6 | Annualized. | ||||||||||||||||||||||||||||||||||||||||||||||||||||||||||||||||||||||||||||||||||
| 7 | The portfolio turnover is shown for the period from 3-1-15 to 2-29-16. | ||||||||||||||||||||||||||||||||||||||||||||||||||||||||||||||||||||||||||||||||||
Note 1 — Organization
John Hancock International Growth Fund (the fund) is a series of John Hancock Funds III (the Trust), an open-end management investment company organized as a Massachusetts business trust and registered under the Investment Company Act of 1940, as amended (the 1940 Act). The investment objective of the fund is to seek high total return primarily through capital appreciation.
The fund may offer multiple classes of shares. The shares currently offered are detailed in the Statements of assets and liabilities. Class A and Class C shares are offered to all investors. Class B shares are closed to new investors. Class I shares are offered to institutions and certain investors. Class R2 and Class R4 shares are available only to certain retirement plans. Class R6 shares are only available to certain retirement plans, institutions and other investors. Class 1 shares are offered only to certain affiliates of Manulife Financial Corporation (MFC). Class NAV shares are offered to John Hancock affiliated funds of funds, retirement plans for employees of John Hancock and/or Manulife Financial Corporation, and certain 529 plans. Shareholders of each class have exclusive voting rights to matters that affect that class. The distribution and service fees, if any, and transfer agent fees for each class may differ. Class B shares convert to Class A shares eight years after purchase.
On December 14, 2017, the Board of Trustees voted to change the fund's fiscal year end from February 28 to March 31. Effective March 23, 2018, the fund is closed to new investors.
Note 2 — Significant accounting policies
The financial statements have been prepared in conformity with accounting principles generally accepted in the United States of America (US GAAP), which require management to make certain estimates and assumptions as of the date of the financial statements. Actual results could differ from those estimates and those differences could be significant. The fund qualifies as an investment company under Topic 946 of Accounting Standards Codification of US GAAP.
Events or transactions occurring after the end of the fiscal period through the date that the financial statements were issued have been evaluated in the preparation of the financial statements. The following summarizes the significant accounting policies of the fund:
Security valuation. Investments are stated at value as of the scheduled close of regular trading on the New York Stock Exchange (NYSE), normally at 4:00 P.M., Eastern Time. In case of emergency or other disruption resulting in the NYSE not opening for trading or the NYSE closing at a time other than the regularly scheduled close, the net asset value (NAV) may be determined as of the regularly scheduled close of the NYSE pursuant to the fund's Valuation Policies and Procedures.
In order to value the securities, the fund uses the following valuation techniques: Equity securities held by the fund are typically valued at the last sale price or official closing price on the exchange or principal market where the security trades. In the event there were no sales during the day or closing prices are not available, the securities are valued using the last available bid price. Investments by the fund in open-end mutual funds, including John Hancock Collateral Trust (JHCT), are valued at their respective NAVs each business day. Foreign securities and currencies are valued in U.S. dollars, based on foreign currency exchange rates supplied by an independent pricing vendor.
In certain instances, the Pricing Committee may determine to value equity securities using prices obtained from another exchange or market if trading on the exchange or market on which prices are typically obtained did not open for trading as scheduled, or if trading closed earlier than scheduled, and trading occurred as normal on another exchange or market.
Other portfolio securities and assets, for which reliable market quotations are not readily available, are valued at fair value as determined in good faith by the fund's Pricing Committee following procedures established by the Board of Trustees. The frequency with which these fair valuation procedures are used cannot be predicted and fair value of securities may differ significantly from the value that would have been used had a ready market for such securities existed. Trading in foreign securities may be completed before the scheduled daily close of trading on the NYSE. Significant events at the issuer or market level may affect the values of securities between the time when the valuation of the securities is generally determined and the close of the NYSE. If a significant event occurs, these securities may be fair valued, as determined in good faith by the fund's Pricing Committee, following procedures established by the Board of Trustees. The fund uses fair value adjustment factors provided by an independent pricing vendor to value certain foreign securities in order to adjust for events that may occur between the close of foreign exchanges or markets and the close of the NYSE.
The fund uses a three-tier hierarchy to prioritize the pricing assumptions, referred to as inputs, used in valuation techniques to measure fair value. Level 1 includes securities valued using quoted prices in active markets for identical securities. Level 2 includes securities valued using other significant observable inputs. Observable inputs may include quoted prices for similar securities, interest rates, prepayment speeds and credit risk. Prices for securities valued using these inputs are received from independent pricing vendors and brokers and are based on an evaluation of the inputs described. Level 3 includes securities valued using significant unobservable inputs when market prices are not readily available or reliable, including the fund's own assumptions in determining the fair value of investments. Factors used in determining value may include market or issuer specific events or trends, changes in interest rates and credit quality. The inputs or methodology used for valuing securities are not necessarily an indication of the risks associated with investing in those securities. Changes in valuation techniques and related inputs may result in transfers into or out of an assigned level within the disclosure hierarchy.
The following is a summary of the values by input classification of the fund's investments as of March 31, 2018 and February 28, 2018, by major security category or type:
| Total value at 3-31-18 | Level 1 quoted price | Level 2 significant observable inputs | Level 3 significant unobservable inputs | ||
| Investments in securities: | |||||
| Assets | |||||
| Common stocks | |||||
| Australia | $371,323,078 | — | $371,323,078 | — | |
| Brazil | 148,255,656 | $148,255,656 | — | — | |
| Canada | 101,124,001 | 101,124,001 | — | — | |
| China | 1,259,748,523 | 636,582,185 | 623,166,338 | — | |
| Denmark | 105,109,453 | — | 105,109,453 | — | |
| France | 1,192,165,011 | — | 1,192,165,011 | — | |
| Germany | 121,810,217 | — | 121,810,217 | — | |
| Hong Kong | 499,094,036 | 164,177,757 | 334,916,279 | — | |
| India | 371,205,982 | — | 371,205,982 | — | |
| Indonesia | 123,239,457 | — | 123,239,457 | — | |
| Ireland | 359,380,813 | 359,380,813 | — | — | |
| Italy | 118,356,659 | — | 118,356,659 | — | |
| Japan | 829,045,752 | — | 829,045,752 | — | |
| Luxembourg | 94,239,934 | — | 94,239,934 | — | |
| Netherlands | 589,969,668 | — | 589,969,668 | — | |
| Norway | 109,627,976 | — | 109,627,976 | — | |
| Singapore | 148,678,118 | — | 148,678,118 | — | |
| South Korea | 264,447,057 | — | 264,447,057 | — | |
| Sweden | 122,486,585 | — | 122,486,585 | — | |
| Switzerland | 794,843,747 | — | 794,843,747 | — | |
| Taiwan | 315,887,742 | — | 315,887,742 | — | |
| United Kingdom | 1,230,104,983 | 257,592,888 | 972,512,095 | — | |
| United States | 308,225,000 | 308,225,000 | — | — | |
| Preferred securities | 148,474,102 | 148,474,102 | — | — | |
| Securities lending collateral | 35,549,634 | 35,549,634 | — | — | |
| Short-term investments | 138,700,000 | — | 138,700,000 | — | |
| Total investments in securities | $9,901,093,184 | $2,159,362,036 | $7,741,731,148 | — | |
| Total value at 2-28-18 | Level 1 quoted price | Level 2 significant observable inputs | Level 3 significant unobservable inputs | ||
| Investments in securities: | |||||
| Assets | |||||
| Common stocks | |||||
| Australia | $387,480,080 | — | $387,480,080 | — | |
| Brazil | 129,991,684 | $129,991,684 | — | — | |
| Canada | 92,964,058 | 92,964,058 | — | — | |
| China | 1,348,051,900 | 676,578,724 | 671,473,176 | — | |
| Denmark | 101,150,916 | — | 101,150,916 | — | |
| France | 1,155,397,185 | — | 1,155,397,185 | — | |
| Germany | $122,788,107 | — | $122,788,107 | — | |
| Hong Kong | 278,966,188 | $152,367,319 | 126,598,869 | — | |
| India | 350,847,752 | — | 350,847,752 | — | |
| Indonesia | 114,398,700 | — | 114,398,700 | — | |
| Ireland | 333,089,885 | 333,089,885 | — | — | |
| Italy | 100,964,604 | — | 100,964,604 | — | |
| Japan | 831,995,568 | — | 831,995,568 | — | |
| Luxembourg | 93,526,865 | — | 93,526,865 | — | |
| Netherlands | 432,567,025 | — | 432,567,025 | — | |
| Norway | 99,983,608 | — | 99,983,608 | — | |
| Singapore | 148,215,559 | — | 148,215,559 | — | |
| South Korea | 240,982,492 | — | 240,982,492 | — | |
| Sweden | 112,403,712 | — | 112,403,712 | — | |
| Switzerland | 773,394,116 | — | 773,394,116 | — | |
| Taiwan | 300,407,563 | — | 300,407,563 | — | |
| United Kingdom | 1,366,671,251 | 241,829,918 | 1,124,841,333 | — | |
| United States | 291,560,528 | 291,560,528 | — | — | |
| Preferred securities | 145,236,033 | 145,236,033 | — | — | |
| Securities lending collateral | 13,691,573 | 13,691,573 | — | — | |
| Short-term investments | 147,700,000 | — | 147,700,000 | — | |
| Total investments in securities | $9,514,426,952 | $2,077,309,722 | $7,437,117,230 | — | |
Repurchase agreements. The fund may enter into repurchase agreements. When the fund enters into a repurchase agreement, it receives collateral that is held in a segregated account by the fund's custodian, or for tri-party repurchase agreements, collateral is held at a third-party custodian bank in a segregated account for the benefit of the fund. The collateral amount is marked-to-market and monitored on a daily basis to ensure that the collateral held is in an amount not less than the principal amount of the repurchase agreement plus any accrued interest. Collateral received by the fund for repurchase agreements is disclosed in the Fund's investments as part of the caption related to the repurchase agreement.
Repurchase agreements are typically governed by the terms and conditions of the Master Repurchase Agreement and/or Global Master Repurchase Agreement (collectively, MRA). Upon an event of default, the non-defaulting party may close out all transactions traded under the MRA and net amounts owed. Absent an event of default, assets and liabilities resulting from repurchase agreements are not offset in the Statements of assets and liabilities. In the event of a default by the counterparty, realization of the collateral proceeds could be delayed, during which time the collateral value may decline or the counterparty may have insufficient assets to pay back claims resulting from close-out of the transactions.
Security transactions and related investment income. Investment security transactions are accounted for on a trade date plus one basis for daily NAV calculations. However, for financial reporting purposes, investment transactions are reported on trade date. Interest income is accrued as earned. Dividend income is recorded on the ex-date, except for dividends of foreign securities where the dividend may not be known until after the ex-date. In those cases, dividend income, net of withholding taxes, is recorded when the fund becomes aware of the dividends. Foreign taxes are provided for based on the fund's understanding of the tax rules and rates that exist in the foreign markets in which it invests. Gains and losses on securities sold are determined on the basis of identified cost and may include proceeds from litigation.
Securities lending. The fund may lend its securities to earn additional income. The fund receives cash collateral from the borrower in an amount not less than the market value of the loaned securities. The fund will invest its collateral in JHCT, an affiliate of the fund which has a floating NAV and is registered with the Securities and Exchange Commission (SEC) as an investment company. JHCT invests cash received in short-term money market investments. The fund will receive the benefit of any gains and bear any losses generated by JHCT with respect to the cash collateral.
The fund has the right to recall loaned securities on demand. If a borrower fails to return loaned securities when due, then the lending agent is responsible and indemnifies the fund for the lent securities. The lending agent uses the collateral received from the borrower to purchase replacement securities of the same issue, type, class and series of the loaned securities. If the value of the collateral is less than the purchase cost of replacement securities, the lending agent is responsible for satisfying the shortfall but only to the extent that the shortfall is not due to any decrease in the value of JHCT.
Although the risk of the loss of the securities lent is mitigated by receiving collateral from the borrower and through lending agent indemnification, the fund could experience a delay in recovering securities or could experience a lower than expected return if the borrower fails to return the securities on a timely basis. The fund receives compensation for lending its securities by retaining a portion of the return on the investment of the collateral and compensation from fees earned from borrowers of the securities. Securities lending income received by the fund is net of fees retained by the securities lending agent. Net income received from JHCT is a component of securities lending income as recorded on the Statements of operations.
Obligations to repay collateral received by the fund are shown on the Statements of assets and liabilities as Payable upon return of securities loaned and are secured by the loaned securities. As of March 31, 2018 and February 28, 2018, the fund loaned common stocks valued at $34,813,574 and $13,453,925 and received $35,562,575 and $13,733,181 of cash collateral, respectively.
Foreign investing. Assets, including investments and liabilities denominated in foreign currencies, are translated into U.S. dollar values each day at the prevailing exchange rate. Purchases and sales of securities, income and expenses are translated into U.S. dollars at the prevailing exchange rate on the date of the transaction. The effect of changes in foreign currency exchange rates on the value of securities is reflected as a component of the realized and unrealized gains (losses) on investments. Foreign investments are subject to a decline in the value of a foreign currency versus the U.S. dollar, which reduces the dollar value of securities denominated in that currency.
Funds that invest internationally generally carry more risk than funds that invest strictly in U.S. securities. These risks are heightened for investments in emerging markets. Risks can result from differences in economic and political conditions, regulations, market practices (including higher transaction costs), accounting standards and other factors.
Foreign taxes. The fund may be subject to withholding tax on income and/or capital gains or repatriation taxes imposed by certain countries in which the fund invests. Taxes are accrued based upon investment income, realized gains or unrealized appreciation.
Line of credit. The fund may have the ability to borrow from banks for temporary or emergency purposes, including meeting redemption requests that otherwise might require the untimely sale of securities. Pursuant to the fund's custodian agreement, the custodian may loan money to the fund to make properly authorized payments. The fund is obligated to repay the custodian for any overdraft, including any related costs or expenses. The custodian may have a lien, security interest or security entitlement in any fund property that is not otherwise segregated or pledged, to the extent of any overdraft, and to the maximum extent permitted by law.
Effective June 29, 2017, the fund and other affiliated funds have entered into a syndicated line of credit agreement with Citibank, N.A. as the administrative agent that enables them to participate in a $750 million unsecured committed line of credit. Excluding commitments designated for a certain fund and subject to the needs of all other affiliated funds, the fund can borrow up to an aggregate commitment amount of $500 million, subject to asset coverage and other limitations as specified in the agreement. A commitment fee payable at the end of each calendar quarter, based on the average daily unused portion of the line of credit, is charged to each participating fund based on a combination of fixed and asset based allocations and is reflected in Other expenses on the Statements of operations. Prior to June 29, 2017, the fund had a similar agreement that enabled it to participate in a $1 billion unsecured committed line of credit. For the period ended March 31, 2018 and for the year ended February 28, 2018, the fund had no borrowings under either line of credit. Commitment fees for the period ended March 31, 2018 and for the year ended February 28, 2018 were $1,036 and $15,665, respectively.
Expenses. Within the John Hancock group of funds complex, expenses that are directly attributable to an individual fund are allocated to such fund. Expenses that are not readily attributable to a specific fund are allocated among all funds in an equitable manner, taking into consideration, among other things, the nature and type of expense and the fund's relative net assets. Expense estimates are accrued in the period to which they relate and adjustments are made when actual amounts are known.
Class allocations. Income, common expenses and realized and unrealized gains (losses) are determined at the fund level and allocated daily to each class of shares based on the net assets of the class. Class-specific expenses, such as distribution and service fees, if any, and transfer agent fees, for all classes, are charged daily at the class level based on the net assets of each class and the specific expense rates applicable to each class.
Federal income taxes. The fund intends to continue to qualify as a regulated investment company by complying with the applicable provisions of the Internal Revenue Code and will not be subject to federal income tax on taxable income that is distributed to shareholders. Therefore, no federal income tax provision is required.
As of March 31, 2018 and February 28, 2018, the fund had no uncertain tax positions that would require financial statement recognition, derecognition or disclosure. The fund's federal tax returns are subject to examination by the Internal Revenue Service for a period of three years.
Distribution of income and gains. Distributions to shareholders from net investment income and net realized gains, if any, are recorded on the ex-date. The fund typically declares and pays dividends and capital gain distributions, if any, at least annually.
The tax character of distributions for the period ended March 31, 2018 and for the years ended February 28, 2018 and 2017 was as follows:
| March 31, 2018 | February 28, 2018 | February 28, 2017 | |
| Ordinary Income | — | $38,875,085 | $24,876,009 |
Distributions paid by the fund with respect to each class of shares are calculated in the same manner, at the same time and in the same amount, except for the effect of class level expenses that may be applied differently to each class. As of March 31, 2018 and February 28, 2018, the components of distributable earnings on a tax basis consisted of $12,725,873 and $0 of undistributed ordinary income and $108,706,706 and $91,191,704 of undistributed long term capital gains, respectively.
Such distributions and distributable earnings, on a tax basis, are determined in conformity with income tax regulations, which may differ from US GAAP. Distributions in excess of tax basis earnings and profits, if any, are reported in the fund's financial statements as a return of capital.
Capital accounts within the financial statements are adjusted for permanent book-tax differences. These adjustments have no impact on net assets or the results of operations. Temporary book-tax differences, if any, will reverse in a subsequent period. The fund had no material book-tax differences at March 31, 2018 and February 28, 2018.
Note 3 — Guarantees and indemnifications
Under the Trust's organizational documents, its Officers and Trustees are indemnified against certain liabilities arising out of the performance of their duties to the Trust, including the fund. Additionally, in the normal course of business, the fund enters into contracts with service providers that contain general indemnification clauses. The fund's maximum exposure under these arrangements is unknown, as this would involve future claims that may be made against the fund that have not yet occurred. The risk of material loss from such claims is considered remote.
Note 4 — Fees and transactions with affiliates
John Hancock Advisers, LLC (the Advisor) serves as investment advisor for the fund. John Hancock Funds, LLC (the Distributor), an affiliate of the Advisor, serves as principal underwriter of the fund. The Advisor and the Distributor are indirect, wholly owned subsidiaries of Manulife Financial Corporation.
Management fee. The fund has an investment management agreement with the Advisor under which the fund pays a daily management fee to the Advisor, equivalent on an annual basis to the sum of (a) 0.900% of the first $500 million of the fund's aggregate average daily net assets (together with the assets of any other applicable fund identified in the advisory agreement); (b) 0.850% of the next $500 million of the fund's aggregate average daily net assets, and (c) 0.800% of the fund's aggregate average daily net assets in excess of $1 billion. The Advisor has a subadvisory agreement with Wellington Management Company LLP. The fund is not responsible for payment of the subadvisory fees.
The Advisor has contractually agreed to waive a portion of its management fee and/or reimburse expenses for certain funds of the John Hancock group of funds complex, including the fund (the participating portfolios). This waiver is based upon aggregate net assets of all the participating portfolios. The amount of the reimbursement is calculated daily and allocated among all the participating portfolios in proportion to the daily net assets of each fund. During the period ended March 31, 2018 and the year ended February 28, 2018 this waiver amounted to 0.01% (on an annualized basis) and 0.01% of the fund's average net assets, respectively. This arrangement may be amended or terminated at any time by the Advisor upon notice to the fund and with the approval of the Board of Trustees.
The Advisor has contractually agreed to waive fees and/or reimburse certain expenses for each share class of the fund. This agreement excludes taxes, brokerage commissions, interest expense, litigation and indemnification expenses and other extraordinary expenses not incurred in the ordinary course of the fund's business, acquired fees and expenses paid indirectly and short dividend expense. The fee waivers and/or reimbursements are such that these expenses will not exceed 1.35%, 2.05%, 2.05%, 1.05%, 1.45%, and 1.20% of average net assets for Class A, Class B, Class C, Class I, Class R2, and Class R4 shares, respectively. The current expense limitation agreement will remain in effect through June 30, 2018, unless renewed by mutual agreement of the fund and the Advisor based upon a determination that this is appropriate under the circumstances at the time.
Prior to July 1, 2017, the Advisor had contractually agreed to waive and/or reimburse all class specific expenses for Class R6 shares of the fund to the extent they exceed 0.00% of average net assets, on an annualized basis.
For the period ended March 31, 2018 and for the year ended February 28, 2018, the expense reductions described above amounted to the following:
| Class | Expense reductions as of March 31, 2018 | Expense reductions as of February 28, 2018 | ||||||
| Class A | $5,928 | $51,922 | ||||||
| Class B | 13 | 138 | ||||||
| Class C | 2,483 | 18,951 | ||||||
| Class I | 40,263 | 335,812 | ||||||
| Class R2 | 288 | 1,314 | ||||||
| Class R4 | 61 | 559 | ||||||
| Class R6 | 12,759 | 50,572 | ||||||
| Class 1 | 666 | 5,814 |
| Class | Expense reductions as of March 31, 2018 | Expense reductions as of February 28, 2018 | ||||||
| Class NAV | $8,313 | $86,035 | ||||||
| Total | $70,774 | $551,117 |
Expenses waived or reimbursed in the current fiscal period are not subject to recapture in future fiscal periods.
The investment management fees, including the impact of the waivers and reimbursements as described above, incurred for the period ended March 31, 2018 and for the year ended February 28, 2018, were in each case equivalent to a net annual effective rate of 0.80% of the fund's average daily net assets.
Accounting and legal services. Pursuant to a service agreement, the fund reimburses the Advisor for all expenses associated with providing the administrative, financial, legal, accounting and recordkeeping services to the fund, including the preparation of all tax returns, periodic reports to shareholders and regulatory reports, among other services. These expenses are allocated to each share class based on its relative net assets at the time the expense was incurred. These accounting and legal services fees incurred for the period ended March 31, 2018 and for the year ended February 28, 2018 amounted to an annual rate of 0.02% and 0.01% of the fund's average daily net assets, respectively.
Distribution and service plans. The fund has a distribution agreement with the Distributor. The fund has adopted distribution and service plans with respect to Class A, Class B, Class C, Class R2, Class R4 and Class 1 shares pursuant to Rule 12b-1 under the 1940 Act, to pay the Distributor for services provided as the distributor of shares of the fund. In addition, under a service plan for Class R2 and Class R4 shares, the fund pays for certain other services. The fund may pay up to the following contractual rates of distribution and service fees under these arrangements, expressed as an annual percentage of average daily net assets for each class of the fund's shares:
| Class | Rule 12b-1 fee | Service fee | Class | Rule 12b-1 fee | Service fee | |
| Class A | 0.30% | — | Class R2 | 0.25% | 0.25% | |
| Class B | 1.00% | — | Class R4 | 0.25% | 0.10% | |
| Class C | 1.00% | — | Class 1 | 0.05% | — |
The fund's Distributor has contractually agreed to waive 0.10% of Rule 12b-1 fees for Class R4 shares. The current waiver agreement expires on June 30, 2018, unless renewed by mutual agreement of the fund and the Distributor based upon a determination that this is appropriate under the circumstances at the time. This contractual waiver amounted to $xx and $6,745 for Class R4 shares for the period ended March 31, 2018 and for the year ended February 28, 2018, respectively.
Sales charges. Class A shares are assessed up-front sales charges of up to 5.00% of the net asset value of such shares. The following summarizes the net up-front sales charges received by the Distributor during the period ended March 31, 2018 and the year ended February 28, 2018:
| March 31, 2018 | February 28, 2018 | |
| Net sales charges | $337,142 | $3,872,201 |
| Retained for printing prospectus, advertising and sales literature | 55,369 | 643,904 |
| Sales commission to unrelated broker-dealers | 281,540 | 3,218,812 |
| Sales commission to affiliated sales personnel | 233 | 9,485 |
Class A, Class B and Class C shares may be subject to contingent deferred sales charges (CDSCs). Certain Class A shares that are acquired through purchases of $1 million or more and are redeemed within one year of purchase are subject to a 1.00% sales charge. Class B shares that are redeemed within six years of purchase are subject to CDSCs, at declining rates, beginning at 5.00%. Class C shares that are redeemed within one year of purchase are subject to a 1.00% CDSC. CDSCs are applied to the lesser of the current market value at the time of redemption or the original purchase cost of the shares being redeemed. Proceeds from CDSCs are used to compensate the Distributor for providing distribution-related services in
connection with the sale of these shares. During the period ended March 31, 2018 and the year ended February 28, 2018, CDSCs received by the Distributor were as follows:
| Class | March 31, 2018 | February 28, 2018 |
| Class A | $469 | $3,422 |
| Class B | 4 | 373 |
| Class C | 4,045 | 31,944 |
Transfer agent fees. The John Hancock Group of Funds has a complex-wide transfer agent agreement with John Hancock Signature Services, Inc. (Signature Services), an affiliate of the Advisor. The transfer agent fees paid to Signature Services are determined based on the cost to Signature Services (Signature Services Cost) of providing recordkeeping services. It also includes out-of-pocket expenses, including payments made to third-parties for recordkeeping services provided to their clients who invest in one or more John Hancock funds. In addition, Signature Services Cost may be reduced by certain fees that Signature Services receives in connection with retirement and small accounts. Signature Services Cost is calculated monthly and allocated, as applicable, to five categories of share classes: Retail Share and Institutional Share Classes of Non-Municipal Bond Funds, Class R6 Shares, Retirement Share Classes and Municipal Bond Share Classes. Within each of these categories, the applicable costs are allocated to the affected John Hancock affiliated funds and/or classes, based on the relative average daily net assets.
Class level expenses. Class level expenses for the period ended March 31, 2018 and for the year ended February 28, 2018 were:
| Class | Distribution and service fees as of March 31, 2018 | Transfer agent fees as of March 31, 2018 | Distribution and service fees as of February 28, 2018 | Transfer agent fees as of February 28, 2018 | ||||
| Class A | $209,202 | $80,930 | $1,880,791 | $694,461 | ||||
| Class B | 1,504 | 174 | 16,801 | 1,869 | ||||
| Class C | 291,886 | 33,839 | 2,280,854 | 252,135 | ||||
| Class I | — | 570,120 | — | 4,320,175 | ||||
| Class R2 | 14,535 | 452 | 78,734 | 2,033 | ||||
| Class R4 | 2,593 | 102 | 23,476 | 870 | ||||
| Class R6 | — | 20,701 | — | 67,291 | ||||
| Class 1 | 3,916 | — | 35,116 | — | ||||
| Total | $523,636 | $706,318 | $4,315,772 | $5,338,834 |
Trustee expenses. The fund compensates each Trustee who is not an employee of the Advisor or its affiliates. The costs of paying Trustee compensation and expenses are allocated to each fund based on its net assets relative to other funds within the John Hancock group of funds complex.
Note 5 — Fund share transactions
Transactions in fund shares for the period ended March 31, 2018 and for the years ended February 28, 2018 and 2017 were as follows:
| Period ended 3-31-181 | Year ended 2-28-18 | Year ended 2-28-17 | |||||||||||||||||||||||||||||||||||||||
| Shares | Amount | Shares | Amount | Shares | Amount | ||||||||||||||||||||||||||||||||||||
| Class A shares | |||||||||||||||||||||||||||||||||||||||||
| Sold | 1,369,375 | $39,331,187 | 16,827,952 | $435,490,087 | 16,001,157 | $339,897,058 | |||||||||||||||||||||||||||||||||||
| Distributions reinvested | — | — | 59,193 | 1,614,645 | 196,175 | 3,966,659 | |||||||||||||||||||||||||||||||||||
| Repurchased | (616,943 | ) | (17,750,693 | ) | (8,333,545 | ) | (215,492,018 | ) | (27,443,668 | ) | (587,270,568 | ) | |||||||||||||||||||||||||||||
| Net increase (decrease) | 752,432 | $21,580,494 | 8,553,600 | $221,612,714 | (11,246,336 | ) | ($243,406,851 | ) | |||||||||||||||||||||||||||||||||
| Period ended 3-31-181 | Year ended 2-28-18 | Year ended 2-28-17 | |||||||||||||||||||||||||||||||||||||||
| Shares | Amount | Shares | Amount | Shares | Amount | ||||||||||||||||||||||||||||||||||||
| Class B shares | |||||||||||||||||||||||||||||||||||||||||
| Sold | 1,430 | $40,577 | 23,039 | $598,399 | 6,462 | $132,615 | |||||||||||||||||||||||||||||||||||
| Repurchased | (2,470 | ) | (70,580 | ) | (29,951 | ) | (766,342 | ) | (37,113 | ) | (782,533 | ) | |||||||||||||||||||||||||||||
| Net decrease | (1,040 | ) | ($30,003 | ) | (6,912 | ) | ($167,943 | ) | (30,651 | ) | ($649,918 | ) | |||||||||||||||||||||||||||||
| Class C shares | |||||||||||||||||||||||||||||||||||||||||
| Sold | 631,118 | $17,797,977 | 6,925,342 | $179,456,288 | 3,157,986 | $66,136,615 | |||||||||||||||||||||||||||||||||||
| Repurchased | (121,827 | ) | (3,433,949 | ) | (1,766,592 | ) | (44,720,499 | ) | (2,147,869 | ) | (44,798,519 | ) | |||||||||||||||||||||||||||||
| Net increase | 509,291 | $14,364,028 | 5,158,750 | $134,735,789 | 1,010,117 | $21,338,096 | |||||||||||||||||||||||||||||||||||
| Class I shares | |||||||||||||||||||||||||||||||||||||||||
| Sold | 12,147,309 | $349,823,313 | 147,491,547 | $3,830,388,336 | 90,657,790 | $1,938,510,713 | |||||||||||||||||||||||||||||||||||
| Distributions reinvested | — | — | 688,414 | 18,793,707 | 704,235 | 14,253,717 | |||||||||||||||||||||||||||||||||||
| Repurchased | (5,561,623 | ) | (161,104,653 | ) | (67,338,886 | ) | (1,796,486,369 | ) | (40,391,991 | ) | (855,244,453 | ) | |||||||||||||||||||||||||||||
| Net increase | 6,585,686 | $188,718,660 | 80,841,075 | $2,052,695,674 | 50,970,034 | $1,097,519,977 | |||||||||||||||||||||||||||||||||||
| Class R2 shares | |||||||||||||||||||||||||||||||||||||||||
| Sold | 251,550 | $7,258,324 | 966,184 | $26,281,352 | 562,895 | $12,363,392 | |||||||||||||||||||||||||||||||||||
| Distributions reinvested | — | — | 609 | 16,628 | 2,087 | 42,253 | |||||||||||||||||||||||||||||||||||
| Repurchased | (49,793 | ) | (1,422,538 | ) | (227,564 | ) | (5,989,130 | ) | (76,255 | ) | (1,618,262 | ) | |||||||||||||||||||||||||||||
| Net increase | 201,757 | $5,835,786 | 739,229 | $20,308,850 | 488,727 | $10,787,383 | |||||||||||||||||||||||||||||||||||
| Class R4 shares | |||||||||||||||||||||||||||||||||||||||||
| Sold | 3,850 | $110,237 | 233,097 | $5,973,541 | 121,641 | $2,513,391 | |||||||||||||||||||||||||||||||||||
| Distributions reinvested | — | — | 919 | 25,088 | 1,077 | 21,812 | |||||||||||||||||||||||||||||||||||
| Repurchased | (10,385 | ) | (301,353 | ) | (154,003 | ) | (3,958,215 | ) | (39,004 | ) | (826,106 | ) | |||||||||||||||||||||||||||||
| Net increase (decrease) | (6,535 | ) | ($191,116 | ) | 80,013 | $2,040,414 | 83,714 | $1,709,097 | |||||||||||||||||||||||||||||||||
| Class R6 shares | |||||||||||||||||||||||||||||||||||||||||
| Sold | 3,650,068 | $104,895,931 | 61,414,212 | $1,676,296,468 | 2,241,015 | $47,393,271 | |||||||||||||||||||||||||||||||||||
| Distributions reinvested | — | — | 294,022 | 8,032,680 | 19,894 | 402,651 | |||||||||||||||||||||||||||||||||||
| Repurchased | (593,470 | ) | (17,082,438 | ) | (2,835,726 | ) | (79,251,533 | ) | (1,553,248 | ) | (33,698,306 | ) | |||||||||||||||||||||||||||||
| Net increase | 3,056,598 | $87,813,493 | 58,872,508 | $1,605,077,615 | 707,661 | $14,097,616 | |||||||||||||||||||||||||||||||||||
| Class 1 shares | |||||||||||||||||||||||||||||||||||||||||
| Sold | 91,868 | $2,655,806 | 1,143,563 | $30,003,926 | 677,086 | $14,407,914 | |||||||||||||||||||||||||||||||||||
| Distributions reinvested | — | — | 16,066 | 438,430 | 22,598 | 457,163 | |||||||||||||||||||||||||||||||||||
| Repurchased | (9,903 | ) | (279,084 | ) | (269,432 | ) | (6,916,625 | ) | (345,698 | ) | (7,385,847 | ) | |||||||||||||||||||||||||||||
| Net increase | 81,965 | $2,376,722 | 890,197 | $23,525,731 | 353,986 | $7,479,230 | |||||||||||||||||||||||||||||||||||
| Period ended 3-31-181 | Year ended 2-28-18 | Year ended 2-28-17 | |||||||||||||||||||||||||||||||||||||||
| Shares | Amount | Shares | Amount | Shares | Amount | ||||||||||||||||||||||||||||||||||||
| Class NAV shares | |||||||||||||||||||||||||||||||||||||||||
| Sold | 28,046 | $807,458 | 10,273,748 | $264,034,315 | 36,007,828 | $770,657,902 | |||||||||||||||||||||||||||||||||||
| Distributions reinvested | — | — | 249,616 | 6,809,529 | 148,349 | 2,999,617 | |||||||||||||||||||||||||||||||||||
| Repurchased | (688,191 | ) | (20,022,384 | ) | (9,896,358 | ) | (256,155,809 | ) | (672,404 | ) | (14,475,418 | ) | |||||||||||||||||||||||||||||
| Net increase (decrease) | (660,145 | ) | ($19,214,926 | ) | 627,006 | $14,688,035 | 35,483,773 | $759,182,101 | |||||||||||||||||||||||||||||||||
| Total net increase | 10,520,009 | $301,253,138 | 155,755,466 | $4,074,516,879 | 77,821,025 | $1,668,056,731 | |||||||||||||||||||||||||||||||||||
1For the one-month period ended 3-31-18. The fund changed its fiscal year end from February 28 to March 31.
Affiliates of the fund owned 100% of shares of Class 1 and Class NAV on March 31, 2018 and February 28, 2018. Such concentration of shareholders' capital could have a material effect on the fund if such shareholders redeem from the fund.
Note 6 — Purchase and sale of securities
Purchases and sales of securities, other than short-term investments, amounted to $700,890,561 and $350,867,639 for the period ended March 31, 2018 and amounted to $8,151,515,770 and $4,182,719,354 for the year ended February 28, 2018, respectively.
Note 7 — Industry or sector risk
The fund may invest a large percentage of its assets in one or more particular industries or sectors of the economy. If a large percentage of the fund's assets are economically tied to a single or small number of industries or sectors of the economy, the fund will be less diversified than a more broadly diversified fund, and it may cause the fund to underperform if that industry or sector underperforms. In addition, focusing on a particular industry or sector may make the fund's NAV more volatile. Further, a fund that invests in particular industries or sectors is particularly susceptible to the impact of market, economic, regulatory and other factors affecting those industries or sectors.
Note 8 — Investment by affiliated funds
Certain investors in the fund are affiliated funds that are managed by the Advisor and its affiliates. The affiliated funds do not invest in the fund for the purpose of exercising management or control; however, this investment may represent a significant portion of the fund's net assets. At March 31, 2018 and February 28, 2018, funds within the John Hancock group of funds complex held 10.4% and 11.0%, respectively, of the fund's net assets. At March 31, 2018 and February 28, 2018, there were no affiliated funds with an ownership of 5% or more of the fund's net assets.
REPORT OF INDEPENDENT REGISTERED PUBLIC ACCOUNTING FIRM
To the Board of Trustees of John Hancock Funds III and Shareholders of John Hancock International Growth Fund
Opinion on the Financial Statements
We have audited the accompanying statements of assets and liabilities, including the fund's investments, of John Hancock International Growth Fund (the "Fund") as of March 31, 2018 and February 28, 2018, the related statements of operations for the period from March 1, 2018 to March 31, 2018 and for the year ended February 28, 2018, the statements of changes in net assets for the period from March 1, 2018 to March 31, 2018 and for each of the two years in the period ended February 28, 2018, including the related notes, and the financial highlights for each of the periods indicated therein (collectively referred to as the "financial statements"). In our opinion, the financial statements present fairly, in all material respects, the financial position of the Fund as of March 31, 2018 and February 28, 2018, the results of its operations for the period from March 1, 2018 to March 31, 2018 and the year ended February 28, 2018, the changes in its net assets for the period from March 1, 2018 to March 31, 2018 and for each of the two years in the period ended February 28, 2018 and the financial highlights for each of the periods indicated therein in conformity with accounting principles generally accepted in the United States of America.
Basis for Opinion
These financial statements are the responsibility of the Fund's management. Our responsibility is to express an opinion on the Fund's financial statements based on our audits. We are a public accounting firm registered with the Public Company Accounting Oversight Board (United States) ("PCAOB") and are required to be independent with respect to the Fund in accordance with the U.S. federal securities laws and the applicable rules and regulations of the Securities and Exchange Commission and the PCAOB.
We conducted our audits of these financial statements in accordance with the standards of the PCAOB. Those standards require that we plan and perform the audit to obtain reasonable assurance about whether the financial statements are free of material misstatement, whether due to error or fraud.
Our audits included performing procedures to assess the risks of material misstatement of the financial statements, whether due to error or fraud, and performing procedures that respond to those risks. Such procedures included examining, on a test basis, evidence regarding the amounts and disclosures in the financial statements. Our audits also included evaluating the accounting principles used and significant estimates made by management, as well as evaluating the overall presentation of the financial statements. Our procedures included confirmation of securities owned as of March 31, 2018 and February 28, 2018 by correspondence with the custodian, transfer agent, and brokers; when replies were not received from brokers, we performed other auditing procedures. We believe that our audits provide reasonable basis for our opinion.
PricewaterhouseCoopers LLP
Boston, Massachusetts
April 30, 2018
We have served as the auditor of one or more investment companies in the John Hancock family of funds since 1988.
Unaudited
For federal income tax purposes, the following information is furnished with respect to the distributions of the fund, if any, paid during its taxable year ended March 31, 2018 and February 28, 2018.
The fund reports the maximum amount allowable of its net taxable income as eligible for the corporate dividends-received deduction.
The fund reports the maximum amount allowable of its net taxable income as qualified dividend income as provided in the Jobs and Growth Tax Relief Reconciliation Act of 2003.
The fund has the following amounts as foreign tax credits, which represent taxes paid on income derived from foreign sources.
| March 31, 2018 | February 28, 2018 | |
| Foreign sourced income | $17,895,580 | $97,425,576 |
| Foreign tax credit | $1,845,265 | $6,469,611 |
Eligible shareholders will be mailed a 2018 Form 1099-DIV in early 2019. This will reflect the tax character of all distributions paid in calendar year 2018.
Please consult a tax advisor regarding the tax consequences of your investment in the fund.
This chart provides information about the Trustees and Officers who oversee your John Hancock fund. Officers elected by the Trustees manage the day-to-day operations of the fund and execute policies formulated by the Trustees.
Independent Trustees
| Name, year of birth Position(s) held with Trust Principal occupation(s) and other directorships during past 5 years | Trustee of the Trust since1 | Number of John Hancock funds overseen by Trustee |
| Hassell H. McClellan, Born: 1945 | 2012 | 221 |
| Trustee and Chairperson of the Board Director/Trustee, Virtus Funds (since 2008); Director, The Barnes Group (since 2010); Associate Professor, The Wallace E. Carroll School of Management, Boston College (retired 2013). Trustee (since 2014) and Chairperson of the Board (since 2017), John Hancock Collateral Trust; Trustee (since 2015) and Chairperson of the Board (since 2017), John Hancock Exchange-Traded Fund Trust; Trustee (since 2012) and Chairperson of the Board (since 2017), John Hancock retail funds3; Trustee (2005-2006 and since 2012) and Chairperson of the Board (since 2017), John Hancock Funds III; Trustee (since 2005) and Chairperson of the Board (since 2017), John Hancock Variable Insurance Trust and John Hancock Funds II. | ||
| Charles L. Bardelis,2 Born: 1941 | 2012 | 221 |
| Trustee Director, Island Commuter Corp. (marine transport). Trustee, John Hancock Collateral Trust (since 2014), Trustee, John Hancock Exchange-Traded Fund Trust (since 2015); Trustee, John Hancock retail funds3 (since 2012); Trustee, John Hancock Funds III (2005-2006 and since 2012); Trustee, John Hancock Variable Insurance Trust (since 1988); Trustee, John Hancock Funds II (since 2005). | ||
| James R. Boyle, Born: 1959 | 2015 | 221 |
| Trustee Chief Executive Officer, Foresters Financial (since 2018); Chairman and Chief Executive Officer, Zillion Group, Inc. (formerly HealthFleet, Inc.) (healthcare) (2014-2018); Executive Vice President and Chief Executive Officer, U.S. Life Insurance Division of Genworth Financial, Inc. (insurance) (January 2014-July 2014); Senior Executive Vice President, Manulife Financial Corporation, President and Chief Executive Officer, John Hancock (1999-2012); Chairman and Director, John Hancock Advisers, LLC, John Hancock Funds, LLC, and John Hancock Investment Management Services, LLC (2005-2010). Trustee, John Hancock Collateral Trust and John Hancock Exchange-Traded Fund Trust (since 2015); Trustee, John Hancock retail funds3 (2005-2010; 2012-2014 and since 2015); Trustee, John Hancock Variable Insurance Trust and John Hancock Funds II (2005-2014 and since 2015). | ||
| Peter S. Burgess,2 Born: 1942 | 2012 | 221 |
| Trustee Consultant (financial, accounting, and auditing matters) (since 1999); Certified Public Accountant; Partner, Arthur Andersen (independent public accounting firm) (prior to 1999); Director, Lincoln Educational Services Corporation (since 2004); Director, Symetra Financial Corporation (2010-2016); Director, PMA Capital Corporation (2004-2010). Trustee, John Hancock Collateral Trust (since 2014); Trustee, John Hancock Exchange-Traded Fund Trust (since 2015); Trustee, John Hancock retail funds3 (since 2012); Trustee, John Hancock Funds III (2005-2006 and since 2012); Trustee, John Hancock Variable Insurance Trust and John Hancock Funds II (since 2005). | ||
| William H. Cunningham, Born: 1944 | 2006 | 221 |
| Trustee Professor, University of Texas, Austin, Texas (since 1971); former Chancellor, University of Texas System and former President of the University of Texas, Austin, Texas; Chairman (since 2009) and Director (since 2006), Lincoln National Corporation (insurance); Director, Southwest Airlines (since 2000); former Director, LIN Television (2009-2014). Trustee, John Hancock retail funds3 (since 1986); Trustee, John Hancock Variable Insurance Trust (since 2012); Trustee, John Hancock Funds II (2005-2006 and since 2012); Trustee, John Hancock Collateral Trust (since 2014); Trustee, John Hancock Exchange-Traded Fund Trust (since 2015). | ||
Independent Trustees (continued)
| Name, year of birth Position(s) held with Trust Principal occupation(s) and other directorships during past 5 years | Trustee of the Trust since1 | Number of John Hancock funds overseen by Trustee |
| Grace K. Fey, Born: 1946 | 2012 | 221 |
| Trustee Chief Executive Officer, Grace Fey Advisors (since 2007); Director and Executive Vice President, Frontier Capital Management Company (1988-2007); Director, Fiduciary Trust (since 2009). Trustee, John Hancock Collateral Trust (since 2014); Trustee, John Hancock Exchange-Traded Fund Trust (since 2015); Trustee, John Hancock retail funds3 (since 2012); Trustee, John Hancock Variable Insurance Trust and John Hancock Funds II (since 2008). | ||
| Theron S. Hoffman,2 Born: 1947 | 2012 | 221 |
| Trustee Chief Executive Officer, T. Hoffman Associates, LLC (consulting firm) (since 2003); Director, The Todd Organization (consulting firm) (2003-2010); President, Westport Resources Management (investment management consulting firm) (2006-2008); Board Member, Senior Managing Director, Partner, and Operating Head, Putnam Investments (2000-2003); Executive Vice President, The Thomson Corp. (financial and legal information publishing) (1997-2000). Trustee, John Hancock Collateral Trust (since 2014); Trustee, John Hancock Exchange-Traded Fund Trust (since 2015); Trustee, John Hancock retail funds3 (since 2012); Trustee, John Hancock Variable Insurance Trust and John Hancock Funds II (since 2008). | ||
| Deborah C. Jackson, Born: 1952 | 2008 | 221 |
| Trustee President, Cambridge College, Cambridge, Massachusetts (since 2011); Board of Directors, National Association of Corporate Directors/New England (since 2015); Board of Directors, Association of Independent Colleges and Universities of Massachusetts (since 2014); Chief Executive Officer, American Red Cross of Massachusetts Bay (2002-2011); Board of Directors of Eastern Bank Corporation (since 2001); Board of Directors of Eastern Bank Charitable Foundation (since 2001); Board of Directors of American Student Assistance Corporation (1996-2009); Board of Directors of Boston Stock Exchange (2002-2008); Board of Directors of Harvard Pilgrim Healthcare (health benefits company) (2007-2011). Trustee, John Hancock retail funds3 (since 2008); Trustee, John Hancock Variable Insurance Trust and John Hancock Funds II (since 2012); Trustee, John Hancock Collateral Trust (since 2014); and Trustee, John Hancock Exchange-Traded Fund Trust (since 2015). | ||
| James M. Oates, Born: 1946 | 2012 | 221 |
Trustee | ||
Independent Trustees (continued)
| Name, year of birth Position(s) held with Trust Principal occupation(s) and other directorships during past 5 years | Trustee of the Trust since1 | Number of John Hancock funds overseen by Trustee |
| Steven R. Pruchansky, Born: 1944 | 2006 | 221 |
| Trustee and Vice Chairperson of the Board Managing Director, Pru Realty (since 2017); Chairman and Chief Executive Officer, Greenscapes of Southwest Florida, Inc. (since 2000); Director and President, Greenscapes of Southwest Florida, Inc. (until 2000); Member, Board of Advisors, First American Bank (until 2010); Managing Director, Jon James, LLC (real estate) (since 2000); Partner, Right Funding, LLC (2014-2017); Director, First Signature Bank & Trust Company (until 1991); Director, Mast Realty Trust (until 1994); President, Maxwell Building Corp. (until 1991). Trustee (since 1992) and Chairperson of the Board (2011-2012), John Hancock retail funds3; Trustee and Vice Chairperson of the Board, John Hancock retail funds3 John Hancock Variable Insurance Trust, and John Hancock Funds II (since 2012); Trustee and Vice Chairperson of the Board, John Hancock Collateral Trust (since 2014); Trustee and Vice Chairperson of the Board, John Hancock Exchange-Traded Fund Trust (since 2015). | ||
| Gregory A. Russo, Born: 1949 | 2008 | 221 |
| Trustee Director and Audit Committee Chairman (since 2012), and Member, Audit Committee and Finance Committee (since 2011), NCH Healthcare System, Inc. (holding company for multi-entity healthcare system); Director and Member (since 2012) and Finance Committee Chairman (since 2014), The Moorings, Inc. (nonprofit continuing care community); Vice Chairman, Risk & Regulatory Matters, KPMG LLP (KPMG) (2002-2006); Vice Chairman, Industrial Markets, KPMG (1998-2002); Chairman and Treasurer, Westchester County, New York, Chamber of Commerce (1986-1992); Director, Treasurer, and Chairman of Audit and Finance Committees, Putnam Hospital Center (1989-1995); Director and Chairman of Fundraising Campaign, United Way of Westchester and Putnam Counties, New York (1990-1995). Trustee, John Hancock retail funds3 (since 2008); Trustee, John Hancock Variable Insurance Trust and John Hancock Funds II (since 2012); Trustee, John Hancock Collateral Trust (since 2014); Trustee, John Hancock Exchange-Traded Fund Trust (since 2015). | ||
Non-Independent Trustees4
| Name, year of birth Position(s) held with Trust Principal occupation(s) and other directorships during past 5 years | Trustee of the Trust since1 | Number of John Hancock funds overseen by Trustee |
| Andrew G. Arnott, Born: 1971 | 2017 | 221 |
President and Non-Independent Trustee | ||
| Warren A. Thomson, Born: 1955 | 2012 | 221 |
| Non-Independent Trustee Senior Executive Vice President and Chief Investment Officer, Manulife Financial Corporation and The Manufacturers Life Insurance Company (since 2009); Chairman, Manulife Asset Management (since 2001, including prior positions); Director and Chairman, Manulife Asset Management Limited (since 2006); Director and Chairman, Hancock Natural Resources Group, Inc. (since 2013). Trustee, John Hancock retail funds,3 John Hancock Variable Insurance Trust, and John Hancock Funds II (since 2012); Trustee, John Hancock Collateral Trust (since 2014); Trustee, John Hancock Exchange-Traded Fund Trust (since 2015). | ||
Principal officers who are not Trustees
| Name, year of birth Position(s) held with Trust Principal occupation(s) during past 5 years | Officer of the Trust since |
| John J. Danello, Born: 1955 | 2014 |
| Senior Vice President, Secretary, and Chief Legal Officer Vice President and Chief Counsel, John Hancock Wealth Management (since 2005); Senior Vice President (since 2007) and Chief Legal Counsel (2007-2010), John Hancock Funds, LLC and The Berkeley Financial Group, LLC; Senior Vice President (since 2006, including prior positions) and Chief Legal Officer and Secretary (since 2014), John Hancock retail funds,3 John Hancock Funds II and John Hancock Variable Insurance Trust; Senior Vice President, Secretary and Chief Legal Officer, John Hancock Collateral Trust and John Hancock Exchange-Traded Fund Trust (since 2014); Vice President, John Hancock Life & Health Insurance Company (since 2009); Vice President, John Hancock Life Insurance Company (USA) and John Hancock Life Insurance Company of New York (since 2010); and Senior Vice President, Secretary and Chief Legal Counsel (2007-2014, including prior positions) of John Hancock Advisers, LLC and John Hancock Investment Management Services, LLC. | |
| Francis V. Knox, Jr., Born: 1947 | 2006 |
| Chief Compliance Officer Vice President, John Hancock Financial Services (since 2005); Chief Compliance Officer, John Hancock retail funds,3 John Hancock Variable Insurance Trust, John Hancock Funds II, John Hancock Advisers, LLC, and John Hancock Investment Management Services, LLC (since 2005); Chief Compliance Officer, John Hancock Collateral Trust and John Hancock Exchange-Traded Fund Trust (since 2014). | |
| Charles A. Rizzo, Born: 1957 | 2007 |
| Chief Financial Officer Vice President, John Hancock Financial Services (since 2008); Senior Vice President, John Hancock Advisers, LLC and John Hancock Investment Management Services, LLC (since 2008); Chief Financial Officer, John Hancock retail funds,3 John Hancock Variable Insurance Trust and John Hancock Funds II (since 2007); Chief Financial Officer, John Hancock Collateral Trust and John Hancock Exchange-Traded Fund Trust (since 2014). | |
| Salvatore Schiavone, Born: 1965 | 2010 |
| Treasurer Assistant Vice President, John Hancock Financial Services (since 2007); Vice President, John Hancock Advisers, LLC and John Hancock Investment Management Services, LLC (since 2007); Treasurer, John Hancock retail funds3 (since 2007, including prior positions); Treasurer, John Hancock Variable Insurance Trust and John Hancock Funds II (2007-2009 and since 2010, including prior positions); Treasurer, John Hancock Collateral Trust and John Hancock Exchange-Traded Fund Trust (since 2014). | |
The business address for all Trustees and Officers is 601 Congress Street, Boston, Massachusetts 02210-2805.
The Statement of Additional Information of the fund includes additional information about members of the Board of Trustees of the Trust and is available without charge, upon request, by calling 800-225-5291.
| 1 | Each Trustee holds office until his or her successor is elected and qualified, or until the Trustee's death, retirement, resignation, or removal. Mr. Boyle has served as Trustee at various times prior to the date listed in the table. |
| 2 | Member of the Audit Committee. |
| 3 | "John Hancock retail funds" comprises John Hancock Funds III and 40 other John Hancock funds consisting of 30 series of other John Hancock trusts and 10 closed-end funds. |
| 4 | The Trustee is a Non-Independent Trustee due to current or former positions with the Advisor and certain affiliates. |
Trustees Hassell H. McClellan, Chairperson Officers Andrew G. Arnott John J. Danello Francis V. Knox, Jr. Charles A. Rizzo Salvatore Schiavone | Investment advisor John Hancock Advisers, LLC Subadvisor Wellington Management Company LLP Principal distributor John Hancock Funds, LLC Custodian Citibank. N.A. Transfer agent John Hancock Signature Services, Inc. Legal counsel K&L Gates LLP Independent registered public accounting firm PricewaterhouseCoopers LLP |
*Member of the Audit Committee
†Non-Independent Trustee
#Effective 6-20-17
The fund's proxy voting policies and procedures, as well as the fund proxy voting record for the most recent twelve-month period ended June 30, are available free of charge on the Securities and Exchange Commission (SEC) website at sec.gov or on our website.
The fund's complete list of portfolio holdings, for the first and third fiscal quarters, is filed with the SEC on Form N-Q. The fund's Form N-Q is available on our website and the SEC's website, sec.gov, and can be reviewed and copied (for a fee) at the SEC's Public Reference Room in Washington, DC. Call 800-SEC-0330 to receive information on the operation of the SEC's Public Reference Room.
We make this information on your fund, as well as monthly portfolio holdings, and other fund details available on our website at jhinvestments.com or by calling 800-225-5291.
| You can also contact us: | |||
| 800-225-5291 jhinvestments.com | Regular mail: John Hancock Signature Services, Inc. | Express mail: John Hancock Signature Services, Inc. | |
John Hancock family of funds
DOMESTIC EQUITY FUNDS Balanced Blue Chip Growth Classic Value Disciplined Value Disciplined Value Mid Cap Equity Income Fundamental All Cap Core Fundamental Large Cap Core Fundamental Large Cap Value New Opportunities Small Cap Core Small Cap Growth Small Cap Value Strategic Growth U.S. Global Leaders Growth U.S. Growth Value Equity GLOBAL AND INTERNATIONAL EQUITY FUNDS Disciplined Value International Emerging Markets Emerging Markets Equity Fundamental Global Franchise Global Equity Global Shareholder Yield Greater China Opportunities International Growth International Small Company International Value Equity | INCOME FUNDS Bond California Tax-Free Income Emerging Markets Debt Floating Rate Income Global Income Government Income High Yield High Yield Municipal Bond Income Investment Grade Bond Money Market Short Duration Credit Opportunities Spectrum Income Strategic Income Opportunities Tax-Free Bond ALTERNATIVE AND SPECIALTY FUNDS Absolute Return Currency Alternative Asset Allocation Enduring Assets Financial Industries Global Absolute Return Strategies Global Conservative Absolute Return Global Focused Strategies Natural Resources Redwood Regional Bank Seaport Technical Opportunities |
A fund's investment objectives, risks, charges, and expenses should be considered carefully before investing. The prospectus contains this and other important information about the fund. To obtain a prospectus, contact your financial professional, call John Hancock Investments at 800-225-5291, or visit our website at jhinvestments.com. Please read the prospectus carefully before investing or sending money.
ASSET ALLOCATION Income Allocation Multi-Index Lifetime Portfolios Multi-Index Preservation Portfolios Multimanager Lifestyle Portfolios Multimanager Lifetime Portfolios Retirement Income 2040 EXCHANGE-TRADED FUNDS John Hancock Multifactor Consumer Discretionary ETF John Hancock Multifactor Consumer Staples ETF John Hancock Multifactor Developed International ETF John Hancock Multifactor Energy ETF John Hancock Multifactor Financials ETF John Hancock Multifactor Healthcare ETF John Hancock Multifactor Industrials ETF John Hancock Multifactor Large Cap ETF John Hancock Multifactor Materials ETF John Hancock Multifactor Mid Cap ETF John Hancock Multifactor Small Cap ETF John Hancock Multifactor Technology ETF John Hancock Multifactor Utilities ETF | ENVIRONMENTAL, SOCIAL, AND GOVERNANCE FUNDS ESG All Cap Core ESG Core Bond ESG International Equity ESG Large Cap Core CLOSED-END FUNDS Financial Opportunities Hedged Equity & Income Income Securities Trust Investors Trust Preferred Income Preferred Income II Preferred Income III Premium Dividend Tax-Advantaged Dividend Income Tax-Advantaged Global Shareholder Yield |
John Hancock Multifactor ETF shares are bought and sold at market price (not NAV), and are not individually redeemed
from the fund. Brokerage commissions will reduce returns.
John Hancock ETFs are distributed by Foreside Fund Services, LLC, and are subadvised by Dimensional Fund Advisors LP.
Foreside is not affiliated with John Hancock Funds, LLC or Dimensional Fund Advisors LP.
Dimensional Fund Advisors LP receives compensation from John Hancock in connection with licensing rights to the
John Hancock Dimensional indexes. Dimensional Fund Advisors LP does not sponsor, endorse, or sell, and makes no
representation as to the advisability of investing in, John Hancock Multifactor ETFs.
John Hancock Investments
A trusted brand
John Hancock Investments is a premier asset manager representing one of
America's most trusted brands, with a heritage of financial stewardship dating
back to 1862. Helping our shareholders pursue their financial goals is at the
core of everything we do. It's why we support the role of professional financial
advice and operate with the highest standards of conduct and integrity.
A better way to invest
We serve investors globally through a unique multimanager approach:
We search the world to find proven portfolio teams with specialized
expertise for every strategy we offer, then we apply robust investment
oversight to ensure they continue to meet our uncompromising standards
and serve the best interests of our shareholders.
Results for investors
Our unique approach to asset management enables us to provide a diverse set
of investments backed by some of the world's best managers, along with strong
risk-adjusted returns across asset classes.

 | John Hancock Funds, LLC n Member FINRA, SIPC 601 Congress Street n Boston, MA 02210-2805 800-225-5291 n jhinvestments.com | |
| This report is for the information of the shareholders of John Hancock International Growth Fund. It is not authorized for distribution to prospective investors unless preceded or accompanied by a prospectus. | ||
| MF444965 | 87A 3/18 5/18 | |
John Hancock
Global Shareholder Yield Fund
Annual report 2/28/18 (and one month 3/31/18)
A message to shareholders
Dear shareholder,
The markets spent much of 2017 on an upward trajectory, fueled by broad-based expansion of economic growth, supportive monetary policy, and benign inflation. Global equities rose throughout most of the period and outperformed U.S. equities. As the global economy continued to gain momentum, central banks began to normalize their long-standing accommodative monetary policies with the U.S. Federal Reserve leading this charge.
However, two significant developments materialized in early 2018 that bear watching. The first was a pronounced and sudden correction in most international equity indexes, with stocks selling off 10% from their peaks before stabilizing. The second is that the growth prospects in developed international markets, which had been quite promising, cooled. While many indicators remain positive, the likelihood of continued volatility remains higher now than a year ago.
While the global equity markets delivered positive results for the overall period, it's important for investors to be cognizant of the downside risks. Your best resource in unpredictable markets is your financial advisor, who can help position your portfolio so that it's sufficiently diversified to meet your long-term objectives and to withstand the inevitable turbulence along the way.
On behalf of everyone at John Hancock Investments, I'd like to take this opportunity to welcome new shareholders and to thank existing shareholders for the continued trust you've placed in us.
Sincerely,
Andrew G. Arnott
President and CEO,
John Hancock Investments
Head of Wealth and Asset Management,
United States and Europe
This commentary reflects the CEO's views, which are subject to change at any time. Investing involves risks, including the potential loss of principal. Diversification does not guarantee investment returns and does not eliminate risk of loss. For more up-to-date information, please visit our website at jhinvestments.com.
John Hancock
Global Shareholder Yield Fund
Table of contents
| 2 | Your fund at a glance | |
| 6 | Discussion of fund performance | |
| 11 | A look at performance | |
| 15 | Your expenses | |
| 17 | Fund's investments | |
| 25 | Financial statements | |
| 29 | Financial highlights | |
| 36 | Notes to financial statements | |
| 45 | Report of independent registered public accounting firm | |
| 46 | Tax information | |
| 47 | Trustees and Officers | |
| 51 | More information |
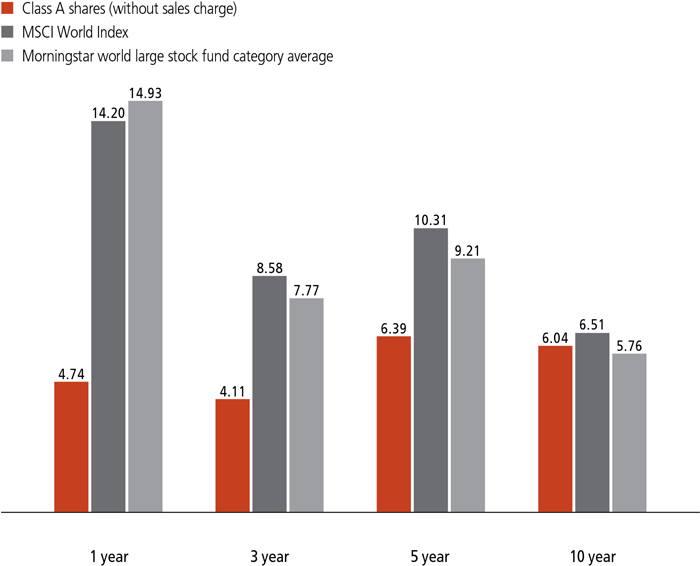
AVERAGE ANNUAL TOTAL RETURNS AS OF 2/28/18 (%)
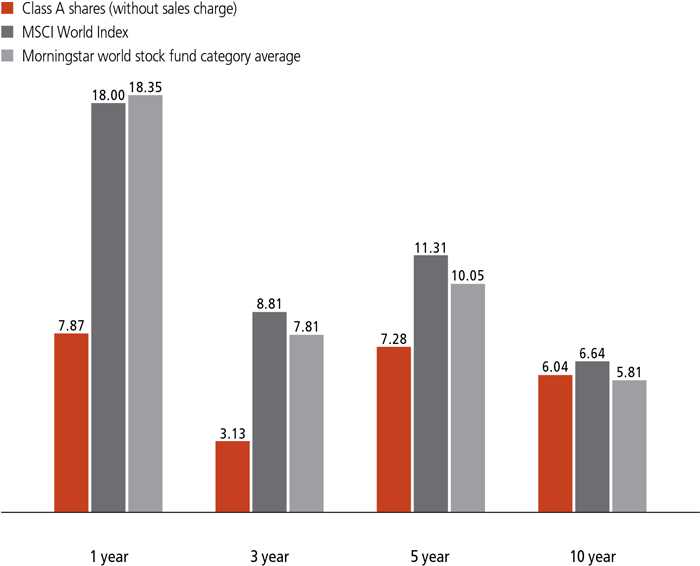
The MSCI World Index (gross of foreign withholding tax on dividends) is a free float-adjusted market capitalization weighted index that is designed to measure the equity market performance of developed markets.
It is not possible to invest directly in an index. Index figures do not reflect expenses or sales charges, which would result in lower returns.
Figures from Morningstar, Inc. include reinvested distributions and do not take into account sales charges. Actual load-adjusted performance is lower.
The past performance shown here reflects reinvested distributions and the beneficial effect of any expense reductions, and does not guarantee future results. Performance of the other share classes will vary based on the difference in the fees and expenses of those classes. Shares will fluctuate in value and, when redeemed, may be worth more or less than their original cost. Current month-end performance may be lower or higher than the performance cited, and can be found at jhinvestments.com or by calling 800-225-5291. For further information on the fund's objectives, risks, and strategy, see the fund's prospectus.
PERFORMANCE HIGHLIGHTS
Global equities rallied
Global equities posted double-digit returns as improving economic conditions provided a favorable backdrop, although market volatility increased substantially toward the end of the period as some economies showed signs of slowing.
The fund trailed its benchmark index
The fund posted a positive overall return, but it trailed the performance of its benchmark, the MSCI World Index, by a wide margin.
Sector allocations detracted
The fund's sector underweight in information technology and its overweight in telecommunication services detracted from performance relative to the benchmark.
SECTOR COMPOSITION AS OF 3/31/18 (%)

SECTOR COMPOSITION AS OF 2/28/18 (%)
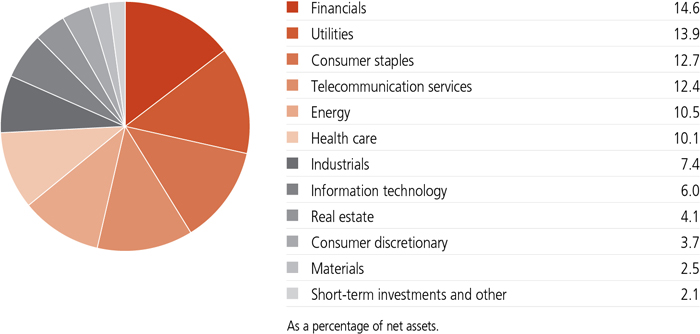
A note about risks
Foreign investing, especially in emerging markets, has additional risks, such as currency and market volatility and political and social instability. Liquidity—the extent to which a security may be sold or a derivative position closed without negatively affecting its market value—may be impaired by reduced trading volume, heightened volatility, rising interest rates, and other market conditions. Investments in higher-yielding, lower-rated securities include a higher risk of default. The value of a company's equity securities is subject to changes in the company's financial condition and overall market and economic conditions. Actively trading securities can increase transaction costs (thus lowering performance) and taxable distributions. Derivatives transactions, including hedging and other strategic transactions, may increase a fund's volatility and could produce disproportionate losses, potentially more than the fund's principal investment. Fund distributions generally depend on income and realized gains from underlying investments and may vary or cease altogether in the future. Please see the fund's prospectus for additional risks.

Kera Van Valen, CFA
Portfolio Manager
Epoch Investment Partners, Inc.
Why does this discussion cover two periods?
The fund has changed its fiscal year for reporting purposes, moving from a period ending at the close of February each year to a schedule concluding at the close of March. This discussion covers a 12-month period plus an additional one-month period.
Can you discuss the global equity market environment during the period covered by this report?
The fund's benchmark, the MSCI World Index, posted a double-digit return, thanks in part to improving economic growth in many regions. In Europe, an economic recovery gained momentum, and the European Central Bank moved to begin gradually scaling back some of its economic stimulus measures. Early in the period, centrist candidates won over antiestablishment populists in the French and Dutch presidential elections, easing investor concerns about nationalist sentiment and its potential impact on the European Union.
Elsewhere, the Chinese economy stabilized after several years of decelerating growth, providing a catalyst for improving economic growth across Asia. In the United States, economic momentum remained solidly positive and corporate earnings continued to strengthen despite additional interest-rate increases by the U.S. Federal Reserve (Fed). The Fed also announced a plan to reduce the amount of U.S. Treasury and mortgage-backed securities on its balance sheet.
Although stocks climbed on a fairly steady arc through much of the period, they fell sharply in late January and early February as investors focused on inflationary risks in the United States and concerns that the Fed might accelerate its pace of interest-rate increases. A host of geopolitical and other concerns also fueled the rise in volatility, and stock performance remained choppy through late February and into March.
On a sector basis, information technology was the benchmark's top performer, telecommunication services was the weakest. On a geographic basis, some of the larger equity markets in Europe significantly outperformed the broad index, notably Italy, the Netherlands, France, and Germany. Among other countries with large representation in the benchmark, the United States and the United Kingdom modestly underperformed, while Japan outperformed.
In the market environment described above, how did the fund perform?
The fund trailed the performance of its benchmark by a wide margin. Sector allocation, which is driven by our fundamental bottom-up investment process, was the primary reason for the underperformance. As global economic conditions improved, investors favored more cyclical segments of the market, but stocks in these sectors tend to lack the shareholder yield characteristics that we seek in our investments.
One example of a more cyclical sector is information technology, where the fund was underweight, as returning cash to shareholders is not a priority for many companies in the sector, relative to the
TOP 10 HOLDINGS AS OF 3/31/18 (%)
| TOTAL SA | 1.9 |
| Vodafone Group PLC | 1.9 |
| Royal Dutch Shell PLC, ADR, Class A | 1.8 |
| GlaxoSmithKline PLC | 1.8 |
| Muenchener Rueckversicherungs-Gesellschaft AG | 1.8 |
| BCE, Inc. | 1.8 |
| Verizon Communications, Inc. | 1.7 |
| Altria Group, Inc. | 1.7 |
| AstraZeneca PLC, ADR | 1.7 |
| AT&T, Inc. | 1.7 |
| TOTAL | 17.8 |
| As a percentage of net assets. | |
| Cash and cash equivalents are not included. | |
TOP 10 HOLDINGS AS OF 2/28/18 (%)
| TOTAL SA | 1.9 |
| Vodafone Group PLC | 1.9 |
| AXA SA | 1.8 |
| Royal Dutch Shell PLC, ADR, Class A | 1.8 |
| BCE, Inc. | 1.8 |
| Muenchener Rueckversicherungs-Gesellschaft AG | 1.7 |
| Verizon Communications, Inc. | 1.7 |
| AT&T, Inc. | 1.7 |
| GlaxoSmithKline PLC | 1.7 |
| Imperial Brands PLC | 1.6 |
| TOTAL | 17.6 |
| As a percentage of net assets. | |
| Cash and cash equivalents are not included. | |
The fund's overweights in the utilities and telecommunication services sectors also had a negative impact on relative performance, as the sectors underperformed.
In telecommunication services, however, this negative impact was mitigated somewhat by our effective security selection in the sector. Our stock picking in energy also had a beneficial effect on relative performance.
Although the fund trailed its benchmark
TOP 10 COUNTRIES AS OF 3/31/18 (%)
| United States | 45.1 |
| United Kingdom | 15.0 |
| Germany | 8.6 |
| France | 8.1 |
| Canada | 5.7 |
| Switzerland | 3.9 |
| Italy | 3.4 |
| Australia | 2.2 |
| Norway | 2.1 |
| Netherlands | 1.8 |
| TOTAL | 95.9 |
| As a percentage of net assets. | |
| Cash and cash equivalents are not included. |
TOP 10 COUNTRIES AS OF 2/28/18 (%)
| United States | 42.7 |
| United Kingdom | 14.5 |
| Germany | 8.6 |
| France | 8.5 |
| Canada | 5.7 |
| Switzerland | 4.3 |
| Italy | 3.2 |
| Australia | 2.3 |
| Norway | 2.1 |
| Netherlands | 1.8 |
| TOTAL | 93.7 |
| As a percentage of net assets. | |
| Cash and cash equivalents are not included. |
overall, it posted a gain, capturing returns from cash dividends generated by a diversified portfolio of high-quality companies and also benefiting from share buybacks and debt reduction efforts.
What were the key drivers of relative performance at the individual security level?
The position that had the most significant negative impact was Imperial Brands PLC, a U.K.-based tobacco company. Its shares, along those of other industry peers, were pressured after the U.S. Food and Drug Administration announced a proposal to reduce nicotine levels in cigarettes. While Imperial Brands is a global tobacco company, it's modestly exposed to the U.S. market, and the regulatory concerns there weighed on the stock. Imperial's shares were also under pressure as investors became increasingly concerned about the company's growth opportunities and its challenges in carving out a strong position in next-generation products. The fund's position in another tobacco company, U.S.-based Altria Group, Inc., also had a negative impact on relative performance.
The positions in Imperial and Altria remained in the fund's portfolio at the end of the period, as the stocks' shareholder yield characteristics were attractive, in our view. Over the years, stocks of tobacco companies have generated stable growth, in our view, although they are susceptible to occasional bouts of volatility caused by news about potential regulatory changes, as we saw during the period covered by this report.
Other positions that weighed on relative performance were U.K.-based enterprise software provider Micro Focus International plc, U.S.-based electric utility PPL Corp., and U.S.-based real estate investment trust Welltower, Inc.
The position that had the most positive impact on relative performance was AbbVie, Inc., a U.S.-based pharmaceutical company. Its shares climbed amid positive sales momentum for its immunosuppressive drug, Humira, and strong early sales momentum for a blood cancer drug, Imbruvica.
Other positions that contributed were Muenchener Rueckversicherungs-Gesellschaft AG, a Germany insurance company, and Royal Dutch Shell PLC, a global energy company based in the Netherlands.
How did the fund's positioning change during the period, and how did this reflect your outlook for global equities at the end of the period?
In our ongoing efforts to improve the fund's shareholder yield, we added several new positions during the period and sold several holdings. We believe companies that have the ability to generate cash flow and allocate that cash effectively will continue to provide attractive returns, and we remain positive on the outlook for cash returns to shareholders including dividends and buybacks.
Were there any changes during the period to the fund's management team?
Effective October 31, 2017, Eric L. Sappenfield left the team.
MANAGED BY
 | William W. Priest, CFA On the fund since inception Investing since 1965 |
 | John Tobin, Ph.D., CFA On the fund since 2014 Investing since 1981 |
| | Kera Van Valen, CFA On the fund since 2014 Investing since 2001 |
 | Michael A. Welhoelter, CFA On the fund since inception Investing since 1986 |
![]()
TOTAL RETURNS FOR THE PERIOD ENDED MARCH 31, 2018
| Average annual total returns (%) with maximum sales charge | Cumulative total returns (%) with maximum sales charge | SEC 30-day yield (%) subsidized | SEC 30-day yield (%) unsubsidized1 | ||||||||||||||||||||||||||||||||||||||
| 1-year | 5-year | 10-year | Since inception | 5-year | 10-year | Since inception | as of 3-31-18 | as of 3-31-18 | |||||||||||||||||||||||||||||||||
| Class A | -0.54 | 5.30 | 5.50 | — | 29.44 | 70.87 | — | 2.62 | 2.43 | ||||||||||||||||||||||||||||||||
| Class B | -1.14 | 5.26 | 5.27 | — | 29.23 | 67.07 | — | 2.01 | 1.85 | ||||||||||||||||||||||||||||||||
| Class C | 2.95 | 5.64 | 5.29 | — | 31.53 | 67.46 | — | 2.01 | 1.85 | ||||||||||||||||||||||||||||||||
| Class I2 | 4.99 | 6.71 | 6.44 | — | 38.34 | 86.73 | — | 3.02 | 2.86 | ||||||||||||||||||||||||||||||||
| Class R22,3 | 4.56 | 6.26 | 5.97 | — | 35.48 | 78.52 | — | 2.59 | 2.44 | ||||||||||||||||||||||||||||||||
| Class R62,3 | 5.00 | 6.81 | 6.33 | — | 39.03 | 84.75 | — | 3.12 | 2.97 | ||||||||||||||||||||||||||||||||
| Class NAV2 | 5.09 | 6.82 | — | 6.26 | 4 | 39.10 | — | 82.64 | 4 | 3.12 | 2.98 | ||||||||||||||||||||||||||||||
| Index† | 14.20 | 10.31 | 6.51 | — | 63.36 | 87.82 | — | — | — | ||||||||||||||||||||||||||||||||
TOTAL RETURNS FOR THE PERIOD ENDED FEBRUARY 28, 2018
| Average annual total returns (%) with maximum sales charge | Cumulative total returns (%) with maximum sales charge | SEC 30-day yield (%) subsidized | SEC 30-day yield (%) unsubsidized1 | ||||||||||||||||||||||||||||||||||||||
| 1-year | 5-year | 10-year | Since inception | 5-year | 10-year | Since inception | as of 2-28-18 | as of 2-28-18 | |||||||||||||||||||||||||||||||||
| Class A | 2.45 | 6.19 | 5.50 | — | 35.01 | 70.86 | — | 2.80 | 2.64 | ||||||||||||||||||||||||||||||||
| Class B | 1.98 | 6.14 | 5.28 | — | 34.74 | 67.21 | — | 2.18 | 2.07 | ||||||||||||||||||||||||||||||||
| Class C | 5.98 | 6.51 | 5.30 | — | 37.05 | 67.60 | — | 2.19 | 2.07 | ||||||||||||||||||||||||||||||||
| Class I2 | 8.10 | 7.60 | 6.45 | — | 44.25 | 86.88 | — | 3.21 | 3.10 | ||||||||||||||||||||||||||||||||
| Class R22,3 | 7.68 | 7.14 | 5.96 | — | 41.14 | 78.48 | — | 2.79 | 2.67 | ||||||||||||||||||||||||||||||||
| Class R62,3 | 8.22 | 7.71 | 6.33 | — | 44.96 | 84.80 | — | 3.31 | 3.19 | ||||||||||||||||||||||||||||||||
| Class NAV2 | 8.11 | 7.72 | — | 6.42 | 4 | 45.04 | — | 84.37 | 4 | 3.31 | 3.19 | ||||||||||||||||||||||||||||||
| Index† | 18.00 | 11.31 | 6.64 | — | 70.90 | 90.13 | — | — | — | ||||||||||||||||||||||||||||||||
Performance figures assume all distributions have been reinvested. Figures reflect maximum sales charges on Class A shares of 5%, and the applicable contingent deferred sales charge (CDSC) on Class B and Class C shares. The Class B shares' CDSC declines annually between years 1 to 6 according to the following schedule: 5%, 4%, 3%, 3%, 2%, and 1%. No sales charge will be assessed after the sixth year. Class C shares sold within one year of purchase are subject to a 1% CDSC. Sales charges are not applicable to Class I, Class R2, Class R6, and Class NAV shares.
The expense ratios of the fund, both net (including any fee waivers and/or expense limitations) and gross (excluding any fee waivers and/or expense limitations), are set forth according to the most recent publicly available prospectuses for the fund and may differ from those disclosed in the Financial highlights tables in this report. Net expenses reflect contractual expense limitations in effect until June 30, 2018 and are subject to change. Had the contractual fee waivers and expense limitations not been in place, gross expenses would apply. The expense ratios are as follows:
| Class A | Class B | Class C | Class I | Class R2 | Class R6 | Class NAV | |
| Gross (%) | 1.29 | 1.99 | 1.99 | 0.97 | 1.38 | 0.88 | 0.86 |
| Net (%) | 1.09 | 1.84 | 1.84 | 0.84 | 1.24 | 0.74 | 0.86 |
Please refer to the most recent prospectus and annual or semiannual report for more information on expenses and any expense limitation arrangements for each class.
The returns reflect past results and should not be considered indicative of future performance. The return and principal value of an investment will fluctuate so that shares, when redeemed, may be worth more or less than their original cost. Due to market volatility and other factors, the fund's current performance may be higher or lower than the performance shown. For current to the most recent month-end performance data, please call 800-225-5291 or visit the fund's website at jhinvestments.com.
The performance table above and the chart on the next page do not reflect the deduction of taxes that a shareholder would pay on fund distributions or the redemption of fund shares. The fund's performance results reflect any applicable fee waivers or expense reductions, without which the expenses would increase and results would have been less favorable.
| † | Index is the MSCI World Index. |
See page 13 for footnotes.
This chart and table show what happened to a hypothetical $10,000 investment in John Hancock Global Shareholder Yield Fund for the share classes and periods indicated, assuming all distributions were reinvested. For comparison, we've shown the same investment in the MSCI World Index.
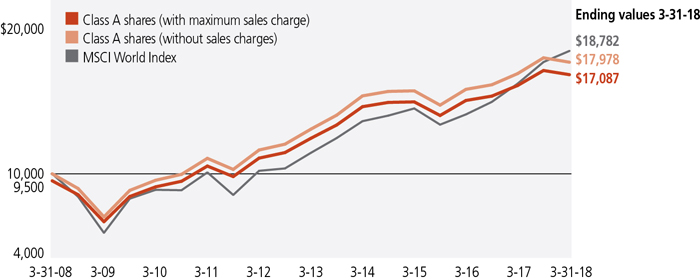
| Start date | With maximum sales charge ($) | Without sales charge ($) | Index ($) | |
| Class B5 | 3-31-08 | 16,707 | 16,707 | 18,782 |
| Class C5 | 3-31-08 | 16,746 | 16,746 | 18,782 |
| Class I2 | 3-31-08 | 18,673 | 18,673 | 18,782 |
| Class R22,3 | 3-31-08 | 17,852 | 17,852 | 18,782 |
| Class R62,3 | 3-31-08 | 18,475 | 18,475 | 18,782 |
| Class NAV2 | 4-28-08 | 18,264 | 18,264 | 17,779 |
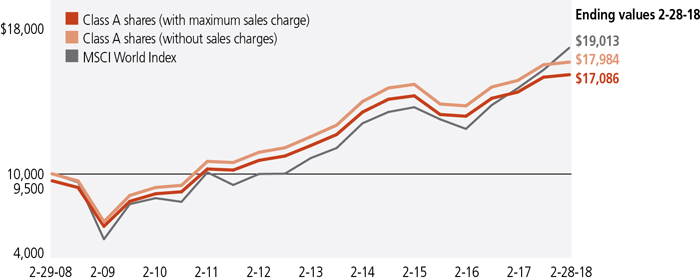
| Start date | With maximum sales charge ($) | Without sales charge ($) | Index ($) | |
| Class B5 | 2-29-08 | 16,721 | 16,721 | 19,013 |
| Class C5 | 2-29-08 | 16,760 | 16,760 | 19,013 |
| Class I2 | 2-29-08 | 18,688 | 18,688 | 19,013 |
| Class R22,3 | 2-29-08 | 17,848 | 17,848 | 19,013 |
| Class R62,3 | 2-29-08 | 18,480 | 18,480 | 19,013 |
| Class NAV2 | 4-28-08 | — | — | 19,013 |
The MSCI World Index (gross of foreign withholding tax on dividends) is a free float-adjusted market capitalization weighted index that is designed to measure the equity market performance of developed markets.
It is not possible to invest directly in an index. Index figures do not reflect expenses or sales charges, which would result in lower returns.
Footnotes related to performance pages
| 1 | Unsubsidized yield reflects what the yield would have been without the effect of reimbursements and waivers. |
| 2 | For certain types of investors, as described in the fund's prospectuses. |
| 3 | Class R2 and Class R6 shares were first offered 3-1-12 and 9-1-11, respectively. The returns prior to these dates are those of Class A shares that have not been adjusted for class-specific expenses; otherwise, returns would vary. |
| 4 | From 4-28-08. |
| 5 | The contingent deferred sales charge is not applicable. |
These examples are intended to help you understand your ongoing operating expenses of investing in the fund so you can compare these costs with the ongoing costs of investing in other mutual funds.
Understanding fund expenses
As a shareholder of the fund, you incur two types of costs:
| • | Transaction costs, which include sales charges (loads) on purchases or redemptions (varies by share class), minimum account fee charge, etc. |
| • | Ongoing operating expenses, including management fees, distribution and service fees (if applicable), and other fund expenses. |
We are presenting only your ongoing operating expenses here.
Actual expenses/actual returns
The first line of each share class in the tables on the following page is intended to provide information about the fund's actual ongoing operating expenses, and is based on the fund's actual return. It assumes an account value of $1,000.00 on October 1, 2017 and September 1, 2017, with the same investment held until March 31, 2018 and February 28, 2018, respectively.
Together with the value of your account, you may use this information to estimate the operating expenses that you paid over the period. Simply divide your account value at March 31, 2018 and February 28, 2018, by $1,000.00, then multiply it by the "expenses paid" for your share class from the table. For example, for an account value of $8,600.00, the operating expenses should be calculated as follows:
Hypothetical example for comparison purposes
The second line of each share class in the tables on the following page allows you to compare the fund's ongoing operating expenses with those of any other fund. It provides an example of the fund's hypothetical account values and hypothetical expenses based on each class's actual expense ratio and an assumed 5% annualized return before expenses (which is not the fund's actual return). It assumes an account value of $1,000.00 on October 1, 2017 and September 1, 2017, with the same investment held until March 31, 2018 and February 28, 2018, respectively. Look in any other fund shareholder report to find its hypothetical example and you will be able to compare these expenses. Please remember that these hypothetical account values and expenses may not be used to estimate the actual ending account balance or expenses you paid for the period.
Remember, these examples do not include any transaction costs, therefore, these examples will not help you to determine the relative total costs of owning different funds. If transaction costs were included, your expenses would have been higher. See the prospectuses for details regarding transaction costs.
SHAREHOLDER EXPENSE EXAMPLE CHART
| Account value on 10-1-2017 | Ending value on 3-31-2018 | Expenses paid during period ended 3-31-20181 | Annualized expense ratio | ||
| Class A | Actual expenses/actual returns | $1,000.00 | $982.90 | $5.39 | 1.09% |
| Hypothetical example for comparison purposes | 1,000.00 | 1,019.50 | 5.49 | 1.09% | |
| Class B | Actual expenses/actual returns | 1,000.00 | 978.40 | 9.08 | 1.84% |
| Hypothetical example for comparison purposes | 1,000.00 | 1,015.80 | 9.25 | 1.84% | |
| Class C | Actual expenses/actual returns | 1,000.00 | 979.20 | 9.08 | 1.84% |
| Hypothetical example for comparison purposes | 1,000.00 | 1,015.80 | 9.25 | 1.84% | |
| Class I | Actual expenses/actual returns | 1,000.00 | 984.20 | 4.16 | 0.84% |
| Hypothetical example for comparison purposes | 1,000.00 | 1,020.70 | 4.23 | 0.84% | |
| Class R2 | Actual expenses/actual returns | 1,000.00 | 982.30 | 6.13 | 1.24% |
| Hypothetical example for comparison purposes | 1,000.00 | 1,018.70 | 6.24 | 1.24% | |
| Class R6 | Actual expenses/actual returns | 1,000.00 | 983.90 | 3.66 | 0.74% |
| Hypothetical example for comparison purposes | 1,000.00 | 1,021.20 | 3.73 | 0.74% | |
| Class NAV | Actual expenses/actual returns | 1,000.00 | 983.90 | 3.66 | 0.74% |
| Hypothetical example for comparison purposes | 1,000.00 | 1,021.20 | 3.73 | 0.74% | |
| 1 | Expenses are equal to the annualized expense ratio, multiplied by the average account value over the period, multiplied by 182/365 (to reflect the one-half year period). |
| Account value on 9-1-2017 | Ending value on 2-28-2018 | Expenses paid during period ended 2-28-20181 | Annualized expense ratio | ||
| Class A | Actual expenses/actual returns | $1,000.00 | $1,010.70 | $5.43 | 1.09% |
| Hypothetical example for comparison purposes | 1,000.00 | 1,019.40 | 5.46 | 1.09% | |
| Class B | Actual expenses/actual returns | 1,000.00 | 1,006.00 | 9.15 | 1.84% |
| Hypothetical example for comparison purposes | 1,000.00 | 1,015.70 | 9.20 | 1.84% | |
| Class C | Actual expenses/actual returns | 1,000.00 | 1,006.00 | 9.15 | 1.84% |
| Hypothetical example for comparison purposes | 1,000.00 | 1,015.70 | 9.20 | 1.84% | |
| Class I | Actual expenses/actual returns | 1,000.00 | 1,011.00 | 4.19 | 0.84% |
| Hypothetical example for comparison purposes | 1,000.00 | 1,020.60 | 4.21 | 0.84% | |
| Class R2 | Actual expenses/actual returns | 1,000.00 | 1,009.00 | 6.18 | 1.24% |
| Hypothetical example for comparison purposes | 1,000.00 | 1,018.60 | 6.21 | 1.24% | |
| Class R6 | Actual expenses/actual returns | 1,000.00 | 1,012.40 | 3.69 | 0.74% |
| Hypothetical example for comparison purposes | 1,000.00 | 1,021.10 | 3.71 | 0.74% | |
| Class NAV | Actual expenses/actual returns | 1,000.00 | 1,011.50 | 3.69 | 0.74% |
| Hypothetical example for comparison purposes | 1,000.00 | 1,021.10 | 3.71 | 0.74% | |
| 1 | Expenses are equal to the annualized expense ratio, multiplied by the average account value over the period, multiplied by 181/365 (to reflect the one-half year period). |
| Fund’s investments |
| Shares | Value | ||||
| Common stocks 97.8% | $2,281,123,766 | ||||
| (Cost $1,999,828,544) | |||||
| Australia 2.2% | 51,511,088 | ||||
| Commonwealth Bank of Australia (A) | 289,354 | 16,181,185 | |||
| Sonic Healthcare, Ltd. | 797,570 | 14,112,355 | |||
| Westpac Banking Corp. (A) | 957,928 | 21,217,548 | |||
| Canada 5.7% | 132,095,567 | ||||
| BCE, Inc. | 959,601 | 41,293,344 | |||
| Nutrien, Ltd. | 309,744 | 14,638,501 | |||
| Pembina Pipeline Corp. | 530,820 | 16,563,018 | |||
| Rogers Communications, Inc., Class B | 520,697 | 23,255,253 | |||
| Royal Bank of Canada (A) | 226,170 | 17,470,748 | |||
| TELUS Corp. | 537,516 | 18,874,703 | |||
| France 8.1% | 188,379,633 | ||||
| AXA SA | 1,375,703 | 36,570,365 | |||
| Cie Generale des Etablissements Michelin SCA | 129,895 | 19,230,031 | |||
| Sanofi | 216,061 | 17,336,771 | |||
| SCOR SE | 447,820 | 18,282,372 | |||
| TOTAL SA | 779,846 | 44,700,574 | |||
| Unibail-Rodamco SE | 139,258 | 31,809,847 | |||
| Vinci SA | 207,621 | 20,449,673 | |||
| Germany 8.6% | 200,678,052 | ||||
| Allianz SE | 142,067 | 32,115,301 | |||
| BASF SE | 259,104 | 26,277,670 | |||
| Daimler AG | 309,741 | 26,389,971 | |||
| Deutsche Post AG | 602,608 | 26,393,846 | |||
| Deutsche Telekom AG | 1,886,624 | 30,866,527 | |||
| Muenchener Rueckversicherungs-Gesellschaft AG | 183,145 | 42,588,848 | |||
| Siemens AG | 125,754 | 16,045,889 | |||
| Italy 3.4% | 78,100,439 | ||||
| Assicurazioni Generali SpA | 742,711 | 14,276,580 | |||
| Snam SpA | 5,488,468 | 25,229,459 | |||
| Terna Rete Elettrica Nazionale SpA | 6,604,223 | 38,594,400 | |||
| Netherlands 1.8% | 42,692,144 | ||||
| Royal Dutch Shell PLC, ADR, Class A | 669,051 | 42,692,144 | |||
| Norway 2.1% | 49,714,888 | ||||
| Orkla ASA | 2,092,251 | 22,548,173 | |||
| Statoil ASA | 1,147,826 | 27,166,715 | |||
| Singapore 1.2% | 27,061,436 | ||||
| Singapore Exchange, Ltd. | 2,352,151 | 13,278,901 | |||
| Singapore Telecommunications, Ltd. | 5,336,483 | 13,782,535 |
| SEE NOTES TO FINANCIAL STATEMENTS | ANNUAL REPORT | JOHN HANCOCK GLOBAL SHAREHOLDER YIELD FUND | 17 |
| Shares | Value | ||||
| Spain 1.7% | $40,294,053 | ||||
| Gas Natural SDG SA | 744,399 | 17,767,388 | |||
| Red Electrica Corp. SA | 1,091,279 | 22,526,665 | |||
| Sweden 0.7% | 17,145,517 | ||||
| Svenska Handelsbanken AB, A Shares (A) | 1,369,796 | 17,145,517 | |||
| Switzerland 3.9% | 90,630,608 | ||||
| Nestle SA | 282,736 | 22,347,886 | |||
| Novartis AG | 299,616 | 24,233,204 | |||
| Roche Holding AG | 98,746 | 22,652,049 | |||
| Swisscom AG (A) | 43,131 | 21,397,469 | |||
| Taiwan 0.6% | 14,699,334 | ||||
| Taiwan Semiconductor Manufacturing Company, Ltd., ADR | 335,908 | 14,699,334 | |||
| United Kingdom 15.0% | 349,719,990 | ||||
| AstraZeneca PLC, ADR (A) | 1,128,906 | 39,477,843 | |||
| BAE Systems PLC | 3,675,577 | 30,072,375 | |||
| British American Tobacco PLC | 499,642 | 28,882,674 | |||
| British American Tobacco PLC, ADR | 238,005 | 13,730,508 | |||
| Diageo PLC | 384,859 | 13,015,790 | |||
| GlaxoSmithKline PLC | 2,193,530 | 42,600,538 | |||
| Imperial Brands PLC | 1,071,867 | 36,496,455 | |||
| Lloyds Banking Group PLC | 21,243,918 | 19,324,001 | |||
| Micro Focus International PLC | 536,194 | 7,487,189 | |||
| National Grid PLC | 2,894,886 | 32,586,165 | |||
| SSE PLC | 1,023,760 | 18,365,536 | |||
| Unilever PLC | 440,562 | 24,434,637 | |||
| Vodafone Group PLC | 15,806,247 | 43,246,279 | |||
| United States 42.8% | 998,401,017 | ||||
| AbbVie, Inc. | 161,202 | 15,257,769 | |||
| Altria Group, Inc. | 642,634 | 40,048,951 | |||
| Ameren Corp. | 284,424 | 16,106,931 | |||
| American Electric Power Company, Inc. | 255,729 | 17,540,452 | |||
| Arthur J. Gallagher & Company | 200,025 | 13,747,718 | |||
| AT&T, Inc. | 1,105,627 | 39,415,604 | |||
| BlackRock, Inc. | 27,851 | 15,087,444 | |||
| CenturyLink, Inc. | 726,030 | 11,928,673 | |||
| Cisco Systems, Inc. | 730,051 | 31,311,887 | |||
| CME Group, Inc. | 84,391 | 13,649,400 | |||
| Dominion Energy, Inc. | 396,084 | 26,707,944 | |||
| DowDuPont, Inc. | 251,509 | 16,023,638 | |||
| Duke Energy Corp. | 471,790 | 36,549,571 | |||
| Eaton Corp. PLC | 259,104 | 20,705,001 | |||
| Emerson Electric Company | 253,078 | 17,285,227 | |||
| Entergy Corp. | 345,191 | 27,194,147 | |||
| Enterprise Products Partners LP (A) | 1,073,633 | 26,282,536 |
| 18 | JOHN HANCOCK GLOBAL SHAREHOLDER YIELD FUND | ANNUAL REPORT | SEE NOTES TO FINANCIAL STATEMENTS |
| Shares | Value | ||||
| United States (continued) | |||||
| Exxon Mobil Corp. | 314,808 | $23,487,825 | |||
| FirstEnergy Corp. | 510,765 | 17,371,118 | |||
| Intel Corp. | 383,171 | 19,955,546 | |||
| Iron Mountain, Inc. | 679,412 | 22,325,478 | |||
| Johnson & Johnson | 124,910 | 16,007,217 | |||
| Kimberly-Clark Corp. | 176,393 | 19,426,161 | |||
| Las Vegas Sands Corp. | 246,784 | 17,743,770 | |||
| Leggett & Platt, Inc. | 339,794 | 15,073,262 | |||
| Lockheed Martin Corp. | 52,327 | 17,682,863 | |||
| Magellan Midstream Partners LP (A) | 250,324 | 14,606,405 | |||
| McDonald's Corp. | 113,938 | 17,817,624 | |||
| Merck & Company, Inc. | 284,424 | 15,492,575 | |||
| MetLife, Inc. | 431,500 | 19,801,535 | |||
| Microsoft Corp. | 178,925 | 16,330,485 | |||
| Occidental Petroleum Corp. | 407,305 | 26,458,533 | |||
| People's United Financial, Inc. | 830,486 | 15,496,869 | |||
| PepsiCo, Inc. | 129,130 | 14,094,540 | |||
| Pfizer, Inc. | 890,409 | 31,600,615 | |||
| Philip Morris International, Inc. | 356,163 | 35,402,602 | |||
| PPL Corp. | 831,560 | 23,524,832 | |||
| Public Storage | 68,840 | 13,794,848 | |||
| QUALCOMM, Inc. | 294,552 | 16,321,126 | |||
| Texas Instruments, Inc. | 227,877 | 23,674,142 | |||
| The Coca-Cola Company | 286,956 | 12,462,499 | |||
| The Procter & Gamble Company | 199,181 | 15,791,070 | |||
| The Southern Company | 363,350 | 16,227,211 | |||
| United Parcel Service, Inc., Class B | 178,053 | 18,635,027 | |||
| Verizon Communications, Inc. | 843,005 | 40,312,499 | |||
| WEC Energy Group, Inc. | 261,636 | 16,404,577 | |||
| Wells Fargo & Company | 224,907 | 11,787,376 | |||
| Welltower, Inc. | 522,651 | 28,447,894 | |||
| Yield (%) | Shares | Value | |||
| Securities lending collateral 0.8% | $17,294,075 | ||||
| (Cost $17,300,537) | |||||
| John Hancock Collateral Trust (B) | 1.8276(C) | 1,729,540 | 17,294,075 | ||
| Total investments (Cost $2,017,129,081) 98.6% | $2,298,417,841 | ||||
| Other assets and liabilities, net 1.4% | 33,241,203 | ||||
| Total net assets 100.0% | $2,331,659,044 | ||||
| The percentage shown for each investment category is the total value of the category as a percentage of the net assets of the fund. | |
| Security Abbreviations and Legend | |
| ADR | American Depositary Receipt |
| (A) | A portion of this security is on loan as of 3-31-18. |
| (B) | Investment is an affiliate of the fund, the advisor and/or subadvisor. This security represents the investment of cash collateral received for securities lending. |
| SEE NOTES TO FINANCIAL STATEMENTS | ANNUAL REPORT | JOHN HANCOCK GLOBAL SHAREHOLDER YIELD FUND | 19 |
| (C) | The rate shown is the annualized seven-day yield as of 3-31-18. |
| 20 | JOHN HANCOCK GLOBAL SHAREHOLDER YIELD FUND | ANNUAL REPORT | SEE NOTES TO FINANCIAL STATEMENTS |
| Fund’s investments |
| Shares | Value | ||||
| Common stocks 97.9% | $2,313,768,657 | ||||
| (Cost $1,998,138,699) | |||||
| Australia 2.3% | 54,778,312 | ||||
| Commonwealth Bank of Australia (A) | 289,354 | 17,030,607 | |||
| Sonic Healthcare, Ltd. | 797,570 | 15,046,430 | |||
| Westpac Banking Corp. (A) | 957,928 | 22,701,275 | |||
| Canada 5.7% | 134,883,364 | ||||
| BCE, Inc. | 959,601 | 41,877,849 | |||
| Nutrien, Ltd. (B) | 309,744 | 15,254,892 | |||
| Pembina Pipeline Corp. | 530,820 | 17,067,981 | |||
| Rogers Communications, Inc., Class B | 520,697 | 23,462,204 | |||
| Royal Bank of Canada | 226,170 | 17,817,585 | |||
| TELUS Corp. | 537,516 | 19,402,853 | |||
| France 8.5% | 200,388,320 | ||||
| AXA SA | 1,375,703 | 43,085,843 | |||
| Cie Generale des Etablissements Michelin SCA | 156,138 | 23,999,205 | |||
| Sanofi | 216,061 | 17,058,035 | |||
| SCOR SE | 447,820 | 18,986,072 | |||
| TOTAL SA (A) | 779,846 | 44,356,797 | |||
| Unibail-Rodamco SE | 139,258 | 32,401,767 | |||
| Vinci SA | 207,621 | 20,500,601 | |||
| Germany 8.6% | 203,179,861 | ||||
| Allianz SE | 142,067 | 33,001,015 | |||
| BASF SE | 259,104 | 27,068,552 | |||
| Daimler AG | 359,539 | 30,699,907 | |||
| Deutsche Post AG | 602,608 | 27,491,804 | |||
| Deutsche Telekom AG | 1,710,768 | 27,486,448 | |||
| Muenchener Rueckversicherungs-Gesellschaft AG | 183,145 | 40,953,181 | |||
| Siemens AG | 125,754 | 16,478,954 | |||
| Italy 3.2% | 75,070,053 | ||||
| Assicurazioni Generali SpA | 742,711 | 13,894,174 | |||
| Snam SpA | 5,488,468 | 24,569,527 | |||
| Terna Rete Elettrica Nazionale SpA | 6,604,223 | 36,606,352 | |||
| Netherlands 1.8% | 42,330,857 | ||||
| Royal Dutch Shell PLC, ADR, Class A | 669,051 | 42,330,857 | |||
| Norway 2.1% | 49,066,168 | ||||
| Orkla ASA | 2,092,251 | 22,939,905 | |||
| Statoil ASA | 1,147,826 | 26,126,263 | |||
| Singapore 1.2% | 26,873,689 | ||||
| Singapore Exchange, Ltd. | 2,352,151 | 13,328,192 | |||
| Singapore Telecommunications, Ltd. | 5,336,483 | 13,545,497 |
| SEE NOTES TO FINANCIAL STATEMENTS | ANNUAL REPORT | JOHN HANCOCK GLOBAL SHAREHOLDER YIELD FUND | 21 |
| Shares | Value | ||||
| Spain 1.6% | $38,264,037 | ||||
| Gas Natural SDG SA | 744,399 | 17,031,163 | |||
| Red Electrica Corp. SA | 1,091,279 | 21,232,874 | |||
| Sweden 0.8% | 18,741,407 | ||||
| Svenska Handelsbanken AB, A Shares | 1,369,796 | 18,741,407 | |||
| Switzerland 4.3% | 102,166,896 | ||||
| Nestle SA | 282,736 | 22,463,676 | |||
| Novartis AG | 299,616 | 24,994,518 | |||
| Roche Holding AG | 98,746 | 22,808,351 | |||
| Swisscom AG | 59,079 | 31,900,351 | |||
| Taiwan 0.6% | 14,561,612 | ||||
| Taiwan Semiconductor Manufacturing Company, Ltd., ADR | 335,908 | 14,561,612 | |||
| United Kingdom 14.5% | 343,100,004 | ||||
| AstraZeneca PLC, ADR (A) | 1,128,906 | 37,468,390 | |||
| BAE Systems PLC | 3,675,577 | 29,173,089 | |||
| British American Tobacco PLC | 499,642 | 29,490,310 | |||
| British American Tobacco PLC, ADR | 238,005 | 14,056,575 | |||
| Diageo PLC | 384,859 | 13,058,575 | |||
| GlaxoSmithKline PLC | 2,193,530 | 39,338,448 | |||
| Imperial Brands PLC | 1,071,867 | 38,483,852 | |||
| Lloyds Banking Group PLC | 14,350,268 | 13,558,681 | |||
| Micro Focus International PLC | 536,194 | 15,128,719 | |||
| National Grid PLC | 2,894,886 | 29,297,664 | |||
| SSE PLC | 1,023,760 | 17,204,531 | |||
| Unilever PLC | 440,562 | 22,653,041 | |||
| Vodafone Group PLC | 15,806,247 | 44,188,129 | |||
| United States 42.7% | 1,010,364,077 | ||||
| AbbVie, Inc. | 161,202 | 18,672,028 | |||
| Altria Group, Inc. | 592,481 | 37,296,679 | |||
| Ameren Corp. | 284,424 | 15,444,223 | |||
| American Electric Power Company, Inc. | 255,729 | 16,770,708 | |||
| Arthur J. Gallagher & Company | 200,025 | 13,823,728 | |||
| AT&T, Inc. | 1,105,627 | 40,134,261 | |||
| BlackRock, Inc. | 27,851 | 15,302,175 | |||
| CenturyLink, Inc. | 590,793 | 10,439,312 | |||
| Cisco Systems, Inc. | 730,051 | 32,691,684 | |||
| CME Group, Inc. | 99,590 | 16,547,874 | |||
| Dominion Energy, Inc. | 396,084 | 29,337,942 | |||
| DowDuPont, Inc. | 251,509 | 17,681,083 | |||
| Duke Energy Corp. | 471,790 | 35,544,659 | |||
| Eaton Corp. PLC | 259,104 | 20,909,693 | |||
| Emerson Electric Company | 285,268 | 20,271,144 | |||
| Entergy Corp. | 345,191 | 26,172,382 | |||
| Enterprise Products Partners LP | 1,073,633 | 27,291,751 |
| 22 | JOHN HANCOCK GLOBAL SHAREHOLDER YIELD FUND | ANNUAL REPORT | SEE NOTES TO FINANCIAL STATEMENTS |
| Shares | Value | ||||
| United States (continued) | |||||
| Exxon Mobil Corp. | 314,808 | $23,843,558 | |||
| FirstEnergy Corp. | 510,765 | 16,513,032 | |||
| Intel Corp. | 383,171 | 18,886,499 | |||
| Iron Mountain, Inc. | 679,412 | 21,374,302 | |||
| Johnson & Johnson | 124,910 | 16,223,311 | |||
| Kimberly-Clark Corp. | 176,393 | 19,565,512 | |||
| Las Vegas Sands Corp. | 207,935 | 15,139,747 | |||
| Lockheed Martin Corp. | 52,327 | 18,442,128 | |||
| Magellan Midstream Partners LP (A) | 250,324 | 15,635,237 | |||
| McDonald's Corp. | 113,938 | 17,972,580 | |||
| Merck & Company, Inc. | 284,424 | 15,421,469 | |||
| MetLife, Inc. | 300,460 | 13,878,247 | |||
| Microsoft Corp. | 178,925 | 16,777,797 | |||
| Occidental Petroleum Corp. | 407,305 | 26,719,208 | |||
| People's United Financial, Inc. | 830,486 | 15,895,502 | |||
| PepsiCo, Inc. | 129,130 | 14,169,435 | |||
| Pfizer, Inc. | 890,409 | 32,330,751 | |||
| Philip Morris International, Inc. | 356,163 | 36,880,679 | |||
| PPL Corp. | 1,229,693 | 35,230,704 | |||
| Public Storage | 68,840 | 13,385,250 | |||
| QUALCOMM, Inc. | 294,552 | 19,145,880 | |||
| Texas Instruments, Inc. | 227,877 | 24,690,473 | |||
| The Coca-Cola Company | 286,956 | 12,402,238 | |||
| The Procter & Gamble Company | 199,181 | 15,639,692 | |||
| The Southern Company | 363,350 | 15,645,851 | |||
| United Parcel Service, Inc., Class B | 202,557 | 21,148,976 | |||
| Verizon Communications, Inc. | 843,005 | 40,245,059 | |||
| WEC Energy Group, Inc. | 261,636 | 15,677,229 | |||
| Wells Fargo & Company | 286,112 | 16,711,802 | |||
| Welltower, Inc. | 579,821 | 30,440,603 | |||
| Yield (%) | Shares | Value | |||
| Securities lending collateral 1.4% | $34,478,946 | ||||
| (Cost $34,478,697) | |||||
| John Hancock Collateral Trust (C) | 1.5822(D) | 3,446,663 | 34,478,946 | ||
| Total investments (Cost $2,032,617,396) 99.3% | $2,348,247,603 | ||||
| Other assets and liabilities, net 0.7% | 16,126,627 | ||||
| Total net assets 100.0% | $2,364,374,230 | ||||
| The percentage shown for each investment category is the total value of the category as a percentage of the net assets of the fund. | |
| Security Abbreviations and Legend | |
| ADR | American Depositary Receipt |
| (A) | A portion of this security is on loan as of 2-28-18. |
| (B) | Non-income producing security. |
| (C) | Investment is an affiliate of the fund, the advisor and/or subadvisor. This security represents the investment of cash collateral received for securities lending. |
| SEE NOTES TO FINANCIAL STATEMENTS | ANNUAL REPORT | JOHN HANCOCK GLOBAL SHAREHOLDER YIELD FUND | 23 |
| (D) | The rate shown is the annualized seven-day yield as of 2-28-18. |
| 24 | JOHN HANCOCK GLOBAL SHAREHOLDER YIELD FUND | ANNUAL REPORT | SEE NOTES TO FINANCIAL STATEMENTS |
Financial statements
STATEMENTS OF ASSETS AND LIABILITIES
| 3-31-181 | 2-28-18 | ||||||||||||||||||||||||||||||||||||||||||||
| Assets | |||||||||||||||||||||||||||||||||||||||||||||
| Unaffiliated investments, at value | $2,281,123,766 | $2,313,768,657 | |||||||||||||||||||||||||||||||||||||||||||
| Affiliated investments, at value | 17,294,075 | 34,478,946 | |||||||||||||||||||||||||||||||||||||||||||
| Total investments, at value | 2,298,417,841 | 2,348,247,603 | |||||||||||||||||||||||||||||||||||||||||||
| Cash | 41,547,767 | 39,413,411 | |||||||||||||||||||||||||||||||||||||||||||
| Foreign currency, at value | 814,280 | 104,449 | |||||||||||||||||||||||||||||||||||||||||||
| Receivable for fund shares sold | 3,008,572 | 3,747,125 | |||||||||||||||||||||||||||||||||||||||||||
| Dividends and interest receivable | 7,909,483 | 10,834,889 | |||||||||||||||||||||||||||||||||||||||||||
| Receivable for securities lending income | 190,767 | 56,806 | |||||||||||||||||||||||||||||||||||||||||||
| Receivable due from advisor | 73,738 | — | |||||||||||||||||||||||||||||||||||||||||||
| Other receivables and prepaid expenses | 201,686 | 171,082 | |||||||||||||||||||||||||||||||||||||||||||
| Total assets | 2,352,164,134 | 2,402,575,365 | |||||||||||||||||||||||||||||||||||||||||||
| Liabilities | |||||||||||||||||||||||||||||||||||||||||||||
| Payable for fund shares repurchased | 2,501,758 | 3,165,724 | |||||||||||||||||||||||||||||||||||||||||||
| Payable upon return of securities loaned | 17,349,785 | 34,521,947 | |||||||||||||||||||||||||||||||||||||||||||
| Payable to affiliates | |||||||||||||||||||||||||||||||||||||||||||||
| Accounting and legal services fees | 123,000 | 79,383 | |||||||||||||||||||||||||||||||||||||||||||
| Transfer agent fees | 131,857 | 122,295 | |||||||||||||||||||||||||||||||||||||||||||
| Distribution and service fees | 207 | 252 | |||||||||||||||||||||||||||||||||||||||||||
| Trustees' fees | 1,715 | 3,311 | |||||||||||||||||||||||||||||||||||||||||||
| Investment management fees | — | 9,863 | |||||||||||||||||||||||||||||||||||||||||||
| Other liabilities and accrued expenses | 396,768 | 298,360 | |||||||||||||||||||||||||||||||||||||||||||
| Total liabilities | 20,505,090 | 38,201,135 | |||||||||||||||||||||||||||||||||||||||||||
| Net assets | $2,331,659,044 | $2,364,374,230 | |||||||||||||||||||||||||||||||||||||||||||
| Net assets consist of | |||||||||||||||||||||||||||||||||||||||||||||
| Paid-in capital | $2,018,509,912 | $2,016,204,066 | |||||||||||||||||||||||||||||||||||||||||||
| Undistributed net investment income | 2,015,467 | 6,274,718 | |||||||||||||||||||||||||||||||||||||||||||
| Accumulated net realized gain (loss) on investments and foreign currency transactions | 29,713,302 | 26,145,970 | |||||||||||||||||||||||||||||||||||||||||||
| Net unrealized appreciation (depreciation) on investments and translation of assets and liabilities in foreign currencies | 281,420,363 | 315,749,476 | |||||||||||||||||||||||||||||||||||||||||||
| Net assets | $2,331,659,044 | $2,364,374,230 | |||||||||||||||||||||||||||||||||||||||||||
| Unaffiliated investments, at cost | $1,999,828,544 | $1,998,138,699 | |||||||||||||||||||||||||||||||||||||||||||
| Affiliated investments, at cost | $17,300,537 | $34,478,697 | |||||||||||||||||||||||||||||||||||||||||||
| Foreign currency, at cost | $814,310 | $104,936 | |||||||||||||||||||||||||||||||||||||||||||
| Securities loaned, unaffiliated investments, at value | $16,767,009 | $33,541,828 | |||||||||||||||||||||||||||||||||||||||||||
STATEMENTS OF ASSETS AND LIABILITIES (continued)
| Net asset value per share | |||||||||||||||||||||||||||
| Based on net asset value and shares outstanding - The fund has an unlimited number of shares authorized with no par value | |||||||||||||||||||||||||||
| Class A2 | |||||||||||||||||||||||||||
| Net assets | $347,834,155 | $355,009,122 | |||||||||||||||||||||||||
| Shares outstanding | 31,221,667 | 31,401,414 | |||||||||||||||||||||||||
| Net asset value and redemption price per share | $11.14 | $11.31 | |||||||||||||||||||||||||
| Class B2 | |||||||||||||||||||||||||||
| Net assets | $6,722,832 | $7,039,466 | |||||||||||||||||||||||||
| Shares outstanding | 602,774 | 622,793 | |||||||||||||||||||||||||
| Net asset value, offering price and redemption price per share | $11.15 | $11.30 | |||||||||||||||||||||||||
| Class C2 | |||||||||||||||||||||||||||
| Net assets | $106,671,073 | $110,217,943 | |||||||||||||||||||||||||
| Shares outstanding | 9,559,699 | 9,746,544 | |||||||||||||||||||||||||
| Net asset value, offering price and redemption price per share | $11.16 | $11.31 | |||||||||||||||||||||||||
| Class I | |||||||||||||||||||||||||||
| Net assets | $881,307,599 | $894,385,084 | |||||||||||||||||||||||||
| Shares outstanding | 78,829,220 | 78,800,231 | |||||||||||||||||||||||||
| Net asset value, offering price and redemption price per share | $11.18 | $11.35 | |||||||||||||||||||||||||
| Class R2 | |||||||||||||||||||||||||||
| Net assets | $1,153,899 | $1,138,649 | |||||||||||||||||||||||||
| Shares outstanding | 103,142 | 100,326 | |||||||||||||||||||||||||
| Net asset value, offering price and redemption price per share | $11.19 | $11.35 | |||||||||||||||||||||||||
| Class R6 | |||||||||||||||||||||||||||
| Net assets | $477,011,022 | $482,877,199 | |||||||||||||||||||||||||
| Shares outstanding | 42,724,036 | 42,593,522 | |||||||||||||||||||||||||
| Net asset value, offering price and redemption price per share | $11.16 | $11.34 | |||||||||||||||||||||||||
| Class NAV | |||||||||||||||||||||||||||
| Net assets | $510,958,464 | $513,706,767 | |||||||||||||||||||||||||
| Shares outstanding | 45,736,662 | 45,285,506 | |||||||||||||||||||||||||
| Net asset value, offering price and redemption price per share | $11.17 | $11.34 | |||||||||||||||||||||||||
| Maximum offering price per share | |||||||||||||||||||||||||||
| Class A (net assets value per share ÷ 95%)3 | $11.73 | $11.91 | |||||||||||||||||||||||||
| 1 | The fund changed its fiscal year end from February 28 to March 31. | |||||||||||||||||||||||||
| 2 | Redemption price per share is equal to net asset value less any applicable contingent deferred sales charge. | |||||||||||||||||||||||||
| 3 | On single retail sales of less than $50,000. On sales of $50,000 or more and on group sales the offering price is reduced. | |||||||||||||||||||||||||
STATEMENTS OF OPERATIONS
| Period ended 3-31-181 | Year ended 2-28-18 | ||||||||||||||||||||||||||||||||||||||||||||||||||||||||
| Investment income | |||||||||||||||||||||||||||||||||||||||||||||||||||||||||
| Dividends | $10,255,383 | $97,733,621 | |||||||||||||||||||||||||||||||||||||||||||||||||||||||
| Securities lending | 212,382 | 1,180,571 | |||||||||||||||||||||||||||||||||||||||||||||||||||||||
| Interest | 32,304 | 540,784 | |||||||||||||||||||||||||||||||||||||||||||||||||||||||
| Less foreign taxes withheld | (787,609 | ) | (5,029,781 | ) | |||||||||||||||||||||||||||||||||||||||||||||||||||||
| Total investment income | 9,712,460 | 94,425,195 | |||||||||||||||||||||||||||||||||||||||||||||||||||||||
| Expenses | |||||||||||||||||||||||||||||||||||||||||||||||||||||||||
| Investment management fees | 1,595,991 | 19,314,935 | |||||||||||||||||||||||||||||||||||||||||||||||||||||||
| Distribution and service fees | 188,078 | 2,452,232 | |||||||||||||||||||||||||||||||||||||||||||||||||||||||
| Accounting and legal services fees | 44,004 | 366,406 | |||||||||||||||||||||||||||||||||||||||||||||||||||||||
| Transfer agent fees | 143,295 | 1,876,153 | |||||||||||||||||||||||||||||||||||||||||||||||||||||||
| Trustees' fees | 2,622 | 40,198 | |||||||||||||||||||||||||||||||||||||||||||||||||||||||
| State registration fees | 8,798 | 212,564 | |||||||||||||||||||||||||||||||||||||||||||||||||||||||
| Printing and postage | 24,287 | 215,593 | |||||||||||||||||||||||||||||||||||||||||||||||||||||||
| Professional fees | 12,022 | 73,777 | |||||||||||||||||||||||||||||||||||||||||||||||||||||||
| Custodian fees | 64,601 | 538,889 | |||||||||||||||||||||||||||||||||||||||||||||||||||||||
| Other | 1,926 | 58,657 | |||||||||||||||||||||||||||||||||||||||||||||||||||||||
| Total expenses | 2,085,624 | 25,149,404 | |||||||||||||||||||||||||||||||||||||||||||||||||||||||
| Less expense reductions | (321,025 | ) | (3,294,333 | ) | |||||||||||||||||||||||||||||||||||||||||||||||||||||
| Net expenses | 1,764,599 | 21,855,071 | |||||||||||||||||||||||||||||||||||||||||||||||||||||||
| Net investment income | 7,947,861 | 72,570,124 | |||||||||||||||||||||||||||||||||||||||||||||||||||||||
| Realized and unrealized gain (loss) | |||||||||||||||||||||||||||||||||||||||||||||||||||||||||
| Net realized gain (loss) on | |||||||||||||||||||||||||||||||||||||||||||||||||||||||||
| Unaffiliated investments and foreign currency transactions | 3,584,051 | 127,584,453 | |||||||||||||||||||||||||||||||||||||||||||||||||||||||
| Affiliated investments | (5,998 | ) | (36,580 | ) | |||||||||||||||||||||||||||||||||||||||||||||||||||||
| 3,578,053 | 127,547,873 | ||||||||||||||||||||||||||||||||||||||||||||||||||||||||
| Change in net unrealized appreciation (depreciation) of | |||||||||||||||||||||||||||||||||||||||||||||||||||||||||
| Unaffiliated investments and translation of assets and liabilities in foreign currencies | (34,322,402 | ) | (15,036,985 | ) | |||||||||||||||||||||||||||||||||||||||||||||||||||||
| Affiliated investments | (6,711 | ) | (5,852 | ) | |||||||||||||||||||||||||||||||||||||||||||||||||||||
| (34,329,113 | ) | (15,042,837 | ) | ||||||||||||||||||||||||||||||||||||||||||||||||||||||
| Net realized and unrealized gain (loss) | (30,751,060 | ) | 112,505,036 | ||||||||||||||||||||||||||||||||||||||||||||||||||||||
| Increase (decrease) in net assets from operations | ($22,803,199 | ) | $185,075,160 | ||||||||||||||||||||||||||||||||||||||||||||||||||||||
| 1 | For the one-month period ended 3-31-18. The fund changed its fiscal year end from February 28 to March 31. | ||||||||||||||||||||||||||||||||||
STATEMENTS OF CHANGES IN NET ASSETS
| Period ended 3-31-181 | Year ended 2-28-18 | Year ended 2-28-17 | |||||||||||||||||||||||||||||||||||||||||||||||||||||||||||||||||||
| Increase (decrease) in net assets | |||||||||||||||||||||||||||||||||||||||||||||||||||||||||||||||||||||
| From operations | |||||||||||||||||||||||||||||||||||||||||||||||||||||||||||||||||||||
| Net investment income | $7,947,861 | $72,570,124 | $61,460,505 | ||||||||||||||||||||||||||||||||||||||||||||||||||||||||||||||||||
| Net realized gain | 3,578,053 | 127,547,873 | 11,490,466 | ||||||||||||||||||||||||||||||||||||||||||||||||||||||||||||||||||
| Change in net unrealized appreciation (depreciation) | (34,329,113 | ) | (15,042,837 | ) | 186,838,768 | ||||||||||||||||||||||||||||||||||||||||||||||||||||||||||||||||
| Increase (decrease) in net assets resulting from operations | (22,803,199 | ) | 185,075,160 | 259,789,739 | |||||||||||||||||||||||||||||||||||||||||||||||||||||||||||||||||
| Distributions to shareholders | |||||||||||||||||||||||||||||||||||||||||||||||||||||||||||||||||||||
| From net investment income | |||||||||||||||||||||||||||||||||||||||||||||||||||||||||||||||||||||
| Class A | (1,642,129 | ) | (10,646,620 | ) | (14,191,542 | ) | |||||||||||||||||||||||||||||||||||||||||||||||||||||||||||||||
| Class B | (18,828 | ) | (193,095 | ) | (261,696 | ) | |||||||||||||||||||||||||||||||||||||||||||||||||||||||||||||||
| Class C | (298,338 | ) | (2,491,298 | ) | (2,974,793 | ) | |||||||||||||||||||||||||||||||||||||||||||||||||||||||||||||||
| Class I | (4,719,273 | ) | (37,696,763 | ) | (29,470,689 | ) | |||||||||||||||||||||||||||||||||||||||||||||||||||||||||||||||
| Class R2 | (4,972 | ) | (31,069 | ) | (27,249 | ) | |||||||||||||||||||||||||||||||||||||||||||||||||||||||||||||||
| Class R6 | (2,671,430 | ) | (3,176,809 | ) | (34,696 | ) | |||||||||||||||||||||||||||||||||||||||||||||||||||||||||||||||
| Class NAV | (2,862,863 | ) | (16,626,561 | ) | (18,198,344 | ) | |||||||||||||||||||||||||||||||||||||||||||||||||||||||||||||||
| Total distributions | (12,217,833 | ) | (70,862,215 | ) | (65,159,009 | ) | |||||||||||||||||||||||||||||||||||||||||||||||||||||||||||||||
| From fund share transactions | 2,305,846 | (49,203,839 | ) | (22,649,680 | ) | ||||||||||||||||||||||||||||||||||||||||||||||||||||||||||||||||
| Total increase (decrease) | (32,715,186 | ) | 65,009,106 | 171,981,050 | |||||||||||||||||||||||||||||||||||||||||||||||||||||||||||||||||
| Net assets | |||||||||||||||||||||||||||||||||||||||||||||||||||||||||||||||||||||
| Beginning of period | 2,364,374,230 | 2,299,365,124 | 2,127,384,074 | ||||||||||||||||||||||||||||||||||||||||||||||||||||||||||||||||||
| End of period | $2,331,659,044 | $2,364,374,230 | $2,299,365,124 | ||||||||||||||||||||||||||||||||||||||||||||||||||||||||||||||||||
| Undistributed net investment income | $2,015,467 | $6,274,718 | $5,749,239 | ||||||||||||||||||||||||||||||||||||||||||||||||||||||||||||||||||
| 1 | For the one-month period ended 3-31-18. The fund changed its fiscal year end from February 28 to March 31. | |||||||||||||||||||||||||||||||||||||||||||||||||||||||||||||||||||||||||
Financial highlights
| Class A Shares Period ended | 3-31-18 | 1 | 2-28-18 | 2-28-17 | 2-29-16 | 2-28-15 | 2-28-14 | |||||||||||||||||||||||||||||||||||||||||||||||||||||||||||||||||||||||||||||||||||||||||||||||||||||||||||||||
| Per share operating performance | ||||||||||||||||||||||||||||||||||||||||||||||||||||||||||||||||||||||||||||||||||||||||||||||||||||||||||||||||||||||
| Net asset value, beginning of period | $11.31 | $10.78 | $9.89 | $11.78 | $11.74 | $10.46 | ||||||||||||||||||||||||||||||||||||||||||||||||||||||||||||||||||||||||||||||||||||||||||||||||||||||||||||||||
| Net investment income2 | 0.04 | 0.32 | 0.27 | 0.33 | 0.36 | 0.45 | 3 | |||||||||||||||||||||||||||||||||||||||||||||||||||||||||||||||||||||||||||||||||||||||||||||||||||||||||||||||
| Net realized and unrealized gain (loss) on investments | (0.16 | ) | 0.53 | 0.92 | (1.42 | ) | 0.55 | 1.57 | ||||||||||||||||||||||||||||||||||||||||||||||||||||||||||||||||||||||||||||||||||||||||||||||||||||||||||||||
| Total from investment operations | (0.12 | ) | 0.85 | 1.19 | (1.09 | ) | 0.91 | 2.02 | ||||||||||||||||||||||||||||||||||||||||||||||||||||||||||||||||||||||||||||||||||||||||||||||||||||||||||||||
| Less distributions | ||||||||||||||||||||||||||||||||||||||||||||||||||||||||||||||||||||||||||||||||||||||||||||||||||||||||||||||||||||||
| From net investment income | (0.05 | ) | (0.32 | ) | (0.30 | ) | (0.32 | ) | (0.44 | ) | (0.31 | ) | ||||||||||||||||||||||||||||||||||||||||||||||||||||||||||||||||||||||||||||||||||||||||||||||||||||||||||
| From net realized gain | — | — | — | (0.48 | ) | (0.43 | ) | (0.43 | ) | |||||||||||||||||||||||||||||||||||||||||||||||||||||||||||||||||||||||||||||||||||||||||||||||||||||||||||||
| Total distributions | (0.05 | ) | (0.32 | ) | (0.30 | ) | (0.80 | ) | (0.87 | ) | (0.74 | ) | ||||||||||||||||||||||||||||||||||||||||||||||||||||||||||||||||||||||||||||||||||||||||||||||||||||||||||
| Net asset value, end of period | $11.14 | $11.31 | $10.78 | $9.89 | $11.78 | $11.74 | ||||||||||||||||||||||||||||||||||||||||||||||||||||||||||||||||||||||||||||||||||||||||||||||||||||||||||||||||
| Total return (%)4,5 | (1.03 | ) 6 | 7.87 | 12.21 | (9.38 | ) | 8.10 | 19.85 | ||||||||||||||||||||||||||||||||||||||||||||||||||||||||||||||||||||||||||||||||||||||||||||||||||||||||||||||
| Ratios and supplemental data | ||||||||||||||||||||||||||||||||||||||||||||||||||||||||||||||||||||||||||||||||||||||||||||||||||||||||||||||||||||||
| Net assets, end of period (in millions) | $348 | $355 | $381 | $470 | $580 | $553 | ||||||||||||||||||||||||||||||||||||||||||||||||||||||||||||||||||||||||||||||||||||||||||||||||||||||||||||||||
| Ratios (as a percentage of average net assets): | ||||||||||||||||||||||||||||||||||||||||||||||||||||||||||||||||||||||||||||||||||||||||||||||||||||||||||||||||||||||
| Expenses before reductions | �� | 1.30 | 7 | 1.27 | 1.29 | 1.29 | 1.33 | 1.34 | ||||||||||||||||||||||||||||||||||||||||||||||||||||||||||||||||||||||||||||||||||||||||||||||||||||||||||||||
| Expenses including reductions | 1.09 | 7 | 1.09 | 1.26 | 1.28 | 1.32 | 1.34 | |||||||||||||||||||||||||||||||||||||||||||||||||||||||||||||||||||||||||||||||||||||||||||||||||||||||||||||||
| Net investment income | 3.78 | 7 | 2.85 | 2.62 | 3.03 | 2.99 | 4.01 | 3 | ||||||||||||||||||||||||||||||||||||||||||||||||||||||||||||||||||||||||||||||||||||||||||||||||||||||||||||||
| Portfolio turnover (%) | 2 | 19 | 25 | 33 | 23 | 40 | ||||||||||||||||||||||||||||||||||||||||||||||||||||||||||||||||||||||||||||||||||||||||||||||||||||||||||||||||
| 1 | For the one-month period ended 3-31-18. The fund changed its fiscal year end from February 28 to March 31. | ||||||||||||||||||||||||||||||||||||||||||||||||||||||||||||||||||||||||||||||||||
| 2 | Based on average daily shares outstanding. | ||||||||||||||||||||||||||||||||||||||||||||||||||||||||||||||||||||||||||||||||||
| 3 | Net investment income per share and the percentage of average net assets reflect special dividends received by the fund, which amounted to $0.08 and 0.72%. | ||||||||||||||||||||||||||||||||||||||||||||||||||||||||||||||||||||||||||||||||||
| 4 | Does not reflect the effect of sales charges, if any. | ||||||||||||||||||||||||||||||||||||||||||||||||||||||||||||||||||||||||||||||||||
| 5 | Total returns would have been lower had certain expenses not been reduced during the applicable periods. | ||||||||||||||||||||||||||||||||||||||||||||||||||||||||||||||||||||||||||||||||||
| 6 | Not annualized. | ||||||||||||||||||||||||||||||||||||||||||||||||||||||||||||||||||||||||||||||||||
| 7 | Annualized. | ||||||||||||||||||||||||||||||||||||||||||||||||||||||||||||||||||||||||||||||||||
| Class B Shares Period ended | 3-31-18 | 1 | 2-28-18 | 2-28-17 | 2-29-16 | 2-28-15 | 2-28-14 | |||||||||||||||||||||||||||||||||||||||||||||||||||||||||||||||||||||||||||||||||||||||||||||||||||||||||||||||
| Per share operating performance | ||||||||||||||||||||||||||||||||||||||||||||||||||||||||||||||||||||||||||||||||||||||||||||||||||||||||||||||||||||||
| Net asset value, beginning of period | $11.30 | $10.78 | $9.89 | $11.78 | $11.74 | $10.46 | ||||||||||||||||||||||||||||||||||||||||||||||||||||||||||||||||||||||||||||||||||||||||||||||||||||||||||||||||
| Net investment income2 | 0.03 | 0.25 | 0.20 | 0.25 | 0.27 | 0.35 | 3 | |||||||||||||||||||||||||||||||||||||||||||||||||||||||||||||||||||||||||||||||||||||||||||||||||||||||||||||||
| Net realized and unrealized gain (loss) on investments | (0.15 | ) | 0.50 | 0.92 | (1.42 | ) | 0.55 | 1.58 | ||||||||||||||||||||||||||||||||||||||||||||||||||||||||||||||||||||||||||||||||||||||||||||||||||||||||||||||
| Total from investment operations | (0.12 | ) | 0.75 | 1.12 | (1.17 | ) | 0.82 | 1.93 | ||||||||||||||||||||||||||||||||||||||||||||||||||||||||||||||||||||||||||||||||||||||||||||||||||||||||||||||
| Less distributions | ||||||||||||||||||||||||||||||||||||||||||||||||||||||||||||||||||||||||||||||||||||||||||||||||||||||||||||||||||||||
| From net investment income | (0.03 | ) | (0.23 | ) | (0.23 | ) | (0.24 | ) | (0.35 | ) | (0.22 | ) | ||||||||||||||||||||||||||||||||||||||||||||||||||||||||||||||||||||||||||||||||||||||||||||||||||||||||||
| From net realized gain | — | — | — | (0.48 | ) | (0.43 | ) | (0.43 | ) | |||||||||||||||||||||||||||||||||||||||||||||||||||||||||||||||||||||||||||||||||||||||||||||||||||||||||||||
| Total distributions | (0.03 | ) | (0.23 | ) | (0.23 | ) | (0.72 | ) | (0.78 | ) | (0.65 | ) | ||||||||||||||||||||||||||||||||||||||||||||||||||||||||||||||||||||||||||||||||||||||||||||||||||||||||||
| Net asset value, end of period | $11.15 | $11.30 | $10.78 | $9.89 | $11.78 | $11.74 | ||||||||||||||||||||||||||||||||||||||||||||||||||||||||||||||||||||||||||||||||||||||||||||||||||||||||||||||||
| Total return (%)4,5 | (1.05 | ) 6 | 6.98 | 11.42 | (10.10 | ) | 7.26 | 18.95 | ||||||||||||||||||||||||||||||||||||||||||||||||||||||||||||||||||||||||||||||||||||||||||||||||||||||||||||||
| Ratios and supplemental data | ||||||||||||||||||||||||||||||||||||||||||||||||||||||||||||||||||||||||||||||||||||||||||||||||||||||||||||||||||||||
| Net assets, end of period (in millions) | $7 | $7 | $11 | $12 | $17 | $17 | ||||||||||||||||||||||||||||||||||||||||||||||||||||||||||||||||||||||||||||||||||||||||||||||||||||||||||||||||
| Ratios (as a percentage of average net assets): | ||||||||||||||||||||||||||||||||||||||||||||||||||||||||||||||||||||||||||||||||||||||||||||||||||||||||||||||||||||||
| Expenses before reductions | 2.00 | 7 | 1.97 | 1.99 | 2.02 | 2.10 | 2.15 | |||||||||||||||||||||||||||||||||||||||||||||||||||||||||||||||||||||||||||||||||||||||||||||||||||||||||||||||
| Expenses including reductions | 1.84 | 7 | 1.84 | 1.97 | 2.02 | 2.10 | 2.12 | |||||||||||||||||||||||||||||||||||||||||||||||||||||||||||||||||||||||||||||||||||||||||||||||||||||||||||||||
| Net investment income | 3.03 | 7 | 2.19 | 1.94 | 2.31 | 2.24 | 3.11 | 3 | ||||||||||||||||||||||||||||||||||||||||||||||||||||||||||||||||||||||||||||||||||||||||||||||||||||||||||||||
| Portfolio turnover (%) | 2 | 19 | 25 | 33 | 23 | 40 | ||||||||||||||||||||||||||||||||||||||||||||||||||||||||||||||||||||||||||||||||||||||||||||||||||||||||||||||||
| 1 | For the one-month period ended 3-31-18. The fund changed its fiscal year end from February 28 to March 31. | ||||||||||||||||||||||||||||||||||||||||||||||||||||||||||||||||||||||||||||||||||
| 2 | Based on average daily shares outstanding. | ||||||||||||||||||||||||||||||||||||||||||||||||||||||||||||||||||||||||||||||||||
| 3 | Net investment income per share and the percentage of average net assets reflect special dividends received by the fund, which amounted to $0.08 and 0.72%. | ||||||||||||||||||||||||||||||||||||||||||||||||||||||||||||||||||||||||||||||||||
| 4 | Does not reflect the effect of sales charges, if any. | ||||||||||||||||||||||||||||||||||||||||||||||||||||||||||||||||||||||||||||||||||
| 5 | Total returns would have been lower had certain expenses not been reduced during the applicable periods. | ||||||||||||||||||||||||||||||||||||||||||||||||||||||||||||||||||||||||||||||||||
| 6 | Not annualized. | ||||||||||||||||||||||||||||||||||||||||||||||||||||||||||||||||||||||||||||||||||
| 7 | Annualized. | ||||||||||||||||||||||||||||||||||||||||||||||||||||||||||||||||||||||||||||||||||
| Class C Shares Period ended | 3-31-18 | 1 | 2-28-18 | 2-28-17 | 2-29-16 | 2-28-15 | 2-28-14 | |||||||||||||||||||||||||||||||||||||||||||||||||||||||||||||||||||||||||||||||||||||||||||||||||||||||||||||||
| Per share operating performance | ||||||||||||||||||||||||||||||||||||||||||||||||||||||||||||||||||||||||||||||||||||||||||||||||||||||||||||||||||||||
| Net asset value, beginning of period | $11.31 | $10.78 | $9.90 | $11.79 | $11.74 | $10.46 | ||||||||||||||||||||||||||||||||||||||||||||||||||||||||||||||||||||||||||||||||||||||||||||||||||||||||||||||||
| Net investment income2 | 0.03 | 0.24 | 0.20 | 0.25 | 0.27 | 0.36 | 3 | |||||||||||||||||||||||||||||||||||||||||||||||||||||||||||||||||||||||||||||||||||||||||||||||||||||||||||||||
| Net realized and unrealized gain (loss) on investments | (0.15 | ) | 0.52 | 0.91 | (1.41 | ) | 0.56 | 1.58 | ||||||||||||||||||||||||||||||||||||||||||||||||||||||||||||||||||||||||||||||||||||||||||||||||||||||||||||||
| Total from investment operations | (0.12 | ) | 0.76 | 1.11 | (1.16 | ) | 0.83 | 1.94 | ||||||||||||||||||||||||||||||||||||||||||||||||||||||||||||||||||||||||||||||||||||||||||||||||||||||||||||||
| Less distributions | ||||||||||||||||||||||||||||||||||||||||||||||||||||||||||||||||||||||||||||||||||||||||||||||||||||||||||||||||||||||
| From net investment income | (0.03 | ) | (0.23 | ) | (0.23 | ) | (0.25 | ) | (0.35 | ) | (0.23 | ) | ||||||||||||||||||||||||||||||||||||||||||||||||||||||||||||||||||||||||||||||||||||||||||||||||||||||||||
| From net realized gain | — | — | — | (0.48 | ) | (0.43 | ) | (0.43 | ) | |||||||||||||||||||||||||||||||||||||||||||||||||||||||||||||||||||||||||||||||||||||||||||||||||||||||||||||
| Total distributions | (0.03 | ) | (0.23 | ) | (0.23 | ) | (0.73 | ) | (0.78 | ) | (0.66 | ) | ||||||||||||||||||||||||||||||||||||||||||||||||||||||||||||||||||||||||||||||||||||||||||||||||||||||||||
| Net asset value, end of period | $11.16 | $11.31 | $10.78 | $9.90 | $11.79 | $11.74 | ||||||||||||||||||||||||||||||||||||||||||||||||||||||||||||||||||||||||||||||||||||||||||||||||||||||||||||||||
| Total return (%)4,5 | (1.05 | ) 6 | 6.98 | 11.41 | (10.02 | ) | 7.42 | 18.97 | ||||||||||||||||||||||||||||||||||||||||||||||||||||||||||||||||||||||||||||||||||||||||||||||||||||||||||||||
| Ratios and supplemental data | ||||||||||||||||||||||||||||||||||||||||||||||||||||||||||||||||||||||||||||||||||||||||||||||||||||||||||||||||||||||
| Net assets, end of period (in millions) | $107 | $110 | $126 | $133 | $168 | $127 | ||||||||||||||||||||||||||||||||||||||||||||||||||||||||||||||||||||||||||||||||||||||||||||||||||||||||||||||||
| Ratios (as a percentage of average net assets): | ||||||||||||||||||||||||||||||||||||||||||||||||||||||||||||||||||||||||||||||||||||||||||||||||||||||||||||||||||||||
| Expenses before reductions | 2.00 | 7 | 1.97 | 1.99 | 1.99 | 2.03 | 2.05 | |||||||||||||||||||||||||||||||||||||||||||||||||||||||||||||||||||||||||||||||||||||||||||||||||||||||||||||||
| Expenses including reductions | 1.84 | 7 | 1.84 | 1.97 | 1.98 | 2.02 | 2.05 | |||||||||||||||||||||||||||||||||||||||||||||||||||||||||||||||||||||||||||||||||||||||||||||||||||||||||||||||
| Net investment income | 3.03 | 7 | 2.11 | 1.92 | 2.33 | 2.24 | 3.22 | 3 | ||||||||||||||||||||||||||||||||||||||||||||||||||||||||||||||||||||||||||||||||||||||||||||||||||||||||||||||
| Portfolio turnover (%) | 2 | 19 | 25 | 33 | 23 | 40 | ||||||||||||||||||||||||||||||||||||||||||||||||||||||||||||||||||||||||||||||||||||||||||||||||||||||||||||||||
| 1 | For the one-month period ended 3-31-18. The fund changed its fiscal year end from February 28 to March 31. | ||||||||||||||||||||||||||||||||||||||||||||||||||||||||||||||||||||||||||||||||||
| 2 | Based on average daily shares outstanding. | ||||||||||||||||||||||||||||||||||||||||||||||||||||||||||||||||||||||||||||||||||
| 3 | Net investment income per share and the percentage of average net assets reflect special dividends received by the fund, which amounted to $0.08 and 0.72%. | ||||||||||||||||||||||||||||||||||||||||||||||||||||||||||||||||||||||||||||||||||
| 4 | Does not reflect the effect of sales charges, if any. | ||||||||||||||||||||||||||||||||||||||||||||||||||||||||||||||||||||||||||||||||||
| 5 | Total returns would have been lower had certain expenses not been reduced during the applicable periods. | ||||||||||||||||||||||||||||||||||||||||||||||||||||||||||||||||||||||||||||||||||
| 6 | Not annualized. | ||||||||||||||||||||||||||||||||||||||||||||||||||||||||||||||||||||||||||||||||||
| 7 | Annualized. | ||||||||||||||||||||||||||||||||||||||||||||||||||||||||||||||||||||||||||||||||||
| Class I Shares Period ended | 3-31-18 | 1 | 2-28-18 | 2-28-17 | 2-29-16 | 2-28-15 | 2-28-14 | |||||||||||||||||||||||||||||||||||||||||||||||||||||||||||||||||||||||||||||||||||||||||||||||||||||||||||||||
| Per share operating performance | ||||||||||||||||||||||||||||||||||||||||||||||||||||||||||||||||||||||||||||||||||||||||||||||||||||||||||||||||||||||
| Net asset value, beginning of period | $11.35 | $10.82 | $9.93 | $11.83 | $11.78 | $10.49 | ||||||||||||||||||||||||||||||||||||||||||||||||||||||||||||||||||||||||||||||||||||||||||||||||||||||||||||||||
| Net investment income2 | 0.04 | 0.36 | 0.31 | 0.37 | 0.39 | 0.47 | 3 | |||||||||||||||||||||||||||||||||||||||||||||||||||||||||||||||||||||||||||||||||||||||||||||||||||||||||||||||
| Net realized and unrealized gain (loss) on investments | (0.15 | ) | 0.51 | 0.91 | (1.43 | ) | 0.56 | 1.59 | ||||||||||||||||||||||||||||||||||||||||||||||||||||||||||||||||||||||||||||||||||||||||||||||||||||||||||||||
| Total from investment operations | (0.11 | ) | 0.87 | 1.22 | (1.06 | ) | 0.95 | 2.06 | ||||||||||||||||||||||||||||||||||||||||||||||||||||||||||||||||||||||||||||||||||||||||||||||||||||||||||||||
| Less distributions | ||||||||||||||||||||||||||||||||||||||||||||||||||||||||||||||||||||||||||||||||||||||||||||||||||||||||||||||||||||||
| From net investment income | (0.06 | ) | (0.34 | ) | (0.33 | ) | (0.36 | ) | (0.47 | ) | (0.34 | ) | ||||||||||||||||||||||||||||||||||||||||||||||||||||||||||||||||||||||||||||||||||||||||||||||||||||||||||
| From net realized gain | — | — | — | (0.48 | ) | (0.43 | ) | (0.43 | ) | |||||||||||||||||||||||||||||||||||||||||||||||||||||||||||||||||||||||||||||||||||||||||||||||||||||||||||||
| Total distributions | (0.06 | ) | (0.34 | ) | (0.33 | ) | (0.84 | ) | (0.90 | ) | (0.77 | ) | ||||||||||||||||||||||||||||||||||||||||||||||||||||||||||||||||||||||||||||||||||||||||||||||||||||||||||
| Net asset value, end of period | $11.18 | $11.35 | $10.82 | $9.93 | $11.83 | $11.78 | ||||||||||||||||||||||||||||||||||||||||||||||||||||||||||||||||||||||||||||||||||||||||||||||||||||||||||||||||
| Total return (%)4 | (0.96 | ) 5 | 8.10 | 12.51 | (9.13 | ) | 8.50 | 20.28 | ||||||||||||||||||||||||||||||||||||||||||||||||||||||||||||||||||||||||||||||||||||||||||||||||||||||||||||||
| Ratios and supplemental data | ||||||||||||||||||||||||||||||||||||||||||||||||||||||||||||||||||||||||||||||||||||||||||||||||||||||||||||||||||||||
| Net assets, end of period (in millions) | $881 | $894 | $1,245 | $957 | $1,242 | $893 | ||||||||||||||||||||||||||||||||||||||||||||||||||||||||||||||||||||||||||||||||||||||||||||||||||||||||||||||||
| Ratios (as a percentage of average net assets): | ||||||||||||||||||||||||||||||||||||||||||||||||||||||||||||||||||||||||||||||||||||||||||||||||||||||||||||||||||||||
| Expenses before reductions | 1.00 | 6 | 0.97 | 0.97 | 0.97 | 1.01 | 1.01 | |||||||||||||||||||||||||||||||||||||||||||||||||||||||||||||||||||||||||||||||||||||||||||||||||||||||||||||||
| Expenses including reductions | 0.84 | 6 | 0.84 | 0.95 | 0.97 | 1.00 | 1.01 | |||||||||||||||||||||||||||||||||||||||||||||||||||||||||||||||||||||||||||||||||||||||||||||||||||||||||||||||
| Net investment income | 4.03 | 6 | 3.12 | 2.91 | 3.37 | 3.24 | 4.19 | 3 | ||||||||||||||||||||||||||||||||||||||||||||||||||||||||||||||||||||||||||||||||||||||||||||||||||||||||||||||
| Portfolio turnover (%) | 2 | 19 | 25 | 33 | 23 | 40 | ||||||||||||||||||||||||||||||||||||||||||||||||||||||||||||||||||||||||||||||||||||||||||||||||||||||||||||||||
| 1 | For the one-month period ended 3-31-18. The fund changed its fiscal year end from February 28 to March 31. | ||||||||||||||||||||||||||||||||||||||||||||||||||||||||||||||||||||||||||||||||||
| 2 | Based on average daily shares outstanding. | ||||||||||||||||||||||||||||||||||||||||||||||||||||||||||||||||||||||||||||||||||
| 3 | Net investment income per share and the percentage of average net assets reflect special dividends received by the fund, which amounted to $0.08 and 0.72%. | ||||||||||||||||||||||||||||||||||||||||||||||||||||||||||||||||||||||||||||||||||
| 4 | Total returns would have been lower had certain expenses not been reduced during the applicable periods. | ||||||||||||||||||||||||||||||||||||||||||||||||||||||||||||||||||||||||||||||||||
| 5 | Not annualized. | ||||||||||||||||||||||||||||||||||||||||||||||||||||||||||||||||||||||||||||||||||
| 6 | Annualized. | ||||||||||||||||||||||||||||||||||||||||||||||||||||||||||||||||||||||||||||||||||
| Class R2 Shares Period ended | 3-31-18 | 1 | 2-28-18 | 2-28-17 | 2-29-16 | 2-28-15 | 2-28-14 | |||||||||||||||||||||||||||||||||||||||||||||||||||||||||||||||||||||||||||||||||||||||||||||||||||||||||||||||
| Per share operating performance | ||||||||||||||||||||||||||||||||||||||||||||||||||||||||||||||||||||||||||||||||||||||||||||||||||||||||||||||||||||||
| Net asset value, beginning of period | $11.35 | $10.82 | $9.93 | $11.82 | $11.78 | $10.49 | ||||||||||||||||||||||||||||||||||||||||||||||||||||||||||||||||||||||||||||||||||||||||||||||||||||||||||||||||
| Net investment income2 | 0.03 | 0.30 | 0.26 | 0.32 | 0.31 | 0.50 | 3 | |||||||||||||||||||||||||||||||||||||||||||||||||||||||||||||||||||||||||||||||||||||||||||||||||||||||||||||||
| Net realized and unrealized gain (loss) on investments | (0.14 | ) | 0.53 | 0.92 | (1.43 | ) | 0.58 | 1.52 | ||||||||||||||||||||||||||||||||||||||||||||||||||||||||||||||||||||||||||||||||||||||||||||||||||||||||||||||
| Total from investment operations | (0.11 | ) | 0.83 | 1.18 | (1.11 | ) | 0.89 | 2.02 | ||||||||||||||||||||||||||||||||||||||||||||||||||||||||||||||||||||||||||||||||||||||||||||||||||||||||||||||
| Less distributions | ||||||||||||||||||||||||||||||||||||||||||||||||||||||||||||||||||||||||||||||||||||||||||||||||||||||||||||||||||||||
| From net investment income | (0.05 | ) | (0.30 | ) | (0.29 | ) | (0.30 | ) | (0.42 | ) | (0.30 | ) | ||||||||||||||||||||||||||||||||||||||||||||||||||||||||||||||||||||||||||||||||||||||||||||||||||||||||||
| From net realized gain | — | — | — | (0.48 | ) | (0.43 | ) | (0.43 | ) | |||||||||||||||||||||||||||||||||||||||||||||||||||||||||||||||||||||||||||||||||||||||||||||||||||||||||||||
| Total distributions | (0.05 | ) | (0.30 | ) | (0.29 | ) | (0.78 | ) | (0.85 | ) | (0.73 | ) | ||||||||||||||||||||||||||||||||||||||||||||||||||||||||||||||||||||||||||||||||||||||||||||||||||||||||||
| Net asset value, end of period | $11.19 | $11.35 | $10.82 | $9.93 | $11.82 | $11.78 | ||||||||||||||||||||||||||||||||||||||||||||||||||||||||||||||||||||||||||||||||||||||||||||||||||||||||||||||||
| Total return (%)4 | (0.98 | ) 5 | 7.68 | 12.04 | (9.51 | ) | 7.93 | 19.78 | ||||||||||||||||||||||||||||||||||||||||||||||||||||||||||||||||||||||||||||||||||||||||||||||||||||||||||||||
| Ratios and supplemental data | ||||||||||||||||||||||||||||||||||||||||||||||||||||||||||||||||||||||||||||||||||||||||||||||||||||||||||||||||||||||
| Net assets, end of period (in millions) | $1 | $1 | $1 | $1 | $1 | $1 | ||||||||||||||||||||||||||||||||||||||||||||||||||||||||||||||||||||||||||||||||||||||||||||||||||||||||||||||||
| Ratios (as a percentage of average net assets): | ||||||||||||||||||||||||||||||||||||||||||||||||||||||||||||||||||||||||||||||||||||||||||||||||||||||||||||||||||||||
| Expenses before reductions | 1.38 | 6 | 1.37 | 1.36 | 1.86 | 3.22 | 8.52 | |||||||||||||||||||||||||||||||||||||||||||||||||||||||||||||||||||||||||||||||||||||||||||||||||||||||||||||||
| Expenses including reductions | 1.24 | 6 | 1.24 | 1.34 | 1.43 | 1.47 | 1.47 | |||||||||||||||||||||||||||||||||||||||||||||||||||||||||||||||||||||||||||||||||||||||||||||||||||||||||||||||
| Net investment income | 3.62 | 6 | 2.62 | 2.50 | 2.92 | 2.66 | 4.38 | 3 | ||||||||||||||||||||||||||||||||||||||||||||||||||||||||||||||||||||||||||||||||||||||||||||||||||||||||||||||
| Portfolio turnover (%) | 2 | 19 | 25 | 33 | 23 | 40 | ||||||||||||||||||||||||||||||||||||||||||||||||||||||||||||||||||||||||||||||||||||||||||||||||||||||||||||||||
| 1 | For the one-month period ended 3-31-18. The fund changed its fiscal year end from February 28 to March 31. | ||||||||||||||||||||||||||||||||||||||||||||||||||||||||||||||||||||||||||||||||||
| 2 | Based on average daily shares outstanding. | ||||||||||||||||||||||||||||||||||||||||||||||||||||||||||||||||||||||||||||||||||
| 3 | Net investment income per share and the percentage of average net assets reflect special dividends received by the fund, which amounted to $0.08 and 0.72%. | ||||||||||||||||||||||||||||||||||||||||||||||||||||||||||||||||||||||||||||||||||
| 4 | Total returns would have been lower had certain expenses not been reduced during the applicable periods. | ||||||||||||||||||||||||||||||||||||||||||||||||||||||||||||||||||||||||||||||||||
| 5 | Not annualized. | ||||||||||||||||||||||||||||||||||||||||||||||||||||||||||||||||||||||||||||||||||
| 6 | Annualized. | ||||||||||||||||||||||||||||||||||||||||||||||||||||||||||||||||||||||||||||||||||
| Class R6 Shares Period ended | 3-31-18 | 1 | 2-28-18 | 2-28-17 | 2-29-16 | 2-28-15 | 2-28-14 | |||||||||||||||||||||||||||||||||||||||||||||||||||||||||||||||||||||||||||||||||||||||||||||||||||||||||||||||
| Per share operating performance | ||||||||||||||||||||||||||||||||||||||||||||||||||||||||||||||||||||||||||||||||||||||||||||||||||||||||||||||||||||||
| Net asset value, beginning of period | $11.34 | $10.81 | $9.92 | $11.81 | $11.77 | $10.49 | ||||||||||||||||||||||||||||||||||||||||||||||||||||||||||||||||||||||||||||||||||||||||||||||||||||||||||||||||
| Net investment income2 | 0.04 | 0.31 | 0.30 | 0.38 | 0.39 | 0.48 | 3 | |||||||||||||||||||||||||||||||||||||||||||||||||||||||||||||||||||||||||||||||||||||||||||||||||||||||||||||||
| Net realized and unrealized gain (loss) on investments | (0.16 | ) | 0.57 | 0.93 | (1.42 | ) | 0.57 | 1.58 | ||||||||||||||||||||||||||||||||||||||||||||||||||||||||||||||||||||||||||||||||||||||||||||||||||||||||||||||
| Total from investment operations | (0.12 | ) | 0.88 | 1.23 | (1.04 | ) | 0.96 | 2.06 | ||||||||||||||||||||||||||||||||||||||||||||||||||||||||||||||||||||||||||||||||||||||||||||||||||||||||||||||
| Less distributions | ||||||||||||||||||||||||||||||||||||||||||||||||||||||||||||||||||||||||||||||||||||||||||||||||||||||||||||||||||||||
| From net investment income | (0.06 | ) | (0.35 | ) | (0.34 | ) | (0.37 | ) | (0.49 | ) | (0.35 | ) | ||||||||||||||||||||||||||||||||||||||||||||||||||||||||||||||||||||||||||||||||||||||||||||||||||||||||||
| From net realized gain | — | — | — | (0.48 | ) | (0.43 | ) | (0.43 | ) | |||||||||||||||||||||||||||||||||||||||||||||||||||||||||||||||||||||||||||||||||||||||||||||||||||||||||||||
| Total distributions | (0.06 | ) | (0.35 | ) | (0.34 | ) | (0.85 | ) | (0.92 | ) | (0.78 | ) | ||||||||||||||||||||||||||||||||||||||||||||||||||||||||||||||||||||||||||||||||||||||||||||||||||||||||||
| Net asset value, end of period | $11.16 | $11.34 | $10.81 | $9.92 | $11.81 | $11.77 | ||||||||||||||||||||||||||||||||||||||||||||||||||||||||||||||||||||||||||||||||||||||||||||||||||||||||||||||||
| Total return (%)4 | (1.03 | ) 5 | 8.22 | 12.66 | (8.94 | ) | 8.56 | 20.29 | ||||||||||||||||||||||||||||||||||||||||||||||||||||||||||||||||||||||||||||||||||||||||||||||||||||||||||||||
| Ratios and supplemental data | ||||||||||||||||||||||||||||||||||||||||||||||||||||||||||||||||||||||||||||||||||||||||||||||||||||||||||||||||||||||
| Net assets, end of period (in millions) | $477 | $483 | $2 | $1 | — | 6 | — | 6 | ||||||||||||||||||||||||||||||||||||||||||||||||||||||||||||||||||||||||||||||||||||||||||||||||||||||||||||||
| Ratios (as a percentage of average net assets): | ||||||||||||||||||||||||||||||||||||||||||||||||||||||||||||||||||||||||||||||||||||||||||||||||||||||||||||||||||||||
| Expenses before reductions | 0.89 | 7 | 0.87 | 0.87 | 1.45 | 6.51 | 10.30 | |||||||||||||||||||||||||||||||||||||||||||||||||||||||||||||||||||||||||||||||||||||||||||||||||||||||||||||||
| Expenses including reductions | 0.74 | 7 | 0.74 | 0.85 | 0.85 | 0.87 | 0.97 | |||||||||||||||||||||||||||||||||||||||||||||||||||||||||||||||||||||||||||||||||||||||||||||||||||||||||||||||
| Net investment income | 4.13 | 7 | 2.61 | 2.85 | 3.48 | 3.32 | 4.26 | 3 | ||||||||||||||||||||||||||||||||||||||||||||||||||||||||||||||||||||||||||||||||||||||||||||||||||||||||||||||
| Portfolio turnover (%) | 2 | 19 | 25 | 33 | 23 | 40 | ||||||||||||||||||||||||||||||||||||||||||||||||||||||||||||||||||||||||||||||||||||||||||||||||||||||||||||||||
| 1 | For the one-month period ended 3-31-18. The fund changed its fiscal year end from February 28 to March 31. | ||||||||||||||||||||||||||||||||||||||||||||||||||||||||||||||||||||||||||||||||||
| 2 | Based on average daily shares outstanding. | ||||||||||||||||||||||||||||||||||||||||||||||||||||||||||||||||||||||||||||||||||
| 3 | Net investment income per share and the percentage of average net assets reflect special dividends received by the fund, which amounted to $0.08 and 0.72%. | ||||||||||||||||||||||||||||||||||||||||||||||||||||||||||||||||||||||||||||||||||
| 4 | Total returns would have been lower had certain expenses not been reduced during the applicable periods. | ||||||||||||||||||||||||||||||||||||||||||||||||||||||||||||||||||||||||||||||||||
| 5 | Not annualized. | ||||||||||||||||||||||||||||||||||||||||||||||||||||||||||||||||||||||||||||||||||
| 6 | Less than $500,000. | ||||||||||||||||||||||||||||||||||||||||||||||||||||||||||||||||||||||||||||||||||
| 7 | Annualized. | ||||||||||||||||||||||||||||||||||||||||||||||||||||||||||||||||||||||||||||||||||
| Class NAV Shares Period ended | 3-31-18 | 1 | 2-28-18 | 2-28-17 | 2-29-16 | 2-28-15 | 2-28-14 | |||||||||||||||||||||||||||||||||||||||||||||||||||||||||||||||||||||||||||||||||||||||||||||||||||||||||||||||
| Per share operating performance | ||||||||||||||||||||||||||||||||||||||||||||||||||||||||||||||||||||||||||||||||||||||||||||||||||||||||||||||||||||||
| Net asset value, beginning of period | $11.34 | $10.81 | $9.92 | $11.82 | $11.78 | $10.49 | ||||||||||||||||||||||||||||||||||||||||||||||||||||||||||||||||||||||||||||||||||||||||||||||||||||||||||||||||
| Net investment income2 | 0.04 | 0.36 | 0.32 | 0.37 | 0.41 | 0.49 | 3 | |||||||||||||||||||||||||||||||||||||||||||||||||||||||||||||||||||||||||||||||||||||||||||||||||||||||||||||||
| Net realized and unrealized gain (loss) on investments | (0.15 | ) | 0.52 | 0.91 | (1.42 | ) | 0.55 | 1.59 | ||||||||||||||||||||||||||||||||||||||||||||||||||||||||||||||||||||||||||||||||||||||||||||||||||||||||||||||
| Total from investment operations | (0.11 | ) | 0.88 | 1.23 | (1.05 | ) | 0.96 | 2.08 | ||||||||||||||||||||||||||||||||||||||||||||||||||||||||||||||||||||||||||||||||||||||||||||||||||||||||||||||
| Less distributions | ||||||||||||||||||||||||||||||||||||||||||||||||||||||||||||||||||||||||||||||||||||||||||||||||||||||||||||||||||||||
| From net investment income | (0.06 | ) | (0.35 | ) | (0.34 | ) | (0.37 | ) | (0.49 | ) | (0.36 | ) | ||||||||||||||||||||||||||||||||||||||||||||||||||||||||||||||||||||||||||||||||||||||||||||||||||||||||||
| From net realized gain | — | — | — | (0.48 | ) | (0.43 | ) | (0.43 | ) | |||||||||||||||||||||||||||||||||||||||||||||||||||||||||||||||||||||||||||||||||||||||||||||||||||||||||||||
| Total distributions | (0.06 | ) | (0.35 | ) | (0.34 | ) | (0.85 | ) | (0.92 | ) | (0.79 | ) | ||||||||||||||||||||||||||||||||||||||||||||||||||||||||||||||||||||||||||||||||||||||||||||||||||||||||||
| Net asset value, end of period | $11.17 | $11.34 | $10.81 | $9.92 | $11.82 | $11.78 | ||||||||||||||||||||||||||||||||||||||||||||||||||||||||||||||||||||||||||||||||||||||||||||||||||||||||||||||||
| Total return (%)4 | (0.94 | ) 5 | 8.11 | 12.76 | (9.03 | ) | 8.57 | 20.47 | ||||||||||||||||||||||||||||||||||||||||||||||||||||||||||||||||||||||||||||||||||||||||||||||||||||||||||||||
| Ratios and supplemental data | ||||||||||||||||||||||||||||||||||||||||||||||||||||||||||||||||||||||||||||||||||||||||||||||||||||||||||||||||||||||
| Net assets, end of period (in millions) | $511 | $514 | $535 | $554 | $696 | $653 | ||||||||||||||||||||||||||||||||||||||||||||||||||||||||||||||||||||||||||||||||||||||||||||||||||||||||||||||||
| Ratios (as a percentage of average net assets): | ||||||||||||||||||||||||||||||||||||||||||||||||||||||||||||||||||||||||||||||||||||||||||||||||||||||||||||||||||||||
| Expenses before reductions | 0.88 | 6 | 0.86 | 0.86 | 0.86 | 0.88 | 0.88 | |||||||||||||||||||||||||||||||||||||||||||||||||||||||||||||||||||||||||||||||||||||||||||||||||||||||||||||||
| Expenses including reductions | 0.74 | 6 | 0.74 | 0.85 | 0.85 | 0.87 | 0.87 | |||||||||||||||||||||||||||||||||||||||||||||||||||||||||||||||||||||||||||||||||||||||||||||||||||||||||||||||
| Net investment income | 4.13 | 6 | 3.19 | 3.03 | 3.45 | 3.42 | 4.35 | 3 | ||||||||||||||||||||||||||||||||||||||||||||||||||||||||||||||||||||||||||||||||||||||||||||||||||||||||||||||
| Portfolio turnover (%) | 2 | 19 | 25 | 33 | 23 | 40 | ||||||||||||||||||||||||||||||||||||||||||||||||||||||||||||||||||||||||||||||||||||||||||||||||||||||||||||||||
| 1 | For the one-month period ended 3-31-18. The fund changed its fiscal year end from February 28 to March 31. | ||||||||||||||||||||||||||||||||||||||||||||||||||||||||||||||||||||||||||||||||||
| 2 | Based on average daily shares outstanding. | ||||||||||||||||||||||||||||||||||||||||||||||||||||||||||||||||||||||||||||||||||
| 3 | Net investment income per share and the percentage of average net assets reflect special dividends received by the fund, which amounted to $0.08 and 0.72%. | ||||||||||||||||||||||||||||||||||||||||||||||||||||||||||||||||||||||||||||||||||
| 4 | Total returns would have been lower had certain expenses not been reduced during the applicable periods. | ||||||||||||||||||||||||||||||||||||||||||||||||||||||||||||||||||||||||||||||||||
| 5 | Not annualized. | ||||||||||||||||||||||||||||||||||||||||||||||||||||||||||||||||||||||||||||||||||
| 6 | Annualized. | ||||||||||||||||||||||||||||||||||||||||||||||||||||||||||||||||||||||||||||||||||
Note 1 — Organization
John Hancock Global Shareholder Yield Fund (the fund) is a series of John Hancock Funds III (the Trust), an open-end management investment company organized as a Massachusetts business trust and registered under the Investment Company Act of 1940, as amended (the 1940 Act). The primary investment objective of the fund is to seek to provide a high level of income. Capital appreciation is a secondary investment objective.
The fund may offer multiple classes of shares. The shares currently offered are detailed in the Statements of assets and liabilities. Class A and Class C shares are offered to all investors. Class B shares are closed to new investors. Class I shares are offered to institutions and certain investors. Class R2 shares are available only to certain retirement plans. Class R6 shares are only available to certain retirement plans, institutions and other investors. Class NAV shares are offered to John Hancock affiliated funds, retirement plans for employees of John Hancock and/or Manulife Financial Corporation, and certain 529 plans. Shareholders of each class have exclusive voting rights to matters that affect that class. The distribution and service fees, if any, and transfer agent fees for each class may differ. Class B shares convert to Class A shares eight years after purchase.
On December 14, 2017, the Board of Trustees voted to change the fund's fiscal year end from February 28 to March 31.
Note 2 — Significant accounting policies
The financial statements have been prepared in conformity with accounting principles generally accepted in the United States of America (US GAAP), which require management to make certain estimates and assumptions as of the date of the financial statements. Actual results could differ from those estimates and those differences could be significant. The fund qualifies as an investment company under Topic 946 of Accounting Standards Codification of US GAAP.
Events or transactions occurring after the end of the fiscal period through the date that the financial statements were issued have been evaluated in the preparation of the financial statements. The following summarizes the significant accounting policies of the fund:
Security valuation. Investments are stated at value as of the scheduled close of regular trading on the New York Stock Exchange (NYSE), normally at 4:00 p.m., Eastern Time. In case of emergency or other disruption resulting in the NYSE not opening for trading or the NYSE closing at a time other than the regularly scheduled close, the net asset value (NAV) may be determined as of the regularly scheduled close of the NYSE pursuant to the fund's Valuation Policies and Procedures.
In order to value the securities, the fund uses the following valuation techniques: Equity securities held by the fund are typically valued at the last sale price or official closing price on the exchange or principal market where the security trades. In the event there were no sales during the day or closing prices are not available, the securities are valued using the last available bid price. Investments by the fund in open-end mutual funds, including John Hancock Collateral Trust (JHCT), are valued at their respective NAVs each business day. Foreign securities and currencies are valued in U.S. dollars based on foreign currency exchange rates supplied by an independent pricing vendor.
In certain instances, the Pricing Committee may determine to value equity securities using prices obtained from another exchange or market if trading on the exchange or market on which prices are typically obtained did not open for trading as scheduled, or if trading closed earlier than scheduled, and trading occurred as normal on another exchange or market.
Other portfolio securities and assets, for which reliable market quotations are not readily available, are valued at fair value as determined in good faith by the fund's Pricing Committee following procedures established by the Board of Trustees. The frequency with which these fair valuation procedures are used cannot be predicted and fair value of securities may differ significantly from the value that would have been used had a ready market for such securities existed. Trading in foreign securities may be completed before the scheduled daily close of trading on the NYSE. Significant events at the issuer or market level may affect the values of securities between the time when the valuation of the securities is generally determined and the close of the NYSE. If a significant event occurs, these securities may be fair valued, as determined in good faith by the fund's Pricing Committee, following procedures established by the Board of Trustees. The fund uses fair value adjustment
factors provided by an independent pricing vendor to value certain foreign securities in order to adjust for events that may occur between the close of foreign exchanges or markets and the close of the NYSE.
The fund uses a three-tier hierarchy to prioritize the pricing assumptions, referred to as inputs, used in valuation techniques to measure fair value. Level 1 includes securities valued using quoted prices in active markets for identical securities. Level 2 includes securities valued using other significant observable inputs. Observable inputs may include quoted prices for similar securities, interest rates, prepayment speeds and credit risk. Prices for securities valued using these inputs are received from independent pricing vendors and brokers and are based on an evaluation of the inputs described. Level 3 includes securities valued using significant unobservable inputs when market prices are not readily available or reliable, including the fund's own assumptions in determining the fair value of investments. Factors used in determining value may include market or issuer specific events or trends, changes in interest rates and credit quality. The inputs or methodology used for valuing securities are not necessarily an indication of the risks associated with investing in those securities. Changes in valuation techniques and related inputs may result in transfers into or out of an assigned level within the disclosure hierarchy.
The following is a summary of the values by input classification of the fund's investments as of March 31, 2018 and February 28, 2018, by major security category or type:
| Total value at 3-31-18 | Level 1 quoted price | Level 2 significant observable inputs | Level 3 significant unobservable inputs | ||
| Investments in securities: | |||||
| Assets | |||||
| Common stocks | |||||
| Australia | $51,511,088 | — | $51,511,088 | — | |
| Canada | 132,095,567 | $132,095,567 | — | — | |
| France | 188,379,633 | — | 188,379,633 | — | |
| Germany | 200,678,052 | — | 200,678,052 | — | |
| Italy | 78,100,439 | — | 78,100,439 | — | |
| Netherlands | 42,692,144 | 42,692,144 | — | — | |
| Norway | 49,714,888 | — | 49,714,888 | — | |
| Singapore | 27,061,436 | — | 27,061,436 | — | |
| Spain | 40,294,053 | — | 40,294,053 | — | |
| Sweden | 17,145,517 | — | 17,145,517 | — | |
| Switzerland | 90,630,608 | — | 90,630,608 | — | |
| Taiwan | 14,699,334 | 14,699,334 | — | — | |
| United Kingdom | 349,719,990 | 53,208,351 | 296,511,639 | — | |
| United States | 998,401,017 | 998,401,017 | — | — | |
| Securities lending collateral | 17,294,075 | 17,294,075 | — | — | |
| Total investments in securities | $2,298,417,841 | $1,258,390,488 | $1,040,027,353 | — | |
| Total value at 2-28-18 | Level 1 quoted price | Level 2 significant observable inputs | Level 3 significant unobservable inputs | ||||||||||||||
| Investments in securities: | |||||||||||||||||
| Assets | |||||||||||||||||
| Common stocks | |||||||||||||||||
| Australia | $54,778,312 | — | $54,778,312 | — | |||||||||||||
| Canada | 134,883,364 | $134,883,364 | — | — | |||||||||||||
| France | 200,388,320 | — | 200,388,320 | — | |||||||||||||
| Total value at 2-28-18 | Level 1 quoted price | Level 2 significant observable inputs | Level 3 significant unobservable inputs | ||||||||||||||
| Germany | 203,179,861 | — | $203,179,861 | — | |||||||||||||
| Italy | 75,070,053 | — | 75,070,053 | — | |||||||||||||
| Netherlands | 42,330,857 | $42,330,857 | — | — | |||||||||||||
| Norway | 49,066,168 | — | 49,066,168 | — | |||||||||||||
| Singapore | 26,873,689 | — | 26,873,689 | — | |||||||||||||
| Spain | 38,264,037 | — | 38,264,037 | — | |||||||||||||
| Sweden | 18,741,407 | — | 18,741,407 | — | |||||||||||||
| Switzerland | 102,166,896 | — | 102,166,896 | — | |||||||||||||
| Taiwan | 14,561,612 | 14,561,612 | — | — | |||||||||||||
| United Kingdom | 343,100,004 | 51,524,965 | 291,575,039 | — | |||||||||||||
| United States | 1,010,364,077 | 1,010,364,077 | — | — | |||||||||||||
| Securities lending collateral | 34,478,946 | 34,478,946 | — | — | |||||||||||||
| Total investments in securities | $2,348,247,603 | $1,288,143,821 | $1,060,103,782 | — | |||||||||||||
Security transactions and related investment income. Investment security transactions are accounted for on a trade date plus one basis for daily NAV calculations. However, for financial reporting purposes, investment transactions are reported on trade date. Interest income is accrued as earned. Dividend income is recorded on the ex-date, except for dividends of foreign securities where the dividend may not be known until after the ex-date. In those cases, dividend income, net of withholding taxes, is recorded when the fund becomes aware of the dividends. Foreign taxes are provided for based on the fund's understanding of the tax rules and rates that exist in the foreign markets in which it invests. Gains and losses on securities sold are determined on the basis of identified cost and may include proceeds from litigation.
Securities lending. The fund may lend its securities to earn additional income. The fund receives cash collateral from the borrower in an amount not less than the market value of the loaned securities. The fund will invest its collateral in JHCT, an affiliate of the fund, which has a floating NAV and is registered with the Securities and Exchange Commission as an investment company. JHCT invests in short-term money market investments. The fund will receive the benefit of any gains and bear any losses generated by JHCT with respect to the cash collateral.
The fund has the right to recall loaned securities on demand. If a borrower fails to return loaned securities when due, then the lending agent is responsible and indemnifies the fund for the lent securities. The lending agent uses the collateral received from the borrower to purchase replacement securities of the same issue, type, class and series of the loaned securities. If the value of the collateral is less than the purchase cost of replacement securities, the lending agent is responsible for satisfying the shortfall but only to the extent that the shortfall is not due to any decrease in the value of JHCT.
Although the risk of the loss of the securities lent is mitigated by receiving collateral from the borrower and through lending agent indemnification, the fund could experience a delay in recovering securities or could experience a lower than expected return if the borrower fails to return the securities on a timely basis. The fund receives compensation for lending its securities by retaining a portion of the return on the investment of the collateral and compensation from fees earned from borrowers of the securities. Securities lending income received by the fund is net of fees retained by the securities lending agent. Net income received from JHCT is a component of securities lending income as recorded on the Statements of operations.
Obligations to repay collateral received by the fund are shown on the Statements of assets and liabilities as Payable upon return of securities loaned and are secured by the loaned securities. As of March 31, 2018 and February 28, 2018, the fund loaned common stocks valued at $16,767,009 and $33,541,828 and received $17,349,785 and $34,521,947 of cash collateral, respectively.
Foreign investing. Assets, including investments and liabilities denominated in foreign currencies, are translated into U.S. dollar values each day at the prevailing exchange rate. Purchases and sales of securities, income and expenses are translated
into U.S. dollars at the prevailing exchange rate on the date of the transaction. The effect of changes in foreign currency exchange rates on the value of securities is reflected as a component of the realized and unrealized gains (losses) on investments. Foreign investments are subject to a decline in the value of a foreign currency versus the U.S. dollar, which reduces the dollar value of securities denominated in that currency.
Funds that invest internationally generally carry more risk than funds that invest strictly in U.S. securities. These risks are heightened for investments in emerging markets. Risks can result from differences in economic and political conditions, regulations, market practices (including higher transaction costs), accounting standards and other factors.
Foreign taxes. The fund may be subject to withholding tax on income and/or capital gains or repatriation taxes imposed by certain countries in which the fund invests. Taxes are accrued based upon investment income, realized gains or unrealized appreciation.
Line of credit. The fund may have the ability to borrow from banks for temporary or emergency purposes, including meeting redemption requests that otherwise might require the untimely sale of securities. Pursuant to the fund's custodian agreement, the custodian may loan money to the fund to make properly authorized payments. The fund is obligated to repay the custodian for any overdraft, including any related costs or expenses. The custodian may have a lien, security interest or security entitlement in any fund property that is not otherwise segregated or pledged, to the extent of any overdraft, and to the maximum extent permitted by law.
Effective June 29, 2017, the fund and other affiliated funds have entered into a syndicated line of credit agreement with Citibank, N.A. as the administrative agent that enables them to participate in a $750 million unsecured committed line of credit. Excluding commitments designated for a certain fund and subject to the needs of all other affiliated funds, the fund can borrow up to an aggregate commitment amount of $500 million, subject to asset coverage and other limitations as specified in the agreement. A commitment fee payable at the end of each calendar quarter, based on the average daily unused portion of the line of credit, is charged to each participating fund based on a combination of fixed and asset based allocations and is reflected in Other expenses on the Statements of operations. Prior to June 29, 2017, the fund had a similar agreement that enabled it to participate in a $1 billion unsecured committed line of credit. For the period ended March 31, 2018 and the year ended February 28, 2018, the fund had no borrowings under either line of credit. Commitment fees for the period ended March 31, 2018 and for the year ended February 28, 2018 were $434 and $7,611 respectively.
Expenses. Within the John Hancock group of funds complex, expenses that are directly attributable to an individual fund are allocated to such fund. Expenses that are not readily attributable to a specific fund are allocated among all funds in an equitable manner, taking into consideration, among other things, the nature and type of expense and the fund's relative net assets. Expense estimates are accrued in the period to which they relate and adjustments are made when actual amounts are known.
Class allocations. Income, common expenses and realized and unrealized gains (losses) are determined at the fund level and allocated daily to each class of shares based on the net assets of the class. Class-specific expenses, such as distribution and service fees, if any, and transfer agent fees, for all classes, are charged daily at the class level based on the net assets of each class and the specific expense rates applicable to each class.
Federal income taxes. The fund intends to continue to qualify as a regulated investment company by complying with the applicable provisions of the Internal Revenue Code and will not be subject to federal income tax on taxable income that is distributed to shareholders. Therefore, no federal income tax provision is required.
As of March 31, 2018 and February 28, 2018, the fund had no uncertain tax positions that would require financial statement recognition, derecognition or disclosure. The fund's federal tax returns are subject to examination by the Internal Revenue Service for a period of three years.
Distribution of income and gains. Distributions to shareholders from net investment income and net realized gains, if any, are recorded on the ex-date. The fund typically declares and pays dividends quarterly. Capital gain distributions, if any, at least annually.
The tax character of distributions for the period ended March 31, 2018 and for the years ended February 28, 2018 and 2017 was as follows:
| March 31, 2018 | February 28, 2018 | February 28, 2017 | |
| Ordinary Income | $12,217,833 | $70,862,215 | $65,159,009 |
Distributions paid by the fund with respect to each class of shares are calculated in the same manner, at the same time and in the same amount, except for the effect of class level expenses that may be applied differently to each class. As of March 31, 2018 and February 28, 2018, the components of distributable earnings on a tax basis consisted of $2,014,885 and $6,274,718 of undistributed ordinary income and $36,199,907 and $32,651,677 of undistributed long term capital gains, respectively.
Such distributions and distributable earnings, on a tax basis, are determined in conformity with income tax regulations, which may differ from US GAAP. Distributions in excess of tax basis earnings and profits, if any, are reported in the fund's financial statements as a return of capital.
Capital accounts within the financial statements are adjusted for permanent book-tax differences. These adjustments have no impact on net assets or the results of operations. Temporary book-tax differences, if any, will reverse in a subsequent period. Book-tax differences are primarily attributable to wash sale loss deferrals and partnerships.
Note 3 — Guarantees and indemnifications
Under the Trust's organizational documents, its Officers and Trustees are indemnified against certain liabilities arising out of the performance of their duties to the Trust, including the fund. Additionally, in the normal course of business, the fund enters into contracts with service providers that contain general indemnification clauses. The fund's maximum exposure under these arrangements is unknown, as this would involve future claims that may be made against the fund that have not yet occurred. The risk of material loss from such claims is considered remote.
Note 4 — Fees and transactions with affiliates
John Hancock Advisers, LLC (the Advisor) serves as investment advisor for the fund. John Hancock Distributors, LLC (the Distributor), an affiliate of the Advisor, serves as principal underwriter of the fund. The Advisor and the Distributor are indirect, wholly owned subsidiaries of Manulife Financial Corporation (MFC).
Management fee. The fund has an investment management agreement with the Advisor under which the fund pays a daily management fee to the Advisor, equivalent on an annual basis to the sum of 0.800% of average daily net assets. The Advisor has a subadvisory agreement with Epoch Investment Partners, Inc.. The fund is not responsible for payment of the subadvisory fees.
The Advisor has contractually agreed to waive a portion of its management fee and/or reimburse expenses for certain funds of the John Hancock group of funds complex, including the fund (the participating portfolios). This waiver is based upon aggregate net assets of all the participating portfolios. The amount of the reimbursement is calculated daily and allocated among all the participating portfolios in proportion to the daily net assets of each fund. During the period ended March 31, 2018 and the year ended February 28, 2018 this waiver amounted to 0.01% (on an annualized basis) and 0.01% of the fund's average net assets, respectively. This arrangement may be amended or terminated at any time by the Advisor upon notice to the fund and with the approval of the Board of Trustees.
The Advisor contractually agrees to reduce its management fee or, if necessary, make payment to the applicable class in an amount equal to the amount by which expenses of Class A, Class B, Class C, Class I, Class R2, and Class R6 shares, as applicable, exceed 1.09%, 1.84%, 1.84%, 0.84%, 1.24%, and 0.74%, respectively, of average net assets attributable to the applicable class. For purposes of this agreement, "expenses of Class A, Class B, Class C, Class I, Class R2, and Class R6 shares" means all class expenses (including fund expenses attributable to the class), excluding taxes, brokerage commissions, interest expense, litigation and indemnification expenses and other extraordinary expenses not incurred in the ordinary course of the fund's business, acquired fund fees and expenses paid indirectly, and short dividend expense. This
agreement expires on June 30, 2018, unless renewed by mutual agreement of the fund and the Advisor based on upon a determination that this is appropriate under the circumstances at that time.
Prior to July 1, 2017, the Advisor had contractually agreed to waive and/or reimburse all class-specific expenses for Class R6 shares of the fund to the extent they exceed 0.00% of average net assets.
The Advisor has voluntarily agreed to reduce its management fee, or if necessary make payment to the applicable class in an amount equal to the amount by which the expenses of Class NAV shares exceed 0.74% of average net assets attributable to the class. "Expenses" means all the expenses of Class NAV shares, excluding taxes, brokerage commissions, interest expense, litigation and indemnification expenses and other extraordinary expenses not incurred in the ordinary course of the fund's business, acquired fund fees and expenses paid indirectly, and short dividend expense. This voluntary expense reduction will continue in effect until terminated at any time by the Advisor on notice to the fund.
For the period ended March 31, 2018 and for the year ended February 28, 2018, the expense reductions described above amounted to the following:
| Class | Expense reductions as of March 31, 2018 | Expense reductions as of February 28, 2018 |
| Class A | $61,268 | $700,762 |
| Class B | 906 | 12,289 |
| Class C | 14,272 | 161,270 |
| Class I | 121,059 | 1,551,162 |
| Class R2 | 139 | 1,573 |
| Class R6 | 62,500 | 213,927 |
| Class NAV | 60,881 | 653,350 |
| Total | $321,025 | $3,294,333 |
Expenses waived or reimbursed in the current fiscal period are not subject to recapture in future fiscal periods.
The investment management fees, including the impact of the waivers and reimbursements as described above, incurred for the period ended March 31, 2018 and for the year ended February 28, 2018 were in each case equivalent to a net annual effective rate of 0.64% and 0.66% of the fund's average daily net assets, respectively.
Accounting and legal services. Pursuant to a service agreement, the fund reimburses the Advisor for all expenses associated with providing the administrative, financial, legal, accounting and recordkeeping services to the fund, including the preparation of all tax returns, periodic reports to shareholders and regulatory reports, among other services. These expenses are allocated to each share class based on its relative net assets at the time the expense was incurred. These accounting and legal services fees incurred for the period ended March 31, 2018 and for the year ended February 28, 2018 amounted to an annual rate of 0.02% of the fund's average daily net assets.
Distribution and service plans. The fund has a distribution agreement with the Distributor. The fund has adopted distribution and service plans with respect to Class A, Class B, Class C and Class R2 shares pursuant to Rule 12b-1 under the 1940 Act, to pay the Distributor for services provided as the distributor of shares of the fund. In addition, under a service plan for Class R2 shares, the fund pays for certain other services. The fund may pay up to the following contractual rates of distribution and service fees under these arrangements, expressed as an annual percentage of average daily net assets for each class of the fund's shares:
| Class | Rule 12b-1 fee | Service fee | Class | Rule 12b-1 fee | Service fee | |
| Class A | 0.30% | — | Class C | 1.00% | — | |
| Class B | 1.00% | — | Class R2 | 0.25% | 0.25% |
Sales charges. Class A shares are assessed up-front sales charges of up to 5.00% of the net asset value of such shares. The following summarizes the net up-front sales charges received by the Distributor during the period ended March 31, 2018 and the year ended February 28, 2018:
| March 31, 2018 | February 28, 2018 | |
| Net sales charges | $41,669 | $762,553 |
| Retained for printing prospectus, advertising and sales literature | 7,037 | 132,199 |
| Sales commission to unrelated broker-dealers | 34,356 | 626,542 |
| Sales commission to affiliated sales personnel | 276 | 3,812 |
Class A, Class B and Class C shares may be subject to contingent deferred sales charges (CDSCs). Certain Class A shares that are acquired through purchases of $1 million or more and are redeemed within one year of purchase are subject to a 1.00% sales charge. Class B shares that are redeemed within six years of purchase are subject to CDSCs, at declining rates, beginning at 5.00%. Class C shares that are redeemed within one year of purchase are subject to a 1.00% CDSC. CDSCs are applied to the lesser of the current market value at the time of redemption or the original purchase cost of the shares being redeemed. Proceeds from CDSCs are used to compensate the Distributor for providing distribution-related services in connection with the sale of these shares. During the period ended March 31, 2018 and the year ended February 28, 2018, CDSCs received by the Distributor were as follows:
| Class | March 31, 2018 | February 28, 2018 |
| Class A | $370 | $1,486 |
| Class B | 388 | 7,836 |
| Class C | 482 | 10,467 |
Transfer agent fees. The John Hancock Group of Funds has a complex-wide transfer agent agreement with John Hancock Signature Services, Inc. (Signature Services), an affiliate of the Advisor. The transfer agent fees paid to Signature Services are determined based on the cost to Signature Services (Signature Services Cost) of providing recordkeeping services. It also includes out-of-pocket expenses, including payments made to third-parties for recordkeeping services provided to their clients who invest in one or more John Hancock funds. In addition, Signature Services Cost may be reduced by certain fees that Signature Services receives in connection with retirement and small accounts. Signature Services Cost is calculated monthly and allocated, as applicable, to five categories of share classes: Retail Share and Institutional Share Classes of Non-Municipal Bond Funds, Class R6 Shares, Retirement Share Classes and Municipal Bond Share Classes. Within each of these categories, the applicable costs are allocated to the affected John Hancock affiliated funds and/or classes, based on the relative average daily net assets.
Class level expenses. Class level expenses for period ended March 31, 2018 and year ended February 28, 2018 were:
| Class | Distribution and service fees as of March 31, 2018 | Transfer agent fees as of March 31, 2018 | Distribution and service fees as of February 28, 2018 | Transfer agent fees as of February 28, 2018 | ||||
| Class A | $89,520 | $34,744 | $1,145,156 | $425,569 | ||||
| Class B | 5,857 | 683 | 92,330 | 10,329 | ||||
| Class C | 92,228 | 10,739 | 1,208,805 | 134,838 | ||||
| Class I | — | 91,435 | — | 1,287,470 | ||||
| Class R2 | 473 | 14 | 5,941 | 157 | ||||
| Class R6 | — | 5,680 | — | 17,790 | ||||
| Total | $188,078 | $143,295 | $2,452,232 | $1,876,153 |
Trustee expenses. The fund compensates each Trustee who is not an employee of the Advisor or its affiliates. The costs of paying Trustee compensation and expenses are allocated to each fund based on its net assets relative to other funds within the John Hancock group of funds complex.
Note 5 — Fund share transactions
Transactions in fund shares for the period ended March 31, 2018 and for the years ended February 28, 2018 and 2017 were as follows:
| Period ended 3-31-181 | Year ended 2-28-18 | Year ended 2-28-17 | |||||||||||||||||||||||||||||||||||||||
| Shares | Amount | Shares | Amount | Shares | Amount | ||||||||||||||||||||||||||||||||||||
| Class A shares | |||||||||||||||||||||||||||||||||||||||||
| Sold | 328,635 | $3,690,424 | 4,887,570 | $55,317,402 | 10,495,512 | $110,012,405 | |||||||||||||||||||||||||||||||||||
| Distributions reinvested | 146,351 | 1,612,789 | 924,739 | 10,462,524 | 1,364,405 | 13,995,516 | |||||||||||||||||||||||||||||||||||
| Repurchased | (654,733 | ) | (7,383,805 | ) | (9,765,823 | ) | (110,840,941 | ) | (23,980,304 | ) | (251,777,384 | ) | |||||||||||||||||||||||||||||
| Net decrease | (179,747 | ) | ($2,080,592 | ) | (3,953,514 | ) | ($45,061,015 | ) | (12,120,387 | ) | ($127,769,463 | ) | |||||||||||||||||||||||||||||
| Class B shares | |||||||||||||||||||||||||||||||||||||||||
| Sold | 234 | $2,590 | 8,773 | $100,317 | 46,334 | $483,148 | |||||||||||||||||||||||||||||||||||
| Distributions reinvested | 1,379 | 15,210 | 13,227 | 149,606 | 18,961 | 194,376 | |||||||||||||||||||||||||||||||||||
| Repurchased | (21,632 | ) | (244,352 | ) | (378,607 | ) | (4,328,572 | ) | (296,555 | ) | (3,105,472 | ) | |||||||||||||||||||||||||||||
| Net decrease | (20,019 | ) | ($226,552 | ) | (356,607 | ) | ($4,078,649 | ) | (231,260 | ) | ($2,427,948 | ) | |||||||||||||||||||||||||||||
| Class C shares | |||||||||||||||||||||||||||||||||||||||||
| Sold | 48,700 | $550,543 | 766,239 | $8,681,591 | 2,017,179 | $21,196,030 | |||||||||||||||||||||||||||||||||||
| Distributions reinvested | 26,090 | 288,029 | 211,666 | 2,396,367 | 274,676 | 2,817,422 | |||||||||||||||||||||||||||||||||||
| Repurchased | (261,635 | ) | (2,942,356 | ) | (2,888,788 | ) | (32,746,743 | ) | (4,093,360 | ) | (42,785,906 | ) | |||||||||||||||||||||||||||||
| Net decrease | (186,845 | ) | ($2,103,784 | ) | (1,910,883 | ) | ($21,668,785 | ) | (1,801,505 | ) | ($18,772,454 | ) | |||||||||||||||||||||||||||||
| Class I shares | |||||||||||||||||||||||||||||||||||||||||
| Sold | 1,293,551 | $14,608,777 | 29,000,429 | $328,965,528 | 71,471,059 | $752,004,989 | |||||||||||||||||||||||||||||||||||
| Distributions reinvested | 421,098 | 4,657,346 | 3,290,903 | 37,305,368 | 2,811,312 | 29,001,772 | |||||||||||||||||||||||||||||||||||
| Repurchased | (1,685,660 | ) | (19,015,316 | ) | (68,523,697 | ) | (789,962,651 | ) | (55,588,014 | ) | (587,635,516 | ) | |||||||||||||||||||||||||||||
| Net increase (decrease) | 28,989 | $250,807 | (36,232,365 | ) | ($423,691,755 | ) | 18,694,357 | $193,371,245 | |||||||||||||||||||||||||||||||||
| Class R2 shares | |||||||||||||||||||||||||||||||||||||||||
| Sold | 3,814 | $42,501 | 19,164 | $218,403 | 36,435 | $380,649 | |||||||||||||||||||||||||||||||||||
| Distributions reinvested | 443 | 4,906 | 2,709 | 30,823 | 2,631 | 27,105 | |||||||||||||||||||||||||||||||||||
| Repurchased | (1,441 | ) | (16,412 | ) | (21,441 | ) | (250,223 | ) | (29,789 | ) | (312,790 | ) | |||||||||||||||||||||||||||||
| Net increase (decrease) | 2,816 | $30,995 | 432 | ($997 | ) | 9,277 | $94,964 | ||||||||||||||||||||||||||||||||||
| Class R6 shares | |||||||||||||||||||||||||||||||||||||||||
| Sold | 853,833 | $9,621,634 | 45,525,783 | $528,602,558 | 67,568 | $711,304 | |||||||||||||||||||||||||||||||||||
| Distributions reinvested | 241,967 | 2,671,316 | 270,948 | 3,176,809 | 3,370 | 34,696 | |||||||||||||||||||||||||||||||||||
| Repurchased | (965,286 | ) | (10,893,128 | ) | (3,342,342 | ) | (39,222,455 | ) | (21,368 | ) | (223,952 | ) | |||||||||||||||||||||||||||||
| Net increase | 130,514 | $1,399,822 | 42,454,389 | $492,556,912 | 49,570 | $522,048 | |||||||||||||||||||||||||||||||||||
| Period ended 3-31-181 | Year ended 2-28-18 | Year ended 2-28-17 | |||||||||||||||||||||||||||||||||||||||
| Shares | Amount | Shares | Amount | Shares | Amount | ||||||||||||||||||||||||||||||||||||
| Class NAV shares | |||||||||||||||||||||||||||||||||||||||||
| Sold | 241,335 | $2,725,544 | 883,085 | $10,113,962 | 2,603,181 | $27,412,499 | |||||||||||||||||||||||||||||||||||
| Distributions reinvested | 259,083 | 2,862,863 | 1,465,285 | 16,626,561 | 1,767,262 | 18,198,344 | |||||||||||||||||||||||||||||||||||
| Repurchased | (49,262 | ) | (553,257 | ) | (6,494,055 | ) | (74,000,073 | ) | (10,780,446 | ) | (113,278,915 | ) | |||||||||||||||||||||||||||||
| Net increase (decrease) | 451,156 | $5,035,150 | (4,145,685 | ) | ($47,259,550 | ) | (6,410,003 | ) | ($67,668,072 | ) | |||||||||||||||||||||||||||||||
| Total net increase (decrease) | 226,864 | $2,305,846 | (4,144,233 | ) | ($49,203,839 | ) | (1,809,951 | ) | ($22,649,680 | ) | |||||||||||||||||||||||||||||||
1For the one-month period ended 3-31-18. The fund changed its fiscal year end from February 28 to March 31.
Affiliates of the fund owned 100% of shares of Class NAV, on March 31, 2018 and February 28, 2018. Such concentration of shareholders' capital could have a material effect on the fund if such shareholders redeem from the fund.
Note 6 — Purchase and sale of securities
Purchases and sales of securities, other than short-term investments, amounted to $39,966,551 and $41,849,935 for the period ended March 31, 2018 and amounted to $445,437,347 and $484,299,040 for the year ended February 28, 2018, respectively.
Note 7 — Investment by affiliated funds
Certain investors in the fund are affiliated funds that are managed by the Advisor and its affiliates. The affiliated funds do not invest in the fund for the purpose of exercising management or control; however, this investment may represent a significant portion of the fund's net assets. At March 31, 2018 and February 28, 2018, funds within the John Hancock group of funds complex held 21.7% and 21.5% of the fund's net assets, respectively. The following funds had an affiliate ownership of 5% or more of the fund's net assets:
| Affiliated concentration | ||
| Fund | March 31, 2018 | February 28, 2018 |
| John Hancock Funds II Multimanager Lifestyle Growth Portfolio | 6.9% | 6.9% |
| John Hancock Funds II Multimanager Lifestyle Balanced Portfolio | 6.7% | 6.6% |
REPORT OF INDEPENDENT REGISTERED PUBLIC ACCOUNTING FIRM
To the Board of Trustees of John Hancock Funds III and Shareholders of John Hancock Global Shareholder Yield Fund
Opinion on the Financial Statements
We have audited the accompanying statements of assets and liabilities, including the fund's investments, of John Hancock Global Shareholder Yield Fund (the "Fund") as of March 31, 2018 and February 28, 2018, the related statements of operations for the period from March 1, 2018 to March 31, 2018 and for the year ended February 28, 2018, the statements of changes in net assets for the period from March 1, 2018 to March 31, 2018 and for each of the two years in the period ended February 28, 2018, including the related notes, and the financial highlights for each of the periods indicated therein (collectively referred to as the "financial statements"). In our opinion, the financial statements present fairly, in all material respects, the financial position of the Fund as of March 31, 2018 and February 28, 2018, the results of its operations for the period from March 1, 2018 to March 31, 2018 and the year ended February 28, 2018, the changes in its net assets for the period from March 1, 2018 to March 31, 2018 and for each of the two years in the period ended February 28, 2018 and the financial highlights for each of the periods indicated therein in conformity with accounting principles generally accepted in the United States of America.
Basis for Opinion
These financial statements are the responsibility of the Fund's management. Our responsibility is to express an opinion on the Fund's financial statements based on our audits. We are a public accounting firm registered with the Public Company Accounting Oversight Board (United States) ("PCAOB") and are required to be independent with respect to the Fund in accordance with the U.S. federal securities laws and the applicable rules and regulations of the Securities and Exchange Commission and the PCAOB.
We conducted our audits of these financial statements in accordance with the standards of the PCAOB. Those standards require that we plan and perform the audit to obtain reasonable assurance about whether the financial statements are free of material misstatement, whether due to error or fraud.
Our audits included performing procedures to assess the risks of material misstatement of the financial statements, whether due to error or fraud, and performing procedures that respond to those risks. Such procedures included examining, on a test basis, evidence regarding the amounts and disclosures in the financial statements. Our audits also included evaluating the accounting principles used and significant estimates made by management, as well as evaluating the overall presentation of the financial statements. Our procedures included confirmation of securities owned as of March 31, 2018 and February 28, 2018 by correspondence with the custodian and transfer agent. We believe that our audits provide reasonable basis for our opinion.
PricewaterhouseCoopers LLP
Boston, Massachusetts
April 30, 2018
We have served as the auditor of one or more investment companies in the John Hancock family of funds since 1988.
Unaudited
For federal income tax purposes, the following information is furnished with respect to the distributions of the fund, if any, paid during its taxable year ended March 31, 2018 and February 28, 2018.
The fund reports the maximum amount allowable of its net taxable income as eligible for the corporate dividends-received deduction.
The fund reports the maximum amount allowable of its net taxable income as qualified dividend income as provided in the Jobs and Growth Tax Relief Reconciliation Act of 2003.
The fund has the following amounts as foreign tax credits, which represent taxes paid on income derived from foreign sources.
| March 31, 2018 | February 28, 2018 | |
| Foreign sourced income | $4,430,014 | $41,253,948 |
| Foreign tax credit | $493,633 | $2,501,021 |
Eligible shareholders will be mailed a 2018 Form 1099-DIV in early 2019. This will reflect the tax character of all distributions paid in calendar year 2018.
Please consult a tax advisor regarding the tax consequences of your investment in the fund.
This chart provides information about the Trustees and Officers who oversee your John Hancock fund. Officers elected by the Trustees manage the day-to-day operations of the fund and execute policies formulated by the Trustees.
Independent Trustees
| Name, year of birth Position(s) held with Trust Principal occupation(s) and other directorships during past 5 years | Trustee of the Trust since1 | Number of John Hancock funds overseen by Trustee |
| Hassell H. McClellan, Born: 1945 | 2012 | 221 |
| Trustee and Chairperson of the Board Director/Trustee, Virtus Funds (since 2008); Director, The Barnes Group (since 2010); Associate Professor, The Wallace E. Carroll School of Management, Boston College (retired 2013). Trustee (since 2014) and Chairperson of the Board (since 2017), John Hancock Collateral Trust; Trustee (since 2015) and Chairperson of the Board (since 2017), John Hancock Exchange-Traded Fund Trust; Trustee (since 2012) and Chairperson of the Board (since 2017), John Hancock retail funds3; Trustee (2005-2006 and since 2012) and Chairperson of the Board (since 2017), John Hancock Funds III; Trustee (since 2005) and Chairperson of the Board (since 2017), John Hancock Variable Insurance Trust and John Hancock Funds II. | ||
| Charles L. Bardelis,2 Born: 1941 | 2012 | 221 |
| Trustee Director, Island Commuter Corp. (marine transport). Trustee, John Hancock Collateral Trust (since 2014), Trustee, John Hancock Exchange-Traded Fund Trust (since 2015); Trustee, John Hancock retail funds3 (since 2012); Trustee, John Hancock Funds III (2005-2006 and since 2012); Trustee, John Hancock Variable Insurance Trust (since 1988); Trustee, John Hancock Funds II (since 2005). | ||
| James R. Boyle, Born: 1959 | 2015 | 221 |
| Trustee Chief Executive Officer, Foresters Financial (since 2018); Chairman and Chief Executive Officer, Zillion Group, Inc. (formerly HealthFleet, Inc.) (healthcare) (2014-2018); Executive Vice President and Chief Executive Officer, U.S. Life Insurance Division of Genworth Financial, Inc. (insurance) (January 2014-July 2014); Senior Executive Vice President, Manulife Financial Corporation, President and Chief Executive Officer, John Hancock (1999-2012); Chairman and Director, John Hancock Advisers, LLC, John Hancock Funds, LLC, and John Hancock Investment Management Services, LLC (2005-2010). Trustee, John Hancock Collateral Trust and John Hancock Exchange-Traded Fund Trust (since 2015); Trustee, John Hancock retail funds3 (2005-2010; 2012-2014 and since 2015); Trustee, John Hancock Variable Insurance Trust and John Hancock Funds II (2005-2014 and since 2015). | ||
| Peter S. Burgess,2 Born: 1942 | 2012 | 221 |
| Trustee Consultant (financial, accounting, and auditing matters) (since 1999); Certified Public Accountant; Partner, Arthur Andersen (independent public accounting firm) (prior to 1999); Director, Lincoln Educational Services Corporation (since 2004); Director, Symetra Financial Corporation (2010-2016); Director, PMA Capital Corporation (2004-2010). Trustee, John Hancock Collateral Trust (since 2014); Trustee, John Hancock Exchange-Traded Fund Trust (since 2015); Trustee, John Hancock retail funds3 (since 2012); Trustee, John Hancock Funds III (2005-2006 and since 2012); Trustee, John Hancock Variable Insurance Trust and John Hancock Funds II (since 2005). | ||
| William H. Cunningham, Born: 1944 | 2006 | 221 |
| Trustee Professor, University of Texas, Austin, Texas (since 1971); former Chancellor, University of Texas System and former President of the University of Texas, Austin, Texas; Chairman (since 2009) and Director (since 2006), Lincoln National Corporation (insurance); Director, Southwest Airlines (since 2000); former Director, LIN Television (2009-2014). Trustee, John Hancock retail funds3 (since 1986); Trustee, John Hancock Variable Insurance Trust (since 2012); Trustee, John Hancock Funds II (2005-2006 and since 2012); Trustee, John Hancock Collateral Trust (since 2014); Trustee, John Hancock Exchange-Traded Fund Trust (since 2015). | ||
Independent Trustees (continued)
| Name, year of birth Position(s) held with Trust Principal occupation(s) and other directorships during past 5 years | Trustee of the Trust since1 | Number of John Hancock funds overseen by Trustee |
| Grace K. Fey, Born: 1946 | 2012 | 221 |
| Trustee Chief Executive Officer, Grace Fey Advisors (since 2007); Director and Executive Vice President, Frontier Capital Management Company (1988-2007); Director, Fiduciary Trust (since 2009). Trustee, John Hancock Collateral Trust (since 2014); Trustee, John Hancock Exchange-Traded Fund Trust (since 2015); Trustee, John Hancock retail funds3 (since 2012); Trustee, John Hancock Variable Insurance Trust and John Hancock Funds II (since 2008). | ||
| Theron S. Hoffman,2 Born: 1947 | 2012 | 221 |
| Trustee Chief Executive Officer, T. Hoffman Associates, LLC (consulting firm) (since 2003); Director, The Todd Organization (consulting firm) (2003-2010); President, Westport Resources Management (investment management consulting firm) (2006-2008); Board Member, Senior Managing Director, Partner, and Operating Head, Putnam Investments (2000-2003); Executive Vice President, The Thomson Corp. (financial and legal information publishing) (1997-2000). Trustee, John Hancock Collateral Trust (since 2014); Trustee, John Hancock Exchange-Traded Fund Trust (since 2015); Trustee, John Hancock retail funds3 (since 2012); Trustee, John Hancock Variable Insurance Trust and John Hancock Funds II (since 2008). | ||
| Deborah C. Jackson, Born: 1952 | 2008 | 221 |
| Trustee President, Cambridge College, Cambridge, Massachusetts (since 2011); Board of Directors, National Association of Corporate Directors/New England (since 2015); Board of Directors, Association of Independent Colleges and Universities of Massachusetts (since 2014); Chief Executive Officer, American Red Cross of Massachusetts Bay (2002-2011); Board of Directors of Eastern Bank Corporation (since 2001); Board of Directors of Eastern Bank Charitable Foundation (since 2001); Board of Directors of American Student Assistance Corporation (1996-2009); Board of Directors of Boston Stock Exchange (2002-2008); Board of Directors of Harvard Pilgrim Healthcare (health benefits company) (2007-2011). Trustee, John Hancock retail funds3 (since 2008); Trustee, John Hancock Variable Insurance Trust and John Hancock Funds II (since 2012); Trustee, John Hancock Collateral Trust (since 2014); and Trustee, John Hancock Exchange-Traded Fund Trust (since 2015). | ||
| James M. Oates, Born: 1946 | 2012 | 221 |
Trustee | ||
Independent Trustees (continued)
| Name, year of birth Position(s) held with Trust Principal occupation(s) and other directorships during past 5 years | Trustee of the Trust since1 | Number of John Hancock funds overseen by Trustee |
| Steven R. Pruchansky, Born: 1944 | 2006 | 221 |
| Trustee and Vice Chairperson of the Board Managing Director, Pru Realty (since 2017); Chairman and Chief Executive Officer, Greenscapes of Southwest Florida, Inc. (since 2000); Director and President, Greenscapes of Southwest Florida, Inc. (until 2000); Member, Board of Advisors, First American Bank (until 2010); Managing Director, Jon James, LLC (real estate) (since 2000); Partner, Right Funding, LLC (2014-2017); Director, First Signature Bank & Trust Company (until 1991); Director, Mast Realty Trust (until 1994); President, Maxwell Building Corp. (until 1991). Trustee (since 1992) and Chairperson of the Board (2011-2012), John Hancock retail funds3; Trustee and Vice Chairperson of the Board, John Hancock retail funds3 John Hancock Variable Insurance Trust, and John Hancock Funds II (since 2012); Trustee and Vice Chairperson of the Board, John Hancock Collateral Trust (since 2014); Trustee and Vice Chairperson of the Board, John Hancock Exchange-Traded Fund Trust (since 2015). | ||
| Gregory A. Russo, Born: 1949 | 2008 | 221 |
| Trustee Director and Audit Committee Chairman (since 2012), and Member, Audit Committee and Finance Committee (since 2011), NCH Healthcare System, Inc. (holding company for multi-entity healthcare system); Director and Member (since 2012) and Finance Committee Chairman (since 2014), The Moorings, Inc. (nonprofit continuing care community); Vice Chairman, Risk & Regulatory Matters, KPMG LLP (KPMG) (2002-2006); Vice Chairman, Industrial Markets, KPMG (1998-2002); Chairman and Treasurer, Westchester County, New York, Chamber of Commerce (1986-1992); Director, Treasurer, and Chairman of Audit and Finance Committees, Putnam Hospital Center (1989-1995); Director and Chairman of Fundraising Campaign, United Way of Westchester and Putnam Counties, New York (1990-1995). Trustee, John Hancock retail funds3 (since 2008); Trustee, John Hancock Variable Insurance Trust and John Hancock Funds II (since 2012); Trustee, John Hancock Collateral Trust (since 2014); Trustee, John Hancock Exchange-Traded Fund Trust (since 2015). | ||
Non-Independent Trustees4
| Name, year of birth Position(s) held with Trust Principal occupation(s) and other directorships during past 5 years | Trustee of the Trust since1 | Number of John Hancock funds overseen by Trustee |
| Andrew G. Arnott, Born: 1971 | 2017 | 221 |
President and Non-Independent Trustee | ||
| Warren A. Thomson, Born: 1955 | 2012 | 221 |
| Non-Independent Trustee Senior Executive Vice President and Chief Investment Officer, Manulife Financial Corporation and The Manufacturers Life Insurance Company (since 2009); Chairman, Manulife Asset Management (since 2001, including prior positions); Director and Chairman, Manulife Asset Management Limited (since 2006); Director and Chairman, Hancock Natural Resources Group, Inc. (since 2013). Trustee, John Hancock retail funds,3 John Hancock Variable Insurance Trust, and John Hancock Funds II (since 2012); Trustee, John Hancock Collateral Trust (since 2014); Trustee, John Hancock Exchange-Traded Fund Trust (since 2015). | ||
Principal officers who are not Trustees
| Name, year of birth Position(s) held with Trust Principal occupation(s) during past 5 years | Officer of the Trust since |
| John J. Danello, Born: 1955 | 2014 |
| Senior Vice President, Secretary, and Chief Legal Officer Vice President and Chief Counsel, John Hancock Wealth Management (since 2005); Senior Vice President (since 2007) and Chief Legal Counsel (2007-2010), John Hancock Funds, LLC and The Berkeley Financial Group, LLC; Senior Vice President (since 2006, including prior positions) and Chief Legal Officer and Secretary (since 2014), John Hancock retail funds,3 John Hancock Funds II and John Hancock Variable Insurance Trust; Senior Vice President, Secretary and Chief Legal Officer, John Hancock Collateral Trust and John Hancock Exchange-Traded Fund Trust (since 2014); Vice President, John Hancock Life & Health Insurance Company (since 2009); Vice President, John Hancock Life Insurance Company (USA) and John Hancock Life Insurance Company of New York (since 2010); and Senior Vice President, Secretary and Chief Legal Counsel (2007-2014, including prior positions) of John Hancock Advisers, LLC and John Hancock Investment Management Services, LLC. | |
| Francis V. Knox, Jr., Born: 1947 | 2006 |
| Chief Compliance Officer Vice President, John Hancock Financial Services (since 2005); Chief Compliance Officer, John Hancock retail funds,3 John Hancock Variable Insurance Trust, John Hancock Funds II, John Hancock Advisers, LLC, and John Hancock Investment Management Services, LLC (since 2005); Chief Compliance Officer, John Hancock Collateral Trust and John Hancock Exchange-Traded Fund Trust (since 2014). | |
| Charles A. Rizzo, Born: 1957 | 2007 |
| Chief Financial Officer Vice President, John Hancock Financial Services (since 2008); Senior Vice President, John Hancock Advisers, LLC and John Hancock Investment Management Services, LLC (since 2008); Chief Financial Officer, John Hancock retail funds,3 John Hancock Variable Insurance Trust and John Hancock Funds II (since 2007); Chief Financial Officer, John Hancock Collateral Trust and John Hancock Exchange-Traded Fund Trust (since 2014). | |
| Salvatore Schiavone, Born: 1965 | 2010 |
| Treasurer Assistant Vice President, John Hancock Financial Services (since 2007); Vice President, John Hancock Advisers, LLC and John Hancock Investment Management Services, LLC (since 2007); Treasurer, John Hancock retail funds3 (since 2007, including prior positions); Treasurer, John Hancock Variable Insurance Trust and John Hancock Funds II (2007-2009 and since 2010, including prior positions); Treasurer, John Hancock Collateral Trust and John Hancock Exchange-Traded Fund Trust (since 2014). | |
The business address for all Trustees and Officers is 601 Congress Street, Boston, Massachusetts 02210-2805.
The Statement of Additional Information of the fund includes additional information about members of the Board of Trustees of the Trust and is available without charge, upon request, by calling 800-225-5291.
| 1 | Each Trustee holds office until his or her successor is elected and qualified, or until the Trustee's death, retirement, resignation, or removal. Mr. Boyle has served as Trustee at various times prior to the date listed in the table. |
| 2 | Member of the Audit Committee. |
| 3 | "John Hancock retail funds" comprises John Hancock Funds III and 40 other John Hancock funds consisting of 30 series of other John Hancock trusts and 10 closed-end funds. |
| 4 | The Trustee is a Non-Independent Trustee due to current or former positions with the Advisor and certain affiliates. |
Trustees Hassell H. McClellan, Chairperson Officers Andrew G. Arnott John J. Danello Francis V. Knox, Jr. Charles A. Rizzo Salvatore Schiavone | Investment advisor John Hancock Advisers, LLC Subadvisor Epoch Investment Partners, Inc. Principal distributor John Hancock Funds, LLC Custodian Citibank, N.A. Transfer agent John Hancock Signature Services, Inc. Legal counsel K&L Gates LLP Independent registered public accounting firm PricewaterhouseCoopers LLP |
*Member of the Audit Committee
†Non-Independent Trustee
#Effective 6-20-17
The fund's proxy voting policies and procedures, as well as the fund proxy voting record for the most recent twelve-month period ended June 30, are available free of charge on the Securities and Exchange Commission (SEC) website at sec.gov or on our website.
The fund's complete list of portfolio holdings, for the first and third fiscal quarters, is filed with the SEC on Form N-Q. The fund's Form N-Q is available on our website and the SEC's website, sec.gov, and can be reviewed and copied (for a fee) at the SEC's Public Reference Room in Washington, DC. Call 800-SEC-0330 to receive information on the operation of the SEC's Public Reference Room.
We make this information on your fund, as well as monthly portfolio holdings, and other fund details available on our website at jhinvestments.com or by calling 800-225-5291.
| You can also contact us: | |||
| 800-225-5291 jhinvestments.com | Regular mail: John Hancock Signature Services, Inc. | Express mail: John Hancock Signature Services, Inc. | |
John Hancock family of funds
DOMESTIC EQUITY FUNDS Balanced Blue Chip Growth Classic Value Disciplined Value Disciplined Value Mid Cap Equity Income Fundamental All Cap Core Fundamental Large Cap Core Fundamental Large Cap Value New Opportunities Small Cap Core Small Cap Growth Small Cap Value Strategic Growth U.S. Global Leaders Growth U.S. Growth Value Equity GLOBAL AND INTERNATIONAL EQUITY FUNDS Disciplined Value International Emerging Markets Emerging Markets Equity Fundamental Global Franchise Global Equity Global Shareholder Yield Greater China Opportunities International Growth International Small Company International Value Equity | INCOME FUNDS Bond California Tax-Free Income Emerging Markets Debt Floating Rate Income Global Income Government Income High Yield High Yield Municipal Bond Income Investment Grade Bond Money Market Short Duration Credit Opportunities Spectrum Income Strategic Income Opportunities Tax-Free Bond ALTERNATIVE AND SPECIALTY FUNDS Absolute Return Currency Alternative Asset Allocation Enduring Assets Financial Industries Global Absolute Return Strategies Global Conservative Absolute Return Global Focused Strategies Natural Resources Redwood Regional Bank Seaport Technical Opportunities |
A fund's investment objectives, risks, charges, and expenses should be considered carefully before investing. The prospectus contains this and other important information about the fund. To obtain a prospectus, contact your financial professional, call John Hancock Investments at 800-225-5291, or visit our website at jhinvestments.com. Please read the prospectus carefully before investing or sending money.
ASSET ALLOCATION Income Allocation Multi-Index Lifetime Portfolios Multi-Index Preservation Portfolios Multimanager Lifestyle Portfolios Multimanager Lifetime Portfolios Retirement Income 2040 EXCHANGE-TRADED FUNDS John Hancock Multifactor Consumer Discretionary ETF John Hancock Multifactor Consumer Staples ETF John Hancock Multifactor Developed International ETF John Hancock Multifactor Energy ETF John Hancock Multifactor Financials ETF John Hancock Multifactor Healthcare ETF John Hancock Multifactor Industrials ETF John Hancock Multifactor Large Cap ETF John Hancock Multifactor Materials ETF John Hancock Multifactor Mid Cap ETF John Hancock Multifactor Small Cap ETF John Hancock Multifactor Technology ETF John Hancock Multifactor Utilities ETF | ENVIRONMENTAL, SOCIAL, AND GOVERNANCE FUNDS ESG All Cap Core ESG Core Bond ESG International Equity ESG Large Cap Core CLOSED-END FUNDS Financial Opportunities Hedged Equity & Income Income Securities Trust Investors Trust Preferred Income Preferred Income II Preferred Income III Premium Dividend Tax-Advantaged Dividend Income Tax-Advantaged Global Shareholder Yield |
John Hancock Multifactor ETF shares are bought and sold at market price (not NAV), and are not individually redeemed
from the fund. Brokerage commissions will reduce returns.
John Hancock ETFs are distributed by Foreside Fund Services, LLC, and are subadvised by Dimensional Fund Advisors LP.
Foreside is not affiliated with John Hancock Funds, LLC or Dimensional Fund Advisors LP.
Dimensional Fund Advisors LP receives compensation from John Hancock in connection with licensing rights to the
John Hancock Dimensional indexes. Dimensional Fund Advisors LP does not sponsor, endorse, or sell, and makes no
representation as to the advisability of investing in, John Hancock Multifactor ETFs.
John Hancock Investments
A trusted brand
John Hancock Investments is a premier asset manager representing one of
America's most trusted brands, with a heritage of financial stewardship dating
back to 1862. Helping our shareholders pursue their financial goals is at the
core of everything we do. It's why we support the role of professional financial
advice and operate with the highest standards of conduct and integrity.
A better way to invest
We serve investors globally through a unique multimanager approach:
We search the world to find proven portfolio teams with specialized
expertise for every strategy we offer, then we apply robust investment
oversight to ensure they continue to meet our uncompromising standards
and serve the best interests of our shareholders.
Results for investors
Our unique approach to asset management enables us to provide a diverse set
of investments backed by some of the world's best managers, along with strong
risk-adjusted returns across asset classes.
| | John Hancock Funds, LLC n Member FINRA, SIPC 601 Congress Street n Boston, MA 02210-2805 800-225-5291 n jhinvestments.com | |
| This report is for the information of the shareholders of John Hancock Global Shareholder Yield Fund. It is not authorized for distribution to prospective investors unless preceded or accompanied by a prospectus. | ||
| MF444963 | 320A 3/18 5/18 | |
ITEM 2. CODE OF ETHICS.
As of the end of the year, March 31, 2018, the registrant has adopted a code of ethics, as defined in Item 2 of Form N-CSR, that applies to its Chief Executive Officer, Chief Financial Officer and Treasurer (respectively, the principal executive officer, the principal financial officer and the principal accounting officer, the “Senior Financial Officers”). A copy of the code of ethics is filed as an exhibit to this Form N-CSR.
ITEM 3. AUDIT COMMITTEE FINANCIAL EXPERT.
Peter S. Burgess is the audit committee financial expert and is “independent”, pursuant to general instructions on Form N-CSR Item 3.
ITEM 4. PRINCIPAL ACCOUNTANT FEES AND SERVICES.
(a) Audit Fees
The aggregate fees billed for professional services rendered by the principal accountant, for the audits of the registrant’s annual financial statements or services that are normally provided by the accountant in connection with statutory and regulatory filings or engagements amounted to the following for the fiscal period ended March 31, 2018 (the fiscal year end for John Hancock Global Shareholder Yield Fund and John Hancock International Growth Fund changed from February 28 to March 31) and the fiscal years ended February 28, 2018 and February 28, 2017. These fees were billed to the registrant and were approved by the registrant’s audit committee.
| Fund | March 31, 2018 | February 28, 2018 | February 28, 2017 | |||
| John Hancock Global Shareholder Yield Fund | $ | 9,386 | $ | 39,144 | $ | 39,717 |
| John Hancock International Growth Fund | 12,407 | 50,277 | 49,066 | |||
| Total | $ | 21,793 | $ | 89,421 | $ | 88,783 |
(b) Audit-Related Services
Audit-related service fees for assurance and related services by the principal accountant are billed to the registrant or to the registrant's investment adviser (not including any sub-adviser whose role is primarily portfolio management and is subcontracted with or overseen by another investment adviser), and any entity controlling, controlled by, or under common control with the adviser (“control affiliates”) that provides ongoing services to the registrant. The nature of the services provided was affiliated service provider internal controls reviews. In addition, amounts billed to control affiliates for service provider internal controls reviews were $110,200, $110,200 and $106,517 for the fiscal period ended March 31, 2018 and the fiscal years ended February 28, 2018 and February 29, 2017, respectively.
| Fund | March 31, 2018 | February 28, 2018 | February 28, 2017 | |||
| John Hancock Global Shareholder Yield Fund | $ | 0 | $ | 540 | $ | 510 |
| John Hancock International Growth Fund | 0 | 540 | 510 | |||
| Total | $ | 0 | $ | 1,080 | $ | 1,020 |
(c) Tax Fees
The aggregate fees billed for professional services rendered by the principal accountant for tax compliance, tax advice and tax planning (“tax fees”) amounted to the following for the fiscal period ended March 31, 2018 and the fiscal years ended February 28, 2018 and February 28, 2017. The nature of the services comprising the tax fees was the review of the registrant’s tax returns and tax distribution requirements. These fees were billed to the registrant and were approved by the registrant’s audit committee.
| Fund | March 31, 2018 | February 28, 2018 | February 28, 2017 | |||
| John Hancock Global Shareholder Yield Fund | $ | 0 | $ | 3,725 | $ | 3,647 |
| John Hancock International Growth Fund | 0 | 4,275 | 4,197 | |||
| Total | $ | 0 | $ | 8,000 | $ | 7,844 |
(d) All Other Fees
The nature of the services comprising all other fees is attestation services surrounding advisory projects. Other fees amounted to the following for the fiscal period ended March 31, 2018 and the fiscal years ended February 28, 2018 and February 28, 2017 billed to the registrant or to the control affiliates.
| Fund | March 31, 2018 | February 28, 2018 | February 28, 2017 | |||
| John Hancock Global Shareholder Yield Fund | $ | 176 | $ | 860 | $ | 24 |
| John Hancock International Growth Fund | 176 | 860 | 24 | |||
| Total | $ | 352 | $ | 1,720 | $ | 48 |
(e)(1) Audit Committee Pre-Approval Policies and Procedures:
The trust’s Audit Committee must pre-approve all audit and non-audit services provided by the independent registered public accounting firm (the “Auditor”) relating to the operations or financial reporting of the funds. Prior to the commencement of any audit or non-audit services to a fund, the Audit Committee reviews the services to determine whether they are appropriate and permissible under applicable law.
The trust’s Audit Committee has adopted policies and procedures to, among other purposes, provide a framework for the Committee’s consideration of audit-related and non-audit services by the Auditor. The policies and procedures require that any audit-related and non-audit service provided by the Auditor and any non-audit service provided by the Auditor to a fund service provider that relates directly to the operations and financial reporting of a fund are subject to approval by the Audit Committee before such service is provided. Audit-related services provided by the Auditor that are expected to exceed $25,000 per year/per fund are subject to specific pre-approval by the Audit Committee. Tax services provided by the Auditor that are expected to exceed $30,000 per year/per fund are subject to specific pre-approval by the Audit Committee.
All audit services, as well as the audit-related and non-audit services that are expected to exceed the amounts stated above, must be approved in advance of provision of the service by formal resolution of the Audit Committee. At the regularly scheduled Audit Committee meetings, the Committee reviews a report summarizing the services, including fees, provided by the Auditor.
(e)(2) Services approved pursuant to paragraph (c)(7)(i)(C) of Rule 2-01 of Regulation S-X:
Audit-Related Fees, Tax Fees and All Other Fees:
There were no amounts that were approved by the Audit Committee pursuant to the de minimis exception under Rule 2-01 of Regulation S-X.
(f) According to the registrant’s principal accountant for the fiscal period ended March 31, 2018 and the fiscal year ended February 28, 2018, the percentage of hours spent on the audit of the registrant's financial statements for the most recent fiscal year that were attributed to work performed by persons who were not full-time, permanent employees of principal accountant was less than 50%.
(g) The aggregate non-audit fees billed by the registrant’s principal accountant for non-audit services rendered to the registrant and rendered to the registrant's control affiliates were $7,692,718 for the fiscal period ended March 31, 2018, $8,088,435 for the fiscal year ended February 28, 2018 and $5,409,579 for the fiscal year ended February 28, 2017.
(h) The audit committee of the registrant has considered the non-audit services provided by the registrant’s principal accountant to the control affiliates and has determined that the services that were not pre-approved are compatible with maintaining the principal accountant’s independence.
ITEM 5. AUDIT COMMITTEE OF LISTED REGISTRANTS.
The registrant has a separately-designated standing audit committee comprised of independent trustees. The members of the audit committee are as follows:
Peter S. Burgess - Chairman
Charles L. Bardelis
Theron S. Hoffman
ITEM 6. SCHEDULE OF INVESTMENTS.
ITEM 7. DISCLOSURE OF PROXY VOTING POLICIES AND PROCEDURES FOR CLOSED-END MANAGEMENT INVESTMENT COMPANIES.
Not applicable.
ITEM 8. PORTFOLIO MANAGERS OF CLOSED-END MANAGEMENT INVESTMENT COMPANIES.
Not applicable.
ITEM 9. PURCHASES OF EQUITY SECURITIES BY CLOSED-END MANAGEMENT INVESTMENT COMPANY AND AFFILIATED PURCHASERS.
Not applicable.
ITEM 10. SUBMISSION OF MATTERS TO A VOTE OF SECURITY HOLDERS.
The registrant has adopted procedures by which shareholders may recommend nominees to the registrant's Board of Trustees. A copy of the procedures is filed as an exhibit to this Form N-CSR. See attached “John Hancock Funds – Nominating, Governance and Administration Committee Charter”.
ITEM 11. CONTROLS AND PROCEDURES.
(a) Based upon their evaluation of the registrant's disclosure controls and procedures as conducted within 90 days of the filing date of this Form N-CSR, the registrant's principal executive officer and principal financial officer have concluded that those disclosure controls and procedures provide reasonable assurance that the material information required to be disclosed by the registrant on this report is recorded, processed, summarized and reported within the time periods specified in the Securities and Exchange Commission's rules and forms.
(b) There were no changes in the registrant's internal control over financial reporting that occurred during the second fiscal quarter of the period covered by this report that have materially affected, or are reasonably likely to materially affect, the registrant's internal control over financial reporting.
ITEM 12. DISCLOSURE OF SECURITIES LENDING ACTIVITIES FOR CLOSED-END MANAGEMENT INVESTMENT COMPANIES.
Not applicable.
ITEM 13. EXHIBITS.
(a)(1) Code of Ethics for Senior Financial Officers is attached.
(a)(2) Separate certifications for the registrant's principal executive officer and principal financial officer, as required by Section 302 of the Sarbanes-Oxley Act of 2002 and Rule 30a-2(a) under the Investment Company Act of 1940, are attached.
(b)(1) Separate certifications for the registrant's principal executive officer and principal financial officer, as required by 18 U.S.C. Section 1350, as adopted pursuant to Section 906 of the Sarbanes-Oxley Act of 2002, and Rule 30a-2(b) under the Investment Company Act of 1940, are attached. The certifications furnished pursuant to this paragraph are not deemed to be "filed" for purposes of Section 18 of the Securities Exchange Act of 1934, or otherwise subject to the liability of that section. Such certifications are not deemed to be incorporated by reference into any filing under the Securities Act of 1933 or the Securities Exchange Act of 1934, except to the extent that the Registrant specifically incorporates them by reference.
(c)(1) Submission of Matters to a Vote of Security Holders is attached. See attached “John Hancock Funds – Nominating, Governance and Administration Committee Charter”.
SIGNATURES
Pursuant to the requirements of the Securities Exchange Act of 1934 and the Investment Company Act of 1940, the registrant has duly caused this report to be signed on its behalf by the undersigned, thereunto duly authorized.
| John Hancock Funds III | ||
| By: | /s/ Andrew Arnott | |
| Andrew Arnott | ||
| President | ||
| Date: | May 4, 2018 | |
Pursuant to the requirements of the Securities Exchange Act of 1934 and the Investment Company Act of 1940, this report has been signed below by the following persons on behalf of the registrant and in the capacities and on the dates indicated.
| By: | /s/ Andrew Arnott | |
| Andrew Arnott | ||
| President | ||
| Date: | May 4, 2018 | |
| By: | /s/ Charles A. Rizzo | |
| Charles A. Rizzo | ||
| Chief Financial Officer | ||
| Date: | May 4, 2018 |