UNITED STATES
SECURITIES AND EXCHANGE COMMISSION
Washington, D.C. 20549
FORM N-CSR
CERTIFIED SHAREHOLDER REPORT OF REGISTERED
MANAGEMENT INVESTMENT COMPANIES
Investment Company Act file number 811-21777
John Hancock Funds III
(Exact name of registrant as specified in charter)
601 Congress Street, Boston, Massachusetts 02210
(Address of principal executive offices) (Zip code)
Salvatore Schiavone
Treasurer
601 Congress Street
Boston, Massachusetts 02210
(Name and address of agent for service)
Registrant's telephone number, including area code: 617-663-4497
Date of fiscal year end: | March 31 |
|
|
Date of reporting period: | March 31, 2016 |
ITEM 1. REPORTS TO SHAREHOLDERS.
John Hancock
Select Growth Fund
Annual report 3/31/16


A message to shareholders
Dear shareholder,
The 12-month period covered by this report was a challenging one for U.S. equity investors. Many market indexes tumbled late last summer and again in the winter amid concerns about slowing global growth, particularly in China. The volatility extended to commodity markets, as oil prices hit multi-year lows before rebounding toward the end of the period. The investment landscape improved late in the period as stocks and other so-called risk assets regained positive momentum.
Despite the increase in volatility, the economic picture in the United States offers reasons for optimism. In December, the U.S. Federal Reserve raised short-term interest rates for the first time in nine years on evidence that the persistent strength in the labor markets warranted a somewhat less accommodative stance. Economic data generally remained strong entering the spring.
Volatile market environments are naturally unsettling. At John Hancock Investments, portfolio risk management is a critical part of our role as an asset manager, and our dedicated risk team is focused on these issues every day. We continually strive for new ways to analyze potential risks and have liquidity tools in place. However, your best resource in times like these is your financial advisor, who can ensure your portfolio is sufficiently diversified to meet your long-term objectives and to withstand the inevitable bumps along the way.
On behalf of everyone at John Hancock Investments, I'd like to take this opportunity to thank you for the continued trust you've placed in us.
Sincerely,

Andrew G. Arnott
President and Chief Executive Officer
John Hancock Investments
This commentary reflects the CEO's views as of March 31, 2016. They are subject to change at any time. All investments entail risks, including the possible loss of principal. Diversification does not guarantee a profit or eliminate the risk of a loss. For more up-to-date information, you can visit our website at jhinvestments.com.
John Hancock
Select Growth Fund
Table of contents
| 2 | Your fund at a glance | |
| 4 | Discussion of fund performance | |
| 8 | A look at performance | |
| 10 | Your expenses | |
| 12 | Fund's investments | |
| 15 | Financial statements | |
| 19 | Financial highlights | |
| 30 | Notes to financial statements | |
| 39 | Auditor's report | |
| 40 | Tax information | |
| 41 | Shareholder meeting | |
| 42 | Trustees and Officers | |
| 46 | More information |
INVESTMENT OBJECTIVE
The fund seeks to maximize long-term capital appreciation.
AVERAGE ANNUAL TOTAL RETURNS AS OF 3/31/16 (%)
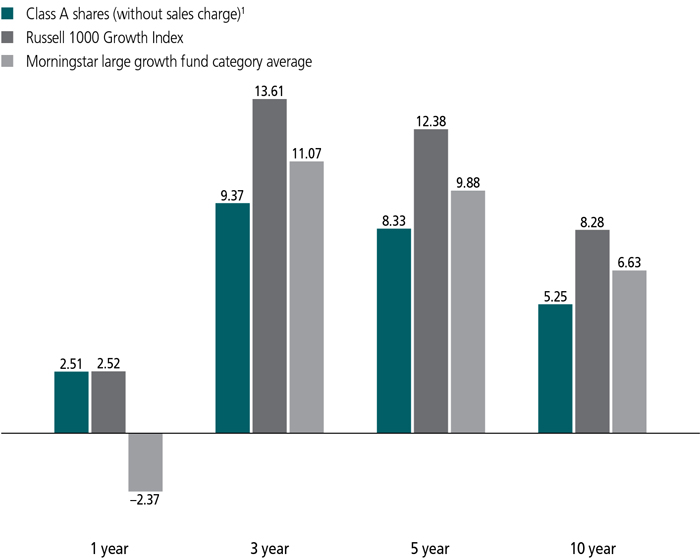
The Russell 1000 Growth Index is an unmanaged index containing those securities in the Russell 1000 Index with a greater-than-average growth orientation.
It is not possible to invest directly in an index. Index figures do not reflect expenses or sales charges, which would result in lower returns.
Figures from Morningstar, Inc. include reinvested distributions and do not take into account sales charges. Actual load-adjusted performance is lower.
| 1 | On 4-25-08, through a reorganization, the fund acquired all of the assets of Rainier Large Cap Growth Equity Portfolio (the predecessor fund). On that date, the predecessor fund's Original shares were exchanged for Class A shares of John Hancock Select Growth Fund (formerly, Rainier Growth Fund). Class A shares were first offered on 4-28-08. Class A shares' returns shown above are those of the predecessor fund's Original shares that have been recalculated to reflect the gross fees and expenses of Class A shares. |
The past performance shown here reflects reinvested distributions and the beneficial effect of any expense reductions, and does not guarantee future results. Performance of the other share classes will vary based on the difference in the fees and expenses of those classes. Shares will fluctuate in value and, when redeemed, may be worth more or less than their original cost. Current month-end performance may be lower or higher than the performance cited, and can be found at jhinvestments.com or by calling 800-225-5291. For further information on the fund's objectives, risks, and strategy, see the fund's prospectus.
PERFORMANCE HIGHLIGHTS OVER THE LAST TWELVE MONTHS
U.S. stocks were mixed but generally higher
In a volatile market environment, U.S. stocks posted mixed results, with the broad indexes advancing modestly despite concerns about slowing global economic growth.
Fund performed in line with its benchmark
The fund's return was just behind that of the Russell 1000 Growth Index for the 12-month period.
Materials and technology contributed, consumer stocks detracted
Portfolio holdings in the materials and information technology sectors contributed to fund performance compared with the benchmark, while positions in the consumer sectors detracted from relative results.
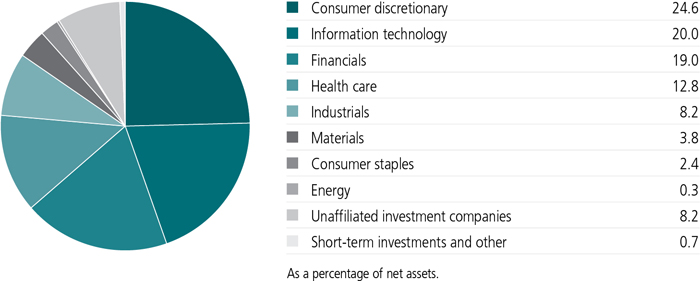
SECTOR COMPOSITION AS OF 3/31/16 (%)
A note about risks
Large company stocks could fall out of favor. The value of a company's equity securities is subject to changes in the company's financial condition, and overall market and economic conditions. Foreign investing has additional risks, such as currency and market volatility and political and social instability. Sector investing is subject to greater risks than the market as a whole. Because the fund may focus on particular sectors of the economy, its performance may depend on the performance of those sectors and investments focused in one sector may fluctuate more than investments in a wider variety of sectors. Frequent trading may increase fund transaction costs. Please see the fund's prospectuses for additional risks.

Gary Robinson, CFA
Portfolio Manager
Baillie Gifford
Can you describe the market environment over the past 12 months?
The major U.S. stock indexes produced mixed results for the reporting period amid significant volatility, with risk-on/risk-off sentiment driving stock market oscillations. Investors worried about various economic and geopolitical issues, including slowing Chinese economic growth, European migration policies, continued conflict in the Middle East, and plunging energy and commodity prices. Investors also scrutinized central bank activity, ranging from quantitative easing and negative interest rates in Europe and Japan to the U.S. Federal Reserve's first interest-rate increase in nine years.
For the 12-month period, the fund's benchmark, the Russell 1000 Growth Index, delivered a modestly positive return, reflecting the outperformance of both large-cap stocks and growth-oriented shares.
As always, our approach to market volatility is to remain focused on the underlying fundamentals of the businesses in which we invest. We aim to identify exceptional U.S. growth businesses and own them for long enough that the advantages of their business models and strength of their cultures become the dominant drivers of stock prices. Bouts of market weakness during the reporting period enabled us to purchase a range of outstanding growth businesses at attractive entry points.
Were there any themes among the portfolio's holdings?
Given our focus on individual stock selection, any sector representation or thematic elements generally result from the individual companies in which we invest. That said, however, the fund was positioned to benefit from a healthy domestic economy and pockets of economic strength—robust employment growth, lower fuel costs for consumers, rising new home sales—that provided a tailwind to a range of U.S.-focused businesses.
We have also been attracted to several large, innovative online platforms whose competitive advantage continues to grow as they attract additional users and expand into new markets. The combination of network scale, mobile technology expertise, and execution ability are powerful advantages that we believe will increase in importance. The power of these large online network
Can you give some examples?
E-commerce giant Amazon.com, Inc., online search and advertising firm Alphabet, Inc. (parent company of Google), and social networking company Facebook, Inc. represent significant holdings in the fund, and all three were among the top contributors to performance for the 12-month period. Operational results for each of these companies were impressive. For example, Facebook's daily active users grew to over a billion, while its instant message apps—WhatsApp and Messenger—have 900 million and 800 million monthly active users, respectively. Paid clicks on Alphabet websites and Amazon Web Services, Inc. both grew substantially.
We have had sufficient evidence over the past decade to say that Alphabet has been excellent at execution, not only in its core search business, but also in branching out into new businesses—Google Maps, Gmail, and the Android smartphone operating system are just a few examples. In the past 18 months, Facebook (Messenger, Instagram) and Amazon (Prime, Web Services, Fulfillment) have demonstrated that they also possess these execution skills. Smaller competitors have been unable to keep pace.
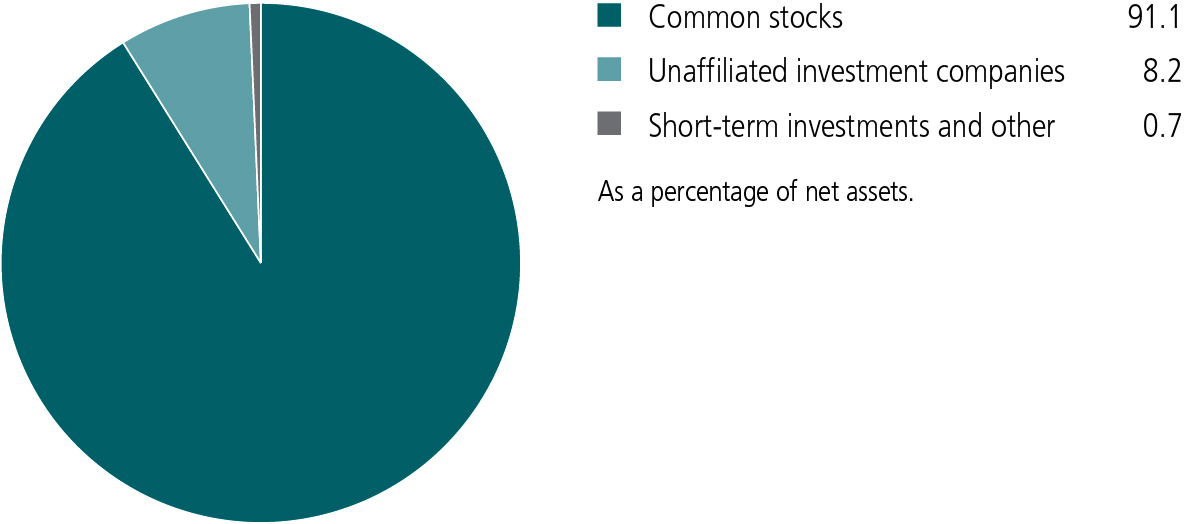
PORTFOLIO COMPOSITION AS OF 3/31/16 (%)
What other holdings aided fund performance during the reporting period?
Two financial companies—electronic bond platform MarketAxess Holdings, Inc. and regional bank First Republic Bank—were among the leading contributors to both absolute and relative performance. MarketAxess saw greater trading volumes and increased market share in 2015, while First Republic Bank maintained its extended track record of strong loan and deposit growth.
Other domestic-focused businesses that fared well during the period included auto parts retailer O'Reilly Automotive, Inc., construction materials companies Vulcan Materials Company and Martin Marietta Materials, Inc., and HVAC equipment company Watsco, Inc. Each of these companies produced strong operational results, consolidated market-leading positions, and benefited from the relative strength of the U.S. economy. We eliminated Vulcan from the portfolio during the reporting period.
What holdings detracted from performance over the past 12 months?
Stock selection in the consumer discretionary sector was a drag on performance during the reporting period, and two of the most notable detractors came from this sector of the portfolio. Online travel company TripAdvisor, Inc. continued to develop its direct booking capabilities, which pressured profit margins in the near term and contributed to share price weakness. However, we are encouraged by the investment and long-term vision, which we believe will strengthen the company's competitive advantage over time.
Restaurant chain Chipotle Mexican Grill, Inc. declined due to multiple food safety scares that linked a number of Chipotle restaurants to norovirus and E. coli outbreaks. Sales have fallen significantly since the outbreaks, but management acted quickly in closing stores, and we don't think there has been long-term damage to the brand.
TOP 10 HOLDINGS AS OF 3/31/16 (%)
| Amazon.com, Inc. | 8.2 |
| Tesla Motors, Inc. | 6.1 |
| First Republic Bank | 4.5 |
| MarketAxess Holdings, Inc. | 4.4 |
| Vanguard S&P 500 ETF | 4.1 |
| iShares Russell 1000 Growth Index Fund | 4.1 |
| MasterCard, Inc., Class A | 4.0 |
| Martin Marietta Materials, Inc. | 3.8 |
| M&T Bank Corp. | 3.5 |
| Facebook, Inc., Class A | 3.5 |
| TOTAL | 46.2 |
| As a percentage of net assets. | |
| Cash and cash equivalents are not included. | |
Can you talk about some of the most recent additions to the portfolio?
There has been a strong flow of new investment ideas from our team recently, and we believe we have added some excellent growth businesses to the portfolio. Examples include streaming content provider Netflix, Inc., online discount broker Interactive Brokers Group, Inc., and visualization software company Tableau Software, Inc. In all three cases, the businesses are run by ambitious founders who invest capital with a long-term mindset. We believe that their distinct cultures make them more adaptable to changing market conditions.
In the recent past, we have also communicated our growing interest in the healthcare sector. We recently initiated two positions in the biotechnology sector, Alnylam Pharmaceuticals, Inc. and Juno Therapeutics, Inc. We believe both of these companies have the potential to be leaders in new therapeutic classes of drugs.
Can you provide some details about the fund's merger?
On December 10, 2015, the fund's Board of Trustees voted to recommend that the shareholders of the fund approve its merger into John Hancock Strategic Growth Fund. On March 30, 2016, shareholders approved the merger, and it occurred as of the close of business on April 22, 2016.
MANAGED BY
| | Gary Robinson, CFA On the fund since 2015 Investing since 2003 |
![]()
TOTAL RETURNS FOR THE PERIOD ENDED MARCH 31, 2016
| Average annual total returns (%) with maximum sales charge | Cumulative total returns (%) with maximum sales charge | ||||||
| 1-year | 5-year | 10-year | 5-year | 10-year | |||
| Class A1 | -2.60 | 7.23 | 4.71 | 41.77 | 58.52 | ||
| Class B1 | -3.11 | 7.19 | 4.30 | 41.53 | 52.33 | ||
| Class C1 | 0.74 | 7.44 | 4.29 | 43.19 | 52.21 | ||
| Class I1,2 | 2.80 | 8.65 | 5.59 | 51.42 | 72.34 | ||
| Class R11,2 | 2.05 | 7.82 | 4.68 | 45.74 | 57.99 | ||
| Class R21,2 | 2.27 | 7.84 | 4.19 | 45.85 | 50.70 | ||
| Class R31,2 | 2.18 | 7.94 | 4.79 | 46.51 | 59.68 | ||
| Class R41,2 | 2.55 | 8.34 | 5.14 | 49.24 | 65.13 | ||
| Class R61,2 | 2.88 | 8.76 | 5.66 | 52.19 | 73.45 | ||
| Class T1,2 | -2.69 | 7.14 | 4.37 | 41.48 | 53.40 | ||
| Class ADV1,2 | 2.61 | 8.42 | 5.35 | 49.83 | 68.39 | ||
| Index 1† | 2.52 | 12.38 | 8.28 | 79.23 | 121.63 | ||
| Index 2† | 1.78 | 11.58 | 7.01 | 72.95 | 96.87 | ||
Performance figures assume all distributions have been reinvested. Figures reflect maximum sales charge on Class A and Class T shares of 5%, and the applicable contingent deferred sales charge (CDSC) on Class B and Class C shares. The Class B shares' CDSC declines annually between years 1 to 6 according to the following schedule: 5%, 4%, 3%, 3%, 2%, and 1%. No sales charge will be assessed after the sixth year. Class C shares sold within one year of purchase are subject to a 1% CDSC. Sales charges are not applicable to Class I, Class R1, Class R2, Class R3, Class R4, Class R6, and Class ADV shares.
The expense ratios of the fund, both net (including any fee waivers and/or expense limitations) and gross (excluding any fee waivers and/or expense limitations), are set forth according to the most recent publicly available prospectuses for the fund and may differ from those disclosed in the Financial highlights tables in this report. Had the fee waivers and expense limitations not been in place, gross expenses would apply. The expense ratios are as follows:
| Class A | Class B | Class C | Class I | Class R1 | Class R2 | Class R3 | Class R4 | Class R6 | Class T | Class ADV | |
| Gross (%) | 1.24 | 1.99 | 1.99 | 0.98 | 1.64 | 1.39 | 1.54 | 1.24 | 0.89 | 1.29 | 1.24 |
| Net (%) | 1.20 | 1.99 | 1.99 | 0.95 | 1.64 | 1.39 | 1.54 | 1.14 | 0.87 | 1.25 | 1.14 |
Please refer to the most recent prospectus and annual or semiannual report for more information on expenses and any expense limitation arrangements for each class.
The returns reflect past results and should not be considered indicative of future performance. The return and principal value of an investment will fluctuate so that shares, when redeemed, may be worth more or less than their original cost. Due to market volatility and other factors, the fund's current performance may be higher or lower than the performance shown. For current to the most recent month-end performance data, please call 800-225-5291 or visit the fund's website at jhinvestments.com.
The performance table above and the chart on the next page do not reflect the deduction of taxes that a shareholder would pay on fund distributions or the redemption of fund shares. The fund's performance results reflect any applicable fee waivers or expense reductions, without which the expenses would increase and results would have been less favorable.
| † | Index 1 is the Russell 1000 Growth Index; Index 2 is the S&P 500 Index. |
See the following page for footnotes.
This chart and table show what happened to a hypothetical $10,000 investment in John Hancock Select Growth Fund for the share classes and periods indicated, assuming all distributions were reinvested. For comparison, we've shown the same investment in two separate indexes.
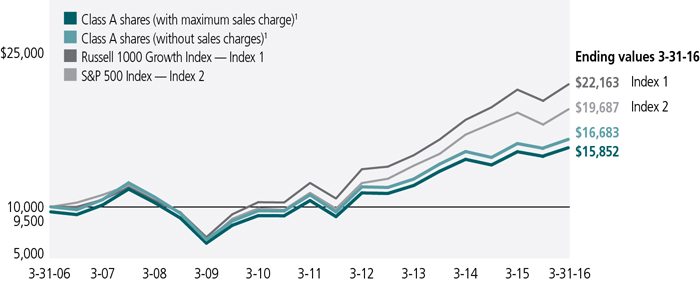
| Start date | With maximum sales charge ($) | Without sales charge ($) | Index 1 ($) | Index 2 ($) | |
| Class B1,3 | 3-31-06 | 15,233 | 15,233 | 22,163 | 19,687 |
| Class C1,3 | 3-31-06 | 15,221 | 15,221 | 22,163 | 19,687 |
| Class I1,2 | 3-31-06 | 17,234 | 17,234 | 22,163 | 19,687 |
| Class R11,2 | 3-31-06 | 15,799 | 15,799 | 22,163 | 19,687 |
| Class R21,2 | 3-31-06 | 15,070 | 15,070 | 22,163 | 19,687 |
| Class R31,2 | 3-31-06 | 15,968 | 15,968 | 22,163 | 19,687 |
| Class R41,2 | 3-31-06 | 16,513 | 16,513 | 22,163 | 19,687 |
| Class R61,2 | 3-31-06 | 17,345 | 17,345 | 22,163 | 19,687 |
| Class T1,2 | 3-31-06 | 15,340 | 16,144 | 22,163 | 19,687 |
| Class ADV1,2 | 3-31-06 | 16,839 | 16,839 | 22,163 | 19,687 |
The Russell 1000 Growth Index is an unmanaged index containing those securities in the Russell 1000 Index with a greater-than-average growth orientation.
The S&P 500 Index is an unmanaged index that includes 500 widely traded common stocks.
It is not possible to invest directly in an index. Index figures do not reflect expenses or sales charges, which would result in lower returns.
Footnotes related to performance pages
| 1 | On 4-25-08, through a reorganization, the fund acquired all of the assets of Rainier Large Cap Growth Equity Portfolio (the predecessor fund). On that date, the predecessor fund's Original shares and Institutional shares were exchanged for Class A and Class I shares, respectively, of John Hancock Select Growth (formerly, Rainier Growth) Fund, which were first offered on 4-28-08. Class A, Class B, Class C, Class I, Class R1, Class R3, Class R4, and Class ADV shares of John Hancock Rainier Growth Fund were first offered on 4-28-08; Class T shares were first offered on 10-6-08; Class R6 shares were first offered on 9-1-11; Class R2 shares were first offered on 3-1-12. The returns prior to these dates are those of the predecessor fund's Original shares that have been recalculated to reflect the gross fees and expenses of Class A, Class B, Class C, Class I, Class R1, Class R3, Class R4, Class ADV, Class T, Class R6, and Class R2 shares, as applicable. |
| 2 | For certain types of investors, as described in the fund's prospectuses. |
| 3 | The contingent deferred sales charge is not applicable. |
These examples are intended to help you understand your ongoing operating expenses of investing in the fund so you can compare these costs with the ongoing costs of investing in other mutual funds.
Understanding fund expenses
As a shareholder of the fund, you incur two types of costs:
| • | Transaction costs, which include sales charges (loads) on purchases or redemptions (varies by share class), minimum account fee charge, etc. |
| • | Ongoing operating expenses, including management fees, distribution and service fees (if applicable), and other fund expenses. |
We are presenting only your ongoing operating expenses here.
Actual expenses/actual returns
This example is intended to provide information about the fund's actual ongoing operating expenses, and is based on the fund's actual return. It assumes an account value of $1,000.00 on October 1, 2015, with the same investment held until March 31, 2016.
| Account value on 10-1-2015 | Ending value on 3-31-2016 | Expenses paid during period ended 3-31-20161 | Annualized expense ratio | |
| Class A | $1,000.00 | $1,056.10 | $6.17 | 1.20% |
| Class B | 1,000.00 | 1,052.00 | 10.26 | 2.00% |
| Class C | 1,000.00 | 1,051.50 | 10.26 | 2.00% |
| Class I | 1,000.00 | 1,057.60 | 4.89 | 0.95% |
| Class R1 | 1,000.00 | 1,053.80 | 8.42 | 1.64% |
| Class R2 | 1,000.00 | 1,055.10 | 7.14 | 1.39% |
| Class R3 | 1,000.00 | 1,054.20 | 7.91 | 1.54% |
| Class R4 | 1,000.00 | 1,056.30 | 6.12 | 1.19% |
| Class R6 | 1,000.00 | 1,058.20 | 4.48 | 0.87% |
| Class T | 1,000.00 | 1,055.90 | 6.42 | 1.25% |
| Class ADV | 1,000.00 | 1,056.70 | 5.86 | 1.14% |
Together with the value of your account, you may use this information to estimate the operating expenses that you paid over the period. Simply divide your account value at March 31, 2016, by $1,000.00, then multiply it by the "expenses paid" for your share class from the table above. For example, for an account value of $8,600.00, the operating expenses should be calculated as follows:

Hypothetical example for comparison purposes
This table allows you to compare the fund's ongoing operating expenses with those of any other fund. It provides an example of the fund's hypothetical account values and hypothetical expenses based on each class's actual expense ratio and an assumed 5% annualized return before expenses (which is not the fund's actual return). It assumes an account value of $1,000.00 on October 1, 2015, with the same investment held until March 31, 2016. Look in any other fund shareholder report to find its hypothetical example and you will be able to compare these expenses. Please remember that these hypothetical account values and expenses may not be used to estimate the actual ending account balance or expenses you paid for the period.
| Account value on 10-1-2015 | Ending value on 3-31-2016 | Expenses paid during period ended 3-31-20161 | Annualized expense ratio | |
| Class A | $1,000.00 | $1,019.00 | $6.06 | 1.20% |
| Class B | 1,000.00 | 1,015.00 | 10.07 | 2.00% |
| Class C | 1,000.00 | 1,015.00 | 10.07 | 2.00% |
| Class I | 1,000.00 | 1,020.30 | 4.80 | 0.95% |
| Class R1 | 1,000.00 | 1,016.80 | 8.27 | 1.64% |
| Class R2 | 1,000.00 | 1,018.10 | 7.01 | 1.39% |
| Class R3 | 1,000.00 | 1,017.30 | 7.77 | 1.54% |
| Class R4 | 1,000.00 | 1,019.10 | 6.01 | 1.19% |
| Class R6 | 1,000.00 | 1,020.70 | 4.40 | 0.87% |
| Class T | 1,000.00 | 1,018.80 | 6.31 | 1.25% |
| Class ADV | 1,000.00 | 1,019.30 | 5.76 | 1.14% |
Remember, these examples do not include any transaction costs, therefore, these examples will not help you to determine the relative total costs of owning different funds. If transaction costs were included, your expenses would have been higher. See the prospectuses for details regarding transaction costs.
| 1 | Expenses are equal to the fund's annualized expense ratio, multiplied by the average account value over the period, multiplied by 183/366 (to reflect the one-half year period). |
Fund's investments
| As of 3-31-16 | ||||||||||||||
| Shares | Value | |||||||||||||
| Common stocks 91.1% | $325,597,931 | |||||||||||||
| (Cost $295,978,176) | ||||||||||||||
| Consumer discretionary 24.6% | 88,011,171 | |||||||||||||
| Automobiles 7.3% | ||||||||||||||
| Harley-Davidson, Inc. | 85,903 | 4,409,401 | ||||||||||||
| Tesla Motors, Inc. (I) | 94,227 | 21,650,538 | ||||||||||||
| Hotels, restaurants and leisure 2.6% | ||||||||||||||
| Chipotle Mexican Grill, Inc. (I) | 20,073 | 9,453,781 | ||||||||||||
| Internet and catalog retail 11.9% | ||||||||||||||
| Amazon.com, Inc. (I) | 49,314 | 29,274,763 | ||||||||||||
| Netflix, Inc. (I) | 53,700 | 5,489,751 | ||||||||||||
| TripAdvisor, Inc. (I) | 117,315 | 7,801,448 | ||||||||||||
| Specialty retail 2.8% | ||||||||||||||
| CarMax, Inc. (I) | 95,740 | 4,892,314 | ||||||||||||
| O'Reilly Automotive, Inc. (I) | 18,414 | 5,039,175 | ||||||||||||
| Consumer staples 2.4% | 8,616,820 | |||||||||||||
| Beverages 1.2% | ||||||||||||||
| Brown-Forman Corp., Class B | 43,210 | 4,254,889 | ||||||||||||
| Household products 1.2% | ||||||||||||||
| Colgate-Palmolive Company | 61,740 | 4,361,931 | ||||||||||||
| Energy 0.3% | 1,152,648 | |||||||||||||
| Oil, gas and consumable fuels 0.3% | ||||||||||||||
| Apache Corp. | 23,615 | 1,152,648 | ||||||||||||
| Financials 19.0% | 67,831,751 | |||||||||||||
| Banks 8.0% | ||||||||||||||
| First Republic Bank | 242,330 | 16,148,871 | ||||||||||||
| M&T Bank Corp. | 112,155 | 12,449,204 | ||||||||||||
| Capital markets 2.7% | ||||||||||||||
| Interactive Brokers Group, Inc., Class A | 98,100 | 3,857,292 | ||||||||||||
| TD Ameritrade Holding Corp. | 187,000 | 5,896,110 | ||||||||||||
| Consumer finance 0.6% | ||||||||||||||
| LendingClub Corp. (I) | 252,008 | 2,091,666 | ||||||||||||
| Diversified financial services 4.4% | ||||||||||||||
| MarketAxess Holdings, Inc. | 124,715 | 15,568,173 | ||||||||||||
| Insurance 3.3% | ||||||||||||||
| Markel Corp. (I) | 13,258 | 11,820,435 | ||||||||||||
| Shares | Value | |||||||||||||
| Health care 12.8% | $45,601,806 | |||||||||||||
| Biotechnology 4.6% | ||||||||||||||
| Alnylam Pharmaceuticals, Inc. (I) | 55,315 | 3,472,123 | ||||||||||||
| Genomic Health, Inc. (I) | 216,793 | 5,369,963 | ||||||||||||
| Juno Therapeutics, Inc. (I) | 129,900 | 4,947,891 | ||||||||||||
| Seattle Genetics, Inc. (I) | 75,300 | 2,642,277 | ||||||||||||
| Health care equipment and supplies 4.4% | ||||||||||||||
| ABIOMED, Inc. (I) | 86,595 | 8,210,072 | ||||||||||||
| IDEXX Laboratories, Inc. (I) | 93,114 | 7,292,688 | ||||||||||||
| Life sciences tools and services 2.7% | ||||||||||||||
| Illumina, Inc. (I) | 11,479 | 1,860,861 | ||||||||||||
| Waters Corp. (I) | 59,645 | 7,868,368 | ||||||||||||
| Pharmaceuticals 1.1% | ||||||||||||||
| Bristol-Myers Squibb Company | 61,640 | 3,937,563 | ||||||||||||
| Industrials 8.2% | 29,385,020 | |||||||||||||
| Industrial conglomerates 1.5% | ||||||||||||||
| Danaher Corp. | 54,780 | 5,196,431 | ||||||||||||
| Machinery 2.1% | ||||||||||||||
| Wabtec Corp. | 96,700 | 7,667,343 | ||||||||||||
| Trading companies and distributors 4.6% | ||||||||||||||
| NOW, Inc. (I) | 254,643 | 4,512,274 | ||||||||||||
| Watsco, Inc. | 89,127 | 12,008,972 | ||||||||||||
| Information technology 20.0% | 71,399,371 | |||||||||||||
| Internet software and services 14.3% | ||||||||||||||
| Alphabet, Inc., Class A (I) | 16,130 | 12,305,577 | ||||||||||||
| Alphabet, Inc., Class C (I) | 15,870 | 11,822,357 | ||||||||||||
| eBay, Inc. (I) | 148,413 | 3,541,134 | ||||||||||||
| Facebook, Inc., Class A (I) | 109,040 | 12,441,464 | ||||||||||||
| GrubHub, Inc. (I) | 366,947 | 9,221,378 | ||||||||||||
| Zillow Group, Inc., Class A (I) | 28,300 | 723,065 | ||||||||||||
| Zillow Group, Inc., Class C (I) | 46,618 | 1,106,245 | ||||||||||||
| IT services 4.2% | ||||||||||||||
| MasterCard, Inc., Class A | 152,780 | 14,437,710 | ||||||||||||
| Source HOV (I)(R) | 510 | 360,259 | ||||||||||||
| Software 1.5% | ||||||||||||||
| Tableau Software, Inc., Class A (I) | 118,600 | 5,440,182 | ||||||||||||
| Materials 3.8% | 13,599,344 | |||||||||||||
| Construction materials 3.8% | ||||||||||||||
| Martin Marietta Materials, Inc. | 85,257 | 13,599,344 | ||||||||||||
| Shares | Value | |||||||||||||
| Warrants 0.0% | $14,924 | |||||||||||||
| (Cost $0) | ||||||||||||||
| Health care 0.0% | 14,924 | |||||||||||||
| HealthSouth Corp. (Expiration Date: 1-17-17; Strike Price: $41.40) (I) | 7,280 | 14,924 | ||||||||||||
| Unaffiliated investment companies 8.2% | $29,528,389 | |||||||||||||
| (Cost $29,680,073) | ||||||||||||||
| iShares Russell 1000 Growth Index Fund | 147,863 | 14,753,770 | ||||||||||||
| Vanguard S&P 500 ETF | 78,355 | 14,774,619 | ||||||||||||
| Yield (%) | Shares | Value | ||||||||||||
| Short-term investments 0.9% | $3,116,133 | |||||||||||||
| (Cost $3,116,133) | ||||||||||||||
| Money market funds 0.9% | 3,116,133 | |||||||||||||
| State Street Institutional Liquid Reserves Fund | 0.4442(Y | ) | 3,116,133 | 3,116,133 | ||||||||||
| Total investments (Cost $328,774,382)† 100.2% | $358,257,377 | |||||||||||||
| Other assets and liabilities, net (0.2%) | ($822,264 | ) | ||||||||||||
| Total net assets 100.0% | $357,435,113 | |||||||||||||
| The percentage shown for each investment category is the total value of the category as a percentage of the net assets of the fund. | ||||||||||||||
| Key to Security Abbreviations and Legend | ||||||||||||||
| (I) | Non-income producing security. | |||||||||||||
| (R) | Direct placement securities are restricted as to resale and the fund has limited rights to registration under the Securities Act of 1933. For more information on this security refer to the Notes to financial statements. | |||||||||||||
| (Y) | The rate shown is the annualized seven-day yield as of 3-31-16. | |||||||||||||
| † | At 3-31-16, the aggregate cost of investment securities for federal income tax purposes was $329,004,396. Net unrealized appreciation aggregated to $29,252,981, of which $50,647,184 related to appreciated investment securities and $21,394,203 related to depreciated investment securities. | |||||||||||||
Financial statements
STATEMENT OF ASSETS AND LIABILITIES 3-31-16
| Assets | ||||||||||||||||||||||||||||||
| Investments, at value (Cost $328,774,382) | $358,257,377 | |||||||||||||||||||||||||||||
| Receivable for investments sold | 29,222,322 | |||||||||||||||||||||||||||||
| Receivable for fund shares sold | 18,593 | |||||||||||||||||||||||||||||
| Dividends and interest receivable | 73,272 | |||||||||||||||||||||||||||||
| Other receivables and prepaid expenses | 110,244 | |||||||||||||||||||||||||||||
| Total assets | 387,681,808 | |||||||||||||||||||||||||||||
| Liabilities | ||||||||||||||||||||||||||||||
| Payable for investments purchased | 29,680,073 | |||||||||||||||||||||||||||||
| Payable for fund shares repurchased | 372,785 | |||||||||||||||||||||||||||||
| Payable to affiliates | ||||||||||||||||||||||||||||||
| Accounting and legal services fees | 3,200 | |||||||||||||||||||||||||||||
| Transfer agent fees | 38,047 | |||||||||||||||||||||||||||||
| Distribution and service fees | 212 | |||||||||||||||||||||||||||||
| Investment management fees | 10,565 | |||||||||||||||||||||||||||||
| Other liabilities and accrued expenses | 141,813 | |||||||||||||||||||||||||||||
| Total liabilities | 30,246,695 | |||||||||||||||||||||||||||||
| Net assets | $357,435,113 | |||||||||||||||||||||||||||||
| Net assets consist of | ||||||||||||||||||||||||||||||
| Paid-in capital | $339,473,206 | |||||||||||||||||||||||||||||
| Undistributed net investment income (loss) | (538,543 | ) | ||||||||||||||||||||||||||||
| Accumulated net realized gain (loss) on investments | (10,982,545 | ) | ||||||||||||||||||||||||||||
| Net unrealized appreciation (depreciation) on investments | 29,482,995 | |||||||||||||||||||||||||||||
| Net assets | $357,435,113 | |||||||||||||||||||||||||||||
STATEMENT OF ASSETS AND LIABILITIES (continued)
| Net asset value per share | ||||||||||||||||||
| Based on net asset values and shares outstanding-the fund has an unlimited number of shares authorized with no par value | ||||||||||||||||||
| Class A ($254,250,648 ÷ 12,554,958 shares)1 | $20.25 | |||||||||||||||||
| Class B ($9,774,407 ÷ 526,521 shares)1 | $18.56 | |||||||||||||||||
| Class C ($16,279,549 ÷ 877,840 shares)1 | $18.55 | |||||||||||||||||
| Class I ($4,374,795 ÷ 207,871 shares) | $21.05 | |||||||||||||||||
| Class R1 ($453,712 ÷ 23,443 shares) | $19.35 | |||||||||||||||||
| Class R2 ($240,739 ÷ 11,684 shares) | $20.60 | |||||||||||||||||
| Class R3 ($206,092 ÷ 10,520 shares) | $19.59 | |||||||||||||||||
| Class R4 ($136,317 ÷ 6,693 shares) | $20.37 | |||||||||||||||||
| Class R6 ($5,188,256 ÷ 244,847 shares) | $21.19 | |||||||||||||||||
| Class T ($65,526,572 ÷ 3,282,503 shares) | $19.96 | |||||||||||||||||
| Class ADV ($1,004,026 ÷ 48,691 shares) | $20.62 | |||||||||||||||||
| Maximum offering price per share | ||||||||||||||||||
| Class A (net asset value per share ÷ 95%)2 | $21.32 | |||||||||||||||||
| Class T (net asset value per share ÷ 95%)2 | $21.01 | |||||||||||||||||
| 1 | Redemption price per share is equal to net asset value less any applicable contingent deferred sales charge. | ||||||||||||||||
| 2 | On single retail sales of less than $50,000. On sales of $50,000 or more and on group sales the offering price is reduced. | ||||||||||||||||
STATEMENT OF OPERATIONS For the year ended 3-31-16
| Investment income | ||||||||||||||||||||||||
| Dividends | $2,785,674 | |||||||||||||||||||||||
| Interest | 13,914 | |||||||||||||||||||||||
| Total investment income | 2,799,588 | |||||||||||||||||||||||
| Expenses | ||||||||||||||||||||||||
| Investment management fees | 2,757,731 | |||||||||||||||||||||||
| Distribution and service fees | 1,148,814 | |||||||||||||||||||||||
| Accounting and legal services fees | 49,431 | |||||||||||||||||||||||
| Transfer agent fees | 466,702 | |||||||||||||||||||||||
| Trustees' fees | 4,753 | |||||||||||||||||||||||
| State registration fees | 184,627 | |||||||||||||||||||||||
| Printing and postage | 78,443 | |||||||||||||||||||||||
| Professional fees | 57,755 | |||||||||||||||||||||||
| Custodian fees | 46,201 | |||||||||||||||||||||||
| Registration and filing fees | 27,228 | |||||||||||||||||||||||
| Other | 71,134 | |||||||||||||||||||||||
| Total expenses | 4,892,819 | |||||||||||||||||||||||
| Less expense reductions | (154,297 | ) | ||||||||||||||||||||||
| Net expenses | 4,738,522 | |||||||||||||||||||||||
| Net investment loss | (1,938,934 | ) | ||||||||||||||||||||||
| Realized and unrealized gain (loss) | ||||||||||||||||||||||||
| Net realized gain (loss) on | ||||||||||||||||||||||||
| Investments | 15,513,132 | |||||||||||||||||||||||
| Change in net unrealized appreciation (depreciation) of | ||||||||||||||||||||||||
| Investments | (5,481,963 | ) | ||||||||||||||||||||||
| Net realized and unrealized gain | 10,031,169 | |||||||||||||||||||||||
| Increase in net assets from operations | $8,092,235 | |||||||||||||||||||||||
STATEMENTS OF CHANGES IN NET ASSETS
| Year ended 3-31-16 | Year ended 3-31-15 | ||||||||||||||||||||||||||||||||||||||||||||
| Increase (decrease) in net assets | |||||||||||||||||||||||||||||||||||||||||||||
| From operations | |||||||||||||||||||||||||||||||||||||||||||||
| Net investment income (loss) | ($1,938,934 | ) | $391,256 | ||||||||||||||||||||||||||||||||||||||||||
| Net realized gain | 15,513,132 | 176,686,267 | |||||||||||||||||||||||||||||||||||||||||||
| Change in net unrealized appreciation (depreciation) | (5,481,963 | ) | (177,443,971 | ) | |||||||||||||||||||||||||||||||||||||||||
| Increase (decrease) in net assets resulting from operations | 8,092,235 | (366,448 | ) | ||||||||||||||||||||||||||||||||||||||||||
| Distributions to shareholders | |||||||||||||||||||||||||||||||||||||||||||||
| From net realized gain | |||||||||||||||||||||||||||||||||||||||||||||
| Class A | (13,179,126 | ) | (82,788,478 | ) | |||||||||||||||||||||||||||||||||||||||||
| Class B | (596,600 | ) | (4,836,642 | ) | |||||||||||||||||||||||||||||||||||||||||
| Class C | (931,520 | ) | (4,983,406 | ) | |||||||||||||||||||||||||||||||||||||||||
| Class I | (529,956 | ) | (15,648,152 | ) | |||||||||||||||||||||||||||||||||||||||||
| Class R1 | (21,572 | ) | (154,733 | ) | |||||||||||||||||||||||||||||||||||||||||
| Class R2 | (12,105 | ) | (28,961 | ) | |||||||||||||||||||||||||||||||||||||||||
| Class R3 | (11,422 | ) | (31,001 | ) | |||||||||||||||||||||||||||||||||||||||||
| Class R4 | (6,941 | ) | (39,217 | ) | |||||||||||||||||||||||||||||||||||||||||
| Class R5 | (4,758 | ) | (28,514 | ) | |||||||||||||||||||||||||||||||||||||||||
| Class R6 | (225,195 | ) | (1,660,185 | ) | |||||||||||||||||||||||||||||||||||||||||
| Class T | (3,439,252 | ) | (19,276,497 | ) | |||||||||||||||||||||||||||||||||||||||||
| Class ADV | (55,925 | ) | (4,206,121 | ) | |||||||||||||||||||||||||||||||||||||||||
| Class NAV | — | (96,887,085 | ) | ||||||||||||||||||||||||||||||||||||||||||
| Total distributions | (19,014,372 | ) | (230,568,992 | ) | |||||||||||||||||||||||||||||||||||||||||
| From fund share transactions | (38,165,131 | ) | (373,649,348 | ) | |||||||||||||||||||||||||||||||||||||||||
| Total decrease | (49,087,268 | ) | (604,584,788 | ) | |||||||||||||||||||||||||||||||||||||||||
| Net assets | |||||||||||||||||||||||||||||||||||||||||||||
| Beginning of year | 406,522,381 | 1,011,107,169 | |||||||||||||||||||||||||||||||||||||||||||
| End of year | $357,435,113 | $406,522,381 | |||||||||||||||||||||||||||||||||||||||||||
| Undistributed net investment income (loss) | ($538,543 | ) | — | ||||||||||||||||||||||||||||||||||||||||||
Financial highlights
| Class A Shares Period ended | 3-31-16 | 3-31-15 | 3-31-14 | 3-31-13 | 3-31-12 | ||||||||||||||||||||||||||||||||||||||||||||||||||||||||||||||||||||||||||||||||||||||||||||||||||
| Per share operating performance | |||||||||||||||||||||||||||||||||||||||||||||||||||||||||||||||||||||||||||||||||||||||||||||||||||||||
| Net asset value, beginning of period | $20.77 | $26.39 | $24.32 | $22.84 | $21.32 | ||||||||||||||||||||||||||||||||||||||||||||||||||||||||||||||||||||||||||||||||||||||||||||||||||
| Net investment income (loss)1 | (0.09 | ) | 0.03 | (0.15 | ) | (0.01 | ) | (0.09 | ) | ||||||||||||||||||||||||||||||||||||||||||||||||||||||||||||||||||||||||||||||||||||||||||||||
| Net realized and unrealized gain on investments | 0.64 | 0.74 | 5.29 | 1.49 | 1.61 | ||||||||||||||||||||||||||||||||||||||||||||||||||||||||||||||||||||||||||||||||||||||||||||||||||
| Total from investment operations | 0.55 | 0.77 | 5.14 | 1.48 | 1.52 | ||||||||||||||||||||||||||||||||||||||||||||||||||||||||||||||||||||||||||||||||||||||||||||||||||
| Less distributions | |||||||||||||||||||||||||||||||||||||||||||||||||||||||||||||||||||||||||||||||||||||||||||||||||||||||
| From net realized gain | (1.07 | ) | (6.39 | ) | (3.07 | ) | — | — | |||||||||||||||||||||||||||||||||||||||||||||||||||||||||||||||||||||||||||||||||||||||||||||||
| Net asset value, end of period | $20.25 | $20.77 | $26.39 | $24.32 | $22.84 | ||||||||||||||||||||||||||||||||||||||||||||||||||||||||||||||||||||||||||||||||||||||||||||||||||
| Total return (%)2,3 | 2.51 | 5.13 | 21.38 | 6.48 | 7.13 | ||||||||||||||||||||||||||||||||||||||||||||||||||||||||||||||||||||||||||||||||||||||||||||||||||
| Ratios and supplemental data | |||||||||||||||||||||||||||||||||||||||||||||||||||||||||||||||||||||||||||||||||||||||||||||||||||||||
| Net assets, end of period (in millions) | $254 | $274 | $356 | $356 | $369 | ||||||||||||||||||||||||||||||||||||||||||||||||||||||||||||||||||||||||||||||||||||||||||||||||||
| Ratios (as a percentage of average net assets): | |||||||||||||||||||||||||||||||||||||||||||||||||||||||||||||||||||||||||||||||||||||||||||||||||||||||
| Expenses before reductions | 1.24 | 1.21 | 1.19 | 1.25 | 1.27 | ||||||||||||||||||||||||||||||||||||||||||||||||||||||||||||||||||||||||||||||||||||||||||||||||||
| Expenses including reductions | 1.20 | 1.20 | 1.19 | 1.25 | 1.27 | ||||||||||||||||||||||||||||||||||||||||||||||||||||||||||||||||||||||||||||||||||||||||||||||||||
| Net investment income (loss) | (0.46 | ) | 0.15 | (0.58 | ) | (0.04 | ) | (0.45 | ) | ||||||||||||||||||||||||||||||||||||||||||||||||||||||||||||||||||||||||||||||||||||||||||||||
| Portfolio turnover (%) | 49 | 155 | 81 | 92 | 90 | ||||||||||||||||||||||||||||||||||||||||||||||||||||||||||||||||||||||||||||||||||||||||||||||||||
| 1 | Based on average daily shares outstanding. | ||||||||||||||||||||||||||||||||||||||||||||||||||||||||||||||||||||||||||||||||||
| 2 | Does not reflect the effect of sales charges, if any. | ||||||||||||||||||||||||||||||||||||||||||||||||||||||||||||||||||||||||||||||||||
| 3 | Total returns would have been lower had certain expenses not been reduced during the applicable periods. | ||||||||||||||||||||||||||||||||||||||||||||||||||||||||||||||||||||||||||||||||||
| Class B Shares Period ended | 3-31-16 | 3-31-15 | 3-31-14 | 3-31-13 | 3-31-12 | ||||||||||||||||||||||||||||||||||||||||||||||||||||||||||||||||||||||||||||||||||||||||||||||||||
| Per share operating performance | |||||||||||||||||||||||||||||||||||||||||||||||||||||||||||||||||||||||||||||||||||||||||||||||||||||||
| Net asset value, beginning of period | $19.27 | $25.12 | $23.46 | $22.22 | $20.90 | ||||||||||||||||||||||||||||||||||||||||||||||||||||||||||||||||||||||||||||||||||||||||||||||||||
| Net investment loss1 | (0.24 | ) | (0.13 | ) | (0.35 | ) | (0.19 | ) | (0.25 | ) | |||||||||||||||||||||||||||||||||||||||||||||||||||||||||||||||||||||||||||||||||||||||||||||
| Net realized and unrealized gain on investments | 0.60 | 0.67 | 5.08 | 1.43 | 1.57 | ||||||||||||||||||||||||||||||||||||||||||||||||||||||||||||||||||||||||||||||||||||||||||||||||||
| Total from investment operations | 0.36 | 0.54 | 4.73 | 1.24 | 1.32 | ||||||||||||||||||||||||||||||||||||||||||||||||||||||||||||||||||||||||||||||||||||||||||||||||||
| Less distributions | |||||||||||||||||||||||||||||||||||||||||||||||||||||||||||||||||||||||||||||||||||||||||||||||||||||||
| From net realized gain | (1.07 | ) | (6.39 | ) | (3.07 | ) | — | — | |||||||||||||||||||||||||||||||||||||||||||||||||||||||||||||||||||||||||||||||||||||||||||||||
| Net asset value, end of period | $18.56 | $19.27 | $25.12 | $23.46 | $22.22 | ||||||||||||||||||||||||||||||||||||||||||||||||||||||||||||||||||||||||||||||||||||||||||||||||||
| Total return (%)2,3 | 1.71 | 4.27 | 20.38 | 5.58 | 6.32 | ||||||||||||||||||||||||||||||||||||||||||||||||||||||||||||||||||||||||||||||||||||||||||||||||||
| Ratios and supplemental data | |||||||||||||||||||||||||||||||||||||||||||||||||||||||||||||||||||||||||||||||||||||||||||||||||||||||
| Net assets, end of period (in millions) | $10 | $13 | $20 | $20 | $25 | ||||||||||||||||||||||||||||||||||||||||||||||||||||||||||||||||||||||||||||||||||||||||||||||||||
| Ratios (as a percentage of average net assets): | |||||||||||||||||||||||||||||||||||||||||||||||||||||||||||||||||||||||||||||||||||||||||||||||||||||||
| Expenses before reductions | 2.00 | 2.04 | 2.00 | 2.06 | 2.07 | ||||||||||||||||||||||||||||||||||||||||||||||||||||||||||||||||||||||||||||||||||||||||||||||||||
| Expenses including reductions | 1.99 | 2.03 | 2.00 | 2.06 | 2.07 | ||||||||||||||||||||||||||||||||||||||||||||||||||||||||||||||||||||||||||||||||||||||||||||||||||
| Net investment loss | (1.25 | ) | (0.69 | ) | (1.39 | ) | (0.86 | ) | (1.24 | ) | |||||||||||||||||||||||||||||||||||||||||||||||||||||||||||||||||||||||||||||||||||||||||||||
| Portfolio turnover (%) | 49 | 155 | 81 | 92 | 90 | ||||||||||||||||||||||||||||||||||||||||||||||||||||||||||||||||||||||||||||||||||||||||||||||||||
| 1 | Based on average daily shares outstanding. | ||||||||||||||||||||||||||||||||||||||||||||||||||||||||||||||||||||||||||||||||||
| 2 | Does not reflect the effect of sales charges, if any. | ||||||||||||||||||||||||||||||||||||||||||||||||||||||||||||||||||||||||||||||||||
| 3 | Total returns would have been lower had certain expenses not been reduced during the applicable periods. | ||||||||||||||||||||||||||||||||||||||||||||||||||||||||||||||||||||||||||||||||||
| Class C Shares Period ended | 3-31-16 | 3-31-15 | 3-31-14 | 3-31-13 | 3-31-12 | ||||||||||||||||||||||||||||||||||||||||||||||||||||||||||||||||||||||||||||||||||||||||||||||||||
| Per share operating performance | |||||||||||||||||||||||||||||||||||||||||||||||||||||||||||||||||||||||||||||||||||||||||||||||||||||||
| Net asset value, beginning of period | $19.26 | $25.10 | $23.45 | $22.21 | $20.90 | ||||||||||||||||||||||||||||||||||||||||||||||||||||||||||||||||||||||||||||||||||||||||||||||||||
| Net investment loss1 | (0.24 | ) | (0.13 | ) | (0.36 | ) | (0.19 | ) | (0.26 | ) | |||||||||||||||||||||||||||||||||||||||||||||||||||||||||||||||||||||||||||||||||||||||||||||
| Net realized and unrealized gain on investments | 0.60 | 0.68 | 5.08 | 1.43 | 1.57 | ||||||||||||||||||||||||||||||||||||||||||||||||||||||||||||||||||||||||||||||||||||||||||||||||||
| Total from investment operations | 0.36 | 0.55 | 4.72 | 1.24 | 1.31 | ||||||||||||||||||||||||||||||||||||||||||||||||||||||||||||||||||||||||||||||||||||||||||||||||||
| Less distributions | |||||||||||||||||||||||||||||||||||||||||||||||||||||||||||||||||||||||||||||||||||||||||||||||||||||||
| From net realized gain | (1.07 | ) | (6.39 | ) | (3.07 | ) | — | — | |||||||||||||||||||||||||||||||||||||||||||||||||||||||||||||||||||||||||||||||||||||||||||||||
| Net asset value, end of period | $18.55 | $19.26 | $25.10 | $23.45 | $22.21 | ||||||||||||||||||||||||||||||||||||||||||||||||||||||||||||||||||||||||||||||||||||||||||||||||||
| Total return (%)2,3 | 1.71 | 4.26 | 20.35 | 5.58 | 6.27 | ||||||||||||||||||||||||||||||||||||||||||||||||||||||||||||||||||||||||||||||||||||||||||||||||||
| Ratios and supplemental data | |||||||||||||||||||||||||||||||||||||||||||||||||||||||||||||||||||||||||||||||||||||||||||||||||||||||
| Net assets, end of period (in millions) | $16 | $17 | $19 | $17 | $20 | ||||||||||||||||||||||||||||||||||||||||||||||||||||||||||||||||||||||||||||||||||||||||||||||||||
| Ratios (as a percentage of average net assets): | |||||||||||||||||||||||||||||||||||||||||||||||||||||||||||||||||||||||||||||||||||||||||||||||||||||||
| Expenses before reductions | 2.00 | 2.05 | 2.03 | 2.07 | 2.11 | ||||||||||||||||||||||||||||||||||||||||||||||||||||||||||||||||||||||||||||||||||||||||||||||||||
| Expenses including reductions | 1.99 | 2.04 | 2.02 | 2.07 | 2.10 | ||||||||||||||||||||||||||||||||||||||||||||||||||||||||||||||||||||||||||||||||||||||||||||||||||
| Net investment loss | (1.26 | ) | (0.69 | ) | (1.42 | ) | (0.88 | ) | (1.27 | ) | |||||||||||||||||||||||||||||||||||||||||||||||||||||||||||||||||||||||||||||||||||||||||||||
| Portfolio turnover (%) | 49 | 155 | 81 | 92 | 90 | ||||||||||||||||||||||||||||||||||||||||||||||||||||||||||||||||||||||||||||||||||||||||||||||||||
| 1 | Based on average daily shares outstanding. | ||||||||||||||||||||||||||||||||||||||||||||||||||||||||||||||||||||||||||||||||||
| 2 | Does not reflect the effect of sales charges, if any. | ||||||||||||||||||||||||||||||||||||||||||||||||||||||||||||||||||||||||||||||||||
| 3 | Total returns would have been lower had certain expenses not been reduced during the applicable periods. | ||||||||||||||||||||||||||||||||||||||||||||||||||||||||||||||||||||||||||||||||||
| Class I Shares Period ended | 3-31-16 | 3-31-15 | 3-31-14 | 3-31-13 | 3-31-12 | ||||||||||||||||||||||||||||||||||||||||||||||||||||||||||||||||||||||||||||||||||||||||||||||||||
| Per share operating performance | |||||||||||||||||||||||||||||||||||||||||||||||||||||||||||||||||||||||||||||||||||||||||||||||||||||||
| Net asset value, beginning of period | $21.50 | $27.03 | $24.80 | $23.24 | $21.61 | ||||||||||||||||||||||||||||||||||||||||||||||||||||||||||||||||||||||||||||||||||||||||||||||||||
| Net investment income (loss)1 | (0.05 | ) | 0.07 | (0.08 | ) | 0.06 | (0.02 | ) | |||||||||||||||||||||||||||||||||||||||||||||||||||||||||||||||||||||||||||||||||||||||||||||||
| Net realized and unrealized gain on investments | 0.67 | 0.79 | 5.41 | 1.52 | 1.65 | ||||||||||||||||||||||||||||||||||||||||||||||||||||||||||||||||||||||||||||||||||||||||||||||||||
| Total from investment operations | 0.62 | 0.86 | 5.33 | 1.58 | 1.63 | ||||||||||||||||||||||||||||||||||||||||||||||||||||||||||||||||||||||||||||||||||||||||||||||||||
| Less distributions | |||||||||||||||||||||||||||||||||||||||||||||||||||||||||||||||||||||||||||||||||||||||||||||||||||||||
| From net investment income | — | — | (0.03 | ) | (0.02 | ) | — | ||||||||||||||||||||||||||||||||||||||||||||||||||||||||||||||||||||||||||||||||||||||||||||||||
| From net realized gain | (1.07 | ) | (6.39 | ) | (3.07 | ) | — | — | |||||||||||||||||||||||||||||||||||||||||||||||||||||||||||||||||||||||||||||||||||||||||||||||
| Total distributions | (1.07 | ) | (6.39 | ) | (3.10 | ) | (0.02 | ) | — | ||||||||||||||||||||||||||||||||||||||||||||||||||||||||||||||||||||||||||||||||||||||||||||||
| Net asset value, end of period | $21.05 | $21.50 | $27.03 | $24.80 | $23.24 | ||||||||||||||||||||||||||||||||||||||||||||||||||||||||||||||||||||||||||||||||||||||||||||||||||
| Total return (%)2 | 2.80 | 5.35 | 21.71 | 6.81 | 7.54 | ||||||||||||||||||||||||||||||||||||||||||||||||||||||||||||||||||||||||||||||||||||||||||||||||||
| Ratios and supplemental data | |||||||||||||||||||||||||||||||||||||||||||||||||||||||||||||||||||||||||||||||||||||||||||||||||||||||
| Net assets, end of period (in millions) | $4 | $13 | $72 | $113 | $256 | ||||||||||||||||||||||||||||||||||||||||||||||||||||||||||||||||||||||||||||||||||||||||||||||||||
| Ratios (as a percentage of average net assets): | |||||||||||||||||||||||||||||||||||||||||||||||||||||||||||||||||||||||||||||||||||||||||||||||||||||||
| Expenses before reductions | 1.00 | 1.00 | 0.91 | 0.91 | 0.91 | ||||||||||||||||||||||||||||||||||||||||||||||||||||||||||||||||||||||||||||||||||||||||||||||||||
| Expenses including reductions | 0.97 | 0.99 | 0.91 | 0.91 | 0.91 | ||||||||||||||||||||||||||||||||||||||||||||||||||||||||||||||||||||||||||||||||||||||||||||||||||
| Net investment income (loss) | (0.21 | ) | 0.31 | (0.28 | ) | 0.25 | (0.08 | ) | |||||||||||||||||||||||||||||||||||||||||||||||||||||||||||||||||||||||||||||||||||||||||||||||
| Portfolio turnover (%) | 49 | 155 | 81 | 92 | 90 | ||||||||||||||||||||||||||||||||||||||||||||||||||||||||||||||||||||||||||||||||||||||||||||||||||
| 1 | Based on average daily shares outstanding. | ||||||||||||||||||||||||||||||||||||||||||||||||||||||||||||||||||||||||||||||||||
| 2 | Total returns would have been lower had certain expenses not been reduced during the applicable periods. | ||||||||||||||||||||||||||||||||||||||||||||||||||||||||||||||||||||||||||||||||||
| Class R1 Shares Period ended | 3-31-16 | 3-31-15 | 3-31-14 | 3-31-13 | 3-31-12 | ||||||||||||||||||||||||||||||||||||||||||||||||||||||||||||||||||||||||||||||||||||||||||||||||||
| Per share operating performance | |||||||||||||||||||||||||||||||||||||||||||||||||||||||||||||||||||||||||||||||||||||||||||||||||||||||
| Net asset value, beginning of period | $19.99 | $25.74 | $23.90 | $22.55 | $21.14 | ||||||||||||||||||||||||||||||||||||||||||||||||||||||||||||||||||||||||||||||||||||||||||||||||||
| Net investment loss1 | (0.18 | ) | (0.07 | ) | (0.29 | ) | (0.11 | ) | (0.17 | ) | |||||||||||||||||||||||||||||||||||||||||||||||||||||||||||||||||||||||||||||||||||||||||||||
| Net realized and unrealized gain on investments | 0.61 | 0.71 | 5.20 | 1.46 | 1.58 | ||||||||||||||||||||||||||||||||||||||||||||||||||||||||||||||||||||||||||||||||||||||||||||||||||
| Total from investment operations | 0.43 | 0.64 | 4.91 | 1.35 | 1.41 | ||||||||||||||||||||||||||||||||||||||||||||||||||||||||||||||||||||||||||||||||||||||||||||||||||
| Less distributions | |||||||||||||||||||||||||||||||||||||||||||||||||||||||||||||||||||||||||||||||||||||||||||||||||||||||
| From net realized gain | (1.07 | ) | (6.39 | ) | (3.07 | ) | — | — | |||||||||||||||||||||||||||||||||||||||||||||||||||||||||||||||||||||||||||||||||||||||||||||||
| Net asset value, end of period | $19.35 | $19.99 | $25.74 | $23.90 | $22.55 | ||||||||||||||||||||||||||||||||||||||||||||||||||||||||||||||||||||||||||||||||||||||||||||||||||
| Total return (%)2 | 2.05 | 4.59 | 20.77 | 5.99 | 6.67 | ||||||||||||||||||||||||||||||||||||||||||||||||||||||||||||||||||||||||||||||||||||||||||||||||||
| Ratios and supplemental data | |||||||||||||||||||||||||||||||||||||||||||||||||||||||||||||||||||||||||||||||||||||||||||||||||||||||
| Net assets, end of period (in millions) | — | 3 | $1 | $1 | — | 3 | — | 3 | |||||||||||||||||||||||||||||||||||||||||||||||||||||||||||||||||||||||||||||||||||||||||||||||
| Ratios (as a percentage of average net assets): | |||||||||||||||||||||||||||||||||||||||||||||||||||||||||||||||||||||||||||||||||||||||||||||||||||||||
| Expenses before reductions | 2.00 | 4.13 | 4.13 | 5.79 | 7.03 | ||||||||||||||||||||||||||||||||||||||||||||||||||||||||||||||||||||||||||||||||||||||||||||||||||
| Expenses including reductions | 1.67 | 1.70 | 1.70 | 1.70 | 1.70 | ||||||||||||||||||||||||||||||||||||||||||||||||||||||||||||||||||||||||||||||||||||||||||||||||||
| Net investment loss | (0.91 | ) | (0.34 | ) | (1.12 | ) | (0.49 | ) | (0.86 | ) | |||||||||||||||||||||||||||||||||||||||||||||||||||||||||||||||||||||||||||||||||||||||||||||
| Portfolio turnover (%) | 49 | 155 | 81 | 92 | 90 | ||||||||||||||||||||||||||||||||||||||||||||||||||||||||||||||||||||||||||||||||||||||||||||||||||
| 1 | Based on average daily shares outstanding. | ||||||||||||||||||||||||||||||||||||||||||||||||||||||||||||||||||||||||||||||||||
| 2 | Total returns would have been lower had certain expenses not been reduced during the applicable periods. | ||||||||||||||||||||||||||||||||||||||||||||||||||||||||||||||||||||||||||||||||||
| 3 | Less than $500,000. | ||||||||||||||||||||||||||||||||||||||||||||||||||||||||||||||||||||||||||||||||||
| Class R2 Shares Period ended | 3-31-16 | 3-31-15 | 3-31-14 | 3-31-13 | 3-31-12 | 1 | |||||||||||||||||||||||||||||||||||||||||||||||||||||||||||||||||||||||||||||||||||||||||||||||||
| Per share operating performance | |||||||||||||||||||||||||||||||||||||||||||||||||||||||||||||||||||||||||||||||||||||||||||||||||||||||
| Net asset value, beginning of period | $21.16 | $26.81 | $24.72 | $23.27 | $22.45 | ||||||||||||||||||||||||||||||||||||||||||||||||||||||||||||||||||||||||||||||||||||||||||||||||||
| Net investment loss2 | (0.14 | ) | (0.02 | ) | (0.23 | ) | (0.06 | ) | — | 3 | |||||||||||||||||||||||||||||||||||||||||||||||||||||||||||||||||||||||||||||||||||||||||||||
| Net realized and unrealized gain on investments | 0.65 | 0.76 | 5.39 | 1.51 | 0.82 | ||||||||||||||||||||||||||||||||||||||||||||||||||||||||||||||||||||||||||||||||||||||||||||||||||
| Total from investment operations | 0.51 | 0.74 | 5.16 | 1.45 | 0.82 | ||||||||||||||||||||||||||||||||||||||||||||||||||||||||||||||||||||||||||||||||||||||||||||||||||
| Less distributions | |||||||||||||||||||||||||||||||||||||||||||||||||||||||||||||||||||||||||||||||||||||||||||||||||||||||
| From net realized gain | (1.07 | ) | (6.39 | ) | (3.07 | ) | — | — | |||||||||||||||||||||||||||||||||||||||||||||||||||||||||||||||||||||||||||||||||||||||||||||||
| Net asset value, end of period | $20.60 | $21.16 | $26.81 | $24.72 | $23.27 | ||||||||||||||||||||||||||||||||||||||||||||||||||||||||||||||||||||||||||||||||||||||||||||||||||
| Total return (%)4 | 2.27 | 4.89 | 21.10 | 6.23 | 3.65 | 5 | |||||||||||||||||||||||||||||||||||||||||||||||||||||||||||||||||||||||||||||||||||||||||||||||||
| Ratios and supplemental data | |||||||||||||||||||||||||||||||||||||||||||||||||||||||||||||||||||||||||||||||||||||||||||||||||||||||
| Net assets, end of period (in millions) | — | 6 | — | 6 | — | 6 | — | 6 | — | 6 | |||||||||||||||||||||||||||||||||||||||||||||||||||||||||||||||||||||||||||||||||||||||||||||
| Ratios (as a percentage of average net assets): | |||||||||||||||||||||||||||||||||||||||||||||||||||||||||||||||||||||||||||||||||||||||||||||||||||||||
| Expenses before reductions | 3.26 | 17.03 | 15.50 | 20.41 | 15.96 | 7 | |||||||||||||||||||||||||||||||||||||||||||||||||||||||||||||||||||||||||||||||||||||||||||||||||
| Expenses including reductions | 1.41 | 1.45 | 1.45 | 1.45 | 1.45 | 7 | |||||||||||||||||||||||||||||||||||||||||||||||||||||||||||||||||||||||||||||||||||||||||||||||||
| Net investment loss | (0.68 | ) | (0.09 | ) | (0.85 | ) | (0.24 | ) | (0.12 | ) 7 | |||||||||||||||||||||||||||||||||||||||||||||||||||||||||||||||||||||||||||||||||||||||||||||
| Portfolio turnover (%) | 49 | 155 | 81 | 92 | 90 | 8 | |||||||||||||||||||||||||||||||||||||||||||||||||||||||||||||||||||||||||||||||||||||||||||||||||
| 1 | The inception date for Class R2 shares is 3-1-12. | ||||||||||||||||||||||||||||||||||||||||||||||||||||||||||||||||||||||||||||||||||
| 2 | Based on average daily shares outstanding. | ||||||||||||||||||||||||||||||||||||||||||||||||||||||||||||||||||||||||||||||||||
| 3 | Less than $0.005 per share. | ||||||||||||||||||||||||||||||||||||||||||||||||||||||||||||||||||||||||||||||||||
| 4 | Total returns would have been lower had certain expenses not been reduced during the applicable periods. | ||||||||||||||||||||||||||||||||||||||||||||||||||||||||||||||||||||||||||||||||||
| 5 | Not annualized. | ||||||||||||||||||||||||||||||||||||||||||||||||||||||||||||||||||||||||||||||||||
| 6 | Less than $500,000. | ||||||||||||||||||||||||||||||||||||||||||||||||||||||||||||||||||||||||||||||||||
| 7 | Annualized. | ||||||||||||||||||||||||||||||||||||||||||||||||||||||||||||||||||||||||||||||||||
| 8 | The portfolio turnover is shown for the period from 4-1-11 to 3-31-12. | ||||||||||||||||||||||||||||||||||||||||||||||||||||||||||||||||||||||||||||||||||
| Class R3 Shares Period ended | 3-31-16 | 3-31-15 | 3-31-14 | 3-31-13 | 3-31-12 | ||||||||||||||||||||||||||||||||||||||||||||||||||||||||||||||||||||||||||||||||||||||||||||||||||
| Per share operating performance | |||||||||||||||||||||||||||||||||||||||||||||||||||||||||||||||||||||||||||||||||||||||||||||||||||||||
| Net asset value, beginning of period | $20.20 | $25.92 | $24.03 | $22.65 | $21.21 | ||||||||||||||||||||||||||||||||||||||||||||||||||||||||||||||||||||||||||||||||||||||||||||||||||
| Net investment loss1 | (0.17 | ) | (0.05 | ) | (0.26 | ) | (0.09 | ) | (0.16 | ) | |||||||||||||||||||||||||||||||||||||||||||||||||||||||||||||||||||||||||||||||||||||||||||||
| Net realized and unrealized gain on investments | 0.63 | 0.72 | 5.22 | 1.47 | 1.60 | ||||||||||||||||||||||||||||||||||||||||||||||||||||||||||||||||||||||||||||||||||||||||||||||||||
| Total from investment operations | 0.46 | 0.67 | 4.96 | 1.38 | 1.44 | ||||||||||||||||||||||||||||||||||||||||||||||||||||||||||||||||||||||||||||||||||||||||||||||||||
| Less distributions | |||||||||||||||||||||||||||||||||||||||||||||||||||||||||||||||||||||||||||||||||||||||||||||||||||||||
| From net realized gain | (1.07 | ) | (6.39 | ) | (3.07 | ) | — | — | |||||||||||||||||||||||||||||||||||||||||||||||||||||||||||||||||||||||||||||||||||||||||||||||
| Net asset value, end of period | $19.59 | $20.20 | $25.92 | $24.03 | $22.65 | ||||||||||||||||||||||||||||||||||||||||||||||||||||||||||||||||||||||||||||||||||||||||||||||||||
| Total return (%)2 | 2.18 | 4.71 | 20.87 | 6.09 | 6.79 | ||||||||||||||||||||||||||||||||||||||||||||||||||||||||||||||||||||||||||||||||||||||||||||||||||
| Ratios and supplemental data | |||||||||||||||||||||||||||||||||||||||||||||||||||||||||||||||||||||||||||||||||||||||||||||||||||||||
| Net assets, end of period (in millions) | — | 3 | — | 3 | — | 3 | — | 3 | — | 3 | |||||||||||||||||||||||||||||||||||||||||||||||||||||||||||||||||||||||||||||||||||||||||||||
| Ratios (as a percentage of average net assets): | |||||||||||||||||||||||||||||||||||||||||||||||||||||||||||||||||||||||||||||||||||||||||||||||||||||||
| Expenses before reductions | 2.61 | 16.32 | 12.99 | 15.02 | 15.86 | ||||||||||||||||||||||||||||||||||||||||||||||||||||||||||||||||||||||||||||||||||||||||||||||||||
| Expenses including reductions | 1.56 | 1.60 | 1.60 | 1.60 | 1.59 | ||||||||||||||||||||||||||||||||||||||||||||||||||||||||||||||||||||||||||||||||||||||||||||||||||
| Net investment loss | (0.83 | ) | (0.24 | ) | (1.00 | ) | (0.39 | ) | (0.76 | ) | |||||||||||||||||||||||||||||||||||||||||||||||||||||||||||||||||||||||||||||||||||||||||||||
| Portfolio turnover (%) | 49 | 155 | 81 | 92 | 90 | ||||||||||||||||||||||||||||||||||||||||||||||||||||||||||||||||||||||||||||||||||||||||||||||||||
| 1 | Based on average daily shares outstanding. | ||||||||||||||||||||||||||||||||||||||||||||||||||||||||||||||||||||||||||||||||||
| 2 | Total returns would have been lower had certain expenses not been reduced during the applicable periods. | ||||||||||||||||||||||||||||||||||||||||||||||||||||||||||||||||||||||||||||||||||
| 3 | Less than $500,000. | ||||||||||||||||||||||||||||||||||||||||||||||||||||||||||||||||||||||||||||||||||
| Class R4 Shares Period ended | 3-31-16 | 3-31-15 | 3-31-14 | 3-31-13 | 3-31-12 | ||||||||||||||||||||||||||||||||||||||||||||||||||||||||||||||||||||||||||||||||||||||||||||||||||
| Per share operating performance | |||||||||||||||||||||||||||||||||||||||||||||||||||||||||||||||||||||||||||||||||||||||||||||||||||||||
| Net asset value, beginning of period | $20.88 | $26.49 | $24.40 | $22.91 | $21.40 | ||||||||||||||||||||||||||||||||||||||||||||||||||||||||||||||||||||||||||||||||||||||||||||||||||
| Net investment income (loss)1 | (0.09 | ) | 0.03 | (0.17 | ) | — | 2 | (0.10 | ) | ||||||||||||||||||||||||||||||||||||||||||||||||||||||||||||||||||||||||||||||||||||||||||||||
| Net realized and unrealized gain on investments | 0.65 | 0.75 | 5.33 | 1.49 | 1.61 | ||||||||||||||||||||||||||||||||||||||||||||||||||||||||||||||||||||||||||||||||||||||||||||||||||
| Total from investment operations | 0.56 | 0.78 | 5.16 | 1.49 | 1.51 | ||||||||||||||||||||||||||||||||||||||||||||||||||||||||||||||||||||||||||||||||||||||||||||||||||
| Less distributions | |||||||||||||||||||||||||||||||||||||||||||||||||||||||||||||||||||||||||||||||||||||||||||||||||||||||
| From net realized gain | (1.07 | ) | (6.39 | ) | (3.07 | ) | — | — | |||||||||||||||||||||||||||||||||||||||||||||||||||||||||||||||||||||||||||||||||||||||||||||||
| Net asset value, end of period | $20.37 | $20.88 | $26.49 | $24.40 | $22.91 | ||||||||||||||||||||||||||||||||||||||||||||||||||||||||||||||||||||||||||||||||||||||||||||||||||
| Total return (%)3 | 2.55 | 5.15 | 21.39 | 6.50 | 7.06 | ||||||||||||||||||||||||||||||||||||||||||||||||||||||||||||||||||||||||||||||||||||||||||||||||||
| Ratios and supplemental data | |||||||||||||||||||||||||||||||||||||||||||||||||||||||||||||||||||||||||||||||||||||||||||||||||||||||
| Net assets, end of period (in millions) | — | 4 | — | 4 | — | 4 | — | 4 | — | 4 | |||||||||||||||||||||||||||||||||||||||||||||||||||||||||||||||||||||||||||||||||||||||||||||
| Ratios (as a percentage of average net assets): | |||||||||||||||||||||||||||||||||||||||||||||||||||||||||||||||||||||||||||||||||||||||||||||||||||||||
| Expenses before reductions | 2.71 | 13.72 | 10.91 | 14.55 | 15.46 | ||||||||||||||||||||||||||||||||||||||||||||||||||||||||||||||||||||||||||||||||||||||||||||||||||
| Expenses including reductions | 1.20 | 1.20 | 1.20 | 1.22 | 1.29 | ||||||||||||||||||||||||||||||||||||||||||||||||||||||||||||||||||||||||||||||||||||||||||||||||||
| Net investment income (loss) | (0.46 | ) | 0.13 | (0.62 | ) | 0.01 | (0.46 | ) | |||||||||||||||||||||||||||||||||||||||||||||||||||||||||||||||||||||||||||||||||||||||||||||||
| Portfolio turnover (%) | 49 | 155 | 81 | 92 | 90 | ||||||||||||||||||||||||||||||||||||||||||||||||||||||||||||||||||||||||||||||||||||||||||||||||||
| 1 | Based on average daily shares outstanding. | ||||||||||||||||||||||||||||||||||||||||||||||||||||||||||||||||||||||||||||||||||
| 2 | Less than $0.005 per share. | ||||||||||||||||||||||||||||||||||||||||||||||||||||||||||||||||||||||||||||||||||
| 3 | Total returns would have been lower had certain expenses not been reduced during the applicable periods. | ||||||||||||||||||||||||||||||||||||||||||||||||||||||||||||||||||||||||||||||||||
| 4 | Less than $500,000. | ||||||||||||||||||||||||||||||||||||||||||||||||||||||||||||||||||||||||||||||||||
| Class R6 Shares Period ended | 3-31-16 | 3-31-15 | 3-31-14 | 3-31-13 | 3-31-12 | 1 | |||||||||||||||||||||||||||||||||||||||||||||||||||||||||||||||||||||||||||||||||||||||||||||||||
| Per share operating performance | |||||||||||||||||||||||||||||||||||||||||||||||||||||||||||||||||||||||||||||||||||||||||||||||||||||||
| Net asset value, beginning of period | $21.61 | $27.10 | $24.84 | $23.27 | $20.01 | ||||||||||||||||||||||||||||||||||||||||||||||||||||||||||||||||||||||||||||||||||||||||||||||||||
| Net investment income (loss)2 | (0.03 | ) | 0.11 | (0.07 | ) | 0.08 | 0.03 | ||||||||||||||||||||||||||||||||||||||||||||||||||||||||||||||||||||||||||||||||||||||||||||||||
| Net realized and unrealized gain on investments | 0.68 | 0.79 | 5.43 | 1.51 | 3.23 | ||||||||||||||||||||||||||||||||||||||||||||||||||||||||||||||||||||||||||||||||||||||||||||||||||
| Total from investment operations | 0.65 | 0.90 | 5.36 | 1.59 | 3.26 | ||||||||||||||||||||||||||||||||||||||||||||||||||||||||||||||||||||||||||||||||||||||||||||||||||
| Less distributions | |||||||||||||||||||||||||||||||||||||||||||||||||||||||||||||||||||||||||||||||||||||||||||||||||||||||
| From net investment income | — | — | (0.03 | ) | (0.02 | ) | — | ||||||||||||||||||||||||||||||||||||||||||||||||||||||||||||||||||||||||||||||||||||||||||||||||
| From net realized gain | (1.07 | ) | (6.39 | ) | (3.07 | ) | — | — | |||||||||||||||||||||||||||||||||||||||||||||||||||||||||||||||||||||||||||||||||||||||||||||||
| Total distributions | (1.07 | ) | (6.39 | ) | (3.10 | ) | (0.02 | ) | — | ||||||||||||||||||||||||||||||||||||||||||||||||||||||||||||||||||||||||||||||||||||||||||||||
| Net asset value, end of period | $21.19 | $21.61 | $27.10 | $24.84 | $23.27 | ||||||||||||||||||||||||||||||||||||||||||||||||||||||||||||||||||||||||||||||||||||||||||||||||||
| Total return (%)3 | 2.88 | 5.58 | 21.82 | 6.86 | 16.29 | 4 | |||||||||||||||||||||||||||||||||||||||||||||||||||||||||||||||||||||||||||||||||||||||||||||||||
| Ratios and supplemental data | |||||||||||||||||||||||||||||||||||||||||||||||||||||||||||||||||||||||||||||||||||||||||||||||||||||||
| Net assets, end of period (in millions) | $5 | $3 | $8 | $4 | $4 | ||||||||||||||||||||||||||||||||||||||||||||||||||||||||||||||||||||||||||||||||||||||||||||||||||
| Ratios (as a percentage of average net assets): | |||||||||||||||||||||||||||||||||||||||||||||||||||||||||||||||||||||||||||||||||||||||||||||||||||||||
| Expenses before reductions | 0.96 | 1.27 | 1.09 | 1.33 | 1.58 | 5 | |||||||||||||||||||||||||||||||||||||||||||||||||||||||||||||||||||||||||||||||||||||||||||||||||
| Expenses including reductions | 0.85 | 0.79 | 0.86 | 0.86 | 0.86 | 5 | |||||||||||||||||||||||||||||||||||||||||||||||||||||||||||||||||||||||||||||||||||||||||||||||||
| Net investment income (loss) | (0.13 | ) | 0.52 | (0.27 | ) | 0.34 | 0.20 | 5 | |||||||||||||||||||||||||||||||||||||||||||||||||||||||||||||||||||||||||||||||||||||||||||||||
| Portfolio turnover (%) | 49 | 155 | 81 | 92 | 90 | 6 | |||||||||||||||||||||||||||||||||||||||||||||||||||||||||||||||||||||||||||||||||||||||||||||||||
| 1 | The inception date for Class R6 shares is 9-1-11. | ||||||||||||||||||||||||||||||||||||||||||||||||||||||||||||||||||||||||||||||||||
| 2 | Based on average daily shares outstanding. | ||||||||||||||||||||||||||||||||||||||||||||||||||||||||||||||||||||||||||||||||||
| 3 | Total returns would have been lower had certain expenses not been reduced during the applicable periods. | ||||||||||||||||||||||||||||||||||||||||||||||||||||||||||||||||||||||||||||||||||
| 4 | Not annualized. | ||||||||||||||||||||||||||||||||||||||||||||||||||||||||||||||||||||||||||||||||||
| 5 | Annualized. | ||||||||||||||||||||||||||||||||||||||||||||||||||||||||||||||||||||||||||||||||||
| 6 | The portfolio turnover is shown for the period from 4-1-11 to 3-31-12. | ||||||||||||||||||||||||||||||||||||||||||||||||||||||||||||||||||||||||||||||||||
| Class T Shares Period ended | 3-31-16 | 3-31-15 | 3-31-14 | 3-31-13 | 3-31-12 | ||||||||||||||||||||||||||||||||||||||||||||||||||||||||||||||||||||||||||||||||||||||||||||||||||
| Per share operating performance | |||||||||||||||||||||||||||||||||||||||||||||||||||||||||||||||||||||||||||||||||||||||||||||||||||||||
| Net asset value, beginning of period | $20.50 | $26.14 | $24.13 | $22.69 | $21.20 | ||||||||||||||||||||||||||||||||||||||||||||||||||||||||||||||||||||||||||||||||||||||||||||||||||
| Net investment income (loss)1 | (0.10 | ) | 0.01 | (0.17 | ) | (0.03 | ) | (0.11 | ) | ||||||||||||||||||||||||||||||||||||||||||||||||||||||||||||||||||||||||||||||||||||||||||||||
| Net realized and unrealized gain on investments | 0.63 | 0.74 | 5.25 | 1.47 | 1.60 | ||||||||||||||||||||||||||||||||||||||||||||||||||||||||||||||||||||||||||||||||||||||||||||||||||
| Total from investment operations | 0.53 | 0.75 | 5.08 | 1.44 | 1.49 | ||||||||||||||||||||||||||||||||||||||||||||||||||||||||||||||||||||||||||||||||||||||||||||||||||
| Less distributions | |||||||||||||||||||||||||||||||||||||||||||||||||||||||||||||||||||||||||||||||||||||||||||||||||||||||
| From net realized gain | (1.07 | ) | (6.39 | ) | (3.07 | ) | — | — | |||||||||||||||||||||||||||||||||||||||||||||||||||||||||||||||||||||||||||||||||||||||||||||||
| Net asset value, end of year | $19.96 | $20.50 | $26.14 | $24.13 | $22.69 | ||||||||||||||||||||||||||||||||||||||||||||||||||||||||||||||||||||||||||||||||||||||||||||||||||
| Total return (%)2,3 | 2.44 | 5.10 | 21.29 | 6.35 | 7.03 | ||||||||||||||||||||||||||||||||||||||||||||||||||||||||||||||||||||||||||||||||||||||||||||||||||
| Ratios and supplemental data | |||||||||||||||||||||||||||||||||||||||||||||||||||||||||||||||||||||||||||||||||||||||||||||||||||||||
| Net assets, end of year (in millions) | $66 | $71 | $78 | $73 | $77 | ||||||||||||||||||||||||||||||||||||||||||||||||||||||||||||||||||||||||||||||||||||||||||||||||||
| Ratios (as a percentage of average net assets): | |||||||||||||||||||||||||||||||||||||||||||||||||||||||||||||||||||||||||||||||||||||||||||||||||||||||
| Expenses before reductions | 1.29 | 1.28 | 1.27 | 1.33 | 1.37 | ||||||||||||||||||||||||||||||||||||||||||||||||||||||||||||||||||||||||||||||||||||||||||||||||||
| Expenses including reductions | 1.26 | 1.27 | 1.26 | 1.33 | 1.37 | ||||||||||||||||||||||||||||||||||||||||||||||||||||||||||||||||||||||||||||||||||||||||||||||||||
| Net investment income (loss) | (0.52 | ) | 0.07 | (0.66 | ) | (0.13 | ) | (0.54 | ) | ||||||||||||||||||||||||||||||||||||||||||||||||||||||||||||||||||||||||||||||||||||||||||||||
| Portfolio turnover (%) | 49 | 155 | 81 | 92 | 90 | ||||||||||||||||||||||||||||||||||||||||||||||||||||||||||||||||||||||||||||||||||||||||||||||||||
| 1 | Based on average daily shares outstanding. | ||||||||||||||||||||||||||||||||||||||||||||||||||||||||||||||||||||||||||||||||||
| 2 | Does not reflect the effect of sales charges, if any. | ||||||||||||||||||||||||||||||||||||||||||||||||||||||||||||||||||||||||||||||||||
| 3 | Total returns would have been lower had certain expenses not been reduced during the applicable periods. | ||||||||||||||||||||||||||||||||||||||||||||||||||||||||||||||||||||||||||||||||||
| Class ADV Shares Period ended | 3-31-16 | 3-31-15 | 3-31-14 | 3-31-13 | 3-31-12 | ||||||||||||||||||||||||||||||||||||||||||||||||||||||||||||||||||||||||||||||||||||||||||||||||||
| Per share operating performance | |||||||||||||||||||||||||||||||||||||||||||||||||||||||||||||||||||||||||||||||||||||||||||||||||||||||
| Net asset value, beginning of period | $21.12 | $26.70 | $24.57 | $23.05 | $21.49 | ||||||||||||||||||||||||||||||||||||||||||||||||||||||||||||||||||||||||||||||||||||||||||||||||||
| Net investment income (loss)1 | (0.08 | ) | 0.03 | (0.14 | ) | 0.02 | (0.06 | ) | |||||||||||||||||||||||||||||||||||||||||||||||||||||||||||||||||||||||||||||||||||||||||||||||
| Net realized and unrealized gain on investments | 0.65 | 0.78 | 5.34 | 1.50 | 1.62 | ||||||||||||||||||||||||||||||||||||||||||||||||||||||||||||||||||||||||||||||||||||||||||||||||||
| Total from investment operations | 0.57 | 0.81 | 5.20 | 1.52 | 1.56 | ||||||||||||||||||||||||||||||||||||||||||||||||||||||||||||||||||||||||||||||||||||||||||||||||||
| Less distributions | |||||||||||||||||||||||||||||||||||||||||||||||||||||||||||||||||||||||||||||||||||||||||||||||||||||||
| From net realized gain | (1.07 | ) | (6.39 | ) | (3.07 | ) | — | — | |||||||||||||||||||||||||||||||||||||||||||||||||||||||||||||||||||||||||||||||||||||||||||||||
| Net asset value, end of period | $20.62 | $21.12 | $26.70 | $24.57 | $23.05 | ||||||||||||||||||||||||||||||||||||||||||||||||||||||||||||||||||||||||||||||||||||||||||||||||||
| Total return (%)2 | 2.61 | 5.20 | 21.40 | 6.59 | 7.26 | ||||||||||||||||||||||||||||||||||||||||||||||||||||||||||||||||||||||||||||||||||||||||||||||||||
| Ratios and supplemental data | |||||||||||||||||||||||||||||||||||||||||||||||||||||||||||||||||||||||||||||||||||||||||||||||||||||||
| Net assets, end of period (in millions) | $1 | $2 | $19 | $20 | $20 | ||||||||||||||||||||||||||||||||||||||||||||||||||||||||||||||||||||||||||||||||||||||||||||||||||
| Ratios (as a percentage of average net assets): | |||||||||||||||||||||||||||||||||||||||||||||||||||||||||||||||||||||||||||||||||||||||||||||||||||||||
| Expenses before reductions | 1.55 | 1.49 | 1.26 | 1.33 | 1.35 | ||||||||||||||||||||||||||||||||||||||||||||||||||||||||||||||||||||||||||||||||||||||||||||||||||
| Expenses including reductions | 1.14 | 1.14 | 1.14 | 1.14 | 1.14 | ||||||||||||||||||||||||||||||||||||||||||||||||||||||||||||||||||||||||||||||||||||||||||||||||||
| Net investment income (loss) | (0.38 | ) | 0.13 | (0.53 | ) | 0.08 | (0.31 | ) | |||||||||||||||||||||||||||||||||||||||||||||||||||||||||||||||||||||||||||||||||||||||||||||||
| Portfolio turnover (%) | 49 | 155 | 81 | 92 | 90 | ||||||||||||||||||||||||||||||||||||||||||||||||||||||||||||||||||||||||||||||||||||||||||||||||||
| 1 | Based on average daily shares outstanding. | ||||||||||||||||||||||||||||||||||||||||||||||||||||||||||||||||||||||||||||||||||
| 2 | Total returns would have been lower had certain expenses not been reduced during the applicable periods. | ||||||||||||||||||||||||||||||||||||||||||||||||||||||||||||||||||||||||||||||||||
Note 1 — Organization
John Hancock Select Growth Fund (the fund) is a series of John Hancock Funds III (the Trust), an open-end management investment company organized as a Massachusetts business trust and registered under the Investment Company Act of 1940, as amended (the 1940 Act). The investment objective of the fund is to seek to maximize long-term capital appreciation.
The fund may offer multiple classes of shares. The shares currently offered are detailed in the Statement of assets and liabilities. Class A and Class C shares are offered to all investors. Class I shares are offered to institutions and certain investors. Class R1, Class R2, Class R3, and Class R4 shares are available only to certain retirement plans. Class R6 shares are available only to certain retirement plans, institutions and other investors. Class B, Class T and Class ADV shares are closed to new investors. Shareholders of each class have exclusive voting rights to matters that affect that class. The distribution and service fees, if any, and transfer agent fees, state registration fees and printing and postage for each class may differ. Class B shares convert to Class A shares eight years after purchase.
Effective August 28, 2015, Class NAV shares were liquidated. Effective March 10, 2016, Class R5 shares were liquidated.
On December 10, 2015, the Board of Trustees voted to recommend that the shareholders of the fund approve a tax-free reorganization of the fund into John Hancock Strategic Growth Fund, also a series of John Hancock Funds III. The shareholders approved the reorganization at a special shareholder meeting held on March 30, 2016. The reorganization occurred at the close of business on April 22, 2016.
Note 2 — Significant accounting policies
The financial statements have been prepared in conformity with accounting principles generally accepted in the United States of America (US GAAP), which require management to make certain estimates and assumptions as of the date of the financial statements. Actual results could differ from those estimates and those differences could be significant. The fund qualifies as an investment company under Topic 946 of Accounting Standards Codification of US GAAP.
Events or transactions occurring after the end of the fiscal period through the date that the financial statements were issued have been evaluated in the preparation of the financial statements. The following summarizes the significant accounting policies of the fund:
Security valuation. Investments are stated at value as of the scheduled close of regular trading on the New York Stock Exchange (NYSE), normally at 4:00 P.M., Eastern Time. In case of emergency or other disruption resulting in the NYSE not opening for trading or the NYSE closing at a time other than the regularly scheduled close, the net asset value (NAV) may be determined as of the regularly scheduled close of the NYSE pursuant to the fund's Valuation Policies and Procedures. The time at which shares and transactions are priced and until which orders are accepted may vary to the extent permitted by the Securities and Exchange Commission and applicable regulations.
In order to value the securities, the fund uses the following valuation techniques: Equity securities, including exchange-traded funds, held by the fund are typically valued at the last sale price or official closing price on the exchange or principal market where the security was acquired or most likely will be sold. In the event there were no sales during the day or closing prices are not available, the securities are valued using the last available bid price. Investments by the fund in open-end mutual funds are valued at their respective NAVs each business day.
In certain instances, the Pricing Committee may determine to value equity securities using prices obtained from another exchange or market if trading on the exchange or market on which prices are typically obtained did not open for trading as scheduled, or if trading closed earlier than scheduled, and trading occurred as normal on another exchange or market.
Other portfolio securities and assets, for which reliable market quotations are not readily available, are valued at fair value as determined in good faith by the fund's Pricing Committee following procedures established by the Board of Trustees. The frequency with which these fair valuation procedures are used cannot be predicted and fair value of securities may differ significantly from the value that would have been used had a ready market for such securities existed.
The fund uses a three-tier hierarchy to prioritize the pricing assumptions, referred to as inputs, used in valuation techniques to measure fair value. Level 1 includes securities valued using quoted prices in active markets for identical securities. Level 2 includes securities valued using other significant observable inputs. Observable inputs may include quoted prices for similar securities, interest rates, prepayment speeds and credit risk. Prices for securities valued using these inputs are received from independent pricing vendors and brokers and are based on an evaluation of the inputs described. Level 3 includes securities valued using significant unobservable inputs when market prices are not readily available or reliable, including the fund's own assumptions in determining the fair value of investments. Factors used in determining value may include market or issuer specific events or trends, changes in interest rates and credit quality. The inputs or methodology used for valuing securities are not necessarily an indication of the risks associated with investing in those securities. Changes in valuation techniques and related inputs may result in transfers into or out of an assigned level within the disclosure hierarchy.
The following is a summary of the values by input classification of the fund's investments as of March 31, 2016, by major security category or type:
| Total value at 3-31-16 | Level 1 quoted price | Level 2 significant observable inputs | Level 3 significant unobservable inputs | ||
| Common stocks | |||||
| Consumer discretionary | $88,011,171 | $88,011,171 | — | — | |
| Consumer staples | 8,616,820 | 8,616,820 | — | — | |
| Energy | 1,152,648 | 1,152,648 | — | — | |
| Financials | 67,831,751 | 67,831,751 | — | — | |
| Health care | 45,601,806 | 45,601,806 | — | — | |
| Industrials | 29,385,020 | 29,385,020 | — | — | |
| Information technology | 71,399,371 | 71,039,112 | — | $360,259 | |
| Materials | 13,599,344 | 13,599,344 | — | — | |
| Warrants | 14,924 | 14,924 | — | — | |
| Unaffiliated investment companies | 29,528,389 | 29,528,389 | — | — | |
| Short-term investments | 3,116,133 | 3,116,133 | — | — | |
| Total investments in securities | $358,257,377 | $357,897,118 | — | $360,259 | |
Security transactions and related investment income. Investment security transactions are accounted for on a trade date plus one basis for daily NAV calculations. However, for financial reporting purposes, investment transactions are reported on trade date. Interest income is accrued as earned. Dividend income is recorded on the ex-date, except for dividends of foreign securities where the dividend may not be known until after the ex-date. In those cases, dividend income, net of withholding taxes, is recorded when the fund becomes aware of the dividends. Gains and losses on securities sold are determined on the basis of identified cost and may include proceeds from litigation.
Line of credit. The fund may borrow from banks for temporary or emergency purposes, including meeting redemption requests that otherwise might require the untimely sale of securities. Pursuant to the fund's custodian agreement, the custodian may loan money to the fund to make properly authorized payments. The fund is obligated to repay the custodian for any overdraft, including any related costs or expenses. The custodian may have a lien, security interest or security entitlement in any fund property that is not otherwise segregated or pledged, to the extent of any overdraft, and to the maximum extent permitted by law.
The fund and other affiliated funds have entered into a syndicated line of credit agreement, with Citibank, N.A. (Citibank) as the administrative agent, that enables them to participate in a $750 million unsecured committed line of credit. Prior to June 30, 2015, the fund and other affiliated funds had an agreement with Citibank that enabled them to participate in a $300 million unsecured committed line of credit. A commitment fee, payable at the end of each calendar quarter, based on the average daily unused portion of the effective line of credit, is charged to each participating fund on a pro rata basis and is
reflected in Other expenses on the Statement of operations. Commitment fees for the year ended March 31, 2016 were $1,651. For the year ended March 31, 2016, the fund had no borrowings under either line of credit.
Expenses. Within the John Hancock group of funds complex, expenses that are directly attributable to an individual fund are allocated to such fund. Expenses that are not readily attributable to a specific fund are allocated among all funds in an equitable manner, taking into consideration, among other things, the nature and type of expense and the fund's relative net assets. Expense estimates are accrued in the period to which they relate and adjustments are made when actual amounts are known.
Class allocations. Income, common expenses and realized and unrealized gains (losses) are determined at the fund level and allocated daily to each class of shares based on the net assets of the class. Class-specific expenses, such as distribution and service fees, if any, and transfer agent fees, are calculated daily at the class level based on the net assets of each class and the specific expense rates applicable to each class. Through June 30, 2015, class-specific expenses, such as state registration fees and printing and postage, for all classes, were calculated daily at the class level based on net assets of each class and the specific expense rates applicable to each class.
Federal income taxes. The fund intends to continue to qualify as a regulated investment company by complying with the applicable provisions of the Internal Revenue Code and will not be subject to federal income tax on taxable income that is distributed to shareholders. Therefore, no federal income tax provision is required.
Under the Regulated Investment Company Modernization Act of 2010, the fund is permitted to carry forward capital losses incurred in taxable years beginning after December 22, 2010 for an unlimited period. Any losses incurred during those taxable years will be required to be utilized prior to the losses incurred in pre-enactment taxable years. As a result of this ordering rule, pre-enactment capital loss carryforwards may be more likely to expire unused. Additionally, post-enactment capital losses that are carried forward will retain their character as either short-term or long-term capital losses rather than being considered all short-term as under previous law.
For federal income tax purposes, as of March 31, 2016, the fund has a capital loss carryforward of $9,977,093 available to offset future net realized capital gains. The following table details the capital loss carryforward available as of March 31, 2016:
| Capital Loss Carryforward Expiring March 31, | |
| 2017 | 2018 |
| $850,715 | $9,126,378 |
Availability of a certain amount of the loss carryforward, which was acquired in a merger, may be limited in a given year. Net capital losses of $775,439 that are the result of security transactions occurring after October 31, 2015, are treated as occurring on April 1, 2016, the first day of the fund's next taxable year. Qualified late year ordinary losses of $538,543 are being deferred and are treated as occurring on April 1, 2016, the first day of the fund's next taxable year.
As of March 31, 2016, the fund had no uncertain tax positions that would require financial statement recognition, derecognition or disclosure. The fund's federal tax returns are subject to examination by the Internal Revenue Service for a period of three years.
Distribution of income and gains. Distributions to shareholders from net investment income and net realized gains, if any, are recorded on the ex-date. The fund generally declares and pays dividends and capital gain distributions, if any, annually. The tax character of distributions for the years ended March 31, 2016 and 2015 was as follows:
| March 31, 2016 | March 31, 2015 | |
| Ordinary Income | — | $58,022,280 |
| Long-Term Capital Gain | $19,014,372 | $172,546,712 |
| Total | $19,014,372 | $230,568,992 |
Distributions paid by the fund with respect to each class of shares are calculated in the same manner, at the same time and in the same amount, except for the effect of class level expenses that may be applied differently to each class. As of March 31, 2016, the fund has no distributable earnings on a tax basis.
Such distributions and distributable earnings, on a tax basis, are determined in conformity with income tax regulations, which may differ from US GAAP. Distributions in excess of tax basis earnings and profits, if any, are reported in the fund's financial statements as a return of capital.
Capital accounts within the financial statements are adjusted for permanent book-tax differences. These adjustments have no impact on net assets or the results of operations. Temporary book-tax differences, if any, will reverse in a subsequent period. Book-tax differences are primarily attributable to net operating losses and wash sale loss deferrals.
Note 3 — Guarantees and indemnifications
Under the Trust's organizational documents, its Officers and Trustees are indemnified against certain liabilities arising out of the performance of their duties to the Trust, including the fund. Additionally, in the normal course of business, the fund enters into contracts with service providers that contain general indemnification clauses. The fund's maximum exposure under these arrangements is unknown, as this would involve future claims that may be made against the fund that have not yet occurred. The risk of material loss from such claims is considered remote.
Note 4 — Fees and transactions with affiliates
John Hancock Advisers, LLC (the Advisor) serves as investment advisor for the fund. John Hancock Funds, LLC (the Distributor), an affiliate of the Advisor, serves as principal underwriter of the fund. The Advisor and the Distributor are indirect, wholly owned subsidiaries of Manulife Financial Corporation (MFC).
Management fee. The fund has an investment management agreement with the Advisor under which the fund pays a daily management fee to the Advisor equivalent on an annual basis to the sum of: (a) 0.730% of the first $3.0 billion of the fund's average daily net assets; (b) 0.725% of the next $3.0 billion of the fund's average daily net assets; and (c) 0.700% of the fund's average daily net assets in excess of $6.0 billion. The Advisor has a subadvisory agreement with Baillie Gifford Overseas Limited. The fund is not responsible for payment of the subadvisory fees.
The Advisor has contractually agreed to waive a portion of its management fee and/or reimburse expenses for certain funds of the John Hancock group of funds complex, including the fund (the participating portfolios). This waiver is based upon aggregate net assets of all the participating portfolios. The amount of the reimbursement is calculated daily and allocated among all the participating portfolios in proportion to the daily net assets of each fund. During the year ended March 31, 2016, this waiver amounted to 0.01% of the fund's average net assets. This arrangement may be amended or terminated at any time by the Advisor upon notice to the fund and with the approval of the Board of Trustees.
The Advisor has contractually agreed to waive all or a portion of its management fee and/or reimburse or pay operating expenses of the fund to the extent necessary to maintain the fund's total operating expenses at 1.70%, 1.45%, 1.60%, 1.20%, 1.00%, and 1.14% for Class R1, Class R2, Class R3, Class R4, Class R5, and Class ADV shares, respectively, excluding certain expenses such as taxes, brokerage commissions, interest expense, litigation and indemnification expenses and other extraordinary expenses not incurred in the ordinary course of the fund's business, acquired fund fees and short dividend expense. These expense limitations shall remain in effect until June 30, 2016, unless renewed by mutual agreement of the fund and the Advisor based upon a determination that this is appropriate under the circumstances at the time. Prior to July 1, 2015, Class R6 shares had fee waivers and/or reimbursement such that the expenses would not exceed 0.86% of the total operating expenses for Class R6 shares.
Effective July 1,2015 the Advisor has contractually agreed to waive all or a portion of its management fee and/or reimburse or pay operating expenses of the fund to the extent necessary to maintain the fund's total operating expenses at 1.20%, 2.05%, 0.95%, and 1.25% for Class A, Class B, Class I, and Class T shares, respectively, excluding certain expenses such as taxes, brokerage commissions, interest expense, litigation and indemnification expenses and other extraordinary expenses not incurred in the ordinary course of the fund's business, acquired fund fees and short dividend expense. These expense
limitations shall remain in effect until June 30, 2016, unless renewed by mutual agreement of the fund and the Advisor based upon a determination that this is appropriate under the circumstances at the time.
The Advisor has contractually agreed to waive and/or reimburse all class-specific expenses for Class R6 shares of the fund to the extent they exceed 0.00% of average annual net assets, on an annualized basis. The expense limitation expires on June 30, 2016, unless renewed by mutual agreement of the fund and the advisor based upon a determination that this is appropriate under the circumstances at the time.
Prior to July 1, 2015, the Advisor contractually agreed to waive and/or reimburse all class-specific expenses for Class B shares of the fund, including Rule 12b-1 fees and transfer agency fees and service fees, as applicable, to the extent they exceed 1.30% of average annual net assets (on an annualized basis) attributable to Class B shares (the Class Expense Waiver).
For the year ended March 31, 2016, these expense reductions amounted to the following:
| Class | Expense reduction | Class | Expense reduction | |
| Class A | $101,193 | Class R4 | $1,912 | |
| Class B | 858 | Class R5 | 2,021 | |
| Class C | 1,260 | Class R6 | 4,555 | |
| Class I | 2,823 | Class NAV | 362 | |
| Class R1 | 1,784 | Class T | 26,133 | |
| Class R2 | 3,824 | Class ADV | 5,542 | |
| Class R3 | 1,895 | Total | $154,162 |
The investment management fees, including the impact of the waivers and reimbursements as described above, incurred for the year ended March 31, 2016 were equivalent to a net annual effective rate of 0.69% of the fund's average daily net assets.
Accounting and legal services. Pursuant to a service agreement, the fund reimburses the Advisor for all expenses associated with providing the administrative, financial, legal, accounting and recordkeeping services to the fund, including the preparation of all tax returns, periodic reports to shareholders and regulatory reports, among other services. These expenses are allocated to each share class based on its relative net assets at the time the expense was incurred. These accounting and legal services fees incurred for the year ended March 31, 2016 amounted to an annual rate of 0.01% of the fund's average daily net assets.
Distribution and service plans. The fund has a distribution agreement with the Distributor. The fund has adopted distribution and service plans with respect to Class A, Class B, Class C, Class R1, Class R2, Class R3 and Class R4, Class T and Class ADV shares pursuant to Rule 12b-1 under the 1940 Act, to pay the Distributor for services provided as the distributor of shares of the fund. In addition, under a service plan for Class R1, Class R2, Class R3, Class R4 and Class R5 shares, the fund pays for certain other services. The fund may pay up to the following contractual rates of distribution and service fees under these arrangements, expressed as an annual percentage of average daily net assets for each class of the fund's shares:
| Class | Rule 12b-1 fee | Service fee | Class | Rule 12b-1 fee | Service fee | |
| Class A | 0.30% | — | Class R3 | 0.50% | 0.15% | |
| Class B | 1.00% | — | Class R4 | 0.25% | 0.10% | |
| Class C | 1.00% | — | Class R5 | — | 0.05% | |
| Class R1 | 0.50% | 0.25% | Class T | 0.30% | — | |
| Class R2 | 0.25% | 0.25% | Class ADV | 0.25% | — |
Class A shares are currently charged 0.25% for Rule 12b-1 fees.
The fund's Distributor has contractually agreed to waive 0.10% of Rule 12b-1 fees for Class R4 shares. The current waiver agreement expires on June 30, 2016, unless renewed by mutual agreement of the fund and the Distributor based upon a
determination that this is appropriate under the circumstances at the time. This contractual waiver amounted to $135 for Class R4 shares for the year ended March 31, 2016.
Sales charges. Class A and Class T shares are assessed up-front sales charges of up to 5% of NAV of such shares. The following summarizes the net up front sales charges received by the Distributor during the year ended March 31, 2016:
| Class A | Class T | |
| Retained for printing prospectuses, advertising and sales literature | $75,167 | $3,162 |
| Sales commission to unrelated broker-dealers | 352,275 | 11,317 |
| Sales commission to affiliated sales personnel | 17,033 | 5,809 |
| Net sales charges | $444,475 | $20,288 |
Class A, Class B, Class C and Class T shares may be subject to contingent deferred sales charges (CDSCs). Certain Class A shares and Class I shares that are acquired through purchases of $1 million or more and are redeemed within one year of purchase are subject to a 1.00% sales charge. Class B shares that are redeemed within six years of purchase are subject to CDSCs, at declining rates, beginning at 5.00%. Class C shares that are redeemed within one year of purchase are subject to a 1.00% CDSC. CDSCs are applied to the lesser of the current market value at the time of redemption or the original purchase cost of the shares being redeemed. Proceeds from CDSCs are used to compensate the Distributor for providing distribution-related services in connection with the sale of these shares. During the year ended March 31, 2016, CDSCs received by the Distributor amounted to $1,031, $6,837, $852 and $216 for Class A, Class B, Class C and Class T shares, respectively.
Transfer agent fees. The fund has a transfer agent agreement with John Hancock Signature Services, Inc. (Signature Services), an affiliate of the Advisor. The transfer agent fees paid to Signature Services are determined based on the cost to Signature Services (Signature Services Cost) of providing recordkeeping services. It also includes out-of-pocket expenses, including payments made to third-parties for recordkeeping services provided to their clients who invest in one or more John Hancock funds. In addition, Signature Services Cost may be reduced by certain fees that Signature Services receives in connection with retirement and small accounts. Signature Services Cost is calculated monthly and allocated, as applicable, to five categories of share classes: Retail Share and Institutional Share Classes of Non-Municipal Bond Funds, Class R6 Shares, Retirement Share Classes and Municipal Bond Share Classes. Within each of these categories, the applicable costs are allocated to the affected John Hancock affiliated funds and/or classes, based on the relative average daily net assets.
Class level expenses. Class level expenses for the year ended March 31, 2016 were:
| Class | Distribution and service fees | Transfer agent fees | State registration fees | Printing and postage |
| Class A | $654,322 | $332,395 | $2,908 | $16,191 |
| Class B | 113,895 | 14,452 | 2,270 | 532 |
| Class C | 167,635 | 21,293 | 2,379 | 1,475 |
| Class I | — | 9,858 | 2,548 | 447 |
| Class R1 | 3,979 | 88 | 2,105 | 37 |
| Class R2 | 798 | 34 | 4,120 | 5 |
| Class R3 | 1,021 | 30 | 2,105 | 8 |
| Class R4 | 379 | 22 | 2,105 | 7 |
| Class R5 | — | 14 | 2,105 | 4 |
| Class R6 | — | 694 | 3,455 | 94 |
| Class T | 203,385 | 86,098 | 3,764 | 6,581 |
| Class ADV | 3,400 | 1,724 | 3,635 | 785 |
| Total | $1,148,814 | $466,702 | $33,499 | $26,166 |
Effective July 1, 2015, state registration fees and printing and postage are treated as fund level expenses and are not included in the table above. For the period July 1, 2015 to March 31, 2016, state registration fees and printing and postage amounted to $151,128 and $52,277, respectively.
Trustee expenses. The fund compensates each Trustee who is not an employee of the Advisor or its affiliates. The costs of paying Trustee compensation and expenses are allocated to each fund based on its net assets relative to other funds within the John Hancock group of funds complex.
Note 5 — Fund share transactions
Transactions in fund shares for the years ended March 31, 2016 and 2015 were as follows:
| Year ended 3-31-16 | Year ended 3-31-15 | |||||||||||||||||||||||||
| Shares | Amount | Shares | Amount | |||||||||||||||||||||||
| Class A shares | ||||||||||||||||||||||||||
| Sold | 978,130 | $20,352,328 | 1,594,677 | $32,566,080 | ||||||||||||||||||||||
| Distributions reinvested | 605,954 | 12,694,773 | 4,084,927 | 79,703,498 | ||||||||||||||||||||||
| Repurchased | (2,206,397 | ) | (45,450,113 | ) | (6,000,597 | ) | (122,896,343 | ) | ||||||||||||||||||
| Net decrease | (622,313 | ) | ($12,403,012 | ) | (320,993 | ) | ($10,626,765 | ) | ||||||||||||||||||
| Class B shares | ||||||||||||||||||||||||||
| Sold | 16,646 | $322,075 | 6,791 | $133,579 | ||||||||||||||||||||||
| Distributions reinvested | 30,663 | 590,260 | 261,367 | 4,775,451 | ||||||||||||||||||||||
| Repurchased | (205,670 | ) | (3,885,784 | ) | (362,154 | ) | (6,862,245 | ) | ||||||||||||||||||
| Net decrease | (158,361 | ) | ($2,973,449 | ) | (93,996 | ) | ($1,953,215 | ) | ||||||||||||||||||
| Class C shares | ||||||||||||||||||||||||||
| Sold | 115,279 | $2,241,270 | 88,923 | $1,668,019 | ||||||||||||||||||||||
| Distributions reinvested | 42,654 | 820,234 | 236,281 | 4,313,585 | ||||||||||||||||||||||
| Repurchased | (188,079 | ) | (3,510,193 | ) | (192,450 | ) | (3,650,364 | ) | ||||||||||||||||||
| Net increase (decrease) | (30,146 | ) | ($448,689 | ) | 132,754 | $2,331,240 | ||||||||||||||||||||
| Class I shares | ||||||||||||||||||||||||||
| Sold | 273,719 | $5,919,699 | 178,835 | $3,825,264 | ||||||||||||||||||||||
| Distributions reinvested | 23,452 | 510,308 | 759,379 | 15,298,480 | ||||||||||||||||||||||
| Repurchased | (696,761 | ) | (14,394,878 | ) | (2,991,369 | ) | (61,609,116 | ) | ||||||||||||||||||
| Net decrease | (399,590 | ) | ($7,964,871 | ) | (2,053,155 | ) | ($42,485,372 | ) | ||||||||||||||||||
| Class R1 shares | ||||||||||||||||||||||||||
| Sold | 5,737 | $111,401 | 9,405 | $182,794 | ||||||||||||||||||||||
| Distributions reinvested | 1,067 | 21,399 | 5,105 | 96,316 | ||||||||||||||||||||||
| Repurchased | (17,624 | ) | (357,497 | ) | (3,277 | ) | (64,675 | ) | ||||||||||||||||||
| Net increase (decrease) | (10,820 | ) | ($224,697 | ) | 11,233 | $214,435 | ||||||||||||||||||||
| Class R2 shares | ||||||||||||||||||||||||||
| Sold | 5,852 | $124,832 | 1,364 | $27,983 | ||||||||||||||||||||||
| Distributions reinvested | 325 | 6,924 | 25 | 482 | ||||||||||||||||||||||
| Repurchased | (349 | ) | (6,432 | ) | — | — | ||||||||||||||||||||
| Net increase | 5,828 | $125,324 | 1,389 | $28,465 | ||||||||||||||||||||||
| Class R3 shares | ||||||||||||||||||||||||||
| Sold | 5,119 | $103,111 | 2,310 | $45,979 | ||||||||||||||||||||||
| Distributions reinvested | 329 | 6,672 | 133 | 2,534 | ||||||||||||||||||||||
| Repurchased | (1,335 | ) | (26,362 | ) | (794 | ) | (16,024 | ) | ||||||||||||||||||
| Net increase | 4,113 | $83,421 | 1,649 | $32,489 | ||||||||||||||||||||||
| Year ended 3-31-16 | Year ended 3-31-15 | |||||||||||||||||||||||||
| Shares | Amount | Shares | Amount | |||||||||||||||||||||||
| Class R4 shares | ||||||||||||||||||||||||||
| Sold | 258 | $5,336 | 1,287 | $26,768 | ||||||||||||||||||||||
| Distributions reinvested | 104 | 2,191 | 548 | 10,751 | ||||||||||||||||||||||
| Repurchased | (172 | ) | (3,757 | ) | (1,415 | ) | (27,985 | ) | ||||||||||||||||||
| Net increase | 190 | $3,770 | 420 | $9,534 | ||||||||||||||||||||||
| Class R5 shares1 | ||||||||||||||||||||||||||
| Repurchased | (4,460 | ) | (89,753 | ) | — | — | ||||||||||||||||||||
| Net decrease | (4,460 | ) | ($89,753 | ) | — | — | ||||||||||||||||||||
| Class R6 shares | ||||||||||||||||||||||||||
| Sold | 162,708 | $3,508,946 | 67,594 | $1,413,018 | ||||||||||||||||||||||
| Distributions reinvested | 10,283 | 225,195 | 82,171 | 1,660,185 | ||||||||||||||||||||||
| Repurchased | (83,763 | ) | (1,775,450 | ) | (274,859 | ) | (5,727,525 | ) | ||||||||||||||||||
| Net increase (decrease) | 89,228 | $1,958,691 | (125,094 | ) | ($2,654,322 | ) | ||||||||||||||||||||
| Class T shares | ||||||||||||||||||||||||||
| Sold | 41,795 | $835,029 | 41,904 | $841,233 | ||||||||||||||||||||||
| Distributions reinvested | 158,528 | 3,275,201 | 938,410 | 18,081,064 | ||||||||||||||||||||||
| Repurchased | (374,681 | ) | (7,601,971 | ) | (501,662 | ) | (9,963,242 | ) | ||||||||||||||||||
| Net increase (decrease) | (174,358 | ) | ($3,491,741 | ) | 478,652 | $8,959,055 | ||||||||||||||||||||
| Class ADV shares | ||||||||||||||||||||||||||
| Sold | 408 | $8,621 | 51,204 | $1,153,970 | ||||||||||||||||||||||
| Distributions reinvested | 2,622 | 55,925 | 211,182 | 4,186,945 | ||||||||||||||||||||||
| Repurchased | (51,223 | ) | (1,073,280 | ) | (876,241 | ) | (17,829,367 | ) | ||||||||||||||||||
| Net decrease | (48,193 | ) | ($1,008,734 | ) | (613,855 | ) | ($12,488,452 | ) | ||||||||||||||||||
| Class NAV shares2 | ||||||||||||||||||||||||||
| Sold | — | — | 443,565 | $11,546,739 | ||||||||||||||||||||||
| Distributions reinvested | — | — | 4,784,638 | 96,887,085 | ||||||||||||||||||||||
| Repurchased | (537,683 | ) | (11,731,391 | ) | (20,846,865 | ) | (423,450,264 | ) | ||||||||||||||||||
| Net decrease | (537,683 | ) | ($11,731,391 | ) | (15,618,662 | ) | ($315,016,440 | ) | ||||||||||||||||||
| Total net decrease | (1,886,565 | ) | ($38,165,131 | ) | (18,199,658 | ) | ($373,649,348 | ) | ||||||||||||||||||
1 Effective 3-10-16, Class R5 shares were liquidated.
2 Effective 8-28-15, Class NAV shares were liquidated.
Affiliates of the fund owned 38%, 44%, and 74% of shares of beneficial interest of Class R2, Class R3, and Class R4, respectively, on March 31, 2016.
Note 6 — Purchase and sale of securities
Purchases and sales of securities, other than short-term investments, amounted to $179,640,078 and $232,737,496, respectively, for the year ended March 31, 2016.
Note 7 — Direct placement securities
The fund may hold private placement securities which are restricted as to resale and the fund has limited rights to registration under the Securities Act of 1933. The following table summarizes the direct placement securities held at March 31, 2016:
| Issuer, description | Original acquisition date | Acquisition cost | Beginning share amount | Ending share amount | Value as a percentage of fund's net assets | Value as of 3-31-16 | |
| Source HOV | 10-31-14 | $4,726,919 | 510 | 510 | 0.10% | $360,259 | |
Report of Independent Registered Public Accounting Firm
To the Board of Trustees and Shareholders of John Hancock Funds III and John Hancock Select Growth Fund:
In our opinion, the accompanying statement of assets and liabilities, including the fund's investments, and the related statements of operations and of changes in net assets and the financial highlights present fairly, in all material respects, the financial position of John Hancock Select Growth Fund (the "Fund") at March 31, 2016, the results of its operations for the year then ended, the changes in its net assets for each of the two years in the period then ended and the financial highlights for each of the periods indicated, in conformity with accounting principles generally accepted in the United States of America. These financial statements and financial highlights (hereafter referred to as "financial statements") are the responsibility of the Fund's management. Our responsibility is to express an opinion on these financial statements based on our audits. We conducted our audits of these financial statements in accordance with the standards of the Public Company Accounting Oversight Board (United States). Those standards require that we plan and perform the audit to obtain reasonable assurance about whether the financial statements are free of material misstatement. An audit includes examining, on a test basis, evidence supporting the amounts and disclosures in the financial statements, assessing the accounting principles used and significant estimates made by management, and evaluating the overall financial statement presentation. We believe that our audits, which included confirmation of securities at March 31, 2016 by correspondence with the custodian, transfer agent, and brokers, and the application of alternative auditing procedures where securities purchased confirmations had not been received, provide a reasonable basis for our opinion.
PricewaterhouseCoopers LLP
Boston, Massachusetts
May 13, 2016
Unaudited
For federal income tax purposes, the following information is furnished with respect to the distributions of the fund, if any, paid during its taxable year ended March 31, 2016.
The fund reports the maximum amount allowable of its net taxable income as eligible for the corporate dividends-received deduction.
The fund reports the maximum amount allowable of its net taxable income as qualified dividend income as provided in the Jobs and Growth Tax Relief Reconciliation Act of 2003.
The fund paid $19,014,372 in capital gain dividends.
Eligible shareholders will be mailed a 2016 Form 1099-DIV in early 2017. This will reflect the tax character of all distributions paid in calendar year 2016.
Please consult a tax advisor regarding the tax consequences of your investment in the fund.
The fund held a Special Meeting of Shareholders on March 30, 2016. The following proposal was considered by the shareholders:
Proposal: Approve an Agreement and Plan of Reorganization between John Hancock Select Growth Fund and John Hancock Strategic Growth Fund.
| FOR | AGAINST | ABSTAIN |
| 8,790,826.813 | 314,306.034 | 561,452,190 |
As a result of the shareholders' approval of the proposal, the reorganization is expected to occur as of the close of business on April 22, 2016.
This chart provides information about the Trustees and Officers who oversee your John Hancock fund. Officers elected by the Trustees manage the day-to-day operations of the fund and execute policies formulated by the Trustees.
Independent Trustees
| Name, year of birth Position(s) held with fund Principal occupation(s) and other directorships during past 5 years | Trustee of the Trust since1 | Number of John Hancock funds overseen by Trustee |
| James M. Oates, Born: 1946 | 2012 | 230 |
| Trustee and Chairperson of the Board Managing Director, Wydown Group (financial consulting firm) (since 1994); Chairman and Director, Emerson Investment Management, Inc. (since 2000); Independent Chairman, Hudson Castle Group, Inc. (formerly IBEX Capital Markets, Inc.) (financial services company) (1997-2011); Director, Stifel Financial (since 1996); Director, Investor Financial Services Corporation (1995-2007); Director, Connecticut River Bancorp (1998-2014); Director, Virtus Funds (formerly Phoenix Mutual Funds) (since 1988). Trustee and Chairperson of the Board, John Hancock Collateral Trust and John Hancock Exchange-Traded Fund Trust (since 2015); Trustee and Chairperson of the Board, John Hancock retail funds3 (since 2012); Trustee (2005-2006 and since 2012) and Chairperson of the Board (since 2012), John Hancock Funds III; Trustee (since 2004) and Chairperson of the Board (since 2005), John Hancock Variable Insurance Trust; Trustee and Chairperson of the Board, John Hancock Funds II (since 2005). | ||
| Charles L. Bardelis,2 Born: 1941 | 2012 | 230 |
| Trustee Director, Island Commuter Corp. (marine transport). Trustee, John Hancock Collateral Trust and John Hancock Exchange-Traded Fund Trust (since 2015); Trustee, John Hancock retail funds3 (since 2012); Trustee, John Hancock Funds III (2005-2006 and since 2012); Trustee, John Hancock Variable Insurance Trust (since 1988); Trustee, John Hancock Funds II (since 2005). | ||
| Peter S. Burgess,2 Born: 1942 | 2012 | 230 |
| Trustee Consultant (financial, accounting, and auditing matters) (since 1999); Certified Public Accountant; Partner, Arthur Andersen (independent public accounting firm) (prior to 1999); Director, Lincoln Educational Services Corporation (since 2004); Director, Symetra Financial Corporation (2010-2016); Director, PMA Capital Corporation (2004-2010). Trustee, John Hancock Collateral Trust and John Hancock Exchange-Traded Fund Trust (since 2015); Trustee, John Hancock retail funds3 (since 2012); Trustee, John Hancock Funds III (2005-2006 and since 2012); Trustee, John Hancock Variable Insurance Trust and John Hancock Funds II (since 2005). | ||
| William H. Cunningham, Born: 1944 | 2006 | 230 |
| Trustee Professor, University of Texas, Austin, Texas (since 1971); former Chancellor, University of Texas System and former President of the University of Texas, Austin, Texas; Chairman (since 2009) and Director (since 2006), Lincoln National Corporation (insurance); Director, Southwest Airlines (since 2000); former Director, LIN Television (2009-2014). Trustee, John Hancock retail funds3 (since 1986); Trustee, John Hancock Variable Insurance Trust (since 2012); Trustee, John Hancock Funds II (2005-2006 and since 2012); Trustee, John Hancock Collateral Trust and John Hancock Exchange-Traded Fund Trust (since 2015). | ||
| Grace K. Fey, Born: 1946 | 2012 | 230 |
| Trustee Chief Executive Officer, Grace Fey Advisors (since 2007); Director and Executive Vice President, Frontier Capital Management Company (1988-2007); Director, Fiduciary Trust (since 2009). Trustee, John Hancock Collateral Trust and John Hancock Exchange-Traded Fund Trust (since 2015); Trustee, John Hancock retail funds3 (since 2012); Trustee, John Hancock Variable Insurance Trust and John Hancock Funds II (since 2008). | ||
Independent Trustees (continued)
| Name, year of birth Position(s) held with fund Principal occupation(s) and other directorships during past 5 years | Trustee of the Trust since1 | Number of John Hancock funds overseen by Trustee |
| Theron S. Hoffman,2 Born: 1947 | 2012 | 230 |
| Trustee Chief Executive Officer, T. Hoffman Associates, LLC (consulting firm) (since 2003); Director, The Todd Organization (consulting firm) (2003-2010); President, Westport Resources Management (investment management consulting firm) (2006-2008); Senior Managing Director, Partner, and Operating Head, Putnam Investments (2000-2003); Executive Vice President, The Thomson Corp. (financial and legal information publishing) (1997-2000). Trustee, John Hancock Collateral Trust and John Hancock Exchange-Traded Fund Trust (since 2015); Trustee, John Hancock retail funds3 (since 2012); Trustee, John Hancock Variable Insurance Trust and John Hancock Funds II (since 2008). | ||
| Deborah C. Jackson, Born: 1952 | 2008 | 230 |
| Trustee President, Cambridge College, Cambridge, Massachusetts (since 2011); Chief Executive Officer, American Red Cross of Massachusetts Bay (2002-2011); Board of Directors of Eastern Bank Corporation (since 2001); Board of Directors of Eastern Bank Charitable Foundation (since 2001); Board of Directors of American Student Assistance Corporation (1996-2009); Board of Directors of Boston Stock Exchange (2002-2008); Board of Directors of Harvard Pilgrim Healthcare (health benefits company) (2007-2011). Trustee, John Hancock retail funds3 (since 2008); Trustee, John Hancock Variable Insurance Trust and John Hancock Funds II (since 2012); Trustee, John Hancock Collateral Trust and John Hancock Exchange-Traded Fund Trust (since 2015). | ||
| Hassell H. McClellan, Born: 1945 | 2012 | 230 |
| Trustee Trustee, Virtus Variable Insurance Trust (formerly Phoenix Edge Series Funds) (since 2008); Director, The Barnes Group (since 2010); Associate Professor, The Wallace E. Carroll School of Management, Boston College (retired 2013). Trustee, John Hancock Collateral Trust and John Hancock Exchange-Traded Fund Trust (since 2015); Trustee, John Hancock retail funds3 (since 2012); Trustee, John Hancock Funds III (2005-2006 and since 2012); Trustee, John Hancock Variable Insurance Trust and John Hancock Funds II (since 2005). | ||
| Steven R. Pruchansky, Born: 1944 | 2006 | 230 |
| Trustee and Vice Chairperson of the Board Chairman and Chief Executive Officer, Greenscapes of Southwest Florida, Inc. (since 2000); Director and President, Greenscapes of Southwest Florida, Inc. (until 2000); Member, Board of Advisors, First American Bank (until 2010); Managing Director, Jon James, LLC (real estate) (since 2000); Partner, Right Funding, LLC (since 2014); Director, First Signature Bank & Trust Company (until 1991); Director, Mast Realty Trust (until 1994); President, Maxwell Building Corp. (until 1991). Trustee (since 1992) and Chairperson of the Board (2011-2012), John Hancock retail funds3; Trustee and Vice Chairperson of the Board, John Hancock retail funds3 John Hancock Variable Insurance Trust, and John Hancock Funds II (since 2012); Trustee, and Vice Chairperson of the Board, John Hancock Collateral Trust and John Hancock Exchange-Traded Fund Trust (since 2015). | ||
Independent Trustees (continued)
| Name, year of birth Position(s) held with fund Principal occupation(s) and other directorships during past 5 years | Trustee of the Trust since1 | Number of John Hancock funds overseen by Trustee |
| Gregory A. Russo, Born: 1949 | 2008 | 230 |
| Trustee Director and Audit Committee Chairman (since 2012), and Member, Audit Committee and Finance Committee (since 2011), NCH Healthcare System, Inc. (holding company for multi-entity healthcare system); Director and Member (since 2012) and Finance Committee Chairman (since 2014), The Moorings, Inc. (nonprofit continuing care community); Vice Chairman, Risk & Regulatory Matters, KPMG LLP (KPMG) (2002-2006); Vice Chairman, Industrial Markets, KPMG (1998-2002); Chairman and Treasurer, Westchester County, New York, Chamber of Commerce (1986-1992); Director, Treasurer, and Chairman of Audit and Finance Committees, Putnam Hospital Center (1989-1995); Director and Chairman of Fundraising Campaign, United Way of Westchester and Putnam Counties, New York (1990-1995). Trustee, John Hancock retail funds3 (since 2008); Trustee, John Hancock Variable Insurance Trust and John Hancock Funds II (since 2012); Trustee, John Hancock Collateral Trust and John Hancock Exchange-Traded Fund Trust (since 2015). | ||
Non-Independent Trustees4
| Name, year of birth Position(s) held with fund Principal occupation(s) and other directorships during past 5 years | Trustee of the Trust since1 | Number of John Hancock funds overseen by Trustee |
| James R. Boyle, Born: 1959 | 2015 | 230 |
| Non-Independent Trustee Chairman and Chief Executive Officer, Zillion Group, Inc. (formerly HealthFleet, Inc.) (healthcare) (since 2014); Executive Vice President and Chief Executive Officer, U.S. Life Insurance Division of Genworth Financial, Inc. (insurance) (January 2014-July 2014); Senior Executive Vice President, Manulife Financial Corporation, President and Chief Executive Officer, John Hancock (1999-2012); Chairman and Director, John Hancock Advisers, LLC, John Hancock Funds, LLC, and John Hancock Investment Management Services, LLC (2005-2010). Trustee, John Hancock Collateral Trust and John Hancock Exchange-Traded Fund Trust (since 2015); Trustee, John Hancock retail funds3 (2005-2010; 2012-2014 and since 2015); Trustee, John Hancock Variable Insurance Trust and John Hancock Funds II (2005-2014 and since 2015). | ||
| Craig Bromley, Born: 1966 | 2012 | 230 |
| Non-Independent Trustee President, John Hancock Financial Service (since 2012); Senior Executive Vice President and General Manager, U.S. Division, Manulife Financial Corporation (since 2012); President and Chief Executive Officer, Manulife Insurance Company (Manulife Japan) (2005-2012, including prior positions). Trustee, John Hancock retail funds,3 John Hancock Variable Insurance Trust, and John Hancock Funds II (since 2012); Trustee, John Hancock Collateral Trust and John Hancock Exchange-Traded Fund Trust (since 2015). | ||
| Warren A. Thomson, Born: 1955 | 2012 | 230 |
| Non-Independent Trustee Senior Executive Vice President and Chief Investment Officer, Manulife Financial Corporation and The Manufacturers Life Insurance Company (since 2009); Chairman, Manulife Asset Management (since 2001, including prior positions); Director and Chairman, Manulife Asset Management Limited (since 2006); Director and Chairman, Hancock Natural Resources Group, Inc. (since 2013). Trustee, John Hancock retail funds,3 John Hancock Variable Insurance Trust, and John Hancock Funds II (since 2012); Trustee, John Hancock Collateral Trust and John Hancock Exchange-Traded Fund Trust (since 2015). | ||
Principal officers who are not Trustees
| Name, year of birth Position(s) held with fund Principal occupation(s) during past 5 years | Officer of the Trust since |
| Andrew G. Arnott, Born: 1971 | 2009 |
| President Senior Vice President, John Hancock Financial Services (since 2009); Director and Executive Vice President, John Hancock Advisers, LLC (since 2005, including prior positions); Director and Executive Vice President, John Hancock Investment Management Services, LLC (since 2006, including prior positions); President, John Hancock Funds, LLC (since 2004, including prior positions); President, John Hancock retail funds,3 John Hancock Variable Insurance Trust, and John Hancock Funds II (since 2007, including prior positions); President, John Hancock Collateral Trust (since 2015); President, John Hancock Exchange-Traded Fund Trust (since 2014). | |
| John J. Danello, Born: 1955 | 2014 |
| Senior Vice President, Secretary, and Chief Legal Officer Vice President and Chief Counsel, John Hancock Wealth Management (since 2005); Senior Vice President (since 2007) and Chief Legal Counsel (2007-2010), John Hancock Funds, LLC and The Berkeley Financial Group, LLC; Senior Vice President (since 2006, including prior positions) and Chief Legal Officer and Secretary (since 2014), John Hancock retail funds,3 John Hancock Funds II and John Hancock Variable Insurance Trust; Senior Vice President, Chief Legal Officer and Secretary, John Hancock Collateral Trust and John Hancock Exchange-Traded Fund Trust (since 2015); Vice President, John Hancock Life & Health Insurance Company (since 2009); Vice President, John Hancock Life Insurance Company (USA) and John Hancock Life Insurance Company of New York (since 2010); and Senior Vice President, Secretary, and Chief Legal Counsel (2007-2014, including prior positions) of John Hancock Advisers, LLC and John Hancock Investment Management Services, LLC. | |
| Francis V. Knox, Jr., Born: 1947 | 2006 |
| Chief Compliance Officer Vice President, John Hancock Financial Services (since 2005); Chief Compliance Officer, John Hancock retail funds,3 John Hancock Variable Insurance Trust, John Hancock Funds II, John Hancock Advisers, LLC, and John Hancock Investment Management Services, LLC (since 2005); Chief Compliance Officer, John Hancock Collateral Trust and John Hancock Exchange-Traded Fund Trust (since 2015). | |
| Charles A. Rizzo, Born: 1957 | 2007 |
| Chief Financial Officer Vice President, John Hancock Financial Services (since 2008); Senior Vice President, John Hancock Advisers, LLC and John Hancock Investment Management Services, LLC (since 2008); Chief Financial Officer, John Hancock retail funds,3 John Hancock Variable Insurance Trust and John Hancock Funds II (since 2007); Chief Financial Officer, John Hancock Collateral Trust and John Hancock Exchange-Traded Fund Trust (since 2015). | |
| Salvatore Schiavone, Born: 1965 | 2010 |
| Treasurer Assistant Vice President, John Hancock Financial Services (since 2007); Vice President, John Hancock Advisers, LLC and John Hancock Investment Management Services, LLC (since 2007); Treasurer, John Hancock retail funds3 (since 2007, including prior positions); Treasurer, John Hancock Variable Insurance Trust and John Hancock Funds II (2007-2009 and since 2010, including prior positions); Treasurer, John Hancock Collateral Trust and John Hancock Exchange-Traded Fund Trust (since 2015). | |
The business address for all Trustees and Officers is 601 Congress Street, Boston, Massachusetts 02210-2805.
The Statement of Additional Information of the fund includes additional information about members of the Board of Trustees of the Trust and is available without charge, upon request, by calling 800-225-5291.
| 1 | Each Trustee holds office until his or her successor is elected and qualified, or until the Trustee's death, retirement, resignation, or removal. Mr. Boyle has served as Trustee at various times prior to the date listed in the table. |
| 2 | Member of the Audit Committee. |
| 3 | "John Hancock retail funds" comprises John Hancock Funds III and 35 other John Hancock funds consisting of 25 series of other John Hancock trusts and 10 closed-end funds. |
| 4 | The Trustee is a Non-Independent Trustee due to current or former positions with the Advisor and certain affiliates. |
Trustees James M. Oates, Chairperson Officers Andrew G. Arnott John J. Danello Francis V. Knox, Jr. Charles A. Rizzo Salvatore Schiavone | Investment advisor John Hancock Advisers, LLC Subadvisor Baillie Gifford Overseas Limited (BG Overseas) Principal distributor John Hancock Funds, LLC Custodian State Street Bank and Trust Company Transfer agent John Hancock Signature Services, Inc. Legal counsel K&L Gates LLP Independent registered public accounting firm PricewaterhouseCoopers LLP |
*Member of the Audit Committee
†Non-Independent Trustee
The fund's proxy voting policies and procedures, as well as the fund proxy voting record for the most recent twelve-month period ended June 30, are available free of charge on the Securities and Exchange Commission (SEC) website at sec.gov or on our website.
The fund's complete list of portfolio holdings, for the first and third fiscal quarters, is filed with the SEC on Form N-Q. The fund's Form N-Q is available on our website and the SEC's website, sec.gov, and can be reviewed and copied (for a fee) at the SEC's Public Reference Room in Washington, DC. Call 800-SEC-0330 to receive information on the operation of the SEC's Public Reference Room.
We make this information on your fund, as well as monthly portfolio holdings, and other fund details available on our website at jhinvestments.com or by calling 800-225-5291.
| You can also contact us: | |||
| 800-225-5291 jhinvestments.com | Regular mail: John Hancock Signature Services, Inc. | Express mail: John Hancock Signature Services, Inc. | |
John Hancock family of funds
DOMESTIC EQUITY FUNDS Balanced Blue Chip Growth Classic Value Disciplined Value Disciplined Value Mid Cap Equity Income Fundamental All Cap Core Fundamental Large Cap Core Fundamental Large Cap Value New Opportunities Small Cap Value Small Company Strategic Growth U.S. Equity U.S. Global Leaders Growth Value Equity GLOBAL AND INTERNATIONAL EQUITY FUNDS Disciplined Value International Emerging Markets Emerging Markets Equity Global Equity Global Shareholder Yield Greater China Opportunities International Core International Growth International Small Company International Value Equity | INCOME FUNDS Bond California Tax-Free Income Core High Yield Emerging Markets Debt Floating Rate Income Focused High Yield Global Income Government Income High Yield Municipal Bond Income Investment Grade Bond Money Market Short Duration Credit Opportunities Spectrum Income Strategic Income Opportunities Tax-Free Bond ALTERNATIVE AND SPECIALTY FUNDS Absolute Return Currency Alternative Asset Allocation Enduring Assets Financial Industries Global Absolute Return Strategies Global Conservative Absolute Return Global Focused Strategies Global Real Estate Natural Resources Redwood Regional Bank Seaport Technical Opportunities |
A fund's investment objectives, risks, charges, and expenses should be considered carefully before investing. The prospectus contains this and other important information about the fund. To obtain a prospectus, contact your financial professional, call John Hancock Investments at 800-225-5291, or visit our website at jhinvestments.com. Please read the prospectus carefully before investing or sending money.
ASSET ALLOCATION Income Allocation Fund Lifestyle Aggressive Portfolio Lifestyle Balanced Portfolio Lifestyle Conservative Portfolio Lifestyle Growth Portfolio Lifestyle Moderate Portfolio Retirement Choices Portfolios (2010-2060) Retirement Living Portfolios (2010-2060) Retirement Living II Portfolios (2010-2060) EXCHANGE-TRADED FUNDS John Hancock Multifactor Consumer Discretionary ETF John Hancock Multifactor Consumer Staples ETF John Hancock Multifactor Energy ETF John Hancock Multifactor Financials ETF John Hancock Multifactor Healthcare ETF John Hancock Multifactor Industrials ETF John Hancock Multifactor Large Cap ETF John Hancock Multifactor Materials ETF John Hancock Multifactor Mid Cap ETF John Hancock Multifactor Technology ETF John Hancock Multifactor Utilities ETF | CLOSED-END FUNDS Financial Opportunities Hedged Equity & Income Income Securities Trust Investors Trust Preferred Income Preferred Income II Preferred Income III Premium Dividend Tax-Advantaged Dividend Income Tax-Advantaged Global Shareholder Yield |
John Hancock Multifactor ETF shares are bought and sold at market price (not NAV), and are not individually redeemed
from the fund. Brokerage commissions will reduce returns.
John Hancock ETFs are distributed by Foreside Fund Services, LLC, and are subadvised by Dimensional Fund Advisors LP.
Foreside is not affiliated with John Hancock Funds, LLC or Dimensional Fund Advisors LP.
Dimensional Fund Advisors LP receives compensation from John Hancock in connection with licensing rights to the
John Hancock Dimensional indexes. Dimensional Fund Advisors LP does not sponsor, endorse, or sell, and makes no
representation as to the advisability of investing in, John Hancock Multifactor ETFs.
John Hancock Investments
A trusted brand
John Hancock Investments is a premier asset manager representing
one of America's most trusted brands, with a heritage of financial
stewardship dating back to 1862. Helping our shareholders pursue
their financial goals is at the core of everything we do. It's why we
support the role of professional financial advice and operate with the
highest standards of conduct and integrity.
A better way to invest
We build funds based on investor needs, then search the world to find
proven portfolio teams with specialized expertise in those strategies.
As a manager of managers, we apply vigorous oversight to ensure that
they continue to meet our uncompromising standards and serve the
best interests of our shareholders.
Results for investors
Our unique approach to asset management enables us to provide
a diverse set of investments backed by some of the world's best
managers, along with strong risk-adjusted returns across asset classes.

 | John Hancock Funds, LLC n Member FINRA, SIPC 601 Congress Street n Boston, MA 02210-2805 800-225-5291 n jhinvestments.com | |
| This report is for the information of the shareholders of John Hancock Select Growth Fund. It is not authorized for distribution to prospective investors unless preceded or accompanied by a prospectus. | ||
| MF288159 | 334A 3/16 5/16 | |
John Hancock
Disciplined Value Fund
Annual report 3/31/16
A message to shareholders
Dear shareholder,
The 12-month period covered by this report was a challenging one for U.S. equity investors. Many market indexes tumbled late last summer and again in the winter amid concerns about slowing global growth, particularly in China. The volatility extended to commodity markets, as oil prices hit multi-year lows before rebounding toward the end of the period. The investment landscape improved late in the period as stocks and other so-called risk assets regained positive momentum.
Despite the increase in volatility, the economic picture in the United States offers reasons for optimism. In December, the U.S. Federal Reserve raised short-term interest rates for the first time in nine years on evidence that the persistent strength in the labor markets warranted a somewhat less accommodative stance. Economic data generally remained strong entering the spring.
Volatile market environments are naturally unsettling. At John Hancock Investments, portfolio risk management is a critical part of our role as an asset manager, and our dedicated risk team is focused on these issues every day. We continually strive for new ways to analyze potential risks and have liquidity tools in place. However, your best resource in times like these is your financial advisor, who can ensure your portfolio is sufficiently diversified to meet your long-term objectives and to withstand the inevitable bumps along the way.
On behalf of everyone at John Hancock Investments, I'd like to take this opportunity to thank you for the continued trust you've placed in us.
Sincerely,
Andrew G. Arnott
President and Chief Executive Officer
John Hancock Investments
This commentary reflects the CEO's views as of March 31, 2016. They are subject to change at any time. All investments entail risks, including the possible loss of principal. Diversification does not guarantee a profit or eliminate the risk of a loss. For more up-to-date information, you can visit our website at jhinvestments.com.
John Hancock
Disciplined Value Fund
INVESTMENT OBJECTIVE
The fund seeks to provide long-term growth of capital primarily through investments in equity securities. Current income is a secondary objective.
AVERAGE ANNUAL TOTAL RETURNS AS OF 3/31/16 (%)
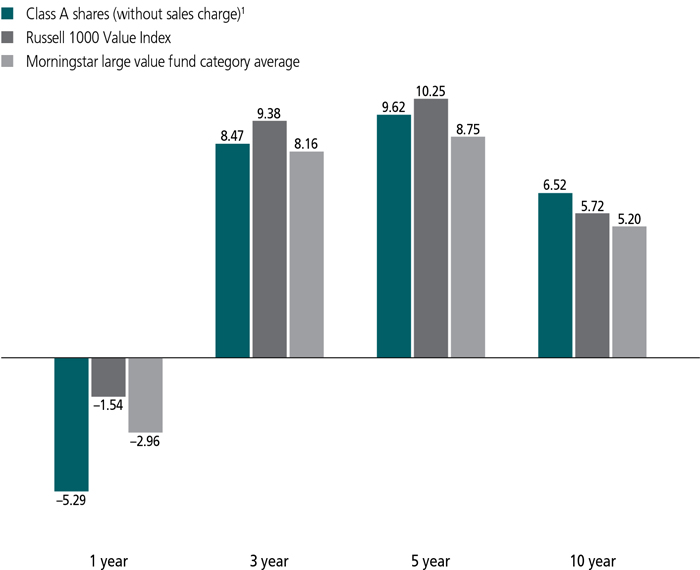
The Russell 1000 Value Index is an unmanaged index containing those securities in the Russell 1000 Index with a lower price-to-book ratio and less-than-average growth orientation.
It is not possible to invest directly in an index. Index figures do not reflect expenses or sales charges, which would result in lower returns.
Figures from Morningstar, Inc. include reinvested distributions and do not take into account sales charges. Actual load-adjusted performance is lower.
| 1 | On 12-19-08, through a reorganization, the fund acquired all of the assets of Robeco Boston Partners Large Cap Value Fund (the predecessor fund). On that date, the predecessor fund's Investor shares were exchanged for Class A shares of John Hancock Disciplined Value Fund. Class A shares were first offered on 12-22-08. Class A shares' performance shown above for periods prior to this date is that of the predecessor fund's Investor shares that have been recalculated to reflect the gross fees and expenses of Class A shares. |
The past performance shown here reflects reinvested distributions and the beneficial effect of any expense reductions, and does not guarantee future results. Performance of the other share classes will vary based on the difference in the fees and expenses of those classes. Shares will fluctuate in value and, when redeemed, may be worth more or less than their original cost. Current month-end performance may be lower or higher than the performance cited, and can be found at jhinvestments.com or by calling 800-225-5291. For further information on the fund's objectives, risks, and strategy, see the fund's prospectus.
PERFORMANCE HIGHLIGHTS OVER THE LAST TWELVE MONTHS
Equity markets affected by periods of global volatility
The market was extremely volatile during the period, as equities continued to be affected by slowing global growth and lower oil prices.
The fund was down, and underperformed its benchmark
The fund trailed its benchmark, the Russell 1000 Value Index, due to detrimental stock selection and sector allocation.
Underweights in utilities and stock selection in industrials, materials, information technology, and healthcare were the top relative detractors
From a sector standpoint, utilities, industrials, materials, information technology, and healthcare were the top relative detractors; the energy and consumer staples sectors helped.
SECTOR COMPOSITION AS OF 3/31/16 (%)
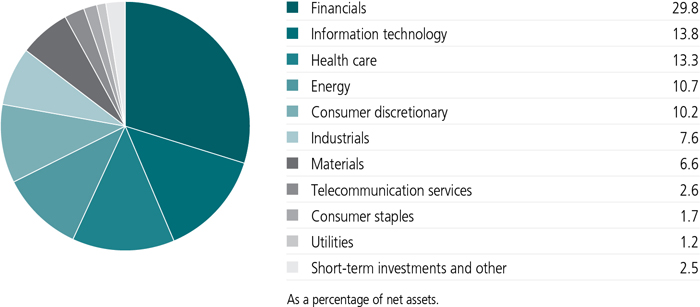
A note about risks
Value stocks may decline in price. Large company stocks could fall out of favor, and illiquid securities may be difficult to sell at a price approximating their value. The value of a company's equity securities is subject to changes in the company's financial condition, and overall market and economic conditions. Events in the financial markets have resulted, and may continue to result, in an unusually high degree of volatility in the financial markets, both domestic and foreign. Foreign investing has additional risks, such as currency and market volatility and political and social instability. Sector investing is subject to greater risks than the market as a whole. Because the fund may focus on particular sectors of the economy, its performance may depend on the performance of those sectors, and investments focused in one sector may fluctuate more widely than investments in a wider variety of sectors. Please see the fund's prospectuses for additional risks.

Mark E. Donovan, CFA
Portfolio Manager
Boston Partners
Can you briefly describe the market environment over the past 12 months?
U.S. equities generally declined over the 12-month period ended March 31, 2016. For the first part of the period, the market traded in a tight band and was generally positive. Major indexes reached record highs, but then experienced their worst quarterly returns since 2011 as a significant slowdown in China and a drop in commodity prices signaled a potential for an impending global recession. Markets were mostly positive to end the calendar year, overcoming concerns of monetary policy and global growth, as well as continued weakness in oil prices. U.S. equities experienced double-digit declines from early January until mid-February, which resulted from oil prices dropping into the mid-$20 range, a strengthening U.S. dollar, and fears of a slowing global economy. Near the end of the fiscal year, as the U.S. Federal Reserve became more dovish with its rate expectations, the dollar weakened, oil prices rallied as production expectations tempered, and the European Central Bank embarked on a more aggressive quantitative easing program. In this environment, the fund's primary benchmark, the Russell 1000 Value Index, was down 1.54%.
What factors caused the fund to underperform its benchmark?
Adverse stock selection primarily drove relative underperformance. The utilities sector was the most significant detractor to relative returns due to a detrimental underweight position and unfavorable stock selection. The industrials and materials sectors also detracted from relative returns due primarily to stock selection.
Relative to the benchmark, General Electric Company and AT&T Inc. were the top detractors, as the companies perfomed well but were not the portfolio. In healthcare, Express Scripts Holding
What performed well?
The energy and consumer staples sector were the top contributors to relative performance due to a favorable underweight position in energy and positive stock selection in consumer staples. In consumer staples, an overweight position in Tyson Foods, Inc. was beneficial, as the company experienced strong growth from its chicken division and management set attractive profit margin targets for future periods.
What were some notable additions and deletions to the portfolio?
New positions included drug and medical products distributor Cardinal Health, Inc., which has attractive free cash flow characteristics and is well positioned for continued growth from its joint venture with CVS Health Corp. During the first half market correction, we purchased eBay, Inc., exploiting a valuation opportunity to own a leader in the online e-commerce marketplace that has
TOP 10 HOLDINGS AS OF 3/31/16 (%)
| Berkshire Hathaway, Inc., Class B | 5.0 |
| JPMorgan Chase & Co. | 4.0 |
| Johnson & Johnson | 3.9 |
| Wells Fargo & Company | 3.1 |
| Microsoft Corp. | 3.0 |
| Capital One Financial Corp. | 2.9 |
| Verizon Communications, Inc. | 2.6 |
| Citigroup, Inc. | 2.4 |
| Occidental Petroleum Corp. | 2.4 |
| Phillips 66 | 2.3 |
| TOTAL | 31.6 |
| As a percentage of net assets. | |
| Cash and cash equivalents are not included. | |
During the period, we liquidated positions on deteriorating business momentum, such as ON Semiconductor Corp. and EMC Corp.; weak business momentum and poor merger and acquisition in the case of Scripps Networks Interactive, Inc.; and, we reached target valuation in the case of TE Connectivity, Ltd. We also closed the fund's position in NXP Semiconductors NV, because of negative momentum created by lowered earnings guidance.
How was the fund positioned at the end of the period?
Looking ahead, we continue to favor healthcare and consumer services given that these are stable industries with solid free cash flow. The fund is overweight in financials, and banks in particular, based on attractive valuation and the potential for improved profitability as currently depressed net interest margins have the potential for marked improvement when interest rates rise. We continue to see yield sectors as expensive relative to their historical averages and levels of profitability and growth.
The fund continues to be underweight yield-focused segments such as utilities, consumer staples, and real estate investment trusts, and continues to hold meaningful weights in large banks on improved capital ratios, healthier balance sheets, and attractive valuations.
The largest sector overweights were consumer discretionary, materials, healthcare, technology, and financials. Conversely, the biggest sector underweights were utilities, consumer staples, industrials,
energy, and telecommunication services. We continue to invest on a stock-by-stock basis within our three-circle discipline of attractive valuation, sound fundamentals, and a catalyst for improvement.
MANAGED BY
| | Mark E. Donovan, CFA On the fund since inception Investing since 1981 |
 | David J. Pyle, CFA On the fund since 2000 Investing since 1995 |
![]()
TOTAL RETURNS FOR THE PERIOD ENDED MARCH 31, 2016
| Average annual total returns (%) with maximum sales charge | Cumulative total returns (%) with maximum sales charge | |||||||||
| 1-year | 5-year | 10-year | Since inception | 5-year | 10-year | Since inception | ||||
| Class A1 | -10.02 | 8.51 | 5.97 | — | 50.40 | 78.58 | — | |||
| Class B1 | -10.55 | 8.43 | 5.56 | — | 49.91 | 71.73 | — | |||
| Class C1 | -6.91 | 8.79 | 5.59 | — | 52.37 | 72.24 | — | |||
| Class I1,2 | -5.02 | 9.95 | 6.86 | — | 60.68 | 94.22 | — | |||
| Class I21,2 | -5.07 | 9.95 | 6.79 | — | 60.69 | 92.90 | — | |||
| Class R11,2 | -5.66 | 9.16 | 6.10 | — | 55.00 | 80.77 | — | |||
| Class R21,2 | -5.42 | 9.44 | 6.29 | — | 56.99 | 84.06 | — | |||
| Class R31,2 | -5.57 | 9.27 | 6.21 | — | 55.78 | 82.62 | — | |||
| Class R41,2 | -5.22 | 9.71 | 6.58 | — | 58.93 | 89.08 | — | |||
| Class R51,2 | -5.02 | 10.00 | 6.88 | — | 61.08 | 94.58 | — | |||
| Class R61,2 | -5.00 | 10.04 | 6.91 | — | 61.34 | 95.13 | — | |||
| Class NAV2,3 | -4.95 | 10.08 | — | 13.82 | 61.65 | — | 142.42 | |||
| Index 1† | -1.54 | 10.25 | 5.72 | — | 62.86 | 74.37 | — | |||
| Index 2† | 1.78 | 11.58 | 7.01 | — | 72.95 | 96.87 | — | |||
Performance figures assume all distributions have been reinvested. Figures reflect maximum sales charge on Class A shares of 5%, and the applicable contingent deferred sales charge (CDSC) on Class B and Class C shares. The Class B shares' CDSC declines annually between years 1 to 6 according to the following schedule: 5%, 4%, 3%, 3%, 2%, and 1%. No sales charge will be assessed after the sixth year. Class C shares sold within one year of purchase are subject to a 1% CDSC. Sales charges are not applicable to Class I, Class I2, Class R1, Class R2, Class R3, Class R4, Class R5, Class R6, and Class NAV shares.
The expense ratios of the fund, both net (including any fee waivers and/or expense limitations) and gross (excluding any fee waivers and/or expense limitations), are set forth according to the most recent publicly available prospectuses for the fund and may differ from those disclosed in the Financial highlights tables in this report. Had the fee waivers and expense limitations not been in place, gross expenses would apply. The expense ratios are as follows:
| Class A | Class B | Class C | Class I | Class I2 | Class R1 | Class R2 | Class R3 | Class R4 | Class R5 | Class R6 | Class NAV | |
| Gross (%) | 1.08 | 1.83 | 1.83 | 0.82 | 0.82 | 1.47 | 1.22 | 1.37 | 1.07 | 0.77 | 0.72 | 0.70 |
| Net (%) | 1.08 | 1.83 | 1.83 | 0.82 | 0.82 | 1.47 | 1.22 | 1.37 | 0.97 | 0.77 | 0.70 | 0.70 |
Please refer to the most recent prospectuses and annual or semiannual report for more information on expenses and any expense limitation arrangements for each class.
The returns reflect past results and should not be considered indicative of future performance. The return and principal value of an investment will fluctuate so that shares, when redeemed, may be worth more or less than their original cost. Due to market volatility and other factors, the fund's current performance may be higher or lower than the performance shown. For current to the most recent month-end performance data, please call 800-225-5291 or visit the fund's website at jhinvestments.com.
The performance table above and the chart on the next page do not reflect the deduction of taxes that a shareholder would pay on fund distributions or the redemption of fund shares. The fund's performance results reflect any applicable fee waivers or expense reductions, without which the expenses would increase and results would have been less favorable.
| † | Index 1 is the Russell 1000 Value Index; Index 2 is the S&P 500 Index. |
See the following page for footnotes.
This chart and table show what happened to a hypothetical $10,000 investment in John Hancock Disciplined Value Fund for the share classes and periods indicated, assuming all distributions were reinvested. For comparison, we've shown the same investment in two separate indexes.
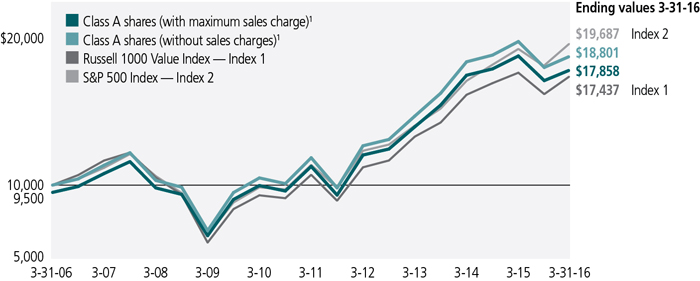
| Start date | With maximum sales charge ($) | Without sales charge ($) | Index 1 ($) | Index 2 ($) | |
| Class B1,4 | 3-31-06 | 17,173 | 17,173 | 17,437 | 19,687 |
| Class C1,4 | 3-31-06 | 17,224 | 17,224 | 17,437 | 19,687 |
| Class I1,2 | 3-31-06 | 19,422 | 19,422 | 17,437 | 19,687 |
| Class I21,2 | 3-31-06 | 19,290 | 19,290 | 17,437 | 19,687 |
| Class R11,2 | 3-31-06 | 18,077 | 18,077 | 17,437 | 19,687 |
| Class R21,2 | 3-31-06 | 18,406 | 18,406 | 17,437 | 19,687 |
| Class R31,2 | 3-31-06 | 18,262 | 18,262 | 17,437 | 19,687 |
| Class R41,2 | 3-31-06 | 18,908 | 18,908 | 17,437 | 19,687 |
| Class R51,2 | 3-31-06 | 19,458 | 19,458 | 17,437 | 19,687 |
| Class R61,2 | 3-31-06 | 19,513 | 19,513 | 17,437 | 19,687 |
| Class NAV2 | 5-29-09 | 24,242 | 24,242 | 24,807 | 26,242 |
The Russell 1000 Value Index is an unmanaged index containing those securities in the Russell 1000 Index with a lower price-to-book ratio and less-than-average growth orientation.
The S&P 500 Index is an unmanaged index that includes 500 widely traded common stocks.
It is not possible to invest directly in an index. Index figures do not reflect expenses or sales charges, which would result in lower returns.
Footnotes related to performance pages
| 1 | On 12-19-08, through a reorganization, the fund acquired all of the assets of Robeco Boston Partners Large Cap Value Fund (the predecessor fund). On that date, the predecessor fund's Investor shares were exchanged for Class A shares and its Institutional shares were exchanged for Class I shares of John Hancock Disciplined Value Fund. Class A, Class B, and Class C shares were first offered on 12-22-08. The returns prior to this date are those of the predecessor fund's Investor shares that have been recalculated to reflect the gross fees and expenses of Class A, Class B, and Class C shares, as applicable. Class I and Class I2 shares were first offered on 12-22-08. The returns prior to this date are those of the predecessor fund's institutional shares that have been recalculated to reflect the gross fees and expenses of Class I and Class I2 shares, as applicable. Class R1 shares were first offered on 7-13-09; Class R2 shares were first offered on 3-1-12; Class R3, Class R4, and Class R5 shares were first offered on 5-22-09; Class R6 shares were first offered on 9-1-11. The returns prior to these dates are those of Class A shares that have been recalculated to apply the gross fees and expenses of Class R1, Class R2, Class R3, Class R4, Class R5, and Class R6 shares, as applicable. |
| 2 | For certain types of investors, as described in the fund's prospectuses. |
| 3 | From 5-29-09. |
| 4 | The contingent deferred sales charge is not applicable. |
These examples are intended to help you understand your ongoing operating expenses of investing in the fund so you can compare these costs with the ongoing costs of investing in other mutual funds.
Understanding fund expenses
As a shareholder of the fund, you incur two types of costs:
| • | Transaction costs, which include sales charges (loads) on purchases or redemptions (varies by share class), minimum account fee charge, etc. |
| • | Ongoing operating expenses, including management fees, distribution and service fees (if applicable), and other fund expenses. |
We are presenting only your ongoing operating expenses here.
Actual expenses/actual returns
This example is intended to provide information about the fund's actual ongoing operating expenses, and is based on the fund's actual return. It assumes an account value of $1,000.00 on October 1, 2015, with the same investment held until March 31, 2016.
| Account value on 10-1-2015 | Ending value on 3-31-2016 | Expenses paid during period ended 3-31-20161 | Annualized expense ratio | |
| Class A | $1,000.00 | $1,040.30 | $5.46 | 1.07% |
| Class B | 1,000.00 | 1,036.20 | 9.26 | 1.82% |
| Class C | 1,000.00 | 1,036.10 | 9.26 | 1.82% |
| Class I | 1,000.00 | 1,041.80 | 4.08 | 0.80% |
| Class I2 | 1,000.00 | 1,041.80 | 4.08 | 0.80% |
| Class R1 | 1,000.00 | 1,038.40 | 7.49 | 1.47% |
| Class R2 | 1,000.00 | 1,039.30 | 6.17 | 1.21% |
| Class R3 | 1,000.00 | 1,038.90 | 6.93 | 1.36% |
| Class R4 | 1,000.00 | 1,040.80 | 4.90 | 0.96% |
| Class R5 | 1,000.00 | 1,041.70 | 3.88 | 0.76% |
| Class R6 | 1,000.00 | 1,041.90 | 3.52 | 0.69% |
| Class NAV | 1,000.00 | 1,042.40 | 3.52 | 0.69% |
Together with the value of your account, you may use this information to estimate the operating expenses that you paid over the period. Simply divide your account value at March 31, 2016, by $1,000.00, then multiply it by the "expenses paid" for your share class from the table above. For example, for an account value of $8,600.00, the operating expenses should be calculated as follows:
Hypothetical example for comparison purposes
This table allows you to compare the fund's ongoing operating expenses with those of any other fund. It provides an example of the fund's hypothetical account values and hypothetical expenses based on each class's actual expense ratio and an assumed 5% annualized return before expenses (which is not the fund's actual return). It assumes an account value of $1,000.00 on October 1, 2015, with the same investment held until March 31, 2016. Look in any other fund shareholder report to find its hypothetical example and you will be able to compare these expenses. Please remember that these hypothetical account values and expenses may not be used to estimate the actual ending account balance or expenses you paid for the period.
| Account value on 10-1-2015 | Ending value on 3-31-2016 | Expenses paid during period ended 3-31-20161 | Annualized expense ratio | |
| Class A | $1,000.00 | $1,019.70 | $5.40 | 1.07% |
| Class B | 1,000.00 | 1,015.90 | 9.17 | 1.82% |
| Class C | 1,000.00 | 1,015.90 | 9.17 | 1.82% |
| Class I | 1,000.00 | 1,021.00 | 4.04 | 0.80% |
| Class I2 | 1,000.00 | 1,021.00 | 4.04 | 0.80% |
| Class R1 | 1,000.00 | 1,017.70 | 7.42 | 1.47% |
| Class R2 | 1,000.00 | 1,019.00 | 6.11 | 1.21% |
| Class R3 | 1,000.00 | 1,018.20 | 6.86 | 1.36% |
| Class R4 | 1,000.00 | 1,020.20 | 4.85 | 0.96% |
| Class R5 | 1,000.00 | 1,021.20 | 3.84 | 0.76% |
| Class R6 | 1,000.00 | 1,021.60 | 3.49 | 0.69% |
| Class NAV | 1,000.00 | 1,021.60 | 3.49 | 0.69% |
Remember, these examples do not include any transaction costs, therefore, these examples will not help you to determine the relative total costs of owning different funds. If transaction costs were included, your expenses would have been higher. See the prospectuses for details regarding transaction costs.
| 1 | Expenses are equal to the fund's annualized expense ratio, multiplied by the average account value over the period, multiplied by 183/366 (to reflect the one-half year period). |
Fund's investments
| As of 3-31-16 | ||||||||||||||
| Shares | Value | |||||||||||||
| Common stocks 97.5% | $12,662,662,264 | |||||||||||||
| (Cost $11,920,536,570) | ||||||||||||||
| Consumer discretionary 10.2% | 1,328,045,310 | |||||||||||||
| Auto components 0.5% | ||||||||||||||
| Lear Corp. | 531,159 | 59,048,946 | ||||||||||||
| Hotels, restaurants and leisure 0.5% | ||||||||||||||
| Six Flags Entertainment Corp. | 1,231,531 | 68,337,655 | ||||||||||||
| Household durables 1.1% | ||||||||||||||
| DR Horton, Inc. | 1,366,368 | 41,305,305 | ||||||||||||
| PulteGroup, Inc. | 5,662,251 | 105,940,716 | ||||||||||||
| Media 6.4% | ||||||||||||||
| CBS Corp., Class B | 3,919,242 | 215,911,042 | ||||||||||||
| Comcast Corp., Class A | 2,033,066 | 124,179,671 | ||||||||||||
| Liberty Global PLC LiLAC, Series C (I) | 1,169,585 | 44,303,880 | ||||||||||||
| Liberty Global PLC, Series C (I) | 3,909,659 | 146,846,792 | ||||||||||||
| Liberty Media Corp., Series C (I) | 1,393,936 | 53,095,022 | ||||||||||||
| Omnicom Group, Inc. | 982,893 | 81,806,184 | ||||||||||||
| Time Warner, Inc. | 2,196,317 | 159,342,798 | ||||||||||||
| Multiline retail 1.3% | ||||||||||||||
| Target Corp. | 2,132,641 | 175,473,701 | ||||||||||||
| Specialty retail 0.4% | ||||||||||||||
| Best Buy Company, Inc. | 1,616,942 | 52,453,598 | ||||||||||||
| Consumer staples 1.7% | 215,553,237 | |||||||||||||
| Food and staples retailing 0.8% | ||||||||||||||
| CVS Health Corp. | 951,695 | 98,719,322 | ||||||||||||
| Food products 0.9% | ||||||||||||||
| Tyson Foods, Inc., Class A | 1,752,684 | 116,833,915 | ||||||||||||
| Energy 10.7% | 1,386,352,718 | |||||||||||||
| Oil, gas and consumable fuels 10.7% | ||||||||||||||
| California Resources Corp. | 471,665 | 485,814 | ||||||||||||
| Canadian Natural Resources, Ltd. | 4,669,846 | 126,085,842 | ||||||||||||
| Cimarex Energy Company | 852,088 | 82,882,600 | ||||||||||||
| Diamondback Energy, Inc. (I) | 1,220,615 | 94,207,066 | ||||||||||||
| Energen Corp. | 1,483,820 | 54,292,974 | ||||||||||||
| EOG Resources, Inc. | 3,367,007 | 244,377,368 | ||||||||||||
| EQT Corp. | 351,930 | 23,670,812 | ||||||||||||
| Marathon Petroleum Corp. | 1,038,580 | 38,614,404 | ||||||||||||
| Occidental Petroleum Corp. | 4,466,084 | 305,614,128 | ||||||||||||
| Phillips 66 | 3,388,915 | 293,446,150 | ||||||||||||
| QEP Resources, Inc. | 4,396,380 | 62,032,922 | ||||||||||||
| Shares | Value | |||||||||||||
| Energy (continued) | ||||||||||||||
| Oil, gas and consumable fuels (continued) | ||||||||||||||
| Valero Energy Corp. | 945,473 | $60,642,638 | ||||||||||||
| Financials 29.8% | 3,862,624,367 | |||||||||||||
| Banks 12.9% | ||||||||||||||
| Bank of America Corp. | 19,722,041 | 266,641,994 | ||||||||||||
| BB&T Corp. | 2,644,447 | 87,980,752 | ||||||||||||
| Citigroup, Inc. | 7,581,963 | 316,546,955 | ||||||||||||
| Fifth Third Bancorp | 4,155,237 | 69,350,906 | ||||||||||||
| JPMorgan Chase & Co. | 8,830,587 | 522,947,362 | ||||||||||||
| Wells Fargo & Company | 8,397,003 | 406,079,065 | ||||||||||||
| Consumer finance 6.0% | ||||||||||||||
| Ally Financial, Inc. (I) | 6,064,637 | 113,530,005 | ||||||||||||
| Capital One Financial Corp. | 5,431,744 | 376,474,177 | ||||||||||||
| Discover Financial Services | 4,393,983 | 223,741,614 | ||||||||||||
| Navient Corp. | 5,266,677 | 63,042,124 | ||||||||||||
| Diversified financial services 5.0% | ||||||||||||||
| Berkshire Hathaway, Inc., Class B (I) | 4,571,902 | 648,661,456 | ||||||||||||
| Insurance 5.6% | ||||||||||||||
| Aon PLC | 1,015,401 | 106,058,634 | ||||||||||||
| Chubb, Ltd. | 1,797,165 | 214,132,210 | ||||||||||||
| MetLife, Inc. | 2,043,517 | 89,792,137 | ||||||||||||
| The Allstate Corp. | 2,127,150 | 143,306,096 | ||||||||||||
| The Travelers Companies, Inc. | 587,163 | 68,527,794 | ||||||||||||
| XL Group PLC | 2,967,902 | 109,218,794 | ||||||||||||
| Real estate investment trusts 0.3% | ||||||||||||||
| American Homes 4 Rent, Class A | 2,301,402 | 36,592,292 | ||||||||||||
| Health care 13.3% | 1,728,550,791 | |||||||||||||
| Biotechnology 1.5% | ||||||||||||||
| Gilead Sciences, Inc. | 2,174,566 | 199,755,633 | ||||||||||||
| Health care equipment and supplies 0.6% | ||||||||||||||
| Zimmer Biomet Holdings, Inc. | 664,574 | 70,863,526 | ||||||||||||
| Health care providers and services 5.2% | ||||||||||||||
| Anthem, Inc. | 826,495 | 114,874,540 | ||||||||||||
| Cardinal Health, Inc. | 1,313,659 | 107,654,355 | ||||||||||||
| Cigna Corp. | 1,149,987 | 157,824,216 | ||||||||||||
| Express Scripts Holding Company (I) | 1,814,788 | 124,657,788 | ||||||||||||
| McKesson Corp. | 531,721 | 83,613,127 | ||||||||||||
| UnitedHealth Group, Inc. | 687,394 | 88,605,087 | ||||||||||||
| Pharmaceuticals 6.0% | ||||||||||||||
| Johnson & Johnson | 4,721,386 | 510,853,965 | ||||||||||||
| Merck & Company, Inc. | 4,149,112 | 219,529,516 | ||||||||||||
| Shares | Value | |||||||||||||
| Health care (continued) | ||||||||||||||
| Pharmaceuticals (continued) | ||||||||||||||
| Teva Pharmaceutical Industries, Ltd., ADR | 940,367 | $50,319,038 | ||||||||||||
| Industrials 7.6% | 986,017,785 | |||||||||||||
| Aerospace and defense 4.7% | ||||||||||||||
| General Dynamics Corp. | 1,381,738 | 181,518,921 | ||||||||||||
| Honeywell International, Inc. | 641,095 | 71,834,695 | ||||||||||||
| Lockheed Martin Corp. | 587,291 | 130,084,957 | ||||||||||||
| Raytheon Company | 1,133,191 | 138,963,212 | ||||||||||||
| Textron, Inc. | 2,290,526 | 83,512,578 | ||||||||||||
| Airlines 2.9% | ||||||||||||||
| Delta Air Lines, Inc. | 5,234,969 | 254,838,291 | ||||||||||||
| United Continental Holdings, Inc. (I) | 2,092,635 | 125,265,131 | ||||||||||||
| Information technology 13.8% | 1,793,559,455 | |||||||||||||
| Communications equipment 2.7% | ||||||||||||||
| Cisco Systems, Inc. | 7,376,822 | 210,018,122 | ||||||||||||
| Harris Corp. | 1,751,804 | 136,395,459 | ||||||||||||
| Electronic equipment, instruments and components 1.2% | ||||||||||||||
| Flextronics International, Ltd. (I) | 12,634,844 | 152,376,218 | ||||||||||||
| Internet software and services 1.8% | ||||||||||||||
| Alphabet, Inc., Class A (I) | 120,599 | 92,004,977 | ||||||||||||
| eBay, Inc. (I) | 5,790,701 | 138,166,126 | ||||||||||||
| IT services 0.7% | ||||||||||||||
| Computer Sciences Corp. | 2,647,896 | 91,061,143 | ||||||||||||
| Semiconductors and semiconductor equipment 0.5% | ||||||||||||||
| Texas Instruments, Inc. | 1,191,900 | 68,438,898 | ||||||||||||
| Software 4.9% | ||||||||||||||
| Activision Blizzard, Inc. | 2,011,074 | 68,054,744 | ||||||||||||
| Microsoft Corp. | 7,023,243 | 387,893,711 | ||||||||||||
| Oracle Corp. | 4,530,957 | 185,361,451 | ||||||||||||
| Technology hardware, storage and peripherals 2.0% | ||||||||||||||
| Apple, Inc. | 928,753 | 101,224,789 | ||||||||||||
| Hewlett Packard Enterprise Company | 9,168,856 | 162,563,817 | ||||||||||||
| Materials 6.6% | 862,458,874 | |||||||||||||
| Chemicals 4.0% | ||||||||||||||
| Huntsman Corp. | 4,214,957 | 56,058,928 | ||||||||||||
| LyondellBasell Industries NV, Class A | 1,074,970 | 91,995,933 | ||||||||||||
| Methanex Corp. (L) | 2,220,267 | 71,314,976 | ||||||||||||
| PPG Industries, Inc. | 1,205,217 | 134,369,643 | ||||||||||||
| The Dow Chemical Company | 3,319,417 | 168,825,549 | ||||||||||||
| Shares | Value | |||||||||||||
| Materials (continued) | ||||||||||||||
| Containers and packaging 1.9% | ||||||||||||||
| Crown Holdings, Inc. (I) | 2,407,408 | $119,383,363 | ||||||||||||
| International Paper Company | 1,927,886 | 79,120,441 | ||||||||||||
| WestRock Company | 1,164,618 | 45,455,041 | ||||||||||||
| Metals and mining 0.7% | ||||||||||||||
| Barrick Gold Corp. | 7,064,433 | 95,935,000 | ||||||||||||
| Telecommunication services 2.6% | 340,023,836 | |||||||||||||
| Diversified telecommunication services 2.6% | ||||||||||||||
| Verizon Communications, Inc. | 6,287,423 | 340,023,836 | ||||||||||||
| Utilities 1.2% | 159,475,891 | |||||||||||||
| Independent power and renewable electricity producers 1.2% | ||||||||||||||
| AES Corp. | 13,514,906 | 159,475,891 | ||||||||||||
| Yield (%) | Shares | Value | ||||||||||||
| Securities lending collateral 0.2% | $24,955,196 | |||||||||||||
| (Cost $24,953,066) | ||||||||||||||
| John Hancock Collateral Trust (W) | 0.4918(Y | ) | 2,493,948 | 24,955,196 | ||||||||||
| Short-term investments 1.3% | $162,806,580 | |||||||||||||
| (Cost $162,806,580) | ||||||||||||||
| Money market funds 1.3% | 162,806,580 | |||||||||||||
| State Street Institutional U.S. Government Money Market Fund | 0.2385(Y | ) | 162,806,580 | 162,806,580 | ||||||||||
| Total investments (Cost $12,108,296,216)† 99.0% | $12,850,424,040 | |||||||||||||
| Other assets and liabilities, net 1.0% | $136,238,533 | |||||||||||||
| Total net assets 100.0% | $12,986,662,573 | |||||||||||||
| The percentage shown for each investment category is the total value of the category as a percentage of the net assets of the fund. | ||||||||||||||
| Key to Security Abbreviations and Legend | ||||||||||||||
| ADR | American Depositary Receipts | |||||||||||||
| (I) | Non-income producing security. | |||||||||||||
| (L) | A portion of this security is on loan as of 3-31-16. | |||||||||||||
| (W) | Investment is an affiliate of the fund, the advisor and/or subadvisor. This security represents the investment of cash collateral received for securities lending. | |||||||||||||
| (Y) | The rate shown is the annualized seven-day yield as of 3-31-16. | |||||||||||||
| † | At 3-31-16, the aggregate cost of investment securities for federal income tax purposes was $12,188,748,196. Net unrealized appreciation aggregated to $661,675,844, of which $1,171,554,955 related to appreciated investment securities and $509,879,111 related to depreciated investment securities. | |||||||||||||
Financial statements
STATEMENT OF ASSETS AND LIABILITIES 3-31-16
| Assets | ||||||||||||||||||||||||||||||
| Unaffiliated investments, at value (Cost $12,083,343,150) including $24,428,775 of securities loaned | $12,825,468,844 | |||||||||||||||||||||||||||||
| Affiliated investments, at value (Cost $24,953,066) | 24,955,196 | |||||||||||||||||||||||||||||
| Total investments, at value (Cost $12,108,296,216) | 12,850,424,040 | |||||||||||||||||||||||||||||
| Cash | 58,593 | |||||||||||||||||||||||||||||
| Receivable for investments sold | 158,011,814 | |||||||||||||||||||||||||||||
| Receivable for fund shares sold | 31,742,252 | |||||||||||||||||||||||||||||
| Dividends and interest receivable | 15,367,725 | |||||||||||||||||||||||||||||
| Receivable for securities lending income | 62,742 | |||||||||||||||||||||||||||||
| Receivable due from advisor | 1,024 | |||||||||||||||||||||||||||||
| Other receivables and prepaid expenses | 308,107 | |||||||||||||||||||||||||||||
| Total assets | 13,055,976,297 | |||||||||||||||||||||||||||||
| Liabilities | ||||||||||||||||||||||||||||||
| Payable for investments purchased | 17,689,692 | |||||||||||||||||||||||||||||
| Payable for fund shares repurchased | 24,285,571 | |||||||||||||||||||||||||||||
| Payable upon return of securities loaned | 24,954,125 | |||||||||||||||||||||||||||||
| Payable to affiliates | ||||||||||||||||||||||||||||||
| Accounting and legal services fees | 125,742 | |||||||||||||||||||||||||||||
| Transfer agent fees | 1,006,193 | |||||||||||||||||||||||||||||
| Distribution and service fees | 136,319 | |||||||||||||||||||||||||||||
| Trustees' fees | 2,654 | |||||||||||||||||||||||||||||
| Other liabilities and accrued expenses | 1,113,428 | |||||||||||||||||||||||||||||
| Total liabilities | 69,313,724 | |||||||||||||||||||||||||||||
| Net assets | $12,986,662,573 | |||||||||||||||||||||||||||||
| Net assets consist of | ||||||||||||||||||||||||||||||
| Paid-in capital | $12,537,323,298 | |||||||||||||||||||||||||||||
| Undistributed net investment income | 38,532,555 | |||||||||||||||||||||||||||||
| Accumulated net realized gain (loss) on investments and foreign currency transactions | (331,340,806 | ) | ||||||||||||||||||||||||||||
| Net unrealized appreciation (depreciation) on investments and translation of assets and liabilities in foreign currencies | 742,147,526 | |||||||||||||||||||||||||||||
| Net assets | $12,986,662,573 | |||||||||||||||||||||||||||||
STATEMENT OF ASSETS AND LIABILITIES (continued)
| Net asset value per share | ||||||||||||||||||
| Based on net asset values and shares outstanding-the fund has an unlimited number of shares authorized with no par value | ||||||||||||||||||
| Class A ($2,374,706,176 ÷ 134,628,058 shares)1 | $17.64 | |||||||||||||||||
| Class B ($14,149,918 ÷ 850,147 shares)1 | $16.64 | |||||||||||||||||
| Class C ($308,763,718 ÷ 18,500,853 shares)1 | $16.69 | |||||||||||||||||
| Class I ($6,730,257,852 ÷ 392,719,715 shares) | $17.14 | |||||||||||||||||
| Class I2 ($49,259,443 ÷ 2,874,487 shares) | $17.14 | |||||||||||||||||
| Class R1 ($26,295,069 ÷ 1,535,421 shares) | $17.13 | |||||||||||||||||
| Class R2 ($135,706,535 ÷ 7,922,742 shares) | $17.13 | |||||||||||||||||
| Class R3 ($29,971,121 ÷ 1,750,921 shares) | $17.12 | |||||||||||||||||
| Class R4 ($268,388,787 ÷ 15,655,751 shares) | $17.14 | |||||||||||||||||
| Class R5 ($274,718,209 ÷ 16,010,719 shares) | $17.16 | |||||||||||||||||
| Class R6 ($2,023,962,723 ÷ 117,980,118 shares) | $17.16 | |||||||||||||||||
| Class NAV ($750,483,022 ÷ 43,732,647 shares) | $17.16 | |||||||||||||||||
| Maximum offering price per share | ||||||||||||||||||
| Class A (net asset value per share ÷ 95%)2 | $18.57 | |||||||||||||||||
| 1 | Redemption price per share is equal to net asset value less any applicable contingent deferred sales charge. | ||||||||||||||||
| 2 | On single retail sales of less than $50,000. On sales of $50,000 or more and on group sales the offering price is reduced. | ||||||||||||||||
STATEMENT OF OPERATIONS For the year ended 3-31-16
| Investment income | ||||||||||||||||||||||||
| Dividends | $259,580,666 | |||||||||||||||||||||||
| Securities lending | 257,123 | |||||||||||||||||||||||
| Interest | 150,622 | |||||||||||||||||||||||
| Less foreign taxes withheld | (1,031,371 | ) | ||||||||||||||||||||||
| Total investment income | 258,957,040 | |||||||||||||||||||||||
| Expenses | ||||||||||||||||||||||||
| Investment management fees | 87,988,411 | |||||||||||||||||||||||
| Distribution and service fees | 11,967,001 | |||||||||||||||||||||||
| Accounting and legal services fees | 1,764,301 | |||||||||||||||||||||||
| Transfer agent fees | 12,302,847 | |||||||||||||||||||||||
| Trustees' fees | 190,397 | |||||||||||||||||||||||
| State registration fees | 507,126 | |||||||||||||||||||||||
| Printing and postage | 749,987 | |||||||||||||||||||||||
| Professional fees | 345,351 | |||||||||||||||||||||||
| Custodian fees | 1,487,748 | |||||||||||||||||||||||
| Registration and filing fees | 139,098 | |||||||||||||||||||||||
| Other | 189,098 | |||||||||||||||||||||||
| Total expenses | 117,631,365 | |||||||||||||||||||||||
| Less expense reductions | (1,539,309 | ) | ||||||||||||||||||||||
| Net expenses | 116,092,056 | |||||||||||||||||||||||
| Net investment income | 142,864,984 | |||||||||||||||||||||||
| Realized and unrealized gain (loss) | ||||||||||||||||||||||||
| Net realized gain (loss) on | ||||||||||||||||||||||||
| Unaffiliated investments and foreign currency transactions | (26,762,126 | ) | ||||||||||||||||||||||
| Affiliated investments | (962 | ) | ||||||||||||||||||||||
| Redemption in kind | (20,206,425 | ) | ||||||||||||||||||||||
| (46,969,513 | ) | |||||||||||||||||||||||
| Change in net unrealized appreciation (depreciation) of | ||||||||||||||||||||||||
| Unaffiliated investments and translation of assets and liabilities in foreign currencies | (877,254,170 | ) | ||||||||||||||||||||||
| Affiliated investments | 2,130 | |||||||||||||||||||||||
| (877,252,040 | ) | |||||||||||||||||||||||
| Net realized and unrealized loss | (924,221,553 | ) | ||||||||||||||||||||||
| Decrease in net assets from operations | ($781,356,569 | ) | ||||||||||||||||||||||
STATEMENTS OF CHANGES IN NET ASSETS
| Year ended 3-31-16 | Year ended 3-31-15 | ||||||||||||||||||||||||||||||||||||||||||||
| Increase (decrease) in net assets | |||||||||||||||||||||||||||||||||||||||||||||
| From operations | |||||||||||||||||||||||||||||||||||||||||||||
| Net investment income | $142,864,984 | $144,622,642 | |||||||||||||||||||||||||||||||||||||||||||
| Net realized gain (loss) | (46,969,513 | ) | 566,408,861 | ||||||||||||||||||||||||||||||||||||||||||
| Change in net unrealized appreciation (depreciation) | (877,252,040 | ) | 175,795,879 | ||||||||||||||||||||||||||||||||||||||||||
| Increase (decrease) in net assets resulting from operations | (781,356,569 | ) | 886,827,382 | ||||||||||||||||||||||||||||||||||||||||||
| Distributions to shareholders | |||||||||||||||||||||||||||||||||||||||||||||
| From net investment income | |||||||||||||||||||||||||||||||||||||||||||||
| Class A | (27,728,943 | ) | (12,683,136 | ) | |||||||||||||||||||||||||||||||||||||||||
| Class B | (46,278 | ) | — | ||||||||||||||||||||||||||||||||||||||||||
| Class C | (972,189 | ) | — | ||||||||||||||||||||||||||||||||||||||||||
| Class I | (99,117,523 | ) | (51,067,801 | ) | |||||||||||||||||||||||||||||||||||||||||
| Class I2 | (856,842 | ) | (680,456 | ) | |||||||||||||||||||||||||||||||||||||||||
| Class R1 | (162,991 | ) | (13,155 | ) | |||||||||||||||||||||||||||||||||||||||||
| Class R2 | (1,237,692 | ) | (439,223 | ) | |||||||||||||||||||||||||||||||||||||||||
| Class R3 | (227,765 | ) | (52,490 | ) | |||||||||||||||||||||||||||||||||||||||||
| Class R4 | (3,084,295 | ) | (1,076,510 | ) | |||||||||||||||||||||||||||||||||||||||||
| Class R5 | (5,356,973 | ) | (3,033,264 | ) | |||||||||||||||||||||||||||||||||||||||||
| Class R6 | (26,166,598 | ) | (11,805,127 | ) | |||||||||||||||||||||||||||||||||||||||||
| Class NAV | (10,834,910 | ) | (7,020,069 | ) | |||||||||||||||||||||||||||||||||||||||||
| From net realized gain | |||||||||||||||||||||||||||||||||||||||||||||
| Class A | (84,699,290 | ) | (103,062,586 | ) | |||||||||||||||||||||||||||||||||||||||||
| Class B | (510,604 | ) | (791,952 | ) | |||||||||||||||||||||||||||||||||||||||||
| Class C | (10,725,915 | ) | (10,999,627 | ) | |||||||||||||||||||||||||||||||||||||||||
| Class I | (242,069,838 | ) | (274,429,513 | ) | |||||||||||||||||||||||||||||||||||||||||
| Class I2 | (2,092,624 | ) | (3,703,254 | ) | |||||||||||||||||||||||||||||||||||||||||
| Class R1 | (797,491 | ) | (838,821 | ) | |||||||||||||||||||||||||||||||||||||||||
| Class R2 | (4,353,601 | ) | (4,578,609 | ) | |||||||||||||||||||||||||||||||||||||||||
| Class R3 | (965,781 | ) | (1,002,415 | ) | |||||||||||||||||||||||||||||||||||||||||
| Class R4 | (8,517,823 | ) | (7,472,393 | ) | |||||||||||||||||||||||||||||||||||||||||
| Class R5 | (12,597,550 | ) | (14,084,398 | ) | |||||||||||||||||||||||||||||||||||||||||
| Class R6 | (58,494,746 | ) | (54,545,637 | ) | |||||||||||||||||||||||||||||||||||||||||
| Class NAV | (24,221,158 | ) | (32,436,257 | ) | |||||||||||||||||||||||||||||||||||||||||
| Total distributions | (625,839,420 | ) | (595,816,693 | ) | |||||||||||||||||||||||||||||||||||||||||
| From fund share transactions | 1,190,687,737 | 4,642,210,923 | |||||||||||||||||||||||||||||||||||||||||||
| Total increase (decrease) | (216,508,252 | ) | 4,933,221,612 | ||||||||||||||||||||||||||||||||||||||||||
| Net assets | |||||||||||||||||||||||||||||||||||||||||||||
| Beginning of year | 13,203,170,825 | 8,269,949,213 | |||||||||||||||||||||||||||||||||||||||||||
| End of year | $12,986,662,573 | $13,203,170,825 | |||||||||||||||||||||||||||||||||||||||||||
| Undistributed net investment income | $38,532,555 | $72,933,906 | |||||||||||||||||||||||||||||||||||||||||||
Financial highlights
| Class A Shares Period ended | 3-31-16 | 3-31-15 | 3-31-14 | 3-31-13 | 3-31-12 | ||||||||||||||||||||||||||||||||||||||||||||||||||||||||||||||||||||||||||||||||||||||||||||||||||
| Per share operating performance | |||||||||||||||||||||||||||||||||||||||||||||||||||||||||||||||||||||||||||||||||||||||||||||||||||||||
| Net asset value, beginning of period | $19.44 | $18.94 | $15.94 | $14.33 | $13.83 | ||||||||||||||||||||||||||||||||||||||||||||||||||||||||||||||||||||||||||||||||||||||||||||||||||
| Net investment income1 | 0.16 | 0.20 | 0.12 | 0.14 | 0.11 | ||||||||||||||||||||||||||||||||||||||||||||||||||||||||||||||||||||||||||||||||||||||||||||||||||
| Net realized and unrealized gain (loss) on investments | (1.18 | ) | 1.19 | 3.85 | 2.09 | 0.77 | |||||||||||||||||||||||||||||||||||||||||||||||||||||||||||||||||||||||||||||||||||||||||||||||||
| Total from investment operations | (1.02 | ) | 1.39 | 3.97 | 2.23 | 0.88 | |||||||||||||||||||||||||||||||||||||||||||||||||||||||||||||||||||||||||||||||||||||||||||||||||
| Less distributions | |||||||||||||||||||||||||||||||||||||||||||||||||||||||||||||||||||||||||||||||||||||||||||||||||||||||
| From net investment income | (0.19 | ) | (0.10 | ) | (0.09 | ) | (0.12 | ) | (0.07 | ) | |||||||||||||||||||||||||||||||||||||||||||||||||||||||||||||||||||||||||||||||||||||||||||||
| From net realized gain | (0.59 | ) | (0.79 | ) | (0.88 | ) | (0.50 | ) | (0.31 | ) | |||||||||||||||||||||||||||||||||||||||||||||||||||||||||||||||||||||||||||||||||||||||||||||
| Total distributions | (0.78 | ) | (0.89 | ) | (0.97 | ) | (0.62 | ) | (0.38 | ) | |||||||||||||||||||||||||||||||||||||||||||||||||||||||||||||||||||||||||||||||||||||||||||||
| Net asset value, end of period | $17.64 | $19.44 | $18.94 | $15.94 | $14.33 | ||||||||||||||||||||||||||||||||||||||||||||||||||||||||||||||||||||||||||||||||||||||||||||||||||
| Total return (%)2,3 | (5.29 | ) | 7.53 | 25.30 | 16.04 | 6.91 | |||||||||||||||||||||||||||||||||||||||||||||||||||||||||||||||||||||||||||||||||||||||||||||||||
| Ratios and supplemental data | |||||||||||||||||||||||||||||||||||||||||||||||||||||||||||||||||||||||||||||||||||||||||||||||||||||||
| Net assets, end of period (in millions) | $2,375 | $2,705 | $2,702 | $1,481 | $1,068 | ||||||||||||||||||||||||||||||||||||||||||||||||||||||||||||||||||||||||||||||||||||||||||||||||||
| Ratios (as a percentage of average net assets): | |||||||||||||||||||||||||||||||||||||||||||||||||||||||||||||||||||||||||||||||||||||||||||||||||||||||
| Expenses before reductions | 1.08 | 1.08 | 1.12 | 1.20 | 1.24 | ||||||||||||||||||||||||||||||||||||||||||||||||||||||||||||||||||||||||||||||||||||||||||||||||||
| Expenses including reductions | 1.07 | 1.08 | 1.11 | 1.20 | 1.24 | ||||||||||||||||||||||||||||||||||||||||||||||||||||||||||||||||||||||||||||||||||||||||||||||||||
| Net investment income | 0.87 | 1.04 | 0.68 | 0.95 | 0.82 | ||||||||||||||||||||||||||||||||||||||||||||||||||||||||||||||||||||||||||||||||||||||||||||||||||
| Portfolio turnover (%) | 61 | 44 | 45 | 44 | 44 | ||||||||||||||||||||||||||||||||||||||||||||||||||||||||||||||||||||||||||||||||||||||||||||||||||
| 1 | Based on average daily shares outstanding. | ||||||||||||||||||||||||||||||||||||||||||||||||||||||||||||||||||||||||||||||||||
| 2 | Does not reflect the effect of sales charges, if any. | ||||||||||||||||||||||||||||||||||||||||||||||||||||||||||||||||||||||||||||||||||
| 3 | Total returns would have been lower had certain expenses not been reduced during the applicable periods. | ||||||||||||||||||||||||||||||||||||||||||||||||||||||||||||||||||||||||||||||||||
| Class B Shares Period ended | 3-31-16 | 3-31-15 | 3-31-14 | 3-31-13 | 3-31-12 | ||||||||||||||||||||||||||||||||||||||||||||||||||||||||||||||||||||||||||||||||||||||||||||||||||
| Per share operating performance | |||||||||||||||||||||||||||||||||||||||||||||||||||||||||||||||||||||||||||||||||||||||||||||||||||||||
| Net asset value, beginning of period | $18.38 | $18.00 | $15.24 | $13.73 | $13.30 | ||||||||||||||||||||||||||||||||||||||||||||||||||||||||||||||||||||||||||||||||||||||||||||||||||
| Net investment income (loss)1 | 0.02 | 0.04 | (0.03 | ) | 0.01 | — | 2 | ||||||||||||||||||||||||||||||||||||||||||||||||||||||||||||||||||||||||||||||||||||||||||||||||
| Net realized and unrealized gain (loss) on investments | (1.12 | ) | 1.13 | 3.67 | 2.01 | 0.74 | |||||||||||||||||||||||||||||||||||||||||||||||||||||||||||||||||||||||||||||||||||||||||||||||||
| Total from investment operations | (1.10 | ) | 1.17 | 3.64 | 2.02 | 0.74 | |||||||||||||||||||||||||||||||||||||||||||||||||||||||||||||||||||||||||||||||||||||||||||||||||
| Less distributions | |||||||||||||||||||||||||||||||||||||||||||||||||||||||||||||||||||||||||||||||||||||||||||||||||||||||
| From net investment income | (0.05 | ) | — | — | (0.01 | ) | — | ||||||||||||||||||||||||||||||||||||||||||||||||||||||||||||||||||||||||||||||||||||||||||||||||
| From net realized gain | (0.59 | ) | (0.79 | ) | (0.88 | ) | (0.50 | ) | (0.31 | ) | |||||||||||||||||||||||||||||||||||||||||||||||||||||||||||||||||||||||||||||||||||||||||||||
| Total distributions | (0.64 | ) | (0.79 | ) | (0.88 | ) | �� | (0.51 | ) | (0.31 | ) | ||||||||||||||||||||||||||||||||||||||||||||||||||||||||||||||||||||||||||||||||||||||||||||
| Net asset value, end of period | $16.64 | $18.38 | $18.00 | $15.24 | $13.73 | ||||||||||||||||||||||||||||||||||||||||||||||||||||||||||||||||||||||||||||||||||||||||||||||||||
| Total return (%)3,4 | (6.02 | ) | 6.68 | 24.21 | 15.09 | 5.99 | |||||||||||||||||||||||||||||||||||||||||||||||||||||||||||||||||||||||||||||||||||||||||||||||||
| Ratios and supplemental data | |||||||||||||||||||||||||||||||||||||||||||||||||||||||||||||||||||||||||||||||||||||||||||||||||||||||
| Net assets, end of period (in millions) | $14 | $19 | $19 | $14 | $10 | ||||||||||||||||||||||||||||||||||||||||||||||||||||||||||||||||||||||||||||||||||||||||||||||||||
| Ratios (as a percentage of average net assets): | |||||||||||||||||||||||||||||||||||||||||||||||||||||||||||||||||||||||||||||||||||||||||||||||||||||||
| Expenses before reductions | 1.85 | 1.91 | 1.96 | 2.08 | 2.14 | ||||||||||||||||||||||||||||||||||||||||||||||||||||||||||||||||||||||||||||||||||||||||||||||||||
| Expenses including reductions | 1.84 | 1.90 | 1.96 | 2.05 | 2.05 | ||||||||||||||||||||||||||||||||||||||||||||||||||||||||||||||||||||||||||||||||||||||||||||||||||
| Net investment income (loss) | 0.09 | 0.20 | (0.17 | ) | 0.10 | 0.01 | |||||||||||||||||||||||||||||||||||||||||||||||||||||||||||||||||||||||||||||||||||||||||||||||||
| Portfolio turnover (%) | 61 | 44 | 45 | 44 | 44 | ||||||||||||||||||||||||||||||||||||||||||||||||||||||||||||||||||||||||||||||||||||||||||||||||||
| 1 | Based on average daily shares outstanding. | ||||||||||||||||||||||||||||||||||||||||||||||||||||||||||||||||||||||||||||||||||
| 2 | Less than $0.005 per share. | ||||||||||||||||||||||||||||||||||||||||||||||||||||||||||||||||||||||||||||||||||
| 3 | Does not reflect the effect of sales charges, if any. | ||||||||||||||||||||||||||||||||||||||||||||||||||||||||||||||||||||||||||||||||||
| 4 | Total returns would have been lower had certain expenses not been reduced during the applicable periods. | ||||||||||||||||||||||||||||||||||||||||||||||||||||||||||||||||||||||||||||||||||
| Class C Shares Period ended | 3-31-16 | 3-31-15 | 3-31-14 | 3-31-13 | 3-31-12 | ||||||||||||||||||||||||||||||||||||||||||||||||||||||||||||||||||||||||||||||||||||||||||||||||||
| Per share operating performance | |||||||||||||||||||||||||||||||||||||||||||||||||||||||||||||||||||||||||||||||||||||||||||||||||||||||
| Net asset value, beginning of period | $18.43 | $18.03 | $15.26 | $13.74 | $13.30 | ||||||||||||||||||||||||||||||||||||||||||||||||||||||||||||||||||||||||||||||||||||||||||||||||||
| Net investment income (loss)1 | 0.02 | 0.07 | (0.02 | ) | 0.02 | 0.01 | |||||||||||||||||||||||||||||||||||||||||||||||||||||||||||||||||||||||||||||||||||||||||||||||||
| Net realized and unrealized gain (loss) on investments | (1.12 | ) | 1.12 | 3.67 | 2.01 | 0.74 | |||||||||||||||||||||||||||||||||||||||||||||||||||||||||||||||||||||||||||||||||||||||||||||||||
| Total from investment operations | (1.10 | ) | 1.19 | 3.65 | 2.03 | 0.75 | |||||||||||||||||||||||||||||||||||||||||||||||||||||||||||||||||||||||||||||||||||||||||||||||||
| Less distributions | |||||||||||||||||||||||||||||||||||||||||||||||||||||||||||||||||||||||||||||||||||||||||||||||||||||||
| From net investment income | (0.05 | ) | — | — | (0.01 | ) | — | ||||||||||||||||||||||||||||||||||||||||||||||||||||||||||||||||||||||||||||||||||||||||||||||||
| From net realized gain | (0.59 | ) | (0.79 | ) | (0.88 | ) | (0.50 | ) | (0.31 | ) | |||||||||||||||||||||||||||||||||||||||||||||||||||||||||||||||||||||||||||||||||||||||||||||
| Total distributions | (0.64 | ) | (0.79 | ) | (0.88 | ) | (0.51 | ) | (0.31 | ) | |||||||||||||||||||||||||||||||||||||||||||||||||||||||||||||||||||||||||||||||||||||||||||||
| Net asset value, end of period | $16.69 | $18.43 | $18.03 | $15.26 | $13.74 | ||||||||||||||||||||||||||||||||||||||||||||||||||||||||||||||||||||||||||||||||||||||||||||||||||
| Total return (%)2,3 | (6.00 | ) | 6.78 | 24.25 | 15.19 | 6.07 | |||||||||||||||||||||||||||||||||||||||||||||||||||||||||||||||||||||||||||||||||||||||||||||||||
| Ratios and supplemental data | |||||||||||||||||||||||||||||||||||||||||||||||||||||||||||||||||||||||||||||||||||||||||||||||||||||||
| Net assets, end of period (in millions) | $309 | $302 | $171 | $59 | $40 | ||||||||||||||||||||||||||||||||||||||||||||||||||||||||||||||||||||||||||||||||||||||||||||||||||
| Ratios (as a percentage of average net assets): | |||||||||||||||||||||||||||||||||||||||||||||||||||||||||||||||||||||||||||||||||||||||||||||||||||||||
| Expenses before reductions | 1.83 | 1.84 | 1.88 | 1.98 | 2.02 | ||||||||||||||||||||||||||||||||||||||||||||||||||||||||||||||||||||||||||||||||||||||||||||||||||
| Expenses including reductions | 1.82 | 1.83 | 1.88 | 1.98 | 2.02 | ||||||||||||||||||||||||||||||||||||||||||||||||||||||||||||||||||||||||||||||||||||||||||||||||||
| Net investment income (loss) | 0.12 | 0.35 | (0.09 | ) | 0.17 | 0.04 | |||||||||||||||||||||||||||||||||||||||||||||||||||||||||||||||||||||||||||||||||||||||||||||||||
| Portfolio turnover (%) | 61 | 44 | 45 | 44 | 44 | ||||||||||||||||||||||||||||||||||||||||||||||||||||||||||||||||||||||||||||||||||||||||||||||||||
| 1 | Based on average daily shares outstanding. | ||||||||||||||||||||||||||||||||||||||||||||||||||||||||||||||||||||||||||||||||||
| 2 | Does not reflect the effect of sales charges, if any. | ||||||||||||||||||||||||||||||||||||||||||||||||||||||||||||||||||||||||||||||||||
| 3 | Total returns would have been lower had certain expenses not been reduced during the applicable periods. | ||||||||||||||||||||||||||||||||||||||||||||||||||||||||||||||||||||||||||||||||||
| Class I Shares Period ended | 3-31-16 | 3-31-15 | 3-31-14 | 3-31-13 | 3-31-12 | ||||||||||||||||||||||||||||||||||||||||||||||||||||||||||||||||||||||||||||||||||||||||||||||||||
| Per share operating performance | |||||||||||||||||||||||||||||||||||||||||||||||||||||||||||||||||||||||||||||||||||||||||||||||||||||||
| Net asset value, beginning of period | $18.91 | $18.44 | $15.54 | $13.99 | $13.52 | ||||||||||||||||||||||||||||||||||||||||||||||||||||||||||||||||||||||||||||||||||||||||||||||||||
| Net investment income1 | 0.20 | 0.25 | 0.17 | 0.18 | 0.15 | ||||||||||||||||||||||||||||||||||||||||||||||||||||||||||||||||||||||||||||||||||||||||||||||||||
| Net realized and unrealized gain (loss) on investments | (1.14 | ) | 1.16 | 3.75 | 2.04 | 0.75 | |||||||||||||||||||||||||||||||||||||||||||||||||||||||||||||||||||||||||||||||||||||||||||||||||
| Total from investment operations | (0.94 | ) | 1.41 | 3.92 | 2.22 | 0.90 | |||||||||||||||||||||||||||||||||||||||||||||||||||||||||||||||||||||||||||||||||||||||||||||||||
| Less distributions | |||||||||||||||||||||||||||||||||||||||||||||||||||||||||||||||||||||||||||||||||||||||||||||||||||||||
| From net investment income | (0.24 | ) | (0.15 | ) | (0.14 | ) | (0.17 | ) | (0.12 | ) | |||||||||||||||||||||||||||||||||||||||||||||||||||||||||||||||||||||||||||||||||||||||||||||
| From net realized gain | (0.59 | ) | (0.79 | ) | (0.88 | ) | (0.50 | ) | (0.31 | ) | |||||||||||||||||||||||||||||||||||||||||||||||||||||||||||||||||||||||||||||||||||||||||||||
| Total distributions | (0.83 | ) | (0.94 | ) | (1.02 | ) | (0.67 | ) | (0.43 | ) | |||||||||||||||||||||||||||||||||||||||||||||||||||||||||||||||||||||||||||||||||||||||||||||
| Net asset value, end of period | $17.14 | $18.91 | $18.44 | $15.54 | $13.99 | ||||||||||||||||||||||||||||||||||||||||||||||||||||||||||||||||||||||||||||||||||||||||||||||||||
| Total return (%)2 | (5.02 | ) | 7.86 | 25.61 | 16.40 | 7.27 | |||||||||||||||||||||||||||||||||||||||||||||||||||||||||||||||||||||||||||||||||||||||||||||||||
| Ratios and supplemental data | |||||||||||||||||||||||||||||||||||||||||||||||||||||||||||||||||||||||||||||||||||||||||||||||||||||||
| Net assets, end of period (in millions) | $6,730 | $7,026 | $3,671 | $1,680 | $711 | ||||||||||||||||||||||||||||||||||||||||||||||||||||||||||||||||||||||||||||||||||||||||||||||||||
| Ratios (as a percentage of average net assets): | |||||||||||||||||||||||||||||||||||||||||||||||||||||||||||||||||||||||||||||||||||||||||||||||||||||||
| Expenses before reductions | 0.81 | 0.81 | 0.83 | 0.87 | 0.88 | ||||||||||||||||||||||||||||||||||||||||||||||||||||||||||||||||||||||||||||||||||||||||||||||||||
| Expenses including reductions | 0.80 | 0.81 | 0.83 | 0.87 | 0.88 | ||||||||||||||||||||||||||||||||||||||||||||||||||||||||||||||||||||||||||||||||||||||||||||||||||
| Net investment income | 1.13 | 1.34 | 0.96 | 1.26 | 1.18 | ||||||||||||||||||||||||||||||||||||||||||||||||||||||||||||||||||||||||||||||||||||||||||||||||||
| Portfolio turnover (%) | 61 | 44 | 45 | 44 | 44 | ||||||||||||||||||||||||||||||||||||||||||||||||||||||||||||||||||||||||||||||||||||||||||||||||||
| 1 | Based on average daily shares outstanding. | ||||||||||||||||||||||||||||||||||||||||||||||||||||||||||||||||||||||||||||||||||
| 2 | Total returns would have been lower had certain expenses not been reduced during the applicable periods. | ||||||||||||||||||||||||||||||||||||||||||||||||||||||||||||||||||||||||||||||||||
| Class I2 Shares Period ended | 3-31-16 | 3-31-15 | 3-31-14 | 3-31-13 | 3-31-12 | ||||||||||||||||||||||||||||||||||||||||||||||||||||||||||||||||||||||||||||||||||||||||||||||||||
| Per share operating performance | |||||||||||||||||||||||||||||||||||||||||||||||||||||||||||||||||||||||||||||||||||||||||||||||||||||||
| Net asset value, beginning of period | $18.92 | $18.45 | $15.55 | $13.99 | $13.53 | ||||||||||||||||||||||||||||||||||||||||||||||||||||||||||||||||||||||||||||||||||||||||||||||||||
| Net investment income1 | 0.20 | 0.24 | 0.17 | 0.18 | 0.15 | ||||||||||||||||||||||||||||||||||||||||||||||||||||||||||||||||||||||||||||||||||||||||||||||||||
| Net realized and unrealized gain (loss) on investments | (1.15 | ) | 1.17 | 3.75 | 2.05 | 0.75 | |||||||||||||||||||||||||||||||||||||||||||||||||||||||||||||||||||||||||||||||||||||||||||||||||
| Total from investment operations | (0.95 | ) | 1.41 | 3.92 | 2.23 | 0.90 | |||||||||||||||||||||||||||||||||||||||||||||||||||||||||||||||||||||||||||||||||||||||||||||||||
| Less distributions | |||||||||||||||||||||||||||||||||||||||||||||||||||||||||||||||||||||||||||||||||||||||||||||||||||||||
| From net investment income | (0.24 | ) | (0.15 | ) | (0.14 | ) | (0.17 | ) | (0.13 | ) | |||||||||||||||||||||||||||||||||||||||||||||||||||||||||||||||||||||||||||||||||||||||||||||
| From net realized gain | (0.59 | ) | (0.79 | ) | (0.88 | ) | (0.50 | ) | (0.31 | ) | |||||||||||||||||||||||||||||||||||||||||||||||||||||||||||||||||||||||||||||||||||||||||||||
| Total distributions | (0.83 | ) | (0.94 | ) | (1.02 | ) | (0.67 | ) | (0.44 | ) | |||||||||||||||||||||||||||||||||||||||||||||||||||||||||||||||||||||||||||||||||||||||||||||
| Net asset value, end of period | $17.14 | $18.92 | $18.45 | $15.55 | $13.99 | ||||||||||||||||||||||||||||||||||||||||||||||||||||||||||||||||||||||||||||||||||||||||||||||||||
| Total return (%)2 | (5.07 | ) | 7.85 | 25.63 | 16.51 | 7.24 | |||||||||||||||||||||||||||||||||||||||||||||||||||||||||||||||||||||||||||||||||||||||||||||||||
| Ratios and supplemental data | |||||||||||||||||||||||||||||||||||||||||||||||||||||||||||||||||||||||||||||||||||||||||||||||||||||||
| Net assets, end of period (in millions) | $49 | $89 | $75 | $34 | $25 | ||||||||||||||||||||||||||||||||||||||||||||||||||||||||||||||||||||||||||||||||||||||||||||||||||
| Ratios (as a percentage of average net assets): | |||||||||||||||||||||||||||||||||||||||||||||||||||||||||||||||||||||||||||||||||||||||||||||||||||||||
| Expenses before reductions | 0.82 | 0.84 | 0.87 | 0.92 | 0.93 | ||||||||||||||||||||||||||||||||||||||||||||||||||||||||||||||||||||||||||||||||||||||||||||||||||
| Expenses including reductions | 0.81 | 0.83 | 0.85 | 0.85 | 0.85 | ||||||||||||||||||||||||||||||||||||||||||||||||||||||||||||||||||||||||||||||||||||||||||||||||||
| Net investment income | 1.11 | 1.28 | 0.96 | 1.29 | 1.21 | ||||||||||||||||||||||||||||||||||||||||||||||||||||||||||||||||||||||||||||||||||||||||||||||||||
| Portfolio turnover (%) | 61 | 44 | 45 | 44 | 44 | ||||||||||||||||||||||||||||||||||||||||||||||||||||||||||||||||||||||||||||||||||||||||||||||||||
| 1 | Based on average daily shares outstanding. | ||||||||||||||||||||||||||||||||||||||||||||||||||||||||||||||||||||||||||||||||||
| 2 | Total returns would have been lower had certain expenses not been reduced during the applicable periods. | ||||||||||||||||||||||||||||||||||||||||||||||||||||||||||||||||||||||||||||||||||
| Class R1 Shares Period ended | 3-31-16 | 3-31-15 | 3-31-14 | 3-31-13 | 3-31-12 | ||||||||||||||||||||||||||||||||||||||||||||||||||||||||||||||||||||||||||||||||||||||||||||||||||
| Per share operating performance | |||||||||||||||||||||||||||||||||||||||||||||||||||||||||||||||||||||||||||||||||||||||||||||||||||||||
| Net asset value, beginning of period | $18.90 | $18.43 | $15.54 | $13.99 | $13.52 | ||||||||||||||||||||||||||||||||||||||||||||||||||||||||||||||||||||||||||||||||||||||||||||||||||
| Net investment income1 | 0.09 | 0.12 | 0.04 | 0.08 | 0.06 | ||||||||||||||||||||||||||||||||||||||||||||||||||||||||||||||||||||||||||||||||||||||||||||||||||
| Net realized and unrealized gain (loss) on investments | (1.15 | ) | 1.15 | 3.75 | 2.04 | 0.74 | |||||||||||||||||||||||||||||||||||||||||||||||||||||||||||||||||||||||||||||||||||||||||||||||||
| Total from investment operations | (1.06 | ) | 1.27 | 3.79 | 2.12 | 0.80 | |||||||||||||||||||||||||||||||||||||||||||||||||||||||||||||||||||||||||||||||||||||||||||||||||
| Less distributions | |||||||||||||||||||||||||||||||||||||||||||||||||||||||||||||||||||||||||||||||||||||||||||||||||||||||
| From net investment income | (0.12 | ) | (0.01 | ) | (0.02 | ) | (0.07 | ) | (0.02 | ) | |||||||||||||||||||||||||||||||||||||||||||||||||||||||||||||||||||||||||||||||||||||||||||||
| From net realized gain | (0.59 | ) | (0.79 | ) | (0.88 | ) | (0.50 | ) | (0.31 | ) | |||||||||||||||||||||||||||||||||||||||||||||||||||||||||||||||||||||||||||||||||||||||||||||
| Total distributions | (0.71 | ) | (0.80 | ) | (0.90 | ) | (0.57 | ) | (0.33 | ) | |||||||||||||||||||||||||||||||||||||||||||||||||||||||||||||||||||||||||||||||||||||||||||||
| Net asset value, end of period | $17.13 | $18.90 | $18.43 | $15.54 | $13.99 | ||||||||||||||||||||||||||||||||||||||||||||||||||||||||||||||||||||||||||||||||||||||||||||||||||
| Total return (%)2 | (5.66 | ) | 7.09 | 24.69 | 15.63 | 6.41 | |||||||||||||||||||||||||||||||||||||||||||||||||||||||||||||||||||||||||||||||||||||||||||||||||
| Ratios and supplemental data | |||||||||||||||||||||||||||||||||||||||||||||||||||||||||||||||||||||||||||||||||||||||||||||||||||||||
| Net assets, end of period (in millions) | $26 | $22 | $13 | $6 | $3 | ||||||||||||||||||||||||||||||||||||||||||||||||||||||||||||||||||||||||||||||||||||||||||||||||||
| Ratios (as a percentage of average net assets): | |||||||||||||||||||||||||||||||||||||||||||||||||||||||||||||||||||||||||||||||||||||||||||||||||||||||
| Expenses before reductions | 1.48 | 1.54 | 1.67 | 1.85 | 2.16 | ||||||||||||||||||||||||||||||||||||||||||||||||||||||||||||||||||||||||||||||||||||||||||||||||||
| Expenses including reductions | 1.47 | 1.53 | 1.57 | 1.58 | 1.65 | ||||||||||||||||||||||||||||||||||||||||||||||||||||||||||||||||||||||||||||||||||||||||||||||||||
| Net investment income | 0.48 | 0.63 | 0.22 | 0.56 | 0.45 | ||||||||||||||||||||||||||||||||||||||||||||||||||||||||||||||||||||||||||||||||||||||||||||||||||
| Portfolio turnover (%) | 61 | 44 | 45 | 44 | 44 | ||||||||||||||||||||||||||||||||||||||||||||||||||||||||||||||||||||||||||||||||||||||||||||||||||
| 1 | Based on average daily shares outstanding. | ||||||||||||||||||||||||||||||||||||||||||||||||||||||||||||||||||||||||||||||||||
| 2 | Total returns would have been lower had certain expenses not been reduced during the applicable periods. | ||||||||||||||||||||||||||||||||||||||||||||||||||||||||||||||||||||||||||||||||||
| Class R2 Shares Period ended | 3-31-16 | 3-31-15 | 3-31-14 | 3-31-13 | 3-31-12 | 1 | |||||||||||||||||||||||||||||||||||||||||||||||||||||||||||||||||||||||||||||||||||||||||||||||||
| Per share operating performance | |||||||||||||||||||||||||||||||||||||||||||||||||||||||||||||||||||||||||||||||||||||||||||||||||||||||
| Net asset value, beginning of period | $18.90 | $18.44 | $15.55 | $14.00 | $13.49 | ||||||||||||||||||||||||||||||||||||||||||||||||||||||||||||||||||||||||||||||||||||||||||||||||||
| Net investment income2 | 0.13 | 0.19 | 0.08 | 0.12 | — | 3 | |||||||||||||||||||||||||||||||||||||||||||||||||||||||||||||||||||||||||||||||||||||||||||||||||
| Net realized and unrealized gain (loss) on investments | (1.14 | ) | 1.14 | 3.75 | 2.04 | 0.51 | |||||||||||||||||||||||||||||||||||||||||||||||||||||||||||||||||||||||||||||||||||||||||||||||||
| Total from investment operations | (1.01 | ) | 1.33 | 3.83 | 2.16 | 0.51 | |||||||||||||||||||||||||||||||||||||||||||||||||||||||||||||||||||||||||||||||||||||||||||||||||
| Less distributions | |||||||||||||||||||||||||||||||||||||||||||||||||||||||||||||||||||||||||||||||||||||||||||||||||||||||
| From net investment income | (0.17 | ) | (0.08 | ) | (0.06 | ) | (0.11 | ) | — | ||||||||||||||||||||||||||||||||||||||||||||||||||||||||||||||||||||||||||||||||||||||||||||||
| From net realized gain | (0.59 | ) | (0.79 | ) | (0.88 | ) | (0.50 | ) | — | ||||||||||||||||||||||||||||||||||||||||||||||||||||||||||||||||||||||||||||||||||||||||||||||
| Total distributions | (0.76 | ) | (0.87 | ) | (0.94 | ) | (0.61 | ) | — | ||||||||||||||||||||||||||||||||||||||||||||||||||||||||||||||||||||||||||||||||||||||||||||||
| Net asset value, end of period | $17.13 | $18.90 | $18.44 | $15.55 | $14.00 | ||||||||||||||||||||||||||||||||||||||||||||||||||||||||||||||||||||||||||||||||||||||||||||||||||
| Total return (%)4 | (5.42 | ) | 7.39 | 24.98 | 15.90 | 3.78 | 5 | ||||||||||||||||||||||||||||||||||||||||||||||||||||||||||||||||||||||||||||||||||||||||||||||||
| Ratios and supplemental data | |||||||||||||||||||||||||||||||||||||||||||||||||||||||||||||||||||||||||||||||||||||||||||||||||||||||
| Net assets, end of period (in millions) | $136 | $120 | $38 | $4 | — | 6 | |||||||||||||||||||||||||||||||||||||||||||||||||||||||||||||||||||||||||||||||||||||||||||||||||
| Ratios (as a percentage of average net assets): | |||||||||||||||||||||||||||||||||||||||||||||||||||||||||||||||||||||||||||||||||||||||||||||||||||||||
| Expenses before reductions | 1.22 | 1.25 | 1.33 | 3.02 | 15.96 | 7 | |||||||||||||||||||||||||||||||||||||||||||||||||||||||||||||||||||||||||||||||||||||||||||||||||
| Expenses including reductions | 1.21 | 1.24 | 1.32 | 1.32 | 1.40 | 7 | |||||||||||||||||||||||||||||||||||||||||||||||||||||||||||||||||||||||||||||||||||||||||||||||||
| Net investment income | 0.74 | 0.99 | 0.45 | 0.80 | 0.41 | 7 | |||||||||||||||||||||||||||||||||||||||||||||||||||||||||||||||||||||||||||||||||||||||||||||||||
| Portfolio turnover (%) | 61 | 44 | 45 | 44 | 44 | 8 | |||||||||||||||||||||||||||||||||||||||||||||||||||||||||||||||||||||||||||||||||||||||||||||||||
| 1 | The inception date for Class R2 shares is 3-1-12. | ||||||||||||||||||||||||||||||||||||||||||||||||||||||||||||||||||||||||||||||||||
| 2 | Based on average daily shares outstanding. | ||||||||||||||||||||||||||||||||||||||||||||||||||||||||||||||||||||||||||||||||||
| 3 | Less than $0.005 per share. | ||||||||||||||||||||||||||||||||||||||||||||||||||||||||||||||||||||||||||||||||||
| 4 | Total returns would have been lower had certain expenses not been reduced during the applicable periods. | ||||||||||||||||||||||||||||||||||||||||||||||||||||||||||||||||||||||||||||||||||
| 5 | Not annualized. | ||||||||||||||||||||||||||||||||||||||||||||||||||||||||||||||||||||||||||||||||||
| 6 | Less than $500,000. | ||||||||||||||||||||||||||||||||||||||||||||||||||||||||||||||||||||||||||||||||||
| 7 | Annualized. | ||||||||||||||||||||||||||||||||||||||||||||||||||||||||||||||||||||||||||||||||||
| 8 | The portfolio turnover is shown for the period from 4-1-11 to 3-31-12. | ||||||||||||||||||||||||||||||||||||||||||||||||||||||||||||||||||||||||||||||||||
| Class R3 Shares Period ended | 3-31-16 | 3-31-15 | 3-31-14 | 3-31-13 | 3-31-12 | ||||||||||||||||||||||||||||||||||||||||||||||||||||||||||||||||||||||||||||||||||||||||||||||||||
| Per share operating performance | |||||||||||||||||||||||||||||||||||||||||||||||||||||||||||||||||||||||||||||||||||||||||||||||||||||||
| Net asset value, beginning of period | $18.89 | $18.43 | $15.54 | $13.99 | $13.52 | ||||||||||||||||||||||||||||||||||||||||||||||||||||||||||||||||||||||||||||||||||||||||||||||||||
| Net investment income1 | 0.10 | 0.14 | 0.06 | 0.10 | 0.07 | ||||||||||||||||||||||||||||||||||||||||||||||||||||||||||||||||||||||||||||||||||||||||||||||||||
| Net realized and unrealized gain (loss) on investments | (1.14 | ) | 1.15 | 3.74 | 2.04 | 0.75 | |||||||||||||||||||||||||||||||||||||||||||||||||||||||||||||||||||||||||||||||||||||||||||||||||
| Total from investment operations | (1.04 | ) | 1.29 | 3.80 | 2.14 | 0.82 | |||||||||||||||||||||||||||||||||||||||||||||||||||||||||||||||||||||||||||||||||||||||||||||||||
| Less distributions | |||||||||||||||||||||||||||||||||||||||||||||||||||||||||||||||||||||||||||||||||||||||||||||||||||||||
| From net investment income | (0.14 | ) | (0.04 | ) | (0.03 | ) | (0.09 | ) | (0.04 | ) | |||||||||||||||||||||||||||||||||||||||||||||||||||||||||||||||||||||||||||||||||||||||||||||
| From net realized gain | (0.59 | ) | (0.79 | ) | (0.88 | ) | (0.50 | ) | (0.31 | ) | |||||||||||||||||||||||||||||||||||||||||||||||||||||||||||||||||||||||||||||||||||||||||||||
| Total distributions | (0.73 | ) | (0.83 | ) | (0.91 | ) | (0.59 | ) | (0.35 | ) | |||||||||||||||||||||||||||||||||||||||||||||||||||||||||||||||||||||||||||||||||||||||||||||
| Net asset value, end of period | $17.12 | $18.89 | $18.43 | $15.54 | $13.99 | ||||||||||||||||||||||||||||||||||||||||||||||||||||||||||||||||||||||||||||||||||||||||||||||||||
| Total return (%)2 | (5.57 | ) | 7.20 | 24.81 | 15.75 | 6.52 | |||||||||||||||||||||||||||||||||||||||||||||||||||||||||||||||||||||||||||||||||||||||||||||||||
| Ratios and supplemental data | |||||||||||||||||||||||||||||||||||||||||||||||||||||||||||||||||||||||||||||||||||||||||||||||||||||||
| Net assets, end of period (in millions) | $30 | $28 | $15 | $4 | — | 3 | |||||||||||||||||||||||||||||||||||||||||||||||||||||||||||||||||||||||||||||||||||||||||||||||||
| Ratios (as a percentage of average net assets): | |||||||||||||||||||||||||||||||||||||||||||||||||||||||||||||||||||||||||||||||||||||||||||||||||||||||
| Expenses before reductions | 1.37 | 1.43 | 1.57 | 2.33 | 11.16 | ||||||||||||||||||||||||||||||||||||||||||||||||||||||||||||||||||||||||||||||||||||||||||||||||||
| Expenses including reductions | 1.37 | 1.42 | 1.47 | 1.48 | 1.55 | ||||||||||||||||||||||||||||||||||||||||||||||||||||||||||||||||||||||||||||||||||||||||||||||||||
| Net investment income | 0.57 | 0.73 | 0.35 | 0.67 | 0.54 | ||||||||||||||||||||||||||||||||||||||||||||||||||||||||||||||||||||||||||||||||||||||||||||||||||
| Portfolio turnover (%) | 61 | 44 | 45 | 44 | 44 | ||||||||||||||||||||||||||||||||||||||||||||||||||||||||||||||||||||||||||||||||||||||||||||||||||
| 1 | Based on average daily shares outstanding. | ||||||||||||||||||||||||||||||||||||||||||||||||||||||||||||||||||||||||||||||||||
| 2 | Total returns would have been lower had certain expenses not been reduced during the applicable periods. | ||||||||||||||||||||||||||||||||||||||||||||||||||||||||||||||||||||||||||||||||||
| 3 | Less than $500,000. | ||||||||||||||||||||||||||||||||||||||||||||||||||||||||||||||||||||||||||||||||||
| Class R4 Shares Period ended | 3-31-16 | 3-31-15 | 3-31-14 | 3-31-13 | 3-31-12 | ||||||||||||||||||||||||||||||||||||||||||||||||||||||||||||||||||||||||||||||||||||||||||||||||||
| Per share operating performance | |||||||||||||||||||||||||||||||||||||||||||||||||||||||||||||||||||||||||||||||||||||||||||||||||||||||
| Net asset value, beginning of period | $18.92 | $18.45 | $15.54 | $13.99 | $13.52 | ||||||||||||||||||||||||||||||||||||||||||||||||||||||||||||||||||||||||||||||||||||||||||||||||||
| Net investment income1 | 0.18 | 0.25 | 0.13 | 0.16 | 0.11 | ||||||||||||||||||||||||||||||||||||||||||||||||||||||||||||||||||||||||||||||||||||||||||||||||||
| Net realized and unrealized gain (loss) on investments | (1.16 | ) | 1.12 | 3.76 | 2.03 | 0.75 | |||||||||||||||||||||||||||||||||||||||||||||||||||||||||||||||||||||||||||||||||||||||||||||||||
| Total from investment operations | (0.98 | ) | 1.37 | 3.89 | 2.19 | 0.86 | |||||||||||||||||||||||||||||||||||||||||||||||||||||||||||||||||||||||||||||||||||||||||||||||||
| Less distributions | |||||||||||||||||||||||||||||||||||||||||||||||||||||||||||||||||||||||||||||||||||||||||||||||||||||||
| From net investment income | (0.21 | ) | (0.11 | ) | (0.10 | ) | (0.14 | ) | (0.08 | ) | |||||||||||||||||||||||||||||||||||||||||||||||||||||||||||||||||||||||||||||||||||||||||||||
| From net realized gain | (0.59 | ) | (0.79 | ) | (0.88 | ) | (0.50 | ) | (0.31 | ) | |||||||||||||||||||||||||||||||||||||||||||||||||||||||||||||||||||||||||||||||||||||||||||||
| Total distributions | (0.80 | ) | (0.90 | ) | (0.98 | ) | (0.64 | ) | (0.39 | ) | |||||||||||||||||||||||||||||||||||||||||||||||||||||||||||||||||||||||||||||||||||||||||||||
| Net asset value, end of period | $17.14 | $18.92 | $18.45 | $15.54 | $13.99 | ||||||||||||||||||||||||||||||||||||||||||||||||||||||||||||||||||||||||||||||||||||||||||||||||||
| Total return (%)2 | (5.22 | ) | 7.67 | 25.44 | 16.19 | 6.86 | |||||||||||||||||||||||||||||||||||||||||||||||||||||||||||||||||||||||||||||||||||||||||||||||||
| Ratios and supplemental data | |||||||||||||||||||||||||||||||||||||||||||||||||||||||||||||||||||||||||||||||||||||||||||||||||||||||
| Net assets, end of period (in millions) | $268 | $228 | $75 | $5 | $1 | ||||||||||||||||||||||||||||||||||||||||||||||||||||||||||||||||||||||||||||||||||||||||||||||||||
| Ratios (as a percentage of average net assets): | |||||||||||||||||||||||||||||||||||||||||||||||||||||||||||||||||||||||||||||||||||||||||||||||||||||||
| Expenses before reductions | 1.06 | 1.08 | 1.11 | 1.63 | 2.35 | ||||||||||||||||||||||||||||||||||||||||||||||||||||||||||||||||||||||||||||||||||||||||||||||||||
| Expenses including reductions | 0.96 | 0.97 | 1.01 | 1.09 | 1.25 | ||||||||||||||||||||||||||||||||||||||||||||||||||||||||||||||||||||||||||||||||||||||||||||||||||
| Net investment income | 1.00 | 1.31 | 0.75 | 1.09 | 0.85 | ||||||||||||||||||||||||||||||||||||||||||||||||||||||||||||||||||||||||||||||||||||||||||||||||||
| Portfolio turnover (%) | 61 | 44 | 45 | 44 | 44 | ||||||||||||||||||||||||||||||||||||||||||||||||||||||||||||||||||||||||||||||||||||||||||||||||||
| 1 | Based on average daily shares outstanding. | ||||||||||||||||||||||||||||||||||||||||||||||||||||||||||||||||||||||||||||||||||
| 2 | Total returns would have been lower had certain expenses not been reduced during the applicable periods. | ||||||||||||||||||||||||||||||||||||||||||||||||||||||||||||||||||||||||||||||||||
| Class R5 Shares Period ended | 3-31-16 | 3-31-15 | 3-31-14 | 3-31-13 | 3-31-12 | ||||||||||||||||||||||||||||||||||||||||||||||||||||||||||||||||||||||||||||||||||||||||||||||||||
| Per share operating performance | |||||||||||||||||||||||||||||||||||||||||||||||||||||||||||||||||||||||||||||||||||||||||||||||||||||||
| Net asset value, beginning of period | $18.94 | $18.47 | $15.57 | $14.00 | $13.53 | ||||||||||||||||||||||||||||||||||||||||||||||||||||||||||||||||||||||||||||||||||||||||||||||||||
| Net investment income1 | 0.21 | 0.24 | 0.18 | 0.20 | 0.15 | ||||||||||||||||||||||||||||||||||||||||||||||||||||||||||||||||||||||||||||||||||||||||||||||||||
| Net realized and unrealized gain (loss) on investments | (1.15 | ) | 1.19 | 3.76 | 2.04 | 0.74 | |||||||||||||||||||||||||||||||||||||||||||||||||||||||||||||||||||||||||||||||||||||||||||||||||
| Total from investment operations | (0.94 | ) | 1.43 | 3.94 | 2.24 | 0.89 | |||||||||||||||||||||||||||||||||||||||||||||||||||||||||||||||||||||||||||||||||||||||||||||||||
| Less distributions | |||||||||||||||||||||||||||||||||||||||||||||||||||||||||||||||||||||||||||||||||||||||||||||||||||||||
| From net investment income | (0.25 | ) | (0.17 | ) | (0.16 | ) | (0.17 | ) | (0.11 | ) | |||||||||||||||||||||||||||||||||||||||||||||||||||||||||||||||||||||||||||||||||||||||||||||
| From net realized gain | (0.59 | ) | (0.79 | ) | (0.88 | ) | (0.50 | ) | (0.31 | ) | |||||||||||||||||||||||||||||||||||||||||||||||||||||||||||||||||||||||||||||||||||||||||||||
| Total distributions | (0.84 | ) | (0.96 | ) | (1.04 | ) | (0.67 | ) | (0.42 | ) | |||||||||||||||||||||||||||||||||||||||||||||||||||||||||||||||||||||||||||||||||||||||||||||
| Net asset value, end of period | $17.16 | $18.94 | $18.47 | $15.57 | $14.00 | ||||||||||||||||||||||||||||||||||||||||||||||||||||||||||||||||||||||||||||||||||||||||||||||||||
| Total return (%)2 | (5.02 | ) | 7.98 | 25.71 | 16.55 | 7.20 | |||||||||||||||||||||||||||||||||||||||||||||||||||||||||||||||||||||||||||||||||||||||||||||||||
| Ratios and supplemental data | |||||||||||||||||||||||||||||||||||||||||||||||||||||||||||||||||||||||||||||||||||||||||||||||||||||||
| Net assets, end of period (in millions) | $275 | $376 | $591 | $415 | $33 | ||||||||||||||||||||||||||||||||||||||||||||||||||||||||||||||||||||||||||||||||||||||||||||||||||
| Ratios (as a percentage of average net assets): | |||||||||||||||||||||||||||||||||||||||||||||||||||||||||||||||||||||||||||||||||||||||||||||||||||||||
| Expenses before reductions | 0.77 | 0.73 | 0.74 | 0.78 | 0.90 | ||||||||||||||||||||||||||||||||||||||||||||||||||||||||||||||||||||||||||||||||||||||||||||||||||
| Expenses including reductions | 0.76 | 0.72 | 0.73 | 0.78 | 0.90 | ||||||||||||||||||||||||||||||||||||||||||||||||||||||||||||||||||||||||||||||||||||||||||||||||||
| Net investment income | 1.16 | 1.27 | 1.05 | 1.42 | 1.19 | ||||||||||||||||||||||||||||||||||||||||||||||||||||||||||||||||||||||||||||||||||||||||||||||||||
| Portfolio turnover (%) | 61 | 44 | 45 | 44 | 44 | ||||||||||||||||||||||||||||||||||||||||||||||||||||||||||||||||||||||||||||||||||||||||||||||||||
| 1 | Based on average daily shares outstanding. | ||||||||||||||||||||||||||||||||||||||||||||||||||||||||||||||||||||||||||||||||||
| 2 | Total returns would have been lower had certain expenses not been reduced during the applicable periods. | ||||||||||||||||||||||||||||||||||||||||||||||||||||||||||||||||||||||||||||||||||
| Class R6 Shares Period ended | 3-31-16 | 3-31-15 | 3-31-14 | 3-31-13 | 3-31-12 | 1 | |||||||||||||||||||||||||||||||||||||||||||||||||||||||||||||||||||||||||||||||||||||||||||||||||
| Per share operating performance | |||||||||||||||||||||||||||||||||||||||||||||||||||||||||||||||||||||||||||||||||||||||||||||||||||||||
| Net asset value, beginning of period | $18.94 | $18.47 | $15.57 | $14.00 | $12.19 | ||||||||||||||||||||||||||||||||||||||||||||||||||||||||||||||||||||||||||||||||||||||||||||||||||
| Net investment income2 | 0.23 | 0.31 | 0.19 | 0.19 | 0.10 | ||||||||||||||||||||||||||||||||||||||||||||||||||||||||||||||||||||||||||||||||||||||||||||||||||
| Net realized and unrealized gain (loss) on investments | (1.15 | ) | 1.12 | 3.75 | 2.06 | 2.15 | |||||||||||||||||||||||||||||||||||||||||||||||||||||||||||||||||||||||||||||||||||||||||||||||||
| Total from investment operations | (0.92 | ) | 1.43 | 3.94 | 2.25 | 2.25 | |||||||||||||||||||||||||||||||||||||||||||||||||||||||||||||||||||||||||||||||||||||||||||||||||
| Less distributions | |||||||||||||||||||||||||||||||||||||||||||||||||||||||||||||||||||||||||||||||||||||||||||||||||||||||
| From net investment income | (0.27 | ) | (0.17 | ) | (0.16 | ) | (0.18 | ) | (0.13 | ) | |||||||||||||||||||||||||||||||||||||||||||||||||||||||||||||||||||||||||||||||||||||||||||||
| From net realized gain | (0.59 | ) | (0.79 | ) | (0.88 | ) | (0.50 | ) | (0.31 | ) | |||||||||||||||||||||||||||||||||||||||||||||||||||||||||||||||||||||||||||||||||||||||||||||
| Total distributions | (0.86 | ) | (0.96 | ) | (1.04 | ) | (0.68 | ) | (0.44 | ) | |||||||||||||||||||||||||||||||||||||||||||||||||||||||||||||||||||||||||||||||||||||||||||||
| Net asset value, end of period | $17.16 | $18.94 | $18.47 | $15.57 | $14.00 | ||||||||||||||||||||||||||||||||||||||||||||||||||||||||||||||||||||||||||||||||||||||||||||||||||
| Total return (%)3 | (5.00 | ) | 7.99 | 25.72 | 16.60 | 19.09 | 4 | ||||||||||||||||||||||||||||||||||||||||||||||||||||||||||||||||||||||||||||||||||||||||||||||||
| Ratios and supplemental data | |||||||||||||||||||||||||||||||||||||||||||||||||||||||||||||||||||||||||||||||||||||||||||||||||||||||
| Net assets, end of period (in millions) | $2,024 | $1,444 | $356 | $118 | $1 | ||||||||||||||||||||||||||||||||||||||||||||||||||||||||||||||||||||||||||||||||||||||||||||||||||
| Ratios (as a percentage of average net assets): | |||||||||||||||||||||||||||||||||||||||||||||||||||||||||||||||||||||||||||||||||||||||||||||||||||||||
| Expenses before reductions | 0.72 | 0.72 | 0.74 | 0.82 | 2.32 | 5 | |||||||||||||||||||||||||||||||||||||||||||||||||||||||||||||||||||||||||||||||||||||||||||||||||
| Expenses including reductions | 0.69 | 0.69 | 0.73 | 0.82 | 0.86 | 5 | |||||||||||||||||||||||||||||||||||||||||||||||||||||||||||||||||||||||||||||||||||||||||||||||||
| Net investment income | 1.26 | 1.63 | 1.06 | 1.28 | 1.31 | 5 | |||||||||||||||||||||||||||||||||||||||||||||||||||||||||||||||||||||||||||||||||||||||||||||||||
| Portfolio turnover (%) | 61 | 44 | 45 | 44 | 44 | 6 | |||||||||||||||||||||||||||||||||||||||||||||||||||||||||||||||||||||||||||||||||||||||||||||||||
| 1 | The inception date for Class R6 shares is 9-1-11. | ||||||||||||||||||||||||||||||||||||||||||||||||||||||||||||||||||||||||||||||||||
| 2 | Based on average daily shares outstanding. | ||||||||||||||||||||||||||||||||||||||||||||||||||||||||||||||||||||||||||||||||||
| 3 | Total returns would have been lower had certain expenses not been reduced during the applicable periods. | ||||||||||||||||||||||||||||||||||||||||||||||||||||||||||||||||||||||||||||||||||
| 4 | Not annualized. | ||||||||||||||||||||||||||||||||||||||||||||||||||||||||||||||||||||||||||||||||||
| 5 | Annualized. | ||||||||||||||||||||||||||||||||||||||||||||||||||||||||||||||||||||||||||||||||||
| 6 | The portfolio turnover is shown for the period from 4-1-11 to 3-31-12. | ||||||||||||||||||||||||||||||||||||||||||||||||||||||||||||||||||||||||||||||||||
| Class NAV Shares Period ended | 3-31-16 | 3-31-15 | 3-31-14 | 3-31-13 | 3-31-12 | ||||||||||||||||||||||||||||||||||||||||||||||||||||||||||||||||||||||||||||||||||||||||||||||||||
| Per share operating performance | |||||||||||||||||||||||||||||||||||||||||||||||||||||||||||||||||||||||||||||||||||||||||||||||||||||||
| Net asset value, beginning of period | $18.94 | $18.47 | $15.57 | $14.00 | $13.53 | ||||||||||||||||||||||||||||||||||||||||||||||||||||||||||||||||||||||||||||||||||||||||||||||||||
| Net investment income1 | 0.23 | 0.27 | 0.19 | 0.20 | 0.16 | ||||||||||||||||||||||||||||||||||||||||||||||||||||||||||||||||||||||||||||||||||||||||||||||||||
| Net realized and unrealized gain (loss) on investments | (1.15 | ) | 1.16 | 3.75 | 2.05 | 0.75 | |||||||||||||||||||||||||||||||||||||||||||||||||||||||||||||||||||||||||||||||||||||||||||||||||
| Total from investment operations | (0.92 | ) | 1.43 | 3.94 | 2.25 | 0.91 | |||||||||||||||||||||||||||||||||||||||||||||||||||||||||||||||||||||||||||||||||||||||||||||||||
| Less distributions | |||||||||||||||||||||||||||||||||||||||||||||||||||||||||||||||||||||||||||||||||||||||||||||||||||||||
| From net investment income | (0.27 | ) | (0.17 | ) | (0.16 | ) | (0.18 | ) | (0.13 | ) | |||||||||||||||||||||||||||||||||||||||||||||||||||||||||||||||||||||||||||||||||||||||||||||
| From net realized gain | (0.59 | ) | (0.79 | ) | (0.88 | ) | (0.50 | ) | (0.31 | ) | |||||||||||||||||||||||||||||||||||||||||||||||||||||||||||||||||||||||||||||||||||||||||||||
| Total distributions | (0.86 | ) | (0.96 | ) | (1.04 | ) | (0.68 | ) | (0.44 | ) | |||||||||||||||||||||||||||||||||||||||||||||||||||||||||||||||||||||||||||||||||||||||||||||
| Net asset value, end of period | $17.16 | $18.94 | $18.47 | $15.57 | $14.00 | ||||||||||||||||||||||||||||||||||||||||||||||||||||||||||||||||||||||||||||||||||||||||||||||||||
| Total return (%)2 | (4.95 | ) | 7.98 | 25.73 | 16.66 | 7.38 | |||||||||||||||||||||||||||||||||||||||||||||||||||||||||||||||||||||||||||||||||||||||||||||||||
| Ratios and supplemental data | |||||||||||||||||||||||||||||||||||||||||||||||||||||||||||||||||||||||||||||||||||||||||||||||||||||||
| Net assets, end of period (in millions) | $750 | $844 | $543 | $524 | $338 | ||||||||||||||||||||||||||||||||||||||||||||||||||||||||||||||||||||||||||||||||||||||||||||||||||
| Ratios (as a percentage of average net assets): | |||||||||||||||||||||||||||||||||||||||||||||||||||||||||||||||||||||||||||||||||||||||||||||||||||||||
| Expenses before reductions | 0.70 | 0.69 | 0.71 | 0.74 | 0.77 | ||||||||||||||||||||||||||||||||||||||||||||||||||||||||||||||||||||||||||||||||||||||||||||||||||
| Expenses including reductions | 0.69 | 0.69 | 0.71 | 0.74 | 0.77 | ||||||||||||||||||||||||||||||||||||||||||||||||||||||||||||||||||||||||||||||||||||||||||||||||||
| Net investment income | 1.25 | 1.45 | 1.09 | 1.40 | 1.28 | ||||||||||||||||||||||||||||||||||||||||||||||||||||||||||||||||||||||||||||||||||||||||||||||||||
| Portfolio turnover (%) | 61 | 44 | 45 | 44 | 44 | ||||||||||||||||||||||||||||||||||||||||||||||||||||||||||||||||||||||||||||||||||||||||||||||||||
| 1 | Based on average daily shares outstanding. | ||||||||||||||||||||||||||||||||||||||||||||||||||||||||||||||||||||||||||||||||||
| 2 | Total returns would have been lower had certain expenses not been reduced during the applicable periods. | ||||||||||||||||||||||||||||||||||||||||||||||||||||||||||||||||||||||||||||||||||
Note 1 — Organization
John Hancock Disciplined Value Fund (the fund) is a series of John Hancock Funds III (the Trust), an open-end management investment company organized as a Massachusetts business trust and registered under the Investment Company Act of 1940, as amended (the 1940 Act). The investment objective of the fund is to provide long-term growth of capital primarily through investments in equity securities. Current income is a secondary objective.
The fund may offer multiple classes of shares. The shares currently offered are detailed in the Statement of assets and liabilities. Class A and Class C shares are offered to all investors. Class I shares are offered to institutions and certain investors. Class B and Class I2 shares are closed to new investors. Class R1, Class R2, Class R3, Class R4 and Class R5 shares are available only to certain retirement plans. Class R6 shares are available only to certain retirement plans, institutions and other investors. Class NAV shares are offered to John Hancock affiliated funds of funds and certain 529 plans. Shareholders of each class have exclusive voting rights to matters that affect that class. The distribution and service fees, if any, transfer agent fees, state registration fees and printing and postage for each class may differ. Class B shares convert to Class A shares eight years after purchase.
Note 2 — Significant accounting policies
The financial statements have been prepared in conformity with accounting principles generally accepted in the United States of America (US GAAP), which require management to make certain estimates and assumptions as of the date of the financial statements. Actual results could differ from those estimates and those differences could be significant. The fund qualifies as an investment company under Topic 946 of Accounting Standards Codification of US GAAP.
Events or transactions occurring after the end of the fiscal period through the date that the financial statements were issued have been evaluated in the preparation of the financial statements. The following summarizes the significant accounting policies of the fund:
Security valuation. Investments are stated at value as of the scheduled close of regular trading on the New York Stock Exchange (NYSE), normally at 4:00 p.m., Eastern Time. In case of emergency or other disruption resulting in the NYSE not opening for trading or the NYSE closing at a time other than the regularly scheduled close, the net asset value (NAV) may be determined as of the regularly scheduled close of the NYSE pursuant to the fund's Valuation Policies and Procedures. The time at which shares and transactions are priced and until which orders are accepted may vary to the extent permitted by the Securities and Exchange Commission (SEC) and applicable regulations. In order to value the securities, the fund uses the following valuation techniques: Equity securities held by the fund are valued at the last sale price or official closing price on the exchange or principal market where the security was acquired or most likely will be sold. In the event there were no sales during the day or closing prices are not available, the securities are valued using the last available bid price. Investments by the fund in open-end mutual funds, including John Hancock Collateral Trust (JHCT), are valued at their respective net asset values each business day. Foreign securities and currencies are valued in U.S. dollars, based on foreign currency exchange rates supplied by an independent pricing vendor.
In certain instances, the Pricing Committee may determine to value equity securities using prices obtained from another exchange or market if trading on the exchange or market on which prices are typically obtained did not open for trading as scheduled, or if trading closed earlier than scheduled, and trading occurred as normal on another exchange or market.
Other portfolio securities and assets, for which reliable market quotations are not readily available, are valued at fair value as determined in good faith by the fund's Pricing Committee following procedures established by the Board of Trustees. The frequency with which these fair valuation procedures are used cannot be predicted and fair value of securities may differ significantly from the value that would have been used had a ready market for such securities existed.
The fund uses a three-tier hierarchy to prioritize the pricing assumptions, referred to as inputs, used in valuation techniques to measure fair value. Level 1 includes securities valued using quoted prices in active markets for identical securities, including registered investment companies. Level 2 includes securities valued using other significant observable inputs. Observable inputs may include quoted prices for similar securities, interest rates, prepayment speeds and credit risk. Prices for securities valued using these inputs are received from independent pricing vendors and brokers and are based on an evaluation of the
inputs described. Level 3 includes securities valued using significant unobservable inputs when market prices are not readily available or reliable, including the fund's own assumptions in determining the fair value of investments. Factors used in determining value may include market or issuer specific events or trends, changes in interest rates and credit quality. The inputs or methodology used for valuing securities are not necessarily an indication of the risks associated with investing in those securities. Changes in valuation techniques and related inputs may result in transfers into or out of an assigned level within the disclosure hierarchy.
As of March 31, 2016, all investments are categorized as Level 1 under the hierarchy described above.
Security transactions and related investment income. Investment security transactions are accounted for on a trade date plus one basis for daily NAV calculations. However, for financial reporting purposes, investment transactions are reported on trade date. Interest income is accrued as earned. Dividend income is recorded on the ex-date, except for dividends of foreign securities where the dividend may not be known until after the ex-date. In those cases, dividend income, net of withholding taxes, is recorded when the fund becomes aware of the dividends. Foreign taxes are provided for based on the fund's understanding of the tax rules and rates that exist in the foreign markets in which it invests. Gains and losses on securities sold are determined on the basis of identified cost and may include proceeds from litigation.
Securities lending. The fund may lend its securities to earn additional income. The fund receives cash collateral from the borrower in an amount not less than the market value of the loaned securities. The fund will invest its collateral in JHCT, an affiliate of the fund, which has a floating NAV and is registered with the SEC as an investment company. JHCT invests cash received as collateral as part of the securities lending program in short-term money market investments. The fund will receive the benefit of any gains and bear any losses generated by JHCT with respect to the cash collateral.
The fund has the right to recall loaned securities on demand. If a borrower fails to return loaned securities when due, then the lending agent is responsible and indemnifies the fund for the lent securities. The lending agent uses the collateral received from the borrower to purchase replacement securities of the same issue, type, class and series of the loaned securities. If the value of the collateral is less than the purchase cost of replacement securities, the lending agent is responsible for satisfying the shortfall but only to the extent that the shortfall is not due to any decrease in the value of JHCT.
Although the risk of the loss of the securities lent is mitigated by receiving collateral from the borrower and through lending agent indemnification, the fund could experience a delay in recovering securities or could experience a lower than expected return if the borrower fails to return the securities on a timely basis. The fund may receive compensation for lending its securities by retaining a portion of the return on the investment of the collateral and compensation from fees earned from borrowers of the securities. Net income received from JHCT is a component of securities lending income as recorded on the Statement of operations.
Obligations to repay collateral received by the fund are shown on the Statement of assets and liabilities as Payable upon return of securities loaned and are secured by the loaned securities. As of March 31, 2016, the fund loaned common stocks valued at $24,428,775 and received $24,954,125 of cash collateral.
Foreign taxes. The fund may be subject to withholding tax on income and/or capital gains or repatriation taxes imposed by certain countries in which the fund invests. Taxes are accrued based upon investment income, realized gains or unrealized appreciation.
Line of credit. The fund may borrow from banks for temporary or emergency purposes, including meeting redemption requests that otherwise might require the untimely sale of securities. Pursuant to the fund's custodian agreement, the custodian may loan money to the fund to make properly authorized payments. The fund is obligated to repay the custodian for any overdraft, including any related costs or expenses. The custodian may have a lien, security interest or security entitlement in any fund property that is not otherwise segregated or pledged, to the extent of any overdraft, and to the maximum extent permitted by law.
The fund and other affiliated funds have entered into a syndicated line of credit agreement, with Citibank, N.A. (Citibank) as the administrative agent, that enables them to participate in a $750 million unsecured committed line of credit. Prior to June
30, 2015, the fund and other affiliated funds had an agreement with Citibank that enabled them to participate in a $300 million unsecured committed line of credit. A commitment fee, payable at the end of each calendar quarter, based on the average daily unused portion of the effective line of credit, is charged to each participating fund on a pro rata basis and is reflected in Other expenses on the Statement of operations. Commitment fees for the year ended March 31, 2016 were $18,255. For the year ended March 31, 2016, the fund had no borrowings under either line of credit.
Expenses. Within the John Hancock group of funds complex, expenses that are directly attributable to an individual fund are allocated to such fund. Expenses that are not readily attributable to a specific fund are allocated among all funds in an equitable manner, taking into consideration, among other things, the nature and type of expense and the fund's relative net assets. Expense estimates are accrued in the period to which they relate and adjustments are made when actual amounts are known.
Class allocations. Income, common expenses and realized and unrealized gains (losses) are determined at the fund level and allocated daily to each class of shares based on the net assets of the class. Class-specific expenses, such as distribution and service fees, if any, and transfer agent fees, for all classes, are calculated daily at the class level based on the net assets of each class and the specific expense rates applicable to each class. Through June 30, 2015, class-specific expenses, such as state registration fees and printing and postage, for all classes, were calculated daily at the class level based on the net assets of each class and the specific expense rates applicable to each class.
Federal income taxes. The fund intends to continue to qualify as a regulated investment company by complying with the applicable provisions of the Internal Revenue Code and will not be subject to federal income tax on taxable income that is distributed to shareholders. Therefore, no federal income tax provision is required.
Under the Regulated Investment Company Modernization Act of 2010, the fund is permitted to carry forward capital losses incurred in taxable years beginning after December 22, 2010 for an unlimited period. Any losses incurred during those taxable years will be required to be utilized prior to the losses incurred in pre-enactment taxable years. As a result of this ordering rule, pre-enactment capital loss carryforwards may be more likely to expire unused. Additionally, post-enactment capital losses that are carried forward will retain their character as either short-term or long-term capital losses rather than being considered all short-term as under previous law.
For federal income tax purposes, as of March 31, 2016, the fund has a capital loss carryforward of $42,613,675 available to offset future net realized capital gains. This carryforward expires on March 31, 2017.
For federal income tax purposes, net capital losses of $208,275,151 that are the result of security transactions occurring after October 31, 2015, are treated as occurring on April 1, 2016, the first day of the fund's next taxable year.
It is estimated that $42,613,675 of the capital loss carryforward, which was acquired on July 10, 2009, in a merger with John Hancock Classic Value Fund II, will likely expire unused because of limitations of its use under tax rules.
As of March 31, 2016, the fund had no uncertain tax positions that would require financial statement recognition, derecognition or disclosure. The fund's federal tax returns are subject to examination by the Internal Revenue Service for a period of three years.
Distribution of income and gains. Distributions to shareholders from net investment income and net realized gains, if any, are recorded on the ex-date. The fund generally declares and pays dividends and capital gain distributions, if any, annually.
The tax character of distributions for the years ended March 31, 2016 and 2015 was as follows:
| March 31, 2016 | March 31, 2015 | |
| Ordinary Income | $194,725,548 | $153,764,113 |
| Long-Term Capital Gain | 431,113,872 | 442,052,580 |
| Total | $625,839,420 | $595,816,693 |
Distributions paid by the fund with respect to each class of shares are calculated in the same manner, at the same time and in the same amount, except for the effect of class level expenses that may be applied differently to each class. As of March 31, 2016, the components of distributable earnings on a tax basis consisted of $38,532,555 of undistributed ordinary income.
Such distributions and distributable earnings, on a tax basis, are determined in conformity with income tax regulations, which may differ from US GAAP. Distributions in excess of tax basis earnings and profits, if any, are reported in the fund's financial statements as a return of capital.
Capital accounts within the financial statements are adjusted for permanent book-tax differences. These adjustments have no impact on net assets or the results of operations. Temporary book-tax differences, if any, will reverse in a subsequent period. Book-tax differences are primarily attributable to expiration of capital loss carryforwards, redemptions-in-kind and wash sale loss deferrals.
Note 3 — Guarantees and indemnifications
Under the Trust's organizational documents, its Officers and Trustees are indemnified against certain liabilities arising out of the performance of their duties to the Trust, including fund. Additionally, in the normal course of business, the fund enters into contracts with service providers that contain general indemnification clauses. The fund's maximum exposure under these arrangements is unknown, as this would involve future claims that may be made against the fund that have not yet occurred. The risk of material loss from such claims is considered remote.
Note 4 — Fees and transactions with affiliates
John Hancock Advisers, LLC (the Advisor) serves as investment advisor for the fund. John Hancock Funds, LLC (the Distributor), an affiliate of the Advisor, serves as principal underwriter of the fund. The Advisor and the Distributor are indirect, wholly owned subsidiaries of Manulife Financial Corporation (MFC).
Management fee. The fund has an investment management agreement with the Advisor under which the fund pays a daily management fee to the Advisor equivalent on an annual basis to the sum of: (a) 0.750% of the first $500 million of the fund's average daily net assets; (b) 0.725% of the next $500 million of the fund's average daily net assets; (c) 0.700% of the next $500 million of the fund's average daily net assets; (d) 0.675% of the next $1 billion of the fund's average daily net assets; (e) 0.650% of the next $10 billion of the fund's average daily net assets; and (f) 0.625% of the fund's average daily net assets in excess of $12.5 billion. The Advisor has a subadvisory agreement with Boston Partners, a division of Robeco Investment Management, Inc. The fund is not responsible for payment of subadvisory fees.
The Advisor has contractually agreed to waive a portion of its management fee and/or reimburse expenses for certain funds of the John Hancock funds complex, including the fund (the participating portfolios). This waiver is based upon aggregate net assets of all the participating portfolios. The amount of the reimbursement is calculated daily and allocated among all the participating portfolios in proportion to the daily net assets of each fund. During the year ended March 31, 2016, the waiver amounted to 0.01% of the fund's average net assets on an annualized basis. This arrangement may be amended or terminated at any time by the Advisor upon notice to the fund and with the approval of the Board of Trustees.
The Advisor has contractually agreed to waive all or a portion of its management fee and/or reimburse or pay operating expenses of the fund to the extent necessary to maintain the fund's total operating expenses at 0.85% for Class I2 shares, excluding certain expenses such as taxes, brokerage commissions, interest expense, litigation and indemnification expenses and other extraordinary expenses not incurred in the ordinary course of the fund's business, acquired fund fees and short dividend expense. The expense limitation expires on June 30, 2016, unless renewed by mutual agreement of the fund and the Advisor based upon a determination that this is appropriate under the circumstances at the time. Prior to July 1, 2015, Class R1, Class R2, Class R3, and Class R4 shares had fee waivers and/or reimbursement such that the expenses would not exceed 1.57%, 1.32%, 1.47%, and 1.07% for Class R1, Class R2, Class R3, and Class R4 shares, respectively.
Prior to July 1, 2015, the Advisor contractually agreed to waive and/or reimburse all class specific expenses for Class B shares of the fund, including Rule 12b-1 fees and transfer agency fees and service fees, as applicable, to the extent they exceed 1.30% of average annual net assets (on an annualized basis) attributable to Class B shares (the Class Expense Waiver).
The Advisor has contractually agreed to waive and/or reimburse all class specific expenses for Class R6 shares of the fund to the extent they exceed 0.00% of average annual net assets, on an annualized basis. The expense limitation expires on June 30, 2016, unless renewed by mutual agreement of the fund and the advisor based upon a determination that this is appropriate under the circumstances at the time.
For the year ended March 31, 2016, these expense reductions amounted to the following:
| Class | Expense reduction | Class | Expense reduction | |
| Class A | $200,002 | Class R3 | $2,129 | |
| Class B | 1,225 | Class R4 | 18,638 | |
| Class C | 23,348 | Class R5 | 27,655 | |
| Class I | 531,428 | Class R6 | 411,941 | |
| Class I2 | 5,533 | Class NAV | 57,924 | |
| Class R1 | 1,773 | Total | $1,290,979 | |
| Class R2 | 9,383 |
The investment management fees, including the impact of the waivers and reimbursements as described above, incurred for the year ended March 31, 2016 were equivalent to a net annual effective rate of 0.65% of the fund's average daily net assets.
Accounting and legal services. Pursuant to a service agreement, the fund reimburses the Advisor for all expenses associated with providing the administrative, financial, legal, accounting and recordkeeping services to the fund, including the preparation of all tax returns, periodic reports to shareholders and regulatory reports, among other services. These expenses are allocated to each share class based on its relative net assets at the time the expense was incurred. These accounting and legal services fees incurred for the year ended March 31, 2016 amounted to an annual rate of 0.01% of the fund's average daily net assets.
Distribution and service plans. The fund has a distribution agreement with the Distributor. The fund has adopted distribution and service plans with respect to Class A, Class B, Class C, Class R1, Class R2, Class R3 and Class R4 pursuant to Rule 12b-1 under the 1940 Act, to pay the Distributor for services provided as the distributor of shares of the fund. In addition, under a service plan for Class R1, Class R2, Class R3, Class R4 and Class R5, the fund pays for certain other services. The fund may pay up to the following contractual rates of distribution and service fees under these arrangements, expressed as an annual percentage of average daily net assets for each class of the fund's shares:
| Class | Rule 12b-1 fee | Service fee | Class | Rule 12b-1 fee | Service fee | |
| Class A | 0.30% | — | Class R2 | 0.25% | 0.25% | |
| Class B | 1.00% | — | Class R3 | 0.50% | 0.15% | |
| Class C | 1.00% | — | Class R4 | 0.25% | 0.10% | |
| Class R1 | 0.50% | 0.25% | Class R5 | — | 0.05% |
Class A shares are currently charged 0.25% for Rule 12b-1 fees.
The fund's Distributor has contractually agreed to waive 0.10% of Rule 12b-1 fees for Class R4 shares. The current waiver agreement expires on June 30, 2016, unless renewed by mutual agreement of the fund and the Distributor based upon a determination that this is appropriate under the circumstances at the time. This contractual waiver amounted to $248,330 for Class R4 shares for the year ended March 31, 2016.
Sales charges. Class A shares are assessed up-front sales charges, which resulted in payments to the Distributor amounting to $ 6,751,355 for the year ended March 31, 2016. Of this amount, $1,128,391 was retained and used for printing prospectuses, advertising, sales literature and other purposes, $5,598,907 was paid as sales commissions to broker-dealers and $24,057 was paid as sales commissions to sales personnel of Signator Investors, Inc., a broker-dealer affiliate of the Advisor.
Class A, Class B and Class C shares may be subject to contingent deferred sales charges (CDSCs). Certain Class A shares that are acquired through purchases of $1 million or more and are redeemed within one year of purchase are subject to a 1.00% sales charge. Class B shares that are redeemed within six years of purchase are subject to CDSCs, at declining rates, beginning at 5.00%. Class C shares that are redeemed within one year of purchase are subject to a 1.00% CDSC. CDSCs are applied to the lesser of the current market value at the time of redemption or the original purchase cost of the shares being redeemed. Proceeds from CDSCs are used to compensate the Distributor for providing distribution-related services in connection with the sale of these shares. During the year ended March 31, 2016, CDSCs received by the Distributor amounted to $4,189, $15,407 and $52,757 for Class A, Class B and Class C shares, respectively.
Transfer agent fees. The fund has a transfer agent agreement with John Hancock Signature Services, Inc. (Signature Services), an affiliate of the Advisor. The transfer agent fees paid to Signature Services are determined based on the cost to Signature Services (Signature Services Cost) of providing recordkeeping services. It also includes out-of-pocket expenses, including payments made to third-parties for recordkeeping services provided to their clients who invest in one or more John Hancock funds. In addition, Signature Services Cost may be reduced by certain fees that Signature Services receives in connection with retirement and small accounts. Signature Services Cost is calculated monthly and allocated, as applicable, to five categories of share classes: Retail Share and Institutional Share Classes of Non-Municipal Bond Funds, Class R6 Shares, Retirement Share Classes and Municipal Bond Share Classes. Within each of these categories, the applicable costs are allocated to the affected John Hancock affiliated funds and/or classes, based on the relative average daily net assets.
Class level expenses. Class level expenses for the year ended March 31, 2016 were:
| Class | Distribution and service fees | Transfer agent fees | State registration fees | Printing and postage |
| Class A | $6,651,780 | $3,379,528 | $34,258 | $54,512 |
| Class B | 162,687 | 20,650 | 3,392 | 336 |
| Class C | 3,107,206 | 394,750 | 7,996 | 4,064 |
| Class I | — | 8,018,902 | 51,466 | 73,539 |
| Class I2 | — | 83,099 | 5,000 | 480 |
| Class R1 | 177,365 | 3,902 | 2,353 | 194 |
| Class R2 | 625,508 | 20,638 | 6,293 | 684 |
| Class R3 | 184,255 | 4,669 | 2,393 | 162 |
| Class R4 | 865,210 | 40,991 | 1,745 | 1,545 |
| Class R5 | 192,990 | 60,015 | 2,735 | 3,157 |
| Class R6 | — | 275,703 | 7,070 | 4,341 |
| Total | $11,967,001 | $12,302,847 | $124,701 | $143,014 |
Effective July 1, 2015, state registration fees and printing and postage are treated as fund level expenses and are not included in the table above. For the period July 1, 2015 to March 31, 2016, state registration fees and printing and postage amounted to $382,425 and $606,973, respectively.
Trustee expenses. The fund compensates each Trustee who is not an employee of the Advisor or its affiliates. The costs of paying Trustee compensation and expenses are allocated to each fund based on its net assets relative to other funds within the John Hancock group of funds complex.
Note 5 — Fund share transactions
Transactions in fund shares for the years ended March 31, 2016 and 2015 were as follows:
| Year ended 3-31-16 | Year ended 3-31-15 | |||||||||||||||||||||||||
| Shares | Amount | Shares | Amount | |||||||||||||||||||||||
| Class A shares | ||||||||||||||||||||||||||
| Sold | 44,301,255 | $815,798,359 | 56,841,350 | $1,096,662,923 | ||||||||||||||||||||||
| Distributions reinvested | 6,158,076 | 110,599,044 | 6,096,271 | 113,512,560 | ||||||||||||||||||||||
| Repurchased | (54,962,551 | ) | (993,920,242 | ) | (66,480,727 | ) | (1,293,771,383 | ) | ||||||||||||||||||
| Net decrease | (4,503,220 | ) | ($67,522,839 | ) | (3,543,106 | ) | ($83,595,900 | ) | ||||||||||||||||||
| Class B shares | ||||||||||||||||||||||||||
| Sold | 59,738 | $1,047,300 | 153,510 | $2,811,812 | ||||||||||||||||||||||
| Distributions reinvested | 30,922 | 525,357 | 41,496 | 732,408 | ||||||||||||||||||||||
| Repurchased | (256,680 | ) | (4,503,364 | ) | (241,758 | ) | (4,433,014 | ) | ||||||||||||||||||
| Net decrease | (166,020 | ) | ($2,930,707 | ) | (46,752 | ) | ($888,794 | ) | ||||||||||||||||||
| Class C shares | ||||||||||||||||||||||||||
| Sold | 5,528,820 | $97,427,585 | 8,106,379 | $148,626,164 | ||||||||||||||||||||||
| Distributions reinvested | 569,548 | 9,699,400 | 496,009 | 8,774,404 | ||||||||||||||||||||||
| Repurchased | (3,996,905 | ) | (69,093,915 | ) | (1,710,943 | ) | (31,451,792 | ) | ||||||||||||||||||
| Net increase | 2,101,463 | $38,033,070 | 6,891,445 | $125,948,776 | ||||||||||||||||||||||
| Class I shares | ||||||||||||||||||||||||||
| Sold | 190,491,019 | $3,407,661,480 | 247,842,283 | $4,642,725,693 | ||||||||||||||||||||||
| Distributions reinvested | 16,212,130 | 282,739,548 | 15,934,799 | 288,419,864 | ||||||||||||||||||||||
| Repurchased | (185,473,837 | ) | (3,207,447,590 | ) | (91,316,321 | ) | (1,722,347,847 | ) | ||||||||||||||||||
| Net increase | 21,229,312 | $482,953,438 | 172,460,761 | $3,208,797,710 | ||||||||||||||||||||||
| Class I2 shares | ||||||||||||||||||||||||||
| Sold | 307,430 | $5,381,768 | 1,656,290 | $30,693,940 | ||||||||||||||||||||||
| Distributions reinvested | 168,625 | 2,940,817 | 241,901 | 4,378,406 | ||||||||||||||||||||||
| Repurchased | (2,314,009 | ) | (39,718,862 | ) | (1,269,673 | ) | (23,897,663 | ) | ||||||||||||||||||
| Net increase | (1,837,954 | ) | ($31,396,277 | ) | 628,518 | $11,174,683 | ||||||||||||||||||||
| Class R1 shares | ||||||||||||||||||||||||||
| Sold | 833,092 | $15,071,611 | 664,083 | $12,450,925 | ||||||||||||||||||||||
| Distributions reinvested | 37,411 | 653,189 | 33,470 | 606,476 | ||||||||||||||||||||||
| Repurchased | (485,576 | ) | (8,813,049 | ) | (264,782 | ) | (4,984,982 | ) | ||||||||||||||||||
| Net increase | 384,927 | $6,911,751 | 432,771 | $8,072,419 | ||||||||||||||||||||||
| Class R2 shares | ||||||||||||||||||||||||||
| Sold | 3,045,759 | $54,867,155 | 6,005,834 | $112,997,028 | ||||||||||||||||||||||
| Distributions reinvested | 251,595 | 4,390,340 | 215,651 | 3,905,448 | ||||||||||||||||||||||
| Repurchased | (1,707,876 | ) | (30,900,304 | ) | (1,928,853 | ) | (36,498,709 | ) | ||||||||||||||||||
| Net increase | 1,589,478 | $28,357,191 | 4,292,632 | $80,403,767 | ||||||||||||||||||||||
| Class R3 shares | ||||||||||||||||||||||||||
| Sold | 717,928 | $12,779,175 | 1,086,659 | $20,350,336 | ||||||||||||||||||||||
| Distributions reinvested | 68,397 | 1,193,531 | 58,249 | 1,054,888 | ||||||||||||||||||||||
| Repurchased | (503,038 | ) | (9,017,120 | ) | (509,459 | ) | (9,588,533 | ) | ||||||||||||||||||
| Net increase | 283,287 | $4,955,586 | 635,449 | $11,816,691 | ||||||||||||||||||||||
| Year ended 3-31-16 | Year ended 3-31-15 | |||||||||||||||||||||||||
| Shares | Amount | Shares | Amount | |||||||||||||||||||||||
| Class R4 shares | ||||||||||||||||||||||||||
| Sold | 6,987,432 | $128,107,381 | 9,353,161 | $178,036,022 | ||||||||||||||||||||||
| Distributions reinvested | 664,878 | 11,602,118 | 472,054 | 8,548,903 | ||||||||||||||||||||||
| Repurchased | (4,055,369 | ) | (73,641,619 | ) | (1,824,905 | ) | (34,592,289 | ) | ||||||||||||||||||
| Net increase | 3,596,941 | $66,067,880 | 8,000,310 | $151,992,636 | ||||||||||||||||||||||
| Class R5 shares | ||||||||||||||||||||||||||
| Sold | 6,518,206 | $118,337,460 | 23,298,183 | $442,099,467 | ||||||||||||||||||||||
| Distributions reinvested | 1,028,324 | 17,954,523 | 944,683 | 17,117,662 | ||||||||||||||||||||||
| Repurchased | (11,368,179 | ) | (189,153,298 | ) | (36,393,140 | ) | (710,984,144 | ) | ||||||||||||||||||
| Net decrease | (3,821,649 | ) | ($52,861,315 | ) | (12,150,274 | ) | ($251,767,015 | ) | ||||||||||||||||||
| Class R6 shares | ||||||||||||||||||||||||||
| Sold | 51,954,451 | $924,773,229 | 59,066,693 | $1,140,106,261 | ||||||||||||||||||||||
| Distributions reinvested | 4,781,990 | 83,445,718 | 3,663,764 | 66,350,764 | ||||||||||||||||||||||
| Repurchased | (15,027,396 | ) | (268,907,175 | ) | (5,757,098 | ) | (109,055,462 | ) | ||||||||||||||||||
| Net increase | 41,709,045 | $739,311,772 | 56,973,359 | $1,097,401,563 | ||||||||||||||||||||||
| Class NAV shares | ||||||||||||||||||||||||||
| Sold | 3,426,415 | $60,770,799 | 14,604,013 | $274,185,711 | ||||||||||||||||||||||
| Distributions reinvested | 2,007,793 | 35,056,068 | 2,177,501 | 39,456,326 | ||||||||||||||||||||||
| Repurchased | (6,282,156 | ) | (117,018,680 | ) | (1,608,154 | ) | (30,787,650 | ) | ||||||||||||||||||
| Net increase (decrease) | (847,948 | ) | ($21,191,813 | ) | 15,173,360 | $282,854,387 | ||||||||||||||||||||
| Total net increase | 59,717,662 | $1,190,687,737 | 249,748,473 | $4,642,210,923 | ||||||||||||||||||||||
On January 19, 2016, the fund had a redemption in kind in the amount of $102,894,079, which represented approximately 1% of the fund on that date. For purposes of US GAAP, this transaction was treated as a sale of securities and the resulting gains and losses were recognized based on the market value of the securities on the date of the transfer. For tax purposes, no gains or losses were recognized. Net realized loss resulting from such redemption in kind is shown on the Statement of operations.
Affiliates of the fund owned 100% of shares of beneficial interest of Class NAV on March 31, 2016.
Note 6 — Purchase and sale of securities
Purchases and sales of securities, other than short-term investments, amounted to $8,679,838,672 and $7,949,734,356, respectively, for the year ended March 31, 2016.
Note 7 — Industry or sector risk
The fund may invest a large percentage of its assets in one or more particular industries or sectors of the economy. If a large percentage of the fund's assets are economically tied to a single or small number of industries or sectors of the economy, the fund will be less diversified than a more broadly diversified fund, and it may cause the fund to underperform if that industry or sector underperforms. In addition, focusing on a particular industry or sector may make the fund's NAV more volatile. Further, a fund that invests in particular industries or sectors is particularly susceptible to the impact of market, economic, regulatory and other factors affecting those industries or sectors.
Note 8 — Investment by affiliated funds
Certain investors in the fund are affiliated funds that are managed by the Advisor and its affiliates. The affiliated funds do not invest in the fund for the purpose of exercising management or control; however, this investment may represent a significant portion of the fund's net assets. At March 31, 2016, funds within the John Hancock group of funds complex held 4.65% of the fund's net assets.
Report of Independent Registered Public Accounting Firm
To the Board of Trustees and Shareholders of John Hancock Funds III and John Hancock Disciplined Value Fund:
In our opinion, the accompanying statement of assets and liabilities, including the fund's investments, and the related statements of operations and of changes in net assets and the financial highlights present fairly, in all material respects, the financial position of John Hancock Disciplined Value Fund (the "Fund") at March 31, 2016, the results of its operations for the year then ended, the changes in its net assets for each of the two years in the period then ended and the financial highlights for each of the periods indicated, in conformity with accounting principles generally accepted in the United States of America. These financial statements and financial highlights (hereafter referred to as "financial statements") are the responsibility of the Fund's management. Our responsibility is to express an opinion on these financial statements based on our audits. We conducted our audits of these financial statements in accordance with the standards of the Public Company Accounting Oversight Board (United States). Those standards require that we plan and perform the audit to obtain reasonable assurance about whether the financial statements are free of material misstatement. An audit includes examining, on a test basis, evidence supporting the amounts and disclosures in the financial statements, assessing the accounting principles used and significant estimates made by management, and evaluating the overall financial statement presentation. We believe that our audits, which included confirmation of securities at March 31, 2016 by correspondence with the custodian, transfer agent, and brokers, and the application of alternative auditing procedures where securities purchased confirmations had not been received, provide a reasonable basis for our opinion.
PricewaterhouseCoopers LLP
Boston, Massachusetts
May 13, 2016
Unaudited
For federal income tax purposes, the following information is furnished with respect to the distributions of the fund, if any, paid during its taxable year ended March 31, 2016.
The fund reports the maximum amount allowable of its net taxable income as eligible for the corporate dividends-received deduction.
The fund reports the maximum amount allowable of its net taxable income as qualified dividend income as provided in the Jobs and Growth Tax Relief Reconciliation Act of 2003.
The fund paid $431,113,872 in capital gain dividends.
Eligible shareholders will be mailed a 2016 Form 1099-DIV in early 2017. This will reflect the tax character of all distributions paid in calendar year 2016.
Please consult a tax advisor regarding the tax consequences of your investment in the fund.
This chart provides information about the Trustees and Officers who oversee your John Hancock fund. Officers elected by the Trustees manage the day-to-day operations of the fund and execute policies formulated by the Trustees.
Independent Trustees
| Name, year of birth Position(s) held with fund Principal occupation(s) and other directorships during past 5 years | Trustee of the Trust since1 | Number of John Hancock funds overseen by Trustee |
| James M. Oates, Born: 1946 | 2012 | 230 |
| Trustee and Chairperson of the Board Managing Director, Wydown Group (financial consulting firm) (since 1994); Chairman and Director, Emerson Investment Management, Inc. (since 2000); Independent Chairman, Hudson Castle Group, Inc. (formerly IBEX Capital Markets, Inc.) (financial services company) (1997-2011); Director, Stifel Financial (since 1996); Director, Investor Financial Services Corporation (1995-2007); Director, Connecticut River Bancorp (1998-2014); Director, Virtus Funds (formerly Phoenix Mutual Funds) (since 1988). Trustee and Chairperson of the Board, John Hancock Collateral Trust and John Hancock Exchange-Traded Fund Trust (since 2015); Trustee and Chairperson of the Board, John Hancock retail funds3 (since 2012); Trustee (2005-2006 and since 2012) and Chairperson of the Board (since 2012), John Hancock Funds III; Trustee (since 2004) and Chairperson of the Board (since 2005), John Hancock Variable Insurance Trust; Trustee and Chairperson of the Board, John Hancock Funds II (since 2005). | ||
| Charles L. Bardelis,2 Born: 1941 | 2012 | 230 |
| Trustee Director, Island Commuter Corp. (marine transport). Trustee, John Hancock Collateral Trust and John Hancock Exchange-Traded Fund Trust (since 2015); Trustee, John Hancock retail funds3 (since 2012); Trustee, John Hancock Funds III (2005-2006 and since 2012); Trustee, John Hancock Variable Insurance Trust (since 1988); Trustee, John Hancock Funds II (since 2005). | ||
| Peter S. Burgess,2 Born: 1942 | 2012 | 230 |
| Trustee Consultant (financial, accounting, and auditing matters) (since 1999); Certified Public Accountant; Partner, Arthur Andersen (independent public accounting firm) (prior to 1999); Director, Lincoln Educational Services Corporation (since 2004); Director, Symetra Financial Corporation (2010-2016); Director, PMA Capital Corporation (2004-2010). Trustee, John Hancock Collateral Trust and John Hancock Exchange-Traded Fund Trust (since 2015); Trustee, John Hancock retail funds3 (since 2012); Trustee, John Hancock Funds III (2005-2006 and since 2012); Trustee, John Hancock Variable Insurance Trust and John Hancock Funds II (since 2005). | ||
| William H. Cunningham, Born: 1944 | 2006 | 230 |
| Trustee Professor, University of Texas, Austin, Texas (since 1971); former Chancellor, University of Texas System and former President of the University of Texas, Austin, Texas; Chairman (since 2009) and Director (since 2006), Lincoln National Corporation (insurance); Director, Southwest Airlines (since 2000); former Director, LIN Television (2009-2014). Trustee, John Hancock retail funds3 (since 1986); Trustee, John Hancock Variable Insurance Trust (since 2012); Trustee, John Hancock Funds II (2005-2006 and since 2012); Trustee, John Hancock Collateral Trust and John Hancock Exchange-Traded Fund Trust (since 2015). | ||
| Grace K. Fey, Born: 1946 | 2012 | 230 |
| Trustee Chief Executive Officer, Grace Fey Advisors (since 2007); Director and Executive Vice President, Frontier Capital Management Company (1988-2007); Director, Fiduciary Trust (since 2009). Trustee, John Hancock Collateral Trust and John Hancock Exchange-Traded Fund Trust (since 2015); Trustee, John Hancock retail funds3 (since 2012); Trustee, John Hancock Variable Insurance Trust and John Hancock Funds II (since 2008). | ||
Independent Trustees (continued)
| Name, year of birth Position(s) held with fund Principal occupation(s) and other directorships during past 5 years | Trustee of the Trust since1 | Number of John Hancock funds overseen by Trustee |
| Theron S. Hoffman,2 Born: 1947 | 2012 | 230 |
| Trustee Chief Executive Officer, T. Hoffman Associates, LLC (consulting firm) (since 2003); Director, The Todd Organization (consulting firm) (2003-2010); President, Westport Resources Management (investment management consulting firm) (2006-2008); Senior Managing Director, Partner, and Operating Head, Putnam Investments (2000-2003); Executive Vice President, The Thomson Corp. (financial and legal information publishing) (1997-2000). Trustee, John Hancock Collateral Trust and John Hancock Exchange-Traded Fund Trust (since 2015); Trustee, John Hancock retail funds3 (since 2012); Trustee, John Hancock Variable Insurance Trust and John Hancock Funds II (since 2008). | ||
| Deborah C. Jackson, Born: 1952 | 2008 | 230 |
| Trustee President, Cambridge College, Cambridge, Massachusetts (since 2011); Chief Executive Officer, American Red Cross of Massachusetts Bay (2002-2011); Board of Directors of Eastern Bank Corporation (since 2001); Board of Directors of Eastern Bank Charitable Foundation (since 2001); Board of Directors of American Student Assistance Corporation (1996-2009); Board of Directors of Boston Stock Exchange (2002-2008); Board of Directors of Harvard Pilgrim Healthcare (health benefits company) (2007-2011). Trustee, John Hancock retail funds3 (since 2008); Trustee, John Hancock Variable Insurance Trust and John Hancock Funds II (since 2012); Trustee, John Hancock Collateral Trust and John Hancock Exchange-Traded Fund Trust (since 2015). | ||
| Hassell H. McClellan, Born: 1945 | 2012 | 230 |
| Trustee Trustee, Virtus Variable Insurance Trust (formerly Phoenix Edge Series Funds) (since 2008); Director, The Barnes Group (since 2010); Associate Professor, The Wallace E. Carroll School of Management, Boston College (retired 2013). Trustee, John Hancock Collateral Trust and John Hancock Exchange-Traded Fund Trust (since 2015); Trustee, John Hancock retail funds3 (since 2012); Trustee, John Hancock Funds III (2005-2006 and since 2012); Trustee, John Hancock Variable Insurance Trust and John Hancock Funds II (since 2005). | ||
| Steven R. Pruchansky, Born: 1944 | 2006 | 230 |
| Trustee and Vice Chairperson of the Board Chairman and Chief Executive Officer, Greenscapes of Southwest Florida, Inc. (since 2000); Director and President, Greenscapes of Southwest Florida, Inc. (until 2000); Member, Board of Advisors, First American Bank (until 2010); Managing Director, Jon James, LLC (real estate) (since 2000); Partner, Right Funding, LLC (since 2014); Director, First Signature Bank & Trust Company (until 1991); Director, Mast Realty Trust (until 1994); President, Maxwell Building Corp. (until 1991). Trustee (since 1992) and Chairperson of the Board (2011-2012), John Hancock retail funds3; Trustee and Vice Chairperson of the Board, John Hancock retail funds3 John Hancock Variable Insurance Trust, and John Hancock Funds II (since 2012); Trustee, and Vice Chairperson of the Board, John Hancock Collateral Trust and John Hancock Exchange-Traded Fund Trust (since 2015). | ||
Independent Trustees (continued)
| Name, year of birth Position(s) held with fund Principal occupation(s) and other directorships during past 5 years | Trustee of the Trust since1 | Number of John Hancock funds overseen by Trustee |
| Gregory A. Russo, Born: 1949 | 2008 | 230 |
| Trustee Director and Audit Committee Chairman (since 2012), and Member, Audit Committee and Finance Committee (since 2011), NCH Healthcare System, Inc. (holding company for multi-entity healthcare system); Director and Member (since 2012) and Finance Committee Chairman (since 2014), The Moorings, Inc. (nonprofit continuing care community); Vice Chairman, Risk & Regulatory Matters, KPMG LLP (KPMG) (2002-2006); Vice Chairman, Industrial Markets, KPMG (1998-2002); Chairman and Treasurer, Westchester County, New York, Chamber of Commerce (1986-1992); Director, Treasurer, and Chairman of Audit and Finance Committees, Putnam Hospital Center (1989-1995); Director and Chairman of Fundraising Campaign, United Way of Westchester and Putnam Counties, New York (1990-1995). Trustee, John Hancock retail funds3 (since 2008); Trustee, John Hancock Variable Insurance Trust and John Hancock Funds II (since 2012); Trustee, John Hancock Collateral Trust and John Hancock Exchange-Traded Fund Trust (since 2015). | ||
Non-Independent Trustees4
| Name, year of birth Position(s) held with fund Principal occupation(s) and other directorships during past 5 years | Trustee of the Trust since1 | Number of John Hancock funds overseen by Trustee |
| James R. Boyle, Born: 1959 | 2015 | 230 |
| Non-Independent Trustee* Chairman and Chief Executive Officer, Zillion Group, Inc. (formerly HealthFleet, Inc.) (healthcare) (since 2014); Executive Vice President and Chief Executive Officer, U.S. Life Insurance Division of Genworth Financial, Inc. (insurance) (January 2014-July 2014); Senior Executive Vice President, Manulife Financial Corporation, President and Chief Executive Officer, John Hancock (1999-2012); Chairman and Director, John Hancock Advisers, LLC, John Hancock Funds, LLC, and John Hancock Investment Management Services, LLC (2005-2010). Trustee, John Hancock Collateral Trust and John Hancock Exchange-Traded Fund Trust (since 2015); Trustee, John Hancock retail funds3 (2005-2010; 2012-2014 and since 2015); Trustee, John Hancock Variable Insurance Trust and John Hancock Funds II (2005-2014 and since 2015). *Effective 3-10-15. | ||
| Craig Bromley, Born: 1966 | 2012 | 230 |
| Non-Independent Trustee President, John Hancock Financial Service (since 2012); Senior Executive Vice President and General Manager, U.S. Division, Manulife Financial Corporation (since 2012); President and Chief Executive Officer, Manulife Insurance Company (Manulife Japan) (2005-2012, including prior positions). Trustee, John Hancock retail funds,3 John Hancock Variable Insurance Trust, and John Hancock Funds II (since 2012); Trustee, John Hancock Collateral Trust and John Hancock Exchange-Traded Fund Trust (since 2015). | ||
| Warren A. Thomson, Born: 1955 | 2012 | 230 |
| Non-Independent Trustee Senior Executive Vice President and Chief Investment Officer, Manulife Financial Corporation and The Manufacturers Life Insurance Company (since 2009); Chairman, Manulife Asset Management (since 2001, including prior positions); Director and Chairman, Manulife Asset Management Limited (since 2006); Director and Chairman, Hancock Natural Resources Group, Inc. (since 2013). Trustee, John Hancock retail funds,3 John Hancock Variable Insurance Trust, and John Hancock Funds II (since 2012); Trustee, John Hancock Collateral Trust and John Hancock Exchange-Traded Fund Trust (since 2015). | ||
Principal officers who are not Trustees
| Name, year of birth Position(s) held with fund Principal occupation(s) during past 5 years | Officer of the Trust since |
| Andrew G. Arnott, Born: 1971 | 2009 |
| President Senior Vice President, John Hancock Financial Services (since 2009); Director and Executive Vice President, John Hancock Advisers, LLC (since 2005, including prior positions); Director and Executive Vice President, John Hancock Investment Management Services, LLC (since 2006, including prior positions); President, John Hancock Funds, LLC (since 2004, including prior positions); President, John Hancock retail funds,3 John Hancock Variable Insurance Trust, and John Hancock Funds II (since 2007, including prior positions); President, John Hancock Collateral Trust (since 2015); President, John Hancock Exchange-Traded Fund Trust (since 2014). | |
| John J. Danello, Born: 1955 | 2014 |
| Senior Vice President, Secretary, and Chief Legal Officer Vice President and Chief Counsel, John Hancock Wealth Management (since 2005); Senior Vice President (since 2007) and Chief Legal Counsel (2007-2010), John Hancock Funds, LLC and The Berkeley Financial Group, LLC; Senior Vice President (since 2006, including prior positions) and Chief Legal Officer and Secretary (since 2014), John Hancock retail funds,3 John Hancock Funds II and John Hancock Variable Insurance Trust; Senior Vice President, Chief Legal Officer and Secretary, John Hancock Collateral Trust and John Hancock Exchange-Traded Fund Trust (since 2015); Vice President, John Hancock Life & Health Insurance Company (since 2009); Vice President, John Hancock Life Insurance Company (USA) and John Hancock Life Insurance Company of New York (since 2010); and Senior Vice President, Secretary, and Chief Legal Counsel (2007-2014, including prior positions) of John Hancock Advisers, LLC and John Hancock Investment Management Services, LLC. | |
| Francis V. Knox, Jr., Born: 1947 | 2006 |
| Chief Compliance Officer Vice President, John Hancock Financial Services (since 2005); Chief Compliance Officer, John Hancock retail funds,3 John Hancock Variable Insurance Trust, John Hancock Funds II, John Hancock Advisers, LLC, and John Hancock Investment Management Services, LLC (since 2005); Chief Compliance Officer, John Hancock Collateral Trust and John Hancock Exchange-Traded Fund Trust (since 2015). | |
| Charles A. Rizzo, Born: 1957 | 2007 |
| Chief Financial Officer Vice President, John Hancock Financial Services (since 2008); Senior Vice President, John Hancock Advisers, LLC and John Hancock Investment Management Services, LLC (since 2008); Chief Financial Officer, John Hancock retail funds,3 John Hancock Variable Insurance Trust and John Hancock Funds II (since 2007); Chief Financial Officer, John Hancock Collateral Trust and John Hancock Exchange-Traded Fund Trust (since 2015). | |
| Salvatore Schiavone, Born: 1965 | 2010 |
| Treasurer Assistant Vice President, John Hancock Financial Services (since 2007); Vice President, John Hancock Advisers, LLC and John Hancock Investment Management Services, LLC (since 2007); Treasurer, John Hancock retail funds3 (since 2007, including prior positions); Treasurer, John Hancock Variable Insurance Trust and John Hancock Funds II (2007-2009 and since 2010, including prior positions); Treasurer, John Hancock Collateral Trust and John Hancock Exchange-Traded Fund Trust (since 2015). | |
The business address for all Trustees and Officers is 601 Congress Street, Boston, Massachusetts 02210-2805.
The Statement of Additional Information of the fund includes additional information about members of the Board of Trustees of the Trust and is available without charge, upon request, by calling 800-225-5291.
| 1 | Each Trustee holds office until his or her successor is elected and qualified, or until the Trustee's death, retirement, resignation, or removal. Mr. Boyle has served as Trustee at various times prior to the date listed in the table. |
| 2 | Member of the Audit Committee. |
| 3 | "John Hancock retail funds" comprises John Hancock Funds III and 36 other John Hancock funds consisting of 26 series of other John Hancock trusts and 10 closed-end funds. |
| 4 | The Trustee is a Non-Independent Trustee due to current or former positions with the Advisor and certain affiliates. |
Trustees James M. Oates, Chairperson Officers Andrew G. Arnott John J. Danello Francis V. Knox, Jr. Charles A. Rizzo Salvatore Schiavone | Investment advisor John Hancock Advisers, LLC Subadvisor Robeco Investment Management, Inc. Principal distributor John Hancock Funds, LLC Custodian State Street Bank and Trust Company Transfer agent John Hancock Signature Services, Inc. Legal counsel K&L Gates LLP Independent registered public accounting firm PricewaterhouseCoopers LLP |
*Member of the Audit Committee
†Non-Independent Trustee
The fund's proxy voting policies and procedures, as well as the fund proxy voting record for the most recent twelve-month period ended June 30, are available free of charge on the Securities and Exchange Commission (SEC) website at sec.gov or on our website.
The fund's complete list of portfolio holdings, for the first and third fiscal quarters, is filed with the SEC on Form N-Q. The fund's Form N-Q is available on our website and the SEC's website, sec.gov, and can be reviewed and copied (for a fee) at the SEC's Public Reference Room in Washington, DC. Call 800-SEC-0330 to receive information on the operation of the SEC's Public Reference Room.
We make this information on your fund, as well as monthly portfolio holdings, and other fund details available on our website at jhinvestments.com or by calling 800-225-5291.
| You can also contact us: | |||
| 800-225-5291 jhinvestments.com | Regular mail: John Hancock Signature Services, Inc. | Express mail: John Hancock Signature Services, Inc. | |
John Hancock family of funds
DOMESTIC EQUITY FUNDS Balanced Blue Chip Growth Classic Value Disciplined Value Disciplined Value Mid Cap Equity Income Fundamental All Cap Core Fundamental Large Cap Core Fundamental Large Cap Value New Opportunities Small Cap Value Small Company Strategic Growth U.S. Equity U.S. Global Leaders Growth Value Equity GLOBAL AND INTERNATIONAL EQUITY FUNDS Disciplined Value International Emerging Markets Emerging Markets Equity Global Equity Global Shareholder Yield Greater China Opportunities International Core International Growth International Small Company International Value Equity | INCOME FUNDS Bond California Tax-Free Income Core High Yield Emerging Markets Debt Floating Rate Income Focused High Yield Global Income Government Income High Yield Municipal Bond Income Investment Grade Bond Money Market Short Duration Credit Opportunities Spectrum Income Strategic Income Opportunities Tax-Free Bond ALTERNATIVE AND SPECIALTY FUNDS Absolute Return Currency Alternative Asset Allocation Enduring Assets Financial Industries Global Absolute Return Strategies Global Conservative Absolute Return Global Focused Strategies Global Real Estate Natural Resources Redwood Regional Bank Seaport Technical Opportunities |
A fund's investment objectives, risks, charges, and expenses should be considered carefully before investing. The prospectus contains this and other important information about the fund. To obtain a prospectus, contact your financial professional, call John Hancock Investments at 800-225-5291, or visit our website at jhinvestments.com. Please read the prospectus carefully before investing or sending money.
ASSET ALLOCATION Income Allocation Fund Lifestyle Aggressive Portfolio Lifestyle Balanced Portfolio Lifestyle Conservative Portfolio Lifestyle Growth Portfolio Lifestyle Moderate Portfolio Retirement Choices Portfolios (2010-2060) Retirement Living Portfolios (2010-2060) Retirement Living II Portfolios (2010-2060) EXCHANGE-TRADED FUNDS John Hancock Multifactor Consumer Discretionary ETF John Hancock Multifactor Consumer Staples ETF John Hancock Multifactor Energy ETF John Hancock Multifactor Financials ETF John Hancock Multifactor Healthcare ETF John Hancock Multifactor Industrials ETF John Hancock Multifactor Large Cap ETF John Hancock Multifactor Materials ETF John Hancock Multifactor Mid Cap ETF John Hancock Multifactor Technology ETF John Hancock Multifactor Utilities ETF | CLOSED-END FUNDS Financial Opportunities Hedged Equity & Income Income Securities Trust Investors Trust Preferred Income Preferred Income II Preferred Income III Premium Dividend Tax-Advantaged Dividend Income Tax-Advantaged Global Shareholder Yield |
John Hancock Multifactor ETF shares are bought and sold at market price (not NAV), and are not individually redeemed
from the fund. Brokerage commissions will reduce returns.
John Hancock ETFs are distributed by Foreside Fund Services, LLC, and are subadvised by Dimensional Fund Advisors LP.
Foreside is not affiliated with John Hancock Funds, LLC or Dimensional Fund Advisors LP.
Dimensional Fund Advisors LP receives compensation from John Hancock in connection with licensing rights to the
John Hancock Dimensional indexes. Dimensional Fund Advisors LP does not sponsor, endorse, or sell, and makes no
representation as to the advisability of investing in, John Hancock Multifactor ETFs.
John Hancock Investments
A trusted brand
John Hancock Investments is a premier asset manager representing
one of America's most trusted brands, with a heritage of financial
stewardship dating back to 1862. Helping our shareholders pursue
their financial goals is at the core of everything we do. It's why we
support the role of professional financial advice and operate with the
highest standards of conduct and integrity.
A better way to invest
We build funds based on investor needs, then search the world to find
proven portfolio teams with specialized expertise in those strategies.
As a manager of managers, we apply vigorous oversight to ensure that
they continue to meet our uncompromising standards and serve the
best interests of our shareholders.
Results for investors
Our unique approach to asset management enables us to provide
a diverse set of investments backed by some of the world's best
managers, along with strong risk-adjusted returns across asset classes.
| | John Hancock Funds, LLC n Member FINRA, SIPC 601 Congress Street n Boston, MA 02210-2805 800-225-5291 n jhinvestments.com | |
| This report is for the information of the shareholders of John Hancock Disciplined Value Fund. It is not authorized for distribution to prospective investors unless preceded or accompanied by a prospectus. | ||
| MF288153 | 340A 3/16 5/16 | |
John Hancock
Core High Yield Fund
Annual report 3/31/16

A message to shareholders
Dear shareholder,
The 12-month period covered by this report was a challenging one for investors, and fixed-income markets were no exception. A slowdown in global growth, particularly in China, was a source of anxiety throughout the period. Oil prices hit multi-year lows before rebounding late in the period, and high-yield corporate bonds generally declined on fears of a wave of defaults from commodity-linked issuers. The investment landscape somewhat improved after the close of the period as a wide variety of so-called risk assets rallied.
Despite the volatility, the economic picture in the United States offers reasons for optimism. In December, the U.S. Federal Reserve raised short-term interest rates for the first time in nine years on evidence that the persistent strength in the labor markets warranted a somewhat less accommodative stance. Economic data generally remained strong entering the spring.
Volatile market environments are naturally unsettling. At John Hancock Investments, portfolio risk management is a critical part of our role as an asset manager, and our dedicated risk team is focused on these issues every day. We continually strive for new ways to analyze potential risks and have liquidity tools in place. However, your best resource in times like these is your financial advisor, who can ensure your portfolio is sufficiently diversified to meet your long-term objectives and to withstand the inevitable bumps along the way.
On behalf of everyone at John Hancock Investments, I'd like to take this opportunity to thank you for the continued trust you've placed in us.
Sincerely,
Andrew G. Arnott
President and Chief Executive Officer
John Hancock Investments
This commentary reflects the CEO's views as of March 31, 2016. They are subject to change at any time. All investments entail risks, including the possible loss of principal. Diversification does not guarantee a profit or eliminate the risk of a loss. For more up-to-date information, you can visit our website at jhinvestments.com.
John Hancock
Core High Yield Fund
INVESTMENT OBJECTIVE
The fund seeks total return, consisting of a high level of current income and capital appreciation.
AVERAGE ANNUAL TOTAL RETURNS AS OF 3/31/16 (%)
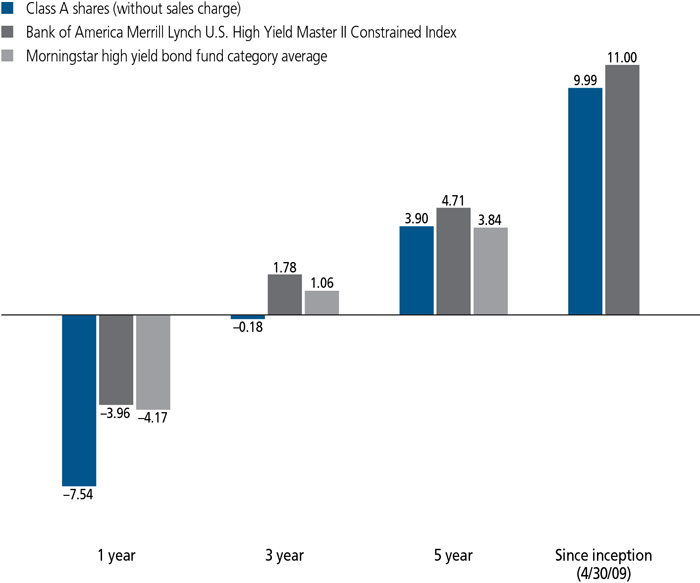
The Bank of America Merrill Lynch U.S. High Yield Master II Constrained Index is an unmanaged index composed of U.S. currency high-yield bonds issued by U.S. and non-U.S. issuers.
It is not possible to invest directly in an index. Index figures do not reflect expenses or sales charges, which would result in lower returns.
Figures from Morningstar, Inc. include reinvested distributions and do not take into account sales charges. Actual load-adjusted performance is lower. Since inception returns for the Morningstar fund category average are not available.
The past performance shown here reflects reinvested distributions and the beneficial effect of any expense reductions, and does not guarantee future results. Performance of the other share classes will vary based on the difference in the fees and expenses of those classes. Shares will fluctuate in value and, when redeemed, may be worth more or less than their original cost. Current month-end performance may be lower or higher than the performance cited, and can be found at jhinvestments.com or by calling 800-225-5291. For further information on the fund's objectives, risks, and strategy, see the fund's prospectus.
PERFORMANCE HIGHLIGHTS OVER THE LAST TWELVE MONTHS
High-yield bonds finished in the red
Falling oil prices and heightened investor risk aversion contributed to a negative return for the high-yield market.
The fund underperformed its benchmark
Security selection, particularly in the energy sector, had an adverse impact on results.
An underweight in BB-rated bonds also detracted
At a time in which investors gravitated toward higher-quality bonds, the fund's underweight in BBs (the market's highest credit tier) detracted from performance.
PORTFOLIO COMPOSITION AS OF 3/31/16 (%)
A note about risks
Fixed-income investments are subject to interest-rate and credit risk; their value will normally decline as interest rates rise or if a creditor, grantor, or counterparty is unable or unwilling to make principal, interest, or settlement payments. Investments in higher-yielding, lower-rated securities include a higher risk of default. Frequent trading may increase fund transaction costs and increase taxable distributions. Loan participations and assignments involve additional risks, including credit risk, interest-rate risk, counterparty risk, liquidity risk, extended settlement risk, and the risks of being a lender. Hedging, derivatives, and other strategic transactions may increase a fund's volatility and could produce disproportionate losses, potentially more than the fund's principal investment. Liquidity—the extent to which a security may be sold or a derivative position closed without negatively affecting its market value, if at all—may be impaired by reduced trading volume, heightened volatility, rising interest rates, and other market conditions. Events in the financial markets have resulted, and may continue to result, in an unusually high degree of volatility in the financial markets, both domestic and foreign. Foreign investing has additional risks, such as currency and market volatility and political and social instability. Hedging, derivatives, and other strategic transactions may increase a fund's volatility and could produce disproportionate losses, potentially more than the fund's principal investment. Please see the fund's prospectuses for additional risks.
An interview with Portfolio Manager Konstantin Kizunov, CFA, John Hancock Asset Management a division of Manulife Asset Management (North America) Limited

Konstantin Kizunov, CFA
Portfolio Manager
John Hancock Asset Management
Can you describe the market environment of the past 12 months?
High-yield bonds experienced significant headwinds during the past year, as evidenced by the 3.96% return of the Bank of America Merrill Lynch U.S. High Yield Master II Constrained Index. The market fell in an almost uninterrupted fashion from the beginning of the period through mid-February, before making up a portion of the lost ground in the final six weeks.
The downturn in the prices of oil and other commodities, which contributed to rising defaults in the natural resources space, was the primary factor weighing on the market's performance. High yield was also pressured by the general decrease in investors' appetite for risk that occurred through the second half of 2015. During this time, the markets were on edge due to concerns about slowing growth in China and uncertainty related to the timing of the U.S. Federal Reserve's first interest-rate hike in more than nine years. These factors led to substantial outflows from high-yield mutual funds and exchange-traded funds, draining demand from the market.
The late rally, while providing a measure of relief for investors, was insufficient to make up for the earlier market downturn. The bounce of late February and March largely mirrored the revival of investor demand that accompanied the announcement of new, increasingly stimulative policies by the world's central banks. Commodity prices also rallied on the news, lifting a key worry from the high-yield market in the final weeks of the period.
When the dust settled at the end of March, the yield spread of the Bank of America Merrill Lynch U.S. High Yield Master II Index stood at 7.05 percentage points over U.S. Treasuries, up from 4.82 on March 31, 2015. (Rising yield spreads indicate underperformance relative to U.S. Treasuries). The peak yield spread of 8.87 percentage points, achieved on February 11, 2016, marked the highest level since October, 2011.
What aspects of the fund's positioning helped and hurt performance?
Security selection was the most important driver of the fund's underperformance relative to the benchmark. While the fund had a large underweight in energy, several holdings in the sector were among its leading individual detractors. Many of the fund's positions in energy were issued by companies that had hedged a large percentage of their production, meaning their finances would be less affected by the direction of oil prices. We also favored secured debt (or bonds backed by
The fund's positioning among the various credit tiers detracted from its results, as well. The fund held a relative underweight position in securities rated BB and above—where we found it more difficult to identify compelling values—and an overweight in those rated B. Higher-quality bonds in fact outperformed, reflecting investors' heightened aversion to risk. As a result, the fund was hurt by the sell-off in risk assets that occurred through late 2015 and into the early part of this year. This was offset to some degree by the fund's average underweight position in CCC-rated issues, which lagged considerably.
The fund's strategy with respect to duration (interest-rate sensitivity) also detracted, but to a lesser extent than security selection. We believed the U.S. Federal Reserve was going to increase rates faster than it ultimately did, so we positioned the fund with a duration below that of the benchmark. As global growth concerns began to weigh on returns across the financial markets, yields in fact fell as investors sought the safety of U.S. Treasuries.
Certain aspects of the fund's sector allocations contributed positively to performance. In addition to being helped by its below-benchmark weighting in energy, the fund benefited from its overweight positions in the consumer staples and financial services sectors.
QUALITY COMPOSITION AS OF 3/31/16 (%)
How was the fund positioned at the end of the period?
Although commodity markets rebounded from mid-February onward, we believe the prices of oil and natural gas still aren't high enough to support the majority of the energy companies represented in the high-yield market. We therefore stayed underweight in the sector, and we expect to maintain this positioning until energy prices stabilize at higher levels.
Given the slowdown in China and its impact on global growth, we emphasized sectors and companies whose exposure to U.S. end markets should enable them to benefit from the improving domestic economy. This view formed the basis for the overweight positions in U.S.-focused industries such as forest products, building materials, construction-rental companies, and home builders.
We continued to see value in B-rated bonds, but we selectively reduced the fund's overweight position in this space late in the period. We made a corresponding increase to BB-rated debt, but we maintained an underweight in the segment overall. The fund's allocation to CCC-rated issues, while an underweight for the vast majority of the period, grew to a modest overweight by the end of March. However, this was the result of the positive returns for the fund's investments in this tier during the final weeks of the period, rather than an active decision to add to the weighting.
The fund continues to hold an allocation to term loans, which are loans to below-investment-grade companies that banks package and sell to investors in the form of securities. We don't see
SECTOR COMPOSITION AS OF 3/31/16 (%)
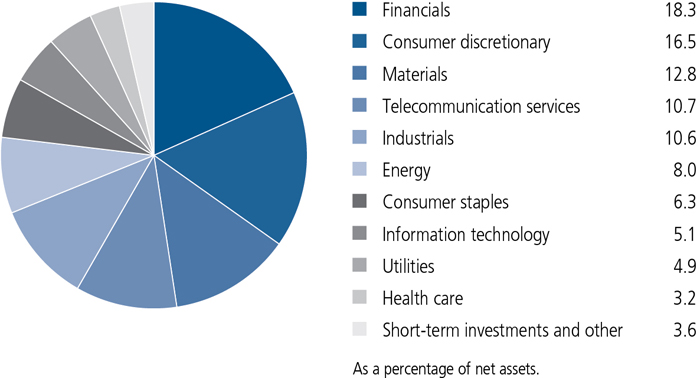
How would you characterize your overall view of the high-yield market at the close of the period?
We believed the market looked healthy from a fundamental standpoint given the moderate growth of the U.S. economy and the low default rate outside of the energy sector. Still, the Bank of America Merrill Lynch U.S. High Yield Master II Constrained Index closed the period with an absolute yield of 8.37% and a yield spread that was 7.05 percentage points over U.S. Treasuries—well above the average of recent years. We maintain a cautious approach due to the above-average likelihood of additional market volatility. However, we believe yields at these levels could provide adequate compensation for the potential risks.
MANAGED BY
 | Terry Carr, CFA On the fund since inception Investing since 1986 |
| | Konstantin Kizunov, CFA On the fund since inception Investing since 1996 |
 | Richard Kos, CFA On the fund since inception Investing since 1993 |
![]()
COUNTRY COMPOSITION AS OF 3/31/16 (%)
| United States | 80.3 |
| Canada | 8.7 |
| Luxembourg | 4.5 |
| United Kingdom | 2.1 |
| Netherlands | 1.5 |
| Other countries | 2.9 |
| TOTAL | 100.0 |
| As a percentage of net assets. |
TOTAL RETURNS FOR THE PERIOD ENDED MARCH 31, 2016
| Average annual total returns (%) with maximum sales charge | Cumulative total returns (%) with maximum sales charge | SEC 30-day yield (%) subsidized | SEC 30-day yield (%) unsubsidized1 | ||||||||
| 1-year | 5-year | Since inception2 | 5-year | Since inception2 | as of 3-31-16 | as of 3-31-16 | |||||
| Class A | -11.22 | 3.06 | 9.34 | 16.28 | 85.51 | 8.69 | 8.68 | ||||
| Class C3,4 | -9.01 | 2.89 | 8.82 | 15.29 | 79.45 | 8.30 | 8.29 | ||||
| Class I4 | -7.19 | 4.20 | 10.33 | 22.84 | 97.43 | 9.29 | 9.28 | ||||
| Class R23,4 | -7.61 | 3.70 | 9.77 | 19.92 | 90.63 | 8.92 | 8.92 | ||||
| Class R43,4 | -7.43 | 3.86 | 9.94 | 20.87 | 92.69 | 9.07 | 9.07 | ||||
| Class R63,4 | -7.10 | 4.30 | 10.41 | 23.44 | 98.44 | 9.46 | 9.43 | ||||
| Class NAV3,4 | -7.08 | 4.31 | 10.41 | 23.50 | 98.47 | 9.44 | 9.43 | ||||
| Index† | -3.96 | 4.71 | 11.00 | 25.86 | 105.87 | — | — | ||||
Performance figures assume all distributions are reinvested. Figures reflect maximum sales charge on Class A shares of 4% and the applicable contingent deferred sales charge (CDSC) on Class C shares. The returns for Class A shares have been adjusted to reflect the reduction in the maximum sales charge from 4.5% to 4.0%, effective 2-3-14. Class C shares sold within one year of purchase are subject to a 1% CDSC. Sales charges are not applicable to Class I, Class R2, Class R4, Class R6, and Class NAV shares.
The expense ratios of the fund, both net (including any fee waivers and/or expense limitations) and gross (excluding any fee waivers and/or expense limitations), are set forth according to the most recent publicly available prospectuses for the fund and may differ from those disclosed in the Financial highlights tables in this report. Had the fee waivers and expense limitations not been in place, gross expenses would apply. The expense ratios are as follows:
| Class A | Class C | Class I | Class R2* | Class R4* | Class R6* | Class NAV | |
| Gross (%) | 1.08 | 1.83 | 0.81 | 1.21 | 1.06 | 0.71 | 0.69 |
| Net (%) | 1.08 | 1.83 | 0.81 | 1.21 | 0.96 | 0.69 | 0.69 |
| * | Expenses have been estimated for the first year of operation for Class R2, Class R4 and Class R6 shares, respectively. |
Please refer to the most recent prospectus and annual or semiannual report for more information on expenses and any expense limitation arrangements for each class.
The returns reflect past results and should not be considered indicative of future performance. The return and principal value of an investment will fluctuate so that shares, when redeemed, may be worth more or less than their original cost. Due to market volatility and other factors, the fund's current performance may be higher or lower than the performance shown. For current to the most recent month-end performance data, please call 800-225-5291 or visit the fund's website at jhinvestments.com.
The performance table above and the chart on the next page do not reflect the deduction of taxes that a shareholder would pay on fund distributions or the redemption of fund shares. The fund's performance results reflect any applicable fee waivers or expense reductions, without which the expenses would increase and results would have been less favorable.
| † | Index is the Bank of America Merrill Lynch U.S. High Yield Master II Constrained Index. |
See the following page for footnotes.
This chart and table show what happened to a hypothetical $10,000 investment in John Hancock Core High Yield Fund for the share classes and periods indicated, assuming all distributions were reinvested. For comparison, we've shown the same investment in the Bank of America Merrill Lynch U.S. High Yield Master II Constrained Index.
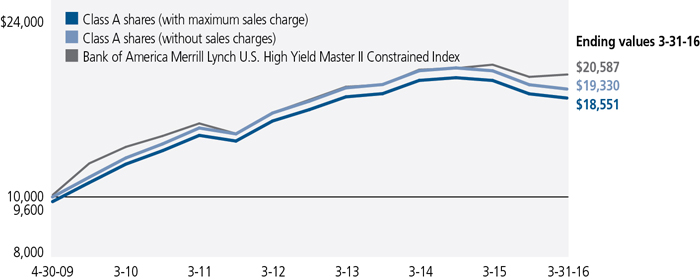
| Start date | With maximum sales charge ($) | Without sales charge ($) | Index ($) | |
| Class C3,5 | 4-30-09 | 17,945 | 17,945 | 20,587 |
| Class I4 | 4-30-09 | 19,743 | 19,743 | 20,587 |
| Class R23,4 | 4-30-09 | 19,063 | 19,063 | 20,587 |
| Class R43,4 | 4-30-09 | 19,269 | 19,269 | 20,587 |
| Class R63,4 | 4-30-09 | 19,844 | 19,844 | 20,587 |
| Class NAV3,4 | 4-30-09 | 19,847 | 19,847 | 20,587 |
The values shown in the chart for Class A with maximum sales charge have been adjusted to reflect the reduction in the Class A maximum sales charge from 4.5% to 4.0%, which became effective on 2-3-14.
The Bank of America Merrill Lynch U.S. High Yield Master II Constrained Index is an unmanaged index composed of U.S. currency high-yield bonds issued by U.S. and non-U.S. issuers.
It is not possible to invest directly in an index. Index figures do not reflect expenses or sales charges, which would result in lower returns.
Footnotes related to performance pages
| 1 | Unsubsidized yield reflects what the yield would have been without the effect of reimbursements and waivers. |
| 2 | From 4-30-09. |
| 3 | Class C shares were first offered on 3-27-13; Class R2, Class R4, and Class R6 shares were first offered on 3-27-15; Class NAV shares were first offered on 8-28-14. The returns prior to these dates are those of Class A shares that have been recalculated to reflect the gross fees and expenses of Class C, Class R2, Class R4, Class R6, and Class NAV shares, as applicable. |
| 4 | For certain types of investors, as described in the fund's prospectuses. |
| 5 | The contingent deferred sales charge is not applicable. |
These examples are intended to help you understand your ongoing operating expenses of investing in the fund so you can compare these costs with the ongoing costs of investing in other mutual funds.
Understanding fund expenses
As a shareholder of the fund, you incur two types of costs:
| • | Transaction costs, which include sales charges (loads) on purchases or redemptions (varies by share class), minimum account fee charge, etc. |
| • | Ongoing operating expenses, including management fees, distribution and service fees (if applicable), and other fund expenses. |
We are presenting only your ongoing operating expenses here.
Actual expenses/actual returns
This example is intended to provide information about the fund's actual ongoing operating expenses, and is based on the fund's actual return. It assumes an account value of $1,000.00 on October 1, 2015, with the same investment held until March 31, 2016.
| Account value on 10-1-2015 | Ending value on 3-31-2016 | Expenses paid during period ended 3-31-20161 | Annualized expense ratio | |
| Class A | $1,000.00 | $981.10 | $5.45 | 1.10% |
| Class C | 1,000.00 | 978.50 | 9.15 | 1.85% |
| Class I | 1,000.00 | 983.50 | 4.07 | 0.82% |
| Class R2 | 1,000.00 | 981.00 | 5.99 | 1.21% |
| Class R4 | 1,000.00 | 981.70 | 5.25 | 1.06% |
| Class R6 | 1,000.00 | 983.40 | 3.57 | 0.72% |
| Class NAV | 1,000.00 | 984.00 | 3.57 | 0.72% |
Together with the value of your account, you may use this information to estimate the operating expenses that you paid over the period. Simply divide your account value at March 31, 2016, by $1,000.00, then multiply it by the "expenses paid" for your share class from the table above. For example, for an account value of $8,600.00, the operating expenses should be calculated as follows:
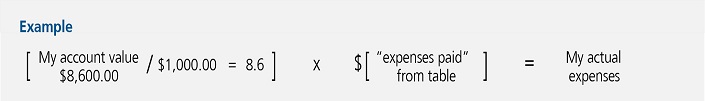
Hypothetical example for comparison purposes
This table allows you to compare the fund's ongoing operating expenses with those of any other fund. It provides an example of the fund's hypothetical account values and hypothetical expenses based on each class's actual expense ratio and an assumed 5% annualized return before expenses (which is not the fund's actual return). It assumes an account value of $1,000.00 on October 1, 2015, with the same investment held until March 31, 2016. Look in any other fund shareholder report to find its hypothetical example and you will be able to compare these expenses. Please remember that these hypothetical account values and expenses may not be used to estimate the actual ending account balance or expenses you paid for the period.
| Account value on 10-1-2015 | Ending value on 3-31-2016 | Expenses paid during period ended 3-31-20161 | Annualized expense ratio | |
| Class A | $1,000.00 | $1,019.50 | $5.55 | 1.10% |
| Class C | 1,000.00 | 1,015.80 | 9.32 | 1.85% |
| Class I | 1,000.00 | 1,020.90 | 4.14 | 0.82% |
| Class R2 | 1,000.00 | 1,019.00 | 6.11 | 1.21% |
| Class R4 | 1,000.00 | 1,019.70 | 5.35 | 1.06% |
| Class R6 | 1,000.00 | 1,021.40 | 3.64 | 0.72% |
| Class NAV | 1,000.00 | 1,021.40 | 3.64 | 0.72% |
Remember, these examples do not include any transaction costs, therefore, these examples will not help you to determine the relative total costs of owning different funds. If transaction costs were included, your expenses would have been higher. See the prospectuses for details regarding transaction costs.
| 1 | Expenses are equal to the fund's annualized expense ratio, multiplied by the average account value over the period, multiplied by 183/366 (to reflect the one-half year period). |
Fund's investments
| As of 3-31-16 | |||||||||||||||||||||||
| Rate (%) | Maturity date | Par value^ | Value | ||||||||||||||||||||
| Corporate bonds 89.3% | $431,900,235 | ||||||||||||||||||||||
| (Cost $519,121,425) | |||||||||||||||||||||||
| Consumer discretionary 15.2% | 73,334,254 | ||||||||||||||||||||||
| Auto components 1.0% | |||||||||||||||||||||||
| Icahn Enterprises LP | 5.875 | 02-01-22 | 5,000,000 | 4,745,000 | |||||||||||||||||||
| Automobiles 0.5% | |||||||||||||||||||||||
| Fiat Chrysler Automobiles NV | 5.250 | 04-15-23 | 2,530,000 | 2,516,085 | |||||||||||||||||||
| Hotels, restaurants and leisure 2.5% | |||||||||||||||||||||||
| ESH Hospitality, Inc. (S) | 5.250 | 05-01-25 | 2,250,000 | 2,196,563 | |||||||||||||||||||
| Great Canadian Gaming Corp. | 6.625 | 07-25-22 | CAD | 2,000,000 | 1,555,342 | ||||||||||||||||||
| Scientific Games International, Inc. (S) | 7.000 | 01-01-22 | 8,000,000 | 8,160,000 | |||||||||||||||||||
| Household durables 3.7% | |||||||||||||||||||||||
| Beazer Homes USA, Inc. | 9.125 | 05-15-19 | 3,000,000 | 2,850,000 | |||||||||||||||||||
| Century Communities, Inc. | 6.875 | 05-15-22 | 945,000 | 902,475 | |||||||||||||||||||
| Modular Space Corp. (S) | 10.250 | 01-31-19 | 13,375,000 | 7,423,125 | |||||||||||||||||||
| William Lyon Homes, Inc. | 5.750 | 04-15-19 | 640,000 | 617,600 | |||||||||||||||||||
| William Lyon Homes, Inc. | 7.000 | 08-15-22 | 6,210,000 | 5,961,600 | |||||||||||||||||||
| Media 5.7% | |||||||||||||||||||||||
| Altice Financing SA (S) | 6.625 | 02-15-23 | 3,000,000 | 3,007,500 | |||||||||||||||||||
| Altice Finco SA (S) | 8.125 | 01-15-24 | 2,700,000 | 2,673,000 | |||||||||||||||||||
| Altice Luxembourg SA (S) | 7.625 | 02-15-25 | 3,000,000 | 2,872,500 | |||||||||||||||||||
| Altice Luxembourg SA (S) | 7.750 | 05-15-22 | 5,000,000 | 4,920,400 | |||||||||||||||||||
| DISH DBS Corp. | 5.875 | 11-15-24 | 2,570,000 | 2,354,763 | |||||||||||||||||||
| iHeartCommunications, Inc. | 10.625 | 03-15-23 | 2,000,000 | 1,385,000 | |||||||||||||||||||
| MDC Partners, Inc. (S) | 6.500 | 05-01-24 | 2,000,000 | 2,042,500 | |||||||||||||||||||
| Postmedia Network, Inc. | 12.500 | 07-15-18 | 2,000,000 | 220,000 | |||||||||||||||||||
| Quebecor Media, Inc. (S) | 6.625 | 01-15-23 | CAD | 3,000,000 | 2,384,986 | ||||||||||||||||||
| Sirius XM Radio, Inc. (S) | 6.000 | 07-15-24 | 3,000,000 | 3,149,064 | |||||||||||||||||||
| SiTV LLC (S) | 10.375 | 07-01-19 | 2,250,000 | 1,732,500 | |||||||||||||||||||
| Videotron, Ltd. (S) | 5.375 | 06-15-24 | 1,055,000 | 1,094,563 | |||||||||||||||||||
| Specialty retail 1.8% | |||||||||||||||||||||||
| GameStop Corp. (S) | 6.750 | 03-15-21 | 4,000,000 | 3,870,000 | |||||||||||||||||||
| Group 1 Automotive, Inc. | 5.000 | 06-01-22 | 2,500,000 | 2,475,000 | |||||||||||||||||||
| The Men's Wearhouse, Inc. | 7.000 | 07-01-22 | 2,625,000 | 2,224,688 | |||||||||||||||||||
| Consumer staples 5.5% | 26,478,380 | ||||||||||||||||||||||
| Food and staples retailing 3.5% | |||||||||||||||||||||||
| Simmons Foods, Inc. (S) | 7.875 | 10-01-21 | 1,500,000 | 1,263,750 | |||||||||||||||||||
| SUPERVALU, Inc. | 6.750 | 06-01-21 | 2,000,000 | 1,705,000 | |||||||||||||||||||
| SUPERVALU, Inc. | 7.750 | 11-15-22 | 4,500,000 | 3,813,750 | |||||||||||||||||||
| Tops Holding LLC (S) | 8.000 | 06-15-22 | 5,245,000 | 4,851,625 | |||||||||||||||||||
| Whole Foods Market, Inc. (S) | 5.200 | 12-03-25 | 5,000,000 | 5,241,755 | |||||||||||||||||||
| Rate (%) | Maturity date | Par value^ | Value | ||||||||||||||||||||
| Consumer staples (continued) | |||||||||||||||||||||||
| Food products 0.8% | |||||||||||||||||||||||
| Southern States Cooperative, Inc. (S) | 10.000 | 08-15-21 | 6,000,000 | $3,690,000 | |||||||||||||||||||
| Tobacco 1.2% | |||||||||||||||||||||||
| Alliance One International, Inc. | 9.875 | 07-15-21 | 5,000,000 | 3,812,500 | |||||||||||||||||||
| Vector Group, Ltd. | 7.750 | 02-15-21 | 2,000,000 | 2,100,000 | |||||||||||||||||||
| Energy 7.7% | 37,085,944 | ||||||||||||||||||||||
| Energy equipment and services 1.2% | |||||||||||||||||||||||
| CSI Compressco LP | 7.250 | 08-15-22 | 2,865,000 | 1,998,338 | |||||||||||||||||||
| Seventy Seven Energy, Inc. | 6.500 | 07-15-22 | 3,130,000 | 140,850 | |||||||||||||||||||
| Summit Midstream Holdings LLC | 5.500 | 08-15-22 | 5,000,000 | 3,550,000 | |||||||||||||||||||
| Oil, gas and consumable fuels 6.5% | |||||||||||||||||||||||
| Calumet Specialty Products Partners LP | 6.500 | 04-15-21 | 8,000,000 | 5,680,000 | |||||||||||||||||||
| Calumet Specialty Products Partners LP | 7.625 | 01-15-22 | 1,450,000 | 1,000,500 | |||||||||||||||||||
| Chesapeake Energy Corp. | 6.500 | 08-15-17 | 3,571,000 | 2,392,570 | |||||||||||||||||||
| Citgo Holding, Inc. (S) | 10.750 | 02-15-20 | 3,000,000 | 2,910,000 | |||||||||||||||||||
| Crestwood Midstream Partners LP (S) | 6.250 | 04-01-23 | 2,500,000 | 1,856,250 | |||||||||||||||||||
| Energy XXI Gulf Coast, Inc. (H)(S) | 11.000 | 03-15-20 | 4,000,000 | 560,000 | |||||||||||||||||||
| FTS International, Inc. (P)(S) | 8.134 | 06-15-20 | 4,000,000 | 2,697,956 | |||||||||||||||||||
| Genesis Energy LP | 6.000 | 05-15-23 | 1,205,000 | 1,060,400 | |||||||||||||||||||
| Halcon Resources Corp. (S) | 8.625 | 02-01-20 | 2,000,000 | 1,420,000 | |||||||||||||||||||
| Halcon Resources Corp. (S) | 12.000 | 02-15-22 | 2,301,000 | 1,530,165 | |||||||||||||||||||
| PBF Holding Company LLC (S) | 7.000 | 11-15-23 | 3,000,000 | 2,846,250 | |||||||||||||||||||
| SandRidge Energy, Inc. (H)(S) | 8.750 | 06-01-20 | 4,000,000 | 970,000 | |||||||||||||||||||
| SM Energy Company | 5.625 | 06-01-25 | 1,000,000 | 694,690 | |||||||||||||||||||
| Teekay Offshore Partners LP | 6.000 | 07-30-19 | 5,540,000 | 3,476,350 | |||||||||||||||||||
| Ultra Petroleum Corp. (S) | 6.125 | 10-01-24 | 2,000,000 | 150,000 | |||||||||||||||||||
| Whiting Petroleum Corp. | 6.250 | 04-01-23 | 2,000,000 | 1,335,000 | |||||||||||||||||||
| WPX Energy, Inc. | 5.250 | 09-15-24 | 1,175,000 | 816,625 | |||||||||||||||||||
| Financials 16.4% | 79,459,915 | ||||||||||||||||||||||
| Banks 3.7% | |||||||||||||||||||||||
| Citigroup, Inc. (5.800% to 11-15-19, then 3 month LIBOR + 4.093%) (Q) | 5.800 | 11-15-19 | 5,000,000 | 4,782,500 | |||||||||||||||||||
| Credit Agricole SA (8.125% to 12-23-25, then 5 Year U.S. Swap Rate + 6.185%) (Q)(S) | 8.125 | 12-23-25 | 1,190,000 | 1,187,120 | |||||||||||||||||||
| HSBC Holdings PLC (5.625% to 1-17-20, then 5 Year ISDAFIX + 3.626%) (Q) | 5.625 | 01-17-20 | 1,630,000 | 1,565,778 | |||||||||||||||||||
| ING Groep NV (6.000% to 4-16-20, then 5 Year U.S. Swap Rate + 4.445%) (Q) | 6.000 | 04-16-20 | 4,000,000 | 3,742,500 | |||||||||||||||||||
| ING Groep NV (6.500% to 4-16-25, then 5 Year U.S. Swap Rate + 4.446%) (Q) | 6.500 | 04-16-25 | 4,000,000 | 3,665,000 | |||||||||||||||||||
| Societe Generale SA (S) | 4.250 | 04-14-25 | 3,000,000 | 2,889,144 | |||||||||||||||||||
| Capital markets 0.4% | |||||||||||||||||||||||
| GFI Group, Inc. | 8.375 | 07-19-18 | 2,000,000 | 2,120,000 | |||||||||||||||||||
| Rate (%) | Maturity date | Par value^ | Value | ||||||||||||||||||||
| Financials (continued) | |||||||||||||||||||||||
| Consumer finance 2.1% | |||||||||||||||||||||||
| Credit Acceptance Corp. | 6.125 | 02-15-21 | 5,771,000 | $5,453,595 | |||||||||||||||||||
| Enova International, Inc. | 9.750 | 06-01-21 | 3,000,000 | 2,130,000 | |||||||||||||||||||
| TMX Finance LLC (S) | 8.500 | 09-15-18 | 2,948,000 | 2,358,400 | |||||||||||||||||||
| Diversified financial services 3.3% | |||||||||||||||||||||||
| iPayment, Inc. (S) | 9.500 | 12-15-19 | 3,562,500 | 3,713,906 | |||||||||||||||||||
| Jefferies Finance LLC (S) | 7.500 | 04-15-21 | 6,000,000 | 5,160,000 | |||||||||||||||||||
| NewStar Financial, Inc. | 7.250 | 05-01-20 | 8,150,000 | 7,335,000 | |||||||||||||||||||
| Real estate investment trusts 1.7% | |||||||||||||||||||||||
| DuPont Fabros Technology LP | 5.875 | 09-15-21 | 1,100,000 | 1,152,250 | |||||||||||||||||||
| iStar, Inc. | 5.000 | 07-01-19 | 4,890,000 | 4,694,400 | |||||||||||||||||||
| iStar, Inc. | 6.500 | 07-01-21 | 2,360,000 | 2,306,900 | |||||||||||||||||||
| Real estate management and development 1.1% | |||||||||||||||||||||||
| Mattamy Group Corp. (S) | 6.500 | 11-15-20 | 4,500,000 | 4,050,000 | |||||||||||||||||||
| Mattamy Group Corp. (S) | 6.875 | 11-15-20 | CAD | 2,000,000 | 1,409,047 | ||||||||||||||||||
| Thrifts and mortgage finance 4.1% | |||||||||||||||||||||||
| Ladder Capital Finance Holdings LLLP (S) | 5.875 | 08-01-21 | 6,725,000 | 5,884,375 | |||||||||||||||||||
| Ladder Capital Finance Holdings LLLP | 7.375 | 10-01-17 | 2,000,000 | 1,987,500 | |||||||||||||||||||
| Nationstar Mortgage LLC | 6.500 | 06-01-22 | 7,000,000 | 6,037,500 | |||||||||||||||||||
| Quicken Loans, Inc. (S) | 5.750 | 05-01-25 | 4,000,000 | 3,880,000 | |||||||||||||||||||
| Stearns Holdings LLC (S) | 9.375 | 08-15-20 | 2,000,000 | 1,955,000 | |||||||||||||||||||
| Health care 2.8% | 13,695,688 | ||||||||||||||||||||||
| Health care providers and services 1.6% | |||||||||||||||||||||||
| Community Health Systems, Inc. | 6.875 | 02-01-22 | 5,500,000 | 4,963,750 | |||||||||||||||||||
| Select Medical Corp. | 6.375 | 06-01-21 | 3,000,000 | 2,835,000 | |||||||||||||||||||
| Pharmaceuticals 1.2% | |||||||||||||||||||||||
| Mallinckrodt International Finance SA (S) | 5.750 | 08-01-22 | 2,000,000 | 1,842,500 | |||||||||||||||||||
| Valeant Pharmaceuticals International, Inc. (S) | 5.500 | 03-01-23 | 1,175,000 | 919,438 | |||||||||||||||||||
| Valeant Pharmaceuticals International, Inc. (S) | 5.875 | 05-15-23 | 4,000,000 | 3,135,000 | |||||||||||||||||||
| Industrials 9.9% | 48,033,829 | ||||||||||||||||||||||
| Air freight and logistics 2.0% | |||||||||||||||||||||||
| XPO Logistics, Inc. (S) | 6.500 | 06-15-22 | 9,900,000 | 9,615,375 | |||||||||||||||||||
| Building products 1.5% | |||||||||||||||||||||||
| Builders FirstSource, Inc. (S) | 10.750 | 08-15-23 | 7,000,000 | 7,052,500 | |||||||||||||||||||
| Commercial services and supplies 1.1% | |||||||||||||||||||||||
| GFL Environmental Corp. (S) | 7.500 | 06-18-18 | CAD | 1,196,000 | 920,885 | ||||||||||||||||||
| Tervita Corp. (S) | 10.875 | 02-15-18 | 450,000 | 71,994 | |||||||||||||||||||
| The ADT Corp. | 4.125 | 06-15-23 | 5,000,000 | 4,350,000 | |||||||||||||||||||
| Construction and engineering 2.2% | |||||||||||||||||||||||
| AECOM | 5.750 | 10-15-22 | 7,500,000 | 7,781,250 | |||||||||||||||||||
| Michael Baker International, Inc. (S) | 8.250 | 10-15-18 | 900,000 | 774,000 | |||||||||||||||||||
| Rate (%) | Maturity date | Par value^ | Value | ||||||||||||||||||||
| Industrials (continued) | |||||||||||||||||||||||
| Construction and engineering (continued) | |||||||||||||||||||||||
| Weekley Homes LLC | 6.000 | 02-01-23 | 2,500,000 | $2,293,750 | |||||||||||||||||||
| Machinery 0.3% | |||||||||||||||||||||||
| Optimas OE Solutions Holding LLC (S) | 8.625 | 06-01-21 | 1,750,000 | 1,321,250 | |||||||||||||||||||
| Marine 0.6% | |||||||||||||||||||||||
| Navios Maritime Holdings, Inc. (S) | 7.375 | 01-15-22 | 8,810,000 | 3,171,600 | |||||||||||||||||||
| Trading companies and distributors 0.8% | |||||||||||||||||||||||
| Ahern Rentals, Inc. (S) | 7.375 | 05-15-23 | 5,500,000 | 3,795,000 | |||||||||||||||||||
| Transportation infrastructure 1.4% | |||||||||||||||||||||||
| CHC Helicopter SA | 9.250 | 10-15-20 | 180,000 | 76,050 | |||||||||||||||||||
| CHC Helicopter SA | 9.375 | 06-01-21 | 1,836,250 | 110,175 | |||||||||||||||||||
| Florida East Coast Holdings Corp. (S) | 6.750 | 05-01-19 | 6,700,000 | 6,700,000 | |||||||||||||||||||
| Information technology 4.5% | 21,635,469 | ||||||||||||||||||||||
| Communications equipment 0.7% | |||||||||||||||||||||||
| Avaya, Inc. (S) | 7.000 | 04-01-19 | 3,000,000 | 2,025,000 | |||||||||||||||||||
| Avaya, Inc. (S) | 9.000 | 04-01-19 | 2,000,000 | 1,350,000 | |||||||||||||||||||
| Internet software and services 0.8% | |||||||||||||||||||||||
| Rackspace Hosting, Inc. (S) | 6.500 | 01-15-24 | 4,000,000 | 3,950,000 | |||||||||||||||||||
| Semiconductors and semiconductor equipment 2.1% | |||||||||||||||||||||||
| Advanced Micro Devices, Inc. | 7.750 | 08-01-20 | 3,500,000 | 2,432,500 | |||||||||||||||||||
| Micron Technology, Inc. (S) | 5.250 | 08-01-23 | 4,750,000 | 3,883,125 | |||||||||||||||||||
| Micron Technology, Inc. | 5.500 | 02-01-25 | 4,350,000 | 3,526,219 | |||||||||||||||||||
| Software 0.4% | |||||||||||||||||||||||
| Open Text Corp. (S) | 5.625 | 01-15-23 | 2,000,000 | 2,040,000 | |||||||||||||||||||
| Technology hardware, storage and peripherals 0.5% | |||||||||||||||||||||||
| Western Digital Corp. (S) | 7.375 | 04-01-23 | 1,400,000 | 1,428,000 | |||||||||||||||||||
| Western Digital Corp. (S) | 10.500 | 04-01-24 | 1,000,000 | 1,000,625 | |||||||||||||||||||
| Materials 12.8% | 62,007,119 | ||||||||||||||||||||||
| Building materials 0.6% | |||||||||||||||||||||||
| Standard Industries, Inc. (S) | 5.375 | 11-15-24 | 2,845,000 | 2,887,675 | |||||||||||||||||||
| Chemicals 2.2% | |||||||||||||||||||||||
| Platform Specialty Products Corp. (S) | 6.500 | 02-01-22 | 5,125,000 | 4,324,219 | |||||||||||||||||||
| The Chemours Company (S) | 7.000 | 05-15-25 | 1,000,000 | 801,250 | |||||||||||||||||||
| Tronox Finance LLC (S) | 7.500 | 03-15-22 | 7,500,000 | 5,625,000 | |||||||||||||||||||
| Construction materials 2.6% | |||||||||||||||||||||||
| Algeco Scotsman Global Finance PLC (S) | 8.500 | 10-15-18 | 8,000,000 | 6,160,000 | |||||||||||||||||||
| Hardwoods Acquisition, Inc. (S) | 7.500 | 08-01-21 | 9,300,000 | 6,324,000 | |||||||||||||||||||
| Containers and packaging 0.7% | |||||||||||||||||||||||
| Cascades, Inc. (S) | 5.500 | 07-15-22 | 2,057,000 | 1,978,577 | |||||||||||||||||||
| Techniplas LLC (S) | 10.000 | 05-01-20 | 1,750,000 | 1,251,250 | |||||||||||||||||||
| Rate (%) | Maturity date | Par value^ | Value | ||||||||||||||||||||
| Materials (continued) | |||||||||||||||||||||||
| Metals and mining 3.3% | |||||||||||||||||||||||
| Essar Steel Algoma, Inc. (H)(S) | 9.500 | 11-15-19 | 4,000,000 | $120,000 | |||||||||||||||||||
| First Quantum Minerals, Ltd. (S) | 7.250 | 10-15-19 | 7,000,000 | 5,022,500 | |||||||||||||||||||
| First Quantum Minerals, Ltd. (S) | 7.250 | 05-15-22 | 2,750,000 | 1,842,500 | |||||||||||||||||||
| Optima Specialty Steel, Inc. (S) | 12.500 | 12-15-16 | 213,000 | 174,660 | |||||||||||||||||||
| Signode Industrial Group Lux SA (S) | 6.375 | 05-01-22 | 6,410,000 | 5,825,088 | |||||||||||||||||||
| Thompson Creek Metals Company, Inc. | 9.750 | 12-01-17 | 1,500,000 | 1,406,250 | |||||||||||||||||||
| Thompson Creek Metals Company, Inc. | 12.500 | 05-01-19 | 7,000,000 | 1,881,250 | |||||||||||||||||||
| Paper and forest products 3.4% | |||||||||||||||||||||||
| Norbord, Inc. (S) | 6.250 | 04-15-23 | 3,650,000 | 3,595,250 | |||||||||||||||||||
| Resolute Forest Products, Inc. | 5.875 | 05-15-23 | 9,758,000 | 6,586,650 | |||||||||||||||||||
| Tembec Industries, Inc. (S) | 9.000 | 12-15-19 | 8,000,000 | 5,520,000 | |||||||||||||||||||
| UPM-Kymmene OYJ (S) | 7.450 | 11-26-27 | 600,000 | 681,000 | |||||||||||||||||||
| Telecommunication services 9.6% | 46,431,412 | ||||||||||||||||||||||
| Diversified telecommunication services 6.8% | |||||||||||||||||||||||
| AT&T, Inc. | 5.000 | 04-01-23 | 515,000 | 517,575 | |||||||||||||||||||
| CenturyLink, Inc. (C) | 7.500 | 04-01-24 | 2,550,000 | 2,553,188 | |||||||||||||||||||
| Columbus International, Inc. (S) | 7.375 | 03-30-21 | 1,700,000 | 1,810,500 | |||||||||||||||||||
| Frontier Communications Corp. | 6.250 | 09-15-21 | 1,130,000 | 1,044,561 | |||||||||||||||||||
| Frontier Communications Corp. | 7.125 | 01-15-23 | 7,500,000 | 6,637,500 | |||||||||||||||||||
| Frontier Communications Corp. (S) | 10.500 | 09-15-22 | 1,205,000 | 1,235,125 | |||||||||||||||||||
| Frontier Communications Corp. (S) | 11.000 | 09-15-25 | 1,930,000 | 1,939,650 | |||||||||||||||||||
| Goodman Networks, Inc. | 12.125 | 07-01-18 | 3,600,000 | 1,296,000 | |||||||||||||||||||
| Intelsat Jackson Holdings SA | 7.500 | 04-01-21 | 6,000,000 | 3,810,000 | |||||||||||||||||||
| T-Mobile USA, Inc. | 6.000 | 03-01-23 | 6,000,000 | 6,150,000 | |||||||||||||||||||
| The Procter & Gamble Company | 6.000 | 04-15-24 | 2,100,000 | 2,121,000 | |||||||||||||||||||
| Wind Acquisition Finance SA (S) | 7.375 | 04-23-21 | 3,000,000 | 2,715,000 | |||||||||||||||||||
| Windstream Services LLC | 7.750 | 10-01-21 | 1,000,000 | 815,625 | |||||||||||||||||||
| Wireless telecommunication services 2.8% | |||||||||||||||||||||||
| Digicel, Ltd. (S) | 6.000 | 04-15-21 | 5,000,000 | 4,475,000 | |||||||||||||||||||
| Sprint Communications, Inc. | 6.000 | 11-15-22 | 2,000,000 | 1,462,500 | |||||||||||||||||||
| Sprint Communications, Inc. | 8.375 | 08-15-17 | 3,000,000 | 2,966,250 | |||||||||||||||||||
| Sprint Corp. | 7.125 | 06-15-24 | 6,575,000 | 4,881,938 | |||||||||||||||||||
| Utilities 4.9% | 23,738,225 | ||||||||||||||||||||||
| Electric utilities 2.2% | |||||||||||||||||||||||
| Talen Energy Supply LLC | 4.600 | 12-15-21 | 3,500,000 | 2,800,000 | |||||||||||||||||||
| Talen Energy Supply LLC (S) | 4.625 | 07-15-19 | 8,900,000 | 7,720,750 | |||||||||||||||||||
| Independent power and renewable electricity producers 2.7% | |||||||||||||||||||||||
| Dynegy, Inc. | 5.875 | 06-01-23 | 6,585,000 | 5,498,475 | |||||||||||||||||||
| NRG Yield Operating LLC | 5.375 | 08-15-24 | 8,300,000 | 7,719,000 | |||||||||||||||||||
| Rate (%) | Maturity date | Par value^ | Value | ||||||||||||||||||||
| Term loans (M) 6.8% | $32,859,148 | ||||||||||||||||||||||
| (Cost $41,678,043) | |||||||||||||||||||||||
| Consumer discretionary 1.3% | 6,248,331 | ||||||||||||||||||||||
| Diversified consumer services 0.2% | |||||||||||||||||||||||
| Orchard Acquisition Company LLC | 7.000 | 02-07-19 | 2,345,217 | 938,087 | |||||||||||||||||||
| Specialty retail 0.6% | |||||||||||||||||||||||
| Payless, Inc. | 5.000 | 03-11-21 | 1,965,000 | 953,025 | |||||||||||||||||||
| Toys R Us Property Company I LLC | 6.000 | 08-21-19 | 2,259,914 | 1,971,775 | |||||||||||||||||||
| Textiles, apparel and luxury goods 0.5% | |||||||||||||||||||||||
| Charlotte Russe, Inc. | 6.750 | 05-21-19 | 3,751,135 | 1,950,590 | |||||||||||||||||||
| Charlotte Russe, Inc. | 6.750 | 05-22-19 | 836,258 | 434,854 | |||||||||||||||||||
| Consumer staples 0.8% | 4,097,467 | ||||||||||||||||||||||
| Food and staples retailing 0.1% | |||||||||||||||||||||||
| Reddy Ice Corp. | 10.750 | 11-01-19 | 500,000 | 326,667 | |||||||||||||||||||
| Household products 0.7% | |||||||||||||||||||||||
| The Sun Products Corp. | 5.500 | 03-23-20 | 3,907,565 | 3,770,800 | |||||||||||||||||||
| Energy 0.3% | 1,337,529 | ||||||||||||||||||||||
| Oil, gas and consumable fuels 0.3% | |||||||||||||||||||||||
| Arch Coal, Inc. (H) | 6.250 | 05-16-18 | 3,871,286 | 1,337,529 | |||||||||||||||||||
| Financials 1.6% | 7,562,153 | ||||||||||||||||||||||
| Diversified financial services 1.6% | |||||||||||||||||||||||
| iPayment, Inc. | 6.750 | 05-08-17 | 2,000,000 | 1,901,666 | |||||||||||||||||||
| PGX Holdings, Inc. | 5.750 | 09-29-20 | 5,712,857 | 5,660,487 | |||||||||||||||||||
| Health care 0.4% | 1,977,375 | ||||||||||||||||||||||
| Health care providers and services 0.4% | |||||||||||||||||||||||
| Western Dental Services, Inc. | 7.500 | 11-01-18 | 2,240,652 | 1,977,375 | |||||||||||||||||||
| Industrials 0.7% | 3,509,707 | ||||||||||||||||||||||
| Road and rail 0.7% | |||||||||||||||||||||||
| Livingston International, Inc. | 5.000 | 04-18-19 | 1,945,000 | 1,769,950 | |||||||||||||||||||
| Livingston International, Inc. | 9.000 | 04-18-20 | 1,954,783 | 1,739,757 | |||||||||||||||||||
| Information technology 0.6% | 2,800,328 | ||||||||||||||||||||||
| Software 0.6% | |||||||||||||||||||||||
| Compuware Corp. | 6.250 | 12-15-21 | 2,942,551 | 2,800,328 | |||||||||||||||||||
| Telecommunication services 1.1% | 5,326,258 | ||||||||||||||||||||||
| Diversified telecommunication services 1.1% | |||||||||||||||||||||||
| Birch Communications, Inc. | 7.750 | 07-17-20 | 6,157,523 | 5,326,258 | |||||||||||||||||||
| Shares | Value | ||||||||||||||||||||||
| Common stocks 0.3% | $1,378,960 | ||||||||||||||||||||||
| (Cost $598,460) | |||||||||||||||||||||||
| Energy 0.0% | 40,960 | ||||||||||||||||||||||
| Energy equipment and services 0.0% | |||||||||||||||||||||||
| TPT Acquisition, Inc. (I) | 2,560 | 40,960 | |||||||||||||||||||||
| Financials 0.3% | 1,338,000 | ||||||||||||||||||||||
| Diversified financial services 0.3% | |||||||||||||||||||||||
| iPayment, Inc. (I) | 223,000 | 1,338,000 | |||||||||||||||||||||
| Par value^ | Value | ||||||||||||||||||||||
| Short-term investments 0.3% | $1,326,000 | ||||||||||||||||||||||
| (Cost $1,326,000) | |||||||||||||||||||||||
| Repurchase agreement 0.3% | 1,326,000 | ||||||||||||||||||||||
| Repurchase Agreement with State Street Corp. dated 3-31-16 at 0.030% to be repurchased at $1,326,001 on 4-1-16, collateralized by $1,355,000 Federal Home Loan Bank, 0.875% due 3-19-18 (valued at $1,357,168, including interest) | 1,326,000 | 1,326,000 | |||||||||||||||||||||
| Total investments (Cost $562,723,928)† 96.7% | $467,464,343 | ||||||||||||||||||||||
| Other assets and liabilities, net 3.3% | $15,852,686 | ||||||||||||||||||||||
| Total net assets 100.0% | $483,317,029 | ||||||||||||||||||||||
| The percentage shown for each investment category is the total value of the category as a percentage of the net assets of the fund. | |||||||||||||||||||||||
| ^All par values are denominated in U.S. dollars unless otherwise indicated. | |||||||||||||||||||||||
| Key to Currency Abbreviations | |||||||||||||||||||||||
| CAD | Canadian Dollar | ||||||||||||||||||||||
| Key to Security Abbreviations and Legend | |||||||||||||||||||||||
| ISDAFIX | International Swaps and Derivatives Association Fixed Interest Rate Swap Rate | ||||||||||||||||||||||
| LIBOR | London Interbank Offered Rate | ||||||||||||||||||||||
| (C) | Security purchased or sold on a when-issued or delayed delivery basis. | ||||||||||||||||||||||
| (H) | Non-income producing - Issuer is in default. | ||||||||||||||||||||||
| (I) | Non-income producing security. | ||||||||||||||||||||||
| (M) | Term loans are variable rate obligations. The coupon rate shown represents the rate at period end. | ||||||||||||||||||||||
| (P) | Variable rate obligation. The coupon rate shown represents the rate at period end. | ||||||||||||||||||||||
| (Q) | Perpetual bonds have no stated maturity date. Date shown as maturity date is next call date. | ||||||||||||||||||||||
| (S) | These securities are exempt from registration under Rule 144A of the Securities Act of 1933. Such securities may be resold, normally to qualified institutional buyers, in transactions exempt from registration. Rule 144A securities amounted to $235,026,730 or 48.6% of the fund's net assets as of 3-31-16. | ||||||||||||||||||||||
| † | At 3-31-16, the aggregate cost of investment securities for federal income tax purposes was $563,483,080. Net unrealized depreciation aggregated to $96,018,737, of which $5,827,726 related to appreciated investment securities and $101,846,463 related to depreciated investment securities. | ||||||||||||||||||||||
Financial statements
STATEMENT OF ASSETS AND LIABILITIES 3-31-16
| Assets | ||||||||||||||||||||||||||||||
| Investments, at value (Cost $562,723,928) | $467,464,343 | |||||||||||||||||||||||||||||
| Cash | 6,227,103 | |||||||||||||||||||||||||||||
| Cash segregated at custodian for derivative contracts | 490,000 | |||||||||||||||||||||||||||||
| Receivable for investments sold | 10,650,255 | |||||||||||||||||||||||||||||
| Receivable for fund shares sold | 781,348 | |||||||||||||||||||||||||||||
| Unrealized appreciation on forward foreign currency contracts | 347,961 | |||||||||||||||||||||||||||||
| Interest receivable | 10,944,325 | |||||||||||||||||||||||||||||
| Other receivables and prepaid expenses | 75,593 | |||||||||||||||||||||||||||||
| Total assets | 496,980,928 | |||||||||||||||||||||||||||||
| Liabilities | ||||||||||||||||||||||||||||||
| Payable for investments purchased | 7,490,117 | |||||||||||||||||||||||||||||
| Payable for delayed delivery securities purchased | 2,550,000 | |||||||||||||||||||||||||||||
| Unrealized depreciation on forward foreign currency contracts | 750,868 | |||||||||||||||||||||||||||||
| Payable for fund shares repurchased | 2,590,001 | |||||||||||||||||||||||||||||
| Distributions payable | 90,496 | |||||||||||||||||||||||||||||
| Payable to affiliates | ||||||||||||||||||||||||||||||
| Accounting and legal services fees | 5,414 | |||||||||||||||||||||||||||||
| Transfer agent fees | 44,293 | |||||||||||||||||||||||||||||
| Trustees' fees | 119 | |||||||||||||||||||||||||||||
| Other liabilities and accrued expenses | 142,591 | |||||||||||||||||||||||||||||
| Total liabilities | 13,663,899 | |||||||||||||||||||||||||||||
| Net assets | $483,317,029 | |||||||||||||||||||||||||||||
| Net assets consist of | ||||||||||||||||||||||||||||||
| Paid-in capital | $637,488,804 | |||||||||||||||||||||||||||||
| Accumulated distributions in excess of net investment income | (2,448,400 | ) | ||||||||||||||||||||||||||||
| Accumulated net realized gain (loss) on investments and foreign currency transactions | (56,067,264 | ) | ||||||||||||||||||||||||||||
| Net unrealized appreciation (depreciation) on investments and translation of assets and liabilities in foreign currencies | (95,656,111 | ) | ||||||||||||||||||||||||||||
| Net assets | $483,317,029 | |||||||||||||||||||||||||||||
STATEMENT OF ASSETS AND LIABILITIES (continued)
| Net asset value per share | ||||||||||||||||||
| Based on net asset values and shares outstanding-the fund has an unlimited number of shares authorized with no par value | ||||||||||||||||||
| Class A ($252,243,115 ÷ 28,296,642 shares)1 | $8.91 | |||||||||||||||||
| Class C ($51,667,575 ÷ 5,797,264 shares)1 | $8.91 | |||||||||||||||||
| Class I ($112,134,920 ÷ 12,576,107 shares) | $8.92 | |||||||||||||||||
| Class R2 ($86,125 ÷ 9,662 shares) | $8.91 | |||||||||||||||||
| Class R4 ($86,125 ÷ 9,662 shares) | $8.91 | |||||||||||||||||
| Class R6 ($134,758 ÷ 15,118 shares) | $8.91 | |||||||||||||||||
| Class NAV ($66,964,411 ÷ 7,508,962 shares) | $8.92 | |||||||||||||||||
| Maximum offering price per share | ||||||||||||||||||
| Class A (net asset value per share ÷ 96%)2 | $9.28 | |||||||||||||||||
| 1 | Redemption price per share is equal to net asset value less any applicable contingent deferred sales charge. | ||||||||||||||||
| 2 | On single retail sales of less than $100,000. On sales of $100,000 or more and on group sales the offering price is reduced. | ||||||||||||||||
STATEMENT OF OPERATIONS For the year ended 3-31-16
| Investment income | ||||||||||||||||||||||||
| Interest | $53,524,366 | |||||||||||||||||||||||
| Dividends | 224,734 | |||||||||||||||||||||||
| Less foreign taxes withheld | (1,002 | ) | ||||||||||||||||||||||
| Total investment income | 53,748,098 | |||||||||||||||||||||||
| Expenses | ||||||||||||||||||||||||
| Investment management fees | 4,331,948 | |||||||||||||||||||||||
| Distribution and service fees | 1,389,423 | |||||||||||||||||||||||
| Accounting and legal services fees | 90,968 | |||||||||||||||||||||||
| Transfer agent fees | 733,829 | |||||||||||||||||||||||
| Trustees' fees | 11,003 | |||||||||||||||||||||||
| State registration fees | 155,768 | |||||||||||||||||||||||
| Printing and postage | 63,706 | |||||||||||||||||||||||
| Professional fees | 101,491 | |||||||||||||||||||||||
| Custodian fees | 100,623 | |||||||||||||||||||||||
| Registration and filing fees | 74,603 | |||||||||||||||||||||||
| Other | 19,171 | |||||||||||||||||||||||
| Total expenses | 7,072,533 | |||||||||||||||||||||||
| Less expense reductions | (63,023 | ) | ||||||||||||||||||||||
| Net expenses | 7,009,510 | |||||||||||||||||||||||
| Net investment income | 46,738,588 | |||||||||||||||||||||||
| Realized and unrealized gain (loss) | ||||||||||||||||||||||||
| Net realized gain (loss) on | ||||||||||||||||||||||||
| Investments and foreign currency transactions | (46,959,989 | ) | ||||||||||||||||||||||
| (46,959,989 | ) | |||||||||||||||||||||||
| Change in net unrealized appreciation (depreciation) of | ||||||||||||||||||||||||
| Investments and translation of assets and liabilities in foreign currencies | (61,051,997 | ) | ||||||||||||||||||||||
| (61,051,997 | ) | |||||||||||||||||||||||
| Net realized and unrealized loss | (108,011,986 | ) | ||||||||||||||||||||||
| Decrease in net assets from operations | ($61,273,398 | ) | ||||||||||||||||||||||
STATEMENTS OF CHANGES IN NET ASSETS
| Year ended 3-31-16 | Year ended 3-31-15 | ||||||||||||||||||||||||||||||||||||||||||||
| Increase (decrease) in net assets | |||||||||||||||||||||||||||||||||||||||||||||
| From operations | |||||||||||||||||||||||||||||||||||||||||||||
| Net investment income | $46,738,588 | $41,934,331 | |||||||||||||||||||||||||||||||||||||||||||
| Net realized loss | (46,959,989 | ) | (6,813,349 | ) | |||||||||||||||||||||||||||||||||||||||||
| Change in net unrealized appreciation (depreciation) | (61,051,997 | ) | (44,471,026 | ) | |||||||||||||||||||||||||||||||||||||||||
| Decrease in net assets resulting from operations | (61,273,398 | ) | (9,350,044 | ) | |||||||||||||||||||||||||||||||||||||||||
| Distributions to shareholders | |||||||||||||||||||||||||||||||||||||||||||||
| From net investment income | |||||||||||||||||||||||||||||||||||||||||||||
| Class A | (22,694,766 | ) | (22,338,021 | ) | |||||||||||||||||||||||||||||||||||||||||
| Class C | (3,808,119 | ) | (2,756,952 | ) | |||||||||||||||||||||||||||||||||||||||||
| Class I | (16,415,472 | ) | (14,286,376 | ) | |||||||||||||||||||||||||||||||||||||||||
| Class R2 | (6,632 | ) | — | ||||||||||||||||||||||||||||||||||||||||||
| Class R4 | (6,816 | ) | — | ||||||||||||||||||||||||||||||||||||||||||
| Class R6 | (7,983 | ) | — | ||||||||||||||||||||||||||||||||||||||||||
| Class NAV | (6,628,140 | ) | (4,714,036 | ) | |||||||||||||||||||||||||||||||||||||||||
| Total distributions | (49,567,928 | ) | (44,095,385 | ) | |||||||||||||||||||||||||||||||||||||||||
| From fund share transactions | (233,564,053 | ) | 420,856,660 | ||||||||||||||||||||||||||||||||||||||||||
| Total increase (decrease) | (344,405,379 | ) | 367,411,231 | ||||||||||||||||||||||||||||||||||||||||||
| Net assets | |||||||||||||||||||||||||||||||||||||||||||||
| Beginning of year | 827,722,408 | 460,311,177 | |||||||||||||||||||||||||||||||||||||||||||
| End of year | $483,317,029 | $827,722,408 | |||||||||||||||||||||||||||||||||||||||||||
| Undistributed (accumulated distributions in excess of) net investment income | ($2,448,400 | ) | $1,778,376 | ||||||||||||||||||||||||||||||||||||||||||
Financial highlights
| Class A Shares Period ended | 3-31-16 | 3-31-15 | 3-31-14 | 3-31-13 | 3-31-12 | ||||||||||||||||||||||||||||||||||||||||||||||||||||||||||||||||||||||||||||||||||||||||||||||||||
| Per share operating performance | |||||||||||||||||||||||||||||||||||||||||||||||||||||||||||||||||||||||||||||||||||||||||||||||||||||||
| Net asset value, beginning of period | $10.37 | $11.03 | $11.02 | $10.52 | $11.35 | ||||||||||||||||||||||||||||||||||||||||||||||||||||||||||||||||||||||||||||||||||||||||||||||||||
| Net investment income1 | 0.65 | 0.63 | 0.71 | 0.74 | 1.07 | ||||||||||||||||||||||||||||||||||||||||||||||||||||||||||||||||||||||||||||||||||||||||||||||||||
| Net realized and unrealized gain (loss) on investments | (1.42 | ) | (0.63 | ) | 0.10 | 0.53 | (0.25 | ) | |||||||||||||||||||||||||||||||||||||||||||||||||||||||||||||||||||||||||||||||||||||||||||||||
| Total from investment operations | (0.77 | ) | — | 0.81 | 1.27 | 0.82 | |||||||||||||||||||||||||||||||||||||||||||||||||||||||||||||||||||||||||||||||||||||||||||||||||
| Less distributions | |||||||||||||||||||||||||||||||||||||||||||||||||||||||||||||||||||||||||||||||||||||||||||||||||||||||
| From net investment income | (0.69 | ) | (0.66 | ) | (0.74 | ) | (0.76 | ) | (1.04 | ) | |||||||||||||||||||||||||||||||||||||||||||||||||||||||||||||||||||||||||||||||||||||||||||||
| From net realized gain | — | — | (0.06 | ) | (0.01 | ) | (0.61 | ) | |||||||||||||||||||||||||||||||||||||||||||||||||||||||||||||||||||||||||||||||||||||||||||||||
| Total distributions | (0.69 | ) | (0.66 | ) | (0.80 | ) | (0.77 | ) | (1.65 | ) | |||||||||||||||||||||||||||||||||||||||||||||||||||||||||||||||||||||||||||||||||||||||||||||
| Net asset value, end of period | $8.91 | $10.37 | $11.03 | $11.02 | $10.52 | ||||||||||||||||||||||||||||||||||||||||||||||||||||||||||||||||||||||||||||||||||||||||||||||||||
| Total return (%)2,3 | (7.54 | ) | (0.03 | ) | 7.62 | 12.59 | 8.12 | ||||||||||||||||||||||||||||||||||||||||||||||||||||||||||||||||||||||||||||||||||||||||||||||||
| Ratios and supplemental data | |||||||||||||||||||||||||||||||||||||||||||||||||||||||||||||||||||||||||||||||||||||||||||||||||||||||
| Net assets, end of period (in millions) | $252 | $373 | $313 | $208 | $16 | ||||||||||||||||||||||||||||||||||||||||||||||||||||||||||||||||||||||||||||||||||||||||||||||||||
| Ratios (as a percentage of average net assets): | |||||||||||||||||||||||||||||||||||||||||||||||||||||||||||||||||||||||||||||||||||||||||||||||||||||||
| Expenses before reductions | 1.09 | 1.08 | 1.15 | 1.30 | 1.68 | ||||||||||||||||||||||||||||||||||||||||||||||||||||||||||||||||||||||||||||||||||||||||||||||||||
| Expenses including reductions | 1.08 | 1.07 | 1.15 | 1.18 | 1.24 | ||||||||||||||||||||||||||||||||||||||||||||||||||||||||||||||||||||||||||||||||||||||||||||||||||
| Net investment income | 6.71 | 5.87 | 6.45 | 6.83 | 9.82 | ||||||||||||||||||||||||||||||||||||||||||||||||||||||||||||||||||||||||||||||||||||||||||||||||||
| Portfolio turnover (%) | 41 | 28 | 26 | 15 | 64 | ||||||||||||||||||||||||||||||||||||||||||||||||||||||||||||||||||||||||||||||||||||||||||||||||||
| 1 | Based on average daily shares outstanding. | ||||||||||||||||||||||||||||||||||||||||||||||||||||||||||||||||||||||||||||||||||
| 2 | Does not reflect the effect of sales charges, if any. | ||||||||||||||||||||||||||||||||||||||||||||||||||||||||||||||||||||||||||||||||||
| 3 | Total returns would have been lower had certain expenses not been reduced during the applicable periods. | ||||||||||||||||||||||||||||||||||||||||||||||||||||||||||||||||||||||||||||||||||
| Class C Shares Period ended | 3-31-16 | 3-31-15 | 3-31-14 | 3-31-13 | 1 | |||||||||||||||||||||||||||||||||||||||||||||||||||||||||||||||||||||||||||||||||||
| Per share operating performance | ||||||||||||||||||||||||||||||||||||||||||||||||||||||||||||||||||||||||||||||||||||||||
| Net asset value, beginning of period | $10.36 | $11.03 | $11.02 | $11.01 | ||||||||||||||||||||||||||||||||||||||||||||||||||||||||||||||||||||||||||||||||||||
| Net investment income2 | 0.58 | 0.55 | 0.61 | 0.01 | ||||||||||||||||||||||||||||||||||||||||||||||||||||||||||||||||||||||||||||||||||||
| Net realized and unrealized gain (loss) on investments | (1.41 | ) | (0.64 | ) | 0.10 | — | 3 | |||||||||||||||||||||||||||||||||||||||||||||||||||||||||||||||||||||||||||||||||
| Total from investment operations | (0.83 | ) | (0.09 | ) | 0.71 | 0.01 | ||||||||||||||||||||||||||||||||||||||||||||||||||||||||||||||||||||||||||||||||||
| Less distributions | ||||||||||||||||||||||||||||||||||||||||||||||||||||||||||||||||||||||||||||||||||||||||
| From net investment income | (0.62 | ) | (0.58 | ) | (0.64 | ) | — | |||||||||||||||||||||||||||||||||||||||||||||||||||||||||||||||||||||||||||||||||
| From net realized gain | — | — | (0.06 | ) | — | |||||||||||||||||||||||||||||||||||||||||||||||||||||||||||||||||||||||||||||||||||
| Total distributions | (0.62 | ) | (0.58 | ) | (0.70 | ) | — | |||||||||||||||||||||||||||||||||||||||||||||||||||||||||||||||||||||||||||||||||
| Net asset value, end of period | $8.91 | $10.36 | $11.03 | $11.02 | ||||||||||||||||||||||||||||||||||||||||||||||||||||||||||||||||||||||||||||||||||||
| Total return (%)4,5 | (8.15 | ) | (0.86 | ) | 6.73 | 0.09 | 6 | |||||||||||||||||||||||||||||||||||||||||||||||||||||||||||||||||||||||||||||||||
| Ratios and supplemental data | ||||||||||||||||||||||||||||||||||||||||||||||||||||||||||||||||||||||||||||||||||||||||
| Net assets, end of period (in millions) | $52 | $64 | $28 | — | 7 | |||||||||||||||||||||||||||||||||||||||||||||||||||||||||||||||||||||||||||||||||||
| Ratios (as a percentage of average net assets): | ||||||||||||||||||||||||||||||||||||||||||||||||||||||||||||||||||||||||||||||||||||||||
| Expenses before reductions | 1.85 | 1.83 | 2.22 | 16.98 | 8 | |||||||||||||||||||||||||||||||||||||||||||||||||||||||||||||||||||||||||||||||||||
| Expenses including reductions | 1.84 | 1.82 | 1.93 | 1.93 | 8 | |||||||||||||||||||||||||||||||||||||||||||||||||||||||||||||||||||||||||||||||||||
| Net investment income | 5.99 | 5.12 | 5.58 | 5.54 | 8 | |||||||||||||||||||||||||||||||||||||||||||||||||||||||||||||||||||||||||||||||||||
| Portfolio turnover (%) | 41 | 28 | 26 | 15 | 9 | |||||||||||||||||||||||||||||||||||||||||||||||||||||||||||||||||||||||||||||||||||
| 1 | The inception date for Class C shares is 3-27-13. | ||||||||||||||||||||||||||||||||||||||||||||||||||||||||||||||||||||||||||||||||||
| 2 | Based on average daily shares outstanding. | ||||||||||||||||||||||||||||||||||||||||||||||||||||||||||||||||||||||||||||||||||
| 3 | Less than $0.005 per share. | ||||||||||||||||||||||||||||||||||||||||||||||||||||||||||||||||||||||||||||||||||
| 4 | Does not reflect the effect of sales charges, if any. | ||||||||||||||||||||||||||||||||||||||||||||||||||||||||||||||||||||||||||||||||||
| 5 | Total returns would have been lower had certain expenses not been reduced during the applicable periods. | ||||||||||||||||||||||||||||||||||||||||||||||||||||||||||||||||||||||||||||||||||
| 6 | Not annualized. | ||||||||||||||||||||||||||||||||||||||||||||||||||||||||||||||||||||||||||||||||||
| 7 | Less than $500,000. | ||||||||||||||||||||||||||||||||||||||||||||||||||||||||||||||||||||||||||||||||||
| 8 | Annualized. | ||||||||||||||||||||||||||||||||||||||||||||||||||||||||||||||||||||||||||||||||||
| 9 | The portfolio turnover is shown for the period from 4-1-12 to 3-31-13. | ||||||||||||||||||||||||||||||||||||||||||||||||||||||||||||||||||||||||||||||||||
| Class I Shares Period ended | 3-31-16 | 3-31-15 | 3-31-14 | 3-31-13 | 3-31-12 | ||||||||||||||||||||||||||||||||||||||||||||||||||||||||||||||||||||||||||||||||||||||||||||||||||
| Per share operating performance | |||||||||||||||||||||||||||||||||||||||||||||||||||||||||||||||||||||||||||||||||||||||||||||||||||||||
| Net asset value, beginning of period | $10.37 | $11.04 | $11.02 | $10.52 | $11.36 | ||||||||||||||||||||||||||||||||||||||||||||||||||||||||||||||||||||||||||||||||||||||||||||||||||
| Net investment income1 | 0.67 | 0.66 | 0.73 | 0.77 | 1.10 | ||||||||||||||||||||||||||||||||||||||||||||||||||||||||||||||||||||||||||||||||||||||||||||||||||
| Net realized and unrealized gain (loss) on investments | (1.40 | ) | (0.64 | ) | 0.12 | 0.53 | (0.26 | ) | |||||||||||||||||||||||||||||||||||||||||||||||||||||||||||||||||||||||||||||||||||||||||||||||
| Total from investment operations | (0.73 | ) | 0.02 | 0.85 | 1.30 | 0.84 | |||||||||||||||||||||||||||||||||||||||||||||||||||||||||||||||||||||||||||||||||||||||||||||||||
| Less distributions | |||||||||||||||||||||||||||||||||||||||||||||||||||||||||||||||||||||||||||||||||||||||||||||||||||||||
| From net investment income | (0.72 | ) | (0.69 | ) | (0.77 | ) | (0.79 | ) | (1.07 | ) | |||||||||||||||||||||||||||||||||||||||||||||||||||||||||||||||||||||||||||||||||||||||||||||
| From net realized gain | — | — | (0.06 | ) | (0.01 | ) | (0.61 | ) | |||||||||||||||||||||||||||||||||||||||||||||||||||||||||||||||||||||||||||||||||||||||||||||||
| Total distributions | (0.72 | ) | (0.69 | ) | (0.83 | ) | (0.80 | ) | (1.68 | ) | |||||||||||||||||||||||||||||||||||||||||||||||||||||||||||||||||||||||||||||||||||||||||||||
| Net asset value, end of period | $8.92 | $10.37 | $11.04 | $11.02 | $10.52 | ||||||||||||||||||||||||||||||||||||||||||||||||||||||||||||||||||||||||||||||||||||||||||||||||||
| Total return (%)2 | (7.19 | ) | 0.14 | 8.01 | 12.90 | 8.39 | |||||||||||||||||||||||||||||||||||||||||||||||||||||||||||||||||||||||||||||||||||||||||||||||||
| Ratios and supplemental data | |||||||||||||||||||||||||||||||||||||||||||||||||||||||||||||||||||||||||||||||||||||||||||||||||||||||
| Net assets, end of period (in millions) | $112 | $277 | $119 | $40 | — | 3 | |||||||||||||||||||||||||||||||||||||||||||||||||||||||||||||||||||||||||||||||||||||||||||||||||
| Ratios (as a percentage of average net assets): | |||||||||||||||||||||||||||||||||||||||||||||||||||||||||||||||||||||||||||||||||||||||||||||||||||||||
| Expenses before reductions | 0.83 | 0.81 | 0.89 | 1.07 | 4.23 | ||||||||||||||||||||||||||||||||||||||||||||||||||||||||||||||||||||||||||||||||||||||||||||||||||
| Expenses including reductions | 0.82 | 0.80 | 0.87 | 0.87 | 0.90 | ||||||||||||||||||||||||||||||||||||||||||||||||||||||||||||||||||||||||||||||||||||||||||||||||||
| Net investment income | 6.91 | 6.13 | 6.71 | 7.06 | 10.17 | ||||||||||||||||||||||||||||||||||||||||||||||||||||||||||||||||||||||||||||||||||||||||||||||||||
| Portfolio turnover (%) | 41 | 28 | 26 | 15 | 64 | ||||||||||||||||||||||||||||||||||||||||||||||||||||||||||||||||||||||||||||||||||||||||||||||||||
| 1 | Based on average daily shares outstanding. | ||||||||||||||||||||||||||||||||||||||||||||||||||||||||||||||||||||||||||||||||||
| 2 | Total returns would have been lower had certain expenses not been reduced during the applicable periods. | ||||||||||||||||||||||||||||||||||||||||||||||||||||||||||||||||||||||||||||||||||
| 3 | Less than $500,000. | ||||||||||||||||||||||||||||||||||||||||||||||||||||||||||||||||||||||||||||||||||
| Class R2 Shares Period ended | 3-31-16 | 3-31-15 | 1 | |||||||||||||||||||||||||||||||||||||||||||||||
| Per share operating performance | ||||||||||||||||||||||||||||||||||||||||||||||||||
| Net asset value, beginning of period | $10.37 | $10.35 | ||||||||||||||||||||||||||||||||||||||||||||||||
| Net investment income2 | 0.63 | 0.01 | ||||||||||||||||||||||||||||||||||||||||||||||||
| Net realized and unrealized gain (loss) on investments | (1.40 | ) | 0.01 | |||||||||||||||||||||||||||||||||||||||||||||||
| Total from investment operations | (0.77 | ) | 0.02 | |||||||||||||||||||||||||||||||||||||||||||||||
| Less distributions | ||||||||||||||||||||||||||||||||||||||||||||||||||
| From net investment income | (0.69 | ) | — | |||||||||||||||||||||||||||||||||||||||||||||||
| Net asset value, end of period | $8.91 | $10.37 | ||||||||||||||||||||||||||||||||||||||||||||||||
| Total return (%)3 | (7.61 | ) | 0.19 | 4 | ||||||||||||||||||||||||||||||||||||||||||||||
| Ratios and supplemental data | ||||||||||||||||||||||||||||||||||||||||||||||||||
| Net assets, end of period (in millions) | — | 5 | — | 5 | ||||||||||||||||||||||||||||||||||||||||||||||
| Ratios (as a percentage of average net assets): | ||||||||||||||||||||||||||||||||||||||||||||||||||
| Expenses before reductions | 4.87 | 15.03 | 6 | |||||||||||||||||||||||||||||||||||||||||||||||
| Expenses including reductions | 1.26 | 1.32 | 6 | |||||||||||||||||||||||||||||||||||||||||||||||
| Net investment income | 6.60 | 7.59 | 6 | |||||||||||||||||||||||||||||||||||||||||||||||
| Portfolio turnover (%) | 41 | 28 | 7 | |||||||||||||||||||||||||||||||||||||||||||||||
| 1 | The inception date for Class R2 shares is 3-27-15. | ||||||||||||||||||||||||||||||||||||||||||||||||||||||||||
| 2 | Based on average daily shares outstanding. | ||||||||||||||||||||||||||||||||||||||||||||||||||||||||||
| 3 | Total returns would have been lower had certain expenses not been reduced during the applicable periods. | ||||||||||||||||||||||||||||||||||||||||||||||||||||||||||
| 4 | Not annualized. | ||||||||||||||||||||||||||||||||||||||||||||||||||||||||||
| 5 | Less than $500,000. | ||||||||||||||||||||||||||||||||||||||||||||||||||||||||||
| 6 | Annualized. | ||||||||||||||||||||||||||||||||||||||||||||||||||||||||||
| 7 | The portfolio turnover is shown for the period from 4-1-14 to 3-31-15. | ||||||||||||||||||||||||||||||||||||||||||||||||||||||||||
| Class R4 Shares Period ended | 3-31-16 | 3-31-15 | 1 | |||||||||||||||||||||||||||||||||||||||||||||||
| Per share operating performance | ||||||||||||||||||||||||||||||||||||||||||||||||||
| Net asset value, beginning of period | $10.37 | $10.35 | ||||||||||||||||||||||||||||||||||||||||||||||||
| Net investment income2 | 0.65 | 0.01 | ||||||||||||||||||||||||||||||||||||||||||||||||
| Net realized and unrealized gain (loss) on investments | (1.40 | ) | 0.01 | |||||||||||||||||||||||||||||||||||||||||||||||
| Total from investment operations | (0.75 | ) | 0.02 | |||||||||||||||||||||||||||||||||||||||||||||||
| Less distributions | ||||||||||||||||||||||||||||||||||||||||||||||||||
| From net investment income | (0.71 | ) | — | |||||||||||||||||||||||||||||||||||||||||||||||
| Net asset value, end of period | $8.91 | $10.37 | ||||||||||||||||||||||||||||||||||||||||||||||||
| Total return (%)3 | (7.43 | ) | 0.19 | 4 | ||||||||||||||||||||||||||||||||||||||||||||||
| Ratios and supplemental data | ||||||||||||||||||||||||||||||||||||||||||||||||||
| Net assets, end of period (in millions) | — | 5 | — | 5 | ||||||||||||||||||||||||||||||||||||||||||||||
| Ratios (as a percentage of average net assets): | ||||||||||||||||||||||||||||||||||||||||||||||||||
| Expenses before reductions | 4.87 | 15.03 | 6 | |||||||||||||||||||||||||||||||||||||||||||||||
| �� | Expenses including reductions | 1.07 | 1.07 | 6 | ||||||||||||||||||||||||||||||||||||||||||||||
| Net investment income | 6.80 | 7.84 | 6 | |||||||||||||||||||||||||||||||||||||||||||||||
| Portfolio turnover (%) | 41 | 28 | 7 | |||||||||||||||||||||||||||||||||||||||||||||||
| 1 | The inception date for Class R4 shares is 3-27-15. | ||||||||||||||||||||||||||||||||||||||||||||||||||||||||||
| 2 | Based on average daily shares outstanding. | ||||||||||||||||||||||||||||||||||||||||||||||||||||||||||
| 3 | Total returns would have been lower had certain expenses not been reduced during the applicable periods. | ||||||||||||||||||||||||||||||||||||||||||||||||||||||||||
| 4 | Not annualized. | ||||||||||||||||||||||||||||||||||||||||||||||||||||||||||
| 5 | Less than $500,000. | ||||||||||||||||||||||||||||||||||||||||||||||||||||||||||
| 6 | Annualized. | ||||||||||||||||||||||||||||||||||||||||||||||||||||||||||
| 7 | The portfolio turnover is shown for the period from 4-1-14 to 3-31-15. | ||||||||||||||||||||||||||||||||||||||||||||||||||||||||||
| Class R6 Shares Period ended | 3-31-16 | 3-31-15 | 1 | |||||||||||||||||||||||||||||||||||||||||||||||
| Per share operating performance | ||||||||||||||||||||||||||||||||||||||||||||||||||
| Net asset value, beginning of period | $10.37 | $10.35 | ||||||||||||||||||||||||||||||||||||||||||||||||
| Net investment income2 | 0.69 | 0.01 | ||||||||||||||||||||||||||||||||||||||||||||||||
| Net realized and unrealized gain (loss) on investments | (1.41 | ) | 0.01 | |||||||||||||||||||||||||||||||||||||||||||||||
| Total from investment operations | (0.72 | ) | 0.02 | |||||||||||||||||||||||||||||||||||||||||||||||
| Less distributions | ||||||||||||||||||||||||||||||||||||||||||||||||||
| From net investment income | (0.74 | ) | — | |||||||||||||||||||||||||||||||||||||||||||||||
| Net asset value, end of period | $8.91 | $10.37 | ||||||||||||||||||||||||||||||||||||||||||||||||
| Total return (%)3 | (7.10 | ) | 0.19 | 4 | ||||||||||||||||||||||||||||||||||||||||||||||
| Ratios and supplemental data | ||||||||||||||||||||||||||||||||||||||||||||||||||
| Net assets, end of period (in millions) | — | 5 | — | 5 | ||||||||||||||||||||||||||||||||||||||||||||||
| Ratios (as a percentage of average net assets): | ||||||||||||||||||||||||||||||||||||||||||||||||||
| Expenses before reductions | 4.51 | 15.86 | 6 | |||||||||||||||||||||||||||||||||||||||||||||||
| Expenses including reductions | 0.70 | 0.67 | 6 | |||||||||||||||||||||||||||||||||||||||||||||||
| Net investment income | 7.26 | 8.24 | 6 | |||||||||||||||||||||||||||||||||||||||||||||||
| Portfolio turnover (%) | 41 | 28 | 7 | |||||||||||||||||||||||||||||||||||||||||||||||
| 1 | The inception date for Class R6 shares is 3-27-15. | ||||||||||||||||||||||||||||||||||||||||||||||||||||||||||
| 2 | Based on average daily shares outstanding. | ||||||||||||||||||||||||||||||||||||||||||||||||||||||||||
| 3 | Total returns would have been lower had certain expenses not been reduced during the applicable periods. | ||||||||||||||||||||||||||||||||||||||||||||||||||||||||||
| 4 | Not annualized. | ||||||||||||||||||||||||||||||||||||||||||||||||||||||||||
| 5 | Less than $500,000. | ||||||||||||||||||||||||||||||||||||||||||||||||||||||||||
| 6 | Annualized. | ||||||||||||||||||||||||||||||||||||||||||||||||||||||||||
| 7 | The portfolio turnover is shown for the period from 4-1-14 to 3-31-15. | ||||||||||||||||||||||||||||||||||||||||||||||||||||||||||
| Class NAV Shares Period ended | 3-31-16 | 3-31-15 | 1 | |||||||||||||||||||||||||||||||||||||||||||||||
| Per share operating performance | ||||||||||||||||||||||||||||||||||||||||||||||||||
| Net asset value, beginning of period | $10.37 | $11.08 | ||||||||||||||||||||||||||||||||||||||||||||||||
| Net investment income2 | 0.68 | 0.40 | ||||||||||||||||||||||||||||||||||||||||||||||||
| Net realized and unrealized loss on investments | (1.40 | ) | (0.69 | ) | ||||||||||||||||||||||||||||||||||||||||||||||
| Total from investment operations | (0.72 | ) | (0.29 | ) | ||||||||||||||||||||||||||||||||||||||||||||||
| Less distributions | ||||||||||||||||||||||||||||||||||||||||||||||||||
| From net investment income | (0.73 | ) | (0.42 | ) | ||||||||||||||||||||||||||||||||||||||||||||||
| Net asset value, end of period | $8.92 | $10.37 | ||||||||||||||||||||||||||||||||||||||||||||||||
| Total return (%)3 | (7.08 | ) | (2.58 | ) 4 | ||||||||||||||||||||||||||||||||||||||||||||||
| Ratios and supplemental data | ||||||||||||||||||||||||||||||||||||||||||||||||||
| Net assets, end of period (in millions) | $67 | $113 | ||||||||||||||||||||||||||||||||||||||||||||||||
| Ratios (as a percentage of average net assets): | ||||||||||||||||||||||||||||||||||||||||||||||||||
| Expenses before reductions | 0.71 | 0.67 | 5 | |||||||||||||||||||||||||||||||||||||||||||||||
| Expenses including reductions | 0.70 | 0.67 | 5 | |||||||||||||||||||||||||||||||||||||||||||||||
| Net investment income | 7.06 | 6.40 | 5 | |||||||||||||||||||||||||||||||||||||||||||||||
| Portfolio turnover (%) | 41 | 28 | 6 | |||||||||||||||||||||||||||||||||||||||||||||||
| 1 | The inception date for Class NAV shares is 8-28-14. | ||||||||||||||||||||||||||||||||||||||||||||||||||||||||||
| 2 | Based on average daily shares outstanding. | ||||||||||||||||||||||||||||||||||||||||||||||||||||||||||
| 3 | Total returns would have been lower had certain expenses not been reduced during the applicable periods. | ||||||||||||||||||||||||||||||||||||||||||||||||||||||||||
| 4 | Not annualized. | ||||||||||||||||||||||||||||||||||||||||||||||||||||||||||
| 5 | Annualized. | ||||||||||||||||||||||||||||||||||||||||||||||||||||||||||
| 6 | The portfolio turnover is shown for the period from 4-1-14 to 3-31-15. | ||||||||||||||||||||||||||||||||||||||||||||||||||||||||||
Note 1 — Organization
John Hancock Core High Yield Fund (the fund) is a series of John Hancock Funds III (the Trust), an open-end management investment company organized as a Massachusetts business trust and registered under the Investment Company Act of 1940, as amended (the 1940 Act). The investment objective of the fund is to seek total return, consisting of a high level of current income and capital appreciation.
The fund may offer multiple classes of shares. The shares currently offered are detailed in the Statement of assets and liabilities. Class A and Class C shares are offered to all investors. Class I shares are offered to institutions and certain investors. Class R2 and Class R4 shares are available only to certain retirement plans. Class R6 shares are available only to certain retirement plans, institutions and other investors. Class NAV shares are offered to John Hancock affiliated funds of funds and certain 529 plans. Shareholders of each class have exclusive voting rights to matters that affect that class. The distribution and service fees, if any, transfer agent fees, state registration fees and printing and postage for each class may differ.
Note 2 — Significant accounting policies
The financial statements have been prepared in conformity with accounting principles generally accepted in the United States of America (US GAAP), which require management to make certain estimates and assumptions as of the date of the financial statements. Actual results could differ from those estimates and those differences could be significant. The fund qualifies as an investment company under Topic 946 of Accounting Standards Codification of US GAAP.
Events or transactions occurring after the end of the fiscal period through the date that the financial statements were issued have been evaluated in the preparation of the financial statements. The following summarizes the significant accounting policies of the fund:
Security valuation. Investments are stated at value as of the scheduled close of regular trading on the New York Stock Exchange (NYSE), normally at 4:00 p.m., Eastern Time. In case of emergency or other disruption resulting in the NYSE not opening for trading or the NYSE closing at a time other than the regularly scheduled close, the net asset value (NAV) may be determined as of the regularly scheduled close of the NYSE pursuant to the fund's Valuation Policies and Procedures. The time at which shares and transactions are priced and until which orders are accepted may vary to the extent permitted by the Securities and Exchange Commission and applicable regulations.
In order to value the securities, the fund uses the following valuation techniques: Debt obligations are valued based on the evaluated prices provided by an independent pricing vendor or from broker-dealers. Independent pricing vendors utilize matrix pricing which takes into account factors such as institutional-size trading in similar groups of securities, yield, quality, coupon rate, maturity, type of issue, trading characteristics and other market data, as well as broker supplied prices. Equity securities held by the fund are typically valued at the last sale price or official closing price on the exchange or principal market where the security was acquired or most likely will be sold. In the event there were no sales during the day or closing prices are not available, the securities are valued using the last available bid price. Foreign securities and currencies, including forward foreign currency contracts, are valued in U.S. dollars, based on foreign currency exchange rates supplied by an independent pricing vendor.
In certain instances, the Pricing Committee may determine to value equity securities using prices obtained from another exchange or market if trading on the exchange or market on which prices are typically obtained did not open for trading as scheduled, or if trading closed earlier than scheduled, and trading occurred as normal on another exchange or market.
Other portfolio securities and assets, for which reliable market quotations are not readily available, are valued at fair value as determined in good faith by the fund's Pricing Committee following procedures established by the Board of Trustees. The frequency with which these fair valuation procedures are used cannot be predicted and fair value of securities may differ significantly from the value that would have been used had a ready market for such securities existed. Trading in foreign securities may be completed before the scheduled daily close of trading on the NYSE. Significant events at the issuer or market level may affect the values of securities between the time when the valuation of the securities is generally determined
and the close of the NYSE. If a significant event occurs, these securities may be fair valued, as determined in good faith by the fund's Pricing Committee, following procedures established by the Board of Trustees.
The fund uses a three-tier hierarchy to prioritize the pricing assumptions, referred to as inputs, used in valuation techniques to measure fair value. Level 1 includes securities valued using quoted prices in active markets for identical securities. Level 2 includes securities valued using other significant observable inputs. Observable inputs may include quoted prices for similar securities, interest rates, prepayment speeds and credit risk. Prices for securities valued using these inputs are received from independent pricing vendors and brokers and are based on an evaluation of the inputs described. Level 3 includes securities valued using significant unobservable inputs when market prices are not readily available or reliable, including the fund's own assumptions in determining the fair value of investments. Factors used in determining value may include market or issuer specific events or trends, changes in interest rates and credit quality. The inputs or methodology used for valuing securities are not necessarily an indication of the risks associated with investing in those securities. Changes in valuation techniques and related inputs may result in transfers into or out of an assigned level within the disclosure hierarchy. The following is a summary of the values by input classification of the fund's investments as of March 31, 2016, by major security category or type:
| Total value at 3-31-16 | Level 1 quoted price | Level 2 significant observable inputs | Level 3 significant unobservable inputs | ||||||||||||||
| Corporate bonds | |||||||||||||||||
| Consumer discretionary | $73,334,254 | — | $73,334,254 | — | |||||||||||||
| Consumer staples | 26,478,380 | — | 26,478,380 | — | |||||||||||||
| Energy | 37,085,944 | — | 37,085,944 | — | |||||||||||||
| Financials | 79,459,915 | — | 79,459,915 | — | |||||||||||||
| Health care | 13,695,688 | — | 13,695,688 | — | |||||||||||||
| Industrials | 48,033,829 | — | 48,033,829 | — | |||||||||||||
| Information technology | 21,635,469 | — | 21,635,469 | — | |||||||||||||
| Materials | 62,007,119 | — | 62,007,119 | — | |||||||||||||
| Telecommunication services | 46,431,412 | — | 46,431,412 | — | |||||||||||||
| Utilities | 23,738,225 | — | 23,738,225 | — | |||||||||||||
| Term loans | |||||||||||||||||
| Consumer discretionary | 6,248,331 | — | 6,248,331 | — | |||||||||||||
| Consumer staples | 4,097,467 | — | 4,097,467 | — | |||||||||||||
| Energy | 1,337,529 | — | 1,337,529 | — | |||||||||||||
| Financials | 7,562,153 | — | 7,562,153 | — | |||||||||||||
| Health care | 1,977,375 | — | 1,977,375 | — | |||||||||||||
| Industrials | 3,509,707 | — | 3,509,707 | — | |||||||||||||
| Information technology | 2,800,328 | — | 2,800,328 | — | |||||||||||||
| Telecommunication services | 5,326,258 | — | 5,326,258 | — | |||||||||||||
| Common stocks | |||||||||||||||||
| Energy | 40,960 | — | — | $40,960 | |||||||||||||
| Financials | 1,338,000 | — | 1,338,000 | — | |||||||||||||
| Short-term investments | 1,326,000 | — | 1,326,000 | — | |||||||||||||
| Total investments in securities | $467,464,343 | — | $467,423,383 | $40,960 | |||||||||||||
| Other financial instruments | |||||||||||||||||
| Forward foreign currency contracts | ($402,907 | ) | — | ($402,907 | ) | — | |||||||||||
Repurchase agreements. The fund may enter into repurchase agreements. When the fund enters into a repurchase agreement, it receives collateral that is held in a segregated account by the fund's custodian. The collateral amount is
marked-to-market and monitored on a daily basis to ensure that the collateral held is in an amount not less than the principal amount of the repurchase agreement plus any accrued interest. Collateral received by the fund for repurchase agreements is disclosed in the Fund's investments as part of the caption related to the repurchase agreement.
Repurchase agreements are typically governed by the terms and conditions of the Master Repurchase Agreement and/or Global Master Repurchase Agreement (collectively, MRA). Upon an event of default, the non-defaulting party may close out all transactions traded under the MRA and net amounts owed. Absent an event of default, assets and liabilities resulting from repurchase agreements are not offset in the Statement of assets and liabilities. In the event of a default by the counterparty, realization of the collateral proceeds could be delayed, during which time the collateral value may decline or the counterparty may have insufficient assets to pay back claims resulting from close-out of the transactions.
Term loans (Floating rate loans). The fund may invest in term loans, which often include debt securities that are rated below investment grade at the time of purchase. Term loans are generally subject to legal or contractual restrictions on resale and generally have longer settlement periods than conventional debt securities. Term loans involve special types of risk, including credit risk, interest-rate risk, counterparty risk, risk associated with extended settlement, and the risks of being a lender. The liquidity of term loans, including the volume and frequency of secondary market trading in such loans, varies significantly over time and among individual loans. During periods of infrequent trading, valuing a term loan can be more difficult and buying and selling a term loan at an acceptable price can be more difficult and delayed, which could result in a loss.
The fund's ability to receive payments of principal, interest and other amounts in connection with term loans will depend primarily on the financial condition of the borrower. The fund's failure to receive scheduled payments on a term loan due to a default, bankruptcy or other reason would adversely affect the fund's income and would likely reduce the value of its assets. Transactions in loan investments typically take a significant amount of time (i.e., seven days or longer) to settle. This could pose a liquidity risk to the fund and, if the fund's exposure to such investments is substantial, could impair the fund's ability to meet redemptions. Because term loans may not be rated by independent credit rating agencies, a decision to invest in a particular loan could depend exclusively on the subadvisor's credit analysis of the borrower and/or term loan agents. There is greater risk that the fund may have limited rights to enforce the terms of an underlying loan than for other types of debt instruments.
Security transactions and related investment income. Investment security transactions are accounted for on a trade date plus one basis for daily NAV calculations. However, for financial reporting purposes, investment transactions are reported on trade date. Interest income includes coupon interest and amortization/accretion of premiums/discounts on debt securities. Debt obligations may be placed in a non-accrual status and related interest income may be reduced by stopping current accruals and writing off interest receivable when the collection of all or a portion of interest has become doubtful. Dividend income is recorded on the ex-date, except for dividends of foreign securities where the dividend may not be known until after the ex-date. In those cases, dividend income, net of withholding taxes, is recorded when the fund becomes aware of the dividends. Foreign taxes are provided for based on the fund's understanding of the tax rules and rates that exist in the foreign markets in which it invests. Gains and losses on securities sold are determined on the basis of identified cost and may include proceeds from litigation.
Foreign currency translation. Assets, including investments and liabilities denominated in foreign currencies, are translated into U.S. dollar values each day at the prevailing exchange rate. Purchases and sales of securities, income and expenses are translated into U.S. dollars at the prevailing exchange rate on the date of the transaction. The effect of changes in foreign currency exchange rates on the value of securities is reflected as a component of the realized and unrealized gains (losses) on investments.
Funds that invest internationally generally carry more risk than funds that invest strictly in U.S. securities. Risks can result from differences in economic and political conditions, regulations, market practices (including higher transaction costs), accounting standards and other factors. Foreign investments are also subject to a decline in the value of a foreign currency versus the U.S. dollar, which reduces the dollar value of securities denominated in that currency.
Foreign taxes. The fund may be subject to withholding tax on income and/or capital gains or repatriation taxes imposed by certain countries in which the fund invests. Taxes are accrued based upon investment income, realized gains or unrealized appreciation.
Line of credit. The fund may borrow from banks for temporary or emergency purposes, including meeting redemption requests that otherwise might require the untimely sale of securities. Pursuant to the fund's custodian agreement, the custodian may loan money to the fund to make properly authorized payments. The fund is obligated to repay the custodian for any overdraft, including any related costs or expenses. The custodian may have a lien, security interest or security entitlement in any fund property that is not otherwise segregated or pledged, to the extent of any overdraft, and to the maximum extent permitted by law.
The fund and other affiliated funds have entered into a syndicated line of credit agreement, with Citibank, N.A. (Citibank) as the administrative agent, that enables them to participate in a $750 million unsecured committed line of credit. Prior to June 30, 2015, the fund and other affiliated funds had an agreement with Citibank that enabled them to participate in a $300 million unsecured committed line of credit. A commitment fee, payable at the end of each calendar quarter, based on the average daily unused portion of the line of credit, is charged to each participating fund on a pro rata basis and is reflected in Other expenses on the Statement of operations. Commitment fees for the year ended March 31, 2016 were $2,064. For the year ended March 31, 2016, the fund had no borrowings under either line of credit.
Expenses. Within the John Hancock group of funds complex, expenses that are directly attributable to an individual fund are allocated to such fund. Expenses that are not readily attributable to a specific fund are allocated among all funds in an equitable manner, taking into consideration, among other things, the nature and type of expense and the fund's relative net assets. Expense estimates are accrued in the period to which they relate and adjustments are made when actual amounts are known.
Class allocations. Income, common expenses and realized and unrealized gains (losses) are determined at the fund level and allocated daily to each class of shares based on the net assets of the class. Class-specific expenses, such as distribution and service fees, if any, and transfer agent fees for all classes, are calculated daily at the class level based on the net assets of each class and the specific expense rates applicable to each class. Through June 30, 2015, class-specific expenses, such as state registration fees and printing and postage, for all classes, were calculated daily at the class level based on the net assets of each class and the specific expense rates applicable to each class.
Federal income taxes. The fund intends to continue to qualify as a regulated investment company by complying with the applicable provisions of the Internal Revenue Code and will not be subject to federal income tax on taxable income that is distributed to shareholders. Therefore, no federal income tax provision is required.
For federal income tax purposes, as of March 31, 2016, the fund has a short-term capital loss carryforward of $7,393,376 and a long-term capital loss carryforward of $47,914,735 available to offset future net realized capital gains. These carryforwards do not expire. Qualified late year ordinary losses of $2,760,810 are being deferred and are treated as occurring on April 1, 2016, the first day of the fund's next taxable year.
As of March 31, 2016, the fund had no uncertain tax positions that would require financial statement recognition, derecognition or disclosure. The fund's federal tax returns are subject to examination by the Internal Revenue Service for a period of three years.
Distribution of income and gains. Distributions to shareholders from net investment income and net realized gains, if any, are recorded on the ex-date. The fund generally declares dividends daily and pays them monthly. Capital gain distributions, if any, are distributed annually. The tax character of distributions for the years ended March 31, 2016 and 2015 was as follows:
| March 31, 2016 | March 31, 2015 | |
| Ordinary Income | $49,567,928 | $44,095,385 |
Distributions paid by the fund with respect to each class of shares are calculated in the same manner, at the same time and in the same amount, except for the effect of class level expenses that may be applied differently to each class. As of March 31, 2016, the fund has no distributable earnings on a tax basis.
Such distributions and distributable earnings, on a tax basis, are determined in conformity with income tax regulations, which may differ from US GAAP. Distributions in excess of tax basis earnings and profits, if any, are reported in the fund's financial statements as a return of capital.
Capital accounts within the financial statements are adjusted for permanent book-tax differences. These adjustments have no impact on net assets or the results of operations. Temporary book-tax differences, if any, will reverse in a subsequent period. Book-tax differences are primarily attributable to foreign currency transactions, characterization of distributions, derivative transactions and amortization and accretion on debt securities.
Note 3 — Derivative instruments
The fund may invest in derivatives in order to meet its investment objective. Derivatives include a variety of different instruments that may be traded in the OTC market, on a regulated exchange or through a clearing facility. The risks in using derivatives vary depending upon the structure of the instruments, including the use of leverage, optionality, the liquidity or lack of liquidity of the contract, the creditworthiness of the counterparty or clearing organization and the volatility of the position. Some derivatives involve risks that are potentially greater than the risks associated with investing directly in the referenced securities or other referenced underlying instrument. Specifically, the fund is exposed to the risk that the counterparty to an OTC derivatives contract will be unable or unwilling to make timely settlement payments or otherwise honor its obligations. OTC derivatives transactions typically can only be closed out with the other party to the transaction.
Forward foreign currency contracts are typically traded through the OTC market. Certain forwards are regulated by the Commodity Futures Trading Commission (the CFTC) as swaps. Derivative counterparty risk is managed through an ongoing evaluation of the creditworthiness of all potential counterparties and, if applicable, designated clearing organizations. The fund attempts to reduce its exposure to counterparty risk for derivatives traded in the OTC market, whenever possible, by entering into an International Swaps and Derivatives Association (ISDA) Master Agreement with each of its OTC counterparties. The ISDA gives each party to the agreement the right to terminate all transactions traded under the agreement if there is certain deterioration in the credit quality or contractual default of the other party, as defined in the ISDA. Upon an event of default or a termination of the ISDA, the non-defaulting party has the right to close out all transactions and to net amounts owed.
Forward foreign currency contracts. A forward foreign currency contract is an agreement between two parties to buy and sell specific currencies at a price that is set on the date of the contract. The forward contract calls for delivery of the currencies on a future date that is specified in the contract. Risks related to the use of forwards include the possible failure of counterparties to meet the terms of the forward agreement, the failure of the counterparties to timely post collateral if applicable, the risk that currency movements will not favor the fund thereby reducing the fund's total return, and the potential for losses in excess of the amounts recognized on the Statement of assets and liabilities.
The market value of a forward foreign currency contract fluctuates with changes in foreign currency exchange rates. Forward foreign currency contracts are marked-to-market daily and the change in value is recorded by the fund as an unrealized gain or loss. Realized gains or losses, equal to the difference between the value of the contract at the time it was opened and the value at the time it was closed, are recorded upon delivery or receipt of the currency or settlement with the counterparty.
During the year ended March 31, 2016, the fund used forward foreign currency contracts to manage currency exposure and as a substitute for securities purchased. The fund held forward foreign currency contracts with U.S. Dollar notional values ranging from $12.4 million to $20.3 million, as measured at each quarter end. The following table summarizes the contracts held at March 31, 2016:
| Contract to buy | Contract to sell | Counterparty | Contractual settlement date | Unrealized appreciation | Unrealized depreciation | Net unrealized appreciation/ (depreciation) | ||||||||||||||||||||||||||
| CAD | 9,820,000 | USD | 7,214,488 | State Street Bank and Trust Company | 5/18/2016 | $347,009 | — | $347,009 | ||||||||||||||||||||||||
| USD | 131,854 | CAD | 170,000 | Bank of Montreal | 5/18/2016 | 952 | — | 952 | ||||||||||||||||||||||||
| USD | 12,947,438 | CAD | 17,789,780 | Royal Bank of Canada | 5/18/2016 | — | ($750,868 | ) | (750,868 | ) | ||||||||||||||||||||||
| $347,961 | ($750,868 | ) | ($402,907 | ) | ||||||||||||||||||||||||||||
Fair value of derivative instruments by risk category
The table below summarizes the fair value of derivatives held by the fund at March 31, 2016 by risk category:
| Risk | Statement of assets and liabilities location | Financial instruments location | Asset derivatives fair value | Liabilities derivatives fair value | ||||||||||
| Foreign currency | Unrealized appreciation/depreciation on forward foreign currency contracts | Forward foreign currency contracts | $347,961 | ($750,868 | ) |
For financial reporting purposes, the fund does not offset OTC derivative assets or liabilities that are subject to master netting arrangements, as defined by the ISDAs, in the Statement of assets and liabilities. In the event of default by the counterparty or a termination of the agreement, the ISDA allows an offset of amounts across the various transactions between the fund and the applicable counterparty.
Effect of derivative instruments on the Statement of operations
The table below summarizes the net realized gain (loss) included in the net increase (decrease) in net assets from operations, classified by derivative instrument and risk category, for the year ended March 31, 2016:
| Risk | Statement of operations location | Investments and foreign currency transactions* |
| Foreign currency | Net realized gain (loss) on: | $1,430,789 |
*Realized gain/loss associated with forward foreign currency contracts is included in this caption on the Statement of operations.
The table below summarizes the net change in unrealized appreciation (depreciation) included in the net increase (decrease) in net assets from operations, classified by derivative instrument and risk category, for the year ended March 31, 2016:
| Risk | Statement of operations location | Investments and translation of assets and liabilities in foreign currencies* | ||||||
| Foreign currency | Change in unrealized appreciation (depreciation) | ($716,782 | ) |
*Change in unrealized appreciation/depreciation associated with forward foreign currency contracts is included in this caption on the Statement of operations.
Note 4 — Guarantees and indemnifications
Under the Trust's organizational documents, its Officers and Trustees are indemnified against certain liabilities arising out of the performance of their duties to the Trust, including the fund. Additionally, in the normal course of business, the fund enters into contracts with service providers that contain general indemnification clauses. The fund's maximum exposure under these arrangements is unknown, as this would involve future claims that may be made against the fund that have not yet occurred. The risk of material loss from such claims is considered remote.
Note 5 — Fees and transactions with affiliates
John Hancock Advisers, LLC (the Advisor) serves as investment advisor for the fund. John Hancock Funds, LLC (the Distributor), an affiliate of the Advisor, serves as principal underwriter of the fund. The Advisor and the Distributor are indirect, wholly owned subsidiaries of Manulife Financial Corporation (MFC).
Management fee. The fund has an investment management agreement with the Advisor under which the fund pays a daily management fee to the Advisor equivalent on an annual basis to the sum of: (a) 0.650% of the first $250 million of the fund's aggregate daily net assets; (b) 0.625% of the next $250 million of the fund's aggregate daily net assets; (c) 0.600% of the next $500 million of the fund's aggregate daily net assets; (d) 0.550% of the next $1.5 billion of the fund's aggregate daily net assets; and (e) 0.525% of the fund's aggregate daily net assets in excess of $2.5 billion. Aggregate net assets generally include the net assets of the fund and other funds identified in the management agreement. The Advisor has a subadvisory agreement with John Hancock Asset Management a division of Manulife Asset Management (North America) Limited, an indirectly owned subsidiary of MFC and an affiliate of the Advisor. The fund is not responsible for payment of the subadvisory fees.
The Advisor has contractually agreed to waive a portion of its management fee and/or reimburse expenses for certain funds of the John Hancock funds complex, including the fund (the participating portfolios). This waiver is based upon aggregate net assets of all the participating portfolios. The amount of the reimbursement is calculated daily and allocated among all the participating portfolios in proportion to the daily net assets of each fund. During the year ended March 31, 2016, this waiver amounted to 0.01% of the fund's average net assets. This arrangement may be amended or terminated at any time by the Advisor upon notice to the fund and with the approval of the Board of Trustees.
The Advisor has contractually agreed to waive all or a portion of its management fee and reimburse or pay operating expenses of the fund to the extent necessary to maintain the fund's total operating expenses at 0.87%,1.32% and 1.07% for Class I, Class R2 and Class R4 shares, respectively. This agreement excludes certain expenses such as taxes, brokerage commissions, interest expense, litigation and indemnification expenses and other extraordinary expenses not incurred in the ordinary course of the fund's business, acquired fund fees and expenses paid indirectly and short dividend expense. The current expense limitation agreement expires on June 30, 2016, unless renewed by the mutual agreement of the fund and the Advisor based upon a determination that this is appropriate under the circumstances at the time. Prior to July 1, 2015, Class A and Class C shares had fee waivers and/or reimbursement such that the expenses would not exceed 1.18% and 1.93% for Class A and Class C shares, respectively. In addition, effective September 1, 2015, the Advisor voluntarily agreed to waive all or a portion of its management fee and/or reimburse or pay operating expenses of the fund to the extent necessary to maintain the fund's total operating expenses at 1.21% and 1.06%, for Class R2 and Class R4 shares, respectively, excluding certain expenses such as taxes, brokerage commissions, interest expense, litigation and indemnification expenses and other extraordinary expenses not incurred in the ordinary course of the fund's business, acquired fund fees and expenses paid indirectly and short dividend expense. These expense limitations shall remain in effect until terminated by the Advisor on notice to the fund.
The Advisor has contractually agreed to waive and/or reimburse all class-specific expenses for Class R6 shares of the fund to the extent they exceed 0.00% of average annual net assets attributable to Class R6 shares, on an annualized basis. The waiver expires on June 30, 2016, unless renewed by mutual agreement of the fund and the Advisor based upon a determination that this is appropriate under the circumstances at that time.
For the year ended March 31, 2016, these expense reductions amounted to the following:
| Class | Expense reduction | Class | Expense reduction | |
| Class A | $24,027 | Class R4 | $3,436 | |
| Class C | 4,473 | Class R6 | 3,907 | |
| Class I | 17,009 | Class NAV | 6,729 | |
| Class R2 | 3,349 | Total | $62,930 |
The investment management fees, including the impact of the waivers and reimbursements as described above, incurred for the year ended March 31, 2016 were equivalent to a net annual effective rate of 0.62% of the fund's average daily net assets.
Accounting and legal services. Pursuant to a service agreement, the fund reimburses the Advisor for all expenses associated with providing the administrative, financial, legal, accounting and recordkeeping services to the fund, including the preparation of all tax returns, periodic reports to shareholders and regulatory reports, among other services. These expenses are allocated to each share class based on its relative net assets at the time the expense was incurred. These accounting and legal services fees incurred for the year ended March 31, 2016 amounted to an annual rate of 0.01% of the fund's average daily net assets.
Distribution and service plans. The fund has a distribution agreement with the Distributor. The fund has adopted distribution and service plans with respect to Class A, Class C, Class R2 and Class R4 shares pursuant to Rule 12b-1 under the 1940 Act, to pay the Distributor for services provided as the distributor of shares of the fund. In addition, under a service plan for Class R2 and Class R4 shares, the fund pays for certain other services. The fund may pay up to the following contractual rates of distribution and service fees under these arrangements, expressed as an annual percentage of average daily net assets for each class of the fund's shares:
| Class | Rule 12b-1 fee | Service fees |
| Class A | 0.30% | — |
| Class C | 1.00% | — |
| Class R2 | 0.25% | 0.25% |
| Class R4 | 0.25% | 0.10% |
Class A shares are currently charged 0.25% for Rule 12b-1 fees.
The fund's Distributor has contractually agreed to waive 0.10% of Rule 12b-1 fees for Class R4 shares. The current waiver agreement expires on June 30, 2016, unless renewed by mutual agreement of the fund and the Distributor based upon a determination that this is appropriate under the circumstances at the time. This contractual waiver amounted to $93 for Class R4 shares for the year ended March 31, 2016.
Sales charges. Class A shares are assessed up-front sales charges, which resulted in payments to the Distributor amounting to $699,404 for the year ended March 31, 2016. Of this amount, $96,857 was retained and used for printing prospectuses, advertising, sales literature and other purposes, $595,977 was paid as sales commissions to broker-dealers and $6,570 was paid as sales commissions to sales personnel of Signator Investors, Inc., a broker-dealer affiliate of the Advisor.
Class A and Class C shares may be subject to contingent deferred sales charges (CDSCs). Certain Class A shares that are acquired through purchases of $1 million or more and are redeemed within one year of purchase are subject to a 1.00% sales charge. Class C shares that are redeemed within one year of purchase are subject to a 1.00% CDSC. CDSCs are applied to the lesser of the current market value at the time of redemption or the original purchase cost of the shares being redeemed. Proceeds from CDSCs are used to compensate the Distributor for providing distribution-related services in connection with the sale of these shares. During the year ended March 31, 2016, CDSCs received by the Distributor amounted to $2,485 and $19,638 for Class A and Class C shares, respectively.
Transfer agent fees. The fund has a transfer agent agreement with John Hancock Signature Services, Inc. (Signature Services), an affiliate of the Advisor. The transfer agent fees paid to Signature Services are determined based on the cost to Signature Services (Signature Services Cost) of providing recordkeeping services. It also includes out-of-pocket expenses, including payments made to third-parties for recordkeeping services provided to their clients who invest in one or more John Hancock funds. In addition, Signature Services Cost may be reduced by certain fees that Signature Services receives in connection with retirement and small accounts. Signature Services Cost is calculated monthly and allocated, as applicable, to five categories of share classes: Retail Share and Institutional Share Classes of Non-Municipal Bond Funds, Class R6 Shares,
Retirement Share Classes and Municipal Bond Share Classes. Within each of these categories, the applicable costs are allocated to the affected John Hancock affiliated funds and/or classes, based on the relative average daily net assets.
Class level expenses. Class level expenses for the year ended March 31, 2016 were:
| Class | Distribution and service fees | Transfer agent fees | State registration fees | Printing and postage |
| Class A | $795,736 | $403,785 | $15,535 | $7,943 |
| Class C | 593,223 | 75,314 | 6,027 | 1,226 |
| Class I | — | 254,683 | 14,953 | 4,086 |
| Class R2 | 232 | 15 | 3,606 | 8 |
| Class R4 | 232 | 15 | 3,606 | 8 |
| Class R6 | — | 17 | 3,874 | 7 |
| Total | $1,389,423 | $733,829 | $47,601 | $13,278 |
Effective July 1, 2015, state registration fees and printing and postage are treated as fund level expenses and are not included in the table above. For the period July 1, 2015 to March 31, 2016, state registration fees and printing and postage amounted to $108,167 and $50,428, respectively.
Trustee expenses. The fund compensates each Trustee who is not an employee of the Advisor or its affiliates. The costs of paying Trustee compensation and expenses are allocated to each fund based on its net assets relative to other funds within the John Hancock group of funds complex.
Interfund lending program Pursuant to an Exemptive Order issued by the SEC, the fund, along with certain other funds advised by the Advisor, may participate in an interfund lending program. This program provides an alternative credit facility allowing the funds to borrow from, or lend money to, other participating affiliated funds. At period end, no interfund loans were outstanding. The fund's activity in this program during the period for which loans were outstanding was as follows:
| Borrower or lender | Weighted average loan balance | Days outstanding | Weighted average interest rate | Interest income |
| Lender | $26,500,000 | 1 | 0.46% | $339 |
Note 6 — Fund share transactions
Transactions in fund shares for the years ended March 31, 2016 and 2015 were as follows:
| Year ended 3-31-16 | Year ended 3-31-15 | |||||||||||||||||||||||||
| Shares | Amount | Shares | Amount | |||||||||||||||||||||||
| Class A shares | ||||||||||||||||||||||||||
| Sold | 8,238,328 | $79,682,372 | 22,340,271 | $241,569,465 | ||||||||||||||||||||||
| Distributions reinvested | 2,283,743 | 21,677,352 | 1,997,259 | 21,385,159 | ||||||||||||||||||||||
| Repurchased | (18,233,718 | ) | (172,858,434 | ) | (16,744,517 | ) | (178,572,004 | ) | ||||||||||||||||||
| Net increase (decrease) | (7,711,647 | ) | ($71,498,710 | ) | 7,593,013 | $84,382,620 | ||||||||||||||||||||
| Class C shares | ||||||||||||||||||||||||||
| Sold | 1,639,390 | $15,897,798 | 4,676,512 | $50,683,255 | ||||||||||||||||||||||
| Distributions reinvested | 391,305 | 3,697,636 | 249,024 | 2,651,961 | ||||||||||||||||||||||
| Repurchased | (2,408,134 | ) | (22,793,426 | ) | (1,294,897 | ) | (13,633,334 | ) | ||||||||||||||||||
| Net increase (decrease) | (377,439 | ) | ($3,197,992 | ) | 3,630,639 | $39,701,882 | ||||||||||||||||||||
| Year ended 3-31-16 | Year ended 3-31-15 | |||||||||||||||||||||||||
| Shares | Amount | Shares | Amount | |||||||||||||||||||||||
| Class I shares | ||||||||||||||||||||||||||
| Sold | 12,609,508 | $124,812,848 | 29,631,814 | $321,444,280 | ||||||||||||||||||||||
| Distributions reinvested | 1,716,341 | 16,390,711 | 1,319,756 | 14,053,244 | ||||||||||||||||||||||
| Repurchased | (28,483,388 | ) | (267,210,065 | ) | (14,979,167 | ) | (159,837,253 | ) | ||||||||||||||||||
| Net increase (decrease) | (14,157,539 | ) | ($126,006,506 | ) | 15,972,403 | $175,660,271 | ||||||||||||||||||||
| Class R2 shares1 | ||||||||||||||||||||||||||
| Sold | — | — | 9,662 | $100,000 | ||||||||||||||||||||||
| Net increase | — | — | 9,662 | $100,000 | ||||||||||||||||||||||
| Class R4 shares1 | ||||||||||||||||||||||||||
| Sold | — | — | 9,662 | $100,000 | ||||||||||||||||||||||
| Net increase | — | — | 9,662 | $100,000 | ||||||||||||||||||||||
| Class R6 shares1 | ||||||||||||||||||||||||||
| Sold | 6,500 | $56,186 | 9,662 | $100,000 | ||||||||||||||||||||||
| Distributions reinvested | 96 | 831 | — | — | ||||||||||||||||||||||
| Repurchased | (1,140 | ) | (10,181 | ) | — | — | ||||||||||||||||||||
| Net increase | 5,456 | $46,836 | 9,662 | $100,000 | ||||||||||||||||||||||
| Class NAV shares2 | ||||||||||||||||||||||||||
| Sold | 210,393 | $2,100,332 | 11,716,804 | $129,314,621 | ||||||||||||||||||||||
| Distributions reinvested | 695,135 | 6,628,140 | 448,496 | 4,714,036 | ||||||||||||||||||||||
| Repurchased | (4,298,480 | ) | (41,636,153 | ) | (1,263,386 | ) | (13,216,770 | ) | ||||||||||||||||||
| Net increase (decrease) | (3,392,952 | ) | ($32,907,681 | ) | 10,901,914 | $120,811,887 | ||||||||||||||||||||
| Total net increase (decrease) | (25,634,121 | ) | ($233,564,053 | ) | 38,126,955 | $420,856,660 | ||||||||||||||||||||
1 The inception date for Class R2, Class R4 and Class R6 shares is 3-27-15.
2 The inception date for Class NAV shares is 8-28-14.
Affiliates of the fund owned 100%, 100%, 64% and 100% of shares of beneficial interest of Class R2, Class R4, Class R6 and Class NAV on March 31, 2016.
Note 7 — Purchase and sale of securities
Purchases and sales of securities, other than short-term investments, amounted to $269,666,039 and $486,755,075, respectively, for the year ended March 31, 2016.
Note 8 — Investment by affiliated funds
Certain investors in the fund are affiliated funds that are managed by the Advisor and its affiliates. The affiliated funds do not invest in the fund for the purpose of exercising management or control; however, this investment may represent a significant portion of the fund's net assets. At March 31, 2016, funds within the John Hancock group of funds complex held 13.9% of the fund's net assets. John Hancock Funds II Lifestyle Conservative Portfolio had an affiliated ownership of 9.2% of the fund's net assets.
Report of Independent Registered Public Accounting Firm
To the Board of Trustees and Shareholders of John Hancock Funds III and John Hancock Core High Yield Fund:
In our opinion, the accompanying statement of assets and liabilities, including the fund's investments, and the related statements of operations and of changes in net assets and the financial highlights present fairly, in all material respects, the financial position of John Hancock Core High Yield Fund (the "Fund") at March 31, 2016, the results of its operations for the year then ended, the changes in its net assets for each of the two years in the period then ended and the financial highlights for each of the periods indicated, in conformity with accounting principles generally accepted in the United States of America. These financial statements and financial highlights (hereafter referred to as "financial statements") are the responsibility of the Fund's management. Our responsibility is to express an opinion on these financial statements based on our audits. We conducted our audits of these financial statements in accordance with the standards of the Public Company Accounting Oversight Board (United States). Those standards require that we plan and perform the audit to obtain reasonable assurance about whether the financial statements are free of material misstatement. An audit includes examining, on a test basis, evidence supporting the amounts and disclosures in the financial statements, assessing the accounting principles used and significant estimates made by management, and evaluating the overall financial statement presentation. We believe that our audits, which included confirmation of securities at March 31, 2016 by correspondence with the custodian and brokers, and the application of alternative auditing procedures where securities purchased confirmations had not been received, provide a reasonable basis for our opinion.
PricewaterhouseCoopers LLP
Boston, Massachusetts
May 13, 2016
Unaudited
For federal income tax purposes, the following information is furnished with respect to the distributions of the fund, if any, paid during its taxable year ended March 31, 2016.
The fund reports the maximum amount allowable of its net taxable income as eligible for the corporate dividends-received deduction.
The fund reports the maximum amount allowable of its net taxable income as qualified dividend income as provided in the Jobs and Growth Tax Relief Reconciliation Act of 2003.
Eligible shareholders will be mailed a 2016 Form 1099-DIV in early 2017. This will reflect the tax character of all distributions paid in calendar year 2016.
Please consult a tax advisor regarding the tax consequences of your investment in the fund.
This chart provides information about the Trustees and Officers who oversee your John Hancock fund. Officers elected by the Trustees manage the day-to-day operations of the fund and execute policies formulated by the Trustees.
Independent Trustees
| Name, year of birth Position(s) held with fund Principal occupation(s) and other directorships during past 5 years | Trustee of the Trust since1 | Number of John Hancock funds overseen by Trustee |
| James M. Oates, Born: 1946 | 2012 | 230 |
| Trustee and Chairperson of the Board Managing Director, Wydown Group (financial consulting firm) (since 1994); Chairman and Director, Emerson Investment Management, Inc. (since 2000); Independent Chairman, Hudson Castle Group, Inc. (formerly IBEX Capital Markets, Inc.) (financial services company) (1997-2011); Director, Stifel Financial (since 1996); Director, Investor Financial Services Corporation (1995-2007); Director, Connecticut River Bancorp (1998-2014); Director, Virtus Funds (formerly Phoenix Mutual Funds) (since 1988). Trustee and Chairperson of the Board, John Hancock Collateral Trust and John Hancock Exchange-Traded Fund Trust (since 2015); Trustee and Chairperson of the Board, John Hancock retail funds3 (since 2012); Trustee (2005-2006 and since 2012) and Chairperson of the Board (since 2012), John Hancock Funds III; Trustee (since 2004) and Chairperson of the Board (since 2005), John Hancock Variable Insurance Trust; Trustee and Chairperson of the Board, John Hancock Funds II (since 2005). | ||
| Charles L. Bardelis,2 Born: 1941 | 2012 | 230 |
| Trustee Director, Island Commuter Corp. (marine transport). Trustee, John Hancock Collateral Trust and John Hancock Exchange-Traded Fund Trust (since 2015); Trustee, John Hancock retail funds3 (since 2012); Trustee, John Hancock Funds III (2005-2006 and since 2012); Trustee, John Hancock Variable Insurance Trust (since 1988); Trustee, John Hancock Funds II (since 2005). | ||
| Peter S. Burgess,2 Born: 1942 | 2012 | 230 |
| Trustee Consultant (financial, accounting, and auditing matters) (since 1999); Certified Public Accountant; Partner, Arthur Andersen (independent public accounting firm) (prior to 1999); Director, Lincoln Educational Services Corporation (since 2004); Director, Symetra Financial Corporation (2010-2016); Director, PMA Capital Corporation (2004-2010). Trustee, John Hancock Collateral Trust and John Hancock Exchange-Traded Fund Trust (since 2015); Trustee, John Hancock retail funds3 (since 2012); Trustee, John Hancock Funds III (2005-2006 and since 2012); Trustee, John Hancock Variable Insurance Trust and John Hancock Funds II (since 2005). | ||
| William H. Cunningham, Born: 1944 | 2006 | 230 |
| Trustee Professor, University of Texas, Austin, Texas (since 1971); former Chancellor, University of Texas System and former President of the University of Texas, Austin, Texas; Chairman (since 2009) and Director (since 2006), Lincoln National Corporation (insurance); Director, Southwest Airlines (since 2000); former Director, LIN Television (2009-2014). Trustee, John Hancock retail funds3 (since 1986); Trustee, John Hancock Variable Insurance Trust (since 2012); Trustee, John Hancock Funds II (2005-2006 and since 2012); Trustee, John Hancock Collateral Trust and John Hancock Exchange-Traded Fund Trust (since 2015). | ||
| Grace K. Fey, Born: 1946 | 2012 | 230 |
| Trustee Chief Executive Officer, Grace Fey Advisors (since 2007); Director and Executive Vice President, Frontier Capital Management Company (1988-2007); Director, Fiduciary Trust (since 2009). Trustee, John Hancock Collateral Trust and John Hancock Exchange-Traded Fund Trust (since 2015); Trustee, John Hancock retail funds3 (since 2012); Trustee, John Hancock Variable Insurance Trust and John Hancock Funds II (since 2008). | ||
Independent Trustees (continued)
| Name, year of birth Position(s) held with fund Principal occupation(s) and other directorships during past 5 years | Trustee of the Trust since1 | Number of John Hancock funds overseen by Trustee |
| Theron S. Hoffman,2 Born: 1947 | 2012 | 230 |
| Trustee Chief Executive Officer, T. Hoffman Associates, LLC (consulting firm) (since 2003); Director, The Todd Organization (consulting firm) (2003-2010); President, Westport Resources Management (investment management consulting firm) (2006-2008); Senior Managing Director, Partner, and Operating Head, Putnam Investments (2000-2003); Executive Vice President, The Thomson Corp. (financial and legal information publishing) (1997-2000). Trustee, John Hancock Collateral Trust and John Hancock Exchange-Traded Fund Trust (since 2015); Trustee, John Hancock retail funds3 (since 2012); Trustee, John Hancock Variable Insurance Trust and John Hancock Funds II (since 2008). | ||
| Deborah C. Jackson, Born: 1952 | 2008 | 230 |
| Trustee President, Cambridge College, Cambridge, Massachusetts (since 2011); Chief Executive Officer, American Red Cross of Massachusetts Bay (2002-2011); Board of Directors of Eastern Bank Corporation (since 2001); Board of Directors of Eastern Bank Charitable Foundation (since 2001); Board of Directors of American Student Assistance Corporation (1996-2009); Board of Directors of Boston Stock Exchange (2002-2008); Board of Directors of Harvard Pilgrim Healthcare (health benefits company) (2007-2011). Trustee, John Hancock retail funds3 (since 2008); Trustee, John Hancock Variable Insurance Trust and John Hancock Funds II (since 2012); Trustee, John Hancock Collateral Trust and John Hancock Exchange-Traded Fund Trust (since 2015). | ||
| Hassell H. McClellan, Born: 1945 | 2012 | 230 |
| Trustee Trustee, Virtus Variable Insurance Trust (formerly Phoenix Edge Series Funds) (since 2008); Director, The Barnes Group (since 2010); Associate Professor, The Wallace E. Carroll School of Management, Boston College (retired 2013). Trustee, John Hancock Collateral Trust and John Hancock Exchange-Traded Fund Trust (since 2015); Trustee, John Hancock retail funds3 (since 2012); Trustee, John Hancock Funds III (2005-2006 and since 2012); Trustee, John Hancock Variable Insurance Trust and John Hancock Funds II (since 2005). | ||
| Steven R. Pruchansky, Born: 1944 | 2006 | 230 |
| Trustee and Vice Chairperson of the Board Chairman and Chief Executive Officer, Greenscapes of Southwest Florida, Inc. (since 2000); Director and President, Greenscapes of Southwest Florida, Inc. (until 2000); Member, Board of Advisors, First American Bank (until 2010); Managing Director, Jon James, LLC (real estate) (since 2000); Partner, Right Funding, LLC (since 2014); Director, First Signature Bank & Trust Company (until 1991); Director, Mast Realty Trust (until 1994); President, Maxwell Building Corp. (until 1991). Trustee (since 1992) and Chairperson of the Board (2011-2012), John Hancock retail funds3; Trustee and Vice Chairperson of the Board, John Hancock retail funds3 John Hancock Variable Insurance Trust, and John Hancock Funds II (since 2012); Trustee, and Vice Chairperson of the Board, John Hancock Collateral Trust and John Hancock Exchange-Traded Fund Trust (since 2015). | ||
Independent Trustees (continued)
| Name, year of birth Position(s) held with fund Principal occupation(s) and other directorships during past 5 years | Trustee of the Trust since1 | Number of John Hancock funds overseen by Trustee |
| Gregory A. Russo, Born: 1949 | 2008 | 230 |
| Trustee Director and Audit Committee Chairman (since 2012), and Member, Audit Committee and Finance Committee (since 2011), NCH Healthcare System, Inc. (holding company for multi-entity healthcare system); Director and Member (since 2012) and Finance Committee Chairman (since 2014), The Moorings, Inc. (nonprofit continuing care community); Vice Chairman, Risk & Regulatory Matters, KPMG LLP (KPMG) (2002-2006); Vice Chairman, Industrial Markets, KPMG (1998-2002); Chairman and Treasurer, Westchester County, New York, Chamber of Commerce (1986-1992); Director, Treasurer, and Chairman of Audit and Finance Committees, Putnam Hospital Center (1989-1995); Director and Chairman of Fundraising Campaign, United Way of Westchester and Putnam Counties, New York (1990-1995). Trustee, John Hancock retail funds3 (since 2008); Trustee, John Hancock Variable Insurance Trust and John Hancock Funds II (since 2012); Trustee, John Hancock Collateral Trust and John Hancock Exchange-Traded Fund Trust (since 2015). | ||
Non-Independent Trustees4
| Name, year of birth Position(s) held with fund Principal occupation(s) and other directorships during past 5 years | Trustee of the Trust since1 | Number of John Hancock funds overseen by Trustee |
| James R. Boyle, Born: 1959 | 2015 | 230 |
| Non-Independent Trustee* Chairman and Chief Executive Officer, Zillion Group, Inc. (formerly HealthFleet, Inc.) (healthcare) (since 2014); Executive Vice President and Chief Executive Officer, U.S. Life Insurance Division of Genworth Financial, Inc. (insurance) (January 2014-July 2014); Senior Executive Vice President, Manulife Financial Corporation, President and Chief Executive Officer, John Hancock (1999-2012); Chairman and Director, John Hancock Advisers, LLC, John Hancock Funds, LLC, and John Hancock Investment Management Services, LLC (2005-2010). Trustee, John Hancock Collateral Trust and John Hancock Exchange-Traded Fund Trust (since 2015); Trustee, John Hancock retail funds3 (2005-2010; 2012-2014 and since 2015); Trustee, John Hancock Variable Insurance Trust and John Hancock Funds II (2005-2014 and since 2015). *Effective 3-10-15. | ||
| Craig Bromley, Born: 1966 | 2012 | 230 |
| Non-Independent Trustee President, John Hancock Financial Service (since 2012); Senior Executive Vice President and General Manager, U.S. Division, Manulife Financial Corporation (since 2012); President and Chief Executive Officer, Manulife Insurance Company (Manulife Japan) (2005-2012, including prior positions). Trustee, John Hancock retail funds,3 John Hancock Variable Insurance Trust, and John Hancock Funds II (since 2012); Trustee, John Hancock Collateral Trust and John Hancock Exchange-Traded Fund Trust (since 2015). | ||
| Warren A. Thomson, Born: 1955 | 2012 | 230 |
| Non-Independent Trustee Senior Executive Vice President and Chief Investment Officer, Manulife Financial Corporation and The Manufacturers Life Insurance Company (since 2009); Chairman, Manulife Asset Management (since 2001, including prior positions); Director and Chairman, Manulife Asset Management Limited (since 2006); Director and Chairman, Hancock Natural Resources Group, Inc. (since 2013). Trustee, John Hancock retail funds,3 John Hancock Variable Insurance Trust, and John Hancock Funds II (since 2012); Trustee, John Hancock Collateral Trust and John Hancock Exchange-Traded Fund Trust (since 2015). | ||
Principal officers who are not Trustees
| Name, year of birth Position(s) held with fund Principal occupation(s) during past 5 years | Officer of the Trust since |
| Andrew G. Arnott, Born: 1971 | 2009 |
| President Senior Vice President, John Hancock Financial Services (since 2009); Director and Executive Vice President, John Hancock Advisers, LLC (since 2005, including prior positions); Director and Executive Vice President, John Hancock Investment Management Services, LLC (since 2006, including prior positions); President, John Hancock Funds, LLC (since 2004, including prior positions); President, John Hancock retail funds,3 John Hancock Variable Insurance Trust, and John Hancock Funds II (since 2007, including prior positions); President, John Hancock Collateral Trust (since 2015); President, John Hancock Exchange-Traded Fund Trust (since 2014). | |
| John J. Danello, Born: 1955 | 2014 |
| Senior Vice President, Secretary, and Chief Legal Officer Vice President and Chief Counsel, John Hancock Wealth Management (since 2005); Senior Vice President (since 2007) and Chief Legal Counsel (2007-2010), John Hancock Funds, LLC and The Berkeley Financial Group, LLC; Senior Vice President (since 2006, including prior positions) and Chief Legal Officer and Secretary (since 2014), John Hancock retail funds,3 John Hancock Funds II and John Hancock Variable Insurance Trust; Senior Vice President, Chief Legal Officer and Secretary, John Hancock Collateral Trust and John Hancock Exchange-Traded Fund Trust (since 2015); Vice President, John Hancock Life & Health Insurance Company (since 2009); Vice President, John Hancock Life Insurance Company (USA) and John Hancock Life Insurance Company of New York (since 2010); and Senior Vice President, Secretary, and Chief Legal Counsel (2007-2014, including prior positions) of John Hancock Advisers, LLC and John Hancock Investment Management Services, LLC. | |
| Francis V. Knox, Jr., Born: 1947 | 2006 |
| Chief Compliance Officer Vice President, John Hancock Financial Services (since 2005); Chief Compliance Officer, John Hancock retail funds,3 John Hancock Variable Insurance Trust, John Hancock Funds II, John Hancock Advisers, LLC, and John Hancock Investment Management Services, LLC (since 2005); Chief Compliance Officer, John Hancock Collateral Trust and John Hancock Exchange-Traded Fund Trust (since 2015). | |
| Charles A. Rizzo, Born: 1957 | 2007 |
| Chief Financial Officer Vice President, John Hancock Financial Services (since 2008); Senior Vice President, John Hancock Advisers, LLC and John Hancock Investment Management Services, LLC (since 2008); Chief Financial Officer, John Hancock retail funds,3 John Hancock Variable Insurance Trust and John Hancock Funds II (since 2007); Chief Financial Officer, John Hancock Collateral Trust and John Hancock Exchange-Traded Fund Trust (since 2015). | |
| Salvatore Schiavone, Born: 1965 | 2010 |
| Treasurer Assistant Vice President, John Hancock Financial Services (since 2007); Vice President, John Hancock Advisers, LLC and John Hancock Investment Management Services, LLC (since 2007); Treasurer, John Hancock retail funds3 (since 2007, including prior positions); Treasurer, John Hancock Variable Insurance Trust and John Hancock Funds II (2007-2009 and since 2010, including prior positions); Treasurer, John Hancock Collateral Trust and John Hancock Exchange-Traded Fund Trust (since 2015). | |
The business address for all Trustees and Officers is 601 Congress Street, Boston, Massachusetts 02210-2805.
The Statement of Additional Information of the fund includes additional information about members of the Board of Trustees of the Trust and is available without charge, upon request, by calling 800-225-5291.
| 1 | Each Trustee holds office until his or her successor is elected and qualified, or until the Trustee's death, retirement, resignation, or removal. Mr. Boyle has served as Trustee at various times prior to the date listed in the table. |
| 2 | Member of the Audit Committee. |
| 3 | "John Hancock retail funds" comprises John Hancock Funds III and 36 other John Hancock funds consisting of 26 series of other John Hancock trusts and 10 closed-end funds. |
| 4 | The Trustee is a Non-Independent Trustee due to current or former positions with the Advisor and certain affiliates. |
Trustees James M. Oates, Chairperson Officers Andrew G. Arnott John J. Danello Francis V. Knox, Jr. Charles A. Rizzo Salvatore Schiavone | Investment advisor John Hancock Advisers, LLC Subadvisor John Hancock Asset Management a division of Manulife Asset Management (North America) Limited Principal distributor John Hancock Funds, LLC Custodian State Street Bank and Trust Company Transfer agent John Hancock Signature Services, Inc. Legal counsel K&L Gates LLP Independent registered public accounting firm PricewaterhouseCoopers LLP |
*Member of the Audit Committee
†Non-Independent Trustee
The fund's proxy voting policies and procedures, as well as the fund proxy voting record for the most recent twelve-month period ended June 30, are available free of charge on the Securities and Exchange Commission (SEC) website at sec.gov or on our website.
The fund's complete list of portfolio holdings, for the first and third fiscal quarters, is filed with the SEC on Form N-Q. The fund's Form N-Q is available on our website and the SEC's website, sec.gov, and can be reviewed and copied (for a fee) at the SEC's Public Reference Room in Washington, DC. Call 800-SEC-0330 to receive information on the operation of the SEC's Public Reference Room.
We make this information on your fund, as well as monthly portfolio holdings, and other fund details available on our website at jhinvestments.com or by calling 800-225-5291.
| You can also contact us: | |||
| 800-225-5291 jhinvestments.com | Regular mail: John Hancock Signature Services, Inc. | Express mail: John Hancock Signature Services, Inc. | |
John Hancock family of funds
DOMESTIC EQUITY FUNDS Balanced Blue Chip Growth Classic Value Disciplined Value Disciplined Value Mid Cap Equity Income Fundamental All Cap Core Fundamental Large Cap Core Fundamental Large Cap Value New Opportunities Small Cap Value Small Company Strategic Growth U.S. Equity U.S. Global Leaders Growth Value Equity GLOBAL AND INTERNATIONAL EQUITY FUNDS Disciplined Value International Emerging Markets Emerging Markets Equity Global Equity Global Shareholder Yield Greater China Opportunities International Core International Growth International Small Company International Value Equity | INCOME FUNDS Bond California Tax-Free Income Core High Yield Emerging Markets Debt Floating Rate Income Focused High Yield Global Income Government Income High Yield Municipal Bond Income Investment Grade Bond Money Market Short Duration Credit Opportunities Spectrum Income Strategic Income Opportunities Tax-Free Bond ALTERNATIVE AND SPECIALTY FUNDS Absolute Return Currency Alternative Asset Allocation Enduring Assets Financial Industries Global Absolute Return Strategies Global Conservative Absolute Return Global Focused Strategies Global Real Estate Natural Resources Redwood Regional Bank Seaport Technical Opportunities |
A fund's investment objectives, risks, charges, and expenses should be considered carefully before investing. The prospectus contains this and other important information about the fund. To obtain a prospectus, contact your financial professional, call John Hancock Investments at 800-225-5291, or visit our website at jhinvestments.com. Please read the prospectus carefully before investing or sending money.
ASSET ALLOCATION Income Allocation Fund Lifestyle Aggressive Portfolio Lifestyle Balanced Portfolio Lifestyle Conservative Portfolio Lifestyle Growth Portfolio Lifestyle Moderate Portfolio Retirement Choices Portfolios (2010-2060) Retirement Living Portfolios (2010-2060) Retirement Living II Portfolios (2010-2060) EXCHANGE-TRADED FUNDS John Hancock Multifactor Consumer Discretionary ETF John Hancock Multifactor Consumer Staples ETF John Hancock Multifactor Energy ETF John Hancock Multifactor Financials ETF John Hancock Multifactor Healthcare ETF John Hancock Multifactor Industrials ETF John Hancock Multifactor Large Cap ETF John Hancock Multifactor Materials ETF John Hancock Multifactor Mid Cap ETF John Hancock Multifactor Technology ETF John Hancock Multifactor Utilities ETF | CLOSED-END FUNDS Financial Opportunities Hedged Equity & Income Income Securities Trust Investors Trust Preferred Income Preferred Income II Preferred Income III Premium Dividend Tax-Advantaged Dividend Income Tax-Advantaged Global Shareholder Yield |
John Hancock Multifactor ETF shares are bought and sold at market price (not NAV), and are not individually redeemed
from the fund. Brokerage commissions will reduce returns.
John Hancock ETFs are distributed by Foreside Fund Services, LLC, and are subadvised by Dimensional Fund Advisors LP.
Foreside is not affiliated with John Hancock Funds, LLC or Dimensional Fund Advisors LP.
Dimensional Fund Advisors LP receives compensation from John Hancock in connection with licensing rights to the
John Hancock Dimensional indexes. Dimensional Fund Advisors LP does not sponsor, endorse, or sell, and makes no
representation as to the advisability of investing in, John Hancock Multifactor ETFs.
John Hancock Investments
A trusted brand
John Hancock Investments is a premier asset manager representing
one of America's most trusted brands, with a heritage of financial
stewardship dating back to 1862. Helping our shareholders pursue
their financial goals is at the core of everything we do. It's why we
support the role of professional financial advice and operate with the
highest standards of conduct and integrity.
A better way to invest
We build funds based on investor needs, then search the world to find
proven portfolio teams with specialized expertise in those strategies.
As a manager of managers, we apply vigorous oversight to ensure that
they continue to meet our uncompromising standards and serve the
best interests of our shareholders.
Results for investors
Our unique approach to asset management enables us to provide
a diverse set of investments backed by some of the world's best
managers, along with strong risk-adjusted returns across asset classes.
| | John Hancock Funds, LLC n Member FINRA, SIPC 601 Congress Street n Boston, MA 02210-2805 800-225-5291 n jhinvestments.com | |
| This report is for the information of the shareholders of John Hancock Core High Yield Fund. It is not authorized for distribution to prospective investors unless preceded or accompanied by a prospectus. | ||
| MF288154 | 346A 3/16 5/16 | |
John Hancock
Small Company Fund
Annual report 3/31/16
A message to shareholders
Dear shareholder,
The 12-month period covered by this report was a challenging one for U.S. equity investors. Many market indexes tumbled late last summer and again in the winter amid concerns about slowing global growth, particularly in China. The volatility extended to commodity markets, as oil prices hit multi-year lows before rebounding toward the end of the period. The investment landscape improved late in the period as stocks and other so-called risk assets regained positive momentum.
Despite the increase in volatility, the economic picture in the United States offers reasons for optimism. In December, the U.S. Federal Reserve raised short-term interest rates for the first time in nine years on evidence that the persistent strength in the labor markets warranted a somewhat less accommodative stance. Economic data generally remained strong entering the spring.
Volatile market environments are naturally unsettling. At John Hancock Investments, portfolio risk management is a critical part of our role as an asset manager, and our dedicated risk team is focused on these issues every day. We continually strive for new ways to analyze potential risks and have liquidity tools in place. However, your best resource in times like these is your financial advisor, who can ensure your portfolio is sufficiently diversified to meet your long-term objectives and to withstand the inevitable bumps along the way.
On behalf of everyone at John Hancock Investments, I'd like to take this opportunity to thank you for the continued trust you've placed in us.
Sincerely,
Andrew G. Arnott
President and Chief Executive Officer
John Hancock Investments
This commentary reflects the CEO's views as of March 31, 2016. They are subject to change at any time. All investments entail risks, including the possible loss of principal. Diversification does not guarantee a profit or eliminate the risk of a loss. For more up-to-date information, you can visit our website at jhinvestments.com.
John Hancock
Small Company Fund
INVESTMENT OBJECTIVE
The fund seeks maximum long-term total return.
AVERAGE ANNUAL TOTAL RETURNS AS OF 3/31/16 (%)
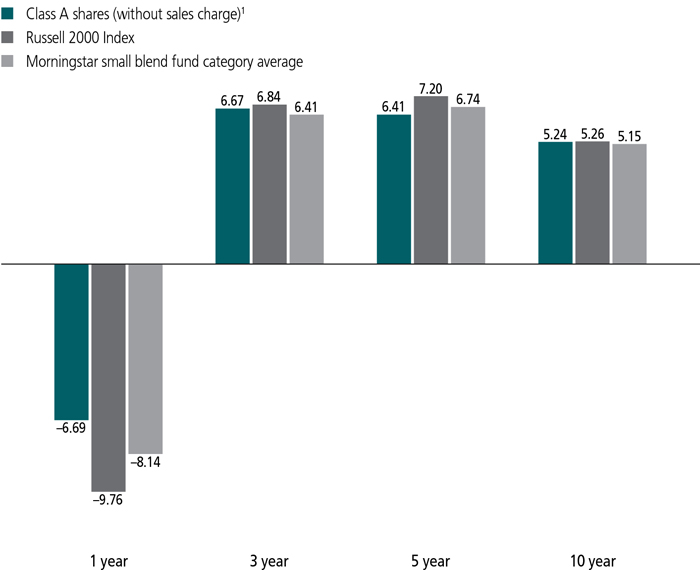
The Russell 2000 Index is an index that measures performance of the 2,000 smallest companies in the Russell 3000 Index.
It is not possible to invest directly in an index. Index figures do not reflect expenses or sales charges, which would result in lower returns.
Figures from Morningstar, Inc. include reinvested distributions and do not take into account sales charges. Actual load-adjusted performance is lower.
| 1 | On 12-11-09, through a reorganization, the fund acquired all of the assets of the FMA Small Company Portfolio (the predecessor fund). On that date, the predecessor fund offered its Investor shares in exchange for Class A shares of John Hancock Small Company Fund, which were first offered on 12-14-09. Class A shares' returns shown above for periods prior to this date are those of the predecessor fund's Investor shares that have been recalculated to reflect the gross fees and expenses of Class A shares. |
The past performance shown here reflects reinvested distributions and the beneficial effect of any expense reductions, and does not guarantee future results. Performance of the other share classes will vary based on the difference in the fees and expenses of those classes. Shares will fluctuate in value and, when redeemed, may be worth more or less than their original cost. Current month-end performance may be lower or higher than the performance cited, and can be found at jhinvestments.com or by calling 800-225-5291. For further information on the fund's objectives, risks, and strategy, see the fund's prospectus.
PERFORMANCE HIGHLIGHTS OVER THE LAST TWELVE MONTHS
Signs of global stress negatively affected markets
The market was extremely volatile during the period, as equities continued to be affected by slowing global growth and lower oil prices.
The fund was down, but led its benchmark
The fund outpaced its benchmark, the Russell 2000 Index, due to beneficial stock selection.
Stock selection in healthcare, information technology, and energy was the top relative contributor
From a sector standpoint, healthcare, information technology, and energy were the top relative contributors; the industrials sector was the biggest detractor relative to the index.
SECTOR COMPOSITION AS OF 3/31/16 (%)
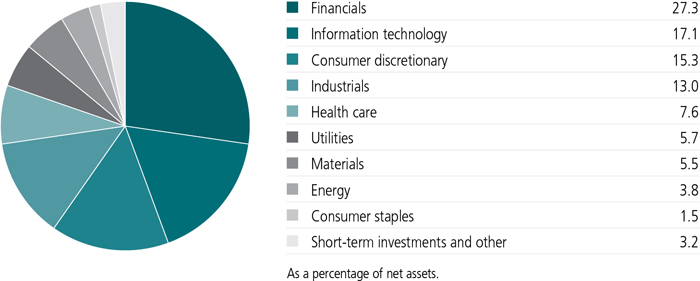
A note about risks
The stock prices of small companies can change more frequently and dramatically than those of large companies. The value of a company's equity securities is subject to changes in the company's financial condition and overall market and economic conditions. Frequent trading may increase fund transaction costs. Sector investing is subject to greater risks than the market as a whole. Investments focused in one sector may fluctuate more than investments in a wider variety of sectors. Owning an exchange-traded fund generally reflects the risks of owning the underlying securities it is designed to track. Please see the fund's prospectuses for additional risks.

Kathryn Vorisek
Portfolio Manager
Mesirow Financial,which acquired FMA,effective April 1
Can you briefly describe the market environment over the past 12 months?
For the 12 months ended March 31, 2016, U.S. small-cap equities, as measured by the Russell 2000 Index, declined 9.76%. Market leadership was mixed, as noncyclical sectors—such as utilities and consumer staples—outperformed and industrials and energy underperformed.
During the beginning of the period, U.S. equity markets stalled due to mixed economic data and headline risks, including debt issues in Greece and Chinese stock market volatility. Few markets were safe from the escalating concerns about a global growth slowdown. An unexpected currency devaluation and weak economic signs from China, weakening commodity prices, and guessing how and when the U.S. Federal Reserve (Fed) would actually take action all conspired to pull the bottom out from under the equity markets by the middle of the fiscal year. Although markets recovered from a correction, the final months of the fiscal year exhibited volatility as investors worried about the effects of rising interest rates, economic conditions abroad, and weak commodity prices.
U.S. economic activity was extremely inconsistent as industrial and manufacturing activity continued to show relative weakness while employment, housing, construction, and consumer spending maintained strength. Signs of global stress in the economy, particularly activity levels in China, slower emerging-market growth, and lower commodity prices, continued to negatively affect markets. The backdrop of weaker global demand and reduced investment spending has caused the Fed to reconsider its path for raising short-term interest rates and move at a more deliberate pace even though employment metrics in the United States suggest otherwise. Various accommodative global policy decisions helped drive a market rebound in the final weeks of the period, as a lower
Although the fund was down, it outperformed its benchmark. What drove this?
Favorable stock selection within the healthcare, information technology, and energy sectors drove relative outperformance. Stock selection in financials and materials also contributed to relative returns. These results were partially offset by adverse stock selection in industrials, which detracted from relative performance.
Within the sectors, which stocks were the leading contributors to and detractors from performance relative to the index?
Top contributors to relative performance included ambulatory and physician service provider Amsurg Corp., financial services firm StanCorp Financial Group, Inc., and DealerTrack Technologies, Inc., a provider of automotive retail services. Shares of Amsurg rose as the company's improved
TOP 10 HOLDINGS AS OF 3/31/16 (%)
| PNM Resources, Inc. | 2.2 |
| The Laclede Group, Inc. | 2.0 |
| Forward Air Corp. | 1.7 |
| ITT Corp. | 1.7 |
| Capitol Federal Financial, Inc. | 1.6 |
| Headwaters, Inc. | 1.6 |
| The Hanover Insurance Group, Inc. | 1.6 |
| Western Alliance Bancorp | 1.6 |
| Portland General Electric Company | 1.5 |
| Healthcare Trust of America, Inc., Class A | 1.5 |
| TOTAL | 17.0 |
| As a percentage of net assets. | |
| Cash and cash equivalents are not included. | |
Top relative detractors included aircraft supplier Triumph Group, Inc., label solutions company Mutli-Color Corp., and Boot Barn Holdings, Inc., a provider of Western wear. Shares of Triumph Group declined on production rate reductions on key programs, which weakened organic sales growth. Shares of Multi-Color Corp. were negatively affected by a sales decline in low margin beverage labels. Declining oil prices affected Boot Barn's sales, as many of its retail stores are located in areas affected by the energy slowdown. We exited the fund's positions in Triumph Group and Multi-Color., on a slowdown in industrial spending. We also sold the fund's holdings in Boot Barn.
How was the portfolio positioned at the end of the period?
The fund's cyclical exposure centered on U.S.-focused, consumer-oriented, and technology-related companies. Activity in employment and construction, as well as global monetary stimulus, should be a benefit to economic growth. We continue to identify individual investments with favorable valuations and visible growth prospects that can weather the seemingly ever-changing environment. Investment themes include an emphasis on increasing the fund's exposure to consumer-focused and non-residential construction companies.
Bottom-up stock decisions resulted in the largest overweights in the materials and utilities sectors at the end of the period. The healthcare and consumer staples sectors represented the fund's largest underweights.
Can you tell us about management's name change?
Fiduciary Management Associates, LLC was recently acquired by Mesirow Financial. The combined companies will now be known as Mesirow Financial Investment Management, Inc. The portfolio management team will remain in place.
MANAGED BY
 | Kathryn Vorisek On the fund since 1996 Investing since 1984 |
 | Leo Harmon, CFA On the fund since 2003 Investing since 1993 |
![]()
TOTAL RETURNS FOR THE PERIOD ENDED MARCH 31, 2016
| Average annual total returns (%) with maximum sales charge | Cumulative total returns (%) with maximum sales charge | ||||||
| 1-year | 5-year | 10-year | 5-year | 10-year | |||
| Class A1 | -11.36 | 5.32 | 4.70 | 29.61 | 58.29 | ||
| Class I1,2 | -6.40 | 6.78 | 5.60 | 38.80 | 72.42 | ||
| Class R11,2 | -7.01 | 6.05 | 4.83 | 34.13 | 60.35 | ||
| Class R21,2 | -6.82 | 6.01 | 4.25 | 33.90 | 51.65 | ||
| Class R31,2 | -6.93 | 6.15 | 4.94 | 34.78 | 61.93 | ||
| Class R41,2 | -6.58 | 6.55 | 5.29 | 37.35 | 67.45 | ||
| Class R51,2 | -6.36 | 6.80 | 5.57 | 38.94 | 71.94 | ||
| Class R61,2 | -6.30 | 6.87 | 5.67 | 39.40 | 73.59 | ||
| Class ADV1,2 | -6.62 | 6.53 | 5.22 | 37.21 | 66.41 | ||
| Index† | -9.76 | 7.20 | 5.26 | 41.59 | 66.93 | ||
Performance figures assume all distributions are reinvested. Figures reflect maximum sales charge on Class A shares of 5%. Sales charges are not applicable to Class I, Class R1, Class R2, Class R3, Class R4, Class R5, Class R6, and Class ADV shares.
The expense ratios of the fund, both net (including any fee waivers or expense limitations) and gross (excluding any fee waivers or expense limitations), are set forth according to the most recent publicly available prospectuses for the fund and may differ from those disclosed in the Financial highlights tables in this report. Had the fee waivers and expense limitations not been in place, gross expenses would apply. The expense ratios are as follows:
| Class A | Class I | Class R1 | Class R2 | Class R3 | Class R4 | Class R5 | Class R6 | Class ADV | |
| Gross (%) | 1.49 | 1.18 | 1.83 | 1.58 | 1.73 | 1.43 | 1.13 | 1.08 | 1.44 |
| Net (%) | 1.43 | 1.13 | 1.80 | 1.55 | 1.70 | 1.30 | 1.10 | 1.06 | 1.34 |
Please refer to the most recent prospectus and annual or semiannual report for more information on expenses and any expense limitation arrangements for each class.
The returns reflect past results and should not be considered indicative of future performance. The return and principal value of an investment will fluctuate so that shares, when redeemed, may be worth more or less than their original cost. Due to market volatility and other factors, the fund's current performance may be higher or lower than the performance shown. For current to the most recent month-end performance data, please call 800-225-5291 or visit the fund's website at jhinvestments.com.
The performance table above and the chart on the next page do not reflect the deduction of taxes that a shareholder would pay on fund distributions or the redemption of fund shares. The fund's performance results reflect any applicable fee waivers or expense reductions, without which the expenses would increase and results would have been less favorable.
| † | Index is the Russell 2000 Index. |
See the following page for footnotes.
This chart and table show what happened to a hypothetical $10,000 investment in John Hancock Small Company Fund for the share classes and periods indicated, assuming all distributions were reinvested. For comparison, we've shown the same investment in the Russell 2000 Index.
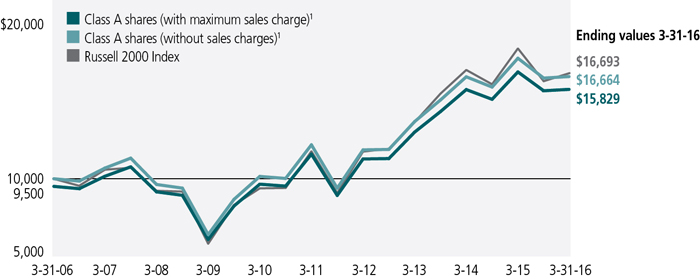
| Start date | With maximum sales charge ($) | Without sales charge ($) | Index ($) | |
| Class I1,2 | 3-31-06 | 17,242 | 17,242 | 16,693 |
| Class R11,2 | 3-31-06 | 16,035 | 16,035 | 16,693 |
| Class R21,2 | 3-31-06 | 15,165 | 15,165 | 16,693 |
| Class R31,2 | 3-31-06 | 16,193 | 16,193 | 16,693 |
| Class R41,2 | 3-31-06 | 16,745 | 16,745 | 16,693 |
| Class R51,2 | 3-31-06 | 17,194 | 17,194 | 16,693 |
| Class R61,2 | 3-31-06 | 17,359 | 17,359 | 16,693 |
| Class ADV1,2 | 3-31-06 | 16,641 | 16,641 | 16,693 |
The Russell 2000 Index is an index that measures performance of the 2,000 smallest companies in the Russell 3000 Index.
It is not possible to invest directly in an index. Index figures do not reflect expenses or sales charges, which would result in lower returns.
Footnotes related to performance pages
| 1 | On 12-11-09, through a reorganization, the fund acquired all of the assets of FMA Small Company Portfolio (the predecessor fund). On that date, the predecessor fund offered its Investor shares in exchange for Class A shares and the Institutional shares in exchange for Class I shares of John Hancock Small Company Fund, which were first offered on 12-14-09. Class A, Class I, and Class ADV shares were first offered on 12-14-09. The returns of Class A, Class I, and Class ADV shares prior to this date are those of the predecessor fund's Investor shares that have been recalculated to apply the gross fees and expenses of Class A, Class I, and Class ADV shares, as applicable. Class R1, Class R3, Class R4, and Class R5 shares were first offered on 4-30-10; Class R2 shares were first offered on 3-1-12; Class R6 shares were first offered on 9-1-11. Returns prior to these dates are those of Class A shares recalculated to apply the gross fees and expenses of Class R1, Class R3, Class R4, Class R5, Class R2, and Class R6 shares, as applicable. |
| 2 | For certain types of investors, as described in the fund's prospectuses. |
These examples are intended to help you understand your ongoing operating expenses of investing in the fund so you can compare these costs with the ongoing costs of investing in other mutual funds.
Understanding fund expenses
As a shareholder of the fund, you incur two types of costs:
| • | Transaction costs, which include sales charges (loads) on purchases or redemptions (varies by share class), minimum account fee charge, etc. |
| • | Ongoing operating expenses, including management fees, distribution and service fees (if applicable), and other fund expenses. |
We are presenting only your ongoing operating expenses here.
Actual expenses/actual returns
This example is intended to provide information about the fund's actual ongoing operating expenses, and is based on the fund's actual return. It assumes an account value of $1,000.00 on October 1, 2015, with the same investment held until March 31, 2016.
| Account value on 10-1-2015 | Ending value on 3-31-2016 | Expenses paid during period ended 3-31-20161 | Annualized expense ratio | |
| Class A | $1,000.00 | $1,005.90 | $7.17 | 1.43% |
| Class I | 1,000.00 | 1,007.40 | 5.62 | 1.12% |
| Class R1 | 1,000.00 | 1,004.40 | 9.02 | 1.80% |
| Class R2 | 1,000.00 | 1,005.50 | 7.77 | 1.55% |
| Class R3 | 1,000.00 | 1,004.80 | 8.52 | 1.70% |
| Class R4 | 1,000.00 | 1,006.70 | 6.52 | 1.30% |
| Class R5 | 1,000.00 | 1,007.80 | 5.57 | 1.11% |
| Class R6 | 1,000.00 | 1,008.20 | 5.22 | 1.04% |
| Class ADV | 1,000.00 | 1,006.30 | 6.72 | 1.34% |
Together with the value of your account, you may use this information to estimate the operating expenses that you paid over the period. Simply divide your account value at March 31, 2016, by $1,000.00, then multiply it by the "expenses paid" for your share class from the table above. For example, for an account value of $8,600.00, the operating expenses should be calculated as follows:
Hypothetical example for comparison purposes
This table allows you to compare the fund's ongoing operating expenses with those of any other fund. It provides an example of the fund's hypothetical account values and hypothetical expenses based on each class's actual expense ratio and an assumed 5% annualized return before expenses (which is not the fund's actual return). It assumes an account value of $1,000.00 on October 1, 2015, with the same investment held until March 31, 2016. Look in any other fund shareholder report to find its hypothetical example and you will be able to compare these expenses. Please remember that these hypothetical account values and expenses may not be used to estimate the actual ending account balance or expenses you paid for the period.
| Account value on 10-1-2015 | Ending value on 3-31-2016 | Expenses paid during period ended 3-31-20161 | Annualized expense ratio | |
| Class A | $1,000.00 | $1,017.90 | $7.21 | 1.43% |
| Class I | 1,000.00 | 1,019.40 | 5.65 | 1.12% |
| Class R1 | 1,000.00 | 1,016.00 | 9.07 | 1.80% |
| Class R2 | 1,000.00 | 1,017.30 | 7.82 | 1.55% |
| Class R3 | 1,000.00 | 1,016.50 | 8.57 | 1.70% |
| Class R4 | 1,000.00 | 1,018.50 | 6.56 | 1.30% |
| Class R5 | 1,000.00 | 1,019.50 | 5.60 | 1.11% |
| Class R6 | 1,000.00 | 1,019.80 | 5.25 | 1.04% |
| Class ADV | 1,000.00 | 1,018.30 | 6.76 | 1.34% |
Remember, these examples do not include any transaction costs, therefore, these examples will not help you to determine the relative total costs of owning different funds. If transaction costs were included, your expenses would have been higher. See the prospectuses for details regarding transaction costs.
| 1 | Expenses are equal to the fund's annualized expense ratio, multiplied by the average account value over the period, multiplied by 183/366 (to reflect the one-half year period). |
Fund's investments
| As of 3-31-16 | ||||||||||||||
| Shares | Value | |||||||||||||
| Common stocks 96.8% | $252,460,254 | |||||||||||||
| (Cost $231,882,482) | ||||||||||||||
| Consumer discretionary 15.3% | 39,888,255 | |||||||||||||
| Auto components 1.3% | ||||||||||||||
| Visteon Corp. | 40,910 | 3,256,027 | ||||||||||||
| Distributors 1.5% | ||||||||||||||
| Pool Corp. | 43,800 | 3,843,012 | ||||||||||||
| Diversified consumer services 1.2% | ||||||||||||||
| Bright Horizons Family Solutions, Inc. (I) | 48,655 | 3,151,871 | ||||||||||||
| Hotels, restaurants and leisure 4.8% | ||||||||||||||
| ClubCorp Holdings, Inc. | 216,495 | 3,039,590 | ||||||||||||
| Fiesta Restaurant Group, Inc. (I) | 83,795 | 2,746,800 | ||||||||||||
| Marriott Vacations Worldwide Corp. | 45,445 | 3,067,538 | ||||||||||||
| Texas Roadhouse, Inc. | 86,240 | 3,758,339 | ||||||||||||
| Household durables 1.5% | ||||||||||||||
| Helen of Troy, Ltd. (I) | 37,600 | 3,898,741 | ||||||||||||
| Leisure products 1.5% | ||||||||||||||
| Vista Outdoor, Inc. (I) | 75,055 | 3,896,105 | ||||||||||||
| Media 1.2% | ||||||||||||||
| Nexstar Broadcasting Group, Inc., Class A | 71,230 | 3,153,352 | ||||||||||||
| Specialty retail 1.1% | ||||||||||||||
| Select Comfort Corp. (I) | 148,060 | 2,870,883 | ||||||||||||
| Textiles, apparel and luxury goods 1.2% | ||||||||||||||
| Steven Madden, Ltd. (I) | 86,555 | 3,205,997 | ||||||||||||
| Consumer staples 1.5% | 3,868,679 | |||||||||||||
| Food products 1.5% | ||||||||||||||
| B&G Foods, Inc. | 111,137 | 3,868,679 | ||||||||||||
| Energy 3.8% | 9,973,332 | |||||||||||||
| Energy equipment and services 2.7% | ||||||||||||||
| Oil States International, Inc. (I) | 83,180 | 2,621,834 | ||||||||||||
| Patterson-UTI Energy, Inc. | 152,300 | 2,683,526 | ||||||||||||
| Superior Energy Services, Inc. | 139,150 | 1,863,219 | ||||||||||||
| Oil, gas and consumable fuels 1.1% | ||||||||||||||
| Carrizo Oil & Gas, Inc. (I) | 90,710 | 2,804,753 | ||||||||||||
| Financials 27.3% | 71,187,102 | |||||||||||||
| Banks 9.3% | ||||||||||||||
| Bank of the Ozarks, Inc. | 61,520 | 2,581,994 | ||||||||||||
| Great Western Bancorp, Inc. | 143,740 | 3,919,790 | ||||||||||||
| IBERIABANK Corp. | 54,475 | 2,792,933 | ||||||||||||
| Shares | Value | |||||||||||||
| Financials (continued) | ||||||||||||||
| Banks (continued) | ||||||||||||||
| PrivateBancorp, Inc. | 90,380 | $3,488,668 | ||||||||||||
| Webster Financial Corp. | 105,275 | 3,779,373 | ||||||||||||
| Western Alliance Bancorp (I) | 122,795 | 4,098,897 | ||||||||||||
| Wintrust Financial Corp. | 80,040 | 3,548,974 | ||||||||||||
| Capital markets 1.0% | ||||||||||||||
| Evercore Partners, Inc., Class A | 53,325 | 2,759,569 | ||||||||||||
| Insurance 5.7% | ||||||||||||||
| Argo Group International Holdings, Ltd. | 56,005 | 3,214,127 | ||||||||||||
| CNO Financial Group, Inc. | 208,755 | 3,740,890 | ||||||||||||
| ProAssurance Corp. | 74,040 | 3,746,424 | ||||||||||||
| The Hanover Insurance Group, Inc. | 45,630 | 4,116,739 | ||||||||||||
| Real estate investment trusts 8.4% | ||||||||||||||
| American Homes 4 Rent, Class A | 230,645 | 3,667,256 | ||||||||||||
| Chesapeake Lodging Trust | 93,155 | 2,464,881 | ||||||||||||
| EPR Properties | 59,410 | 3,957,894 | ||||||||||||
| Healthcare Trust of America, Inc., Class A | 136,610 | 4,019,066 | ||||||||||||
| National Health Investors, Inc. | 58,180 | 3,870,134 | ||||||||||||
| QTS Realty Trust, Inc., Class A | 81,505 | 3,861,707 | ||||||||||||
| Thrifts and mortgage finance 2.9% | ||||||||||||||
| Capitol Federal Financial, Inc. | 323,055 | 4,283,709 | ||||||||||||
| EverBank Financial Corp. | 216,970 | 3,274,077 | ||||||||||||
| Health care 7.6% | 19,835,279 | |||||||||||||
| Biotechnology 2.3% | ||||||||||||||
| Emergent BioSolutions, Inc. (I) | 85,295 | 3,100,473 | ||||||||||||
| Ligand Pharmaceuticals, Inc. (I) | 26,515 | 2,839,491 | ||||||||||||
| Health care equipment and supplies 2.3% | ||||||||||||||
| Cynosure, Inc., Class A (I) | 68,705 | 3,031,265 | ||||||||||||
| Globus Medical, Inc., Class A (I) | 128,930 | 3,062,088 | ||||||||||||
| Health care providers and services 1.5% | ||||||||||||||
| Amsurg Corp. (I) | 51,584 | 3,848,166 | ||||||||||||
| Pharmaceuticals 1.5% | ||||||||||||||
| Prestige Brands Holdings, Inc. (I) | 74,055 | 3,953,796 | ||||||||||||
| Industrials 13.0% | 33,938,264 | |||||||||||||
| Aerospace and defense 1.5% | ||||||||||||||
| HEICO Corp. | 64,245 | 3,863,052 | ||||||||||||
| Air freight and logistics 1.7% | ||||||||||||||
| Forward Air Corp. | 98,905 | 4,482,375 | ||||||||||||
| Construction and engineering 1.5% | ||||||||||||||
| EMCOR Group, Inc. | 80,420 | 3,908,412 | ||||||||||||
| Shares | Value | |||||||||||||
| Industrials (continued) | ||||||||||||||
| Electrical equipment 1.4% | ||||||||||||||
| Regal Beloit Corp. | 59,080 | $3,727,357 | ||||||||||||
| Machinery 5.8% | ||||||||||||||
| Barnes Group, Inc. | 111,540 | 3,907,246 | ||||||||||||
| ITT Corp. | 119,570 | 4,410,937 | ||||||||||||
| Proto Labs, Inc. (I) | 48,920 | 3,771,243 | ||||||||||||
| Standex International Corp. | 39,760 | 3,093,726 | ||||||||||||
| Trading companies and distributors 1.1% | ||||||||||||||
| Beacon Roofing Supply, Inc. (I) | 67,640 | 2,773,916 | ||||||||||||
| Information technology 17.1% | 44,456,644 | |||||||||||||
| Electronic equipment, instruments and components 1.5% | ||||||||||||||
| Littelfuse, Inc. | 31,450 | 3,871,810 | ||||||||||||
| Internet software and services 1.9% | ||||||||||||||
| comScore, Inc. (I) | 66,425 | 1,995,407 | ||||||||||||
| j2 Global, Inc. | 49,070 | 3,021,731 | ||||||||||||
| IT services 4.5% | ||||||||||||||
| CACI International, Inc., Class A (I) | 36,340 | 3,877,478 | ||||||||||||
| Convergys Corp. | 137,690 | 3,823,651 | ||||||||||||
| ExlService Holdings, Inc. (I) | 74,480 | 3,858,064 | ||||||||||||
| Semiconductors and semiconductor equipment 5.0% | ||||||||||||||
| Inphi Corp. (I) | 95,680 | 3,189,971 | ||||||||||||
| MaxLinear, Inc., Class A (I) | 191,845 | 3,549,133 | ||||||||||||
| Microsemi Corp. (I) | 85,360 | 3,270,142 | ||||||||||||
| Monolithic Power Systems, Inc. | 48,390 | 3,079,540 | ||||||||||||
| Software 4.2% | ||||||||||||||
| Blackbaud, Inc. | 56,185 | 3,533,475 | ||||||||||||
| CommVault Systems, Inc. (I) | 83,645 | 3,610,955 | ||||||||||||
| Take-Two Interactive Software, Inc. (I) | 100,220 | 3,775,287 | ||||||||||||
| Materials 5.5% | 14,368,619 | |||||||||||||
| Chemicals 2.6% | ||||||||||||||
| Cabot Corp. | 78,130 | 3,776,023 | ||||||||||||
| Sensient Technologies Corp. | 48,855 | 3,100,338 | ||||||||||||
| Construction materials 1.6% | ||||||||||||||
| Headwaters, Inc. (I) | 214,985 | 4,265,302 | ||||||||||||
| Containers and packaging 1.3% | ||||||||||||||
| Graphic Packaging Holding Company | 251,125 | 3,226,956 | ||||||||||||
| Utilities 5.7% | 14,944,080 | |||||||||||||
| Electric utilities 3.7% | ||||||||||||||
| PNM Resources, Inc. | 166,345 | 5,609,153 | ||||||||||||
| Portland General Electric Company | 101,865 | 4,022,649 | ||||||||||||
| Shares | Value | |||||||||||||
| Utilities (continued) | ||||||||||||||
| Gas utilities 2.0% | ||||||||||||||
| The Laclede Group, Inc. | 78,410 | $5,312,278 | ||||||||||||
| Yield (%) | Shares | Value | ||||||||||||
| Short-term investments 3.7% | $9,765,907 | |||||||||||||
| (Cost $9,765,907) | ||||||||||||||
| Money market funds 3.7% | 9,765,907 | |||||||||||||
| State Street Institutional Liquid Reserves Fund | 0.4442(Y | ) | 9,765,907 | 9,765,907 | ||||||||||
| Total investments (Cost $241,648,389)† 100.5% | $262,226,161 | |||||||||||||
| Other assets and liabilities, net (0.5%) | ($1,367,389 | ) | ||||||||||||
| Total net assets 100.0% | $260,858,772 | |||||||||||||
| The percentage shown for each investment category is the total value of the category as a percentage of the net assets of the fund. | ||||||||||||||
| Key to Security Abbreviations and Legend | ||||||||||||||
| (I) | Non-income producing security. | |||||||||||||
| (Y) | The rate shown is the annualized seven-day yield as of 3-31-16. | |||||||||||||
| † | At 3-31-16, the aggregate cost of investment securities for federal income tax purposes was $242,618,331. Net unrealized appreciation aggregated to $19,607,830, of which $28,745,745 related to appreciated investment securities and $9,137,915 related to depreciated investment securities. | |||||||||||||
Financial statements
STATEMENT OF ASSETS AND LIABILITIES 3-31-16
| Assets | ||||||||||||||||||||||||||||||
| Investments, at value (Cost $241,648,389) | $262,226,161 | |||||||||||||||||||||||||||||
| Receivable for investments sold | 3,256,666 | |||||||||||||||||||||||||||||
| Receivable for fund shares sold | 911,273 | |||||||||||||||||||||||||||||
| Dividends and interest receivable | 409,073 | |||||||||||||||||||||||||||||
| Receivable due from advisor | 2,266 | |||||||||||||||||||||||||||||
| Other receivables and prepaid expenses | 87,523 | |||||||||||||||||||||||||||||
| Total assets | 266,892,962 | |||||||||||||||||||||||||||||
| Liabilities | ||||||||||||||||||||||||||||||
| Payable for investments purchased | 5,427,203 | |||||||||||||||||||||||||||||
| Payable for fund shares repurchased | 489,624 | |||||||||||||||||||||||||||||
| Payable to affiliates | ||||||||||||||||||||||||||||||
| Accounting and legal services fees | 2,620 | |||||||||||||||||||||||||||||
| Transfer agent fees | 26,642 | |||||||||||||||||||||||||||||
| Distribution and service fees | 645 | |||||||||||||||||||||||||||||
| Other liabilities and accrued expenses | 87,456 | |||||||||||||||||||||||||||||
| Total liabilities | 6,034,190 | |||||||||||||||||||||||||||||
| Net assets | $260,858,772 | |||||||||||||||||||||||||||||
| Net assets consist of | ||||||||||||||||||||||||||||||
| Paid-in capital | $252,869,266 | |||||||||||||||||||||||||||||
| Accumulated net realized gain (loss) on investments | (12,588,266 | ) | ||||||||||||||||||||||||||||
| Net unrealized appreciation (depreciation) on investments | 20,577,772 | |||||||||||||||||||||||||||||
| Net assets | $260,858,772 | |||||||||||||||||||||||||||||
STATEMENT OF ASSETS AND LIABILITIES (continued)
| Net asset value per share | ||||||||||||||||||
| Based on net asset values and shares outstanding-the fund has an unlimited number of shares authorized with no par value | ||||||||||||||||||
| Class A ($214,239,227 ÷ 8,878,177 shares)1 | $24.13 | |||||||||||||||||
| Class I ($39,261,878 ÷ 1,592,862 shares) | $24.65 | |||||||||||||||||
| Class R1 ($765,707 ÷ 32,505 shares) | $23.56 | |||||||||||||||||
| Class R2 ($838,320 ÷ 34,681 shares) | $24.17 | |||||||||||||||||
| Class R3 ($259,269 ÷ 10,932 shares) | $23.72 | |||||||||||||||||
| Class R4 ($97,847 ÷ 4,023 shares) | $24.32 | |||||||||||||||||
| Class R5 ($76,622 ÷ 3,105 shares) | $24.68 | |||||||||||||||||
| Class R6 ($4,749,187 ÷ 191,573 shares) | $24.79 | |||||||||||||||||
| Class ADV ($570,715 ÷ 23,493 shares) | $24.29 | |||||||||||||||||
| Maximum offering price per share | ||||||||||||||||||
| Class A (net asset value per share ÷ 95%)2 | $25.40 | |||||||||||||||||
| 1 | Redemption price per share is equal to net asset value less any applicable contingent deferred sales charge. | ||||||||||||||||
| 2 | On single retail sales of less than $50,000. On sales of $50,000 or more and on group sales the offering price is reduced. | ||||||||||||||||
STATEMENT OF OPERATIONS For the year ended 3-31-16
| Investment income | ||||||||||||||||||||||||
| Dividends | $3,044,343 | |||||||||||||||||||||||
| Interest | 16,915 | |||||||||||||||||||||||
| Total investment income | 3,061,258 | |||||||||||||||||||||||
| Expenses | ||||||||||||||||||||||||
| Investment management fees | 2,146,016 | |||||||||||||||||||||||
| Distribution and service fees | 587,353 | |||||||||||||||||||||||
| Accounting and legal services fees | 31,831 | |||||||||||||||||||||||
| Transfer agent fees | 291,704 | |||||||||||||||||||||||
| Trustees' fees | 3,199 | |||||||||||||||||||||||
| State registration fees | 151,010 | |||||||||||||||||||||||
| Printing and postage | 42,770 | |||||||||||||||||||||||
| Professional fees | 53,625 | |||||||||||||||||||||||
| Custodian fees | 28,626 | |||||||||||||||||||||||
| Registration and filing fees | 25,246 | |||||||||||||||||||||||
| Other | 11,405 | |||||||||||||||||||||||
| Total expenses | 3,372,785 | |||||||||||||||||||||||
| Less expense reductions | (98,717 | ) | ||||||||||||||||||||||
| Net expenses | 3,274,068 | |||||||||||||||||||||||
| Net investment loss | (212,810 | ) | ||||||||||||||||||||||
| Realized and unrealized gain (loss) | ||||||||||||||||||||||||
| Net realized gain (loss) on | ||||||||||||||||||||||||
| Investments | (1,844,412 | ) | ||||||||||||||||||||||
| (1,844,412 | ) | |||||||||||||||||||||||
| Change in net unrealized appreciation (depreciation) of | ||||||||||||||||||||||||
| Investments | (13,995,380 | ) | ||||||||||||||||||||||
| (13,995,380 | ) | |||||||||||||||||||||||
| Net realized and unrealized loss | (15,839,792 | ) | ||||||||||||||||||||||
| Decrease in net assets from operations | ($16,052,602 | ) | ||||||||||||||||||||||
STATEMENTS OF CHANGES IN NET ASSETS
| Year ended 3-31-16 | Year ended 3-31-15 | ||||||||||||||||||||||||||||||||||||||||||||
| Increase (decrease) in net assets | |||||||||||||||||||||||||||||||||||||||||||||
| From operations | |||||||||||||||||||||||||||||||||||||||||||||
| Net investment loss | ($212,810 | ) | ($233,159 | ) | |||||||||||||||||||||||||||||||||||||||||
| Net realized gain (loss) | (1,844,412 | ) | 16,082,230 | ||||||||||||||||||||||||||||||||||||||||||
| Change in net unrealized appreciation (depreciation) | (13,995,380 | ) | (413,140 | ) | |||||||||||||||||||||||||||||||||||||||||
| Increase (decrease) in net assets resulting from operations | (16,052,602 | ) | 15,435,931 | ||||||||||||||||||||||||||||||||||||||||||
| Distributions to shareholders | |||||||||||||||||||||||||||||||||||||||||||||
| From net realized gain | |||||||||||||||||||||||||||||||||||||||||||||
| Class A | (13,629,651 | ) | (15,753,572 | ) | |||||||||||||||||||||||||||||||||||||||||
| Class I | (2,785,011 | ) | (4,348,300 | ) | |||||||||||||||||||||||||||||||||||||||||
| Class R1 | (52,347 | ) | (132,775 | ) | |||||||||||||||||||||||||||||||||||||||||
| Class R2 | (55,274 | ) | (44,943 | ) | |||||||||||||||||||||||||||||||||||||||||
| Class R3 | (19,705 | ) | (20,688 | ) | |||||||||||||||||||||||||||||||||||||||||
| Class R4 | (5,111 | ) | (6,731 | ) | |||||||||||||||||||||||||||||||||||||||||
| Class R5 | (5,405 | ) | (30,858 | ) | |||||||||||||||||||||||||||||||||||||||||
| Class R6 | (337,695 | ) | (31,652 | ) | |||||||||||||||||||||||||||||||||||||||||
| Class ADV | (39,750 | ) | (51,546 | ) | |||||||||||||||||||||||||||||||||||||||||
| Total distributions | (16,929,949 | ) | (20,421,065 | ) | |||||||||||||||||||||||||||||||||||||||||
| From fund share transactions | 66,902,529 | 16,173,082 | |||||||||||||||||||||||||||||||||||||||||||
| Total increase | 33,919,978 | 11,187,948 | |||||||||||||||||||||||||||||||||||||||||||
| Net assets | |||||||||||||||||||||||||||||||||||||||||||||
| Beginning of year | 226,938,794 | 215,750,846 | |||||||||||||||||||||||||||||||||||||||||||
| End of year | $260,858,772 | $226,938,794 | |||||||||||||||||||||||||||||||||||||||||||
Financial highlights
| Class A Shares Period ended | 3-31-16 | 3-31-15 | 3-31-14 | 3-31-13 | 3-31-12 | ||||||||||||||||||||||||||||||||||||||||||||||||||||||||||||||||||||||||||||||||||||||||||||||||||
| Per share operating performance | |||||||||||||||||||||||||||||||||||||||||||||||||||||||||||||||||||||||||||||||||||||||||||||||||||||||
| Net asset value, beginning of period | $27.75 | $28.67 | $24.10 | $20.86 | $21.44 | ||||||||||||||||||||||||||||||||||||||||||||||||||||||||||||||||||||||||||||||||||||||||||||||||||
| Net investment loss1 | (0.04 | ) | (0.05 | ) | (0.13 | ) | (0.07 | ) | (0.01 | ) | |||||||||||||||||||||||||||||||||||||||||||||||||||||||||||||||||||||||||||||||||||||||||||||
| Net realized and unrealized gain (loss) on investments | (1.77 | ) | 1.87 | 5.23 | 3.31 | (0.57 | ) | ||||||||||||||||||||||||||||||||||||||||||||||||||||||||||||||||||||||||||||||||||||||||||||||||
| Total from investment operations | (1.81 | ) | 1.82 | 5.10 | 3.24 | (0.58 | ) | ||||||||||||||||||||||||||||||||||||||||||||||||||||||||||||||||||||||||||||||||||||||||||||||||
| Less distributions | |||||||||||||||||||||||||||||||||||||||||||||||||||||||||||||||||||||||||||||||||||||||||||||||||||||||
| From net realized gain | (1.81 | ) | (2.74 | ) | (0.53 | ) | — | — | |||||||||||||||||||||||||||||||||||||||||||||||||||||||||||||||||||||||||||||||||||||||||||||||
| Total distributions | (1.81 | ) | (2.74 | ) | (0.53 | ) | — | — | |||||||||||||||||||||||||||||||||||||||||||||||||||||||||||||||||||||||||||||||||||||||||||||||
| Net asset value, end of period | $24.13 | $27.75 | $28.67 | $24.10 | $20.86 | ||||||||||||||||||||||||||||||||||||||||||||||||||||||||||||||||||||||||||||||||||||||||||||||||||
| Total return (%)2,3 | (6.69 | ) | 7.28 | 21.26 | 15.53 | (2.71 | ) | ||||||||||||||||||||||||||||||||||||||||||||||||||||||||||||||||||||||||||||||||||||||||||||||||
| Ratios and supplemental data | |||||||||||||||||||||||||||||||||||||||||||||||||||||||||||||||||||||||||||||||||||||||||||||||||||||||
| Net assets, end of period (in millions) | $214 | $180 | $162 | $120 | $129 | ||||||||||||||||||||||||||||||||||||||||||||||||||||||||||||||||||||||||||||||||||||||||||||||||||
| Ratios (as a percentage of average net assets): | |||||||||||||||||||||||||||||||||||||||||||||||||||||||||||||||||||||||||||||||||||||||||||||||||||||||
| Expenses before reductions | 1.46 | 1.43 | 1.47 | 1.54 | 1.54 | ||||||||||||||||||||||||||||||||||||||||||||||||||||||||||||||||||||||||||||||||||||||||||||||||||
| Expenses including reductions | 1.43 | 1.43 | 1.47 | 1.50 | 1.44 | ||||||||||||||||||||||||||||||||||||||||||||||||||||||||||||||||||||||||||||||||||||||||||||||||||
| Net investment loss | (0.14 | ) | (0.17 | ) | (0.47 | ) | (0.36 | ) | (0.07 | ) | |||||||||||||||||||||||||||||||||||||||||||||||||||||||||||||||||||||||||||||||||||||||||||||
| Portfolio turnover (%) | 108 | 79 | 85 | 97 | 133 | ||||||||||||||||||||||||||||||||||||||||||||||||||||||||||||||||||||||||||||||||||||||||||||||||||
| 1 | Based on average daily shares outstanding. | ||||||||||||||||||||||||||||||||||||||||||||||||||||||||||||||||||||||||||||||||||
| 2 | Does not reflect the effect of sales charges, if any. | ||||||||||||||||||||||||||||||||||||||||||||||||||||||||||||||||||||||||||||||||||
| 3 | Total returns would have been lower had certain expenses not been reduced during the applicable periods. | ||||||||||||||||||||||||||||||||||||||||||||||||||||||||||||||||||||||||||||||||||
| Class I Shares Period ended | 3-31-16 | 3-31-15 | 3-31-14 | 3-31-13 | 3-31-12 | ||||||||||||||||||||||||||||||||||||||||||||||||||||||||||||||||||||||||||||||||||||||||||||||||||
| Per share operating performance | |||||||||||||||||||||||||||||||||||||||||||||||||||||||||||||||||||||||||||||||||||||||||||||||||||||||
| Net asset value, beginning of period | $28.22 | $29.02 | $24.32 | $20.96 | $21.51 | ||||||||||||||||||||||||||||||||||||||||||||||||||||||||||||||||||||||||||||||||||||||||||||||||||
| Net investment income (loss)1 | 0.04 | 0.03 | (0.04 | ) | — | 2 | 0.07 | ||||||||||||||||||||||||||||||||||||||||||||||||||||||||||||||||||||||||||||||||||||||||||||||||
| Net realized and unrealized gain (loss) on investments | (1.80 | ) | 1.91 | 5.27 | 3.36 | (0.58 | ) | ||||||||||||||||||||||||||||||||||||||||||||||||||||||||||||||||||||||||||||||||||||||||||||||||
| Total from investment operations | (1.76 | ) | 1.94 | 5.23 | 3.36 | (0.51 | ) | ||||||||||||||||||||||||||||||||||||||||||||||||||||||||||||||||||||||||||||||||||||||||||||||||
| Less distributions | |||||||||||||||||||||||||||||||||||||||||||||||||||||||||||||||||||||||||||||||||||||||||||||||||||||||
| From net investment income | — | — | — | — | (0.04 | ) | |||||||||||||||||||||||||||||||||||||||||||||||||||||||||||||||||||||||||||||||||||||||||||||||||
| From net realized gain | (1.81 | ) | (2.74 | ) | (0.53 | ) | — | — | |||||||||||||||||||||||||||||||||||||||||||||||||||||||||||||||||||||||||||||||||||||||||||||||
| Total distributions | (1.81 | ) | (2.74 | ) | (0.53 | ) | — | (0.04 | ) | ||||||||||||||||||||||||||||||||||||||||||||||||||||||||||||||||||||||||||||||||||||||||||||||
| Net asset value, end of period | $24.65 | $28.22 | $29.02 | $24.32 | $20.96 | ||||||||||||||||||||||||||||||||||||||||||||||||||||||||||||||||||||||||||||||||||||||||||||||||||
| Total return (%)3 | (6.40 | ) | 7.61 | 21.61 | 16.03 | (2.34 | ) | ||||||||||||||||||||||||||||||||||||||||||||||||||||||||||||||||||||||||||||||||||||||||||||||||
| Ratios and supplemental data | |||||||||||||||||||||||||||||||||||||||||||||||||||||||||||||||||||||||||||||||||||||||||||||||||||||||
| Net assets, end of period (in millions) | $39 | $43 | $50 | $49 | $69 | ||||||||||||||||||||||||||||||||||||||||||||||||||||||||||||||||||||||||||||||||||||||||||||||||||
| Ratios (as a percentage of average net assets): | |||||||||||||||||||||||||||||||||||||||||||||||||||||||||||||||||||||||||||||||||||||||||||||||||||||||
| Expenses before reductions | 1.15 | 1.14 | 1.15 | 1.18 | 1.16 | ||||||||||||||||||||||||||||||||||||||||||||||||||||||||||||||||||||||||||||||||||||||||||||||||||
| Expenses including reductions | 1.13 | 1.13 | 1.14 | 1.11 | 1.04 | ||||||||||||||||||||||||||||||||||||||||||||||||||||||||||||||||||||||||||||||||||||||||||||||||||
| Net investment income (loss) | 0.13 | 0.12 | (0.15 | ) | 0.02 | 0.34 | |||||||||||||||||||||||||||||||||||||||||||||||||||||||||||||||||||||||||||||||||||||||||||||||||
| Portfolio turnover (%) | 108 | 79 | 85 | 97 | 133 | ||||||||||||||||||||||||||||||||||||||||||||||||||||||||||||||||||||||||||||||||||||||||||||||||||
| 1 | Based on average daily shares outstanding. | ||||||||||||||||||||||||||||||||||||||||||||||||||||||||||||||||||||||||||||||||||
| 2 | Less than $0.005 per share. | ||||||||||||||||||||||||||||||||||||||||||||||||||||||||||||||||||||||||||||||||||
| 3 | Total returns would have been lower had certain expenses not been reduced during the applicable periods. | ||||||||||||||||||||||||||||||||||||||||||||||||||||||||||||||||||||||||||||||||||
| Class R1 Shares Period ended | 3-31-16 | 3-31-15 | 3-31-14 | 3-31-13 | 3-31-12 | ||||||||||||||||||||||||||||||||||||||||||||||||||||||||||||||||||||||||||||||||||||||||||||||||||
| Per share operating performance | |||||||||||||||||||||||||||||||||||||||||||||||||||||||||||||||||||||||||||||||||||||||||||||||||||||||
| Net asset value, beginning of period | $27.23 | $28.29 | $23.87 | $20.71 | $21.37 | ||||||||||||||||||||||||||||||||||||||||||||||||||||||||||||||||||||||||||||||||||||||||||||||||||
| Net investment loss1 | (0.15 | ) | (0.15 | ) | (0.21 | ) | (0.13 | ) | (0.08 | ) | |||||||||||||||||||||||||||||||||||||||||||||||||||||||||||||||||||||||||||||||||||||||||||||
| Net realized and unrealized gain (loss) on investments | (1.71 | ) | 1.83 | 5.16 | 3.29 | (0.58 | ) | ||||||||||||||||||||||||||||||||||||||||||||||||||||||||||||||||||||||||||||||||||||||||||||||||
| Total from investment operations | (1.86 | ) | 1.68 | 4.95 | 3.16 | (0.66 | ) | ||||||||||||||||||||||||||||||||||||||||||||||||||||||||||||||||||||||||||||||||||||||||||||||||
| Less distributions | |||||||||||||||||||||||||||||||||||||||||||||||||||||||||||||||||||||||||||||||||||||||||||||||||||||||
| From net realized gain | (1.81 | ) | (2.74 | ) | (0.53 | ) | — | — | |||||||||||||||||||||||||||||||||||||||||||||||||||||||||||||||||||||||||||||||||||||||||||||||
| Total distributions | (1.81 | ) | (2.74 | ) | (0.53 | ) | — | — | |||||||||||||||||||||||||||||||||||||||||||||||||||||||||||||||||||||||||||||||||||||||||||||||
| Net asset value, end of period | $23.56 | $27.23 | $28.29 | $23.87 | $20.71 | ||||||||||||||||||||||||||||||||||||||||||||||||||||||||||||||||||||||||||||||||||||||||||||||||||
| Total return (%)2 | (7.01 | ) | 6.86 | 20.84 | 15.26 | (3.09 | ) | ||||||||||||||||||||||||||||||||||||||||||||||||||||||||||||||||||||||||||||||||||||||||||||||||
| Ratios and supplemental data | |||||||||||||||||||||||||||||||||||||||||||||||||||||||||||||||||||||||||||||||||||||||||||||||||||||||
| Net assets, end of period (in millions) | $1 | $1 | $1 | $1 | — | 3 | |||||||||||||||||||||||||||||||||||||||||||||||||||||||||||||||||||||||||||||||||||||||||||||||||
| Ratios (as a percentage of average net assets): | |||||||||||||||||||||||||||||||||||||||||||||||||||||||||||||||||||||||||||||||||||||||||||||||||||||||
| Expenses before reductions | 1.95 | 2.84 | 2.94 | 4.37 | 13.34 | ||||||||||||||||||||||||||||||||||||||||||||||||||||||||||||||||||||||||||||||||||||||||||||||||||
| Expenses including reductions | 1.80 | 1.80 | 1.80 | 1.80 | 1.80 | ||||||||||||||||||||||||||||||||||||||||||||||||||||||||||||||||||||||||||||||||||||||||||||||||||
| Net investment loss | (0.56 | ) | (0.55 | ) | (0.82 | ) | (0.60 | ) | (0.40 | ) | |||||||||||||||||||||||||||||||||||||||||||||||||||||||||||||||||||||||||||||||||||||||||||||
| Portfolio turnover (%) | 108 | 79 | 85 | 97 | 133 | ||||||||||||||||||||||||||||||||||||||||||||||||||||||||||||||||||||||||||||||||||||||||||||||||||
| 1 | Based on average daily shares outstanding. | ||||||||||||||||||||||||||||||||||||||||||||||||||||||||||||||||||||||||||||||||||
| 2 | Total returns would have been lower had certain expenses not been reduced during the applicable periods. | ||||||||||||||||||||||||||||||||||||||||||||||||||||||||||||||||||||||||||||||||||
| 3 | Less than $500,000. | ||||||||||||||||||||||||||||||||||||||||||||||||||||||||||||||||||||||||||||||||||
| Class R2 Shares Period ended | 3-31-16 | 3-31-15 | 3-31-14 | 3-31-13 | 3-31-12 | 1 | |||||||||||||||||||||||||||||||||||||||||||||||||||||||||||||||||||||||||||||||||||||||||||||||||
| Per share operating performance | |||||||||||||||||||||||||||||||||||||||||||||||||||||||||||||||||||||||||||||||||||||||||||||||||||||||
| Net asset value, beginning of period | $27.83 | $28.77 | $24.21 | $20.96 | $20.56 | ||||||||||||||||||||||||||||||||||||||||||||||||||||||||||||||||||||||||||||||||||||||||||||||||||
| Net investment income (loss)2 | (0.05 | ) | (0.08 | ) | (0.14 | ) | (0.08 | ) | 0.02 | ||||||||||||||||||||||||||||||||||||||||||||||||||||||||||||||||||||||||||||||||||||||||||||||
| Net realized and unrealized gain (loss) on investments | (1.80 | ) | 1.88 | 5.23 | 3.33 | 0.38 | |||||||||||||||||||||||||||||||||||||||||||||||||||||||||||||||||||||||||||||||||||||||||||||||||
| Total from investment operations | (1.85 | ) | 1.80 | 5.09 | 3.25 | 0.40 | |||||||||||||||||||||||||||||||||||||||||||||||||||||||||||||||||||||||||||||||||||||||||||||||||
| Less distributions | |||||||||||||||||||||||||||||||||||||||||||||||||||||||||||||||||||||||||||||||||||||||||||||||||||||||
| From net realized gain | (1.81 | ) | (2.74 | ) | (0.53 | ) | — | — | |||||||||||||||||||||||||||||||||||||||||||||||||||||||||||||||||||||||||||||||||||||||||||||||
| Total distributions | (1.81 | ) | (2.74 | ) | (0.53 | ) | — | — | |||||||||||||||||||||||||||||||||||||||||||||||||||||||||||||||||||||||||||||||||||||||||||||||
| Net asset value, end of period | $24.17 | $27.83 | $28.77 | $24.21 | $20.96 | ||||||||||||||||||||||||||||||||||||||||||||||||||||||||||||||||||||||||||||||||||||||||||||||||||
| Total return (%)3 | (6.82 | ) | 7.18 | 21.12 | 15.51 | 1.95 | 4 | ||||||||||||||||||||||||||||||||||||||||||||||||||||||||||||||||||||||||||||||||||||||||||||||||
| Ratios and supplemental data | |||||||||||||||||||||||||||||||||||||||||||||||||||||||||||||||||||||||||||||||||||||||||||||||||||||||
| Net assets, end of period (in millions) | $1 | $1 | — | 5 | — | 5 | — | 5 | |||||||||||||||||||||||||||||||||||||||||||||||||||||||||||||||||||||||||||||||||||||||||||||||
| Ratios (as a percentage of average net assets): | |||||||||||||||||||||||||||||||||||||||||||||||||||||||||||||||||||||||||||||||||||||||||||||||||||||||
| Expenses before reductions | 2.21 | 4.66 | 7.99 | 20.22 | 16.31 | 6 | |||||||||||||||||||||||||||||||||||||||||||||||||||||||||||||||||||||||||||||||||||||||||||||||||
| Expenses including reductions | 1.55 | 1.55 | 1.55 | 1.55 | 1.55 | 6 | |||||||||||||||||||||||||||||||||||||||||||||||||||||||||||||||||||||||||||||||||||||||||||||||||
| Net investment income (loss) | (0.20 | ) | (0.29 | ) | (0.54 | ) | (0.39 | ) | 1.31 | 6 | |||||||||||||||||||||||||||||||||||||||||||||||||||||||||||||||||||||||||||||||||||||||||||||
| Portfolio turnover (%) | 108 | 79 | 85 | 97 | 133 | 7 | |||||||||||||||||||||||||||||||||||||||||||||||||||||||||||||||||||||||||||||||||||||||||||||||||
| 1 | The inception date for Class R2 shares is 3-1-12. | ||||||||||||||||||||||||||||||||||||||||||||||||||||||||||||||||||||||||||||||||||
| 2 | Based on average daily shares outstanding. | ||||||||||||||||||||||||||||||||||||||||||||||||||||||||||||||||||||||||||||||||||
| 3 | Total returns would have been lower had certain expenses not been reduced during the applicable periods. | ||||||||||||||||||||||||||||||||||||||||||||||||||||||||||||||||||||||||||||||||||
| 4 | Not annualized. | ||||||||||||||||||||||||||||||||||||||||||||||||||||||||||||||||||||||||||||||||||
| 5 | Less than $500,000. | ||||||||||||||||||||||||||||||||||||||||||||||||||||||||||||||||||||||||||||||||||
| 6 | Annualized. | ||||||||||||||||||||||||||||||||||||||||||||||||||||||||||||||||||||||||||||||||||
| 7 | The portfolio turnover is shown for the period from 4-1-11 to 3-31-12. | ||||||||||||||||||||||||||||||||||||||||||||||||||||||||||||||||||||||||||||||||||
| Class R3 Shares Period ended | 3-31-16 | 3-31-15 | 3-31-14 | 3-31-13 | 3-31-12 | ||||||||||||||||||||||||||||||||||||||||||||||||||||||||||||||||||||||||||||||||||||||||||||||||||
| Per share operating performance | |||||||||||||||||||||||||||||||||||||||||||||||||||||||||||||||||||||||||||||||||||||||||||||||||||||||
| Net asset value, beginning of period | $27.38 | $28.39 | $23.94 | $20.76 | $21.39 | ||||||||||||||||||||||||||||||||||||||||||||||||||||||||||||||||||||||||||||||||||||||||||||||||||
| Net investment loss1 | (0.11 | ) | (0.12 | ) | (0.19 | ) | (0.12 | ) | (0.06 | ) | |||||||||||||||||||||||||||||||||||||||||||||||||||||||||||||||||||||||||||||||||||||||||||||
| Net realized and unrealized gain (loss) on investments | (1.74 | ) | 1.85 | 5.17 | 3.30 | (0.57 | ) | ||||||||||||||||||||||||||||||||||||||||||||||||||||||||||||||||||||||||||||||||||||||||||||||||
| Total from investment operations | (1.85 | ) | 1.73 | 4.98 | 3.18 | (0.63 | ) | ||||||||||||||||||||||||||||||||||||||||||||||||||||||||||||||||||||||||||||||||||||||||||||||||
| Less distributions | |||||||||||||||||||||||||||||||||||||||||||||||||||||||||||||||||||||||||||||||||||||||||||||||||||||||
| From net realized gain | (1.81 | ) | (2.74 | ) | (0.53 | ) | — | — | |||||||||||||||||||||||||||||||||||||||||||||||||||||||||||||||||||||||||||||||||||||||||||||||
| Total distributions | (1.81 | ) | (2.74 | ) | (0.53 | ) | — | — | |||||||||||||||||||||||||||||||||||||||||||||||||||||||||||||||||||||||||||||||||||||||||||||||
| Net asset value, end of period | $23.72 | $27.38 | $28.39 | $23.94 | $20.76 | ||||||||||||||||||||||||||||||||||||||||||||||||||||||||||||||||||||||||||||||||||||||||||||||||||
| Total return (%)2 | (6.93 | ) | 7.02 | 20.90 | 15.32 | (2.95 | ) | ||||||||||||||||||||||||||||||||||||||||||||||||||||||||||||||||||||||||||||||||||||||||||||||||
| Ratios and supplemental data | |||||||||||||||||||||||||||||||||||||||||||||||||||||||||||||||||||||||||||||||||||||||||||||||||||||||
| Net assets, end of period (in millions) | — | 3 | — | 3 | — | 3 | — | 3 | — | 3 | |||||||||||||||||||||||||||||||||||||||||||||||||||||||||||||||||||||||||||||||||||||||||||||
| Ratios (as a percentage of average net assets): | |||||||||||||||||||||||||||||||||||||||||||||||||||||||||||||||||||||||||||||||||||||||||||||||||||||||
| Expenses before reductions | 2.54 | 9.06 | 10.89 | 5.15 | 4.65 | ||||||||||||||||||||||||||||||||||||||||||||||||||||||||||||||||||||||||||||||||||||||||||||||||||
| Expenses including reductions | 1.70 | 1.70 | 1.70 | 1.70 | 1.70 | ||||||||||||||||||||||||||||||||||||||||||||||||||||||||||||||||||||||||||||||||||||||||||||||||||
| Net investment loss | (0.42 | ) | (0.43 | ) | (0.75 | ) | (0.56 | ) | (0.32 | ) | |||||||||||||||||||||||||||||||||||||||||||||||||||||||||||||||||||||||||||||||||||||||||||||
| Portfolio turnover (%) | 108 | 79 | 85 | 97 | 133 | ||||||||||||||||||||||||||||||||||||||||||||||||||||||||||||||||||||||||||||||||||||||||||||||||||
| 1 | Based on average daily shares outstanding. | ||||||||||||||||||||||||||||||||||||||||||||||||||||||||||||||||||||||||||||||||||
| 2 | Total returns would have been lower had certain expenses not been reduced during the applicable periods. | ||||||||||||||||||||||||||||||||||||||||||||||||||||||||||||||||||||||||||||||||||
| 3 | Less than $500,000. | ||||||||||||||||||||||||||||||||||||||||||||||||||||||||||||||||||||||||||||||||||
| Class R4 Shares Period ended | 3-31-16 | 3-31-15 | 3-31-14 | 3-31-13 | 3-31-12 | ||||||||||||||||||||||||||||||||||||||||||||||||||||||||||||||||||||||||||||||||||||||||||||||||||
| Per share operating performance | |||||||||||||||||||||||||||||||||||||||||||||||||||||||||||||||||||||||||||||||||||||||||||||||||||||||
| Net asset value, beginning of period | $27.92 | $28.79 | $24.17 | $20.87 | $21.44 | ||||||||||||||||||||||||||||||||||||||||||||||||||||||||||||||||||||||||||||||||||||||||||||||||||
| Net investment income (loss)1 | — | 2 | (0.01 | ) | (0.08 | ) | (0.03 | ) | (0.01 | ) | |||||||||||||||||||||||||||||||||||||||||||||||||||||||||||||||||||||||||||||||||||||||||||||
| Net realized and unrealized gain (loss) on investments | (1.79 | ) | 1.88 | 5.23 | 3.33 | (0.56 | ) | ||||||||||||||||||||||||||||||||||||||||||||||||||||||||||||||||||||||||||||||||||||||||||||||||
| Total from investment operations | (1.79 | ) | 1.87 | 5.15 | 3.30 | (0.57 | ) | ||||||||||||||||||||||||||||||||||||||||||||||||||||||||||||||||||||||||||||||||||||||||||||||||
| Less distributions | |||||||||||||||||||||||||||||||||||||||||||||||||||||||||||||||||||||||||||||||||||||||||||||||||||||||
| From net realized gain | (1.81 | ) | (2.74 | ) | (0.53 | ) | — | — | |||||||||||||||||||||||||||||||||||||||||||||||||||||||||||||||||||||||||||||||||||||||||||||||
| Total distributions | (1.81 | ) | (2.74 | ) | (0.53 | ) | — | — | |||||||||||||||||||||||||||||||||||||||||||||||||||||||||||||||||||||||||||||||||||||||||||||||
| Net asset value, end of period | $24.32 | $27.92 | $28.79 | $24.17 | $20.87 | ||||||||||||||||||||||||||||||||||||||||||||||||||||||||||||||||||||||||||||||||||||||||||||||||||
| Total return (%)3 | (6.58 | ) | 7.42 | 21.41 | 15.81 | (2.66 | ) | ||||||||||||||||||||||||||||||||||||||||||||||||||||||||||||||||||||||||||||||||||||||||||||||||
| Ratios and supplemental data | |||||||||||||||||||||||||||||||||||||||||||||||||||||||||||||||||||||||||||||||||||||||||||||||||||||||
| Net assets, end of period (in millions) | — | 4 | — | 4 | — | 4 | — | 4 | — | 4 | |||||||||||||||||||||||||||||||||||||||||||||||||||||||||||||||||||||||||||||||||||||||||||||
| Ratios (as a percentage of average net assets): | |||||||||||||||||||||||||||||||||||||||||||||||||||||||||||||||||||||||||||||||||||||||||||||||||||||||
| Expenses before reductions | 4.26 | 19.97 | 18.99 | 18.82 | 28.72 | ||||||||||||||||||||||||||||||||||||||||||||||||||||||||||||||||||||||||||||||||||||||||||||||||||
| Expenses including reductions | 1.30 | 1.30 | 1.30 | 1.31 | 1.40 | ||||||||||||||||||||||||||||||||||||||||||||||||||||||||||||||||||||||||||||||||||||||||||||||||||
| Net investment loss | (0.01 | ) | (0.05 | ) | (0.31 | ) | (0.17 | ) | (0.03 | ) | |||||||||||||||||||||||||||||||||||||||||||||||||||||||||||||||||||||||||||||||||||||||||||||
| Portfolio turnover (%) | 108 | 79 | 85 | 97 | 133 | ||||||||||||||||||||||||||||||||||||||||||||||||||||||||||||||||||||||||||||||||||||||||||||||||||
| 1 | Based on average daily shares outstanding. | ||||||||||||||||||||||||||||||||||||||||||||||||||||||||||||||||||||||||||||||||||
| 2 | Less than $0.005 per share. | ||||||||||||||||||||||||||||||||||||||||||||||||||||||||||||||||||||||||||||||||||
| 3 | Total returns would have been lower had certain expenses not been reduced during the applicable periods. | ||||||||||||||||||||||||||||||||||||||||||||||||||||||||||||||||||||||||||||||||||
| 4 | Less than $500,000. | ||||||||||||||||||||||||||||||||||||||||||||||||||||||||||||||||||||||||||||||||||
| Class R5 Shares Period ended | 3-31-16 | 3-31-15 | 3-31-14 | 3-31-13 | 3-31-12 | ||||||||||||||||||||||||||||||||||||||||||||||||||||||||||||||||||||||||||||||||||||||||||||||||||
| Per share operating performance | |||||||||||||||||||||||||||||||||||||||||||||||||||||||||||||||||||||||||||||||||||||||||||||||||||||||
| Net asset value, beginning of period | $28.24 | $29.03 | $24.32 | $20.96 | $21.50 | ||||||||||||||||||||||||||||||||||||||||||||||||||||||||||||||||||||||||||||||||||||||||||||||||||
| Net investment income (loss)1 | 0.03 | 0.04 | (0.03 | ) | 0.01 | 0.05 | |||||||||||||||||||||||||||||||||||||||||||||||||||||||||||||||||||||||||||||||||||||||||||||||||
| Net realized and unrealized gain (loss) on investments | (1.78 | ) | 1.91 | 5.27 | 3.35 | (0.56 | ) | ||||||||||||||||||||||||||||||||||||||||||||||||||||||||||||||||||||||||||||||||||||||||||||||||
| Total from investment operations | (1.75 | ) | 1.95 | 5.24 | 3.36 | (0.51 | ) | ||||||||||||||||||||||||||||||||||||||||||||||||||||||||||||||||||||||||||||||||||||||||||||||||
| Less distributions | |||||||||||||||||||||||||||||||||||||||||||||||||||||||||||||||||||||||||||||||||||||||||||||||||||||||
| From net investment income | — | — | — | — | (0.03 | ) | |||||||||||||||||||||||||||||||||||||||||||||||||||||||||||||||||||||||||||||||||||||||||||||||||
| From net realized gain | (1.81 | ) | (2.74 | ) | (0.53 | ) | — | — | |||||||||||||||||||||||||||||||||||||||||||||||||||||||||||||||||||||||||||||||||||||||||||||||
| Total distributions | (1.81 | ) | (2.74 | ) | (0.53 | ) | — | (0.03 | ) | ||||||||||||||||||||||||||||||||||||||||||||||||||||||||||||||||||||||||||||||||||||||||||||||
| Net asset value, end of period | $24.68 | $28.24 | $29.03 | $24.32 | $20.96 | ||||||||||||||||||||||||||||||||||||||||||||||||||||||||||||||||||||||||||||||||||||||||||||||||||
| Total return (%)2 | (6.36 | ) | 7.64 | 21.65 | 16.03 | (2.34 | ) | ||||||||||||||||||||||||||||||||||||||||||||||||||||||||||||||||||||||||||||||||||||||||||||||||
| Ratios and supplemental data | |||||||||||||||||||||||||||||||||||||||||||||||||||||||||||||||||||||||||||||||||||||||||||||||||||||||
| Net assets, end of period (in millions) | — | 3 | — | 3 | — | 3 | — | 3 | — | 3 | |||||||||||||||||||||||||||||||||||||||||||||||||||||||||||||||||||||||||||||||||||||||||||||
| Ratios (as a percentage of average net assets): | |||||||||||||||||||||||||||||||||||||||||||||||||||||||||||||||||||||||||||||||||||||||||||||||||||||||
| Expenses before reductions | 2.53 | 5.61 | 6.05 | 7.78 | 8.75 | ||||||||||||||||||||||||||||||||||||||||||||||||||||||||||||||||||||||||||||||||||||||||||||||||||
| Expenses including reductions | 1.10 | 1.10 | 1.10 | 1.10 | 1.10 | ||||||||||||||||||||||||||||||||||||||||||||||||||||||||||||||||||||||||||||||||||||||||||||||||||
| Net investment income (loss) | 0.11 | 0.16 | (0.11 | ) | 0.05 | 0.28 | |||||||||||||||||||||||||||||||||||||||||||||||||||||||||||||||||||||||||||||||||||||||||||||||||
| Portfolio turnover (%) | 108 | 79 | 85 | 97 | 133 | ||||||||||||||||||||||||||||||||||||||||||||||||||||||||||||||||||||||||||||||||||||||||||||||||||
| 1 | Based on average daily shares outstanding. | ||||||||||||||||||||||||||||||||||||||||||||||||||||||||||||||||||||||||||||||||||
| 2 | Total returns would have been lower had certain expenses not been reduced during the applicable periods. | ||||||||||||||||||||||||||||||||||||||||||||||||||||||||||||||||||||||||||||||||||
| 3 | Less than $500,000. | ||||||||||||||||||||||||||||||||||||||||||||||||||||||||||||||||||||||||||||||||||
| Class R6 Shares Period ended | 3-31-16 | 3-31-15 | 3-31-14 | 3-31-13 | 3-31-12 | 1 | |||||||||||||||||||||||||||||||||||||||||||||||||||||||||||||||||||||||||||||||||||||||||||||||||
| Per share operating performance | |||||||||||||||||||||||||||||||||||||||||||||||||||||||||||||||||||||||||||||||||||||||||||||||||||||||
| Net asset value, beginning of period | $28.34 | $29.08 | $24.34 | $20.97 | $18.69 | ||||||||||||||||||||||||||||||||||||||||||||||||||||||||||||||||||||||||||||||||||||||||||||||||||
| Net investment income (loss)2 | 0.09 | 0.09 | (0.02 | ) | 0.02 | 0.06 | |||||||||||||||||||||||||||||||||||||||||||||||||||||||||||||||||||||||||||||||||||||||||||||||||
| Net realized and unrealized gain (loss) on investments | (1.83 | ) | 1.91 | 5.29 | 3.35 | 2.26 | |||||||||||||||||||||||||||||||||||||||||||||||||||||||||||||||||||||||||||||||||||||||||||||||||
| Total from investment operations | (1.74 | ) | 2.00 | 5.27 | 3.37 | 2.32 | |||||||||||||||||||||||||||||||||||||||||||||||||||||||||||||||||||||||||||||||||||||||||||||||||
| Less distributions | |||||||||||||||||||||||||||||||||||||||||||||||||||||||||||||||||||||||||||||||||||||||||||||||||||||||
| From net investment income | — | — | — | — | (0.04 | ) | |||||||||||||||||||||||||||||||||||||||||||||||||||||||||||||||||||||||||||||||||||||||||||||||||
| From net realized gain | (1.81 | ) | (2.74 | ) | (0.53 | ) | — | — | |||||||||||||||||||||||||||||||||||||||||||||||||||||||||||||||||||||||||||||||||||||||||||||||
| Total distributions | (1.81 | ) | (2.74 | ) | (0.53 | ) | — | (0.04 | ) | ||||||||||||||||||||||||||||||||||||||||||||||||||||||||||||||||||||||||||||||||||||||||||||||
| Net asset value, end of period | $24.79 | $28.34 | $29.08 | $24.34 | $20.97 | ||||||||||||||||||||||||||||||||||||||||||||||||||||||||||||||||||||||||||||||||||||||||||||||||||
| Total return (%)3 | (6.30 | ) | 7.80 | 21.75 | 16.07 | 12.45 | 4 | ||||||||||||||||||||||||||||||||||||||||||||||||||||||||||||||||||||||||||||||||||||||||||||||||
| Ratios and supplemental data | |||||||||||||||||||||||||||||||||||||||||||||||||||||||||||||||||||||||||||||||||||||||||||||||||||||||
| Net assets, end of period (in millions) | $5 | $1 | $1 | — | 5 | — | 5 | ||||||||||||||||||||||||||||||||||||||||||||||||||||||||||||||||||||||||||||||||||||||||||||||||
| Ratios (as a percentage of average net assets): | |||||||||||||||||||||||||||||||||||||||||||||||||||||||||||||||||||||||||||||||||||||||||||||||||||||||
| Expenses before reductions | 1.17 | 4.54 | 7.66 | 18.63 | 15.46 | 6 | |||||||||||||||||||||||||||||||||||||||||||||||||||||||||||||||||||||||||||||||||||||||||||||||||
| Expenses including reductions | 1.04 | 0.97 | 1.04 | 1.04 | 1.04 | 6 | |||||||||||||||||||||||||||||||||||||||||||||||||||||||||||||||||||||||||||||||||||||||||||||||||
| Net investment income (loss) | 0.34 | 0.32 | (0.06 | ) | 0.11 | 0.55 | 6 | ||||||||||||||||||||||||||||||||||||||||||||||||||||||||||||||||||||||||||||||||||||||||||||||||
| Portfolio turnover (%) | 108 | 79 | 85 | 97 | 133 | 7 | |||||||||||||||||||||||||||||||||||||||||||||||||||||||||||||||||||||||||||||||||||||||||||||||||
| 1 | The inception date for Class R6 shares is 9-1-11. | ||||||||||||||||||||||||||||||||||||||||||||||||||||||||||||||||||||||||||||||||||
| 2 | Based on average daily shares outstanding. | ||||||||||||||||||||||||||||||||||||||||||||||||||||||||||||||||||||||||||||||||||
| 3 | Total returns would have been lower had certain expenses not been reduced during the applicable periods. | ||||||||||||||||||||||||||||||||||||||||||||||||||||||||||||||||||||||||||||||||||
| 4 | Not annualized. | ||||||||||||||||||||||||||||||||||||||||||||||||||||||||||||||||||||||||||||||||||
| 5 | Less than $500,000. | ||||||||||||||||||||||||||||||||||||||||||||||||||||||||||||||||||||||||||||||||||
| 6 | Annualized. | ||||||||||||||||||||||||||||||||||||||||||||||||||||||||||||||||||||||||||||||||||
| 7 | The portfolio turnover is shown for the period from 4-1-11 to 3-31-12. | ||||||||||||||||||||||||||||||||||||||||||||||||||||||||||||||||||||||||||||||||||
| Class ADV Shares Period ended | 3-31-16 | 3-31-15 | 3-31-14 | 3-31-13 | 3-31-12 | ||||||||||||||||||||||||||||||||||||||||||||||||||||||||||||||||||||||||||||||||||||||||||||||||||
| Per share operating performance | |||||||||||||||||||||||||||||||||||||||||||||||||||||||||||||||||||||||||||||||||||||||||||||||||||||||
| Net asset value, beginning of period | $27.90 | $28.78 | $24.17 | $20.88 | $21.44 | ||||||||||||||||||||||||||||||||||||||||||||||||||||||||||||||||||||||||||||||||||||||||||||||||||
| Net investment income (loss)1 | (0.02 | ) | (0.03 | ) | (0.09 | ) | (0.04 | ) | 0.01 | ||||||||||||||||||||||||||||||||||||||||||||||||||||||||||||||||||||||||||||||||||||||||||||||
| Net realized and unrealized gain (loss) on investments | (1.78 | ) | 1.89 | 5.23 | 3.33 | (0.57 | ) | ||||||||||||||||||||||||||||||||||||||||||||||||||||||||||||||||||||||||||||||||||||||||||||||||
| Total from investment operations | (1.80 | ) | 1.86 | 5.14 | 3.29 | (0.56 | ) | ||||||||||||||||||||||||||||||||||||||||||||||||||||||||||||||||||||||||||||||||||||||||||||||||
| Less distributions | |||||||||||||||||||||||||||||||||||||||||||||||||||||||||||||||||||||||||||||||||||||||||||||||||||||||
| From net realized gain | (1.81 | ) | (2.74 | ) | (0.53 | ) | — | — | |||||||||||||||||||||||||||||||||||||||||||||||||||||||||||||||||||||||||||||||||||||||||||||||
| Total distributions | (1.81 | ) | (2.74 | ) | (0.53 | ) | — | — | |||||||||||||||||||||||||||||||||||||||||||||||||||||||||||||||||||||||||||||||||||||||||||||||
| Net asset value, end of year | $24.29 | $27.90 | $28.78 | $24.17 | $20.88 | ||||||||||||||||||||||||||||||||||||||||||||||||||||||||||||||||||||||||||||||||||||||||||||||||||
| Total return (%)2 | (6.62 | ) | 7.39 | 21.37 | 15.76 | (2.61 | ) | ||||||||||||||||||||||||||||||||||||||||||||||||||||||||||||||||||||||||||||||||||||||||||||||||
| Ratios and supplemental data | |||||||||||||||||||||||||||||||||||||||||||||||||||||||||||||||||||||||||||||||||||||||||||||||||||||||
| Net assets, end of period (in millions) | $1 | $1 | $1 | — | 3 | $1 | |||||||||||||||||||||||||||||||||||||||||||||||||||||||||||||||||||||||||||||||||||||||||||||||||
| Ratios (as a percentage of average net assets): | |||||||||||||||||||||||||||||||||||||||||||||||||||||||||||||||||||||||||||||||||||||||||||||||||||||||
| Expenses before reductions | 2.05 | 4.17 | 4.51 | 4.91 | 4.34 | ||||||||||||||||||||||||||||||||||||||||||||||||||||||||||||||||||||||||||||||||||||||||||||||||||
| Expenses net of fee waivers | 1.34 | 1.34 | 1.34 | 1.34 | 1.34 | ||||||||||||||||||||||||||||||||||||||||||||||||||||||||||||||||||||||||||||||||||||||||||||||||||
| Net investment income (loss) | (0.07 | ) | (0.09 | ) | (0.35 | ) | (0.20 | ) | 0.03 | ||||||||||||||||||||||||||||||||||||||||||||||||||||||||||||||||||||||||||||||||||||||||||||||
| Portfolio turnover (%) | 108 | 79 | 85 | 97 | 133 | ||||||||||||||||||||||||||||||||||||||||||||||||||||||||||||||||||||||||||||||||||||||||||||||||||
| 1 | Based on average daily shares outstanding. | ||||||||||||||||||||||||||||||||||||||||||||||||||||||||||||||||||||||||||||||||||
| 2 | Total returns would have been lower had certain expenses not been reduced during the applicable periods. | ||||||||||||||||||||||||||||||||||||||||||||||||||||||||||||||||||||||||||||||||||
| 3 | Less than $500,000. | ||||||||||||||||||||||||||||||||||||||||||||||||||||||||||||||||||||||||||||||||||
Note 1 — Organization
John Hancock Small Company Fund (the fund) is a series of John Hancock Funds III (the Trust), an open-end management investment company organized as a Massachusetts business trust and registered under the Investment Company Act of 1940, as amended (the 1940 Act). The investment objective of the fund is to seek maximum long-term total return.
The fund may offer multiple classes of shares. The shares currently offered are detailed in the Statement of assets and liabilities. Class A shares are offered to all investors. Class I shares are offered to institutions and certain investors. Class R1, Class R2, Class R3, Class R4 and Class R5 shares are available only to certain retirement plans. Class R6 shares are available only to certain retirement plans, institutions and other investors. Class ADV shares are available to investors who acquired Class A shares as a result of the reorganization of the FMA Small Company Portfolio into the fund and are closed to new investors. Shareholders of each class have exclusive voting rights to matters that affect that class. The distribution and service fees, if any, transfer agent fees, state registration fees and printing and postage for each class may differ.
Note 2 — Significant accounting policies
The financial statements have been prepared in conformity with accounting principles generally accepted in the United States of America (US GAAP), which require management to make certain estimates and assumptions as of the date of the financial statements. Actual results could differ from those estimates and those differences could be significant. The fund qualifies as an investment company under Topic 946 of Accounting Standards Codification of US GAAP.
Events or transactions occurring after the end of the fiscal period through the date that the financial statements were issued have been evaluated in the preparation of the financial statements. The following summarizes the significant accounting policies of the fund:
Security valuation. Investments are stated at value as of the scheduled close of regular trading on the New York Stock Exchange (NYSE), normally at 4:00 p.m., Eastern Time. In case of emergency or other disruption resulting in the NYSE not opening for trading or the NYSE closing at a time other than the regularly scheduled close, the net asset value (NAV) may be determined as of the regularly scheduled close of the NYSE pursuant to the fund's Valuation Policies and Procedures. The time at which shares and transactions are priced and until which orders are accepted may vary to the extent permitted by the Securities and Exchange Commission (SEC) and applicable regulations.
In order to value the securities, the fund uses the following valuation techniques: Equity securities, held by the fund are typically valued at the last sale price or official closing price on the exchange or principal market where the security was acquired or most likely will be sold. In the event there were no sales during the day or closing prices are not available, the securities are valued using the last available bid price. Investments by the fund in open-end mutual funds are valued at their respective NAV each business day.
In certain instances, the Pricing Committee may determine to value equity securities using prices obtained from another exchange or market if trading on the exchange or market on which prices are typically obtained did not open for trading as scheduled, or if trading closed earlier than scheduled, and trading occurred as normal on another exchange or market.
Other portfolio securities and assets, for which reliable market quotations are not readily available, are valued at fair value as determined in good faith by the fund's Pricing Committee following procedures established by the Board of Trustees. The frequency with which these fair valuation procedures are used cannot be predicted and fair value of securities may differ significantly from the value that would have been used had a ready market for such securities existed.
The fund uses a three-tier hierarchy to prioritize the pricing assumptions, referred to as inputs, used in valuation techniques to measure fair value. Level 1 includes securities valued using quoted prices in active markets for identical securities. Level 2 includes securities valued using other significant observable inputs. Observable inputs may include quoted prices for similar securities, interest rates, prepayment speeds and credit risk. Prices for securities valued using these inputs are received from independent pricing vendors and brokers and are based on an evaluation of the inputs described. Level 3 includes securities valued using significant unobservable inputs when market prices are not readily available or reliable, including the fund's own assumptions in determining the fair value of investments. Factors used in determining value may include market or
issuer specific events or trends, changes in interest rates and credit quality. The inputs or methodology used for valuing securities are not necessarily an indication of the risks associated with investing in those securities. Changes in valuation techniques and related inputs may result in transfers into or out of an assigned level within the disclosure hierarchy.
As of March 31, 2016, all investments are categorized as Level 1 under the hierarchy described above.
Security transactions and related investment income. Investment security transactions are accounted for on a trade date plus one basis for daily NAV calculations. However, for financial reporting purposes, investment transactions are reported on trade date. Interest income is accrued as earned. Dividend income is recorded on the ex-date. Gains and losses on securities sold are determined on the basis of identified cost and may include proceeds from litigation.
Line of credit. The fund may borrow from banks for temporary or emergency purposes, including meeting redemption requests that otherwise might require the untimely sale of securities. Pursuant to the fund's custodian agreement, the custodian may loan money to the fund to make properly authorized payments. The fund is obligated to repay the custodian for any overdraft, including any related costs or expenses. The custodian may have a lien, security interest or security entitlement in any fund property that is not otherwise segregated or pledged, to the extent of any overdraft, and to the maximum extent permitted by law.
The fund and other affiliated funds have entered into a syndicated line of credit agreement, with Citibank, N.A. (Citibank) as the administrative agent, that enables them to participate in a $750 million unsecured committed line of credit. Prior to June 30, 2015, the fund and other affiliated funds had an agreement with Citibank that enabled them to participate in a $300 million unsecured committed line of credit. A commitment fee, payable at the end of each calendar quarter, based on the average daily unused portion of the effective line of credit, is charged to each participating fund on a pro rata basis and is reflected in other expenses on the Statement of operations. Commitment fees for the year ended March 31, 2016 were $1,477. For the year ended March 31, 2016, the fund had no borrowings under either line of credit.
Expenses. Within the John Hancock group of funds complex, expenses that are directly attributable to an individual fund are allocated to such fund. Expenses that are not readily attributable to a specific fund are allocated among all funds in an equitable manner, taking into consideration, among other things, the nature and type of expense and the fund's relative net assets. Expense estimates are accrued in the period to which they relate and adjustments are made when actual amounts are known.
Class allocations. Income, common expenses and realized and unrealized gains (losses) are determined at the fund level and allocated daily to each class of shares based on the net assets of the class. Class-specific expenses, such as distribution and service fees, if any, and transfer agent fees, for all classes, are calculated daily at the class level based on the net assets of each class and the specific expense rates applicable to each class. Through June 30, 2015, class-specific expenses, such as state registration fees and printing and postage, for all classes, were calculated daily at the class level based on net assets of each class and the specific expense rates applicable to each class.
Federal income taxes. The fund intends to continue to qualify as a regulated investment company by complying with the applicable provisions of the Internal Revenue Code and will not be subject to federal income tax on taxable income that is distributed to shareholders. Therefore, no federal income tax provision is required.
For federal income tax purposes, net capital losses of $11,618,324 that are the result of security transactions occurring after October 31, 2015, are treated as occurring on April 1, 2016 the first day of the fund's next taxable year.
As of March 31, 2016, the fund had no uncertain tax positions that would require financial statement recognition, derecognition or disclosure. The fund's federal tax returns are subject to examination by the Internal Revenue Service for a period of three years.
Distribution of income and gains. Distributions to shareholders from net investment income and net realized gains, if any, are recorded on the ex-date. The fund generally declares and pays dividends and capital gain distributions, if any, annually. The tax character of distributions for the years ended March 31, 2016 and 2015 was $16,929,949 and $20,421,065 of long-term capital gains, respectively.
Distributions paid by the fund with respect to each class of shares are calculated in the same manner, at the same time and in the same amount, except for the effect of class level expenses that may be applied differently to each class. As of March 31, 2016, the fund has no distributable earnings on a tax basis.
Such distributions and distributable earnings, on a tax basis, are determined in conformity with income tax regulations, which may differ from US GAAP. Distributions in excess of tax basis earnings and profits, if any, are reported in the fund's financial statements as a return of capital.
Capital accounts within the financial statements are adjusted for permanent book-tax differences. These adjustments have no impact on net assets or the results of operations. Temporary book-tax differences, if any, will reverse in a subsequent period. Book tax differences are primarily attributable to wash sale loss deferrals, net operating losses and late year ordinary loss deferral.
Note 3 — Guarantees and indemnifications
Under the Trust's organizational documents, its Officers and Trustees are indemnified against certain liabilities arising out of the performance of their duties to the Trust, including the fund. Additionally, in the normal course of business, the fund enters into contracts with service providers that contain general indemnification clauses. The fund's maximum exposure under these arrangements is unknown, as this would involve future claims that may be made against the fund that have not yet occurred. The risk of material loss from such claims is considered remote.
Note 4 — Fees and transactions with affiliates
John Hancock Advisers, LLC (the Advisor) serves as investment advisor for the fund. John Hancock Funds, LLC (the Distributor), an affiliate of the Advisor, serves as principal underwriter of the fund. The Advisor and the Distributor are indirect, wholly owned subsidiaries of Manulife Financial Corporation (MFC).
Management fee. The fund has an investment management agreement with the Advisor under which the fund pays a daily management fee to the Advisor, on an annual basis, equal to the sum of: (a) 0.90% of the first $500 million of the fund's average daily net assets; (b) 0.85% of the next $500 million of the fund's average daily net assets; and (c) 0.80% of the fund's average daily net assets in excess of $1 billion. The Advisor has a subadvisory agreement with Mesirow Financial Investment Management, Inc., formerly, Fiduciary Management Associates, LLC. The fund is not responsible for payment of the subadvisory fees.
The Advisor has contractually agreed to waive a portion of its management fee and/or reimburse expenses for certain funds of the John Hancock funds complex, including the fund (the participating portfolios). This waiver is based upon aggregate net assets of all the participating portfolios. The amount of the reimbursement is calculated daily and allocated among all the participating portfolios in proportion to the daily net assets of each fund. During the year ended March 31, 2016, this waiver amounted to 0.01% of the fund's average net assets on an annualized basis. This arrangement may be amended or terminated at any time by the Advisor upon notice to the fund and with the approval of the Board of Trustees.
The Advisor has contractually agreed to reduce its management fee or, if necessary, make payment to the fund to the extent necessary to maintain the fund's total operating expenses at 1.43%, 1.13%, 1.80%, 1.55%, 1.70%, 1.30%,1.10%, and 1.34% for Class A, Class I, Class R1, Class R2, Class R3, Class R4, Class R5, and Class ADV shares, respectively, excluding certain expenses such as taxes, brokerage commissions, interest expense, litigation and indemnification expenses and other extraordinary expenses not incurred in the ordinary course of the fund's business, acquired fund fees and expenses paid indirectly and short dividend expense. The current expense limitation agreement expires on June 30, 2016, unless renewed by mutual agreement of the fund and the Advisor based upon a determination that this is appropriate under the circumstances at that time. Prior to July 1, 2015, Class A, Class I, and Class R6 shares had fee waivers and/or reimbursement such that expenses would not exceed 1.50%, 1.14%, and 1.04%, respectively.
For Class R6 shares, the Advisor has contractually agreed to waive and/or reimburse all class specific expenses of the fund, to the extent they exceed 0.00% of average net assets. The fee waiver and/or reimbursement will continue in effect until June
30, 2016, unless renewed by mutual agreement of the fund and Advisor based upon a determination that this is appropriate under the circumstances at the time.
For the year ended March 31, 2016, these expense reductions amounted to the following:
| Class | Expense reduction | Class | Expense reduction | |
| Class A | $68,491 | Class R4 | $2,131 | |
| Class I | 9,748 | Class R5 | 2,131 | |
| Class R1 | 1,828 | Class R6 | 3,930 | |
| Class R2 | 4,117 | Class ADV | 4,093 | |
| Class R3 | 2,173 | Total | $98,642 |
The investment management fees, including the impact of the waivers and reimbursements as described above, incurred for the year ended March 31, 2016 were equivalent to a net annual effective rate of 0.86% of the fund's average daily net assets.
Accounting and legal services. Pursuant to a service agreement, the fund reimburses the Advisor for all expenses associated with providing the administrative, financial, legal, accounting and recordkeeping services to the fund, including the preparation of all tax returns, periodic reports to shareholders and regulatory reports, among other services. These expenses are allocated to each share class based on its relative net assets at the time the expense was incurred. These accounting and legal services fees incurred for the year ended March 31, 2016 amounted to an annual rate of 0.01% of the fund's average daily net assets.
Distribution and service plans. The fund has a distribution agreement with the Distributor. The fund has adopted distribution and service plans with respect to Class A, Class R1, Class R2, Class R3, Class R4 and Class ADV shares pursuant to Rule 12b-1 under the 1940 Act, to pay the Distributor for services provided as the distributor of shares of the fund. In addition, under a service plan for Class R1, Class R2, Class R3, Class R4 and Class R5 shares, the fund pays for certain other services. The fund may pay up to the following contractual rates of distribution and service fees under these arrangements, expressed as an annual percentage of average daily net assets for each class of the fund's shares.
| Class | Rule 12b-1 fee | Service fee | Class | Rule 12b-1 fee | Service fee | |
| Class A | 0.30% | — | Class R4 | 0.25% | 0.10% | |
| Class R1 | 0.50% | 0.25% | Class R5 | — | 0.05% | |
| Class R2 | 0.25% | 0.25% | Class ADV | 0.25% | — | |
| Class R3 | 0.50% | 0.15% |
The fund's Distributor has contractually agreed to waive 0.10% of Rule 12b-1 fees for Class R4 shares to limit the Rule 12b-1 fees on Class R4 to 0.15% of the average daily net assets of Class R4 shares, until at least June 30, 2016, unless renewed by mutual agreement of the fund and the Distributor based upon a determination that this is appropriate under the circumstances at the time. Reimbursements related to this contractual waiver amounted to $75 for Class R4 shares for the year ended March 31, 2016.
Sales charges. Class A shares are assessed up-front sales charges, which resulted in payments to the Distributor amounting to $1,561,653 for the year ended March 31, 2016. Of this amount, $267,032 was retained and used for printing prospectuses, advertising, sales literature and other purposes, $1,290,931 was paid as sales commissions to broker-dealers and $3,690 was paid as sales commissions to sales personnel of Signator Investors, Inc., a broker-dealer affiliate of the Advisor.
Class A shares may be subject to contingent deferred sales charges (CDSCs). Certain Class A shares that are acquired through purchases of $1 million or more and are redeemed within one year of purchase are subject to a 1.00% sales charge. CDSCs are applied to the lesser of the current market value at the time of redemption or the original purchase cost of the shares being redeemed. Proceeds from CDSCs are used to compensate the Distributor for providing distribution-related
services in connection with the sale of these shares. During the year ended March 31, 2016, CDSCs received by the Distributor amounted to $926 for Class A shares.
Transfer agent fees. The fund has a transfer agent agreement with John Hancock Signature Services, Inc. (Signature Services), an affiliate of the Advisor. The transfer agent fees paid to Signature Services are determined based on the cost to Signature Services (Signature Services Cost) of providing recordkeeping services. It also includes out-of-pocket expenses, including payments made to third-parties for recordkeeping services provided to their clients who invest in one or more John Hancock funds. In addition, Signature Services Cost may be reduced by certain fees that Signature Services receives in connection with retirement and small accounts. Signature Services Cost is calculated monthly and allocated, as applicable, to five categories of share classes: Retail Share and Institutional Share Classes of Non-Municipal Bond Funds, Class R6 Shares, Retirement Share Classes and Municipal Bond Share Classes. Within each of these categories, the applicable costs are allocated to the affected John Hancock affiliated funds and/or classes, based on the relative average daily net assets.
Class level expenses. Class level expenses for the year ended March 31, 2016 were:
| Class | Distribution and service fees | Transfer agent fees | State registration fees | Printing and postage |
| Class A | $572,306 | $242,586 | $5,893 | $7,341 |
| Class I | — | 47,514 | 3,756 | 1,974 |
| Class R1 | 8,578 | 193 | 2,171 | 62 |
| Class R2 | 3,036 | 103 | 4,172 | 28 |
| Class R3 | 1,694 | 43 | 2,172 | 14 |
| Class R4 | 225 | 12 | 2,171 | 2 |
| Class R5 | 74 | 24 | 2,171 | 12 |
| Class R6 | — | 497 | 3,161 | 55 |
| Class ADV | 1,440 | 732 | 3,647 | 65 |
| Total | $587,353 | $291,704 | $29,314 | $9,553 |
Effective July 1, 2015, state registration fees and printing and postage are treated as fund level expenses and are not included in the table above. For the period July 1, 2015 to March 31, 2016, state registration fees and printing and postage amounted to $121,696 and $33,217, respectively.
Trustee expenses. The fund compensates each Trustee who is not an employee of the Advisor or its affiliates. The costs of paying Trustee compensation and expenses are allocated to each fund based on its net assets relative to other funds within the John Hancock group of funds complex.
Note 5 — Fund share transactions
Transactions in fund shares for the years ended March 31, 2016 and 2015 were as follows:
| Year ended 3-31-16 | Year ended 3-31-15 | |||||||||||||||||||||||||
| Shares | Amount | Shares | Amount | |||||||||||||||||||||||
| Class A shares | ||||||||||||||||||||||||||
| Sold | 3,037,876 | $77,883,439 | 1,216,719 | $33,765,371 | ||||||||||||||||||||||
| Distributions reinvested | 543,417 | 13,498,483 | 615,709 | 15,558,946 | ||||||||||||||||||||||
| Repurchased | (1,181,047 | ) | (30,454,452 | ) | (1,018,751 | ) | (28,165,325 | ) | ||||||||||||||||||
| Net increase | 2,400,246 | $60,927,470 | 813,677 | $21,158,992 | ||||||||||||||||||||||
| Class I shares | ||||||||||||||||||||||||||
| Sold | 363,685 | $9,845,616 | 193,349 | $5,479,237 | ||||||||||||||||||||||
| Distributions reinvested | 109,806 | 2,783,592 | 169,243 | 4,346,160 | ||||||||||||||||||||||
| Repurchased | (413,755 | ) | (10,987,061 | ) | (549,058 | ) | (15,317,986 | ) | ||||||||||||||||||
| Net increase (decrease) | 59,736 | $1,642,147 | (186,466 | ) | ($5,492,589 | ) | ||||||||||||||||||||
| Year ended 3-31-16 | Year ended 3-31-15 | |||||||||||||||||||||||||
| Shares | Amount | Shares | Amount | |||||||||||||||||||||||
| Class R1 shares | ||||||||||||||||||||||||||
| Sold | 10,830 | $280,665 | 12,602 | $336,999 | ||||||||||||||||||||||
| Distributions reinvested | 1,502 | 36,475 | 2,662 | 66,104 | ||||||||||||||||||||||
| Repurchased | (29,848 | ) | (771,336 | ) | (13,846 | ) | (376,272 | ) | ||||||||||||||||||
| Net increase (decrease) | (17,516 | ) | ($454,196 | ) | 1,418 | $26,831 | ||||||||||||||||||||
| Class R2 shares | ||||||||||||||||||||||||||
| Sold | 22,743 | $612,600 | 7,432 | $202,439 | ||||||||||||||||||||||
| Distributions reinvested | 1,606 | 39,988 | 284 | 7,204 | ||||||||||||||||||||||
| Repurchased | (10,192 | ) | (279,303 | ) | (1,088 | ) | (28,525 | ) | ||||||||||||||||||
| Net increase | 14,157 | $373,285 | 6,628 | $181,118 | ||||||||||||||||||||||
| Class R3 shares | ||||||||||||||||||||||||||
| Sold | 3,898 | $102,088 | 2,095 | $57,825 | ||||||||||||||||||||||
| Distributions reinvested | 806 | 19,705 | 829 | 20,688 | ||||||||||||||||||||||
| Repurchased | (2,421 | ) | (59,287 | ) | (337 | ) | (8,949 | ) | ||||||||||||||||||
| Net increase | 2,283 | $62,506 | 2,587 | $69,564 | ||||||||||||||||||||||
| Class R4 shares | ||||||||||||||||||||||||||
| Sold | 3,663 | $86,767 | 185 | $5,140 | ||||||||||||||||||||||
| Distributions reinvested | 111 | 2,770 | 126 | 3,200 | ||||||||||||||||||||||
| Repurchased | (2,371 | ) | (56,921 | ) | (799 | ) | (21,874 | ) | ||||||||||||||||||
| Net increase (decrease) | 1,403 | $32,616 | (488 | ) | ($13,534 | ) | ||||||||||||||||||||
| Class R5 shares | ||||||||||||||||||||||||||
| Sold | 613 | $17,345 | 1,753 | $49,707 | ||||||||||||||||||||||
| Distributions reinvested | 213 | 5,405 | 1,201 | 30,858 | ||||||||||||||||||||||
| Repurchased | (9,406 | ) | (265,975 | ) | (2,380 | ) | (66,340 | ) | ||||||||||||||||||
| Net increase (decrease) | (8,580 | ) | ($243,225 | ) | 574 | $14,225 | ||||||||||||||||||||
| Class R6 shares | ||||||||||||||||||||||||||
| Sold | 179,541 | $4,857,547 | 18,765 | $503,716 | ||||||||||||||||||||||
| Distributions reinvested | 13,248 | 337,695 | 659 | 17,006 | ||||||||||||||||||||||
| Repurchased | (29,082 | ) | (724,893 | ) | (10,003 | ) | (286,860 | ) | ||||||||||||||||||
| Net increase | 163,707 | $4,470,349 | 9,421 | $233,862 | ||||||||||||||||||||||
| Class ADV shares | ||||||||||||||||||||||||||
| Sold | 2,155 | $59,907 | — | — | ||||||||||||||||||||||
| Distributions reinvested | 1,590 | 39,750 | 2,029 | $51,546 | ||||||||||||||||||||||
| Repurchased | (359 | ) | (8,080 | ) | (2,065 | ) | (56,933 | ) | ||||||||||||||||||
| Net increase | 3,386 | $91,577 | (36 | ) | ($5,387 | ) | ||||||||||||||||||||
| Total net increase | 2,618,822 | $66,902,529 | 647,315 | $16,173,082 | ||||||||||||||||||||||
Affiliates of the Trust owned 32% of shares of beneficial interest of Class R4 on March 31, 2016.
Note 6 — Purchase and sale of securities
Purchases and sales of securities, other than short-term investments, amounted to $298,079,665 and $249,884,341, respectively, for the year ended March 31, 2016.
Note 7 — Industry or sector risk
The fund may invest a large percentage of its assets in one or more particular industries or sectors of the economy. If a large percentage of the fund's assets are economically tied to a single or small number of industries or sectors of the economy, the fund will be less diversified than a more broadly diversified fund, and it may cause the fund to underperform if that industry or sector underperforms. In addition, focusing on a particular industry or sector may make the fund's NAV more volatile. Further, a fund that invests in particular industries or sectors is particularly susceptible to the impact of market, economic, regulatory and other factors affecting those industries or sectors.
Report of Independent Registered Public Accounting Firm
To the Board of Trustees and Shareholders of John Hancock Funds III and John Hancock Small Company Fund:
In our opinion, the accompanying statement of assets and liabilities, including the fund's investments, and the related statements of operations and of changes in net assets and the financial highlights present fairly, in all material respects, the financial position of John Hancock Small Company Fund (the "Fund") at March 31, 2016, the results of its operations for the year then ended, the changes in its net assets for each of the two years in the period then ended and the financial highlights for each of the periods indicated, in conformity with accounting principles generally accepted in the United States of America. These financial statements and financial highlights (hereafter referred to as "financial statements") are the responsibility of the Fund's management. Our responsibility is to express an opinion on these financial statements based on our audits. We conducted our audits of these financial statements in accordance with the standards of the Public Company Accounting Oversight Board (United States). Those standards require that we plan and perform the audit to obtain reasonable assurance about whether the financial statements are free of material misstatement. An audit includes examining, on a test basis, evidence supporting the amounts and disclosures in the financial statements, assessing the accounting principles used and significant estimates made by management, and evaluating the overall financial statement presentation. We believe that our audits, which included confirmation of securities at March 31, 2016 by correspondence with the custodian and brokers, and the application of alternative auditing procedures where securities purchased confirmations had not been received, provide a reasonable basis for our opinion.
PricewaterhouseCoopers LLP
Boston, Massachusetts
May 13, 2016
Unaudited
For federal income tax purposes, the following information is furnished with respect to the distributions of the fund, if any, paid during its taxable year ended March 31, 2016.
The fund reports the maximum amount allowable of its net taxable income as eligible for the corporate dividends-received deduction.
The fund reports the maximum amount allowable of its net taxable income as qualified dividend income as provided in the Jobs and Growth Tax Relief Reconciliation Act of 2003.
The fund paid $16,929,949 in capital gain dividends.
Eligible shareholders will be mailed a 2016 Form 1099-DIV in early 2017. This will reflect the tax character of all distributions paid in calendar year 2016.
Please consult a tax advisor regarding the tax consequences of your investment in the fund.
This chart provides information about the Trustees and Officers who oversee your John Hancock fund. Officers elected by the Trustees manage the day-to-day operations of the fund and execute policies formulated by the Trustees.
Independent Trustees
| Name, year of birth Position(s) held with fund Principal occupation(s) and other directorships during past 5 years | Trustee of the Trust since1 | Number of John Hancock funds overseen by Trustee |
| James M. Oates, Born: 1946 | 2012 | 230 |
| Trustee and Chairperson of the Board Managing Director, Wydown Group (financial consulting firm) (since 1994); Chairman and Director, Emerson Investment Management, Inc. (since 2000); Independent Chairman, Hudson Castle Group, Inc. (formerly IBEX Capital Markets, Inc.) (financial services company) (1997-2011); Director, Stifel Financial (since 1996); Director, Investor Financial Services Corporation (1995-2007); Director, Connecticut River Bancorp (1998-2014); Director, Virtus Funds (formerly Phoenix Mutual Funds) (since 1988). Trustee and Chairperson of the Board, John Hancock Collateral Trust and John Hancock Exchange-Traded Fund Trust (since 2015); Trustee and Chairperson of the Board, John Hancock retail funds3 (since 2012); Trustee (2005-2006 and since 2012) and Chairperson of the Board (since 2012), John Hancock Funds III; Trustee (since 2004) and Chairperson of the Board (since 2005), John Hancock Variable Insurance Trust; Trustee and Chairperson of the Board, John Hancock Funds II (since 2005). | ||
| Charles L. Bardelis,2 Born: 1941 | 2012 | 230 |
| Trustee Director, Island Commuter Corp. (marine transport). Trustee, John Hancock Collateral Trust and John Hancock Exchange-Traded Fund Trust (since 2015); Trustee, John Hancock retail funds3 (since 2012); Trustee, John Hancock Funds III (2005-2006 and since 2012); Trustee, John Hancock Variable Insurance Trust (since 1988); Trustee, John Hancock Funds II (since 2005). | ||
| Peter S. Burgess,2 Born: 1942 | 2012 | 230 |
| Trustee Consultant (financial, accounting, and auditing matters) (since 1999); Certified Public Accountant; Partner, Arthur Andersen (independent public accounting firm) (prior to 1999); Director, Lincoln Educational Services Corporation (since 2004); Director, Symetra Financial Corporation (2010-2016); Director, PMA Capital Corporation (2004-2010). Trustee, John Hancock Collateral Trust and John Hancock Exchange-Traded Fund Trust (since 2015); Trustee, John Hancock retail funds3 (since 2012); Trustee, John Hancock Funds III (2005-2006 and since 2012); Trustee, John Hancock Variable Insurance Trust and John Hancock Funds II (since 2005). | ||
| William H. Cunningham, Born: 1944 | 2006 | 230 |
| Trustee Professor, University of Texas, Austin, Texas (since 1971); former Chancellor, University of Texas System and former President of the University of Texas, Austin, Texas; Chairman (since 2009) and Director (since 2006), Lincoln National Corporation (insurance); Director, Southwest Airlines (since 2000); former Director, LIN Television (2009-2014). Trustee, John Hancock retail funds3 (since 1986); Trustee, John Hancock Variable Insurance Trust (since 2012); Trustee, John Hancock Funds II (2005-2006 and since 2012); Trustee, John Hancock Collateral Trust and John Hancock Exchange-Traded Fund Trust (since 2015). | ||
| Grace K. Fey, Born: 1946 | 2012 | 230 |
| Trustee Chief Executive Officer, Grace Fey Advisors (since 2007); Director and Executive Vice President, Frontier Capital Management Company (1988-2007); Director, Fiduciary Trust (since 2009). Trustee, John Hancock Collateral Trust and John Hancock Exchange-Traded Fund Trust (since 2015); Trustee, John Hancock retail funds3 (since 2012); Trustee, John Hancock Variable Insurance Trust and John Hancock Funds II (since 2008). | ||
Independent Trustees (continued)
| Name, year of birth Position(s) held with fund Principal occupation(s) and other directorships during past 5 years | Trustee of the Trust since1 | Number of John Hancock funds overseen by Trustee |
| Theron S. Hoffman,2 Born: 1947 | 2012 | 230 |
| Trustee Chief Executive Officer, T. Hoffman Associates, LLC (consulting firm) (since 2003); Director, The Todd Organization (consulting firm) (2003-2010); President, Westport Resources Management (investment management consulting firm) (2006-2008); Senior Managing Director, Partner, and Operating Head, Putnam Investments (2000-2003); Executive Vice President, The Thomson Corp. (financial and legal information publishing) (1997-2000). Trustee, John Hancock Collateral Trust and John Hancock Exchange-Traded Fund Trust (since 2015); Trustee, John Hancock retail funds3 (since 2012); Trustee, John Hancock Variable Insurance Trust and John Hancock Funds II (since 2008). | ||
| Deborah C. Jackson, Born: 1952 | 2008 | 230 |
| Trustee President, Cambridge College, Cambridge, Massachusetts (since 2011); Chief Executive Officer, American Red Cross of Massachusetts Bay (2002-2011); Board of Directors of Eastern Bank Corporation (since 2001); Board of Directors of Eastern Bank Charitable Foundation (since 2001); Board of Directors of American Student Assistance Corporation (1996-2009); Board of Directors of Boston Stock Exchange (2002-2008); Board of Directors of Harvard Pilgrim Healthcare (health benefits company) (2007-2011). Trustee, John Hancock retail funds3 (since 2008); Trustee, John Hancock Variable Insurance Trust and John Hancock Funds II (since 2012); Trustee, John Hancock Collateral Trust and John Hancock Exchange-Traded Fund Trust (since 2015). | ||
| Hassell H. McClellan, Born: 1945 | 2012 | 230 |
| Trustee Trustee, Virtus Variable Insurance Trust (formerly Phoenix Edge Series Funds) (since 2008); Director, The Barnes Group (since 2010); Associate Professor, The Wallace E. Carroll School of Management, Boston College (retired 2013). Trustee, John Hancock Collateral Trust and John Hancock Exchange-Traded Fund Trust (since 2015); Trustee, John Hancock retail funds3 (since 2012); Trustee, John Hancock Funds III (2005-2006 and since 2012); Trustee, John Hancock Variable Insurance Trust and John Hancock Funds II (since 2005). | ||
| Steven R. Pruchansky, Born: 1944 | 2006 | 230 |
| Trustee and Vice Chairperson of the Board Chairman and Chief Executive Officer, Greenscapes of Southwest Florida, Inc. (since 2000); Director and President, Greenscapes of Southwest Florida, Inc. (until 2000); Member, Board of Advisors, First American Bank (until 2010); Managing Director, Jon James, LLC (real estate) (since 2000); Partner, Right Funding, LLC (since 2014); Director, First Signature Bank & Trust Company (until 1991); Director, Mast Realty Trust (until 1994); President, Maxwell Building Corp. (until 1991). Trustee (since 1992) and Chairperson of the Board (2011-2012), John Hancock retail funds3; Trustee and Vice Chairperson of the Board, John Hancock retail funds3 John Hancock Variable Insurance Trust, and John Hancock Funds II (since 2012); Trustee, and Vice Chairperson of the Board, John Hancock Collateral Trust and John Hancock Exchange-Traded Fund Trust (since 2015). | ||
Independent Trustees (continued)
| Name, year of birth Position(s) held with fund Principal occupation(s) and other directorships during past 5 years | Trustee of the Trust since1 | Number of John Hancock funds overseen by Trustee |
| Gregory A. Russo, Born: 1949 | 2008 | 230 |
| Trustee Director and Audit Committee Chairman (since 2012), and Member, Audit Committee and Finance Committee (since 2011), NCH Healthcare System, Inc. (holding company for multi-entity healthcare system); Director and Member (since 2012) and Finance Committee Chairman (since 2014), The Moorings, Inc. (nonprofit continuing care community); Vice Chairman, Risk & Regulatory Matters, KPMG LLP (KPMG) (2002-2006); Vice Chairman, Industrial Markets, KPMG (1998-2002); Chairman and Treasurer, Westchester County, New York, Chamber of Commerce (1986-1992); Director, Treasurer, and Chairman of Audit and Finance Committees, Putnam Hospital Center (1989-1995); Director and Chairman of Fundraising Campaign, United Way of Westchester and Putnam Counties, New York (1990-1995). Trustee, John Hancock retail funds3 (since 2008); Trustee, John Hancock Variable Insurance Trust and John Hancock Funds II (since 2012); Trustee, John Hancock Collateral Trust and John Hancock Exchange-Traded Fund Trust (since 2015). | ||
Non-Independent Trustees4
| Name, year of birth Position(s) held with fund Principal occupation(s) and other directorships during past 5 years | Trustee of the Trust since1 | Number of John Hancock funds overseen by Trustee |
| James R. Boyle, Born: 1959 | 2015 | 230 |
| Non-Independent Trustee* Chairman and Chief Executive Officer, Zillion Group, Inc. (formerly HealthFleet, Inc.) (healthcare) (since 2014); Executive Vice President and Chief Executive Officer, U.S. Life Insurance Division of Genworth Financial, Inc. (insurance) (January 2014-July 2014); Senior Executive Vice President, Manulife Financial Corporation, President and Chief Executive Officer, John Hancock (1999-2012); Chairman and Director, John Hancock Advisers, LLC, John Hancock Funds, LLC, and John Hancock Investment Management Services, LLC (2005-2010). Trustee, John Hancock Collateral Trust and John Hancock Exchange-Traded Fund Trust (since 2015); Trustee, John Hancock retail funds3 (2005-2010; 2012-2014 and since 2015); Trustee, John Hancock Variable Insurance Trust and John Hancock Funds II (2005-2014 and since 2015). *Effective 3-10-15. | ||
| Craig Bromley, Born: 1966 | 2012 | 230 |
| Non-Independent Trustee President, John Hancock Financial Service (since 2012); Senior Executive Vice President and General Manager, U.S. Division, Manulife Financial Corporation (since 2012); President and Chief Executive Officer, Manulife Insurance Company (Manulife Japan) (2005-2012, including prior positions). Trustee, John Hancock retail funds,3 John Hancock Variable Insurance Trust, and John Hancock Funds II (since 2012); Trustee, John Hancock Collateral Trust and John Hancock Exchange-Traded Fund Trust (since 2015). | ||
| Warren A. Thomson, Born: 1955 | 2012 | 230 |
| Non-Independent Trustee Senior Executive Vice President and Chief Investment Officer, Manulife Financial Corporation and The Manufacturers Life Insurance Company (since 2009); Chairman, Manulife Asset Management (since 2001, including prior positions); Director and Chairman, Manulife Asset Management Limited (since 2006); Director and Chairman, Hancock Natural Resources Group, Inc. (since 2013). Trustee, John Hancock retail funds,3 John Hancock Variable Insurance Trust, and John Hancock Funds II (since 2012); Trustee, John Hancock Collateral Trust and John Hancock Exchange-Traded Fund Trust (since 2015). | ||
Principal officers who are not Trustees
| Name, year of birth Position(s) held with fund Principal occupation(s) during past 5 years | Officer of the Trust since |
| Andrew G. Arnott, Born: 1971 | 2009 |
| President Senior Vice President, John Hancock Financial Services (since 2009); Director and Executive Vice President, John Hancock Advisers, LLC (since 2005, including prior positions); Director and Executive Vice President, John Hancock Investment Management Services, LLC (since 2006, including prior positions); President, John Hancock Funds, LLC (since 2004, including prior positions); President, John Hancock retail funds,3 John Hancock Variable Insurance Trust, and John Hancock Funds II (since 2007, including prior positions); President, John Hancock Collateral Trust (since 2015); President, John Hancock Exchange-Traded Fund Trust (since 2014). | |
| John J. Danello, Born: 1955 | 2014 |
| Senior Vice President, Secretary, and Chief Legal Officer Vice President and Chief Counsel, John Hancock Wealth Management (since 2005); Senior Vice President (since 2007) and Chief Legal Counsel (2007-2010), John Hancock Funds, LLC and The Berkeley Financial Group, LLC; Senior Vice President (since 2006, including prior positions) and Chief Legal Officer and Secretary (since 2014), John Hancock retail funds,3 John Hancock Funds II and John Hancock Variable Insurance Trust; Senior Vice President, Chief Legal Officer and Secretary, John Hancock Collateral Trust and John Hancock Exchange-Traded Fund Trust (since 2015); Vice President, John Hancock Life & Health Insurance Company (since 2009); Vice President, John Hancock Life Insurance Company (USA) and John Hancock Life Insurance Company of New York (since 2010); and Senior Vice President, Secretary, and Chief Legal Counsel (2007-2014, including prior positions) of John Hancock Advisers, LLC and John Hancock Investment Management Services, LLC. | |
| Francis V. Knox, Jr., Born: 1947 | 2006 |
| Chief Compliance Officer Vice President, John Hancock Financial Services (since 2005); Chief Compliance Officer, John Hancock retail funds,3 John Hancock Variable Insurance Trust, John Hancock Funds II, John Hancock Advisers, LLC, and John Hancock Investment Management Services, LLC (since 2005); Chief Compliance Officer, John Hancock Collateral Trust and John Hancock Exchange-Traded Fund Trust (since 2015). | |
| Charles A. Rizzo, Born: 1957 | 2007 |
| Chief Financial Officer Vice President, John Hancock Financial Services (since 2008); Senior Vice President, John Hancock Advisers, LLC and John Hancock Investment Management Services, LLC (since 2008); Chief Financial Officer, John Hancock retail funds,3 John Hancock Variable Insurance Trust and John Hancock Funds II (since 2007); Chief Financial Officer, John Hancock Collateral Trust and John Hancock Exchange-Traded Fund Trust (since 2015). | |
| Salvatore Schiavone, Born: 1965 | 2010 |
| Treasurer Assistant Vice President, John Hancock Financial Services (since 2007); Vice President, John Hancock Advisers, LLC and John Hancock Investment Management Services, LLC (since 2007); Treasurer, John Hancock retail funds3 (since 2007, including prior positions); Treasurer, John Hancock Variable Insurance Trust and John Hancock Funds II (2007-2009 and since 2010, including prior positions); Treasurer, John Hancock Collateral Trust and John Hancock Exchange-Traded Fund Trust (since 2015). | |
The business address for all Trustees and Officers is 601 Congress Street, Boston, Massachusetts 02210-2805.
The Statement of Additional Information of the fund includes additional information about members of the Board of Trustees of the Trust and is available without charge, upon request, by calling 800-225-5291.
| 1 | Each Trustee holds office until his or her successor is elected and qualified, or until the Trustee's death, retirement, resignation, or removal. Mr. Boyle has served as Trustee at various times prior to the date listed in the table. |
| 2 | Member of the Audit Committee. |
| 3 | "John Hancock retail funds" comprises John Hancock Funds III and 36 other John Hancock funds consisting of 26 series of other John Hancock trusts and 10 closed-end funds. |
| 4 | The Trustee is a Non-Independent Trustee due to current or former positions with the Advisor and certain affiliates. |
Trustees James M. Oates, Chairperson Officers Andrew G. Arnott John J. Danello Francis V. Knox, Jr. Charles A. Rizzo Salvatore Schiavone | Investment advisor John Hancock Advisers, LLC Subadvisor Mesirow Financial Investment Management, Inc. Principal distributor John Hancock Funds, LLC Custodian State Street Bank and Trust Company Transfer agent John Hancock Signature Services, Inc. Legal counsel K&L Gates LLP Independent registered public accounting firm PricewaterhouseCoopers LLP |
*Member of the Audit Committee
†Non-Independent Trustee
The fund's proxy voting policies and procedures, as well as the fund proxy voting record for the most recent twelve-month period ended June 30, are available free of charge on the Securities and Exchange Commission (SEC) website at sec.gov or on our website.
The fund's complete list of portfolio holdings, for the first and third fiscal quarters, is filed with the SEC on Form N-Q. The fund's Form N-Q is available on our website and the SEC's website, sec.gov, and can be reviewed and copied (for a fee) at the SEC's Public Reference Room in Washington, DC. Call 800-SEC-0330 to receive information on the operation of the SEC's Public Reference Room.
We make this information on your fund, as well as monthly portfolio holdings, and other fund details available on our website at jhinvestments.com or by calling 800-225-5291.
| You can also contact us: | |||
| 800-225-5291 jhinvestments.com | Regular mail: John Hancock Signature Services, Inc. | Express mail: John Hancock Signature Services, Inc. | |
John Hancock family of funds
DOMESTIC EQUITY FUNDS Balanced Blue Chip Growth Classic Value Disciplined Value Disciplined Value Mid Cap Equity Income Fundamental All Cap Core Fundamental Large Cap Core Fundamental Large Cap Value New Opportunities Small Cap Value Small Company Strategic Growth U.S. Equity U.S. Global Leaders Growth Value Equity GLOBAL AND INTERNATIONAL EQUITY FUNDS Disciplined Value International Emerging Markets Emerging Markets Equity Global Equity Global Shareholder Yield Greater China Opportunities International Core International Growth International Small Company International Value Equity | INCOME FUNDS Bond California Tax-Free Income Core High Yield Emerging Markets Debt Floating Rate Income Focused High Yield Global Income Government Income High Yield Municipal Bond Income Investment Grade Bond Money Market Short Duration Credit Opportunities Spectrum Income Strategic Income Opportunities Tax-Free Bond ALTERNATIVE AND SPECIALTY FUNDS Absolute Return Currency Alternative Asset Allocation Enduring Assets Financial Industries Global Absolute Return Strategies Global Conservative Absolute Return Global Focused Strategies Global Real Estate Natural Resources Redwood Regional Bank Seaport Technical Opportunities |
A fund's investment objectives, risks, charges, and expenses should be considered carefully before investing. The prospectus contains this and other important information about the fund. To obtain a prospectus, contact your financial professional, call John Hancock Investments at 800-225-5291, or visit our website at jhinvestments.com. Please read the prospectus carefully before investing or sending money.
ASSET ALLOCATION Income Allocation Fund Lifestyle Aggressive Portfolio Lifestyle Balanced Portfolio Lifestyle Conservative Portfolio Lifestyle Growth Portfolio Lifestyle Moderate Portfolio Retirement Choices Portfolios (2010-2060) Retirement Living Portfolios (2010-2060) Retirement Living II Portfolios (2010-2060) EXCHANGE-TRADED FUNDS John Hancock Multifactor Consumer Discretionary ETF John Hancock Multifactor Consumer Staples ETF John Hancock Multifactor Energy ETF John Hancock Multifactor Financials ETF John Hancock Multifactor Healthcare ETF John Hancock Multifactor Industrials ETF John Hancock Multifactor Large Cap ETF John Hancock Multifactor Materials ETF John Hancock Multifactor Mid Cap ETF John Hancock Multifactor Technology ETF John Hancock Multifactor Utilities ETF | CLOSED-END FUNDS Financial Opportunities Hedged Equity & Income Income Securities Trust Investors Trust Preferred Income Preferred Income II Preferred Income III Premium Dividend Tax-Advantaged Dividend Income Tax-Advantaged Global Shareholder Yield |
John Hancock Multifactor ETF shares are bought and sold at market price (not NAV), and are not individually redeemed
from the fund. Brokerage commissions will reduce returns.
John Hancock ETFs are distributed by Foreside Fund Services, LLC, and are subadvised by Dimensional Fund Advisors LP.
Foreside is not affiliated with John Hancock Funds, LLC or Dimensional Fund Advisors LP.
Dimensional Fund Advisors LP receives compensation from John Hancock in connection with licensing rights to the
John Hancock Dimensional indexes. Dimensional Fund Advisors LP does not sponsor, endorse, or sell, and makes no
representation as to the advisability of investing in, John Hancock Multifactor ETFs.
John Hancock Investments
A trusted brand
John Hancock Investments is a premier asset manager representing
one of America's most trusted brands, with a heritage of financial
stewardship dating back to 1862. Helping our shareholders pursue
their financial goals is at the core of everything we do. It's why we
support the role of professional financial advice and operate with the
highest standards of conduct and integrity.
A better way to invest
We build funds based on investor needs, then search the world to find
proven portfolio teams with specialized expertise in those strategies.
As a manager of managers, we apply vigorous oversight to ensure that
they continue to meet our uncompromising standards and serve the
best interests of our shareholders.
Results for investors
Our unique approach to asset management enables us to provide
a diverse set of investments backed by some of the world's best
managers, along with strong risk-adjusted returns across asset classes.
| | John Hancock Funds, LLC n Member FINRA, SIPC 601 Congress Street n Boston, MA 02210-2805 800-225-5291 n jhinvestments.com | |
| This report is for the information of the shareholders of John Hancock Small Company Fund. It is not authorized for distribution to prospective investors unless preceded or accompanied by a prospectus. | ||
| MF288157 | 348A 3/16 5/16 | |
John Hancock
Disciplined Value Mid Cap Fund
Annual report 3/31/16
A message to shareholders
Dear shareholder,
The 12-month period covered by this report was a challenging one for U.S. equity investors. Many market indexes tumbled late last summer and again in the winter amid concerns about slowing global growth, particularly in China. The volatility extended to commodity markets, as oil prices hit multi-year lows before rebounding toward the end of the period. The investment landscape improved late in the period as stocks and other so-called risk assets regained positive momentum.
Despite the increase in volatility, the economic picture in the United States offers reasons for optimism. In December, the U.S. Federal Reserve raised short-term interest rates for the first time in nine years on evidence that the persistent strength in the labor markets warranted a somewhat less accommodative stance. Economic data generally remained strong entering the spring.
Volatile market environments are naturally unsettling. At John Hancock Investments, portfolio risk management is a critical part of our role as an asset manager, and our dedicated risk team is focused on these issues every day. We continually strive for new ways to analyze potential risks and have liquidity tools in place. However, your best resource in times like these is your financial advisor, who can ensure your portfolio is sufficiently diversified to meet your long-term objectives and to withstand the inevitable bumps along the way.
On behalf of everyone at John Hancock Investments, I'd like to take this opportunity to thank you for the continued trust you've placed in us.
Sincerely,
Andrew G. Arnott
President and Chief Executive Officer
John Hancock Investments
This commentary reflects the CEO's views as of March 31, 2016. They are subject to change at any time. All investments entail risks, including the possible loss of principal. Diversification does not guarantee a profit or eliminate the risk of a loss. For more up-to-date information, you can visit our website at jhinvestments.com.
John Hancock
Disciplined Value Mid Cap Fund
INVESTMENT OBJECTIVE
The fund seeks long-term growth of capital with current income as a secondary objective.
AVERAGE ANNUAL TOTAL RETURNS AS OF 3/31/16 (%)
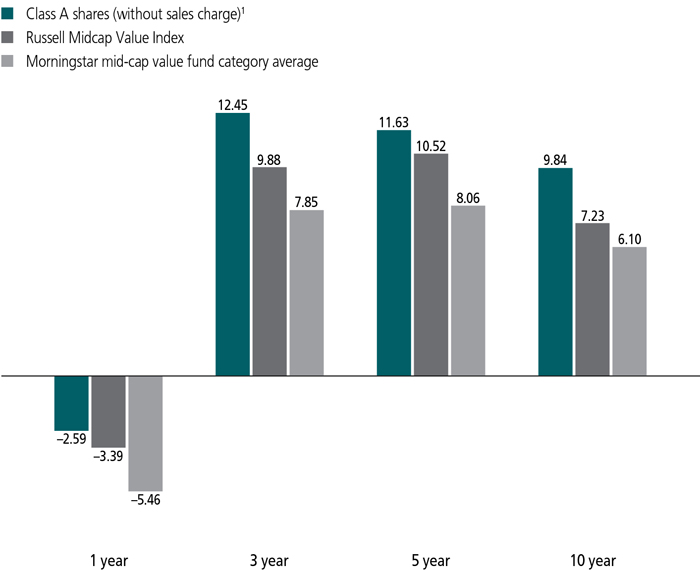
The Russell Midcap Value Index is an unmanaged index that measures the performance of those Russell Midcap Index companies with lower price-to-book ratios and lower forecasted growth values.
It is not possible to invest directly in an index. Index figures do not reflect expenses or sales charges, which would result in lower returns.
Figures from Morningstar, Inc. include reinvested distributions and do not take into account sales charges. Actual load-adjusted performance is lower.
| 1 | After the close of business on 7-9-10, holders of Investor shares of the former Robeco Boston Partners Mid Cap Value Fund (the predecessor fund) became owners of an equal number of full and fractional Class A shares of John Hancock Disciplined Value Mid Cap Fund, which were first offered on 7-12-10. Class A shares' performance shown above for periods prior to this date is that of the predecessor fund's Investor shares that have been recalculated to reflect the gross fees and expenses of Class A shares. |
The past performance shown here reflects reinvested distributions and the beneficial effect of any expense reductions, and does not guarantee future results. Performance of the other share classes will vary based on the difference in the fees and expenses of those classes. Shares will fluctuate in value and, when redeemed, may be worth more or less than their original cost. Current month-end performance may be lower or higher than the performance cited, and can be found at jhinvestments.com or by calling 800-225-5291. For further information on the fund's objectives, risks, and strategy, see the fund's prospectus.
PERFORMANCE HIGHLIGHTS OVER THE LAST TWELVE MONTHS
Equity markets were affected by periods of global volatility
The market was extremely volatile during the period, as equities continued to be affected by slowing global growth and lower oil prices.
The fund was down, but outperformed its benchmark
The fund outpaced its benchmark, the Russell Midcap Value Index, due to beneficial stock selection and sector allocation.
An underweight in energy and stock selection in consumer discretionary were the top relative contributors
From a sector standpoint, energy and consumer discretionary were the top relative contributors; the financials and utilities sectors were relative detractors, and financials accounted for most of the absolute loss.
SECTOR COMPOSITION AS OF 3/31/16 (%)
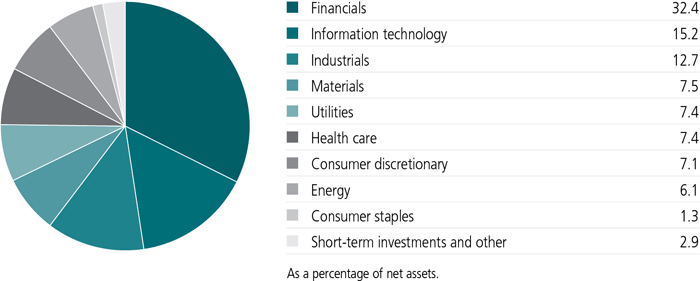
A note about risks
The stock prices of midsize companies can change more frequently and dramatically than those of large companies. Value stocks may decline in price. The value of a company's equity securities is subject to changes in the company's financial condition and overall market and economic conditions. Foreign investing has additional risks, such as currency and market volatility and political and social instability. Liquidity—the extent to which a security may be sold or a derivative position closed without negatively affecting its market value, if at all—may be impaired by reduced trading volume, heightened volatility, rising interest rates, and other market conditions. Sector investing is subject to greater risks than the market as a whole. A higher portfolio turnover rate may indicate higher transaction costs and may result in higher taxes when fund shares are held in a taxable account. Because the fund may focus on particular sectors of the economy, its performance may depend on the performance of those sectors and investments focused in one sector may fluctuate more than investments in a wider variety of sectors. Please see the fund's prospectuses for additional risks.

Steven L. Pollack, CFA
Portfolio Manager
Boston Partners
Can you briefly describe the market environment over the past 12 months?
U.S. equities generally declined over the 12-month period. For the first half of the period, the market traded in a tight band and was generally positive. Major indexes reached record highs and then experienced their worst quarterly returns since 2011 as a significant slowdown in China and a drop in commodity prices signaled a potential for an impending global recession. Some indexes stayed positive to the end of the calendar year, overcoming concerns of monetary policy and global growth, as well as continued weakness in oil prices. U.S. equities experienced double-digit declines from early January until mid-February, which resulted from oil prices dropping into the mid-$20 range, a strengthening U.S. dollar, and fears of a slowing global economy. Near the end of the the fiscal year, as the U.S. Federal Reserve became more dovish with its rate expectations, the dollar weakened, oil prices rallied as production expectations tempered, and the European Central Bank embarked on a more aggressive quantitative easing program.
We believe the market is rewarding companies for high dividend yields and paying little attention to quality companies with attractive valuations. The utilities sector, with a high average dividend yield, produced strong returns as a result. Most utility companies still look expensive to us, trading at substantial price-to-earnings premiums to the Russell Midcap Value Index despite limited opportunity for improving overall returns due to substantial regulation and high capital needs of these businesses. Staying true to our investment process, we see opportunities to buy higher quality companies with more attractive valuation characteristics elsewhere in the market and we expect that our position will be rewarded over time.
In this environment, the fund's primary benchmark, the Russell Midcap Value Index, was down 3.39%. The energy and telecommunication services sectors declined the most, followed by the healthcare and materials sectors; the utilities and consumer staples sectors were the top gainers.
Although down for the year, the fund outperformed its benchmark. What drove this relative performance?
Beneficial stock selection and sector allocation primarily drove relative performance. The energy sector was the most significant contributor to relative returns due to a beneficial underweight position and favorable stock selection. The consumer discretionary sector also contributed to relative returns due primarily to positive stock selection.
Activision Blizzard, Inc. (information technology) was the top contributor as Xbox and PS4 console sales drove demand for new versions of existing titles. New titles and innovative distribution
TOP 10 HOLDINGS AS OF 3/31/16 (%)
| Aon PLC | 1.7 |
| Robert Half International, Inc. | 1.6 |
| Amdocs, Ltd. | 1.6 |
| Activision Blizzard, Inc. | 1.6 |
| Masco Corp. | 1.6 |
| Regency Centers Corp. | 1.5 |
| Graphic Packaging Holding Company | 1.5 |
| Equity Residential | 1.4 |
| Fifth Third Bancorp | 1.4 |
| Cardinal Health, Inc. | 1.4 |
| TOTAL | 15.3 |
| As a percentage of net assets. | |
| Cash and cash equivalents are not included. |
What hindered performance?
The financials and utilities sectors were the top detractors from relative performance due to an unfavorable underweight position in utilities and adverse stock selection in financials. Western Digital Corp. was the greatest relative detractor as it lagged due to tepid demand and investor unease with Western Digital's intention to acquire flash drive manufacturer SanDisk Corp.
What were some notable additions and deletions to the portfolio?
We continue to find buying opportunities emphasizing our value circle approach and using high momentum companies as a source of funds. We have been adding to attractively priced basic industries companies with more consistent earnings models, such as PPG Industries, Inc. and Berry Plastics Group, Inc., as well as cyclical companies that are near trough pricing and expected to improve over the next year, such as CF Industries Holdings, Inc. and WestRock Company. We believe the discrepancy in valuation between perceived stable growth companies that are expensive and high-quality cyclical growth companies that are relatively inexpensive is extremely large by historical standards. We initiated a position in electronic retailer Best Buy Company, Inc., which offers compelling value, substantial return of capital, and business momentum that appears to be picking up due to increased sales in new 4K televisions. Other new positions included Ally Financial, Inc. and Textron Inc. Ally Financial is positioned for stronger returns on capital and Textron should benefit from an improving business jet cycle.
We sold long-held positions in Tyson Foods, Inc. and H&R Block, Inc., as the stocks achieved price objectives. We also sold Macy's, Inc., as margin expansion opportunities appear to have stalled and
same-store sales have been disappointing as shoppers increasingly avoid stores in favor of the Internet. Foot Locker, Inc. and construction materials manufacturer Carlisle Companies, Inc. were sold, as the stocks approached our price targets and business momentum was beginning to slow. During the period we liquidated drug distributor and healthcare IT company McKesson Corp. and communications products and services business Motorola Solutions, Inc. upon reaching target valuation.
MANAGED BY
 | Steven L. Pollack, CFA On the fund since 2000 Investing since 1984 |
 | Joseph F. Feeney, Jr., CFA On the fund since 2010 Investing since 1985 |
![]()
TOTAL RETURNS FOR THE PERIOD ENDED MARCH 31, 2016
| Average annual total returns (%) with maximum sales charge | Cumulative total returns (%) with maximum sales charge | ||||||
| 1-year | 5-year | 10-year | 5-year | 10-year | |||
| Class A1 | -7.45 | 10.49 | 9.27 | 64.69 | 142.74 | ||
| Class C1 | -4.19 | 10.78 | 8.99 | 66.87 | 136.59 | ||
| Class I1,2 | -2.35 | 11.96 | 10.21 | 75.92 | 164.36 | ||
| Class R21,2 | -2.74 | 11.47 | 9.66 | 72.12 | 151.58 | ||
| Class R41,2 | -2.50 | 11.74 | 10.03 | 74.21 | 160.01 | ||
| Class R61,2 | -2.25 | 12.04 | 10.29 | 76.53 | 166.24 | ||
| Class ADV1,2 | -2.59 | 11.60 | 9.81 | 73.10 | 154.92 | ||
| Index† | -3.39 | 10.52 | 7.23 | 64.86 | 100.98 | ||
Performance figures assume all distributions are reinvested. Figures reflect maximum sales charges on Class A shares of 5% and the applicable contingent deferred sales charge (CDSC) on Class C shares. Class C shares sold within one year of purchase are subject to a 1% CDSC. Sales charges are not applicable to Class I, Class R2, Class R4, Class R6, and Class ADV shares.
The expense ratios of the fund, both net (including any fee waivers and/or expense limitations) and gross (excluding any fee waivers and/or expense limitations), are set forth according to the most recent publicly available prospectuses for the fund and may differ from those disclosed in the Financial highlights tables in this report. Had the fee waivers and expense limitations not been in place, gross expenses would apply. The expense ratios are as follows:
| Class A | Class C | Class I | Class R2 | Class R4 | Class R6 | Class ADV | |
| Gross (%) | 1.13 | 1.88 | 0.87 | 1.27 | 1.12 | 0.77 | 1.13 |
| Net (%) | 1.13 | 1.88 | 0.87 | 1.27 | 1.02 | 0.77 | 1.13 |
Please refer to the most recent prospectus and annual or semiannual report for more information on expenses and any expense limitation arrangements for each class.
The returns reflect past results and should not be considered indicative of future performance. The return and principal value of an investment will fluctuate so that shares, when redeemed, may be worth more or less than their original cost. Due to market volatility and other factors, the fund's current performance may be higher or lower than the performance shown. For current to the most recent month-end performance data, please call 800-225-5291 or visit the fund's website at jhinvestments.com.
The performance table above and the chart on the next page do not reflect the deduction of taxes that a shareholder would pay on fund distributions or the redemption of fund shares. The fund's performance results reflect any applicable fee waivers or expense reductions, without which the expenses would increase and results would have been less favorable.
| † | Index is the Russell Midcap Value Index. |
See the following page for footnotes.
This chart and table show what happened to a hypothetical $10,000 investment in John Hancock Disciplined Value Mid Cap Fund for the share classes and periods indicated, assuming all distributions were reinvested. For comparison, we've shown the same investment in the Russell Midcap Value Index.
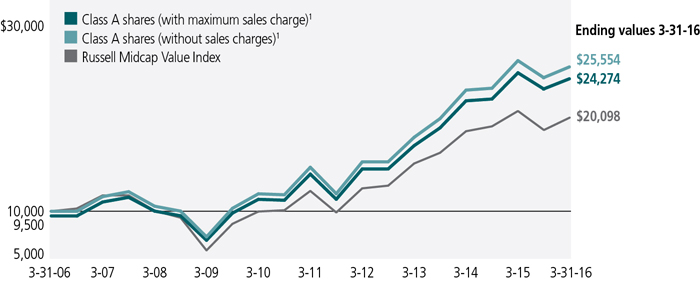
| Start date | With maximum sales charge ($) | Without sales charge ($) | Index ($) | |
| Class C1,3 | 3-31-06 | 23,659 | 23,659 | 20,098 |
| Class I1,2 | 3-31-06 | 26,436 | 26,436 | 20,098 |
| Class R21,2 | 3-31-06 | 25,158 | 25,158 | 20,098 |
| Class R41,2 | 3-31-06 | 26,001 | 26,001 | 20,098 |
| Class R61,2 | 3-31-06 | 26,624 | 26,624 | 20,098 |
| Class ADV1,2 | 3-31-06 | 25,492 | 25,492 | 20,098 |
The Russell Midcap Value Index is an unmanaged index that measures the performance of those Russell Midcap companies with lower price-to-book ratios and lower forecasted growth values.
It is not possible to invest directly in an index. Index figures do not reflect expenses or sales charges, which would result in lower returns.
Footnotes related to performance pages
| 1 | After the close of business on 7-9-10, holders of Investor shares and Institutional shares of the former Robeco Boston Partners Mid Cap Value Fund (the predecessor fund) became owners of an equal number of full and fractional Class A and Class I shares, respectively, of John Hancock Disciplined Value Mid Cap Fund. Class A, Class I, and Class ADV shares were first offered on 7-12-10. The returns prior to this date for Class A and Class ADV shares are those of the predecessor fund's Investor shares that have been recalculated to reflect the gross fees and expenses of the fund's Class A and Class ADV shares. For Class I shares, the returns prior to this date are those of the predecessor fund's Institutional shares that have been recalculated to reflect the gross fees and expenses of the fund's Class I shares. Class C, Class R2, Class R4, and Class R6 shares were first offered on 8-15-11, 3-1-12, 7-2-13, and 9-1-11, respectively. The returns prior to these dates are those of Class A shares that have been recalculated to apply the gross fees and expenses of Class C, Class R2, Class R4, and Class R6 shares, as applicable. |
| 2 | For certain types of investors, as described in the fund's prospectuses. |
| 3 | The contingent deferred sales charge is not applicable. |
These examples are intended to help you understand your ongoing operating expenses of investing in the fund so you can compare these costs with the ongoing costs of investing in other mutual funds.
Understanding fund expenses
As a shareholder of the fund, you incur two types of costs:
| • | Transaction costs, which include sales charges (loads) on purchases or redemptions (varies by share class), minimum account fee charge, etc. |
| • | Ongoing operating expenses, including management fees, distribution and service fees (if applicable), and other fund expenses. |
We are presenting only your ongoing operating expenses here.
Actual expenses/actual returns
This example is intended to provide information about the fund's actual ongoing operating expenses, and is based on the fund's actual return. It assumes an account value of $1,000.00 on October 1, 2015, with the same investment held until March 31, 2016.
| Account value on 10-1-15 | Ending value on 3-31-16 | Expenses paid during period ended 3-31-161 | Annualized expense ratio | |
| Class A | $1,000.00 | $1,047.80 | $5.79 | 1.13% |
| Class C | 1,000.00 | 1,043.90 | 9.61 | 1.88% |
| Class I | 1,000.00 | 1,048.90 | 4.41 | 0.86% |
| Class R2 | 1,000.00 | 1,047.10 | 6.50 | 1.27% |
| Class R4 | 1,000.00 | 1,048.50 | 5.22 | 1.02% |
| Class R6 | 1,000.00 | 1,049.40 | 3.95 | 0.77% |
| Class ADV | 1,000.00 | 1,047.90 | 5.79 | 1.13% |
Together with the value of your account, you may use this information to estimate the operating expenses that you paid over the period. Simply divide your account value at March 31, 2016, by $1,000.00, then multiply it by the "expenses paid" for your share class from the table above. For example, for an account value of $8,600.00, the operating expenses should be calculated as follows:
Hypothetical example for comparison purposes
This table allows you to compare the fund's ongoing operating expenses with those of any other fund. It provides an example of the fund's hypothetical account values and hypothetical expenses based on each class's actual expense ratio and an assumed 5% annualized return before expenses (which is not the fund's actual return). It assumes an account value of $1,000.00 on October 1, 2015, with the same investment held until March 31, 2016. Look in any other fund shareholder report to find its hypothetical example and you will be able to compare these expenses. Please remember that these hypothetical account values and expenses may not be used to estimate the actual ending account balance or expenses you paid for the period.
| Account value on 10-1-15 | Ending value on 3-31-16 | Expenses paid during period ended 3-31-161 | Annualized expense ratio | |
| Class A | $1,000.00 | $1,019.40 | $5.70 | 1.13% |
| Class C | 1,000.00 | 1,015.60 | 9.47 | 1.88% |
| Class I | 1,000.00 | 1,020.70 | 4.34 | 0.86% |
| Class R2 | 1,000.00 | 1,018.70 | 6.41 | 1.27% |
| Class R4 | 1,000.00 | 1,019.90 | 5.15 | 1.02% |
| Class R6 | 1,000.00 | 1,021.20 | 3.89 | 0.77% |
| Class ADV | 1,000.00 | 1,019.40 | 5.70 | 1.13% |
Remember, these examples do not include any transaction costs, therefore, these examples will not help you to determine the relative total costs of owning different funds. If transaction costs were included, your expenses would have been higher. See the prospectuses for details regarding transaction costs.
| 1 | Expenses are equal to the fund's annualized expense ratio, multiplied by the average account value over the period, multiplied by 183/366 (to reflect the one-half year period). |
Fund's investments
| As of 3-31-16 | ||||||||||||||
| Shares | Value | |||||||||||||
| Common stocks 97.1% | $11,162,384,257 | |||||||||||||
| (Cost $9,353,643,443) | ||||||||||||||
| Consumer discretionary 7.1% | 820,404,288 | |||||||||||||
| Auto components 2.0% | ||||||||||||||
| Lear Corp. | 1,111,466 | 123,561,675 | ||||||||||||
| Tenneco, Inc. (I) | 2,105,211 | 108,439,418 | ||||||||||||
| Automobiles 0.4% | ||||||||||||||
| Harley-Davidson, Inc. | 975,069 | 50,050,292 | ||||||||||||
| Household durables 1.1% | ||||||||||||||
| Newell Rubbermaid, Inc. (L) | 2,723,194 | 120,610,262 | ||||||||||||
| Internet and catalog retail 0.7% | ||||||||||||||
| Expedia, Inc. | 727,846 | 78,476,356 | ||||||||||||
| Leisure products 1.0% | ||||||||||||||
| Brunswick Corp. | 2,404,207 | 115,353,852 | ||||||||||||
| Media 1.5% | ||||||||||||||
| CBS Corp., Class B | 845,127 | 46,558,046 | ||||||||||||
| Omnicom Group, Inc. | 1,401,522 | 116,648,676 | ||||||||||||
| Starz, Class A (I) | 391,065 | 10,296,741 | ||||||||||||
| Specialty retail 0.4% | ||||||||||||||
| Best Buy Company, Inc. | 1,553,914 | 50,408,970 | ||||||||||||
| Consumer staples 1.3% | 152,038,965 | |||||||||||||
| Beverages 1.3% | ||||||||||||||
| Coca-Cola Enterprises, Inc. | 1,374,701 | 69,752,329 | ||||||||||||
| Constellation Brands, Inc., Class A | 544,620 | 82,286,636 | ||||||||||||
| Energy 6.1% | 701,806,137 | |||||||||||||
| Energy equipment and services 0.2% | ||||||||||||||
| Bristow Group, Inc. | 1,294,008 | 24,482,631 | ||||||||||||
| Oil, gas and consumable fuels 5.9% | ||||||||||||||
| Anadarko Petroleum Corp. | 488,041 | 22,728,069 | ||||||||||||
| Cimarex Energy Company | 951,887 | 92,590,048 | ||||||||||||
| Diamondback Energy, Inc. (I) | 1,315,928 | 101,563,323 | ||||||||||||
| Energen Corp. | 2,838,455 | 103,859,068 | ||||||||||||
| EQT Corp. | 1,069,545 | 71,937,597 | ||||||||||||
| Kosmos Energy, Ltd. (I) | 1,666,623 | 9,699,746 | ||||||||||||
| Marathon Petroleum Corp. | 2,315,342 | 86,084,416 | ||||||||||||
| Parsley Energy, Inc., Class A (I) | 4,138,168 | 93,522,597 | ||||||||||||
| RSP Permian, Inc. (I) | 1,930,275 | 56,055,186 | ||||||||||||
| Western Refining, Inc. (L) | 1,350,411 | 39,283,456 | ||||||||||||
| Shares | Value | |||||||||||||
| Financials 32.4% | $3,725,317,502 | |||||||||||||
| Banks 5.2% | ||||||||||||||
| BB&T Corp. | 3,026,278 | 100,684,269 | ||||||||||||
| East West Bancorp, Inc. | 2,225,720 | 72,291,386 | ||||||||||||
| Fifth Third Bancorp | 9,622,375 | 160,597,439 | ||||||||||||
| Huntington Bancshares, Inc. | 15,362,524 | 146,558,479 | ||||||||||||
| SunTrust Banks, Inc. | 3,381,959 | 122,021,081 | ||||||||||||
| Capital markets 3.9% | ||||||||||||||
| Raymond James Financial, Inc. | 2,297,708 | 109,393,878 | ||||||||||||
| SEI Investments Company | 2,224,143 | 95,749,356 | ||||||||||||
| State Street Corp. | 876,361 | 51,284,646 | ||||||||||||
| TD Ameritrade Holding Corp. | 4,658,132 | 146,870,902 | ||||||||||||
| The Charles Schwab Corp. | 1,745,254 | 48,902,017 | ||||||||||||
| Consumer finance 2.3% | ||||||||||||||
| Ally Financial, Inc. (I) | 2,856,295 | 53,469,842 | ||||||||||||
| Discover Financial Services | 2,788,259 | 141,978,148 | ||||||||||||
| Navient Corp. | 3,158,959 | 37,812,739 | ||||||||||||
| SLM Corp. (I) | 5,581,262 | 35,496,826 | ||||||||||||
| Diversified financial services 0.4% | ||||||||||||||
| Moody's Corp. | 465,336 | 44,932,844 | ||||||||||||
| Insurance 10.2% | ||||||||||||||
| Alleghany Corp. (I) | 262,637 | 130,320,479 | ||||||||||||
| Aon PLC | 1,899,686 | 198,422,203 | ||||||||||||
| CNO Financial Group, Inc. | 2,954,546 | 52,945,464 | ||||||||||||
| Loews Corp. | 1,912,852 | 73,185,718 | ||||||||||||
| Marsh & McLennan Companies, Inc. | 1,761,981 | 107,110,825 | ||||||||||||
| Reinsurance Group of America, Inc. | 1,066,655 | 102,665,544 | ||||||||||||
| The Allstate Corp. | 1,676,663 | 112,956,786 | ||||||||||||
| Torchmark Corp. | 1,168,297 | 63,274,966 | ||||||||||||
| Unum Group | 4,424,250 | 136,797,810 | ||||||||||||
| W.R. Berkley Corp. | 1,392,063 | 78,233,941 | ||||||||||||
| Willis Towers Watson PLC | 372,889 | 44,247,009 | ||||||||||||
| XL Group PLC | 1,836,698 | 67,590,486 | ||||||||||||
| Real estate investment trusts 10.4% | ||||||||||||||
| American Assets Trust, Inc. | 1,232,348 | 49,195,332 | ||||||||||||
| American Homes 4 Rent, Class A | 3,226,394 | 51,299,665 | ||||||||||||
| Boston Properties, Inc. | 1,156,675 | 146,990,259 | ||||||||||||
| Douglas Emmett, Inc. | 2,631,062 | 79,221,277 | ||||||||||||
| Equity Residential | 2,183,914 | 163,859,067 | ||||||||||||
| Essex Property Trust, Inc. | 318,499 | 74,484,176 | ||||||||||||
| General Growth Properties, Inc. | 1,969,039 | 58,539,529 | ||||||||||||
| Kilroy Realty Corp. | 630,075 | 38,982,740 | ||||||||||||
| Kimco Realty Corp. | 4,414,600 | 127,052,188 | ||||||||||||
| Regency Centers Corp. | 2,340,136 | 175,159,180 | ||||||||||||
| Shares | Value | |||||||||||||
| Financials (continued) | ||||||||||||||
| Real estate investment trusts (continued) | ||||||||||||||
| SL Green Realty Corp. | 1,502,947 | $145,605,505 | ||||||||||||
| The Macerich Company | 998,656 | 79,133,501 | ||||||||||||
| Health care 7.4% | 845,168,855 | |||||||||||||
| Health care equipment and supplies 3.3% | ||||||||||||||
| Becton, Dickinson and Company | 571,725 | 86,799,290 | ||||||||||||
| Boston Scientific Corp. (I) | 5,268,560 | 99,101,614 | ||||||||||||
| St. Jude Medical, Inc. | 1,363,793 | 75,008,615 | ||||||||||||
| Zimmer Biomet Holdings, Inc. | 1,095,364 | 116,798,663 | ||||||||||||
| Health care providers and services 2.6% | ||||||||||||||
| Cardinal Health, Inc. | 1,915,311 | 156,959,736 | ||||||||||||
| DaVita HealthCare Partners, Inc. (I) | 839,849 | 61,628,120 | ||||||||||||
| Laboratory Corp. of America Holdings (I) | 669,176 | 78,380,585 | ||||||||||||
| Life sciences tools and services 1.5% | ||||||||||||||
| Bruker Corp. | 1,220,286 | 34,168,008 | ||||||||||||
| ICON PLC (I) | 1,815,236 | 136,324,224 | ||||||||||||
| Industrials 12.7% | 1,461,082,808 | |||||||||||||
| Aerospace and defense 1.7% | ||||||||||||||
| Curtiss-Wright Corp. | 528,234 | 39,971,467 | ||||||||||||
| Huntington Ingalls Industries, Inc. | 679,469 | 93,046,485 | ||||||||||||
| Textron, Inc. | 1,710,002 | 62,346,673 | ||||||||||||
| Airlines 0.3% | ||||||||||||||
| Delta Air Lines, Inc. | 669,772 | 32,604,501 | ||||||||||||
| Building products 1.6% | ||||||||||||||
| Masco Corp. | 5,729,207 | 180,183,560 | ||||||||||||
| Construction and engineering 0.5% | ||||||||||||||
| Fluor Corp. | 1,107,113 | 59,451,968 | ||||||||||||
| Electrical equipment 0.5% | ||||||||||||||
| Hubbell, Inc. | 501,464 | 53,120,082 | ||||||||||||
| Machinery 3.3% | ||||||||||||||
| Ingersoll-Rand PLC | 1,753,697 | 108,746,751 | ||||||||||||
| Parker-Hannifin Corp. | 419,513 | 46,599,504 | ||||||||||||
| Stanley Black & Decker, Inc. | 1,237,828 | 130,231,884 | ||||||||||||
| The Timken Company | 1,321,738 | 44,265,006 | ||||||||||||
| WABCO Holdings, Inc. (I) | 485,040 | 51,860,477 | ||||||||||||
| Professional services 4.1% | ||||||||||||||
| Equifax, Inc. | 1,331,557 | 152,183,650 | ||||||||||||
| ManpowerGroup, Inc. | 1,664,924 | 135,558,112 | ||||||||||||
| Robert Half International, Inc. | 4,027,417 | 187,597,084 | ||||||||||||
| Trading companies and distributors 0.7% | ||||||||||||||
| WESCO International, Inc. (I)(L) | 1,523,973 | 83,315,604 | ||||||||||||
| Shares | Value | |||||||||||||
| Information technology 15.2% | $1,746,162,791 | |||||||||||||
| Communications equipment 1.2% | ||||||||||||||
| Harris Corp. | 1,760,548 | 137,076,267 | ||||||||||||
| Electronic equipment, instruments and components 4.1% | ||||||||||||||
| Arrow Electronics, Inc. (I) | 2,071,755 | 133,441,740 | ||||||||||||
| Avnet, Inc. | 2,342,891 | 103,790,071 | ||||||||||||
| Flextronics International, Ltd. (I) | 6,475,800 | 78,098,146 | ||||||||||||
| Jabil Circuit, Inc. | 4,144,016 | 79,855,188 | ||||||||||||
| TE Connectivity, Ltd. | 1,134,060 | 70,220,995 | ||||||||||||
| Internet software and services 1.4% | ||||||||||||||
| eBay, Inc. (I) | 1,651,107 | 39,395,413 | ||||||||||||
| InterActiveCorp | 1,257,789 | 59,216,706 | ||||||||||||
| NetEase, Inc., ADR | 462,858 | 66,457,152 | ||||||||||||
| IT services 4.1% | ||||||||||||||
| Alliance Data Systems Corp. (I) | 287,831 | 63,322,820 | ||||||||||||
| Amdocs, Ltd. | 3,056,502 | 184,673,851 | ||||||||||||
| Fidelity National Information Services, Inc. | 2,172,571 | 137,545,470 | ||||||||||||
| Total System Services, Inc. | 1,730,487 | 82,336,571 | ||||||||||||
| Semiconductors and semiconductor equipment 1.9% | ||||||||||||||
| Broadcom, Ltd. | 631,381 | 97,548,365 | ||||||||||||
| Microsemi Corp. (I) | 2,523,800 | 96,686,778 | ||||||||||||
| ON Semiconductor Corp. (I) | 2,541,673 | 24,374,644 | ||||||||||||
| Software 1.6% | ||||||||||||||
| Activision Blizzard, Inc. | 5,415,115 | 183,247,492 | ||||||||||||
| Technology hardware, storage and peripherals 0.9% | ||||||||||||||
| Seagate Technology PLC (L) | 1,088,019 | 37,482,255 | ||||||||||||
| Western Digital Corp. | 1,511,280 | 71,392,867 | ||||||||||||
| Materials 7.5% | 857,241,905 | |||||||||||||
| Chemicals 2.7% | ||||||||||||||
| CF Industries Holdings, Inc. | 1,698,358 | 53,226,540 | ||||||||||||
| Methanex Corp. (L) | 983,850 | 31,601,262 | ||||||||||||
| PolyOne Corp. | 1,245,505 | 37,676,526 | ||||||||||||
| PPG Industries, Inc. | 507,525 | 56,583,962 | ||||||||||||
| The Mosaic Company | 1,712,107 | 46,226,889 | ||||||||||||
| The Valspar Corp. | 830,049 | 88,831,844 | ||||||||||||
| Containers and packaging 4.3% | ||||||||||||||
| Avery Dennison Corp. | 1,042,123 | 75,147,490 | ||||||||||||
| Berry Plastics Group, Inc. (I) | 1,265,245 | 45,738,607 | ||||||||||||
| Crown Holdings, Inc. (I) | 1,476,377 | 73,213,535 | ||||||||||||
| Graphic Packaging Holding Company | 13,460,026 | 172,961,334 | ||||||||||||
| Packaging Corp. of America | 1,177,572 | 71,125,349 | ||||||||||||
| WestRock Company | 1,246,315 | 48,643,674 | ||||||||||||
| Shares | Value | |||||||||||||
| Materials (continued) | ||||||||||||||
| Metals and mining 0.5% | ||||||||||||||
| Steel Dynamics, Inc. | 2,499,551 | $56,264,893 | ||||||||||||
| Utilities 7.4% | 853,161,006 | |||||||||||||
| Electric utilities 4.9% | ||||||||||||||
| American Electric Power Company, Inc. | 2,216,221 | 147,157,074 | ||||||||||||
| Edison International | 2,181,209 | 156,807,115 | ||||||||||||
| FirstEnergy Corp. | 1,987,052 | 71,474,260 | ||||||||||||
| Great Plains Energy, Inc. | 2,643,035 | 85,237,879 | ||||||||||||
| Portland General Electric Company | 1,779,444 | 70,270,244 | ||||||||||||
| Westar Energy, Inc. | 586,296 | 29,086,145 | ||||||||||||
| Multi-utilities 2.5% | ||||||||||||||
| Alliant Energy Corp. | 994,034 | 73,836,846 | ||||||||||||
| Ameren Corp. | 1,688,019 | 84,569,752 | ||||||||||||
| PG&E Corp. | 2,255,889 | 134,721,691 | ||||||||||||
| Yield (%) | Shares | Value | ||||||||||||
| Securities lending collateral 1.3% | $145,352,507 | |||||||||||||
| (Cost $145,333,770) | ||||||||||||||
| John Hancock Collateral Trust (W) | 0.4918(Y | ) | 14,526,099 | 145,352,507 | ||||||||||
| Short-term investments 2.3% | $262,470,876 | |||||||||||||
| (Cost $262,470,876) | ||||||||||||||
| Money market funds 2.3% | 262,470,876 | |||||||||||||
| State Street Institutional US Government Money Market Fund | 0.2385(Y | ) | 262,470,876 | 262,470,876 | ||||||||||
| Total investments (Cost $9,761,448,089)† 100.7% | $11,570,207,640 | |||||||||||||
| Other assets and liabilities, net (0.7%) | ($76,594,527 | ) | ||||||||||||
| Total net assets 100.0% | $11,493,613,113 | |||||||||||||
| The percentage shown for each investment category is the total value of the category as a percentage of the net assets of the fund. | ||||||||||||||
| Key to Security Abbreviations and Legend | ||||||||||||||
| ADR | American Depositary Receipts | |||||||||||||
| (I) | Non-income producing security. | |||||||||||||
| (L) | A portion of this security is on loan as of 3-31-16. | |||||||||||||
| (W) | Investment is an affiliate of the fund, the advisor and/or subadvisor. This security represents the investment of cash collateral received for securities lending. | |||||||||||||
| (Y) | The rate shown is the annualized seven-day yield as of 3-31-16. | |||||||||||||
| † | At 3-31-16, the aggregate cost of investment securities for federal income tax purposes was $9,828,593,247. Net unrealized appreciation aggregated to $1,741,614,393, of which $2,032,180,167 related to appreciated investment securities and $290,565,774 related to depreciated investment securities. | |||||||||||||
Financial statements
STATEMENT OF ASSETS AND LIABILITIES 3-31-16
| Assets | ||||||||||||||||||||||||||||||
| Unaffiliated investments, at value (Cost $9,616,114,319) including $141,524,026 of securities loaned | $11,424,855,133 | |||||||||||||||||||||||||||||
| Affiliated investments, at value (Cost $145,333,770) | 145,352,507 | |||||||||||||||||||||||||||||
| Total investments, at value (Cost $9,761,448,089) | 11,570,207,640 | |||||||||||||||||||||||||||||
| Cash | 31,216 | |||||||||||||||||||||||||||||
| Receivable for investments sold | 23,450,169 | |||||||||||||||||||||||||||||
| Receivable for fund shares sold | 77,001,659 | |||||||||||||||||||||||||||||
| Dividends and interest receivable | 20,044,738 | |||||||||||||||||||||||||||||
| Receivable for securities lending income | 69,805 | |||||||||||||||||||||||||||||
| Other receivables and prepaid expenses | 176,776 | |||||||||||||||||||||||||||||
| Total assets | 11,690,982,003 | |||||||||||||||||||||||||||||
| Liabilities | ||||||||||||||||||||||||||||||
| Payable for fund shares repurchased | 49,738,683 | |||||||||||||||||||||||||||||
| Payable upon return of securities loaned | 145,335,555 | |||||||||||||||||||||||||||||
| Payable to affiliates | ||||||||||||||||||||||||||||||
| Accounting and legal services fees | 111,237 | |||||||||||||||||||||||||||||
| Transfer agent fees | 1,002,117 | |||||||||||||||||||||||||||||
| Distribution and service fees | 107,814 | |||||||||||||||||||||||||||||
| Trustees' fees | 1,889 | |||||||||||||||||||||||||||||
| Other liabilities and accrued expenses | 1,071,595 | |||||||||||||||||||||||||||||
| Total liabilities | 197,368,890 | |||||||||||||||||||||||||||||
| Net assets | $11,493,613,113 | |||||||||||||||||||||||||||||
| Net assets consist of | ||||||||||||||||||||||||||||||
| Paid-in capital | $9,700,209,058 | |||||||||||||||||||||||||||||
| Undistributed net investment income | 36,138,144 | |||||||||||||||||||||||||||||
| Accumulated net realized gain (loss) on investments | (51,493,640 | ) | ||||||||||||||||||||||||||||
| Net unrealized appreciation (depreciation) on investments | 1,808,759,551 | |||||||||||||||||||||||||||||
| Net assets | $11,493,613,113 | |||||||||||||||||||||||||||||
STATEMENT OF ASSETS AND LIABILITIES (continued)
| Net asset value per share | ||||||||||||||||||
| Based on net asset values and shares outstanding-the fund has an unlimited number of shares authorized with no par value | ||||||||||||||||||
| Class A ($1,970,853,305 ÷ 106,580,636 shares)1 | $18.49 | |||||||||||||||||
| Class C ($329,084,172 ÷ 17,649,236 shares)1 | $18.65 | |||||||||||||||||
| Class I ($7,802,164,928 ÷ 407,600,629 shares) | $19.14 | |||||||||||||||||
| Class R2 ($233,695,407 ÷ 12,240,447 shares) | $19.09 | |||||||||||||||||
| Class R4 ($104,070,864 ÷ 5,440,074 shares) | $19.13 | |||||||||||||||||
| Class R6 ($1,052,967,319 ÷ 55,038,600 shares) | $19.13 | |||||||||||||||||
| Class ADV ($777,118 ÷ 42,108 shares) | $18.46 | |||||||||||||||||
| Maximum offering price per share | ||||||||||||||||||
| Class A (net asset value per share ÷ 95%)2 | $19.46 | |||||||||||||||||
| 1 | Redemption price per share is equal to net asset value less any applicable contingent deferred sales charge. | ||||||||||||||||
| 2 | On single retail sales of less than $50,000. On sales of $50,000 or more and on group sales the offering price is reduced. | ||||||||||||||||
STATEMENT OF OPERATIONS For the year ended 3-31-16
| Investment income | ||||||||||||||||||||||||
| Dividends | $204,536,912 | |||||||||||||||||||||||
| Securities lending | 240,145 | |||||||||||||||||||||||
| Interest | 132,266 | |||||||||||||||||||||||
| Less foreign taxes withheld | (65,319 | ) | ||||||||||||||||||||||
| Total investment income | 204,844,004 | |||||||||||||||||||||||
| Expenses | ||||||||||||||||||||||||
| Investment management fees | 79,039,498 | |||||||||||||||||||||||
| Distribution and service fees | 10,167,082 | |||||||||||||||||||||||
| Accounting and legal services fees | 1,478,350 | |||||||||||||||||||||||
| Transfer agent fees | 11,725,198 | |||||||||||||||||||||||
| Trustees' fees | 154,627 | |||||||||||||||||||||||
| State registration fees | 454,423 | |||||||||||||||||||||||
| Printing and postage | 691,295 | |||||||||||||||||||||||
| Professional fees | 284,004 | |||||||||||||||||||||||
| Custodian fees | 1,246,429 | |||||||||||||||||||||||
| Registration and filing fees | 187,756 | |||||||||||||||||||||||
| Other | 152,311 | |||||||||||||||||||||||
| Total expenses | 105,580,973 | |||||||||||||||||||||||
| Less expense reductions | (957,038 | ) | ||||||||||||||||||||||
| Net expenses | 104,623,935 | |||||||||||||||||||||||
| Net investment income | 100,220,069 | |||||||||||||||||||||||
| Realized and unrealized gain (loss) | ||||||||||||||||||||||||
| Net realized gain (loss) on | ||||||||||||||||||||||||
| Unaffiliated investments | 377,904,611 | |||||||||||||||||||||||
| Affiliated investments | (842 | ) | ||||||||||||||||||||||
| 377,903,769 | ||||||||||||||||||||||||
| Change in net unrealized appreciation (depreciation) of | ||||||||||||||||||||||||
| Unaffiliated investments | (750,854,027 | ) | ||||||||||||||||||||||
| Affiliated investments | 18,833 | |||||||||||||||||||||||
| (750,835,194 | ) | |||||||||||||||||||||||
| Net realized and unrealized loss | (372,931,425 | ) | ||||||||||||||||||||||
| Decrease in net assets from operations | ($272,711,356 | ) | ||||||||||||||||||||||
STATEMENTS OF CHANGES IN NET ASSETS
| Year ended 3-31-16 | Year ended 3-31-15 | ||||||||||||||||||||||||||||||||||||||||||||
| Increase (decrease) in net assets | |||||||||||||||||||||||||||||||||||||||||||||
| From operations | |||||||||||||||||||||||||||||||||||||||||||||
| Net investment income | $100,220,069 | $47,078,725 | |||||||||||||||||||||||||||||||||||||||||||
| Net realized gain | 377,903,769 | 369,708,115 | |||||||||||||||||||||||||||||||||||||||||||
| Change in net unrealized appreciation (depreciation) | (750,835,194 | ) | 845,450,967 | ||||||||||||||||||||||||||||||||||||||||||
| Increase (decrease) in net assets resulting from operations | (272,711,356 | ) | 1,262,237,807 | ||||||||||||||||||||||||||||||||||||||||||
| Distributions to shareholders | |||||||||||||||||||||||||||||||||||||||||||||
| From net investment income | |||||||||||||||||||||||||||||||||||||||||||||
| Class A | (6,909,198 | ) | (5,490,148 | ) | |||||||||||||||||||||||||||||||||||||||||
| Class I | (44,367,788 | ) | (33,378,448 | ) | |||||||||||||||||||||||||||||||||||||||||
| Class R2 | (449,251 | ) | (344,941 | ) | |||||||||||||||||||||||||||||||||||||||||
| Class R4 | (516,113 | ) | (435,019 | ) | |||||||||||||||||||||||||||||||||||||||||
| Class R6 | (6,282,487 | ) | (4,227,049 | ) | |||||||||||||||||||||||||||||||||||||||||
| Class ADV | (2,444 | ) | (1,901 | ) | |||||||||||||||||||||||||||||||||||||||||
| From net realized gain | |||||||||||||||||||||||||||||||||||||||||||||
| Class A | (118,530,557 | ) | (45,312,346 | ) | |||||||||||||||||||||||||||||||||||||||||
| Class C | (19,552,094 | ) | (7,850,524 | ) | |||||||||||||||||||||||||||||||||||||||||
| Class I | (426,532,269 | ) | (142,457,350 | ) | |||||||||||||||||||||||||||||||||||||||||
| Class R2 | (13,446,594 | ) | (5,341,303 | ) | |||||||||||||||||||||||||||||||||||||||||
| Class R4 | (6,646,956 | ) | (2,434,355 | ) | |||||||||||||||||||||||||||||||||||||||||
| Class R6 | (51,664,209 | ) | (14,736,399 | ) | |||||||||||||||||||||||||||||||||||||||||
| Class ADV | (50,644 | ) | (20,467 | ) | |||||||||||||||||||||||||||||||||||||||||
| Total distributions | (694,950,604 | ) | (262,030,250 | ) | |||||||||||||||||||||||||||||||||||||||||
| From fund share transactions | 1,654,438,937 | 1,530,028,017 | |||||||||||||||||||||||||||||||||||||||||||
| Total increase | 686,776,977 | 2,530,235,574 | |||||||||||||||||||||||||||||||||||||||||||
| Net assets | |||||||||||||||||||||||||||||||||||||||||||||
| Beginning of year | 10,806,836,136 | 8,276,600,562 | |||||||||||||||||||||||||||||||||||||||||||
| End of year | $11,493,613,113 | $10,806,836,136 | |||||||||||||||||||||||||||||||||||||||||||
| Undistributed net investment income | $36,138,144 | $7,307,844 | |||||||||||||||||||||||||||||||||||||||||||
Financial highlights
| Class A Shares Period ended | 3-31-16 | 3-31-15 | 3-31-14 | 3-31-13 | 3-31-12 | ||||||||||||||||||||||||||||||||||||||||||||||||||||||||||||||||||||||||||||||||||||||||||||||||||
| Per share operating performance | |||||||||||||||||||||||||||||||||||||||||||||||||||||||||||||||||||||||||||||||||||||||||||||||||||||||
| Net asset value, beginning of period | $20.19 | $18.23 | $14.51 | $12.41 | $11.98 | ||||||||||||||||||||||||||||||||||||||||||||||||||||||||||||||||||||||||||||||||||||||||||||||||||
| Net investment income1 | 0.13 | 0.05 | 0.05 | 0.05 | 0.04 | ||||||||||||||||||||||||||||||||||||||||||||||||||||||||||||||||||||||||||||||||||||||||||||||||||
| Net realized and unrealized gain (loss) on investments | (0.63 | ) | 2.42 | 4.03 | 2.09 | 0.42 | |||||||||||||||||||||||||||||||||||||||||||||||||||||||||||||||||||||||||||||||||||||||||||||||||
| Total from investment operations | (0.50 | ) | 2.47 | 4.08 | 2.14 | 0.46 | |||||||||||||||||||||||||||||||||||||||||||||||||||||||||||||||||||||||||||||||||||||||||||||||||
| Less distributions | |||||||||||||||||||||||||||||||||||||||||||||||||||||||||||||||||||||||||||||||||||||||||||||||||||||||
| From net investment income | (0.07 | ) | (0.06 | ) | (0.04 | ) | (0.04 | ) | — | ||||||||||||||||||||||||||||||||||||||||||||||||||||||||||||||||||||||||||||||||||||||||||||||
| From net realized gain | (1.13 | ) | (0.45 | ) | (0.32 | ) | — | (0.03 | ) | ||||||||||||||||||||||||||||||||||||||||||||||||||||||||||||||||||||||||||||||||||||||||||||||
| Total distributions | (1.20 | ) | (0.51 | ) | (0.36 | ) | (0.04 | ) | (0.03 | ) | |||||||||||||||||||||||||||||||||||||||||||||||||||||||||||||||||||||||||||||||||||||||||||||
| Net asset value, end of period | $18.49 | $20.19 | $18.23 | $14.51 | $12.41 | ||||||||||||||||||||||||||||||||||||||||||||||||||||||||||||||||||||||||||||||||||||||||||||||||||
| Total return (%)2,3 | (2.59 | ) | 13.78 | 28.30 | 17.31 | 3.92 | |||||||||||||||||||||||||||||||||||||||||||||||||||||||||||||||||||||||||||||||||||||||||||||||||
| Ratios and supplemental data | |||||||||||||||||||||||||||||||||||||||||||||||||||||||||||||||||||||||||||||||||||||||||||||||||||||||
| Net assets, end of period (in millions) | $1,971 | $2,148 | $3,086 | $1,169 | $517 | ||||||||||||||||||||||||||||||||||||||||||||||||||||||||||||||||||||||||||||||||||||||||||||||||||
| Ratios (as a percentage of average net assets): | |||||||||||||||||||||||||||||||||||||||||||||||||||||||||||||||||||||||||||||||||||||||||||||||||||||||
| Expenses before reductions | 1.13 | 1.13 | 1.18 | 1.27 | 1.33 | ||||||||||||||||||||||||||||||||||||||||||||||||||||||||||||||||||||||||||||||||||||||||||||||||||
| Expenses including reductions | 1.12 | 1.13 | 1.17 | 1.27 | 1.29 | ||||||||||||||||||||||||||||||||||||||||||||||||||||||||||||||||||||||||||||||||||||||||||||||||||
| Net investment income | 0.70 | 0.28 | 0.32 | 0.38 | 0.32 | ||||||||||||||||||||||||||||||||||||||||||||||||||||||||||||||||||||||||||||||||||||||||||||||||||
| Portfolio turnover (%) | 47 | 35 | 39 | 55 | 41 | ||||||||||||||||||||||||||||||||||||||||||||||||||||||||||||||||||||||||||||||||||||||||||||||||||
| 1 | Based on average daily shares outstanding. | ||||||||||||||||||||||||||||||||||||||||||||||||||||||||||||||||||||||||||||||||||
| 2 | Total returns would have been lower had certain expenses not been reduced during the applicable periods. | ||||||||||||||||||||||||||||||||||||||||||||||||||||||||||||||||||||||||||||||||||
| 3 | Does not reflect the effect of sales charges, if any. | ||||||||||||||||||||||||||||||||||||||||||||||||||||||||||||||||||||||||||||||||||
| Class C Shares Period ended | 3-31-16 | 3-31-15 | 3-31-14 | 3-31-13 | 3-31-12 | 1 | |||||||||||||||||||||||||||||||||||||||||||||||||||||||||||||||||||||||||||||||||||||||||||||||||
| Per share operating performance | |||||||||||||||||||||||||||||||||||||||||||||||||||||||||||||||||||||||||||||||||||||||||||||||||||||||
| Net asset value, beginning of period | $20.43 | $18.53 | $14.82 | $12.74 | $10.63 | ||||||||||||||||||||||||||||||||||||||||||||||||||||||||||||||||||||||||||||||||||||||||||||||||||
| Net investment income (loss)2 | (0.01 | ) | (0.08 | ) | (0.07 | ) | (0.05 | ) | (0.02 | ) | |||||||||||||||||||||||||||||||||||||||||||||||||||||||||||||||||||||||||||||||||||||||||||||
| Net realized and unrealized gain (loss) on investments | (0.64 | ) | 2.43 | 4.10 | 2.13 | 2.16 | |||||||||||||||||||||||||||||||||||||||||||||||||||||||||||||||||||||||||||||||||||||||||||||||||
| Total from investment operations | (0.65 | ) | 2.35 | 4.03 | 2.08 | 2.14 | |||||||||||||||||||||||||||||||||||||||||||||||||||||||||||||||||||||||||||||||||||||||||||||||||
| Less distributions | |||||||||||||||||||||||||||||||||||||||||||||||||||||||||||||||||||||||||||||||||||||||||||||||||||||||
| From net realized gain | (1.13 | ) | (0.45 | ) | (0.32 | ) | — | (0.03 | ) | ||||||||||||||||||||||||||||||||||||||||||||||||||||||||||||||||||||||||||||||||||||||||||||||
| Total distributions | (1.13 | ) | (0.45 | ) | (0.32 | ) | — | (0.03 | ) | ||||||||||||||||||||||||||||||||||||||||||||||||||||||||||||||||||||||||||||||||||||||||||||||
| Net asset value, end of period | $18.65 | $20.43 | $18.53 | $14.82 | $12.74 | ||||||||||||||||||||||||||||||||||||||||||||||||||||||||||||||||||||||||||||||||||||||||||||||||||
| Total return (%)3,4 | (3.27 | ) | 12.90 | 27.32 | 16.33 | 20.22 | 5 | ||||||||||||||||||||||||||||||||||||||||||||||||||||||||||||||||||||||||||||||||||||||||||||||||
| Ratios and supplemental data | |||||||||||||||||||||||||||||||||||||||||||||||||||||||||||||||||||||||||||||||||||||||||||||||||||||||
| Net assets, end of period (in millions) | $329 | $366 | $329 | $90 | $20 | ||||||||||||||||||||||||||||||||||||||||||||||||||||||||||||||||||||||||||||||||||||||||||||||||||
| Ratios (as a percentage of average net assets): | |||||||||||||||||||||||||||||||||||||||||||||||||||||||||||||||||||||||||||||||||||||||||||||||||||||||
| Expenses before reductions | 1.88 | 1.89 | 1.94 | 2.08 | 2.10 | 6 | |||||||||||||||||||||||||||||||||||||||||||||||||||||||||||||||||||||||||||||||||||||||||||||||||
| Expenses including reductions | 1.87 | 1.88 | 1.93 | 2.08 | 2.10 | 6 | |||||||||||||||||||||||||||||||||||||||||||||||||||||||||||||||||||||||||||||||||||||||||||||||||
| Net investment income (loss) | (0.06 | ) | (0.42 | ) | (0.43 | ) | (0.39 | ) | (0.26 | ) 6 | |||||||||||||||||||||||||||||||||||||||||||||||||||||||||||||||||||||||||||||||||||||||||||||
| Portfolio turnover (%) | 47 | 35 | 39 | 55 | 41 | 7 | |||||||||||||||||||||||||||||||||||||||||||||||||||||||||||||||||||||||||||||||||||||||||||||||||
| 1 | The inception date for Class C shares is 8-15-11. | ||||||||||||||||||||||||||||||||||||||||||||||||||||||||||||||||||||||||||||||||||
| 2 | Based on average daily shares outstanding. | ||||||||||||||||||||||||||||||||||||||||||||||||||||||||||||||||||||||||||||||||||
| 3 | Does not reflect the effect of sales charges, if any. | ||||||||||||||||||||||||||||||||||||||||||||||||||||||||||||||||||||||||||||||||||
| 4 | Total returns would have been lower had certain expenses not been reduced during the applicable periods. | ||||||||||||||||||||||||||||||||||||||||||||||||||||||||||||||||||||||||||||||||||
| 5 | Not annualized. | ||||||||||||||||||||||||||||||||||||||||||||||||||||||||||||||||||||||||||||||||||
| 6 | Annualized. | ||||||||||||||||||||||||||||||||||||||||||||||||||||||||||||||||||||||||||||||||||
| 7 | The portfolio turnover is shown for the period from 4-1-11 to 3-31-12. | ||||||||||||||||||||||||||||||||||||||||||||||||||||||||||||||||||||||||||||||||||
| Class I Shares Period ended | 3-31-16 | 3-31-15 | 3-31-14 | 3-31-13 | 3-31-12 | ||||||||||||||||||||||||||||||||||||||||||||||||||||||||||||||||||||||||||||||||||||||||||||||||||
| Per share operating performance | |||||||||||||||||||||||||||||||||||||||||||||||||||||||||||||||||||||||||||||||||||||||||||||||||||||||
| Net asset value, beginning of period | $20.86 | $18.81 | $14.95 | $12.79 | $12.33 | ||||||||||||||||||||||||||||||||||||||||||||||||||||||||||||||||||||||||||||||||||||||||||||||||||
| Net investment income1 | 0.20 | 0.12 | 0.10 | 0.09 | 0.07 | ||||||||||||||||||||||||||||||||||||||||||||||||||||||||||||||||||||||||||||||||||||||||||||||||||
| Net realized and unrealized gain (loss) on investments | (0.67 | ) | 2.49 | 4.16 | 2.15 | 0.45 | |||||||||||||||||||||||||||||||||||||||||||||||||||||||||||||||||||||||||||||||||||||||||||||||||
| Total from investment operations | (0.47 | ) | 2.61 | 4.26 | 2.24 | 0.52 | |||||||||||||||||||||||||||||||||||||||||||||||||||||||||||||||||||||||||||||||||||||||||||||||||
| Less distributions | |||||||||||||||||||||||||||||||||||||||||||||||||||||||||||||||||||||||||||||||||||||||||||||||||||||||
| From net investment income | (0.12 | ) | (0.11 | ) | (0.08 | ) | (0.08 | ) | (0.03 | ) | |||||||||||||||||||||||||||||||||||||||||||||||||||||||||||||||||||||||||||||||||||||||||||||
| From net realized gain | (1.13 | ) | (0.45 | ) | (0.32 | ) | — | (0.03 | ) | ||||||||||||||||||||||||||||||||||||||||||||||||||||||||||||||||||||||||||||||||||||||||||||||
| Total distributions | (1.25 | ) | (0.56 | ) | (0.40 | ) | (0.08 | ) | (0.06 | ) | |||||||||||||||||||||||||||||||||||||||||||||||||||||||||||||||||||||||||||||||||||||||||||||
| Net asset value, end of period | $19.14 | $20.86 | $18.81 | $14.95 | $12.79 | ||||||||||||||||||||||||||||||||||||||||||||||||||||||||||||||||||||||||||||||||||||||||||||||||||
| Total return (%)2 | (2.35 | ) | 14.13 | 28.67 | 17.64 | 4.28 | |||||||||||||||||||||||||||||||||||||||||||||||||||||||||||||||||||||||||||||||||||||||||||||||||
| Ratios and supplemental data | |||||||||||||||||||||||||||||||||||||||||||||||||||||||||||||||||||||||||||||||||||||||||||||||||||||||
| Net assets, end of period (in millions) | $7,802 | $7,116 | $4,168 | $1,762 | $948 | ||||||||||||||||||||||||||||||||||||||||||||||||||||||||||||||||||||||||||||||||||||||||||||||||||
| Ratios (as a percentage of average net assets): | |||||||||||||||||||||||||||||||||||||||||||||||||||||||||||||||||||||||||||||||||||||||||||||||||||||||
| Expenses before reductions | 0.87 | 0.87 | 0.89 | 0.93 | 0.98 | ||||||||||||||||||||||||||||||||||||||||||||||||||||||||||||||||||||||||||||||||||||||||||||||||||
| Expenses including reductions | 0.86 | 0.86 | 0.89 | 0.93 | 0.98 | ||||||||||||||||||||||||||||||||||||||||||||||||||||||||||||||||||||||||||||||||||||||||||||||||||
| Net investment income | 0.99 | 0.63 | 0.59 | 0.71 | 0.63 | ||||||||||||||||||||||||||||||||||||||||||||||||||||||||||||||||||||||||||||||||||||||||||||||||||
| Portfolio turnover (%) | 47 | 35 | 39 | 55 | 41 | ||||||||||||||||||||||||||||||||||||||||||||||||||||||||||||||||||||||||||||||||||||||||||||||||||
| 1 | Based on average daily shares outstanding. | ||||||||||||||||||||||||||||||||||||||||||||||||||||||||||||||||||||||||||||||||||
| 2 | Total returns would have been lower had certain expenses not been reduced during the applicable periods. | ||||||||||||||||||||||||||||||||||||||||||||||||||||||||||||||||||||||||||||||||||
| Class R2 Shares Period ended | 3-31-16 | 3-31-15 | 3-31-14 | 3-31-13 | 3-31-12 | 1 | |||||||||||||||||||||||||||||||||||||||||||||||||||||||||||||||||||||||||||||||||||||||||||||||||
| Per share operating performance | |||||||||||||||||||||||||||||||||||||||||||||||||||||||||||||||||||||||||||||||||||||||||||||||||||||||
| Net asset value, beginning of period | $20.81 | $18.77 | $14.94 | $12.78 | $12.43 | ||||||||||||||||||||||||||||||||||||||||||||||||||||||||||||||||||||||||||||||||||||||||||||||||||
| Net investment income2 | 0.11 | 0.04 | 0.04 | 0.05 | 0.01 | ||||||||||||||||||||||||||||||||||||||||||||||||||||||||||||||||||||||||||||||||||||||||||||||||||
| Net realized and unrealized gain (loss) on investments | (0.66 | ) | 2.48 | 4.14 | 2.14 | 0.34 | |||||||||||||||||||||||||||||||||||||||||||||||||||||||||||||||||||||||||||||||||||||||||||||||||
| Total from investment operations | (0.55 | ) | 2.52 | 4.18 | 2.19 | 0.35 | |||||||||||||||||||||||||||||||||||||||||||||||||||||||||||||||||||||||||||||||||||||||||||||||||
| Less distributions | |||||||||||||||||||||||||||||||||||||||||||||||||||||||||||||||||||||||||||||||||||||||||||||||||||||||
| From net investment income | (0.04 | ) | (0.03 | ) | (0.03 | ) | (0.03 | ) | — | ||||||||||||||||||||||||||||||||||||||||||||||||||||||||||||||||||||||||||||||||||||||||||||||
| From net realized gain | (1.13 | ) | (0.45 | ) | (0.32 | ) | — | — | |||||||||||||||||||||||||||||||||||||||||||||||||||||||||||||||||||||||||||||||||||||||||||||||
| Total distributions | (1.17 | ) | (0.48 | ) | (0.35 | ) | (0.03 | ) | — | ||||||||||||||||||||||||||||||||||||||||||||||||||||||||||||||||||||||||||||||||||||||||||||||
| Net asset value, end of period | $19.09 | $20.81 | $18.77 | $14.94 | $12.78 | ||||||||||||||||||||||||||||||||||||||||||||||||||||||||||||||||||||||||||||||||||||||||||||||||||
| Total return (%)3 | (2.74 | ) | 13.66 | 28.15 | 17.15 | 2.82 | 4 | ||||||||||||||||||||||||||||||||||||||||||||||||||||||||||||||||||||||||||||||||||||||||||||||||
| Ratios and supplemental data | |||||||||||||||||||||||||||||||||||||||||||||||||||||||||||||||||||||||||||||||||||||||||||||||||||||||
| Net assets, end of period (in millions) | $234 | $250 | $205 | $15 | — | 5 | |||||||||||||||||||||||||||||||||||||||||||||||||||||||||||||||||||||||||||||||||||||||||||||||||
| Ratios (as a percentage of average net assets): | |||||||||||||||||||||||||||||||||||||||||||||||||||||||||||||||||||||||||||||||||||||||||||||||||||||||
| Expenses before reductions | 1.27 | 1.29 | 1.28 | 2.15 | 16.13 | 6 | |||||||||||||||||||||||||||||||||||||||||||||||||||||||||||||||||||||||||||||||||||||||||||||||||
| Expenses including reductions | 1.27 | 1.28 | 1.27 | 1.40 | 1.45 | 6 | |||||||||||||||||||||||||||||||||||||||||||||||||||||||||||||||||||||||||||||||||||||||||||||||||
| Net investment income | 0.56 | 0.19 | 0.25 | 0.33 | 1.00 | 6 | |||||||||||||||||||||||||||||||||||||||||||||||||||||||||||||||||||||||||||||||||||||||||||||||||
| Portfolio turnover (%) | 47 | 35 | 39 | 55 | 41 | 7 | |||||||||||||||||||||||||||||||||||||||||||||||||||||||||||||||||||||||||||||||||||||||||||||||||
| �� | |||||||||||||||||||||||||||||||||||||||||||||||||||||||||||||||||||||||||||||||||||
| 1 | The inception date for Class R2 shares is 3-1-12. | ||||||||||||||||||||||||||||||||||||||||||||||||||||||||||||||||||||||||||||||||||
| 2 | Based on average daily shares outstanding. | ||||||||||||||||||||||||||||||||||||||||||||||||||||||||||||||||||||||||||||||||||
| 3 | Total returns would have been lower had certain expenses not been reduced during the applicable periods. | ||||||||||||||||||||||||||||||||||||||||||||||||||||||||||||||||||||||||||||||||||
| 4 | Not annualized. | ||||||||||||||||||||||||||||||||||||||||||||||||||||||||||||||||||||||||||||||||||
| 5 | Less than $500,000. | ||||||||||||||||||||||||||||||||||||||||||||||||||||||||||||||||||||||||||||||||||
| 6 | Annualized. | ||||||||||||||||||||||||||||||||||||||||||||||||||||||||||||||||||||||||||||||||||
| 7 | The portfolio turnover is shown for the period from 4-1-11 to 3-31-12. | ||||||||||||||||||||||||||||||||||||||||||||||||||||||||||||||||||||||||||||||||||
| Class R4 Shares Period ended | 3-31-16 | 3-31-15 | 3-31-14 | 1 | |||||||||||||||||||||||||||||||||||||||||||||||||||||||||||||||||||
| Per share operating performance | |||||||||||||||||||||||||||||||||||||||||||||||||||||||||||||||||||||||
| Net asset value, beginning of period | $20.85 | $18.81 | $15.63 | ||||||||||||||||||||||||||||||||||||||||||||||||||||||||||||||||||||
| Net investment income2 | 0.16 | 0.10 | 0.06 | ||||||||||||||||||||||||||||||||||||||||||||||||||||||||||||||||||||
| Net realized and unrealized gain (loss) on investments | (0.66 | ) | 2.47 | 3.49 | |||||||||||||||||||||||||||||||||||||||||||||||||||||||||||||||||||
| Total from investment operations | (0.50 | ) | 2.57 | 3.55 | |||||||||||||||||||||||||||||||||||||||||||||||||||||||||||||||||||
| Less distributions | |||||||||||||||||||||||||||||||||||||||||||||||||||||||||||||||||||||||
| From net investment income | (0.09 | ) | (0.08 | ) | (0.05 | ) | |||||||||||||||||||||||||||||||||||||||||||||||||||||||||||||||||
| From net realized gain | (1.13 | ) | (0.45 | ) | (0.32 | ) | |||||||||||||||||||||||||||||||||||||||||||||||||||||||||||||||||
| Total distributions | (1.22 | ) | (0.53 | ) | (0.37 | ) | |||||||||||||||||||||||||||||||||||||||||||||||||||||||||||||||||
| Net asset value, end of period | $19.13 | $20.85 | $18.81 | ||||||||||||||||||||||||||||||||||||||||||||||||||||||||||||||||||||
| Total return (%)3 | (2.50 | ) | 13.93 | 22.85 | 4 | ||||||||||||||||||||||||||||||||||||||||||||||||||||||||||||||||||
| Ratios and supplemental data | |||||||||||||||||||||||||||||||||||||||||||||||||||||||||||||||||||||||
| Net assets, end of period (in millions) | $104 | $118 | $44 | ||||||||||||||||||||||||||||||||||||||||||||||||||||||||||||||||||||
| Ratios (as a percentage of average net assets): | |||||||||||||||||||||||||||||||||||||||||||||||||||||||||||||||||||||||
| Expenses before reductions | 1.12 | 1.15 | 1.30 | 5 | |||||||||||||||||||||||||||||||||||||||||||||||||||||||||||||||||||
| Expenses including reductions | 1.02 | 1.04 | 1.14 | 5 | |||||||||||||||||||||||||||||||||||||||||||||||||||||||||||||||||||
| Net investment income | 0.81 | 0.49 | 0.44 | 5 | |||||||||||||||||||||||||||||||||||||||||||||||||||||||||||||||||||
| Portfolio turnover (%) | 47 | 35 | 39 | 6 | |||||||||||||||||||||||||||||||||||||||||||||||||||||||||||||||||||
| 1 | The inception date for Class R4 shares is 7-2-13. | |||||||||||||||||||||||||||||||||||||||||||||||||||||||||||||||||||||||||||||||
| 2 | Based on average daily shares outstanding. | |||||||||||||||||||||||||||||||||||||||||||||||||||||||||||||||||||||||||||||||
| 3 | Total returns would have been lower had certain expenses not been reduced during the applicable periods. | |||||||||||||||||||||||||||||||||||||||||||||||||||||||||||||||||||||||||||||||
| 4 | Not annualized. | |||||||||||||||||||||||||||||||||||||||||||||||||||||||||||||||||||||||||||||||
| 5 | Annualized. | |||||||||||||||||||||||||||||||||||||||||||||||||||||||||||||||||||||||||||||||
| 6 | The portfolio turnover is shown for the period from 4-1-13 to 3-31-14. | |||||||||||||||||||||||||||||||||||||||||||||||||||||||||||||||||||||||||||||||
| Class R6 Shares Period ended | 3-31-16 | 3-31-15 | 3-31-14 | 3-31-13 | 3-31-12 | 1 | |||||||||||||||||||||||||||||||||||||||||||||||||||||||||||||||||||||||||||||||||||||||||||||||||
| Per share operating performance | |||||||||||||||||||||||||||||||||||||||||||||||||||||||||||||||||||||||||||||||||||||||||||||||||||||||
| Net asset value, beginning of period | $20.85 | $18.81 | $14.95 | $12.79 | $10.95 | ||||||||||||||||||||||||||||||||||||||||||||||||||||||||||||||||||||||||||||||||||||||||||||||||||
| Net investment income2 | 0.22 | 0.14 | 0.12 | 0.11 | 0.08 | ||||||||||||||||||||||||||||||||||||||||||||||||||||||||||||||||||||||||||||||||||||||||||||||||||
| Net realized and unrealized gain (loss) on investments | (0.67 | ) | 2.48 | 4.16 | 2.14 | 1.82 | |||||||||||||||||||||||||||||||||||||||||||||||||||||||||||||||||||||||||||||||||||||||||||||||||
| Total from investment operations | (0.45 | ) | 2.62 | 4.28 | 2.25 | 1.90 | |||||||||||||||||||||||||||||||||||||||||||||||||||||||||||||||||||||||||||||||||||||||||||||||||
| Less distributions | |||||||||||||||||||||||||||||||||||||||||||||||||||||||||||||||||||||||||||||||||||||||||||||||||||||||
| From net investment income | (0.14 | ) | (0.13 | ) | (0.10 | ) | (0.09 | ) | (0.03 | ) | |||||||||||||||||||||||||||||||||||||||||||||||||||||||||||||||||||||||||||||||||||||||||||||
| From net realized gain | (1.13 | ) | (0.45 | ) | (0.32 | ) | — | (0.03 | ) | ||||||||||||||||||||||||||||||||||||||||||||||||||||||||||||||||||||||||||||||||||||||||||||||
| Total distributions | (1.27 | ) | (0.58 | ) | (0.42 | ) | (0.09 | ) | (0.06 | ) | |||||||||||||||||||||||||||||||||||||||||||||||||||||||||||||||||||||||||||||||||||||||||||||
| Net asset value, end of period | $19.13 | $20.85 | $18.81 | $14.95 | $12.79 | ||||||||||||||||||||||||||||||||||||||||||||||||||||||||||||||||||||||||||||||||||||||||||||||||||
| Total return (%)3 | (2.25 | ) | 14.21 | 28.81 | 17.68 | 17.45 | 4 | ||||||||||||||||||||||||||||||||||||||||||||||||||||||||||||||||||||||||||||||||||||||||||||||||
| Ratios and supplemental data | |||||||||||||||||||||||||||||||||||||||||||||||||||||||||||||||||||||||||||||||||||||||||||||||||||||||
| Net assets, end of period (in millions) | $1,053 | $807 | $444 | $100 | $2 | ||||||||||||||||||||||||||||||||||||||||||||||||||||||||||||||||||||||||||||||||||||||||||||||||||
| Ratios (as a percentage of average net assets): | |||||||||||||||||||||||||||||||||||||||||||||||||||||||||||||||||||||||||||||||||||||||||||||||||||||||
| Expenses before reductions | 0.77 | 0.78 | 0.81 | 0.89 | 4.22 | 5 | |||||||||||||||||||||||||||||||||||||||||||||||||||||||||||||||||||||||||||||||||||||||||||||||||
| Expenses including reductions | 0.76 | 0.77 | 0.80 | 0.89 | 0.99 | 5 | |||||||||||||||||||||||||||||||||||||||||||||||||||||||||||||||||||||||||||||||||||||||||||||||||
| Net investment income | 1.13 | 0.73 | 0.71 | 0.84 | 1.25 | 5 | |||||||||||||||||||||||||||||||||||||||||||||||||||||||||||||||||||||||||||||||||||||||||||||||||
| Portfolio turnover (%) | 47 | 35 | 39 | 55 | 41 | 6 | |||||||||||||||||||||||||||||||||||||||||||||||||||||||||||||||||||||||||||||||||||||||||||||||||
| 1 | The inception date for Class R6 shares is 9-1-11. | ||||||||||||||||||||||||||||||||||||||||||||||||||||||||||||||||||||||||||||||||||
| 2 | Based on average daily shares outstanding. | ||||||||||||||||||||||||||||||||||||||||||||||||||||||||||||||||||||||||||||||||||
| 3 | Total returns would have been lower had certain expenses not been reduced during the applicable periods. | ||||||||||||||||||||||||||||||||||||||||||||||||||||||||||||||||||||||||||||||||||
| 4 | Not annualized. | ||||||||||||||||||||||||||||||||||||||||||||||||||||||||||||||||||||||||||||||||||
| 5 | Annualized. | ||||||||||||||||||||||||||||||||||||||||||||||||||||||||||||||||||||||||||||||||||
| 6 | The portfolio turnover is shown for the period from 4-1-11 to 3-31-12. | ||||||||||||||||||||||||||||||||||||||||||||||||||||||||||||||||||||||||||||||||||
| Class ADV Shares Period ended | 3-31-16 | 3-31-15 | 3-31-14 | 3-31-13 | 3-31-12 | ||||||||||||||||||||||||||||||||||||||||||||||||||||||||||||||||||||||||||||||||||||||||||||||||||
| Per share operating performance | |||||||||||||||||||||||||||||||||||||||||||||||||||||||||||||||||||||||||||||||||||||||||||||||||||||||
| Net asset value, beginning of period | $20.15 | $18.20 | $14.49 | $12.40 | $11.97 | ||||||||||||||||||||||||||||||||||||||||||||||||||||||||||||||||||||||||||||||||||||||||||||||||||
| Net investment income1 | 0.12 | 0.04 | 0.03 | 0.04 | 0.04 | ||||||||||||||||||||||||||||||||||||||||||||||||||||||||||||||||||||||||||||||||||||||||||||||||||
| Net realized and unrealized gain (loss) on investments | (0.63 | ) | 2.40 | 4.03 | 2.10 | 0.43 | |||||||||||||||||||||||||||||||||||||||||||||||||||||||||||||||||||||||||||||||||||||||||||||||||
| Total from investment operations | (0.51 | ) | 2.44 | 4.06 | 2.14 | 0.47 | |||||||||||||||||||||||||||||||||||||||||||||||||||||||||||||||||||||||||||||||||||||||||||||||||
| Less distributions | |||||||||||||||||||||||||||||||||||||||||||||||||||||||||||||||||||||||||||||||||||||||||||||||||||||||
| From net investment income | (0.05 | ) | (0.04 | ) | (0.03 | ) | (0.05 | ) | (0.01 | ) | |||||||||||||||||||||||||||||||||||||||||||||||||||||||||||||||||||||||||||||||||||||||||||||
| From net realized gain | (1.13 | ) | (0.45 | ) | (0.32 | ) | — | (0.03 | ) | ||||||||||||||||||||||||||||||||||||||||||||||||||||||||||||||||||||||||||||||||||||||||||||||
| Total distributions | (1.18 | ) | (0.49 | ) | (0.35 | ) | (0.05 | ) | (0.04 | ) | |||||||||||||||||||||||||||||||||||||||||||||||||||||||||||||||||||||||||||||||||||||||||||||
| Net asset value, end of period | $18.46 | $20.15 | $18.20 | $14.49 | $12.40 | ||||||||||||||||||||||||||||||||||||||||||||||||||||||||||||||||||||||||||||||||||||||||||||||||||
| Total return (%)2 | (2.59 | ) | 13.67 | 28.19 | 17.33 | 3.94 | |||||||||||||||||||||||||||||||||||||||||||||||||||||||||||||||||||||||||||||||||||||||||||||||||
| Ratios and supplemental data | |||||||||||||||||||||||||||||||||||||||||||||||||||||||||||||||||||||||||||||||||||||||||||||||||||||||
| Net assets, end of period (in millions) | $1 | $1 | $1 | $1 | $1 | ||||||||||||||||||||||||||||||||||||||||||||||||||||||||||||||||||||||||||||||||||||||||||||||||||
| Ratios (as a percentage of average net assets): | |||||||||||||||||||||||||||||||||||||||||||||||||||||||||||||||||||||||||||||||||||||||||||||||||||||||
| Expenses before reductions | 1.42 | 3.12 | 3.46 | 3.74 | 4.18 | ||||||||||||||||||||||||||||||||||||||||||||||||||||||||||||||||||||||||||||||||||||||||||||||||||
| Expenses including reductions | 1.16 | 1.25 | 1.25 | 1.25 | 1.25 | ||||||||||||||||||||||||||||||||||||||||||||||||||||||||||||||||||||||||||||||||||||||||||||||||||
| Net investment income | 0.63 | 0.21 | 0.19 | 0.35 | 0.37 | ||||||||||||||||||||||||||||||||||||||||||||||||||||||||||||||||||||||||||||||||||||||||||||||||||
| Portfolio turnover (%) | 47 | 35 | 39 | 55 | 41 | ||||||||||||||||||||||||||||||||||||||||||||||||||||||||||||||||||||||||||||||||||||||||||||||||||
| 1 | Based on average daily shares outstanding. | ||||||||||||||||||||||||||||||||||||||||||||||||||||||||||||||||||||||||||||||||||
| 2 | Total returns would have been lower had certain expenses not been reduced during the applicable periods. | ||||||||||||||||||||||||||||||||||||||||||||||||||||||||||||||||||||||||||||||||||
Note 1 — Organization
John Hancock Disciplined Value Mid Cap Fund (the fund) is a series of John Hancock Funds III (the Trust), an open-end management investment company organized as a Massachusetts business trust and registered under the Investment Company Act of 1940, as amended (the 1940 Act). The investment objective of the fund is to seek long-term growth of capital with current income as a secondary objective.
The fund may offer multiple classes of shares. The shares currently offered are detailed in the Statement of assets and liabilities. Class A and Class C shares are offered to all investors. Class I shares are offered to institutions and certain investors. Class R2 and Class R4 shares are available only to certain retirement plans. Class R6 shares are available only to certain retirement plans, institutions and other investors. Class ADV shares are available only to investors who acquired Class A shares as a result of the reorganization of the Robeco Boston Partners Mid Cap Value Fund into the fund. Shareholders of each class have exclusive voting rights to matters that affect that class. The distribution and service fees, if any, transfer agent fees, state registration fees and printing and postage for each class may differ.
Effective January 31, 2014, the fund was closed to new investors, subject to certain exceptions described in the fund's prospectus.
Note 2 — Significant accounting policies
The financial statements have been prepared in conformity with accounting principles generally accepted in the United States of America (US GAAP), which require management to make certain estimates and assumptions as of the date of the financial statements. Actual results could differ from those estimates and those differences could be significant. The fund qualifies as an investment company under Topic 946 of Accounting Standards Codification of US GAAP.
Events or transactions occurring after the end of the fiscal period through the date that the financial statements were issued have been evaluated in the preparation of the financial statements. The following summarizes the significant accounting policies of the fund:
Security valuation. Investments are stated at value as of the scheduled close of regular trading on the New York Stock Exchange (NYSE), normally at 4:00 p.m., Eastern Time. In case of emergency or other disruption resulting in the NYSE not opening for trading or the NYSE closing at a time other than the regularly scheduled close, the net asset value (NAV) may be determined as of the regularly scheduled close of the NYSE pursuant to the fund's Valuation Policies and Procedures. The time at which shares and transactions are priced and until which orders are accepted may vary to the extent permitted by the Securities and Exchange Commission (SEC) and applicable regulations.
In order to value the securities, the fund uses the following valuation techniques: Equity securities held by the fund are typically valued at the last sale price or official closing price on the exchange or principal market where the security was acquired or most likely will be sold. In the event there were no sales during the day or closing prices are not available, the securities are valued using the last available bid price. Investments by the fund in open-end mutual funds, including John Hancock Collateral Trust (JHCT), are valued at their respective NAVs each business day. Foreign securities and currencies, are valued in U.S. dollars, based on foreign currency exchange rates supplied by an independent pricing vendor.
In certain instances, the Pricing Committee may determine to value equity securities using prices obtained from another exchange or market if trading on the exchange or market on which prices are typically obtained did not open for trading as scheduled, or if trading closed earlier than scheduled, and trading occurred as normal on another exchange or market.
Other portfolio securities and assets, for which reliable market quotations are not readily available, are valued at fair value as determined in good faith by the fund's Pricing Committee following procedures established by the Board of Trustees. The frequency with which these fair valuation procedures are used cannot be predicted and fair value of securities may differ significantly from the value that would have been used had a ready market for such securities existed.
The fund uses a three-tier hierarchy to prioritize the pricing assumptions, referred to as inputs, used in valuation techniques to measure fair value. Level 1 includes securities valued using quoted prices in active markets for identical securities. Level 2 includes securities valued using other significant observable inputs. Observable inputs may include quoted prices for similar
securities, interest rates, prepayment speeds and credit risk. Prices for securities valued using these inputs are received from independent pricing vendors and brokers and are based on an evaluation of the inputs described. Level 3 includes securities valued using significant unobservable inputs when market prices are not readily available or reliable, including the fund's own assumptions in determining the fair value of investments. Factors used in determining value may include market or issuer specific events or trends, changes in interest rates and credit quality. The inputs or methodology used for valuing securities are not necessarily an indication of the risks associated with investing in those securities. Changes in valuation techniques and related inputs may result in transfers into or out of an assigned level within the disclosure hierarchy.
As of March 31, 2016, all investments are categorized as Level 1 under the hierarchy described above.
Security transactions and related investment income. Investment security transactions are accounted for on a trade date plus one basis for daily NAV calculations. However, for financial reporting purposes, investment transactions are reported on trade date. Interest income is accrued as earned. Dividend income is recorded on the ex-date, except for dividends of foreign securities where the dividend may not be known until after the ex-date. In those cases, dividend income, net of withholding taxes, is recorded when the fund becomes aware of the dividends. Foreign taxes are provided for based on the fund's understanding of the tax rules and rates that exist in the foreign markets in which it invests. Gains and losses on securities sold are determined on the basis of identified cost and may include proceeds from litigation.
Real estate investment trusts. The fund may invest in real estate investment trusts (REITs). Distributions from REITs may be recorded as income and subsequently characterized by the REIT at the end of the fiscal year as a reduction of cost of investments and/or as a realized gain. As a result, the fund will estimate the components of distributions from these securities. Such estimates are revised when the actual components of the distributions are known.
Securities lending. The fund may lend its securities to earn additional income. The fund receives cash collateral from the borrower in an amount not less than the market value of the loaned securities. The fund will invest its collateral in JHCT, an affiliate of the fund, which has a floating NAV and is registered with the SEC as an investment company. JHCT invests cash received as collateral as part of the securities lending program in short-term money market investments. The fund will receive the benefit of any gains and bear any losses generated by JHCT with respect to the cash collateral.
The fund has the right to recall loaned securities on demand. If a borrower fails to return loaned securities when due, then the lending agent is responsible and indemnifies the fund for the lent securities. The lending agent uses the collateral received from the borrower to purchase replacement securities of the same issue, type, class and series of the loaned securities. If the value of the collateral is less than the purchase cost of replacement securities, the lending agent is responsible for satisfying the shortfall but only to the extent that the shortfall is not due to any decrease in the value of JHCT.
Although the risk of the loss of the securities lent is mitigated by receiving collateral from the borrower and through lending agent indemnification, the fund could experience a delay in recovering securities or could experience a lower than expected return if the borrower fails to return the securities on a timely basis. The fund may receive compensation for lending its securities by retaining a portion of the return on the investment of the collateral and compensation from fees earned from borrowers of the securities. Net income received from JHCT is a component of securities lending income as recorded on the Statement of operations.
Obligations to repay collateral received by the fund are shown on the Statement of assets and liabilities as Payable upon return of securities loaned and are secured by the loaned securities. As of March 31, 2016, the fund loaned common stocks valued at $141,524,026 and received $145,335,555 of cash collateral.
Foreign taxes. The fund may be subject to withholding tax on income and/or capital gains or repatriation taxes imposed by certain countries in which the fund invests. Taxes are accrued based upon investment income, realized gains or unrealized appreciation.
Line of credit. The fund may borrow from banks for temporary or emergency purposes, including meeting redemption requests that otherwise might require the untimely sale of securities. Pursuant to the fund's custodian agreement, the custodian may loan money to the fund to make properly authorized payments. The fund is obligated to repay the custodian
for any overdraft, including any related costs or expenses. The custodian may have a lien, security interest or security entitlement in any fund property that is not otherwise segregated or pledged, to the extent of any overdraft, and to the maximum extent permitted by law.
The fund and other affiliated funds entered into a syndicated line of credit agreement, with Citibank, N.A. (Citibank) as the administrative agent, that enables them to participate in a $750 million unsecured committed line of credit. Prior to June 30, 2015, the fund and other affiliated funds had an agreement with Citibank that enabled them to participate in a $300 million unsecured committed line of credit. A commitment fee, payable at the end of each calendar quarter, based on the average daily unused portion of the effective line of credit, is charged to each participating fund on a pro rata basis and is reflected in other expenses on the Statement of operations. Commitment fees for the year ended March 31, 2016 were $15,283. For the year ended March 31, 2016, the fund had no borrowings under either line of credit.
Expenses. Within the John Hancock group of funds complex, expenses that are directly attributable to an individual fund are allocated to such fund. Expenses that are not readily attributable to a specific fund are allocated among all funds in an equitable manner, taking into consideration, among other things, the nature and type of expense and the fund's relative net assets. Expense estimates are accrued in the period to which they relate and adjustments are made when actual amounts are known.
Class allocations. Income, common expenses and realized and unrealized gains (losses) are determined at the fund level and allocated daily to each class of shares based on the net assets of the class. Class-specific expenses, such as distribution and service fees, if any, and transfer agent fees, for all classes, are calculated daily at the class level based on the net assets of each class and the specific expense rates applicable to each class. Through June 30, 2015, class-specific expenses, such as state registration fees and printing and postage, for all classes, were calculated daily at the class level based on net assets of each class and the specific expense rates applicable to each class.
Federal income taxes. The fund intends to continue to qualify as a regulated investment company by complying with the applicable provisions of the Internal Revenue Code and will not be subject to federal income tax on taxable income that is distributed to shareholders. Therefore, no federal income tax provision is required.
As of March 31, 2016, the fund had no uncertain tax positions that would require financial statement recognition, derecognition or disclosure. The fund's federal tax returns are subject to examination by the Internal Revenue Service for a period of three years.
Distribution of income and gains. Distributions to shareholders from net investment income and net realized gains, if any, are recorded on the ex-date. The fund generally declares and pays dividends and capital gain distributions, if any, annually.
The tax character of distributions for the years ended March 31, 2016 and 2015 was as follows:
| March 31, 2016 | March 31, 2015 | |
| Ordinary Income | $114,826,724 | $112,302,853 |
| Long-Term Capital Gain | 580,123,880 | 149,727,397 |
| Total | $694,950,604 | $262,030,250 |
Distributions paid by the fund with respect to each class of shares are calculated in the same manner, at the same time and in the same amount, except for the effect of class level expenses that may be applied differently to each class. As of March 31, 2016, the components of distributable earnings on a tax basis consisted of $36,138,144 of undistributed ordinary income and $15,651,518 of undistributed long-term capital gains.
Such distributions and distributable earnings, on a tax basis, are determined in conformity with income tax regulations, which may differ from US GAAP. Distributions in excess of tax basis earnings and profits, if any, are reported in the fund's financial statements as a return of capital.
Capital accounts within the financial statements are adjusted for permanent book-tax differences. These adjustments have no impact on net assets or the results of operations. Temporary book-tax differences, if any, will reverse in a subsequent period. Book-tax differences are primarily attributable to wash sale loss deferrals and characterization of distributions.
Note 3 — Guarantees and indemnifications
Under the Trust's organizational documents, its Officers and Trustees are indemnified against certain liabilities arising out of the performance of their duties to the Trust, including the fund. Additionally, in the normal course of business, the fund enters into contracts with service providers that contain general indemnification clauses. The fund's maximum exposure under these arrangements is unknown, as this would involve future claims that may be made against the fund that have not yet occurred. The risk of material loss from such claims is considered remote.
Note 4 — Fees and transactions with affiliates
John Hancock Advisers, LLC (the Advisor) serves as investment advisor for the fund. John Hancock Funds, LLC (the Distributor), an affiliate of the Advisor, serves as principal underwriter of the fund. The Advisor and the Distributor are indirect, wholly owned subsidiaries of Manulife Financial Corporation (MFC).
Management fee. The fund has an investment management agreement with the Advisor under which the fund pays a daily management fee to the Advisor equivalent, on an annual basis, to the sum of: (a) 0.800% of the first $500 million of the fund's average daily net assets; (b) 0.775% of the next $500 million of the fund's average daily net assets; (c) 0.750% of the next $500 million of the fund's average daily net assets; (d) 0.725% of the next $1 billion of the fund's average daily net assets; and (e) 0.700% of the fund's average daily net assets in excess of $2.5 billion. The Advisor has a subadvisory agreement with Boston Partners, a division of Robeco Investment Management, Inc. The fund is not responsible for payment of the subadvisory fees.
The Advisor has contractually agreed to waive a portion of its management fee and/or reimburse expenses for certain funds of the John Hancock group of funds complex, including the fund (the participating portfolios). This waiver is based upon aggregate net assets of all the participating portfolios. The amount of the reimbursement is calculated daily and allocated among all the participating portfolios in proportion to the daily net assets of each fund. During the year ended March 31, 2016, this waiver amounted to 0.01% of the fund's average net assets. This arrangement may be amended or terminated at any time by the Advisor upon notice to the fund and with approval of the Board of Trustees.
Prior to July 1, 2015, the Advisor had contractually agreed to reimburse or limit certain expenses for certain share classes of the fund. This agreement excluded certain expenses such as taxes, brokerage commissions, interest expense, acquired fund fees and expenses paid indirectly, litigation and indemnification expenses and other extraordinary expenses not incurred in the ordinary course of the fund's business and short dividend expense. These reimbursements and limits are such that these expenses would not exceed 1.15% and 1.25% for Class R4 and Class ADV shares, respectively.
For the year ended March 31, 2016, these expense reductions amounted to the following:
| Class | Expense reduction | Class | Expense reduction | |
| Class A | $154,485 | Class R4 | $8,590 | |
| Class C | 25,845 | Class R6 | 72,541 | |
| Class I | 561,028 | Class ADV | 2,277 | |
| Class R2 | 17,842 | Total | $842,608 |
The investment management fees, including the impact of the waivers and reimbursements as described above, incurred for the year ended March 31, 2016 were equivalent to a net annual effective rate of 0.70% of the fund's average daily net assets.
Accounting and legal services. Pursuant to a service agreement, the fund reimburses the Advisor for all expenses associated with providing the administrative, financial, legal, accounting and recordkeeping services to the fund, including the preparation of all tax returns, periodic reports to shareholders and regulatory reports, among other services. These
expenses are allocated to each share class based on its relative net assets at the time the expense was incurred. These accounting and legal services fees incurred for the year ended March 31, 2016, amounted to an annual rate of 0.01% of the fund's average daily net assets.
Distribution and service plans. The fund has a distribution agreement with the Distributor. The fund has adopted distribution and service plans with respect to Class A, Class C, Class R2, Class R4 and Class ADV shares pursuant to Rule 12b-1 under the 1940 Act, to pay the Distributor for services provided as the distributor of shares of the fund. In addition, under a service plan for Class R2 and Class R4 shares, the fund pays for certain other services. The fund may pay up to the following contractual rates of distribution and service fees under these arrangements, expressed as an annual percentage of average daily net assets for each class of the fund's shares.
| Class | Rule 12b-1 fee | Service fee | Class | Rule 12b-1 fee | Service fee | |
| Class A | 0.30% | — | Class R4 | 0.25% | 0.10% | |
| Class C | 1.00% | — | Class ADV | 0.25% | — | |
| Class R2 | 0.25% | 0.25% |
Currently only 0.25% is charged to Class A shares for Rule 12b-1 fees.
The fund's Distributor has contractually agreed to waive 0.10% of Rule 12b-1 fees for Class R4 shares. The current waiver agreement expires on June 30, 2016, unless renewed by mutual agreement of the fund and the Distributor based upon a determination that this is appropriate under the circumstances at the time. Reimbursements related to this contractual waiver amounted to $114,430 for Class R4 shares for the year ended March 31, 2016.
Sales charges. Class A shares are assessed up-front sales charges, which resulted in payments to the Distributor amounting to $917,696 for the year ended March 31, 2016. Of this amount, $127,097 was retained and used for printing prospectuses, advertising, sales literature and other purposes, $785,556 was paid as sales commissions to broker-dealers and $5,043 was paid as sales commissions to sales personnel of Signator Investors, Inc., a broker-dealer affiliate of the Advisor.
Class A and Class C shares may be subject to contingent deferred sales charges (CDSCs). Certain Class A shares that are acquired through purchases of $1 million or more and are redeemed within one year of purchase are subject to a 1.00% sales charge. Class C shares that are redeemed within one year of purchase are subject to a 1.00% CDSC.CDSCs are applied to the lesser of the current market value at the time of redemption or the original purchase cost of the shares being redeemed. Proceeds from CDSCs are used to compensate the Distributor for providing distribution-related services in connection with the sale of these shares. During the year ended March 31, 2016, CDSCs received by the Distributor amounted to $8,600 and $14,389 for Class A and Class C shares, respectively.
Transfer agent fees. The fund has a transfer agent agreement with John Hancock Signature Services, Inc. (Signature Services), an affiliate of the Advisor. The transfer agent fees paid to Signature Services are determined based on the cost to Signature Services (Signature Services Cost) of providing recordkeeping services. It also includes out-of-pocket expenses, including payments made to third-parties for recordkeeping services provided to their clients who invest in one or more John Hancock funds. In addition, Signature Services Cost may be reduced by certain fees that Signature Services receives in connection with retirement and small accounts. Signature Services Cost is calculated monthly and allocated, as applicable, to five categories of share classes: Retail Share and Institutional Share Classes of Non-Municipal Bond Funds, Class R6 Shares, Retirement Share Classes and Municipal Bond Share Classes. Within each of these categories, the applicable costs are allocated to the affected John Hancock affiliated funds and/or classes, based on the relative average daily net assets.
Class level expenses. Class level expenses for the year ended March 31, 2016, were:
| Class | Distribution and service fees | Transfer agent fees | State registration fees | Printing and postage |
| Class A | $5,137,572 | $2,609,458 | $2,291 | $37,820 |
| Class C | 3,437,667 | 436,501 | 4,462 | 6,834 |
| Class I | — | 8,476,051 | 46,053 | 98,415 |
| Class R2 | 1,188,524 | 39,075 | 5,270 | 5,722 |
| Class R4 | 401,143 | 18,874 | 2,783 | 2,961 |
| Class R6 | — | 144,135 | 9,041 | 8,046 |
| Class ADV | 2,176 | 1,104 | 2,509 | 30 |
| Total | $10,167,082 | $11,725,198 | $72,409 | $159,828 |
Effective July 1, 2015, state registration fees and printing and postage are treated as fund level expenses and are not included in the table above. For the period July 1, 2015 to March 31, 2016, state registration fees and printing and postage amounted to $382,014 and $531,467, respectively.
Trustee expenses. The fund compensates each Trustee who is not an employee of the Advisor or its affiliates. The costs of paying Trustee compensation and expenses are allocated to each fund based on its net assets relative to other funds within the John Hancock group of funds complex.
Note 5 — Fund share transactions
Transactions in funds shares for the years ended March 31, 2016 and 2015 were as follows:
| Year ended 3-31-16 | Year ended 3-31-15 | |||||||||||||||||||||||||
| Shares | Amount | Shares | Amount | |||||||||||||||||||||||
| Class A shares | ||||||||||||||||||||||||||
| Sold | 21,552,676 | $412,766,577 | 32,606,414 | $614,618,999 | ||||||||||||||||||||||
| Distributions reinvested | 6,034,797 | 112,911,059 | 2,469,274 | 45,632,185 | ||||||||||||||||||||||
| Repurchased | (27,405,721 | ) | (516,146,241 | ) | (97,962,941 | ) | (1,825,851,830 | ) | ||||||||||||||||||
| Net increase (decrease) | 181,752 | $9,531,395 | (62,887,253 | ) | ($1,165,600,646 | ) | ||||||||||||||||||||
| Class C shares | ||||||||||||||||||||||||||
| Sold | 1,462,579 | $28,488,911 | 1,863,493 | $35,732,899 | ||||||||||||||||||||||
| Distributions reinvested | 779,448 | 14,731,558 | 319,998 | 5,996,751 | ||||||||||||||||||||||
| Repurchased | (2,507,649 | ) | (47,704,933 | ) | (2,013,291 | ) | (38,394,466 | ) | ||||||||||||||||||
| Net increase (decrease) | (265,622 | ) | ($4,484,464 | ) | 170,200 | $3,335,184 | ||||||||||||||||||||
| Class I shares | ||||||||||||||||||||||||||
| Sold | 135,576,524 | $2,682,776,608 | 179,397,290 | $3,490,528,185 | ||||||||||||||||||||||
| Distributions reinvested | 20,560,074 | 397,837,424 | 7,680,784 | 146,549,365 | ||||||||||||||||||||||
| Repurchased | (89,741,468 | ) | (1,747,523,008 | ) | (67,435,720 | ) | (1,322,571,055 | ) | ||||||||||||||||||
| Net increase | 66,395,130 | $1,333,091,024 | 119,642,354 | $2,314,506,495 | ||||||||||||||||||||||
| Class R2 shares | ||||||||||||||||||||||||||
| Sold | 4,196,078 | $82,483,640 | 4,744,884 | $91,982,585 | ||||||||||||||||||||||
| Distributions reinvested | 579,958 | 11,204,789 | 238,454 | 4,544,932 | ||||||||||||||||||||||
| Repurchased | (4,536,126 | ) | (88,402,820 | ) | (3,924,520 | ) | (77,036,868 | ) | ||||||||||||||||||
| Net increase | 239,910 | $5,285,609 | 1,058,818 | $19,490,649 | ||||||||||||||||||||||
| Year ended 3-31-16 | Year ended 3-31-15 | |||||||||||||||||||||||||
| Shares | Amount | Shares | Amount | |||||||||||||||||||||||
| Class R4 shares | ||||||||||||||||||||||||||
| Sold | 2,262,975 | $44,142,313 | 4,157,048 | $79,815,427 | ||||||||||||||||||||||
| Distributions reinvested | 370,181 | 7,163,001 | 150,209 | 2,865,994 | ||||||||||||||||||||||
| Repurchased | (2,860,512 | ) | (54,855,218 | ) | (963,521 | ) | (18,992,090 | ) | ||||||||||||||||||
| Net increase (decrease) | (227,356 | ) | ($3,549,904 | ) | 3,343,736 | $63,689,331 | ||||||||||||||||||||
| Class R6 shares | ||||||||||||||||||||||||||
| Sold | 21,727,749 | $420,412,366 | 19,293,797 | $376,912,961 | ||||||||||||||||||||||
| Distributions reinvested | 2,997,760 | 57,946,695 | 994,934 | 18,963,448 | ||||||||||||||||||||||
| Repurchased | (8,408,365 | ) | (163,716,912 | ) | (5,177,399 | ) | (101,270,715 | ) | ||||||||||||||||||
| Net increase | 16,317,144 | $314,642,149 | 15,111,332 | $294,605,694 | ||||||||||||||||||||||
| Class ADV shares | ||||||||||||||||||||||||||
| Sold | 1,872 | $33,000 | — | — | ||||||||||||||||||||||
| Distributions reinvested | 2,844 | 53,088 | 1,212 | $22,368 | ||||||||||||||||||||||
| Repurchased | (8,980 | ) | (162,960 | ) | (1,170 | ) | (21,058 | ) | ||||||||||||||||||
| Net increase (decrease) | (4,264 | ) | ($76,872 | ) | 42 | $1,310 | ||||||||||||||||||||
| Total net increase | 82,636,694 | $1,654,438,937 | 76,439,229 | $1,530,028,017 | ||||||||||||||||||||||
Note 6 — Purchase and sale of securities
Purchases and sales of securities, other than short-term investments, amounted to $6,077,682,013 and $5,090,868,831, respectively, for the year ended March 31, 2016.
Note 7 — Industry or sector risk
The fund may invest a large percentage of its assets in one or more particular industries or sectors of the economy. If a large percentage of the fund's assets are economically tied to a single or small number of industries or sectors of the economy, the fund will be less diversified than a more broadly diversified fund, and it may cause the fund to underperform if that industry or sector underperforms. In addition, focusing on a particular industry or sector may make the fund's NAV more volatile. Further, a fund that invests in particular industries or sectors is particularly susceptible to the impact of market, economic, regulatory and other factors affecting those industries or sectors.
Report of Independent Registered Public Accounting Firm
To the Board of Trustees and Shareholders of John Hancock Funds III and John Hancock Disciplined Value Mid Cap Fund:
In our opinion, the accompanying statement of assets and liabilities, including the fund's investments, and the related statements of operations and of changes in net assets and the financial highlights present fairly, in all material respects, the financial position of John Hancock Disciplined Value Mid Cap Fund (the "Fund") at March 31, 2016, the results of its operations for the year then ended, the changes in its net assets for each of the two years in the period then ended and the financial highlights for each of the periods indicated, in conformity with accounting principles generally accepted in the United States of America. These financial statements and financial highlights (hereafter referred to as "financial statements") are the responsibility of the Fund's management. Our responsibility is to express an opinion on these financial statements based on our audits. We conducted our audits of these financial statements in accordance with the standards of the Public Company Accounting Oversight Board (United States). Those standards require that we plan and perform the audit to obtain reasonable assurance about whether the financial statements are free of material misstatement. An audit includes examining, on a test basis, evidence supporting the amounts and disclosures in the financial statements, assessing the accounting principles used and significant estimates made by management, and evaluating the overall financial statement presentation. We believe that our audits, which included confirmation of securities at March 31, 2016 by correspondence with the custodian, transfer agent, and brokers, provide a reasonable basis for our opinion.
PricewaterhouseCoopers LLP
Boston, Massachusetts
May 13, 2016
Unaudited
For federal income tax purposes, the following information is furnished with respect to the distributions of the fund, if any, paid during its taxable year ended March 31, 2016.
The fund reports the maximum amount allowable of its net taxable income as eligible for the corporate dividends-received deduction.
The fund reports the maximum amount allowable of its net taxable income as qualified dividend income as provided in the Jobs and Growth Tax Relief Reconciliation Act of 2003.
The fund paid $580,123,880 in capital gain dividends.
Eligible shareholders will be mailed a 2016 Form 1099-DIV in early 2017. This will reflect the tax character of all distributions paid in calendar year 2016.
Please consult a tax advisor regarding the tax consequences of your investment in the fund.
This chart provides information about the Trustees and Officers who oversee your John Hancock fund. Officers elected by the Trustees manage the day-to-day operations of the fund and execute policies formulated by the Trustees.
Independent Trustees
| Name, year of birth Position(s) held with fund Principal occupation(s) and other directorships during past 5 years | Trustee of the Trust since1 | Number of John Hancock funds overseen by Trustee |
| James M. Oates, Born: 1946 | 2012 | 230 |
| Trustee and Chairperson of the Board Managing Director, Wydown Group (financial consulting firm) (since 1994); Chairman and Director, Emerson Investment Management, Inc. (since 2000); Independent Chairman, Hudson Castle Group, Inc. (formerly IBEX Capital Markets, Inc.) (financial services company) (1997-2011); Director, Stifel Financial (since 1996); Director, Investor Financial Services Corporation (1995-2007); Director, Connecticut River Bancorp (1998-2014); Director, Virtus Funds (formerly Phoenix Mutual Funds) (since 1988). Trustee and Chairperson of the Board, John Hancock Collateral Trust and John Hancock Exchange-Traded Fund Trust (since 2015); Trustee and Chairperson of the Board, John Hancock retail funds3 (since 2012); Trustee (2005-2006 and since 2012) and Chairperson of the Board (since 2012), John Hancock Funds III; Trustee (since 2004) and Chairperson of the Board (since 2005), John Hancock Variable Insurance Trust; Trustee and Chairperson of the Board, John Hancock Funds II (since 2005). | ||
| Charles L. Bardelis,2 Born: 1941 | 2012 | 230 |
| Trustee Director, Island Commuter Corp. (marine transport). Trustee, John Hancock Collateral Trust and John Hancock Exchange-Traded Fund Trust (since 2015); Trustee, John Hancock retail funds3 (since 2012); Trustee, John Hancock Funds III (2005-2006 and since 2012); Trustee, John Hancock Variable Insurance Trust (since 1988); Trustee, John Hancock Funds II (since 2005). | ||
| Peter S. Burgess,2 Born: 1942 | 2012 | 230 |
| Trustee Consultant (financial, accounting, and auditing matters) (since 1999); Certified Public Accountant; Partner, Arthur Andersen (independent public accounting firm) (prior to 1999); Director, Lincoln Educational Services Corporation (since 2004); Director, Symetra Financial Corporation (2010-2016); Director, PMA Capital Corporation (2004-2010). Trustee, John Hancock Collateral Trust and John Hancock Exchange-Traded Fund Trust (since 2015); Trustee, John Hancock retail funds3 (since 2012); Trustee, John Hancock Funds III (2005-2006 and since 2012); Trustee, John Hancock Variable Insurance Trust and John Hancock Funds II (since 2005). | ||
| William H. Cunningham, Born: 1944 | 2006 | 230 |
| Trustee Professor, University of Texas, Austin, Texas (since 1971); former Chancellor, University of Texas System and former President of the University of Texas, Austin, Texas; Chairman (since 2009) and Director (since 2006), Lincoln National Corporation (insurance); Director, Southwest Airlines (since 2000); former Director, LIN Television (2009-2014). Trustee, John Hancock retail funds3 (since 1986); Trustee, John Hancock Variable Insurance Trust (since 2012); Trustee, John Hancock Funds II (2005-2006 and since 2012); Trustee, John Hancock Collateral Trust and John Hancock Exchange-Traded Fund Trust (since 2015). | ||
| Grace K. Fey, Born: 1946 | 2012 | 230 |
| Trustee Chief Executive Officer, Grace Fey Advisors (since 2007); Director and Executive Vice President, Frontier Capital Management Company (1988-2007); Director, Fiduciary Trust (since 2009). Trustee, John Hancock Collateral Trust and John Hancock Exchange-Traded Fund Trust (since 2015); Trustee, John Hancock retail funds3 (since 2012); Trustee, John Hancock Variable Insurance Trust and John Hancock Funds II (since 2008). | ||
Independent Trustees (continued)
| Name, year of birth Position(s) held with fund Principal occupation(s) and other directorships during past 5 years | Trustee of the Trust since1 | Number of John Hancock funds overseen by Trustee |
| Theron S. Hoffman,2 Born: 1947 | 2012 | 230 |
| Trustee Chief Executive Officer, T. Hoffman Associates, LLC (consulting firm) (since 2003); Director, The Todd Organization (consulting firm) (2003-2010); President, Westport Resources Management (investment management consulting firm) (2006-2008); Senior Managing Director, Partner, and Operating Head, Putnam Investments (2000-2003); Executive Vice President, The Thomson Corp. (financial and legal information publishing) (1997-2000). Trustee, John Hancock Collateral Trust and John Hancock Exchange-Traded Fund Trust (since 2015); Trustee, John Hancock retail funds3 (since 2012); Trustee, John Hancock Variable Insurance Trust and John Hancock Funds II (since 2008). | ||
| Deborah C. Jackson, Born: 1952 | 2008 | 230 |
| Trustee President, Cambridge College, Cambridge, Massachusetts (since 2011); Chief Executive Officer, American Red Cross of Massachusetts Bay (2002-2011); Board of Directors of Eastern Bank Corporation (since 2001); Board of Directors of Eastern Bank Charitable Foundation (since 2001); Board of Directors of American Student Assistance Corporation (1996-2009); Board of Directors of Boston Stock Exchange (2002-2008); Board of Directors of Harvard Pilgrim Healthcare (health benefits company) (2007-2011). Trustee, John Hancock retail funds3 (since 2008); Trustee, John Hancock Variable Insurance Trust and John Hancock Funds II (since 2012); Trustee, John Hancock Collateral Trust and John Hancock Exchange-Traded Fund Trust (since 2015). | ||
| Hassell H. McClellan, Born: 1945 | 2012 | 230 |
| Trustee Trustee, Virtus Variable Insurance Trust (formerly Phoenix Edge Series Funds) (since 2008); Director, The Barnes Group (since 2010); Associate Professor, The Wallace E. Carroll School of Management, Boston College (retired 2013). Trustee, John Hancock Collateral Trust and John Hancock Exchange-Traded Fund Trust (since 2015); Trustee, John Hancock retail funds3 (since 2012); Trustee, John Hancock Funds III (2005-2006 and since 2012); Trustee, John Hancock Variable Insurance Trust and John Hancock Funds II (since 2005). | ||
| Steven R. Pruchansky, Born: 1944 | 2006 | 230 |
| Trustee and Vice Chairperson of the Board Chairman and Chief Executive Officer, Greenscapes of Southwest Florida, Inc. (since 2000); Director and President, Greenscapes of Southwest Florida, Inc. (until 2000); Member, Board of Advisors, First American Bank (until 2010); Managing Director, Jon James, LLC (real estate) (since 2000); Partner, Right Funding, LLC (since 2014); Director, First Signature Bank & Trust Company (until 1991); Director, Mast Realty Trust (until 1994); President, Maxwell Building Corp. (until 1991). Trustee (since 1992) and Chairperson of the Board (2011-2012), John Hancock retail funds3; Trustee and Vice Chairperson of the Board, John Hancock retail funds3 John Hancock Variable Insurance Trust, and John Hancock Funds II (since 2012); Trustee, and Vice Chairperson of the Board, John Hancock Collateral Trust and John Hancock Exchange-Traded Fund Trust (since 2015). | ||
Independent Trustees (continued)
| Name, year of birth Position(s) held with fund Principal occupation(s) and other directorships during past 5 years | Trustee of the Trust since1 | Number of John Hancock funds overseen by Trustee |
| Gregory A. Russo, Born: 1949 | 2008 | 230 |
| Trustee Director and Audit Committee Chairman (since 2012), and Member, Audit Committee and Finance Committee (since 2011), NCH Healthcare System, Inc. (holding company for multi-entity healthcare system); Director and Member (since 2012) and Finance Committee Chairman (since 2014), The Moorings, Inc. (nonprofit continuing care community); Vice Chairman, Risk & Regulatory Matters, KPMG LLP (KPMG) (2002-2006); Vice Chairman, Industrial Markets, KPMG (1998-2002); Chairman and Treasurer, Westchester County, New York, Chamber of Commerce (1986-1992); Director, Treasurer, and Chairman of Audit and Finance Committees, Putnam Hospital Center (1989-1995); Director and Chairman of Fundraising Campaign, United Way of Westchester and Putnam Counties, New York (1990-1995). Trustee, John Hancock retail funds3 (since 2008); Trustee, John Hancock Variable Insurance Trust and John Hancock Funds II (since 2012); Trustee, John Hancock Collateral Trust and John Hancock Exchange-Traded Fund Trust (since 2015). | ||
Non-Independent Trustees4
| Name, year of birth Position(s) held with fund Principal occupation(s) and other directorships during past 5 years | Trustee of the Trust since1 | Number of John Hancock funds overseen by Trustee |
| James R. Boyle, Born: 1959 | 2015 | 230 |
| Non-Independent Trustee* Chairman and Chief Executive Officer, Zillion Group, Inc. (formerly HealthFleet, Inc.) (healthcare) (since 2014); Executive Vice President and Chief Executive Officer, U.S. Life Insurance Division of Genworth Financial, Inc. (insurance) (January 2014-July 2014); Senior Executive Vice President, Manulife Financial Corporation, President and Chief Executive Officer, John Hancock (1999-2012); Chairman and Director, John Hancock Advisers, LLC, John Hancock Funds, LLC, and John Hancock Investment Management Services, LLC (2005-2010). Trustee, John Hancock Collateral Trust and John Hancock Exchange-Traded Fund Trust (since 2015); Trustee, John Hancock retail funds3 (2005-2010; 2012-2014 and since 2015); Trustee, John Hancock Variable Insurance Trust and John Hancock Funds II (2005-2014 and since 2015). *Effective 3-10-15. | ||
| Craig Bromley, Born: 1966 | 2012 | 230 |
| Non-Independent Trustee President, John Hancock Financial Service (since 2012); Senior Executive Vice President and General Manager, U.S. Division, Manulife Financial Corporation (since 2012); President and Chief Executive Officer, Manulife Insurance Company (Manulife Japan) (2005-2012, including prior positions). Trustee, John Hancock retail funds,3 John Hancock Variable Insurance Trust, and John Hancock Funds II (since 2012); Trustee, John Hancock Collateral Trust and John Hancock Exchange-Traded Fund Trust (since 2015). | ||
| Warren A. Thomson, Born: 1955 | 2012 | 230 |
| Non-Independent Trustee Senior Executive Vice President and Chief Investment Officer, Manulife Financial Corporation and The Manufacturers Life Insurance Company (since 2009); Chairman, Manulife Asset Management (since 2001, including prior positions); Director and Chairman, Manulife Asset Management Limited (since 2006); Director and Chairman, Hancock Natural Resources Group, Inc. (since 2013). Trustee, John Hancock retail funds,3 John Hancock Variable Insurance Trust, and John Hancock Funds II (since 2012); Trustee, John Hancock Collateral Trust and John Hancock Exchange-Traded Fund Trust (since 2015). | ||
Principal officers who are not Trustees
| Name, year of birth Position(s) held with fund Principal occupation(s) during past 5 years | Officer of the Trust since |
| Andrew G. Arnott, Born: 1971 | 2009 |
| President Senior Vice President, John Hancock Financial Services (since 2009); Director and Executive Vice President, John Hancock Advisers, LLC (since 2005, including prior positions); Director and Executive Vice President, John Hancock Investment Management Services, LLC (since 2006, including prior positions); President, John Hancock Funds, LLC (since 2004, including prior positions); President, John Hancock retail funds,3 John Hancock Variable Insurance Trust, and John Hancock Funds II (since 2007, including prior positions); President, John Hancock Collateral Trust (since 2015); President, John Hancock Exchange-Traded Fund Trust (since 2014). | |
| John J. Danello, Born: 1955 | 2014 |
| Senior Vice President, Secretary, and Chief Legal Officer Vice President and Chief Counsel, John Hancock Wealth Management (since 2005); Senior Vice President (since 2007) and Chief Legal Counsel (2007-2010), John Hancock Funds, LLC and The Berkeley Financial Group, LLC; Senior Vice President (since 2006, including prior positions) and Chief Legal Officer and Secretary (since 2014), John Hancock retail funds,3 John Hancock Funds II and John Hancock Variable Insurance Trust; Senior Vice President, Chief Legal Officer and Secretary, John Hancock Collateral Trust and John Hancock Exchange-Traded Fund Trust (since 2015); Vice President, John Hancock Life & Health Insurance Company (since 2009); Vice President, John Hancock Life Insurance Company (USA) and John Hancock Life Insurance Company of New York (since 2010); and Senior Vice President, Secretary, and Chief Legal Counsel (2007-2014, including prior positions) of John Hancock Advisers, LLC and John Hancock Investment Management Services, LLC. | |
| Francis V. Knox, Jr., Born: 1947 | 2006 |
| Chief Compliance Officer Vice President, John Hancock Financial Services (since 2005); Chief Compliance Officer, John Hancock retail funds,3 John Hancock Variable Insurance Trust, John Hancock Funds II, John Hancock Advisers, LLC, and John Hancock Investment Management Services, LLC (since 2005); Chief Compliance Officer, John Hancock Collateral Trust and John Hancock Exchange-Traded Fund Trust (since 2015). | |
| Charles A. Rizzo, Born: 1957 | 2007 |
| Chief Financial Officer Vice President, John Hancock Financial Services (since 2008); Senior Vice President, John Hancock Advisers, LLC and John Hancock Investment Management Services, LLC (since 2008); Chief Financial Officer, John Hancock retail funds,3 John Hancock Variable Insurance Trust and John Hancock Funds II (since 2007); Chief Financial Officer, John Hancock Collateral Trust and John Hancock Exchange-Traded Fund Trust (since 2015). | |
| Salvatore Schiavone, Born: 1965 | 2010 |
| Treasurer Assistant Vice President, John Hancock Financial Services (since 2007); Vice President, John Hancock Advisers, LLC and John Hancock Investment Management Services, LLC (since 2007); Treasurer, John Hancock retail funds3 (since 2007, including prior positions); Treasurer, John Hancock Variable Insurance Trust and John Hancock Funds II (2007-2009 and since 2010, including prior positions); Treasurer, John Hancock Collateral Trust and John Hancock Exchange-Traded Fund Trust (since 2015). | |
The business address for all Trustees and Officers is 601 Congress Street, Boston, Massachusetts 02210-2805.
The Statement of Additional Information of the fund includes additional information about members of the Board of Trustees of the Trust and is available without charge, upon request, by calling 800-225-5291.
| 1 | Each Trustee holds office until his or her successor is elected and qualified, or until the Trustee's death, retirement, resignation, or removal. Mr. Boyle has served as Trustee at various times prior to the date listed in the table. |
| 2 | Member of the Audit Committee. |
| 3 | "John Hancock retail funds" comprises John Hancock Funds III and 36 other John Hancock funds consisting of 26 series of other John Hancock trusts and 10 closed-end funds. |
| 4 | The Trustee is a Non-Independent Trustee due to current or former positions with the Advisor and certain affiliates. |
Trustees James M. Oates, Chairperson Officers Andrew G. Arnott John J. Danello Francis V. Knox, Jr. Charles A. Rizzo Salvatore Schiavone | Investment advisor John Hancock Advisers, LLC Subadvisor Robeco Investment Management, Inc. Principal distributor John Hancock Funds, LLC Custodian State Street Bank and Trust Company Transfer agent John Hancock Signature Services, Inc. Legal counsel K&L Gates LLP Independent registered public accounting firm PricewaterhouseCoopers LLP |
*Member of the Audit Committee
†Non-Independent Trustee
The fund's proxy voting policies and procedures, as well as the fund proxy voting record for the most recent twelve-month period ended June 30, are available free of charge on the Securities and Exchange Commission (SEC) website at sec.gov or on our website.
The fund's complete list of portfolio holdings, for the first and third fiscal quarters, is filed with the SEC on Form N-Q. The fund's Form N-Q is available on our website and the SEC's website, sec.gov, and can be reviewed and copied (for a fee) at the SEC's Public Reference Room in Washington, DC. Call 800-SEC-0330 to receive information on the operation of the SEC's Public Reference Room.
We make this information on your fund, as well as monthly portfolio holdings, and other fund details available on our website at jhinvestments.com or by calling 800-225-5291.
| You can also contact us: | |||
| 800-225-5291 jhinvestments.com | Regular mail: John Hancock Signature Services, Inc. | Express mail: John Hancock Signature Services, Inc. | |
John Hancock family of funds
DOMESTIC EQUITY FUNDS Balanced Blue Chip Growth Classic Value Disciplined Value Disciplined Value Mid Cap Equity Income Fundamental All Cap Core Fundamental Large Cap Core Fundamental Large Cap Value New Opportunities Small Cap Value Small Company Strategic Growth U.S. Equity U.S. Global Leaders Growth Value Equity GLOBAL AND INTERNATIONAL EQUITY FUNDS Disciplined Value International Emerging Markets Emerging Markets Equity Global Equity Global Shareholder Yield Greater China Opportunities International Core International Growth International Small Company International Value Equity | INCOME FUNDS Bond California Tax-Free Income Core High Yield Emerging Markets Debt Floating Rate Income Focused High Yield Global Income Government Income High Yield Municipal Bond Income Investment Grade Bond Money Market Short Duration Credit Opportunities Spectrum Income Strategic Income Opportunities Tax-Free Bond ALTERNATIVE AND SPECIALTY FUNDS Absolute Return Currency Alternative Asset Allocation Enduring Assets Financial Industries Global Absolute Return Strategies Global Conservative Absolute Return Global Focused Strategies Global Real Estate Natural Resources Redwood Regional Bank Seaport Technical Opportunities |
A fund's investment objectives, risks, charges, and expenses should be considered carefully before investing. The prospectus contains this and other important information about the fund. To obtain a prospectus, contact your financial professional, call John Hancock Investments at 800-225-5291, or visit our website at jhinvestments.com. Please read the prospectus carefully before investing or sending money.
ASSET ALLOCATION Income Allocation Fund Lifestyle Aggressive Portfolio Lifestyle Balanced Portfolio Lifestyle Conservative Portfolio Lifestyle Growth Portfolio Lifestyle Moderate Portfolio Retirement Choices Portfolios (2010-2060) Retirement Living Portfolios (2010-2060) Retirement Living II Portfolios (2010-2060) EXCHANGE-TRADED FUNDS John Hancock Multifactor Consumer Discretionary ETF John Hancock Multifactor Consumer Staples ETF John Hancock Multifactor Energy ETF John Hancock Multifactor Financials ETF John Hancock Multifactor Healthcare ETF John Hancock Multifactor Industrials ETF John Hancock Multifactor Large Cap ETF John Hancock Multifactor Materials ETF John Hancock Multifactor Mid Cap ETF John Hancock Multifactor Technology ETF John Hancock Multifactor Utilities ETF | CLOSED-END FUNDS Financial Opportunities Hedged Equity & Income Income Securities Trust Investors Trust Preferred Income Preferred Income II Preferred Income III Premium Dividend Tax-Advantaged Dividend Income Tax-Advantaged Global Shareholder Yield |
John Hancock Multifactor ETF shares are bought and sold at market price (not NAV), and are not individually redeemed
from the fund. Brokerage commissions will reduce returns.
John Hancock ETFs are distributed by Foreside Fund Services, LLC, and are subadvised by Dimensional Fund Advisors LP.
Foreside is not affiliated with John Hancock Funds, LLC or Dimensional Fund Advisors LP.
Dimensional Fund Advisors LP receives compensation from John Hancock in connection with licensing rights to the
John Hancock Dimensional indexes. Dimensional Fund Advisors LP does not sponsor, endorse, or sell, and makes no
representation as to the advisability of investing in, John Hancock Multifactor ETFs.
John Hancock Investments
A trusted brand
John Hancock Investments is a premier asset manager representing
one of America's most trusted brands, with a heritage of financial
stewardship dating back to 1862. Helping our shareholders pursue
their financial goals is at the core of everything we do. It's why we
support the role of professional financial advice and operate with the
highest standards of conduct and integrity.
A better way to invest
We build funds based on investor needs, then search the world to find
proven portfolio teams with specialized expertise in those strategies.
As a manager of managers, we apply vigorous oversight to ensure that
they continue to meet our uncompromising standards and serve the
best interests of our shareholders.
Results for investors
Our unique approach to asset management enables us to provide
a diverse set of investments backed by some of the world's best
managers, along with strong risk-adjusted returns across asset classes.
| | John Hancock Funds, LLC n Member FINRA, SIPC 601 Congress Street n Boston, MA 02210-2805 800-225-5291 n jhinvestments.com | |
| This report is for the information of the shareholders of John Hancock Disciplined Value Mid Cap Fund. It is not authorized for distribution to prospective investors unless preceded or accompanied by a prospectus. | ||
| MF288158 | 363A 3/16 5/16 | |
John Hancock
International Value Equity Fund
Annual report 3/31/16

A message to shareholders
Dear shareholder,
The 12-month period covered by this report was a challenging one for investors in international equities. Stocks tumbled late last summer and again in the winter, with Chinese equities posting some of the steepest declines. A slowdown in global growth, particularly in China, was a source of anxiety throughout the period. The volatility extended to commodity markets, as oil prices hit multi-year lows before rebounding entering the spring.
The investment landscape improved toward the end of the period as stocks and other so-called risk assets regained positive momentum. Aggressive economic stimulus measures from central banks in the eurozone and Japan provided a key source of support.
Volatile market environments are naturally unsettling. At John Hancock Investments, portfolio risk management is a critical part of our role as an asset manager, and our dedicated risk team is focused on these issues every day. We continually strive for new ways to analyze potential risks and have liquidity tools in place. However, your best resource in times like these is your financial advisor, who can ensure your portfolio is sufficiently diversified to meet your long-term objectives and to withstand the inevitable bumps along the way.
On behalf of everyone at John Hancock Investments, I'd like to take this opportunity to thank you for the continued trust you've placed in us.
Sincerely,
Andrew G. Arnott
President and Chief Executive Officer
John Hancock Investments
This commentary reflects the CEO's views as of March 31, 2016. They are subject to change at any time. All investments entail risks, including the possible loss of principal. Diversification does not guarantee a profit or eliminate the risk of a loss. For more up-to-date information, you can visit our website at jhinvestments.com.
John Hancock
International Value Equity Fund
INVESTMENT OBJECTIVE
The fund seeks long-term capital appreciation.
AVERAGE ANNUAL TOTAL RETURNS AS OF 3/31/16 (%)
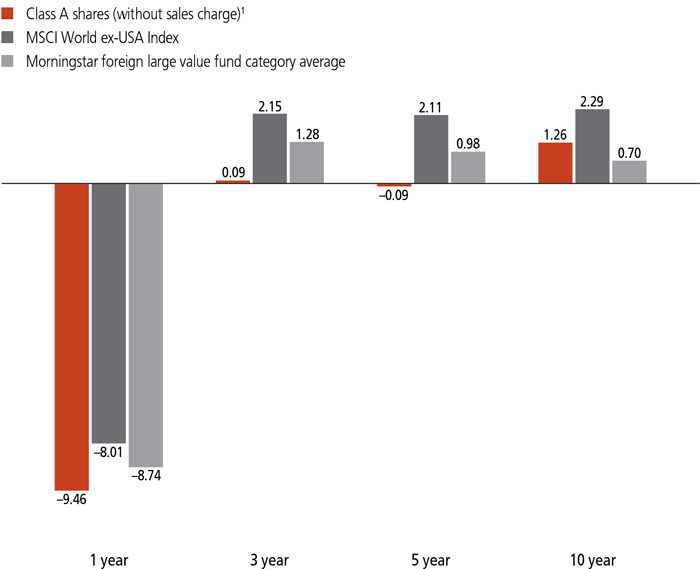
The MSCI World ex-USA Index (gross of foreign withholding taxes on dividends) is a free float-adjusted market capitalization weighted index that is designed to measure the equity market performance of developed markets, excluding the United States.
It is not possible to invest directly in an index. Index figures do not reflect expenses or sales charges, which would result in lower returns.
Figures from Morningstar, Inc. include reinvested distributions and do not take into account sales charges. Actual load-adjusted performance is lower.
| 1 | After the close of business on 2-11-11, holders of the former Optique International Value Fund became owners of an equal number of full and fractional Class A shares of John Hancock International Value Equity Fund, which were first offered on 2-14-11. Class A shares' performance shown above for periods prior to this date reflects the historical performance of Optique International Value Fund. |
The past performance shown here reflects reinvested distributions and the beneficial effect of any expense reductions, and does not guarantee future results. Performance of the other share classes will vary based on the difference in the fees and expenses of those classes. Shares will fluctuate in value and, when redeemed, may be worth more or less than their original cost. Current month-end performance may be lower or higher than the performance cited, and can be found at jhinvestments.com or by calling 800-225-5291. For further information on the fund's objectives, risks, and strategy, see the fund's prospectus.
PERFORMANCE HIGHLIGHTS OVER THE LAST TWELVE MONTHS
Global markets fell amid a challenging economic environment
Most developed-market stocks outside the United States declined as expectations for global economic growth were scaled back, despite aggressive monetary easing by key central banks.
The fund trailed its benchmark, and stock picking in the Pacific Rim weighed on results
The fund trailed its benchmark, the MSCI World ex-USA Index, as our security selection in key Pacific Rim markets and in the materials, financials, and energy sectors weighed on relative performance.
Stock picking in Europe and select sectors aided relative performance
Although the fund was down, our security selection in Continental Europe and in the consumer discretionary and healthcare sectors aided performance relative to the benchmark.
SECTOR COMPOSITION AS OF 3/31/16 (%)
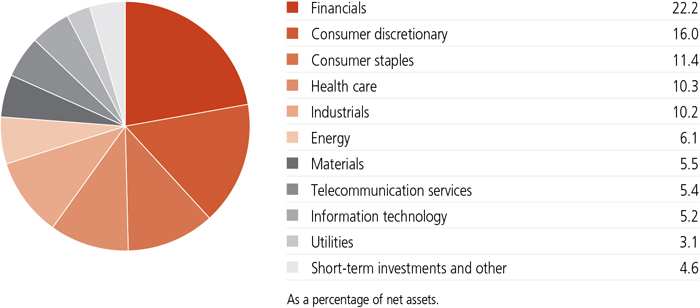
A note about risks
Foreign investing has additional risks, such as currency and market volatility and political and social instability. Value stocks may decline in price. The stock prices of midsize companies can change more frequently and dramatically than those of large companies. The value of a company's equity securities is subject to changes in the company's financial condition and overall market and economic conditions. Hedging, derivatives, and other strategic transactions could produce disproportionate gains or losses and may increase costs. Please see the fund's prospectuses for additional risks.
An interview with Portfolio Manager Wendell Perkins, CFA, John Hancock Asset Management a division of Manulife Asset Management (US) LLC

Wendell Perkins, CFA
Portfolio Manager
John Hancock Asset Management
Can you describe the factors behind the negative returns that most non-U.S. developed-market equities posted during the 12-month period?
While the U.S. economy remained relatively strong, economic news from other key developed markets, such as Europe and Japan, was largely disappointing. Projections of global growth were scaled back, and the fund's benchmark, the MSCI World ex-USA Index, posted a loss of 8.01% for the period. A slowdown in China, long a source of strength on the global economic scene, weighed on economic prospects among many of its trading partners in Asia and beyond.
Key central banks implemented increasingly accommodative monetary policies to stimulate lending and investment activity. The European Central Bank expanded a program to purchase sovereign bonds from member countries in the eurozone, and central banks in Japan and selected European countries took the unusual step of introducing negative interest rates, effectively charging banks to hold their deposits overnight. Although these measures provided a source of short-term support for equities, they appeared to largely fall short in terms of generating broad-based, long-term growth.
Uncertainty about the pace of increases in U.S. interest rates also weighed on global investment sentiment. While the U.S. Federal Reserve (Fed) in December 2015 implemented its first rate hike in more than nine years, mixed economic data in early 2016 led the Fed to hold off on approving further increases through the end of the period covered by this report. Amid this negative environment, crude oil prices dropped sharply during the period, sinking to multi-year lows in early 2016 before making a modest comeback in the period's closing weeks.
The oil price decline and weakening in prices of other commodities had a negative impact on many stocks in the energy and materials sectors, which underperformed. In financials, the scaled-back outlook for global growth and central banks' aggressive monetary policies had a negative impact on the shares of many commercial banks and insurance companies. Consumer staples, telecommunication services, and utilities were the only sectors to post positive returns for the period.
How did this environment affect your team's management of the fund?
We positioned the fund fairly defensively, as we have been skeptical about the long-term sustainability of a global economic recovery that, in our view, may be traced as much to central bank stimulus as to strong economic fundamentals and solid earnings growth. Some of our concerns were borne out as consensus expectations for global growth diminished during the period, triggering declines in equities. For the period, value stocks within the fund's international equity benchmark underperformed their growth-oriented counterparts by a wide margin. As a result, the fund's focus on value stocks within a benchmark made up of value and growth stocks alike had a negative impact on relative performance. While we maintained a cautious investment approach based on our views about the global economy, we continued to evaluate stocks primarily based on a value-oriented, bottom-up basis, aligned with our assessment of the risks and opportunities specific to each stock.
The fund was down and trailed its benchmark for the period. At the regional and sector levels, what factors had the most significant impact on this result?
From a regional perspective, our stock picking in Japan and in certain other markets across the Pacific Rim had a negative impact on relative results. Security selection in the United Kingdom was also a detractor. At the sector level, stock picking in materials, financials, and energy—the three sectors that, respectively, posted the weakest results within the index—had a negative impact.
TOP 10 HOLDINGS AS OF 3/31/16 (%)
| Novartis AG | 1.2 |
| Japan Tobacco, Inc. | 1.2 |
| Nippon Telegraph & Telephone Corp. | 1.1 |
| Unilever PLC | 1.1 |
| Wolters Kluwer NV | 1.1 |
| AGL Energy, Ltd. | 1.1 |
| SAP SE | 1.1 |
| Imperial Tobacco Group PLC | 1.1 |
| Informa PLC | 1.1 |
| Nestle SA | 1.1 |
| TOTAL | 11.2 |
| As a percentage of net assets. | |
| Cash and cash equivalents are not included. | |
Despite the fund's negative return, our stock picking contributed to somewhat better performance than the benchmark in certain segments of the broad market. Our stock picking in Europe (excluding the U.K.) contributed to relative results, as did security selection in the consumer discretionary and healthcare sectors.
Which positions had the biggest negative impact on performance relative to the benchmark?
Among the top detractors was a position in Fujitsu, Ltd., a Japanese provider of information technology services. Concerns about the profitability of Fujitsu's consumer electronics business segment weighed on the stock, as did concerns about rising strategic costs.
Another key detractor was Standard Chartered PLC, a U.K.-based international bank with substantial commercial lending operations in China and other key Asian markets. Amid growing concerns about the health of China's economy, this Asian exposure weighed on the company's shares during the period.
Other positions that were among the top detractors relative to the benchmark were aerospace company Bombardier, Inc. (Canada), chemical maker Asahi Kasei Corp. (Japan), property developer Hang Lung Group, Ltd. (Hong Kong), and Deutsche Bank AG (Germany). During the period, we sold the fund's positions in Bombardier, Asahi Kasei, and Deutsche Bank.
TOP 10 COUNTRIES AS OF 3/31/16 (%)
| Japan | 20.2 |
| United Kingdom | 16.8 |
| France | 10.0 |
| Germany | 8.0 |
| Switzerland | 6.1 |
| Canada | 5.8 |
| Netherlands | 5.6 |
| Australia | 4.4 |
| Sweden | 3.7 |
| Hong Kong | 3.1 |
| TOTAL | 83.7 |
| As a percentage of net assets. | |
| Cash and cash equivalents are not included. |
Which positions had the biggest positive impact on performance?
The most significant relative contributor was a position in Gerresheimer AG, a German maker of glass and plastic containers and packaging for pharmaceuticals and other healthcare applications. We added this position to the portfolio during the early months of the period, and its shares surged. Catalysts included Gerresheimer's sale of its pharmaceutical glass tubing business and its subsequent proposed acquisition of a U.S.-based manufacturer of plastic vials for prescription medications.
Another key contributor was a position in Nippon Telegraph & Telephone Corp. Shares of the Japan-based telecommunication services company rallied amid its relatively strong earnings performance in a slow growth environment. Growth in Nippon Telegraph & Telephone's wireless communications business was a key source of the company's strength.
Other positions that were among the top contributors relative to the benchmark were information services company Wolters Kluwer NV (Netherlands) and cigarette makers Imperial Brands PLC (U.K.) and Japan Tobacco, Inc.
How was the fund positioned at the end of the period?
At the sector level, the fund was overweight in consumer discretionary at the end of the period, and it was underweight in the financials, industrials, and materials sectors. At the regional level, the fund was modestly overweight in the United Kingdom and modestly underweight in Europe and in the Pacific Rim region. We maintained the fund's modest weighting in emerging-market equities.
MANAGED BY
| | Wendell Perkins, CFA On the fund since 1998 Investing since 1985 |
 | Edward Maraccini, CFA On the fund since 2007 Investing since 1995 |
 | Margaret McKay, CFA On the fund since 2001 Investing since 1992 |
![]()
TOTAL RETURNS FOR THE PERIOD ENDED MARCH 31, 2016
| Average annual total returns (%) with maximum sales charge | Cumulative total returns (%) with maximum sales charge | |||||||
| 1-year | 5-year | 10-year | 5-year | 10-year | ||||
| Class A1,2 | -13.98 | -1.11 | 0.74 | -5.43 | 7.64 | |||
| Class C1,2 | -11.07 | -0.80 | 0.54 | -3.95 | 5.55 | |||
| Class I1,2,3 | -9.29 | 0.22 | 1.41 | 1.08 | 15.05 | |||
| Class R21,2,3 | -9.53 | -0.13 | 1.20 | -0.66 | 12.65 | |||
| Class R41,2,3 | -9.34 | 0.11 | 1.45 | 0.54 | 15.44 | |||
| Class R61,2,3 | -8.97 | 0.41 | 1.73 | 2.09 | 18.69 | |||
| Class NAV1,2,3 | -9.09 | 0.41 | 1.74 | 2.07 | 18.84 | |||
| Index 1† | -8.01 | 2.11 | 2.29 | 11.01 | 25.46 | |||
| Index 2† | -11.86 | 0.96 | 1.37 | 4.90 | 14.59 | |||
Performance figures assume all distributions are reinvested. Figures reflect the maximum sales charge on Class A shares of 5% and the applicable contingent deferred sales charge (CDSC) on Class C shares. Class C shares sold within one year of purchase are subject to a 1% CDSC. Sales charges are not applicable to Class I, Class R2, Class R4, Class R6, and Class NAV shares.
The expense ratios of the fund, both net (including any fee waivers and/or expense limitations) and gross (excluding any fee waivers and/or expense limitations), are set forth according to the most recent publicly available prospectuses for the fund and may differ from those disclosed in the Financial highlights tables in this report. Had the fee waivers and expense limitations not been in place, gross expenses would apply. The expense ratios are as follows:
| Class A | Class C | Class I | Class R2 | Class R4 | Class R6 | Class NAV | |
| Gross (%) | 1.36 | 2.11 | 1.09 | 1.50 | 1.35 | 1.00 | 0.98 |
| Net (%) | 1.36 | 2.11 | 1.09 | 1.50 | 1.25 | 0.98 | 0.98 |
Please refer to the most recent prospectus and annual or semiannual report for more information on expenses and any expense limitation arrangements for each class.
The returns reflect past results and should not be considered indicative of future performance. The return and principal value of an investment will fluctuate so that shares, when redeemed, may be worth more or less than their original cost. Due to market volatility and other factors, the fund's current performance may be higher or lower than the performance shown. For current to the most recent month-end performance data, please call 800-225-5291 or visit the fund's website at jhinvestments.com.
The performance table above and the chart on the next page do not reflect the deduction of taxes that a shareholder would pay on fund distributions or the redemption of fund shares. The fund's performance results reflect any applicable fee waivers or expense reductions, without which the expenses would increase and results would have been less favorable.
| † | Index 1 is the MSCI World ex-USA Index; Index 2 is the MSCI World ex-USA Value Index. |
See the following page for footnotes.
This chart and table show what happened to a hypothetical $10,000 investment in John Hancock International Value Equity Fund for the share classes and periods indicated, assuming all distributions were reinvested. For comparison, we've shown the same investment in two separate indexes.
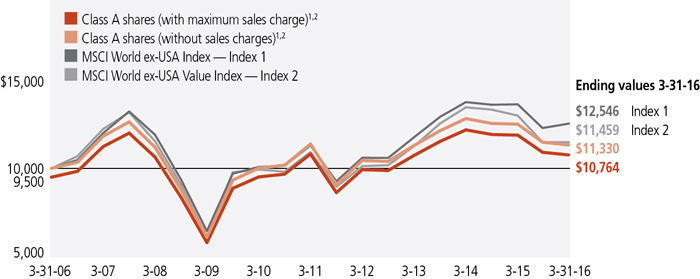
| Start date | With maximum sales charge ($) | Without sales charge ($) | Index 1 ($) | Index 2 ($) | |
| Class C1,2,4 | 3-31-06 | 10,555 | 10,555 | 12,546 | 11,459 |
| Class I1,2,3 | 3-31-06 | 11,505 | 11,505 | 12,546 | 11,459 |
| Class R21,2,3 | 3-31-06 | 11,265 | 11,265 | 12,546 | 11,459 |
| Class R41,2,3 | 3-31-06 | 11,544 | 11,544 | 12,546 | 11,459 |
| Class R61,2,3 | 3-31-06 | 11,869 | 11,869 | 12,546 | 11,459 |
| Class NAV1,2,3 | 3-31-06 | 11,884 | 11,884 | 12,546 | 11,459 |
The MSCI World ex-USA Index (gross of foreign withholding taxes on dividends) is a free float-adjusted market capitalization weighted index that is designed to measure the equity market performance of developed markets, excluding the United States of America.
The MSCI World ex-USA Value Index (gross of foreign withholding taxes on dividends) is a free float-adjusted market capitalization weighted index that is designed to measure the equity market performance of developed markets, excluding the United States of America, that have higher than average value characteristics.
It is not possible to invest directly in an index. Index figures do not reflect expenses or sales charges, which would result in lower returns.
Footnotes related to performance pages
| 1 | After the close of business on 2-11-11, holders of the former Optique International Value Fund (the predecessor fund, first offered on 4-1-98) became owners of an equal number of full and fractional Class A shares or Class I shares of John Hancock International Value Equity Fund, which were first offered on 2-14-11. The performance shown for Class A and Class I shares for periods prior to this date reflects the historical performance of Optique International Value Fund. Class C shares were first offered on 8-28-14; Class R2, Class R4, and Class R6 shares were first offered on 7-2-13; Class NAV shares were first offered on 12-16-11. The returns prior to these dates are that of Class A shares recalculated to reflect the gross fees and expenses of Class C, Class R2, Class R4, Class R6, and Class NAV shares, as applicable. |
| 2 | In October 2011, the advisor made a voluntary payment to the fund of $6,950, or approximately $0.018 per share. Without this payment, performance would have been lower. |
| 3 | For certain types of investors, as described in the fund's prospectuses. |
| 4 | The contingent deferred sales charge is not applicable. |
These examples are intended to help you understand your ongoing operating expenses of investing in the fund so you can compare these costs with the ongoing costs of investing in other mutual funds.
Understanding fund expenses
As a shareholder of the fund, you incur two types of costs:
| • | Transaction costs, which include sales charges (loads) on purchases or redemptions (varies by share class), minimum account fee charge, etc. |
| • | Ongoing operating expenses, including management fees, distribution and service fees (if applicable), and other fund expenses. |
We are presenting only your ongoing operating expenses here.
Actual expenses/actual returns
This example is intended to provide information about the fund's actual ongoing operating expenses, and is based on the fund's actual return. It assumes an account value of $1,000.00 on October 1, 2015, with the same investment held until March 31, 2016.
| Account value on 10-1-2015 | Ending value on 3-31-2016 | Expenses paid during period ended 3-31-20161 | Annualized expense ratio | |
| Class A | $1,000.00 | $986.30 | 6.77 | 1.37% |
| Class C | 1,000.00 | 981.50 | 10.44 | 2.12% |
| Class I | 1,000.00 | 986.80 | 5.38 | 1.09% |
| Class R2 | 1,000.00 | 985.40 | 7.50 | 1.52% |
| Class R4 | 1,000.00 | 987.50 | 5.68 | 1.15% |
| Class R6 | 1,000.00 | 989.10 | 4.80 | 0.97% |
| Class NAV | 1,000.00 | 987.80 | 4.89 | 0.99% |
Together with the value of your account, you may use this information to estimate the operating expenses that you paid over the period. Simply divide your account value at March 31, 2016, by $1,000.00, then multiply it by the "expenses paid" for your share class from the table above. For example, for an account value of $8,600.00, the operating expenses should be calculated as follows:
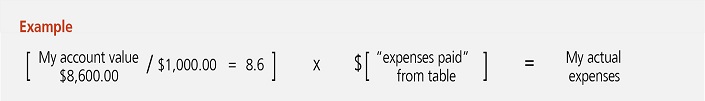
Hypothetical example for comparison purposes
This table allows you to compare the fund's ongoing operating expenses with those of any other fund. It provides an example of the fund's hypothetical account values and hypothetical expenses based on each class's actual expense ratio and an assumed 5% annualized return before expenses (which is not the fund's actual return). It assumes an account value of $1,000.00 on October 1, 2015, with the same investment held until March 31, 2016. Look in any other fund shareholder report to find its hypothetical example and you will be able to compare these expenses. Please remember that these hypothetical account values and expenses may not be used to estimate the actual ending account balance or expenses you paid for the period.
| Account value on 10-1-2015 | Ending value on 3-31-2016 | Expenses paid during period ended 3-31-20161 | Annualized expense ratio | |
| Class A | $1,000.00 | $1,018.10 | $6.87 | 1.37% |
| Class C | 1,000.00 | 1,014.32 | 10.62 | 2.12% |
| Class I | 1,000.00 | 1,019.40 | 5.47 | 1.09% |
| Class R2 | 1,000.00 | 1,017.30 | 7.62 | 1.52% |
| Class R4 | 1,000.00 | 1,019.10 | 5.77 | 1.15% |
| Class R6 | 1,000.00 | 1,020.00 | 4.87 | 0.97% |
| Class NAV | 1,000.00 | 1,019.90 | 4.97 | 0.99% |
Remember, these examples do not include any transaction costs, therefore, these examples will not help you to determine the relative total costs of owning different funds. If transaction costs were included, your expenses would have been higher. See the prospectuses for details regarding transaction costs.
| 1 | Expenses are equal to the fund's annualized expense ratio, multiplied by the average account value over the period, multiplied by 182/366 (to reflect the one-half year period). |
Fund's investments
| As of 3-31-16 | |||||||||||||||||
| Shares | Value | ||||||||||||||||
| Common stocks 95.4% | $481,296,379 | ||||||||||||||||
| (Cost $519,467,427) | |||||||||||||||||
| Australia 4.4% | 22,222,666 | ||||||||||||||||
| AGL Energy, Ltd. | 402,655 | 5,669,068 | |||||||||||||||
| Australia & New Zealand Banking Group, Ltd. | 213,731 | 3,831,429 | |||||||||||||||
| BHP Billiton, Ltd. | 287,089 | 3,709,699 | |||||||||||||||
| National Australia Bank, Ltd. | 191,524 | 3,845,593 | |||||||||||||||
| QBE Insurance Group, Ltd. | 426,313 | 3,562,566 | |||||||||||||||
| Santos, Ltd. | 517,774 | 1,604,311 | |||||||||||||||
| Canada 5.8% | 29,525,526 | ||||||||||||||||
| Bank of Montreal | 73,813 | 4,482,488 | |||||||||||||||
| Barrick Gold Corp. | 238,209 | 3,235,424 | |||||||||||||||
| Husky Energy, Inc. | 308,379 | 3,839,452 | |||||||||||||||
| IGM Financial, Inc. (L) | 180,734 | 5,443,938 | |||||||||||||||
| Magna International, Inc. | 85,241 | 3,664,296 | |||||||||||||||
| Suncor Energy, Inc. | 145,730 | 4,058,559 | |||||||||||||||
| The Toronto-Dominion Bank | 111,234 | 4,801,369 | |||||||||||||||
| Chile 0.4% | 1,865,949 | ||||||||||||||||
| Antofagasta PLC | 277,651 | 1,865,949 | |||||||||||||||
| China 1.0% | 5,339,561 | ||||||||||||||||
| China Petroleum & Chemical Corp., H Shares | 2,934,279 | 1,906,113 | |||||||||||||||
| CNOOC, Ltd. | 2,942,000 | 3,433,448 | |||||||||||||||
| Denmark 1.8% | 9,065,884 | ||||||||||||||||
| Carlsberg A/S, B Shares | 49,064 | 4,665,270 | |||||||||||||||
| Danske Bank A/S | 155,937 | 4,400,614 | |||||||||||||||
| France 10.0% | 50,260,421 | ||||||||||||||||
| Atos SE | 46,563 | 3,781,793 | |||||||||||||||
| AXA SA | 193,684 | 4,541,650 | |||||||||||||||
| BNP Paribas SA | 71,965 | 3,615,572 | |||||||||||||||
| Christian Dior SE | 21,728 | 3,934,409 | |||||||||||||||
| Cie de Saint-Gobain | 97,692 | 4,291,054 | |||||||||||||||
| Engie SA | 206,022 | 3,192,032 | |||||||||||||||
| Kering | 26,673 | 4,762,284 | |||||||||||||||
| Orange SA | 287,564 | 5,021,716 | |||||||||||||||
| Publicis Groupe SA | 65,198 | 4,571,763 | |||||||||||||||
| Sanofi | 48,973 | 3,937,233 | |||||||||||||||
| Schneider Electric SE | 74,304 | 4,682,684 | |||||||||||||||
| Total SA | 86,332 | 3,928,231 | |||||||||||||||
| Shares | Value | ||||||||||||||||
| Germany 8.0% | $40,297,433 | ||||||||||||||||
| Allianz SE | 28,530 | 4,633,427 | |||||||||||||||
| BASF SE | 53,290 | 4,007,179 | |||||||||||||||
| Bayerische Motoren Werke AG | 47,368 | 4,348,666 | |||||||||||||||
| E.ON SE | 272,805 | 2,608,558 | |||||||||||||||
| Gerresheimer AG | 63,020 | 4,930,731 | |||||||||||||||
| Merck KGaA | 51,733 | 4,303,353 | |||||||||||||||
| Muenchener Rueckversicherungs-Gesellschaft AG | 23,693 | 4,808,369 | |||||||||||||||
| SAP SE | 69,876 | 5,622,822 | |||||||||||||||
| Siemens AG | 47,601 | 5,034,328 | |||||||||||||||
| Hong Kong 3.1% | 15,547,704 | ||||||||||||||||
| China Mobile, Ltd. | 327,582 | 3,627,960 | |||||||||||||||
| Guangdong Investment, Ltd. | 3,168,098 | 4,005,953 | |||||||||||||||
| Hang Lung Group, Ltd. | 1,247,538 | 3,581,181 | |||||||||||||||
| Yue Yuen Industrial Holdings, Ltd. | 1,260,202 | 4,332,610 | |||||||||||||||
| Ireland 1.6% | 8,322,851 | ||||||||||||||||
| C&C Group PLC | 912,002 | 4,114,725 | |||||||||||||||
| Shire PLC | 73,782 | 4,208,126 | |||||||||||||||
| Israel 1.0% | 5,000,342 | ||||||||||||||||
| Teva Pharmaceutical Industries, Ltd. | 92,971 | 5,000,342 | |||||||||||||||
| Japan 20.2% | 101,719,777 | ||||||||||||||||
| Bandai Namco Holdings, Inc. | 195,394 | 4,259,279 | |||||||||||||||
| Bridgestone Corp. | 121,786 | 4,545,403 | |||||||||||||||
| East Japan Railway Company | 51,163 | 4,413,296 | |||||||||||||||
| Ebara Corp. | 989,706 | 4,129,493 | |||||||||||||||
| Fujitsu, Ltd. | 929,798 | 3,438,182 | |||||||||||||||
| Honda Motor Company, Ltd. | 157,627 | 4,309,695 | |||||||||||||||
| Inpex Corp. | 428,819 | 3,247,396 | |||||||||||||||
| Japan Tobacco, Inc. | 144,119 | 5,998,615 | |||||||||||||||
| Komatsu, Ltd. | 242,508 | 4,122,865 | |||||||||||||||
| Kyocera Corp. | 101,425 | 4,465,863 | |||||||||||||||
| Mitsubishi Chemical Holdings Corp. | 702,147 | 3,665,979 | |||||||||||||||
| Mitsubishi Corp. | 221,509 | 3,748,259 | |||||||||||||||
| Mitsubishi UFJ Financial Group, Inc. | 845,810 | 3,919,150 | |||||||||||||||
| Mitsui Fudosan Company, Ltd. | 178,185 | 4,438,172 | |||||||||||||||
| Mizuho Financial Group, Inc. | 2,458,484 | 3,663,837 | |||||||||||||||
| MS&AD Insurance Group Holdings, Inc. | 168,659 | 4,700,740 | |||||||||||||||
| Nippon Telegraph & Telephone Corp. | 134,200 | 5,797,106 | |||||||||||||||
| Nippon Television Holdings, Inc. | 253,468 | 4,178,131 | |||||||||||||||
| Nissan Motor Company, Ltd. | 477,225 | 4,412,062 | |||||||||||||||
| Rohm Company, Ltd. | 88,324 | 3,714,631 | |||||||||||||||
| Sumitomo Chemical Company, Ltd. | 889,000 | 4,023,975 | |||||||||||||||
| Taiheiyo Cement Corp. | 1,416,467 | 3,260,155 | |||||||||||||||
| Shares | Value | ||||||||||||||||
| Japan (continued) | |||||||||||||||||
| Toyo Suisan Kaisha, Ltd. | 137,987 | $4,953,222 | |||||||||||||||
| Toyota Motor Corp. | 81,347 | 4,314,271 | |||||||||||||||
| Netherlands 5.6% | 28,228,289 | ||||||||||||||||
| Aegon NV | 708,076 | 3,891,445 | |||||||||||||||
| Akzo Nobel NV | 60,021 | 4,091,458 | |||||||||||||||
| Heineken Holding NV | 69,438 | 5,406,026 | |||||||||||||||
| ING Groep NV | 372,392 | 4,456,359 | |||||||||||||||
| Royal Dutch Shell PLC, A Shares | 191,041 | 4,629,633 | |||||||||||||||
| Wolters Kluwer NV | 144,348 | 5,753,368 | |||||||||||||||
| Singapore 2.6% | 13,011,730 | ||||||||||||||||
| DBS Group Holdings, Ltd. | 382,193 | 4,353,933 | |||||||||||||||
| Sembcorp Industries, Ltd. | 1,798,916 | 4,026,208 | |||||||||||||||
| Singapore Telecommunications, Ltd. | 1,645,118 | 4,631,589 | |||||||||||||||
| South Africa 0.6% | 3,194,522 | ||||||||||||||||
| Tiger Brands, Ltd. | 145,232 | 3,194,522 | |||||||||||||||
| Spain 2.7% | 13,621,132 | ||||||||||||||||
| Banco Santander SA | 720,226 | 3,163,155 | |||||||||||||||
| CaixaBank SA | 1,029,569 | 3,034,734 | |||||||||||||||
| Ebro Foods SA | 170,935 | 3,725,551 | |||||||||||||||
| Telefonica SA | 330,841 | 3,697,692 | |||||||||||||||
| Sweden 3.7% | 18,489,834 | ||||||||||||||||
| Getinge AB, B Shares (L) | 184,346 | 4,240,774 | |||||||||||||||
| Modern Times Group MTG AB, B Shares | 161,462 | 4,831,032 | |||||||||||||||
| SKF AB, B Shares (L) | 245,904 | 4,432,812 | |||||||||||||||
| Telefonaktiebolaget LM Ericsson, B Shares | 497,889 | 4,985,216 | |||||||||||||||
| Switzerland 6.1% | 30,893,978 | ||||||||||||||||
| Aryzta AG (I) | 98,748 | 4,080,795 | |||||||||||||||
| Bucher Industries AG | 1,644 | 399,151 | |||||||||||||||
| Credit Suisse Group AG (I) | 217,854 | 3,076,525 | |||||||||||||||
| Julius Baer Group, Ltd. (I) | 71,199 | 3,051,372 | |||||||||||||||
| Nestle SA | 73,202 | 5,462,390 | |||||||||||||||
| Novartis AG | 83,855 | 6,067,071 | |||||||||||||||
| Roche Holding AG | 20,040 | 4,920,627 | |||||||||||||||
| Zurich Insurance Group AG (I) | 16,541 | 3,836,047 | |||||||||||||||
| United Kingdom 16.8% | 84,688,780 | ||||||||||||||||
| AstraZeneca PLC | 68,130 | 3,803,810 | |||||||||||||||
| Barclays PLC | 1,179,487 | 2,531,879 | |||||||||||||||
| BP PLC | 705,972 | 3,532,223 | |||||||||||||||
| Carillion PLC (L) | 964,153 | 4,070,113 | |||||||||||||||
| CYBG PLC (I) | 47,881 | 144,610 | |||||||||||||||
| Shares | Value | ||||||||||||||||
| United Kingdom (continued) | |||||||||||||||||
| Debenhams PLC | 3,590,040 | $3,873,538 | |||||||||||||||
| Diageo PLC | 169,761 | 4,577,431 | |||||||||||||||
| easyJet PLC | 166,467 | 3,623,115 | |||||||||||||||
| GlaxoSmithKline PLC | 250,678 | 5,074,523 | |||||||||||||||
| HSBC Holdings PLC | 702,960 | 4,371,669 | |||||||||||||||
| Imperial Brands PLC | 100,486 | 5,563,617 | |||||||||||||||
| Informa PLC | 550,462 | 5,477,975 | |||||||||||||||
| Kingfisher PLC | 863,133 | 4,655,374 | |||||||||||||||
| Meggitt PLC | 781,180 | 4,553,955 | |||||||||||||||
| Premier Oil PLC (I) | 803,673 | 508,752 | |||||||||||||||
| RSA Insurance Group PLC | 723,579 | 4,931,111 | |||||||||||||||
| Sky PLC | 305,148 | 4,483,999 | |||||||||||||||
| Smith & Nephew PLC | 322,555 | 5,306,900 | |||||||||||||||
| Standard Chartered PLC | 492,763 | 3,332,550 | |||||||||||||||
| Unilever PLC | 128,345 | 5,787,410 | |||||||||||||||
| Vodafone Group PLC | 1,411,178 | 4,484,226 | |||||||||||||||
| Yield (%) | Shares | Value | |||||||||||||||
| Securities lending collateral 3.4% | $17,274,602 | ||||||||||||||||
| (Cost $17,274,125) | |||||||||||||||||
| John Hancock Collateral Trust (W) | 0.4918(Y) | 1,726,373 | 17,274,602 | ||||||||||||||
| Short-term investments 2.1% | $10,265,969 | ||||||||||||||||
| (Cost $10,265,969) | |||||||||||||||||
| Money market funds 1.4% | 7,069,969 | ||||||||||||||||
| JPMorgan U.S. Treasury Plus Money Market Fund | 0.1600(Y) | 7,069,969 | 7,069,969 | ||||||||||||||
| Par value^ | Value | ||||||||||||||||
| Repurchase agreement 0.7% | 3,196,000 | ||||||||||||||||
| Barclays Capital Tri-Party Repurchase Agreement dated 3-31-16 at 0.300% to be repurchased at $3,196,027 on 4-1-16, collateralized by $2,385,700 U.S. Treasury Bonds, 4.500% due 8-15-39 (valued at $3,260,062, including interest) | 3,196,000 | $3,196,000 | |||||||||||||||
| Total investments (Cost $547,007,521)† 100.9% | $508,836,950 | ||||||||||||||||
| Other assets and liabilities, net (0.9%) | ($4,437,850 | ) | |||||||||||||||
| Total net assets 100.0% | $504,399,100 | ||||||||||||||||
| The percentage shown for each investment category is the total value of the category as a percentage of the net assets of the fund. | |||||||||||||||||
| ^All par values are denominated in U.S. dollars unless otherwise indicated. | |||||||||||||||||
| Key to Security Abbreviations and Legend | |||||||||||||||||
| (I) | Non-income producing security. | ||||||||||||||||
| (L) | A portion of this security is on loan as of 3-31-16. | ||||||||||||||||
| (W) | Investment is an affiliate of the fund, the advisor and/or subadvisor. This security represents the investment of cash collateral received for securities lending. | ||||||||||||||||
| (Y) | The rate shown is the annualized seven-day yield as of 3-31-16. | ||||||||||||||||
| † | At 3-31-16, the aggregate cost of investment securities for federal income tax purposes was $547,567,815. Net unrealized depreciation aggregated to $38,730,865, of which $36,139,815 related to appreciated investment securities and $74,870,680 related to depreciated investment securities. | ||||||||||||||||
Financial statements
STATEMENT OF ASSETS AND LIABILITIES 3-31-16
| Assets | |||||||||||||||||||||||||||||||||
| Unaffiliated investments, at value (Cost $529,733,396) including $16,389,165 of securities loaned | 491,562,348 | ||||||||||||||||||||||||||||||||
| Affiliated investments, at value (Cost $17,274,125) | 17,274,602 | ||||||||||||||||||||||||||||||||
| Total investments, at value (Cost $547,007,521) | 508,836,950 | ||||||||||||||||||||||||||||||||
| Cash | 10,429,526 | ||||||||||||||||||||||||||||||||
| Foreign currency, at value (Cost $546,507) | 553,649 | ||||||||||||||||||||||||||||||||
| Receivable for investments sold | 2,990,168 | ||||||||||||||||||||||||||||||||
| Receivable for fund shares sold | 30,723 | ||||||||||||||||||||||||||||||||
| Dividends and interest receivable | 2,263,494 | ||||||||||||||||||||||||||||||||
| Receivable for securities lending income | 21,144 | ||||||||||||||||||||||||||||||||
| Other receivables and prepaid expenses | 37,423 | ||||||||||||||||||||||||||||||||
| Total assets | 525,163,077 | ||||||||||||||||||||||||||||||||
| Liabilities | |||||||||||||||||||||||||||||||||
| Payable for investments purchased | 1,923,200 | ||||||||||||||||||||||||||||||||
| Payable for fund shares repurchased | 1,398,362 | ||||||||||||||||||||||||||||||||
| Payable upon return of securities loaned | 17,273,512 | ||||||||||||||||||||||||||||||||
| Payable to affiliates | |||||||||||||||||||||||||||||||||
| Accounting and legal services fees | 5,209 | ||||||||||||||||||||||||||||||||
| Transfer agent fees | 2,953 | ||||||||||||||||||||||||||||||||
| Distribution and service fees | 389 | ||||||||||||||||||||||||||||||||
| Other liabilities and accrued expenses | 160,352 | ||||||||||||||||||||||||||||||||
| Total liabilities | 20,763,977 | ||||||||||||||||||||||||||||||||
| Net assets | $504,399,100 | ||||||||||||||||||||||||||||||||
| Net assets consist of | |||||||||||||||||||||||||||||||||
| Paid-in capital | $549,552,238 | ||||||||||||||||||||||||||||||||
| Undistributed net investment income | 1,759,759 | ||||||||||||||||||||||||||||||||
| Accumulated net realized gain (loss) on investments and foreign currency transactions | (8,765,549 | ) | |||||||||||||||||||||||||||||||
| Net unrealized appreciation (depreciation) on investments and translation of assets and liabilities in foreign currencies | (38,147,348 | ) | |||||||||||||||||||||||||||||||
| Net assets | $504,399,100 | ||||||||||||||||||||||||||||||||
STATEMENT OF ASSETS AND LIABILITIES (continued)
| Net asset value per share | |||||||||||||||||||||
| Based on net asset values and shares outstanding - The fund has an unlimited number of shares authorized with no par value | |||||||||||||||||||||
| Class A ($24,676,489 ÷ 3,427,510 shares)1 | $7.20 | ||||||||||||||||||||
| Class C ($444,769 ÷ 61,139 shares)1 | $7.27 | ||||||||||||||||||||
| Class I ($2,074,917 ÷ 287,998 shares) | $7.20 | ||||||||||||||||||||
| Class R2 ($768,735 ÷ 106,396 shares) | $7.23 | ||||||||||||||||||||
| Class R4 ($84,551 ÷ 11,723 shares) | $7.21 | ||||||||||||||||||||
| Class R6 ($173,061 ÷ 24,042 shares) | $7.20 | ||||||||||||||||||||
| Class NAV ($476,176,578 ÷ 66,116,204 shares) | $7.20 | ||||||||||||||||||||
| Maximum offering price per share | |||||||||||||||||||||
| Class A (net assets value per share ÷ 95%)2 | $7.58 | ||||||||||||||||||||
| 1 | Redemption price per share is equal to net asset value less any applicable contingent deferred sales charge. | |||||||||||||||||||
| 2 | On single retail sales of less than $50,000. On sales of $50,000 or more and on group sales the offering price is reduced. | |||||||||||||||||||
STATEMENT OF OPERATIONS For the year ended 3-31-16
| Investment income | ||||||||||||||||||||||||
| Dividends | $16,691,429 | |||||||||||||||||||||||
| Securities lending | 332,126 | |||||||||||||||||||||||
| Interest | 29,863 | |||||||||||||||||||||||
| Less foreign taxes withheld | (1,425,996 | ) | ||||||||||||||||||||||
| Total investment income | 15,627,422 | |||||||||||||||||||||||
| Expenses | ||||||||||||||||||||||||
| Investment management fees | 4,611,112 | |||||||||||||||||||||||
| Distribution and service fees | 71,863 | |||||||||||||||||||||||
| Accounting and legal services fees | 69,983 | |||||||||||||||||||||||
| Transfer agent fees | 34,636 | |||||||||||||||||||||||
| Trustees' fees | 7,092 | |||||||||||||||||||||||
| State registration fees | 103,113 | |||||||||||||||||||||||
| Printing and postage | 11,078 | |||||||||||||||||||||||
| Professional fees | 60,039 | |||||||||||||||||||||||
| Custodian fees | 280,097 | |||||||||||||||||||||||
| Registration and filing fees | 34,284 | |||||||||||||||||||||||
| Other | 16,603 | |||||||||||||||||||||||
| Total expenses | 5,299,900 | |||||||||||||||||||||||
| Less expense reductions | (54,302 | ) | ||||||||||||||||||||||
| Net expenses | 5,245,598 | |||||||||||||||||||||||
| Net investment income | 10,381,824 | |||||||||||||||||||||||
| Realized and unrealized gain (loss) | ||||||||||||||||||||||||
| Net realized gain (loss) on | ||||||||||||||||||||||||
| Unaffiliated investments and foreign currency transactions | 2,207,423 | |||||||||||||||||||||||
| Affiliated investments | 718 | |||||||||||||||||||||||
| 2,208,141 | ||||||||||||||||||||||||
| Change in net unrealized appreciation (depreciation) of | ||||||||||||||||||||||||
| Unaffiliated investments and translation of assets and liabilities in foreign currencies | (65,986,902 | ) | ||||||||||||||||||||||
| Affiliated investments | 564 | |||||||||||||||||||||||
| (65,986,338 | ) | |||||||||||||||||||||||
| Net realized and unrealized loss | (63,778,197 | ) | ||||||||||||||||||||||
| Decrease in net assets from operations | ($53,396,373 | ) | ||||||||||||||||||||||
STATEMENTS OF CHANGES IN NET ASSETS
| Year ended 3-31-16 | Year ended 3-31-15 | |||||||||||||||||||||||||||||||||||||||||||||||
| Increase (decrease) in net assets | ||||||||||||||||||||||||||||||||||||||||||||||||
| From operations | ||||||||||||||||||||||||||||||||||||||||||||||||
| Net investment income | $10,381,824 | $9,059,549 | ||||||||||||||||||||||||||||||||||||||||||||||
| Net realized gain | 2,208,141 | 17,205,758 | ||||||||||||||||||||||||||||||||||||||||||||||
| Change in net unrealized appreciation (depreciation) | (65,986,338 | ) | (35,101,952 | ) | ||||||||||||||||||||||||||||||||||||||||||||
| Decrease in net assets resulting from operations | �� | (53,396,373 | ) | (8,836,645 | ) | |||||||||||||||||||||||||||||||||||||||||||
| Distributions to shareholders | ||||||||||||||||||||||||||||||||||||||||||||||||
| From net investment income | ||||||||||||||||||||||||||||||||||||||||||||||||
| Class A | (339,258 | ) | (436,690 | ) | ||||||||||||||||||||||||||||||||||||||||||||
| Class C | (1,537 | ) | (1,748 | ) | ||||||||||||||||||||||||||||||||||||||||||||
| Class I | (41,309 | ) | (77,715 | ) | ||||||||||||||||||||||||||||||||||||||||||||
| Class R2 | (14,968 | ) | (30,910 | ) | ||||||||||||||||||||||||||||||||||||||||||||
| Class R4 | (1,350 | ) | (2,362 | ) | ||||||||||||||||||||||||||||||||||||||||||||
| Class R6 | (6,549 | ) | (132,686 | ) | ||||||||||||||||||||||||||||||||||||||||||||
| Class NAV | (8,722,583 | ) | (10,843,162 | ) | ||||||||||||||||||||||||||||||||||||||||||||
| From net realized gain | ||||||||||||||||||||||||||||||||||||||||||||||||
| Class A | (665,493 | ) | (1,291,448 | ) | ||||||||||||||||||||||||||||||||||||||||||||
| Class C | (11,674 | ) | (8,516 | ) | ||||||||||||||||||||||||||||||||||||||||||||
| Class I | (71,479 | ) | (207,524 | ) | ||||||||||||||||||||||||||||||||||||||||||||
| Class R2 | (35,430 | ) | (99,379 | ) | ||||||||||||||||||||||||||||||||||||||||||||
| Class R4 | (2,438 | ) | (6,715 | ) | ||||||||||||||||||||||||||||||||||||||||||||
| Class R6 | (9,907 | ) | (318,341 | ) | ||||||||||||||||||||||||||||||||||||||||||||
| Class NAV | (13,194,256 | ) | (26,014,960 | ) | ||||||||||||||||||||||||||||||||||||||||||||
| Total distributions | (23,118,231 | ) | (39,472,156 | ) | ||||||||||||||||||||||||||||||||||||||||||||
| From fund share transactions | 132,393,210 | 36,851,531 | ||||||||||||||||||||||||||||||||||||||||||||||
| Total increase (decrease) | 55,878,606 | (11,457,270 | ) | |||||||||||||||||||||||||||||||||||||||||||||
| Net assets | ||||||||||||||||||||||||||||||||||||||||||||||||
| Beginning of year | 448,520,494 | 459,977,764 | ||||||||||||||||||||||||||||||||||||||||||||||
| End of year | $504,399,100 | $448,520,494 | ||||||||||||||||||||||||||||||||||||||||||||||
| Undistributed net investment income | $1,759,759 | $835,180 | ||||||||||||||||||||||||||||||||||||||||||||||
Financial highlights
| Class A Shares Period ended | 3-31-16 | 3-31-15 | 3-31-14 | 3-31-13 | 3-31-12 | ||||||||||||||||||||||||||||||||||||||||||||||||||||||||||||||||||||||||||||||||||||||||||||||||||
| Per share operating performance | |||||||||||||||||||||||||||||||||||||||||||||||||||||||||||||||||||||||||||||||||||||||||||||||||||||||
| Net asset value, beginning of period | $8.29 | $9.33 | $8.66 | $8.22 | $9.09 | ||||||||||||||||||||||||||||||||||||||||||||||||||||||||||||||||||||||||||||||||||||||||||||||||||
| Net investment income1 | 0.12 | 0.13 | 0.17 | 2 | 0.12 | 0.14 | |||||||||||||||||||||||||||||||||||||||||||||||||||||||||||||||||||||||||||||||||||||||||||||||||
| Net realized and unrealized gain (loss) on investments | (0.89 | ) | (0.41 | ) | 0.97 | 0.54 | (0.92 | ) 3 | |||||||||||||||||||||||||||||||||||||||||||||||||||||||||||||||||||||||||||||||||||||||||||||||
| Total from investment operations | (0.77 | ) | (0.28 | ) | 1.14 | 0.66 | (0.78 | ) | |||||||||||||||||||||||||||||||||||||||||||||||||||||||||||||||||||||||||||||||||||||||||||||||
| Less distributions | |||||||||||||||||||||||||||||||||||||||||||||||||||||||||||||||||||||||||||||||||||||||||||||||||||||||
| From net investment income | (0.11 | ) | (0.19 | ) | (0.09 | ) | (0.08 | ) | (0.06 | ) | |||||||||||||||||||||||||||||||||||||||||||||||||||||||||||||||||||||||||||||||||||||||||||||
| From net realized gain | (0.21 | ) | (0.57 | ) | (0.38 | ) | (0.14 | ) | (0.05 | ) | |||||||||||||||||||||||||||||||||||||||||||||||||||||||||||||||||||||||||||||||||||||||||||||
| Total distributions | (0.32 | ) | (0.76 | ) | (0.47 | ) | (0.22 | ) | (0.11 | ) | |||||||||||||||||||||||||||||||||||||||||||||||||||||||||||||||||||||||||||||||||||||||||||||
| Contribution from adviser | — | — | — | — | 0.02 | 6 | |||||||||||||||||||||||||||||||||||||||||||||||||||||||||||||||||||||||||||||||||||||||||||||||||
| Net asset value, end of period | $7.20 | $8.29 | $9.33 | $8.66 | $8.22 | ||||||||||||||||||||||||||||||||||||||||||||||||||||||||||||||||||||||||||||||||||||||||||||||||||
| Total return (%)4,5 | (9.46 | ) | (2.45 | ) | 13.51 | 8.16 | (8.20 | ) 6 | |||||||||||||||||||||||||||||||||||||||||||||||||||||||||||||||||||||||||||||||||||||||||||||||
| Ratios and supplemental data | |||||||||||||||||||||||||||||||||||||||||||||||||||||||||||||||||||||||||||||||||||||||||||||||||||||||
| Net assets, end of period (in millions) | $25 | $22 | $18 | $7 | $3 | ||||||||||||||||||||||||||||||||||||||||||||||||||||||||||||||||||||||||||||||||||||||||||||||||||
| Ratios (as a percentage of average net assets): | |||||||||||||||||||||||||||||||||||||||||||||||||||||||||||||||||||||||||||||||||||||||||||||||||||||||
| Expenses before reductions | 1.39 | 1.53 | 1.63 | 1.99 | 3.73 | ||||||||||||||||||||||||||||||||||||||||||||||||||||||||||||||||||||||||||||||||||||||||||||||||||
| Expenses including reductions | 1.38 | 1.52 | 1.60 | 1.60 | 1.60 | ||||||||||||||||||||||||||||||||||||||||||||||||||||||||||||||||||||||||||||||||||||||||||||||||||
| Net investment income | 1.57 | 1.50 | 1.85 | 2 | 1.52 | 1.68 | |||||||||||||||||||||||||||||||||||||||||||||||||||||||||||||||||||||||||||||||||||||||||||||||||
| Portfolio turnover (%) | 18 | 25 | 38 | 27 | 21 | ||||||||||||||||||||||||||||||||||||||||||||||||||||||||||||||||||||||||||||||||||||||||||||||||||
| 1 | Based on average daily shares outstanding. | ||||||||||||||||||||||||||||||||||||||||||||||||||||||||||||||||||||||||||||||||||
| 2 | Net investment income (loss) per share and ratio of net investment income (loss) to average net assets reflect a special dividend received by the fund which amounted to $0.04 and 0.41%, respectively. | ||||||||||||||||||||||||||||||||||||||||||||||||||||||||||||||||||||||||||||||||||
| 3 | The amount shown for a share outstanding does not correspond with the aggregate net gain (loss) on investments for the period due to the timing of sales and repurchases of shares in relation to fluctuating market values of the investments of the fund. | ||||||||||||||||||||||||||||||||||||||||||||||||||||||||||||||||||||||||||||||||||
| 4 | Total returns would have been lower had certain expenses not been reduced during the applicable periods. | ||||||||||||||||||||||||||||||||||||||||||||||||||||||||||||||||||||||||||||||||||
| 5 | Does not reflect the effect of sales charges, if any. | ||||||||||||||||||||||||||||||||||||||||||||||||||||||||||||||||||||||||||||||||||
| 6 | In October 2011, the advisor made a voluntary payment to the fund of $6,950. Without this payment, performance would have been lower. | ||||||||||||||||||||||||||||||||||||||||||||||||||||||||||||||||||||||||||||||||||
| Class C Shares Period ended | 3-31-16 | 3-31-15 | 1 | |||||||||||||||||||||||||||||||||||||||||||||||
| Per share operating performance | ||||||||||||||||||||||||||||||||||||||||||||||||||
| Net asset value, beginning of period | $8.35 | $9.63 | ||||||||||||||||||||||||||||||||||||||||||||||||
| Net investment income2 | 0.06 | 0.01 | ||||||||||||||||||||||||||||||||||||||||||||||||
| Net realized and unrealized loss on investments | (0.90 | ) | (0.60 | ) | ||||||||||||||||||||||||||||||||||||||||||||||
| Total from investment operations | (0.84 | ) | (0.59 | ) | ||||||||||||||||||||||||||||||||||||||||||||||
| Less distributions | ||||||||||||||||||||||||||||||||||||||||||||||||||
| From net investment income | (0.03 | ) | (0.12 | ) | ||||||||||||||||||||||||||||||||||||||||||||||
| From net realized gain | (0.21 | ) | (0.57 | ) | ||||||||||||||||||||||||||||||||||||||||||||||
| Total distributions | (0.24 | ) | (0.69 | ) | ||||||||||||||||||||||||||||||||||||||||||||||
| Net asset value, end of period | $7.27 | $8.35 | ||||||||||||||||||||||||||||||||||||||||||||||||
| Total return (%)3,4 | (10.19 | ) | (5.72 | ) 5 | ||||||||||||||||||||||||||||||||||||||||||||||
| Ratios and supplemental data | ||||||||||||||||||||||||||||||||||||||||||||||||||
| Net assets, end of period (in millions) | — | 6 | — | 6 | ||||||||||||||||||||||||||||||||||||||||||||||
| Ratios (as a percentage of average net assets): | ||||||||||||||||||||||||||||||||||||||||||||||||||
| Expenses before reductions | 3.23 | 13.81 | 7 | |||||||||||||||||||||||||||||||||||||||||||||||
| Expenses including reductions | 2.21 | 2.35 | 7 | |||||||||||||||||||||||||||||||||||||||||||||||
| Net investment income | 0.70 | 0.11 | 7 | |||||||||||||||||||||||||||||||||||||||||||||||
| Portfolio turnover (%) | 18 | 25 | 8 | |||||||||||||||||||||||||||||||||||||||||||||||
| 1 | The inception date for Class C shares is 8-28-14. | ||||||||||||||||||||||||||||||||||||||||||||||||||||||||||
| 2 | Based on average daily shares outstanding. | ||||||||||||||||||||||||||||||||||||||||||||||||||||||||||
| 3 | Total returns would have been lower had certain expenses not been reduced during the applicable periods. | ||||||||||||||||||||||||||||||||||||||||||||||||||||||||||
| 4 | Does not reflect the effect of sales charges, if any. | ||||||||||||||||||||||||||||||||||||||||||||||||||||||||||
| 5 | Not annualized. | ||||||||||||||||||||||||||||||||||||||||||||||||||||||||||
| 6 | Less than $500,000. | ||||||||||||||||||||||||||||||||||||||||||||||||||||||||||
| 7 | Annualized. | ||||||||||||||||||||||||||||||||||||||||||||||||||||||||||
| 8 | The portfolio turnover is shown for the period from 4-1-14 to 3-31-15. | ||||||||||||||||||||||||||||||||||||||||||||||||||||||||||
| Class I Shares Period ended | 3-31-16 | 3-31-15 | 3-31-14 | 3-31-13 | 3-31-12 | ||||||||||||||||||||||||||||||||||||||||||||||||||||||||||||||||||||||||||||||||||||||||||||||||||
| Per share operating performance | |||||||||||||||||||||||||||||||||||||||||||||||||||||||||||||||||||||||||||||||||||||||||||||||||||||||
| Net asset value, beginning of period | $8.29 | $9.33 | $8.66 | $8.21 | $9.09 | ||||||||||||||||||||||||||||||||||||||||||||||||||||||||||||||||||||||||||||||||||||||||||||||||||
| Net investment income1 | 0.15 | 0.18 | 0.20 | 2 | 0.13 | 0.19 | |||||||||||||||||||||||||||||||||||||||||||||||||||||||||||||||||||||||||||||||||||||||||||||||||
| Net realized and unrealized gain (loss) on investments | �� | (0.91 | ) | (0.44 | ) | 0.97 | 0.57 | (0.95 | ) 3 | ||||||||||||||||||||||||||||||||||||||||||||||||||||||||||||||||||||||||||||||||||||||||||||||
| Total from investment operations | (0.76 | ) | (0.26 | ) | 1.17 | 0.70 | (0.76 | ) | |||||||||||||||||||||||||||||||||||||||||||||||||||||||||||||||||||||||||||||||||||||||||||||||
| Less distributions | |||||||||||||||||||||||||||||||||||||||||||||||||||||||||||||||||||||||||||||||||||||||||||||||||||||||
| From net investment income | (0.12 | ) | (0.21 | ) | (0.12 | ) | (0.11 | ) | (0.09 | ) | |||||||||||||||||||||||||||||||||||||||||||||||||||||||||||||||||||||||||||||||||||||||||||||
| From net realized gain | (0.21 | ) | (0.57 | ) | (0.38 | ) | (0.14 | ) | (0.05 | ) | |||||||||||||||||||||||||||||||||||||||||||||||||||||||||||||||||||||||||||||||||||||||||||||
| Total distributions | (0.33 | ) | (0.78 | ) | (0.50 | ) | (0.25 | ) | (0.14 | ) | |||||||||||||||||||||||||||||||||||||||||||||||||||||||||||||||||||||||||||||||||||||||||||||
| Contribution from adviser | — | — | — | — | 0.02 | 4 | |||||||||||||||||||||||||||||||||||||||||||||||||||||||||||||||||||||||||||||||||||||||||||||||||
| Net asset value, end of period | $7.20 | $8.29 | $9.33 | $8.66 | $8.21 | ||||||||||||||||||||||||||||||||||||||||||||||||||||||||||||||||||||||||||||||||||||||||||||||||||
| Total return (%)5 | (9.29 | ) | (2.20 | ) | 13.87 | 8.61 | (7.87 | ) 4 | |||||||||||||||||||||||||||||||||||||||||||||||||||||||||||||||||||||||||||||||||||||||||||||||
| Ratios and supplemental data | |||||||||||||||||||||||||||||||||||||||||||||||||||||||||||||||||||||||||||||||||||||||||||||||||||||||
| Net assets, end of period (in millions) | $2 | $3 | $8 | $6 | $1 | ||||||||||||||||||||||||||||||||||||||||||||||||||||||||||||||||||||||||||||||||||||||||||||||||||
| Ratios (as a percentage of average net assets): | |||||||||||||||||||||||||||||||||||||||||||||||||||||||||||||||||||||||||||||||||||||||||||||||||||||||
| Expenses before reductions | 1.28 | 1.41 | 1.46 | 2.08 | 7.59 | ||||||||||||||||||||||||||||||||||||||||||||||||||||||||||||||||||||||||||||||||||||||||||||||||||
| Expenses including reductions | 1.14 | 1.29 | 1.29 | 1.28 | 1.18 | ||||||||||||||||||||||||||||||||||||||||||||||||||||||||||||||||||||||||||||||||||||||||||||||||||
| Net investment income | 1.87 | 1.93 | 2.20 | 2 | 1.52 | 2.36 | |||||||||||||||||||||||||||||||||||||||||||||||||||||||||||||||||||||||||||||||||||||||||||||||||
| Portfolio turnover (%) | 18 | 25 | 38 | 27 | 21 | ||||||||||||||||||||||||||||||||||||||||||||||||||||||||||||||||||||||||||||||||||||||||||||||||||
| 1 | Based on average daily shares outstanding. | ||||||||||||||||||||||||||||||||||||||||||||||||||||||||||||||||||||||||||||||||||
| 2 | Net investment income (loss) per share and ratio of net investment income (loss) to average net assets reflect a special dividend received by the fund which amounted to $0.04 and 0.41%, respectively. | ||||||||||||||||||||||||||||||||||||||||||||||||||||||||||||||||||||||||||||||||||
| 3 | The amount shown for a share outstanding does not correspond with the aggregate net gain (loss) on investments for the period due to the timing of sales and repurchases of shares in relation to fluctuating market values of the investments of the fund. | ||||||||||||||||||||||||||||||||||||||||||||||||||||||||||||||||||||||||||||||||||
| 4 | In October 2011, the advisor made a voluntary payment to the fund of $6,950. Without this payment, performance would have been lower. | ||||||||||||||||||||||||||||||||||||||||||||||||||||||||||||||||||||||||||||||||||
| 5 | Total returns would have been lower had certain expenses not been reduced during the applicable periods. | ||||||||||||||||||||||||||||||||||||||||||||||||||||||||||||||||||||||||||||||||||
| Class R2 Shares Period ended | 3-31-16 | 3-31-15 | 3-31-14 | 1 | |||||||||||||||||||||||||||||||||||||||||||||||||||||||||||||||||||
| Per share operating performance | |||||||||||||||||||||||||||||||||||||||||||||||||||||||||||||||||||||||
| Net asset value, beginning of period | $8.31 | $9.35 | $8.53 | ||||||||||||||||||||||||||||||||||||||||||||||||||||||||||||||||||||
| Net investment income2 | 0.11 | 0.11 | 0.19 | 3 | |||||||||||||||||||||||||||||||||||||||||||||||||||||||||||||||||||
| Net realized and unrealized gain (loss) on investments | (0.89 | ) | (0.40 | ) | 1.09 | ||||||||||||||||||||||||||||||||||||||||||||||||||||||||||||||||||
| Total from investment operations | (0.78 | ) | (0.29 | ) | 1.28 | ||||||||||||||||||||||||||||||||||||||||||||||||||||||||||||||||||
| Less distributions | |||||||||||||||||||||||||||||||||||||||||||||||||||||||||||||||||||||||
| From net investment income | (0.09 | ) | (0.18 | ) | (0.08 | ) | |||||||||||||||||||||||||||||||||||||||||||||||||||||||||||||||||
| From net realized gain | (0.21 | ) | (0.57 | ) | (0.38 | ) | |||||||||||||||||||||||||||||||||||||||||||||||||||||||||||||||||
| Total distributions | (0.30 | ) | (0.75 | ) | (0.46 | ) | |||||||||||||||||||||||||||||||||||||||||||||||||||||||||||||||||
| Net asset value, end of period | $7.23 | $8.31 | $9.35 | ||||||||||||||||||||||||||||||||||||||||||||||||||||||||||||||||||||
| Total return (%)4 | (9.53 | ) | (2.63 | ) | 15.38 | 5 | |||||||||||||||||||||||||||||||||||||||||||||||||||||||||||||||||
| Ratios and supplemental data | |||||||||||||||||||||||||||||||||||||||||||||||||||||||||||||||||||||||
| Net assets, end of period (in millions) | $1 | $2 | $1 | ||||||||||||||||||||||||||||||||||||||||||||||||||||||||||||||||||||
| Ratios (as a percentage of average net assets): | |||||||||||||||||||||||||||||||||||||||||||||||||||||||||||||||||||||||
| Expenses before reductions | 1.68 | 2.76 | 5.96 | 6 | |||||||||||||||||||||||||||||||||||||||||||||||||||||||||||||||||||
| Expenses including reductions | 1.55 | 1.68 | 1.68 | 6 | |||||||||||||||||||||||||||||||||||||||||||||||||||||||||||||||||||
| Net investment income | 1.41 | 1.20 | 2.84 | 3,6 | |||||||||||||||||||||||||||||||||||||||||||||||||||||||||||||||||||
| Portfolio turnover (%) | 18 | 25 | 38 | 7 | |||||||||||||||||||||||||||||||||||||||||||||||||||||||||||||||||||
| 1 | The inception date for Class R2 shares is 7-2-13. | |||||||||||||||||||||||||||||||||||||||||||||||||||||||||||||||||||||||||||||||
| 2 | Based on average daily shares outstanding. | |||||||||||||||||||||||||||||||||||||||||||||||||||||||||||||||||||||||||||||||
| 3 | Net investment income (loss) per share and ratio of net investment income (loss) to average net assets reflect a special dividend received by the fund which amounted to $0.04 and 0.41%, respectively. | |||||||||||||||||||||||||||||||||||||||||||||||||||||||||||||||||||||||||||||||
| 4 | Total returns would have been lower had certain expenses not been reduced during the applicable periods. | |||||||||||||||||||||||||||||||||||||||||||||||||||||||||||||||||||||||||||||||
| 5 | Not annualized. | |||||||||||||||||||||||||||||||||||||||||||||||||||||||||||||||||||||||||||||||
| 6 | Annualized. | |||||||||||||||||||||||||||||||||||||||||||||||||||||||||||||||||||||||||||||||
| 7 | The portfolio turnover is shown for the period from 4-1-13 to 3-31-14. | |||||||||||||||||||||||||||||||||||||||||||||||||||||||||||||||||||||||||||||||
| Class R4 Shares Period ended | 3-31-16 | 3-31-15 | 3-31-14 | 1 | |||||||||||||||||||||||||||||||||||||||||||||||||||||||||||||||||||
| Per share operating performance | |||||||||||||||||||||||||||||||||||||||||||||||||||||||||||||||||||||||
| Net asset value, beginning of period | $8.30 | $9.34 | $8.53 | ||||||||||||||||||||||||||||||||||||||||||||||||||||||||||||||||||||
| Net investment income2 | 0.14 | 0.15 | 0.10 | 3 | |||||||||||||||||||||||||||||||||||||||||||||||||||||||||||||||||||
| Net realized and unrealized gain (loss) on investments | (0.90 | ) | (0.42 | ) | 1.20 | ||||||||||||||||||||||||||||||||||||||||||||||||||||||||||||||||||
| Total from investment operations | (0.76 | ) | (0.27 | ) | 1.30 | ||||||||||||||||||||||||||||||||||||||||||||||||||||||||||||||||||
| Less distributions | |||||||||||||||||||||||||||||||||||||||||||||||||||||||||||||||||||||||
| From net investment income | (0.12 | ) | (0.20 | ) | (0.11 | ) | |||||||||||||||||||||||||||||||||||||||||||||||||||||||||||||||||
| From net realized gain | (0.21 | ) | (0.57 | ) | (0.38 | ) | |||||||||||||||||||||||||||||||||||||||||||||||||||||||||||||||||
| Total distributions | (0.33 | ) | (0.77 | ) | (0.49 | ) | |||||||||||||||||||||||||||||||||||||||||||||||||||||||||||||||||
| Net asset value, end of period | $7.21 | $8.30 | $9.34 | ||||||||||||||||||||||||||||||||||||||||||||||||||||||||||||||||||||
| Total return (%)4 | (9.34 | ) | (2.36 | ) | 15.55 | 5 | |||||||||||||||||||||||||||||||||||||||||||||||||||||||||||||||||
| Ratios and supplemental data | |||||||||||||||||||||||||||||||||||||||||||||||||||||||||||||||||||||||
| Net assets, end of period (in millions) | — | 6 | — | 6 | — | 6 | |||||||||||||||||||||||||||||||||||||||||||||||||||||||||||||||||
| Ratios (as a percentage of average net assets): | |||||||||||||||||||||||||||||||||||||||||||||||||||||||||||||||||||||||
| Expenses before reductions | 3.82 | 18.12 | 15.49 | 7 | |||||||||||||||||||||||||||||||||||||||||||||||||||||||||||||||||||
| Expenses including reductions | 1.22 | 1.43 | 1.43 | 7 | |||||||||||||||||||||||||||||||||||||||||||||||||||||||||||||||||||
| Net investment income | 1.78 | 1.67 | 1.43 | 3,7 | |||||||||||||||||||||||||||||||||||||||||||||||||||||||||||||||||||
| Portfolio turnover (%) | 18 | 25 | 38 | 8 | |||||||||||||||||||||||||||||||||||||||||||||||||||||||||||||||||||
| 1 | The inception date for Class R4 shares is 7-2-13. | |||||||||||||||||||||||||||||||||||||||||||||||||||||||||||||||||||||||||||||||
| 2 | Based on average daily shares outstanding. | |||||||||||||||||||||||||||||||||||||||||||||||||||||||||||||||||||||||||||||||
| 3 | Net investment income (loss) per share and ratio of net investment income (loss) to average net assets reflect a special dividend received by the fund which amounted to $0.04 and 0.41%, respectively. | |||||||||||||||||||||||||||||||||||||||||||||||||||||||||||||||||||||||||||||||
| 4 | Total returns would have been lower had certain expenses not been reduced during the applicable periods. | |||||||||||||||||||||||||||||||||||||||||||||||||||||||||||||||||||||||||||||||
| 5 | Not annualized. | |||||||||||||||||||||||||||||||||||||||||||||||||||||||||||||||||||||||||||||||
| 6 | Less than $500,000. | |||||||||||||||||||||||||||||||||||||||||||||||||||||||||||||||||||||||||||||||
| 7 | Annualized. | |||||||||||||||||||||||||||||||||||||||||||||||||||||||||||||||||||||||||||||||
| 8 | The portfolio turnover is shown for the period from 4-1-13 to 3-31-14. | |||||||||||||||||||||||||||||||||||||||||||||||||||||||||||||||||||||||||||||||
| Class R6 Shares Period ended | 3-31-16 | 3-31-15 | 3-31-14 | 1 | |||||||||||||||||||||||||||||||||||||||||||||||||||||||||||||||||||
| Per share operating performance | |||||||||||||||||||||||||||||||||||||||||||||||||||||||||||||||||||||||
| Net asset value, beginning of period | $8.28 | $9.33 | $8.53 | ||||||||||||||||||||||||||||||||||||||||||||||||||||||||||||||||||||
| Net investment income2 | 0.25 | 0.10 | 0.12 | 3 | |||||||||||||||||||||||||||||||||||||||||||||||||||||||||||||||||||
| Net realized and unrealized gain (loss) on investments | (0.98 | ) | (0.34 | ) | 1.20 | ||||||||||||||||||||||||||||||||||||||||||||||||||||||||||||||||||
| Total from investment operations | (0.73 | ) | (0.24 | ) | 1.32 | ||||||||||||||||||||||||||||||||||||||||||||||||||||||||||||||||||
| Less distributions | |||||||||||||||||||||||||||||||||||||||||||||||||||||||||||||||||||||||
| From net investment income | (0.14 | ) | (0.24 | ) | (0.14 | ) | |||||||||||||||||||||||||||||||||||||||||||||||||||||||||||||||||
| From net realized gain | (0.21 | ) | (0.57 | ) | (0.38 | ) | |||||||||||||||||||||||||||||||||||||||||||||||||||||||||||||||||
| Total distributions | (0.35 | ) | (0.81 | ) | (0.52 | ) | |||||||||||||||||||||||||||||||||||||||||||||||||||||||||||||||||
| Net asset value, end of period | $7.20 | $8.28 | $9.33 | ||||||||||||||||||||||||||||||||||||||||||||||||||||||||||||||||||||
| Total return (%)4 | (8.97 | ) | (2.04 | ) | 15.83 | 5 | |||||||||||||||||||||||||||||||||||||||||||||||||||||||||||||||||
| Ratios and supplemental data | |||||||||||||||||||||||||||||||||||||||||||||||||||||||||||||||||||||||
| Net assets, end of period (in millions) | — | 6 | $4 | — | 6 | ||||||||||||||||||||||||||||||||||||||||||||||||||||||||||||||||||
| Ratios (as a percentage of average net assets): | |||||||||||||||||||||||||||||||||||||||||||||||||||||||||||||||||||||||
| Expenses before reductions | 1.16 | 2.32 | 16.37 | 7 | |||||||||||||||||||||||||||||||||||||||||||||||||||||||||||||||||||
| Expenses including reductions | 0.97 | 1.04 | 1.10 | 7 | |||||||||||||||||||||||||||||||||||||||||||||||||||||||||||||||||||
| Net investment income | 2.95 | 1.15 | 1.76 | 3,7 | |||||||||||||||||||||||||||||||||||||||||||||||||||||||||||||||||||
| Portfolio turnover (%) | 18 | 25 | 38 | 8 | |||||||||||||||||||||||||||||||||||||||||||||||||||||||||||||||||||
| 1 | The inception date for Class R6 shares is 7-2-13. | |||||||||||||||||||||||||||||||||||||||||||||||||||||||||||||||||||||||||||||||
| 2 | Based on average daily shares outstanding. | |||||||||||||||||||||||||||||||||||||||||||||||||||||||||||||||||||||||||||||||
| 3 | Net investment income (loss) per share and ratio of net investment income (loss) to average net assets reflect a special dividend received by the fund which amounted to $0.04 and 0.41%, respectively. | |||||||||||||||||||||||||||||||||||||||||||||||||||||||||||||||||||||||||||||||
| 4 | Total returns would have been lower had certain expenses not been reduced during the applicable periods. | |||||||||||||||||||||||||||||||||||||||||||||||||||||||||||||||||||||||||||||||
| 5 | Not annualized. | |||||||||||||||||||||||||||||||||||||||||||||||||||||||||||||||||||||||||||||||
| 6 | Less than $500,000. | |||||||||||||||||||||||||||||||||||||||||||||||||||||||||||||||||||||||||||||||
| 7 | Annualized. | |||||||||||||||||||||||||||||||||||||||||||||||||||||||||||||||||||||||||||||||
| 8 | The portfolio turnover is shown for the period from 4-1-13 to 3-31-14. | |||||||||||||||||||||||||||||||||||||||||||||||||||||||||||||||||||||||||||||||
| Class NAV Shares Period ended | 3-31-16 | 3-31-15 | 3-31-14 | 3-31-13 | 3-31-12 | 1 | |||||||||||||||||||||||||||||||||||||||||||||||||||||||||||||||||||||||||||||||||||||||||||||||||
| Per share operating performance | |||||||||||||||||||||||||||||||||||||||||||||||||||||||||||||||||||||||||||||||||||||||||||||||||||||||
| Net asset value, beginning of period | $8.29 | $9.34 | $8.66 | $8.22 | $7.21 | ||||||||||||||||||||||||||||||||||||||||||||||||||||||||||||||||||||||||||||||||||||||||||||||||||
| Net investment income2 | 0.16 | 0.18 | 0.21 | 3 | 0.15 | 0.05 | |||||||||||||||||||||||||||||||||||||||||||||||||||||||||||||||||||||||||||||||||||||||||||||||||
| Net realized and unrealized gain (loss) on investments | (0.90 | ) | (0.42 | ) | 0.99 | 0.55 | 0.96 | ||||||||||||||||||||||||||||||||||||||||||||||||||||||||||||||||||||||||||||||||||||||||||||||||
| Total from investment operations | (0.74 | ) | (0.24 | ) | 1.20 | 0.70 | 1.01 | ||||||||||||||||||||||||||||||||||||||||||||||||||||||||||||||||||||||||||||||||||||||||||||||||
| Less distributions | |||||||||||||||||||||||||||||||||||||||||||||||||||||||||||||||||||||||||||||||||||||||||||||||||||||||
| From net investment income | (0.14 | ) | (0.24 | ) | (0.14 | ) | (0.12 | ) | — | 4 | |||||||||||||||||||||||||||||||||||||||||||||||||||||||||||||||||||||||||||||||||||||||||||||
| From net realized gain | (0.21 | ) | (0.57 | ) | (0.38 | ) | (0.14 | ) | — | ||||||||||||||||||||||||||||||||||||||||||||||||||||||||||||||||||||||||||||||||||||||||||||||
| Total distributions | (0.35 | ) | (0.81 | ) | (0.52 | ) | (0.26 | ) | — | 4 | |||||||||||||||||||||||||||||||||||||||||||||||||||||||||||||||||||||||||||||||||||||||||||||
| Net asset value, end of period | $7.20 | $8.29 | $9.34 | $8.66 | $8.22 | ||||||||||||||||||||||||||||||||||||||||||||||||||||||||||||||||||||||||||||||||||||||||||||||||||
| Total return (%)5 | (9.09 | ) | (2.03 | ) | 14.23 | 8.69 | 14.05 | 6 | |||||||||||||||||||||||||||||||||||||||||||||||||||||||||||||||||||||||||||||||||||||||||||||||
| Ratios and supplemental data | |||||||||||||||||||||||||||||||||||||||||||||||||||||||||||||||||||||||||||||||||||||||||||||||||||||||
| Net assets, end of period (in millions) | $476 | $417 | $433 | $307 | $114 | ||||||||||||||||||||||||||||||||||||||||||||||||||||||||||||||||||||||||||||||||||||||||||||||||||
| Ratios (as a percentage of average net assets): | |||||||||||||||||||||||||||||||||||||||||||||||||||||||||||||||||||||||||||||||||||||||||||||||||||||||
| Expenses before reductions | 0.99 | 1.04 | 1.03 | 1.08 | 1.08 | 7 | |||||||||||||||||||||||||||||||||||||||||||||||||||||||||||||||||||||||||||||||||||||||||||||||||
| Expenses including reductions | 0.98 | 1.03 | 1.03 | 1.08 | 1.08 | 7 | |||||||||||||||||||||||||||||||||||||||||||||||||||||||||||||||||||||||||||||||||||||||||||||||||
| Net investment income | 2.00 | 2.05 | 2.37 | 3 | 1.78 | 2.21 | 7 | ||||||||||||||||||||||||||||||||||||||||||||||||||||||||||||||||||||||||||||||||||||||||||||||||
| Portfolio turnover (%) | 18 | 25 | 38 | 27 | 21 | 8 | |||||||||||||||||||||||||||||||||||||||||||||||||||||||||||||||||||||||||||||||||||||||||||||||||
| 1 | The inception date for Class NAV shares is 12-16-11. | ||||||||||||||||||||||||||||||||||||||||||||||||||||||||||||||||||||||||||||||||||
| 2 | Based on average daily shares outstanding. | ||||||||||||||||||||||||||||||||||||||||||||||||||||||||||||||||||||||||||||||||||
| 3 | Net investment income (loss) per share and ratio of net investment income (loss) to average net assets reflect a special dividend received by the fund which amounted to $0.04 and 0.41%, respectively. | ||||||||||||||||||||||||||||||||||||||||||||||||||||||||||||||||||||||||||||||||||
| 4 | Less than $0.005 per share. | ||||||||||||||||||||||||||||||||||||||||||||||||||||||||||||||||||||||||||||||||||
| 5 | Total returns would have been lower had certain expenses not been reduced during the applicable periods. | ||||||||||||||||||||||||||||||||||||||||||||||||||||||||||||||||||||||||||||||||||
| 6 | Not annualized. | ||||||||||||||||||||||||||||||||||||||||||||||||||||||||||||||||||||||||||||||||||
| 7 | Annualized. | ||||||||||||||||||||||||||||||||||||||||||||||||||||||||||||||||||||||||||||||||||
| 8 | The portfolio turnover is shown for the period from 4-1-11 to 3-31-12. | ||||||||||||||||||||||||||||||||||||||||||||||||||||||||||||||||||||||||||||||||||
Note 1 — Organization
John Hancock International Value Equity Fund (the fund) is a series of John Hancock Funds III (the Trust), an open-end management investment company organized as a Massachusetts business trust and registered under the Investment Company Act of 1940, as amended (the 1940 Act). The investment objective of the fund is to seek long-term capital appreciation.
The fund may offer multiple classes of shares. The shares currently offered are detailed in the Statement of assets and liabilities. Class A and Class C shares are offered to all investors. Class I shares are offered to institutions and certain investors. Class R2 and Class R4 shares are available only to certain retirement plans. Class R6 shares are available only to certain retirement plans, institutions and other investors. Class NAV shares are offered to John Hancock affiliated funds of funds and certain 529 plans. Shareholders of each class have exclusive voting rights to matters that affect that class. The distribution and service fees, if any, and transfer agent fees, state registration fees and printing and postage for each class may differ.
Note 2 — Significant accounting policies
The financial statements have been prepared in conformity with accounting principles generally accepted in the United States of America (US GAAP), which require management to make certain estimates and assumptions as of the date of the financial statements. Actual results could differ from those estimates and those differences could be significant. The fund qualifies as an investment company under Topic 946 of Accounting Standards Codification of US GAAP.
Events or transactions occurring after the end of the fiscal period through the date that the financial statements were issued have been evaluated in the preparation of the financial statements. The following summarizes the significant accounting policies of the fund:
Security valuation. Investments are stated at value as of the scheduled close of regular trading on the New York Stock Exchange (NYSE), normally at 4:00 p.m., Eastern Time. In case of emergency or other disruption resulting in the NYSE not opening for trading or the NYSE closing at a time other than the regularly scheduled close, the net asset value (NAV) may be determined as of the regularly scheduled close of the NYSE pursuant to the fund's Valuation Policies and Procedures. The time at which shares and transactions are priced and until which orders are accepted may vary to the extent permitted by the Securities and Exchange Commission (SEC) and applicable regulations.
In order to value the securities, the fund uses the following valuation techniques: Equity securities held by the fund are typically valued at the last sale price or official closing price on the exchange where the security was acquired or most likely will be sold. In the event there were no sales during the day or closing prices are not available, the securities are valued using the last available bid price. Investments by the fund in open-end mutual funds, including John Hancock Collateral Trust (JHCT), are valued at their respective NAVs each business day. Foreign securities and currencies are valued in U.S. dollars, based on foreign currency exchange rates supplied by an independent pricing vendor.
In certain instances, the Pricing Committee may determine to value equity securities using prices obtained from another exchange or market if trading on the exchange or market on which prices are typically obtained did not open for trading as scheduled, or if trading closed earlier than scheduled, and trading occurred as normal on another exchange or market.
Other portfolio securities and assets, for which reliable market quotations are not readily available, are valued at fair value as determined in good faith by the fund's Pricing Committee following procedures established by the Board of Trustees. The frequency with which these fair valuation procedures are used cannot be predicted and fair value of securities may differ significantly from the value that would have been used had a ready market for such securities existed. Trading in foreign securities may be completed before the scheduled daily close of trading on the NYSE. Significant events at the issuer or market level may affect the values of securities between the time when the valuation of the securities is generally determined and the close of the NYSE. If a significant event occurs, these securities may be fair valued, as determined in good faith by the fund's Pricing Committee, following procedures established by the Board of Trustees. The fund uses fair value adjustment factors provided by an independent pricing vendor to value certain foreign securities in order to adjust for events that may occur between the close of foreign exchanges or markets and the close of the NYSE.
The fund uses a three-tier hierarchy to prioritize the pricing assumptions, referred to as inputs, used in valuation techniques to measure fair value. Level 1 includes securities valued using quoted prices in active markets for identical securities. Level 2 includes securities valued using other significant observable inputs. Observable inputs may include quoted prices for similar securities, interest rates, prepayment speeds and credit risk. Prices for securities valued using these inputs are received from independent pricing vendors and brokers and are based on an evaluation of the inputs described. Level 3 includes securities valued using significant unobservable inputs when market prices are not readily available or reliable, including the fund's own assumptions in determining the fair value of investments. Factors used in determining value may include market or issuer specific events or trends, changes in interest rates and credit quality. The inputs or methodology used for valuing securities are not necessarily an indication of the risks associated with investing in those securities. Changes in valuation techniques and related inputs may result in transfers into or out of an assigned level within the disclosure hierarchy.
The following is a summary of the values by input classification of the fund's investments as of March 31, 2016, by major security category or type:
| Total value at 3-31-16 | Level 1 quoted price | Level 2 significant observable inputs | Level 3 significant unobservable inputs | ||
| Common stocks | |||||
| Australia | $22,222,666 | — | $22,222,666 | — | |
| Canada | 29,525,526 | $29,525,526 | — | — | |
| Chile | 1,865,949 | — | 1,865,949 | — | |
| China | 5,339,561 | — | 5,339,561 | — | |
| Denmark | 9,065,884 | — | 9,065,884 | — | |
| France | 50,260,421 | — | 50,260,421 | — | |
| Germany | 40,297,433 | — | 40,297,433 | — | |
| Hong Kong | 15,547,704 | — | 15,547,704 | — | |
| Ireland | 8,322,851 | — | 8,322,851 | — | |
| Israel | 5,000,342 | — | 5,000,342 | — | |
| Japan | 101,719,777 | — | 101,719,777 | — | |
| Netherlands | 28,228,289 | — | 28,228,289 | — | |
| Singapore | 13,011,730 | — | 13,011,730 | — | |
| South Africa | 3,194,522 | — | 3,194,522 | — | |
| Spain | 13,621,132 | — | 13,621,132 | — | |
| Sweden | 18,489,834 | — | 18,489,834 | — | |
| Switzerland | 30,893,978 | — | 30,893,978 | — | |
| United Kingdom | 84,688,780 | — | 84,688,780 | — | |
| Securities lending collateral | 17,274,602 | 17,274,602 | — | — | |
| Short-term investments | 10,265,969 | 7,069,969 | 3,196,000 | — | |
| Total investments in securities | $508,836,950 | $53,870,097 | $454,966,853 | — | |
Repurchase agreements. The fund may enter into repurchase agreements. When the fund enters into a repurchase agreement, it receives collateral that is held in a segregated account by the fund's custodian, or for tri-party repurchase agreements, collateral is held at a third-party custodian bank in a segregated account for the benefit of the fund. The collateral amount is marked-to-market and monitored on a daily basis to ensure that the collateral held is in an amount not less than the principal amount of the repurchase agreement plus any accrued interest. Collateral received by the fund for repurchase agreements is disclosed in the Fund's investments as part of the caption related to the repurchase agreement.
Repurchase agreements are typically governed by the terms and conditions of the Master Repurchase Agreement and/or Global Master Repurchase Agreement (collectively, MRA). Upon an event of default, the non-defaulting party may close out
all transactions traded under the MRA and net amounts owed. Absent an event of default, assets and liabilities resulting from repurchase agreements are not offset in the Statement of assets and liabilities. In the event of a default by the counterparty, realization of the collateral proceeds could be delayed, during which time the collateral value may decline or the counterparty may have insufficient assets to pay back claims resulting from close-out of the transactions.
Security transactions and related investment income. Investment security transactions are accounted for on a trade date plus one basis for daily NAV calculations. However, for financial reporting purposes, investment transactions are reported on trade date. Interest income is accrued as earned. Dividend income is recorded on the ex-date, except for dividends of foreign securities where the dividend may not be known until after the ex-date. In those cases, dividend income, net of withholding taxes, is recorded when the fund becomes aware of the dividends. Foreign taxes are provided for based on the fund's understanding of the tax rules and rates that exist in the foreign markets in which it invests. Gains and losses on securities sold are determined on the basis of identified cost and may include proceeds from litigation.
Securities lending. The fund may lend its securities to earn additional income. The fund receives cash collateral from the borrower in an amount not less than the market value of the loaned securities. The fund will invest its collateral in JHCT, an affiliate of the fund, which has a floating NAV and is registered with the SEC as an investment company. JHCT invests cash received as collateral as part of the securities lending program in short-term money market investments. The fund will receive the benefit of any gains and bear any losses generated by JHCT with respect to the cash collateral.
The fund has the right to recall loaned securities on demand. If a borrower fails to return loaned securities when due, then the lending agent is responsible and indemnifies the fund for the lent securities. The lending agent uses the collateral received from the borrower to purchase replacement securities of the same issue, type, class and series of the loaned securities. If the value of the collateral is less than the purchase cost of replacement securities, the lending agent is responsible for satisfying the shortfall but only to the extent that the shortfall is not due to any decrease in the value of JHCT.
Although the risk of the loss of the securities lent is mitigated by receiving collateral from the borrower and through lending agent indemnification, the fund could experience a delay in recovering securities or could experience a lower than expected return if the borrower fails to return the securities on a timely basis. The fund may receive compensation for lending its securities by retaining a portion of the return on the investment of the collateral and compensation from fees earned from borrowers of the securities. Net income received from JHCT is a component of securities lending income as recorded on the Statement of operations.
Obligations to repay collateral received by the fund are shown on the Statement of assets and liabilities as Payable upon return of securities loaned and are secured by the loaned securities. As of March 31, 2016, the fund loaned common stocks valued at $16,389,165 and received $17,273,512 of cash collateral.
Foreign currency translation. Assets, including investments and liabilities denominated in foreign currencies, are translated into U.S. dollar values each day at the prevailing exchange rate. Purchases and sales of securities, income and expenses are translated into U.S. dollars at the prevailing exchange rate on the date of the transaction. The effect of changes in foreign currency exchange rates on the value of securities is reflected as a component of the realized and unrealized gains (losses) on investments.
Funds that invest internationally generally carry more risk than funds that invest strictly in U.S. securities. These risks are heightened for investments in emerging market. Risks can result from differences in economic and political conditions, regulations, market practices (including higher transaction costs), accounting standards and other factors. Foreign investments are also subject to a decline in the value of a foreign currency versus the U.S. dollar, which reduces the dollar value of securities denominated in that currency.
Foreign taxes. The fund may be subject to withholding tax on income and/or capital gains or repatriation taxes imposed by certain countries in which the fund invests. Taxes are accrued based upon investment income, realized gains or unrealized appreciation.
Line of credit. The fund may borrow from banks for temporary or emergency purposes, including meeting redemption requests that otherwise might require the untimely sale of securities. Pursuant to the fund's custodian agreement, the custodian may loan money to the fund to make properly authorized payments. The fund is obligated to repay the custodian for any overdraft, including any related costs or expenses. The custodian may have a lien, security interest or security entitlement in any fund property that is not otherwise segregated or pledged, to the extent of any overdraft, and to the maximum extent permitted by law.
Effective June 30, 2015, the fund and other affiliated funds entered into a syndicated line of credit agreement, with Citibank, N.A. as the administrative agent, that enables them to participate in a $750 million unsecured committed line of credit. Prior to June 30, 2015, the fund and other affiliated funds had an agreement with Citibank that enabled them to participate in a $300 million unsecured line of credit. A commitment fee, payable at the end of each calendar quarter, based on the average daily unused portion of the effective line of credit, is charged to each participating fund on a pro rata basis and is reflected in other expenses on the Statement of operations. Commitment fees for the year ended March 31, 2016 were $1,837. For the year ended March 31, 2016, the fund had no borrowings under either line of credit.
Expenses. Within the John Hancock group of funds complex, expenses that are directly attributable to an individual fund are allocated to such fund. Expenses that are not readily attributable to a specific fund are allocated among all funds in an equitable manner, taking into consideration, among other things, the nature and type of expense and the fund's relative net assets. Expense estimates are accrued in the period to which they relate and adjustments are made when actual amounts are known.
Class allocations. Income, common expenses and realized and unrealized gains (losses) are determined at the fund level and allocated daily to each class of shares based on the net assets of the class. Class-specific expenses, such as distribution and service fees, if any, and transfer agent fees, for all classes, are calculated daily at the class level based on the net assets of each class and the specific expense rates applicable to each class. Through June 30, 2015, class specific expenses, such as state registration fees and printing and postage, for all-classes, were calculated daily at the class level based on the appropriate net assets of each class and the specific expense rates applicable to each class.
Federal income taxes. The fund intends to continue to qualify as a regulated investment company by complying with the applicable provisions of the Internal Revenue Code and will not be subject to federal income tax on taxable income that is distributed to shareholders. Therefore, no federal income tax provision is required.
For federal income tax purposes, net capital losses of $8,582,003, that are a result of security transactions occurring after October 31, 2015, are treated as occurring on April 1, 2016, the first day of the fund's next taxable year.
As of March 31, 2016, the fund had no uncertain tax positions that would require financial statement recognition, derecognition or disclosure. The fund's federal tax returns are subject to examination by the Internal Revenue Service for a period of three years.
Distribution of income and gains. Distributions to shareholders from net investment income and net realized gains, if any, are recorded on the ex-date. The fund generally declares and pays dividends and capital gain distributions, if any, annually. The tax character of distributions for the years ended March 31, 2016 and 2015 was as follows:
| March 31, 2016 | March 31, 2015 | |
| Ordinary Income | $10,261,782 | $17,454,124 |
| Long-Term Capital Gain | $12,856,449 | $22,018,032 |
| Total | $23,118,231 | $39,472,156 |
Distributions paid by the fund with respect to each class of shares are calculated in the same manner, at the same time and in the same amount, except for the effect of class level expenses that may be applied differently to each class. As of March 31, 2016, the components of distributable earnings on a tax basis consisted of $2,136,507 of undistributed ordinary income.
Such distributions and distributable earnings, on a tax basis, are determined in conformity with income tax regulations, which may differ from US GAAP. Distributions in excess of tax basis earnings and profits, if any, are reported in the fund's financial statements as a return of capital.
Capital accounts within the financial statements are adjusted for permanent book-tax differences. These adjustments have no impact on net assets or the results of operations. Temporary book-tax differences, if any, will reverse in a subsequent period. Book-tax differences are primarily attributable to foreign currency transactions and investments in passive foreign investment companies.
Note 3 — Guarantees and indemnifications
Under the Trust's organizational documents, its Officers and Trustees are indemnified against certain liabilities arising out of the performance of their duties to the Trust, including the fund. Additionally, in the normal course of business, the fund enters into contracts with service providers that contain general indemnification clauses. The fund's maximum exposure under these arrangements is unknown, as this would involve future claims that may be made against the fund that have not yet occurred. The risk of material loss from such claims is considered remote.
Note 4 — Fees and transactions with affiliates
John Hancock Advisers, LLC (the Advisor) serves as investment advisor for the fund. John Hancock Funds, LLC (the Distributor), an affiliate of the Advisor, serves as principal underwriter of the fund. The Advisor and the Distributor are indirect, wholly owned subsidiaries of Manulife Financial Corporation (MFC).
Management fee. The fund has an investment management agreement with the Advisor under which the fund pays a daily management fee to the Advisor, equivalent on an annual basis to the sum of: (a) 0.900% of the first $100 million of the fund's average daily net assets; (b) 0.875% of the next $900 million of the fund's average daily net assets; (c) 0.850% of the next $1 billion of the fund's average daily net assets; (d) 0.825% of the next $1 billion of the fund's average daily net assets; (e) 0.800% of the next $1 billion of the fund's average daily net assets and (f) 0.775% of the fund's average daily net assets in excess of $4 billion. The Advisor has a subadvisory agreement with John Hancock Asset Management a division of Manulife Asset Management (US) LLC, an indirectly owned subsidiary of MFC and an affiliate of the Advisor. The fund is not responsible for payment of the subadvisory fees.
The Advisor has contractually agreed to waive a portion of its management fee and/or reimburse expenses for certain funds of the John Hancock group of funds complex, including the fund (the participating portfolios). This waiver is based upon aggregate net assets of all the participating portfolios. The amount of the reimbursement is calculated daily and allocated among all the participating portfolios in proportion to the daily net assets of each fund. During the year ended March 31, 2016, this waiver amounted to 0.01% of the fund's average net assets. This arrangement may be amended or terminated at any time by the Advisor upon notice to the fund and with the approval of the Board of Trustees.
The Advisor has contractually agreed to waive all or a portion of its management fee and reimburse or pay operating expenses of the fund to the extent necessary to maintain the fund's total operating expenses at 2.35% of average annual net assets for Class C shares. This agreement excludes certain expenses such as taxes, brokerage commissions, interest expense, litigation and indemnification expenses and other extraordinary expenses not incurred in the ordinary course of the fund's business, acquired fund fees and expenses paid indirectly and short dividend expense. These expense limitations shall remain in effect until at least June 30, 2016, unless renewed by mutual agreement of the fund and the Advisor based upon a determination that this is appropriate under the circumstances at the time. Prior to July 1, 2015, the Advisor had contractually agreed to waive all or a portion of its management fee and reimburse or pay operating expenses of the fund to the extent necessary to maintain the fund's total operating expenses at 1.60%, 1.29%, 1.68%, 1.43% and 1.10% of average annual net assets for Class A, Class I, Class R2, Class R4 and Class R6 shares, respectively. This agreement excluded certain expenses such as taxes, brokerage commissions, interest expense, litigation and indemnification expenses and other extraordinary expenses not incurred in the ordinary course of the fund's business, acquired fund fees and expenses paid indirectly and short dividend expense.
The Advisor has contractually agreed to waive and/or reimburse all class-specific expenses for Class R6 shares of the fund to the extent they exceed 0.00% of average annual net assets (on an annualized basis) attributable to Class R6 shares (the Class Expense Waiver). The Class Expense Waiver expires on June 30, 2016, unless renewed by mutual agreement of the fund and the Advisor based upon a determination that this is appropriate under the circumstances at that time.
The expense reductions described above amounted to the following for the year ended March 31, 2016:
| Class | Expense reduction | Class | Expense reduction | |
| Class A | $1,808 | Class R4 | $2,323 | |
| Class C | 4,653 | Class R6 | 2,907 | |
| Class I | 3,536 | Class NAV | 37,126 | |
| Class R2 | 1,856 | Total | $54,209 |
The investment management fees, including the impact of the waivers and reimbursements as described above, incurred for the year ended March 31, 2016 were equivalent to a net annual effective rate of 0.87% of the fund's average daily net assets.
Accounting and legal services. Pursuant to a service agreement, the fund reimburses the Advisor for all expenses associated with providing the administrative, financial, legal, accounting and recordkeeping services to the fund, including the preparation of all tax returns, periodic reports to shareholders and regulatory reports, among other services. These expenses are allocated to each share class based on its relative net assets at the time the expense was incurred. These accounting and legal services fees incurred for the year ended March 31, 2016 amounted to an annual rate of 0.01% of the fund's average daily net assets.
Distribution and service plans. The fund has a distribution agreement with the Distributor. The fund has adopted distribution and service plans with respect to Class A, Class C, Class R2 and Class R4 shares pursuant to Rule 12b-1 under the 1940 Act, to pay the Distributor for services provided as the distributor of shares of the fund. In addition, under a service plan for Class R2 and Class R4 shares, the fund pays for certain other services. The fund may pay up to the following contractual rates of distribution and service fees under these arrangements, expressed as an annual percentage of average daily net assets for each class of the fund's shares.
| Class | Rule 12b-1 fee | Service fee | Class | Rule 12b-1 fee | Service fee | |
| Class A | 0.30% | — | Class R2 | 0.25% | 0.25% | |
| Class C | 1.00% | — | Class R4 | 0.25% | 0.10% |
Class A shares are currently charged 0.25% for Rule 12b-1 fees.
The fund's Distributor has contractually agreed to waive 0.10% of Rule 12b-1 fees for Class R4 shares. The current waiver agreement expires on June 30, 2016, unless renewed by mutual agreement of the fund and the Distributor based upon a determination that this is appropriate under the circumstances at the time. This contractual waiver amounted to $93 for Class R4 shares for the year ended March 31, 2016.
Sales charges. Class A shares are assessed up-front sales charges, which resulted in payments to the Distributor amounting to $158,544 for the year ended March 31, 2016. Of this amount, $27,496 was retained and used for printing prospectuses, advertising, sales literature and other purposes, $130,945 was paid as sales commissions to broker-dealers and $103 was paid as sales commissions to sales personnel of Signator Investors, Inc., a broker-dealer affiliate of the Advisor.
Class A and Class C shares may be subject to contingent deferred sales charges (CDSCs). Certain Class A shares that are acquired through purchases of $1 million or more and are redeemed within one year of purchase are subject to a 1.00% sales charge. Class C shares that are redeemed within one year of purchase are subject to a 1.00% CDSC. CDSCs are applied to the lesser of the current market value at the time of redemption or the original purchase cost of the shares being redeemed. Proceeds from CDSCs are used to compensate the Distributor for providing distribution-related services in
connection with the sale of these shares. During the year ended March 31, 2016, CDSCs received by the Distributor amounted to $3 and $527 for Class A and Class C shares, respectively.
Transfer agent fees. The fund has a transfer agent agreement with John Hancock Signature Services, Inc. (Signature Services), an affiliate of the Advisor. The transfer agent fees paid to Signature Services are determined based on the cost to Signature Services (Signature Services Cost) of providing recordkeeping services. It also includes out-of-pocket expenses, including payments made to third-parties for recordkeeping services provided to their clients who invest in one or more John Hancock funds. In addition, Signature Services Cost may be reduced by certain fees that Signature Services receives in connection with retirement and small accounts. Signature Services Cost is calculated monthly and allocated, as applicable, to five categories of share classes: Retail Share and Institutional Share Classes of Non-Municipal Bond Funds, Class R6 Shares, Retirement Share Classes and Municipal Bond Share Classes. Within each of these categories, the applicable costs are allocated to the affected John Hancock affiliated funds and/or classes, based on the relative average daily net assets.
Class level expenses. Class level expenses for the year ended March 31, 2016 were:
| Distribution and service fees | Transfer agent fees | State registration fees | Printing and postage | |
| Class A | $60,255 | $30,635 | $3,917 | $1,332 |
| Class C | 4,565 | 580 | 5,067 | 33 |
| Class I | — | 2,935 | 4,292 | 460 |
| Class R2 | 6,810 | 223 | 2,367 | 140 |
| Class R4 | 233 | 15 | 2,367 | 19 |
| Class R6 | — | 248 | 2,514 | 25 |
| Total | $71,863 | $34,636 | $20,524 | $2,009 |
Effective July 1, 2015, state registration fees and printing and postage are treated as fund level expenses and are not included in the table above. For the period July 1, 2015 to March 31, 2016, state registration fees and printing and postage amounted to $82,589 and $9,069, respectively.
Trustee expenses. The fund compensates each Trustee who is not an employee of the Advisor or its affiliates. The costs of paying Trustee compensation and expenses are allocated to each fund based on its net assets relative to other funds within the John Hancock group of funds complex.
Interfund lending program. Pursuant to an Exemptive Order issued by the SEC, the fund, along with certain other funds advised by the Advisor, may participate in an interfund lending program. This program provides an alternative credit facility allowing the funds to borrow from, or lend money to, other participating affiliated funds. Any open loans at period end are presented under the caption Payable for interfund lending in the Statement of assets and liabilities. At year end, no interfund loans were outstanding. Interest expense is included in Other expenses on the Statement of operations. The fund's activity in this program during the year for which loans were outstanding was as follows:
| Borrower or lender | Weighted average loan balance | Days outstanding | Weighted average interest rate | Interest income |
| Lender | $5,000,000 | 3 | 0.46% | $192 |
Note 5 — Fund share transactions
Transactions in fund shares for the years ended March 31, 2016 and 2015 were as follows:
| Year ended 3-31-16 | Year ended 3-31-15 | |||||||||||||||||||||||||
| Shares | Amount | Shares | Amount | |||||||||||||||||||||||
| Class A shares | ||||||||||||||||||||||||||
| Sold | 1,083,193 | $8,562,305 | 885,731 | $7,909,041 | ||||||||||||||||||||||
| Distributions reinvested | 135,930 | 1,004,523 | 220,604 | 1,727,328 | ||||||||||||||||||||||
| Repurchased | (482,641 | ) | (3,695,925 | ) | (317,567 | ) | (2,806,805 | ) | ||||||||||||||||||
| Net increase | 736,482 | $5,870,903 | 788,768 | $6,829,564 | ||||||||||||||||||||||
| Class C shares1 | ||||||||||||||||||||||||||
| Sold | 51,939 | $432,836 | 33,264 | $292,650 | ||||||||||||||||||||||
| Distributions reinvested | 1,748 | 13,077 | 391 | 3,095 | ||||||||||||||||||||||
| Repurchased | (26,012 | ) | (208,290 | ) | (191 | ) | (1,506 | ) | ||||||||||||||||||
| Net increase | 27,675 | $237,623 | 33,464 | $294,239 | ||||||||||||||||||||||
| Class I shares | ||||||||||||||||||||||||||
| Sold | 94,277 | $709,420 | 200,945 | $1,806,486 | ||||||||||||||||||||||
| Distributions reinvested | 15,262 | 112,787 | 35,355 | 276,472 | ||||||||||||||||||||||
| Repurchased | (163,927 | ) | (1,220,872 | ) | (728,720 | ) | (6,344,131 | ) | ||||||||||||||||||
| Net decrease | (54,388 | ) | ($398,665 | ) | (492,420 | ) | ($4,261,173 | ) | ||||||||||||||||||
| Class R2 shares | ||||||||||||||||||||||||||
| Sold | 21,907 | $171,343 | 68,675 | $653,805 | ||||||||||||||||||||||
| Distributions reinvested | 6,792 | 50,399 | 15,456 | 121,485 | ||||||||||||||||||||||
| Repurchased | (110,506 | ) | (806,649 | ) | (20,446 | ) | (180,182 | ) | ||||||||||||||||||
| Net increase (decrease) | (81,807 | ) | ($584,907 | ) | 63,685 | $595,108 | ||||||||||||||||||||
| Class R6 shares | ||||||||||||||||||||||||||
| Sold | 31,318 | $262,895 | 544,642 | $4,830,146 | ||||||||||||||||||||||
| Distributions reinvested | 2,230 | 16,456 | 56,459 | 441,512 | ||||||||||||||||||||||
| Repurchased | (525,820 | ) | (4,449,258 | ) | (96,510 | ) | (809,843 | ) | ||||||||||||||||||
| Net increase | (492,272 | ) | ($4,169,907 | ) | 504,591 | $4,461,815 | ||||||||||||||||||||
| Class NAV shares | ||||||||||||||||||||||||||
| Sold | 13,922,125 | $117,421,574 | 1,517,012 | $13,856,834 | ||||||||||||||||||||||
| Distributions reinvested | 2,965,743 | 21,916,839 | 4,713,315 | 36,858,122 | ||||||||||||||||||||||
| Repurchased | (1,093,231 | ) | (7,900,250 | ) | (2,295,671 | ) | (21,782,978 | ) | ||||||||||||||||||
| Net increase | 15,794,637 | $131,438,163 | 3,934,656 | $28,931,978 | ||||||||||||||||||||||
| Total net increase | 15,930,327 | $132,393,210 | 4,832,744 | $36,851,531 | ||||||||||||||||||||||
1 The inception date for Class C shares is 8-28-14.
There were no fund share transactions during the years ended March 31, 2016 and 2015 for Class R4 shares.
Affiliates of the Trust owned 100% of shares of beneficial interest of Class R4 and Class NAV shares on March 31, 2016.
Note 6 — Purchase and sale of securities
Purchases and sales of securities, other than short-term investments, amounted to $203,618,495 and $87,375,308, respectively, for the year ended March 31, 2016.
Note 7 — Investment by affiliated funds
Certain investors in the fund are affiliated funds that are managed by the Advisor and its affiliates. The affiliated funds do not invest in the fund for the purpose of exercising management or control; however, this investment may represent a significant portion of the fund's net assets. At March 31, 2016, funds within the John Hancock group of funds complex held 94.4% of the fund's net assets. The following funds had an affiliate ownership of 5% or more of the fund's net assets:
| Fund | Affiliated concentration |
| John Hancock Funds II Lifestyle Growth Portfolio | 38.9% |
| John Hancock Funds II Lifestyle Balanced Portfolio | 29.0% |
| John Hancock Funds II Lifestyle Aggressive Portfolio | 15.3% |
| John Hancock Funds II Lifestyle Moderate Portfolio | 5.4% |
Report of Independent Registered Public Accounting Firm
To the Board of Trustees and Shareholders of John Hancock Funds III and John Hancock International Value Equity Fund:
In our opinion, the accompanying statement of assets and liabilities, including the fund's investments, and the related statements of operations and of changes in net assets and the financial highlights present fairly, in all material respects, the financial position of John Hancock International Value Equity Fund (the "Fund") at March 31, 2016, the results of its operations for the year then ended, the changes in its net assets for each of the two years in the period then ended and the financial highlights for each of the periods indicated, in conformity with accounting principles generally accepted in the United States of America. These financial statements and financial highlights (hereafter referred to as "financial statements") are the responsibility of the Fund's management. Our responsibility is to express an opinion on these financial statements based on our audits. We conducted our audits of these financial statements in accordance with the standards of the Public Company Accounting Oversight Board (United States). Those standards require that we plan and perform the audit to obtain reasonable assurance about whether the financial statements are free of material misstatement. An audit includes examining, on a test basis, evidence supporting the amounts and disclosures in the financial statements, assessing the accounting principles used and significant estimates made by management, and evaluating the overall financial statement presentation. We believe that our audits, which included confirmation of securities at March 31, 2016 by correspondence with the custodian, transfer agent, and brokers, and the application of alternative auditing procedures where securities purchased confirmations had not been received, provide a reasonable basis for our opinion.
PricewaterhouseCoopers LLP
Boston, Massachusetts
May 13, 2016
Unaudited
For federal income tax purposes, the following information is furnished with respect to the distributions of the fund, if any, paid during its taxable year ended March 31, 2016.
The fund reports the maximum amount allowable of its net taxable income as eligible for the corporate dividends-received deduction.
The fund reports the maximum amount allowable of its net taxable income as qualified dividend income as provided in the Jobs and Growth Tax Relief Reconciliation Act of 2003.
Income derived from foreign sources was $14,657,511. The fund intends to pass through foreign tax credits of $1,043,187.
The fund paid $12,856,449 in capital gain dividends.
Eligible shareholders will be mailed a 2016 Form 1099-DIV in early 2017. This will reflect the tax character of all distributions paid in calendar year 2016.
Please consult a tax advisor regarding the tax consequences of your investment in the fund.
This chart provides information about the Trustees and Officers who oversee your John Hancock fund. Officers elected by the Trustees manage the day-to-day operations of the fund and execute policies formulated by the Trustees.
Independent Trustees
| Name, year of birth Position(s) held with fund Principal occupation(s) and other directorships during past 5 years | Trustee of the Trust since1 | Number of John Hancock funds overseen by Trustee |
| James M. Oates, Born: 1946 | 2012 | 230 |
| Trustee and Chairperson of the Board Managing Director, Wydown Group (financial consulting firm) (since 1994); Chairman and Director, Emerson Investment Management, Inc. (since 2000); Independent Chairman, Hudson Castle Group, Inc. (formerly IBEX Capital Markets, Inc.) (financial services company) (1997-2011); Director, Stifel Financial (since 1996); Director, Investor Financial Services Corporation (1995-2007); Director, Connecticut River Bancorp (1998-2014); Director, Virtus Funds (formerly Phoenix Mutual Funds) (since 1988). Trustee and Chairperson of the Board, John Hancock Collateral Trust and John Hancock Exchange-Traded Fund Trust (since 2015); Trustee and Chairperson of the Board, John Hancock retail funds3 (since 2012); Trustee (2005-2006 and since 2012) and Chairperson of the Board (since 2012), John Hancock Funds III; Trustee (since 2004) and Chairperson of the Board (since 2005), John Hancock Variable Insurance Trust; Trustee and Chairperson of the Board, John Hancock Funds II (since 2005). | ||
| Charles L. Bardelis,2 Born: 1941 | 2012 | 230 |
| Trustee Director, Island Commuter Corp. (marine transport). Trustee, John Hancock Collateral Trust and John Hancock Exchange-Traded Fund Trust (since 2015); Trustee, John Hancock retail funds3 (since 2012); Trustee, John Hancock Funds III (2005-2006 and since 2012); Trustee, John Hancock Variable Insurance Trust (since 1988); Trustee, John Hancock Funds II (since 2005). | ||
| Peter S. Burgess,2 Born: 1942 | 2012 | 230 |
| Trustee Consultant (financial, accounting, and auditing matters) (since 1999); Certified Public Accountant; Partner, Arthur Andersen (independent public accounting firm) (prior to 1999); Director, Lincoln Educational Services Corporation (since 2004); Director, Symetra Financial Corporation (2010-2016); Director, PMA Capital Corporation (2004-2010). Trustee, John Hancock Collateral Trust and John Hancock Exchange-Traded Fund Trust (since 2015); Trustee, John Hancock retail funds3 (since 2012); Trustee, John Hancock Funds III (2005-2006 and since 2012); Trustee, John Hancock Variable Insurance Trust and John Hancock Funds II (since 2005). | ||
| William H. Cunningham, Born: 1944 | 2006 | 230 |
| Trustee Professor, University of Texas, Austin, Texas (since 1971); former Chancellor, University of Texas System and former President of the University of Texas, Austin, Texas; Chairman (since 2009) and Director (since 2006), Lincoln National Corporation (insurance); Director, Southwest Airlines (since 2000); former Director, LIN Television (2009-2014). Trustee, John Hancock retail funds3 (since 1986); Trustee, John Hancock Variable Insurance Trust (since 2012); Trustee, John Hancock Funds II (2005-2006 and since 2012); Trustee, John Hancock Collateral Trust and John Hancock Exchange-Traded Fund Trust (since 2015). | ||
| Grace K. Fey, Born: 1946 | 2012 | 230 |
| Trustee Chief Executive Officer, Grace Fey Advisors (since 2007); Director and Executive Vice President, Frontier Capital Management Company (1988-2007); Director, Fiduciary Trust (since 2009). Trustee, John Hancock Collateral Trust and John Hancock Exchange-Traded Fund Trust (since 2015); Trustee, John Hancock retail funds3 (since 2012); Trustee, John Hancock Variable Insurance Trust and John Hancock Funds II (since 2008). | ||
Independent Trustees (continued)
| Name, year of birth Position(s) held with fund Principal occupation(s) and other directorships during past 5 years | Trustee of the Trust since1 | Number of John Hancock funds overseen by Trustee |
| Theron S. Hoffman,2 Born: 1947 | 2012 | 230 |
| Trustee Chief Executive Officer, T. Hoffman Associates, LLC (consulting firm) (since 2003); Director, The Todd Organization (consulting firm) (2003-2010); President, Westport Resources Management (investment management consulting firm) (2006-2008); Senior Managing Director, Partner, and Operating Head, Putnam Investments (2000-2003); Executive Vice President, The Thomson Corp. (financial and legal information publishing) (1997-2000). Trustee, John Hancock Collateral Trust and John Hancock Exchange-Traded Fund Trust (since 2015); Trustee, John Hancock retail funds3 (since 2012); Trustee, John Hancock Variable Insurance Trust and John Hancock Funds II (since 2008). | ||
| Deborah C. Jackson, Born: 1952 | 2008 | 230 |
| Trustee President, Cambridge College, Cambridge, Massachusetts (since 2011); Chief Executive Officer, American Red Cross of Massachusetts Bay (2002-2011); Board of Directors of Eastern Bank Corporation (since 2001); Board of Directors of Eastern Bank Charitable Foundation (since 2001); Board of Directors of American Student Assistance Corporation (1996-2009); Board of Directors of Boston Stock Exchange (2002-2008); Board of Directors of Harvard Pilgrim Healthcare (health benefits company) (2007-2011). Trustee, John Hancock retail funds3 (since 2008); Trustee, John Hancock Variable Insurance Trust and John Hancock Funds II (since 2012); Trustee, John Hancock Collateral Trust and John Hancock Exchange-Traded Fund Trust (since 2015). | ||
| Hassell H. McClellan, Born: 1945 | 2012 | 230 |
| Trustee Trustee, Virtus Variable Insurance Trust (formerly Phoenix Edge Series Funds) (since 2008); Director, The Barnes Group (since 2010); Associate Professor, The Wallace E. Carroll School of Management, Boston College (retired 2013). Trustee, John Hancock Collateral Trust and John Hancock Exchange-Traded Fund Trust (since 2015); Trustee, John Hancock retail funds3 (since 2012); Trustee, John Hancock Funds III (2005-2006 and since 2012); Trustee, John Hancock Variable Insurance Trust and John Hancock Funds II (since 2005). | ||
| Steven R. Pruchansky, Born: 1944 | 2006 | 230 |
| Trustee and Vice Chairperson of the Board Chairman and Chief Executive Officer, Greenscapes of Southwest Florida, Inc. (since 2000); Director and President, Greenscapes of Southwest Florida, Inc. (until 2000); Member, Board of Advisors, First American Bank (until 2010); Managing Director, Jon James, LLC (real estate) (since 2000); Partner, Right Funding, LLC (since 2014); Director, First Signature Bank & Trust Company (until 1991); Director, Mast Realty Trust (until 1994); President, Maxwell Building Corp. (until 1991). Trustee (since 1992) and Chairperson of the Board (2011-2012), John Hancock retail funds3; Trustee and Vice Chairperson of the Board, John Hancock retail funds3 John Hancock Variable Insurance Trust, and John Hancock Funds II (since 2012); Trustee, and Vice Chairperson of the Board, John Hancock Collateral Trust and John Hancock Exchange-Traded Fund Trust (since 2015). | ||
Independent Trustees (continued)
| Name, year of birth Position(s) held with fund Principal occupation(s) and other directorships during past 5 years | Trustee of the Trust since1 | Number of John Hancock funds overseen by Trustee |
| Gregory A. Russo, Born: 1949 | 2008 | 230 |
| Trustee Director and Audit Committee Chairman (since 2012), and Member, Audit Committee and Finance Committee (since 2011), NCH Healthcare System, Inc. (holding company for multi-entity healthcare system); Director and Member (since 2012) and Finance Committee Chairman (since 2014), The Moorings, Inc. (nonprofit continuing care community); Vice Chairman, Risk & Regulatory Matters, KPMG LLP (KPMG) (2002-2006); Vice Chairman, Industrial Markets, KPMG (1998-2002); Chairman and Treasurer, Westchester County, New York, Chamber of Commerce (1986-1992); Director, Treasurer, and Chairman of Audit and Finance Committees, Putnam Hospital Center (1989-1995); Director and Chairman of Fundraising Campaign, United Way of Westchester and Putnam Counties, New York (1990-1995). Trustee, John Hancock retail funds3 (since 2008); Trustee, John Hancock Variable Insurance Trust and John Hancock Funds II (since 2012); Trustee, John Hancock Collateral Trust and John Hancock Exchange-Traded Fund Trust (since 2015). | ||
Non-Independent Trustees4
| Name, year of birth Position(s) held with fund Principal occupation(s) and other directorships during past 5 years | Trustee of the Trust since1 | Number of John Hancock funds overseen by Trustee |
| James R. Boyle, Born: 1959 | 2015 | 230 |
| Non-Independent Trustee* Chairman and Chief Executive Officer, Zillion Group, Inc. (formerly HealthFleet, Inc.) (healthcare) (since 2014); Executive Vice President and Chief Executive Officer, U.S. Life Insurance Division of Genworth Financial, Inc. (insurance) (January 2014-July 2014); Senior Executive Vice President, Manulife Financial Corporation, President and Chief Executive Officer, John Hancock (1999-2012); Chairman and Director, John Hancock Advisers, LLC, John Hancock Funds, LLC, and John Hancock Investment Management Services, LLC (2005-2010). Trustee, John Hancock Collateral Trust and John Hancock Exchange-Traded Fund Trust (since 2015); Trustee, John Hancock retail funds3 (2005-2010; 2012-2014 and since 2015); Trustee, John Hancock Variable Insurance Trust and John Hancock Funds II (2005-2014 and since 2015). *Effective 3-10-15. | ||
| Craig Bromley, Born: 1966 | 2012 | 230 |
| Non-Independent Trustee President, John Hancock Financial Service (since 2012); Senior Executive Vice President and General Manager, U.S. Division, Manulife Financial Corporation (since 2012); President and Chief Executive Officer, Manulife Insurance Company (Manulife Japan) (2005-2012, including prior positions). Trustee, John Hancock retail funds,3 John Hancock Variable Insurance Trust, and John Hancock Funds II (since 2012); Trustee, John Hancock Collateral Trust and John Hancock Exchange-Traded Fund Trust (since 2015). | ||
| Warren A. Thomson, Born: 1955 | 2012 | 230 |
| Non-Independent Trustee Senior Executive Vice President and Chief Investment Officer, Manulife Financial Corporation and The Manufacturers Life Insurance Company (since 2009); Chairman, Manulife Asset Management (since 2001, including prior positions); Director and Chairman, Manulife Asset Management Limited (since 2006); Director and Chairman, Hancock Natural Resources Group, Inc. (since 2013). Trustee, John Hancock retail funds,3 John Hancock Variable Insurance Trust, and John Hancock Funds II (since 2012); Trustee, John Hancock Collateral Trust and John Hancock Exchange-Traded Fund Trust (since 2015). | ||
Principal officers who are not Trustees
| Name, year of birth Position(s) held with fund Principal occupation(s) during past 5 years | Officer of the Trust since |
| Andrew G. Arnott, Born: 1971 | 2009 |
| President Senior Vice President, John Hancock Financial Services (since 2009); Director and Executive Vice President, John Hancock Advisers, LLC (since 2005, including prior positions); Director and Executive Vice President, John Hancock Investment Management Services, LLC (since 2006, including prior positions); President, John Hancock Funds, LLC (since 2004, including prior positions); President, John Hancock retail funds,3 John Hancock Variable Insurance Trust, and John Hancock Funds II (since 2007, including prior positions); President, John Hancock Collateral Trust (since 2015); President, John Hancock Exchange-Traded Fund Trust (since 2014). | |
| John J. Danello, Born: 1955 | 2014 |
| Senior Vice President, Secretary, and Chief Legal Officer Vice President and Chief Counsel, John Hancock Wealth Management (since 2005); Senior Vice President (since 2007) and Chief Legal Counsel (2007-2010), John Hancock Funds, LLC and The Berkeley Financial Group, LLC; Senior Vice President (since 2006, including prior positions) and Chief Legal Officer and Secretary (since 2014), John Hancock retail funds,3 John Hancock Funds II and John Hancock Variable Insurance Trust; Senior Vice President, Chief Legal Officer and Secretary, John Hancock Collateral Trust and John Hancock Exchange-Traded Fund Trust (since 2015); Vice President, John Hancock Life & Health Insurance Company (since 2009); Vice President, John Hancock Life Insurance Company (USA) and John Hancock Life Insurance Company of New York (since 2010); and Senior Vice President, Secretary, and Chief Legal Counsel (2007-2014, including prior positions) of John Hancock Advisers, LLC and John Hancock Investment Management Services, LLC. | |
| Francis V. Knox, Jr., Born: 1947 | 2006 |
| Chief Compliance Officer Vice President, John Hancock Financial Services (since 2005); Chief Compliance Officer, John Hancock retail funds,3 John Hancock Variable Insurance Trust, John Hancock Funds II, John Hancock Advisers, LLC, and John Hancock Investment Management Services, LLC (since 2005); Chief Compliance Officer, John Hancock Collateral Trust and John Hancock Exchange-Traded Fund Trust (since 2015). | |
| Charles A. Rizzo, Born: 1957 | 2007 |
| Chief Financial Officer Vice President, John Hancock Financial Services (since 2008); Senior Vice President, John Hancock Advisers, LLC and John Hancock Investment Management Services, LLC (since 2008); Chief Financial Officer, John Hancock retail funds,3 John Hancock Variable Insurance Trust and John Hancock Funds II (since 2007); Chief Financial Officer, John Hancock Collateral Trust and John Hancock Exchange-Traded Fund Trust (since 2015). | |
| Salvatore Schiavone, Born: 1965 | 2010 |
| Treasurer Assistant Vice President, John Hancock Financial Services (since 2007); Vice President, John Hancock Advisers, LLC and John Hancock Investment Management Services, LLC (since 2007); Treasurer, John Hancock retail funds3 (since 2007, including prior positions); Treasurer, John Hancock Variable Insurance Trust and John Hancock Funds II (2007-2009 and since 2010, including prior positions); Treasurer, John Hancock Collateral Trust and John Hancock Exchange-Traded Fund Trust (since 2015). | |
The business address for all Trustees and Officers is 601 Congress Street, Boston, Massachusetts 02210-2805.
The Statement of Additional Information of the fund includes additional information about members of the Board of Trustees of the Trust and is available without charge, upon request, by calling 800-225-5291.
| 1 | Each Trustee holds office until his or her successor is elected and qualified, or until the Trustee's death, retirement, resignation, or removal. Mr. Boyle has served as Trustee at various times prior to the date listed in the table. |
| 2 | Member of the Audit Committee. |
| 3 | "John Hancock retail funds" comprises John Hancock Funds III and 36 other John Hancock funds consisting of 26 series of other John Hancock trusts and 10 closed-end funds. |
| 4 | The Trustee is a Non-Independent Trustee due to current or former positions with the Advisor and certain affiliates. |
Trustees James M. Oates, Chairperson Officers Andrew G. Arnott John J. Danello Francis V. Knox, Jr. Charles A. Rizzo Salvatore Schiavone | Investment advisor John Hancock Advisers, LLC Subadvisor John Hancock Asset Management a division of Manulife Asset Management (US) LLC Principal distributor John Hancock Funds, LLC Custodian Citibank, N.A. Transfer agent John Hancock Signature Services, Inc. Legal counsel K&L Gates LLP Independent registered public accounting firm PricewaterhouseCoopers LLP |
*Member of the Audit Committee
†Non-Independent Trustee
The fund's proxy voting policies and procedures, as well as the fund proxy voting record for the most recent twelve-month period ended June 30, are available free of charge on the Securities and Exchange Commission (SEC) website at sec.gov or on our website.
The fund's complete list of portfolio holdings, for the first and third fiscal quarters, is filed with the SEC on Form N-Q. The fund's Form N-Q is available on our website and the SEC's website, sec.gov, and can be reviewed and copied (for a fee) at the SEC's Public Reference Room in Washington, DC. Call 800-SEC-0330 to receive information on the operation of the SEC's Public Reference Room.
We make this information on your fund, as well as monthly portfolio holdings, and other fund details available on our website at jhinvestments.com or by calling 800-225-5291.
| You can also contact us: | |||
| 800-225-5291 jhinvestments.com | Regular mail: John Hancock Signature Services, Inc. | Express mail: John Hancock Signature Services, Inc. | |
John Hancock family of funds
DOMESTIC EQUITY FUNDS Balanced Blue Chip Growth Classic Value Disciplined Value Disciplined Value Mid Cap Equity Income Fundamental All Cap Core Fundamental Large Cap Core Fundamental Large Cap Value New Opportunities Small Cap Value Small Company Strategic Growth U.S. Equity U.S. Global Leaders Growth Value Equity GLOBAL AND INTERNATIONAL EQUITY FUNDS Disciplined Value International Emerging Markets Emerging Markets Equity Global Equity Global Shareholder Yield Greater China Opportunities International Core International Growth International Small Company International Value Equity | INCOME FUNDS Bond California Tax-Free Income Core High Yield Emerging Markets Debt Floating Rate Income Focused High Yield Global Income Government Income High Yield Municipal Bond Income Investment Grade Bond Money Market Short Duration Credit Opportunities Spectrum Income Strategic Income Opportunities Tax-Free Bond ALTERNATIVE AND SPECIALTY FUNDS Absolute Return Currency Alternative Asset Allocation Enduring Assets Financial Industries Global Absolute Return Strategies Global Conservative Absolute Return Global Focused Strategies Global Real Estate Natural Resources Redwood Regional Bank Seaport Technical Opportunities |
A fund's investment objectives, risks, charges, and expenses should be considered carefully before investing. The prospectus contains this and other important information about the fund. To obtain a prospectus, contact your financial professional, call John Hancock Investments at 800-225-5291, or visit our website at jhinvestments.com. Please read the prospectus carefully before investing or sending money.
ASSET ALLOCATION Income Allocation Fund Lifestyle Aggressive Portfolio Lifestyle Balanced Portfolio Lifestyle Conservative Portfolio Lifestyle Growth Portfolio Lifestyle Moderate Portfolio Retirement Choices Portfolios (2010-2060) Retirement Living Portfolios (2010-2060) Retirement Living II Portfolios (2010-2060) EXCHANGE-TRADED FUNDS John Hancock Multifactor Consumer Discretionary ETF John Hancock Multifactor Consumer Staples ETF John Hancock Multifactor Energy ETF John Hancock Multifactor Financials ETF John Hancock Multifactor Healthcare ETF John Hancock Multifactor Industrials ETF John Hancock Multifactor Large Cap ETF John Hancock Multifactor Materials ETF John Hancock Multifactor Mid Cap ETF John Hancock Multifactor Technology ETF John Hancock Multifactor Utilities ETF | CLOSED-END FUNDS Financial Opportunities Hedged Equity & Income Income Securities Trust Investors Trust Preferred Income Preferred Income II Preferred Income III Premium Dividend Tax-Advantaged Dividend Income Tax-Advantaged Global Shareholder Yield |
John Hancock Multifactor ETF shares are bought and sold at market price (not NAV), and are not individually redeemed
from the fund. Brokerage commissions will reduce returns.
John Hancock ETFs are distributed by Foreside Fund Services, LLC, and are subadvised by Dimensional Fund Advisors LP.
Foreside is not affiliated with John Hancock Funds, LLC or Dimensional Fund Advisors LP.
Dimensional Fund Advisors LP receives compensation from John Hancock in connection with licensing rights to the
John Hancock Dimensional indexes. Dimensional Fund Advisors LP does not sponsor, endorse, or sell, and makes no
representation as to the advisability of investing in, John Hancock Multifactor ETFs.
John Hancock Investments
A trusted brand
John Hancock Investments is a premier asset manager representing
one of America's most trusted brands, with a heritage of financial
stewardship dating back to 1862. Helping our shareholders pursue
their financial goals is at the core of everything we do. It's why we
support the role of professional financial advice and operate with the
highest standards of conduct and integrity.
A better way to invest
We build funds based on investor needs, then search the world to find
proven portfolio teams with specialized expertise in those strategies.
As a manager of managers, we apply vigorous oversight to ensure that
they continue to meet our uncompromising standards and serve the
best interests of our shareholders.
Results for investors
Our unique approach to asset management enables us to provide
a diverse set of investments backed by some of the world's best
managers, along with strong risk-adjusted returns across asset classes.
| | John Hancock Funds, LLC n Member FINRA, SIPC 601 Congress Street n Boston, MA 02210-2805 800-225-5291 n jhinvestments.com | |
| This report is for the information of the shareholders of John Hancock International Value Equity Fund. It is not authorized for distribution to prospective investors unless preceded or accompanied by a prospectus. | ||
| MF288160 | 366A 3/16 5/16 | |
John Hancock
Strategic Growth Fund
Annual report 3/31/16
A message to shareholders
Dear shareholder,
The 12-month period covered by this report was a challenging one for U.S. equity investors. Many market indexes tumbled late last summer and again in the winter amid concerns about slowing global growth, particularly in China. The volatility extended to commodity markets, as oil prices hit multi-year lows before rebounding toward the end of the period. The investment landscape improved late in the period as stocks and other so-called risk assets regained positive momentum.
Despite the increase in volatility, the economic picture in the United States offers reasons for optimism. In December, the U.S. Federal Reserve raised short-term interest rates for the first time in nine years on evidence that the persistent strength in the labor markets warranted a somewhat less accommodative stance. Economic data generally remained strong entering the spring.
Volatile market environments are naturally unsettling. At John Hancock Investments, portfolio risk management is a critical part of our role as an asset manager, and our dedicated risk team is focused on these issues every day. We continually strive for new ways to analyze potential risks and have liquidity tools in place. However, your best resource in times like these is your financial advisor, who can ensure your portfolio is sufficiently diversified to meet your long-term objectives and to withstand the inevitable bumps along the way.
On behalf of everyone at John Hancock Investments, I'd like to take this opportunity to thank you for the continued trust you've placed in us.
Sincerely,
Andrew G. Arnott
President and Chief Executive Officer
John Hancock Investments
This commentary reflects the CEO's views as of March 31, 2016. They are subject to change at any time. All investments entail risks, including the possible loss of principal. Diversification does not guarantee a profit or eliminate the risk of a loss. For more up-to-date information, you can visit our website at jhinvestments.com.
John Hancock
Strategic Growth Fund
INVESTMENT OBJECTIVE
The fund seeks long-term capital appreciation.
AVERAGE ANNUAL TOTAL RETURNS AS OF 3/31/16 (%)
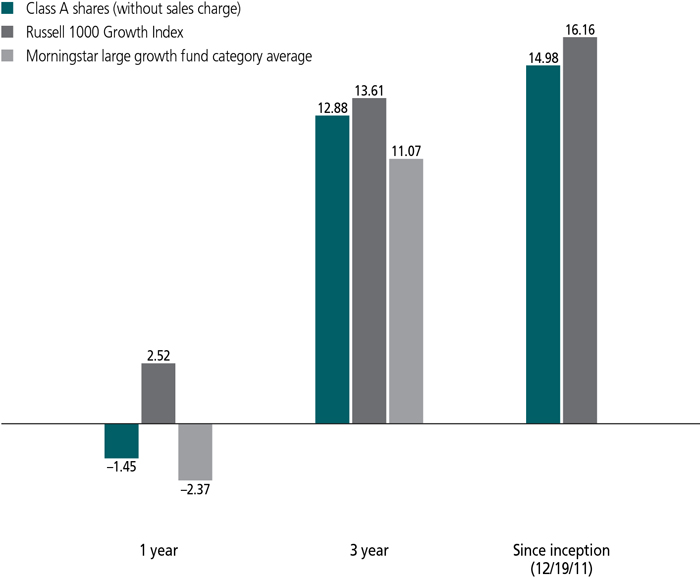
The Russell 1000 Growth Index is an unmanaged index that measures the performance of the small-cap growth segment of the U.S. equity universe. It includes those Russell 1000 Index companies with higher price-to-book ratios and higher forecasted growth values.
It is not possible to invest directly in an index. Index figures do not reflect expenses or sales charges, which would result in lower returns.
Figures from Morningstar, Inc. include reinvested distributions and do not take into account sales charges. Actual load-adjusted performance is lower. Since inception returns for the Morningstar fund category average are not available.
The past performance shown here reflects reinvested distributions and the beneficial effect of any expense reductions, and does not guarantee future results. Performance of the other share classes will vary based on the difference in the fees and expenses of those classes. Shares will fluctuate in value and, when redeemed, may be worth more or less than their original cost. Current month-end performance may be lower or higher than the performance cited, and can be found at jhinvestments.com or by calling 800-225-5291. For further information on the fund's objectives, risks, and strategy, see the fund's prospectus.
PERFORMANCE HIGHLIGHTS OVER THE LAST TWELVE MONTHS
A modestly up market
Large-cap growth stocks overcame significant market volatility to finish the 12-month reporting period in modestly positive territory.
Underperformance relative to the benchmark
The fund's results relative to its benchmark, the Russell 1000 Growth Index, were hurt by unfavorable security selection in the industrials sector and, to a lesser extent, in financials and healthcare.
Mixed results in consumer discretionary
Stock picking was subpar in consumer discretionary, although a relative overweighting in this sector proved beneficial.
SECTOR COMPOSITION AS OF 3/31/16 (%)
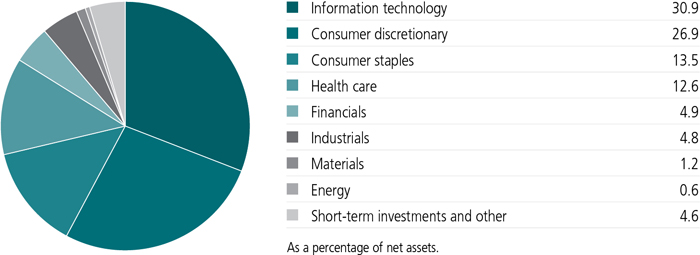
A note about risks
Growth stocks may be more susceptible to earnings disappointments. The value of a company's equity securities is subject to changes in the company's financial condition and overall market and economic conditions. Foreign investing has additional risks, such as currency and market volatility and political and social instability. Sector investing is subject to greater risks than the market as a whole. Because the fund may focus on particular sectors of the economy, its performance may depend on the performance of those sectors, and investments focused on one sector may fluctuate more widely than investments in a wider variety of sectors. Liquidity—the extent to which a security may be sold or a derivative position closed without negatively affecting its market value, if at all—may be impaired by reduced trading volume, heightened volatility, rising interest rates, and other market conditions. Hedging, derivatives, and other strategic transactions may increase a fund's volatility and could produce disproportionate losses, potentially more than the fund's principal investment. Please see the fund's prospectuses for additional risks.
An interview with Portfolio Manager W. Shannon Reid, CFA, John Hancock Asset Management a division of Manulife Asset Management (US) LLC

W. Shannon Reid, CFA
Portfolio Manager
John Hancock Asset Management
What factors were behind the fund's underperformance of its benchmark, the Russell 1000 Growth Index?
Large-cap growth stocks finished the 12-month reporting period in modestly positive territory, but to arrive at that small gain, U.S. stocks experienced big ups and downs throughout the timeframe. The market's volatility reflected alternating periods of investor concern about slowing global economic growth, especially in China, with stretches of growing confidence that the world's central banks were prepared to implement economically stimulative policies.
Against this backdrop, the fund's results relative to the benchmark were hurt the most by unfavorable security selection in industrials and, to a lesser extent, the financials and healthcare sectors. Stock picking was also subpar in consumer discretionary, although a relative overweighting in this group proved beneficial. Our choices in the energy sector also added value, as the names the fund held here declined less, on average, than those in the benchmark.
Which stocks detracted the most relative to the benchmark?
The fund was hampered by a position in ServiceNow, Inc. Shares of this provider of enterprise cloud computing services performed poorly after the company's financial results fell short of investors' expectations. We, too, developed some concerns about ServiceNow's ability to continue to grow at such a rapid pace and ultimately sold the fund's stake late in the period.
Another notable detractor was Biogen, Inc., a biotechnology company whose shares fell over the past 12 months. Biogen's stock fell sharply last summer, as the firm encountered various business challenges. The biggest of those challenges was slower-than-expected growth in Tecfidera, the company's key multiple sclerosis drug. We had reduced the fund's exposure to Biogen before this sales slowdown; however, we did maintain a smaller position in the stock as of the end of the period.
A handful of consumer discretionary stocks also weighed on results. These included housewares retailer Williams-Sonoma, Inc., discount retailer Dollar Tree, Inc., and luxury apparel and accessories company Michael Kors Holdings, Ltd. We sold all three stocks during the period, partly because disappointing financial results reduced our confidence in their performance potential.
Which stocks helped relative performance?
The biggest relative contributor was Amazon.com, Inc. The online retailer reported better-than-anticipated earnings, driven by strength in the company's cloud computing business, Amazon Web Services (AWS). Companies of all sizes are outsourcing their information technology operations to lower their costs and gain efficiencies, and AWS has emerged as the leader in this burgeoning business.
Also contributing were social networking company Facebook, Inc. and Alphabet, Inc., the parent company of Internet search leader Google. As advertisers continue to shift their spending from offline to online, Facebook and Alphabet have been the two prime beneficiaries, especially in the increasingly lucrative mobile and video markets.
Other sources of strong results were tobacco manufacturers Philip Morris International, Inc. and Altria Group, Inc. Both fund holdings have a history of producing relatively steady and predictable earnings and cash flow, as well as high dividend yields. As they looked for ways to help insulate themselves from market volatility, investors appeared to favor companies with these and other defensive characteristics.
What changes did you make to the fund?
As we became increasingly concerned about the pace of global economic growth, we looked for ways to reduce the fund's risk. This entailed trimming exposure to industrial, energy, and material stocks, which we saw as more vulnerable to a cyclical slowdown. We simultaneously emphasized larger, less-volatile companies that do a substantial portion of their business in the United States, whose prospects we saw as more favorable.
Another change this period was to reduce exposure to the healthcare sector, moving from a relative overweight to an underweight. More specifically, our investment focus shifted to healthcare companies whose business involves developing innovative products, while we cut back on exposure to companies benefiting from inflation in the prices of generic drugs, as we saw less potential in this part of the market. Among the stocks we sold were drug distribution companies McKesson Corp., AmerisourceBergen Corp., and Cardinal Health, Inc.
As of the end of the period, how were you positioning the fund?
The global economy avoided falling into recession over the past year, but economic growth has been anemic, which has slowed corporate profits. Central banks around the world continue to try to stimulate their economies, but those efforts have had a diminishing impact over time. Other possible future challenges include the level of sovereign debt in Europe and in emerging-market countries as well as the potential financial consequences to banks and other creditors exposed to the sharp decline in oil prices.
Although the U.S. economy has faced its challenges, it has been a relatively better performer, which has led us to prefer stocks whose business is focused on this market.
In our opinion, these conditions warrant a relatively defensive posture for the fund. In general, we
TOP 10 HOLDINGS AS OF 3/31/16 (%)
| Apple, Inc. | 7.6 |
| Facebook, Inc., Class A | 4.0 |
| Amazon.com, Inc. | 3.9 |
| Microsoft Corp. | 3.8 |
| Alphabet, Inc., Class C | 3.5 |
| Comcast Corp., Class A | 2.9 |
| Visa, Inc., Class A | 2.7 |
| The Walt Disney Company | 2.7 |
| CVS Health Corp. | 2.4 |
| The Home Depot, Inc. | 2.4 |
| TOTAL | 35.9 |
| As a percentage of net assets. | |
| Cash and cash equivalents are not included. | |
wanted to favor stocks able to benefit from broad market trends rather than cyclical movements in the economy, given the potential for future headwinds.
In this environment, we are overweighting stocks in the consumer discretionary, information technology and consumer staples sectors. The fund also finished the period underweighted in industrials and materials, which, after rallying late, we believed were offering a less attractive risk/reward trade-off for investors.
MANAGED BY
| | W. Shannon Reid, CFA On the fund since 2011 Investing since 1981 |
 | David M. Chow, CFA On the fund since 2011 Investing since 1992 |
 | Curtis Ifill, CFA On the fund since 2011 Investing since 1996 |
 | Jay Zelko On the fund since 2011 Investing since 1987 |
![]()
TOTAL RETURNS FOR THE PERIOD ENDED MARCH 31, 2016
| Average annual total returns (%) with maximum sales charge | Cumulative total returns (%) with maximum sales charge | ||||||
| 1-year | Since inception1 | Since inception1 | |||||
| Class A | -6.38 | 13.62 | 72.93 | ||||
| Class C2 | -3.17 | 14.66 | 79.83 | ||||
| Class I3 | -1.17 | 15.38 | 84.78 | ||||
| Class R22,3 | -1.63 | 14.95 | 81.81 | ||||
| Class R42,3 | -1.47 | 15.00 | 82.12 | ||||
| Class R62,3 | -1.09 | 15.10 | 82.81 | ||||
| Class NAV3 | -1.09 | 15.58 | 86.10 | ||||
| Index† | 2.52 | 16.16 | 90.01 | ||||
Performance figures assume all distributions are reinvested. Figures reflect the maximum sales charge on Class A shares of 5% and the applicable contingent deferred sales charge (CDSC) on Class C shares. Class C shares sold within one year of purchase are subject to a 1% CDSC. Sales charges are not applicable to Class I, Class R2, Class R4, Class R6, and Class NAV shares.
The expense ratios of the fund, both net (including any fee waivers or expense limitations) and gross (excluding any fee waivers or expense limitations), are set forth according to the most recent publicly available prospectuses for the fund and may differ from those disclosed in the Financial highlights tables in this report. The expense ratios are as follows:
| Class A | Class C | Class I | Class R2* | Class R4* | Class R6* | Class NAV | |
| Gross (%) | 1.10 | 1.85 | 0.86 | 1.24 | 1.09 | 0.74 | 0.72 |
| Net (%) | 1.10 | 1.85 | 0.86 | 1.24 | 0.99 | 0.72 | 0.72 |
Please refer to the most recent prospectus and annual or semiannual report for more information on expenses and any expense limitation arrangements for each class.
| * | Expenses have been estimated for the first year of operation for Class R2, Class R4 and Class R6 shares. |
The returns reflect past results and should not be considered indicative of future performance. The return and principal value of an investment will fluctuate so that shares, when redeemed, may be worth more or less than their original cost. Due to market volatility and other factors, the fund's current performance may be higher or lower than the performance shown. For current to the most recent month-end performance data, please call 800-225-5291 or visit the fund's website at jhinvestments.com.
The performance table above and the chart on the next page do not reflect the deduction of taxes that a shareholder would pay on fund distributions or the redemption of fund shares. The fund's performance results reflect any applicable fee waivers or expense reductions, without which the expenses would increase and results would have been less favorable.
| † | Index is the Russell 1000 Growth Index. |
See the following page for footnotes.
This chart and table show what happened to a hypothetical $10,000 investment in John Hancock Strategic Growth Fund for the share classes and periods indicated, assuming all distributions were reinvested. For comparison, we've shown the same investment in the Russell 1000 Growth Index.
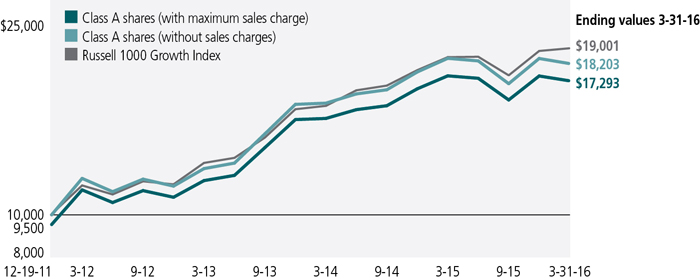
| Start date | With maximum sales charge ($) | Without sales charge ($) | Index ($) | |
| Class C2,4 | 12-19-11 | 17,983 | 17,983 | 19,001 |
| Class I3 | 12-19-11 | 18,478 | 18,478 | 19,001 |
| Class R22,3 | 12-19-11 | 18,181 | 18,181 | 19,001 |
| Class R42,3 | 12-19-11 | 18,212 | 18,212 | 19,001 |
| Class R62,3 | 12-19-11 | 18,281 | 18,281 | 19,001 |
| Class NAV3 | 12-19-11 | 18,610 | 18,610 | 19,001 |
The Russell 1000 Growth Index is an unmanaged index that measures the performance of the small-cap growth segment of the U.S. equity universe. It includes those Russell 1000 companies with higher price-to-book ratios and higher forecasted growth values.
It is not possible to invest directly in an index. Index figures do not reflect expenses or sales charges, which would result in lower returns.
Footnotes related to performance pages
| 1 | From 12-19-11. |
| 2 | Class C shares were first offered on 8-28-14. The returns prior to this date are those of Class A shares, which have lower expenses than Class C. Had the returns reflected Class C expenses, returns would be lower. Class R2, Class R4, and Class R6 shares were first offered on 3-27-15. The returns prior to these dates are those of Class A shares and may be higher or lower than if adjusted to reflect the expenses of any other share classes. |
| 3 | For certain types of investors, as described in the fund's prospectuses. |
| 4 | The contingent deferred sales charge is not applicable. |
These examples are intended to help you understand your ongoing operating expenses of investing in the fund so you can compare these costs with the ongoing costs of investing in other mutual funds.
Understanding fund expenses
As a shareholder of the fund, you incur two types of costs:
| • | Transaction costs, which include sales charges (loads) on purchases or redemptions (varies by share class), minimum account fee charge, etc. |
| • | Ongoing operating expenses, including management fees, distribution and service fees (if applicable), and other fund expenses. |
We are presenting only your ongoing operating expenses here.
Actual expenses/actual returns
This example is intended to provide information about the fund's actual ongoing operating expenses, and is based on the fund's actual return. It assumes an account value of $1,000.00 on October 1, 2015, with the same investment held until March 31, 2016.
| Account value on 10-1-2015 | Ending value on 3-31-2016 | Expenses paid during period ended 3-31-20161 | Annualized expense ratio | |
| Class A | $1,000.00 | $1,062.40 | $5.98 | 1.16% |
| Class C | 1,000.00 | 1,057.70 | 9.52 | 1.85% |
| Class I | 1,000.00 | 1,063.60 | 4.49 | 0.87% |
| Class R2 | 1,000.00 | 1,061.90 | 6.39 | 1.24% |
| Class R4 | 1,000.00 | 1,062.40 | 5.62 | 1.09% |
| Class R6 | 1,000.00 | 1,063.60 | 3.87 | 0.75% |
| Class NAV | 1,000.00 | 1,063.60 | 3.92 | 0.76% |
Together with the value of your account, you may use this information to estimate the operating expenses that you paid over the period. Simply divide your account value at March 31, 2016, by $1,000.00, then multiply it by the "expenses paid" for your share class from the table above. For example, for an account value of $8,600.00, the operating expenses should be calculated as follows:
Hypothetical example for comparison purposes
This table allows you to compare the fund's ongoing operating expenses with those of any other fund. It provides an example of the fund's hypothetical account values and hypothetical expenses based on each class's actual expense ratio and an assumed 5% annualized return before expenses (which is not the fund's actual return). It assumes an account value of $1,000.00 on October 1, 2015, with the same investment held until March 31, 2016. Look in any other fund shareholder report to find its hypothetical example and you will be able to compare these expenses. Please remember that these hypothetical account values and expenses may not be used to estimate the actual ending account balance or expenses you paid for the period.
| Account value on 10-1-2015 | Ending value on 3-31-2016 | Expenses paid during period ended 3-31-20161 | Annualized expense ratio | |
| Class A | $1,000.00 | $1,019.20 | $5.86 | 1.16% |
| Class C | 1,000.00 | 1,015.80 | 9.32 | 1.85% |
| Class I | 1,000.00 | 1,020.70 | 4.40 | 0.87% |
| Class R2 | 1,000.00 | 1,018.80 | 6.26 | 1.24% |
| Class R4 | 1,000.00 | 1,019.60 | 5.50 | 1.09% |
| Class R6 | 1,000.00 | 1,021.30 | 3.79 | 0.75% |
| Class NAV | 1,000.00 | 1,021.20 | 3.84 | 0.76% |
Remember, these examples do not include any transaction costs, therefore, these examples will not help you to determine the relative total costs of owning different funds. If transaction costs were included, your expenses would have been higher. See the prospectuses for details regarding transaction costs.
| 1 | Expenses are equal to the fund's annualized expense ratio, multiplied by the average account value over the period, multiplied by 183/366 (to reflect the one-half year period). |
Fund's investments
| As of 3-31-16 | |||||||||||||||||
| Shares | Value | ||||||||||||||||
| Common stocks 95.4% | $1,617,061,005 | ||||||||||||||||
| (Cost $1,266,853,254) | |||||||||||||||||
| Consumer discretionary 26.9% | 455,503,540 | ||||||||||||||||
| Auto components 3.7% | |||||||||||||||||
| BorgWarner, Inc. | 342,918 | 13,168,051 | |||||||||||||||
| Delphi Automotive PLC | 234,878 | 17,620,548 | |||||||||||||||
| Lear Corp. | 212,026 | 23,570,930 | |||||||||||||||
| Tenneco, Inc. (I) | 179,093 | 9,225,080 | |||||||||||||||
| Hotels, restaurants and leisure 3.1% | |||||||||||||||||
| McDonald's Corp. | 240,029 | 30,166,845 | |||||||||||||||
| Starbucks Corp. | 374,267 | 22,343,740 | |||||||||||||||
| Household durables 0.4% | |||||||||||||||||
| Harman International Industries, Inc. | 81,566 | 7,262,637 | |||||||||||||||
| Internet and catalog retail 5.3% | |||||||||||||||||
| Amazon.com, Inc. (I) | 112,597 | 66,842,083 | |||||||||||||||
| The Priceline Group, Inc. (I) | 17,472 | 22,520,709 | |||||||||||||||
| Media 5.6% | |||||||||||||||||
| Comcast Corp., Class A | 802,856 | 49,038,444 | |||||||||||||||
| The Walt Disney Company | 461,492 | 45,830,771 | |||||||||||||||
| Specialty retail 6.0% | |||||||||||||||||
| Lowe's Companies, Inc. | 350,255 | 26,531,816 | |||||||||||||||
| O'Reilly Automotive, Inc. (I) | 45,958 | 12,576,866 | |||||||||||||||
| The Home Depot, Inc. | 307,174 | 40,986,227 | |||||||||||||||
| Tractor Supply Company | 231,294 | 20,922,855 | |||||||||||||||
| Textiles, apparel and luxury goods 2.8% | |||||||||||||||||
| Hanesbrands, Inc. | 565,441 | 16,024,598 | |||||||||||||||
| NIKE, Inc., Class B | 502,218 | 30,871,340 | |||||||||||||||
| Consumer staples 13.5% | 228,638,033 | ||||||||||||||||
| Beverages 3.5% | |||||||||||||||||
| Constellation Brands, Inc., Class A | 135,010 | 20,398,661 | |||||||||||||||
| Monster Beverage Corp. (I) | 168,674 | 22,497,738 | |||||||||||||||
| The Coca-Cola Company | 335,948 | 15,584,628 | |||||||||||||||
| Food and staples retailing 4.1% | |||||||||||||||||
| Costco Wholesale Corp. | 182,853 | 28,813,976 | |||||||||||||||
| CVS Health Corp. | 397,893 | 41,273,441 | |||||||||||||||
| Food products 0.6% | |||||||||||||||||
| The WhiteWave Foods Company (I) | 259,912 | 10,562,824 | |||||||||||||||
| Tobacco 5.3% | |||||||||||||||||
| Altria Group, Inc. | 570,558 | 35,751,164 | |||||||||||||||
| Philip Morris International, Inc. | 294,897 | 28,932,345 | |||||||||||||||
| Reynolds American, Inc. | 493,406 | 24,823,256 | |||||||||||||||
| Shares | Value | ||||||||||||||||
| Energy 0.6% | $9,892,452 | ||||||||||||||||
| Oil, gas and consumable fuels 0.6% | |||||||||||||||||
| California Resources Corp. | 7,248 | 7,465 | |||||||||||||||
| Hess Corp. | 87,129 | 4,587,342 | |||||||||||||||
| Occidental Petroleum Corp. | 77,417 | 5,297,645 | |||||||||||||||
| Financials 4.9% | 82,827,906 | ||||||||||||||||
| Banks 2.5% | |||||||||||||||||
| First Republic Bank | 261,859 | 17,450,284 | |||||||||||||||
| Signature Bank (I) | 183,035 | 24,914,724 | |||||||||||||||
| Capital markets 2.4% | |||||||||||||||||
| KKR & Company LP | 1,410,918 | 20,726,385 | |||||||||||||||
| The Blackstone Group LP | 703,619 | 19,736,513 | |||||||||||||||
| Health care 12.6% | 212,831,337 | ||||||||||||||||
| Biotechnology 8.6% | |||||||||||||||||
| AbbVie, Inc. | 577,655 | 32,995,654 | |||||||||||||||
| Amgen, Inc. | 247,546 | 37,114,572 | |||||||||||||||
| Biogen, Inc. (I) | 79,656 | 20,736,050 | |||||||||||||||
| Celgene Corp. (I) | 321,554 | 32,184,340 | |||||||||||||||
| Vertex Pharmaceuticals, Inc. (I) | 278,014 | 22,099,331 | |||||||||||||||
| Health care providers and services 1.8% | |||||||||||||||||
| UnitedHealth Group, Inc. | 234,383 | 30,211,969 | |||||||||||||||
| Pharmaceuticals 2.2% | |||||||||||||||||
| Johnson & Johnson | 79,208 | 8,570,306 | |||||||||||||||
| Mylan NV (I) | 216,006 | 10,011,878 | |||||||||||||||
| Pfizer, Inc. | 637,896 | 18,907,237 | |||||||||||||||
| Industrials 4.8% | 82,187,010 | ||||||||||||||||
| Air freight and logistics 1.3% | |||||||||||||||||
| FedEx Corp. | 134,957 | 21,960,203 | |||||||||||||||
| Airlines 1.0% | |||||||||||||||||
| Southwest Airlines Company | 400,405 | 17,938,144 | |||||||||||||||
| Electrical equipment 0.9% | |||||||||||||||||
| Emerson Electric Company | 293,965 | 15,985,817 | |||||||||||||||
| Professional services 0.3% | |||||||||||||||||
| Verisk Analytics, Inc. (I) | 55,137 | 4,406,549 | |||||||||||||||
| Road and rail 1.3% | |||||||||||||||||
| Union Pacific Corp. | 275,252 | 21,896,297 | |||||||||||||||
| Information technology 30.9% | 524,326,188 | ||||||||||||||||
| Internet software and services 9.9% | |||||||||||||||||
| Alphabet, Inc., Class A (I) | 53,166 | 40,560,341 | |||||||||||||||
| Alphabet, Inc., Class C (I) | 78,946 | 58,810,823 | |||||||||||||||
| Facebook, Inc., Class A (I) | 596,348 | 68,043,307 | |||||||||||||||
| Shares | Value | ||||||||||||||||
| Information technology (continued) | |||||||||||||||||
| IT services 3.8% | |||||||||||||||||
| MasterCard, Inc., Class A | 186,602 | $17,633,889 | |||||||||||||||
| Visa, Inc., Class A | 607,617 | 46,470,548 | |||||||||||||||
| Semiconductors and semiconductor equipment 2.0% | |||||||||||||||||
| NXP Semiconductors NV (I) | 204,167 | 16,551,819 | |||||||||||||||
| QUALCOMM, Inc. | 350,332 | 17,915,978 | |||||||||||||||
| Software 7.6% | |||||||||||||||||
| Electronic Arts, Inc. (I) | 473,151 | 31,280,013 | |||||||||||||||
| Microsoft Corp. | 1,169,058 | 64,567,073 | |||||||||||||||
| Mobileye NV (I)(L) | 105,899 | 3,948,974 | |||||||||||||||
| salesforce.com, Inc. (I) | 276,534 | 20,416,505 | |||||||||||||||
| The Ultimate Software Group, Inc. (I) | 49,265 | 9,532,778 | |||||||||||||||
| Technology hardware, storage and peripherals 7.6% | |||||||||||||||||
| Apple, Inc. | 1,179,871 | 128,594,140 | |||||||||||||||
| Materials 1.2% | 20,854,539 | ||||||||||||||||
| Chemicals 1.2% | |||||||||||||||||
| PPG Industries, Inc. | 187,053 | 20,854,539 | |||||||||||||||
| Yield (%) | Shares | Value | |||||||||||||||
| Securities lending collateral 0.2% | $3,606,995 | ||||||||||||||||
| (Cost $3,606,667) | |||||||||||||||||
| John Hancock Collateral Trust (W) | 0.4918(Y) | 360,472 | 3,606,995 | ||||||||||||||
| Par value^ | Value | ||||||||||||||||
| Short-term investments 0.9% | $14,380,000 | ||||||||||||||||
| (Cost $14,380,000) | |||||||||||||||||
| Repurchase agreement 0.9% | 14,380,000 | ||||||||||||||||
| Repurchase Agreement with State Street Corp. dated 3-31-16 at 0.030% to be repurchased at $14,380,012 on 4-1-16, collateralized by $14,650,000 Federal Home Loan Mortgage Corp., 1.250% due 3-30-18 (valued at $14,669,045, including interest) | 14,380,000 | 14,380,000 | |||||||||||||||
| Total investments (Cost $1,284,839,921)† 96.5% | $1,635,048,000 | ||||||||||||||||
| Other assets and liabilities, net 3.5% | $59,845,860 | ||||||||||||||||
| Total net assets 100.0% | $1,694,893,860 | ||||||||||||||||
| The percentage shown for each investment category is the total value of the category as a percentage of the net assets of the fund. | |||||||||||||||||
| ^All par values are denominated in U.S. dollars unless otherwise indicated. | |||||||||||||||||
| Key to Security Abbreviations and Legend | |||||||||||||||||
| (I) | Non-income producing security. | ||||||||||||||||
| (L) | A portion of this security is on loan as of 3-31-16. | ||||||||||||||||
| (W) | Investment is an affiliate of the fund, the advisor and/or subadvisor. This security represents the investment of cash collateral received for securities lending. | ||||||||||||||||
| (Y) | The rate shown is the annualized seven-day yield as of 3-31-16. | ||||||||||||||||
| † | At 3-31-16, the aggregate cost of investment securities for federal income tax purposes was $1,286,570,665. Net unrealized appreciation aggregated to $348,477,335, of which $368,919,151 related to appreciated investment securities and $20,441,816 related to depreciated investment securities. | ||||||||||||||||
Financial statements
STATEMENT OF ASSETS AND LIABILITIES 3-31-16
| Assets | ||||||||||||||||||||||||||||||
| Unaffiliated investments, at value (Cost $1,281,233,254) including $3,538,821 of securities loaned | $1,631,441,005 | |||||||||||||||||||||||||||||
| Affiliated investments, at value (Cost $3,606,667) | 3,606,995 | |||||||||||||||||||||||||||||
| Total investments, at value (Cost $1,284,839,921) | 1,635,048,000 | |||||||||||||||||||||||||||||
| Cash | 65,683,835 | |||||||||||||||||||||||||||||
| Receivable for investments sold | 9,300,467 | |||||||||||||||||||||||||||||
| Receivable for fund shares sold | 70,800 | |||||||||||||||||||||||||||||
| Dividends and interest receivable | 977,858 | |||||||||||||||||||||||||||||
| Receivable for securities lending income | 4,359 | |||||||||||||||||||||||||||||
| Other receivables and prepaid expenses | 62,692 | |||||||||||||||||||||||||||||
| Total assets | 1,711,148,011 | |||||||||||||||||||||||||||||
| Liabilities | ||||||||||||||||||||||||||||||
| Payable for investments purchased | 1,378,200 | |||||||||||||||||||||||||||||
| Payable for fund shares repurchased | 10,875,617 | |||||||||||||||||||||||||||||
| Payable upon return of securities loaned | 3,606,200 | |||||||||||||||||||||||||||||
| Payable to affiliates | ||||||||||||||||||||||||||||||
| Accounting and legal services fees | 17,070 | |||||||||||||||||||||||||||||
| Transfer agent fees | 2,990 | |||||||||||||||||||||||||||||
| Trustees' fees | 289 | |||||||||||||||||||||||||||||
| Investment management fees | 15 | |||||||||||||||||||||||||||||
| Other liabilities and accrued expenses | 373,770 | |||||||||||||||||||||||||||||
| Total liabilities | 16,254,151 | |||||||||||||||||||||||||||||
| Net assets | $1,694,893,860 | |||||||||||||||||||||||||||||
| Net assets consist of | ||||||||||||||||||||||||||||||
| Paid-in capital | $1,328,017,717 | |||||||||||||||||||||||||||||
| Undistributed net investment income | 574,004 | |||||||||||||||||||||||||||||
| Accumulated net realized gain (loss) on investments | 16,094,060 | |||||||||||||||||||||||||||||
| Net unrealized appreciation (depreciation) on investments | 350,208,079 | |||||||||||||||||||||||||||||
| Net assets | $1,694,893,860 | |||||||||||||||||||||||||||||
STATEMENT OF ASSETS AND LIABILITIES (continued)
| Net asset value per share | ||||||||||||||||||
| Based on net asset values and shares outstanding-the fund has an unlimited number of shares authorized with no par value | ||||||||||||||||||
| Class A ($18,168,592 ÷ 1,185,376 shares)1 | $15.33 | |||||||||||||||||
| Class C ($863,022 ÷ 56,322 shares)1 | $15.32 | |||||||||||||||||
| Class I ($9,849,254 ÷ 639,241 shares) | $15.41 | |||||||||||||||||
| Class R2 ($93,560 ÷ 6,061 shares) | $15.44 | |||||||||||||||||
| Class R4 ($93,524 ÷ 6,061 shares) | $15.43 | |||||||||||||||||
| Class R6 ($93,482 ÷ 6,061 shares) | $15.42 | |||||||||||||||||
| Class NAV ($1,665,732,426 ÷ 108,011,467 shares) | $15.42 | |||||||||||||||||
| Maximum offering price per share | ||||||||||||||||||
| Class A (net asset value per share ÷ 95%)2 | $16.14 | |||||||||||||||||
| 1 | Redemption price per share is equal to net asset value less any applicable contingent deferred sales charge. | ||||||||||||||||
| 2 | On single retail sales of less than $50,000. On sales of $50,000 or more and on group sales the offering price is reduced. | ||||||||||||||||
STATEMENT OF OPERATIONS For the year ended 3-31-16
| Investment income | ||||||||||||||||||||||||
| Dividends | $25,776,623 | |||||||||||||||||||||||
| Securities lending | 52,035 | |||||||||||||||||||||||
| Interest | 3,435 | |||||||||||||||||||||||
| Less foreign taxes withheld | (19,183 | ) | ||||||||||||||||||||||
| Total investment income | 25,812,910 | |||||||||||||||||||||||
| Expenses | ||||||||||||||||||||||||
| Investment management fees | 12,938,052 | |||||||||||||||||||||||
| Distribution and service fees | 58,870 | |||||||||||||||||||||||
| Accounting and legal services fees | 248,810 | |||||||||||||||||||||||
| Transfer agent fees | 36,351 | |||||||||||||||||||||||
| Trustees' fees | 26,924 | |||||||||||||||||||||||
| State registration fees | 82,103 | |||||||||||||||||||||||
| Printing and postage | 12,568 | |||||||||||||||||||||||
| Professional fees | 103,611 | |||||||||||||||||||||||
| Custodian fees | 214,021 | |||||||||||||||||||||||
| Registration and filing fees | 71,106 | |||||||||||||||||||||||
| Other | 291,081 | |||||||||||||||||||||||
| Total expenses | 14,083,497 | |||||||||||||||||||||||
| Less expense reductions | (157,714 | ) | ||||||||||||||||||||||
| Net expenses | 13,925,783 | |||||||||||||||||||||||
| Net investment income | 11,887,127 | |||||||||||||||||||||||
| Realized and unrealized gain (loss) | ||||||||||||||||||||||||
| Net realized gain (loss) on | ||||||||||||||||||||||||
| Unaffiliated investments | 45,484,345 | |||||||||||||||||||||||
| Affiliated investments | 340 | |||||||||||||||||||||||
| 45,484,685 | ||||||||||||||||||||||||
| Change in net unrealized appreciation (depreciation) of | ||||||||||||||||||||||||
| Unaffiliated investments | (76,310,682 | ) | ||||||||||||||||||||||
| Affiliated investments | 328 | |||||||||||||||||||||||
| (76,310,354 | ) | |||||||||||||||||||||||
| Net realized and unrealized loss | (30,825,669 | ) | ||||||||||||||||||||||
| Decrease in net assets from operations | ($18,938,542 | ) | ||||||||||||||||||||||
STATEMENTS OF CHANGES IN NET ASSETS
| Year ended 3-31-16 | Year ended 3-31-15 | ||||||||||||||||||||||||||||||||||||||||||||
| Increase (decrease) in net assets | |||||||||||||||||||||||||||||||||||||||||||||
| From operations | |||||||||||||||||||||||||||||||||||||||||||||
| Net investment income | $11,887,127 | $14,453,128 | |||||||||||||||||||||||||||||||||||||||||||
| Net realized gain | 45,484,685 | 140,862,498 | |||||||||||||||||||||||||||||||||||||||||||
| Change in net unrealized appreciation (depreciation) | (76,310,354 | ) | 145,254,820 | ||||||||||||||||||||||||||||||||||||||||||
| Increase (decrease) in net assets resulting from operations | (18,938,542 | ) | 300,570,446 | ||||||||||||||||||||||||||||||||||||||||||
| Distributions to shareholders | |||||||||||||||||||||||||||||||||||||||||||||
| From net investment income | |||||||||||||||||||||||||||||||||||||||||||||
| Class A | (53,812 | ) | — | ||||||||||||||||||||||||||||||||||||||||||
| Class I | (77,682 | ) | (7,670 | ) | |||||||||||||||||||||||||||||||||||||||||
| Class R2 | (111 | ) | — | ||||||||||||||||||||||||||||||||||||||||||
| Class R4 | (344 | ) | — | ||||||||||||||||||||||||||||||||||||||||||
| Class R6 | (790 | ) | — | ||||||||||||||||||||||||||||||||||||||||||
| Class NAV | (14,002,668 | ) | (10,952,106 | ) | |||||||||||||||||||||||||||||||||||||||||
| From net realized gain | |||||||||||||||||||||||||||||||||||||||||||||
| Class A | (905,789 | ) | (998,273 | ) | |||||||||||||||||||||||||||||||||||||||||
| Class C | (41,821 | ) | (16,646 | ) | |||||||||||||||||||||||||||||||||||||||||
| Class I | (613,676 | ) | (165,697 | ) | |||||||||||||||||||||||||||||||||||||||||
| Class R2 | (5,142 | ) | — | ||||||||||||||||||||||||||||||||||||||||||
| Class R4 | (5,142 | ) | — | ||||||||||||||||||||||||||||||||||||||||||
| Class R6 | (5,142 | ) | — | ||||||||||||||||||||||||||||||||||||||||||
| Class NAV | (91,112,925 | ) | (151,510,488 | ) | |||||||||||||||||||||||||||||||||||||||||
| Total distributions | (106,825,044 | ) | (163,650,880 | ) | |||||||||||||||||||||||||||||||||||||||||
| From fund share transactions | (288,801,728 | ) | 508,654,024 | ||||||||||||||||||||||||||||||||||||||||||
| Total increase (decrease) | (414,565,314 | ) | 645,573,590 | ||||||||||||||||||||||||||||||||||||||||||
| Net assets | |||||||||||||||||||||||||||||||||||||||||||||
| Beginning of year | 2,109,459,174 | 1,463,885,584 | |||||||||||||||||||||||||||||||||||||||||||
| End of year | $1,694,893,860 | $2,109,459,174 | |||||||||||||||||||||||||||||||||||||||||||
| Undistributed net investment income | $574,004 | $4,849,319 | |||||||||||||||||||||||||||||||||||||||||||
Financial highlights
| Class A Shares Period ended | 3-31-16 | 3-31-15 | 3-31-14 | 3-31-13 | 3-31-12 | 1 | |||||||||||||||||||||||||||||||||||||||||||||||||||||||||||||||||||||||||||||||||||||||||||||||||
| Per share operating performance | |||||||||||||||||||||||||||||||||||||||||||||||||||||||||||||||||||||||||||||||||||||||||||||||||||||||
| Net asset value, beginning of period | $16.44 | $15.50 | $12.62 | $12.14 | $10.00 | ||||||||||||||||||||||||||||||||||||||||||||||||||||||||||||||||||||||||||||||||||||||||||||||||||
| Net investment income (loss)2 | 0.03 | 0.03 | (0.04 | ) | 0.02 | (0.01 | ) | ||||||||||||||||||||||||||||||||||||||||||||||||||||||||||||||||||||||||||||||||||||||||||||||||
| Net realized and unrealized gain (loss) on investments | (0.24 | ) | 2.14 | 3.46 | 0.49 | 2.15 | |||||||||||||||||||||||||||||||||||||||||||||||||||||||||||||||||||||||||||||||||||||||||||||||||
| Total from investment operations | (0.21 | ) | 2.17 | 3.42 | 0.51 | 2.14 | |||||||||||||||||||||||||||||||||||||||||||||||||||||||||||||||||||||||||||||||||||||||||||||||||
| Less distributions | |||||||||||||||||||||||||||||||||||||||||||||||||||||||||||||||||||||||||||||||||||||||||||||||||||||||
| From net investment income | (0.05 | ) | — | — | — | — | 3 | ||||||||||||||||||||||||||||||||||||||||||||||||||||||||||||||||||||||||||||||||||||||||||||||||
| From net realized gain | (0.85 | ) | (1.23 | ) | (0.54 | ) | (0.03 | ) | — | ||||||||||||||||||||||||||||||||||||||||||||||||||||||||||||||||||||||||||||||||||||||||||||||
| Total distributions | (0.90 | ) | (1.23 | ) | (0.54 | ) | (0.03 | ) | — | 3 | |||||||||||||||||||||||||||||||||||||||||||||||||||||||||||||||||||||||||||||||||||||||||||||
| Net asset value, end of period | $15.33 | $16.44 | $15.50 | $12.62 | $12.14 | ||||||||||||||||||||||||||||||||||||||||||||||||||||||||||||||||||||||||||||||||||||||||||||||||||
| Total return (%)4,5 | (1.45 | ) | 14.68 | 27.27 | 4.25 | 21.41 | 6 | ||||||||||||||||||||||||||||||||||||||||||||||||||||||||||||||||||||||||||||||||||||||||||||||||
| Ratios and supplemental data | |||||||||||||||||||||||||||||||||||||||||||||||||||||||||||||||||||||||||||||||||||||||||||||||||||||||
| Net assets, end of period (in millions) | $18 | $18 | $10 | $5 | $3 | ||||||||||||||||||||||||||||||||||||||||||||||||||||||||||||||||||||||||||||||||||||||||||||||||||
| Ratios (as a percentage of average net assets): | |||||||||||||||||||||||||||||||||||||||||||||||||||||||||||||||||||||||||||||||||||||||||||||||||||||||
| Expenses before reductions | 1.19 | 1.33 | 1.51 | 2.01 | 2.05 | 7 | |||||||||||||||||||||||||||||||||||||||||||||||||||||||||||||||||||||||||||||||||||||||||||||||||
| Expenses including reductions | 1.18 | 1.30 | 1.30 | 1.30 | 1.30 | 7 | |||||||||||||||||||||||||||||||||||||||||||||||||||||||||||||||||||||||||||||||||||||||||||||||||
| Net investment income (loss) | 0.20 | 0.16 | (0.29 | ) | 0.18 | (0.32 | ) 7 | ||||||||||||||||||||||||||||||||||||||||||||||||||||||||||||||||||||||||||||||||||||||||||||||||
| Portfolio turnover (%) | 90 | 109 | 91 | 100 | 26 | ||||||||||||||||||||||||||||||||||||||||||||||||||||||||||||||||||||||||||||||||||||||||||||||||||
| 1 | Period from 12-19-11 (commencement of operations) to 3-31-12. | ||||||||||||||||||||||||||||||||||||||||||||||||||||||||||||||||||||||||||||||||||
| 2 | Based on average daily shares outstanding. | ||||||||||||||||||||||||||||||||||||||||||||||||||||||||||||||||||||||||||||||||||
| 3 | Less than $0.005 per share. | ||||||||||||||||||||||||||||||||||||||||||||||||||||||||||||||||||||||||||||||||||
| 4 | Does not reflect the effect of sales charges, if any. | ||||||||||||||||||||||||||||||||||||||||||||||||||||||||||||||||||||||||||||||||||
| 5 | Total returns would have been lower had certain expenses not been reduced during the applicable periods. | ||||||||||||||||||||||||||||||||||||||||||||||||||||||||||||||||||||||||||||||||||
| 6 | Not annualized. | ||||||||||||||||||||||||||||||||||||||||||||||||||||||||||||||||||||||||||||||||||
| 7 | Annualized. | ||||||||||||||||||||||||||||||||||||||||||||||||||||||||||||||||||||||||||||||||||
| Class C Shares Period ended | 3-31-16 | 3-31-15 | 1 | |||||||||||||||||||||||||||||||||||||||||||||||
| Per share operating performance | ||||||||||||||||||||||||||||||||||||||||||||||||||
| Net asset value, beginning of period | $16.51 | $16.49 | ||||||||||||||||||||||||||||||||||||||||||||||||
| Net investment loss2 | (0.09 | ) | (0.04 | ) | ||||||||||||||||||||||||||||||||||||||||||||||
| Net realized and unrealized gain (loss) on investments | (0.25 | ) | 1.29 | |||||||||||||||||||||||||||||||||||||||||||||||
| Total from investment operations | (0.34 | ) | 1.25 | |||||||||||||||||||||||||||||||||||||||||||||||
| Less distributions | ||||||||||||||||||||||||||||||||||||||||||||||||||
| From net realized gain | (0.85 | ) | (1.23 | ) | ||||||||||||||||||||||||||||||||||||||||||||||
| Total distributions | (0.85 | ) | (1.23 | ) | ||||||||||||||||||||||||||||||||||||||||||||||
| Net asset value, end of period | $15.32 | $16.51 | ||||||||||||||||||||||||||||||||||||||||||||||||
| Total return (%)3,4 | (2.24 | ) | 8.20 | 5 | ||||||||||||||||||||||||||||||||||||||||||||||
| Ratios and supplemental data | ||||||||||||||||||||||||||||||||||||||||||||||||||
| Net assets, end of period (in millions) | $1 | $1 | ||||||||||||||||||||||||||||||||||||||||||||||||
| Ratios (as a percentage of average net assets): | ||||||||||||||||||||||||||||||||||||||||||||||||||
| Expenses before reductions | 2.50 | 7.03 | 6 | |||||||||||||||||||||||||||||||||||||||||||||||
| Expenses including reductions | 1.94 | 2.05 | 6 | |||||||||||||||||||||||||||||||||||||||||||||||
| Net investment loss | (0.54 | ) | (0.42 | ) 6 | ||||||||||||||||||||||||||||||||||||||||||||||
| Portfolio turnover (%) | 90 | 109 | 7 | |||||||||||||||||||||||||||||||||||||||||||||||
| 1 | The inception date for Class C shares is 8-28-14. | ||||||||||||||||||||||||||||||||||||||||||||||||||||||||||
| 2 | Based on average daily shares outstanding. | ||||||||||||||||||||||||||||||||||||||||||||||||||||||||||
| 3 | Total returns would have been lower had certain expenses not been reduced during the period. | ||||||||||||||||||||||||||||||||||||||||||||||||||||||||||
| 4 | Does not reflect the effect of sales charges, if any. | ||||||||||||||||||||||||||||||||||||||||||||||||||||||||||
| 5 | Not annualized. | ||||||||||||||||||||||||||||||||||||||||||||||||||||||||||
| 6 | Annualized. | ||||||||||||||||||||||||||||||||||||||||||||||||||||||||||
| 7 | The portfolio turnover is shown for the period from 4-1-14 to 3-31-15. | ||||||||||||||||||||||||||||||||||||||||||||||||||||||||||
| Class I Shares Period ended | 3-31-16 | 3-31-15 | 3-31-14 | 3-31-13 | 3-31-12 | 1 | |||||||||||||||||||||||||||||||||||||||||||||||||||||||||||||||||||||||||||||||||||||||||||||||||
| Per share operating performance | |||||||||||||||||||||||||||||||||||||||||||||||||||||||||||||||||||||||||||||||||||||||||||||||||||||||
| Net asset value, beginning of period | $16.53 | $15.58 | $12.67 | $12.16 | $10.00 | ||||||||||||||||||||||||||||||||||||||||||||||||||||||||||||||||||||||||||||||||||||||||||||||||||
| Net investment income2 | 0.08 | 0.10 | 0.01 | 0.06 | — | 3 | |||||||||||||||||||||||||||||||||||||||||||||||||||||||||||||||||||||||||||||||||||||||||||||||||
| Net realized and unrealized gain (loss) on investments | (0.24 | ) | 2.14 | 3.47 | 0.50 | 2.16 | |||||||||||||||||||||||||||||||||||||||||||||||||||||||||||||||||||||||||||||||||||||||||||||||||
| Total from investment operations | (0.16 | ) | 2.24 | 3.48 | 0.56 | 2.16 | |||||||||||||||||||||||||||||||||||||||||||||||||||||||||||||||||||||||||||||||||||||||||||||||||
| Less distributions | |||||||||||||||||||||||||||||||||||||||||||||||||||||||||||||||||||||||||||||||||||||||||||||||||||||||
| From net investment income | (0.11 | ) | (0.06 | ) | (0.03 | ) | (0.02 | ) | — | 3 | |||||||||||||||||||||||||||||||||||||||||||||||||||||||||||||||||||||||||||||||||||||||||||||
| From net realized gain | (0.85 | ) | (1.23 | ) | (0.54 | ) | (0.03 | ) | — | ||||||||||||||||||||||||||||||||||||||||||||||||||||||||||||||||||||||||||||||||||||||||||||||
| Total distributions | (0.96 | ) | (1.29 | ) | (0.57 | ) | (0.05 | ) | — | 3 | |||||||||||||||||||||||||||||||||||||||||||||||||||||||||||||||||||||||||||||||||||||||||||||
| Net asset value, end of period | $15.41 | $16.53 | $15.58 | $12.67 | $12.16 | ||||||||||||||||||||||||||||||||||||||||||||||||||||||||||||||||||||||||||||||||||||||||||||||||||
| Total return (%)4 | (1.17 | ) | 15.07 | 27.68 | 4.62 | 21.63 | 5 | ||||||||||||||||||||||||||||||||||||||||||||||||||||||||||||||||||||||||||||||||||||||||||||||||
| Ratios and supplemental data | |||||||||||||||||||||||||||||||||||||||||||||||||||||||||||||||||||||||||||||||||||||||||||||||||||||||
| Net assets, end of period (in millions) | $10 | $12 | $2 | $1 | — | 6 | |||||||||||||||||||||||||||||||||||||||||||||||||||||||||||||||||||||||||||||||||||||||||||||||||
| Ratios (as a percentage of average net assets): | |||||||||||||||||||||||||||||||||||||||||||||||||||||||||||||||||||||||||||||||||||||||||||||||||||||||
| Expenses before reductions | 0.90 | 1.50 | 2.62 | 5.88 | 11.44 | 7 | |||||||||||||||||||||||||||||||||||||||||||||||||||||||||||||||||||||||||||||||||||||||||||||||||
| Expenses including reductions | 0.88 | 0.94 | 0.94 | 0.94 | 0.94 | 7 | |||||||||||||||||||||||||||||||||||||||||||||||||||||||||||||||||||||||||||||||||||||||||||||||||
| Net investment income | 0.50 | 0.62 | 0.09 | 0.51 | 0.14 | 7 | |||||||||||||||||||||||||||||||||||||||||||||||||||||||||||||||||||||||||||||||||||||||||||||||||
| Portfolio turnover (%) | 90 | 109 | 91 | 100 | 26 | ||||||||||||||||||||||||||||||||||||||||||||||||||||||||||||||||||||||||||||||||||||||||||||||||||
| 1 | Period from 12-19-11 (commencement of operations) to 3-31-12. | ||||||||||||||||||||||||||||||||||||||||||||||||||||||||||||||||||||||||||||||||||
| 2 | Based on average daily shares outstanding. | ||||||||||||||||||||||||||||||||||||||||||||||||||||||||||||||||||||||||||||||||||
| 3 | Less than $0.005 per share. | ||||||||||||||||||||||||||||||||||||||||||||||||||||||||||||||||||||||||||||||||||
| 4 | Total returns would have been lower had certain expenses not been reduced during the applicable periods. | ||||||||||||||||||||||||||||||||||||||||||||||||||||||||||||||||||||||||||||||||||
| 5 | Not annualized. | ||||||||||||||||||||||||||||||||||||||||||||||||||||||||||||||||||||||||||||||||||
| 6 | Less than $500,000. | ||||||||||||||||||||||||||||||||||||||||||||||||||||||||||||||||||||||||||||||||||
| 7 | Annualized. | ||||||||||||||||||||||||||||||||||||||||||||||||||||||||||||||||||||||||||||||||||
| Class R2 Shares Period ended | 3-31-16 | 3-31-15 | 1 | |||||||||||||||||||||||||||||||||||||||||||||||
| Per share operating performance | ||||||||||||||||||||||||||||||||||||||||||||||||||
| Net asset value, beginning of period | $16.55 | $16.50 | ||||||||||||||||||||||||||||||||||||||||||||||||
| Net investment loss2 | 0.01 | — | 3 | |||||||||||||||||||||||||||||||||||||||||||||||
| Net realized and unrealized gain on investments | (0.25 | ) | 0.05 | |||||||||||||||||||||||||||||||||||||||||||||||
| Total from investment operations | (0.24 | ) | 0.05 | |||||||||||||||||||||||||||||||||||||||||||||||
| Less distributions | ||||||||||||||||||||||||||||||||||||||||||||||||||
| From net investment income | (0.02 | ) | — | |||||||||||||||||||||||||||||||||||||||||||||||
| From net realized gain | (0.85 | ) | — | |||||||||||||||||||||||||||||||||||||||||||||||
| Total distributions | (0.87 | ) | — | |||||||||||||||||||||||||||||||||||||||||||||||
| Net asset value, end of period | $15.44 | $16.55 | ||||||||||||||||||||||||||||||||||||||||||||||||
| Total return (%)4 | (1.63 | ) | 0.30 | 5 | ||||||||||||||||||||||||||||||||||||||||||||||
| Ratios and supplemental data | ||||||||||||||||||||||||||||||||||||||||||||||||||
| Net assets, end of period (in millions) | — | 6 | — | 6 | ||||||||||||||||||||||||||||||||||||||||||||||
| Ratios (as a percentage of average net assets): | ||||||||||||||||||||||||||||||||||||||||||||||||||
| Expenses before reductions | 4.73 | 15.09 | 7 | |||||||||||||||||||||||||||||||||||||||||||||||
| Expenses including reductions | 1.32 | 1.43 | 7 | |||||||||||||||||||||||||||||||||||||||||||||||
| Net investment loss | 0.06 | — | 7,8 | |||||||||||||||||||||||||||||||||||||||||||||||
| Portfolio turnover (%) | 90 | 109 | 9 | |||||||||||||||||||||||||||||||||||||||||||||||
| 1 | The inception date for Class R2 shares is 3-27-15. | ||||||||||||||||||||||||||||||||||||||||||||||||||||||||||
| 2 | Based on average daily shares outstanding. | ||||||||||||||||||||||||||||||||||||||||||||||||||||||||||
| 3 | Less than $0.005 per share. | ||||||||||||||||||||||||||||||||||||||||||||||||||||||||||
| 4 | Total returns would have been lower had certain expenses not been reduced during the period. | ||||||||||||||||||||||||||||||||||||||||||||||||||||||||||
| 5 | Not annualized. | ||||||||||||||||||||||||||||||||||||||||||||||||||||||||||
| 6 | Less than $500,000. | ||||||||||||||||||||||||||||||||||||||||||||||||||||||||||
| 7 | Annualized. | ||||||||||||||||||||||||||||||||||||||||||||||||||||||||||
| 8 | Less than 0.005%. | ||||||||||||||||||||||||||||||||||||||||||||||||||||||||||
| 9 | The portfolio turnover is shown for the period from 4-1-14 to 3-31-15. | ||||||||||||||||||||||||||||||||||||||||||||||||||||||||||
| Class R4 Shares Period ended | 3-31-16 | 3-31-15 | 1 | |||||||||||||||||||||||||||||||||||||||||||||||
| Per share operating performance | ||||||||||||||||||||||||||||||||||||||||||||||||||
| Net asset value, beginning of period | $16.55 | $16.50 | ||||||||||||||||||||||||||||||||||||||||||||||||
| Net investment income2 | 0.04 | — | 3 | |||||||||||||||||||||||||||||||||||||||||||||||
| Net realized and unrealized gain (loss) on investments | (0.25 | ) | 0.05 | |||||||||||||||||||||||||||||||||||||||||||||||
| Total from investment operations | (0.21 | ) | 0.05 | |||||||||||||||||||||||||||||||||||||||||||||||
| Less distributions | ||||||||||||||||||||||||||||||||||||||||||||||||||
| From net investment income | (0.06 | ) | — | |||||||||||||||||||||||||||||||||||||||||||||||
| From net realized gain | (0.85 | ) | — | |||||||||||||||||||||||||||||||||||||||||||||||
| Total distributions | (0.91 | ) | — | |||||||||||||||||||||||||||||||||||||||||||||||
| Net asset value, end of period | $15.43 | $16.55 | ||||||||||||||||||||||||||||||||||||||||||||||||
| Total return (%)4 | (1.47 | ) | 0.30 | 5 | ||||||||||||||||||||||||||||||||||||||||||||||
| Ratios and supplemental data | ||||||||||||||||||||||||||||||||||||||||||||||||||
| Net assets, end of period (in millions) | — | 6 | — | 6 | ||||||||||||||||||||||||||||||||||||||||||||||
| Ratios (as a percentage of average net assets): | ||||||||||||||||||||||||||||||||||||||||||||||||||
| Expenses before reductions | 4.73 | 15.09 | 7 | |||||||||||||||||||||||||||||||||||||||||||||||
| Expenses including reductions | 1.13 | 1.18 | 7 | |||||||||||||||||||||||||||||||||||||||||||||||
| Net investment income | 0.25 | 0.18 | 7 | |||||||||||||||||||||||||||||||||||||||||||||||
| Portfolio turnover (%) | 90 | 109 | 8 | |||||||||||||||||||||||||||||||||||||||||||||||
| 1 | The inception date for Class R4 shares is 3-27-15. | ||||||||||||||||||||||||||||||||||||||||||||||||||||||||||
| 2 | Based on average daily shares outstanding. | ||||||||||||||||||||||||||||||||||||||||||||||||||||||||||
| 3 | Less than $0.005 per share. | ||||||||||||||||||||||||||||||||||||||||||||||||||||||||||
| 4 | Total returns would have been lower had certain expenses not been reduced during the period. | ||||||||||||||||||||||||||||||||||||||||||||||||||||||||||
| 5 | Not annualized. | ||||||||||||||||||||||||||||||||||||||||||||||||||||||||||
| 6 | Less than $500,000. | ||||||||||||||||||||||||||||||||||||||||||||||||||||||||||
| 7 | Annualized. | ||||||||||||||||||||||||||||||||||||||||||||||||||||||||||
| 8 | The portfolio turnover is shown for the period from 4-1-14 to 3-31-15. | ||||||||||||||||||||||||||||||||||||||||||||||||||||||||||
| Class R6 Shares Period ended | 3-31-16 | 3-31-15 | 1 | |||||||||||||||||||||||||||||||||||||||||||||||
| Per share operating performance | ||||||||||||||||||||||||||||||||||||||||||||||||||
| Net asset value, beginning of period | $16.55 | $16.50 | ||||||||||||||||||||||||||||||||||||||||||||||||
| Net investment loss2 | 0.10 | — | 3 | |||||||||||||||||||||||||||||||||||||||||||||||
| Net realized and unrealized gain on investments | (0.25 | ) | 0.05 | |||||||||||||||||||||||||||||||||||||||||||||||
| Total from investment operations | (0.15 | ) | 0.05 | |||||||||||||||||||||||||||||||||||||||||||||||
| Less distributions | ||||||||||||||||||||||||||||||||||||||||||||||||||
| From net investment income | (0.13 | ) | — | |||||||||||||||||||||||||||||||||||||||||||||||
| From net realized gain | (0.85 | ) | — | |||||||||||||||||||||||||||||||||||||||||||||||
| Total distributions | (0.98 | ) | — | |||||||||||||||||||||||||||||||||||||||||||||||
| Net asset value, end of period | $15.42 | $16.55 | ||||||||||||||||||||||||||||||||||||||||||||||||
| Total return (%)4 | (1.09 | ) | 0.30 | 5 | ||||||||||||||||||||||||||||||||||||||||||||||
| Ratios and supplemental data | ||||||||||||||||||||||||||||||||||||||||||||||||||
| Net assets, end of period (in millions) | — | 6 | — | 6 | ||||||||||||||||||||||||||||||||||||||||||||||
| Ratios (as a percentage of average net assets): | ||||||||||||||||||||||||||||||||||||||||||||||||||
| Expenses before reductions | 4.75 | 15.91 | 7 | |||||||||||||||||||||||||||||||||||||||||||||||
| Expenses including reductions | 0.73 | 0.81 | 7 | |||||||||||||||||||||||||||||||||||||||||||||||
| Net investment loss | 0.65 | 0.63 | 7 | |||||||||||||||||||||||||||||||||||||||||||||||
| Portfolio turnover (%) | 90 | 109 | 8 | |||||||||||||||||||||||||||||||||||||||||||||||
| 1 | The inception date for Class R6 shares is 3-27-15. | ||||||||||||||||||||||||||||||||||||||||||||||||||||||||||
| 2 | Based on average daily shares outstanding. | ||||||||||||||||||||||||||||||||||||||||||||||||||||||||||
| 3 | Less than $0.005 per share. | ||||||||||||||||||||||||||||||||||||||||||||||||||||||||||
| 4 | Total returns would have been lower had certain expenses not been reduced during the period. | ||||||||||||||||||||||||||||||||||||||||||||||||||||||||||
| 5 | Not annualized. | ||||||||||||||||||||||||||||||||||||||||||||||||||||||||||
| 6 | Less than $500,000. | ||||||||||||||||||||||||||||||||||||||||||||||||||||||||||
| 7 | Annualized. | ||||||||||||||||||||||||||||||||||||||||||||||||||||||||||
| 8 | The portfolio turnover is shown for the period from 4-1-14 to 3-31-15. | ||||||||||||||||||||||||||||||||||||||||||||||||||||||||||
| Class NAV Shares Period ended | 3-31-16 | 3-31-15 | 3-31-14 | 3-31-13 | 3-31-12 | 1 | |||||||||||||||||||||||||||||||||||||||||||||||||||||||||||||||||||||||||||||||||||||||||||||||||
| Per share operating performance | |||||||||||||||||||||||||||||||||||||||||||||||||||||||||||||||||||||||||||||||||||||||||||||||||||||||
| Net asset value, beginning of period | $16.55 | $15.58 | $12.67 | $12.16 | $10.00 | ||||||||||||||||||||||||||||||||||||||||||||||||||||||||||||||||||||||||||||||||||||||||||||||||||
| Net investment income2 | 0.10 | 0.12 | 0.04 | 0.08 | — | 3 | |||||||||||||||||||||||||||||||||||||||||||||||||||||||||||||||||||||||||||||||||||||||||||||||||
| Net realized and unrealized gain (loss) on investments | (0.25 | ) | 2.17 | 3.47 | 0.50 | 2.16 | |||||||||||||||||||||||||||||||||||||||||||||||||||||||||||||||||||||||||||||||||||||||||||||||||
| Total from investment operations | (0.15 | ) | 2.29 | 3.51 | 0.58 | 2.16 | |||||||||||||||||||||||||||||||||||||||||||||||||||||||||||||||||||||||||||||||||||||||||||||||||
| Less distributions | |||||||||||||||||||||||||||||||||||||||||||||||||||||||||||||||||||||||||||||||||||||||||||||||||||||||
| From net investment income | (0.13 | ) | (0.09 | ) | (0.06 | ) | (0.04 | ) | — | 3 | |||||||||||||||||||||||||||||||||||||||||||||||||||||||||||||||||||||||||||||||||||||||||||||
| From net realized gain | (0.85 | ) | (1.23 | ) | (0.54 | ) | (0.03 | ) | — | ||||||||||||||||||||||||||||||||||||||||||||||||||||||||||||||||||||||||||||||||||||||||||||||
| Total distributions | (0.98 | ) | (1.32 | ) | (0.60 | ) | (0.07 | ) | — | 3 | |||||||||||||||||||||||||||||||||||||||||||||||||||||||||||||||||||||||||||||||||||||||||||||
| Net asset value, end of period | $15.42 | $16.55 | $15.58 | $12.67 | $12.16 | ||||||||||||||||||||||||||||||||||||||||||||||||||||||||||||||||||||||||||||||||||||||||||||||||||
| Total return (%)4 | (1.09 | ) | 15.43 | 27.88 | 4.80 | 21.63 | 5 | ||||||||||||||||||||||||||||||||||||||||||||||||||||||||||||||||||||||||||||||||||||||||||||||||
| Ratios and supplemental data | |||||||||||||||||||||||||||||||||||||||||||||||||||||||||||||||||||||||||||||||||||||||||||||||||||||||
| Net assets, end of period (in millions) | $1,666 | $2,078 | $1,452 | $1,013 | $336 | ||||||||||||||||||||||||||||||||||||||||||||||||||||||||||||||||||||||||||||||||||||||||||||||||||
| Ratios (as a percentage of average net assets): | |||||||||||||||||||||||||||||||||||||||||||||||||||||||||||||||||||||||||||||||||||||||||||||||||||||||
| Expenses before reductions | 0.74 | 0.72 | 0.74 | 0.78 | 0.85 | 6 | |||||||||||||||||||||||||||||||||||||||||||||||||||||||||||||||||||||||||||||||||||||||||||||||||
| Expenses including reductions | 0.74 | 0.72 | 0.73 | 0.78 | 0.85 | 6 | |||||||||||||||||||||||||||||||||||||||||||||||||||||||||||||||||||||||||||||||||||||||||||||||||
| Net investment income | 0.64 | 0.72 | 0.26 | 0.71 | 0.15 | 6 | |||||||||||||||||||||||||||||||||||||||||||||||||||||||||||||||||||||||||||||||||||||||||||||||||
| Portfolio turnover (%) | 90 | 109 | 91 | 100 | 26 | ||||||||||||||||||||||||||||||||||||||||||||||||||||||||||||||||||||||||||||||||||||||||||||||||||
| 1 | Period from 12-19-11 (commencement of operations) to 3-31-12. | ||||||||||||||||||||||||||||||||||||||||||||||||||||||||||||||||||||||||||||||||||
| 2 | Based on average daily shares outstanding. | ||||||||||||||||||||||||||||||||||||||||||||||||||||||||||||||||||||||||||||||||||
| 3 | Less than 0.005%. | ||||||||||||||||||||||||||||||||||||||||||||||||||||||||||||||||||||||||||||||||||
| 4 | Total returns would have been lower had certain expenses not been reduced during the applicable periods. | ||||||||||||||||||||||||||||||||||||||||||||||||||||||||||||||||||||||||||||||||||
| 5 | Not annualized. | ||||||||||||||||||||||||||||||||||||||||||||||||||||||||||||||||||||||||||||||||||
| 6 | Annualized. | ||||||||||||||||||||||||||||||||||||||||||||||||||||||||||||||||||||||||||||||||||
Note 1 — Organization
John Hancock Strategic Growth Fund (the fund) is a series of John Hancock Funds III (the Trust), an open-end management investment company organized as a Massachusetts business trust and registered under the Investment Company Act of 1940, as amended (the 1940 Act). The investment objective of the fund is to seek long-term capital appreciation.
The fund may offer multiple classes of shares. The shares currently offered are detailed in the Statement of assets and liabilities. Class A and Class C shares are offered to all investors. Class I shares are offered to institutions and certain investors. Class R2 and R4 and shares are available only to certain retirement plans. Class R6 shares are available only to certain retirement plans, institutions and other investors. Class NAV shares are offered to John Hancock affiliated funds of funds and certain 529 plans. Shareholders of each class have exclusive voting rights to matters that affect that class. The distribution and service fees, if any, transfer agent fees, state registration fees and printing and postage for each class may differ.
Note 2 — Significant accounting policies
The financial statements have been prepared in conformity with accounting principles generally accepted in the United States of America (US GAAP), which require management to make certain estimates and assumptions as of the date of the financial statements. Actual results could differ from those estimates and those differences could be significant. The fund qualifies as an investment company under Topic 946 of Accounting Standards Codification of US GAAP.
Events or transactions occurring after the end of the fiscal period through the date that the financial statements were issued have been evaluated in the preparation of the financial statements. The following summarizes the significant accounting policies of the fund:
Security valuation. Investments are stated at value as of the scheduled close of regular trading on the New York Stock Exchange (NYSE), normally at 4:00 p.m., Eastern Time. In case of emergency or other disruption resulting in the NYSE not opening for trading or the NYSE closing at a time other than the regularly scheduled close, the net asset value (NAV) may be determined as of the regularly scheduled close of the NYSE pursuant to the fund's Valuation Policies and Procedures. The time at which shares and transactions are priced and until which orders are accepted may vary to the extent permitted by the Securities and Exchange Commission (SEC) and applicable regulations.
In order to value the securities, the fund uses the following valuation techniques: Equity securities held by the fund are typically valued at the last sale price or official closing price on the exchange or principal market where the security was acquired or most likely will be sold. In the event there were no sales during the day or closing prices are not available, the securities are valued using the last available bid price. Investments by the fund in open-end mutual funds, including John Hancock Collateral Trust (JHCT), are valued at their respective NAVs each business day. Foreign securities and currencies, are valued in U.S. dollars, based on foreign currency exchange rates supplied by an independent pricing vendor.
In certain instances, the Pricing Committee may determine to value equity securities using prices obtained from another exchange or market if trading on the exchange or market on which prices are typically obtained did not open for trading as scheduled, or if trading closed earlier than scheduled, and trading occurred as normal on another exchange or market.
Other portfolio securities and assets, for which reliable market quotations are not readily available, are valued at fair value as determined in good faith by the fund's Pricing Committee following procedures established by the Board of Trustees. The frequency with which these fair valuation procedures are used cannot be predicted and fair value of securities may differ significantly from the value that would have been used had a ready market for such securities existed
The fund uses a three-tier hierarchy to prioritize the pricing assumptions, referred to as inputs, used in valuation techniques to measure fair value. Level 1 includes securities valued using quoted prices in active markets for identical securities. Level 2 includes securities valued using other significant observable inputs. Observable inputs may include quoted prices for similar securities, interest rates, prepayment speeds and credit risk. Prices for securities valued using these inputs are received from independent pricing vendors and brokers and are based on an evaluation of the inputs described. Level 3 includes securities valued using significant unobservable inputs when market prices are not readily available or reliable, including the fund's
own assumptions in determining the fair value of investments. Factors used in determining value may include market or issuer specific events or trends, changes in interest rates and credit quality. The inputs or methodology used for valuing securities are not necessarily an indication of the risks associated with investing in those securities. Changes in valuation techniques and related inputs may result in transfers into or out of an assigned level within the disclosure hierarchy.
As of March 31, 2016, all investments are categorized as Level 1 under the hierarchy described above, except for repurchase agreements which are categorized as Level 2.
Repurchase agreements. The fund may enter into repurchase agreements. When the fund enters into a repurchase agreement, it receives collateral that is held in a segregated account by the fund's custodian. The collateral amount is marked-to-market and monitored on a daily basis to ensure that the collateral held is in an amount not less than the principal amount of the repurchase agreement plus any accrued interest. Collateral received by the fund for repurchase agreements is disclosed in the Fund's investments as part of the caption related to the repurchase agreement.
Repurchase agreements are typically governed by the terms and conditions of the Master Repurchase Agreement and/or Global Master Repurchase Agreement (collectively, MRA). Upon an event of default, the non-defaulting party may close out all transactions traded under the MRA and net amounts owed. Absent an event of default, assets and liabilities resulting from repurchase agreements are not offset in the Statement of assets and liabilities. In the event of a default by the counterparty, realization of the collateral proceeds could be delayed, during which time the collateral value may decline or the counterparty may have insufficient assets to pay back claims resulting from close-out of the transactions.
Security transactions and related investment income. Investment security transactions are accounted for on a trade date plus one basis for daily NAV calculations. However, for financial reporting purposes, investment transactions are reported on trade date. Interest income is accrued as earned. Dividend income is recorded on the ex-date, except for dividends of foreign securities where the dividend may not be known until after the ex-date. In those cases, dividend income, net of withholding taxes, is recorded when the fund becomes aware of the dividends. Foreign taxes are provided for based on the fund's understanding of the tax rules and rates that exist in the foreign markets in which it invests. Gains and losses on securities sold are determined on the basis of identified cost and may include proceeds from litigation.
Securities lending. The fund may lend its securities to earn additional income. The fund receives cash collateral from the borrower in an amount not less than the market value of the loaned securities. The fund will invest its collateral in JHCT, an affiliate of the fund, which has a floating NAV and is registered with the SEC as an investment company. JHCT invests cash received as collateral as part of the securities lending program in short-term money market investments. The fund will receive the benefit of any gains and bear any losses generated by JHCT with respect to the cash collateral.
The fund has the right to recall loaned securities on demand. If a borrower fails to return loaned securities when due, then the lending agent is responsible and indemnifies the fund for the lent securities. The lending agent uses the collateral received from the borrower to purchase replacement securities of the same issue, type, class and series of the loaned securities. If the value of the collateral is less than the purchase cost of replacement securities, the lending agent is responsible for satisfying the shortfall but only to the extent that the shortfall is not due to any decrease in the value of JHCT.
Although the risk of the loss of the securities lent is mitigated by receiving collateral from the borrower and through lending agent indemnification, the fund could experience a delay in recovering securities or could experience a lower than expected return if the borrower fails to return the securities on a timely basis. The fund may receive compensation for lending its securities by retaining a portion of the return on the investment of the collateral and compensation from fees earned from borrowers of the securities. Net income received from JHCT is a component of securities lending income as recorded on the Statement of operations.
Obligations to repay collateral received by the fund are shown on the Statement of assets and liabilities as Payable upon return of securities loaned and are secured by the loaned securities. As of March 31, 2016, the fund loaned common stocks valued at $3,538,821 and received $3,606,200 of cash collateral.
Foreign taxes. The fund may be subject to withholding tax on income and/or capital gains or repatriation taxes imposed by certain countries in which the fund invests. Taxes are accrued based upon investment income, realized gains or unrealized appreciation.
Line of credit. The fund may borrow from banks for temporary or emergency purposes, including meeting redemption requests that otherwise might require the untimely sale of securities. Pursuant to the fund's custodian agreement, the custodian may loan money to the fund to make properly authorized payments. The fund is obligated to repay the custodian for any overdraft, including any related costs or expenses. The custodian may have a lien, security interest or security entitlement in any fund property that is not otherwise segregated or pledged, to the extent of any overdraft, and to the maximum extent permitted by law.
The fund and other affiliated funds entered into a syndicated line of credit agreement, with Citibank, N.A. (Citibank) as the administrative agent, that enables them to participate in a $750 million unsecured committed line of credit. Prior to June 30, 2015, the fund and other affiliated funds had an agreement with Citibank that enabled them to participate in a $300 million unsecured committed line of credit. A commitment fee, payable at the end of each calendar quarter, based on the average daily unused portion of the effective line of credit, is charged to each participating fund on a pro rata basis and is reflected in other expenses on the Statement of operations. Commitment fees for the year ended March 31, 2016 were $3,517. For the year ended March 31, 2016, the fund had no borrowings under either line of credit.
Expenses. Within the John Hancock group of funds complex, expenses that are directly attributable to an individual fund are allocated to such fund. Expenses that are not readily attributable to a specific fund are allocated among all funds in an equitable manner, taking into consideration, among other things, the nature and type of expense and the fund's relative net assets. Expense estimates are accrued in the period to which they relate and adjustments are made when actual amounts are known.
Class allocations. Income, common expenses and realized and unrealized gains (losses) are determined at the fund level and allocated daily to each class of shares based on the net assets of the class. Class-specific expenses, such as distribution and service fees, if any, and transfer agent fees, for all classes, are calculated daily at the class level based on the net assets of each class and the specific expense rates applicable to each class. Through June 30, 2015, class-specific expenses, such as state registration fees and printing and postage, for all classes, were calculated daily at the class level based on net assets of each class and the specific expense rates applicable to each class.
Federal income taxes. The fund intends to continue to qualify as a regulated investment company by complying with the applicable provisions of the Internal Revenue Code and will not be subject to federal income tax on taxable income that is distributed to shareholders. Therefore, no federal income tax provision is required.
As of March 31, 2016, the fund had no uncertain tax positions that would require financial statement recognition, derecognition or disclosure. The fund's federal tax returns are subject to examination by the Internal Revenue Service for a period of three years.
Distribution of income and gains. Distributions to shareholders from net investment income and net realized gains, if any, are recorded on the ex-date. The fund generally declares and pays dividends and capital gain distributions, if any, annually. The tax character of distributions for the years ended March 31, 2016 and 2015 was as follows:
| March 31, 2016 | March 31, 2015 | |
| Ordinary Income | $38,200,449 | $65,969,894 |
| Long term capital gains | 68,624,595 | 97,680,986 |
| Total | $106,825,044 | $163,650,880 |
Distributions paid by the fund with respect to each class of shares are calculated in the same manner, at the same time and in the same amount, except for the effect of class level expenses that may be applied differently to each class. As of March 31, 2016, the components of distributable earnings on a tax basis consisted of $574,004 of undistributed ordinary income and $17,824,804 of undistributed long-term capital gain.
Such distributions and distributable earnings, on a tax basis, are determined in conformity with income tax regulations, which may differ from US GAAP. Distributions in excess of tax basis earnings and profits, if any, are reported in the fund's financial statements as a return of capital.
Capital accounts within the financial statements are adjusted for permanent book-tax differences. These adjustments have no impact on net assets or the results of operations. Temporary book-tax differences, if any, will reverse in a subsequent period. Book-tax differences are primarily attributable to wash sale deferrals.
Note 3 — Guarantees and indemnifications
Under the Trust's organizational documents, its Officers and Trustees are indemnified against certain liabilities arising out of the performance of their duties to the Trust, including the fund. Additionally, in the normal course of business, the fund enters into contracts with service providers that contain general indemnification clauses. The fund's maximum exposure under these arrangements is unknown, as this would involve future claims that may be made against the fund that have not yet occurred. The risk of material loss from such claims is considered remote.
Note 4 — Fees and transactions with affiliates
John Hancock Advisers, LLC (the Advisor) serves as investment advisor for the fund. John Hancock Funds, LLC (the Distributor), an affiliate of the Advisor, serves as principal underwriter of the fund. The Advisor and the Distributor are indirect, wholly owned subsidiaries of Manulife Financial Corporation (MFC).
Management fee. The fund has an investment management agreement with the Advisor under which the fund pays a daily management fee to the Advisor equivalent on an annual basis to the sum of: (a) 0.725% of the first $500 million of the fund's average daily net assets; (b) 0.700% of the next $500 million of the fund's average daily net assets; (c) 0.675% of the next $500 million of the fund's average daily net assets; and (d) 0.650% of the fund's average daily net assets in excess of $1.5 billion. The Advisor has a subadvisory agreement with John Hancock Asset Management a division of Manulife Asset Management (US) LLC, an indirectly owned subsidiary of MFC and an affiliate of the Advisor. The fund is not responsible for payment of the subadvisory fees.
The Advisor has contractually agreed to waive a portion of its management fee and/or reimburse expenses for certain funds of the John Hancock funds complex, including the fund (the participating portfolios). This waiver is based upon aggregate net assets of all the participating portfolios. The amount of the reimbursement is calculated daily and allocated among all the participating portfolios in proportion to the daily net assets of each fund. During the year ended March 31, 2016, this waiver amounted to 0.01% of the fund's average net assets on an annualized basis. This arrangement may be amended or terminated at any time by the Advisor upon notice to the fund and with the approval of the Board of Trustees.
The Advisor has contractually agreed to waive all or a portion of its management fee and/or reimburse or pay operating expenses of the fund to the extent necessary to maintain the fund's total operating expenses at 2.05%, 1.43%, and 1.18% for Class C, Class R2, and Class R4 shares, respectively, excluding certain expenses such as taxes, brokerage commissions, interest expense, litigation and indemnification expenses and other extraordinary expenses not incurred in the ordinary course of the fund's business, acquired fund fees and short dividend expense. These expense limitations shall remain in effect until June 30, 2016, unless renewed by mutual agreement of the fund and the Advisor based upon a determination that this is appropriate under the circumstances at the time. Prior to July 1, 2015, Class A and Class I shares had fee waivers and/or reimbursement such that the expenses would not exceed 1.30% and 0.94% for Class A and Class I shares, respectively.
In addition, effective September 1, 2015, the Advisor voluntarily agreed to waive all or a portion of its management fee and/or reimburse or pay operating expenses of the fund to the extent necessary to maintain the fund's total operating expenses at 1.85%, 1.24%, and 1.09% for Class C, Class R2, and Class R4 shares, respectively, excluding certain expenses such as taxes, brokerage commissions, interest expense, litigation and indemnification expenses and other extraordinary expenses not incurred in the ordinary course of the fund's business, acquired fund fees and expenses paid indirectly and short dividend expense. These expense limitations shall remain in effect until terminated by the Advisor on notice to the fund.
The Advisor has contractually agreed to waive and/or reimburse all class specific expenses for Class R6 shares of the fund to the extent they exceed 0.00% of average annual net assets, on an annualized basis. The expense limitation expires on June 30, 2016, unless renewed by mutual agreement of the fund and the advisor based upon a determination that this is appropriate under the circumstances at the time.
For the year ended March 31, 2016, these expense reductions amounted to the following:
| Class | Expense reduction | Class | Expense reduction | |
| Class A | $1,307 | Class R4 | $3,397 | |
| Class C | 5,033 | Class R6 | 3,905 | |
| Class I | 1,793 | Class NAV | 138,875 | |
| Class R2 | 3,307 | Total | $157,617 |
The investment management fees, including the impact of the waivers and reimbursements as described above, incurred for the year ended March 31, 2016 were equivalent to a net annual effective rate of 0.68% of the fund's average daily net assets.
Accounting and legal services. Pursuant to a service agreement, the fund reimburses the Advisor for all expenses associated with providing the administrative, financial, legal, accounting and recordkeeping services to the fund, including the preparation of all tax returns, periodic reports to shareholders and regulatory reports, among other services. These expenses are allocated to each share class based on its relative net assets at the time the expense was incurred. These accounting and legal services fees incurred for the year ended March 31, 2016 amounted to an annual rate of 0.01% of the fund's average daily net assets.
Distribution and service plans. The fund has a distribution agreement with the Distributor. The fund has adopted distribution and service plans with respect to Class A, Class C, Class R2 and Class R4 pursuant to Rule 12b-1 under the 1940 Act, to pay the Distributor for services provided as the distributor of shares of the fund. In addition, under a service plan for Class R2 and Class R4, the fund pays for certain other services. The fund may pay up to the following contractual rates of distribution and service fees under these arrangements, expressed as an annual percentage of average daily net assets for each class of the fund's shares:
| Class | Rule 12b-1 fee | Service fees |
| Class A | 0.25% | — |
| Class C | 1.00% | — |
| Class R2 | 0.25% | 0.25% |
| Class R4 | 0.25% | 0.10% |
Class A shares were charged 0.30% for Rule 12b-1 fees through December 10, 2015.
The fund's Distributor has contractually agreed to waive 0.10% of Rule 12b-1 fees for Class R4 shares. The current waiver agreement expires on June 30, 2016, unless renewed by mutual agreement of the fund and the Distributor based upon a determination that this is appropriate under the circumstances at the time. This contractual waiver amounted to $97 for Class R4 shares for the year ended March 31, 2016.
Sales charges. Class A shares are assessed up-front sales charges, which resulted in payments to the Distributor amounting to $56,015 for the year ended March 31, 2016. Of this amount, $9,114 was retained and used for printing prospectuses, advertising, sales literature and other purposes, $45,974 was paid as sales commissions to broker-dealers and $927 was paid as sales commissions to sales personnel of Signator Investors, Inc., a broker-dealer affiliate of the Advisor.
Class A and Class C shares may be subject to contingent deferred sales charges (CDSCs). Certain Class A shares that are acquired through purchases of $1 million or more and are redeemed within one year of purchase are subject to a 1.00% sales charge. Class C shares that are redeemed within one year of purchase are subject to a 1.00% CDSC. CDSCs are applied to the lesser of the current market value at the time of redemption or the original purchase cost of the shares being
redeemed. Proceeds from CDSCs are used to compensate the Distributor for providing distribution-related services in connection with the sale of these shares. During the year ended March 31, 2016, CDSCs received by the Distributor amounted to $1,078 for Class C shares.
Transfer agent fees. The fund has a transfer agent agreement with John Hancock Signature Services, Inc. (Signature Services), an affiliate of the Advisor. The transfer agent fees paid to Signature Services are determined based on the cost to Signature Services (Signature Services Cost) of providing recordkeeping services. It also includes out-of-pocket expenses, including payments made to third-parties for recordkeeping services provided to their clients who invest in one or more John Hancock funds. In addition, Signature Services Cost may be reduced by certain fees that Signature Services receives in connection with retirement and small accounts. Signature Services Cost is calculated monthly and allocated, as applicable, to five categories of share classes: Retail Share and Institutional Share Classes of Non-Municipal Bond Funds, Class R6 Shares, Retirement Share Classes and Municipal Bond Share Classes. Within each of these categories, the applicable costs are allocated to the affected John Hancock affiliated funds and/or classes, based on the relative average daily net assets.
Class level expenses. Class level expenses for the year ended March 31, 2016 were:
| Class | Distribution and service fees | Transfer agent fees | State registration fees | Printing and postage |
| Class A | $49,507 | $22,085 | $4,354 | $946 |
| Class C | 8,877 | 1,126 | 5,484 | 65 |
| Class I | — | 13,092 | 4,041 | 232 |
| Class R2 | 243 | 16 | 3,607 | 7 |
| Class R4 | 243 | 16 | 3,607 | 7 |
| Class R6 | — | 16 | 3,874 | 7 |
| Class NAV | — | — | — | — |
| Total | $58,870 | $36,351 | $24,967 | $1,264 |
Effective July 1, 2015, state registration fees and printing and postage are treated as fund level expenses and are not included in the table above. For the period July 1, 2015 to March 31, 2016, state registration fees and printing and postage amounted to $57,136 and $11,304, respectively.
Trustee expenses. The fund compensates each Trustee who is not an employee of the Advisor or its affiliates. The costs of paying Trustee compensation and expenses are allocated to each fund based on its net assets relative to other funds within the John Hancock group of funds complex.
Interfund lending program Pursuant to an Exemptive Order issued by the SEC, the fund, along with certain other funds advised by the Advisor, may participate in an interfund lending program. This program provides an alternative credit facility allowing the funds to borrow from, or lend money to, other participating affiliated funds. At period end, no interfund loans were outstanding. The fund's activity in this program during the period for which loans were outstanding was as follows:
| Borrower or lender | Weighted average loan balance | Days outstanding | Weighted average interest rate | Interest income |
| Lender | $60,000,000 | 1 | 0.47% | $775 |
Note 5 — Fund share transactions
Transactions in fund shares for the year ended March 31, 2016 and 2015 were as follows:
| Year ended 3-31-16 | Year ended 3-31-15 | |||||||||||||||||||||||||
| Shares | Amount | Shares | Amount | |||||||||||||||||||||||
| Class A shares | ||||||||||||||||||||||||||
| Sold | 527,971 | $8,398,745 | 545,810 | $8,919,693 | ||||||||||||||||||||||
| Distributions reinvested | 60,658 | 959,600 | 50,333 | 764,053 | ||||||||||||||||||||||
| Repurchased | (480,948 | ) | (7,650,606 | ) | (168,439 | ) | (2,718,915 | ) | ||||||||||||||||||
| Net increase | 107,681 | $1,707,739 | 427,704 | $6,964,831 | ||||||||||||||||||||||
| Class C shares1 | ||||||||||||||||||||||||||
| Sold | 48,784 | $771,679 | 51,000 | $837,082 | ||||||||||||||||||||||
| Distributions reinvested | 2,596 | 41,145 | 600 | 9,170 | ||||||||||||||||||||||
| Repurchased | (44,509 | ) | (699,509 | ) | (2,149 | ) | (34,571 | ) | ||||||||||||||||||
| Net increase | 6,871 | $113,315 | 49,451 | $811,681 | ||||||||||||||||||||||
| Class I shares | ||||||||||||||||||||||||||
| Sold | 98,491 | $1,567,114 | 640,174 | $10,595,132 | ||||||||||||||||||||||
| Distributions reinvested | 43,509 | 691,359 | 10,523 | 160,469 | ||||||||||||||||||||||
| Repurchased | (245,410 | ) | (3,856,027 | ) | (39,542 | ) | (632,486 | ) | ||||||||||||||||||
| Net increase (decrease) | (103,410 | ) | ($1,597,554 | ) | 611,155 | $10,123,115 | ||||||||||||||||||||
| Class R2 shares2 | ||||||||||||||||||||||||||
| Sold | — | — | 6,061 | $100,000 | ||||||||||||||||||||||
| Net increase | — | — | 6,061 | $100,000 | ||||||||||||||||||||||
| Class R4 shares2 | ||||||||||||||||||||||||||
| Sold | — | — | 6,061 | $100,000 | ||||||||||||||||||||||
| Net increase | — | — | 6,061 | $100,000 | ||||||||||||||||||||||
| Class R6 shares2 | ||||||||||||||||||||||||||
| Sold | — | — | 6,061 | $100,000 | ||||||||||||||||||||||
| Net increase | — | — | 6,061 | $100,000 | ||||||||||||||||||||||
| Class NAV shares | ||||||||||||||||||||||||||
| Sold | 345,929 | $5,468,712 | 43,936,891 | $695,148,002 | ||||||||||||||||||||||
| Distributions reinvested | 6,611,043 | 105,115,593 | 10,653,285 | 162,462,594 | ||||||||||||||||||||||
| Repurchased | (24,558,115 | ) | (399,609,533 | ) | (22,138,313 | ) | (367,156,199 | ) | ||||||||||||||||||
| Net increase (decrease) | (17,601,143 | ) | ($289,025,228 | ) | 32,451,863 | $490,454,397 | ||||||||||||||||||||
| Total net increase (decrease) | (17,590,001 | ) | ($288,801,728 | ) | 33,558,356 | $508,654,024 | ||||||||||||||||||||
1 The inception date for Class C shares is 8-28-14.
2 The inception date for Class R2, Class R4 and Class R6 shares is 3-27-15.
Affiliates of the fund owned 100% of shares of beneficial interest of Class R2, Class R4, Class R6 and Class NAV on March 31, 2016.
Note 6 — Purchase and sale of securities
Purchases and sales of securities, other than short-term investments, amounted to $1,629,634,284 and $1,970,867,844 respectively, for the year ended March 31, 2016.
Note 7 — Industry or sector risk
The fund may invest a large percentage of its assets in one or more particular industries or sectors of the economy. If a large percentage of the fund's assets are economically tied to a single or small number of industries or sectors of the economy, the fund will be less diversified than a more broadly diversified fund, and it may cause the fund to underperform if that industry or
sector underperforms. In addition, focusing on a particular industry or sector may make the fund's NAV more volatile. Further, a fund that invests in particular industries or sectors is particularly susceptible to the impact of market, economic, regulatory and other factors affecting those industries or sectors.
Note 8 — Investment by affiliated funds
Certain investors in the fund are affiliated funds that are managed by the Advisor and its affiliates. The affiliated funds do not invest in the fund for the purpose of exercising management or control; however, this investment may represent a significant portion of the fund's net assets. At March 31, 2016, funds within the John Hancock group of funds complex held 98.3% of the fund's net assets. The following funds had an affiliate ownership of 5% or more of the fund's net assets:
| Fund | Affiliated concentration |
| John Hancock Lifestyle Growth Fund | 27.2% |
| John Hancock Lifestyle Balanced Fund | 19.7% |
| John Hancock Lifestyle Growth MVP | 16.6% |
| John Hancock Lifestyle Aggressive Fund | 10.7% |
| John Hancock Lifestyle Balanced MVP | 9.1% |
Note 9 — Subsequent Event
On December 10, 2015, the Board of Trustees approved a proposal to merge John Hancock Select Growth Fund into John Hancock Strategic Growth Fund. Shareholders of John Hancock Select Growth Fund approved the proposal on March 30, 2016. The merger was completed on April 22, 2016.
Report of Independent Registered Public Accounting Firm
To the Board of Trustees and Shareholders of John Hancock Funds III and John Hancock Strategic Growth Fund:
In our opinion, the accompanying statement of assets and liabilities, including the fund's investments, and the related statements of operations and of changes in net assets and the financial highlights present fairly, in all material respects, the financial position of John Hancock Strategic Growth Fund (the "Fund") at March 31, 2016, the results of its operations for the year then ended, the changes in its net assets for each of the two years in the period then ended and the financial highlights for each of the periods indicated, in conformity with accounting principles generally accepted in the United States of America. These financial statements and financial highlights (hereafter referred to as "financial statements") are the responsibility of the Fund's management. Our responsibility is to express an opinion on these financial statements based on our audits. We conducted our audits of these financial statements in accordance with the standards of the Public Company Accounting Oversight Board (United States). Those standards require that we plan and perform the audit to obtain reasonable assurance about whether the financial statements are free of material misstatement. An audit includes examining, on a test basis, evidence supporting the amounts and disclosures in the financial statements, assessing the accounting principles used and significant estimates made by management, and evaluating the overall financial statement presentation. We believe that our audits, which included confirmation of securities at March 31, 2016 by correspondence with the custodian, transfer agent, and brokers, and the application of alternative auditing procedures where securities purchased confirmations had not been received, provide a reasonable basis for our opinion.
PricewaterhouseCoopers LLP
Boston, Massachusetts
May 13, 2016
Unaudited
For federal income tax purposes, the following information is furnished with respect to the distributions of the fund, if any, paid during its taxable year ended March 31, 2016.
The fund reports the maximum amount allowable of its net taxable income as eligible for the corporate dividends-received deduction.
The fund reports the maximum amount allowable of its net taxable income as qualified dividend income as provided in the Jobs and Growth Tax Relief Reconciliation Act of 2003.
The fund paid $68,624,595 in capital gain dividends.
Eligible shareholders will be mailed a 2016 Form 1099-DIV in early 2017. This will reflect the tax character of all distributions paid in calendar year 2016.
Please consult a tax advisor regarding the tax consequences of your investment in the fund.
This chart provides information about the Trustees and Officers who oversee your John Hancock fund. Officers elected by the Trustees manage the day-to-day operations of the fund and execute policies formulated by the Trustees.
Independent Trustees
| Name, year of birth Position(s) held with fund Principal occupation(s) and other directorships during past 5 years | Trustee of the Trust since1 | Number of John Hancock funds overseen by Trustee |
| James M. Oates, Born: 1946 | 2012 | 230 |
| Trustee and Chairperson of the Board Managing Director, Wydown Group (financial consulting firm) (since 1994); Chairman and Director, Emerson Investment Management, Inc. (since 2000); Independent Chairman, Hudson Castle Group, Inc. (formerly IBEX Capital Markets, Inc.) (financial services company) (1997-2011); Director, Stifel Financial (since 1996); Director, Investor Financial Services Corporation (1995-2007); Director, Connecticut River Bancorp (1998-2014); Director, Virtus Funds (formerly Phoenix Mutual Funds) (since 1988). Trustee and Chairperson of the Board, John Hancock Collateral Trust and John Hancock Exchange-Traded Fund Trust (since 2015); Trustee and Chairperson of the Board, John Hancock retail funds3 (since 2012); Trustee (2005-2006 and since 2012) and Chairperson of the Board (since 2012), John Hancock Funds III; Trustee (since 2004) and Chairperson of the Board (since 2005), John Hancock Variable Insurance Trust; Trustee and Chairperson of the Board, John Hancock Funds II (since 2005). | ||
| Charles L. Bardelis,2 Born: 1941 | 2012 | 230 |
| Trustee Director, Island Commuter Corp. (marine transport). Trustee, John Hancock Collateral Trust and John Hancock Exchange-Traded Fund Trust (since 2015); Trustee, John Hancock retail funds3 (since 2012); Trustee, John Hancock Funds III (2005-2006 and since 2012); Trustee, John Hancock Variable Insurance Trust (since 1988); Trustee, John Hancock Funds II (since 2005). | ||
| Peter S. Burgess,2 Born: 1942 | 2012 | 230 |
| Trustee Consultant (financial, accounting, and auditing matters) (since 1999); Certified Public Accountant; Partner, Arthur Andersen (independent public accounting firm) (prior to 1999); Director, Lincoln Educational Services Corporation (since 2004); Director, Symetra Financial Corporation (2010-2016); Director, PMA Capital Corporation (2004-2010). Trustee, John Hancock Collateral Trust and John Hancock Exchange-Traded Fund Trust (since 2015); Trustee, John Hancock retail funds3 (since 2012); Trustee, John Hancock Funds III (2005-2006 and since 2012); Trustee, John Hancock Variable Insurance Trust and John Hancock Funds II (since 2005). | ||
| William H. Cunningham, Born: 1944 | 2006 | 230 |
| Trustee Professor, University of Texas, Austin, Texas (since 1971); former Chancellor, University of Texas System and former President of the University of Texas, Austin, Texas; Chairman (since 2009) and Director (since 2006), Lincoln National Corporation (insurance); Director, Southwest Airlines (since 2000); former Director, LIN Television (2009-2014). Trustee, John Hancock retail funds3 (since 1986); Trustee, John Hancock Variable Insurance Trust (since 2012); Trustee, John Hancock Funds II (2005-2006 and since 2012); Trustee, John Hancock Collateral Trust and John Hancock Exchange-Traded Fund Trust (since 2015). | ||
| Grace K. Fey, Born: 1946 | 2012 | 230 |
| Trustee Chief Executive Officer, Grace Fey Advisors (since 2007); Director and Executive Vice President, Frontier Capital Management Company (1988-2007); Director, Fiduciary Trust (since 2009). Trustee, John Hancock Collateral Trust and John Hancock Exchange-Traded Fund Trust (since 2015); Trustee, John Hancock retail funds3 (since 2012); Trustee, John Hancock Variable Insurance Trust and John Hancock Funds II (since 2008). | ||
Independent Trustees (continued)
| Name, year of birth Position(s) held with fund Principal occupation(s) and other directorships during past 5 years | Trustee of the Trust since1 | Number of John Hancock funds overseen by Trustee |
| Theron S. Hoffman,2 Born: 1947 | 2012 | 230 |
| Trustee Chief Executive Officer, T. Hoffman Associates, LLC (consulting firm) (since 2003); Director, The Todd Organization (consulting firm) (2003-2010); President, Westport Resources Management (investment management consulting firm) (2006-2008); Senior Managing Director, Partner, and Operating Head, Putnam Investments (2000-2003); Executive Vice President, The Thomson Corp. (financial and legal information publishing) (1997-2000). Trustee, John Hancock Collateral Trust and John Hancock Exchange-Traded Fund Trust (since 2015); Trustee, John Hancock retail funds3 (since 2012); Trustee, John Hancock Variable Insurance Trust and John Hancock Funds II (since 2008). | ||
| Deborah C. Jackson, Born: 1952 | 2008 | 230 |
| Trustee President, Cambridge College, Cambridge, Massachusetts (since 2011); Chief Executive Officer, American Red Cross of Massachusetts Bay (2002-2011); Board of Directors of Eastern Bank Corporation (since 2001); Board of Directors of Eastern Bank Charitable Foundation (since 2001); Board of Directors of American Student Assistance Corporation (1996-2009); Board of Directors of Boston Stock Exchange (2002-2008); Board of Directors of Harvard Pilgrim Healthcare (health benefits company) (2007-2011). Trustee, John Hancock retail funds3 (since 2008); Trustee, John Hancock Variable Insurance Trust and John Hancock Funds II (since 2012); Trustee, John Hancock Collateral Trust and John Hancock Exchange-Traded Fund Trust (since 2015). | ||
| Hassell H. McClellan, Born: 1945 | 2012 | 230 |
| Trustee Trustee, Virtus Variable Insurance Trust (formerly Phoenix Edge Series Funds) (since 2008); Director, The Barnes Group (since 2010); Associate Professor, The Wallace E. Carroll School of Management, Boston College (retired 2013). Trustee, John Hancock Collateral Trust and John Hancock Exchange-Traded Fund Trust (since 2015); Trustee, John Hancock retail funds3 (since 2012); Trustee, John Hancock Funds III (2005-2006 and since 2012); Trustee, John Hancock Variable Insurance Trust and John Hancock Funds II (since 2005). | ||
| Steven R. Pruchansky, Born: 1944 | 2006 | 230 |
| Trustee and Vice Chairperson of the Board Chairman and Chief Executive Officer, Greenscapes of Southwest Florida, Inc. (since 2000); Director and President, Greenscapes of Southwest Florida, Inc. (until 2000); Member, Board of Advisors, First American Bank (until 2010); Managing Director, Jon James, LLC (real estate) (since 2000); Partner, Right Funding, LLC (since 2014); Director, First Signature Bank & Trust Company (until 1991); Director, Mast Realty Trust (until 1994); President, Maxwell Building Corp. (until 1991). Trustee (since 1992) and Chairperson of the Board (2011-2012), John Hancock retail funds3; Trustee and Vice Chairperson of the Board, John Hancock retail funds3 John Hancock Variable Insurance Trust, and John Hancock Funds II (since 2012); Trustee, and Vice Chairperson of the Board, John Hancock Collateral Trust and John Hancock Exchange-Traded Fund Trust (since 2015). | ||
Independent Trustees (continued)
| Name, year of birth Position(s) held with fund Principal occupation(s) and other directorships during past 5 years | Trustee of the Trust since1 | Number of John Hancock funds overseen by Trustee |
| Gregory A. Russo, Born: 1949 | 2008 | 230 |
| Trustee Director and Audit Committee Chairman (since 2012), and Member, Audit Committee and Finance Committee (since 2011), NCH Healthcare System, Inc. (holding company for multi-entity healthcare system); Director and Member (since 2012) and Finance Committee Chairman (since 2014), The Moorings, Inc. (nonprofit continuing care community); Vice Chairman, Risk & Regulatory Matters, KPMG LLP (KPMG) (2002-2006); Vice Chairman, Industrial Markets, KPMG (1998-2002); Chairman and Treasurer, Westchester County, New York, Chamber of Commerce (1986-1992); Director, Treasurer, and Chairman of Audit and Finance Committees, Putnam Hospital Center (1989-1995); Director and Chairman of Fundraising Campaign, United Way of Westchester and Putnam Counties, New York (1990-1995). Trustee, John Hancock retail funds3 (since 2008); Trustee, John Hancock Variable Insurance Trust and John Hancock Funds II (since 2012); Trustee, John Hancock Collateral Trust and John Hancock Exchange-Traded Fund Trust (since 2015). | ||
Non-Independent Trustees4
| Name, year of birth Position(s) held with fund Principal occupation(s) and other directorships during past 5 years | Trustee of the Trust since1 | Number of John Hancock funds overseen by Trustee |
| James R. Boyle, Born: 1959 | 2015 | 230 |
| Non-Independent Trustee* Chairman and Chief Executive Officer, Zillion Group, Inc. (formerly HealthFleet, Inc.) (healthcare) (since 2014); Executive Vice President and Chief Executive Officer, U.S. Life Insurance Division of Genworth Financial, Inc. (insurance) (January 2014-July 2014); Senior Executive Vice President, Manulife Financial Corporation, President and Chief Executive Officer, John Hancock (1999-2012); Chairman and Director, John Hancock Advisers, LLC, John Hancock Funds, LLC, and John Hancock Investment Management Services, LLC (2005-2010). Trustee, John Hancock Collateral Trust and John Hancock Exchange-Traded Fund Trust (since 2015); Trustee, John Hancock retail funds3 (2005-2010; 2012-2014 and since 2015); Trustee, John Hancock Variable Insurance Trust and John Hancock Funds II (2005-2014 and since 2015). *Effective 3-10-15. | ||
| Craig Bromley, Born: 1966 | 2012 | 230 |
| Non-Independent Trustee President, John Hancock Financial Service (since 2012); Senior Executive Vice President and General Manager, U.S. Division, Manulife Financial Corporation (since 2012); President and Chief Executive Officer, Manulife Insurance Company (Manulife Japan) (2005-2012, including prior positions). Trustee, John Hancock retail funds,3 John Hancock Variable Insurance Trust, and John Hancock Funds II (since 2012); Trustee, John Hancock Collateral Trust and John Hancock Exchange-Traded Fund Trust (since 2015). | ||
| Warren A. Thomson, Born: 1955 | 2012 | 230 |
| Non-Independent Trustee Senior Executive Vice President and Chief Investment Officer, Manulife Financial Corporation and The Manufacturers Life Insurance Company (since 2009); Chairman, Manulife Asset Management (since 2001, including prior positions); Director and Chairman, Manulife Asset Management Limited (since 2006); Director and Chairman, Hancock Natural Resources Group, Inc. (since 2013). Trustee, John Hancock retail funds,3 John Hancock Variable Insurance Trust, and John Hancock Funds II (since 2012); Trustee, John Hancock Collateral Trust and John Hancock Exchange-Traded Fund Trust (since 2015). | ||
Principal officers who are not Trustees
| Name, year of birth Position(s) held with fund Principal occupation(s) during past 5 years | Officer of the Trust since |
| Andrew G. Arnott, Born: 1971 | 2009 |
| President Senior Vice President, John Hancock Financial Services (since 2009); Director and Executive Vice President, John Hancock Advisers, LLC (since 2005, including prior positions); Director and Executive Vice President, John Hancock Investment Management Services, LLC (since 2006, including prior positions); President, John Hancock Funds, LLC (since 2004, including prior positions); President, John Hancock retail funds,3 John Hancock Variable Insurance Trust, and John Hancock Funds II (since 2007, including prior positions); President, John Hancock Collateral Trust (since 2015); President, John Hancock Exchange-Traded Fund Trust (since 2014). | |
| John J. Danello, Born: 1955 | 2014 |
| Senior Vice President, Secretary, and Chief Legal Officer Vice President and Chief Counsel, John Hancock Wealth Management (since 2005); Senior Vice President (since 2007) and Chief Legal Counsel (2007-2010), John Hancock Funds, LLC and The Berkeley Financial Group, LLC; Senior Vice President (since 2006, including prior positions) and Chief Legal Officer and Secretary (since 2014), John Hancock retail funds,3 John Hancock Funds II and John Hancock Variable Insurance Trust; Senior Vice President, Chief Legal Officer and Secretary, John Hancock Collateral Trust and John Hancock Exchange-Traded Fund Trust (since 2015); Vice President, John Hancock Life & Health Insurance Company (since 2009); Vice President, John Hancock Life Insurance Company (USA) and John Hancock Life Insurance Company of New York (since 2010); and Senior Vice President, Secretary, and Chief Legal Counsel (2007-2014, including prior positions) of John Hancock Advisers, LLC and John Hancock Investment Management Services, LLC. | |
| Francis V. Knox, Jr., Born: 1947 | 2006 |
| Chief Compliance Officer Vice President, John Hancock Financial Services (since 2005); Chief Compliance Officer, John Hancock retail funds,3 John Hancock Variable Insurance Trust, John Hancock Funds II, John Hancock Advisers, LLC, and John Hancock Investment Management Services, LLC (since 2005); Chief Compliance Officer, John Hancock Collateral Trust and John Hancock Exchange-Traded Fund Trust (since 2015). | |
| Charles A. Rizzo, Born: 1957 | 2007 |
| Chief Financial Officer Vice President, John Hancock Financial Services (since 2008); Senior Vice President, John Hancock Advisers, LLC and John Hancock Investment Management Services, LLC (since 2008); Chief Financial Officer, John Hancock retail funds,3 John Hancock Variable Insurance Trust and John Hancock Funds II (since 2007); Chief Financial Officer, John Hancock Collateral Trust and John Hancock Exchange-Traded Fund Trust (since 2015). | |
| Salvatore Schiavone, Born: 1965 | 2010 |
| Treasurer Assistant Vice President, John Hancock Financial Services (since 2007); Vice President, John Hancock Advisers, LLC and John Hancock Investment Management Services, LLC (since 2007); Treasurer, John Hancock retail funds3 (since 2007, including prior positions); Treasurer, John Hancock Variable Insurance Trust and John Hancock Funds II (2007-2009 and since 2010, including prior positions); Treasurer, John Hancock Collateral Trust and John Hancock Exchange-Traded Fund Trust (since 2015). | |
The business address for all Trustees and Officers is 601 Congress Street, Boston, Massachusetts 02210-2805.
The Statement of Additional Information of the fund includes additional information about members of the Board of Trustees of the Trust and is available without charge, upon request, by calling 800-225-5291.
| 1 | Each Trustee holds office until his or her successor is elected and qualified, or until the Trustee's death, retirement, resignation, or removal. Mr. Boyle has served as Trustee at various times prior to the date listed in the table. |
| 2 | Member of the Audit Committee. |
| 3 | "John Hancock retail funds" comprises John Hancock Funds III and 36 other John Hancock funds consisting of 26 series of other John Hancock trusts and 10 closed-end funds. |
| 4 | The Trustee is a Non-Independent Trustee due to current or former positions with the Advisor and certain affiliates. |
Trustees James M. Oates, Chairperson Officers Andrew G. Arnott John J. Danello Francis V. Knox, Jr. Charles A. Rizzo Salvatore Schiavone | Investment advisor John Hancock Advisers, LLC Subadvisor John Hancock Asset Management a division of Manulife Asset Management (US) LLC Principal distributor John Hancock Funds, LLC Custodian State Street Bank and Trust Company Transfer agent John Hancock Signature Services, Inc. Legal counsel K&L Gates LLP Independent registered public accounting firm PricewaterhouseCoopers LLP |
*Member of the Audit Committee
†Non-Independent Trustee
The fund's proxy voting policies and procedures, as well as the fund proxy voting record for the most recent twelve-month period ended June 30, are available free of charge on the Securities and Exchange Commission (SEC) website at sec.gov or on our website.
The fund's complete list of portfolio holdings, for the first and third fiscal quarters, is filed with the SEC on Form N-Q. The fund's Form N-Q is available on our website and the SEC's website, sec.gov, and can be reviewed and copied (for a fee) at the SEC's Public Reference Room in Washington, DC. Call 800-SEC-0330 to receive information on the operation of the SEC's Public Reference Room.
We make this information on your fund, as well as monthly portfolio holdings, and other fund details available on our website at jhinvestments.com or by calling 800-225-5291.
| You can also contact us: | |||
| 800-225-5291 jhinvestments.com | Regular mail: John Hancock Signature Services, Inc. | Express mail: John Hancock Signature Services, Inc. | |
John Hancock family of funds
DOMESTIC EQUITY FUNDS Balanced Blue Chip Growth Classic Value Disciplined Value Disciplined Value Mid Cap Equity Income Fundamental All Cap Core Fundamental Large Cap Core Fundamental Large Cap Value New Opportunities Small Cap Value Small Company Strategic Growth U.S. Equity U.S. Global Leaders Growth Value Equity GLOBAL AND INTERNATIONAL EQUITY FUNDS Disciplined Value International Emerging Markets Emerging Markets Equity Global Equity Global Shareholder Yield Greater China Opportunities International Core International Growth International Small Company International Value Equity | INCOME FUNDS Bond California Tax-Free Income Core High Yield Emerging Markets Debt Floating Rate Income Focused High Yield Global Income Government Income High Yield Municipal Bond Income Investment Grade Bond Money Market Short Duration Credit Opportunities Spectrum Income Strategic Income Opportunities Tax-Free Bond ALTERNATIVE AND SPECIALTY FUNDS Absolute Return Currency Alternative Asset Allocation Enduring Assets Financial Industries Global Absolute Return Strategies Global Conservative Absolute Return Global Focused Strategies Global Real Estate Natural Resources Redwood Regional Bank Seaport Technical Opportunities |
A fund's investment objectives, risks, charges, and expenses should be considered carefully before investing. The prospectus contains this and other important information about the fund. To obtain a prospectus, contact your financial professional, call John Hancock Investments at 800-225-5291, or visit our website at jhinvestments.com. Please read the prospectus carefully before investing or sending money.
ASSET ALLOCATION Income Allocation Fund Lifestyle Aggressive Portfolio Lifestyle Balanced Portfolio Lifestyle Conservative Portfolio Lifestyle Growth Portfolio Lifestyle Moderate Portfolio Retirement Choices Portfolios (2010-2060) Retirement Living Portfolios (2010-2060) Retirement Living II Portfolios (2010-2060) EXCHANGE-TRADED FUNDS John Hancock Multifactor Consumer Discretionary ETF John Hancock Multifactor Consumer Staples ETF John Hancock Multifactor Energy ETF John Hancock Multifactor Financials ETF John Hancock Multifactor Healthcare ETF John Hancock Multifactor Industrials ETF John Hancock Multifactor Large Cap ETF John Hancock Multifactor Materials ETF John Hancock Multifactor Mid Cap ETF John Hancock Multifactor Technology ETF John Hancock Multifactor Utilities ETF | CLOSED-END FUNDS Financial Opportunities Hedged Equity & Income Income Securities Trust Investors Trust Preferred Income Preferred Income II Preferred Income III Premium Dividend Tax-Advantaged Dividend Income Tax-Advantaged Global Shareholder Yield |
John Hancock Multifactor ETF shares are bought and sold at market price (not NAV), and are not individually redeemed
from the fund. Brokerage commissions will reduce returns.
John Hancock ETFs are distributed by Foreside Fund Services, LLC, and are subadvised by Dimensional Fund Advisors LP.
Foreside is not affiliated with John Hancock Funds, LLC or Dimensional Fund Advisors LP.
Dimensional Fund Advisors LP receives compensation from John Hancock in connection with licensing rights to the
John Hancock Dimensional indexes. Dimensional Fund Advisors LP does not sponsor, endorse, or sell, and makes no
representation as to the advisability of investing in, John Hancock Multifactor ETFs.
John Hancock Investments
A trusted brand
John Hancock Investments is a premier asset manager representing
one of America's most trusted brands, with a heritage of financial
stewardship dating back to 1862. Helping our shareholders pursue
their financial goals is at the core of everything we do. It's why we
support the role of professional financial advice and operate with the
highest standards of conduct and integrity.
A better way to invest
We build funds based on investor needs, then search the world to find
proven portfolio teams with specialized expertise in those strategies.
As a manager of managers, we apply vigorous oversight to ensure that
they continue to meet our uncompromising standards and serve the
best interests of our shareholders.
Results for investors
Our unique approach to asset management enables us to provide
a diverse set of investments backed by some of the world's best
managers, along with strong risk-adjusted returns across asset classes.
| | John Hancock Funds, LLC n Member FINRA, SIPC 601 Congress Street n Boston, MA 02210-2805 800-225-5291 n jhinvestments.com | |
| This report is for the information of the shareholders of John Hancock Strategic Growth Fund. It is not authorized for distribution to prospective investors unless preceded or accompanied by a prospectus. | ||
| MF288155 | 393A 3/16 5/16 | |
ITEM 2. CODE OF ETHICS.
As of the end of the year, March 31, 2016, the registrant has adopted a code of ethics, as defined in Item 2 of Form N-CSR, that applies to its Chief Executive Officer, Chief Financial Officer and Treasurer (respectively, the principal executive officer, the principal financial officer and the principal accounting officer, the “Covered Officers”). A copy of the code of ethics is filed as an exhibit to this Form N-CSR.
ITEM 3. AUDIT COMMITTEE FINANCIAL EXPERT.
Peter S. Burgess is the audit committee financial expert and is “independent”, pursuant to general instructions on Form N-CSR Item 3.
ITEM 4. PRINCIPAL ACCOUNTANT FEES AND SERVICES.
(a) Audit Fees
The aggregate fees billed for professional services rendered by the principal accountant for the audits of the registrant’s annual financial statements or services that are normally provided by the accountant in connection with statutory and regulatory filings or engagements amounted to the following for the fiscal years ended March 31, 2016 and 2015. These fees were billed to the registrant and were approved by the registrant’s audit committee.
Fund | March 31, 2016 | March 31, 2015 |
Core High Yield Fund | $ 69,967 | $ 66,141 |
Disciplined Value Fund | 35,786 | 34,907 |
Disciplined Value Mid Cap Fund | 45,870 | 43,045 |
International Value Equity Fund | 52,289 | 45,306 |
Select Growth Fund | 41,923 | 40,895 |
Small Company Fund | 43,367 | 42,303 |
Strategic Growth Fund | 36,935 | 35,609 |
Total | $ 326,137 | $ 308,206 |
|
|
|
(b) Audit-Related Services
Audit-related fees for assurance and related services by the principal accountant are billed to the registrant or to the registrant’s investment adviser (not including any sub-adviser whose role is primarily portfolio management and is subcontracted with or overseen by another investment adviser), and any entity controlling, controlled by, or under common control with the adviser ("control affiliates") that provides ongoing services to the registrant. The nature of the services provided was affiliated service provider internal controls reviews. Amounts billed to the registrant were as follows:
Fund | March 31, 2016 | March 31, 2015 |
Core High Yield Fund | $ 525 | $ 519 |
Disciplined Value Fund | 525 | 519 |
Disciplined Value Mid Cap Fund | 525 | 519 |
International Value Equity Fund | 525 | 519 |
Select Growth Fund | 525 | 519 |
Small Company Fund | 525 | 519 |
Strategic Growth Fund | 525 | 519 |
Total | $ 3,675 | $ 3,633 |
Amounts billed to control affiliates were $103,474 and $103,940 for the fiscal years ended March 31, 2016 and 2015, respectively.
(c) Tax Fees
The aggregate fees billed for professional services rendered by the principal accountant for tax compliance, tax advice and tax planning (“tax fees”) amounted to the following for the fiscal years ended March 31, 2016 and 2015. The nature of the services comprising the tax fees was the review of the registrant’s tax returns and tax distribution requirements. These fees were billed to the registrant and were approved by the registrant’s audit committee.
Fund | March 31, 2016 | March 31, 2015 |
Core High Yield Fund | $ 3,500 | $ 3,450 |
Disciplined Value Fund | 3,500 | 3,450 |
Disciplined Value Mid Cap Fund | 3,500 | 3,450 |
International Value Equity Fund | 4,000 | 3,900 |
Select Growth Fund | 3,500 | 3,450 |
Small Company Fund | 3,500 | 3,450 |
Strategic Growth Fund | 3,500 | 3,450 |
Total | $ 25,000 | $ 24,600 |
(d) All Other Fees
The nature of the services comprising all other fees is attestation services surrounding new class launches and miscellaneous tax services. Other fees amounted to the following for the fiscal years ended March 31, 2016 and 2015:
Fund | March 31, 2016 | March 31, 2015 |
Core High Yield Fund | $ 5,009 | $ 216 |
Disciplined Value Fund | 109 | 216 |
Disciplined Value Mid Cap Fund | 109 | 216 |
International Value Equity Fund | 1,609 | 216 |
Select Growth Fund | 109 | 216 |
Small Company Fund | 109 | 216 |
Strategic Growth Fund | 5,009 | 216 |
Total |
$ 12,063 | $ 1,512 |
(e)(1) Audit Committee Pre-Approval Policies and Procedures:
The trust’s Audit Committee must pre-approve all audit and non-audit services provided by the independent registered public accounting firm (the “Auditor”) relating to the operations or financial reporting of the funds. Prior to the commencement of any audit or non-audit services to a fund, the Audit Committee reviews the services to determine whether they are appropriate and permissible under applicable law.
The trust’s Audit Committee has adopted policies and procedures to, among other purposes, provide a framework for the Committee’s consideration of audit-related and non-audit services by the Auditor. The policies and procedures require that any audit-related and non-audit service provided by the Auditor and any non-audit service provided by the Auditor to a fund service provider that relates directly to the operations and financial reporting of a fund are subject to approval by the Audit Committee before such service is provided. Audit-related services provided by the Auditor that are expected to exceed $25,000 per year/per fund are subject to specific pre-approval by the Audit Committee. Tax services provided by the Auditor that are expected to exceed $30,000 per year/per fund are subject to specific pre-approval by the Audit Committee.
All audit services, as well as the audit-related and non-audit services that are expected to exceed the amounts stated above, must be approved in advance of provision of the service by formal resolution of the Audit Committee. At the regularly scheduled Audit Committee meetings, the Committee reviews a report summarizing the services, including fees, provided by the Auditor.
(e)(2) Services approved pursuant to paragraph (c)(7)(i)(C) of Rule 2-01 of Regulation S-X:
Audit-Related Fees, Tax Fees and All Other Fees:
There were no amounts that were approved by the Audit Committee pursuant to the de minimis exception under Rule 2-01 of Regulation S-X.
(f) According to the registrant’s principal accountant for the fiscal year ended March 31, 2016, the percentage of hours spent on the audit of the registrant's financial statements for the most recent fiscal year that were attributed to work performed by persons who were not full-time, permanent employees of principal accountant was less than 50%.
(g) The aggregate non-audit fees billed by the registrant’s principal accountant for non-audit services rendered to the registrant and rendered to the registrant's control affiliates were $5,941,933 for the fiscal year ended March 31, 2016 and $6,756,525 for the fiscal year ended March 31, 2015.
(h) The audit committee of the registrant has considered the non-audit services provided by the registrant’s principal accountant to the control affiliates and has determined that the services that were not pre-approved are compatible with maintaining the principal accountant’s independence.
ITEM 5. AUDIT COMMITTEE OF LISTED REGISTRANTS.
The registrant has a separately-designated standing audit committee comprised of independent trustees. The members of the audit committee are as follows:
Peter S. Burgess
Charles L. Bardelis
Theron S. Hoffman
ITEM 6. SCHEDULE OF INVESTMENTS.
(a)
Not applicable.
(b)
Not applicable.
ITEM 7. DISCLOSURE OF PROXY VOTING POLICIES AND PROCEDURES FOR CLOSED-END MANAGEMENT INVESTMENT COMPANIES.
Not applicable.
ITEM 8. PORTFOLIO MANAGERS OF CLOSED-END MANAGEMENT INVESTMENT COMPANIES.
Not applicable.
ITEM 9. PURCHASES OF EQUITY SECURITIES BY CLOSED-END MANAGEMENT INVESTMENT COMPANY AND AFFILIATED PURCHASERS.
Not applicable.
ITEM 10. SUBMISSION OF MATTERS TO A VOTE OF SECURITY HOLDERS.
The registrant has adopted procedures by which shareholders may recommend nominees to the registrant's Board of Trustees. A copy of the procedures is filed as an exhibit to this Form N-CSR. See attached “John Hancock Funds – Nominating, Governance and Administration Committee Charter”.
ITEM 11. CONTROLS AND PROCEDURES.
(a) Based upon their evaluation of the registrant's disclosure controls and procedures as conducted within 90 days of the filing date of this Form N-CSR, the registrant's principal executive officer and principal financial officer have concluded that those disclosure controls and procedures provide reasonable assurance that the material information required to be disclosed by the registrant on this report is recorded, processed, summarized and reported within the time periods specified in the Securities and Exchange Commission's rules and forms.
(b) There were no changes in the registrant's internal control over financial reporting that occurred during the registrant's most recent fiscal half-year (the registrant's second fiscal half-year in the case of an annual report) that have materially affected, or are reasonably likely to materially affect, the registrant's internal control over financial reporting.
ITEM 12. EXHIBITS.
(a)(1) Code of Ethics for Covered Officers is attached.
(a)(2) Separate certifications for the registrant's principal executive officer and principal financial officer, as required by Section 302 of the Sarbanes-Oxley Act of 2002 and Rule 30a-2(a) under the Investment Company Act of 1940, are attached.
(b)(1) Separate certifications for the registrant's principal executive officer and principal financial officer, as required by 18 U.S.C. Section 1350, as adopted pursuant to Section 906 of the Sarbanes-Oxley Act of 2002, and Rule 30a-2(b) under the Investment Company Act of 1940, are attached. The certifications furnished pursuant to this paragraph are not deemed to be "filed" for purposes of Section 18 of the Securities Exchange Act of 1934, or otherwise subject to the liability of that section. Such certifications are not deemed to be incorporated by reference into any filing under the Securities Act of 1933 or the Securities Exchange Act of 1934, except to the extent that the Registrant specifically incorporates them by reference.
(c)(1) Submission of Matters to a Vote of Security Holders is attached. See attached “John Hancock Funds – Nominating, Governance and Administration Committee Charter”.
(c)(2) Contact person at the registrant.
SIGNATURES
Pursuant to the requirements of the Securities Exchange Act of 1934 and the Investment Company Act of 1940, the registrant has duly caused this report to be signed on its behalf by the undersigned, thereunto duly authorized.
John Hancock Funds III
By:
/s/ Andrew Arnott
_______________________________
Andrew Arnott
President
Date: May 13, 2016
Pursuant to the requirements of the Securities Exchange Act of 1934 and the Investment Company Act of 1940, this report has been signed below by the following persons on behalf of the registrant and in the capacities and on the dates indicated.
By:
/s/ Andrew Arnott
_______________________________
Andrew Arnott
President
Date: May 13, 2016
By:
/s/ Charles A. Rizzo
_______________________________
Charles A. Rizzo
Chief Financial Officer
Date: May 13, 2016