UNITED STATES
SECURITIES AND EXCHANGE COMMISSION
Washington, D.C. 20549
FORM N-CSR
CERTIFIED SHAREHOLDER REPORT OF REGISTERED
MANAGEMENT INVESTMENT COMPANIES
Investment Company Act file number 811-21777
John Hancock Funds III
(Exact name of registrant as specified in charter)
601 Congress Street, Boston, Massachusetts 02210
(Address of principal executive offices) (Zip code)
Salvatore Schiavone
Treasurer
601 Congress Street
Boston, Massachusetts 02210
(Name and address of agent for service)
Registrant's telephone number, including area code: 617-663-4497
| Date of fiscal year end: | March 31 |
| Date of reporting period: | March 31, 2017 |
ITEM 1. REPORTS TO SHAREHOLDERS.


A message to shareholders
Dear shareholder,
Financial markets are by their very nature unpredictable, but few market observers could have imagined the dramatic twists and turns that would come to characterize the latter half of 2016 and the beginning of 2017. Donald Trump's victory in the November U.S. presidential election sent both U.S. equity prices and bond yields sharply higher. Investors bid up the prices of riskier assets, believing that the new administration would pursue more pro-growth, market-friendly economic policies. While this may yet prove to be the case, change in policy has been slow to materialize and valuations in certain sectors and asset classes are now appearing somewhat stretched.
While we believe there are good reasons for economic optimism and that stocks may go on to extend their recent rally in the coming months, we encourage you to talk with your financial advisor, who can help ensure your portfolio is sufficiently diversified to meet your long-term objectives and to withstand the inevitable bumps along the way.
On behalf of everyone at John Hancock Investments, I'd like to take this opportunity to thank you for the continued trust you've placed in us.
Sincerely,

Andrew G. Arnott
President and Chief Executive Officer
John Hancock Investments
This commentary reflects the CEO's views, which are subject to change at any time. Investing involves risks, including the potential loss of principal. Diversification does not guarantee a profit or eliminate the risk of a loss. For more up-to-date information, please visit our website at jhinvestments.com.
John Hancock
Disciplined Value Fund
INVESTMENT OBJECTIVE
The fund seeks to provide long-term growth of capital primarily through investments in equity securities. Current income is a secondary objective.
AVERAGE ANNUAL TOTAL RETURNS AS OF 3/31/17 (%)
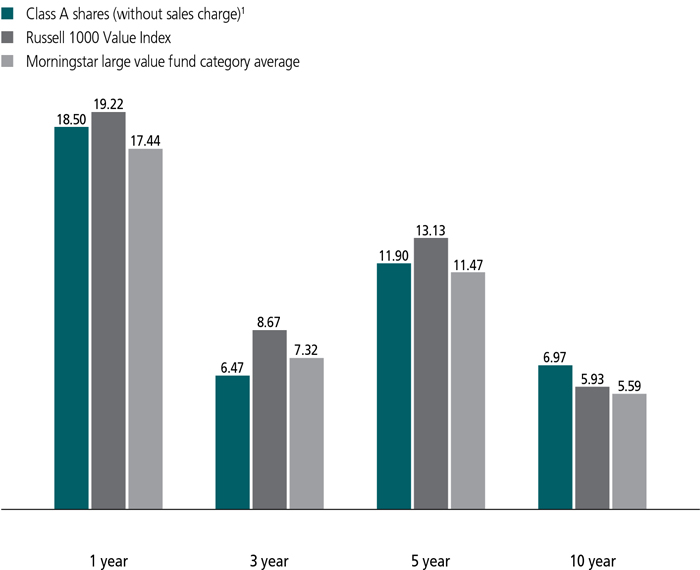
The Russell 1000 Value Index is an unmanaged index containing those securities in the Russell 1000 Index with a lower price-to-book ratio and less-than-average growth orientation.
It is not possible to invest directly in an index. Index figures do not reflect expenses or sales charges, which would result in lower returns.
Figures from Morningstar, Inc. include reinvested distributions and do not take into account sales charges. Actual load-adjusted performance is lower.
| 1 | On 12-19-08, through a reorganization, the fund acquired all of the assets of Robeco Boston Partners Large Cap Value Fund (the predecessor fund). On that date, the predecessor fund's Investor shares were exchanged for Class A shares of John Hancock Disciplined Value Fund. Class A shares were first offered on 12-22-08. Class A shares' performance shown above for periods prior to this date is that of the predecessor fund's Investor shares that have been recalculated to reflect the gross fees and expenses of Class A shares. |
The past performance shown here reflects reinvested distributions and the beneficial effect of any expense reductions, and does not guarantee future results. Performance of the other share classes will vary based on the difference in the fees and expenses of those classes. Shares will fluctuate in value and, when redeemed, may be worth more or less than their original cost. Current month-end performance may be lower or higher than the performance cited, and can be found at jhinvestments.com or by calling 800-225-5291. For further information on the fund's objectives, risks, and strategy, see the fund's prospectus.
PERFORMANCE HIGHLIGHTS OVER THE LAST TWELVE MONTHS
Equity markets surged following the election
Equities struggled in the first half of the period, but surged following the U.S. presidential election on hopes the new administration would lower taxes, increase infrastructure spending, and reduce regulation.
The fund was up, but slightly trailed its benchmark
The fund trailed its benchmark, the Russell 1000 Value Index, due to disappointing security selection, particularly in healthcare.
Information technology was the top relative contributor
From a sector standpoint, information technology, telecommunication services, and consumer staples were among the relative contributors.
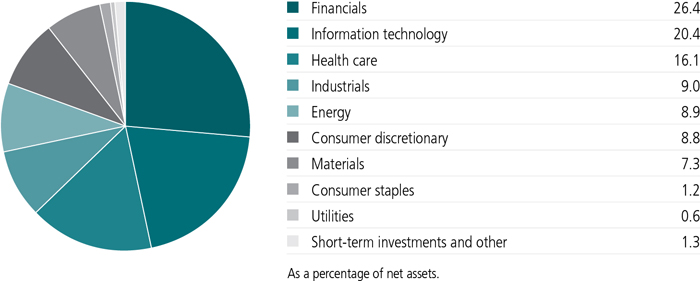
SECTOR COMPOSITION AS OF 3/31/17 (%)
A note about risks
Value stocks may decline in price. Large company stocks could fall out of favor. The value of a company's equity securities is subject to changes in the company's financial condition and overall market and economic conditions. Events in the financial markets have resulted, and may continue to result, in an unusually high degree of volatility in the financial markets, both domestic and foreign. Foreign investing has additional risks, such as currency and market volatility and political and social instability. Sector investing is subject to greater risks than the market as a whole. Because the fund may focus on particular sectors of the economy, its performance may depend on the performance of those sectors, and investments focused in one sector may fluctuate more widely than investments in a wider variety of sectors. Please see the fund's prospectus for additional risks.

Mark E. Donovan, CFA
Portfolio Manager
Boston Partners
Can you describe the market environment during the 12 months ended March 31, 2017?
U.S. equities advanced strongly during the period, despite a lengthy list of challenges that included high valuations for stocks, gradually rising interest rates, and concerns over the U.S. presidential election. The June news of the U.K.'s referendum vote to withdraw from the European Union sent shock waves through the markets and resulted in a brief, but sharp, decline; however, stocks stabilized and regained much of what they lost.
The market began to grow more cautious regarding certain sectors that some have begun to refer to as RUST (real estate, utilities, consumer staples, and telecommunication services). Following the U.S. presidential election, U.S. equity markets produced gains, as the rotation into economically sensitive sectors continued and accelerated. Investors seemed to be anticipating that the Trump administration would lower taxes, increase infrastructure spending, and reduce regulation.
Equity markets set records, but stumbled later in the period as certain legislative initiatives proved challenging to implement. In this environment, the fund's benchmark, the Russell 1000 Value Index, was up 19.22%.
The fund underperformed its benchmark. What factors detracted from performance?
Security selection in the healthcare and transportation industries detracted from relative returns. Healthcare was weakened by the biotech and medical supplier segments.
McKesson Corp. accounted for most of the underperformance, as the company missed quarterly earnings and guided projections down when a competitor, AmerisourceBergen Corp. (not held), lowered prices competitively. Express Scripts Holding Co. and Gilead Sciences, Inc. were also detractors during the period. We sold McKesson and Express Scripts, but still hold Gilead.
What factors helped the fund relative to its benchmark?
Sector allocation was the primary driver of performance. The information technology, telecommunication services, and consumer staples sectors were significant contributors to relative returns, as was the fund's underweights in the utilities and real estate sectors.
General Dynamics Corp. was among the specific securities that boosted the fund's return relative to its benchmark. In information technology, Computer Sciences Corp. was the greatest relative contributor, as its value doubled during the period. TE Connectivity, Ltd., which manufactures
TOP 10 HOLDINGS AS OF 3/31/17 (%)
| JPMorgan Chase & Co. | 4.9 |
| Bank of America Corp. | 4.5 |
| Berkshire Hathaway, Inc., Class B | 3.7 |
| Johnson & Johnson | 3.5 |
| Citigroup, Inc. | 3.0 |
| Merck & Company, Inc. | 2.4 |
| Cisco Systems, Inc. | 2.4 |
| Apple, Inc. | 2.3 |
| Discover Financial Services | 2.2 |
| Chevron Corp. | 2.2 |
| TOTAL | 31.1 |
| As a percentage of net assets. | |
| Cash and cash equivalents are not included. | |
What were some notable additions and deletions to the portfolio?
Key purchases included WABCO Holdings, Inc., an auto parts supplier that continues to grow market share, while seeking innovation and effective cost controls. The stock's valuation remains attractive, and a potential catalyst for the stock is a recovery in the North American truck market. Other buys included Pfizer, Inc., Chevron Corp., Marathon Oil Corp., Coca-Cola European Partners PLC, and Nucor Corp.
Recent sales included Walgreen Boots Alliance, Inc., MetLife, Inc., Tyson Foods, Inc., Target Corp., The Travelers Companies, Inc., and The Liberty Media Corp.
How was the portfolio positioned at the end of the period?
We have positive views on information technology, consumer discretionary, healthcare, and materials given that we believe these are stable industries with solid free cash flow. Our significant increase in information technology exposure (from 13.8% to more than 20%) was generated by the solid nature of the sector, highlighted by companies with healthy balance sheets with relatively low debt. This fiscal flexibility allows technology companies to efficiently initiate increases in dividend payments and share repurchases. The fund was underweight in consumer staples, real estate, telecommunication services, and utilities.
We believe there are attractive opportunities that fit our three-circle investment process of attractive valuation, sound fundamentals, and a catalyst for improvement. We are continually
working to incorporate them while staying connected to companies we already own. The fund's advantages over the benchmark of generally lower valuations and higher-quality companies will remain our focus as we position it for the long term.
MANAGED BY
| | Mark E. Donovan, CFA On the fund since inception Investing since 1981 |
 | David J. Pyle, CFA On the fund since 2000 Investing since 1995 |
![]()
TOTAL RETURNS FOR THE PERIOD ENDED MARCH 31, 2017
Performance figures assume all distributions have been reinvested. Figures reflect maximum sales charge on Class A shares of 5%, and the applicable contingent deferred sales charge (CDSC) on Class B and Class C shares. The Class B shares' CDSC declines annually between years 1 to 6 according to the following schedule: 5%, 4%, 3%, 3%, 2%, and 1%. No sales charge will be assessed after the sixth year. Class C shares sold within one year of purchase are subject to a 1% CDSC. Sales charges are not applicable to Class I, Class I2, Class R1, Class R2, Class R3, Class R4, Class R5, Class R6, and Class NAV shares.
The expense ratios of the fund, both net (including any fee waivers and/or expense limitations) and gross (excluding any fee waivers and/or expense limitations), are set forth according to the most recent publicly available prospectuses for the fund and may differ from those disclosed in the Financial highlights tables in this report. Had the contractual fee waivers and expense limitations not been in place, gross expenses would apply. The expense ratios are as follows:
| Class A | Class B | Class C | Class I | Class I2 | Class R1 | Class R2 | Class R3 | Class R4 | Class R5 | Class R6 | Class NAV | |
| Gross (%) | 1.08 | 1.83 | 1.83 | 0.81 | 0.81 | 1.47 | 1.22 | 1.37 | 1.07 | 0.77 | 0.72 | 0.70 |
| Net (%) | 1.08 | 1.83 | 1.83 | 0.81 | 0.81 | 1.47 | 1.22 | 1.37 | 0.97 | 0.77 | 0.70 | 0.70 |
Please refer to the most recent prospectus and annual or semiannual report for more information on expenses and any expense limitation arrangements for each class.
The returns reflect past results and should not be considered indicative of future performance. The return and principal value of an investment will fluctuate so that shares, when redeemed, may be worth more or less than their original cost. Due to market volatility and other factors, the fund's current performance may be higher or lower than the performance shown. For current to the most recent month-end performance data, please call 800-225-5291 or visit the fund's website at jhinvestments.com.
The performance table above and the chart on the next page do not reflect the deduction of taxes that a shareholder would pay on fund distributions or the redemption of fund shares. The fund's performance results reflect any applicable fee waivers or expense reductions, without which the expenses would increase and results would have been less favorable.
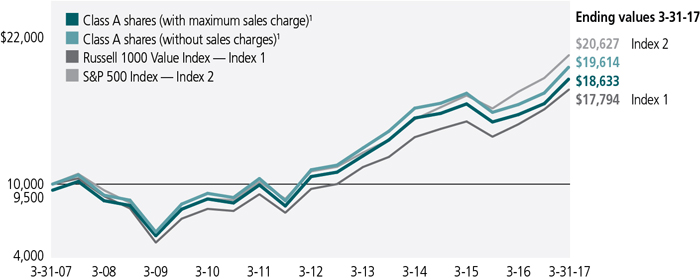
| † | Index 1 is the Russell 1000 Value Index; Index 2 is the S&P 500 Index. |
See the following page for footnotes.
This chart and table show what happened to a hypothetical $10,000 investment in John Hancock Disciplined Value Fund for the share classes and periods indicated, assuming all distributions were reinvested. For comparison, we've shown the same investment in two separate indexes.
| Start date | With maximum sales charge ($) | Without sales charge ($) | Index 1 ($) | Index 2 ($) | |
| Class B1,4 | 3-31-07 | 17,972 | 17,972 | 17,794 | 20,627 |
| Class C1,4 | 3-31-07 | 18,017 | 18,017 | 17,794 | 20,627 |
| Class I1,2 | 3-31-07 | 20,232 | 20,232 | 17,794 | 20,627 |
| Class I21,2 | 3-31-07 | 20,151 | 20,151 | 17,794 | 20,627 |
| Class R11,2 | 3-31-07 | 18,845 | 18,845 | 17,794 | 20,627 |
| Class R21,2 | 3-31-07 | 19,209 | 19,209 | 17,794 | 20,627 |
| Class R31,2 | 3-31-07 | 19,047 | 19,047 | 17,794 | 20,627 |
| Class R41,2 | 3-31-07 | 19,739 | 19,739 | 17,794 | 20,627 |
| Class R51,2 | 3-31-07 | 20,295 | 20,295 | 17,794 | 20,627 |
| Class R61,2 | 3-31-07 | 20,345 | 20,345 | 17,794 | 20,627 |
| Class NAV2 | 5-29-09 | 28,838 | 28,838 | 29,575 | 30,748 |
The Russell 1000 Value Index is an unmanaged index containing those securities in the Russell 1000 Index with a lower price-to-book ratio and less-than-average growth orientation.
The S&P 500 Index is an unmanaged index that includes 500 widely traded common stocks.
It is not possible to invest directly in an index. Index figures do not reflect expenses or sales charges, which would result in lower returns.
Footnotes related to performance pages
| 1 | On 12-19-08, through a reorganization, the fund acquired all of the assets of Robeco Boston Partners Large Cap Value Fund (the predecessor fund). On that date, the predecessor fund's Investor shares were exchanged for Class A shares and its Institutional shares were exchanged for Class I shares of John Hancock Disciplined Value Fund. Class A, Class B, and Class C shares were first offered on 12-22-08. The returns prior to this date are those of the predecessor fund's Investor shares that have been recalculated to reflect the gross fees and expenses of Class A, Class B, and Class C shares, as applicable. Class I and Class I2 shares were first offered on 12-22-08. The returns prior to this date are those of the predecessor fund's Institutional shares that have been recalculated to reflect the gross fees and expenses of Class I and Class I2 shares, as applicable. Class R1 shares were first offered on 7-13-09; Class R2 shares were first offered on 3-1-12; Class R3, Class R4, and Class R5 shares were first offered on 5-22-09; Class R6 shares were first offered on 9-1-11. The returns prior to these dates are those of Class A shares that have been recalculated to apply the gross fees and expenses of Class R1, Class R2, Class R3, Class R4, Class R5, and Class R6 shares, as applicable. |
| 2 | For certain types of investors, as described in the fund's prospectuses. |
| 3 | From 5-29-09. |
| 4 | The contingent deferred sales charge is not applicable. |
These examples are intended to help you understand your ongoing operating expenses of investing in the fund so you can compare these costs with the ongoing costs of investing in other mutual funds.
Understanding fund expenses
As a shareholder of the fund, you incur two types of costs:
| • | Transaction costs, which include sales charges (loads) on purchases or redemptions (varies by share class), minimum account fee charge, etc. |
| • | Ongoing operating expenses, including management fees, distribution and service fees (if applicable), and other fund expenses. |
We are presenting only your ongoing operating expenses here.
Actual expenses/actual returns
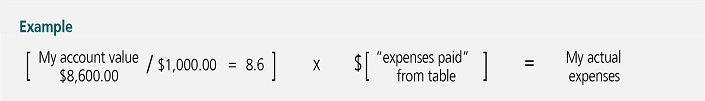
The first line of each share class in the table on the following page is intended to provide information about the fund's actual ongoing operating expenses, and is based on the fund's actual return. It assumes an account value of $1,000.00 on October 1, 2016, with the same investment held until March 31, 2017.
Together with the value of your account, you may use this information to estimate the operating expenses that you paid over the period. Simply divide your account value at March 31, 2017, by $1,000.00, then multiply it by the "expenses paid" for your share class from the table. For example, for an account value of $8,600.00, the operating expenses should be calculated as follows:
Hypothetical example for comparison purposes
The second line of each share class in the table on the following page allows you to compare the fund's ongoing operating expenses with those of any other fund. It provides an example of the fund's hypothetical account values and hypothetical expenses based on each class's actual expense ratio and an assumed 5% annualized return before expenses (which is not the fund's actual return). It assumes an account value of $1,000.00 on October 1, 2016, with the same investment held until March 31, 2017. Look in any other fund shareholder report to find its hypothetical example and you will be able to compare these expenses. Please remember that these hypothetical account values and expenses may not be used to estimate the actual ending account balance or expenses you paid for the period.
Remember, these examples do not include any transaction costs, therefore, these examples will not help you to determine the relative total costs of owning different funds. If transaction costs were included, your expenses would have been higher. See the prospectuses for details regarding transaction costs.
SHAREHOLDER EXPENSE EXAMPLE CHART
| Account value on 10-1-2016 | Ending value on 3-31-2017 | Expenses paid during period ended 3-31-20171 | Annualized expense ratio | ||
| Class A | Actual expenses/actual returns | $1,000.00 | $1,120.80 | $5.60 | 1.06% |
| Hypothetical example for comparison purposes | 1,000.00 | 1,019.60 | 5.34 | 1.06% | |
| Class B | Actual expenses/actual returns | 1,000.00 | 1,116.80 | 9.55 | 1.81% |
| Hypothetical example for comparison purposes | 1,000.00 | 1,015.90 | 9.10 | 1.81% | |
| Class C | Actual expenses/actual returns | 1,000.00 | 1,116.50 | 9.55 | 1.81% |
| Hypothetical example for comparison purposes | 1,000.00 | 1,015.90 | 9.10 | 1.81% | |
| Class I | Actual expenses/actual returns | 1,000.00 | 1,122.50 | 4.23 | 0.80% |
| Hypothetical example for comparison purposes | 1,000.00 | 1,020.90 | 4.03 | 0.80% | |
| Class I2 | Actual expenses/actual returns | 1,000.00 | 1,122.50 | 4.23 | 0.80% |
| Hypothetical example for comparison purposes | 1,000.00 | 1,020.90 | 4.03 | 0.80% | |
| Class R1 | Actual expenses/actual returns | 1,000.00 | 1,118.60 | 7.66 | 1.45% |
| Hypothetical example for comparison purposes | 1,000.00 | 1,017.70 | 7.29 | 1.45% | |
| Class R2 | Actual expenses/actual returns | 1,000.00 | 1,119.80 | 6.34 | 1.20% |
| Hypothetical example for comparison purposes | 1,000.00 | 1,018.90 | 6.04 | 1.20% | |
| Class R3 | Actual expenses/actual returns | 1,000.00 | 1,119.60 | 7.13 | 1.35% |
| Hypothetical example for comparison purposes | 1,000.00 | 1,018.20 | 6.79 | 1.35% | |
| Class R4 | Actual expenses/actual returns | 1,000.00 | 1,120.90 | 5.08 | 0.96% |
| Hypothetical example for comparison purposes | 1,000.00 | 1,020.10 | 4.83 | 0.96% | |
| Class R5 | Actual expenses/actual returns | 1,000.00 | 1,122.70 | 3.97 | 0.75% |
| Hypothetical example for comparison purposes | 1,000.00 | 1,021.20 | 3.78 | 0.75% | |
| Class R6 | Actual expenses/actual returns | 1,000.00 | 1,122.90 | 3.65 | 0.69% |
| Hypothetical example for comparison purposes | 1,000.00 | 1,021.50 | 3.48 | 0.69% | |
| Class NAV | Actual expenses/actual returns | 1,000.00 | 1,122.80 | 3.65 | 0.69% |
| Hypothetical example for comparison purposes | 1,000.00 | 1,021.50 | 3.48 | 0.69% | |
| 1 | Expenses are equal to the fund's annualized expense ratio, multiplied by the average account value over the period, multiplied by 182/365 (to reflect the one-half year period). |
Fund's investments
| As of 3-31-17 | ||||||||||||||
| Shares | Value | |||||||||||||
| Common stocks 98.7% | $14,152,834,882 | |||||||||||||
| (Cost $11,564,569,320) | ||||||||||||||
| Consumer discretionary 8.8% | 1,261,475,561 | |||||||||||||
| Auto components 1.0% | ||||||||||||||
| BorgWarner, Inc. | 3,473,631 | 145,163,039 | ||||||||||||
| Household durables 0.5% | ||||||||||||||
| PulteGroup, Inc. | 2,991,778 | 70,456,372 | ||||||||||||
| Media 6.0% | ||||||||||||||
| CBS Corp., Class B | 1,288,272 | 89,354,546 | ||||||||||||
| Comcast Corp., Class A | 4,075,458 | 153,196,466 | ||||||||||||
| Liberty Global PLC LiLAC, Series C (I) | 2,025,759 | 46,673,487 | ||||||||||||
| Liberty Global PLC, Series C (I) | 1,457,630 | 51,075,355 | ||||||||||||
| The Interpublic Group of Companies, Inc. | 4,332,842 | 106,457,928 | ||||||||||||
| Time Warner, Inc. | 2,653,026 | 259,227,170 | ||||||||||||
| Twenty-First Century Fox, Inc., Class A | 4,689,741 | 151,900,711 | ||||||||||||
| Specialty retail 1.3% | ||||||||||||||
| Best Buy Company, Inc. | 889,946 | 43,740,846 | ||||||||||||
| The Home Depot, Inc. | 982,290 | 144,229,641 | ||||||||||||
| Consumer staples 1.2% | 177,729,125 | |||||||||||||
| Beverages 0.7% | ||||||||||||||
| Coca-Cola European Partners PLC | 2,574,207 | 97,021,862 | ||||||||||||
| Food and staples retailing 0.5% | ||||||||||||||
| CVS Health Corp. | 1,028,118 | 80,707,263 | ||||||||||||
| Energy 8.9% | 1,279,708,698 | |||||||||||||
| Oil, gas and consumable fuels 8.9% | ||||||||||||||
| Chevron Corp. | 2,890,092 | 310,309,178 | ||||||||||||
| ConocoPhillips | 2,905,472 | 144,895,889 | ||||||||||||
| Diamondback Energy, Inc. (I) | 914,534 | 94,850,894 | ||||||||||||
| Energen Corp. (I) | 1,200,284 | 65,343,461 | ||||||||||||
| EOG Resources, Inc. | 849,368 | 82,855,848 | ||||||||||||
| EQT Corp. | 879,639 | 53,745,943 | ||||||||||||
| Gulfport Energy Corp. (I) | 1,740,985 | 29,927,532 | ||||||||||||
| Marathon Oil Corp. | 4,763,557 | 75,264,201 | ||||||||||||
| Marathon Petroleum Corp. | 3,498,103 | 176,794,126 | ||||||||||||
| Phillips 66 | 1,029,562 | 81,561,902 | ||||||||||||
| Pioneer Natural Resources Company | 361,674 | 67,354,549 | ||||||||||||
| Tesoro Corp. | 1,194,241 | 96,805,175 | ||||||||||||
| Financials 26.4% | 3,785,796,548 | |||||||||||||
| Banks 14.1% | ||||||||||||||
| Bank of America Corp. | 27,411,567 | 646,638,866 | ||||||||||||
| Shares | Value | |||||||||||||
| Financials (continued) | ||||||||||||||
| Banks (continued) | ||||||||||||||
| Citigroup, Inc. | 7,212,159 | $431,431,351 | ||||||||||||
| Fifth Third Bancorp | 3,804,453 | 96,633,106 | ||||||||||||
| JPMorgan Chase & Co. | 7,943,830 | 697,786,027 | ||||||||||||
| Lloyds Banking Group PLC, ADR (L) | 26,136,685 | 88,864,729 | ||||||||||||
| Wells Fargo & Company | 1,153,550 | 64,206,593 | ||||||||||||
| Capital markets 1.5% | ||||||||||||||
| The Goldman Sachs Group, Inc. | 943,515 | 216,744,266 | ||||||||||||
| Consumer finance 4.6% | ||||||||||||||
| Capital One Financial Corp. | 2,066,849 | 179,113,134 | ||||||||||||
| Discover Financial Services | 4,670,658 | 319,426,301 | ||||||||||||
| Navient Corp. | 4,401,512 | 64,966,317 | ||||||||||||
| Synchrony Financial | 2,858,898 | 98,060,201 | ||||||||||||
| Diversified financial services 3.7% | ||||||||||||||
| Berkshire Hathaway, Inc., Class B (I) | 3,166,577 | 527,805,054 | ||||||||||||
| Insurance 2.5% | ||||||||||||||
| Chubb, Ltd. | 1,434,220 | 195,412,472 | ||||||||||||
| The Allstate Corp. | 1,947,578 | 158,708,131 | ||||||||||||
| Health care 16.1% | 2,307,240,983 | |||||||||||||
| Biotechnology 2.0% | ||||||||||||||
| Gilead Sciences, Inc. | 3,074,707 | 208,834,099 | ||||||||||||
| Shire PLC, ADR | 410,072 | 71,446,845 | ||||||||||||
| Health care equipment and supplies 0.9% | ||||||||||||||
| Abbott Laboratories | 2,944,627 | 130,770,885 | ||||||||||||
| Health care providers and services 4.3% | ||||||||||||||
| Anthem, Inc. | 999,621 | 165,317,321 | ||||||||||||
| Cigna Corp. | 1,052,906 | 154,240,200 | ||||||||||||
| DaVita, Inc. (I) | 1,320,814 | 89,775,728 | ||||||||||||
| Laboratory Corp. of America Holdings (I) | 491,112 | 70,459,839 | ||||||||||||
| UnitedHealth Group, Inc. | 843,411 | 138,327,838 | ||||||||||||
| Pharmaceuticals 8.9% | ||||||||||||||
| Johnson & Johnson | 4,061,980 | 505,919,609 | ||||||||||||
| Merck & Company, Inc. | 5,434,005 | 345,276,678 | ||||||||||||
| Pfizer, Inc. | 8,389,231 | 286,995,593 | ||||||||||||
| Sanofi, ADR | 3,091,190 | 139,876,348 | ||||||||||||
| Industrials 9.0% | 1,291,593,358 | |||||||||||||
| Aerospace and defense 4.1% | ||||||||||||||
| General Dynamics Corp. | 1,058,928 | 198,231,322 | ||||||||||||
| L3 Technologies, Inc. | 525,325 | 86,830,969 | ||||||||||||
| Raytheon Company | 783,880 | 119,541,700 | ||||||||||||
| United Technologies Corp. | 1,676,344 | 188,102,560 | ||||||||||||
| Shares | Value | |||||||||||||
| Industrials (continued) | ||||||||||||||
| Air freight and logistics 0.6% | ||||||||||||||
| United Parcel Service, Inc., Class B | 817,463 | $87,713,780 | ||||||||||||
| Airlines 1.4% | ||||||||||||||
| Delta Air Lines, Inc. | 2,579,294 | 118,544,352 | ||||||||||||
| United Continental Holdings, Inc. (I) | 1,096,530 | 77,458,879 | ||||||||||||
| Electrical equipment 1.0% | ||||||||||||||
| Eaton Corp. PLC | 2,026,632 | 150,274,763 | ||||||||||||
| Industrial conglomerates 1.3% | ||||||||||||||
| Koninklijke Philips NV - NY Shares | 5,793,219 | 186,020,262 | ||||||||||||
| Machinery 0.6% | ||||||||||||||
| WABCO Holdings, Inc. (I) | 671,732 | 78,874,771 | ||||||||||||
| Information technology 20.4% | 2,917,745,180 | |||||||||||||
| Communications equipment 3.7% | ||||||||||||||
| Brocade Communications Systems, Inc. | 3,899,632 | 48,667,407 | ||||||||||||
| Cisco Systems, Inc. | 10,107,737 | 341,641,511 | ||||||||||||
| Harris Corp. | 1,267,074 | 140,987,324 | ||||||||||||
| Electronic equipment, instruments and components 2.8% | ||||||||||||||
| Flex, Ltd. (I) | 9,625,172 | 161,702,890 | ||||||||||||
| TE Connectivity, Ltd. | 3,229,877 | 240,787,330 | ||||||||||||
| Internet software and services 3.4% | ||||||||||||||
| Alphabet, Inc., Class A (I) | 332,016 | 281,483,165 | ||||||||||||
| eBay, Inc. (I) | 5,947,780 | 199,666,975 | ||||||||||||
| IT services 1.9% | ||||||||||||||
| Cognizant Technology Solutions Corp., Class A (I) | 1,763,188 | 104,944,950 | ||||||||||||
| Computer Sciences Corp. | 1,707,153 | 117,810,629 | ||||||||||||
| Leidos Holdings, Inc. | 879,308 | 44,967,811 | ||||||||||||
| Semiconductors and semiconductor equipment 2.0% | ||||||||||||||
| KLA-Tencor Corp. | 897,210 | 85,297,755 | ||||||||||||
| Texas Instruments, Inc. | 2,432,902 | 195,994,585 | ||||||||||||
| Software 3.0% | ||||||||||||||
| Microsoft Corp. | 2,904,565 | 191,294,651 | ||||||||||||
| Oracle Corp. | 5,491,459 | 244,973,986 | ||||||||||||
| Technology hardware, storage and peripherals 3.6% | ||||||||||||||
| Apple, Inc. | 2,267,921 | 325,809,531 | ||||||||||||
| Hewlett Packard Enterprise Company | 8,089,227 | 191,714,680 | ||||||||||||
| Materials 7.3% | 1,044,713,309 | |||||||||||||
| Chemicals 3.5% | ||||||||||||||
| Celanese Corp., Series A | 976,451 | 87,734,122 | ||||||||||||
| Methanex Corp. | 1,942,103 | 91,084,631 | ||||||||||||
| PPG Industries, Inc. | 589,494 | 61,944,030 | ||||||||||||
| The Dow Chemical Company | 4,083,903 | 259,491,197 | ||||||||||||
| Shares | Value | |||||||||||||
| Materials (continued) | ||||||||||||||
| Construction materials 0.6% | ||||||||||||||
| CRH PLC, ADR | 2,643,452 | $92,970,207 | ||||||||||||
| Containers and packaging 0.9% | ||||||||||||||
| WestRock Company | 2,427,347 | 126,294,864 | ||||||||||||
| Metals and mining 2.3% | ||||||||||||||
| Barrick Gold Corp. | 5,386,785 | 102,295,047 | ||||||||||||
| Nucor Corp. | 1,578,787 | 94,285,160 | ||||||||||||
| Steel Dynamics, Inc. | 3,700,059 | 128,614,051 | ||||||||||||
| Utilities 0.6% | 86,832,120 | |||||||||||||
| Independent power and renewable electricity producers 0.6% | ||||||||||||||
| AES Corp. | 7,766,737 | 86,832,120 | ||||||||||||
| Yield (%) | Shares | Value | ||||||||||||
| Securities lending collateral 0.0% | $1,530,947 | |||||||||||||
| (Cost $1,530,956) | ||||||||||||||
| John Hancock Collateral Trust (W) | 0.9609(Y | ) | 152,997 | 1,530,947 | ||||||||||
| Short-term investments 1.4% | $199,495,879 | |||||||||||||
| (Cost $199,495,879) | ||||||||||||||
| Money market funds 1.4% | 199,495,879 | |||||||||||||
| State Street Institutional U.S. Government Money Market Fund, Premier Class | 0.6179(Y | ) | 199,495,879 | 199,495,879 | ||||||||||
| Total investments (Cost $11,765,596,155)† 100.1% | $14,353,861,708 | |||||||||||||
| Other assets and liabilities, net (0.1%) | ($13,532,213 | ) | ||||||||||||
| Total net assets 100.0% | $14,340,329,495 | |||||||||||||
| The percentage shown for each investment category is the total value of the category as a percentage of the net assets of the fund. | ||||||||||||||
| Security Abbreviations and Legend | ||||||||||||||
| ADR | American Depositary Receipts | |||||||||||||
| (I) | Non-income producing security. | |||||||||||||
| (L) | A portion of this security is on loan as of 3-31-17. | |||||||||||||
| (W) | Investment is an affiliate of the fund, the advisor and/or subadvisor. This security represents the investment of cash collateral received for securities lending. | |||||||||||||
| (Y) | The rate shown is the annualized seven-day yield as of 3-31-17. | |||||||||||||
| † | At 3-31-17, the aggregate cost of investment securities for federal income tax purposes was $11,834,363,091. Net unrealized appreciation aggregated to $2,519,498,617, of which $2,667,308,884 related to appreciated investment securities and $147,810,267 related to depreciated investment securities. | |||||||||||||
Financial statements
STATEMENT OF ASSETS AND LIABILITIES 3-31-17
| Assets | ||||||||||||||||||||||||||||||
| Unaffiliated investments, at value (Cost $11,764,065,199) including $1,489,540 of securities loaned | $14,352,330,761 | |||||||||||||||||||||||||||||
| Affiliated investments, at value (Cost $1,530,956) | 1,530,947 | |||||||||||||||||||||||||||||
| Total investments, at value (Cost $11,765,596,155) | 14,353,861,708 | |||||||||||||||||||||||||||||
| Receivable for investments sold | 54,619,026 | |||||||||||||||||||||||||||||
| Receivable for fund shares sold | 71,458,853 | |||||||||||||||||||||||||||||
| Dividends and interest receivable | 11,783,524 | |||||||||||||||||||||||||||||
| Receivable for securities lending income | 12,188 | |||||||||||||||||||||||||||||
| Receivable due from advisor | 1,370 | |||||||||||||||||||||||||||||
| Other receivables and prepaid expenses | 258,083 | |||||||||||||||||||||||||||||
| Total assets | 14,491,994,752 | |||||||||||||||||||||||||||||
| Liabilities | ||||||||||||||||||||||||||||||
| Payable for investments purchased | 54,864,385 | |||||||||||||||||||||||||||||
| Payable for fund shares repurchased | 92,955,620 | |||||||||||||||||||||||||||||
| Payable upon return of securities loaned | 1,533,350 | |||||||||||||||||||||||||||||
| Payable to affiliates | ||||||||||||||||||||||||||||||
| Accounting and legal services fees | 308,323 | |||||||||||||||||||||||||||||
| Transfer agent fees | 960,092 | |||||||||||||||||||||||||||||
| Distribution and service fees | 134,592 | |||||||||||||||||||||||||||||
| Trustees' fees | 12,025 | |||||||||||||||||||||||||||||
| Other liabilities and accrued expenses | 896,870 | |||||||||||||||||||||||||||||
| Total liabilities | 151,665,257 | |||||||||||||||||||||||||||||
| Net assets | $14,340,329,495 | |||||||||||||||||||||||||||||
| Net assets consist of | ||||||||||||||||||||||||||||||
| Paid-in capital | $11,654,292,587 | |||||||||||||||||||||||||||||
| Undistributed net investment income | 27,495,582 | |||||||||||||||||||||||||||||
| Accumulated net realized gain (loss) on investments and foreign currency transactions | 70,275,773 | |||||||||||||||||||||||||||||
| Net unrealized appreciation (depreciation) on investments | 2,588,265,553 | |||||||||||||||||||||||||||||
| Net assets | $14,340,329,495 | |||||||||||||||||||||||||||||
STATEMENT OF ASSETS AND LIABILITIES (continued)
| Net asset value per share | ||||||||||||||||||
| Based on net asset values and shares outstanding-the fund has an unlimited number of shares authorized with no par value | ||||||||||||||||||
| Class A ($1,448,981,124 ÷ 69,968,890 shares)1 | $20.71 | |||||||||||||||||
| Class B ($12,548,849 ÷ 642,929 shares)1 | $19.52 | |||||||||||||||||
| Class C ($292,619,923 ÷ 14,951,541 shares)1 | $19.57 | |||||||||||||||||
| Class I ($7,539,668,878 ÷ 374,752,703 shares) | $20.12 | |||||||||||||||||
| Class I2 ($53,717,857 ÷ 2,670,093 shares) | $20.12 | |||||||||||||||||
| Class R1 ($27,163,981 ÷ 1,352,021 shares) | $20.09 | |||||||||||||||||
| Class R2 ($135,311,373 ÷ 6,731,393 shares) | $20.10 | |||||||||||||||||
| Class R3 ($22,262,485 ÷ 1,108,392 shares) | $20.09 | |||||||||||||||||
| Class R4 ($285,864,291 ÷ 14,205,509 shares) | $20.12 | |||||||||||||||||
| Class R5 ($200,221,319 ÷ 9,938,383 shares) | $20.15 | |||||||||||||||||
| Class R6 ($3,076,921,035 ÷ 152,756,803 shares) | $20.14 | |||||||||||||||||
| Class NAV ($1,245,048,380 ÷ 61,793,795 shares) | $20.15 | |||||||||||||||||
| Maximum offering price per share | ||||||||||||||||||
| Class A (net asset value per share ÷ 95%)2 | $21.80 | |||||||||||||||||
| 1 | Redemption price per share is equal to net asset value less any applicable contingent deferred sales charge. | ||||||||||||||||
| 2 | On single retail sales of less than $50,000. On sales of $50,000 or more and on group sales the offering price is reduced. | ||||||||||||||||
STATEMENT OF OPERATIONS For the year ended 3-31-17
| Investment income | ||||||||||||||||||||||||
| Dividends | $272,685,561 | |||||||||||||||||||||||
| Securities lending | 1,271,915 | |||||||||||||||||||||||
| Interest | 958,868 | |||||||||||||||||||||||
| Less foreign taxes withheld | (740,921 | ) | ||||||||||||||||||||||
| Total investment income | 274,175,423 | |||||||||||||||||||||||
| Expenses | ||||||||||||||||||||||||
| Investment management fees | 90,732,553 | |||||||||||||||||||||||
| Distribution and service fees | 10,268,976 | |||||||||||||||||||||||
| Accounting and legal services fees | 2,024,873 | |||||||||||||||||||||||
| Transfer agent fees | 11,626,254 | |||||||||||||||||||||||
| Trustees' fees | 235,066 | |||||||||||||||||||||||
| State registration fees | 522,280 | |||||||||||||||||||||||
| Printing and postage | 822,055 | |||||||||||||||||||||||
| Professional fees | 433,708 | |||||||||||||||||||||||
| Custodian fees | 1,513,913 | |||||||||||||||||||||||
| Other | 188,558 | |||||||||||||||||||||||
| Total expenses | 118,368,236 | |||||||||||||||||||||||
| Less expense reductions | (1,731,966 | ) | ||||||||||||||||||||||
| Net expenses | 116,636,270 | |||||||||||||||||||||||
| Net investment income | 157,539,153 | |||||||||||||||||||||||
| Realized and unrealized gain (loss) | ||||||||||||||||||||||||
| Net realized gain (loss) on | ||||||||||||||||||||||||
| Unaffiliated investments and foreign currency transactions | 360,394,604 | |||||||||||||||||||||||
| Affiliated investments | 2,171 | |||||||||||||||||||||||
| 360,396,775 | ||||||||||||||||||||||||
| Change in net unrealized appreciation (depreciation) of | ||||||||||||||||||||||||
| Unaffiliated investments and translation of assets and liabilities in foreign currencies | 1,846,120,166 | |||||||||||||||||||||||
| Affiliated investments | (2,139 | ) | ||||||||||||||||||||||
| 1,846,118,027 | ||||||||||||||||||||||||
| Net realized and unrealized gain | 2,206,514,802 | |||||||||||||||||||||||
| Increase in net assets from operations | $2,364,053,955 | |||||||||||||||||||||||
STATEMENTS OF CHANGES IN NET ASSETS
| Year ended 3-31-17 | Year ended 3-31-16 | ||||||||||||||||||||||||||||||||||||||||||||
| Increase (decrease) in net assets | |||||||||||||||||||||||||||||||||||||||||||||
| From operations | |||||||||||||||||||||||||||||||||||||||||||||
| Net investment income | $157,539,153 | $142,864,984 | |||||||||||||||||||||||||||||||||||||||||||
| Net realized gain (loss) | 360,396,775 | (46,969,513 | ) | ||||||||||||||||||||||||||||||||||||||||||
| Change in net unrealized appreciation (depreciation) | 1,846,118,027 | (877,252,040 | ) | ||||||||||||||||||||||||||||||||||||||||||
| Increase (decrease) in net assets resulting from operations | 2,364,053,955 | (781,356,569 | ) | ||||||||||||||||||||||||||||||||||||||||||
| Distributions to shareholders | |||||||||||||||||||||||||||||||||||||||||||||
| From net investment income | |||||||||||||||||||||||||||||||||||||||||||||
| Class A | (16,450,212 | ) | (27,728,943 | ) | |||||||||||||||||||||||||||||||||||||||||
| Class B | (39,753 | ) | (46,278 | ) | |||||||||||||||||||||||||||||||||||||||||
| Class C | (887,691 | ) | (972,189 | ) | |||||||||||||||||||||||||||||||||||||||||
| Class I | (92,487,888 | ) | (99,117,523 | ) | |||||||||||||||||||||||||||||||||||||||||
| Class I2 | (621,376 | ) | (856,842 | ) | |||||||||||||||||||||||||||||||||||||||||
| Class R1 | (164,299 | ) | (162,991 | ) | |||||||||||||||||||||||||||||||||||||||||
| Class R2 | (1,181,963 | ) | (1,237,692 | ) | |||||||||||||||||||||||||||||||||||||||||
| Class R3 | (180,430 | ) | (227,765 | ) | |||||||||||||||||||||||||||||||||||||||||
| Class R4 | (3,068,524 | ) | (3,084,295 | ) | |||||||||||||||||||||||||||||||||||||||||
| Class R5 | (3,917,043 | ) | (5,356,973 | ) | |||||||||||||||||||||||||||||||||||||||||
| Class R6 | (35,963,782 | ) | (26,166,598 | ) | |||||||||||||||||||||||||||||||||||||||||
| Class NAV | (13,573,944 | ) | (10,834,910 | ) | |||||||||||||||||||||||||||||||||||||||||
| From net realized gain | |||||||||||||||||||||||||||||||||||||||||||||
| Class A | — | (84,699,290 | ) | ||||||||||||||||||||||||||||||||||||||||||
| Class B | — | (510,604 | ) | ||||||||||||||||||||||||||||||||||||||||||
| Class C | — | (10,725,915 | ) | ||||||||||||||||||||||||||||||||||||||||||
| Class I | — | (242,069,838 | ) | ||||||||||||||||||||||||||||||||||||||||||
| Class I2 | — | (2,092,624 | ) | ||||||||||||||||||||||||||||||||||||||||||
| Class R1 | — | (797,491 | ) | ||||||||||||||||||||||||||||||||||||||||||
| Class R2 | — | (4,353,601 | ) | ||||||||||||||||||||||||||||||||||||||||||
| Class R3 | — | (965,781 | ) | ||||||||||||||||||||||||||||||||||||||||||
| Class R4 | — | (8,517,823 | ) | ||||||||||||||||||||||||||||||||||||||||||
| Class R5 | — | (12,597,550 | ) | ||||||||||||||||||||||||||||||||||||||||||
| Class R6 | — | (58,494,746 | ) | ||||||||||||||||||||||||||||||||||||||||||
| Class NAV | — | (24,221,158 | ) | ||||||||||||||||||||||||||||||||||||||||||
| Total distributions | (168,536,905 | ) | (625,839,420 | ) | |||||||||||||||||||||||||||||||||||||||||
| From fund share transactions | (841,850,128 | ) | 1,190,687,737 | ||||||||||||||||||||||||||||||||||||||||||
| Total increase (decrease) | 1,353,666,922 | (216,508,252 | ) | ||||||||||||||||||||||||||||||||||||||||||
| Net assets | |||||||||||||||||||||||||||||||||||||||||||||
| Beginning of year | 12,986,662,573 | 13,203,170,825 | |||||||||||||||||||||||||||||||||||||||||||
| End of year | $14,340,329,495 | $12,986,662,573 | |||||||||||||||||||||||||||||||||||||||||||
| Undistributed net investment income | $27,495,582 | $38,532,555 | |||||||||||||||||||||||||||||||||||||||||||
Financial highlights
| Class A Shares Period ended | 3-31-17 | 3-31-16 | 3-31-15 | 3-31-14 | 3-31-13 | ||||||||||||||||||||||||||||||||||||||||||||||||||||||||||||||||||||||||||||||||||||||||||||||||||
| Per share operating performance | |||||||||||||||||||||||||||||||||||||||||||||||||||||||||||||||||||||||||||||||||||||||||||||||||||||||
| Net asset value, beginning of period | $17.64 | $19.44 | $18.94 | $15.94 | $14.33 | ||||||||||||||||||||||||||||||||||||||||||||||||||||||||||||||||||||||||||||||||||||||||||||||||||
| Net investment income1 | 0.18 | 0.16 | 0.20 | 0.12 | 0.14 | ||||||||||||||||||||||||||||||||||||||||||||||||||||||||||||||||||||||||||||||||||||||||||||||||||
| Net realized and unrealized gain (loss) on investments | 3.08 | (1.18 | ) | 1.19 | 3.85 | 2.09 | |||||||||||||||||||||||||||||||||||||||||||||||||||||||||||||||||||||||||||||||||||||||||||||||||
| Total from investment operations | 3.26 | (1.02 | ) | 1.39 | 3.97 | 2.23 | |||||||||||||||||||||||||||||||||||||||||||||||||||||||||||||||||||||||||||||||||||||||||||||||||
| Less distributions | |||||||||||||||||||||||||||||||||||||||||||||||||||||||||||||||||||||||||||||||||||||||||||||||||||||||
| From net investment income | (0.19 | ) | (0.19 | ) | (0.10 | ) | (0.09 | ) | (0.12 | ) | |||||||||||||||||||||||||||||||||||||||||||||||||||||||||||||||||||||||||||||||||||||||||||||
| From net realized gain | — | (0.59 | ) | (0.79 | ) | (0.88 | ) | (0.50 | ) | ||||||||||||||||||||||||||||||||||||||||||||||||||||||||||||||||||||||||||||||||||||||||||||||
| Total distributions | (0.19 | ) | (0.78 | ) | (0.89 | ) | (0.97 | ) | (0.62 | ) | |||||||||||||||||||||||||||||||||||||||||||||||||||||||||||||||||||||||||||||||||||||||||||||
| Net asset value, end of period | $20.71 | $17.64 | $19.44 | $18.94 | $15.94 | ||||||||||||||||||||||||||||||||||||||||||||||||||||||||||||||||||||||||||||||||||||||||||||||||||
| Total return (%)2,3 | 18.50 | (5.29 | ) | 7.53 | 25.30 | 16.04 | |||||||||||||||||||||||||||||||||||||||||||||||||||||||||||||||||||||||||||||||||||||||||||||||||
| Ratios and supplemental data | |||||||||||||||||||||||||||||||||||||||||||||||||||||||||||||||||||||||||||||||||||||||||||||||||||||||
| Net assets, end of period (in millions) | $1,449 | $2,375 | $2,705 | $2,702 | $1,481 | ||||||||||||||||||||||||||||||||||||||||||||||||||||||||||||||||||||||||||||||||||||||||||||||||||
| Ratios (as a percentage of average net assets): | |||||||||||||||||||||||||||||||||||||||||||||||||||||||||||||||||||||||||||||||||||||||||||||||||||||||
| Expenses before reductions | 1.07 | 1.08 | 1.08 | 1.12 | 1.20 | ||||||||||||||||||||||||||||||||||||||||||||||||||||||||||||||||||||||||||||||||||||||||||||||||||
| Expenses including reductions | 1.06 | 1.07 | 1.08 | 1.11 | 1.20 | ||||||||||||||||||||||||||||||||||||||||||||||||||||||||||||||||||||||||||||||||||||||||||||||||||
| Net investment income | 0.96 | 0.87 | 1.04 | 0.68 | 0.95 | ||||||||||||||||||||||||||||||||||||||||||||||||||||||||||||||||||||||||||||||||||||||||||||||||||
| Portfolio turnover (%) | 65 | 61 | 44 | 45 | 44 | ||||||||||||||||||||||||||||||||||||||||||||||||||||||||||||||||||||||||||||||||||||||||||||||||||
| 1 | Based on average daily shares outstanding. | ||||||||||||||||||||||||||||||||||||||||||||||||||||||||||||||||||||||||||||||||||
| 2 | Does not reflect the effect of sales charges, if any. | ||||||||||||||||||||||||||||||||||||||||||||||||||||||||||||||||||||||||||||||||||
| 3 | Total returns would have been lower had certain expenses not been reduced during the applicable periods. | ||||||||||||||||||||||||||||||||||||||||||||||||||||||||||||||||||||||||||||||||||
| Class B Shares Period ended | 3-31-17 | 3-31-16 | 3-31-15 | 3-31-14 | 3-31-13 | ||||||||||||||||||||||||||||||||||||||||||||||||||||||||||||||||||||||||||||||||||||||||||||||||||
| Per share operating performance | |||||||||||||||||||||||||||||||||||||||||||||||||||||||||||||||||||||||||||||||||||||||||||||||||||||||
| Net asset value, beginning of period | $16.64 | $18.38 | $18.00 | $15.24 | $13.73 | ||||||||||||||||||||||||||||||||||||||||||||||||||||||||||||||||||||||||||||||||||||||||||||||||||
| Net investment income (loss)1 | 0.03 | 0.02 | 0.04 | (0.03 | ) | 0.01 | |||||||||||||||||||||||||||||||||||||||||||||||||||||||||||||||||||||||||||||||||||||||||||||||||
| Net realized and unrealized gain (loss) on investments | 2.91 | (1.12 | ) | 1.13 | 3.67 | 2.01 | |||||||||||||||||||||||||||||||||||||||||||||||||||||||||||||||||||||||||||||||||||||||||||||||||
| Total from investment operations | 2.94 | (1.10 | ) | 1.17 | 3.64 | 2.02 | |||||||||||||||||||||||||||||||||||||||||||||||||||||||||||||||||||||||||||||||||||||||||||||||||
| Less distributions | |||||||||||||||||||||||||||||||||||||||||||||||||||||||||||||||||||||||||||||||||||||||||||||||||||||||
| From net investment income | (0.06 | ) | (0.05 | ) | — | — | (0.01 | ) | |||||||||||||||||||||||||||||||||||||||||||||||||||||||||||||||||||||||||||||||||||||||||||||||
| From net realized gain | — | (0.59 | ) | (0.79 | ) | (0.88 | ) | (0.50 | ) | ||||||||||||||||||||||||||||||||||||||||||||||||||||||||||||||||||||||||||||||||||||||||||||||
| Total distributions | (0.06 | ) | (0.64 | ) | (0.79 | ) | (0.88 | ) | (0.51 | ) | |||||||||||||||||||||||||||||||||||||||||||||||||||||||||||||||||||||||||||||||||||||||||||||
| Net asset value, end of period | $19.52 | $16.64 | $18.38 | $18.00 | $15.24 | ||||||||||||||||||||||||||||||||||||||||||||||||||||||||||||||||||||||||||||||||||||||||||||||||||
| Total return (%)2,3 | 17.66 | (6.02 | ) | 6.68 | 24.21 | 15.09 | |||||||||||||||||||||||||||||||||||||||||||||||||||||||||||||||||||||||||||||||||||||||||||||||||
| Ratios and supplemental data | |||||||||||||||||||||||||||||||||||||||||||||||||||||||||||||||||||||||||||||||||||||||||||||||||||||||
| Net assets, end of period (in millions) | $13 | $14 | $19 | $19 | $14 | ||||||||||||||||||||||||||||||||||||||||||||||||||||||||||||||||||||||||||||||||||||||||||||||||||
| Ratios (as a percentage of average net assets): | |||||||||||||||||||||||||||||||||||||||||||||||||||||||||||||||||||||||||||||||||||||||||||||||||||||||
| Expenses before reductions | 1.82 | 1.85 | 1.91 | 1.96 | 2.08 | ||||||||||||||||||||||||||||||||||||||||||||||||||||||||||||||||||||||||||||||||||||||||||||||||||
| Expenses including reductions | 1.81 | 1.84 | 1.90 | 1.96 | 2.05 | ||||||||||||||||||||||||||||||||||||||||||||||||||||||||||||||||||||||||||||||||||||||||||||||||||
| Net investment income (loss) | 0.18 | 0.09 | 0.20 | (0.17 | ) | 0.10 | |||||||||||||||||||||||||||||||||||||||||||||||||||||||||||||||||||||||||||||||||||||||||||||||||
| Portfolio turnover (%) | 65 | 61 | 44 | 45 | 44 | ||||||||||||||||||||||||||||||||||||||||||||||||||||||||||||||||||||||||||||||||||||||||||||||||||
| 1 | Based on average daily shares outstanding. | ||||||||||||||||||||||||||||||||||||||||||||||||||||||||||||||||||||||||||||||||||
| 2 | Does not reflect the effect of sales charges, if any. | ||||||||||||||||||||||||||||||||||||||||||||||||||||||||||||||||||||||||||||||||||
| 3 | Total returns would have been lower had certain expenses not been reduced during the applicable periods. | ||||||||||||||||||||||||||||||||||||||||||||||||||||||||||||||||||||||||||||||||||
| Class C Shares Period ended | 3-31-17 | 3-31-16 | 3-31-15 | 3-31-14 | 3-31-13 | ||||||||||||||||||||||||||||||||||||||||||||||||||||||||||||||||||||||||||||||||||||||||||||||||||
| Per share operating performance | |||||||||||||||||||||||||||||||||||||||||||||||||||||||||||||||||||||||||||||||||||||||||||||||||||||||
| Net asset value, beginning of period | $16.69 | $18.43 | $18.03 | $15.26 | $13.74 | ||||||||||||||||||||||||||||||||||||||||||||||||||||||||||||||||||||||||||||||||||||||||||||||||||
| Net investment income (loss)1 | 0.03 | 0.02 | 0.07 | (0.02 | ) | 0.02 | |||||||||||||||||||||||||||||||||||||||||||||||||||||||||||||||||||||||||||||||||||||||||||||||||
| Net realized and unrealized gain (loss) on investments | 2.91 | (1.12 | ) | 1.12 | 3.67 | 2.01 | |||||||||||||||||||||||||||||||||||||||||||||||||||||||||||||||||||||||||||||||||||||||||||||||||
| Total from investment operations | 2.94 | (1.10 | ) | 1.19 | 3.65 | 2.03 | |||||||||||||||||||||||||||||||||||||||||||||||||||||||||||||||||||||||||||||||||||||||||||||||||
| Less distributions | |||||||||||||||||||||||||||||||||||||||||||||||||||||||||||||||||||||||||||||||||||||||||||||||||||||||
| From net investment income | (0.06 | ) | (0.05 | ) | — | — | (0.01 | ) | |||||||||||||||||||||||||||||||||||||||||||||||||||||||||||||||||||||||||||||||||||||||||||||||
| From net realized gain | — | (0.59 | ) | (0.79 | ) | (0.88 | ) | (0.50 | ) | ||||||||||||||||||||||||||||||||||||||||||||||||||||||||||||||||||||||||||||||||||||||||||||||
| Total distributions | (0.06 | ) | (0.64 | ) | (0.79 | ) | (0.88 | ) | (0.51 | ) | |||||||||||||||||||||||||||||||||||||||||||||||||||||||||||||||||||||||||||||||||||||||||||||
| Net asset value, end of period | $19.57 | $16.69 | $18.43 | $18.03 | $15.26 | ||||||||||||||||||||||||||||||||||||||||||||||||||||||||||||||||||||||||||||||||||||||||||||||||||
| Total return (%)2,3 | 17.61 | (6.00 | ) | 6.78 | 24.25 | 15.19 | |||||||||||||||||||||||||||||||||||||||||||||||||||||||||||||||||||||||||||||||||||||||||||||||||
| Ratios and supplemental data | |||||||||||||||||||||||||||||||||||||||||||||||||||||||||||||||||||||||||||||||||||||||||||||||||||||||
| Net assets, end of period (in millions) | $293 | $309 | $302 | $171 | $59 | ||||||||||||||||||||||||||||||||||||||||||||||||||||||||||||||||||||||||||||||||||||||||||||||||||
| Ratios (as a percentage of average net assets): | |||||||||||||||||||||||||||||||||||||||||||||||||||||||||||||||||||||||||||||||||||||||||||||||||||||||
| Expenses before reductions | 1.82 | 1.83 | 1.84 | 1.88 | 1.98 | ||||||||||||||||||||||||||||||||||||||||||||||||||||||||||||||||||||||||||||||||||||||||||||||||||
| Expenses including reductions | 1.81 | 1.82 | 1.83 | 1.88 | 1.98 | ||||||||||||||||||||||||||||||||||||||||||||||||||||||||||||||||||||||||||||||||||||||||||||||||||
| Net investment income (loss) | 0.18 | 0.12 | 0.35 | (0.09 | ) | 0.17 | |||||||||||||||||||||||||||||||||||||||||||||||||||||||||||||||||||||||||||||||||||||||||||||||||
| Portfolio turnover (%) | 65 | 61 | 44 | 45 | 44 | ||||||||||||||||||||||||||||||||||||||||||||||||||||||||||||||||||||||||||||||||||||||||||||||||||
| 1 | Based on average daily shares outstanding. | ||||||||||||||||||||||||||||||||||||||||||||||||||||||||||||||||||||||||||||||||||
| 2 | Does not reflect the effect of sales charges, if any. | ||||||||||||||||||||||||||||||||||||||||||||||||||||||||||||||||||||||||||||||||||
| 3 | Total returns would have been lower had certain expenses not been reduced during the applicable periods. | ||||||||||||||||||||||||||||||||||||||||||||||||||||||||||||||||||||||||||||||||||
| Class I Shares Period ended | 3-31-17 | 3-31-16 | 3-31-15 | 3-31-14 | 3-31-13 | ||||||||||||||||||||||||||||||||||||||||||||||||||||||||||||||||||||||||||||||||||||||||||||||||||
| Per share operating performance | |||||||||||||||||||||||||||||||||||||||||||||||||||||||||||||||||||||||||||||||||||||||||||||||||||||||
| Net asset value, beginning of period | $17.14 | $18.91 | $18.44 | $15.54 | $13.99 | ||||||||||||||||||||||||||||||||||||||||||||||||||||||||||||||||||||||||||||||||||||||||||||||||||
| Net investment income1 | 0.22 | 0.20 | 0.25 | 0.17 | 0.18 | ||||||||||||||||||||||||||||||||||||||||||||||||||||||||||||||||||||||||||||||||||||||||||||||||||
| Net realized and unrealized gain (loss) on investments | 3.00 | (1.14 | ) | 1.16 | 3.75 | 2.04 | |||||||||||||||||||||||||||||||||||||||||||||||||||||||||||||||||||||||||||||||||||||||||||||||||
| Total from investment operations | 3.22 | (0.94 | ) | 1.41 | 3.92 | 2.22 | |||||||||||||||||||||||||||||||||||||||||||||||||||||||||||||||||||||||||||||||||||||||||||||||||
| Less distributions | |||||||||||||||||||||||||||||||||||||||||||||||||||||||||||||||||||||||||||||||||||||||||||||||||||||||
| From net investment income | (0.24 | ) | (0.24 | ) | (0.15 | ) | (0.14 | ) | (0.17 | ) | |||||||||||||||||||||||||||||||||||||||||||||||||||||||||||||||||||||||||||||||||||||||||||||
| From net realized gain | — | (0.59 | ) | (0.79 | ) | (0.88 | ) | (0.50 | ) | ||||||||||||||||||||||||||||||||||||||||||||||||||||||||||||||||||||||||||||||||||||||||||||||
| Total distributions | (0.24 | ) | (0.83 | ) | (0.94 | ) | (1.02 | ) | (0.67 | ) | |||||||||||||||||||||||||||||||||||||||||||||||||||||||||||||||||||||||||||||||||||||||||||||
| Net asset value, end of period | $20.12 | $17.14 | $18.91 | $18.44 | $15.54 | ||||||||||||||||||||||||||||||||||||||||||||||||||||||||||||||||||||||||||||||||||||||||||||||||||
| Total return (%)2 | 18.80 | (5.02 | ) | 7.86 | 25.61 | 16.40 | |||||||||||||||||||||||||||||||||||||||||||||||||||||||||||||||||||||||||||||||||||||||||||||||||
| Ratios and supplemental data | |||||||||||||||||||||||||||||||||||||||||||||||||||||||||||||||||||||||||||||||||||||||||||||||||||||||
| Net assets, end of period (in millions) | $7,540 | $6,730 | $7,026 | $3,671 | $1,680 | ||||||||||||||||||||||||||||||||||||||||||||||||||||||||||||||||||||||||||||||||||||||||||||||||||
| Ratios (as a percentage of average net assets): | |||||||||||||||||||||||||||||||||||||||||||||||||||||||||||||||||||||||||||||||||||||||||||||||||||||||
| Expenses before reductions | 0.81 | 0.81 | 0.81 | 0.83 | 0.87 | ||||||||||||||||||||||||||||||||||||||||||||||||||||||||||||||||||||||||||||||||||||||||||||||||||
| Expenses including reductions | 0.80 | 0.80 | 0.81 | 0.83 | 0.87 | ||||||||||||||||||||||||||||||||||||||||||||||||||||||||||||||||||||||||||||||||||||||||||||||||||
| Net investment income | 1.18 | 1.13 | 1.34 | 0.96 | 1.26 | ||||||||||||||||||||||||||||||||||||||||||||||||||||||||||||||||||||||||||||||||||||||||||||||||||
| Portfolio turnover (%) | 65 | 61 | 44 | 45 | 44 | ||||||||||||||||||||||||||||||||||||||||||||||||||||||||||||||||||||||||||||||||||||||||||||||||||
| 1 | Based on average daily shares outstanding. | ||||||||||||||||||||||||||||||||||||||||||||||||||||||||||||||||||||||||||||||||||
| 2 | Total returns would have been lower had certain expenses not been reduced during the applicable periods. | ||||||||||||||||||||||||||||||||||||||||||||||||||||||||||||||||||||||||||||||||||
| Class I2 Shares Period ended | 3-31-17 | 3-31-16 | 3-31-15 | 3-31-14 | 3-31-13 | ||||||||||||||||||||||||||||||||||||||||||||||||||||||||||||||||||||||||||||||||||||||||||||||||||
| Per share operating performance | |||||||||||||||||||||||||||||||||||||||||||||||||||||||||||||||||||||||||||||||||||||||||||||||||||||||
| Net asset value, beginning of period | $17.14 | $18.92 | $18.45 | $15.55 | $13.99 | ||||||||||||||||||||||||||||||||||||||||||||||||||||||||||||||||||||||||||||||||||||||||||||||||||
| Net investment income1 | 0.22 | 0.20 | 0.24 | 0.17 | 0.18 | ||||||||||||||||||||||||||||||||||||||||||||||||||||||||||||||||||||||||||||||||||||||||||||||||||
| Net realized and unrealized gain (loss) on investments | 3.00 | (1.15 | ) | 1.17 | 3.75 | 2.05 | |||||||||||||||||||||||||||||||||||||||||||||||||||||||||||||||||||||||||||||||||||||||||||||||||
| Total from investment operations | 3.22 | (0.95 | ) | 1.41 | 3.92 | 2.23 | |||||||||||||||||||||||||||||||||||||||||||||||||||||||||||||||||||||||||||||||||||||||||||||||||
| Less distributions | |||||||||||||||||||||||||||||||||||||||||||||||||||||||||||||||||||||||||||||||||||||||||||||||||||||||
| From net investment income | (0.24 | ) | (0.24 | ) | (0.15 | ) | (0.14 | ) | (0.17 | ) | |||||||||||||||||||||||||||||||||||||||||||||||||||||||||||||||||||||||||||||||||||||||||||||
| From net realized gain | — | (0.59 | ) | (0.79 | ) | (0.88 | ) | (0.50 | ) | ||||||||||||||||||||||||||||||||||||||||||||||||||||||||||||||||||||||||||||||||||||||||||||||
| Total distributions | (0.24 | ) | (0.83 | ) | (0.94 | ) | (1.02 | ) | (0.67 | ) | |||||||||||||||||||||||||||||||||||||||||||||||||||||||||||||||||||||||||||||||||||||||||||||
| Net asset value, end of period | $20.12 | $17.14 | $18.92 | $18.45 | $15.55 | ||||||||||||||||||||||||||||||||||||||||||||||||||||||||||||||||||||||||||||||||||||||||||||||||||
| Total return (%)2 | 18.80 | (5.07 | ) | 7.85 | 25.63 | 16.51 | |||||||||||||||||||||||||||||||||||||||||||||||||||||||||||||||||||||||||||||||||||||||||||||||||
| Ratios and supplemental data | |||||||||||||||||||||||||||||||||||||||||||||||||||||||||||||||||||||||||||||||||||||||||||||||||||||||
| Net assets, end of period (in millions) | $54 | $49 | $89 | $75 | $34 | ||||||||||||||||||||||||||||||||||||||||||||||||||||||||||||||||||||||||||||||||||||||||||||||||||
| Ratios (as a percentage of average net assets): | |||||||||||||||||||||||||||||||||||||||||||||||||||||||||||||||||||||||||||||||||||||||||||||||||||||||
| Expenses before reductions | 0.81 | 0.82 | 0.84 | 0.87 | 0.92 | ||||||||||||||||||||||||||||||||||||||||||||||||||||||||||||||||||||||||||||||||||||||||||||||||||
| Expenses including reductions | 0.80 | 0.81 | 0.83 | 0.85 | 0.85 | ||||||||||||||||||||||||||||||||||||||||||||||||||||||||||||||||||||||||||||||||||||||||||||||||||
| Net investment income | 1.18 | 1.11 | 1.28 | 0.96 | 1.29 | ||||||||||||||||||||||||||||||||||||||||||||||||||||||||||||||||||||||||||||||||||||||||||||||||||
| Portfolio turnover (%) | 65 | 61 | 44 | 45 | 44 | ||||||||||||||||||||||||||||||||||||||||||||||||||||||||||||||||||||||||||||||||||||||||||||||||||
| 1 | Based on average daily shares outstanding. | ||||||||||||||||||||||||||||||||||||||||||||||||||||||||||||||||||||||||||||||||||
| 2 | Total returns would have been lower had certain expenses not been reduced during the applicable periods. | ||||||||||||||||||||||||||||||||||||||||||||||||||||||||||||||||||||||||||||||||||
| Class R1 Shares Period ended | 3-31-17 | 3-31-16 | 3-31-15 | 3-31-14 | 3-31-13 | ||||||||||||||||||||||||||||||||||||||||||||||||||||||||||||||||||||||||||||||||||||||||||||||||||
| Per share operating performance | |||||||||||||||||||||||||||||||||||||||||||||||||||||||||||||||||||||||||||||||||||||||||||||||||||||||
| Net asset value, beginning of period | $17.13 | $18.90 | $18.43 | $15.54 | $13.99 | ||||||||||||||||||||||||||||||||||||||||||||||||||||||||||||||||||||||||||||||||||||||||||||||||||
| Net investment income1 | 0.10 | 0.09 | 0.12 | 0.04 | 0.08 | ||||||||||||||||||||||||||||||||||||||||||||||||||||||||||||||||||||||||||||||||||||||||||||||||||
| Net realized and unrealized gain (loss) on investments | 2.98 | (1.15 | ) | 1.15 | 3.75 | 2.04 | |||||||||||||||||||||||||||||||||||||||||||||||||||||||||||||||||||||||||||||||||||||||||||||||||
| Total from investment operations | 3.08 | (1.06 | ) | 1.27 | 3.79 | 2.12 | |||||||||||||||||||||||||||||||||||||||||||||||||||||||||||||||||||||||||||||||||||||||||||||||||
| Less distributions | |||||||||||||||||||||||||||||||||||||||||||||||||||||||||||||||||||||||||||||||||||||||||||||||||||||||
| From net investment income | (0.12 | ) | (0.12 | ) | (0.01 | ) | (0.02 | ) | (0.07 | ) | |||||||||||||||||||||||||||||||||||||||||||||||||||||||||||||||||||||||||||||||||||||||||||||
| From net realized gain | — | (0.59 | ) | (0.79 | ) | (0.88 | ) | (0.50 | ) | ||||||||||||||||||||||||||||||||||||||||||||||||||||||||||||||||||||||||||||||||||||||||||||||
| Total distributions | (0.12 | ) | (0.71 | ) | (0.80 | ) | (0.90 | ) | (0.57 | ) | |||||||||||||||||||||||||||||||||||||||||||||||||||||||||||||||||||||||||||||||||||||||||||||
| Net asset value, end of period | $20.09 | $17.13 | $18.90 | $18.43 | $15.54 | ||||||||||||||||||||||||||||||||||||||||||||||||||||||||||||||||||||||||||||||||||||||||||||||||||
| Total return (%)2 | 18.00 | (5.66 | ) | 7.09 | 24.69 | 15.63 | |||||||||||||||||||||||||||||||||||||||||||||||||||||||||||||||||||||||||||||||||||||||||||||||||
| Ratios and supplemental data | |||||||||||||||||||||||||||||||||||||||||||||||||||||||||||||||||||||||||||||||||||||||||||||||||||||||
| Net assets, end of period (in millions) | $27 | $26 | $22 | $13 | $6 | ||||||||||||||||||||||||||||||||||||||||||||||||||||||||||||||||||||||||||||||||||||||||||||||||||
| Ratios (as a percentage of average net assets): | |||||||||||||||||||||||||||||||||||||||||||||||||||||||||||||||||||||||||||||||||||||||||||||||||||||||
| Expenses before reductions | 1.47 | 1.48 | 1.54 | 1.67 | 1.85 | ||||||||||||||||||||||||||||||||||||||||||||||||||||||||||||||||||||||||||||||||||||||||||||||||||
| Expenses including reductions | 1.46 | 1.47 | 1.53 | 1.57 | 1.58 | ||||||||||||||||||||||||||||||||||||||||||||||||||||||||||||||||||||||||||||||||||||||||||||||||||
| Net investment income | 0.53 | 0.48 | 0.63 | 0.22 | 0.56 | ||||||||||||||||||||||||||||||||||||||||||||||||||||||||||||||||||||||||||||||||||||||||||||||||||
| Portfolio turnover (%) | 65 | 61 | 44 | 45 | 44 | ||||||||||||||||||||||||||||||||||||||||||||||||||||||||||||||||||||||||||||||||||||||||||||||||||
| 1 | Based on average daily shares outstanding. | ||||||||||||||||||||||||||||||||||||||||||||||||||||||||||||||||||||||||||||||||||
| 2 | Total returns would have been lower had certain expenses not been reduced during the applicable periods. | ||||||||||||||||||||||||||||||||||||||||||||||||||||||||||||||||||||||||||||||||||
| Class R2 Shares Period ended | 3-31-17 | 3-31-16 | 3-31-15 | 3-31-14 | 3-31-13 | ||||||||||||||||||||||||||||||||||||||||||||||||||||||||||||||||||||||||||||||||||||||||||||||||||
| Per share operating performance | |||||||||||||||||||||||||||||||||||||||||||||||||||||||||||||||||||||||||||||||||||||||||||||||||||||||
| Net asset value, beginning of period | $17.13 | $18.90 | $18.44 | $15.55 | $14.00 | ||||||||||||||||||||||||||||||||||||||||||||||||||||||||||||||||||||||||||||||||||||||||||||||||||
| Net investment income1 | 0.14 | 0.13 | 0.19 | 0.08 | 0.12 | ||||||||||||||||||||||||||||||||||||||||||||||||||||||||||||||||||||||||||||||||||||||||||||||||||
| Net realized and unrealized gain (loss) on investments | 2.99 | (1.14 | ) | 1.14 | 3.75 | 2.04 | |||||||||||||||||||||||||||||||||||||||||||||||||||||||||||||||||||||||||||||||||||||||||||||||||
| Total from investment operations | 3.13 | (1.01 | ) | 1.33 | 3.83 | 2.16 | |||||||||||||||||||||||||||||||||||||||||||||||||||||||||||||||||||||||||||||||||||||||||||||||||
| Less distributions | |||||||||||||||||||||||||||||||||||||||||||||||||||||||||||||||||||||||||||||||||||||||||||||||||||||||
| From net investment income | (0.16 | ) | (0.17 | ) | (0.08 | ) | (0.06 | ) | (0.11 | ) | |||||||||||||||||||||||||||||||||||||||||||||||||||||||||||||||||||||||||||||||||||||||||||||
| From net realized gain | — | (0.59 | ) | (0.79 | ) | (0.88 | ) | (0.50 | ) | ||||||||||||||||||||||||||||||||||||||||||||||||||||||||||||||||||||||||||||||||||||||||||||||
| Total distributions | (0.16 | ) | (0.76 | ) | (0.87 | ) | (0.94 | ) | (0.61 | ) | |||||||||||||||||||||||||||||||||||||||||||||||||||||||||||||||||||||||||||||||||||||||||||||
| Net asset value, end of period | $20.10 | $17.13 | $18.90 | $18.44 | $15.55 | ||||||||||||||||||||||||||||||||||||||||||||||||||||||||||||||||||||||||||||||||||||||||||||||||||
| Total return (%)2 | 18.32 | (5.42 | ) | 7.39 | 24.98 | 15.90 | |||||||||||||||||||||||||||||||||||||||||||||||||||||||||||||||||||||||||||||||||||||||||||||||||
| Ratios and supplemental data | |||||||||||||||||||||||||||||||||||||||||||||||||||||||||||||||||||||||||||||||||||||||||||||||||||||||
| Net assets, end of period (in millions) | $135 | $136 | $120 | $38 | $4 | ||||||||||||||||||||||||||||||||||||||||||||||||||||||||||||||||||||||||||||||||||||||||||||||||||
| Ratios (as a percentage of average net assets): | |||||||||||||||||||||||||||||||||||||||||||||||||||||||||||||||||||||||||||||||||||||||||||||||||||||||
| Expenses before reductions | 1.21 | 1.22 | 1.25 | 1.33 | 3.02 | ||||||||||||||||||||||||||||||||||||||||||||||||||||||||||||||||||||||||||||||||||||||||||||||||||
| Expenses including reductions | 1.21 | 1.21 | 1.24 | 1.32 | 1.32 | ||||||||||||||||||||||||||||||||||||||||||||||||||||||||||||||||||||||||||||||||||||||||||||||||||
| Net investment income | 0.78 | 0.74 | 0.99 | 0.45 | 0.80 | ||||||||||||||||||||||||||||||||||||||||||||||||||||||||||||||||||||||||||||||||||||||||||||||||||
| Portfolio turnover (%) | 65 | 61 | 44 | 45 | 44 | ||||||||||||||||||||||||||||||||||||||||||||||||||||||||||||||||||||||||||||||||||||||||||||||||||
| 1 | Based on average daily shares outstanding. | ||||||||||||||||||||||||||||||||||||||||||||||||||||||||||||||||||||||||||||||||||
| 2 | Total returns would have been lower had certain expenses not been reduced during the applicable periods. | ||||||||||||||||||||||||||||||||||||||||||||||||||||||||||||||||||||||||||||||||||
| Class R3 Shares Period ended | 3-31-17 | 3-31-16 | 3-31-15 | 3-31-14 | 3-31-13 | ||||||||||||||||||||||||||||||||||||||||||||||||||||||||||||||||||||||||||||||||||||||||||||||||||
| Per share operating performance | |||||||||||||||||||||||||||||||||||||||||||||||||||||||||||||||||||||||||||||||||||||||||||||||||||||||
| Net asset value, beginning of period | $17.12 | $18.89 | $18.43 | $15.54 | $13.99 | ||||||||||||||||||||||||||||||||||||||||||||||||||||||||||||||||||||||||||||||||||||||||||||||||||
| Net investment income1 | 0.12 | 0.10 | 0.14 | 0.06 | 0.10 | ||||||||||||||||||||||||||||||||||||||||||||||||||||||||||||||||||||||||||||||||||||||||||||||||||
| Net realized and unrealized gain (loss) on investments | 2.99 | (1.14 | ) | 1.15 | 3.74 | 2.04 | |||||||||||||||||||||||||||||||||||||||||||||||||||||||||||||||||||||||||||||||||||||||||||||||||
| Total from investment operations | 3.11 | (1.04 | ) | 1.29 | 3.80 | 2.14 | |||||||||||||||||||||||||||||||||||||||||||||||||||||||||||||||||||||||||||||||||||||||||||||||||
| Less distributions | |||||||||||||||||||||||||||||||||||||||||||||||||||||||||||||||||||||||||||||||||||||||||||||||||||||||
| From net investment income | (0.14 | ) | (0.14 | ) | (0.04 | ) | (0.03 | ) | (0.09 | ) | |||||||||||||||||||||||||||||||||||||||||||||||||||||||||||||||||||||||||||||||||||||||||||||
| From net realized gain | — | (0.59 | ) | (0.79 | ) | (0.88 | ) | (0.50 | ) | ||||||||||||||||||||||||||||||||||||||||||||||||||||||||||||||||||||||||||||||||||||||||||||||
| Total distributions | (0.14 | ) | (0.73 | ) | (0.83 | ) | (0.91 | ) | (0.59 | ) | |||||||||||||||||||||||||||||||||||||||||||||||||||||||||||||||||||||||||||||||||||||||||||||
| Net asset value, end of period | $20.09 | $17.12 | $18.89 | $18.43 | $15.54 | ||||||||||||||||||||||||||||||||||||||||||||||||||||||||||||||||||||||||||||||||||||||||||||||||||
| Total return (%)2 | 18.17 | (5.57 | ) | 7.20 | 24.81 | 15.75 | |||||||||||||||||||||||||||||||||||||||||||||||||||||||||||||||||||||||||||||||||||||||||||||||||
| Ratios and supplemental data | |||||||||||||||||||||||||||||||||||||||||||||||||||||||||||||||||||||||||||||||||||||||||||||||||||||||
| Net assets, end of period (in millions) | $22 | $30 | $28 | $15 | $4 | ||||||||||||||||||||||||||||||||||||||||||||||||||||||||||||||||||||||||||||||||||||||||||||||||||
| Ratios (as a percentage of average net assets): | |||||||||||||||||||||||||||||||||||||||||||||||||||||||||||||||||||||||||||||||||||||||||||||||||||||||
| Expenses before reductions | 1.36 | 1.37 | 1.43 | 1.57 | 2.33 | ||||||||||||||||||||||||||||||||||||||||||||||||||||||||||||||||||||||||||||||||||||||||||||||||||
| Expenses including reductions | 1.35 | 1.37 | 1.42 | 1.47 | 1.48 | ||||||||||||||||||||||||||||||||||||||||||||||||||||||||||||||||||||||||||||||||||||||||||||||||||
| Net investment income | 0.66 | 0.57 | 0.73 | 0.35 | 0.67 | ||||||||||||||||||||||||||||||||||||||||||||||||||||||||||||||||||||||||||||||||||||||||||||||||||
| Portfolio turnover (%) | 65 | 61 | 44 | 45 | 44 | ||||||||||||||||||||||||||||||||||||||||||||||||||||||||||||||||||||||||||||||||||||||||||||||||||
| 1 | Based on average daily shares outstanding. | ||||||||||||||||||||||||||||||||||||||||||||||||||||||||||||||||||||||||||||||||||
| 2 | Total returns would have been lower had certain expenses not been reduced during the applicable periods. | ||||||||||||||||||||||||||||||||||||||||||||||||||||||||||||||||||||||||||||||||||
| Class R4 Shares Period ended | 3-31-17 | 3-31-16 | 3-31-15 | 3-31-14 | 3-31-13 | ||||||||||||||||||||||||||||||||||||||||||||||||||||||||||||||||||||||||||||||||||||||||||||||||||
| Per share operating performance | |||||||||||||||||||||||||||||||||||||||||||||||||||||||||||||||||||||||||||||||||||||||||||||||||||||||
| Net asset value, beginning of period | $17.14 | $18.92 | $18.45 | $15.54 | $13.99 | ||||||||||||||||||||||||||||||||||||||||||||||||||||||||||||||||||||||||||||||||||||||||||||||||||
| Net investment income1 | 0.19 | 0.18 | 0.25 | 0.13 | 0.16 | ||||||||||||||||||||||||||||||||||||||||||||||||||||||||||||||||||||||||||||||||||||||||||||||||||
| Net realized and unrealized gain (loss) on investments | 3.00 | (1.16 | ) | 1.12 | 3.76 | 2.03 | |||||||||||||||||||||||||||||||||||||||||||||||||||||||||||||||||||||||||||||||||||||||||||||||||
| Total from investment operations | 3.19 | (0.98 | ) | 1.37 | 3.89 | 2.19 | |||||||||||||||||||||||||||||||||||||||||||||||||||||||||||||||||||||||||||||||||||||||||||||||||
| Less distributions | |||||||||||||||||||||||||||||||||||||||||||||||||||||||||||||||||||||||||||||||||||||||||||||||||||||||
| From net investment income | (0.21 | ) | (0.21 | ) | (0.11 | ) | (0.10 | ) | (0.14 | ) | |||||||||||||||||||||||||||||||||||||||||||||||||||||||||||||||||||||||||||||||||||||||||||||
| From net realized gain | — | (0.59 | ) | (0.79 | ) | (0.88 | ) | (0.50 | ) | ||||||||||||||||||||||||||||||||||||||||||||||||||||||||||||||||||||||||||||||||||||||||||||||
| Total distributions | (0.21 | ) | (0.80 | ) | (0.90 | ) | (0.98 | ) | (0.64 | ) | |||||||||||||||||||||||||||||||||||||||||||||||||||||||||||||||||||||||||||||||||||||||||||||
| Net asset value, end of period | $20.12 | $17.14 | $18.92 | $18.45 | $15.54 | ||||||||||||||||||||||||||||||||||||||||||||||||||||||||||||||||||||||||||||||||||||||||||||||||||
| Total return (%)2 | 18.63 | (5.22 | ) | 7.67 | 25.44 | 16.19 | |||||||||||||||||||||||||||||||||||||||||||||||||||||||||||||||||||||||||||||||||||||||||||||||||
| Ratios and supplemental data | |||||||||||||||||||||||||||||||||||||||||||||||||||||||||||||||||||||||||||||||||||||||||||||||||||||||
| Net assets, end of period (in millions) | $286 | $268 | $228 | $75 | $5 | ||||||||||||||||||||||||||||||||||||||||||||||||||||||||||||||||||||||||||||||||||||||||||||||||||
| Ratios (as a percentage of average net assets): | |||||||||||||||||||||||||||||||||||||||||||||||||||||||||||||||||||||||||||||||||||||||||||||||||||||||
| Expenses before reductions | 1.07 | 1.06 | 1.08 | 1.11 | 1.63 | ||||||||||||||||||||||||||||||||||||||||||||||||||||||||||||||||||||||||||||||||||||||||||||||||||
| Expenses including reductions | 0.96 | 0.96 | 0.97 | 1.01 | 1.09 | ||||||||||||||||||||||||||||||||||||||||||||||||||||||||||||||||||||||||||||||||||||||||||||||||||
| Net investment income | 1.03 | 1.00 | 1.31 | 0.75 | 1.09 | ||||||||||||||||||||||||||||||||||||||||||||||||||||||||||||||||||||||||||||||||||||||||||||||||||
| Portfolio turnover (%) | 65 | 61 | 44 | 45 | 44 | ||||||||||||||||||||||||||||||||||||||||||||||||||||||||||||||||||||||||||||||||||||||||||||||||||
| 1 | Based on average daily shares outstanding. | ||||||||||||||||||||||||||||||||||||||||||||||||||||||||||||||||||||||||||||||||||
| 2 | Total returns would have been lower had certain expenses not been reduced during the applicable periods. | ||||||||||||||||||||||||||||||||||||||||||||||||||||||||||||||||||||||||||||||||||
| Class R5 Shares Period ended | 3-31-17 | 3-31-16 | 3-31-15 | 3-31-14 | 3-31-13 | ||||||||||||||||||||||||||||||||||||||||||||||||||||||||||||||||||||||||||||||||||||||||||||||||||
| Per share operating performance | |||||||||||||||||||||||||||||||||||||||||||||||||||||||||||||||||||||||||||||||||||||||||||||||||||||||
| Net asset value, beginning of period | $17.16 | $18.94 | $18.47 | $15.57 | $14.00 | ||||||||||||||||||||||||||||||||||||||||||||||||||||||||||||||||||||||||||||||||||||||||||||||||||
| Net investment income1 | 0.23 | 0.21 | 0.24 | 0.18 | 0.20 | ||||||||||||||||||||||||||||||||||||||||||||||||||||||||||||||||||||||||||||||||||||||||||||||||||
| Net realized and unrealized gain (loss) on investments | 3.00 | (1.15 | ) | 1.19 | 3.76 | 2.04 | |||||||||||||||||||||||||||||||||||||||||||||||||||||||||||||||||||||||||||||||||||||||||||||||||
| Total from investment operations | 3.23 | (0.94 | ) | 1.43 | 3.94 | 2.24 | |||||||||||||||||||||||||||||||||||||||||||||||||||||||||||||||||||||||||||||||||||||||||||||||||
| Less distributions | |||||||||||||||||||||||||||||||||||||||||||||||||||||||||||||||||||||||||||||||||||||||||||||||||||||||
| From net investment income | (0.24 | ) | (0.25 | ) | (0.17 | ) | (0.16 | ) | (0.17 | ) | |||||||||||||||||||||||||||||||||||||||||||||||||||||||||||||||||||||||||||||||||||||||||||||
| From net realized gain | — | (0.59 | ) | (0.79 | ) | (0.88 | ) | (0.50 | ) | ||||||||||||||||||||||||||||||||||||||||||||||||||||||||||||||||||||||||||||||||||||||||||||||
| Total distributions | (0.24 | ) | (0.84 | ) | (0.96 | ) | (1.04 | ) | (0.67 | ) | |||||||||||||||||||||||||||||||||||||||||||||||||||||||||||||||||||||||||||||||||||||||||||||
| Net asset value, end of period | $20.15 | $17.16 | $18.94 | $18.47 | $15.57 | ||||||||||||||||||||||||||||||||||||||||||||||||||||||||||||||||||||||||||||||||||||||||||||||||||
| Total return (%)2 | 18.88 | (5.02 | ) | 7.98 | 25.71 | 16.55 | |||||||||||||||||||||||||||||||||||||||||||||||||||||||||||||||||||||||||||||||||||||||||||||||||
| Ratios and supplemental data | |||||||||||||||||||||||||||||||||||||||||||||||||||||||||||||||||||||||||||||||||||||||||||||||||||||||
| Net assets, end of period (in millions) | $200 | $275 | $376 | $591 | $415 | ||||||||||||||||||||||||||||||||||||||||||||||||||||||||||||||||||||||||||||||||||||||||||||||||||
| Ratios (as a percentage of average net assets): | |||||||||||||||||||||||||||||||||||||||||||||||||||||||||||||||||||||||||||||||||||||||||||||||||||||||
| Expenses before reductions | 0.76 | 0.77 | 0.73 | 0.74 | 0.78 | ||||||||||||||||||||||||||||||||||||||||||||||||||||||||||||||||||||||||||||||||||||||||||||||||||
| Expenses including reductions | 0.75 | 0.76 | 0.72 | 0.73 | 0.78 | ||||||||||||||||||||||||||||||||||||||||||||||||||||||||||||||||||||||||||||||||||||||||||||||||||
| Net investment income | 1.27 | 1.16 | 1.27 | 1.05 | 1.42 | ||||||||||||||||||||||||||||||||||||||||||||||||||||||||||||||||||||||||||||||||||||||||||||||||||
| Portfolio turnover (%) | 65 | 61 | 44 | 45 | 44 | ||||||||||||||||||||||||||||||||||||||||||||||||||||||||||||||||||||||||||||||||||||||||||||||||||
| 1 | Based on average daily shares outstanding. | ||||||||||||||||||||||||||||||||||||||||||||||||||||||||||||||||||||||||||||||||||
| 2 | Total returns would have been lower had certain expenses not been reduced during the applicable periods. | ||||||||||||||||||||||||||||||||||||||||||||||||||||||||||||||||||||||||||||||||||
| Class R6 Shares Period ended | 3-31-17 | 3-31-16 | 3-31-15 | 3-31-14 | 3-31-13 | ||||||||||||||||||||||||||||||||||||||||||||||||||||||||||||||||||||||||||||||||||||||||||||||||||
| Per share operating performance | |||||||||||||||||||||||||||||||||||||||||||||||||||||||||||||||||||||||||||||||||||||||||||||||||||||||
| Net asset value, beginning of period | $17.16 | $18.94 | $18.47 | $15.57 | $14.00 | ||||||||||||||||||||||||||||||||||||||||||||||||||||||||||||||||||||||||||||||||||||||||||||||||||
| Net investment income1 | 0.24 | 0.23 | 0.31 | 0.19 | 0.19 | ||||||||||||||||||||||||||||||||||||||||||||||||||||||||||||||||||||||||||||||||||||||||||||||||||
| Net realized and unrealized gain (loss) on investments | 3.00 | (1.15 | ) | 1.12 | 3.75 | 2.06 | |||||||||||||||||||||||||||||||||||||||||||||||||||||||||||||||||||||||||||||||||||||||||||||||||
| Total from investment operations | 3.24 | (0.92 | ) | 1.43 | 3.94 | 2.25 | |||||||||||||||||||||||||||||||||||||||||||||||||||||||||||||||||||||||||||||||||||||||||||||||||
| Less distributions | |||||||||||||||||||||||||||||||||||||||||||||||||||||||||||||||||||||||||||||||||||||||||||||||||||||||
| From net investment income | (0.26 | ) | (0.27 | ) | (0.17 | ) | (0.16 | ) | (0.18 | ) | |||||||||||||||||||||||||||||||||||||||||||||||||||||||||||||||||||||||||||||||||||||||||||||
| From net realized gain | — | (0.59 | ) | (0.79 | ) | (0.88 | ) | (0.50 | ) | ||||||||||||||||||||||||||||||||||||||||||||||||||||||||||||||||||||||||||||||||||||||||||||||
| Total distributions | (0.26 | ) | (0.86 | ) | (0.96 | ) | (1.04 | ) | (0.68 | ) | |||||||||||||||||||||||||||||||||||||||||||||||||||||||||||||||||||||||||||||||||||||||||||||
| Net asset value, end of period | $20.14 | $17.16 | $18.94 | $18.47 | $15.57 | ||||||||||||||||||||||||||||||||||||||||||||||||||||||||||||||||||||||||||||||||||||||||||||||||||
| Total return (%)2 | 18.97 | (5.00 | ) | 7.99 | 25.72 | 16.60 | |||||||||||||||||||||||||||||||||||||||||||||||||||||||||||||||||||||||||||||||||||||||||||||||||
| Ratios and supplemental data | |||||||||||||||||||||||||||||||||||||||||||||||||||||||||||||||||||||||||||||||||||||||||||||||||||||||
| Net assets, end of period (in millions) | $3,077 | $2,024 | $1,444 | $356 | $118 | ||||||||||||||||||||||||||||||||||||||||||||||||||||||||||||||||||||||||||||||||||||||||||||||||||
| Ratios (as a percentage of average net assets): | |||||||||||||||||||||||||||||||||||||||||||||||||||||||||||||||||||||||||||||||||||||||||||||||||||||||
| Expenses before reductions | 0.72 | 0.72 | 0.72 | 0.74 | 0.82 | ||||||||||||||||||||||||||||||||||||||||||||||||||||||||||||||||||||||||||||||||||||||||||||||||||
| Expenses including reductions | 0.69 | 0.69 | 0.69 | 0.73 | 0.82 | ||||||||||||||||||||||||||||||||||||||||||||||||||||||||||||||||||||||||||||||||||||||||||||||||||
| Net investment income | 1.27 | 1.26 | 1.63 | 1.06 | 1.28 | ||||||||||||||||||||||||||||||||||||||||||||||||||||||||||||||||||||||||||||||||||||||||||||||||||
| Portfolio turnover (%) | 65 | 61 | 44 | 45 | 44 | ||||||||||||||||||||||||||||||||||||||||||||||||||||||||||||||||||||||||||||||||||||||||||||||||||
| 1 | Based on average daily shares outstanding. | ||||||||||||||||||||||||||||||||||||||||||||||||||||||||||||||||||||||||||||||||||
| 2 | Total returns would have been lower had certain expenses not been reduced during the applicable periods. | ||||||||||||||||||||||||||||||||||||||||||||||||||||||||||||||||||||||||||||||||||
| Class NAV Shares Period ended | 3-31-17 | 3-31-16 | 3-31-15 | 3-31-14 | 3-31-13 | ||||||||||||||||||||||||||||||||||||||||||||||||||||||||||||||||||||||||||||||||||||||||||||||||||
| Per share operating performance | |||||||||||||||||||||||||||||||||||||||||||||||||||||||||||||||||||||||||||||||||||||||||||||||||||||||
| Net asset value, beginning of period | $17.16 | $18.94 | $18.47 | $15.57 | $14.00 | ||||||||||||||||||||||||||||||||||||||||||||||||||||||||||||||||||||||||||||||||||||||||||||||||||
| Net investment income1 | 0.24 | 0.23 | 0.27 | 0.19 | 0.20 | ||||||||||||||||||||||||||||||||||||||||||||||||||||||||||||||||||||||||||||||||||||||||||||||||||
| Net realized and unrealized gain (loss) on investments | 3.01 | (1.15 | ) | 1.16 | 3.75 | 2.05 | |||||||||||||||||||||||||||||||||||||||||||||||||||||||||||||||||||||||||||||||||||||||||||||||||
| Total from investment operations | 3.25 | (0.92 | ) | 1.43 | 3.94 | 2.25 | |||||||||||||||||||||||||||||||||||||||||||||||||||||||||||||||||||||||||||||||||||||||||||||||||
| Less distributions | |||||||||||||||||||||||||||||||||||||||||||||||||||||||||||||||||||||||||||||||||||||||||||||||||||||||
| From net investment income | (0.26 | ) | (0.27 | ) | (0.17 | ) | (0.16 | ) | (0.18 | ) | |||||||||||||||||||||||||||||||||||||||||||||||||||||||||||||||||||||||||||||||||||||||||||||
| From net realized gain | — | (0.59 | ) | (0.79 | ) | (0.88 | ) | (0.50 | ) | ||||||||||||||||||||||||||||||||||||||||||||||||||||||||||||||||||||||||||||||||||||||||||||||
| Total distributions | (0.26 | ) | (0.86 | ) | (0.96 | ) | (1.04 | ) | (0.68 | ) | |||||||||||||||||||||||||||||||||||||||||||||||||||||||||||||||||||||||||||||||||||||||||||||
| Net asset value, end of period | $20.15 | $17.16 | $18.94 | $18.47 | $15.57 | ||||||||||||||||||||||||||||||||||||||||||||||||||||||||||||||||||||||||||||||||||||||||||||||||||
| Total return (%)2 | 18.95 | (4.95 | ) | 7.98 | 25.73 | 16.66 | |||||||||||||||||||||||||||||||||||||||||||||||||||||||||||||||||||||||||||||||||||||||||||||||||
| Ratios and supplemental data | |||||||||||||||||||||||||||||||||||||||||||||||||||||||||||||||||||||||||||||||||||||||||||||||||||||||
| Net assets, end of period (in millions) | $1,245 | $750 | $844 | $543 | $524 | ||||||||||||||||||||||||||||||||||||||||||||||||||||||||||||||||||||||||||||||||||||||||||||||||||
| Ratios (as a percentage of average net assets): | |||||||||||||||||||||||||||||||||||||||||||||||||||||||||||||||||||||||||||||||||||||||||||||||||||||||
| Expenses before reductions | 0.70 | 0.70 | 0.69 | 0.71 | 0.74 | ||||||||||||||||||||||||||||||||||||||||||||||||||||||||||||||||||||||||||||||||||||||||||||||||||
| Expenses including reductions | 0.69 | 0.69 | 0.69 | 0.71 | 0.74 | ||||||||||||||||||||||||||||||||||||||||||||||||||||||||||||||||||||||||||||||||||||||||||||||||||
| Net investment income | 1.27 | 1.25 | 1.45 | 1.09 | 1.40 | ||||||||||||||||||||||||||||||||||||||||||||||||||||||||||||||||||||||||||||||||||||||||||||||||||
| Portfolio turnover (%) | 65 | 61 | 44 | 45 | 44 | ||||||||||||||||||||||||||||||||||||||||||||||||||||||||||||||||||||||||||||||||||||||||||||||||||
| 1 | Based on average daily shares outstanding. | ||||||||||||||||||||||||||||||||||||||||||||||||||||||||||||||||||||||||||||||||||
| 2 | Total returns would have been lower had certain expenses not been reduced during the applicable periods. | ||||||||||||||||||||||||||||||||||||||||||||||||||||||||||||||||||||||||||||||||||
Note 1 — Organization
John Hancock Disciplined Value Fund (the fund) is a series of John Hancock Funds III (the Trust), an open-end management investment company organized as a Massachusetts business trust and registered under the Investment Company Act of 1940, as amended (the 1940 Act). The investment objective of the fund is to provide long-term growth of capital primarily through investments in equity securities. Current income is a secondary objective.
The fund may offer multiple classes of shares. The shares currently offered are detailed in the Statement of assets and liabilities. Class A and Class C shares are offered to all investors. Class I shares are offered to institutions and certain investors. Class B and Class I2 shares are closed to new investors. Class R1, Class R2, Class R3, Class R4 and Class R5 shares are available only to certain retirement plans. Class R6 shares are available only to certain retirement plans, institutions and other investors. Class NAV shares are offered to John Hancock affiliated funds of funds and certain 529 plans. Shareholders of each class have exclusive voting rights to matters that affect that class. The distribution and service fees, if any, and transfer agent fees for each class may differ. Class B shares convert to Class A shares eight years after purchase.
Note 2 — Significant accounting policies
The financial statements have been prepared in conformity with accounting principles generally accepted in the United States of America (US GAAP), which require management to make certain estimates and assumptions as of the date of the financial statements. Actual results could differ from those estimates and those differences could be significant. The fund qualifies as an investment company under Topic 946 of Accounting Standards Codification of US GAAP.
Events or transactions occurring after the end of the fiscal period through the date that the financial statements were issued have been evaluated in the preparation of the financial statements. The following summarizes the significant accounting policies of the fund:
Security valuation. Investments are stated at value as of the scheduled close of regular trading on the New York Stock Exchange (NYSE), normally at 4:00 p.m., Eastern Time. In case of emergency or other disruption resulting in the NYSE not opening for trading or the NYSE closing at a time other than the regularly scheduled close, the net asset value (NAV) may be determined as of the regularly scheduled close of the NYSE pursuant to the fund's Valuation Policies and Procedures.
In order to value the securities, the fund uses the following valuation techniques: Equity securities held by the fund are typically valued at the last sale price or official closing price on the exchange or principal market where the security trades. In the event there were no sales during the day or closing prices are not available, the securities are valued using the last available bid price. Investments by the fund in open-end mutual funds, including John Hancock Collateral Trust (JHCT), are valued at their respective NAVs each business day. Foreign securities and currencies are valued in U.S. dollars based on foreign currency exchange rates supplied by an independent pricing vendor.
In certain instances, the Pricing Committee may determine to value equity securities using prices obtained from another exchange or market if trading on the exchange or market on which prices are typically obtained did not open for trading as scheduled, or if trading closed earlier than scheduled, and trading occurred as normal on another exchange or market.
Other portfolio securities and assets, for which reliable market quotations are not readily available, are valued at fair value as determined in good faith by the fund's Pricing Committee following procedures established by the Board of Trustees. The frequency with which these fair valuation procedures are used cannot be predicted and fair value of securities may differ significantly from the value that would have been used had a ready market for such securities existed.
The fund uses a three-tier hierarchy to prioritize the pricing assumptions, referred to as inputs, used in valuation techniques to measure fair value. Level 1 includes securities valued using quoted prices in active markets for identical securities. Level 2 includes securities valued using other significant observable inputs. Observable inputs may include quoted prices for similar securities, interest rates, prepayment speeds and credit risk. Prices for securities valued using these inputs are received from independent pricing vendors and brokers and are based on an evaluation of the inputs described. Level 3 includes securities valued using significant unobservable inputs when market prices are not readily available or reliable, including the fund's own assumptions in determining the fair value of investments. Factors used in determining value may include market or
issuer specific events or trends, changes in interest rates and credit quality. The inputs or methodology used for valuing securities are not necessarily an indication of the risks associated with investing in those securities. Changes in valuation techniques and related inputs may result in transfers into or out of an assigned level within the disclosure hierarchy.
As of March 31, 2017, all investments are categorized as Level 1 under the hierarchy described above.
Security transactions and related investment income. Investment security transactions are accounted for on a trade date plus one basis for daily NAV calculations. However, for financial reporting purposes, investment transactions are reported on trade date. Interest income is accrued as earned. Dividend income is recorded on the ex-date, except for dividends of foreign securities where the dividend may not be known until after the ex-date. In those cases, dividend income, net of withholding taxes, is recorded when the fund becomes aware of the dividends. Foreign taxes are provided for based on the fund's understanding of the tax rules and rates that exist in the foreign markets in which it invests. Gains and losses on securities sold are determined on the basis of identified cost and may include proceeds from litigation.
Securities lending. The fund may lend its securities to earn additional income. The fund receives cash collateral from the borrower in an amount not less than the market value of the loaned securities. The fund will invest its collateral in JHCT, an affiliate of the fund, which has a floating NAV and is registered with the Securities and Exchange Commission (SEC) as an investment company. JHCT invests cash received as collateral as part of the securities lending program in short-term money market investments. The fund will receive the benefit of any gains and bear any losses generated by JHCT with respect to the cash collateral.
The fund has the right to recall loaned securities on demand. If a borrower fails to return loaned securities when due, then the lending agent is responsible and indemnifies the fund for the lent securities. The lending agent uses the collateral received from the borrower to purchase replacement securities of the same issue, type, class and series of the loaned securities. If the value of the collateral is less than the purchase cost of replacement securities, the lending agent is responsible for satisfying the shortfall but only to the extent that the shortfall is not due to any decrease in the value of JHCT.
Although the risk of the loss of the securities lent is mitigated by receiving collateral from the borrower and through lending agent indemnification, the fund could experience a delay in recovering securities or could experience a lower than expected return if the borrower fails to return the securities on a timely basis. The fund receives compensation for lending its securities by retaining a portion of the return on the investment of the collateral and compensation from fees earned from borrowers of the securities. Securities lending income received by the fund is net of fees retained by the securities lending agent. Net income received from JHCT is a component of securities lending income as recorded on the Statement of operations.
Obligations to repay collateral received by the fund are shown on the Statements of assets and liabilities as Payable upon return of securities loaned and are secured by the loaned securities. As of March 31, 2017, the fund loaned common stocks valued at $1,489,540 and received $1,533,350 of cash collateral.
Foreign currency translation. Assets, including investments and liabilities denominated in foreign currencies, are translated into U.S. dollar values each day at the prevailing exchange rate. Purchases and sales of securities, income and expenses are translated into U.S. dollars at the prevailing exchange rate on the date of the transaction. The effect of changes in foreign currency exchange rates on the value of securities is reflected as a component of the realized and unrealized gains (losses) on investments.
Risks can result from differences in economic and political conditions, regulations, market practices (including higher transaction costs), accounting standards and other factors. Foreign investments are also subject to a decline in the value of a foreign currency versus the U.S. dollar, which reduces the dollar value of securities denominated in that currency.
Foreign taxes. The fund may be subject to withholding tax on income and/or capital gains or repatriation taxes imposed by certain countries in which the fund invests. Taxes are accrued based upon investment income, realized gains or unrealized appreciation.
Line of credit. The fund may borrow from banks for temporary or emergency purposes, including meeting redemption requests that otherwise might require the untimely sale of securities. Pursuant to the fund's custodian agreement, the
custodian may loan money to the fund to make properly authorized payments. The fund is obligated to repay the custodian for any overdraft, including any related costs or expenses. The custodian may have a lien, security interest or security entitlement in any fund property that is not otherwise segregated or pledged, to the extent of any overdraft, and to the maximum extent permitted by law.
Effective June 30, 2016, the fund and other affiliated funds have entered into a syndicated line of credit agreement with Citibank, N.A. as the administrative agent that enables them to participate in a $1 billion unsecured committed line of credit. Excluding commitments designated for a certain fund and subject to the need of other affiliated funds, the fund can borrow up to an aggregate commitment amount of $750 million, subject to asset coverage and other limitations as specified in the agreement. A commitment fee payable at the end of each calendar quarter, based on the average daily unused portion of the line of credit, is charged to each participating fund based on a combination of fixed and asset based allocations and is reflected in Other expenses on the Statement of operations. Prior to June 30, 2016, the fund had a similar agreement that enabled it to participate in a $750 million unsecured committed line of credit. For the year ended March 31, 2017, the fund had no borrowings under either line of credit. Commitment fees for the year ended March 31, 2017, were $34,817.
Expenses. Within the John Hancock group of funds complex, expenses that are directly attributable to an individual fund are allocated to such fund. Expenses that are not readily attributable to a specific fund are allocated among all funds in an equitable manner, taking into consideration, among other things, the nature and type of expense and the fund's relative net assets. Expense estimates are accrued in the period to which they relate and adjustments are made when actual amounts are known.
Class allocations. Income, common expenses and realized and unrealized gains (losses) are determined at the fund level and allocated daily to each class of shares based on the net assets of the class. Class-specific expenses, such as distribution and service fees, if any, and transfer agent fees, for all classes, are calculated daily at the class level based on the net assets of each class and the specific expense rates applicable to each class.
Federal income taxes. The fund intends to continue to qualify as a regulated investment company by complying with the applicable provisions of the Internal Revenue Code and will not be subject to federal income tax on taxable income that is distributed to shareholders. Therefore, no federal income tax provision is required.
As of March 31, 2017, the fund had a capital loss carryforward of $41,180,583 which expired unused because of limitation of its use under tax rules. This capital loss carryforward was acquired on July 10, 2009, in a merger with John Hancock Classic Value Fund II.
As of March 31, 2017, the fund had no uncertain tax positions that would require financial statement recognition, derecognition or disclosure. The fund's federal tax returns are subject to examination by the Internal Revenue Service for a period of three years.
Distribution of income and gains. Distributions to shareholders from net investment income and net realized gains, if any, are recorded on the ex-date. The fund generally declares and pays dividends and capital gain distributions, if any, annually.
The tax character of distributions for the years ended March 31, 2017 and 2016 was as follows:
| March 31, 2017 | March 31, 2016 | |
| Ordinary Income | $168,536,905 | $194,725,548 |
| Long-Term Capital Gain | — | 431,113,872 |
| Total | $168,536,905 | $625,839,420 |
Distributions paid by the fund with respect to each class of shares are calculated in the same manner, at the same time and in the same amount, except for the effect of class level expenses that may be applied differently to each class. As of March 31, 2017, the components of distributable earnings on a tax basis consisted of $27,495,582 of undistributed ordinary income and $139,042,709 of undistributed long-term capital gains.
Such distributions and distributable earnings, on a tax basis, are determined in conformity with income tax regulations, which may differ from US GAAP. Distributions in excess of tax basis earnings and profits, if any, are reported in the fund's financial statements as a return of capital.
Capital accounts within the financial statements are adjusted for permanent book-tax differences. These adjustments have no impact on net assets or the results of operations. Temporary book-tax differences, if any, will reverse in a subsequent period. Book-tax differences are primarily attributable to expiration of capital loss carryforwards and wash sale loss deferrals.
Note 3 — Guarantees and indemnifications
Under the Trust's organizational documents, its Officers and Trustees are indemnified against certain liabilities arising out of the performance of their duties to the Trust, including the fund. Additionally, in the normal course of business, the fund enters into contracts with service providers that contain general indemnification clauses. The fund's maximum exposure under these arrangements is unknown, as this would involve future claims that may be made against the fund that have not yet occurred. The risk of material loss from such claims is considered remote.
Note 4 — Fees and transactions with affiliates
John Hancock Advisers, LLC (the Advisor) serves as investment advisor for the fund. John Hancock Funds, LLC (the Distributor), an affiliate of the Advisor, serves as principal underwriter of the fund. The Advisor and the Distributor are indirect, wholly owned subsidiaries of Manulife Financial Corporation (MFC).
Management fee. The fund has an investment management agreement with the Advisor under which the fund pays a daily management fee to the Advisor equivalent on an annual basis to the sum of: (a) 0.750% of the first $500 million of the fund's average daily net assets; (b) 0.725% of the next $500 million of the fund's average daily net assets; (c) 0.700% of the next $500 million of the fund's average daily net assets; (d) 0.675% of the next $1 billion of the fund's average daily net assets; (e) 0.650% of the next $10 billion of the fund's average daily net assets; and (f) 0.625% of the fund's average daily net assets in excess of $12.5 billion. The Advisor has a subadvisory agreement with Boston Partners, a division of Robeco Investment Management, Inc. The fund is not responsible for payment of subadvisory fees.
The Advisor has contractually agreed to waive a portion of its management fee and/or reimburse expenses for certain funds of the John Hancock funds complex, including the fund (the participating portfolios). This waiver is based upon aggregate net assets of all the participating portfolios. The amount of the reimbursement is calculated daily and allocated among all the participating portfolios in proportion to the daily net assets of each fund. During the year ended March 31, 2017, the waiver amounted to 0.01% of the fund's average net assets. This arrangement may be amended or terminated at any time by the Advisor upon notice to the fund and with the approval of the Board of Trustees.
The Advisor has contractually agreed to waive all or a portion of its management fee and/or reimburse or pay operating expenses of the fund to the extent necessary to maintain the fund's total operating expenses at 0.85% for Class I2 shares, excluding certain expenses such as taxes, brokerage commissions, interest expense, litigation and indemnification expenses and other extraordinary expenses not incurred in the ordinary course of the fund's business, acquired fund fees and short dividend expense. The expense limitation expires on June 30, 2017, unless renewed by mutual agreement of the fund and the Advisor based upon a determination that this is appropriate under the circumstances at the time.
The Advisor has contractually agreed to waive and/or reimburse all class specific expenses for Class R6 shares of the fund to the extent they exceed 0.00% of average net assets. The expense limitation expires on June 30, 2017, unless renewed by mutual agreement of the fund and the advisor based upon a determination that this is appropriate under the circumstances at the time.
For the year ended March 31, 2017, these expense reductions amounted to the following:
| Class | Expense reduction | Class | Expense reduction | |||||||||||
| Class A | $150,444 | Class R3 | $2,078 | |||||||||||
| Class B | 1,009 | Class R4 | 21,297 |
| Class | Expense reduction | Class | Expense reduction | |||||||||||
| Class C | 22,575 | Class R5 | 20,463 | |||||||||||
| Class I | 555,932 | Class R6 | 592,367 | |||||||||||
| Class I2 | 3,740 | Class NAV | 68,777 | |||||||||||
| Class R1 | 2,036 | Total | $1,451,129 | |||||||||||
| Class R2 | 10,411 |
Expenses waived or reimbursed in the current fiscal period are not subject to recapture in future fiscal periods.
The investment management fees, including the impact of the waivers and reimbursements as described above, incurred for the year ended March 31, 2017 were equivalent to a net annual effective rate of 0.65% of the fund's average daily net assets.
Accounting and legal services. Pursuant to a service agreement, the fund reimburses the Advisor for all expenses associated with providing the administrative, financial, legal, accounting and recordkeeping services to the fund, including the preparation of all tax returns, periodic reports to shareholders and regulatory reports, among other services. These expenses are allocated to each share class based on its relative net assets at the time the expense was incurred. These accounting and legal services fees incurred for the year ended March 31, 2017 amounted to an annual rate of 0.01% of the fund's average daily net assets.
Distribution and service plans. The fund has a distribution agreement with the Distributor. The fund has adopted distribution and service plans with respect to Class A, Class B,Class C, Class R1, Class R2, Class R3 and Class R4 pursuant to Rule 12b-1 under the 1940 Act, to pay the Distributor for services provided as the distributor of shares of the fund. In addition, under a service plan for Class R1, Class R2, Class R3, Class R4 and Class R5, the fund pays for certain other services. The fund may pay up to the following contractual rates of distribution and service fees under these arrangements, expressed as an annual percentage of average daily net assets for each class of the fund's shares.
| Class | Rule 12b-1 fee | Service fee | Class | Rule 12b-1 fee | Service fee | |
| Class A | 0.30% | — | Class R2 | 0.25% | 0.25% | |
| Class B | 1.00% | — | Class R3 | 0.50% | 0.15% | |
| Class C | 1.00% | — | Class R4 | 0.25% | 0.10% | |
| Class R1 | 0.50% | 0.25% | Class R5 | — | 0.05% |
Class A shares are currently charged 0.25% for Rule 12b-1 fees.
The fund's Distributor has contractually agreed to waive 0.10% of Rule12b-1 fees for Class R4 shares. The current waiver agreement expires on June 30, 2017, unless renewed by mutual agreement of the fund and the Distributor based upon a determination that this is appropriate under the circumstances at the time. This contractual waiver amounted to $280,837 for Class R4 shares for the year ended March 31, 2017.
Sales charges. Class A shares are assessed up-front sales charges, which resulted in payments to the Distributor amounting to $3,030,641 for the year ended March 31, 2017. Of this amount, $502,270 was retained and used for printing prospectuses, advertising, sales literature and other purposes, $2,515,141 was paid as sales commissions to broker-dealers and $13,230 was paid as sales commissions to sales personnel of Signator Investors, Inc., a broker-dealer affiliate of the Advisor.
Class A, Class B and Class C shares may be subject to contingent deferred sales charges (CDSCs). Certain Class A shares that are acquired through purchases of $1 million or more and are redeemed within one year of purchase are subject to a 1.00% sales charge. Class B shares that are redeemed within six years of purchase are subject to CDSCs, at declining rates, beginning at 5.00%. Class C shares that are redeemed within one year of purchase are subject to a 1.00% CDSC. CDSCs are applied to the lesser of the current market value at the time of redemption or the original purchase cost of the shares being redeemed. Proceeds from CDSCs are used to compensate the Distributor for providing distribution-related services in
connection with the sale of these shares. During the year ended March 31, 2017, CDSCs received by the Distributor amounted to $6,716, $14,903 and $44,382 for Class A, Class B and Class C shares, respectively.
Transfer agent fees. The fund has a transfer agent agreement with John Hancock Signature Services, Inc. (Signature Services), an affiliate of the Advisor. The transfer agent fees paid to Signature Services are determined based on the cost to Signature Services (Signature Services Cost) of providing recordkeeping services. It also includes out-of-pocket expenses, including payments made to third-parties for recordkeeping services provided to their clients who invest in one or more John Hancock funds. In addition, Signature Services Cost may be reduced by certain fees that Signature Services receives in connection with retirement and small accounts. Signature Services Cost is calculated monthly and allocated, as applicable, to five categories of share classes: Retail Share and Institutional Share Classes of Non-Municipal Bond Funds, Class R6 Shares, Retirement Share Classes and Municipal Bond Share Classes. Within each of these categories, the applicable costs are allocated to the affected John Hancock affiliated funds and/or classes, based on the relative average daily net assets.
Class level expenses. Class level expenses for the year ended March 31, 2017 were:
| Class | Distribution and service fees | Transfer agent fees |
| Class A | $4,980,998 | $2,452,399 |
| Class B | 133,170 | 16,392 |
| Class C | 2,979,852 | 366,786 |
| Class I | — | 8,208,764 |
| Class I2 | — | 55,215 |
| Class R1 | 201,442 | 4,411 |
| Class R2 | 684,892 | 22,563 |
| Class R3 | 177,125 | 4,527 |
| Class R4 | 982,169 | 46,137 |
| Class R5 | 129,328 | 44,731 |
| Class R6 | — | 404,329 |
| Total | $10,268,976 | $11,626,254 |
Trustee expenses. The fund compensates each Trustee who is not an employee of the Advisor or its affiliates. The costs of paying Trustee compensation and expenses are allocated to each fund based on its net assets relative to other funds within the John Hancock group of funds complex.
Interfund lending program Pursuant to an Exemptive Order issued by the SEC, the fund, along with certain other funds advised by the Advisor or its affiliates, may participate in an interfund lending program. This program provides an alternative credit facility allowing the funds to borrow from, or lend money to, other participating affiliated funds. At period end, no interfund loans were outstanding. Interest expense is included in Other expenses and interest income is included in Interest on the Statement of operations. The fund's activity in this program during the period for which loans were outstanding was as follows:
| Borrower or lender | Weighted average loan balance | Days outstanding | Weighted average interest rate | Interest income (expense) |
| Borrower | $161,661,868 | 5 | 0.715% | ($16,054) |
| Lender | $63,553,512 | 2 | 0.731% | $2,579 |
Note 5 — Fund share transactions
Transactions in fund shares for the years ended March 31, 2017 and 2016 were as follows:
| Year ended 3-31-17 | Year ended 3-31-16 | |||||||||||||||||||||||||
| Shares | Amount | Shares | Amount | |||||||||||||||||||||||
| Class A shares | ||||||||||||||||||||||||||
| Sold | 20,539,114 | $388,446,807 | 44,301,255 | $815,798,359 | ||||||||||||||||||||||
| Distributions reinvested | 802,052 | 16,169,365 | 6,158,076 | 110,599,044 | ||||||||||||||||||||||
| Repurchased | (86,000,334 | ) | (1,631,815,250 | ) | (54,962,551 | ) | (993,920,242 | ) | ||||||||||||||||||
| Net decrease | (64,659,168 | ) | ($1,227,199,078 | ) | (4,503,220 | ) | ($67,522,839 | ) | ||||||||||||||||||
| Class B shares | ||||||||||||||||||||||||||
| Sold | 53,502 | $983,572 | 59,738 | $1,047,300 | ||||||||||||||||||||||
| Distributions reinvested | 1,954 | 37,205 | 30,922 | 525,357 | ||||||||||||||||||||||
| Repurchased | (262,674 | ) | (4,703,935 | ) | (256,680 | ) | (4,503,364 | ) | ||||||||||||||||||
| Net decrease | (207,218 | ) | ($3,683,158 | ) | (166,020 | ) | ($2,930,707 | ) | ||||||||||||||||||
| Class C shares | ||||||||||||||||||||||||||
| Sold | 2,294,799 | $41,457,536 | 5,528,820 | $97,427,585 | ||||||||||||||||||||||
| Distributions reinvested | 40,366 | 770,594 | 569,548 | 9,699,400 | ||||||||||||||||||||||
| Repurchased | (5,884,477 | ) | (105,397,298 | ) | (3,996,905 | ) | (69,093,915 | ) | ||||||||||||||||||
| Net increase (decrease) | (3,549,312 | ) | ($63,169,168 | ) | 2,101,463 | $38,033,070 | ||||||||||||||||||||
| Class I shares | ||||||||||||||||||||||||||
| Sold | 144,377,699 | $2,676,144,389 | 190,491,019 | $3,407,661,480 | ||||||||||||||||||||||
| Distributions reinvested | 3,746,922 | 73,327,256 | 16,212,130 | 282,739,548 | ||||||||||||||||||||||
| Repurchased | (166,091,633 | ) | (3,115,519,988 | ) | (185,473,837 | ) | (3,207,447,590 | ) | ||||||||||||||||||
| Net increase (decrease) | (17,967,012 | ) | ($366,048,343 | ) | 21,229,312 | $482,953,438 | ||||||||||||||||||||
| Class I2 shares | ||||||||||||||||||||||||||
| Sold | 132,018 | $2,457,900 | 307,430 | $5,381,768 | ||||||||||||||||||||||
| Distributions reinvested | 31,696 | 620,294 | 168,625 | 2,940,817 | ||||||||||||||||||||||
| Repurchased | (368,108 | ) | (6,547,472 | ) | (2,314,009 | ) | (39,718,862 | ) | ||||||||||||||||||
| Net decrease | (204,394 | ) | ($3,469,278 | ) | (1,837,954 | ) | ($31,396,277 | ) | ||||||||||||||||||
| Class R1 shares | ||||||||||||||||||||||||||
| Sold | 392,546 | $7,252,549 | 833,092 | $15,071,611 | ||||||||||||||||||||||
| Distributions reinvested | 5,244 | 102,673 | 37,411 | 653,189 | ||||||||||||||||||||||
| Repurchased | (581,190 | ) | (10,847,710 | ) | (485,576 | ) | (8,813,049 | ) | ||||||||||||||||||
| Net increase (decrease) | (183,400 | ) | ($3,492,488 | ) | 384,927 | $6,911,751 | ||||||||||||||||||||
| Class R2 shares | ||||||||||||||||||||||||||
| Sold | 1,364,536 | $25,299,713 | 3,045,759 | $54,867,155 | ||||||||||||||||||||||
| Distributions reinvested | 46,808 | 916,021 | 251,595 | 4,390,340 | ||||||||||||||||||||||
| Repurchased | (2,602,693 | ) | (48,478,299 | ) | (1,707,876 | ) | (30,900,304 | ) | ||||||||||||||||||
| Net increase (decrease) | (1,191,349 | ) | ($22,262,565 | ) | 1,589,478 | $28,357,191 | ||||||||||||||||||||
| Class R3 shares | ||||||||||||||||||||||||||
| Sold | 372,780 | $6,931,485 | 717,928 | $12,779,175 | ||||||||||||||||||||||
| Distributions reinvested | 9,224 | 180,427 | 68,397 | 1,193,531 | ||||||||||||||||||||||
| Repurchased | (1,024,533 | ) | (19,234,010 | ) | (503,038 | ) | (9,017,120 | ) | ||||||||||||||||||
| Net increase (decrease) | (642,529 | ) | ($12,122,098 | ) | 283,287 | $4,955,586 | ||||||||||||||||||||
| Year ended 3-31-17 | Year ended 3-31-16 | |||||||||||||||||||||||||
| Shares | Amount | Shares | Amount | |||||||||||||||||||||||
| Class R4 shares | ||||||||||||||||||||||||||
| Sold | 2,587,790 | $47,469,756 | 6,987,432 | $128,107,381 | ||||||||||||||||||||||
| Distributions reinvested | 156,717 | 3,068,524 | 664,878 | 11,602,118 | ||||||||||||||||||||||
| Repurchased | (4,194,749 | ) | (77,959,405 | ) | (4,055,369 | ) | (73,641,619 | ) | ||||||||||||||||||
| Net increase (decrease) | (1,450,242 | ) | ($27,421,125 | ) | 3,596,941 | $66,067,880 | ||||||||||||||||||||
| Class R5 shares | ||||||||||||||||||||||||||
| Sold | 3,586,479 | $65,382,957 | 6,518,206 | $118,337,460 | ||||||||||||||||||||||
| Distributions reinvested | 199,923 | 3,916,493 | 1,028,324 | 17,954,523 | ||||||||||||||||||||||
| Repurchased | (9,858,738 | ) | (189,143,056 | ) | (11,368,179 | ) | (189,153,298 | ) | ||||||||||||||||||
| Net decrease | (6,072,336 | ) | ($119,843,606 | ) | (3,821,649 | ) | ($52,861,315 | ) | ||||||||||||||||||
| Class R6 shares | ||||||||||||||||||||||||||
| Sold | 59,716,606 | $1,122,362,824 | 51,954,451 | $924,773,229 | ||||||||||||||||||||||
| Distributions reinvested | 1,819,568 | 35,627,141 | 4,781,990 | 83,445,718 | ||||||||||||||||||||||
| Repurchased | (26,759,489 | ) | (498,284,467 | ) | (15,027,396 | ) | (268,907,175 | ) | ||||||||||||||||||
| Net increase | 34,776,685 | $659,705,498 | 41,709,045 | $739,311,772 | ||||||||||||||||||||||
| Class NAV shares | ||||||||||||||||||||||||||
| Sold | 22,946,485 | $438,822,065 | 3,426,415 | $60,770,799 | ||||||||||||||||||||||
| Distributions reinvested | 692,902 | 13,573,944 | 2,007,793 | 35,056,068 | ||||||||||||||||||||||
| Repurchased | (5,578,239 | ) | (105,240,728 | ) | (6,282,156 | ) | (117,018,680 | ) | ||||||||||||||||||
| Net increase (decrease) | 18,061,148 | $347,155,281 | (847,948 | ) | ($21,191,813 | ) | ||||||||||||||||||||
| Total net increase (decrease) | (43,289,127 | ) | ($841,850,128 | ) | 59,717,662 | $1,190,687,737 | ||||||||||||||||||||
Affiliates of the fund owned 100% of shares of the fund of Class NAV on March 31, 2017. Such concentration of shareholders' capital could have a material effect on the fund if such shareholders redeem from the fund.
Note 6 — Purchase and sale of securities
Purchases and sales of securities, other than short-term investments, amounted to $8,746,873,406 and $9,462,677,557, respectively, for the year ended March 31, 2017.
Note 7 — Investment by affiliated funds
Certain investors in the fund are affiliated funds that are managed by the Advisor and its affiliates. The affiliated funds do not invest in the fund for the purpose of exercising management or control; however, this investment may represent a significant portion of the fund's net assets. At March 31, 2017, funds within the John Hancock group of funds complex held 7.6% of the fund's net assets.
Note 8 — Interfund trading
The fund is permitted to purchase or sell securities from or to certain other affiliated funds, as set forth in Rule 17a-7 of the 1940 Act, under specified conditions outlined in procedures adopted by the Board of Trustees of the Trust. The procedures have been designed to ensure that any purchase or sale of securities by the fund from or to another fund that is or could be considered an affiliate complies with Rule 17a-7 of the 1940 Act. Further, as defined under the procedures, each transaction is effected at the current market price. Pursuant to these procedures, for the year ended March 31, 2017, the fund engaged in sales amounting to $46,745,093.
Note 9 — New rule issuance
In October 2016, the SEC issued Final Rule Release No.33-10231, Investment Company Reporting Modernization (the Release). The Release calls for the adoption of new rules and forms as well as amendments to its rules and forms to modernize the reporting and disclosure of information by registered investment companies. The SEC is adopting amendments to Regulation S-X, which will require standardized, enhanced disclosure about derivatives in investment company financial statements, as well as other amendments. The updates to Regulation S-X are effective August 1, 2017 and may result in additional disclosure relating to the presentation of derivatives and certain other financial instruments. These updates will have no impact on the fund's net assets or results of operations.
Report of Independent Registered Public Accounting Firm
To the Board of Trustees of John Hancock Funds III and Shareholders of John Hancock Disciplined Value Fund:
In our opinion, the accompanying statement of assets and liabilities, including the fund's investments, and the related statements of operations and of changes in net assets and the financial highlights present fairly, in all material respects, the financial position of the John Hancock Disciplined Value Fund (the "Fund") as of March 31, 2017, the results of its operations for the year then ended, the changes in its net assets for each of the two years in the period then ended and the financial highlights for each of the five years in the period then ended, in conformity with accounting principles generally accepted in the United States of America. These financial statements and financial highlights (hereafter referred to as "financial statements") are the responsibility of the Fund's management. Our responsibility is to express an opinion on these financial statements based on our audits. We conducted our audits of these financial statements in accordance with the standards of the Public Company Accounting Oversight Board (United States). Those standards require that we plan and perform the audit to obtain reasonable assurance about whether the financial statements are free of material misstatement. An audit includes examining, on a test basis, evidence supporting the amounts and disclosures in the financial statements, assessing the accounting principles used and significant estimates made by management, and evaluating the overall financial statement presentation. We believe that our audits, which included confirmation of securities as of March 31, 2017 by correspondence with the custodian, brokers, and transfer agent, and the application of alternative auditing procedures where securities purchased confirmations had not been received, provide a reasonable basis for our opinion.
PricewaterhouseCoopers LLP
Boston, Massachusetts
May 16, 2017
Unaudited
For federal income tax purposes, the following information is furnished with respect to the distributions of the fund, if any, paid during its taxable year ended March 31, 2017.
The fund reports the maximum amount allowable of its net taxable income as eligible for the corporate dividends-received deduction.
The fund reports the maximum amount allowable of its net taxable income as qualified dividend income as provided in the Jobs and Growth Tax Relief Reconciliation Act of 2003.
Eligible shareholders will be mailed a 2017 Form 1099-DIV in early 2018. This will reflect the tax character of all distributions paid in calendar year 2017.
Please consult a tax advisor regarding the tax consequences of your investment in the fund.
This chart provides information about the Trustees and Officers who oversee your John Hancock fund. Officers elected by the Trustees manage the day-to-day operations of the fund and execute policies formulated by the Trustees.
Independent Trustees
| Name, year of birth Position(s) held with Trust Principal occupation(s) and other directorships during past 5 years | Trustee of the Trust since1 | Number of John Hancock funds overseen by Trustee |
| Hassell H. McClellan, Born: 1945 | 2012 | 228 |
| Trustee and Chairperson of the Board Director/Trustee, Virtus Funds (since 2008); Director, The Barnes Group (since 2010); Associate Professor, The Wallace E. Carroll School of Management, Boston College (retired 2013). Trustee (since 2014) and Chairperson of the Board (since 2017), John Hancock Collateral Trust; Trustee (since 2015) and Chairperson of the Board (since 2017), John Hancock Exchange-Traded Fund Trust; Trustee (since 2012) and Chairperson of the Board (since 2017), John Hancock retail funds3; Trustee (2005-2006 and since 2012) and Chairperson of the Board (since 2017), John Hancock Funds III; Trustee (since 2005) and Chairperson of the Board (since 2017), John Hancock Variable Insurance Trust and John Hancock Funds II. | ||
| Charles L. Bardelis,2 Born: 1941 | 2012 | 228 |
| Trustee Director, Island Commuter Corp. (marine transport). Trustee, John Hancock Collateral Trust (since 2014), Trustee, John Hancock Exchange-Traded Fund Trust (since 2015); Trustee, John Hancock retail funds3 (since 2012); Trustee, John Hancock Funds III (2005-2006 and since 2012); Trustee, John Hancock Variable Insurance Trust (since 1988); Trustee, John Hancock Funds II (since 2005). | ||
| Peter S. Burgess,2 Born: 1942 | 2012 | 228 |
| Trustee Consultant (financial, accounting, and auditing matters) (since 1999); Certified Public Accountant; Partner, Arthur Andersen (independent public accounting firm) (prior to 1999); Director, Lincoln Educational Services Corporation (since 2004); Director, Symetra Financial Corporation (2010-2016); Director, PMA Capital Corporation (2004-2010). Trustee, John Hancock Collateral Trust (since 2014); Trustee, John Hancock Exchange-Traded Fund Trust (since 2015); Trustee, John Hancock retail funds3 (since 2012); Trustee, John Hancock Funds III (2005-2006 and since 2012); Trustee, John Hancock Variable Insurance Trust and John Hancock Funds II (since 2005). | ||
| William H. Cunningham, Born: 1944 | 2006 | 228 |
| Trustee Professor, University of Texas, Austin, Texas (since 1971); former Chancellor, University of Texas System and former President of the University of Texas, Austin, Texas; Chairman (since 2009) and Director (since 2006), Lincoln National Corporation (insurance); Director, Southwest Airlines (since 2000); former Director, LIN Television (2009-2014). Trustee, John Hancock retail funds3 (since 1986); Trustee, John Hancock Variable Insurance Trust (since 2012); Trustee, John Hancock Funds II (2005-2006 and since 2012); Trustee, John Hancock Collateral Trust (since 2014); Trustee, John Hancock Exchange-Traded Fund Trust (since 2015). | ||
| Grace K. Fey, Born: 1946 | 2012 | 228 |
| Trustee Chief Executive Officer, Grace Fey Advisors (since 2007); Director and Executive Vice President, Frontier Capital Management Company (1988-2007); Director, Fiduciary Trust (since 2009). Trustee, John Hancock Collateral Trust (since 2014); Trustee, John Hancock Exchange-Traded Fund Trust (since 2015); Trustee, John Hancock retail funds3 (since 2012); Trustee, John Hancock Variable Insurance Trust and John Hancock Funds II (since 2008). | ||
Independent Trustees (continued)
| Name, year of birth Position(s) held with Trust Principal occupation(s) and other directorships during past 5 years | Trustee of the Trust since1 | Number of John Hancock funds overseen by Trustee |
| Theron S. Hoffman,2 Born: 1947 | 2012 | 228 |
| Trustee Chief Executive Officer, T. Hoffman Associates, LLC (consulting firm) (since 2003); Director, The Todd Organization (consulting firm) (2003-2010); President, Westport Resources Management (investment management consulting firm) (2006-2008); Senior Managing Director, Partner, and Operating Head, Putnam Investments (2000-2003); Executive Vice President, The Thomson Corp. (financial and legal information publishing) (1997-2000). Trustee, John Hancock Collateral Trust (since 2014); Trustee, John Hancock Exchange-Traded Fund Trust (since 2015); Trustee, John Hancock retail funds3 (since 2012); Trustee, John Hancock Variable Insurance Trust and John Hancock Funds II (since 2008). | ||
| Deborah C. Jackson, Born: 1952 | 2008 | 228 |
| Trustee President, Cambridge College, Cambridge, Massachusetts (since 2011); Board of Directors, National Association of Corporate Directors/New England (since 2015); Board of Directors, Association of Independent Colleges and Universities of Massachusetts, (since 2014); Chief Executive Officer, American Red Cross of Massachusetts Bay (2002-2011); Board of Directors of Eastern Bank Corporation (since 2001); Board of Directors of Eastern Bank Charitable Foundation (since 2001); Board of Directors of American Student Assistance Corporation (1996-2009); Board of Directors of Boston Stock Exchange (2002-2008); Board of Directors of Harvard Pilgrim Healthcare (health benefits company) (2007-2011). Trustee, John Hancock retail funds3 (since 2008); Trustee, John Hancock Variable Insurance Trust and John Hancock Funds II (since 2012); Trustee, John Hancock Collateral Trust (since 2014); and Trustee, John Hancock Exchange-Traded Fund Trust (since 2015). | ||
| James M. Oates, Born: 1946 | 2012 | 228 |
Trustee | ||
| Steven R. Pruchansky, Born: 1944 | 2006 | 228 |
| Trustee and Vice Chairperson of the Board Chairman and Chief Executive Officer, Greenscapes of Southwest Florida, Inc. (since 2000); Director and President, Greenscapes of Southwest Florida, Inc. (until 2000); Member, Board of Advisors, First American Bank (until 2010); Managing Director, Jon James, LLC (real estate) (since 2000); Partner, Right Funding, LLC (since 2014); Director, First Signature Bank & Trust Company (until 1991); Director, Mast Realty Trust (until 1994); President, Maxwell Building Corp. (until 1991). Trustee (since 1992) and Chairperson of the Board (2011-2012), John Hancock retail funds3; Trustee and Vice Chairperson of the Board, John Hancock retail funds3 John Hancock Variable Insurance Trust, and John Hancock Funds II (since 2012); Trustee and Vice Chairperson of the Board, John Hancock Collateral Trust (since 2014); Trustee and Vice Chairperson of the Board, John Hancock Exchange-Traded Fund Trust (since 2015). | ||
Independent Trustees (continued)
| Name, year of birth Position(s) held with Trust Principal occupation(s) and other directorships during past 5 years | Trustee of the Trust since1 | Number of John Hancock funds overseen by Trustee |
| Gregory A. Russo, Born: 1949 | 2008 | 228 |
| Trustee Director and Audit Committee Chairman (since 2012), and Member, Audit Committee and Finance Committee (since 2011), NCH Healthcare System, Inc. (holding company for multi-entity healthcare system); Director and Member (since 2012) and Finance Committee Chairman (since 2014), The Moorings, Inc. (nonprofit continuing care community); Vice Chairman, Risk & Regulatory Matters, KPMG LLP (KPMG) (2002-2006); Vice Chairman, Industrial Markets, KPMG (1998-2002); Chairman and Treasurer, Westchester County, New York, Chamber of Commerce (1986-1992); Director, Treasurer, and Chairman of Audit and Finance Committees, Putnam Hospital Center (1989-1995); Director and Chairman of Fundraising Campaign, United Way of Westchester and Putnam Counties, New York (1990-1995). Trustee, John Hancock retail funds3 (since 2008); Trustee, John Hancock Variable Insurance Trust and John Hancock Funds II (since 2012); Trustee, John Hancock Collateral Trust (since 2014); Trustee, John Hancock Exchange-Traded Fund Trust (since 2015). | ||
Non-Independent Trustees4
| Name, year of birth Position(s) held with Trust Principal occupation(s) and other directorships during past 5 years | Trustee of the Trust since1 | Number of John Hancock funds overseen by Trustee |
| James R. Boyle, Born: 1959 | 2015 | 228 |
| Non-Independent Trustee Chairman and Chief Executive Officer, Zillion Group, Inc. (formerly HealthFleet, Inc.) (healthcare) (since 2014); Executive Vice President and Chief Executive Officer, U.S. Life Insurance Division of Genworth Financial, Inc. (insurance) (January 2014-July 2014); Senior Executive Vice President, Manulife Financial Corporation, President and Chief Executive Officer, John Hancock (1999-2012); Chairman and Director, John Hancock Advisers, LLC, John Hancock Funds, LLC, and John Hancock Investment Management Services, LLC (2005-2010). Trustee, John Hancock Collateral Trust and John Hancock Exchange-Traded Fund Trust (since 2015); Trustee, John Hancock retail funds3 (2005-2010; 2012-2014 and since 2015); Trustee, John Hancock Variable Insurance Trust and John Hancock Funds II (2005-2014 and since 2015). | ||
| Craig Bromley, Born: 1966 | 2012 | 228 |
| Non-Independent Trustee President, John Hancock Financial Service (since 2012); Senior Executive Vice President and General Manager, U.S. Division, Manulife Financial Corporation (since 2012); President and Chief Executive Officer, Manulife Insurance Company (Manulife Japan) (2005-2012, including prior positions). Trustee, John Hancock retail funds,3 John Hancock Variable Insurance Trust, and John Hancock Funds II (since 2012); Trustee, John Hancock Collateral Trust (since 2014); Trustee, John Hancock Exchange-Traded Fund Trust (since 2015). | ||
| Warren A. Thomson, Born: 1955 | 2012 | 228 |
| Non-Independent Trustee Senior Executive Vice President and Chief Investment Officer, Manulife Financial Corporation and The Manufacturers Life Insurance Company (since 2009); Chairman, Manulife Asset Management (since 2001, including prior positions); Director and Chairman, Manulife Asset Management Limited (since 2006); Director and Chairman, Hancock Natural Resources Group, Inc. (since 2013). Trustee, John Hancock retail funds,3 John Hancock Variable Insurance Trust, and John Hancock Funds II (since 2012); Trustee, John Hancock Collateral Trust (since 2014); Trustee, John Hancock Exchange-Traded Fund Trust (since 2015). | ||
Principal officers who are not Trustees
| Name, year of birth Position(s) held with Trust Principal occupation(s) during past 5 years | Officer of the Trust since |
| Andrew G. Arnott, Born: 1971 | 2009 |
| President Senior Vice President, John Hancock Financial Services (since 2009); Director and Executive Vice President, John Hancock Advisers, LLC (since 2005, including prior positions); Director and Executive Vice President, John Hancock Investment Management Services, LLC (since 2006, including prior positions); President, John Hancock Funds, LLC (since 2004, including prior positions); President, John Hancock retail funds,3 John Hancock Variable Insurance Trust, and John Hancock Funds II (since 2007, including prior positions); President, John Hancock Collateral Trust and John Hancock Exchange-Traded Fund Trust (since 2014). | |
| John J. Danello, Born: 1955 | 2014 |
| Senior Vice President, Secretary, and Chief Legal Officer Vice President and Chief Counsel, John Hancock Wealth Management (since 2005); Senior Vice President (since 2007) and Chief Legal Counsel (2007-2010), John Hancock Funds, LLC and The Berkeley Financial Group, LLC; Senior Vice President (since 2006, including prior positions) and Chief Legal Officer and Secretary (since 2014), John Hancock retail funds,3 John Hancock Funds II and John Hancock Variable Insurance Trust; Senior Vice President, Secretary and Chief Legal Officer, John Hancock Collateral Trust and John Hancock Exchange-Traded Fund Trust (since 2014); Vice President, John Hancock Life & Health Insurance Company (since 2009); Vice President, John Hancock Life Insurance Company (USA) and John Hancock Life Insurance Company of New York (since 2010); and Senior Vice President, Secretary and Chief Legal Counsel (2007-2014, including prior positions) of John Hancock Advisers, LLC and John Hancock Investment Management Services, LLC. | |
| Francis V. Knox, Jr., Born: 1947 | 2006 |
| Chief Compliance Officer Vice President, John Hancock Financial Services (since 2005); Chief Compliance Officer, John Hancock retail funds,3 John Hancock Variable Insurance Trust, John Hancock Funds II, John Hancock Advisers, LLC, and John Hancock Investment Management Services, LLC (since 2005); Chief Compliance Officer, John Hancock Collateral Trust and John Hancock Exchange-Traded Fund Trust (since 2014). | |
| Charles A. Rizzo, Born: 1957 | 2007 |
| Chief Financial Officer Vice President, John Hancock Financial Services (since 2008); Senior Vice President, John Hancock Advisers, LLC and John Hancock Investment Management Services, LLC (since 2008); Chief Financial Officer, John Hancock retail funds,3 John Hancock Variable Insurance Trust and John Hancock Funds II (since 2007); Chief Financial Officer, John Hancock Collateral Trust and John Hancock Exchange-Traded Fund Trust (since 2014). | |
| Salvatore Schiavone, Born: 1965 | 2010 |
| Treasurer Assistant Vice President, John Hancock Financial Services (since 2007); Vice President, John Hancock Advisers, LLC and John Hancock Investment Management Services, LLC (since 2007); Treasurer, John Hancock retail funds3 (since 2007, including prior positions); Treasurer, John Hancock Variable Insurance Trust and John Hancock Funds II (2007-2009 and since 2010, including prior positions); Treasurer, John Hancock Collateral Trust and John Hancock Exchange-Traded Fund Trust (since 2014). | |
The business address for all Trustees and Officers is 601 Congress Street, Boston, Massachusetts 02210-2805.
The Statement of Additional Information of the fund includes additional information about members of the Board of Trustees of the Trust and is available without charge, upon request, by calling 800-225-5291.
| 1 | Each Trustee holds office until his or her successor is elected and qualified, or until the Trustee's death, retirement, resignation, or removal. Mr. Boyle has served as Trustee at various times prior to the date listed in the table. |
| 2 | Member of the Audit Committee. |
| 3 | "John Hancock retail funds" comprises John Hancock Funds III and 40 other John Hancock funds consisting of 30 series of other John Hancock trusts and 10 closed-end funds. |
| 4 | The Trustee is a Non-Independent Trustee due to current or former positions with the Advisor and certain affiliates. |
Trustees Hassell H. McClellan, Chairperson# Officers Andrew G. Arnott John J. Danello Francis V. Knox, Jr. Charles A. Rizzo Salvatore Schiavone | Investment advisor John Hancock Advisers, LLC Subadvisor Robeco Investment Management, Inc. Principal distributor John Hancock Funds, LLC Custodian State Street Bank and Trust Company Transfer agent John Hancock Signature Services, Inc. Legal counsel K&L Gates LLP Independent registered public accounting firm PricewaterehouseCoopers LLP |
*Member of the Audit Committee
†Non-Independent Trustee
#Effective 1-1-17
The fund's proxy voting policies and procedures, as well as the fund proxy voting record for the most recent twelve-month period ended June 30, are available free of charge on the Securities and Exchange Commission (SEC) website at sec.gov or on our website.
The fund's complete list of portfolio holdings, for the first and third fiscal quarters, is filed with the SEC on Form N-Q. The fund's Form N-Q is available on our website and the SEC's website, sec.gov, and can be reviewed and copied (for a fee) at the SEC's Public Reference Room in Washington, DC. Call 800-SEC-0330 to receive information on the operation of the SEC's Public Reference Room.
We make this information on your fund, as well as monthly portfolio holdings, and other fund details available on our website at jhinvestments.com or by calling 800-225-5291.
| You can also contact us: | |||
| 800-225-5291 jhinvestments.com | Regular mail: John Hancock Signature Services, Inc. | Express mail: John Hancock Signature Services, Inc. | |
John Hancock family of funds
DOMESTIC EQUITY FUNDS Balanced Blue Chip Growth Classic Value Disciplined Value Disciplined Value Mid Cap Equity Income Fundamental All Cap Core Fundamental Large Cap Core Fundamental Large Cap Value New Opportunities Small Cap Value Small Company Strategic Growth U.S. Global Leaders Growth U.S. Growth Value Equity GLOBAL AND INTERNATIONAL EQUITY FUNDS Disciplined Value International Emerging Markets Emerging Markets Equity Fundamental Global Franchise Global Equity Global Shareholder Yield Greater China Opportunities International Growth International Small Company International Value Equity | INCOME FUNDS Bond California Tax-Free Income Emerging Markets Debt Floating Rate Income Global Income Government Income High Yield High Yield Municipal Bond Income Investment Grade Bond Money Market Short Duration Credit Opportunities Spectrum Income Strategic Income Opportunities Tax-Free Bond ALTERNATIVE AND SPECIALTY FUNDS Absolute Return Currency Alternative Asset Allocation Enduring Assets Financial Industries Global Absolute Return Strategies Global Conservative Absolute Return Global Focused Strategies Natural Resources Redwood Regional Bank Seaport Technical Opportunities |
A fund's investment objectives, risks, charges, and expenses should be considered carefully before investing. The prospectus contains this and other important information about the fund. To obtain a prospectus, contact your financial professional, call John Hancock Investments at 800-225-5291, or visit our website at jhinvestments.com. Please read the prospectus carefully before investing or sending money.
ASSET ALLOCATION Income Allocation Fund Multi-Index Lifetime Portfolios Multi-Index Preservation Portfolios Multimanager Lifestyle Portfolios Multimanager Lifetime Portfolios EXCHANGE-TRADED FUNDS John Hancock Multifactor Consumer Discretionary ETF John Hancock Multifactor Consumer Staples ETF John Hancock Multifactor Developed International ETF John Hancock Multifactor Energy ETF John Hancock Multifactor Financials ETF John Hancock Multifactor Healthcare ETF John Hancock Multifactor Industrials ETF John Hancock Multifactor Large Cap ETF John Hancock Multifactor Materials ETF John Hancock Multifactor Mid Cap ETF John Hancock Multifactor Technology ETF John Hancock Multifactor Utilities ETF | ENVIRONMENTAL, SOCIAL, AND GOVERNANCE FUNDS ESG All Cap Core ESG Core Bond ESG International Equity ESG Large Cap Core CLOSED-END FUNDS Financial Opportunities Hedged Equity & Income Income Securities Trust Investors Trust Preferred Income Preferred Income II Preferred Income III Premium Dividend Tax-Advantaged Dividend Income Tax-Advantaged Global Shareholder Yield |
John Hancock Multifactor ETF shares are bought and sold at market price (not NAV), and are not individually redeemed
from the fund. Brokerage commissions will reduce returns.
John Hancock ETFs are distributed by Foreside Fund Services, LLC, and are subadvised by Dimensional Fund Advisors LP.
Foreside is not affiliated with John Hancock Funds, LLC or Dimensional Fund Advisors LP.
Dimensional Fund Advisors LP receives compensation from John Hancock in connection with licensing rights to the
John Hancock Dimensional indexes. Dimensional Fund Advisors LP does not sponsor, endorse, or sell, and makes no
representation as to the advisability of investing in, John Hancock Multifactor ETFs.
John Hancock Investments
A trusted brand
John Hancock Investments is a premier asset manager representing one of
America's most trusted brands, with a heritage of financial stewardship dating
back to 1862. Helping our shareholders pursue their financial goals is at the
core of everything we do. It's why we support the role of professional financial
advice and operate with the highest standards of conduct and integrity.
A better way to invest
We serve investors globally through a unique multimanager approach:
We search the world to find proven portfolio teams with specialized
expertise for every strategy we offer, then we apply robust investment
oversight to ensure they continue to meet our uncompromising standards
and serve the best interests of our shareholders.
Results for investors
Our unique approach to asset management enables us to provide a diverse set
of investments backed by some of the world's best managers, along with strong
risk-adjusted returns across asset classes.

 | John Hancock Funds, LLC n Member FINRA, SIPC 601 Congress Street n Boston, MA 02210-2805 800-225-5291 n jhinvestments.com | |
| This report is for the information of the shareholders of John Hancock Disciplined Value Fund. It is not authorized for distribution to prospective investors unless preceded or accompanied by a prospectus. | ||
| MF361881 | 340A 3/17 5/17 | |
A message to shareholders
Dear shareholder,
Financial markets are by their very nature unpredictable, but few market observers could have imagined the dramatic twists and turns that would come to characterize the latter half of 2016 and the beginning of 2017. Donald Trump's victory in the November U.S. presidential election sent both U.S. equity prices and bond yields sharply higher. Investors bid up the prices of riskier assets, believing that the new administration would pursue more pro-growth, market-friendly economic policies. While this may yet prove to be the case, change in policy has been slow to materialize and valuations in certain sectors and asset classes are now appearing somewhat stretched.
While we believe there are good reasons for economic optimism and that stocks may go on to extend their recent rally in the coming months, we encourage you to talk with your financial advisor, who can help ensure your portfolio is sufficiently diversified to meet your long-term objectives and to withstand the inevitable bumps along the way.
On behalf of everyone at John Hancock Investments, I'd like to take this opportunity to thank you for the continued trust you've placed in us.
Sincerely,
Andrew G. Arnott
President and Chief Executive Officer
John Hancock Investments
This commentary reflects the CEO's views, which are subject to change at any time. Investing involves risks, including the potential loss of principal. Diversification does not guarantee a profit or eliminate the risk of a loss. For more up-to-date information, please visit our website at jhinvestments.com.
John Hancock
Small Company Fund
INVESTMENT OBJECTIVE
The fund seeks maximum long-term total return.
AVERAGE ANNUAL TOTAL RETURNS AS OF 3/31/17 (%)
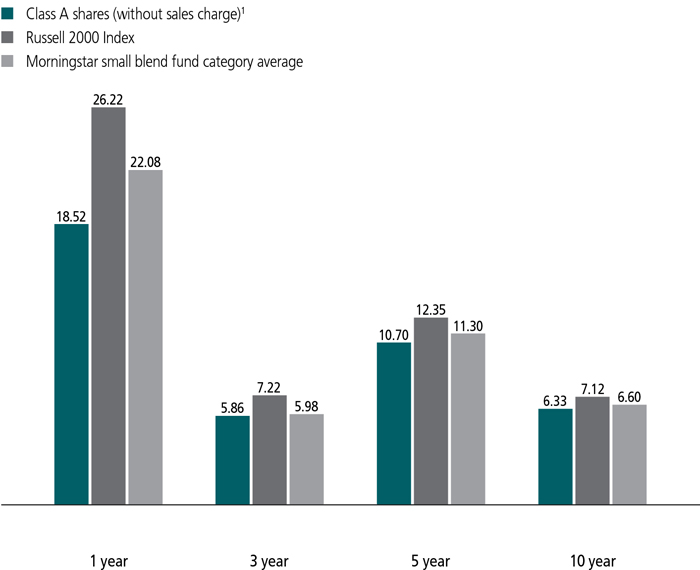
The Russell 2000 Index is an index that measures performance of the 2,000 smallest companies in the Russell 3000 Index.
It is not possible to invest directly in an index. Index figures do not reflect expenses or sales charges, which would result in lower returns.
Figures from Morningstar, Inc. include reinvested distributions and do not take into account sales charges. Actual load-adjusted performance is lower.
| 1 | On 12-11-09, through a reorganization, the fund acquired all of the assets of the FMA Small Company Portfolio (the predecessor fund). On that date, the predecessor fund offered its Investor shares in exchange for Class A shares of John Hancock Small Company Fund, which were first offered on 12-14-09. Class A shares' returns shown above for periods prior to this date are those of the predecessor fund's Investor shares that have been recalculated to reflect the gross fees and expenses of Class A shares. |
The past performance shown here reflects reinvested distributions and the beneficial effect of any expense reductions, and does not guarantee future results. Performance of the other share classes will vary based on the difference in the fees and expenses of those classes. Shares will fluctuate in value and, when redeemed, may be worth more or less than their original cost. Current month-end performance may be lower or higher than the performance cited, and can be found at jhinvestments.com or by calling 800-225-5291. For further information on the fund's objectives, risks, and strategy, see the fund's prospectus.
PERFORMANCE HIGHLIGHTS OVER THE LAST TWELVE MONTHS
Relative underperformance
The fund produced strong absolute performance in a favorable market environment but fell considerably short of its benchmark, the Russell 2000 Index.
Challenges early on
Most of the fund's underperformance came in the first half of the period, when investors were rewarding more cyclical and volatile stocks, neither of which we emphasize.
Stock picking challenges
Stock picking in industrials and materials, as well as a few companies in healthcare, energy, and financials hurt results, while security selection in consumer categories added value.
SECTOR COMPOSITION AS OF 3/31/17 (%)
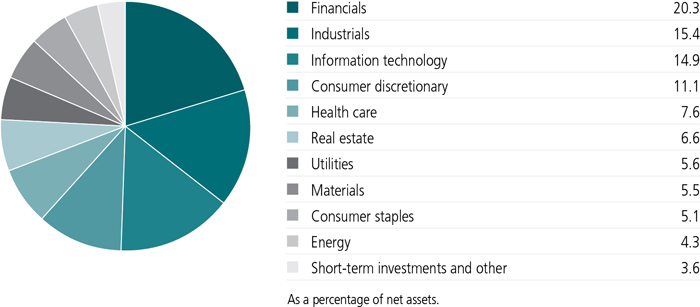
A note about risks
The stock prices of small companies can change more frequently and dramatically than those of large companies. The value of a company's equity securities is subject to changes in the company's financial condition and overall market and economic conditions. Frequent trading may increase fund transaction costs. Sector investing is subject to greater risks than the market as a whole. Investments focused in one sector may fluctuate more than investments in a wider variety of sectors. Owning an exchange-traded fund generally reflects the risks of owning the underlying securities it is designed to track. Please see the fund's prospectus for additional risks.
An interview with Portfolio Manager Kathryn A. Vorisek, Mesirow Financial Investment Management, Inc.

Kathryn A. Vorisek
Portfolio Manager
Mesirow Financial
How did the fund perform during the 12 months ended March 31, 2017?
In a very strong market environment, the fund fared well in absolute terms; however, it fell short of its benchmark, the Russell 2000 Index. Most of the fund's underperformance came in the first half of the reporting period. Just a few weeks before this period began, investor sentiment had shifted dramatically to favor highly cyclical (economically sensitive) volatile stocks. Many were of lower-quality businesses that had earlier struggled but then significantly rallied once it became clear that monetary policymakers were willing to step in to boost global economic growth.
Given our management philosophy, we are not surprised by the performance shortfall this period. We prioritize higher-quality, less-volatile small-cap stocks, which lagged their counterparts with the opposite characteristics. By the second half of the period, when the small-cap rally turned broader based, the fund's performance relative to the benchmark significantly improved.
Also weighing on the fund's results this period was subpar stock picking, especially in the industrials and materials sectors, along with individual names in healthcare, energy, and financials. In contrast, the fund benefited from security selection in the consumer discretionary and consumer staples sectors.
Which individual stocks were among the biggest relative detractors?
One of the biggest individual detractors was Banc of California, Inc. Shares of the company fell sharply in October in response to news about potential corporate governance problems. We sold the stock late last year.
We encountered a similar situation with a company purchased early in the period, Commercial Metals Company, which makes steel bars (rebar) widely used in the construction industry. Unfortunately, portions of our holding period coincided with downturns in the stock price amid lower-than-expected rebar prices. At period end, we maintained the fund's stake in the company, in light of what we saw as its better future prospects for infrastructure spending.
Proto Labs, Inc., a provider of short-run custom production services, had previously done very well but ran into difficulties around the first half of the reporting period, as the company experienced a slowdown in its revenue growth and reported weaker-than-expected financial results. As our confidence in the stock's prospects diminished, we sold the fund's stake during the summer.
Meanwhile, in the healthcare sector, a position in drug manufacturer Impax Laboratories, Inc. hurt relative performance, as the company issued two consecutive disappointing quarterly financial reports. We ultimately sold the position, having lost confidence in Impax's ability to successfully address sales challenges associated with the company's key products.
TOP 10 HOLDINGS AS OF 3/31/17 (%)
| Capitol Federal Financial, Inc. | 1.9 |
| Chemical Financial Corp. | 1.7 |
| IDACORP, Inc. | 1.7 |
| Nexstar Media Group, Inc. | 1.6 |
| Boyd Gaming Corp. | 1.6 |
| ALLETE, Inc. | 1.5 |
| Selective Insurance Group, Inc. | 1.5 |
| Barnes Group, Inc. | 1.5 |
| ITT, Inc. | 1.5 |
| STAG Industrial, Inc. | 1.5 |
| TOTAL | 16.0 |
| As a percentage of net assets. | |
| Cash and cash equivalents are not included. | |
Other notable detractors this period included Vista Outdoor, Inc., a maker of outdoor recreational equipment, and ExlService Holdings, Inc., an operations management and analytics company. We sold both holdings before the end of the period.
Which stocks contributed to relative performance?
The fund's top individual contributor this period was Nexstar Media Group, Inc. This television broadcaster and media company acquired Media General, Inc. during the period, and we believed the combination would add greatly to Nexstar's earnings over time. The stock also benefited from the market's postelection optimism, as investors saw the potential for greater industry deregulation boosting the company's growth prospects.
Another relative contributor was Central Garden & Pet Company, an operator of gardening and pet businesses, two areas of the retail industry that have been experiencing growth. Besides benefiting from a more favorable business backdrop, the company has a new management team, which has already made progress in improving the firm's operating margins. As of period end, we saw the potential for even more progress on that front, and this was a factor in our decision to continue holding the stock in the fund.
Also contributing to relative performance was Marriott Vacations Worldwide Corp., a leisure-oriented company that specializes in vacation ownership resorts, destination clubs, and vacation rentals. Marriott Vacations has benefited from healthy consumer spending trends for leisure travel and has also built sales centers in new markets. Both trends have helped boost the company's earnings and revenue growth and led to positive results for the stock this period.
What was your management approach during the period?
Regardless of the market backdrop, we follow a consistent management strategy, emphasizing high-quality small-cap companies with good earnings power. Applying this approach, we gradually
became more confident in the economy's fundamental improvement and thus increased the fund's exposure to economically sensitive stocks in the second half of the period.
By the period's final months, however, amid rising stock prices and valuations we found relatively high in light of the economy's underlying growth potential, we sought to manage the fund's allocation to certain sectors by trimming exposure to various economically sensitive stocks and categories that had grown to occupy a larger-than-desired portion of the fund.
How was the fund positioned at period end?
We believe the market backdrop appears to be better suited to our investment approach, which emphasizes individual stock selection rather than performance based on macroeconomic drivers or geopolitical events. We think a return to an environment that rewards research-based stock selection, as opposed to one in which most stocks are rising or falling together in response to market conditions, is a far better backdrop for our style of investing.
MANAGED BY
| | Kathryn A. Vorisek On the fund since 1996 Investing since 1984 |
 | Leo Harmon, CFA On the fund since 2003 Investing since 1993 |
![]()
TOTAL RETURNS FOR THE PERIOD ENDED MARCH 31, 2017
| Average annual total returns (%) with maximum sales charge | Cumulative total returns (%) with maximum sales charge | ||||||
| 1-year | 5-year | 10-year | 5-year | 10-year | |||
| Class A1 | 12.60 | 9.56 | 5.78 | 57.88 | 75.42 | ||
| Class I1,2 | 18.90 | 11.06 | 6.68 | 68.99 | 90.93 | ||
| Class R11,2 | 18.08 | 10.32 | 5.92 | 63.42 | 77.76 | ||
| Class R21,2 | 18.45 | 10.60 | 5.48 | 65.50 | 70.47 | ||
| Class R31,2 | 18.21 | 10.42 | 6.03 | 64.16 | 79.53 | ||
| Class R41,2 | 18.79 | 10.88 | 6.40 | 67.62 | 86.00 | ||
| Class R51,2 | 18.92 | 11.09 | 6.66 | 69.19 | 90.64 | ||
| Class R61,2 | 19.04 | 11.19 | 6.76 | 69.93 | 92.43 | ||
| Class ADV1,2 | 18.65 | 10.82 | 6.34 | 67.16 | 84.94 | ||
| Index† | 26.22 | 12.35 | 7.12 | 79.03 | 98.94 | ||
Performance figures assume all distributions are reinvested. Figures reflect maximum sales charge on Class A shares of 5%. Sales charges are not applicable to Class I, Class R1, Class R2, Class R3, Class R4, Class R5, Class R6, and Class ADV shares.
The expense ratios of the fund, both net (including any fee waivers or expense limitations) and gross (excluding any fee waivers or expense limitations), are set forth according to the most recent publicly available prospectus for the fund and may differ from those disclosed in the Financial highlights tables in this report. Had the contractual fee waivers and expense limitations not been in place, gross expenses would apply. The expense ratios are as follows:
| Class A | Class I | Class R1 | Class R2 | Class R3 | Class R4 | Class R5 | Class R6 | Class ADV | |
| Gross (%) | 1.49 | 1.17 | 1.83 | 1.58 | 1.73 | 1.43 | 1.13 | 1.08 | 1.44 |
| Net (%) | 1.43 | 1.13 | 1.80 | 1.55 | 1.70 | 1.30 | 1.10 | 1.06 | 1.34 |
Please refer to the most recent prospectus and annual or semiannual report for more information on expenses and any expense limitation arrangements for each class.
The returns reflect past results and should not be considered indicative of future performance. The return and principal value of an investment will fluctuate so that shares, when redeemed, may be worth more or less than their original cost. Due to market volatility and other factors, the fund's current performance may be higher or lower than the performance shown. For current to the most recent month-end performance data, please call 800-225-5291 or visit the fund's website at jhinvestments.com.
The performance table above and the chart on the next page do not reflect the deduction of taxes that a shareholder would pay on fund distributions or the redemption of fund shares. The fund's performance results reflect any applicable fee waivers or expense reductions, without which the expenses would increase and results would have been less favorable.
| † | Index is the Russell 2000 Index. |
See the following page for footnotes.
This chart and table show what happened to a hypothetical $10,000 investment in John Hancock Small Company Fund for the share classes and periods indicated, assuming all distributions were reinvested. For comparison, we've shown the same investment in the Russell 2000 Index.
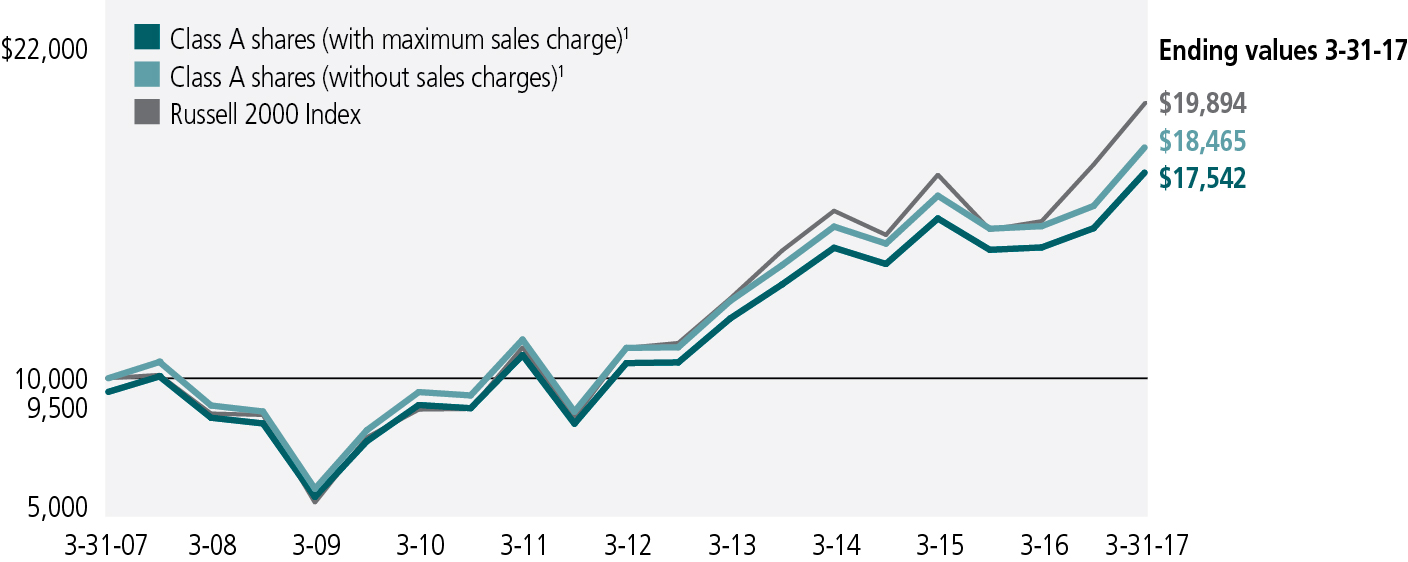
The Russell 2000 Index is an index that measures performance of the 2,000 smallest companies in the Russell 3000 Index.
It is not possible to invest directly in an index. Index figures do not reflect expenses or sales charges, which would result in lower returns.
Footnotes related to performance pages
| 1 | On 12-11-09, through a reorganization, the fund acquired all of the assets of FMA Small Company Portfolio (the predecessor fund). On that date, the predecessor fund offered its Investor shares in exchange for Class A shares and the Institutional shares in exchange for Class I shares of John Hancock Small Company Fund, which were first offered on 12-14-09. Class A, Class I, and Class ADV shares were first offered on 12-14-09. The returns of Class A, Class I, and Class ADV shares prior to this date are those of the predecessor fund's Investor shares that have been recalculated to apply the gross fees and expenses of Class A, Class I, and Class ADV shares, as applicable. Class R1, Class R3, Class R4, and Class R5 shares were first offered on 4-30-10; Class R2 shares were first offered on 3-1-12; Class R6 shares were first offered on 9-1-11. Returns prior to these dates are those of Class A shares recalculated to apply the gross fees and expenses of Class R1, Class R3, Class R4, Class R5, Class R2, and Class R6 shares, as applicable. |
| 2 | For certain types of investors, as described in the fund's prospectus. |
These examples are intended to help you understand your ongoing operating expenses of investing in the fund so you can compare these costs with the ongoing costs of investing in other mutual funds.
Understanding fund expenses
As a shareholder of the fund, you incur two types of costs:
| • | Transaction costs, which include sales charges (loads) on purchases or redemptions (varies by share class), minimum account fee charge, etc. |
| • | Ongoing operating expenses, including management fees, distribution and service fees (if applicable), and other fund expenses. |
We are presenting only your ongoing operating expenses here.
Actual expenses/actual returns
The first line of each share class in the table on the following page is intended to provide information about the fund's actual ongoing operating expenses, and is based on the fund's actual return. It assumes an account value of $1,000.00 on October 1, 2016, with the same investment held until March 31, 2017.
Together with the value of your account, you may use this information to estimate the operating expenses that you paid over the period. Simply divide your account value at March 31, 2017, by $1,000.00, then multiply it by the "expenses paid" for your share class from the table. For example, for an account value of $8,600.00, the operating expenses should be calculated as follows:
Hypothetical example for comparison purposes
The second line of each share class in the table on the following page allows you to compare the fund's ongoing operating expenses with those of any other fund. It provides an example of the fund's hypothetical account values and hypothetical expenses based on each class's actual expense ratio and an assumed 5% annualized return before expenses (which is not the fund's actual return). It assumes an account value of $1,000.00 on October 1, 2016, with the same investment held until March 31, 2017. Look in any other fund shareholder report to find its hypothetical example and you will be able to compare these expenses. Please remember that these hypothetical account values and expenses may not be used to estimate the actual ending account balance or expenses you paid for the period.
Remember, these examples do not include any transaction costs, therefore, these examples will not help you to determine the relative total costs of owning different funds. If transaction costs were included, your expenses would have been higher. See the prospectus for details regarding transaction costs.
SHAREHOLDER EXPENSE EXAMPLE CHART
| Account value on 10-1-2016 | Ending value on 3-31-2017 | Expenses paid during period ended 3-31-20171 | Annualized expense ratio | ||
| Class A | Actual expenses/actual returns | $1,000.00 | $1,131.30 | $7.65 | 1.44% |
| Hypothetical example for comparison purposes | 1,000.00 | 1,017.80 | 7.24 | 1.44% | |
| Class I | Actual expenses/actual returns | 1,000.00 | 1,133.40 | 6.06 | 1.14% |
| Hypothetical example for comparison purposes | 1,000.00 | 1,019.20 | 5.74 | 1.14% | |
| Class R1 | Actual expenses/actual returns | 1,000.00 | 1,129.50 | 9.56 | 1.80% |
| Hypothetical example for comparison purposes | 1,000.00 | 1,016.00 | 9.05 | 1.80% | |
| Class R2 | Actual expenses/actual returns | 1,000.00 | 1,130.70 | 8.18 | 1.54% |
| Hypothetical example for comparison purposes | 1,000.00 | 1,017.30 | 7.75 | 1.54% | |
| Class R3 | Actual expenses/actual returns | 1,000.00 | 1,129.70 | 8.97 | 1.69% |
| Hypothetical example for comparison purposes | 1,000.00 | 1,016.50 | 8.50 | 1.69% | |
| Class R4 | Actual expenses/actual returns | 1,000.00 | 1,132.50 | 6.49 | 1.22% |
| Hypothetical example for comparison purposes | 1,000.00 | 1,018.80 | 6.14 | 1.22% | |
| Class R5 | Actual expenses/actual returns | 1,000.00 | 1,133.20 | 5.85 | 1.10% |
| Hypothetical example for comparison purposes | 1,000.00 | 1,019.40 | 5.54 | 1.10% | |
| Class R6 | Actual expenses/actual returns | 1,000.00 | 1,133.70 | 5.48 | 1.03% |
| Hypothetical example for comparison purposes | 1,000.00 | 1,019.80 | 5.19 | 1.03% | |
| Class ADV | Actual expenses/actual returns | 1,000.00 | 1,132.00 | 7.23 | 1.36% |
| Hypothetical example for comparison purposes | 1,000.00 | 1,018.20 | 6.84 | 1.36% | |
| 1 | Expenses are equal to the fund's annualized expense ratio, multiplied by the average account value over the period, multiplied by 182/365 (to reflect the one-half year period). |
Fund's investments
| As of 3-31-17 | ||||||||||||||
| Shares | Value | |||||||||||||
| Common stocks 96.0% | $326,931,326 | |||||||||||||
| (Cost $284,207,836) | ||||||||||||||
| Consumer discretionary 11.1% | 37,663,800 | |||||||||||||
| Auto components 2.5% | ||||||||||||||
| Dana, Inc. | 218,160 | 4,212,670 | ||||||||||||
| Visteon Corp. (I) | 42,995 | 4,211,360 | ||||||||||||
| Diversified consumer services 1.1% | ||||||||||||||
| DeVry Education Group, Inc. | 109,360 | 3,876,812 | ||||||||||||
| Hotels, restaurants and leisure 2.6% | ||||||||||||||
| Boyd Gaming Corp. (I) | 241,315 | 5,311,343 | ||||||||||||
| Marriott Vacations Worldwide Corp. | 34,315 | 3,429,098 | ||||||||||||
| Household durables 1.1% | ||||||||||||||
| Installed Building Products, Inc. (I) | 68,985 | 3,638,959 | ||||||||||||
| Media 1.6% | ||||||||||||||
| Nexstar Media Group, Inc. | 77,050 | 5,405,058 | ||||||||||||
| Specialty retail 1.0% | ||||||||||||||
| Party City Holdco, Inc. (I) | 255,750 | 3,593,288 | ||||||||||||
| Textiles, apparel and luxury goods 1.2% | ||||||||||||||
| Wolverine World Wide, Inc. | 159,600 | 3,985,212 | ||||||||||||
| Consumer staples 5.1% | 17,410,199 | |||||||||||||
| Food and staples retailing 1.3% | ||||||||||||||
| Performance Food Group Company (I) | 191,620 | 4,560,556 | ||||||||||||
| Food products 2.4% | ||||||||||||||
| B&G Foods, Inc. | 86,322 | 3,474,461 | ||||||||||||
| Snyder's-Lance, Inc. | 111,660 | 4,501,015 | ||||||||||||
| Household products 1.4% | ||||||||||||||
| Central Garden & Pet Company, Class A (I) | 140,385 | 4,874,167 | ||||||||||||
| Energy 4.3% | 14,751,999 | |||||||||||||
| Energy equipment and services 3.2% | ||||||||||||||
| Forum Energy Technologies, Inc. (I) | 175,575 | 3,634,403 | ||||||||||||
| Oil States International, Inc. (I) | 103,875 | 3,443,456 | ||||||||||||
| Patterson-UTI Energy, Inc. | 164,010 | 3,980,523 | ||||||||||||
| Oil, gas and consumable fuels 1.1% | ||||||||||||||
| Callon Petroleum Company (I) | 280,670 | 3,693,617 | ||||||||||||
| Financials 19.9% | 67,818,851 | |||||||||||||
| Banks 11.7% | ||||||||||||||
| Ameris Bancorp | 93,545 | 4,312,425 | ||||||||||||
| Chemical Financial Corp. | 114,930 | 5,878,670 | ||||||||||||
| FNB Corp. | 282,430 | 4,199,734 | ||||||||||||
| Shares | Value | |||||||||||||
| Financials (continued) | ||||||||||||||
| Banks (continued) | ||||||||||||||
| Great Western Bancorp, Inc. | 104,760 | $4,442,872 | ||||||||||||
| IBERIABANK Corp. | 55,230 | 4,368,693 | ||||||||||||
| Independent Bank Group, Inc. | 62,065 | 3,990,780 | ||||||||||||
| Old National Bancorp | 261,450 | 4,536,158 | ||||||||||||
| Western Alliance Bancorp (I) | 100,415 | 4,929,372 | ||||||||||||
| Wintrust Financial Corp. | 47,355 | 3,273,178 | ||||||||||||
| Capital markets 1.0% | ||||||||||||||
| Legg Mason, Inc. | 94,985 | 3,429,908 | ||||||||||||
| Insurance 5.3% | ||||||||||||||
| American Equity Investment Life Holding Company | 159,395 | 3,766,504 | ||||||||||||
| Argo Group International Holdings, Ltd. | 66,105 | 4,481,909 | ||||||||||||
| ProAssurance Corp. | 79,530 | 4,791,683 | ||||||||||||
| Selective Insurance Group, Inc. | 108,380 | 5,110,117 | ||||||||||||
| Thrifts and mortgage finance 1.9% | ||||||||||||||
| Capitol Federal Financial, Inc. | 431,090 | 6,306,848 | ||||||||||||
| Health care 7.6% | 25,806,238 | |||||||||||||
| Biotechnology 2.4% | ||||||||||||||
| Ligand Pharmaceuticals, Inc. (I) | 39,460 | 4,176,446 | ||||||||||||
| MiMedx Group, Inc. (I) | 408,005 | 3,888,288 | ||||||||||||
| Health care providers and services 1.3% | ||||||||||||||
| Acadia Healthcare Company, Inc. (I) | 98,990 | 4,315,964 | ||||||||||||
| Health care technology 1.3% | ||||||||||||||
| Omnicell, Inc. (I) | 113,130 | 4,598,735 | ||||||||||||
| Life sciences tools and services 1.4% | ||||||||||||||
| PRA Health Sciences, Inc. (I) | 71,905 | 4,690,363 | ||||||||||||
| Pharmaceuticals 1.2% | ||||||||||||||
| Prestige Brands Holdings, Inc. (I) | 74,450 | 4,136,442 | ||||||||||||
| Industrials 15.4% | 52,483,443 | |||||||||||||
| Aerospace and defense 2.8% | ||||||||||||||
| Curtiss-Wright Corp. | 50,905 | 4,645,590 | ||||||||||||
| Esterline Technologies Corp. (I) | 56,523 | 4,863,804 | ||||||||||||
| Building products 1.0% | ||||||||||||||
| American Woodmark Corp. (I) | 37,705 | 3,461,319 | ||||||||||||
| Commercial services and supplies 1.0% | ||||||||||||||
| MSA Safety, Inc. | 47,935 | 3,388,525 | ||||||||||||
| Construction and engineering 1.1% | ||||||||||||||
| MasTec, Inc. (I) | 90,750 | 3,634,538 | ||||||||||||
| Machinery 6.6% | ||||||||||||||
| Barnes Group, Inc. | 98,935 | 5,079,323 | ||||||||||||
| Shares | Value | |||||||||||||
| Industrials (continued) | ||||||||||||||
| Machinery (continued) | ||||||||||||||
| Crane Company | 56,645 | $4,238,745 | ||||||||||||
| Franklin Electric Company, Inc. | 83,850 | 3,609,743 | ||||||||||||
| ITT, Inc. | 122,940 | 5,042,999 | ||||||||||||
| Kennametal, Inc. | 116,280 | 4,561,664 | ||||||||||||
| Road and rail 0.9% | ||||||||||||||
| Swift Transportation Company (I) | 152,040 | 3,122,902 | ||||||||||||
| Trading companies and distributors 2.0% | ||||||||||||||
| BMC Stock Holdings, Inc. (I) | 152,445 | 3,445,257 | ||||||||||||
| MRC Global, Inc. (I) | 184,890 | 3,389,034 | ||||||||||||
| Information technology 14.9% | 50,819,685 | |||||||||||||
| Electronic equipment, instruments and components 6.8% | ||||||||||||||
| Anixter International, Inc. (I) | 43,605 | 3,457,877 | ||||||||||||
| II-VI, Inc. (I) | 131,395 | 4,736,790 | ||||||||||||
| Itron, Inc. (I) | 52,955 | 3,214,369 | ||||||||||||
| Littelfuse, Inc. | 21,705 | 3,470,847 | ||||||||||||
| Sanmina Corp. (I) | 87,575 | 3,555,545 | ||||||||||||
| Tech Data Corp. (I) | 51,970 | 4,879,983 | ||||||||||||
| Internet software and services 0.5% | ||||||||||||||
| The Trade Desk, Inc., Class A (I) | 45,710 | 1,702,698 | ||||||||||||
| IT services 1.4% | ||||||||||||||
| Blackhawk Network Holdings, Inc. (I) | 116,125 | 4,714,675 | ||||||||||||
| Semiconductors and semiconductor equipment 2.3% | ||||||||||||||
| Inphi Corp. (I) | 94,805 | 4,628,380 | ||||||||||||
| MKS Instruments, Inc. | 49,015 | 3,369,781 | ||||||||||||
| Software 2.5% | ||||||||||||||
| Bottomline Technologies (de), Inc. (I) | 171,575 | 4,057,749 | ||||||||||||
| Nuance Communications, Inc. (I) | 249,110 | 4,312,094 | ||||||||||||
| Technology hardware, storage and peripherals 1.4% | ||||||||||||||
| Diebold Nixdorf, Inc. | 153,710 | 4,718,897 | ||||||||||||
| Materials 5.5% | 18,626,860 | |||||||||||||
| Chemicals 3.3% | ||||||||||||||
| Ingevity Corp. (I) | 70,175 | 4,270,149 | ||||||||||||
| Minerals Technologies, Inc. | 46,585 | 3,568,411 | ||||||||||||
| Sensient Technologies Corp. | 43,565 | 3,452,962 | ||||||||||||
| Containers and packaging 1.2% | ||||||||||||||
| Silgan Holdings, Inc. | 69,993 | 4,154,784 | ||||||||||||
| Metals and mining 1.0% | ||||||||||||||
| Commercial Metals Company | 166,260 | 3,180,554 | ||||||||||||
| Shares | Value | |||||||||||||
| Real estate 6.6% | $22,620,554 | |||||||||||||
| Equity real estate investment trusts 6.6% | ||||||||||||||
| Brandywine Realty Trust | 207,999 | 3,375,824 | ||||||||||||
| CyrusOne, Inc. | 87,770 | 4,517,522 | ||||||||||||
| DiamondRock Hospitality Company | 438,660 | 4,891,059 | ||||||||||||
| Life Storage, Inc. | 58,515 | 4,805,252 | ||||||||||||
| STAG Industrial, Inc. | 201,075 | 5,030,897 | ||||||||||||
| Utilities 5.6% | 18,929,697 | |||||||||||||
| Electric utilities 4.3% | ||||||||||||||
| ALLETE, Inc. | 76,000 | 5,145,960 | ||||||||||||
| IDACORP, Inc. | 69,955 | 5,803,467 | ||||||||||||
| PNM Resources, Inc. | 96,135 | 3,556,995 | ||||||||||||
| Gas utilities 1.3% | ||||||||||||||
| Spire, Inc. | 65,530 | 4,423,275 | ||||||||||||
| Exchange-traded funds 0.4% | $1,360,365 | |||||||||||||
| (Cost $1,320,127) | ||||||||||||||
| iShares Russell 2000 ETF | 9,895 | 1,360,365 | ||||||||||||
| Yield (%) | Shares | Value | ||||||||||||
| Short-term investments 3.8% | $13,026,063 | |||||||||||||
| (Cost $13,026,063) | ||||||||||||||
| Money market funds 3.8% | 13,026,063 | |||||||||||||
| State Street Institutional U.S. Government Money Market Fund, Premier Class | 0.6179(Y | ) | 13,026,063 | 13,026,063 | ||||||||||
| Total investments (Cost $298,554,026)† 100.2% | $341,317,754 | |||||||||||||
| Other assets and liabilities, net (0.2%) | ($815,375 | ) | ||||||||||||
| Total net assets 100.0% | $340,502,379 | |||||||||||||
| The percentage shown for each investment category is the total value of the category as a percentage of the net assets of the fund. | ||||||||||||||
| Security Abbreviations and Legend | ||||||||||||||
| (I) | Non-income producing security. | |||||||||||||
| (Y) | The rate shown is the annualized seven-day yield as of 3-31-17. | |||||||||||||
| † | At 3-31-17, the aggregate cost of investment securities for federal income tax purposes was $299,005,818. Net unrealized appreciation aggregated to $42,311,936, of which $46,149,594 related to appreciated investment securities and $3,837,658 related to depreciated investment securities. | |||||||||||||
Financial statements
STATEMENT OF ASSETS AND LIABILITIES 3-31-17
| Assets | ||||||||||||||||||||||||||||||
| Investments, at value (Cost $298,554,026) | $341,317,754 | |||||||||||||||||||||||||||||
| Receivable for fund shares sold | 976,647 | |||||||||||||||||||||||||||||
| Dividends and interest receivable | 340,124 | |||||||||||||||||||||||||||||
| Receivable due from advisor | 436 | |||||||||||||||||||||||||||||
| Other receivables and prepaid expenses | 87,068 | |||||||||||||||||||||||||||||
| Total assets | 342,722,029 | |||||||||||||||||||||||||||||
| Liabilities | ||||||||||||||||||||||||||||||
| Payable for investments purchased | 1,298,569 | |||||||||||||||||||||||||||||
| Payable for fund shares repurchased | 802,388 | |||||||||||||||||||||||||||||
| Payable to affiliates | ||||||||||||||||||||||||||||||
| Accounting and legal services fees | 7,298 | |||||||||||||||||||||||||||||
| Transfer agent fees | 32,689 | |||||||||||||||||||||||||||||
| Distribution and service fees | 688 | |||||||||||||||||||||||||||||
| Trustees' fees | 240 | |||||||||||||||||||||||||||||
| Other liabilities and accrued expenses | 77,778 | |||||||||||||||||||||||||||||
| Total liabilities | 2,219,650 | |||||||||||||||||||||||||||||
| Net assets | $340,502,379 | |||||||||||||||||||||||||||||
| Net assets consist of | ||||||||||||||||||||||||||||||
| Paid-in capital | $280,684,411 | |||||||||||||||||||||||||||||
| Accumulated net investment loss | (207,673 | ) | ||||||||||||||||||||||||||||
| Accumulated net realized gain (loss) on investments | 17,261,913 | |||||||||||||||||||||||||||||
| Net unrealized appreciation (depreciation) on investments | 42,763,728 | |||||||||||||||||||||||||||||
| Net assets | $340,502,379 | |||||||||||||||||||||||||||||
| Net asset value per share | ||||||||||||||||||||||||||||||
| Based on net asset values and shares outstanding-the fund has an unlimited number of shares authorized with no par value | ||||||||||||||||||||||||||||||
| Class A ($243,350,730 ÷ 8,507,708 shares)1 | $28.60 | |||||||||||||||||||||||||||||
| Class I ($89,622,846 ÷ 3,058,233 shares) | $29.31 | |||||||||||||||||||||||||||||
| Class R1 ($676,321 ÷ 24,309 shares) | $27.82 | |||||||||||||||||||||||||||||
| Class R2 ($925,676 ÷ 32,331 shares) | $28.63 | |||||||||||||||||||||||||||||
| Class R3 ($211,251 ÷ 7,534 shares) | $28.04 | |||||||||||||||||||||||||||||
| Class R4 ($104,354 ÷ 3,612 shares) | $28.89 | |||||||||||||||||||||||||||||
| Class R5 ($93,416 ÷ 3,183 shares) | $29.35 | |||||||||||||||||||||||||||||
| Class R6 ($5,451,480 ÷ 184,764 shares) | $29.51 | |||||||||||||||||||||||||||||
| Class ADV ($66,305 ÷ 2,301 shares) | $28.82 | |||||||||||||||||||||||||||||
| Maximum offering price per share | ||||||||||||||||||||||||||||||
| Class A (net asset value per share ÷ 95%)2 | $30.11 | |||||||||||||||||||||||||||||
| 1 | Redemption price per share is equal to net asset value less any applicable contingent deferred sales charge. | ||||||||||||||||
| 2 | On single retail sales of less than $50,000. On sales of $50,000 or more and on group sales the offering price is reduced. | ||||||||||||||||
STATEMENT OF OPERATIONS For the year ended 3-31-17
| Investment income | ||||||||||||||||||||||||
| Dividends | $3,856,170 | |||||||||||||||||||||||
| Interest | 41,176 | |||||||||||||||||||||||
| Total investment income | 3,897,346 | |||||||||||||||||||||||
| Expenses | ||||||||||||||||||||||||
| Investment management fees | 2,709,642 | |||||||||||||||||||||||
| Distribution and service fees | 710,308 | |||||||||||||||||||||||
| Accounting and legal services fees | 44,164 | |||||||||||||||||||||||
| Transfer agent fees | 356,572 | |||||||||||||||||||||||
| Trustees' fees | 5,313 | |||||||||||||||||||||||
| State registration fees | 180,029 | |||||||||||||||||||||||
| Printing and postage | 73,910 | |||||||||||||||||||||||
| Professional fees | 62,697 | |||||||||||||||||||||||
| Custodian fees | 17,383 | |||||||||||||||||||||||
| Other | 14,451 | |||||||||||||||||||||||
| Total expenses | 4,174,469 | |||||||||||||||||||||||
| Less expense reductions | (69,450 | ) | ||||||||||||||||||||||
| Net expenses | 4,105,019 | |||||||||||||||||||||||
| Net investment loss | (207,673 | ) | ||||||||||||||||||||||
| Realized and unrealized gain (loss) | ||||||||||||||||||||||||
| Net realized gain (loss) on | ||||||||||||||||||||||||
| Investments | 29,850,179 | |||||||||||||||||||||||
| 29,850,179 | ||||||||||||||||||||||||
| Change in net unrealized appreciation (depreciation) of | ||||||||||||||||||||||||
| Investments | 22,185,956 | |||||||||||||||||||||||
| 22,185,956 | ||||||||||||||||||||||||
| Net realized and unrealized gain | 52,036,135 | |||||||||||||||||||||||
| Increase in net assets from operations | $51,828,462 | |||||||||||||||||||||||
STATEMENTS OF CHANGES IN NET ASSETS
| Year ended 3-31-17 | Year ended 3-31-16 | ||||||||||||||||||||||||||||||||||||||||||||
| Increase (decrease) in net assets | |||||||||||||||||||||||||||||||||||||||||||||
| From operations | |||||||||||||||||||||||||||||||||||||||||||||
| Net investment loss | ($207,673 | ) | ($212,810 | ) | |||||||||||||||||||||||||||||||||||||||||
| Net realized gain (loss) | 29,850,179 | (1,844,412 | ) | ||||||||||||||||||||||||||||||||||||||||||
| Change in net unrealized appreciation (depreciation) | 22,185,956 | (13,995,380 | ) | ||||||||||||||||||||||||||||||||||||||||||
| Increase (decrease) in net assets resulting from operations | 51,828,462 | (16,052,602 | ) | ||||||||||||||||||||||||||||||||||||||||||
| Distributions to shareholders | |||||||||||||||||||||||||||||||||||||||||||||
| From net realized gain | |||||||||||||||||||||||||||||||||||||||||||||
| Class A | — | (13,629,651 | ) | ||||||||||||||||||||||||||||||||||||||||||
| Class I | — | (2,785,011 | ) | ||||||||||||||||||||||||||||||||||||||||||
| Class R1 | — | (52,347 | ) | ||||||||||||||||||||||||||||||||||||||||||
| Class R2 | — | (55,274 | ) | ||||||||||||||||||||||||||||||||||||||||||
| Class R3 | — | (19,705 | ) | ||||||||||||||||||||||||||||||||||||||||||
| Class R4 | — | (5,111 | ) | ||||||||||||||||||||||||||||||||||||||||||
| Class R5 | — | (5,405 | ) | ||||||||||||||||||||||||||||||||||||||||||
| Class R6 | — | (337,695 | ) | ||||||||||||||||||||||||||||||||||||||||||
| Class ADV | — | (39,750 | ) | ||||||||||||||||||||||||||||||||||||||||||
| Total distributions | — | (16,929,949 | ) | ||||||||||||||||||||||||||||||||||||||||||
| From fund share transactions | 27,815,145 | 66,902,529 | |||||||||||||||||||||||||||||||||||||||||||
| Total increase | 79,643,607 | 33,919,978 | |||||||||||||||||||||||||||||||||||||||||||
| Net assets | |||||||||||||||||||||||||||||||||||||||||||||
| Beginning of year | 260,858,772 | 226,938,794 | |||||||||||||||||||||||||||||||||||||||||||
| End of year | $340,502,379 | $260,858,772 | |||||||||||||||||||||||||||||||||||||||||||
| Accumulated net investment loss | ($207,673 | ) | — | ||||||||||||||||||||||||||||||||||||||||||
Financial highlights
| Class A Shares Period ended | 3-31-17 | 3-31-16 | 3-31-15 | 3-31-14 | 3-31-13 | ||||||||||||||||||||||||||||||||||||||||||||||||||||||||||||||||||||||||||||||||||||||||||||||||||
| Per share operating performance | |||||||||||||||||||||||||||||||||||||||||||||||||||||||||||||||||||||||||||||||||||||||||||||||||||||||
| Net asset value, beginning of period | $24.13 | $27.75 | $28.67 | $24.10 | $20.86 | ||||||||||||||||||||||||||||||||||||||||||||||||||||||||||||||||||||||||||||||||||||||||||||||||||
| Net investment loss1 | (0.04 | ) | (0.04 | ) | (0.05 | ) | (0.13 | ) | (0.07 | ) | |||||||||||||||||||||||||||||||||||||||||||||||||||||||||||||||||||||||||||||||||||||||||||||
| Net realized and unrealized gain (loss) on investments | 4.51 | (1.77 | ) | 1.87 | 5.23 | 3.31 | |||||||||||||||||||||||||||||||||||||||||||||||||||||||||||||||||||||||||||||||||||||||||||||||||
| Total from investment operations | 4.47 | (1.81 | ) | 1.82 | 5.10 | 3.24 | |||||||||||||||||||||||||||||||||||||||||||||||||||||||||||||||||||||||||||||||||||||||||||||||||
| Less distributions | |||||||||||||||||||||||||||||||||||||||||||||||||||||||||||||||||||||||||||||||||||||||||||||||||||||||
| From net realized gain | — | (1.81 | ) | (2.74 | ) | (0.53 | ) | — | |||||||||||||||||||||||||||||||||||||||||||||||||||||||||||||||||||||||||||||||||||||||||||||||
| Net asset value, end of period | $28.60 | $24.13 | $27.75 | $28.67 | $24.10 | ||||||||||||||||||||||||||||||||||||||||||||||||||||||||||||||||||||||||||||||||||||||||||||||||||
| Total return (%)2,3 | 18.52 | (6.69 | ) | 7.28 | 21.26 | 15.53 | |||||||||||||||||||||||||||||||||||||||||||||||||||||||||||||||||||||||||||||||||||||||||||||||||
| Ratios and supplemental data | |||||||||||||||||||||||||||||||||||||||||||||||||||||||||||||||||||||||||||||||||||||||||||||||||||||||
| Net assets, end of period (in millions) | $243 | $214 | $180 | $162 | $120 | ||||||||||||||||||||||||||||||||||||||||||||||||||||||||||||||||||||||||||||||||||||||||||||||||||
| Ratios (as a percentage of average net assets): | |||||||||||||||||||||||||||||||||||||||||||||||||||||||||||||||||||||||||||||||||||||||||||||||||||||||
| Expenses before reductions | 1.45 | 1.46 | 1.43 | 1.47 | 1.54 | ||||||||||||||||||||||||||||||||||||||||||||||||||||||||||||||||||||||||||||||||||||||||||||||||||
| Expenses including reductions | 1.43 | 1.43 | 1.43 | 1.47 | 1.50 | ||||||||||||||||||||||||||||||||||||||||||||||||||||||||||||||||||||||||||||||||||||||||||||||||||
| Net investment loss | (0.14 | ) | (0.14 | ) | (0.17 | ) | (0.47 | ) | (0.36 | ) | |||||||||||||||||||||||||||||||||||||||||||||||||||||||||||||||||||||||||||||||||||||||||||||
| Portfolio turnover (%) | 123 | 108 | 79 | 85 | 97 | ||||||||||||||||||||||||||||||||||||||||||||||||||||||||||||||||||||||||||||||||||||||||||||||||||
| 1 | Based on average daily shares outstanding. | ||||||||||||||||||||||||||||||||||||||||||||||||||||||||||||||||||||||||||||||||||
| 2 | Does not reflect the effect of sales charges, if any. | ||||||||||||||||||||||||||||||||||||||||||||||||||||||||||||||||||||||||||||||||||
| 3 | Total returns would have been lower had certain expenses not been reduced during the applicable periods. | ||||||||||||||||||||||||||||||||||||||||||||||||||||||||||||||||||||||||||||||||||
| Class I Shares Period ended | 3-31-17 | 3-31-16 | 3-31-15 | 3-31-14 | 3-31-13 | ||||||||||||||||||||||||||||||||||||||||||||||||||||||||||||||||||||||||||||||||||||||||||||||||||
| Per share operating performance | |||||||||||||||||||||||||||||||||||||||||||||||||||||||||||||||||||||||||||||||||||||||||||||||||||||||
| Net asset value, beginning of period | $24.65 | $28.22 | $29.02 | $24.32 | $20.96 | ||||||||||||||||||||||||||||||||||||||||||||||||||||||||||||||||||||||||||||||||||||||||||||||||||
| Net investment income (loss)1 | 0.05 | 0.04 | 0.03 | (0.04 | ) | — | 2 | ||||||||||||||||||||||||||||||||||||||||||||||||||||||||||||||||||||||||||||||||||||||||||||||||
| Net realized and unrealized gain (loss) on investments | 4.61 | (1.80 | ) | 1.91 | 5.27 | 3.36 | |||||||||||||||||||||||||||||||||||||||||||||||||||||||||||||||||||||||||||||||||||||||||||||||||
| Total from investment operations | 4.66 | (1.76 | ) | 1.94 | 5.23 | 3.36 | |||||||||||||||||||||||||||||||||||||||||||||||||||||||||||||||||||||||||||||||||||||||||||||||||
| Less distributions | |||||||||||||||||||||||||||||||||||||||||||||||||||||||||||||||||||||||||||||||||||||||||||||||||||||||
| From net realized gain | — | (1.81 | ) | (2.74 | ) | (0.53 | ) | — | |||||||||||||||||||||||||||||||||||||||||||||||||||||||||||||||||||||||||||||||||||||||||||||||
| Net asset value, end of period | $29.31 | $24.65 | $28.22 | $29.02 | $24.32 | ||||||||||||||||||||||||||||||||||||||||||||||||||||||||||||||||||||||||||||||||||||||||||||||||||
| Total return (%)3 | 18.90 | (6.40 | ) | 7.61 | 21.61 | 16.03 | |||||||||||||||||||||||||||||||||||||||||||||||||||||||||||||||||||||||||||||||||||||||||||||||||
| Ratios and supplemental data | |||||||||||||||||||||||||||||||||||||||||||||||||||||||||||||||||||||||||||||||||||||||||||||||||||||||
| Net assets, end of period (in millions) | $90 | $39 | $43 | $50 | $49 | ||||||||||||||||||||||||||||||||||||||||||||||||||||||||||||||||||||||||||||||||||||||||||||||||||
| Ratios (as a percentage of average net assets): | |||||||||||||||||||||||||||||||||||||||||||||||||||||||||||||||||||||||||||||||||||||||||||||||||||||||
| Expenses before reductions | 1.15 | 1.15 | 1.14 | 1.15 | 1.18 | ||||||||||||||||||||||||||||||||||||||||||||||||||||||||||||||||||||||||||||||||||||||||||||||||||
| Expenses including reductions | 1.13 | 1.13 | 1.13 | 1.14 | 1.11 | ||||||||||||||||||||||||||||||||||||||||||||||||||||||||||||||||||||||||||||||||||||||||||||||||||
| Net investment income (loss) | 0.20 | 0.13 | 0.12 | (0.15 | ) | 0.02 | |||||||||||||||||||||||||||||||||||||||||||||||||||||||||||||||||||||||||||||||||||||||||||||||||
| Portfolio turnover (%) | 123 | 108 | 79 | 85 | 97 | ||||||||||||||||||||||||||||||||||||||||||||||||||||||||||||||||||||||||||||||||||||||||||||||||||
| 1 | Based on average daily shares outstanding. | ||||||||||||||||||||||||||||||||||||||||||||||||||||||||||||||||||||||||||||||||||
| 2 | Less than $0.005 per share. | ||||||||||||||||||||||||||||||||||||||||||||||||||||||||||||||||||||||||||||||||||
| 3 | Total returns would have been lower had certain expenses not been reduced during the applicable periods. | ||||||||||||||||||||||||||||||||||||||||||||||||||||||||||||||||||||||||||||||||||
| Class R1 Shares Period ended | 3-31-17 | 3-31-16 | 3-31-15 | 3-31-14 | 3-31-13 | ||||||||||||||||||||||||||||||||||||||||||||||||||||||||||||||||||||||||||||||||||||||||||||||||||
| Per share operating performance | |||||||||||||||||||||||||||||||||||||||||||||||||||||||||||||||||||||||||||||||||||||||||||||||||||||||
| Net asset value, beginning of period | $23.56 | $27.23 | $28.29 | $23.87 | $20.71 | ||||||||||||||||||||||||||||||||||||||||||||||||||||||||||||||||||||||||||||||||||||||||||||||||||
| Net investment loss1 | (0.13 | ) | (0.15 | ) | (0.15 | ) | (0.21 | ) | (0.13 | ) | |||||||||||||||||||||||||||||||||||||||||||||||||||||||||||||||||||||||||||||||||||||||||||||
| Net realized and unrealized gain (loss) on investments | 4.39 | (1.71 | ) | 1.83 | 5.16 | 3.29 | |||||||||||||||||||||||||||||||||||||||||||||||||||||||||||||||||||||||||||||||||||||||||||||||||
| Total from investment operations | 4.26 | (1.86 | ) | 1.68 | 4.95 | 3.16 | |||||||||||||||||||||||||||||||||||||||||||||||||||||||||||||||||||||||||||||||||||||||||||||||||
| Less distributions | |||||||||||||||||||||||||||||||||||||||||||||||||||||||||||||||||||||||||||||||||||||||||||||||||||||||
| From net realized gain | — | (1.81 | ) | (2.74 | ) | (0.53 | ) | — | |||||||||||||||||||||||||||||||||||||||||||||||||||||||||||||||||||||||||||||||||||||||||||||||
| Net asset value, end of period | $27.82 | $23.56 | $27.23 | $28.29 | $23.87 | ||||||||||||||||||||||||||||||||||||||||||||||||||||||||||||||||||||||||||||||||||||||||||||||||||
| Total return (%)2 | 18.08 | (7.01 | ) | 6.86 | 20.84 | 15.26 | |||||||||||||||||||||||||||||||||||||||||||||||||||||||||||||||||||||||||||||||||||||||||||||||||
| Ratios and supplemental data | |||||||||||||||||||||||||||||||||||||||||||||||||||||||||||||||||||||||||||||||||||||||||||||||||||||||
| Net assets, end of period (in millions) | $1 | $1 | $1 | $1 | $1 | ||||||||||||||||||||||||||||||||||||||||||||||||||||||||||||||||||||||||||||||||||||||||||||||||||
| Ratios (as a percentage of average net assets): | |||||||||||||||||||||||||||||||||||||||||||||||||||||||||||||||||||||||||||||||||||||||||||||||||||||||
| Expenses before reductions | 1.80 | 1.95 | 2.84 | 2.94 | 4.37 | ||||||||||||||||||||||||||||||||||||||||||||||||||||||||||||||||||||||||||||||||||||||||||||||||||
| Expenses including reductions | 1.79 | 1.80 | 1.80 | 1.80 | 1.80 | ||||||||||||||||||||||||||||||||||||||||||||||||||||||||||||||||||||||||||||||||||||||||||||||||||
| Net investment loss | (0.52 | ) | (0.56 | ) | (0.55 | ) | (0.82 | ) | (0.60 | ) | |||||||||||||||||||||||||||||||||||||||||||||||||||||||||||||||||||||||||||||||||||||||||||||
| Portfolio turnover (%) | 123 | 108 | 79 | 85 | 97 | ||||||||||||||||||||||||||||||||||||||||||||||||||||||||||||||||||||||||||||||||||||||||||||||||||
| 1 | Based on average daily shares outstanding. | ||||||||||||||||||||||||||||||||||||||||||||||||||||||||||||||||||||||||||||||||||
| 2 | Total returns would have been lower had certain expenses not been reduced during the applicable periods. | ||||||||||||||||||||||||||||||||||||||||||||||||||||||||||||||||||||||||||||||||||
| Class R2 Shares Period ended | 3-31-17 | 3-31-16 | 3-31-15 | 3-31-14 | 3-31-13 | ||||||||||||||||||||||||||||||||||||||||||||||||||||||||||||||||||||||||||||||||||||||||||||||||||
| Per share operating performance | |||||||||||||||||||||||||||||||||||||||||||||||||||||||||||||||||||||||||||||||||||||||||||||||||||||||
| Net asset value, beginning of period | $24.17 | $27.83 | $28.77 | $24.21 | $20.96 | ||||||||||||||||||||||||||||||||||||||||||||||||||||||||||||||||||||||||||||||||||||||||||||||||||
| Net investment loss1 | (0.06 | ) | (0.05 | ) | (0.08 | ) | (0.14 | ) | (0.08 | ) | |||||||||||||||||||||||||||||||||||||||||||||||||||||||||||||||||||||||||||||||||||||||||||||
| Net realized and unrealized gain (loss) on investments | 4.52 | (1.80 | ) | 1.88 | 5.23 | 3.33 | |||||||||||||||||||||||||||||||||||||||||||||||||||||||||||||||||||||||||||||||||||||||||||||||||
| Total from investment operations | 4.46 | (1.85 | ) | 1.80 | 5.09 | 3.25 | |||||||||||||||||||||||||||||||||||||||||||||||||||||||||||||||||||||||||||||||||||||||||||||||||
| Less distributions | |||||||||||||||||||||||||||||||||||||||||||||||||||||||||||||||||||||||||||||||||||||||||||||||||||||||
| From net realized gain | — | (1.81 | ) | (2.74 | ) | (0.53 | ) | — | |||||||||||||||||||||||||||||||||||||||||||||||||||||||||||||||||||||||||||||||||||||||||||||||
| Net asset value, end of period | $28.63 | $24.17 | $27.83 | $28.77 | $24.21 | ||||||||||||||||||||||||||||||||||||||||||||||||||||||||||||||||||||||||||||||||||||||||||||||||||
| Total return (%)2 | 18.45 | (6.82 | ) | 7.18 | 21.12 | 15.51 | |||||||||||||||||||||||||||||||||||||||||||||||||||||||||||||||||||||||||||||||||||||||||||||||||
| Ratios and supplemental data | |||||||||||||||||||||||||||||||||||||||||||||||||||||||||||||||||||||||||||||||||||||||||||||||||||||||
| Net assets, end of period (in millions) | $1 | $1 | $1 | — | 3 | — | 3 | ||||||||||||||||||||||||||||||||||||||||||||||||||||||||||||||||||||||||||||||||||||||||||||||||
| Ratios (as a percentage of average net assets): | |||||||||||||||||||||||||||||||||||||||||||||||||||||||||||||||||||||||||||||||||||||||||||||||||||||||
| Expenses before reductions | 1.51 | 2.21 | 4.66 | 7.99 | 20.22 | ||||||||||||||||||||||||||||||||||||||||||||||||||||||||||||||||||||||||||||||||||||||||||||||||||
| Expenses including reductions | 1.50 | 1.55 | 1.55 | 1.55 | 1.55 | ||||||||||||||||||||||||||||||||||||||||||||||||||||||||||||||||||||||||||||||||||||||||||||||||||
| Net investment loss | (0.22 | ) | (0.20 | ) | (0.29 | ) | (0.54 | ) | (0.39 | ) | |||||||||||||||||||||||||||||||||||||||||||||||||||||||||||||||||||||||||||||||||||||||||||||
| Portfolio turnover (%) | 123 | 108 | 79 | 85 | 97 | ||||||||||||||||||||||||||||||||||||||||||||||||||||||||||||||||||||||||||||||||||||||||||||||||||
| 1 | Based on average daily shares outstanding. | ||||||||||||||||||||||||||||||||||||||||||||||||||||||||||||||||||||||||||||||||||
| 2 | Total returns would have been lower had certain expenses not been reduced during the applicable periods. | ||||||||||||||||||||||||||||||||||||||||||||||||||||||||||||||||||||||||||||||||||
| 3 | Less than $500,000. | ||||||||||||||||||||||||||||||||||||||||||||||||||||||||||||||||||||||||||||||||||
| Class R3 Shares Period ended | 3-31-17 | 3-31-16 | 3-31-15 | 3-31-14 | 3-31-13 | ||||||||||||||||||||||||||||||||||||||||||||||||||||||||||||||||||||||||||||||||||||||||||||||||||
| Per share operating performance | |||||||||||||||||||||||||||||||||||||||||||||||||||||||||||||||||||||||||||||||||||||||||||||||||||||||
| Net asset value, beginning of period | $23.72 | $27.38 | $28.39 | $23.94 | $20.76 | ||||||||||||||||||||||||||||||||||||||||||||||||||||||||||||||||||||||||||||||||||||||||||||||||||
| Net investment loss1 | (0.10 | ) | (0.11 | ) | (0.12 | ) | (0.19 | ) | (0.12 | ) | |||||||||||||||||||||||||||||||||||||||||||||||||||||||||||||||||||||||||||||||||||||||||||||
| Net realized and unrealized gain (loss) on investments | 4.42 | (1.74 | ) | 1.85 | 5.17 | 3.30 | |||||||||||||||||||||||||||||||||||||||||||||||||||||||||||||||||||||||||||||||||||||||||||||||||
| Total from investment operations | 4.32 | (1.85 | ) | 1.73 | 4.98 | 3.18 | |||||||||||||||||||||||||||||||||||||||||||||||||||||||||||||||||||||||||||||||||||||||||||||||||
| Less distributions | |||||||||||||||||||||||||||||||||||||||||||||||||||||||||||||||||||||||||||||||||||||||||||||||||||||||
| From net realized gain | — | (1.81 | ) | (2.74 | ) | (0.53 | ) | — | |||||||||||||||||||||||||||||||||||||||||||||||||||||||||||||||||||||||||||||||||||||||||||||||
| Net asset value, end of period | $28.04 | $23.72 | $27.38 | $28.39 | $23.94 | ||||||||||||||||||||||||||||||||||||||||||||||||||||||||||||||||||||||||||||||||||||||||||||||||||
| Total return (%)2 | 18.21 | (6.93 | ) | 7.02 | 20.90 | 15.32 | |||||||||||||||||||||||||||||||||||||||||||||||||||||||||||||||||||||||||||||||||||||||||||||||||
| Ratios and supplemental data | |||||||||||||||||||||||||||||||||||||||||||||||||||||||||||||||||||||||||||||||||||||||||||||||||||||||
| Net assets, end of period (in millions) | — | 3 | — | 3 | — | 3 | — | 3 | — | 3 | |||||||||||||||||||||||||||||||||||||||||||||||||||||||||||||||||||||||||||||||||||||||||||||
| Ratios (as a percentage of average net assets): | |||||||||||||||||||||||||||||||||||||||||||||||||||||||||||||||||||||||||||||||||||||||||||||||||||||||
| Expenses before reductions | 1.69 | 2.54 | 9.06 | 10.89 | 5.15 | ||||||||||||||||||||||||||||||||||||||||||||||||||||||||||||||||||||||||||||||||||||||||||||||||||
| Expenses including reductions | 1.68 | 1.70 | 1.70 | 1.70 | 1.70 | ||||||||||||||||||||||||||||||||||||||||||||||||||||||||||||||||||||||||||||||||||||||||||||||||||
| Net investment loss | (0.41 | ) | (0.42 | ) | (0.43 | ) | (0.75 | ) | (0.56 | ) | |||||||||||||||||||||||||||||||||||||||||||||||||||||||||||||||||||||||||||||||||||||||||||||
| Portfolio turnover (%) | 123 | 108 | 79 | 85 | 97 | ||||||||||||||||||||||||||||||||||||||||||||||||||||||||||||||||||||||||||||||||||||||||||||||||||
| 1 | Based on average daily shares outstanding. | ||||||||||||||||||||||||||||||||||||||||||||||||||||||||||||||||||||||||||||||||||
| 2 | Total returns would have been lower had certain expenses not been reduced during the applicable periods. | ||||||||||||||||||||||||||||||||||||||||||||||||||||||||||||||||||||||||||||||||||
| 3 | Less than $500,000. | ||||||||||||||||||||||||||||||||||||||||||||||||||||||||||||||||||||||||||||||||||
| Class R4 Shares Period ended | 3-31-17 | 3-31-16 | 3-31-15 | 3-31-14 | 3-31-13 | ||||||||||||||||||||||||||||||||||||||||||||||||||||||||||||||||||||||||||||||||||||||||||||||||||
| Per share operating performance | |||||||||||||||||||||||||||||||||||||||||||||||||||||||||||||||||||||||||||||||||||||||||||||||||||||||
| Net asset value, beginning of period | $24.32 | $27.92 | $28.79 | $24.17 | $20.87 | ||||||||||||||||||||||||||||||||||||||||||||||||||||||||||||||||||||||||||||||||||||||||||||||||||
| Net investment income (loss)1 | 0.02 | — | 2 | (0.01 | ) | (0.08 | ) | (0.03 | ) | ||||||||||||||||||||||||||||||||||||||||||||||||||||||||||||||||||||||||||||||||||||||||||||||
| Net realized and unrealized gain (loss) on investments | 4.55 | (1.79 | ) | 1.88 | 5.23 | 3.33 | |||||||||||||||||||||||||||||||||||||||||||||||||||||||||||||||||||||||||||||||||||||||||||||||||
| Total from investment operations | 4.57 | (1.79 | ) | 1.87 | 5.15 | 3.30 | |||||||||||||||||||||||||||||||||||||||||||||||||||||||||||||||||||||||||||||||||||||||||||||||||
| Less distributions | |||||||||||||||||||||||||||||||||||||||||||||||||||||||||||||||||||||||||||||||||||||||||||||||||||||||
| From net realized gain | — | (1.81 | ) | (2.74 | ) | (0.53 | ) | — | |||||||||||||||||||||||||||||||||||||||||||||||||||||||||||||||||||||||||||||||||||||||||||||||
| Net asset value, end of period | $28.89 | $24.32 | $27.92 | $28.79 | $24.17 | ||||||||||||||||||||||||||||||||||||||||||||||||||||||||||||||||||||||||||||||||||||||||||||||||||
| Total return (%)3 | 18.79 | (6.58 | ) | 7.42 | 21.41 | 15.81 | |||||||||||||||||||||||||||||||||||||||||||||||||||||||||||||||||||||||||||||||||||||||||||||||||
| Ratios and supplemental data | |||||||||||||||||||||||||||||||||||||||||||||||||||||||||||||||||||||||||||||||||||||||||||||||||||||||
| Net assets, end of period (in millions) | — | 4 | — | 4 | — | 4 | — | 4 | — | 4 | |||||||||||||||||||||||||||||||||||||||||||||||||||||||||||||||||||||||||||||||||||||||||||||
| Ratios (as a percentage of average net assets): | |||||||||||||||||||||||||||||||||||||||||||||||||||||||||||||||||||||||||||||||||||||||||||||||||||||||
| Expenses before reductions | 1.32 | 4.26 | 19.97 | 18.99 | 18.82 | ||||||||||||||||||||||||||||||||||||||||||||||||||||||||||||||||||||||||||||||||||||||||||||||||||
| Expenses including reductions | 1.21 | 1.30 | 1.30 | 1.30 | 1.31 | ||||||||||||||||||||||||||||||||||||||||||||||||||||||||||||||||||||||||||||||||||||||||||||||||||
| Net investment income (loss) | 0.07 | (0.01 | ) | (0.05 | ) | (0.31 | ) | (0.17 | ) | ||||||||||||||||||||||||||||||||||||||||||||||||||||||||||||||||||||||||||||||||||||||||||||||
| Portfolio turnover (%) | 123 | 108 | 79 | 85 | 97 | ||||||||||||||||||||||||||||||||||||||||||||||||||||||||||||||||||||||||||||||||||||||||||||||||||
| 1 | Based on average daily shares outstanding. | ||||||||||||||||||||||||||||||||||||||||||||||||||||||||||||||||||||||||||||||||||
| 2 | Less than $0.005 per share. | ||||||||||||||||||||||||||||||||||||||||||||||||||||||||||||||||||||||||||||||||||
| 3 | Total returns would have been lower had certain expenses not been reduced during the applicable periods. | ||||||||||||||||||||||||||||||||||||||||||||||||||||||||||||||||||||||||||||||||||
| 4 | Less than $500,000. | ||||||||||||||||||||||||||||||||||||||||||||||||||||||||||||||||||||||||||||||||||
| Class R5 Shares Period ended | 3-31-17 | 3-31-16 | 3-31-15 | 3-31-14 | 3-31-13 | ||||||||||||||||||||||||||||||||||||||||||||||||||||||||||||||||||||||||||||||||||||||||||||||||||
| Per share operating performance | |||||||||||||||||||||||||||||||||||||||||||||||||||||||||||||||||||||||||||||||||||||||||||||||||||||||
| Net asset value, beginning of period | $24.68 | $28.24 | $29.03 | $24.32 | $20.96 | ||||||||||||||||||||||||||||||||||||||||||||||||||||||||||||||||||||||||||||||||||||||||||||||||||
| Net investment income (loss)1 | 0.05 | 0.03 | 0.04 | (0.03 | ) | 0.01 | |||||||||||||||||||||||||||||||||||||||||||||||||||||||||||||||||||||||||||||||||||||||||||||||||
| Net realized and unrealized gain (loss) on investments | 4.62 | (1.78 | ) | 1.91 | 5.27 | 3.35 | |||||||||||||||||||||||||||||||||||||||||||||||||||||||||||||||||||||||||||||||||||||||||||||||||
| Total from investment operations | 4.67 | (1.75 | ) | 1.95 | 5.24 | 3.36 | |||||||||||||||||||||||||||||||||||||||||||||||||||||||||||||||||||||||||||||||||||||||||||||||||
| Less distributions | |||||||||||||||||||||||||||||||||||||||||||||||||||||||||||||||||||||||||||||||||||||||||||||||||||||||
| From net realized gain | — | (1.81 | ) | (2.74 | ) | (0.53 | ) | — | |||||||||||||||||||||||||||||||||||||||||||||||||||||||||||||||||||||||||||||||||||||||||||||||
| Net asset value, end of period | $29.35 | $24.68 | $28.24 | $29.03 | $24.32 | ||||||||||||||||||||||||||||||||||||||||||||||||||||||||||||||||||||||||||||||||||||||||||||||||||
| Total return (%)2 | 18.92 | (6.36 | ) | 7.64 | 21.65 | 16.03 | |||||||||||||||||||||||||||||||||||||||||||||||||||||||||||||||||||||||||||||||||||||||||||||||||
| Ratios and supplemental data | |||||||||||||||||||||||||||||||||||||||||||||||||||||||||||||||||||||||||||||||||||||||||||||||||||||||
| Net assets, end of period (in millions) | — | 3 | — | 3 | — | 3 | — | 3 | — | 3 | |||||||||||||||||||||||||||||||||||||||||||||||||||||||||||||||||||||||||||||||||||||||||||||
| Ratios (as a percentage of average net assets): | |||||||||||||||||||||||||||||||||||||||||||||||||||||||||||||||||||||||||||||||||||||||||||||||||||||||
| Expenses before reductions | 1.10 | 2.53 | 5.61 | 6.05 | 7.78 | ||||||||||||||||||||||||||||||||||||||||||||||||||||||||||||||||||||||||||||||||||||||||||||||||||
| Expenses including reductions | 1.09 | 1.10 | 1.10 | 1.10 | 1.10 | ||||||||||||||||||||||||||||||||||||||||||||||||||||||||||||||||||||||||||||||||||||||||||||||||||
| Net investment income | 0.20 | 0.11 | 0.16 | (0.11 | ) | 0.05 | |||||||||||||||||||||||||||||||||||||||||||||||||||||||||||||||||||||||||||||||||||||||||||||||||
| Portfolio turnover (%) | 123 | 108 | 79 | 85 | 97 | ||||||||||||||||||||||||||||||||||||||||||||||||||||||||||||||||||||||||||||||||||||||||||||||||||
| 1 | Based on average daily shares outstanding. | ||||||||||||||||||||||||||||||||||||||||||||||||||||||||||||||||||||||||||||||||||
| 2 | Total returns would have been lower had certain expenses not been reduced during the applicable periods. | ||||||||||||||||||||||||||||||||||||||||||||||||||||||||||||||||||||||||||||||||||
| 3 | Less than $500,000. | ||||||||||||||||||||||||||||||||||||||||||||||||||||||||||||||||||||||||||||||||||
| Class R6 Shares Period ended | 3-31-17 | 3-31-16 | 3-31-15 | 3-31-14 | 3-31-13 | ||||||||||||||||||||||||||||||||||||||||||||||||||||||||||||||||||||||||||||||||||||||||||||||||||
| Per share operating performance | |||||||||||||||||||||||||||||||||||||||||||||||||||||||||||||||||||||||||||||||||||||||||||||||||||||||
| Net asset value, beginning of period | $24.79 | $28.34 | $29.08 | $24.34 | $20.97 | ||||||||||||||||||||||||||||||||||||||||||||||||||||||||||||||||||||||||||||||||||||||||||||||||||
| Net investment income (loss)1 | 0.07 | 0.09 | 0.09 | (0.02 | ) | 0.02 | |||||||||||||||||||||||||||||||||||||||||||||||||||||||||||||||||||||||||||||||||||||||||||||||||
| Net realized and unrealized gain (loss) on investments | 4.65 | (1.83 | ) | 1.91 | 5.29 | 3.35 | |||||||||||||||||||||||||||||||||||||||||||||||||||||||||||||||||||||||||||||||||||||||||||||||||
| Total from investment operations | 4.72 | (1.74 | ) | 2.00 | 5.27 | 3.37 | |||||||||||||||||||||||||||||||||||||||||||||||||||||||||||||||||||||||||||||||||||||||||||||||||
| Less distributions | |||||||||||||||||||||||||||||||||||||||||||||||||||||||||||||||||||||||||||||||||||||||||||||||||||||||
| From net realized gain | — | (1.81 | ) | (2.74 | ) | (0.53 | ) | — | |||||||||||||||||||||||||||||||||||||||||||||||||||||||||||||||||||||||||||||||||||||||||||||||
| Net asset value, end of period | $29.51 | $24.79 | $28.34 | $29.08 | $24.34 | ||||||||||||||||||||||||||||||||||||||||||||||||||||||||||||||||||||||||||||||||||||||||||||||||||
| Total return (%)2 | 19.04 | (6.30 | ) | 7.80 | 21.75 | 16.07 | |||||||||||||||||||||||||||||||||||||||||||||||||||||||||||||||||||||||||||||||||||||||||||||||||
| Ratios and supplemental data | |||||||||||||||||||||||||||||||||||||||||||||||||||||||||||||||||||||||||||||||||||||||||||||||||||||||
| Net assets, end of period (in millions) | $5 | $5 | $1 | $1 | — | 3 | |||||||||||||||||||||||||||||||||||||||||||||||||||||||||||||||||||||||||||||||||||||||||||||||||
| Ratios (as a percentage of average net assets): | |||||||||||||||||||||||||||||||||||||||||||||||||||||||||||||||||||||||||||||||||||||||||||||||||||||||
| Expenses before reductions | 1.05 | 1.17 | 4.54 | 7.66 | 18.63 | ||||||||||||||||||||||||||||||||||||||||||||||||||||||||||||||||||||||||||||||||||||||||||||||||||
| Expenses including reductions | 1.02 | 1.04 | 0.97 | 1.04 | 1.04 | ||||||||||||||||||||||||||||||||||||||||||||||||||||||||||||||||||||||||||||||||||||||||||||||||||
| Net investment income (loss) | 0.26 | 0.34 | 0.32 | (0.06 | ) | 0.11 | |||||||||||||||||||||||||||||||||||||||||||||||||||||||||||||||||||||||||||||||||||||||||||||||||
| Portfolio turnover (%) | 123 | 108 | 79 | 85 | 97 | ||||||||||||||||||||||||||||||||||||||||||||||||||||||||||||||||||||||||||||||||||||||||||||||||||
| 1 | Based on average daily shares outstanding. | ||||||||||||||||||||||||||||||||||||||||||||||||||||||||||||||||||||||||||||||||||
| 2 | Total returns would have been lower had certain expenses not been reduced during the applicable periods. | ||||||||||||||||||||||||||||||||||||||||||||||||||||||||||||||||||||||||||||||||||
| 3 | Less than $500,000. | ||||||||||||||||||||||||||||||||||||||||||||||||||||||||||||||||||||||||||||||||||
| Class ADV Shares Period ended | 3-31-17 | 3-31-16 | 3-31-15 | 3-31-14 | 3-31-13 | ||||||||||||||||||||||||||||||||||||||||||||||||||||||||||||||||||||||||||||||||||||||||||||||||||
| Per share operating performance | |||||||||||||||||||||||||||||||||||||||||||||||||||||||||||||||||||||||||||||||||||||||||||||||||||||||
| Net asset value, beginning of period | $24.29 | $27.90 | $28.78 | $24.17 | $20.88 | ||||||||||||||||||||||||||||||||||||||||||||||||||||||||||||||||||||||||||||||||||||||||||||||||||
| Net investment loss1 | (0.08 | ) | (0.02 | ) | (0.03 | ) | (0.09 | ) | (0.04 | ) | |||||||||||||||||||||||||||||||||||||||||||||||||||||||||||||||||||||||||||||||||||||||||||||
| Net realized and unrealized gain (loss) on investments | 4.61 | (1.78 | ) | 1.89 | 5.23 | 3.33 | |||||||||||||||||||||||||||||||||||||||||||||||||||||||||||||||||||||||||||||||||||||||||||||||||
| Total from investment operations | 4.53 | (1.80 | ) | 1.86 | 5.14 | 3.29 | |||||||||||||||||||||||||||||||||||||||||||||||||||||||||||||||||||||||||||||||||||||||||||||||||
| Less distributions | |||||||||||||||||||||||||||||||||||||||||||||||||||||||||||||||||||||||||||||||||||||||||||||||||||||||
| From net realized gain | — | (1.81 | ) | (2.74 | ) | (0.53 | ) | — | |||||||||||||||||||||||||||||||||||||||||||||||||||||||||||||||||||||||||||||||||||||||||||||||
| Net asset value, end of year | $28.82 | $24.29 | $27.90 | $28.78 | $24.17 | ||||||||||||||||||||||||||||||||||||||||||||||||||||||||||||||||||||||||||||||||||||||||||||||||||
| Total return (%)2 | 18.65 | (6.62 | ) | 7.39 | 21.37 | 15.76 | |||||||||||||||||||||||||||||||||||||||||||||||||||||||||||||||||||||||||||||||||||||||||||||||||
| Ratios and supplemental data | |||||||||||||||||||||||||||||||||||||||||||||||||||||||||||||||||||||||||||||||||||||||||||||||||||||||
| Net assets, end of period (in millions) | — | 3 | $1 | $1 | $1 | — | 3 | ||||||||||||||||||||||||||||||||||||||||||||||||||||||||||||||||||||||||||||||||||||||||||||||||
| Ratios (as a percentage of average net assets): | |||||||||||||||||||||||||||||||||||||||||||||||||||||||||||||||||||||||||||||||||||||||||||||||||||||||
| Expenses before reductions | 1.38 | 2.05 | 4.17 | 4.51 | 4.91 | ||||||||||||||||||||||||||||||||||||||||||||||||||||||||||||||||||||||||||||||||||||||||||||||||||
| Expenses net of fee waivers | 1.34 | 1.34 | 1.34 | 1.34 | 1.34 | ||||||||||||||||||||||||||||||||||||||||||||||||||||||||||||||||||||||||||||||||||||||||||||||||||
| Net investment loss | (0.32 | ) | (0.07 | ) | (0.09 | ) | (0.35 | ) | (0.20 | ) | |||||||||||||||||||||||||||||||||||||||||||||||||||||||||||||||||||||||||||||||||||||||||||||
| Portfolio turnover (%) | 123 | 108 | 79 | 85 | 97 | ||||||||||||||||||||||||||||||||||||||||||||||||||||||||||||||||||||||||||||||||||||||||||||||||||
| 1 | Based on average daily shares outstanding. | ||||||||||||||||||||||||||||||||||||||||||||||||||||||||||||||||||||||||||||||||||
| 2 | Total returns would have been lower had certain expenses not been reduced during the applicable periods. | ||||||||||||||||||||||||||||||||||||||||||||||||||||||||||||||||||||||||||||||||||
| 3 | Less than $500,000. | ||||||||||||||||||||||||||||||||||||||||||||||||||||||||||||||||||||||||||||||||||
Note 1 — Organization
John Hancock Small Company Fund (the fund) is a series of John Hancock Funds III (the Trust), an open-end management investment company organized as a Massachusetts business trust and registered under the Investment Company Act of 1940, as amended (the 1940 Act). The investment objective of the fund is to seek maximum long-term total return.
The fund may offer multiple classes of shares. The shares currently offered are detailed in the Statement of assets and liabilities. Class A shares are offered to all investors. Class I shares are offered to institutions and certain investors. Class R1, Class R2, Class R3, Class R4 and Class R5 shares are available only to certain retirement plans. Class R6 shares are available only to certain retirement plans, institutions and other investors. Class ADV shares are available to investors who acquired Class A shares as a result of the reorganization of the FMA Small Company Portfolio into the fund and are closed to new investors. Shareholders of each class have exclusive voting rights to matters that affect that class. The distribution and service fees, if any, and transfer agent fees for each class may differ.
Note 2 — Significant accounting policies
The financial statements have been prepared in conformity with accounting principles generally accepted in the United States of America (US GAAP), which require management to make certain estimates and assumptions as of the date of the financial statements. Actual results could differ from those estimates and those differences could be significant. The fund qualifies as an investment company under Topic 946 of Accounting Standards Codification of US GAAP.
Events or transactions occurring after the end of the fiscal period through the date that the financial statements were issued have been evaluated in the preparation of the financial statements. The following summarizes the significant accounting policies of the fund:
Security valuation. Investments are stated at value as of the scheduled close of regular trading on the New York Stock Exchange (NYSE), normally at 4:00 p.m., Eastern Time. In case of emergency or other disruption resulting in the NYSE not opening for trading or the NYSE closing at a time other than the regularly scheduled close, the net asset value (NAV) may be determined as of the regularly scheduled close of the NYSE pursuant to the fund's Valuation Policies and Procedures.
In order to value the securities, the fund uses the following valuation techniques: Equity securities held by the fund are typically valued at the last sale price or official closing price on the exchange or principal market where the security trades. In the event there were no sales during the day or closing prices are not available, the securities are valued using the last available bid price. Investments by the fund in open-end mutual funds are valued at their respective NAVs each business day.
In certain instances, the Pricing Committee may determine to value equity securities using prices obtained from another exchange or market if trading on the exchange or market on which prices are typically obtained did not open for trading as scheduled, or if trading closed earlier than scheduled, and trading occurred as normal on another exchange or market.
Other portfolio securities and assets, for which reliable market quotations are not readily available, are valued at fair value as determined in good faith by the fund's Pricing Committee following procedures established by the Board of Trustees. The frequency with which these fair valuation procedures are used cannot be predicted and fair value of securities may differ significantly from the value that would have been used had a ready market for such securities existed.
The fund uses a three-tier hierarchy to prioritize the pricing assumptions, referred to as inputs, used in valuation techniques to measure fair value. Level 1 includes securities valued using quoted prices in active markets for identical securities. Level 2 includes securities valued using other significant observable inputs. Observable inputs may include quoted prices for similar securities, interest rates, prepayment speeds and credit risk. Prices for securities valued using these inputs are received from independent pricing vendors and brokers and are based on an evaluation of the inputs described. Level 3 includes securities valued using significant unobservable inputs when market prices are not readily available or reliable, including the fund's own assumptions in determining the fair value of investments. Factors used in determining value may include market or issuer specific events or trends, changes in interest rates and credit quality. The inputs or methodology used for valuing securities are not necessarily an indication of the risks associated with investing in those securities. Changes in valuation techniques and related inputs may result in transfers into or out of an assigned level within the disclosure hierarchy.
As of March 31, 2017, all investments are categorized as Level 1 under the hierarchy described on the previous page.
Security transactions and related investment income. Investment security transactions are accounted for on a trade date plus one basis for daily NAV calculations. However, for financial reporting purposes, investment transactions are reported on trade date. Interest income is accrued as earned. Dividend income is recorded on the ex-date, except for dividends of foreign securities where the dividend may not be known until after the ex-date. In those cases, dividend income, net of withholding taxes, is recorded when the fund becomes aware of the dividends. Foreign taxes are provided for based on the fund's understanding of the tax rules and rates that exist in the foreign markets in which it invests. Gains and losses on securities sold are determined on the basis of identified cost and may include proceeds from litigation.
Real estate investment trusts. The fund may invest in real estate investment trusts (REITs). Distributions from REITs may be recorded as income and subsequently characterized by the REIT at the end of the fiscal year as a reduction of cost of investments and/or as a realized gain. As a result, the fund will estimate the components of distributions from these securities. Such estimates are revised when the actual components of the distributions are known.
Line of credit. The fund may borrow from banks for temporary or emergency purposes, including meeting redemption requests that otherwise might require the untimely sale of securities. Pursuant to the fund's custodian agreement, the custodian may loan money to the fund to make properly authorized payments. The fund is obligated to repay the custodian for any overdraft, including any related costs or expenses. The custodian may have a lien, security interest or security entitlement in any fund property that is not otherwise segregated or pledged, to the extent of any overdraft, and to the maximum extent permitted by law.
Effective June 30, 2016, the fund and other affiliated funds have entered into a syndicated line of credit agreement with Citibank, N.A. as the administrative agent that enables them to participate in a $1 billion unsecured committed line of credit. Excluding commitments designated for a certain fund and subject to the need of other affiliated funds, the fund can borrow up to an aggregate commitment amount of $750 million, subject to asset coverage and other limitations as specified in the agreement. A commitment fee payable at the end of each calendar quarter, based on the average daily unused portion of the line of credit, is charged to each participating fund based on a combination of fixed and asset based allocations and is reflected in Other expenses on the Statement of operations. Prior to June 30, 2016, the fund had a similar agreement that enabled it to participate in a $750 million unsecured committed line of credit. For the year ended March 31, 2017, the fund had no borrowings under either line of credit. Commitment fees for the year ended March 31, 2017 were $3,142.
Expenses. Within the John Hancock group of funds complex, expenses that are directly attributable to an individual fund are allocated to such fund. Expenses that are not readily attributable to a specific fund are allocated among all funds in an equitable manner, taking into consideration, among other things, the nature and type of expense and the fund's relative net assets. Expense estimates are accrued in the period to which they relate and adjustments are made when actual amounts are known.
Class allocations. Income, common expenses and realized and unrealized gains (losses) are determined at the fund level and allocated daily to each class of shares based on the net assets of the class. Class-specific expenses, such as distribution and service fees, if any, and transfer agent fees, for all classes, are calculated daily at the class level based on the net assets of each class and the specific expense rates applicable to each class.
Federal income taxes. The fund intends to continue to qualify as a regulated investment company by complying with the applicable provisions of the Internal Revenue Code and will not be subject to federal income tax on taxable income that is distributed to shareholders. Therefore, no federal income tax provision is required.
For federal income tax purposes, qualified late year ordinary losses of $207,673 are being deferred and are treated as occurring on April 1, 2017, the first day of the fund's next taxable year.
As of March 31, 2017, the fund had no uncertain tax positions that would require financial statement recognition, derecognition or disclosure. The fund's federal tax returns are subject to examination by the Internal Revenue Service for a period of three years.
Distribution of income and gains. Distributions to shareholders from net investment income and net realized gains, if any, are recorded on the ex-date. The fund generally declares and pays dividends and capital gain distributions, if any, annually. The tax character of distributions for the years ended March 31, 2017 and 2016 was $0 and $16,929,949 of long-term capital gains, respectively.
Distributions paid by the fund with respect to each class of shares are calculated in the same manner, at the same time and in the same amount, except for the effect of class level expenses that may be applied differently to each class. As of March 31, 2017, the components of distributable earnings on a tax basis consisted of $17,713,704 of undistributed long-term capital gains.
Such distributions and distributable earnings, on a tax basis, are determined in conformity with income tax regulations, which may differ from US GAAP. Distributions in excess of tax basis earnings and profits, if any, are reported in the fund's financial statements as a return of capital.
Capital accounts within the financial statements are adjusted for permanent book-tax differences. These adjustments have no impact on net assets or the results of operations. Temporary book-tax differences, if any, will reverse in a subsequent period. Book tax differences are primarily attributable to wash sale loss deferrals.
Note 3 — Guarantees and indemnifications
Under the Trust's organizational documents, its Officers and Trustees are indemnified against certain liabilities arising out of the performance of their duties to the fund. Additionally, in the normal course of business, the fund enters into contracts with service providers that contain general indemnification clauses. The fund's maximum exposure under these arrangements is unknown, as this would involve future claims that may be made against the fund that have not yet occurred. The risk of material loss from such claims is considered remote.
Note 4 — Fees and transactions with affiliates
John Hancock Advisers, LLC (the Advisor) serves as investment advisor for the fund. John Hancock Funds, LLC (the Distributor), an affiliate of the Advisor, serves as principal underwriter of the fund. The Advisor and the Distributor are indirect, wholly owned subsidiaries of Manulife Financial Corporation (MFC).
Management fee. The fund has an investment management agreement with the Advisor under which the fund pays a daily management fee to the Advisor equivalent on an annual basis to the sum of: (a) 0.90% of the first $500 million of the fund's average daily net assets; (b) 0.85% of the next $500 million of the fund's average daily net assets; and (c) 0.80% of the fund's average daily net assets in excess of $1 billion. The Advisor has a subadvisory agreement with Mesirow Financial Investment Management, Inc. The fund is not responsible for payment of the subadvisory fees.
The Advisor has contractually agreed to waive a portion of its management fee and/or reimburse expenses for certain funds of the John Hancock group of funds complex, including the fund (the participating portfolios). This waiver is based upon aggregate net assets of all the participating portfolios. The amount of the reimbursement is calculated daily and allocated among all the participating portfolios in proportion to the daily net assets of each fund. During the year ended March, 31, 2017, this waiver amounted to 0.01% of the fund's average net assets. This arrangement may be amended or terminated at any time by the Advisor upon notice to the fund and with the approval of the Board of Trustees.
The Advisor has contractually agreed to reduce its management fee or, if necessary, make payment to the fund to the extent necessary to maintain the fund's total operating expenses at 1.43%, 1.13%, 1.80%, 1.55%, 1.70%, 1.30%,1.10%, and 1.34% for Class A, Class I, Class R1, Class R2, Class R3, Class R4, Class R5, and Class ADV shares, respectively, excluding certain expenses such as taxes, brokerage commissions, interest expense, litigation and indemnification expenses and other extraordinary expenses not incurred in the ordinary course of the fund's business, acquired fund fees and expenses paid indirectly and short dividend expense. The current expense limitation agreement expires on June 30, 2017, unless renewed by mutual agreement of the fund and the Advisor based upon a determination that this is appropriate under the circumstances at that time.
For Class R6 shares, the Advisor has contractually agreed to waive and/or reimburse all class specific expenses of the fund, to the extent they exceed 0.00% of average net assets. The fee waiver and/or reimbursement will continue in effect until June 30, 2017, unless renewed by mutual agreement of the fund and Advisor based upon a determination that this is appropriate under the circumstances at the time.
For the year ended March 31, 2017, these expense reductions amounted to the following:
| Class | Expense reduction | Class | Expense reduction | |
| Class A | $57,393 | Class R4 | $10 | |
| Class I | 10,481 | Class R5 | 7 | |
| Class R1 | 54 | Class R6 | 1,225 | |
| Class R2 | 62 | Class ADV | 67 | |
| Class R3 | 18 | Total | $69,317 |
Expenses waived or reimbursed in the current fiscal period are not subject to recapture in future fiscal periods.
The investment management fees incurred for the year ended March 31, 2017 were equivalent to a net annual effective rate of 0.88% of the fund's average daily net assets.
Accounting and legal services. Pursuant to a service agreement, the fund reimburses the Advisor for all expenses associated with providing the administrative, financial, legal, accounting and recordkeeping services to the fund, including the preparation of all tax returns, periodic reports to shareholders and regulatory reports, among other services. These expenses are allocated to each share class based on its relative net assets at the time the expense was incurred. These accounting and legal services fees incurred for the year ended March 31, 2017 amounted to an annual rate of 0.01% of the fund's average daily net assets.
Distribution and service plans. The fund has a distribution agreement with the Distributor. The fund has adopted distribution and service plans with respect to Class A, Class R1, Class R2, Class R3, Class R4 and Class ADV shares pursuant to Rule 12b-1 under the 1940 Act, to pay the Distributor for services provided as the distributor of shares of the fund. In addition, under a service plan for Class R1, Class R2, Class R3, Class R4 and Class R5 shares, the fund pays for certain other services. The fund may pay up to the following contractual rates of distribution and service fees under these arrangements, expressed as an annual percentage of average daily net assets for each class of the fund's shares.
| Class | Rule 12b-1 fee | Service fee | Class | Rule 12b-1 fee | Service fee | |
| Class A | 0.30% | — | Class R4 | 0.25% | 0.10% | |
| Class R1 | 0.50% | 0.25% | Class R5 | — | 0.05% | |
| Class R2 | 0.25% | 0.25% | Class ADV | 0.25% | — | |
| Class R3 | 0.50% | 0.15% |
The fund's Distributor has contractually agreed to waive 0.10% of Rule12b-1 fees for Class R4 shares. The current waiver agreement expires on June 30, 2017, unless renewed by mutual agreement of the fund and the Distributor based upon a determination that this is appropriate under the circumstances at the time. This contractual waiver amounted to $133 for Class R4 shares for the year ended March 31, 2017.
Sales charges. Class A shares are assessed up-front sales charges, which resulted in payments to the Distributor amounting to $1,108,789 for the year ended March 31, 2017. Of this amount, $190,147 was retained and used for printing prospectuses, advertising, sales literature and other purposes, $915,587 was paid as sales commissions to broker-dealers and $3,055 was paid as sales commissions to sales personnel of Signator Investors, Inc., a broker-dealer affiliate of the Advisor.
Class A shares may be subject to contingent deferred sales charges (CDSCs). Certain Class A shares that are acquired through purchases of $1 million or more and are redeemed within one year of purchase are subject to a 1.00% sales charge CDSCs are applied to the lesser of the current market value at the time of redemption or the original purchase cost of the
shares being redeemed. Proceeds from CDSCs are used to compensate the Distributor for providing distribution-related services in connection with the sale of these shares. During the year ended March 31, 2017, CDSCs received by the Distributor amounted to $3,989 for Class A shares.
Transfer agent fees. The fund has a transfer agent agreement with John Hancock Signature Services, Inc. (Signature Services), an affiliate of the Advisor. The transfer agent fees paid to Signature Services are determined based on the cost to Signature Services (Signature Services Cost) of providing recordkeeping services. It also includes out-of-pocket expenses, including payments made to third-parties for recordkeeping services provided to their clients who invest in one or more John Hancock funds. In addition, Signature Services Cost may be reduced by certain fees that Signature Services receives in connection with retirement and small accounts. Signature Services Cost is calculated monthly and allocated, as applicable, to five categories of share classes: Retail Share and Institutional Share Classes of Non-Municipal Bond Funds, Class R6 Shares, Retirement Share Classes and Municipal Bond Share Classes. Within each of these categories, the applicable costs are allocated to the affected John Hancock affiliated funds and/or classes, based on the relative average daily net assets.
Class level expenses. Class level expenses for the year ended March 31, 2017 were:
| Class | Distribution and service fees | Transfer agent fees |
| Class A | $698,912 | $286,923 |
| Class I | — | 68,307 |
| Class R1 | 5,345 | 117 |
| Class R2 | 3,772 | 135 |
| Class R3 | 1,503 | 39 |
| Class R4 | 371 | 22 |
| Class R5 | 40 | 14 |
| Class R6 | — | 838 |
| Class ADV | 365 | 177 |
| Total | $710,308 | $356,572 |
Trustee expenses. The fund compensates each Trustee who is not an employee of the Advisor or its affiliates. The costs of paying Trustee compensation and expenses are allocated to each fund based on its net assets relative to other funds within the John Hancock group of funds complex.
Interfund lending program Pursuant to an Exemptive Order issued by the SEC, the fund(s), along with certain other funds advised by the Advisor or its affiliates, may participate in an interfund lending program. This program provides an alternative credit facility allowing the funds to borrow from, or lend money to, other participating affiliated funds. At period end, no interfund loans were outstanding. Interest income is included in Interest on the Statement of operations. The fund's activity in this program during the period for which loans were outstanding was as follows:
| Borrower or lender | Weighted average loan balance | Days outstanding | Weighted average interest rate | Interest income |
| Lender | $6,807,174 | 2 | 0.740% | $280 |
Note 5 — Fund share transactions
Transactions in fund shares for the years ended March 31, 2017 and 2016 were as follows:
| Year ended 3-31-17 | Year ended 3-31-16 | |||||||||||||||||||||||||
| Shares | Amount | Shares | Amount | |||||||||||||||||||||||
| Class A shares | ||||||||||||||||||||||||||
| Sold | 2,372,316 | $61,488,996 | 3,037,876 | $77,883,439 | ||||||||||||||||||||||
| Distributions reinvested | — | — | 543,417 | 13,498,483 | ||||||||||||||||||||||
| Repurchased | (2,742,785 | ) | (71,806,566 | ) | (1,181,047 | ) | (30,454,452 | ) | ||||||||||||||||||
| Net increase (decrease) | (370,469 | ) | ($10,317,570 | ) | 2,400,246 | $60,927,470 | ||||||||||||||||||||
| Class I shares | ||||||||||||||||||||||||||
| Sold | 2,293,124 | $61,229,488 | 363,685 | $9,845,616 | ||||||||||||||||||||||
| Distributions reinvested | — | — | 109,806 | 2,783,592 | ||||||||||||||||||||||
| Repurchased | (827,753 | ) | (22,051,241 | ) | (413,755 | ) | (10,987,061 | ) | ||||||||||||||||||
| Net increase | 1,465,371 | $39,178,247 | 59,736 | $1,642,147 | ||||||||||||||||||||||
| Class R1 shares | ||||||||||||||||||||||||||
| Sold | 6,347 | $160,129 | 10,830 | $280,665 | ||||||||||||||||||||||
| Distributions reinvested | — | — | 1,502 | 36,475 | ||||||||||||||||||||||
| Repurchased | (14,543 | ) | (364,899 | ) | (29,848 | ) | (771,336 | ) | ||||||||||||||||||
| Net decrease | (8,196 | ) | ($204,770 | ) | (17,516 | ) | ($454,196 | ) | ||||||||||||||||||
| Class R2 shares | ||||||||||||||||||||||||||
| Sold | 9,527 | $257,486 | 22,743 | $612,600 | ||||||||||||||||||||||
| Distributions reinvested | — | — | 1,606 | 39,988 | ||||||||||||||||||||||
| Repurchased | (11,877 | ) | (302,577 | ) | (10,192 | ) | (279,303 | ) | ||||||||||||||||||
| Net increase (decrease) | (2,350 | ) | ($45,091 | ) | 14,157 | $373,285 | ||||||||||||||||||||
| Class R3 shares | ||||||||||||||||||||||||||
| Sold | 1,129 | $28,446 | 3,898 | $102,088 | ||||||||||||||||||||||
| Distributions reinvested | — | — | 806 | 19,705 | ||||||||||||||||||||||
| Repurchased | (4,527 | ) | (115,287 | ) | (2,421 | ) | (59,287 | ) | ||||||||||||||||||
| Net increase (decrease) | (3,398 | ) | ($86,841 | ) | 2,283 | $62,506 | ||||||||||||||||||||
| Class R4 shares | ||||||||||||||||||||||||||
| Sold | 2,235 | $56,134 | 3,663 | $86,767 | ||||||||||||||||||||||
| Distributions reinvested | — | — | 111 | 2,770 | ||||||||||||||||||||||
| Repurchased | (2,646 | ) | (72,390 | ) | (2,371 | ) | (56,921 | ) | ||||||||||||||||||
| Net increase (decrease) | (411 | ) | ($16,256 | ) | 1,403 | $32,616 | ||||||||||||||||||||
| Class R5 shares | ||||||||||||||||||||||||||
| Sold | 157 | $4,307 | 613 | $17,345 | ||||||||||||||||||||||
| Distributions reinvested | — | — | 213 | 5,405 | ||||||||||||||||||||||
| Repurchased | (79 | ) | (2,194 | ) | (9,406 | ) | (265,975 | ) | ||||||||||||||||||
| Net increase (decrease) | 78 | $2,113 | (8,580 | ) | ($243,225 | ) | ||||||||||||||||||||
| Class R6 shares | ||||||||||||||||||||||||||
| Sold | 33,935 | $897,813 | 179,541 | $4,857,547 | ||||||||||||||||||||||
| Distributions reinvested | — | — | 13,248 | 337,695 | ||||||||||||||||||||||
| Repurchased | (40,744 | ) | (1,078,519 | ) | (29,082 | ) | (724,893 | ) | ||||||||||||||||||
| Net increase (decrease) | (6,809 | ) | ($180,706 | ) | 163,707 | $4,470,349 | ||||||||||||||||||||
| Year ended 3-31-17 | Year ended 3-31-16 | |||||||||||||||||||||||||
| Shares | Amount | Shares | Amount | |||||||||||||||||||||||
| Class ADV shares | ||||||||||||||||||||||||||
| Sold | 1,654 | $43,025 | 2,155 | $59,907 | ||||||||||||||||||||||
| Distributions reinvested | — | — | 1,590 | 39,750 | ||||||||||||||||||||||
| Repurchased | (22,846 | ) | (557,006 | ) | (359 | ) | (8,080 | ) | ||||||||||||||||||
| Net increase (decrease) | (21,192 | ) | ($513,981 | ) | 3,386 | $91,577 | ||||||||||||||||||||
| Total net increase | 1,052,624 | $27,815,145 | 2,618,822 | $66,902,529 | ||||||||||||||||||||||
Affiliates of the Trust owned 36% of the fund's Class R4 shares on March 31, 2017.
Note 6 — Purchase and sale of securities
Purchases and sales of securities, other than short-term investments, amounted to $382,246,891 and $358,064,712, respectively, for the year ended March 31, 2017.
Note 7 — New rule issuance
In October 2016, the SEC issued Final Rule Release No.33-10231, Investment Company Reporting Modernization (the Release). The Release calls for the adoption of new rules and forms as well as amendments to its rules and forms to modernize the reporting and disclosure of information by registered investment companies. The SEC is adopting amendments to Regulation S-X, which will require standardized, enhanced disclosure about derivatives in investment company financial statements, as well as other amendments. The updates to Regulation S-X are effective August 1, 2017 and may result in additional disclosure relating to the presentation of derivatives and certain other financial instruments. These updates will have no impact on the fund's net assets or results of operations.
Report of Independent Registered Public Accounting Firm
To the Board of Trustees of John Hancock Funds III and Shareholders of John Hancock Small Company Fund
In our opinion, the accompanying statement of assets and liabilities, including the fund's investments, and the related statements of operations and of changes in net assets and the financial highlights present fairly, in all material respects, the financial position of the John Hancock Small Company Fund (the "Fund") as of March 31, 2017, the results of its operations for the year then ended, the changes in its net assets for each of the two years in the period then ended and the financial highlights for each of the five years in the period then ended, in conformity with accounting principles generally accepted in the United States of America. These financial statements and financial highlights (hereafter referred to as "financial statements") are the responsibility of the Fund's management. Our responsibility is to express an opinion on these financial statements based on our audits. We conducted our audits of these financial statements in accordance with the standards of the Public Company Accounting Oversight Board (United States). Those standards require that we plan and perform the audit to obtain reasonable assurance about whether the financial statements are free of material misstatement. An audit includes examining, on a test basis, evidence supporting the amounts and disclosures in the financial statements, assessing the accounting principles used and significant estimates made by management, and evaluating the overall financial statement presentation. We believe that our audits, which included confirmation of securities as of March 31, 2017 by correspondence with the custodian and brokers, and the application of alternative auditing procedures where securities purchased confirmations had not been received, provide a reasonable basis for our opinion.
PricewaterhouseCoopers LLP
Boston, Massachusetts
May 16, 2017
This chart provides information about the Trustees and Officers who oversee your John Hancock fund. Officers elected by the Trustees manage the day-to-day operations of the fund and execute policies formulated by the Trustees.
Independent Trustees
| Name, year of birth Position(s) held with Trust Principal occupation(s) and other directorships during past 5 years | Trustee of the Trust since1 | Number of John Hancock funds overseen by Trustee |
| Hassell H. McClellan, Born: 1945 | 2012 | 228 |
| Trustee and Chairperson of the Board Director/Trustee, Virtus Funds (since 2008); Director, The Barnes Group (since 2010); Associate Professor, The Wallace E. Carroll School of Management, Boston College (retired 2013). Trustee (since 2014) and Chairperson of the Board (since 2017), John Hancock Collateral Trust; Trustee (since 2015) and Chairperson of the Board (since 2017), John Hancock Exchange-Traded Fund Trust; Trustee (since 2012) and Chairperson of the Board (since 2017), John Hancock retail funds3; Trustee (2005-2006 and since 2012) and Chairperson of the Board (since 2017), John Hancock Funds III; Trustee (since 2005) and Chairperson of the Board (since 2017), John Hancock Variable Insurance Trust and John Hancock Funds II. | ||
| Charles L. Bardelis,2 Born: 1941 | 2012 | 228 |
| Trustee Director, Island Commuter Corp. (marine transport). Trustee, John Hancock Collateral Trust (since 2014), Trustee, John Hancock Exchange-Traded Fund Trust (since 2015); Trustee, John Hancock retail funds3 (since 2012); Trustee, John Hancock Funds III (2005-2006 and since 2012); Trustee, John Hancock Variable Insurance Trust (since 1988); Trustee, John Hancock Funds II (since 2005). | ||
| Peter S. Burgess,2 Born: 1942 | 2012 | 228 |
| Trustee Consultant (financial, accounting, and auditing matters) (since 1999); Certified Public Accountant; Partner, Arthur Andersen (independent public accounting firm) (prior to 1999); Director, Lincoln Educational Services Corporation (since 2004); Director, Symetra Financial Corporation (2010-2016); Director, PMA Capital Corporation (2004-2010). Trustee, John Hancock Collateral Trust (since 2014); Trustee, John Hancock Exchange-Traded Fund Trust (since 2015); Trustee, John Hancock retail funds3 (since 2012); Trustee, John Hancock Funds III (2005-2006 and since 2012); Trustee, John Hancock Variable Insurance Trust and John Hancock Funds II (since 2005). | ||
| William H. Cunningham, Born: 1944 | 2006 | 228 |
| Trustee Professor, University of Texas, Austin, Texas (since 1971); former Chancellor, University of Texas System and former President of the University of Texas, Austin, Texas; Chairman (since 2009) and Director (since 2006), Lincoln National Corporation (insurance); Director, Southwest Airlines (since 2000); former Director, LIN Television (2009-2014). Trustee, John Hancock retail funds3 (since 1986); Trustee, John Hancock Variable Insurance Trust (since 2012); Trustee, John Hancock Funds II (2005-2006 and since 2012); Trustee, John Hancock Collateral Trust (since 2014); Trustee, John Hancock Exchange-Traded Fund Trust (since 2015). | ||
| Grace K. Fey, Born: 1946 | 2012 | 228 |
| Trustee Chief Executive Officer, Grace Fey Advisors (since 2007); Director and Executive Vice President, Frontier Capital Management Company (1988-2007); Director, Fiduciary Trust (since 2009). Trustee, John Hancock Collateral Trust (since 2014); Trustee, John Hancock Exchange-Traded Fund Trust (since 2015); Trustee, John Hancock retail funds3 (since 2012); Trustee, John Hancock Variable Insurance Trust and John Hancock Funds II (since 2008). | ||
Independent Trustees (continued)
| Name, year of birth Position(s) held with Trust Principal occupation(s) and other directorships during past 5 years | Trustee of the Trust since1 | Number of John Hancock funds overseen by Trustee |
| Theron S. Hoffman,2 Born: 1947 | 2012 | 228 |
| Trustee Chief Executive Officer, T. Hoffman Associates, LLC (consulting firm) (since 2003); Director, The Todd Organization (consulting firm) (2003-2010); President, Westport Resources Management (investment management consulting firm) (2006-2008); Senior Managing Director, Partner, and Operating Head, Putnam Investments (2000-2003); Executive Vice President, The Thomson Corp. (financial and legal information publishing) (1997-2000). Trustee, John Hancock Collateral Trust (since 2014); Trustee, John Hancock Exchange-Traded Fund Trust (since 2015); Trustee, John Hancock retail funds3 (since 2012); Trustee, John Hancock Variable Insurance Trust and John Hancock Funds II (since 2008). | ||
| Deborah C. Jackson, Born: 1952 | 2008 | 228 |
| Trustee President, Cambridge College, Cambridge, Massachusetts (since 2011); Board of Directors, National Association of Corporate Directors/New England (since 2015); Board of Directors, Association of Independent Colleges and Universities of Massachusetts, (since 2014); Chief Executive Officer, American Red Cross of Massachusetts Bay (2002-2011); Board of Directors of Eastern Bank Corporation (since 2001); Board of Directors of Eastern Bank Charitable Foundation (since 2001); Board of Directors of American Student Assistance Corporation (1996-2009); Board of Directors of Boston Stock Exchange (2002-2008); Board of Directors of Harvard Pilgrim Healthcare (health benefits company) (2007-2011). Trustee, John Hancock retail funds3 (since 2008); Trustee, John Hancock Variable Insurance Trust and John Hancock Funds II (since 2012); Trustee, John Hancock Collateral Trust (since 2014); and Trustee, John Hancock Exchange-Traded Fund Trust (since 2015). | ||
| James M. Oates, Born: 1946 | 2012 | 228 |
Trustee | ||
| Steven R. Pruchansky, Born: 1944 | 2006 | 228 |
| Trustee and Vice Chairperson of the Board Chairman and Chief Executive Officer, Greenscapes of Southwest Florida, Inc. (since 2000); Director and President, Greenscapes of Southwest Florida, Inc. (until 2000); Member, Board of Advisors, First American Bank (until 2010); Managing Director, Jon James, LLC (real estate) (since 2000); Partner, Right Funding, LLC (since 2014); Director, First Signature Bank & Trust Company (until 1991); Director, Mast Realty Trust (until 1994); President, Maxwell Building Corp. (until 1991). Trustee (since 1992) and Chairperson of the Board (2011-2012), John Hancock retail funds3; Trustee and Vice Chairperson of the Board, John Hancock retail funds3 John Hancock Variable Insurance Trust, and John Hancock Funds II (since 2012); Trustee and Vice Chairperson of the Board, John Hancock Collateral Trust (since 2014); Trustee and Vice Chairperson of the Board, John Hancock Exchange-Traded Fund Trust (since 2015). | ||
Independent Trustees (continued)
| Name, year of birth Position(s) held with Trust Principal occupation(s) and other directorships during past 5 years | Trustee of the Trust since1 | Number of John Hancock funds overseen by Trustee |
| Gregory A. Russo, Born: 1949 | 2008 | 228 |
| Trustee Director and Audit Committee Chairman (since 2012), and Member, Audit Committee and Finance Committee (since 2011), NCH Healthcare System, Inc. (holding company for multi-entity healthcare system); Director and Member (since 2012) and Finance Committee Chairman (since 2014), The Moorings, Inc. (nonprofit continuing care community); Vice Chairman, Risk & Regulatory Matters, KPMG LLP (KPMG) (2002-2006); Vice Chairman, Industrial Markets, KPMG (1998-2002); Chairman and Treasurer, Westchester County, New York, Chamber of Commerce (1986-1992); Director, Treasurer, and Chairman of Audit and Finance Committees, Putnam Hospital Center (1989-1995); Director and Chairman of Fundraising Campaign, United Way of Westchester and Putnam Counties, New York (1990-1995). Trustee, John Hancock retail funds3 (since 2008); Trustee, John Hancock Variable Insurance Trust and John Hancock Funds II (since 2012); Trustee, John Hancock Collateral Trust (since 2014); Trustee, John Hancock Exchange-Traded Fund Trust (since 2015). | ||
Non-Independent Trustees4
| Name, year of birth Position(s) held with Trust Principal occupation(s) and other directorships during past 5 years | Trustee of the Trust since1 | Number of John Hancock funds overseen by Trustee |
| James R. Boyle, Born: 1959 | 2015 | 228 |
| Non-Independent Trustee Chairman and Chief Executive Officer, Zillion Group, Inc. (formerly HealthFleet, Inc.) (healthcare) (since 2014); Executive Vice President and Chief Executive Officer, U.S. Life Insurance Division of Genworth Financial, Inc. (insurance) (January 2014-July 2014); Senior Executive Vice President, Manulife Financial Corporation, President and Chief Executive Officer, John Hancock (1999-2012); Chairman and Director, John Hancock Advisers, LLC, John Hancock Funds, LLC, and John Hancock Investment Management Services, LLC (2005-2010). Trustee, John Hancock Collateral Trust and John Hancock Exchange-Traded Fund Trust (since 2015); Trustee, John Hancock retail funds3 (2005-2010; 2012-2014 and since 2015); Trustee, John Hancock Variable Insurance Trust and John Hancock Funds II (2005-2014 and since 2015). | ||
| Craig Bromley, Born: 1966 | 2012 | 228 |
| Non-Independent Trustee President, John Hancock Financial Service (since 2012); Senior Executive Vice President and General Manager, U.S. Division, Manulife Financial Corporation (since 2012); President and Chief Executive Officer, Manulife Insurance Company (Manulife Japan) (2005-2012, including prior positions). Trustee, John Hancock retail funds,3 John Hancock Variable Insurance Trust, and John Hancock Funds II (since 2012); Trustee, John Hancock Collateral Trust (since 2014); Trustee, John Hancock Exchange-Traded Fund Trust (since 2015). | ||
| Warren A. Thomson, Born: 1955 | 2012 | 228 |
| Non-Independent Trustee Senior Executive Vice President and Chief Investment Officer, Manulife Financial Corporation and The Manufacturers Life Insurance Company (since 2009); Chairman, Manulife Asset Management (since 2001, including prior positions); Director and Chairman, Manulife Asset Management Limited (since 2006); Director and Chairman, Hancock Natural Resources Group, Inc. (since 2013). Trustee, John Hancock retail funds,3 John Hancock Variable Insurance Trust, and John Hancock Funds II (since 2012); Trustee, John Hancock Collateral Trust (since 2014); Trustee, John Hancock Exchange-Traded Fund Trust (since 2015). | ||
Principal officers who are not Trustees
| Name, year of birth Position(s) held with Trust Principal occupation(s) during past 5 years | Officer of the Trust since |
| Andrew G. Arnott, Born: 1971 | 2009 |
| President Senior Vice President, John Hancock Financial Services (since 2009); Director and Executive Vice President, John Hancock Advisers, LLC (since 2005, including prior positions); Director and Executive Vice President, John Hancock Investment Management Services, LLC (since 2006, including prior positions); President, John Hancock Funds, LLC (since 2004, including prior positions); President, John Hancock retail funds,3 John Hancock Variable Insurance Trust, and John Hancock Funds II (since 2007, including prior positions); President, John Hancock Collateral Trust and John Hancock Exchange-Traded Fund Trust (since 2014). | |
| John J. Danello, Born: 1955 | 2014 |
| Senior Vice President, Secretary, and Chief Legal Officer Vice President and Chief Counsel, John Hancock Wealth Management (since 2005); Senior Vice President (since 2007) and Chief Legal Counsel (2007-2010), John Hancock Funds, LLC and The Berkeley Financial Group, LLC; Senior Vice President (since 2006, including prior positions) and Chief Legal Officer and Secretary (since 2014), John Hancock retail funds,3 John Hancock Funds II and John Hancock Variable Insurance Trust; Senior Vice President, Secretary and Chief Legal Officer, John Hancock Collateral Trust and John Hancock Exchange-Traded Fund Trust (since 2014); Vice President, John Hancock Life & Health Insurance Company (since 2009); Vice President, John Hancock Life Insurance Company (USA) and John Hancock Life Insurance Company of New York (since 2010); and Senior Vice President, Secretary and Chief Legal Counsel (2007-2014, including prior positions) of John Hancock Advisers, LLC and John Hancock Investment Management Services, LLC. | |
| Francis V. Knox, Jr., Born: 1947 | 2006 |
| Chief Compliance Officer Vice President, John Hancock Financial Services (since 2005); Chief Compliance Officer, John Hancock retail funds,3 John Hancock Variable Insurance Trust, John Hancock Funds II, John Hancock Advisers, LLC, and John Hancock Investment Management Services, LLC (since 2005); Chief Compliance Officer, John Hancock Collateral Trust and John Hancock Exchange-Traded Fund Trust (since 2014). | |
| Charles A. Rizzo, Born: 1957 | 2007 |
| Chief Financial Officer Vice President, John Hancock Financial Services (since 2008); Senior Vice President, John Hancock Advisers, LLC and John Hancock Investment Management Services, LLC (since 2008); Chief Financial Officer, John Hancock retail funds,3 John Hancock Variable Insurance Trust and John Hancock Funds II (since 2007); Chief Financial Officer, John Hancock Collateral Trust and John Hancock Exchange-Traded Fund Trust (since 2014). | |
| Salvatore Schiavone, Born: 1965 | 2010 |
| Treasurer Assistant Vice President, John Hancock Financial Services (since 2007); Vice President, John Hancock Advisers, LLC and John Hancock Investment Management Services, LLC (since 2007); Treasurer, John Hancock retail funds3 (since 2007, including prior positions); Treasurer, John Hancock Variable Insurance Trust and John Hancock Funds II (2007-2009 and since 2010, including prior positions); Treasurer, John Hancock Collateral Trust and John Hancock Exchange-Traded Fund Trust (since 2014). | |
The business address for all Trustees and Officers is 601 Congress Street, Boston, Massachusetts 02210-2805.
The Statement of Additional Information of the fund includes additional information about members of the Board of Trustees of the Trust and is available without charge, upon request, by calling 800-225-5291.
| 1 | Each Trustee holds office until his or her successor is elected and qualified, or until the Trustee's death, retirement, resignation, or removal. Mr. Boyle has served as Trustee at various times prior to the date listed in the table. |
| 2 | Member of the Audit Committee. |
| 3 | "John Hancock retail funds" comprises John Hancock Funds III and 40 other John Hancock funds consisting of 30 series of other John Hancock trusts and 10 closed-end funds. |
| 4 | The Trustee is a Non-Independent Trustee due to current or former positions with the Advisor and certain affiliates. |
Trustees Hassell H. McClellan, Chairperson# Officers Andrew G. Arnott John J. Danello Francis V. Knox, Jr. Charles A. Rizzo Salvatore Schiavone | Investment advisor John Hancock Advisers, LLC Subadvisor Mesirow Financial Investment Management, Inc. Principal distributor John Hancock Funds, LLC Custodian State Street Bank and Trust Company Transfer agent John Hancock Signature Services, Inc. Legal counsel K&L Gates LLP Independent registered public accounting firm PricewaterhouseCoopers LLP |
*Member of the Audit Committee
†Non-Independent Trustee
#Effective 1-1-17
The fund's proxy voting policies and procedures, as well as the fund proxy voting record for the most recent twelve-month period ended June 30, are available free of charge on the Securities and Exchange Commission (SEC) website at sec.gov or on our website.
The fund's complete list of portfolio holdings, for the first and third fiscal quarters, is filed with the SEC on Form N-Q. The fund's Form N-Q is available on our website and the SEC's website, sec.gov, and can be reviewed and copied (for a fee) at the SEC's Public Reference Room in Washington, DC. Call 800-SEC-0330 to receive information on the operation of the SEC's Public Reference Room.
We make this information on your fund, as well as monthly portfolio holdings, and other fund details available on our website at jhinvestments.com or by calling 800-225-5291.
| You can also contact us: | |||
| 800-225-5291 jhinvestments.com | Regular mail: John Hancock Signature Services, Inc. | Express mail: John Hancock Signature Services, Inc. | |
John Hancock family of funds
DOMESTIC EQUITY FUNDS Balanced Blue Chip Growth Classic Value Disciplined Value Disciplined Value Mid Cap Equity Income Fundamental All Cap Core Fundamental Large Cap Core Fundamental Large Cap Value New Opportunities Small Cap Value Small Company Strategic Growth U.S. Global Leaders Growth U.S. Growth Value Equity GLOBAL AND INTERNATIONAL EQUITY FUNDS Disciplined Value International Emerging Markets Emerging Markets Equity Fundamental Global Franchise Global Equity Global Shareholder Yield Greater China Opportunities International Growth International Small Company International Value Equity | INCOME FUNDS Bond California Tax-Free Income Emerging Markets Debt Floating Rate Income Global Income Government Income High Yield High Yield Municipal Bond Income Investment Grade Bond Money Market Short Duration Credit Opportunities Spectrum Income Strategic Income Opportunities Tax-Free Bond ALTERNATIVE AND SPECIALTY FUNDS Absolute Return Currency Alternative Asset Allocation Enduring Assets Financial Industries Global Absolute Return Strategies Global Conservative Absolute Return Global Focused Strategies Natural Resources Redwood Regional Bank Seaport Technical Opportunities |
A fund's investment objectives, risks, charges, and expenses should be considered carefully before investing. The prospectus contains this and other important information about the fund. To obtain a prospectus, contact your financial professional, call John Hancock Investments at 800-225-5291, or visit our website at jhinvestments.com. Please read the prospectus carefully before investing or sending money.
ASSET ALLOCATION Income Allocation Fund Multi-Index Lifetime Portfolios Multi-Index Preservation Portfolios Multimanager Lifestyle Portfolios Multimanager Lifetime Portfolios EXCHANGE-TRADED FUNDS John Hancock Multifactor Consumer Discretionary ETF John Hancock Multifactor Consumer Staples ETF John Hancock Multifactor Developed International ETF John Hancock Multifactor Energy ETF John Hancock Multifactor Financials ETF John Hancock Multifactor Healthcare ETF John Hancock Multifactor Industrials ETF John Hancock Multifactor Large Cap ETF John Hancock Multifactor Materials ETF John Hancock Multifactor Mid Cap ETF John Hancock Multifactor Technology ETF John Hancock Multifactor Utilities ETF | ENVIRONMENTAL, SOCIAL, AND GOVERNANCE FUNDS ESG All Cap Core ESG Core Bond ESG International Equity ESG Large Cap Core CLOSED-END FUNDS Financial Opportunities Hedged Equity & Income Income Securities Trust Investors Trust Preferred Income Preferred Income II Preferred Income III Premium Dividend Tax-Advantaged Dividend Income Tax-Advantaged Global Shareholder Yield |
John Hancock Multifactor ETF shares are bought and sold at market price (not NAV), and are not individually redeemed
from the fund. Brokerage commissions will reduce returns.
John Hancock ETFs are distributed by Foreside Fund Services, LLC, and are subadvised by Dimensional Fund Advisors LP.
Foreside is not affiliated with John Hancock Funds, LLC or Dimensional Fund Advisors LP.
Dimensional Fund Advisors LP receives compensation from John Hancock in connection with licensing rights to the
John Hancock Dimensional indexes. Dimensional Fund Advisors LP does not sponsor, endorse, or sell, and makes no
representation as to the advisability of investing in, John Hancock Multifactor ETFs.
John Hancock Investments
A trusted brand
John Hancock Investments is a premier asset manager representing one of
America's most trusted brands, with a heritage of financial stewardship dating
back to 1862. Helping our shareholders pursue their financial goals is at the
core of everything we do. It's why we support the role of professional financial
advice and operate with the highest standards of conduct and integrity.
A better way to invest
We serve investors globally through a unique multimanager approach:
We search the world to find proven portfolio teams with specialized
expertise for every strategy we offer, then we apply robust investment
oversight to ensure they continue to meet our uncompromising standards
and serve the best interests of our shareholders.
Results for investors
Our unique approach to asset management enables us to provide a diverse set
of investments backed by some of the world's best managers, along with strong
risk-adjusted returns across asset classes.
| | John Hancock Funds, LLC n Member FINRA, SIPC 601 Congress Street n Boston, MA 02210-2805 800-225-5291 n jhinvestments.com | |
| This report is for the information of the shareholders of John Hancock Small Company Fund. It is not authorized for distribution to prospective investors unless preceded or accompanied by a prospectus. | ||
| MF361885 | 348A 3/17 5/17 | |
A message to shareholders
Dear shareholder,
Financial markets are by their very nature unpredictable, but few market observers could have imagined the dramatic twists and turns that would come to characterize the latter half of 2016 and the beginning of 2017. Donald Trump's victory in the November U.S. presidential election sent both U.S. equity prices and bond yields sharply higher. Investors bid up the prices of riskier assets, believing that the new administration would pursue more pro-growth, market-friendly economic policies. While this may yet prove to be the case, change in policy has been slow to materialize and valuations in certain sectors and asset classes are now appearing somewhat stretched.
While we believe there are good reasons for economic optimism and that stocks may go on to extend their recent rally in the coming months, we encourage you to talk with your financial advisor, who can help ensure your portfolio is sufficiently diversified to meet your long-term objectives and to withstand the inevitable bumps along the way.
On behalf of everyone at John Hancock Investments, I'd like to take this opportunity to thank you for the continued trust you've placed in us.
Sincerely,
Andrew G. Arnott
President and Chief Executive Officer
John Hancock Investments
This commentary reflects the CEO's views, which are subject to change at any time. Investing involves risks, including the potential loss of principal. Diversification does not guarantee a profit or eliminate the risk of a loss. For more up-to-date information, please visit our website at jhinvestments.com.
John Hancock
Disciplined Value Mid Cap Fund
INVESTMENT OBJECTIVE
The fund seeks long-term growth of capital with current income as a secondary objective.
AVERAGE ANNUAL TOTAL RETURNS AS OF 3/31/17 (%)
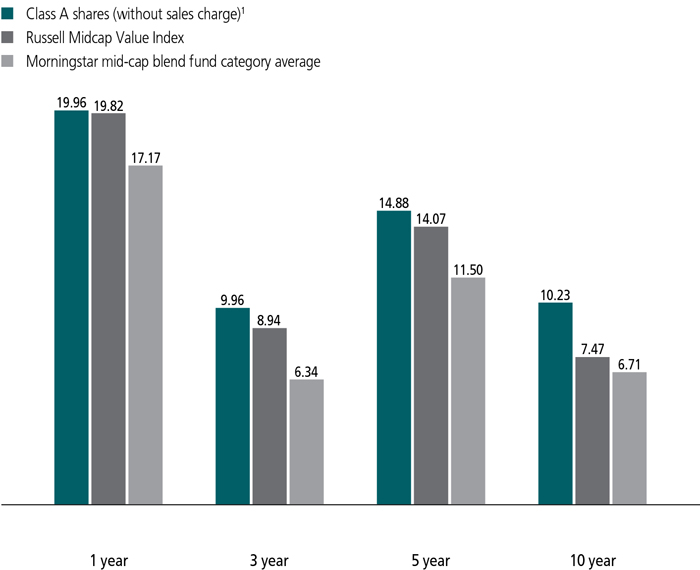
The Russell Midcap Value Index is an unmanaged index that measures the performance of those Russell Midcap Index companies with lower price-to-book ratios and lower forecasted growth values.
It is not possible to invest directly in an index. Index figures do not reflect expenses or sales charges, which would result in lower returns.
Figures from Morningstar, Inc. include reinvested distributions and do not take into account sales charges. Actual load-adjusted performance is lower.
| 1 | After the close of business on 7-9-10, holders of Investor shares of the former Robeco Boston Partners Mid Cap Value Fund (the predecessor fund) became owners of an equal number of full and fractional Class A shares of John Hancock Disciplined Value Mid Cap Fund, which were first offered on 7-12-10. Class A shares' performance shown above for periods prior to this date is that of the predecessor fund's Investor shares that have been recalculated to reflect the gross fees and expenses of Class A shares. |
The past performance shown here reflects reinvested distributions and the beneficial effect of any expense reductions, and does not guarantee future results. Performance of the other share classes will vary based on the difference in the fees and expenses of those classes. Shares will fluctuate in value and, when redeemed, may be worth more or less than their original cost. Current month-end performance may be lower or higher than the performance cited, and can be found at jhinvestments.com or by calling 800-225-5291. For further information on the fund's objectives, risks, and strategy, see the fund's prospectus.
PERFORMANCE HIGHLIGHTS OVER THE LAST TWELVE MONTHS
Markets surged following the election
Equities struggled in the first half of the period, but surged following the U.S. presidential election on hopes the new administration would lower taxes, increase infrastructure spending, and reduce regulation.
The fund was up, and outperformed its benchmark
The fund led its benchmark, the Russell Midcap Value Index, due to favorable sector allocation and stock picking in the information technology sector.
Financials and utilities also contributed
The financials and utilities sectors were big contributors relative to the benchmark, while materials and industrials detracted.
SECTOR COMPOSITION AS OF 3/31/17 (%)

A note about risks
The stock prices of midsize companies can change more frequently and dramatically than those of large companies. Value stocks may decline in price. The value of a company's equity securities is subject to changes in the company's financial condition and overall market and economic conditions. Foreign investing has additional risks, such as currency and market volatility and political and social instability. Sector investing is subject to greater risks than the market as a whole. Because the fund may focus on particular sectors of the economy, its performance may depend on the performance of those sectors, and investments focused in one sector may fluctuate more than investments in a wider variety of sectors. Please see the fund's prospectus for additional risks.

Steven L. Pollack, CFA
Portfolio Manager
Boston Partners
Can you briefly describe the market environment during the 12 months ended March 31, 2017?
U.S. equities advanced strongly for the period, despite challenges that included high valuations for stocks, rising interest rates, and concerns over the U.S. presidential election. The June news of the U.K.'s referendum vote to withdraw from the European Union sent a brief shock wave through the markets; however, stocks stabilized and regained much of what they lost in that short period of time. The market began to grow more cautious regarding certain sectors that some have begun to refer to as RUST (real estate, utilities, consumer staples, and telecommunication services).
Following the U.S. presidential election, U.S. equity markets produced strong gains, as the rotation out of bonds and into economically sensitive sectors continued and accelerated. Investors seemed to be anticipating that the Trump administration would lower taxes, increase infrastructure spending, and reduce regulation. Equity markets set records, but pulled back near the end of the period as certain legislative initiatives proved challenging to implement. In this environment, the fund's benchmark, the Russell Midcap Value Index, was up 19.82%.
What factors contributed to outperformance relative to the benchmark?
The financials, information technology, and utilities sectors were significant contributors to relative outperformance, primarily driven by positive sector allocation. The fund was underweight in the real estate and utilities sectors throughout the year, as these businesses traded at significant premiums to their historical averages. In the financials sector, the fund's holdings performed well and an overweight position in the sector added value to relative return.
Out-of-benchmark holding Discover Financial Services benefited from a very strong balance sheet and continued to return capital to its shareholders. Video game producer Activision Blizzard, Inc.'s business momentum picked up as revenues from popular online game franchises drove better-than-expected earnings. Our preference for Internet services companies such as NetEase, Inc. also aided the fund's returns.
What detracted from relative performance?
Security selection in the materials and industrials sectors detracted from relative returns. Security selection lagged partly due to our avoidance of the volatile precious metals industry. Several metals companies, such as Freeport McMoRan, Inc., did well on a low-quality rally, but such stocks don't fit our investment strategy.
The fund's positions in materials sector companies Graphic Packaging Holding Company, Sealed Air Corp., and Crown Holdings, Inc. lagged as high-quality companies have fallen out of favor relative to more volatile, cyclical commodity companies. Security selection in real estate was also a negative for the period.
TOP 10 HOLDINGS AS OF 3/31/17 (%)
| Harris Corp. | 2.0 |
| Activision Blizzard, Inc. | 1.9 |
| Unum Group | 1.8 |
| Stanley Black & Decker, Inc. | 1.7 |
| Fidelity National Information Services, Inc. | 1.6 |
| Amdocs, Ltd. | 1.6 |
| Boston Properties, Inc. | 1.5 |
| Huntington Bancshares, Inc. | 1.5 |
| Brunswick Corp. | 1.5 |
| SL Green Realty Corp. | 1.5 |
| TOTAL | 16.6 |
| As a percentage of net assets. | |
| Cash and cash equivalents are not included. |
What were some notable additions and deletions to the portfolio?
Among the holdings we added during the period were diversified industrial company AMETEK, Inc., which has a wide customer base that uses the company's measurement and analysis tools and is seeing solid business momentum. In financials, we bought Regions Financial Corp., which is trading at an attractive valuation and we believe will be able to expand its net interest margins with the potential for a steepening yield curve and rising short-term rates.
We purchased Hasbro, Inc., a toy company that has historically generated strong returns and has an attractive balance sheet. We also added Computer Sciences Corp., a technology services and consulting company with what we believe is a steady business model, high recurring revenue, and free cash flow generation.
In the energy sector, we continued to build the fund's positions in high-quality exploration and production companies such as Rice Energy, Inc., Gulfport Energy Corp., and QEP Resources, Inc. These companies appear to trade at a steep discount to their net asset values and we think that they will be able to generate significant returns over time. We also initiated a position in home builder PulteGroup, Inc., which trades at a discount to its peers, has revitalized its balance sheet, and has seen strong business momentum with the improvement of the housing market.
We sold positions in auto parts supplier Lear Corp. and consumer credit reporting agency Equifax, Inc., as they approached our target prices. We exited positions in a few commodity chemical companies from the basic industries segment. We sold CF Industries Holdings, Inc. due to slowing business momentum on uncertain overseas demand and recent earnings disappointments. We also sold Methanex Corp. on slowing momentum concerns, as the demand for methanol has decreased, putting pressure on prices and earnings.
How was the portfolio positioned at the end of the period?
We have positive views of the financials, information technology, and healthcare sectors, given that we believe these are stable industries with solid free cash flow. The fund was underweight in utilities and real estate. Our process remains focused on stocks with attractive valuations, strong business fundamentals, and positive business momentum.
MANAGED BY
 | Steven L. Pollack, CFA On the fund since 2000 Investing since 1984 |
 | Joseph F. Feeney, Jr., CFA On the fund since 2010 Investing since 1985 |
![]()
TOTAL RETURNS FOR THE PERIOD ENDED MARCH 31, 2017
| Average annual total returns (%) with maximum sales charge | Cumulative total returns (%) with maximum sales charge | ||||||
| 1-year | 5-year | 10-year | 5-year | 10-year | |||
| Class A1 | 13.98 | 13.72 | 9.66 | 90.15 | 151.42 | ||
| Class C1 | 17.99 | 13.99 | 9.38 | 92.47 | 145.05 | ||
| Class I1,2 | 20.25 | 15.20 | 10.58 | 102.87 | 173.47 | ||
| Class R21,2 | 19.76 | 14.73 | 10.05 | 98.75 | 160.66 | ||
| Class R41,2 | 20.09 | 14.98 | 10.40 | 100.93 | 169.02 | ||
| Class R61,2 | 20.35 | 15.29 | 10.67 | 103.67 | 175.51 | ||
| Class ADV1,2 | 19.88 | 14.83 | 10.19 | 99.65 | 163.95 | ||
| Index† | 19.82 | 14.07 | 7.47 | 93.13 | 105.59 | ||
Performance figures assume all distributions are reinvested. Figures reflect maximum sales charges on Class A shares of 5% and the applicable contingent deferred sales charge (CDSC) on Class C shares. Class C shares sold within one year of purchase are subject to a 1% CDSC. Sales charges are not applicable to Class I, Class R2, Class R4, Class R6, and Class ADV shares.
The expense ratios of the fund, both net (including any fee waivers and/or expense limitations) and gross (excluding any fee waivers and/or expense limitations), are set forth according to the most recent publicly available prospectuses for the fund and may differ from those disclosed in the Financial highlights tables in this report. Had the contractual fee waivers and expense limitations not been in place, gross expenses would apply. The expense ratios are as follows:
| Class A | Class C | Class I | Class R2 | Class R4 | Class R6 | Class ADV | |
| Gross (%) | 1.13 | 1.88 | 0.86 | 1.27 | 1.12 | 0.77 | 1.13 |
| Net (%) | 1.13 | 1.88 | 0.86 | 1.27 | 1.02 | 0.77 | 1.13 |
Please refer to the most recent prospectus and annual or semiannual report for more information on expenses and any expense limitation arrangements for each class.
The returns reflect past results and should not be considered indicative of future performance. The return and principal value of an investment will fluctuate so that shares, when redeemed, may be worth more or less than their original cost. Due to market volatility and other factors, the fund's current performance may be higher or lower than the performance shown. For current to the most recent month-end performance data, please call 800-225-5291 or visit the fund's website at jhinvestments.com.
The performance table above and the chart on the next page do not reflect the deduction of taxes that a shareholder would pay on fund distributions or the redemption of fund shares. The fund's performance results reflect any applicable fee waivers or expense reductions, without which the expenses would increase and results would have been less favorable.
| † | Index is the Russell Midcap Value Index. |
See the following page for footnotes.
This chart and table show what happened to a hypothetical $10,000 investment in John Hancock Disciplined Value Mid Cap Fund for the share classes and periods indicated, assuming all distributions were reinvested. For comparison, we've shown the same investment in the Russell Midcap Value Index.
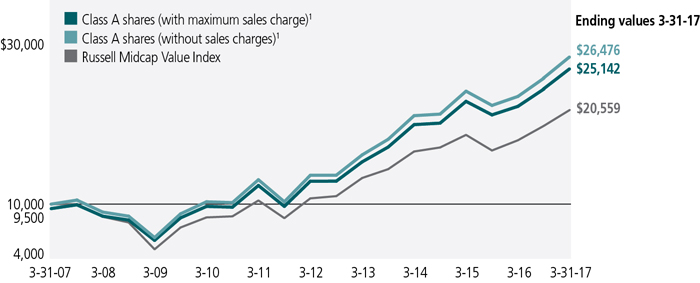
The Russell Midcap Value Index is an unmanaged index that measures the performance of those Russell Midcap companies with lower price-to-book ratios and lower forecasted growth values.
It is not possible to invest directly in an index. Index figures do not reflect expenses or sales charges, which would result in lower returns.
Footnotes related to performance pages
| 1 | After the close of business on 7-9-10, holders of Investor shares and Institutional shares of the former Robeco Boston Partners Mid Cap Value Fund (the predecessor fund) became owners of an equal number of full and fractional Class A and Class I shares, respectively, of John Hancock Disciplined Value Mid Cap Fund. Class A, Class I, and Class ADV shares were first offered on 7-12-10. The returns prior to this date for Class A and Class ADV shares are those of the predecessor fund's Investor shares that have been recalculated to reflect the gross fees and expenses of the fund's Class A and Class ADV shares. For Class I shares, the returns prior to this date are those of the predecessor fund's Institutional shares that have been recalculated to reflect the gross fees and expenses of the fund's Class I shares. Class C, Class R2, Class R4, and Class R6 shares were first offered on 8-15-11, 3-1-12, 7-2-13, and 9-1-11, respectively. The returns prior to these dates are those of Class A shares that have been recalculated to apply the gross fees and expenses of Class C, Class R2, Class R4, and Class R6 shares, as applicable. |
| 2 | For certain types of investors, as described in the fund's prospectuses. |
| 3 | The contingent deferred sales charge is not applicable. |
These examples are intended to help you understand your ongoing operating expenses of investing in the fund so you can compare these costs with the ongoing costs of investing in other mutual funds.
Understanding fund expenses
As a shareholder of the fund, you incur two types of costs:
| • | Transaction costs, which include sales charges (loads) on purchases or redemptions (varies by share class), minimum account fee charge, etc. |
| • | Ongoing operating expenses, including management fees, distribution and service fees (if applicable), and other fund expenses. |
We are presenting only your ongoing operating expenses here.
Actual expenses/actual returns
The first line of each share class in the table on the following page is intended to provide information about the fund's actual ongoing operating expenses, and is based on the fund's actual return. It assumes an account value of $1,000.00 on October 1, 2016, with the same investment held until March 31, 2017.
Together with the value of your account, you may use this information to estimate the operating expenses that you paid over the period. Simply divide your account value at March 31, 2017, by $1,000.00, then multiply it by the "expenses paid" for your share class from the table. For example, for an account value of $8,600.00, the operating expenses should be calculated as follows:
Hypothetical example for comparison purposes
The second line of each share class in the table on the following page allows you to compare the fund's ongoing operating expenses with those of any other fund. It provides an example of the fund's hypothetical account values and hypothetical expenses based on each class's actual expense ratio and an assumed 5% annualized return before expenses (which is not the fund's actual return). It assumes an account value of $1,000.00 on October 1, 2016, with the same investment held until March 31, 2017. Look in any other fund shareholder report to find its hypothetical example and you will be able to compare these expenses. Please remember that these hypothetical account values and expenses may not be used to estimate the actual ending account balance or expenses you paid for the period.
Remember, these examples do not include any transaction costs, therefore, these examples will not help you to determine the relative total costs of owning different funds. If transaction costs were included, your expenses would have been higher. See the prospectuses for details regarding transaction costs.
SHAREHOLDER EXPENSE EXAMPLE CHART
| Account value on 10-1-2016 | Ending value on 3-31-2017 | Expenses paid during period ended 3-31-20171 | Annualized expense ratio | ||
| Class A | Actual expenses/actual returns | $1,000.00 | $1,098.00 | $5.86 | 1.12% |
| Hypothetical example for comparison purposes | 1,000.00 | 1,019.30 | 5.64 | 1.12% | |
| Class C | Actual expenses/actual returns | 1,000.00 | 1,093.80 | 9.76 | 1.87% |
| Hypothetical example for comparison purposes | 1,000.00 | 1,015.60 | 9.40 | 1.87% | |
| Class I | Actual expenses/actual returns | 1,000.00 | 1,099.10 | 4.50 | 0.86% |
| Hypothetical example for comparison purposes | 1,000.00 | 1,020.60 | 4.33 | 0.86% | |
| Class R2 | Actual expenses/actual returns | 1,000.00 | 1,097.00 | 6.59 | 1.26% |
| Hypothetical example for comparison purposes | 1,000.00 | 1,018.60 | 6.34 | 1.26% | |
| Class R4 | Actual expenses/actual returns | 1,000.00 | 1,098.70 | 5.18 | 0.99% |
| Hypothetical example for comparison purposes | 1,000.00 | 1,020.00 | 4.99 | 0.99% | |
| Class R6 | Actual expenses/actual returns | 1,000.00 | 1,099.50 | 3.98 | 0.76% |
| Hypothetical example for comparison purposes | 1,000.00 | 1,021.10 | 3.83 | 0.76% | |
| Class ADV | Actual expenses/actual returns | 1,000.00 | 1,097.70 | 5.86 | 1.12% |
| Hypothetical example for comparison purposes | 1,000.00 | 1,019.30 | 5.64 | 1.12% | |
| 1 | Expenses are equal to the fund's annualized expense ratio, multiplied by the average account value over the period, multiplied by 182/365 (to reflect the one-half year period). |
Fund's investments
| As of 3-31-17 | ||||||||||||||
| Shares | Value | |||||||||||||
| Common stocks 97.3% | $13,632,828,742 | |||||||||||||
| (Cost $10,206,873,568) | ||||||||||||||
| Consumer discretionary 6.9% | 970,789,209 | |||||||||||||
| Auto components 1.1% | ||||||||||||||
| BorgWarner, Inc. | 1,769,436 | 73,944,730 | ||||||||||||
| Tenneco, Inc. | 1,256,903 | 78,455,885 | ||||||||||||
| Household durables 1.2% | ||||||||||||||
| Newell Brands, Inc. | 2,801,993 | 132,170,010 | ||||||||||||
| PulteGroup, Inc. | 1,741,019 | 41,000,997 | ||||||||||||
| Internet and direct marketing retail 0.6% | ||||||||||||||
| Expedia, Inc. | 694,772 | 87,659,383 | ||||||||||||
| Leisure products 1.8% | ||||||||||||||
| Brunswick Corp. | 3,433,276 | 210,116,491 | ||||||||||||
| Hasbro, Inc. | 384,950 | 38,425,709 | ||||||||||||
| Media 1.4% | ||||||||||||||
| Omnicom Group, Inc. | 1,073,057 | 92,508,244 | ||||||||||||
| The Interpublic Group of Companies, Inc. | 4,347,744 | 106,824,070 | ||||||||||||
| Specialty retail 0.8% | ||||||||||||||
| Advance Auto Parts, Inc. | 458,988 | 68,049,561 | ||||||||||||
| Best Buy Company, Inc. (L) | 847,083 | 41,634,129 | ||||||||||||
| Consumer staples 0.5% | 73,989,767 | |||||||||||||
| Beverages 0.5% | ||||||||||||||
| Coca-Cola European Partners PLC | 1,963,114 | 73,989,767 | ||||||||||||
| Energy 8.2% | 1,139,593,468 | |||||||||||||
| Oil, gas and consumable fuels 8.2% | ||||||||||||||
| Cimarex Energy Company | 350,290 | 41,856,152 | ||||||||||||
| Diamondback Energy, Inc. (I) | 1,761,398 | 182,683,394 | ||||||||||||
| Energen Corp. (I) | 2,650,799 | 144,309,498 | ||||||||||||
| EQT Corp. | 1,184,351 | 72,363,846 | ||||||||||||
| Gulfport Energy Corp. (I) | 2,153,638 | 37,021,037 | ||||||||||||
| Marathon Oil Corp. | 5,550,709 | 87,701,202 | ||||||||||||
| Marathon Petroleum Corp. | 2,490,718 | 125,880,888 | ||||||||||||
| Newfield Exploration Company (I) | 2,266,051 | 83,639,942 | ||||||||||||
| Parsley Energy, Inc., Class A (I) | 4,053,977 | 131,794,792 | ||||||||||||
| QEP Resources, Inc. (I) | 3,341,262 | 42,467,440 | ||||||||||||
| Rice Energy, Inc. (I) | 1,551,210 | 36,763,677 | ||||||||||||
| RSP Permian, Inc. (I)(L) | 2,662,551 | 110,309,488 | ||||||||||||
| Tesoro Corp. | 528,030 | 42,802,112 | ||||||||||||
| Shares | Value | |||||||||||||
| Financials 24.4% | $3,418,244,038 | |||||||||||||
| Banks 6.3% | ||||||||||||||
| BB&T Corp. | 1,415,342 | 63,265,787 | ||||||||||||
| East West Bancorp, Inc. | 3,178,389 | 164,036,656 | ||||||||||||
| Fifth Third Bancorp | 7,602,578 | 193,105,481 | ||||||||||||
| Huntington Bancshares, Inc. (L) | 15,835,119 | 212,032,243 | ||||||||||||
| Regions Financial Corp. | 3,501,639 | 50,878,815 | ||||||||||||
| SunTrust Banks, Inc. | 3,569,575 | 197,397,498 | ||||||||||||
| Capital markets 4.6% | ||||||||||||||
| Moody's Corp. | 413,052 | 46,278,346 | ||||||||||||
| Raymond James Financial, Inc. (L) | 2,703,110 | 206,139,169 | ||||||||||||
| SEI Investments Company | 1,955,541 | 98,637,488 | ||||||||||||
| State Street Corp. (L) | 1,912,921 | 152,287,641 | ||||||||||||
| TD Ameritrade Holding Corp. | 3,704,334 | 143,950,419 | ||||||||||||
| Consumer finance 2.9% | ||||||||||||||
| Discover Financial Services | 2,905,371 | 198,698,323 | ||||||||||||
| Navient Corp. | 4,511,090 | 66,583,688 | ||||||||||||
| SLM Corp. (I) | 8,410,157 | 101,762,900 | ||||||||||||
| Synchrony Financial | 1,010,308 | 34,653,564 | ||||||||||||
| Insurance 10.6% | ||||||||||||||
| Alleghany Corp. (I) | 326,929 | 200,950,179 | ||||||||||||
| Aon PLC | 1,292,830 | 153,445,993 | ||||||||||||
| Loews Corp. | 2,731,607 | 127,757,259 | ||||||||||||
| Marsh & McLennan Companies, Inc. | 1,812,892 | 133,954,590 | ||||||||||||
| Reinsurance Group of America, Inc. | 1,523,217 | 193,418,095 | ||||||||||||
| The Allstate Corp. | 1,920,819 | 156,527,540 | ||||||||||||
| Torchmark Corp. | 1,158,995 | 89,288,975 | ||||||||||||
| Unum Group | 5,346,010 | 250,674,409 | ||||||||||||
| W.R. Berkley Corp. | 1,987,909 | 140,406,013 | ||||||||||||
| XL Group, Ltd. | 1,056,522 | 42,112,967 | ||||||||||||
| Health care 5.7% | 800,420,812 | |||||||||||||
| Health care equipment and supplies 2.4% | ||||||||||||||
| Becton, Dickinson and Company | 650,463 | 119,320,933 | ||||||||||||
| Boston Scientific Corp. (I) | 5,199,609 | 129,314,276 | ||||||||||||
| Zimmer Biomet Holdings, Inc. | 687,835 | 83,991,532 | ||||||||||||
| Health care providers and services 2.8% | ||||||||||||||
| Cardinal Health, Inc. | 913,536 | 74,498,861 | ||||||||||||
| DaVita, Inc. (I) | 1,418,266 | 96,399,540 | ||||||||||||
| Laboratory Corp. of America Holdings (I) | 944,590 | 135,520,327 | ||||||||||||
| Universal Health Services, Inc., Class B | 684,904 | 85,236,303 | ||||||||||||
| Life sciences tools and services 0.5% | ||||||||||||||
| Bruker Corp. | 1,745,775 | 40,728,931 | ||||||||||||
| ICON PLC (I) | 444,181 | 35,410,109 | ||||||||||||
| Shares | Value | |||||||||||||
| Industrials 13.7% | $1,920,082,644 | |||||||||||||
| Aerospace and defense 1.4% | ||||||||||||||
| Curtiss-Wright Corp. | 538,218 | 49,117,775 | ||||||||||||
| Huntington Ingalls Industries, Inc. | 333,102 | 66,700,344 | ||||||||||||
| Textron, Inc. | 1,643,288 | 78,204,076 | ||||||||||||
| Airlines 0.6% | ||||||||||||||
| Delta Air Lines, Inc. | 920,598 | 42,310,684 | ||||||||||||
| United Continental Holdings, Inc. (I) | 633,027 | 44,717,027 | ||||||||||||
| Building products 1.1% | ||||||||||||||
| Masco Corp. | 4,370,957 | 148,568,828 | ||||||||||||
| Construction and engineering 0.4% | ||||||||||||||
| Fluor Corp. | 1,069,725 | 56,288,930 | ||||||||||||
| Electrical equipment 1.9% | ||||||||||||||
| AMETEK, Inc. | 1,167,073 | 63,115,308 | ||||||||||||
| Eaton Corp. PLC | 1,107,447 | 82,117,195 | ||||||||||||
| EnerSys | 487,649 | 38,495,012 | ||||||||||||
| Hubbell, Inc. | 716,114 | 85,969,486 | ||||||||||||
| Machinery 4.2% | ||||||||||||||
| Ingersoll-Rand PLC | 2,144,851 | 174,419,283 | ||||||||||||
| Stanley Black & Decker, Inc. | 1,767,658 | 234,868,718 | ||||||||||||
| The Timken Company | 1,887,482 | 85,314,186 | ||||||||||||
| WABCO Holdings, Inc. (I) | 808,945 | 94,986,322 | ||||||||||||
| Professional services 2.9% | ||||||||||||||
| ManpowerGroup, Inc. | 1,807,406 | 185,385,633 | ||||||||||||
| Nielsen Holdings PLC | 983,717 | 40,637,349 | ||||||||||||
| Robert Half International, Inc. | 3,650,070 | 178,232,918 | ||||||||||||
| Trading companies and distributors 1.2% | ||||||||||||||
| HD Supply Holdings, Inc. (I) | 1,935,508 | 79,597,767 | ||||||||||||
| WESCO International, Inc. (I) | 1,308,926 | 91,035,803 | ||||||||||||
| Information technology 17.9% | 2,512,011,323 | |||||||||||||
| Communications equipment 2.7% | ||||||||||||||
| CommScope Holding Company, Inc. (I) | 2,248,767 | 93,796,072 | ||||||||||||
| Harris Corp. | 2,514,111 | 279,745,131 | ||||||||||||
| Electronic equipment, instruments and components 3.9% | ||||||||||||||
| Arrow Electronics, Inc. (I) | 2,462,505 | 180,772,492 | ||||||||||||
| Flex, Ltd. (I) | 9,247,642 | 155,360,389 | ||||||||||||
| Jabil Circuit, Inc. | 2,914,189 | 84,278,346 | ||||||||||||
| TE Connectivity, Ltd. | 1,619,475 | 120,731,861 | ||||||||||||
| Internet software and services 2.3% | ||||||||||||||
| eBay, Inc. (I) | 3,820,591 | 128,257,240 | ||||||||||||
| InterActiveCorp (I) | 1,317,438 | 97,121,529 | ||||||||||||
| NetEase, Inc., ADR | 369,226 | 104,860,184 | ||||||||||||
| Shares | Value | |||||||||||||
| Information technology (continued) | ||||||||||||||
| IT services 4.8% | ||||||||||||||
| Alliance Data Systems Corp. | 155,968 | $38,836,032 | ||||||||||||
| Amdocs, Ltd. | 3,691,282 | 225,131,289 | ||||||||||||
| Cognizant Technology Solutions Corp., Class A (I) | 690,918 | 41,123,439 | ||||||||||||
| Computer Sciences Corp. | 1,169,625 | 80,715,821 | ||||||||||||
| Fidelity National Information Services, Inc. | 2,828,223 | 225,183,115 | ||||||||||||
| Leidos Holdings, Inc. | 1,287,260 | 65,830,476 | ||||||||||||
| Semiconductors and semiconductor equipment 1.9% | ||||||||||||||
| Broadcom, Ltd. | 201,783 | 44,182,406 | ||||||||||||
| Microsemi Corp. (I) | 1,594,505 | 82,164,843 | ||||||||||||
| ON Semiconductor Corp. (I) | 5,739,687 | 88,907,752 | ||||||||||||
| Skyworks Solutions, Inc. | 551,798 | 54,065,168 | ||||||||||||
| Software 1.9% | ||||||||||||||
| Activision Blizzard, Inc. | 5,355,976 | 267,048,963 | ||||||||||||
| Technology hardware, storage and peripherals 0.4% | ||||||||||||||
| Western Digital Corp. | 653,081 | 53,898,775 | ||||||||||||
| Materials 5.3% | 737,333,323 | |||||||||||||
| Chemicals 0.6% | ||||||||||||||
| PPG Industries, Inc. | 717,211 | 75,364,532 | ||||||||||||
| Valvoline, Inc. (L) | 386,656 | 9,492,405 | ||||||||||||
| Containers and packaging 3.7% | ||||||||||||||
| Avery Dennison Corp. | 483,541 | 38,973,405 | ||||||||||||
| Berry Plastics Group, Inc. (I) | 2,875,863 | 139,680,666 | ||||||||||||
| Crown Holdings, Inc. (I) | 2,492,095 | 131,956,430 | ||||||||||||
| Graphic Packaging Holding Company | 3,364,411 | 43,299,970 | ||||||||||||
| Sealed Air Corp. | 2,426,283 | 105,737,413 | ||||||||||||
| WestRock Company | 1,103,070 | 57,392,732 | ||||||||||||
| Metals and mining 1.0% | ||||||||||||||
| Steel Dynamics, Inc. | 3,896,311 | 135,435,770 | ||||||||||||
| Real estate 8.5% | 1,189,062,138 | |||||||||||||
| Equity real estate investment trusts 8.5% | ||||||||||||||
| American Assets Trust, Inc. | 1,412,475 | 59,097,954 | ||||||||||||
| American Homes 4 Rent, Class A (L) | 2,100,590 | 48,229,546 | ||||||||||||
| Boston Properties, Inc. | 1,607,675 | 212,872,247 | ||||||||||||
| Douglas Emmett, Inc. | 2,549,068 | 97,884,211 | ||||||||||||
| Equity Residential | 1,188,953 | 73,976,656 | ||||||||||||
| Essex Property Trust, Inc. | 227,064 | 52,572,128 | ||||||||||||
| GGP, Inc. (L) | 3,470,768 | 80,452,402 | ||||||||||||
| Kilroy Realty Corp. | 592,721 | 42,723,330 | ||||||||||||
| Kimco Realty Corp. | 4,071,245 | 89,933,802 | ||||||||||||
| Regency Centers Corp. | 2,631,060 | 174,676,073 | ||||||||||||
| SL Green Realty Corp. (L) | 1,963,628 | 209,362,017 | ||||||||||||
| Shares | Value | |||||||||||||
| Real estate (continued) | ||||||||||||||
| Equity real estate investment trusts (continued) | ||||||||||||||
| The Macerich Company | 734,189 | $47,281,772 | ||||||||||||
| Utilities 6.2% | 871,302,020 | |||||||||||||
| Electric utilities 5.6% | ||||||||||||||
| Alliant Energy Corp. | 2,185,813 | 86,580,053 | ||||||||||||
| American Electric Power Company, Inc. | 2,275,691 | 152,767,137 | ||||||||||||
| Edison International | 2,347,633 | 186,895,063 | ||||||||||||
| Great Plains Energy, Inc. | 4,435,361 | 129,601,248 | ||||||||||||
| PG&E Corp. | 2,275,343 | 150,991,761 | ||||||||||||
| Portland General Electric Company | 1,737,806 | 77,193,343 | ||||||||||||
| Multi-utilities 0.6% | ||||||||||||||
| Ameren Corp. | 1,598,707 | 87,273,415 | ||||||||||||
| Yield (%) | Shares | Value | ||||||||||||
| Securities lending collateral 0.7% | $93,840,677 | |||||||||||||
| (Cost $93,840,726) | ||||||||||||||
| John Hancock Collateral Trust (W) | 0.9609(Y | ) | 9,378,066 | 93,840,677 | ||||||||||
| Short-term investments 2.4% | $338,728,349 | |||||||||||||
| (Cost $338,728,349) | ||||||||||||||
| Money market funds 2.4% | 338,728,349 | |||||||||||||
| State Street Institutional U.S. Government Money Market Fund, Premier Class | 0.6179(Y | ) | 338,728,349 | 338,728,349 | ||||||||||
| Total investments (Cost $10,639,442,643)† 100.4% | $14,065,397,768 | |||||||||||||
| Other assets and liabilities, net (0.4%) | ($58,700,471 | ) | ||||||||||||
| Total net assets 100.0% | $14,006,697,297 | |||||||||||||
| The percentage shown for each investment category is the total value of the category as a percentage of the net assets of the fund. | ||||||||||||||
| Security Abbreviations and Legend | ||||||||||||||
| ADR | American Depositary Receipts | |||||||||||||
| (I) | Non-income producing security. | |||||||||||||
| (L) | A portion of this security is on loan as of 3-31-17. | |||||||||||||
| (W) | Investment is an affiliate of the fund, the advisor and/or subadvisor. This security represents the investment of cash collateral received for securities lending. | |||||||||||||
| (Y) | The rate shown is the annualized seven-day yield as of 3-31-17. | |||||||||||||
| † | At 3-31-17, the aggregate cost of investment securities for federal income tax purposes was $10,719,208,062. Net unrealized appreciation aggregated to $3,346,189,706, of which $3,439,129,895 related to appreciated investment securities and $92,940,189 related to depreciated investment securities. | |||||||||||||
Financial statements
STATEMENT OF ASSETS AND LIABILITIES 3-31-17
| Assets | ||||||||||||||||||||||||||||||
| Unaffiliated investments, at value (Cost $10,545,601,917) including $90,556,251 of securities loaned | $13,971,557,091 | |||||||||||||||||||||||||||||
| Affiliated investments, at value (Cost $93,840,726) | 93,840,677 | |||||||||||||||||||||||||||||
| Total investments, at value (Cost $10,639,442,643) | 14,065,397,768 | |||||||||||||||||||||||||||||
| Receivable for investments sold | 25,329,345 | |||||||||||||||||||||||||||||
| Receivable for fund shares sold | 26,217,014 | |||||||||||||||||||||||||||||
| Dividends and interest receivable | 18,077,577 | |||||||||||||||||||||||||||||
| Receivable for securities lending income | 6,040 | |||||||||||||||||||||||||||||
| Other receivables and prepaid expenses | 239,517 | |||||||||||||||||||||||||||||
| Total assets | 14,135,267,261 | |||||||||||||||||||||||||||||
| Liabilities | ||||||||||||||||||||||||||||||
| Payable for investments purchased | 1,884,894 | |||||||||||||||||||||||||||||
| Payable for fund shares repurchased | 30,371,461 | |||||||||||||||||||||||||||||
| Payable upon return of securities loaned | 93,839,743 | |||||||||||||||||||||||||||||
| Payable to affiliates | ||||||||||||||||||||||||||||||
| Accounting and legal services fees | 306,322 | |||||||||||||||||||||||||||||
| Transfer agent fees | 1,165,104 | |||||||||||||||||||||||||||||
| Distribution and service fees | 101,844 | |||||||||||||||||||||||||||||
| Trustees' fees | 7,474 | |||||||||||||||||||||||||||||
| Other liabilities and accrued expenses | 893,122 | |||||||||||||||||||||||||||||
| Total liabilities | 128,569,964 | |||||||||||||||||||||||||||||
| Net assets | $14,006,697,297 | |||||||||||||||||||||||||||||
| Net assets consist of | ||||||||||||||||||||||||||||||
| Paid-in capital | $10,251,100,423 | |||||||||||||||||||||||||||||
| Undistributed net investment income | 11,619,265 | |||||||||||||||||||||||||||||
| Accumulated net realized gain (loss) on investments and investments | 318,022,484 | |||||||||||||||||||||||||||||
| Net unrealized appreciation (depreciation) on investments | 3,425,955,125 | |||||||||||||||||||||||||||||
| Net assets | $14,006,697,297 | |||||||||||||||||||||||||||||
STATEMENT OF ASSETS AND LIABILITIES (continued)
| Net asset value per share | ||||||||||||||||||
| Based on net asset values and shares outstanding-the fund has an unlimited number of shares authorized with no par value | ||||||||||||||||||
| Class A ($2,088,458,451 ÷ 96,647,532 shares)1 | $21.61 | |||||||||||||||||
| Class C ($318,688,047 ÷ 14,636,012 shares)1 | $21.77 | |||||||||||||||||
| Class I ($9,512,176,905 ÷ 424,778,373 shares) | $22.39 | |||||||||||||||||
| Class R2 ($215,858,559 ÷ 9,669,060 shares) | $22.32 | |||||||||||||||||
| Class R4 ($95,427,889 ÷ 4,264,516 shares) | $22.38 | |||||||||||||||||
| Class R6 ($1,773,944,315 ÷ 79,248,370 shares) | $22.38 | |||||||||||||||||
| Class ADV ($2,143,131 ÷ 99,389 shares) | $21.56 | |||||||||||||||||
| Maximum offering price per share | ||||||||||||||||||
| Class A (net asset value per share ÷ 95%)2 | $22.75 | |||||||||||||||||
| 1 | Redemption price per share is equal to net asset value less any applicable contingent deferred sales charge. | ||||||||||||||||
| 2 | On single retail sales of less than $50,000. On sales of $50,000 or more and on group sales the offering price is reduced. | ||||||||||||||||
STATEMENT OF OPERATIONS For the year ended 3-31-17
| Investment income | ||||||||||||||||||||||||
| Dividends | $201,782,886 | |||||||||||||||||||||||
| Interest | 867,867 | |||||||||||||||||||||||
| Securities lending | 758,253 | |||||||||||||||||||||||
| Less foreign taxes withheld | (43,469 | ) | ||||||||||||||||||||||
| Total investment income | 203,365,537 | |||||||||||||||||||||||
| Expenses | ||||||||||||||||||||||||
| Investment management fees | 90,044,579 | |||||||||||||||||||||||
| Distribution and service fees | 10,084,910 | |||||||||||||||||||||||
| Accounting and legal services fees | 1,864,634 | |||||||||||||||||||||||
| Transfer agent fees | 12,805,500 | |||||||||||||||||||||||
| Trustees' fees | 204,914 | |||||||||||||||||||||||
| State registration fees | 350,986 | |||||||||||||||||||||||
| Printing and postage | 752,965 | |||||||||||||||||||||||
| Professional fees | 397,810 | |||||||||||||||||||||||
| Custodian fees | 1,376,504 | |||||||||||||||||||||||
| Other | 153,106 | |||||||||||||||||||||||
| Total expenses | 118,035,908 | |||||||||||||||||||||||
| Less expense reductions | (1,051,460 | ) | ||||||||||||||||||||||
| Net expenses | 116,984,448 | |||||||||||||||||||||||
| Net investment income | 86,381,089 | |||||||||||||||||||||||
| Realized and unrealized gain (loss) | ||||||||||||||||||||||||
| Net realized gain (loss) on | ||||||||||||||||||||||||
| Unaffiliated investments | 620,467,024 | |||||||||||||||||||||||
| Affiliated investments | 22,330 | |||||||||||||||||||||||
| 620,489,354 | ||||||||||||||||||||||||
| Change in net unrealized appreciation (depreciation) of | ||||||||||||||||||||||||
| Unaffiliated investments | 1,617,214,360 | |||||||||||||||||||||||
| Affiliated investments | (18,786 | ) | ||||||||||||||||||||||
| 1,617,195,574 | ||||||||||||||||||||||||
| Net realized and unrealized gain | 2,237,684,928 | |||||||||||||||||||||||
| Increase in net assets from operations | $2,324,066,017 | |||||||||||||||||||||||
STATEMENTS OF CHANGES IN NET ASSETS
| Year ended 3-31-17 | Year ended 3-31-16 | ||||||||||||||||||||||||||||||||||||||||||||
| Increase (decrease) in net assets | |||||||||||||||||||||||||||||||||||||||||||||
| From operations | |||||||||||||||||||||||||||||||||||||||||||||
| Net investment income | $86,381,089 | $100,220,069 | |||||||||||||||||||||||||||||||||||||||||||
| Net realized gain | 620,489,354 | 377,903,769 | |||||||||||||||||||||||||||||||||||||||||||
| Change in net unrealized appreciation (depreciation) | 1,617,195,574 | (750,835,194 | ) | ||||||||||||||||||||||||||||||||||||||||||
| Increase (decrease) in net assets resulting from operations | 2,324,066,017 | (272,711,356 | ) | ||||||||||||||||||||||||||||||||||||||||||
| Distributions to shareholders | |||||||||||||||||||||||||||||||||||||||||||||
| From net investment income | |||||||||||||||||||||||||||||||||||||||||||||
| Class A | (15,701,779 | ) | (6,909,198 | ) | |||||||||||||||||||||||||||||||||||||||||
| Class I | (77,837,376 | ) | (44,367,788 | ) | |||||||||||||||||||||||||||||||||||||||||
| Class R2 | (1,161,617 | ) | (449,251 | ) | |||||||||||||||||||||||||||||||||||||||||
| Class R4 | (658,127 | ) | (516,113 | ) | |||||||||||||||||||||||||||||||||||||||||
| Class R6 | (15,527,072 | ) | (6,282,487 | ) | |||||||||||||||||||||||||||||||||||||||||
| Class ADV | (13,997 | ) | (2,444 | ) | |||||||||||||||||||||||||||||||||||||||||
| From net realized gain | |||||||||||||||||||||||||||||||||||||||||||||
| Class A | (45,260,409 | ) | (118,530,557 | ) | |||||||||||||||||||||||||||||||||||||||||
| Class C | (6,373,935 | ) | (19,552,094 | ) | |||||||||||||||||||||||||||||||||||||||||
| Class I | (163,576,275 | ) | (426,532,269 | ) | |||||||||||||||||||||||||||||||||||||||||
| Class R2 | (4,147,662 | ) | (13,446,594 | ) | |||||||||||||||||||||||||||||||||||||||||
| Class R4 | (1,647,589 | ) | (6,646,956 | ) | |||||||||||||||||||||||||||||||||||||||||
| Class R6 | (29,927,014 | ) | (51,664,209 | ) | |||||||||||||||||||||||||||||||||||||||||
| Class ADV | (40,346 | ) | (50,644 | ) | |||||||||||||||||||||||||||||||||||||||||
| Total distributions | (361,873,198 | ) | (694,950,604 | ) | |||||||||||||||||||||||||||||||||||||||||
| From fund share transactions | 550,891,365 | 1,654,438,937 | |||||||||||||||||||||||||||||||||||||||||||
| Total increase | 2,513,084,184 | 686,776,977 | |||||||||||||||||||||||||||||||||||||||||||
| Net assets | |||||||||||||||||||||||||||||||||||||||||||||
| Beginning of year | 11,493,613,113 | 10,806,836,136 | |||||||||||||||||||||||||||||||||||||||||||
| End of year | $14,006,697,297 | $11,493,613,113 | |||||||||||||||||||||||||||||||||||||||||||
| Undistributed net investment income | $11,619,265 | $36,138,144 | |||||||||||||||||||||||||||||||||||||||||||
Financial highlights
| Class A Shares Period ended | 3-31-17 | 3-31-16 | 3-31-15 | 3-31-14 | 3-31-13 | ||||||||||||||||||||||||||||||||||||||||||||||||||||||||||||||||||||||||||||||||||||||||||||||||||
| Per share operating performance | |||||||||||||||||||||||||||||||||||||||||||||||||||||||||||||||||||||||||||||||||||||||||||||||||||||||
| Net asset value, beginning of period | $18.49 | $20.19 | $18.23 | $14.51 | $12.41 | ||||||||||||||||||||||||||||||||||||||||||||||||||||||||||||||||||||||||||||||||||||||||||||||||||
| Net investment income1 | 0.10 | 0.13 | 0.05 | 0.05 | 0.05 | ||||||||||||||||||||||||||||||||||||||||||||||||||||||||||||||||||||||||||||||||||||||||||||||||||
| Net realized and unrealized gain (loss) on investments | 3.57 | (0.63 | ) | 2.42 | 4.03 | 2.09 | |||||||||||||||||||||||||||||||||||||||||||||||||||||||||||||||||||||||||||||||||||||||||||||||||
| Total from investment operations | 3.67 | (0.50 | ) | 2.47 | 4.08 | 2.14 | |||||||||||||||||||||||||||||||||||||||||||||||||||||||||||||||||||||||||||||||||||||||||||||||||
| Less distributions | |||||||||||||||||||||||||||||||||||||||||||||||||||||||||||||||||||||||||||||||||||||||||||||||||||||||
| From net investment income | (0.14 | ) | (0.07 | ) | (0.06 | ) | (0.04 | ) | (0.04 | ) | |||||||||||||||||||||||||||||||||||||||||||||||||||||||||||||||||||||||||||||||||||||||||||||
| From net realized gain | (0.41 | ) | (1.13 | ) | (0.45 | ) | (0.32 | ) | — | ||||||||||||||||||||||||||||||||||||||||||||||||||||||||||||||||||||||||||||||||||||||||||||||
| Total distributions | (0.55 | ) | (1.20 | ) | (0.51 | ) | (0.36 | ) | (0.04 | ) | |||||||||||||||||||||||||||||||||||||||||||||||||||||||||||||||||||||||||||||||||||||||||||||
| Net asset value, end of period | $21.61 | $18.49 | $20.19 | $18.23 | $14.51 | ||||||||||||||||||||||||||||||||||||||||||||||||||||||||||||||||||||||||||||||||||||||||||||||||||
| Total return (%)2,3 | 19.96 | (2.59 | ) | 13.78 | 28.30 | 17.31 | |||||||||||||||||||||||||||||||||||||||||||||||||||||||||||||||||||||||||||||||||||||||||||||||||
| Ratios and supplemental data | |||||||||||||||||||||||||||||||||||||||||||||||||||||||||||||||||||||||||||||||||||||||||||||||||||||||
| Net assets, end of period (in millions) | $2,088 | $1,971 | $2,148 | $3,086 | $1,169 | ||||||||||||||||||||||||||||||||||||||||||||||||||||||||||||||||||||||||||||||||||||||||||||||||||
| Ratios (as a percentage of average net assets): | |||||||||||||||||||||||||||||||||||||||||||||||||||||||||||||||||||||||||||||||||||||||||||||||||||||||
| Expenses before reductions | 1.12 | 1.13 | 1.13 | 1.18 | 1.27 | ||||||||||||||||||||||||||||||||||||||||||||||||||||||||||||||||||||||||||||||||||||||||||||||||||
| Expenses including reductions | 1.12 | 1.12 | 1.13 | 1.17 | 1.27 | ||||||||||||||||||||||||||||||||||||||||||||||||||||||||||||||||||||||||||||||||||||||||||||||||||
| Net investment income | 0.48 | 0.70 | 0.28 | 0.32 | 0.38 | ||||||||||||||||||||||||||||||||||||||||||||||||||||||||||||||||||||||||||||||||||||||||||||||||||
| Portfolio turnover (%) | 50 | 47 | 35 | 39 | 55 | ||||||||||||||||||||||||||||||||||||||||||||||||||||||||||||||||||||||||||||||||||||||||||||||||||
| 1 | Based on average daily shares outstanding. | ||||||||||||||||||||||||||||||||||||||||||||||||||||||||||||||||||||||||||||||||||
| 2 | Total returns would have been lower had certain expenses not been reduced during the applicable periods. | ||||||||||||||||||||||||||||||||||||||||||||||||||||||||||||||||||||||||||||||||||
| 3 | Does not reflect the effect of sales charges, if any. | ||||||||||||||||||||||||||||||||||||||||||||||||||||||||||||||||||||||||||||||||||
| Class C Shares Period ended | 3-31-17 | 3-31-16 | 3-31-15 | 3-31-14 | 3-31-13 | ||||||||||||||||||||||||||||||||||||||||||||||||||||||||||||||||||||||||||||||||||||||||||||||||||
| Per share operating performance | |||||||||||||||||||||||||||||||||||||||||||||||||||||||||||||||||||||||||||||||||||||||||||||||||||||||
| Net asset value, beginning of period | $18.65 | $20.43 | $18.53 | $14.82 | $12.74 | ||||||||||||||||||||||||||||||||||||||||||||||||||||||||||||||||||||||||||||||||||||||||||||||||||
| Net investment loss1 | (0.05 | ) | (0.01 | ) | (0.08 | ) | (0.07 | ) | (0.05 | ) | |||||||||||||||||||||||||||||||||||||||||||||||||||||||||||||||||||||||||||||||||||||||||||||
| Net realized and unrealized gain (loss) on investments | 3.58 | (0.64 | ) | 2.43 | 4.10 | 2.13 | |||||||||||||||||||||||||||||||||||||||||||||||||||||||||||||||||||||||||||||||||||||||||||||||||
| Total from investment operations | 3.53 | (0.65 | ) | 2.35 | 4.03 | 2.08 | |||||||||||||||||||||||||||||||||||||||||||||||||||||||||||||||||||||||||||||||||||||||||||||||||
| Less distributions | |||||||||||||||||||||||||||||||||||||||||||||||||||||||||||||||||||||||||||||||||||||||||||||||||||||||
| From net realized gain | (0.41 | ) | (1.13 | ) | (0.45 | ) | (0.32 | ) | — | ||||||||||||||||||||||||||||||||||||||||||||||||||||||||||||||||||||||||||||||||||||||||||||||
| Net asset value, end of period | $21.77 | $18.65 | $20.43 | $18.53 | $14.82 | ||||||||||||||||||||||||||||||||||||||||||||||||||||||||||||||||||||||||||||||||||||||||||||||||||
| Total return (%)2,3 | 18.99 | (3.27 | ) | 12.90 | 27.32 | 16.33 | |||||||||||||||||||||||||||||||||||||||||||||||||||||||||||||||||||||||||||||||||||||||||||||||||
| Ratios and supplemental data | |||||||||||||||||||||||||||||||||||||||||||||||||||||||||||||||||||||||||||||||||||||||||||||||||||||||
| Net assets, end of period (in millions) | $319 | $329 | $366 | $329 | $90 | ||||||||||||||||||||||||||||||||||||||||||||||||||||||||||||||||||||||||||||||||||||||||||||||||||
| Ratios (as a percentage of average net assets): | |||||||||||||||||||||||||||||||||||||||||||||||||||||||||||||||||||||||||||||||||||||||||||||||||||||||
| Expenses before reductions | 1.87 | 1.88 | 1.89 | 1.94 | 2.08 | ||||||||||||||||||||||||||||||||||||||||||||||||||||||||||||||||||||||||||||||||||||||||||||||||||
| Expenses including reductions | 1.87 | 1.87 | 1.88 | 1.93 | 2.08 | ||||||||||||||||||||||||||||||||||||||||||||||||||||||||||||||||||||||||||||||||||||||||||||||||||
| Net investment loss | (0.27 | ) | (0.06 | ) | (0.42 | ) | (0.43 | ) | (0.39 | ) | |||||||||||||||||||||||||||||||||||||||||||||||||||||||||||||||||||||||||||||||||||||||||||||
| Portfolio turnover (%) | 50 | 47 | 35 | 39 | 55 | ||||||||||||||||||||||||||||||||||||||||||||||||||||||||||||||||||||||||||||||||||||||||||||||||||
| 1 | Based on average daily shares outstanding. | ||||||||||||||||||||||||||||||||||||||||||||||||||||||||||||||||||||||||||||||||||
| 2 | Does not reflect the effect of sales charges, if any. | ||||||||||||||||||||||||||||||||||||||||||||||||||||||||||||||||||||||||||||||||||
| 3 | Total returns would have been lower had certain expenses not been reduced during the applicable periods. | ||||||||||||||||||||||||||||||||||||||||||||||||||||||||||||||||||||||||||||||||||
| Class I Shares Period ended | 3-31-17 | 3-31-16 | 3-31-15 | 3-31-14 | 3-31-13 | ||||||||||||||||||||||||||||||||||||||||||||||||||||||||||||||||||||||||||||||||||||||||||||||||||
| Per share operating performance | |||||||||||||||||||||||||||||||||||||||||||||||||||||||||||||||||||||||||||||||||||||||||||||||||||||||
| Net asset value, beginning of period | $19.14 | $20.86 | $18.81 | $14.95 | $12.79 | ||||||||||||||||||||||||||||||||||||||||||||||||||||||||||||||||||||||||||||||||||||||||||||||||||
| Net investment income1 | 0.16 | 0.20 | 0.12 | 0.10 | 0.09 | ||||||||||||||||||||||||||||||||||||||||||||||||||||||||||||||||||||||||||||||||||||||||||||||||||
| Net realized and unrealized gain (loss) on investments | 3.69 | (0.67 | ) | 2.49 | 4.16 | 2.15 | |||||||||||||||||||||||||||||||||||||||||||||||||||||||||||||||||||||||||||||||||||||||||||||||||
| Total from investment operations | 3.85 | (0.47 | ) | 2.61 | 4.26 | 2.24 | |||||||||||||||||||||||||||||||||||||||||||||||||||||||||||||||||||||||||||||||||||||||||||||||||
| Less distributions | |||||||||||||||||||||||||||||||||||||||||||||||||||||||||||||||||||||||||||||||||||||||||||||||||||||||
| From net investment income | (0.19 | ) | (0.12 | ) | (0.11 | ) | (0.08 | ) | (0.08 | ) | |||||||||||||||||||||||||||||||||||||||||||||||||||||||||||||||||||||||||||||||||||||||||||||
| From net realized gain | (0.41 | ) | (1.13 | ) | (0.45 | ) | (0.32 | ) | — | ||||||||||||||||||||||||||||||||||||||||||||||||||||||||||||||||||||||||||||||||||||||||||||||
| Total distributions | (0.60 | ) | (1.25 | ) | (0.56 | ) | (0.40 | ) | (0.08 | ) | |||||||||||||||||||||||||||||||||||||||||||||||||||||||||||||||||||||||||||||||||||||||||||||
| Net asset value, end of period | $22.39 | $19.14 | $20.86 | $18.81 | $14.95 | ||||||||||||||||||||||||||||||||||||||||||||||||||||||||||||||||||||||||||||||||||||||||||||||||||
| Total return (%)2 | 20.25 | (2.35 | ) | 14.13 | 28.67 | 17.64 | |||||||||||||||||||||||||||||||||||||||||||||||||||||||||||||||||||||||||||||||||||||||||||||||||
| Ratios and supplemental data | |||||||||||||||||||||||||||||||||||||||||||||||||||||||||||||||||||||||||||||||||||||||||||||||||||||||
| Net assets, end of period (in millions) | $9,512 | $7,802 | $7,116 | $4,168 | $1,762 | ||||||||||||||||||||||||||||||||||||||||||||||||||||||||||||||||||||||||||||||||||||||||||||||||||
| Ratios (as a percentage of average net assets): | |||||||||||||||||||||||||||||||||||||||||||||||||||||||||||||||||||||||||||||||||||||||||||||||||||||||
| Expenses before reductions | 0.86 | 0.87 | 0.87 | 0.89 | 0.93 | ||||||||||||||||||||||||||||||||||||||||||||||||||||||||||||||||||||||||||||||||||||||||||||||||||
| Expenses including reductions | 0.86 | 0.86 | 0.86 | 0.89 | 0.93 | ||||||||||||||||||||||||||||||||||||||||||||||||||||||||||||||||||||||||||||||||||||||||||||||||||
| Net investment income | 0.75 | 0.99 | 0.63 | 0.59 | 0.71 | ||||||||||||||||||||||||||||||||||||||||||||||||||||||||||||||||||||||||||||||||||||||||||||||||||
| Portfolio turnover (%) | 50 | 47 | 35 | 39 | 55 | ||||||||||||||||||||||||||||||||||||||||||||||||||||||||||||||||||||||||||||||||||||||||||||||||||
| 1 | Based on average daily shares outstanding. | ||||||||||||||||||||||||||||||||||||||||||||||||||||||||||||||||||||||||||||||||||
| 2 | Total returns would have been lower had certain expenses not been reduced during the applicable periods. | ||||||||||||||||||||||||||||||||||||||||||||||||||||||||||||||||||||||||||||||||||
| Class R2 Shares Period ended | 3-31-17 | 3-31-16 | 3-31-15 | 3-31-14 | 3-31-13 | ||||||||||||||||||||||||||||||||||||||||||||||||||||||||||||||||||||||||||||||||||||||||||||||||||
| Per share operating performance | |||||||||||||||||||||||||||||||||||||||||||||||||||||||||||||||||||||||||||||||||||||||||||||||||||||||
| Net asset value, beginning of period | $19.09 | $20.81 | $18.77 | $14.94 | $12.78 | ||||||||||||||||||||||||||||||||||||||||||||||||||||||||||||||||||||||||||||||||||||||||||||||||||
| Net investment income1 | 0.07 | 0.11 | 0.04 | 0.04 | 0.05 | ||||||||||||||||||||||||||||||||||||||||||||||||||||||||||||||||||||||||||||||||||||||||||||||||||
| Net realized and unrealized gain (loss) on investments | 3.68 | (0.66 | ) | 2.48 | 4.14 | 2.14 | |||||||||||||||||||||||||||||||||||||||||||||||||||||||||||||||||||||||||||||||||||||||||||||||||
| Total from investment operations | 3.75 | (0.55 | ) | 2.52 | 4.18 | 2.19 | |||||||||||||||||||||||||||||||||||||||||||||||||||||||||||||||||||||||||||||||||||||||||||||||||
| Less distributions | |||||||||||||||||||||||||||||||||||||||||||||||||||||||||||||||||||||||||||||||||||||||||||||||||||||||
| From net investment income | (0.11 | ) | (0.04 | ) | (0.03 | ) | (0.03 | ) | (0.03 | ) | |||||||||||||||||||||||||||||||||||||||||||||||||||||||||||||||||||||||||||||||||||||||||||||
| From net realized gain | (0.41 | ) | (1.13 | ) | (0.45 | ) | (0.32 | ) | — | ||||||||||||||||||||||||||||||||||||||||||||||||||||||||||||||||||||||||||||||||||||||||||||||
| Total distributions | (0.52 | ) | (1.17 | ) | (0.48 | ) | (0.35 | ) | (0.03 | ) | |||||||||||||||||||||||||||||||||||||||||||||||||||||||||||||||||||||||||||||||||||||||||||||
| Net asset value, end of period | $22.32 | $19.09 | $20.81 | $18.77 | $14.94 | ||||||||||||||||||||||||||||||||||||||||||||||||||||||||||||||||||||||||||||||||||||||||||||||||||
| Total return (%)2 | 19.76 | (2.74 | ) | 13.66 | 28.15 | 17.15 | |||||||||||||||||||||||||||||||||||||||||||||||||||||||||||||||||||||||||||||||||||||||||||||||||
| Ratios and supplemental data | |||||||||||||||||||||||||||||||||||||||||||||||||||||||||||||||||||||||||||||||||||||||||||||||||||||||
| Net assets, end of period (in millions) | $216 | $234 | $250 | $205 | $15 | ||||||||||||||||||||||||||||||||||||||||||||||||||||||||||||||||||||||||||||||||||||||||||||||||||
| Ratios (as a percentage of average net assets): | |||||||||||||||||||||||||||||||||||||||||||||||||||||||||||||||||||||||||||||||||||||||||||||||||||||||
| Expenses before reductions | 1.27 | 1.27 | 1.29 | 1.28 | 2.15 | ||||||||||||||||||||||||||||||||||||||||||||||||||||||||||||||||||||||||||||||||||||||||||||||||||
| Expenses including reductions | 1.26 | 1.27 | 1.28 | 1.27 | 1.40 | ||||||||||||||||||||||||||||||||||||||||||||||||||||||||||||||||||||||||||||||||||||||||||||||||||
| Net investment income | 0.35 | 0.56 | 0.19 | 0.25 | 0.33 | ||||||||||||||||||||||||||||||||||||||||||||||||||||||||||||||||||||||||||||||||||||||||||||||||||
| Portfolio turnover (%) | 50 | 47 | 35 | 39 | 55 | ||||||||||||||||||||||||||||||||||||||||||||||||||||||||||||||||||||||||||||||||||||||||||||||||||
| 1 | Based on average daily shares outstanding. | ||||||||||||||||||||||||||||||||||||||||||||||||||||||||||||||||||||||||||||||||||
| 2 | Total returns would have been lower had certain expenses not been reduced during the applicable periods. | ||||||||||||||||||||||||||||||||||||||||||||||||||||||||||||||||||||||||||||||||||
| Class R4 Shares Period ended | 3-31-17 | 3-31-16 | 3-31-15 | 3-31-141 | ||||||||||||||||||||||||||||||||||||||||||||||||||||||||||||||||||||||||||||||||||||
| Per share operating performance | ||||||||||||||||||||||||||||||||||||||||||||||||||||||||||||||||||||||||||||||||||||||||
| Net asset value, beginning of period | $19.13 | $20.85 | $18.81 | $15.63 | ||||||||||||||||||||||||||||||||||||||||||||||||||||||||||||||||||||||||||||||||||||
| Net investment income2 | 0.12 | 0.16 | 0.10 | 0.06 | ||||||||||||||||||||||||||||||||||||||||||||||||||||||||||||||||||||||||||||||||||||
| Net realized and unrealized gain (loss) on investments | 3.70 | (0.66 | ) | 2.47 | 3.49 | |||||||||||||||||||||||||||||||||||||||||||||||||||||||||||||||||||||||||||||||||||
| Total from investment operations | 3.82 | (0.50 | ) | 2.57 | 3.55 | |||||||||||||||||||||||||||||||||||||||||||||||||||||||||||||||||||||||||||||||||||
| Less distributions | ||||||||||||||||||||||||||||||||||||||||||||||||||||||||||||||||||||||||||||||||||||||||
| From net investment income | (0.16 | ) | (0.09 | ) | (0.08 | ) | (0.05 | ) | ||||||||||||||||||||||||||||||||||||||||||||||||||||||||||||||||||||||||||||||||
| From net realized gain | (0.41 | ) | (1.13 | ) | (0.45 | ) | (0.32 | ) | ||||||||||||||||||||||||||||||||||||||||||||||||||||||||||||||||||||||||||||||||
| Total distributions | (0.57 | ) | (1.22 | ) | (0.53 | ) | (0.37 | ) | ||||||||||||||||||||||||||||||||||||||||||||||||||||||||||||||||||||||||||||||||
| Net asset value, end of period | $22.38 | $19.13 | $20.85 | $18.81 | ||||||||||||||||||||||||||||||||||||||||||||||||||||||||||||||||||||||||||||||||||||
| Total return (%)3 | 20.09 | (2.50 | ) | 13.93 | 22.85 | 4 | ||||||||||||||||||||||||||||||||||||||||||||||||||||||||||||||||||||||||||||||||||
| Ratios and supplemental data | ||||||||||||||||||||||||||||||||||||||||||||||||||||||||||||||||||||||||||||||||||||||||
| Net assets, end of period (in millions) | $95 | $104 | $118 | $44 | ||||||||||||||||||||||||||||||||||||||||||||||||||||||||||||||||||||||||||||||||||||
| Ratios (as a percentage of average net assets): | ||||||||||||||||||||||||||||||||||||||||||||||||||||||||||||||||||||||||||||||||||||||||
| Expenses before reductions | 1.11 | 1.12 | 1.15 | 1.30 | 5 | |||||||||||||||||||||||||||||||||||||||||||||||||||||||||||||||||||||||||||||||||||
| Expenses including reductions | 1.00 | 1.02 | 1.04 | 1.14 | 5 | |||||||||||||||||||||||||||||||||||||||||||||||||||||||||||||||||||||||||||||||||||
| Net investment income | 0.60 | 0.81 | 0.49 | 0.44 | 5 | |||||||||||||||||||||||||||||||||||||||||||||||||||||||||||||||||||||||||||||||||||
| Portfolio turnover (%) | 50 | 47 | 35 | 39 | 6 | |||||||||||||||||||||||||||||||||||||||||||||||||||||||||||||||||||||||||||||||||||
| 1 | The inception date for Class R4 shares is 7-2-13. | ||||||||||||||||||||||||||||||||||||||||||||||||||||||||||||||||||||||||||||||||||
| 2 | Based on average daily shares outstanding. | ||||||||||||||||||||||||||||||||||||||||||||||||||||||||||||||||||||||||||||||||||
| 3 | Total returns would have been lower had certain expenses not been reduced during the applicable periods. | ||||||||||||||||||||||||||||||||||||||||||||||||||||||||||||||||||||||||||||||||||
| 4 | Not annualized. | ||||||||||||||||||||||||||||||||||||||||||||||||||||||||||||||||||||||||||||||||||
| 5 | Annualized. | ||||||||||||||||||||||||||||||||||||||||||||||||||||||||||||||||||||||||||||||||||
| 6 | The portfolio turnover is shown for the period from 4-1-13 to 3-31-14. | ||||||||||||||||||||||||||||||||||||||||||||||||||||||||||||||||||||||||||||||||||
| Class R6 Shares Period ended | 3-31-17 | 3-31-16 | 3-31-15 | 3-31-14 | 3-31-13 | ||||||||||||||||||||||||||||||||||||||||||||||||||||||||||||||||||||||||||||||||||||||||||||||||||
| Per share operating performance | |||||||||||||||||||||||||||||||||||||||||||||||||||||||||||||||||||||||||||||||||||||||||||||||||||||||
| Net asset value, beginning of period | $19.13 | $20.85 | $18.81 | $14.95 | $12.79 | ||||||||||||||||||||||||||||||||||||||||||||||||||||||||||||||||||||||||||||||||||||||||||||||||||
| Net investment income1 | 0.18 | 0.22 | 0.14 | 0.12 | 0.11 | ||||||||||||||||||||||||||||||||||||||||||||||||||||||||||||||||||||||||||||||||||||||||||||||||||
| Net realized and unrealized gain (loss) on investments | 3.69 | (0.67 | ) | 2.48 | 4.16 | 2.14 | |||||||||||||||||||||||||||||||||||||||||||||||||||||||||||||||||||||||||||||||||||||||||||||||||
| Total from investment operations | 3.87 | (0.45 | ) | 2.62 | 4.28 | 2.25 | |||||||||||||||||||||||||||||||||||||||||||||||||||||||||||||||||||||||||||||||||||||||||||||||||
| Less distributions | |||||||||||||||||||||||||||||||||||||||||||||||||||||||||||||||||||||||||||||||||||||||||||||||||||||||
| From net investment income | (0.21 | ) | (0.14 | ) | (0.13 | ) | (0.10 | ) | (0.09 | ) | |||||||||||||||||||||||||||||||||||||||||||||||||||||||||||||||||||||||||||||||||||||||||||||
| From net realized gain | (0.41 | ) | (1.13 | ) | (0.45 | ) | (0.32 | ) | — | ||||||||||||||||||||||||||||||||||||||||||||||||||||||||||||||||||||||||||||||||||||||||||||||
| Total distributions | (0.62 | ) | (1.27 | ) | (0.58 | ) | (0.42 | ) | (0.09 | ) | |||||||||||||||||||||||||||||||||||||||||||||||||||||||||||||||||||||||||||||||||||||||||||||
| Net asset value, end of period | $22.38 | $19.13 | $20.85 | $18.81 | $14.95 | ||||||||||||||||||||||||||||||||||||||||||||||||||||||||||||||||||||||||||||||||||||||||||||||||||
| Total return (%)2 | 20.35 | (2.25 | ) | 14.21 | 28.81 | 17.68 | |||||||||||||||||||||||||||||||||||||||||||||||||||||||||||||||||||||||||||||||||||||||||||||||||
| Ratios and supplemental data | |||||||||||||||||||||||||||||||||||||||||||||||||||||||||||||||||||||||||||||||||||||||||||||||||||||||
| Net assets, end of period (in millions) | $1,774 | $1,053 | $807 | $444 | $100 | ||||||||||||||||||||||||||||||||||||||||||||||||||||||||||||||||||||||||||||||||||||||||||||||||||
| Ratios (as a percentage of average net assets): | |||||||||||||||||||||||||||||||||||||||||||||||||||||||||||||||||||||||||||||||||||||||||||||||||||||||
| Expenses before reductions | 0.77 | 0.77 | 0.78 | 0.81 | 0.89 | ||||||||||||||||||||||||||||||||||||||||||||||||||||||||||||||||||||||||||||||||||||||||||||||||||
| Expenses including reductions | 0.76 | 0.76 | 0.77 | 0.80 | 0.89 | ||||||||||||||||||||||||||||||||||||||||||||||||||||||||||||||||||||||||||||||||||||||||||||||||||
| Net investment income | 0.86 | 1.13 | 0.73 | 0.71 | 0.84 | ||||||||||||||||||||||||||||||||||||||||||||||||||||||||||||||||||||||||||||||||||||||||||||||||||
| Portfolio turnover (%) | 50 | 47 | 35 | 39 | 55 | ||||||||||||||||||||||||||||||||||||||||||||||||||||||||||||||||||||||||||||||||||||||||||||||||||
| 1 | Based on average daily shares outstanding. | ||||||||||||||||||||||||||||||||||||||||||||||||||||||||||||||||||||||||||||||||||
| 2 | Total returns would have been lower had certain expenses not been reduced during the applicable periods. | ||||||||||||||||||||||||||||||||||||||||||||||||||||||||||||||||||||||||||||||||||
| Class ADV Shares Period ended | 3-31-17 | 3-31-16 | 3-31-15 | 3-31-14 | 3-31-13 | ||||||||||||||||||||||||||||||||||||||||||||||||||||||||||||||||||||||||||||||||||||||||||||||||||
| Per share operating performance | |||||||||||||||||||||||||||||||||||||||||||||||||||||||||||||||||||||||||||||||||||||||||||||||||||||||
| Net asset value, beginning of period | $18.46 | $20.15 | $18.20 | $14.49 | $12.40 | ||||||||||||||||||||||||||||||||||||||||||||||||||||||||||||||||||||||||||||||||||||||||||||||||||
| Net investment income1 | 0.11 | 0.12 | 0.04 | 0.03 | 0.04 | ||||||||||||||||||||||||||||||||||||||||||||||||||||||||||||||||||||||||||||||||||||||||||||||||||
| Net realized and unrealized gain (loss) on investments | 3.54 | (0.63 | ) | 2.40 | 4.03 | 2.10 | |||||||||||||||||||||||||||||||||||||||||||||||||||||||||||||||||||||||||||||||||||||||||||||||||
| Total from investment operations | 3.65 | (0.51 | ) | 2.44 | 4.06 | 2.14 | |||||||||||||||||||||||||||||||||||||||||||||||||||||||||||||||||||||||||||||||||||||||||||||||||
| Less distributions | |||||||||||||||||||||||||||||||||||||||||||||||||||||||||||||||||||||||||||||||||||||||||||||||||||||||
| From net investment income | (0.14 | ) | (0.05 | ) | (0.04 | ) | (0.03 | ) | (0.05 | ) | |||||||||||||||||||||||||||||||||||||||||||||||||||||||||||||||||||||||||||||||||||||||||||||
| From net realized gain | (0.41 | ) | (1.13 | ) | (0.45 | ) | (0.32 | ) | — | ||||||||||||||||||||||||||||||||||||||||||||||||||||||||||||||||||||||||||||||||||||||||||||||
| Total distributions | (0.55 | ) | (1.18 | ) | (0.49 | ) | (0.35 | ) | (0.05 | ) | |||||||||||||||||||||||||||||||||||||||||||||||||||||||||||||||||||||||||||||||||||||||||||||
| Net asset value, end of period | $21.56 | $18.46 | $20.15 | $18.20 | $14.49 | ||||||||||||||||||||||||||||||||||||||||||||||||||||||||||||||||||||||||||||||||||||||||||||||||||
| Total return (%)2 | 19.88 | (2.59 | ) | 13.67 | 28.19 | 17.33 | |||||||||||||||||||||||||||||||||||||||||||||||||||||||||||||||||||||||||||||||||||||||||||||||||
| Ratios and supplemental data | |||||||||||||||||||||||||||||||||||||||||||||||||||||||||||||||||||||||||||||||||||||||||||||||||||||||
| Net assets, end of period (in millions) | $2 | $1 | $1 | $1 | $1 | ||||||||||||||||||||||||||||||||||||||||||||||||||||||||||||||||||||||||||||||||||||||||||||||||||
| Ratios (as a percentage of average net assets): | |||||||||||||||||||||||||||||||||||||||||||||||||||||||||||||||||||||||||||||||||||||||||||||||||||||||
| Expenses before reductions | 1.13 | 1.42 | 3.12 | 3.46 | 3.74 | ||||||||||||||||||||||||||||||||||||||||||||||||||||||||||||||||||||||||||||||||||||||||||||||||||
| Expenses net of fee waivers | 1.12 | 1.16 | 1.25 | 1.25 | 1.25 | ||||||||||||||||||||||||||||||||||||||||||||||||||||||||||||||||||||||||||||||||||||||||||||||||||
| Net investment income | 0.55 | 0.63 | 0.21 | 0.19 | 0.35 | ||||||||||||||||||||||||||||||||||||||||||||||||||||||||||||||||||||||||||||||||||||||||||||||||||
| Portfolio turnover (%) | 50 | 47 | 35 | 39 | 55 | ||||||||||||||||||||||||||||||||||||||||||||||||||||||||||||||||||||||||||||||||||||||||||||||||||
| 1 | Based on average daily shares outstanding. | ||||||||||||||||||||||||||||||||||||||||||||||||||||||||||||||||||||||||||||||||||
| 2 | Total returns would have been lower had certain expenses not been reduced during the applicable periods. | ||||||||||||||||||||||||||||||||||||||||||||||||||||||||||||||||||||||||||||||||||
Note 1 — Organization
John Hancock Disciplined Value Mid Cap Fund (the fund) is a series of John Hancock Funds III (the Trust), an open-end management investment company organized as a Massachusetts business trust and registered under the Investment Company Act of 1940, as amended (the 1940 Act). The investment objective of the fund is to seek long-term growth of capital with current income as a secondary objective.
The fund may offer multiple classes of shares. The shares currently offered are detailed in the Statement of assets and liabilities. Class A and Class C shares are offered to all investors. Class I shares are offered to institutions and certain investors. Class R2 and Class R4 shares are available only to certain retirement plans. Class R6 shares are available only to certain retirement plans, institutions and other investors. Class ADV shares are available only to investors who acquired Class A shares as a result of the reorganization of the Robeco Boston Partners Mid Cap Value Fund into the fund. Shareholders of each class have exclusive voting rights to matters that affect that class. The distribution and service fees, if any, and transfer agent fees for each class may differ.
The fund is closed to new investors, subject to certain exceptions described in the fund's prospectus.
Note 2 — Significant accounting policies
The financial statements have been prepared in conformity with accounting principles generally accepted in the United States of America (US GAAP), which require management to make certain estimates and assumptions as of the date of the financial statements. Actual results could differ from those estimates and those differences could be significant. The fund qualifies as an investment company under Topic 946 of Accounting Standards Codification of US GAAP.
Events or transactions occurring after the end of the fiscal period through the date that the financial statements were issued have been evaluated in the preparation of the financial statements. The following summarizes the significant accounting policies of the fund:
Security valuation. Investments are stated at value as of the scheduled close of regular trading on the New York Stock Exchange (NYSE), normally at 4:00 p.m., Eastern Time. In case of emergency or other disruption resulting in the NYSE not opening for trading or the NYSE closing at a time other than the regularly scheduled close, the net asset value (NAV) may be determined as of the regularly scheduled close of the NYSE pursuant to the fund's Valuation Policies and Procedures.
In order to value the securities, the fund uses the following valuation techniques: Equity securities held by the fund are typically valued at the last sale price or official closing price on the exchange or principal market where the security trades. In the event there were no sales during the day or closing prices are not available, the securities are valued using the last available bid price. Investments by the fund in open-end mutual funds, including John Hancock Collateral Trust (JHCT), are valued at their respective NAVs each business day. Foreign securities and currencies are valued in U.S. dollars based on foreign currency exchange rates supplied by an independent pricing vendor.
In certain instances, the Pricing Committee may determine to value equity securities using prices obtained from another exchange or market if trading on the exchange or market on which prices are typically obtained did not open for trading as scheduled, or if trading closed earlier than scheduled, and trading occurred as normal on another exchange or market.
Other portfolio securities and assets, for which reliable market quotations are not readily available, are valued at fair value as determined in good faith by the fund's Pricing Committee following procedures established by the Board of Trustees. The frequency with which these fair valuation procedures are used cannot be predicted and fair value of securities may differ significantly from the value that would have been used had a ready market for such securities existed.
The fund uses a three-tier hierarchy to prioritize the pricing assumptions, referred to as inputs, used in valuation techniques to measure fair value. Level 1 includes securities valued using quoted prices in active markets for identical securities. Level 2 includes securities valued using other significant observable inputs. Observable inputs may include quoted prices for similar securities, interest rates, prepayment speeds and credit risk. Prices for securities valued using these inputs are received from independent pricing vendors and brokers and are based on an evaluation of the inputs described. Level 3 includes securities valued using significant unobservable inputs when market prices are not readily available or reliable, including the fund's
own assumptions in determining the fair value of investments. Factors used in determining value may include market or issuer specific events or trends, changes in interest rates and credit quality. The inputs or methodology used for valuing securities are not necessarily an indication of the risks associated with investing in those securities. Changes in valuation techniques and related inputs may result in transfers into or out of an assigned level within the disclosure hierarchy.
As of March 31, 2017, all investments are categorized as Level 1 under the hierarchy described above.
Security transactions and related investment income. Investment security transactions are accounted for on a trade date plus one basis for daily NAV calculations. However, for financial reporting purposes, investment transactions are reported on trade date. Interest income is accrued as earned. Dividend income is recorded on the ex-date, except for dividends of foreign securities where the dividend may not be known until after the ex-date. In those cases, dividend income, net of withholding taxes, is recorded when the fund becomes aware of the dividends. Foreign taxes are provided for based on the fund's understanding of the tax rules and rates that exist in the foreign markets in which it invests. Gains and losses on securities sold are determined on the basis of identified cost and may include proceeds from litigation.
Real estate investment trusts. The fund may invest in real estate investment trusts (REITs). Distributions from REITs may be recorded as income and subsequently characterized by the REIT at the end of the fiscal year as a reduction of cost of investments and/or as a realized gain. As a result, the fund will estimate the components of distributions from these securities. Such estimates are revised when the actual components of the distributions are known.
Securities lending. The fund may lend its securities to earn additional income. The fund receives cash collateral from the borrower in an amount not less than the market value of the loaned securities. The fund will invest its collateral in JHCT, an affiliate of the fund, which has a floating NAV and is registered with the Securities and Exchange Commission (SEC) as an investment company. JHCT invests cash received as collateral as part of the securities lending program in short-term money market investments. The fund will receive the benefit of any gains and bear any losses generated by JHCT with respect to the cash collateral.
The fund has the right to recall loaned securities on demand. If a borrower fails to return loaned securities when due, then the lending agent is responsible and indemnifies the fund for the lent securities. The lending agent uses the collateral received from the borrower to purchase replacement securities of the same issue, type, class and series of the loaned securities. If the value of the collateral is less than the purchase cost of replacement securities, the lending agent is responsible for satisfying the shortfall but only to the extent that the shortfall is not due to any decrease in the value of JHCT.
Although the risk of the loss of the securities lent is mitigated by receiving collateral from the borrower and through lending agent indemnification, the fund could experience a delay in recovering securities or could experience a lower than expected return if the borrower fails to return the securities on a timely basis. The fund receives compensation for lending its securities by retaining a portion of the return on the investment of the collateral and compensation from fees earned from borrowers of the securities. Securities lending income received by the fund is net of fees retained by the securities lending agent. Net income received from JHCT is a component of securities lending income as recorded on the Statement of operations.
Obligations to repay collateral received by the fund are shown on the Statements of assets and liabilities as Payable upon return of securities loaned and are secured by the loaned securities. As of March 31, 2017, the fund loaned common stocks valued at $90,556,251 and received $93,839,743 of cash collateral.
Foreign taxes. The fund may be subject to withholding tax on income and/or capital gains or repatriation taxes imposed by certain countries in which the fund invests. Taxes are accrued based upon investment income, realized gains or unrealized appreciation.
Line of credit. The fund may borrow from banks for temporary or emergency purposes, including meeting redemption requests that otherwise might require the untimely sale of securities. Pursuant to the fund's custodian agreement, the custodian may loan money to the fund to make properly authorized payments. The fund is obligated to repay the custodian for any overdraft, including any related costs or expenses. The custodian may have a lien, security interest or security
entitlement in any fund property that is not otherwise segregated or pledged, to the extent of any overdraft, and to the maximum extent permitted by law.
Effective June 30, 2016, the fund and other affiliated funds have entered into a syndicated line of credit agreement with Citibank, N.A. as the administrative agent that enables them to participate in a $1 billion unsecured committed line of credit. Excluding commitments designated for a certain fund and subject to the need of other affiliated funds, the fund can borrow up to an aggregate commitment amount of $750 million, subject to asset coverage and other limitations as specified in the agreement. A commitment fee payable at the end of each calendar quarter, based on the average daily unused portion of the line of credit, is charged to each participating fund based on a combination of fixed and asset based allocations and is reflected in Other expenses on the Statement of operations. Prior to June 30, 2016, the fund had a similar agreement that enabled it to participate in a $750 million unsecured committed line of credit. For the year ended March 31, 2017, the fund had no borrowings under either the line of credit. Commitment fees for the year ended March 31, 2017, were $32,185.
Expenses. Within the John Hancock group of funds complex, expenses that are directly attributable to an individual fund are allocated to such fund. Expenses that are not readily attributable to a specific fund are allocated among all funds in an equitable manner, taking into consideration, among other things, the nature and type of expense and the fund's relative net assets. Expense estimates are accrued in the period to which they relate and adjustments are made when actual amounts are known.
Class allocations. Income, common expenses and realized and unrealized gains (losses) are determined at the fund level and allocated daily to each class of shares based on the net assets of the class. Class-specific expenses, such as distribution and service fees, if any, and transfer agent fees, for all classes, are calculated daily at the class level based on the net assets of each class and the specific expense rates applicable to each class.
Federal income taxes. The fund intends to continue to qualify as a regulated investment company by complying with the applicable provisions of the Internal Revenue Code and will not be subject to federal income tax on taxable income that is distributed to shareholders. Therefore, no federal income tax provision is required.
As of March 31, 2017, the fund had no uncertain tax positions that would require financial statement recognition, derecognition or disclosure. The fund's federal tax returns are subject to examination by the Internal Revenue Service for a period of three years.
Distribution of income and gains. Distributions to shareholders from net investment income and net realized gains, if any, are recorded on the ex-date. The fund generally declares and pays dividends and capital gain distributions, if any, annually.
The tax character of distributions for the years ended March 31, 2017 and 2016 was as follows:
| March 31, 2017 | March 31, 2016 | |
| Ordinary Income | $110,899,968 | $114,826,724 |
| Long-Term Capital Gain | 250,973,230 | 580,123,880 |
| Total | $361,873,198 | $694,950,604 |
Distributions paid by the fund with respect to each class of shares are calculated in the same manner, at the same time and in the same amount, except for the effect of class level expenses that may be applied differently to each class. As of March 31, 2017, the components of distributable earnings on a tax basis consisted of $26,799,060 of undistributed ordinary income and $382,608,108 of undistributed long-term capital gains.
Such distributions and distributable earnings, on a tax basis, are determined in conformity with income tax regulations, which may differ from US GAAP. Distributions in excess of tax basis earnings and profits, if any, are reported in the fund's financial statements as a return of capital.
Capital accounts within the financial statements are adjusted for permanent book-tax differences. These adjustments have no impact on net assets or the results of operations. Temporary book-tax differences, if any, will reverse in a subsequent period. Book-tax differences are primarily attributable to wash sale loss deferrals.
Note 3 — Guarantees and indemnifications
Under the Trust's organizational documents, its Officers and Trustees are indemnified against certain liabilities arising out of the performance of their duties to the Trust, including the fund. Additionally, in the normal course of business, the fund enters into contracts with service providers that contain general indemnification clauses. The fund's maximum exposure under these arrangements is unknown, as this would involve future claims that may be made against the fund that have not yet occurred. The risk of material loss from such claims is considered remote.
Note 4 — Fees and transactions with affiliates
John Hancock Advisers, LLC (the Advisor) serves as investment advisor for the fund. John Hancock Funds, LLC (the Distributor), an affiliate of the Advisor, serves as principal underwriter of the fund. The Advisor and the Distributor are indirect, wholly owned subsidiaries of Manulife Financial Corporation (MFC).
Management fee. The fund has an investment management agreement with the Advisor under which the fund pays a daily management fee to the Advisor equivalent on an annual basis to the sum of: (a) 0.800% of the first $500 million of the fund's average daily net assets; (b) 0.775% of the next $500 million of the fund's average daily net assets; (c) 0.750% of the next $500 million of the fund's average daily net assets; (d) 0.725% of the next $1 billion of the fund's average daily net assets; and (e) 0.700% of the fund's average daily net assets in excess of $2.5 billion. The Advisor has a subadvisory agreement with Boston Partners, a division of Robeco Investment Management, Inc. The fund is not responsible for payment of the subadvisory fees.
The Advisor has contractually agreed to waive a portion of its management fee and/or reimburse expenses for certain funds of the John Hancock group of funds complex, including the fund (the participating portfolios). This waiver is based upon aggregate net assets of all the participating portfolios. The amount of the reimbursement is calculated daily and allocated among all the participating portfolios in proportion to the daily net assets of each fund. During the year end March 31, 2017, this waiver amounted to 0.01% of the fund's average net assets. This arrangement may be amended or terminated at any time by the Advisor upon notice to the fund and with the approval of the Board of Trustees.
For the year ended March 31, 2017, these expense reductions amounted to the following:
| Class | Expense reduction | Class | Expense reduction | |
| Class A | $162,016 | Class R4 | $6,822 | |
| Class C | 25,002 | Class R6 | 108,216 | |
| Class I | 642,148 | Class ADV | 130 | |
| Class R2 | 17,093 | Total | $961,427 |
Expenses waived or reimbursed in the current fiscal period are not subject to recapture in future fiscal periods.
The investment management fees, including the impact of the waivers and reimbursements as described above, incurred for the year ended March 31, 2017, were equivalent to a net annual effective rate of 0.70% of the fund's average daily net assets.
Accounting and legal services. Pursuant to a service agreement, the fund reimburses the Advisor for all expenses associated with providing the administrative, financial, legal, accounting and recordkeeping services to the fund, including the preparation of all tax returns, periodic reports to shareholders and regulatory reports, among other services. These expenses are allocated to each share class based on its relative net assets at the time the expense was incurred. These accounting and legal services fees incurred for the year ended March 31, 2017 amounted to an annual rate of 0.01% of the fund's average daily net assets.
Distribution and service plans. The fund has a distribution agreement with the Distributor. The fund has adopted distribution and service plans with respect to Class A, Class C,Class R2, Class R4 and Class ADV pursuant to Rule 12b-1 under the 1940 Act, to pay the Distributor for services provided as the distributor of shares of the fund. In addition, under a service plan for Class R2 and Class R4, the fund pays for certain other services. The fund may pay up to the following contractual rates of distribution and service fees under these arrangements, expressed as an annual percentage of average daily net assets for each class of the fund's shares:
| Class | Rule 12b-1 fee | Service fee | Class | Rule 12b-1 fee | Service fee | |
| Class A | 0.30% | — | Class R4 | 0.25% | 0.10% | |
| Class C | 1.00% | — | Class ADV | 0.25% | — | |
| Class R2 | 0.25% | 0.25% |
Currently only 0.25% is charged to Class A shares for Rule 12b-1 fees.
The fund's Distributor has contractually agreed to waive 0.10% of Rule12b-1 fees for Class R4 shares. The current waiver agreement expires on June 30, 2017, unless renewed by mutual agreement of the fund and the Distributor based upon a determination that this is appropriate under the circumstances at the time. This contractual waiver amounted to $90,033 for Class R4 shares for the year ended March 31, 2017.
Sales charges. Class A shares are assessed up-front sales charges, which resulted in payments to the Distributor amounting to $721,325 for the year ended March 31, 2017. Of this amount, $100,519 was retained and used for printing prospectuses, advertising, sales literature and other purposes, $618,757 was paid as sales commissions to broker-dealers and $2,049 was paid as sales commissions to sales personnel of Signator Investors, Inc., a broker-dealer affiliate of the Advisor.
Class A and Class C shares may be subject to contingent deferred sales charges (CDSCs). Certain Class A shares that are acquired through purchases of $1 million or more and are redeemed within one year of purchase are subject to a 1.00% sales charge. Class C shares that are redeemed within one year of purchase are subject to a 1.00% CDSC. CDSCs are applied to the lesser of the current market value at the time of redemption or the original purchase cost of the shares being redeemed. Proceeds from CDSCs are used to compensate the Distributor for providing distribution-related services in connection with the sale of these shares. During the year ended March 31, 2017, CDSCs received by the Distributor amounted to $1,043 and $9,242 for Class A and Class C shares, respectively.
Transfer agent fees. The fund has a transfer agent agreement with John Hancock Signature Services, Inc. (Signature Services), an affiliate of the Advisor. The transfer agent fees paid to Signature Services are determined based on the cost to Signature Services (Signature Services Cost) of providing recordkeeping services. It also includes out-of-pocket expenses, including payments made to third-parties for recordkeeping services provided to their clients who invest in one or more John Hancock funds. In addition, Signature Services Cost may be reduced by certain fees that Signature Services receives in connection with retirement and small accounts. Signature Services Cost is calculated monthly and allocated, as applicable, to five categories of share classes: Retail Share and Institutional Share Classes of Non-Municipal Bond Funds, Class R6 Shares, Retirement Share Classes and Municipal Bond Share Classes. Within each of these categories, the applicable costs are allocated to the affected John Hancock affiliated funds and/or classes, based on the relative average daily net assets.
Class level expenses. Class level expenses for the year ended March 31, 2017 were:
| Class | Distribution and service fees | Transfer agent fees |
| Class A | $5,347,094 | $2,633,979 |
| Class C | 3,300,649 | 406,418 |
| Class I | — | 9,478,379 |
| Class R2 | 1,125,294 | 37,109 |
| Class R4 | 307,605 | 14,764 |
| Class R6 | — | 232,747 |
| Class ADV | 4,268 | 2,104 |
| Total | $10,084,910 | $12,805,500 |
Trustee expenses. The fund compensates each Trustee who is not an employee of the Advisor or its affiliates. The costs of paying Trustee compensation and expenses are allocated to each fund based on its net assets relative to other funds within the John Hancock group of funds complex.
Interfund lending program Pursuant to an Exemptive Order issued by the SEC, the fund, along with certain other funds advised by the Advisor or its affiliates, may participate in an interfund lending program. This program provides an alternative credit facility allowing the funds to borrow from, or lend money to, other participating affiliated funds. At period end, no interfund loans were outstanding. Interest income is included in Interest on the Statement of operations. The fund's activity in this program during the period for which loans were outstanding was as follows:
| Borrower or lender | Weighted average loan balance | Days outstanding | Weighted average interest rate | Interest income |
| Lender | $5,969,897 | 4 | 0.763% | $506 |
Note 5 — Fund share transactions
Transactions in fund shares for the years ended March 31, 2017 and 2016 were as follows:
| Year ended 3-31-17 | Year ended 3-31-16 | |||||||||||||||||||||||||
| Shares | Amount | Shares | Amount | |||||||||||||||||||||||
| Class A shares | ||||||||||||||||||||||||||
| Sold | 32,092,415 | $642,654,563 | 21,552,676 | $412,766,577 | ||||||||||||||||||||||
| Distributions reinvested | 2,643,041 | 55,239,558 | 6,034,797 | 112,911,059 | ||||||||||||||||||||||
| Repurchased | (44,668,560 | ) | (918,731,589 | ) | (27,405,721 | ) | (516,146,241 | ) | ||||||||||||||||||
| Net increase (decrease) | (9,933,104 | ) | ($220,837,468 | ) | 181,752 | $9,531,395 | ||||||||||||||||||||
| Class C shares | ||||||||||||||||||||||||||
| Sold | 809,373 | $16,578,524 | 1,462,579 | $28,488,911 | ||||||||||||||||||||||
| Distributions reinvested | 242,188 | 5,112,582 | 779,448 | 14,731,558 | ||||||||||||||||||||||
| Repurchased | (4,064,785 | ) | (83,233,975 | ) | (2,507,649 | ) | (47,704,933 | ) | ||||||||||||||||||
| Net decrease | (3,013,224 | ) | ($61,542,869 | ) | (265,622 | ) | ($4,484,464 | ) | ||||||||||||||||||
| Class I shares | ||||||||||||||||||||||||||
| Sold | 122,616,811 | $2,588,164,269 | 135,576,524 | $2,682,776,608 | ||||||||||||||||||||||
| Distributions reinvested | 9,584,442 | 207,407,334 | 20,560,074 | 397,837,424 | ||||||||||||||||||||||
| Repurchased | (115,023,509 | ) | (2,392,671,881 | ) | (89,741,468 | ) | (1,747,523,008 | ) | ||||||||||||||||||
| Net increase | 17,177,744 | $402,899,722 | 66,395,130 | $1,333,091,024 | ||||||||||||||||||||||
| Year ended 3-31-17 | Year ended 3-31-16 | |||||||||||||||||||||||||
| Shares | Amount | Shares | Amount | |||||||||||||||||||||||
| Class R2 shares | ||||||||||||||||||||||||||
| Sold | 2,485,001 | $51,904,984 | 4,196,078 | $82,483,640 | ||||||||||||||||||||||
| Distributions reinvested | 198,101 | 4,278,977 | 579,958 | 11,204,789 | ||||||||||||||||||||||
| Repurchased | (5,254,489 | ) | (109,019,917 | ) | (4,536,126 | ) | (88,402,820 | ) | ||||||||||||||||||
| Net increase (decrease) | (2,571,387 | ) | ($52,835,956 | ) | 239,910 | $5,285,609 | ||||||||||||||||||||
| Class R4 shares | ||||||||||||||||||||||||||
| Sold | 1,673,787 | $35,547,064 | 2,262,975 | $44,142,313 | ||||||||||||||||||||||
| Distributions reinvested | 106,549 | 2,305,716 | 370,181 | 7,163,001 | ||||||||||||||||||||||
| Repurchased | (2,955,894 | ) | (59,446,028 | ) | (2,860,512 | ) | (54,855,218 | ) | ||||||||||||||||||
| Net decrease | (1,175,558 | ) | ($21,593,248 | ) | (227,356 | ) | ($3,549,904 | ) | ||||||||||||||||||
| Class R6 shares | ||||||||||||||||||||||||||
| Sold | 36,871,080 | $769,060,764 | 21,727,749 | $420,412,366 | ||||||||||||||||||||||
| Distributions reinvested | 2,031,233 | 43,935,568 | 2,997,760 | 57,946,695 | ||||||||||||||||||||||
| Repurchased | (14,692,543 | ) | (309,311,150 | ) | (8,408,365 | ) | (163,716,912 | ) | ||||||||||||||||||
| Net increase | 24,209,770 | $503,685,182 | 16,317,144 | $314,642,149 | ||||||||||||||||||||||
| Class ADV shares | ||||||||||||||||||||||||||
| Sold | 71,637 | $1,404,952 | 1,872 | $33,000 | ||||||||||||||||||||||
| Distributions reinvested | 2,605 | 54,343 | 2,844 | 53,088 | ||||||||||||||||||||||
| Repurchased | (16,961 | ) | (343,293 | ) | (8,980 | ) | (162,960 | ) | ||||||||||||||||||
| Net increase (decrease) | 57,281 | $1,116,002 | (4,264 | ) | ($76,872 | ) | ||||||||||||||||||||
| Total net increase | 24,751,522 | $550,891,365 | 82,636,694 | $1,654,438,937 | ||||||||||||||||||||||
Note 6 — Purchase and sale of securities
Purchases and sales of securities, other than short-term investments, amounted to $6,448,152,496 and $6,197,841,083, respectively, for the year ended March 31, 2017.
Note 7 — Interfund trading
The fund is permitted to purchase or sell securities from or to certain other affiliated funds, as set forth in Rule 17a-7 of the 1940 Act, under specified conditions outlined in procedures adopted by the Board of Trustees of the Trust. The procedures have been designed to ensure that any purchase or sale of securities by the fund from or to another fund that is or could be considered an affiliate complies with Rule 17a-7 of the 1940 Act. Further, as defined under the procedures, each transaction is effected at the current market price. Pursuant to these procedures, for the year ended March 31, 2017, the fund engaged in purchases amounting to $46,745,093.
Note 8 — New rule issuance
In October 2016, the SEC issued Final Rule Release No.33-10231, Investment Company Reporting Modernization (the Release). The Release calls for the adoption of new rules and forms as well as amendments to its rules and forms to modernize the reporting and disclosure of information by registered investment companies. The SEC is adopting amendments to Regulation S-X, which will require standardized, enhanced disclosure about derivatives in investment company financial statements, as well as other amendments. The updates to Regulation S-X are effective August 1, 2017 and may result in additional disclosure relating to the presentation of derivatives and certain other financial instruments. These updates will have no impact on the fund's net assets or results of operations.
Report of Independent Registered Public Accounting Firm
To the Board of Trustees of John Hancock Funds III and Shareholders of John Hancock Disciplined Value Mid Cap Fund:
In our opinion, the accompanying statement of assets and liabilities, including the fund's investments, and the related statements of operations and of changes in net assets and the financial highlights present fairly, in all material respects, the financial position of the John Hancock Disciplined Value Mid Cap Fund (the "Fund") as of March 31, 2017, the results of its operations for the year then ended, the changes in its net assets for each of the two years in the period then ended and the financial highlights for each of the periods presented, in conformity with accounting principles generally accepted in the United States of America. These financial statements and financial highlights (hereafter referred to as "financial statements") are the responsibility of the Fund's management. Our responsibility is to express an opinion on these financial statements based on our audits. We conducted our audits of these financial statements in accordance with the standards of the Public Company Accounting Oversight Board (United States). Those standards require that we plan and perform the audit to obtain reasonable assurance about whether the financial statements are free of material misstatement. An audit includes examining, on a test basis, evidence supporting the amounts and disclosures in the financial statements, assessing the accounting principles used and significant estimates made by management, and evaluating the overall financial statement presentation. We believe that our audits, which included confirmation of securities as of March 31, 2017 by correspondence with the custodian, brokers, and transfer agent, and the application of alternative auditing procedures where securities purchased confirmations had not been received, provide a reasonable basis for our opinion.
PricewaterhouseCoopers LLP
Boston, Massachusetts
May 16, 2017
Unaudited
For federal income tax purposes, the following information is furnished with respect to the distributions of the fund, if any, paid during its taxable year ended March 31, 2017.
The fund reports the maximum amount allowable of its net taxable income as eligible for the corporate dividends-received deduction.
The fund reports the maximum amount allowable of its net taxable income as qualified dividend income as provided in the Jobs and Growth Tax Relief Reconciliation Act of 2003.
The fund paid $250,973,230 in capital gain dividends.
Eligible shareholders will be mailed a 2017 Form 1099-DIV in early 2018. This will reflect the tax character of all distributions paid in calendar year 2017.
Please consult a tax advisor regarding the tax consequences of your investment in the fund.
This chart provides information about the Trustees and Officers who oversee your John Hancock fund. Officers elected by the Trustees manage the day-to-day operations of the fund and execute policies formulated by the Trustees.
Independent Trustees
| Name, year of birth Position(s) held with Trust Principal occupation(s) and other directorships during past 5 years | Trustee of the Trust since1 | Number of John Hancock funds overseen by Trustee |
| Hassell H. McClellan, Born: 1945 | 2012 | 228 |
| Trustee and Chairperson of the Board Director/Trustee, Virtus Funds (since 2008); Director, The Barnes Group (since 2010); Associate Professor, The Wallace E. Carroll School of Management, Boston College (retired 2013). Trustee (since 2014) and Chairperson of the Board (since 2017), John Hancock Collateral Trust; Trustee (since 2015) and Chairperson of the Board (since 2017), John Hancock Exchange-Traded Fund Trust; Trustee (since 2012) and Chairperson of the Board (since 2017), John Hancock retail funds3; Trustee (2005-2006 and since 2012) and Chairperson of the Board (since 2017), John Hancock Funds III; Trustee (since 2005) and Chairperson of the Board (since 2017), John Hancock Variable Insurance Trust and John Hancock Funds II. | ||
| Charles L. Bardelis,2 Born: 1941 | 2012 | 228 |
| Trustee Director, Island Commuter Corp. (marine transport). Trustee, John Hancock Collateral Trust (since 2014), Trustee, John Hancock Exchange-Traded Fund Trust (since 2015); Trustee, John Hancock retail funds3 (since 2012); Trustee, John Hancock Funds III (2005-2006 and since 2012); Trustee, John Hancock Variable Insurance Trust (since 1988); Trustee, John Hancock Funds II (since 2005). | ||
| Peter S. Burgess,2 Born: 1942 | 2012 | 228 |
| Trustee Consultant (financial, accounting, and auditing matters) (since 1999); Certified Public Accountant; Partner, Arthur Andersen (independent public accounting firm) (prior to 1999); Director, Lincoln Educational Services Corporation (since 2004); Director, Symetra Financial Corporation (2010-2016); Director, PMA Capital Corporation (2004-2010). Trustee, John Hancock Collateral Trust (since 2014); Trustee, John Hancock Exchange-Traded Fund Trust (since 2015); Trustee, John Hancock retail funds3 (since 2012); Trustee, John Hancock Funds III (2005-2006 and since 2012); Trustee, John Hancock Variable Insurance Trust and John Hancock Funds II (since 2005). | ||
| William H. Cunningham, Born: 1944 | 2006 | 228 |
| Trustee Professor, University of Texas, Austin, Texas (since 1971); former Chancellor, University of Texas System and former President of the University of Texas, Austin, Texas; Chairman (since 2009) and Director (since 2006), Lincoln National Corporation (insurance); Director, Southwest Airlines (since 2000); former Director, LIN Television (2009-2014). Trustee, John Hancock retail funds3 (since 1986); Trustee, John Hancock Variable Insurance Trust (since 2012); Trustee, John Hancock Funds II (2005-2006 and since 2012); Trustee, John Hancock Collateral Trust (since 2014); Trustee, John Hancock Exchange-Traded Fund Trust (since 2015). | ||
| Grace K. Fey, Born: 1946 | 2012 | 228 |
| Trustee Chief Executive Officer, Grace Fey Advisors (since 2007); Director and Executive Vice President, Frontier Capital Management Company (1988-2007); Director, Fiduciary Trust (since 2009). Trustee, John Hancock Collateral Trust (since 2014); Trustee, John Hancock Exchange-Traded Fund Trust (since 2015); Trustee, John Hancock retail funds3 (since 2012); Trustee, John Hancock Variable Insurance Trust and John Hancock Funds II (since 2008). | ||
Independent Trustees (continued)
| Name, year of birth Position(s) held with Trust Principal occupation(s) and other directorships during past 5 years | Trustee of the Trust since1 | Number of John Hancock funds overseen by Trustee |
| Theron S. Hoffman,2 Born: 1947 | 2012 | 228 |
| Trustee Chief Executive Officer, T. Hoffman Associates, LLC (consulting firm) (since 2003); Director, The Todd Organization (consulting firm) (2003-2010); President, Westport Resources Management (investment management consulting firm) (2006-2008); Senior Managing Director, Partner, and Operating Head, Putnam Investments (2000-2003); Executive Vice President, The Thomson Corp. (financial and legal information publishing) (1997-2000). Trustee, John Hancock Collateral Trust (since 2014); Trustee, John Hancock Exchange-Traded Fund Trust (since 2015); Trustee, John Hancock retail funds3 (since 2012); Trustee, John Hancock Variable Insurance Trust and John Hancock Funds II (since 2008). | ||
| Deborah C. Jackson, Born: 1952 | 2008 | 228 |
| Trustee President, Cambridge College, Cambridge, Massachusetts (since 2011); Board of Directors, National Association of Corporate Directors/New England (since 2015); Board of Directors, Association of Independent Colleges and Universities of Massachusetts, (since 2014); Chief Executive Officer, American Red Cross of Massachusetts Bay (2002-2011); Board of Directors of Eastern Bank Corporation (since 2001); Board of Directors of Eastern Bank Charitable Foundation (since 2001); Board of Directors of American Student Assistance Corporation (1996-2009); Board of Directors of Boston Stock Exchange (2002-2008); Board of Directors of Harvard Pilgrim Healthcare (health benefits company) (2007-2011). Trustee, John Hancock retail funds3 (since 2008); Trustee, John Hancock Variable Insurance Trust and John Hancock Funds II (since 2012); Trustee, John Hancock Collateral Trust (since 2014); and Trustee, John Hancock Exchange-Traded Fund Trust (since 2015). | ||
| James M. Oates, Born: 1946 | 2012 | 228 |
Trustee | ||
| Steven R. Pruchansky, Born: 1944 | 2006 | 228 |
| Trustee and Vice Chairperson of the Board Chairman and Chief Executive Officer, Greenscapes of Southwest Florida, Inc. (since 2000); Director and President, Greenscapes of Southwest Florida, Inc. (until 2000); Member, Board of Advisors, First American Bank (until 2010); Managing Director, Jon James, LLC (real estate) (since 2000); Partner, Right Funding, LLC (since 2014); Director, First Signature Bank & Trust Company (until 1991); Director, Mast Realty Trust (until 1994); President, Maxwell Building Corp. (until 1991). Trustee (since 1992) and Chairperson of the Board (2011-2012), John Hancock retail funds3; Trustee and Vice Chairperson of the Board, John Hancock retail funds3 John Hancock Variable Insurance Trust, and John Hancock Funds II (since 2012); Trustee and Vice Chairperson of the Board, John Hancock Collateral Trust (since 2014); Trustee and Vice Chairperson of the Board, John Hancock Exchange-Traded Fund Trust (since 2015). | ||
Independent Trustees (continued)
| Name, year of birth Position(s) held with Trust Principal occupation(s) and other directorships during past 5 years | Trustee of the Trust since1 | Number of John Hancock funds overseen by Trustee |
| Gregory A. Russo, Born: 1949 | 2008 | 228 |
| Trustee Director and Audit Committee Chairman (since 2012), and Member, Audit Committee and Finance Committee (since 2011), NCH Healthcare System, Inc. (holding company for multi-entity healthcare system); Director and Member (since 2012) and Finance Committee Chairman (since 2014), The Moorings, Inc. (nonprofit continuing care community); Vice Chairman, Risk & Regulatory Matters, KPMG LLP (KPMG) (2002-2006); Vice Chairman, Industrial Markets, KPMG (1998-2002); Chairman and Treasurer, Westchester County, New York, Chamber of Commerce (1986-1992); Director, Treasurer, and Chairman of Audit and Finance Committees, Putnam Hospital Center (1989-1995); Director and Chairman of Fundraising Campaign, United Way of Westchester and Putnam Counties, New York (1990-1995). Trustee, John Hancock retail funds3 (since 2008); Trustee, John Hancock Variable Insurance Trust and John Hancock Funds II (since 2012); Trustee, John Hancock Collateral Trust (since 2014); Trustee, John Hancock Exchange-Traded Fund Trust (since 2015). | ||
Non-Independent Trustees4
| Name, year of birth Position(s) held with Trust Principal occupation(s) and other directorships during past 5 years | Trustee of the Trust since1 | Number of John Hancock funds overseen by Trustee |
| James R. Boyle, Born: 1959 | 2015 | 228 |
| Non-Independent Trustee Chairman and Chief Executive Officer, Zillion Group, Inc. (formerly HealthFleet, Inc.) (healthcare) (since 2014); Executive Vice President and Chief Executive Officer, U.S. Life Insurance Division of Genworth Financial, Inc. (insurance) (January 2014-July 2014); Senior Executive Vice President, Manulife Financial Corporation, President and Chief Executive Officer, John Hancock (1999-2012); Chairman and Director, John Hancock Advisers, LLC, John Hancock Funds, LLC, and John Hancock Investment Management Services, LLC (2005-2010). Trustee, John Hancock Collateral Trust and John Hancock Exchange-Traded Fund Trust (since 2015); Trustee, John Hancock retail funds3 (2005-2010; 2012-2014 and since 2015); Trustee, John Hancock Variable Insurance Trust and John Hancock Funds II (2005-2014 and since 2015). | ||
| Craig Bromley, Born: 1966 | 2012 | 228 |
| Non-Independent Trustee President, John Hancock Financial Service (since 2012); Senior Executive Vice President and General Manager, U.S. Division, Manulife Financial Corporation (since 2012); President and Chief Executive Officer, Manulife Insurance Company (Manulife Japan) (2005-2012, including prior positions). Trustee, John Hancock retail funds,3 John Hancock Variable Insurance Trust, and John Hancock Funds II (since 2012); Trustee, John Hancock Collateral Trust (since 2014); Trustee, John Hancock Exchange-Traded Fund Trust (since 2015). | ||
| Warren A. Thomson, Born: 1955 | 2012 | 228 |
| Non-Independent Trustee Senior Executive Vice President and Chief Investment Officer, Manulife Financial Corporation and The Manufacturers Life Insurance Company (since 2009); Chairman, Manulife Asset Management (since 2001, including prior positions); Director and Chairman, Manulife Asset Management Limited (since 2006); Director and Chairman, Hancock Natural Resources Group, Inc. (since 2013). Trustee, John Hancock retail funds,3 John Hancock Variable Insurance Trust, and John Hancock Funds II (since 2012); Trustee, John Hancock Collateral Trust (since 2014); Trustee, John Hancock Exchange-Traded Fund Trust (since 2015). | ||
Principal officers who are not Trustees
| Name, year of birth Position(s) held with Trust Principal occupation(s) during past 5 years | Officer of the Trust since |
| Andrew G. Arnott, Born: 1971 | 2009 |
| President Senior Vice President, John Hancock Financial Services (since 2009); Director and Executive Vice President, John Hancock Advisers, LLC (since 2005, including prior positions); Director and Executive Vice President, John Hancock Investment Management Services, LLC (since 2006, including prior positions); President, John Hancock Funds, LLC (since 2004, including prior positions); President, John Hancock retail funds,3 John Hancock Variable Insurance Trust, and John Hancock Funds II (since 2007, including prior positions); President, John Hancock Collateral Trust and John Hancock Exchange-Traded Fund Trust (since 2014). | |
| John J. Danello, Born: 1955 | 2014 |
| Senior Vice President, Secretary, and Chief Legal Officer Vice President and Chief Counsel, John Hancock Wealth Management (since 2005); Senior Vice President (since 2007) and Chief Legal Counsel (2007-2010), John Hancock Funds, LLC and The Berkeley Financial Group, LLC; Senior Vice President (since 2006, including prior positions) and Chief Legal Officer and Secretary (since 2014), John Hancock retail funds,3 John Hancock Funds II and John Hancock Variable Insurance Trust; Senior Vice President, Secretary and Chief Legal Officer, John Hancock Collateral Trust and John Hancock Exchange-Traded Fund Trust (since 2014); Vice President, John Hancock Life & Health Insurance Company (since 2009); Vice President, John Hancock Life Insurance Company (USA) and John Hancock Life Insurance Company of New York (since 2010); and Senior Vice President, Secretary and Chief Legal Counsel (2007-2014, including prior positions) of John Hancock Advisers, LLC and John Hancock Investment Management Services, LLC. | |
| Francis V. Knox, Jr., Born: 1947 | 2006 |
| Chief Compliance Officer Vice President, John Hancock Financial Services (since 2005); Chief Compliance Officer, John Hancock retail funds,3 John Hancock Variable Insurance Trust, John Hancock Funds II, John Hancock Advisers, LLC, and John Hancock Investment Management Services, LLC (since 2005); Chief Compliance Officer, John Hancock Collateral Trust and John Hancock Exchange-Traded Fund Trust (since 2014). | |
| Charles A. Rizzo, Born: 1957 | 2007 |
| Chief Financial Officer Vice President, John Hancock Financial Services (since 2008); Senior Vice President, John Hancock Advisers, LLC and John Hancock Investment Management Services, LLC (since 2008); Chief Financial Officer, John Hancock retail funds,3 John Hancock Variable Insurance Trust and John Hancock Funds II (since 2007); Chief Financial Officer, John Hancock Collateral Trust and John Hancock Exchange-Traded Fund Trust (since 2014). | |
| Salvatore Schiavone, Born: 1965 | 2010 |
| Treasurer Assistant Vice President, John Hancock Financial Services (since 2007); Vice President, John Hancock Advisers, LLC and John Hancock Investment Management Services, LLC (since 2007); Treasurer, John Hancock retail funds3 (since 2007, including prior positions); Treasurer, John Hancock Variable Insurance Trust and John Hancock Funds II (2007-2009 and since 2010, including prior positions); Treasurer, John Hancock Collateral Trust and John Hancock Exchange-Traded Fund Trust (since 2014). | |
The business address for all Trustees and Officers is 601 Congress Street, Boston, Massachusetts 02210-2805.
The Statement of Additional Information of the fund includes additional information about members of the Board of Trustees of the Trust and is available without charge, upon request, by calling 800-225-5291.
| 1 | Each Trustee holds office until his or her successor is elected and qualified, or until the Trustee's death, retirement, resignation, or removal. Mr. Boyle has served as Trustee at various times prior to the date listed in the table. |
| 2 | Member of the Audit Committee. |
| 3 | "John Hancock retail funds" comprises John Hancock Funds III and 40 other John Hancock funds consisting of 30 series of other John Hancock trusts and 10 closed-end funds. |
| 4 | The Trustee is a Non-Independent Trustee due to current or former positions with the Advisor and certain affiliates. |
Trustees Hassell H. McClellan, Chairperson# Officers Andrew G. Arnott John J. Danello Francis V. Knox, Jr. Charles A. Rizzo Salvatore Schiavone | Investment advisor John Hancock Advisers, LLC Subadvisor Robeco Investment Management, Inc. Principal distributor John Hancock Funds, LLC Custodian State Street Bank and Trust Company Transfer agent John Hancock Signature Services, Inc. Legal counsel K&L Gates LLP Independent registered public accounting firm PricewaterhouseCoopers LLP |
*Member of the Audit Committee
†Non-Independent Trustee
#Effective 1-1-17
The fund's proxy voting policies and procedures, as well as the fund proxy voting record for the most recent twelve-month period ended June 30, are available free of charge on the Securities and Exchange Commission (SEC) website at sec.gov or on our website.
The fund's complete list of portfolio holdings, for the first and third fiscal quarters, is filed with the SEC on Form N-Q. The fund's Form N-Q is available on our website and the SEC's website, sec.gov, and can be reviewed and copied (for a fee) at the SEC's Public Reference Room in Washington, DC. Call 800-SEC-0330 to receive information on the operation of the SEC's Public Reference Room.
We make this information on your fund, as well as monthly portfolio holdings, and other fund details available on our website at jhinvestments.com or by calling 800-225-5291.
| You can also contact us: | |||
| 800-225-5291 jhinvestments.com | Regular mail: John Hancock Signature Services, Inc. | Express mail: John Hancock Signature Services, Inc. | |
John Hancock family of funds
DOMESTIC EQUITY FUNDS Balanced Blue Chip Growth Classic Value Disciplined Value Disciplined Value Mid Cap Equity Income Fundamental All Cap Core Fundamental Large Cap Core Fundamental Large Cap Value New Opportunities Small Cap Value Small Company Strategic Growth U.S. Global Leaders Growth U.S. Growth Value Equity GLOBAL AND INTERNATIONAL EQUITY FUNDS Disciplined Value International Emerging Markets Emerging Markets Equity Fundamental Global Franchise Global Equity Global Shareholder Yield Greater China Opportunities International Growth International Small Company International Value Equity | INCOME FUNDS Bond California Tax-Free Income Emerging Markets Debt Floating Rate Income Global Income Government Income High Yield High Yield Municipal Bond Income Investment Grade Bond Money Market Short Duration Credit Opportunities Spectrum Income Strategic Income Opportunities Tax-Free Bond ALTERNATIVE AND SPECIALTY FUNDS Absolute Return Currency Alternative Asset Allocation Enduring Assets Financial Industries Global Absolute Return Strategies Global Conservative Absolute Return Global Focused Strategies Natural Resources Redwood Regional Bank Seaport Technical Opportunities |
A fund's investment objectives, risks, charges, and expenses should be considered carefully before investing. The prospectus contains this and other important information about the fund. To obtain a prospectus, contact your financial professional, call John Hancock Investments at 800-225-5291, or visit our website at jhinvestments.com. Please read the prospectus carefully before investing or sending money.
ASSET ALLOCATION Income Allocation Fund Multi-Index Lifetime Portfolios Multi-Index Preservation Portfolios Multimanager Lifestyle Portfolios Multimanager Lifetime Portfolios EXCHANGE-TRADED FUNDS John Hancock Multifactor Consumer Discretionary ETF John Hancock Multifactor Consumer Staples ETF John Hancock Multifactor Developed International ETF John Hancock Multifactor Energy ETF John Hancock Multifactor Financials ETF John Hancock Multifactor Healthcare ETF John Hancock Multifactor Industrials ETF John Hancock Multifactor Large Cap ETF John Hancock Multifactor Materials ETF John Hancock Multifactor Mid Cap ETF John Hancock Multifactor Technology ETF John Hancock Multifactor Utilities ETF | ENVIRONMENTAL, SOCIAL, AND GOVERNANCE FUNDS ESG All Cap Core ESG Core Bond ESG International Equity ESG Large Cap Core CLOSED-END FUNDS Financial Opportunities Hedged Equity & Income Income Securities Trust Investors Trust Preferred Income Preferred Income II Preferred Income III Premium Dividend Tax-Advantaged Dividend Income Tax-Advantaged Global Shareholder Yield |
John Hancock Multifactor ETF shares are bought and sold at market price (not NAV), and are not individually redeemed
from the fund. Brokerage commissions will reduce returns.
John Hancock ETFs are distributed by Foreside Fund Services, LLC, and are subadvised by Dimensional Fund Advisors LP.
Foreside is not affiliated with John Hancock Funds, LLC or Dimensional Fund Advisors LP.
Dimensional Fund Advisors LP receives compensation from John Hancock in connection with licensing rights to the
John Hancock Dimensional indexes. Dimensional Fund Advisors LP does not sponsor, endorse, or sell, and makes no
representation as to the advisability of investing in, John Hancock Multifactor ETFs.
John Hancock Investments
A trusted brand
John Hancock Investments is a premier asset manager representing one of
America's most trusted brands, with a heritage of financial stewardship dating
back to 1862. Helping our shareholders pursue their financial goals is at the
core of everything we do. It's why we support the role of professional financial
advice and operate with the highest standards of conduct and integrity.
A better way to invest
We serve investors globally through a unique multimanager approach:
We search the world to find proven portfolio teams with specialized
expertise for every strategy we offer, then we apply robust investment
oversight to ensure they continue to meet our uncompromising standards
and serve the best interests of our shareholders.
Results for investors
Our unique approach to asset management enables us to provide a diverse set
of investments backed by some of the world's best managers, along with strong
risk-adjusted returns across asset classes.
| | John Hancock Funds, LLC n Member FINRA, SIPC 601 Congress Street n Boston, MA 02210-2805 800-225-5291 n jhinvestments.com | |
| This report is for the information of the shareholders of John Hancock Disciplined Value Mid Cap Fund. It is not authorized for distribution to prospective investors unless preceded or accompanied by a prospectus. | ||
| MF361882 | 363A 3/17 5/17 | |

A message to shareholders
Dear shareholder,
Financial markets are by their very nature unpredictable, but few market observers could have imagined the dramatic twists and turns that would come to characterize the latter half of 2016 and the beginning of 2017. Donald Trump's victory in the November U.S. presidential election sent both U.S. equity prices and bond yields sharply higher. Investors bid up the prices of riskier assets, believing that the new administration would pursue more pro-growth, market-friendly economic policies. While this may yet prove to be the case, change in policy has been slow to materialize and valuations in certain sectors and asset classes are now appearing somewhat stretched.
Outside the United States, economic activity in Europe appears to be picking up, but the outlook is far from rosy. Populist factions continue to shape the political landscape across the Atlantic, and 2017 will be a pivotal year for the European Union. Investors have been encouraged lately by the rejection of candidates with potentially trade-inhibiting agendas, although sentiment could quickly shift later this year as France's new president pursues his legislative agenda and Germany holds a federal election in September.
While we believe there are good reasons for economic optimism and that stocks may go on to extend their recent rally in the coming months, we encourage you to talk with your financial advisor, who can help ensure your portfolio is sufficiently diversified to meet your long-term objectives and to withstand the inevitable bumps along the way.
On behalf of everyone at John Hancock Investments, I'd like to take this opportunity to thank you for the continued trust you've placed in us.
Sincerely,
Andrew G. Arnott
President and Chief Executive Officer
John Hancock Investments
This commentary reflects the CEO's views, which are subject to change at any time. Investing involves risks, including the potential loss of principal. Diversification does not guarantee a profit or eliminate the risk of a loss. For more up-to-date information, please visit our website at jhinvestments.com.
John Hancock
International Value Equity Fund
INVESTMENT OBJECTIVE
The fund seeks long-term capital appreciation.
AVERAGE ANNUAL TOTAL RETURNS AS OF 3/31/17 (%)
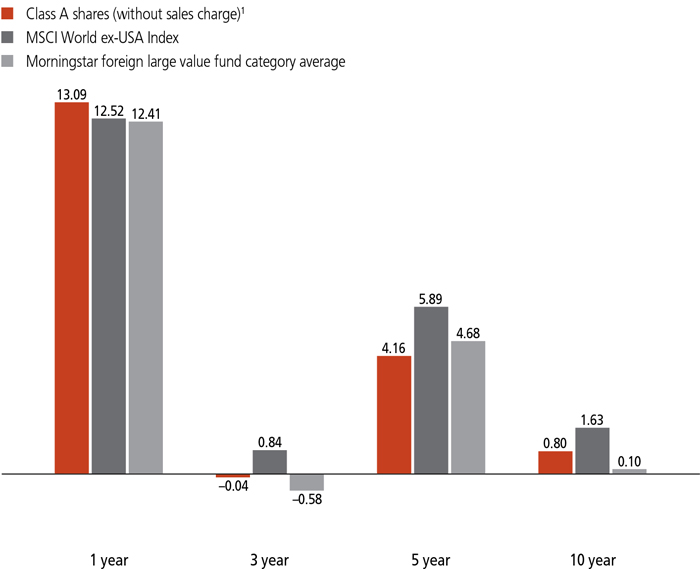
The MSCI World ex-USA Index (gross of foreign withholding taxes on dividends) is a free float-adjusted market capitalization weighted index that is designed to measure the equity market performance of developed markets, excluding the United States.
It is not possible to invest directly in an index. Index figures do not reflect expenses or sales charges, which would result in lower returns.
Figures from Morningstar, Inc. include reinvested distributions and do not take into account sales charges. Actual load-adjusted performance is lower.
| 1 | After the close of business on 2-11-11, holders of the former Optique International Value Fund became owners of an equal number of full and fractional Class A shares of John Hancock International Value Equity Fund, which were first offered on 2-14-11. Class A shares' performance shown above for periods prior to this date reflects the historical performance of Optique International Value Fund. |
The past performance shown here reflects reinvested distributions and the beneficial effect of any expense reductions, and does not guarantee future results. Performance of the other share classes will vary based on the difference in the fees and expenses of those classes. Shares will fluctuate in value and, when redeemed, may be worth more or less than their original cost. Current month-end performance may be lower or higher than the performance cited, and can be found at jhinvestments.com or by calling 800-225-5291. For further information on the fund's objectives, risks, and strategy, see the fund's prospectus.
PERFORMANCE HIGHLIGHTS OVER THE LAST TWELVE MONTHS
Most international stocks rose amid an improving economic environment
Most developed-market stocks outside the United States posted solid returns as economic conditions generally improved, helping to offset concerns about rising political uncertainties.
The fund outperformed on a relative basis
The fund slightly outpaced its benchmark, the MSCI World ex-USA Index, as our stock picking in Japan and in the financials sector significantly aided relative performance.
Our U.K. stock picking had a negative impact
Security selection in the United Kingdom weighed on performance relative to the benchmark.
SECTOR COMPOSITION AS OF 3/31/17 (%)
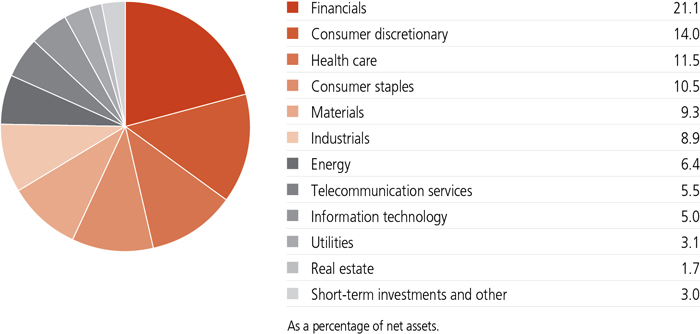
A note about risks
Foreign investing has additional risks, such as currency and market volatility and political and social instability. Value stocks may decline in price. The stock prices of midsize companies can change more frequently and dramatically than those of large companies. The value of a company's equity securities is subject to changes in the company's financial condition and overall market and economic conditions. Hedging, derivatives, and other strategic transactions may increase a fund's volatility and could produce disproportionate losses, potentially more than the fund's principal investment. Please see the fund's prospectus for additional risks.
An interview with Portfolio Manager Wendell L. Perkins, CFA, John Hancock Asset Management a division of Manulife Asset Management (US) LLC

Wendell L. Perkins, CFA
Portfolio Manager
John Hancock Asset Management
Can you describe the factors behind the positive returns that most non-U.S. developed-market equities posted for the 12 months ended March 31, 2017?
Most stocks outside the United States posted solid gains in the double digits, in percentage terms. It was an eventful 12 months, accentuated by the United Kingdom's approval in June 2016 of a referendum to exit the European Union (Brexit), the rise of populist political forces in certain western European countries, and Chinese policymakers' efforts to stem a slowdown in the country's economic growth rate. The pace of increases in U.S. interest rates was also in the spotlight.
Despite the potential negative impact of these events, there were many positive catalysts for equities, including improvement in global economic indicators, positive earnings momentum, and continued monetary policy accommodation by most central banks. Equity indexes enjoyed further support from recoveries in the prices of oil and other commodities, which had dropped to multi-year lows in February 2016, prior to the start of the period. Announcements in the United Kingdom and other key non-U.S. markets to implement fresh rounds of fiscal stimulus contributed to a shift in investor sentiment favoring cyclical stocks and sectors—those most sensitive to changes in economic trends. This trend gained further momentum across global markets following the U.S. presidential election victory of Donald Trump in November.
From a sector perspective, materials and financials posted the strongest returns within the benchmark, while telecommunication services and healthcare were the weakest performers. At the geographic level, stocks from the Pacific Rim region were the strongest, while U.K. stocks were the weakest.
How did this environment affect your management of the fund?
We continued to evaluate stocks on a value-oriented, bottom-up basis, aligned with our assessment of the risks and opportunities specific to each stock. We supplemented this bottom-up approach by
While economic indicators and earnings trends were generally positive for the period, equity valuations climbed to levels that may not be sustainable, and several developments suggested to us the need for a cautious approach. The transition to new U.S. political leadership presents uncertainties for trade and other policies affecting the global economy. It also remains to be seen how the actual Brexit process will play out between the United Kingdom and the European Union.
The fund outpaced its benchmark, the MSCI World ex-USA Index, for the period. At the regional and sector levels, what factors had the most significant impact on this result?
From a regional perspective, our stock picking in Japan contributed to relative results, as did security selection in Continental Europe and the Pacific Rim. At the sector level, stock picking in the financials, materials, and utilities sectors added value on a relative basis. On the negative side, stock picking in the United Kingdom had a negative impact on relative results.
Which positions had the biggest positive impact on performance?
A position in Fujitsu, Ltd., a Japanese provider of information technology equipment and services, was the most significant contributor relative to the benchmark. Fujitsu's shares rose as the company
TOP 10 HOLDINGS AS OF 3/31/17 (%)
| Nestle SA | 1.3 |
| Unilever PLC | 1.2 |
| AGL Energy, Ltd. | 1.1 |
| SAP SE | 1.1 |
| Telefonica SA | 1.0 |
| Novartis AG | 1.0 |
| BASF SE | 1.0 |
| Akzo Nobel NV | 1.0 |
| HSBC Holdings PLC | 1.0 |
| Sanofi | 1.0 |
| TOTAL | 10.7 |
| As a percentage of net assets. | |
| Cash and cash equivalents are not included. | |
Another key contributor was a position in Rohm Company, Ltd., a Japanese maker of semiconductors and other electronic components. Shares of Rohm rallied, as global demand for semiconductors remained robust, and the company posted stronger-than-expected financial results.
Other positions that had a significantly positive impact were Chilean copper miner Antofagasta PLC, Hong Kong-based property developer Hang Lung Group, Ltd., and Spanish financial services company CaixaBank SA.
Which positions had the biggest negative impact on performance relative to the benchmark?
Among the largest detractors were positions in two U.K.-based stocks: easyJet PLC, a low-cost airline with routes in the United Kingdom and Continental Europe, and Debenhams PLC, a department store chain. Despite our assessment that neither company has suffered poor financial or operational performance in recent months, shares of both stocks declined as most investors appeared to take a negative view of Brexit's potential impact on U.K.-based equities broadly.
TOP 10 COUNTRIES AS OF 3/31/17 (%)
| Japan | 20.1 |
| United Kingdom | 12.2 |
| France | 10.5 |
| Germany | 9.8 |
| Switzerland | 7.2 |
| Australia | 6.3 |
| Canada | 5.8 |
| Netherlands | 4.4 |
| Hong Kong | 3.7 |
| Spain | 3.5 |
| TOTAL | 83.5 |
| As a percentage of net assets. | |
| Cash and cash equivalents are not included. |
easyJet shares were also hurt by the weakening value of the U.K.'s currency, the pound sterling, which had a negative impact on overseas travel by U.K. citizens.
Other positions that had a significantly negative impact on relative results were Israel-based Teva Pharmaceutical Industries, Ltd., and Swedish telecommunications equipment maker Telefonaktiebolaget LM Ericsson.
How was the fund positioned at the end of the period?
At the sector level, the fund's most significant overweight was in consumer discretionary, while its most significant underweight was in industrials. During the period, the underweight in industrials became more pronounced, and the fund went from underweight in materials at the start of the period to overweight by the end.
At the regional level, the fund was modestly underweight in the United Kingdom and Canada. The fund held a modest weighting in emerging-market equities, which are not part of the benchmark.
MANAGED BY
 | Wendell L. Perkins, CFA On the fund since 1998 Investing since 1985 |
 | Edward Maraccini, CFA On the fund since 2007 Investing since 1995 |
 | Margaret McKay, CFA On the fund since 2001 Investing since 1992 |
![]()
TOTAL RETURNS FOR THE PERIOD ENDED MARCH 31, 2017
| Average annual total returns (%) with maximum sales charge | Cumulative total returns (%) with maximum sales charge | |||||||
| 1-year | 5-year | 10-year | 5-year | 10-year | ||||
| Class A1,2 | 7.43 | 3.10 | 0.29 | 16.50 | 2.90 | |||
| Class C1,2 | 11.30 | 3.40 | 0.11 | 18.17 | 1.10 | |||
| Class I1,2,3 | 13.52 | 4.49 | 0.99 | 24.55 | 10.37 | |||
| Class R21,2,3 | 12.94 | 4.08 | 0.76 | 22.16 | 7.85 | |||
| Class R41,2,3 | 13.44 | 4.37 | 1.02 | 23.87 | 10.73 | |||
| Class R61,2,3 | 13.36 | 4.63 | 1.27 | 25.38 | 13.49 | |||
| Class NAV1,2,3 | 13.64 | 4.68 | 1.31 | 25.67 | 13.88 | |||
| Index 1† | 12.52 | 5.89 | 1.63 | 33.16 | 17.56 | |||
| Index 2† | 17.24 | 5.82 | 0.93 | 32.68 | 9.73 | |||
Performance figures assume all distributions are reinvested. Figures reflect the maximum sales charge on Class A shares of 5% and the applicable contingent deferred sales charge (CDSC) on Class C shares. Class C shares sold within one year of purchase are subject to a 1% CDSC. Sales charges are not applicable to Class I, Class R2, Class R4, Class R6, and Class NAV shares.
The expense ratios of the fund, both net (including any fee waivers and/or expense limitations) and gross (excluding any fee waivers and/or expense limitations), are set forth according to the most recent publicly available prospectuses for the fund and may differ from those disclosed in the Financial highlights tables in this report. Had the contractual fee waivers and expense limitations not been in place, gross expenses would apply. The expense ratios are as follows:
| Class A | Class C | Class I | Class R2 | Class R4 | Class R6 | Class NAV | |
| Gross (%) | 1.35 | 2.10 | 1.08 | 1.49 | 1.34 | 0.99 | 0.97 |
| Net (%) | 1.35 | 2.10 | 1.08 | 1.49 | 1.24 | 0.97 | 0.97 |
Please refer to the most recent prospectus and annual or semiannual report for more information on expenses and any expense limitation arrangements for each class.
The returns reflect past results and should not be considered indicative of future performance. The return and principal value of an investment will fluctuate so that shares, when redeemed, may be worth more or less than their original cost. Due to market volatility and other factors, the fund's current performance may be higher or lower than the performance shown. For current to the most recent month-end performance data, please call 800-225-5291 or visit the fund's website at jhinvestments.com.
The performance table above and the chart on the next page do not reflect the deduction of taxes that a shareholder would pay on fund distributions or the redemption of fund shares. The fund's performance results reflect any applicable fee waivers or expense reductions, without which the expenses would increase and results would have been less favorable.
| † | Index 1 is the MSCI World ex-USA Index; Index 2 is the MSCI World ex-USA Value Index. |
See the following page for footnotes.
This chart and table show what happened to a hypothetical $10,000 investment in John Hancock International Value Equity Fund for the share classes and periods indicated, assuming all distributions were reinvested. For comparison, we've shown the same investment in two separate indexes.
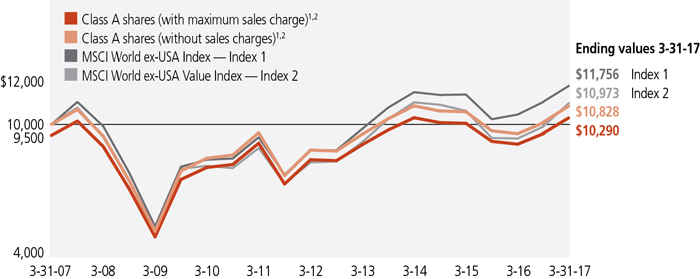
The MSCI World ex-USA Index (gross of foreign withholding taxes on dividends) is a free float-adjusted market capitalization weighted index that is designed to measure the equity market performance of developed markets, excluding the United States of America.
The MSCI World ex-USA Value Index (gross of foreign withholding taxes on dividends) is a free float-adjusted market capitalization weighted index that is designed to measure the equity market performance of developed markets, excluding the United States of America, that have higher than average value characteristics.
It is not possible to invest directly in an index. Index figures do not reflect expenses or sales charges, which would result in lower returns.
Footnotes related to performance pages
| 1 | After the close of business on 2-11-11, holders of the former Optique International Value Fund (the predecessor fund, first offered on 4-1-98) became owners of an equal number of full and fractional Class A shares or Class I shares of John Hancock International Value Equity Fund, which were first offered on 2-14-11. The performance shown for Class A and Class I shares for periods prior to this date reflects the historical performance of Optique International Value Fund. Class C shares were first offered on 8-28-14; Class R2, Class R4, and Class R6 shares were first offered on 7-2-13; Class NAV shares were first offered on 12-16-11. The returns prior to these dates are that of Class A shares recalculated to reflect the gross fees and expenses of Class C, Class R2, Class R4, Class R6, and Class NAV shares, as applicable. |
| 2 | In October 2011, the advisor made a voluntary payment to the fund of $6,950, or approximately $0.018 per share. Without this payment, performance would have been lower. |
| 3 | For certain types of investors, as described in the fund's prospectuses. |
| 4 | The contingent deferred sales charge is not applicable. |
These examples are intended to help you understand your ongoing operating expenses of investing in the fund so you can compare these costs with the ongoing costs of investing in other mutual funds.
Understanding fund expenses
As a shareholder of the fund, you incur two types of costs:
| • | Transaction costs, which include sales charges (loads) on purchases or redemptions (varies by share class), minimum account fee charge, etc. |
| • | Ongoing operating expenses, including management fees, distribution and service fees (if applicable), and other fund expenses. |
We are presenting only your ongoing operating expenses here.
Actual expenses/actual returns
The first line of each share class in the table on the following page is intended to provide information about the fund's actual ongoing operating expenses, and is based on the fund's actual return. It assumes an account value of $1,000.00 on October 1, 2016, with the same investment held until March 31, 2017.
Together with the value of your account, you may use this information to estimate the operating expenses that you paid over the period. Simply divide your account value at March 31, 2017, by $1,000.00, then multiply it by the "expenses paid" for your share class from the table. For example, for an account value of $8,600.00, the operating expenses should be calculated as follows:
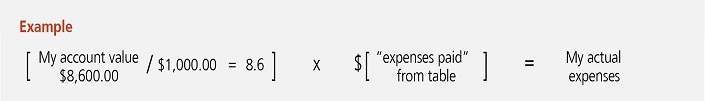
Hypothetical example for comparison purposes
The second line of each share class in the table on the following page allows you to compare the fund's ongoing operating expenses with those of any other fund. It provides an example of the fund's hypothetical account values and hypothetical expenses based on each class's actual expense ratio and an assumed 5% annualized return before expenses (which is not the fund's actual return). It assumes an account value of $1,000.00 on October 1, 2016, with the same investment held until March 31, 2017. Look in any other fund shareholder report to find its hypothetical example and you will be able to compare these expenses. Please remember that these hypothetical account values and expenses may not be used to estimate the actual ending account balance or expenses you paid for the period.
Remember, these examples do not include any transaction costs, therefore, these examples will not help you to determine the relative total costs of owning different funds. If transaction costs were included, your expenses would have been higher. See the prospectuses for details regarding transaction costs.
SHAREHOLDER EXPENSE EXAMPLE CHART
| Account value on 10-1-2016 | Ending value on 3-31-2017 | Expenses paid during period ended 3-31-20171 | Annualized expense ratio | ||
| Class A | Actual expenses/actual returns | $1,000.00 | $1,074.20 | $6.93 | 1.34% |
| Hypothetical example for comparison purposes | 1,000.00 | 1,018.20 | 6.74 | 1.34% | |
| Class C | Actual expenses/actual returns | 1,000.00 | 1,070.00 | 10.79 | 2.09% |
| Hypothetical example for comparison purposes | 1,000.00 | 1,014.50 | 10.50 | 2.09% | |
| Class I | Actual expenses/actual returns | 1,000.00 | 1,076.90 | 5.59 | 1.08% |
| Hypothetical example for comparison purposes | 1,000.00 | 1,019.50 | 5.44 | 1.08% | |
| Class R2 | Actual expenses/actual returns | 1,000.00 | 1,074.40 | 7.65 | 1.48% |
| Hypothetical example for comparison purposes | 1,000.00 | 1,017.60 | 7.44 | 1.48% | |
| Class R4 | Actual expenses/actual returns | 1,000.00 | 1,076.10 | 5.85 | 1.13% |
| Hypothetical example for comparison purposes | 1,000.00 | 1,019.30 | 5.69 | 1.13% | |
| Class R6 | Actual expenses/actual returns | 1,000.00 | 1,076.80 | 5.02 | 0.97% |
| Hypothetical example for comparison purposes | 1,000.00 | 1,020.10 | 4.89 | 0.97% | |
| Class NAV | Actual expenses/actual returns | 1,000.00 | 1,078.00 | 5.03 | 0.97% |
| Hypothetical example for comparison purposes | 1,000.00 | 1,020.10 | 4.89 | 0.97% | |
| 1 | Expenses are equal to the fund's annualized expense ratio, multiplied by the average account value over the period, multiplied by 182/365 (to reflect the one-half year period). |
Fund's investments
| As of 3-31-17 | |||||||||||||||||||||||
| Shares | Value | ||||||||||||||||||||||
| Common stocks 97.0% | $610,734,017 | ||||||||||||||||||||||
| (Cost $588,556,521) | |||||||||||||||||||||||
| Australia 6.3% | 39,628,886 | ||||||||||||||||||||||
| AGL Energy, Ltd. | 333,735 | 6,722,459 | |||||||||||||||||||||
| Australia & New Zealand Banking Group, Ltd. | 249,353 | 6,054,462 | |||||||||||||||||||||
| BHP Billiton, Ltd. | 307,488 | 5,592,031 | |||||||||||||||||||||
| Coca-Cola Amatil, Ltd. | 738,926 | 6,109,123 | |||||||||||||||||||||
| National Australia Bank, Ltd. | 239,979 | 6,110,436 | |||||||||||||||||||||
| QBE Insurance Group, Ltd. | 522,168 | 5,140,661 | |||||||||||||||||||||
| Santos, Ltd. (I) | 1,343,839 | 3,899,714 | |||||||||||||||||||||
| Belgium 0.6% | 3,718,591 | ||||||||||||||||||||||
| Ontex Group NV | 115,863 | 3,718,591 | |||||||||||||||||||||
| Canada 5.8% | 36,733,205 | ||||||||||||||||||||||
| Bank of Montreal | 76,470 | 5,711,746 | |||||||||||||||||||||
| Barrick Gold Corp. | 297,395 | 5,648,906 | |||||||||||||||||||||
| Husky Energy, Inc. (I) | 383,380 | 4,327,205 | |||||||||||||||||||||
| IGM Financial, Inc. (L) | 184,995 | 5,517,090 | |||||||||||||||||||||
| Magna International, Inc. | 116,042 | 5,007,821 | |||||||||||||||||||||
| Suncor Energy, Inc. | 161,188 | 4,948,909 | |||||||||||||||||||||
| The Toronto-Dominion Bank | 111,234 | 5,571,528 | |||||||||||||||||||||
| Chile 0.9% | 5,618,986 | ||||||||||||||||||||||
| Antofagasta PLC | 538,185 | 5,618,986 | |||||||||||||||||||||
| China 1.2% | 7,777,905 | ||||||||||||||||||||||
| China Petroleum & Chemical Corp., H Shares | 3,878,279 | 3,156,789 | |||||||||||||||||||||
| CNOOC, Ltd. | 3,866,000 | 4,621,116 | |||||||||||||||||||||
| Denmark 1.8% | 11,011,570 | ||||||||||||||||||||||
| Carlsberg A/S, B Shares | 60,071 | 5,547,112 | |||||||||||||||||||||
| Novo Nordisk A/S, B Shares | 159,133 | 5,464,458 | |||||||||||||||||||||
| France 10.5% | 66,385,343 | ||||||||||||||||||||||
| AXA SA | 222,375 | 5,745,251 | |||||||||||||||||||||
| BNP Paribas SA | 85,338 | 5,678,755 | |||||||||||||||||||||
| Christian Dior SE | 24,810 | 5,759,095 | |||||||||||||||||||||
| Engie SA | 206,022 | 2,911,434 | |||||||||||||||||||||
| Ingenico Group SA | 55,399 | 5,225,044 | |||||||||||||||||||||
| Lagardere SCA | 203,699 | 5,991,887 | |||||||||||||||||||||
| Orange SA | 375,122 | 5,824,005 | |||||||||||||||||||||
| Publicis Groupe SA | 79,794 | 5,571,252 | |||||||||||||||||||||
| Sanofi | 70,017 | 6,329,226 | |||||||||||||||||||||
| Schneider Electric SE | 77,797 | 5,715,666 | |||||||||||||||||||||
| TOTAL SA | 106,802 | 5,400,290 | |||||||||||||||||||||
| Shares | Value | ||||||||||||||||||||||
| France (continued) | |||||||||||||||||||||||
| Vinci SA | 78,498 | $6,233,438 | |||||||||||||||||||||
| Germany 9.8% | 61,825,918 | ||||||||||||||||||||||
| Allianz SE | 32,314 | 5,992,531 | |||||||||||||||||||||
| BASF SE | 65,681 | 6,503,338 | |||||||||||||||||||||
| Bayer AG | 52,521 | 6,051,148 | |||||||||||||||||||||
| Bayerische Motoren Werke AG | 56,789 | 5,181,548 | |||||||||||||||||||||
| E.ON SE | 514,061 | 4,086,853 | |||||||||||||||||||||
| Gerresheimer AG | 65,448 | 5,181,282 | |||||||||||||||||||||
| Merck KGaA | 54,017 | 6,155,430 | |||||||||||||||||||||
| METRO AG | 161,558 | 5,162,212 | |||||||||||||||||||||
| Muenchener Rueckversicherungs-Gesellschaft AG | 28,524 | 5,583,656 | |||||||||||||||||||||
| SAP SE | 67,772 | 6,648,994 | |||||||||||||||||||||
| Siemens AG | 38,540 | 5,278,926 | |||||||||||||||||||||
| Hong Kong 3.7% | 23,104,936 | ||||||||||||||||||||||
| China Mobile, Ltd. | 532,582 | 5,857,073 | |||||||||||||||||||||
| Guangdong Investment, Ltd. | 3,946,098 | 5,626,822 | |||||||||||||||||||||
| Hang Lung Group, Ltd. | 1,439,113 | 6,138,387 | |||||||||||||||||||||
| Yue Yuen Industrial Holdings, Ltd. | 1,395,202 | 5,482,654 | |||||||||||||||||||||
| Ireland 2.4% | 15,205,638 | ||||||||||||||||||||||
| ICON PLC (I) | 61,214 | 4,879,973 | |||||||||||||||||||||
| Shire PLC | 91,968 | 5,358,697 | |||||||||||||||||||||
| Smurfit Kappa Group PLC | 187,980 | 4,966,968 | |||||||||||||||||||||
| Israel 0.7% | 4,230,293 | ||||||||||||||||||||||
| Teva Pharmaceutical Industries, Ltd. | 129,358 | 4,230,293 | |||||||||||||||||||||
| Italy 0.6% | 3,604,084 | ||||||||||||||||||||||
| Eni SpA | 220,119 | 3,604,084 | |||||||||||||||||||||
| Japan 20.1% | 126,811,938 | ||||||||||||||||||||||
| Bandai Namco Holdings, Inc. | 198,531 | 5,951,098 | |||||||||||||||||||||
| Bridgestone Corp. | 140,586 | 5,706,830 | |||||||||||||||||||||
| East Japan Railway Company | 58,263 | 5,087,614 | |||||||||||||||||||||
| Fujitsu, Ltd. | 886,623 | 5,442,431 | |||||||||||||||||||||
| Hitachi, Ltd. | 899,629 | 4,884,761 | |||||||||||||||||||||
| Honda Motor Company, Ltd. | 176,927 | 5,341,257 | |||||||||||||||||||||
| Isuzu Motors, Ltd. | 390,507 | 5,171,988 | |||||||||||||||||||||
| Japan Tobacco, Inc. | 157,398 | 5,122,920 | |||||||||||||||||||||
| Keisei Electric Railway Company, Ltd. | 215,478 | 5,015,453 | |||||||||||||||||||||
| Mitsubishi Chemical Holdings Corp. | 795,547 | 6,176,572 | |||||||||||||||||||||
| Mitsubishi Corp. | 230,409 | 4,993,558 | |||||||||||||||||||||
| Mitsubishi Electric Corp. | 345,280 | 4,974,898 | |||||||||||||||||||||
| Mitsubishi UFJ Financial Group, Inc. | 858,710 | 5,409,158 | |||||||||||||||||||||
| Mitsui Fudosan Company, Ltd. | 219,185 | 4,679,999 | |||||||||||||||||||||
| Mizuho Financial Group, Inc. | 2,829,184 | 5,193,185 | |||||||||||||||||||||
| Shares | Value | ||||||||||||||||||||||
| Japan (continued) | |||||||||||||||||||||||
| Nippon Telegraph & Telephone Corp. | 126,225 | $5,396,538 | |||||||||||||||||||||
| Nippon Television Holdings, Inc. | 296,568 | 5,128,912 | |||||||||||||||||||||
| Nissan Motor Company, Ltd. | 523,925 | 5,051,886 | |||||||||||||||||||||
| Rohm Company, Ltd. | 82,594 | 5,498,692 | |||||||||||||||||||||
| Seven & i Holdings Company, Ltd. | 137,248 | 5,391,601 | |||||||||||||||||||||
| Sumitomo Chemical Company, Ltd. | 1,104,000 | 6,183,620 | |||||||||||||||||||||
| Taiheiyo Cement Corp. | 1,494,467 | 5,014,965 | |||||||||||||||||||||
| Toyo Suisan Kaisha, Ltd. | 138,621 | 5,171,578 | |||||||||||||||||||||
| Toyota Motor Corp. | 88,847 | 4,822,424 | |||||||||||||||||||||
| Netherlands 4.4% | 27,806,556 | ||||||||||||||||||||||
| Aegon NV | 863,282 | 4,397,444 | |||||||||||||||||||||
| Akzo Nobel NV | 77,654 | 6,428,516 | |||||||||||||||||||||
| Heineken Holding NV | 71,991 | 5,718,253 | |||||||||||||||||||||
| ING Groep NV | 372,392 | 5,624,727 | |||||||||||||||||||||
| Royal Dutch Shell PLC, A Shares | 214,126 | 5,637,616 | |||||||||||||||||||||
| Norway 0.8% | 4,710,967 | ||||||||||||||||||||||
| DNB ASA | 296,687 | 4,710,967 | |||||||||||||||||||||
| Singapore 2.5% | 15,904,138 | ||||||||||||||||||||||
| DBS Group Holdings, Ltd. | 367,821 | 5,095,019 | |||||||||||||||||||||
| Sembcorp Industries, Ltd. | 2,276,716 | 5,173,853 | |||||||||||||||||||||
| Singapore Telecommunications, Ltd. | 2,010,918 | 5,635,266 | |||||||||||||||||||||
| South Africa 0.5% | 3,208,063 | ||||||||||||||||||||||
| Tiger Brands, Ltd. | 107,527 | 3,208,063 | |||||||||||||||||||||
| Spain 3.5% | 22,121,847 | ||||||||||||||||||||||
| Banco Santander SA | 989,784 | 6,058,795 | |||||||||||||||||||||
| Bolsas y Mercados Espanoles SHMSF SA | 99,278 | 3,290,719 | |||||||||||||||||||||
| CaixaBank SA | 1,450,899 | 6,238,139 | |||||||||||||||||||||
| Telefonica SA | 583,756 | 6,534,194 | |||||||||||||||||||||
| Sweden 1.5% | 9,354,723 | ||||||||||||||||||||||
| Modern Times Group MTG AB, B Shares | 160,501 | 5,366,594 | |||||||||||||||||||||
| Telefonaktiebolaget LM Ericsson, B Shares (L) | 597,350 | 3,988,129 | |||||||||||||||||||||
| Switzerland 7.2% | 45,194,767 | ||||||||||||||||||||||
| Adecco Group AG | 69,588 | 4,941,055 | |||||||||||||||||||||
| Credit Suisse Group AG (I) | 249,361 | 3,710,149 | |||||||||||||||||||||
| Julius Baer Group, Ltd. (I) | 110,398 | 5,515,047 | |||||||||||||||||||||
| LafargeHolcim, Ltd. (I) | 104,121 | 6,143,077 | |||||||||||||||||||||
| Nestle SA | 106,825 | 8,199,008 | |||||||||||||||||||||
| Novartis AG | 87,800 | 6,519,814 | |||||||||||||||||||||
| Roche Holding AG | 22,494 | 5,752,474 | |||||||||||||||||||||
| Zurich Insurance Group AG | 16,541 | 4,414,143 | |||||||||||||||||||||
| Shares | Value | ||||||||||||||||||||||
| United Kingdom 12.2% | $76,775,663 | ||||||||||||||||||||||
| AstraZeneca PLC | 91,245 | 5,610,373 | |||||||||||||||||||||
| Barclays PLC | 1,865,096 | 5,264,747 | |||||||||||||||||||||
| BP PLC | 832,076 | 4,789,517 | |||||||||||||||||||||
| Debenhams PLC | 4,129,169 | 2,817,888 | |||||||||||||||||||||
| easyJet PLC | 262,251 | 3,371,690 | |||||||||||||||||||||
| GlaxoSmithKline PLC | 250,678 | 5,212,321 | |||||||||||||||||||||
| HSBC Holdings PLC | 782,548 | 6,383,112 | |||||||||||||||||||||
| Imperial Brands PLC | 107,192 | 5,194,906 | |||||||||||||||||||||
| Informa PLC | 626,931 | 5,124,428 | |||||||||||||||||||||
| Kingfisher PLC | 1,171,233 | 4,792,200 | |||||||||||||||||||||
| Meggitt PLC | 891,252 | 4,974,320 | |||||||||||||||||||||
| Smith & Nephew PLC | 358,329 | 5,455,833 | |||||||||||||||||||||
| Standard Chartered PLC (I) | 513,786 | 4,914,315 | |||||||||||||||||||||
| Unilever PLC | 149,501 | 7,374,458 | |||||||||||||||||||||
| Vodafone Group PLC | 2,108,824 | 5,495,555 | |||||||||||||||||||||
| Yield (%) | Shares | Value | |||||||||||||||||||||
| Securities lending collateral 1.5% | $9,479,792 | ||||||||||||||||||||||
| (Cost $9,479,792) | |||||||||||||||||||||||
| John Hancock Collateral Trust (W) | 0.9609(Y) | 947,373 | 9,479,792 | ||||||||||||||||||||
| Yield* (%) | Maturity date | Par value^ | Value | ||||||||||||||||||||
| Short-term investments 2.7% | $17,175,000 | ||||||||||||||||||||||
| (Cost $17,174,696) | |||||||||||||||||||||||
| U.S. Government Agency 2.6% | 16,147,000 | ||||||||||||||||||||||
| Federal Agricultural Mortgage Corp. Discount Note | 0.500 | 04-03-17 | 1,476,000 | 1,476,000 | |||||||||||||||||||
| Federal Home Loan Bank Discount Note | 0.323 | 04-03-17 | 14,671,000 | 14,671,000 | |||||||||||||||||||
| Par value^ | Value | ||||||||||||||||||||||
| Repurchase agreement 0.1% | 1,028,000 | ||||||||||||||||||||||
| Barclays Capital Tri-Party Repurchase Agreement dated 3-31-17 at 0.770% to be repurchased at $1,028,066 on 4-3-17, collateralized by $1,026,700 U.S. Treasury Bonds, 3.130% due 8-15-44 (valued at $1,048,727, including interest) | 1,028,000 | 1,028,000 | |||||||||||||||||||||
| Total investments (Cost $615,211,009)† 101.2% | $637,388,809 | ||||||||||||||||||||||
| Other assets and liabilities, net (1.2%) | ($7,463,760 | ) | |||||||||||||||||||||
| Total net assets 100.0% | $629,925,049 | ||||||||||||||||||||||
| The percentage shown for each investment category is the total value of the category as a percentage of the net assets of the fund. | |||||||||||||||||||||||
| ^All par values are denominated in U.S. dollars unless otherwise indicated. | |||||||||||||||||||||||
| Security Abbreviations and Legend | |||||||||||||||||||||||
| (I) | Non-income producing security. | ||||||||||||||||||||||
| (L) | A portion of this security is on loan as of 3-31-17. | ||||||||||||||||||||||
| (W) | Investment is an affiliate of the fund, the advisor and/or subadvisor. This security represents the investment of cash collateral received for securities lending. | ||||||||||||||||||||||
| (Y) | The rate shown is the annualized seven-day yield as of 3-31-17. | ||||||||||||||||||||||
| * | Yield represents either the annualized yield at the date of purchase, the stated coupon rate or, for floating rate securities, the rate at period end. | ||||||||||||||||||||||
| † | At 3-31-17, the aggregate cost of investment securities for federal income tax purposes was $616,220,629. Net unrealized appreciation aggregated to $21,168,180, of which $64,731,237 related to appreciated investment securities and $43,563,057 related to depreciated investment securities. | ||||||||||||||||||||||
Financial statements
STATEMENT OF ASSETS AND LIABILITIES 3-31-17
| Assets | |||||||||||||||||||||||||||||||||
| Unaffiliated investments, at value (Cost $605,731,217) including $9,016,552 of securities loaned | $627,909,017 | ||||||||||||||||||||||||||||||||
| Affiliated investments, at value (Cost $9,479,792) | 9,479,792 | ||||||||||||||||||||||||||||||||
| Total investments, at value (Cost $615,211,009) | 637,388,809 | ||||||||||||||||||||||||||||||||
| Cash | 1,978,420 | ||||||||||||||||||||||||||||||||
| Foreign currency, at value (Cost $167,288) | 166,741 | ||||||||||||||||||||||||||||||||
| Receivable for investments sold | 1,750 | ||||||||||||||||||||||||||||||||
| Receivable for fund shares sold | 76,814 | ||||||||||||||||||||||||||||||||
| Dividends and interest receivable | 2,958,683 | ||||||||||||||||||||||||||||||||
| Receivable for securities lending income | 5,819 | ||||||||||||||||||||||||||||||||
| Other receivables and prepaid expenses | 35,063 | ||||||||||||||||||||||||||||||||
| Total assets | 642,612,099 | ||||||||||||||||||||||||||||||||
| Liabilities | |||||||||||||||||||||||||||||||||
| Payable for investments purchased | 1,750 | ||||||||||||||||||||||||||||||||
| Payable for fund shares repurchased | 3,047,349 | ||||||||||||||||||||||||||||||||
| Payable upon return of securities loaned | 9,480,100 | ||||||||||||||||||||||||||||||||
| Payable to affiliates | |||||||||||||||||||||||||||||||||
| Accounting and legal services fees | 12,767 | ||||||||||||||||||||||||||||||||
| Transfer agent fees | 2,309 | ||||||||||||||||||||||||||||||||
| Distribution and service fees | 317 | ||||||||||||||||||||||||||||||||
| Trustees' fees | 563 | ||||||||||||||||||||||||||||||||
| Other liabilities and accrued expenses | 141,895 | ||||||||||||||||||||||||||||||||
| Total liabilities | 12,687,050 | ||||||||||||||||||||||||||||||||
| Net assets | $629,925,049 | ||||||||||||||||||||||||||||||||
| Net assets consist of | |||||||||||||||||||||||||||||||||
| Paid-in capital | $611,290,990 | ||||||||||||||||||||||||||||||||
| Undistributed net investment income | 2,277,501 | ||||||||||||||||||||||||||||||||
| Accumulated net realized gain (loss) on investments and foreign currency transactions | (5,803,590 | ) | |||||||||||||||||||||||||||||||
| Net unrealized appreciation (depreciation) on investments and translation of assets and liabilities in foreign currencies | 22,160,148 | ||||||||||||||||||||||||||||||||
| Net assets | $629,925,049 | ||||||||||||||||||||||||||||||||
STATEMENT OF ASSETS AND LIABILITIES (continued)
| Net asset value per share | |||||||||||||||||||||
| Based on net asset values and shares outstanding - The fund has an unlimited number of shares authorized with no par value | |||||||||||||||||||||
| Class A ($18,098,599 ÷ 2,259,097 shares)1 | $8.01 | ||||||||||||||||||||
| Class C ($782,545 ÷ 96,689 shares)1 | $8.09 | ||||||||||||||||||||
| Class I ($4,653,798 ÷ 580,453 shares) | $8.02 | ||||||||||||||||||||
| Class R2 ($797,122 ÷ 99,167 shares) | $8.04 | ||||||||||||||||||||
| Class R4 ($94,098 ÷ 11,723 shares) | $8.03 | ||||||||||||||||||||
| Class R6 ($855,126 ÷ 106,830 shares) | $8.00 | ||||||||||||||||||||
| Class NAV ($604,643,761 ÷ 75,439,827 shares) | $8.01 | ||||||||||||||||||||
| Maximum offering price per share | |||||||||||||||||||||
| Class A (net assets value per share ÷ 95%)2 | $8.43 | ||||||||||||||||||||
| 1 | Redemption price per share is equal to net asset value less any applicable contingent deferred sales charge. | |||||||||||||||||||
| 2 | On single retail sales of less than $50,000. On sales of $50,000 or more and on group sales the offering price is reduced. | |||||||||||||||||||
STATEMENT OF OPERATIONS For the year ended 3-31-17
| Investment income | |||||||||||||||||||||||||||||||||
| Dividends | $18,590,198 | ||||||||||||||||||||||||||||||||
| Securities lending | 398,919 | ||||||||||||||||||||||||||||||||
| Interest | 73,989 | ||||||||||||||||||||||||||||||||
| Less foreign taxes withheld | (1,559,473 | ) | |||||||||||||||||||||||||||||||
| Total investment income | 17,503,633 | ||||||||||||||||||||||||||||||||
| Expenses | |||||||||||||||||||||||||||||||||
| Investment management fees | 4,969,034 | ||||||||||||||||||||||||||||||||
| Distribution and service fees | 60,007 | ||||||||||||||||||||||||||||||||
| Accounting and legal services fees | 81,937 | ||||||||||||||||||||||||||||||||
| Transfer agent fees | 28,631 | ||||||||||||||||||||||||||||||||
| Trustees' fees | 8,555 | ||||||||||||||||||||||||||||||||
| State registration fees | 102,578 | ||||||||||||||||||||||||||||||||
| Printing and postage | 14,975 | ||||||||||||||||||||||||||||||||
| Professional fees | 81,644 | ||||||||||||||||||||||||||||||||
| Custodian fees | 235,105 | ||||||||||||||||||||||||||||||||
| Other | 19,013 | ||||||||||||||||||||||||||||||||
| Total expenses | 5,601,479 | ||||||||||||||||||||||||||||||||
| Less expense reductions | (43,069 | ) | |||||||||||||||||||||||||||||||
| Net expenses | 5,558,410 | ||||||||||||||||||||||||||||||||
| Net investment income | 11,945,223 | ||||||||||||||||||||||||||||||||
| Realized and unrealized gain (loss) | |||||||||||||||||||||||||||||||||
| Net realized gain (loss) on | |||||||||||||||||||||||||||||||||
| Unaffiliated investments and foreign currency transactions | 3,845,533 | ||||||||||||||||||||||||||||||||
| Affiliated investments | 2,272 | ||||||||||||||||||||||||||||||||
| 3,847,805 | |||||||||||||||||||||||||||||||||
| Change in net unrealized appreciation (depreciation) of | |||||||||||||||||||||||||||||||||
| Unaffiliated investments and translation of assets and liabilities in foreign currencies | 60,307,973 | ||||||||||||||||||||||||||||||||
| Affiliated investments | (477 | ) | |||||||||||||||||||||||||||||||
| 60,307,496 | |||||||||||||||||||||||||||||||||
| Net realized and unrealized gain | 64,155,301 | ||||||||||||||||||||||||||||||||
| Increase in net assets from operations | $76,100,524 | ||||||||||||||||||||||||||||||||
STATEMENTS OF CHANGES IN NET ASSETS
| Year ended 3-31-17 | Year ended 3-31-16 | |||||||||||||||||||||||||||||||||||||||||||||||
| Increase (decrease) in net assets | ||||||||||||||||||||||||||||||||||||||||||||||||
| From operations | ||||||||||||||||||||||||||||||||||||||||||||||||
| Net investment income | $11,945,223 | $10,381,824 | ||||||||||||||||||||||||||||||||||||||||||||||
| Net realized gain | 3,847,805 | 2,208,141 | ||||||||||||||||||||||||||||||||||||||||||||||
| Change in net unrealized appreciation (depreciation) | 60,307,496 | (65,986,338 | ) | |||||||||||||||||||||||||||||||||||||||||||||
| Increase (decrease) in net assets resulting from operations | 76,100,524 | (53,396,373 | ) | |||||||||||||||||||||||||||||||||||||||||||||
| Distributions to shareholders | ||||||||||||||||||||||||||||||||||||||||||||||||
| From net investment income | ||||||||||||||||||||||||||||||||||||||||||||||||
| Class A | (296,601 | ) | (339,258 | ) | ||||||||||||||||||||||||||||||||||||||||||||
| Class C | (5,101 | ) | (1,537 | ) | ||||||||||||||||||||||||||||||||||||||||||||
| Class I | (52,380 | ) | (41,309 | ) | ||||||||||||||||||||||||||||||||||||||||||||
| Class R2 | (11,361 | ) | (14,968 | ) | ||||||||||||||||||||||||||||||||||||||||||||
| Class R4 | (1,634 | ) | (1,350 | ) | ||||||||||||||||||||||||||||||||||||||||||||
| Class R6 | (10,496 | ) | (6,549 | ) | ||||||||||||||||||||||||||||||||||||||||||||
| Class NAV | (11,935,754 | ) | (8,722,583 | ) | ||||||||||||||||||||||||||||||||||||||||||||
| From net realized gain | ||||||||||||||||||||||||||||||||||||||||||||||||
| Class A | — | (665,493 | ) | |||||||||||||||||||||||||||||||||||||||||||||
| Class C | — | (11,674 | ) | |||||||||||||||||||||||||||||||||||||||||||||
| Class I | — | (71,479 | ) | |||||||||||||||||||||||||||||||||||||||||||||
| Class R2 | — | (35,430 | ) | |||||||||||||||||||||||||||||||||||||||||||||
| Class R4 | — | (2,438 | ) | |||||||||||||||||||||||||||||||||||||||||||||
| Class R6 | — | (9,907 | ) | |||||||||||||||||||||||||||||||||||||||||||||
| Class NAV | — | (13,194,256 | ) | |||||||||||||||||||||||||||||||||||||||||||||
| Total distributions | (12,313,327 | ) | (23,118,231 | ) | ||||||||||||||||||||||||||||||||||||||||||||
| From fund share transactions | 61,738,752 | 132,393,210 | ||||||||||||||||||||||||||||||||||||||||||||||
| Total increase | 125,525,949 | 55,878,606 | ||||||||||||||||||||||||||||||||||||||||||||||
| Net assets | ||||||||||||||||||||||||||||||||||||||||||||||||
| Beginning of year | 504,399,100 | 448,520,494 | ||||||||||||||||||||||||||||||||||||||||||||||
| End of year | $629,925,049 | $504,399,100 | ||||||||||||||||||||||||||||||||||||||||||||||
| Undistributed net investment income | $2,277,501 | $1,759,759 | ||||||||||||||||||||||||||||||||||||||||||||||
Financial highlights
| Class A Shares Period ended | 3-31-17 | 3-31-16 | 3-31-15 | 3-31-14 | 3-31-13 | ||||||||||||||||||||||||||||||||||||||||||||||||||||||||||||||||||||||||||||||||||||||||||||||||||
| Per share operating performance | |||||||||||||||||||||||||||||||||||||||||||||||||||||||||||||||||||||||||||||||||||||||||||||||||||||||
| Net asset value, beginning of period | $7.20 | $8.29 | $9.33 | $8.66 | $8.22 | ||||||||||||||||||||||||||||||||||||||||||||||||||||||||||||||||||||||||||||||||||||||||||||||||||
| Net investment income1 | 0.14 | 0.12 | 0.13 | 0.17 | 2 | 0.12 | |||||||||||||||||||||||||||||||||||||||||||||||||||||||||||||||||||||||||||||||||||||||||||||||||
| Net realized and unrealized gain (loss) on investments | 0.79 | (0.89 | ) | (0.41 | ) | 0.97 | 0.54 | ||||||||||||||||||||||||||||||||||||||||||||||||||||||||||||||||||||||||||||||||||||||||||||||||
| Total from investment operations | 0.93 | (0.77 | ) | (0.28 | ) | 1.14 | 0.66 | ||||||||||||||||||||||||||||||||||||||||||||||||||||||||||||||||||||||||||||||||||||||||||||||||
| Less distributions | |||||||||||||||||||||||||||||||||||||||||||||||||||||||||||||||||||||||||||||||||||||||||||||||||||||||
| From net investment income | (0.12 | ) | (0.11 | ) | (0.19 | ) | (0.09 | ) | (0.08 | ) | |||||||||||||||||||||||||||||||||||||||||||||||||||||||||||||||||||||||||||||||||||||||||||||
| From net realized gain | — | (0.21 | ) | (0.57 | ) | (0.38 | ) | (0.14 | ) | ||||||||||||||||||||||||||||||||||||||||||||||||||||||||||||||||||||||||||||||||||||||||||||||
| Total distributions | (0.12 | ) | (0.32 | ) | (0.76 | ) | (0.47 | ) | (0.22 | ) | |||||||||||||||||||||||||||||||||||||||||||||||||||||||||||||||||||||||||||||||||||||||||||||
| Net asset value, end of period | $8.01 | $7.20 | $8.29 | $9.33 | $8.66 | ||||||||||||||||||||||||||||||||||||||||||||||||||||||||||||||||||||||||||||||||||||||||||||||||||
| Total return (%)3,4 | 13.09 | (9.46 | ) | (2.45 | ) | 13.51 | 8.16 | ||||||||||||||||||||||||||||||||||||||||||||||||||||||||||||||||||||||||||||||||||||||||||||||||
| Ratios and supplemental data | |||||||||||||||||||||||||||||||||||||||||||||||||||||||||||||||||||||||||||||||||||||||||||||||||||||||
| Net assets, end of period (in millions) | $18 | $25 | $22 | $18 | $7 | ||||||||||||||||||||||||||||||||||||||||||||||||||||||||||||||||||||||||||||||||||||||||||||||||||
| Ratios (as a percentage of average net assets): | |||||||||||||||||||||||||||||||||||||||||||||||||||||||||||||||||||||||||||||||||||||||||||||||||||||||
| Expenses before reductions | 1.35 | 1.39 | 1.53 | 1.63 | 1.99 | ||||||||||||||||||||||||||||||||||||||||||||||||||||||||||||||||||||||||||||||||||||||||||||||||||
| Expenses including reductions | 1.34 | 1.38 | 1.52 | 1.60 | 1.60 | ||||||||||||||||||||||||||||||||||||||||||||||||||||||||||||||||||||||||||||||||||||||||||||||||||
| Net investment income | 1.89 | 1.57 | 1.50 | 1.85 | 2 | 1.52 | |||||||||||||||||||||||||||||||||||||||||||||||||||||||||||||||||||||||||||||||||||||||||||||||||
| Portfolio turnover (%) | �� | 27 | 18 | 25 | 38 | 27 | |||||||||||||||||||||||||||||||||||||||||||||||||||||||||||||||||||||||||||||||||||||||||||||||||
| 1 | Based on average daily shares outstanding. | ||||||||||||||||||||||||||||||||||||||||||||||||||||||||||||||||||||||||||||||||||
| 2 | Net investment income (loss) per share and ratio of net investment income (loss) to average net assets reflect a special dividend received by the fund which amounted to $0.04 and 0.41%, respectively. | ||||||||||||||||||||||||||||||||||||||||||||||||||||||||||||||||||||||||||||||||||
| 3 | Total returns would have been lower had certain expenses not been reduced during the applicable periods. | ||||||||||||||||||||||||||||||||||||||||||||||||||||||||||||||||||||||||||||||||||
| 4 | Does not reflect the effect of sales charges, if any. | ||||||||||||||||||||||||||||||||||||||||||||||||||||||||||||||||||||||||||||||||||
| Class C Shares Period ended | 3-31-17 | 3-31-16 | 3-31-151 | ||||||||||||||||||||||||||||||||||||||||||||||||||||||||||||||||||||
| Per share operating performance | |||||||||||||||||||||||||||||||||||||||||||||||||||||||||||||||||||||||
| Net asset value, beginning of period | $7.27 | $8.35 | $9.63 | ||||||||||||||||||||||||||||||||||||||||||||||||||||||||||||||||||||
| Net investment income2 | 0.08 | 0.06 | 0.01 | ||||||||||||||||||||||||||||||||||||||||||||||||||||||||||||||||||||
| Net realized and unrealized gain (loss) on investments | 0.81 | (0.90 | ) | (0.60 | ) | ||||||||||||||||||||||||||||||||||||||||||||||||||||||||||||||||||
| Total from investment operations | 0.89 | (0.84 | ) | (0.59 | ) | ||||||||||||||||||||||||||||||||||||||||||||||||||||||||||||||||||
| Less distributions | |||||||||||||||||||||||||||||||||||||||||||||||||||||||||||||||||||||||
| From net investment income | (0.07 | ) | (0.03 | ) | (0.12 | ) | |||||||||||||||||||||||||||||||||||||||||||||||||||||||||||||||||
| From net realized gain | — | (0.21 | ) | (0.57 | ) | ||||||||||||||||||||||||||||||||||||||||||||||||||||||||||||||||||
| Total distributions | (0.07 | ) | (0.24 | ) | (0.69 | ) | |||||||||||||||||||||||||||||||||||||||||||||||||||||||||||||||||
| Net asset value, end of period | $8.09 | $7.27 | $8.35 | ||||||||||||||||||||||||||||||||||||||||||||||||||||||||||||||||||||
| Total return (%)3,4 | 12.30 | (10.19 | ) | (5.72 | ) 5 | ||||||||||||||||||||||||||||||||||||||||||||||||||||||||||||||||||
| Ratios and supplemental data | |||||||||||||||||||||||||||||||||||||||||||||||||||||||||||||||||||||||
| Net assets, end of period (in millions) | $1 | — | 6 | — | 6 | ||||||||||||||||||||||||||||||||||||||||||||||||||||||||||||||||||
| Ratios (as a percentage of average net assets): | |||||||||||||||||||||||||||||||||||||||||||||||||||||||||||||||||||||||
| Expenses before reductions | 2.10 | 3.23 | 13.81 | 7 | |||||||||||||||||||||||||||||||||||||||||||||||||||||||||||||||||||
| Expenses including reductions | 2.09 | 2.21 | 2.35 | 7 | |||||||||||||||||||||||||||||||||||||||||||||||||||||||||||||||||||
| Net investment income | 1.03 | 0.70 | 0.11 | 7 | |||||||||||||||||||||||||||||||||||||||||||||||||||||||||||||||||||
| Portfolio turnover (%) | 27 | 18 | 25 | 8 | |||||||||||||||||||||||||||||||||||||||||||||||||||||||||||||||||||
| 1 | The inception date for Class C shares is 8-28-14. | |||||||||||||||||||||||||||||||||||||||||||||||||||||||||||||||||||||||||||||||
| 2 | Based on average daily shares outstanding. | |||||||||||||||||||||||||||||||||||||||||||||||||||||||||||||||||||||||||||||||
| 3 | Total returns would have been lower had certain expenses not been reduced during the applicable periods. | |||||||||||||||||||||||||||||||||||||||||||||||||||||||||||||||||||||||||||||||
| 4 | Does not reflect the effect of sales charges, if any. | |||||||||||||||||||||||||||||||||||||||||||||||||||||||||||||||||||||||||||||||
| 5 | Not annualized. | |||||||||||||||||||||||||||||||||||||||||||||||||||||||||||||||||||||||||||||||
| 6 | Less than $500,000. | |||||||||||||||||||||||||||||||||||||||||||||||||||||||||||||||||||||||||||||||
| 7 | Annualized. | |||||||||||||||||||||||||||||||||||||||||||||||||||||||||||||||||||||||||||||||
| 8 | The portfolio turnover is shown for the period from 4-1-14 to 3-31-15. | |||||||||||||||||||||||||||||||||||||||||||||||||||||||||||||||||||||||||||||||
| Class I Shares Period ended | 3-31-17 | 3-31-16 | 3-31-15 | 3-31-14 | 3-31-13 | ||||||||||||||||||||||||||||||||||||||||||||||||||||||||||||||||||||||||||||||||||||||||||||||||||
| Per share operating performance | |||||||||||||||||||||||||||||||||||||||||||||||||||||||||||||||||||||||||||||||||||||||||||||||||||||||
| Net asset value, beginning of period | $7.20 | $8.29 | $9.33 | $8.66 | $8.21 | ||||||||||||||||||||||||||||||||||||||||||||||||||||||||||||||||||||||||||||||||||||||||||||||||||
| Net investment income1 | 0.16 | 0.15 | 0.18 | 0.20 | 2 | 0.13 | |||||||||||||||||||||||||||||||||||||||||||||||||||||||||||||||||||||||||||||||||||||||||||||||||
| Net realized and unrealized gain (loss) on investments | 0.80 | (0.91 | ) | (0.44 | ) | 0.97 | 0.57 | ||||||||||||||||||||||||||||||||||||||||||||||||||||||||||||||||||||||||||||||||||||||||||||||||
| Total from investment operations | 0.96 | (0.76 | ) | (0.26 | ) | 1.17 | 0.70 | ||||||||||||||||||||||||||||||||||||||||||||||||||||||||||||||||||||||||||||||||||||||||||||||||
| Less distributions | |||||||||||||||||||||||||||||||||||||||||||||||||||||||||||||||||||||||||||||||||||||||||||||||||||||||
| From net investment income | (0.14 | ) | (0.12 | ) | (0.21 | ) | (0.12 | ) | (0.11 | ) | |||||||||||||||||||||||||||||||||||||||||||||||||||||||||||||||||||||||||||||||||||||||||||||
| From net realized gain | — | (0.21 | ) | (0.57 | ) | (0.38 | ) | (0.14 | ) | ||||||||||||||||||||||||||||||||||||||||||||||||||||||||||||||||||||||||||||||||||||||||||||||
| Total distributions | (0.14 | ) | (0.33 | ) | (0.78 | ) | (0.50 | ) | (0.25 | ) | |||||||||||||||||||||||||||||||||||||||||||||||||||||||||||||||||||||||||||||||||||||||||||||
| Net asset value, end of period | $8.02 | �� | $7.20 | $8.29 | $9.33 | $8.66 | |||||||||||||||||||||||||||||||||||||||||||||||||||||||||||||||||||||||||||||||||||||||||||||||||
| Total return (%)3 | 13.52 | (9.29 | ) | (2.20 | ) | 13.87 | 8.61 | ||||||||||||||||||||||||||||||||||||||||||||||||||||||||||||||||||||||||||||||||||||||||||||||||
| Ratios and supplemental data | |||||||||||||||||||||||||||||||||||||||||||||||||||||||||||||||||||||||||||||||||||||||||||||||||||||||
| Net assets, end of period (in millions) | $5 | $2 | $3 | $8 | $6 | ||||||||||||||||||||||||||||||||||||||||||||||||||||||||||||||||||||||||||||||||||||||||||||||||||
| Ratios (as a percentage of average net assets): | |||||||||||||||||||||||||||||||||||||||||||||||||||||||||||||||||||||||||||||||||||||||||||||||||||||||
| Expenses before reductions | 1.09 | 1.28 | 1.41 | 1.46 | 2.08 | ||||||||||||||||||||||||||||||||||||||||||||||||||||||||||||||||||||||||||||||||||||||||||||||||||
| Expenses including reductions | 1.08 | 1.14 | 1.29 | 1.29 | 1.28 | ||||||||||||||||||||||||||||||||||||||||||||||||||||||||||||||||||||||||||||||||||||||||||||||||||
| Net investment income | 2.16 | 1.87 | 1.93 | 2.20 | 2 | 1.52 | |||||||||||||||||||||||||||||||||||||||||||||||||||||||||||||||||||||||||||||||||||||||||||||||||
| Portfolio turnover (%) | 27 | 18 | 25 | 38 | 27 | ||||||||||||||||||||||||||||||||||||||||||||||||||||||||||||||||||||||||||||||||||||||||||||||||||
| 1 | Based on average daily shares outstanding. | ||||||||||||||||||||||||||||||||||||||||||||||||||||||||||||||||||||||||||||||||||
| 2 | Net investment income (loss) per share and ratio of net investment income (loss) to average net assets reflect a special dividend received by the fund which amounted to $0.04 and 0.41%, respectively. | ||||||||||||||||||||||||||||||||||||||||||||||||||||||||||||||||||||||||||||||||||
| 3 | Total returns would have been lower had certain expenses not been reduced during the applicable periods. | ||||||||||||||||||||||||||||||||||||||||||||||||||||||||||||||||||||||||||||||||||
| Class R2 Shares Period ended | 3-31-17 | 3-31-16 | 3-31-15 | 3-31-141 | ||||||||||||||||||||||||||||||||||||||||||||||||||||||||||||||||||||||||||||||||||||
| Per share operating performance | ||||||||||||||||||||||||||||||||||||||||||||||||||||||||||||||||||||||||||||||||||||||||
| Net asset value, beginning of period | $7.23 | $8.31 | $9.35 | $8.53 | ||||||||||||||||||||||||||||||||||||||||||||||||||||||||||||||||||||||||||||||||||||
| Net investment income2 | 0.13 | 0.11 | 0.11 | 0.19 | 3 | |||||||||||||||||||||||||||||||||||||||||||||||||||||||||||||||||||||||||||||||||||
| Net realized and unrealized gain (loss) on investments | 0.80 | (0.89 | ) | (0.40 | ) | 1.09 | ||||||||||||||||||||||||||||||||||||||||||||||||||||||||||||||||||||||||||||||||||
| Total from investment operations | 0.93 | (0.78 | ) | (0.29 | ) | 1.28 | ||||||||||||||||||||||||||||||||||||||||||||||||||||||||||||||||||||||||||||||||||
| Less distributions | ||||||||||||||||||||||||||||||||||||||||||||||||||||||||||||||||||||||||||||||||||||||||
| From net investment income | (0.12 | ) | (0.09 | ) | (0.18 | ) | (0.08 | ) | ||||||||||||||||||||||||||||||||||||||||||||||||||||||||||||||||||||||||||||||||
| From net realized gain | — | (0.21 | ) | (0.57 | ) | (0.38 | ) | |||||||||||||||||||||||||||||||||||||||||||||||||||||||||||||||||||||||||||||||||
| Total distributions | (0.12 | ) | (0.30 | ) | (0.75 | ) | (0.46 | ) | ||||||||||||||||||||||||||||||||||||||||||||||||||||||||||||||||||||||||||||||||
| Net asset value, end of period | $8.04 | $7.23 | $8.31 | $9.35 | ||||||||||||||||||||||||||||||||||||||||||||||||||||||||||||||||||||||||||||||||||||
| Total return (%)4 | 12.94 | (9.53 | ) | (2.63 | ) | 15.38 | 5 | |||||||||||||||||||||||||||||||||||||||||||||||||||||||||||||||||||||||||||||||||
| Ratios and supplemental data | ||||||||||||||||||||||||||||||||||||||||||||||||||||||||||||||||||||||||||||||||||||||||
| Net assets, end of period (in millions) | $1 | $1 | $2 | $1 | ||||||||||||||||||||||||||||||||||||||||||||||||||||||||||||||||||||||||||||||||||||
| Ratios (as a percentage of average net assets): | ||||||||||||||||||||||||||||||||||||||||||||||||||||||||||||||||||||||||||||||||||||||||
| Expenses before reductions | 1.46 | 1.68 | 2.76 | 5.96 | 6 | |||||||||||||||||||||||||||||||||||||||||||||||||||||||||||||||||||||||||||||||||||
| Expenses including reductions | 1.46 | 1.55 | 1.68 | 1.68 | 6 | |||||||||||||||||||||||||||||||||||||||||||||||||||||||||||||||||||||||||||||||||||
| Net investment income | 1.73 | 1.41 | 1.20 | 2.84 | 3,6 | |||||||||||||||||||||||||||||||||||||||||||||||||||||||||||||||||||||||||||||||||||
| Portfolio turnover (%) | 27 | 18 | 25 | 38 | 7 | |||||||||||||||||||||||||||||||||||||||||||||||||||||||||||||||||||||||||||||||||||
| 1 | The inception date for Class R2 shares is 7-2-13. | ||||||||||||||||||||||||||||||||||||||||||||||||||||||||||||||||||||||||||||||||||
| 2 | Based on average daily shares outstanding. | ||||||||||||||||||||||||||||||||||||||||||||||||||||||||||||||||||||||||||||||||||
| 3 | Net investment income (loss) per share and ratio of net investment income (loss) to average net assets reflect a special dividend received by the fund which amounted to $0.04 and 0.41%, respectively. | ||||||||||||||||||||||||||||||||||||||||||||||||||||||||||||||||||||||||||||||||||
| 4 | Total returns would have been lower had certain expenses not been reduced during the applicable periods. | ||||||||||||||||||||||||||||||||||||||||||||||||||||||||||||||||||||||||||||||||||
| 5 | Not annualized. | ||||||||||||||||||||||||||||||||||||||||||||||||||||||||||||||||||||||||||||||||||
| 6 | Annualized. | ||||||||||||||||||||||||||||||||||||||||||||||||||||||||||||||||||||||||||||||||||
| 7 | The portfolio turnover is shown for the period from 4-1-13 to 3-31-14. | ||||||||||||||||||||||||||||||||||||||||||||||||||||||||||||||||||||||||||||||||||
| Class R4 Shares Period ended | 3-31-17 | 3-31-16 | 3-31-15 | 3-31-141 | ||||||||||||||||||||||||||||||||||||||||||||||||||||||||||||||||||||||||||||||||||||
| Per share operating performance | ||||||||||||||||||||||||||||||||||||||||||||||||||||||||||||||||||||||||||||||||||||||||
| Net asset value, beginning of period | $7.21 | $8.30 | $9.34 | $8.53 | ||||||||||||||||||||||||||||||||||||||||||||||||||||||||||||||||||||||||||||||||||||
| Net investment income2 | 0.15 | 0.14 | 0.15 | 0.10 | 3 | |||||||||||||||||||||||||||||||||||||||||||||||||||||||||||||||||||||||||||||||||||
| Net realized and unrealized gain (loss) on investments | 0.81 | (0.90 | ) | (0.42 | ) | 1.20 | ||||||||||||||||||||||||||||||||||||||||||||||||||||||||||||||||||||||||||||||||||
| Total from investment operations | 0.96 | (0.76 | ) | (0.27 | ) | 1.30 | ||||||||||||||||||||||||||||||||||||||||||||||||||||||||||||||||||||||||||||||||||
| Less distributions | ||||||||||||||||||||||||||||||||||||||||||||||||||||||||||||||||||||||||||||||||||||||||
| From net investment income | (0.14 | ) | (0.12 | ) | (0.20 | ) | (0.11 | ) | ||||||||||||||||||||||||||||||||||||||||||||||||||||||||||||||||||||||||||||||||
| From net realized gain | — | (0.21 | ) | (0.57 | ) | (0.38 | ) | |||||||||||||||||||||||||||||||||||||||||||||||||||||||||||||||||||||||||||||||||
| Total distributions | (0.14 | ) | (0.33 | ) | (0.77 | ) | (0.49 | ) | ||||||||||||||||||||||||||||||||||||||||||||||||||||||||||||||||||||||||||||||||
| Net asset value, end of period | $8.03 | $7.21 | $8.30 | $9.34 | ||||||||||||||||||||||||||||||||||||||||||||||||||||||||||||||||||||||||||||||||||||
| Total return (%)4 | 13.44 | (9.34 | ) | (2.36 | ) | 15.55 | 5 | |||||||||||||||||||||||||||||||||||||||||||||||||||||||||||||||||||||||||||||||||
| Ratios and supplemental data | ||||||||||||||||||||||||||||||||||||||||||||||||||||||||||||||||||||||||||||||||||||||||
| Net assets, end of period (in millions) | — | 6 | — | 6 | — | 6 | — | 6 | ||||||||||||||||||||||||||||||||||||||||||||||||||||||||||||||||||||||||||||||||
| Ratios (as a percentage of average net assets): | ||||||||||||||||||||||||||||||||||||||||||||||||||||||||||||||||||||||||||||||||||||||||
| Expenses before reductions | 1.24 | 3.82 | 18.12 | 15.49 | 7 | |||||||||||||||||||||||||||||||||||||||||||||||||||||||||||||||||||||||||||||||||||
| Expenses including reductions | 1.13 | 1.22 | 1.43 | 1.43 | 7 | |||||||||||||||||||||||||||||||||||||||||||||||||||||||||||||||||||||||||||||||||||
| Net investment income | 2.03 | 1.78 | 1.67 | 1.43 | 3,7 | |||||||||||||||||||||||||||||||||||||||||||||||||||||||||||||||||||||||||||||||||||
| Portfolio turnover (%) | 27 | 18 | 25 | 38 | 8 | |||||||||||||||||||||||||||||||||||||||||||||||||||||||||||||||||||||||||||||||||||
| 1 | The inception date for Class R4 shares is 7-2-13. | ||||||||||||||||||||||||||||||||||||||||||||||||||||||||||||||||||||||||||||||||||
| 2 | Based on average daily shares outstanding. | ||||||||||||||||||||||||||||||||||||||||||||||||||||||||||||||||||||||||||||||||||
| 3 | Net investment income (loss) per share and ratio of net investment income (loss) to average net assets reflect a special dividend received by the fund which amounted to $0.04 and 0.41%, respectively. | ||||||||||||||||||||||||||||||||||||||||||||||||||||||||||||||||||||||||||||||||||
| 4 | Total returns would have been lower had certain expenses not been reduced during the applicable periods. | ||||||||||||||||||||||||||||||||||||||||||||||||||||||||||||||||||||||||||||||||||
| 5 | Not annualized. | ||||||||||||||||||||||||||||||||||||||||||||||||||||||||||||||||||||||||||||||||||
| 6 | Less than $500,000. | ||||||||||||||||||||||||||||||||||||||||||||||||||||||||||||||||||||||||||||||||||
| 7 | Annualized. | ||||||||||||||||||||||||||||||||||||||||||||||||||||||||||||||||||||||||||||||||||
| 8 | The portfolio turnover is shown for the period from 4-1-13 to 3-31-14. | ||||||||||||||||||||||||||||||||||||||||||||||||||||||||||||||||||||||||||||||||||
| Class R6 Shares Period ended | 3-31-17 | 3-31-16 | 3-31-15 | 3-31-141 | ||||||||||||||||||||||||||||||||||||||||||||||||||||||||||||||||||||||||||||||||||||
| Per share operating performance | ||||||||||||||||||||||||||||||||||||||||||||||||||||||||||||||||||||||||||||||||||||||||
| Net asset value, beginning of period | $7.20 | $8.28 | $9.33 | $8.53 | ||||||||||||||||||||||||||||||||||||||||||||||||||||||||||||||||||||||||||||||||||||
| Net investment income2 | 0.15 | 0.25 | 0.10 | 0.12 | 3 | |||||||||||||||||||||||||||||||||||||||||||||||||||||||||||||||||||||||||||||||||||
| Net realized and unrealized gain (loss) on investments | 0.80 | (0.98 | ) | (0.34 | ) | 1.20 | ||||||||||||||||||||||||||||||||||||||||||||||||||||||||||||||||||||||||||||||||||
| Total from investment operations | 0.95 | (0.73 | ) | (0.24 | ) | 1.32 | ||||||||||||||||||||||||||||||||||||||||||||||||||||||||||||||||||||||||||||||||||
| Less distributions | ||||||||||||||||||||||||||||||||||||||||||||||||||||||||||||||||||||||||||||||||||||||||
| From net investment income | (0.15 | ) | (0.14 | ) | (0.24 | ) | (0.14 | ) | ||||||||||||||||||||||||||||||||||||||||||||||||||||||||||||||||||||||||||||||||
| From net realized gain | — | (0.21 | ) | (0.57 | ) | (0.38 | ) | |||||||||||||||||||||||||||||||||||||||||||||||||||||||||||||||||||||||||||||||||
| Total distributions | (0.15 | ) | (0.35 | ) | (0.81 | ) | (0.52 | ) | ||||||||||||||||||||||||||||||||||||||||||||||||||||||||||||||||||||||||||||||||
| Net asset value, end of period | $8.00 | $7.20 | $8.28 | $9.33 | ||||||||||||||||||||||||||||||||||||||||||||||||||||||||||||||||||||||||||||||||||||
| Total return (%)4 | 13.36 | (8.97 | ) | (2.04 | ) | 15.83 | 5 | |||||||||||||||||||||||||||||||||||||||||||||||||||||||||||||||||||||||||||||||||
| Ratios and supplemental data | ||||||||||||||||||||||||||||||||||||||||||||||||||||||||||||||||||||||||||||||||||||||||
| Net assets, end of period (in millions) | $1 | — | 6 | $4 | — | 6 | ||||||||||||||||||||||||||||||||||||||||||||||||||||||||||||||||||||||||||||||||||
| Ratios (as a percentage of average net assets): | ||||||||||||||||||||||||||||||||||||||||||||||||||||||||||||||||||||||||||||||||||||||||
| Expenses before reductions | 0.99 | 1.16 | 2.32 | 16.37 | 7 | |||||||||||||||||||||||||||||||||||||||||||||||||||||||||||||||||||||||||||||||||||
| Expenses including reductions | 0.97 | 0.97 | 1.04 | 1.10 | 7 | |||||||||||||||||||||||||||||||||||||||||||||||||||||||||||||||||||||||||||||||||||
| Net investment income | 2.02 | 2.95 | 1.15 | 1.76 | 3,7 | |||||||||||||||||||||||||||||||||||||||||||||||||||||||||||||||||||||||||||||||||||
| Portfolio turnover (%) | 27 | 18 | 25 | 38 | 8 | |||||||||||||||||||||||||||||||||||||||||||||||||||||||||||||||||||||||||||||||||||
| 1 | The inception date for Class R6 shares is 7-2-13. | ||||||||||||||||||||||||||||||||||||||||||||||||||||||||||||||||||||||||||||||||||
| 2 | Based on average daily shares outstanding. | ||||||||||||||||||||||||||||||||||||||||||||||||||||||||||||||||||||||||||||||||||
| 3 | Net investment income (loss) per share and ratio of net investment income (loss) to average net assets reflect a special dividend received by the fund which amounted to $0.04 and 0.41%, respectively. | ||||||||||||||||||||||||||||||||||||||||||||||||||||||||||||||||||||||||||||||||||
| 4 | Total returns would have been lower had certain expenses not been reduced during the applicable periods. | ||||||||||||||||||||||||||||||||||||||||||||||||||||||||||||||||||||||||||||||||||
| 5 | Not annualized. | ||||||||||||||||||||||||||||||||||||||||||||||||||||||||||||||||||||||||||||||||||
| 6 | Less than $500,000. | ||||||||||||||||||||||||||||||||||||||||||||||||||||||||||||||||||||||||||||||||||
| 7 | Annualized. | ||||||||||||||||||||||||||||||||||||||||||||||||||||||||||||||||||||||||||||||||||
| 8 | The portfolio turnover is shown for the period from 4-1-13 to 3-31-14. | ||||||||||||||||||||||||||||||||||||||||||||||||||||||||||||||||||||||||||||||||||
| Class NAV Shares Period ended | 3-31-17 | 3-31-16 | 3-31-15 | 3-31-14 | 3-31-13 | ||||||||||||||||||||||||||||||||||||||||||||||||||||||||||||||||||||||||||||||||||||||||||||||||||
| Per share operating performance | |||||||||||||||||||||||||||||||||||||||||||||||||||||||||||||||||||||||||||||||||||||||||||||||||||||||
| Net asset value, beginning of period | $7.20 | $8.29 | $9.34 | $8.66 | $8.22 | ||||||||||||||||||||||||||||||||||||||||||||||||||||||||||||||||||||||||||||||||||||||||||||||||||
| Net investment income1 | 0.16 | 0.16 | 0.18 | 0.21 | 2 | 0.15 | |||||||||||||||||||||||||||||||||||||||||||||||||||||||||||||||||||||||||||||||||||||||||||||||||
| Net realized and unrealized gain (loss) on investments | 0.80 | (0.90 | ) | (0.42 | ) | 0.99 | 0.55 | ||||||||||||||||||||||||||||||||||||||||||||||||||||||||||||||||||||||||||||||||||||||||||||||||
| Total from investment operations | 0.96 | (0.74 | ) | (0.24 | ) | 1.20 | 0.70 | ||||||||||||||||||||||||||||||||||||||||||||||||||||||||||||||||||||||||||||||||||||||||||||||||
| Less distributions | |||||||||||||||||||||||||||||||||||||||||||||||||||||||||||||||||||||||||||||||||||||||||||||||||||||||
| From net investment income | (0.15 | ) | (0.14 | ) | (0.24 | ) | (0.14 | ) | (0.12 | ) | |||||||||||||||||||||||||||||||||||||||||||||||||||||||||||||||||||||||||||||||||||||||||||||
| From net realized gain | — | (0.21 | ) | (0.57 | ) | (0.38 | ) | (0.14 | ) | ||||||||||||||||||||||||||||||||||||||||||||||||||||||||||||||||||||||||||||||||||||||||||||||
| Total distributions | (0.15 | ) | (0.35 | ) | (0.81 | ) | (0.52 | ) | (0.26 | ) | |||||||||||||||||||||||||||||||||||||||||||||||||||||||||||||||||||||||||||||||||||||||||||||
| Net asset value, end of period | $8.01 | $7.20 | $8.29 | $9.34 | $8.66 | ||||||||||||||||||||||||||||||||||||||||||||||||||||||||||||||||||||||||||||||||||||||||||||||||||
| Total return (%)3 | 13.64 | (9.09 | ) | (2.03 | ) | 14.23 | 8.69 | ||||||||||||||||||||||||||||||||||||||||||||||||||||||||||||||||||||||||||||||||||||||||||||||||
| Ratios and supplemental data | |||||||||||||||||||||||||||||||||||||||||||||||||||||||||||||||||||||||||||||||||||||||||||||||||||||||
| Net assets, end of period (in millions) | $605 | $476 | $417 | $433 | $307 | ||||||||||||||||||||||||||||||||||||||||||||||||||||||||||||||||||||||||||||||||||||||||||||||||||
| Ratios (as a percentage of average net assets): | |||||||||||||||||||||||||||||||||||||||||||||||||||||||||||||||||||||||||||||||||||||||||||||||||||||||
| Expenses before reductions | 0.98 | 0.99 | 1.04 | 1.03 | 1.08 | ||||||||||||||||||||||||||||||||||||||||||||||||||||||||||||||||||||||||||||||||||||||||||||||||||
| Expenses including reductions | 0.97 | 0.98 | 1.03 | 1.03 | 1.08 | ||||||||||||||||||||||||||||||||||||||||||||||||||||||||||||||||||||||||||||||||||||||||||||||||||
| Net investment income | 2.12 | 2.00 | 2.05 | 2.37 | 2 | 1.78 | |||||||||||||||||||||||||||||||||||||||||||||||||||||||||||||||||||||||||||||||||||||||||||||||||
| Portfolio turnover (%) | 27 | 18 | 25 | 38 | 27 | ||||||||||||||||||||||||||||||||||||||||||||||||||||||||||||||||||||||||||||||||||||||||||||||||||
| 1 | Based on average daily shares outstanding. | ||||||||||||||||||||||||||||||||||||||||||||||||||||||||||||||||||||||||||||||||||
| 2 | Net investment income (loss) per share and ratio of net investment income (loss) to average net assets reflect a special dividend received by the fund which amounted to $0.04 and 0.41%, respectively. | ||||||||||||||||||||||||||||||||||||||||||||||||||||||||||||||||||||||||||||||||||
| 3 | Total returns would have been lower had certain expenses not been reduced during the applicable periods. | ||||||||||||||||||||||||||||||||||||||||||||||||||||||||||||||||||||||||||||||||||
Note 1 — Organization
John Hancock International Value Equity Fund (the fund) is a series of John Hancock Funds III (the Trust), an open-end management investment company organized as a Massachusetts business trust and registered under the Investment Company Act of 1940, as amended (the 1940 Act). The investment objective of the fund is to seek long-term capital appreciation.
The fund may offer multiple classes of shares. The shares currently offered are detailed in the Statement of assets and liabilities. Class A and Class C shares are offered to all investors. Class I shares are offered to institutions and certain investors. Class R2 and R4 shares are available only to certain retirement plans. Class R6 shares are available only to certain retirement plans, institutions and other investors. Class NAV shares are offered to John Hancock affiliated funds of funds and certain 529 plans. Shareholders of each class have exclusive voting rights to matters that affect that class. The distribution and service fees, if any, and transfer agent fees for each class may differ.
Note 2 — Significant accounting policies
The financial statements have been prepared in conformity with accounting principles generally accepted in the United States of America (US GAAP), which require management to make certain estimates and assumptions as of the date of the financial statements. Actual results could differ from those estimates and those differences could be significant. The fund qualifies as an investment company under Topic 946 of Accounting Standards Codification of US GAAP.
Events or transactions occurring after the end of the fiscal period through the date that the financial statements were issued have been evaluated in the preparation of the financial statements. The following summarizes the significant accounting policies of the fund:
Security valuation. Investments are stated at value as of the scheduled close of regular trading on the New York Stock Exchange (NYSE), normally at 4:00 p.m., Eastern Time. In case of emergency or other disruption resulting in the NYSE not opening for trading or the NYSE closing at a time other than the regularly scheduled close, the net asset value (NAV) may be determined as of the regularly scheduled close of the NYSE pursuant to the fund's Valuation Policies and Procedures.
In order to value the securities, the fund uses the following valuation techniques: Equity securities held by the fund are typically valued at the last sale price or official closing price on the exchange or principal market where the security trades. In the event there were no sales during the day or closing prices are not available, the securities are valued using the last available bid price. Investments by the fund in open-end mutual funds, including John Hancock Collateral Trust (JHCT), are valued at their respective NAVs each business day. Debt obligations are valued based on the evaluated prices provided by an independent pricing vendor or from broker-dealers. Independent pricing vendors utilize matrix pricing which takes into account factors such as institutional-size trading in similar groups of securities, yield, quality, coupon rate, maturity, type of issue, trading characteristics and other market data, as well as broker supplied prices. Foreign securities and currencies are valued in U.S. dollars, based on foreign currency exchange rates supplied by an independent pricing vendor.
In certain instances, the Pricing Committee may determine to value equity securities using prices obtained from another exchange or market if trading on the exchange or market on which prices are typically obtained did not open for trading as scheduled, or if trading closed earlier than scheduled, and trading occurred as normal on another exchange or market.
Other portfolio securities and assets, for which reliable market quotations are not readily available, are valued at fair value as determined in good faith by the fund's Pricing Committee following procedures established by the Board of Trustees. The frequency with which these fair valuation procedures are used cannot be predicted and fair value of securities may differ significantly from the value that would have been used had a ready market for such securities existed. Trading in foreign securities may be completed before the scheduled daily close of trading on the NYSE. Significant events at the issuer or market level may affect the values of securities between the time when the valuation of the securities is generally determined and the close of the NYSE. If a significant event occurs, these securities may be fair valued, as determined in good faith by the fund's Pricing Committee, following procedures established by the Board of Trustees. The fund uses fair value adjustment factors provided by an independent pricing vendor to value certain foreign securities in order to adjust for events that may occur between the close of foreign exchanges or markets and the close of the NYSE.
The fund uses a three-tier hierarchy to prioritize the pricing assumptions, referred to as inputs, used in valuation techniques to measure fair value. Level 1 includes securities valued using quoted prices in active markets for identical securities. Level 2 includes securities valued using other significant observable inputs. Observable inputs may include quoted prices for similar securities, interest rates, prepayment speeds and credit risk. Prices for securities valued using these inputs are received from independent pricing vendors and brokers and are based on an evaluation of the inputs described. Level 3 includes securities valued using significant unobservable inputs when market prices are not readily available or reliable, including the fund's own assumptions in determining the fair value of investments. Factors used in determining value may include market or issuer specific events or trends, changes in interest rates and credit quality. The inputs or methodology used for valuing securities are not necessarily an indication of the risks associated with investing in those securities. Changes in valuation techniques and related inputs may result in transfers into or out of an assigned level within the disclosure hierarchy.
The following is a summary of the values by input classification of the fund's investments as of March 31, 2017, by major security category or type:
| Total value at 3-31-17 | Level 1 quoted price | Level 2 significant observable inputs | Level 3 significant unobservable inputs | ||
| Common stocks | |||||
| Australia | $39,628,886 | — | $39,628,886 | — | |
| Belgium | 3,718,591 | — | 3,718,591 | — | |
| Canada | 36,733,205 | $36,733,205 | — | — | |
| Chile | 5,618,986 | — | 5,618,986 | — | |
| China | 7,777,905 | — | 7,777,905 | — | |
| Denmark | 11,011,570 | — | 11,011,570 | — | |
| France | 66,385,343 | — | 66,385,343 | — | |
| Germany | 61,825,918 | — | 61,825,918 | — | |
| Hong Kong | 23,104,936 | — | 23,104,936 | — | |
| Ireland | 15,205,638 | 4,879,973 | 10,325,665 | — | |
| Israel | 4,230,293 | — | 4,230,293 | — | |
| Italy | 3,604,084 | — | 3,604,084 | — | |
| Japan | 126,811,938 | — | 126,811,938 | — | |
| Netherlands | 27,806,556 | — | 27,806,556 | — | |
| Norway | 4,710,967 | — | 4,710,967 | — | |
| Singapore | 15,904,138 | — | 15,904,138 | — | |
| South Africa | 3,208,063 | — | 3,208,063 | — | |
| Spain | 22,121,847 | — | 22,121,847 | — | |
| Sweden | 9,354,723 | — | 9,354,723 | — | |
| Switzerland | 45,194,767 | — | 45,194,767 | — | |
| United Kingdom | 76,775,663 | — | 76,775,663 | — | |
| Securities lending collateral | 9,479,792 | 9,479,792 | — | — | |
| Short-term investments | 17,175,000 | — | 17,175,000 | — | |
| Total investments in securities | $637,388,809 | $51,092,970 | $586,295,839 | — | |
Repurchase agreements. The fund may enter into repurchase agreements. When the fund enters into a repurchase agreement, it receives collateral that is held in a segregated account by the fund's custodian, or for tri-party repurchase agreements, collateral is held at a third-party custodian bank in a segregated account for the benefit of the fund. The collateral amount is marked-to-market and monitored on a daily basis to ensure that the collateral held is in an amount not less than the principal amount of the repurchase agreement plus any accrued interest. Collateral received by the fund for repurchase agreements is disclosed in the Fund's investments as part of the caption related to the repurchase agreement.
Repurchase agreements are typically governed by the terms and conditions of the Master Repurchase Agreement and/or Global Master Repurchase Agreement (collectively, MRA). Upon an event of default, the non-defaulting party may close out all transactions traded under the MRA and net amounts owed. Absent an event of default, assets and liabilities resulting from repurchase agreements are not offset in the Statement of assets and liabilities. In the event of a default by the counterparty, realization of the collateral proceeds could be delayed, during which time the collateral value may decline or the counterparty may have insufficient assets to pay back claims resulting from close-out of the transactions.
Security transactions and related investment income. Investment security transactions are accounted for on a trade date plus one basis for daily NAV calculations. However, for financial reporting purposes, investment transactions are reported on trade date. Interest income is accrued as earned. Dividend income is recorded on the ex-date, except for dividends of foreign securities where the dividend may not be known until after the ex-date. In those cases, dividend income, net of withholding taxes, is recorded when the fund becomes aware of the dividends. Foreign taxes are provided for based on the fund's understanding of the tax rules and rates that exist in the foreign markets in which it invests. Gains and losses on securities sold are determined on the basis of identified cost and may include proceeds from litigation.
Securities lending. The fund may lend its securities to earn additional income. The fund receives cash collateral from the borrower in an amount not less than the market value of the loaned securities. The fund will invest its collateral in JHCT, an affiliate of the fund, which has a floating NAV and is registered with the Securities and Exchange Commission (SEC) as an investment company. JHCT invests cash received as collateral as part of the securities lending program in short-term money market investments. The fund will receive the benefit of any gains and bear any losses generated by JHCT with respect to the cash collateral.
The fund has the right to recall loaned securities on demand. If a borrower fails to return loaned securities when due, then the lending agent is responsible and indemnifies the fund for the lent securities. The lending agent uses the collateral received from the borrower to purchase replacement securities of the same issue, type, class and series of the loaned securities. If the value of the collateral is less than the purchase cost of replacement securities, the lending agent is responsible for satisfying the shortfall but only to the extent that the shortfall is not due to any decrease in the value of JHCT.
Although the risk of the loss of the securities lent is mitigated by receiving collateral from the borrower and through lending agent indemnification, the fund could experience a delay in recovering securities or could experience a lower than expected return if the borrower fails to return the securities on a timely basis. The fund receives compensation for lending its securities by retaining a portion of the return on the investment of the collateral and compensation from fees earned from borrowers of the securities. Securities lending income received by the fund is net of fees retained by the securities lending agent. Net income received from JHCT is a component of securities lending income as recorded on the Statement of operations.
Obligations to repay collateral received by the fund are shown on the Statement of assets and liabilities as Payable upon return of securities loaned and are secured by the loaned securities. As of March 31, 2017, the fund loaned common stocks valued at $9,016,552 and received $9,480,100 of cash collateral.
Foreign currency translation. Assets, including investments and liabilities denominated in foreign currencies, are translated into U.S. dollar values each day at the prevailing exchange rate. Purchases and sales of securities, income and expenses are translated into U.S. dollars at the prevailing exchange rate on the date of the transaction. The effect of changes in foreign currency exchange rates on the value of securities is reflected as a component of the realized and unrealized gains (losses) on investments.
Funds that invest internationally generally carry more risk than funds that invest strictly in U.S. securities. These risks are heightened for investments in emerging markets. Risks can result from differences in economic and political conditions, regulations, market practices (including higher transaction costs), accounting standards and other factors. Foreign investments are also subject to a decline in the value of a foreign currency versus the U.S. dollar, which reduces the dollar value of securities denominated in that currency.
Foreign taxes. The fund may be subject to withholding tax on income and/or capital gains or repatriation taxes imposed by certain countries in which the fund invests. Taxes are accrued based upon investment income, realized gains or unrealized appreciation.
Line of credit. The fund may borrow from banks for temporary or emergency purposes, including meeting redemption requests that otherwise might require the untimely sale of securities. Pursuant to the fund's custodian agreement, the custodian may loan money to the fund to make properly authorized payments. The fund is obligated to repay the custodian for any overdraft, including any related costs or expenses. The custodian may have a lien, security interest or security entitlement in any fund property that is not otherwise segregated or pledged, to the extent of any overdraft, and to the maximum extent permitted by law.
Effective June 30, 2016, the fund and other affiliated funds have entered into a syndicated line of credit agreement with Citibank, N.A. as the administrative agent that enables them to participate in a $1 billion unsecured committed line of credit. Excluding commitments designated for a certain fund and subject to the need of other affiliated funds, the fund can borrow up to an aggregate commitment amount of $750 million, subject to asset coverage and other limitations as specified in the agreement. A commitment fee payable at the end of each calendar quarter, based on the average daily unused portion of the line of credit, is charged to each participating fund based on a combination of fixed and asset based allocations and is reflected in Other expenses on the Statement of operations. Prior to June 30, 2016, the fund had a similar agreement that enabled it to participate in a $750 million unsecured committed line of credit. For the year ended March 31, 2017, the fund had no borrowings under either line of credit. Commitment fees for the year ended March 31, 2017, were $3,736.
Expenses. Within the John Hancock group of funds complex, expenses that are directly attributable to an individual fund are allocated to such fund. Expenses that are not readily attributable to a specific fund are allocated among all funds in an equitable manner, taking into consideration, among other things, the nature and type of expense and the fund's relative net assets. Expense estimates are accrued in the period to which they relate and adjustments are made when actual amounts are known.
Class allocations. Income, common expenses and realized and unrealized gains (losses) are determined at the fund level and allocated daily to each class of shares based on the net assets of the class. Class-specific expenses, such as distribution and service fees, if any, and transfer agent fees, for all classes, are calculated daily at the class level based on the net assets of each class and the specific expense rates applicable to each class.
Federal income taxes. The fund intends to continue to qualify as a regulated investment company by complying with the applicable provisions of the Internal Revenue Code and will not be subject to federal income tax on taxable income that is distributed to shareholders. Therefore, no federal income tax provision is required.
For federal income tax purposes, as of March 31, 2017, the fund has a long-term capital loss carryforward of $5,382,665 available to offset future net realized capital gains. This carryforward does not expire.
As of March 31, 2017, the fund had no uncertain tax positions that would require financial statement recognition, derecognition or disclosure. The fund's federal tax returns are subject to examination by the Internal Revenue Service for a period of three years.
Distribution of income and gains. Distributions to shareholders from net investment income and net realized gains, if any, are recorded on the ex-date. The fund typically declares and pays dividends and capital gain distributions, if any, at least annually.
The tax character of distributions for the years ended March 31, 2017 and 2016 was as follows:
| March 31, 2017 | March 31, 2016 | |
| Ordinary Income | $12,313,327 | $10,261,782 |
| Long-Term Capital Gain | — | 12,856,449 |
| Total | $12,313,327 | $23,118,231 |
Distributions paid by the fund with respect to each class of shares are calculated in the same manner, at the same time and in the same amount, except for the effect of class level expenses that may be applied differently to each class. As of March 31, 2017, the components of distributable earnings on a tax basis consisted of $2,866,196 of undistributed ordinary income.
Such distributions and distributable earnings, on a tax basis, are determined in conformity with income tax regulations, which may differ from US GAAP. Distributions in excess of tax basis earnings and profits, if any, are reported in the fund's financial statements as a return of capital.
Capital accounts within the financial statements are adjusted for permanent book-tax differences. These adjustments have no impact on net assets or the results of operations. Temporary book-tax differences, if any, will reverse in a subsequent period. Book-tax differences are primarily attributable to investments in passive foreign investment companies and wash sale loss deferrals.
Note 3 — Guarantees and indemnifications
Under the Trust's organizational documents, its Officers and Trustees are indemnified against certain liabilities arising out of the performance of their duties to the Trust, including the fund. Additionally, in the normal course of business, the fund enters into contracts with service providers that contain general indemnification clauses. The fund's maximum exposure under these arrangements is unknown, as this would involve future claims that may be made against the fund that have not yet occurred. The risk of material loss from such claims is considered remote.
Note 4 — Fees and transactions with affiliates
John Hancock Advisers, LLC (the Advisor) serves as investment advisor for the fund. John Hancock Funds, LLC (the Distributor), an affiliate of the Advisor, serves as principal underwriter of the fund. The Advisor and the Distributor are indirect, wholly owned subsidiaries of Manulife Financial Corporation (MFC).
Management fee. The fund has an investment management agreement with the Advisor under which the fund pays a daily management fee to the Advisor equivalent on an annual basis to the sum of: (a) 0.900% of the first $100 million of the fund's average daily net assets; (b) 0.875% of the next $900 million of the fund's average daily net assets; (c) 0.850% of the next $1 billion of the fund's average daily net assets; (d) 0.825% of the next $1 billion of the fund's average daily net assets; (e) 0.800% of the next $1 billion of the fund's average daily net assets and (f) 0.775% of the fund's average daily net assets in excess of $4 billion. The Advisor has a subadvisory agreement with John Hancock Asset Management a division of Manulife Asset Management (US) LLC, an indirectly owned subsidiary of MFC and an affiliate of the Advisor. The fund is not responsible for payment of the subadvisory fees.
The Advisor has contractually agreed to waive a portion of its management fee and/or reimburse expenses for certain funds of the John Hancock group of funds complex, including the fund (the participating portfolios). This waiver is based upon aggregate net assets of all the participating portfolios. The amount of the reimbursement is calculated daily and allocated among all the participating portfolios in proportion to the daily net assets of each fund. During the year ended March 31, 2017, this waiver amounted to 0.01% of the fund's average net assets. This arrangement may be amended or terminated at any time by the Advisor upon notice to the fund and with the approval of the Board of Trustees.
Prior to July 1, 2016, the Advisor had contractually agreed to waive all or a portion of its management fee and reimburse or pay operating expenses of the fund to the extent necessary to maintain the fund's total operating expenses at 2.35% of average annual net assets for Class C shares. This agreement excluded certain expenses such as taxes, brokerage commissions, interest expense, litigation and indemnification expenses and other extraordinary expenses not incurred in the ordinary course of the fund's business, acquired fund fees and expenses paid indirectly and short dividend expense.
The Advisor contractually agreed to waive and/or reimburse all class-specific expenses for Class R6 shares to the extent they exceed 0.00% of average annual net assets (on an annualized basis) attributable to the class. This agreement expires on June 30, 2017, unless renewed by mutual agreement of the fund and the Advisor based upon a determination that this is appropriate under the circumstances at that time.
The expense reductions described above amounted to the following for the year ended March 31, 2017:
| Class | Expense reduction | Class | Expense reduction | |
| Class A | $1,522 | Class R4 | $7 | |
| Class C | 57 | Class R6 | 111 | |
| Class I | 200 | Class NAV | 41,026 | |
| Class R2 | 58 | Total | $42,981 |
Expenses waived or reimbursed in the current fiscal period are not subject to recapture in future fiscal periods.
The investment management fees, including the impact of the waivers and reimbursements as described above, incurred for the year ended March 31, 2017 were equivalent to a net annual effective rate of 0.87% of the fund's average daily net assets.
Accounting and legal services. Pursuant to a service agreement, the fund reimburses the Advisor for all expenses associated with providing the administrative, financial, legal, accounting and recordkeeping services to the fund, including the preparation of all tax returns, periodic reports to shareholders and regulatory reports, among other services. These expenses are allocated to each share class based on its relative net assets at the time the expense was incurred. These accounting and legal services fees incurred for the year ended March 31, 2017 amounted to an annual rate of 0.01% of the fund's average daily net assets.
Distribution and service plans. The fund has a distribution agreement with the Distributor. The fund has adopted distribution and service plans with respect to Class A, Class C, Class R2 and Class R4 shares pursuant to Rule 12b-1 under the 1940 Act, to pay the Distributor for services provided as the distributor of shares of the fund. In addition, under a service plan for Class R2 and Class R4 shares, the fund pays for certain other services. The fund may pay up to the following contractual rates of distribution and service fees under these arrangements, expressed as an annual percentage of average daily net assets for each class of the fund's shares.
| Class | Rule 12b-1 fee | Service fee | Class | Rule 12b-1 fee | Service fee | |
| Class A | 0.30% | — | Classs R2 | 0.25% | 0.25% | |
| Class C | 1.00% | — | Class R4 | 0.25% | 0.10% |
Class A shares are currently charged 0.25% for Rule 12b-1 fees.
The fund's Distributor has contractually agreed to waive 0.10% of Rule12b-1 fees for Class R4 shares. The current waiver agreement expires on June 30, 2017, unless renewed by mutual agreement of the fund and the Distributor based upon a determination that this is appropriate under the circumstances at the time. This contractual waiver amounted to $88 for Class R4 shares for the year ended March 31, 2017.
Sales charges. Class A shares are assessed up-front sales charges, which resulted in payments to the Distributor amounting to $41,354 for the year ended March 31, 2017. Of this amount, $7,151 was retained and used for printing prospectuses, advertising, sales literature and other purposes, and $34,203 was paid as sales commissions to broker-dealers.
Class A and Class C shares may be subject to contingent deferred sales charges (CDSCs). Certain Class A shares that are acquired through purchases of $1 million or more and are redeemed within one year of purchase are subject to a 1.00% sales charge. Class C shares that are redeemed within one year of purchase are subject to a 1.00% CDSC. CDSCs are applied to the lesser of the current market value at the time of redemption or the original purchase cost of the shares being redeemed. Proceeds from CDSCs are used to compensate the Distributor for providing distribution-related services in connection with the sale of these shares. During the year ended March 31, 2017, CDSCs received by the Distributor amounted to $1,660 and $184 for Class A and Class C shares, respectively.
Transfer agent fees. The fund has a transfer agent agreement with John Hancock Signature Services, Inc. (Signature Services), an affiliate of the Advisor. The transfer agent fees paid to Signature Services are determined based on the cost to Signature Services (Signature Services Cost) of providing recordkeeping services. It also includes out-of-pocket expenses,
including payments made to third-parties for recordkeeping services provided to their clients who invest in one or more John Hancock funds. In addition, Signature Services Cost may be reduced by certain fees that Signature Services receives in connection with retirement and small accounts. Signature Services Cost is calculated monthly and allocated, as applicable, to five categories of share classes: Retail Share and Institutional Share Classes of Non-Municipal Bond Funds, Class R6 Shares, Retirement Share Classes and Municipal Bond Share Classes. Within each of these categories, the applicable costs are allocated to the affected John Hancock affiliated funds and/or classes, based on the relative average daily net assets.
Class level expenses. Class level expenses for the year ended March 31, 2017 were:
| Class | Distribution and service fees | Transfer agent fees |
| Class A | $50,345 | $24,774 |
| Class C | 5,843 | 719 |
| Class I | — | 2,924 |
| Class R2 | 3,599 | 125 |
| Class R4 | 220 | 14 |
| Class R6 | — | 75 |
| Total | $60,007 | $28,631 |
Trustee expenses. The fund compensates each Trustee who is not an employee of the Advisor or its affiliates. The costs of paying Trustee compensation and expenses are allocated to each fund based on its net assets relative to other funds within the John Hancock group of funds complex.
Interfund lending program. Pursuant to an Exemptive Order issued by the SEC, the fund, along with certain other funds advised by the Advisor or its affiliates, may participate in an interfund lending program. This program provides an alternative credit facility allowing the funds to borrow from, or lend money to, other participating affiliated funds. Any open loans at period end are presented under the caption Payable for interfund lending in the Statement of assets and liabilities. At period end, no interfund loans were outstanding. Interest expense is included in Other expenses on the Statement of operations. During the year ended March 31, 2017, the fund's activity in this program during the period for which loans were outstanding was as follows:
| Borrower or lender | Weighted average loan balance | Days outstanding | Weighted average interest rate | Interest income |
| Lender | $14,058,282 | 1 | 0.660% | $258 |
Note 5 — Fund share transactions
Transactions in fund shares for the years ended March 31, 2017 and 2016 were as follows:
| Year ended 3-31-17 | Year ended 3-31-16 | |||||||||||||||||||||||||
| Shares | Amount | Shares | Amount | |||||||||||||||||||||||
| Class A shares | ||||||||||||||||||||||||||
| Sold | 500,739 | $3,759,558 | 1,083,193 | $8,562,305 | ||||||||||||||||||||||
| Distributions reinvested | 39,485 | 296,922 | 135,930 | 1,004,523 | ||||||||||||||||||||||
| Repurchased | (1,708,637 | ) | (12,642,491 | ) | (482,641 | ) | (3,695,925 | ) | ||||||||||||||||||
| Net increase (decrease) | (1,168,413 | ) | ($8,586,011 | ) | 736,482 | $5,870,903 | ||||||||||||||||||||
| Class C shares | ||||||||||||||||||||||||||
| Sold | 66,211 | $500,683 | 51,939 | $432,836 | ||||||||||||||||||||||
| Distributions reinvested | 670 | 5,101 | 1,748 | 13,077 | ||||||||||||||||||||||
| Repurchased | (31,331 | ) | (233,589 | ) | (26,012 | ) | (208,290 | ) | ||||||||||||||||||
| Net increase | 35,550 | $272,195 | 27,675 | $237,623 | ||||||||||||||||||||||
| Year ended 3-31-17 | Year ended 3-31-16 | |||||||||||||||||||||||||
| Shares | Amount | Shares | Amount | |||||||||||||||||||||||
| Class I shares | ||||||||||||||||||||||||||
| Sold | 589,714 | $4,514,221 | 94,277 | $709,420 | ||||||||||||||||||||||
| Distributions reinvested | 6,965 | 52,380 | 15,262 | 112,787 | ||||||||||||||||||||||
| Repurchased | (304,224 | ) | (2,287,859 | ) | (163,927 | ) | (1,220,872 | ) | ||||||||||||||||||
| Net increase (decrease) | 292,455 | $2,278,742 | (54,388 | ) | ($398,665 | ) | ||||||||||||||||||||
| Class R2 shares | ||||||||||||||||||||||||||
| Sold | 11,417 | $85,795 | 21,907 | $171,343 | ||||||||||||||||||||||
| Distributions reinvested | 1,507 | 11,361 | 6,792 | 50,399 | ||||||||||||||||||||||
| Repurchased | (20,153 | ) | (150,412 | ) | (110,506 | ) | (806,649 | ) | ||||||||||||||||||
| Net decrease | (7,229 | ) | ($53,256 | ) | (81,807 | ) | ($584,907 | ) | ||||||||||||||||||
| Class R6 shares | ||||||||||||||||||||||||||
| Sold | 115,910 | $867,371 | 31,318 | $262,895 | ||||||||||||||||||||||
| Distributions reinvested | 1,399 | 10,496 | 2,230 | 16,456 | ||||||||||||||||||||||
| Repurchased | (34,521 | ) | (258,715 | ) | (525,820 | ) | (4,449,258 | ) | ||||||||||||||||||
| Net increase (decrease) | 82,788 | $619,152 | (492,272 | ) | ($4,169,907 | ) | ||||||||||||||||||||
| Class NAV shares | ||||||||||||||||||||||||||
| Sold | 19,105,581 | $142,061,646 | 13,922,125 | $117,421,574 | ||||||||||||||||||||||
| Distributions reinvested | 1,589,315 | 11,935,754 | 2,965,743 | 21,916,839 | ||||||||||||||||||||||
| Repurchased | (11,371,273 | ) | (86,789,470 | ) | (1,093,231 | ) | (7,900,250 | ) | ||||||||||||||||||
| Net increase | 9,323,623 | $67,207,930 | 15,794,637 | $131,438,163 | ||||||||||||||||||||||
| Total net increase | 8,558,774 | $61,738,752 | 15,930,327 | $132,393,210 | ||||||||||||||||||||||
There were no fund share transactions during the years ended March 31, 2017 and 2016 for Class R4 shares.
Affiliates of the fund owned 100% of shares of the fund of Class R4 and Class NAV on March 31, 2017. Such concentration of shareholders' capital could have a material effect on the fund if such shareholders redeem from the fund.
Note 6 — Purchase and sale of securities
Purchases and sales of securities, other than short-term investments, amounted to $210,226,937 and $145,710,465, respectively, for the year ended March 31, 2017.
Note 7 — Investment by affiliated funds
Certain investors in the fund are affiliated funds that are managed by the Advisor and its affiliates. The affiliated funds do not invest in the fund for the purpose of exercising management or control; however, this investment may represent a significant portion of the fund's net assets. At March 31, 2017, funds within the John Hancock group of funds complex held 96.0% of the fund's net assets. The following affiliated funds owned 5% or more of the fund's net assets:
| Fund | Affiliated concentration |
| JHF II Multimanager Lifestyle Growth Portfolio | 35.4% |
| JHF II Multimanager Lifestyle Balanced Portfolio | 23.9% |
| JHF II Multimanager Lifestyle Aggressive Portfolio | 13.1% |
Note 8 — New rule issuance
In October 2016, the SEC issued Final Rule Release No.33-10231, Investment Company Reporting Modernization (the Release). The Release calls for the adoption of new rules and forms as well as amendments to its rules and forms to modernize the reporting and disclosure of information by registered investment companies. The SEC is adopting
amendments to Regulation S-X, which will require standardized, enhanced disclosure about derivatives in investment company financial statements, as well as other amendments. The updates to Regulation S-X are effective August 1, 2017 and may result in additional disclosure relating to the presentation of derivatives and certain other financial instruments. These updates will have no impact on the fund's net assets or results of operations.
Report of Independent Registered Public Accounting Firm
To the Board of Trustees of John Hancock Funds III and Shareholders of John Hancock International Value Equity Fund
In our opinion, the accompanying statement of assets and liabilities, including the fund's investments, and the related statements of operations and of changes in net assets and the financial highlights present fairly, in all material respects, the financial position of the John Hancock International Value Equity Fund (the "Fund") as of March 31, 2017, the results of its operations for the year then ended, the changes in its net assets for each of the two years in the period then ended and the financial highlights for each of the periods presented, in conformity with accounting principles generally accepted in the United States of America. These financial statements and financial highlights (hereafter referred to as "financial statements") are the responsibility of the Fund's management. Our responsibility is to express an opinion on these financial statements based on our audits. We conducted our audits of these financial statements in accordance with the standards of the Public Company Accounting Oversight Board (United States). Those standards require that we plan and perform the audit to obtain reasonable assurance about whether the financial statements are free of material misstatement. An audit includes examining, on a test basis, evidence supporting the amounts and disclosures in the financial statements, assessing the accounting principles used and significant estimates made by management, and evaluating the overall financial statement presentation. We believe that our audits, which included confirmation of securities as of March 31, 2017 by correspondence with the custodian, brokers, and transfer agent, and the application of alternative auditing procedures where securities purchased confirmations had not been received, provide a reasonable basis for our opinion.
PricewaterhouseCoopers LLP
Boston, Massachusetts
May 16, 2017
Unaudited
For federal income tax purposes, the following information is furnished with respect to the distributions of the fund, if any, paid during its taxable year ended March 31, 2017.
The fund reports the maximum amount allowable of its net taxable income as eligible for the corporate dividends-received deduction.
The fund reports the maximum amount allowable of its net taxable income as qualified dividend income as provided in the Jobs and Growth
Income derived from foreign sources was $16,120,049. The fund intends to pass through foreign tax credits of $1,211,999.
Eligible shareholders will be mailed a 2017 Form 1099-DIV in early 2018. This will reflect the tax character of all distributions paid in calendar year 2017.
Please consult a tax advisor regarding the tax consequences of your investment in the fund.
This chart provides information about the Trustees and Officers who oversee your John Hancock fund. Officers elected by the Trustees manage the day-to-day operations of the fund and execute policies formulated by the Trustees.
Independent Trustees
| Name, year of birth Position(s) held with Trust Principal occupation(s) and other directorships during past 5 years | Trustee of the Trust since1 | Number of John Hancock funds overseen by Trustee |
| Hassell H. McClellan, Born: 1945 | 2012 | 228 |
| Trustee and Chairperson of the Board Director/Trustee, Virtus Funds (since 2008); Director, The Barnes Group (since 2010); Associate Professor, The Wallace E. Carroll School of Management, Boston College (retired 2013). Trustee (since 2014) and Chairperson of the Board (since 2017), John Hancock Collateral Trust; Trustee (since 2015) and Chairperson of the Board (since 2017), John Hancock Exchange-Traded Fund Trust; Trustee (since 2012) and Chairperson of the Board (since 2017), John Hancock retail funds3; Trustee (2005-2006 and since 2012) and Chairperson of the Board (since 2017), John Hancock Funds III; Trustee (since 2005) and Chairperson of the Board (since 2017), John Hancock Variable Insurance Trust and John Hancock Funds II. | ||
| Charles L. Bardelis,2 Born: 1941 | 2012 | 228 |
| Trustee Director, Island Commuter Corp. (marine transport). Trustee, John Hancock Collateral Trust (since 2014), Trustee, John Hancock Exchange-Traded Fund Trust (since 2015); Trustee, John Hancock retail funds3 (since 2012); Trustee, John Hancock Funds III (2005-2006 and since 2012); Trustee, John Hancock Variable Insurance Trust (since 1988); Trustee, John Hancock Funds II (since 2005). | ||
| Peter S. Burgess,2 Born: 1942 | 2012 | 228 |
| Trustee Consultant (financial, accounting, and auditing matters) (since 1999); Certified Public Accountant; Partner, Arthur Andersen (independent public accounting firm) (prior to 1999); Director, Lincoln Educational Services Corporation (since 2004); Director, Symetra Financial Corporation (2010-2016); Director, PMA Capital Corporation (2004-2010). Trustee, John Hancock Collateral Trust (since 2014); Trustee, John Hancock Exchange-Traded Fund Trust (since 2015); Trustee, John Hancock retail funds3 (since 2012); Trustee, John Hancock Funds III (2005-2006 and since 2012); Trustee, John Hancock Variable Insurance Trust and John Hancock Funds II (since 2005). | ||
| William H. Cunningham, Born: 1944 | 2006 | 228 |
| Trustee Professor, University of Texas, Austin, Texas (since 1971); former Chancellor, University of Texas System and former President of the University of Texas, Austin, Texas; Chairman (since 2009) and Director (since 2006), Lincoln National Corporation (insurance); Director, Southwest Airlines (since 2000); former Director, LIN Television (2009-2014). Trustee, John Hancock retail funds3 (since 1986); Trustee, John Hancock Variable Insurance Trust (since 2012); Trustee, John Hancock Funds II (2005-2006 and since 2012); Trustee, John Hancock Collateral Trust (since 2014); Trustee, John Hancock Exchange-Traded Fund Trust (since 2015). | ||
| Grace K. Fey, Born: 1946 | 2012 | 228 |
| Trustee Chief Executive Officer, Grace Fey Advisors (since 2007); Director and Executive Vice President, Frontier Capital Management Company (1988-2007); Director, Fiduciary Trust (since 2009). Trustee, John Hancock Collateral Trust (since 2014); Trustee, John Hancock Exchange-Traded Fund Trust (since 2015); Trustee, John Hancock retail funds3 (since 2012); Trustee, John Hancock Variable Insurance Trust and John Hancock Funds II (since 2008). | ||
Independent Trustees (continued)
| Name, year of birth Position(s) held with Trust Principal occupation(s) and other directorships during past 5 years | Trustee of the Trust since1 | Number of John Hancock funds overseen by Trustee |
| Theron S. Hoffman,2 Born: 1947 | 2012 | 228 |
| Trustee Chief Executive Officer, T. Hoffman Associates, LLC (consulting firm) (since 2003); Director, The Todd Organization (consulting firm) (2003-2010); President, Westport Resources Management (investment management consulting firm) (2006-2008); Senior Managing Director, Partner, and Operating Head, Putnam Investments (2000-2003); Executive Vice President, The Thomson Corp. (financial and legal information publishing) (1997-2000). Trustee, John Hancock Collateral Trust (since 2014); Trustee, John Hancock Exchange-Traded Fund Trust (since 2015); Trustee, John Hancock retail funds3 (since 2012); Trustee, John Hancock Variable Insurance Trust and John Hancock Funds II (since 2008). | ||
| Deborah C. Jackson, Born: 1952 | 2008 | 228 |
| Trustee President, Cambridge College, Cambridge, Massachusetts (since 2011); Board of Directors, National Association of Corporate Directors/New England (since 2015); Board of Directors, Association of Independent Colleges and Universities of Massachusetts, (since 2014); Chief Executive Officer, American Red Cross of Massachusetts Bay (2002-2011); Board of Directors of Eastern Bank Corporation (since 2001); Board of Directors of Eastern Bank Charitable Foundation (since 2001); Board of Directors of American Student Assistance Corporation (1996-2009); Board of Directors of Boston Stock Exchange (2002-2008); Board of Directors of Harvard Pilgrim Healthcare (health benefits company) (2007-2011). Trustee, John Hancock retail funds3 (since 2008); Trustee, John Hancock Variable Insurance Trust and John Hancock Funds II (since 2012); Trustee, John Hancock Collateral Trust (since 2014); and Trustee, John Hancock Exchange-Traded Fund Trust (since 2015). | ||
| James M. Oates, Born: 1946 | 2012 | 228 |
Trustee | ||
| Steven R. Pruchansky, Born: 1944 | 2006 | 228 |
| Trustee and Vice Chairperson of the Board Chairman and Chief Executive Officer, Greenscapes of Southwest Florida, Inc. (since 2000); Director and President, Greenscapes of Southwest Florida, Inc. (until 2000); Member, Board of Advisors, First American Bank (until 2010); Managing Director, Jon James, LLC (real estate) (since 2000); Partner, Right Funding, LLC (since 2014); Director, First Signature Bank & Trust Company (until 1991); Director, Mast Realty Trust (until 1994); President, Maxwell Building Corp. (until 1991). Trustee (since 1992) and Chairperson of the Board (2011-2012), John Hancock retail funds3; Trustee and Vice Chairperson of the Board, John Hancock retail funds3 John Hancock Variable Insurance Trust, and John Hancock Funds II (since 2012); Trustee and Vice Chairperson of the Board, John Hancock Collateral Trust (since 2014); Trustee and Vice Chairperson of the Board, John Hancock Exchange-Traded Fund Trust (since 2015). | ||
Independent Trustees (continued)
| Name, year of birth Position(s) held with Trust Principal occupation(s) and other directorships during past 5 years | Trustee of the Trust since1 | Number of John Hancock funds overseen by Trustee |
| Gregory A. Russo, Born: 1949 | 2008 | 228 |
| Trustee Director and Audit Committee Chairman (since 2012), and Member, Audit Committee and Finance Committee (since 2011), NCH Healthcare System, Inc. (holding company for multi-entity healthcare system); Director and Member (since 2012) and Finance Committee Chairman (since 2014), The Moorings, Inc. (nonprofit continuing care community); Vice Chairman, Risk & Regulatory Matters, KPMG LLP (KPMG) (2002-2006); Vice Chairman, Industrial Markets, KPMG (1998-2002); Chairman and Treasurer, Westchester County, New York, Chamber of Commerce (1986-1992); Director, Treasurer, and Chairman of Audit and Finance Committees, Putnam Hospital Center (1989-1995); Director and Chairman of Fundraising Campaign, United Way of Westchester and Putnam Counties, New York (1990-1995). Trustee, John Hancock retail funds3 (since 2008); Trustee, John Hancock Variable Insurance Trust and John Hancock Funds II (since 2012); Trustee, John Hancock Collateral Trust (since 2014); Trustee, John Hancock Exchange-Traded Fund Trust (since 2015). | ||
Non-Independent Trustees4
| Name, year of birth Position(s) held with Trust Principal occupation(s) and other directorships during past 5 years | Trustee of the Trust since1 | Number of John Hancock funds overseen by Trustee |
| James R. Boyle, Born: 1959 | 2015 | 228 |
| Non-Independent Trustee Chairman and Chief Executive Officer, Zillion Group, Inc. (formerly HealthFleet, Inc.) (healthcare) (since 2014); Executive Vice President and Chief Executive Officer, U.S. Life Insurance Division of Genworth Financial, Inc. (insurance) (January 2014-July 2014); Senior Executive Vice President, Manulife Financial Corporation, President and Chief Executive Officer, John Hancock (1999-2012); Chairman and Director, John Hancock Advisers, LLC, John Hancock Funds, LLC, and John Hancock Investment Management Services, LLC (2005-2010). Trustee, John Hancock Collateral Trust and John Hancock Exchange-Traded Fund Trust (since 2015); Trustee, John Hancock retail funds3 (2005-2010; 2012-2014 and since 2015); Trustee, John Hancock Variable Insurance Trust and John Hancock Funds II (2005-2014 and since 2015). | ||
| Craig Bromley, Born: 1966 | 2012 | 228 |
| Non-Independent Trustee President, John Hancock Financial Service (since 2012); Senior Executive Vice President and General Manager, U.S. Division, Manulife Financial Corporation (since 2012); President and Chief Executive Officer, Manulife Insurance Company (Manulife Japan) (2005-2012, including prior positions). Trustee, John Hancock retail funds,3 John Hancock Variable Insurance Trust, and John Hancock Funds II (since 2012); Trustee, John Hancock Collateral Trust (since 2014); Trustee, John Hancock Exchange-Traded Fund Trust (since 2015). | ||
| Warren A. Thomson, Born: 1955 | 2012 | 228 |
| Non-Independent Trustee Senior Executive Vice President and Chief Investment Officer, Manulife Financial Corporation and The Manufacturers Life Insurance Company (since 2009); Chairman, Manulife Asset Management (since 2001, including prior positions); Director and Chairman, Manulife Asset Management Limited (since 2006); Director and Chairman, Hancock Natural Resources Group, Inc. (since 2013). Trustee, John Hancock retail funds,3 John Hancock Variable Insurance Trust, and John Hancock Funds II (since 2012); Trustee, John Hancock Collateral Trust (since 2014); Trustee, John Hancock Exchange-Traded Fund Trust (since 2015). | ||
Principal officers who are not Trustees
| Name, year of birth Position(s) held with Trust Principal occupation(s) during past 5 years | Officer of the Trust since |
| Andrew G. Arnott, Born: 1971 | 2009 |
| President Senior Vice President, John Hancock Financial Services (since 2009); Director and Executive Vice President, John Hancock Advisers, LLC (since 2005, including prior positions); Director and Executive Vice President, John Hancock Investment Management Services, LLC (since 2006, including prior positions); President, John Hancock Funds, LLC (since 2004, including prior positions); President, John Hancock retail funds,3 John Hancock Variable Insurance Trust, and John Hancock Funds II (since 2007, including prior positions); President, John Hancock Collateral Trust and John Hancock Exchange-Traded Fund Trust (since 2014). | |
| John J. Danello, Born: 1955 | 2014 |
| Senior Vice President, Secretary, and Chief Legal Officer Vice President and Chief Counsel, John Hancock Wealth Management (since 2005); Senior Vice President (since 2007) and Chief Legal Counsel (2007-2010), John Hancock Funds, LLC and The Berkeley Financial Group, LLC; Senior Vice President (since 2006, including prior positions) and Chief Legal Officer and Secretary (since 2014), John Hancock retail funds,3 John Hancock Funds II and John Hancock Variable Insurance Trust; Senior Vice President, Secretary and Chief Legal Officer, John Hancock Collateral Trust and John Hancock Exchange-Traded Fund Trust (since 2014); Vice President, John Hancock Life & Health Insurance Company (since 2009); Vice President, John Hancock Life Insurance Company (USA) and John Hancock Life Insurance Company of New York (since 2010); and Senior Vice President, Secretary and Chief Legal Counsel (2007-2014, including prior positions) of John Hancock Advisers, LLC and John Hancock Investment Management Services, LLC. | |
| Francis V. Knox, Jr., Born: 1947 | 2006 |
| Chief Compliance Officer Vice President, John Hancock Financial Services (since 2005); Chief Compliance Officer, John Hancock retail funds,3 John Hancock Variable Insurance Trust, John Hancock Funds II, John Hancock Advisers, LLC, and John Hancock Investment Management Services, LLC (since 2005); Chief Compliance Officer, John Hancock Collateral Trust and John Hancock Exchange-Traded Fund Trust (since 2014). | |
| Charles A. Rizzo, Born: 1957 | 2007 |
| Chief Financial Officer Vice President, John Hancock Financial Services (since 2008); Senior Vice President, John Hancock Advisers, LLC and John Hancock Investment Management Services, LLC (since 2008); Chief Financial Officer, John Hancock retail funds,3 John Hancock Variable Insurance Trust and John Hancock Funds II (since 2007); Chief Financial Officer, John Hancock Collateral Trust and John Hancock Exchange-Traded Fund Trust (since 2014). | |
| Salvatore Schiavone, Born: 1965 | 2010 |
| Treasurer Assistant Vice President, John Hancock Financial Services (since 2007); Vice President, John Hancock Advisers, LLC and John Hancock Investment Management Services, LLC (since 2007); Treasurer, John Hancock retail funds3 (since 2007, including prior positions); Treasurer, John Hancock Variable Insurance Trust and John Hancock Funds II (2007-2009 and since 2010, including prior positions); Treasurer, John Hancock Collateral Trust and John Hancock Exchange-Traded Fund Trust (since 2014). | |
The business address for all Trustees and Officers is 601 Congress Street, Boston, Massachusetts 02210-2805.
The Statement of Additional Information of the fund includes additional information about members of the Board of Trustees of the Trust and is available without charge, upon request, by calling 800-225-5291.
| 1 | Each Trustee holds office until his or her successor is elected and qualified, or until the Trustee's death, retirement, resignation, or removal. Mr. Boyle has served as Trustee at various times prior to the date listed in the table. |
| 2 | Member of the Audit Committee. |
| 3 | "John Hancock retail funds" comprises John Hancock Funds III and 40 other John Hancock funds consisting of 30 series of other John Hancock trusts and 10 closed-end funds. |
| 4 | The Trustee is a Non-Independent Trustee due to current or former positions with the Advisor and certain affiliates. |
Trustees Hassell H. McClellan, Chairperson# Officers Andrew G. Arnott John J. Danello Francis V. Knox, Jr. Charles A. Rizzo Salvatore Schiavone | Investment advisor John Hancock Advisers, LLC Subadvisor John Hancock Asset Management a division of Manulife Asset Management (US) LLC Principal distributor John Hancock Funds, LLC Custodian Citibank, N.A. Transfer agent John Hancock Signature Services, Inc. Legal counsel K&L Gates LLP Independent registered public accounting firm PricewaterhouseCoopers LLP |
*Member of the Audit Committee
†Non-Independent Trustee
#Effective 1-1-17
The fund's proxy voting policies and procedures, as well as the fund proxy voting record for the most recent twelve-month period ended June 30, are available free of charge on the Securities and Exchange Commission (SEC) website at sec.gov or on our website.
The fund's complete list of portfolio holdings, for the first and third fiscal quarters, is filed with the SEC on Form N-Q. The fund's Form N-Q is available on our website and the SEC's website, sec.gov, and can be reviewed and copied (for a fee) at the SEC's Public Reference Room in Washington, DC. Call 800-SEC-0330 to receive information on the operation of the SEC's Public Reference Room.
We make this information on your fund, as well as monthly portfolio holdings, and other fund details available on our website at jhinvestments.com or by calling 800-225-5291.
| You can also contact us: | |||
| 800-225-5291 jhinvestments.com | Regular mail: John Hancock Signature Services, Inc. | Express mail: John Hancock Signature Services, Inc. | |
John Hancock family of funds
DOMESTIC EQUITY FUNDS Balanced Blue Chip Growth Classic Value Disciplined Value Disciplined Value Mid Cap Equity Income Fundamental All Cap Core Fundamental Large Cap Core Fundamental Large Cap Value New Opportunities Small Cap Value Small Company Strategic Growth U.S. Global Leaders Growth U.S. Growth Value Equity GLOBAL AND INTERNATIONAL EQUITY FUNDS Disciplined Value International Emerging Markets Emerging Markets Equity Fundamental Global Franchise Global Equity Global Shareholder Yield Greater China Opportunities International Growth International Small Company International Value Equity | INCOME FUNDS Bond California Tax-Free Income Emerging Markets Debt Floating Rate Income Global Income Government Income High Yield High Yield Municipal Bond Income Investment Grade Bond Money Market Short Duration Credit Opportunities Spectrum Income Strategic Income Opportunities Tax-Free Bond ALTERNATIVE AND SPECIALTY FUNDS Absolute Return Currency Alternative Asset Allocation Enduring Assets Financial Industries Global Absolute Return Strategies Global Conservative Absolute Return Global Focused Strategies Natural Resources Redwood Regional Bank Seaport Technical Opportunities |
A fund's investment objectives, risks, charges, and expenses should be considered carefully before investing. The prospectus contains this and other important information about the fund. To obtain a prospectus, contact your financial professional, call John Hancock Investments at 800-225-5291, or visit our website at jhinvestments.com. Please read the prospectus carefully before investing or sending money.
ASSET ALLOCATION Income Allocation Fund Multi-Index Lifetime Portfolios Multi-Index Preservation Portfolios Multimanager Lifestyle Portfolios Multimanager Lifetime Portfolios EXCHANGE-TRADED FUNDS John Hancock Multifactor Consumer Discretionary ETF John Hancock Multifactor Consumer Staples ETF John Hancock Multifactor Developed International ETF John Hancock Multifactor Energy ETF John Hancock Multifactor Financials ETF John Hancock Multifactor Healthcare ETF John Hancock Multifactor Industrials ETF John Hancock Multifactor Large Cap ETF John Hancock Multifactor Materials ETF John Hancock Multifactor Mid Cap ETF John Hancock Multifactor Technology ETF John Hancock Multifactor Utilities ETF | ENVIRONMENTAL, SOCIAL, AND GOVERNANCE FUNDS ESG All Cap Core ESG Core Bond ESG International Equity ESG Large Cap Core CLOSED-END FUNDS Financial Opportunities Hedged Equity & Income Income Securities Trust Investors Trust Preferred Income Preferred Income II Preferred Income III Premium Dividend Tax-Advantaged Dividend Income Tax-Advantaged Global Shareholder Yield |
John Hancock Multifactor ETF shares are bought and sold at market price (not NAV), and are not individually redeemed
from the fund. Brokerage commissions will reduce returns.
John Hancock ETFs are distributed by Foreside Fund Services, LLC, and are subadvised by Dimensional Fund Advisors LP.
Foreside is not affiliated with John Hancock Funds, LLC or Dimensional Fund Advisors LP.
Dimensional Fund Advisors LP receives compensation from John Hancock in connection with licensing rights to the
John Hancock Dimensional indexes. Dimensional Fund Advisors LP does not sponsor, endorse, or sell, and makes no
representation as to the advisability of investing in, John Hancock Multifactor ETFs.
John Hancock Investments
A trusted brand
John Hancock Investments is a premier asset manager representing one of
America's most trusted brands, with a heritage of financial stewardship dating
back to 1862. Helping our shareholders pursue their financial goals is at the
core of everything we do. It's why we support the role of professional financial
advice and operate with the highest standards of conduct and integrity.
A better way to invest
We serve investors globally through a unique multimanager approach:
We search the world to find proven portfolio teams with specialized
expertise for every strategy we offer, then we apply robust investment
oversight to ensure they continue to meet our uncompromising standards
and serve the best interests of our shareholders.
Results for investors
Our unique approach to asset management enables us to provide a diverse set
of investments backed by some of the world's best managers, along with strong
risk-adjusted returns across asset classes.
| | John Hancock Funds, LLC n Member FINRA, SIPC 601 Congress Street n Boston, MA 02210-2805 800-225-5291 n jhinvestments.com | |
| This report is for the information of the shareholders of John Hancock International Value Equity Fund. It is not authorized for distribution to prospective investors unless preceded or accompanied by a prospectus. | ||
| MF361883 | 366A 3/17 5/17 | |
A message to shareholders
Dear shareholder,
Financial markets are by their very nature unpredictable, but few market observers could have imagined the dramatic twists and turns that would come to characterize the latter half of 2016 and the beginning of 2017. Donald Trump's victory in the November U.S. presidential election sent both U.S. equity prices and bond yields sharply higher. Investors bid up the prices of riskier assets, believing that the new administration would pursue more pro-growth, market-friendly economic policies. While this may yet prove to be the case, change in policy has been slow to materialize and valuations in certain sectors and asset classes are now appearing somewhat stretched.
While we believe there are good reasons for economic optimism and that stocks may go on to extend their recent rally in the coming months, we encourage you to talk with your financial advisor, who can help ensure your portfolio is sufficiently diversified to meet your long-term objectives and to withstand the inevitable bumps along the way.
On behalf of everyone at John Hancock Investments, I'd like to take this opportunity to thank you for the continued trust you've placed in us.
Sincerely,
Andrew G. Arnott
President and Chief Executive Officer
John Hancock Investments
This commentary reflects the CEO's views, which are subject to change at any time. Investing involves risks, including the potential loss of principal. Diversification does not guarantee a profit or eliminate the risk of a loss. For more up-to-date information, please visit our website at jhinvestments.com.
John Hancock
Strategic Growth Fund
INVESTMENT OBJECTIVE
The fund seeks long-term capital appreciation.
AVERAGE ANNUAL TOTAL RETURNS AS OF 3/31/17 (%)
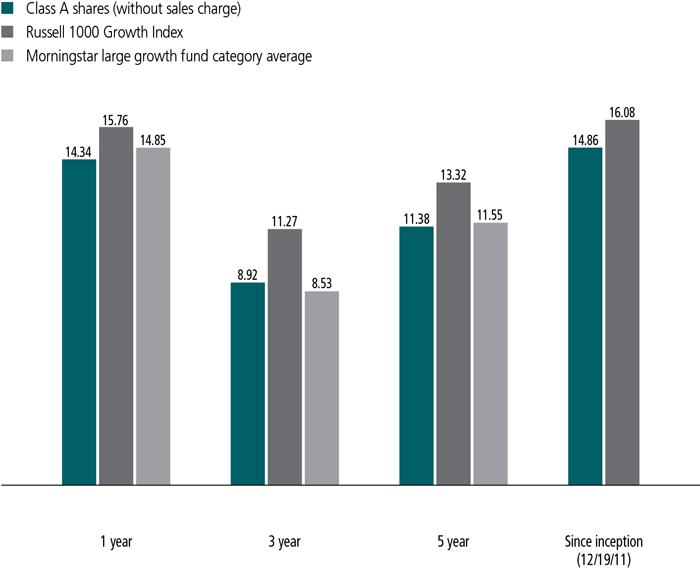
The Russell 1000 Growth Index is an unmanaged index that measures the performance of the small-cap growth segment of the U.S. equity universe. It includes those Russell 1000 Index companies with higher price-to-book ratios and higher forecasted growth values.
It is not possible to invest directly in an index. Index figures do not reflect expenses or sales charges, which would result in lower returns.
Figures from Morningstar, Inc. include reinvested distributions and do not take into account sales charges. Actual load-adjusted performance is lower. Since-inception returns for the Morningstar fund category average are not available.
The past performance shown here reflects reinvested distributions and the beneficial effect of any expense reductions, and does not guarantee future results. Performance of the other share classes will vary based on the difference in the fees and expenses of those classes. Shares will fluctuate in value and, when redeemed, may be worth more or less than their original cost. Current month-end performance may be lower or higher than the performance cited, and can be found at jhinvestments.com or by calling 800-225-5291. For further information on the fund's objectives, risks, and strategy, see the fund's prospectus.
PERFORMANCE HIGHLIGHTS OVER THE LAST TWELVE MONTHS
A strong market backdrop
Stock markets enjoyed strong returns throughout the period, especially after the November U.S. elections, as expectations for pro-growth policies boosted equity valuations.
Performance challenges for the fund
A combination of stock picking and a relative underweighting in the industrials sector detracted when compared to its benchmark, the Russell 1000 Growth Index, as did security selection in consumer discretionary.
Sources of strength
The fund benefited from security selection in the healthcare and information technology sectors.
SECTOR COMPOSITION AS OF 3/31/17 (%)
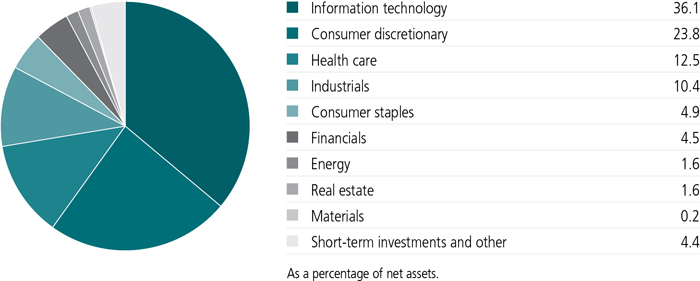
A note about risks
Growth stocks may be more susceptible to earnings disappointments. The value of a company's equity securities is subject to changes in the company's financial condition and overall market and economic conditions. Foreign investing has additional risks, such as currency and market volatility and political and social instability. Sector investing is subject to greater risks than the market as a whole. Because the fund may focus on particular sectors of the economy, its performance may depend on the performance of those sectors, and investments focused on one sector may fluctuate more widely than investments in a wider variety of sectors. Hedging, derivatives, and other strategic transactions may increase a fund's volatility and could produce disproportionate losses, potentially more than the fund's principal investment. Please see the fund's prospectus for additional risks.
An interview with Portfolio Manager W. Shannon Reid, CFA, John Hancock Asset Management a division of Manulife Asset Management (US) LLC

W. Shannon Reid, CFA
Portfolio Manager
John Hancock Asset Management
How did the fund perform during the 12 months ended March 31, 2017?
For most of this timeframe, favorable market conditions lifted the fund's results. In the period's first half, the promise of economically stimulative policies from global central banks provided a tailwind for stock valuations. In June, markets quickly recovered from their initial shock over the decision of U.K. voters to leave the European Union (Brexit).
Stocks rallied in the second half of the reporting period, especially after the November U.S. elections, when Donald Trump won the presidency. This event provided Republicans with a majority position in Washington and was seen as boosting the prospects for pro-growth policies such as lower taxes, fewer regulations, tax reform, and infrastructure spending.
Against this backdrop, the fund's Class A shares gained 14.34% (excluding sales charges), underperforming its benchmark, the Russell 1000 Growth Index. A combination of stock picking, coupled with a relative underweight in the strong-performing industrials sector, detracted from results, as did security selection in financials and consumer discretionary. In contrast, the fund benefited from security selection in the healthcare and information technology sectors.
Which stocks detracted relative to the benchmark?
The fund's biggest relative detractor was CVS Health Corp., best known as an operator of retail drugstores. The main source of difficulty for CVS came from its pharmacy benefits management division, where growing competition has weighed on the company's operating margins and earnings. We believed these difficulties could continue for CVS, and last fall we sold the fund's stake in the stock.
Around that time, we also sold Tractor Supply Company, a farm-supply retail chain. During the period, Tractor Supply reported lower-than-expected earnings and same-store sales, due partly to weakness in the farm community. As with CVS, we anticipated that Tractor Supply would continue
Aerospace parts supplier TransDigm Group, Inc. also detracted. The stock was an especially poor performer in the first quarter of 2017, due to some investors' concerns about the company's approach to pricing and the potential for a government investigation into the matter. As of period end, we disagreed with this concern and continued to hold the stock.
Which individual stocks added to the fund's results in relative terms?
Several of the fund's top contributors were Internet-oriented companies that have become household names, a list topped by Amazon.com, Inc. Amazon continued to produce strong earnings and cash flow, while also solidifying its position atop the online retail market, as well as in cloud computing via its Amazon Web Services division. For the 12 months, Amazon's shares gained close to 50%.
Similarly, social networking giant Facebook, Inc. continued to generate very strong earnings, particularly from mobile advertising, which has become the company's key revenue driver.
Another relative contributor this period was video game publisher Electronic Arts, Inc. (EA). We see EA as benefiting from several broad trends that have been lifting the entire video gaming industry, and that we believe have the potential to produce increasingly strong earnings growth. These include the growing worldwide popularity of gaming and the move from packaged to digital distribution of video games. Both factors have helped make EA and other game publishers more consistently profitable and less vulnerable to down cycles in the industry.
ServiceNow, Inc. also added value. This provider of enterprise cloud computing services has been enhancing and expanding its product offerings, which, in turn, has given the company a larger addressable market and boosted its business prospects.
Throughout the period, and especially after the November U.S. elections, financial stocks were especially strong performers. They benefited from the prospect of fewer regulations, more robust capital markets, and faster economic growth leading to higher interest rates and, in turn, a more
We increased the fund's exposure to economically sensitive areas of the market with the potential to benefit from more expansionary economic policies, which became more likely with a new Republican president joining the Republican Congress. This entailed increasing the fund's exposure to the industrials sector, where we established new positions in Northrop Grumman Corp., Rockwell Collins, Inc., and United Rentals, Inc., among others. We also increased the fund's allocation to energy, moving from a neutral stance to a modest overweighting.
Meanwhile, we increased the fund's exposure to the information technology sector, where we were finding various attractive opportunities. Among the new purchases was Oracle Corp., whose move to offering its products in the cloud we believe should help the company offset declining growth in its legacy database software business.
We were significantly reducing exposure to consumer staples, moving from an overweight to an
TOP 10 HOLDINGS AS OF 3/31/17 (%)
| Apple, Inc. | 6.1 |
| Microsoft Corp. | 5.7 |
| Amazon.com, Inc. | 4.6 |
| Facebook, Inc., Class A | 4.5 |
| Alphabet, Inc., Class C | 3.7 |
| The Walt Disney Company | 2.8 |
| UnitedHealth Group, Inc. | 2.7 |
| Alphabet, Inc., Class A | 2.3 |
| Celgene Corp. | 2.2 |
| Comcast Corp., Class A | 2.2 |
| TOTAL | 36.8 |
| As a percentage of net assets. | |
| Cash and cash equivalents are not included. | |
underweight in the category. In our view, many consumer staples stocks had become overly expensive relative to their underlying growth prospects, and we were seeing better opportunities elsewhere in the marketplace.
It's worth emphasizing that the changes were made in the context of our bottom-up investment approach, meaning we select stocks one by one based on company-specific research, finding securities that we expect to live up to our assessments.
How was the fund positioned at period end?
The largest relative overweights were in consumer discretionary and information technology. The fund also had modest overweights in financials and energy. All of these sectors tend to be relatively economically sensitive and included various stocks that we believed could benefit from growth-oriented policies.
The fund's largest underweights were in consumer staples, materials, and healthcare, where we have lately been finding fewer compelling growth opportunities.
MANAGED BY
| | W. Shannon Reid, CFA On the fund since 2011 Investing since 1981 |
 | David M. Chow, CFA On the fund since 2011 Investing since 1992 |
 | Curtis Ifill, CFA On the fund since 2011 Investing since 1996 |
 | Jay Zelko On the fund since 2011 Investing since 1987 |
![]()
TOTAL RETURNS FOR THE PERIOD ENDED MARCH 31, 2017
| Average annual total returns (%) with maximum sales charge | Cumulative total returns (%) with maximum sales charge | ||||||
| 1-year | 5-year | Since inception1 | 5-year | Since inception1 | |||
| Class A | 8.63 | 10.25 | 13.75 | 62.86 | 97.73 | ||
| Class C2 | 12.53 | 10.95 | 14.44 | 68.15 | 104.16 | ||
| Class I3 | 14.70 | 11.75 | 15.25 | 74.24 | 111.93 | ||
| Class R22,3 | 14.30 | 11.35 | 14.83 | 71.16 | 107.81 | ||
| Class R42,3 | 14.60 | 11.44 | 14.92 | 71.89 | 108.70 | ||
| Class R62,3 | 14.87 | 11.58 | 15.05 | 72.96 | 109.99 | ||
| Class NAV3 | 14.81 | 11.93 | 15.43 | 75.66 | 113.66 | ||
| Index† | 15.76 | 13.32 | 16.08 | 86.87 | 119.95 | ||
Performance figures assume all distributions are reinvested. Figures reflect the maximum sales charge on Class A shares of 5% and the applicable contingent deferred sales charge (CDSC) on Class C shares. Class C shares sold within one year of purchase are subject to a 1% CDSC. Sales charges are not applicable to Class I, Class R2, Class R4, Class R6, and Class NAV shares.
The expense ratios of the fund, both net (including any fee waivers or expense limitations) and gross (excluding any fee waivers or expense limitations), are set forth according to the most recent publicly available prospectuses for the fund and may differ from those disclosed in the Financial highlights tables in this report. Had the contractual fee waivers and expense limitations not been in place, gross expenses would apply. The expense ratios are as follows:
| Class A | Class C | Class I | Class R2 | Class R4 | Class R6 | Class NAV | |
| Gross (%) | 1.12 | 1.87 | 0.85 | 1.26 | 1.11 | 0.76 | 0.74 |
| Net (%) | 1.12 | 1.87 | 0.85 | 1.26 | 1.01 | 0.74 | 0.74 |
Please refer to the most recent prospectus and annual or semiannual report for more information on expenses and any expense limitation arrangements for each class.
The returns reflect past results and should not be considered indicative of future performance. The return and principal value of an investment will fluctuate so that shares, when redeemed, may be worth more or less than their original cost. Due to market volatility and other factors, the fund's current performance may be higher or lower than the performance shown. For current to the most recent month-end performance data, please call 800-225-5291 or visit the fund's website at jhinvestments.com.
The performance table above and the chart on the next page do not reflect the deduction of taxes that a shareholder would pay on fund distributions or the redemption of fund shares. The fund's performance results reflect any applicable fee waivers or expense reductions, without which the expenses would increase and results would have been less favorable.
| † | Index is the Russell 1000 Growth Index. |
See the following page for footnotes.
This chart and table show what happened to a hypothetical $10,000 investment in John Hancock Strategic Growth Fund for the share classes and periods indicated, assuming all distributions were reinvested. For comparison, we've shown the same investment in the Russell 1000 Growth Index.
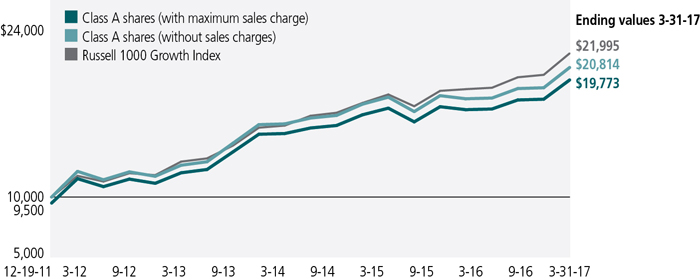
| Start date | With maximum sales charge ($) | Without sales charge ($) | Index ($) | |
| Class C2,4 | 12-19-11 | 20,416 | 20,416 | 21,995 |
| Class I3 | 12-19-11 | 21,193 | 21,193 | 21,995 |
| Class R22,3 | 12-19-11 | 20,781 | 20,781 | 21,995 |
| Class R42,3 | 12-19-11 | 20,870 | 20,870 | 21,995 |
| Class R62,3 | 12-19-11 | 20,999 | 20,999 | 21,995 |
| Class NAV3 | 12-19-11 | 21,366 | 21,366 | 21,995 |
The Russell 1000 Growth Index is an unmanaged index that measures the performance of the small-cap growth segment of the U.S. equity universe. It includes those Russell 1000 companies with higher price-to-book ratios and higher forecasted growth values.
It is not possible to invest directly in an index. Index figures do not reflect expenses or sales charges, which would result in lower returns.
Footnotes related to performance pages
| 1 | From 12-19-11. |
| 2 | Class C shares were first offered on 8-28-14; Class R2, Class R4, and Class R6 shares were first offered on 3-27-15. The returns prior to these dates are those of Class A shares and may be higher or lower than if adjusted to reflect the expenses of any other share classes. |
| 3 | For certain types of investors, as described in the fund's prospectuses. |
| 4 | The contingent deferred sales charge is not applicable. |
These examples are intended to help you understand your ongoing operating expenses of investing in the fund so you can compare these costs with the ongoing costs of investing in other mutual funds.
Understanding fund expenses
As a shareholder of the fund, you incur two types of costs:
| • | Transaction costs, which include sales charges (loads) on purchases or redemptions (varies by share class), minimum account fee charge, etc. |
| • | Ongoing operating expenses, including management fees, distribution and service fees (if applicable), and other fund expenses. |
We are presenting only your ongoing operating expenses here.
Actual expenses/actual returns
The first line of each share class in the table on the following page is intended to provide information about the fund's actual ongoing operating expenses, and is based on the fund's actual return. It assumes an account value of $1,000.00 on October 1, 2016, with the same investment held until March 31, 2017.
Together with the value of your account, you may use this information to estimate the operating expenses that you paid over the period. Simply divide your account value at March 31, 2017, by $1,000.00, then multiply it by the "expenses paid" for your share class from the table. For example, for an account value of $8,600.00, the operating expenses should be calculated as follows:
Hypothetical example for comparison purposes
The second line of each share class in the table on the following page allows you to compare the fund's ongoing operating expenses with those of any other fund. It provides an example of the fund's hypothetical account values and hypothetical expenses based on each class's actual expense ratio and an assumed 5% annualized return before expenses (which is not the fund's actual return). It assumes an account value of $1,000.00 on October 1, 2016, with the same investment held until March 31, 2017. Look in any other fund shareholder report to find its hypothetical example and you will be able to compare these expenses. Please remember that these hypothetical account values and expenses may not be used to estimate the actual ending account balance or expenses you paid for the period.
Remember, these examples do not include any transaction costs, therefore, these examples will not help you to determine the relative total costs of owning different funds. If transaction costs were included, your expenses would have been higher. See the prospectuses for details regarding transaction costs.
SHAREHOLDER EXPENSE EXAMPLE CHART
| Account value on 10-1-2016 | Ending value on 3-31-2017 | Expenses paid during period ended 3-31-20171 | Annualized expense ratio | ||
| Class A | Actual expenses/actual returns | $1,000.00 | $1,092.10 | $5.74 | 1.10% |
| Hypothetical example for comparison purposes | 1,000.00 | 1,019.40 | 5.54 | 1.10% | |
| Class C | Actual expenses/actual returns | 1,000.00 | 1,087.70 | 9.63 | 1.85% |
| Hypothetical example for comparison purposes | 1,000.00 | 1,015.70 | 9.30 | 1.85% | |
| Class I | Actual expenses/actual returns | 1,000.00 | 1,093.70 | 4.38 | 0.84% |
| Hypothetical example for comparison purposes | 1,000.00 | 1,020.70 | 4.23 | 0.84% | |
| Class R2 | Actual expenses/actual returns | 1,000.00 | 1,092.10 | 6.05 | 1.16% |
| Hypothetical example for comparison purposes | 1,000.00 | 1,019.10 | 5.84 | 1.16% | |
| Class R4 | Actual expenses/actual returns | 1,000.00 | 1,092.80 | 4.80 | 0.92% |
| Hypothetical example for comparison purposes | 1,000.00 | 1,020.30 | 4.63 | 0.92% | |
| Class R6 | Actual expenses/actual returns | 1,000.00 | 1,094.70 | 4.28 | 0.82% |
| Hypothetical example for comparison purposes | 1,000.00 | 1,020.80 | 4.13 | 0.82% | |
| Class NAV | Actual expenses/actual returns | 1,000.00 | 1,094.10 | 3.76 | 0.72% |
| Hypothetical example for comparison purposes | 1,000.00 | 1,021.30 | 3.63 | 0.72% | |
| 1 | Expenses are equal to the fund's annualized expense ratio, multiplied by the average account value over the period, multiplied by 182/365 (to reflect the one-half year period). |
Fund's investments
| As of 3-31-17 | ||||||||||||||||||||||||||
| Shares | Value | |||||||||||||||||||||||||
| Common stocks 95.6% | $1,884,388,593 | |||||||||||||||||||||||||
| (Cost $1,377,997,263) | ||||||||||||||||||||||||||
| Consumer discretionary 23.8% | 469,511,183 | |||||||||||||||||||||||||
| Hotels, restaurants and leisure 3.9% | ||||||||||||||||||||||||||
| Las Vegas Sands Corp. | 491,027 | 28,022,911 | ||||||||||||||||||||||||
| MGM Resorts International | 910,356 | 24,943,754 | ||||||||||||||||||||||||
| Wyndham Worldwide Corp. | 292,176 | 24,627,516 | ||||||||||||||||||||||||
| Internet and direct marketing retail 6.5% | ||||||||||||||||||||||||||
| Amazon.com, Inc. (I) | 102,627 | 90,982,941 | ||||||||||||||||||||||||
| Netflix, Inc. (I) | 68,302 | 10,095,719 | ||||||||||||||||||||||||
| The Priceline Group, Inc. (I) | 15,315 | 27,260,241 | ||||||||||||||||||||||||
| Media 5.0% | ||||||||||||||||||||||||||
| Comcast Corp., Class A | 1,128,594 | 42,423,848 | ||||||||||||||||||||||||
| The Walt Disney Company | 486,924 | 55,212,312 | ||||||||||||||||||||||||
| Specialty retail 6.7% | ||||||||||||||||||||||||||
| Advance Auto Parts, Inc. | 63,719 | 9,446,979 | ||||||||||||||||||||||||
| Lowe's Companies, Inc. | 445,855 | 36,653,740 | ||||||||||||||||||||||||
| O'Reilly Automotive, Inc. (I) | 126,916 | 34,247,013 | ||||||||||||||||||||||||
| The Home Depot, Inc. | 214,527 | 31,498,999 | ||||||||||||||||||||||||
| The TJX Companies, Inc. | 267,456 | 21,150,420 | ||||||||||||||||||||||||
| Textiles, apparel and luxury goods 1.7% | ||||||||||||||||||||||||||
| NIKE, Inc., Class B | 591,150 | 32,944,790 | ||||||||||||||||||||||||
| Consumer staples 4.9% | 96,621,517 | |||||||||||||||||||||||||
| Beverages 2.2% | ||||||||||||||||||||||||||
| Monster Beverage Corp. (I) | 647,026 | 29,873,190 | ||||||||||||||||||||||||
| The Coca-Cola Company | 299,421 | 12,707,427 | ||||||||||||||||||||||||
| Food and staples retailing 1.3% | ||||||||||||||||||||||||||
| Sprouts Farmers Market, Inc. (I)(L) | 1,122,327 | 25,948,200 | ||||||||||||||||||||||||
| Tobacco 1.4% | ||||||||||||||||||||||||||
| Altria Group, Inc. | 393,345 | 28,092,700 | ||||||||||||||||||||||||
| Energy 1.6% | 32,164,037 | |||||||||||||||||||||||||
| Oil, gas and consumable fuels 1.6% | ||||||||||||||||||||||||||
| Anadarko Petroleum Corp. | 79,915 | 4,954,730 | ||||||||||||||||||||||||
| Apache Corp. | 141,721 | 7,283,042 | ||||||||||||||||||||||||
| Devon Energy Corp. | 477,619 | 19,926,265 | ||||||||||||||||||||||||
| Financials 4.5% | 88,201,200 | |||||||||||||||||||||||||
| Banks 2.6% | ||||||||||||||||||||||||||
| Bank of America Corp. | 410,539 | 9,684,615 | ||||||||||||||||||||||||
| Citigroup, Inc. | 397,029 | 23,750,275 | ||||||||||||||||||||||||
| Shares | Value | |||||||||||||||||||||||||
| Financials (continued) | ||||||||||||||||||||||||||
| Banks (continued) | ||||||||||||||||||||||||||
| First Republic Bank | 189,288 | $17,757,107 | ||||||||||||||||||||||||
| Capital markets 1.9% | ||||||||||||||||||||||||||
| Morgan Stanley | 214,881 | 9,205,502 | ||||||||||||||||||||||||
| The Goldman Sachs Group, Inc. | 121,033 | 27,803,701 | ||||||||||||||||||||||||
| Health care 12.5% | 246,658,930 | |||||||||||||||||||||||||
| Biotechnology 4.0% | ||||||||||||||||||||||||||
| Amgen, Inc. | 128,360 | 21,060,025 | ||||||||||||||||||||||||
| Celgene Corp. (I) | 348,388 | 43,349,919 | ||||||||||||||||||||||||
| Gilead Sciences, Inc. | 221,327 | 15,032,530 | ||||||||||||||||||||||||
| Health care equipment and supplies 2.1% | ||||||||||||||||||||||||||
| Abbott Laboratories | 554,070 | 24,606,249 | ||||||||||||||||||||||||
| Boston Scientific Corp. (I) | 636,341 | 15,825,801 | ||||||||||||||||||||||||
| Health care providers and services 3.8% | ||||||||||||||||||||||||||
| Anthem, Inc. | 138,248 | 22,863,454 | ||||||||||||||||||||||||
| UnitedHealth Group, Inc. | 318,502 | 52,237,513 | ||||||||||||||||||||||||
| Pharmaceuticals 2.6% | ||||||||||||||||||||||||||
| Allergan PLC | 95,473 | 22,810,409 | ||||||||||||||||||||||||
| Bristol-Myers Squibb Company | 266,295 | 14,481,122 | ||||||||||||||||||||||||
| Pfizer, Inc. | 420,693 | 14,391,908 | ||||||||||||||||||||||||
| Industrials 10.4% | 204,701,413 | |||||||||||||||||||||||||
| Aerospace and defense 3.3% | ||||||||||||||||||||||||||
| Northrop Grumman Corp. | 64,568 | 15,356,853 | ||||||||||||||||||||||||
| Rockwell Collins, Inc. | 234,973 | 22,829,977 | ||||||||||||||||||||||||
| TransDigm Group, Inc. (L) | 119,657 | 26,343,685 | ||||||||||||||||||||||||
| Air freight and logistics 1.8% | ||||||||||||||||||||||||||
| FedEx Corp. | 120,828 | 23,579,584 | ||||||||||||||||||||||||
| XPO Logistics, Inc. (I) | 248,427 | 11,897,169 | ||||||||||||||||||||||||
| Building products 1.7% | ||||||||||||||||||||||||||
| Fortune Brands Home & Security, Inc. | 551,254 | 33,543,806 | ||||||||||||||||||||||||
| Machinery 0.5% | ||||||||||||||||||||||||||
| Oshkosh Corp. | 153,649 | 10,538,785 | ||||||||||||||||||||||||
| Road and rail 0.7% | ||||||||||||||||||||||||||
| CSX Corp. | 277,975 | 12,939,736 | ||||||||||||||||||||||||
| Trading companies and distributors 2.4% | ||||||||||||||||||||||||||
| HD Supply Holdings, Inc. (I) | 671,898 | 27,631,805 | ||||||||||||||||||||||||
| United Rentals, Inc. (I) | 160,256 | 20,040,013 | ||||||||||||||||||||||||
| Information technology 36.1% | 710,765,261 | |||||||||||||||||||||||||
| Internet software and services 12.2% | ||||||||||||||||||||||||||
| Alphabet, Inc., Class A (I) | 53,479 | 45,339,496 | ||||||||||||||||||||||||
| Shares | Value | |||||||||||||||||||||||||
| Information technology (continued) | ||||||||||||||||||||||||||
| Internet software and services (continued) | ||||||||||||||||||||||||||
| Alphabet, Inc., Class C (I) | 87,199 | $72,336,802 | ||||||||||||||||||||||||
| Facebook, Inc., Class A (I) | 626,527 | 88,998,160 | ||||||||||||||||||||||||
| New Relic, Inc. (I) | 261,198 | 9,682,610 | ||||||||||||||||||||||||
| Shopify, Inc., Class A (I)(L) | 211,307 | 14,387,894 | ||||||||||||||||||||||||
| Twilio, Inc., Class A (I)(L) | 324,852 | 9,378,477 | ||||||||||||||||||||||||
| IT services 3.2% | ||||||||||||||||||||||||||
| Gartner, Inc. (I) | 45,138 | 4,874,453 | ||||||||||||||||||||||||
| SourceHOV LLC (I)(R) | 510 | 816,000 | ||||||||||||||||||||||||
| Vantiv, Inc., Class A (I) | 295,287 | 18,933,802 | ||||||||||||||||||||||||
| Visa, Inc., Class A (L) | 430,013 | 38,215,255 | ||||||||||||||||||||||||
| Semiconductors and semiconductor equipment 2.0% | ||||||||||||||||||||||||||
| Broadcom, Ltd. | 182,041 | 39,859,697 | ||||||||||||||||||||||||
| Software 12.6% | ||||||||||||||||||||||||||
| Adobe Systems, Inc. (I) | 305,259 | 39,723,354 | ||||||||||||||||||||||||
| BancTec, Inc. (I) | 197,026 | 0 | ||||||||||||||||||||||||
| Electronic Arts, Inc. (I) | 384,775 | 34,445,058 | ||||||||||||||||||||||||
| Microsoft Corp. | 1,712,411 | 112,779,388 | ||||||||||||||||||||||||
| Oracle Corp. | 610,733 | 27,244,799 | ||||||||||||||||||||||||
| RingCentral, Inc., Class A (I) | 168,476 | 4,767,871 | ||||||||||||||||||||||||
| ServiceNow, Inc. (I) | 326,540 | 28,562,454 | ||||||||||||||||||||||||
| Technology hardware, storage and peripherals 6.1% | ||||||||||||||||||||||||||
| Apple, Inc. | 838,227 | 120,419,691 | ||||||||||||||||||||||||
| Materials 0.2% | 3,371,516 | |||||||||||||||||||||||||
| Metals and mining 0.2% | ||||||||||||||||||||||||||
| Freeport-McMoRan, Inc. (I) | 252,359 | 3,371,516 | ||||||||||||||||||||||||
| Real estate 1.6% | 32,393,536 | |||||||||||||||||||||||||
| Equity real estate investment trusts 1.6% | ||||||||||||||||||||||||||
| Equinix, Inc. | 80,909 | 32,393,536 | ||||||||||||||||||||||||
| Yield (%) | Shares | Value | ||||||||||||||||||||||||
| Securities lending collateral 2.5% | $49,814,553 | |||||||||||||||||||||||||
| (Cost $49,814,802) | ||||||||||||||||||||||||||
| John Hancock Collateral Trust (W) | 0.9609(Y) | 4,978,269 | 49,814,553 | |||||||||||||||||||||||
| Yield* (%) | Maturity date | Par value | Value | |||||||||||||||||||||||
| Short-term investments 4.8% | $94,442,329 | |||||||||||||||||||||||||
| (Cost $94,442,329) | ||||||||||||||||||||||||||
| U.S. Government Agency 4.7% | 92,668,329 | |||||||||||||||||||||||||
| Federal Home Loan Bank Discount Note | 0.325 | 04-03-17 | 92,670,000 | 92,668,329 | ||||||||||||||||||||||
| Par value^ | Value | |||||||||||||||||||||||||
| Repurchase agreement 0.1% | $1,774,000 | |||||||||||||||||||||||||
| Repurchase Agreement with State Street Corp. dated 3-31-17 at 0.220% to be repurchased at $1,774,033 on 4-3-17, collateralized by $1,520,000 U.S. Treasury Inflation Indexed Notes, 2.625% due 7-15-17 (valued at $1,814,772, including interest) | 1,774,000 | 1,774,000 | ||||||||||||||||||||||||
| Total investments (Cost $1,522,254,394)† 102.9% | $2,028,645,475 | |||||||||||||||||||||||||
| Other assets and liabilities, net (2.9%) | ($57,452,667 | ) | ||||||||||||||||||||||||
| Total net assets 100.0% | $1,971,192,808 | |||||||||||||||||||||||||
| The percentage shown for each investment category is the total value of the category as a percentage of the net assets of the fund. | ||||||||||||||||||||||||||
| ^All par values are denominated in U.S. dollars unless otherwise indicated. | ||||||||||||||||||||||||||
| Security Abbreviations and Legend | ||||||||||||||||||||||||||
| (I) | Non-income producing security. | |||||||||||||||||||||||||
| (L) | A portion of this security is on loan as of 3-31-17. | |||||||||||||||||||||||||
| (R) | Direct placement securities are restricted as to resale, and the fund has limited rights to registration under the Securities Act of 1933. For more information on this security refer to the Notes to financial statements. | |||||||||||||||||||||||||
| (W) | Investment is an affiliate of the fund, the advisor and/or subadvisor. This security represents the investment of cash collateral received for securities lending. | |||||||||||||||||||||||||
| (Y) | The rate shown is the annualized seven-day yield as of 3-31-17. | |||||||||||||||||||||||||
| † | At 3-31-17, the aggregate cost of investment securities for federal income tax purposes was $1,526,566,099. Net unrealized appreciation aggregated to $502,079,376, of which $522,692,225 related to appreciated investment securities and $20,612,849 related to depreciated investment securities. | |||||||||||||||||||||||||
Financial statements
STATEMENT OF ASSETS AND LIABILITIES 3-31-17
| Assets | ||||||||||||||||||||||||||||||
| Unaffiliated investments, at value (Cost $1,472,439,592) including $48,705,008 of securities loaned | $1,978,830,922 | |||||||||||||||||||||||||||||
| Affiliated investments, at value (Cost $49,814,802) | 49,814,553 | |||||||||||||||||||||||||||||
| Total investments, at value (Cost $1,522,254,394) | 2,028,645,475 | |||||||||||||||||||||||||||||
| Cash | 75,831 | |||||||||||||||||||||||||||||
| Receivable for investments sold | 7,575,875 | |||||||||||||||||||||||||||||
| Receivable for fund shares sold | 162,772 | |||||||||||||||||||||||||||||
| Dividends and interest receivable | 524,288 | |||||||||||||||||||||||||||||
| Receivable for securities lending income | 23,074 | |||||||||||||||||||||||||||||
| Other receivables and prepaid expenses | 1,034,237 | |||||||||||||||||||||||||||||
| Total assets | 2,038,041,552 | |||||||||||||||||||||||||||||
| Liabilities | ||||||||||||||||||||||||||||||
| Payable for investments purchased | 7,494,483 | |||||||||||||||||||||||||||||
| Payable for fund shares repurchased | 9,308,768 | |||||||||||||||||||||||||||||
| Payable upon return of securities loaned | 49,814,582 | |||||||||||||||||||||||||||||
| Payable to affiliates | ||||||||||||||||||||||||||||||
| Accounting and legal services fees | 42,954 | |||||||||||||||||||||||||||||
| Transfer agent fees | 37,732 | |||||||||||||||||||||||||||||
| Distribution and service fees | 323 | |||||||||||||||||||||||||||||
| Trustees' fees | 1,731 | |||||||||||||||||||||||||||||
| Other liabilities and accrued expenses | 148,171 | |||||||||||||||||||||||||||||
| Total liabilities | 66,848,744 | |||||||||||||||||||||||||||||
| Net assets | $1,971,192,808 | |||||||||||||||||||||||||||||
| Net assets consist of | ||||||||||||||||||||||||||||||
| Paid-in capital | $1,399,817,524 | |||||||||||||||||||||||||||||
| Undistributed net investment income | 1,277,457 | |||||||||||||||||||||||||||||
| Accumulated net realized gain (loss) on investments and investments | 63,706,746 | |||||||||||||||||||||||||||||
| Net unrealized appreciation (depreciation) on investments | 506,391,081 | |||||||||||||||||||||||||||||
| Net assets | $1,971,192,808 | |||||||||||||||||||||||||||||
STATEMENT OF ASSETS AND LIABILITIES (continued)
| Net asset value per share | ||||||||||||||||||
| Based on net asset values and shares outstanding-the fund has an unlimited number of shares authorized with no par value | ||||||||||||||||||
| Class A ($343,314,870 ÷ 20,325,468 shares)1 | $16.89 | |||||||||||||||||
| Class C ($16,699,284 ÷ 993,905 shares)1 | $16.80 | |||||||||||||||||
| Class I ($16,939,290 ÷ 997,334 shares) | $16.98 | |||||||||||||||||
| Class R2 ($1,009,878 ÷ 59,346 shares) | $17.02 | |||||||||||||||||
| Class R4 ($253,923 ÷ 14,928 shares) | $17.01 | |||||||||||||||||
| Class R6 ($970,135 ÷ 57,044 shares) | $17.01 | |||||||||||||||||
| Class NAV ($1,592,005,428 ÷ 93,643,606 shares) | $17.00 | |||||||||||||||||
| Maximum offering price per share | ||||||||||||||||||
| Class A (net asset value per share ÷ 95%)2 | $17.78 | |||||||||||||||||
| 1 | Redemption price per share is equal to net asset value less any applicable contingent deferred sales charge. | ||||||||||||||||
| 2 | On single retail sales of less than $50,000. On sales of $50,000 or more and on group sales the offering price is reduced. | ||||||||||||||||
STATEMENT OF OPERATIONS For the year ended 3-31-17
| Investment income | ||||||||||||||||||||||||
| Dividends | $26,442,801 | |||||||||||||||||||||||
| Interest | 137,259 | |||||||||||||||||||||||
| Securities lending | 48,582 | |||||||||||||||||||||||
| Total investment income | 26,628,642 | |||||||||||||||||||||||
| Expenses | ||||||||||||||||||||||||
| Investment management fees | 13,633,321 | |||||||||||||||||||||||
| Distribution and service fees | 965,468 | |||||||||||||||||||||||
| Accounting and legal services fees | 289,675 | |||||||||||||||||||||||
| Transfer agent fees | 425,314 | |||||||||||||||||||||||
| Trustees' fees | 33,969 | |||||||||||||||||||||||
| State registration fees | 135,726 | |||||||||||||||||||||||
| Printing and postage | 100,089 | |||||||||||||||||||||||
| Professional fees | 106,640 | |||||||||||||||||||||||
| Custodian fees | 217,853 | |||||||||||||||||||||||
| Other | 32,374 | |||||||||||||||||||||||
| Total expenses | 15,940,429 | |||||||||||||||||||||||
| Less expense reductions | (150,635 | ) | ||||||||||||||||||||||
| Net expenses | 15,789,794 | |||||||||||||||||||||||
| Net investment income | 10,838,848 | |||||||||||||||||||||||
| Realized and unrealized gain (loss) | ||||||||||||||||||||||||
| Net realized gain (loss) on | ||||||||||||||||||||||||
| Unaffiliated investments | 119,735,979 | |||||||||||||||||||||||
| Affiliated investments | (1,271 | ) | ||||||||||||||||||||||
| 119,734,708 | ||||||||||||||||||||||||
| Change in net unrealized appreciation (depreciation) of | ||||||||||||||||||||||||
| Unaffiliated investments | 140,637,415 | |||||||||||||||||||||||
| Affiliated investments | (577 | ) | ||||||||||||||||||||||
| 140,636,838 | ||||||||||||||||||||||||
| Net realized and unrealized gain | 260,371,546 | |||||||||||||||||||||||
| Increase in net assets from operations | $271,210,394 | |||||||||||||||||||||||
STATEMENTS OF CHANGES IN NET ASSETS
| Year ended 3-31-17 | Year ended 3-31-16 | ||||||||||||||||||||||||||||||||||||||||||||
| Increase (decrease) in net assets | |||||||||||||||||||||||||||||||||||||||||||||
| From operations | |||||||||||||||||||||||||||||||||||||||||||||
| Net investment income | $10,838,848 | $11,887,127 | |||||||||||||||||||||||||||||||||||||||||||
| Net realized gain | 119,734,708 | 45,484,685 | |||||||||||||||||||||||||||||||||||||||||||
| Change in net unrealized appreciation (depreciation) | 140,636,838 | (76,310,354 | ) | ||||||||||||||||||||||||||||||||||||||||||
| Increase (decrease) in net assets resulting from operations | 271,210,394 | (18,938,542 | ) | ||||||||||||||||||||||||||||||||||||||||||
| Distributions to shareholders | |||||||||||||||||||||||||||||||||||||||||||||
| From net investment income | |||||||||||||||||||||||||||||||||||||||||||||
| Class A | (855,968 | ) | (53,812 | ) | |||||||||||||||||||||||||||||||||||||||||
| Class I | (56,175 | ) | (77,682 | ) | |||||||||||||||||||||||||||||||||||||||||
| Class R2 | (2,001 | ) | (111 | ) | |||||||||||||||||||||||||||||||||||||||||
| Class R4 | (1,064 | ) | (344 | ) | |||||||||||||||||||||||||||||||||||||||||
| Class R6 | (3,723 | ) | (790 | ) | |||||||||||||||||||||||||||||||||||||||||
| Class NAV | (9,806,198 | ) | (14,002,668 | ) | |||||||||||||||||||||||||||||||||||||||||
| From net realized gain | |||||||||||||||||||||||||||||||||||||||||||||
| Class A | (11,508,730 | ) | (905,789 | ) | |||||||||||||||||||||||||||||||||||||||||
| Class C | (556,546 | ) | (41,821 | ) | |||||||||||||||||||||||||||||||||||||||||
| Class I | (377,009 | ) | (613,676 | ) | |||||||||||||||||||||||||||||||||||||||||
| Class R2 | (34,722 | ) | (5,142 | ) | |||||||||||||||||||||||||||||||||||||||||
| Class R4 | (8,259 | ) | (5,142 | ) | |||||||||||||||||||||||||||||||||||||||||
| Class R6 | (20,753 | ) | (5,142 | ) | |||||||||||||||||||||||||||||||||||||||||
| Class NAV | (54,659,622 | ) | (91,112,925 | ) | |||||||||||||||||||||||||||||||||||||||||
| Total distributions | (77,890,770 | ) | (106,825,044 | ) | |||||||||||||||||||||||||||||||||||||||||
| From fund share transactions | 82,979,324 | (288,801,728 | ) | ||||||||||||||||||||||||||||||||||||||||||
| Total increase (decrease) | 276,298,948 | (414,565,314 | ) | ||||||||||||||||||||||||||||||||||||||||||
| Net assets | |||||||||||||||||||||||||||||||||||||||||||||
| Beginning of year | 1,694,893,860 | 2,109,459,174 | |||||||||||||||||||||||||||||||||||||||||||
| End of year | $1,971,192,808 | $1,694,893,860 | |||||||||||||||||||||||||||||||||||||||||||
| Undistributed net investment income | $1,277,457 | $574,004 | |||||||||||||||||||||||||||||||||||||||||||
Financial highlights
| Class A Shares Period ended | 3-31-17 | 3-31-16 | 3-31-15 | 3-31-14 | 3-31-13 | ||||||||||||||||||||||||||||||||||||||||||||||||||||||||||||||||||||||||||||||||||||||||||||||||||
| Per share operating performance | |||||||||||||||||||||||||||||||||||||||||||||||||||||||||||||||||||||||||||||||||||||||||||||||||||||||
| Net asset value, beginning of period | $15.33 | $16.44 | $15.50 | $12.62 | $12.14 | ||||||||||||||||||||||||||||||||||||||||||||||||||||||||||||||||||||||||||||||||||||||||||||||||||
| Net investment income (loss)1 | 0.04 | 0.03 | 0.03 | (0.04 | ) | 0.02 | |||||||||||||||||||||||||||||||||||||||||||||||||||||||||||||||||||||||||||||||||||||||||||||||||
| Net realized and unrealized gain (loss) on investments | 2.12 | (0.24 | ) | 2.14 | 3.46 | 0.49 | |||||||||||||||||||||||||||||||||||||||||||||||||||||||||||||||||||||||||||||||||||||||||||||||||
| Total from investment operations | 2.16 | (0.21 | ) | 2.17 | 3.42 | 0.51 | |||||||||||||||||||||||||||||||||||||||||||||||||||||||||||||||||||||||||||||||||||||||||||||||||
| Less distributions | |||||||||||||||||||||||||||||||||||||||||||||||||||||||||||||||||||||||||||||||||||||||||||||||||||||||
| From net investment income | (0.04 | ) | (0.05 | ) | — | — | — | ||||||||||||||||||||||||||||||||||||||||||||||||||||||||||||||||||||||||||||||||||||||||||||||||
| From net realized gain | (0.56 | ) | (0.85 | ) | (1.23 | ) | (0.54 | ) | (0.03 | ) | |||||||||||||||||||||||||||||||||||||||||||||||||||||||||||||||||||||||||||||||||||||||||||||
| Total distributions | (0.60 | ) | (0.90 | ) | (1.23 | ) | (0.54 | ) | (0.03 | ) | |||||||||||||||||||||||||||||||||||||||||||||||||||||||||||||||||||||||||||||||||||||||||||||
| Net asset value, end of period | $16.89 | $15.33 | $16.44 | $15.50 | $12.62 | ||||||||||||||||||||||||||||||||||||||||||||||||||||||||||||||||||||||||||||||||||||||||||||||||||
| Total return (%)2,3 | 14.34 | (1.45 | ) | 14.68 | 27.27 | 4.25 | |||||||||||||||||||||||||||||||||||||||||||||||||||||||||||||||||||||||||||||||||||||||||||||||||
| Ratios and supplemental data | |||||||||||||||||||||||||||||||||||||||||||||||||||||||||||||||||||||||||||||||||||||||||||||||||||||||
| Net assets, end of period (in millions) | $343 | $18 | $18 | $10 | $5 | ||||||||||||||||||||||||||||||||||||||||||||||||||||||||||||||||||||||||||||||||||||||||||||||||||
| Ratios (as a percentage of average net assets): | |||||||||||||||||||||||||||||||||||||||||||||||||||||||||||||||||||||||||||||||||||||||||||||||||||||||
| Expenses before reductions | 1.11 | 1.19 | 1.33 | 1.51 | 2.01 | ||||||||||||||||||||||||||||||||||||||||||||||||||||||||||||||||||||||||||||||||||||||||||||||||||
| Expenses including reductions | 1.10 | 1.18 | 1.30 | 1.30 | 1.30 | ||||||||||||||||||||||||||||||||||||||||||||||||||||||||||||||||||||||||||||||||||||||||||||||||||
| Net investment income (loss) | 0.27 | 0.20 | 0.16 | (0.29 | ) | 0.18 | |||||||||||||||||||||||||||||||||||||||||||||||||||||||||||||||||||||||||||||||||||||||||||||||||
| Portfolio turnover (%) | 94 | 90 | 109 | 91 | 100 | ||||||||||||||||||||||||||||||||||||||||||||||||||||||||||||||||||||||||||||||||||||||||||||||||||
| 1 | Based on average daily shares outstanding. | ||||||||||||||||||||||||||||||||||||||||||||||||||||||||||||||||||||||||||||||||||
| 2 | Does not reflect the effect of sales charges, if any. | ||||||||||||||||||||||||||||||||||||||||||||||||||||||||||||||||||||||||||||||||||
| 3 | Total returns would have been lower had certain expenses not been reduced during the applicable periods. | ||||||||||||||||||||||||||||||||||||||||||||||||||||||||||||||||||||||||||||||||||
| Class C Shares Period ended | 3-31-17 | 3-31-16 | 3-31-151 | ||||||||||||||||||||||||||||||||||||||||||||||||||||||||||||||||||||
| Per share operating performance | |||||||||||||||||||||||||||||||||||||||||||||||||||||||||||||||||||||||
| Net asset value, beginning of period | $15.32 | $16.51 | $16.49 | ||||||||||||||||||||||||||||||||||||||||||||||||||||||||||||||||||||
| Net investment loss2 | (0.08 | ) | (0.09 | ) | (0.04 | ) | |||||||||||||||||||||||||||||||||||||||||||||||||||||||||||||||||
| Net realized and unrealized gain (loss) on investments | 2.12 | (0.25 | ) | 1.29 | |||||||||||||||||||||||||||||||||||||||||||||||||||||||||||||||||||
| Total from investment operations | 2.04 | (0.34 | ) | 1.25 | |||||||||||||||||||||||||||||||||||||||||||||||||||||||||||||||||||
| Less distributions | |||||||||||||||||||||||||||||||||||||||||||||||||||||||||||||||||||||||
| From net realized gain | (0.56 | ) | (0.85 | ) | (1.23 | ) | |||||||||||||||||||||||||||||||||||||||||||||||||||||||||||||||||
| Total distributions | (0.56 | ) | (0.85 | ) | (1.23 | ) | |||||||||||||||||||||||||||||||||||||||||||||||||||||||||||||||||
| Net asset value, end of period | $16.80 | $15.32 | $16.51 | ||||||||||||||||||||||||||||||||||||||||||||||||||||||||||||||||||||
| Total return (%)3,4 | 13.53 | (2.24 | ) | 8.20 | 5 | ||||||||||||||||||||||||||||||||||||||||||||||||||||||||||||||||||
| Ratios and supplemental data | |||||||||||||||||||||||||||||||||||||||||||||||||||||||||||||||||||||||
| Net assets, end of period (in millions) | $17 | $1 | $1 | ||||||||||||||||||||||||||||||||||||||||||||||||||||||||||||||||||||
| Ratios (as a percentage of average net assets): | |||||||||||||||||||||||||||||||||||||||||||||||||||||||||||||||||||||||
| Expenses before reductions | 1.86 | 2.50 | 7.03 | 6 | |||||||||||||||||||||||||||||||||||||||||||||||||||||||||||||||||||
| Expenses including reductions | 1.85 | 1.94 | 2.05 | 6 | |||||||||||||||||||||||||||||||||||||||||||||||||||||||||||||||||||
| Net investment loss | (0.48 | ) | (0.54 | ) | (0.42 | ) 6 | |||||||||||||||||||||||||||||||||||||||||||||||||||||||||||||||||
| Portfolio turnover (%) | 94 | 90 | 109 | 7 | |||||||||||||||||||||||||||||||||||||||||||||||||||||||||||||||||||
| 1 | The inception date for Class C shares is 8-28-14. | |||||||||||||||||||||||||||||||||||||||||||||||||||||||||||||||||||||||||||||||
| 2 | Based on average daily shares outstanding. | |||||||||||||||||||||||||||||||||||||||||||||||||||||||||||||||||||||||||||||||
| 3 | Total returns would have been lower had certain expenses not been reduced during the period. | |||||||||||||||||||||||||||||||||||||||||||||||||||||||||||||||||||||||||||||||
| 4 | Does not reflect the effect of sales charges, if any. | |||||||||||||||||||||||||||||||||||||||||||||||||||||||||||||||||||||||||||||||
| 5 | Not annualized. | |||||||||||||||||||||||||||||||||||||||||||||||||||||||||||||||||||||||||||||||
| 6 | Annualized. | |||||||||||||||||||||||||||||||||||||||||||||||||||||||||||||||||||||||||||||||
| 7 | The portfolio turnover is shown for the period from 4-1-14 to 3-31-15. | |||||||||||||||||||||||||||||||||||||||||||||||||||||||||||||||||||||||||||||||
| Class I Shares Period ended | 3-31-17 | 3-31-16 | 3-31-15 | 3-31-14 | 3-31-13 | ||||||||||||||||||||||||||||||||||||||||||||||||||||||||||||||||||||||||||||||||||||||||||||||||||
| Per share operating performance | |||||||||||||||||||||||||||||||||||||||||||||||||||||||||||||||||||||||||||||||||||||||||||||||||||||||
| Net asset value, beginning of period | $15.41 | $16.53 | $15.58 | $12.67 | $12.16 | ||||||||||||||||||||||||||||||||||||||||||||||||||||||||||||||||||||||||||||||||||||||||||||||||||
| Net investment income1 | 0.08 | 0.08 | 0.10 | 0.01 | 0.06 | ||||||||||||||||||||||||||||||||||||||||||||||||||||||||||||||||||||||||||||||||||||||||||||||||||
| Net realized and unrealized gain (loss) on investments | 2.13 | (0.24 | ) | 2.14 | 3.47 | 0.50 | |||||||||||||||||||||||||||||||||||||||||||||||||||||||||||||||||||||||||||||||||||||||||||||||||
| Total from investment operations | 2.21 | (0.16 | ) | 2.24 | 3.48 | 0.56 | |||||||||||||||||||||||||||||||||||||||||||||||||||||||||||||||||||||||||||||||||||||||||||||||||
| Less distributions | |||||||||||||||||||||||||||||||||||||||||||||||||||||||||||||||||||||||||||||||||||||||||||||||||||||||
| From net investment income | (0.08 | ) | (0.11 | ) | (0.06 | ) | (0.03 | ) | (0.02 | ) | |||||||||||||||||||||||||||||||||||||||||||||||||||||||||||||||||||||||||||||||||||||||||||||
| From net realized gain | (0.56 | ) | (0.85 | ) | (1.23 | ) | (0.54 | ) | (0.03 | ) | |||||||||||||||||||||||||||||||||||||||||||||||||||||||||||||||||||||||||||||||||||||||||||||
| Total distributions | (0.64 | ) | (0.96 | ) | (1.29 | ) | (0.57 | ) | (0.05 | ) | |||||||||||||||||||||||||||||||||||||||||||||||||||||||||||||||||||||||||||||||||||||||||||||
| Net asset value, end of period | $16.98 | $15.41 | $16.53 | $15.58 | $12.67 | ||||||||||||||||||||||||||||||||||||||||||||||||||||||||||||||||||||||||||||||||||||||||||||||||||
| Total return (%)2 | 14.70 | (1.17 | ) | 15.07 | 27.68 | 4.62 | |||||||||||||||||||||||||||||||||||||||||||||||||||||||||||||||||||||||||||||||||||||||||||||||||
| Ratios and supplemental data | |||||||||||||||||||||||||||||||||||||||||||||||||||||||||||||||||||||||||||||||||||||||||||||||||||||||
| Net assets, end of period (in millions) | $17 | $10 | $12 | $2 | $1 | ||||||||||||||||||||||||||||||||||||||||||||||||||||||||||||||||||||||||||||||||||||||||||||||||||
| Ratios (as a percentage of average net assets): | |||||||||||||||||||||||||||||||||||||||||||||||||||||||||||||||||||||||||||||||||||||||||||||||||||||||
| Expenses before reductions | 0.85 | 0.90 | 1.50 | 2.62 | 5.88 | ||||||||||||||||||||||||||||||||||||||||||||||||||||||||||||||||||||||||||||||||||||||||||||||||||
| Expenses including reductions | 0.84 | 0.88 | 0.94 | 0.94 | 0.94 | ||||||||||||||||||||||||||||||||||||||||||||||||||||||||||||||||||||||||||||||||||||||||||||||||||
| Net investment income | 0.47 | 0.50 | 0.62 | 0.09 | 0.51 | ||||||||||||||||||||||||||||||||||||||||||||||||||||||||||||||||||||||||||||||||||||||||||||||||||
| Portfolio turnover (%) | 94 | 90 | 109 | 91 | 100 | ||||||||||||||||||||||||||||||||||||||||||||||||||||||||||||||||||||||||||||||||||||||||||||||||||
| 1 | Based on average daily shares outstanding. | ||||||||||||||||||||||||||||||||||||||||||||||||||||||||||||||||||||||||||||||||||
| 2 | Total returns would have been lower had certain expenses not been reduced during the applicable periods. | ||||||||||||||||||||||||||||||||||||||||||||||||||||||||||||||||||||||||||||||||||
| Class R2 Shares Period ended | 3-31-17 | 3-31-16 | 3-31-151 | ||||||||||||||||||||||||||||||||||||||||||||||||||||||||||||||||||||
| Per share operating performance | |||||||||||||||||||||||||||||||||||||||||||||||||||||||||||||||||||||||
| Net asset value, beginning of period | $15.44 | $16.55 | $16.50 | ||||||||||||||||||||||||||||||||||||||||||||||||||||||||||||||||||||
| Net investment income2 | 0.03 | 0.01 | — | 3 | |||||||||||||||||||||||||||||||||||||||||||||||||||||||||||||||||||
| Net realized and unrealized gain (loss) on investments | 2.14 | (0.25 | ) | 0.05 | |||||||||||||||||||||||||||||||||||||||||||||||||||||||||||||||||||
| Total from investment operations | 2.17 | (0.24 | ) | 0.05 | |||||||||||||||||||||||||||||||||||||||||||||||||||||||||||||||||||
| Less distributions | |||||||||||||||||||||||||||||||||||||||||||||||||||||||||||||||||||||||
| From net investment income | (0.03 | ) | (0.02 | ) | — | ||||||||||||||||||||||||||||||||||||||||||||||||||||||||||||||||||
| From net realized gain | (0.56 | ) | (0.85 | ) | — | ||||||||||||||||||||||||||||||||||||||||||||||||||||||||||||||||||
| Total distributions | (0.59 | ) | (0.87 | ) | — | ||||||||||||||||||||||||||||||||||||||||||||||||||||||||||||||||||
| Net asset value, end of period | $17.02 | $15.44 | $16.55 | ||||||||||||||||||||||||||||||||||||||||||||||||||||||||||||||||||||
| Total return (%)4 | 14.30 | (1.63 | ) | 0.30 | 5 | ||||||||||||||||||||||||||||||||||||||||||||||||||||||||||||||||||
| Ratios and supplemental data | |||||||||||||||||||||||||||||||||||||||||||||||||||||||||||||||||||||||
| Net assets, end of period (in millions) | $1 | — | 6 | — | 6 | ||||||||||||||||||||||||||||||||||||||||||||||||||||||||||||||||||
| Ratios (as a percentage of average net assets): | |||||||||||||||||||||||||||||||||||||||||||||||||||||||||||||||||||||||
| Expenses before reductions | 1.18 | 4.73 | 15.09 | 7 | |||||||||||||||||||||||||||||||||||||||||||||||||||||||||||||||||||
| Expenses including reductions | 1.17 | 1.32 | 13.96 | 7 | |||||||||||||||||||||||||||||||||||||||||||||||||||||||||||||||||||
| Net investment income | 0.19 | 0.06 | — | 7,8 | |||||||||||||||||||||||||||||||||||||||||||||||||||||||||||||||||||
| Portfolio turnover (%) | 94 | 90 | 109 | 9 | |||||||||||||||||||||||||||||||||||||||||||||||||||||||||||||||||||
| 1 | The inception date for Class R2 shares is 3-27-15. | |||||||||||||||||||||||||||||||||||||||||||||||||||||||||||||||||||||||||||||||
| 2 | Based on average daily shares outstanding. | |||||||||||||||||||||||||||||||||||||||||||||||||||||||||||||||||||||||||||||||
| 3 | Less than $0.005 per share. | |||||||||||||||||||||||||||||||||||||||||||||||||||||||||||||||||||||||||||||||
| 4 | Total returns would have been lower had certain expenses not been reduced during the period. | |||||||||||||||||||||||||||||||||||||||||||||||||||||||||||||||||||||||||||||||
| 5 | Not annualized. | |||||||||||||||||||||||||||||||||||||||||||||||||||||||||||||||||||||||||||||||
| 6 | Less than $500,000. | |||||||||||||||||||||||||||||||||||||||||||||||||||||||||||||||||||||||||||||||
| 7 | Annualized. | |||||||||||||||||||||||||||||||||||||||||||||||||||||||||||||||||||||||||||||||
| 8 | Less than 0.005%. | |||||||||||||||||||||||||||||||||||||||||||||||||||||||||||||||||||||||||||||||
| 9 | The portfolio turnover is shown for the period from 4-1-14 to 3-31-15. | |||||||||||||||||||||||||||||||||||||||||||||||||||||||||||||||||||||||||||||||
| Class R4 Shares Period ended | 3-31-17 | 3-31-16 | 3-31-151 | ||||||||||||||||||||||||||||||||||||||||||||||||||||||||||||||||||||
| Per share operating performance | |||||||||||||||||||||||||||||||||||||||||||||||||||||||||||||||||||||||
| Net asset value, beginning of period | $15.43 | $16.55 | $16.50 | ||||||||||||||||||||||||||||||||||||||||||||||||||||||||||||||||||||
| Net investment income2 | 0.07 | 0.04 | — | 3 | |||||||||||||||||||||||||||||||||||||||||||||||||||||||||||||||||||
| Net realized and unrealized gain (loss) on investments | 2.14 | (0.25 | ) | 0.05 | |||||||||||||||||||||||||||||||||||||||||||||||||||||||||||||||||||
| Total from investment operations | 2.21 | (0.21 | ) | 0.05 | |||||||||||||||||||||||||||||||||||||||||||||||||||||||||||||||||||
| Less distributions | |||||||||||||||||||||||||||||||||||||||||||||||||||||||||||||||||||||||
| From net investment income | (0.07 | ) | (0.06 | ) | — | ||||||||||||||||||||||||||||||||||||||||||||||||||||||||||||||||||
| From net realized gain | (0.56 | ) | (0.85 | ) | — | ||||||||||||||||||||||||||||||||||||||||||||||||||||||||||||||||||
| Total distributions | (0.63 | ) | (0.91 | ) | — | ||||||||||||||||||||||||||||||||||||||||||||||||||||||||||||||||||
| Net asset value, end of period | $17.01 | $15.43 | $16.55 | ||||||||||||||||||||||||||||||||||||||||||||||||||||||||||||||||||||
| Total return (%)4 | 14.60 | (1.47 | ) | 0.30 | 5 | ||||||||||||||||||||||||||||||||||||||||||||||||||||||||||||||||||
| Ratios and supplemental data | |||||||||||||||||||||||||||||||||||||||||||||||||||||||||||||||||||||||
| Net assets, end of period (in millions) | — | 6 | — | 6 | — | 6 | |||||||||||||||||||||||||||||||||||||||||||||||||||||||||||||||||
| Ratios (as a percentage of average net assets): | |||||||||||||||||||||||||||||||||||||||||||||||||||||||||||||||||||||||
| Expenses before reductions | 1.02 | 4.73 | 15.09 | 7 | |||||||||||||||||||||||||||||||||||||||||||||||||||||||||||||||||||
| Expenses including reductions | 0.91 | 1.13 | 1.18 | 7 | |||||||||||||||||||||||||||||||||||||||||||||||||||||||||||||||||||
| Net investment income | 0.44 | 0.25 | 0.18 | 7 | |||||||||||||||||||||||||||||||||||||||||||||||||||||||||||||||||||
| Portfolio turnover (%) | 94 | 90 | 109 | 8 | |||||||||||||||||||||||||||||||||||||||||||||||||||||||||||||||||||
| 1 | The inception date for Class R4 shares is 3-27-15. | |||||||||||||||||||||||||||||||||||||||||||||||||||||||||||||||||||||||||||||||
| 2 | Based on average daily shares outstanding. | |||||||||||||||||||||||||||||||||||||||||||||||||||||||||||||||||||||||||||||||
| 3 | Less than $0.005 per share. | |||||||||||||||||||||||||||||||||||||||||||||||||||||||||||||||||||||||||||||||
| 4 | Total returns would have been lower had certain expenses not been reduced during the period. | |||||||||||||||||||||||||||||||||||||||||||||||||||||||||||||||||||||||||||||||
| 5 | Not annualized. | |||||||||||||||||||||||||||||||||||||||||||||||||||||||||||||||||||||||||||||||
| 6 | Less than $500,000. | |||||||||||||||||||||||||||||||||||||||||||||||||||||||||||||||||||||||||||||||
| 7 | Annualized. | |||||||||||||||||||||||||||||||||||||||||||||||||||||||||||||||||||||||||||||||
| 8 | The portfolio turnover is shown for the period from 4-1-14 to 3-31-15. | |||||||||||||||||||||||||||||||||||||||||||||||||||||||||||||||||||||||||||||||
| Class R6 Shares Period ended | 3-31-17 | 3-31-16 | 3-31-151 | ||||||||||||||||||||||||||||||||||||||||||||||||||||||||||||||||||||
| Per share operating performance | |||||||||||||||||||||||||||||||||||||||||||||||||||||||||||||||||||||||
| Net asset value, beginning of period | $15.42 | $16.55 | $16.50 | ||||||||||||||||||||||||||||||||||||||||||||||||||||||||||||||||||||
| Net investment income2 | 0.09 | 0.10 | — | 3 | |||||||||||||||||||||||||||||||||||||||||||||||||||||||||||||||||||
| Net realized and unrealized gain (loss) on investments | 2.16 | (0.25 | ) | 0.05 | |||||||||||||||||||||||||||||||||||||||||||||||||||||||||||||||||||
| Total from investment operations | 2.25 | (0.15 | ) | 0.05 | |||||||||||||||||||||||||||||||||||||||||||||||||||||||||||||||||||
| Less distributions | |||||||||||||||||||||||||||||||||||||||||||||||||||||||||||||||||||||||
| From net investment income | (0.10 | ) | (0.13 | ) | — | ||||||||||||||||||||||||||||||||||||||||||||||||||||||||||||||||||
| From net realized gain | (0.56 | ) | (0.85 | ) | — | ||||||||||||||||||||||||||||||||||||||||||||||||||||||||||||||||||
| Total distributions | (0.66 | ) | (0.98 | ) | — | ||||||||||||||||||||||||||||||||||||||||||||||||||||||||||||||||||
| Net asset value, end of period | $17.01 | $15.42 | $16.55 | ||||||||||||||||||||||||||||||||||||||||||||||||||||||||||||||||||||
| Total return (%)4 | 14.87 | (1.09 | ) | 0.30 | 5 | ||||||||||||||||||||||||||||||||||||||||||||||||||||||||||||||||||
| Ratios and supplemental data | |||||||||||||||||||||||||||||||||||||||||||||||||||||||||||||||||||||||
| Net assets, end of period (in millions) | $1 | — | 6 | — | 6 | ||||||||||||||||||||||||||||||||||||||||||||||||||||||||||||||||||
| Ratios (as a percentage of average net assets): | |||||||||||||||||||||||||||||||||||||||||||||||||||||||||||||||||||||||
| Expenses before reductions | 0.75 | 4.75 | 15.91 | 7 | |||||||||||||||||||||||||||||||||||||||||||||||||||||||||||||||||||
| Expenses including reductions | 0.73 | 0.73 | 0.81 | 7 | |||||||||||||||||||||||||||||||||||||||||||||||||||||||||||||||||||
| Net investment income | 0.50 | 0.65 | 0.63 | 7 | |||||||||||||||||||||||||||||||||||||||||||||||||||||||||||||||||||
| Portfolio turnover (%) | 94 | 90 | 109 | 8 | |||||||||||||||||||||||||||||||||||||||||||||||||||||||||||||||||||
| 1 | The inception date for Class R6 shares is 3-27-15. | |||||||||||||||||||||||||||||||||||||||||||||||||||||||||||||||||||||||||||||||
| 2 | Based on average daily shares outstanding. | |||||||||||||||||||||||||||||||||||||||||||||||||||||||||||||||||||||||||||||||
| 3 | Less than $0.005 per share. | |||||||||||||||||||||||||||||||||||||||||||||||||||||||||||||||||||||||||||||||
| 4 | Total returns would have been lower had certain expenses not been reduced during the period. | |||||||||||||||||||||||||||||||||||||||||||||||||||||||||||||||||||||||||||||||
| 5 | Not annualized. | |||||||||||||||||||||||||||||||||||||||||||||||||||||||||||||||||||||||||||||||
| 6 | Less than $500,000. | |||||||||||||||||||||||||||||||||||||||||||||||||||||||||||||||||||||||||||||||
| 7 | Annualized. | |||||||||||||||||||||||||||||||||||||||||||||||||||||||||||||||||||||||||||||||
| 8 | The portfolio turnover is shown for the period from 4-1-14 to 3-31-15. | |||||||||||||||||||||||||||||||||||||||||||||||||||||||||||||||||||||||||||||||
| Class NAV Shares Period ended | 3-31-17 | 3-31-16 | 3-31-15 | 3-31-14 | 3-31-13 | ||||||||||||||||||||||||||||||||||||||||||||||||||||||||||||||||||||||||||||||||||||||||||||||||||
| Per share operating performance | |||||||||||||||||||||||||||||||||||||||||||||||||||||||||||||||||||||||||||||||||||||||||||||||||||||||
| Net asset value, beginning of period | $15.42 | $16.55 | $15.58 | $12.67 | $12.16 | ||||||||||||||||||||||||||||||||||||||||||||||||||||||||||||||||||||||||||||||||||||||||||||||||||
| Net investment income1 | 0.10 | 0.10 | 0.12 | 0.04 | 0.08 | ||||||||||||||||||||||||||||||||||||||||||||||||||||||||||||||||||||||||||||||||||||||||||||||||||
| Net realized and unrealized gain (loss) on investments | 2.14 | (0.25 | ) | 2.17 | 3.47 | 0.50 | |||||||||||||||||||||||||||||||||||||||||||||||||||||||||||||||||||||||||||||||||||||||||||||||||
| Total from investment operations | 2.24 | (0.15 | ) | 2.29 | 3.51 | 0.58 | |||||||||||||||||||||||||||||||||||||||||||||||||||||||||||||||||||||||||||||||||||||||||||||||||
| Less distributions | |||||||||||||||||||||||||||||||||||||||||||||||||||||||||||||||||||||||||||||||||||||||||||||||||||||||
| From net investment income | (0.10 | ) | (0.13 | ) | (0.09 | ) | (0.06 | ) | (0.04 | ) | |||||||||||||||||||||||||||||||||||||||||||||||||||||||||||||||||||||||||||||||||||||||||||||
| From net realized gain | (0.56 | ) | (0.85 | ) | (1.23 | ) | (0.54 | ) | (0.03 | ) | |||||||||||||||||||||||||||||||||||||||||||||||||||||||||||||||||||||||||||||||||||||||||||||
| Total distributions | (0.66 | ) | (0.98 | ) | (1.32 | ) | (0.60 | ) | (0.07 | ) | |||||||||||||||||||||||||||||||||||||||||||||||||||||||||||||||||||||||||||||||||||||||||||||
| Net asset value, end of period | $17.00 | $15.42 | $16.55 | $15.58 | $12.67 | ||||||||||||||||||||||||||||||||||||||||||||||||||||||||||||||||||||||||||||||||||||||||||||||||||
| Total return (%)2 | 14.81 | (1.09 | ) | 15.43 | 27.88 | 4.80 | |||||||||||||||||||||||||||||||||||||||||||||||||||||||||||||||||||||||||||||||||||||||||||||||||
| Ratios and supplemental data | |||||||||||||||||||||||||||||||||||||||||||||||||||||||||||||||||||||||||||||||||||||||||||||||||||||||
| Net assets, end of period (in millions) | $1,592 | $1,666 | $2,078 | $1,452 | $1,013 | ||||||||||||||||||||||||||||||||||||||||||||||||||||||||||||||||||||||||||||||||||||||||||||||||||
| Ratios (as a percentage of average net assets): | |||||||||||||||||||||||||||||||||||||||||||||||||||||||||||||||||||||||||||||||||||||||||||||||||||||||
| Expenses before reductions | 0.73 | 0.74 | 0.72 | 0.74 | 0.78 | ||||||||||||||||||||||||||||||||||||||||||||||||||||||||||||||||||||||||||||||||||||||||||||||||||
| Expenses including reductions | 0.73 | 0.74 | 0.72 | 0.73 | 0.78 | ||||||||||||||||||||||||||||||||||||||||||||||||||||||||||||||||||||||||||||||||||||||||||||||||||
| Net investment income | 0.61 | 0.64 | 0.72 | 0.26 | 0.71 | ||||||||||||||||||||||||||||||||||||||||||||||||||||||||||||||||||||||||||||||||||||||||||||||||||
| Portfolio turnover (%) | 94 | 90 | 109 | 91 | 100 | ||||||||||||||||||||||||||||||||||||||||||||||||||||||||||||||||||||||||||||||||||||||||||||||||||
| 1 | Based on average daily shares outstanding. | ||||||||||||||||||||||||||||||||||||||||||||||||||||||||||||||||||||||||||||||||||
| 2 | Total returns would have been lower had certain expenses not been reduced during the applicable periods. | ||||||||||||||||||||||||||||||||||||||||||||||||||||||||||||||||||||||||||||||||||
Note 1 — Organization
John Hancock Strategic Growth Fund (the fund) is a series of John Hancock Funds III (the Trust), an open-end management investment company organized as a Massachusetts business trust and registered under the Investment Company Act of 1940, as amended (the 1940 Act). The investment objective of the fund is to seek long-term capital appreciation.
The fund may offer multiple classes of shares. The shares currently offered are detailed in the Statement of assets and liabilities. Class A and Class C shares are offered to all investors. Class I shares are offered to institutions and certain investors. Class R2 and Class R4 shares are available only to certain retirement plans. Class R6 shares are available only to certain retirement plans, institutions and other investors. Class NAV shares are offered to John Hancock affiliated funds of funds and certain 529 plans. Shareholders of each class have exclusive voting rights to matters that affect that class. The distribution and service fees, if any, and transfer agent fees for each class may differ.
Note 2 — Significant accounting policies
The financial statements have been prepared in conformity with accounting principles generally accepted in the United States of America (US GAAP), which require management to make certain estimates and assumptions as of the date of the financial statements. Actual results could differ from those estimates and those differences could be significant. The fund qualifies as an investment company under Topic 946 of Accounting Standards Codification of US GAAP.
Events or transactions occurring after the end of the fiscal period through the date that the financial statements were issued have been evaluated in the preparation of the financial statements. The following summarizes the significant accounting policies of the fund:
Security valuation. Investments are stated at value as of the scheduled close of regular trading on the New York Stock Exchange (NYSE), normally at 4:00 p.m., Eastern Time. In case of emergency or other disruption resulting in the NYSE not opening for trading or the NYSE closing at a time other than the regularly scheduled close, the net asset value (NAV) may be determined as of the regularly scheduled close of the NYSE pursuant to the fund's Valuation Policies and Procedures.
In order to value the securities, the fund uses the following valuation techniques: Equity securities held by the fund are typically valued at the last sale price or official closing price on the exchange or principal market where the security trades. In the event there were no sales during the day or closing prices are not available, the securities are valued using the last available bid price. Investments by the fund in open-end mutual funds, including John Hancock Collateral Trust (JHCT), are valued at their respective NAVs each business day. Foreign securities and currencies are valued in U.S. dollars based on foreign currency exchange rates supplied by an independent pricing vendor.
In certain instances, the Pricing Committee may determine to value equity securities using prices obtained from another exchange or market if trading on the exchange or market on which prices are typically obtained did not open for trading as scheduled, or if trading closed earlier than scheduled, and trading occurred as normal on another exchange or market.
Other portfolio securities and assets, for which reliable market quotations are not readily available, are valued at fair value as determined in good faith by the fund's Pricing Committee following procedures established by the Board of Trustees. The frequency with which these fair valuation procedures are used cannot be predicted and fair value of securities may differ significantly from the value that would have been used had a ready market for such securities existed.
The fund uses a three-tier hierarchy to prioritize the pricing assumptions, referred to as inputs, used in valuation techniques to measure fair value. Level 1 includes securities valued using quoted prices in active markets for identical securities. Level 2 includes securities valued using other significant observable inputs. Observable inputs may include quoted prices for similar securities, interest rates, prepayment speeds and credit risk. Prices for securities valued using these inputs are received from independent pricing vendors and brokers and are based on an evaluation of the inputs described. Level 3 includes securities valued using significant unobservable inputs when market prices are not readily available or reliable, including the fund's own assumptions in determining the fair value of investments. Factors used in determining value may include market or issuer specific events or trends, changes in interest rates and credit quality. The inputs or methodology used for valuing
securities are not necessarily an indication of the risks associated with investing in those securities. Changes in valuation techniques and related inputs may result in transfers into or out of an assigned level within the disclosure hierarchy.
The following is a summary of the values by input classification of the fund's investments as of March 31, 2017, by major security category or type:
| Total value at 3-31-17 | Level 1 quoted price | Level 2 significant observable inputs | Level 3 significant unobservable inputs | ||
| Common stocks | |||||
| Consumer discretionary | $469,511,183 | $469,511,183 | — | — | |
| Consumer staples | 96,621,517 | 96,621,517 | — | — | |
| Energy | 32,164,037 | 32,164,037 | — | — | |
| Financials | 88,201,200 | 88,201,200 | — | — | |
| Health care | 246,658,930 | 246,658,930 | — | — | |
| Industrials | 204,701,413 | 204,701,413 | — | — | |
| Information technology | 710,765,261 | 709,949,261 | — | $816,000 | |
| Materials | 3,371,516 | 3,371,516 | — | — | |
| Real estate | 32,393,536 | 32,393,536 | — | — | |
| Securities lending collateral | 49,814,553 | 49,814,553 | — | — | |
| Short-term investments | 94,442,329 | — | $94,442,329 | — | |
| Total investments in securities | $2,028,645,475 | $1,933,387,146 | $94,442,329 | $816,000 | |
Repurchase agreements. The fund may enter into repurchase agreements. When the fund enters into a repurchase agreement, it receives collateral that is held in a segregated account by the fund's custodian. The collateral amount is marked-to-market and monitored on a daily basis to ensure that the collateral held is in an amount not less than the principal amount of the repurchase agreement plus any accrued interest. Collateral received by the fund for repurchase agreements is disclosed in the Fund's investments as part of the caption related to the repurchase agreement.
Repurchase agreements are typically governed by the terms and conditions of the Master Repurchase Agreement and/or Global Master Repurchase Agreement (collectively, MRA). Upon an event of default, the non-defaulting party may close out all transactions traded under the MRA and net amounts owed. Absent an event of default, assets and liabilities resulting from repurchase agreements are not offset in the Statement of assets and liabilities. In the event of a default by the counterparty, realization of the collateral proceeds could be delayed, during which time the collateral value may decline or the counterparty may have insufficient assets to pay back claims resulting from close-out of the transactions.
Security transactions and related investment income. Investment security transactions are accounted for on a trade date plus one basis for daily NAV calculations. However, for financial reporting purposes, investment transactions are reported on trade date. Interest income is accrued as earned. Dividend income is recorded on the ex-date, except for dividends of foreign securities where the dividend may not be known until after the ex-date. In those cases, dividend income, net of withholding taxes, is recorded when the fund becomes aware of the dividends. Foreign taxes are provided for based on the fund's understanding of the tax rules and rates that exist in the foreign markets in which it invests. Gains and losses on securities sold are determined on the basis of identified cost and may include proceeds from litigation.
Securities lending. The fund may lend its securities to earn additional income. The fund receives cash collateral from the borrower in an amount not less than the market value of the loaned securities. The fund will invest its collateral in JHCT, an affiliate of the fund, which has a floating NAV and is registered with the Securities and Exchange Commission (SEC) as an investment company. JHCT invests cash received as collateral as part of the securities lending program in short-term money market investments. The fund will receive the benefit of any gains and bear any losses generated by JHCT with respect to the cash collateral.
The fund has the right to recall loaned securities on demand. If a borrower fails to return loaned securities when due, then the lending agent is responsible and indemnifies the fund for the lent securities. The lending agent uses the collateral received from the borrower to purchase replacement securities of the same issue, type, class and series of the loaned securities. If the value of the collateral is less than the purchase cost of replacement securities, the lending agent is responsible for satisfying the shortfall but only to the extent that the shortfall is not due to any decrease in the value of JHCT.
Although the risk of the loss of the securities lent is mitigated by receiving collateral from the borrower and through lending agent indemnification, the fund could experience a delay in recovering securities or could experience a lower than expected return if the borrower fails to return the securities on a timely basis. The fund receives compensation for lending its securities by retaining a portion of the return on the investment of the collateral and compensation from fees earned from borrowers of the securities. Securities lending income received by the fund is net of fees retained by the securities lending agent. Net income received from JHCT is a component of securities lending income as recorded on the Statement of operations.
Obligations to repay collateral received by the fund are shown on the Statements of assets and liabilities as Payable upon return of securities loaned and are secured by the loaned securities. As of March 31, 2017, the fund loaned common stocks valued at $48,705,008 and received $49,814,582 of cash collateral.
Line of credit. The fund may borrow from banks for temporary or emergency purposes, including meeting redemption requests that otherwise might require the untimely sale of securities. Pursuant to the fund's custodian agreement, the custodian may loan money to the fund to make properly authorized payments. The fund is obligated to repay the custodian for any overdraft, including any related costs or expenses. The custodian may have a lien, security interest or security entitlement in any fund property that is not otherwise segregated or pledged, to the extent of any overdraft, and to the maximum extent permitted by law.
Effective June 30, 2016, the fund and other affiliated funds have entered into a syndicated line of credit agreement with Citibank, N.A. as the administrative agent that enables them to participate in a $1 billion unsecured committed line of credit. Excluding commitments designated for a certain fund and subject to the need of other affiliated funds, the fund can borrow up to an aggregate commitment amount of $750 million, subject to asset coverage and other limitations as specified in the agreement. A commitment fee payable at the end of each calendar quarter, based on the average daily unused portion of the line of credit, is charged to each participating fund based on a combination of fixed and asset based allocations and is reflected in Other expenses on the Statement of operations. Prior to June 30, 2016, the fund had a similar agreement that enabled it to participate in a $750 million unsecured committed line of credit. For the year ended March 31, 2017, the fund had no borrowings under either line of credit. Commitment fees for the year ended March 31, 2017, were $7,106.
Expenses. Within the John Hancock group of funds complex, expenses that are directly attributable to an individual fund are allocated to such fund. Expenses that are not readily attributable to a specific fund are allocated among all funds in an equitable manner, taking into consideration, among other things, the nature and type of expense and the fund's relative net assets. Expense estimates are accrued in the period to which they relate and adjustments are made when actual amounts are known.
Class allocations. Income, common expenses and realized and unrealized gains (losses) are determined at the fund level and allocated daily to each class of shares based on the net assets of the class. Class-specific expenses, such as distribution and service fees, if any, and transfer agent fees, for all classes, are calculated daily at the class level based on the net assets of each class and the specific expense rates applicable to each class.
Federal income taxes. The fund intends to continue to qualify as a regulated investment company by complying with the applicable provisions of the Internal Revenue Code and will not be subject to federal income tax on taxable income that is distributed to shareholders. Therefore, no federal income tax provision is required.
As of March 31, 2017, the fund had no uncertain tax positions that would require financial statement recognition, derecognition or disclosure. The fund's federal tax returns are subject to examination by the Internal Revenue Service for a period of three years.
Distribution of income and gains. Distributions to shareholders from net investment income and net realized gains, if any, are recorded on the ex-date. The fund generally declares and pays dividends and capital gain distributions, if any, annually.
The tax character of distributions for the years ended March 31, 2017 and 2016 was as follows:
| March 31, 2017 | March 31, 2016 | |
| Ordinary Income | $16,265,008 | $38,200,449 |
| Long term capital gains | 61,625,762 | 68,624,595 |
| Total | $77,890,770 | $106,825,044 |
Distributions paid by the fund with respect to each class of shares are calculated in the same manner, at the same time and in the same amount, except for the effect of class level expenses that may be applied differently to each class. As of March 31, 2017, the components of distributable earnings on a tax basis consisted of $21,670,077 of undistributed ordinary income and $47,625,831 of undistributed long-term capital gain.
Such distributions and distributable earnings, on a tax basis, are determined in conformity with income tax regulations, which may differ from US GAAP. Distributions in excess of tax basis earnings and profits, if any, are reported in the fund's financial statements as a return of capital.
Capital accounts within the financial statements are adjusted for permanent book-tax differences. These adjustments have no impact on net assets or the results of operations. Temporary book-tax differences, if any, will reverse in a subsequent period. Book-tax differences are primarily attributable to wash sale loss deferrals, expiration of capital loss carryforwards and merger related transactions.
Note 3 — Guarantees and indemnifications
Under the Trust's organizational documents, its Officers and Trustees are indemnified against certain liabilities arising out of the performance of their duties to the Trust, including the fund. Additionally, in the normal course of business, the fund enters into contracts with service providers that contain general indemnification clauses. The fund's maximum exposure under these arrangements is unknown, as this would involve future claims that may be made against the fund that have not yet occurred. The risk of material loss from such claims is considered remote.
Note 4 — Fees and transactions with affiliates
John Hancock Advisers, LLC (the Advisor) serves as investment advisor for the fund. John Hancock Funds, LLC (the Distributor), an affiliate of the Advisor, serves as principal underwriter of the fund. The Advisor and the Distributor are indirect, wholly owned subsidiaries of Manulife Financial Corporation (MFC).
Management fee. The fund has an investment management agreement with the Advisor under which the fund pays a daily management fee to the Advisor equivalent on an annual basis to the sum of: (a) 0.725% of the first $500 million of the fund's average daily net assets; (b) 0.700% of the next $500 million of the fund's average daily net assets; (c) 0.675% of the next $500 million of the fund's average daily net assets; and (d) 0.650% of the fund's average daily net assets in excess of $1.5 billion. The Advisor has a subadvisory agreement with John Hancock Asset Management a division of Manulife Asset Management (US) LLC, an indirectly owned subsidiary of MFC and an affiliate of the Advisor. The fund is not responsible for payment of the subadvisory fees.
The Advisor has contractually agreed to waive a portion of its management fee and/or reimburse expenses for certain funds of the John Hancock group of funds complex, including the fund (the participating portfolios). This waiver is based upon aggregate net assets of all the participating portfolios. The amount of the reimbursement is calculated daily and allocated among all the participating portfolios in proportion to the daily net assets of each fund. During the year ended March 31, 2017, this waiver amounted to 0.01% of the fund's average net assets. This arrangement may be amended or terminated at any time by the Advisor upon notice to the fund and with the approval of the Board of Trustees.
Prior to July 1, 2016, the Advisor had contractually agreed to waive all or a portion of its management fee and/or reimburse or pay operating expenses of the fund to the extent necessary to maintain the fund's total operating expenses at 2.05%, 1.43%, and 1.18% for Class C, Class R2, and Class R4 shares, respectively, excluding certain expenses such as taxes, brokerage commissions, interest expense, litigation and indemnification expenses and other extraordinary expenses not incurred in the ordinary course of the fund's business, acquired fund fees and short dividend expense.
The Advisor has contractually agreed to waive and/or reimburse all class specific expenses for Class R6 shares of the fund to the extent they exceed 0.00% of average net assets. The expense limitation expires on June 30, 2017, unless renewed by mutual agreement of the fund and the Advisor based upon a determination that this is appropriate under the circumstances at the time.
For the year ended March 31, 2017, these expense reductions amounted to the following:
| Class | Expense reduction | Class | Expense reduction | |
| Class A | $24,438 | Class R4 | $17 | |
| Class C | 1,186 | Class R6 | 122 | |
| Class I | 793 | Class NAV | 123,777 | |
| Class R2 | 74 | Total | $150,407 |
Expenses waived or reimbursed in the current fiscal period are not subject to recapture in future fiscal periods.
The investment management fees, including the impact of the waivers and reimbursements as described above, incurred for the year ended March 31, 2017 were equivalent to a net annual effective rate of 0.68% of the fund's average daily net assets.
Accounting and legal services. Pursuant to a service agreement, the fund reimburses the Advisor for all expenses associated with providing the administrative, financial, legal, accounting and recordkeeping services to the fund, including the preparation of all tax returns, periodic reports to shareholders and regulatory reports, among other services. These expenses are allocated to each share class based on its relative net assets at the time the expense was incurred. These accounting and legal services fees incurred for the year ended March 31, 2017 amounted to an annual rate of 0.01% of the fund's average daily net assets.
Distribution and service plans. The fund has a distribution agreement with the Distributor. The fund has adopted distribution and service plans with respect to Class A, Class C, Class R2 and Class R4 pursuant to Rule 12b-1 under the 1940 Act, to pay the Distributor for services provided as the distributor of shares of the fund. In addition, under a service plan for Class R2 and Class R4, the fund pays for certain other services. The fund may pay up to the following contractual rates of distribution and service fees under these arrangements, expressed as an annual percentage of average daily net assets for each class of the fund's shares.
| Class | Rule 12b-1 fee | Service fees | Class | Rule 12b-1 fee | Service fees | |
| Class A | 0.30% | — | Class R2 | 0.25% | 0.25% | |
| Class C | 1.00% | — | Class R4 | 0.25% | 0.10% |
Currently only 0.25% is charged to Class A shares for Rule 12b-1 fees.
The fund's Distributor has contractually agreed to waive 0.10% of Rule12b-1 fees for Class R4 shares. The current waiver agreement expires on June 30, 2017, unless renewed by mutual agreement of the fund and the Distributor based upon a determination that this is appropriate under the circumstances at the time. This contractual waiver amounted to $228 for Class R4 shares for the year ended March 31, 2017.
Sales charges. Class A shares are assessed up-front sales charges, which resulted in payments to the Distributor amounting to $169,419 for the year ended March 31, 2017. Of this amount, $27,167 was retained and used for printing prospectuses, advertising, sales literature and other purposes, $118,518 was paid as sales commissions to broker-dealers
and $23,734 was paid as sales commissions to sales personnel of Signator Investors, Inc., a broker-dealer affiliate of the Advisor.
Class A and Class C shares may be subject to contingent deferred sales charges (CDSCs). Certain Class A shares that are acquired through purchases of $1 million or more and are redeemed within one year of purchase are subject to a 1.00% sales charge. Class C shares that are redeemed within one year of purchase are subject to a 1.00% CDSC. CDSCs are applied to the lesser of the current market value at the time of redemption or the original purchase cost of the shares being redeemed. Proceeds from CDSCs are used to compensate the Distributor for providing distribution-related services in connection with the sale of these shares. During the year ended March 31, 2017, CDSCs received by the Distributor amounted to $1,156 and $1,569 for Class A and Class C shares, respectively.
Transfer agent fees. The fund has a transfer agent agreement with John Hancock Signature Services, Inc. (Signature Services), an affiliate of the Advisor. The transfer agent fees paid to Signature Services are determined based on the cost to Signature Services (Signature Services Cost) of providing recordkeeping services. It also includes out-of-pocket expenses, including payments made to third-parties for recordkeeping services provided to their clients who invest in one or more John Hancock funds. In addition, Signature Services Cost may be reduced by certain fees that Signature Services receives in connection with retirement and small accounts. Signature Services Cost is calculated monthly and allocated, as applicable, to five categories of share classes: Retail Share and Institutional Share Classes of Non-Municipal Bond Funds, Class R6 Shares, Retirement Share Classes and Municipal Bond Share Classes. Within each of these categories, the applicable costs are allocated to the affected John Hancock affiliated funds and/or classes, based on the relative average daily net assets.
Class level expenses. Class level expenses for the year ended March 31, 2017 were:
| Class | Distribution and service fees | Transfer agent fees |
| Class A | $804,511 | $394,270 |
| Class C | 156,176 | 19,132 |
| Class I | — | 11,633 |
| Class R2 | 4,166 | 159 |
| Class R4 | 615 | 37 |
| Class R6 | — | 83 |
| Total | $965,468 | $425,314 |
Trustee expenses. The fund compensates each Trustee who is not an employee of the Advisor or its affiliates. The costs of paying Trustee compensation and expenses are allocated to each fund based on its net assets relative to other funds within the John Hancock group of funds complex.
Interfund lending program Pursuant to an Exemptive Order issued by the SEC, the fund, along with certain other funds advised by the Advisor or its affiliates, may participate in an interfund lending program. This program provides an alternative credit facility allowing the funds to borrow from, or lend money to, other participating affiliated funds. At period end, no interfund loans were outstanding. Interest income is included in Interest on the Statement of operations. The fund's activity in this program during the period for which loans were outstanding was as follows:
| Borrower or lender | Weighted average loan balance | Days outstanding | Weighted average interest rate | Interest income |
| Lender | $12,558,324 | 1 | 0.715% | $249 |
Note 5 — Fund share transactions
Transactions in fund shares for the years ended March 31, 2017 and 2016 were as follows:
| Year ended 3-31-17 | Year ended 3-31-16 | |||||||||||||||||||||||||
| Shares | Amount | Shares | Amount | |||||||||||||||||||||||
| Class A shares | ||||||||||||||||||||||||||
| Sold | 749,612 | $11,943,328 | 527,971 | $8,398,745 | ||||||||||||||||||||||
| Issued in reorganization (Note 10) | 21,468,382 | 331,978,464 | — | — | ||||||||||||||||||||||
| Distributions reinvested | 761,147 | 11,919,564 | 60,658 | 959,600 | ||||||||||||||||||||||
| Repurchased | (3,839,049 | ) | (61,321,302 | ) | (480,948 | ) | (7,650,606 | ) | ||||||||||||||||||
| Net increase | 19,140,092 | $294,520,054 | 107,681 | $1,707,739 | ||||||||||||||||||||||
| Class C shares | ||||||||||||||||||||||||||
| Sold | 62,516 | $988,888 | 48,784 | $771,679 | ||||||||||||||||||||||
| Issued in reorganization (Note 10) | 1,055,831 | 16,315,435 | — | — | ||||||||||||||||||||||
| Distributions reinvested | 31,916 | 498,210 | 2,596 | 41,145 | ||||||||||||||||||||||
| Repurchased | (212,680 | ) | (3,370,383 | ) | (44,509 | ) | (699,509 | ) | ||||||||||||||||||
| Net increase | 937,583 | $14,432,150 | 6,871 | $113,315 | ||||||||||||||||||||||
| Class I shares | ||||||||||||||||||||||||||
| Sold | 943,754 | $15,295,486 | 98,491 | $1,567,114 | ||||||||||||||||||||||
| Issued in reorganization (Note 10) | 281,166 | 4,371,431 | — | — | ||||||||||||||||||||||
| Distributions reinvested | 26,643 | 419,092 | 43,509 | 691,359 | ||||||||||||||||||||||
| Repurchased | (893,470 | ) | (14,057,354 | ) | (245,410 | ) | (3,856,027 | ) | ||||||||||||||||||
| Net increase (decrease) | 358,093 | $6,028,655 | (103,410 | ) | ($1,597,554 | ) | ||||||||||||||||||||
| Class R2 shares | ||||||||||||||||||||||||||
| Sold | 10,833 | $173,528 | — | — | ||||||||||||||||||||||
| Issued in reorganization (Note 10) | 58,403 | 909,678 | — | — | ||||||||||||||||||||||
| Distributions reinvested | 1,620 | 25,559 | — | — | ||||||||||||||||||||||
| Repurchased | (17,571 | ) | (285,072 | ) | — | — | ||||||||||||||||||||
| Net increase | 53,285 | $823,693 | — | — | ||||||||||||||||||||||
| Class R4 shares | ||||||||||||||||||||||||||
| Sold | 224 | $3,588 | — | — | ||||||||||||||||||||||
| Issued in reorganization (Note 10) | 8,608 | 134,034 | — | — | ||||||||||||||||||||||
| Distributions reinvested | 123 | 1,938 | — | — | ||||||||||||||||||||||
| Repurchased | (88 | ) | (1,395 | ) | — | — | ||||||||||||||||||||
| Net increase | 8,867 | $138,165 | — | — | ||||||||||||||||||||||
| Class R6 shares | ||||||||||||||||||||||||||
| Sold | 47,217 | $771,958 | — | — | ||||||||||||||||||||||
| Issued in reorganization (Note 10) | 362,123 | 5,636,589 | — | — | ||||||||||||||||||||||
| Distributions reinvested | 1,300 | 20,472 | — | — | ||||||||||||||||||||||
| Repurchased | (359,657 | ) | (5,600,153 | ) | — | — | ||||||||||||||||||||
| Net increase | 50,983 | $828,866 | — | — | ||||||||||||||||||||||
| Class NAV shares | ||||||||||||||||||||||||||
| Sold | 1,762,330 | $28,246,290 | 345,929 | $5,468,712 | ||||||||||||||||||||||
| Distributions reinvested | 4,095,668 | 64,465,820 | 6,611,043 | 105,115,593 | ||||||||||||||||||||||
| Repurchased | (20,225,859 | ) | (326,504,369 | ) | (24,558,115 | ) | (399,609,533 | ) | ||||||||||||||||||
| Net decrease | (14,367,861 | ) | ($233,792,259 | ) | (17,601,143 | ) | ($289,025,228 | ) | ||||||||||||||||||
| Year ended 3-31-17 | Year ended 3-31-16 | |||||||||||||||||||||||||
| Shares | Amount | Shares | Amount | |||||||||||||||||||||||
| Total net increase (decrease) | 6,181,042 | $82,979,324 | (17,590,001 | ) | ($288,801,728 | ) | ||||||||||||||||||||
Affiliates of the fund owned 29%, 78%, 11% and 100% of shares of the fund of Class R2, Class R4, Class R6 and Class NAV, respectively, on March 31, 2017. Such concentration of shareholders' capital could have a material effect on the fund if such shareholders redeem from the fund.
Note 6 — Purchase and sale of securities
Purchases and sales of securities, other than short-term investments, amounted to $1,807,452,944 and $2,136,646,459, respectively, for the year ended March 31, 2017.
Note 7 — Industry or sector risk
The fund may invest a large percentage of its assets in one or more particular industries or sectors of the economy. If a large percentage of the fund's assets are economically tied to a single or small number of industries or sectors of the economy, the fund will be less diversified than a more broadly diversified fund, and it may cause the fund to underperform if that industry or sector underperforms. In addition, focusing on a particular industry or sector may make the fund's NAV more volatile. Further, a fund that invests in particular industries or sectors is particularly susceptible to the impact of market, economic, regulatory and other factors affecting those industries or sectors.
Note 8 — Investment by affiliated funds
Certain investors in the fund are affiliated funds that are managed by the Advisor and its affiliates. The affiliated funds do not invest in the fund for the purpose of exercising management or control; however, this investment may represent a significant portion of the fund's net assets. At March 31, 2017, funds within the John Hancock group of funds complex held 80.8% of the fund's net assets. The following affiliated funds owned 5% or more of the fund's net assets:
| Fund | Affiliated concentration |
| John Hancock Funds II Multimanager Lifestyle Growth Portfolio | 20.1% |
| John Hancock Funds II Multimanager Lifestyle Balanced Portfolio | 15.1% |
| John Hancock Variable Insurance Trust Lifestyle Growth MVP | 14.4% |
| John Hancock Variable Insurance Trust Lifestyle Balanced MVP | 9.6% |
| John Hancock Funds II Multimanager Lifestyle Aggressive Portfolio | 8.0% |
Note 9 — Direct placement securities
The fund may hold private placement securities which are restricted as to resale and the fund has limited rights to registration under the Securities Act of 1933. The following table summarizes the direct placement securities held at March 31, 2017.
| Issuer, description | Original acquisition date* | Acquisition cost | Beginning share amount | Ending share amount | Value as a percentage of fund's net assets | Value as of 3-31-17 |
| SourceHOV | 10-31-14 | $4,726,919 | 510 | 510 | 0.04% | $816,000 |
*Original acquisition date represents date security was acquired by John Hancock Select Growth Fund. On April 22, 2016, the security was acquired at value in connection with acquisition of John Hancock Select Growth Fund. See Note 10.
Note 10 — Reorganization
On March 30, 2016, the shareholders of John Hancock Select Growth Fund (the Acquired Portfolio) voted to approve an Agreement and Plan of Reorganization (the Agreement) which provided for an exchange of shares of the fund (the Acquiring Portfolio) with a value equal to the net assets transferred.
The Agreement provided for (a) the acquisition of all the assets, subject to all of the liabilities, of the Acquired Portfolio in exchange for shares of the Acquiring Portfolio with a value equal to the net assets transferred; (b) the liquidation of the Acquired Portfolio; and (c) the distribution to Acquired Portfolio's shareholders of the Acquiring Portfolio's shares. The reorganization was intended to consolidate the Acquired Portfolio with a portfolio with similar objectives and achieve economies of scale. As a result of the reorganization, the Acquiring Portfolio is the legal and accounting survivor.
Based on the opinion of tax counsel, the reorganization qualified as a tax-free reorganization for federal income tax purposes with no gain or loss recognized by the Acquired Portfolio or its shareholders. Thus, the investments were transferred to the Acquiring Portfolio at the Acquired Portfolio's identified cost. All distributable amounts of net income and realized gains from the Acquired Portfolio were distributed prior to the reorganization. In addition, the expenses of the reorganization were borne by the Acquired Portfolio. The effective time of the reorganization occurred immediately after the close of regularly scheduled trading on the New York Stock Exchange (NYSE) on April 22, 2016. The following outlines the reorganization:
| Acquiring portfolio | Acquired portfolio | Net asset value of the acquired portfolio | Appreciation of the acquired portfolio investment | Shares redeemed by the acquired portfolio | Shares issued by the acquiring portfolio | Acquiring portfolio net assets prior to combination | Acquiring portfolio total net assets after combination |
| Strategic Growth Fund | Select Growth Fund | $359,345,631 | $15,546,164 | 18,553,593 | 23,234,512 | $1,692,096,430 | $2,051,442,061 |
Because the combined portfolio has been managed as a single integrated portfolio since the reorganization was completed, it is not practicable to separate the amounts of net investment income and gains attributable to the Acquired Portfolio that have been included in the Acquiring Portfolio's Statement of operations at March 31, 2017. See Note 5 for capital shares issued in connection with the above referenced reorganization.
Note 11 — New rule issuance
In October 2016, the SEC issued Final Rule Release No.33-10231, Investment Company Reporting Modernization (the Release). The Release calls for the adoption of new rules and forms as well as amendments to its rules and forms to modernize the reporting and disclosure of information by registered investment companies. The SEC is adopting amendments to Regulation S-X, which will require standardized, enhanced disclosure about derivatives in investment company financial statements, as well as other amendments. The updates to Regulation S-X are effective August 1, 2017 and may result in additional disclosure relating to the presentation of derivatives and certain other financial instruments. These updates will have no impact on the fund's net assets or results of operations.
Report of Independent Registered Public Accounting Firm
To the Board of Trustees of John Hancock Funds III and Shareholders of John Hancock Strategic Growth Fund:
In our opinion, the accompanying statement of assets and liabilities, including the fund's investments, and the related statements of operations and of changes in net assets and the financial highlights present fairly, in all material respects, the financial position of the John Hancock Strategic Growth Fund (the "Fund") as of March 31, 2017, the results of its operations for the year then ended, the changes in its net assets for each of the two years in the period then ended and the financial highlights for each of the periods presented, in conformity with accounting principles generally accepted in the United States of America. These financial statements and financial highlights (hereafter referred to as "financial statements") are the responsibility of the Fund's management. Our responsibility is to express an opinion on these financial statements based on our audits. We conducted our audits of these financial statements in accordance with the standards of the Public Company Accounting Oversight Board (United States). Those standards require that we plan and perform the audit to obtain reasonable assurance about whether the financial statements are free of material misstatement. An audit includes examining, on a test basis, evidence supporting the amounts and disclosures in the financial statements, assessing the accounting principles used and significant estimates made by management, and evaluating the overall financial statement presentation. We believe that our audits, which included confirmation of securities as of March 31, 2017 by correspondence with the custodian, brokers, and transfer agent, and the application of alternative auditing procedures where securities purchased confirmations had not been received, provide a reasonable basis for our opinion.
PricewaterhouseCoopers LLP
Boston, Massachusetts
May 16, 2017
Unaudited
For federal income tax purposes, the following information is furnished with respect to the distributions of the fund, if any, paid during its taxable year ended March 31, 2017.
The fund reports the maximum amount allowable of its net taxable income as eligible for the corporate dividends-received deduction.
The fund reports the maximum amount allowable of its net taxable income as qualified dividend income as provided in the Jobs and Growth Tax Relief Reconciliation Act of 2003.
The fund paid $61,625,762 in capital gain dividends.
Eligible shareholders will be mailed a 2017 Form 1099-DIV in early 2018. This will reflect the tax character of all distributions paid in calendar year 2017.
Please consult a tax advisor regarding the tax consequences of your investment in the fund.
This chart provides information about the Trustees and Officers who oversee your John Hancock fund. Officers elected by the Trustees manage the day-to-day operations of the fund and execute policies formulated by the Trustees.
Independent Trustees
| Name, year of birth Position(s) held with Trust Principal occupation(s) and other directorships during past 5 years | Trustee of the Trust since1 | Number of John Hancock funds overseen by Trustee |
| Hassell H. McClellan, Born: 1945 | 2012 | 228 |
| Trustee and Chairperson of the Board Director/Trustee, Virtus Funds (since 2008); Director, The Barnes Group (since 2010); Associate Professor, The Wallace E. Carroll School of Management, Boston College (retired 2013). Trustee (since 2014) and Chairperson of the Board (since 2017), John Hancock Collateral Trust; Trustee (since 2015) and Chairperson of the Board (since 2017), John Hancock Exchange-Traded Fund Trust; Trustee (since 2012) and Chairperson of the Board (since 2017), John Hancock retail funds3; Trustee (2005-2006 and since 2012) and Chairperson of the Board (since 2017), John Hancock Funds III; Trustee (since 2005) and Chairperson of the Board (since 2017), John Hancock Variable Insurance Trust and John Hancock Funds II. | ||
| Charles L. Bardelis,2 Born: 1941 | 2012 | 228 |
| Trustee Director, Island Commuter Corp. (marine transport). Trustee, John Hancock Collateral Trust (since 2014), Trustee, John Hancock Exchange-Traded Fund Trust (since 2015); Trustee, John Hancock retail funds3 (since 2012); Trustee, John Hancock Funds III (2005-2006 and since 2012); Trustee, John Hancock Variable Insurance Trust (since 1988); Trustee, John Hancock Funds II (since 2005). | ||
| Peter S. Burgess,2 Born: 1942 | 2012 | 228 |
| Trustee Consultant (financial, accounting, and auditing matters) (since 1999); Certified Public Accountant; Partner, Arthur Andersen (independent public accounting firm) (prior to 1999); Director, Lincoln Educational Services Corporation (since 2004); Director, Symetra Financial Corporation (2010-2016); Director, PMA Capital Corporation (2004-2010). Trustee, John Hancock Collateral Trust (since 2014); Trustee, John Hancock Exchange-Traded Fund Trust (since 2015); Trustee, John Hancock retail funds3 (since 2012); Trustee, John Hancock Funds III (2005-2006 and since 2012); Trustee, John Hancock Variable Insurance Trust and John Hancock Funds II (since 2005). | ||
| William H. Cunningham, Born: 1944 | 2006 | 228 |
| Trustee Professor, University of Texas, Austin, Texas (since 1971); former Chancellor, University of Texas System and former President of the University of Texas, Austin, Texas; Chairman (since 2009) and Director (since 2006), Lincoln National Corporation (insurance); Director, Southwest Airlines (since 2000); former Director, LIN Television (2009-2014). Trustee, John Hancock retail funds3 (since 1986); Trustee, John Hancock Variable Insurance Trust (since 2012); Trustee, John Hancock Funds II (2005-2006 and since 2012); Trustee, John Hancock Collateral Trust (since 2014); Trustee, John Hancock Exchange-Traded Fund Trust (since 2015). | ||
| Grace K. Fey, Born: 1946 | 2012 | 228 |
| Trustee Chief Executive Officer, Grace Fey Advisors (since 2007); Director and Executive Vice President, Frontier Capital Management Company (1988-2007); Director, Fiduciary Trust (since 2009). Trustee, John Hancock Collateral Trust (since 2014); Trustee, John Hancock Exchange-Traded Fund Trust (since 2015); Trustee, John Hancock retail funds3 (since 2012); Trustee, John Hancock Variable Insurance Trust and John Hancock Funds II (since 2008). | ||
Independent Trustees (continued)
| Name, year of birth Position(s) held with Trust Principal occupation(s) and other directorships during past 5 years | Trustee of the Trust since1 | Number of John Hancock funds overseen by Trustee |
| Theron S. Hoffman,2 Born: 1947 | 2012 | 228 |
| Trustee Chief Executive Officer, T. Hoffman Associates, LLC (consulting firm) (since 2003); Director, The Todd Organization (consulting firm) (2003-2010); President, Westport Resources Management (investment management consulting firm) (2006-2008); Senior Managing Director, Partner, and Operating Head, Putnam Investments (2000-2003); Executive Vice President, The Thomson Corp. (financial and legal information publishing) (1997-2000). Trustee, John Hancock Collateral Trust (since 2014); Trustee, John Hancock Exchange-Traded Fund Trust (since 2015); Trustee, John Hancock retail funds3 (since 2012); Trustee, John Hancock Variable Insurance Trust and John Hancock Funds II (since 2008). | ||
| Deborah C. Jackson, Born: 1952 | 2008 | 228 |
| Trustee President, Cambridge College, Cambridge, Massachusetts (since 2011); Board of Directors, National Association of Corporate Directors/New England (since 2015); Board of Directors, Association of Independent Colleges and Universities of Massachusetts, (since 2014); Chief Executive Officer, American Red Cross of Massachusetts Bay (2002-2011); Board of Directors of Eastern Bank Corporation (since 2001); Board of Directors of Eastern Bank Charitable Foundation (since 2001); Board of Directors of American Student Assistance Corporation (1996-2009); Board of Directors of Boston Stock Exchange (2002-2008); Board of Directors of Harvard Pilgrim Healthcare (health benefits company) (2007-2011). Trustee, John Hancock retail funds3 (since 2008); Trustee, John Hancock Variable Insurance Trust and John Hancock Funds II (since 2012); Trustee, John Hancock Collateral Trust (since 2014); and Trustee, John Hancock Exchange-Traded Fund Trust (since 2015). | ||
| James M. Oates, Born: 1946 | 2012 | 228 |
Trustee | ||
| Steven R. Pruchansky, Born: 1944 | 2006 | 228 |
| Trustee and Vice Chairperson of the Board Chairman and Chief Executive Officer, Greenscapes of Southwest Florida, Inc. (since 2000); Director and President, Greenscapes of Southwest Florida, Inc. (until 2000); Member, Board of Advisors, First American Bank (until 2010); Managing Director, Jon James, LLC (real estate) (since 2000); Partner, Right Funding, LLC (since 2014); Director, First Signature Bank & Trust Company (until 1991); Director, Mast Realty Trust (until 1994); President, Maxwell Building Corp. (until 1991). Trustee (since 1992) and Chairperson of the Board (2011-2012), John Hancock retail funds3; Trustee and Vice Chairperson of the Board, John Hancock retail funds3 John Hancock Variable Insurance Trust, and John Hancock Funds II (since 2012); Trustee and Vice Chairperson of the Board, John Hancock Collateral Trust (since 2014); Trustee and Vice Chairperson of the Board, John Hancock Exchange-Traded Fund Trust (since 2015). | ||
Independent Trustees (continued)
| Name, year of birth Position(s) held with Trust Principal occupation(s) and other directorships during past 5 years | Trustee of the Trust since1 | Number of John Hancock funds overseen by Trustee |
| Gregory A. Russo, Born: 1949 | 2008 | 228 |
| Trustee Director and Audit Committee Chairman (since 2012), and Member, Audit Committee and Finance Committee (since 2011), NCH Healthcare System, Inc. (holding company for multi-entity healthcare system); Director and Member (since 2012) and Finance Committee Chairman (since 2014), The Moorings, Inc. (nonprofit continuing care community); Vice Chairman, Risk & Regulatory Matters, KPMG LLP (KPMG) (2002-2006); Vice Chairman, Industrial Markets, KPMG (1998-2002); Chairman and Treasurer, Westchester County, New York, Chamber of Commerce (1986-1992); Director, Treasurer, and Chairman of Audit and Finance Committees, Putnam Hospital Center (1989-1995); Director and Chairman of Fundraising Campaign, United Way of Westchester and Putnam Counties, New York (1990-1995). Trustee, John Hancock retail funds3 (since 2008); Trustee, John Hancock Variable Insurance Trust and John Hancock Funds II (since 2012); Trustee, John Hancock Collateral Trust (since 2014); Trustee, John Hancock Exchange-Traded Fund Trust (since 2015). | ||
Non-Independent Trustees4
| Name, year of birth Position(s) held with Trust Principal occupation(s) and other directorships during past 5 years | Trustee of the Trust since1 | Number of John Hancock funds overseen by Trustee |
| James R. Boyle, Born: 1959 | 2015 | 228 |
| Non-Independent Trustee Chairman and Chief Executive Officer, Zillion Group, Inc. (formerly HealthFleet, Inc.) (healthcare) (since 2014); Executive Vice President and Chief Executive Officer, U.S. Life Insurance Division of Genworth Financial, Inc. (insurance) (January 2014-July 2014); Senior Executive Vice President, Manulife Financial Corporation, President and Chief Executive Officer, John Hancock (1999-2012); Chairman and Director, John Hancock Advisers, LLC, John Hancock Funds, LLC, and John Hancock Investment Management Services, LLC (2005-2010). Trustee, John Hancock Collateral Trust and John Hancock Exchange-Traded Fund Trust (since 2015); Trustee, John Hancock retail funds3 (2005-2010; 2012-2014 and since 2015); Trustee, John Hancock Variable Insurance Trust and John Hancock Funds II (2005-2014 and since 2015). | ||
| Craig Bromley, Born: 1966 | 2012 | 228 |
| Non-Independent Trustee President, John Hancock Financial Service (since 2012); Senior Executive Vice President and General Manager, U.S. Division, Manulife Financial Corporation (since 2012); President and Chief Executive Officer, Manulife Insurance Company (Manulife Japan) (2005-2012, including prior positions). Trustee, John Hancock retail funds,3 John Hancock Variable Insurance Trust, and John Hancock Funds II (since 2012); Trustee, John Hancock Collateral Trust (since 2014); Trustee, John Hancock Exchange-Traded Fund Trust (since 2015). | ||
| Warren A. Thomson, Born: 1955 | 2012 | 228 |
| Non-Independent Trustee Senior Executive Vice President and Chief Investment Officer, Manulife Financial Corporation and The Manufacturers Life Insurance Company (since 2009); Chairman, Manulife Asset Management (since 2001, including prior positions); Director and Chairman, Manulife Asset Management Limited (since 2006); Director and Chairman, Hancock Natural Resources Group, Inc. (since 2013). Trustee, John Hancock retail funds,3 John Hancock Variable Insurance Trust, and John Hancock Funds II (since 2012); Trustee, John Hancock Collateral Trust (since 2014); Trustee, John Hancock Exchange-Traded Fund Trust (since 2015). | ||
Principal officers who are not Trustees
| Name, year of birth Position(s) held with Trust Principal occupation(s) during past 5 years | Officer of the Trust since |
| Andrew G. Arnott, Born: 1971 | 2009 |
| President Senior Vice President, John Hancock Financial Services (since 2009); Director and Executive Vice President, John Hancock Advisers, LLC (since 2005, including prior positions); Director and Executive Vice President, John Hancock Investment Management Services, LLC (since 2006, including prior positions); President, John Hancock Funds, LLC (since 2004, including prior positions); President, John Hancock retail funds,3 John Hancock Variable Insurance Trust, and John Hancock Funds II (since 2007, including prior positions); President, John Hancock Collateral Trust and John Hancock Exchange-Traded Fund Trust (since 2014). | |
| John J. Danello, Born: 1955 | 2014 |
| Senior Vice President, Secretary, and Chief Legal Officer Vice President and Chief Counsel, John Hancock Wealth Management (since 2005); Senior Vice President (since 2007) and Chief Legal Counsel (2007-2010), John Hancock Funds, LLC and The Berkeley Financial Group, LLC; Senior Vice President (since 2006, including prior positions) and Chief Legal Officer and Secretary (since 2014), John Hancock retail funds,3 John Hancock Funds II and John Hancock Variable Insurance Trust; Senior Vice President, Secretary and Chief Legal Officer, John Hancock Collateral Trust and John Hancock Exchange-Traded Fund Trust (since 2014); Vice President, John Hancock Life & Health Insurance Company (since 2009); Vice President, John Hancock Life Insurance Company (USA) and John Hancock Life Insurance Company of New York (since 2010); and Senior Vice President, Secretary and Chief Legal Counsel (2007-2014, including prior positions) of John Hancock Advisers, LLC and John Hancock Investment Management Services, LLC. | |
| Francis V. Knox, Jr., Born: 1947 | 2006 |
| Chief Compliance Officer Vice President, John Hancock Financial Services (since 2005); Chief Compliance Officer, John Hancock retail funds,3 John Hancock Variable Insurance Trust, John Hancock Funds II, John Hancock Advisers, LLC, and John Hancock Investment Management Services, LLC (since 2005); Chief Compliance Officer, John Hancock Collateral Trust and John Hancock Exchange-Traded Fund Trust (since 2014). | |
| Charles A. Rizzo, Born: 1957 | 2007 |
| Chief Financial Officer Vice President, John Hancock Financial Services (since 2008); Senior Vice President, John Hancock Advisers, LLC and John Hancock Investment Management Services, LLC (since 2008); Chief Financial Officer, John Hancock retail funds,3 John Hancock Variable Insurance Trust and John Hancock Funds II (since 2007); Chief Financial Officer, John Hancock Collateral Trust and John Hancock Exchange-Traded Fund Trust (since 2014). | |
| Salvatore Schiavone, Born: 1965 | 2010 |
| Treasurer Assistant Vice President, John Hancock Financial Services (since 2007); Vice President, John Hancock Advisers, LLC and John Hancock Investment Management Services, LLC (since 2007); Treasurer, John Hancock retail funds3 (since 2007, including prior positions); Treasurer, John Hancock Variable Insurance Trust and John Hancock Funds II (2007-2009 and since 2010, including prior positions); Treasurer, John Hancock Collateral Trust and John Hancock Exchange-Traded Fund Trust (since 2014). | |
The business address for all Trustees and Officers is 601 Congress Street, Boston, Massachusetts 02210-2805.
The Statement of Additional Information of the fund includes additional information about members of the Board of Trustees of the Trust and is available without charge, upon request, by calling 800-225-5291.
| 1 | Each Trustee holds office until his or her successor is elected and qualified, or until the Trustee's death, retirement, resignation, or removal. Mr. Boyle has served as Trustee at various times prior to the date listed in the table. |
| 2 | Member of the Audit Committee. |
| 3 | "John Hancock retail funds" comprises John Hancock Funds III and 40 other John Hancock funds consisting of 30 series of other John Hancock trusts and 10 closed-end funds. |
| 4 | The Trustee is a Non-Independent Trustee due to current or former positions with the Advisor and certain affiliates. |
Trustees Hassell H. McClellan, Chairperson# Officers Andrew G. Arnott John J. Danello Francis V. Knox, Jr. Charles A. Rizzo Salvatore Schiavone | Investment advisor John Hancock Advisers, LLC Subadvisor John Hancock Asset Management a division of Manulife Asset Management (US) LLC Principal distributor John Hancock Funds, LLC Custodian State Street Bank and Trust Company Transfer agent John Hancock Signature Services, Inc. Legal counsel K&L Gates LLP Independent registered public accounting firm PricewaterhouseCoopers LLP |
*Member of the Audit Committee
†Non-Independent Trustee
#Effective 1-1-17
The fund's proxy voting policies and procedures, as well as the fund proxy voting record for the most recent twelve-month period ended June 30, are available free of charge on the Securities and Exchange Commission (SEC) website at sec.gov or on our website.
The fund's complete list of portfolio holdings, for the first and third fiscal quarters, is filed with the SEC on Form N-Q. The fund's Form N-Q is available on our website and the SEC's website, sec.gov, and can be reviewed and copied (for a fee) at the SEC's Public Reference Room in Washington, DC. Call 800-SEC-0330 to receive information on the operation of the SEC's Public Reference Room.
We make this information on your fund, as well as monthly portfolio holdings, and other fund details available on our website at jhinvestments.com or by calling 800-225-5291.
| You can also contact us: | |||
| 800-225-5291 jhinvestments.com | Regular mail: John Hancock Signature Services, Inc. | Express mail: John Hancock Signature Services, Inc. | |
John Hancock family of funds
DOMESTIC EQUITY FUNDS Balanced Blue Chip Growth Classic Value Disciplined Value Disciplined Value Mid Cap Equity Income Fundamental All Cap Core Fundamental Large Cap Core Fundamental Large Cap Value New Opportunities Small Cap Value Small Company Strategic Growth U.S. Global Leaders Growth U.S. Growth Value Equity GLOBAL AND INTERNATIONAL EQUITY FUNDS Disciplined Value International Emerging Markets Emerging Markets Equity Fundamental Global Franchise Global Equity Global Shareholder Yield Greater China Opportunities International Growth International Small Company International Value Equity | INCOME FUNDS Bond California Tax-Free Income Emerging Markets Debt Floating Rate Income Global Income Government Income High Yield High Yield Municipal Bond Income Investment Grade Bond Money Market Short Duration Credit Opportunities Spectrum Income Strategic Income Opportunities Tax-Free Bond ALTERNATIVE AND SPECIALTY FUNDS Absolute Return Currency Alternative Asset Allocation Enduring Assets Financial Industries Global Absolute Return Strategies Global Conservative Absolute Return Global Focused Strategies Natural Resources Redwood Regional Bank Seaport Technical Opportunities |
A fund's investment objectives, risks, charges, and expenses should be considered carefully before investing. The prospectus contains this and other important information about the fund. To obtain a prospectus, contact your financial professional, call John Hancock Investments at 800-225-5291, or visit our website at jhinvestments.com. Please read the prospectus carefully before investing or sending money.
ASSET ALLOCATION Income Allocation Fund Multi-Index Lifetime Portfolios Multi-Index Preservation Portfolios Multimanager Lifestyle Portfolios Multimanager Lifetime Portfolios EXCHANGE-TRADED FUNDS John Hancock Multifactor Consumer Discretionary ETF John Hancock Multifactor Consumer Staples ETF John Hancock Multifactor Developed International ETF John Hancock Multifactor Energy ETF John Hancock Multifactor Financials ETF John Hancock Multifactor Healthcare ETF John Hancock Multifactor Industrials ETF John Hancock Multifactor Large Cap ETF John Hancock Multifactor Materials ETF John Hancock Multifactor Mid Cap ETF John Hancock Multifactor Technology ETF John Hancock Multifactor Utilities ETF | ENVIRONMENTAL, SOCIAL, AND GOVERNANCE FUNDS ESG All Cap Core ESG Core Bond ESG International Equity ESG Large Cap Core CLOSED-END FUNDS Financial Opportunities Hedged Equity & Income Income Securities Trust Investors Trust Preferred Income Preferred Income II Preferred Income III Premium Dividend Tax-Advantaged Dividend Income Tax-Advantaged Global Shareholder Yield |
John Hancock Multifactor ETF shares are bought and sold at market price (not NAV), and are not individually redeemed
from the fund. Brokerage commissions will reduce returns.
John Hancock ETFs are distributed by Foreside Fund Services, LLC, and are subadvised by Dimensional Fund Advisors LP.
Foreside is not affiliated with John Hancock Funds, LLC or Dimensional Fund Advisors LP.
Dimensional Fund Advisors LP receives compensation from John Hancock in connection with licensing rights to the
John Hancock Dimensional indexes. Dimensional Fund Advisors LP does not sponsor, endorse, or sell, and makes no
representation as to the advisability of investing in, John Hancock Multifactor ETFs.
John Hancock Investments
A trusted brand
John Hancock Investments is a premier asset manager representing one of
America's most trusted brands, with a heritage of financial stewardship dating
back to 1862. Helping our shareholders pursue their financial goals is at the
core of everything we do. It's why we support the role of professional financial
advice and operate with the highest standards of conduct and integrity.
A better way to invest
We serve investors globally through a unique multimanager approach:
We search the world to find proven portfolio teams with specialized
expertise for every strategy we offer, then we apply robust investment
oversight to ensure they continue to meet our uncompromising standards
and serve the best interests of our shareholders.
Results for investors
Our unique approach to asset management enables us to provide a diverse set
of investments backed by some of the world's best managers, along with strong
risk-adjusted returns across asset classes.
| | John Hancock Funds, LLC n Member FINRA, SIPC 601 Congress Street n Boston, MA 02210-2805 800-225-5291 n jhinvestments.com | |
| This report is for the information of the shareholders of John Hancock Strategic Growth Fund. It is not authorized for distribution to prospective investors unless preceded or accompanied by a prospectus. | ||
| MF361886 | 393A 3/17 5/17 | |
ITEM 2. CODE OF ETHICS.
As of the end of the year, March 31, 2017, the registrant has adopted a code of ethics, as defined in Item 2 of Form N-CSR, that applies to its Chief Executive Officer, Chief Financial Officer and Treasurer (respectively, the principal executive officer, the principal financial officer and the principal accounting officer, the “Covered Officers”). A copy of the code of ethics is filed as an exhibit to this Form N-CSR.
ITEM 3. AUDIT COMMITTEE FINANCIAL EXPERT.
Peter S. Burgess is the audit committee financial expert and is “independent”, pursuant to general instructions on Form N-CSR Item 3.
ITEM 4. PRINCIPAL ACCOUNTANT FEES AND SERVICES.
(a) Audit Fees
The aggregate fees billed for professional services rendered by the principal accountant for the audits of the registrant’s annual financial statements or services that are normally provided by the accountant in connection with statutory and regulatory filings or engagements amounted to the following for the fiscal years ended March 31, 2017 and 2016. These fees were billed to the registrant and were approved by the registrant’s audit committee.
| Fund | March 31, 2017 | March 31, 2016 | ||||
| Disciplined Value Fund | $ | 36,684 | $ | 35,786 | ||
| Disciplined Value Mid Cap Fund | 47,920 | 45,870 | ||||
| International Value Equity Fund | 53,611 | 52,289 | ||||
| Small Company Fund | 44,491 | 43,367 | ||||
| Strategic Growth Fund | 38,866 | 36,935 | ||||
| Total | $ | 221,572 | $ | 214,247 | ||
(b) Audit-Related Services
Audit-related fees for assurance and related services by the principal accountant are billed to the registrant or to the registrant’s investment adviser (not including any sub-adviser whose role is primarily portfolio management and is subcontracted with or overseen by another investment adviser), and any entity controlling, controlled by, or under common control with the adviser ("control affiliates") that provides ongoing services to the registrant. The nature of the services provided was affiliated service provider internal controls reviews. Amounts billed to the registrant were as follows:
| Fund | March 31, 2017 | March 31, 2016 | ||||
| Disciplined Value Fund | $ | 510 | $ | 525 | ||
| Disciplined Value Mid Cap Fund | 510 | 525 | ||||
| International Value Equity Fund | 510 | 525 | ||||
| Small Company Fund | 510 | 525 | ||||
| Strategic Growth Fund | 510 | 525 | ||||
| Total | $ | 2,550 | $ | 2,625 | ||
Amounts billed to control affiliates were $106,517 and $103,474 for the fiscal years ended March 31, 2017 and 2016, respectively.
(c) Tax Fees
The aggregate fees billed for professional services rendered by the principal accountant for tax compliance, tax advice and tax planning (“tax fees”) amounted to the following for the fiscal years ended March 31, 2017 and 2016. The nature of the services comprising the tax fees was the review of the registrant’s tax returns and tax distribution requirements. These fees were billed to the registrant and were approved by the registrant’s audit committee.
| Fund | March 31, 2017 | March 31, 2016 | ||||
| Disciplined Value Fund | $ | 3,647 | $ | 3,500 | ||
| Disciplined Value Mid Cap Fund | 4,337 | 3,500 | ||||
| International Value Equity Fund | 4,197 | 4,000 | ||||
| Small Company Fund | 3,647 | 3,500 | ||||
| Strategic Growth Fund | 12,097 | 3,500 | ||||
| Total | $ | 27,925 | $ | 18,000 | ||
(d) All Other Fees
The nature of the services comprising all other fees is advisory services provided to the investment manager. Other fees amounted to the following for the fiscal years ended March 31, 2017 and 2016:
| Fund | March 31, 2017 | March 31, 2016 | ||||
| Disciplined Value Fund | $ | 832 | $ | 109 | ||
| Disciplined Value Mid Cap Fund | 832 | 109 | ||||
| International Value Equity Fund | 832 | 1,609 | ||||
| Small Company Fund | 832 | 109 | ||||
| Strategic Growth Fund | 832 | 5,009 | ||||
| Total | $ | 4,160 | $ | 6,945 | ||
(e)(1) Audit Committee Pre-Approval Policies and Procedures:
The trust’s Audit Committee must pre-approve all audit and non-audit services provided by the independent registered public accounting firm (the “Auditor”) relating to the operations or financial reporting of the funds. Prior to the commencement of any audit or non-audit services to a fund, the Audit Committee reviews the services to determine whether they are appropriate and permissible under applicable law.
The trust’s Audit Committee has adopted policies and procedures to, among other purposes, provide a framework for the Committee’s consideration of audit-related and non-audit services by the Auditor. The policies and procedures require that any audit-related and non-audit service provided by the Auditor and any non-audit service provided by the Auditor to a fund service provider that relates directly to the operations and financial reporting of a fund are subject to approval by the Audit Committee before such service is provided. Audit-related services provided by the Auditor that are expected to exceed $25,000 per year/per fund are subject to specific pre-approval by the Audit Committee. Tax services provided by the Auditor that are expected to exceed $30,000 per year/per fund are subject to specific pre-approval by the Audit Committee.
All audit services, as well as the audit-related and non-audit services that are expected to exceed the amounts stated above, must be approved in advance of provision of the service by formal resolution of the Audit Committee. At the regularly scheduled Audit Committee meetings, the Committee reviews a report summarizing the services, including fees, provided by the Auditor.
(e)(2) Services approved pursuant to paragraph (c)(7)(i)(C) of Rule 2-01 of Regulation S-X:
Audit-Related Fees, Tax Fees and All Other Fees:
There were no amounts that were approved by the Audit Committee pursuant to the de minimis exception under Rule 2-01 of Regulation S-X.
(f) According to the registrant’s principal accountant for the fiscal year ended March 31, 2017, the percentage of hours spent on the audit of the registrant's financial statements for the most recent fiscal year that were attributed to work performed by persons who were not full-time, permanent employees of principal accountant was less than 50%.
(g) The aggregate non-audit fees billed by the registrant’s principal accountant for non-audit services rendered to the registrant and rendered to the registrant's control affiliates were $5,908,499 for the fiscal year ended March 31, 2017 and $5,941,933 for the fiscal year ended March 31, 2016.
(h) The audit committee of the registrant has considered the non-audit services provided by the registrant’s principal accountant to the control affiliates and has determined that the services that were not pre-approved are compatible with maintaining the principal accountant’s independence.
ITEM 5. AUDIT COMMITTEE OF LISTED REGISTRANTS.
The registrant has a separately-designated standing audit committee comprised of independent trustees. The members of the audit committee are as follows:
Peter S. Burgess
Charles L. Bardelis
Theron S. Hoffman
ITEM 6. SCHEDULE OF INVESTMENTS.
ITEM 7. DISCLOSURE OF PROXY VOTING POLICIES AND PROCEDURES FOR CLOSED-END MANAGEMENT INVESTMENT COMPANIES.
Not applicable.
ITEM 8. PORTFOLIO MANAGERS OF CLOSED-END MANAGEMENT INVESTMENT COMPANIES.
Not applicable.
ITEM 9. PURCHASES OF EQUITY SECURITIES BY CLOSED-END MANAGEMENT INVESTMENT COMPANY AND AFFILIATED PURCHASERS.
Not applicable.
ITEM 10. SUBMISSION OF MATTERS TO A VOTE OF SECURITY HOLDERS.
The registrant has adopted procedures by which shareholders may recommend nominees to the registrant's Board of Trustees. A copy of the procedures is filed as an exhibit to this Form N-CSR. See attached “John Hancock Funds – Nominating, Governance and Administration Committee Charter”.
ITEM 11. CONTROLS AND PROCEDURES.
(a) Based upon their evaluation of the registrant's disclosure controls and procedures as conducted within 90 days of the filing date of this Form N-CSR, the registrant's principal executive officer and principal financial officer have concluded that those disclosure controls and procedures provide reasonable assurance that the material information required to be disclosed by the registrant on this report is recorded, processed, summarized and reported within the time periods specified in the Securities and Exchange Commission's rules and forms.
(b) There were no changes in the registrant's internal control over financial reporting that occurred during the registrant's most recent fiscal half-year (the registrant's second fiscal half-year in the case of an annual report) that have materially affected, or are reasonably likely to materially affect, the registrant's internal control over financial reporting.
ITEM 12. EXHIBITS.
(a)(1) Code of Ethics for Covered Officers is attached.
(a)(2) Separate certifications for the registrant's principal executive officer and principal financial officer, as required by Section 302 of the Sarbanes-Oxley Act of 2002 and Rule 30a-2(a) under the Investment Company Act of 1940, are attached.
(b)(1) Separate certifications for the registrant's principal executive officer and principal financial officer, as required by 18 U.S.C. Section 1350, as adopted pursuant to Section 906 of the Sarbanes-Oxley Act of 2002, and Rule 30a-2(b) under the Investment Company Act of 1940, are attached. The certifications furnished pursuant to this paragraph are not deemed to be "filed" for purposes of Section 18 of the Securities Exchange Act of 1934, or otherwise subject to the liability of that section. Such certifications are not deemed to be incorporated by reference into any filing under the Securities Act of 1933 or the Securities Exchange Act of 1934, except to the extent that the Registrant specifically incorporates them by reference.
(c)(1) Submission of Matters to a Vote of Security Holders is attached. See attached “John Hancock Funds – Nominating, Governance and Administration Committee Charter”.
(c)(2) Contact person at the registrant.
SIGNATURES
Pursuant to the requirements of the Securities Exchange Act of 1934 and the Investment Company Act of 1940, the registrant has duly caused this report to be signed on its behalf by the undersigned, thereunto duly authorized.
John Hancock Funds III
| By: | /s/ Andrew Arnott | |
| Andrew Arnott President | ||
| Date: | May 12, 2017 | |
Pursuant to the requirements of the Securities Exchange Act of 1934 and the Investment Company Act of 1940, this report has been signed below by the following persons on behalf of the registrant and in the capacities and on the dates indicated.
| By: | /s/ Andrew Arnott | |
| Andrew Arnott President | ||
| Date: | May 12, 2017 | |
| By: | /s/ Charles A. Rizzo | |
| Charles A. Rizzo Chief Financial Officer | ||
| Date: | May 12, 2017 | |