UNITED STATES
SECURITIES AND EXCHANGE COMMISSION
Washington, D.C. 20549
FORM N-CSR
CERTIFIED SHAREHOLDER REPORT OF REGISTERED
MANAGEMENT INVESTMENT COMPANIES
Investment Company Act file number 811-21781
Pioneer Series Trust IV
(Exact name of registrant as specified in charter)
60 State Street, Boston, MA 02109
(Address of principal executive offices) (ZIP code)
Christopher J. Kelley, Amundi Asset Management, Inc.,
60 State Street, Boston, MA 02109
(Name and address of agent for service)
Registrant’s telephone number, including area code: (617) 742-7825
Date of fiscal year end: July 31, 2023
Date of reporting period: August 1, 2022 through July 31, 2023
Form N-CSR is to be used by management investment companies to file reports with the Commission not later than 10 days after the transmission to stockholders of any report that is required to be transmitted to stockholders under Rule 30e-1 under the Investment Company Act of 1940 (17 CFR 270.30e-1). The Commission may use the information provided on Form N-CSR in its regulatory, disclosure review, inspection, and policymaking roles.
A registrant is required to disclose the information specified by Form N-CSR, and the Commission will make this information public. A registrant is not required to respond to the collection of information contained in Form N-CSR unless the Form displays a currently valid Office of Management and Budget (“OMB”) control number. Please direct comments concerning the accuracy of the information collection burden estimate and any suggestions for reducing the burden to Secretary, Securities and Exchange Commission, 450 Fifth Street, NW, Washington, DC 20549-0609. The OMB has reviewed this collection of information under the clearance requirements of 44 U.S.C. ss. 3507.
ITEM 1. REPORTS TO STOCKHOLDERS.
Pioneer Balanced ESG Fund
Annual Report | July 31, 2023
| | | | | |
| A: AOBLX | C: PCBCX | K: PCBKX | R: CBPRX | Y: AYBLX |
visit us: www.amundi.com/us
Pioneer Balanced ESG Fund | Annual Report | 7/31/231
President’s Letter
Dear Shareholders,
On February 13, 2023, Amundi US celebrated the 95th anniversary of Pioneer Fund, the second-oldest mutual fund in the United States. We recognized the anniversary with ringing of the closing bell at the New York Stock Exchange, which seemed fitting for this special milestone.
Pioneer Fund was launched on February 13, 1928 by Phil Carret, one of the earliest proponents of value investing and a leading innovator in the asset management industry. Mr. Carret began investing in the 1920s and founded Pioneer Investments (now Amundi US) in 1928, and was one of the first investors to realize he could uncover value through rigorous, innovative, fundamental research techniques.
Consistent with Mr. Carret’s investment approach and employing many of the same techniques utilized in the 1920s, Amundi US's portfolio managers have adapted Mr. Carret’s philosophy to a new age of “active” investing.
The last few years have seen investors face some unprecedented challenges, from a global pandemic that shuttered much of the world’s economy for months, to geopolitical strife, to rising inflation that has reached levels not seen in decades. Now, more than ever, Amundi US believes active management – that is, making active investment decisions across all of our portfolios – can help mitigate risk during periods of market volatility.
At Amundi US, active management begins with our own fundamental, bottom-up research process. Our team of dedicated research analysts and portfolio managers analyzes each security under consideration, communicating frequently with the management teams of the companies and other entities issuing the securities, and working together to identify those securities that we believe best meet our investment criteria for our family of funds. Our risk management approach begins with each security under consideration, as we strive to develop a deep understanding of the potential opportunity, while considering any potential risk factors.
Today, as shareholders, we have many options. It is our view that active management can serve shareholders well, not only when markets are thriving, but also during periods of market stress. As you consider your long-term investment goals, we encourage you to work with your financial professional to develop an investment plan that paves the way for you to pursue both your short-term and long-term goals.
2Pioneer Balanced ESG Fund | Annual Report | 7/31/23
We greatly appreciate the trust you have placed in us and look forward to continuing to serve you in the future.
Lisa M. Jones
Head of the Americas, President and CEO of US
Amundi Asset Management US, Inc.
September 2023
Any information in this shareowner report regarding market or economic trends or the factors influencing the Fund’s historical or future performance are statements of opinion as of the date of this report. Past performance is no guarantee of future results.
Pioneer Balanced ESG Fund | Annual Report | 7/31/233
Portfolio Management Discussion | 7/31/23
In the following interview, Howard Weiss, Bradley Komenda, and Lawrence Zeno discuss the factors that affected the performance of Pioneer Balanced ESG Fund during the 12-month period ended July 31, 2023. Mr. Weiss, CFA, a Senior Vice President and Director of Multi-Asset Solutions, US, and a portfolio manager at Amundi Asset Management US, Inc. (Amundi US), co-manages the Fund, along with Mr. Komenda, Managing Director, Director of Investment Grade Corporates, and a portfolio manager at Amundi US; Mr.Zeno, a Vice President and a portfolio manager at Amundi US; and Fergal Jackson, a Vice President and a portfolio manager at Amundi US.
| Q | How did the Fund perform during the 12-month period ended July 31, 2023? |
| A | Pioneer Balanced ESG Fund’s Class A shares returned 6.51% at net asset value during the 12-month period ended July 31, 2023, while the Fund’s benchmarks, the Standard & Poor’s 500 Index (the S&P 500) and the Bloomberg US Aggregate Bond Index (the Bloomberg Index), returned 13.02% and -3.37%, respectively. During the same 12-month period, the average return of the 739 mutual funds in Morningstar’s 50% to 70% Equity Allocation Funds category was 5.57%. |
| Q | Could you describe the investment environment during the 12-month period ended July 31, 2023? |
| A | Entering the period in August 2022, the prospect of continued tightening of monetary policy by various central banks, including the US Federal Reserve (Fed), dominated the market’s focus. With data showing that US year-over-year consumer price inflation (CPI) had reached a new high of 9.1% in June 2022, investors’ expectations were that the Fed would continue to aggressively raise its benchmark federal funds rate target range, which it had begun raising earlier in the year. Indeed, the Fed implemented successive increases of 75 basis points (bps) to the federal funds rate target range at both its July 2022 and September 2022 meetings. (A basis point is equal to 1/100th of a percentage point.) The Fed’s actions weighed on investors’ sentiment towards credit-sensitive fixed-income securities (such as corporate bonds) and on riskier assets (such as equities), in general. During that portion of the 12-month period (summer 2022), value stocks led performance within equities as the market |
4Pioneer Balanced ESG Fund | Annual Report | 7/31/23
| | discounted the more future-based (projected) earnings and cash flows of growth stocks to reflect the Fed’s higher interest-rate regime. |
| | As post-June 2022 inflation data showed signs of modest easing, investors began to anticipate a pivot by the Fed to a more dovish stance on monetary policy. The shift in market sentiment led to strong bond and stock market returns in October and November of 2022, despite another 75 bps increase in the federal funds target range by the Fed in early November. However, in December 2022, the market soon turned its attention to the potential recessionary effects of the higher interest-rate regime put in place by the Fed, which led riskier assets to give back some of their gains from earlier in the fourth quarter. The Fed then implemented a more modest increase of 50 bps to the federal funds rate target at its December meeting, leaving the target range at 4.25% – 4.50% at the end of 2022, the highest level since the fall of 2007. |
| | Entering 2023, investors became increasingly optimistic that the Fed and other leading central banks were poised to finally stop raising interest rates. January 2023 saw Treasury yields pull back from their more recent highs on the market’s outlook for a potential easing of monetary policy. That, in turn, boosted performance for bonds in general. In addition, the reopening of China’s economy as the government unwound its “Zero-COVID” policy eased concerns about slowing global economic growth. Against that backdrop, areas of the market that had lagged during the 2022 sell-off, such as growth stocks and corporate credit, outperformed. On February 1, 2023, the Fed increased the federal funds rate target again, but this time by a comparatively moderate 25 bps, bringing the target range to 4.50% – 4.75%. |
| | Soon after, the spring of 2023 saw the failure of multiple US banks and the collapse of European giant Credit Suisse, raising the prospect of a financial crisis. In response, the Fed implemented a new lending program to support bank liquidity, while market participants began to forecast decreases in the federal funds rate target range by the Fed over the second half of the calendar year. At its March 23 meeting, the Fed went forward with another modest 25 bps increase to the federal funds target, bringing the range to 4.75% ‒ 5.00%. The financial markets |
Pioneer Balanced ESG Fund | Annual Report | 7/31/235
| | viewed that increase as an indication that the Fed believed the financial system, overall, remained on solid footing. The Fed would implement another increase to the federal funds target range of 25 bps in early May, bringing the range to 5.00% ‒ 5.25%, before taking a pause at its June meeting. On July 26, however, the Fed increased the federal funds target range by another quarter-point (25 bps), leaving the range at 5.25% ‒ 5.50% as of period-end. |
| | As of July 31, 2023, the 10-year US Treasury yield stood at 3.97%, an increase of 130 bps relative to the 10-year Treasury’s 2.67% yield 12 months earlier. Within equities, growth stocks notably outperformed their value counterparts over the latter part of the 12-month period as economic data remained surprisingly resilient and the Fed appeared to be nearing the end of its rate-hiking cycle. In particular, headlines around the potential commercial applications of generative Artificial Intelligence (AI) drove strong returns for growth-oriented companies perceived as possible beneficiaries of that secular trend. |
| Q | How did you broadly position the Fund’s portfolio during the 12-month period ended July 31, 2023? |
| A | At the start of the period, we had allocated approximately 60% of the Fund’s invested assets to equities and nearly 38% to fixed-income securities. As of July 31, 2023, the Fund’s equity allocation stood at roughly 63% in equities, with roughly 34% of the Fund’s invested assets allocated to fixed-income investments (with the remainder invested in cash/cash equivalents). The portfolio’s strategic target allocations typically have been 62.5% equity/37.5% fixed income. |
| Q | Could you review the Fund’s commitment to environmental, social, and governance (ESG) investing? |
| A | The Fund applies ESG criteria to its investments, and Amundi US integrates ESG factors in our fundamental research and investment selection processes. Under normal circumstances, the Fund invests at least 80% of its net assets (plus the amount of borrowings, if any, for investment purposes) in securities of issuers that Amundi US believes adhere to the Fund’s ESG |
6Pioneer Balanced ESG Fund | Annual Report | 7/31/23
| | criteria. Amundi US believes that ESG-related information helps us gain a more complete understanding of a company and its business. |
| | For purposes of the Fund's 80% investment policy, “ESG criteria” is defined as the exclusion of investments issued by companies significantly involved in certain business activities, including but not limited to the production of alcohol, tobacco products, and certain controversial military weapons (as defined by the Fund's prospectus), and the operation of thermal coal mines and gambling casinos and other gaming businesses. Amundi US also considers pertinent ESG information, including ESG ratings, in seeking to avoid investing in companies perceived to have the most ESG-related risk. |
| Q | What specific investments within the portfolio’s equity allocation had noteworthy effects on the Fund’s benchmark-relative performance during the 12-month period ended July 31, 2023? |
| A | Our equity investment strategy has emphasized portfolio diversification*, and seeking to own shares of companies that we believe feature reasonable valuations, good ESG standings (for sustainable performance), and that have a history of consistent capital allocation methodologies, which often has included the payment of dividends** as well as share buybacks. |
| | Sector allocation results detracted modestly from the equity portfolio’s (and the Fund’s) performance versus the S&P 500 Index for the 12-month period, while stock selection results had an essentially neutral effect on the Fund’s benchmark-relative performance. |
| | Positive contributions to the Fund’s benchmark-relative performance on the equity side were led by stock selection results within the financials and industrials sectors, along with the portfolio’s lack of exposure to utilities stocks, which lagged during the 12-month period. Conversely, stock selection results within the consumer discretionary sector and the Fund’s underweight to information technology stocks versus the S&P 500 weighed most heavily on benchmark-relative returns. |
| * | Diversification does not assure a profit nor protect against loss. |
| ** | Dividends are not guaranteed. |
Pioneer Balanced ESG Fund | Annual Report | 7/31/237
| | With regard to individual equity positions, positive contributions to the Fund’s benchmark-relative performance for the 12-month period were led by the portfolio’s overweight position in pharmaceutical and medical product distributor Cardinal Health, within the health care sector. Within the consumer discretionary sector, a lack of portfolio exposure to Tesla proved additive for the Fund’s relative returns, as the electric vehicle manufacturer has been compelled to lower prices in response to increased competition. Within the information technology sector, the Fund’s out-of-benchmark position in automated test equipment manufacturer National Instruments contributed positively to relative performance, as the company’s stock price rallied in the wake of its receiving a merger offer. |
| | On the downside, the biggest individual detractor from the Fund’s benchmark-relative results for the 12-month period was a lack of exposure to NVIDIA (information technology), as the semiconductor company holds a prominent position as a provider of chips deployed in AI applications, and AI-related stocks rallied strongly over the period. Similarly, a lack of portfolio exposure to Facebook parent Meta, within the communication services sector, weighed on the Fund’s benchmark-relative returns, as the social media giant’s efforts to trim capital expenditures in response to a weak advertising climate were well received by the market. Finally, the Fund’s overweight position versus the S&P 500 in Amazon.com, within the consumer discretionary sector, also detracted from relative returns as the online retailer’s growth has slowed in the post-pandemic economic climate. |
| Q | What investment strategies within the portfolio’s fixed-income allocations had noteworthy effects on the Fund’s benchmark-relative performance during the 12-month period ended July 31, 2023? |
| A | The Fund’s positioning along the yield curve had an essentially neutral effect on performance relative to the Bloomberg Index, as the negative impact from the portfolio’s overall long-duration stance versus the benchmark was offset by the positive effects of being overweight to the long end of the yield curve, which outperformed both the front and belly (middle) parts of the curve. (A yield curve is a line that plots the interest rates, at a set point in time, of bonds having equal credit quality but |
8Pioneer Balanced ESG Fund | Annual Report | 7/31/23
| | differing maturity dates. Duration is a measure of the sensitivity of the price, or the value of principal, of a fixed-income investment to a change in interest rates, expressed as a number of years.) |
| | The Fund’s sector allocation results within the fixed-income portion of the portfolio meaningfully contributed to positive relative performance versus the Bloomberg Index for the 12-month period. Most notably, relative returns benefited from the Fund’s overweight to the debt of issuers within the financials sector, within corporate credit. A portfolio overweight versus the Bloomberg Index to non-agency mortgage-backed securities (MBS) and an underweight to US Treasuries also proved additive for the Fund’s benchmark-relative performance. |
| | On the negative side within fixed income, the Fund’s overweight to commercial MBS (CMBS) was the lone meaningful detractor from benchmark-relative returns from an asset allocation standpoint. Security selection results within CMBS helped offset some of the negative effects of asset allocation, as we avoided investing the Fund in some of the weaker CMBS segments. |
| | The Fund’s overall security selection results were a positive contributor to benchmark-relative performance within fixed income. Along with the contribution from selection results within CMBS, the Fund experienced strong selection results within the financials sector, as our focus on investing in highly regulated, systemically important banks largely insulated the portfolio from the pitfalls resulting from the banking crisis during the spring of 2023. Within the portfolio’s allocation to agency MBS, an overweight versus the Bloomberg Index to higher-coupon mortgage pools modestly supported the Fund’s benchmark-relative results, as agency MBS backed by lower-coupon pools suffered a performance shortfall driven by duration extension during a period featuring rising mortgage rates. |
| Q | Did the Fund have any exposure to derivative securities during the 12-month period ended July 31, 2023? If so, did the use of derivatives have a material effect on performance? |
| A | Yes, we invested the Fund in Treasury futures as part of our duration-management strategy within the fixed-income portion of the portfolio. We believe the use of Treasury futures allows us |
Pioneer Balanced ESG Fund | Annual Report | 7/31/239
| | to express our views on duration and yield-curve positioning in the most efficient manner. The use of Treasury futures, mainly for hedging purposes, had a negligible effect on the Fund’s relative performance during the 12-month period. |
| Q | Did the Fund’s yield, or distributions*** to shareholders, change during the 12-month period ended July 31, 2023? |
| A | Rising Treasury yields over the course of the 12-month period resulted in an increase in the Fund’s distribution rate, while having a negative effect on total returns, due to declining bond prices. |
| Q | What is your investment outlook heading into the Fund’s new fiscal year? |
| A | With elevated inflation proving to be sticky and the Fed committed to bringing inflation down to its 2% long-term target, we believe the federal funds rate target range will remain “higher for longer.” The market now appears to agree with this view, as expectations for the Fed’s first interest-rate cut have been pushed out to May 2024. We believe financial conditions will become more restrictive, and that the likelihood of a recession has increased as banks have tightened lending standards and as the Fed has maintained higher rates, given lingering inflation concerns. Consequently, we expect to maintain a relatively defensive posture in the portfolio as recession risks increase over the remainder of the calendar year, with weak manufacturing activity and higher mortgage rates weighing on the economy. |
| | As is typically the case during recessions, we would expect some credit-oriented bond issuers to face pressures, which could lead to increased ratings downgrades. However, we do not expect a deep recession, such as during the global financial crisis (GFC) of 2008. In our opinion, the economy will likely be on the upswing and the default rate headed lower at some point in 2024. We expect that by 2024 inflation will have fallen closer to the Fed’s targeted 2% area and that Treasury yields will be lower than today’s levels. In that scenario, we expect the default rate to remain lower than what we saw in the wake of the GFC. |
| *** | Distributions are not guaranteed. |
10Pioneer Balanced ESG Fund | Annual Report | 7/31/23
| | In our view, US fixed-income duration exposure remains attractive in both nominal and inflation-indexed terms. As spreads in credit-oriented sectors have narrowed back to early March (pre-bank crisis) levels, we have been selectively reducing corporate, securitized credit and agency MBS exposures. However, the Fund’s fixed-income positioning will actively evolve along with shifts in our outlook and views on relative valuations. (Credit spreads are commonly defined as the differences in yield between Treasuries and other types of fixed-income securities with similar maturities.) |
| | At period-end, within the Fund’s equity portfolio, the largest sector overweights relative to the S&P 500 were to health care and energy. Within the health care sector, the portfolio has been tilted toward holdings of life sciences and biotechnology companies. The largest underweight in the Fund’s equity portfolio versus the S&P 500 as of period-end was to the information technology sector, as it is anticipated that continued tightening of monetary policy by the Fed and other central banks could compress valuations and limit future growth potential for companies in the sector. |
Pioneer Balanced ESG Fund | Annual Report | 7/31/2311
Please refer to the Schedule of Investments on pages 24 - 58 for a full listing of Fund securities.
All investments are subject to risk, including the possible loss of principal. In the past several years, financial markets have experienced increased volatility and heightened uncertainty. The market prices of securities may go up or down, sometimes rapidly or unpredictably, due to general market conditions, such as real or perceived adverse economic, political, or regulatory conditions, recessions, inflation, changes in interest or currency rates, lack of liquidity in the bond markets, the spread of infectious illness or other public health issues, armed conflict including Russia's military invasion of Ukraine, sanctions against Russia, other nations or individuals or companies and possible countermeasures, market disruptions caused by tariffs, trade disputes or other government actions, or adverse investor sentiment. These conditions may continue, recur, worsen or spread.
The Fund generally excludes corporate issuers that do not meet or exceed minimum ESG standards. Excluding specific issuers limits the universe of investments available to the Fund, which may mean forgoing some investment opportunities available to funds without similar ESG standards.
The market price of securities may fluctuate when interest rates change. When interest rates rise, the prices of fixed income securities in the Fund will generally fall. Conversely, when interest rates fall, the prices of fixed income securities in the Fund will generally rise.
Until recently, a commonly used reference rate for floating rate securities was LIBOR (London Interbank Offered Rate). Publication of most LIBOR settings has ceased on a representative basis. The impact of the transition from LIBOR on the Fund's transactions and financial markets generally cannot yet be determined.
Investments in the Fund are subject to possible loss due to the financial failure of issuers of underlying securities and their inability to meet their debt obligations.
Prepayment risk is the chance that an issuer may exercise its right to prepay its security, if falling interest rates prompt the issuer to do so. Forced to reinvest the unanticipated proceeds at lower interest rates, the Fund would experience a decline in income and lose the opportunity for additional price appreciation.
The securities issued by US Government-sponsored entities (e.g., FNMA, Freddie Mac) are neither guaranteed nor issued by the US Government.
The portfolio may invest in mortgage-backed securities, which during times of fluctuating interest rates may increase or decrease more than other fixed income securities. Mortgage-backed securities are also subject to prepayments.
12Pioneer Balanced ESG Fund | Annual Report | 7/31/23
Investments in high-yield or lower rated securities are subject to greater-thanaverage price volatility, illiquidity and possibility of default.
Investing in foreign and/or emerging markets securities involves risks relating to interest rates, currency exchange rates, economic, and political conditions.
The portfolio invests in REIT (real estate investment trust) securities, the value of which can fall for a variety of reasons, such as declines in rental income, fluctuating interest rates, poor property management, environmental liabilities, uninsured damage, increased competition, or changes in real estate tax laws.
For more information on this or any Pioneer fund, please visit amundi.com/usinvestors or call 1-800-622-9876. This material must be preceded or accompanied by the Fund's current prospectus or summary prospectus.
Any information in this shareholder report regarding market or economic trends or the factors influencing the Fund’s historical or future performance are statements of opinion as of the date of this report. Past performance is not a guarantee of future results.
Pioneer Balanced ESG Fund | Annual Report | 7/31/2313
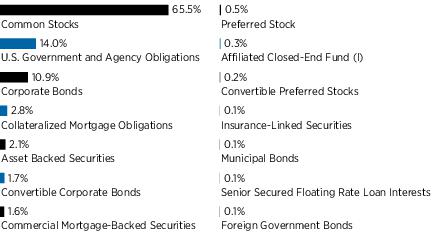
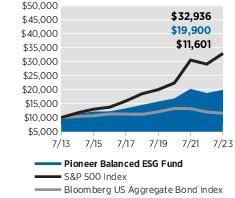
Portfolio Summary | 7/31/23
Portfolio Diversification
(As a percentage of total investments)*
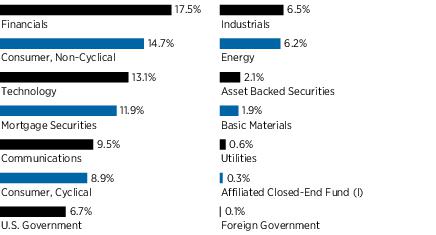
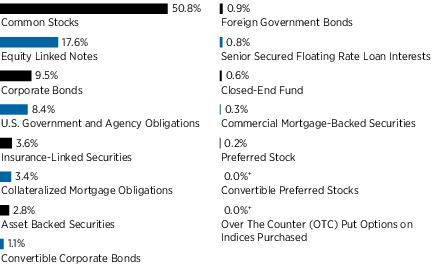
Sector Distribution
(As a percentage of total investments)*
14Pioneer Balanced ESG Fund | Annual Report | 7/31/23
10 Largest Holdings
| (As a percentage of total investments)* |
| 1. | Alphabet, Inc., Class A | 5.06% |
| 2. | Microsoft Corp. | 3.60 |
| 3. | U.S. Treasury Bonds, 3.125%, 5/15/48 | 2.61 |
| 4. | Medtronic Plc | 1.87 |
| 5. | Visa, Inc., Class A | 1.72 |
| 6. | Cisco Systems, Inc. | 1.69 |
| 7. | Advanced Micro Devices, Inc. | 1.68 |
| 8. | Ferguson Plc | 1.51 |
| 9. | Cardinal Health, Inc. | 1.50 |
| 10. | Adobe, Inc. | 1.50 |
| | |
| * | Excludes short-term investments and all derivative contracts except for options purchased. The Fund is actively managed, and current holdings may be different. The holdings listed should not be considered recommendations to buy or sell any securities. |
(l) Pioneer ILS Interval Fund is an affiliated closed-end fund managed by Amundi Asset Management US, Inc. (the “Adviser”).
Pioneer Balanced ESG Fund | Annual Report | 7/31/2315
Prices and Distributions | 7/31/23
Net Asset Value per Share
| Class | 7/31/23 | 7/31/22 |
| A | $ 9.95 | $9.66 |
| C | $ 9.84 | $9.57 |
| K | $ 9.92 | $9.64 |
| R | $ 9.97 | $9.68 |
| Y | $10.04 | $9.74 |
| | | |
Distributions per Share: 8/1/22 - 7/31/23
| Class | Net
Investment
Income | Short-Term
Capital Gains | Long-Term
Capital Gains |
| A | $0.1779 | $— | $0.1317 |
| C | $0.1205 | $— | $0.1317 |
| K | $0.2050 | $— | $0.1317 |
| R | $0.1514 | $— | $0.1317 |
| Y | $0.2040 | $— | $0.1317 |
Index Definitions
The Standard & Poor’s 500 Index is an unmanaged, commonly used measure of the broad U.S. stock market. The Bloomberg US Aggregate Bond Index is an unmanaged measure of the US bond market. Indices are unmanaged and their returns assume reinvestment of dividends and do not reflect any fees or expenses. It is not possible to invest directly in an index.
The indices defined here pertain to the “Value of $10,000 Investment” and “Value of $5 Million Investment” charts on pages 17 - 21 .
16Pioneer Balanced ESG Fund | Annual Report | 7/31/23
| Performance Update | 7/31/23 | Class A Shares |
Investment Returns
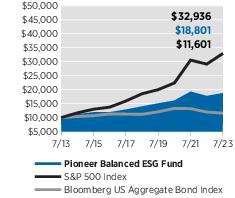
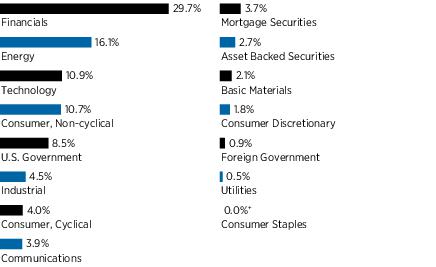
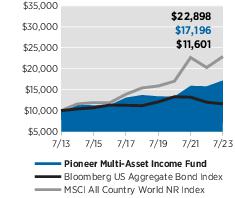
The mountain chart on the right shows the change in value of a $10,000 investment made in Class A shares of Pioneer Balanced ESG Fund at public offering price during the periods shown, compared to that of the Standard & Poor’s 500 Index and the Bloomberg US Aggregate Bond Index.
Average Annual Total Returns
(As of July 31, 2023) |
| Period | Net
Asset
Value
(NAV) | Public
Offering
Price
(POP) | S&P
500
Index | Bloomberg
US
Aggregate
Bond
Index |
| 10 Years | 7.33% | 6.83% | 12.66% | 1.50% |
| 5 Years | 6.82 | 5.85 | 12.20 | 0.75 |
| 1 Year | 6.51 | 1.66 | 13.02 | -3.37 |
Expense Ratio
(Per prospectus dated December 1, 2022) |
| Gross |
| 0.95% |
Value of $10,000 Investment
Call 1-800-225-6292 or visit www.amundi.com/us for the most recent month-end performance results. Current performance may be lower or higher than the performance data quoted.
The performance data quoted represents past performance, which is no guarantee of future results. Investment return and principal value will fluctuate, and shares, when redeemed, may be worth more or less than their original cost.
NAV results represent the percent change in net asset value per share. NAV returns would have been lower had sales charges been reflected. POP returns reflect deduction of the maximum 4.50% sales charge. All results are historical and assume the reinvestment of dividends and capital gains. Other share classes are available for which performance and expenses will differ.
Performance results reflect any applicable expense waivers in effect during the periods shown. Without such waivers Fund performance would be lower. Waivers may not be in effect for all funds. Certain fee waivers are contractual through a specified period. Otherwise, fee waivers can be rescinded at any time. See the prospectus and financial statements for more information.
The performance table and graph do not reflect the deduction of fees and taxes that a shareowner would pay on Fund distributions or the redemption of Fund shares.
Please see the financial highlights for a more current expense ratio.
Pioneer Balanced ESG Fund | Annual Report | 7/31/2317
| Performance Update | 7/31/23 | Class C Shares |
Investment Returns
The mountain chart on the right shows the change in value of a $10,000 investment made in Class C shares of Pioneer Balanced ESG Fund during the periods shown, compared to that of the Standard & Poor’s 500 Index and the Bloomberg US Aggregate Bond Index.
Average Annual Total Returns
(As of July 31, 2023) |
| Period | Net
Asset
Value
(NAV) | Public
Offering
Price
(POP) | S&P
500
Index | Bloomberg
US
Aggregate
Bond
Index |
| 10 Years | 6.52% | 6.52% | 12.66% | 1.50% |
| 5 Years | 6.01 | 6.01 | 12.20 | 0.75 |
| 1 Year | 5.69 | 4.69 | 13.02 | -3.37 |
Expense Ratio
(Per prospectus dated December 1, 2022) |
| Gross |
| 1.69% |
Value of $10,000 Investment
Call 1-800-225-6292 or visit www.amundi.com/us for the most recent month-end performance results. Current performance may be lower or higher than the performance data quoted.
The performance data quoted represents past performance, which is no guarantee of future results. Investment return and principal value will fluctuate, and shares, when redeemed, may be worth more or less than their original cost.
Class C shares held for less than one year are subject to a 1% contingent deferred sales charge (CDSC). “If Held” results represent the percent change in net asset value per share. “If Redeemed” returns reflect deduction of the CDSC for the one-year period, assuming a complete redemption of shares at the last price calculated on the last business day of the period, and no CDSC for the five- and 10-year periods. All results are historical and assume the reinvestment of dividends and capital gains. Other share classes are available for which performance and expenses will differ.
Performance results reflect any applicable expense waivers in effect during the periods shown. Without such waivers Fund performance would be lower. Waivers may not be in effect for all funds. Certain fee waivers are contractual through a specified period. Otherwise, fee waivers can be rescinded at any time. See the prospectus and financial statements for more information.
The performance table and graph do not reflect the deduction of fees and taxes that a shareowner would pay on Fund distributions or the redemption of Fund shares.
Please see the financial highlights for a more current expense ratio.
18Pioneer Balanced ESG Fund | Annual Report | 7/31/23
| Performance Update | 7/31/23 | Class K Shares |
Investment Returns
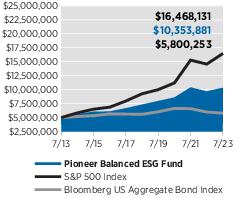
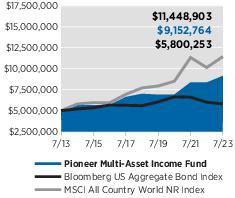
The mountain chart on the right shows the change in value of a $5 million investment made in Class K shares of Pioneer Balanced ESG Fund during the periods shown, compared to that of the Standard & Poor’s 500 Index and the Bloomberg US Aggregate Bond Index.
Average Annual Total Returns
(As of July 31, 2023) |
| Period | Net
Asset
Value
(NAV) | S&P
500
Index | Bloomberg
US
Aggregate
Bond
Index |
| 10 Years | 7.55% | 12.66% | 1.50% |
| 5 Years | 7.12 | 12.20 | 0.75 |
| 1 Year | 6.72 | 13.02 | -3.37 |
Expense Ratio
(Per prospectus dated December 1, 2022) |
| Gross |
| 0.65% |
Value of $5 Million Investment
Call 1-800-225-6292 or visit www.amundi.com/us for the most recent month-end performance results. Current performance may be lower or higher than the performance data quoted.
The performance data quoted represents past performance, which is no guarantee of future results. Investment return and principal value will fluctuate, and shares, when redeemed, may be worth more or less than their original cost.
The performance shown for Class K shares for the period prior to the commencement of operations of Class K shares on December 1, 2015, is the net asset value performance of the Fund’s Class A shares, which has not been restated to reflect any differences in expenses, including Rule 12b-1 fees applicable to Class A shares. Since fees for Class A shares generally are higher than those of Class K shares, the performance of Class K shares prior to their inception on December 1, 2015, would have been higher than the performance shown. For the period beginning December 1, 2015, the actual performance of Class K shares is reflected. Class K shares are not subject to sales charges and are available for limited groups of eligible investors, including institutional investors. All results are historical and assume the reinvestment of dividends and capital gains. Other share classes are available for which performance and expenses will differ.
Performance results reflect any applicable expense waivers in effect during the periods shown. Without such waivers Fund performance would be lower. Waivers may not be in effect for all funds. Certain fee waivers are contractual through a specified period. Otherwise, fee waivers can be rescinded at any time. See the prospectus and financial statements for more information.
The performance table and graph do not reflect the deduction of fees and taxes that a shareowner would pay on Fund distributions or the redemption of Fund shares.
Please see the financial highlights for a more current expense ratio.
Pioneer Balanced ESG Fund | Annual Report | 7/31/2319
| Performance Update | 7/31/23 | Class R Shares |
Investment Returns
The mountain chart on the right shows the change in value of a $10,000 investment made in Class R shares of Pioneer Balanced ESG Fund during the periods shown, compared to that of the Standard & Poor’s 500 Index and the Bloomberg US Aggregate Bond Index.
Average Annual Total Returns
(As of July 31, 2023) |
| Period | Net
Asset
Value
(NAV) | S&P
500
Index | Bloomberg
US
Aggregate
Bond
Index |
| 10 Years | 7.12% | 12.66% | 1.50% |
| 5 Years | 6.52 | 12.20 | 0.75 |
| 1 Year | 6.19 | 13.02 | -3.37 |
Expense Ratio
(Per prospectus dated December 1, 2022) |
| Gross |
| 1.20% |
Value of $10,000 Investment
Call 1-800-225-6292 or visit www.amundi.com/us for the most recent month-end performance results. Current performance may be lower or higher than the performance data quoted.
The performance data quoted represents past performance, which is no guarantee of future results. Investment return and principal value will fluctuate, and shares, when redeemed, may be worth more or less than their original cost.
The performance shown for Class R shares for the period prior to the commencement of operations of Class R shares on July 1, 2015, is the net asset value performance of the Fund’s Class A shares, which has not been restated to reflect any differences in expenses, including Rule 12b-1 fees applicable to Class A shares. Since fees for Class A shares generally are higher than those of Class R shares, the performance of Class R shares prior to their inception would have been higher than the performance shown. For the period beginning July 1, 2015, the actual performance of Class R shares is reflected. Class R shares are not subject to sales charges and are available for limited groups of eligible investors, including institutional investors. All results are historical and assume the reinvestment of dividends and capital gains. Other share classes are available for which performance and expenses will differ.
Performance results reflect any applicable expense waivers in effect during the periods shown. Without such waivers Fund performance would be lower. Waivers may not be in effect for all funds. Certain fee waivers are contractual through a specified period. Otherwise, fee waivers can be rescinded at any time. See the prospectus and financial statements for more information.
The performance table and graph do not reflect the deduction of fees and taxes that a shareowner would pay on Fund distributions or the redemption of Fund shares.
Please see the financial highlights for a more current expense ratio.
20Pioneer Balanced ESG Fund | Annual Report | 7/31/23
| Performance Update | 7/31/23 | Class Y Shares |
Investment Returns
The mountain chart on the right shows the change in value of a $5 million investment made in Class Y shares of Pioneer Balanced ESG Fund during the periods shown, compared to that of the Standard & Poor’s 500 Index and the Bloomberg US Aggregate Bond Index.
Average Annual Total Returns
(As of July 31, 2023) |
| Period | Net
Asset
Value
(NAV) | S&P
500
Index | Bloomberg
US
Aggregate
Bond
Index |
| 10 Years | 7.62% | 12.66% | 1.50% |
| 5 Years | 7.15 | 12.20 | 0.75 |
| 1 Year | 6.85 | 13.02 | -3.37 |
Expense Ratio
(Per prospectus dated December 1, 2022) |
| Gross | Net |
| 0.75% | 0.65% |
Value of $5 Million Investment
Call 1-800-225-6292 or visit www.amundi.com/us for the most recent month-end performance results. Current performance may be lower or higher than the performance data quoted.
The performance data quoted represents past performance, which is no guarantee of future results. Investment return and principal value will fluctuate, and shares, when redeemed, may be worth more or less than their original cost.
Class Y shares are not subject to sales charges and are available for limited groups of eligible investors, including institutional investors. All results are historical and assume the reinvestment of dividends and capital gains. Other share classes are available for which performance and expenses will differ.
Performance results reflect any applicable expense waivers in effect during the periods shown. Without such waivers Fund performance would be lower. Waivers may not be in effect for all funds. Certain fee waivers are contractual through a specified period. Otherwise, fee waivers can be rescinded at any time. See the prospectus and financial statements for more information.
The net expense ratio reflects the contractual expense limitation currently in effect through December 1, 2023 for Class Y shares. There can be no assurance that Amundi US will extend the expense limitation beyond such time. Please see the prospectus and financial statements for more information.
The performance table and graph do not reflect the deduction of fees and taxes that a shareowner would pay on Fund distributions or the redemption of Fund shares.
Please see the financial highlights for more current expense ratios.
Pioneer Balanced ESG Fund | Annual Report | 7/31/2321
Comparing Ongoing Fund Expenses
As a shareowner in the Fund, you incur two types of costs:
| (1) | ongoing costs, including management fees, distribution and/or service (12b-1) fees, and other Fund expenses; and |
| (2) | transaction costs, including sales charges (loads) on purchase payments. |
This example is intended to help you understand your ongoing expenses (in dollars) of investing in the Fund and to compare these costs with the ongoing costs of investing in other mutual funds. The example is based on an investment of $1,000 at the beginning of the Fund’s latest six-month period and held throughout the six months.
Using the Tables
Actual Expenses
The first table below provides information about actual account values and actual expenses. You may use the information in this table, together with the amount you invested, to estimate the expenses that you paid over the period as follows:
| (1) | Divide your account value by $1,000
Example: an $8,600 account value ÷ $1,000 = 8.6 |
| (2) | Multiply the result in (1) above by the corresponding share class’s number in the third row under the heading entitled “Expenses Paid During Period” to estimate the expenses you paid on your account during this period. |
Expenses Paid on a $1,000 Investment in Pioneer Balanced ESG Fund
Based on actual returns from February 1, 2023 through July 31, 2023.
| Share Class | A | C | K | R | Y |
Beginning Account
Value on 2/1/23 | $1,000.00 | $1,000.00 | $1,000.00 | $1,000.00 | $1,000.00 |
Ending Account Value
(after expenses) on 7/31/23 | $1,054.10 | $1,050.20 | $1,055.30 | $1,052.90 | $1,056.90 |
Expenses Paid
During Period* | $4.79 | $8.59 | $3.31 | $6.36 | $3.31 |
| | |
| * | Expenses are equal to the Fund’s annualized expense ratio of 0.94%, 1.69%, 0.65%, 1.25%, and 0.65% for Class A, Class C, Class K, Class R, and Class Y shares, respectively, multiplied by the average account value over the period, multiplied by 181/365 (to reflect the one-half year period). |
22Pioneer Balanced ESG Fund | Annual Report | 7/31/23
Hypothetical Example for Comparison Purposes
The table below provides information about hypothetical account values and hypothetical expenses based on the Fund’s actual expense ratio and an assumed rate of return of 5% per year before expenses, which is not the Fund’s actual return. The hypothetical account values and expenses may not be used to estimate the actual ending account balance or expenses you paid for the period.
You may use this information to compare the ongoing costs of investing in the Fund and other funds. To do so, compare this 5% hypothetical example with the 5% hypothetical examples that appear in the shareholder reports of the other funds.
Please note that the expenses shown in the tables are meant to highlight your ongoing costs only and do not reflect any transaction costs, such as sales charges (loads) that are charged at the time of the transaction. Therefore, the table below is useful in comparing ongoing costs only and will not help you determine the relative total costs of owning different funds. In addition, if these transaction costs were included, your costs would have been higher.
Expenses Paid on a $1,000 Investment in Pioneer Balanced ESG Fund
Based on a hypothetical 5% return per year before expenses, reflecting the period from February 1, 2023 through July 31, 2023.
| Share Class | A | C | K | R | Y |
Beginning Account
Value on 2/1/23 | $1,000.00 | $1,000.00 | $1,000.00 | $1,000.00 | $1,000.00 |
Ending Account Value
(after expenses) on 7/31/23 | $1,020.13 | $1,016.41 | $1,021.57 | $1,018.60 | $1,021.57 |
Expenses Paid
During Period* | $4.71 | $8.45 | $3.26 | $6.26 | $3.26 |
| | |
| * | Expenses are equal to the Fund’s annualized expense ratio of 0.94%, 1.69%, 0.65%, 1.25%, and 0.65% for Class A, Class C, Class K, Class R, and Class Y shares, respectively, multiplied by the average account value over the period, multiplied by 181/365 (to reflect the one-half year period). |
Pioneer Balanced ESG Fund | Annual Report | 7/31/2323
Schedule of Investments | 7/31/23
Principal
Amount
USD ($) | | | | | | Value |
| | UNAFFILIATED ISSUERS — 102.0% | |
| | Senior Secured Floating Rate Loan
Interests — 0.1% of Net Assets*(a) | |
| | Chemicals-Diversified — 0.0%† | |
| 39,500 | LSF11 A5 HoldCo LLC, Term Loan, 8.933% (Term SOFR + 350 bps), 10/15/28 | $ 39,130 |
| | Total Chemicals-Diversified | $39,130 |
|
|
| | Chemicals-Specialty — 0.0%† | |
| 107,800 | Mativ Holdings, Inc., Term B Loan, 9.183% (Term SOFR + 375 bps), 4/20/28 | $ 104,835 |
| | Total Chemicals-Specialty | $104,835 |
|
|
| | Finance-Leasing Company — 0.0%† | |
| 71,861 | Avolon TLB Borrower 1 (US) LLC, Term B-4 Loan, 6.855% (Term SOFR + 150 bps), 2/12/27 | $ 71,541 |
| | Total Finance-Leasing Company | $71,541 |
|
|
| | Medical-Wholesale Drug Distribution — 0.0%† | |
| 60,938 | Owens & Minor, Inc., Term B-1 Loan, 8.715% (Term SOFR + 375 bps), 3/29/29 | $ 61,014 |
| | Total Medical-Wholesale Drug Distribution | $61,014 |
|
|
| | Metal Processors & Fabrication — 0.0%† | |
| 98,250 | Grinding Media, Inc. (Molycop, Ltd.), First Lien Initial Term Loan, 9.53% (Term SOFR + 400 bps), 10/12/28 | $ 96,531 |
| | Total Metal Processors & Fabrication | $96,531 |
|
|
| | REITS-Storage — 0.1% | |
| 165,812 | Iron Mountain Information Management LLC, Incremental Term B Loan , 7.183% (LIBOR + 175 bps), 1/2/26 | $ 165,536 |
| | Total REITS-Storage | $165,536 |
|
|
| | Total Senior Secured Floating Rate Loan Interests
(Cost $541,963) | $538,587 |
|
|
| Shares | | | | | | |
| | Common Stocks — 62.9% of Net Assets | |
| | Air Freight & Logistics — 0.4% | |
| 9,639 | United Parcel Service, Inc., Class B | $ 1,803,746 |
| | Total Air Freight & Logistics | $1,803,746 |
|
|
The accompanying notes are an integral part of these financial statements.
24Pioneer Balanced ESG Fund | Annual Report | 7/31/23
| Shares | | | | | | Value |
| | Automobiles — 0.8% | |
| 44,114 | Honda Motor Co., Ltd. (A.D.R.) | $ 1,408,119 |
| 100,800 | Subaru Corp. | 1,903,484 |
| | Total Automobiles | $3,311,603 |
|
|
| | Banks — 2.2% | |
| 43,366 | PNC Financial Services Group, Inc. | $ 5,936,372 |
| 79,246 | Regions Financial Corp. | 1,614,241 |
| 41,119 | Truist Financial Corp. | 1,365,973 |
| | Total Banks | $8,916,586 |
|
|
| | Beverages — 0.9% | |
| 19,873 | PepsiCo., Inc. | $ 3,725,393 |
| | Total Beverages | $3,725,393 |
|
|
| | Biotechnology — 1.2% | |
| 32,135 | AbbVie, Inc. | $ 4,806,753 |
| | Total Biotechnology | �� $4,806,753 |
|
|
| | Building Products — 1.2% | |
| 74,166 | Johnson Controls International Plc | $ 5,158,245 |
| | Total Building Products | $5,158,245 |
|
|
| | Capital Markets — 1.7% | |
| 21,437 | CME Group, Inc. | $ 4,265,105 |
| 131,758 | UBS Group AG | 2,921,075 |
| | Total Capital Markets | $7,186,180 |
|
|
| | Chemicals — 0.5% | |
| 7,315 | Air Products and Chemicals, Inc. | $ 2,233,489 |
| | Total Chemicals | $2,233,489 |
|
|
| | Communications Equipment — 2.8% | |
| 129,541 | Cisco Systems, Inc. | $ 6,741,314 |
| 16,356 | Motorola Solutions, Inc. | 4,688,120 |
| | Total Communications Equipment | $11,429,434 |
|
|
| | Construction Materials — 1.1% | |
| 78,258 | CRH Plc (A.D.R.) | $ 4,718,957 |
| | Total Construction Materials | $4,718,957 |
|
|
| | Electrical Equipment — 1.5% | |
| 24,162 | Eaton Corp. Plc | $ 4,960,942 |
| 35,193 | Prysmian S.p.A. | 1,402,683 |
| | Total Electrical Equipment | $6,363,625 |
|
|
The accompanying notes are an integral part of these financial statements.
Pioneer Balanced ESG Fund | Annual Report | 7/31/2325
Schedule of Investments | 7/31/23 (continued)
| Shares | | | | | | Value |
| | Electronic Equipment, Instruments & Components —
0.6% | |
| 17,871 | TE Connectivity, Ltd. | $ 2,564,310 |
| | Total Electronic Equipment, Instruments & Components | $2,564,310 |
|
|
| | Entertainment — 1.2% | |
| 54,883(b) | Walt Disney Co. | $ 4,878,550 |
| | Total Entertainment | $4,878,550 |
|
|
| | Financial Services — 1.7% | |
| 28,791 | Visa, Inc., Class A | $ 6,844,485 |
| | Total Financial Services | $6,844,485 |
|
|
| | Food Products — 1.4% | |
| 55,538 | Lamb Weston Holdings, Inc. | $ 5,755,403 |
| | Total Food Products | $5,755,403 |
|
|
| | Health Care Equipment & Supplies — 2.5% | |
| 8,468(b) | Intuitive Surgical, Inc. | $ 2,747,019 |
| 84,850 | Medtronic Plc | 7,446,436 |
| | Total Health Care Equipment & Supplies | $10,193,455 |
|
|
| | Health Care Providers & Services — 3.3% | |
| 65,319 | Cardinal Health, Inc. | $ 5,974,729 |
| 15,412 | Cigna Group | 4,548,081 |
| 7,146 | Elevance Health, Inc. | 3,370,268 |
| | Total Health Care Providers & Services | $13,893,078 |
|
|
| | Hotels, Restaurants & Leisure — 2.0% | |
| 117,119 | Cedar Fair LP | $ 4,561,785 |
| 5,249 | Vail Resorts, Inc. | 1,236,087 |
| 32,748 | Wyndham Hotels & Resorts, Inc. | 2,551,724 |
| | Total Hotels, Restaurants & Leisure | $8,349,596 |
|
|
| | Household Durables — 0.6% | |
| 27,559 | Sony Group Corp. (A.D.R.) | $ 2,579,522 |
| | Total Household Durables | $2,579,522 |
|
|
| | Household Products — 0.7% | |
| 36,610 | Reckitt Benckiser Group Plc | $ 2,742,894 |
| | Total Household Products | $2,742,894 |
|
|
| | Insurance — 1.4% | |
| 14,775 | Chubb, Ltd. | $ 3,020,158 |
| 51,249 | Sun Life Financial, Inc. | 2,696,210 |
| | Total Insurance | $5,716,368 |
|
|
The accompanying notes are an integral part of these financial statements.
26Pioneer Balanced ESG Fund | Annual Report | 7/31/23
| Shares | | | | | | Value |
| | Interactive Media & Services — 4.9% | |
| 151,829(b) | Alphabet, Inc., Class A | $ 20,150,745 |
| | Total Interactive Media & Services | $20,150,745 |
|
|
| | Life Sciences Tools & Services — 0.5% | |
| 9,402(b) | IQVIA Holdings, Inc. | $ 2,103,792 |
| | Total Life Sciences Tools & Services | $2,103,792 |
|
|
| | Machinery — 0.9% | |
| 8,394 | Deere & Co. | $ 3,606,062 |
| | Total Machinery | $3,606,062 |
|
|
| | Metals & Mining — 1.8% | |
| 9,813 | Reliance Steel & Aluminum Co. | $ 2,873,835 |
| 106,116 | Teck Resources, Ltd., Class B | 4,714,734 |
| | Total Metals & Mining | $7,588,569 |
|
|
| | Oil, Gas & Consumable Fuels — 4.1% | |
| 29,080 | Phillips 66 | $ 3,243,874 |
| 16,622 | Pioneer Natural Resources Co. | 3,751,087 |
| 59,442 | Shell Plc, (A.D.R.) | 3,663,410 |
| 62,846 | Targa Resources Corp. | 5,152,744 |
| 9,914 | Valero Energy Corp. | 1,278,014 |
| | Total Oil, Gas & Consumable Fuels | $17,089,129 |
|
|
| | Pharmaceuticals — 2.3% | |
| 13,015 | Eli Lilly & Co. | $ 5,915,968 |
| 20,210 | Merck KGaA | 3,550,899 |
| | Total Pharmaceuticals | $9,466,867 |
|
|
| | Professional Services — 0.7% | |
| 11,808 | Automatic Data Processing, Inc. | $ 2,919,646 |
| | Total Professional Services | $2,919,646 |
|
|
| | Semiconductors & Semiconductor Equipment — 3.5% | |
| 58,554(b) | Advanced Micro Devices, Inc. | $ 6,698,578 |
| 12,537 | Analog Devices, Inc. | 2,501,508 |
| 4,309 | Lam Research Corp. | 3,095,973 |
| 24,864 | Microchip Technology, Inc. | 2,335,724 |
| | Total Semiconductors & Semiconductor Equipment | $14,631,783 |
|
|
| | Software — 5.8% | |
| 10,928(b) | Adobe, Inc. | $ 5,968,546 |
| 42,698 | Microsoft Corp. | 14,343,112 |
| 31,135 | Oracle Corp. | 3,649,956 |
| | Total Software | $23,961,614 |
|
|
| | Specialized REITs — 1.0% | |
| 14,768 | Crown Castle, Inc. | $ 1,599,227 |
The accompanying notes are an integral part of these financial statements.
Pioneer Balanced ESG Fund | Annual Report | 7/31/2327
Schedule of Investments | 7/31/23 (continued)
| Shares | | | | | | Value |
| | Specialized REITs — (continued) | |
| 8,278 | Digital Realty Trust, Inc. | $ 1,031,604 |
| 1,963 | Equinix, Inc. | 1,589,873 |
| | Total Specialized REITs | $4,220,704 |
|
|
| | Specialty Retail — 1.9% | |
| 11,026 | Home Depot, Inc. | $ 3,680,920 |
| 50,566 | TJX Cos., Inc. | 4,375,476 |
| | Total Specialty Retail | $8,056,396 |
|
|
| | Technology Hardware, Storage & Peripherals — 3.0% | |
| 335,956 | Hewlett Packard Enterprise Co. | $ 5,838,915 |
| 104,992(b) | Pure Storage, Inc., Class A | 3,883,654 |
| 1,957 | Samsung Electronics Co., Ltd. (G.D.R.) (144A) | 2,663,477 |
| | Total Technology Hardware, Storage & Peripherals | $12,386,046 |
|
|
| | Textiles, Apparel & Luxury Goods — 0.5% | |
| 51,142 | Tapestry, Inc. | $ 2,206,777 |
| | Total Textiles, Apparel & Luxury Goods | $2,206,777 |
|
|
| | Trading Companies & Distributors — 2.3% | |
| 57,913(b) | AerCap Holdings NV | $ 3,695,428 |
| 37,356 | Ferguson Plc | 6,037,477 |
| | Total Trading Companies & Distributors | $9,732,905 |
|
|
| | Total Common Stocks
(Cost $182,358,274) | $261,292,707 |
|
|
Principal
Amount
USD ($) | | | | | | |
| | Asset Backed Securities — 2.0% of Net
Assets | |
| 72,157 | Accelerated LLC, Series 2021-1H, Class C, 2.35%, 10/20/40 (144A) | $ 64,177 |
| 300,000 | Amur Equipment Finance Receivables XI LLC, Series 2022-2A, Class D, 7.25%, 5/21/29 (144A) | 293,058 |
| 100,000 | Amur Equipment Finance Receivables XII LLC, Series 2023-1A, Class C, 6.36%, 12/20/29 (144A) | 99,719 |
| 300,000(a) | Arbor Realty Commercial Real Estate Notes, Ltd., Series 2021-FL3, Class C, 7.186% (1 Month Term SOFR + 196 bps), 8/15/34 (144A) | 282,973 |
| 250,000(a) | Arbor Realty Commercial Real Estate Notes, Ltd., Series 2022-FL1, Class C, 7.368% (SOFR30A + 230 bps), 1/15/37 (144A) | 237,917 |
| 400,000(a) | Arbor Realty Commercial Real Estate Notes, Ltd., Series 2022-FL2, Class C, 8.672% (1 Month Term SOFR + 345 bps), 5/15/37 (144A) | 390,697 |
The accompanying notes are an integral part of these financial statements.
28Pioneer Balanced ESG Fund | Annual Report | 7/31/23
Principal
Amount
USD ($) | | | | | | Value |
| | Asset Backed Securities — (continued) | |
| 250,000(a) | Benefit Street Partners CLO XIX, Ltd., Series 2019-19A, Class D, 9.37% (3 Month Term SOFR + 406 bps), 1/15/33 (144A) | $ 243,433 |
| 198,398 | Blackbird Capital Aircraft, Series 2021-1A, Class A, 2.443%, 7/15/46 (144A) | 171,132 |
| 160,000(a) | BSPRT Issuer, Ltd., Series 2022-FL8, Class C, 7.368% (SOFR30A + 230 bps), 2/15/37 (144A) | 152,514 |
| 132,141 | BXG Receivables Note Trust, Series 2018-A, Class C, 4.44%, 2/2/34 (144A) | 124,119 |
| 250,000(a) | Carlyle US CLO, Ltd., Series 2019-4A, Class CR, 8.508% (3 Month Term SOFR + 320 bps), 4/15/35 (144A) | 234,664 |
| 131,947(c) | Cascade MH Asset Trust, Series 2019-MH1, Class A, 4.00%, 11/25/44 (144A) | 124,432 |
| 150,000 | Cascade MH Asset Trust, Series 2021-MH1, Class M1, 2.992%, 2/25/46 (144A) | 109,965 |
| 200,000 | Commercial Equipment Finance LLC, Series 2021-A, Class C, 3.55%, 12/15/28 (144A) | 187,306 |
| 400,000 | Continental Finance Credit Card ABS Master Trust, Series 2022-A, Class A, 6.19%, 10/15/30 (144A) | 383,934 |
| 104,284 | CoreVest American Finance Trust, Series 2020-3, Class A, 1.358%, 8/15/53 (144A) | 94,246 |
| 500,000 | Crossroads Asset Trust, Series 2021-A, Class D, 2.52%, 1/20/26 (144A) | 480,035 |
| 100,000 | DataBank Issuer, Series 2021-1A, Class B, 2.65%, 2/27/51 (144A) | 85,999 |
| 193,000 | Domino's Pizza Master Issuer LLC, Series 2019-1A, Class A2, 3.668%, 10/25/49 (144A) | 168,309 |
| 30,000 | Drive Auto Receivables Trust, Series 2020-2, Class D, 3.05%, 5/15/28 | 29,455 |
| 400,000(c) | Finance of America HECM Buyout, Series 2022-HB1, Class M3, 5.084%, 2/25/32 (144A) | 347,007 |
| 40,160 | Foundation Finance Trust, Series 2021-1A, Class A, 1.27%, 5/15/41 (144A) | 35,766 |
| 341,348(a) | Gracie Point International Funding, Series 2022-2A, Class A, 7.828% (SOFR30A + 275 bps), 7/1/24 (144A) | 341,390 |
| 125,000(a) | HGI CRE CLO, Ltd., Series 2021-FL2, Class C, 7.136% (1 Month USD LIBOR + 180 bps), 9/17/36 (144A) | 117,824 |
| 196,500 | HOA Funding LLC - HOA, Series 2021-1A, Class A2, 4.723%, 8/20/51 (144A) | 162,186 |
| 118,674 | Home Partners of America Trust, Series 2019-1, Class D, 3.406%, 9/17/39 (144A) | 104,926 |
| 166,025 | Home Partners of America Trust, Series 2019-2, Class E, 3.32%, 10/19/39 (144A) | 140,589 |
| 450,000(a) | MF1, Ltd., Series 2021-FL7, Class D, 7.894% (1 Month Term SOFR + 266 bps), 10/16/36 (144A) | 419,594 |
The accompanying notes are an integral part of these financial statements.
Pioneer Balanced ESG Fund | Annual Report | 7/31/2329
Schedule of Investments | 7/31/23 (continued)
Principal
Amount
USD ($) | | | | | | Value |
| | Asset Backed Securities — (continued) | |
| 37,393 | Mosaic Solar Loan Trust, Series 2019-2A, Class A, 2.88%, 9/20/40 (144A) | $ 32,509 |
| 93,762 | Mosaic Solar Loan Trust, Series 2020-1A, Class A, 2.10%, 4/20/46 (144A) | 80,188 |
| 150,000 | Nelnet Student Loan Trust, Series 2021-A, Class B1, 2.85%, 4/20/62 (144A) | 122,485 |
| 17,427 | NMEF Funding LLC, Series 2019-A, Class C, 3.30%, 8/17/26 (144A) | 17,404 |
| 100,000 | NMEF Funding LLC, Series 2021-A, Class C, 2.58%, 12/15/27 (144A) | 94,860 |
| 100,000 | NMEF Funding LLC, Series 2022-B, Class C, 8.54%, 6/15/29 (144A) | 99,677 |
| 151,055 | Oportun Funding XIV LLC, Series 2021-A, Class C, 3.44%, 3/8/28 (144A) | 145,237 |
| 250,000(a) | Palmer Square Loan Funding, Ltd., Series 2020-1A, Class B, 7.279% (3 Month USD LIBOR + 190 bps), 2/20/28 (144A) | 249,042 |
| 250,000(a) | ReadyCap Lending Small Business Loan Trust, Series 2023-3, Class A, 8.32% (SOFR30A + 325 bps), 4/25/48 (144A) | 250,000 |
| 250,000 | Republic Finance Issuance Trust, Series 2021-A, Class A, 2.30%, 12/22/31 (144A) | 229,669 |
| 100,000 | Republic Finance Issuance Trust, Series 2021-A, Class C, 3.53%, 12/22/31 (144A) | 85,540 |
| 250,000 | SCF Equipment Leasing LLC, Series 2021-1A, Class D, 1.93%, 9/20/30 (144A) | 221,900 |
| 74,253 | SpringCastle America Funding LLC, Series 2020-AA, Class A, 1.97%, 9/25/37 (144A) | 67,210 |
| 325,000(a) | STWD, Ltd., Series 2022-FL3, Class B, 7.018% (SOFR30A + 195 bps), 11/15/38 (144A) | 311,922 |
| 74,322 | Tricolor Auto Securitization Trust, Series 2021-1A, Class D, 1.92%, 5/15/26 (144A) | 73,721 |
| 120,000 | Tricon American Homes Trust, Series 2020-SFR2, Class E1, 2.73%, 11/17/39 (144A) | 101,935 |
| 132,379 | Welk Resorts LLC, Series 2019-AA, Class C, 3.34%, 6/15/38 (144A) | 127,023 |
| 54,217 | Westgate Resorts LLC, Series 2020-1A, Class C, 6.213%, 3/20/34 (144A) | 53,473 |
| 239,254 | Westgate Resorts LLC, Series 2022-1A, Class C, 2.488%, 8/20/36 (144A) | 224,410 |
| | Total Asset Backed Securities
(Cost $8,815,984) | $8,215,571 |
|
|
The accompanying notes are an integral part of these financial statements.
30Pioneer Balanced ESG Fund | Annual Report | 7/31/23
Principal
Amount
USD ($) | | | | | | Value |
| | Collateralized Mortgage
Obligations—2.7% of Net Assets | |
| 90,537(a) | Bellemeade Re, Ltd., Series 2020-3A, Class M1C, 9.112% (1 Month USD LIBOR + 370 bps), 10/25/30 (144A) | $ 91,535 |
| 46,676(a) | Bellemeade Re, Ltd., Series 2020-4A, Class M2B, 9.012% (1 Month USD LIBOR + 360 bps), 6/25/30 (144A) | 47,009 |
| 425,000(c) | BINOM Securitization Trust, Series 2022-RPL1, Class M2, 3.00%, 2/25/61 (144A) | 291,927 |
| 100,000(c) | Bunker Hill Loan Depositary Trust, Series 2020-1, Class A3, 3.253%, 2/25/55 (144A) | 84,581 |
| 100,000(c) | Cascade Funding Mortgage Trust, Series 2021-HB6, Class M3, 3.735%, 6/25/36 (144A) | 91,402 |
| 450,000(c) | CFMT LLC, Series 2021-HB5, Class M3, 2.91%, 2/25/31 (144A) | 413,728 |
| 200,000(c) | CFMT LLC, Series 2021-HB7, Class M3, 3.849%, 10/27/31 (144A) | 181,599 |
| 130,000(c) | CFMT LLC, Series 2022-HB9, Class M3, 3.25%, 9/25/37 (144A) | 100,990 |
| 500,000(c) | Citigroup Mortgage Loan Trust, Series 2018-RP3, Class M3, 3.25%, 3/25/61 (144A) | 404,112 |
| 667,685(c) | Citigroup Mortgage Loan Trust, Series 2021-INV2, Class B1W, 2.989%, 5/25/51 (144A) | 519,952 |
| 6,296(a) | Connecticut Avenue Securities Trust, Series 2019-R07, Class 1M2, 7.283% (SOFR30A + 221 bps), 10/25/39 (144A) | 6,306 |
| 36,137(a) | Connecticut Avenue Securities Trust, Series 2020-R02, Class 2M2, 7.183% (SOFR30A + 211 bps), 1/25/40 (144A) | 36,182 |
| 150,000(a) | Connecticut Avenue Securities Trust, Series 2022-R02, Class 2M2, 8.069% (SOFR30A + 300 bps), 1/25/42 (144A) | 150,747 |
| 82,591(a) | Eagle Re, Ltd., Series 2018-1, Class M1, 6.85% (1 Month USD LIBOR + 170 bps), 11/25/28 (144A) | 82,662 |
| 6,011(a) | Federal Home Loan Mortgage Corp. REMICs, Series 1671, Class S, 5.832% (SOFR30A + 76 bps), 2/15/24 | 6,003 |
| 207,784 | Federal Home Loan Mortgage Corp. REMICs, Series 3816, Class HA, 3.50%, 11/15/25 | 202,434 |
| 13,211(a) | Federal Home Loan Mortgage Corp. REMICs, Series 3868, Class FA, 5.582% (SOFR30A + 51 bps), 5/15/41 | 12,964 |
| 105,912(a)(d) | Federal Home Loan Mortgage Corp. REMICs, Series 4091, Class SH, 1.368% (SOFR30A + 644 bps), 8/15/42 | 11,616 |
The accompanying notes are an integral part of these financial statements.
Pioneer Balanced ESG Fund | Annual Report | 7/31/2331
Schedule of Investments | 7/31/23 (continued)
Principal
Amount
USD ($) | | | | | | Value |
| | Collateralized Mortgage
Obligations—(continued) | |
| 84,487(d) | Federal Home Loan Mortgage Corp. REMICs, Series 4999, Class QI, 4.00%, 5/25/50 | $ 15,410 |
| 112,713(d) | Federal Home Loan Mortgage Corp. REMICs, Series 5067, Class GI, 4.00%, 12/25/50 | 21,534 |
| 14,486(a) | Federal National Mortgage Association REMICs, Series 2006-104, Class GF, 5.503% (SOFR30A + 43 bps), 11/25/36 | 14,231 |
| 19,264(a) | Federal National Mortgage Association REMICs, Series 2006-23, Class FP, 5.483% (SOFR30A + 41 bps), 4/25/36 | 18,872 |
| 7,438(a) | Federal National Mortgage Association REMICs, Series 2007-93, Class FD, 5.733% (SOFR30A + 66 bps), 9/25/37 | 7,347 |
| 47,571(a) | Federal National Mortgage Association REMICs, Series 2011-63, Class FG, 5.633% (SOFR30A + 56 bps), 7/25/41 | 46,762 |
| 72,244(d) | Federal National Mortgage Association REMICs, Series 2020-83, Class EI, 4.00%, 11/25/50 | 14,482 |
| 108,850(a) | Freddie Mac STACR REMIC Trust, Series 2020-DNA3, Class B1, 10.283% (SOFR30A + 521 bps), 6/25/50 (144A) | 117,013 |
| 124,659(a) | Freddie Mac STACR REMIC Trust, Series 2020-DNA4, Class B1, 11.183% (SOFR30A + 611 bps), 8/25/50 (144A) | 139,057 |
| 50,241(a) | Freddie Mac STACR REMIC Trust, Series 2020-DNA5, Class M2, 7.869% (SOFR30A + 280 bps), 10/25/50 (144A) | 50,964 |
| 485,000(a) | Freddie Mac STACR REMIC Trust, Series 2021-HQA3, Class B1, 8.419% (SOFR30A + 335 bps), 9/25/41 (144A) | 483,191 |
| 400,000(a) | Freddie Mac STACR REMIC Trust, Series 2021-HQA3, Class M2, 7.169% (SOFR30A + 210 bps), 9/25/41 (144A) | 392,000 |
| 309,255(d) | Government National Mortgage Association, Series 2019-159, Class CI, 3.50%, 12/20/49 | 54,231 |
| 260,293(a)(d) | Government National Mortgage Association, Series 2020-9, Class SA, 0.000% (1 Month Term SOFR + 324 bps), 1/20/50 | 4,278 |
| 160,000(c) | GS Mortgage-Backed Securities Corp. Trust, Series 2022-PJ4, Class A33, 3.00%, 9/25/52 (144A) | 111,496 |
| 50,386(c) | GS Mortgage-Backed Securities Trust, Series 2020-NQM1, Class A3, 2.352%, 9/27/60 (144A) | 46,581 |
| 301,504(c) | GS Mortgage-Backed Securities Trust, Series 2022-PJ1, Class A4, 2.50%, 5/28/52 (144A) | 230,615 |
The accompanying notes are an integral part of these financial statements.
32Pioneer Balanced ESG Fund | Annual Report | 7/31/23
Principal
Amount
USD ($) | | | | | | Value |
| | Collateralized Mortgage
Obligations—(continued) | |
| 68,968(a) | Home Re, Ltd., Series 2019-1, Class M1, 7.062% (1 Month USD LIBOR + 165 bps), 5/25/29 (144A) | $ 68,961 |
| 107,211(a) | Home Re, Ltd., Series 2020-1, Class M2, 10.662% (1 Month USD LIBOR + 525 bps), 10/25/30 (144A) | 108,592 |
| 100,000(c) | Homeward Opportunities Fund I Trust, Series 2020-2, Class A3, 3.196%, 5/25/65 (144A) | 91,913 |
| 100,000(c) | Imperial Fund Mortgage Trust, Series 2021-NQM2, Class B1, 3.295%, 9/25/56 (144A) | 57,514 |
| 100,000(c) | Imperial Fund Mortgage Trust, Series 2021-NQM2, Class M1, 2.489%, 9/25/56 (144A) | 58,986 |
| 349,709 | IMS Ecuadorian Mortgage Trust, Series 2021-1, Class GA, 3.40%, 8/18/43 (144A) | 318,235 |
| 125,167(c) | JP Morgan Mortgage Trust, Series 2021-13, Class B1, 3.142%, 4/25/52 (144A) | 98,076 |
| 284,781(c) | JP Morgan Mortgage Trust, Series 2021-7, Class B2, 2.80%, 11/25/51 (144A) | 204,667 |
| 123,221(c) | JP Morgan Mortgage Trust, Series 2021-INV1, Class B1, 2.983%, 10/25/51 (144A) | 96,080 |
| 800,000(c) | JP Morgan Mortgage Trust, Series 2022-2, Class A5A, 2.50%, 8/25/52 (144A) | 514,337 |
| 210,000(c) | JP Morgan Mortgage Trust, Series 2022-4, Class A5, 3.00%, 10/25/52 (144A) | 145,921 |
| 670,964(c) | JP Morgan Mortgage Trust, Series 2022-8, Class B2, 4.674%, 1/25/53 (144A) | 575,700 |
| 250,000(c) | JP Morgan Mortgage Trust, Series 2022-LTV1, Class M1, 3.524%, 7/25/52 (144A) | 152,080 |
| 342,893(c) | Mello Mortgage Capital Acceptance, Series 2021-INV2, Class A15, 2.50%, 8/25/51 (144A) | 265,274 |
| 300,000(c) | Mello Mortgage Capital Acceptance, Series 2021-INV2, Class A5, 2.50%, 8/25/51 (144A) | 194,109 |
| 50,203(c) | MFA Trust, Series 2020-NQM1, Class A3, 2.30%, 8/25/49 (144A) | 44,794 |
| 300,000(c) | Mill City Mortgage Loan Trust, Series 2019-GS2, Class M3, 3.25%, 8/25/59 (144A) | 235,168 |
| 35,180(c) | New Residential Mortgage Loan Trust, Series 2019-NQM4, Class A1, 2.492%, 9/25/59 (144A) | 32,480 |
| 113,468(a) | Oaktown Re V, Ltd., Series 2020-2A, Class M2, 10.433% (SOFR30A + 536 bps), 10/25/30 (144A) | 115,708 |
| 565,258(c) | PRMI Securitization Trust, Series 2021-1, Class B1, 2.479%, 4/25/51 (144A) | 405,106 |
| 272,769(c) | Provident Funding Mortgage Trust, Series 2021-2, Class A9, 2.25%, 4/25/51 (144A) | 208,978 |
| 150,000(a)(e) | Radnor Re, Ltd., Series 2023-1, Class M1A, 7.767% (SOFR30A + 270 bps), 7/25/33 (144A) | 150,000 |
The accompanying notes are an integral part of these financial statements.
Pioneer Balanced ESG Fund | Annual Report | 7/31/2333
Schedule of Investments | 7/31/23 (continued)
Principal
Amount
USD ($) | | | | | | Value |
| | Collateralized Mortgage
Obligations—(continued) | |
| 317,083(c) | RCKT Mortgage Trust, Series 2021-3, Class A25, 2.50%, 7/25/51 (144A) | $ 245,702 |
| 277,701(c) | RCKT Mortgage Trust, Series 2021-4, Class B1A, 3.007%, 9/25/51 (144A) | 216,435 |
| 385,000(c) | RCKT Mortgage Trust, Series 2022-3, Class A17, 3.00%, 5/25/52 (144A) | 264,459 |
| 37,733(c) | RMF Proprietary Issuance Trust, Series 2019-1, Class A, 2.75%, 10/25/63 (144A) | 30,347 |
| 329,946(c) | RMF Proprietary Issuance Trust, Series 2021-2, Class A, 2.125%, 9/25/61 (144A) | 234,224 |
| 150,000(c) | Sequoia Mortgage Trust, Series 2022-1, Class A7, 2.50%, 2/25/52 (144A) | 96,531 |
| 311,568(a) | STACR Trust, Series 2018-HRP2, Class M3, 7.583% (SOFR30A + 251 bps), 2/25/47 (144A) | 316,773 |
| 400,000(c) | UWM Mortgage Trust, Series 2021-INV1, Class A5, 2.50%, 8/25/51 (144A) | 261,076 |
| 675,000(c) | UWM Mortgage Trust, Series 2021-INV2, Class A5, 2.50%, 9/25/51 (144A) | 440,538 |
| 64,921(c) | Visio Trust, Series 2019-2, Class A1, 2.722%, 11/25/54 (144A) | 61,228 |
| 371,067(c) | Wells Fargo Mortgage Backed Securities Trust, Series 2020-5, Class B2, 2.916%, 9/25/50 (144A) | 288,257 |
| 100,000(c) | Wells Fargo Mortgage Backed Securities Trust, Series 2022-2, Class A5, 3.00%, 12/25/51 (144A) | 69,403 |
| 335,000(c) | Wells Fargo Mortgage Backed Securities Trust, Series 2022-2, Class A6, 2.50%, 12/25/51 (144A) | 214,709 |
| | Total Collateralized Mortgage Obligations
(Cost $13,237,845) | $11,386,174 |
|
|
| | Commercial Mortgage-Backed
Securities—1.6% of Net Assets | |
| 300,000 | Benchmark Mortgage Trust, Series 2018-B8, Class A4, 3.963%, 1/15/52 | $ 283,709 |
| 200,000(c) | Benchmark Mortgage Trust, Series 2022-B34, Class AM, 3.832%, 4/15/55 | 169,030 |
| 160,081(a) | CHC Commercial Mortgage Trust, Series 2019-CHC, Class D, 7.386% (1 Month Term SOFR + 216 bps), 6/15/34 (144A) | 155,235 |
| 200,101(a) | CHC Commercial Mortgage Trust, Series 2019-CHC, Class E, 7.686% (1 Month Term SOFR + 246 bps), 6/15/34 (144A) | 188,104 |
| 207,730 | Citigroup Commercial Mortgage Trust, Series 2018-C5, Class A3, 3.963%, 6/10/51 | 192,091 |
| 8,397,151(c)(d) | COMM Mortgage Trust, Series 2014-CR18, Class XA, 0.916%, 7/15/47 | 41,431 |
The accompanying notes are an integral part of these financial statements.
34Pioneer Balanced ESG Fund | Annual Report | 7/31/23
Principal
Amount
USD ($) | | | | | | Value |
| | Commercial Mortgage-Backed
Securities—(continued) | |
| 847 | Credit Suisse First Boston Mortgage Securities Corp., Series 2005-C2, Class AMFX, 4.877%, 4/15/37 | $ 830 |
| 250,000(c) | CSAIL Commercial Mortgage Trust, Series 2015-C4, Class AS, 4.174%, 11/15/48 | 233,959 |
| 14,309(a) | Freddie Mac Multifamily Structured Credit Risk, Series 2021-MN1, Class M1, 7.069% (SOFR30A + 200 bps), 1/25/51 (144A) | 13,746 |
| 550,000(a) | Freddie Mac Multifamily Structured Credit Risk, Series 2021-MN3, Class M2, 9.069% (SOFR30A + 400 bps), 11/25/51 (144A) | 516,222 |
| 300,000 | Freddie Mac Multifamily Structured Pass Through Certificates, Series K729, Class A2, 3.136%, 10/25/24 | 291,532 |
| 100,000(c) | FREMF Mortgage Trust, Series 2017-KW03, Class B, 4.077%, 7/25/27 (144A) | 91,142 |
| 109,745(a) | FREMF Mortgage Trust, Series 2019-KF64, Class B, 7.518% (1 Month USD LIBOR + 230 bps), 6/25/26 (144A) | 104,551 |
| 207,604(a) | FREMF Mortgage Trust, Series 2019-KF66, Class B, 7.618% (1 Month USD LIBOR + 240 bps), 7/25/29 (144A) | 190,397 |
| 250,000(c) | FREMF Trust, Series 2018-KW04, Class B, 3.925%, 9/25/28 (144A) | 213,494 |
| 829,431(c)(d) | Government National Mortgage Association, Series 2017-21, Class IO, 0.633%, 10/16/58 | 29,651 |
| 400,000(a) | GS Mortgage Securities Corportation Trust, Series 2021-IP, Class D, 7.436% (1 Month Term SOFR + 221 bps), 10/15/36 (144A) | 361,570 |
| 375,000 | JP Morgan Chase Commercial Mortgage Securities Trust, Series 2018-WPT, Class AFX, 4.248%, 7/5/33 (144A) | 336,367 |
| 250,000 | JPMDB Commercial Mortgage Securities Trust, Series 2018-C8, Class A4, 4.211%, 6/15/51 | 231,620 |
| 2,450,000(c)(d) | JPMDB Commercial Mortgage Securities Trust, Series 2018-C8, Class XB, 0.125%, 6/15/51 | 13,284 |
| 250,000 | Key Commercial Mortgage Securities Trust, Series 2019-S2, Class A3, 3.469%, 6/15/52 (144A) | 223,949 |
| 398,090(a) | Med Trust, Series 2021-MDLN, Class E, 8.486% (1 Month Term SOFR + 326 bps), 11/15/38 (144A) | 376,149 |
| 250,000(a) | MF1 Multifamily Housing Mortgage Loan Trust, Series 2021-FL5, Class D, 7.836% (1 Month Term SOFR + 261 bps), 7/15/36 (144A) | 237,330 |
| 300,000(c) | Morgan Stanley Capital I Trust, Series 2018-MP, Class A, 4.276%, 7/11/40 (144A) | 244,619 |
| 50,000 | Palisades Center Trust, Series 2016-PLSD, Class A, 2.713%, 4/13/33 (144A) | 28,500 |
The accompanying notes are an integral part of these financial statements.
Pioneer Balanced ESG Fund | Annual Report | 7/31/2335
Schedule of Investments | 7/31/23 (continued)
Principal
Amount
USD ($) | | | | | | Value |
| | Commercial Mortgage-Backed
Securities—(continued) | |
| 500,000(a) | Ready Capital Mortgage Financing LLC, Series 2021-FL7, Class D, 8.362% (1 Month Term SOFR + 306 bps), 11/25/36 (144A) | $ 468,055 |
| 475,000 | SLG Office Trust, Series 2021-OVA, Class E, 2.851%, 7/15/41 (144A) | 337,637 |
| 125,000(c) | Soho Trust, Series 2021-SOHO, Class A, 2.697%, 8/10/38 (144A) | 87,004 |
| 325,000(a) | Taubman Centers Commercial Mortgage Trust, Series 2022-DPM, Class B, 8.154% (1 Month Term SOFR + 293 bps), 5/15/37 (144A) | 315,251 |
| 348,734(a) | TTAN, Series 2021-MHC, Class B, 6.436% (1 Month Term SOFR + 121 bps), 3/15/38 (144A) | 342,611 |
| 250,000(c) | UBS Commercial Mortgage Trust, Series 2018-C9, Class C, 4.948%, 3/15/51 | 180,585 |
| 1,007,650(c)(d) | Wells Fargo Commercial Mortgage Trust, Series 2015-NXS3, Class XA, 0.874%, 9/15/57 | 15,251 |
| 2,311,983(c)(d) | Wells Fargo Commercial Mortgage Trust, Series 2016-LC24, Class XA, 1.601%, 10/15/49 | 88,172 |
| | Total Commercial Mortgage-Backed Securities
(Cost $7,596,575) | $6,603,078 |
|
|
| | Convertible Corporate Bonds — 1.7% of
Net Assets | |
| | REITs — 1.7% | |
| 4,484,000 | PennyMac Corp., 5.50%, 3/15/26 | $ 3,945,920 |
| 3,227,000 | Redwood Trust, Inc., 7.75%, 6/15/27 | 2,930,520 |
| | Total REITs | $6,876,440 |
|
|
| | Total Convertible Corporate Bonds
(Cost $7,043,529) | $6,876,440 |
|
|
| | Corporate Bonds — 10.5% of Net Assets | |
| | Aerospace & Defense — 0.1% | |
| 355,000 | RTX Corp., 3.20%, 3/15/24 | $ 349,684 |
| | Total Aerospace & Defense | $349,684 |
|
|
| | Airlines — 0.0%† | |
| 118,296 | Air Canada 2017-1 Class AA Pass Through Trust, 3.30%, 7/15/31 (144A) | $ 103,694 |
| 60,000 | Delta Air Lines, Inc./SkyMiles IP, Ltd., 4.75%, 10/20/28 (144A) | 58,071 |
| | Total Airlines | $161,765 |
|
|
| | Auto Manufacturers — 0.2% | |
| 165,000 | General Motors Financial Co., Inc., 3.10%, 1/12/32 | $ 134,850 |
The accompanying notes are an integral part of these financial statements.
36Pioneer Balanced ESG Fund | Annual Report | 7/31/23
Principal
Amount
USD ($) | | | | | | Value |
| | Auto Manufacturers — (continued) | |
| 410,000(a) | General Motors Financial Co., Inc., 5.958% (SOFR + 76 bps), 3/8/24 | $ 409,896 |
| 285,000 | Hyundai Capital America, 5.80%, 4/1/30 (144A) | 286,462 |
| | Total Auto Manufacturers | $831,208 |
|
|
| | Banks — 3.8% | |
| 400,000(c) | ABN AMRO Bank NV, 2.47% (1 Year CMT Index + 110 bps), 12/13/29 (144A) | $ 339,147 |
| 200,000 | ABN AMRO Bank NV, 4.80%, 4/18/26 (144A) | 192,478 |
| 200,000(c) | AIB Group Plc, 4.263% (3 Month USD LIBOR + 187 bps), 4/10/25 (144A) | 196,376 |
| 200,000 | Banco Santander Chile, 2.70%, 1/10/25 (144A) | 191,240 |
| 200,000(c) | Banco Santander SA, 1.722% (1 Year CMT Index + 90 bps), 9/14/27 | 175,584 |
| 600,000(c) | Banco Santander SA, 3.225% (1 Year CMT Index + 160 bps), 11/22/32 | 478,097 |
| 335,000(c) | Bank of America Corp., 2.572% (SOFR + 121 bps), 10/20/32 | 271,881 |
| 150,000(c) | Bank of New York Mellon Corp., 5.834% (SOFR + 207 bps), 10/25/33 | 155,344 |
| 565,000(c) | Bank of Nova Scotia, 4.588% (5 Year CMT Index + 205 bps), 5/4/37 | 488,595 |
| 445,000(c) | Barclays Plc, 5.746% (1 Year CMT Index + 300 bps), 8/9/33 | 435,711 |
| 2,235,000(c)(f) | Barclays Plc, 8.00% (5 Year CMT Index + 543 bps) | 2,078,550 |
| 225,000(c) | BNP Paribas SA, 2.159% (SOFR + 122 bps), 9/15/29 (144A) | 188,869 |
| 350,000(c) | BPCE SA, 3.116% (SOFR + 173 bps), 10/19/32 (144A) | 272,420 |
| 250,000(c) | BPCE SA, 3.648% (5 Year CMT Index + 190 bps), 1/14/37 (144A) | 199,778 |
| 220,000(c) | Citigroup, Inc., 2.52% (SOFR + 118 bps), 11/3/32 | 177,064 |
| 205,000(c) | Citigroup, Inc., 4.91% (SOFR + 209 bps), 5/24/33 | 198,240 |
| 95,000(c) | Citigroup, Inc., 6.174% (SOFR + 266 bps), 5/25/34 | 96,503 |
| 375,000(c) | Comerica Bank, 5.332% (SOFR + 261 bps), 8/25/33 | 325,997 |
| 210,000(c) | Goldman Sachs Group, Inc., 2.65% (SOFR + 126 bps), 10/21/32 | 170,533 |
| 195,000(c) | Goldman Sachs Group, Inc., 3.272% (3 Month Term SOFR + 146 bps), 9/29/25 | 189,125 |
| 140,000(c) | Goldman Sachs Group, Inc., 4.223% (3 Month Term SOFR + 156 bps), 5/1/29 | 132,765 |
| 305,000(c) | HSBC Holdings Plc, 2.206% (SOFR + 129 bps), 8/17/29 | 256,668 |
| 335,000(c) | HSBC Holdings Plc, 2.871% (SOFR + 141 bps), 11/22/32 | 270,880 |
| 200,000(c) | HSBC Holdings Plc, 6.161% (SOFR + 197 bps), 3/9/29 | 202,646 |
| 200,000(c) | ING Groep NV, 4.252% (SOFR + 207 bps), 3/28/33 | 182,645 |
The accompanying notes are an integral part of these financial statements.
Pioneer Balanced ESG Fund | Annual Report | 7/31/2337
Schedule of Investments | 7/31/23 (continued)
Principal
Amount
USD ($) | | | | | | Value |
| | Banks — (continued) | |
| 585,000(c)(f) | ING Groep NV, 4.25% (5 Year CMT Index + 286 bps) | $ 409,375 |
| 250,000(c) | Intesa Sanpaolo S.p.A., 7.778% (1 Year CMT Index + 390 bps), 6/20/54 (144A) | 252,915 |
| 275,000(c) | JPMorgan Chase & Co., 2.545% (SOFR + 118 bps), 11/8/32 | 225,952 |
| 90,000(c) | JPMorgan Chase & Co., 4.586% (SOFR + 180 bps), 4/26/33 | 85,874 |
| 285,000(c) | Lloyds Banking Group Plc, 4.976% (1 Year CMT Index + 230 bps), 8/11/33 | 268,151 |
| 260,000(c) | Lloyds Banking Group Plc, 7.953% (1 Year CMT Index + 375 bps), 11/15/33 | 283,496 |
| 205,000(c)(f) | Lloyds Banking Group Plc, 8.00% (5 Year CMT Index + 391 bps) | 191,880 |
| 300,000(c) | Macquarie Group, Ltd., 2.691% (SOFR + 144 bps), 6/23/32 (144A) | 236,681 |
| 175,000(c) | Macquarie Group, Ltd., 2.871% (SOFR + 153 bps), 1/14/33 (144A) | 138,873 |
| 200,000(c) | Mitsubishi UFJ Financial Group, Inc., 2.494% (1 Year CMT Index + 97 bps), 10/13/32 | 160,907 |
| 290,000(c) | Morgan Stanley, 5.297% (SOFR + 262 bps), 4/20/37 | 275,207 |
| 65,000(c) | Morgan Stanley, 5.948% (5 Year CMT Index + 243 bps), 1/19/38 | 64,661 |
| 585,000(c)(f) | Nordea Bank Abp, 3.75% (5 Year CMT Index + 260 bps) (144A) | 448,369 |
| 195,000(c) | Santander Holdings USA, Inc., 2.49% (SOFR + 125 bps), 1/6/28 | 169,459 |
| 200,000(c) | Societe Generale SA, 4.027% (1 Year CMT Index + 190 bps), 1/21/43 (144A) | 137,213 |
| 200,000(c)(f) | Societe Generale SA, 5.375% (5 Year CMT Index + 451 bps) (144A) | 159,520 |
| 245,000(c) | Societe Generale SA, 6.221% (1 Year CMT Index + 320 bps), 6/15/33 (144A) | 232,598 |
| 330,000(c) | Standard Chartered Plc, 3.603% (1 Year CMT Index + 190 bps), 1/12/33 (144A) | 266,474 |
| 200,000(c) | Standard Chartered Plc, 6.296% (1 Year CMT Index + 258 bps), 7/6/34 (144A) | 203,771 |
| 53,000(c) | Truist Financial Corp., 4.916% (SOFR + 224 bps), 7/28/33 | 48,529 |
| 385,000(c) | UBS Group AG, 2.746% (1 Year CMT Index + 110 bps), 2/11/33 (144A) | 305,133 |
| 2,500,000(c)(f) | UBS Group AG, 4.875% (5 Year CMT Index + 340 bps) (144A) | 2,078,125 |
| 200,000(c) | UBS Group AG, 4.988% (1 Year CMT Index + 240 bps), 8/5/33 (144A) | 188,625 |
The accompanying notes are an integral part of these financial statements.
38Pioneer Balanced ESG Fund | Annual Report | 7/31/23
Principal
Amount
USD ($) | | | | | | Value |
| | Banks — (continued) | |
| 350,000(c) | UniCredit S.p.A., 2.569% (1 Year CMT Index + 230 bps), 9/22/26 (144A) | $ 320,349 |
| 230,000(c) | UniCredit S.p.A., 5.459% (5 Year CMT Index + 475 bps), 6/30/35 (144A) | 200,743 |
| 200,000(c) | UniCredit S.p.A., 7.296% (5 Year USD Swap Rate + 491 bps), 4/2/34 (144A) | 194,082 |
| 530,000(c) | US Bancorp, 2.491% (5 Year CMT Index + 95 bps), 11/3/36 | 399,015 |
| | Total Banks | $15,813,113 |
|
|
| | Biotechnology — 0.0%† | |
| 165,000 | Amgen, Inc., 5.25%, 3/2/33 | $ 164,675 |
| | Total Biotechnology | $164,675 |
|
|
| | Building Materials — 0.0%† | |
| 140,000 | Fortune Brands Innovations, Inc., 4.50%, 3/25/52 | $ 110,000 |
| | Total Building Materials | $110,000 |
|
|
| | Chemicals — 0.3% | |
| 236,000 | Albemarle Corp., 5.05%, 6/1/32 | $ 225,729 |
| 329,000 | Albemarle Corp., 5.65%, 6/1/52 | 309,060 |
| 205,000 | Celanese US Holdings LLC, 6.379%, 7/15/32 | 207,369 |
| 385,000 | OCI NV, 6.70%, 3/16/33 (144A) | 380,136 |
| | Total Chemicals | $1,122,294 |
|
|
| | Commercial Services — 0.2% | |
| 35,000 | Allied Universal Holdco LLC/Allied Universal Finance Corp., 6.625%, 7/15/26 (144A) | $ 33,422 |
| 200,000 | Ashtead Capital, Inc., 5.50%, 8/11/32 (144A) | 193,764 |
| 110,000 | Element Fleet Management Corp., 1.60%, 4/6/24 (144A) | 106,477 |
| 195,000 | Garda World Security Corp., 4.625%, 2/15/27 (144A) | 180,116 |
| 115,000 | Prime Security Services Borrower LLC/Prime Finance, Inc., 6.25%, 1/15/28 (144A) | 108,264 |
| | Total Commercial Services | $622,043 |
|
|
| | Cosmetics/Personal Care — 0.1% | |
| 210,000 | Estee Lauder Cos., Inc., 5.15%, 5/15/53 | $ 210,705 |
| | Total Cosmetics/Personal Care | $210,705 |
|
|
| | Diversified Financial Services — 1.1% | |
| 205,000 | AerCap Ireland Capital DAC/AerCap Global Aviation Trust, 3.30%, 1/30/32 | $ 168,206 |
| 595,000 | Air Lease Corp., 2.875%, 1/15/32 | 479,229 |
| 410,000 | Ally Financial, Inc., 4.75%, 6/9/27 | 386,411 |
| 45,000(c) | Ally Financial, Inc., 6.992% (SOFR + 326 bps), 6/13/29 | 45,333 |
The accompanying notes are an integral part of these financial statements.
Pioneer Balanced ESG Fund | Annual Report | 7/31/2339
Schedule of Investments | 7/31/23 (continued)
Principal
Amount
USD ($) | | | | | | Value |
| | Diversified Financial Services — (continued) | |
| 55,000 | Ally Financial, Inc., 8.00%, 11/1/31 | $ 58,355 |
| 245,000 | Ameriprise Financial, Inc., 5.15%, 5/15/33 | 243,047 |
| 18,000 | Avolon Holdings Funding, Ltd., 3.95%, 7/1/24 (144A) | 17,512 |
| 570,000 | Avolon Holdings Funding, Ltd., 6.375%, 5/4/28 (144A) | 568,113 |
| 200,000 | B3 SA - Brasil Bolsa Balcao, 4.125%, 9/20/31 (144A) | 171,100 |
| 206,000 | Bread Financial Holdings, Inc., 7.00%, 1/15/26 (144A) | 198,959 |
| 22,000(c) | Capital One Financial Corp., 2.359% (SOFR + 134 bps), 7/29/32 | 15,962 |
| 150,000 | Capital One Financial Corp., 3.75%, 4/24/24 | 147,466 |
| 110,000 | Capital One Financial Corp., 4.25%, 4/30/25 | 106,693 |
| 35,000(c) | Capital One Financial Corp., 5.247% (SOFR + 260 bps), 7/26/30 | 33,578 |
| 80,000(c) | Capital One Financial Corp., 5.268% (SOFR + 237 bps), 5/10/33 | 76,207 |
| 95,000(c) | Capital One Financial Corp., 5.817% (SOFR + 260 bps), 2/1/34 | 92,318 |
| 140,000(c) | Capital One Financial Corp., 6.377% (SOFR + 286 bps), 6/8/34 | 141,336 |
| 220,000(c) | Charles Schwab Corp., 5.853% (SOFR + 250 bps), 5/19/34 | 226,707 |
| 445,000 | Nomura Holdings, Inc., 2.999%, 1/22/32 | 358,021 |
| 225,000 | Nomura Holdings, Inc., 5.605%, 7/6/29 | 222,330 |
| 120,000 | OneMain Finance Corp., 3.50%, 1/15/27 | 103,761 |
| 305,000 | OneMain Finance Corp., 4.00%, 9/15/30 | 239,613 |
| 143,000 | Raymond James Financial, Inc., 3.75%, 4/1/51 | 107,393 |
| 163,000 | United Wholesale Mortgage LLC, 5.50%, 4/15/29 (144A) | 143,298 |
| | Total Diversified Financial Services | $4,350,948 |
|
|
| | Electric — 0.4% | |
| 195,000(c) | Algonquin Power & Utilities Corp., 4.75% (5 Year CMT Index + 325 bps), 1/18/82 | $ 157,355 |
| 125,000 | American Electric Power Co., Inc., 4.30%, 12/1/28 | 119,878 |
| 220,000 | Consolidated Edison Co. of New York, Inc., 4.625%, 12/1/54 | 191,702 |
| 76,000(g) | Dominion Energy, Inc., 3.071%, 8/15/24 | 73,795 |
| 250,000 | Duke Energy Carolinas LLC, 3.95%, 3/15/48 | 200,992 |
| 75,000 | Entergy Louisiana LLC, 4.75%, 9/15/52 | 67,915 |
| 121,000 | New York State Electric & Gas Corp., 3.30%, 9/15/49 (144A) | 82,001 |
| 185,000 | NextEra Energy Capital Holdings, Inc., 6.051%, 3/1/25 | 186,342 |
| 75,000 | Niagara Mohawk Power Corp., 5.783%, 9/16/52 (144A) | 75,707 |
| 205,000 | Puget Energy, Inc., 2.379%, 6/15/28 | 176,820 |
The accompanying notes are an integral part of these financial statements.
40Pioneer Balanced ESG Fund | Annual Report | 7/31/23
Principal
Amount
USD ($) | | | | | | Value |
| | Electric — (continued) | |
| 142,000 | Puget Energy, Inc., 4.10%, 6/15/30 | $ 128,485 |
| 120,000 | Puget Energy, Inc., 4.224%, 3/15/32 | 107,559 |
| 200,000 | Virginia Electric and Power Co., 4.45%, 2/15/44 | 171,959 |
| | Total Electric | $1,740,510 |
|
|
| | Energy-Alternate Sources — 0.0%† | |
| 35,226 | Alta Wind Holdings LLC, 7.00%, 6/30/35 (144A) | $ 32,054 |
| | Total Energy-Alternate Sources | $32,054 |
|
|
| | Food — 0.1% | |
| 200,000 | Minerva Luxembourg SA, 4.375%, 3/18/31 (144A) | $ 163,239 |
| 215,000 | Smithfield Foods, Inc., 2.625%, 9/13/31 (144A) | 158,393 |
| 155,000 | Smithfield Foods, Inc., 3.00%, 10/15/30 (144A) | 123,608 |
| 4,000 | Smithfield Foods, Inc., 5.20%, 4/1/29 (144A) | 3,702 |
| | Total Food | $448,942 |
|
|
| | Gas — 0.2% | |
| 325,000 | Boston Gas Co., 3.15%, 8/1/27 (144A) | $ 296,424 |
| 375,000 | KeySpan Gas East Corp., 5.994%, 3/6/33 (144A) | 375,911 |
| 120,000 | NiSource, Inc., 5.40%, 6/30/33 | 120,971 |
| | Total Gas | $793,306 |
|
|
| | Hand & Machine Tools — 0.0%† | |
| 125,000 | Regal Rexnord Corp., 6.30%, 2/15/30 (144A) | $ 124,795 |
| | Total Hand & Machine Tools | $124,795 |
|
|
| | Healthcare-Products — 0.1% | |
| 48,000 | Edwards Lifesciences Corp., 4.30%, 6/15/28 | $ 46,537 |
| 244,000 | Smith & Nephew Plc, 2.032%, 10/14/30 | 196,672 |
| | Total Healthcare-Products | $243,209 |
|
|
| | Healthcare-Services — 0.1% | |
| 135,000 | Elevance Health, Inc., 4.55%, 5/15/52 | $ 119,392 |
| 65,000 | Elevance Health, Inc., 6.10%, 10/15/52 | 70,754 |
| 250,000 | Fresenius Medical Care US Finance III, Inc., 2.375%, 2/16/31 (144A) | 191,431 |
| | Total Healthcare-Services | $381,577 |
|
|
| | Insurance — 0.7% | |
| 185,000 | Brown & Brown, Inc., 4.20%, 3/17/32 | $ 167,267 |
| 435,000 | CNO Global Funding, 2.65%, 1/6/29 (144A) | 370,065 |
| 50,000(c) | Farmers Exchange Capital III, 5.454% (3 Month USD LIBOR + 345 bps), 10/15/54 (144A) | 43,629 |
| 385,000(c) | Farmers Insurance Exchange, 4.747% (3 Month USD LIBOR + 323 bps), 11/1/57 (144A) | 299,891 |
The accompanying notes are an integral part of these financial statements.
Pioneer Balanced ESG Fund | Annual Report | 7/31/2341
Schedule of Investments | 7/31/23 (continued)
Principal
Amount
USD ($) | | | | | | Value |
| | Insurance — (continued) | |
| 875,000 | Liberty Mutual Insurance Co., 7.697%, 10/15/97 (144A) | $ 957,198 |
| 160,000 | Metropolitan Life Global Funding I, 5.15%, 3/28/33 (144A) | 158,784 |
| 270,000(c) | Nippon Life Insurance Co., 2.75% (5 Year CMT Index + 265 bps), 1/21/51 (144A) | 221,619 |
| 200,000(c) | Nippon Life Insurance Co., 2.90% (5 Year CMT Index + 260 bps), 9/16/51 (144A) | 163,874 |
| 79,000 | Primerica, Inc., 2.80%, 11/19/31 | 65,526 |
| 305,000 | Prudential Financial, Inc., 3.00%, 3/10/40 | 230,615 |
| 163,000 | Prudential Financial, Inc., 3.878%, 3/27/28 | 156,655 |
| 110,000 | Teachers Insurance & Annuity Association of America, 4.27%, 5/15/47 (144A) | 90,387 |
| 110,000 | Teachers Insurance & Annuity Association of America, 4.90%, 9/15/44 (144A) | 99,898 |
| 20,000 | Teachers Insurance & Annuity Association of America, 6.85%, 12/16/39 (144A) | 22,185 |
| 40,000 | Willis North America, Inc., 2.95%, 9/15/29 | 34,760 |
| | Total Insurance | $3,082,353 |
|
|
| | Iron & Steel — 0.0%† | |
| 67,000 | Commercial Metals Co., 4.375%, 3/15/32 | $ 58,116 |
| | Total Iron & Steel | $58,116 |
|
|
| | Lodging — 0.1% | |
| 405,000 | Marriott International, Inc., 4.90%, 4/15/29 | $ 397,209 |
| | Total Lodging | $397,209 |
|
|
| | Machinery-Diversified — 0.1% | |
| 500,000 | CNH Industrial Capital LLC, 1.875%, 1/15/26 | $ 458,223 |
| | Total Machinery-Diversified | $458,223 |
|
|
| | Media — 0.1% | |
| 125,000 | CCO Holdings LLC/CCO Holdings Capital Corp., 4.50%, 6/1/33 (144A) | $ 98,912 |
| 70,000 | CCO Holdings LLC/CCO Holdings Capital Corp., 7.375%, 3/1/31 (144A) | 69,601 |
| 215,000 | Charter Communications Operating LLC/Charter Communications Operating Capital, 4.40%, 4/1/33 | 189,298 |
| | Total Media | $357,811 |
|
|
| | Mining — 0.3% | |
| 290,000 | AngloGold Ashanti Holdings Plc, 3.75%, 10/1/30 | $ 250,407 |
| 250,000 | Corp. Nacional del Cobre de Chile, 5.625%, 10/18/43 (144A) | 247,279 |
The accompanying notes are an integral part of these financial statements.
42Pioneer Balanced ESG Fund | Annual Report | 7/31/23
Principal
Amount
USD ($) | | | | | | Value |
| | Mining — (continued) | |
| 270,000 | First Quantum Minerals, Ltd., 8.625%, 6/1/31 (144A) | $ 276,412 |
| 275,000 | Rio Tinto Finance USA Plc, 5.125%, 3/9/53 | 275,754 |
| | Total Mining | $1,049,852 |
|
|
| | Multi-National — 0.1% | |
| 370,000 | Banque Ouest Africaine de Developpement, 4.70%, 10/22/31 (144A) | $ 309,431 |
| | Total Multi-National | $309,431 |
|
|
| | Oil & Gas — 0.3% | |
| 600,000 | Aker BP ASA, 3.10%, 7/15/31 (144A) | $ 497,604 |
| 400,000 | Phillips 66 Co., 3.75%, 3/1/28 | 375,394 |
| 250,000 | Sinopec Group Overseas Development 2014, Ltd., 4.375%, 4/10/24 (144A) | 247,762 |
| 162,000 | Valero Energy Corp., 6.625%, 6/15/37 | 174,274 |
| | Total Oil & Gas | $1,295,034 |
|
|
| | Pharmaceuticals — 0.2% | |
| 618,000 | AbbVie, Inc., 3.20%, 11/21/29 | $ 559,794 |
| 117,000 | AbbVie, Inc., 4.05%, 11/21/39 | 101,869 |
| 40,000 | CVS Health Corp., 5.25%, 1/30/31 | 40,003 |
| 250,000 | CVS Health Corp., 5.25%, 2/21/33 | 248,710 |
| | Total Pharmaceuticals | $950,376 |
|
|
| | Pipelines — 0.4% | |
| 125,000 | Crestwood Midstream Partners LP/Crestwood Midstream Finance Corp., 7.375%, 2/1/31 (144A) | $ 124,683 |
| 555,000 | Kinder Morgan, Inc., 5.45%, 8/1/52 | 512,476 |
| 260,000 | MPLX LP, 4.95%, 3/14/52 | 220,842 |
| 180,000 | NGPL PipeCo LLC, 3.25%, 7/15/31 (144A) | 148,250 |
| 65,000 | Venture Global LNG, Inc., 8.125%, 6/1/28 (144A) | 66,065 |
| 120,000 | Venture Global LNG, Inc., 8.375%, 6/1/31 (144A) | 121,766 |
| 205,000 | Williams Cos., Inc., 5.75%, 6/24/44 | 200,671 |
| 242,000 | Williams Cos., Inc., 7.75%, 6/15/31 | 267,273 |
| | Total Pipelines | $1,662,026 |
|
|
| | REITs — 0.4% | |
| 489,000 | HAT Holdings I LLC/HAT Holdings II LLC , 3.375%, 6/15/26 (144A) | $ 441,676 |
| 19,000 | Highwoods Realty LP, 2.60%, 2/1/31 | 13,991 |
| 18,000 | Highwoods Realty LP, 3.05%, 2/15/30 | 14,069 |
| 490,000 | Simon Property Group LP , 5.50%, 3/8/33 | 489,521 |
| 480,000 | Sun Communities Operating LP , 5.70%, 1/15/33 | 471,793 |
The accompanying notes are an integral part of these financial statements.
Pioneer Balanced ESG Fund | Annual Report | 7/31/2343
Schedule of Investments | 7/31/23 (continued)
Principal
Amount
USD ($) | | | | | | Value |
| | REITs — (continued) | |
| 205,000 | UDR, Inc., 1.90%, 3/15/33 | $ 151,528 |
| 140,000 | UDR, Inc., 4.40%, 1/26/29 | 131,741 |
| | Total REITs | $1,714,319 |
|
|
| | Retail — 0.4% | |
| 240,000 | 7-Eleven, Inc., 2.80%, 2/10/51 (144A) | $ 151,017 |
| 50,000 | AutoNation, Inc., 1.95%, 8/1/28 | 41,273 |
| 50,000 | AutoNation, Inc., 2.40%, 8/1/31 | 38,415 |
| 140,000 | AutoNation, Inc., 3.85%, 3/1/32 | 118,724 |
| 250,000 | AutoNation, Inc., 4.75%, 6/1/30 | 235,253 |
| 565,000 | Best Buy Co., Inc., 1.95%, 10/1/30 | 456,882 |
| 335,000 | Dollar Tree, Inc., 2.65%, 12/1/31 | 274,812 |
| 280,000 | Lowe's Cos., Inc., 3.75%, 4/1/32 | 253,894 |
| 90,000 | Tractor Supply Co., 5.25%, 5/15/33 | 88,980 |
| | Total Retail | $1,659,250 |
|
|
| | Semiconductors — 0.2% | |
| 391,000 | Broadcom, Inc., 3.187%, 11/15/36 (144A) | $ 295,653 |
| 125,000 | Broadcom, Inc., 4.15%, 4/15/32 (144A) | 113,023 |
| 60,000 | Broadcom, Inc., 4.30%, 11/15/32 | 54,735 |
| 200,000 | Foundry JV Holdco LLC, 5.875%, 1/25/34 (144A) | 197,996 |
| 269,000 | Skyworks Solutions, Inc., 3.00%, 6/1/31 | 223,082 |
| | Total Semiconductors | $884,489 |
|
|
| | Software — 0.1% | |
| 379,000 | Autodesk, Inc., 2.40%, 12/15/31 | $ 310,738 |
| 175,000 | Infor, Inc., 1.75%, 7/15/25 (144A) | 160,595 |
| | Total Software | $471,333 |
|
|
| | Telecommunications — 0.2% | |
| 215,000 | Motorola Solutions, Inc., 2.30%, 11/15/30 | $ 172,935 |
| 230,000 | Motorola Solutions, Inc., 5.60%, 6/1/32 | 228,274 |
| 350,000 | T-Mobile USA, Inc., 2.55%, 2/15/31 | 290,848 |
| 170,000 | T-Mobile USA, Inc., 5.05%, 7/15/33 | 166,371 |
| 230,000 | Verizon Communications, Inc., 3.55%, 3/22/51 | 166,576 |
| | Total Telecommunications | $1,025,004 |
|
|
| | Transportation — 0.1% | |
| 250,000 | FedEx Corp., 4.55%, 4/1/46 | $ 215,687 |
| | Total Transportation | $215,687 |
|
|
| | Trucking & Leasing — 0.1% | |
| 98,000 | Penske Truck Leasing Co. LP/PTL Finance Corp., 4.40%, 7/1/27 (144A) | $ 92,897 |
The accompanying notes are an integral part of these financial statements.
44Pioneer Balanced ESG Fund | Annual Report | 7/31/23
Principal
Amount
USD ($) | | | | | | Value |
| | Trucking & Leasing — (continued) | |
| 255,000 | Penske Truck Leasing Co. LP/PTL Finance Corp., 5.55%, 5/1/28 (144A) | $ 251,053 |
| 35,000(e) | Penske Truck Leasing Co. LP/PTL Finance Corp., 6.05%, 8/1/28 (144A) | 35,103 |
| 40,000 | Penske Truck Leasing Co. LP/PTL Finance Corp., 6.20%, 6/15/30 (144A) | 40,394 |
| | Total Trucking & Leasing | $419,447 |
|
|
| | Total Corporate Bonds
(Cost $48,090,478) | $43,510,788 |
|
|
| Shares | | | | | | |
| | Convertible Preferred Stock — 0.2% of
Net Assets | |
| | Banks — 0.2% | |
| 577(f) | Wells Fargo & Co., 7.50% | $ 680,277 |
| | Total Banks | $680,277 |
|
|
| | Total Convertible Preferred Stock
(Cost $824,732) | $680,277 |
|
|
Principal
Amount
USD ($) | | | | | | |
| | Municipal Bonds — 0.1% of Net Assets(h) | |
| | Massachusetts — 0.0%† | |
| 100,000 | Massachusetts Development Finance Agency, Federally Taxable, Series B, 4.844%, 9/1/43 | $ 94,056 |
| | Total Massachusetts | $ 94,056 |
|
|
| | Missouri — 0.0%† | |
| 100,000 | Health & Educational Facilities Authority of the State of Missouri, Washington University, Series A, 3.685%, 2/15/47 | $ 78,912 |
| | Total Missouri | $ 78,912 |
|
|
| | Texas — 0.1% | |
| 100,000(i) | Central Texas Regional Mobility Authority, 1/1/25 | $ 94,503 |
| | Total Texas | $ 94,503 |
|
|
| | Total Municipal Bonds
(Cost $292,578) | $ 267,471 |
|
|
The accompanying notes are an integral part of these financial statements.
Pioneer Balanced ESG Fund | Annual Report | 7/31/2345
Schedule of Investments | 7/31/23 (continued)
| Shares | | | | | | Value |
| | Preferred Stock — 0.4% of Net Assets | |
| | Automobiles — 0.4% | |
| 15,107(b) | Porsche AG (144A) | $ 1,847,048 |
| | Total Automobiles | $1,847,048 |
|
|
| | Total Preferred Stock
(Cost $1,237,220) | $1,847,048 |
|
|
Principal
Amount
USD ($) | | | | | | |
| | Insurance-Linked Securities — 0.1% of Net
Assets# | |
| | Event Linked Bonds — 0.1% | |
| | Multiperil – U.S. — 0.1% | |
| 250,000(a) | Easton Re Pte, 9.916%, (3 Month U.S. Treasury Bill + 453 bps), 1/8/24 (144A) | $ 248,100 |
| | Windstorm – U.S. — 0.0%† | |
| 250,000(a) | Bonanza Re, 10.279%, (3 Month U.S. Treasury Bill + 487 bps), 12/23/24 (144A) | $ 224,800 |
| | Total Event Linked Bonds | $ 472,900 |
|
|
Face
Amount
USD ($) | | | | | | | |
| | Reinsurance Sidecars — 0.0%† | | |
| | Multiperil – Worldwide — 0.0%† | | |
| 100,000(j) + | Sector Re V, 3/1/24 (144A) | $ 50,740 | |
| | Total Reinsurance Sidecars | $50,740 | |
| |
| |
| | Total Insurance-Linked Securities
(Cost $568,166) | $523,640 | |
| |
| |
Principal
Amount
USD ($) | | | | | | |
| | Foreign Government Bond — 0.0%† of Net
Assets | |
| | Philippines — 0.0%† | |
| 200,000 | Philippine Government International Bond, 5.000%, 1/13/37 | $ 196,744 |
| | Total Philippines | $196,744 |
|
|
| | Total Foreign Government Bond
(Cost $260,250) | $196,744 |
|
|
The accompanying notes are an integral part of these financial statements.
46Pioneer Balanced ESG Fund | Annual Report | 7/31/23
Principal
Amount
USD ($) | | | | | | Value |
| | U.S. Government and Agency Obligations
— 13.4% of Net Assets | |
| 358,673 | Federal Home Loan Mortgage Corp., 1.500%, 12/1/41 | $ 288,972 |
| 92,478 | Federal Home Loan Mortgage Corp., 1.500%, 1/1/42 | 74,468 |
| 91,079 | Federal Home Loan Mortgage Corp., 1.500%, 1/1/42 | 73,341 |
| 452,589 | Federal Home Loan Mortgage Corp., 1.500%, 1/1/42 | 364,448 |
| 181,104 | Federal Home Loan Mortgage Corp., 1.500%, 2/1/42 | 145,834 |
| 272,303 | Federal Home Loan Mortgage Corp., 1.500%, 2/1/42 | 219,159 |
| 95,132 | Federal Home Loan Mortgage Corp., 2.000%, 3/1/52 | 77,130 |
| 732,162 | Federal Home Loan Mortgage Corp., 2.500%, 5/1/51 | 619,484 |
| 186,571 | Federal Home Loan Mortgage Corp., 2.500%, 4/1/52 | 157,350 |
| 75,843 | Federal Home Loan Mortgage Corp., 3.000%, 6/1/46 | 67,859 |
| 18,548 | Federal Home Loan Mortgage Corp., 3.000%, 12/1/46 | 16,524 |
| 7,804 | Federal Home Loan Mortgage Corp., 3.000%, 11/1/47 | 6,979 |
| 87,084 | Federal Home Loan Mortgage Corp., 3.500%, 8/1/46 | 80,617 |
| 81,194 | Federal Home Loan Mortgage Corp., 3.500%, 8/1/46 | 75,164 |
| 8,679 | Federal Home Loan Mortgage Corp., 3.500%, 6/1/47 | 8,007 |
| 85,772 | Federal Home Loan Mortgage Corp., 3.500%, 4/1/52 | 78,330 |
| 254,162 | Federal Home Loan Mortgage Corp., 3.500%, 4/1/52 | 232,537 |
| 89,343 | Federal Home Loan Mortgage Corp., 4.000%, 11/1/37 | 86,191 |
| 108,223 | Federal Home Loan Mortgage Corp., 4.000%, 2/1/40 | 103,629 |
| 131,077 | Federal Home Loan Mortgage Corp., 4.000%, 11/1/40 | 125,513 |
| 135,374 | Federal Home Loan Mortgage Corp., 4.000%, 11/1/40 | 129,627 |
| 82,882 | Federal Home Loan Mortgage Corp., 4.000%, 1/1/41 | 79,363 |
| 11,852 | Federal Home Loan Mortgage Corp., 4.000%, 4/1/47 | 11,224 |
| 22,179 | Federal Home Loan Mortgage Corp., 4.000%, 9/1/51 | 20,749 |
| 14,651 | Federal Home Loan Mortgage Corp., 4.500%, 8/1/34 | 14,398 |
| 49,652 | Federal Home Loan Mortgage Corp., 4.500%, 5/1/40 | 48,883 |
| 25,655 | Federal Home Loan Mortgage Corp., 4.500%, 7/1/40 | 25,257 |
| 48,430 | Federal Home Loan Mortgage Corp., 4.500%, 5/1/41 | 47,679 |
| 10,907 | Federal Home Loan Mortgage Corp., 5.000%, 11/1/34 | 10,963 |
| 10,260 | Federal Home Loan Mortgage Corp., 5.000%, 8/1/37 | 10,312 |
| 2,648 | Federal Home Loan Mortgage Corp., 5.000%, 5/1/39 | 2,647 |
| 6,579 | Federal Home Loan Mortgage Corp., 5.000%, 12/1/39 | 6,577 |
| 22,901 | Federal Home Loan Mortgage Corp., 5.000%, 10/1/49 | 22,466 |
| 191,231 | Federal Home Loan Mortgage Corp., 5.000%, 12/1/49 | 188,920 |
| 93,899 | Federal Home Loan Mortgage Corp., 5.000%, 10/1/52 | 93,809 |
| 195,741 | Federal Home Loan Mortgage Corp., 5.000%, 4/1/53 | 191,196 |
| 393,000 | Federal Home Loan Mortgage Corp., 5.000%, 4/1/53 | 383,876 |
| 99,680 | Federal Home Loan Mortgage Corp., 5.000%, 4/1/53 | 97,534 |
| 6,863 | Federal Home Loan Mortgage Corp., 5.500%, 11/1/34 | 7,021 |
| 188,598 | Federal Home Loan Mortgage Corp., 5.500%, 7/1/49 | 190,069 |
| 3,754 | Federal Home Loan Mortgage Corp., 6.000%, 1/1/38 | 3,875 |
| 7,908 | Federal Home Loan Mortgage Corp., 6.000%, 10/1/38 | 8,157 |
The accompanying notes are an integral part of these financial statements.
Pioneer Balanced ESG Fund | Annual Report | 7/31/2347
Schedule of Investments | 7/31/23 (continued)
Principal
Amount
USD ($) | | | | | | Value |
| | U.S. Government and Agency Obligations —
(continued) | |
| 99,789 | Federal Home Loan Mortgage Corp., 6.000%, 4/1/53 | $ 101,339 |
| 3,479 | Federal Home Loan Mortgage Corp., 6.500%, 10/1/33 | 3,610 |
| 28,721 | Federal Home Loan Mortgage Corp., 6.500%, 1/1/53 | 29,377 |
| 191,494 | Federal Home Loan Mortgage Corp., 6.500%, 2/1/53 | 201,070 |
| 100,000 | Federal Home Loan Mortgage Corp., 6.500%, 8/1/53 | 102,402 |
| 883,040 | Federal National Mortgage Association, 1.500%, 11/1/41 | 711,545 |
| 539,274 | Federal National Mortgage Association, 1.500%, 1/1/42 | 434,762 |
| 361,055 | Federal National Mortgage Association, 1.500%, 1/1/42 | 290,782 |
| 461,482 | Federal National Mortgage Association, 1.500%, 2/1/42 | 371,471 |
| 181,722 | Federal National Mortgage Association, 1.500%, 3/1/42 | 146,201 |
| 184,949 | Federal National Mortgage Association, 2.000%, 3/1/52 | 149,870 |
| 17,323 | Federal National Mortgage Association, 2.500%, 3/1/43 | 14,859 |
| 12,919 | Federal National Mortgage Association, 2.500%, 4/1/43 | 11,082 |
| 5,637 | Federal National Mortgage Association, 2.500%, 8/1/43 | 4,836 |
| 13,242 | Federal National Mortgage Association, 2.500%, 4/1/45 | 11,360 |
| 20,216 | Federal National Mortgage Association, 2.500%, 4/1/45 | 17,340 |
| 9,829 | Federal National Mortgage Association, 2.500%, 8/1/45 | 8,432 |
| 69,245 | Federal National Mortgage Association, 2.500%, 9/1/50 | 59,510 |
| 76,587 | Federal National Mortgage Association, 2.500%, 9/1/50 | 65,579 |
| 831,077 | Federal National Mortgage Association, 2.500%, 5/1/51 | 712,707 |
| 262,751 | Federal National Mortgage Association, 2.500%, 11/1/51 | 224,674 |
| 267,824 | Federal National Mortgage Association, 2.500%, 12/1/51 | 228,212 |
| 631,457 | Federal National Mortgage Association, 2.500%, 1/1/52 | 537,826 |
| 88,550 | Federal National Mortgage Association, 2.500%, 2/1/52 | 75,659 |
The accompanying notes are an integral part of these financial statements.
48Pioneer Balanced ESG Fund | Annual Report | 7/31/23
Principal
Amount
USD ($) | | | | | | Value |
| | U.S. Government and Agency Obligations —
(continued) | |
| 797,636 | Federal National Mortgage Association, 2.500%, 4/1/52 | $ 672,190 |
| 270,677 | Federal National Mortgage Association, 2.500%, 4/1/52 | 230,925 |
| 1,338,426 | Federal National Mortgage Association, 2.500%, 4/1/52 | 1,128,692 |
| 30,081 | Federal National Mortgage Association, 3.000%, 10/1/30 | 28,587 |
| 10,179 | Federal National Mortgage Association, 3.000%, 2/1/43 | 9,135 |
| 2,611 | Federal National Mortgage Association, 3.000%, 5/1/46 | 2,331 |
| 4,244 | Federal National Mortgage Association, 3.000%, 10/1/46 | 3,794 |
| 2,709 | Federal National Mortgage Association, 3.000%, 1/1/47 | 2,419 |
| 83,323 | Federal National Mortgage Association, 3.000%, 3/1/47 | 74,656 |
| 42,006 | Federal National Mortgage Association, 3.000%, 4/1/47 | 37,546 |
| 434,458 | Federal National Mortgage Association, 3.000%, 1/1/52 | 384,963 |
| 583,279 | Federal National Mortgage Association, 3.000%, 3/1/52 | 519,922 |
| 2,000,000 | Federal National Mortgage Association, 3.000%, 8/1/53 (TBA) | 1,749,766 |
| 89,520 | Federal National Mortgage Association, 3.000%, 2/1/57 | 77,571 |
| 5,588 | Federal National Mortgage Association, 3.500%, 2/1/49 | 5,070 |
| 147,121 | Federal National Mortgage Association, 3.500%, 5/1/49 | 136,225 |
| 226,709 | Federal National Mortgage Association, 3.500%, 5/1/49 | 211,592 |
| 21,093 | Federal National Mortgage Association, 3.500%, 4/1/52 | 19,118 |
| 80,710 | Federal National Mortgage Association, 3.500%, 4/1/52 | 73,126 |
| 164,929 | Federal National Mortgage Association, 3.500%, 4/1/52 | 150,858 |
| 177,959 | Federal National Mortgage Association, 3.500%, 5/1/52 | 162,519 |
| 73,796 | Federal National Mortgage Association, 4.000%, 10/1/40 | 71,037 |
The accompanying notes are an integral part of these financial statements.
Pioneer Balanced ESG Fund | Annual Report | 7/31/2349
Schedule of Investments | 7/31/23 (continued)
Principal
Amount
USD ($) | | | | | | Value |
| | U.S. Government and Agency Obligations —
(continued) | |
| 107,959 | Federal National Mortgage Association, 4.000%, 3/1/41 | $ 103,255 |
| 155,356 | Federal National Mortgage Association, 4.000%, 6/1/42 | 148,632 |
| 48,852 | Federal National Mortgage Association, 4.000%, 9/1/42 | 46,725 |
| 36,928 | Federal National Mortgage Association, 4.000%, 11/1/50 | 34,683 |
| 18,487 | Federal National Mortgage Association, 4.000%, 12/1/50 | 17,316 |
| 7,852 | Federal National Mortgage Association, 4.000%, 1/1/51 | 7,348 |
| 10,993 | Federal National Mortgage Association, 4.000%, 2/1/51 | 10,298 |
| 12,990 | Federal National Mortgage Association, 4.000%, 4/1/51 | 12,175 |
| 27,064 | Federal National Mortgage Association, 4.000%, 6/1/51 | 25,323 |
| 74,502 | Federal National Mortgage Association, 4.000%, 7/1/51 | 69,674 |
| 38,037 | Federal National Mortgage Association, 4.000%, 7/1/56 | 35,623 |
| 68,176 | Federal National Mortgage Association, 4.000%, 1/1/57 | 63,764 |
| 600,000 | Federal National Mortgage Association, 4.500%, 8/1/38 (TBA) | 587,719 |
| 99,086 | Federal National Mortgage Association, 4.500%, 6/1/40 | 97,178 |
| 76,619 | Federal National Mortgage Association, 4.500%, 4/1/41 | 75,830 |
| 104,475 | Federal National Mortgage Association, 4.500%, 9/1/43 | 102,735 |
| 167,387 | Federal National Mortgage Association, 4.500%, 12/1/43 | 162,899 |
| 66,175 | Federal National Mortgage Association, 4.500%, 1/1/44 | 65,073 |
| 840,293 | Federal National Mortgage Association, 4.500%, 7/1/44 | 821,971 |
| 59,105 | Federal National Mortgage Association, 4.500%, 8/1/47 | 58,046 |
| 48,679 | Federal National Mortgage Association, 5.000%, 5/1/31 | 48,512 |
| 1,000,000 | Federal National Mortgage Association, 5.000%, 8/1/38 (TBA) | 993,047 |
The accompanying notes are an integral part of these financial statements.
50Pioneer Balanced ESG Fund | Annual Report | 7/31/23
Principal
Amount
USD ($) | | | | | | Value |
| | U.S. Government and Agency Obligations —
(continued) | |
| 9,554 | Federal National Mortgage Association, 5.000%, 6/1/49 | $ 9,386 |
| 94,746 | Federal National Mortgage Association, 5.000%, 10/1/50 | 93,777 |
| 98,413 | Federal National Mortgage Association, 5.000%, 6/1/52 | 96,419 |
| 284,514 | Federal National Mortgage Association, 5.000%, 8/1/52 | 277,912 |
| 302,388 | Federal National Mortgage Association, 5.000%, 8/1/52 | 295,605 |
| 99,622 | Federal National Mortgage Association, 5.000%, 4/1/53 | 97,358 |
| 100,000 | Federal National Mortgage Association, 5.000%, 8/1/53 (TBA) | 97,684 |
| 2,092 | Federal National Mortgage Association, 5.500%, 3/1/34 | 2,077 |
| 4,522 | Federal National Mortgage Association, 5.500%, 12/1/34 | 4,529 |
| 23,872 | Federal National Mortgage Association, 5.500%, 10/1/35 | 24,296 |
| 9,916 | Federal National Mortgage Association, 5.500%, 12/1/35 | 10,147 |
| 11,658 | Federal National Mortgage Association, 5.500%, 12/1/35 | 11,927 |
| 6,287 | Federal National Mortgage Association, 5.500%, 5/1/37 | 6,444 |
| 65,682 | Federal National Mortgage Association, 5.500%, 5/1/38 | 67,162 |
| 97,450 | Federal National Mortgage Association, 5.500%, 4/1/50 | 98,209 |
| 190,633 | Federal National Mortgage Association, 5.500%, 4/1/50 | 192,119 |
| 98,232 | Federal National Mortgage Association, 5.500%, 1/1/53 | 98,135 |
| 99,482 | Federal National Mortgage Association, 5.500%, 2/1/53 | 99,384 |
| 98,786 | Federal National Mortgage Association, 5.500%, 4/1/53 | 98,331 |
| 97,037 | Federal National Mortgage Association, 5.500%, 4/1/53 | 96,481 |
| 100,000 | Federal National Mortgage Association, 5.500%, 7/1/53 | 100,282 |
| 2,000,000 | Federal National Mortgage Association, 5.500%, 8/1/53 (TBA) | 1,986,094 |
The accompanying notes are an integral part of these financial statements.
Pioneer Balanced ESG Fund | Annual Report | 7/31/2351
Schedule of Investments | 7/31/23 (continued)
Principal
Amount
USD ($) | | | | | | Value |
| | U.S. Government and Agency Obligations —
(continued) | |
| 227 | Federal National Mortgage Association, 6.000%, 9/1/29 | $ 233 |
| 718 | Federal National Mortgage Association, 6.000%, 8/1/32 | 736 |
| 5,256 | Federal National Mortgage Association, 6.000%, 12/1/33 | 5,291 |
| 4,743 | Federal National Mortgage Association, 6.000%, 10/1/37 | 4,896 |
| 3,361 | Federal National Mortgage Association, 6.000%, 12/1/37 | 3,466 |
| 48,665 | Federal National Mortgage Association, 6.000%, 1/1/53 | 49,856 |
| 19,549 | Federal National Mortgage Association, 6.000%, 1/1/53 | 19,904 |
| 97,331 | Federal National Mortgage Association, 6.000%, 1/1/53 | 98,740 |
| 99,596 | Federal National Mortgage Association, 6.000%, 3/1/53 | 100,313 |
| 99,702 | Federal National Mortgage Association, 6.000%, 5/1/53 | 102,146 |
| 99,605 | Federal National Mortgage Association, 6.000%, 5/1/53 | 101,111 |
| 99,891 | Federal National Mortgage Association, 6.000%, 6/1/53 | 101,685 |
| 100,000 | Federal National Mortgage Association, 6.000%, 7/1/53 | 101,364 |
| 100,000 | Federal National Mortgage Association, 6.000%, 7/1/53 | 101,709 |
| 100,000 | Federal National Mortgage Association, 6.000%, 7/1/53 | 101,580 |
| 1,500,000 | Federal National Mortgage Association, 6.000%, 8/15/53 (TBA) | 1,508,906 |
| 4,176 | Federal National Mortgage Association, 6.500%, 4/1/29 | 4,194 |
| 2,475 | Federal National Mortgage Association, 6.500%, 7/1/29 | 2,524 |
| 7,106 | Federal National Mortgage Association, 6.500%, 5/1/32 | 7,352 |
| 6,570 | Federal National Mortgage Association, 6.500%, 9/1/32 | 6,810 |
| 2,987 | Federal National Mortgage Association, 6.500%, 10/1/32 | 3,049 |
| 97,172 | Federal National Mortgage Association, 6.500%, 3/1/53 | 100,337 |
The accompanying notes are an integral part of these financial statements.
52Pioneer Balanced ESG Fund | Annual Report | 7/31/23
Principal
Amount
USD ($) | | | | | | Value |
| | U.S. Government and Agency Obligations —
(continued) | |
| 100,000 | Federal National Mortgage Association, 6.500%, 8/1/53 | $ 102,285 |
| 8,462 | Federal National Mortgage Association, 7.000%, 1/1/36 | 8,680 |
| 600,000 | Government National Mortgage Association, 3.000%, 8/20/53 (TBA) | 533,742 |
| 200,000 | Government National Mortgage Association, 3.500%, 8/20/53 (TBA) | 183,750 |
| 700,000 | Government National Mortgage Association, 5.000%, 8/15/53 (TBA) | 685,891 |
| 500,000 | Government National Mortgage Association, 5.500%, 8/15/53 (TBA) | 496,875 |
| 700,000 | Government National Mortgage Association, 6.000%, 8/15/53 (TBA) | 703,309 |
| 65,884 | Government National Mortgage Association I, 3.500%, 11/15/41 | 61,691 |
| 8,651 | Government National Mortgage Association I, 3.500%, 10/15/42 | 8,100 |
| 109,518 | Government National Mortgage Association I, 4.000%, 9/15/41 | 104,794 |
| 19,041 | Government National Mortgage Association I, 4.000%, 4/15/45 | 18,224 |
| 31,131 | Government National Mortgage Association I, 4.000%, 6/15/45 | 29,961 |
| 19,451 | Government National Mortgage Association I, 4.500%, 5/15/39 | 19,131 |
| 4,612 | Government National Mortgage Association I, 5.500%, 8/15/33 | 4,656 |
| 7,917 | Government National Mortgage Association I, 5.500%, 9/15/33 | 7,907 |
| 4,956 | Government National Mortgage Association I, 6.000%, 10/15/33 | 4,993 |
| 8,272 | Government National Mortgage Association I, 6.000%, 9/15/34 | 8,337 |
| 22,038 | Government National Mortgage Association I, 6.000%, 9/15/38 | 22,825 |
| 1,595 | Government National Mortgage Association I, 6.500%, 10/15/28 | 1,623 |
| 5,447 | Government National Mortgage Association I, 6.500%, 5/15/31 | 5,544 |
| 5,306 | Government National Mortgage Association I, 6.500%, 6/15/32 | 5,405 |
| 8,100 | Government National Mortgage Association I, 6.500%, 12/15/32 | 8,258 |
The accompanying notes are an integral part of these financial statements.
Pioneer Balanced ESG Fund | Annual Report | 7/31/2353
Schedule of Investments | 7/31/23 (continued)
Principal
Amount
USD ($) | | | | | | Value |
| | U.S. Government and Agency Obligations —
(continued) | |
| 11,083 | Government National Mortgage Association I, 6.500%, 5/15/33 | $ 11,281 |
| 105 | Government National Mortgage Association I, 7.000%, 8/15/28 | 106 |
| 1,993 | Government National Mortgage Association I, 8.000%, 2/15/30 | 1,989 |
| 673,800 | Government National Mortgage Association II, 3.500%, 9/20/52 | 618,852 |
| 478,885 | Government National Mortgage Association II, 4.000%, 9/20/52 | 450,916 |
| 26,776 | Government National Mortgage Association II, 4.500%, 9/20/44 | 26,461 |
| 12,663 | Government National Mortgage Association II, 4.500%, 10/20/44 | 12,507 |
| 25,133 | Government National Mortgage Association II, 4.500%, 11/20/44 | 24,824 |
| 476,205 | Government National Mortgage Association II, 4.500%, 9/20/52 | 458,129 |
| 9,887 | Government National Mortgage Association II, 5.500%, 2/20/34 | 10,080 |
| 100,369 | Government National Mortgage Association II, 5.500%, 9/20/52 | 99,768 |
| 13,277 | Government National Mortgage Association II, 6.500%, 11/20/28 | 13,488 |
| 795 | Government National Mortgage Association II, 7.500%, 9/20/29 | 805 |
| 1,357,000 | U.S. Treasury Bonds, 2.000%, 2/15/50 | 903,412 |
| 2,440,000 | U.S. Treasury Bonds, 3.000%, 2/15/48 | 2,001,181 |
| 12,374,000 | U.S. Treasury Bonds, 3.125%, 5/15/48 | 10,385,943 |
| 255,000 | U.S. Treasury Bonds, 3.625%, 2/15/53 | 237,827 |
| 5,039,000 | U.S. Treasury Notes, 1.125%, 2/15/31 | 4,121,154 |
| 2,500,000 | U.S. Treasury Notes, 1.500%, 2/15/30 | 2,132,324 |
| 340,000 | U.S. Treasury Notes, 2.625%, 5/31/27 | 319,507 |
| 250,000 | U.S. Treasury Notes, 2.750%, 5/31/29 | 231,943 |
| 2,090,000 | U.S. Treasury Notes, 2.875%, 5/15/32 | 1,919,861 |
| 850,000 | U.S. Treasury Notes, 3.250%, 6/30/27 | 817,428 |
| 353,000 | U.S. Treasury Notes, 3.375%, 5/15/33 | 336,729 |
| 2,830,000 | U.S. Treasury Notes, 3.500%, 2/15/33 | 2,727,412 |
| | Total U.S. Government and Agency Obligations
(Cost $59,814,956) | $55,630,379 |
|
|
The accompanying notes are an integral part of these financial statements.
54Pioneer Balanced ESG Fund | Annual Report | 7/31/23
| Shares | | | | | | Value |
| | SHORT TERM INVESTMENTS — 6.3% of Net
Assets | |
| | Open-End Fund — 6.3% | |
| 26,266,484(k) | Dreyfus Government Cash Management,
Institutional Shares, 5.14% | $ 26,266,484 |
| | | | | | | $ 26,266,484 |
|
|
| | TOTAL SHORT TERM INVESTMENTS
(Cost $26,266,484) | $26,266,484 |
|
|
| | TOTAL INVESTMENTS IN UNAFFILIATED ISSUERS — 102.0%
(Cost $356,949,034) | $423,835,388 |
| | | Dividend
Income | Net
Realized
Gain (Loss) | Change
in Net
Unrealized
Appreciation
(Depreciation) | |
| | Affiliated Issuer — 0.2% | |
| | Closed-End Fund — 0.2% of Net Assets | |
| 115,672(l) | Pioneer ILS Interval Fund | $24,446 | $— | $48,899 | $ 1,023,698 |
| | Total Closed-End Fund
(Cost $1,166,789) | $ 1,023,698 |
|
|
| | Total Investments in Affiliated Issuer — 0.2%
(Cost $1,166,789) | $ 1,023,698 |
|
|
| | OTHER ASSETS AND LIABILITIES — (2.2)% | $ (9,290,902) |
| | net assets — 100.0% | $415,568,184 |
| | | | | | | |
| (A.D.R.) | American Depositary Receipts. |
| (G.D.R.) | Global Depositary Receipts. |
| (TBA) | “To Be Announced” Securities. |
| bps | Basis Points. |
| CMT | Constant Maturity Treasury Index. |
| FREMF | Freddie Mac Multifamily Fixed-Rate Mortgage Loans. |
| LIBOR | London Interbank Offered Rate. |
| REIT | Real Estate Investment Trust. |
| REMICs | Real Estate Mortgage Investment Conduits. |
| SOFR | Secured Overnight Financing Rate. |
| SOFR30A | Secured Overnight Financing Rate 30 Day Average. |
The accompanying notes are an integral part of these financial statements.
Pioneer Balanced ESG Fund | Annual Report | 7/31/2355
Schedule of Investments | 7/31/23 (continued)
| (144A) | The resale of such security is exempt from registration under Rule 144A of the Securities Act of 1933. Such securities may be resold normally to qualified institutional buyers. At July 31, 2023, the value of these securities amounted to $46,543,358, or 11.2% of net assets. |
| (a) | Floating rate note. Coupon rate, reference index and spread shown at July 31, 2023. |
| (b) | Non-income producing security. |
| (c) | The interest rate is subject to change periodically. The interest rate and/or reference index and spread shown at July 31, 2023. |
| (d) | Security represents the interest-only portion payments on a pool of underlying mortgages or mortgage-backed securities. |
| (e) | Securities purchased on a when-issued basis. Rates do not take effect until settlement date. |
| (f) | Security is perpetual in nature and has no stated maturity date. |
| (g) | Debt obligation initially issued at one coupon which converts to a higher coupon at a specific date. The rate shown is the rate at July 31, 2023. |
| (h) | Consists of Revenue Bonds unless otherwise indicated. |
| (i) | Security issued with a zero coupon. Income is recognized through accretion of discount. |
| (j) | Issued as participation notes. |
| (k) | Rate periodically changes. Rate disclosed is the 7-day yield at July 31, 2023. |
| (l) | Pioneer ILS Interval Fund is an affiliated closed-end fund managed by Amundi Asset Management US, Inc. (the “Adviser”). |
| * | Senior secured floating rate loan interests in which the Fund invests generally pay interest at rates that are periodically re-determined by reference to a base lending rate plus a premium. These base lending rates are generally (i) the lending rate offered by one or more major European banks, such as LIBOR or SOFR, (ii) the prime rate offered by one or more major United States banks, (iii) the rate of a certificate of deposit or (iv) other base lending rates used by commercial lenders. The interest rate shown is the rate accruing at July 31, 2023. |
| † | Amount rounds to less than 0.1%. |
| + | Security is valued using significant unobservable inputs (Level 3). |
| # | Securities are restricted as to resale. |
| Restricted Securities | Acquisition date | Cost | Value |
| Bonanza Re | 12/15/2020 | $250,000 | $224,800 |
| Easton Re Pte | 12/15/2020 | 250,000 | 248,100 |
| Sector Re V | 4/23/2019 | 68,166 | 50,740 |
| Total Restricted Securities | | | $523,640 |
| % of Net assets | | | 0.1% |
The accompanying notes are an integral part of these financial statements.
56Pioneer Balanced ESG Fund | Annual Report | 7/31/23
FUTURES CONTRACTS
FIXED INCOME INDEX FUTURES CONTRACTS
Number of
Contracts
Long | Description | Expiration
Date | Notional
Amount | Market
Value | Unrealized
(Depreciation) |
| 71 | U.S. 2 Year Note (CBT) | 9/29/23 | $14,632,016 | $14,415,219 | $(216,797) |
| 201 | U.S. 5 Year Note (CBT) | 9/29/23 | 21,648,836 | 21,470,882 | (177,954) |
| 19 | U.S. 10 Year Note (CBT) | 9/20/23 | 2,148,160 | 2,116,719 | (31,441) |
| 19 | U.S. 10 Year Ultra Bond (CBT) | 9/20/23 | 2,224,767 | 2,222,703 | (2,064) |
| 45 | U.S. Long Bond (CBT) | 9/20/23 | 5,709,387 | 5,599,688 | (109,699) |
| | | | $46,363,166 | $45,825,211 | $(537,955) |
Number of
Contracts
Short | Description | Expiration
Date | Notional
Amount | Market
Value | Unrealized
Appreciation |
| 13 | U.S. Ultra Bond (CBT) | 9/20/23 | $ (1,722,691) | $ (1,718,844) | $ 3,847 |
| TOTAL FUTURES CONTRACTS | $44,640,475 | $44,106,367 | $(534,108) |
Principal amounts are denominated in U.S. dollars (“USD”) unless otherwise noted.
Purchases and sales of securities (excluding short-term investments) for the year ended July 31, 2023 were as follows:
| | Purchases | Sales |
| Long-Term U.S. Government Securities | $ 14,745,749 | $ 7,404,853 |
| Other Long-Term Securities | $149,345,854 | $165,008,872 |
At July 31, 2023, the net unrealized appreciation on investments based on cost for federal tax purposes of $358,076,367 was as follows:
| Aggregate gross unrealized appreciation for all investments in which there is an excess of value over tax cost | $ 83,793,918 |
| Aggregate gross unrealized depreciation for all investments in which there is an excess of tax cost over value | (17,545,307) |
| Net unrealized appreciation | $ 66,248,611 |
The accompanying notes are an integral part of these financial statements.
Pioneer Balanced ESG Fund | Annual Report | 7/31/2357
Schedule of Investments | 7/31/23 (continued)
Various inputs are used in determining the value of the Fund's investments. These inputs are summarized in the three broad levels below.
| Level 1 | – | unadjusted quoted prices in active markets for identical securities. |
| Level 2 | – | other significant observable inputs (including quoted prices for similar securities, interest rates, prepayment speeds, credit risks, etc.). See Notes to Financial Statements — Note 1A. |
| Level 3 | – | significant unobservable inputs (including the Adviser's own assumptions in determining fair value of investments). See Notes to Financial Statements — Note 1A. |
The following is a summary of the inputs used as of July 31, 2023, in valuing the Fund's investments:
| | Level 1 | Level 2 | Level 3 | Total |
| Senior Secured Floating Rate Loan Interests | $ — | $ 538,587 | $ — | $ 538,587 |
| Common Stocks | 261,292,707 | — | — | 261,292,707 |
| Asset Backed Securities | — | 8,215,571 | — | 8,215,571 |
| Collateralized Mortgage Obligations | — | 11,386,174 | — | 11,386,174 |
| Commercial Mortgage-Backed Securities | — | 6,603,078 | — | 6,603,078 |
| Convertible Corporate Bonds | — | 6,876,440 | — | 6,876,440 |
| Corporate Bonds | — | 43,510,788 | — | 43,510,788 |
| Convertible Preferred Stock | 680,277 | — | — | 680,277 |
| Municipal Bonds | — | 267,471 | — | 267,471 |
| Preferred Stock | 1,847,048 | — | — | 1,847,048 |
| Insurance-Linked Securities | | | | |
| Reinsurance Sidecars | | | | |
| Multiperil – Worldwide | — | — | 50,740 | 50,740 |
| All Other Insurance-Linked Securities | — | 472,900 | — | 472,900 |
| Foreign Government Bond | — | 196,744 | — | 196,744 |
| U.S. Government and Agency Obligations | — | 55,630,379 | — | 55,630,379 |
| Open-End Fund | 26,266,484 | — | — | 26,266,484 |
| Affiliated Closed-End Fund | 1,023,698 | — | — | 1,023,698 |
| Total Investments in Securities | $ 291,110,214 | $133,698,132 | $ 50,740 | $ 424,859,086 |
| Other Financial Instruments | | | | |
| Net unrealized depreciation on futures contracts | $ (534,108) | $ — | $ — | $ (534,108) |
| Total Other Financial Instruments | $ (534,108) | $ — | $ — | $ (534,108) |
During the year ended July 31, 2023, there were no significant transfers in or out of Level 3.
The accompanying notes are an integral part of these financial statements.
58Pioneer Balanced ESG Fund | Annual Report | 7/31/23
Statement of Assets and Liabilities | 7/31/23
| ASSETS: | |
| Investments in unaffiliated issuers, at value (cost $356,949,034) | $423,835,388 |
| Investments in affiliated issuers, at value (cost $1,166,789) | 1,023,698 |
| Cash | 263,277 |
| Foreign currencies, at value (cost $161) | 165 |
| Futures collateral | 691,690 |
| Collateral due from broker for TBA Securities | 10,000 |
| Variation margin for futures contracts | 24,750 |
| Receivables — | |
| Investment securities sold | 906,753 |
| Fund shares sold | 156,350 |
| Dividends | 234,746 |
| Interest | 1,214,943 |
| Due from the Adviser | 1,646 |
| Other assets | 27,099 |
| Total assets | $ 428,390,505 |
| LIABILITIES: | |
| Payables — | |
| Investment securities purchased | $ 11,971,889 |
| Fund shares repurchased | 578,642 |
| Distributions | 13 |
| Trustees' fees | 2,009 |
| Management fees | 28,173 |
| Administrative expenses | 10,162 |
| Distribution fees | 14,444 |
| Accrued expenses | 216,989 |
| Total liabilities | $ 12,822,321 |
| NET ASSETS: | |
| Paid-in capital | $358,227,505 |
| Distributable earnings | 57,340,679 |
| Net assets | $415,568,184 |
| NET ASSET VALUE PER SHARE: | |
| No par value (unlimited number of shares authorized) | |
| Class A (based on $270,803,573/27,221,970 shares) | $ 9.95 |
| Class C (based on $35,935,673/3,651,785 shares) | $ 9.84 |
| Class K (based on $38,360,068/3,865,153 shares) | $ 9.92 |
| Class R (based on $3,948,202/396,077 shares) | $ 9.97 |
| Class Y (based on $66,520,668/6,627,907 shares) | $ 10.04 |
| MAXIMUM OFFERING PRICE PER SHARE: | |
| Class A (based on $9.95 net asset value per share/100%-4.50% maximum sales charge) | $ 10.42 |
The accompanying notes are an integral part of these financial statements.
Pioneer Balanced ESG Fund | Annual Report | 7/31/23 59
Statement of Operations FOR THE YEAR ENDED 7/31/23
| INVESTMENT INCOME: | | |
| Interest from unaffiliated issuers (net of foreign taxes withheld $846) | $ 6,309,458 | |
| Dividends from unaffiliated issuers (net of foreign taxes withheld $52,415) | 5,398,108 | |
| Dividends from affiliated issuers | 24,446 | |
| Total Investment Income | | $ 11,732,012 |
| EXPENSES: | | |
| Management fees | $ 1,975,202 | |
| Administrative expenses | 149,557 | |
| Transfer agent fees | | |
| Class A | 120,296 | |
| Class C | 18,620 | |
| Class K | 176 | |
| Class R | 3,066 | |
| Class Y | 72,989 | |
| Distribution fees | | |
| Class A | 662,462 | |
| Class C | 382,218 | |
| Class R | 16,953 | |
| Shareowner communications expense | 59,986 | |
| Custodian fees | 3,651 | |
| Registration fees | 86,427 | |
| Professional fees | 144,230 | |
| Printing expense | 18,088 | |
| Officers' and Trustees' fees | 20,025 | |
| Insurance expense | 4,218 | |
| Miscellaneous | 143,659 | |
| Total expenses | | $ 3,881,823 |
| Less fees waived and expenses reimbursed by the Adviser | | (119,815) |
| Net expenses | | $ 3,762,008 |
| Net investment income | | $ 7,970,004 |
| REALIZED AND UNREALIZED GAIN (LOSS) ON INVESTMENTS: | | |
| Net realized gain (loss) on: | | |
| Investments in unaffiliated issuers | $ (7,831,541) | |
| Futures contracts | (1,275,020) | |
| Other assets and liabilities denominated in foreign currencies | 57,937 | $ (9,048,624) |
| Change in net unrealized appreciation (depreciation) on: | | |
| Investments in unaffiliated issuers | $26,384,552 | |
| Investments in affiliated issuers | 48,899 | |
| Futures contracts | (732,907) | |
| Other assets and liabilities denominated in foreign currencies | (274) | $25,700,270 |
| Net realized and unrealized gain (loss) on investments | | $16,651,646 |
| Net increase in net assets resulting from operations | | $24,621,650 |
The accompanying notes are an integral part of these financial statements.
60Pioneer Balanced ESG Fund | Annual Report | 7/31/23
Statements of Changes in Net Assets
| | Year
Ended
7/31/23 | Year
Ended
7/31/22 |
| FROM OPERATIONS: | | |
| Net investment income (loss) | $ 7,970,004 | $ 4,439,971 |
| Net realized gain (loss) on investments | (9,048,624) | 12,713,768 |
| Change in net unrealized appreciation (depreciation) on investments | 25,700,270 | (49,462,972) |
| Net increase (decrease) in net assets resulting from operations | $ 24,621,650 | $ (32,309,233) |
| DISTRIBUTIONS TO SHAREOWNERS: | | |
| Class A ($0.31 and $0.91 per share, respectively) | $ (8,818,454) | $ (24,678,235) |
| Class C ($0.25 and $0.83 per share, respectively) | (1,055,140) | (3,865,458) |
| Class K ($0.34 and $0.95 per share, respectively) | (619,119) | (393,068) |
| Class R ($0.28 and $0.88 per share, respectively) | (100,787) | (166,585) |
| Class Y ($0.33 and $0.94 per share, respectively) | (2,421,250) | (6,264,634) |
| Total distributions to shareowners | $ (13,014,750) | $ (35,367,980) |
| FROM FUND SHARE TRANSACTIONS: | | |
| Net proceeds from sales of shares | $ 79,317,089 | $ 85,210,523 |
| Reinvestment of distributions | 12,781,779 | 34,584,331 |
| Cost of shares repurchased | (96,329,928) | (76,584,713) |
| Net increase (decrease) in net assets resulting from Fund share transactions | $ (4,231,060) | $ 43,210,141 |
| Net increase (decrease) in net assets | $ 7,375,840 | $ (24,467,072) |
| NET ASSETS: | | |
| Beginning of year | $408,192,344 | $432,659,416 |
| End of year | $415,568,184 | $408,192,344 |
The accompanying notes are an integral part of these financial statements.
Pioneer Balanced ESG Fund | Annual Report | 7/31/2361
Statements of Changes in Net Assets (continued)
| | Year
Ended
7/31/23
Shares | Year
Ended
7/31/23
Amount | Year
Ended
7/31/22
Shares | Year
Ended
7/31/22
Amount |
| Class A | | | | |
| Shares sold | 2,865,557 | $ 26,869,048 | 3,892,101 | $ 41,513,795 |
| Reinvestment of distributions | 934,805 | 8,615,109 | 2,248,900 | 24,068,744 |
| Less shares repurchased | (5,555,638) | (51,920,689) | (3,777,059) | (39,682,763) |
Net increase
(decrease) | (1,755,276) | $(16,436,532) | 2,363,942 | $ 25,899,776 |
| Class C | | | | |
| Shares sold | 302,886 | $ 2,798,958 | 740,583 | $ 7,924,096 |
| Reinvestment of distributions | 115,665 | 1,054,662 | 363,341 | 3,865,458 |
| Less shares repurchased | (1,339,715) | (12,410,536) | (1,467,546) | (15,492,417) |
| Net decrease | (921,164) | $ (8,556,916) | (363,622) | $ (3,702,863) |
| Class K | | | | |
| Shares sold | 3,547,274 | $ 33,238,329 | 632,906 | $ 6,535,090 |
| Reinvestment of distributions | 66,599 | 619,119 | 36,982 | 391,612 |
| Less shares repurchased | (550,872) | (5,126,715) | (95,764) | (957,960) |
| Net increase | 3,063,001 | $ 28,730,733 | 574,124 | $ 5,968,742 |
| Class R | | | | |
| Shares sold | 136,795 | $ 1,266,678 | 167,700 | $ 1,719,826 |
| Reinvestment of distributions | 10,923 | 100,787 | 15,541 | 166,585 |
| Less shares repurchased | (49,484) | (463,625) | (95,664) | (1,027,343) |
| Net increase | 98,234 | $ 903,840 | 87,577 | $ 859,068 |
| Class Y | | | | |
| Shares sold | 1,603,646 | $ 15,144,076 | 2,599,392 | $ 27,517,716 |
| Reinvestment of distributions | 257,110 | 2,392,102 | 565,081 | 6,091,932 |
| Less shares repurchased | (2,809,314) | (26,408,363) | (1,844,458) | (19,424,230) |
Net increase
(decrease) | (948,558) | $ (8,872,185) | 1,320,015 | $ 14,185,418 |
The accompanying notes are an integral part of these financial statements.
62Pioneer Balanced ESG Fund | Annual Report | 7/31/23
| | Year
Ended
7/31/23 | Year
Ended
7/31/22 | Year
Ended
7/31/21 | Year
Ended
7/31/20 | Year
Ended
7/31/19 |
| Class A | | | | | |
| Net asset value, beginning of period | $ 9.66 | $ 11.31 | $ 9.72 | $ 9.57 | $ 9.64 |
| Increase (decrease) from investment operations: | | | | | |
| Net investment income (loss) (a) | $ 0.19 | $ 0.11 | $ 0.12 | $ 0.15 | $ 0.18 |
| Net realized and unrealized gain (loss) on investments | 0.41 | (0.85) | 1.84 | 0.54 | 0.56 |
| Net increase (decrease) from investment operations | $ 0.60 | $ (0.74) | $ 1.96 | $ 0.69 | $ 0.74 |
| Distributions to shareowners: | | | | | |
| Net investment income | $ (0.18) | $ (0.13) | $ (0.11) | $ (0.15) | $ (0.18) |
| Net realized gain | (0.13) | (0.78) | (0.26) | (0.39) | (0.63) |
| Total distributions | $ (0.31) | $ (0.91) | $ (0.37) | $ (0.54) | $ (0.81) |
| Net increase (decrease) in net asset value | $ 0.29 | $ (1.65) | $ 1.59 | $ 0.15 | $ (0.07) |
| Net asset value, end of period | $ 9.95 | $ 9.66 | $ 11.31 | $ 9.72 | $ 9.57 |
| Total return (b) | 6.51% | (7.23)% | 20.60% | 7.55% | 8.51% |
| Ratio of net expenses to average net assets | 0.94% | 0.95% | 0.99% | 0.99% | 1.01% |
| Ratio of net investment income (loss) to average net assets | 2.02% | 1.07% | 1.12% | 1.65% | 1.97% |
| Portfolio turnover rate | 44% | 40% | 54% | 65% | 60% |
| Net assets, end of period (in thousands) | $270,804 | $279,982 | $301,068 | $233,421 | $219,544 |
| Ratios with no waiver of fees and assumption of expenses by the Adviser and no reduction for fees paid indirectly: | | | | | |
| Total expenses to average net assets | 0.96% | 0.95% | 1.00% | 1.04% | 1.07% |
| Net investment income (loss) to average net assets | 2.00% | 1.07% | 1.11% | 1.60% | 1.91% |
| (a) | The per-share data presented above is based on the average shares outstanding for the period presented. |
| (b) | Assumes initial investment at net asset value at the beginning of each period, reinvestment of all distributions, the complete redemption of the investment at net asset value at the end of each period and no sales charges. Total return would be reduced if sales charges were taken into account. |
The accompanying notes are an integral part of these financial statements.
Pioneer Balanced ESG Fund | Annual Report | 7/31/2363
Financial Highlights (continued)
| | Year
Ended
7/31/23 | Year
Ended
7/31/22 | Year
Ended
7/31/21 | Year
Ended
7/31/20 | Year
Ended
7/31/19 |
| Class C | | | | | |
| Net asset value, beginning of period | $ 9.57 | $ 11.21 | $ 9.65 | $ 9.50 | $ 9.57 |
| Increase (decrease) from investment operations: | | | | | |
| Net investment income (loss) (a) | $ 0.12 | $ 0.03 | $ 0.04 | $ 0.09 | $ 0.11 |
| Net realized and unrealized gain (loss) on investments | 0.40 | (0.84) | 1.82 | 0.54 | 0.55 |
| Net increase (decrease) from investment operations | $ 0.52 | $ (0.81) | $ 1.86 | $ 0.63 | $ 0.66 |
| Distributions to shareowners: | | | | | |
| Net investment income | $ (0.12) | $ (0.05) | $ (0.04) | $ (0.09) | $ (0.10) |
| Net realized gain | (0.13) | (0.78) | (0.26) | (0.39) | (0.63) |
| Total distributions | $ (0.25) | $ (0.83) | $ (0.30) | $ (0.48) | $ (0.73) |
| Net increase (decrease) in net asset value | $ 0.27 | $ (1.64) | $ 1.56 | $ 0.15 | $ (0.07) |
| Net asset value, end of period | $ 9.84 | $ 9.57 | $ 11.21 | $ 9.65 | $ 9.50 |
| Total return (b) | 5.69% | (7.92)% | 19.63% | 6.82% | 7.68% |
| Ratio of net expenses to average net assets | 1.69% | 1.68% | 1.72% | 1.72% | 1.75% |
| Ratio of net investment income (loss) to average net assets | 1.28% | 0.33% | 0.41% | 0.92% | 1.23% |
| Portfolio turnover rate | 44% | 40% | 54% | 65% | 60% |
| Net assets, end of period (in thousands) | $35,936 | $43,776 | $55,342 | $56,387 | $46,993 |
| Ratios with no waiver of fees and assumption of expenses by the Adviser and no reduction for fees paid indirectly: | | | | | |
| Total expenses to average net assets | 1.70% | 1.69% | 1.73% | 1.76% | 1.79% |
| Net investment income (loss) to average net assets | 1.27% | 0.32% | 0.40% | 0.88% | 1.19% |
| (a) | The per-share data presented above is based on the average shares outstanding for the period presented. |
| (b) | Assumes initial investment at net asset value at the beginning of each period, reinvestment of all distributions, the complete redemption of the investment at net asset value at the end of each period and no sales charges. Total return would be reduced if sales charges were taken into account. |
The accompanying notes are an integral part of these financial statements.
64Pioneer Balanced ESG Fund | Annual Report | 7/31/23
| | Year
Ended
7/31/23 | Year
Ended
7/31/22 | Year
Ended
7/31/21 | Year
Ended
7/31/20 | Year
Ended
7/31/19 |
| Class K | | | | | |
| Net asset value, beginning of period | $ 9.64 | $11.29 | $ 9.71 | $ 9.56 | $ 9.63 |
| Increase (decrease) from investment operations: | | | | | |
| Net investment income (loss) (a) | $ 0.22 | $ 0.15 | $ 0.15 | $ 0.18 | $ 0.20 |
| Net realized and unrealized gain (loss) on investments | 0.40 | (0.85) | 1.84 | 0.54 | 0.55 |
| Net increase (decrease) from investment operations | $ 0.62 | $ (0.70) | $ 1.99 | $ 0.72 | $ 0.75 |
| Distributions to shareowners: | | | | | |
| Net investment income | $ (0.21) | $ (0.17) | $ (0.15) | $ (0.18) | $ (0.19) |
| Net realized gain | (0.13) | (0.78) | (0.26) | (0.39) | (0.63) |
| Total distributions | $ (0.34) | $ (0.95) | $ (0.41) | $(0.57) | $(0.82) |
| Net increase (decrease) in net asset value | $ 0.28 | $ (1.65) | $ 1.58 | $ 0.15 | $ (0.07) |
| Net asset value, end of period | $ 9.92 | $ 9.64 | $11.29 | $ 9.71 | $ 9.56 |
| Total return (b) | 6.72% | (6.90)% | 20.96% | 7.93% | 8.72% |
| Ratio of net expenses to average net assets | 0.65% | 0.65% | 0.65% | 0.65% | 0.76% |
| Ratio of net investment income (loss) to average net assets | 2.35% | 1.44% | 1.43% | 1.95% | 2.21% |
| Portfolio turnover rate | 44% | 40% | 54% | 65% | 60% |
| Net assets, end of period (in thousands) | $38,360 | $7,732 | $2,575 | $ 606 | $ 281 |
| Ratios with no waiver of fees and assumption of expenses by the Adviser and no reduction for fees paid indirectly: | | | | | |
| Total expenses to average net assets | 0.66% | 0.65% | 0.70% | 0.71% | 0.81% |
| Net investment income (loss) to average net assets | 2.34% | 1.44% | 1.38% | 1.89% | 2.16% |
| (a) | The per-share data presented above is based on the average shares outstanding for the period presented. |
| (b) | Assumes initial investment at net asset value at the beginning of each period, reinvestment of all distributions and the complete redemption of the investment at net asset value at the end of each period. |
The accompanying notes are an integral part of these financial statements.
Pioneer Balanced ESG Fund | Annual Report | 7/31/2365
Financial Highlights (continued)
| | Year
Ended
7/31/23 | Year
Ended
7/31/22 | Year
Ended
7/31/21 | Year
Ended
7/31/20 | Year
Ended
7/31/19 |
| Class R | | | | | |
| Net asset value, beginning of period | $ 9.68 | $11.33 | $ 9.75 | $ 9.59 | $ 9.64 |
| Increase (decrease) from investment operations: | | | | | |
| Net investment income (loss) (a) | $ 0.16 | $ 0.09 | $ 0.09 | $ 0.12 | $ 0.15 |
| Net realized and unrealized gain (loss) on investments | 0.41 | (0.86) | 1.83 | 0.56 | 0.56 |
| Net increase (decrease) from investment operations | $ 0.57 | $ (0.77) | $ 1.92 | $ 0.68 | $ 0.71 |
| Distributions to shareowners: | | | | | |
| Net investment income | $ (0.15) | $ (0.10) | $ (0.08) | $ (0.13) | $ (0.13) |
| Net realized gain | (0.13) | (0.78) | (0.26) | (0.39) | (0.63) |
| Total distributions | $ (0.28) | $ (0.88) | $ (0.34) | $ (0.52) | $ (0.76) |
| Net increase (decrease) in net asset value | $ 0.29 | $ (1.65) | $ 1.58 | $ 0.16 | $ (0.05) |
| Net asset value, end of period | $ 9.97 | $ 9.68 | $11.33 | $ 9.75 | $ 9.59 |
| Total return (b) | 6.19% | (7.45)% | 20.12% | 7.32% | 8.24% |
| Ratio of net expenses to average net assets | 1.25% | 1.20% | 1.30% | 1.30% | 1.30% |
| Ratio of net investment income (loss) to average net assets | 1.73% | 0.84% | 0.81% | 1.32% | 1.65% |
| Portfolio turnover rate | 44% | 40% | 54% | 65% | 60% |
| Net assets, end of period (in thousands) | $3,948 | $2,884 | $2,383 | $2,047 | $1,363 |
| Ratios with no waiver of fees and assumption of expenses by the Adviser and no reduction for fees paid indirectly: | | | | | |
| Total expenses to average net assets | 1.26% | 1.20% | 1.45% | 1.59% | 1.77% |
| Net investment income (loss) to average net assets | 1.72% | 0.84% | 0.66% | 1.03% | 1.18% |
| (a) | The per-share data presented above is based on the average shares outstanding for the period presented. |
| (b) | Assumes initial investment at net asset value at the beginning of each period, reinvestment of all distributions and the complete redemption of the investment at net asset value at the end of each period. |
The accompanying notes are an integral part of these financial statements.
66Pioneer Balanced ESG Fund | Annual Report | 7/31/23
| | Year
Ended
7/31/23 | Year
Ended
7/31/22 | Year
Ended
7/31/21 | Year
Ended
7/31/20 | Year
Ended
7/31/19 |
| Class Y | | | | | |
| Net asset value, beginning of period | $ 9.74 | $ 11.39 | $ 9.79 | $ 9.64 | $ 9.71 |
| Increase (decrease) from investment operations: | | | | | |
| Net investment income (loss) (a) | $ 0.22 | $ 0.14 | $ 0.15 | $ 0.19 | $ 0.21 |
| Net realized and unrealized gain (loss) on investments | 0.41 | (0.85) | 1.86 | 0.54 | 0.55 |
| Net increase (decrease) from investment operations | $ 0.63 | $ (0.71) | $ 2.01 | $ 0.73 | $ 0.76 |
| Distributions to shareowners: | | | | | |
| Net investment income | $ (0.20) | $ (0.16) | $ (0.15) | $ (0.19) | $ (0.20) |
| Net realized gain | (0.13) | (0.78) | (0.26) | (0.39) | (0.63) |
| Total distributions | $ (0.33) | $ (0.94) | $ (0.41) | $ (0.58) | $ (0.83) |
| Net increase (decrease) in net asset value | $ 0.30 | $ (1.65) | $ 1.60 | $ 0.15 | $ (0.07) |
| Net asset value, end of period | $ 10.04 | $ 9.74 | $ 11.39 | $ 9.79 | $ 9.64 |
| Total return (b) | 6.85% | (6.95)% | 20.99% | 7.95% | 8.77% |
| Ratio of net expenses to average net assets | 0.65% | 0.65% | 0.65% | 0.65% | 0.69% |
| Ratio of net investment income (loss) to average net assets | 2.32% | 1.37% | 1.46% | 1.99% | 2.29% |
| Portfolio turnover rate | 44% | 40% | 54% | 65% | 60% |
| Net assets, end of period (in thousands) | $66,521 | $73,819 | $71,290 | $53,142 | $33,930 |
| Ratios with no waiver of fees and assumption of expenses by the Adviser and no reduction for fees paid indirectly: | | | | | |
| Total expenses to average net assets | 0.75% | 0.75% | 0.77% | 0.82% | 0.84% |
| Net investment income (loss) to average net assets | 2.22% | 1.27% | 1.34% | 1.82% | 2.14% |
| (a) | The per-share data presented above is based on the average shares outstanding for the period presented. |
| (b) | Assumes initial investment at net asset value at the beginning of each period, reinvestment of all distributions and the complete redemption of the investment at net asset value at the end of each period. |
The accompanying notes are an integral part of these financial statements.
Pioneer Balanced ESG Fund | Annual Report | 7/31/2367
Notes to Financial Statements | 7/31/23
1. Organization and Significant Accounting Policies
Pioneer Balanced ESG Fund (the “Fund”) is one of four portfolios comprising Pioneer Series Trust IV (the "Trust"), a Delaware statutory trust. The Fund is registered under the Investment Company Act of 1940, as amended (the "1940 Act"), as a diversified, open-end management investment company. The Fund’s investment objective is to seek capital growth and current income through a diversified portfolio of equity securities and bonds.
The Fund offers five classes of shares designated as Class A, Class C, Class K, Class R and Class Y shares. Each class of shares represents an interest in the same portfolio of investments of the Fund and has identical rights (based on relative net asset values) to assets and liquidation proceeds. Share classes can bear different rates of class-specific fees and expenses, such as transfer agent and distribution fees. Differences in class-specific fees and expenses will result in differences in net investment income and, therefore, the payment of different dividends from net investment income earned by each class. The Amended and Restated Declaration of Trust of the Trust gives the Board of Trustees the flexibility to specify either per-share voting or dollar-weighted voting when submitting matters for shareowner approval. Under per-share voting, each share of a class of the Fund is entitled to one vote. Under dollar-weighted voting, a shareowner’s voting power is determined not by the number of shares owned, but by the dollar value of the shares on the record date. Each share class has exclusive voting rights with respect to matters affecting only that class, including with respect to the distribution plan for that class. There is no distribution plan for Class K or Class Y shares.
Amundi Asset Management US, Inc., an indirect, wholly owned subsidiary of Amundi and Amundi’s wholly owned subsidiary, Amundi USA, Inc., serves as the Fund’s investment adviser (the “Adviser”). Amundi Distributor US, Inc., an affiliate of the Adviser, serves as the Fund’s distributor (the “Distributor”).
In March 2020, FASB issued an Accounting Standard Update, ASU 2020-04, Reference Rate Reform (Topic 848) — Facilitation of the Effects of Reference Rate Reform on Financial Reporting (“ASU 2020-04”), which provides optional, temporary relief with respect to the financial reporting of contracts subject to certain types of modifications due to the planned discontinuation of the London Interbank Offered Rate (“LIBOR”) and other LIBOR-based reference rates at the end of 2021. The temporary relief provided by ASU 2020-04 is effective for certain reference rate-related
68Pioneer Balanced ESG Fund | Annual Report | 7/31/23
contract modifications that occur during the period from March 12, 2020 through December 31, 2023. Management is evaluating the impact of ASU 2020-04 on the Fund's investments, derivatives, debt and other contracts, if applicable, that will undergo reference rate-related modifications as a result of the reference rate reform.
The Fund is required to comply with Rule 18f-4 under the 1940 Act, which governs the use of derivatives by registered investment companies. Rule 18f-4 permits funds to enter into derivatives transactions (as defined in Rule 18f-4) and certain other transactions notwithstanding the restrictions on the issuance of “senior securities” under Section 18 of the 1940 Act. In accordance with Rule 18f-4, the Fund has established and maintains a comprehensive derivatives risk management program, has appointed a derivatives risk manager and complies with a relative or absolute limit on fund leverage risk calculated based on value-at-risk ("VaR").
The Fund is an investment company and follows investment company accounting and reporting guidance under U.S. Generally Accepted Accounting Principles (“U.S. GAAP”). U.S. GAAP requires the management of the Fund to make estimates and assumptions that affect the reported amounts of assets and liabilities, the disclosure of contingent assets and liabilities at the date of the financial statements, and the reported amounts of income, expenses and gain or loss on investments during the reporting period. Actual results could differ from those estimates.
The following is a summary of significant accounting policies followed by the Fund in the preparation of its financial statements:
| A. | Security Valuation |
| | The net asset value of the Fund is computed once daily, on each day the New York Stock Exchange (“NYSE”) is open, as of the close of regular trading on the NYSE. |
| | Equity securities that have traded on an exchange are valued by using the last sale price on the principal exchange where they are traded. Equity securities that have not traded on the date of valuation, or securities for which sale prices are not available, generally are valued using the mean between the last bid and asked prices or, if both last bid and asked prices are not available, at the last quoted bid price. Last sale and bid and asked prices are provided by independent third party pricing services. In the case of equity securities not traded on an exchange, prices are typically determined by independent third party pricing services using a variety of techniques and methods. |
Pioneer Balanced ESG Fund | Annual Report | 7/31/2369
| | The value of foreign securities is translated into U.S. dollars based on foreign currency exchange rate quotations supplied by a third party pricing source. Trading in non-U.S. equity securities is substantially completed each day at various times prior to the close of the NYSE. The values of such securities used in computing the net asset value of the Fund's shares are determined as of such times. The Adviser may use a fair value model developed by an independent pricing service to value non-U.S. equity securities. |
| | Fixed-income securities are valued by using prices supplied by independent pricing services, which consider such factors as market prices, market events, quotations from one or more brokers, Treasury spreads, yields, maturities and ratings, or may use a pricing matrix or other fair value methods or techniques to provide an estimated value of the security or instrument. A pricing matrix is a means of valuing a debt security on the basis of current market prices for other debt securities, historical trading patterns in the market for fixed-income securities and/or other factors. Non-U.S. debt securities that are listed on an exchange will be valued at the bid price obtained from an independent third party pricing service. When independent third party pricing services are unable to supply prices, or when prices or market quotations are considered to be unreliable, the value of that security may be determined using quotations from one or more broker-dealers. |
| | Loan interests are valued at the mean between the last available bid and asked prices from one or more brokers or dealers as obtained from Loan Pricing Corporation, an independent third party pricing service. If price information is not available from Loan Pricing Corporation, or if the price information is deemed to be unreliable, price information will be obtained from an alternative loan interest pricing service. If no reliable price quotes are available from either the primary or alternative pricing service, broker quotes will be solicited. |
| | Event-linked bonds are valued at the bid price obtained from an independent third party pricing service. Other insurance-linked securities (including reinsurance sidecars, collateralized reinsurance and industry loss warranties) may be valued at the bid price obtained from an independent pricing service, or through a third party using a pricing matrix, insurance valuation models, or other fair value methods or techniques to provide an estimated value of the instrument. |
| | Futures contracts are generally valued at the closing settlement price established by the exchange on which they are traded. |
| | Shares of open-end registered investment companies (including money market mutual funds) are valued at such funds' net asset value. |
70Pioneer Balanced ESG Fund | Annual Report | 7/31/23
| | Shares of closed-end interval funds that offer their shares at net asset value are valued at such funds’ net asset value. |
| | Repurchase agreements are valued at par. Cash may include overnight time deposits at approved financial institutions. |
| | Securities or loan interests for which independent pricing services or broker-dealers are unable to supply prices or for which market prices and/or quotations are not readily available or are considered to be unreliable are valued by a fair valuation team comprised of certain personnel of the Adviser. The Adviser is designated as the valuation designee for the Fund pursuant to Rule 2a-5 under the 1940 Act. The Adviser’s fair valuation team is responsible for monitoring developments that may impact fair valued securities. |
| | Inputs used when applying fair value methods to value a security may include credit ratings, the financial condition of the company, current market conditions and comparable securities. The Adviser may use fair value methods if it is determined that a significant event has occurred after the close of the exchange or market on which the security trades and prior to the determination of the Fund's net asset value. Examples of a significant event might include political or economic news, corporate restructurings, natural disasters, terrorist activity or trading halts. Thus, the valuation of the Fund's securities may differ significantly from exchange prices, and such differences could be material. |
| B. | Investment Income and Transactions |
| | Dividend income is recorded on the ex-dividend date, except that certain dividends from foreign securities where the ex-dividend date may have passed are recorded as soon as the Fund becomes aware of the ex-dividend data in the exercise of reasonable diligence. |
| | Interest income, including interest on income-bearing cash accounts, is recorded on the accrual basis. Dividend and interest income are reported net of unrecoverable foreign taxes withheld at the applicable country rates and net of income accrued on defaulted securities. |
| | Interest and dividend income payable by delivery of additional shares is reclassified as PIK (payment-in-kind) income upon receipt and is included in interest and dividend income, respectively. |
| | Principal amounts of mortgage-backed securities are adjusted for monthly paydowns. Premiums and discounts related to certain mortgage-backed securities are amortized or accreted in proportion to the monthly paydowns. All discounts/premiums on purchase prices of |
Pioneer Balanced ESG Fund | Annual Report | 7/31/2371
| | debt securities are accreted/amortized for financial reporting purposes over the life of the respective securities, and such accretion/amortization is included in interest income. |
| | Security transactions are recorded as of trade date. Gains and losses on sales of investments are calculated on the identified cost method for both financial reporting and federal income tax purposes. |
| C. | Foreign Currency Translation |
| | The books and records of the Fund are maintained in U.S. dollars. Amounts denominated in foreign currencies are translated into U.S. dollars using current exchange rates. |
| | Net realized gains and losses on foreign currency transactions, if any, represent, among other things, the net realized gains and losses on foreign currency exchange contracts, disposition of foreign currencies and the difference between the amount of income accrued and the U.S. dollars actually received. Further, the effects of changes in foreign currency exchange rates on investments are not segregated on the Statement of Operations from the effects of changes in the market prices of those securities, but are included with the net realized and unrealized gain or loss on investments. |
| D. | Federal Income Taxes |
| | It is the Fund's policy to comply with the requirements of the Internal Revenue Code applicable to regulated investment companies and to distribute all of its net taxable income and net realized capital gains, if any, to its shareowners. Therefore, no provision for federal income taxes is required. As of July 31, 2023, the Fund did not accrue any interest or penalties with respect to uncertain tax positions, which, if applicable, would be recorded as an income tax expense on the Statement of Operations. Tax returns filed within the prior three years remain subject to examination by federal and state tax authorities. |
| | The amount and character of income and capital gain distributions to shareowners are determined in accordance with federal income tax rules, which may differ from U.S. GAAP. Distributions in excess of net investment income or net realized gains are temporary over distributions for financial statement purposes resulting from differences in the recognition or classification of income or distributions for financial statement and tax purposes. Capital accounts within the financial statements are adjusted for permanent book/tax differences to reflect tax character, but are not adjusted for temporary differences. |
72Pioneer Balanced ESG Fund | Annual Report | 7/31/23
| | A portion of the dividend income recorded by the Fund is from distributions by publicly traded real estate investment trusts (“REITs”), and such distributions for tax purposes may also consist of capital gains and return of capital. The actual return of capital and capital gains portions of such distributions will be determined by formal notifications from the REITs subsequent to the calendar year-end. Distributions received from the REITs that are determined to be a return of capital are recorded by the Fund as a reduction of the cost basis of the securities held and those determined to be capital gain are reflected as such on the Statement of Operations. |
| | At July 31, 2023, the Fund reclassified $19,648 to increase distributable earnings and $19,648 to decrease paid-in capital to reflect permanent book/tax differences. These adjustments have no impact on net assets or the results of operations. |
| | At July 31, 2023, the Fund was permitted to carry forward indefinitely $5,158,977 of short-term losses and $4,611,142 of long-term losses. |
| | The tax character of distributions paid during the years ended July 31, 2023 and July 31, 2022, was as follows: |
| | 2023 | 2022 |
| Distributions paid from: | | |
| Ordinary income | $ 7,519,615 | $ 5,477,754 |
| Long-term capital gains | 5,495,135 | 29,890,226 |
| Total | $13,014,750 | $35,367,980 |
The following shows the components of distributable earnings (losses) on a federal income tax basis at July 31, 2023:
| | 2023 |
| Distributable earnings/(losses): | |
| Undistributed ordinary income | $ 862,187 |
| Capital loss carryforward | (9,770,119) |
| Net unrealized appreciation | 66,248,611 |
| Total | $ 57,340,679 |
The difference between book-basis and tax-basis net unrealized appreciation is attributable to the tax deferral of losses on wash sales, the tax treatment of premium and amortization, the mark to market of futures contracts, and tax basis adjustments on partnership holdings.
| E. | Fund Shares |
| | The Fund records sales and repurchases of its shares as of trade date. The Distributor earned $23,530 in underwriting commissions on the sale of Class A shares during the year ended July 31, 2023. |
Pioneer Balanced ESG Fund | Annual Report | 7/31/2373
| F. | Class Allocations |
| | Income, common expenses and realized and unrealized gains and losses are calculated at the Fund level and allocated daily to each class of shares based on its respective percentage of adjusted net assets at the beginning of the day. |
| | Distribution fees are calculated based on the average daily net asset value attributable to Class A, Class C and Class R shares of the Fund, respectively (see Note 5). Class K and Class Y shares do not pay distribution fees. All expenses and fees paid to the Fund's transfer agent for its services are allocated among the classes of shares based on the number of accounts in each class and the ratable allocation of related out-of-pocket expenses (see Note 4). |
| | Distributions to shareowners are recorded as of the ex-dividend date. Distributions paid by the Fund with respect to each class of shares are calculated in the same manner and at the same time, except that net investment income dividends to Class A, Class C, Class K, Class R and Class Y shares can reflect different transfer agent and distribution expense rates. |
| G. | Risks |
| | The value of securities held by the Fund may go up or down, sometimes rapidly or unpredictably, due to general market conditions, such as real or perceived adverse economic, political or regulatory conditions, recessions, the spread of infectious illness or other public health issues, inflation, changes in interest rates, armed conflict including Russia's military invasion of Ukraine, sanctions against Russia, other nations or individuals or companies and possible countermeasures, lack of liquidity in the bond markets or adverse investor sentiment. In the past several years, financial markets have experienced increased volatility, depressed valuations, decreased liquidity and heightened uncertainty. These conditions may continue, recur, worsen or spread. Inflation and interest rates have increased and may rise further. These circumstances could adversely affect the value and liquidity of the Fund's investments and negatively impact the Fund's performance. |
| | The long-term impact of the COVID-19 pandemic and its subsequent variants on economies, markets, industries and individual issuers, are not known. Some sectors of the economy and individual issuers have experienced or may experience particularly large losses. Periods of extreme volatility in the financial markets, reduced liquidity of many instruments, increased government debt, inflation, and disruptions to supply chains, consumer demand and employee availability, may |
74Pioneer Balanced ESG Fund | Annual Report | 7/31/23
| | continue for some time. Following Russia's invasion of Ukraine, Russian securities lost all, or nearly all, their market value. Other securities or markets could be similarly affected by past or future political, geopolitical or other events or conditions. |
| | Governments and central banks, including the U.S. Federal Reserve, have taken extraordinary and unprecedented actions to support local and global economies and the financial markets. These actions have resulted in significant expansion of public debt, including in the U.S. The consequences of high public debt, including its future impact on the economy and securities markets, may not be known for some time. |
| | The U.S. and other countries are periodically involved in disputes over trade and other matters, which may result in tariffs, investment restrictions and adverse impacts on affected companies and securities. For example, the U.S. has imposed tariffs and other trade barriers on Chinese exports, has restricted sales of certain categories of goods to China, and has established barriers to investments in China. Trade disputes may adversely affect the economies of the U.S. and its trading partners, as well as companies directly or indirectly affected and financial markets generally. If the political climate between the U.S. and China does not improve or continues to deteriorate, if China were to attempt unification of Taiwan by force, or if other geopolitical conflicts develop or get worse, economies, markets and individual securities may be severely affected both regionally and globally, and the value of the Fund's assets may go down. |
| | At times, the Fund’s investments may represent industries or industry sectors that are interrelated or have common risks, making the Fund more susceptible to any economic, political, or regulatory developments or other risks affecting those industries and sectors. |
| | The Adviser allocates the Fund's assets between equity and debt securities based on its assessment of current business, economic and market conditions. Normally, equity and debt securities each represent 35% to 65% of the Fund's net assets. The Fund’s investments in foreign markets and countries with limited developing markets may subject the Fund to a greater degree of risk than investments in a developed market. These risks include disruptive political or economic conditions, military conflicts and sanctions, terrorism, sustained economic downturns, financial instability, less liquid trading markets, extreme price volatility, currency risks, reduction of government or central bank support, inadequate accounting standards, tariffs, tax disputes or other tax burdens, nationalization or expropriation of assets and the imposition of adverse governmental laws, arbitrary application of laws and regulations |
Pioneer Balanced ESG Fund | Annual Report | 7/31/2375
| | or lack of rule of law and investment and repatriation restrictions. Lack of information and less market regulation also may affect the value of these securities. Withholding and other non-U.S. taxes may decrease the Fund’s return. Non-U.S. issuers may be located in parts of the world that have historically been prone to natural disasters. Investing in depositary receipts is subject to many of the same risks as investing directly in non-U.S. issuers. Depositary receipts may involve higher expenses and may trade at a discount (or premium) to the underlying security. |
| | Russia launched a large-scale invasion of Ukraine on February 24, 2022. In response to the military action by Russia, various countries, including the U.S., the United Kingdom, and European Union issued broad-ranging economic sanctions against Russia and Belarus and certain companies and individuals. Since then, Russian securities have lost all, or nearly all, their market value, and many other issuers, securities and markets have been adversely affected. The United States and other countries may impose sanctions on other countries, companies and individuals in light of Russia’s military invasion. The extent and duration of the military action or future escalation of such hostilities, the extent and impact of existing and future sanctions, market disruptions and volatility, and the result of any diplomatic negotiations cannot be predicted. These and any related events could have a significant impact on the value and liquidity of certain Fund investments, on Fund performance and the value of an investment in the Fund, particularly with respect to securities and commodities, such as oil, natural gas and food commodities, as well as other sectors with exposure to Russian issuers or issuers in other countries affected by the invasion, and are likely to have collateral impacts on market sectors globally. |
| | The Fund may invest in REIT securities, the value of which can fall for a variety of reasons, such as declines in rental income, fluctuating interest rates, poor property management, environmental liabilities, uninsured damage, increased competition, or changes in real estate tax laws. |
| | The Fund invests in below-investment-grade (high-yield) debt securities and preferred stocks. Some of these high-yield securities may be convertible into equity securities of the issuer. Debt securities rated below-investment-grade are commonly referred to as “junk bonds” and are considered speculative with respect to the issuer’s capacity to pay interest and repay principal. These securities involve greater risk of loss, are subject to greater price volatility, and may be less liquid and more difficult to value, especially during periods of economic uncertainty or change, than higher rated debt securities. |
76Pioneer Balanced ESG Fund | Annual Report | 7/31/23
| | The Fund’s ESG criteria exclude securities of issuers in certain industries, and the Adviser considers ESG factors in making investment decisions. Excluding specific issuers limits the universe of investments available to the Fund as compared with other funds that do not consider ESG criteria or ESG factors, which may mean forgoing some investment opportunities available to funds that do not consider ESG criteria or ESG factors. Accordingly, the Fund may underperform other funds that do not utilize an investment strategy that considers ESG criteria or ESG factors. However, the strategy of seeking to identify companies with sustainable business models is believed to provide potential return and risk benefits, including the selection of issuers with fewer ESG-related risks. In considering ESG factors, the Adviser may use third party ESG ratings information that it believes to be reliable, but such information may not be accurate or complete, or may be biased. |
| | The Fund's investments, payment obligations and financing terms may be based on floating rates, such as LIBOR (London Interbank Offered Rate) or SOFR (Secured Overnight Financing Rate). ICE Benchmark Administration, the administrator of LIBOR, has ceased publication of most LIBOR settings on a representative basis. Actions by regulators have resulted in the establishment of alternative reference rates to LIBOR in most major currencies. In the U.S., a common benchmark replacement is based on the SOFR published by the Federal Reserve Bank of New York, including certain spread adjustments and benchmark replacement conforming changes, although other benchmark replacements (without or without spread adjustments) may be used in certain transactions. The impact of the transition from LIBOR on the Fund's transactions and financial markets generally cannot yet be determined. The transition away from LIBOR may lead to increased volatility and illiquidity in markets for instruments that have relied on LIBOR and may adversely affect the Fund's performance. |
| | With the increased use of technologies such as the Internet to conduct business, the Fund is susceptible to operational, information security and related risks. While the Fund’s Adviser has established business continuity plans in the event of, and risk management systems to prevent, limit or mitigate, such cyber-attacks, there are inherent limitations in such plans and systems, including the possibility that certain risks have not been identified. Furthermore, the Fund cannot control the cybersecurity plans and systems put in place by service providers to the Fund such as the Fund’s custodian and accounting agent, and the Fund’s transfer agent. In addition, many beneficial owners of Fund shares hold them through accounts at broker-dealers, retirement platforms and other financial market participants |
Pioneer Balanced ESG Fund | Annual Report | 7/31/2377
| | over which neither the Fund nor the Adviser exercises control. Each of these may in turn rely on service providers to them, which are also subject to the risk of cyber-attacks. Cybersecurity failures or breaches at the Adviser or the Fund’s service providers or intermediaries have the ability to cause disruptions and impact business operations, potentially resulting in financial losses, interference with the Fund’s ability to calculate its net asset value, impediments to trading, the inability of Fund shareowners to effect share purchases, redemptions or exchanges or receive distributions, loss of or unauthorized access to private shareowner information and violations of applicable privacy and other laws, regulatory fines, penalties, reputational damage, or additional compliance costs. Such costs and losses may not be covered under any insurance. In addition, maintaining vigilance against cyber-attacks may involve substantial costs over time, and system enhancements may themselves be subject to cyber-attacks. |
| | The Fund’s prospectus contains unaudited information regarding the Fund’s principal risks. Please refer to that document when considering the Fund’s principal risks. |
| H. | Restricted Securities |
| | Restricted Securities are subject to legal or contractual restrictions on resale. Restricted securities generally are resold in transactions exempt from registration under the Securities Act of 1933. Private placement securities are generally considered to be restricted except for those securities traded between qualified institutional investors under the provisions of Rule 144A of the Securities Act of 1933. |
| | Disposal of restricted investments may involve negotiations and expenses, and prompt sale at an acceptable price may be difficult to achieve. Restricted investments held by the Fund at July 31, 2023 are listed in the Schedule of Investments. |
| I. | Insurance-Linked Securities (“ILS”) |
| | The Fund invests in ILS. The Fund could lose a portion or all of the principal it has invested in an ILS, and the right to additional interest or dividend payments with respect to the security, upon the occurrence of one or more trigger events, as defined within the terms of an insurance-linked security. Trigger events, generally, are hurricanes, earthquakes, or other natural events of a specific size or magnitude that occur in a designated geographic region during a specified time period, and/or that involve losses or other metrics that exceed a specific amount. There is no way to accurately predict whether a trigger event will occur, and accordingly, ILS carry significant risk. The Fund is entitled to receive |
78Pioneer Balanced ESG Fund | Annual Report | 7/31/23
| | principal, and interest and/or dividend payments so long as no trigger event occurs of the description and magnitude specified by the instrument. In addition to the specified trigger events, ILS may expose the Fund to other risks, including but not limited to issuer (credit) default, adverse regulatory or jurisdictional interpretations and adverse tax consequences. |
| | The Fund’s investments in ILS may include event-linked bonds. ILS also may include special purpose vehicles (“SPVs”) or similar instruments structured to comprise a portion of a reinsurer’s catastrophe-oriented business, known as quota share instruments (sometimes referred to as reinsurance sidecars), or to provide reinsurance relating to specific risks to insurance or reinsurance companies through a collateralized instrument, known as collateralized reinsurance. Structured reinsurance investments also may include industry loss warranties (“ILWs”). A traditional ILW takes the form of a bilateral reinsurance contract, but there are also products that take the form of derivatives, collateralized structures, or exchange-traded instruments. |
| | Where the ILS are based on the performance of underlying reinsurance contracts, the Fund has limited transparency into the individual underlying contracts, and therefore must rely upon the risk assessment and sound underwriting practices of the issuer. Accordingly, it may be more difficult for the Adviser to fully evaluate the underlying risk profile of the Fund's structured reinsurance investments, and therefore the Fund's assets are placed at greater risk of loss than if the Adviser had more complete information. Structured reinsurance instruments generally will be considered illiquid securities by the Fund. These securities may be difficult to purchase, sell or unwind. Illiquid securities also may be difficult to value. If the Fund is forced to sell an illiquid asset, the Fund may be forced to sell at a loss. |
| | Additionally, the Fund may gain exposure to ILS by investing in a closed-end interval fund, Pioneer ILS Interval Fund, an affiliate of the Adviser. The Fund’s investment in Pioneer ILS Interval Fund at July 31, 2023 is listed in the Schedule of Investments. |
| J. | Repurchase Agreements |
| | Repurchase agreements are arrangements under which the Fund purchases securities from a broker-dealer or a bank, called the counterparty, upon the agreement of the counterparty to repurchase the securities from the Fund at a later date, and at a specific price, which is typically higher than the purchase price paid by the Fund. The securities purchased serve as the Fund’s collateral for the obligation of the counterparty to repurchase the securities. The value of the collateral, |
Pioneer Balanced ESG Fund | Annual Report | 7/31/2379
| | including accrued interest, is required to be equal to or in excess of the repurchase price. The collateral for all repurchase agreements is held in safekeeping in the customer-only account of the Fund’s custodian or a sub-custodian of the Fund. The Adviser is responsible for determining that the value of the collateral remains at least equal to the repurchase price. In the event of a default by the counterparty, the Fund is entitled to sell the securities, but the Fund may not be able to sell them for the price at which they were purchased, thus causing a loss to the Fund. Additionally, if the counterparty becomes insolvent, there is some risk that the Fund will not have a right to the securities, or the immediate right to sell the securities. |
| | As of and for the year ended July 31, 2023, the Fund had no open repurchase agreements. |
| K. | Futures Contracts |
| | The Fund may enter into futures transactions in order to attempt to hedge against changes in interest rates, securities prices and currency exchange rates or to seek to increase total return. Futures contracts are types of derivatives. |
| | All futures contracts entered into by the Fund are traded on a futures exchange. Upon entering into a futures contract, the Fund is required to deposit with a broker an amount of cash or securities equal to the minimum "initial margin" requirements of the associated futures exchange. The amount of cash deposited with the broker as collateral at July 31, 2023 is recorded as "Futures collateral" on the Statement of Assets and Liabilities. |
| | Subsequent payments for futures contracts ("variation margin") are paid or received by the Fund, depending on the daily fluctuation in the value of the contracts, and are recorded by the Fund as unrealized appreciation or depreciation. Cash received from or paid to the broker related to previous margin movement is held in a segregated account at the broker and is recorded as either "Due from broker for futures" or "Due to broker for futures" on the Statement of Assets and Liabilities. When the contract is closed, the Fund realizes a gain or loss equal to the difference between the opening and closing value of the contract as well as any fluctuation in foreign currency exchange rates where applicable. Futures contracts are subject to market risk, interest rate risk and currency exchange rate risk. Changes in value of the contracts may not directly correlate to the changes in value of the underlying securities. With futures, there is reduced counterparty credit risk to the Fund since |
80Pioneer Balanced ESG Fund | Annual Report | 7/31/23
| | futures are exchange-traded and the exchange's clearinghouse, as counterparty to all exchange-traded futures, guarantees the futures against default. |
| | The average notional values of futures contracts long position and futures contracts short position during the year ended July 31, 2023 were $32,074,801 and $5,872,320, respectively. Open futures contracts outstanding at July 31, 2023 are listed in the Schedule of Investments. |
2. Management Agreement
The Adviser manages the Fund’s portfolio. Management fees payable under the Fund’s Investment Management Agreement with the Adviser are calculated daily and paid monthly at the annual rate of 0.50% of the Fund’s average daily net assets up to $1 billion and 0.45% of the Fund’s average daily net assets over $1 billion. For the year ended July 31, 2023, the effective management fee (excluding waivers and/or assumption of expenses) was equivalent to 0.50% of the Fund’s average daily net assets.
The Adviser has agreed to waive its management fee with respect to any portion of the Fund’s assets invested in Pioneer ILS Interval Fund, an affiliated fund managed by the Adviser. For the year ended July 31, 2023, the Adviser waived $16,749 in management fees with respect to the Fund, which is reflected on the Statement of Operations as a fee waiver.
The Adviser has contractually agreed to waive and/or reimburse ordinary operating expenses (ordinary operating expenses means all fund expenses other than taxes, brokerage, acquired fund fees and expenses and extraordinary expenses, such as litigation) of the Fund to the extent required to reduce Fund expenses to 0.99%, 0.65%, 1.30% and 0.65% of the average daily net assets attributable to Class A, Class K, Class R and Class Y shares, respectively. These expense limitations are in effect through December 1, 2023. There can be no assurance that the Adviser will extend the expense limitation agreement for a class of shares beyond the date referred to above. Fees waived and expenses reimbursed during the year ended January 31, 2023 are reflected on the Statement of Operations.
In addition, under the management and administration agreements, certain other services and costs, including accounting, regulatory reporting and insurance premiums, are paid by the Fund as administrative reimbursements. Reflected on the Statement of Assets and Liabilities is $28,173 in management fees payable to the Adviser at July 31, 2023.
3. Compensation of Officers and Trustees
The Fund pays an annual fee to its Trustees. The Adviser reimburses the Fund for fees paid to the Interested Trustees. Except for the chief
Pioneer Balanced ESG Fund | Annual Report | 7/31/2381
compliance officer, the Fund does not pay any salary or other compensation to its officers. The Fund pays a portion of the chief compliance officer's compensation for his services as the Fund's chief compliance officer. Amundi US pays the remaining portion of the chief compliance officer's compensation. For the year ended July 31, 2023, the Fund paid $20,025 in Officers' and Trustees' compensation, which is reflected on the Statement of Operations as Officers' and Trustees' fees. At July 31, 2023, on its Statement of Assets and Liabilities, the Fund had a payable for Trustees' fees of $2,009 and a payable for administrative expenses of $10,162, which includes the payable for Officers' compensation.
4. Transfer Agent
BNY Mellon Investment Servicing (US) Inc. serves as the transfer agent to the Fund at negotiated rates. Transfer agent fees and payables shown on the Statement of Operations and the Statement of Assets and Liabilities, respectively, include sub-transfer agent expenses incurred through the Fund’s omnibus relationship contracts.
In addition, the Fund reimbursed the transfer agent for out-of-pocket expenses incurred by the transfer agent related to shareowner communications activities such as proxy and statement mailings, and outgoing phone calls. For the year ended July 31, 2023, such out-of-pocket expenses by class of shares were as follows:
| Shareowner Communications: | |
| Class A | $51,661 |
| Class C | 4,622 |
| Class K | 543 |
| Class R | 833 |
| Class Y | 2,327 |
| Total | $59,986 |
5. Distribution and Service Plans
The Fund has adopted a distribution plan (the “Plan”) pursuant to Rule 12b-1 of the Investment Company Act of 1940 with respect to its Class A, Class C and Class R shares. Pursuant to the Plan, the Fund pays the Distributor 0.25% of the Fund's average daily net assets attributable to Class A shares as compensation for personal services and/or account maintenance services or distribution services with regard to Class A shares. Pursuant to the Plan, the Fund also pays the Distributor 1.00% of the average daily net assets attributable to Class C shares. The fee for Class C shares consists of a 0.25% service fee and a 0.75% distribution fee paid as compensation for personal services and/or account maintenance services or distribution services with regard to Class C shares. Pursuant to the Plan, the Fund further pays the Distributor 0.50% of the average daily net assets
82Pioneer Balanced ESG Fund | Annual Report | 7/31/23
attributable to Class R shares for distribution services. Reflected on the Statement of Assets and Liabilities is $14,444 in distribution fees payable to the Distributor at July 31, 2023.
The Fund also has adopted a separate service plan for Class R shares (the “Service Plan”). The Service Plan authorizes the Fund to pay securities dealers, plan administrators or other service organizations that agree to provide certain services to retirement plans or plan participants holding shares of the Fund a service fee of up to 0.25% of the Fund’s average daily net assets attributable to Class R shares held by such plans.
In addition, redemptions of Class A and Class C shares may be subject to a contingent deferred sales charge (“CDSC”). A CDSC of 1.00% may be imposed on redemptions of certain net asset value purchases of Class A shares within 12 months of purchase. Redemptions of Class C shares within 12 months of purchase are subject to a CDSC of 1.00% based on the lower of cost or market value of shares being redeemed. Shares purchased as part of an exchange remain subject to any CDSC that applied to the original purchase of those shares. There is no CDSC for Class K, Class R or Class Y shares. Proceeds from the CDSCs are paid to the Distributor. For the year ended July 31, 2023, CDSCs in the amount of $4,340 were paid to the Distributor.
6. Line of Credit Facility
The Fund, along with certain other funds in the Pioneer Family of Funds, participates in a committed, unsecured revolving line of credit (“credit facility”). Borrowings are used solely for temporary or emergency purposes. The Fund may borrow up to the lesser of the amount available under the credit facility or the limits set for borrowing by the Fund’s prospectus and the 1940 Act. The Fund participates in a credit facility in the amount of $380 million. Under such credit facility, depending on the type of loan, interest on borrowings is payable at the Secured Overnight Financing Rate ("SOFR") plus a credit spread. The Fund also pays both an upfront fee and an annual commitment fee to participate in the credit facility. The upfront fee in the amount of 0.15% of the total credit facility and the commitment fee in the amount of 0.30% of the daily unused portion of each lender's commitment are allocated among participating funds based on an allocation schedule set forth in the credit agreement. For the year ended July 31, 2023, the Fund had no borrowings under the credit facility.
Pioneer Balanced ESG Fund | Annual Report | 7/31/2383
7. Transactions in Underlying Funds
An affiliated issuer is a company in which the Fund has a direct or indirect ownership of, control of, or voting power of 5 percent or more of the outstanding voting shares, or a company which is under common ownership or control. At July 31, 2023, the value of the Fund’s investments in affiliated issuers was $1,023,698, which represents 0.2% of the Fund’s net assets.
Transactions in affiliated issuers by the Fund for the year ended July 31, 2023 were as follows:
Name of the
Affiliated Issuer | Value at
July 31,
2022 | Purchases
Costs | Change in
Net Unrealized
Appreciation/
(Depreciation) | Net
Realized
Gain/(Loss) | Dividends
Received
and
Reinvested | Sales
Proceeds | Shares
held at
July 31,
2023 | Value at
July 31,
2023 |
| Pioneer ILS Interval Fund | $950,353 | $ — | $48,899 | $ — | $24,446 | $ — | 115,672 | $1,023,698 |
| Total | $ 950,353 | $— | $48,899 | $— | $24,446 | $— | 115,672 | $ 1,023,698 |
Annual and semi-annual reports for the Pioneer ILS Interval Fund is available on the funds’ web page(s) at www.amundi.com/us.
84Pioneer Balanced ESG Fund | Annual Report | 7/31/23
8. Additional Disclosures about Derivative Instruments and Hedging Activities
The Fund’s use of derivatives may enhance or mitigate the Fund’s exposure to the following risks:
Interest rate risk relates to the fluctuations in the value of interest-bearing securities due to changes in the prevailing levels of market interest rates.
Credit risk relates to the ability of the issuer of a financial instrument to make further principal or interest payments on an obligation or commitment that it has to the Fund.
Foreign exchange rate risk relates to fluctuations in the value of an asset or liability due to changes in currency exchange rates.
Equity risk relates to the fluctuations in the value of financial instruments as a result of changes in market prices (other than those arising from interest rate risk or foreign exchange rate risk), whether caused by factors specific to an individual investment, its issuer, or all factors affecting all instruments traded in a market or market segment.
Commodity risk relates to the risk that the value of a commodity or commodity index will fluctuate based on increases or decreases in the commodities market and factors specific to a particular industry or commodity.
The fair value of open derivative instruments (not considered to be hedging instruments for accounting disclosure purposes) by risk exposure at July 31, 2023, was as follows:
Statement of Assets
and Liabilities | Interest
Rate Risk | Credit
Risk | Foreign
Exchange
Rate Risk | Equity
Risk | Commodity
Risk |
| Assets | | | | | |
| Net unrealized appreciation on futures contracts* | $ 3,847 | $ — | $ — | $ — | $ — |
| Total Value | $ 3,847 | $— | $— | $— | $— |
| Liabilities | | | | | |
| Net unrealized depreciation on futures contracts* | $537,955 | $ — | $ — | $ — | $ — |
| Total Value | $537,955 | $— | $— | $— | $— |
| | |
| * | Includes cumulative unrealized appreciation (depreciation) of futures contracts as reported in the Schedule of Investments. Only net variation margin is reported within the assets and/or liabilities on the Statement of Assets and Liabilities. |
Pioneer Balanced ESG Fund | Annual Report | 7/31/2385
The effect of derivative instruments (not considered to be hedging instruments for accounting disclosure purposes) on the Statement of Operations by risk exposure at July 31, 2023 was as follows:
| Statement of Operations | Interest
Rate Risk | Credit
Risk | Foreign
Exchange
Rate Risk | Equity
Risk | Commodity
Risk |
| Net Realized Gain (Loss) on | | | | | |
| Futures contracts | $ (1,275,020) | $ — | $ — | $ — | $ — |
| Total Value | $(1,275,020) | $— | $— | $— | $— |
| Change in Net Unrealized Appreciation (Depreciation) on | | | | | |
| Futures contracts | $ (732,907) | $ — | $ — | $ — | $ — |
| Total Value | $ (732,907) | $— | $— | $— | $— |
86Pioneer Balanced ESG Fund | Annual Report | 7/31/23
Report of Independent Registered Public Accounting Firm
To the Board of Trustees of Pioneer Series Trust IV and the Shareholders of Pioneer Balanced ESG Fund:
Opinion on the Financial Statements
We have audited the accompanying statement of assets and liabilities of Pioneer Balanced ESG Fund (the “Fund”) (one of the funds constituting Pioneer Series Trust IV (the “Trust”)), including the schedule of investments, as of July 31, 2023, and the related statement of operations for the year then ended, the statements of changes in net assets for each of the two years in the period then ended, the financial highlights for each of the five years in the period then ended and the related notes (collectively referred to as the “financial statements”). In our opinion, the financial statements present fairly, in all material respects, the financial position of the Fund (one of the funds constituting Pioneer Series Trust IV) at July 31, 2023, the results of its operations for the year then ended, the changes in its net assets for each of the two years in the period then ended, and its financial highlights for each of the five years in the period then ended in conformity with U.S. generally accepted accounting principles.
Basis for Opinion
These financial statements are the responsibility of the Trust’s management. Our responsibility is to express an opinion on the Fund’s financial statements based on our audits. We are a public accounting firm registered with the Public Company Accounting Oversight Board (United States) ("PCAOB") and are required to be independent with respect to the Trust in accordance with the U.S. federal securities laws and the applicable rules and regulations of the Securities and Exchange Commission and the PCAOB.
We conducted our audits in accordance with the standards of the PCAOB. Those standards require that we plan and perform the audit to obtain reasonable assurance about whether the financial statements are free of material misstatement, whether due to error or fraud. The Trust is not required to have, nor were we engaged to perform, an audit of the Trust’s internal control over financial reporting. As part of our audits, we are required to obtain an understanding of internal control over financial reporting, but not for the purpose of expressing an opinion on the effectiveness of the Trust’s internal control over financial reporting. Accordingly, we express no such opinion.
Pioneer Balanced ESG Fund | Annual Report | 7/31/2387
Our audits included performing procedures to assess the risks of material misstatement of the financial statements, whether due to error or fraud, and performing procedures that respond to those risks. Such procedures included examining, on a test basis, evidence regarding the amounts and disclosures in the financial statements. Our procedures included confirmation of securities owned as of July 31, 2023, by correspondence with the custodian, brokers and others; when replies were not received from brokers and others, we performed other auditing procedures. Our audits also included evaluating the accounting principles used and significant estimates made by management, as well as evaluating the overall presentation of the financial statements. We believe that our audits provide a reasonable basis for our opinion.
We have served as the auditor of one or more investment companies in the Pioneer family of funds since 2017.
Boston, Massachusetts
September 29, 2023
88Pioneer Balanced ESG Fund | Annual Report | 7/31/23
Additional Information (unaudited)
For the year ended July 31, 2023, certain dividends paid by the Fund may be subject to a maximum tax rate of 20%. The Fund intends to designate up to the maximum amount of such dividends allowable, as taxed at a maximum rate of 20%. Complete information will be computed and reported in conjunction with our 2023 Form 1099-DIV.
The Fund designated $5,495,135 as long-term capital gains distributions during the year ended July 31, 2023. Distributable long-term gains are based on net realized long-term gains determined on a tax basis and may differ from such amounts for financial reporting purposes.
The qualifying percentage of the Fund’s ordinary income dividends for the purpose of the corporate dividends received deduction was 49.90%.
Qualified interest income is exempt from nonresident alien (NRA) tax withholding. The percentage of the Fund’s ordinary income distributions derived from qualified interest income was 46.29%.
Pioneer Balanced ESG Fund | Annual Report | 7/31/2389
Statement Regarding Liquidity Risk Management Program
As required by law, the Fund has adopted and implemented a liquidity risk management program (the “Program”) that is designed to assess and manage liquidity risk. Liquidity risk is the risk that the Fund could not meet requests to redeem its shares without significant dilution of remaining investors’ interests in the Fund. The Fund’s Board of Trustees designated a liquidity risk management committee (the “Committee”) consisting of employees of Amundi Asset Management US, Inc. (the “Adviser”) to administer the Program.
The Committee provided the Board of Trustees with a report that addressed the operation of the Program and assessed its adequacy and effectiveness of implementation (the “Report”). The Report covered the period from January 1, 2022 through December 31, 2022 (the “Reporting Period”).
The Report confirmed that, throughout the Reporting Period, the Committee had monitored the Fund’s portfolio liquidity and liquidity risk on an ongoing basis, as described in the Program and in Board reporting throughout the Reporting Period.
The Report discussed the Committee’s annual review of the Program, which addressed, among other things, the following elements of the Program:
The Committee reviewed the Fund’s investment strategy and liquidity of portfolio investments during both normal and reasonably foreseeable stressed conditions. The Committee noted that the Fund’s investment strategy continues to be appropriate for an open-end fund, taking into account, among other things, whether and to what extent the Fund held less liquid and illiquid assets and the extent to which any such investments affected the Fund’s ability to meet redemption requests. In managing and reviewing the Fund’s liquidity risk, the Committee also considered the extent to which the Fund’s investment strategy involves a relatively concentrated portfolio or large positions in particular issuers, the extent to which the Fund uses borrowing for investment purposes, and the extent to which the Fund uses derivatives (including for hedging purposes). The Committee also reviewed the Fund’s short-term and long-term cash flow projections during both normal and reasonably foreseeable stressed conditions. In assessing the Fund’s cash flow projections, the Committee considered, among other factors, historical net redemption activity, redemption policies, ownership concentration, distribution channels, and the degree of certainty associated with the Fund’s short-term and long-term cash flow projections. The Committee also considered the Fund’s holdings of cash and cash equivalents, as well as borrowing arrangements
90Pioneer Balanced ESG Fund | Annual Report | 7/31/23
and other funding sources, including, if applicable, the Fund’s participation in a credit facility, as components of the Fund’s ability to meet redemption requests. The Fund has adopted an in-kind redemption policy which may be utilized to meet larger redemption requests.
The Committee reviewed the Program’s liquidity classification methodology for categorizing the Fund’s investments into one of four liquidity buckets. In reviewing the Fund’s investments, the Committee considered, among other factors, whether trading varying portions of a position in a particular portfolio investment or asset class in sizes the Fund would reasonably anticipate trading, would be reasonably expected to significantly affect liquidity.
The Committee performed an analysis to determine whether the Fund is required to maintain a Highly Liquid Investment Minimum, and determined that no such minimum is required because the Fund primarily holds highly liquid investments.
The Report stated that the Committee concluded the Program operates adequately and effectively, in all material respects, to assess and manage the Fund’s liquidity risk throughout the Reporting Period.
Pioneer Balanced ESG Fund | Annual Report | 7/31/23 91
Trustees, Officers and Service Providers
Investment Adviser and Administrator
Amundi Asset Management US, Inc.
Custodian and Sub-Administrator
The Bank of New York Mellon Corporation
Independent Registered Public Accounting Firm
Ernst & Young LLP
Principal Underwriter
Amundi Distributor US, Inc.
Legal Counsel
Morgan, Lewis & Bockius LLP
Transfer Agent
BNY Mellon Investment Servicing (US) Inc.
Proxy Voting Policies and Procedures of the Fund are available without charge, upon request, by calling our toll free number (1-800-225-6292). Information regarding how the Fund voted proxies relating to portfolio securities during the most recent 12-month period ended June 30 is publicly available to shareowners at www.amundi.com/us. This information is also available on the Securities and Exchange Commission’s web site at www.sec.gov.
Trustees and Officers
The Fund's Trustees and officers are listed below, together with their principal occupations and other directorships they have held during at least the past five years. Trustees who are interested persons of the Fund within the meaning of the 1940 Act are referred to as Interested Trustees. Trustees who are not interested persons of the Fund are referred to as Independent Trustees. Each of the Trustees serves as a Trustee of each of the 49 U.S. registered investment portfolios for which Amundi US serves as investment adviser (the “Pioneer Funds”). The address for all Trustees and all officers of the Fund is 60 State Street, Boston, Massachusetts 02109.
The Statement of Additional Information of the Fund includes additional information about the Directors and is available, without charge, upon request, by calling 1-800-225-6292.
92Pioneer Balanced ESG Fund | Annual Report | 7/31/23
Name, Age and Position
Held With the Fund | Term of Office and
Length of Service | Principal Occupation(s) During At Least The Past Five Years | Other Directorships Held by Trustee
During At Least The Past Five Years |
Thomas J. Perna (72)
Chairman of the Board
and Trustee | Trustee since 2006.
Serves until a successor
trustee is elected or
earlier retirement
or removal. | Private investor (2004 – 2008 and 2013 – present); Chairman (2008 – 2013) and Chief Executive Officer (2008 – 2012), Quadriserv, Inc. (technology products for securities lending industry); and Senior Executive Vice President, The Bank of New York (financial and securities services) (1986 ��� 2004) | Director, Broadridge Financial Solutions, Inc.
(investor communications and securities
processing provider for financial services industry)
(2009 – present); Director, Quadriserv, Inc. (2005 –
2013); and Commissioner, New Jersey State
Civil Service
Commission (2011 – 2015) |
John E. Baumgardner,
Jr. (72)*
Trustee | Trustee since 2019.
Serves until a successor
trustee is elected or
earlier retirement
or removal. | Of Counsel (2019 – present), Partner (1983-2018), Sullivan & Cromwell LLP (law firm). | Chairman, The Lakeville Journal Company, LLC,
(privately-held community newspaper group)
(2015-present) |
Diane Durnin (66)
Trustee | Trustee since 2019.
Serves until a successor
trustee is elected or
earlier retirement
or removal. | Managing Director - Head of Product Strategy and Development, BNY Mellon Investment Management (investment management firm) (2012-2018); Vice Chairman – The Dreyfus Corporation (2005 – 2018): Executive Vice President Head of Product, BNY Mellon Investment Management (2007-2012); Executive Director- Product Strategy, Mellon Asset Management (2005-2007); Executive Vice President Head of Products, Marketing and Client Service, Dreyfus Corporation (investment management firm) (2000-2005); Senior Vice President Strategic Product and Business Development, Dreyfus Corporation (1994-2000) | None |
Pioneer Balanced ESG Fund | Annual Report | 7/31/2393
Independent Trustees (continued)
Name, Age and Position
Held With the Fund | Term of Office and
Length of Service | Principal Occupation(s) During At Least The Past Five Years | Other Directorships Held by Trustee
During At Least The Past Five Years |
Benjamin M. Friedman (78)
Trustee | Trustee since 2008.
Serves until a successor
trustee is elected or
earlier retirement
or removal. | William Joseph Maier Professor of Political Economy, Harvard University (1972 – present) | Trustee, Mellon Institutional Funds Investment
Trust and Mellon Institutional Funds Master
Portfolio (oversaw 17 portfolios in fund complex)
(1989 - 2008) |
Craig C. MacKay (60)
Trustee | Trustee since 2021.
Serves until a successor
trustee is elected or
earlier retirement
or removal. | Partner, England & Company, LLC (advisory firm) (2012 – present); Group Head – Leveraged Finance Distribution, Oppenheimer & Company (investment bank) (2006 – 2012); Group Head – Private Finance & High Yield Capital Markets Origination, SunTrust Robinson Humphrey (investment bank) (2003 – 2006); and Founder and Chief Executive Officer, HNY Associates, LLC (investment bank) (1996 – 2003) | Director, Equitable Holdings, Inc. (financial
services holding company) (2022 – present);
Board Member of Carver Bancorp, Inc. (holding
company) and Carver Federal Savings Bank,
NA (2017 – present); Advisory Council Member,
MasterShares ETF (2016 – 2017); Advisory
Council Member, The Deal (financial market
information publisher) (2015 – 2016); Board
Co-Chairman and Chief Executive Officer, Danis
Transportation Company (privately-owned
commercial carrier) (2000 – 2003); Board
Member and Chief Financial Officer, Customer
Access Resources (privately-owned
teleservices company) (1998 – 2000); Board
Member, Federation of Protestant Welfare
Agencies (human services agency) (1993 –
present); and Board Treasurer, Harlem Dowling
Westside Center (foster care agency)
(1999 – 2018) |
94Pioneer Balanced ESG Fund | Annual Report | 7/31/23
Name, Age and Position
Held With the Fund | Term of Office and
Length of Service | Principal Occupation(s) During At Least The Past Five Years | Other Directorships Held by Trustee
During At Least The Past Five Years |
Lorraine H. Monchak (67)
Trustee | Trustee since 2017.
(Advisory Trustee from
2014 - 2017). Serves
until a successor trustee
is elected or earlier
retirement or removal. | Chief Investment Officer, 1199 SEIU Funds (healthcare workers union pension funds) (2001 – present); Vice President – International Investments Group, American International Group, Inc. (insurance company) (1993 – 2001); Vice President Corporate Finance and Treasury Group, Citibank, N.A. (1980 – 1986 and 1990 – 1993); Vice President – Asset/Liability Management Group, Federal Farm Funding Corporation (government-sponsored issuer of debt securities) (1988 – 1990); Mortgage Strategies Group, Shearson Lehman Hutton, Inc. (investment bank) (1987 – 1988); Mortgage Strategies Group, Drexel Burnham Lambert, Ltd. (investment bank) (1986 – 1987) | None |
Marguerite A. Piret (75)
Trustee | Trustee since 2005.
Serves until a successor
trustee is elected or
earlier retirement
or removal. | Chief Financial Officer, American Ag Energy, Inc. (technology for the environment, energy and agriculture ) (2019 – present); Chief Operating Officer, North Country Growers LLC (controlled environment agriculture company) (2020 – present); Chief Executive Officer, Green Heat LLC (biofuels company) (2022 – present); President and Chief Executive Officer, Newbury Piret Company (investment banking firm) (1981 – 2019) | Director of New America High Income Fund,
Inc. (closed-end investment company) (2004 –
present); and Member, Board of Governors,
Investment Company Institute (2000 – 2006) |
Pioneer Balanced ESG Fund | Annual Report | 7/31/2395
Independent Trustees (continued)
Name, Age and Position
Held With the Fund | Term of Office and
Length of Service | Principal Occupation(s) During At Least The Past Five Years | Other Directorships Held by Trustee
During At Least The Past Five Years |
Fred J. Ricciardi (76)
Trustee | Trustee since 2014.
Serves until a successor
trustee is elected or
earlier retirement
or removal. | Private investor (2020 – present); Consultant (investment company services) (2012 – 2020); Executive Vice President, BNY Mellon (financial and investment company services) (1969 – 2012); Director, BNY International Financing Corp. (financial services) (2002 – 2012); Director, Mellon Overseas Investment Corp. (financial services) (2009 – 2012); Director, Financial Models (technology) (2005-2007); Director, BNY Hamilton Funds, Ireland (offshore investment companies) (2004-2007); Chairman/Director, AIB/BNY Securities Services, Ltd., Ireland (financial services) (1999-2006); Chairman, BNY Alternative Investment Services, Inc. (financial services) (2005-2007) | None |
| * Mr. Baumgardner is Of Counsel to Sullivan & Cromwell LLP, which acts as counsel to the Independent Trustees of each Pioneer Fund. |
96Pioneer Balanced ESG Fund | Annual Report | 7/31/23
Name, Age and Position
Held With the Fund | Term of Office and
Length of Service | Principal Occupation(s) During At Least The Past Five Years | Other Directorships Held by Trustee
During At Least The Past Five Years |
Lisa M. Jones (61)**
Trustee, President and Chief
Executive Officer | Trustee since 2017. Serves
until a successor trustee is
elected or earlier retirement
or removal | Director, CEO and President of Amundi US, Inc. (investment management firm) (since September 2014); Director, CEO and President of Amundi Asset Management US, Inc. (since September 2014); Director, CEO and President of Amundi Distributor US, Inc. (since September 2014); Director, CEO and President of Amundi Asset Management US, Inc. (since September 2014); Chair, Amundi US, Inc., Amundi Distributor US, Inc. and Amundi Asset Management US, Inc. (September 2014 – 2018); Managing Director, Morgan Stanley Investment Management (investment management firm) (2010 – 2013); Director of Institutional Business, CEO of International, Eaton Vance Management (investment management firm) (2005 – 2010); Director of Amundi Holdings US, Inc. (since 2017) | Director of Clearwater Analytics (provider of
web-based investment accounting software
for reporting and reconciliation services)
(September 2022 – present) |
Kenneth J. Taubes (65)**
Trustee | Trustee since 2014. Serves
until a successor trustee is
elected or earlier retirement
or removal | Director and Executive Vice President (since 2008) and Chief Investment Officer, U.S. (since 2010) of Amundi US, Inc. (investment management firm); Director and Executive Vice President and Chief Investment Officer, U.S. of Amundi US (since 2008); Executive Vice President and Chief Investment Officer, U.S. of Amundi Asset Management US, Inc. (since 2009); Portfolio Manager of Amundi US (since 1999); Director of Amundi Holdings US, Inc. (since 2017) | None |
| ** Ms. Jones and Mr. Taubes are Interested Trustees because they are officers or directors of the Fund’s investment adviser and certain of its affiliates. |
Pioneer Balanced ESG Fund | Annual Report | 7/31/2397
Name, Age and Position
Held With the Fund | Term of Office and
Length of Service | Principal Occupation(s) During At Least The Past Five Years | Other Directorships Held by Trustee
During At Least The Past Five Years |
Christopher J. Kelley (58)
Secretary and Chief
Legal Officer | Since 2005. Serves at
the discretion of
the Board | Vice President and Associate General Counsel of Amundi US since January 2008; Secretary and Chief Legal Officer of all of the Pioneer Funds since June 2010; Assistant Secretary of all of the Pioneer Funds from September 2003 to May 2010; Vice President and Senior Counsel of Amundi US from July 2002 to December 2007 | None |
Thomas Reyes (60)
Assistant Secretary | Since 2010. Serves at
the discretion of
the Board | Assistant General Counsel of Amundi US since May 2013 and Assistant Secretary of all the Pioneer Funds since June 2010; Counsel of Amundi US from June 2007 to May 2013 | None |
Heather L. Melito-Dezan (46)
Assistant Secretary | Since 2022. Serves at
the discretion of the Board | Director - Trustee and Board Relationships of Amundi US since September 2019; Assistant Secretary of Amundi US, Inc. since July 2020: Assistant Secretary of Amundi Asset Management US, Inc. since July 2020: Assistant Secretary of Amundi Distributor US, Inc. since July 2020; Assistant Secretary of all the Pioneer Funds since September 2022; Private practice from 2017 – 2019. | None |
Anthony J. Koenig, Jr. (59)
Treasurer and
Chief Financial and
Accounting Officer | Since 2021. Serves at
the discretion of
the Board | Managing Director, Chief Operations Officer and Fund Treasurer of Amundi US since May 2021; Treasurer of all of the Pioneer Funds since May 2021; Assistant Treasurer of all of the Pioneer Funds from January 2021 to May 2021; and Chief of Staff, US Investment Management of Amundi US from May 2008 to January 2021 | None |
Luis I. Presutti (58)
Assistant Treasurer | Since 2005. Serves at
the discretion of
the Board | Director – Fund Treasury of Amundi US since 1999; and Assistant Treasurer of all of the Pioneer Funds since 1999 | None |
98Pioneer Balanced ESG Fund | Annual Report | 7/31/23
Name, Age and Position
Held With the Fund | Term of Office and
Length of Service | Principal Occupation(s) During At Least The Past Five Years | Other Directorships Held by Trustee
During At Least The Past Five Years |
Gary Sullivan (65)
Assistant Treasurer | Since 2005. Serves at
the discretion of
the Board | Senior Manager – Fund Treasury of Amundi US since 2012; and Assistant Treasurer of all of the Pioneer Funds since 2002 | None |
Antonio Furtado (41)
Assistant Treasurer | Since 2020. Serves at
the discretion of
the Board | Fund Oversight Manager – Fund Treasury of Amundi US since 2020; Assistant Treasurer of all of the Pioneer Funds since 2020; and Senior Fund Treasury Analyst from 2012 - 2020 | None |
Michael Melnick (52)
Assistant Treasurer | Since 2021. Serves at
the discretion of
the Board | Vice President - Deputy Fund Treasurer of Amundi US since May 2021; Assistant Treasurer of all of the Pioneer Funds since July 2021; Director of Regulatory Reporting of Amundi US from 2001 – 2021; and Director of Tax of Amundi US from 2000 - 2001 | None |
John Malone (52)
Chief Compliance Officer | Since 2008. Serves at
the discretion of
the Board | Managing Director, Chief Compliance Officer of Amundi US Asset Management; Amundi Asset Management US, Inc.; and the Pioneer Funds since September 2018; Chief Compliance Officer of Amundi Distributor US, Inc. since January 2014. | None |
Brandon Austin (51)
Anti-Money
Laundering Officer | Since March 2022. Serves at
the discretion of
the Board | Director, Financial Security – Amundi Asset Management; Anti-Money Laundering Officer of all the Pioneer Funds since March 2022 Director of Financial Security of Amundi US since July 2021; Vice President, Head of BSA, AML and OFAC, Deputy Compliance Manager, Crédit Agricole Indosuez Wealth Management (investment management firm) (2013 – 2021) | None |
Pioneer Balanced ESG Fund | Annual Report | 7/31/2399
How to Contact Amundi
We are pleased to offer a variety of convenient ways for you to contact us for assistance or information.
Call us for:
Account Information, including existing accounts,
new accounts, prospectuses, applications
and service forms
1-800-225-6292
FactFoneSMfor automated fund yields, prices,
account information and transactions
1-800-225-4321
| Retirement plans information | 1-800-622-0176 |
Write to us:
Amundi
P.O. Box 534427
Pittsburgh, PA 15253-4427
| Our toll-free fax | 1-800-225-4240 |
| Our internet e-mail address | us.askamundi@amundi.com
(for general questions about Amundi only) |
Visit our web site: www.amundi.com/us
This report must be preceded or accompanied by a prospectus.
The Fund files a complete schedule of portfolio holdings with the Securities and Exchange Commission for the first and third quarters of each fiscal year as an exhibit to its reports on Form N-PORT. Shareholders may view the filed Form N-PORT by visiting the Commission’s web site at https://www.sec.gov.
Amundi Asset Management US, Inc.
60 State Street
Boston, MA 02109
www.amundi.com/us
Securities offered through Amundi Distributor US, Inc.
60 State Street, Boston, MA 02109
Underwriter of Pioneer Mutual Funds, Member SIPC
© 2023 Amundi Asset Management US, Inc. 19418-17-0923
Pioneer Multi-Asset Income Fund
Annual Report | July 31, 2023
| | | | | |
| A: PMAIX | C: PMACX | K: PMFKX | R: PMFRX | Y: PMFYX |
visit us: www.amundi.com/us
Pioneer Multi-Asset Income Fund | Annual Report | 7/31/231
President’s Letter
Dear Shareholders,
On February 13, 2023, Amundi US celebrated the 95th anniversary of Pioneer Fund, the second-oldest mutual fund in the United States. We recognized the anniversary with ringing of the closing bell at the New York Stock Exchange, which seemed fitting for this special milestone.
Pioneer Fund was launched on February 13, 1928 by Phil Carret, one of the earliest proponents of value investing and a leading innovator in the asset management industry. Mr. Carret began investing in the 1920s and founded Pioneer Investments (now Amundi US) in 1928, and was one of the first investors to realize he could uncover value through rigorous, innovative, fundamental research techniques.
Consistent with Mr. Carret’s investment approach and employing many of the same techniques utilized in the 1920s, Amundi US's portfolio managers have adapted Mr. Carret’s philosophy to a new age of “active” investing.
The last few years have seen investors face some unprecedented challenges, from a global pandemic that shuttered much of the world’s economy for months, to geopolitical strife, to rising inflation that has reached levels not seen in decades. Now, more than ever, Amundi US believes active management – that is, making active investment decisions across all of our portfolios – can help mitigate risk during periods of market volatility.
At Amundi US, active management begins with our own fundamental, bottom-up research process. Our team of dedicated research analysts and portfolio managers analyzes each security under consideration, communicating frequently with the management teams of the companies and other entities issuing the securities, and working together to identify those securities that we believe best meet our investment criteria for our family of funds. Our risk management approach begins with each security under consideration, as we strive to develop a deep understanding of the potential opportunity, while considering any potential risk factors.
Today, as shareholders, we have many options. It is our view that active management can serve shareholders well, not only when markets are thriving, but also during periods of market stress. As you consider your long-term investment goals, we encourage you to work with your financial professional to develop an investment plan that paves the way for you to pursue both your short-term and long-term goals.
2Pioneer Multi-Asset Income Fund | Annual Report | 7/31/23
We greatly appreciate the trust you have placed in us and look forward to continuing to serve you in the future.
Lisa M. Jones
Head of the Americas, President and CEO of US
Amundi Asset Management US, Inc.
September 2023
Any information in this shareowner report regarding market or economic trends or the factors influencing the Fund’s historical or future performance are statements of opinion as of the date of this report. Past performance is no guarantee of future results.
Pioneer Multi-Asset Income Fund | Annual Report | 7/31/233
Portfolio Management Discussion | 7/31/23
In the following interview, Howard Weiss discusses Pioneer Multi-Asset Income Fund’s performance and investment strategies during the 12-month period ended July 31, 2023, along with the management team’s outlook for the coming months. Mr. Weiss, CFA, a Senior Vice President, Director of Multi-Asset Solutions, US, and a portfolio manager at Amundi Asset Management US, Inc. (Amundi US), co-manages the Fund, along with Marco Pirondini, Senior Managing Director, Head of Equities, US, and a portfolio manager at Amundi US; and Fergal Jackson, a Vice President and a portfolio manager at Amundi US.
| Q | How did the Fund perform during 12-month period ended July 31, 2023? |
| A | The Fund’s Class A shares returned 9.19% at net asset value during the 12-month period ended July 31, 2023, while the Fund’s benchmarks, the Bloomberg US Aggregate Bond Index (the Bloomberg Index) and the Morgan Stanley Capital International Index (MSCI) All Country World NR Index (the MSCI Index)*, returned -3.37% and 12.91%, respectively. During the same period, the average return of the 393 mutual funds in Morningstar’s Global Allocation Funds category was 4.80%. |
| Q | How would you describe the global investment environment during the 12-month period ended July 31, 2023? |
| A | Amid considerable market and interest-rate volatility, equities rallied and strongly outperformed fixed-income assets. From November 2022, a few months after the beginning of the period, through January 2023, investor sentiment improved, due to signs that various central banks, including the US Federal Reserve |
| * | The MSCI information may only be used for your internal use, may not be reproduced or redisseminated in any form and may not be used as a basis for or a component of any financial instruments or products or indices. None of the MSCI information is intended to constitute investment advice or a recommendation to make (or refrain from making) any kind of investment decision and may not be relied on as such. Historical data and analysis should not be taken as an indication or guarantee of any future performance analysis, forecast or prediction. The MSCI information is provided on an “as is” basis and the user of this information assumes the entire risk of any use made of this information. MSCI, each of its affiliates and each other person involved in or related to compiling, computing or creating any MSCI information (collectively, the “MSCI Parties”) expressly disclaims all warranties (including, without limitation, any warranties of originality, accuracy, completeness, timeliness, non-infringement, merchantability and fitness for a particular purpose) , with respect to this information. Without limiting any of the foregoing, in no event shall any MSCI Party have any liability for any direct, indirect, special, incidental, punitive, consequential (including, without limitation, lost profits) or any other damages. |
4Pioneer Multi-Asset Income Fund | Annual Report | 7/31/23
| | (Fed), were making headway with regard to tamping down elevated levels of inflation. That, in turn, raised optimism among market participants that those central banks might slow the degree and pace of future interest-rates increases. China’s economic reopening due to an easing of its “Zero-COVID” policies also helped fuel the rally. |
| | In February 2023, however, market sentiment deteriorated as investors feared the Fed might raise interest rates to higher-than-anticipated levels after the release of rising inflation data in January. In addition, new concerns arose in March 2023, driven by turmoil in the banking sector. The failure of multiple US regional banks and the forced merger of a bank in Switzerland (Credit Suisse) led to worries about a potential liquidity crisis and slower economic growth. Quick actions by central banks, including the Fed, to minimize systemic risk, including shoring-up bank deposits, helped prevent contagion of those problems across the global financial system. |
| | Despite the stabilizing actions of central banks, concerns over the balance sheets of numerous banks in both the US and Europe revived recession fears and led to changing expectations about the future path of monetary policy, although investors remained hopeful that a continued economic slowdown might give the Fed and the European Central Bank (ECB), in particular, room to end their series of interest-rate increases. In the wake of the banking system issues, higher-growth stocks in the information technology sector began a multi-month rally that lasted for the balance of the 12-month period. |
| | In June 2023, the rally picked up new momentum with the Fed’s decision to pause interest-rate hikes after 10 consecutive meetings in which it had increased the federal funds rate target range. The prospect of China's enacting new stimulus measures also helped boost market sentiment, as the economic rebound after the country’s post-COVID reopening had fallen short of expectations. In Japan, monetary policy continued to diverge from those of other developed countries, with the Bank of Japan maintaining its ultra-loose policies due to concerns about slowing economic growth. That resulted in the continued weakening of the yen versus other major currencies and strong performance of Japanese equity markets, as a weaker yen has tended to lend |
Pioneer Multi-Asset Income Fund | Annual Report | 7/31/235
| | support to the competitiveness of domestic manufacturers in the international markets. As a result, in June 2023, the Nikkei Index reached its highest level in 30 years. |
| | For the 12-month period, other developed-market equities outperformed US equities on a relative basis. At the regional level, European and Japanese equities rose by 19.62% and 15.10%, respectively, for the full period, while in the US, the Standard & Poor’s 500 Index (the S&P 500) returned 13.02%. Meanwhile, emerging markets equities were positive, but lagged other regions, returning 8.35% for the 12-month period. |
| | Global growth stocks, led by companies in the information technology, industrials, and communication services sectors, outperformed global value stocks over the 12-month period. On the other hand, amid continued tightening of monetary policy by various central banks, global fixed-income assets lost ground for the 12-month period, delivering returns in the low-negative single digits, on average. A notable exception was the high-yield segment, as the Bloomberg Global High Yield Index returned more than 8% for the period. |
| Q | What factors drove the Fund’s benchmark-relative performance during the 12-month period ended July 31, 2023? |
| A | As a diversified** multi-asset portfolio, the Fund’s returns have generally fallen in between its fixed-income benchmark, the Bloomberg Index, and its global equity benchmark, the MSCI Index. That was indeed the case over the full 12-month period. |
| | During the first half of reporting period, the Fund solidly outperformed both benchmarks, with the outperformance driven by our valuation-oriented approach, in which we favored holding equities in the portfolio that we believed could perform well in an environment of higher interest rates, elevated inflation, and weaker economic data, and featuring a Fed that appeared to be moving toward maintaining a tighter monetary policy for longer than many investors had anticipated. Global value stocks significantly outperformed growth stocks during that time frame, and our security selection decisions, coupled with overweight portfolio allocations (versus the MSCI Index) to the |
| ** | Diversification does not assure a profit nor protect against loss. |
6Pioneer Multi-Asset Income Fund | Annual Report | 7/31/23
| | outperforming energy and financials sectors, aided the Fund’s benchmark-relative returns. |
| | During the second half of the reporting period, the Fund outperformed the Bloomberg Index, but underperformed the MSCI Index. With economic and inflation data suggesting a more resilient economic picture, riskier assets, such as stocks and corporate bonds, rallied strongly during the April through July 2023 timeframe. In the US, signs of moderating inflation led to expectations that the Fed might relax its monetary policy. At the same time, recession fears eased, with many investors embracing a “soft landing” narrative, in which economic growth slows but remains positive while inflation is brought under control. Stocks gained ground in Europe, despite the ECB’s raising its key Deposit Facility rate to the highest level in over 20 years. Inflation data in the euro zone also came in better than expected for June 2023. In that “risk-on” market environment, global growth stocks outperformed value stocks. Our security selection decisions, including the Fund’s underweight exposure (versus the MSCI Index) to the outperforming information technology sector, weighed on benchmark-relative results. The Fund’s somewhat defensive positioning also was a headwind during a period of strong equity-market performance. |
| | For the 12-month period ended July 31, 2023, security selection results within the portfolio’s equity allocation were the largest detractors from the Fund’s benchmark-relative performance. In particular, our decision to limit the Fund’s exposure to large-cap and mega-cap information technology stocks was a headwind for relative returns, as those types of stocks soared in price, driven by heightened investor interest in potential Artificial Intelligence (AI) applications, and especially in shares of semiconductor companies, which are necessary for the development of those technological advancements. At period-end, we had retained the Fund’s underweight allocation to information technology, given what we viewed as the sector’s excessive valuations and the general lack of dividend*** payments by those companies. Conversely, our valuation-based approach pointed us toward |
| *** | Dividends are not guaranteed. |
Pioneer Multi-Asset Income Fund | Annual Report | 7/31/237
| | investments in companies that we believe still may offer opportunities for growth, but, in our view, at much more reasonable prices. |
| | At the individual security level, equity positions that aided the Fund’s benchmark-relative performance during the 12-month period included ABN AMRO, a large Dutch bank, energy giant Shell, and Cardinal Health, a health care services provider. The Fund’s investments in those companies exemplify our preference for businesses with large free-cash flows, which could enable them to increase dividends and engage in share buybacks. Positions that detracted from the Fund’s benchmark-relative returns during the period included Pfizer and CVS Health, as well as residual portfolio exposure to equity-linked debentures issued by Lumen Technologies. |
| | On the fixed-income side, the Fund outperformed the Bloomberg Index by a fairly wide margin during the period. Given our view that market risks had leaned more towards inflationary pressures than recessionary conditions, we reduced the portfolio’s allocation to fixed-income assets across both duration and credit-sensitive sectors early in the 12-month period. (Duration is a measure of the sensitivity of the price, or the value of principal, of a fixed-income investment to changes in interest rates expressed as a number of years.) Alternatively, we increased the Fund’s exposures to cash and to US Treasuries with one- and two-year maturities, as we felt the increased yields offered by those securities presented us with the opportunity to invest in them, in a material way, for the first time since the Fund’s inception in 2011. The strategy provided the portfolio with incremental yield during the period, as well as liquidity for the potential redeployment of assets if and when new investment opportunities arise. |
| | An allocation to equity-linked notes (ELNs) also made a solid positive contribution to the Fund’s benchmark-relative performance during the 12-month period. ELNs have provided, in our view, better coupon and yield profiles, with lower duration characteristics than we believed we could source from traditional fixed-income assets, such as high-yield bonds. ELNs are products that combine a fixed-income investment with the potential for additional returns tied to the performance of underlying equities, |
8Pioneer Multi-Asset Income Fund | Annual Report | 7/31/23
| | or equity-related securities. ELNs seek to produce yield by selling volatility against a single equity, basket of equities, or equity index. They are, in effect, covered call strategies, in which a call option – or a contractual agreement to buy a security at a predetermined price and within a predetermined timeframe – against the underlying investment is sold in an effort to produce income. (Selling volatility entails seeking relatively expensive options of highly volatile investments, with the goal of selling the options at a higher-than-average price, in anticipation that they will lose value at a faster rate than lower-cost, comparable options might decline in value.) While ELNs still bear the price risk of the referenced stock(s), periods of elevated volatility may result in ELNs offering richer coupons (yields); that, in turn, could help to mute volatility of net returns when compared to actually owning the stock shares. ELNs are subject to additional risks and, of course, there is no assurance that investments in ELNs will be profitable. |
| Q | Did the Fund’s monthly distributions**** to shareholders change during the 12-month period ended July 31, 2023? |
| A | Yes, the Fund’s monthly distribution rate modestly increased over the 12-month period, and the Fund released a year-end special distribution in December 2022. A special distribution has been paid to shareholders each year since the Fund’s inception. |
| | We feel the income-generation results referenced above are a testament to our flexible, “go anywhere” investment approach in managing the Fund, and multi-asset view of portfolio construction. We believe those features distinguish the Fund from many of its peers, and may potentially provide investors with an effective way to navigate complex market environments. Our message has consistently been one of prioritizing not just income, but also seeking out the best channels through which said income could be produced. |
| **** | Distributions are not guaranteed. |
Pioneer Multi-Asset Income Fund | Annual Report | 7/31/239
| Q | Did the Fund have exposure to derivative investments during the 12-month period ended July 31, 2023, and did the derivatives have an effect on the Fund’s benchmark performance? |
| A | Yes. As we discussed earlier, the Fund had exposure to ELNs, which aided benchmark-relative performance. We also purchased equity hedges, through the purchase of equity-index futures contracts, in an effort to help temper the effects of increased market volatility and sell-offs on the portfolio during the 12-month period. (Equity hedges are investments utilized to help reduce the risk of adverse price movements in a stock in which the investor already owns shares outright.) |
| | While the equity hedges helped backstop the Fund’s performance during times of market sell-offs, they detracted from benchmark-relative returns when US equities rallied during the 12-month period. Overall, the hedge positions produced a negative net effect on the Fund’s performance for the full reporting period, given the strong performance of US equities. We continue to believe our hedging strategy may help to mitigate the market-volatility risks associated with holding common stocks in the portfolio over the long term. |
| Q | What is your outlook, and how have you positioned the Fund heading into a new fiscal year? |
| A | Global equities, as measured by the MSCI Index, have delivered rewarding performance on a year-to-date basis from January 1, 2023 through July 31, 2023, returning more than 18%. Returns have been strong across all regions, with US (up 21%), European (up 17%), Japanese (up 16%), and emerging markets equities (up 11%) all soaring by double digits. After such strong performance in a relatively short period of time, we believe caution is warranted. Many investors have remained overly optimistic, in our view, and have been ignoring the risk of a recession as well as underestimating the potentially negative effects a slowdown in economic growth could have on corporate earnings. |
| | In our opinion, the risk that inflation would reaccelerate appears limited, but we believe tighter credit conditions are likely to remain in place as central banks, including the Fed, have remained focused on meeting their inflation targets. In this environment, we favor investing the portfolio in shares of |
10Pioneer Multi-Asset Income Fund | Annual Report | 7/31/23
companies that we believe can continue to deliver earnings, including stocks in the financials sector. The international bank stocks held in the portfolio, many of which are companies located in Asia and Europe, have very high capital standards, in our view, and do not have relevant exposure to bond losses. Within the energy sector, which has been another strong focus for us in managing the portfolio, we continue to see a structural opportunity, as there has been underinvestment in fossel fuels across most of the globe. Within the sector, we have maintained the Fund’s exposure to natural gas companies, which we view as key to a smooth transition to more renewable fuels over time. Lastly, we believe the health care sector has offered solid income opportunities at attractive valuations. Given the more defensive nature of health care companies in general, we believe the sector could play an important role as we move through the later stages of the current economic cycle.
Pioneer Multi-Asset Income Fund | Annual Report | 7/31/2311
Please refer to the Schedule of Investments on pages 25 - 57 for a full listing of Fund securities.
All investments are subject to risk, including the possible loss of principal. In the past several years, financial markets have experienced increased volatility and heightened uncertainty. The market prices of securities may go up or down, sometimes rapidly or unpredictably, due to general market conditions, such as real or perceived adverse economic, political, or regulatory conditions, recessions, inflation, changes in interest or currency rates, lack of liquidity in the bond markets, the spread of infectious illness or other public health issues, armed conflict including Russia's military invasion of Ukraine, sanctions against Russia, other nations or individuals or companies and possible countermeasures, market disruptions caused by tariffs, trade disputes or other government actions, or adverse investor sentiment. These conditions may continue, recur, worsen or spread.
Pioneer Multi-Asset Income (“MAI”) Fund has the ability to invest in a wide variety of securities and asset classes.
Equity-linked notes (ELNs) may not perform as expected and could cause the fund to realize significant losses including its entire principal investment. Other risks include the risk of counterparty default, liquidity risk and imperfect correlation between ELNs and the underlying securities.
Until recently, a commonly used reference rate for floating rate securities was LIBOR (London Interbank Offered Rate). Publication of most LIBOR settings has ceased on a representative basis. The impact of the transition from LIBOR on the Fund's transactions and financial markets generally cannot yet be determined.
High yield bonds possess greater price volatility, illiquidity, and possibility of default.
Investments in fixed income securities involve interest rate, credit, inflation, and reinvestment risks. As interest rates rise, the value of fixed income securities falls.
Prepayment risk is the chance that an issuer may exercise its right to prepay its security, if falling interest rates prompt the issuer to do so. Forced to reinvest the unanticipated proceeds at lower interest rates, the Fund would experience a decline in income and lose the opportunity for additional price appreciation.
The Fund may invest in mortgage-backed securities, which during times of fluctuating interest rates may increase or decrease more than other fixed income securities. Mortgage-backed securities are also subject to pre-payments.
12Pioneer Multi-Asset Income Fund | Annual Report | 7/31/23
The Fund may invest in subordinated securities which may be disproportionately adversely affected by a default or even a perceived decline in creditworthiness of the issuer.
International investments are subject to special risks including currency fluctuations, social, economic and political uncertainties, which could increase volatility. These risks are magnified in emerging markets.
The Fund may invest in inflation-linked securities. As inflationary expectations increase, inflation-linked securities may become more attractive, because they protect future interest payments against inflation. Conversely, as inflationary concerns decrease, inflation-linked securities will become less attractive and less valuable.
The Fund may invest in insurance-linked securities (ILS). The Fund could lose a portion or all of the principal it has invested in an ILS, and the right to additional interest and/or dividend payments with respect to the security, upon the occurrence of a trigger event that leads to physical or economic loss. ILS may expose the Fund to issuer (credit) default, liquidity, and other risks.
The Fund may invest in floating rate loans. The value of collateral, if any, securing a floating rate loan can decline or may be insufficient to meet the issuer’s obligations or may be difficult to liquidate.
The Fund may invest in underlying funds, including ETFs. In addition to the Fund’s operating expenses, investors will indirectly bear the operating expenses of investments in any underlying funds.
Investments in equity securities are subject to price fluctuation.
Investments in small-and mid-cap stocks involve greater risks and volatility than large-cap stocks.
The Fund may invest in Master Limited Partnerships, which are subject to increased risks of liquidity, price valuation, control, voting rights and taxation.
The Fund may invest in zero coupon bonds and payment in kind securities, which may be more speculative and fluctuate more in value than other fixed income securities. The accrual of income from these securities are payable as taxable annual dividends to shareholders.
The Fund may use derivatives, such as options and futures, which can be illiquid, may disproportionately increase losses, and have a potentially large impact on performance.
Pioneer Multi-Asset Income Fund | Annual Report | 7/31/2313
The Fund may invest in credit default swaps, a type of derivative, which may in some cases be illiquid, and increases credit risk since the Fund has exposure to both the issuer of the referenced obligation and the counterparty to the credit default swap.
The Fund and some of the underlying funds may employ leverage, which increases the volatility of investment returns and subjects the Fund to magnified losses if the Fund's or the underlying funds' investments decline in value.
There is no assurance that these and other strategies used by the Fund or underlying funds will be successful. Please see the prospectus for a more complete discussion of the Fund’s risks.
For more information on this or any Pioneer fund, please visit amundi.com/usinvestors or call 1-800-622-9876. This material must be preceded or accompanied by the Fund's current prospectus or summary prospectus.
Any information in this shareholder report regarding market or economic trends or the factors influencing the Fund’s historical or future performance are statements of opinion as of the date of this report. Past performance is not a guarantee of future results.
14Pioneer Multi-Asset Income Fund | Annual Report | 7/31/23
Portfolio Summary | 7/31/23
Portfolio Diversification
(As a percentage of total investments)*
Sector Distribution
(As a percentage of total investments)*
+ Amount rounds to less than 0.1%.
Pioneer Multi-Asset Income Fund | Annual Report | 7/31/2315
Portfolio Summary | 7/31/23 (continued)
10 Largest Holdings
| (As a percentage of total investments)* |
| 1. | Energy Transfer LP | 3.34% |
| 2. | Shell Plc, (A.D.R.) | 3.31 |
| 3. | Pfizer, Inc. | 3.07 |
| 4. | ABN AMRO Bank NV, (C.V.A.) (144A) | 2.92 |
| 5. | U.S. Treasury Notes, 3.00%, 6/30/24 | 2.36 |
| 6. | International Business Machines Corp. | 2.09 |
| 7. | KB Financial Group, Inc. | 2.03 |
| 8. | Sanofi | 1.94 |
| 9. | State Street Corp. | 1.89 |
| 10. | Level 3 Financing, Inc., 10.50%, 5/15/30 (144A) | 1.70 |
| | |
| * | Excludes short-term investments and all derivative contracts except for options purchased. The Fund is actively managed, and current holdings may be different. The holdings listed should not be considered recommendations to buy or sell any securities. |
16Pioneer Multi-Asset Income Fund | Annual Report | 7/31/23
Prices and Distributions | 7/31/23
Net Asset Value per Share
| Class | 7/31/23 | 7/31/22 |
| A | $11.32 | $10.98 |
| C | $11.28 | $10.94 |
| K | $11.64 | $11.28 |
| R | $11.32 | $10.98 |
| Y | $11.28 | $10.94 |
| | | |
Distributions per Share: 8/1/22 - 7/31/23
| Class | Net
Investment
Income | Short-Term
Capital Gains | Long-Term
Capital Gains |
| A | $0.6331 | $— | $— |
| C | $0.5474 | $— | $— |
| K | $0.6813 | $— | $— |
| R | $0.5977 | $— | $— |
| Y | $0.6530 | $— | $— |
Index Definitions
The Bloomberg US Aggregate Bond Index is an unmanaged measure of the US bond market. The MSCI All Country World NR Index is an unmanaged, free float-adjusted, market capitalization-weighted index that is designed to measure the equity market performance of developed and emerging markets. The Index consists of 45 country indices comprising 24 developed and 21 emerging market country indices. Indices are unmanaged and their returns assume reinvestment of dividends and do not reflect any fees or expenses. It is not possible to invest directly in an index.
The indices defined here pertain to the “Value of $10,000 Investment” and “Value of $5 Million Investment” charts on pages 18 – 22.
Pioneer Multi-Asset Income Fund | Annual Report | 7/31/2317
| Performance Update | 7/31/23 | Class A Shares |
Investment Returns
The mountain chart on the right shows the change in value of a $10,000 investment made in Class A shares of Pioneer Multi-Asset Income Fund at public offering price during the periods shown, compared to that of the Bloomberg US Aggregate Bond Index and the MSCI All Country World NR Index.
Average Annual Total Returns
(As of July 31, 2023) |
| Period | Net
Asset
Value
(NAV) | Public
Offering
Price
(POP) | Bloomberg
US
Aggregate
Bond
Index | MSCI
All
Country
World
NR
Index |
| 10 Years | 6.04% | 5.56% | 1.50% | 8.64% |
| 5 Years | 5.31 | 4.33 | 0.75 | 8.24 |
| 1 Year | 9.19 | 4.25 | -3.37 | 12.91 |
Expense Ratio
(Per prospectus dated December 1, 2022) |
| Gross |
| 0.86% |
Value of $10,000 Investment
Call 1-800-225-6292 or visit www.amundi.com/us for the most recent month-end performance results. Current performance may be lower or higher than the performance data quoted.
The performance data quoted represents past performance, which is no guarantee of future results. Investment return and principal value will fluctuate, and shares, when redeemed, may be worth more or less than their original cost.
NAV results represent the percent change in net asset value per share. NAV returns would have been lower had sales charges been reflected. POP returns reflect deduction of maximum 4.50% sales charge. All results are historical and assume the reinvestment of dividends and capital gains. Other share classes are available for which performance and expenses will differ.
Performance results reflect any applicable expense waivers in effect during the periods shown. Without such waivers Fund performance would be lower. Waivers may not be in effect for all funds. Certain fee waivers are contractual through a specified period. Otherwise, fee waivers can be rescinded at any time. See the prospectus and financial statements for more information.
The performance table and graph do not reflect the deduction of fees and taxes that a shareowner would pay on Fund distributions or the redemption of Fund shares.
Please see the financial highlights for a more current expense ratio.
18Pioneer Multi-Asset Income Fund | Annual Report | 7/31/23
| Performance Update | 7/31/23 | Class C Shares |
Investment Returns
The mountain chart on the right shows the change in value of a $10,000 investment made in Class C shares of Pioneer Multi-Asset Income Fund during the periods shown, compared to that of the Bloomberg US Aggregate Bond Index and the MSCI All Country World NR Index.
Average Annual Total Returns
(As of July 31, 2023) |
| Period | If
Held | If
Redeemed | Bloomberg
US
Aggregate
Bond
Index | MSCI
All
Country
World
NR
Index |
| 10 Years | 5.20% | 5.20% | 1.50% | 8.64% |
| 5 Years | 4.48 | 4.48 | 0.75 | 8.24 |
| 1 Year | 8.38 | 7.38 | -3.37 | 12.91 |
Expense Ratio
(Per prospectus dated December 1, 2022) |
| Gross |
| 1.62% |
Value of $10,000 Investment
Call 1-800-225-6292 or visit www.amundi.com/us for the most recent month-end performance results. Current performance may be lower or higher than the performance data quoted.
The performance data quoted represents past performance, which is no guarantee of future results. Investment return and principal value will fluctuate, and shares, when redeemed, may be worth more or less than their original cost.
Class C shares held for less than one year are also subject to a 1% contingent deferred sales charge (CDSC). “If Held” results represent the percent change in net asset value per share. “If Redeemed” returns reflect deduction of the CDSC for the one-year period, assuming a complete redemption of shares at the last price calculated on the last business day of the period, and no CDSC for the five- and 10-year periods. All results are historical and assume the reinvestment of dividends and capital gains. Other share classes are available for which performance and expenses will differ.
Performance results reflect any applicable expense waivers in effect during the periods shown. Without such waivers Fund performance would be lower. Waivers may not be in effect for all funds. Certain fee waivers are contractual through a specified period. Otherwise, fee waivers can be rescinded at any time. See the prospectus and financial statements for more information.
The performance table and graph do not reflect the deduction of fees and taxes that a shareowner would pay on Fund distributions or the redemption of Fund shares.
Please see the financial highlights for a more current expense ratio.
Pioneer Multi-Asset Income Fund | Annual Report | 7/31/2319
| Performance Update | 7/31/23 | Class K Shares |
Investment Returns
The mountain chart on the right shows the change in value of a $5 million investment made in Class K shares of Pioneer Multi-Asset Income Fund during the periods shown, compared to that of the Bloomberg US Aggregate Bond Index and the MSCI All Country World NR Index.
Average Annual Total Returns
(As of July 31, 2023) |
| Period | Net
Asset
Value
(NAV) | Bloomberg
US
Aggregate
Bond
Index | MSCI
All
Country
World
NR
Index |
| 10 Years | 6.58% | 1.50% | 8.64% |
| 5 Years | 5.54 | 0.75 | 8.24 |
| 1 Year | 9.58 | -3.37 | 12.91 |
Expense Ratio
(Per prospectus dated December 1, 2022) |
| Gross |
| 0.56% |
Value of $5 Million Investment
Call 1-800-225-6292 or visit www.amundi.com/us for the most recent month-end performance results. Current performance may be lower or higher than the performance data quoted.
The performance data quoted represents past performance, which is no guarantee of future results. Investment return and principal value will fluctuate, and shares, when redeemed, may be worth more or less than their original cost.
The performance shown for Class K shares for the period prior to the commencement of operations of Class K shares on December 1, 2014, is the net asset value performance of the Fund’s Class A shares, which has not been restated to reflect any differences in expenses, including Rule 12b-1 fees applicable to Class A shares. Since fees for Class A shares generally are higher than those of Class K shares, the performance of Class K shares prior to their inception on December 1, 2014, would have been higher than the performance shown. For the period beginning December 1, 2014, the actual performance of Class K shares is reflected. Class K shares are not subject to sales charges and are available for limited groups of eligible investors, including institutional investors. All results are historical and assume the reinvestment of dividends and capital gains. Other share classes are available for which performance and expenses will differ.
Performance results reflect any applicable expense waivers in effect during the periods shown. Without such waivers Fund performance would be lower. Waivers may not be in effect for all funds. Certain fee waivers are contractual through a specified period. Otherwise, fee waivers can be rescinded at any time. See the prospectus and financial statements for more information.
The performance table and graph do not reflect the deduction of fees and taxes that a shareowner would pay on Fund distributions or the redemption of Fund shares.
Please see the financial highlights for a more current expense ratio.
20Pioneer Multi-Asset Income Fund | Annual Report | 7/31/23
| Performance Update | 7/31/23 | Class R Shares |
Investment Returns
The mountain chart on the right shows the change in value of a $10,000 investment made in Class R shares of Pioneer Multi-Asset Income Fund during the periods shown, compared to that of the Bloomberg US Aggregate Bond Index and the MSCI All Country World NR Index.
Average Annual Total Returns
(As of July 31, 2023) |
| Period | Net
Asset
Value
(NAV) | Bloomberg
US
Aggregate
Bond
Index | MSCI
All
Country
World
NR
Index |
| 10 Years | 5.57% | 1.50% | 8.64% |
| 5 Years | 4.62 | 0.75 | 8.24 |
| 1 Year | 8.84 | -3.37 | 12.91 |
Expense Ratio
(Per prospectus dated December 1, 2022) |
| Gross |
| 1.19% |
Value of $10,000 Investment
Call 1-800-225-6292 or visit www.amundi.com/us for the most recent month-end performance results. Current performance may be lower or higher than the performance data quoted.
The performance data quoted represents past performance, which is no guarantee of future results. Investment return and principal value will fluctuate, and shares, when redeemed, may be worth more or less than their original cost.
The performance shown for Class R shares for the period prior to the commencement of operations of Class R shares on December 1, 2014, is based on the performance of Class A shares, reduced to reflect the higher distribution and service fees of Class R shares. For the period beginning December 1, 2014, the actual performance of Class R shares is reflected. Class R shares are not subject to sales charges and are available for limited groups of eligible investors, including institutional investors. All results are historical and assume the reinvestment of dividends and capital gains. Other share classes are available for which performance and expenses will differ.
Performance results reflect any applicable expense waivers in effect during the periods shown. Without such waivers Fund performance would be lower. Waivers may not be in effect for all funds. Certain fee waivers are contractual through a specified period. Otherwise, fee waivers can be rescinded at any time. See the prospectus and financial statements for more information.
The performance table and graph do not reflect the deduction of fees and taxes that a shareowner would pay on Fund distributions or the redemption of Fund shares.
Please see the financial highlights for a more current expense ratio.
Pioneer Multi-Asset Income Fund | Annual Report | 7/31/2321
| Performance Update | 7/31/23 | Class Y Shares |
Investment Returns
The mountain chart on the right shows the change in value of a $5 million investment made in Class Y shares of Pioneer Multi-Asset Income Fund during the periods shown, compared to that of the Bloomberg US Aggregate Bond Index and the MSCI All Country World NR Index.
Average Annual Total Returns
(As of July 31, 2023) |
| Period | Net
Asset
Value
(NAV) | Bloomberg
US
Aggregate
Bond
Index | MSCI
All
Country
World
NR
Index |
| 10 Years | 6.23% | 1.50% | 8.64% |
| 5 Years | 5.47 | 0.75 | 8.24 |
| 1 Year | 9.42 | -3.37 | 12.91 |
Expense Ratio
(Per prospectus dated December 1, 2022) |
| Gross | Net |
| 0.67% | 0.66% |
Value of $5 Million Investment
Call 1-800-225-6292 or visit www.amundi.com/us for the most recent month-end performance results. Current performance may be lower or higher than the performance data quoted.
The performance data quoted represents past performance, which is no guarantee of future results. Investment return and principal value will fluctuate, and shares, when redeemed, may be worth more or less than their original cost.
Class Y shares are not subject to sales charges and are available for limited groups of eligible investors, including institutional investors. All results are historical and assume the reinvestment of dividends and capital gains. Other share classes are available for which performance and expenses will differ.
Performance results reflect any applicable expense waivers in effect during the periods shown. Without such waivers Fund performance would be lower. Waivers may not be in effect for all funds. Certain fee waivers are contractual through a specified period. Otherwise, fee waivers can be rescinded at any time. See the prospectus and financial statements for more information.
The net expense ratio reflects the contractual expense limitation currently in effect through December 1, 2023 for Class Y shares. There can be no assurance that Amundi US will extend the expense limitation beyond such time. Please see the prospectus for more information. Expense ratios in the financial highlights, unlike those shown in the prospectus, do not reflect acquired fund fees and expenses.
The performance table and graph do not reflect the deduction of fees and taxes that a shareowner would pay on Fund distributions or the redemption of Fund shares.
Please see the financial highlights for more current expense ratios.
22Pioneer Multi-Asset Income Fund | Annual Report | 7/31/23
Comparing Ongoing Fund Expenses
As a shareowner in the Fund, you incur two types of costs:
| (1) | ongoing costs, including management fees, distribution and/or service (12b-1) fees, and other Fund expenses; and |
| (2) | transaction costs, including sales charges (loads) on purchase payments. |
This example is intended to help you understand your ongoing expenses (in dollars) of investing in the Fund and to compare these costs with the ongoing costs of investing in other mutual funds. The example is based on an investment of $1,000 at the beginning of the Fund’s latest six-month period and held throughout the six months.
Using the Tables
Actual Expenses
The first table below provides information about actual account values and actual expenses. You may use the information in this table, together with the amount you invested, to estimate the expenses that you paid over the period as follows:
| (1) | Divide your account value by $1,000
Example: an $8,600 account value ÷ $1,000 = 8.6 |
| (2) | Multiply the result in (1) above by the corresponding share class’s number in the third row under the heading entitled “Expenses Paid During Period” to estimate the expenses you paid on your account during this period. |
Expenses Paid on a $1,000 Investment in Pioneer Multi-Asset Income Fund
Based on actual returns from February 1, 2023 through July 31, 2023.
| Share Class | A | C | K | R | Y |
Beginning Account
Value on 2/1/23 | $1,000.00 | $1,000.00 | $1,000.00 | $1,000.00 | $1,000.00 |
Ending Account Value
(after expenses) on 7/31/23 | $1,009.40 | $1,006.30 | $1,011.30 | $1,008.60 | $1,011.20 |
Expenses Paid
During Period* | $4.23 | $8.06 | $2.79 | $5.98 | $3.24 |
| | |
| * | Expenses are equal to the Fund’s annualized expense ratio of 0.85%, 1.62%, 0.56%, 1.20%, and 0.65% for Class A, Class C, Class K, Class R, and Class Y shares, respectively, multiplied by the average account value over the period, multiplied by 181/365 (to reflect the one-half year period). |
Pioneer Multi-Asset Income Fund | Annual Report | 7/31/2323
Comparing Ongoing Fund Expenses (continued)
Hypothetical Example for Comparison Purposes
The table below provides information about hypothetical account values and hypothetical expenses based on the Fund’s actual expense ratio and an assumed rate of return of 5% per year before expenses, which is not the Fund’s actual return. The hypothetical account values and expenses may not be used to estimate the actual ending account balance or expenses you paid for the period.
You may use this information to compare the ongoing costs of investing in the Fund and other funds. To do so, compare this 5% hypothetical example with the 5% hypothetical examples that appear in the shareholder reports of the other funds.
Please note that the expenses shown in the tables are meant to highlight your ongoing costs only and do not reflect any transaction costs, such as sales charges (loads) that are charged at the time of the transaction. Therefore, the table below is useful in comparing ongoing costs only and will not help you determine the relative total costs of owning different funds. In addition, if these transaction costs were included, your costs would have been higher.
Expenses Paid on a $1,000 Investment in Pioneer Multi-Asset Income Fund
Based on a hypothetical 5% return per year before expenses, reflecting the period from February 1, 2023 through July 31, 2023.
| Share Class | A | C | K | R | Y |
Beginning Account
Value on 2/1/23 | $1,000.00 | $1,000.00 | $1,000.00 | $1,000.00 | $1,000.00 |
Ending Account Value
(after expenses) on 7/31/23 | $1,020.58 | $1,016.76 | $1,022.02 | $1,018.84 | $1,021.57 |
Expenses Paid
During Period* | $4.26 | $8.10 | $2.81 | $6.01 | $3.26 |
| | |
| * | Expenses are equal to the Fund’s annualized expense ratio of 0.85%, 1.62%, 0.56%, 1.20%, and 0.65% for Class A, Class C, Class K, Class R, and Class Y shares, respectively, multiplied by the average account value over the period, multiplied by 181/365 (to reflect the one-half year period). |
24Pioneer Multi-Asset Income Fund | Annual Report | 7/31/23
Schedule of Investments | 7/31/23
Principal
Amount
USD ($) | | | | | | Value |
| | UNAFFILIATED ISSUERS — 98.1% | |
| | Senior Secured Floating Rate Loan
Interests — 0.8% of Net Assets*(a) | |
| | Advanced Materials — 0.0%† | |
| 980,000 | Groupe Solmax, Inc., Initial Term Loan, 10.253% (Term SOFR + 475 bps), 5/29/28 | $ 930,847 |
| | Total Advanced Materials | $930,847 |
|
|
| | Advertising Sales — 0.1% | |
| 1,954,315 | Clear Channel Outdoor Holdings, Inc., Term B Loan, 8.933% (Term SOFR + 350 bps), 8/21/26 | $ 1,897,313 |
| | Total Advertising Sales | $1,897,313 |
|
|
| | Aerospace & Defense — 0.0%† | |
| 887,500 | ADS Tactical, Inc., Initial Term Loan, 11.183% (Term SOFR + 575 bps), 3/19/26 | $ 856,438 |
| | Total Aerospace & Defense | $856,438 |
|
|
| | Auto Parts & Equipment — 0.0%† | |
| 977,500 | First Brands Group LLC, First Lien 2021 Term Loan, 10.881% (Term SOFR + 500 bps), 3/30/27 | $ 970,169 |
| | Total Auto Parts & Equipment | $970,169 |
|
|
| | Building & Construction Products — 0.0%† | |
| 977,959 | CP Atlas Buyer, Inc., Term B Loan, 9.169% (Term SOFR + 375 bps), 11/23/27 | $ 930,283 |
| | Total Building & Construction Products | $930,283 |
|
|
| | Building-Maintenance & Service — 0.0%† | |
| 491,250 | ArchKey Holdings, Inc., First Lien Initial Term Loan, 10.788% (Term SOFR + 525 bps), 6/29/28 | $ 489,817 |
| | Total Building-Maintenance & Service | $489,817 |
|
|
| | Casino Services — 0.0%† | |
| 237,500(b) | Lucky Bucks LLC, Initial Term Loan, 10.933% (LIBOR + 750 bps), 7/30/27 | $ 75,703 |
| 5,928 | Lucky Bucks LLC, New Money OpCo DIP Loan, 15.148% (Term SOFR + 1000 bps), 10/8/23 | 5,928 |
| | Total Casino Services | $81,631 |
|
|
| | Chemicals-Specialty — 0.1% | |
| 869,358 | CPC Acquisition Corp., First Lien Initial Term Loan, 9.253% (Term SOFR + 375 bps), 12/29/27 | $ 688,423 |
| 980,000 | Mativ Holdings, Inc., Term B Loan, 9.183% (Term SOFR + 375 bps), 4/20/28 | 953,050 |
| | Total Chemicals-Specialty | $1,641,473 |
|
|
The accompanying notes are an integral part of these financial statements.
Pioneer Multi-Asset Income Fund | Annual Report | 7/31/2325
Schedule of Investments | 7/31/23 (continued)
Principal
Amount
USD ($) | | | | | | Value |
| | Commercial Services — 0.0%† | |
| 553,198 | CoreLogic, Inc. (fka First American Corporation), First Lien Initial Term Loan, 8.933% (Term SOFR + 350 bps), 6/2/28 | $ 511,131 |
| | Total Commercial Services | $511,131 |
|
|
| | Diagnostic Equipment — 0.0%† | |
| 490,000 | Curia Global, Inc., First Lien 2021 Term Loan, 9.169% (Term SOFR + 375 bps), 8/30/26 | $ 427,831 |
| | Total Diagnostic Equipment | $427,831 |
|
|
| | Dialysis Centers — 0.0%† | |
| 977,152 | US Renal Care, Inc., Initial Term Loan, 10.433% (LIBOR + 500 bps), 6/26/26 | $ 493,462 |
| | Total Dialysis Centers | $493,462 |
|
|
| | Distribution & Wholesale — 0.1% | |
| 1,953,608 | Patriot Container Corp. (aka Wastequip), First Lien Closing Date Term Loan, 9.169% (Term SOFR + 375 bps), 3/20/25 | $ 1,851,288 |
| 980,000 | SRS Distribution, Inc., 2021 Refinancing Term Loan, 8.933% (Term SOFR + 350 bps), 6/2/28 | 968,914 |
| | Total Distribution & Wholesale | $2,820,202 |
|
|
| | Electric-Generation — 0.0%† | |
| 358,422 | Eastern Power LLC (Eastern Covert Midco LLC), Term Loan, 9.183% (Term SOFR + 375 bps), 10/2/25 | $ 345,355 |
| | Total Electric-Generation | $345,355 |
|
|
| | Electronic Composition — 0.0%† | |
| 978,891 | Energy Acquisition LP, First Lien Initial Term Loan, 9.614% (Term SOFR + 425 bps), 6/26/25 | $ 926,072 |
| | Total Electronic Composition | $926,072 |
|
|
| | Enterprise Software & Services — 0.1% | |
| 1,473,750 | Polaris Newco LLC, First Lien Dollar Term Loan, 9.538% (Term SOFR + 400 bps), 6/2/28 | $ 1,395,342 |
| | Total Enterprise Software & Services | $1,395,342 |
|
|
| | Investment Management & Advisory Services —
0.1% | |
| 1,464,150 | Russell Investments US Institutional Holdco, Inc., 2025 Term Loan, 8.919% (Term SOFR + 350 bps), 5/30/25 | $ 1,355,384 |
| | Total Investment Management & Advisory Services | $1,355,384 |
|
|
The accompanying notes are an integral part of these financial statements.
26Pioneer Multi-Asset Income Fund | Annual Report | 7/31/23
Principal
Amount
USD ($) | | | | | | Value |
| | Machinery — 0.0%† | |
| 985,000 | Engineered Components & Systems LLC, First Lien Initial Term Loan, 11.369% (Term SOFR + 600 bps), 8/2/28 | $ 966,531 |
| | Total Machinery | $966,531 |
|
|
| | Medical-Biomedical & Generation — 0.1% | |
| 1,231,250 | ANI Pharmaceuticals, Inc., Initial Term Loan, 11.433% (Term SOFR + 600 bps), 11/19/27 | $ 1,232,789 |
| | Total Medical-Biomedical & Generation | $1,232,789 |
|
|
| | Medical-Drugs — 0.1% | |
| 977,157 | Curium BidCo S.a.r.l., Facility B, 9.538% (LIBOR + 400 bps), 7/9/26 | $ 978,379 |
| | Total Medical-Drugs | $978,379 |
|
|
| | Protection-Safety — 0.0%† | |
| 491,250 | APX Group, Inc., Initial Term Loan, 10.75% (Term SOFR + 325 bps), 7/10/28 | $ 491,352 |
| | Total Protection-Safety | $491,352 |
|
|
| | Retail — 0.1% | |
| 656,326 | Staples, Inc., 2019 Refinancing New Term B-2 Loan, 9.799% (LIBOR + 450 bps), 9/12/24 | $ 649,435 |
| 456,250 | Torrid LLC, Closing Date Term Loan, 11.003% (Term SOFR + 550 bps), 6/14/28 | 388,953 |
| | Total Retail | $1,038,388 |
|
|
| | Theaters — 0.0%† | |
| 488,520 | AMC Entertainment Holdings, Inc. (fka AMC Entertainment, Inc.), Term B-1 Loan, 8.202% (Term SOFR + 300 bps), 4/22/26 | $ 382,512 |
| | Total Theaters | $382,512 |
|
|
| | Total Senior Secured Floating Rate Loan Interests
(Cost $22,728,701) | $21,162,701 |
|
|
| Shares | | | | | | |
| | Common Stocks — 49.6% of Net Assets | |
| | Aerospace & Defense — 1.0% | |
| 761,108 | Hensoldt AG | $ 25,875,039 |
| | Total Aerospace & Defense | $25,875,039 |
|
|
The accompanying notes are an integral part of these financial statements.
Pioneer Multi-Asset Income Fund | Annual Report | 7/31/2327
Schedule of Investments | 7/31/23 (continued)
| Shares | | | | | | Value |
| | Air Freight & Logistics — 0.8% | |
| 349,283 | Cia de Distribucion Integral Logista Holdings S.A. | $ 9,723,808 |
| 60,278 | United Parcel Service, Inc., Class B | 11,279,822 |
| | Total Air Freight & Logistics | $21,003,630 |
|
|
| | Automobile Components — 0.4% | |
| 255,600 | Bridgestone Corp. | $ 10,587,641 |
| | Total Automobile Components | $10,587,641 |
|
|
| | Automobiles — 0.8% | |
| 1,060,600 | Subaru Corp. | $ 20,028,130 |
| | Total Automobiles | $20,028,130 |
|
|
| | Banks — 9.5% | |
| 4,298,865 | ABN AMRO Bank NV (C.V.A.) (144A) | $ 73,073,268 |
| 363,983 | Citizens Financial Group, Inc. | 11,742,092 |
| 899,318 | FinecoBank Banca Fineco S.p.A. | 13,956,914 |
| 1,368,040 | Grupo Financiero Banorte S.A.B de CV, Class O | 12,966,356 |
| 693,810 | Hana Financial Group, Inc. | 21,391,545 |
| 5,747,079 | Intesa Sanpaolo S.p.A. | 16,612,423 |
| 1,271,241 | KB Financial Group, Inc. | 50,863,602 |
| 166,500 | Sumitomo Mitsui Trust Holdings, Inc. | 6,468,531 |
| 666,369 | Truist Financial Corp. | 22,136,778 |
| 591,317 | UniCredit S.p.A. | 14,953,520 |
| | Total Banks | $244,165,029 |
|
|
| | Broadline Retail — 0.2% | |
| 111,662 | eBay, Inc. | $ 4,970,076 |
| | Total Broadline Retail | $4,970,076 |
|
|
| | Capital Markets — 5.3% | |
| 511,334 | Bank of New York Mellon Corp. | $ 23,194,110 |
| 142,584 | Brightsphere Investment Group, Inc. | 3,034,187 |
| 287,257 | Euronext NV (144A) | 21,871,856 |
| 651,693 | State Street Corp. | 47,208,641 |
| 1,800,711 | UBS Group AG | 39,801,278 |
| | Total Capital Markets | $135,110,072 |
|
|
| | Chemicals — 0.0%† | |
| 1,752,813 | Chevron Lubricants Lanka Plc | $ 507,278 |
| | Total Chemicals | $507,278 |
|
|
| | Communications Equipment — 1.0% | |
| 460,393 | Cisco Systems, Inc. | $ 23,958,852 |
| 201,639 | Telefonaktiebolaget LM Ericsson, Class B | 1,013,137 |
| | Total Communications Equipment | $24,971,989 |
|
|
The accompanying notes are an integral part of these financial statements.
28Pioneer Multi-Asset Income Fund | Annual Report | 7/31/23
| Shares | | | | | | Value |
| | Construction Materials — 0.9% | |
| 366,435 | CRH Plc (A.D.R.) | $ 22,096,031 |
| | Total Construction Materials | $22,096,031 |
|
|
| | Consumer Staples Distribution & Retail — 0.0%† | |
| 195,032 +# | Magnit PJSC | $ 618,044 |
| 48,325(c) +# | X5 Retail Group NV (G.D.R.) | 29,164 |
| | Total Consumer Staples Distribution & Retail | $647,208 |
|
|
| | Diversified Telecommunication Services — 0.6% | |
| 689,905 | Deutsche Telekom AG | $ 15,051,160 |
| | Total Diversified Telecommunication Services | $15,051,160 |
|
|
| | Electric Utilities — 0.5% | |
| 297,785 | FirstEnergy Corp. | $ 11,729,751 |
| | Total Electric Utilities | $11,729,751 |
|
|
| | Electrical Equipment — 0.6% | |
| 1,015,200 | Mitsubishi Electric Corp. | $ 14,635,892 |
| | Total Electrical Equipment | $14,635,892 |
|
|
| | Food Products — 0.2% | |
| 182,872 | Associated British Foods Plc | $ 4,811,120 |
| | Total Food Products | $4,811,120 |
|
|
| | Health Care Equipment & Supplies — 0.7% | |
| 226,186(c) | Koninklijke Philips NV | $ 4,702,259 |
| 162,095 | Medtronic Plc | 14,225,457 |
| | Total Health Care Equipment & Supplies | $18,927,716 |
|
|
| | Health Care Providers & Services — 2.5% | |
| 424,588 | Cardinal Health, Inc. | $ 38,837,064 |
| 82,871 | Cigna Group | 24,455,232 |
| | Total Health Care Providers & Services | $63,292,296 |
|
|
| | Household Durables — 1.4% | |
| 224,027 | Ariston Holding NV | $ 2,085,079 |
| 723,000 | Panasonic Holdings Corp. | 8,944,435 |
| 1,766,314 | Persimmon Plc | 26,272,201 |
| | Total Household Durables | $37,301,715 |
|
|
| | Household Products — 0.2% | |
| 60,037 | Reckitt Benckiser Group Plc | $ 4,498,091 |
| | Total Household Products | $4,498,091 |
|
|
| | Insurance — 0.8% | |
| 93,591 | Hartford Financial Services Group, Inc. | $ 6,727,321 |
| 34,799 | NN Group NV | 1,334,561 |
| 13,025 | Old Republic International Corp. | 359,099 |
| 144,800 | Power Corp. of Canada | 4,102,475 |
The accompanying notes are an integral part of these financial statements.
Pioneer Multi-Asset Income Fund | Annual Report | 7/31/2329
Schedule of Investments | 7/31/23 (continued)
| Shares | | | | | | Value |
| | Insurance — (continued) | |
| 20,252 | Willis Towers Watson Plc | $ 4,279,855 |
| 7,547 | Zurich Insurance Group AG | 3,641,738 |
| | Total Insurance | $20,445,049 |
|
|
| | IT Services — 2.0% | |
| 362,577 | International Business Machines Corp. | $ 52,276,352 |
| | Total IT Services | $52,276,352 |
|
|
| | Leisure Products — 0.1% | |
| 5,134,000 | Honma Golf, Ltd. (144A) | $ 2,185,549 |
| | Total Leisure Products | $2,185,549 |
|
|
| | Metals & Mining — 0.7% | |
| 30,112 | Rio Tinto Plc | $ 1,990,178 |
| 317,806 | Royal Bafokeng Platinum, Ltd. | 2,274,467 |
| 294,447 | Teck Resources, Ltd., Class B | 13,082,280 |
| | Total Metals & Mining | $17,346,925 |
|
|
| | Mortgage Real Estate Investment Trusts (REITs)
— 1.3% | |
| 730,230 | AGNC Investment Corp. | $ 7,441,044 |
| 297,120 | Angel Oak Mortgage, Inc. | 2,816,698 |
| 52,118 | Great Ajax Corp. | 359,614 |
| 528,740 | Ladder Capital Corp. | 5,810,852 |
| 906,673 | Rithm Capital Corp. | 9,139,264 |
| 609,873 | Two Harbors Investment Corp. | 8,178,397 |
| | Total Mortgage Real Estate Investment Trusts (REITs) | $33,745,869 |
|
|
| | Office REITs — 0.1% | |
| 14,864 | Alexandria Real Estate Equities, Inc. | $ 1,868,108 |
| | Total Office REITs | $1,868,108 |
|
|
| | Oil, Gas & Consumable Fuels — 11.7% | |
| 112,859(c) | Antero Resources Corp. | $ 3,018,978 |
| 1,250,961 | BW LPG, Ltd. (144A) | 13,392,067 |
| 18,609 | Cheniere Energy Partners LP | 961,155 |
| 64,310 | Chesapeake Energy Corp. | 5,423,905 |
| 229,945 | Comstock Resources, Inc. | 2,931,799 |
| 14,236 | ConocoPhillips | 1,675,862 |
| 195,838 | Coterra Energy, Inc. | 5,393,379 |
| 6,292,270 | Energy Transfer LP | 83,624,268 |
| 18,493 | Enterprise Products Partners LP | 490,249 |
| 63,050 | EQT Corp. | 2,659,449 |
| 200,600 | Inpex Corp. | 2,583,907 |
| 400,877(c) | Kosmos Energy, Ltd. | 2,846,227 |
| 47,954 +# | LUKOIL PJSC | 155,622 |
The accompanying notes are an integral part of these financial statements.
30Pioneer Multi-Asset Income Fund | Annual Report | 7/31/23
| Shares | | | | | | Value |
| | Oil, Gas & Consumable Fuels — (continued) | |
| 119,488 | Marathon Oil Corp. | $ 3,138,950 |
| 814,362 | MPLX LP | 28,917,995 |
| 43,240 | Murphy Oil Corp. | 1,870,995 |
| 225,476 | Occidental Petroleum Corp. | 14,234,300 |
| 183,303 | Ovintiv, Inc. | 8,448,435 |
| 577,075 | Permian Resources Corp. | 6,746,007 |
| 194,305 | Plains All American Pipeline LP | 2,891,258 |
| 664,211 | Range Resources Corp. | 20,876,152 |
| 1,271,403 +# | Rosneft Oil Co. PJSC | 353,360 |
| 1,342,345 | Shell Plc, (A.D.R.) | 82,728,722 |
| 117,051(c) | Southwestern Energy Co. | 758,490 |
| 244,341(c) | Talos Energy, Inc. | 3,909,456 |
| | Total Oil, Gas & Consumable Fuels | $300,030,987 |
|
|
| | Pharmaceuticals — 5.2% | |
| 360,817 | Organon & Co. | $ 7,930,758 |
| 2,130,894 | Pfizer, Inc. | 76,840,037 |
| 453,666 | Sanofi | 48,429,052 |
| | Total Pharmaceuticals | $133,199,847 |
|
|
| | Semiconductors & Semiconductor Equipment —
0.1% | |
| 27,077 | MKS Instruments, Inc. | $ 2,955,996 |
| | Total Semiconductors & Semiconductor Equipment | $2,955,996 |
|
|
| | Technology Hardware, Storage & Peripherals —
0.5% | |
| 339,000 | Asustek Computer, Inc. | $ 3,926,495 |
| 614,000 | Catcher Technology Co., Ltd. | 3,389,783 |
| 339,317 | Hewlett Packard Enterprise Co. | 5,897,329 |
| | Total Technology Hardware, Storage & Peripherals | $13,213,607 |
|
|
| | Textiles, Apparel & Luxury Goods — 0.4% | |
| 218,847 | Tapestry, Inc. | $ 9,443,248 |
| | Total Textiles, Apparel & Luxury Goods | $9,443,248 |
|
|
| | Trading Companies & Distributors — 0.1% | |
| 38,048(c) | AerCap Holdings NV | $ 2,427,843 |
| 52,100 | Inaba Denki Sangyo Co., Ltd. | 1,155,418 |
| | Total Trading Companies & Distributors | $3,583,261 |
|
|
| | Total Common Stocks
(Cost $1,143,718,390) | $1,270,504,662 |
|
|
The accompanying notes are an integral part of these financial statements.
Pioneer Multi-Asset Income Fund | Annual Report | 7/31/2331
Schedule of Investments | 7/31/23 (continued)
Principal
Amount
USD ($) | | | | | | Value |
| | Asset Backed Securities — 2.7% of Net
Assets | |
| 2,000,000 | ACC Auto Trust, Series 2022-A, Class D, 10.07%, 3/15/29 (144A) | $ 1,923,626 |
| 3,000,000 | ACM Auto Trust, Series 2022-1A, Class D, 8.58%, 4/20/29 (144A) | 2,979,537 |
| 1,150,000 | American Credit Acceptance Receivables Trust, Series 2021-3, Class F, 3.64%, 5/15/28 (144A) | 1,060,626 |
| 575,000 | AMSR Trust, Series 2020-SFR2, Class G, 4.00%, 7/17/37 (144A) | 532,241 |
| 2,500,000 | Avid Automobile Receivables Trust, Series 2023-1, Class C, 7.35%, 12/15/27 (144A) | 2,495,286 |
| 1,214,203(d) | Blackbird Capital Aircraft Lease Securitization, Ltd., Series 2016-1A, Class B, 5.682%, 12/16/41 (144A) | 862,120 |
| 3,200,000(a) | CAL Receivables LLC, Series 2022-1, Class B, 9.418% (SOFR30A + 435 bps), 10/15/26 (144A) | 3,140,779 |
| 4,000,000 | CarNow Auto Receivables Trust, Series 2023-1A, Class D, 7.99%, 2/15/28 (144A) | 3,925,363 |
| 1,400,000 | Cartiga Asset Finance Trust LLC, Series 2023-1, Class C, 10.00%, 3/15/35 (144A) | 1,308,496 |
| 852,000 | Crossroads Asset Trust, Series 2021-A, Class E, 5.48%, 1/20/28 (144A) | 816,934 |
| 4,517,000(e) | Finance of America HECM Buyout, Series 2022-HB1, Class M5, 7.87%, 2/25/32 (144A) | 3,765,437 |
| 700,000(a) | GRACIE POINT INTERNATIONAL FUNDING, Series 2022-1A, Class E, 10.815% (SOFR30A + 575 bps), 4/1/24 (144A) | 698,081 |
| 2,400,000 | JPMorgan Chase Bank NA - CACLN, Series 2021-2, Class G, 8.482%, 12/26/28 (144A) | 2,248,894 |
| 2,850,682 | Libra Solutions LLC, Series 2023-1A, Class B, 10.25%, 2/15/35 (144A) | 2,847,831 |
| 2,000,000 | LL ABS Trust, Series 2022-1A, Class D, 7.83%, 11/15/29 (144A) | 1,839,154 |
| 3,000,000 | Mercury Financial Credit Card Master Trust, Series 2022-2A, Class C, 10.83%, 3/22/27 (144A) | 2,932,733 |
| 3,500,000 | Mercury Financial Credit Card Master Trust, Series 2023-1A, Class A, 8.04%, 9/20/27 (144A) | 3,521,260 |
| 1,664,000 | Octane Receivables Trust 2022-1, Series 2022-1A, Class E, 7.33%, 12/20/29 (144A) | 1,573,346 |
| 2,000,000 | PEAR LLC, Series 2023-1, Class C, 10.00%, 7/15/35 (144A) | 1,892,132 |
| 500,000 | Rosy Blue Carat SCS, Series 2018-1, Class A1R, 8.481%, 3/15/30 (144A) | 508,800 |
| 3,570,000 | Santander Bank Auto Credit-Linked Notes, Series 2022-A, Class D, 9.965%, 5/15/32 (144A) | 3,445,334 |
The accompanying notes are an integral part of these financial statements.
32Pioneer Multi-Asset Income Fund | Annual Report | 7/31/23
Principal
Amount
USD ($) | | | | | | Value |
| | Asset Backed Securities — (continued) | |
| 1,200,000 | Santander Bank Auto Credit-Linked Notes, Series 2022-A, Class E, 12.662%, 5/15/32 (144A) | $ 1,103,135 |
| 3,500,000 | Santander Bank Auto Credit-Linked Notes, Series 2022-B, Class F, 11.91%, 8/16/32 (144A) | 3,399,689 |
| 5,100,000 | Santander Bank N.A. - SBCLN, Series 2021-1A, Class E, 6.171%, 12/15/31 (144A) | 4,292,340 |
| 4,500,000 | SCF Equipment Leasing LLC, Series 2022-1A, Class F, 6.00%, 7/20/32 (144A) | 3,880,886 |
| 1,338,000 | SCF Equipment Leasing LLC, Series 2022-2A, Class E, 6.50%, 6/20/35 (144A) | 1,156,678 |
| 800,000(a) | STAR, Series 2021-SFR1, Class H, 9.786% (1 Month Term SOFR + 456 bps), 4/17/38 (144A) | 758,197 |
| 2,500,000 | Tricolor Auto Securitization Trust, Series 2022-1A, Class F, 9.80%, 7/16/29 (144A) | 2,398,755 |
| 5,000,000 | Tricolor Auto Securitization Trust, Series 2023-1A, Class E, 13.45%, 6/15/28 (144A) | 5,151,258 |
| 2,150,824 | Westgate Resorts LLC, Series 2023-1A, Class D, 10.14%, 12/20/37 (144A) | 2,138,028 |
| | Total Asset Backed Securities
(Cost $71,014,971) | $68,596,976 |
|
|
| | Collateralized Mortgage
Obligations—3.3% of Net Assets | |
| 290,000(a) | Bellemeade Re, Ltd., Series 2020-3A, Class B1, 11.762% (1 Month USD LIBOR + 635 bps), 10/25/30 (144A) | $ 301,311 |
| 2,100,000(a) | Bellemeade Re, Ltd., Series 2020-3A, Class M2, 10.262% (1 Month USD LIBOR + 485 bps), 10/25/30 (144A) | 2,191,304 |
| 2,400,000(a) | Bellemeade Re, Ltd., Series 2022-1, Class B1, 10.569% (SOFR30A + 550 bps), 1/26/32 (144A) | 2,330,813 |
| 1,250,000(e) | CFMT LLC, Series 2021-HB5, Class M4, 5.683%, 2/25/31 (144A) | 1,147,013 |
| 4,350,000(e) | CFMT LLC, Series 2023-HB12, Class M2, 4.25%, 4/25/33 (144A) | 3,707,646 |
| 1,600,000(e) | CFMT LLC, Series 2023-HB12, Class M3, 4.25%, 4/25/33 (144A) | 1,267,329 |
| 2,860,000(a) | Connecticut Avenue Securities Trust, Series 2021-R01, Class 1B2, 11.069% (SOFR30A + 600 bps), 10/25/41 (144A) | 2,888,285 |
| 2,660,000(a) | Connecticut Avenue Securities Trust, Series 2022-R01, Class 1B2, 11.069% (SOFR30A + 600 bps), 12/25/41 (144A) | 2,669,941 |
| 2,900,000(a) | Eagle RE, Ltd., Series 2021-1, Class M2, 9.519% (SOFR30A + 445 bps), 10/25/33 (144A) | 2,977,708 |
The accompanying notes are an integral part of these financial statements.
Pioneer Multi-Asset Income Fund | Annual Report | 7/31/2333
Schedule of Investments | 7/31/23 (continued)
Principal
Amount
USD ($) | | | | | | Value |
| | Collateralized Mortgage
Obligations—(continued) | |
| 970,000(a) | Fannie Mae Connecticut Avenue Securities, Series 2021-R02, Class 2B2, 11.269% (SOFR30A + 620 bps), 11/25/41 (144A) | $ 974,346 |
| 1,059,469(a) | Freddie Mac STACR REMIC Trust, Series 2020-DNA3, Class B1, 10.283% (SOFR30A + 521 bps), 6/25/50 (144A) | 1,138,929 |
| 1,100,000(a) | Freddie Mac STACR REMIC Trust, Series 2020-DNA3, Class B2, 14.533% (SOFR30A + 946 bps), 6/25/50 (144A) | 1,380,603 |
| 1,065,000(a) | Freddie Mac STACR REMIC Trust, Series 2020-DNA5, Class B1, 9.869% (SOFR30A + 480 bps), 10/25/50 (144A) | 1,150,856 |
| 850,000(a) | Freddie Mac STACR REMIC Trust, Series 2020-DNA6, Class B1, 8.069% (SOFR30A + 300 bps), 12/25/50 (144A) | 841,500 |
| 2,675,000(a) | Freddie Mac STACR REMIC Trust, Series 2020-DNA6, Class B2, 10.719% (SOFR30A + 565 bps), 12/25/50 (144A) | 2,730,004 |
| 2,765,000(a) | Freddie Mac STACR REMIC Trust, Series 2021-DNA1, Class B2, 9.819% (SOFR30A + 475 bps), 1/25/51 (144A) | 2,664,796 |
| 2,170,000(a) | Freddie Mac STACR REMIC Trust, Series 2021-DNA3, Class B2, 11.319% (SOFR30A + 625 bps), 10/25/33 (144A) | 2,231,689 |
| 3,530,000(a) | Freddie Mac STACR REMIC Trust, Series 2021-DNA5, Class B2, 10.569% (SOFR30A + 550 bps), 1/25/34 (144A) | 3,268,081 |
| 3,480,000(a) | Freddie Mac STACR REMIC Trust, Series 2021-DNA7, Class B2, 12.869% (SOFR30A + 780 bps), 11/25/41 (144A) | 3,610,491 |
| 2,910,000(a) | Freddie Mac STACR REMIC Trust, Series 2021-HQA1, Class B2, 10.069% (SOFR30A + 500 bps), 8/25/33 (144A) | 2,801,990 |
| 1,970,000(a) | Freddie Mac STACR REMIC Trust, Series 2021-HQA3, Class B2, 11.319% (SOFR30A + 625 bps), 9/25/41 (144A) | 1,922,301 |
| 3,450,000(a) | Freddie Mac STACR REMIC Trust, Series 2022-DNA1, Class B2, 12.169% (SOFR30A + 710 bps), 1/25/42 (144A) | 3,511,855 |
| 2,650,000(a) | Freddie Mac STACR REMIC Trust, Series 2022-DNA2, Class B2, 13.569% (SOFR30A + 850 bps), 2/25/42 (144A) | 2,805,647 |
| 6,608,000(a) | Freddie Mac STACR Trust, Series 2019-DNA3, Class B2, 13.333% (SOFR30A + 826 bps), 7/25/49 (144A) | 7,291,094 |
The accompanying notes are an integral part of these financial statements.
34Pioneer Multi-Asset Income Fund | Annual Report | 7/31/23
Principal
Amount
USD ($) | | | | | | Value |
| | Collateralized Mortgage
Obligations—(continued) | |
| 3,150,000(a) | Freddie Mac STACR Trust, Series 2019-DNA4, Class B2, 11.433% (SOFR30A + 636 bps), 10/25/49 (144A) | $ 3,287,120 |
| 3,635,000(a) | Freddie Mac STACR Trust, Series 2019-FTR3, Class B2, 9.95% (SOFR30A + 491 bps), 9/25/47 (144A) | 3,526,812 |
| 1,900,000(a) | Freddie Mac Structured Agency Credit Risk Debt Notes, Series 2020-HQA5, Class B2, 12.469% (SOFR30A + 740 bps), 11/25/50 (144A) | 2,114,897 |
| 795,000(a) | Freddie Mac Structured Agency Credit Risk Debt Notes, Series 2021-DNA2, Class B2, 11.069% (SOFR30A + 600 bps), 8/25/33 (144A) | 808,759 |
| 14,603 | Global Mortgage Securitization, Ltd., Series 2004-A, Class B1, 5.25%, 11/25/32 (144A) | 6,573 |
| 176,418 | Global Mortgage Securitization, Ltd., Series 2004-A, Class B2, 5.25%, 11/25/32 (144A) | 2 |
| 430,000(a) | Home Re, Ltd., Series 2020-1, Class B1, 12.412% (1 Month USD LIBOR + 700 bps), 10/25/30 (144A) | 439,766 |
| 1,207,914(a) | Home Re, Ltd., Series 2020-1, Class M2, 10.662% (1 Month USD LIBOR + 525 bps), 10/25/30 (144A) | 1,223,466 |
| 3,170,000(a) | Home Re, Ltd., Series 2021-2, Class B1, 9.219% (SOFR30A + 415 bps), 1/25/34 (144A) | 3,048,558 |
| 1,172,498(a) | Oaktown Re V, Ltd., Series 2020-2A, Class M2, 10.433% (SOFR30A + 536 bps), 10/25/30 (144A) | 1,195,648 |
| 4,930,000(a) | PNMAC GMSR Issuer Trust, Series 2018-GT1, Class A, 9.262% (1 Month USD LIBOR + 385 bps), 2/25/25 (144A) | 4,927,515 |
| 1,800,000(e) | RMF Buyout Issuance Trust, Series 2022-HB1, Class M5, 4.50%, 4/25/32 (144A) | 200,250 |
| 5,880,000(a) | STACR Trust, Series 2018-HRP2, Class B2, 15.683% (SOFR30A + 1,061 bps), 2/25/47 (144A) | 6,804,097 |
| | Total Collateralized Mortgage Obligations
(Cost $84,316,771) | $85,388,995 |
|
|
| | Commercial Mortgage-Backed
Securities—0.3% of Net Assets | |
| 899,000(a) | Freddie Mac Multifamily Structured Credit Risk, Series 2021-MN1, Class B1, 12.819% (SOFR30A + 775 bps), 1/25/51 (144A) | $ 859,884 |
The accompanying notes are an integral part of these financial statements.
Pioneer Multi-Asset Income Fund | Annual Report | 7/31/2335
Schedule of Investments | 7/31/23 (continued)
Principal
Amount
USD ($) | | | | | | Value |
| | Commercial Mortgage-Backed
Securities—(continued) | |
| 3,210,039(a) | Freddie Mac Multifamily Structured Credit Risk, Series 2021-MN3, Class M1, 7.369% (SOFR30A + 230 bps), 11/25/51 (144A) | $ 3,097,077 |
| 2,500,000(a) | Multifamily Connecticut Avenue Securities Trust, Series 2020-01, Class M10, 8.933% (SOFR30A + 386 bps), 3/25/50 (144A) | 2,404,050 |
| | Total Commercial Mortgage-Backed Securities
(Cost $6,135,048) | $6,361,011 |
|
|
| | Convertible Corporate Bonds —
1.0% of Net Assets | |
| | REITs — 1.0% | |
| 4,895,000 | PennyMac Corp., 5.50%, 3/15/26 | $ 4,307,600 |
| 24,685,100 | Redwood Trust, Inc., 7.75%, 6/15/27 | 22,417,156 |
| | Total REITs | $26,724,756 |
|
|
| | Total Convertible Corporate Bonds
(Cost $26,484,767) | $26,724,756 |
|
|
| | Corporate Bonds — 9.3% of Net Assets | |
| | Advertising — 0.1% | |
| 1,860,000 | Clear Channel Outdoor Holdings, Inc., 7.50%, 6/1/29 (144A) | $ 1,480,578 |
| 570,000 | Clear Channel Outdoor Holdings, Inc., 7.75%, 4/15/28 (144A) | 476,651 |
| | Total Advertising | $1,957,229 |
|
|
| | Aerospace & Defense — 0.3% | |
| 5,000,000 | Boeing Co., 5.15%, 5/1/30 | $ 4,957,582 |
| 3,369,000 | Bombardier, Inc., 7.875%, 4/15/27 (144A) | 3,358,272 |
| | Total Aerospace & Defense | $8,315,854 |
|
|
| | Airlines — 0.2% | |
| 4,550,000 | American Airlines 2021-1 Class B Pass Through Trust, 3.95%, 7/11/30 | $ 3,938,744 |
| 363,517 | British Airways 2020-1 Class B Pass Through Trust, 8.375%, 11/15/28 (144A) | 366,498 |
| | Total Airlines | $4,305,242 |
|
|
The accompanying notes are an integral part of these financial statements.
36Pioneer Multi-Asset Income Fund | Annual Report | 7/31/23
Principal
Amount
USD ($) | | | | | | Value |
| | Auto Parts & Equipment — 0.1% | |
| 1,126,000 | American Axle & Manufacturing, Inc., 6.25%, 3/15/26 | $ 1,097,927 |
| 1,773,000 | Dealer Tire LLC/DT Issuer LLC, 8.00%, 2/1/28 (144A) | 1,630,588 |
| | Total Auto Parts & Equipment | $2,728,515 |
|
|
| | Banks — 5.0% | |
| EUR 4,700,000(e)(f) | ABN AMRO Bank NV, 4.375% (5 yr. EUR Swap + 467 bps) | $ 4,763,953 |
| EUR 5,300,000(e)(f) | ABN AMRO Bank NV, 4.75% (5 yr. EUR Swap + 390 bps) | 5,054,643 |
| 5,000,000(e) | Banco Santander SA, 3.225% (1 Year CMT Index + 160 bps), 11/22/32 | 3,984,142 |
| 5,000,000(e) | BPCE SA, 3.116% (SOFR + 173 bps), 10/19/32 (144A) | 3,891,712 |
| 4,000,000 | BPCE SA, 4.875%, 4/1/26 (144A) | 3,847,474 |
| 1,818,000 | Freedom Mortgage Corp., 8.25%, 4/15/25 (144A) | 1,796,522 |
| 8,650,000(e)(f) | ING Groep NV, 6.50% (5 Year USD Swap Rate + 445 bps) | 8,152,735 |
| 4,917,000(e) | Intesa Sanpaolo S.p.A., 7.778% (1 Year CMT Index + 390 bps), 6/20/54 (144A) | 4,974,339 |
| 5,857,000(e)(f) | Lloyds Banking Group Plc, 7.50% (5 Year USD Swap Rate + 450 bps) | 5,536,329 |
| 8,700,000(e) | Morgan Stanley, 5.297% (SOFR + 262 bps), 4/20/37 | 8,256,216 |
| 8,125,000(e)(f) | NatWest Group Plc, 8.00% (5 Year USD Swap Rate + 572 bps) | 8,035,219 |
| 6,220,000(e) | Societe Generale SA, 6.221% (1 Year CMT Index + 320 bps), 6/15/33 (144A) | 5,905,137 |
| 9,300,000(e) | Standard Chartered Plc, 3.603% (1 Year CMT Index + 190 bps), 1/12/33 (144A) | 7,509,725 |
| 31,703,000(e)(f) | UBS Group AG, 3.875% (5 Year CMT Index + 310 bps) (144A) | 26,246,914 |
| 29,708,000(e)(f) | UBS Group AG, 4.875% (5 Year CMT Index + 340 bps) (144A) | 24,694,775 |
| 7,425,000(e)(f) | UBS Group AG, 5.125% (5 Year CMT Index + 486 bps) | 6,647,424 |
| | Total Banks | $129,297,259 |
|
|
| | Chemicals — 0.1% | |
| 3,487,000 | LSF11 A5 HoldCo LLC, 6.625%, 10/15/29 (144A) | $ 2,911,544 |
| | Total Chemicals | $2,911,544 |
|
|
The accompanying notes are an integral part of these financial statements.
Pioneer Multi-Asset Income Fund | Annual Report | 7/31/2337
Schedule of Investments | 7/31/23 (continued)
Principal
Amount
USD ($) | | | | | | Value |
| | Commercial Services — 0.1% | |
| 2,255,000 | Allied Universal Holdco LLC/Allied Universal Finance Corp., 9.75%, 7/15/27 (144A) | $ 2,068,035 |
| | Total Commercial Services | $2,068,035 |
|
|
| | Diversified Financial Services — 0.4% | |
| 8,630,000(e) | Capital One Financial Corp., 5.268% (SOFR + 237 bps), 5/10/33 | $ 8,220,812 |
| 2,920,000 | Provident Funding Associates LP/PFG Finance Corp., 6.375%, 6/15/25 (144A) | 2,585,860 |
| | Total Diversified Financial Services | $10,806,672 |
|
|
| | Food — 0.2% | |
| 4,450,000 | JBS USA LUX SA/JBS USA Food Co./JBS USA Finance, Inc., 5.75%, 4/1/33 (144A) | $ 4,276,529 |
| | Total Food | $4,276,529 |
|
|
| | Oil & Gas — 0.2% | |
| 5,000,000 | Aker BP ASA, 3.10%, 7/15/31 (144A) | $ 4,146,702 |
| | Total Oil & Gas | $4,146,702 |
|
|
| | Pipelines — 0.3% | |
| 2,200,000 | Delek Logistics Partners LP/Delek Logistics Finance Corp., 6.75%, 5/15/25 | $ 2,157,474 |
| 2,741,000(e)(f) | Energy Transfer LP, 9.349% (3 Month USD LIBOR + 403 bps) | 2,480,618 |
| 3,328,000 | EnLink Midstream Partners LP, 5.60%, 4/1/44 | 2,738,646 |
| | Total Pipelines | $7,376,738 |
|
|
| | Retail — 0.2% | |
| 4,880,000 | AutoNation, Inc., 3.85%, 3/1/32 | $ 4,138,372 |
| | Total Retail | $4,138,372 |
|
|
| | Semiconductors — 0.1% | |
| 5,000,000 | Broadcom, Inc., 2.45%, 2/15/31 (144A) | $ 4,060,192 |
| | Total Semiconductors | $4,060,192 |
|
|
| | Software — 0.1% | |
| 3,580,000 | AthenaHealth Group, Inc., 6.50%, 2/15/30 (144A) | $ 3,033,373 |
| | Total Software | $3,033,373 |
|
|
| | Telecommunications — 1.8% | |
| 41,014,000 | Level 3 Financing, Inc., 10.50%, 5/15/30 (144A) | $ 42,484,973 |
| 3,364,000 | Windstream Escrow LLC/Windstream Escrow Finance Corp., 7.75%, 8/15/28 (144A) | 2,833,365 |
| | Total Telecommunications | $45,318,338 |
|
|
The accompanying notes are an integral part of these financial statements.
38Pioneer Multi-Asset Income Fund | Annual Report | 7/31/23
Principal
Amount
USD ($) | | | | | | Value |
| | Transportation — 0.1% | |
| 2,065,000 | Danaos Corp., 8.50%, 3/1/28 (144A) | $ 2,086,600 |
| | Total Transportation | $2,086,600 |
|
|
| | Total Corporate Bonds
(Cost $239,960,785) | $236,827,194 |
|
|
| Shares | | | | | | |
| | Convertible Preferred Stock — 0.0%†
of Net Assets | |
| | Professional Services — 0.0%† | |
| 15,562 | Clarivate Plc, 5.25%, 6/1/24 | $ 648,002 |
| | Total Professional Services | $648,002 |
|
|
| | Total Convertible Preferred Stock
(Cost $743,177) | $648,002 |
|
|
| | Preferred Stock — 0.2% of Net Assets | |
| | Technology Hardware, Storage & Peripherals —
0.2% | |
| 105,743(g) | Samsung Electronics Co., Ltd. | $ 4,761,816 |
| | Total Technology Hardware, Storage & Peripherals | $4,761,816 |
|
|
| | Total Preferred Stock
(Cost $4,325,784) | $4,761,816 |
|
|
Principal
Amount
USD ($) | | | | | | |
| | Insurance-Linked Securities —
3.5% of Net Assets# | |
| | Event Linked Bonds — 1.9% | |
| | Earthquakes – California — 0.0%† | |
| 500,000(a) | Sutter Re, 12.159%, (3 Month U.S. Treasury Bill + 675 bps), 6/19/26 (144A) | $ 502,600 |
| | Earthquakes – U.S. — 0.1% | |
| 500,000(a) | Torrey Pines Re Pte, 9.329%, (3 Month U.S. Treasury Bill + 392 bps), 6/7/24 (144A) | $ 490,650 |
| 1,000,000(a) | Ursa Re, 10.909%, (3 Month U.S. Treasury Bill + 550 bps), 12/6/25 (144A) | 1,000,000 |
| | | | | | | $ 1,490,650 |
|
|
The accompanying notes are an integral part of these financial statements.
Pioneer Multi-Asset Income Fund | Annual Report | 7/31/2339
Schedule of Investments | 7/31/23 (continued)
Principal
Amount
USD ($) | | | | | | Value |
| | Flood – U.S. — 0.1% | |
| 1,350,000(a) | FloodSmart Re, 18.989%, (3 Month U.S. Treasury Bill + 1,358 bps), 3/1/24 (144A) | $ 1,305,450 |
| 1,000,000(a) | FloodSmart Re, 21.659%, (1 Month U.S. Treasury Bill + 1,625 bps), 3/11/26 (144A) | 1,029,400 |
| | | | | | | $ 2,334,850 |
|
|
| | Health – U.S. — 0.2% | |
| 1,750,000(a) | Vitality Re XIII, 7.409%, (3 Month U.S. Treasury Bill + 200 bps), 1/6/26 (144A) | $ 1,713,425 |
| 1,750,000(a) | Vitality Re XIV, 8.909%, (3 Month U.S. Treasury Bill + 350 bps), 1/5/27 (144A) | 1,790,600 |
| 600,000(a) | Vitality Re XIV, 9.909%, (3 Month U.S. Treasury Bill + 450 bps), 1/5/27 (144A) | 599,580 |
| | | | | | | $ 4,103,605 |
|
|
| | Multiperil – Florida — 0.0%† | |
| 650,000(a) | Sanders Re, 13.409%, (3 Month U.S. Treasury Bill + 800 bps), 6/5/26 (144A) | $ 662,350 |
| | Multiperil – U.S. — 0.5% | |
| 1,200,000(a) | Bonanza Re, 10.256%, (3 Month U.S. Treasury Bill + 487 bps), 2/20/24 (144A) | $ 1,115,760 |
| 1,250,000(a) | Easton Re Pte, 9.916%, (3 Month U.S. Treasury Bill + 453 bps), 1/8/24 (144A) | 1,240,500 |
| 250,000(a) | Four Lakes Re, 11.909%, (3 Month U.S. Treasury Bill + 650 bps), 1/7/26 (144A) | 249,175 |
| 500,000(a) | Four Lakes Re, 12.709%, (3 Month U.S. Treasury Bill + 730 bps), 1/5/24 (144A) | 489,350 |
| 500,000(a) | Four Lakes Re, 15.569%, (3 Month U.S. Treasury Bill + 1,016 bps), 1/5/24 (144A) | 489,850 |
| 500,000(a) | Herbie Re, 15.129%, (3 Month U.S. Treasury Bill + 972 bps), 1/8/25 (144A) | 484,700 |
| 1,300,000(a) | Merna Re II, 13.159%, (3 Month U.S. Treasury Bill + 775 bps), 7/7/26 (144A) | 1,288,040 |
| 500,000(a) | Residential Re, 10.589%, (3 Month U.S. Treasury Bill + 518 bps), 12/6/25 (144A) | 477,500 |
| 1,000,000(a) | Residential Re, 11.919%, (3 Month U.S. Treasury Bill + 651 bps), 12/6/24 (144A) | 959,600 |
| 500,000(a) | Residential Re, 12.409%, (3 Month U.S. Treasury Bill + 700 bps), 12/6/26 (144A) | 496,450 |
| 250,000(a) | Residential Re, 13.649%, (3 Month U.S. Treasury Bill + 824 bps), 12/6/24 (144A) | 241,900 |
The accompanying notes are an integral part of these financial statements.
40Pioneer Multi-Asset Income Fund | Annual Report | 7/31/23
Principal
Amount
USD ($) | | | | | | Value |
| | Multiperil – U.S. — (continued) | |
| 750,000(a) | Residential Re, 17.319%, (3 Month U.S. Treasury Bill + 1,191 bps), 12/6/25 (144A) | $ 713,850 |
| 500,000(a) | Sakura Re, 18.909%, (3 Month U.S. Treasury Bill + 1,350 bps), 1/5/26 (144A) | 538,700 |
| 1,250,000(a) | Sanders Re II, 8.659%, (3 Month U.S. Treasury Bill + 325 bps), 4/7/25 (144A) | 1,192,500 |
| 800,000(a) | Sanders Re III, 8.909%, (3 Month U.S. Treasury Bill + 350 bps), 4/7/26 (144A) | 747,440 |
| 1,600,000(a) | Sanders Re III, 11.159%, (3 Month U.S. Treasury Bill + 575 bps), 4/7/27 (144A) | 1,574,240 |
| 250,000(a) | Solomon Re, 10.659%, (3 Month U.S. Treasury Bill + 525 bps), 6/8/26 (144A) | 250,150 |
| 300,000(a) | Sussex Re, 13.789%, (3 Month U.S. Treasury Bill + 838 bps), 1/8/25 (144A) | 288,330 |
| | | | | | | $ 12,838,035 |
|
|
| | Multiperil – U.S. & Canada — 0.2% | |
| 250,000(a) | Kilimanjaro III Re, 9.969%, (3 Month U.S. Treasury Bill + 456 bps), 4/20/26 (144A) | $ 236,000 |
| 250,000(a) | Kilimanjaro III Re, 10.269%, (3 Month U.S. Treasury Bill + 486 bps), 4/21/25 (144A) | 237,000 |
| 250,000(a) | Kilimanjaro III Re, 17.769%, (3 Month U.S. Treasury Bill + 1,236 bps), 4/21/25 (144A) | 237,275 |
| 250,000(a) | Kilimanjaro III Re, 17.769%, (3 Month U.S. Treasury Bill + 1,236 bps), 4/20/26 (144A) | 232,825 |
| 500,000(a) | Mona Lisa Re, 12.409%, (3 Month U.S. Treasury Bill + 700 bps), 7/8/25 (144A) | 479,250 |
| 1,000,000(a) | Mona Lisa Re, 17.909%, (3 Month U.S. Treasury Bill + 1,250 bps), 1/8/26 (144A) | 1,076,000 |
| 1,750,000(a) | Mystic Re IV, 11.539%, (3 Month U.S. Treasury Bill + 613 bps), 1/8/25 (144A) | 1,643,600 |
| 500,000(a) | Mystic Re IV, 11.69%, (3 Month U.S. Treasury Bill + 1,160 bps), 1/8/25 (144A) | 471,050 |
| 500,000(a) | Mystic Re IV, 15.159%, (3 Month U.S. Treasury Bill + 975 bps), 1/8/24 (144A) | 487,200 |
| | | | | | | $ 5,100,200 |
|
|
| | Multiperil – U.S. Regional — 0.1% | |
| 500,000(a) | Aquila Re, 12.909%, (3 Month U.S. Treasury Bill + 750 bps), 6/8/26 (144A) | $ 499,600 |
The accompanying notes are an integral part of these financial statements.
Pioneer Multi-Asset Income Fund | Annual Report | 7/31/2341
Schedule of Investments | 7/31/23 (continued)
Principal
Amount
USD ($) | | | | | | Value |
| | Multiperil – U.S. Regional — (continued) | |
| 250,000(a) | Aquila Re, 14.659%, (3 Month U.S. Treasury Bill + 925 bps), 6/8/26 (144A) | $ 253,125 |
| 1,300,000(a) | Locke Tavern Re, 4.75%, (3 Month U.S. Treasury Bill + 475 bps), 4/9/26 (144A) | 1,314,950 |
| | | | | | | $ 2,067,675 |
|
|
| | Multiperil – Worldwide — 0.1% | |
| 1,250,000(a) | Atlas Capital Re, 12.55%, (SOFR + 725 bps), 6/5/26 (144A) | $ 1,259,125 |
| 1,000,000(a) | Northshore Re II, 11.159%, (3 Month U.S. Treasury Bill + 575 bps), 1/8/24 (144A) | 989,000 |
| | | | | | | $ 2,248,125 |
|
|
| | Pandemic – U.S — 0.0%† | |
| 250,000(a) | Vitality Re XI, 7.209%, (3 Month U.S. Treasury Bill + 180 bps), 1/9/24 (144A) | $ 247,150 |
| | Windstorm – Florida — 0.1% | |
| 1,250,000(a) | First Coast Re III Pte, 11.529%, (3 Month U.S. Treasury Bill + 618 bps), 4/7/25 (144A) | $ 1,181,750 |
| 1,000,000(a) | First Coast Re IV, 9.00%, (3 Month U.S. Treasury Bill + 900 bps), 4/7/26 (144A) | 998,500 |
| 750,000(a) | Merna Re II, 10.909%, (3 Month U.S. Treasury Bill + 550 bps), 7/8/24 (144A) | 704,850 |
| | | | | | | $ 2,885,100 |
|
|
| | Windstorm – Japan — 0.0%† | |
| 500,000(a) | Sakura Re, 7.659%, (3 Month U.S. Treasury Bill + 225 bps), 4/7/25 (144A) | $ 491,100 |
| | Windstorm – North Carolina — 0.0%† | |
| 1,000,000(a) | Cape Lookout Re, 9.109%, (1 Month U.S. Treasury Bill + 370 bps), 3/22/24 (144A) | $ 972,200 |
| | Windstorm – U.S. — 0.3% | |
| 1,500,000(a) | Alamo Re, 13.909%, (1 Month U.S. Treasury Bill + 850 bps), 6/7/26 (144A) | $ 1,513,500 |
| 500,000(a) | Bonanza Re, 10.279%, (3 Month U.S. Treasury Bill + 487 bps), 12/23/24 (144A) | 449,600 |
| 250,000(a) | Bonanza Re, 11.159%, (3 Month U.S. Treasury Bill + 575 bps), 3/16/25 (144A) | 175,000 |
| 250,000(a) | Bonanza Re, 13.659%, (3 Month U.S. Treasury Bill + 825 bps), 1/8/26 (144A) | 246,900 |
| 1,500,000(a) | Cape Lookout Re, 11.909%, (1 Month U.S. Treasury Bill + 650 bps), 4/28/26 (144A) | 1,515,750 |
| 600,000(a) | Gateway Re, 18.409%, (1 Month U.S. Treasury Bill + 1,300 bps), 2/24/26 (144A) | 624,780 |
The accompanying notes are an integral part of these financial statements.
42Pioneer Multi-Asset Income Fund | Annual Report | 7/31/23
Principal
Amount
USD ($) | | | | | | Value |
| | Windstorm – U.S. — (continued) | |
| 1,600,000(a) | Merna Re II, 15.659%, (3 Month U.S. Treasury Bill + 1,025 bps), 7/7/26 (144A) | $ 1,657,120 |
| 1,500,000(a) | Queen Street Re, 12.909%, (3 Month U.S. Treasury Bill + 750 bps), 12/8/25 (144A) | 1,504,050 |
| | | | | | | $ 7,686,700 |
| |
| |
| | Windstorm – U.S. Multistate — 0.0%† | | |
| 250,000(a) | Commonwealth Re, 9.409%, (3 Month U.S. Treasury Bill + 400 bps), 7/8/26 (144A) | $ 254,275 | |
| | Windstorm – U.S. Regional — 0.0%† | | |
| 1,000,000(a) | Citrus Re, 12.136%, (3 Month U.S. Treasury Bill + 675 bps), 6/7/26 (144A) | $ 1,002,900 | |
| | Winterstorm – Florida — 0.2% | | |
| 2,000,000(a) | Integrity Re, 17.409%, (1 Month U.S. Treasury Bill + 1,200 bps), 6/6/25 (144A) | $ 2,029,200 | |
| 1,500,000(a) | Lightning Re, 16.409%, (3 Month U.S. Treasury Bill + 1,100 bps), 3/31/26 (144A) | 1,541,700 | |
| | | | | | | $ 3,570,900 | |
| |
| |
| | Total Event Linked Bonds | $ 48,458,415 | |
| |
| |
Face
Amount
USD ($) | | | | | | |
| | Collateralized Reinsurance — 0.4% | |
| | Multiperil – U.S. — 0.3% | |
| 1,800,000(c)(h) + | Ballybunion Re 2020, 2/29/24 | $ 203,353 |
| 750,000(c)(h) + | Ballybunion Re 2021-3, 7/31/25 | 16,769 |
| 4,000,000(c)(h) + | Ballybunion Re 2023, 12/31/28 | 4,130,536 |
| 3,750,000(c)(h) + | Gamboge Re, 3/31/29 | 3,419,866 |
| | | | | | | $ 7,770,524 |
|
|
| | Multiperil – Worldwide — 0.1% | |
| 500,000(c)(h) + | Amaranth Re 2023, 12/31/28 | $ 479,236 |
| 1,000,000(c)(h) + | Clarendon Re 2023, 12/31/28 | 993,009 |
| 700,000(c)(h) + | Cypress Re 2017, 1/31/24 | 70 |
| 500,000(h) + | Limestone Re 2020-1, 3/1/24 (144A) | — |
| 500,000(c)(h) + | Merion Re 2023-1, 12/31/28 | 490,876 |
| 250,000(c)(h) + | Old Head Re 2023, 12/31/28 | 222,534 |
| 500,000(c)(h) + | Pine Valley Re 2023, 12/31/28 | — |
| 250,000(c)(h) + | Porthcawl Re 2023, 12/31/28 | 234,852 |
| 700,000(c)(h) + | Resilience Re, 5/1/24 | — |
The accompanying notes are an integral part of these financial statements.
Pioneer Multi-Asset Income Fund | Annual Report | 7/31/2343
Schedule of Investments | 7/31/23 (continued)
Face
Amount
USD ($) | | | | | | Value |
| | Multiperil – Worldwide — (continued) | |
| 300,000(c)(h) + | Walton Health Re 2019, 6/30/24 | $ 158,410 |
| 250,000(c)(h) + | Walton Heath Re 2021, 1/15/24 | 30,944 |
| | | | | | | $ 2,609,931 |
|
|
| | Total Collateralized Reinsurance | $10,380,455 |
|
|
| | Reinsurance Sidecars — 1.2% | |
| | Multiperil – U.S. — 0.1% | |
| 2,500,000(c)(h) + | Carnoustie Re 2023, 12/31/28 | $ 2,725,000 |
| 1,500,000(c)(g) + | Harambee Re 2019, 12/31/24 | 2,700 |
| | | | | | | $ 2,727,700 |
|
|
| | Multiperil – Worldwide — 1.1% | |
| 439,922(c)(g) + | Alturas Re 2021-2, 12/31/24 | $ — |
| 1,000,000(c)(g) + | Alturas Re 2021-3, 7/31/25 | 126,600 |
| 24,956(c)(g) + | Alturas Re 2022-2, 12/31/27 | 7,215 |
| 750,000(c)(h) + | Bantry Re 2021, 12/31/24 | 1,500 |
| 4,000,000(c)(h) + | Bantry Re 2023, 12/31/28 | 4,479,913 |
| 1,391,977(c)(h) + | Berwick Re 2019-1, 12/31/24 | 222,020 |
| 2,500,000(c)(h) + | Berwick Re 2023, 12/31/28 | 2,799,928 |
| 3,000,000(c)(h) + | Eccleston Re 2023, 11/30/28 | 3,087,445 |
| 100,000(c)(h) + | Eden Re II, 3/22/24 (144A) | 36,700 |
| 74,892(c)(h) + | Eden Re II, 3/21/25 (144A) | 26,047 |
| 54,774(c)(h) + | Eden Re II, 3/21/25 (144A) | 19,176 |
| 500,000(c)(h) + | Gleneagles Re 2021, 12/31/24 | 50 |
| 3,000,000(c)(h) + | Gullane Re 2023, 12/31/28 | 3,328,037 |
| 250,000(c)(g) + | Lion Rock Re 2021, 12/31/24 | 52,325 |
| 2,000,000(c)(h) + | Merion Re 2021-2, 12/31/24 | 393,000 |
| 3,500,000(c)(h) + | Pangaea Re 2023-1, 12/31/28 | 3,920,000 |
| 1,250,000(c)(h) + | Pangaea Re 2023-3, 5/31/29 | 1,300,000 |
| 500,000(h) + | RosaPenna Re 2021, 7/31/25 | 20,000 |
| 200,000(h) + | Sector Re V, 3/1/24 (144A) | 101,480 |
| 100,000(h) + | Sector Re V, 12/1/24 (144A) | 172,140 |
| 1,500,000(g) + | Thopas Re 2019, 12/31/24 | 4,950 |
| 1,000,000(g) + | Thopas Re 2020, 12/31/23 | — |
| 1,500,000(g) + | Thopas Re 2021, 12/31/24 | 24,150 |
| 2,500,000(c)(g) + | Thopas Re 2023, 12/31/28 | 2,782,250 |
| 1,500,000(g) + | Torricelli Re 2021, 7/31/25 | 47,399 |
| 2,500,000(c)(g) + | Torricelli Re 2023, 6/30/29 | 2,563,100 |
| 1,500,000(g) + | Viribus Re 2019, 12/31/24 | 10,650 |
| 1,000,000(c)(g) + | Viribus Re 2020, 12/31/23 | 34,500 |
The accompanying notes are an integral part of these financial statements.
44Pioneer Multi-Asset Income Fund | Annual Report | 7/31/23
Face
Amount
USD ($) | | | | | | Value |
| | Multiperil – Worldwide — (continued) | |
| 2,000,000(c)(g) + | Viribus Re 2023, 12/31/28 | $ 2,411,800 |
| 600,000(c)(h) + | Woburn Re 2019, 12/31/24 | 103,848 |
| | | | | | | $ 28,076,223 |
|
|
| | Total Reinsurance Sidecars | $30,803,923 |
|
|
| | Total Insurance-Linked Securities
(Cost $87,234,404) | $89,642,793 |
|
|
Principal
Amount
USD ($) | | | | | | |
| | Foreign Government Bonds — 0.9% of
Net Assets | |
| | Czech Republic — 0.4% | |
| CZK 243,110,000 | Czech Republic Government Bond, 5.700%, 5/25/24 | $ 11,153,309 |
| | Total Czech Republic | $11,153,309 |
|
|
| | Russia — 0.0%† | |
| RUB 59,913,000(b)+ | Russian Federal Bond - OFZ, 7.000%, 8/16/23 | $ 32,650 |
| RUB 61,885,000(b)+ | Russian Federal Bond - OFZ, 7.700%, 3/23/33 | 33,725 |
| RUB 59,074,000(b)+ | Russian Federal Bond - OFZ, 8.150%, 2/3/27 | 32,193 |
| | Total Russia | $98,568 |
|
|
| | South Africa — 0.3% | |
| ZAR 153,782,964 | Republic of South Africa Government Bond, 8.250%, 3/31/32 | $ 7,340,135 |
| | Total South Africa | $7,340,135 |
|
|
| | Trinidad — 0.1% | |
| 2,113,000 | Trinidad & Tobago Government International Bond, 4.500%, 8/4/26 (144A) | $ 2,050,220 |
| | Total Trinidad | $2,050,220 |
|
|
| | United Kingdom — 0.1% | |
| GBP 1,483,668 | United Kingdom Gilt, 4.250%, 6/7/32 | $ 1,908,658 |
| | Total United Kingdom | $1,908,658 |
|
|
| | Total Foreign Government Bonds
(Cost $26,994,344) | $22,550,890 |
|
|
| Shares | | | | | | |
| | Closed-End Funds — 0.6% of Net Assets | |
| 1,886,372 | Aberdeen Asia-Pacific Income Fund, Inc. | $ 5,187,523 |
The accompanying notes are an integral part of these financial statements.
Pioneer Multi-Asset Income Fund | Annual Report | 7/31/2345
Schedule of Investments | 7/31/23 (continued)
| Shares | | | | | | Value |
| | Closed-End Funds — (continued) | |
| 165,651 | Cohen & Steers Tax-Advantaged Preferred Securities & Income Fund | $ 3,019,817 |
| 285,533 | Highland Income Fund | 2,429,886 |
| 1,354,239 | Invesco Senior Income Trust | 5,240,905 |
| | Total Closed-End Funds
(Cost $17,492,881) | $15,878,131 |
|
|
Principal
Amount
USD ($) | | | | | | |
| | Equity Linked Notes — 17.2% of Net
Assets | |
| | Automobiles — 0.5% | |
| 769,400 | Canadian Imperial Bank of Commerce (Stellantis NV), 14.01% (N/A + 0 bps), 2/7/24 | $ 13,160,587 |
| | Total Automobiles | $ 13,160,587 |
|
|
| | Banks — 0.7% | |
| 430,700 | Goldman Sachs International (Truist Financial Corp.), 20.28%, 3/29/24 | $ 14,600,730 |
| 244,300 | Mizuho Markets Cayman LP (Regions Financial Corp.), 16.40%, 4/1/24 | 4,827,368 |
| | Total Banks | $ 19,428,098 |
|
|
| | Broadline Retail — 1.3% | |
| 86,500 | Citigroup Global Markets Holdings, Inc. (Ebay Inc.), 15.31%, 11/10/23 (144A) | $ 3,651,598 |
| 59,500 | Goldman Sachs International (Amazon.com, Inc.), 12.45%, 4/24/24 | 6,628,300 |
| 18,600 | Goldman Sachs International (Amazon.com, Inc.), 13.48%, 3/26/24 | 1,999,221 |
| 161,500 | Royal Bank of Canada (Ebay, Inc.), 12.15%, 3/5/24 (144A) | 7,328,062 |
| 131,700 | Toronto-Dominion Bank (Alibaba Group Holding Ltd.), 21.40%, 10/13/23 | 13,183,170 |
| | Total Broadline Retail | $ 32,790,351 |
|
|
| | Capital Markets — 0.9% | |
| 118,200 | Canadian Imperial Bank of Commerce (The Charles Schwab Corp.), 14.20%, 3/19/24 | $ 7,678,154 |
| 150,600 | Citigroup Global Markets Holdings, Inc. (The Charles Schwab Corp.), 10.45%, 3/7/24 (144A) | 10,395,918 |
| 79,100 | Goldman Sachs International (The Charles Schwab Corp.), 16.21%, 3/29/24 | 5,064,773 |
| | Total Capital Markets | $ 23,138,845 |
|
|
The accompanying notes are an integral part of these financial statements.
46Pioneer Multi-Asset Income Fund | Annual Report | 7/31/23
Principal
Amount
USD ($) | | | | | | Value |
| | Chemicals — 0.2% | |
| 61,000 | Citigroup Global Markets Holdings, Inc. (CF Industries Holdings Inc.), 18.44%, 10/12/23 (144A) | $ 5,190,795 |
| | Total Chemicals | $ 5,190,795 |
|
|
| | Consumer Finance — 0.7% | |
| 132,700 | Citigroup Global Markets Holdings, Inc. (Aercap Holdings NV), 15.43%, 9/21/23 (144A) | $ 7,122,805 |
| 76,700 | Mizuho Markets Cayman LP (Aercap Holdings NV), 9.50%, 7/23/24 | 4,975,913 |
| 79,200 | Mizuho Markets Cayman LP (Aercap Holdings NV), 9.65%, 8/8/24 | 5,124,240 |
| | Total Consumer Finance | $ 17,222,958 |
|
|
| | Electrical Equipment — 0.8% | |
| 37,000 | Merrill Lynch International & Co. CV (Generac Holdings Inc.), 22.37%, 10/23/23 | $ 4,544,044 |
| 52,400 | Mizuho Markets Cayman LP (Generac Holdings Inc.), 18.54%, 2/8/24 | 6,468,518 |
| 65,300 | Royal Bank of Canada (Generac Holdings, Inc.), 18.58%, 2/26/24 (144A) | 9,224,278 |
| | Total Electrical Equipment | $ 20,236,840 |
|
|
| | Entertainment — 0.2% | |
| 314,600 | Goldman Sachs International (Warner Bros. Discovery, Inc.), 18.72%, 3/29/24 | $ 4,371,367 |
| | Total Entertainment | $ 4,371,367 |
|
|
| | Health Care Equipment & Supplies — 0.6% | |
| 28,500 | Merrill Lynch International & Co. CV (Stryker Corp.), 8.23%, 2/9/24 | $ 7,678,755 |
| 85,100 | Mizuho Markets Cayman LP (Medtronic plc), 8.74%, 5/2/24 | 7,517,308 |
| | Total Health Care Equipment & Supplies | $ 15,196,063 |
|
|
| | Health Care Providers & Services — 0.1% | |
| 72,000 | Royal Bank of Canada (Syneos Health Inc.), 14.41%, 10/13/23 | $ 3,214,800 |
| | Total Health Care Providers & Services | $ 3,214,800 |
|
|
The accompanying notes are an integral part of these financial statements.
Pioneer Multi-Asset Income Fund | Annual Report | 7/31/2347
Schedule of Investments | 7/31/23 (continued)
Principal
Amount
USD ($) | | | | | | Value |
| | Hotels, Restaurants & Leisure — 0.4% | |
| 326,500 | Canadian Imperial Bank of Commerce (Draftkings Inc.), 28.90%, 11/17/23 | $ 4,551,084 |
| 180,600 | Merrill Lynch International & Co. CV (International Game Technology Plc), 15.85%, 3/11/24 | 5,339,439 |
| | Total Hotels, Restaurants & Leisure | $ 9,890,523 |
|
|
| | IT Services — 2.6% | |
| 56,400 | Canadian Imperial Bank of Commerce (Alphabet, Inc.), 10.15%, 4/24/24 | $ 6,595,585 |
| 65,000 | Citigroup Global Markets Holdings, Inc. (Cognizant Technology Solutions Corp.), 12.39%, 11/20/23 (144A) | 3,737,500 |
| 18,100 | Goldman Sachs International (Alphabet, Inc.), 11.13%, 3/26/24 | 2,004,249 |
| 379,200 | Merrill Lynch International & Co. CV (Pure Storage, Inc.), 14.28%, 2/26/24 | 12,697,512 |
| 249,600 | Morgan Stanley (Pure Storage, Inc.), 14.07%, 2/9/24 | 7,869,888 |
| 166,900 | Royal Bank of Canada (Advanced Micro Devices, Inc.), 17.13%, 1/23/24 (144A) | 12,881,509 |
| 110,200 | Toronto-Dominion Bank (Alphabet, Inc.), 10.25%, 5/21/24 | 12,855,381 |
| 67,900 | Toronto-Dominion Bank (Alphabet, Inc.), 10.51%, 4/12/24 | 7,765,723 |
| | Total IT Services | $ 66,407,347 |
|
|
| | Metals & Mining — 0.9% | |
| 195,700 | Canadian Imperial Bank of Commerce (Teck Resources, Ltd.), 15.95% (N/A + 0 bps), 1/29/24 | $ 8,361,087 |
| 307,200 | Citigroup Global Markets Holdings, Inc. (Barrick Gold Corp.), 14.74%, 1/26/24 (144A) | 5,349,888 |
| 298,500 | Citigroup Global Markets Holdings, Inc. (Teck Resources, Ltd.), 20.23%, 11/9/23 (144A) | 10,233,177 |
| | Total Metals & Mining | $ 23,944,152 |
|
|
| | Oil, Gas & Consumable Fuels — 3.1% | |
| 264,500 | BNP Paribas Issuance BV (Comstock Resources Inc.), 23.70%, 8/31/23 (144A) | $ 3,576,040 |
| 438,500 | BNP Paribas Issuance BV (Kosmos Energy Ltd.), 21.08%, 3/8/24 (144A) | 3,350,140 |
| 279,300 | Canadian Imperial Bank of Commerce (Antero Resources Corp.), 19.15%, 6/26/24 | 6,655,998 |
| 164,300 | Citigroup Global Markets Holdings, Inc. (EQT Corp.), 19.08%, 1/26/24 (144A) | 6,252,436 |
The accompanying notes are an integral part of these financial statements.
48Pioneer Multi-Asset Income Fund | Annual Report | 7/31/23
Principal
Amount
USD ($) | | | | | | Value |
| | Oil, Gas & Consumable Fuels — (continued) | |
| 85,000 | Citigroup Global Markets Holdings, Inc. (Occidental Petroleum Corp.), 19.37%, 9/28/23 (144A) | $ 5,408,125 |
| 101,000 | Citigroup Global Markets Holdings, Inc. (Occidental Petroleum Corp.), 19.62%, 10/10/23 (144A) | 6,397,845 |
| 226,800 | Citigroup Global Markets Holdings, Inc. (Range Resources Corp.), 19.36%, 1/26/24 (144A) | 6,325,452 |
| 555,000 | Goldman Sachs International (Energy Transfer LP), 18.47%, 10/10/23 | 6,727,710 |
| 343,900 | Goldman Sachs International (Kosmos Energy Ltd.), 21.33%, 3/29/24 | 2,439,971 |
| 155,800 | Royal Bank of Canada (EQT Corp.), 16.46%, 6/26/24 (144A) | 6,486,733 |
| 102,500 | Royal Bank of Canada (EQT Corp.), 20.50%, 8/31/23 | 4,423,900 |
| 208,800 | Toronto-Dominion Bank (EQT Corp.), 21.21%, 8/14/23 | 8,887,572 |
| 164,800 | Toronto-Dominion Bank (Occidental Petroleum Corp.), 15.75%, 3/13/24 | 10,302,472 |
| 48,800 | Toronto-Dominion Bank (Occidental Petroleum Corp.), 17.70%, 9/1/23 | 3,129,300 |
| | Total Oil, Gas & Consumable Fuels | $ 80,363,694 |
|
|
| | Pharmaceuticals — 0.2% | |
| 26,100 | Toronto-Dominion Bank (Alnylam Pharmaceuticals Inc.), 14.70%, 2/8/24 | $ 5,407,920 |
| | Total Pharmaceuticals | $ 5,407,920 |
|
|
| | Semiconductors & Semiconductor Equipment —
2.7% | |
| 100,000 | Citigroup Global Markets Holdings, Inc. (Micron Technology Inc.), 17.68%, 10/26/23 (144A) | $ 5,903,300 |
| 81,600 | Merrill Lynch International & Co. CV (Applied Materials), 0.144%, 3/11/24 | 10,615,507 |
| 192,300 | Merrill Lynch International & Co. CV (Microchip Technology, Inc.), 13.63%, 5/24/24 | 15,636,875 |
| 115,000 | Merrill Lynch International & Co. CV (Micron Technology Inc.), 16.45%, 10/13/23 | 6,908,050 |
| 50,000 | Merrill Lynch International & Co. CV (MKS Instruments Inc.), 17.63%, 11/10/23 | 3,897,850 |
| 88,800 | Royal Bank of Canada (Microchip Technology Incorporated), 13.57%, 3/5/24 (144A) | 7,589,736 |
The accompanying notes are an integral part of these financial statements.
Pioneer Multi-Asset Income Fund | Annual Report | 7/31/2349
Schedule of Investments | 7/31/23 (continued)
Principal
Amount
USD ($) | | | | | | Value |
| | Semiconductors & Semiconductor Equipment —
(continued) | |
| 140,000 | Royal Bank of Canada (Micron Technology Inc.), 14.35%, 8/14/23 | $ 9,725,100 |
| 74,800 | Royal Bank of Canada (MKS Instruments, Inc.), 13.38%, 8/14/23 | 8,290,084 |
| | Total Semiconductors & Semiconductor Equipment | $ 68,566,502 |
|
|
| | Software — 1.3% | |
| 128,700 | Citigroup Global Markets Holdings, Inc. (DocuSign, Inc.), 26.39%, 12/19/23 (144A) | $ 6,733,584 |
| 72,700 | Citigroup Global Markets Holdings, Inc. (Zoom Video Communications Inc.), 23.01%, 10/26/23 (144A) | 5,350,720 |
| 156,900 | Mizuho Markets Cayman LP (Zoom Video Communications, Inc.), 19.80%, 3/8/24 | 11,594,125 |
| 49,500 | Mizuho Markets Cayman LP (Zoom Video Communications, Inc.), 22.45%, 11/21/23 | 3,777,098 |
| 67,200 | Royal Bank of Canada (Zoom Video Communications, Inc.), 20.63%, 1/23/24 (144A) | 4,826,304 |
| | Total Software | $ 32,281,831 |
|
|
| | Total Equity Linked Notes
(Cost $426,947,556) | $ 440,812,673 |
|
|
| | U.S. Government and Agency
Obligations — 8.3% of Net Assets | |
| 34,637,200 | U.S. Treasury Bonds, 4.375%, 10/31/24 | $ 34,252,944 |
| 33,515,200 | U.S. Treasury Bonds, 4.500%, 11/30/24 | 33,177,430 |
| 60,239,900 | U.S. Treasury Notes, 3.000%, 6/30/24 | 58,943,330 |
| 33,011,000 | U.S. Treasury Notes, 3.000%, 7/31/24 | 32,251,489 |
| 13,639,000 | U.S. Treasury Notes, 4.125%, 1/31/25 | 13,431,751 |
| 39,594,700 | U.S. Treasury Notes, 4.250%, 9/30/24 | 39,109,046 |
| | Total U.S. Government and Agency Obligations
(Cost $212,759,691) | $211,165,990 |
|
|
The accompanying notes are an integral part of these financial statements.
50Pioneer Multi-Asset Income Fund | Annual Report | 7/31/23
| Shares | | | | | | Value |
| | SHORT TERM INVESTMENTS — 0.4% of Net
Assets | |
| | Open-End Fund — 0.4% | |
| 11,368,367(i) | Dreyfus Government Cash Management,
Institutional Shares, 5.14% | $ 11,368,367 |
| | | | | | | $ 11,368,367 |
|
|
| | TOTAL SHORT TERM INVESTMENTS
(Cost $11,368,367) | $11,368,367 |
|
|
Number of
Contracts | Description | Counterparty | Amount | Strike
Price | Expiration
Date | |
| | Over The Counter (OTC) Put Options On Indices Purchased — 0.0%† | |
| 28,803 | S&P 500 INDEX | Citibank NA | USD 3,992,424 | USD 3,978.09 | 11/17/23 | $ 640,089 |
| | Total Over The Counter (OTC) Put Options On Indices Purchased
(Premiums paid $ 3,992,424) | $ 640,089 |
|
|
| | TOTAL OPTIONS PURCHASED
(Premiums paid $ 3,992,424) | $ 640,089 |
|
|
| | TOTAL INVESTMENTS IN UNAFFILIATED ISSUERS — 98.1%
(Cost $2,386,218,061) | $ 2,513,035,046 |
| | OTHER ASSETS AND LIABILITIES — 1.9% | $ 47,776,145 |
| | net assets — 100.0% | $2,560,811,191 |
| | | | | | | |
| (A.D.R.) | American Depositary Receipts. |
| (C.V.A.) | Certificaaten van aandelen (Share Certificates) |
| (G.D.R.) | Global Depositary Receipts. |
| bps | Basis Points. |
| CMT | Constant Maturity Treasury Index. |
| LIBOR | London Interbank Offered Rate. |
| REIT | Real Estate Investment Trust. |
| SOFR | Secured Overnight Financing Rate. |
| SOFR30A | Secured Overnight Financing Rate 30 Day Average. |
| (144A) | The resale of such security is exempt from registration under Rule 144A of the Securities Act of 1933. Such securities may be resold normally to qualified institutional buyers. At July 31, 2023, the value of these securities amounted to $621,716,203, or 24.3% of net assets. |
| (a) | Floating rate note. Coupon rate, reference index and spread shown at July 31, 2023. |
| (b) | Security is in default. |
| (c) | Non-income producing security. |
| (d) | Debt obligation initially issued at one coupon which converts to a higher coupon at a specific date. The rate shown is the rate at July 31, 2023. |
The accompanying notes are an integral part of these financial statements.
Pioneer Multi-Asset Income Fund | Annual Report | 7/31/2351
Schedule of Investments | 7/31/23 (continued)
| (e) | The interest rate is subject to change periodically. The interest rate and/or reference index and spread shown at July 31, 2023. |
| (f) | Security is perpetual in nature and has no stated maturity date. |
| (g) | Issued as preference shares. |
| (h) | Issued as participation notes. |
| (i) | Rate periodically changes. Rate disclosed is the 7-day yield at July 31, 2023. |
| * | Senior secured floating rate loan interests in which the Fund invests generally pay interest at rates that are periodically re-determined by reference to a base lending rate plus a premium. These base lending rates are generally (i) the lending rate offered by one or more major European banks, such as LIBOR or SOFR, (ii) the prime rate offered by one or more major United States banks, (iii) the rate of a certificate of deposit or (iv) other base lending rates used by commercial lenders. The interest rate shown is the rate accruing at July 31, 2023. |
| + | Security is valued using significant unobservable inputs (Level 3). |
| † | Amount rounds to less than 0.1%. |
| # | Securities are restricted as to resale. |
| Restricted Securities | Acquisition date | Cost | Value |
| Alamo Re | 4/12/2023 | $ 1,500,000 | $ 1,513,500 |
| Alturas Re 2021-2 | 2/16/2021 | 22,989 | — |
| Alturas Re 2021-3 | 7/1/2021 | 235,326 | 126,600 |
| Alturas Re 2022-2 | 4/11/2023 | 5,284 | 7,215 |
| Amaranth Re 2023 | 1/26/2023 | 417,924 | 479,236 |
| Aquila Re | 5/10/2023 | 500,000 | 499,600 |
| Aquila Re | 5/10/2023 | 250,000 | 253,125 |
| Atlas Capital Re | 5/17/2023 | 1,250,000 | 1,259,125 |
| Ballybunion Re 2020 | 12/31/2019 | 123,519 | 203,353 |
| Ballybunion Re 2021-3 | 8/4/2021 | 15,764 | 16,769 |
| Ballybunion Re 2023 | 3/20/2023 | 4,000,000 | 4,130,536 |
| Bantry Re 2021 | 1/11/2021 | 12,214 | 1,500 |
| Bantry Re 2023 | 1/10/2023 | 4,000,000 | 4,479,913 |
| Berwick Re 2019-1 | 2/27/2019 | 166,329 | 222,020 |
| Berwick Re 2023 | 2/1/2023 | 2,500,000 | 2,799,928 |
| Bonanza Re | 2/13/2020 | 1,153,152 | 1,115,760 |
| Bonanza Re | 12/15/2020 | 500,000 | 449,600 |
| Bonanza Re | 1/6/2023 | 250,000 | 246,900 |
| Bonanza Re | 7/25/2023 | 208,046 | 175,000 |
| Cape Lookout Re | 3/9/2021 | 1,000,000 | 972,200 |
| Cape Lookout Re | 4/14/2023 | 1,500,000 | 1,515,750 |
| Carnoustie Re 2023 | 2/15/2023 | 2,500,000 | 2,725,000 |
| Citrus Re | 4/27/2023 | 1,000,000 | 1,002,900 |
| Clarendon Re 2023 | 3/20/2023 | 916,657 | 993,009 |
| Commonwealth Re | 6/7/2023 | 250,000 | 254,275 |
| Cypress Re 2017 | 1/24/2017 | 2,353 | 70 |
| Easton Re Pte | 12/15/2020 | 1,250,000 | 1,240,500 |
| Eccleston Re 2023 | 7/13/2023 | 3,000,000 | 3,087,445 |
The accompanying notes are an integral part of these financial statements.
52Pioneer Multi-Asset Income Fund | Annual Report | 7/31/23
| Restricted Securities | Acquisition date | Cost | Value |
| Eden Re II | 12/23/2019 | $ 82,639 | $ 36,700 |
| Eden Re II | 12/14/2020 | 43,888 | 19,176 |
| Eden Re II | 1/25/2021 | 59,884 | 26,047 |
| First Coast Re III Pte | 3/4/2021 | 1,250,000 | 1,181,750 |
| First Coast Re IV | 3/24/2023 | 1,000,000 | 998,500 |
| FloodSmart Re | 2/16/2021 | 1,350,000 | 1,305,450 |
| FloodSmart Re | 2/23/2023 | 1,000,000 | 1,029,400 |
| Four Lakes Re | 11/5/2020 | 500,000 | 489,350 |
| Four Lakes Re | 11/5/2020 | 500,000 | 489,850 |
| Four Lakes Re | 12/22/2022 | 250,000 | 249,175 |
| Gamboge Re | 4/20/2023 | 3,169,466 | 3,419,866 |
| Gateway Re | 2/3/2023 | 600,000 | 624,780 |
| Gleneagles Re 2021 | 1/13/2021 | 9,150 | 50 |
| Gullane Re 2023 | 1/10/2023 | 3,000,000 | 3,328,037 |
| Harambee Re 2019 | 12/20/2018 | — | 2,700 |
| Herbie Re | 10/19/2020 | 500,000 | 484,700 |
| Integrity Re | 3/23/2023 | 2,000,000 | 2,029,200 |
| Kilimanjaro III Re | 4/8/2021 | 250,000 | 237,275 |
| Kilimanjaro III Re | 4/8/2021 | 250,000 | 232,825 |
| Kilimanjaro III Re | 4/8/2021 | 250,000 | 236,000 |
| Kilimanjaro III Re | 4/8/2021 | 250,000 | 237,000 |
| Lightning Re | 3/20/2023 | 1,500,000 | 1,541,700 |
| Limestone Re 2020-1 | 1/3/2020 | — | — |
| Lion Rock Re 2021 | 12/30/2020 | 107,115 | 52,325 |
| Locke Tavern Re | 3/23/2023 | 1,300,000 | 1,314,950 |
| LUKOIL PJSC | 4/3/2020 | 3,354,083 | 155,622 |
| Magnit PJSC | 4/15/2020 | 12,536,598 | 618,044 |
| Merion Re 2021-2 | 12/28/2020 | 544,188 | 393,000 |
| Merion Re 2023-1 | 1/11/2023 | 441,808 | 490,876 |
| Merna Re II | 6/8/2021 | 750,000 | 704,850 |
| Merna Re II | 4/5/2023 | 1,300,000 | 1,288,040 |
| Merna Re II | 4/5/2023 | 1,600,000 | 1,657,120 |
| Mona Lisa Re | 6/22/2021 | 500,000 | 479,250 |
| Mona Lisa Re | 12/30/2022 | 1,000,000 | 1,076,000 |
| Mystic Re IV | 12/15/2020 | 500,000 | 487,200 |
| Mystic Re IV | 6/9/2021 | 1,749,106 | 1,643,600 |
| Mystic Re IV | 6/9/2021 | 500,000 | 471,050 |
| Northshore Re II | 12/2/2020 | 1,000,000 | 989,000 |
| Old Head Re 2023 | 1/11/2023 | 168,990 | 222,534 |
| Pangaea Re 2023-1 | 1/19/2023 | 3,500,000 | 3,920,000 |
| Pangaea Re 2023-3 | 6/29/2023 | 1,250,000 | 1,300,000 |
| Pine Valley Re 2023 | 1/18/2023 | 446,865 | — |
| Porthcawl Re 2023 | 1/23/2023 | 197,811 | 234,852 |
| Queen Street Re | 5/12/2023 | 1,500,000 | 1,504,050 |
| Residential Re | 10/30/2020 | 1,002,724 | 959,600 |
| Residential Re | 10/28/2021 | 500,000 | 477,500 |
The accompanying notes are an integral part of these financial statements.
Pioneer Multi-Asset Income Fund | Annual Report | 7/31/2353
Schedule of Investments | 7/31/23 (continued)
| Restricted Securities | Acquisition date | Cost | Value |
| Residential Re | 10/28/2021 | $ 750,000 | $ 713,850 |
| Residential Re | 11/22/2022 | 500,000 | 496,450 |
| Residential Re | 1/17/2023 | 238,489 | 241,900 |
| Resilience Re | 2/8/2017 | 338 | — |
| RosaPenna Re 2021 | 7/16/2021 | — | 20,000 |
| Rosneft Oil Co. PJSC | 12/6/2019 | 9,625,119 | 353,360 |
| Sakura Re | 3/24/2021 | 500,000 | 491,100 |
| Sakura Re | 12/22/2022 | 500,000 | 538,700 |
| Sanders Re | 5/24/2023 | 650,000 | 662,350 |
| Sanders Re II | 5/24/2021 | 1,250,000 | 1,192,500 |
| Sanders Re III | 2/14/2023 | 749,593 | 747,440 |
| Sanders Re III | 3/24/2023 | 1,600,000 | 1,574,240 |
| Sector Re V | 4/23/2019 | 136,333 | 101,480 |
| Sector Re V | 12/4/2019 | 1,675 | 172,140 |
| Solomon Re | 6/12/2023 | 250,000 | 250,150 |
| Sussex Re | 1/27/2023 | 276,785 | 288,330 |
| Sutter Re | 6/6/2023 | 500,000 | 502,600 |
| Thopas Re 2019 | 12/21/2018 | — | 4,950 |
| Thopas Re 2020 | 2/5/2020 | — | — |
| Thopas Re 2021 | 12/30/2020 | — | 24,150 |
| Thopas Re 2023 | 2/13/2023 | 2,500,000 | 2,782,250 |
| Torrey Pines Re Pte | 3/12/2021 | 500,000 | 490,650 |
| Torricelli Re 2021 | 7/1/2021 | — | 47,399 |
| Torricelli Re 2023 | 7/19/2023 | 2,500,000 | 2,563,100 |
| Ursa Re | 4/12/2023 | 1,000,000 | 1,000,000 |
| Viribus Re 2019 | 12/27/2018 | — | 10,650 |
| Viribus Re 2020 | 3/12/2020 | 101,920 | 34,500 |
| Viribus Re 2023 | 1/8/2023 | 2,000,000 | 2,411,800 |
| Vitality Re XI | 1/31/2020 | 249,637 | 247,150 |
| Vitality Re XIII | 3/6/2023 | 1,681,983 | 1,713,425 |
| Vitality Re XIV | 1/25/2023 | 1,750,000 | 1,790,600 |
| Vitality Re XIV | 1/25/2023 | 600,000 | 599,580 |
| Walton Health Re 2019 | 7/18/2019 | 91,391 | 158,410 |
| Walton Heath Re 2021 | 6/28/2021 | 69,944 | 30,944 |
| Woburn Re 2019 | 1/30/2019 | 83,125 | 103,848 |
| X5 Retail Group NV (G.D.R.) | 9/17/2020 | 1,738,218 | 29,164 |
| Total Restricted Securities | | | $90,798,983 |
| % of Net assets | | | 3.5% |
The accompanying notes are an integral part of these financial statements.
54Pioneer Multi-Asset Income Fund | Annual Report | 7/31/23
FUTURES CONTRACTS
INDEX FUTURES CONTRACTS
Number of
Contracts
Long | Description | Expiration
Date | Notional
Amount | Market
Value | Unrealized
Appreciation |
| 403 | Hang Seng Index Futures | 9/28/23 | $50,521,235 | $52,185,526 | $1,664,291 |
Number of
Contracts
Short | Description | Expiration
Date | Notional
Amount | Market
Value | Unrealized
Appreciation
(Depreciation) |
| 165 | Japan 10Y Bond (OSE) | 9/12/23 | $ (171,642,841) | $ (170,259,727) | $ 1,383,114 |
| 229 | NASDAQ 100 E- Mini | 9/15/23 | (68,881,759) | (72,627,350) | (3,745,591) |
| 1,884 | S&P 500 E-MINI | 9/15/23 | (417,116,001) | (434,685,900) | (17,569,899) |
| | | | $ (657,640,601) | $ (677,572,977) | $ (19,932,376) |
| TOTAL FUTURES CONTRACTS | $(607,119,366) | $(625,387,451) | $(18,268,085) |
Principal amounts are denominated in U.S. dollars (“USD”) unless otherwise noted.
| CZK | — Czech Republic Koruna |
| EUR | — Euro |
| GBP | — Great British Pound |
| RUB | — Russia Ruble |
| ZAR | — South Africa Rand |
Purchases and sales of securities (excluding short-term investments) for the year ended July 31, 2023 were as follows:
| | Purchases | Sales |
| Long-Term U.S. Government Securities | $ 579,109,992 | $ 367,820,823 |
| Other Long-Term Securities | $1,651,350,424 | $1,176,043,944 |
At July 31, 2023, the net unrealized appreciation on investments based on cost for federal tax purposes of $2,383,065,567 was as follows:
| Aggregate gross unrealized appreciation for all investments in which there is an excess of value over tax cost | $ 276,997,656 |
| Aggregate gross unrealized depreciation for all investments in which there is an excess of tax cost over value | (165,296,262) |
| Net unrealized appreciation | $ 111,701,394 |
The accompanying notes are an integral part of these financial statements.
Pioneer Multi-Asset Income Fund | Annual Report | 7/31/2355
Schedule of Investments | 7/31/23 (continued)
Various inputs are used in determining the value of the Fund's investments. These inputs are summarized in the three broad levels below.
| Level 1 | – | unadjusted quoted prices in active markets for identical securities. |
| Level 2 | – | other significant observable inputs (including quoted prices for similar securities, interest rates, prepayment speeds, credit risks, etc.). See Notes to Financial Statements — Note 1A. |
| Level 3 | – | significant unobservable inputs (including the Adviser's own assumptions in determining fair value of investments). See Notes to Financial Statements — Note 1A. |
The following is a summary of the inputs used as of July 31, 2023, in valuing the Fund's investments:
| | Level 1 | Level 2 | Level 3 | Total |
| Senior Secured Floating Rate Loan Interests | $ — | $ 21,162,701 | $ — | $ 21,162,701 |
| Common Stocks | | | | |
| Consumer Staples Distribution & Retail | — | — | 647,208 | 647,208 |
| Oil, Gas & Consumable Fuels | 299,522,005 | — | 508,982 | 300,030,987 |
| All Other Common Stocks | 969,826,467 | — | — | 969,826,467 |
| Asset Backed Securities | — | 68,596,976 | — | 68,596,976 |
| Collateralized Mortgage Obligations | — | 85,388,995 | — | 85,388,995 |
| Commercial Mortgage-Backed Securities | — | 6,361,011 | — | 6,361,011 |
| Convertible Corporate Bonds | — | 26,724,756 | — | 26,724,756 |
| Corporate Bonds | — | 236,827,194 | — | 236,827,194 |
| Convertible Preferred Stock | 648,002 | — | — | 648,002 |
| Preferred Stock | 4,761,816 | — | — | 4,761,816 |
| Insurance-Linked Securities | | | | |
| Collateralized Reinsurance | | | | |
| Multiperil – U.S. | — | — | 7,770,524 | 7,770,524 |
| Multiperil – Worldwide | — | — | 2,609,931 | 2,609,931 |
| Reinsurance Sidecars | | | | |
| Multiperil – U.S. | — | — | 2,727,700 | 2,727,700 |
| Multiperil – Worldwide | — | — | 28,076,223 | 28,076,223 |
| All Other Insurance-Linked Securities | — | 48,458,415 | — | 48,458,415 |
| Foreign Government Bonds | | | | |
| Russia | — | — | 98,568 | 98,568 |
| All Other Foreign Government Bonds | — | 22,452,322 | — | 22,452,322 |
| Closed-End Funds | 15,878,131 | — | — | 15,878,131 |
| Equity Linked Notes | — | 440,812,673 | — | 440,812,673 |
The accompanying notes are an integral part of these financial statements.
56Pioneer Multi-Asset Income Fund | Annual Report | 7/31/23
| | Level 1 | Level 2 | Level 3 | Total |
| U.S. Government and Agency Obligations | $ — | $ 211,165,990 | $ — | $ 211,165,990 |
| Over The Counter (OTC) Put Options On Indices Purchased | — | 640,089 | — | 640,089 |
| Open-End Fund | 11,368,367 | — | — | 11,368,367 |
| Total Investments in Securities | $1,302,004,788 | $1,168,591,122 | $ 42,439,136 | $2,513,035,046 |
| Other Financial Instruments | | | | |
| Net unrealized depreciation on futures contracts | $ (18,268,085) | $ — | $ — | $ (18,268,085) |
| Total Other Financial Instruments | $ (18,268,085) | $ — | $ — | $ (18,268,085) |
During the year ended July 31, 2023, there were no significant transfers in or out of Level 3.
The accompanying notes are an integral part of these financial statements.
Pioneer Multi-Asset Income Fund | Annual Report | 7/31/2357
Statement of Assets and Liabilities | 7/31/23
| ASSETS: | |
| Investments in unaffiliated issuers, at value (cost $2,386,218,061) | $2,513,035,046 |
| Cash | 67,534 |
| Foreign currencies, at value (cost $10,807) | 12,226 |
| Futures collateral | 33,350,698 |
| Variation margin for futures contracts | 480,457 |
| Receivables — | |
| Investment securities sold | 18,974,815 |
| Fund shares sold | 7,565,707 |
| Dividends | 4,398,817 |
| Interest | 11,051,863 |
| Due from custodian | 1,303,052 |
| Other assets | 41,934 |
| Total assets | $ 2,590,282,149 |
| LIABILITIES: | |
| Payables — | |
| Investment securities purchased | $ 15,040,134 |
| Fund shares repurchased | 12,440,054 |
| Distributions | 102,652 |
| Trustees' fees | 12,227 |
| Collateral due to broker for options | 850,000 |
| Due to Adviser | 8,220 |
| Management fees | 163,925 |
| Administrative expenses | 70,707 |
| Distribution fees | 53,284 |
| Accrued expenses | 729,755 |
| Total liabilities | $ 29,470,958 |
| NET ASSETS: | |
| Paid-in capital | $2,692,127,064 |
| Distributable earnings (loss) | (131,315,873) |
| Net assets | $ 2,560,811,191 |
| NET ASSET VALUE PER SHARE: | |
| No par value (unlimited number of shares authorized) | |
| Class A (based on $492,295,318/43,478,533 shares) | $ 11.32 |
| Class C (based on $268,091,420/23,769,029 shares) | $ 11.28 |
| Class K (based on $119,557,685/10,273,646 shares) | $ 11.64 |
| Class R (based on $1,140,359/100,753 shares) | $ 11.32 |
| Class Y (based on $1,679,726,409/148,902,973 shares) | $ 11.28 |
| MAXIMUM OFFERING PRICE PER SHARE: | |
| Class A (based on $11.32 net asset value per share/100%-4.50% maximum sales charge) | $ 11.85 |
The accompanying notes are an integral part of these financial statements.
58Pioneer Multi-Asset Income Fund | Annual Report | 7/31/23
Statement of Operations FOR THE YEAR ENDED 7/31/23
| INVESTMENT INCOME: | | |
| Interest from unaffiliated issuers | $116,653,114 | |
| Dividends from unaffiliated issuers (net of foreign taxes withheld $3,326,348) | 47,552,305 | |
| Total Investment Income | | $ 164,205,419 |
| EXPENSES: | | |
| Management fees | $ 10,410,148 | |
| Administrative expenses | 674,596 | |
| Transfer agent fees | | |
| Class A | 188,083 | |
| Class C | 145,787 | |
| Class K | 43 | |
| Class R | 938 | |
| Class Y | 1,365,371 | |
| Distribution fees | | |
| Class A | 1,112,152 | |
| Class C | 2,567,144 | |
| Class R | 4,659 | |
| Shareowner communications expense | 123,598 | |
| Custodian fees | 128,123 | |
| Registration fees | 257,794 | |
| Professional fees | 233,967 | |
| Printing expense | 40,937 | |
| Officers' and Trustees' fees | 148,398 | |
| Insurance expense | 20,710 | |
| Miscellaneous | 414,403 | |
| Total expenses | | $ 17,836,851 |
| Less fees waived and expenses reimbursed by the Adviser | | (246,915) |
| Net expenses | | $ 17,589,936 |
| Net investment income | | $ 146,615,483 |
| REALIZED AND UNREALIZED GAIN (LOSS) ON INVESTMENTS: | | |
| Net realized gain (loss) on: | | |
| Investments in unaffiliated issuers | $ (61,147,869) | |
| Futures contracts | (39,349,454) | |
| Written options | 376,889 | |
| Other assets and liabilities denominated in foreign currencies | (1,181,462) | $(101,301,896) |
| Change in net unrealized appreciation (depreciation) on: | | |
| Investments in unaffiliated issuers | $166,460,174 | |
| Futures contracts | (13,714,672) | |
| Other assets and liabilities denominated in foreign currencies | 473,295 | $ 153,218,797 |
| Net realized and unrealized gain (loss) on investments | | $ 51,916,901 |
| Net increase in net assets resulting from operations | | $ 198,532,384 |
The accompanying notes are an integral part of these financial statements.
Pioneer Multi-Asset Income Fund | Annual Report | 7/31/2359
Statements of Changes in Net Assets
| | Year
Ended
7/31/23 | Year
Ended
7/31/22 |
| FROM OPERATIONS: | | |
| Net investment income (loss) | $ 146,615,483 | $ 91,755,628 |
| Net realized gain (loss) on investments | (101,301,896) | 53,239,342 |
| Change in net unrealized appreciation (depreciation) on investments | 153,218,797 | (157,366,269) |
| Net increase (decrease) in net assets resulting from operations | $ 198,532,384 | $ (12,371,299) |
| DISTRIBUTIONS TO SHAREOWNERS: | | |
| Class A ($0.63 and $0.65 per share, respectively) | $ (25,497,137) | $ (21,882,630) |
| Class C ($0.55 and $0.56 per share, respectively) | (12,769,214) | (13,538,133) |
| Class K ($0.68 and $0.70 per share, respectively) | (6,960,933) | (7,891,529) |
| Class R ($0.60 and $0.59 per share, respectively) | (50,189) | (37,145) |
| Class Y ($0.65 and $0.67 per share, respectively) | (82,359,534) | (50,912,345) |
| Total distributions to shareowners | $ (127,637,007) | $ (94,261,782) |
| FROM FUND SHARE TRANSACTIONS: | | |
| Net proceeds from sales of shares | $1,255,867,301 | $ 630,259,970 |
| Reinvestment of distributions | 126,852,760 | 92,674,086 |
| Cost of shares repurchased | (651,211,343) | (431,048,442) |
| Net increase in net assets resulting from Fund share transactions | $ 731,508,718 | $ 291,885,614 |
| Net increase in net assets | $ 802,404,095 | $ 185,252,533 |
| NET ASSETS: | | |
| Beginning of year | $1,758,407,096 | $1,573,154,563 |
| End of year | $ 2,560,811,191 | $ 1,758,407,096 |
The accompanying notes are an integral part of these financial statements.
60Pioneer Multi-Asset Income Fund | Annual Report | 7/31/23
| | Year
Ended
7/31/23
Shares | Year
Ended
7/31/23
Amount | Year
Ended
7/31/22
Shares | Year
Ended
7/31/22
Amount |
| Class A | | | | |
| Shares sold | 13,614,271 | $ 150,475,084 | 10,942,592 | $ 126,376,070 |
| Reinvestment of distributions | 2,296,769 | 25,299,143 | 1,874,970 | 21,526,503 |
| Less shares repurchased | (9,220,100) | (101,358,676) | (6,588,391) | (75,511,992) |
| Net increase | 6,690,940 | $ 74,415,551 | 6,229,171 | $ 72,390,581 |
| Class C | | | | |
| Shares sold | 5,901,728 | $ 65,091,251 | 3,352,366 | $ 38,380,079 |
| Reinvestment of distributions | 1,163,826 | 12,765,742 | 1,173,326 | 13,452,189 |
| Less shares repurchased | (6,403,436) | (70,277,889) | (6,920,946) | (79,466,297) |
Net increase
(decrease) | 662,118 | $ 7,579,104 | (2,395,254) | $ (27,634,029) |
| Class K | | | | |
| Shares sold | 403,320 | $ 4,615,552 | 2,997,657 | $ 36,486,044 |
| Reinvestment of distributions | 609,865 | 6,900,872 | 648,245 | 7,672,877 |
| Less shares repurchased | (1,256,261) | (14,155,284) | (4,739,246) | (56,362,194) |
| Net decrease | (243,076) | $ (2,638,860) | (1,093,344) | $ (12,203,273) |
| Class R | | | | |
| Shares sold | 51,848 | $ 568,684 | 28,656 | $ 332,560 |
| Reinvestment of distributions | 4,534 | 49,942 | 3,209 | 36,773 |
| Less shares repurchased | (27,662) | (304,868) | (15,037) | (175,230) |
| Net increase | 28,720 | $ 313,758 | 16,828 | $ 194,103 |
| Class Y | | | | |
| Shares sold | 94,190,114 | $1,035,116,730 | 37,651,330 | $ 428,685,217 |
| Reinvestment of distributions | 7,445,204 | 81,837,061 | 4,372,212 | 49,985,744 |
| Less shares repurchased | (42,488,849) | (465,114,626) | (19,319,152) | (219,532,729) |
| Net increase | 59,146,469 | $ 651,839,165 | 22,704,390 | $ 259,138,232 |
The accompanying notes are an integral part of these financial statements.
Pioneer Multi-Asset Income Fund | Annual Report | 7/31/2361
| | Year
Ended
7/31/23 | Year
Ended
7/31/22 | Year
Ended
7/31/21 | Year
Ended
7/31/20 | Year
Ended
7/31/19 |
| Class A | | | | | |
| Net asset value, beginning of period | $ 10.98 | $ 11.67 | $ 10.17 | $ 10.79 | $ 11.59 |
| Increase (decrease) from investment operations: | | | | | |
| Net investment income (loss) (a) | $ 0.73 | $ 0.63 | $ 0.65 | $ 0.62 | $ 0.62 |
| Net realized and unrealized gain (loss) on investments | 0.24 | (0.67) | 1.41 | (0.60) | (0.80) |
| Net increase (decrease) from investment operations | $ 0.97 | $ (0.04) | $ 2.06 | $ 0.02 | $ (0.18) |
| Distributions to shareowners: | | | | | |
| Net investment income | $ (0.63) | $ (0.65) | $ (0.56) | $ (0.64) | $ (0.62) |
| Total distributions | $ (0.63) | $ (0.65) | $ (0.56) | $ (0.64) | $ (0.62) |
| Net increase (decrease) in net asset value | $ 0.34 | $ (0.69) | $ 1.50 | $ (0.62) | $ (0.80) |
| Net asset value, end of period | $ 11.32 | $ 10.98 | $ 11.67 | $ 10.17 | $ 10.79 |
| Total return (b) | 9.19% | (0.43)% | 20.66% | 0.28% | (1.56)% |
| Ratio of net expenses to average net assets | 0.85% | 0.85% | 0.85% | 0.85% | 0.85% |
| Ratio of net investment income (loss) to average net assets | 6.62% | 5.51% | 5.82% | 6.01% | 5.58% |
| Portfolio turnover rate | 74% | 73% | 106% | 126% | 108% |
| Net assets, end of period (in thousands) | $492,295 | $403,985 | $356,626 | $310,126 | $377,722 |
| Ratios with no waiver of fees and assumption of expenses by the Adviser and no reduction for fees paid indirectly: | | | | | |
| Total expenses to average net assets | 0.86% | 0.85% | 0.88% | 0.89% | 0.89% |
| Net investment income (loss) to average net assets | 6.61% | 5.51% | 5.79% | 5.97% | 5.54% |
| (a) | The per-share data presented above is based on the average shares outstanding for the period presented. |
| (b) | Assumes initial investment at net asset value at the beginning of each period, reinvestment of all distributions, the complete redemption of the investment at net asset value at the end of each period and no sales charges. Total return would be reduced if sales charges were taken into account. |
The accompanying notes are an integral part of these financial statements.
62Pioneer Multi-Asset Income Fund | Annual Report | 7/31/23
| | Year
Ended
7/31/23 | Year
Ended
7/31/22 | Year
Ended
7/31/21 | Year
Ended
7/31/20 | Year
Ended
7/31/19 |
| Class C | | | | | |
| Net asset value, beginning of period | $ 10.94 | $ 11.63 | $ 10.13 | $ 10.76 | $ 11.56 |
| Increase (decrease) from investment operations: | | | | | |
| Net investment income (loss) (a) | $ 0.64 | $ 0.54 | $ 0.56 | $ 0.54 | $ 0.53 |
| Net realized and unrealized gain (loss) on investments | 0.25 | (0.67) | 1.41 | (0.61) | (0.80) |
| Net increase (decrease) from investment operations | $ 0.89 | $ (0.13) | $ 1.97 | $ (0.07) | $ (0.27) |
| Distributions to shareowners: | | | | | |
| Net investment income | $ (0.55) | $ (0.56) | $ (0.47) | $ (0.56) | $ (0.53) |
| Total distributions | $ (0.55) | $ (0.56) | $ (0.47) | $ (0.56) | $ (0.53) |
| Net increase (decrease) in net asset value | $ 0.34 | $ (0.69) | $ 1.50 | $ (0.63) | $ (0.80) |
| Net asset value, end of period | $ 11.28 | $ 10.94 | $ 11.63 | $ 10.13 | $ 10.76 |
| Total return (b) | 8.38% | (1.20)% | 19.78% | (0.62)% | (2.33)% |
| Ratio of net expenses to average net assets | 1.62% | 1.61% | 1.64% | 1.65% | 1.64% |
| Ratio of net investment income (loss) to average net assets | 5.85% | 4.72% | 5.04% | 5.20% | 4.78% |
| Portfolio turnover rate | 74% | 73% | 106% | 126% | 108% |
| Net assets, end of period (in thousands) | $268,091 | $252,795 | $296,575 | $312,559 | $422,863 |
| Ratios with no waiver of fees and assumption of expenses by the Adviser and no reduction for fees paid indirectly: | | | | | |
| Total expenses to average net assets | 1.62% | 1.61% | 1.64% | 1.66% | 1.65% |
| Net investment income (loss) to average net assets | 5.85% | 4.72% | 5.04% | 5.19% | 4.77% |
| (a) | The per-share data presented above is based on the average shares outstanding for the period presented. |
| (b) | Assumes initial investment at net asset value at the beginning of each period, reinvestment of all distributions, the complete redemption of the investment at net asset value at the end of each period and no sales charges. Total return would be reduced if sales charges were taken into account. |
The accompanying notes are an integral part of these financial statements.
Pioneer Multi-Asset Income Fund | Annual Report | 7/31/2363
Financial Highlights (continued)
| | Year
Ended
7/31/23 | Year
Ended
7/31/22 | Year
Ended
7/31/21 | Year
Ended
7/31/20 | Year
Ended
7/31/19 |
| Class K | | | | | |
| Net asset value, beginning of period | $ 11.28 | $ 12.02 | $ 10.47 | $ 11.12 | $ 11.95 |
| Increase (decrease) from investment operations: | | | | | |
| Net investment income (loss) (a) | $ 0.78 | $ 0.69 | $ 0.70 | $ 0.67 | $ 0.67 |
| Net realized and unrealized gain (loss) on investments | 0.26 | (0.73) | 1.46 | (0.63) | (0.83) |
| Net increase (decrease) from investment operations | $ 1.04 | $ (0.04) | $ 2.16 | $ 0.04 | $ (0.16) |
| Distributions to shareowners: | | | | | |
| Net investment income | $ (0.68) | $ (0.70) | $ (0.61) | $ (0.69) | $ (0.67) |
| Total distributions | $ (0.68) | $ (0.70) | $ (0.61) | $ (0.69) | $ (0.67) |
| Net increase (decrease) in net asset value | $ 0.36 | $ (0.74) | $ 1.55 | $ (0.65) | $ (0.83) |
| Net asset value, end of period | $ 11.64 | $ 11.28 | $ 12.02 | $ 10.47 | $ 11.12 |
| Total return (b) | 9.58% | (0.42)% | 21.05% | 0.44% | (1.32)% |
| Ratio of net expenses to average net assets | 0.56% | 0.55% | 0.57% | 0.58% | 0.56% |
| Ratio of net investment income (loss) to average net assets | 6.92% | 5.79% | 6.07% | 6.30% | 5.87% |
| Portfolio turnover rate | 74% | 73% | 106% | 126% | 108% |
| Net assets, end of period (in thousands) | $119,558 | $118,667 | $139,556 | $121,281 | $125,831 |
| Ratios with no waiver of fees and assumption of expenses by the Adviser and no reduction for fees paid indirectly: | | | | | |
| Total expenses to average net assets | 0.56% | 0.55% | 0.57% | 0.58% | 0.57% |
| Net investment income (loss) to average net assets | 6.92% | 5.79% | 6.07% | 6.30% | 5.86% |
| (a) | The per-share data presented above is based on the average shares outstanding for the period presented. |
| (b) | Assumes initial investment at net asset value at the beginning of each period, reinvestment of all distributions and the complete redemption of the investment at net asset value at the end of each period. |
The accompanying notes are an integral part of these financial statements.
64Pioneer Multi-Asset Income Fund | Annual Report | 7/31/23
| | Year
Ended
7/31/23 | Year
Ended
7/31/22 | Year
Ended
7/31/21 | Year
Ended
7/31/20 | Year
Ended
7/31/19 |
| Class R | | | | | |
| Net asset value, beginning of period | $10.98 | $11.64 | $10.19 | $10.83 | $11.64 |
| Increase (decrease) from investment operations: | | | | | |
| Net investment income (loss) (a) | $ 0.69 | $ 0.59 | $ 0.53 | $ 0.53 | $ 0.55 |
| Net realized and unrealized gain (loss) on investments | 0.25 | (0.66) | 1.40 | (0.60) | (0.81) |
| Net increase (decrease) from investment operations | $ 0.94 | $ (0.07) | $ 1.93 | $ (0.07) | $ (0.26) |
| Distributions to shareowners: | | | | | |
| Net investment income | $ (0.60) | $ (0.59) | $ (0.48) | $ (0.57) | $ (0.55) |
| Total distributions | $ (0.60) | $ (0.59) | $ (0.48) | $ (0.57) | $ (0.55) |
| Net increase (decrease) in net asset value | $ 0.34 | $ (0.66) | $ 1.45 | $ (0.64) | $ (0.81) |
| Net asset value, end of period | $11.32 | $10.98 | $11.64 | $10.19 | $10.83 |
| Total return (b) | 8.84% | (0.71)% | 19.27% | 0.57% | (2.22)% |
| Ratio of net expenses to average net assets | 1.20% | 1.18% | 1.80% | 1.63% | 1.57% |
| Ratio of net investment income (loss) to average net assets | 6.26% | 5.18% | 4.82% | 5.13% | 4.92% |
| Portfolio turnover rate | 74% | 73% | 106% | 126% | 108% |
| Net assets, end of period (in thousands) | $1,140 | $ 791 | $ 643 | $1,470 | $ 835 |
| Ratios with no waiver of fees and assumption of expenses by the Adviser and no reduction for fees paid indirectly: | | | | | |
| Total expenses to average net assets | 1.20% | 1.18% | 1.80% | 1.63% | 1.59% |
| Net investment income (loss) to average net assets | 6.26% | 5.18% | 4.82% | 5.13% | 4.90% |
| (a) | The per-share data presented above is based on the average shares outstanding for the period presented. |
| (b) | Assumes initial investment at net asset value at the beginning of each period, reinvestment of all distributions and the complete redemption of the investment at net asset value at the end of each period. |
The accompanying notes are an integral part of these financial statements.
Pioneer Multi-Asset Income Fund | Annual Report | 7/31/2365
Financial Highlights (continued)
| | Year
Ended
7/31/23 | Year
Ended
7/31/22 | Year
Ended
7/31/21 | Year
Ended
7/31/20 | Year
Ended
7/31/19 |
| Class Y | | | | | |
| Net asset value, beginning of period | $ 10.94 | $ 11.63 | $ 10.13 | $ 10.77 | $ 11.57 |
| Increase (decrease) from investment operations: | | | | | |
| Net investment income (loss) (a) | $ 0.75 | $ 0.65 | $ 0.67 | $ 0.64 | $ 0.64 |
| Net realized and unrealized gain (loss) on investments | 0.24 | (0.67) | 1.41 | (0.62) | (0.80) |
| Net increase (decrease) from investment operations | $ 0.99 | $ (0.02) | $ 2.08 | $ 0.02 | $ (0.16) |
| Distributions to shareowners: | | | | | |
| Net investment income | $ (0.65) | $ (0.67) | $ (0.58) | $ (0.66) | $ (0.64) |
| Total distributions | $ (0.65) | $ (0.67) | $ (0.58) | $ (0.66) | $ (0.64) |
| Net increase (decrease) in net asset value | $ 0.34 | $ (0.69) | $ 1.50 | $ (0.64) | $ (0.80) |
| Net asset value, end of period | $ 11.28 | $ 10.94 | $ 11.63 | $ 10.13 | $ 10.77 |
| Total return (b) | 9.42% | (0.24)% | 20.97% | 0.27% | (1.36)% |
| Ratio of net expenses to average net assets | 0.65% | 0.65% | 0.65% | 0.65% | 0.65% |
| Ratio of net investment income (loss) to average net assets | 6.80% | 5.71% | 6.01% | 6.20% | 5.83% |
| Portfolio turnover rate | 74% | 73% | 106% | 126% | 108% |
| Net assets, end of period (in thousands) | $1,679,726 | $982,169 | $779,755 | $586,958 | $840,851 |
| Ratios with no waiver of fees and assumption of expenses by the Adviser and no reduction for fees paid indirectly: | | | | | |
| Total expenses to average net assets | 0.66% | 0.66% | 0.67% | 0.68% | 0.68% |
| Net investment income (loss) to average net assets | 6.79% | 5.70% | 5.99% | 6.17% | 5.80% |
| (a) | The per-share data presented above is based on the average shares outstanding for the period presented. |
| (b) | Assumes initial investment at net asset value at the beginning of each period, reinvestment of all distributions and the complete redemption of the investment at net asset value at the end of each period. |
The accompanying notes are an integral part of these financial statements.
66Pioneer Multi-Asset Income Fund | Annual Report | 7/31/23
Notes to Financial Statements | 7/31/23
1. Organization and Significant Accounting Policies
Pioneer Multi-Asset Income Fund (the “Fund”) is one of four portfolios comprising Pioneer Series Trust IV (the "Trust"), a Delaware statutory trust. The Fund is registered under the Investment Company Act of 1940, as amended (the "1940 Act"), as a diversified, open-end management investment company. The investment objective of the Fund is to seek a high level of current income to the extent consistent with a relatively high level of stability of principal.
The Fund offers five classes of shares designated as Class A, Class C, Class K, Class R and Class Y shares. Each class of shares represents an interest in the same portfolio of investments of the Fund and has identical rights (based on relative net asset values) to assets and liquidation proceeds. Share classes can bear different rates of class-specific fees and expenses, such as transfer agent and distribution fees. Differences in class-specific fees and expenses will result in differences in net investment income and, therefore, the payment of different dividends from net investment income earned by each class. The Amended and Restated Declaration of Trust of the Trust gives the Board of Trustees the flexibility to specify either per-share voting or dollar-weighted voting when submitting matters for shareowner approval. Under per-share voting, each share of a class of the Fund is entitled to one vote. Under dollar-weighted voting, a shareowner’s voting power is determined not by the number of shares owned, but by the dollar value of the shares on the record date. Each share class has exclusive voting rights with respect to matters affecting only that class, including with respect to the distribution plan for that class. There is no distribution plan for Class K or Class Y shares.
Amundi Asset Management US, Inc., an indirect, wholly owned subsidiary of Amundi and Amundi’s wholly owned subsidiary, Amundi USA, Inc., serves as the Fund’s investment adviser (the “Adviser”). Amundi Distributor US, Inc., an affiliate of the Adviser, serves as the Fund’s distributor (the “Distributor”).
In March 2020, FASB issued an Accounting Standard Update, ASU 2020-04, Reference Rate Reform (Topic 848) — Facilitation of the Effects of Reference Rate Reform on Financial Reporting (“ASU 2020-04”), which provides optional, temporary relief with respect to the financial reporting of contracts subject to certain types of modifications due to the planned discontinuation of the London Interbank Offered Rate (“LIBOR”) and other LIBOR-based reference rates at the end of 2021. The temporary relief provided by ASU 2020-04 is effective for certain reference rate-related
Pioneer Multi-Asset Income Fund | Annual Report | 7/31/2367
contract modifications that occur during the period from March 12, 2020 through December 31, 2023. Management is evaluating the impact of ASU 2020-04 on the Fund's investments, derivatives, debt and other contracts, if applicable, that will undergo reference rate-related modifications as a result of the reference rate reform.
The Fund is required to comply with Rule 18f-4 under the 1940 Act, which governs the use of derivatives by registered investment companies. Rule 18f-4 permits funds to enter into derivatives transactions (as defined in Rule 18f-4) and certain other transactions notwithstanding the restrictions on the issuance of “senior securities” under Section 18 of the 1940 Act. In accordance with Rule 18f-4, the Fund has established and maintains a comprehensive derivatives risk management program, has appointed a derivatives risk manager and complies with a relative or absolute limit on fund leverage risk calculated based on value-at-risk ("VaR").
The Fund is an investment company and follows investment company accounting and reporting guidance under U.S. Generally Accepted Accounting Principles (“U.S. GAAP”). U.S. GAAP requires the management of the Fund to make estimates and assumptions that affect the reported amounts of assets and liabilities, the disclosure of contingent assets and liabilities at the date of the financial statements, and the reported amounts of income, expenses and gain or loss on investments during the reporting period. Actual results could differ from those estimates.
The following is a summary of significant accounting policies followed by the Fund in the preparation of its financial statements:
| A. | Security Valuation |
| | The net asset value of the Fund is computed once daily, on each day the New York Stock Exchange (“NYSE”) is open, as of the close of regular trading on the NYSE. |
| | Equity securities that have traded on an exchange are valued by using the last sale price on the principal exchange where they are traded. Equity securities that have not traded on the date of valuation, or securities for which sale prices are not available, generally are valued using the mean between the last bid and asked prices or, if both last bid and asked prices are not available, at the last quoted bid price. Last sale and bid and asked prices are provided by independent third party pricing services. In the case of equity securities not traded on an exchange, prices are typically determined by independent third party pricing services using a variety of techniques and methods. |
68Pioneer Multi-Asset Income Fund | Annual Report | 7/31/23
| | The value of foreign securities is translated into U.S. dollars based on foreign currency exchange rate quotations supplied by a third party pricing source. Trading in non-U.S. equity securities is substantially completed each day at various times prior to the close of the NYSE. The values of such securities used in computing the net asset value of the Fund's shares are determined as of such times. The Adviser may use a fair value model developed by an independent pricing service to value non-U.S. equity securities. |
| | Equity-linked notes and fixed-income securities are valued by using prices supplied by independent pricing services, which consider such factors as market prices, market events, quotations from one or more brokers, Treasury spreads, yields, maturities and ratings, or may use a pricing matrix or other fair value methods or techniques to provide an estimated value of the security or instrument. A pricing matrix is a means of valuing a debt security on the basis of current market prices for other debt securities, historical trading patterns in the market for fixed-income securities and/or other factors. Non-U.S. debt securities that are listed on an exchange will be valued at the bid price obtained from an independent third party pricing service. When independent third party pricing services are unable to supply prices, or when prices or market quotations are considered to be unreliable, the value of that security may be determined using quotations from one or more broker-dealers. |
| | Loan interests are valued at the mean between the last available bid and asked prices from one or more brokers or dealers as obtained from Loan Pricing Corporation, an independent third party pricing service. If price information is not available from Loan Pricing Corporation, or if the price information is deemed to be unreliable, price information will be obtained from an alternative loan interest pricing service. If no reliable price quotes are available from either the primary or alternative pricing service, broker quotes will be solicited. |
| | Event-linked bonds are valued at the bid price obtained from an independent third party pricing service. Other insurance-linked securities (including reinsurance sidecars, collateralized reinsurance and industry loss warranties) may be valued at the bid price obtained from an independent pricing service, or through a third party using a pricing matrix, insurance valuation models, or other fair value methods or techniques to provide an estimated value of the instrument. |
| | Options contracts are generally valued at the mean between the last bid and ask prices on the principal exchange where they are traded. Over-the-counter (“OTC”) options and options on swaps (“swaptions”) are |
Pioneer Multi-Asset Income Fund | Annual Report | 7/31/2369
| | valued using prices supplied by independent pricing services, which consider suchfactors as market prices, market events, quotations from one or more brokers, Treasury spreads, yields, maturities and ratings, or may use a pricing matrix or other fair value methods or techniques to provide an estimated value of the security or instrument. |
| | Forward foreign currency exchange contracts are valued daily using the foreign exchange rate or, for longer term forward contract positions, the spot currency rate and the forward points on a daily basis, in each case provided by a third party pricing service. Contracts whose forward settlement date falls between two quoted days are valued by interpolation. |
| | Futures contracts are generally valued at the closing settlement price established by the exchange on which they are traded. |
| | Shares of open-end registered investment companies (including money market mutual funds) are valued at such funds’ net asset value. Shares of exchange-listed closed-end funds are valued by using the last sale price on the principal exchange where they are traded. |
| | Repurchase agreements are valued at par. Cash may include overnight time deposits at approved financial institutions. |
| | Securities or loan interests for which independent pricing services or broker-dealers are unable to supply prices or for which market prices and/or quotations are not readily available or are considered to be unreliable are valued by a fair valuation team comprised of certain personnel of the Adviser. The Adviser is designated as the valuation designee for the Fund pursuant to Rule 2a-5 under the 1940 Act. The Adviser’s fair valuation team is responsible for monitoring developments that may impact fair valued securities. |
| | Inputs used when applying fair value methods to value a security may include credit ratings, the financial condition of the company, current market conditions and comparable securities. The Adviser may use fair value methods if it is determined that a significant event has occurred after the close of the exchange or market on which the security trades and prior to the determination of the Fund's net asset value. Examples of a significant event might include political or economic news, corporate restructurings, natural disasters, terrorist activity or trading halts. Thus, the valuation of the Fund's securities may differ significantly from exchange prices, and such differences could be material. |
70Pioneer Multi-Asset Income Fund | Annual Report | 7/31/23
| B. | Investment Income and Transactions |
| | Dividend income is recorded on the ex-dividend date, except that certain dividends from foreign securities where the ex-dividend date may have passed are recorded as soon as the Fund becomes aware of the ex-dividend data in the exercise of reasonable diligence. |
| | Interest income, including interest on income-bearing cash accounts, is recorded on the accrual basis. Dividend and interest income are reported net of unrecoverable foreign taxes withheld at the applicable country rates and net of income accrued on defaulted securities. |
| | Interest and dividend income payable by delivery of additional shares is reclassified as PIK (payment-in-kind) income upon receipt and is included in interest and dividend income, respectively. |
| | Principal amounts of mortgage-backed securities are adjusted for monthly paydowns. Premiums and discounts related to certain mortgage-backed securities are amortized or accreted in proportion to the monthly paydowns. All discounts/premiums on purchase prices of debt securities are accreted/amortized for financial reporting purposes over the life of the respective securities, and such accretion/amortization is included in interest income. |
| | Security transactions are recorded as of trade date. Gains and losses on sales of investments are calculated on the identified cost method for both financial reporting and federal income tax purposes. |
| C. | Foreign Currency Translation |
| | The books and records of the Fund are maintained in U.S. dollars. Amounts denominated in foreign currencies are translated into U.S. dollars using current exchange rates. |
| | Net realized gains and losses on foreign currency transactions, if any, represent, among other things, the net realized gains and losses on foreign currency exchange contracts, disposition of foreign currencies and the difference between the amount of income accrued and the U.S. dollars actually received. Further, the effects of changes in foreign currency exchange rates on investments are not segregated on the Statement of Operations from the effects of changes in the market prices of those securities, but are included with the net realized and unrealized gain or loss on investments. |
Pioneer Multi-Asset Income Fund | Annual Report | 7/31/2371
| D. | Federal Income Taxes |
| | It is the Fund's policy to comply with the requirements of the Internal Revenue Code applicable to regulated investment companies and to distribute all of its net taxable income and net realized capital gains, if any, to its shareowners. Therefore, no provision for federal income taxes is required. As of July 31, 2023, the Fund did not accrue any interest or penalties with respect to uncertain tax positions, which, if applicable, would be recorded as an income tax expense on the Statement of Operations. Tax returns filed within the prior three years remain subject to examination by federal and state tax authorities. |
| | In determining the daily net asset value, the Fund estimates the reserve for the repatriation of taxes, if any, associated with its investments in certain countries. The estimated reserve for capital gains is based on the net unrealized appreciation on certain portfolio securities, the holding period of such securities and the related tax rates, tax loss carryforwards (if applicable) and other such factors. As of July 31, 2023, the Fund has not accrued any reserve for repatriation taxes related to capital gains. |
| | A portion of the dividend income recorded by the Fund is from distributions by publicly traded real estate investment trusts (“REITs”), and such distributions for tax purposes may also consist of capital gains and return of capital. The actual return of capital and capital gains portions of such distributions will be determined by formal notifications from the REITs subsequent to the calendar year-end. Distributions received from the REITs that are determined to be a return of capital are recorded by the Fund as a reduction of the cost basis of the securities held and those determined to be capital gain are reflected as such on the Statement of Operations. |
| | The amount and character of income and capital gain distributions to shareowners are determined in accordance with federal income tax rules, which may differ from U.S. GAAP. Distributions in excess of net investment income or net realized gains are temporary over distributions for financial statement purposes resulting from differences in the recognition or classification of income or distributions for financial statement and tax purposes. Capital accounts within the financial statements are adjusted for permanent book/tax differences to reflect tax character, but are not adjusted for temporary differences. |
| | At July 31, 2023, the Fund reclassified $3,687 to increase distributable earnings and $3,687 to decrease paid-in capital to reflect permanent book/tax differences. These adjustments have no impact on net assets or the results of operations. |
72Pioneer Multi-Asset Income Fund | Annual Report | 7/31/23
| | At July 31, 2023, the Fund was permitted to carry forward indefinitely $126,592,797 of short-term losses and $153,670,087 of long-term losses. |
| | The tax character of distributions paid during the years ended July 31, 2023 and July 31, 2022, was as follows: |
| | 2023 | 2022 |
| Distributions paid from: | | |
| Ordinary income | $127,637,007 | $94,261,782 |
| Total | $ 127,637,007 | $94,261,782 |
The following shows the components of distributable earnings (losses) on a federal income tax basis at July 31, 2023:
| | 2023 |
| Distributable earnings/(losses): | |
| Undistributed ordinary income | $ 24,235,809 |
| Capital loss carryforward | (280,262,884) |
| Other book/tax temporary differences | 13,009,808 |
| Net unrealized appreciation | 111,701,394 |
| Total | $(131,315,873) |
The difference between book-basis and tax-basis net unrealized appreciation is attributable to the tax deferral of losses on wash sales, realization for tax purposes of unrealized gains on investments in passive foreign investment companies and the book/tax differences in the adjustments relating to insurance-linked securities, the tax treatment of premium and amortization, accrual of income on securities in default, the mark to market of futures contracts, and tax basis adjustments on partnership holdings.
| E. | Fund Shares |
| | The Fund records sales and repurchases of its shares as of trade date. The Distributor earned $199,252 in underwriting commissions on the sale of Class A shares during the year ended July 31, 2023. |
| F. | Class Allocations |
| | Income, common expenses and realized and unrealized gains and losses are calculated at the Fund level and allocated daily to each class of shares based on its respective percentage of adjusted net assets at the beginning of the day. |
| | Distribution fees are calculated based on the average daily net asset value attributable to Class A, Class C and Class R shares of the Fund, respectively (see Note 5). Class K and Class Y shares do not pay distribution fees. All expenses and fees paid to the Fund's transfer agent |
Pioneer Multi-Asset Income Fund | Annual Report | 7/31/2373
| | for its services are allocated among the classes of shares based on the number of accounts in each class and the ratable allocation of related out-of-pocket expenses (see Note 4). |
| | The Fund declares as daily dividends substantially all of its net investment income. All dividends are paid on a monthly basis. Short-term capital gain distributions, if any, may be declared with the daily dividends. |
| | Distributions to shareowners are recorded as of the ex-dividend date. Distributions paid by the Fund with respect to each class of shares are calculated in the same manner and at the same time, except that net investment income dividends to Class A, Class C, Class K, Class R and Class Y shares can reflect different transfer agent and distribution expense rates. |
| G. | Risks |
| | The value of securities held by the Fund may go up or down, sometimes rapidly or unpredictably, due to general market conditions, such as real or perceived adverse economic, political or regulatory conditions, recessions, the spread of infectious illness or other public health issues, inflation, changes in interest rates, armed conflict including Russia's military invasion of Ukraine, sanctions against Russia, other nations or individuals or companies and possible countermeasures, lack of liquidity in the bond markets or adverse investor sentiment. In the past several years, financial markets have experienced increased volatility, depressed valuations, decreased liquidity and heightened uncertainty. These conditions may continue, recur, worsen or spread. Inflation and interest rates have increased and may rise further. These circumstances could adversely affect the value and liquidity of the Fund's investments and negatively impact the Fund's performance. |
| | The long-term impact of the COVID-19 pandemic and its subsequent variants on economies, markets, industries and individual issuers, are not known. Some sectors of the economy and individual issuers have experienced or may experience particularly large losses. Periods of extreme volatility in the financial markets, reduced liquidity of many instruments, increased government debt, inflation, and disruptions to supply chains, consumer demand and employee availability, may continue for some time. Following Russia's invasion of Ukraine, Russian securities lost all, or nearly all, their market value. Other securities or markets could be similarly affected by past or future political, geopolitical or other events or conditions. |
74Pioneer Multi-Asset Income Fund | Annual Report | 7/31/23
| | Governments and central banks, including the U.S. Federal Reserve, have taken extraordinary and unprecedented actions to support local and global economies and the financial markets. These actions have resulted in significant expansion of public debt, including in the U.S. The consequences of high public debt, including its future impact on the economy and securities markets, may not be known for some time. |
| | The U.S. and other countries are periodically involved in disputes over trade and other matters, which may result in tariffs, investment restrictions and adverse impacts on affected companies and securities. For example, the U.S. has imposed tariffs and other trade barriers on Chinese exports, has restricted sales of certain categories of goods to China, and has established barriers to investments in China. Trade disputes may adversely affect the economies of the U.S. and its trading partners, as well as companies directly or indirectly affected and financial markets generally. If the political climate between the U.S. and China does not improve or continues to deteriorate, if China were to attempt unification of Taiwan by force, or if other geopolitical conflicts develop or get worse, economies, markets and individual securities may be severely affected both regionally and globally, and the value of the Fund's assets may go down. |
| | At times, the Fund’s investments may represent industries or industry sectors that are interrelated or have common risks, making the Fund more susceptible to any economic, political, or regulatory developments or other risks affecting those industries and sectors. |
| | The Fund’s investments in foreign markets and countries with limited developing markets may subject the Fund to a greater degree of risk than investments in a developed market. These risks include disruptive political or economic conditions, military conflicts and sanctions, terrorism, sustained economic downturns, financial instability, less liquid trading markets, extreme price volatility, currency risks, reduction of government or central bank support, inadequate accounting standards, tariffs, tax disputes or other tax burdens, nationalization or expropriation of assets and the imposition of adverse governmental laws, arbitrary application of laws and regulations or lack of rule of law and investment and repatriation restrictions. Lack of information and less market regulation also may affect the value of these securities. Withholding and other non-U.S. taxes may decrease the Fund’s return. Non-U.S. issuers may be located in parts of the world that have historically been prone to natural disasters. Investing in depositary receipts is subject to many of the same risks as investing directly in non-U.S. issuers. Depositary receipts may involve higher expenses and may trade at a discount (or premium) to the underlying security. |
Pioneer Multi-Asset Income Fund | Annual Report | 7/31/2375
| | Russia launched a large-scale invasion of Ukraine on February 24, 2022. In response to the military action by Russia, various countries, including the U.S., the United Kingdom, and European Union issued broad-ranging economic sanctions against Russia and Belarus and certain companies and individuals. Since then, Russian securities have lost all, or nearly all, their market value, and many other issuers, securities and markets have been adversely affected. The United States and other countries may impose sanctions on other countries, companies and individuals in light of Russia’s military invasion. The extent and duration of the military action or future escalation of such hostilities, the extent and impact of existing and future sanctions, market disruptions and volatility, and the result of any diplomatic negotiations cannot be predicted. These and any related events could have a significant impact on the value and liquidity of certain Fund investments, on Fund performance and the value of an investment in the Fund, particularly with respect to securities and commodities, such as oil, natural gas and food commodities, as well as other sectors with exposure to Russian issuers or issuers in other countries affected by the invasion, and are likely to have collateral impacts on market sectors globally. |
| | The Fund has the flexibility to invest in a broad range of income-producing investments, including both debt securities and equity securities. The Fund may invest in the securities of issuers located throughout the world, including in emerging markets. |
| | The Fund invests at least 80% of it's total asset in below-investment-grade (high-yield) debt securities. Some of these high-yield securities may be convertible into equity securities of the issuer. Debt securities rated below-investment-grade are commonly referred to as “junk bonds” and are considered speculative with respect to the issuer’s capacity to pay interest and repay principal. These securities involve greater risk of loss, are subject to greater price volatility, and may be less liquid and more difficult to value, especially during periods of economic uncertainty or change, than higher rated debt securities. |
| | The Fund's investments, payment obligations and financing terms may be based on floating rates, such as LIBOR (London Interbank Offered Rate) or SOFR (Secured Overnight Financing Rate). ICE Benchmark Administration, the administrator of LIBOR, has ceased publication of most LIBOR settings on a representative basis. Actions by regulators have resulted in the establishment of alternative reference rates to LIBOR in most major currencies. In the U.S., a common benchmark replacement is based on the SOFR published by the Federal Reserve Bank of New York, including certain spread adjustments and benchmark replacement conforming changes, although other benchmark |
76Pioneer Multi-Asset Income Fund | Annual Report | 7/31/23
| | replacements (without or without spread adjustments) may be used in certain transactions. The impact of the transition from LIBOR on the Fund's transactions and financial markets generally cannot yet be determined. The transition away from LIBOR may lead to increased volatility and illiquidity in markets for instruments that have relied on LIBOR and may adversely affect the Fund's performance. |
| | The Fund may invest in equity-linked notes (ELNs). ELNs may not perform as expected and could cause the fund to realize significant losses including its entire principal investment. Investments in ELNs often have risks similar to their underlying securities, which may include market risk and, as applicable, risks of non-U.S. investments and currency risks. In addition, since ELNs are in note form, ELNs are also subject to certain risks of fixed income securities, such as interest rate and credit risks. Investments in ELNs are also subject to liquidity risk, which may make ELNs difficult to sell and value. In addition, ELNs may exhibit price behavior that does not correlate with the underlying securities or a fixed income investment. |
| | The Fund may invest in REIT securities, the value of which can fall for a variety of reasons, such as declines in rental income, fluctuating interest rates, poor property management, environmental liabilities, uninsured damage, increased competition, or changes in real estate tax laws. |
| | With the increased use of technologies such as the Internet to conduct business, the Fund is susceptible to operational, information security and related risks. While the Fund’s Adviser has established business continuity plans in the event of, and risk management systems to prevent, limit or mitigate, such cyber-attacks, there are inherent limitations in such plans and systems, including the possibility that certain risks have not been identified. Furthermore, the Fund cannot control the cybersecurity plans and systems put in place by service providers to the Fund such as the Fund’s custodian and accounting agent, and the Fund’s transfer agent. In addition, many beneficial owners of Fund shares hold them through accounts at broker-dealers, retirement platforms and other financial market participants over which neither the Fund nor the Adviser exercises control. Each of these may in turn rely on service providers to them, which are also subject to the risk of cyber-attacks. Cybersecurity failures or breaches at the Adviser or the Fund’s service providers or intermediaries have the ability to cause disruptions and impact business operations, potentially resulting in financial losses, interference with the Fund’s ability to calculate its net asset value, impediments to trading, the inability of Fund shareowners to effect share purchases, redemptions or exchanges or receive distributions, loss of or unauthorized access to private |
Pioneer Multi-Asset Income Fund | Annual Report | 7/31/2377
| | shareowner information and violations of applicable privacy and other laws, regulatory fines, penalties, reputational damage, or additional compliance costs. Such costs and losses may not be covered under any insurance. In addition, maintaining vigilance against cyber-attacks may involve substantial costs over time, and system enhancements may themselves be subject to cyber-attacks. |
| | The Fund’s prospectus contains unaudited information regarding the Fund’s principal risks. Please refer to that document when considering the Fund’s principal risks. |
| H. | Restricted Securities |
| | Restricted Securities are subject to legal or contractual restrictions on resale. Restricted securities generally are resold in transactions exempt from registration under the Securities Act of 1933. Private placement securities are generally considered to be restricted except for those securities traded between qualified institutional investors under the provisions of Rule 144A of the Securities Act of 1933. |
| | Disposal of restricted investments may involve negotiations and expenses, and prompt sale at an acceptable price may be difficult to achieve. Restricted investments held by the Fund at July 31, 2023 are listed in the Schedule of Investments. |
| I. | Insurance-Linked Securities (“ILS”) |
| | The Fund invests in ILS. The Fund could lose a portion or all of the principal it has invested in an ILS, and the right to additional interest or dividend payments with respect to the security, upon the occurrence of one or more trigger events, as defined within the terms of an insurance-linked security. Trigger events, generally, are hurricanes, earthquakes, or other natural events of a specific size or magnitude that occur in a designated geographic region during a specified time period, and/or that involve losses or other metrics that exceed a specific amount. There is no way to accurately predict whether a trigger event will occur, and accordingly, ILS carry significant risk. The Fund is entitled to receive principal, and interest and/or dividend payments so long as no trigger event occurs of the description and magnitude specified by the instrument. In addition to the specified trigger events, ILS may expose the Fund to other risks, including but not limited to issuer (credit) default, adverse regulatory or jurisdictional interpretations and adverse tax consequences. |
| | The Fund’s investments in ILS may include event-linked bonds. ILS also may include special purpose vehicles (“SPVs”) or similar instruments |
78Pioneer Multi-Asset Income Fund | Annual Report | 7/31/23
| | structured to comprise a portion of a reinsurer’s catastrophe-oriented business, known as quota share instruments (sometimes referred to as reinsurance sidecars), or to provide reinsurance relating to specific risks to insurance or reinsurance companies through a collateralized instrument, known as collateralized reinsurance. Structured reinsurance investments also may include industry loss warranties (“ILWs”). A traditional ILW takes the form of a bilateral reinsurance contract, but there are also products that take the form of derivatives, collateralized structures, or exchange-traded instruments. |
| | Where the ILS are based on the performance of underlying reinsurance contracts, the Fund has limited transparency into the individual underlying contracts, and therefore must rely upon the risk assessment and sound underwriting practices of the issuer. Accordingly, it may be more difficult for the Adviser to fully evaluate the underlying risk profile of the Fund's structured reinsurance investments, and therefore the Fund's assets are placed at greater risk of loss than if the Adviser had more complete information. Structured reinsurance instruments generally will be considered illiquid securities by the Fund. These securities may be difficult to purchase, sell or unwind. Illiquid securities also may be difficult to value. If the Fund is forced to sell an illiquid asset, the Fund may be forced to sell at a loss. |
| J. | Repurchase Agreements |
| | Repurchase agreements are arrangements under which the Fund purchases securities from a broker-dealer or a bank, called the counterparty, upon the agreement of the counterparty to repurchase the securities from the Fund at a later date, and at a specific price, which is typically higher than the purchase price paid by the Fund. The securities purchased serve as the Fund’s collateral for the obligation of the counterparty to repurchase the securities. The value of the collateral, including accrued interest, is required to be equal to or in excess of the repurchase price. The collateral for all repurchase agreements is held in safekeeping in the customer-only account of the Fund’s custodian or a sub-custodian of the Fund. The Adviser is responsible for determining that the value of the collateral remains at least equal to the repurchase price. In the event of a default by the counterparty, the Fund is entitled to sell the securities, but the Fund may not be able to sell them for the price at which they were purchased, thus causing a loss to the Fund. Additionally, if the counterparty becomes insolvent, there is some risk that the Fund will not have a right to the securities, or the immediate right to sell the securities. |
Pioneer Multi-Asset Income Fund | Annual Report | 7/31/2379
| | For the year ended July 31, 2023, the Fund had no open repurchase agreements. |
| K. | Purchased Options |
| | The Fund may purchase put and call options to seek to increase total return. Purchased call and put options entitle the Fund to buy and sell a specified number of shares or units of a particular security, currency or index at a specified price at a specific date or within a specific period of time. Upon the purchase of a call or put option, the premium paid by the Fund is included on the Statement of Assets and Liabilities as an investment. All premiums are marked-to-market daily, and any unrealized appreciation or depreciation is recorded on the Fund’s Statement of Operations. As the purchaser of an index option, the Fund has the right to receive a cash payment equal to any depreciation in the value of the index below the strike price of the option (in the case of a put) or equal to any appreciation in the value of the index over the strike price of the option (in the case of a call) as of the valuation date of the option. Premiums paid for purchased call and put options which have expired are treated as realized losses on investments on the Statement of Operations. Upon the exercise or closing of a purchased put option, the premium is offset against the proceeds on the sale of the underlying security or financial instrument in order to determine the realized gain or loss on investments. Upon the exercise or closing of a purchased call option, the premium is added to the cost of the security or financial instrument. The risk associated with purchasing options is limited to the premium originally paid. |
| | The average market value of purchased options contracts open during the year ended July 31, 2023 was $128,018. Open purchased options contracts at July 31, 2023 are listed in the Schedule of Investments. |
| L. | Option Writing |
| | The Fund may write put and covered call options to seek to increase total return. When an option is written, the Fund receives a premium and becomes obligated to purchase or sell the underlying security at a fixed price, upon the exercise of the option. When the Fund writes an option, an amount equal to the premium received by the Fund is recorded as “Written options outstanding” on the Statement of Assets and Liabilities and is subsequently adjusted to the current value of the option written. Premiums received from writing options that expire unexercised are treated by the Fund on the expiration date as realized gains from investments on the Statement of Operations. The difference between the premium and the amount paid on effecting a closing |
80Pioneer Multi-Asset Income Fund | Annual Report | 7/31/23
| | purchase transaction, including brokerage commissions, is also treated as a realized gain on the Statement of Operations, or, if the premium is less than the amount paid for the closing purchase transaction, as a realized loss on the Statement of Operations. If a call option is exercised, the premium is added to the proceeds from the sale of the underlying security in determining whether the Fund has realized a gain or loss. The Fund as writer of an option bears the market risk of an unfavorable change in the price of the security underlying the written option. |
| | The average market value of written options contracts for the year ended July 31, 2023 was $(9,085). There were no open written options contracts at July 31, 2023. |
| M. | Futures Contracts |
| | The Fund may enter into futures transactions in order to attempt to hedge against changes in interest rates, securities prices and currency exchange rates or to seek to increase total return. Futures contracts are types of derivatives. All futures contracts entered into by the Fund are traded on a futures exchange. Upon entering into a futures contract, the Fund is required to deposit with a broker an amount of cash or securities equal to the minimum “initial margin” requirements of the associated futures exchange. The amount of cash deposited with the broker as collateral at July 31, 2023, is recorded as “Futures collateral” on the Statement of Assets and Liabilities. |
| | Subsequent payments for futures contracts ("variation margin") are paid or received by the Fund, depending on the daily fluctuation in the value of the contracts, and are recorded by the Fund as unrealized appreciation or depreciation. Cash received from or paid to the broker related to previous margin movement is held in a segregated account at the broker and is recorded as either "Due from broker for futures" or "Due to broker for futures" on the Statement of Assets and Liabilities. When the contract is closed, the Fund realizes a gain or loss equal to the difference between the opening and closing value of the contract as well as any fluctuation in foreign currency exchange rates where applicable. Futures contracts are subject to market risk, interest rate risk and currency exchange rate risk. Changes in value of the contracts may not directly correlate to the changes in value of the underlying securities. With futures, there is reduced counterparty credit risk to the Fund since futures are exchange-traded and the exchange's clearinghouse, as counterparty to all exchange-traded futures, guarantees the futures against default. |
| | The average notional values of futures contracts long position and futures contracts short position during the year ended July 31, 2023 were |
Pioneer Multi-Asset Income Fund | Annual Report | 7/31/2381
| | $29,623,725 and $470,377,707, respectively. Open futures contracts outstanding at July 31, 2023 are listed in the Schedule of Investments. |
| N. | Equity-Linked Notes |
| | Equity-linked notes seek to generate income and provide exposure to the performance of an underlying security, group of securities or exchange-traded funds (the “underlying reference instrument”). In an equity-linked note, the Fund purchases a note from a bank or broker-dealer and in return, the issuer provides for interest payments during the term of the note. At maturity or when the security is sold, the Fund will either settle by taking physical delivery of the underlying reference instrument or by receipt of a cash settlement amount equal to the value of the note at termination or maturity. The use of equity-linked notes involves the risk that the value of the note changes unfavorably due to movements in the value of the underlying reference instrument. Equity-linked notes are considered general unsecured contractual obligations of the bank or broker-dealer. The Fund must rely on the creditworthiness of the issuer for its investment returns. |
2. Management Agreement
The Adviser manages the Fund’s portfolio. Management fees payable under the Fund's Investment Management Agreement with the Adviser are calculated daily and paid monthly at the annual rate of 0.50% of the Fund’s average daily net assets up to $1 billion, 0.45% of the next $4 billion and 0.40% on assets over $5 billion. For the year ended July 31, 2023, the effective management fee (excluding waivers and/or assumption of expenses) was equivalent to 0.47% of the Fund’s average daily net assets.
The Adviser has contractually agreed to limit ordinary operating expenses (ordinary operating expenses means all fund expenses other than taxes, brokerage commissions, acquired fund fees and expenses and extraordinary expenses, such as litigation) of the Fund to the extent required to reduce Fund expenses to 0.85% and 0.65% of the average daily net assets attributable to Class A and Class Y shares, respectively. These expense limitations are in effect through December 1, 2023. There can be no assurance that the Adviser will extend the expense limitation agreement for a class of shares beyond the date referred to above. Fees waived and expenses reimbursed during the year ended July 31, 2023, are reflected on the Statement of Operations.
In addition, under the management and administration agreements, certain other services and costs, including accounting, regulatory reporting and insurance premiums, are paid by the Fund as administrative
82Pioneer Multi-Asset Income Fund | Annual Report | 7/31/23
reimbursements. Reflected on the Statement of Assets and Liabilities is $163,925 in management fees payable to the Adviser at July 31, 2023.
3. Compensation of Officers and Trustees
The Fund pays an annual fee to its Trustees. The Adviser reimburses the Fund for fees paid to the Interested Trustees. Except for the chief compliance officer, the Fund does not pay any salary or other compensation to its officers. The Fund pays a portion of the chief compliance officer's compensation for his services as the Fund's chief compliance officer. Amundi US pays the remaining portion of the chief compliance officer's compensation. For the year ended July 31, 2023, the Fund paid $148,398 in Officers' and Trustees' compensation, which is reflected on the Statement of Operations as Officers' and Trustees' fees. At July 31, 2023, on its Statement of Assets and Liabilities, the Fund had a payable for Trustees' fees of $12,227 and a payable for administrative expenses of $70,707, which includes the payable for Officers' compensation.
4. Transfer Agent
BNY Mellon Investment Servicing (US) Inc. serves as the transfer agent to the Fund at negotiated rates. Transfer agent fees and payables shown on the Statement of Operations and the Statement of Assets and Liabilities, respectively, include sub-transfer agent expenses incurred through the Fund’s omnibus relationship contracts.
In addition, the Fund reimbursed the transfer agent for out-of-pocket expenses incurred by the transfer agent related to shareowner communications activities such as proxy and statement mailings, and outgoing phone calls. For the year ended July 31, 2023, such out-of-pocket expenses by class of shares were as follows:
| Shareowner Communications: | |
| Class A | $ 26,398 |
| Class C | 16,595 |
| Class K | 195 |
| Class R | 383 |
| Class Y | 80,027 |
| Total | $123,598 |
5. Distribution and Service Plans
The Fund has adopted a distribution plan (the “Plan”) pursuant to Rule 12b-1 of the Investment Company Act of 1940 with respect to its Class A, Class C and Class R shares. Pursuant to the Plan, the Fund pays the Distributor 0.25% of the Fund's average daily net assets attributable to Class A shares as compensation for personal services and/or account maintenance services or distribution services with regard to Class A shares.
Pioneer Multi-Asset Income Fund | Annual Report | 7/31/2383
Pursuant to the Plan, the Fund also pays the Distributor 1.00% of the average daily net assets attributable to Class C shares. The fee for Class C shares consists of a 0.25% service fee and a 0.75% distribution fee paid as compensation for personal services and/or account maintenance services or distribution services with regard to Class C shares. Pursuant to the Plan, the Fund further pays the Distributor 0.50% of the average daily net assets attributable to Class R shares for distribution services. Reflected on the Statement of Assets and Liabilities is $53,284 in distribution fees payable to the Distributor at July 31, 2023.
The Fund also has adopted a separate service plan for Class R shares (the “Service Plan”). The Service Plan authorizes the Fund to pay securities dealers, plan administrators or other service organizations that agree to provide certain services to retirement plans or plan participants holding shares of the Fund a service fee of up to 0.25% of the Fund’s average daily net assets attributable to Class R shares held by such plans.
In addition, redemptions of Class A and Class C shares may be subject to a contingent deferred sales charge (“CDSC”). A CDSC of 1.00% may be imposed on redemptions of certain net asset value purchases of Class A shares within 12 months of purchase. Redemptions of Class C shares within 12 months of purchase are subject to a CDSC of 1.00% based on the lower of cost or market value of shares being redeemed. Shares purchased as part of an exchange remain subject to any CDSC that applied to the original purchase of those shares. There is no CDSC for Class K, Class R or Class Y shares. Proceeds from the CDSCs are paid to the Distributor. For the year ended July 31, 2023, CDSCs in the amount of $32,173 were paid to the Distributor.
6. Line of Credit Facility
The Fund, along with certain other funds in the Pioneer Family of Funds, participates in a committed, unsecured revolving line of credit (“credit facility”). Borrowings are used solely for temporary or emergency purposes. The Fund may borrow up to the lesser of the amount available under the credit facility or the limits set for borrowing by the Fund’s prospectus and the 1940 Act. The Fund participates in a credit facility in the amount of $380 million. Under such credit facility, depending on the type of loan, interest on borrowings is payable at the Secured Overnight Financing Rate ("SOFR") plus a credit spread. The Fund also pays both an upfront fee and an annual commitment fee to participate in the credit facility. The upfront fee in the amount of 0.15% of the total credit facility and the commitment fee in the amount of 0.30% of the daily unused portion of each lender's commitment are allocated among participating funds based on an
84Pioneer Multi-Asset Income Fund | Annual Report | 7/31/23
allocation schedule set forth in the credit agreement. For the year ended July 31, 2023, the Fund had no borrowings under the credit facility.
7. Master Netting Agreements
The Fund has entered into an International Swaps and Derivatives Association, Inc. Master Agreement (“ISDA Master Agreement”) or similar agreement with substantially all of its derivative counterparties. An ISDA Master Agreement is a bilateral agreement between the Fund and a counterparty that governs the trading of certain Over the Counter (“OTC”) derivatives and typically contains, among other things, close-out and set- off provisions which apply upon the occurrence of an event of default and/or a termination event as defined under the relevant ISDA Master Agreement. The ISDA Master Agreement may also give a party the right to terminate all transactions traded under such agreement if, among other things, there is deterioration in the credit quality of the other party.
Upon an event of default or a termination of the ISDA Master Agreement, the non-defaulting party has the right to close-out all transactions under such agreement and to net amounts owed under each transaction to determine one net amount payable by one party to the other. The right to close out and net payments across all transactions under the ISDA Master Agreement could result in a reduction of the Fund’s credit risk to its counterparty equal to any amounts payable by the Fund under the applicable transactions, if any. However, the Fund’s right to set-off may be restricted or prohibited by the bankruptcy or insolvency laws of the particular jurisdiction to which each specific ISDA Master Agreement of each counterparty is subject.
The collateral requirements for derivatives transactions under an ISDA Master Agreement are governed by a credit support annex to the ISDA Master Agreement. Collateral requirements are generally determined at the close of business each day and are typically based on changes in market values for each transaction under an ISDA Master Agreement and netted into one amount for such agreement. Generally, the amount of collateral due from or to a counterparty is subject to threshold (a “minimum transfer amount”) before a transfer is required, which may vary by counterparty. Collateral pledged for the benefit of the Fund and/or counterparty is held in segregated accounts by the Fund’s custodian and cannot be sold, re- pledged, assigned or otherwise used while pledged. Cash that has been segregated to cover the Fund’s collateral obligations, if any, will be reported separately on the Statement of Assets and Liabilities as “Swaps collateral”. Securities pledged by the Fund as collateral, if any, are identified as such in the Schedule of Investments.
Pioneer Multi-Asset Income Fund | Annual Report | 7/31/2385
Financial instruments subject to an enforceable master netting agreement, such as an ISDA Master Agreement, have been offset on the Statement of Assets and Liabilities. The following charts show gross assets and liabilities of the Fund as of July 31, 2023.
| Counterparty | Derivative
Assets
Subject to
Master Netting
Agreement | Derivatives
Available
for Offset | Non-Cash
Collateral
Received (a) | Cash
Collateral
Received (a) | Net Amount
of Derivative
Assets (b) |
| Citibank NA | $640,089 | $— | $— | $(640,089) | $— |
| Counterparty | Derivative
Liabilities
Subject to
Master Netting
Agreement | Derivatives
Available
for Offset | Non-Cash
Collateral
Pledged (a) | Cash
Collateral
Pledged (a) | Net Amount
of Derivative
Liabilities (c) |
| Citibank NA | $— | $— | $— | $— | $— |
(a) The amount presented here may be less than the total amount of collateral received/pledged as the net amount of derivative assets and liabilities cannot be less than $0.
(b) Represents the net amount due from the counterparty in the event of default.
(c) Represents the net amount payable to the counterparty in the event of default.
8. Additional Disclosures about Derivative Instruments and Hedging Activities
The Fund’s use of derivatives may enhance or mitigate the Fund’s exposure to the following risks:
Interest rate risk relates to the fluctuations in the value of interest-bearing securities due to changes in the prevailing levels of market interest rates.
Credit risk relates to the ability of the issuer of a financial instrument to make further principal or interest payments on an obligation or commitment that it has to the Fund.
Foreign exchange rate risk relates to fluctuations in the value of an asset or liability due to changes in currency exchange rates.
Equity risk relates to the fluctuations in the value of financial instruments as a result of changes in market prices (other than those arising from interest rate risk or foreign exchange rate risk), whether caused by factors specific to an individual investment, its issuer, or all factors affecting all instruments traded in a market or market segment.
86Pioneer Multi-Asset Income Fund | Annual Report | 7/31/23
Commodity risk relates to the risk that the value of a commodity or commodity index will fluctuate based on increases or decreases in the commodities market and factors specific to a particular industry or commodity.
The fair value of open derivative instruments (not considered to be hedging instruments for accounting disclosure purposes) by risk exposure at July 31, 2023, was as follows:
Statement of Assets
and Liabilities | Interest
Rate Risk | Credit
Risk | Foreign
Exchange
Rate Risk | Equity
Risk | Commodity
Risk |
| Assets | | | | | |
| Net unrealized appreciation on futures contracts^ | $1,383,114 | $ — | $ — | $ 1,664,291 | $ — |
| Options purchased* | — | — | — | 640,089 | — |
| Total Value | $1,383,114 | $— | $— | $ 2,304,380 | $— |
| Liabilities | | | | | |
| Net unrealized depreciation on futures contracts^ | $ — | $ — | $ — | $21,315,490 | $ — |
| Total Value | $ — | $— | $— | $21,315,490 | $— |
| | |
| ^ | Includes cumulative unrealized appreciation (depreciation) of futures contracts as reported in the Schedule of Investments. Only net variation margin is reported within the assets and/or liabilities on the Statement of Assets and Liabilities. |
| * | Reflects the market value of purchased option contracts (see Note 1K). These amounts are included in investments in unaffiliated issuers, at value, on the Statement of Assets and Liabilities. |
Pioneer Multi-Asset Income Fund | Annual Report | 7/31/2387
The effect of derivative instruments (not considered to be hedging instruments for accounting disclosure purposes) on the Statement of Operations by risk exposure at July 31, 2023 was as follows:
| Statement of Operations | Interest
Rate Risk | Credit
Risk | Foreign
Exchange
Rate Risk | Equity
Risk | Commodity
Risk |
| Net Realized Gain (Loss) on | | | | | |
| Futures contracts | $ (3,091,153) | $ — | $ — | $ (36,258,301) | $ — |
| Options purchased* | — | — | — | 1,317,890 | — |
| Options written | — | — | — | 376,889 | — |
| Total Value | $(3,091,153) | $— | $— | $(34,563,522) | $— |
| Change in Net Unrealized Appreciation (Depreciation) on | | | | | |
| Futures contracts | $ 2,013,593 | $ — | $ — | $ (15,728,265) | $ — |
| Options purchased** | — | — | — | (3,352,335) | — |
| Total Value | $ 2,013,593 | $— | $— | $ (19,080,600) | $— |
| | |
| * | Reflects the net realized gain (loss) on purchased option contracts (see Note 1K). These amounts are included in net realized gain (loss) on investments in unaffiliated issuers, on the Statement of Operations. |
| ** | Reflects the change in net unrealized appreciation (depreciation) on purchased option contracts (see Note 1K). These amounts are included in change in net unrealized appreciation (depreciation) on investments in unaffiliated issuers, on the Statement of Operations. |
88Pioneer Multi-Asset Income Fund | Annual Report | 7/31/23
Report of Independent Registered Public Accounting Firm
To the Board of Trustees of Pioneer Series Trust IV and the Shareholders of Pioneer Multi-Asset Income Fund:
Opinion on the Financial Statements
We have audited the accompanying statement of assets and liabilities of Pioneer Multi-Asset Income Fund (the “Fund”) (one of the funds constituting Pioneer Series Trust IV (the “Trust”)), including the schedule of investments, as of July 31, 2023, and the related statement of operations for the year then ended, the statements of changes in net assets for each of the two years in the period then ended, the financial highlights for each of the five years in the period then ended and the related notes (collectively referred to as the “financial statements”). In our opinion, the financial statements present fairly, in all material respects, the financial position of the Fund (one of the funds constituting Pioneer Series Trust IV) at July 31, 2023, the results of its operations for the year then ended, the changes in its net assets for each of the two years in the period then ended, and its financial highlights for each of the five years in the period then ended in conformity with U.S. generally accepted accounting principles.
Basis for Opinion
These financial statements are the responsibility of the Trust’s management. Our responsibility is to express an opinion on the Fund’s financial statements based on our audits. We are a public accounting firm registered with the Public Company Accounting Oversight Board (United States) ("PCAOB") and are required to be independent with respect to the Trust in accordance with the U.S. federal securities laws and the applicable rules and regulations of the Securities and Exchange Commission and the PCAOB.
We conducted our audits in accordance with the standards of the PCAOB. Those standards require that we plan and perform the audit to obtain reasonable assurance about whether the financial statements are free of material misstatement, whether due to error or fraud. The Trust is not required to have, nor were we engaged to perform, an audit of the Trust’s internal control over financial reporting. As part of our audits, we are required to obtain an understanding of internal control over financial reporting, but not for the purpose of expressing an opinion on the effectiveness of the Trust’s internal control over financial reporting. Accordingly, we express no such opinion.
Pioneer Multi-Asset Income Fund | Annual Report | 7/31/2389
Our audits included performing procedures to assess the risks of material misstatement of the financial statements, whether due to error or fraud, and performing procedures that respond to those risks. Such procedures included examining, on a test basis, evidence regarding the amounts and disclosures in the financial statements. Our procedures included confirmation of securities owned as of July 31, 2023,by correspondence with the custodian, brokers and others; when replies were not received from brokers and others, we performed other auditing procedures. Our audits also included evaluating the accounting principles used and significant estimates made by management, as well as evaluating the overall presentation of the financial statements. We believe that our audits provide a reasonable basis for our opinion.
We have served as the auditor of one or more investment companies in the Pioneer family of funds since 2017.
Boston, Massachusetts
September 29, 2023
90Pioneer Multi-Asset Income Fund | Annual Report | 7/31/23
Additional Information (unaudited)
For the year ended July 31, 2023, certain dividends paid by the Fund may be subject to a maximum tax rate of 20%. The Fund intends to designate up to the maximum amount of such dividends allowable, as taxed at a maximum rate of 20%. Complete information will be computed and reported in conjunction with our 2023 Form 1099-DIV.
The qualifying percentage of the Fund’s ordinary income dividends for the purpose of the corporate dividends received deduction was 8.80%.
Qualified interest income is exempt from nonresident alien (NRA) tax withholding. The percentage of the Fund’s ordinary income distributions derived from qualified interest income was 61.46%.
Pioneer Multi-Asset Income Fund | Annual Report | 7/31/2391
Statement Regarding Liquidity Risk Management Program
As required by law, the Fund has adopted and implemented a liquidity risk management program (the “Program”) that is designed to assess and manage liquidity risk. Liquidity risk is the risk that the Fund could not meet requests to redeem its shares without significant dilution of remaining investors’ interests in the Fund. The Fund’s Board of Trustees designated a liquidity risk management committee (the “Committee”) consisting of employees of Amundi Asset Management US, Inc. (the “Adviser”) to administer the Program.
The Committee provided the Board of Trustees with a report that addressed the operation of the Program and assessed its adequacy and effectiveness of implementation (the “Report”). The Report covered the period from January 1, 2022 through December 31, 2022 (the “Reporting Period”).
The Report confirmed that, throughout the Reporting Period, the Committee had monitored the Fund’s portfolio liquidity and liquidity risk on an ongoing basis, as described in the Program and in Board reporting throughout the Reporting Period.
The Report discussed the Committee’s annual review of the Program, which addressed, among other things, the following elements of the Program:
The Committee reviewed the Fund’s investment strategy and liquidity of portfolio investments during both normal and reasonably foreseeable stressed conditions. The Committee noted that the Fund’s investment strategy continues to be appropriate for an open-end fund, taking into account, among other things, whether and to what extent the Fund held less liquid and illiquid assets and the extent to which any such investments affected the Fund’s ability to meet redemption requests. In managing and reviewing the Fund’s liquidity risk, the Committee also considered the extent to which the Fund’s investment strategy involves a relatively concentrated portfolio or large positions in particular issuers, the extent to which the Fund uses borrowing for investment purposes, and the extent to which the Fund uses derivatives (including for hedging purposes). The Committee also reviewed the Fund’s short-term and long-term cash flow projections during both normal and reasonably foreseeable stressed conditions. In assessing the Fund’s cash flow projections, the Committee considered, among other factors, historical net redemption activity, redemption policies, ownership concentration, distribution channels, and the degree of certainty associated with the Fund’s short-term and long-term cash flow projections. The Committee also considered the Fund’s holdings of cash and cash equivalents, as well as borrowing arrangements
92Pioneer Multi-Asset Income Fund | Annual Report | 7/31/23
and other funding sources, including, if applicable, the Fund’s participation in a credit facility, as components of the Fund’s ability to meet redemption requests. The Fund has adopted an in-kind redemption policy which may be utilized to meet larger redemption requests.
The Committee reviewed the Program’s liquidity classification methodology for categorizing the Fund’s investments into one of four liquidity buckets. In reviewing the Fund’s investments, the Committee considered, among other factors, whether trading varying portions of a position in a particular portfolio investment or asset class in sizes the Fund would reasonably anticipate trading, would be reasonably expected to significantly affect liquidity.
The Committee performed an analysis to determine whether the Fund is required to maintain a Highly Liquid Investment Minimum, and determined that no such minimum is required because the Fund primarily holds highly liquid investments.
The Report stated that the Committee concluded the Program operates adequately and effectively, in all material respects, to assess and manage the Fund’s liquidity risk throughout the Reporting Period.
Pioneer Multi-Asset Income Fund | Annual Report | 7/31/23 93
Trustees, Officers and Service Providers
Investment Adviser and Administrator
Amundi Asset Management US, Inc.
Custodian and Sub-Administrator
The Bank of New York Mellon Corporation
Independent Registered Public Accounting Firm
Ernst & Young LLP
Principal Underwriter
Amundi Distributor US, Inc.
Legal Counsel
Morgan, Lewis & Bockius LLP
Transfer Agent
BNY Mellon Investment Servicing (US) Inc.
Proxy Voting Policies and Procedures of the Fund are available without charge, upon request, by calling our toll free number (1-800-225-6292). Information regarding how the Fund voted proxies relating to portfolio securities during the most recent 12-month period ended June 30 is publicly available to shareowners at www.amundi.com/us. This information is also available on the Securities and Exchange Commission’s web site at www.sec.gov.
Trustees and Officers
The Fund's Trustees and officers are listed below, together with their principal occupations and other directorships they have held during at least the past five years. Trustees who are interested persons of the Fund within the meaning of the 1940 Act are referred to as Interested Trustees. Trustees who are not interested persons of the Fund are referred to as Independent Trustees. Each of the Trustees serves as a Trustee of each of the 49 U.S. registered investment portfolios for which Amundi US serves as investment adviser (the “Pioneer Funds”). The address for all Trustees and all officers of the Fund is 60 State Street, Boston, Massachusetts 02109.
The Statement of Additional Information of the Fund includes additional information about the Directors and is available, without charge, upon request, by calling 1-800-225-6292.
94Pioneer Multi-Asset Income Fund | Annual Report | 7/31/23
Name, Age and Position
Held With the Fund | Term of Office and
Length of Service | Principal Occupation(s) During At Least The Past Five Years | Other Directorships Held by Trustee
During At Least The Past Five Years |
Thomas J. Perna (72)
Chairman of the Board
and Trustee | Trustee since 2011.
Serves until a successor
trustee is elected or
earlier retirement
or removal. | Private investor (2004 – 2008 and 2013 – present); Chairman (2008 – 2013) and Chief Executive Officer (2008 – 2012), Quadriserv, Inc. (technology products for securities lending industry); and Senior Executive Vice President, The Bank of New York (financial and securities services) (1986 – 2004) | Director, Broadridge Financial Solutions, Inc.
(investor communications and securities
processing provider for financial services industry)
(2009 – present); Director, Quadriserv, Inc. (2005 –
2013); and Commissioner, New Jersey State
Civil Service
Commission (2011 – 2015) |
John E. Baumgardner,
Jr. (72)*
Trustee | Trustee since 2019.
Serves until a successor
trustee is elected or
earlier retirement
or removal. | Of Counsel (2019 – present), Partner (1983-2018), Sullivan & Cromwell LLP (law firm). | Chairman, The Lakeville Journal Company, LLC,
(privately-held community newspaper group)
(2015-present) |
Diane Durnin (66)
Trustee | Trustee since 2019.
Serves until a successor
trustee is elected or
earlier retirement
or removal. | Managing Director - Head of Product Strategy and Development, BNY Mellon Investment Management (investment management firm) (2012-2018); Vice Chairman – The Dreyfus Corporation (2005 – 2018): Executive Vice President Head of Product, BNY Mellon Investment Management (2007-2012); Executive Director- Product Strategy, Mellon Asset Management (2005-2007); Executive Vice President Head of Products, Marketing and Client Service, Dreyfus Corporation (investment management firm) (2000-2005); Senior Vice President Strategic Product and Business Development, Dreyfus Corporation (1994-2000) | None |
| * Mr. Baumgardner is Of Counsel to Sullivan & Cromwell LLP, which acts as counsel to the Independent Trustees of each Pioneer Fund. |
Pioneer Multi-Asset Income Fund | Annual Report | 7/31/2395
Independent Trustees (continued)
Name, Age and Position
Held With the Fund | Term of Office and
Length of Service | Principal Occupation(s) During At Least The Past Five Years | Other Directorships Held by Trustee
During At Least The Past Five Years |
Benjamin M. Friedman (78)
Trustee | Trustee since 2011.
Serves until a successor
trustee is elected or
earlier retirement
or removal. | William Joseph Maier Professor of Political Economy, Harvard University (1972 – present) | Trustee, Mellon Institutional Funds Investment
Trust and Mellon Institutional Funds Master
Portfolio (oversaw 17 portfolios in fund complex)
(1989 - 2008) |
Craig C. MacKay (60)
Trustee | Trustee since 2021.
Serves until a successor
trustee is elected or
earlier retirement
or removal. | Partner, England & Company, LLC (advisory firm) (2012 – present); Group Head – Leveraged Finance Distribution, Oppenheimer & Company (investment bank) (2006 – 2012); Group Head – Private Finance & High Yield Capital Markets Origination, SunTrust Robinson Humphrey (investment bank) (2003 – 2006); and Founder and Chief Executive Officer, HNY Associates, LLC (investment bank) (1996 – 2003) | Director, Equitable Holdings, Inc. (financial
services holding company) (2022 – present);
Board Member of Carver Bancorp, Inc. (holding
company) and Carver Federal Savings Bank,
NA (2017 – present); Advisory Council Member,
MasterShares ETF (2016 – 2017); Advisory
Council Member, The Deal (financial market
information publisher) (2015 – 2016); Board
Co-Chairman and Chief Executive Officer, Danis
Transportation Company (privately-owned
commercial carrier) (2000 – 2003); Board
Member and Chief Financial Officer, Customer
Access Resources (privately-owned
teleservices company) (1998 – 2000); Board
Member, Federation of Protestant Welfare
Agencies (human services agency) (1993 –
present); and Board Treasurer, Harlem Dowling
Westside Center (foster care agency)
(1999 – 2018) |
96Pioneer Multi-Asset Income Fund | Annual Report | 7/31/23
Name, Age and Position
Held With the Fund | Term of Office and
Length of Service | Principal Occupation(s) During At Least The Past Five Years | Other Directorships Held by Trustee
During At Least The Past Five Years |
Lorraine H. Monchak (67)
Trustee | Trustee since 2017.
(Advisory Trustee from
2014 - 2017). Serves
until a successor trustee
is elected or earlier
retirement or removal. | Chief Investment Officer, 1199 SEIU Funds (healthcare workers union pension funds) (2001 – present); Vice President – International Investments Group, American International Group, Inc. (insurance company) (1993 – 2001); Vice President – Corporate Finance and Treasury Group, Citibank, N.A. (1980 – 1986 and 1990 – 1993); Vice President – Asset/Liability Management Group, Federal Farm Funding Corporation (government-sponsored issuer of debt securities) (1988 – 1990); Mortgage Strategies Group, Shearson Lehman Hutton, Inc. (investment bank) (1987 – 1988); Mortgage Strategies Group, Drexel Burnham Lambert, Ltd. (investment bank) (1986 – 1987) | None |
Marguerite A. Piret (75)
Trustee | Trustee since 2011.
Serves until a successor
trustee is elected or
earlier retirement
or removal. | Chief Financial Officer, American Ag Energy, Inc. (technology for the environment, energy and agriculture) (2019 – present); Chief Operating Officer, North Country Growers LLC (controlled environment agriculture company) (2020 – present); Chief
Executive Officer, Green Heat LLC (biofuels company) (2022 – present); President and Chief Executive Officer, Newbury Piret Company (investment banking firm) (1981 – 2019) | Director of New America High Income Fund,
Inc. (closed-end investment company) (2004 –
present); and Member, Board of Governors,
Investment Company Institute (2000 – 2006) |
Pioneer Multi-Asset Income Fund | Annual Report | 7/31/2397
Independent Trustees (continued)
Name, Age and Position
Held With the Fund | Term of Office and
Length of Service | Principal Occupation(s) During At Least The Past Five Years | Other Directorships Held by Trustee
During At Least The Past Five Years |
Fred J. Ricciardi (76)
Trustee | Trustee since 2014.
Serves until a successor
trustee is elected or
earlier retirement
or removal. | Private investor (2020 – present); Consultant (investment company services) (2012 – 2020); Executive Vice President, BNY Mellon (financial and investment company services) (1969 – 2012); Director, BNY International Financing Corp. (financial services) (2002 – 2012); Director, Mellon Overseas Investment Corp. (financial services) (2009 – 2012); Director, Financial Models (technology) (2005-2007); Director, BNY Hamilton Funds, Ireland (offshore investment companies) (2004-2007); Chairman/Director, AIB/BNY Securities Services, Ltd., Ireland (financial services) (1999-2006); Chairman, BNY Alternative Investment Services, Inc. (financial services) (2005-2007) | None |
98Pioneer Multi-Asset Income Fund | Annual Report | 7/31/23
Name, Age and Position
Held With the Fund | Term of Office and
Length of Service | Principal Occupation(s) During At Least The Past Five Years | Other Directorships Held by Trustee
During At Least The Past Five Years |
Lisa M. Jones (61)**
Trustee, President and Chief
Executive Officer | Trustee since 2017. Serves
until a successor trustee is
elected or earlier retirement
or removal | Director, CEO and President of Amundi US, Inc. (investment management firm) (since September 2014); Director, CEO and President of Amundi Asset Management US, Inc. (since September 2014); Director, CEO and President of Amundi Distributor US, Inc. (since September 2014); Director, CEO and President of Amundi Asset Management US, Inc. (since September 2014); Chair, Amundi US, Inc., Amundi Distributor US, Inc. and Amundi Asset Management US, Inc. (September 2014 – 2018); Managing Director, Morgan Stanley Investment Management (investment management firm) (2010 – 2013); Director of Institutional Business, CEO of International, Eaton Vance Management (investment management firm) (2005 – 2010); Director of Amundi Holdings US, Inc. (since 2017) | Director of Clearwater
Analytics (provider of
web-based investment
accounting software
for reporting and
reconciliation services)
(September 2022 –
present) |
Kenneth J. Taubes (65)**
Trustee | Trustee since 2014. Serves
until a successor trustee is
elected or earlier retirement
or removal | Director and Executive Vice President (since 2008) and Chief Investment Officer, U.S. (since 2010) of Amundi US, Inc. (investment management firm); Director and Executive Vice President and Chief Investment Officer, U.S. of Amundi US (since 2008); Executive Vice President and Chief Investment Officer, U.S. of Amundi Asset Management US, Inc. (since 2009); Portfolio Manager of Amundi US (since 1999); Director of Amundi Holdings US, Inc. (since 2017) | None |
| ** Ms. Jones and Mr. Taubes are Interested Trustees because they are officers or directors of the Fund’s investment adviser and certain of its affiliates. |
Pioneer Multi-Asset Income Fund | Annual Report | 7/31/2399
Name, Age and Position
Held With the Fund | Term of Office and
Length of Service | Principal Occupation(s) During At Least The Past Five Years | Other Directorships Held by Officer
During At Least The Past Five Years |
Christopher J. Kelley (58)
Secretary and Chief
Legal Officer | Since 2011. Serves at
the discretion of
the Board | Vice President and Associate General Counsel of Amundi US since January 2008; Secretary and Chief Legal Officer of all of the Pioneer Funds since June 2010; Assistant Secretary of all of the Pioneer Funds from September 2003 to May 2010; Vice President and Senior Counsel of Amundi US from July 2002 to December 2007 | None |
Thomas Reyes (60)
Assistant Secretary | Since 2011. Serves at
the discretion of
the Board | Assistant General Counsel of Amundi US since May 2013 and Assistant Secretary of all the Pioneer Funds since June 2010; Counsel of Amundi US from June 2007 to May 2013 | None |
Heather L. Melito-Dezan (46)
Assistant Secretary | Since 2022. Serves at the
discretion of the Board | Director - Trustee and Board Relationships of Amundi US since
September 2019; Assistant Secretary of Amundi US, Inc. since July 2020: Assistant Secretary of Amundi Asset Management US, Inc. since July 2020: Assistant Secretary of Amundi Distributor US, Inc. since July 2020; Assistant Secretary of all the Pioneer
Funds since September 2022; Private practice from 2017 – 2019. | None |
Anthony J. Koenig, Jr. (59)
Treasurer and
Chief Financial and
Accounting Officer | Since 2021. Serves at
the discretion of
the Board | Managing Director, Chief Operations Officer and Fund Treasurer of Amundi US since May 2021; Treasurer of all of the Pioneer Funds since May 2021; Assistant Treasurer of all of the Pioneer
Funds from January 2021 to May 2021; and Chief of Staff, US Investment Management of Amundi US from May 2008 to January 2021 | None |
Luis I. Presutti (58)
Assistant Treasurer | Since 2011. Serves at
the discretion of
the Board | Director – Fund Treasury of Amundi US since 1999; and Assistant Treasurer of all of the Pioneer Funds since 1999 | None |
Gary Sullivan (65)
Assistant Treasurer | Since 2011. Serves at
the discretion of
the Board | Senior Manager – Fund Treasury of Amundi US since 2012; and Assistant Treasurer of all of the Pioneer Funds since 2002 | None |
100Pioneer Multi-Asset Income Fund | Annual Report | 7/31/23
Name, Age and Position
Held With the Fund | Term of Office and
Length of Service | Principal Occupation(s) During At Least The Past Five Years | Other Directorships Held by Officer
During At Least The Past Five Years |
Antonio Furtado (41)
Assistant Treasurer | Since 2020. Serves at
the discretion of
the Board | Fund Oversight Manager – Fund Treasury of Amundi US since 2020; Assistant Treasurer of all of the Pioneer Funds since 2020; and Senior Fund Treasury Analyst from 2012 - 2020 | None |
Michael Melnick (52)
Assistant Treasurer | Since 2021. Serves at
the discretion of
the Board | Vice President - Deputy Fund Treasurer of Amundi US since May 2021; Assistant Treasurer of all of the Pioneer Funds since July 2021; Director of Regulatory Reporting of Amundi US from 2001 – 2021; and Director of Tax of Amundi US from 2000 - 2001 | None |
John Malone (52)
Chief Compliance Officer | Since 2018. Serves at
the discretion of
the Board | Managing Director, Chief Compliance Officer of Amundi US Asset Management; Amundi Asset Management US, Inc.; and the Pioneer Funds since September 2018; Chief Compliance Officer of Amundi Distributor US, Inc. since January 2014. | None |
Brandon Austin (51)
Anti-Money
Laundering Officer | Since 2022. Serves at
the discretion of
the Board | Director, Financial Security – Amundi Asset Management; Anti-Money Laundering Officer of all the Pioneer Funds since March 2022 Director of Financial Security of Amundi US since July 2021; Vice President, Head of BSA, AML and OFAC, Deputy Compliance Manager, Crédit Agricole Indosuez Wealth Management (investment management firm) (2013 – 2021) | None |
Pioneer Multi-Asset Income Fund | Annual Report | 7/31/23101
How to Contact Amundi
We are pleased to offer a variety of convenient ways for you to contact us for assistance or information.
Call us for:
Account Information, including existing accounts,
new accounts, prospectuses, applications
and service forms
1-800-225-6292
FactFoneSMfor automated fund yields, prices,
account information and transactions
1-800-225-4321
| Retirement plans information | 1-800-622-0176 |
Write to us:
Amundi
P.O. Box 534427
Pittsburgh, PA 15253-4427
| Our toll-free fax | 1-800-225-4240 |
| Our internet e-mail address | us.askamundi@amundi.com
(for general questions about Amundi only) |
Visit our web site: www.amundi.com/us
This report must be preceded or accompanied by a prospectus.
The Fund files a complete schedule of portfolio holdings with the Securities and Exchange Commission for the first and third quarters of each fiscal year as an exhibit to its reports on Form N-PORT. Shareholders may view the filed Form N-PORT by visiting the Commission’s web site at https://www.sec.gov.
Amundi Asset Management US, Inc.
60 State Street
Boston, MA 02109
www.amundi.com/us
Securities offered through Amundi Distributor US, Inc.
60 State Street, Boston, MA 02109
Underwriter of Pioneer Mutual Funds, Member SIPC
© 2023 Amundi Asset Management US, Inc. 25962-11-0923
Pioneer Securitized Income Fund
Annual Report | July 31, 2023
visit us: www.amundi.com/us
Pioneer Securitized Income Fund | Annual Report | 7/31/231
President’s Letter
Dear Shareholders,
On February 13, 2023, Amundi US celebrated the 95th anniversary of Pioneer Fund, the second-oldest mutual fund in the United States. We recognized the anniversary with ringing of the closing bell at the New York Stock Exchange, which seemed fitting for this special milestone.
Pioneer Fund was launched on February 13, 1928 by Phil Carret, one of the earliest proponents of value investing and a leading innovator in the asset management industry. Mr. Carret began investing in the 1920s and founded Pioneer Investments (now Amundi US) in 1928, and was one of the first investors to realize he could uncover value through rigorous, innovative, fundamental research techniques.
Consistent with Mr. Carret’s investment approach and employing many of the same techniques utilized in the 1920s, Amundi US's portfolio managers have adapted Mr. Carret’s philosophy to a new age of “active” investing.
The last few years have seen investors face some unprecedented challenges, from a global pandemic that shuttered much of the world’s economy for months, to geopolitical strife, to rising inflation that has reached levels not seen in decades. Now, more than ever, Amundi US believes active management – that is, making active investment decisions across all of our portfolios – can help mitigate risk during periods of market volatility.
At Amundi US, active management begins with our own fundamental, bottom-up research process. Our team of dedicated research analysts and portfolio managers analyzes each security under consideration, communicating frequently with the management teams of the companies and other entities issuing the securities, and working together to identify those securities that we believe best meet our investment criteria for our family of funds. Our risk management approach begins with each security under consideration, as we strive to develop a deep understanding of the potential opportunity, while considering any potential risk factors.
Today, as shareholders, we have many options. It is our view that active management can serve shareholders well, not only when markets are thriving, but also during periods of market stress. As you consider your long-term investment goals, we encourage you to work with your financial professional to develop an investment plan that paves the way for you to pursue both your short-term and long-term goals.
2Pioneer Securitized Income Fund | Annual Report | 7/31/23
We greatly appreciate the trust you have placed in us and look forward to continuing to serve you in the future.
Lisa M. Jones
Head of the Americas, President and CEO of US
Amundi Asset Management US, Inc.
September 2023
Any information in this shareowner report regarding market or economic trends or the factors influencing the Fund’s historical or future performance are statements of opinion as of the date of this report. Past performance is no guarantee of future results.
Pioneer Securitized Income Fund | Annual Report | 7/31/233
Portfolio Management Discussion | 7/31/23
In the following interview, portfolio managers Noah Funderburk and Nicolas Pauwels discuss the market environment and the factors that affected the performance of Pioneer Securitized Income Fund during the 12-month period ended July 31, 2023. Mr. Funderburk, a senior vice president, Director of Securitized Credit, and a portfolio manager at Amundi Asset Management US, Inc. (Amundi US), and Mr. Pauwels, a vice president, Deputy Director of Securitized Credit, and a portfolio manager at Amundi US, are responsible for the day-to-day management of the Fund.
| Q | How did the Fund perform during the 12-month period ended July 31, 2023? |
| A | Pioneer Securitized Income Fund’s Class A shares returned 5.25% at net asset value during the 12-month period ended July 31, 2023, while the Fund’s benchmark, the Bloomberg US Securitized MBS/ABS/CMBS Index (the Bloomberg Index), returned -4.50%. During the same period, the average return of the 329 mutual funds in Morningstar’s Nontraditional Bond Fund Category was 2.56%. |
| Q | What factors drove the performance of securitized assets during the 12-month period ended July 31, 2023? |
| A | Higher-yielding securitized assets delivered positive absolute returns and outperformed the broad-based fixed-income market indices during the 12-month period. The performance of securitized assets received a boost from the contribution of the category’s above-average income generation, as well as a compression in yield spreads from the attractive levels that had existed at the beginning of the period. (Credit, or yield spreads, are commonly defined as the differences in yield between Treasuries and other types of fixed-income securities with similar maturities.) On the other hand, more interest-rate sensitive securitized assets backed by government guarantees, such as agency mortgage-backed securities (MBS), generally lagged. |
| | The MBS, asset-backed securities (ABS), and commercial MBS (CMBS) represented in the Fund’s benchmark, which tracks predominantly high-quality assets, returned -4.75%, 1.12% and -3.26%, respectively, for the 12-month period. MBS have typically been the key driver of the Blomberg Index’s return, given their large benchmark weighting of 92% (as of July 31, 2023). CMBS and ABS represented benchmark weights of 6% and 2%, |
4Pioneer Securitized Income Fund | Annual Report | 7/31/23
| | respectively, as of period-end. The underperformance of CMBS during the period was largely a function of mounting investor concerns about both the office and retail sectors. |
| Q | What elements of the Fund’s positioning played the largest role in its benchmark-relative results during the 12-month period ended July 31, 2023? |
| A | The Fund’s positioning with respect to duration versus the Bloomberg Index was a key positive contributor to benchmark-relative outperformance. (Duration is a measure of the sensitivity of the price, or the value of principal, of a fixed-income investment to a change in interest rates, expressed as a number of years.) Coming into the 12-month period, the Fund’s duration had been significantly below that of the benchmark, which worked out well given the persistent increase in prevailing yields during the latter part of 2022. The portfolio’s positions in floating-rate securities, which have low durations since their coupons reset higher as interest rates rise, were particularly helpful to the Fund’s relative returns in that regard. As the 12-month period progressed, it became apparent, in our view, that the US Federal Reserve (Fed) was moving closer to the point at which it could stop raising interest rates. We therefore allowed the portfolio’s duration to rise from about 1.4 years at the start of the period to 2.8 years at the end of July 2023. Still, the Fund’s duration remained well below that of the Bloomberg Index. This is a typical approach for us in managing the Fund, given that the portfolio has tended to be less focused on agency MBS than the Bloomberg Index, and has a larger focus on the higher-yielding segments of the securitized market. |
| | From a sector standpoint, an allocation to non-agency MBS was the largest positive contributor to both the Fund’s absolute and benchmark-relative performance. The performance of non-agency MBS benefited during the period from their above-average yield, floating-rate coupons, and robust investor demand. Better-than-expected economic growth and strength in the housing market also benefited non-agency MBS during the period. On the other hand, the Fund’s holdings in agency MBS detracted from benchmark-relative returns for the 12-month period. Although the portfolio has had a large underweight to agency MBS compared to the benchmark, the Fund’s positions still lagged. |
Pioneer Securitized Income Fund | Annual Report | 7/31/235
| | Since agency MBS are “AAA” rated government-backed securities, their performance has tended to derive primarily from interest-rate trends — a negative in the predominant environment over the past 12 months (bond prices and interest rates tend to move in opposite directions). |
| | Another detractor from the Fund’s benchmark-relative performance during the period was our effort to manage interest-rate risk in the portfolio through the use of US Treasury futures. The majority of the adverse effect from the use of the futures occurred in the second half of the 12-month period, when interest rates began to take a more uneven path following their steady increase throughout most of 2022. Despite the negative effect on the Fund’s return, that aspect of our investment strategy helped dampen overall portfolio volatility in a time of unusually large swings in the fixed-income market. |
| | The Fund’s positioning with respect to CMBS contributed positively to benchmark-relative performance during the 12-month period, but was a modest detractor in terms of absolute returns. We had identified risks in the office sector due to continued work-from-home trends, rising borrowing costs, and, later in the period, the challenges related to the weakening US regional banking sector. We therefore reduced the Fund’s exposure to the office sector, which helped mitigate the effects of the downturn. However, the Fund’s remaining positions in the sector detracted from benchmark-relative results. |
| | Positioning in ABS was an additional positive for the Fund’s relative returns. The portfolio’s ABS allocation benefited from holdings in the more esoteric, or non-traditional, segments of the category, as well as in securities backed by aircraft collateral. (Non-traditional ABS commonly include debt backed by franchise royalties, single-family rentals, data centers, and aircraft and railcar leases.) In general, we have maintained a preference for investing the Fund in ABS backed by auto loans, given the robust jobs market and the low overall level of consumer debt. |
| | Holdings in collateralized loan obligations (CLOs) were additional positive contributors to the Fund’s benchmark-relative performance for the 12-month period. CLOs fared well over the period, thanks to their floating-rate characteristics, above- |
6Pioneer Securitized Income Fund | Annual Report | 7/31/23
| | average yield spreads, and solid relative value versus corporate bonds with similar ratings. |
| Q | Did the Fund have any exposure to derivative investments during the 12-month period ended July 31, 2023? If so, did the use of derivatives have an effect on performance? |
| A | Yes. As noted above, our use of US Treasury futures in an effort to manage the portfolio’s interest-rate risk detracted from the Fund’s performance for the 12-month period. |
| Q | How would you characterize the Fund’s distributions* to shareholders during the 12-month period ended July 31, 2023? |
| A | The Fund’s monthly distribution rate fluctuated in response to volatility in prevailing yields over the 12-month period, but finished the period higher on July 31, 2023 than it had been 12 months earlier. |
| Q | What is your current view on the securitized market heading into the Fund’s new fiscal year? |
| A | We have positioned the portfolio for a possible slowdown in economic growth, as well as for the growing likelihood, in our view, that the Fed will soon wrap up its long series of interest-rate increases. We have remained focused on investing the Fund in securities backed by collateral in the healthier segments of the economy, while seeking to avoid areas that are under stress. We think the US consumer, in particular, remains an area of relative strength for the securitized market. More broadly speaking, we believe securitized assets have continued to be a source of opportunity, given that yield spreads have remained attractive versus other segments of the fixed-income market. |
| * | Distributions are not guaranteed. |
Pioneer Securitized Income Fund | Annual Report | 7/31/237
Please refer to the Schedule of Investments on pages 17 - 23 for a full listing of Fund securities.
All investments are subject to risk, including the possible loss of principal. In the past several years, financial markets have experienced increased volatility and heightened uncertainty. The market prices of securities may go up or down, sometimes rapidly or unpredictably, due to general market conditions, such as real or perceived adverse economic, political, or regulatory conditions, recessions, inflation, changes in interest or currency rates, lack of liquidity in the bond markets, the spread of infectious illness or other public health issues, armed conflict including Russia's military invasion of Ukraine, sanctions against Russia, other nations or individuals or companies and possible countermeasures, market disruptions caused by tariffs, trade disputes or other government actions, or adverse investor sentiment. These conditions may continue, recur, worsen or spread.
The Fund invests primarily in securitized asset instruments, including mortgage-backed securities, asset-backed securities and other securities.
A substantial portion of the Fund’s assets ordinarily will consist of high yield debt securities that involve substantial risk of loss.
Investments in the Fund are subject to possible loss due to the financial failure of issuers of underlying securities and their inability to meet their debt obligations.
Investments in high yield or lower-rated securities are subject to greater-than-average price volatility, illiquidity and possibility of default. The market price of securities may fluctuate when interest rates change. When interest rates rise, the prices of fixed-income securities in the Fund will generally fall. Conversely, when interest rates fall, the prices of fixed-income securities in the Fund will generally rise.
Until recently, a commonly used reference rate for floating rate securities was LIBOR (London Interbank Offered Rate). Publication of most LIBOR settings has ceased on a representative basis. The impact of the transition from LIBOR on the Fund's transactions and financial markets generally cannot yet be determined.
The value of mortgage-related and asset backed securities will be influenced by factors affecting the real estate market and the assets underlying those securities. These securities are also subject to prepayment and extension risks and risk of default.
The Fund may employ leverage, which increases the volatility of investment returns and subjects the Fund to magnified losses if an underlying investment
8Pioneer Securitized Income Fund | Annual Report | 7/31/23
declines in value. Certain securities and derivatives held by the Fund may be impossible or difficult to purchase, sell or unwind. Such securities may also be difficult to value.
The use of interest rate futures and options and other derivatives can increase fund losses and reduce opportunities for gain. The Fund may invest in credit default swaps, inverse floating rate obligations, and other derivative instruments. Derivatives may have a leveraging effect on the Fund.
The Fund is non-diversified, which means that it can invest a large percentage of its assets in the securities of any one or more issuers. Being non-diversified may magnify the Fund’s losses from adverse events affecting a particular issuer.
Please see a prospectus for a complete discussion of the Fund’s risks.
For more information on this or any Pioneer fund, please visit amundi.com/usinvestors or call 1-800-622-9876. This material must be preceded or accompanied by the Fund's current prospectus or summary prospectus.
Any information in this shareholder report regarding market or economic trends or the factors influencing the Fund’s historical or future performance are statements of opinion as of the date of this report. Past performance is not a guarantee of future results.
Pioneer Securitized Income Fund | Annual Report | 7/31/239
Portfolio Summary | 7/31/23
Sector Distribution
(As a percentage of total investments)*
10 Largest Holdings
| (As a percentage of total investments)* |
| 1. | Freddie Mac STACR Trust, Series 2018-HQA2, Class B2, 16.183% (SOFR30A + 1,111 bps), 10/25/48 (144A) | 2.81% |
| 2. | Santander Bank Auto Credit-Linked Notes, Series 2022-A, Class E, 12.662%, 5/15/32 (144A) | 2.68 |
| 3. | Santander Bank N.A. - SBCLN, Series 2021-1A, Class E, 6.171%, 12/15/31 (144A) | 2.64 |
| 4. | STACR Trust, Series 2018-HRP2, Class B2, 15.683% (SOFR30A + 1,061 bps), 2/25/47 (144A) | 2.60 |
| 5. | Continental Credit Card ABS LLC, Series 2019-1A, Class C, 6.16%, 8/15/26 (144A) | 2.58 |
| 6. | Cascade Funding Mortgage Trust, Series 2018-RM2, Class D, 4.00%, 10/25/68 (144A) | 2.52 |
| 7. | JPMorgan Chase Bank N.A. - CACLN, Series 2021-2, Class F, 4.393%, 12/26/28 (144A) | 2.50 |
| 8. | STACR Trust, Series 2018-HRP2, Class B1, 9.383% (SOFR30A + 431 bps), 2/25/47 (144A) | 2.40 |
| 9. | Arivo Acceptance Auto Loan Receivables Trust, Series 2021-1A, Class D, 5.83%, 1/18/28 (144A) | 2.31 |
| 10. | Freddie Mac STACR Trust, Series 2019-FTR2, Class B1, 8.183% (SOFR30A + 311 bps), 11/25/48 (144A) | 2.20 |
| | |
| * | Excludes short-term investments and all derivative contracts except for options purchased. The Fund is actively managed, and current holdings may be different. The holdings listed should not be considered recommendations to buy or sell any securities. |
10Pioneer Securitized Income Fund | Annual Report | 7/31/23
Prices and Distributions | 7/31/23
Net Asset Value per Share
| Class | 7/31/23 | 7/31/22 |
| A | $9.12 | $9.43 |
| Y | $9.12 | $9.44 |
| | | |
Distributions per Share: 8/1/22 - 7/31/23
| Class | Net
Investment
Income | Short-Term
Capital Gains | Long-Term
Capital Gains |
| A | $0.6335 | $— | $0.1477 |
| Y | $0.6561 | $— | $0.1477 |
Index Definitions
Bloomberg US Securitized MBS/ABS/CMBS Index tracks agency mortgage backed pass-through securities (both fixed-rate and hybrid ARM) guaranteed by Ginnie Mae (GNMA), Fannie Mae (FNMA), and Freddie Mac (FHLMC); investment-grade debt asset-backed securities; and investment-grade commercial mortgage backed securities. The index is constructed by grouping individual pools into aggregates or generics based on program, coupon, and vintage. Indices are unmanaged and their returns assume reinvestment of dividends and do not reflect any fees or expenses. It is not possible to invest directly in an index.
The indices defined here pertains to the “Value of $10,000 Investment” and “Value of $1 Million Investment” charts on pages 12 – 14.
Pioneer Securitized Income Fund | Annual Report | 7/31/2311
| Performance Update | 7/31/23 | Class A Shares |
Investment Returns
The mountain chart on the right shows the change in value of a $10,000 investment made in Class A shares of Pioneer Securitized Income Fund at public offering price during the periods shown, compared to that of the Bloomberg US Securitized MBS/ABS/CMBS Index.*
Average Annual Total Returns
(As of July 31, 2023) |
| Period | Net
Asset
Value
(NAV) | Public
Offering
Price
(POP) | Bloomberg
US
Securitized
MBS/ABS
/CMBS Index |
Life of Class
(7/2/21) | 2.17% | -0.08% | -5.17% |
| 1 Year | 5.36 | 0.67 | -4.50 |
Expense Ratio
(Per prospectus dated December 1, 2022) |
| Gross | Net |
| 1.97% | 0.90% |
Value of $10,000 Investment
*Performance of Class A shares shown in the graph above is from the inception of Class A shares on 7/2/21 through 7/31/23. Index information shown in the graph above is from 7/31/21 through 7/31/23.
Call 1-800-225-6292 or visit www.amundi.com/us for the most recent month-end performance results. Current performancemay be lower or higher than the performance data quoted.
The performance data quoted represents past performance, which is no guarantee of future results. Investment return and principal value will fluctuate, and shares, when redeemed, may be worth more or less than their original cost.
NAV results represent the percent change in net asset value per share. NAV returns would have been lower had sales charges been reflected. POP returns reflect deduction of the maximum 4.50% sales charge. All results are historical and assume the reinvestment of dividends and capital gains. Other share classes are available for which performance and expenses will differ.
Performance results reflect any applicable expense waivers in effect during the periods shown. Without such waivers Fund performance would be lower. Waivers may not be in effect for all funds. Certain fee waivers are contractual through a specified period. Otherwise, fee waivers can be rescinded at any time. See the prospectus and financial statements for more information.
The net expense ratio reflects the contractual expense limitation currently in effect through December 1, 2023. There can be no assurance that Amundi US will extend the expense limitation beyond such time. Please see the prospectus and financial statements for more information.
The performance table and graph do not reflect the deduction of fees and taxes that a shareowner would pay on Fund distributions.
Please refer to the financial highlights for more current expense ratios.
12Pioneer Securitized Income Fund | Annual Report | 7/31/23
| Performance Update | 7/31/23 | Class Y Shares |
Investment Returns
The mountain chart on the right shows the change in value of a $5 million investment made in Class Y shares of Pioneer Securitized Income Fund during the periods shown, compared to that of the Bloomberg US Securitized MBS/ABS/CMBS Index.*
Average Annual Total Returns
(As of July 31, 2023) |
| Period | Net
Asset
Value
(NAV) | Bloomberg
US
Securitized
MBS/ABS
/CMBS Index |
Life of Class
(12/10/19) | 4.38% | -1.99% |
| 1 Year | 5.51 | -4.50 |
Expense Ratio
(Per prospectus dated December 1, 2022) |
| Gross | Net |
| 1.76% | 0.65% |
Value of $5 Million Investment
*Performance of Class Y shares shown in the graph above is from the inception of Class Y shares on 12/10/19 through 7/31/23. Index information shown in the graph above is from 12/31/19 through 7/31/23.
Call 1-800-225-6292 or visit www.amundi.com/us for the most recent month-end performance results. Current performancemay be lower or higher than the performance data quoted.
The performance data quoted represents past performance, which is no guarantee of future results. Investment return and principal value will fluctuate, and shares, when redeemed, may be worth more or less than their original cost.
Class Y shares are not subject to sales charges and are available for limited groups of eligible investors, including institutional investors. All results are historical and assume the reinvestment of dividends and capital gains. Other share classes are available for which performance and expenses will differ.
Performance results reflect any applicable expense waivers in effect during the periods shown. Without such waivers Fund performance would be lower. Waivers may not be in effect for all funds. Certain fee waivers are contractual through a specified period. Otherwise, fee waivers can be rescinded at any time. See the prospectus and financial statements for more information.
The net expense ratio reflects the contractual expense limitation currently in effect through December 1, 2023. There can be no assurance that Amundi US will extend the expense limitation beyond such time. Please see the prospectus and financial statements for more information.
The performance table and graph do not reflect the deduction of fees and taxes that a shareowner would pay on Fund distributions.
The Fund acquired the assets and liabilities of Pioneer Securitized Income Fund (the “Predecessor Fund”) on June 30, 2021 (the “Reorganization”). As a result of the
Pioneer Securitized Income Fund | Annual Report | 7/31/2313
| Performance Update | 7/31/23 | Class Y Shares |
Reorganization, the Predecessor Fund’s performance and financial history became the performance and financial history of the Fund. The performance of Class Y shares of the Fund is the performance of the common shares of the Predecessor Fund for periods prior to the Reorganization, and has not been restated to reflect any differences in expenses.
Please refer to the financial highlights for more current expense ratios.
14Pioneer Securitized Income Fund | Annual Report | 7/31/23
Comparing Ongoing Fund Expenses
As a shareowner in the Fund, you incur two types of costs:
| (1) | ongoing costs, including management fees, distribution and/or service (12b-1) fees, and other Fund expenses; and |
| (2) | transaction costs, including sales charges (loads) on purchase payments. |
This example is intended to help you understand your ongoing expenses (in dollars) of investing in the Fund and to compare these costs with the ongoing costs of investing in other mutual funds. The example is based on an investment of $1,000 at the beginning of the Fund’s latest six-month period and held throughout the six months.
Using the Tables
Actual Expenses
The first table below provides information about actual account values and actual expenses. You may use the information in this table, together with the amount you invested, to estimate the expenses that you paid over the period as follows:
| (1) | Divide your account value by $1,000
Example: an $8,600 account value ÷ $1,000 = 8.6 |
| (2) | Multiply the result in (1) above by the corresponding share class’s number in the third row under the heading entitled “Expenses Paid During Period” to estimate the expenses you paid on your account during this period. |
Expenses Paid on a $1,000 Investment in Pioneer Securitized Income Fund
Based on actual returns from February 1, 2023 through July 31, 2023.
| Share Class | A | Y |
Beginning Account
Value on 2/1/23 | $1,000.00 | $1,000.00 |
Ending Account Value
(after expenses) on 7/31/23 | $1,038.70 | $1,040.00 |
Expenses Paid
During Period* | $4.55 | $3.29 |
| | |
| * | Expenses are equal to the Fund’s annualized expense ratio of 0.90% and 0.65% for Class A and Y shares, respectively, multiplied by the average account value over the period, multiplied by 181/365 (to reflect the partial year period). |
Pioneer Securitized Income Fund | Annual Report | 7/31/2315
Comparing Ongoing Fund Expenses (continued)
Hypothetical Example for Comparison Purposes
The table below provides information about hypothetical account values and hypothetical expenses based on the Fund’s actual expense ratio and an assumed rate of return of 5% per year before expenses, which is not the Fund’s actual return. The hypothetical account values and expenses may not be used to estimate the actual ending account balance or expenses you paid for the period.
You may use this information to compare the ongoing costs of investing in the Fund and other funds. To do so, compare this 5% hypothetical example with the 5% hypothetical examples that appear in the shareholder reports of the other funds.
Please note that the expenses shown in the tables are meant to highlight your ongoing costs only and do not reflect any transaction costs, such as sales charges (loads) that are charged at the time of the transaction. Therefore, the table below is useful in comparing ongoing costs only and will not help you determine the relative total costs of owning different funds. In addition, if these transaction costs were included, your costs would have been higher.
Expenses Paid on a $1,000 Investment in Pioneer Securitized Income Fund
Based on a hypothetical 5% return per year before expenses, reflecting the period from February 1, 2023 through July 31, 2023.
| Share Class | A | Y |
Beginning Account
Value on 2/1/23 | $1,000.00 | $1,000.00 |
Ending Account Value
(after expenses) on 7/31/23 | $1,020.33 | $1,021.57 |
Expenses Paid
During Period* | $4.51 | $3.26 |
| | |
| * | Expenses are equal to the Fund’s annualized expense ratio of 0.90% and 0.65% for Class A and Y shares, respectively, multiplied by the average account value over the period, multiplied by 181/365 (to reflect the partial year period). |
16Pioneer Securitized Income Fund | Annual Report | 7/31/23
Schedule of Investments | 7/31/23
Principal
Amount
USD ($) | | | | | | Value |
| | UNAFFILIATED ISSUERS — 94.2% | |
| | Asset Backed Securities — 47.8% of Net
Assets | |
| 120,000 | AMSR Trust, Series 2022-SFR3, Class E2, 4.00%, 10/17/39 (144A) | $ 103,193 |
| 550,000 | Arivo Acceptance Auto Loan Receivables Trust, Series 2021-1A, Class D, 5.83%, 1/18/28 (144A) | 514,577 |
| 400,000 | Arivo Acceptance Auto Loan Receivables Trust, Series 2022-1A, Class D, 7.38%, 9/17/29 (144A) | 369,488 |
| 200,000 | Arivo Acceptance Auto Loan Receivables Trust, Series 2022-2A, Class C, 9.84%, 3/15/29 (144A) | 205,521 |
| 350,000 | Avid Automobile Receivables Trust, Series 2021-1, Class F, 5.16%, 10/16/28 (144A) | 316,499 |
| 235,000 | BHG Securitization Trust, Series 2023-A, Class B, 6.35%, 4/17/36 (144A) | 231,397 |
| 260,191 | Blackbird Capital Aircraft, Series 2021-1A, Class B, 3.446%, 7/15/46 (144A) | 215,076 |
| 250,000(a) | Clover CLO LLC, Series 2020-1A, Class ER, 11.87% (3 Month Term SOFR + 656 bps), 4/15/34 (144A) | 236,364 |
| 220,896 | Conn's Receivables Funding LLC, Series 2021-A, Class C, 4.59%, 5/15/26 (144A) | 219,196 |
| 600,000 | Continental Credit Card ABS LLC, Series 2019-1A, Class C, 6.16%, 8/15/26 (144A) | 576,018 |
| 200,000 | Continental Finance Credit Card ABS Master Trust, Series 2022-A, Class C, 9.33%, 10/15/30 (144A) | 189,401 |
| 400,000 | Crossroads Asset Trust, Series 2021-A, Class E, 5.48%, 1/20/28 (144A) | 383,537 |
| 62,500 | Diamond Resorts Owner Trust, Series 2019-1A, Class D, 5.25%, 2/20/32 (144A) | 58,850 |
| 200,000 | Exeter Automobile Receivables Trust, Series 2022-5A, Class D, 7.40%, 2/15/29 | 202,493 |
| 500,000 | First Investors Auto Owner Trust, Series 2021-1A, Class F, 5.37%, 4/17/28 (144A) | 458,706 |
| 175,000 | GLS Auto Receivables Issuer Trust, Series 2023-1A, Class D, 7.01%, 1/16/29 (144A) | 176,260 |
| 400,000(a) | GRACIE POINT INTERNATIONAL FUNDING, Series 2022-1A, Class E, 10.815% (SOFR30A + 575 bps), 4/1/24 (144A) | 398,903 |
| 200,000 | HOA Funding LLC - HOA, Series 2021-1A, Class B, 7.432%, 8/20/51 (144A) | 154,462 |
| 300,000(a) | ICG US CLO, Ltd., Series 2016-1A, Class DRR, 13.071% (3 Month Term SOFR + 770 bps), 4/29/34 (144A) | 227,619 |
| 600,000 | JPMorgan Chase Bank N.A. - CACLN, Series 2021-2, Class F, 4.393%, 12/26/28 (144A) | 556,876 |
| 148,937 | Libra Solutions LLC, Series 2022-2A, Class B, 8.85%, 10/15/34 (144A) | 147,634 |
The accompanying notes are an integral part of these financial statements.
Pioneer Securitized Income Fund | Annual Report | 7/31/2317
Schedule of Investments | 7/31/23 (continued)
Principal
Amount
USD ($) | | | | | | Value |
| | Asset Backed Securities — (continued) | |
| 250,000(a) | Madison Park Funding XLV, Ltd., Series 2020-45A, Class ER, 11.92% (3 Month Term SOFR + 661 bps), 7/15/34 (144A) | $ 226,841 |
| 210,000 | NMEF Funding LLC, Series 2022-B, Class C, 8.54%, 6/15/29 (144A) | 209,323 |
| 250,000(a) | Ocean Trails CLO IX, Series 2020-9A, Class ER, 13.02% (3 Month Term SOFR + 771 bps), 10/15/34 (144A) | 219,901 |
| 270,000 | Octane Receivables Trust, Series 2022-2A, Class D, 7.70%, 2/20/30 (144A) | 269,460 |
| 135,000 | Octane Receivables Trust, Series 2023-1A, Class D, 7.76%, 3/20/30 (144A) | 134,840 |
| 302,110 | Oportun Funding XIV LLC, Series 2021-A, Class C, 3.44%, 3/8/28 (144A) | 290,474 |
| 311,108 | Pagaya AI Debt Trust, Series 2023-1, Class A, 7.556%, 7/15/30 (144A) | 311,470 |
| 94,827 | Pagaya AI Debt Trust, Series 2023-3, Class A, 7.60%, 12/16/30 (144A) | 94,995 |
| 400,000 | Pawneee Equipment Receivables Series LLC, Series 2021-1, Class E, 5.21%, 5/15/28 (144A) | 359,419 |
| 200,000 | Progress Residential Trust, Series 2021-SFR8, Class G, 4.005%, 10/17/38 (144A) | 170,156 |
| 100,000 | Progress Residential Trust, Series 2021-SFR9, Class F, 4.053%, 11/17/40 (144A) | 81,820 |
| 650,000 | Santander Bank Auto Credit-Linked Notes, Series 2022-A, Class E, 12.662%, 5/15/32 (144A) | 597,532 |
| 700,000 | Santander Bank N.A. - SBCLN, Series 2021-1A, Class E, 6.171%, 12/15/31 (144A) | 589,145 |
| 500,000 | Tricolor Auto Securitization Trust, Series 2021-1A, Class F, 5.08%, 5/15/28 (144A) | 475,155 |
| 500,000 | Tricolor Auto Securitization Trust, Series 2022-1A, Class F, 9.80%, 7/16/29 (144A) | 479,751 |
| 350,000 | Tricon American Homes Trust, Series 2017-SFR2, Class F, 5.104%, 1/17/36 (144A) | 345,376 |
| 330,000 | Westlake Automobile Receivables Trust, Series 2023-1A, Class D, 6.79%, 11/15/28 (144A) | 329,441 |
| 175,000 | Westlake Automobile Receivables Trust, Series 2023-2A, Class D, 7.01%, 11/15/28 (144A) | 174,831 |
| | Total Asset Backed Securities
(Cost $12,044,988) | $11,302,000 |
|
|
| | Collateralized Mortgage
Obligations—33.3% of Net Assets | |
| 206,000(a) | Bellemeade Re, Ltd., Series 2021-3A, Class B1, 8.919% (SOFR30A + 385 bps), 9/25/31 (144A) | $ 198,469 |
| 600,895(b) | Cascade Funding Mortgage Trust, Series 2018-RM2, Class D, 4.00%, 10/25/68 (144A) | 560,590 |
The accompanying notes are an integral part of these financial statements.
18Pioneer Securitized Income Fund | Annual Report | 7/31/23
Principal
Amount
USD ($) | | | | | | Value |
| | Collateralized Mortgage
Obligations—(continued) | |
| 200,000(b) | CFMT LLC, Series 2023-HB12, Class M3, 4.25%, 4/25/33 (144A) | $ 158,416 |
| 140,000(a) | Connecticut Avenue Securities Trust, Series 2023-R06, Class 1M1, 6.769% (SOFR30A + 170 bps), 7/25/43 (144A) | 140,350 |
| 290,000(a) | Eagle Re, Ltd., Series 2021-2, Class M2, 9.319% (SOFR30A + 425 bps), 4/25/34 (144A) | 294,431 |
| 85,786(b) | FARM 21-1 Mortgage Trust, Series 2021-1, Class B, 3.237%, 7/25/51 (144A) | 58,966 |
| 6,294,102(b)(c) | Flagstar Mortgage Trust, Series 2021-4, Class AX1, 0.206%, 6/1/51 (144A) | 65,710 |
| 150,000(a) | Freddie Mac STACR REMIC Trust, Series 2020-DNA3, Class B2, 14.533% (SOFR30A + 946 bps), 6/25/50 (144A) | 188,264 |
| 500,000(a) | Freddie Mac STACR Trust, Series 2018-HQA2, Class B2, 16.183% (SOFR30A + 1,111 bps), 10/25/48 (144A) | 625,858 |
| 434,000(a) | Freddie Mac STACR Trust, Series 2019-DNA3, Class B2, 13.333% (SOFR30A + 826 bps), 7/25/49 (144A) | 478,864 |
| 500,000(a) | Freddie Mac STACR Trust, Series 2019-FTR2, Class B1, 8.183% (SOFR30A + 311 bps), 11/25/48 (144A) | 490,006 |
| 400,000(a) | Freddie Mac STACR Trust, Series 2019-FTR3, Class B2, 9.95% (SOFR30A + 491 bps), 9/25/47 (144A) | 388,095 |
| 330,000(a) | Freddie Mac Structured Agency Credit Risk Debt Notes, Series 2023-HQA2, Class M1B, 8.419% (SOFR30A + 335 bps), 6/25/43 (144A) | 337,857 |
| 110,000(b) | GCAT Trust, Series 2021-CM1, Class M1, 2.276%, 4/25/65 (144A) | 86,046 |
| 200,000(b) | GS Mortgage-Backed Securities Trust, Series 2020-NQM1, Class B1, 5.143%, 9/27/60 (144A) | 161,902 |
| 300,000(a) | Home Re, Ltd., Series 2020-1, Class B1, 12.412% (1 Month USD LIBOR + 700 bps), 10/25/30 (144A) | 306,814 |
| 500,000(a) | Home Re, Ltd., Series 2021-2, Class B1, 9.219% (SOFR30A + 415 bps), 1/25/34 (144A) | 480,845 |
| 175,000(a) | Home Re, Ltd., Series 2022-1, Class B1, 14.069% (SOFR30A + 900 bps), 10/25/34 (144A) | 185,786 |
| 4,150,598(b)(c) | Hundred Acre Wood Trust, Series 2021-INV1, Class AX1, 0.225%, 7/25/51 (144A) | 44,612 |
| 205,000(b) | Imperial Fund Mortgage Trust, Series 2021-NQM2, Class B2, 4.302%, 9/25/56 (144A) | 128,610 |
| 8,117,864(b)(c) | JP Morgan Mortgage Trust, Series 2021-10, Class AX1, 0.122%, 12/25/51 (144A) | 48,949 |
| 6,981,308(b)(c) | JP Morgan Mortgage Trust, Series 2021-8, Class AX1, 0.122%, 12/25/51 (144A) | 39,535 |
The accompanying notes are an integral part of these financial statements.
Pioneer Securitized Income Fund | Annual Report | 7/31/2319
Schedule of Investments | 7/31/23 (continued)
Principal
Amount
USD ($) | | | | | | Value |
| | Collateralized Mortgage
Obligations—(continued) | |
| 150,000(a) | Oaktown Re VII, Ltd., Series 2021-2, Class B1, 9.469% (SOFR30A + 440 bps), 4/25/34 (144A) | $ 150,470 |
| 260,000(a)(d) | Radnor Re, Ltd., Series 2023-1, Class M1A, 7.767% (SOFR30A + 270 bps), 7/25/33 (144A) | 260,000 |
| 150,000(a)(d) | Radnor Re, Ltd., Series 2023-1, Class M1B, 9.417% (SOFR30A + 435 bps), 7/25/33 (144A) | 150,000 |
| 450,000(b) | RMF Buyout Issuance Trust, Series 2022-HB1, Class M5, 4.50%, 4/25/32 (144A) | 50,063 |
| 218,709(b) | Seasoned Credit Risk Transfer Trust, Series 2018-1, Class M, 4.75%, 5/25/57 | 200,735 |
| 150,000(b) | Seasoned Credit Risk Transfer Trust, Series 2019-3, Class M, 4.75%, 10/25/58 | 134,766 |
| 500,000(a) | STACR Trust, Series 2018-HRP2, Class B1, 9.383% (SOFR30A + 431 bps), 2/25/47 (144A) | 533,883 |
| 500,000(a) | STACR Trust, Series 2018-HRP2, Class B2, 15.683% (SOFR30A + 1,061 bps), 2/25/47 (144A) | 578,580 |
| 150,000(a) | Triangle Re, Ltd., Series 2021-3, Class B1, 10.019% (SOFR30A + 495 bps), 2/25/34 (144A) | 145,254 |
| 200,000(a) | Triangle Re, Ltd., Series 2021-3, Class M2, 8.819% (SOFR30A + 375 bps), 2/25/34 (144A) | 198,767 |
| | Total Collateralized Mortgage Obligations
(Cost $8,284,139) | $7,871,493 |
|
|
| | Commercial Mortgage-Backed
Securities—12.6% of Net Assets | |
| 500,000(b) | COMM Mortgage Trust, Series 2020-CBM, Class F, 3.633%, 2/10/37 (144A) | $ 441,800 |
| 250,000(a) | Freddie Mac Multifamily Structured Credit Risk, Series 2021-MN1, Class B1, 12.819% (SOFR30A + 775 bps), 1/25/51 (144A) | 239,122 |
| 250,000(a) | Freddie Mac Multifamily Structured Credit Risk, Series 2021-MN3, Class B1, 11.919% (SOFR30A + 685 bps), 11/25/51 (144A) | 226,875 |
| 250,000(a) | Freddie Mac Multifamily Structured Credit Risk, Series 2021-MN3, Class M2, 9.069% (SOFR30A + 400 bps), 11/25/51 (144A) | 234,647 |
| 250,000(a) | MF1 Multifamily Housing Mortgage Loan Trust, Series 2021-FL5, Class D, 7.836% (1 Month Term SOFR + 261 bps), 7/15/36 (144A) | 237,330 |
| 500,000(a) | Multifamily Connecticut Avenue Securities Trust, Series 2020-01, Class M10, 8.933% (SOFR30A + 386 bps), 3/25/50 (144A) | 480,810 |
| 500,000(b) | Natixis Commercial Mortgage Securities Trust, Series 2019-FAME, Class E, 4.398%, 8/15/36 (144A) | 261,545 |
The accompanying notes are an integral part of these financial statements.
20Pioneer Securitized Income Fund | Annual Report | 7/31/23
Principal
Amount
USD ($) | | | | | | Value |
| | Commercial Mortgage-Backed
Securities—(continued) | |
| 500,000(a) | Natixis Commercial Mortgage Securities Trust, Series 2019-MILE, Class E, 8.801% (1 Month Term SOFR + 358 bps), 7/15/36 (144A) | $ 360,071 |
| 260,000(a) | Ready Capital Mortgage Financing LLC, Series 2021-FL6, Class AS, 6.612% (1 Month Term SOFR + 131 bps), 7/25/36 (144A) | 250,426 |
| 343,384(b) | Velocity Commercial Capital Loan Trust, Series 2020-1, Class M5, 4.29%, 2/25/50 (144A) | 256,861 |
| | Total Commercial Mortgage-Backed Securities
(Cost $3,389,342) | $2,989,487 |
|
|
| | Corporate Bonds — 0.5% of Net Assets | |
| | Airlines — 0.5% | |
| 77,896 | British Airways 2020-1 Class B Pass Through Trust, 8.375%, 11/15/28 (144A) | $ 78,535 |
| 50,427 | United Airlines 2020-1 Class B Pass Through Trust, 4.875%, 1/15/26 | 48,672 |
| | Total Airlines | $127,207 |
|
|
| | Total Corporate Bonds
(Cost $128,323) | $127,207 |
|
|
| | TOTAL INVESTMENTS IN UNAFFILIATED ISSUERS — 94.2%
(Cost $23,846,792) | $22,290,187 |
| | OTHER ASSETS AND LIABILITIES — 5.8% | $ 1,370,797 |
| | net assets — 100.0% | $23,660,984 |
| | | | | | | |
| bps | Basis Points. |
| LIBOR | London Interbank Offered Rate. |
| SOFR | Secured Overnight Financing Rate. |
| SOFR30A | Secured Overnight Financing Rate 30 Day Average. |
| (144A) | The resale of such security is exempt from registration under Rule 144A of the Securities Act of 1933. Such securities may be resold normally to qualified institutional buyers. At July 31, 2023, the value of these securities amounted to $21,703,521, or 91.7% of net assets. |
| (a) | Floating rate note. Coupon rate, reference index and spread shown at July 31, 2023. |
| (b) | The interest rate is subject to change periodically. The interest rate and/or reference index and spread shown at July 31, 2023. |
| (c) | Security represents the interest-only portion payments on a pool of underlying mortgages or mortgage-backed securities. |
The accompanying notes are an integral part of these financial statements.
Pioneer Securitized Income Fund | Annual Report | 7/31/2321
Schedule of Investments | 7/31/23 (continued)
| (d) | Securities purchased on a when-issued basis. Rates do not take effect until settlement date. |
FUTURES CONTRACTS
FIXED INCOME INDEX FUTURES CONTRACTS
Number of
Contracts
Long | Description | Expiration
Date | Notional
Amount | Market
Value | Unrealized
(Depreciation) |
| 20 | U.S. 5 Year Note (CBT) | 9/29/23 | $2,181,648 | $2,136,406 | $ (45,242) |
| 45 | U.S. 10 Year Note (CBT) | 9/20/23 | 5,138,353 | 5,013,281 | (125,072) |
| | | | $7,320,001 | $7,149,687 | $ (170,314) |
| TOTAL FUTURES CONTRACTS | $ 7,320,001 | $7,149,687 | $(170,314) |
Purchases and sales of securities (excluding short-term investments) for the year ended July 31, 2023, aggregated $9,008,485 and $11,503,838, respectively.
At July 31, 2023, the net unrealized depreciation on investments based on cost for federal tax purposes of $23,676,478 was as follows:
| Aggregate gross unrealized appreciation for all investments in which there is an excess of value over tax cost | $ 386,173 |
| Aggregate gross unrealized depreciation for all investments in which there is an excess of tax cost over value | (1,942,778) |
| Net unrealized depreciation | $(1,556,605) |
The accompanying notes are an integral part of these financial statements.
22Pioneer Securitized Income Fund | Annual Report | 7/31/23
Various inputs are used in determining the value of the Fund's investments. These inputs are summarized in the three broad levels below.
| Level 1 | – | unadjusted quoted prices in active markets for identical securities. |
| Level 2 | – | other significant observable inputs (including quoted prices for similar securities, interest rates, prepayment speeds, credit risks, etc.). See Notes to Financial Statements — Note 1A. |
| Level 3 | – | significant unobservable inputs (including the Adviser's own assumptions in determining fair value of investments). See Notes to Financial Statements — Note 1A. |
The following is a summary of the inputs used as of July 31, 2023, in valuing the Fund's investments:
| | Level 1 | Level 2 | Level 3 | Total |
| Asset Backed Securities | $ — | $11,302,000 | $— | $11,302,000 |
| Collateralized Mortgage Obligations | — | 7,871,493 | — | 7,871,493 |
| Commercial Mortgage-Backed Securities | — | 2,989,487 | — | 2,989,487 |
| Corporate Bonds | — | 127,207 | — | 127,207 |
| Total Investments in Securities | $ — | $ 22,290,187 | $ — | $ 22,290,187 |
| Other Financial Instruments | | | | |
| Net unrealized depreciation on futures contracts | $(170,314) | $ — | $— | $ (170,314) |
| Total Other Financial Instruments | $ (170,314) | $ — | $ — | $ (170,314) |
During the year ended July 31, 2023, there were no transfers in or out of Level 3.
The accompanying notes are an integral part of these financial statements.
Pioneer Securitized Income Fund | Annual Report | 7/31/2323
Statement of Assets and Liabilities | 7/31/23
| ASSETS: | |
| Investments in unaffiliated issuers, at value (cost $23,846,792) | $22,290,187 |
| Cash | 1,671,282 |
| Futures collateral | 166,535 |
| Variation margin for futures contracts | 4,063 |
| Receivables — | |
| Fund shares sold | 13,473 |
| Interest | 86,649 |
| Due from the Adviser | 3,280 |
| Other assets | 19,365 |
| Total assets | $24,254,834 |
| LIABILITIES: | |
| Payables — | |
| Investment securities purchased | $ 414,063 |
| Fund shares repurchased | 5,753 |
| Distributions | 41,054 |
| Trustees' fees | 570 |
| Professional fees | 108,531 |
| Management fees | 1,773 |
| Distribution fees | 72 |
| Accrued expenses | 22,034 |
| Total liabilities | $ 593,850 |
| NET ASSETS: | |
| Paid-in capital | $25,863,889 |
| Distributable earnings (loss) | (2,202,905) |
| Net assets | $ 23,660,984 |
| NET ASSET VALUE PER SHARE: | |
| No par value (unlimited number of shares authorized) | |
| Class A (based on $2,127,437/233,369 shares) | $ 9.12 |
| Class Y (based on $21,533,547/2,360,960 shares) | $ 9.12 |
| MAXIMUM OFFERING PRICE PER SHARE: | |
| Class A (based on $9.12 net asset value per share/100%-4.50% maximum sales charge) | $ 9.55 |
The accompanying notes are an integral part of these financial statements.
24Pioneer Securitized Income Fund | Annual Report | 7/31/23
Statement of Operations FOR THE YEAR ENDED 7/31/23
| INVESTMENT INCOME: | | |
| Interest from unaffiliated issuers | $2,025,977 | |
| Dividends from unaffiliated issuers | 47,256 | |
| Total Investment Income | | $ 2,073,233 |
| EXPENSES: | | |
| Management fees | $ 141,805 | |
| Administrative expenses | 16,676 | |
| Transfer agent fees | | |
| Class A | 61 | |
| Class Y | 4,905 | |
| Distribution fees | | |
| Class A | 5,113 | |
| Shareowner communications expense | 2,316 | |
| Custodian fees | 443 | |
| Registration fees | 49,264 | |
| Professional fees | 168,145 | |
| Printing expense | 26,478 | |
| Officers' and Trustees' fees | 8,073 | |
| Insurance expense | 293 | |
| Miscellaneous | 5,003 | |
| Total expenses | | $ 428,575 |
| Less fees waived and expenses reimbursed by the Adviser | | (255,824) |
| Net expenses | | $ 172,751 |
| Net investment income | | $ 1,900,482 |
| REALIZED AND UNREALIZED GAIN (LOSS) ON INVESTMENTS: | | |
| Net realized gain (loss) on: | | |
| Investments in unaffiliated issuers | $ (389,751) | |
| Futures contracts | (132,207) | $ (521,958) |
| Change in net unrealized appreciation (depreciation) on: | | |
| Investments in unaffiliated issuers | $ 159,178 | |
| Futures contracts | (170,314) | $ (11,136) |
| Net realized and unrealized gain (loss) on investments | | $ (533,094) |
| Net increase in net assets resulting from operations | | $1,367,388 |
The accompanying notes are an integral part of these financial statements.
Pioneer Securitized Income Fund | Annual Report | 7/31/2325
Statement of Changes in Net Assets
| | Year
Ended
7/31/23 | Year
Ended
7/31/22 |
| FROM OPERATIONS: | | |
| Net investment income (loss) | $ 1,900,482 | $ 1,191,702 |
| Net realized gain (loss) on investments | (521,958) | 530,591 |
| Change in net unrealized appreciation (depreciation) on investments | (11,136) | (1,976,260) |
| Net increase (decrease) in net assets resulting from operations | $ 1,367,388 | $ (253,967) |
| DISTRIBUTIONS TO SHAREOWNERS: | | |
| Class A ($0.78 and $0.58 per share, respectively) | $ (174,407) | $ (120,348) |
| Class Y ($0.81 and $0.61 per share, respectively) | (2,103,313) | (1,382,353) |
| Total distributions to shareowners | $ (2,277,720) | $ (1,502,701) |
| FROM FUND SHARE TRANSACTIONS: | | |
| Net proceeds from sales of shares | $ 3,189,419 | $ 6,590,992 |
| Reinvestment of distributions | 1,844,746 | 1,399,934 |
| Cost of shares repurchased | (6,921,356) | (1,763,070) |
| Net increase (decrease) in net assets resulting from Fund share transactions | $ (1,887,191) | $ 6,227,856 |
| Net increase (decrease) in net assets | $ (2,797,523) | $ 4,471,188 |
| NET ASSETS: | | |
| Beginning of year | $26,458,507 | $21,987,319 |
| End of year | $ 23,660,984 | $26,458,507 |
| | Year
Ended
7/31/23
Shares | Year
Ended
7/31/23
Amount | Year
Ended
7/31/22
Shares | Year
Ended
7/31/22
Amount |
| Class A | | | | |
| Shares sold | 2,560 | $ 23,158 | 2,303 | $ 22,392 |
| Reinvestment of distributions | 17,642 | 160,249 | 12,248 | 120,139 |
| Less shares repurchased | (2,128) | (19,031) | — | — |
| Net increase | 18,074 | $ 164,376 | 14,551 | $ 142,531 |
| Class Y | | | | |
| Shares sold | 347,347 | $ 3,166,261 | 669,318 | $ 6,568,600 |
| Reinvestment of distributions | 185,375 | 1,684,497 | 130,490 | 1,279,795 |
| Less shares repurchased | (760,712) | (6,902,325) | (184,428) | (1,763,070) |
Net increase
(decrease) | (227,990) | $(2,051,567) | 615,380 | $ 6,085,325 |
The accompanying notes are an integral part of these financial statements.
26Pioneer Securitized Income Fund | Annual Report | 7/31/23
| | Year
Ended
7/31/23 | Year
Ended
7/31/22 | 7/2/21 to
7/31/21* |
| Class A | | | |
| Net asset value, beginning of period | $ 9.43 | $10.11 | $10.12 |
| Increase (decrease) from investment operations: | | | |
| Net investment income (loss) (a) | $ 0.66 | $ 0.45 | $ 0.04 |
| Net realized and unrealized gain (loss) on investments | (0.19) | (0.55) | (0.01) |
| Net increase (decrease) from investment operations | $ 0.47 | $ (0.10) | $ 0.03 |
| Distributions to shareowners: | | | |
| Net investment income | $ (0.63) | $ (0.45) | $ (0.04) |
| Net realized gain | (0.15) | (0.13) | — |
| Total distributions | $ (0.78) | $ (0.58) | $ (0.04) |
| Net increase (decrease) in net asset value | $ (0.31) | $ (0.68) | $ (0.01) |
| Net asset value, end of period | $ 9.12 | $ 9.43 | $10.11 |
| Total return (b) | 5.36% | (1.03)% | 0.27%(c) |
| Ratio of net expenses to average net assets | 0.90% | 0.88% | 0.90%(d) |
| Ratio of net investment income (loss) to average net assets | 7.19% | 4.58% | 4.56%(d) |
| Portfolio turnover rate | 38% | 36% | 59%(c) |
| Net assets, end of period (in thousands) | $2,127 | $2,031 | $2,029 |
| Ratios with no waiver of fees and assumption of expenses by the Adviser and no reduction for fees paid indirectly: | | | |
| Total expenses to average net assets | 1.87% | 1.97% | 5.42%(d) |
| Net investment income (loss) to average net assets | 6.22% | 3.49% | 0.04%(d) |
| * | Class A commenced operations on July 2, 2021. |
| (a) | The per-share data presented above is based on the average shares outstanding for the period presented. |
| (b) | Assumes initial investment at net asset value at the beginning of each period, reinvestment of all distributions, the complete redemption of the investment at net asset value at the end of each period and no sales charges. Total return would be reduced if sales charges were taken into account. |
| (c) | Not annualized. |
| (d) | Annualized. |
The accompanying notes are an integral part of these financial statements.
Pioneer Securitized Income Fund | Annual Report | 7/31/2327
Financial Highlights (continued)
| | Year
Ended
7/31/23 | Year
Ended
7/31/22 | Year
Ended
7/31/21 | 12/10/19 to
7/31/20* |
| Class Y | | | | |
| Net asset value, beginning of period | $ 9.44 | $ 10.11 | $ 8.67 | $ 10.00 |
| Increase (decrease) from investment operations: | | | | |
| Net investment income (loss) (a) | $ 0.67 | $ 0.48 | $ 0.45 | $ 0.28 |
| Net realized and unrealized gain (loss) on investments | (0.18) | (0.54) | 1.60 | (1.33) |
| Net increase (decrease) from investment operations | $ 0.49 | $ (0.06) | $ 2.05 | $ (1.05) |
| Distributions to shareowners: | | | | |
| Net investment income | $ (0.66) | $ (0.48) | $ (0.45) | $ (0.28) |
| Net realized gain | (0.15) | (0.13) | (0.16) | — |
| Total distributions | $ (0.81) | $ (0.61) | $ (0.61) | $ (0.28) |
| Net increase (decrease) in net asset value | $ (0.32) | $ (0.67) | $ 1.44 | $ (1.33) |
| Net asset value, end of period | $ 9.12 | $ 9.44 | $ 10.11 | $ 8.67 |
| Total return (b) | 5.51% | (0.68)% | 24.32% | (10.30)%(c) |
| Ratio of net expenses to average net assets | 0.65% | 0.65% | 0.96% | 0.99%(d) |
| Ratio of net investment income (loss) to average net assets | 7.39% | 4.88% | 4.69% | 5.06%(d) |
| Portfolio turnover rate | 38% | 36% | 59% | 82%(c) |
| Net assets, end of period (in thousands) | $21,534 | $24,428 | $19,958 | $17,656 |
| Ratios with no waiver of fees and assumption of expenses by the Adviser and no reduction for fees paid indirectly: | | | | |
| Total expenses to average net assets | 1.64% | 1.76% | 2.50% | 2.62%(d) |
| Net investment income (loss) to average net assets | 6.40% | 3.77% | 3.15% | 3.43%(d) |
| * | Class Y commenced operations on December 10, 2019. |
| (a) | The per-share data presented above is based on the average shares outstanding for the period presented. |
| (b) | Assumes initial investment at net asset value at the beginning of each period, reinvestment of all distributions and the complete redemption of the investment at net asset value at the end of each period. |
| (c) | Not annualized. |
| (d) | Annualized. |
The accompanying notes are an integral part of these financial statements.
28Pioneer Securitized Income Fund | Annual Report | 7/31/23
Notes to Financial Statements | 7/31/23
1. Organization and Significant Accounting Policies
Pioneer Securitized Income Fund (the “Fund”) is one of four portfolios comprising Pioneer Series Trust IV (the "Trust"), a Delaware statutory trust. The Fund is registered under the Investment Company Act of 1940, as amended (the “1940 Act”) as a non-diversified, open-end management investment company. The Fund, which commenced operations on June 30, 2021, is the successor to Pioneer Securitized Income Fund, a closed-end interval fund (the “Predecessor Fund”). The Predecessor Fund transferred all of the net assets of common shares of the Predecessor Fund in exchange for Class Y shares of the Fund on June 30, 2021, in a one-to-one exchange ratio, pursuant to an agreement and plan of reorganization (the “Reorganization”) approved by the Board of Trustees of the Fund and the Predecessor Fund and by the majority shareholder of the Predecessor Fund. Accordingly, the Reorganization, which was a tax-free event to shareholders, had no effect on the Fund’s operations. As a result of the Reorganization, the Fund is the accounting successor of the Predecessor Fund, and as such, the financial statements, and financial highlights for Class Y shares, reflect the financial information of the Predecessor Fund through June 30, 2021. The investment objective of the Fund is total return.
The Fund offers four classes of shares designated as Class A, Class C, Class K and Class Y shares. As noted above, all of the net assets of common shares of the Predecessor Fund, which commenced operations on December 10, 2019, were transferred in exchange for Class Y shares of the Fund on June 30, 2021. Class A shares commenced operations on July 2, 2021. Class C and Class K shares had not commenced operations as of July 31, 2023. Each class of shares represents an interest in the same portfolio of investments of the Fund and has identical rights (based on relative net asset values) to assets and liquidation proceeds. Share classes can bear different rates of class-specific fees and expenses, such as transfer agent and distribution fees. Differences in class-specific fees and expenses will result in differences in net investment income and, therefore, the payment of different dividends from net investment income earned by each class. The Amended and Restated Declaration of Trust of the Trust gives the Board of Trustees the flexibility to specify either per-share voting or dollar-weighted voting when submitting matters for shareowner approval. Under per-share voting, each share of a class of the Fund is entitled to one vote. Under dollar-weighted voting, a shareowner’s voting power is determined not by the number of shares owned, but by the dollar value of the shares on the record date. Each share class has exclusive voting rights
Pioneer Securitized Income Fund | Annual Report | 7/31/2329
with respect to matters affecting only that class, including with respect to the distribution plan for that class. There is no distribution plan for Class K or Class Y shares.
Amundi Asset Management US, Inc., an indirect, wholly owned subsidiary of Amundi and Amundi’s wholly owned subsidiary, Amundi USA, Inc., serves as the Fund’s investment adviser (the “Adviser”). Amundi Distributor US, Inc., an affiliate of the Adviser, serves as the Fund’s distributor (the “Distributor”).
In March 2020, FASB issued an Accounting Standard Update, ASU 2020-04, Reference Rate Reform (Topic 848) — Facilitation of the Effects of Reference Rate Reform on Financial Reporting (“ASU 2020-04”), which provides optional, temporary relief with respect to the financial reporting of contracts subject to certain types of modifications due to the planned discontinuation of the London Interbank Offered Rate (“LIBOR”) and other LIBOR-based reference rates at the end of 2021. The temporary relief provided by ASU 2020-04 is effective for certain reference rate-related contract modifications that occur during the period from March 12, 2020 through December 31, 2023. Management is evaluating the impact of ASU 2020-04 on the Fund's investments, derivatives, debt and other contracts, if applicable, that will undergo reference rate-related modifications as a result of the reference rate reform.
The Fund is required to comply with Rule 18f-4 under the 1940 Act, which governs the use of derivatives by registered investment companies. Rule 18f-4 permits funds to enter into derivatives transactions (as defined in Rule 18f-4) and certain other transactions notwithstanding the restrictions on the issuance of “senior securities” under Section 18 of the 1940 Act. In accordance with Rule 18f-4, the Fund has established and maintains a comprehensive derivatives risk management program, has appointed a derivatives risk manager and complies with a relative or absolute limit on fund leverage risk calculated based on value-at-risk ("VaR").
The Fund is an investment company and follows investment company accounting and reporting guidance under U.S. Generally Accepted Accounting Principles (“U.S. GAAP”). U.S. GAAP requires the management of the Fund to make estimates and assumptions that affect the reported amounts of assets and liabilities, the disclosure of contingent assets and liabilities at the date of the financial statements, and the reported amounts of income, expenses and gain or loss on investments during the reporting period. Actual results could differ from those estimates.
The following is a summary of significant accounting policies followed by the Fund in the preparation of its financial statements:
30Pioneer Securitized Income Fund | Annual Report | 7/31/23
| A. | Security Valuation |
| | The net asset value of the Fund is computed once daily, on each day the New York Stock Exchange (“NYSE”) is open, as of the close of regular trading on the NYSE. |
| | Fixed-income securities are valued by using prices supplied by independent pricing services, which consider such factors as market prices, market events, quotations from one or more brokers, Treasury spreads, yields, maturities and ratings, or may use a pricing matrix or other fair value methods or techniques to provide an estimated value of the security or instrument. A pricing matrix is a means of valuing a debt security on the basis of current market prices for other debt securities, historical trading patterns in the market for fixed-income securities and/or other factors. Non-U.S. debt securities that are listed on an exchange will be valued at the bid price obtained from an independent third party pricing service. When independent third party pricing services are unable to supply prices, or when prices or market quotations are considered to be unreliable, the value of that security may be determined using quotations from one or more broker-dealers. |
| | Futures contracts are generally valued at the closing settlement price established by the exchange on which they are traded. |
| | Shares of open-end registered investment companies (including money market mutual funds) are valued at such funds’ net asset value. |
| | Securities or loan interests for which independent pricing services or broker-dealers are unable to supply prices or for which market prices and/or quotations are not readily available or are considered to be unreliable are valued by a fair valuation team comprised of certain personnel of the Adviser. The Adviser is designated as the valuation designee for the Fund pursuant to Rule 2a-5 under the 1940 Act. The Adviser’s fair valuation team is responsible for monitoring developments that may impact fair valued securities. |
| | Inputs used when applying fair value methods to value a security may include credit ratings, the financial condition of the company, current market conditions and comparable securities. The Fund may use fair value methods if it is determined that a significant event has occurred after the close of the exchange or market on which the security trades and prior to the determination of the Fund's net asset value. Examples of a significant event might include political or economic news, corporate restructurings, natural disasters, terrorist activity or trading halts. Thus, the valuation of the Fund's securities may differ significantly from exchange prices, and such differences could be material. |
Pioneer Securitized Income Fund | Annual Report | 7/31/2331
| B. | Investment Income and Transactions |
| | Interest income, including interest on income-bearing cash accounts, is recorded on the accrual basis. Dividend and interest income are reported net of unrecoverable foreign taxes withheld at the applicable country rates and net of income accrued on defaulted securities. |
| | Interest and dividend income payable by delivery of additional shares is reclassified as PIK (payment-in-kind) income upon receipt and is included in interest and dividend income, respectively. |
| | Principal amounts of mortgage-backed securities are adjusted for monthly paydowns. Premiums and discounts related to certain mortgage-backed securities are amortized or accreted in proportion to the monthly paydowns. All discounts/premiums on purchase prices of debt securities are accreted/amortized for financial reporting purposes over the life of the respective securities, and such accretion/amortization is included in interest income. |
| | Security transactions are recorded as of trade date. Gains and losses on sales of investments are calculated on the identified cost method for both financial reporting and federal income tax purposes. |
| C. | Federal Income Taxes |
| | It is the Fund's policy to comply with the requirements of the Internal Revenue Code applicable to regulated investment companies and to distribute all of its net taxable income and net realized capital gains, if any, to its shareowners. Therefore, no provision for federal income taxes is required. As of July 31, 2023, the Fund did not accrue any interest or penalties with respect to uncertain tax positions, which, if applicable, would be recorded as an income tax expense on the Statement of Operations. Tax returns filed within the prior three years remain subject to examination by federal and state tax authorities. |
| | The amount and character of income and capital gain distributions to shareowners are determined in accordance with federal income tax rules, which may differ from U.S. GAAP. Distributions in excess of net investment income or net realized gains are temporary over distributions for financial statement purposes resulting from differences in the recognition or classification of income or distributions for financial statement and tax purposes. Capital accounts within the financial statements are adjusted for permanent book/tax differences to reflect tax character, but are not adjusted for temporary differences. |
| | At July 31, 2023, the Fund was permitted to carry forward indefinitely $210,164 of short-term losses and $459,507 of long-term losses. |
32Pioneer Securitized Income Fund | Annual Report | 7/31/23
| | The tax character of distributions paid during the years ended July 31, 2023 and July 31, 2022, was as follows: |
| | 2023 | 2022 |
| Distributions paid from: | �� | |
| Ordinary income | $1,849,272 | $1,419,855 |
| Long-term capital gains | 428,448 | 82,846 |
| Total | $2,277,720 | $1,502,701 |
The following shows the components of distributable earnings (losses) on a federal income tax basis at July 31, 2023:
| | 2023 |
| Distributable earnings/(losses): | |
| Undistributed ordinary income | $ 64,425 |
| Capital loss carryforward | (669,671) |
| Other book/tax temporary differences | (41,054) |
| Net unrealized depreciation | (1,556,605) |
| Total | $(2,202,905) |
The difference between book-basis and tax-basis net unrealized depreciation is attributable to the mark to market of futures contracts.
| D. | Fund Shares |
| | The Fund records sales and repurchases of its shares as of trade date. The Distributor earned $0 in underwriting commissions on the sale of Class A shares during the year ended July 31, 2023. |
| E. | Class Allocations |
| | Income, common expenses and realized and unrealized gains and losses are calculated at the Fund level and allocated daily to each class of shares based on its respective percentage of adjusted net assets at the beginning of the day. |
| | Distribution fees are calculated based on the average daily net asset value attributable to Class A shares of the Fund (see Note 5). All expenses and fees paid to the Fund's transfer agent for its services are allocated among the classes of shares based on the number of accounts in each class and the ratable allocation of related out-of-pocket expenses (see Note 4). |
| | Distributions to shareowners are recorded as of the ex-dividend date. Distributions paid by the Fund with respect to each class of shares are calculated in the same manner and at the same time, except that net investment income dividends to Class A and Class Y shares can reflect different transfer agent and distribution expense rates. |
Pioneer Securitized Income Fund | Annual Report | 7/31/2333
| F. | Risks |
| | The value of securities held by the Fund may go up or down, sometimes rapidly or unpredictably, due to general market conditions, such as real or perceived adverse economic, political or regulatory conditions, recessions, the spread of infectious illness or other public health issues, inflation, changes in interest rates, armed conflict including Russia's military invasion of Ukraine, sanctions against Russia, other nations or individuals or companies and possible countermeasures, lack of liquidity in the bond markets or adverse investor sentiment. In the past several years, financial markets have experienced increased volatility, depressed valuations, decreased liquidity and heightened uncertainty. These conditions may continue, recur, worsen or spread. Inflation and interest rates have increased and may rise further. These circumstances could adversely affect the value and liquidity of the Fund's investments and negatively impact the Fund's performance. |
| | The long-term impact of the COVID-19 pandemic and its subsequent variants on economies, markets, industries and individual issuers, are not known. Some sectors of the economy and individual issuers have experienced or may experience particularly large losses. Periods of extreme volatility in the financial markets, reduced liquidity of many instruments, increased government debt, inflation, and disruptions to supply chains, consumer demand and employee availability, may continue for some time. Following Russia's invasion of Ukraine, Russian securities lost all, or nearly all, their market value. Other securities or markets could be similarly affected by past or future political, geopolitical or other events or conditions. |
| | Governments and central banks, including the U.S. Federal Reserve, have taken extraordinary and unprecedented actions to support local and global economies and the financial markets. These actions have resulted in significant expansion of public debt, including in the U.S. The consequences of high public debt, including its future impact on the economy and securities markets, may not be known for some time. |
| | The U.S. and other countries are periodically involved in disputes over trade and other matters, which may result in tariffs, investment restrictions and adverse impacts on affected companies and securities. For example, the U.S. has imposed tariffs and other trade barriers on Chinese exports, has restricted sales of certain categories of goods to China, and has established barriers to investments in China. Trade disputes may adversely affect the economies of the U.S. and its trading partners, as well as companies directly or indirectly affected and financial markets generally. If the political climate between the U.S. and |
34Pioneer Securitized Income Fund | Annual Report | 7/31/23
| | China does not improve or continues to deteriorate, if China were to attempt unification of Taiwan by force, or if other geopolitical conflicts develop or get worse, economies, markets and individual securities may be severely affected both regionally and globally, and the value of the Fund's assets may go down. |
| | At times, the Fund’s investments may represent industries or industry sectors that are interrelated or have common risks, making the Fund more susceptible to any economic, political, or regulatory developments or other risks affecting those industries and sectors. |
| | The market prices of the Fund's fixed income securities may fluctuate significantly when interest rates change. The value of your investment will generally go down when interest rates rise. A rise in rates tends to have a greater impact on the prices of longer term or duration securities. For example, if interest rates increase by 1%, the value of a Fund's portfolio with a portfolio duration of ten years would be expected to decrease by 10%, all other things being equal. In recent years interest rates and credit spreads in the U.S. have been at historic lows. The U.S. Federal Reserve has raised certain interest rates, and interest rates may continue to go up. A general rise in interest rates could adversely affect the price and liquidity of fixed income securities. The maturity of a security may be significantly longer than its effective duration. A security's maturity and other features may be more relevant than its effective duration in determining the security's sensitivity to other factors affecting the issuer or markets generally, such as changes in credit quality or in the yield premium that the market may establish for certain types of securities (sometimes called "credit spread"). In general, the longer its maturity the more a security may be susceptible to these factors. When the credit spread for a fixed income security goes up, or "widens," the value of the security will generally go down. |
| | If an issuer or guarantor of a security held by the Fund or a counterparty to a financial contract with the Fund defaults on its obligation to pay principal and/or interest, has its credit rating downgraded or is perceived to be less creditworthy, or the credit quality or value of any underlying assets declines, the value of your investment will typically decline. Changes in actual or perceived creditworthiness may occur quickly. The Fund could be delayed or hindered in its enforcement of rights against an issuer, guarantor or counterparty. |
| | The Fund’s investments in foreign markets and countries with limited developing markets may subject the Fund to a greater degree of risk than investments in a developed market. These risks include disruptive political or economic conditions, military conflicts and sanctions, |
Pioneer Securitized Income Fund | Annual Report | 7/31/2335
| | terrorism, sustained economic downturns, financial instability, less liquid trading markets, extreme price volatility, currency risks, reduction of government or central bank support, inadequate accounting standards, tariffs, tax disputes or other tax burdens, nationalization or expropriation of assets and the imposition of adverse governmental laws, arbitrary application of laws and regulations or lack of rule of law and investment and repatriation restrictions. Lack of information and less market regulation also may affect the value of these securities. Withholding and other non-U.S. taxes may decrease the Fund’s return. Non-U.S. issuers may be located in parts of the world that have historically been prone to natural disasters. Investing in depositary receipts is subject to many of the same risks as investing directly in non-U.S. issuers. Depositary receipts may involve higher expenses and may trade at a discount (or premium) to the underlying security. |
| | Russia launched a large-scale invasion of Ukraine on February 24, 2022. In response to the military action by Russia, various countries, including the U.S., the United Kingdom, and European Union issued broad-ranging economic sanctions against Russia and Belarus and certain companies and individuals. Since then, Russian securities have lost all, or nearly all, their market value, and many other issuers, securities and markets have been adversely affected. The United States and other countries may impose sanctions on other countries, companies and individuals in light of Russia’s military invasion. The extent and duration of the military action or future escalation of such hostilities, the extent and impact of existing and future sanctions, market disruptions and volatility, and the result of any diplomatic negotiations cannot be predicted. These and any related events could have a significant impact on the value and liquidity of certain Fund investments, on Fund performance and the value of an investment in the Fund, particularly with respect to securities and commodities, such as oil, natural gas and food commodities, as well as other sectors with exposure to Russian issuers or issuers in other countries affected by the invasion, and are likely to have collateral impacts on market sectors globally. |
| | The Fund invests in below-investment-grade (high-yield) debt securities and preferred stocks. Some of these high-yield securities may be convertible into equity securities of the issuer. Debt securities rated below-investment-grade are commonly referred to as “junk bonds” and are considered speculative with respect to the issuer’s capacity to pay interest and repay principal. These securities involve greater risk of loss, are subject to greater price volatility, and may be less liquid and more difficult to value, especially during periods of economic uncertainty or change, than higher rated debt securities. |
36Pioneer Securitized Income Fund | Annual Report | 7/31/23
| | Normally, the Fund invests at least 80% of its net assets in securitized asset instruments. The Fund invests in mortgage-related and asset-backed securities. The value of mortgage-related and asset-backed securities will be influenced by factors affecting the assets underlying such securities. As a result, during periods of declining asset value, difficult or frozen credit markets, swings in interest rates, or deteriorating economic conditions, mortgage-related and asset-backed securities may decline in value, face valuation difficulties, become more volatile and/or become illiquid. Mortgage-backed securities tend to be more sensitive to changes in interest rate than other types of debt securities. These securities are also subject to prepayment and extension risks. Some of these securities may receive little or no collateral protection from the underlying assets and are thus subject to the risk of default. The risk of such defaults is generally higher in the case of mortgage-backed investments offered by non-governmental issuers and those that include so-called “sub-prime” mortgages. The structure of some of these securities may be complex and there may be less available information than for other types of debt securities. Upon the occurrence of certain triggering events or defaults, the Fund may become the holder of underlying assets at a time when those assets may be difficult to sell or may be sold only at a loss. |
| | The Fund may invest in credit risk transfer securities. Credit risk transfer securities are unguaranteed and unsecured debt securities issued by government sponsored enterprises and therefore are not directly linked to or backed by the underlying mortgage loans. As a result, in the event that a government sponsored enterprise fails to pay principal or interest on its credit risk transfer securities or goes through a bankruptcy, insolvency or similar proceeding, holders of such credit risk transfer securities have no direct recourse to the underlying mortgage loans and will generally receive recovery on par with other unsecured note holders in such a scenario. The risks associated with an investment in credit risk transfer securities are different than the risks associated with an investment in mortgage-backed securities issued by Fannie Mae and Freddie Mac, or other government sponsored enterprise or issued by a private issuer, because some or all of the mortgage default or credit risk associated with the underlying mortgage loans is transferred to investors. As a result, investors in these securities could lose some or all of their investment in these securities if the underlying mortgage loans default. |
| | The Fund's investments, payment obligations and financing terms may be based on floating rates, such as LIBOR (London Interbank Offered Rate) or SOFR (Secured Overnight Financing Rate). ICE Benchmark |
Pioneer Securitized Income Fund | Annual Report | 7/31/2337
| | Administration, the administrator of LIBOR, has ceased publication of most LIBOR settings on a representative basis. Actions by regulators have resulted in the establishment of alternative reference rates to LIBOR in most major currencies. In the U.S., a common benchmark replacement is based on the SOFR published by the Federal Reserve Bank of New York, including certain spread adjustments and benchmark replacement conforming changes, although other benchmark replacements (without or without spread adjustments) may be used in certain transactions. The impact of the transition from LIBOR on the Fund's transactions and financial markets generally cannot yet be determined. The transition away from LIBOR may lead to increased volatility and illiquidity in markets for instruments that have relied on LIBOR and may adversely affect the Fund's performance. |
| | With the increased use of technologies such as the Internet to conduct business, the Fund is susceptible to operational, information security and related risks. While the Fund’s Adviser has established business continuity plans in the event of, and risk management systems to prevent, limit or mitigate, such cyber-attacks, there are inherent limitations in such plans and systems, including the possibility that certain risks have not been identified. Furthermore, the Fund cannot control the cybersecurity plans and systems put in place by service providers to the Fund such as the Fund’s custodian and accounting agent, and the Fund’s transfer agent. In addition, many beneficial owners of Fund shares hold them through accounts at broker-dealers, retirement platforms and other financial market participants over which neither the Fund nor the Adviser exercises control. Each of these may in turn rely on service providers to them, which are also subject to the risk of cyber-attacks. Cybersecurity failures or breaches at the Adviser or the Fund’s service providers or intermediaries have the ability to cause disruptions and impact business operations, potentially resulting in financial losses, interference with the Fund’s ability to calculate its net asset value, impediments to trading, the inability of Fund shareowners to effect share purchases, redemptions or exchanges or receive distributions, loss of or unauthorized access to private shareowner information and violations of applicable privacy and other laws, regulatory fines, penalties, reputational damage, or additional compliance costs. Such costs and losses may not be covered under any insurance. In addition, maintaining vigilance against cyber-attacks may involve substantial costs over time, and system enhancements may themselves be subject to cyber-attacks. |
38Pioneer Securitized Income Fund | Annual Report | 7/31/23
| | The Fund’s prospectus contains unaudited information regarding the Fund’s principal risks. Please refer to that document when considering the Fund’s principal risks. |
| G. | Futures Contracts |
| | The Fund may enter into futures transactions in order to attempt to hedge against changes in interest rates, securities prices and currency exchange rates or to seek to increase total return. Futures contracts are types of derivatives. |
| | All futures contracts entered into by the Fund are traded on a futures exchange. Upon entering into a futures contract, the Fund is required to deposit with a broker an amount of cash or securities equal to the minimum "initial margin" requirements of the associated futures exchange. The amount of cash deposited with the broker as collateral at July 31, 2023 is recorded as "Futures collateral" on the Statement of Assets and Liabilities. |
| | Subsequent payments for futures contracts ("variation margin") are paid or received by the Fund, depending on the daily fluctuation in the value of the contracts, and are recorded by the Fund as unrealized appreciation or depreciation. Cash received from or paid to the broker related to previous margin movement is held in a segregated account at the broker and is recorded as either "Due from broker for futures" or "Due to broker for futures" on the Statement of Assets and Liabilities. When the contract is closed, the Fund realizes a gain or loss equal to the difference between the opening and closing value of the contract as well as any fluctuation in foreign currency exchange rates where applicable. Futures contracts are subject to market risk, interest rate risk and currency exchange rate risk. Changes in value of the contracts may not directly correlate to the changes in value of the underlying securities. With futures, there is reduced counterparty credit risk to the Fund since futures are exchange-traded and the exchange's clearinghouse, as counterparty to all exchange-traded futures, guarantees the futures against default. |
| | The average notional value of futures contracts long position during the year ended July 31, 2023 was $3,505,349. Open futures contracts outstanding at July 31, 2023 are listed in the Schedule of Investments. |
2. Management Agreement
The Adviser manages the Fund’s portfolio. Management fees payable under the Fund’s Investment Management Agreement with the Adviser are calculated daily and paid monthly at the annual rate of 0.55% of the Fund’s
Pioneer Securitized Income Fund | Annual Report | 7/31/2339
average daily net assets up to $1 billion and 0.50% of the Fund’s average daily net assets over $1 billion. For the year ended July 31, 2023, the effective management fee (excluding waivers and/or assumption of expenses) was equivalent to 0.55% of the Fund's average daily net assets.
The Adviser has contractually agreed to limit ordinary operating expenses (ordinary operating expenses means all fund expenses other than taxes, brokerage commissions, acquired fund fees and expenses, and extraordinary expenses, such as litigation) to the extent required to reduce Fund expenses to 0.90% and 0.65% of the average daily net assets attributable to Class A and Class Y shares, respectively. These expense limitations are in effect through December 1, 2023. There can be no assurance that the Adviser will extend the expense limitations beyond the date referred to above. Fees waived and expenses reimbursed during the year ended July 31, 2023 are reflected in the Statement of Operations.
In addition, under the management and administration agreements, certain other services and costs, including accounting, regulatory reporting and insurance premiums, are paid by the Fund as administrative reimbursements. Reflected on the Statement of Assets and Liabilities is $1,773 in management fees payable to the Adviser at July 31, 2023.
3. Compensation of Officers and Trustees
The Fund pays an annual fee to its Trustees. The Adviser reimburses the Fund for fees paid to the Interested Trustees. Except for the chief compliance officer, the Fund does not pay any salary or other compensation to its officers. The Fund pays a portion of the chief compliance officer's compensation for his services as the Fund's chief compliance officer. Amundi US pays the remaining portion of the chief compliance officer's compensation. For the year ended July 31, 2023, the Fund paid $8,073 in Officers' and Trustees' compensation, which is reflected on the Statement of Operations as Officers' and Trustees' fees. At July 31, 2023, on its Statement of Assets and Liabilities, the Fund had a payable for Trustees' fees of $570 and had no payable for administrative expenses which includes the payable for Officers' compensation.
4. Transfer Agent
BNY Mellon Investment Servicing (US) Inc. serves as the transfer agent to the Fund at negotiated rates. Transfer agent fees and payables shown on the Statement of Operations and the Statement of Assets and Liabilities, respectively, include sub-transfer agent expenses incurred through the Fund’s omnibus relationship contracts.
40Pioneer Securitized Income Fund | Annual Report | 7/31/23
In addition, the Fund reimbursed the transfer agent for out-of-pocket expenses incurred by the transfer agent related to shareowner communications activities such as proxy and statement mailings, and outgoing phone calls. For the year ended July 31, 2023, such out-of-pocket expenses by class of shares were as follows:
| Shareowner Communications: | |
| Class A | $ 73 |
| Class Y | 2,243 |
| Total | $2,316 |
5. Distribution Plan
The Fund has adopted a distribution plan (the “Plan”) pursuant to Rule 12b-1 under the 1940 Act with respect to its Class A shares. Pursuant to the Plan, the Fund pays the Distributor 0.25% of the average daily net assets attributable to Class A shares as compensation for personal services and/or account maintenance services or distribution services with regard to Class A shares. Reflected on the Statement of Assets and Liabilities is $72 in distribution fees payable to the Distributor at July 31, 2023.
In addition, redemptions of each Class A shares may be subject to a contingent deferred sales charge (“CDSC”). A CDSC of 1.00% may be imposed on redemptions of certain net asset value purchases of Class A shares within 12 months of purchase. Shares purchased as part of an exchange remain subject to any CDSC that applied to the original purchase of those shares. There is no CDSC for Class Y shares. Proceeds from the CDSCs are paid to the Distributor. For the year ended July 31, 2023, CDSCs in the amount of $0 were paid to the Distributor.
6. Additional Disclosures about Derivative Instruments and Hedging Activities
The Fund’s use of derivatives may enhance or mitigate the Fund’s exposure to the following risks:
Interest rate risk relates to the fluctuations in the value of interest-bearing securities due to changes in the prevailing levels of market interest rates.
Credit risk relates to the ability of the issuer of a financial instrument to make further principal or interest payments on an obligation or commitment that it has to the Fund.
Foreign exchange rate risk relates to fluctuations in the value of an asset or liability due to changes in currency exchange rates.
Equity risk relates to the fluctuations in the value of financial instruments as a result of changes in market prices (other than those arising from
Pioneer Securitized Income Fund | Annual Report | 7/31/2341
interest rate risk or foreign exchange rate risk), whether caused by factors specific to an individual investment, its issuer, or all factors affecting all instruments traded in a market or market segment.
Commodity risk relates to the risk that the value of a commodity or commodity index will fluctuate based on increases or decreases in the commodities market and factors specific to a particular industry or commodity.
The fair value of open derivative instruments (not considered to be hedging instruments for accounting disclosure purposes) by risk exposure at July 31, 2023, was as follows:
Statement of Assets
and Liabilities | Interest
Rate Risk | Credit
Risk | Foreign
Exchange
Rate Risk | Equity
Risk | Commodity
Risk |
| Liabilities | | | | | |
| Net unrealized depreciation on futures contracts* | $170,314 | $ — | $ — | $ — | $ — |
| Total Value | $ 170,314 | $— | $— | $— | $— |
| | |
| * | Includes cumulative unrealized appreciation (depreciation) of futures contracts as reported in the Schedule of Investments. Only net variation margin is reported within the assets and/or liabilities on the Statement of Assets and Liabilities. |
The effect of derivative instruments (not considered to be hedging instruments for accounting disclosure purposes) on the Statement of Operations by risk exposure at July 31, 2023 was as follows:
| Statement of Operations | Interest
Rate Risk | Credit
Risk | Foreign
Exchange
Rate Risk | Equity
Risk | Commodity
Risk |
| Net Realized Gain (Loss) on | | | | | |
| Futures contracts | $ (132,207) | $ — | $ — | $ — | $ — |
| Total Value | $(132,207) | $— | $— | $— | $— |
| Change in Net Unrealized Appreciation (Depreciation) on | | | | | |
| Futures contracts | $ (170,314) | $ — | $ — | $ — | $ — |
| Total Value | $ (170,314) | $— | $— | $— | $— |
42Pioneer Securitized Income Fund | Annual Report | 7/31/23
Report of Independent Registered Public Accounting Firm
To the Board of Trustees of Pioneer Series Trust IV and the Shareholders of Pioneer Securitized Income Fund:
Opinion on the Financial Statements
We have audited the accompanying statement of assets and liabilities of Pioneer Securitized Income Fund (the “Fund”) (one of the funds constituting Pioneer Series Trust IV (the “Trust”)), including the schedule of investments, as of July 31 2023, and the related statement of operations for the year then ended, the statements of changes in net assets for each of the two years in the period then ended, the financial highlights for each of the three years in the period ended July 31, 2023 and the period from December 10, 2019 (commencement of operations) through July 31, 2020, and the related notes (collectively referred to as the “financial statements”). In our opinion, the financial statements present fairly, in all material respects, the financial position of the Fund (one of the funds constituting Pioneer Series Trust IV) at July 31, 2023, the results of its operations for the year then ended, the changes in its net assets for each of the two years in the period then ended, and its financial highlights for each of the three years in the period ended July 31, 2023 and the period from December 10, 2019 (commencement of operations) through July 31, 2020, in conformity with U.S. generally accepted accounting principles.
Basis for Opinion
These financial statements are the responsibility of the Trust’s management. Our responsibility is to express an opinion on the Fund’s financial statements based on our audits. We are a public accounting firm registered with the Public Company Accounting Oversight Board (United States) ("PCAOB") and are required to be independent with respect to the Trust in accordance with the U.S. federal securities laws and the applicable rules and regulations of the Securities and Exchange Commission and the PCAOB.
We conducted our audits in accordance with the standards of the PCAOB. Those standards require that we plan and perform the audit to obtain reasonable assurance about whether the financial statements are free of material misstatement, whether due to error or fraud. The Trust is not required to have, nor were we engaged to perform, an audit of the Trust’s internal control over financial reporting. As part of our audits, we are required to obtain an understanding of internal control over financial reporting, but not for the purpose of expressing an opinion on the
Pioneer Securitized Income Fund | Annual Report | 7/31/2343
effectiveness of the Trust’s internal control over financial reporting. Accordingly, we express no such opinion.
Our audits included performing procedures to assess the risks of material misstatement of the financial statements, whether due to error or fraud, and performing procedures that respond to those risks. Such procedures included examining, on a test basis, evidence regarding the amounts and disclosures in the financial statements. Our procedures included confirmation of securities owned as of July 31, 2023, by correspondence with the custodian, brokers and others; when replies were not received from brokers and others, we performed other auditing procedures. Our audits also included evaluating the accounting principles used and significant estimates made by management, as well as evaluating the overall presentation of the financial statements. We believe that our audits provide a reasonable basis for our opinion.
We have served as the auditor of one or more investment companies in the Pioneer family of funds since 2017.
Boston, Massachusetts
September 29, 2023
44Pioneer Securitized Income Fund | Annual Report | 7/31/23
Additional Information (unaudited)
The Fund designated $428,448 as long-term capital gains distributions during the year ended July 31, 2023. Distributable long-term gains are based on net realized long-term gains determined on a tax basis and may differ from such amounts for financial reporting purposes.
Qualified interest income is exempt from nonresident alien (NRA) tax withholding. The percentage of the Fund’s ordinary income distributions derived from qualified interest income was 80.45%.
Pioneer Securitized Income Fund | Annual Report | 7/31/2345
Statement Regarding Liquidity Risk Management Program
As required by law, the Fund has adopted and implemented a liquidity risk management program (the “Program”) that is designed to assess and manage liquidity risk. Liquidity risk is the risk that the Fund could not meet requests to redeem its shares without significant dilution of remaining investors’ interests in the Fund. The Fund’s Board of Trustees designated a liquidity risk management committee (the “Committee”) consisting of employees of Amundi Asset Management US, Inc. (the “Adviser”) to administer the Program.
The Committee provided the Board of Trustees with a report that addressed the operation of the Program and assessed its adequacy and effectiveness of implementation (the “Report”). The Report covered the period from January 1, 2022 through December 31, 2022 (the “Reporting Period”).
The Report confirmed that, throughout the Reporting Period, the Committee had monitored the Fund’s portfolio liquidity and liquidity risk on an ongoing basis, as described in the Program and in Board reporting throughout the Reporting Period.
The Report discussed the Committee’s annual review of the Program, which addressed, among other things, the following elements of the Program:
The Committee reviewed the Fund’s investment strategy and liquidity of portfolio investments during both normal and reasonably foreseeable stressed conditions. The Committee noted that the Fund’s investment strategy continues to be appropriate for an open-end fund, taking into account, among other things, whether and to what extent the Fund held less liquid and illiquid assets and the extent to which any such investments affected the Fund’s ability to meet redemption requests. In managing and reviewing the Fund’s liquidity risk, the Committee also considered the extent to which the Fund’s investment strategy involves a relatively concentrated portfolio or large positions in particular issuers, the extent to which the Fund uses borrowing for investment purposes, and the extent to which the Fund uses derivatives (including for hedging purposes). The Committee also reviewed the Fund’s short-term and long-term cash flow projections during both normal and reasonably foreseeable stressed conditions. In assessing the Fund’s cash flow projections, the Committee considered, among other factors, historical net redemption activity, redemption policies, ownership concentration, distribution channels, and the degree of certainty associated with the Fund’s short-term and long-term cash flow projections. The Committee also considered the Fund’s holdings of cash and cash equivalents, as well as borrowing arrangements
46Pioneer Securitized Income Fund | Annual Report | 7/31/23
and other funding sources, including, if applicable, the Fund’s participation in a credit facility, as components of the Fund’s ability to meet redemption requests. The Fund has adopted an in-kind redemption policy which may be utilized to meet larger redemption requests.
The Committee reviewed the Program’s liquidity classification methodology for categorizing the Fund’s investments into one of four liquidity buckets. In reviewing the Fund’s investments, the Committee considered, among other factors, whether trading varying portions of a position in a particular portfolio investment or asset class in sizes the Fund would reasonably anticipate trading, would be reasonably expected to significantly affect liquidity.
The Committee performed an analysis to determine whether the Fund is required to maintain a Highly Liquid Investment Minimum, and determined that no such minimum is required because the Fund primarily holds highly liquid investments.
The Report stated that the Committee concluded the Program operates adequately and effectively, in all material respects, to assess and manage the Fund’s liquidity risk throughout the Reporting Period.
Pioneer Securitized Income Fund | Annual Report | 7/31/23 47
Trustees, Officers and Service Providers
Investment Adviser and Administrator
Amundi Asset Management US, Inc.
Custodian and Sub-Administrator
The Bank of New York Mellon Corporation
Independent Registered Public Accounting Firm
Ernst & Young LLP
Principal Underwriter
Amundi Distributor US, Inc.
Legal Counsel
Morgan, Lewis & Bockius LLP
Transfer Agent
BNY Mellon Investment Servicing (US) Inc.
Proxy Voting Policies and Procedures of the Fund are available without charge, upon request, by calling our toll free number (1-800-225-6292). Information regarding how the Fund voted proxies relating to portfolio securities during the most recent 12-month period ended June 30 is publicly available to shareowners at www.amundi.com/us. This information is also available on the Securities and Exchange Commission’s web site at www.sec.gov.
Trustees and Officers
The Fund's Trustees and officers are listed below, together with their principal occupations and other directorships they have held during at least the past five years. Trustees who are interested persons of the Fund within the meaning of the 1940 Act are referred to as Interested Trustees. Trustees who are not interested persons of the Fund are referred to as Independent Trustees. Each of the Trustees serves as a Trustee of each of the 49 U.S. registered investment portfolios for which Amundi US serves as investment adviser (the “Pioneer Funds”). The address for all Trustees and all officers of the Fund is 60 State Street, Boston, Massachusetts 02109.
The Statement of Additional Information of the Fund includes additional information about the Directors and is available, without charge, upon request, by calling 1-800-225-6292.
48Pioneer Securitized Income Fund | Annual Report | 7/31/23
Name, Age and Position
Held With the Fund | Term of Office and
Length of Service | Principal Occupation(s) During At Least The Past Five Years | Other Directorships Held by Trustee
During At Least The Past Five Years |
Thomas J. Perna (72)
Chairman of the Board
and Trustee | Trustee since 2019.
Serves until a successor
trustee is elected or
earlier retirement
or removal. | Private investor (2004 – 2008 and 2013 – present); Chairman (2008 – 2013) and Chief Executive Officer (2008 – 2012), Quadriserv, Inc. (technology products for securities lending industry); and Senior Executive Vice President, The Bank of New York (financial and securities services) (1986 – 2004) | Director, Broadridge Financial Solutions, Inc.
(investor communications and securities
processing provider for financial services industry)
(2009 – present); Director, Quadriserv, Inc. (2005 –
2013); and Commissioner, New Jersey State
Civil Service
Commission (2011 – 2015) |
John E. Baumgardner,
Jr. (72)*
Trustee | Trustee since 2019.
Serves until a successor
trustee is elected or
earlier retirement
or removal. | Of Counsel (2019 – present), Partner (1983-2018), Sullivan & Cromwell LLP (law firm). | Chairman, The Lakeville Journal Company, LLC,
(privately-held community newspaper group)
(2015-present) |
Diane Durnin (66)
Trustee | Trustee since 2019.
Serves until a successor
trustee is elected or
earlier retirement
or removal. | Managing Director - Head of Product Strategy and Development, BNY Mellon Investment Management (investment management firm) (2012-2018); Vice Chairman – The Dreyfus Corporation (2005 – 2018): Executive Vice President Head of Product, BNY Mellon Investment Management (2007-2012); Executive Director- Product Strategy, Mellon Asset Management (2005-2007); Executive Vice President Head of Products, Marketing and Client Service, Dreyfus Corporation (investment management firm) (2000-2005); Senior Vice President Strategic Product and Business Development, Dreyfus Corporation (1994-2000) | None |
| * Mr. Baumgardner is Of Counsel to Sullivan & Cromwell LLP, which acts as counsel to the Independent Trustees of each Pioneer Fund. |
Pioneer Securitized Income Fund | Annual Report | 7/31/2349
Independent Trustees (continued)
Name, Age and Position
Held With the Fund | Term of Office and
Length of Service | Principal Occupation(s) During At Least The Past Five Years | Other Directorships Held by Trustee
During At Least The Past Five Years |
Benjamin M. Friedman (78)
Trustee | Trustee since 2019.
Serves until a successor
trustee is elected or
earlier retirement
or removal. | William Joseph Maier Professor of Political Economy, Harvard University (1972 – present) | Trustee, Mellon Institutional Funds Investment
Trust and Mellon Institutional Funds Master
Portfolio (oversaw 17 portfolios in fund complex)
(1989 - 2008) |
Craig C. MacKay (60)
Trustee | Trustee since 2021.
Serves until a successor
trustee is elected or
earlier retirement
or removal. | Partner, England & Company, LLC (advisory firm) (2012 – present); Group Head – Leveraged Finance Distribution, Oppenheimer & Company (investment bank) (2006 – 2012); Group Head – Private Finance & High Yield Capital Markets Origination, SunTrust Robinson Humphrey (investment bank) (2003 – 2006); and Founder and Chief Executive Officer, HNY Associates, LLC (investment bank) (1996 – 2003) | Director, Equitable Holdings, Inc. (financial
services holding company) (2022 – present);
Board Member of Carver Bancorp, Inc. (holding
company) and Carver Federal Savings Bank,
NA (2017 – present); Advisory Council Member,
MasterShares ETF (2016 – 2017); Advisory
Council Member, The Deal (financial market
information publisher) (2015 – 2016); Board
Co-Chairman and Chief Executive Officer, Danis
Transportation Company (privately-owned
commercial carrier) (2000 – 2003); Board
Member and Chief Financial Officer, Customer
Access Resources (privately-owned
teleservices company) (1998 – 2000); Board
Member, Federation of Protestant Welfare
Agencies (human services agency) (1993 –
present); and Board Treasurer, Harlem Dowling
Westside Center (foster care agency)
(1999 – 2018) |
50Pioneer Securitized Income Fund | Annual Report | 7/31/23
Name, Age and Position
Held With the Fund | Term of Office and
Length of Service | Principal Occupation(s) During At Least The Past Five Years | Other Directorships Held by Trustee
During At Least The Past Five Years |
Lorraine H. Monchak (67)
Trustee | Trustee since 2019.
(Advisory Trustee from
2014 - 2017). Serves
until a successor trustee
is elected or earlier
retirement or removal. | Chief Investment Officer, 1199 SEIU Funds (healthcare workers union pension funds) (2001 – present); Vice President – International Investments Group, American International Group, Inc. (insurance company) (1993 – 2001); Vice President Corporate Finance and Treasury Group, Citibank, N.A. (1980 – 1986 and 1990 – 1993); Vice President – Asset/Liability Management Group, Federal Farm Funding Corporation (government-sponsored issuer of debt securities) (1988 – 1990); Mortgage Strategies Group, Shearson Lehman Hutton, Inc. (investment bank) (1987 – 1988); Mortgage Strategies Group, Drexel Burnham Lambert, Ltd. (investment bank) (1986 – 1987) | None |
Marguerite A. Piret (75)
Trustee | Trustee since 2019.
Serves until a successor
trustee is elected or
earlier retirement
or removal. | Chief Financial Officer, American Ag Energy, Inc. (technology for the environment, energy and agriculture) (2019 – present); Chief Operating Officer, North Country Growers LLC (controlled environment agriculture company) (2020 – present); Chief Executive Officer, Green Heat LLC (biofuels company) (2022 – present); President and Chief Executive Officer, Newbury Piret Company (investment banking firm) (1981 – 2019) | Director of New America High Income Fund,
Inc. (closed-end investment company) (2004 –
present); and Member, Board of Governors,
Investment Company Institute (2000 – 2006) |
Pioneer Securitized Income Fund | Annual Report | 7/31/2351
Independent Trustees (continued)
Name, Age and Position
Held With the Fund | Term of Office and
Length of Service | Principal Occupation(s) During At Least The Past Five Years | Other Directorships Held by Trustee
During At Least The Past Five Years |
Fred J. Ricciardi (76)
Trustee | Trustee since 2019.
Serves until a successor
trustee is elected or
earlier retirement
or removal. | Private investor (2020 – present); Consultant (investment company services) (2012 – 2020); Executive Vice President, BNY Mellon (financial and investment company services) (1969 – 2012); Director, BNY International Financing Corp. (financial services) (2002 – 2012); Director, Mellon Overseas Investment Corp. (financial services) (2009 – 2012); Director, Financial Models (technology) (2005-2007); Director, BNY Hamilton Funds, Ireland (offshore investment companies) (2004-2007); Chairman/Director, AIB/BNY Securities Services, Ltd., Ireland (financial services) (1999-2006); Chairman, BNY Alternative Investment Services, Inc. (financial services) (2005-2007) | None |
52Pioneer Securitized Income Fund | Annual Report | 7/31/23
Name, Age and Position
Held With the Fund | Term of Office and
Length of Service | Principal Occupation(s) During At Least The Past Five Years | Other Directorships Held by Trustee
During At Least The Past Five Years |
Lisa M. Jones (61)**
Trustee, President and Chief
Executive Officer | Trustee since 2019. Serves
until a successor trustee is
elected or earlier retirement
or removal | Director, CEO and President of Amundi US, Inc. (investment management firm) (since September 2014); Director, CEO and President of Amundi Asset Management US, Inc. (since September 2014); Director, CEO and President of Amundi Distributor US, Inc. (since September 2014); Director, CEO and President of Amundi Asset Management US, Inc. (since September 2014); Chair, Amundi US, Inc., Amundi Distributor US, Inc. and Amundi Asset Management US, Inc. (September 2014 – 2018); Managing Director, Morgan Stanley Investment Management (investment management firm) (2010 – 2013); Director of Institutional Business, CEO of International, Eaton Vance Management (investment management firm) (2005 – 2010); Director of Amundi Holdings US, Inc. (since 2017) | Director of Clearwater Analytics (provider
of web-based investment accounting
software for reporting and reconciliation
services) (September 2022 – present) |
Kenneth J. Taubes (65)**
Trustee | Trustee since 2019. Serves
until a successor trustee is
elected or earlier retirement
or removal | Director and Executive Vice President (since 2008) and Chief Investment Officer, U.S. (since 2010) of Amundi US, Inc. (investment management firm); Director and Executive Vice President and Chief Investment Officer, U.S. of Amundi US (since 2008); Executive Vice President and Chief Investment Officer, U.S. of Amundi Asset Management US, Inc. (since 2009); Portfolio Manager of Amundi US (since 1999); Director of Amundi Holdings US, Inc. (since 2017) | None |
| ** Ms. Jones and Mr. Taubes are Interested Trustees because they are officers or directors of the Fund’s investment adviser and certain of its affiliates. |
Pioneer Securitized Income Fund | Annual Report | 7/31/2353
Name, Age and Position
Held With the Fund | Term of Office and
Length of Service | Principal Occupation(s) During At Least The Past Five Years | Other Directorships Held by Officer
During At Least The Past Five Years |
Christopher J. Kelley (58)
Secretary and Chief
Legal Officer | Since 2019. Serves at
the discretion of
the Board | Vice President and Associate General Counsel of Amundi US since January 2008; Secretary and Chief Legal Officer of all of the Pioneer Funds since June 2010; Assistant Secretary of all of the Pioneer Funds from September 2003 to May 2010; Vice President and Senior Counsel of Amundi US from July 2002 to December 2007 | None |
Thomas Reyes (60)
Assistant Secretary | Since 2019. Serves at
the discretion of
the Board | Assistant General Counsel of Amundi US since May 2013 and Assistant Secretary of all the Pioneer Funds since June 2010; Counsel of Amundi US from June 2007 to May 2013 | None |
Heather L. Melito-Dezan (46)
Assistant Secretary | Since 2022. Serves at
the discretion of
the Board | Director - Trustee and Board Relationships of Amundi US since September 2019; Assistant Secretary of Amundi US, Inc. since July 2020: Assistant Secretary of Amundi Asset Management US, Inc. since July 2020: Assistant Secretary of Amundi Distributor US, Inc. since July 2020; Assistant Secretary of all the Pioneer Funds since September 2022; Private practice from 2017 – 2019. | None |
Anthony J. Koenig, Jr. (59)
Treasurer and
Chief Financial and
Accounting Officer | Since 2021. Serves at
the discretion of
the Board | Managing Director, Chief Operations Officer and Fund Treasurer of Amundi US since May 2021; Treasurer of all of the Pioneer Funds since May 2021; Assistant Treasurer of all of the Pioneer Funds from January 2021 to May 2021; and Chief of Staff, US Investment Management of Amundi US from May 2008 to January 2021 | None |
Luis I. Presutti (58)
Assistant Treasurer | Since 2005. Serves at
the discretion of
the Board | Director – Fund Treasury of Amundi US since 1999; and Assistant Treasurer of all of the Pioneer Funds since 1999 | None |
Gary Sullivan (65)
Assistant Treasurer | Since 2019. Serves at
the discretion of
the Board | Senior Manager – Fund Treasury of Amundi US since 2012; and Assistant Treasurer of all of the Pioneer Funds since 2002 | None |
54Pioneer Securitized Income Fund | Annual Report | 7/31/23
Name, Age and Position
Held With the Fund | Term of Office and
Length of Service | Principal Occupation(s) During At Least The Past Five Years | Other Directorships Held by Officer
During At Least The Past Five Years |
Antonio Furtado (41)
Assistant Treasurer | Since 2020. Serves at
the discretion of
the Board | Fund Oversight Manager – Fund Treasury of Amundi US since 2020; Assistant Treasurer of all of the Pioneer Funds since 2020; and Senior Fund Treasury Analyst from 2012 - 2020 | None |
Michael Melnick (52)
Assistant Treasurer | Since 2021. Serves at
the discretion of
the Board | Vice President - Deputy Fund Treasurer of Amundi US since May 2021; Assistant Treasurer of all of the Pioneer Funds since July 2021; Director of Regulatory Reporting of Amundi US from 2001 – 2021; and Director of Tax of Amundi US from 2000 - 2001 | None |
John Malone (52)
Chief Compliance Officer | Since 2019. Serves at
the discretion of
the Board | Managing Director, Chief Compliance Officer of Amundi US Asset Management; Amundi Asset Management US, Inc.; and the Pioneer Funds since September 2018; Chief Compliance Officer of Amundi Distributor US, Inc. since January 2014. | None |
Brandon Austin (51)
Anti-Money
Laundering Officer | Since 2022. Serves at
the discretion of
the Board | Director, Financial Security – Amundi Asset Management; Anti-Money Laundering Officer of all the Pioneer Funds since March 2022: Director of Financial Security of Amundi US since July 2021; Vice President, Head of BSA, AML and OFAC, Deputy Compliance Manager, Crédit Agricole Indosuez Wealth Management (investment management firm) (2013 – 2021) | None |
Pioneer Securitized Income Fund | Annual Report | 7/31/2355
How to Contact Amundi
We are pleased to offer a variety of convenient ways for you to contact us for assistance or information.
Call us for:
Account Information, including existing accounts,
new accounts, prospectuses, applications
and service forms
1-800-225-6292
FactFoneSMfor automated fund yields, prices,
account information and transactions
1-800-225-4321
| Retirement plans information | 1-800-622-0176 |
Write to us:
Amundi
P.O. Box 534427
Pittsburgh, PA 15253-4427
| Our toll-free fax | 1-800-225-4240 |
| Our internet e-mail address | us.askamundi@amundi.com
(for general questions about Amundi only) |
Visit our web site: www.amundi.com/us
This report must be preceded or accompanied by a prospectus.
The Fund files a complete schedule of portfolio holdings with the Securities and Exchange Commission for the first and third quarters of each fiscal year as an exhibit to its reports on Form N-PORT. Shareholders may view the filed Form N-PORT by visiting the Commission’s web site at https://www.sec.gov.
Amundi Asset Management US, Inc.
60 State Street
Boston, MA 02109
www.amundi.com/us
Securities offered through Amundi Distributor US, Inc.
60 State Street, Boston, MA 02109
Underwriter of Pioneer Mutual Funds, Member SIPC
© 2023 Amundi Asset Management US, Inc. 32216-03-0923
Amundi Climate Transition Core Bond Fund
Annual Report | July 31, 2023
| | | | |
| A: CTBAX | C: ACTCX | K: ACTKX | Y: CTCYX |
visit us: www.amundi.com/us
Amundi Climate Transition Core Bond Fund | Annual Report | 7/31/231
President’s Letter
Dear Shareholders,
On February 13, 2023, Amundi US celebrated the 95th anniversary of Pioneer Fund, the second-oldest mutual fund in the United States. We recognized the anniversary with ringing of the closing bell at the New York Stock Exchange, which seemed fitting for this special milestone.
Pioneer Fund was launched on February 13, 1928 by Phil Carret, one of the earliest proponents of value investing and a leading innovator in the asset management industry. Mr. Carret began investing in the 1920s and founded Pioneer Investments (now Amundi US) in 1928, and was one of the first investors to realize he could uncover value through rigorous, innovative, fundamental research techniques.
Consistent with Mr. Carret’s investment approach and employing many of the same techniques utilized in the 1920s, Amundi US's portfolio managers have adapted Mr. Carret’s philosophy to a new age of “active” investing.
The last few years have seen investors face some unprecedented challenges, from a global pandemic that shuttered much of the world’s economy for months, to geopolitical strife, to rising inflation that has reached levels not seen in decades. Now, more than ever, Amundi US believes active management – that is, making active investment decisions across all of our portfolios – can help mitigate risk during periods of market volatility.
At Amundi US, active management begins with our own fundamental, bottom-up research process. Our team of dedicated research analysts and portfolio managers analyzes each security under consideration, communicating frequently with the management teams of the companies and other entities issuing the securities, and working together to identify those securities that we believe best meet our investment criteria for our family of funds. Our risk management approach begins with each security under consideration, as we strive to develop a deep understanding of the potential opportunity, while considering any potential risk factors.
Today, as shareholders, we have many options. It is our view that active management can serve shareholders well, not only when markets are thriving, but also during periods of market stress. As you consider your long-term investment goals, we encourage you to work with your financial professional to develop an investment plan that paves the way for you to pursue both your short-term and long-term goals.
2Amundi Climate Transition Core Bond Fund | Annual Report | 7/31/23
We greatly appreciate the trust you have placed in us and look forward to continuing to serve you in the future.
Lisa M. Jones
Head of the Americas, President and CEO of US
Amundi Asset Management US, Inc.
September 2023
Any information in this shareowner report regarding market or economic trends or the factors influencing the Fund’s historical or future performance are statements of opinion as of the date of this report. Past performance is no guarantee of future results.
Amundi Climate Transition Core Bond Fund | Annual Report | 7/31/233
Portfolio Management Discussion | 7/31/23
In the following interview, Jonathan Duensing, Bradley Komenda, Jonathan Scott, and Chin Liu discuss the factors that affected the performance of Amundi Climate Transition Core Bond Fund during the abbreviated annual reporting period covering the Fund’s inception date of December 15, 2022 through July 31, 2023. Mr. Duensing, Senior Managing Director, Head of Fixed Income, US, and Director of Multi-Sector Fixed Income of Amundi Asset Management US, Inc. (Amundi US); Mr. Komenda, Managing Director and Director of Investment Grade Corporates of Amundi US; Mr. Scott, Senior Vice President and Deputy Director of Multi-Sector Fixed Income of Amundi US; and Mr. Liu, Managing Director, Director of Insurance-Linked Securities, and Director of Fixed Income Solutions at Amundi US, are responsible for the day-to-day management of the Fund.
| Q | How did the Fund perform during the abbreviated annual reporting period between December 15, 2022 and July 31, 2023? |
| A | Amundi Climate Transition Core Bond Fund’s Class A shares returned -0.46% at net asset value for the period between December 15, 2022 and July 31, 2023, while the Fund’s benchmark, the Bloomberg US Aggregate Bond Index (the Bloomberg Index), returned -0.38%. In addition, for the six-month period between January 31, 2023 and July 31, 2023, the average return of the 627 mutual funds in Morningstar’s Intermediate Core-Plus Bond Category was -0.84%. |
| Q | Could you describe the Fund’s investment approach? |
| A | Our investment approach in managing the Fund’s portfolio takes into consideration an investment’s income and return prospects, relative to perceived risk, while also considering its climate-related characteristics. Under normal circumstances, the Fund will invest at least 80% of its net assets (plus the amount of borrowings, if any, for investment purposes) in fixed-income investments that meet Amundi US's climate transition criteria (the “Climate Transition Criteria”). The Climate Transition Criteria are designed to identify investments that have climate-positive characteristics consistent with the transition to a more sustainable economy in terms of lower global greenhouse gas emissions, as considered by Amundi US. |
| | Investments meeting the Climate Transition Criteria include those whose issuers, in the view of Amundi US, are participating in, or contributing to, the goal of achieving lower carbon emissions; |
4Amundi Climate Transition Core Bond Fund | Annual Report | 7/31/23
| | have developed and are implementing a viable sustainability plan; or have low direct carbon emissions or impact. In addition, bonds designed to support the climate transition or other environmental purposes (known as “green bonds”) may meet the Climate Transition Criteria. |
| Q | How would you describe the investment environment during the abbreviated annual reporting period between December 15, 2022 and July 31, 2023? |
| A | As inflation showed signs of moderating entering 2023, investors became increasingly optimistic that the US Federal Reserve (Fed) and other leading central banks were poised to stop raising interest rates, which many had been doing since early 2022 as inflation levels rose. January 2023 saw Treasury yields pull back from their more recent highs on the market’s outlook for a potential easing of monetary policy. That, in turn, boosted performance for bonds in general. On February 1, 2023, the Fed increased the federal funds rate target again, but this time by a comparatively moderate 25 basis points (bps), bringing the target range to 4.50% – 4.75%. (A basis point is equal to 1/100th of a percentage point.) |
| | The spring of 2023 saw the failure of multiple US banks and the collapse of European giant Credit Suisse, raising the prospect of a financial crisis. In response, the Fed implemented a new lending program to support bank liquidity, while market participants began to anticipate decreases in the federal funds rate target range by the Fed over the second half of the calendar year. At its March 23 meeting, the Fed went forward with another modest 25 bps increase to the federal funds target, bringing the range to 4.75% ‒ 5.00%. The financial markets viewed that increase as an indication that the Fed believed the financial system, overall, remained on solid footing. The Fed would implement another increase to the federal funds target range of 25 bps in early May, bringing the range to 5.00% ‒ 5.25%, before taking a pause at its June meeting. On July 26, however, the Fed increased the federal funds target range by another quarter-point (25 bps), leaving the range at 5.25% ‒ 5.50% as of period-end. |
| | As of July 31, 2023, the yield for the two-year US Treasury note was 4.88%, versus 4.23% as of December 15, 2022, an increase of |
Amundi Climate Transition Core Bond Fund | Annual Report | 7/31/235
| | 65 bps. Meanwhile, the 10-year Treasury yield finished the period 53 bps higher, at 3.97%, versus 3.44% at the start of the period in mid-December. As a result, the Treasury yield curve ended the period significantly inverted, a development that has typically been viewed as a predictor of recession. (A yield curve is a line that plots the interest rates, at a set point in time, of bonds having equal credit quality but differing maturity dates. An inverted yield curve represents a yield curve where shorter-term yields are higher than longer-term yields.) |
| | The upward move in interest rates weighed on returns in the overall bond market during the abbreviated reporting period. The investment-grade corporate bond market, as gauged by the Fund’s benchmark, the Bloomberg Index, posted a return of -0.38% for the abbreviated reporting period, with corporate bonds generating a positive return and notably outperforming more interest-rate-sensitive securities, such as US Treasuries and securitized assets. Below-investment-grade, high-yield corporate bonds also outperformed for the abbreviated period, on the strength of credit-spread tightening. (Credit spreads are commonly defined as the differences in yield between Treasuries and other types of fixed-income securities with similar maturities.) |
| Q | What factors influenced the Fund’s performance relative to the Bloomberg Index during the abbreviated annual reporting period between December 15, 2022 and July 31, 2023? |
| A | A portfolio overweight to agency mortgage-backed securities (MBS), as well as duration positioning, were key detractors from the Fund’s benchmark-relative returns for the period. On the other hand, sector allocation results, security selection results, and the portfolio’s yield-curve positioning all contributed positively to the Fund’s benchmark-relative performance during the reporting period. |
| | In terms of sector allocation, the Fund’s benchmark-relative returns benefited from the portfolio’s underweight to Treasuries versus the Bloomberg Index, as credit spreads tightened during the reporting period. Within corporate credit, the Fund’s substantial overweight to financials, driven by the portfolio’s exposure to large, systemically important banks, was a positive |
6Amundi Climate Transition Core Bond Fund | Annual Report | 7/31/23
| | contributor to benchmark-relative performance, as those issuers overcame the market’s concerns about a financial crisis that had hampered the sector during the spring of 2023. |
| | With regard to the underperformance of the Fund’s agency MBS exposures, the issues that plagued the banking system during the spring put pressure on spreads and increased volatility in the sector, as the Federal Deposit Insurance Corporation (FDIC) began liquidating portfolios with large MBS exposures acquired from the failed banks. |
| | In terms of security selection, within the Fund’s allocation to corporate bonds, benchmark-relative results benefited the most from holdings of industrial issuers, where the portfolio’s exposure to the debt of an aircraft manufacturer and to some non-US banks highlighted positive contributions. Security selection results within the portfolio's allocation to commercial MBS (CMBS) also aided the Fund's benchmark-relative returns. |
| | Another positive contributor to the Fund’s benchmark-relative performance was the portfolio’s yield-curve positioning, where an overweight to securities with longer maturities was beneficial, as prices for that segment of the yield curve rose as the curve flattened, while the opposite was true for securities with shorter maturities. |
| | Finally, the portfolio’s long-duration (above-benchmark) stance versus the Bloomberg Index detracted from the Fund’s benchmark-relative results in a reporting period featuring a rising interest-rate environment. (Duration is a measure of the sensitivity of the price, or the value of principal, of a fixed-income investment to a change in interest rates, expressed as a number of years.) |
| Q | Did the Fund have any exposure to derivative securities during the abbreviated annual reporting period between December 15, 2022 and July 31, 2023? |
| A | Yes, we invested the Fund in Treasury futures during the period. We use Treasury futures as part of our duration/interest-rate-management approach for the portfolio. We believe the use of Treasury futures allows us to express our views on duration and yield-curve positioning in the most efficient manner. We also |
Amundi Climate Transition Core Bond Fund | Annual Report | 7/31/237
| | believe the use of derivatives facilitates efficient portfolio construction. The use of derivatives had essentially a neutral effect on the Fund’s performance during the reporting period, given that yield-curve positioning benefited relative returns, and duration positioning detracted from relative results. |
| Q | Can you discuss the factors that affected the Fund’s income generation, or distributions* to shareholders, during the abbreviated annual reporting period between December 15, 2022 and July 31, 2023? |
| A | The Fund’s monthly distribution rate increased over the reporting period. While the Treasury yield curve finished the period higher than where it began one year ago, most notably on the short end, tightening credit spreads seen across both corporate credit and securitized assets partially offset those effects. |
| Q | What is your investment outlook? |
| A | With elevated inflation proving to be sticky and the Fed committed to bringing inflation down to its 2% long-term target, we believe the federal funds rate target range will remain “higher for longer.” The market now appears to agree with this view, as expectations for the Fed’s first interest-rate cut have been pushed out to May 2024. We believe financial conditions will become more restrictive, and that the likelihood of a recession has increased as banks have tightened lending standards and as the Fed has maintained higher rates, given lingering inflation concerns. Consequently, we expect to maintain a relatively defensive posture in the portfolio as recession risks increase over the remainder of the calendar year, with weak manufacturing activity and higher mortgage rates weighing on the economy. |
| | As is typically the case during recessions, we would expect some credit-oriented bond issuers to face pressures, which could lead to increased ratings downgrades. However, we do not expect a deep recession, such as during the global financial crisis (GFC) of 2008. In our opinion, the economy will likely be on the upswing and the default rate headed lower at some point in 2024. We expect that by 2024 inflation will have fallen closer to the Fed’s targeted 2% area and that Treasury yields will be lower than |
| * | Distributions are not guaranteed. |
8Amundi Climate Transition Core Bond Fund | Annual Report | 7/31/23
| | today’s levels. In that scenario, we expect the default rate to remain lower than what we saw in the wake of the GFC. |
| | In our view, US fixed-income duration exposures remain attractive in both nominal and inflation-indexed terms. As spreads in credit-oriented sectors have narrowed back to early March (pre-bank crisis) levels, we have been selectively reducing the size of the Fund’s corporate, securitized credit, and agency MBS allocations. However, we anticipate the Fund’s fixed-income positioning to continue actively evolving along with shifts in our outlook, and our views on relative valuations. |
Amundi Climate Transition Core Bond Fund | Annual Report | 7/31/239
Please refer to the Schedule of Investments on pages 20 - 27 for a full listing of Fund securities.
All investments are subject to risk, including the possible loss of principal. In the past several years, financial markets have experienced increased volatility and heightened uncertainty. The market prices of securities may go up or down, sometimes rapidly or unpredictably, due to general market conditions, such as real or perceived adverse economic, political, or regulatory conditions, recessions, inflation, changes in interest or currency rates, lack of liquidity in the bond markets, the spread of infectious illness or other public health issues, armed conflict including Russia's military invasion of Ukraine, sanctions against Russia, other nations or individuals or companies and possible countermeasures, market disruptions caused by tariffs, trade disputes or other government actions, or adverse investor sentiment. These conditions may continue, recur, worsen or spread.
Until recently, a commonly used reference rate for floating rate securities was LIBOR (London Interbank Offered Rate). Publication of most LIBOR settings has ceased on a representative basis. The impact of the transition from LIBOR on the Fund's transactions and financial markets generally cannot yet be determined.
Investments in high-yield or lower rated securities are subject to greater-than-average price volatility, illiquidity and possibility of default.
The market price of securities may fluctuate when interest rates change. When interest rates rise, the prices of fixed income securities in the Fund will generally fall. Conversely, when interest rates fall, the prices of fixed income securities in the Fund will generally rise.
Investments in the Fund are subject to possible loss due to the financial failure of issuers of underlying securities and their inability to meet their debt obligations.
Investing in foreign and/or emerging markets securities involves risks relating to interest rates, currency exchange rates, economic, and political conditions.
The Fund’s consideration of the Climate Transition Criteria will result in the exclusion of investments the issuers of which do not meet such criteria. Additionally, to the extent that other ESG information is considered, such other ESG information may also result in the exclusion of investments.
Excluding specific issuers limits the universe of investments available to the Fund, which may mean forgoing some investment opportunities available to funds that do not consider such criteria or information.
10Amundi Climate Transition Core Bond Fund | Annual Report | 7/31/23
Accordingly, the Fund may underperform other funds that do not utilize such an investment strategy or ESG information.
The focus on the carbon and climate-related characteristics of issuers may increase the Fund’s exposure to certain investments.
The Fund is more susceptible to events or factors adversely affecting such investments, such as a decrease in support for climate-related or environmental initiatives or an increase in the cost of implementing climate-related initiatives.
Certain securities and derivatives held by the Fund may be or become impossible or difficult to purchase, sell, or unwind. Such securities may also be difficult to value.
For more information on this or any Pioneer fund, please visit amundi.com/usinvestors or call 1-800-622-9876. This material must be preceded or accompanied by the Fund's current prospectus or summary prospectus.
Any information in this shareholder report regarding market or economic trends or the factors influencing the Fund’s historical or future performance are statements of opinion as of the date of this report. Past performance is not a guarantee of future results.
Amundi Climate Transition Core Bond Fund | Annual Report | 7/31/2311
Portfolio Summary | 7/31/23
Portfolio Diversification
(As a percentage of total investments)*
10 Largest Holdings
| (As a percentage of total investments)* |
| 1. | European Investment Bank, 2.125%, 4/13/26 | 4.10% |
| 2. | Federal Home Loan Mortgage Corp., 3.50%, 6/1/52 | 3.70 |
| 3. | Federal Home Loan Mortgage Corp., 5.50%, 2/1/53 | 3.68 |
| 4. | Federal National Mortgage Association, 2.00%, 2/1/52 | 3.66 |
| 5. | Federal Home Loan Mortgage Corp., 5.00%, 2/1/53 | 3.62 |
| 6. | Federal Home Loan Mortgage Corp., 3.00%, 4/1/42 | 3.62 |
| 7. | Federal Home Loan Mortgage Corp., 2.50%, 3/1/52 | 3.59 |
| 8. | Federal Home Loan Mortgage Corp., 1.50%, 3/1/37 | 3.59 |
| 9. | Federal National Mortgage Association, 2.50%, 4/1/52 | 3.50 |
| 10. | U.S. Treasury Bonds, 4.00%, 11/15/52 | 3.22 |
| | |
| * | Excludes short-term investments and all derivative contracts except for options purchased. The Fund is actively managed, and current holdings may be different. The holdings listed should not be considered recommendations to buy or sell any securities. |
12Amundi Climate Transition Core Bond Fund | Annual Report | 7/31/23
Prices and Distributions | 7/31/23
Net Asset Value per Share
| Class | 7/31/23 | 12/15/22* |
| A | $9.75 | $10.00 |
| C | $9.75 | $10.00 |
| K | $9.75 | $10.00 |
| Y | $9.75 | $10.00 |
| | | |
Distributions per Share: 12/15/22* - 7/31/23
| Class | Net
Investment
Income | Short-Term
Capital Gains | Long-Term
Capital Gains |
| A | $0.2143 | $— | $— |
| C | $0.1710 | $— | $— |
| K | $0.2290 | $— | $— |
| Y | $0.2290 | $— | $— |
* The Fund commenced operations on December 15, 2022.
Index Definition
The Bloomberg U.S. Aggregate Bond Index is an unmanaged measure of the US bond market. Indices are unmanaged and their returns assume reinvestment of dividends and do not reflect any fees or expenses. It is not possible to invest directly in an index.
The index defined here pertains to the “Value of $10,000 Investment” and “Value of $5 Million Investment” charts on pages 14 - 17.
Amundi Climate Transition Core Bond Fund | Annual Report | 7/31/2313
| Performance Update | 7/31/23 | Class A Shares |
Investment Returns
The mountain chart on the right shows the change in value of a $10,000 investment made in Class A shares of Amundi Climate Transition Core Bond Fund at public offering price during the periods shown, compared to that of the Bloomberg U.S. Aggregate Bond Index.*
Average Annual Total Returns
(As of July 31, 2023) |
| Period | Net
Asset
Value
(NAV) | Public
Offering
Price
(POP) | Bloomberg
U.S.
Aggregate
Bond
Index |
Since Inception
(12/15/22) | -0.36% | -4.84% | -0.38% |
Expense Ratio
(Per prospectus dated October 18, 2022) |
| Gross | Net |
| 1.61% | 0.73% |
Value of $10,000 Investment
Call 1-800-225-6292 or visit www.amundi.com/us for the most recent month-end performance results. Current performance may be lower or higher than the performance data quoted.
The performance data quoted represents past performance, which is no guarantee of future results. Investment return and principal value will fluctuate, and shares, when redeemed, may be worth more or less than their original cost.
NAV results represent the percent change in net asset value per share. NAV returns would have been lower had sales charges been reflected. POP returns reflect deduction of maximum 4.50% sales charge. All results are historical and assume the reinvestment of dividends and capital gains. Other share classes are available for which performance and expenses will differ.
Performance results reflect any applicable expense waivers in effect during the periods shown. Without such waivers Fund performance would be lower. Waivers may not be in effect for all funds. Certain fee waivers are contractual through a specified period. Otherwise, fee waivers can be rescinded at any time. See the prospectus and financial statements for more information.
The net expense ratio reflects the contractual expense limitation currently in effect through December 1, 2025 for Class A shares. There can be no assurance that Amundi US will extend the expense limitation beyond such time. Please see the prospectus and financial statements for more information.
* Performance of Class A shares of the Fund shown in the graph above is from the inception of Class A shares on 12/15/22 through 7/31/23. Index information shown in the graph above is from 12/31/22 through 7/31/23.
The performance table and graph do not reflect the deduction of fees and taxes that a shareowner would pay on Fund distributions or the redemption of Fund shares.
Please refer to the financial highlights for more current expense ratios.
14Amundi Climate Transition Core Bond Fund | Annual Report | 7/31/23
| Performance Update | 7/31/23 | Class C Shares |
Investment Returns
The mountain chart on the right shows the change in value of a $10,000 investment made in Class C shares of Amundi Climate Transition Core Bond Fund during the periods shown, compared to that of the Bloomberg U.S. Aggregate Bond Index.*
Average Annual Total Returns
(As of July 31, 2023) |
| Period | If
Held | If
Redeemed | Bloomberg
U.S.
Aggregate
Bond
Index |
Since Inception
(12/15/22) | -0.80% | -1.77% | -0.38% |
Expense Ratio
(Per prospectus dated October 18, 2022) |
| Gross | Net |
| 2.36% | 1.48% |
Value of $10,000 Investment
Call 1-800-225-6292 or visit www.amundi.com/us for the most recent month-end performance results. Current performance may be lower or higher than the performance data quoted.
The performance data quoted represents past performance, which is no guarantee of future results. Investment return and principal value will fluctuate, and shares, when redeemed, may be worth more or less than their original cost.
Class C shares held for less than one year are subject to a 1% contingent deferred sales charge (CDSC). “If Held” results represent the percent change in net asset value per share. "If Redeemed" returns reflect the deduction of the CDSC for periods up to one year, assuming a complete redemption of shares at the last price calculated on the last business day of the period, and no CDSC for the other time periods. All results are historical and assume the reinvestment of dividends and capital gains. Other share classes are available for which performance and expenses will differ.
Performance results reflect any applicable expense waivers in effect during the periods shown. Without such waivers Fund performance would be lower. Waivers may not be in effect for all funds. Certain fee waivers are contractual through a specified period. Otherwise, fee waivers can be rescinded at any time. See the prospectus and financial statements for more information.
The net expense ratio reflects the contractual expense limitation currently in effect through December 1, 2025 for Class C shares. There can be no assurance that Amundi US will extend the expense limitation beyond such time. Please see the prospectus and financial statements for more information.
* Performance of Class C shares of the Fund shown in the graph above is from the inception of Class C shares on 12/15/22 through 7/31/23. Index information shown in the graph above is from 12/31/22 through 7/31/23.
The performance table and graph do not reflect the deduction of fees and taxes that a shareowner would pay on Fund distributions or the redemption of Fund shares.
Please refer to the financial highlights for more current expense ratios.
Amundi Climate Transition Core Bond Fund | Annual Report | 7/31/2315
| Performance Update | 7/31/23 | Class K Shares |
Investment Returns
The mountain chart on the right shows the change in value of a $5 million investment made in Class K shares of Amundi Climate Transition Core Bond Fund during the periods shown, compared to that of the Bloomberg U.S. Aggregate Bond Index.*
Average Annual Total Returns
(As of July 31, 2023) |
| Period | Net
Asset
Value
(NAV) | Bloomberg
U.S.
Aggregate
Bond
Index |
Since Inception
(12/15/22) | -0.21% | -0.38% |
Expense Ratio
(Per prospectus dated October 18, 2022) |
| Gross | Net |
| 1.23% | 0.45% |
Value of $5 Million Investment
Call 1-800-225-6292 or visit www.amundi.com/us for the most recent month-end performance results. Current performance may be lower or higher than the performance data quoted.
The performance data quoted represents past performance, which is no guarantee of future results. Investment return and principal value will fluctuate, and shares, when redeemed, may be worth more or less than their original cost.
The performance shown for Class K shares are not subject to sales charges and are available for limited groups of eligible investors, including institutional investors. All results are historical and assume the reinvestment of dividends and capital gains. Other share classes are available for which performance and expenses will differ.
Performance results reflect any applicable expense waivers in effect during the periods shown. Without such waivers Fund performance would be lower. Waivers may not be in effect for all funds. Certain fee waivers are contractual through a specified period. Otherwise, fee waivers can be rescinded at any time. See the prospectus and financial statements for more information.
The net expense ratio reflects the contractual expense limitation currently in effect through December 1, 2025 for Class K shares. There can be no assurance that Amundi US will extend the expense limitation beyond such time. Please see the prospectus and financial statements for more information.
* Performance of Class K shares of the Fund shown in the graph above is from the inception of Class K shares on 12/15/22 through 7/31/23. Index information shown in the graph above is from 12/31/22 through 7/31/23.
The performance table and graph do not reflect the deduction of fees and taxes that a shareowner would pay on Fund distributions or the redemption of Fund shares.
Please refer to the financial highlights for more current expense ratios.
16Amundi Climate Transition Core Bond Fund | Annual Report | 7/31/23
| Performance Update | 7/31/23 | Class Y Shares |
Investment Returns
The mountain chart on the right shows the change in value of a $5 million investment made in Class Y shares of Amundi Climate Transition Core Bond Fund during the periods shown, compared to that of the Bloomberg U.S. Aggregate Bond Index.*
Average Annual Total Returns
(As of July 31, 2023) |
| Period | Net
Asset
Value
(NAV) | Bloomberg
U.S.
Aggregate
Bond
Index |
Since Inception
(12/15/22) | -0.21% | -0.38% |
Expense Ratio
(Per prospectus dated October 18, 2022) |
| Gross | Net |
| 1.35% | 0.45% |
Value of $5 Million Investment
Call 1-800-225-6292 or visit www.amundi.com/us for the most recent month-end performance results. Current performance may be lower or higher than the performance data quoted.
The performance data quoted represents past performance, which is no guarantee of future results. Investment return and principal value will fluctuate, and shares, when redeemed, may be worth more or less than their original cost.
Class Y shares are not subject to sales charges and are available for limited groups of eligible investors, including institutional investors. All results are historical and assume the reinvestment of dividends and capital gains. Other share classes are available for which performance and expenses will differ.
Performance results reflect any applicable expense waivers in effect during the periods shown. Without such waivers Fund performance would be lower. Waivers may not be in effect for all funds. Certain fee waivers are contractual through a specified period. Otherwise, fee waivers can be rescinded at any time. See the prospectus and financial statements for more information.
The net expense ratio reflects the contractual expense limitation currently in effect through December 1, 2025 for Class Y shares. There can be no assurance that Amundi US will extend the expense limitation beyond such time. Please see the prospectus and financial statements for more information.
* Performance of Class Y shares of the Fund shown in the graph above is from the inception of Class Y shares on 12/15/22 through 7/31/23. Index information shown in the graph above is from 12/31/22 through 7/31/23.
The performance table and graph do not reflect the deduction of fees and taxes that a shareowner would pay on Fund distributions or the redemption of Fund shares.
Please refer to the financial highlights for more current expense ratios.
Amundi Climate Transition Core Bond Fund | Annual Report | 7/31/2317
Comparing Ongoing Fund Expenses
As a shareowner in the Fund, you incur two types of costs:
| (1) | ongoing costs, including management fees, distribution and/or service (12b-1) fees, and other Fund expenses; and |
| (2) | transaction costs, including sales charges (loads) on purchase payments. |
This example is intended to help you understand your ongoing expenses (in dollars) of investing in the Fund and to compare these costs with the ongoing costs of investing in other mutual funds. The example is based on an investment of $1,000 at the beginning of the Fund’s latest six-month period and held throughout the six months.
Using the Tables
Actual Expenses
The first table below provides information about actual account values and actual expenses. You may use the information in this table, together with the amount you invested, to estimate the expenses that you paid over the period as follows:
| (1) | Divide your account value by $1,000
Example: an $8,600 account value ÷ $1,000 = 8.6 |
| (2) | Multiply the result in (1) above by the corresponding share class’s number in the third row under the heading entitled “Expenses Paid During Period” to estimate the expenses you paid on your account during this period. |
Expenses Paid on a $1,000 Investment in Amundi Climate Transition Core Bond Fund
Based on actual returns from February 1, 2023 through July 31, 2023.
| Share Class | A | C | K | Y |
Beginning Account
Value on 12/15/22 | $1,000.00 | $1,000.00 | $1,000.00 | $1,000.00 |
Ending Account Value
(after expenses) on 7/31/23 | $996.40 | $992.00 | $997.90 | $997.90 |
Expenses Paid
During Period* | $2.28 | $5.98 | $1.04 | $1.04 |
| | |
| * | Expenses are equal to the Fund’s annualized expense ratio of 0.46%, 1.21%, 0.21%, and 0.21% for Class A, Class C, Class K, and Class Y shares, respectively, multiplied by the average account value over the period, multiplied by 181/365 (to reflect the one-half year period). |
18Amundi Climate Transition Core Bond Fund | Annual Report | 7/31/23
Hypothetical Example for Comparison Purposes
The table below provides information about hypothetical account values and hypothetical expenses based on the Fund’s actual expense ratio and an assumed rate of return of 5% per year before expenses, which is not the Fund’s actual return. The hypothetical account values and expenses may not be used to estimate the actual ending account balance or expenses you paid for the period.
You may use this information to compare the ongoing costs of investing in the Fund and other funds. To do so, compare this 5% hypothetical example with the 5% hypothetical examples that appear in the shareholder reports of the other funds.
Please note that the expenses shown in the tables are meant to highlight your ongoing costs only and do not reflect any transaction costs, such as sales charges (loads) that are charged at the time of the transaction. Therefore, the table below is useful in comparing ongoing costs only and will not help you determine the relative total costs of owning different funds. In addition, if these transaction costs were included, your costs would have been higher.
Expenses Paid on a $1,000 Investment in Amundi Climate Transition Core Bond Fund
Based on a hypothetical 5% return per year before expenses, reflecting the period from February 1, 2023 through July 31, 2023.
| Share Class | A | C | K | Y |
Beginning Account
Value on 2/1/23 | $1,000.00 | $1,000.00 | $1,000.00 | $1,000.00 |
Ending Account Value
(after expenses) on 7/31/23 | $1,022.51 | $1,018.79 | $1,023.75 | $1,023.75 |
Expenses Paid
During Period* | $2.31 | $6.06 | $1.05 | $1.05 |
| | |
| * | Expenses are equal to the Fund’s annualized expense ratio of 0.46%, 1.21%, 0.21%, and 0.21% for Class A, Class C, Class K, and Class Y shares, respectively, multiplied by the average account value over the period, multiplied by 181/365 (to reflect the one-half year period). |
Amundi Climate Transition Core Bond Fund | Annual Report | 7/31/2319
Schedule of Investments | 7/31/23
Principal
Amount
USD ($) | | | | | | Value |
| | UNAFFILIATED ISSUERS — 97.6% | |
| | Asset Backed Securities — 4.9% of Net Assets | |
| 100,000 | Amur Equipment Finance Receivables XII LLC, Series 2023-1A, Class C, 6.36%, 12/20/29 (144A) | $ 99,719 |
| 100,000(a) | Arbor Realty Commercial Real Estate Notes, Ltd., Series 2021-FL3, Class C, 7.186% (1 Month Term SOFR + 196 bps), 8/15/34 (144A) | 94,324 |
| 100,000(b) | B2R Mortgage Trust, Series 2015-2, Class E, 5.826%, 11/15/48 (144A) | 96,599 |
| 96,438 | BOF VII AL Funding Trust I, Series 2023-CAR3, Class A2, 6.291%, 7/26/32 (144A) | 96,151 |
| 99,817 | Progress Residential Trust, Series 2021-SFR7, Class A, 1.692%, 8/17/40 (144A) | 82,826 |
| 100,000(a) | ReadyCap Lending Small Business Loan Trust, Series 2023-3, Class A, 8.32% (SOFR30A + 325 bps), 4/25/48 (144A) | 100,000 |
| 159,191(a) | STAR Trust, Series 2021-SFR1, Class A, 5.936% (1 Month Term SOFR + 71 bps), 4/17/38 (144A) | 155,719 |
| 250,000 | Tesla Auto Lease Trust, Series 2021-A, Class B, 1.02%, 3/20/25 (144A) | 245,971 |
| | Total Asset Backed Securities
(Cost $965,594) | $971,309 |
|
|
| | Collateralized Mortgage Obligations—1.8%
of Net Assets | |
| 42,574(a) | Connecticut Avenue Securities Trust, Series 2021-R03, Class 1M1, 5.919% (SOFR30A + 85 bps), 12/25/41 (144A) | $ 42,359 |
| 100,000(a) | Freddie Mac STACR REMIC Trust, Series 2021-DNA7, Class M2, 6.869% (SOFR30A + 180 bps), 11/25/41 (144A) | 98,124 |
| 73,607(b) | Seasoned Credit Risk Transfer Trust, Series 2016-1, Class M2, 3.75%, 9/25/55 (144A) | 64,307 |
| 100,801(b) | Seasoned Credit Risk Transfer Trust, Series 2019-3, Class M, 4.75%, 10/25/58 | 90,563 |
| 91,088(b) | Towd Point Mortgage Trust, Series 2021-R1, Class A1, 2.918%, 11/30/60 (144A) | 71,205 |
| | Total Collateralized Mortgage Obligations
(Cost $367,970) | $366,558 |
|
|
| | Commercial Mortgage-Backed
Securities—5.4% of Net Assets | |
| 100,000 | BX Trust, Series 2019-OC11, Class A, 3.202%, 12/9/41 (144A) | $ 86,006 |
| 476,000 | Freddie Mac Multifamily Structured Pass Through Certificates, Series KG04, Class A2, 1.487%, 11/25/30 | 383,626 |
The accompanying notes are an integral part of these financial statements.
20Amundi Climate Transition Core Bond Fund | Annual Report | 7/31/23
Principal
Amount
USD ($) | | | | | | Value |
| | Commercial Mortgage-Backed
Securities—(continued) | |
| 500,000 | Freddie Mac Multifamily Structured Pass Through Certificates, Series KG06, Class A2, 1.777%, 10/25/31 | $ 403,559 |
| 250,000 | SLG Office Trust, Series 2021-OVA, Class A, 2.585%, 7/15/41 (144A) | 201,545 |
| | Total Commercial Mortgage-Backed Securities
(Cost $1,122,499) | $1,074,736 |
|
|
| | Corporate Bonds — 40.6% of Net Assets | |
| | Aerospace & Defense — 0.5% | |
| 100,000 | Boeing Co., 5.805%, 5/1/50 | $ 100,579 |
| | Total Aerospace & Defense | $100,579 |
|
|
| | Auto Manufacturers — 2.0% | |
| 150,000 | Daimler Truck Finance North America LLC, 5.125%, 1/19/28 (144A) | $ 149,094 |
| 105,000 | Ford Motor Co., 6.10%, 8/19/32 | 101,585 |
| 105,000 | General Motors Co., 5.60%, 10/15/32 | 102,831 |
| 40,000 | Hyundai Capital America, 5.80%, 6/26/25 (144A) | 40,024 |
| | Total Auto Manufacturers | $393,534 |
|
|
| | Banks — 16.3% | |
| 300,000(b) | Bank of America Corp., 1.658% (SOFR + 91 bps), 3/11/27 | $ 270,431 |
| 120,000(b) | Bank of America Corp., 2.687% (SOFR + 132 bps), 4/22/32 | 99,394 |
| 300,000(b) | Bank of New York Mellon Corp., 4.543% (SOFR + 117 bps), 2/1/29 | 292,796 |
| 150,000 | Bank of Nova Scotia, 4.75%, 2/2/26 | 148,030 |
| 200,000(b) | Barclays Plc, 6.224% (SOFR + 298 bps), 5/9/34 | 201,862 |
| 200,000(b) | BNP Paribas S.A., 5.125% (1 Year CMT Index + 145 bps), 1/13/29 (144A) | 196,583 |
| 100,000 | Citigroup, Inc., 4.45%, 9/29/27 | 96,189 |
| 100,000(b) | Goldman Sachs Group, Inc., 4.223% (3 Month Term SOFR + 156 bps), 5/1/29 | 94,832 |
| 100,000(b) | JPMorgan Chase & Co., 5.717% (SOFR + 258 bps), 9/14/33 | 101,539 |
| 250,000 | KeyBank N.A., 5.00%, 1/26/33 | 225,905 |
| 130,000(b) | Morgan Stanley, 2.484% (SOFR + 136 bps), 9/16/36 | 99,658 |
| 30,000(b) | Morgan Stanley, 5.948% (5 Year CMT Index + 243 bps), 1/19/38 | 29,844 |
| 200,000(b) | NatWest Group Plc, 5.847% (1 Year CMT Index + 135 bps), 3/2/27 | 198,833 |
| 200,000(b) | Societe Generale S.A., 6.446% (1 Year CMT Index + 255 bps), 1/10/29 (144A) | 203,160 |
| 200,000(b) | Standard Chartered Plc, 6.17% (1 Year CMT Index + 205 bps), 1/9/27 (144A) | 201,720 |
| 200,000 | Sumitomo Mitsui Financial Group, Inc., 5.52%, 1/13/28 | 201,306 |
The accompanying notes are an integral part of these financial statements.
Amundi Climate Transition Core Bond Fund | Annual Report | 7/31/2321
Schedule of Investments | 7/31/23 (continued)
Principal
Amount
USD ($) | | | | | | Value |
| | Banks — (continued) | |
| 200,000(b) | UBS Group AG, 5.711% (1 Year CMT Index + 155 bps), 1/12/27 (144A) | $ 199,680 |
| 300,000(b) | US Bancorp, 4.653% (SOFR + 123 bps), 2/1/29 | 287,871 |
| 100,000(b) | Wells Fargo & Co., 3.526% (SOFR + 151 bps), 3/24/28 | 93,481 |
| | Total Banks | $3,243,114 |
|
|
| | Beverages — 1.5% | |
| 300,000 | Anheuser-Busch Cos. LLC/Anheuser-Busch InBev Worldwide, Inc., 4.70%, 2/1/36 | $ 290,864 |
| | Total Beverages | $290,864 |
|
|
| | Biotechnology — 0.2% | |
| 35,000 | Amgen, Inc., 5.25%, 3/2/33 | $ 34,931 |
| | Total Biotechnology | $34,931 |
|
|
| | Chemicals — 0.3% | |
| 56,000 | Albemarle Corp., 5.05%, 6/1/32 | $ 53,563 |
| | Total Chemicals | $53,563 |
|
|
| | Computers — 1.4% | |
| 405,000 | Apple, Inc., 2.65%, 2/8/51 | $ 277,095 |
| | Total Computers | $277,095 |
|
|
| | Cosmetics/Personal Care — 0.2% | |
| 40,000 | Estee Lauder Cos., Inc., 5.15%, 5/15/53 | $ 40,134 |
| | Total Cosmetics/Personal Care | $40,134 |
|
|
| | Diversified Financial Services — 2.4% | |
| 150,000 | AerCap Ireland Capital DAC/AerCap Global Aviation Trust, 2.45%, 10/29/26 | $ 134,893 |
| 100,000 | Air Lease Corp., 5.30%, 2/1/28 | 98,876 |
| 50,000 | Ameriprise Financial, Inc., 5.15%, 5/15/33 | 49,601 |
| 150,000(b) | Capital One Financial Corp., 5.468% (SOFR + 208 bps), 2/1/29 | 145,976 |
| 30,000(b) | Capital One Financial Corp., 5.817% (SOFR + 260 bps), 2/1/34 | 29,153 |
| 30,000(b) | Charles Schwab Corp., 5.853% (SOFR + 250 bps), 5/19/34 | 30,915 |
| | Total Diversified Financial Services | $489,414 |
|
|
| | Electric — 0.5% | |
| 100,000 | Eversource Energy, 5.45%, 3/1/28 | $ 101,425 |
| | Total Electric | $101,425 |
|
|
The accompanying notes are an integral part of these financial statements.
22Amundi Climate Transition Core Bond Fund | Annual Report | 7/31/23
Principal
Amount
USD ($) | | | | | | Value |
| | Hand & Machine Tools — 0.4% | |
| 85,000 | Regal Rexnord Corp., 6.30%, 2/15/30 (144A) | $ 84,861 |
| | Total Hand & Machine Tools | $84,861 |
|
|
| | Healthcare-Products — 0.2% | |
| 45,000 | Medtronic Global Holdings SCA, 4.50%, 3/30/33 | $ 43,907 |
| | Total Healthcare-Products | $43,907 |
|
|
| | Insurance — 1.6% | |
| 150,000 | Metropolitan Life Global Funding I, 5.05%, 1/6/28 (144A) | $ 149,143 |
| 80,000 | New York Life Global Funding, 4.55%, 1/28/33 (144A) | 76,763 |
| 100,000 | New York Life Global Funding, 4.85%, 1/9/28 (144A) | 99,195 |
| | Total Insurance | $325,101 |
|
|
| | Internet — 1.4% | |
| 385,000 | Amazon.com, Inc., 3.10%, 5/12/51 | $ 281,681 |
| | Total Internet | $281,681 |
|
|
| | Machinery-Diversified — 0.2% | |
| 40,000 | CNH Industrial Capital LLC, 4.55%, 4/10/28 | $ 38,821 |
| | Total Machinery-Diversified | $38,821 |
|
|
| | Media — 1.4% | |
| 420,000 | Comcast Corp., 2.887%, 11/1/51 | $ 279,389 |
| | Total Media | $279,389 |
|
|
| | Oil & Gas — 0.9% | |
| 175,000 | Aker BP ASA, 6.00%, 6/13/33 (144A) | $ 175,848 |
| | Total Oil & Gas | $175,848 |
|
|
| | Pharmaceuticals — 4.0% | |
| 240,000 | AbbVie, Inc., 4.25%, 11/21/49 | $ 205,892 |
| 270,000 | Bristol-Myers Squibb Co., 4.25%, 10/26/49 | 234,545 |
| 300,000 | Cigna Group, 4.375%, 10/15/28 | 290,127 |
| 5,000 | CVS Health Corp., 5.25%, 1/30/31 | 5,000 |
| 55,000 | CVS Health Corp., 5.25%, 2/21/33 | 54,716 |
| | Total Pharmaceuticals | $790,280 |
|
|
| | Pipelines — 0.5% | |
| 100,000 | EnLink Midstream LLC, 6.50%, 9/1/30 (144A) | $ 100,653 |
| | Total Pipelines | $100,653 |
|
|
| | REITs — 1.2% | |
| 100,000 | Simon Property Group LP , 5.50%, 3/8/33 | $ 99,902 |
The accompanying notes are an integral part of these financial statements.
Amundi Climate Transition Core Bond Fund | Annual Report | 7/31/2323
Schedule of Investments | 7/31/23 (continued)
Principal
Amount
USD ($) | | | | | | Value |
| | REITs — (continued) | |
| 35,000 | Sun Communities Operating LP , 5.70%, 1/15/33 | $ 34,402 |
| 100,000 | Weyerhaeuser Co., 4.75%, 5/15/26 | 98,610 |
| | Total REITs | $232,914 |
|
|
| | Retail — 2.0% | |
| 100,000 | AutoZone, Inc., 4.50%, 2/1/28 | $ 97,399 |
| 100,000 | Lowe's Cos., Inc., 5.15%, 7/1/33 | 99,930 |
| 200,000 | Target Corp., 4.40%, 1/15/33 | 193,271 |
| 15,000 | Tractor Supply Co., 5.25%, 5/15/33 | 14,830 |
| | Total Retail | $405,430 |
|
|
| | Semiconductors — 0.5% | |
| 120,000 | Broadcom, Inc., 3.469%, 4/15/34 (144A) | $ 98,425 |
| | Total Semiconductors | $98,425 |
|
|
| | Software — 0.7% | |
| 200,000 | Microsoft Corp., 2.525%, 6/1/50 | $ 136,237 |
| | Total Software | $136,237 |
|
|
| | Telecommunications — 0.3% | |
| 75,000 | Verizon Communications, Inc., 3.55%, 3/22/51 | $ 54,318 |
| | Total Telecommunications | $54,318 |
|
|
| | Total Corporate Bonds
(Cost $8,185,063) | $8,072,518 |
|
|
| | Insurance-Linked Securities — 1.2% of Net
Assets# | |
| | Event Linked Bonds — 1.2% | |
| | Windstorm – U.S. Multistate — 1.2% | |
| 250,000(a) | Gateway Re, 15.386%, (1 Month U.S. Treasury Bill + 1,000 bps), 7/8/26 (144A) | $ 249,625 |
| | Total Event Linked Bonds | $ 249,625 |
|
|
| | Total Insurance-Linked Securities
(Cost $250,000) | $249,625 |
|
|
| | Foreign Government Bonds — 5.0% of Net
Assets | |
| | Israel — 1.0% | |
| 200,000 | Israel Government International Bond, 4.500%, 1/17/33 | $ 193,740 |
| | Total Israel | $193,740 |
|
|
The accompanying notes are an integral part of these financial statements.
24Amundi Climate Transition Core Bond Fund | Annual Report | 7/31/23
Principal
Amount
USD ($) | | | | | | Value |
| | Supranational — 4.0% | |
| 850,000 | European Investment Bank, 2.125%, 4/13/26 | $ 796,065 |
| | Total Supranational | $796,065 |
|
|
| | Total Foreign Government Bonds
(Cost $1,012,077) | $989,805 |
|
|
| | U.S. Government and Agency Obligations —
38.7% of Net Assets | |
| 809,276 | Federal Home Loan Mortgage Corp., 1.500%, 3/1/37 | $ 696,263 |
| 248,140 | Federal Home Loan Mortgage Corp., 2.500%, 8/1/51 | 209,564 |
| 827,677 | Federal Home Loan Mortgage Corp., 2.500%, 3/1/52 | 697,452 |
| 787,506 | Federal Home Loan Mortgage Corp., 3.000%, 4/1/42 | 702,796 |
| 792,163 | Federal Home Loan Mortgage Corp., 3.500%, 6/1/52 | 718,107 |
| 719,684 | Federal Home Loan Mortgage Corp., 5.000%, 2/1/53 | 703,346 |
| 718,244 | Federal Home Loan Mortgage Corp., 5.500%, 2/1/53 | 715,304 |
| 876,577 | Federal National Mortgage Association, 2.000%, 2/1/52 | 710,723 |
| 614,099 | Federal National Mortgage Association, 2.500%, 7/1/37 | 557,267 |
| 805,868 | Federal National Mortgage Association, 2.500%, 4/1/52 | 680,064 |
| 250,000 | Federal National Mortgage Association, 3.010%, 8/1/34 | 213,683 |
| 500,000 | Federal National Mortgage Association, 3.190%, 6/1/29 | 460,659 |
| 625,000 | U.S. Treasury Bonds, 4.000%, 11/15/52 | 624,414 |
| | Total U.S. Government and Agency Obligations
(Cost $7,922,596) | $7,689,642 |
|
|
| | TOTAL INVESTMENTS IN UNAFFILIATED ISSUERS — 97.6%
(Cost $19,825,799) | $19,414,193 |
| | OTHER ASSETS AND LIABILITIES — 2.4% | $ 476,252 |
| | net assets — 100.0% | $ 19,890,445 |
| | | | | | | |
| bps | Basis Points. |
| CMT | Constant Maturity Treasury Index. |
| REIT | Real Estate Investment Trust. |
| SOFR | Secured Overnight Financing Rate. |
| SOFR30A | Secured Overnight Financing Rate 30 Day Average. |
| (144A) | The resale of such security is exempt from registration under Rule 144A of the Securities Act of 1933. Such securities may be resold normally to qualified institutional buyers. At July 31, 2023, the value of these securities amounted to $3,559,629, or 17.9% of net assets. |
| (a) | Floating rate note. Coupon rate, reference index and spread shown at July 31, 2023. |
| (b) | The interest rate is subject to change periodically. The interest rate and/or reference index and spread shown at July 31, 2023. |
| # | Securities are restricted as to resale. |
The accompanying notes are an integral part of these financial statements.
Amundi Climate Transition Core Bond Fund | Annual Report | 7/31/2325
Schedule of Investments | 7/31/23 (continued)
| Restricted Securities | Acquisition date | Cost | Value |
| Gateway Re | 7/14/2023 | $250,000 | $249,625 |
| % of Net assets | | | 1.3% |
FUTURES CONTRACTS
FIXED INCOME INDEX FUTURES CONTRACTS
Number of
Contracts
Long | Description | Expiration
Date | Notional
Amount | Market
Value | Unrealized
(Depreciation) |
| 23 | U.S. 2 Year Note (CBT) | 9/29/23 | $4,739,949 | $4,669,719 | $(70,230) |
| 20 | U.S. 5 Year Note (CBT) | 9/29/23 | 2,138,058 | 2,136,406 | (1,652) |
| 3 | U.S. Ultra Bond (CBT) | 9/20/23 | 406,071 | 396,656 | (9,415) |
| | | | $7,284,078 | $7,202,781 | $(81,297) |
Number of
Contracts
Short | Description | Expiration
Date | Notional
Amount | Market
Value | Unrealized
Appreciation |
| 3 | U.S. 10 Year Note (CBT) | 9/20/23 | $ (342,704) | $ (334,219) | $ 8,485 |
| 11 | U.S. 10 Year Ultra Note (CBT) | 9/20/23 | (1,296,926) | (1,286,828) | 10,098 |
| | | | $(1,639,630) | $(1,621,047) | $ 18,583 |
| TOTAL FUTURES CONTRACTS | $ 5,644,448 | $ 5,581,734 | $(62,714) |
Purchases and sales of securities (excluding short-term investments) for the period ended July 31, 2023 were as follows:
| | Purchases | Sales |
| Long-Term U.S. Government Securities | $ 3,564,804 | $2,982,742 |
| Other Long-Term Securities | $22,423,897 | $3,314,078 |
At July 31, 2023, the net unrealized depreciation on investments based on cost for federal tax purposes of $19,763,085 was as follows:
| Aggregate gross unrealized appreciation for all investments in which there is an excess of value over tax cost | $ 31,100 |
| Aggregate gross unrealized depreciation for all investments in which there is an excess of tax cost over value | (442,706) |
| Net unrealized depreciation | $(411,606) |
The accompanying notes are an integral part of these financial statements.
26Amundi Climate Transition Core Bond Fund | Annual Report | 7/31/23
Various inputs are used in determining the value of the Fund's investments. These inputs are summarized in the three broad levels below.
| Level 1 | – | unadjusted quoted prices in active markets for identical securities. |
| Level 2 | – | other significant observable inputs (including quoted prices for similar securities, interest rates, prepayment speeds, credit risks, etc.). See Notes to Financial Statements — Note 1A. |
| Level 3 | – | significant unobservable inputs (including the Adviser's own assumptions in determining fair value of investments). See Notes to Financial Statements — Note 1A. |
The following is a summary of the inputs used as of July 31, 2023, in valuing the Fund's investments:
| | Level 1 | Level 2 | Level 3 | Total |
| Asset Backed Securities | $ — | $ 971,309 | $— | $ 971,309 |
| Collateralized Mortgage Obligations | — | 366,558 | — | 366,558 |
| Commercial Mortgage-Backed Securities | — | 1,074,736 | — | 1,074,736 |
| Corporate Bonds | — | 8,072,518 | — | 8,072,518 |
| Insurance-Linked Securities | | | | |
| Event Linked Bonds | — | 249,625 | — | 249,625 |
| Foreign Government Bonds | — | 989,805 | — | 989,805 |
| U.S. Government and Agency Obligations | — | 7,689,642 | — | 7,689,642 |
| Total Investments in Securities | $ — | $19,414,193 | $ — | $19,414,193 |
| Other Financial Instruments | | | | |
| Net unrealized depreciation on futures contracts | $(62,714) | $ — | $— | $ (62,714) |
| Total Other Financial Instruments | $ (62,714) | $ — | $ — | $ (62,714) |
During the period ended July 31, 2023, there were no transfers in or out of Level 3.
The accompanying notes are an integral part of these financial statements.
Amundi Climate Transition Core Bond Fund | Annual Report | 7/31/2327
Statement of Assets and Liabilities | 7/31/23
| ASSETS: | |
| Investments in unaffiliated issuers, at value (cost $19,825,799) | $19,414,193 |
| Cash | 31,719 |
| Futures collateral | 135,246 |
| Variation margin for futures contracts | 2,313 |
| Receivables — | |
| Investment securities sold | 200,780 |
| Interest | 143,487 |
| Due from the Adviser | 4,487 |
| Other assets | 63,268 |
| Total assets | $19,995,493 |
| LIABILITIES: | |
| Payables — | |
| Investment securities purchased | $ 2,313 |
| Distributions | 10,214 |
| Trustees' fees | 671 |
| Professional fees | 78,527 |
| Printing expense | 9,297 |
| Management fees | 948 |
| Administrative expenses | 561 |
| Distribution fees | 169 |
| Accrued expenses | 2,348 |
| Total liabilities | $ 105,048 |
| NET ASSETS: | |
| Paid-in capital | $20,386,754 |
| Distributable earnings | (496,309) |
| Net assets | $ 19,890,445 |
| NET ASSET VALUE PER SHARE: | |
| No par value (unlimited number of shares authorized) | |
| Class A (based on $993,619/101,861 shares) | $ 9.75 |
| Class C (based on $989,528/101,483 shares) | $ 9.75 |
| Class K (based on $994,850/101,989 shares) | $ 9.75 |
| Class Y (based on $16,912,448/1,733,818 shares) | $ 9.75 |
| MAXIMUM OFFERING PRICE PER SHARE: | |
| Class A (based on $9.75 net asset value per share/100%-4.50% maximum sales charge) | $ 10.21 |
The accompanying notes are an integral part of these financial statements.
28Amundi Climate Transition Core Bond Fund | Annual Report | 7/31/23
Statement of Operations FOR THE PERIOD FROM 12/15/22* TO 7/31/23
| INVESTMENT INCOME: | | |
| Interest from unaffiliated issuers | $ 546,006 | |
| Dividends from unaffiliated issuers | 53,042 | |
| Total Investment Income | | $ 599,048 |
| EXPENSES: | | |
| Management fees | $ 43,527 | |
| Administrative expenses | 5,034 | |
| Transfer agent fees | | |
| Class A | 8 | |
| Class C | 5 | |
| Class K | 8 | |
| Class Y | 5 | |
| Distribution fees | | |
| Class A | 1,582 | |
| Class C | 6,199 | |
| Shareowner communications expense | 23 | |
| Custodian fees | 289 | |
| Registration fees | 57,212 | |
| Professional fees | 136,469 | |
| Printing expense | 35,076 | |
| Officers' and Trustees' fees | 4,723 | |
| Miscellaneous | 5,100 | |
| Total expenses | | $ 295,260 |
| Less fees waived and expenses reimbursed by the Adviser | | (261,822) |
| Net expenses | | $ 33,438 |
| Net investment income | | $ 565,610 |
| REALIZED AND UNREALIZED GAIN (LOSS) ON INVESTMENTS: | | |
| Net realized gain (loss) on: | | |
| Investments in unaffiliated issuers | $ 27,676 | |
| Futures contracts | (161,566) | $ (133,890) |
| Change in net unrealized appreciation (depreciation) on: | | |
| Investments in unaffiliated issuers | $(411,606) | |
| Futures contracts | (62,714) | $ (474,320) |
| Net realized and unrealized gain (loss) on investments | | $(608,210) |
| Net increase in net assets resulting from operations | | $ (42,600) |
* The Fund commenced operations on December 15, 2022.
The accompanying notes are an integral part of these financial statements.
Amundi Climate Transition Core Bond Fund | Annual Report | 7/31/2329
Statements of Changes in Net Assets
| | Period From
12/15/22* to
7/31/23 |
| FROM OPERATIONS: | |
| Net investment income (loss) | $ 565,610 |
| Net realized gain (loss) on investments | (133,890) |
| Change in net unrealized appreciation (depreciation) on investments | (474,320) |
| Net increase in net assets resulting from operations | $ (42,600) |
| DISTRIBUTIONS TO SHAREOWNERS: | |
| Class A ($0.21 and $— per share, respectively) | $ (22,065) |
| Class C ($0.17 and $— per share, respectively) | (17,208) |
| Class K ($0.23 and $— per share, respectively) | (23,093) |
| Class Y ($0.23 and $— per share, respectively) | (392,579) |
| Total distributions to shareowners | $ (454,945) |
| FROM FUND SHARE TRANSACTIONS: | |
| Net proceeds from sales of shares | $20,075,696 |
| Reinvestment of distributions | 386,710 |
| Cost of shares repurchased | (74,416) |
| Net increase in net assets resulting from Fund share transactions | $20,387,990 |
| Net increase in net assets | $ 19,890,445 |
| NET ASSETS: | |
| Beginning of period | $ — |
| End of period | $ 19,890,445 |
| * | The Fund commenced operations on December 15, 2022. |
The accompanying notes are an integral part of these financial statements.
30Amundi Climate Transition Core Bond Fund | Annual Report | 7/31/23
| | Period From
12/15/22* to
7/31/23
Shares | Period From
12/15/22* to
7/31/23
Amount |
| Class A | | |
| Shares sold | 107,585 | $ 1,075,696 |
| Reinvestment of distributions | 1,901 | 18,753 |
| Less shares repurchased | (7,625) | (74,416) |
| Net increase | 101,861 | $ 1,020,033 |
| Class C | | |
| Shares sold | 100,000 | $ 1,000,000 |
| Reinvestment of distributions | 1,483 | 14,627 |
| Less shares repurchased | — | — |
| Net increase | 101,483 | $ 1,014,627 |
| Class K | | |
| Shares sold | 100,000 | $ 1,000,000 |
| Reinvestment of distributions | 1,989 | 19,630 |
| Less shares repurchased | — | — |
| Net increase | 101,989 | $ 1,019,630 |
| Class Y | | |
| Shares sold | 1,700,000 | $17,000,000 |
| Reinvestment of distributions | 33,818 | 333,700 |
| Less shares repurchased | — | — |
| Net increase | 1,733,818 | $17,333,700 |
| * | The Fund commenced operations on December 15, 2022. |
The accompanying notes are an integral part of these financial statements.
Amundi Climate Transition Core Bond Fund | Annual Report | 7/31/2331
| | 12/15/22* to
7/31/23 |
| Class A | |
| Net asset value, beginning of period | $10.00 |
| Increase (decrease) from investment operations: | |
| Net investment income (loss) (a) | $ 0.27 |
| Net realized and unrealized gain (loss) on investments | (0.31) |
| Net increase (decrease) from investment operations | $ (0.04) |
| Distributions to shareowners: | |
| Net investment income | $ (0.21) |
| Total distributions | $ (0.21) |
| Net increase (decrease) in net asset value | $ (0.25) |
| Net asset value, end of period | $ 9.75 |
| Total return (b) | (0.36)%(c) |
| Ratio of net expenses to average net assets | 0.46%(d) |
| Ratio of net investment income (loss) to average net assets | 4.36%(d) |
| Portfolio turnover rate | 34%(c) |
| Net assets, end of period (in thousands) | $ 994 |
| Ratios with no waiver of fees and assumption of expenses by the Adviser and no reduction for fees paid indirectly: | |
| Total expenses to average net assets | 2.56%(d) |
| Net investment income (loss) to average net assets | 2.26%(d) |
| * | Class A commenced operations on December 15, 2022. |
| (a) | The per-share data presented above is based on the average shares outstanding for the period presented. |
| (b) | Assumes initial investment at net asset value at the beginning of the period, reinvestment of all distributions, the complete redemption of the investment at net asset value at the end of the period and no sales charges. Total return would be reduced if sales charges were taken into account. |
| (c) | Not annualized. |
| (d) | Annualized. |
The accompanying notes are an integral part of these financial statements.
32Amundi Climate Transition Core Bond Fund | Annual Report | 7/31/23
| | 12/15/22* to
7/31/23 |
| Class C | |
| Net asset value, beginning of period | $10.00 |
| Increase (decrease) from investment operations: | |
| Net investment income (loss) (a) | $ 0.22 |
| Net realized and unrealized gain (loss) on investments | (0.30) |
| Net increase (decrease) from investment operations | $ (0.08) |
| Distributions to shareowners: | |
| Net investment income | $ (0.17) |
| Total distributions | $ (0.17) |
| Net increase (decrease) in net asset value | $ (0.25) |
| Net asset value, end of period | $ 9.75 |
| Total return (b) | (0.80)%(c) |
| Ratio of net expenses to average net assets | 1.21%(d) |
| Ratio of net investment income (loss) to average net assets | 3.61%(d) |
| Portfolio turnover rate | 34%(c) |
| Net assets, end of period (in thousands) | $ 990 |
| Ratios with no waiver of fees and assumption of expenses by the Adviser and no reduction for fees paid indirectly: | |
| Total expenses to average net assets | 3.31%(d) |
| Net investment income (loss) to average net assets | 1.51%(d) |
| * | Class C commenced operations on December 15, 2022. |
| (a) | The per-share data presented above is based on the average shares outstanding for the period presented. |
| (b) | Assumes initial investment at net asset value at the beginning of the period, reinvestment of all distributions, the complete redemption of the investment at net asset value at the end of the period and no sales charges. Total return would be reduced if sales charges were taken into account. |
| (c) | Not annualized. |
| (d) | Annualized. |
The accompanying notes are an integral part of these financial statements.
Amundi Climate Transition Core Bond Fund | Annual Report | 7/31/2333
Financial Highlights (continued)
| | 12/15/22* to
7/31/23 |
| Class K | |
| Net asset value, beginning of period | $10.00 |
| Increase (decrease) from investment operations: | |
| Net investment income (loss) (a) | $ 0.28 |
| Net realized and unrealized gain (loss) on investments | (0.30) |
| Net increase (decrease) from investment operations | $ (0.02) |
| Distributions to shareowners: | |
| Net investment income | $ (0.23) |
| Total distributions | $ (0.23) |
| Net increase (decrease) in net asset value | $ (0.25) |
| Net asset value, end of period | $ 9.75 |
| Total return (b) | (0.21)%(c) |
| Ratio of net expenses to average net assets | 0.21%(d) |
| Ratio of net investment income (loss) to average net assets | 4.61%(d) |
| Portfolio turnover rate | 34%(c) |
| Net assets, end of period (in thousands) | $ 995 |
| Ratios with no waiver of fees and assumption of expenses by the Adviser and no reduction for fees paid indirectly: | |
| Total expenses to average net assets | 2.31%(d) |
| Net investment income (loss) to average net assets | 2.51%(d) |
| * | Class K commenced operations on December 15, 2022. |
| (a) | The per-share data presented above is based on the average shares outstanding for the period presented. |
| (b) | Assumes initial investment at net asset value at the beginning of the period, reinvestment of all distributions and the complete redemption of the investment at net asset value at the end of the period. |
| (c) | Not annualized. |
| (d) | Annualized. |
The accompanying notes are an integral part of these financial statements.
34Amundi Climate Transition Core Bond Fund | Annual Report | 7/31/23
| | 12/15/22* to
7/31/23 |
| Class Y | |
| Net asset value, beginning of period | $ 10.00 |
| Increase (decrease) from investment operations: | |
| Net investment income (loss) (a) | $ 0.28 |
| Net realized and unrealized gain (loss) on investments | (0.30) |
| Net increase (decrease) from investment operations | $ (0.02) |
| Distributions to shareowners: | |
| Net investment income | $ (0.23) |
| Total distributions | $ (0.23) |
| Net increase (decrease) in net asset value | $ (0.25) |
| Net asset value, end of period | $ 9.75 |
| Total return (b) | (0.21)%(c) |
| Ratio of net expenses to average net assets | 0.21%(d) |
| Ratio of net investment income (loss) to average net assets | 4.61%(d) |
| Portfolio turnover rate | 34%(c) |
| Net assets, end of period (in thousands) | $16,912 |
| Ratios with no waiver of fees and assumption of expenses by the Adviser and no reduction for fees paid indirectly: | |
| Total expenses to average net assets | 2.31%(d) |
| Net investment income (loss) to average net assets | 2.51%(d) |
| * | Class Y commenced operations on December 15, 2022. |
| (a) | The per-share data presented above is based on the average shares outstanding for the period presented. |
| (b) | Assumes initial investment at net asset value at the beginning of the period, reinvestment of all distributions and the complete redemption of the investment at net asset value at the end of the period. |
| (c) | Not annualized. |
| (d) | Annualized. |
The accompanying notes are an integral part of these financial statements.
Amundi Climate Transition Core Bond Fund | Annual Report | 7/31/2335
Notes to Financial Statements | 7/31/23
1. Organization and Significant Accounting Policies
Amundi Climate Transition Core Bond Fund (the “Fund”) is one of four portfolios comprising Pioneer Series Trust IV (the "Trust"), a Delaware statutory trust. The Fund is registered under the Investment Company Act of 1940, as amended (the “1940 Act”) as a diversified, open-end management investment company. The Fund’s investment objective is to seek a combination of income and capital appreciation.
The Fund offers four classes of shares designated as Class A, Class C, Class K and Class Y shares. Class A, Class C, Class K and Class Y commenced operations on December 15, 2022. Each class of shares represents an interest in the same portfolio of investments of the Fund and has identical rights (based on relative net asset values) to assets and liquidation proceeds. Share classes can bear different rates of class-specific fees and expenses, such as transfer agent and distribution fees. Differences in class-specific fees and expenses will result in differences in net investment income and, therefore, the payment of different dividends from net investment income earned by each class. The Amended and Restated Declaration of Trust of the Trust gives the Board of Trustees the flexibility to specify either per-share voting or dollar-weighted voting when submitting matters for shareowner approval. Under per-share voting, each share of a class of the Fund is entitled to one vote. Under dollar-weighted voting, a shareowner’s voting power is determined not by the number of shares owned, but by the dollar value of the shares on the record date. Each share class has exclusive voting rights with respect to matters affecting only that class, including with respect to the distribution plan for that class. There is no distribution plan for Class K or Class Y shares.
Amundi Asset Management US, Inc., an indirect, wholly owned subsidiary of Amundi and Amundi’s wholly owned subsidiary, Amundi USA, Inc., serves as the Fund’s investment adviser (the “Adviser”). Amundi Distributor US, Inc., an affiliate of the Adviser, serves as the Fund’s distributor (the “Distributor”).
In March 2020, FASB issued an Accounting Standard Update, ASU 2020-04, Reference Rate Reform (Topic 848) — Facilitation of the Effects of Reference Rate Reform on Financial Reporting (“ASU 2020-04”), which provides optional, temporary relief with respect to the financial reporting of contracts subject to certain types of modifications due to the planned discontinuation of the London Interbank Offered Rate (“LIBOR”) and other LIBOR-based reference rates at the end of 2021. The temporary relief provided by ASU 2020-04 is effective for certain reference rate-related
36Amundi Climate Transition Core Bond Fund | Annual Report | 7/31/23
contract modifications that occur during the period from March 12, 2020 through December 31, 2023. Management is evaluating the impact of ASU 2020-04 on the Fund's investments, derivatives, debt and other contracts, if applicable, that will undergo reference rate-related modifications as a result of the reference rate reform.
The Fund is required to comply with Rule 18f-4 under the 1940 Act, which governs the use of derivatives by registered investment companies. Rule 18f-4 permits funds to enter into derivatives transactions (as defined in Rule 18f-4) and certain other transactions notwithstanding the restrictions on the issuance of “senior securities” under Section 18 of the 1940 Act. Rule 18f-4 requires a fund to establish and maintain a comprehensive derivatives risk management program, appoint a derivatives risk manager and comply with a relative or absolute limit on fund leverage risk calculated based on value-at-risk (“VaR”), unless the fund uses derivatives in only a limited manner (a "limited derivatives user"). The Fund is currently a limited derivatives user for purposes of Rule 18f-4.
The Fund is an investment company and follows investment company accounting and reporting guidance under U.S. Generally Accepted Accounting Principles (“U.S. GAAP”). U.S. GAAP requires the management of the Fund to make estimates and assumptions that affect the reported amounts of assets and liabilities, the disclosure of contingent assets and liabilities at the date of the financial statements, and the reported amounts of income, expenses and gain or loss on investments during the reporting period. Actual results could differ from those estimates.
The following is a summary of significant accounting policies followed by the Fund in the preparation of its financial statements:
| A. | Security Valuation |
| | The net asset value of the Fund is computed once daily, on each day the New York Stock Exchange (“NYSE”) is open, as of the close of regular trading on the NYSE. |
| | Fixed-income securities are valued by using prices supplied by independent pricing services, which consider such factors as market prices, market events, quotations from one or more brokers, Treasury spreads, yields, maturities and ratings, or may use a pricing matrix or other fair value methods or techniques to provide an estimated value of the security or instrument. A pricing matrix is a means of valuing a debt security on the basis of current market prices for other debt securities, historical trading patterns in the market for fixed-income securities and/or other factors. Non-U.S. debt securities that are listed on an exchange will be valued at the bid price obtained from an independent |
Amundi Climate Transition Core Bond Fund | Annual Report | 7/31/2337
| | third party pricing service. When independent third party pricing services are unable to supply prices, or when prices or market quotations are considered to be unreliable, the value of that security may be determined using quotations from one or more broker-dealers. |
| | Loan interests are valued at the mean between the last available bid and asked prices from one or more brokers or dealers as obtained from Loan Pricing Corporation, an independent third party pricing service. If price information is not available from Loan Pricing Corporation, or if the price information is deemed to be unreliable, price information will be obtained from an alternative loan interest pricing service. If no reliable price quotes are available from either the primary or alternative pricing service, broker quotes will be solicited. |
| | Equity securities that have traded on an exchange are valued by using the last sale price on the principal exchange where they are traded. Equity securities that have not traded on the date of valuation, or securities for which sale prices are not available, generally are valued using the mean between the last bid and asked prices or, if both last bid and asked prices are not available, at the last quoted bid price. Last sale and bid and asked prices are provided by independent third party pricing services. In the case of equity securities not traded on an exchange, prices are typically determined by independent third party pricing services using a variety of techniques and methods. |
| | The value of foreign securities is translated into U.S. dollars based on foreign currency exchange rate quotations supplied by a third party pricing source. Trading in non-U.S. equity securities is substantially completed each day at various times prior to the close of the NYSE. The values of such securities used in computing the net asset value of the Fund's shares are determined as of such times. The Adviser may use a fair value model developed by an independent pricing service to value non-U.S. equity securities. |
| | Futures contracts are generally valued at the closing settlement price established by the exchange on which they are traded. |
| | Securities or loan interests for which independent pricing services or broker-dealers are unable to supply prices or for which market prices and/or quotations are not readily available or are considered to be unreliable are valued by a fair valuation team comprised of certain personnel of the Adviser. The Adviser is designated as the valuation designee for the Fund pursuant to Rule 2a-5 under the 1940 Act. The Adviser’s fair valuation team is responsible for monitoring developments that may impact fair valued securities. |
38Amundi Climate Transition Core Bond Fund | Annual Report | 7/31/23
| | Inputs used when applying fair value methods to value a security may include credit ratings, the financial condition of the company, current market conditions and comparable securities. The Adviser may use fair value methods if it is determined that a significant event has occurred after the close of the exchange or market on which the security trades and prior to the determination of the Fund's net asset value. Examples of a significant event might include political or economic news, corporate restructurings, natural disasters, terrorist activity or trading halts. Thus, the valuation of the Fund's securities may differ significantly from exchange prices, and such differences could be material. |
| B. | Investment Income and Transactions |
| | Dividend income is recorded on the ex-dividend date, except that certain dividends from foreign securities where the ex-dividend date may have passed are recorded as soon as the Fund becomes aware of the ex-dividend data in the exercise of reasonable diligence. |
| | Interest income, including interest on income-bearing cash accounts, is recorded on the accrual basis. Dividend and interest income are reported net of unrecoverable foreign taxes withheld at the applicable country rates and net of income accrued on defaulted securities. |
| | Interest and dividend income payable by delivery of additional shares is reclassified as PIK (payment-in-kind) income upon receipt and is included in interest and dividend income, respectively. |
| | Principal amounts of mortgage-backed securities are adjusted for monthly paydowns. Premiums and discounts related to certain mortgage-backed securities are amortized or accreted in proportion to the monthly paydowns. All discounts/premiums on purchase prices of debt securities are accreted/amortized for financial reporting purposes over the life of the respective securities, and such accretion/amortization is included in interest income. |
| | Security transactions are recorded as of trade date. Gains and losses on sales of investments are calculated on the identified cost method for both financial reporting and federal income tax purposes. |
| C. | Foreign Currency Translation |
| | The books and records of the Fund are maintained in U.S. dollars. Amounts denominated in foreign currencies are translated into U.S. dollars using current exchange rates. |
Amundi Climate Transition Core Bond Fund | Annual Report | 7/31/2339
| | Net realized gains and losses on foreign currency transactions, if any, represent, among other things, the net realized gains and losses on foreign currency exchange contracts, disposition of foreign currencies and the difference between the amount of income accrued and the U.S. dollars actually received. Further, the effects of changes in foreign currency exchange rates on investments are not segregated on the Statement of Operations from the effects of changes in the market prices of those securities, but are included with the net realized and unrealized gain or loss on investments. |
| D. | Federal Income Taxes |
| | It is the Fund's policy to comply with the requirements of the Internal Revenue Code applicable to regulated investment companies and to distribute all of its net taxable income and net realized capital gains, if any, to its shareowners. Therefore, no provision for federal income taxes is required. As of July 31, 2023, the Fund did not accrue any interest or penalties with respect to uncertain tax positions, which, if applicable, would be recorded as an income tax expense on the Statement of Operations. Tax returns filed within the prior three years remain subject to examination by federal and state tax authorities. |
| | The amount and character of income and capital gain distributions to shareowners are determined in accordance with federal income tax rules, which may differ from U.S. GAAP. Distributions in excess of net investment income or net realized gains are temporary over distributions for financial statement purposes resulting from differences in the recognition or classification of income or distributions for financial statement and tax purposes. Capital accounts within the financial statements are adjusted for permanent book/tax differences to reflect tax character, but are not adjusted for temporary differences. |
| | At July 31, 2023, the Fund reclassified $1,236 to increase distributable earnings and $1,236 to decrease paid-in capital to reflect permanent book/tax differences. These adjustments have no impact on net assets or the results of operations. |
| | At July 31, 2023, the Fund was permitted to carry forward indefinitely $41,971 of short-term losses and $134,568 of long-term losses. |
40Amundi Climate Transition Core Bond Fund | Annual Report | 7/31/23
| | The tax character of distributions paid during the period ended July 31, 2023 was as follows: |
| | 2023 |
| Distributions paid from: | |
| Ordinary income | $454,945 |
| Total | $454,945 |
The following shows the components of distributable earnings (losses) on a federal income tax basis at July 31, 2023:
| | 2023 |
| Distributable earnings/(losses): | |
| Undistributed ordinary income | $ 102,050 |
| Capital loss carryforward | (176,539) |
| Other book/tax temporary differences | (10,214) |
| Net unrealized depreciation | (411,606) |
| Total | $(496,309) |
The difference between book-basis and tax-basis net unrealized depreciation is attributable to the mark to market of futures contracts.
| E. | Fund Shares |
| | The Fund records sales and repurchases of its shares as of trade date. The Distributor earned $0 in underwriting commissions on the sale of Class A shares during the period ended July 31, 2023. |
| F. | Class Allocations |
| | Income, common expenses and realized and unrealized gains and losses are calculated at the Fund level and allocated daily to each class of shares based on its respective percentage of adjusted net assets at the beginning of the day. |
| | Distribution fees are calculated based on the average daily net asset value attributable to Class A and Class C shares of the Fund, respectively (see Note 5). Class K and Class Y shares do not pay distribution fees. All expenses and fees paid to the Fund's transfer agent for its services are allocated among the classes of shares based on the number of accounts in each class and the ratable allocation of related out-of-pocket expenses (see Note 4). |
| | The Fund declares as daily dividends substantially all of its net investment income. All dividends are paid on a monthly basis. Short-term capital gain distributions, if any, may be declared with the daily dividends. Distributions to shareowners are recorded as of the ex-dividend date. Distributions paid by the Fund with respect to each class |
Amundi Climate Transition Core Bond Fund | Annual Report | 7/31/2341
| | of shares are calculated in the same manner and at the same time, except that net investment income dividends to Class A, Class C, Class K and Class Y shares can reflect different transfer agent and distribution expense rates. |
| G. | Risks |
| | The value of securities held by the Fund may go up or down, sometimes rapidly or unpredictably, due to general market conditions, such as real or perceived adverse economic, political or regulatory conditions, recessions, the spread of infectious illness or other public health issues, inflation, changes in interest rates, armed conflict including Russia's military invasion of Ukraine, sanctions against Russia, other nations or individuals or companies and possible countermeasures, lack of liquidity in the bond markets or adverse investor sentiment. In the past several years, financial markets have experienced increased volatility, depressed valuations, decreased liquidity and heightened uncertainty. These conditions may continue, recur, worsen or spread. Inflation and interest rates have increased and may rise further. These circumstances could adversely affect the value and liquidity of the Fund's investments and negatively impact the Fund's performance. |
| | The long-term impact of the COVID-19 pandemic and its subsequent variants on economies, markets, industries and individual issuers, are not known. Some sectors of the economy and individual issuers have experienced or may experience particularly large losses. Periods of extreme volatility in the financial markets, reduced liquidity of many instruments, increased government debt, inflation, and disruptions to supply chains, consumer demand and employee availability, may continue for some time. Following Russia's invasion of Ukraine, Russian securities lost all, or nearly all, their market value. Other securities or markets could be similarly affected by past or future political, geopolitical or other events or conditions. |
| | Governments and central banks, including the U.S. Federal Reserve, have taken extraordinary and unprecedented actions to support local and global economies and the financial markets. These actions have resulted in significant expansion of public debt, including in the U.S. The consequences of high public debt, including its future impact on the economy and securities markets, may not be known for some time. |
| | The U.S. and other countries are periodically involved in disputes over trade and other matters, which may result in tariffs, investment restrictions and adverse impacts on affected companies and securities. For example, the U.S. has imposed tariffs and other trade barriers on Chinese exports, has restricted sales of certain categories of goods to |
42Amundi Climate Transition Core Bond Fund | Annual Report | 7/31/23
| | China, and has established barriers to investments in China. Trade disputes may adversely affect the economies of the U.S. and its trading partners, as well as companies directly or indirectly affected and financial markets generally. If the political climate between the U.S. and China does not improve or continues to deteriorate, if China were to attempt unification of Taiwan by force, or if other geopolitical conflicts develop or get worse, economies, markets and individual securities may be severely affected both regionally and globally, and the value of the Fund's assets may go down. |
| | At times, the Fund’s investments may represent industries or industry sectors that are interrelated or have common risks, making the Fund more susceptible to any economic, political, or regulatory developments or other risks affecting those industries and sectors. |
| | The market prices of the Fund's fixed income securities may fluctuate significantly when interest rates change. The value of your investment will generally go down when interest rates rise. A rise in rates tends to have a greater impact on the prices of longer term or duration securities. For example, if interest rates increase by 1%, the value of a Fund's portfolio with a portfolio duration of ten years would be expected to decrease by 10%, all other things being equal. In recent years interest rates and credit spreads in the U.S. have been at historic lows. The U.S. Federal Reserve has raised certain interest rates, and interest rates may continue to go up. A general rise in interest rates could adversely affect the price and liquidity of fixed income securities. The maturity of a security may be significantly longer than its effective duration. A security's maturity and other features may be more relevant than its effective duration in determining the security's sensitivity to other factors affecting the issuer or markets generally, such as changes in credit quality or in the yield premium that the market may establish for certain types of securities (sometimes called "credit spread"). In general, the longer its maturity the more a security may be susceptible to these factors. When the credit spread for a fixed income security goes up, or "widens," the value of the security will generally go down. |
| | If an issuer or guarantor of a security held by the Fund or a counterparty to a financial contract with the Fund defaults on its obligation to pay principal and/or interest, has its credit rating downgraded or is perceived to be less creditworthy, or the credit quality or value of any underlying assets declines, the value of your investment will typically decline. Changes in actual or perceived creditworthiness may occur quickly. The Fund could be delayed or hindered in its enforcement of rights against an issuer, guarantor or counterparty. |
Amundi Climate Transition Core Bond Fund | Annual Report | 7/31/2343
| | Russia launched a large-scale invasion of Ukraine on February 24, 2022. In response to the military action by Russia, various countries, including the U.S., the United Kingdom, and European Union issued broad-ranging economic sanctions against Russia and Belarus and certain companies and individuals. Since then, Russian securities have lost all, or nearly all, their market value, and many other issuers, securities and markets have been adversely affected. The United States and other countries may impose sanctions on other countries, companies and individuals in light of Russia’s military invasion. The extent and duration of the military action or future escalation of such hostilities, the extent and impact of existing and future sanctions, market disruptions and volatility, and the result of any diplomatic negotiations cannot be predicted. These and any related events could have a significant impact on the value and liquidity of certain Fund investments, on Fund performance and the value of an investment in the Fund, particularly with respect to securities and commodities, such as oil, natural gas and food commodities, as well as other sectors with exposure to Russian issuers or issuers in other countries affected by the invasion, and are likely to have collateral impacts on market sectors globally. |
| | Under normal circumstances, the Fund invests at least 80% of its net assets in fixed income investments that meet Amundi US's climate transition criteria (the “Climate Transition Criteria”). Amundi US’s consideration of the Climate Transition Criteria in making investment decisions will result in the exclusion of investments the issuers of which do not meet the Climate Transition Criteria. To the extent other ESG information is considered in making investment decisions, such other ESG information also may result in the exclusion of investments. Excluding specific issuers limits the universe of investments available to the Fund as compared with other funds that do not consider the Climate Transition Criteria or ESG information, which may mean forgoing some investment opportunities available to funds that do not consider these criteria or information or having a portfolio with fewer holdings and/or less issuer diversification. Accordingly, the Fund may underperform other funds that do not utilize an investment strategy that considers the Climate Transition Criteria or ESG information. Amundi US may use third party climate information (such as pertaining to carbon-related issuer characteristics or whether an issuer has a viable sustainability plan) or ESG ratings information that it believes to be reliable, but such information may not be accurate or complete, or may be biased. |
| | Amundi US's focus on the carbon and climate-related characteristics of issuers may increase the Fund’s exposure to certain investments. The Fund is more susceptible to events or factors adversely affecting such |
44Amundi Climate Transition Core Bond Fund | Annual Report | 7/31/23
| | investments, such as a decrease in governmental or other support for climate-related or environmental initiatives or an increase in the cost of implementing climate-related initiatives. The Fund’s relative performance also may be affected, depending on whether such investments are in or out of favor with the market. Under certain market conditions, the Fund may underperform funds that invest in a broader array of investments. |
| | The Fund invests in below-investment-grade (high-yield) debt securities and preferred stocks. Some of these high-yield securities may be convertible into equity securities of the issuer. Debt securities rated below-investment-grade are commonly referred to as “junk bonds” and are considered speculative with respect to the issuer’s capacity to pay interest and repay principal. These securities involve greater risk of loss, are subject to greater price volatility, and may be less liquid and more difficult to value, especially during periods of economic uncertainty or change, than higher rated debt securities. |
| | The Fund's investments, payment obligations and financing terms may be based on floating rates, such as LIBOR (London Interbank Offered Rate) or SOFR (Secured Overnight Financing Rate). ICE Benchmark Administration, the administrator of LIBOR, has ceased publication of most LIBOR settings on a representative basis. Actions by regulators have resulted in the establishment of alternative reference rates to LIBOR in most major currencies. In the U.S., a common benchmark replacement is based on the SOFR published by the Federal Reserve Bank of New York, including certain spread adjustments and benchmark replacement conforming changes, although other benchmark replacements (without or without spread adjustments) may be used in certain transactions. The impact of the transition from LIBOR on the Fund's transactions and financial markets generally cannot yet be determined. The transition away from LIBOR may lead to increased volatility and illiquidity in markets for instruments that have relied on LIBOR and may adversely affect the Fund's performance. |
| | With the increased use of technologies such as the Internet to conduct business, the Fund is susceptible to operational, information security and related risks. While the Fund’s Adviser has established business continuity plans in the event of, and risk management systems to prevent, limit or mitigate, such cyber-attacks, there are inherent limitations in such plans and systems, including the possibility that certain risks have not been identified. Furthermore, the Fund cannot control the cybersecurity plans and systems put in place by service providers to the Fund such as the Fund’s custodian and accounting agent, and the Fund’s transfer agent. In addition, many |
Amundi Climate Transition Core Bond Fund | Annual Report | 7/31/2345
| | beneficial owners of Fund shares hold them through accounts at broker-dealers, retirement platforms and other financial market participants over which neither the Fund nor the Adviser exercises control. Each of these may in turn rely on service providers to them, which are also subject to the risk of cyber-attacks. Cybersecurity failures or breaches at the Adviser or the Fund’s service providers or intermediaries have the ability to cause disruptions and impact business operations, potentially resulting in financial losses, interference with the Fund’s ability to calculate its net asset value, impediments to trading, the inability of Fund shareowners to effect share purchases, redemptions or exchanges or receive distributions, loss of or unauthorized access to private shareowner information and violations of applicable privacy and other laws, regulatory fines, penalties, reputational damage, or additional compliance costs. Such costs and losses may not be covered under any insurance. In addition, maintaining vigilance against cyber-attacks may involve substantial costs over time, and system enhancements may themselves be subject to cyber-attacks. |
| | The Fund’s prospectus contains unaudited information regarding the Fund’s principal risks. Please refer to that document when considering the Fund’s principal risks. |
| H. | Futures Contracts |
| | The Fund may enter into futures transactions in order to attempt to hedge against changes in interest rates, securities prices and currency exchange rates or to seek to increase total return. Futures contracts are types of derivatives. |
| | Subsequent payments for futures contracts ("variation margin") are paid or received by the Fund, depending on the daily fluctuation in the value of the contracts, and are recorded by the Fund as unrealized appreciation or depreciation. Cash received from or paid to the broker related to previous margin movement is held in a segregated account at the broker and is recorded as either "Due from broker for futures" or "Due to broker for futures" on the Statement of Assets and Liabilities. When the contract is closed, the Fund realizes a gain or loss equal to the difference between the opening and closing value of the contract as well as any fluctuation in foreign currency exchange rates where applicable. Futures contracts are subject to market risk, interest rate risk and currency exchange rate risk. Changes in value of the contracts may not directly correlate to the changes in value of the underlying securities. With futures, there is reduced counterparty credit risk to the Fund since |
46Amundi Climate Transition Core Bond Fund | Annual Report | 7/31/23
| | futures are exchange-traded and the exchange's clearinghouse, as counterparty to all exchange-traded futures, guarantees the futures against default. |
| | The average notional values of futures contracts long position and futures contracts short position during the period ended July 31, 2023 were $3,501,778 and $1,302,527, respectively. Open futures contracts outstanding at July 31, 2023 are listed in the Schedule of Investments. |
2. Management Agreement
The Adviser manages the Fund’s portfolio. Management fees payable under the Fund's Investment Management Agreement with the Adviser are calculated daily and paid monthly at the annual rate of 0.35% of the Fund’s average daily net assets up to $1 billion, 0.30% of the next $5 billion of the Fund’s average daily net assets and 0.25% of the Fund’s average daily net assets over $6 billion. For the period ended July 31, 2023, the effective management fee (excluding waivers and/or assumption of expenses) was equivalent to 0.35% (annualized) of the Fund’s average daily net assets.
The Adviser has contractually agreed to limit ordinary operating expenses (ordinary operating expenses means all fund expenses other than taxes, brokerage commissions, acquired fund fees and expenses and extraordinary expenses, such as litigation) to the extent required to reduce Fund expenses to 0.73%, 1.48%, 0.45% and 0.45%, of the average daily net assets attributable to Class A, Class C, Class K and Class Y shares, respectively. These expense limitations will be in effect through December 1, 2025. There can be no assurance that the Adviser will extend the expense limitation agreement for a class of shares beyond the date referred to above. Fees waived and expenses reimbursed during the period ended July 31, 2023 are reflected on the Statement of Operations.
In addition, under the management and administration agreements, certain other services and costs, including accounting, regulatory reporting and insurance premiums, are paid by the Fund as administrative reimbursements. Reflected on the Statement of Assets and Liabilities is $948 in management fees payable to the Adviser at July 31, 2023.
3. Compensation of Officers and Trustees
The Fund pays an annual fee to its Trustees. The Adviser reimburses the Fund for fees paid to the Interested Trustees. Except for the chief compliance officer, the Fund does not pay any salary or other compensation to its officers. The Fund pays a portion of the chief compliance officer's compensation for his services as the Fund's chief compliance officer. Amundi US pays the remaining portion of the chief compliance officer's
Amundi Climate Transition Core Bond Fund | Annual Report | 7/31/2347
compensation. For the period ended July 31, 2023, the Fund paid $4,723 in Officers' and Trustees' compensation, which is reflected on the Statement of Operations as Officers' and Trustees' fees. At July 31, 2023, on its Statement of Assets and Liabilities, the Fund had a payable for Trustees' fees of $671 and a payable for administrative expenses of $561, which includes the payable for Officers' compensation.
4. Transfer Agent
BNY Mellon Investment Servicing (US) Inc. serves as the transfer agent to the Fund at negotiated rates. Transfer agent fees and payables shown on the Statement of Operations and the Statement of Assets and Liabilities, respectively, include sub-transfer agent expenses incurred through the Fund’s omnibus relationship contracts.
| Shareowner Communications: | |
| Class A | $ 8 |
| Class C | 5 |
| Class K | 5 |
| Class Y | 5 |
| Total | $23 |
5. Distribution Plan
The Fund has adopted a distribution plan (the “Plan”) pursuant to Rule 12b-1 under the 1940 Act with respect to its Class A and Class C shares. Pursuant to the Plan, the Fund pays the Distributor 0.25% of the average daily net assets attributable to Class A shares as compensation for personal services and/or account maintenance services or distribution services with regard to Class A shares. Pursuant to the Plan, the Fund also pays the Distributor 1.00% of the average daily net assets attributable to Class C shares. The fee for Class C shares consists of a 0.25% service fee and a 0.75% distribution fee paid as compensation for personal services and/or account maintenance services or distribution services with regard to Class C shares. Reflected on the Statement of Assets and Liabilities is $169 in distribution fees payable to the Distributor at July 31, 2023.
In addition, redemptions of Class A and Class C shares may be subject to a contingent deferred sales charge (“CDSC”). A CDSC of 1.00% may be imposed on redemptions of certain net asset value purchases of Class A shares within 12 months of purchase. Redemptions of Class C shares within 12 months of purchase are subject to a CDSC of 1.00%, based on the lower of cost or market value of shares being redeemed. Shares purchased as part of an exchange remain subject to any CDSC that applied to the original purchase of those shares. There is no CDSC for Class K or Class Y shares. Proceeds from the CDSCs are paid to the Distributor. For the period ended July 31, 2023, CDSCs in the amount of $0 were paid to the Distributor.
48Amundi Climate Transition Core Bond Fund | Annual Report | 7/31/23
6. Additional Disclosures about Derivative Instruments and Hedging Activities
The Fund’s use of derivatives may enhance or mitigate the Fund’s exposure to the following risks:
Interest rate risk relates to the fluctuations in the value of interest-bearing securities due to changes in the prevailing levels of market interest rates.
Credit risk relates to the ability of the issuer of a financial instrument to make further principal or interest payments on an obligation or commitment that it has to the Fund.
Foreign exchange rate risk relates to fluctuations in the value of an asset or liability due to changes in currency exchange rates.
Equity risk relates to the fluctuations in the value of financial instruments as a result of changes in market prices (other than those arising from interest rate risk or foreign exchange rate risk), whether caused by factors specific to an individual investment, its issuer, or all factors affecting all instruments traded in a market or market segment.
Commodity risk relates to the risk that the value of a commodity or commodity index will fluctuate based on increases or decreases in the commodities market and factors specific to a particular industry or commodity.
The fair value of open derivative instruments (not considered to be hedging instruments for accounting disclosure purposes) by risk exposure at July 31, 2023, was as follows:
Statement of Assets
and Liabilities | Interest
Rate Risk | Credit
Risk | Foreign
Exchange
Rate Risk | Equity
Risk | Commodity
Risk |
| Assets | | | | | |
| Net unrealized appreciation on futures contracts* | $18,583 | $ — | $ — | $ — | $ — |
| Total Value | $18,583 | $— | $— | $— | $— |
| Liabilities | | | | | |
| Net unrealized depreciation on futures contracts* | $81,297 | $ — | $ — | $ — | $ — |
| Total Value | $81,297 | $— | $— | $— | $— |
| | |
| * | Includes cumulative unrealized appreciation (depreciation) of futures contracts as reported in the Schedule of Investments. Only net variation margin is reported within the assets and/or liabilities on the Statement of Assets and Liabilities. |
Amundi Climate Transition Core Bond Fund | Annual Report | 7/31/2349
The effect of derivative instruments (not considered to be hedging instruments for accounting disclosure purposes) on the Statement of Operations by risk exposure at July 31, 2023 was as follows:
| Statement of Operations | Interest
Rate Risk | Credit
Risk | Foreign
Exchange
Rate Risk | Equity
Risk | Commodity
Risk |
| Net Realized Gain (Loss) on | | | | | |
| Futures contracts | $ (161,566) | $ — | $ — | $ — | $ — |
| Total Value | $(161,566) | $— | $— | $— | $— |
| Change in Net Unrealized Appreciation (Depreciation) on | | | | | |
| Futures contracts | $ (62,714) | $ — | $ — | $ — | $ — |
| Total Value | $ (62,714) | $— | $— | $— | $— |
50Amundi Climate Transition Core Bond Fund | Annual Report | 7/31/23
Report of Independent Registered Public Accounting Firm
To the Board of Trustees of Pioneer Series Trust IV and the Shareholders of Amundi Climate Transition Core Bond Fund:
Opinion on the Financial Statements
We have audited the accompanying statement of assets and liabilities of Amundi Climate Transition Core Bond Fund (the “Fund”) (one of the funds constituting Pioneer Series Trust IV (the “Trust”)), including the schedule of investments, as of July 31, 2023, and the related statements of operations, changes in net assets and the financial highlights for the period from December 15, 2022 (commencement of operations) through July 31, 2023 and the related notes (collectively referred to as the “financial statements”). In our opinion, the financial statements present fairly, in all material respects, the financial position of the Fund (one of the funds constituting Pioneer Series Trust IV) at July 31, 2023, the results of its operations, the changes in its net assets, and its financial highlights for the period from December 15, 2022 (commencement of operations) through July 31, 2023, in conformity with U.S. generally accepted accounting principles.
Basis for Opinion
These financial statements are the responsibility of the Trust’s management. Our responsibility is to express an opinion on the Fund’s financial statements based on our audit. We are a public accounting firm registered with the Public Company Accounting Oversight Board (United States) ("PCAOB") and are required to be independent with respect to the Trust in accordance with the U.S. federal securities laws and the applicable rules and regulations of the Securities and Exchange Commission and the PCAOB.
We conducted our audit in accordance with the standards of the PCAOB. Those standards require that we plan and perform the audit to obtain reasonable assurance about whether the financial statements are free of material misstatement, whether due to error or fraud. The Trust is not required to have, nor were we engaged to perform, an audit of the Trust’s internal control over financial reporting. As part of our audit, we are required to obtain an understanding of internal control over financial reporting, but not for the purpose of expressing an opinion on the effectiveness of the Trust’s internal control over financial reporting. Accordingly, we express no such opinion.
Amundi Climate Transition Core Bond Fund | Annual Report | 7/31/2351
Our audit included performing procedures to assess the risks of material misstatement of the financial statements, whether due to error or fraud, and performing procedures that respond to those risks. Such procedures included examining, on a test basis, evidence regarding the amounts and disclosures in the financial statements. Our procedures included confirmation of securities owned as of July 31, 2023, by correspondence with the custodian, brokers and others; when replies were not received from brokers and others, we performed other auditing procedures. Our audit also included evaluating the accounting principles used and significant estimates made by management, as well as evaluating the overall presentation of the financial statements. We believe that our audit provides a reasonable basis for our opinion.
We have served as the auditor of one or more investment companies in the Pioneer family of funds since 2017.
Boston, Massachusetts
September 29, 2023
52Amundi Climate Transition Core Bond Fund | Annual Report | 7/31/23
Additional Information (unaudited)
Qualified interest income is exempt from nonresident alien (NRA) tax withholding. The percentage of the Fund’s ordinary income distributions derived from qualified interest income was 78.38%.
Amundi Climate Transition Core Bond Fund | Annual Report | 7/31/2353
Statement Regarding Liquidity Risk Management Program
As required by law, the Fund has adopted and implemented a liquidity risk management program (the “Program”) that is designed to assess and manage liquidity risk. Liquidity risk is the risk that the Fund could not meet requests to redeem its shares without significant dilution of remaining investors’ interests in the Fund. The Fund’s Board of Trustees designated a liquidity risk management committee (the “Committee”) consisting of employees of Amundi Asset Management US, Inc. (the “Adviser”) to administer the Program.
The Committee provided the Board of Trustees with a report that addressed the operation of the Program and assessed its adequacy and effectiveness of implementation (the “Report”). The Report covered the period from December 15, 2022 (commencement of operations) through December 31, 2022 (the “Reporting Period”).
The Report confirmed that, throughout the Reporting Period, the Committee had monitored the Fund’s portfolio liquidity and liquidity risk on an ongoing basis, as described in the Program and in Board reporting throughout the Reporting Period.
The Report discussed the Committee’s annual review of the Program, which addressed, among other things, the following elements of the Program:
The Committee reviewed the Fund’s investment strategy and liquidity of portfolio investments during both normal and reasonably foreseeable stressed conditions. The Committee noted that the Fund’s investment strategy continues to be appropriate for an open-end fund, taking into account, among other things, whether and to what extent the Fund held less liquid and illiquid assets and the extent to which any such investments affected the Fund’s ability to meet redemption requests. In managing and reviewing the Fund’s liquidity risk, the Committee also considered the extent to which the Fund’s investment strategy involves a relatively concentrated portfolio or large positions in particular issuers, the extent to which the Fund uses borrowing for investment purposes, and the extent to which the Fund uses derivatives (including for hedging purposes). The Committee also reviewed the Fund’s short-term and long-term cash flow projections during both normal and reasonably foreseeable stressed conditions. In assessing the Fund’s cash flow projections, the Committee considered, among other factors, historical net redemption activity, redemption policies, ownership concentration, distribution channels, and the degree of certainty associated with the Fund’s short-term and long-term cash flow projections. The Committee also considered the Fund’s
54Amundi Climate Transition Core Bond Fund | Annual Report | 7/31/23
holdings of cash and cash equivalents, as well as borrowing arrangements and other funding sources, including, if applicable, the Fund’s participation in a credit facility, as components of the Fund’s ability to meet redemption requests. The Fund has adopted an in-kind redemption policy which may be utilized to meet larger redemption requests.
The Committee reviewed the Program’s liquidity classification methodology for categorizing the Fund’s investments into one of four liquidity buckets. In reviewing the Fund’s investments, the Committee considered, among other factors, whether trading varying portions of a position in a particular portfolio investment or asset class in sizes the Fund would reasonably anticipate trading, would be reasonably expected to significantly affect liquidity.
The Committee performed an analysis to determine whether the Fund is required to maintain a Highly Liquid Investment Minimum, and determined that no such minimum is required because the Fund primarily holds highly liquid investments.
The Report stated that the Committee concluded the Program operates adequately and effectively, in all material respects, to assess and manage the Fund’s liquidity risk throughout the Reporting Period.
Amundi Climate Transition Core Bond Fund | Annual Report | 7/31/23 55
Trustees, Officers and Service Providers
Investment Adviser and Administrator
Amundi Asset Management US, Inc.
Custodian and Sub-Administrator
The Bank of New York Mellon Corporation
Independent Registered Public Accounting Firm
Ernst & Young LLP
Principal Underwriter
Amundi Distributor US, Inc.
Legal Counsel
Morgan, Lewis & Bockius LLP
Transfer Agent
BNY Mellon Investment Servicing (US) Inc.
Proxy Voting Policies and Procedures of the Fund are available without charge, upon request, by calling our toll free number (1-800-225-6292). Information regarding how the Fund voted proxies relating to portfolio securities during the most recent 12-month period ended June 30 is publicly available to shareowners at www.amundi.com/us. This information is also available on the Securities and Exchange Commission’s web site at www.sec.gov.
Trustees and Officers
The Fund's Trustees and officers are listed below, together with their principal occupations and other directorships they have held during at least the past five years. Trustees who are interested persons of the Fund within the meaning of the 1940 Act are referred to as Interested Trustees. Trustees who are not interested persons of the Fund are referred to as Independent Trustees. Each of the Trustees serves as a Trustee of each of the 49 U.S. registered investment portfolios for which Amundi US serves as investment adviser (the “Pioneer Funds”). The address for all Trustees and all officers of the Fund is 60 State Street, Boston, Massachusetts 02109.
The Statement of Additional Information of the Fund includes additional information about the Directors and is available, without charge, upon request, by calling 1-800-225-6292.
56Amundi Climate Transition Core Bond Fund | Annual Report | 7/31/23
Name, Age and Position
Held With the Fund | Term of Office and
Length of Service | Principal Occupation(s) During At Least The Past Five Years | Other Directorships Held by Trustee
During At Least The Past Five Years |
Thomas J. Perna (72)
Chairman of the Board
and Trustee | Trustee since 2022.
Serves until a successor
trustee is elected or
earlier retirement
or removal. | Private investor (2004 – 2008 and 2013 – present); Chairman (2008 – 2013) and Chief Executive Officer (2008 – 2012), Quadriserv, Inc. (technology products for securities lending industry); and Senior Executive Vice President, The Bank of New York (financial and securities services) (1986 – 2004) | Director, Broadridge Financial
Solutions, Inc. (investor
communications and securities
processing provider for financial
services industry) (2009 – present);
Director, Quadriserv, Inc. (2005 –
2013); and Commissioner, New
Jersey State Civil Service
Commission (2011 – 2015) |
John E. Baumgardner,
Jr. (72)*
Trustee | Trustee since 2022.
Serves until a successor
trustee is elected or
earlier retirement
or removal. | Of Counsel (2019 – present), Partner (1983-2018), Sullivan & Cromwell LLP (law firm). | Chairman, The Lakeville Journal
Company, LLC, (privately-held
community newspaper group)
(2015-present) |
Diane Durnin (66)
Trustee | Trustee since 2022.
Serves until a successor
trustee is elected or
earlier retirement
or removal. | Managing Director - Head of Product Strategy and Development, BNY Mellon Investment Management (investment management firm) (2012-2018); Vice Chairman – The Dreyfus Corporation (2005 – 2018): Executive Vice President Head of Product, BNY Mellon Investment Management (2007-2012); Executive Director- Product Strategy, Mellon Asset Management (2005-2007); Executive Vice President Head of Products, Marketing and Client Service, Dreyfus Corporation (investment management firm) (2000-2005); Senior Vice President Strategic Product and Business Development, Dreyfus Corporation (1994-2000) | None |
| * Mr. Baumgardner is Of Counsel to Sullivan & Cromwell LLP, which acts as counsel to the Independent Trustees of each Pioneer Fund. |
Amundi Climate Transition Core Bond Fund | Annual Report | 7/31/2357
Independent Trustees (continued)
Name, Age and Position
Held With the Fund | Term of Office and
Length of Service | Principal Occupation(s) During At Least The Past Five Years | Other Directorships Held by Trustee
During At Least The Past Five Years |
Benjamin M. Friedman (78)
Trustee | Trustee since 2022.
Serves until a successor
trustee is elected or
earlier retirement
or removal. | William Joseph Maier Professor of Political Economy, Harvard University (1972 – present) | Trustee, Mellon Institutional Funds
Investment Trust and Mellon
Institutional Funds Master Portfolio
(oversaw 17 portfolios in fund
complex) (1989 - 2008) |
Craig C. MacKay (60)
Trustee | Trustee since 2022.
Serves until a successor
trustee is elected or
earlier retirement
or removal. | Partner, England & Company, LLC (advisory firm) (2012 – present); Group Head – Leveraged Finance Distribution, Oppenheimer & Company (investment bank) (2006 – 2012); Group Head – Private Finance & High Yield Capital Markets Origination, SunTrust Robinson Humphrey (investment bank) (2003 – 2006); and Founder and Chief Executive Officer, HNY Associates, LLC (investment bank) (1996 – 2003) | Director, Equitable Holdings, Inc. (financial
services holding company) (2022 – present);
Board Member of Carver Bancorp, Inc. (holding
company) and Carver Federal Savings Bank,
NA (2017 – present); Advisory Council Member,
MasterShares ETF (2016 – 2017); Advisory
Council Member, The Deal (financial market
information publisher) (2015 – 2016); Board
Co-Chairman and Chief Executive Officer, Danis
Transportation Company (privately-owned
commercial carrier) (2000 – 2003); Board
Member and Chief Financial Officer, Customer
Access Resources (privately-owned
teleservices company) (1998 – 2000); Board
Member, Federation of Protestant Welfare
Agencies (human services agency) (1993 –
present); and Board Treasurer, Harlem Dowling
Westside Center (foster care agency)
(1999 – 2018) |
58Amundi Climate Transition Core Bond Fund | Annual Report | 7/31/23
Name, Age and Position
Held With the Fund | Term of Office and
Length of Service | Principal Occupation(s) During At Least The Past Five Years | Other Directorships Held by Trustee
During At Least The Past Five Years |
Lorraine H. Monchak (67)
Trustee | Trustee since 2022.
(Advisory Trustee from
2014 - 2017). Serves
until a successor trustee
is elected or earlier
retirement or removal. | Chief Investment Officer, 1199 SEIU Funds (healthcare workers union pension funds) (2001 – present); Vice President – International Investments Group, American International Group, Inc. (insurance company) (1993 – 2001); Vice President Corporate Finance and Treasury Group, Citibank, N.A. (1980 – 1986 and 1990 – 1993); Vice President – Asset/Liability Management Group, Federal Farm Funding Corporation (government-sponsored issuer of debt securities) (1988 – 1990); Mortgage Strategies Group, Shearson Lehman Hutton, Inc. (investment bank) (1987 – 1988); Mortgage Strategies Group, Drexel Burnham Lambert, Ltd. (investment bank) (1986 – 1987) | None |
Marguerite A. Piret (75)
Trustee | Trustee since 2022.
Serves until a successor
trustee is elected or
earlier retirement
or removal. | Chief Financial Officer, American Ag Energy, Inc. (technology for the environment, energy and agriculture)
(2019 – present); Chief Operating Officer, North Country Growers LLC (controlled environment agriculture
company) (2020 – present); Chief Executive Officer, Green Heat LLC (biofuels company) (2022 – present);
President and Chief Executive Officer, Newbury Piret Company (investment banking firm) (1981 – 2019) | Director of New America High
Income Fund, Inc. (closed-end
investment company) (2004 –
present); and Member, Board of
Governors, Investment Company
Institute (2000 – 2006) |
Amundi Climate Transition Core Bond Fund | Annual Report | 7/31/2359
Independent Trustees (continued)
Name, Age and Position
Held With the Fund | Term of Office and
Length of Service | Principal Occupation(s) During At Least The Past Five Years | Other Directorships Held by Trustee
During At Least The Past Five Years |
Fred J. Ricciardi (76)
Trustee | Trustee since 2022.
Serves until a successor
trustee is elected or
earlier retirement
or removal. | Private investor (2020 – present); Consultant (investment company services) (2012 – 2020); Executive Vice President, BNY Mellon (financial and investment company services) (1969 – 2012); Director, BNY International Financing Corp. (financial services) (2002 – 2012); Director, Mellon Overseas Investment Corp. (financial services) (2009 – 2012); Director, Financial Models (technology) (2005-2007); Director, BNY Hamilton Funds, Ireland (offshore investment companies) (2004-2007); Chairman/Director, AIB/BNY Securities Services, Ltd., Ireland (financial services) (1999-2006); Chairman, BNY Alternative Investment Services, Inc. (financial services) (2005-2007) | None |
60Amundi Climate Transition Core Bond Fund | Annual Report | 7/31/23
Name, Age and Position
Held With the Fund | Term of Office and
Length of Service | Principal Occupation(s) During At Least The Past Five Years | Other Directorships Held by Trustee
During At Least The Past Five Years |
Lisa M. Jones (61)**
Trustee, President and Chief
Executive Officer | Trustee since 2022. Serves
until a successor trustee is
elected or earlier retirement
or removal | Director, CEO and President of Amundi US, Inc. (investment management firm) (since September 2014); Director, CEO and President of Amundi Asset Management US, Inc. (since September 2014); Director, CEO and President of Amundi Distributor US, Inc. (since September 2014); Director, CEO and President of Amundi Asset Management US, Inc. (since September 2014); Chair, Amundi US, Inc., Amundi Distributor US, Inc. and Amundi Asset Management US, Inc. (September 2014 – 2018); Managing Director, Morgan Stanley Investment Management (investment management firm) (2010 – 2013); Director of Institutional Business, CEO of International, Eaton Vance Management (investment management firm) (2005 – 2010); Director of Amundi Holdings US, Inc. (since 2017) | Director of Clearwater Analytics
(provider of web-based investment
accounting software for reporting
and reconciliation services)
(September 2022 – present) |
Kenneth J. Taubes (65)**
Trustee | Trustee since 2022. Serves
until a successor trustee is
elected or earlier retirement
or removal | Director and Executive Vice President (since 2008) and Chief Investment Officer, U.S. (since 2010) of Amundi US, Inc. (investment management firm); Director and Executive Vice President and Chief Investment Officer, U.S. of Amundi US (since 2008); Executive Vice President and Chief Investment Officer, U.S. of Amundi Asset Management US, Inc. (since 2009); Portfolio Manager of Amundi US (since 1999); Director of Amundi Holdings US, Inc. (since 2017) | None |
| ** Ms. Jones and Mr. Taubes are Interested Trustees because they are officers or directors of the Fund’s investment adviser and certain of its affiliates. |
Amundi Climate Transition Core Bond Fund | Annual Report | 7/31/2361
Name, Age and Position
Held With the Fund | Term of Office and
Length of Service | Principal Occupation(s) During At Least The Past Five Years | Other Directorships Held by Officer
During At Least The Past Five Years |
Christopher J. Kelley (58)
Secretary and Chief Legal Officer | Since 2022. Serves at the
discretion of the Board | Vice President and Associate General Counsel of Amundi US since January 2008; Secretary and Chief Legal Officer of all of the Pioneer Funds since June 2010; Assistant Secretary of all of the Pioneer Funds from September 2003 to May 2010; Vice President and Senior Counsel of Amundi US from July 2002 to December 2007 | None |
Thomas Reyes (60)
Assistant Secretary | Since 2022. Serves at the
discretion of the Board | Assistant General Counsel of Amundi US since May 2013 and Assistant Secretary of all the Pioneer Funds since June 2010; Counsel of Amundi US from June 2007 to May 2013 | None |
Heather L. Melito-Dezan (46)
Assistant Secretary | Since 2022. Serves at the
discretion of the Board | Director - Trustee and Board Relationships of Amundi US since September 2019; Assistant Secretary of Amundi US, Inc. since July 2020: Assistant Secretary of Amundi Asset Management US, Inc. since July 2020: Assistant Secretary of Amundi Distributor US, Inc. since July 2020; Assistant Secretary of all the Pioneer Funds since September 2022; Private practice from 2017 – 2019. | None |
Anthony J. Koenig, Jr. (59)
Treasurer and Chief Financial
and Accounting Officer | Since 2022. Serves at the
discretion of the Board | Managing Director, Chief Operations Officer and Fund Treasurer of Amundi US since May 2021; Treasurer of all of the Pioneer Funds since May 2021; Assistant Treasurer of all of the Pioneer Funds from January 2021 to May 2021; and Chief of Staff, US Investment Management of Amundi US from May 2008 to January 2021 | None |
Luis I. Presutti (58)
Assistant Treasurer | Since 2022. Serves at the
discretion of the Board | Director – Fund Treasury of Amundi US since 1999; and Assistant Treasurer of all of the Pioneer Funds since 1999 | None |
Gary Sullivan (65)
Assistant Treasurer | Since 2022. Serves at the
discretion of the Board | Senior Manager – Fund Treasury of Amundi US since 2012; and Assistant Treasurer of all of the Pioneer Funds since 2002 | None |
62Amundi Climate Transition Core Bond Fund | Annual Report | 7/31/23
Name, Age and Position
Held With the Fund | Term of Office and
Length of Service | Principal Occupation(s) During At Least The Past Five Years | Other Directorships Held by Officer
During At Least The Past Five Years |
Antonio Furtado (41)
Assistant Treasurer | Since 2022. Serves at the
discretion of the Board | Fund Oversight Manager – Fund Treasury of Amundi US since 2020; Assistant Treasurer of all of the Pioneer Funds since 2020; and Senior Fund Treasury Analyst from 2012 - 2020 | None |
Michael Melnick (52)
Assistant Treasurer | Since 2022. Serves at the
discretion of the Board | Vice President - Deputy Fund Treasurer of Amundi US since May 2021; Assistant Treasurer of all of the Pioneer Funds since July 2021; Director of Regulatory Reporting of Amundi US from 2001 – 2021; and Director of Tax of Amundi US from 2000 - 2001 | None |
John Malone (52)
Chief Compliance Officer | Since 2022. Serves at the
discretion of the Board | Managing Director, Chief Compliance Officer of Amundi US Asset Management; Amundi Asset Management US, Inc.; and the Pioneer Funds since September 2018; Chief Compliance Officer of Amundi Distributor US, Inc. since January 2014. | None |
Brandon Austin (51)
Anti-Money Laundering Officer | Since 2022. Serves at the
discretion of the Board | Director, Financial Security – Amundi Asset Management; Anti-Money Laundering Officer of all the Pioneer Funds since March 2022: Director of Financial Security of Amundi US since July 2021; Vice President, Head of BSA, AML and OFAC, Deputy Compliance Manager, Crédit Agricole Indosuez Wealth Management (investment management firm) (2013 – 2021) | None |
Amundi Climate Transition Core Bond Fund | Annual Report | 7/31/2363
How to Contact Amundi
We are pleased to offer a variety of convenient ways for you to contact us for assistance or information.
Call us for:
Account Information, including existing accounts,
new accounts, prospectuses, applications
and service forms
1-800-225-6292
FactFoneSMfor automated fund yields, prices,
account information and transactions
1-800-225-4321
| Retirement plans information | 1-800-622-0176 |
Write to us:
Amundi
P.O. Box 534427
Pittsburgh, PA 15253-4427
| Our toll-free fax | 1-800-225-4240 |
| Our internet e-mail address | us.askamundi@amundi.com
(for general questions about Amundi only) |
Visit our web site: www.amundi.com/us
This report must be preceded or accompanied by a prospectus.
The Fund files a complete schedule of portfolio holdings with the Securities and Exchange Commission for the first and third quarters of each fiscal year as an exhibit to its reports on Form N-PORT. Shareholders may view the filed Form N-PORT by visiting the Commission’s web site at https://www.sec.gov.
Amundi Asset Management US, Inc.
60 State Street
Boston, MA 02109
www.amundi.com/us
Securities offered through Amundi Distributor US, Inc.
60 State Street, Boston, MA 02109
Underwriter of Pioneer Mutual Funds, Member SIPC
© 2023 Amundi Asset Management US, Inc. 33458-00-0923
ITEM 2. CODE OF ETHICS.
(a) Disclose whether, as of the end of the period covered by the report, the registrant has adopted a code of ethics that applies to the registrant’s principal executive officer, principal financial officer, principal accounting officer or controller, or persons performing similar functions, regardless of whether these individuals are employed by the registrant or a third party. If the registrant has not adopted such a code of ethics, explain why it has not done so.
The registrant has adopted, as of the end of the period covered by this report, a code of ethics that applies to the registrant’s principal executive officer, principal financial officer, principal accounting officer and controller.
(b) For purposes of this Item, the term “code of ethics” means written standards that are reasonably designed to deter wrongdoing and to promote:
(1) Honest and ethical conduct, including the ethical handling of actual or apparent conflicts of interest between personal and professional relationships;
(2) Full, fair, accurate, timely, and understandable disclosure in reports and documents that a registrant files with, or submits to, the Commission and in other public communications made by the registrant;
(3) Compliance with applicable governmental laws, rules, and regulations;
(4) The prompt internal reporting of violations of the code to an appropriate person or persons identified in the code; and
(5) Accountability for adherence to the code.
(c) The registrant must briefly describe the nature of any amendment, during the period covered by the report, to a provision of its code of ethics that applies to the registrant’s principal executive officer, principal financial officer, principal accounting officer or controller, or persons performing similar functions, regardless of whether these individuals are employed by the registrant or a third party, and that relates to any element of the code of ethics definition enumerated in paragraph (b) of this Item. The registrant must file a copy of any such amendment as an exhibit pursuant to Item 10(a), unless the registrant has elected to satisfy paragraph (f) of this Item by posting its code of ethics on its website pursuant to paragraph (f)(2) of this Item, or by undertaking to provide its code of ethics to any person without charge, upon request, pursuant to paragraph (f)(3) of this Item.
The registrant has made no amendments to the code of ethics during the period covered by this report.
(d) If the registrant has, during the period covered by the report, granted a waiver, including an implicit waiver, from a provision of the code of ethics to the registrant’s principal executive officer, principal financial officer, principal accounting officer or controller, or persons performing similar functions, regardless of whether these individuals are employed by the registrant or a third party, that relates to one or more of the items set forth in paragraph (b) of this Item, the registrant must briefly describe the nature of the waiver, the name of the person to whom the waiver was granted, and the date of the waiver.
Not applicable.
(e) If the registrant intends to satisfy the disclosure requirement under paragraph (c) or (d) of this Item regarding an amendment to, or a waiver from, a provision of its code of ethics that applies to the registrant’s principal executive officer, principal financial officer, principal accounting officer or controller, or persons performing similar functions and that relates to any element of the code of ethics definition enumerated in paragraph (b) of this Item by posting such information on its Internet website, disclose the registrant’s Internet address and such intention.
Not applicable.
(f) The registrant must:
(1) File with the Commission, pursuant to Item 12(a)(1), a copy of its code of ethics that applies to the registrant’s principal executive officer, principal financial officer, principal accounting officer or controller, or persons performing similar functions, as an exhibit to its annual report on this Form N-CSR (see attachment);
(2) Post the text of such code of ethics on its Internet website and disclose, in its most recent report on this Form N-CSR, its Internet address and the fact that it has posted such code of ethics on its Internet website; or
(3) Undertake in its most recent report on this Form N-CSR to provide to any person without charge, upon request, a copy of such code of ethics and explain the manner in which such request may be made. See Item 10(2)
ITEM 3. AUDIT COMMITTEE FINANCIAL EXPERT.
(a) (1) Disclose that the registrant’s Board of Trustees has determined that the registrant either:
(i) Has at least one audit committee financial expert serving on its audit committee; or
(ii) Does not have an audit committee financial expert serving on its audit committee.
The registrant’s Board of Trustees has determined that the registrant has at least one audit committee financial expert.
(2) If the registrant provides the disclosure required by paragraph (a)(1)(i) of this Item, it must disclose the name of the audit committee financial expert and whether that person is “independent.” In order to be considered “independent” for purposes of this Item, a member of an audit committee may not, other than in his or her capacity as a member of the audit committee, the Board of Trustees, or any other board committee:
(i) Accept directly or indirectly any consulting, advisory, or other compensatory fee from the issuer; or
(ii) Be an “interested person” of the investment company as defined in Section 2(a)(19) of the Act (15 U.S.C. 80a-2(a)(19)).
Mr. Fred J. Ricciardi, an independent Trustee, is such an audit committee financial expert.
(3) If the registrant provides the disclosure required by paragraph (a)(1) (ii) of this Item, it must explain why it does not have an audit committee financial expert.
Not applicable.
ITEM 4. PRINCIPAL ACCOUNTANT FEES AND SERVICES.
(a) Disclose, under the caption AUDIT FEES, the aggregate fees billed for each of the last two fiscal years for professional services rendered by the principal accountant for the audit of the registrant’s annual financial statements or services that are normally provided by the accountant in connection with statutory and regulatory filings or engagements for those fiscal years.
The audit fees for the Trust were $219,520 payable to Ernst & Young LLP for the year ended July 31, 2023 and $167,808 for the year ended July 31, 2022.
(b) Disclose, under the caption AUDIT-RELATED FEES, the aggregate fees billed in each of the last two fiscal years for assurance and related services by the principal accountant that are reasonably related to the performance of the audit of the registrant’s financial statements and are not reported under paragraph (a) of this Item. Registrants shall describe the nature of the services comprising the fees disclosed under this category.
The audit-related services fees for the Trust were $14,991 payable to Ernst & Young LLP for the year ended July 31, 2023 and $3,354 for the year ended July 31, 2022.
(c) Disclose, under the caption TAX FEES, the aggregate fees billed in each of the last two fiscal years for professional services rendered by the principal accountant for tax compliance, tax advice, and tax planning. Registrants shall describe the nature of the services comprising the fees disclosed under this category.
The Trust paid aggregate non-audit fees to Ernst & Young LLP for tax services of $45,403 and $29,234 during the fiscal years ended July 31, 2023 and 2022, respectively.
(d) Disclose, under the caption ALL OTHER FEES, the aggregate fees billed in each of the last two fiscal years for products and services provided by the principal accountant, other than the services reported in paragraphs (a) through (c) of this Item. Registrants shall describe the nature of the services comprising the fees disclosed under this category.
There were no other fees in 2023 or 2022.
(e) (1) Disclose the audit committee’s pre-approval policies and procedures described in paragraph (c)(7) of Rule 2-01 of Regulation S-X.
PIONEER FUNDS
APPROVAL OF AUDIT, AUDIT-RELATED, TAX AND OTHER SERVICES
PROVIDED BY THE INDEPENDENT AUDITOR
SECTION I—POLICY PURPOSE AND APPLICABILITY
The Pioneer Funds recognize the importance of maintaining the independence of their outside auditors. Maintaining independence is a shared responsibility involving Amundi Asset Management US, Inc., the audit committee and the independent auditors.
The Funds recognize that a Fund’s independent auditors: 1) possess knowledge of the Funds, 2) are able to incorporate certain services into the scope of the audit, thereby avoiding redundant work, cost and disruption of Fund personnel and processes, and 3) have expertise that has value to the Funds. As a result, there are situations where it is desirable to use the Fund’s independent auditors for services in addition to the annual audit and where the potential for conflicts of interests are minimal. Consequently, this policy, which is intended to comply with Rule 210.2-01(C)(7), sets forth guidelines and procedures to be followed by the Funds when retaining the independent audit firm to perform audit, audit-related tax and other services under those circumstances, while also maintaining independence.
Approval of a service in accordance with this policy for a Fund shall also constitute approval for any other Fund whose pre-approval is required pursuant to Rule 210.2-01(c)(7)(ii).
In addition to the procedures set forth in this policy, any non-audit services that may be provided consistently with Rule 210.2-01 may be approved by the Audit Committee itself and any pre-approval that may be waived in accordance with Rule 210.2-01(c)(7)(i)(C) is hereby waived.
Selection of a Fund’s independent auditors and their compensation shall be determined by the Audit Committee and shall not be subject to this policy.
SECTION II—POLICY
| | | | |
SERVICE CATEGORY | | SERVICE CATEGORY DESCRIPTION | | SPECIFIC PRE-APPROVED SERVICE SUBCATEGORIES |
| I. AUDIT SERVICES | | Services that are directly related to performing the independent audit of the Funds | | o Accounting research assistance o SEC consultation, registration statements, and reporting o Tax accrual related matters o Implementation of new accounting standards o Compliance letters (e.g. rating agency letters) o Regulatory reviews and assistance regarding financial matters o Semi-annual reviews (if requested) o Comfort letters for closed end offerings |
| | |
| II. AUDIT-RELATED SERVICES | | Services which are not prohibited under Rule 210.2-01(C)(4) (the “Rule”) and are related extensions of the audit services support the audit, or use the knowledge/expertise gained from the audit procedures as a foundation to complete the project. In most cases, if the Audit-Related Services are not performed by the Audit firm, the scope of the Audit Services would likely increase. The Services are typically well-defined and governed by accounting professional standards (AICPA, SEC, etc.) | | o AICPA attest and agreed-upon procedures o Technology control assessments o Financial reporting control assessments o Enterprise security architecture assessment |
| | |
AUDIT COMMITTEE APPROVAL POLICY | | AUDIT COMMITTEE REPORTING POLICY |
o “One-time” pre-approval for the audit period for all pre-approved specific service subcategories. Approval of the independent auditors as auditors for a Fund shall constitute pre approval for these services. o “One-time” pre-approval for the fund fiscal year within a specified dollar limit for all pre-approved specific service subcategories | | o A summary of all such services and related fees reported at each regularly scheduled Audit Committee meeting. o A summary of all such services and related fees (including comparison to specified dollar limits) reported quarterly. |
| | |
o Specific approval is needed to exceed the pre-approved dollar limit for these services (see general Audit Committee approval policy below for details on obtaining specific approvals) o Specific approval is needed to use the Fund’s auditors for Audit-Related Services not denoted as “pre-approved”, or to add a specific service subcategory as “pre-approved” | | |
SECTION III—POLICY DETAIL, CONTINUED
| | | | |
SERVICE CATEGORY | | SERVICE CATEGORY DESCRIPTION | | SPECIFIC PRE-APPROVED
SERVICE SUBCATEGORIES |
| III. TAX SERVICES | | Services which are not prohibited by the Rule, if an officer of the Fund determines that using the Fund’s auditor to provide these services creates significant synergy in the form of efficiency, minimized disruption, or the ability to maintain a desired level of confidentiality. | | o Tax planning and support o Tax controversy assistance o Tax compliance, tax returns, excise tax returns and support o Tax opinions |
| | |
AUDIT COMMITTEE APPROVAL POLICY | | AUDIT COMMITTEE REPORTING POLICY |
o “One-time” pre-approval for the fund fiscal year within a specified dollar limit o Specific approval is needed to exceed the pre-approved dollar limits for these services (see general Audit Committee approval policy below for details on obtaining specific approvals) o Specific approval is needed to use the Fund’s auditors for tax services not denoted as pre-approved, or to add a specific service subcategory as “pre-approved” | | o A summary of all such services and related fees (including comparison to specified dollar limits) reported quarterly. |
SECTION III—POLICY DETAIL, CONTINUED
| | | | |
SERVICE CATEGORY | | SERVICE CATEGORY DESCRIPTION | | SPECIFIC PRE-APPROVED
SERVICE SUBCATEGORIES |
IV. OTHER SERVICES A. SYNERGISTIC, UNIQUE QUALIFICATIONS | | Services which are not prohibited by the Rule, if an officer of the Fund determines that using the Fund’s auditor to provide these services creates significant synergy in the form of efficiency, minimized disruption, the ability to maintain a desired level of confidentiality, or where the Fund’s auditors posses unique or superior qualifications to provide these services, resulting in superior value and results for the Fund. | | o Business Risk Management support o Other control and regulatory compliance projects |
| | |
AUDIT COMMITTEE APPROVAL POLICY | | AUDIT COMMITTEE REPORTING POLICY |
o “One-time” pre-approval for the fund fiscal year within a specified dollar limit o Specific approval is needed to exceed the pre-approved dollar limits for these services (see general Audit Committee approval policy below for details on obtaining specific approvals) o Specific approval is needed to use the Fund’s auditors for “Synergistic” or “Unique Qualifications” Other Services not denoted as pre-approved to the left, or to add a specific service subcategory as “pre-approved” | | o A summary of all such services and related fees (including comparison to specified dollar limits) reported quarterly. |
SECTION III—POLICY DETAIL, CONTINUED
| | | | |
SERVICE CATEGORY | | SERVICE CATEGORY DESCRIPTION | | SPECIFIC PROHIBITED
SERVICE SUBCATEGORIES |
| PROHIBITED SERVICES | | Services which result | | 1. Bookkeeping or other services |
| | in the auditors losing | | related to the accounting records or |
| | independence status | | financial statements of the audit |
| | under the Rule. | | client* |
| | | | 2. Financial information systems design |
| | | | and implementation* |
| | | | 3. Appraisal or valuation services, |
| | | | fairness* opinions, or |
| | | | contribution-in-kind reports |
| | | | 4. Actuarial services (i.e., setting |
| | | | actuarial reserves versus actuarial |
| | | | audit work)* |
| | | | 5. Internal audit outsourcing services* |
| | | | 6. Management functions or human |
| | | | resources |
| | | | 7. Broker or dealer, investment |
| | | | advisor, or investment banking services |
| | | | 8. Legal services and expert services |
| | | | unrelated to the audit |
| | | | 9. Any other service that the Public |
| | | | Company Accounting Oversight Board |
| | | | determines, by regulation, is |
| | | | impermissible |
| | |
AUDIT COMMITTEE APPROVAL POLICY | | AUDIT COMMITTEE REPORTING POLICY |
| o These services are not to be | | o A summary of all |
| performed with the exception of the(*) | | services and related |
| services that may be permitted | | fees reported at each |
| if they would not be subject to audit | | regularly scheduled |
| procedures at the audit client (as | | Audit Committee meeting |
| defined in rule 2-01(f)(4)) level | | will serve as continual |
| the firm providing the service. | | confirmation that has |
| | not provided any restricted services. |
GENERAL AUDIT COMMITTEE APPROVAL POLICY:
o For all projects, the officers of the Funds and the Fund’s auditors will each make an assessment to determine that any proposed projects will not impair independence.
o Potential services will be classified into the four non-restricted service categories and the “Approval of Audit, Audit-Related, Tax and Other Services” Policy above will be applied. Any services outside the specific pre-approved service subcategories set forth above must be specifically approved by the Audit Committee.
o At least quarterly, the Audit Committee shall review a report summarizing the services by service category, including fees, provided by the Audit firm as set forth in the above policy.
(2) Disclose the percentage of services described in each of paragraphs (b) through (d) of this Item that were approved by the audit committee pursuant to paragraph (c)(7)(i)(C) of Rule 2-01 of Regulation S-X.
Non-Audit Services
Beginning with non-audit service contracts entered into on or after May 6, 2003, the effective date of the new SEC pre-approval rules, the Trust’s audit committee is required to pre-approve services to affiliates defined by SEC rules to the extent that the services are determined to have a direct impact on the operations or financial reporting of the Trust. For the years ended July 31, 2023 and 2022, there were no services provided to an affiliate that required the Trust’s audit committee pre-approval.
(f) If greater than 50 percent, disclose the percentage of hours expended on the principal accountants engagement to audit the registrant’s financial statements for the most recent fiscal year that were attributed to work performed by persons other than the principal accountant’s full-time, permanent employees.
N/A
(g) Disclose the aggregate non-audit fees billed by the registrants accountant for services rendered to the registrant, and rendered to the registrants investment adviser (not including any sub-adviser whose role is primarily portfolio management and is subcontracted with or overseen by another investment adviser), and any entity controlling, controlled by, or under common control with the adviser that provides ongoing services to the registrant for each of the last two fiscal years of the registrant.
The Trust paid aggregate non-audit fees to Ernst & Young LLP for tax services of $45,403 and $29,234 during the fiscal years ended July 31, 2023 and 2022, respectively.
(h) Disclose whether the registrants audit committee of the Board of Trustees has considered whether the provision of non-audit services that were rendered to the registrants investment adviser (not including any subadviser whose role is primarily portfolio management and is subcontracted with or overseen by another investment adviser), and any entity controlling, controlled by, or under common control with the investment adviser that provides ongoing services to the registrant that were not pre-approved pursuant to paragraph (c)(7)(ii) of Rule 2-01 of Regulation S-X is compatible with maintaining the principal accountant’s independence.
The Fund’s audit committee of the Board of Trustees has considered whether the provision of non-audit services that were rendered to the Affiliates (as defined) that were not pre-approved pursuant to paragraph (c)(7)(ii) of Rule 2-01 of Regulation S-X is compatible with maintaining the principal accountant’s independence.
(i) A registrant identified by the Commission pursuant to Section 104(i)(2)(A) of the Sarbanes-Oxley Act of 2002 (15 U.S.C. 7214(i)(2)(A)), as having retained, for the preparation of the audit report on its financial statements included in the Form NCSR, a registered public accounting firm that has a branch or office that is located in a foreign jurisdiction and that the Public Company Accounting Oversight Board has determined it is unable to inspect or investigate completely because of a position taken by an authority in the foreign jurisdiction must electronically submit to the Commission on a supplemental basis documentation that establishes that the registrant is not owned or controlled by a governmental entity in the foreign jurisdiction. The registrant must submit this documentation on or before the due date for this form. A registrant that is owned or controlled by a foreign governmental entity is not required to submit such documentation. N/A
(j) A registrant that is a foreign issuer, as defined in 17 CFR 240.3b-4, identified by the Commission pursuant to Section 104(i)(2)(A) of the Sarbanes-Oxley Act of 2002 (15 U.S.C. 7214(i)(2)(A)), as having retained, for the preparation of the audit report on its financial statements included in the Form N-CSR, a registered public accounting firm that has a branch or office that is located in a foreign jurisdiction and that the Public Company Accounting Oversight Board has determined it is unable to inspect or investigate completely because of a position taken by an authority in the foreign jurisdiction, for each year in which the registrant is so identified, must provide the below disclosures. Also, any such identified foreign issuer that uses a variable-interest entity or any similar structure that results in additional foreign entities being consolidated in the financial statements of the registrant is required to provide the below disclosures for itself and its consolidated foreign operating entity or entities. A registrant must disclose:
(1) That, for the immediately preceding annual financial statement period, a registered public accounting firm that the PCAOB was unable to inspect or investigate completely, because of a position taken by an authority in the foreign jurisdiction, issued an audit report for the registrant; N/A
(2) The percentage of shares of the registrant owned by governmental entities in the foreign jurisdiction in which the registrant is incorporated or otherwise organized; N/A
(3) Whether governmental entities in the applicable foreign jurisdiction with respect to that registered public accounting firm have a controlling financial interest with respect to the registrant; N/A
(4) The name of each official of the Chinese Communist Party who is a member of the board of directors of the registrant or the operating entity with respect to the registrant; N/A
(5) Whether the articles of incorporation of the registrant (or equivalent organizing document) contains any charter of the Chinese Communist Party, including the text of any such charter. N/A
ITEM 5. AUDIT COMMITTEE OF LISTED REGISTRANTS
(a) If the registrant is a listed issuer as defined in Rule 10A-3 under the Exchange Act (17 CFR 240.10A-3), state whether or not the registrant has a separately-designated standing audit committee established in accordance with Section 3(a)(58)(A) of the Exchange Act (15 U.S.C. 78c(a)(58)(A)). If the registrant has such a committee, however designated, identify each committee member. If the entire board of directors is acting as the registrant’s audit committee as specified in Section 3(a)(58)(B) of the Exchange Act (15 U.S.C. 78c(a)(58)(B)), so state.
N/A
(b) If applicable, provide the disclosure required by Rule 10A-3(d) under the Exchange Act (17 CFR 240.10A-3(d)) regarding an exemption from the listing standards for audit committees.
N/A
ITEM 6. SCHEDULE OF INVESTMENTS.
File Schedule of Investments in securities of unaffiliated issuers as of the close of the reporting period as set forth in 210.1212 of Regulation S-X [17 CFR 210.12-12], unless the schedule is included as part of the report to shareholders filed under Item 1 of this Form.
Included in Item 1
ITEM 7. DISCLOSURE OF PROXY VOTING POLICIES AND PROCEDURES FOR CLOSED-END MANAGEMENT INVESTMENT COMPANIES.
A closed-end management investment company that is filing an annual report on this Form N-CSR must, unless it invests exclusively in non-voting securities, describe the policies and procedures that it uses to determine how to vote proxies relating to portfolio securities, including the procedures that the company uses when a vote presents a conflict between the interests of its shareholders, on the one hand, and those of the company’s investment adviser; principal underwriter; or any affiliated person (as defined in Section 2(a)(3) of the Investment Company Act of 1940 (15 U.S.C. 80a-2(a)(3)) and the rules thereunder) of the company, its investment adviser, or its principal underwriter, on the other. Include any policies and procedures of the company’s investment adviser, or any other third party, that the company uses, or that are used on the company’s behalf, to determine how to vote proxies relating to portfolio securities.
Not applicable to open-end management investment companies.
ITEM 8. PORTFOLIO MANAGERS OF CLOSED-END MANAGEMENT INVESTMENT COMPANIES.
(a) If the registrant is a closed-end management investment company that is filing an annual report on this Form N-CSR, provide the following information:
(1) State the name, title, and length of service of the person or persons employed by or associated with the registrant or an investment adviser of the registrant who are primarily responsible for the day-to-day management of the registrant’s portfolio (“Portfolio Manager”). Also state each Portfolio Manager’s business experience during the past 5 years.
Not applicable to open-end management investment companies.
ITEM 9. PURCHASES OF EQUITY SECURITIES BY CLOSED-END MANAGEMENT INVESTMENT COMPANY AND AFFILIATED PURCHASERS.
(a) If the registrant is a closed-end management investment company, in the following tabular format, provide the information specified in paragraph (b) of this Item with respect to any purchase made by or on behalf of the registrant or any affiliated purchaser, as defined in Rule 10b-18(a)(3) under the Exchange Act (17 CFR 240.10b-18(a)(3)), of shares or other units of any class of the registrant’s equity securities that is registered by the registrant pursuant to Section 12 of the Exchange Act (15 U.S.C. 781).
Not applicable to open-end management investment companies.
ITEM 10. SUBMISSION OF MATTERS TO A VOTE OF SECURITY HOLDERS.
Describe any material changes to the procedures by which shareholders may recommend nominees to the registrant’s board of directors, where those changes were implemented after the registrant last provided disclosure in response to the requirements of Item 407(c)(2)(iv) of Regulation S-R(17 CFR 229.407)(as required by Item 22(b)(15)) of Schedule 14A (17 CFR 240.14a-101), or this Item.
There have been no material changes to the procedures by which the shareholders may recommend nominees to the registrant’s board of directors since the registrant last provided disclosure in response to the requirements of Item 407(c)(2)(iv) of Regulation S-R of Schedule 14(A) in its definitive proxy statement, or this item.
ITEM 11. CONTROLS AND PROCEDURES.
(a) Disclose the conclusions of the registrant’s principal executive and principal financials officers, or persons performing similar functions, regarding the effectiveness of the registrant’s disclosure controls and procedures (as defined in Rule 30a-3(c) under the Act (17 CFR 270.30a-3(c))) as of a date within 90 days of the filing date of the report that includes the disclosure required by this paragraph, based on the evaluation of these controls and procedures required by Rule 30a-3(b) under the Act (17 CFR 270.30(a)-3(b) and Rules 13a-15(b) or 15d-15(b) under the Exchange Act (17 CFR 240.13a-15(b) or 240.15d-15(b)).
The registrant’s principal executive officer and principal financial officer have concluded that the registrant’s disclosure controls and procedures are effective based on the evaluation of these controls and procedures as of a date within 90 days of the filing date of this report.
(b) Disclose any change in the registrant’s internal control over financial reporting (as defined in Rule 30a-3(d) under the Act (17CFR 270.30a-3(d)) that occurred during the period covered by this report that has materially affected, or is reasonably likely to materially affect, the registrant’s internal control over financial reporting.
There were no significant changes in the registrant’s internal control over financial reporting that occurred during the period covered by this report that have materially affected, or are reasonably likely to materially affect, the registrant’s internal control over financial reporting.
Item 12. Disclosure of Securities Lending Activities for Closed-End Management Investment Companies.
(a) If the registrant is a closed-end management investment company, provide the following dollar amounts of income and compensation related to the securities lending activities of the registrant during its most recent fiscal year:
N/A
(1) Gross income from securities lending activities;
N/A
(2) All fees and/or compensation for each of the following securities lending activities and related services: any share of revenue generated by the securities lending program paid to the securities lending agent(s) (revenue split); fees paid for cash collateral management services (including fees deducted from a pooled cash collateral reinvestment vehicle) that are not included in the revenue split; administrative fees that are not included in the revenue split; fees for indemnification that are not included in the revenue split; rebates paid to borrowers; and any other fees relating to the securities lending program that are not included in the revenue split, including a description of those other fees;
N/A
(3) The aggregate fees/compensation disclosed pursuant to paragraph (2); and
N/A
(4) Net income from securities lending activities (i.e., the dollar amount in paragraph (1) minus the dollar amount in paragraph (3)).
If a fee for a service is included in the revenue split, state that the fee is included in the revenue split.
N/A
(b) If the registrant is a closed-end management investment company, describe the services provided to the registrant by the securities lending agent in the registrants most recent fiscal year.
N/A
ITEM 13. EXHIBITS.
(a) File the exhibits listed below as part of this Form. Letter or number the exhibits in the sequence indicated.
(1) Any code of ethics, or amendment thereto, that is the subject of the disclosure required by Item 2, to the extent that the registrant intends to satisfy the Item 2 requirements through filing of an exhibit.
(2) A separate certification for each principal executive officer and principal financial officer of the registrant as required by Rule 30a-2(a) under the Act (17 CFR 270.30a-2(a)) , exactly as set forth below:
Filed herewith.
(b) Certifications pursuant to Rule 30a-2(b) under the 1940 Act and Section 906 of the Sarbanes-Oxley Act of 2002 are attached hereto.
SIGNATURES
[See General Instruction F]
Pursuant to the requirements of the Securities Exchange Act of 1934 and the Investment Company Act of 1940, the registrant has duly caused this report to be signed on its behalf by the undersigned, thereunto duly authorized.
(Registrant) Pioneer Series Trust IV
By (Signature and Title)* /s/ Lisa M. Jones
Lisa M. Jones, President and Chief Executive Officer
Date October 5, 2023
Pursuant to the requirements of the Securities Exchange Act of 1934 and the Investment Company Act of 1940, this report has been signed below by the following persons on behalf of the registrant and in the capacities and on the dates indicated.
By (Signature and Title)* /s/ Lisa M. Jones
Lisa M. Jones, President and Chief Executive Officer
Date October 5, 2023
By (Signature and Title)* /s/ Anthony J. Koenig, Jr.
Anthony J. Koenig, Jr., Managing Director, Chief Operations Officer & Treasurer of the Funds
Date October 5, 2023
* Print the name and title of each signing officer under his or her signature.