UNITED STATES
SECURITIES AND EXCHANGE COMMISSION
Washington, D.C. 20549
FORM N-CSR
CERTIFIED SHAREHOLDER REPORT OF REGISTERED
MANAGEMENT INVESTMENT COMPANIES
Investment Company Act file number 811-21781
Pioneer Series Trust IV
(Exact name of registrant as specified in charter)
60 State Street, Boston, MA 02109
(Address of principal executive offices) (ZIP code)
Terrence J. Cullen, Amundi Asset Management, Inc.,
60 State Street, Boston, MA 02109
(Name and address of agent for service)
Registrant’s telephone number, including area code: (617) 742-7825
Date of fiscal year end: July 31, 2022
Date of reporting period: August 1, 2021 through July 31, 2022
Form N-CSR is to be used by management investment companies to file reports with the Commission not later than 10 days after the transmission to stockholders of any report that is required to be transmitted to stockholders under Rule 30e-1 under the Investment Company Act of 1940 (17 CFR 270.30e-1). The Commission may use the information provided on Form N-CSR in its regulatory, disclosure review, inspection, and policymaking roles.
A registrant is required to disclose the information specified by Form N-CSR, and the Commission will make this information public. A registrant is not required to respond to the collection of information contained in Form N-CSR unless the Form displays a currently valid Office of Management and Budget (“OMB”) control number. Please direct comments concerning the accuracy of the information collection burden estimate and any suggestions for reducing the burden to Secretary, Securities and Exchange Commission, 450 Fifth Street, NW, Washington, DC 20549-0609. The OMB has reviewed this collection of information under the clearance requirements of 44 U.S.C. ss. 3507.
October 5, 2022
| Registrant | File No. | Form | Original Filing Date | Amended Filing Date | Explanation |
| Pioneer Series Trust IV (Pioneer Balanced ESG Fund) | 811-21781 | N-CSR | 10/5/22 | 10/5/22 | The Registrant amended Form N-CSR for the period ended July 31, 2022 to correct, the filing for a typographical error. The word unaudited was removed from the statement of operations. |
Pioneer Multi-Asset Income Fund
Annual Report | July 31, 2022
| | | | | |
| A: PMAIX | C: PMACX | K: PMFKX | R: PMFRX | Y: PMFYX |

visit us: www.amundi.com/us
Pioneer Multi-Asset Income Fund | Annual Report | 7/31/22 1
Table of Contents
President’s Letter
Dear Shareholders,
Since early 2020, investors have faced unprecedented challenges. The onset of the COVID-19 pandemic in March 2020 was the most significant development, as the pandemic affected the everyday lives of millions and led to significant changes in government and central-bank policies. Central banks, including the US Federal Reserve (Fed), enacted very accommodative monetary policies in the form of extremely low interest rates and quantitative easing (bond purchase) programs, while governments around the globe, including the US government, passed large spending packages in 2020 and in early 2021, in order help citizens navigate the challenging environment caused by the pandemic. The widespread distribution of COVID-19 vaccines approved for emergency use in late 2020 led to a general decline in virus-related hospitalizations in the US and had a positive effect on overall market sentiment during most of the 2021 calendar year. Eventually, however, the easier monetary and fiscal policies enacted during the height of the pandemic as well as ongoing supply chain issues, which were, at least in part, an outgrowth of certain virus-containment measures, were among the numerous factors that combined to drive inflation levels higher in the latter part of 2021.
With rising inflation already a concern as 2021 drew to a close, investor sentiment sharply deteriorated in the first quarter of 2022, with the negativity driven largely by Russia’s invasion of Ukraine in February as well as signs that inflation was more entrenched than transitory in many regions of the world. The war and the resulting economic sanctions placed on Russia by the US and European governments also contributed to a spike in energy prices, given that Russia is a major exporter of natural gas as well as other resources, particularly to Europe.
The persistently high inflation readouts led key central banks, including the Fed, to signal a tightening of monetary policy. The Fed had already announced that it would taper its bond purchases and eventually end its pandemic-era quantitative easing program by the spring of 2022; and, with US inflation hitting 40-year highs, the Fed began aggressively raising its benchmark federal funds rate target range, while indicating that more rate hikes were likely. The magnitude of the rate increases heightened investors’ concerns about the ability of the Fed and other central banks to cool inflation without triggering a recession.
Due to what has been, so far, a tumultuous year for investors, the performance of most asset classes, especially riskier assets such as equities and corporate bonds, has turned negative, as market participants have tried to ascertain the direction and progression of Fed policy, economic growth, the war in Ukraine, and other factors. In the US, the upcoming mid-term
2 Pioneer Multi-Asset Income Fund | Annual Report | 7/31/22
elections in November of this year are another important benchmark that investors are closely monitoring, as political uncertainty has often contributed to increased market volatility.
While the economic news, on balance, has been negative in recent months, one positive development has been the slow, steady transition of COVID-19 from an acute public health crisis and pandemic to a more manageable and perhaps endemic disease, driven by vaccine distributions as well as the development of effective therapeutics to treat the virus.
Since 1928, Amundi US’s investment process has been built on a foundation of fundamental research and active management, principles which have guided our investment decisions for more than 90 years. We believe active management – that is, making active investment decisions – can help mitigate the risks during periods of market volatility.
At Amundi US, active management begins with our own fundamental, bottom-up research process. Our team of dedicated research analysts and portfolio managers analyzes each security under consideration, communicating frequently with the management teams of the companies and other entities issuing the securities, and working together to identify those securities that best meet our investment criteria for our family of funds. Our risk management approach begins with each security under consideration, as we strive to develop a deep understanding of the potential opportunity, while considering any potential risk factors.
Today, as investors, we have many options. It is our view that active management can serve shareholders well, not only when markets are thriving, but also during periods of market stress. As you consider your long-term investment goals, we encourage you to work with your financial professional to develop an investment plan that paves the way for you to pursue both your short-term and long-term goals.
We greatly appreciate the trust you have placed in us and look forward to continuing to serve you in the future.

Lisa M. Jones
Head of the Americas, President and CEO of US
Amundi Asset Management US, Inc.
September 2022
Any information in this shareowner report regarding market or economic trends or the factors influencing the Fund’s historical or future performance are statements of opinion as of the date of this report. Past performance is no guarantee of future results.
Pioneer Multi-Asset Income Fund | Annual Report | 7/31/22 3
Portfolio Management Discussion | 7/31/22
In the following interview, Howard Weiss discusses Pioneer Multi-Asset Income Fund’s performance and investment strategies during the 12-month period ended July 31, 2022, along with the management team’s outlook for the coming months. Mr. Weiss, CFA, a Senior Vice President, Director of Multi-Asset Solutions, US, and a portfolio manager at Amundi Asset Management US, Inc. (Amundi US), co-manages the Fund, along with Marco Pirondini, Senior Managing Director, Head of Equities, US, and a portfolio manager at Amundi US; Michele Garau*, a Senior Vice President and a portfolio manager at Amundi US; and Fergal Jackson*, a Vice President and a portfolio manager at Amundi US.
| Q | | How did the Fund perform during the 12-month period ended July 31, 2022? |
| A | | The Fund’s Class A shares returned -0.43% at net asset value during the 12-month period ended July 31, 2022, while the Fund’s benchmarks, the Bloomberg US Aggregate Bond Index and the Morgan Stanley Capital International Index (MSCI) All Country World (ACWI) NR Index1, returned -9.12% and -10.48%, respectively. During the same period, the average return of the 425 mutual funds in Morningstar’s Global Allocation Funds category was -7.97%. |
| Q | | How would you describe the global investment environment during the 12-month period ended July 31, 2022? |
| A | | Global markets faced a myriad of headwinds that weighed on the performance of so-called “riskier” assets during the 12-month period, including equities and certain types of fixed-income investments. Early in the period (summer 2021), surging COVID-19 cases, driven largely by the emergence of the highly contagious Omicron variant, raised fears of renewed lockdowns and their potential effects on global economic growth. |
| * | | Effective June 16, 2022, Fergal Jackson became a portfolio manager on the Fund. Michele Garau will retire from Amundi US in the fourth quarter of 2022. |
| 1 | | The MSCI information may only be used for your internal use, may not be reproduced or redisseminated in any form and may not be used as a basis for or a component of any financial instruments or products or indices. None of the MSCI information is intended to constitute investment advice or a recommendation to make (or refrain from making) any kind of investment decision and may not be relied on as such. Historical data and analysis should not be taken as an indication or guarantee of any future performance analysis, forecast or prediction. The MSCI information is provided on an “as is” basis and the user of this information assumes the entire risk of any use made of this information. MSCI, each of its affiliates and each other person involved in or related to compiling, computing or creating any MSCI information (collectively, the “MSCI Parties”) expressly disclaims all warranties (including, without limitation, any warranties of originality, accuracy, completeness, timeliness, non-infringement, merchantability and fitness for a particular purpose) with respect to this information. Without limiting any of the foregoing, in no event shall any MSCI Party have any liability for any direct, indirect, special, incidental, punitive, consequential (including, without limitation, lost profits) or any other damages. |
4 Pioneer Multi-Asset Income Fund | Annual Report | 7/31/22
In response, many central banks pledged to keep interest rates low, at least in the short-term, and expressed a greater level of tolerance for what many central-bank officials called “transitory” inflation to run at above-trend levels.
The fourth quarter of 2021 was a bright spot for many developed markets, with the strong third-quarter 2021 corporate earnings season helping to mute macroeconomic worries. However, the combination of stimulus-induced demand, disruptions to the global supply chain, high energy and food prices, and labor-wage pressures contributed to sharply higher inflation. That, in turn, led to speculation that central banks might tighten monetary policy sooner, and more aggressively, than initially anticipated.
Investor sentiment sharply deteriorated in the first quarter of 2022, with the negativity driven largely by Russia’s invasion of Ukraine in February as well as signs that inflation was more entrenched than transitory in many regions of the world. The persistent inflation led key central banks, including the US Federal Reserve (Fed), to tighten monetary policy by raising interest rates. With US inflation hitting 40-year highs in the second half of the 12-month period, the Fed aggressively raised its benchmark federal funds rate target range four times between March and July 2022, resulting in a target range of 2.25% to 2.50% by the end of the period, up from a target range of 0.00% to 0.25% when the Fed began raising rates. The magnitude of the rate increases heightened investors’ concerns about the ability of the Fed and other central banks to cool inflation without triggering a recession. As inflation and interest-rate fears rose, yields moved higher in many developed markets, including the US and Europe.
Amid central-bank monetary tightening, rate-sensitive fixed-income assets lost ground due to selling pressure. Global equities also struggled, hitting their lowest performance levels since the onset of the COVID-19 pandemic more than two years earlier. At the regional level, US equities held up best, returning -4.64% for the 12-month period. Japanese, European, and emerging markets equities fared much worse, returning -14.28%, -15.10%, and -20.09%, respectively, for the 12-month period.
| Q | | What factors drove the Fund’s benchmark-relative performance during the 12-month period ended July 31, 2022? |
| A | | As a diversified**, multi-asset portfolio, the Fund’s returns have generally fallen in between those of the Bloomberg Index, a fixed-income benchmark, and the MSCI ACWI, which measures the performance of |
| ** | | Diversification does not assure a profit nor protect against loss. |
Pioneer Multi-Asset Income Fund | Annual Report | 7/31/22 5
global equities. However, the Fund strongly outperformed both indices during the 12-month period, delivering relatively flat returns, while each benchmark posted a deeply negative result.
The primary factor driving the Fund’s positive relative returns during the period was security selection results within the portfolio’s equity allocation. Given the recovery in commodity prices, the Fund’s overweight positioning in the outperforming energy sector was the leading positive contributor to benchmark-relative performance. Within the energy sector, a position in Energy Transfer, a diversified midstream firm with pipelines and other associated energy infrastructure across 41 US states, was a key contributor to the Fund's benchmark-relative performance.
At the individual security level, the Fund’s equity positions in some large integrated oil-and-gas producers, including Shell, also produced strong gains and aided relative returns. Since the beginning of the Ukraine war, Russia has been selling less oil and gas as a result of sanctions imposed by the European Union, US, and other major economies. As global supplies have declined, there has been little spare global capacity to compensate for the drop in Russian oil available on the market. Given its global operations, Shell found itself in a good position to help meet the rising demand. Shares of Shell also benefited from management’s plans to increase dividends*** and stock buybacks. We remain upbeat in our assessment of the energy sector, and believe commodity prices could remain elevated at levels that may help support continued solid performance for energy companies, including Shell. Additionally, valuations in the energy sector have remained compelling, in our view, given years of underinvestment and limited capacity.
The Fund’s equity hedges aided relative performance during the period. We utilized equity hedges in the portfolio, through the purchase of equity-indexed futures contracts, in an attempt to help temper the effects of increased market volatility and sell-offs during the 12-month period. (Equity hedge investing consists of maintaining core portfolio holdings of equities, or common stock positions, offset with investments in equity-index futures, such as equity-indexed futures tied to the Standard & Poor’s 500 Index.) We continue to believe our hedging strategy in managing the Fund may help to mitigate the market-volatility risks associated with holding common stocks in the portfolio over the long term.
Another significant contributor to the Fund’s positive relative performance during the 12-month period was positioning in equity-linked notes (ELNs). At period-end, the Fund’s ELN investments focused
| *** | | Dividends are not guaranteed. |
6 Pioneer Multi-Asset Income Fund | Annual Report | 7/31/22
primarily on the information technology and consumer discretionary sectors, where we believe we identified the most compelling coupon rates during market corrections. ELNs are products that combine a fixed-income investment with the potential for additional returns tied to the performance of underlying equities or equity-related securities. ELNs seek to produce yield by selling volatility against a single equity, basket of equities, or equity index. They are, in effect, covered call strategies, in which a call option – or a contractual agreement to buy a security at a predetermined price and within a predetermined timeframe – against the underlying investment is sold to produce income. (Selling volatility entails seeking relatively expensive options of highly volatile investments, with the goal of selling the options at a higher-than-average price, in anticipation that they will lose value at a faster rate than lower-cost, comparable options might decline in value.) While ELNs still bear the price risk of the referenced stock(s), periods of elevated volatility may result in ELNs offering richer coupons, which in turn could help mute the volatility of net returns when compared to the actual owning of stock shares. ELNs are subject to additional risks and, of course, there is no assurance that investments in ELNs will be profitable.
Finally, the Fund’s relative returns received a boost from exposure to securitized assets, such as mortgage-backed securities (MBS), and to equity real estate investment trusts (REITs). MBS have played an increasingly important role within the Fund’s fixed-income-related exposures, and we believe REITs have continued to offer relatively attractive yields on a risk/return basis.
On the negative side, the Fund’s exposure to Russia, though modest, including holdings of shares of Rosneft Oil and Magnit, detracted from benchmark-relative results over the 12-month period, as Russian stocks sold off amid increased geopolitical tensions. The share prices of the two companies tumbled as investors perceived that the sanctions imposed on Russia could have a significant negative effect on both their businesses and valuations. While the Russian markets are open, we were unable to trade the stocks during the period due to government prohibitions. We have continued to monitor the situation and are currently reevaluating the risk/reward profiles for the two companies, and the region, in light of the ongoing geopolitical situation.
Given our view that current risks lean more towards inflationary pressures than recessionary conditions, we reduced the Fund’s allocation to fixed-income assets across both duration and credit-sensitive sectors during the period. (Duration is a measure of the sensitivity of the price, or the value of principal, of a fixed-income investment to a change in
Pioneer Multi-Asset Income Fund | Annual Report | 7/31/22 7
interest rates, expressed as a number of years.) While those shifts were beneficial for the Fund’s benchmark-relative performance overall, the portfolio’s underweight to US Treasuries versus the Bloomberg Index detracted from relative results, as Treasuries outperformed other fixed-income assets due to the flight-to-safety trades during market sell-offs. However, we have preferred to invest the Fund in ELNs, given their relatively high-coupon rates and lower-duration characteristics.
| Q | | Did the Fund’s monthly distributions**** to shareholders change during the 12-month period ended July 31, 2022? |
| A | | The Fund’s monthly distribution rate remained steady for most of the period, and actually saw a slight uptick by period-end. We feel the result is a testament to the Fund’s flexible, go-anywhere investment approach and multi-asset portfolio construction, which we believe distinguishes it from many of its peers, and may potentially provide investors with an effective way to navigate through complex market environments. |
| Q | | Did the Fund have exposure to derivative investments during the 12-month period ended July 31, 2022, and did the derivatives have an effect on the Fund’s benchmark performance? |
| A | | Yes. As we discussed earlier, the Fund had exposure to ELNs and equity-indexed futures contracts during the period. The ELNs aided the Fund’s relative performance, and the futures contracts were a net positive contributor to relative returns for the full reporting period, given the general downdraft in equity prices. |
| Q | | What is your outlook for the coming months? |
| A | | We have become more cautious in our outlook. We believe market volatility is likely to remain high for the foreseeable future as investors navigate through myriad headwinds. The headwinds include persistent inflation, rising interest rates, a slowing global economy, and faltering consumer sentiment. |
We believe inflation has already peaked, and that the Fed is closer to a neutral outlook than the markets currently anticipate. In our opinion, however, the Fed, along with the Bank of England, are in a phase where they need to re-establish credibility after being late to acknowledge the persistent inflation that we have seen over the past several months. That said, we believe central banks focused on tightening monetary policy may stop hiking rates earlier than expected in an effort to avert a severe recession.
**** Distributions are not guaranteed.
8 Pioneer Multi-Asset Income Fund | Annual Report | 7/31/22
We believe inflation will remain high, although it could begin to decelerate, and that financing costs are likely to rise due to higher interest rates, which could contribute to a deteriorating economic outlook. Thus, as we move further into the second half of 2022 and then into calendar-year 2023, we think corporate earnings could come under pressure.
While we are cautious on the current state of the markets, we have remained active in our day-to-day management of the Fund. In the fixed-income area, yields have been rising, and we anticipate trying to take advantage of tactical moves in yields amid the market volatility. With regard to equities, we expect to maintain a defensive positioning in the portfolio, while seeking to identify opportunities offering good relative value. As markets reprice corporate earnings expectations, we anticipate favoring investments in stocks of companies with healthy business models and good pricing power, which could position them to operate effectively in an environment of continued supply constraints, high inflation, and lower economic growth.
Please refer to the Schedule of Investments on pages 21–47 for a full listing of Fund securities.
All investments are subject to risk, including the possible loss of principal. In the past several years, financial markets have experienced increased volatility and heightened uncertainty. The market prices of securities may go up or down, sometimes rapidly or unpredictably, due to general market conditions, such as real or perceived adverse economic, political, or regulatory conditions, recessions, inflation, changes in interest or currency rates, lack of liquidity in the bond markets, the spread of infectious illness or other public health issues, armed conflict including Russia's military invasion of Ukraine, sanctions against Russia, other nations or individuals or companies and possible countermeasures, or adverse investor sentiment. These conditions may continue, recur, worsen or spread.
Pioneer Multi-Asset Income (“MAI”) Fund has the ability to invest in a wide variety of securities and asset classes.
Equity-linked notes (ELNs) may not perform as expected and could cause the fund to realize significant losses including its entire principal investment. Other risks include the risk of counterparty default, liquidity risk and imperfect correlation between ELNs and the underlying securities.
The Fund’s investments, payment obligations and financing terms may be based on floating rates, such as LIBOR (London Interbank Offered Rate), or SOFR (Secured Overnight Financing Rate). Plans are underway to phase out the use of LIBOR. There remains uncertainty regarding the nature of any
Pioneer Multi-Asset Income Fund | Annual Report | 7/31/22 9
replacement rate and the impact of the transition from LIBOR on the Fund, issuers of instruments in which the Fund invests, and financial markets generally.
High yield bonds possess greater price volatility, illiquidity, and possibility of default.
Investments in fixed income securities involve interest rate, credit, inflation, and reinvestment risks. As interest rates rise, the value of fixed income securities falls.
Prepayment risk is the chance that an issuer may exercise its right to prepay its security, if falling interest rates prompt the issuer to do so. Forced to reinvest the unanticipated proceeds at lower interest rates, the Fund would experience a decline in income and lose the opportunity for additional price appreciation.
The Fund may invest in mortgage-backed securities, which during times of fluctuating interest rates may increase or decrease more than other fixed-income securities. Mortgage-backed securities are also subject to pre-payments.
The Fund may invest in subordinated securities which may be disproportionately adversely affected by a default or even a perceived decline in creditworthiness of the issuer.
International investments are subject to special risks including currency fluctuations, social, economic and political uncertainties, which could increase volatility. These risks are magnified in emerging markets.
The Fund may invest in inflation-linked securities. As inflationary expectations increase, inflation-linked securities may become more attractive, because they protect future interest payments against inflation. Conversely, as inflationary concerns decrease, inflation-linked securities will become less attractive and less valuable.
The Fund may invest in insurance-linked securities (ILS). The Fund could lose a portion or all of the principal it has invested in an ILS, and the right to additional interest and/or dividend payments with respect to the security, upon the occurrence of a trigger event that leads to physical or economic loss. ILS may expose the Fund to issuer (credit) default, liquidity, and other risks.
The Fund may invest in floating rate loans. The value of collateral, if any, securing a floating rate loan can decline or may be insufficient to meet the issuer’s obligations or may be difficult to liquidate.
The Fund may invest in underlying funds, including ETFs. In addition to the Fund’s operating expenses, investors will indirectly bear the operating expenses of investments in any underlying funds.
Investments in equity securities are subject to price fluctuation.
Investments in small-and mid-cap stocks involve greater risks and volatility than large-cap stocks.
10 Pioneer Multi-Asset Income Fund | Annual Report | 7/31/22
The Fund may invest in Master Limited Partnerships, which are subject to increased risks of liquidity, price valuation, control, voting rights and taxation.
The Fund may invest in zero coupon bonds and payment in kind securities, which may be more speculative and fluctuate more in value than other fixed income securities. The accrual of income from these securities are payable as taxable annual dividends to shareholders.
The Fund may use derivatives, such as options and futures, which can be illiquid, may disproportionately increase losses, and have a potentially large impact on performance.
The Fund may invest in credit default swaps, a type of derivative, which may in some cases be illiquid, and increases credit risk since the Fund has exposure to both the issuer of the referenced obligation and the counterparty to the credit default swap.
The Fund and some of the underlying funds employ leverage, which increases the volatility of investment returns and subjects the Fund to magnified losses if an underlying Fund’s investments decline in value.
There is no assurance that these and other strategies used by the Fund or underlying funds will be successful. Please see the prospectus for a more complete discussion of the Fund’s risks.
Before investing, consider the product’s investment objectives, risks, charges and expenses. Contact your investment professional or Amundi Asset Management US, Inc., for a prospectus or summary prospectus containing this information. Read it carefully.
Any information in this shareholder report regarding market or economic trends or the factors influencing the Fund’s historical or future performance are statements of opinion as of the date of this report. Past performance is not a guarantee of future results.
Pioneer Multi-Asset Income Fund | Annual Report | 7/31/22 11
Portfolio Summary | 7/31/22

| | | |
| 10 Largest Holdings | |
| (As a percentage of total investments)* | |
| 1. | Pfizer, Inc. | 4.58% |
| 2. | Energy Transfer LP | 3.57 |
| 3. | KB Financial Group, Inc. | 2.73 |
| 4. | Occidental Petroleum Corp. | 2.28 |
| 5. | International Business Machines Corp. | 2.11 |
| 6. | MPLX LP | 1.87 |
| 7. | Lumen Technologies, Inc., 7.65%, 3/15/42 | 1.71 |
| 8. | Hewlett Packard Enterprise Co. | 1.70 |
| 9. | Lumen Technologies, Inc., 7.60%, 9/15/39 | 1.64 |
| 10. | NatWest Group Plc | 1.63 |
| * | | Excludes short term investments and all derivative contracts except for options purchased. The Fund is actively managed, and current holdings may be different. The holdings listed should not be considered recommendations to buy or sell any securities. |
12 Pioneer Multi-Asset Income Fund | Annual Report | 7/31/22
Prices and Distributions | 7/31/22
Net Asset Value per Share
| Class | 7/31/22 | 7/31/21 |
| A | $10.98 | $11.67 |
| C | $10.94 | $11.63 |
| K | $11.28 | $12.02 |
| R | $10.98 | $11.64 |
| Y | $10.94 | $11.63 |
| Distributions per Share: 8/1/21–7/31/22 | |
| |
| | Net Investment | Short-Term | Long-Term |
| Class | Income | Capital Gains | Capital Gains |
| A | $0.6524 | $ — | $ — |
| C | $0.5634 | $ — | $ — |
| K | $0.7037 | $ — | $ — |
| R | $0.5899 | $ — | $ — |
| Y | $0.6742 | $ — | $ — |
Index Definitions
The Bloomberg US Aggregate Bond Index is an unmanaged measure of the US bond market. The MSCI All Country World NR Index is an unmanaged, free float-adjusted, market capitalization-weighted index that is designed to measure the equity market performance of developed and emerging markets. The Index consists of 45 country indices comprising 24 developed and 21 emerging market country indices. Index returns are calculated monthly, assume reinvestment of dividends and, unlike Fund returns, do not reflect any fees, expenses or sales charges. It is not possible to invest directly in an index.
The indices defined here pertains to the “Value of $10,000 Investment” and “Value of $5 Million Investment” charts on pages 14–18.
Pioneer Multi-Asset Income Fund | Annual Report | 7/31/22 13
| Performance Update | 7/31/22 | Class A Shares |
Investment Returns
The mountain chart on the right shows the change in value of a $10,000 investment made in Class A shares of Pioneer Multi-Asset Income Fund at public offering price during the periods shown, compared to that of the Bloomberg US Aggregate Bond Index and the MSCI All Country World NR Index.
| Average Annual Total Returns | |
| (As of July 31, 2022) | | |
| | | | | MSCI |
| | | | Bloomberg | All |
| | Net | Public | US | Country |
| | Asset | Offering | Aggregate | World |
| | Value | Price | Bond | NR |
| Period | (NAV) | (POP) | Index | Index |
| 10 years | 6.46% | 5.97% | 1.65% | 9.35% |
| 5 years | 4.55 | 3.59 | 1.28 | 7.86 |
| 1 year | -0.43 | -4.91 | -9.12 | -10.48 |
| Expense Ratio | |
| (Per prospectus dated December 1, 2021) |
| Gross | Net |
| 0.90% | 0.87% |
Call 1-800-225-6292 or visit www.amundi.com/us for the most recent month-end performance results. Current performance may be lower or higher than the performance data quoted.
The performance data quoted represents past performance, which is no guarantee of future results. Investment return and principal value will fluctuate, and shares, when redeemed, may be worth more or less than their original cost.
NAV results represent the percent change in net asset value per share. NAV returns would have been lower had sales charges been reflected. POP returns reflect deduction of maximum 4.50% sales charge. All results are historical and assume the reinvestment of dividends and capital gains. Other share classes are available for which performance and expenses will differ.
Performance results reflect any applicable expense waivers in effect during the periods shown. Without such waivers Fund performance would be lower. Waivers may not be in effect for all funds. Certain fee waivers are contractual through a specified period. Otherwise, fee waivers can be rescinded at any time. See the prospectus and financial statements for more information.
The net expense ratio reflects the contractual expense limitation currently in effect through December 1, 2022 for Class A shares. There can be no assurance that Amundi US will extend the expense limitation beyond such time. Please see the prospectus for more information. Expense ratios in the financial highlights, unlike those shown in the prospectus, do not reflect acquired fund fees and expenses.
The performance table and graph do not reflect the deduction of fees and taxes that a shareowner would pay on Fund distributions or the redemption of Fund shares.
Please see the financial highlights for more current expense ratios.
14 Pioneer Multi-Asset Income Fund | Annual Report | 7/31/22
| Performance Update | 7/31/22 | Class C Shares |
Investment Returns
The mountain chart on the right shows the change in value of a $10,000 investment made in Class C shares of Pioneer Multi-Asset Income Fund during the periods shown, compared to that of the Bloomberg US Aggregate Bond Index and the MSCI All Country World NR Index.
| Average Annual Total Returns | |
| (As of July 31, 2022) | | |
| | | | | MSCI |
| | | | Bloomberg | All |
| | | | US | Country |
| | | | Aggregate | World |
| | If | If | Bond | NR |
| Period | Held | Redeemed | Index | Index |
| 10 years | 5.58% | 5.58% | 1.65% | 9.35% |
| 5 years | 3.74 | 3.74 | 1.28 | 7.86 |
| 1 year | -1.20 | -2.14 | -9.12 | -10.48 |
| Expense Ratio |
| (Per prospectus dated December 1, 2021) |
| Gross |
| 1.66% |
Call 1-800-225-6292 or visit www.amundi.com/us for the most recent month-end performance results. Current performance may be lower or higher than the performance data quoted.
The performance data quoted represents past performance, which is no guarantee of future results. Investment return and principal value will fluctuate, and shares, when redeemed, may be worth more or less than their original cost.
Class C shares held for less than one year are subject to a 1% contingent deferred sales charge (CDSC). “If Held” results represent the percent change in net asset value per share. “If Redeemed” returns reflect deduction of the CDSC for the one-year period, assuming a complete redemption of shares at the last price calculated on the last business day of the period, and no CDSC for the five-and 10-year periods. All results are historical and assume the reinvestment of dividends and capital gains. Other share classes are available for which performance and expenses will differ.
Performance results reflect any applicable expense waivers in effect during the periods shown. Without such waivers Fund performance would be lower. Waivers may not be in effect for all funds. Certain fee waivers are contractual through a specified period. Otherwise, fee waivers can be rescinded at any time. See the prospectus and financial statements for more information.
Expense ratios in the financial highlights, unlike those shown in the prospectus, do not reflect acquired fund fees and expenses.
The performance table and graph do not reflect the deduction of fees and taxes that a shareowner would pay on Fund distributions or the redemption of Fund shares.
Please see the financial highlights for a more current expense ratio.
Pioneer Multi-Asset Income Fund | Annual Report | 7/31/22 15
| Performance Update | 7/31/22 | Class K Shares |
Investment Returns
The mountain chart on the right shows the change in value of a $5 million investment made in Class K shares of Pioneer Multi-Asset Income Fund during the periods shown, compared to that of the Bloomberg US Aggregate Bond Index and the MSCI All Country World NR Index.
| Average Annual Total Returns | |
| (As of July 31, 2022) | | |
| | | | MSCI |
| | | Bloomberg | All |
| | Net | US | Country |
| | Asset | Aggregate | World |
| | Value | Bond | NR |
| Period | (NAV) | Index | Index |
| 10 years | 6.96% | 1.65% | 9.35% |
| 5 years | 5.13 | 1.28 | 7.86 |
| 1 year | -0.42 | -9.12 | -10.48 |
| Expense Ratio |
| (Per prospectus dated December 1, 2021) |
| Gross |
| 0.59% |
Call 1-800-225-6292 or visit www.amundi.com/us for the most recent month-end performance results. Current performance may be lower or higher than the performance data quoted.
The performance data quoted represents past performance, which is no guarantee of future results. Investment return and principal value will fluctuate, and shares, when redeemed, may be worth more or less than their original cost.
The performance shown for Class K shares for the period prior to the commencement of operations of Class K shares on December 1, 2014, is the net asset value performance of the Fund’s Class A shares, which has not been restated to reflect any differences in expenses, including Rule 12b-1 fees applicable to Class A shares. Since fees for Class A shares generally are higher than those of Class K shares, the performance of Class K shares prior to their inception would have been higher than the performance shown. For the period beginning December 1, 2014, the actual performance of Class K shares is reflected. Class K shares are not subject to sales charges and are available for limited groups of eligible investors, including institutional investors. All results are historical and assume the reinvestment of dividends and capital gains. Other share classes are available for which performance and expenses will differ.
Performance results reflect any applicable expense waivers in effect during the periods shown. Without such waivers Fund performance would be lower. Waivers may not be in effect for all funds. Certain fee waivers are contractual through a specified period. Otherwise, fee waivers can be rescinded at any time. See the prospectus and financial statements for more information.
Expense ratios in the financial highlights, unlike those shown in the prospectus, do not reflect acquired fund fees and expenses.
The performance table and graph do not reflect the deduction of fees and taxes that a shareowner would pay on Fund distributions or the redemption of Fund shares.
Please see the financial highlights for a more current expense ratio.
16 Pioneer Multi-Asset Income Fund | Annual Report | 7/31/22
| Performance Update | 7/31/22 | Class R Shares |
Investment Returns
The mountain chart on the right shows the change in value of a $10,000 investment made in Class R shares of Pioneer Multi-Asset Income Fund during the periods shown, compared to that of the Bloomberg US Aggregate Bond Index and the MSCI All Country World NR Index.
| Average Annual Total Returns | |
| (As of July 31, 2022) | | |
| | | | MSCI |
| | | Bloomberg | All |
| | Net | US | Country |
| | Asset | Aggregate | World |
| | Value | Bond | NR |
| Period | (NAV) | Index | Index |
| 10 years | 6.02% | 1.65% | 9.35% |
| 5 years | 3.85 | 1.28 | 7.86 |
| 1 year | -0.71 | -9.12 | -10.48 |
| Expense Ratio |
| (Per prospectus dated December 1, 2021) |
| Gross |
| 1.82% |

Call 1-800-225-6292 or visit www.amundi.com/us for the most recent month-end performance results. Current performance may be lower or higher than the performance data quoted.
The performance data quoted represents past performance, which is no guarantee of future results. Investment return and principal value will fluctuate, and shares, when redeemed, may be worth more or less than their original cost.
The performance shown for Class R shares for the period prior to the commencement of operations of Class R shares on December 1, 2014, is based on the performance of Class A shares, reduced to reflect the higher distribution and service fees of Class R shares. For the period beginning December 1, 2014, the actual performance of Class R shares is reflected. Class R shares are not subject to sales charges and are available for limited groups of eligible investors, including institutional investors. All results are historical and assume the reinvestment of dividends and capital gains. Other share classes are available for which performance and expenses will differ.
Performance results reflect any applicable expense waivers in effect during the periods shown. Without such waivers Fund performance would be lower. Waivers may not be in effect for all funds. Certain fee waivers are contractual through a specified period. Otherwise, fee waivers can be rescinded at any time. See the prospectus and financial statements for more information.
Expense ratios in the financial highlights, unlike those shown in the prospectus, do not reflect acquired fund fees and expenses.
The performance table and graph do not reflect the deduction of fees and taxes that a shareowner would pay on Fund distributions or the redemption of Fund shares.
Please see the financial highlights for a more current expense ratio.
Pioneer Multi-Asset Income Fund | Annual Report | 7/31/22 17
| Performance Update | 7/31/22 | Class Y Shares |
Investment Returns
The mountain chart on the right shows the change in value of a $5 million investment made in Class Y shares of Pioneer Multi-Asset Income Fund during the periods shown, compared to that of the Bloomberg US Aggregate Bond Index and the MSCI All Country World NR Index.
| Average Annual Total Returns | |
| (As of July 31, 2022) | | |
| | | | MSCI |
| | | Bloomberg | All |
| | Net | US | Country |
| | Asset | Aggregate | World |
| | Value | Bond | NR |
| Period | (NAV) | Index | Index |
| 10 years | 6.63% | 1.65% | 9.35% |
| 5 years | 4.73 | 1.28 | 7.86 |
| 1 year | -0.24 | -9.12 | -10.48 |
| Expense Ratio | |
| (Per prospectus dated December 1, 2021) |
| Gross | Net |
| 0.69% | 0.67% |
Call 1-800-225-6292 or visit www.amundi.com/us for the most recent month-end performance results. Current performance may be lower or higher than the performance data quoted.
The performance data quoted represents past performance, which is no guarantee of future results. Investment return and principal value will fluctuate, and shares, when redeemed, may be worth more or less than their original cost.
Class Y shares are not subject to sales charges and are available for limited groups of eligible investors, including institutional investors. All results are historical and assume the reinvestment of dividends and capital gains. Other share classes are available for which performance and expenses will differ.
Performance results reflect any applicable expense waivers in effect during the periods shown. Without such waivers Fund performance would be lower. Waivers may not be in effect for all funds. Certain fee waivers are contractual through a specified period. Otherwise, fee waivers can be rescinded at any time. See the prospectus and financial statements for more information.
The net expense ratio reflects the contractual expense limitation currently in effect through December 1, 2022 for Class Y shares. There can be no assurance that Amundi US will extend the expense limitation beyond such time. Please see the prospectus for more information. Expense ratios in the financial highlights, unlike those shown in the prospectus, do not reflect acquired fund fees and expenses.
The performance table and graph do not reflect the deduction of fees and taxes that a shareowner would pay on Fund distributions or the redemption of Fund shares.
Please see the financial highlights for more current expense ratios.
18 Pioneer Multi-Asset Income Fund | Annual Report | 7/31/22
Comparing Ongoing Fund Expenses
As a shareowner in the Fund, you incur two types of costs:
| (1) | | ongoing costs, including management fees, distribution and/or service (12b-1) fees, and other Fund expenses; and |
| (2) | | transaction costs, including sales charges (loads) on purchase payments. |
This example is intended to help you understand your ongoing expenses (in dollars) of investing in the Fund and to compare these costs with the ongoing costs of investing in other mutual funds. The example is based on an investment of $1,000 at the beginning of the Fund’s latest six-month period and held throughout the six months.
Using the Tables
Actual Expenses
The first table below provides information about actual account values and actual expenses. You may use the information in this table, together with the amount you invested, to estimate the expenses that you paid over the period as follows:
| (1) | | Divide your account value by $1,000 |
Example: an $8,600 account value ÷ $1,000 = 8.6
| (2) | | Multiply the result in (1) above by the corresponding share class’s number in the third row under the heading entitled “Expenses Paid During Period” to estimate the expenses you paid on your account during this period. |
Expenses Paid on a $1,000 Investment in Pioneer Multi-Asset Income Fund
Based on actual returns from February 1, 2022 through July 31, 2022.
| Share Class | A | C | K | R | Y |
| Beginning Account | $1,000.00 | $1,000.00 | $1,000.00 | $1,000.00 | $1,000.00 |
| Value on 2/1/22 | | | | | |
| Ending Account Value | $949.80 | $945.90 | $949.20 | $948.70 | $950.50 |
| (after expenses) | | | | | |
| on 7/31/22 | | | | | |
| Expenses Paid | $4.11 | $7.77 | $2.66 | $5.70 | $3.14 |
| During Period* | | | | | |
| * | | Expenses are equal to the Fund’s annualized expense ratio of 0.85%, 1.61%, 0.55%, 1.18%, and 0.65% for Class A, Class C, Class K, Class R, and Class Y shares, respectively, multiplied by the average account value over the period, multiplied by 181/365 (to reflect the partial year period). |
Pioneer Multi-Asset Income Fund | Annual Report | 7/31/22 19
Hypothetical Example for Comparison Purposes
The table below provides information about hypothetical account values and hypothetical expenses based on the Fund’s actual expense ratio and an assumed rate of return of 5% per year before expenses, which is not the Fund’s actual return. The hypothetical account values and expenses may not be used to estimate the actual ending account balance or expenses you paid for the period.
You may use this information to compare the ongoing costs of investing in the Fund and other funds. To do so, compare this 5% hypothetical example with the 5% hypothetical examples that appear in the shareholder reports of the other funds.
Please note that the expenses shown in the tables are meant to highlight your ongoing costs only and do not reflect any transaction costs, such as sales charges (loads) that are charged at the time of the transaction. Therefore, the table below is useful in comparing ongoing costs only and will not help you determine the relative total costs of owning different funds. In addition, if these transaction costs were included, your costs would have been higher.
Expenses Paid on a $1,000 Investment in Pioneer Multi-Asset Income Fund
Based on a hypothetical 5% return per year before expenses, reflecting the period from February 1, 2022 through July 31, 2022.
| Share Class | A | C | K | R | Y |
| Beginning Account | $1,000.00 | $1,000.00 | $1,000.00 | $1,000.00 | $1,000.00 |
| Value on 2/1/22 | | | | | |
| Ending Account Value | $1,020.58 | $1,016.81 | $1,022.07 | $1,018.94 | $1,021.57 |
| (after expenses) | | | | | |
| on 7/31/22 | | | | | |
| Expenses Paid | $4.26 | $8.05 | $2.76 | $5.91 | $3.26 |
| During Period* | | | | | |
| * | | Expenses are equal to the Fund’s annualized expense ratio of 0.85%, 1.61%, 0.55%, 1.18%, and 0.65% for Class A, Class C, Class K, Class R, and Class Y shares, respectively, multiplied by the average account value over the period, multiplied by 181/365 (to reflect the partial year period). |
20 Pioneer Multi-Asset Income Fund | Annual Report | 7/31/22
Schedule of Investments | 7/31/22
| Principal | | |
| Amount | | |
| USD ($) | | Value |
| | UNAFFILIATED ISSUERS — 99.6% | |
| | SENIOR SECURED FLOATING RATE LOAN |
| | INTERESTS — 1.7% of Net Assets*(a) | |
| | Advanced Materials — 0.0%† | |
| 990,000 | Groupe Solmax, Inc., Initial Term Loan, 7.00% (LIBOR + | |
| | 475 bps), 5/29/28 | $ 851,400 |
| | Total Advanced Materials | $ 851,400 |
| | Advertising Sales — 0.1% | |
| 1,974,619 | Clear Channel Outdoor Holdings, Inc., Term B Loan, | |
| | 5.872% (LIBOR + 350 bps), 8/21/26 | $ 1,806,654 |
| | Total Advertising Sales | $ 1,806,654 |
| | Aerospace & Defense — 0.1% | |
| 937,500 | ADS Tactical, Inc., Initial Term Loan, 7.912% (LIBOR + | |
| | 575 bps), 3/19/26 | $ 871,875 |
| | Total Aerospace & Defense | $ 871,875 |
| | Auto Parts & Equipment — 0.1% | |
| 987,500 | First Brands Group LLC, First Lien 2021 Term Loan, | |
| | 8.368% (Term SOFR + 500 bps), 3/30/27 | $ 944,791 |
| 1,000,000 | Superior Industries International, Inc., Replacement Term | |
| | Loan, 6.372% (LIBOR + 400 bps), 5/22/24 | 975,000 |
| | Total Auto Parts & Equipment | $ 1,919,791 |
| | Building & Construction Products — 0.1% | |
| 1,975,393 | CP Atlas Buyer, Inc., Term B Loan, 6.122% (LIBOR + | |
| | 375 bps), 11/23/27 | $ 1,742,358 |
| | Total Building & Construction Products | $ 1,742,358 |
| | Building-Heavy Construction — 0.0%† | |
| 990,000 | Artera Services LLC, First Lien Tranche B Term Loan, 5.75% | |
| | (LIBOR + 350 bps), 3/6/25 | $ 792,990 |
| | Total Building-Heavy Construction | $ 792,990 |
| | Building-Maintenance & Service — 0.0%† | |
| 496,250 | ArchKey Holdings, Inc., First Lien Initial Term Loan, 8.056% | |
| | (LIBOR + 525 bps), 6/29/28 | $ 473,919 |
| | Total Building-Maintenance & Service | $ 473,919 |
| | Casino Services — 0.0%† | |
| 487,387 | Lucky Bucks LLC, Initial Term Loan, 8.306% (LIBOR + | |
| | 550 bps), 7/30/27 | $ 429,713 |
| | Total Casino Services | $ 429,713 |
| | Chemicals-Diversified — 0.1% | |
| 990,000 | Schweitzer-Mauduit International, Inc., Term B Loan, | |
| | 6.125% (LIBOR + 375 bps), 4/20/28 | $ 940,500 |
| | Total Chemicals-Diversified | $ 940,500 |
The accompanying notes are an integral part of these financial statements.
Pioneer Multi-Asset Income Fund | Annual Report | 7/31/22 21
Schedule of Investments | 7/31/22 (continued)
| Principal | | |
| Amount | | |
| USD ($) | | Value |
| | Chemicals-Specialty — 0.1% | |
| 987,500 | CPC Acquisition Corp., First Lien Initial Term Loan, 6.00% | |
| | (LIBOR + 375 bps), 12/29/27 | $ 862,211 |
| | Total Chemicals-Specialty | $ 862,211 |
| | Commercial Services — 0.0%† | |
| 992,500 | CoreLogic, Inc. (fka First American Corporation), First Lien | |
| | Initial Term Loan, 5.875% (LIBOR + | |
| | 350 bps), 6/2/28 | $ 848,587 |
| | Total Commercial Services | $ 848,587 |
| | Computers-Integrated Systems — 0.1% | |
| 1,480,769 | VeriFone Systems, Inc., First Lien Initial Term Loan, | |
| | 5.524% (LIBOR + 400 bps), 8/20/25 | $ 1,366,935 |
| | Total Computers-Integrated Systems | $ 1,366,935 |
| | Diagnostic Equipment — 0.0%† | |
| 495,000 | Curia Global, Inc., First Lien 2021 Term Loan, 6.556% | |
| | (LIBOR + 375 bps), 8/30/26 | $ 479,338 |
| | Total Diagnostic Equipment | $ 479,338 |
| | Dialysis Centers — 0.0%† | |
| 987,310 | US Renal Care, Inc., Initial Term Loan, 6.688% (LIBOR + | |
| | 500 bps), 6/26/26 | $ 712,979 |
| | Total Dialysis Centers | $ 712,979 |
| | Distribution & Wholesale — 0.1% | |
| 1,974,227 | Patriot Container Corp. (aka Wastequip), First Lien | |
| | Closing Date Term Loan, 6.122% (LIBOR + | |
| | 375 bps), 3/20/25 | $ 1,658,350 |
| | Total Distribution & Wholesale | $ 1,658,350 |
| | Electric-Generation — 0.0%† | |
| 646,948 | Eastern Power, LLC (Eastern Covert Midco, LLC), | |
| | Term Loan, 6.00% (LIBOR + 375 bps), 10/2/25 | $ 540,201 |
| | Total Electric-Generation | $ 540,201 |
| | Electronic Composition — 0.1% | |
| 989,305 | Energy Acquisition LP, First Lien Initial Term Loan, 6.622% | |
| | (LIBOR + 425 bps), 6/26/25 | $ 915,107 |
| | Total Electronic Composition | $ 915,107 |
| | Engines — 0.0%† | |
| 496,250 | Arcline FM Holdings, LLC, First Lien Initial Term Loan, | |
| | 7.627% (LIBOR + 475 bps), 6/23/28 | $ 477,641 |
| | Total Engines | $ 477,641 |
| | Fiduciary Banks — 0.1% | |
| 1,492,509 | Mercury Borrower, Inc., First Line Initial Term Loan, | |
| | 5.813% (LIBOR + 350 bps), 8/2/28 | $ 1,429,078 |
| | Total Fiduciary Banks | $ 1,429,078 |
The accompanying notes are an integral part of these financial statements.
22 Pioneer Multi-Asset Income Fund | Annual Report | 7/31/22
| Principal | | |
| Amount | | |
| USD ($) | | Value |
| | Investment Management & Advisory Services — 0.1% |
| 1,487,415 | Russell Investments US Institutional Holdco, Inc., 2025 | |
| | Term Loan, 5.00% (LIBOR + 350 bps), 5/30/25 | $ 1,403,747 |
| | Total Investment Management & Advisory Services | $ 1,403,747 |
| | Machinery — 0.1% | |
| 995,000 | Engineered Components & Systems LLC, First Lien | |
| | Initial Term Loan, 7.872% (LIBOR + 600 bps), 8/2/28 | $ 910,425 |
| | Total Machinery | $ 910,425 |
| | Medical-Biomedical & Generation — 0.1% | |
| 1,243,750 | ANI Pharmaceuticals, Inc., Initial Term Loan, 8.372% | |
| | (LIBOR + 600 bps), 11/19/27 | $ 1,183,117 |
| | Total Medical-Biomedical & Generation | $ 1,183,117 |
| | Medical-Drugs — 0.1% | |
| 987,310 | Curium BidCo S.a.r.l., Facility B, 6.00% (LIBOR + | |
| | 375 bps), 7/9/26 | $ 962,627 |
| | Total Medical-Drugs | $ 962,627 |
| | Protection-Safety — 0.0%† | |
| 496,250 | APX Group, Inc., Initial Term Loan, 5.656% (LIBOR + | $ 467,948 |
| | 350 bps), 7/10/28 | |
| | Total Protection-Safety | $ 467,948 |
| | Retail — 0.1% | |
| 990,000 | SRS Distribution, Inc., 2021 Refinancing Term Loan, | |
| | 6.306% (LIBOR + 350 bps), 6/2/28 | $ 945,759 |
| 663,163 | Staples, Inc., 2019 Refinancing New Term B-2 Loan, | |
| | 5.786% (LIBOR + 450 bps), 9/12/24 | 615,222 |
| 481,250 | Torrid LLC, Closing Date Term Loan, 6.739% (LIBOR + | |
| | 550 bps), 6/14/28 | 457,187 |
| | Total Retail | $ 2,018,168 |
| | Theaters — 0.0%† | |
| 987,245 | AMC Entertainment Holdings, Inc. (fka AMC Entertainment, | |
| | Inc.), Term B-1 Loan, 4.872% (LIBOR + | |
| | 300 bps), 4/22/26 | $ 856,435 |
| | Total Theaters | $ 856,435 |
| | Transactional Software — 0.1% | |
| 1,488,750 | Polaris Newco, LLC, First Lien Dollar Term Loan, 6.372% | |
| | (LIBOR + 400 bps), 6/2/28 | $ 1,418,593 |
| | Total Transactional Software | $ 1,418,593 |
| | Transport-Equipment & Leasing — 0.1% | |
| 987,113 | IBC Capital I, Ltd., First Lien Tranche B-1 Term Loan, 5.78% | |
| | (LIBOR + 375 bps), 9/11/23 | $ 892,721 |
| | Total Transport-Equipment & Leasing | $ 892,721 |
| | TOTAL SENIOR SECURED FLOATING RATE | |
| | LOAN INTERESTS | |
| | (Cost $31,911,608) | $ 29,233,408 |
The accompanying notes are an integral part of these financial statements.
Pioneer Multi-Asset Income Fund | Annual Report | 7/31/22 23
Schedule of Investments | 7/31/22 (continued)
| Shares | | Value |
| | COMMON STOCKS — 53.6% of Net Assets | |
| | Aerospace & Defense — 0.9% | |
| 628,457 | Hensoldt AG | $ 16,057,862 |
| | Total Aerospace & Defense | $ 16,057,862 |
| | Air Freight & Logistics — 1.2% | |
| 431,634 | Cia de Distribucion Integral Logista Holdings S.A. | $ 8,884,792 |
| 65,140 | United Parcel Service, Inc., Class B | 12,695,134 |
| | Total Air Freight & Logistics | $ 21,579,926 |
| | Automobiles — 2.2% | |
| 1,390,604 | Stellantis NV | $ 19,786,877 |
| 1,060,100 | Subaru Corp. | 18,419,585 |
| | Total Automobiles | $ 38,206,462 |
| | Banks — 8.9% | |
| 1,774,785 | ABN AMRO Bank NV (144A) | $ 18,102,912 |
| 11,838,000 | Bank of China, Ltd., Class H | 4,207,445 |
| 120,228 | BNP Paribas S.A. | 5,652,435 |
| 299,640 | Grupo Financiero Banorte S.A.B de CV, Class O | 1,704,900 |
| 456,491 | Hana Financial Group, Inc. | 13,071,715 |
| 1,277,870 | KB Financial Group, Inc. | 47,658,226 |
| 1,635,600 | Mitsubishi UFJ Financial Group, Inc. | 9,142,679 |
| 9,383,177 | NatWest Group Plc | 28,407,107 |
| 166,500 | Sumitomo Mitsui Trust Holdings, Inc. | 5,446,367 |
| 484,866 | UniCredit S.p.A. | 4,747,439 |
| 425,076 | Wells Fargo & Co. | 18,648,084 |
| | Total Banks | $ 156,789,309 |
| | Biotechnology — 1.4% | |
| 168,475 | AbbVie, Inc. | $ 24,177,847 |
| | Total Biotechnology | $ 24,177,847 |
| | Capital Markets — 0.6% | |
| 142,584 | Brightsphere Investment Group, Inc. | $ 2,696,264 |
| 44,463 | Euronext NV (144A) | 3,611,842 |
| 67,819 | Lazard, Ltd., Class A | 2,554,742 |
| 98,712 | UBS Group AG | 1,605,878 |
| | Total Capital Markets | $ 10,468,726 |
| | Chemicals — 0.3% | |
| 1,752,813 | Chevron Lubricants Lanka Plc | $ 380,018 |
| 47,087 | LyondellBasell Industries NV, Class A | 4,196,393 |
| | Total Chemicals | $ 4,576,411 |
| | Communications Equipment — 0.3% | |
| 118,056 | Cisco Systems, Inc. | $ 5,356,201 |
| | Total Communications Equipment | $ 5,356,201 |
The accompanying notes are an integral part of these financial statements.
24 Pioneer Multi-Asset Income Fund | Annual Report | 7/31/22
| Shares | | Value |
| | Construction & Engineering — 0.4% | |
| 17,074,500 | Sinopec Engineering Group Co., Ltd., Class H | $ 7,330,165 |
| | Total Construction & Engineering | $ 7,330,165 |
| | Diversified Telecommunication Services — 1.2% | |
| 717,768 | Deutsche Telekom AG | $ 13,575,905 |
| 24,180,500 | Telkom Indonesia Persero Tbk PT | 6,895,905 |
| | Total Diversified Telecommunication Services | $ 20,471,810 |
| | Electric Utilities — 0.6% | |
| 249,967 | FirstEnergy Corp. | $ 10,273,644 |
| | Total Electric Utilities | $ 10,273,644 |
| | Electrical Equipment — 0.1% | |
| 204,500 | Mitsubishi Electric Corp. | $ 2,153,116 |
| | Total Electrical Equipment | $ 2,153,116 |
| | Electronic Equipment, Instruments & Components — 0.7% | |
| 303,286 | National Instruments Corp. | $ 11,524,868 |
| | Total Electronic Equipment, Instruments & Components | $ 11,524,868 |
| | Entertainment — 0.3% | |
| 67,733 | Activision Blizzard, Inc. | $ 5,415,253 |
| | Total Entertainment | $ 5,415,253 |
| | Food & Staples Retailing — 0.0%† | |
| 195,032+^# | Magnit PJSC | $ 764,338 |
| 48,325+^# | X5 Retail Group NV (G.D.R.) | 29,164 |
| | Total Food & Staples Retailing | $ 793,502 |
| | Food Products — 0.4% | |
| 326,210 | Associated British Foods Plc | $ 6,642,163 |
| | Total Food Products | $ 6,642,163 |
| | Health Care Providers & Services — 1.9% | |
| 429,647 | Cardinal Health, Inc. | $ 25,589,775 |
| 30,225 | Cigna Corp. | 8,322,756 |
| | Total Health Care Providers & Services | $ 33,912,531 |
| | Hotels, Restaurants & Leisure — 0.2% | |
| 84,674(b) | Las Vegas Sands Corp. | $ 3,191,363 |
| | Total Hotels, Restaurants & Leisure | $ 3,191,363 |
| | Household Durables — 0.4% | |
| 335,573 | Persimmon Plc | $ 7,699,169 |
| | Total Household Durables | $ 7,699,169 |
The accompanying notes are an integral part of these financial statements.
Pioneer Multi-Asset Income Fund | Annual Report | 7/31/22 25
Schedule of Investments | 7/31/22 (continued)
| Shares | | Value |
| | Insurance — 1.8% | |
| 17,736 | Allianz SE | $ 3,214,294 |
| 149,572 | Hartford Financial Services Group, Inc. | 9,642,907 |
| 34,799 | NN Group NV | 1,624,669 |
| 13,025 | Old Republic International Corp. | 303,092 |
| 484,500 | Ping An Insurance Group Co. of China, Ltd., Class H | 2,851,488 |
| 144,800 | Power Corp. of Canada | 3,935,059 |
| 34,839 | Willis Towers Watson Plc | 7,209,583 |
| 7,547 | Zurich Insurance Group AG | 3,289,647 |
| | Total Insurance | $ 32,070,739 |
| | Internet & Direct Marketing Retail — 1.0% | |
| 1,120,000(b) | Alibaba Group Holding, Ltd. | $ 13,283,226 |
| 89,455 | eBay, Inc. | 4,350,197 |
| | Total Internet & Direct Marketing Retail | $ 17,633,423 |
| | IT Services — 2.1% | |
| 280,800 | International Business Machines Corp. | $ 36,725,832 |
| | Total IT Services | $ 36,725,832 |
| | Leisure Products — 0.1% | |
| 5,134,000 | Honma Golf, Ltd. (144A) | $ 2,197,511 |
| | Total Leisure Products | $ 2,197,511 |
| | Machinery — 0.3% | |
| 218,000 | Komatsu, Ltd. | $ 4,919,100 |
| | Total Machinery | $ 4,919,100 |
| | Media — 0.2% | |
| 142,152 | Atresmedia Corp. de Medios de Comunicacion S.A. | $ 435,860 |
| 166,130 | Telenet Group Holding NV | 2,650,471 |
| | Total Media | $ 3,086,331 |
| | Metals & Mining — 0.8% | |
| 89,980 | Rio Tinto Plc | $ 5,396,151 |
| 317,806 | Royal Bafokeng Platinum, Ltd. | 2,868,285 |
| 195,396 | Teck Resources, Ltd., Class B | 5,742,689 |
| | Total Metals & Mining | $ 14,007,125 |
| | Mortgage Real Estate Investment Trusts (REITs) — 2.0% | |
| 628,406 | AGNC Investment Corp. | $ 7,924,200 |
| 259,916 | Angel Oak Mortgage, Inc. | 3,677,811 |
| 52,118 | Great Ajax Corp. | 574,340 |
| 561,217 | Ladder Capital Corp. | 6,667,258 |
| 961,952 | New Residential Investment Corp. | 10,494,896 |
| 1,241,431 | Two Harbors Investment Corp. | 6,678,899 |
| | Total Mortgage Real Estate Investment Trusts (REITs) | $ 36,017,404 |
The accompanying notes are an integral part of these financial statements.
26 Pioneer Multi-Asset Income Fund | Annual Report | 7/31/22
| Shares | | Value |
| | Oil, Gas & Consumable Fuels — 15.4% | |
| 1,341,028 | BW LPG, Ltd. (144A) | $ 11,030,587 |
| 289,027(b) | Comstock Resources, Inc. | 4,604,200 |
| 409,911 | Coterra Energy, Inc. | 12,539,177 |
| 5,493,976 | Energy Transfer LP | 62,136,869 |
| 612,354 | EQT Corp. | 26,961,947 |
| 47,954+^# | Lukoil PJSC | 149,032 |
| 49,022 | Magellan Midstream Partners LP | 2,524,633 |
| 674,728 | Marathon Oil Corp. | 16,733,254 |
| 1,000,401 | MPLX LP | 32,523,037 |
| 603,083 | Occidental Petroleum Corp. | 39,652,707 |
| 111,975 | Ovintiv, Inc. | 5,720,803 |
| 573,131 | PBF Logistics LP | 10,677,431 |
| 18,894 | Pioneer Natural Resources Co. | 4,476,933 |
| 338,952(b) | Range Resources Corp. | 11,209,143 |
| 1,271,403+^# | Rosneft Oil Co. PJSC | 359,764 |
| 202,020 | Shell Midstream Partners LP | 3,242,421 |
| 510,196 | Shell Plc (A.D.R.) | 27,234,262 |
| | Total Oil, Gas & Consumable Fuels | $ 271,776,200 |
| | Pharmaceuticals — 4.5% | |
| 1,581,410 | Pfizer, Inc. | $ 79,877,019 |
| | Total Pharmaceuticals | $ 79,877,019 |
| | Semiconductors & Semiconductor Equipment — 0.8% |
| 83,239 | Micron Technology, Inc. | $ 5,149,165 |
| 70,951 | MKS Instruments, Inc. | 8,386,408 |
| 21,100 | Ulvac, Inc. | 791,151 |
| | Total Semiconductors & Semiconductor Equipment | $ 14,326,724 |
| | Technology Hardware, Storage & Peripherals — 1.9% |
| 339,000 | Asustek Computer, Inc. | $ 3,187,218 |
| 2,075,481 | Hewlett Packard Enterprise Co. | 29,554,850 |
| | Total Technology Hardware, Storage & Peripherals | $ 32,742,068 |
| | Textiles, Apparel & Luxury Goods — 0.6% | |
| 314,180 | Tapestry, Inc. | $ 10,565,873 |
| | Total Textiles, Apparel & Luxury Goods | $ 10,565,873 |
| | Trading Companies & Distributors — 0.1% | |
| 52,100 | Inaba Denki Sangyo Co., Ltd. | $ 1,081,852 |
| | Total Trading Companies & Distributors | $ 1,081,852 |
| | TOTAL COMMON STOCKS | |
| | (Cost $919,182,955) | $ 943,647,529 |
The accompanying notes are an integral part of these financial statements.
Pioneer Multi-Asset Income Fund | Annual Report | 7/31/22 27
Schedule of Investments | 7/31/22 (continued)
| Principal | | |
| Amount | | |
| USD ($) | | Value |
| | ASSET BACKED SECURITIES — 1.9% of Net Assets | |
| 2,000,000 | ACC Auto Trust, Series 2022-A, Class D, 10.07%, | |
| | 3/15/29 (144A) | $ 1,985,559 |
| 2,000,000 | ACM Auto Trust, Series 2022-1A, Class D, 8.58%, | |
| | 4/20/29 (144A) | 1,977,996 |
| 1,150,000 | American Credit Acceptance Receivables Trust, Series | |
| | 2021-3, Class F, 3.64%, 5/15/28 (144A) | 1,069,248 |
| 575,000 | AMSR Trust, Series 2020-SFR2, Class G, 4.00%, | |
| | 7/17/37 (144A) | 541,333 |
| 3,200,000(a) | CAL Receivables LLC, Series 2022-1, Class B, 5.767% | |
| | (SOFR30A + 435 bps), 10/15/26 (144A) | 3,047,763 |
| 852,000 | Crossroads Asset Trust, Series 2021-A, Class E, 5.48%, | |
| | 1/20/28 (144A) | 805,789 |
| 4,517,000(c) | Finance of America HECM Buyout, Series 2022-HB1, | |
| | Class M5, 7.87%, 2/25/32 (144A) | 4,342,736 |
| 700,000(a) | GRACIE POINT INTERNATIONAL FUNDING, Series | |
| | 2022-1A, Class E, 6.814% (SOFR30A + 575 bps), | |
| | 4/1/24 (144A) | 697,900 |
| 2,400,000 | JPMorgan Chase Bank NA - CACLN, Series 2021-2, | |
| | Class G, 8.482%, 12/26/28 (144A) | 2,277,271 |
| 2,000,000 | LL ABS Trust, Series 2022-1A, Class D, 7.83%, | |
| | 11/15/29 (144A) | 1,965,433 |
| 1,664,000 | Octane Receivables Trust 2022-1, Series 2022-1A, | |
| | Class E, 7.33%, 12/20/29 (144A) | 1,635,044 |
| 500,000 | Rosy Blue Carat SA, Series 2018-1, Class A1, 6.25%, | |
| | 12/15/25 (144A) | 500,000 |
| 1,200,000 | Santander Bank Auto Credit-Linked Notes, Series 2022-A, | |
| | Class E, 12.662%, 5/15/32 (144A) | 1,192,409 |
| 1,300,000 | Santander Bank Auto Credit-Linked Notes Series, Series | |
| | 2022-A, Class D, 9.965%, 5/15/32 (144A) | 1,289,608 |
| 2,550,000 | Santander Bank N.A. - SBCLN, Series 2021-1A, Class E, | |
| | 6.171%, 12/15/31 (144A) | 2,321,219 |
| 4,500,000 | SCF Equipment Leasing LLC, Series 2022-1A, Class F, | |
| | 6.00%, 7/20/32 (144A) | 4,068,059 |
| 800,000(a) | STAR, Series 2021-SFR1, Class H, 6.606% (1 Month USD | |
| | LIBOR + 445 bps), 4/17/38 (144A) | 782,992 |
| 2,500,000 | Tricolor Auto Securitization Trust, Series 2022-1A, | |
| | Class F, 9.80%, 7/16/29 (144A) | 2,461,708 |
| | TOTAL ASSET BACKED SECURITIES | |
| | (Cost $34,042,063) | $ 32,962,067 |
| | COLLATERALIZED MORTGAGE OBLIGATIONS — |
| | 4.0% of Net Assets | |
| 290,000(a) | Bellemeade Re, Ltd., Series 2020-3A, Class B1, 8.609% | |
| | (1 Month USD LIBOR + 635 bps), 10/25/30 (144A) | $ 283,926 |
| 2,100,000(a) | Bellemeade Re, Ltd., Series 2020-3A, Class M2, 7.109% | |
| | (1 Month USD LIBOR + 485 bps), 10/25/30 (144A) | 2,082,180 |
| 2,400,000(a) | Bellemeade Re, Ltd., Series 2022-1, Class B1, 7.014% | |
| | (SOFR30A + 550 bps), 1/26/32 (144A) | 2,173,186 |
The accompanying notes are an integral part of these financial statements.
28 Pioneer Multi-Asset Income Fund | Annual Report | 7/31/22
| Principal | | |
| Amount | | |
| USD ($) | | Value |
| | COLLATERALIZED MORTGAGE | |
| | OBLIGATIONS — (continued) | |
| 1,900,000(c) | CFMT LLC, Series 2020-HB4, Class M4, 4.948%, | |
| | 12/26/30 (144A) | $ 1,845,671 |
| 1,270,000(c) | CFMT LLC, Series 2020-HB4, Class M5, 6.00%, | |
| | 12/26/30 (144A) | 1,236,721 |
| 1,250,000(c) | CFMT LLC, Series 2021-HB5, Class M4, 5.683%, | |
| | 2/25/31 (144A) | 1,168,384 |
| 4,100,000(a) | Connecticut Avenue Securities Trust, Series 2019-HRP1, | |
| | Class B1, 11.509% (1 Month USD LIBOR + 925 bps), |
| | 11/25/39 (144A) | 4,061,591 |
| 2,860,000(a) | Connecticut Avenue Securities Trust, Series 2021-R01, | |
| | Class 1B2, 7.514% (SOFR30A + | |
| | 600 bps), 10/25/41 (144A) | 2,523,643 |
| 2,660,000(a) | Connecticut Avenue Securities Trust, Series 2022-R01, | |
| | Class 1B2, 7.514% (SOFR30A + | |
| | 600 bps), 12/25/41 (144A) | 2,331,810 |
| 2,700,000(a) | Eagle Re, Ltd., Series 2019-1, Class B1, 6.759% (1 Month | |
| | USD LIBOR + 450 bps), 4/25/29 (144A) | 2,594,834 |
| 4,430,000(a) | Eagle Re, Ltd., Series 2020-2, Class B1, 9.259% (1 Month | |
| | USD LIBOR + 700 bps), 10/25/30 (144A) | 4,467,671 |
| 909,996(a) | Eagle Re, Ltd., Series 2020-2, Class M2, 7.859% (1 Month | |
| | USD LIBOR + 560 bps), 10/25/30 (144A) | 909,992 |
| 2,900,000(a) | Eagle RE, Ltd., Series 2021-1, Class M2, 5.964% | |
| | (SOFR30A + 445 bps), 10/25/33 (144A) | 2,793,441 |
| 970,000(a) | Fannie Mae Connecticut Avenue Securities, Series | |
| | 2021-R02, Class 2B2, 7.714% (SOFR30A + 620 bps), |
| | 11/25/41 (144A) | 829,985 |
| 1,265,190(a) | Freddie Mac Stacr Remic Trust, Series 2020-DNA3, | |
| | Class B1, 7.359% (1 Month USD LIBOR + | |
| | 510 bps), 6/25/50 (144A) | 1,315,326 |
| 1,100,000(a) | Freddie Mac Stacr Remic Trust, Series 2020-DNA3, | |
| | Class B2, 11.609% (1 Month USD LIBOR + | |
| | 935 bps), 6/25/50 (144A) | 1,259,770 |
| 1,065,000(a) | Freddie Mac Stacr Remic Trust, Series 2020-DNA5, | |
| | Class B1, 6.314% (SOFR30A + | |
| | 480 bps), 10/25/50 (144A) | 1,090,531 |
| 2,300,000(a) | Freddie Mac Stacr Remic Trust, Series 2020-DNA5, | |
| | Class B2, 13.014% (SOFR30A + | |
| | 1,150 bps), 10/25/50 (144A) | 2,726,845 |
| 850,000(a) | Freddie Mac Stacr Remic Trust, Series 2020-DNA6, | |
| | Class B1, 4.514% (SOFR30A + | |
| | 300 bps), 12/25/50 (144A) | 782,085 |
| 2,675,000(a) | Freddie Mac Stacr Remic Trust, Series 2020-DNA6, | |
| | Class B2, 7.164% (SOFR30A + | |
| | 565 bps), 12/25/50 (144A) | 2,321,724 |
| 2,765,000(a) | Freddie Mac Stacr Remic Trust, Series 2021-DNA1, | |
| | Class B2, 6.264% (SOFR30A + | |
| | 475 bps), 1/25/51 (144A) | 2,202,273 |
The accompanying notes are an integral part of these financial statements.
Pioneer Multi-Asset Income Fund | Annual Report | 7/31/22 29
Schedule of Investments | 7/31/22 (continued)
| Principal | | |
| Amount | | |
| USD ($) | | Value |
| | COLLATERALIZED MORTGAGE | |
| | OBLIGATIONS — (continued) | |
| 2,170,000(a) | Freddie Mac Stacr Remic Trust, Series 2021-DNA3, | |
| | Class B2, 7.764% (SOFR30A + 625 bps), | |
| | 10/25/33 (144A) | $ 1,880,864 |
| 3,530,000(a) | Freddie Mac Stacr Remic Trust, Series 2021-DNA5, | |
| | Class B2, 7.014% (SOFR30A + 550 bps), | |
| | 1/25/34 (144A) | 2,824,259 |
| 3,480,000(a) | Freddie Mac Stacr Remic Trust, Series 2021-DNA7, | |
| | Class B2, 9.314% (SOFR30A + 780 bps), | |
| | 11/25/41 (144A) | 2,944,309 |
| 2,910,000(a) | Freddie Mac Stacr Remic Trust, Series 2021-HQA1, | |
| | Class B2, 6.514% (SOFR30A + 500 bps), | |
| | 8/25/33 (144A) | 2,306,250 |
| 1,970,000(a) | Freddie Mac Stacr Remic Trust, Series 2021-HQA3, | |
| | Class B2, 7.764% (SOFR30A + 625 bps), | |
| | 9/25/41 (144A) | 1,651,767 |
| 3,450,000(a) | Freddie Mac Stacr Remic Trust, Series 2022-DNA1, | |
| | Class B2, 8.614% (SOFR30A + 710 bps), | |
| | 1/25/42 (144A) | 2,891,869 |
| 2,650,000(a) | Freddie Mac Stacr Remic Trust, Series 2022-DNA2, | |
| | Class B2, 10.014% (SOFR30A + 850 bps), | |
| | 2/25/42 (144A) | 2,361,310 |
| 996,187(a) | Freddie Mac Structured Agency Credit Risk Debt Notes, | |
| | Series 2015-HQ1, Class B, 13.009% (1 Month USD | |
| | LIBOR + 1,075 bps), 3/25/25 | 1,004,034 |
| 1,900,000(a) | Freddie Mac Structured Agency Credit Risk Debt Notes, | |
| | Series 2020-HQA5, Class B2, 8.914% (SOFR30A + | |
| | 740 bps), 11/25/50 (144A) | 1,829,809 |
| 795,000(a) | Freddie Mac Structured Agency Credit Risk Debt Notes, | |
| | Series 2021-DNA2, Class B2, 7.514% (SOFR30A + | |
| | 600 bps), 8/25/33 (144A) | 687,060 |
| 16,065 | Global Mortgage Securitization, Ltd., Series 2004-A, | |
| | Class B1, 5.25%, 11/25/32 (144A) | 11,430 |
| 176,418 | Global Mortgage Securitization, Ltd., Series 2004-A, | |
| | Class B2, 5.25%, 11/25/32 (144A) | 1,392 |
| 430,000(a) | Home Re, Ltd., Series 2020-1, Class B1, 9.259% (1 Month | |
| | USD LIBOR + 700 bps), 10/25/30 (144A) | 432,246 |
| 1,690,000(a) | Home Re, Ltd., Series 2020-1, Class M2, 7.509% (1 Month | |
| | USD LIBOR + 525 bps), 10/25/30 (144A) | 1,704,446 |
| 3,170,000(a) | Home Re, Ltd., Series 2021-2, Class B1, 5.664% | |
| | (SOFR30A + 415 bps), 1/25/34 (144A) | 2,829,964 |
| 1,550,000(a) | Oaktown Re V, Ltd., Series 2020-2A, Class M2, 7.509% | |
| | (1 Month USD LIBOR + 525 bps), 10/25/30 (144A) | 1,568,771 |
| 1,800,000(c) | RMF Buyout Issuance Trust, Series 2022-HB1, Class M5, | |
| | 4.50%, 4/25/32 (144A) | 1,422,000 |
| 400,000(a) | Triangle Re, Ltd., Series 2020-1, Class B1, 10.009% | |
| | (1 Month USD LIBOR + 775 bps), 10/25/30 (144A) | 402,975 |
| 310,000(c) | Verus Securitization Trust, Series 2020-INV1, Class B1, | |
| | 5.75%, 3/25/60 (144A) | 302,189 |
The accompanying notes are an integral part of these financial statements.
30 Pioneer Multi-Asset Income Fund | Annual Report | 7/31/22
| Principal | | |
| Amount | | |
| USD ($) | | Value |
| | COLLATERALIZED MORTGAGE | |
| | OBLIGATIONS — (continued) | |
| 430,000(c) | Verus Securitization Trust, Series 2020-INV1, Class B2, | |
| | 6.00%, 3/25/60 (144A) | $ 415,954 |
| | TOTAL COLLATERALIZED MORTGAGE OBLIGATIONS |
| | (Cost $75,927,018) | $ 70,474,487 |
| | COMMERCIAL MORTGAGE-BACKED SECURITIES — | |
| | 0.4% of Net Assets | |
| 275,000(a) | Freddie Mac Multifamily Structured Credit Risk, Series | |
| | 2021-MN1, Class B1, 9.264% (SOFR30A + | |
| | 775 bps), 1/25/51 (144A) | $ 268,177 |
| 4,201,881(a) | Freddie Mac Multifamily Structured Credit Risk, Series | |
| | 2021-MN3, Class M1, 3.814% (SOFR30A + | |
| | 230 bps), 11/25/51 (144A) | 3,874,464 |
| 2,500,000(a) | Multifamily Connecticut Avenue Securities Trust, Series | |
| | 2020-01, Class M10, 6.009% (1 Month USD LIBOR + |
| | 375 bps), 3/25/50 (144A) | 2,312,500 |
| 58,665(c) | Sutherland Commercial Mortgage Loans, Series | |
| | 2017-SBC6, Class A, 3.192%, 5/25/37 (144A) | 58,499 |
| | TOTAL COMMERCIAL MORTGAGE-BACKED SECURITIES | |
| | (Cost $6,592,284) | $ 6,513,640 |
| | CONVERTIBLE CORPORATE BONDS — 0.2% of |
| | Net Assets | |
| | REITs — 0.2% | |
| 3,887,100 | Redwood Trust, Inc., 7.75%, 6/15/27 (144A) | $ 3,576,132 |
| | Total REITs | $ 3,576,132 |
| | TOTAL CONVERTIBLE CORPORATE BONDS | |
| | (Cost $3,463,706) | $ 3,576,132 |
| | CORPORATE BONDS — 11.2% of Net Assets |
| | Advertising — 0.1% | |
| 1,860,000 | Clear Channel Outdoor Holdings, Inc., 7.50%, | |
| | 6/1/29 (144A) | $ 1,497,300 |
| 570,000 | Clear Channel Outdoor Holdings, Inc., 7.75%, | |
| | 4/15/28 (144A) | 458,462 |
| | Total Advertising | $ 1,955,762 |
| | Aerospace & Defense — 0.5% | |
| 5,000,000 | Boeing Co., 5.15%, 5/1/30 | $ 5,047,131 |
| 3,369,000 | Bombardier, Inc., 7.875%, 4/15/27 (144A) | 3,116,325 |
| | Total Aerospace & Defense | $ 8,163,456 |
| | Airlines — 0.3% | |
| 5,000,000 | American Airlines 2021-1 Class B Pass Through Trust, | |
| | 3.95%, 7/11/30 | $ 4,120,089 |
| 423,468 | British Airways 2020-1 Class B Pass Through Trust, | |
| | 8.375%, 11/15/28 (144A) | 448,208 |
| | Total Airlines | $ 4,568,297 |
The accompanying notes are an integral part of these financial statements.
Pioneer Multi-Asset Income Fund | Annual Report | 7/31/22 31
Schedule of Investments | 7/31/22 (continued)
| Principal | | |
| Amount | | |
| USD ($) | | Value |
| | Auto Parts & Equipment — 0.2% | |
| 1,126,000 | American Axle & Manufacturing, Inc., 6.25%, 3/15/26 | $ 1,064,605 |
| 1,773,000 | Dealer Tire LLC/DT Issuer LLC, 8.00%, 2/1/28 (144A) | 1,591,090 |
| | Total Auto Parts & Equipment | $ 2,655,695 |
| | Banks — 3.4% | |
| 5,000,000(c) | Banco Santander SA, 3.225% (1 Year CMT Index + | |
| | 160 bps), 11/22/32 | $ 3,944,324 |
| 5,000,000(c) | BPCE SA, 3.116% (SOFR + 173 bps), 10/19/32 (144A) | 4,115,210 |
| 4,000,000 | BPCE SA, 4.875%, 4/1/26 (144A) | 3,975,007 |
| 1,818,000 | Freedom Mortgage Corp., 8.25%, 4/15/25 (144A) | 1,627,110 |
| 8,650,000(c)(d) | ING Groep NV, 6.50% (5 Year USD Swap Rate + 445 bps) | 8,509,783 |
| 5,857,000(c)(d) | Lloyds Banking Group Plc, 7.50% (5 Year USD Swap | |
| | Rate + 450 bps) | 5,930,213 |
| 8,700,000(c) | Morgan Stanley, 5.297% (SOFR + 262 bps), 4/20/37 | 8,764,103 |
| 8,125,000(c)(d) | NatWest Group Plc, 8.00% (5 Year USD Swap | |
| | Rate + 572 bps) | 8,389,062 |
| 6,220,000(c) | Societe Generale SA, 6.221% (1 Year CMT Index + | |
| | 320 bps), 6/15/33 (144A) | 6,104,873 |
| 9,300,000(c) | Standard Chartered Plc, 3.603% (1 Year CMT Index + | |
| | 190 bps), 1/12/33 (144A) | 7,796,303 |
| | Total Banks | $ 59,155,988 |
| | Chemicals — 0.2% | |
| 3,487,000 | LSF11 A5 HoldCo LLC, 6.625%, 10/15/29 (144A) | $ 2,989,789 |
| | Total Chemicals | $ 2,989,789 |
| | Commercial Services — 0.1% | |
| 2,255,000 | Allied Universal Holdco LLC/Allied Universal Finance | |
| | Corp., 9.75%, 7/15/27 (144A) | $ 2,064,588 |
| | Total Commercial Services | $ 2,064,588 |
| | Diversified Financial Services — 0.6% | |
| 8,630,000(c) | Capital One Financial Corp., 5.268% (SOFR + | |
| | 237 bps), 5/10/33 | $ 8,779,055 |
| 2,920,000 | Provident Funding Associates LP/PFG Finance Corp., | |
| | 6.375%, 6/15/25 (144A) | 2,631,650 |
| | Total Diversified Financial Services | $ 11,410,705 |
| | Food — 0.2% | |
| 4,450,000 | JBS USA LUX SA/JBS USA Food Co./JBS USA | |
| | Finance, Inc., 5.75%, 4/1/33 (144A) | $ 4,402,474 |
| | Total Food | $ 4,402,474 |
| | Forest Products & Paper — 0.2% | |
| 3,308,000 | Sylvamo Corp., 7.00%, 9/1/29 (144A) | $ 3,055,978 |
| | Total Forest Products & Paper | $ 3,055,978 |
The accompanying notes are an integral part of these financial statements.
32 Pioneer Multi-Asset Income Fund | Annual Report | 7/31/22
| Principal | | |
| Amount | | |
| USD ($) | | Value |
| | Oil & Gas — 0.2% | |
| 5,000,000 | Aker BP ASA, 3.10%, 7/15/31 (144A) | $ 4,313,623 |
| | Total Oil & Gas | $ 4,313,623 |
| | Pipelines ��� 0.4% | |
| 2,200,000 | Delek Logistics Partners LP/Delek Logistics Finance Corp., | |
| | 6.75%, 5/15/25 | $ 2,095,500 |
| 2,741,000(c)(d) | Energy Transfer LP, 6.25% (3 Month USD LIBOR + 402 bps) | 2,150,626 |
| 3,328,000 | EnLink Midstream Partners LP, 5.60%, 4/1/44 | 2,588,495 |
| | Total Pipelines | $ 6,834,621 |
| | Retail — 0.5% | |
| 3,180,000 | AAG FH LP/AAG FH Finco, Inc., 9.75%, 7/15/24 (144A) | $ 3,164,100 |
| 4,880,000 | AutoNation, Inc., 3.85%, 3/1/32 | 4,348,756 |
| 3,322,000 | Party City Holdings, Inc., 8.75%, 2/15/26 (144A) | 2,011,660 |
| | Total Retail | $ 9,524,516 |
| | Semiconductors — 0.2% | |
| 5,000,000 | Broadcom, Inc., 2.45%, 2/15/31 (144A) | $ 4,177,653 |
| | Total Semiconductors | $ 4,177,653 |
| | Software — 0.2% | |
| 3,580,000 | Minerva Merger Sub, Inc., 6.50%, 2/15/30 (144A) | $ 3,239,900 |
| | Total Software | $ 3,239,900 |
| | Telecommunications — 3.8% | |
| 4,960,000 | Lumen Technologies, Inc., 5.625%, 4/1/25 | $ 4,910,034 |
| 35,401,000 | Lumen Technologies, Inc., 7.60%, 9/15/39 | 28,543,649 |
| 38,222,000 | Lumen Technologies, Inc., 7.65%, 3/15/42 | 29,813,160 |
| 3,364,000 | Windstream Escrow LLC/Windstream Escrow | |
| | Finance Corp., 7.75%, 8/15/28 (144A) | 3,012,126 |
| | Total Telecommunications | $ 66,278,969 |
| | Transportation — 0.1% | |
| 2,065,000 | Danaos Corp., 8.50%, 3/1/28 (144A) | $ 2,064,076 |
| | Total Transportation | $ 2,064,076 |
| | TOTAL CORPORATE BONDS | |
| | (Cost $214,657,443) | $ 196,856,090 |
The accompanying notes are an integral part of these financial statements.
Pioneer Multi-Asset Income Fund | Annual Report | 7/31/22 33
Schedule of Investments | 7/31/22 (continued)
| Shares | | Value |
| | PREFERRED STOCK — 0.0%† of Net Assets |
| | Internet & Direct Marketing Retail — 0.0%† | | |
| 7,000 | Qurate Retail, Inc., 8.00%, 3/15/31 | $ 370,300 |
| | Total Internet & Direct Marketing Retail | $ 370,300 |
| | TOTAL PREFERRED STOCK | | |
| | (Cost $698,222) | $ 370,300 |
| | RIGHT/WARRANT — 0.0%† of Net Assets | | |
| | Metals & Mining — 0.0%† | | |
| 959,816(e) | ANR, Inc., 3/31/23 | $ | 5,759 |
| | Total Metals & Mining | $ 5,759 |
| | TOTAL RIGHT/WARRANT | | |
| | (Cost $—) | $ 5,759 |
| Principal | | | |
| Amount | | | |
| USD ($) | | | |
| | INSURANCE-LINKED SECURITIES — 1.8% of |
| | Net Assets# | | |
| | Event Linked Bonds — 1.3% | | |
| | Earthquakes – U.S. — 0.0%† | | |
| 500,000(a) | Torrey Pines Re Pte, Ltd., 6.237%, (3 Month U.S. Treasury | | |
| | Bill + 400 bps), 6/7/24 (144A) | $ 486,100 |
| | Inland Flood – U.S. — 0.1% | | |
| 1,350,000(a) | FloodSmart Re, 15.897%, (3 Month U.S. Treasury Bill + | | |
| | 1,358 bps), 3/1/24 (144A) | $ 1,223,910 |
| 500,000(a) | FloodSmart Re, 17.397%, (3 Month U.S. Treasury Bill + | | |
| | 1,508 bps), 2/27/23 (144A) | | 464,500 |
| | | $ 1,688,410 |
| | Multiperil – U.S. — 0.4% | | |
| 700,000(a) | Bonanza Re, 7.187%, (3 Month U.S. Treasury Bill + | | |
| | 487 bps), 2/20/24 (144A) | $ 669,900 |
| 250,000(a) | Caelus Re VI, Ltd., 7.697%, (3 Month U.S. Treasury Bill + | | |
| | 538 bps), 6/7/23 (144A) | | 244,575 |
| 1,250,000(a) | Easton Re Pte, 6.471%, (3 Month U.S. Treasury Bill + | | |
| | 400 bps), 1/8/24 (144A) | | 1,213,000 |
| 500,000(a) | Four Lakes Re, 9.617%, (3 Month U.S. Treasury Bill + | | |
| | 700 bps), 1/5/24 (144A) | | 493,350 |
| 500,000(a) | Four Lakes Re, 12.477%, (3 Month U.S. Treasury Bill + | | |
| | 1,106 bps), 1/5/24 (144A) | | 493,300 |
| 500,000(a) | Herbie Re, 12.037%, (3 Month U.S. Treasury Bill + | | |
| | 900 bps), 1/8/25 (144A) | | 492,650 |
| 1,000,000(a) | Residential Reinsurance 2020, 8.497%, (3 Month U.S. | | |
| | Treasury Bill + 651 bps), 12/6/24 (144A) | | 986,400 |
| 500,000(a) | Residential Reinsurance 2021, 7.651%, (3 Month U.S. | | |
| | Treasury Bill + 550 bps), 12/6/25 (144A) | | 480,550 |
The accompanying notes are an integral part of these financial statements.
34 Pioneer Multi-Asset Income Fund | Annual Report | 7/31/22
| Principal | | |
| Amount | | |
| USD ($) | | Value |
| | Multiperil – U.S. — (continued) | |
| 750,000(a) | Residential Reinsurance 2021 Re, 14.227%, (3 Month U.S. | |
| | Treasury Bill + 1,175 bps), 12/6/25 (144A) | $ 721,125 |
| 1,250,000(a) | Sanders Re II, 5.567%, (3 Month U.S. Treasury Bill + | |
| | 350 bps), 4/7/25 (144A) | 1,205,000 |
| | | $ 6,999,850 |
| | Multiperil – U.S. & Canada — 0.2% | |
| 250,000(a) | Kilimanjaro III Re, 6.567%, (3 Month U.S. Treasury Bill + | |
| | 425 bps), 4/20/26 (144A) | $ 239,250 |
| 250,000(a) | Kilimanjaro III Re, 6.817%, (3 Month U.S. Treasury Bill + | |
| | 450 bps), 4/21/25 (144A) | 239,650 |
| 250,000(a) | Kilimanjaro III Re, 13.567%, (3 Month U.S. Treasury Bill + | |
| | 1,125 bps), 4/21/25 (144A) | 238,500 |
| 250,000(a) | Kilimanjaro III Re, 13.567%, (3 Month U.S. Treasury Bill + | |
| | 1,125 bps), 4/20/26 (144A) | 239,350 |
| 500,000(a) | Mona Lisa Re, 9.317%, (3 Month U.S. Treasury Bill + | |
| | 700 bps), 7/8/25 (144A) | 486,050 |
| 250,000(a) | Mona Lisa Re, 10.471%, (3 Month U.S. Treasury Bill + | |
| | 800 bps), 1/9/23 (144A) | 244,425 |
| 1,750,000(a) | Mystic Re IV, 8.127%, (3 Month U.S. Treasury Bill + | |
| | 581 bps), 1/8/25 (144A) | 1,678,250 |
| 500,000(a) | Mystic Re IV, 11.69%, (3 Month U.S. Treasury Bill + | |
| | 1,169 bps), 1/8/25 (144A) | 474,800 |
| 500,000(a) | Mystic Re IV, Ltd., 12.067%, (3 Month U.S. Treasury Bill + | |
| | 975 bps), 1/8/24 (144A) | 490,000 |
| | | $ 4,330,275 |
| | Multiperil – Worldwide — 0.1% | |
| 1,000,000(a) | Northshore Re II, 8.067%, (3 Month U.S. Treasury Bill + | |
| | 575 bps), 1/8/24 (144A) | $ 970,100 |
| | Pandemic – U.S — 0.0%† | |
| 250,000(a) | Vitality Re XI, 4.117%, (3 Month U.S. Treasury Bill + | |
| | 180 bps), 1/9/24 (144A) | $ 243,925 |
| | Windstorm – Florida — 0.1% | |
| 1,250,000(a) | First Coast Re III Pte, Ltd., 8.497%, (3 Month U.S. Treasury | |
| | Bill + 600 bps), 4/7/25 (144A) | $ 1,175,125 |
| 750,000(a) | Merna Reinsurance II, Ltd., 7.817%, (3 Month U.S. Treasury | |
| | Bill + 550 bps), 7/8/24 (144A) | 714,225 |
| | | $ 1,889,350 |
| | Windstorm – Japan — 0.0%† | |
| 500,000(a) | Sakura Re, 4.567%, (3 Month U.S. Treasury Bill + | |
| | 225 bps), 4/7/25 (144A) | $ 489,200 |
| | Windstorm – North Carolina — 0.1% | |
| 1,000,000(a) | Cape Lookout Re, 5.537%, (1 Month U.S. Treasury Bill + | |
| | 325 bps), 3/22/24 (144A) | $ 983,000 |
The accompanying notes are an integral part of these financial statements.
Pioneer Multi-Asset Income Fund | Annual Report | 7/31/22 35
Schedule of Investments | 7/31/22 (continued)
| Principal | | | |
| Amount | | | |
| USD ($) | | Value |
| | Windstorm – Texas — 0.1% | | |
| 1,250,000(a) | Alamo Re, Ltd., 6.317%, (3 Month U.S. Treasury Bill + | | |
| | 400 bps), 6/7/24 (144A) | $ 1,160,625 |
| | Windstorm – U.S — 0.0%† | | |
| 500,000(a) | Bonanza Re, 7.221%, (3 Month U.S. Treasury Bill + | | |
| | 475 bps), 12/23/24 (144A) | $ 476,200 |
| | Windstorm – U.S. Regional — 0.2% | | |
| 750,000(a) | Matterhorn Re, 5.836%, (3 Month USD LIBOR + | | |
| | 425 bps), 12/7/22 (144A) | $ 740,325 |
| 2,000,000(a) | Matterhorn Re, 7.126%, (3 Month USD LIBOR + | | |
| | 550 bps), 12/7/22 (144A) | | 1,970,800 |
| | | $ 2,711,125 |
| | Total Event Linked Bonds | $ 22,428,160 |
| |
| Face | | | |
| Amount | | | |
| USD ($) | | | |
| | Collateralized Reinsurance — 0.2% | | |
| | Multiperil – U.S. — 0.2% | | |
| 1,800,000(b)(f)+ | Ballybunion Re 2020, 2/28/23 | $ 203,353 |
| 1,500,000(b)(f)+ | Ballybunion Re 2021-2, 6/30/25 | | 1,575,000 |
| 750,000(b)(f)+ | Ballybunion Re 2021-3, 7/31/25 | | 767,775 |
| 250,000(f)+ | Dingle Re 2020, 12/31/22 | | 1,488 |
| | | $ 2,547,616 |
| | Multiperil – Worldwide — 0.0%† | | |
| 700,000(b)(f)+ | Cypress Re 2017, 1/31/23 | $ 70 |
| 19,000(b)(f)+ | Limestone Re, 9/9/22 (144A) | | — |
| 26,000(b)(f)+ | Limestone Re, 9/9/22 (144A) | | — |
| 500,000(f)+ | Limestone Re 2020-1, 3/1/24 (144A) | | 17,150 |
| 700,000(b)(f)+ | Resilience Re, 5/1/23 | | — |
| 300,000(b)(f)+ | Walton Health Re 2019, 6/30/23 | | 165,117 |
| 250,000(b)(f)+ | Walton Heath Re 2021, 1/15/24 | | 175,000 |
| | | $ 357,337 |
| | Windstorm – U.S — 0.0%† | | |
| 250,000(f)+ | Shadow Creek Re 2021, 7/31/25 | $ | 3,796 |
| | Windstorm – U.S. Multistate — 0.0%† | | |
| 250,000(f)+ | White Heron Re 2021, 6/30/25 | $ | 5,350 |
| | Windstorm – U.S. Regional — 0.0%† | | |
| 500,000(f)+ | Isosceles Insurance, Ltd., 7/10/23 | $ 495,000 |
| 250,000(b)(f)+ | Oakmont Re 2017, 4/30/23 | | 7,350 |
| | | $ 502,350 |
| | Total Collateralized Reinsurance | $ 3,416,449 |
The accompanying notes are an integral part of these financial statements.
36 Pioneer Multi-Asset Income Fund | Annual Report | 7/31/22
| Face | | | |
| Amount | | | |
| USD ($) | | Value |
| | Reinsurance Sidecars — 0.3% | | |
| | Multiperil – U.S. — 0.0%† | | |
| 500,000(b)(f)+ | Carnoustie Re 2021, 12/31/24 | $ 23,700 |
| 1,500,000(g)+ | Harambee Re 2019, 12/31/22 | | 750 |
| | | $ 24,450 |
| | Multiperil – Worldwide — 0.3% | | |
| 2,400(b)(f)+ | Alturas Re 2019-1, 3/10/23 (144A) | | $ 10,975 |
| 12,149(g)+ | Alturas Re 2019-2, 3/10/23 | | 4,119 |
| 60,078(g)+ | Alturas Re 2020-2, 3/10/23 | | 16,969 |
| 439,922(b)(g)+ | Alturas Re 2021-2, 12/31/24 | | — |
| 1,000,000(b)(g)+ | Alturas Re 2021-3, 7/31/25 | | 922,000 |
| 750,000(b)(f)+ | Bantry Re 2019, 12/31/22 | | 25,473 |
| 750,000(b)(f)+ | Bantry Re 2021, 12/31/24 | | 97,462 |
| 46,259(b)(f)+ | Berwick Re 2018-1, 12/31/22 | | 3,576 |
| 1,391,977(b)(f)+ | Berwick Re 2019-1, 12/31/22 | | 166,341 |
| 100,000(b)(f)+ | Eden Re 2020 Class B, 3/22/24 (144A) | | 54,400 |
| 15,000(f)+ | Eden Re II, 3/22/23 (144A) | | 38,529 |
| 270,000(b)(f)+ | Eden Re II, 3/21/25 (144A) | | 224,100 |
| 180,000(b)+ | Eden Re II, Ltd., 3/21/25 (144A) | | 147,240 |
| 500,000(b)(f)+ | Gleneagles Re 2021, 12/31/24 | | 111,143 |
| 250,000(b)(g)+ | Lion Rock Re 2021, 12/31/24 | | 107,125 |
| 2,000,000(b)(f)+ | Merion Re 2021-2, 12/31/24 | | 434,200 |
| 1,250,000(b)(f)+ | Pangaea Re 2019-1, 2/1/23 | | 26,047 |
| 750,000(b)(f)+ | Pangaea Re 2020-1, 2/1/24 | | 15,916 |
| 1,500,000(b)(f)+ | Pangaea Re 2021-1, 12/31/24 | | 43,276 |
| 500,000(b)(f)+ | RosaPenna Re 2021, 7/31/25 | | 526,000 |
| 200,000(f)+ | Sector Re V, 3/1/24 (144A) | | 150,180 |
| 100,000(f)+ | Sector Re V, 12/1/24 (144A) | | 284,854 |
| 1,109(f)+ | Sector Re V, 12/1/25 (144A) | | 55,766 |
| 1,995(f)+ | Sector Re V, 12/1/25 (144A) | | 100,318 |
| 329(f)+ | Sector Re V, 3/1/26 (144A) | | 21,862 |
| 274(f)+ | Sector Re V, 3/1/26 (144A) | | 18,207 |
| 1,500,000(g)+ | Thopas Re 2019, 12/31/22 | | 2,400 |
| 1,000,000(b)(g)+ | Thopas Re 2020, 12/31/23 | | — |
| 1,500,000(g)+ | Thopas Re 2021, 12/31/24 | | — |
| 1,500,000(b)(g)+ | Torricelli Re 2021, 7/31/25 | | 1,603,350 |
| 1,600,000(f)+ | Versutus Re 2019-B, 12/31/22 | | 4,800 |
| 1,500,000(g)+ | Viribus Re 2019, 12/31/22 | | 13,500 |
| 1,000,000(g)+ | Viribus Re 2020, 12/31/23 | | 44,000 |
| 600,000(b)(f)+ | Woburn Re 2019, 12/31/22 | | 127,948 |
| | | $ 5,402,076 |
| | Total Reinsurance Sidecars | $ 5,426,526 |
| | TOTAL INSURANCE-LINKED SECURITIES | | |
| | (Cost $31,902,660) | $ 31,271,135 |
The accompanying notes are an integral part of these financial statements.
Pioneer Multi-Asset Income Fund | Annual Report | 7/31/22 37
Schedule of Investments | 7/31/22 (continued)
| Principal | | |
| Amount | | |
| USD ($) | | Value |
| | FOREIGN GOVERNMENT BONDS — 3.7% of |
| | Net Assets | |
| | Brazil — 1.0% | |
| BRL 94,154,000 | Brazil Notas do Tesouro Nacional Serie F, 10.000%, 1/1/25 | $ 17,201,889 |
| | Total Brazil | $ 17,201,889 |
| | Czech Republic — 0.8% | |
| CZK343,110,000 | Czech Republic Government Bond, 5.700%, 5/25/24 | $ 14,096,830 |
| | Total Czech Republic | $ 14,096,830 |
| | Egypt — 1.0% | |
| 14,560,000 | Egypt Government International Bond, 5.875%, | |
| | 2/16/31 (144A) | $ 8,931,832 |
| 14,430,000 | Egypt Government International Bond, 7.053%, | |
| | 1/15/32 (144A) | 9,062,906 |
| | Total Egypt | $ 17,994,738 |
| | Hungary — 0.3% | |
| HUF1,259,170,000 | Hungary Government Bond, 4.500%, 5/27/32 | $ 2,380,800 |
| HUF1,219,490,000 | Hungary Government Bond, 4.750%, 11/24/32 | 2,339,449 |
| | Total Hungary | $ 4,720,249 |
| | Russia — 0.0%† | |
| RUB 59,913,000 | Russian Federal Bond - OFZ, 7.000%, 8/16/23 | $ 211,316 |
| RUB 61,885,000 | Russian Federal Bond - OFZ, 7.700%, 3/23/33 | 218,272 |
| RUB 59,074,000 | Russian Federal Bond - OFZ, 8.150%, 2/3/27 | 208,357 |
| | Total Russia | $ 637,945 |
| | South Africa — 0.5% | |
| ZAR153,782,964 | Republic of South Africa Government Bond, | |
| | 8.250%, 3/31/32 | $ 7,862,177 |
| | Total South Africa | $ 7,862,177 |
| | Trinidad — 0.1% | |
| 2,113,000 | Trinidad & Tobago Government International Bond, 4.500%, | |
| | 8/4/26 (144A) | $ 2,054,261 |
| | Total Trinidad | $ 2,054,261 |
| | TOTAL FOREIGN GOVERNMENT BONDS | |
| | (Cost $77,295,006) | $ 64,568,089 |
| |
| Shares | | |
| | CLOSED-END FUNDS — 1.1% of Net Assets |
| 1,906,172 | Aberdeen Asia-Pacific Income Fund, Inc. | $ 5,299,158 |
| 190,651 | Cohen & Steers Tax-Advantaged Preferred Securities & | |
| | Income Fund | 3,799,674 |
| 304,533 | Highland Income Fund | 3,496,039 |
| 1,803,639 | Invesco Senior Income Trust | 7,016,156 |
| | TOTAL CLOSED-END FUNDS | |
| | (Cost $20,535,987) | $ 19,611,027 |
The accompanying notes are an integral part of these financial statements.
38 Pioneer Multi-Asset Income Fund | Annual Report | 7/31/22
| Principal | | |
| Amount | | |
| USD ($) | | Value |
| | EQUITY LINKED NOTES — 19.5% of | |
| | Net Assets | |
| | Aerospace & Defense — 0.2% | |
| 104,600 | Citigroup Global Markets Holdings, Inc. (Spirit | |
| | AeroSystems Holdings, Inc.), 15.15%, 10/17/22 (144A) | $ 3,564,245 |
| | Total Aerospace & Defense | $ 3,564,245 |
| | Auto Manufacturers — 0.3% | |
| 170,700 | Goldman Sachs International (Ford Motor Company), | |
| | 15.89%, 2/10/23 | $ 2,734,614 |
| 177,700 | Mizuho Markets Cayman LP (Stellantis NV), | |
| | 12.21%, 2/10/23 | 2,725,029 |
| | Auto Manufacturers | $ 5,459,643 |
| | Banks — 0.3% | |
| 40,800 | BNP Paribas Issuance BV (JPMorgan Chase & Co.), | |
| | 10.40%, 6/2/23 | $ 4,847,040 |
| | Total Banks | $ 4,847,040 |
| | Beverages — 0.4% | |
| 29,900 | Citigroup Global Markets Holdings, Inc. (Constellation | |
| | Brands Inc.), 6.51%, 10/18/22 (144A) | $ 6,915,122 |
| | Total Beverages | $ 6,915,122 |
| | Consumer Finance — 0.3% | |
| 61,200 | BNP Paribas Issuance BV (AerCap Holdings NV), | |
| | 14.71%, 4/3/23 | $ 2,955,347 |
| 66,200 | Royal Bank of Canada (AerCap Holdings NV), 14.69%, | |
| | 3/31/23 (144A) | 3,251,082 |
| | Total Consumer Finance | $ 6,206,429 |
| | Diversified Financial Services — 0.1% | |
| 42,300 | Merrill Lynch International & Co. CV (Pennymac Financail | |
| | Services Inc.), 10.35%, 2/10/23 | $ 2,364,570 |
| | Total Diversified Financial Services | $ 2,364,570 |
| | Electrical Equipment — 0.3% | |
| 16,800 | Royal Bank of Canada (Generac Holdings Inc.), 13.47%, | |
| | 2/28/23 (144A) | $ 4,590,684 |
| | Total Electrical Equipment | $ 4,590,684 |
| | Healthcare-Services — 0.7% | |
| 15,700 | Goldman Sachs International (Anthem Inc.), | |
| | 8.52%, 2/27/23 | $ 7,269,571 |
| 22,000 | Royal Bank of Canada (Cigna Corp.), 10.38%, | |
| | 5/23/23 (144A) | 5,925,150 |
| | Total Healthcare-Services | $ 13,194,721 |
| | Home Builders — 0.5% | |
| 175,900 | Goldman Sachs International (Toll Brothers), | |
| | 21.06%, 8/26/22 | $ 8,726,399 |
| | Total Home Builders | $ 8,726,399 |
The accompanying notes are an integral part of these financial statements.
Pioneer Multi-Asset Income Fund | Annual Report | 7/31/22 39
Schedule of Investments | 7/31/22 (continued)
| Principal | | |
| Amount | | |
| USD ($) | | Value |
| | Hotels, Restaurants & Leisure — 1.0% | |
| 36,500 | Merrill Lynch International & Co. CV (Darden Restaurants | |
| | Inc.), 10.71%, 2/22/23 | $ 4,723,100 |
| 200,000 | Mizuho Markets Cayman LP (Las Vegas Sands Corp.), | |
| | 12.87%, 6/16/23 (144A) | 7,340,100 |
| 157,000 | Royal Bank of Canada (Las Vegas Sands Corp.), 15.48%, | |
| | 6/23/23 (144A) | 5,571,928 |
| | Total Hotels, Restaurants & Leisure | $ 17,635,128 |
| | Insurance — 0.3% | |
| 23,400 | Toronto-Dominion Bank (Willis Towers Watson Plc), | |
| | 6.65%, 2/22/23 | $ 4,910,771 |
| | Total Insurance | $ 4,910,771 |
| | Interactive Media & Services — 0.3% | |
| 65,300 | JP Morgan Structured Products BV (Twitter, Inc.), | |
| | 23.10%, 10/5/22 | $ 2,905,941 |
| 18,500 | Toronto-Dominion Bank (Meta Platforms Inc.), | |
| | 11.07%, 4/11/23 | 3,231,673 |
| | Total Interactive Media & Services | $ 6,137,614 |
| | Internet & Direct Marketing Retail — 2.4% | |
| 52,300 | Goldman Sachs International (Alibaba Group | |
| | Holdings, Ltd.), 15.39%, 12/20/22 | $ 4,982,621 |
| 22,100 | JP Morgan Structured Products BV (Expedia Group, Inc.), | |
| | 10.61%, 11/22/22 | 2,481,540 |
| 63,400 | Mizuho Markets Cayman LP (Alibaba Group Holding Ltd.), | |
| | 15.66%, 6/30/23 (144A) | 6,481,921 |
| 28,800 | Mizuho Markets Cayman LP (Alibaba Group Holding Ltd.), | |
| | 18.45%, 7/7/23 (144A) | 3,140,841 |
| 31,500 | Royal Bank of Canada (Alibaba Group Holding Ltd.), | |
| | 34.91%, 9/20/22 (144A) | 2,976,592 |
| 15,700 | Royal Bank of Canada (Alibaba Group Holdings, Ltd.), | |
| | 10.56%, 8/15/22 (144A) | 1,433,253 |
| 21,000 | Royal Bank of Canada (Alibaba Group Holdings, Ltd.), | |
| | 13.89%, 10/18/22 (144A) | 1,998,150 |
| 92,100 | Royal Bank of Canada (Paypal Holdings, Inc.), 25.76%, | |
| | 8/1/22 (144A) | 7,907,706 |
| 118,700 | Royal Bank of Canada (TripAdvisor, Inc.), 15.96%, | |
| | 2/22/23 (144A) | 2,543,741 |
| 154,300 | Toronto-Dominion Bank (eBay Inc.), 10.14%, 3/10/23 | 7,715,926 |
| | Total Internet & Direct Marketing Retail | $ 41,662,291 |
| | IT Services — 1.7% | |
| 83,400 | BNP Paribas Issuance BV (National Instrument Corp.), | |
| | 8.63%, 1/31/23 (144A) | $ 3,241,760 |
| 188,200 | Goldman Sachs International (Kyndryl Holdings, Inc.), | |
| | 16.32%, 1/20/23 | 2,209,468 |
| 54,700 | Mizuho Markets Cayman LP (Advanced Micro Devices, | |
| | Inc.), 17.76%, 5/23/23 (144A) | 4,972,093 |
| 65,500 | Royal Bank of Canada (Advanced Micro Devices, Inc.), | |
| | 16.47%, 5/12/23 (144A) | 6,045,322 |
The accompanying notes are an integral part of these financial statements.
40 Pioneer Multi-Asset Income Fund | Annual Report | 7/31/22
| Principal | | |
| Amount | | |
| USD ($) | | Value |
| | IT Services — (continued) | |
| 19,300 | Royal Bank of Canada (CDW Corporation), 8.07%, | |
| | 2/27/23 (144A) | $ 3,497,450 |
| 29,500 | UBS AG (CDW Corp.), 9.55%, 5/23/23 (144A) | 5,050,253 |
| 128,000 | UBS AG (National Instruments Corp.), 10.00%, | |
| | 3/22/23 (144A) | 4,825,600 |
| | Total IT Services | $ 29,841,946 |
| | Leisure Products — 0.8% | |
| 409,900 | JP Morgan Structured Products BV (Tapestry Inc.), | |
| | 13.18%, 2/22/23 | $ 14,348,508 |
| | Total Leisure Products | $ 14,348,508 |
| | Machinery — 0.4% | |
| 64,800 | Mizuho Markets Cayman LP (AGCO Corporation), | |
| | 10.50%, 3/21/23 | $ 7,255,883 |
| | Total Machinery | $ 7,255,883 |
| | Metals & Mining — 1.5% | |
| 342,400 | Goldman Sachs International (Barrick Gold Corporation), | |
| | 11.06%, 2/27/23 | $ 5,685,552 |
| 202,300 | Goldman Sachs International (Teck Resources, Ltd.), | |
| | 13.30%, 1/23/23 | 6,007,299 |
| 131,100 | Toronto-Dominion Bank (Alcoa Corp.), 17.36%, 12/20/22 | 6,359,071 |
| 268,900 | UBS AG (Barrick Gold Corp.), 9.75%, 1/20/23 (144A) | 4,251,309 |
| 236,800 | UBS AG (Barrick Gold Corp.), 10.45%, 11/29/22 (144A) | 3,798,272 |
| | Total Metals & Mining | $ 26,101,503 |
| | Oil, Gas & Consumable Fuels — 2.8% | |
| 80,000 | BNP Paribas Issuance BV (Baker Hughes Co.), 16.04%, | |
| | 6/30/23 (144A) | $ 2,208,000 |
| 171,900 | Goldman Sachs International (Occidental Petroleum | |
| | Corp.), 17.89%, 3/13/23 | 9,162,270 |
| 377,500 | Goldman Sachs International (Range Resources | |
| | Corporation), 18.96%, 1/23/23 | 8,774,988 |
| 51,100 | JP Morgan Structured Products BV (Chesapeake Energy | |
| | Corp.), 13.55%, 3/6/23 | 3,768,967 |
| 343,000 | JP Morgan Structured Products BV (Range Resources | |
| | Corp.), 20.10%, 9/7/22 | 5,385,038 |
| 217,200 | Merrill Lynch International & Co. CV (Range Resources | |
| | Corp.), 0.209%, 9/30/22 | 4,398,300 |
| 167,300 | Mizuho Markets Cayman LP (EQT Corp.), 22.32%, | |
| | 7/25/23 (144A) | 6,400,396 |
| 146,200 | Toronto-Dominion Bank (Occidental Petroleum Corp.), | |
| | 18.05%, 5/2/23 | 8,816,372 |
| | Total Oil, Gas & Consumable Fuels | $ 48,914,331 |
| | Pharmaceuticals — 0.4% | |
| 46,200 | Merrill Lynch International & Co. CV (Alnylam | |
| | Pharmaceuticals Inc.), 20.59%, 2/27/23 | $ 6,457,836 |
| | Total Pharmaceuticals | $ 6,457,836 |
The accompanying notes are an integral part of these financial statements.
Pioneer Multi-Asset Income Fund | Annual Report | 7/31/22 41
Schedule of Investments | 7/31/22 (continued)
| Principal | | |
| Amount | | |
| USD ($) | | Value |
| | Semiconductors & Semiconductor Equipment — 0.9% |
| 27,700 | JP Morgan Structured Products BV (QUALCOMM, Inc.), | |
| | 0.009%, 1/20/23 | $ 4,231,729 |
| 35,500 | Mizuho Markets Cayman LP (QUALCOMM Inc.), | |
| | 13.12%, 5/9/23 | 5,131,081 |
| 49,500 | Royal Bank of Canada (MKS Instruments, Inc.), | |
| | 10.51%, 12/20/22 (144A) | 6,200,123 |
| | Total Semiconductors & Semiconductor Equipment | $ 15,562,933 |
| | Software — 3.9% | |
| 20,800 | Bank of America (Adobe Inc.), 16.20%, 8/1/22 | $ 8,392,800 |
| 43,900 | Bank of America (Autodesk Inc.), 20.35%, 8/1/22 | 9,231,850 |
| 14,500 | Goldman Sachs International (Adobe Inc.), 10.97%, 5/12/23 | 5,892,800 |
| 40,400 | Mizuho Markets Cayman LP (Electronic Arts, Inc.), 9.81%, | |
| | 5/23/23 (144A) | 5,149,889 |
| 120,700 | Mizuho Markets Cayman LP (Zoom Video Communications), | |
| | 20.72%, 6/5/23 (144A) | 12,348,093 |
| 31,000 | Royal Bank of Canada (Autodesk, Inc.), 12.88%, | |
| | 5/12/23 (144A) | 6,295,170 |
| 216,500 | Toronto-Dominion Bank (Oracle Corp.), 9.72%, 3/21/23 | 16,616,159 |
| 12,800 | UBS AG (Adobe Inc.), 12.45%, 5/23/23 (144A) | 5,090,176 |
| | Total Software | $ 69,016,937 |
| | TOTAL EQUITY LINKED NOTES | |
| | (Cost $366,238,434) | $ 343,714,534 |
| |
| Shares | | |
| | SHORT TERM INVESTMENTS — 0.5% of | |
| | Net Assets | |
| | Open-End Fund — 0.5% | |
| 9,228,909(h) | Dreyfus Government Cash Management, Institutional | |
| | Shares, 1.83% | $ 9,228,909 |
| | | $ 9,228,909 |
| | TOTAL SHORT TERM INVESTMENTS | |
| | (Cost $9,228,909) | $ 9,228,909 |
| | TOTAL INVESTMENTS IN UNAFFILIATED ISSUERS — 99.6% | |
| | (Cost $1,791,676,295) | $ 1,752,033,106 |
| | OTHER ASSETS AND LIABILITIES — 0.4% | $ 6,373,990 |
| | NET ASSETS — 100.0% | $ 1,758,407,096 |
| (A.D.R.) | American Depositary Receipts. |
| (G.D.R.) | Global Depositary Receipts. |
| bps | Basis Points. |
| CMT | Constant Maturity Treasury Index. |
| LIBOR | London Interbank Offered Rate. |
| SOFR | Secured Overnight Financing Rate. |
The accompanying notes are an integral part of these financial statements.
42 Pioneer Multi-Asset Income Fund | Annual Report | 7/31/22
| SOFR30A | Secured Overnight Financing Rate 30 Day Average. |
(144A)
| Security is exempt from registration under Rule 144A of the Securities Act of 1933. Such securities may be resold normally to qualified institutional buyers in a transaction exempt from registration. At July 31, 2022, the value of these securities amounted to $401,937,811, or 22.9% of net assets. |
| (a) | Floating rate note. Coupon rate, reference index and spread shown at July 31, 2022. |
| (b) | Non-income producing security. |
| (c) | The interest rate is subject to change periodically. The interest rate and/or reference index and spread shown at July 31, 2022. |
| (d) | Security is perpetual in nature and has no stated maturity date. |
| (e) | ANR, Inc. warrants are exercisable into 959,816 shares. |
| (f) | Issued as participation notes. |
| (g) | Issued as preference shares. |
| (h) | Rate periodically changes. Rate disclosed is the 7-day yield at July 31, 2022. |
*
| Senior secured floating rate loan interests in which the Fund invests generally pay interest at rates that are periodically re-determined by reference to a base lending rate plus a premium. These base lending rates are generally (i) the lending rate offered by one or more major European banks, such as LIBOR or SOFR, (ii) the prime rate offered by one or more major United States banks, (iii) the rate of a certificate of deposit or (iv) other base lending rates used by commercial lenders. The interest rate shown is the rate accruing at July 31, 2022. |
| † | Amount rounds to less than 0.1%. |
| + | Security is valued using significant unobservable inputs (Level 3). |
| ^ | Security is valued using fair value methods (other than prices supplied by independent pricing services or broker dealers). |
| # | Securities are restricted as to resale. |
| Restricted Securities | Acquisition date | Cost | Value |
| Alamo Re, Ltd. | 5/21/2021 | $1,250,000 | $ 1,160,625 |
| Alturas Re 2019-1 | 12/20/2018 | 2,400 | 10,975 |
| Alturas Re 2019-2 | 12/19/2018 | 12,149 | 4,119 |
| Alturas Re 2020-2 | 1/1/2020 | 60,078 | 16,969 |
| Alturas Re 2021-2 | 2/16/2021 | 22,989 | — |
| Alturas Re 2021-3 | 7/1/2021 | 1,000,000 | 922,000 |
| Ballybunion Re 2020 | 12/31/2019 | 123,519 | 203,353 |
| Ballybunion Re 2021-2 | 8/2/2021 | 1,500,000 | 1,575,000 |
| Ballybunion Re 2021-3 | 8/4/2021 | 750,000 | 767,775 |
| Bantry Re 2019 | 2/1/2019 | — | 25,473 |
| Bantry Re 2021 | 1/11/2021 | 108,176 | 97,462 |
| Berwick Re 2018-1 | 1/29/2018 | 6,757 | 3,576 |
| Berwick Re 2019-1 | 2/27/2019 | 166,329 | 166,341 |
| Bonanza Re | 12/15/2020 | 500,000 | 476,200 |
| Bonanza Re | 2/13/2020 | 700,000 | 669,900 |
| Caelus Re VI, Ltd. | 4/9/2021 | 251,447 | 244,575 |
| Cape Lookout Re | 3/9/2021 | 1,000,000 | 983,000 |
| Carnoustie Re 2021 | 1/11/2021 | 16,752 | 23,700 |
| Cypress Re 2017 | 1/24/2017 | 2,353 | 70 |
| Dingle Re 2020 | 2/13/2020 | — | 1,488 |
| Easton Re Pte | 12/15/2020 | 1,250,000 | 1,213,000 |
The accompanying notes are an integral part of these financial statements.
Pioneer Multi-Asset Income Fund | Annual Report | 7/31/22 43
Schedule of Investments | 7/31/22 (continued)
| Restricted Securities | Acquisition date | Cost | Value |
| Eden Re 2020 Class B | | 12/23/2019 | $ 95,660 | $ 54,400 |
| Eden Re II | | 12/14/2018 | 4,320 | 38,529 |
| Eden Re II | | 1/25/2021 | 270,000 | 224,100 |
| Eden Re II, Ltd. | | 12/14/2020 | 180,000 | 147,240 |
| First Coast Re III Pte, Ltd. | 3/4/2021 | 1,250,000 | 1,175,125 |
| FloodSmart Re | | 2/9/2021 | 501,946 | 464,500 |
| FloodSmart Re | | 2/16/2021 | 1,350,000 | 1,223,910 |
| Four Lakes Re | | 11/5/2020 | 500,000 | 493,350 |
| Four Lakes Re | | 11/5/2020 | 500,000 | 493,300 |
| Gleneagles Re 2021 | | 1/13/2021 | 120,293 | 111,143 |
| Harambee Re 2019 | | 12/20/2018 | — | 750 |
| Herbie Re | | 10/19/2020 | 500,000 | 492,650 |
| Isosceles Insurance, Ltd. | 6/25/2021 | 500,000 | 495,000 |
| Kilimanjaro III Re | | 4/8/2021 | 250,000 | 238,500 |
| Kilimanjaro III Re | | 4/8/2021 | 250,000 | 239,350 |
| Kilimanjaro III Re | | 4/8/2021 | 250,000 | 239,250 |
| Kilimanjaro III Re | | 4/8/2021 | 250,000 | 239,650 |
| Limestone Re | | 12/15/2016 | 10,295 | — |
| Limestone Re | | 12/27/2018 | 14,150 | — |
| Limestone Re 2020-1 | | 1/3/2020 | 2,500 | 17,150 |
| Lion Rock Re 2021 | | 12/30/2020 | 161,914 | 107,125 |
| Lukoil PJSC | | 4/3/2020 | 3,354,083 | 149,032 |
| Magnit PJSC | | 4/15/2020 | 12,536,598 | 764,338 |
| Matterhorn Re | | 11/24/2020 | 750,239 | 740,325 |
| Matterhorn Re | | 11/24/2020 | 2,000,461 | 1,970,800 |
| Merion Re 2021-2 | | 12/28/2020 | 544,188 | 434,200 |
| Merna Reinsurance II, Ltd. | 6/8/2021 | 750,000 | 714,225 |
| Mona Lisa Re | | 4/9/2021 | 250,999 | 244,425 |
| Mona Lisa Re | | 6/22/2021 | 500,000 | 486,050 |
| Mystic Re IV | | 6/9/2021 | 1,748,729 | 1,678,250 |
| Mystic Re IV | | 6/9/2021 | 500,000 | 474,800 |
| Mystic Re IV, Ltd. | | 12/15/2020 | 500,000 | 490,000 |
| Northshore Re II | | 12/2/2020 | 1,000,000 | 970,100 |
| Oakmont Re 2017 | | 5/10/2017 | — | 7,350 |
| Pangaea Re 2019-1 | | 1/9/2019 | 13,124 | 26,047 |
| Pangaea Re 2020-1 | | 1/21/2020 | — | 15,916 |
| Pangaea Re 2021-1 | | 1/19/2021 | 81,826 | 43,276 |
| Residential Reinsurance 2020 | 10/30/2020 | 1,004,599 | 986,400 |
| Residential Reinsurance 2021 | 10/28/2021 | 500,000 | 480,550 |
| Residential Reinsurance 2021 Re | 10/28/2021 | 750,000 | 721,125 |
| Resilience Re | | 2/8/2017 | 339 | — |
| RosaPenna Re 2021 | | 7/16/2021 | 500,000 | 526,000 |
| Rosneft Oil Co. PJSC | | 12/6/2019 | 9,625,119 | 359,764 |
| Sakura Re | | 3/24/2021 | 500,000 | 489,200 |
| Sanders Re II | | 5/24/2021 | 1,250,000 | 1,205,000 |
| Sector Re V | | 4/23/2019 | 200,000 | 150,180 |
| Sector Re V | | 12/4/2019 | 100,000 | 284,854 |
| Sector Re V | | 12/4/2020 | 1,109 | 55,766 |
| Sector Re V | | 12/21/2020 | 1,995 | 100,318 |
| Sector Re V | | 5/21/2021 | 329 | 21,862 |
| Sector Re V | | 4/26/2021 | 274 | 18,207 |
| Shadow Creek Re 2021 | | 8/31/2021 | — | 3,796 |
The accompanying notes are an integral part of these financial statements.
44 Pioneer Multi-Asset Income Fund | Annual Report | 7/31/22
| Restricted Securities | Acquisition date | Cost | Value |
| Thopas Re 2019 | 12/21/2018 | $ — | $ 2,400 |
| Thopas Re 2020 | 2/5/2020 | — | — |
| Thopas Re 2021 | 12/30/2020 | — | — |
| Torrey Pines Re Pte, Ltd. | 3/12/2021 | 500,000 | 486,100 |
| Torricelli Re 2021 | 7/1/2021 | 1,500,000 | 1,603,350 |
| Versutus Re 2019-B | 12/24/2018 | — | 4,800 |
| Viribus Re 2019 | 12/27/2018 | — | 13,500 |
| Viribus Re 2020 | 3/12/2020 | 101,920 | 44,000 |
| Vitality Re XI | 1/31/2020 | 249,200 | 243,925 |
| Walton Health Re 2019 | 7/18/2019 | 98,098 | 165,117 |
| Walton Heath Re 2021 | 6/28/2021 | 214,000 | 175,000 |
| White Heron Re 2021 | 6/9/2021 | — | 5,350 |
| Woburn Re 2019 | 1/30/2019 | 107,204 | 127,948 |
| X5 Retail Group NV (G.D.R.) | 9/17/2020 | 1,738,218 | 29,164 |
| Total Restricted Securities | | $32,573,433 |
| % of Net assets | | | 1.9% |
| FUTURES CONTRACTS | | | | |
| INDEX FUTURES CONTRACTS | | | | |
| Number of | | | | | |
| Contracts | | Expiration | Notional | Market | Unrealized |
| Short | Description | Date | Amount | Value | (Depreciation) |
| 63 | Japan 10Y | 9/12/22 | $ (70,476,608) | $ (71,107,087) | $ (630,479) |
| | Bond (OSE) | | | | |
| 646 | S&P 500 | 9/16/22 | (129,589,116) | (133,512,050) | (3,922,934) |
| | E-MINI | | | | |
| | | | $ (200,065,724) | $ (204,619,137) | $ (4,553,413) |
| TOTAL FUTURES CONTRACTS | $(200,065,724) | $(204,619,137) | $ (4,553,413) |
Principal amounts are denominated in U.S. dollars (“USD”) unless otherwise noted.
BRL — Brazil Real
CZK — Czech Republic Koruna
HUF — Hungary Forint
RUB — Russia Ruble
ZAR — South Africa Rand
Purchases and sales of securities (excluding short-term investments) for the year ended July 31, 2022 were as follows:
| | Purchases | Sales |
| Long-Term U.S. Government Securities | $ 84,941,533 | $ 84,845,119 |
| Other Long-Term Securities | $1,373,598,389 | $1,056,393,437 |
The Fund is permitted to engage in purchase and sale transactions (“cross trades”) with certain funds and accounts for which Amundi Asset Management US, Inc. (the “Adviser”) serves as the Fund’s investment adviser, as set forth in Rule 17a-7 under the Investment Company Act of 1940, pursuant to procedures adopted by the Board of Trustees. Under these procedures, cross trades are effected at current market prices. During the year ended July 31, 2022, the Fund did not engage in any cross trade activity.
The accompanying notes are an integral part of these financial statements.
Pioneer Multi-Asset Income Fund | Annual Report | 7/31/22 45
Schedule of Investments | 7/31/22 (continued)
At July 31, 2022, the net unrealized depreciation on investments based on cost for federal tax purposes of $1,788,776,354 was as follows:
| Aggregate gross unrealized appreciation for all investments in which | |
| there is an excess of value over tax cost | $ 143,743,716 |
| Aggregate gross unrealized depreciation for all investments in which | |
| there is an excess of tax cost over value | (185,040,377) |
| Net unrealized depreciation | $ (41,296,661) |
Various inputs are used in determining the value of the Fund’s investments. These inputs are summarized in the three broad levels below.
Level 1 – unadjusted quoted prices in active markets for identical securities.
Level 2 – other significant observable inputs (including quoted prices for similar securities, interest rates, prepayment speeds, credit risks, etc.). See Notes to Financial Statements — Note 1A.
Level 3 – significant unobservable inputs (including the Fund’s own assumptions in determining fair value of investments). See Notes to Financial Statements — Note 1A.
The following is a summary of the inputs used as of July 31, 2022, in valuing the Fund’s investments:
| | Level 1 | Level 2 | Level 3 | Total |
| Senior Secured Floating | | | | |
| Rate Loan Interests | $ — | $ 29,233,408 | $ — | $ 29,233,408 |
| Common Stocks | | | | |
| Food & Staples Retailing | — | — | 793,502 | 793,502 |
| Oil, Gas & Consumable Fuels | 271,267,404 | — | 508,796 | 271,776,200 |
| All Other Common Stocks | 671,077,827 | — | — | 671,077,827 |
| Asset Backed Securities | — | 32,962,067 | — | 32,962,067 |
| Collateralized Mortgage | | | | |
| Obligations | — | 70,474,487 | — | 70,474,487 |
| Commercial Mortgage-Backed | | | | |
| Securities | — | 6,513,640 | — | 6,513,640 |
| Convertible Corporate Bonds | — | 3,576,132 | — | 3,576,132 |
| Corporate Bonds | — | 196,856,090 | — | 196,856,090 |
| Preferred Stock | 370,300 | — | — | 370,300 |
| Right/Warrant | — | 5,759 | — | 5,759 |
| Insurance-Linked Securities | | | | |
| Collateralized Reinsurance | | | | |
| Multiperil – U.S. | — | — | 2,547,616 | 2,547,616 |
| Multiperil – Worldwide | — | — | 357,337 | 357,337 |
| Windstorm – U.S | — | — | 3,796 | 3,796 |
| Windstorm – U.S. Multistate | — | — | 5,350 | 5,350 |
| Windstorm – U.S. Regional | — | — | 502,350 | 502,350 |
| Reinsurance Sidecars | | | | |
| Multiperil – U.S. | — | — | 24,450 | 24,450 |
| Multiperil – Worldwide | — | — | 5,402,076 | 5,402,076 |
| All Other Insurance-Linked | | | | |
| Securities | — | 22,428,160 | — | 22,428,160 |
| Foreign Government Bonds | — | 64,568,089 | — | 64,568,089 |
| Closed-End Funds | 19,611,027 | — | — | 19,611,027 |
The accompanying notes are an integral part of these financial statements.
46 Pioneer Multi-Asset Income Fund | Annual Report | 7/31/22
| | Level 1 | Level 2 | Level 3 | Total |
| Equity Linked Notes | $ — | $ 343,714,534 | $ — | $ 343,714,534 |
| Open-End Fund | 9,228,909 | — | — | 9,228,909 |
| Total Investments in Securities | $ 971,555,467 | $ 770,332,366 | $10,145,273 | $1,752,033,106 |
| Other Financial Instruments | | | | |
| Net unrealized depreciation | | | | |
| on futures contracts | $ (4,553,413) | $ — | $ — | $ (4,553,413) |
| Total Other Financial | | | | | | |
| Instruments | $ (4,553,413) | $ — | $ — | $ (4,553,413) |
The following is a reconciliation of assets valued using significant unobservable inputs (Level 3):
| | | Insurance- | |
| | Common | Linked | |
| | Stocks | Securities | Total |
| Balance as of 7/31/21 | $ — | $ 27,266,511 | $ 27,266,511 |
| Realized gain (loss)(1) | — | (548,383) | (548,383) |
| Changed in unrealized appreciation | | | |
| (depreciation)(2) | (28,153,944) | (1,039,373) | (29,193,317) |
| Accrued discounts/premiums | — | (9,031,454) | (9,031,454) |
| Purchases^ | 22,958,102 | 4,492,085 | 27,450,187 |
| Sales^ | (22,888,843) | (12,296,411) | (35,185,254) |
| Transfers in to Level 3* | 29,386,983 | — | 29,386,983 |
| Transfers out of Level 3* | — | — | — |
| Balance as of 7/31/22 | $ 1,302,298 | $ 8,842,975 | $ 10,145,273 |
| (1) | | Realized gain (loss) on these securities is included in the realized gain (loss) from investments on the Statement of Operations. |
| (2) | | Unrealized appreciation (depreciation) on these securities is included in the change in unrealized appreciation (depreciation) from investments on the Statement of Operations. |
| * | | Transfers are calculated on the beginning of period values. For the year ended July 31, 2022, securities with aggregate market value of $29,386,983 were transferred from Level 1 to Level 3 as there were no significant observable inputs available to determine its value, resulting from a decrease in market activity for the securities. There were no other transfers in or out of Level 3. |
| ^ | | Includes corporate action activity. |
| Net change in unrealized appreciation (depreciation) of Level 3 investments still | |
| held and considered Level 3 at July 31, 2022: | $(26,710,428) |
The accompanying notes are an integral part of these financial statements.
Pioneer Multi-Asset Income Fund | Annual Report | 7/31/22 47
Statement of Assets and Liabilities | 7/31/22
| ASSETS: | |
| Investments in unaffiliated issuers, at value (cost $1,791,676,295) | $ 1,752,033,106 |
| Cash | 2,138,347 |
| Foreign currencies, at value (cost $15,411) | 12,434 |
| Futures collateral | 6,452,902 |
| Receivables — | |
| Investment securities sold | 122,835 |
| Fund shares sold | 5,398,072 |
| Dividends | 4,595,091 |
| Interest | 9,040,648 |
| Other assets | 41,023 |
| Total assets | $ 1,779,834,458 |
| LIABILITIES: | |
| Payables — | |
| Investment securities purchased | $ 11,529,752 |
| Fund shares repurchased | 6,577,383 |
| Distributions | 547,468 |
| Trustees’ fees | 1,185 |
| Due to Adviser | 36,124 |
| Variation margin for futures contracts | 2,060,835 |
| Due to affiliates | 228,983 |
| Accrued expenses | 445,632 |
| Total liabilities | $ 21,427,362 |
| NET ASSETS: | |
| Paid-in capital | $ 1,960,622,033 |
| Distributable earnings (loss) | (202,214,937) |
| Net assets | $ 1,758,407,096 |
| NET ASSET VALUE PER SHARE: | |
| No par value (unlimited number of shares authorized) | |
| Class A (based on $403,985,179/36,787,593 shares) | $ 10.98 |
| Class C (based on $252,795,009/23,106,911 shares) | $ 10.94 |
| Class K (based on $118,667,505/10,516,722 shares) | $ 11.28 |
| Class R (based on $790,815/72,033 shares) | $ 10.98 |
| Class Y (based on $982,168,588/89,756,504 shares) | $ 10.94 |
| MAXIMUM OFFERING PRICE PER SHARE: | |
| Class A (based on $10.98 net asset value per share/100%-4.50% | |
| maximum sales charge) | $ 11.50 |
The accompanying notes are an integral part of these financial statements.
48 Pioneer Multi-Asset Income Fund | Annual Report | 7/31/22
| Statement of Operations | | |
| FOR THE YEAR ENDED 7/31/22 | | |
| |
| INVESTMENT INCOME: | | |
| Interest from unaffiliated issuers (net of foreign taxes | | |
| withheld $85,975) | $ 65,040,708 | |
| Dividends from unaffiliated issuers (net of foreign taxes | | |
| withheld $2,723,889) | 40,882,726 | |
| Total Investment Income | | $ 105,923,434 |
| EXPENSES: | | |
| Management fees | $ 8,002,581 | |
| Administrative expenses | 411,147 | |
| Transfer agent fees | | |
| Class A | 184,422 | |
| Class C | 168,546 | |
| Class K | 165 | |
| Class R | 677 | |
| Class Y | 976,492 | |
| Distribution fees | | |
| Class A | 968,252 | |
| Class C | 2,762,312 | |
| Class R | 3,633 | |
| Shareowner communications expense | 53,623 | |
| Custodian fees | 141,375 | |
| Registration fees | 119,262 | |
| Professional fees | 142,854 | |
| Printing expense | 63,652 | |
| Pricing fees | 5,776 | |
| Trustees’ fees | 74,802 | |
| Insurance expense | 263 | |
| Miscellaneous | 182,681 | |
| Total expenses | | $ 14,262,515 |
| Less fees waived and expenses reimbursed by the Adviser | | (94,709) |
| Net expenses | | $ 14,167,806 |
| Net investment income | | $ 91,755,628 |
| REALIZED AND UNREALIZED GAIN (LOSS) ON INVESTMENTS: | |
| Net realized gain (loss) on: | | |
| Investments in unaffiliated issuers | $ 40,197,030 | |
| Investments in affiliated issuers | 15,074 | |
| Forward foreign currency exchange contracts | (3,767,641) | |
| Futures contracts | 17,850,676 | |
| Other assets and liabilities denominated in | | |
| foreign currencies | (1,055,797) | $ 53,239,342 |
| Change in net unrealized appreciation (depreciation) on: | | |
| Investments in unaffiliated issuers | $ (157,697,914) | |
| Investments in affiliated issuers | (19,389) | |
| Futures contracts | 631,344 | |
| Other assets and liabilities denominated in | | |
| foreign currencies | (280,310) | $ (157,366,269) |
| Net realized and unrealized gain (loss) on investments | | $(104,126,927) |
| Net decrease in net assets resulting from operations | | $ (12,371,299) |
The accompanying notes are an integral part of these financial statements.
Pioneer Multi-Asset Income Fund | Annual Report | 7/31/22 49
Statements of Changes in Net Assets
| | Year | Year |
| | Ended | Ended |
| | 7/31/22 | 7/31/21 |
| FROM OPERATIONS: | | |
| Net investment income (loss) | $ 91,755,628 | $ 82,168,687 |
| Net realized gain (loss) on investments | 53,239,342 | 40,283,716 |
| Change in net unrealized appreciation (depreciation) | | |
| on investments | (157,366,269) | 133,007,285 |
| Net increase (decrease) in net assets resulting | | |
| from operations | $ (12,371,299) | $ 255,459,688 |
| DISTRIBUTIONS TO SHAREOWNERS: | | |
| Class A ($0.65 and $0.56 per share, respectively) | $ (21,882,630) | $ (16,502,065) |
| Class C ($0.56 and $0.47 per share, respectively) | (13,538,133) | (12,924,502) |
| Class K ($0.70 and $0.61 per share, respectively) | (7,891,529) | (7,510,765) |
| Class R ($0.59 and $0.48 per share, respectively) | (37,145) | (51,848) |
| Class Y ($0.67 and $0.58 per share, respectively) | (50,912,345) | (33,683,613) |
| Total distributions to shareowners | $ (94,261,782) | $ (70,672,793) |
| FROM FUND SHARE TRANSACTIONS: | | |
| Net proceeds from sales of shares | $ 630,259,970 | $ 428,700,080 |
| Reinvestment of distributions | 92,674,086 | 69,530,413 |
| Cost of shares repurchased | (431,048,442) | (442,257,320) |
| Net increase in net assets resulting from Fund | | |
| share transactions | $ 291,885,614 | $ 55,973,173 |
| Net increase in net assets | $ 185,252,533 | $ 240,760,068 |
| NET ASSETS: | | |
| Beginning of year | $ 1,573,154,563 | $ 1,332,394,495 |
| End of year | $ 1,758,407,096 | $ 1,573,154,563 |
| * Amount is less than $0.01. | | |
The accompanying notes are an integral part of these financial statements.
50 Pioneer Multi-Asset Income Fund | Annual Report | 7/31/22
| | Year | Year | Year | Year |
| | Ended | Ended | Ended | Ended |
| | 7/31/22 | 7/31/22 | 7/31/21 | 7/31/21 |
| | Shares | Amount | Shares | Amount |
| Class A | | | | |
| Shares sold | 10,942,592 | $ 126,376,070 | 6,607,052 | $ 74,841,192 |
| Reinvestment of distributions | 1,874,970 | 21,526,503 | 1,466,425 | 16,218,036 |
| Less shares repurchased | (6,588,391) | (75,511,992) | (8,013,017) | (87,900,406) |
| Net increase | 6,229,171 | $ 72,390,581 | 60,460 | $ 3,158,822 |
| Class C | | | | |
| Shares sold | 3,352,366 | $ 38,380,079 | 2,439,162 | $ 27,711,174 |
| Reinvestment of distributions | 1,173,326 | 13,452,189 | 1,169,903 | 12,842,204 |
| Less shares repurchased | (6,920,946) | (79,466,297) | (8,956,263) | (98,605,763) |
| Net decrease | (2,395,254) | $ (27,634,029) | (5,347,198) | $ (58,052,385) |
| Class K | | | | |
| Shares sold | 2,997,657 | $ 36,486,044 | 3,430,521 | $ 41,294,650 |
| Reinvestment of distributions | 648,245 | 7,672,877 | 648,832 | 7,426,909 |
| Less shares repurchased | (4,739,246) | (56,362,194) | (4,048,745) | (47,609,375) |
| Net increase | | | | |
| (decrease) | (1,093,344) | $ (12,203,273) | 30,608 | $ 1,112,184 |
| Class R | | | | |
| Shares sold | 28,656 | $ 332,560 | 17,293 | $ 192,649 |
| Reinvestment of distributions | 3,209 | 36,773 | 4,772 | 51,848 |
| Less shares repurchased | (15,037) | (175,230) | (111,182) | (1,253,101) |
| Net increase | | | | |
| (decrease) | 16,828 | $ 194,103 | (89,117) | $ (1,008,604) |
| Class Y | | | | |
| Shares sold | 37,651,330 | $ 428,685,217 | 25,024,826 | $ 284,660,415 |
| Reinvestment of distributions | 4,372,212 | 49,985,744 | 2,986,473 | 32,991,416 |
| Less shares repurchased | (19,319,152) | (219,532,729) | (18,879,285) | (206,888,675) |
| Net increase | 22,704,390 | $ 259,138,232 | 9,132,014 | $ 110,763,156 |
The accompanying notes are an integral part of these financial statements.
Pioneer Multi-Asset Income Fund | Annual Report | 7/31/22 51
Financial Highlights
| | Year | Year | Year | Year | Year |
| | Ended | Ended | Ended | Ended | Ended |
| | 7/31/22 | 7/31/21 | 7/31/20 | 7/31/19 | 7/31/18 |
| Class A | | | | | |
| Net asset value, beginning of period | $ 11.67 | $ 10.17 | $ 10.79 | $ 11.59 | $ 11.69 |
| Increase (decrease) from investment operations: | | | | | |
| Net investment income (loss) (a) | $ 0.63 | $ 0.65 | $ 0.62 | $ 0.62 | $ 0.68 |
| Net realized and unrealized gain (loss) on investments | (0.67) | 1.41 | (0.60) | (0.80) | (0.05) |
| Net increase (decrease) from investment operations | $ (0.04) | $ 2.06 | $ 0.02 | $ (0.18) | $ 0.63 |
| Distributions to shareowners: | | | | | |
| Net investment income | $ (0.65) | $ (0.56) | $ (0.64) | $ (0.62) | $ (0.73) |
| Total distributions | $ (0.65) | $ (0.56) | $ (0.64) | $ (0.62) | $ (0.73) |
| Net increase (decrease) in net asset value | $ (0.69) | $ 1.50 | $ (0.62) | $ (0.80) | $ (0.10) |
| Net asset value, end of period | $ 10.98 | $ 11.67 | $ 10.17 | $ 10.79 | $ 11.59 |
| Total return (b) | (0.43)% | 20.66% | 0.28% | (1.56)% | 5.41% |
| Ratio of net expenses to average net assets | 0.85% | 0.85% | 0.85% | 0.85% | 0.85% |
| Ratio of net investment income (loss) to average net assets | 5.51% | 5.82% | 6.01% | 5.58% | 5.77% |
| Portfolio turnover rate | 73% | 106% | 126% | 108% | 126% |
| Net assets, end of period (in thousands) | $403,985 | $356,626 | $310,126 | $377,722 | $374,395 |
| Ratios with no waiver of fees and assumption of expenses by | | | | | |
| the Adviser and no reduction for fees paid indirectly: | | | | | |
| Total expenses to average net assets | 0.85% | 0.88% | 0.89% | 0.89% | 0.87% |
| Net investment income (loss) to average net assets | 5.51% | | 5.79% | 5.97% | 5.54% | 5.75% |
| (a) | | The per-share data presented above is based on the average shares outstanding for the period presented. |
| (b) | | Assumes initial investment at net asset value at the beginning of each period, reinvestment of all distributions, the complete redemption of the investment at net asset value at the end of each period and no sales charges. Total return would be reduced if sales charges were taken into account. |
The accompanying notes are an integral part of these financial statements.
52 Pioneer Multi-Asset Income Fund | Annual Report | 7/31/22
| | Year | Year | Year | Year | Year |
| | Ended | Ended | Ended | Ended | Ended |
| | 7/31/22 | 7/31/21 | 7/31/20 | 7/31/19 | 7/31/18 |
| Class C | | | | | |
| Net asset value, beginning of period | $ 11.63 | $ 10.13 | $ 10.76 | $ 11.56 | $ 11.66 |
| Increase (decrease) from investment operations: | | | | | |
| Net investment income (loss) (a) | $ 0.54 | $ 0.56 | $ 0.54 | $ 0.53 | $ 0.58 |
| Net realized and unrealized gain (loss) on investments | (0.67) | 1.41 | (0.61) | (0.80) | (0.05) |
| Net increase (decrease) from investment operations | $ (0.13) | $ 1.97 | $ (0.07) | $ (0.27) | $ 0.53 |
| Distributions to shareowners: | | | | | |
| Net investment income | $ (0.56) | $ (0.47) | $ (0.56) | $ (0.53) | $ (0.63) |
| Total distributions | $ (0.56) | $ (0.47) | $ (0.56) | $ (0.53) | $ (0.63) |
| Net increase (decrease) in net asset value | $ (0.69) | $ 1.50 | $ (0.63) | $ (0.80) | $ (0.10) |
| Net asset value, end of period | $ 10.94 | $ 11.63 | $ 10.13 | $ 10.76 | $ 11.56 |
| Total return (b) | (1.20)% | 19.78% | (0.62)% | (2.33)% | 4.60% |
| Ratio of net expenses to average net assets | 1.61% | 1.64% | 1.65% | 1.64% | 1.62% |
| Ratio of net investment income (loss) to average net assets | 4.72% | 5.04% | 5.20% | 4.78% | 4.94% |
| Portfolio turnover rate | 73% | 106% | 126% | 108% | 126% |
| Net assets, end of period (in thousands) | $252,795 | $296,575 | $312,559 | $422,863 | $439,179 |
| Ratios with no waiver of fees and assumption of expenses by | | | | | |
| the Adviser and no reduction for fees paid indirectly: | | | | | | |
| Total expenses to average net assets | 1.61% | 1.64% | 1.66% | 1.65% | 1.62% |
| Net investment income (loss) to average net assets | 4.72% | 5.04% | 5.19% | 4.77% | 4.94% |
| (a) | | The per-share data presented above is based on the average shares outstanding for the period presented. |
| (b) | | Assumes initial investment at net asset value at the beginning of each period, reinvestment of all distributions, the complete redemption of the investment at net asset value at the end of each period and no sales charges. Total return would be reduced if sales charges were taken into account. |
The accompanying notes are an integral part of these financial statements.
Pioneer Multi-Asset Income Fund | Annual Report | 7/31/22 53
Financial Highlights (continued)
| | Year | Year | Year | Year | Year |
| | Ended | Ended | Ended | Ended | Ended |
| | 7/31/22 | 7/31/21 | 7/31/20 | 7/31/19 | 7/31/18 |
| Class K | | | | | |
| Net asset value, beginning of period | $ 12.02 | $ 10.47 | $ 11.12 | $ 11.95 | $ 11.85 |
| Increase (decrease) from investment operations: | | | | | |
| Net investment income (loss) (a) | $ 0.69 | $ 0.70 | $ 0.67 | $ 0.67 | $ 0.90 |
| Net realized and unrealized gain (loss) on investments | (0.73) | 1.46 | (0.63) | (0.83) | (0.03) |
| Net increase (decrease) from investment operations | $ (0.04) | $ 2.16 | $ 0.04 | $ (0.16) | $ 0.87 |
| Distributions to shareowners: | | | | | |
| Net investment income | $ (0.70) | $ (0.61) | $ (0.69) | $ (0.67) | $ (0.77) |
| Total distributions | $ (0.70) | $ (0.61) | $ (0.69) | $ (0.67) | $ (0.77) |
| Net increase (decrease) in net asset value | $ (0.74) | $ 1.55 | $ (0.65) | $ (0.83) | $ 0.10 |
| Net asset value, end of period | $ 11.28 | $ 12.02 | $ 10.47 | $ 11.12 | $ 11.95 |
| Total return (b) | (0.42)% | 21.05% | 0.44% | (1.32)% | 7.51% |
| Ratio of net expenses to average net assets | 0.55% | 0.57% | 0.58% | 0.56% | 0.56% |
| Ratio of net investment income (loss) to average net assets | 5.79% | 6.07% | 6.30% | 5.87% | 7.47% |
| Portfolio turnover rate | 73% | 106% | 126% | 108% | 126% |
| Net assets, end of period (in thousands) | $118,667 | $139,556 | $121,281 | $125,831 | $126,017 |
| Ratios with no waiver of fees and assumption of expenses by | | | | | |
| the Adviser and no reduction for fees paid indirectly: | | | | | | |
| Total expenses to average net assets | 0.55% | 0.57% | 0.58% | 0.57% | 0.56% |
| Net investment income (loss) to average net assets | 5.79% | 6.07% | 6.30% | 5.86% | 7.47% |
| (a) | | The per-share data presented above is based on the average shares outstanding for the period presented. |
| (b) | | Assumes initial investment at net asset value at the beginning of each period, reinvestment of all distributions, the complete redemption of the investment at net asset value at the end of each period and no sales charges. Total return would be reduced if sales charges were taken into account. |
The accompanying notes are an integral part of these financial statements.
54 Pioneer Multi-Asset Income Fund | Annual Report | 7/31/22
| | Year | Year | Year | Year | Year |
| | Ended | Ended | Ended | Ended | Ended |
| | 7/31/22 | 7/31/21 | 7/31/20 | 7/31/19 | 7/31/18 |
| Class R | | | | | |
| Net asset value, beginning of period | $11.64 | $10.19 | $ 10.83 | $11.64 | $11.74 |
| Increase (decrease) from investment operations: | | | | | |
| Net investment income (loss) (a) | $ 0.59 | $ 0.53 | $ 0.53 | $ 0.55 | $ 0.51 |
| Net realized and unrealized gain (loss) on investments | (0.66) | 1.40 | (0.60) | (0.81) | 0.06 |
| Net increase (decrease) from investment operations | $ (0.07) | $ 1.93 | $ (0.07) | $ (0.26) | $ 0.57 |
| Distributions to shareowners: | | | | | |
| Net investment income | $ (0.59) | $ (0.48) | $ (0.57) | $ (0.55) | $ (0.67) |
| Total distributions | $ (0.59) | $ (0.48) | $ (0.57) | $ (0.55) | $ (0.67) |
| Net increase (decrease) in net asset value | $ (0.66) | $ 1.45 | $ (0.64) | $ (0.81) | $ (0.10) |
| Net asset value, end of period | $10.98 | $11.64 | $ 10.19 | $10.83 | $11.64 |
| Total return (b) | (0.71)% | 19.27% | 0.57% | (2.22)% | 4.89% |
| Ratio of net expenses to average net assets | 1.18% | 1.80% | 1.63% | 1.57% | 1.37% |
| Ratio of net investment income (loss) to average net assets | 5.18% | 4.82% | 5.13% | 4.92% | 4.33% |
| Portfolio turnover rate | 73% | 106% | 126% | 108% | 126% |
| Net assets, end of period (in thousands) | $ 791 | $ 643 | $ 1,470 | $ 835 | $ 554 |
| Ratios with no waiver of fees and assumption of expenses by | | | | | |
| the Adviser and no reduction for fees paid indirectly: | | | | | |
| Total expenses to average net assets | 1.18% | 1.80% | 1.63% | 1.59% | 1.37% |
| Net investment income (loss) to average net assets | 5.18% | 4.82% | 5.13% | 4.90% | 4.33% |
| (a) | | The per-share data presented above is based on the average shares outstanding for the period presented. |
| (b) | | Assumes initial investment at net asset value at the beginning of each period, reinvestment of all distributions, the complete redemption of the investment at net asset value at the end of each period and no sales charges. Total return would be reduced if sales charges were taken into account. |
The accompanying notes are an integral part of these financial statements.
Pioneer Multi-Asset Income Fund | Annual Report | 7/31/22 55
Financial Highlights (continued)
| | Year | Year | Year | Year | Year |
| | Ended | Ended | Ended | Ended | Ended |
| | 7/31/22 | 7/31/21 | 7/31/20 | 7/31/19 | 7/31/18 |
| Class Y | | | | | |
| Net asset value, beginning of period | $ 11.63 | $ 10.13 | $ 10.77 | $ 11.57 | $ 11.67 |
| Increase (decrease) from investment operations: | | | | | |
| Net investment income (loss) (a) | $ 0.65 | $ 0.67 | $ 0.64 | $ 0.64 | $ 0.71 |
| Net realized and unrealized gain (loss) on investments | (0.67) | 1.41 | (0.62) | (0.80) | (0.06) |
| Net increase (decrease) from investment operations | $ (0.02) | $ 2.08 | $ 0.02 | $ (0.16) | $ 0.65 |
| Distributions to shareowners: | | | | | |
| Net investment income | $ (0.67) | $ (0.58) | $ (0.66) | $ (0.64) | $ (0.75) |
| Total distributions | $ (0.67) | $ (0.58) | $ (0.66) | $ (0.64) | $ (0.75) |
| Net increase (decrease) in net asset value | $ (0.69) | $ 1.50 | $ (0.64) | $ (0.80) | $ (0.10) |
| Net asset value, end of period | $ 10.94 | $ 11.63 | $ 10.13 | $ 10.77 | $ 11.57 |
| Total return (b) | (0.24)% | 20.97% | 0.27% | (1.36)% | 5.64% |
| Ratio of net expenses to average net assets | 0.65% | 0.65% | 0.65% | 0.65% | 0.65% |
| Ratio of net investment income (loss) to average net assets | 5.71% | 6.01% | 6.20% | 5.83% | 6.03% |
| Portfolio turnover rate | 73% | 106% | 126% | 108% | 126% |
| Net assets, end of period (in thousands) | $982,169 | $779,755 | $586,958 | $840,851 | $637,945 |
| Ratios with no waiver of fees and assumption of expenses by | | | | | |
| the Adviser and no reduction for fees paid indirectly: | | | | | | |
| Total expenses to average net assets | 0.66% | | 0.67% | 0.68% | 0.68% | 0.66% |
| Net investment income (loss) to average net assets | 5.70% | | 5.99% | 6.17% | 5.80% | 6.02% |
| (a) | | The per-share data presented above is based on the average shares outstanding for the period presented. |
| (b) | | Assumes initial investment at net asset value at the beginning of each period, reinvestment of all distributions, the complete redemption of the investment at net asset value at the end of each period and no sales charges. Total return would be reduced if sales charges were taken into account. |
The accompanying notes are an integral part of these financial statements.
56 Pioneer Multi-Asset Income Fund | Annual Report | 7/31/22
Notes to Financial Statements | 7/31/22
1. Organization and Significant Accounting Policies
Pioneer Multi-Asset Income Fund (the “Fund”) is one of three portfolios comprising Pioneer Series Trust IV (the "Trust"), a Delaware statutory trust. The Fund is registered under the Investment Company Act of 1940 (the “1940 Act”) as a diversified, open-end management investment company. The investment objective of the Fund is to seek a high level of current income to the extent consistent with a relatively high level of stability of principal.
The Fund offers five classes of shares designated as Class A, Class C, Class K, Class R and Class Y shares. Each class of shares represents an interest in the same portfolio of investments of the Fund and has identical rights (based on relative net asset values) to assets and liquidation proceeds.Share classes can bear different rates of class-specific fees and expenses, such as transfer agent and distribution fees. Differences in class-specific fees and expenses will result in differences in net investment income and, therefore, the payment of different dividends from net investment income earned by each class. The Amended and Restated Declaration of Trust of the Trust gives the Board of Trustees the flexibility to specify either per-share voting or dollar-weighted voting when submitting matters for shareowner approval. Under per-share voting, each share of a class of the Trust is entitled to one vote. Under dollar-weighted voting, a shareowner’s voting power is determined not by the number of shares owned, but by the dollar value of the shares on the record date. Each share class has exclusive voting rights with respect to matters affecting only that class, including with respect to the distribution plan for that class. There is no distribution plan for Class K or Class Y shares.
Amundi Asset Management US, Inc., an indirect, wholly owned subsidiary of Amundi and Amundi’s wholly owned subsidiary, Amundi USA, Inc., serves as the Fund’s investment adviser (the “Adviser”). Amundi Distributor US, Inc., an affiliate of the Adviser, serves as the Fund’s distributor (the “Distributor”).
In March 2020, FASB issued an Accounting Standard Update, ASU 2020-04, Reference Rate Reform (Topic 848) — Facilitation of the Effects of Reference Rate Reform on Financial Reporting (“ASU 2020-04”), which provides optional, temporary relief with respect to the financial reporting of contracts subject to certain types of modifications due to the planned discontinuation of the London Interbank Offered Rate (“LIBOR”) and other LIBOR-based reference rates at the end of 2021. The temporary relief provided by ASU 2020-04 is effective for certain reference rate-related contract modifications that occur during the period from March 12, 2020
Pioneer Multi-Asset Income Fund | Annual Report | 7/31/22 57
through December 31, 2023. Management is evaluating the impact of ASU 2020-04 on the Fund's investments, derivatives, debt and other contracts, if applicable, that will undergo reference rate-related modifications as a result of the reference rate reform.
Effective August 19, 2022, the Fund was required to comply with Rule 18f-4 under the 1940 Act, which governs the use of derivatives by registered investment companies. Rule 18f-4 permits funds to enter into derivatives transactions (as defined in Rule 18f-4) and certain other transactions notwithstanding the restrictions on the issuance of “senior securities” under Section 18 of the 1940 Act. Rule 18f-4 requires a fund to establish and maintain a comprehensive derivatives risk management program, appoint a derivatives risk manager and comply with a relative or absolute limit on fund leverage risk calculated based on value-at-risk (“VaR”), unless the fund uses derivatives in only a limited manner. Management anticipates Rule 18f-4 will not have a material impact on the Fund.
The Fund is an investment company and follows investment company accounting and reporting guidance under U.S. Generally Accepted Accounting Principles (“U.S. GAAP”). U.S. GAAP requires the management of the Fund to make estimates and assumptions that affect the reported amounts of assets and liabilities, the disclosure of contingent assets and liabilities at the date of the financial statements, and the reported amounts of income, expenses and gain or loss on investments during the reporting period. Actual results could differ from those estimates.
The following is a summary of significant accounting policies followed by the Fund in the preparation of its financial statements:
The net asset value of the Fund is computed once daily, on each day the New York Stock Exchange (“NYSE”) is open, as of the close of regular trading on the NYSE.
Equity securities that have traded on an exchange are valued by using the last sale price on the principal exchange where they are traded. Equity securities that have not traded on the date of valuation, or securities for which sale prices are not available, generally are valued using the mean between the last bid and asked prices or, if both last bid and asked prices are not available, at the last quoted bid price. Last sale and bid and asked prices are provided by independent third party pricing services. In the case of equity securities not traded on an exchange, prices are typically determined by independent third party pricing services using a variety of techniques and methods.
The value of foreign securities is translated into U.S. dollars based on foreign currency exchange rate quotations supplied by a third party pricing source. Trading in non-U.S. equity securities is substantially completed
58 Pioneer Multi-Asset Income Fund | Annual Report | 7/31/22
each day at various times prior to the close of the NYSE. The values of such securities used in computing the net asset value of the Fund's shares are determined as of such times. The Fund may use a fair value model developed by an independent pricing service to value non-U.S. equity securities.
Equity-linked notes and fixed-income securities are valued by using prices supplied by independent pricing services, which consider such factors as market prices, market events, quotations from one or more brokers, Treasury spreads, yields, maturities and ratings, or may use a pricing matrix or other fair value methods or techniques to provide an estimated value of the security or instrument. A pricing matrix is a means of valuing a debt security on the basis of current market prices for other debt securities, historical trading patterns in the market for fixed-income securities and/or other factors. Non-U.S. debt securities that are listed on an exchange will be valued at the bid price obtained from an independent third party pricing service. When independent third party pricing services are unable to supply prices, or when prices or market quotations are considered to be unreliable, the value of that security may be determined using quotations from one or more broker-dealers.
Loan interests are valued at the mean between the last available bid and asked prices from one or more brokers or dealers as obtained from Loan Pricing Corporation, an independent third party pricing service. If price information is not available from Loan Pricing Corporation, or if the price information is deemed to be unreliable, price information will be obtained from an alternative loan interest pricing service. If no reliable price quotes are available from either the primary or alternative pricing service, broker quotes will be solicited.
Event-linked bonds are valued at the bid price obtained from an independent third party pricing service. Other insurance-linked securities (including reinsurance sidecars, collateralized reinsurance and industry loss warranties) may be valued at the bid price obtained from an independent pricing service, or through a third party using a pricing matrix, insurance industry valuation models, or other fair value methods or techniques to provide an estimated value of the instrument.
Options contracts are generally valued at the mean between the last bid and ask prices on the principal exchange where they are traded. Over-the-counter (“OTC”) options and options on swaps (“swaptions”) are valued using prices supplied by independent pricing services, which consider such factors as market prices, market events, quotations from one or more brokers, Treasury spreads, yields, maturities and ratings, or may use a pricing matrix or other fair value methods or techniques to provide an estimated value of the security or instrument.
Pioneer Multi-Asset Income Fund | Annual Report | 7/31/22 59
Forward foreign currency exchange contracts are valued daily using the foreign exchange rate or, for longer term forward contract positions, the spot currency rate and the forward points on a daily basis, in each case provided by a third party pricing service. Contracts whose forward settlement date falls between two quoted days are valued by interpolation.
Futures contracts are generally valued at the closing settlement price established by the exchange on which they are traded.
Swap contracts, including interest rate swaps, caps and floors (other than centrally cleared swap contracts), are valued at the dealer quotations obtained from reputable International Swap Dealers Association members. Centrally cleared swaps are valued at the daily settlement price provided by the central clearing counterparty.
Shares of open-end registered investment companies (including money market mutual funds) are valued at such funds’ net asset value. Shares of exchange-listed closed-end funds are valued by using the last sale price on the principal exchange where they are traded.
Repurchase agreements are valued at par. Cash may include overnight time deposits at approved financial institutions.
Securities or loan interests for which independent pricing services or broker-dealers are unable to supply prices or for which market prices and/or quotations are not readily available or are considered to be unreliable are valued by a fair valuation team comprised of certain personnel of the Adviser. Effective September 8, 2022, the Adviser is designated as the valuation designee for the Fund pursuant to Rule 2a-5 under the 1940 Act. The Adviser’s fair valuation team is responsible for monitoring developments that may impact fair valued securities.
Inputs used when applying fair value methods to value a security may include credit ratings, the financial condition of the company, current market conditions and comparable securities. The Fund may use fair value methods if it is determined that a significant event has occurred after the close of the exchange or market on which the security trades and prior to the determination of the Fund's net asset value. Examples of a significant event might include political or economic news, corporate restructurings, natural disasters, terrorist activity or trading halts. Thus, the valuation of the Fund's securities may differ significantly from exchange prices, and such differences could be material.
At July 31, 2022, four securities were valued using fair value methods (in addition to securities valued using prices supplied by independent pricing services, broker-dealers or using a third party insurance pricing model) representing 0.07% of net assets. The value of these fair valued securities was $1,302,298.
60 Pioneer Multi-Asset Income Fund | Annual Report | 7/31/22
| B. | | Investment Income and Transactions |
Dividend income is recorded on the ex-dividend date, except that certain dividends from foreign securities where the ex-dividend date may have passed are recorded as soon as the Fund becomes aware of the ex-dividend data in the exercise of reasonable diligence.
Interest income, including interest on income-bearing cash accounts, is recorded on the accrual basis. Dividend and interest income are reported net of unrecoverable foreign taxes withheld at the applicable country rates and net of income accrued on defaulted securities.
Interest and dividend income payable by delivery of additional shares is reclassified as PIK (payment-in-kind) income upon receipt and is included in interest and dividend income, respectively.
Principal amounts of mortgage-backed securities are adjusted for monthly paydowns. Premiums and discounts related to certain mortgage-backed securities are amortized or accreted in proportion to the monthly paydowns. All discounts/premiums on purchase prices of debt securities are accreted/amortized for financial reporting purposes over the life of the respective securities, and such accretion/amortization is included in interest income.
Security transactions are recorded as of trade date. Gains and losses on sales of investments are calculated on the identified cost method for both financial reporting and federal income tax purposes.
| C. | | Foreign Currency Translation |
The books and records of the Fund are maintained in U.S. dollars. Amounts denominated in foreign currencies are translated into U.S. dollars using current exchange rates.
Net realized gains and losses on foreign currency transactions, if any, represent, among other things, the net realized gains and losses on foreign currency exchange contracts, disposition of foreign currencies and the difference between the amount of income accrued and the U.S. dollars actually received. Further, the effects of changes in foreign currency exchange rates on investments are not segregated on the Statement of Operations from the effects of changes in the market prices of those securities, but are included with the net realized and unrealized gain or loss on investments.
It is the Fund's policy to comply with the requirements of the Internal Revenue Code applicable to regulated investment companies and to distribute all of its net taxable income and net realized capital gains, if any,
Pioneer Multi-Asset Income Fund | Annual Report | 7/31/22 61
to its shareowners. Therefore, no provision for federal income taxes is required. As of July 31, 2022, the Fund did not accrue any interest or penalties with respect to uncertain tax positions, which, if applicable, would be recorded as an income tax expense on the Statement of Operations. Tax returns filed within the prior three years remain subject to examination by federal and state tax authorities.
In determining the daily net asset value, the Fund estimates the reserve for the repatriation of taxes, if any, associated with its investments in certain countries. The estimated reserve for capital gains is based on the net unrealized appreciation on certain portfolio securities, the holding period of such securities and the related tax rates, tax loss carryforwards (if applicable) and other such factors. As of July 31, 2022, the Fund had accrued $0 in reserve for repatriation taxes related to capital gains.
A portion of the dividend income recorded by the Fund is from distributions by publicly traded real estate investment trusts (“REITs”), and such distributions for tax purposes may also consist of capital gains and return of capital. The actual return of capital and capital gains portions of such distributions will be determined by formal notifications from the REITs subsequent to the calendar year-end. Distributions received from the REITs that are determined to be a return of capital are recorded by the Fund as a reduction of the cost basis of the securities held and those determined to be capital gain are reflected as such on the Statement of Operations.
The amount and character of income and capital gain distributions to shareowners are determined in accordance with federal income tax rules, which may differ from U.S. GAAP. Distributions in excess of net investment income or net realized gains are temporary over distributions for financial statement purposes resulting from differences in the recognition or classification of income or distributions for financial statement and tax purposes. Capital accounts within the financial statements are adjusted for permanent book/tax differences to reflect tax character, but are not adjusted for temporary differences.
At July 31, 2022, the Fund reclassified $46,990 to increase distributable earnings and $46,990 to decrease paid-in capital to reflect permanent book/tax differences. These adjustments have no impact on net assets or the results of operations.
At July 31, 2022, the Fund was permitted to carry forward indefinitely $78,202,545 of short-term losses and $80,762,545 of long-term losses.
During the year ended July 31, 2022, a capital loss carryforward of $63,546,597 was utilized to offset net realized gains by the Fund.
At July 31, 2022, the Fund deferred $1,405,718 of late year ordinary losses, which will be recognized by the Fund as occurring at the start of the next fiscal year ending July 31, 2023.
62 Pioneer Multi-Asset Income Fund | Annual Report | 7/31/22
The tax character of distributions paid during the years ended July 31, 2022 and July 31, 2021, was as follows:
| | 2022 | 2021 |
| Distributions paid from: | | |
| Ordinary income | $94,261,782 | $70,672,793 |
| Total | $94,261,782 | $ 70,672,793 |
The following shows the components of distributable earnings (losses) on a federal income tax basis at July 31, 2022:
| | 2022 |
| Distributable earnings/(losses): | |
| Capital loss carryforward | $(158,965,090) |
| Other book/tax temporary differences | (547,468) |
| Net unrealized depreciation | (41,296,661) |
| Qualified late year loss deferral | (1,405,718) |
| Total | $(202,214,937) |
The difference between book-basis and tax-basis net unrealized depreciation is attributable to the tax deferral of losses on wash sales, adjustments relating to event-linked bonds, the tax treatment of premium and amortization, the mark to market of futures contracts, tax basis adjustments on REIT holdings and common stock.
The Fund records sales and repurchases of its shares as of trade date. The Distributor earned $152,531 in underwriting commissions on the sale of Class A shares during the year ended July 31, 2022.
Income, common expenses and realized and unrealized gains and losses are calculated at the Fund level and allocated daily to each class of shares based on its respective percentage of adjusted net assets at the beginning of the day.
Distribution fees are calculated based on the average daily net asset value attributable to Class A, Class C and Class R shares of the Fund, respectively (see Note 5). Class K and Class Y shares do not pay distribution fees. All expenses and fees paid to the Fund's transfer agent for its services are allocated among the classes of shares based on the number of accounts in each class and the ratable allocation of related out-of-pocket expenses (see Note 4).
The Fund declares as daily dividends substantially all of its net investment income. All dividends are paid on a monthly basis. Short-term capital gain distributions, if any, may be declared with the daily dividends.
Pioneer Multi-Asset Income Fund | Annual Report | 7/31/22 63
Distributions to shareowners are recorded as of the ex-dividend date. Distributions paid by the Fund with respect to each class of shares are calculated in the same manner and at the same time, except that net investment income dividends to Class A, Class C, Class K, Class R and Class Y shares can reflect different transfer agent and distribution expense rates.
The value of securities held by the Fund may go up or down, sometimes rapidly or unpredictably, due to general market conditions, such as real or perceived adverse economic, political or regulatory conditions, recessions, the spread of infectious illness or other public health issues, inflation, changes in interest rates, armed conflict including Russia's military invasion of Ukraine, sanctions against Russia, other nations or individuals or companies and possible countermeasures, lack of liquidity in the bond markets or adverse investor sentiment. In the past several years, financial markets have experienced increased volatility, depressed valuations, decreased liquidity and heightened uncertainty. These conditions may continue, recur, worsen or spread. Interest rates are very low, which means there is more risk that they may go up. The U.S. Federal Reserve has recently started to raise certain interest rates. A general rise in interest rates could adversely affect the price and liquidity of fixed-income securities and could also result in increased redemptions from the Fund. Rates of inflation have recently risen. The value of assets or income from an investment may be worth less in the future as inflation decreases the value of money. As inflation increases, the real value of the Fund’s assets can decline as can the value of the Fund’s distributions.
The global pandemic of the novel coronavirus respiratory disease designated COVID-19 has resulted in major disruption to economies and markets around the world, including the United States. Global financial markets have experienced extreme volatility and severe losses, and trading in many instruments has been disrupted. Liquidity for many instruments has been greatly reduced for periods of time. Some sectors of the economy and individual issuers have experienced particularly large losses. These circumstances may continue for an extended period of time, and may continue to affect adversely the value and liquidity of the Fund’s investments. Following Russia’s invasion of Ukraine, Russian securities have lost all, or nearly all, their market value. Other securities or markets could be similarly affected by past or future geopolitical or other events or conditions.
Governments and central banks, including the U.S. Federal Reserve, have taken extraordinary and unprecedented actions to support local and global economies and the financial markets. These actions have resulted in
64 Pioneer Multi-Asset Income Fund | Annual Report | 7/31/22
significant expansion of public debt, including in the U.S. The consequences of high public debt, including its future impact on the economy and securities markets, may not be known for some time.
At times, the Fund’s investments may represent industries or industry sectors that are interrelated or have common risks, making the Fund more susceptible to any economic, political, or regulatory developments or other risks affecting those industries and sectors.
The Fund’s investments in foreign markets and countries with limited developing markets may subject the Fund to a greater degree of risk than investments in a developed market. These risks include disruptive political or economic conditions, military conflicts and sanctions, terrorism, sustained economic downturns, financial instability, less liquid trading markets, extreme price volatility, currency risks, reduction of government or central bank support, inadequate accounting standards, tariffs, tax disputes or other tax burdens, nationalization or expropriation of assets, and the imposition of adverse governmental laws, arbitrary application of laws and regulations or lack of rule of law and investment and repatriation restrictions. Lack of information and less market regulation also may affect the value of these securities. Withholding and other non-U.S. taxes may decrease the Fund's return. Non-U.S. issuers may be located in parts of the world that have historically been prone to natural disasters. Investing in depositary receipts is subject to many of the same risks as investing directly in non-U.S. issuers. Depositary receipts may involve higher expenses and may trade at a discount (or premium) to the underlying security.
The Fund invests in below-investment-grade (high-yield) debt securities and preferred stocks. Some of these high-yield securities may be convertible into equity securities of the issuer. Debt securities rated below-investment-grade are commonly referred to as “junk bonds” and are considered speculative with respect to the issuer’s capacity to pay interest and repay principal. These securities involve greater risk of loss, are subject to greater price volatility, and may be less liquid and more difficult to value, especially during periods of economic uncertainty or change, than higher rated debt securities.
The Fund's investments, payment obligations and financing terms may be based on floating rates, such as LIBOR (London Interbank Offered Rate) or SOFR (Secured Overnight Financing Rate). ICE Benchmark Administration, the administrator of LIBOR, ceased publication of most LIBOR settings on a representative basis at the end of 2021 and is expected to cease publication of a majority of U.S. dollar LIBOR settings on a representative basis after June 30, 2023. In addition, global regulators have announced that, with limited exceptions, no new LIBOR-based contracts should be
Pioneer Multi-Asset Income Fund | Annual Report | 7/31/22 65
entered into after 2021. Actions by regulators have resulted in the establishment of alternative reference rates to LIBOR in most major currencies. Markets are developing in response to these new rates, but questions around liquidity in these rates and how to appropriately adjust these rates to eliminate any economic value transfer at the time of transition remain a significant concern. The effect of any changes to - or discontinuation of - LIBOR on the Fund will vary depending on, among other things, existing fallback provisions in individual contracts and whether, how, and when industry participants develop and widely adopt new reference rates and fallbacks for both legacy and new products and instruments. In March, 2022, the U.S. federal government enacted legislation to establish a process for replacing LIBOR in existing contracts that do not already provide for the use of a clearly defined or practicable replacement benchmark rate as described in the legislation. Generally speaking, for contracts that do not contain a fallback provision as described in the legislation, a benchmark replacement recommended by the Federal Reserve Board will effectively automatically replace the USD LIBOR benchmark in the contract after June 30, 2023. The recommended benchmark replacement will be based on the SOFR published by the Federal Reserve Bank of New York, including any recommended spread adjustment and benchmark replacement conforming changes. The process of transitioning from LIBOR may involve, among other things, increased volatility or illiquidity in markets for instruments that rely on LIBOR. The transition may also result in a reduction in the value of certain LIBOR-based investments held by the Fund or reduce the effectiveness of related transactions such as hedges. Any such effects of the transition away from LIBOR, as well as other unforeseen effects, could result in losses for the Fund. Because the usefulness of LIBOR as a benchmark may deteriorate during the transition period, these effects could occur at any time.
The Fund may invest in equity-linked notes (ELNs). ELNs may not perform as expected and could cause the fund to realize significant losses including its entire principal investment. Investments in ELNs often have risks similar to their underlying securities, which may include market risk and, as applicable, risks of non-U.S. investments and currency risks. In addition, since ELNs are in note form, ELNs are also subject to certain risks of fixed income securities, such as interest rate and credit risks. Investments in ELNs are also subject to liquidity risk, which may make ELNs difficult to sell and value. In addition, ELNs may exhibit price behavior that does not correlate with the underlying securities or a fixed income investment.
The Fund may invest in REIT securities, the value of which can fall for a variety of reasons, such as declines in rental income, fluctuating interest rates, poor property management, environmental liabilities, uninsured damage, increased competition, or changes in real estate tax laws.
66 Pioneer Multi-Asset Income Fund | Annual Report | 7/31/22
Russia launched a large-scale invasion of Ukraine on February 24, 2022. In response to the military action by Russia, various countries, including the U.S., the United Kingdom, and European Union issued broad-ranging economic sanctions against Russia and Belarus and certain companies and individuals. Since then, Russian securities have lost all, or nearly all, their market value, and many other issuers, securities and markets have been adversely affected. The United States and other countries may impose sanctions on other countries, companies and individuals in light of Russia’s military invasion. The extent and duration of the military action or future escalation of such hostilities, the extent and impact of existing and future sanctions, market disruptions and volatility, and the result of any diplomatic negotiations cannot be predicted. These and any related events could have a significant impact on the value and liquidity of certain Fund investments, on Fund performance and the value of an investment in the Fund, particularly with respect to securities and commodities, such as oil, natural gas and food commodities, with respect to the issuer’s capacity to pay interest and repay principal, as well as other sectors with exposure to Russian issuers or issuers in other countries affected by the invasion, and are likely to have collateral impacts on market sectors globally.
With the increased use of technologies such as the Internet to conduct business, the Fund is susceptible to operational, information security and related risks. While the Fund’s Adviser has established business continuity plans in the event of, and risk management systems to prevent, limit or mitigate, such cyber-attacks, there are inherent limitations in such plans and systems, including the possibility that certain risks have not been identified. Furthermore, the Fund cannot control the cybersecurity plans and systems put in place by service providers to the Fund such as the Fund’s custodian and accounting agent, and the Fund’s transfer agent. In addition, many beneficial owners of Fund shares hold them through accounts at broker-dealers, retirement platforms and other financial market participants over which neither the Fund nor the Adviser exercises control. Each of these may in turn rely on service providers to them, which are also subject to the risk of cyber-attacks. Cybersecurity failures or breaches at the Adviser or the Fund’s service providers or intermediaries have the ability to cause disruptions and impact business operations, potentially resulting in financial losses, interference with the Fund’s ability to calculate its net asset value, impediments to trading, the inability of Fund shareowners to effect share purchases, redemptions or exchanges or receive distributions, loss of or unauthorized access to private shareowner information and violations of applicable privacy and other laws, regulatory fines, penalties, reputational damage, or additional compliance costs. Such costs and
Pioneer Multi-Asset Income Fund | Annual Report | 7/31/22 67
losses may not be covered under any insurance. In addition, maintaining vigilance against cyber-attacks may involve substantial costs over time, and system enhancements may themselves be subject to cyber-attacks.
The Fund’s prospectus contains unaudited information regarding the Fund’s principal risks. Please refer to that document when considering the Fund’s principal risks.
Restricted Securities are subject to legal or contractual restrictions on resale. Restricted securities generally are resold in transactions exempt from registration under the Securities Act of 1933. Private placement securities are generally considered to be restricted except for those securities traded between qualified institutional investors under the provisions of Rule 144A of the Securities Act of 1933.
Disposal of restricted investments may involve negotiations and expenses, and prompt sale at an acceptable price may be difficult to achieve. Restricted investments held by the Fund at July 31, 2022 are listed in the Schedule of Investments.
| I. | | Insurance-Linked Securities (“ILS”) |
The Fund invests in ILS. The Fund could lose a portion or all of the principal it has invested in an ILS, and the right to additional interest or dividend payments with respect to the security, upon the occurrence of one or more trigger events, as defined within the terms of an insurance-linked security. Trigger events, generally, are hurricanes, earthquakes, or other natural events of a specific size or magnitude that occur in a designated geographic region during a specified time period, and/or that involve losses or other metrics that exceed a specific amount. There is no way to accurately predict whether a trigger event will occur, and accordingly, ILS carry significant risk. The Fund is entitled to receive principal, and interest and/or dividend payments so long as no trigger event occurs of the description and magnitude specified by the instrument. In addition to the specified trigger events, ILS may expose the Fund to other risks, including but not limited to issuer (credit) default, adverse regulatory or jurisdictional interpretations and adverse tax consequences.
The Fund’s investments in ILS may include event-linked bonds. ILS also may include special purpose vehicles (“SPVs”) or similar instruments structured to comprise a portion of a reinsurer’s catastrophe-oriented business, known as quota share instruments (sometimes referred to as reinsurance sidecars), or to provide reinsurance relating to specific risks to insurance or reinsurance companies through a collateralized instrument, known as collateralized reinsurance. Structured reinsurance investments also may include industry loss warranties (“ILWs”). A traditional ILW takes
68 Pioneer Multi-Asset Income Fund | Annual Report | 7/31/22
the form of a bilateral reinsurance contract, but there are also products that take the form of derivatives, collateralized structures, or exchange-traded instruments.
Where the ILS are based on the performance of underlying reinsurance contracts, the Fund has limited transparency into the individual underlying contracts, and therefore must rely upon the risk assessment and sound underwriting practices of the issuer. Accordingly, it may be more difficult for the Adviser to fully evaluate the underlying risk profile of the Fund's structured reinsurance investments, and therefore the Fund's assets are placed at greater risk of loss than if the Adviser had more complete information. Structured reinsurance instruments generally will be considered illiquid securities by the Fund. These securities may be difficult to purchase, sell or unwind. Illiquid securities also may be difficult to value. If the Fund is forced to sell an illiquid asset, the Fund may be forced to sell at a loss.
Repurchase agreements are arrangements under which the Fund purchases securities from a broker-dealer or a bank, called the counterparty, upon the agreement of the counterparty to repurchase the securities from the Fund at a later date, and at a specific price, which is typically higher than the purchase price paid by the Fund. The securities purchased serve as the Fund’s collateral for the obligation of the counterparty to repurchase the securities. The value of the collateral, including accrued interest, is required to be equal to or in excess of the repurchase price. The collateral for all repurchase agreements is held in safekeeping in the customer-only account of the Fund’s custodian or a sub-custodian of the Fund. The Adviser is responsible for determining that the value of the collateral remains at least equal to the repurchase price. In the event of a default by the counterparty, the Fund is entitled to sell the securities, but the Fund may not be able to sell them for the price at which they were purchased, thus causing a loss to the Fund. Additionally, if the counterparty becomes insolvent, there is some risk that the Fund will not have a right to the securities, or the immediate right to sell the securities.
For the year ended July 31, 2022, the Fund had no open repurchase agreements.
The Fund may purchase put and call options to seek to increase total return. Purchased call and put options entitle the Fund to buy and sell a specified number of shares or units of a particular security, currency or index at a specified price at a specific date or within a specific period of time. Upon the purchase of a call or put option, the premium paid by the
Pioneer Multi-Asset Income Fund | Annual Report | 7/31/22 69
Fund is included on the Statement of Assets and Liabilities as an investment. All premiums are marked-to-market daily, and any unrealized appreciation or depreciation is recorded on the Fund’s Statement of Operations. As the purchaser of an index option, the Fund has the right to receive a cash payment equal to any depreciation in the value of the index below the strike price of the option (in the case of a put) or equal to any appreciation in the value of the index over the strike price of the option (in the case of a call) as of the valuation date of the option. Premiums paid for purchased call and put options which have expired are treated as realized losses on investments on the Statement of Operations. Upon the exercise or closing of a purchased put option, the premium is offset against the proceeds on the sale of the underlying security or financial instrument in order to determine the realized gain or loss on investments. Upon the exercise or closing of a purchased call option, the premium is added to the cost of the security or financial instrument. The risk associated with purchasing options is limited to the premium originally paid.
The average market value of purchased options contracts open during the year ended July 31, 2022, was $1,470,355. There were no open purchased options contracts at July 31, 2022.
| L. | | Forward Foreign Currency Exchange Contracts |
The Fund may enter into forward foreign currency exchange contracts ("contracts") for the purchase or sale of a specific foreign currency at a fixed price on a future date. All contracts are marked-to-market daily at the applicable exchange rates, and any resulting unrealized appreciation or depreciation is recorded in the Fund's financial statements. The Fund records realized gains and losses at the time a contract is offset by entry into a closing transaction or extinguished by delivery of the currency. Risks may arise upon entering into these contracts from the potential inability of counterparties to meet the terms of the contract and from unanticipated movements in the value of foreign currencies relative to the U.S. dollar (see Note 8).
During the year ended July 31, 2022, the Fund had entered into various forward foreign currency exchange contracts that obligated the Fund to deliver or take delivery of currencies at specified future maturity dates.
Alternatively, prior to the settlement date of a forward foreign currency exchange contract, the Fund may close out such contract by entering into an offsetting contract.
The average market value of forward foreign currency exchange contracts open during the year ended July 31, 2022, was $6,385,929. There were no open forward foreign currency exchange contracts outstanding at July 31, 2022.
70 Pioneer Multi-Asset Income Fund | Annual Report | 7/31/22
The Fund may enter into futures transactions in order to attempt to hedge against changes in interest rates, securities prices and currency exchange rates or to seek to increase total return. Futures contracts are types of derivatives. All futures contracts entered into by the Fund are traded on a futures exchange. Upon entering into a futures contract, the Fund is required to deposit with a broker an amount of cash or securities equal to the minimum “initial margin” requirements of the associated futures exchange. The amount of cash deposited with the broker as collateral at July 31, 2022, is recorded as “Futures collateral” on the Statement of Assets and Liabilities.
Subsequent payments for futures contracts ("variation margin") are paid or received by the Fund, depending on the daily fluctuation in the value of the contracts, and are recorded by the Fund as unrealized appreciation or depreciation. Cash received from or paid to the broker related to previous margin movement is held in a segregated account at the broker and is recorded as either "Due from broker for futures" or "Due to broker for futures" on the Statement of Assets and Liabilities. When the contract is closed, the Fund realizes a gain or loss equal to the difference between the opening and closing value of the contract as well as any fluctuation in foreign currency exchange rates where applicable. Futures contracts are subject to market risk, interest rate risk and currency exchange rate risk. Changes in value of the contracts may not directly correlate to the changes in value of the underlying securities. With futures, there is reduced counterparty credit risk to the Fund since futures are exchange-traded and the exchange's clearinghouse, as counterparty to all exchange-traded futures, guarantees the futures against default.
The average market value of futures contracts open during the year ended July 31, 2022, was $(229,240,583). Open futures contracts outstanding at July 31, 2022, are listed in the Schedule of Investments.
Equity-linked notes seek to generate income and provide exposure to the performance of an underlying security, group of securities or exchange-traded funds (the “underlying reference instrument”). In an equity-linked note, the Fund purchases a note from a bank or broker-dealer and in return, the issuer provides for interest payments during the term of the note. At maturity or when the security is sold, the Fund will either settle by taking physical delivery of the underlying reference instrument or by receipt of a cash settlement amount equal to the value of the note at termination or maturity. The use of equity-linked notes involves the risk that the value of the note changes unfavorably due to movements in the value of the underlying reference instrument. Equity-linked notes are
Pioneer Multi-Asset Income Fund | Annual Report | 7/31/22 71
considered general unsecured contractual obligations of the bank or broker-dealer. The Fund must rely on the creditworthiness of the issuer for its investment returns.
2. Management Agreement
The Adviser manages the Fund’s portfolio. Management fees payable under the Fund's Investment Management Agreement with the Adviser are calculated daily and paid monthly at the annual rate of 0.50% of the Fund’s average daily net assets up to $1 billion, 0.45% of the next $4 billion and 0.40% on assets over $5 billion. For the year ended July 31, 2022, the effective management fee (excluding waivers and/or assumption of expenses) was equivalent to 0.48% of the Fund’s average daily net assets.
The Adviser agreed to waive and/or reimburse its management fee with respect to any portion of the Fund’s assets invested in Pioneer Floating Rate Fund, Inc., an affiliated fund managed by the Adviser. For the year ended July 31, 2022, the Adviser waived $246 in management fees with respect to the Fund, which is reflected on the Statement of Operations as an expense waiver.
The Adviser has contractually agreed to limit ordinary operating expenses (ordinary operating expenses means all fund expenses other than taxes, brokerage commissions, acquired fund fees and expenses and extraordinary expenses, such as litigation) of the Fund to the extent required to reduce Fund expenses to 0.85% and 0.65% of the average daily net assets attributable to Class A and Class Y shares, respectively. These expense limitations are in effect through December 1, 2022. There can be no assurance that the Adviser will extend the expense limitation agreement for a class of shares beyond the date referred to above. Fees waived and expenses reimbursed during the year ended July 31, 2022, are reflected on the Statement of Operations.
In addition, under the management and administration agreements, certain other services and costs, including accounting, regulatory reporting and insurance premiums, are paid by the Fund as administrative reimbursements. Included in “Due to affiliates” reflected on the Statement of Assets and Liabilities is $181,049 in management fees, administrative costs and certain other reimbursements payable to the Adviser at July 31, 2022.
3. Compensation of Trustees and Officers
The Fund pays an annual fee to its Trustees. The Adviser reimburses the Fund for fees paid to the Interested Trustees. The Fund does not pay any salary or other compensation to its officers. For the year ended July 31, 2022, the Fund paid $74,802 in Trustees’ compensation, which is reflected on the Statement of Operations as Trustees’ fees. At July 31, 2022, the Fund had a payable for Trustees’ fees on its Statement of Assets and Liabilities of $1,185.
72 Pioneer Multi-Asset Income Fund | Annual Report | 7/31/22
4. Transfer Agent
For the period from August 1, 2021 to November 21, 2021, DST Asset Manager Solutions, Inc. served as the transfer agent to the Fund at negotiated rates. Effective November 22, 2021, BNY Mellon Investment Servicing (US) Inc. serves as the transfer agent to the Fund at negotiated rates. Transfer agent fees and payables shown on the Statement of Operations and the Statement of Assets and Liabilities, respectively, include sub-transfer agent expenses incurred through the Fund’s omnibus relationship contracts.
In addition, the Fund reimbursed the transfer agent for out-of-pocket expenses incurred by the transfer agent related to shareowner communications activities such as proxy and statement mailings, and outgoing phone calls. For the year ended July 31, 2022, such out-of-pocket expenses by class of shares were as follows:
| Shareowner Communications: | |
| Class A | $ 7,496 |
| Class C | 14,947 |
| Class K | 29 |
| Class R | 251 |
| Class Y | 30,900 |
| Total | $53,623 |
5. Distribution and Service Plans
The Fund has adopted a distribution plan (the “Plan”) pursuant to Rule 12b-1 of the Investment Company Act of 1940 with respect to its Class A, Class C and Class R shares. Pursuant to the Plan, the Fund pays the Distributor 0.25% of the Fund's average daily net assets attributable to Class A shares as compensation for personal services and/or account maintenance services or distribution services with regard to Class A shares. Pursuant to the Plan, the Fund also pays the Distributor 1.00% of the average daily net assets attributable to Class C shares. The fee for Class C shares consists of a 0.25% service fee and a 0.75% distribution fee paid as compensation for personal services and/or account maintenance services or distribution services with regard to Class C shares. Pursuant to the Plan, the Fund further pays the Distributor 0.50% of the average daily net assets attributable to Class R shares for distribution services. Included in “Due to affiliates” reflected on the Statement of Assets and Liabilities is $47,934 in distribution fees payable to the Distributor at July 31, 2022.
The Fund also has adopted a separate service plan for Class R shares (the “Service Plan”). The Service Plan authorizes the Fund to pay securities dealers, plan administrators or other service organizations that agree to
Pioneer Multi-Asset Income Fund | Annual Report | 7/31/22 73
provide certain services to retirement plans or plan participants holding shares of the Fund a service fee of up to 0.25% of the Fund’s average daily net assets attributable to Class R shares held by such plans.
In addition, redemptions of Class A and Class C shares may be subject to a contingent deferred sales charge (“CDSC”). A CDSC of 1.00% may be imposed on redemptions of certain net asset value purchases of Class A shares within 12 months of purchase. Redemptions of Class C shares within 12 months of purchase are subject to a CDSC of 1.00% based on the lower of cost or market value of shares being redeemed. Shares purchased as part of an exchange remain subject to any CDSC that applied to the original purchase of those shares. There is no CDSC for Class K, Class R or Class Y shares. Proceeds from the CDSCs are paid to the Distributor. For the year ended July 31, 2022, CDSCs in the amount of $18,501 were paid to the Distributor.
6. Line of Credit Facility
The Fund, along with certain other funds in the Pioneer Family of Funds, participates in a committed, unsecured revolving line of credit (“credit facility”). Borrowings are used solely for temporary or emergency purposes. The Fund may borrow up to the lesser of the amount available under the credit facility or the limits set for borrowing by the Fund’s prospectus and the 1940 Act. Effective February 2, 2022, the Fund participates in a credit facility in the amount of $380 million. Prior to February 2, 2022, the Fund participated in a facility in the amount of $450 million. Under such credit facility, depending on the type of loan, interest on borrowings is payable at the London Interbank Offered Rate (“LIBOR”) plus a credit spread. The Fund also pays both an upfront fee and an annual commitment fee to participate in the credit facility. The upfront fee in the amount of 0.10% of the total credit facility and the commitment fee in the amount of 0.25% of the daily unused portion of each lender's commitment are allocated among participating funds based on an allocation schedule set forth in the credit agreement. For the year ended July 31, 2022, the Fund had no borrowings under the credit facility.
7. Transactions in Underlying Funds
An affiliated issuer is a company in which the Fund has a direct or indirect ownership of, control of, or voting power of 5 percent or more of the outstanding voting shares, or a company which is under common ownership or control. At July 31, 2022, the Fund did not hold an investment in an affiliated issuer.
74 Pioneer Multi-Asset Income Fund | Annual Report | 7/31/22
Transactions in affiliated issuers by the Fund for the year ended July 31, 2022 were as follows:
| | | | | Net | | Change in net | | |
| | | | | realized | | unrealized | | |
| | | | | gain | Dividends | (depreciation) | Shares | |
| Name | | | | from | from | from | held | |
| of the | Value at | | | Investments | Investments | Investments | at | Value at |
| Affiliated | July 31, | | | in Affiliated | in Affiliated | in Affiliated | July 31, | July 31, |
| Issuer | 2021 | Purchases | Sales | Issuers | Issuers | Issuers | 2022 | 2022 |
| Pioneer | | | | | | | | |
| Floating | | | | | | | | |
| Rate | | | | | | | | |
| Fund, Inc. | $272,472 | $ — | $(268,157) | $15,074 | $ — | $(19,389) | — | $ — |
| Total | $272,472 | $ — | $(268,157) | $15,074 | $ — | $(19,389) | — | $ — |
Annual and semi-annual reports for the underlying Pioneer funds are available on the funds’ web page(s) at www.amundi.com/us.
8. Additional Disclosures about Derivative Instruments and Hedging Activities
The Fund’s use of derivatives may enhance or mitigate the Fund’s exposure to the following risks:
Interest rate risk relates to the fluctuations in the value of interest-bearing securities due to changes in the prevailing levels of market interest rates.
Credit risk relates to the ability of the issuer of a financial instrument to make further principal or interest payments on an obligation or commitment that it has to the Fund.
Foreign exchange rate risk relates to fluctuations in the value of an asset or liability due to changes in currency exchange rates.
Equity risk relates to the fluctuations in the value of financial instruments as a result of changes in market prices (other than those arising from interest rate risk or foreign exchange rate risk), whether caused by factors specific to an individual investment, its issuer, or all factors affecting all instruments traded in a market or market segment.
Commodity risk relates to the risk that the value of a commodity or commodity index will fluctuate based on increases or decreases in the commodities market and factors specific to a particular industry or commodity.
Pioneer Multi-Asset Income Fund | Annual Report | 7/31/22 75
The fair value of open derivative instruments (not considered to be hedging instruments for accounting disclosure purposes) by risk exposure at July 31, 2022, was as follows:
| | | | Foreign | | |
| Statement of | Interest | Credit | Exchange | Equity | Commodity |
| Assets and Liabilities | Rate Risk | Risk | Rate Risk | Risk | Risk |
| Liabilities | | | | | |
| Variation margin | | | | | |
| for futures | | | | | |
| contracts* | $(630,479) | $ — | $ — | $(3,922,934) | $ — |
| Total Value | $(630,479) | $ — | $ — | $(3,922,934) | $ — |
* The fair value presented represents the cumulative unrealized appreciation (depreciation) on futures as reported in the table within the Schedule of Investments. In the Statement of Assets and Liabilities, only current day's unsettled variation margin is report in receivable or payables on futures contracts and the net cumulative unrealized appreciation (depreciation) is included in total distributable earnings (loss).
The effect of derivative instruments (not considered to be hedging instruments for accounting disclosure purposes) on the Statement of Operations by risk exposure at July 31, 2022 was as follows:
| | | | Foreign | | |
| Statement of | Interest | Credit | Exchange | Equity | Commodity |
| Operations | Rate Risk | Risk | Rate Risk | Risk | Risk |
| Net Realized Gain | | | | | |
| (Loss) on | | | | | |
| Futures contracts | $ 1,728 | $ — | $ — | $17,848,948 | $ — |
| Total Value | $ 1,728 | $ — | $ — | $17,848,948 | $ — |
| Change in Net | | | | | |
| Unrealized | | | | | |
| Appreciation | | | | | |
| (Depreciation) on | | | | | |
| Futures contracts | $(630,479) | $ — | $ — | $ 1,261,823 | $ — |
| Total Value | $(630,479) | $ — | $ — | $ 1,261,823 | $ — |
9. Changes in Custodian and Sub-Administrator, and Transfer Agent
Effective November 22, 2021, The Bank of New York Mellon Corporation ("BNY Mellon") serves as the Fund's Custodian and Sub-Administrator.
Effective November 22, 2021, BNY Mellon Investment Servicing (US) Inc. serves as the Fund's shareholder servicing and transfer agent.
76 Pioneer Multi-Asset Income Fund | Annual Report | 7/31/22
Report of Independent Registered Public Accounting Firm
To the Board of Trustees of Pioneer Series Trust IV and the Shareholders of Pioneer Multi-Asset Income Fund:
Opinion on the Financial Statements
We have audited the accompanying statement of assets and liabilities of Pioneer Multi-Asset Income Fund (the “Fund”) (one of the funds constituting Pioneer Series Trust IV (the “Trust”)), including the schedule of investments, as of July 31, 2022, and the related statement of operations for the year then ended, the statements of changes in net assets for each of the two years in the period then ended, the financial highlights for each of the five years in the period then ended and the related notes (collectively referred to as the “financial statements”). In our opinion, the financial statements present fairly, in all material respects, the financial position of Pioneer Multi-Asset Income Fund at July 31, 2022, the results of its operations for the year then ended, the changes in its net assets for each of the two years in the period then ended, and its financial highlights for each of the five years in the period then ended in conformity with U.S. generally accepted accounting principles.
Basis for Opinion
These financial statements are the responsibility of the Trust’s management. Our responsibility is to express an opinion on the Fund’s financial statements based on our audits. We are a public accounting firm registered with the Public Company Accounting Oversight Board (United States) (“PCAOB”) and are required to be independent with respect to the Trust in accordance with the U.S. federal securities laws and the applicable rules and regulations of the Securities and Exchange Commission and the PCAOB.
We conducted our audits in accordance with the standards of the PCAOB. Those standards require that we plan and perform the audit to obtain reasonable assurance about whether the financial statements are free of material misstatement, whether due to error or fraud. The Trust is not required to have, nor were we engaged to perform, an audit of the Trust’s internal control over financial reporting. As part of our audits, we are required to obtain an understanding of internal control over financial reporting, but not for the purpose of expressing an opinion on the effectiveness of the Trust’s internal control over financial reporting. Accordingly, we express no such opinion.
Pioneer Multi-Asset Income Fund | Annual Report | 7/31/22 77
Our audits included performing procedures to assess the risks of material misstatement of the financial statements, whether due to error or fraud, and performing procedures that respond to those risks. Such procedures included examining, on a test basis, evidence regarding the amounts and disclosures in the financial statements. Our procedures included confirmation of securities owned as of July 31, 2022, by correspondence with the custodian and brokers or by other appropriate auditing procedures where replies from brokers were not received. Our audits also included evaluating the accounting principles used and significant estimates made by management, as well as evaluating the overall presentation of the financial statements. We believe that our audits provide a reasonable basis for our opinion.

We have served as the auditor of one or more investment companies in the Pioneer family of funds since 2017.
Boston, Massachusetts
September 28, 2022
78 Pioneer Multi-Asset Income Fund | Annual Report | 7/31/22
Additional Information (unaudited)
For the year ended July 31, 2022, certain dividends paid by the Fund may be subject to a maximum tax rate of 20%, as provided for by the Jobs and Growth Tax Relief Reconciliation Act (the Act) of 2003. The Fund intends to designate up to the maximum amount of such dividends allowable under the Act, as taxed at a maximum rate of 20%. Complete information will be computed and reported in conjunction with your 2022 Form 1099-DIV.
The qualifying percentage of the Fund’s ordinary income dividends for the purpose of the corporate dividends received deduction was 24%.
The percentages of the Fund's ordinary income distributions that are exempt from nonresident alien (NRA) tax withholding resulting from qualified interest income was 43%.
Pioneer Multi-Asset Income Fund | Annual Report | 7/31/22 79
Statement Regarding Liquidity Risk Management Program
As required by law, the Fund has adopted and implemented a liquidity risk management program (the “Program”) that is designed to assess and manage liquidity risk. Liquidity risk is the risk that the Fund could not meet requests to redeem its shares without significant dilution of remaining investors’ interests in the Fund. The Fund’s Board of Trustees designated a liquidity risk management committee (the “Committee”) consisting of employees of Amundi Asset Management US, Inc. (the “Adviser”) to administer the Program.
The Committee provided the Board of Trustees with a report that addressed the operation of the Program and assessed its adequacy and effectiveness of implementation (the “Report”). The Report covered the period from January 1, 2021 through December 31, 2021 (the “Reporting Period”).
The Report confirmed that, throughout the Reporting Period, the Committee had monitored the Fund’s portfolio liquidity and liquidity risk on an ongoing basis, as described in the Program and in Board reporting throughout the Reporting Period.
The Report discussed the Committee’s annual review of the Program, which addressed, among other things, the following elements of the Program:
The Committee reviewed the Fund’s investment strategy and liquidity of portfolio investments during both normal and reasonably foreseeable stressed conditions. The Committee noted that the Fund’s investment strategy continues to be appropriate for an open-end fund, taking into account, among other things, whether and to what extent the Fund held less liquid and illiquid assets and the extent to which any such investments affected the Fund’s ability to meet redemption requests. In managing and reviewing the Fund’s liquidity risk, the Committee also considered the extent to which the Fund’s investment strategy involves a relatively concentrated portfolio or large positions in particular issuers, the extent to which the Fund uses borrowing for investment purposes, and the extent to which the Fund uses derivatives (including for hedging purposes). The Committee also reviewed the Fund’s short-term and long-term cash flow projections during both normal and reasonably foreseeable stressed conditions. In assessing the Fund’s cash flow projections, the Committee considered, among other factors, historical net redemption activity, redemption policies, ownership concentration, distribution channels, and
80 Pioneer Multi-Asset Income Fund | Annual Report | 7/31/22
the degree of certainty associated with the Fund’s short-term and long-term cash flow projections. The Committee also considered the Fund’s holdings of cash and cash equivalents, as well as borrowing arrangements and other funding sources, including, if applicable, the Fund’s participation in a credit facility, as components of the Fund’s ability to meet redemption requests. The Fund has adopted an in-kind redemption policy which may be utilized to meet larger redemption requests.
The Committee reviewed the Program’s liquidity classification methodology for categorizing the Fund’s investments into one of four liquidity buckets. In reviewing the Fund’s investments, the Committee considered, among other factors, whether trading varying portions of a position in a particular portfolio investment or asset class in sizes the Fund would reasonably anticipate trading, would be reasonably expected to significantly affect liquidity.
The Committee performed an analysis to determine whether the Fund is required to maintain a Highly Liquid Investment Minimum, and determined that no such minimum is required because the Fund primarily holds highly liquid investments.
The Report stated that the Committee concluded the Program operates adequately and effectively, in all material respects, to assess and manage the Fund’s liquidity risk throughout the Reporting Period.
Pioneer Multi-Asset Income Fund | Annual Report | 7/31/22 81
Trustees, Officers and Service Providers
Investment Adviser and Administrator
Amundi Asset Management US, Inc.
Custodian and Sub-Administrator
The Bank of New York Mellon Corporation
Independent Registered Public Accounting Firm
Ernst & Young LLP
Principal Underwriter
Amundi Distributor US, Inc.
Legal Counsel
Morgan, Lewis & Bockius LLP
Transfer Agent
BNY Mellon Investment Servicing (US) Inc.
Proxy Voting Policies and Procedures of the Fund are available without charge, upon request, by calling our toll free number (1-800-225-6292). Information regarding how the Fund voted proxies relating to portfolio securities during the most recent 12-month period ended June 30 is publicly available to shareowners at www.amundi.com/us. This information is also available on the Securities and Exchange Commission’s web site at www.sec.gov.
Trustees and Officers
The Fund's Trustees and officers are listed below, together with their principal occupations and other directorships they have held during at least the past five years. Trustees who are interested persons of the Fund within the meaning of the 1940 Act are referred to as Interested Trustees. Trustees who are not interested persons of the Fund are referred to as Independent Trustees. Each of the Trustees serves as a Trustee of each of the 49 U.S. registered investment portfolios for which Amundi US serves as investment adviser (the “Pioneer Funds”). The address for all Trustees and all officers of the Fund is 60 State Street, Boston, Massachusetts 02109.
The Statement of Additional Information of the Fund includes additional information about the Trustees and is available, without charge, upon request, by calling 1-800-225-6292.
82 Pioneer Multi-Asset Income Fund | Annual Report | 7/31/22
Independent Trustees
| Name, Age and Position | Term of Office and | Principal Occupation(s) During At Least | Other Directorships Held by Trustee |
| Held With the Fund | Length of Service | The Past Five Years | During At Least The Past Five Years |
| Thomas J. Perna (71) | Trustee since 2011. | Private investor (2004 – 2008 and 2013 – present); Chairman (2008– | Director, Broadridge Financial |
| Chairman of the Board | Serves until a successor | 2013) and Chief Executive Officer (2008 – 2012), Quadriserv, Inc. | Solutions, Inc. (investor |
| and Trustee | trustee is elected or | (technology products for securities lending industry); and Senior | communications and securities |
| | earlier retirement | Executive Vice President, The Bank of New York (financial and | processing provider for financial |
| | or removal. | securities services) (1986 – 2004) | services industry) (2009 – present); |
| | | | Director, Quadriserv, Inc. (2005 – |
| | | | 2013); and Commissioner, New |
| | | | Jersey State Civil Service |
| | | | Commission (2011 – 2015) |
| John E. Baumgardner, | Trustee since 2019. | Of Counsel (2019 – present), Partner (1983-2018), Sullivan & | Chairman, The Lakeville Journal |
| Jr. (71)* | Serves until a successor | Cromwell LLP (law firm). | Company, LLC, (privately-held |
| Trustee | trustee is elected or | | community newspaper group) |
| | earlier retirement | | (2015-present) |
| | or removal. | | |
| Diane Durnin (65) | Trustee since 2019. | Managing Director - Head of Product Strategy and Development, | None |
| Trustee | Serves until a successor | BNY Mellon Investment Management (investment management | |
| | trustee is elected or | firm) (2012-2018); Vice Chairman – The Dreyfus Corporation (2005– | |
| | earlier retirement | 2018): Executive Vice President Head of Product, BNY Mellon | |
| | or removal. | Investment Management (2007-2012); Executive Director- Product | |
| | | Strategy, Mellon Asset Management (2005-2007); Executive Vice | |
| | | President Head of Products, Marketing and Client Service, Dreyfus | |
| | | Corporation (investment management firm) (2000-2005); Senior Vice | |
| | | President Strategic Product and Business Development, Dreyfus | |
| | | Corporation (1994-2000) | |
* Mr. Baumgardner is Of Counsel to Sullivan & Cromwell LLP, which acts as counsel to the Independent Trustees of each Pioneer Fund.
Pioneer Multi-Asset Income Fund | Annual Report | 7/31/22 83
Independent Trustees (continued)
| Name, Age and Position | Term of Office and | Principal Occupation(s) During At Least | Other Directorships Held by Trustee |
| Held With the Fund | Length of Service | The Past Five Years | During At Least The Past Five Years |
| Benjamin M. Friedman (78) | Trustee since 2011. | William Joseph Maier Professor of Political Economy, Harvard | Trustee, Mellon Institutional Funds |
| Trustee | Serves until a successor | University (1972 – present) | Investment Trust and Mellon |
| | trustee is elected or | | Institutional Funds Master Portfolio |
| | earlier retirement | | (oversaw 17 portfolios in fund |
| | or removal. | | complex) (1989 - 2008) |
| Craig C. MacKay (59) | Trustee since 2021. | Partner, England & Company, LLC (advisory firm) (2012 – | Director, Equitable Holdings, Inc. |
| Trustee | Serves until a successor | present); Group Head – Leveraged Finance Distribution, | (financial services holding company) |
| | trustee is elected or | Oppenheimer & Company (investment bank) (2006 – 2012); | (2022 – present); Board Member of |
| | earlier retirement | Group Head – Private Finance & High Yield Capital Markets | Carver Bancorp, Inc. (holding |
| | or removal. | Origination, SunTrust Robinson Humphrey (investment bank) | company) and Carver Federal |
| | | (2003 – 2006); and Founder and Chief Executive Officer, HNY | Savings Bank, NA (2017 – present); |
| | | Associates, LLC (investment bank) (1996 – 2003) | Advisory Council Member, |
| | | | MasterShares ETF (2016 – 2017); |
| | | | Advisory Council Member, The Deal |
| | | | (financial market information |
| | | | publisher) (2015 – 2016); Board Co- |
| | | | Chairman and Chief Executive |
| | | | Officer, Danis Transportation |
| | | | Company (privately-owned |
| | | | commercial carrier) (2000 – 2003); |
| | | | Board Member and Chief Financial |
| | | | Officer, Customer Access Resources |
| | | | (privately-owned teleservices |
| | | | company) (1998 – 2000); Board |
| | | | Member, Federation of Protestant |
| | | | Welfare Agencies (human services |
| | | | agency) (1993 – present); and Board |
| | | | Treasurer, Harlem Dowling Westside |
| | | | Center (foster care agency) |
| | | | (1999 – 2018) |
84 Pioneer Multi-Asset Income Fund | Annual Report | 7/31/22
| Name, Age and Position | Term of Office and | Principal Occupation(s) During At Least | Other Directorships Held by Trustee |
| Held With the Fund | Length of Service | The Past Five Years | During At Least The Past Five Years |
| Lorraine H. Monchak (66) | Trustee since 2017. | Chief Investment Officer, 1199 SEIU Funds (healthcare workers union | None |
| Trustee | (Advisory Trustee | pension funds) (2001 – present); Vice President – International Investments | |
| | from 2014 - 2017). | Group, American International Group, Inc. (insurance company) (1993 – | |
| | Serves until a successor | 2001); Vice President – Corporate Finance and Treasury Group, Citibank, | |
| | trustee is elected or | N.A. (1980 – 1986 and 1990 – 1993); Vice President – Asset/Liability | |
| | earlier retirement | Management Group, Federal Farm Funding Corporation (government- | |
| | or removal. | sponsored issuer of debt securities) (1988 – 1990); Mortgage Strategies | |
| | | Group, Shearson Lehman Hutton, Inc. (investment bank) (1987 – 1988); | |
| | | Mortgage Strategies Group, Drexel Burnham Lambert, Ltd. (investment | |
| | | bank) (1986 – 1987) | |
| Marguerite A. Piret (74) | Trustee since 2011. | Chief Financial Officer, American Ag Energy, Inc. (controlled environment | Director of New America High |
| Trustee | Serves until a successor | and agriculture company) (2016 – present); President and Chief Executive | Income Fund, Inc. (closed-end |
| | trustee is elected or | Officer, Metric Financial Inc. (formerly known as Newbury Piret Company) | investment company) (2004 – |
| | earlier retirement | (investment banking firm) (1981 – 2019) | present); and Member, Board of |
| | or removal. | | Governors, Investment Company |
| | | | Institute (2000 – 2006) |
Pioneer Multi-Asset Income Fund | Annual Report | 7/31/22 85
Independent Trustees (continued)
| Name, Age and Position | Term of Office and | Principal Occupation(s) During At Least | Other Directorships Held by Trustee |
| Held With the Fund | Length of Service | The Past Five Years | During At Least The Past Five Years |
| Fred J. Ricciardi (75) | Trustee since 2014. | Private investor (2020 – present); Consultant (investment company | None |
| Trustee | Serves until a successor | services) (2012 – 2020); Executive Vice President, BNY Mellon (financial | |
| | trustee is elected or | and investment company services) (1969 – 2012); Director, BNY | |
| | earlier retirement | International Financing Corp. (financial services) (2002 – 2012); Director, | |
| | or removal. | Mellon Overseas Investment Corp. (financial services) (2009 – 2012); | |
| | | Director, Financial Models (technology) (2005-2007); Director, BNY | |
| | | Hamilton Funds, Ireland (offshore investment companies) (2004-2007); | |
| | | Chairman/Director, AIB/BNY Securities Services, Ltd., Ireland (financial | |
| | | services) (1999-2006); Chairman, BNY Alternative Investment Services, | |
| | | Inc. (financial services) (2005-2007) | |
86 Pioneer Multi-Asset Income Fund | Annual Report | 7/31/22
Interested Trustees
| Name, Age and Position | Term of Office and | Principal Occupation(s) During At Least | Other Directorships Held by Trustee |
| Held With the Fund | Length of Service | The Past Five Years | During At Least The Past Five Years |
| Lisa M. Jones (60)** | Trustee since 2017. | Director, CEO and President of Amundi US, Inc. (investment | None |
| Trustee, President and Chief | Serves until a successor | management firm) (since September 2014); Director, CEO and President of | |
| Executive Officer | trustee is elected or | Amundi Asset Management US, Inc. (since September 2014); Director, | |
| | earlier retirement | CEO and President of Amundi Distributor US, Inc. (since September 2014); | |
| | or removal | Director, CEO and President of Amundi Asset Management US, Inc. (since | |
| | | September 2014); Chair, Amundi US, Inc., Amundi Distributor US, Inc. and | |
| | | Amundi Asset Management US, Inc. (September 2014 – 2018); Managing | |
| | | Director, Morgan Stanley Investment Management (investment management | |
| | | firm) (2010 – 2013); Director of Institutional Business, CEO of International, | |
| | | Eaton Vance Management (investment management firm) (2005 – 2010); | |
| | | Director of Amundi Holdings US, Inc. (since 2017) | |
| Kenneth J. Taubes (64)** | Trustee since 2014. | Director and Executive Vice President (since 2008) and Chief Investment | None |
| Trustee | Serves until a successor | Officer, U.S. (since 2010) of Amundi US, Inc. (investment management firm); | |
| | trustee is elected or | Director and Executive Vice President and Chief Investment Officer, U.S. of | |
| | earlier retirement | Amundi US (since 2008); Executive Vice President and Chief Investment | |
| | or removal | Officer, U.S. of Amundi Asset Management US, Inc. (since 2009); Portfolio | |
| | | Manager of Amundi US (since 1999); Director of Amundi Holdings US, Inc. | |
| | | (since 2017) | |
** Ms. Jones and Mr. Taubes are Interested Trustees because they are officers or directors of the Fund’s investment adviser and certain of its affiliates.
Pioneer Multi-Asset Income Fund | Annual Report | 7/31/22 87
Fund Officers
| Name, Age and Position | Term of Office and | Principal Occupation(s) During At Least | Other Directorships Held by Officer |
| Held With the Fund | Length of Service | The Past Five Years | During At Least The Past Five Years |
| Christopher J. Kelley (57) | Since 2011. Serves at | Vice President and Associate General Counsel of Amundi US since | None |
| Secretary and Chief | the discretion of | January 2008; Secretary and Chief Legal Officer of all of the Pioneer Funds | |
| Legal Officer | the Board | since June 2010; Assistant Secretary of all of the Pioneer Funds from | |
| | | September 2003 to May 2010; Vice President and Senior Counsel of | |
| | | Amundi US from July 2002 to December 2007 | |
| Thomas Reyes (59) | Since 2011. Serves at | Assistant General Counsel of Amundi US since May 2013 and Assistant | None |
| Assistant Secretary | the discretion of | Secretary of all the Pioneer Funds since June 2010; Counsel of | |
| | the Board | Amundi US from June 2007 to May 2013 | |
| Anthony J. Koenig, Jr. (58) | Since 2021. Serves at | Senior Vice President – Fund Treasury of Amundi US; Treasurer of all of | None |
| Treasurer and | the discretion of | the Pioneer Funds since May 2021; Assistant Treasurer of all of the | |
| Chief Financial and | the Board | Pioneer Funds from January 2021 to May 2021; and Chief of Staff, | |
| Accounting Officer | | US Investment Management of Amundi US from May 2008 to January 2021 | |
| Luis I. Presutti (57) | Since 2011. Serves | Director – Fund Treasury of Amundi US since 1999; and Assistant | None |
| Assistant Treasurer | at the discretion of | Treasurer of all of the Pioneer Funds since 1999 | |
| | the Board | | |
| Gary Sullivan (64) | Since 2011. Serves at | Senior Manager – Fund Treasury of Amundi US since 2012; and Assistant | None |
| Assistant Treasurer | the discretion of | Treasurer of all of the Pioneer Funds since 2002 | |
| | the Board | | |
| Antonio Furtado (40) | Since 2020. Serves at | Fund Oversight Manager – Fund Treasury of Amundi US since 2020; | None |
| Assistant Treasurer | the discretion of | Assistant Treasurer of all of the Pioneer Funds since 2020; | |
| | the Board | and Senior Fund Treasury Analyst from 2012 - 2020 | |
88 Pioneer Multi-Asset Income Fund | Annual Report | 7/31/22
| Name, Age and Position | Term of Office and | Principal Occupation(s) During At Least | Other Directorships Held by Officer |
| Held With the Fund | Length of Service | The Past Five Years | During At Least The Past Five Years |
| Michael Melnick (51) | Since 2021. Serves at | Vice President - Deputy Fund Treasurer of Amundi US since May 2021; | None |
| Assistant Treasurer | the discretion of | Assistant Treasurer of all of the Pioneer Funds since July 2021; Director | |
| | the Board | of Regulatory Reporting of Amundi US from 2001 – 2021; and Director of | |
| | | Tax of Amundi US from 2000 - 2001 | |
| John Malone (51) | Since 2018. Serves at | Managing Director, Chief Compliance Officer of Amundi US Asset | None |
| Chief Compliance Officer | the discretion of | Management; Amundi Asset Management US, Inc.; and the Pioneer Funds | |
| | the Board | since September 2018; Chief Compliance Officer of Amundi Distributor US, | |
| | | Inc. since January 2014. | |
| Brandon Austin (50) | Since March 2022. | Director, Financial Security – Amundi Asset Management; Anti- Money | None |
| Anti-Money | Serves at | Laundering Officer of all the Pioneer Funds since March 2022 Director of | |
| Laundering Officer | the discretion of | Financial Security of Amundi US since July 2021; Vice President, Head of | |
| | the Board | BSA, AML and OFAC, Deputy Compliance Manager, Crédit Agricole | |
| | | Indosuez Wealth Management (investment management firm) (2013 – 2021) | |
Pioneer Multi-Asset Income Fund | Annual Report | 7/31/22 89
This page was intentionally left blank.
90 Pioneer Multi-Asset Income Fund | Annual Report | 7/31/22
This page was intentionally left blank.
Pioneer Multi-Asset Income Fund | Annual Report | 7/31/22 91
This page was intentionally left blank.
92 Pioneer Multi-Asset Income Fund | Annual Report | 7/31/22
How to Contact Amundi
We are pleased to offer a variety of convenient ways for you to contact us for assistance or information.
| Call us for: | |
| Account Information, including existing accounts, | |
| new accounts, prospectuses, applications | |
| and service forms | 1-800-225-6292 |
| FactFoneSM for automated fund yields, prices, | |
| account information and transactions | 1-800-225-4321 |
| Retirement plans information | 1-800-622-0176 |
Write to us:
Amundi
P.O. Box 9897
Providence, R.I. 02940-8097
| | |
| Our toll-free fax | 1-800-225-4240 |
| | |
| Our internet e-mail address | us.askamundi@amundi.com/us |
| (for general questions about Amundi only) | |
| |
| Visit our web site: www.amundi.com/us. | |
This report must be preceded or accompanied by a prospectus.
The Fund files a complete schedule of portfolio holdings with the Securities and Exchange Commission for the first and third quarters of each fiscal year as an exhibit to its reports on Form N-PORT. Shareholders may view the filed Form N-PORT by visiting the Commission’s web site at https://www.sec.gov.

Amundi Asset Management US, Inc.
60 State Street
Boston, MA 02109
www.amundi.com/us
Securities offered through Amundi Distributor US, Inc.,
60 State Street, Boston, MA 02109
Underwriter of Pioneer Mutual Funds, Member SIPC
© 2022 Amundi Asset Management US, Inc. 25962-10-0922
Pioneer Balanced ESG Fund
Annual Report | July 31, 2022
| | | | | |
| A: AOBLX | C: PCBCX | K: PCBKX | R: CBPRX | Y: AYBLX |

visit us: www.amundi.com/us
Pioneer Balanced ESG Fund | Annual Report | 7/31/22 1
President’s Letter
Dear Shareholders,
Since early 2020, investors have faced unprecedented challenges. The onset of the COVID-19 pandemic in March 2020 was the most significant development, as the pandemic affected the everyday lives of millions and led to significant changes in government and central-bank policies. Central banks, including the US Federal Reserve (Fed), enacted very accommodative monetary policies in the form of extremely low interest rates and quantitative easing (bond purchase) programs, while governments around the globe, including the US government, passed large spending packages in 2020 and in early 2021, in order help citizens navigate the challenging environment caused by the pandemic. The widespread distribution of COVID-19 vaccines approved for emergency use in late 2020 led to a general decline in virus-related hospitalizations in the US and had a positive effect on overall market sentiment during most of the 2021 calendar year. Eventually, however, the easier monetary and fiscal policies enacted during the height of the pandemic as well as ongoing supply chain issues, which were, at least in part, an outgrowth of certain virus-containment measures, were among the numerous factors that combined to drive inflation levels higher in the latter part of 2021.
With rising inflation already a concern as 2021 drew to a close, investor sentiment sharply deteriorated in the first quarter of 2022, with the negativity driven largely by Russia’s invasion of Ukraine in February as well as signs that inflation was more entrenched than transitory in many regions of the world. The war and the resulting economic sanctions placed on Russia by the US and European governments also contributed to a spike in energy prices, given that Russia is a major exporter of natural gas as well as other resources, particularly to Europe.
The persistently high inflation readouts led key central banks, including the Fed, to signal a tightening of monetary policy. The Fed had already announced that it would taper its bond purchases and eventually end its pandemic-era quantitative easing program by the spring of 2022; and, with US inflation hitting 40-year highs, the Fed began aggressively raising its benchmark federal funds rate target range, while indicating that more rate hikes were likely. The magnitude of the rate increases heightened investors’ concerns about the ability of the Fed and other central banks to cool inflation without triggering a recession.
Due to what has been, so far, a tumultuous year for investors, the performance of most asset classes, especially riskier assets such as equities and corporate bonds, has turned negative, as market participants have tried to ascertain the direction and progression of Fed policy, economic growth, the war in Ukraine, and other factors. In the US, the upcoming mid-term
2 Pioneer Balanced ESG Fund | Annual Report | 7/31/22
elections in November of this year are another important benchmark that investors are closely monitoring, as political uncertainty has often contributed to increased market volatility.
While the economic news, on balance, has been negative in recent months, one positive development has been the slow, steady transition of COVID-19 from an acute public health crisis and pandemic to a more manageable and perhaps endemic disease, driven by vaccine distributions as well as the development of effective therapeutics to treat the virus.
Since 1928, Amundi US’s investment process has been built on a foundation of fundamental research and active management, principles which have guided our investment decisions for more than 90 years. We believe active management – that is, making active investment decisions – can help mitigate the risks during periods of market volatility.
At Amundi US, active management begins with our own fundamental, bottom-up research process. Our team of dedicated research analysts and portfolio managers analyzes each security under consideration, communicating frequently with the management teams of the companies and other entities issuing the securities, and working together to identify those securities that best meet our investment criteria for our family of funds. Our risk management approach begins with each security under consideration, as we strive to develop a deep understanding of the potential opportunity, while considering any potential risk factors.
Today, as investors, we have many options. It is our view that active management can serve shareholders well, not only when markets are thriving, but also during periods of market stress. As you consider your long-term investment goals, we encourage you to work with your financial professional to develop an investment plan that paves the way for you to pursue both your short-term and long-term goals.
We greatly appreciate the trust you have placed in us and look forward to continuing to serve you in the future.

Lisa M. Jones
Head of the Americas, President and CEO of US
Amundi Asset Management US, Inc.
September 2022
Any information in this shareowner report regarding market or economic trends or the factors influencing the Fund’s historical or future performance are statements of opinion as of the date of this report. Past performance is no guarantee of future results.
Pioneer Balanced ESG Fund | Annual Report | 7/31/22 3
Portfolio Management Discussion | 7/31/22
In the following interview, Howard Weiss, Bradley Komenda, and Lawrence Zeno discuss the factors that affected the performance of Pioneer Balanced ESG Fund during the 12-month period ended July 31, 2022. Mr. Weiss*, CFA, a Senior Vice President and Director of Multi-Asset Solutions, US, and a portfolio manager at Amundi Asset Management US, Inc. (Amundi US), co-manages the Fund, along with Mr. Komenda, Managing Director, Director of Investment Grade Corporates, and a portfolio manager at Amundi US; Mr. Zeno, a Vice President and a portfolio manager at Amundi US; and Fergal Jackson*, a Vice President and a portfolio manager at Amundi US. and Walter Hunnewell, Jr.*, a Vice President and a portfolio manager at Amundi US, was also a co-manager on the Fund during the 12-month period ended July 31, 2022 (see * footnote below).
| Q | | How did the Fund perform during the 12-month period ended July 31, 2022? |
| A | | Pioneer Balanced ESG Fund’s Class A shares returned -7.23% at net asset value during the 12-month period ended July 31, 2022, while the Fund’s benchmarks, the Standard & Poor’s 500 Index (the S&P 500) and the Bloomberg US Aggregate Bond Index (the Bloomberg Index)**, returned -4.64% and -9.12%, respectively. During the same 12-month period, the Fund’s former fixed-income benchmark, the Bloomberg US Government/Credit Bond Index, returned -10.11%. In addition, during the same 12-month period, the average return of the 755 mutual funds in Morningstar’s 50% to 70% Equity Allocation Funds category was -7.35%. |
| Q | | How would you describe the investment environment in the domestic markets during the 12-month period ended July 31, 2022? |
| A | | As the period opened in August 2021, market conditions were characterized by a continued economic recovery driven by the rollout of the first COVID-19 vaccines, easy monetary and fiscal policies from the US Federal Reserve (Fed) and US government, respectively, and strong corporate profits. As 2021 progressed, we saw accelerating inflation rates driven by base effects, rising oil prices, supply chain disruptions, and a tight labor market. Rising inflation led to a “hawkish” shift in tone regarding monetary policy from many central banks, including the Fed, in |
| * | | Effective June 16, 2022, Fergal Jackson and Howard Weiss became portfolio managers on the Fund. In addition, Walter Hunnewell, Jr. retired from Amundi US on July 31, 2022, and is no longer a portfolio manager on the Fund. |
| ** | | Effective January 1, 2022, the benchmark for the fixed-income portion of the portfolio changed from the Bloomberg US Government/Credit Bond Index to the Bloomberg US Aggregate Bond Index. The Fund’s investment adviser believes that the new fixed-income benchmark is better aligned with the Fund’s investment approach. |
4 Pioneer Balanced ESG Fund | Annual Report | 7/31/22
the fourth quarter of 2021. Most notably, the fourth quarter of 2021 saw the Fed accelerate its previously announced pace for reducing and eventually ending its purchases of Treasuries and mortgage-backed securities (MBS), also known as “quantitative easing.” The Fed had utilized quantitative easing to help keep longer-term borrowing costs low during the height of the COVID-19 pandemic, when virus-containment measures included lockdowns that led to slowing economic growth. The Fed also signaled that it would begin increasing the target range for its benchmark overnight federal funds rate in 2022, with more hikes to follow in 2023.
The first quarter of 2022 saw negative market sentiment driven by increased geopolitical tensions, a worsening growth/inflation mix arising from a spike in commodity prices, and the prospect of rising interest rates due to expectations for changing central-bank monetary policies. In combination, those factors contributed to losses across most asset classes over the second half of the 12-month period. Russia’s invasion of Ukraine in late February, together with US and European sanctions on Russia, led to a spike in energy, metals, and food prices, which added to downside risk to real economic growth and to upside risk to inflation. In addition, another round of lockdowns in China in the wake of increasing COVID-19 infection rates exacerbated supply chain disruptions and raised concerns about further risks to global economic growth.
At its mid-March meeting, the Federal Open Market Committee (FOMC) raised the federal funds rate target range by a quarter-point, to 0.25% -0.50%, and indicated that further increases in the benchmark overnight lending rate would follow rapidly. The Fed also formally ended its quantitative easing program and signaled it would soon begin reducing its overall holdings of Treasury securities and agency MBS by reinvesting only part of the proceeds from maturing securities. The Fed went on to implement rate increases of 50 basis points (bps), 75 bps, and 75 bps in May, June, and July, respectively, bringing the federal funds target up to a range of 2.25% to 2.50%, its highest level since December of 2019. (A basis point is equal to 1/100th of a percentage point.) With inflation posting 40-year highs, Treasury yields moved sharply higher, with the yield on the 10-year Treasury bond peaking at 3.49% in mid-June.
As the period drew to a close, however, equities and credit-sensitive assets rebounded, supported by stronger-than-expected corporate earnings. In addition, Treasury yields retraced some of their earlier rise on the hopes that inflation had peaked. As of July 31, 2022, the yield on
Pioneer Balanced ESG Fund | Annual Report | 7/31/22 5
the 10-year Treasury had dropped to 2.67%, an increase of 143 bps relative to its starting point of 1.24% in August 2021, but down from the 3.49% peak in June (noted earlier).
For the full 12-month period, the Fund’s equity benchmark, the S&P 500 Index, returned -4.64%. The energy sector led performance within the S&P 500 by a wide margin, while the relatively defensive utilities and consumer staples sectors also finished the period in positive territory. The communication services sector was the biggest laggard within the S&P 500, followed by consumer discretionary. The Fund’s fixed-income benchmark, the Bloomberg Index, returned -9.12%. Within fixed-income markets, corporate bonds underperformed Treasuries, given the increased risk-aversion displayed by most investors over the first half of 2022.
| Q | | How did you position the Fund’s portfolio during the 12-month period ended July 31, 2022? |
| A | | At the start of the period, we had allocated approximately 62.5% of the Fund’s invested assets to equities and 35% to fixed-income securities. As of July 31, 2022, the Fund had roughly a 60% equity/40% fixed-income allocation. The portfolio’s strategic target allocations typically have been 62.5% equity/37.5% fixed income. |
| Q | | Could you review the Fund’s commitment to environmental, social, and governance (ESG) investing? |
| A | | The Fund applies environmental, social and governance (ESG) criteria to its investments, and Amundi US considers ESG factors in our fundamental research and investment selection processes. Amundi US believes that ESG-related information helps us gain a more complete understanding of a company and its business. As part of the Fund’s ESG investment criteria, the Fund generally will not invest in companies significantly involved in the production of alcohol, tobacco products, and controversial military weapons consisting of cluster weapons, anti-personnel mines, nuclear weapons, and biological and chemical weapons, and the operation of coal mines and gambling casinos and other gaming businesses. Amundi US also considers pertinent ESG information in its investment decisions, including ESG ratings, in seeking to avoid investing in companies perceived to have the most ESG-related risk. |
6 Pioneer Balanced ESG Fund | Annual Report | 7/31/22
| Q | | What specific investments within the portfolio’s equity allocations had noteworthy effects on the Fund’s benchmark-relative performance during the 12-month period ended July 31, 2022? |
| A | | Our equity investment strategy has emphasized diversification***, stocks of companies that feature what we believe are reasonable valuations, and companies with good ESG standings as well as a history of paying attractive dividends****. Sector allocation decisions contributed positively to the Fund’s performance relative to the S&P 500 Index for the 12-month period, while stock selection results detracted from relative performance. |
Within equities, the most beneficial sector allocation decisions for the Fund’s benchmark-relative returns during the 12-month period were an overweight to the energy sector, which significantly outperformed the overall market, and a portfolio underweight to the lagging communication services sector. A lack of Fund exposure to the more defensive utilities sector weighed on relative performance during a period featuring a declining equity market overall. Stock selection results were positive for the Fund versus the S&P 500 within the health care and communication services sectors. Negative security selection results within the consumer discretionary, information technology, industrials, and energy sectors offset the positive selection results within health care and communication services.
With regard to individual equity positions, positive contributors to the Fund’s benchmark-relative performance included Targa Resources, Elevance Healthcare, and Valero Energy. In addition, lack of portfolio exposure to Meta Platforms (formerly known as Facebook) and PayPal benefited the Fund’s relative returns, as both stocks underperformed during the 12-month period. Shares of Targa Resources, which processes, transports, and markets natural gas and natural gas liquids, benefited from a higher pricing environment for commodities as well as Targa’s improving corporate balance sheet. Elevance Healthcare (formerly known as Anthem) performed well during the 12-month period as the company grew its revenues and income, due to greater client utilization and the expansion of services made available to those clients. The Fund’s position in Valero Energy, an independent refiner, also performed well, as the company reported record refining margins during the period, driven by solid demand coupled with restricted supply.
*** Diversification does not assure a profit nor protect against loss.
**** Dividends are not guaranteed.
Pioneer Balanced ESG Fund | Annual Report | 7/31/22 7
On the downside, a lack of portfolio exposure to strong-performing stocks such as Apple, ExxonMobil, Tesla, and UnitedHealth Group, along with an overweight position (versus the S&P 500) in Google parent Alphabet, weighed on the Fund’s relative returns for the 12-month period. We have avoided investing in Tesla because the stock does not currently meet our valuation parameters for inclusion in the portfolio. Meanwhile, we had avoided Apple because we did not believe the stock would command a valuation comparable to the valuations of what we felt were the highest-quality consumer staples companies, but that view proved mistaken. While the Fund does not currently hold shares of Apple, we have continued to follow the company closely. ExxonMobil, the massive integrated oil company, performed well during the period, due to strong results for its refining and chemicals segments, but we preferred to allocate the Fund’s assets into other energy firms. Lack of portfolio exposure to UnitedHealth also detracted from the Fund's relative returns, as the company fared well during the period, achieving a stronger medical-loss ratio (the share of health care premiums spent on medical claims) than its peers. With regard to Alphabet, the stock underperformed over the 12-month period and detracted from the Fund’s relative performance, due to the company facing increased competition for YouTube, its video-sharing platform, and decreased advertising revenues as consumer spending became more cautious. We continue to have a favorable view of Alphabet, due to its strong position in the search-engine segment, and we have been encouraged by the company’s recent efforts to control expenses.
| Q | | What investment strategies within the portfolio’s fixed-income allocations had noteworthy effects on the Fund’s benchmark-relative performance during the 12-month period ended July 31, 2022? |
| A | | The portfolio’s short-duration positioning versus the Bloomberg Index aided the Fund’s benchmark-relative performance during the period, as US Treasury yields moved higher in early 2022, along with interest rates in Europe. (Duration is a measure of the sensitivity of the price, or the value of principal, of a fixed-income investment to a change in interest rates, expressed as a number of years.) However, yield-curve positioning partially offset the positive effects of the Fund’s duration stance. We had positioned the portfolio to benefit from a potential steepening of the |
8 Pioneer Balanced ESG Fund | Annual Report | 7/31/22
curve, with an underweight to securities with longer maturities. The yield-curve stance weighed on the Fund’s relative returns during the 12-month period as the yield curve flattened.
Sector allocation results within the Fund’s fixed-income sleeve detracted from benchmark-relative performance during the period. The most notable detractor from relative returns was the Fund’s underweight to US Treasuries versus the Bloomberg Index, as credit-sensitive sectors, including investment-grade corporate bonds, underperformed Treasuries over the period. In addition, the portfolio’s allocation to non-agency MBS had a negative effect on the Fund’s relative results. A modest allocation to convertible securities also detracted from the Fund’s benchmark-relative performance, largely driven by exposure to the banking sector, which performed poorly due to the longer spread durations – or sensitivity to changes in credit spreads – of those securities. (Credit spreads are commonly defined as the differences in yield between Treasuries and other types of fixed-income securities with similar maturities.)
Holdings of high-yield, index-based credit-default swaps, which we used as part of our efforts to hedge credit risk in the portfolio, contributed positively to the Fund’s relative performance as credit spreads widened, and partially offset the negative effects of the underweight to Treasuries.
Overall security selection results were essentially a neutral factor in the Fund’s benchmark-relative performance on the fixed-income side of the portfolio. Within agency MBS, an overweight to higher-coupon issues that have featured less prepayment sensitivity modestly benefited the Fund’s relative returns.
With regard to the portfolio’s corporate bond holdings, the lower quality of the Fund’s positions within the industrials and financials sectors (as compared to the Bloomberg Index) detracted from relative returns. The Fund was overweight to “BBB” rated and high-yield issues within those sectors during a period that saw credit spreads widen notably (rising yields, or spreads, typically translate into lower bond prices). Within industrials, exposure to commodity- and aviation-related issues constrained the Fund’s relative results. In financials, the Fund’s benchmark-relative results struggled due to the underperformance of holdings of subordinated-debt issues, and the debt of an aircraft-leasing firm.
Pioneer Balanced ESG Fund | Annual Report | 7/31/22 9
| Q | | Did the Fund have any exposure to derivative securities during the 12-month period ended July 31, 2022? If so, did the derivatives have any effect on the Fund’s relative performance? |
| A | | Yes, as noted earlier, we invested the portfolio in high-yield, index-based credit-default-swaps during the period, which aided relative returns. We also invested the Fund in Treasury futures. We have used Treasury futures as part of our duration-management strategy for the portfolio. We believe the use of Treasury futures has allowed us to express our views on duration and yield-curve positioning in the most efficient manner. We typically have used the index-based credit-default-swap positions as part of our efforts to either gain or reduce the Fund’s exposures to both investment-grade and high-yield corporate bonds very quickly, as cash-bond transactions take a little more time to settle, and have a higher liquidity cost. The use of derivatives, we think, may allow the Fund to benefit, potentially, from the performance impact of the targeted asset class, while retaining a better liquidity profile in the portfolio, which may help reduce risk. |
| Q | | Did the Fund’s yield, or distributions***** to shareholders, change during the 12-month period ended July 31, 2022? |
| A | | The Fund’s distribution rate remained relatively stable during the 12-month period, with some fluctuations driven by tightening credit spreads (lower yields) in the first half of the period, and then by rising Treasury yields and widening credit spreads over the second half of the period. Ultimately, the Fund’s distribution rate was the same at the end of the 12-month period as it was at the beginning, though declining bond prices (as well as the equity market’s struggles) had a negative effect on total returns over the full 12 months. |
| Q | | What is your investment outlook? |
| A | | Recently, the financial media has framed one key question as, “Is the economy headed for recession?” In our view, the focus on “recession, or not,” is too simplistic. We believe it is better to consider the full range of possible outcomes. First, with the Fed apparently determined to slow the economy in order to control inflation, the best-case scenario, in our view, is a "soft landing." Even in that scenario, economic growth could be relatively slow and the unemployment rate could rise. Secondly, historically there has usually been a significant difference between the investment implications of a mild recession and a severe recession. We believe some characteristics of the current economic environment increase |
*****Distributions are not guaranteed.
10 Pioneer Balanced ESG Fund | Annual Report | 7/31/22
the likelihood of a mild recession: household and business balance sheets are mostly strong, and risks in the financial system appear to be manageable. At present, we believe the market has already priced-in a meaningful economic slowdown, as spreads have widened significantly from last year’s tighter levels.
A severe recession, in our view, is more likely to have ties to a Fed policy mistake, or an unforeseen global crisis. Fed Chair Powell and others have indicated that they intend to keep tightening policy until reported inflation numbers come down. Since inflation is typically a lagging economic indicator, such a policy framework could result in the Fed’s raising rates too far and thus causing a “hard landing” for the economy. After being too slow to tighten policy as the economy recovered from the COVID-19-driven recession, the Fed now seems at risk of making another mistake by perhaps being too late to respond to weaker economic conditions. We suspect this is mostly a communications problem, and that the FOMC could take a forward-looking approach in setting the level of the federal funds target range once it has raised rates to neutral. However, with current inflation readings well above target and the federal funds rate still below neutral, we believe the Fed wants to communicate a simple and forceful message to keep inflation expectations from becoming unanchored.
For the next few months, at least, we expect FOMC members to continue to say they will do whatever it takes to bring down inflation. In that scenario, we believe growing “hard landing” concerns among investors favor adding to the portfolio’s duration and being very selective with regard to credit exposures within the Fund’s fixed-income allocation.
At period-end, the Fund’s largest equity-sector overweights versus the S&P 500 were to health care and energy. The equity portfolio’s largest sector underweights were to utilities, where the Fund had no exposure, and to information technology. While information technology is the Fund’s second-largest underweight sector allocation relative to the S&P 500, it is also the single largest absolute sector weight, at roughly 25% of the equity portfolio. As a risk-management measure, we typically seek to limit the Fund’s exposure to any single sector to not more than 25% of invested assets.
Pioneer Balanced ESG Fund | Annual Report | 7/31/22 11
Please refer to the Schedule of Investments on pages 23–58 for a full listing of Fund securities.
All investments are subject to risk, including the possible loss of principal. In the past several years, financial markets have experienced increased volatility and heightened uncertainty. The market prices of securities may go up or down, sometimes rapidly or unpredictably, due to general market conditions, such as real or perceived adverse economic, political, or regulatory conditions, recessions, inflation, changes in interest or currency rates, lack of liquidity in the bond markets, the spread of infectious illness or other public health issues, armed conflict including Russia's military invasion of Ukraine, sanctions against Russia, other nations or individuals or companies and possible countermeasures, or adverse investor sentiment. These conditions may continue, recur, worsen or spread.
The Fund generally excludes corporate issuers that do not meet or exceed minimum ESG standards. Excluding specific issuers limits the universe of investments available to the Fund, which may mean forgoing some investment opportunities available to funds without similar ESG standards.
The market price of securities may fluctuate when interest rates change. When interest rates rise, the prices of fixed income securities in the Fund will generally fall. Conversely, when interest rates fall, the prices of fixed income securities in the Fund will generally rise.
The Fund’s investments, payment obligations and financing terms may be based on floating rates, such as LIBOR (London Interbank Offered Rate), or SOFR (Secured Overnight Financing Rate). Plans are underway to phase out the use of LIBOR. There remains uncertainty regarding the nature of any replacement rate and the impact of the transition from LIBOR on the Fund, issuers of instruments in which the Fund invests, and financial markets generally.
Investments in the Fund are subject to possible loss due to the financial failure of issuers of underlying securities and their inability to meet their debt obligations.
Prepayment risk is the chance that an issuer may exercise its right to prepay its security, if falling interest rates prompt the issuer to do so. Forced to reinvest the unanticipated proceeds at lower interest rates, the Fund would experience a decline in income and lose the opportunity for additional price appreciation.
The securities issued by U.S. Government-sponsored entities (e.g., FNMA, Freddie Mac) are neither guaranteed nor issued by the U.S. Government.
The portfolio may invest in mortgage-backed securities, which during times of fluctuating interest rates may increase or decrease more than other fixed-income securities. Mortgage-backed securities are also subject to pre-payments.
12 Pioneer Balanced ESG Fund | Annual Report | 7/31/22
Investments in high-yield or lower rated securities are subject to greater-than-average price volatility, illiquidity and possibility of default.
Investing in foreign and/or emerging markets securities involves risks relating to interest rates, currency exchange rates, economic, and political conditions.
The portfolio invests in REIT securities, the value of which can fall for a variety of reasons, such as declines in rental income, fluctuating interest rates, poor property management, environmental liabilities, uninsured damage, increased competition, or changes in real estate tax laws.
Before investing, consider the product’s investment objectives, risks, charges and expenses. Contact your investment professional or Amundi Asset Management US, Inc., for a prospectus or summary prospectus containing this information. Read it carefully.
Any information in this shareholder report regarding market or economic trends or the factors influencing the Fund’s historical or future performance are statements of opinion as of the date of this report. Past performance is no guarantee of future results.
Pioneer Balanced ESG Fund | Annual Report | 7/31/22 13
Portfolio Summary | 7/31/22
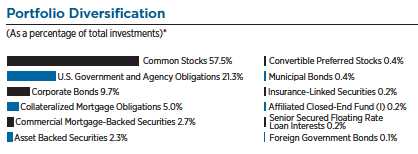

| 10 Largest Holdings | |
| (As a percentage of total investments)* | |
| 1. | Alphabet, Inc., Class A | 4.01% |
| 2. | Microsoft Corp. | 3.03 |
| 3. | Amazon.com, Inc. | 2.40 |
| 4. | Visa, Inc., Class A | 2.15 |
| 5. | AbbVie, Inc. | 2.10 |
| 6. | U.S. Treasury Bills, 8/4/22 | 1.87 |
| 7. | U.S. Treasury Bills, 8/9/22 | 1.87 |
| 8. | U.S. Treasury Bills, 8/2/22 | 1.73 |
| 9. | PNC Financial Services Group, Inc. | 1.63 |
| 10. | PepsiCo., Inc. | 1.50 |
| * | | Excludes short-term investments and all derivative contracts except for options purchased. The Fund is actively managed, and current holdings may be different. The holdings listed should not be considered recommendations to buy or sell any securities. |
| (l) | | Pioneer ILS Interval Fund is an affiliated closed-end fund managed by Amundi Asset Management US, Inc., (the “Adviser”). |
14 Pioneer Balanced ESG Fund | Annual Report | 7/31/22
Prices and Distributions | 7/31/22
Net Asset Value per Share
| Class | 7/31/22 | 7/31/21 |
| A | $9.66 | $11.31 |
| C | $9.57 | $11.21 |
| K | $9.64 | $11.29 |
| R | $9.68 | $11.33 |
| Y | $9.74 | $11.39 |
| Distributions per Share: 8/1/21–7/31/22 | |
| |
| | Net Investment | Short-Term | Long-Term |
| Class | Income | Capital Gains | Capital Gains |
| A | $0.1293 | $0.0094 | $0.7737 |
| C | $0.0489 | $0.0094 | $0.7737 |
| K | $0.1672 | $0.0094 | $0.7737 |
| R | $0.1039 | $0.0094 | $0.7737 |
| Y | $0.1563 | $0.0094 | $0.7737 |
Index Definitions
The Standard & Poor’s 500 Index is an unmanaged, commonly used measure of the broad U.S. stock market. The Bloomberg US Government/Credit Bond Index is unmanaged and measures the performance of debt obligations of the US government agencies and investment-grade domestic corporate debt. The Bloomberg US Aggregate Bond Index is an unmanaged measure of the US bond market. Index returns are calculated monthly, assume reinvestment of dividends and, unlike Fund returns, do not reflect any fees, expenses or sales charges. It is not possible to invest directly in an index.
The indices defined here pertain to the “Value of $10,000 Investment” and “Value of $5 Million Investment” charts on pages 16–20.
Pioneer Balanced ESG Fund | Annual Report | 7/31/22 15
| Performance Update | 7/31/22 | Class A Shares |
Investment Returns
The mountain chart on the right shows the change in value of a $10,000 investment made in Class A shares of Pioneer Balanced ESG Fund at public offering price during the periods shown, compared to that of the Standard & Poor’s 500 Index, the Bloomberg US Government/Credit Bond Index, and the Bloomberg US Aggregate Bond Index.*
| Average Annual Total Returns | |
| (As of July 31, 2022) | | | |
| |
| | | Public | | Bloomberg | Bloomberg |
| | Net | Offer- | | US Govern- | US |
| | Asset | ing | S&P | ment/ | Aggregate |
| | Value | Price | 500 | Credit Bond | Bond |
| Period | (NAV) | (POP) | Index | Index | Index |
| 10 years | 8.17% | 7.68% | 13.80% | 1.72% | 1.65% |
| 5 years | 7.38 | 6.40 | 12.83 | 1.40 | 1.28 |
| 1 year | -7.23 | -11.38 | -4.64 | -10.11 | -9.12 |
| | |
| Expense Ratio | |
| (Per prospectus dated December 1, 2021) |
| Gross | Net |
| 1.00% | 0.99% |
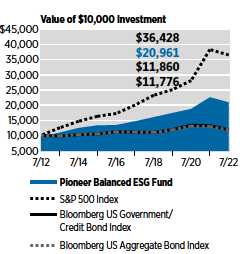
Call 1-800-225-6292 or visit www.amundi.com/us for the most recent month-end performance results. Current performance may be lower or higher than the performance data quoted.
The performance data quoted represents past performance, which is no guarantee of future results. Investment return and principal value will fluctuate, and shares, when redeemed, may be worth more or less than their original cost.
NAV results represent the percent change in net asset value per share. NAV returns would have been lower had sales charges been reflected. POP returns reflect deduction of the maximum 4.50% sales charge. All results are historical and assume the reinvestment of dividends and capital gains. Other share classes are available for which performance and expenses will differ.
Performance results reflect any applicable expense waivers in effect during the periods shown. Without such waivers Fund performance would be lower. Waivers may not be in effect for all funds. Certain fee waivers are contractual through a specified period. Otherwise, fee waivers can be rescinded at any time. See the prospectus and financial statements for more information.
The net expense ratio reflects the contractual expense limitation currently in effect through December 1, 2022 for Class A shares. There can be no assurance that Amundi US will extend the expense limitation beyond such time. Please see the prospectus and financial statements for more information. Expense ratios in the financial highlights, unlike those shown in the prospectus, do not reflect acquired fund fees and expenses.
The performance table and graph do not reflect the deduction of fees and taxes that a shareowner would pay on Fund distributions or the redemption of Fund shares.
*Effective January 1, 2022, the benchmark for the fixed-income portion of the portfolio changed from the Bloomberg US Government/Credit Bond Index to the Bloomberg US Aggregate Bond Index. The Fund's investment adviser believes that the new benchmark is better aligned with the Fund’s investment approach.
Please see the financial highlights for more current expense ratios.
16 Pioneer Balanced ESG Fund | Annual Report | 7/31/22
| Performance Update | 7/31/22 | Class C Shares |
Investment Returns
The mountain chart on the right shows the change in value of a $10,000 investment made in Class C shares of Pioneer Balanced ESG Fund during the periods shown, compared to that of the Standard & Poor’s 500 Index, the Bloomberg US Government/Credit Bond Index, and the Bloomberg US Aggregate Bond Index.*
| Average Annual Total Returns | |
| (As of July 31, 2022) | | | |
| | | | | Bloomberg | Bloomberg |
| | | | | US Govern- | US |
| | | | S&P | ment/ | Aggregate |
| | If | If | 500 | Credit Bond | Bond |
| Period | Held | Redeemed | Index | Index | Index |
| 10 years | 7.36% | 7.36% | 13.80% | 1.72% | 1.65% |
| 5 years | 6.60 | 6.60 | 12.83 | 1.40 | 1.28 |
| 1 year | -7.92 | -8.78 | -4.64 | -10.11 | -9.12 |
| Expense Ratio |
| (Per prospectus dated December 1, 2021) |
| Gross |
| 1.73% |
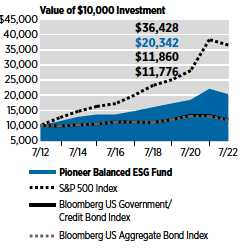
Call 1-800-225-6292 or visit www.amundi.com/us for the most recent month-end performance results. Current performance may be lower or higher than the performance data quoted.
The performance data quoted represents past performance, which is no guarantee of future results. Investment return and principal value will fluctuate, and shares, when redeemed, may be worth more or less than their original cost.
Class C shares held for less than one year are subject to a 1% contingent deferred sales charge (CDSC). “If Held” results represent the percent change in net asset value per share. “If Redeemed” returns reflect deduction of the CDSC for the one-year period, assuming a complete redemption of shares at the last price calculated on the last business day of the period, and no CDSC for the five- and 10-year periods. All results are historical and assume the reinvestment of dividends and capital gains. Other share classes are available for which performance and expenses will differ.
Performance results reflect any applicable expense waivers in effect during the periods shown. Without such waivers Fund performance would be lower. Waivers may not be in effect for all funds. Certain fee waivers are contractual through a specified period. Otherwise, fee waivers can be rescinded at any time. See the prospectus and financial statements for more information.
Expense ratios in the financial highlights, unlike those shown in the prospectus, do not reflect acquired fund fees and expenses.
The performance table and graph do not reflect the deduction of fees and taxes that a shareowner would pay on Fund distributions or the redemption of Fund shares.
*Effective January 1, 2022, the benchmark for the fixed-income portion of the portfolio changed from the Bloomberg US Government/Credit Bond Index to the Bloomberg US Aggregate Bond Index. The Fund's investment adviser believes that the new benchmark is better aligned with the Fund’s investment approach.
Please see the financial highlights for a more current expense ratio.
Pioneer Balanced ESG Fund | Annual Report | 7/31/22 17
| Performance Update | 7/31/22 | Class K Shares |
Investment Returns
The mountain chart on the right shows the change in value of a $5 million investment made in Class K shares of Pioneer Balanced ESG Fund during the periods shown, compared to that of the Standard & Poor’s 500 Index, the Bloomberg US Government/Credit Bond Index, and the Bloomberg US Aggregate Bond Index.*
| Average Annual Total Returns | |
| (As of July 31, 2022) | | |
| | | | Bloomberg | Bloomberg |
| | Net | | US Govern- | US |
| | Asset | S&P | ment/ | Aggregate |
| | Value | 500 | Credit | Bond |
| Period | (NAV) | Index | Bond Index | Index |
| 10 years | 8.38% | 13.80% | 1.72% | 1.65% |
| 5 years | 7.70 | 12.83 | 1.40 | 1.28 |
| 1 year | -6.90 | -4.64 | -10.11 | -9.12 |
| Expense Ratio | |
| (Per prospectus dated December 1, 2021) |
| Gross | Net |
| 0.70% | 0.65% |
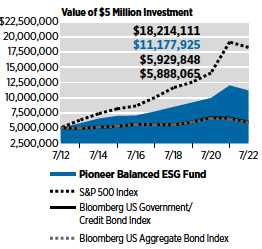
Call 1-800-225-6292 or visit www.amundi.com/us for the most recent month-end performance results. Current performance may be lower or higher than the performance data quoted.
The performance data quoted represents past performance, which is no guarantee of future results. Investment return and principal value will fluctuate, and shares, when redeemed, may be worth more or less than their original cost.
The performance shown for Class K shares for the period prior to the commencement of operations of Class K shares on December 1, 2015, is the net asset value performance of the Fund’s Class A shares, which has not been restated to reflect any differences in expenses, including Rule 12b-1 fees applicable to Class A shares. Since fees for Class A shares generally are higher than those of Class K shares, the performance of Class K shares prior to their inception on December 1, 2015, would have been higher than the performance shown. For the period beginning December 1, 2015, the actual performance of Class K shares is reflected. Class K shares are not subject to sales charges and are available for limited groups of eligible investors, including institutional investors. All results are historical and assume the reinvestment of dividends and capital gains.
Performance results reflect any applicable expense waivers in effect during the periods shown. Without such waivers Fund performance would be lower. Waivers may not be in effect for all funds. Certain fee waivers are contractual through a specified period. Otherwise, fee waivers can be rescinded at any time. See the prospectus and financial statements for more information.
The net expense ratio reflects the contractual expense limitation currently in effect through December 1, 2022 for Class K shares. There can be no assurance that Amundi US will extend the expense limitation beyond such time. Please see the prospectus and financial statements for more information. Expense ratios in the financial highlights, unlike those shown in the prospectus, do not reflect acquired fund fees and expenses.
The performance table and graph do not reflect the deduction of fees and taxes that a shareowner would pay on Fund distributions or the redemption of Fund shares.
*Effective January 1, 2022, the benchmark for the fixed-income portion of the portfolio changed from the Bloomberg US Government/Credit Bond Index to the Bloomberg US Aggregate Bond Index. The Fund's investment adviser believes that the new benchmark is better aligned with the Fund’s investment approach.
Please see the financial highlights for more current expense ratios.
18 Pioneer Balanced ESG Fund | Annual Report | 7/31/22
| Performance Update | 7/31/22 | Class R Shares |
Investment Returns
The mountain chart on the right shows the change in value of a $10,000 investment made in Class R shares of Pioneer Balanced ESG Fund during the periods shown, compared to that of the Standard & Poor’s 500 Index, the Bloomberg US Government/Credit Bond Index, and the Bloomberg US Aggregate Bond Index.*
| Average Annual Total Returns | |
| (As of July 31, 2022) | | |
| |
| | | | Bloomberg Bloomberg |
| | Net | | US Govern- | US |
| | Asset | S&P | ment/ | Aggregate |
| | Value | 500 | Credit | Bond |
| Period | (NAV) | Index | Bond Index | Index |
| 10 years | 8.00% | 13.80% | 1.72% | 1.65% |
| 5 years | 7.11 | 12.83 | 1.40 | 1.28 |
| 1 year | -7.45 | -4.64 | -10.11 | -9.12 |
| Expense Ratio | |
| (Per prospectus dated December 1, 2021) |
| Gross | Net |
| 1.45% | 1.30% |
Call 1-800-225-6292 or visit www.amundi.com/us for the most recent month-end performance results. Current performance may be lower or higher than the performance data quoted.
The performance data quoted represents past performance, which is no guarantee of future results. Investment return and principal value will fluctuate, and shares, when redeemed, may be worth more or less than their original cost.
The performance shown for Class R shares for the period prior to the commencement of operations of Class R shares on July 1, 2015, is the net asset value performance of the Fund’s Class A shares, which has not been restated to reflect any differences in expenses, including Rule 12b-1 fees applicable to Class A shares. Since fees for Class A shares generally are higher than those of Class R shares, the performance of Class R shares prior to their inception would have been higher than the performance shown. For the period beginning July 1, 2015, the actual performance of Class R shares is reflected.
Class R shares are not subject to sales charges and are available for limited groups of eligible investors, including institutional investors. All results are historical and assume the reinvestment of dividends and capital gains. Other share classes are available for which performance and expenses will differ.
Performance results reflect any applicable expense waivers in effect during the periods shown. Without such waivers Fund performance would be lower. Waivers may not be in effect for all funds. Certain fee waivers are contractual through a specified period. Otherwise, fee waivers can be rescinded at any time. See the prospectus and financial statements for more information.
The net expense ratio reflects the contractual expense limitation currently in effect through December 1, 2022 for Class R shares. There can be no assurance that Amundi US will extend the expense limitation beyond such time. Please see the prospectus and financial statements for more information. Expense ratios in the financial highlights, unlike those shown in the prospectus, do not reflect acquired fund fees and expenses.
The performance table and graph do not reflect the deduction of fees and taxes that a shareowner would pay on Fund distributions or the redemption of Fund shares.
*Effective January 1, 2022, the benchmark for the fixed-income portion of the portfolio changed from the Bloomberg US Government/Credit Bond Index to the Bloomberg US Aggregate Bond Index. The Fund's investment adviser believes that the new benchmark is better aligned with the Fund’s investment approach.
Please see the financial highlights for more current expense ratios.
Pioneer Balanced ESG Fund | Annual Report | 7/31/22 19
| Performance Update | 7/31/22 | Class Y Shares |
Investment Returns
The mountain chart on the right shows the change in value of a $5 million investment made in Class Y shares of Pioneer Balanced ESG Fund during the periods shown, compared to that of the Standard & Poor’s 500 Index, the Bloomberg US Government/Credit Bond Index, and the Bloomberg US Aggregate Bond Index.*
| | | | | |
| Average Annual Total Returns | |
| (As of July 31, 2022) | | |
| | | | Bloomberg | Bloomberg |
| | Net | | US Govern- | US |
| | Asset | S&P | ment/ | Aggregate |
| | Value | 500 | Credit | Bond |
| Period | (NAV) | Index | Bond Index | Index |
| 10 years | 8.48% | 13.80% | 1.72% | 1.65% |
| 5 years | 7.71 | 12.83 | 1.40 | 1.28 |
| 1 year | -6.95 | -4.64 | -10.11 | -9.12 |
| Expense Ratio | |
| (Per prospectus dated December 1, 2021) |
| Gross | Net |
| 0.77% | 0.65% |
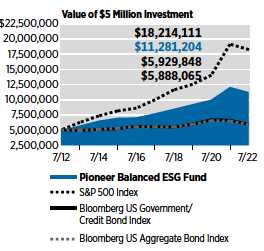
Call 1-800-225-6292 or visit www.amundi.com/us for the most recent month-end performance results. Current performance may be lower or higher than the performance data quoted.
The performance data quoted represents past performance, which is no guarantee of future results. Investment return and principal value will fluctuate, and shares, when redeemed, may be worth more or less than their original cost.
Class Y shares are not subject to sales charges and are available for limited groups of eligible investors, including institutional investors. All results are historical and assume the reinvestment of dividends and capital gains. Other share classes are available for which performance and expenses will differ.
Performance results reflect any applicable expense waivers in effect during the periods shown. Without such waivers Fund performance would be lower. Waivers may not be in effect for all funds. Certain fee waivers are contractual through a specified period. Otherwise, fee waivers can be rescinded at any time. See the prospectus and financial statements for more information.
The net expense ratio reflects the contractual expense limitation currently in effect through December 1, 2022 for Class Y shares. There can be no assurance that Amundi US will extend the expense limitation beyond such time. Please see the prospectus and financial statements for more information. Expense ratios in the financial highlights, unlike those shown in the prospectus, do not reflect acquired fund fees and expenses.
The performance table and graph do not reflect the deduction of fees and taxes that a shareowner would pay on Fund distributions or the redemption of Fund shares.
*Effective January 1, 2022, the benchmark for the fixed-income portion of the portfolio changed from the Bloomberg US Government/Credit Bond Index to the Bloomberg US Aggregate Bond Index. The Fund's investment adviser believes that the new benchmark is better aligned with the Fund’s investment approach.
Please see the financial highlights for more current expense ratios.
20 Pioneer Balanced ESG Fund | Annual Report | 7/31/22
Comparing Ongoing Fund Expenses
As a shareowner in the Fund, you incur two types of costs:
| (1) | | ongoing costs, including management fees, distribution and/or service (12b-1) fees, and other Fund expenses; and |
| (2) | | transaction costs, including sales charges (loads) on purchase payments. |
This example is intended to help you understand your ongoing expenses (in dollars) of investing in the Fund and to compare these costs with the ongoing costs of investing in other mutual funds. The example is based on an investment of $1,000 at the beginning of the Fund’s latest six-month period and held throughout the six months.
Using the Tables
Actual Expenses
The first table below provides information about actual account values and actual expenses. You may use the information in this table, together with the amount you invested, to estimate the expenses that you paid over the period as follows:
| (1) | | Divide your account value by $1,000 |
Example: an $8,600 account value ÷ $1,000 = 8.6
| (2) | | Multiply the result in (1) above by the corresponding share class’s number in the third row under the heading entitled “Expenses Paid During Period” to estimate the expenses you paid on your account during this period. |
Expenses Paid on a $1,000 Investment in Pioneer Balanced ESG Fund
Based on actual returns from February 1, 2022 through July 31, 2022.
| | | | | | |
| Share Class | A | C | K | R | Y |
| Beginning Account | $1,000.00 | $1,000.00 | $1,000.00 | $1,000.00 | $1,000.00 |
| Value on 2/1/22 | | | | | |
| Ending Account | $917.80 | $914.20 | $919.60 | $917.00 | $919.40 |
| Value (after expenses) | | | | | |
| on 7/31/22 | | | | | |
| Expenses Paid | $4.52 | $7.97 | $3.09 | $5.70 | $3.09 |
| During Period* | | | | | |
| * | | Expenses are equal to the Fund’s annualized expense ratio of 0.95%, 1.68%, 0.65%, 1.20%, and 0.65% for Class A, Class C, Class K, Class R, and Class Y shares, respectively, multiplied by the average account value over the period, multiplied by 181/365 (to reflect the partial year period). |
Pioneer Balanced ESG Fund | Annual Report | 7/31/22 21
Hypothetical Example for Comparison Purposes
The table below provides information about hypothetical account values and hypothetical expenses based on the Fund’s actual expense ratio and an assumed rate of return of 5% per year before expenses, which is not the Fund’s actual return. The hypothetical account values and expenses may not be used to estimate the actual ending account balance or expenses you paid for the period.
You may use this information to compare the ongoing costs of investing in the Fund and other funds. To do so, compare this 5% hypothetical example with the 5% hypothetical examples that appear in the shareholder reports of the other funds.
Please note that the expenses shown in the tables are meant to highlight your ongoing costs only and do not reflect any transaction costs, such as sales charges (loads) that are charged at the time of the transaction. Therefore, the table below is useful in comparing ongoing costs only and will not help you determine the relative total costs of owning different funds. In addition, if these transaction costs were included, your costs would have been higher.
Expenses Paid on a $1,000 Investment in Pioneer Balanced ESG Fund
Based on a hypothetical 5% return per year before expenses, reflecting the period from February 1, 2022 through July 31, 2022.
| Share Class | A | C | K | R | Y |
| Beginning Account | $1,000.00 | $1,000.00 | $1,000.00 | $1,000.00 | $1,000.00 |
| Value on 2/1/22 | | | | | |
| Ending Account | $1,020.08 | $1,016.46 | $1,021.57 | $1,018.84 | $1,021.57 |
| Value (after expenses) | | | | | |
| on 7/31/22 | | | | | |
| Expenses Paid | $4.76 | $8.40 | $3.26 | $6.01 | $3.26 |
| During Period* | | | | | |
| * | | Expenses are equal to the Fund’s annualized expense ratio of 0.95%, 1.68%, 0.65%, 1.20%, and 0.65% for Class A, Class C, Class K, Class R, and Class Y shares, respectively, multiplied by the average account value over the period, multiplied by 181/365 (to reflect the partial year period). |
22 Pioneer Balanced ESG Fund | Annual Report | 7/31/22
Schedule of Investments | 7/31/22
| | | |
| Principal | | |
| Amount | | |
| USD ($) | | Value |
| | UNAFFILIATED ISSUERS — 104.8% | |
| | SENIOR SECURED FLOATING RATE LOAN | |
| | INTERESTS — 0.1% of Net Assets*(a) |
| | Chemicals-Diversified — 0.0%† | |
| 39,900 | LSF11 A5 HoldCo LLC, Term Loan, 5.941% (SOFR + | |
| | 350 bps), 10/15/28 | $ 38,670 |
| 108,900 | Schweitzer-Mauduit International, Inc., Term B Loan, | |
| | 6.125% (LIBOR + 375 bps), 4/20/28 | 103,455 |
| | Total Chemicals-Diversified | $ 142,125 |
| | Finance-Leasing Company — 0.0%† | |
| 72,604 | Avolon TLB Borrower 1 (US) LLC, Term B-4 Loan, | |
| | 3.626% (LIBOR + 150 bps), 2/12/27 | $ 70,093 |
| | Total Finance-Leasing Company | $ 70,093 |
| | Medical-Wholesale Drug Distribution — 0.0%† |
| 64,838 | Owens & Minor, Inc., Term B-1 Loan, 6.177% (Term | |
| | SOFR + 375 bps), 3/29/29 | $ 64,675 |
| | Total Medical-Wholesale Drug Distribution | $ 64,675 |
| | Metal Processors & Fabrication — 0.0%† | |
| 99,250 | Grinding Media, Inc. (Molycop, Ltd.), First Lien Initial | |
| | Term Loan, 4.796% (LIBOR + 400 bps), 10/12/28 | $ 93,047 |
| | Total Metal Processors & Fabrication | $ 93,047 |
| | REITS-Storage — 0.1% | |
| 167,562 | Iron Mountain Information Management LLC, Incremental | |
| | Term B Loan , 4.122% (LIBOR + 175 bps), 1/2/26 | $ 161,977 |
| | Total REITS-Storage | $ 161,977 |
| | Transport-Equipment & Leasing — 0.0%† | |
| 129,262 | IBC Capital I, Ltd., First Lien Tranche B-1 Term Loan, | |
| | 5.78% (LIBOR + 375 bps), 9/11/23 | $ 116,902 |
| | Total Transport-Equipment & Leasing | $ 116,902 |
| | TOTAL SENIOR SECURED FLOATING RATE LOAN INTERESTS | |
| | (Cost $679,600) | $ 648,819 |
| |
| Shares | | |
| | COMMON STOCKS — 60.4% of Net Assets | |
| | Air Freight & Logistics — 0.6% | |
| 9,718 | FedEx Corp. | $ 2,265,169 |
| | Total Air Freight & Logistics | $ 2,265,169 |
| | Automobiles — 0.4% | |
| 62,399 | Honda Motor Co., Ltd. (A.D.R.) | $ 1,604,902 |
| | Total Automobiles | $ 1,604,902 |
| | Banks — 3.8% | |
| 179,558 | Bank of America Corp. | $ 6,070,856 |
The accompanying notes are an integral part of these financial statements.
Pioneer Balanced ESG Fund | Annual Report | 7/31/22 23
Schedule of Investments | 7/31/22 (continued)
| | | | |
| Shares | | | Value |
| | | Banks — (continued) | |
| | 42,215 | PNC Financial Services Group, Inc. | $ 7,005,157 |
| | 29,186 | Popular, Inc. | 2,266,877 |
| | | Total Banks | $ 15,342,890 |
| | | Beverages — 1.7% | |
| | 53,229 | Britvic Plc | $ 557,796 |
| | 36,697 | PepsiCo., Inc. | 6,420,507 |
| | | Total Beverages | $ 6,978,303 |
| | | Biotechnology — 2.5% | |
| | 62,740 | AbbVie, Inc. | $ 9,003,818 |
| | 8,681(b) | Alnylam Pharmaceuticals, Inc. | 1,233,049 |
| | | Total Biotechnology | $ 10,236,867 |
| | | Capital Markets — 1.4% | |
| | 27,964 | CME Group, Inc. | $ 5,578,259 |
| | | Total Capital Markets | $ 5,578,259 |
| | | Chemicals — 0.9% | |
| | 20,151 | International Flavors & Fragrances, Inc. | $ 2,499,731 |
| | 22,700 | Mosaic Co. | 1,195,382 |
| | | Total Chemicals | $ 3,695,113 |
| | | Communications Equipment — 2.6% | |
| | 126,104 | Cisco Systems, Inc. | $ 5,721,338 |
| | 20,820 | Motorola Solutions, Inc. | 4,967,444 |
| | | Total Communications Equipment | $ 10,688,782 |
| | | Electrical Equipment — 0.8% | |
| | 20,666 | Eaton Corp. Plc | $ 3,066,628 |
| | | Total Electrical Equipment | $ 3,066,628 |
| | | Electronic Equipment, Instruments & Components — 1.4% | |
| | 85,238 | National Instruments Corp. | $ 3,239,044 |
| | 17,397 | TE Connectivity, Ltd. | 2,326,501 |
| | | Total Electronic Equipment, Instruments & Components | $ 5,565,545 |
| | | Energy Equipment & Services — 0.4% | |
| | 69,014 | Baker Hughes Co. | $ 1,772,970 |
| | | Total Energy Equipment & Services | $ 1,772,970 |
| | | Entertainment — 1.0% | |
| | 14,604(b) | Walt Disney Co. | $ 1,549,484 |
| | 178,407(b) | Warner Bros Discovery, Inc. | 2,676,105 |
| | | Total Entertainment | $ 4,225,589 |
| | | Equity Real Estate Investment Trusts (REITs) — 1.6% | |
| | 14,376 | Crown Castle, Inc. | $ 2,597,168 |
| | 1,911 | Equinix, Inc. | 1,344,847 |
The accompanying notes are an integral part of these financial statements.
24 Pioneer Balanced ESG Fund | Annual Report | 7/31/22
| | | | |
| Shares | | | Value |
| | | Equity Real Estate Investment Trusts | |
| | | (REITs) — (continued) | |
| | 143,605 | Outfront Media, Inc. | $ 2,650,949 |
| | | Total Equity Real Estate Investment Trusts (REITs) | $ 6,592,964 |
| | | Food & Staples Retailing — 0.8% | |
| | 75,500 | Seven & i Holdings Co., Ltd. | $ 3,073,787 |
| | | Total Food & Staples Retailing | $ 3,073,787 |
| | | Food Products — 1.1% | |
| | 54,064 | Lamb Weston Holdings, Inc. | $ 4,306,738 |
| | | Total Food Products | $ 4,306,738 |
| | | Health Care Providers & Services — 3.0% | |
| | 63,586 | Cardinal Health, Inc. | $ 3,787,182 |
| | 40,361 | CVS Health Corp. | 3,861,740 |
| | 9,545 | Elevance Health, Inc. | 4,553,920 |
| | | Total Health Care Providers & Services | $ 12,202,842 |
| | | Hotels, Restaurants & Leisure — 1.5% | |
| | 114,011(b) | Cedar Fair LP | $ 4,810,124 |
| | 17,989 | Wyndham Hotels & Resorts, Inc. | 1,248,617 |
| | | Total Hotels, Restaurants & Leisure | $ 6,058,741 |
| | | Insurance — 1.2% | |
| | 14,383 | Chubb, Ltd. | $ 2,713,209 |
| | 49,889 | Sun Life Financial, Inc. | 2,316,845 |
| | | Total Insurance | $ 5,030,054 |
| | | Interactive Media & Services — 4.2% | |
| | 147,800(b) | Alphabet, Inc., Class A | $ 17,192,096 |
| | | Total Interactive Media & Services | $ 17,192,096 |
| | | Internet & Direct Marketing Retail — 2.5% |
| | 76,380(b) | Amazon.com, Inc. | $ 10,307,481 |
| | | Total Internet & Direct Marketing Retail | $ 10,307,481 |
| | | IT Services — 3.3% | |
| | 17,050 | Automatic Data Processing, Inc. | $ 4,111,096 |
| | 43,367 | Visa, Inc., Class A | 9,198,574 |
| | | Total IT Services | $ 13,309,670 |
| | | Machinery — 1.4% | |
| | 10,464 | Caterpillar, Inc. | $ 2,074,488 |
| | 10,944 | Deere & Co. | 3,755,762 |
| | | Total Machinery | $ 5,830,250 |
| | | Metals & Mining — 1.1% | |
| | 31,172 | Alcoa Corp. | $ 1,586,343 |
| | 39,380 | Freeport-McMoRan, Inc. | 1,242,439 |
| | 9,553 | Reliance Steel & Aluminum Co. | 1,817,458 |
| | | Total Metals & Mining | $ 4,646,240 |
The accompanying notes are an integral part of these financial statements.
Pioneer Balanced ESG Fund | Annual Report | 7/31/22 25
Schedule of Investments | 7/31/22 (continued)
| | | | |
| Shares | | | Value |
| | | Oil, Gas & Consumable Fuels — 3.6% | |
| | 28,308 | Phillips 66 | $ 2,519,412 |
| | 16,102 | Pioneer Natural Resources Co. | 3,815,369 |
| | 57,865 | Shell Plc (A.D.R.) | 3,088,834 |
| | 61,178 | Targa Resources Corp. | 4,228,011 |
| | 9,651 | Valero Energy Corp. | 1,069,041 |
| | | Total Oil, Gas & Consumable Fuels | $ 14,720,667 |
| | | Personal Products — 0.9% | |
| | 12,766 | Estee Lauder Cos., Inc., Class A | $ 3,486,395 |
| | | Total Personal Products | $ 3,486,395 |
| | | Pharmaceuticals — 4.7% | |
| | 68,596 | AstraZeneca Plc (A.D.R.) | $ 4,543,113 |
| | 12,670 | Eli Lilly & Co. | 4,177,172 |
| | 16,516 | Merck KGaA | 3,134,649 |
| | 22,028 | Novo Nordisk AS (A.D.R.) | 2,556,570 |
| | 93,714 | Pfizer, Inc. | 4,733,494 |
| | | Total Pharmaceuticals | $ 19,144,998 |
| | | Professional Services — 0.3% | |
| | 14,608 | Robert Half International, Inc. | $ 1,156,077 |
| | | Total Professional Services | $ 1,156,077 |
| | | Semiconductors & Semiconductor Equipment — 3.4% | |
| | 47,722(b) | Advanced Micro Devices, Inc. | $ 4,508,297 |
| | 12,204 | Analog Devices, Inc. | 2,098,600 |
| | 6,815 | Lam Research Corp. | 3,410,976 |
| | 60,682 | Micron Technology, Inc. | 3,753,788 |
| | | Total Semiconductors & Semiconductor Equipment | $ 13,771,661 |
| | | Software — 3.8% | |
| | 46,317 | Microsoft Corp. | $ 13,003,035 |
| | 14,262(b) | Salesforce, Inc. | 2,624,493 |
| | | Total Software | $ 15,627,528 |
| | | Specialty Retail — 1.8% | |
| | 15,070 | Home Depot, Inc. | $ 4,535,166 |
| | 49,224 | TJX Cos., Inc. | 3,010,540 |
| | | Total Specialty Retail | $ 7,545,706 |
| | | Technology Hardware, Storage & Peripherals — 0.8% | |
| | 237,443 | Hewlett Packard Enterprise Co. | $ 3,381,188 |
| | | Total Technology Hardware, Storage & Peripherals | $ 3,381,188 |
| | | Textiles, Apparel & Luxury Goods — 0.6% | |
| | 73,012 | Levi Strauss & Co., Class A | $ 1,381,387 |
| | 26,395 | VF Corp. | 1,179,329 |
| | | Total Textiles, Apparel & Luxury Goods | $ 2,560,716 |
The accompanying notes are an integral part of these financial statements.
26 Pioneer Balanced ESG Fund | Annual Report | 7/31/22
| | | |
| Shares | | Value |
| | Trading Companies & Distributors — 1.3% |
| 44,163(b) | AerCap Holdings NV | $ 1,981,152 |
| 27,371 | Ferguson Plc | 3,450,936 |
| | Total Trading Companies & Distributors | $ 5,432,088 |
| | TOTAL COMMON STOCKS | |
| | (Cost $196,042,285) | $246,398,904 |
| |
| Principal | | |
| Amount | | |
| USD ($) | | |
| | ASSET BACKED SECURITIES — 2.4% of |
| | Net Assets | |
| 108,789 | Accelerated LLC, Series 2021-1H, Class C, 2.35%, | |
| | 10/20/40 (144A) | $ 99,223 |
| 300,000(a) | Arbor Realty Commercial Real Estate Notes, Ltd., Series | |
| | 2021-FL3, Class C, 3.849% (1 Month USD LIBOR |
| | + 185 bps), 8/15/34 (144A) | 276,852 |
| 750,000(a) | Arbor Realty Commercial Real Estate Notes, Ltd., Series | |
| | 2021-FL4, Class D, 4.899% (1 Month USD LIBOR |
| | + 290 bps), 11/15/36 (144A) | 717,183 |
| 365,000(a) | Arbor Realty Commercial Real Estate Notes, Ltd., Series | |
| | 2022-FL1, Class C, 3.717% (SOFR30A + | |
| | 230 bps), 1/15/37 (144A) | 346,966 |
| 400,000(a) | Arbor Realty Commercial Real Estate Notes, Ltd., Series | |
| | 2022-FL2, Class C, 5.409% (1 Month Term SOFR |
| | + 345 bps), 5/15/37 (144A) | 386,844 |
| 250,000(a) | Benefit Street Partners CLO XIX, Ltd., Series 2019-19A, | |
| | Class D, 6.312% (3 Month USD LIBOR + | |
| | 380 bps), 1/15/33 (144A) | 228,149 |
| 250,000(a) | Benefit Street Partners CLO XIX, Ltd., Series 2019-19A, | |
| | Class E, 9.532% (3 Month USD LIBOR + | |
| | 702 bps), 1/15/33 (144A) | 224,530 |
| 223,976 | Blackbird Capital Aircraft, Series 2021-1A, Class A, | |
| | 2.443%, 7/15/46 (144A) | 193,746 |
| 160,000(a) | BSPRT Issuer, Ltd., Series 2022-FL8, Class C, 3.717% | |
| | (SOFR30A + 230 bps), 2/15/37 (144A) | 154,603 |
| 192,964 | BXG Receivables Note Trust, Series 2018-A, Class C, | |
| | 4.44%, 2/2/34 (144A) | 188,419 |
| 250,000(a) | Carlyle US CLO, Ltd., Series 2019-4A, Class CR, 5.528% | |
| | (3 Month Term SOFR + 320 bps), 4/15/35 (144A) | 227,807 |
| 149,518(c) | Cascade MH Asset Trust, Series 2019-MH1, Class A, | |
| | 4.00%, 11/25/44 (144A) | 142,324 |
| 200,000 | Commercial Equipment Finance LLC, Series 2021-A, | |
| | Class C, 3.55%, 12/15/28 (144A) | 189,446 |
| 155,470 | CoreVest American Finance Trust, Series 2020-3, Class A, | |
| | 1.358%, 8/15/53 (144A) | 141,868 |
| 500,000 | Crossroads Asset Trust, Series 2021-A, Class D, 2.52%, | |
| | 1/20/26 (144A) | 471,964 |
| 100,000 | DataBank Issuer, Series 2021-1A, Class B, 2.65%, | |
| | 2/27/51 (144A) | 89,443 |
The accompanying notes are an integral part of these financial statements.
Pioneer Balanced ESG Fund | Annual Report | 7/31/22 27
Schedule of Investments | 7/31/22 (continued)
| | | | |
| Principal | | | |
| Amount | | | |
| USD ($) | | Value |
| | ASSET BACKED SECURITIES — (continued) |
| 195,000 | Domino’s Pizza Master Issuer LLC, Series 2019-1A, | | |
| | Class A2, 3.668%, 10/25/49 (144A) | $ 179,912 |
| 30,000 | Drive Auto Receivables Trust, Series 2020-2, Class D, | | |
| | 3.05%, 5/15/28 | | 29,641 |
| 400,000(c) | Finance of America HECM Buyout, Series 2022-HB1, | | |
| | Class M3, 5.084%, 2/25/32 (144A) | | 386,546 |
| 59,026 | Foundation Finance Trust, Series 2021-1A, Class A, | | |
| | 1.27%, 5/15/41 (144A) | | 54,449 |
| 380,000(a) | Gracie Point International Funding, Series 2022-2A, | | |
| | Class A, 4.305% (SOFR30A + | | |
| | 275 bps), 7/1/24 (144A) | | 379,920 |
| 125,000(a) | HGI CRE CLO, Ltd., Series 2021-FL2, Class C, 3.956% | | |
| | (1 Month USD LIBOR + 180 bps), 9/17/36 (144A) | | 117,127 |
| 198,500 | HOA Funding LLC - HOA, Series 2021-1A, Class A2, | | |
| | 4.723%, 8/20/51 (144A) | | 169,904 |
| 122,448 | Home Partners of America Trust, Series 2019-1, Class D, | |
| | 3.406%, 9/17/39 (144A) | | 112,576 |
| 166,988 | Home Partners of America Trust, Series 2019-2, Class E, | |
| | 3.32%, 10/19/39 (144A) | | 148,095 |
| 100,000 | Mercury Financial Credit Card Master Trust, Series 2021-1A, | |
| | Class A, 1.54%, 3/20/26 (144A) | | 94,887 |
| 500,000(a) | MF1, Ltd., Series 2021-FL7, Class D, 4.706% (1 Month USD | |
| | LIBOR + 255 bps), 10/16/36 (144A) | | 469,376 |
| 42,023 | Mosaic Solar Loan Trust, Series 2019-2A, Class A, 2.88%, | |
| | 9/20/40 (144A) | | 39,110 |
| 110,511 | Mosaic Solar Loan Trust, Series 2020-1A, Class A, 2.10%, | |
| | 4/20/46 (144A) | | 101,769 |
| 150,000 | Nelnet Student Loan Trust, Series 2021-A, Class B1, | | |
| | 2.85%, 4/20/62 (144A) | | 132,201 |
| 66,351 | NMEF Funding LLC, Series 2019-A, Class B, 3.06%, | | |
| | 8/17/26 (144A) | | 66,202 |
| 100,000 | NMEF Funding LLC, Series 2019-A, Class C, 3.30%, | | |
| | 8/17/26 (144A) | | 98,684 |
| 250,000 | NMEF Funding LLC, Series 2019-A, Class D, 4.39%, | | |
| | 8/17/26 (144A) | | 245,616 |
| 100,000 | NMEF Funding LLC, Series 2021-A, Class C, 2.58%, | | |
| | 12/15/27 (144A) | | 93,247 |
| 200,000 | Oportun Funding XIV LLC, Series 2021-A, Class C, 3.44%, | |
| | 3/8/28 (144A) | | 188,302 |
| 250,000(a) | Palmer Square Loan Funding, Ltd., Series 2020-1A, | | |
| | Class B, 3.378% (3 Month USD LIBOR + | | |
| | 190 bps), 2/20/28 (144A) | | 237,619 |
| 250,000 | Republic Finance Issuance Trust, Series 2021-A, Class A, | |
| | 2.30%, 12/22/31 (144A) | | 232,187 |
| 100,000 | Republic Finance Issuance Trust, Series 2021-A, Class C, | |
| | 3.53%, 12/22/31 (144A) | | 91,406 |
| 250,000 | SCF Equipment Leasing LLC, Series 2021-1A, Class D, | | |
| | 1.93%, 9/20/30 (144A) | | 227,887 |
The accompanying notes are an integral part of these financial statements.
28 Pioneer Balanced ESG Fund | Annual Report | 7/31/22
| | | |
| Principal | | |
| Amount | | |
| USD ($) | | Value |
| | ASSET BACKED SECURITIES — (continued) |
| 250,000(a) | Sound Point CLO XXV, Ltd., Series 2019-4A, | |
| | Class ER, 9.791% (3 Month Term SOFR + 725 bps), | |
| | 4/25/33 (144A) | $ 225,220 |
| 102,086 | SpringCastle America Funding LLC, Series 2020-AA, | |
| | Class A, 1.97%, 9/25/37 (144A) | 93,935 |
| 325,000(a) | STWD, Ltd., Series 2022-FL3, Class B, 3.367% (SOFR30A + | |
| | 195 bps), 11/15/38 (144A) | 309,069 |
| 100,000 | Tricolor Auto Securitization Trust, Series 2021-1A, | |
| | Class D, 1.92%, 5/15/26 (144A) | 97,071 |
| 169,098 | Tricon American Homes Trust, Series 2019-SFR1, Class A, | |
| | 2.75%, 3/17/38 (144A) | 164,253 |
| 120,000 | Tricon American Homes Trust, Series 2020-SFR2, Class E1, | |
| | 2.73%, 11/17/39 (144A) | 104,335 |
| 190,404 | United Auto Credit Securitization Trust, Series 2020-1, | |
| | Class D, 2.88%, 2/10/25 (144A) | 190,338 |
| 195,478 | Welk Resorts LLC, Series 2019-AA, Class C, 3.34%, | |
| | 6/15/38 (144A) | 190,087 |
| 108,534 | Westgate Resorts LLC, Series 2020-1A, Class C, 6.213%, | |
| | 3/20/34 (144A) | 108,720 |
| 345,323 | Westgate Resorts LLC, Series 2022-1A, Class C, 2.488%, | |
| | 8/20/36 (144A) | 329,966 |
| | TOTAL ASSET BACKED SECURITIES | |
| | (Cost $10,396,843) | $ 9,789,024 |
| | COLLATERALIZED MORTGAGE OBLIGATIONS — | |
| | 5.3% of Net Assets | |
| 702,064(c) | Bayview MSR Opportunity Master Fund Trust, Series | |
| | 2021-2, Class A2, 2.50%, 6/25/51 (144A) | $ 619,450 |
| 496,578(c) | Bayview MSR Opportunity Master Fund Trust, Series | |
| | 2022-5, Class B2, 3.472%, 2/25/52 (144A) | 391,152 |
| 40,450(a) | Bellemeade Re, Ltd., Series 2018-3A, Class M1B, 4.109% | |
| | (1 Month USD LIBOR + 185 bps), 10/25/28 (144A) | 40,366 |
| 39,222(a) | Bellemeade Re, Ltd., Series 2019-1A, Class M1B, 4.009% | |
| | (1 Month USD LIBOR + 175 bps), 3/25/29 (144A) | 39,104 |
| 150,000(a) | Bellemeade Re, Ltd., Series 2020-3A, Class M1C, 5.959% | |
| | (1 Month USD LIBOR + 370 bps), 10/25/30 (144A) | 149,877 |
| 150,000(a) | Bellemeade Re, Ltd., Series 2020-3A, Class M2, 7.109% (1 | |
| | Month USD LIBOR + 485 bps), 10/25/30 (144A) | 148,727 |
| 96,630(a) | Bellemeade Re, Ltd., Series 2020-4A, Class M2B, 5.859% | |
| | (1 Month USD LIBOR + 360 bps), 6/25/30 (144A) | 97,387 |
| 300,000(a) | Bellemeade Re, Ltd., Series 2021-3A, Class M2, 4.664% | |
| | (SOFR30A + 315 bps), 9/25/31 (144A) | 266,194 |
| 150,000(a) | Bellemeade Re, Ltd., Series 2022-1, Class M1C, 5.214% | |
| | (SOFR30A + 370 bps), 1/26/32 (144A) | 141,497 |
| 425,000(c) | BINOM Securitization Trust, Series 2022-RPL1, Class M2, | |
| | 3.00%, 2/25/61 (144A) | 387,404 |
| 100,000(c) | Bunker Hill Loan Depositary Trust, Series 2020-1, | |
| | Class A3, 3.253%, 2/25/55 (144A) | 96,928 |
| 100,000(c) | Cascade Funding Mortgage Trust, Series 2021-HB6, | |
| | Class M3, 3.735%, 6/25/36 (144A) | 92,251 |
The accompanying notes are an integral part of these financial statements.
Pioneer Balanced ESG Fund | Annual Report | 7/31/22 29
Schedule of Investments | 7/31/22 (continued)
| | | |
| Principal | | |
| Amount | | |
| USD ($) | | Value |
| | COLLATERALIZED MORTGAGE | |
| | OBLIGATIONS — (continued) | |
| 150,000 | Cascade MH Asset Trust, Series 2021-MH1, Class M1, | |
| | 2.992%, 2/25/46 (144A) | $ 125,902 |
| 450,000(c) | CFMT LLC, Series 2021-HB5, Class M3, 2.91%, | |
| | 2/25/31 (144A) | 423,862 |
| 200,000(c) | CFMT LLC, Series 2021-HB7, Class M3, 3.849%, | |
| | 10/27/31 (144A) | 188,458 |
| 338,833(c) | CIM Trust, Series 2021-J2, Class B1, 2.673%, | |
| | 4/25/51 (144A) | 307,476 |
| 500,000(c) | Citigroup Mortgage Loan Trust, Series 2018-RP3, | |
| | Class M3, 3.25%, 3/25/61 (144A) | 438,613 |
| 684,855(c) | Citigroup Mortgage Loan Trust, Series 2021-INV2, | |
| | Class B1W, 2.988%, 5/25/51 (144A) | 587,496 |
| 8,064(a) | Connecticut Avenue Securities Trust, Series 2019-R06, | |
| | Class 2M2, 4.359% (1 Month USD LIBOR + | |
| | 210 bps), 9/25/39 (144A) | 8,064 |
| 22,475(a) | Connecticut Avenue Securities Trust, Series 2019-R07, | |
| | Class 1M2, 4.359% (1 Month USD LIBOR + | |
| | 210 bps), 10/25/39 (144A) | 22,457 |
| 51,233(a) | Connecticut Avenue Securities Trust, Series 2020-R02, | |
| | Class 2M2, 4.259% (1 Month USD LIBOR + | |
| | 200 bps), 1/25/40 (144A) | 50,721 |
| 660,000(a) | Connecticut Avenue Securities Trust, Series 2022-R02, | |
| | Class 2M2, 4.514% (SOFR30A + | |
| | 300 bps), 1/25/42 (144A) | 626,658 |
| 82,591(a) | Eagle Re, Ltd., Series 2018-1, Class M1, 3.959% (1 Month | |
| | USD LIBOR + 170 bps), 11/25/28 (144A) | 81,969 |
| 210,548(a) | Eagle Re, Ltd., Series 2019-1, Class M1B, 4.059% (1 | |
| | Month USD LIBOR + 180 bps), 4/25/29 (144A) | 208,362 |
| 54,532(a) | Eagle Re, Ltd., Series 2020-2, Class M2, 7.859% (1 Month | |
| | USD LIBOR + 560 bps), 10/25/30 (144A) | 54,531 |
| 150,000(a) | Eagle Re, Ltd., Series 2021-2, Class M1C, 4.964% | |
| | (SOFR30A + 345 bps), 4/25/34 (144A) | 139,713 |
| 26,542(a) | Federal Home Loan Mortgage Corp. REMICs, Series 1671, | |
| | Class S, 2.649% (1 Month USD LIBOR + | |
| | 65 bps), 2/15/24 | 26,468 |
| 366,504 | Federal Home Loan Mortgage Corp. REMICs, Series 3816, | |
| | Class HA, 3.50%, 11/15/25 | 367,888 |
| 15,778(a) | Federal Home Loan Mortgage Corp. REMICs, Series 3868, | |
| | Class FA, 2.399% (1 Month USD LIBOR + | |
| | 40 bps), 5/15/41 | 15,710 |
| 120,470(a)(d) | Federal Home Loan Mortgage Corp. REMICs, Series 4091, | |
| | Class SH, 4.551% (1 Month USD LIBOR + | |
| | 655 bps), 8/15/42 | 19,078 |
| 96,550(d) | Federal Home Loan Mortgage Corp. REMICs, Series 4999, | |
| | Class QI, 4.00%, 5/25/50 | 17,972 |
| 193,002(d) | Federal Home Loan Mortgage Corp. REMICs, Series 5018, | |
| | Class EI, 4.00%, 10/25/50 | 37,491 |
| 129,484(d) | Federal Home Loan Mortgage Corp. REMICs, Series 5067, | |
| | Class GI, 4.00%, 12/25/50 | 24,609 |
The accompanying notes are an integral part of these financial statements.
30 Pioneer Balanced ESG Fund | Annual Report | 7/31/22
| | | |
| Principal | | |
| Amount | | |
| USD ($) | | Value |
| | COLLATERALIZED MORTGAGE | |
| | OBLIGATIONS — (continued) | |
| 17,079(a) | Federal National Mortgage Association REMICs, Series | |
| | 2006-104, Class GF, 2.579% (1 Month USD LIBOR | |
| | + 32 bps), 11/25/36 | $ 16,972 |
| 22,138(a) | Federal National Mortgage Association REMICs, Series | |
| | 2006-23, Class FP, 2.559% (1 Month USD LIBOR |
| | + 30 bps), 4/25/36 | 21,957 |
| 8,888(a) | Federal National Mortgage Association REMICs, Series | |
| | 2007-93, Class FD, 2.809% (1 Month USD LIBOR |
| | + 55 bps), 9/25/37 | 8,917 |
| 54,916(a) | Federal National Mortgage Association REMICs, Series | |
| | 2011-63, Class FG, 2.709% (1 Month USD LIBOR |
| | + 45 bps), 7/25/41 | 54,815 |
| 83,934(d) | Federal National Mortgage Association REMICs, Series | |
| | 2020-83, Class EI, 4.00%, 11/25/50 | 16,615 |
| 164,648(a) | Freddie Mac Stacr Remic Trust, Series 2020-DNA3, | |
| | Class B1, 7.359% (1 Month USD LIBOR + | |
| | 510 bps), 6/25/50 (144A) | 171,173 |
| 190,000(a) | Freddie Mac Stacr Remic Trust, Series 2020-DNA4, | |
| | Class B1, 8.259% (1 Month USD LIBOR + | |
| | 600 bps), 8/25/50 (144A) | 201,451 |
| 2,612(a) | Freddie Mac Stacr Remic Trust, Series 2020-DNA4, | |
| | Class M2, 6.009% (1 Month USD LIBOR + | |
| | 375 bps), 8/25/50 (144A) | 2,615 |
| 105,000(a) | Freddie Mac Stacr Remic Trust, Series 2020-DNA5, | |
| | Class B1, 6.314% (SOFR30A + | |
| | 480 bps), 10/25/50 (144A) | 107,517 |
| 75,248(a) | Freddie Mac Stacr Remic Trust, Series 2020-DNA5, | |
| | Class M2, 4.314% (SOFR30A + | |
| | 280 bps), 10/25/50 (144A) | 75,339 |
| 80,000(a) | Freddie Mac Stacr Remic Trust, Series 2020-DNA6, | |
| | Class B2, 7.164% (SOFR30A + | |
| | 565 bps), 12/25/50 (144A) | 69,435 |
| 60,000(a) | Freddie Mac Stacr Remic Trust, Series 2020-HQA4, | |
| | Class B1, 7.509% (1 Month USD LIBOR + | |
| | 525 bps), 9/25/50 (144A) | 60,452 |
| 40,000(a) | Freddie Mac Stacr Remic Trust, Series 2021-DNA1, | |
| | Class B1, 4.164% (SOFR30A + | |
| | 265 bps), 1/25/51 (144A) | 34,540 |
| 195,000(a) | Freddie Mac Stacr Remic Trust, Series 2021-DNA1, | |
| | Class B2, 6.264% (SOFR30A + | |
| | 475 bps), 1/25/51 (144A) | 155,314 |
| 35,000(a) | Freddie Mac Stacr Remic Trust, Series 2021-DNA5, | |
| | Class B1, 4.564% (SOFR30A + | |
| | 305 bps), 1/25/34 (144A) | 31,284 |
| 120,000(a) | Freddie Mac Stacr Remic Trust, Series 2021-HQA1, | |
| | Class B2, 6.514% (SOFR30A + | |
| | 500 bps), 8/25/33 (144A) | 95,103 |
| 485,000(a) | Freddie Mac Stacr Remic Trust, Series 2021-HQA3, | |
| | Class B1, 4.864% (SOFR30A + | |
| | 335 bps), 9/25/41 (144A) | 431,073 |
The accompanying notes are an integral part of these financial statements.
Pioneer Balanced ESG Fund | Annual Report | 7/31/22 31
Schedule of Investments | 7/31/22 (continued)
| | | |
| Principal | | |
| Amount | | |
| USD ($) | | Value |
| | COLLATERALIZED MORTGAGE | |
| | OBLIGATIONS — (continued) | |
| 400,000(a) | Freddie Mac Stacr Remic Trust, Series 2021-HQA3, | |
| | Class M2, 3.614% (SOFR30A + | |
| | 210 bps), 9/25/41 (144A) | $ 357,792 |
| 200,000(a) | Freddie Mac Stacr Remic Trust, Series 2021-HQA4, | |
| | Class B1, 5.264% (SOFR30A + | |
| | 375 bps), 12/25/41 (144A) | 171,443 |
| 190,000(a) | Freddie Mac Stacr Remic Trust, Series 2022-DNA1, | |
| | Class B1, 4.914% (SOFR30A + | |
| | 340 bps), 1/25/42 (144A) | 166,248 |
| 160,000(a) | Freddie Mac Stacr Remic Trust, Series 2022-DNA3, | |
| | Class M1B, 4.414% (SOFR30A + | |
| | 290 bps), 4/25/42 (144A) | 155,265 |
| 50,000(a) | Freddie Mac Stacr Remic Trust, Series 2022-HQA1, | |
| | Class M1B, 5.014% (SOFR30A + | |
| | 350 bps), 3/25/42 (144A) | 49,505 |
| 120,000(a) | Freddie Mac Stacr Remic Trust, Series 2021-DNA7, Series | |
| | 2021-DNA7, Class B1, 5.164% (SOFR30A + |
| | 365 bps), 11/25/41 (144A) | 110,313 |
| 520,000(a) | Freddie Mac Stacr Remic Trust, Series 2022-DNA2, Series | |
| | 2022-DNA2, Class M2, 5.264% (SOFR30A + |
| | 375 bps), 2/25/42 (144A) | 488,809 |
| 110,000(a) | Freddie Mac Structured Agency Credit Risk Debt Notes, | |
| | Series 2020-HQA5, Class B2, 8.914% (SOFR30A + | |
| | 740 bps), 11/25/50 (144A) | 105,936 |
| 75,000(a) | Freddie Mac Structured Agency Credit Risk Debt Notes, | |
| | Series 2021-DNA2, Class B2, 7.514% (SOFR30A + | |
| | 600 bps), 8/25/33 (144A) | 64,817 |
| 352,301(d) | Government National Mortgage Association, Series | |
| | 2019-159, Class CI, 3.50%, 12/20/49 | 60,754 |
| 297,082(a)(d) | Government National Mortgage Association, Series | |
| | 2020-9, Class SA, 1.224% (1 Month USD LIBOR + | |
| | 335 bps), 1/20/50 | 14,255 |
| 160,000(c) | GS Mortgage-Backed Securities Corp. Trust, Series | |
| | 2022-PJ4, Class A33, 3.00%, 9/25/52 (144A) | 123,117 |
| 296,861(c) | GS Mortgage-Backed Securities Corp. Trust, Series | |
| | 2022-PJ4, Class A34, 2.50%, 9/25/52 (144A) | 257,677 |
| 70,812(c) | GS Mortgage-Backed Securities Trust, Series 2020-NQM1, | |
| | Class A3, 2.352%, 9/27/60 (144A) | 66,707 |
| 345,450(c) | GS Mortgage-Backed Securities Trust, Series 2021-GR3, | |
| | Class B2, 3.392%, 4/25/52 (144A) | 286,349 |
| 316,046(c) | GS Mortgage-Backed Securities Trust, Series 2022-PJ1, | |
| | Class A4, 2.50%, 5/28/52 (144A) | 273,905 |
| 8,926(a) | Home Re, Ltd., Series 2018-1, Class M1, 3.859% (1 Month | |
| | USD LIBOR + 160 bps), 10/25/28 (144A) | 8,915 |
| 68,968(a) | Home Re, Ltd., Series 2019-1, Class M1, 3.909% (1 Month | |
| | USD LIBOR + 165 bps), 5/25/29 (144A) | 68,725 |
| 144,973(a) | Home Re, Ltd., Series 2020-1, Class M1C, 6.409% (1 Month | |
| | USD LIBOR + 415 bps), 10/25/30 (144A) | 145,215 |
The accompanying notes are an integral part of these financial statements.
32 Pioneer Balanced ESG Fund | Annual Report | 7/31/22
| Principal | | |
| Amount | | |
| USD ($) | | Value |
| | COLLATERALIZED MORTGAGE | |
| | OBLIGATIONS — (continued) | |
| 150,000(a) | Home Re, Ltd., Series 2020-1, Class M2, 7.509% (1 Month | |
| | USD LIBOR + 525 bps), 10/25/30 (144A) | $ 151,282 |
| 200,000(a) | Home Re, Ltd., Series 2021-1, Class M2, 5.109% (1 Month | |
| | USD LIBOR + 285 bps), 7/25/33 (144A) | 178,977 |
| 100,000(c) | Homeward Opportunities Fund I Trust, Series 2020-2, | |
| | Class A3, 3.196%, 5/25/65 (144A) | 96,566 |
| 100,000(c) | Imperial Fund Mortgage Trust, Series 2021-NQM2, | |
| | Class B1, 3.295%, 9/25/56 (144A) | 72,872 |
| 100,000(c) | Imperial Fund Mortgage Trust, Series 2021-NQM2, | |
| | Class M1, 2.489%, 9/25/56 (144A) | 74,854 |
| 400,000 | IMS Ecuadorian Mortgage Trust, Series 2021-1, Class GA, | |
| | 3.40%, 8/18/43 (144A) | 385,500 |
| 127,971(c) | JP Morgan Mortgage Trust, Series 2021-13, Class B1, | |
| | 3.144%, 4/25/52 (144A) | 108,108 |
| 349,885(c) | JP Morgan Mortgage Trust, Series 2021-7, Class A3, | |
| | 2.50%, 11/25/51 (144A) | 308,384 |
| 291,958(c) | JP Morgan Mortgage Trust, Series 2021-7, Class B2, | |
| | 2.802%, 11/25/51 (144A) | 231,446 |
| 291,748(c) | JP Morgan Mortgage Trust, Series 2021-INV1, Class B1, | |
| | 2.991%, 10/25/51 (144A) | 242,911 |
| 133,105(c) | JP Morgan Mortgage Trust, Series 2021-INV6, Class A5A, | |
| | 2.50%, 4/25/52 (144A) | 113,789 |
| 800,000(c) | JP Morgan Mortgage Trust, Series 2022-2, Class A5A, | |
| | 2.50%, 8/25/52 (144A) | 587,516 |
| 233,308(c) | JP Morgan Mortgage Trust, Series 2022-3, Class B2, | |
| | 3.12%, 8/25/52 (144A) | 189,567 |
| 210,000(c) | JP Morgan Mortgage Trust, Series 2022-4, Class A5, | |
| | 3.00%, 10/25/52 (144A) | 160,100 |
| 389,993(c) | JP Morgan Mortgage Trust, Series 2022-5, Class A9A, | |
| | 2.50%, 9/25/52 (144A) | 338,654 |
| 685,000(c) | JP Morgan Mortgage Trust, Series 2022-8, Class B2, | |
| | 4.695%, 1/25/53 (144A) | 592,303 |
| 296,889(c) | JP Morgan Mortgage Trust, Series 2022-INV1, Class B2, | |
| | 3.301%, 3/25/52 (144A) | 227,468 |
| 250,000(c) | JP Morgan Mortgage Trust, Series 2022-LTV1, Class M1, | |
| | 3.528%, 7/25/52 (144A) | 192,219 |
| 362,037(c) | Mello Mortgage Capital Acceptance, Series 2021-INV2, | |
| | Class A15, 2.50%, 8/25/51 (144A) | 309,500 |
| 300,000(c) | Mello Mortgage Capital Acceptance, Series 2021-INV2, | |
| | Class A5, 2.50%, 8/25/51 (144A) | 218,616 |
| 484,038(c) | Mello Mortgage Capital Acceptance, Series 2021-MTG1, | |
| | Class B1, 2.652%, 4/25/51 (144A) | 384,440 |
| 65,389(c) | MFA Trust, Series 2020-NQM1, Class A3, 2.30%, | |
| | 8/25/49 (144A) | 63,403 |
| 160,000(c) | MFA Trust, Series 2022-RPL1, Class A2, 3.335%, | |
| | 8/25/61 (144A) | 138,904 |
| 300,000(c) | Mill City Mortgage Loan Trust, Series 2019-GS2, | |
| | Class M3, 3.25%, 8/25/59 (144A) | 268,675 |
The accompanying notes are an integral part of these financial statements.
Pioneer Balanced ESG Fund | Annual Report | 7/31/22 33
Schedule of Investments | 7/31/22 (continued)
| | | | |
| Principal | | | |
| Amount | | | |
| USD ($) | | Value |
| | COLLATERALIZED MORTGAGE | | |
| | OBLIGATIONS — (continued) | | |
| 41,264(c) | New Residential Mortgage Loan Trust, Series 2019-NQM4, | |
| | Class A1, 2.492%, 9/25/59 (144A) | $ 39,863 |
| 63,794(a) | Oaktown Re V, Ltd., Series 2020-2A, Class M1B, 5.859% | |
| | (1 Month USD LIBOR + 360 bps), 10/25/30 (144A) | | 63,650 |
| 150,000(a) | Oaktown Re V, Ltd., Series 2020-2A, Class M2, 7.509% | | |
| | (1 Month USD LIBOR + 525 bps), 10/25/30 (144A) | | 151,817 |
| 581,016(c) | PRMI Securitization Trust, Series 2021-1, Class B1, | | |
| | 2.479%, 4/25/51 (144A) | | 456,718 |
| 268,136(c) | Provident Funding Mortgage Trust, Series 2021-1, | | |
| | Class A5, 2.50%, 4/25/51 (144A) | | 232,292 |
| 287,561(c) | Provident Funding Mortgage Trust, Series 2021-2, | | |
| | Class A9, 2.25%, 4/25/51 (144A) | | 246,386 |
| 5,888(a) | Radnor Re, Ltd., Series 2018-1, Class M1, 3.659% (1 | | |
| | Month USD LIBOR + 140 bps), 3/25/28 (144A) | | 5,887 |
| 191,559(a) | Radnor Re, Ltd., Series 2019-1, Class M1B, 4.209% (1 | | |
| | Month USD LIBOR + 195 bps), 2/25/29 (144A) | | 188,175 |
| 360,000(a) | Radnor Re, Ltd., Series 2020-1, Class M1C, 4.009% (1 | | |
| | Month USD LIBOR + 175 bps), 1/25/30 (144A) | | 337,627 |
| 339,105(c) | RCKT Mortgage Trust, Series 2021-3, Class A25, 2.50%, | |
| | 7/25/51 (144A) | | 294,639 |
| 392,525(c) | RCKT Mortgage Trust, Series 2021-4, Class B1A, 3.011%, | |
| | 9/25/51 (144A) | | 326,882 |
| 385,000(c) | RCKT Mortgage Trust, Series 2022-3, Class A17, 3.00%, | |
| | 5/25/52 (144A) | | 295,082 |
| 100,000(c) | RMF Buyout Issuance Trust, Series 2022-HB1, Class M3, | |
| | 4.50%, 4/25/32 (144A) | | 92,344 |
| 44,200(c) | RMF Proprietary Issuance Trust, Series 2019-1, Class A, | |
| | 2.75%, 10/25/63 (144A) | | 43,185 |
| 347,284(c) | RMF Proprietary Issuance Trust, Series 2021-2, Class A, | |
| | 2.125%, 9/25/61 (144A) | | 311,263 |
| 570,971(c) | Sequoia Mortgage Trust, Series 2021-4, Class A1, 2.50%, | |
| | 6/25/51 (144A) | | 504,639 |
| 150,000(c) | Sequoia Mortgage Trust, Series 2022-1, Class A7, 2.50%, | |
| | 2/25/52 (144A) | | 110,815 |
| 400,000(a) | STACR Trust, Series 2018-HRP2, Class M3, 4.659% (1 Month | |
| | USD LIBOR + 240 bps), 2/25/47 (144A) | | 396,692 |
| 47,353(a) | Triangle Re, Ltd., Series 2020-1, Class M1C, 6.759% (1 | | |
| | Month USD LIBOR + 450 bps), 10/25/30 (144A) | | 47,407 |
| 224,181(a) | Triangle Re, Ltd., Series 2021-1, Class M1C, 5.659% (1 | | |
| | Month USD LIBOR + 340 bps), 8/25/33 (144A) | | 223,941 |
| 400,000(c) | UWM Mortgage Trust, Series 2021-INV1, Class A5, 2.50%, | |
| | 8/25/51 (144A) | | 290,226 |
| 95,028(c) | Visio Trust, Series 2019-2, Class A1, 2.722%, | | |
| | 11/25/54 (144A) | | 91,394 |
| 100,000(c) | Wells Fargo Mortgage Backed Securities Trust, Series | | |
| | 2022-2, Class A5, 3.00%, 12/25/51 (144A) | | 76,819 |
The accompanying notes are an integral part of these financial statements.
34 Pioneer Balanced ESG Fund | Annual Report | 7/31/22
| | | |
| Principal | | |
| Amount | | |
| USD ($) | | Value |
| | COLLATERALIZED MORTGAGE | |
| | OBLIGATIONS — (continued) | |
| 335,000(c) | Wells Fargo Mortgage Backed Securities Trust, Series | |
| | 2022-2, Class A6, 2.50%, 12/25/51 (144A) | $ 239,955 |
| | TOTAL COLLATERALIZED MORTGAGE OBLIGATIONS | |
| | (Cost $23,308,068) | $ 21,477,906 |
| | COMMERCIAL MORTGAGE-BACKED |
| | SECURITIES — 2.8% of Net Assets | |
| 200,000(a) | Austin Fairmont Hotel Trust, Series 2019-FAIR, | |
| | Class A, 3.049% (1 Month USD LIBOR + 105 bps), | |
| | 9/15/32 (144A) | $ 196,212 |
| 500,000 | BANK, Series 2017-BNK7, Class AS, 3.748%, 9/15/60 | 478,932 |
| 250,000(a) | Beast Mortgage Trust, Series 2021-1818, Class A, 3.049% | |
| | (1 Month USD LIBOR + 105 bps), 3/15/36 (144A) | 240,712 |
| 300,000 | Benchmark Mortgage Trust, Series 2018-B8, Class A4, | |
| | 3.963%, 1/15/52 | 298,656 |
| 200,000(c) | Benchmark Mortgage Trust, Series 2022-B34, Class AM, | |
| | 3.833%, 4/15/55 | 188,416 |
| 425,000(a) | BX Commercial Mortgage Trust, Series 2021-VOLT, | |
| | Class F, 4.399% (1 Month USD LIBOR + 240 bps), | |
| | 9/15/36 (144A) | 400,177 |
| 80,000(c) | CCUBS Commercial Mortgage Trust, Series 2017-C1, | |
| | Class AS, 3.907%, 11/15/50 | 77,088 |
| 236,657 | CFCRE Commercial Mortgage Trust, Series 2016-C3, | |
| | Class A2, 3.597%, 1/10/48 | 232,756 |
| 198,501(a) | CHC Commercial Mortgage Trust, Series 2019-CHC, | |
| | Class D, 4.049% (1 Month USD LIBOR + 205 bps), | |
| | 6/15/34 (144A) | 187,797 |
| 248,126(a) | CHC Commercial Mortgage Trust, Series 2019-CHC, | |
| | Class E, 4.349% (1 Month USD LIBOR + 235 bps), | |
| | 6/15/34 (144A) | 233,645 |
| 277,369 | Citigroup Commercial Mortgage Trust, Series 2018-C5, | |
| | Class A3, 3.963%, 6/10/51 | 274,021 |
| 300,000 | Citigroup Commercial Mortgage Trust, Series 2020-GC46, | |
| | Class A5, 2.717%, 2/15/53 | 274,064 |
| 196,598(a) | Cold Storage Trust, Series 2020-ICE5, Class D, 4.099% | |
| | (1 Month USD LIBOR + 210 bps), 11/15/37 (144A) | 190,904 |
| 334,196 | COMM Mortgage Trust, Series 2014-UBS3, Class A3, | |
| | 3.546%, 6/10/47 | 327,755 |
| 1,290 | Credit Suisse First Boston Mortgage Securities Corp., | |
| | Series 2005-C2, Class AMFX, 4.877%, 4/15/37 | 1,291 |
| 400,000(a) | Credit Suisse Mortgage Capital Certificates, Series | |
| | 2019-ICE4, Class E, 4.149% (1 Month USD LIBOR | |
| | + 215 bps), 5/15/36 (144A) | 387,902 |
| 250,000(c) | CSAIL Commercial Mortgage Trust, Series 2015-C4, | |
| | Class AS, 4.174%, 11/15/48 | 245,231 |
| 16,154(a) | Freddie Mac Multifamily Structured Credit Risk, Series | |
| | 2021-MN1, Class M1, 3.514% (SOFR30A + | |
| | 200 bps), 1/25/51 (144A) | 15,173 |
The accompanying notes are an integral part of these financial statements.
Pioneer Balanced ESG Fund | Annual Report | 7/31/22 35
Schedule of Investments | 7/31/22 (continued)
| | | |
| Principal | | |
| Amount | | |
| USD ($) | | Value |
| | COLLATERALIZED MORTGAGE | |
| | OBLIGATIONS — (continued) | |
| 550,000(a) | Freddie Mac Multifamily Structured Credit Risk, Series | |
| | 2021-MN3, Class M2, 5.514% (SOFR30A + | |
| | 400 bps), 11/25/51 (144A) | $ 481,678 |
| 300,000 | Freddie Mac Multifamily Structured Pass Through | |
| | Certificates, Series K729, Class A2, 3.136%, |
| | 10/25/24 | 298,964 |
| 100,000(c) | FREMF Mortgage Trust, Series 2017-KW03, Class B, | |
| | 4.064%, 7/25/27 (144A) | 97,133 |
| 109,746(a) | FREMF Mortgage Trust, Series 2019-KF64, Class B, 4.087% | |
| | (1 Month USD LIBOR + 230 bps), 6/25/26 (144A) | 108,201 |
| 320,342(a) | FREMF Mortgage Trust, Series 2019-KF66, Class B, 4.187% | |
| | (1 Month USD LIBOR + 240 bps), 7/25/29 (144A) | 313,429 |
| 250,000(c) | FREMF Trust, Series 2018-KW04, Class B, 3.913%, | |
| | 9/25/28 (144A) | 234,826 |
| 874,423(c) | Government National Mortgage Association, Series | |
| | 2017-21, Class IO, 0.642%, 10/16/58 | 34,735 |
| 400,000(a) | GS Mortgage Securities Corporation Trust, Series 2021-IP, | |
| | Class D, 4.099% (1 Month USD LIBOR + | |
| | 210 bps), 10/15/36 (144A) | 369,985 |
| 290,000 | GS Mortgage Securities Trust, Series 2015-GC28, | |
| | Class A5, 3.396%, 2/10/48 | 285,801 |
| 200,000 | JP Morgan Chase Commercial Mortgage Securities Trust, | |
| | Series 2016-JP4, Class A3, 3.393%, 12/15/49 | 193,242 |
| 375,000 | JP Morgan Chase Commercial Mortgage Securities Trust, | |
| | Series 2018-WPT, Class AFX, 4.248%, 7/5/33 (144A) | 371,243 |
| 250,000 | JPMDB Commercial Mortgage Securities Trust, Series | |
| | 2018-C8, Class A4, 4.211%, 6/15/51 | 252,095 |
| 2,450,000(c) | JPMDB Commercial Mortgage Securities Trust, Series | |
| | 2018-C8, Class XB, 0.099%, 6/15/51 | 16,118 |
| 250,000 | Key Commercial Mortgage Securities Trust, Series | |
| | 2019-S2, Class A3, 3.469%, 6/15/52 (144A) | 237,156 |
| 600,000(a) | Med Trust, Series 2021-MDLN, Class E, 5.15% (1 Month | |
| | USD LIBOR + 315 bps), 11/15/38 (144A) | 562,305 |
| 405,000(a) | Med Trust, Series 2021-MDLN, Class F, 6.00% (1 Month | |
| | USD LIBOR + 400 bps), 11/15/38 (144A) | 378,324 |
| 300,000(c) | Morgan Stanley Capital I Trust, Series 2018-MP, Class A, | |
| | 4.276%, 7/11/40 (144A) | 292,926 |
| 50,000 | Palisades Center Trust, Series 2016-PLSD, Class A, | |
| | 2.713%, 4/13/33 (144A) | 44,500 |
| 500,000(a) | Ready Capital Mortgage Financing LLC, Series 2021-FL7, | |
| | Class D, 5.209% (1 Month USD LIBOR + | |
| | 295 bps), 11/25/36 (144A) | 464,988 |
| 200,000(a) | Ready Capital Mortgage Financing LLC, Series 2022-FL8, | |
| | Class D, 5.217% (SOFR30A + | |
| | 370 bps), 1/25/37 (144A) | 188,470 |
| 475,000 | SLG Office Trust, Series 2021-OVA, Class E, 2.851%, | |
| | 7/15/41 (144A) | 376,548 |
| 250,000(c) | Soho Trust, Series 2021-SOHO, Class A, 2.697%, | |
| | 8/10/38 (144A) | 218,568 |
The accompanying notes are an integral part of these financial statements.
36 Pioneer Balanced ESG Fund | Annual Report | 7/31/22
| | | |
| Principal | | |
| Amount | | |
| USD ($) | | Value |
| | COLLATERALIZED MORTGAGE | |
| | OBLIGATIONS — (continued) | |
| 610,000(a) | Taubman Centers Commercial Mortgage Trust, Series | |
| | 2022-DPM, Class B, 4.891% (1 Month Term SOFR + | |
| | 293 bps), 5/15/37 (144A) | $ 587,750 |
| 398,731(a) | TTAN, Series 2021-MHC, Class B, 3.10% (1 Month USD | |
| | LIBOR + 110 bps), 3/15/38 (144A) | 381,183 |
| 250,000(c) | UBS Commercial Mortgage Trust, Series 2018-C9, | |
| | Class C, 4.879%, 3/15/51 | 227,055 |
| 120,000(c) | Wells Fargo Commercial Mortgage Trust, Series | |
| | 2018-C43, Class A4, 4.012%, 3/15/51 | 120,502 |
| | TOTAL COMMERCIAL MORTGAGE-BACKED SECURITIES | |
| | (Cost $12,277,831) | $ 11,388,457 |
| | CORPORATE BONDS — 10.2% of Net Assets | |
| | Advertising — 0.1% | |
| 226,000 | Interpublic Group of Cos., Inc., 4.75%, 3/30/30 | $ 226,927 |
| 257,000 | Stagwell Global LLC, 5.625%, 8/15/29 (144A) | 215,232 |
| | Total Advertising | $ 442,159 |
| | Aerospace & Defense — 0.2% | |
| 355,000 | Raytheon Technologies Corp., 3.20%, 3/15/24 | $ 354,289 |
| 310,000 | Teledyne Technologies, Inc., 2.25%, 4/1/28 | 274,573 |
| | Total Aerospace & Defense | $ 628,862 |
| | Airlines — 0.1% | |
| 25,000 | Air Canada, 3.875%, 8/15/26 (144A) | $ 23,000 |
| 126,437 | Air Canada 2017-1 Class AA Pass Through Trust, | |
| | 3.30%, 1/15/30 (144A) | 115,541 |
| 60,000 | Delta Air Lines, Inc./SkyMiles IP, Ltd., 4.75%, | |
| | 10/20/28 (144A) | 58,602 |
| 100,600 | JetBlue 2019-1 Class AA Pass Through Trust, | |
| | 2.75%, 5/15/32 | 88,547 |
| 37,877 | JetBlue 2020-1 Class A Pass Through Trust, | |
| | 4.00%, 11/15/32 | 35,897 |
| | Total Airlines | $ 321,587 |
| | Auto Manufacturers — 0.3% | |
| 410,000(a) | General Motors Financial Co., Inc., 2.528% (SOFR + | |
| | 76 bps), 3/8/24 | $ 400,150 |
| 165,000 | General Motors Financial Co., Inc., 3.10%, 1/12/32 | 138,135 |
| 610,000(a) | Toyota Motor Credit Corp., 2.399% (SOFR + | |
| | 32 bps), 4/6/23 | 608,309 |
| | Total Auto Manufacturers | $ 1,146,594 |
| | Auto Parts & Equipment — 0.0%† | |
| 80,000 | Dana, Inc., 4.25%, 9/1/30 | $ 66,591 |
| | Total Auto Parts & Equipment | $ 66,591 |
The accompanying notes are an integral part of these financial statements.
Pioneer Balanced ESG Fund | Annual Report | 7/31/22 37
Schedule of Investments | 7/31/22 (continued)
| | | |
| Principal | | |
| Amount | | |
| USD ($) | | Value |
| | Banks — 2.6% | |
| 400,000(c) | ABN AMRO Bank NV, 2.47% (1 Year CMT Index + | |
| | 110 bps), 12/13/29 (144A) | $ 348,236 |
| 200,000 | ABN AMRO Bank NV, 4.80%, 4/18/26 (144A) | 199,342 |
| 200,000(c) | AIB Group Plc, 4.263% (3 Month USD LIBOR + | |
| | 187 bps), 4/10/25 (144A) | 196,531 |
| 200,000 | Banco do Brasil SA, 3.25%, 9/30/26 (144A) | 184,500 |
| 200,000 | Banco Santander Chile, 2.70%, 1/10/25 (144A) | 191,750 |
| 200,000(c) | Banco Santander SA, 1.722% (1 Year CMT Index + | |
| | 90 bps), 9/14/27 | 176,568 |
| 600,000(c) | Banco Santander SA, 3.225% (1 Year CMT Index + | |
| | 160 bps), 11/22/32 | 473,319 |
| 335,000(c) | Bank of America Corp., 2.572% (SOFR + | |
| | 121 bps), 10/20/32 | 287,163 |
| 217,000(c) | Bank of America Corp., 4.083% (3 Month USD LIBOR + | |
| | 315 bps), 3/20/51 | 196,911 |
| 565,000(c) | Bank of Nova Scotia, 4.588% (5 Year CMT Index + | |
| | 205 bps), 5/4/37 | 527,568 |
| 225,000(c) | BNP Paribas SA, 2.159% (SOFR + 122 bps), | |
| | 9/15/29 (144A) | 190,647 |
| 350,000(c) | BPCE SA, 3.116% (SOFR + 173 bps), 10/19/32 (144A) | 288,065 |
| 250,000(c) | BPCE SA, 3.648% (5 Year CMT Index + 190 bps), | |
| | 1/14/37 (144A) | 212,554 |
| 220,000(c) | Citigroup, Inc., 2.52% (SOFR + 118 bps), 11/3/32 | 187,314 |
| 205,000(c) | Citigroup, Inc., 4.91% (SOFR + 209 bps), 5/24/33 | 211,204 |
| 210,000(c) | Goldman Sachs Group, Inc., 2.65% (SOFR + | |
| | 126 bps), 10/21/32 | 180,716 |
| 195,000(c) | Goldman Sachs Group, Inc., 3.272% (3 Month USD | |
| | LIBOR + 120 bps), 9/29/25 | 191,196 |
| 140,000(c) | Goldman Sachs Group, Inc., 4.223% (3 Month USD | |
| | LIBOR + 130 bps), 5/1/29 | 138,444 |
| 305,000(c) | HSBC Holdings Plc, 2.206% (SOFR + 129 bps), 8/17/29 | 260,527 |
| 335,000(c) | HSBC Holdings Plc, 2.871% (SOFR + 141 bps), 11/22/32 | 280,682 |
| 200,000(c) | ING Groep NV, 4.252% (SOFR + 207 bps), 3/28/33 | 191,423 |
| 585,000(c)(e) | ING Groep NV, 4.25% (5 Year CMT Index + 286 bps) | 432,208 |
| 275,000(c) | JPMorgan Chase & Co., 2.545% (SOFR + 118 bps), 11/8/32 | 236,352 |
| 90,000(c) | JPMorgan Chase & Co., 4.586% (SOFR + 180 bps), 4/26/33 | 91,129 |
| 300,000(c) | Macquarie Group, Ltd., 2.691% (SOFR + 144 bps), | |
| | 6/23/32 (144A) | 250,156 |
| 175,000(c) | Macquarie Group, Ltd., 2.871% (SOFR + 153 bps), | |
| | 1/14/33 (144A) | 146,293 |
| 200,000(c) | Mitsubishi UFJ Financial Group, Inc., 2.494% (1 Year CMT | |
| | Index + 97 bps), 10/13/32 | 168,588 |
| 290,000(c) | Morgan Stanley, 5.297% (SOFR + 262 bps), 4/20/37 | 292,137 |
| 585,000(c)(e) | Nordea Bank Abp, 3.75% (5 Year CMT Index + | |
| | 260 bps) (144A) | 451,798 |
| 195,000(c) | Santander Holdings USA, Inc., 2.49% (SOFR + | |
| | 125 bps), 1/6/28 | 173,447 |
The accompanying notes are an integral part of these financial statements.
38 Pioneer Balanced ESG Fund | Annual Report | 7/31/22
| | | |
| Principal | | |
| Amount | | |
| USD ($) | | Value |
| | Banks — (continued) | |
| 200,000(c) | Societe Generale SA, 4.027% (1 Year CMT Index + | |
| | 190 bps), 1/21/43 (144A) | $ 141,840 |
| 200,000(c)(e) | Societe Generale SA, 5.375% (5 Year CMT Index + | |
| | 451 bps) (144A) | 167,823 |
| 245,000(c) | Societe Generale SA, 6.221% (1 Year CMT Index + | |
| | 320 bps), 6/15/33 (144A) | 240,465 |
| 530,000(c) | Standard Chartered Plc, 3.603% (1 Year CMT Index + | |
| | 190 bps), 1/12/33 (144A) | 444,305 |
| 70,000(c) | State Street Corp., 4.421% (SOFR + 161 bps), 5/13/33 | 71,689 |
| 280,000 | Toronto-Dominion Bank, 4.456%, 6/8/32 | 285,457 |
| 250,000 | Truist Bank, 2.25%, 3/11/30 | 214,528 |
| 325,000(c) | Truist Financial Corp., 4.916% (SOFR + 224 bps), 7/28/33 | 327,855 |
| 385,000(c) | UBS Group AG, 2.746% (1 Year CMT Index + | |
| | 110 bps), 2/11/33 (144A) | 321,950 |
| 350,000(c) | UniCredit S.p.A., 2.569% (1 Year CMT Index + | |
| | 230 bps), 9/22/26 (144A) | 312,580 |
| 230,000(c) | UniCredit S.p.A., 5.459% (5 Year CMT Index + | |
| | 475 bps), 6/30/35 (144A) | 188,829 |
| 200,000(c) | UniCredit S.p.A., 7.296% (5 Year USD 1100 Run ICE | |
| | Swap Rate + 491 bps), 4/2/34 (144A) | 185,377 |
| 530,000(c) | US Bancorp, 2.491% (5 Year CMT Index + 95 bps), 11/3/36 | 446,890 |
| | Total Banks | $ 10,706,356 |
| | Biotechnology — 0.1% | |
| 170,000 | CSL Finance Plc, 4.25%, 4/27/32 (144A) | $ 173,357 |
| 200,000 | Grifols Escrow Issuer SA, 4.75%, 10/15/28 (144A) | 177,254 |
| | Total Biotechnology | $ 350,611 |
| | Building Materials — 0.1% | |
| 185,000 | Builders FirstSource, Inc., 6.375%, 6/15/32 (144A) | $ 183,761 |
| 116,000 | Carrier Global Corp., 2.70%, 2/15/31 | 102,287 |
| 140,000 | Fortune Brands Home & Security, Inc., 4.50%, 3/25/52 | 112,329 |
| 20,000 | MIWD Holdco II LLC/MIWD Finance Corp., 5.50%, | |
| | 2/1/30 (144A) | 16,925 |
| 150,000 | Standard Industries, Inc., 4.375%, 7/15/30 (144A) | 131,022 |
| 10,000 | Summit Materials LLC/Summit Materials Finance Corp., | |
| | 5.25%, 1/15/29 (144A) | 9,414 |
| | Total Building Materials | $ 555,738 |
| | Chemicals — 0.2% | |
| 565,000 | Albemarle Corp., 5.65%, 6/1/52 | $ 568,144 |
| 115,000 | Celanese US Holdings LLC, 6.379%, 7/15/32 | 118,114 |
| 55,000 | Ingevity Corp., 3.875%, 11/1/28 (144A) | 48,802 |
| 71,000 | NOVA Chemicals Corp., 5.25%, 6/1/27 (144A) | 68,089 |
| 150,000 | Tronox, Inc., 4.625%, 3/15/29 (144A) | 129,303 |
| | Total Chemicals | $ 932,452 |
The accompanying notes are an integral part of these financial statements.
Pioneer Balanced ESG Fund | Annual Report | 7/31/22 39
Schedule of Investments | 7/31/22 (continued)
| | | |
| Principal | | |
| Amount | | |
| USD ($) | | Value |
| | Commercial Services — 0.1% | |
| 35,000 | Allied Universal Holdco LLC/Allied Universal Finance | |
| | Corp., 6.625%, 7/15/26 (144A) | $ 33,914 |
| 90,000 | CoreLogic, Inc., 4.50%, 5/1/28 (144A) | 69,413 |
| 110,000 | Element Fleet Management Corp., 1.60%, 4/6/24 (144A) | 105,034 |
| 195,000 | Garda World Security Corp., 4.625%, 2/15/27 (144A) | 175,919 |
| 115,000 | Prime Security Services Borrower LLC/Prime Finance, | |
| | Inc., 6.25%, 1/15/28 (144A) | 105,418 |
| | Total Commercial Services | $ 489,698 |
| | Cosmetics/Personal Care — 0.0%† | |
| 75,000 | Edgewell Personal Care Co., 5.50%, 6/1/28 (144A) | $ 73,541 |
| | Total Cosmetics/Personal Care | $ 73,541 |
| | Diversified Financial Services — 0.8% | |
| 205,000 | AerCap Ireland Capital DAC/AerCap Global Aviation | |
| | Trust, 3.30%, 1/30/32 | $ 172,171 |
| 595,000 | Air Lease Corp., 2.875%, 1/15/32 | 489,994 |
| 410,000 | Ally Financial, Inc., 4.75%, 6/9/27 | 405,322 |
| 18,000 | Avolon Holdings Funding, Ltd., 3.95%, 7/1/24 (144A) | 17,345 |
| 200,000 | B3 SA - Brasil Bolsa Balcao, 4.125%, 9/20/31 (144A) | 168,052 |
| 206,000 | Bread Financial Holdings, Inc., 7.00%, 1/15/26 (144A) | 193,967 |
| 300,000 | Capital One Financial Corp., 3.75%, 4/24/24 | 299,030 |
| 110,000 | Capital One Financial Corp., 4.25%, 4/30/25 | 110,762 |
| 35,000(c) | Capital One Financial Corp., 5.247% (SOFR + | |
| | 260 bps), 7/26/30 | 35,461 |
| 80,000(c) | Capital One Financial Corp., 5.268% (SOFR + | |
| | 237 bps), 5/10/33 | 81,382 |
| 445,000 | Nomura Holdings, Inc., 2.999%, 1/22/32 | 375,124 |
| 225,000 | Nomura Holdings, Inc., 5.605%, 7/6/29 | 232,042 |
| 120,000 | OneMain Finance Corp., 3.50%, 1/15/27 | 102,173 |
| 305,000 | OneMain Finance Corp., 4.00%, 9/15/30 | 239,425 |
| 143,000 | Raymond James Financial, Inc., 3.75%, 4/1/51 | 120,133 |
| 163,000 | United Wholesale Mortgage LLC, 5.50%, 4/15/29 (144A) | 139,870 |
| | Total Diversified Financial Services | $ 3,182,253 |
| | Electric — 0.5% | |
| 190,000 | AES Corp., 2.45%, 1/15/31 | $ 160,600 |
| 60,000 | AES Corp., 3.95%, 7/15/30 (144A) | 55,878 |
| 195,000(c) | Algonquin Power & Utilities Corp., 4.75% (5 Year CMT | |
| | Index + 325 bps), 1/18/82 | 172,204 |
| 125,000 | American Electric Power Co., Inc., 4.30%, 12/1/28 | 125,023 |
| 220,000 | Consolidated Edison Co. of New York, Inc., | |
| | 4.625%, 12/1/54 | 213,483 |
| 76,000(f) | Dominion Energy, Inc., 3.071%, 8/15/24 | 74,624 |
| 250,000 | Duke Energy Carolinas LLC, 3.95%, 3/15/48 | 226,776 |
| 230,000 | Edison International, 2.95%, 3/15/23 | 229,438 |
| 200,000(c) | Enel S.p.A., 8.75% (5 Year USD Swap Rate + | |
| | 588 bps), 9/24/73 (144A) | 206,030 |
The accompanying notes are an integral part of these financial statements.
40 Pioneer Balanced ESG Fund | Annual Report | 7/31/22
| | | |
| Principal | | |
| Amount | | |
| USD ($) | | Value |
| | Electric — (continued) | |
| 121,000 | New York State Electric & Gas Corp., 3.30%, | |
| | 9/15/49 (144A) | $ 96,327 |
| 205,000 | Puget Energy, Inc., 2.379%, 6/15/28 | 184,051 |
| 145,000 | Puget Energy, Inc., 4.10%, 6/15/30 | 137,722 |
| 120,000 | Puget Energy, Inc., 4.224%, 3/15/32 | 114,894 |
| 200,000 | Virginia Electric and Power Co., 4.45%, 2/15/44 | 194,575 |
| | Total Electric | $ 2,191,625 |
| | Electrical Components & Equipments — 0.0%† |
| 65,000 | Energizer Holdings, Inc., 6.50%, 12/31/27 (144A) | $ 60,206 |
| | Total Electrical Components & Equipments | $ 60,206 |
| | Electronics — 0.0%† | |
| 55,000 | Atkore, Inc., 4.25%, 6/1/31 (144A) | $ 47,850 |
| | Total Electronics | $ 47,850 |
| | Energy-Alternate Sources — 0.0%† | |
| 37,338 | Alta Wind Holdings LLC, 7.00%, 6/30/35 (144A) | $ 38,708 |
| | Total Energy-Alternate Sources | $ 38,708 |
| | Engineering & Construction — 0.0%† | |
| 18,000 | Dycom Industries, Inc., 4.50%, 4/15/29 (144A) | $ 16,512 |
| 95,000 | TopBuild Corp., 4.125%, 2/15/32 (144A) | 82,659 |
| | Total Engineering & Construction | $ 99,171 |
| | Food — 0.1% | |
| 200,000 | Minerva Luxembourg SA, 4.375%, 3/18/31 (144A) | $ 165,000 |
| 215,000 | Smithfield Foods, Inc., 2.625%, 9/13/31 (144A) | 172,087 |
| 155,000 | Smithfield Foods, Inc., 3.00%, 10/15/30 (144A) | 130,408 |
| 4,000 | Smithfield Foods, Inc., 5.20%, 4/1/29 (144A) | 3,993 |
| | Total Food | $ 471,488 |
| | Gas — 0.1% | |
| 325,000 | Boston Gas Co., 3.15%, 8/1/27 (144A) | $ 307,495 |
| | Total Gas | $ 307,495 |
| | Healthcare-Products — 0.1% | |
| 48,000 | Edwards Lifesciences Corp., 4.30%, 6/15/28 | $ 48,510 |
| 244,000 | Smith & Nephew Plc, 2.032%, 10/14/30 | 200,681 |
| | Total Healthcare-Products | $ 249,191 |
| | Healthcare-Services — 0.1% | |
| 135,000 | Elevance Health, Inc., 4.55%, 5/15/52 | $ 134,893 |
| 400,000 | Fresenius Medical Care US Finance III, Inc., 2.375%, | |
| | 2/16/31 (144A) | 320,077 |
| 80,000 | Tenet Healthcare Corp., 6.125%, 6/15/30 (144A) | 80,810 |
| | Total Healthcare-Services | $ 535,780 |
The accompanying notes are an integral part of these financial statements.
Pioneer Balanced ESG Fund | Annual Report | 7/31/22 41
Schedule of Investments | 7/31/22 (continued)
| | | |
| Principal | | |
| Amount | | |
| USD ($) | | Value |
| | Insurance — 0.9% | |
| 50,000 | Aon Corp./Aon Global Holdings Plc, 2.60%, 12/2/31 | $ 43,648 |
| 250,000 | AXA SA, 8.60%, 12/15/30 | 304,615 |
| 435,000 | CNO Global Funding, 2.65%, 1/6/29 (144A) | 387,879 |
| 50,000(c) | Farmers Exchange Capital III, 5.454% (3 Month USD | |
| | LIBOR + 345 bps), 10/15/54 (144A) | 50,126 |
| 225,000(c) | Farmers Insurance Exchange, 4.747% (3 Month USD | |
| | LIBOR + 323 bps), 11/1/57 (144A) | 209,497 |
| 875,000 | Liberty Mutual Insurance Co., 7.697%, 10/15/97 (144A) | 1,073,783 |
| 250,000 | Nationwide Financial Services, Inc., 5.30%, | |
| | 11/18/44 (144A) | 240,781 |
| 402,000 | Nationwide Mutual Insurance Co., 4.35%, 4/30/50 (144A) | 348,860 |
| 270,000(c) | Nippon Life Insurance Co., 2.75% (5 Year CMT Index + | |
| | 265 bps), 1/21/51 (144A) | 222,795 |
| 200,000(c) | Nippon Life Insurance Co., 2.90% (5 Year CMT Index + | |
| | 260 bps), 9/16/51 (144A) | 163,840 |
| 79,000 | Primerica, Inc., 2.80%, 11/19/31 | 68,277 |
| 305,000 | Prudential Financial, Inc., 3.00%, 3/10/40 | 254,967 |
| 163,000 | Prudential Financial, Inc., 3.878%, 3/27/28 | 164,072 |
| 110,000 | Teachers Insurance & Annuity Association of America, | |
| | 4.27%, 5/15/47 (144A) | 101,542 |
| 110,000 | Teachers Insurance & Annuity Association of America, | |
| | 4.90%, 9/15/44 (144A) | 109,427 |
| 20,000 | Teachers Insurance & Annuity Association of America, | |
| | 6.85%, 12/16/39 (144A) | 24,133 |
| 40,000 | Willis North America, Inc., 2.95%, 9/15/29 | 35,540 |
| | Total Insurance | $ 3,803,782 |
| | Iron & Steel — 0.0%† | |
| 90,000 | Commercial Metals Co., 4.375%, 3/15/32 | $ 77,142 |
| 35,000 | Mineral Resources, Ltd., 8.00%, 11/1/27 (144A) | 35,561 |
| 35,000 | Mineral Resources, Ltd., 8.50%, 5/1/30 (144A) | 35,437 |
| | Total Iron & Steel | $ 148,140 |
| | Machinery-Diversified — 0.2% | |
| 500,000 | CNH Industrial Capital LLC, 1.875%, 1/15/26 | $ 460,420 |
| 180,000 | CNH Industrial Capital LLC, 1.95%, 7/2/23 | 176,404 |
| | Total Machinery-Diversified | $ 636,824 |
| | Media — 0.1% | |
| 125,000 | CCO Holdings LLC/CCO Holdings Capital Corp., 4.50%, | |
| | 6/1/33 (144A) | $ 105,625 |
| 215,000 | Charter Communications Operating LLC/Charter | |
| | Communications Operating Capital, 4.40%, 4/1/33 | 199,536 |
| 200,000 | CSC Holdings LLC, 4.625%, 12/1/30 (144A) | 152,000 |
| | Total Media | $ 457,161 |
The accompanying notes are an integral part of these financial statements.
42 Pioneer Balanced ESG Fund | Annual Report | 7/31/22
| | | |
| Principal | | |
| Amount | | |
| USD ($) | | Value |
| | Mining — 0.3% | |
| 200,000 | Anglo American Capital Plc, 2.25%, 3/17/28 (144A) | $ 175,148 |
| 200,000 | Anglo American Capital Plc, 4.75%, 3/16/52 (144A) | 174,012 |
| 290,000 | AngloGold Ashanti Holdings Plc, 3.75%, 10/1/30 | 248,488 |
| 250,000 | Corp. Nacional del Cobre de Chile, 5.625%, | |
| | 10/18/43 (144A) | 254,003 |
| 199,000 | FMG Resources August 2006 Pty, Ltd., 4.375%, | |
| | 4/1/31 (144A) | 172,755 |
| 60,000 | FMG Resources August 2006 Pty, Ltd., 6.125%, | |
| | 4/15/32 (144A) | 57,030 |
| 55,000 | Novelis Corp., 3.875%, 8/15/31 (144A) | 47,025 |
| | Total Mining | $ 1,128,461 |
| | Multi-National — 0.1% | |
| 370,000 | Banque Ouest Africaine de Developpement, 4.70%, | |
| | 10/22/31 (144A) | $ 303,400 |
| | Total Multi-National | $ 303,400 |
| | Oil & Gas — 0.3% | |
| 600,000 | Aker BP ASA, 3.10%, 7/15/31 (144A) | $ 517,635 |
| 400,000 | Phillips 66 Co., 3.75%, 3/1/28 (144A) | 386,663 |
| 250,000 | Sinopec Group Overseas Development 2014, Ltd., | |
| | 4.375%, 4/10/24 (144A) | 254,093 |
| 162,000 | Valero Energy Corp., 6.625%, 6/15/37 | 184,326 |
| | Total Oil & Gas | $ 1,342,717 |
| | Pharmaceuticals — 0.2% | |
| 618,000 | AbbVie, Inc., 3.20%, 11/21/29 | $ 589,702 |
| 117,000 | AbbVie, Inc., 4.05%, 11/21/39 | 110,774 |
| 55,000 | AdaptHealth LLC, 5.125%, 3/1/30 (144A) | 50,448 |
| 147,000 | Bausch Health Americas, Inc., 9.25%, 4/1/26 (144A) | 102,165 |
| | Total Pharmaceuticals | $ 853,089 |
| | Pipelines — 0.6% | |
| 70,000 | Boardwalk Pipelines LP, 3.60%, 9/1/32 | $ 61,447 |
| 40,000 | Energy Transfer LP, 4.15%, 9/15/29 | 37,863 |
| 332,000 | Energy Transfer LP, 4.95%, 5/15/28 | 331,694 |
| 210,000 | EnLink Midstream Partners LP, 5.45%, 6/1/47 | 160,038 |
| 47,000 | EnLink Midstream Partners LP, 5.60%, 4/1/44 | 36,556 |
| 49,000 | Hess Midstream Operations LP, 5.50%, 10/15/30 (144A) | 45,640 |
| 555,000 | Kinder Morgan, Inc., 5.45%, 8/1/52 | 556,179 |
| 280,000 | MPLX LP, 4.25%, 12/1/27 | 277,656 |
| 260,000 | MPLX LP, 4.95%, 3/14/52 | 238,219 |
| 180,000 | NGPL PipeCo LLC, 3.25%, 7/15/31 (144A) | 154,127 |
| 205,000 | Williams Cos., Inc., 5.75%, 6/24/44 | 210,999 |
| 242,000 | Williams Cos., Inc., 7.75%, 6/15/31 | 287,336 |
| | Total Pipelines | $ 2,397,754 |
The accompanying notes are an integral part of these financial statements.
Pioneer Balanced ESG Fund | Annual Report | 7/31/22 43
Schedule of Investments | 7/31/22 (continued)
| | | |
| Principal | | |
| Amount | | |
| USD ($) | | Value |
| | REITs — 0.4% | |
| 50,000 | Alexandria Real Estate Equities, Inc., 3.45%, 4/30/25 | $ 49,587 |
| 489,000 | HAT Holdings I LLC/HAT Holdings II LLC, 3.375%, | |
| | 6/15/26 (144A) | 430,782 |
| 203,000 | Healthcare Realty Holdings LP, 3.10%, 2/15/30 | 179,254 |
| 82,000 | Iron Mountain, Inc., 4.50%, 2/15/31 (144A) | 71,950 |
| 11,000 | iStar, Inc., 4.25%, 8/1/25 | 10,491 |
| 265,000 | LXP Industrial Trust, 2.375%, 10/1/31 | 210,504 |
| 110,000 | LXP Industrial Trust, 2.70%, 9/15/30 | 91,821 |
| 105,000 | Sun Communities Operating LP, 2.30%, 11/1/28 | 91,720 |
| 205,000 | UDR, Inc., 1.90%, 3/15/33 | 159,396 |
| 140,000 | UDR, Inc., 4.40%, 1/26/29 | 138,977 |
| | Total REITs | $ 1,434,482 |
| | Retail — 0.4% | |
| 240,000 | 7-Eleven, Inc., 2.80%, 2/10/51 (144A) | $ 166,134 |
| 50,000 | AutoNation, Inc., 1.95%, 8/1/28 | 42,239 |
| 50,000 | AutoNation, Inc., 2.40%, 8/1/31 | 39,626 |
| 140,000 | AutoNation, Inc., 3.85%, 3/1/32 | 124,759 |
| 250,000 | AutoNation, Inc., 4.75%, 6/1/30 | 241,559 |
| 20,000 | Beacon Roofing Supply, Inc., 4.125%, 5/15/29 (144A) | 17,700 |
| 565,000 | Best Buy Co., Inc., 1.95%, 10/1/30 | 466,423 |
| 335,000 | Dollar Tree, Inc., 2.65%, 12/1/31 | 289,676 |
| 280,000 | Lowe’s Cos., Inc., 3.75%, 4/1/32 | 271,741 |
| | Total Retail | $ 1,659,857 |
| | Semiconductors — 0.2% | |
| 391,000 | Broadcom, Inc., 3.187%, 11/15/36 (144A) | $ 313,189 |
| 125,000 | Broadcom, Inc., 4.15%, 4/15/32 (144A) | 117,599 |
| 60,000 | Broadcom, Inc., 4.30%, 11/15/32 | 56,839 |
| 269,000 | Skyworks Solutions, Inc., 3.00%, 6/1/31 | 227,174 |
| | Total Semiconductors | $ 714,801 |
| | Software — 0.2% | |
| 435,000 | Autodesk, Inc., 2.40%, 12/15/31 | $ 372,200 |
| 357,000 | Broadridge Financial Solutions, Inc., 2.60%, 5/1/31 | 310,507 |
| 175,000 | Infor, Inc., 1.75%, 7/15/25 (144A) | 163,972 |
| | Total Software | $ 846,679 |
| | Telecommunications — 0.5% | |
| 448,000 | Level 3 Financing, Inc., 3.75%, 7/15/29 (144A) | $ 370,720 |
| 96,000 | Level 3 Financing, Inc., 4.625%, 9/15/27 (144A) | 87,748 |
| 215,000 | Motorola Solutions, Inc., 2.30%, 11/15/30 | 175,658 |
| 230,000 | Motorola Solutions, Inc., 5.60%, 6/1/32 | 238,570 |
| 174,000 | Plantronics, Inc., 4.75%, 3/1/29 (144A) | 175,305 |
| 625,000 | T-Mobile USA, Inc., 2.55%, 2/15/31 | 546,494 |
| 160,000 | T-Mobile USA, Inc., 2.70%, 3/15/32 | 139,555 |
The accompanying notes are an integral part of these financial statements.
44 Pioneer Balanced ESG Fund | Annual Report | 7/31/22
| Principal | | |
| Amount | | |
| USD ($) | | Value |
| | Telecommunications — (continued) | |
| 230,000 | Verizon Communications, Inc., 3.55%, 3/22/51 | $ 192,867 |
| | Total Telecommunications | $ 1,926,917 |
| | Transportation — 0.2% | |
| 150,000 | Burlington Northern Santa Fe LLC, 5.15%, 9/1/43 | $ 163,364 |
| 250,000 | FedEx Corp., 4.55%, 4/1/46 | 234,592 |
| 370,000 | Union Pacific Corp., 3.375%, 2/1/35 | 347,743 |
| | Total Transportation | $ 745,699 |
| | Trucking & Leasing — 0.1% | |
| 230,000 | Penske Truck Leasing Co. LP/PTL Finance Corp., | |
| | 4.40%, 7/1/27 (144A) | $ 230,107 |
| | Total Trucking & Leasing | $ 230,107 |
| | TOTAL CORPORATE BONDS | |
| | (Cost $46,090,580) | $ 41,527,826 |
| |
| Shares | | |
| | CONVERTIBLE PREFERRED STOCKS — 0.4% of | |
| | Net Assets | |
| | Banks — 0.4% | |
| 254(e) | Bank of America Corp., 7.25% | $ 315,989 |
| 1,231(e) | Wells Fargo & Co., 7.50% | 1,562,139 |
| | Total Banks | $ 1,878,128 |
| | TOTAL CONVERTIBLE PREFERRED STOCKS |
| | (Cost $2,146,626) | $ 1,878,128 |
| |
| Principal | | |
| Amount | | |
| USD ($) | | |
| | MUNICIPAL BONDS — 0.4% of Net Assets(g) | |
| | Arizona — 0.0%† | |
| 90,000 | Maricopa County Industrial Development Authority, | |
| | Banner Health, Series 2019F, 3.00%, 1/1/49 | $ 74,619 |
| | Total Arizona | $ 74,619 |
| | California — 0.1% | |
| 95,000 | California Health Facilities Financing Authority, Cedars- | |
| | Sinai Health System, Series A, 3.00%, 8/15/51 | $ 79,917 |
| 45,000 | Regents of the University of California, Medical Center | |
| | Pooled Revenue, Series P, 4.00%, 5/15/53 | 45,215 |
| 200,000(h) | University of California, Taxable, Series AG, | |
| | 4.062%, 5/15/33 | 200,822 |
| | Total California | $ 325,954 |
The accompanying notes are an integral part of these financial statements.
Pioneer Balanced ESG Fund | Annual Report | 7/31/22 45
Schedule of Investments | 7/31/22 (continued)
| | | |
| Principal | | |
| Amount | | |
| USD ($) | | Value |
| | Florida — 0.0%† | |
| 70,000 | South Broward Hospital District, Series A, 2.50%, 5/1/47 | $ 51,442 |
| | Total Florida | $ 51,442 |
| | Georgia — 0.0%† | |
| 40,000 | Gainesville & Hall County Hospital Authority, Northeast | |
| | Georgia Health System, Inc. Project, Series A, |
| | 3.00%, 2/15/51 | $ 31,908 |
| | Total Georgia | $ 31,908 |
| | Massachusetts — 0.1% | |
| 75,000(i) | Commonwealth of Massachusetts, Series B, | |
| | 3.00%, 4/1/47 | $ 63,728 |
| 100,000 | Massachusetts Development Finance Agency, | |
| | Federally Taxable, Series B, 4.844%, 9/1/43 | 104,733 |
| | Total Massachusetts | $ 168,461 |
| | Missouri — 0.0%† | |
| 20,000 | Health & Educational Facilities Authority of the State of | |
| | Missouri, BJC Health System, Series A, 3.00%, 7/1/38 | $ 18,089 |
| 100,000 | Health & Educational Facilities Authority of the State of | |
| | Missouri, Washington University, Series A, |
| | 3.685%, 2/15/47 | 87,251 |
| | Total Missouri | $ 105,340 |
| | Nebraska — 0.0%† | |
| 35,000(i) | Lancaster County School District 001, Lincoln Public | |
| | Schools, 2.00%, 1/15/43 | $ 25,566 |
| 140,000 | University of Nebraska Facilities Corp., Green Bond, | |
| | Series B, 3.00%, 7/15/54 | 113,606 |
| | Total Nebraska | $ 139,172 |
| | New Jersey — 0.0%† | |
| 45,000 | New Jersey Health Care Facilities Financing Authority, | |
| | Atlanticare Health System Obligated Group Issue, | |
| | 3.00%, 7/1/46 | $ 37,318 |
| 100,000 | New Jersey Health Care Facilities Financing Authority, | |
| | RWJ Barnabas Health Obligated Group Issue, |
| | 3.00%, 7/1/51 | 80,997 |
| | Total New Jersey | $ 118,315 |
| | New York — 0.0%† | |
| 75,000 | New York State Thruway Authority, Series A1, | |
| | 3.00%, 3/15/50 | $ 60,792 |
| | Total New York | $ 60,792 |
| | North Carolina — 0.0%† | |
| 70,000 | City of Charlotte Airport Revenue, Charlotte Douglas | |
| | International Airport Revenue, Series A, 4.00%, 7/1/47 | $ 70,279 |
| | Total North Carolina | $ 70,279 |
The accompanying notes are an integral part of these financial statements.
46 Pioneer Balanced ESG Fund | Annual Report | 7/31/22
| | | |
| Principal | | |
| Amount | | |
| USD ($) | | Value |
| | Oregon — 0.0%† | |
| 65,000 | Oregon Health & Science University, Green Bond, | |
| | Series A, 3.00%, 7/1/51 | $ 52,270 |
| | Total Oregon | $ 52,270 |
| | Pennsylvania — 0.0%† | |
| 140,000 | Montgomery County Higher Education and Health | |
| | Authority, Thomas Jefferson University, Series B, | |
| | 4.00%, 5/1/56 | $ 136,758 |
| 30,000 | Pennsylvania Turnpike Commission, Series C, | |
| | 3.00%, 12/1/51 | 24,427 |
| | Total Pennsylvania | $ 161,185 |
| | Tennessee — 0.0%† | |
| 10,000 | City of Memphis TN Water Revenue, Memphis Light, | |
| | Gas and Water Division, 3.00%, 12/1/45 | $ 8,655 |
| | Total Tennessee | $ 8,655 |
| | Texas — 0.1% | |
| 100,000(j) | Central Texas Regional Mobility Authority, 1/1/25 | $ 92,382 |
| 130,000 | Harris County Cultural Education Facilities Finance | |
| | Corp., Texas Children’s Hospital, 3.00%, 10/1/51 | 105,562 |
| 45,000 | Texas Water Development Board, State Revolving | |
| | Fund, 3.00%, 8/1/40 | 42,302 |
| | Total Texas | $ 240,246 |
| | Virginia — 0.1% | |
| 30,000 | Hampton Roads Transportation Accountability | |
| | Commission, Series A, 4.00%, 7/1/57 | $ 30,268 |
| 55,000 | Roanoke Economic Development Authority, Carilion | |
| | Clinic Obligated Group, 3.00%, 7/1/45 | 46,107 |
| 25,000 | Rockingham County Economic Development | |
| | Authority, Sentara RMH Medical Center, Series A, | |
| | 3.00%, 11/1/46 | 20,711 |
| 95,000 | Virginia College Building Authority, Public Higher | |
| | Education Financing Program, Series C, 3.00%, 9/1/51 | 79,698 |
| | Total Virginia | $ 176,784 |
| | TOTAL MUNICIPAL BONDS | |
| | (Cost $1,700,150) | $ 1,785,422 |
The accompanying notes are an integral part of these financial statements.
Pioneer Balanced ESG Fund | Annual Report | 7/31/22 47
Schedule of Investments | 7/31/22 (continued)
| | | |
| Principal | | |
| Amount | | |
| USD ($) | | Value |
| | INSURANCE-LINKED SECURITIES — 0.3% of | |
| | Net Assets# | |
| | Event Linked Bonds — 0.3% | |
| | Health – U.S. — 0.1% | |
| 250,000(a) | Vitality Re X, 4.221%, (3 Month U.S. Treasury Bill + | |
| | 175 bps), 1/10/23 (144A) | $ 248,150 |
| | Multiperil – U.S. — 0.1% | |
| 250,000(a) | Easton Re Pte, 6.471%, (3 Month U.S. Treasury Bill + | |
| | 400 bps), 1/8/24 (144A) | $ 242,600 |
| | Multiperil – U.S. & Canada — 0.1% | |
| 250,000(a) | Mona Lisa Re, 10.471%, (3 Month U.S. Treasury Bill + | |
| | 800 bps), 1/9/23 (144A) | $ 244,425 |
| | Windstorm – U.S — 0.0%† | |
| 250,000(a) | Bonanza Re, 7.221%, (3 Month U.S. Treasury Bill + | |
| | 475 bps), 12/23/24 (144A) | $ 238,100 |
| | Total Event Linked Bonds | $ 973,275 |
| |
| Face | | |
| Amount | | |
| USD ($) | | |
| | Reinsurance Sidecars — 0.0%† | |
| | Multiperil – Worldwide — 0.0%† | |
| 250,000(b)(k)+ | Bantry Re 2016, 3/31/23 | $ 15,112 |
| 100,000(k)+ | Sector Re V, 3/1/24 (144A) | 75,090 |
| | | $ 90,202 |
| | Total Reinsurance Sidecars | $ 90,202 |
| | TOTAL INSURANCE-LINKED SECURITIES | |
| | (Cost $1,115,065) | $ 1,063,477 |
| |
| Principal | | |
| Amount | | |
| USD ($) | | |
| | FOREIGN GOVERNMENT BONDS — 0.1% of | |
| | Net Assets | |
| | Mexico — 0.1% | |
| 300,000 | Mexico Government International Bond, 4.600%, 2/10/48 | $ 249,982 |
| | Total Mexico | $ 249,982 |
| | Philippines — 0.0%† | |
| 200,000 | Philippine Government International Bond, | |
| | 5.000%, 1/13/37 | $ 207,117 |
| | Total Philippines | $ 207,117 |
| | TOTAL FOREIGN GOVERNMENT BONDS | |
| | (Cost $537,715) | $ 457,099 |
The accompanying notes are an integral part of these financial statements.
48 Pioneer Balanced ESG Fund | Annual Report | 7/31/22
| Principal | | |
| Amount | | |
| USD ($) | | Value |
| | U.S. GOVERNMENT AND AGENCY | |
| | OBLIGATIONS — 22.4% of Net Assets |
| 952,144 | Fannie Mae, 1.500%, 11/1/41 | $ 847,145 |
| 581,481 | Fannie Mae, 1.500%, 1/1/42 | 517,317 |
| 387,094 | Fannie Mae, 1.500%, 1/1/42 | 344,423 |
| 488,663 | Fannie Mae, 1.500%, 2/1/42 | 434,834 |
| 196,230 | Fannie Mae, 1.500%, 3/1/42 | 174,592 |
| 18,773 | Fannie Mae, 2.500%, 3/1/43 | 17,694 |
| 14,085 | Fannie Mae, 2.500%, 4/1/43 | 13,276 |
| 6,649 | Fannie Mae, 2.500%, 8/1/43 | 6,268 |
| 13,958 | Fannie Mae, 2.500%, 4/1/45 | 13,107 |
| 22,396 | Fannie Mae, 2.500%, 4/1/45 | 21,030 |
| 10,696 | Fannie Mae, 2.500%, 8/1/45 | 10,022 |
| 74,921 | Fannie Mae, 2.500%, 9/1/50 | 70,575 |
| 82,402 | Fannie Mae, 2.500%, 9/1/50 | 77,762 |
| 905,471 | Fannie Mae, 2.500%, 5/1/51 | 852,698 |
| 462,858 | Fannie Mae, 2.500%, 10/1/51 | 432,313 |
| 294,656 | Fannie Mae, 2.500%, 11/1/51 | 277,325 |
| 287,306 | Fannie Mae, 2.500%, 12/1/51 | 268,820 |
| 675,963 | Fannie Mae, 2.500%, 1/1/52 | 632,690 |
| 97,719 | Fannie Mae, 2.500%, 2/1/52 | 91,851 |
| 297,114 | Fannie Mae, 2.500%, 4/1/52 | 278,163 |
| 3,000,000 | Fannie Mae, 2.500%, 8/1/52 (TBA) | 2,795,186 |
| 38,099 | Fannie Mae, 3.000%, 10/1/30 | 38,179 |
| 11,344 | Fannie Mae, 3.000%, 2/1/43 | 11,153 |
| 109,393 | Fannie Mae, 3.000%, 6/1/45 | 107,570 |
| 4,202 | Fannie Mae, 3.000%, 5/1/46 | 4,086 |
| 4,778 | Fannie Mae, 3.000%, 10/1/46 | 4,688 |
| 2,805 | Fannie Mae, 3.000%, 1/1/47 | 2,752 |
| 93,570 | Fannie Mae, 3.000%, 3/1/47 | 91,651 |
| 47,013 | Fannie Mae, 3.000%, 4/1/47 | 45,959 |
| 14,466 | Fannie Mae, 3.000%, 7/1/49 | 14,129 |
| 71,622 | Fannie Mae, 3.000%, 4/1/50 | 70,291 |
| 97,374 | Fannie Mae, 3.000%, 8/1/50 | 95,801 |
| 169,019 | Fannie Mae, 3.000%, 11/1/50 | 165,992 |
| 476,002 | Fannie Mae, 3.000%, 1/1/52 | 463,323 |
| 198,711 | Fannie Mae, 3.000%, 3/1/52 | 191,687 |
| 634,670 | Fannie Mae, 3.000%, 3/1/52 | 620,622 |
| 463,467 | Fannie Mae, 3.000%, 4/1/52 | 450,746 |
| 97,675 | Fannie Mae, 3.000%, 2/1/57 | 94,222 |
| 422,129 | Fannie Mae, 3.500%, 7/1/43 | 425,876 |
| 105,821 | Fannie Mae, 3.500%, 1/1/47 | 106,166 |
| 5,696 | Fannie Mae, 3.500%, 2/1/49 | 5,539 |
| 6,502 | Fannie Mae, 3.500%, 4/1/49 | 6,238 |
| 170,688 | Fannie Mae, 3.500%, 5/1/49 | 173,753 |
| 258,960 | Fannie Mae, 3.500%, 5/1/49 | 265,486 |
The accompanying notes are an integral part of these financial statements.
Pioneer Balanced ESG Fund | Annual Report | 7/31/22 49
Schedule of Investments | 7/31/22 (continued)
| | | |
| Principal | | |
| Amount | | |
| USD ($) | | Value |
| | U.S. GOVERNMENT AND AGENCY | |
| | OBLIGATIONS — (continued) | |
| 295,916 | Fannie Mae, 3.500%, 6/1/49 | $ 296,073 |
| 46,779 | Fannie Mae, 3.500%, 7/1/51 | 46,714 |
| 24,592 | Fannie Mae, 3.500%, 8/1/51 | 24,384 |
| 32,008 | Fannie Mae, 3.500%, 9/1/51 | 31,740 |
| 26,839 | Fannie Mae, 3.500%, 2/1/52 | 26,605 |
| 44,719 | Fannie Mae, 3.500%, 4/1/52 | 44,302 |
| 24,895 | Fannie Mae, 3.500%, 4/1/52 | 24,651 |
| 36,349 | Fannie Mae, 3.500%, 4/1/52 | 36,002 |
| 36,831 | Fannie Mae, 3.500%, 4/1/52 | 36,524 |
| 89,474 | Fannie Mae, 3.500%, 4/1/52 | 88,601 |
| 226,986 | Fannie Mae, 3.500%, 4/1/52 | 225,352 |
| 197,688 | Fannie Mae, 3.500%, 5/1/52 | 195,795 |
| 1,000,000 | Fannie Mae, 4.000%, 8/1/37 (TBA) | 1,016,602 |
| 84,345 | Fannie Mae, 4.000%, 10/1/40 | 86,853 |
| 121,261 | Fannie Mae, 4.000%, 3/1/41 | 124,567 |
| 28,263 | Fannie Mae, 4.000%, 5/1/42 | 29,102 |
| 181,234 | Fannie Mae, 4.000%, 6/1/42 | 186,612 |
| 53,792 | Fannie Mae, 4.000%, 9/1/42 | 55,380 |
| 161,479 | Fannie Mae, 4.000%, 7/1/43 | 164,738 |
| 34,212 | Fannie Mae, 4.000%, 8/1/43 | 35,119 |
| 86,295 | Fannie Mae, 4.000%, 8/1/43 | 88,590 |
| 29,881 | Fannie Mae, 4.000%, 4/1/47 | 30,575 |
| 12,607 | Fannie Mae, 4.000%, 6/1/47 | 12,890 |
| 10,053 | Fannie Mae, 4.000%, 6/1/47 | 10,252 |
| 31,484 | Fannie Mae, 4.000%, 3/1/48 | 31,923 |
| 17,217 | Fannie Mae, 4.000%, 8/1/48 | 17,521 |
| 48,835 | Fannie Mae, 4.000%, 11/1/50 | 49,207 |
| 19,594 | Fannie Mae, 4.000%, 12/1/50 | 19,721 |
| 10,098 | Fannie Mae, 4.000%, 1/1/51 | 10,160 |
| 12,853 | Fannie Mae, 4.000%, 2/1/51 | 12,932 |
| 14,160 | Fannie Mae, 4.000%, 4/1/51 | 14,249 |
| 33,162 | Fannie Mae, 4.000%, 6/1/51 | 33,360 |
| 35,620 | Fannie Mae, 4.000%, 7/1/51 | 35,939 |
| 85,126 | Fannie Mae, 4.000%, 7/1/51 | 85,618 |
| 122,401 | Fannie Mae, 4.000%, 8/1/51 | 123,111 |
| 2,200,000 | Fannie Mae, 4.000%, 8/1/52 (TBA) | 2,210,914 |
| 42,108 | Fannie Mae, 4.000%, 7/1/56 | 43,048 |
| 74,694 | Fannie Mae, 4.000%, 1/1/57 | 75,967 |
| 111,927 | Fannie Mae, 4.500%, 6/1/40 | 116,299 |
| 89,710 | Fannie Mae, 4.500%, 4/1/41 | 93,990 |
| 120,249 | Fannie Mae, 4.500%, 9/1/43 | 125,329 |
| 171,840 | Fannie Mae, 4.500%, 12/1/43 | 178,943 |
| 76,485 | Fannie Mae, 4.500%, 1/1/44 | 79,748 |
| 69,117 | Fannie Mae, 4.500%, 8/1/47 | 72,067 |
The accompanying notes are an integral part of these financial statements.
50 Pioneer Balanced ESG Fund | Annual Report | 7/31/22
| | | |
| Principal | | |
| Amount | | |
| USD ($) | | Value |
| | U.S. GOVERNMENT AND AGENCY | |
| | OBLIGATIONS — (continued) | |
| 232,624 | Fannie Mae, 4.500%, 5/1/49 | $ 240,790 |
| 133,168 | Fannie Mae, 4.500%, 4/1/50 | 137,828 |
| 4,300,000 | Fannie Mae, 4.500%, 8/1/52 (TBA) | 4,374,746 |
| 59,833 | Fannie Mae, 5.000%, 5/1/31 | 62,069 |
| 9,714 | Fannie Mae, 5.000%, 6/1/49 | 9,983 |
| 2,911 | Fannie Mae, 5.000%, 10/1/49 | 2,992 |
| 6,000,000 | Fannie Mae, 5.000%, 8/1/52 (TBA) | 6,162,422 |
| 344 | Fannie Mae, 5.500%, 3/1/23 | 344 |
| 2,281 | Fannie Mae, 5.500%, 3/1/34 | 2,368 |
| 5,054 | Fannie Mae, 5.500%, 12/1/34 | 5,292 |
| 29,037 | Fannie Mae, 5.500%, 10/1/35 | 31,033 |
| 11,031 | Fannie Mae, 5.500%, 12/1/35 | 11,843 |
| 13,839 | Fannie Mae, 5.500%, 12/1/35 | 14,857 |
| 7,178 | Fannie Mae, 5.500%, 5/1/37 | 7,653 |
| 68,727 | Fannie Mae, 5.500%, 5/1/38 | 73,791 |
| 301 | Fannie Mae, 6.000%, 9/1/29 | 320 |
| 906 | Fannie Mae, 6.000%, 8/1/32 | 985 |
| 5,646 | Fannie Mae, 6.000%, 12/1/33 | 5,902 |
| 5,038 | Fannie Mae, 6.000%, 10/1/37 | 5,459 |
| 3,826 | Fannie Mae, 6.000%, 12/1/37 | 4,163 |
| 5,676 | Fannie Mae, 6.500%, 4/1/29 | 5,911 |
| 2,838 | Fannie Mae, 6.500%, 7/1/29 | 3,053 |
| 8,428 | Fannie Mae, 6.500%, 5/1/32 | 9,112 |
| 8,689 | Fannie Mae, 6.500%, 9/1/32 | 9,383 |
| 3,258 | Fannie Mae, 6.500%, 10/1/32 | 3,467 |
| 8,927 | Fannie Mae, 7.000%, 1/1/36 | 9,641 |
| 384,620 | Federal Home Loan Mortgage Corp., 1.500%, 12/1/41 | 342,093 |
| 97,859 | Federal Home Loan Mortgage Corp., 1.500%, 1/1/42 | 87,040 |
| 97,876 | Federal Home Loan Mortgage Corp., 1.500%, 1/1/42 | 87,055 |
| 482,294 | Federal Home Loan Mortgage Corp., 1.500%, 1/1/42 | 428,967 |
| 193,963 | Federal Home Loan Mortgage Corp., 1.500%, 2/1/42 | 172,519 |
| 291,736 | Federal Home Loan Mortgage Corp., 1.500%, 2/1/42 | 259,483 |
| 794,180 | Federal Home Loan Mortgage Corp., 2.500%, 5/1/51 | 744,455 |
| 182,057 | Federal Home Loan Mortgage Corp., 2.500%, 8/1/51 | 170,046 |
| 42,422 | Federal Home Loan Mortgage Corp., 3.000%, 2/1/43 | 41,782 |
| 65,786 | Federal Home Loan Mortgage Corp., 3.000%, 4/1/43 | 64,793 |
| 39,198 | Federal Home Loan Mortgage Corp., 3.000%, 5/1/43 | 38,605 |
| 83,550 | Federal Home Loan Mortgage Corp., 3.000%, 6/1/46 | 81,839 |
| 20,599 | Federal Home Loan Mortgage Corp., 3.000%, 12/1/46 | 20,153 |
| 163,104 | Federal Home Loan Mortgage Corp., 3.000%, 2/1/47 | 160,511 |
| 8,132 | Federal Home Loan Mortgage Corp., 3.000%, 11/1/47 | 7,956 |
| 96,744 | Federal Home Loan Mortgage Corp., 3.000%, 3/1/52 | 93,325 |
| 97,645 | Federal Home Loan Mortgage Corp., 3.000%, 3/1/52 | 94,251 |
| 453,924 | Federal Home Loan Mortgage Corp., 3.000%, 3/1/52 | 439,218 |
The accompanying notes are an integral part of these financial statements.
Pioneer Balanced ESG Fund | Annual Report | 7/31/22 51
Schedule of Investments | 7/31/22 (continued)
| | | |
| Principal | | |
| Amount | | |
| USD ($) | | Value |
| | U.S. GOVERNMENT AND AGENCY | |
| | OBLIGATIONS — (continued) | |
| 86,139 | Federal Home Loan Mortgage Corp., 3.500%, 3/1/42 | $ 87,072 |
| 109,054 | Federal Home Loan Mortgage Corp., 3.500%, 8/1/46 | 110,236 |
| 97,725 | Federal Home Loan Mortgage Corp., 3.500%, 8/1/46 | 98,986 |
| 92,474 | Federal Home Loan Mortgage Corp., 3.500%, 8/1/46 | 93,078 |
| 9,147 | Federal Home Loan Mortgage Corp., 3.500%, 6/1/47 | 9,206 |
| 96,878 | Federal Home Loan Mortgage Corp., 3.500%, 4/1/52 | 96,139 |
| 74,652 | Federal Home Loan Mortgage Corp., 3.500%, 4/1/52 | 73,923 |
| 28,851 | Federal Home Loan Mortgage Corp., 3.500%, 4/1/52 | 28,587 |
| 119,494 | Federal Home Loan Mortgage Corp., 4.000%, 2/1/40 | 123,147 |
| 148,997 | Federal Home Loan Mortgage Corp., 4.000%, 11/1/40 | 153,189 |
| 150,365 | Federal Home Loan Mortgage Corp., 4.000%, 11/1/40 | 154,948 |
| 94,445 | Federal Home Loan Mortgage Corp., 4.000%, 1/1/41 | 97,330 |
| 48,473 | Federal Home Loan Mortgage Corp., 4.000%, 4/1/47 | 49,666 |
| 21,733 | Federal Home Loan Mortgage Corp., 4.000%, 4/1/47 | 22,236 |
| 14,355 | Federal Home Loan Mortgage Corp., 4.000%, 4/1/47 | 14,683 |
| 16,513 | Federal Home Loan Mortgage Corp., 4.000%, 12/1/48 | 16,814 |
| 24,193 | Federal Home Loan Mortgage Corp., 4.000%, 12/1/48 | 24,598 |
| 23,715 | Federal Home Loan Mortgage Corp., 4.000%, 9/1/51 | 23,936 |
| 53,437 | Federal Home Loan Mortgage Corp., 4.000%, 10/1/51 | 53,758 |
| 8,963 | Federal Home Loan Mortgage Corp., 4.000%, 10/1/51 | 9,024 |
| 12,216 | Federal Home Loan Mortgage Corp., 4.000%, 10/1/51 | 12,325 |
| 887,200 | Federal Home Loan Mortgage Corp., 4.000%, 6/1/52 | 892,732 |
| 17,338 | Federal Home Loan Mortgage Corp., 4.500%, 8/1/34 | 18,074 |
| 56,919 | Federal Home Loan Mortgage Corp., 4.500%, 5/1/40 | 59,315 |
| 28,489 | Federal Home Loan Mortgage Corp., 4.500%, 7/1/40 | 29,694 |
| 56,773 | Federal Home Loan Mortgage Corp., 4.500%, 5/1/41 | 59,181 |
| 51,877 | Federal Home Loan Mortgage Corp., 4.500%, 1/1/50 | 53,307 |
| 13,263 | Federal Home Loan Mortgage Corp., 5.000%, 11/1/34 | 14,093 |
| 12,180 | Federal Home Loan Mortgage Corp., 5.000%, 8/1/37 | 12,939 |
| 3,030 | Federal Home Loan Mortgage Corp., 5.000%, 5/1/39 | 3,220 |
| 7,697 | Federal Home Loan Mortgage Corp., 5.000%, 12/1/39 | 8,178 |
| 23,299 | Federal Home Loan Mortgage Corp., 5.000%, 10/1/49 | 23,974 |
| 221,096 | Federal Home Loan Mortgage Corp., 5.000%, 12/1/49 | 229,038 |
| 8,044 | Federal Home Loan Mortgage Corp., 5.500%, 11/1/34 | 8,631 |
| 4,979 | Federal Home Loan Mortgage Corp., 6.000%, 1/1/38 | 5,422 |
| 9,129 | Federal Home Loan Mortgage Corp., 6.000%, 10/1/38 | 9,941 |
| 3,739 | Federal Home Loan Mortgage Corp., 6.500%, 10/1/33 | 4,061 |
| 1,000,000 | Government National Mortgage Association, 2.500%, | |
| | 8/20/52 (TBA) | 947,041 |
| 1,700,000 | Government National Mortgage Association, 3.000%, | |
| | 8/20/52 (TBA) | 1,655,458 |
| 100,000 | Government National Mortgage Association, 3.500%, | |
| | 8/20/52 (TBA) | 99,547 |
The accompanying notes are an integral part of these financial statements.
52 Pioneer Balanced ESG Fund | Annual Report | 7/31/22
| Principal | | |
| Amount | | |
| USD ($) | | Value |
| | U.S. GOVERNMENT AND AGENCY | |
| | OBLIGATIONS — (continued) | |
| 1,200,000 | Government National Mortgage Association, 4.000%, | |
| | 8/20/52 (TBA) | $ 1,212,328 |
| 1,500,000 | Government National Mortgage Association, 4.500%, | |
| | 8/20/52 (TBA) | 1,528,770 |
| 1,000,000 | Government National Mortgage Association, 5.000%, | |
| | 8/20/52 (TBA) | 1,024,805 |
| 76,167 | Government National Mortgage Association I, | |
| | 3.500%, 11/15/41 | 77,681 |
| 8,956 | Government National Mortgage Association I, | |
| | 3.500%, 10/15/42 | 9,135 |
| 125,721 | Government National Mortgage Association I, | |
| | 4.000%, 9/15/41 | 130,004 |
| 20,442 | Government National Mortgage Association I, | |
| | 4.000%, 4/15/45 | 21,130 |
| 37,529 | Government National Mortgage Association I, | |
| | 4.000%, 6/15/45 | 38,968 |
| 22,723 | Government National Mortgage Association I, | |
| | 4.500%, 5/15/39 | 23,822 |
| 5,267 | Government National Mortgage Association I, | |
| | 5.500%, 8/15/33 | 5,740 |
| 8,720 | Government National Mortgage Association I, | |
| | 5.500%, 9/15/33 | 9,132 |
| 7,465 | Government National Mortgage Association I, | |
| | 6.000%, 10/15/33 | 7,950 |
| 8,769 | Government National Mortgage Association I, | |
| | 6.000%, 9/15/34 | 9,226 |
| 25,061 | Government National Mortgage Association I, | |
| | 6.000%, 9/15/38 | 27,374 |
| 3,394 | Government National Mortgage Association I, | |
| | 6.500%, 10/15/28 | 3,579 |
| 10,494 | Government National Mortgage Association I, | |
| | 6.500%, 5/15/31 | 11,064 |
| 5,870 | Government National Mortgage Association I, | |
| | 6.500%, 6/15/32 | 6,308 |
| 9,770 | Government National Mortgage Association I, | |
| | 6.500%, 12/15/32 | 10,616 |
| 12,001 | Government National Mortgage Association I, | |
| | 6.500%, 5/15/33 | 12,653 |
| 128 | Government National Mortgage Association I, | |
| | 7.000%, 8/15/28 | 135 |
| 2,215 | Government National Mortgage Association I, | |
| | 8.000%, 2/15/30 | 2,219 |
| 29,892 | Government National Mortgage Association II, | |
| | 4.500%, 9/20/44 | 31,149 |
| 14,364 | Government National Mortgage Association II, | |
| | 4.500%, 10/20/44 | 15,106 |
| 29,099 | Government National Mortgage Association II, | |
| | 4.500%, 11/20/44 | 30,629 |
The accompanying notes are an integral part of these financial statements.
Pioneer Balanced ESG Fund | Annual Report | 7/31/22 53
Schedule of Investments | 7/31/22 (continued)
| | | | |
| Principal | | | |
| Amount | | | |
| USD ($) | | | Value |
| | U.S. GOVERNMENT AND AGENCY | | |
| | OBLIGATIONS — (continued) | | |
| 11,704 | Government National Mortgage Association II, | |
| | 5.500%, 2/20/34 | | $ 12,352 |
| 17,719 | Government National Mortgage Association II, | |
| | 6.500%, 11/20/28 | | 18,589 |
| 978 | Government National Mortgage Association II, | |
| | 7.500%, 9/20/29 | | 1,044 |
| 7,400,000(j) | U.S. Treasury Bills, 8/2/22 | | 7,399,619 |
| 8,000,000(j) | U.S. Treasury Bills, 8/4/22 | | 7,998,737 |
| 8,000,000(j) | U.S. Treasury Bills, 8/9/22 | | 7,996,407 |
| 5,000,000(j) | U.S. Treasury Bills, 8/23/22 | | 4,993,686 |
| 1,697,000 | U.S. Treasury Bonds, 2.000%, 2/15/50 | | 1,348,452 |
| 170,000 | U.S. Treasury Bonds, 2.875%, 5/15/52 | | 164,422 |
| 2,050,000 | U.S. Treasury Bonds, 3.000%, 2/15/48 | | 1,972,084 |
| 5,406,000 | U.S. Treasury Notes, 0.375%, 4/30/25 | | 5,053,554 |
| 1,248,500 | U.S. Treasury Notes, 0.750%, 5/31/26 | | 1,156,764 |
| 4,579,000 | U.S. Treasury Notes, 1.125%, 2/15/31 | | 4,053,309 |
| 2,500,000 | U.S. Treasury Notes, 1.500%, 2/15/30 | | 2,303,223 |
| 700,000 | U.S. Treasury Notes, 2.625%, 5/31/27 | | 697,703 |
| 250,000 | U.S. Treasury Notes, 2.750%, 5/31/29 | | 250,469 |
| 2,090,000 | U.S. Treasury Notes, 2.875%, 5/15/32 | | 2,127,555 |
| 1,550,000 | U.S. Treasury Notes, 3.250%, 6/30/27 | | 1,588,750 |
| | TOTAL U.S. GOVERNMENT AND AGENCY OBLIGATIONS | |
| | (Cost $93,002,033) | | $ 91,383,536 |
| | TOTAL INVESTMENTS IN UNAFFILIATED ISSUERS — 104.8% | |
| | (Cost $387,296,796) | | $427,798,598 |
| |
| | | Net | Change in Net | |
| | | Realized | Unrealized | |
| | | Dividend | Gain | Appreciation | |
| Shares | | Income | (Loss) | (Depreciation) | |
| | AFFILIATED ISSUER — 0.2% | | |
| | CLOSED-END FUND — 0.2% of Net Assets |
| 112,601(l) | Pioneer ILS | | |
| | Interval Fund | $18,487 | $ — | $(23,947) | $ 950,353 |
| | TOTAL CLOSED-END FUND | | |
| | (Cost $1,142,343) | | $ 950,353 |
| | TOTAL INVESTMENTS IN AFFILIATED ISSUER — 0.2% | |
| | (Cost $1,142,343) | | $ 950,353 |
| | OTHER ASSETS AND LIABILITIES — (5.0)% | $ (20,556,607) |
| | NET ASSETS — 100.0% | | $408,192,344 |
(A.D.R.) American Depositary Receipts.
(TBA) “To Be Announced” Securities.
The accompanying notes are an integral part of these financial statements.
54 Pioneer Balanced ESG Fund | Annual Report | 7/31/22
| CMT | | Constant Maturity Treasury Index. |
| FREMF | | Freddie Mac Multifamily Fixed-Rate Mortgage Loans. |
| ICE | | Intercontinental Exchange. |
| LIBOR | | London Interbank Offered Rate. |
| REMICs | | Real Estate Mortgage Investment Conduits. |
| SOFR | | Secured Overnight Financing Rate. |
| SOFR30A | | Secured Overnight Financing Rate 30 Day Average. |
| (144A) | | Security is exempt from registration under Rule 144A of the Securities Act of 1933. Such securities may be resold normally to qualified institutional buyers in a transaction exempt from registration. At July 31, 2022, the value of these securities amounted to $56,124,380, or 13.7% of net assets. |
| (a) | | Floating rate note. Coupon rate, reference index and spread shown at July 31, 2022. |
| (b) | | Non-income producing security. |
| (c) | | The interest rate is subject to change periodically. The interest rate and/or reference index and spread shown at July 31, 2022. |
| (d) | | Security represents the interest-only portion payments on a pool of underlying mortgages or mortgage-backed securities. |
| (e) | | Security is perpetual in nature and has no stated maturity date. |
| (f) | | Debt obligation initially issued at one coupon which converts to a higher coupon at a specific date. The rate shown is the rate at July 31, 2022. |
| (g) | | Consists of Revenue Bonds unless otherwise indicated. |
| (h) | | Pre-refunded bonds have been collateralized by U.S. Treasury or U.S. Government Agency securities which are held in escrow to pay interest and principal on the tax exempt issue and to retire the bonds in full at the earliest refunding date. |
| (i) | | Represents a General Obligation Bond. |
| (j) | | Security issued with a zero coupon. Income is recognized through accretion of discount. |
| (k) | | Issued as participation notes. |
| (l) | | Pioneer ILS Interval Fund is an affiliated closed-end fund managed by Amundi Asset Management US, Inc. (the “Adviser”), the Fund's investment adviser. |
| * | | Senior secured floating rate loan interests in which the Fund invests generally pay interest at rates that are periodically re-determined by reference to a base lending rate plus a premium. These base lending rates are generally (i) the lending rate offered by one or more major European banks, such as LIBOR or SOFR, (ii) the prime rate offered by one or more major United States banks, (iii) the rate of a certificate of deposit or (iv) other base lending rates used by commercial lenders. The interest rate shown is the rate accruing at July 31, 2022. |
| † | | Amount rounds to less than 0.1%. |
| + | | Security is valued using significant unobservable inputs (Level 3). |
| # | | Securities are restricted as to resale. |
The accompanying notes are an integral part of these financial statements.
Pioneer Balanced ESG Fund | Annual Report | 7/31/22 55
Schedule of Investments | 7/31/22 (continued)
| | | | |
| Restricted Securities | Acquisition date | Cost | Value |
| Bantry Re 2016 | 2/6/2019 | $ 15,112 | $ 15,112 |
| Bonanza Re | 12/15/2020 | 250,000 | 238,100 |
| Easton Re Pte | 12/15/2020 | 250,000 | 242,600 |
| Mona Lisa Re | 12/30/2019 | 250,000 | 244,425 |
| Sector Re V | 4/23/2019 | 100,000 | 75,090 |
| Vitality Re X | 2/3/2020 | 249,953 | 248,150 |
| Total Restricted Securities | | | $1,063,477 |
| % of Net assets | | | 0.3% |
FUTURES CONTRACTS
FIXED INCOME INDEX FUTURES CONTRACTS
| | | | | | |
| Number of | | | | | Unrealized |
| Contracts | | Expiration | Notional | Market | Appreciation |
| Long | Description | Date | Amount | Value | (Depreciation) |
| 22 | U.S. 2 Year | 9/30/22 | $ 4,646,578 | $ 4,630,141 | $ (16,437) |
| | Note (CBT) | | | | |
| 126 | U.S. 5 Year | 9/30/22 | 14,157,282 | 14,329,547 | 172,265 |
| | Note (CBT) | | | | |
| 2 | U.S. Long | 9/21/22 | 282,315 | 288,000 | 5,685 |
| | Bond (CBT) | | | | |
| 59 | U.S. Ultra | 9/21/22 | 9,224,882 | 9,340,438 | 115,556 |
| | Bond (CBT) | | | | |
| | | | $28,311,057 | $28,588,126 | $ 277,069 |
| Number of | | | | | |
| Contracts | | Expiration | Notional | Market | Unrealized |
| Short | Description | Date | Amount | Value | (Depreciation) |
| 2 | U.S. 10 Year | 9/21/22 | $ (233,776) | $ (242,282) | $ (8,506) |
| | Note (CBT) | | | | |
| 28 | U.S. 10 Year | 9/21/22 | (3,605,236) | (3,675,000) | (69,764) |
| | Ultra Bond (CBT) | | | | |
| | | | $ (3,839,012) | $ (3,917,282) | $ (78,270) |
| TOTAL FUTURES CONTRACTS | $24,472,045 | $24,670,844 | $ 198,799 |
Principal amounts are denominated in U.S. dollars (“USD”) unless otherwise noted.
Purchases and sales of securities (excluding short-term investments) for the year ended July 31, 2022 were as follows:
| | | |
| | Purchases | Sales |
| Long-Term U.S. Government Securities | $ 19,601,008 | $ 8,890,573 |
| Other Long-Term Securities | $159,836,751 | $146,256,008 |
The Fund is permitted to engage in purchase and sale transactions (“cross trades”) with certain funds and accounts for which the Adviser serves as the Fund’s investment adviser, as set forth in Rule 17a-7 under the Investment Company Act of 1940, pursuant to procedures adopted by the Board of Trustees. Under these procedures, cross trades are effected at current market prices. During the year ended July 31, 2022, the Fund did not engage in any cross trade activity.
The accompanying notes are an integral part of these financial statements.
56 Pioneer Balanced ESG Fund | Annual Report | 7/31/22
At July 31, 2022, the net unrealized appreciation on investments based on cost for federal tax purposes of $389,066,083 was as follows:
| Aggregate gross unrealized appreciation for all investments in which | |
| there is an excess of value over tax cost | $61,741,184 |
| Aggregate gross unrealized depreciation for all investments in which | |
| there is an excess of tax cost over value | (21,859,517) |
| Net unrealized appreciation | $39,881,667 |
Various inputs are used in determining the value of the Fund’s investments. These inputs are summarized in the three broad levels below.
Level 1 – unadjusted quoted prices in active markets for identical securities.
Level 2 – other significant observable inputs (including quoted prices for similar securities, interest rates, prepayment speeds, credit risks, etc.). See Notes to Financial Statements —Note 1A.
Level 3 – significant unobservable inputs (including the Fund’s own assumptions in determining fair value of investments). See Notes to Financial Statements — Note 1A.
The following is a summary of the inputs used as of July 31, 2022, in valuing the Fund's investments:
| | | | | |
| | Level 1 | Level 2 | Level 3 | Total |
| Senior Secured Floating | | | | |
| Rate Loan Interests | $ — | $ 648,819 | $ — | $ 648,819 |
| Common Stocks | 246,398,904 | — | — | 246,398,904 |
| Asset Backed Securities | — | 9,789,024 | — | 9,789,024 |
| Collateralized Mortgage | | | | |
| Obligations | — | 21,477,906 | — | 21,477,906 |
| Commercial Mortgage- | | | | |
| Backed Securities | — | 11,388,457 | — | 11,388,457 |
| Corporate Bonds | — | 41,527,826 | — | 41,527,826 |
| Convertible Preferred Stocks | 1,878,128 | — | — | 1,878,128 |
| Municipal Bonds | — | 1,785,422 | — | 1,785,422 |
| Insurance-Linked Securities | | | | |
| Reinsurance Sidecars | | | | |
| Multiperil – Worldwide | — | — | 90,202 | 90,202 |
| All Other Insurance-Linked | | | | |
| Securities | — | 973,275 | — | 973,275 |
| Foreign Government Bonds | — | 457,099 | — | 457,099 |
| U.S. Government and | | | | |
| Agency Obligations | — | 91,383,536 | — | 91,383,536 |
| Affiliated Closed-End Fund | 950,353 | — | — | 950,353 |
| Total Investments | | | | |
| in Securities | $249,227,385 | $179,431,364 | $90,202 | $428,748,951 |
| Other Financial Instruments | | | | |
| Net unrealized appreciation | | | | |
| on futures contracts | $ 198,799 | $ — | $ — | $ 198,799 |
| Total Other Financial | | | | |
| Instruments | $ 198,799 | $ — | $ — | $ 198,799 |
The accompanying notes are an integral part of these financial statements.
Pioneer Balanced ESG Fund | Annual Report | 7/31/22 57
Schedule of Investments | 7/31/22 (continued)
The following is a reconciliation of assets valued using significant unobservable inputs (Level 3):
| | Insurance- |
| | Linked |
| | Securities |
| Balance as of 7/31/21 | $82,535 |
| Realized gain (loss)(1) | (19,097) |
| Changed in unrealized appreciation (depreciation)(2) | 34,172 |
| Accrued discounts/premiums | (7,408) |
| Purchases | — |
| Sales | — |
| Transfers in to Level 3* | — |
| Transfers out of Level 3* | — |
| Balance as of 7/31/22 | $90,202 |
| (1) | | Realized gain (loss) on these securities is included in the realized gain (loss) from investments on the Statement of Operations. |
| (2) | | Unrealized appreciation (depreciation) on these securities is included in the change in unrealized appreciation (depreciation) from investments on the Statement of Operations. |
| * | | Transfers are calculated on the beginning of period value. For the year ended July 31, 2022, there were no transfers in or out of Level 3. |
Net change in unrealized appreciation (depreciation) of Level 3 investments still held and considered Level 3 at July 31, 2022: $13,215
The accompanying notes are an integral part of these financial statements.
58 Pioneer Balanced ESG Fund | Annual Report | 7/31/22
Statement of Assets and Liabilities | 7/31/22
| ASSETS: | |
| Investments in unaffiliated issuers, at value (cost $387,296,796) | $427,798,598 |
| Investments in affiliated issuers, at value (cost $1,142,343) | 950,353 |
| Cash | 415,477 |
| Foreign currencies, at value (cost $88) | 86 |
| Futures collateral | 1,604,434 |
| Variation margin for futures contracts | 76,565 |
| Receivables — | |
| Investment securities sold | 13,989,663 |
| Fund shares sold | 913,784 |
| Dividends | 298,569 |
| Interest | 758,856 |
| Due from the Adviser | 1,248 |
| Other assets | 18,813 |
| Total assets | $446,826,446 |
| LIABILITIES: | |
| Payables — | |
| Investment securities purchased | $ 37,358,891 |
| Fund shares repurchased | 992,139 |
| Trustees' fees | 1,838 |
| Due to affiliates | 57,524 |
| Accrued expenses | 223,710 |
| Total liabilities | $ 38,634,102 |
| NET ASSETS: | |
| Paid-in capital | $362,478,213 |
| Distributable earnings | 45,714,131 |
| Net assets | $408,192,344 |
| NET ASSET VALUE PER SHARE: | |
| No par value (unlimited number of shares authorized) | |
| Class A (based on $279,981,549/28,977,246 shares) | $ 9.66 |
| Class C (based on $43,775,983/4,572,949 shares) | $ 9.57 |
| Class K (based on $7,731,984/802,152 shares) | $ 9.64 |
| Class R (based on $2,883,886/297,843 shares) | $ 9.68 |
| Class Y (based on $73,818,942/7,576,465 shares) | $ 9.74 |
| MAXIMUM OFFERING PRICE PER SHARE: | |
| Class A (based on $9.66 net asset value per share/100%-4.50% | |
| maximum sales charge) | $ 10.12 |
The accompanying notes are an integral part of these financial statements.
Pioneer Balanced ESG Fund | Annual Report | 7/31/22 59
Statement of Operations
FOR THE YEAR ENDED 7/31/22
| INVESTMENT INCOME: | | | |
| Dividends from unaffiliated issuers (net of foreign taxes | | | |
| withheld $57,643) | $ 4,904,435 | |
| Interest from unaffiliated issuers (net of foreign taxes | | | |
| withheld $1,158) | | 3,729,934 | |
| Dividends from affiliated issuers | | 18,487 | |
| Total Investment Income | | | $ 8,652,856 |
| EXPENSES: | | | |
| Management fees | $ 2,145,887 | |
| Administrative expenses | | 155,695 | |
| Transfer agent fees | | | |
| Class A | | 166,352 | |
| Class C | | 23,923 | |
| Class K | | 222 | |
| Class R | | 837 | |
| Class Y | | 84,358 | |
| Distribution fees | | | |
| Class A | | 744,713 | |
| Class C | | 503,310 | |
| Class R | | 11,653 | |
| Shareowner communications expense | | 62,623 | |
| Custodian fees | | 23,828 | |
| Registration fees | | 97,625 | |
| Professional fees | | 109,982 | |
| Printing expense | | 61,374 | |
| Pricing fees | | 19,296 | |
| Trustees' fees | | 17,975 | |
| Insurance expense | | 698 | |
| Miscellaneous | | 70,649 | |
| Total expenses | | | $ 4,301,000 |
| Less fees waived and expenses reimbursed by the Adviser | | | (88,115) |
| Net expenses | | | $ 4,212,885 |
| Net investment income | | | $ 4,439,971 |
| REALIZED AND UNREALIZED GAIN (LOSS) ON INVESTMENTS: | | |
| Net realized gain (loss) on: | | | |
| Investments in unaffiliated issuers | $ 14,608,526 | |
| Futures contracts | | (1,892,177) | |
| Other assets and liabilities denominated in foreign currencies | | (2,581) | $ 12,713,768 |
| Change in net unrealized (depreciation) on: | | | |
| Investments in unaffiliated issuers | $(49,340,684) | |
| Investments in affiliated issuers | | (23,947) | |
| Futures contracts | | (97,271) | |
| Other assets and liabilities denominated in foreign currencies | | (1,070) | $(49,462,972) |
| Net realized and unrealized (loss) on investments | | | $(36,749,204) |
| Net decrease in net assets resulting from operations | | | $(32,309,233) |
The accompanying notes are an integral part of these financial statements.
60 Pioneer Balanced ESG Fund | Annual Report | 7/31/22
Statements of Changes in Net Assets
| | | |
| | Year | Year |
| | Ended | Ended |
| | 7/31/22 | 7/31/21 |
| FROM OPERATIONS: | | |
| Net investment income | $ 4,439,971 | $ 4,151,716 |
| Net realized gain on investments | 12,713,768 | 27,478,543 |
| Change in net unrealized appreciation (depreciation) | | |
| on investments | (49,462,972) | 39,704,201 |
| Net increase (decrease) in net assets resulting | | |
| from operations | $ (32,309,233) | $ 71,334,460 |
| DISTRIBUTIONS TO SHAREOWNERS: | | |
| Class A ($0.91 and $0.37 per share, respectively) | $ (24,678,235) | $ (8,974,419) |
| Class C ($0.83 and $0.30 per share, respectively) | (3,865,458) | (1,678,455) |
| Class K ($0.95 and $0.41 per share, respectively) | (393,068) | (46,526) |
| Class R ($0.88 and $0.34 per share, respectively) | (166,585) | (63,358) |
| Class Y ($0.94 and $0.41 per share, respectively) | (6,264,634) | (2,313,749) |
| Total distributions to shareowners | $ (35,367,980) | $ (13,076,507) |
| FROM FUND SHARE TRANSACTIONS: | | |
| Net proceeds from sales of shares | $ 85,210,523 | $105,365,810 |
| Reinvestment of distributions | 34,584,331 | 12,753,156 |
| Cost of shares repurchased | (76,584,713) | (89,320,989) |
| Net increase in net assets resulting from Fund | | |
| share transactions | $ 43,210,141 | $ 28,797,977 |
| Net increase (decrease) in net assets | $ (24,467,072) | $ 87,055,930 |
| NET ASSETS: | | |
| Beginning of year | $432,659,416 | $345,603,486 |
| End of year | $408,192,344 | $432,659,416 |
The accompanying notes are an integral part of these financial statements.
Pioneer Balanced ESG Fund | Annual Report | 7/31/22 61
Statements of Changes in Net Assets
(continued)
| | | | | |
| | Year | Year | Year | Year |
| | Ended | Ended | Ended | Ended |
| | 7/31/22 | 7/31/22 | 7/31/21 | 7/31/21 |
| | Shares | Amount | Shares | Amount |
| Class A | | | | |
| Shares sold | 3,892,101 | $ 41,513,795 | 5,424,585 | $ 57,096,902 |
| Reinvestment of distributions | 2,248,900 | 24,068,744 | 852,444 | 8,733,525 |
| Less shares repurchased | (3,777,059) | (39,682,763) | (3,666,635) | (38,188,624) |
| Net increase | 2,363,942 | $ 25,899,776 | 2,610,394 | $ 27,641,803 |
| Class C | | | | |
| Shares sold | 740,583 | $ 7,924,096 | 1,181,199 | $ 12,255,641 |
| Reinvestment of distributions | 363,341 | 3,865,458 | 165,749 | 1,670,561 |
| Less shares repurchased | (1,467,546) | (15,492,417) | (2,255,957) | (23,251,338) |
| Net decrease | (363,622) | $ (3,702,863) | (909,009) | $ (9,325,136) |
| Class K | | | | |
| Shares sold | 632,906 | $ 6,535,090 | 306,659 | $ 3,295,240 |
| Reinvestment of distributions | 36,982 | 391,612 | 3,969 | 41,015 |
| Less shares repurchased | (95,764) | (957,960) | (144,969) | (1,577,751) |
| Net increase | 574,124 | $ 5,968,742 | 165,659 | $ 1,758,504 |
| Class R | | | | |
| Shares sold | 167,700 | $ 1,719,826 | 70,948 | $ 749,220 |
| Reinvestment of distributions | 15,541 | 166,585 | 6,197 | 63,358 |
| Less shares repurchased | (95,664) | (1,027,343) | (76,836) | (792,626) |
| Net increase | 87,577 | $ 859,068 | 309 | $ 19,952 |
| Class Y | | | | |
| Shares sold | 2,599,392 | $ 27,517,716 | 2,993,443 | $ 31,968,807 |
| Reinvestment of distributions | 565,081 | 6,091,932 | 216,841 | 2,244,697 |
| Less shares repurchased | (1,844,458) | (19,424,230) | (2,379,563) | (25,510,650) |
| Net increase | 1,320,015 | $ 14,185,418 | 830,721 | $ 8,702,854 |
The accompanying notes are an integral part of these financial statements.
62 Pioneer Balanced ESG Fund | Annual Report | 7/31/22
Financial Highlights
| | | | | | |
| | Year | Year | Year | Year | Year |
| | Ended | Ended | Ended | Ended | Ended |
| | 7/31/22 | 7/31/21 | 7/31/20 | 7/31/19 | 7/31/18 |
| Class A | | | | | |
| Net asset value, beginning of period | $ 11.31 | $ 9.72 | $ 9.57 | $ 9.64 | $ 9.65 |
| Increase (decrease) from investment operations: | | | | | |
| Net investment income (loss) (a) | $ 0.11 | $ 0.12 | $ 0.15 | $ 0.18 | $ 0.17 |
| Net realized and unrealized gain (loss) on investments | (0.85) | 1.84 | 0.54 | 0.56 | 0.70 |
| Net increase (decrease) from investment operations | $ (0.74) | $ 1.96 | $ 0.69 | $ 0.74 | $ 0.87 |
| Distributions to shareowners: | | | | | |
| Net investment income | $ (0.13) | $ (0.11) | $ (0.15) | $ (0.18) | $ (0.17) |
| Net realized gain | (0.78) | (0.26) | (0.39) | (0.63) | (0.71) |
| Total distributions | $ (0.91) | $ (0.37) | $ (0.54) | $ (0.81) | $ (0.88) |
| Net increase (decrease) in net asset value | $ (1.65) | $ 1.59 | $ 0.15 | $ (0.07) | $ (0.01) |
| Net asset value, end of period | $ 9.66 | $ 11.31 | $ 9.72 | $ 9.57 | $ 9.64 |
| Total return (b) | (7.23)% | 20.60% | 7.55% | 8.51% | 9.33% |
| Ratio of net expenses to average net assets | 0.95% | 0.99% | 0.99% | 1.01% | 1.16% |
| Ratio of net investment income (loss) to average net assets | 1.07% | 1.12% | 1.65% | 1.97% | 1.76% |
| Portfolio turnover rate | 40% | 54% | 65% | 60% | 65% |
| Net assets, end of period (in thousands) | $279,982 | $301,068 | $233,421 | $219,544 | $185,382 |
| Ratios with no waiver of fees and assumption of expenses by | | | | | |
| the Adviser and no reduction for fees paid indirectly: | | | | | |
| Total expenses to average net assets | 0.95% | 1.00% | 1.04% | 1.07% | 1.17% |
| Net investment income (loss) to average net assets | 1.07% | 1.11% | 1.60% | 1.91% | 1.75% |
| (a) | | The per-share data presented above is based on the average shares outstanding for the period presented. |
| (b) | | Assumes initial investment at net asset value at the beginning of each period, reinvestment of all distributions, the complete redemption of the investment at net asset value at the end of each period and no sales charges. Total return would be reduced if sales charges were taken into account. |
The accompanying notes are an integral part of these financial statements.
Pioneer Balanced ESG Fund | Annual Report | 7/31/22 63
Financial Highlights (continued)
| | | | | | |
| | Year | Year | Year | Year | Year |
| | Ended | Ended | Ended | Ended | Ended |
| | 7/31/22 | 7/31/21 | 7/31/20 | 7/31/19 | 7/31/18 |
| Class C | | | | | |
| Net asset value, beginning of period | $ 11.21 | $ 9.65 | $ 9.50 | $ 9.57 | $ 9.58 |
| Increase (decrease) from investment operations: | | | | | |
| Net investment income (loss) (a) | $ 0.03 | $ 0.04 | $ 0.09 | $ 0.11 | $ 0.10 |
| Net realized and unrealized gain (loss) on investments | (0.84) | 1.82 | 0.54 | 0.55 | 0.70 |
| Net increase (decrease) from investment operations | $ (0.81) | $ 1.86 | $ 0.63 | $ 0.66 | $ 0.80 |
| Distributions to shareowners: | | | | | |
| Net investment income | $ (0.05) | $ (0.04) | $ (0.09) | $ (0.10) | $ (0.10) |
| Net realized gain | (0.78) | (0.26) | (0.39) | (0.63) | (0.71) |
| Total distributions | $ (0.83) | $ (0.30) | $ (0.48) | $ (0.73) | $ (0.81) |
| Net increase (decrease) in net asset value | $ (1.64) | $ 1.56 | $ 0.15 | $ (0.07) | $ (0.01) |
| Net asset value, end of period | $ 9.57 | $ 11.21 | $ 9.65 | $ 9.50 | $ 9.57 |
| Total return (b) | (7.92)% | 19.63% | 6.82% | 7.68% | 8.63% |
| Ratio of net expenses to average net assets | 1.68% | 1.72% | 1.72% | 1.75% | 1.90% |
| Ratio of net investment income (loss) to average net assets | 0.33% | 0.41% | 0.92% | 1.23% | 1.03% |
| Portfolio turnover rate | 40% | 54% | 65% | 60% | 65% |
| Net assets, end of period (in thousands) | $43,776 | $55,342 | $56,387 | $46,993 | $49,205 |
| Ratios with no waiver of fees and assumption of expenses by | | | | | |
| the Adviser and no reduction for fees paid indirectly: | | | | | |
| Total expenses to average net assets | 1.69% | 1.73% | 1.76% | 1.79% | 1.90% |
| Net investment income (loss) to average net assets | 0.32% | 0.40% | 0.88% | 1.19% | 1.03% |
| (a) | | The per-share data presented above is based on the average shares outstanding for the period presented. |
| (b) | | Assumes initial investment at net asset value at the beginning of each period, reinvestment of all distributions, the complete redemption of the investment at net asset value at the end of each period and no sales charges. Total return would be reduced if sales charges were taken into account. |
The accompanying notes are an integral part of these financial statements.
64 Pioneer Balanced ESG Fund | Annual Report 7/31/22
| | | | | | |
| | Year | Year | Year | Year | Year |
| | Ended | Ended | Ended | Ended | Ended |
| | 7/31/22 | 7/31/21 | 7/31/20 | 7/31/19 | 7/31/18 |
| Class K | | | | | |
| Net asset value, beginning of period | $11.29 | $ 9.71 | $ 9.56 | $ 9.63 | $ 9.65 |
| Increase (decrease) from investment operations: | | | | | |
| Net investment income (loss) (a) | $ 0.15 | $ 0.15 | $ 0.18 | $ 0.20 | $ 0.20 |
| Net realized and unrealized gain (loss) on investments | (0.85) | 1.84 | 0.54 | 0.55 | 0.70 |
| Net increase (decrease) from investment operations | $ (0.70) | $ 1.99 | $ 0.72 | $ 0.75 | $ 0.90 |
| Distributions to shareowners: | | | | | |
| Net investment income | $ (0.17) | $ (0.15) | $(0.18) | $(0.19) | $(0.21) |
| Net realized gain | (0.78) | (0.26) | (0.39) | (0.63) | (0.71) |
| Total distributions | $ (0.95) | $ (0.41) | $(0.57) | $(0.82) | $(0.92) |
| Net increase (decrease) in net asset value | $ (1.65) | $ 1.58 | $ 0.15 | $(0.07) | $(0.02) |
| Net asset value, end of period | $ 9.64 | $11.29 | $ 9.71 | $ 9.56 | $ 9.63 |
| Total return (b) | (6.90)% | 20.96% | 7.93% | 8.72% | 9.66% |
| Ratio of net expenses to average net assets | 0.65% | 0.65% | 0.65% | 0.76% | 0.85% |
| Ratio of net investment income (loss) to average net assets | 1.44% | 1.43% | 1.95% | 2.21% | 2.07% |
| Portfolio turnover rate | 40% | 54% | 65% | 60% | 65% |
| Net assets, end of period (in thousands) | $7,732 | $2,575 | $ 606 | $ 281 | $ 108 |
| Ratios with no waiver of fees and assumption of expenses by | | | | | |
| the Adviser and no reduction for fees paid indirectly: | | | | | |
| Total expenses to average net assets | 0.65% | 0.70% | 0.71% | 0.81% | 0.85% |
| Net investment income (loss) to average net assets | 1.44% | 1.38% | 1.89% | 2.16% | 2.07% |
| (a) | | The per-share data presented above is based on the average shares outstanding for the period presented. |
| (b) | | Assumes initial investment at net asset value at the beginning of each period, reinvestment of all distributions and the complete redemption of the investment at net asset value at the end of each period. |
The accompanying notes are an integral part of these financial statements.
Pioneer Balanced ESG Fund | Annual Report | 7/31/22 65
Financial Highlights (continued)
| | | | | | |
| | Year | Year | Year | Year | Year |
| | Ended | Ended | Ended | Ended | Ended |
| | 7/31/22 | 7/31/21 | 7/31/20 | 7/31/19 | 7/31/18 |
| Class R | | | | | |
| Net asset value, beginning of period | $11.33 | $ 9.75 | $ 9.59 | $ 9.64 | $ 9.64 |
| Increase (decrease) from investment operations: | | | | | |
| Net investment income (loss) (a) | $ 0.09 | $ 0.09 | $ 0.12 | $ 0.15 | $ 0.15 |
| Net realized and unrealized gain (loss) on investments | (0.86) | 1.83 | 0.56 | 0.56 | 0.71 |
| Net increase (decrease) from investment operations | $ (0.77) | $ 1.92 | $ 0.68 | $ 0.71 | $ 0.86 |
| Distributions to shareowners: | | | | | |
| Net investment income | $ (0.10) | $ (0.08) | $ (0.13) | $ (0.13) | $ (0.15) |
| Net realized gain | (0.78) | (0.26) | (0.39) | (0.63) | (0.71) |
| Total distributions | $ (0.88) | $ (0.34) | $ (0.52) | $ (0.76) | $ (0.86) |
| Net increase (decrease) in net asset value | $ (1.65) | $ 1.58 | $ 0.16 | $ (0.05) | $ — |
| Net asset value, end of period | $ 9.68 | $11.33 | $ 9.75 | $ 9.59 | $ 9.64 |
| Total return (b) | (7.45)% | 20.12% | 7.32% | 8.24% | 9.17% |
| Ratio of net expenses to average net assets | 1.20% | 1.30% | 1.30% | 1.30% | 1.30% |
| Ratio of net investment income (loss) to average net assets | 0.84% | 0.81% | 1.32% | 1.65% | 1.56% |
| Portfolio turnover rate | 40% | 54% | 65% | 60% | 65% |
| Net assets, end of period (in thousands) | $2,884 | $2,383 | $2,047 | $ 1,363 | $ 5,941 |
| Ratios with no waiver of fees and assumption of expenses by | | | | | |
| the Adviser and no reduction for fees paid indirectly: | | | | | |
| Total expenses to average net assets | 1.20% | 1.45% | 1.59% | 1.77% | 1.57% |
| Net investment income (loss) to average net assets | 0.84% | 0.66% | 1.03% | 1.18% | 1.29% |
| (a) | | The per-share data presented above is based on the average shares outstanding for the period presented. |
| (b) | | Assumes initial investment at net asset value at the beginning of each period, reinvestment of all distributions and the complete redemption of the investment at net asset value at the end of each period. |
The accompanying notes are an integral part of these financial statements.
66 Pioneer Balanced ESG Fund | Annual Report | 7/31/22
| | | | | | |
| | Year | Year | Year | Year | Year |
| | Ended | Ended | Ended | Ended | Ended |
| | 7/31/22 | 7/31/21 | 7/31/20 | 7/31/19 | 7/31/18 |
| Class Y | | | | | |
| Net asset value, beginning of period | $ 11.39 | $ 9.79 | $ 9.64 | $ 9.71 | $ 9.71 |
| Increase (decrease) from investment operations: | | | | | |
| Net investment income (loss) (a) | $ 0.14 | $ 0.15 | $ 0.19 | $ 0.21 | $ 0.19 |
| Net realized and unrealized gain (loss) on investments | (0.85) | 1.86 | 0.54 | 0.55 | 0.72 |
| Net increase (decrease) from investment operations | $ (0.71) | $ 2.01 | $ 0.73 | $ 0.76 | $ 0.91 |
| Distributions to shareowners: | | | | | |
| Net investment income | $ (0.16) | $ (0.15) | $ (0.19) | $ (0.20) | $ (0.20) |
| Net realized gain | (0.78) | (0.26) | (0.39) | (0.63) | (0.71) |
| Total distributions | $ (0.94) | $ (0.41) | $ (0.58) | $ (0.83) | $ (0.91) |
| Net increase (decrease) in net asset value | $ (1.65) | $ 1.60 | $ 0.15 | $ (0.07) | $ — |
| Net asset value, end of period | $ 9.74 | $ 11.39 | $ 9.79 | $ 9.64 | $ 9.71 |
| Total return (b) | (6.95)% | 20.99% | 7.95% | 8.77% | 9.67% |
| Ratio of net expenses to average net assets | 0.65% | 0.65% | 0.65% | 0.69% | 0.93% |
| Ratio of net investment income (loss) to average net assets | 1.37% | 1.46% | 1.99% | 2.29% | 1.99% |
| Portfolio turnover rate | 40% | 54% | 65% | 60% | 65% |
| Net assets, end of period (in thousands) | $73,819 | $71,290 | $53,142 | $33,930 | $30,892 |
| Ratios with no waiver of fees and assumption of expenses by | | | | | |
| the Adviser and no reduction for fees paid indirectly: | | | | | |
| Total expenses to average net assets | 0.75% | 0.77% | 0.82% | 0.84% | 0.93% |
| Net investment income (loss) to average net assets | 1.27% | 1.34% | 1.82% | 2.14% | 1.99% |
| (a) | | The per-share data presented above is based on the average shares outstanding for the period presented. |
| (b) | | Assumes initial investment at net asset value at the beginning of each period, reinvestment of all distributions and the complete redemption of the investment at net asset value at the end of each period. |
The accompanying notes are an integral part of these financial statements.
Pioneer Balanced ESG Fund | Annual Report | 7/31/22 67
Notes to Financial Statements | 7/31/22
1. Organization and Significant Accounting Policies
Pioneer Balanced ESG Fund (the “Fund”) is one of three portfolios comprising Pioneer Series Trust IV (the "Trust"), a Delaware statutory trust. The Fund is registered under the Investment Company Act of 1940 (the “1940 Act”) as a diversified, open-end management investment company. The Fund’s investment objective is to seek capital growth and current income through a diversified portfolio of equity securities and bonds.
The Fund offers five classes of shares designated as Class A, Class C, Class K, Class R and Class Y shares. Each class of shares represents an interest in the same portfolio of investments of the Fund and has identical rights (based on relative net asset values) to assets and liquidation proceeds. Share classes can bear different rates of class-specific fees and expenses, such as transfer agent and distribution fees. Differences in class-specific fees and expenses will result in differences in net investment income and, therefore, the payment of different dividends from net investment income earned by each class. The Amended and Restated Declaration of Trust of the Trust gives the Board of Trustees the flexibility to specify either per-share voting or dollar-weighted voting when submitting matters for shareowner approval. Under per-share voting, each share of a class of the Fund is entitled to one vote. Under dollar-weighted voting, a shareowner’s voting power is determined not by the number of shares owned, but by the dollar value of the shares on the record date. Each share class has exclusive voting rights with respect to matters affecting only that class, including with respect to the distribution plan for that class. There is no distribution plan for Class K or Class Y shares.
Amundi Asset Management US, Inc., an indirect, wholly owned subsidiary of Amundi and Amundi’s wholly owned subsidiary, Amundi USA, Inc., serves as the Fund’s investment adviser (the “Adviser”). Amundi Distributor US, Inc., an affiliate of the Adviser, serves as the Fund’s distributor (the “Distributor”).
In March 2020, FASB issued an Accounting Standard Update, ASU 2020-04, Reference Rate Reform (Topic 848) — Facilitation of the Effects of Reference Rate Reform on Financial Reporting (“ASU 2020-04”), which provides optional, temporary relief with respect to the financial reporting of contracts subject to certain types of modifications due to the planned discontinuation of the London Interbank Offered Rate (“LIBOR”) and other LIBOR-based reference rates at the end of 2021. The temporary relief provided by ASU 2020-04 is effective for certain reference rate-related contract modifications that occur during the period from March 12, 2020 through December 31, 2023. Management is evaluating the impact of ASU
68 Pioneer Balanced ESG Fund | Annual Report | 7/31/22
2020-04 on the Fund's investments, derivatives, debt and other contracts, if applicable, that will undergo reference rate-related modifications as a result of the reference rate reform.
Effective August 19, 2022, the Fund was required to comply with Rule 18f-4 under the 1940 Act, which governs the use of derivatives by registered investment companies. Rule 18f-4 permits funds to enter into derivatives transactions (as defined in Rule 18f-4) and certain other transactions notwithstanding the restrictions on the issuance of “senior securities” under Section 18 of the 1940 Act. Rule 18f-4 requires a fund to establish and maintain a comprehensive derivatives risk management program, appoint a derivatives risk manager and comply with a relative or absolute limit on fund leverage risk calculated based on value-at-risk (“VaR”), unless the fund uses derivatives in only a limited manner. Management anticipates Rule 18f-4 will not have a material impact on the Fund.
The Fund is an investment company and follows investment company accounting and reporting guidance under U.S. Generally Accepted Accounting Principles (“U.S. GAAP”). U.S. GAAP requires the management of the Fund to make estimates and assumptions that affect the reported amounts of assets and liabilities, the disclosure of contingent assets and liabilities at the date of the financial statements, and the reported amounts of income, expenses and gain or loss on investments during the reporting period. Actual results could differ from those estimates.
The following is a summary of significant accounting policies followed by the Fund in the preparation of its financial statements:
A. Security Valuation
The net asset value of the Fund is computed once daily, on each day the New York Stock Exchange (“NYSE”) is open, as of the close of regular trading on the NYSE.
Equity securities that have traded on an exchange are valued by using the last sale price on the principal exchange where they are traded. Equity securities that have not traded on the date of valuation, or securities for which sale prices are not available, generally are valued using the mean between the last bid and asked prices or, if both last bid and asked prices are not available, at the last quoted bid price. Last sale and bid and asked prices are provided by independent third party pricing services. In the case of equity securities not traded on an exchange, prices are typically determined by independent third party pricing services using a variety of techniques and methods.
The value of foreign securities is translated into U.S. dollars based on foreign currency exchange rate quotations supplied by a third party pricing source. Trading in non-U.S. equity securities is substantially completed
Pioneer Balanced ESG Fund | Annual Report | 7/31/22 69
each day at various times prior to the close of the NYSE. The values of such securities used in computing the net asset value of the Fund's shares are determined as of such times. The Fund may use a fair value model developed by an independent pricing service to value non-U.S. equity securities.
Fixed-income securities are valued by using prices supplied by independent pricing services, which consider such factors as market prices, market events, quotations from one or more brokers, Treasury spreads, yields, maturities and ratings, or may use a pricing matrix or other fair value methods or techniques to provide an estimated value of the security or instrument. A pricing matrix is a means of valuing a debt security on the basis of current market prices for other debt securities, historical trading patterns in the market for fixed-income securities and/or other factors. Non-U.S. debt securities that are listed on an exchange will be valued at the bid price obtained from an independent third party pricing service. When independent third party pricing services are unable to supply prices, or when prices or market quotations are considered to be unreliable, the value of that security may be determined using quotations from one or more broker-dealers.
Loan interests are valued at the mean between the last available bid and asked prices from one or more brokers or dealers as obtained from Loan Pricing Corporation, an independent third party pricing service. If price information is not available from Loan Pricing Corporation, or if the price information is deemed to be unreliable, price information will be obtained from an alternative loan interest pricing service. If no reliable price quotes are available from either the primary or alternative pricing service, broker quotes will be solicited.
Event-linked bonds are valued at the bid price obtained from an independent third party pricing service. Other insurance-linked securities (including reinsurance sidecars, collateralized reinsurance and industry loss warranties) may be valued at the bid price obtained from an independent pricing service, or through a third party using a pricing matrix, insurance industry valuation models, or other fair value methods or techniques to provide an estimated value of the instrument.
Futures contracts are generally valued at the closing settlement price established by the exchange on which they are traded.
Shares of open-end registered investment companies (including money market mutual funds) are valued at such funds' net asset value.
Shares of closed-end interval funds that offer their shares at net asset value are valued at such funds’ net asset value.
Repurchase agreements are valued at par. Cash may include overnight time deposits at approved financial institutions.
70 Pioneer Balanced ESG Fund | Annual Report | 7/31/22
Securities or loan interests for which independent pricing services or broker-dealers are unable to supply prices or for which market prices and/or quotations are not readily available or are considered to be unreliable are valued by a fair valuation team comprised of certain personnel of the Adviser. Effective September 8, 2022, the Adviser is designated as the valuation designee for the Fund pursuant to Rule 2a-5 under the 1940 Act. The Adviser’s fair valuation team is responsible for monitoring developments that may impact fair valued securities.
Inputs used when applying fair value methods to value a security may include credit ratings, the financial condition of the company, current market conditions and comparable securities. The Fund may use fair value methods if it is determined that a significant event has occurred after the close of the exchange or market on which the security trades and prior to the determination of the Fund's net asset value. Examples of a significant event might include political or economic news, corporate restructurings, natural disasters, terrorist activity or trading halts. Thus, the valuation of the Fund's securities may differ significantly from exchange prices, and such differences could be material.
At July 31, 2022, no securities were valued using fair value methods (other than securities valued using prices supplied by independent pricing services, broker-dealers or using a third party insurance industry valuation model).
B. Investment Income and Transactions
Dividend income is recorded on the ex-dividend date, except that certain dividends from foreign securities where the ex-dividend date may have passed are recorded as soon as the Fund becomes aware of the ex-dividend data in the exercise of reasonable diligence.
Interest income, including interest on income-bearing cash accounts, is recorded on the accrual basis. Dividend and interest income are reported net of unrecoverable foreign taxes withheld at the applicable country rates and net of income accrued on defaulted securities.
Interest and dividend income payable by delivery of additional shares is reclassified as PIK (payment-in-kind) income upon receipt and is included in interest and dividend income, respectively.
Principal amounts of mortgage-backed securities are adjusted for monthly paydowns. Premiums and discounts related to certain mortgage-backed securities are amortized or accreted in proportion to the monthly paydowns. All discounts/premiums on purchase prices of debt securities are accreted/amortized for financial reporting purposes over the life of the respective securities, and such accretion/amortization is included in interest income.
Pioneer Balanced ESG Fund | Annual Report | 7/31/22 71
Security transactions are recorded as of trade date. Gains and losses on sales of investments are calculated on the identified cost method for both financial reporting and federal income tax purposes.
C. Foreign Currency Translation
The books and records of the Fund are maintained in U.S. dollars. Amounts denominated in foreign currencies are translated into U.S. dollars using current exchange rates.
Net realized gains and losses on foreign currency transactions, if any, represent, among other things, the net realized gains and losses on foreign currency exchange contracts, disposition of foreign currencies and the difference between the amount of income accrued and the U.S. dollars actually received. Further, the effects of changes in foreign currency exchange rates on investments are not segregated on the Statement of Operations from the effects of changes in the market prices of those securities, but are included with the net realized and unrealized gain or loss on investments.
D. Federal Income Taxes
It is the Fund's policy to comply with the requirements of the Internal Revenue Code applicable to regulated investment companies and to distribute all of its net taxable income and net realized capital gains, if any, to its shareowners. Therefore, no provision for federal income taxes is required. As of July 31, 2022, the Fund did not accrue any interest or penalties with respect to uncertain tax positions, which, if applicable, would be recorded as an income tax expense on the Statement of Operations. Tax returns filed within the prior three years remain subject to examination by federal and state tax authorities.
The amount and character of income and capital gain distributions to shareowners are determined in accordance with federal income tax rules, which may differ from U.S. GAAP. Distributions in excess of net investment income or net realized gains are temporary over distributions for financial statement purposes resulting from differences in the recognition or classification of income or distributions for financial statement and tax purposes. Capital accounts within the financial statements are adjusted for permanent book/tax differences to reflect tax character, but are not adjusted for temporary differences.
A portion of the dividend income recorded by the Fund is from distributions by publicly traded real estate investment trusts (“REITs”), and such distributions for tax purposes may also consist of capital gains and return of capital. The actual return of capital and capital gains portions of such distributions will be determined by formal notifications from the REITs
72 Pioneer Balanced ESG Fund | Annual Report | 7/31/22
subsequent to the calendar year-end. Distributions received from the REITs that are determined to be a return of capital are recorded by the Fund as a reduction of the cost basis of the securities held and those determined to be capital gain are reflected as such on the Statement of Operations.
At July 31, 2022, the Fund reclassified $32,281 to increase distributable earnings and $32,281 to decrease paid-in capital to reflect permanent book/tax differences. These adjustments have no impact on net assets or the results of operations.
The tax character of distributions paid during the years ended July 31, 2022 and July 31, 2021, was as follows:
| | 2022 | 2021 |
| Distributions paid from: | | |
| Ordinary income | $ 5,477,754 | $ 3,853,277 |
| Long-term capital gains | 29,890,226 | 9,223,230 |
| Total | $35,367,980 | $13,076,507 |
The following shows the components of distributable earnings (losses) on a federal income tax basis at July 31, 2022:
| | 2022 |
| Distributable earnings/(losses): | |
| Undistributed ordinary income | $ 337,329 |
| Undistributed long-term capital gains | 5,495,135 |
| Net unrealized appreciation | 39,881,667 |
| Total | $45,714,131 |
The difference between book-basis and tax-basis net unrealized appreciation is attributable to the tax deferral of losses on wash sales, adjustments relating to event-linked bonds, the tax treatment of premium and amortization, the mark to market of futures contracts, tax basis adjustments on real estate investment trust (“REIT”) holdings and common stock.
E. Fund Shares
The Fund records sales and repurchases of its shares as of trade date. The Distributor earned $45,337 in underwriting commissions on the sale of Class A shares during the year ended July 31, 2022.
F. Class Allocations
Income, common expenses and realized and unrealized gains and losses are calculated at the Fund level and allocated daily to each class of shares based on its respective percentage of adjusted net assets at the beginning of the day.
Pioneer Balanced ESG Fund | Annual Report | 7/31/22 73
Distribution fees are calculated based on the average daily net asset value attributable to Class A, Class C and Class R shares of the Fund, respectively (see Note 5). Class K and Class Y shares do not pay distribution fees. All expenses and fees paid to the Fund's transfer agent for its services are allocated among the classes of shares based on the number of accounts in each class and the ratable allocation of related out-of-pocket expenses (see Note 4).
Distributions to shareowners are recorded as of the ex-dividend date. Distributions paid by the Fund with respect to each class of shares are calculated in the same manner and at the same time, except that net investment income dividends to Class A, Class C, Class K, Class R and Class Y shares can reflect different transfer agent and distribution expense rates.
G. Risks
The value of securities held by the Fund may go up or down, sometimes rapidly or unpredictably, due to general market conditions, such as real or perceived adverse economic, political or regulatory conditions, recessions, the spread of infectious illness or other public health issues, inflation, changes in interest rates, armed conflict including Russia's military invasion of Ukraine, sanctions against Russia, other nations or individuals or companies and possible countermeasures, lack of liquidity in the bond markets or adverse investor sentiment. In the past several years, financial markets have experienced increased volatility, depressed valuations, decreased liquidity and heightened uncertainty. These conditions may continue, recur, worsen or spread. Interest rates are very low, which means there is more risk that they may go up. The U.S. Federal Reserve has recently started to raise certain interest rates. A general rise in interest rates could adversely affect the price and liquidity of fixed-income securities and could also result in increased redemptions from the Fund. Rates of inflation have recently risen. The value of assets or income from an investment may be worth less in the future as inflation decreases the value of money. As inflation increases, the real value of the Fund’s assets can decline as can the value of the Fund’s distributions.
The global pandemic of the novel coronavirus respiratory disease designated COVID-19 has resulted in major disruption to economies and markets around the world, including the United States. Global financial markets have experienced extreme volatility and severe losses, and trading in many instruments has been disrupted. Liquidity for many instruments has been greatly reduced for periods of time. Some sectors of the economy and individual issuers have experienced particularly large losses. These circumstances may continue for an extended period of time, and may continue to affect adversely the value and liquidity of the Fund’s
74 Pioneer Balanced ESG Fund | Annual Report | 7/31/22
investments. Following Russia’s invasion of Ukraine, Russian securities have lost all, or nearly all, their market value. Other securities or markets could be similarly affected by past or future geopolitical or other events or conditions.
Governments and central banks, including the U.S. Federal Reserve, have taken extraordinary and unprecedented actions to support local and global economies and the financial markets. These actions have resulted in significant expansion of public debt, including in the U.S. The consequences of high public debt, including its future impact on the economy and securities markets, may not be known for some time.
At times, the Fund’s investments may represent industries or industry sectors that are interrelated or have common risks, making the Fund more susceptible to any economic, political, or regulatory developments or other risks affecting those industries and sectors.
The Fund’s ESG criteria exclude securities of issuers in certain industries, and the Adviser considers ESG factors in making investment decisions. Excluding specific issuers limits the universe of investments available to the Fund as compared with other funds that do not consider ESG criteria or ESG factors, which may mean forgoing some investment opportunities available to funds that do not consider ESG criteria or ESG factors. Accordingly, the Fund may underperform other funds that do not utilize an investment strategy that considers ESG criteria or ESG factors. However, the strategy of seeking to identify companies with sustainable business models is believed to provide potential return and risk benefits, including the selection of issuers with fewer ESG-related risks. Further, in implementing its ESG approach, the Adviser focuses on investment considerations that relate to potential return and risk, without sacrificing these considerations for non-economic purposes. In considering ESG factors, the Adviser may use third party ESG ratings information that it believes to be reliable, but such information may not be accurate or complete, or may be biased.
The Fund’s investments in foreign markets and countries with limited developing markets may subject the Fund to a greater degree of risk than investments in a developed market. These risks include disruptive political or economic conditions, military conflicts and sanctions, terrorism, sustained economic downturns, financial instability, less liquid trading markets, extreme price volatility, currency risks, reduction of government or central bank support, inadequate accounting standards, tariffs, tax disputes or other tax burdens, nationalization or expropriation of assets and the imposition of adverse governmental laws, arbitrary application of laws and regulations or lack of rule of law and investment and repatriation restrictions. Lack of information and less market regulation also may affect the value of these securities. Withholding and other non-U.S. taxes may
Pioneer Balanced ESG Fund | Annual Report | 7/31/22 75
decrease the Fund’s return. Non-U.S. issuers may be located in parts of the world that have historically been prone to natural disasters. Investing in depositary receipts is subject to many of the same risks as investing directly in non-U.S. issuers. Depositary receipts may involve higher expenses and may trade at a discount (or premium) to the underlying security.
The Fund may invest in REIT securities, the value of which can fall for a variety of reasons, such as declines in rental income, fluctuating interest rates, poor property management, environmental liabilities, uninsured damage, increased competition, or changes in real estate tax laws.
The Fund invests in below-investment-grade (high-yield) debt securities and preferred stocks. Some of these high-yield securities may be convertible into equity securities of the issuer. Debt securities rated below-investment-grade are commonly referred to as “junk bonds” and are considered speculative with respect to the issuer’s capacity to pay interest and repay principal. These securities involve greater risk of loss, are subject to greater price volatility, and may be less liquid and more difficult to value, especially during periods of economic uncertainty or change, than higher rated debt securities.
The Fund's investments, payment obligations and financing terms may be based on floating rates, such as LIBOR (London Interbank Offered Rate) or SOFR (Secured Overnight Financing Rate). ICE Benchmark Administration, the administrator of LIBOR, ceased publication of most LIBOR settings on a representative basis at the end of 2021 and is expected to cease publication of a majority of U.S. dollar LIBOR settings on a representative basis after June 30, 2023. In addition, global regulators have announced that, with limited exceptions, no new LIBOR-based contracts should be entered into after 2021. Actions by regulators have resulted in the establishment of alternative reference rates to LIBOR in most major currencies. Markets are developing in response to these new rates, but questions around liquidity in these rates and how to appropriately adjust these rates to eliminate any economic value transfer at the time of transition remain a significant concern. The effect of any changes to - or discontinuation of - LIBOR on the Fund will vary depending on, among other things, existing fallback provisions in individual contracts and whether, how, and when industry participants develop and widely adopt new reference rates and fallbacks for both legacy and new products and instruments. In March 2022, the U.S. federal government enacted legislation to establish a process for replacing LIBOR in existing contracts that do not already provide for the use of a clearly defined or practicable replacement benchmark rate as described in the legislation. Generally speaking, for contracts that do not contain a fallback provision as described in the legislation, a benchmark replacement recommended by the Federal Reserve Board will effectively automatically
76 Pioneer Balanced ESG Fund | Annual Report | 7/31/22
replace the USD LIBOR benchmark in the contract after June 30, 2023. The recommended benchmark replacement will be based on the SOFR published by the Federal Reserve Bank of New York, including any recommended spread adjustment and benchmark replacement conforming changes. The process of transitioning from LIBOR may involve, among other things, increased volatility or illiquidity in markets for instruments that rely on LIBOR. The transition may also result in a reduction in the value of certain LIBOR-based investments held by the Fund or reduce the effectiveness of related transactions such as hedges. Any such effects of the transition away from LIBOR, as well as other unforeseen effects, could result in losses for the Fund. Because the usefulness of LIBOR as a benchmark may deteriorate during the transition period, these effects could occur at any time.
Russia launched a large-scale invasion of Ukraine on February 24, 2022. In response to the military action by Russia, various countries, including the U.S., the United Kingdom, and European Union issued broad-ranging economic sanctions against Russia and Belarus and certain companies and individuals. Since then, Russian securities have lost all, or nearly all, their market value, and many other issuers, securities and markets have been adversely affected. The United States and other countries may impose sanctions on other countries, companies and individuals in light of Russia’s military invasion. The extent and duration of the military action or future escalation of such hostilities, the extent and impact of existing and future sanctions, market disruptions and volatility, and the result of any diplomatic negotiations cannot be predicted. These and any related events could have a significant impact on the value and liquidity of certain Fund investments, on Fund performance and the value of an investment in the Fund, particularly with respect to securities and commodities, such as oil, natural gas and food commodities, with respect to the issuer’s capacity to pay interest and repay principal, as well as other sectors with exposure to Russian issuers or issuers in other countries affected by the invasion, and are likely to have collateral impacts on market sectors globally.
With the increased use of technologies such as the Internet to conduct business, the Fund is susceptible to operational, information security and related risks. While the Fund’s Adviser has established business continuity plans in the event of, and risk management systems to prevent, limit or mitigate, such cyber-attacks, there are inherent limitations in such plans and systems, including the possibility that certain risks have not been identified. Furthermore, the Fund cannot control the cybersecurity plans and systems put in place by service providers to the Fund such as the Fund’s custodian and accounting agent, and the Fund’s transfer agent. In addition, many beneficial owners of Fund shares hold them through accounts at broker-dealers, retirement platforms and other financial market participants over which neither the Fund nor the Adviser exercises control.
Pioneer Balanced ESG Fund | Annual Report | 7/31/22 77
Each of these may in turn rely on service providers to them, which are also subject to the risk of cyber-attacks. Cybersecurity failures or breaches at the Adviser or the Fund’s service providers or intermediaries have the ability to cause disruptions and impact business operations, potentially resulting in financial losses, interference with the Fund’s ability to calculate its net asset value, impediments to trading, the inability of Fund shareowners to effect share purchases, redemptions or exchanges or receive distributions, loss of or unauthorized access to private shareowner information and violations of applicable privacy and other laws, regulatory fines, penalties, reputational damage, or additional compliance costs. Such costs and losses may not be covered under any insurance. In addition, maintaining vigilance against cyber-attacks may involve substantial costs over time, and system enhancements may themselves be subject to cyber-attacks.
The Fund’s prospectus contains unaudited information regarding the Fund’s principal risks. Please refer to that document when considering the Fund’s principal risks.
H. Restricted Securities
Restricted Securities are subject to legal or contractual restrictions on resale. Restricted securities generally are resold in transactions exempt from registration under the Securities Act of 1933. Private placement securities are generally considered to be restricted except for those securities traded between qualified institutional investors under the provisions of Rule 144A of the Securities Act of 1933.
Disposal of restricted investments may involve negotiations and expenses, and prompt sale at an acceptable price may be difficult to achieve. Restricted investments held by the Fund at July 31, 2022 are listed in the Schedule of Investments.
I. Insurance-Linked Securities (“ILS”)
The Fund invests in ILS. The Fund could lose a portion or all of the principal it has invested in an ILS, and the right to additional interest or dividend payments with respect to the security, upon the occurrence of one or more trigger events, as defined within the terms of an insurance-linked security. Trigger events, generally, are hurricanes, earthquakes, or other natural events of a specific size or magnitude that occur in a designated geographic region during a specified time period, and/or that involve losses or other metrics that exceed a specific amount. There is no way to accurately predict whether a trigger event will occur, and accordingly, ILS carry significant risk. The Fund is entitled to receive principal, and interest and/or dividend payments so long as no trigger event occurs of the description and magnitude specified by the instrument. In addition to the specified trigger
78 Pioneer Balanced ESG Fund | Annual Report | 7/31/22
events, ILS may expose the Fund to other risks, including but not limited to issuer (credit) default, adverse regulatory or jurisdictional interpretations and adverse tax consequences.
The Fund’s investments in ILS may include event-linked bonds. ILS also may include special purpose vehicles (“SPVs”) or similar instruments structured to comprise a portion of a reinsurer’s catastrophe-oriented business, known as quota share instruments (sometimes referred to as reinsurance sidecars), or to provide reinsurance relating to specific risks to insurance or reinsurance companies through a collateralized instrument, known as collateralized reinsurance. Structured reinsurance investments also may include industry loss warranties (“ILWs”). A traditional ILW takes the form of a bilateral reinsurance contract, but there are also products that take the form of derivatives, collateralized structures, or exchange-traded instruments.
Where the ILS are based on the performance of underlying reinsurance contracts, the Fund has limited transparency into the individual underlying contracts, and therefore must rely upon the risk assessment and sound underwriting practices of the issuer. Accordingly, it may be more difficult for the Adviser to fully evaluate the underlying risk profile of the Fund's structured reinsurance investments, and therefore the Fund's assets are placed at greater risk of loss than if the Adviser had more complete information. Structured reinsurance instruments generally will be considered illiquid securities by the Fund. These securities may be difficult to purchase, sell or unwind. Illiquid securities also may be difficult to value. If the Fund is forced to sell an illiquid asset, the Fund may be forced to sell at a loss.
Additionally, the Fund may gain exposure to ILS by investing in a closed-end interval fund, Pioneer ILS Interval Fund, an affiliate of the Adviser. The Fund’s investment in Pioneer ILS Interval Fund at July 31, 2022, is listed in the Schedule of Investments.
J. Repurchase Agreements
Repurchase agreements are arrangements under which the Fund purchases securities from a broker-dealer or a bank, called the counterparty, upon the agreement of the counterparty to repurchase the securities from the Fund at a later date, and at a specific price, which is typically higher than the purchase price paid by the Fund. The securities purchased serve as the Fund’s collateral for the obligation of the counterparty to repurchase the securities. The value of the collateral, including accrued interest, is required to be equal to or in excess of the repurchase price. The collateral for all repurchase agreements is held in safekeeping in the customer-only account of the Fund’s custodian or a sub-custodian of the Fund. The Adviser is responsible for determining that the value of the collateral remains at least
Pioneer Balanced ESG Fund | Annual Report | 7/31/22 79
equal to the repurchase price. In the event of a default by the counterparty, the Fund is entitled to sell the securities, but the Fund may not be able to sell them for the price at which they were purchased, thus causing a loss to the Fund. Additionally, if the counterparty becomes insolvent, there is some risk that the Fund will not have a right to the securities, or the immediate right to sell the securities.
As of and for the year ended July 31, 2022, the Fund had no open repurchase agreements.
K. Futures Contracts
The Fund may enter into futures transactions in order to attempt to hedge against changes in interest rates, securities prices and currency exchange rates or to seek to increase total return. Futures contracts are types of derivatives.
All futures contracts entered into by the Fund are traded on a futures exchange. Upon entering into a futures contract, the Fund is required to deposit with a broker an amount of cash or securities equal to the minimum "initial margin" requirements of the associated futures exchange. The amount of cash deposited with the broker as collateral at July 31, 2022, is recorded as "Futures collateral" on the Statement of Assets and Liabilities.
Subsequent payments for futures contracts ("variation margin") are paid or received by the Fund, depending on the daily fluctuation in the value of the contracts, and are recorded by the Fund as unrealized appreciation or depreciation. Cash received from or paid to the broker related to previous margin movement is held in a segregated account at the broker and is recorded as either "Due from broker for futures" or "Due to broker for futures" on the Statement of Assets and Liabilities. When the contract is closed, the Fund realizes a gain or loss equal to the difference between the opening and closing value of the contract as well as any fluctuation in foreign currency exchange rates where applicable. Futures contracts are subject to market risk, interest rate risk and currency exchange rate risk. Changes in value of the contracts may not directly correlate to the changes in value of the underlying securities. With futures, there is reduced counterparty credit risk to the Fund since futures are exchange-traded and the exchange's clearinghouse, as counterparty to all exchange-traded futures, guarantees the futures against default.
The average market value of futures contracts open during the year ended July 31, 2022, was $22,992,848. Open futures contracts outstanding at July 31, 2022, are listed in the Schedule of Investments.
80 Pioneer Balanced ESG Fund | Annual Report | 7/31/22
2. Management Agreement
The Adviser manages the Fund’s portfolio. Management fees payable under the Fund’s Investment Management Agreement with the Adviser are calculated daily and paid monthly at the annual rate of 0.50% of the Fund’s average daily net assets up to $1 billion and 0.45% of the Fund’s average daily net assets over $1 billion. For the year ended July 31, 2022, the effective management fee (excluding waivers and/or assumption of expenses) was equivalent to 0.50% of the Fund’s average daily net assets.
The Adviser has agreed to waive its management fee with respect to any portion of the Fund’s assets invested in Pioneer ILS Interval Fund, an affiliated fund managed by the Adviser. For the year ended July 31, 2022, the Adviser waived $16,447 in management fees with respect to the Fund, which is reflected on the Statement of Operations as a fee waiver.
The Adviser has contractually agreed to waive and/or reimburse ordinary operating expenses (ordinary operating expenses means all fund expenses other than taxes, brokerage, acquired fund fees and expenses and extraordinary expenses, such as litigation) of the Fund to the extent required to reduce Fund expenses to 0.99%, 0.65%, 1.30% and 0.65% of the average daily net assets attributable to Class A, Class K, Class R and Class Y shares, respectively. These expense limitations are in effect through December 1, 2022. There can be no assurance that the Adviser will extend the expense limitation agreement for a class of shares beyond the date referred to above. Fees waived and expenses reimbursed during the year ended July 31, 2022 are reflected on the Statement of Operations.
In addition, under the management and administration agreements, certain other services and costs, including accounting, regulatory reporting and insurance premiums, are paid by the Fund as administrative reimbursements. Included in “Due to affiliates” reflected on the Statement of Assets and Liabilities is $41,950 in management fees, administrative costs and certain other reimbursements payable to the Adviser at July 31, 2022.
3. Compensation of Trustees and Officers
The Fund pays an annual fee to its Trustees. The Adviser reimburses the Fund for fees paid to the Interested Trustees. The Fund does not pay any salary or other compensation to its officers. For the year ended July 31, 2022, the Fund paid $17,975 in Trustees’ compensation, which is reflected on the Statement of Operations as Trustees’ fees. At July 31, 2022, the Fund had a payable for Trustees’ fees on its Statement of Assets and Liabilities of $1,838.
Pioneer Balanced ESG Fund | Annual Report | 7/31/22 81
4. Transfer Agent
For the period from August 1, 2021 to November 21, 2021, DST Asset Manager Solutions, Inc. served as the transfer agent to the Fund at negotiated rates. Effective November 22, 2021, BNY Mellon Investment Servicing (US) Inc. serves as the transfer agent to the Fund at negotiated rates. Transfer agent fees and payables shown on the Statement of Operations and the Statement of Assets and Liabilities, respectively, include sub-transfer agent expenses incurred through the Fund’s omnibus relationship contracts.
In addition, the Fund reimbursed the transfer agent for out-of-pocket expenses incurred by the transfer agent related to shareowner communications activities such as proxy and statement mailings, and outgoing phone calls. For the year ended July 31, 2022, such out-of-pocket expenses by class of shares were as follows:
| | |
| Shareowner Communications: | |
| Class A | $51,464 |
| Class C | 5,949 |
| Class K | 184 |
| Class R | 728 |
| Class Y | 4,298 |
| Total | $62,623 |
5. Distribution and Service Plans
The Fund has adopted a distribution plan (the “Plan”) pursuant to Rule 12b-1 of the Investment Company Act of 1940 with respect to its Class A, Class C and Class R shares. Pursuant to the Plan, the Fund pays the Distributor 0.25% of the Fund's average daily net assets attributable to Class A shares as compensation for personal services and/or account maintenance services or distribution services with regard to Class A shares. Pursuant to the Plan, the Fund also pays the Distributor 1.00% of the average daily net assets attributable to Class C shares. The fee for Class C shares consists of a 0.25% service fee and a 0.75% distribution fee paid as compensation for personal services and/or account maintenance services or distribution services with regard to Class C shares. Pursuant to the Plan, the Fund further pays the Distributor 0.50% of the average daily net assets attributable to Class R shares for distribution services. Included in “Due to affiliates” reflected on the Statement of Assets and Liabilities is $15,574 in distribution fees payable to the Distributor at July 31, 2022.
The Fund also has adopted a separate service plan for Class R shares (the “Service Plan”). The Service Plan authorizes the Fund to pay securities dealers, plan administrators or other service organizations that agree to
82 Pioneer Balanced ESG Fund | Annual Report | 7/31/22
provide certain services to retirement plans or plan participants holding shares of the Fund a service fee of up to 0.25% of the Fund’s average daily net assets attributable to Class R shares held by such plans.
In addition, redemptions of Class A and Class C shares may be subject to a contingent deferred sales charge (“CDSC”). A CDSC of 1.00% may be imposed on redemptions of certain net asset value purchases of Class A shares within 12 months of purchase. Redemptions of Class C shares within 12 months of purchase are subject to a CDSC of 1.00% based on the lower of cost or market value of shares being redeemed. Shares purchased as part of an exchange remain subject to any CDSC that applied to the original purchase of those shares. There is no CDSC for Class K, Class R or Class Y shares. Proceeds from the CDSCs are paid to the Distributor. For the year ended July 31, 2022, CDSCs in the amount of $4,773 were paid to the Distributor.
6. Line of Credit Facility
The Fund, along with certain other funds in the Pioneer Family of Funds, participates in a committed, unsecured revolving line of credit (“credit facility”). Borrowings are used solely for temporary or emergency purposes. The Fund may borrow up to the lesser of the amount available under the credit facility or the limits set for borrowing by the Fund’s prospectus and the 1940 Act. Effective February 2, 2022, the Fund participates in a credit facility in the amount of $380 million. Prior to February 2, 2022, the Fund participated in a facility in the amount of $450 million. Under such credit facility, depending on the type of loan, interest on borrowings is payable at the London Interbank Offered Rate (“LIBOR”) plus a credit spread. The Fund also pays both an upfront fee and an annual commitment fee to participate in the credit facility. The upfront fee in the amount of 0.10% of the total credit facility and the commitment fee in the amount of 0.25% of the daily unused portion of each lender's commitment are allocated among participating funds based on an allocation schedule set forth in the credit agreement. For the year ended July 31, 2022, the Fund had no borrowings under the credit facility.
7. Transactions in Underlying Funds
An affiliated issuer is a company in which the Fund has a direct or indirect ownership of, control of, or voting power of 5 percent or more of the outstanding voting shares, or a company which is under common ownership or control. At July 31, 2022, the value of the Fund’s investment in affiliated issuers was $950,353, which represents 0.2% of the Fund’s net assets.
Pioneer Balanced ESG Fund | Annual Report | 7/31/22 83
Transactions in affiliated issuers by the Fund for the year ended July 31, 2022 were as follows:
| | | | | | | | | |
| | | | | | Dividends | | | |
| | | | | Net | Received | Change in | | |
| | | | | Realized | and | Net Unrealized | | |
| | | | | gain/(Loss) | Reinvested | (Depreciation) | | |
| | | | | from | from | from | Shares | |
| Name of | Value at | | | Investments | Investments | Investments | held at | Value at |
| the Affiliated | July 31, | | | in Affiliated | in Affiliated | in Affiliated | July 31, | July 31, |
| Issuer | 2021 | Purchases | Sales | Issuers | Issuers | Issuers | 2022 | 2022 |
| Pioneer ILS | | | | | | | | |
| Interval | | | | | | | | |
| Fund | $955,813 | $ — | $ — | $ — | $18,487 | $(23,947) | 112,601 | $950,353 |
| Total | $955,813 | $ — | $ — | $ — | $18,487 | $(23,947) | 112,601 | $950,353 |
Annual and semi-annual reports for the underlying Pioneer funds are available on the funds’ web page(s) at www.amundi.com/us.
8. Additional Disclosures about Derivative Instruments and Hedging Activities
The Fund’s use of derivatives may enhance or mitigate the Fund’s exposure to the following risks:
Interest rate risk relates to the fluctuations in the value of interest-bearing securities due to changes in the prevailing levels of market interest rates.
Credit risk relates to the ability of the issuer of a financial instrument to make further principal or interest payments on an obligation or commitment that it has to the Fund.
Foreign exchange rate risk relates to fluctuations in the value of an asset or liability due to changes in currency exchange rates.
Equity risk relates to the fluctuations in the value of financial instruments as a result of changes in market prices (other than those arising from interest rate risk or foreign exchange rate risk), whether caused by factors specific to an individual investment, its issuer, or all factors affecting all instruments traded in a market or market segment.
Commodity risk relates to the risk that the value of a commodity or commodity index will fluctuate based on increases or decreases in the commodities market and factors specific to a particular industry or commodity.
84 Pioneer Balanced ESG Fund | Annual Report | 7/31/22
The fair value of open derivative instruments (not considered to be hedging instruments for accounting disclosure purposes) by risk exposure at July 31, 2022, was as follows:
| | | | | | |
| | Interest | | Foreign | | |
| Statement of | Rate | Credit | Exchange | Equity | Commodity |
| Assets and Liabilities | Risk | Risk | Rate Risk | Risk | Risk |
| Assets | | | | | |
| Net unrealized | | | | | |
| appreciation on | | | | | |
| futures contracts | $ 198,799 | $ — | $ — | $ — | $ — |
| Total Value | $ 198,799 | $ — | $ — | $ — | $ — |
The effect of derivative instruments (not considered to be hedging instruments for accounting disclosure purposes) on the Statement of Operations by risk exposure at July 31, 2022 was as follows:
| | Interest | | Foreign | | |
| | Rate | Credit | Exchange | Equity | Commodity |
| Statement of Operations | Risk | Risk | Rate Risk | Risk | Risk |
| Net Realized Gain (Loss) on | | | | | |
| Futures contracts | $(1,892,177) | $ — | $ — | $ — | $ — |
| Total Value | $(1,892,177) | $ — | $ — | $ — | $ — |
| Change in Net Unrealized | | | | | |
| Appreciation | | | | | |
| (Depreciation) on | | | | | |
| Futures contracts | $ (97,271) | $ — | $ — | $ — | $ — |
| Total Value | $ (97,271) | $ — | $ — | $ — | $ — |
9. Changes in Custodian and Sub-Administrator, and Transfer Agent
Effective November 22, 2021, The Bank of New York Mellon Corporation ("BNY Mellon") serves as the Fund's Custodian and Sub-Administrator.
Effective November 22, 2021, BNY Mellon Investment Servicing (US) Inc. serves as the Fund's shareholder servicing and transfer agent.
Pioneer Balanced ESG Fund | Annual Report | 7/31/22 85
Report of Independent Registered Public Accounting Firm
To the Board of Trustees of Pioneer Series Trust IV and the Shareholders of Pioneer Balanced ESG Fund:
Opinion on the Financial Statements
We have audited the accompanying statement of assets and liabilities of Pioneer Balanced ESG Fund (the “Fund”) (one of the funds constituting Pioneer Series Trust IV (the “Trust”)), including the schedule of investments, as of July 31, 2022, and the related statement of operations for the year then ended, the statements of changes in net assets for each of the two years in the period then ended, the financial highlights for each of the five years in the period then ended and the related notes (collectively referred to as the “financial statements”). In our opinion, the financial statements present fairly, in all material respects, the financial position of Pioneer Balanced ESG Fund at July 31, 2022, the results of its operations for the year then ended, the changes in its net assets for each of the two years in the period then ended, and its financial highlights for each of the five years in the period then ended in conformity with U.S. generally accepted accounting principles.
Basis for Opinion
These financial statements are the responsibility of the Trust’s management. Our responsibility is to express an opinion on the Fund’s financial statements based on our audits. We are a public accounting firm registered with the Public Company Accounting Oversight Board (United States) (“PCAOB”) and are required to be independent with respect to the Trust in accordance with the U.S. federal securities laws and the applicable rules and regulations of the Securities and Exchange Commission and the PCAOB.
We conducted our audits in accordance with the standards of the PCAOB. Those standards require that we plan and perform the audit to obtain reasonable assurance about whether the financial statements are free of material misstatement, whether due to error or fraud. The Trust is not required to have, nor were we engaged to perform, an audit of the Trust’s internal control over financial reporting. As part of our audits, we are required to obtain an understanding of internal control over financial reporting, but not for the purpose of expressing an opinion on the effectiveness of the Trust’s internal control over financial reporting. Accordingly, we express no such opinion.
86 Pioneer Balanced ESG Fund | Annual Report | 7/31/22
Our audits included performing procedures to assess the risks of material misstatement of the financial statements, whether due to error or fraud, and performing procedures that respond to those risks. Such procedures included examining, on a test basis, evidence regarding the amounts and disclosures in the financial statements. Our procedures included confirmation of securities owned as of July 31, 2022, by correspondence with the custodian and brokers or by other appropriate auditing procedures where replies from brokers were not received. Our audits also included evaluating the accounting principles used and significant estimates made by management, as well as evaluating the overall presentation of the financial statements. We believe that our audits provide a reasonable basis for our opinion.

We have served as the auditor of one or more investment companies in the Pioneer family of funds since 2017.
Boston, Massachusetts
September 28, 2022
Pioneer Balanced ESG Fund | Annual Report | 7/31/22 87
Additional Information (unaudited)
For the year ended July 31, 2022, certain dividends paid by the Fund may be subject to a maximum tax rate of 20%, as provided for by the Jobs and Growth Tax Relief Reconciliation Act (the Act) of 2003. The Fund intends to designate up to the maximum amount of such dividends allowable under the Act, as taxed at a maximum rate of 20%. Complete information will be computed and reported in conjunction with your 2022 Form 1099-DIV.
The qualifying percentage of the Fund’s ordinary income dividends for the purpose of the corporate dividends received deduction was 98%.
Qualified interest income is exempt from nonresident alien (NRA) tax withholding. The percentage of the Fund’s ordinary income distributions derived from qualified interest income was 42%.
The Fund designated $29,890,226 as long-term capital gains distributions during the year ended July 31, 2022. Distributable long-term gains are based on net realized long-term gains determined on a tax basis and may differ from such amounts for financial reporting purposes.
88 Pioneer Balanced ESG Fund | Annual Report | 7/31/22
Statement Regarding Liquidity Risk Management Program
As required by law, the Fund has adopted and implemented a liquidity risk management program (the “Program”) that is designed to assess and manage liquidity risk. Liquidity risk is the risk that the Fund could not meet requests to redeem its shares without significant dilution of remaining investors’ interests in the Fund. The Fund’s Board of Trustees designated a liquidity risk management committee (the “Committee”) consisting of employees of Amundi Asset Management US, Inc. (the “Adviser”) to administer the Program.
The Committee provided the Board of Trustees with a report that addressed the operation of the Program and assessed its adequacy and effectiveness of implementation (the “Report”). The Report covered the period from January 1, 2021 through December 31, 2021 (the “Reporting Period”).
The Report confirmed that, throughout the Reporting Period, the Committee had monitored the Fund’s portfolio liquidity and liquidity risk on an ongoing basis, as described in the Program and in Board reporting throughout the Reporting Period.
The Report discussed the Committee’s annual review of the Program, which addressed, among other things, the following elements of the Program:
The Committee reviewed the Fund’s investment strategy and liquidity of portfolio investments during both normal and reasonably foreseeable stressed conditions. The Committee noted that the Fund’s investment strategy continues to be appropriate for an open-end fund, taking into account, among other things, whether and to what extent the Fund held less liquid and illiquid assets and the extent to which any such investments affected the Fund’s ability to meet redemption requests. In managing and reviewing the Fund’s liquidity risk, the Committee also considered the extent to which the Fund’s investment strategy involves a relatively concentrated portfolio or large positions in particular issuers, the extent to which the Fund uses borrowing for investment purposes, and the extent to which the Fund uses derivatives (including for hedging purposes). The Committee also reviewed the Fund’s short-term and long-term cash flow projections during both normal and reasonably foreseeable stressed conditions. In assessing the Fund’s cash flow projections, the Committee considered, among other factors, historical net redemption activity, redemption policies, ownership concentration, distribution channels, and the degree of certainty associated with the Fund’s short-term and long-term cash flow projections. The Committee also considered the Fund’s
Pioneer Balanced ESG Fund | Annual Report | 7/31/22 89
holdings of cash and cash equivalents, as well as borrowing arrangements and other funding sources, including, if applicable, the Fund’s participation in a credit facility, as components of the Fund’s ability to meet redemption requests. The Fund has adopted an in-kind redemption policy which may be utilized to meet larger redemption requests.
The Committee reviewed the Program’s liquidity classification methodology for categorizing the Fund’s investments into one of four liquidity buckets. In reviewing the Fund’s investments, the Committee considered, among other factors, whether trading varying portions of a position in a particular portfolio investment or asset class in sizes the Fund would reasonably anticipate trading, would be reasonably expected to significantly affect liquidity.
The Committee performed an analysis to determine whether the Fund is required to maintain a Highly Liquid Investment Minimum, and determined that no such minimum is required because the Fund primarily holds highly liquid investments.
The Report stated that the Committee concluded the Program operates adequately and effectively, in all material respects, to assess and manage the Fund’s liquidity risk throughout the Reporting Period.
90 Pioneer Balanced ESG Fund | Annual Report | 7/31/22
Trustees, Officers and Service Providers
Investment Adviser and Administrator
Amundi Asset Management US, Inc.
Custodian and Sub-Administrator
The Bank of New York Mellon Corporation
Independent Registered Public Accounting Firm
Ernst & Young LLP
Principal Underwriter
Amundi Distributor US, Inc.
Legal Counsel
Morgan, Lewis & Bockius LLP
Transfer Agent
BNY Mellon Investment Servicing (US) Inc.
Proxy Voting Policies and Procedures of the Fund are available without charge, upon request, by calling our toll free number (1-800-225-6292). Information regarding how the Fund voted proxies relating to portfolio securities during the most recent 12-month period ended June 30 is publicly available to shareowners at www.amundi.com/us. This information is also available on the Securities and Exchange Commission’s web site at www.sec.gov.
Trustees and Officers
The Fund's Trustees and officers are listed below, together with their principal occupations and other directorships they have held during at least the past five years. Trustees who are interested persons of the Fund within the meaning of the 1940 Act are referred to as Interested Trustees. Trustees who are not interested persons of the Fund are referred to as Independent Trustees. Each of the Trustees serves as a Trustee of each of the 49 U.S. registered investment portfolios for which Amundi US serves as investment adviser (the “Pioneer Funds”). The address for all Trustees and all officers of the Fund is 60 State Street, Boston, Massachusetts 02109.
The Statement of Additional Information of the Fund includes additional information about the Trustees and is available, without charge, upon request, by calling 1-800-225-6292.
Pioneer Balanced ESG Fund | Annual Report | 7/31/22 91
Independent Trustees
| | | | |
| Name, Age and Position | Term of Office and | Principal Occupation(s) During At Least | Other Directorships Held by Trustee |
| Held With the Fund | Length of Service | The Past Five Years | During At Least The Past Five Years |
| Thomas J. Perna (71) | Trustee since 2006. | Private investor (2004 – 2008 and 2013 – present); Chairman (2008 – 2013) | Director, Broadridge Financial |
| Chairman of the Board | Serves until a successor | and Chief Executive Officer (2008 – 2012), Quadriserv, Inc. (technology | Solutions, Inc. (investor |
| and Trustee | trustee is elected or | products for securities lending industry); and Senior Executive Vice President, | communications and securities |
| | earlier retirement | The Bank of New York (financial and securities services) (1986 – 2004) | processing provider for financial |
| | or removal. | | services industry) (2009 – present); |
| | | | Director, Quadriserv, Inc. (2005 – |
| | | | 2013); and Commissioner, New |
| | | | Jersey State Civil Service |
| | | | Commission (2011 – 2015) |
| John E. Baumgardner, | Trustee since 2019. | Of Counsel (2019 – present), Partner (1983-2018), Sullivan & | Chairman, The Lakeville Journal |
| Jr. (71)* | Serves until a successor | Cromwell LLP (law firm). | Company, LLC, (privately-held |
| Trustee | trustee is elected or | | community newspaper group) |
| | earlier retirement | | (2015-present) |
| | or removal. | | |
| Diane Durnin (65) | Trustee since 2019. | Managing Director - Head of Product Strategy and Development, BNY | None |
| Trustee | Serves until a successor | Mellon Investment Management (investment management firm) (2012-2018); | |
| | trustee is elected or | Vice Chairman – The Dreyfus Corporation (2005 – 2018): Executive Vice | |
| | earlier retirement | President Head of Product, BNY Mellon Investment Management | |
| | or removal. | (2007-2012); Executive Director- Product Strategy, Mellon Asset Management | |
| | | (2005-2007); Executive Vice President Head of Products, Marketing and | |
| | | Client Service, Dreyfus Corporation (investment management firm) | |
| | | (2000-2005); Senior Vice President Strategic Product and Business | |
| | | Development, Dreyfus Corporation (1994-2000) | |
| * | | Mr. Baumgardner is Of Counsel to Sullivan & Cromwell LLP, which acts as counsel to the Independent Trustees of each Pioneer Fund. |
92 Pioneer Balanced ESG Fund | Annual Report | 7/31/22
| Name, Age and Position | Term of Office and | Principal Occupation(s) During At Least | Other Directorships Held by Trustee |
| Held With the Fund | Length of Service | The Past Five Years | During At Least The Past Five Years |
| Benjamin M. Friedman (78) | Trustee since 2008. | William Joseph Maier Professor of Political Economy, Harvard University | Trustee, Mellon Institutional Funds |
| Trustee | Serves until a successor | (1972 – present) | Investment Trust and Mellon |
| | trustee is elected or | | Institutional Funds Master Portfolio |
| | earlier retirement | | (oversaw 17 portfolios in fund |
| | or removal. | | complex) (1989 - 2008) |
| Craig C. MacKay (59) | Trustee since 2021. | Partner, England & Company, LLC (advisory firm) (2012 – present); Group | Director, Equitable Holdings, Inc. |
| Trustee | Serves until a successor | Head – Leveraged Finance Distribution, Oppenheimer & Company | (financial services holding company) |
| | trustee is elected or | (investment bank) (2006 – 2012); Group Head – Private Finance & High Yield | (2022 – present); Board Member of |
| | earlier retirement | Capital Markets Origination, SunTrust Robinson Humphrey (investment | Carver Bancorp, Inc. (holding |
| | or removal. | bank) (2003 – 2006); and Founder and Chief Executive Officer, HNY | company) and Carver Federal |
| | | Associates, LLC (investment bank) (1996 – 2003) | Savings Bank, NA (2017 – present); |
| | | | Advisory Council Member, |
| | | | MasterShares ETF (2016 – 2017); |
| | | | Advisory Council Member, The Deal |
| | | | (financial market information |
| | | | publisher) (2015 – 2016); Board Co- |
| | | | Chairman and Chief Executive |
| | | | Officer, Danis Transportation |
| | | | Company (privately-owned |
| | | | commercial carrier) (2000 – 2003); |
| | | | Board Member and Chief Financial |
| | | | Officer, Customer Access Resources |
| | | | (privately-owned teleservices |
| | | | company) (1998 – 2000); Board |
| | | | Member, Federation of Protestant |
| | | | Welfare Agencies (human services |
| | | | agency) (1993 – present); and Board |
| | | | Treasurer, Harlem Dowling Westside |
| | | | Center (foster care agency) |
| | | | (1999 – 2018) |
Pioneer Balanced ESG Fund | Annual Report | 7/31/22 93
Independent Trustees (continued)
| | | | |
| Name, Age and Position | Term of Office and | Principal Occupation(s) During At Least | Other Directorships Held by Trustee |
| Held With the Fund | Length of Service | The Past Five Years | During At Least The Past Five Years |
| Lorraine H. Monchak (66) | Trustee since 2017. | Chief Investment Officer, 1199 SEIU Funds (healthcare workers union | None |
| Trustee | (Advisory Trustee from | pension funds) (2001 – present); Vice President – International Investments | |
| | 2014 - 2017). Serves until | Group, American International Group, Inc. (insurance company) | |
| | a successor trustee is | (1993 – 2001); Vice President – Corporate Finance and Treasury Group, | |
| | elected or earlier | Citibank, N.A. (1980 – 1986 and 1990 – 1993); Vice President – Asset/Liability | |
| | retirement or removal. | Management Group, Federal Farm Funding Corporation (government- | |
| | | sponsored issuer of debt securities) (1988 – 1990); Mortgage Strategies | |
| | | Group, Shearson Lehman Hutton, Inc. (investment bank) (1987 – 1988); | |
| | | Mortgage Strategies Group, Drexel Burnham Lambert, Ltd. (investment bank) | |
| | | (1986 – 1987) | |
| Marguerite A. Piret (74) | Trustee since 2005. | Chief Financial Officer, American Ag Energy, Inc. (controlled environment | Director of New America High |
| Trustee | Serves until a successor | and agriculture company) (2016 – present); President and Chief Executive | Income Fund, Inc. (closed-end |
| | trustee is elected or | Officer, Metric Financial Inc. (formerly known as Newbury Piret Company) | investment company) |
| | earlier retirement | (investment banking firm) (1981 – 2019) | (2004 – present); and Member, |
| | or removal. | | Board of Governors, Investment |
| | | | Company Institute (2000 – 2006) |
| Fred J. Ricciardi (75) | Trustee since 2014. | Private investor (2020 – present); Consultant (investment company services) | None |
| Trustee | Serves until a successor | (2012 – 2020); Executive Vice President, BNY Mellon (financial and investment | |
| | trustee is elected or | company services) (1969 – 2012); Director, BNY International Financing Corp. | |
| | earlier retirement | (financial services) (2002 – 2012); Director, Mellon Overseas Investment Corp. | |
| | or removal. | (financial services) (2009 – 2012); Director, Financial Models (technology) | |
| | | (2005-2007); Director, BNY Hamilton Funds, Ireland (offshore investment | |
| | | companies) (2004-2007); Chairman/Director, AIB/BNY Securities Services, Ltd., |
| | | Ireland (financial services) (1999-2006); Chairman, BNY Alternative Investment | |
| | | Services, Inc. (financial services) (2005-2007) | |
94 Pioneer Balanced ESG Fund | Annual Report | 7/31/22
Interested Trustees
| | | | |
| Name, Age and Position | Term of Office and | Principal Occupation(s) During At Least | Other Directorships Held by Trustee |
| Held With the Fund | Length of Service | The Past Five Years | During At Least The Past Five Years |
| Lisa M. Jones (60)** | Trustee since 2017. | Director, CEO and President of Amundi US, Inc. (investment management | None |
| Trustee, President and Chief | Serves until a successor | firm) (since September 2014); Director, CEO and President of Amundi Asset | |
| Executive Officer | trustee is elected or | Management US, Inc. (since September 2014); Director, CEO and President | |
| | earlier retirement | of Amundi Distributor US, Inc. (since September 2014); Director, CEO and | |
| | or removal | President of Amundi Asset Management US, Inc. (since September 2014); | |
| | | Chair, Amundi US, Inc., Amundi Distributor US, Inc. and Amundi Asset | |
| | | Management US, Inc. (September 2014 – 2018); Managing Director, Morgan | |
| | | Stanley Investment Management (investment management firm) (2010 – 2013); |
| | | Director of Institutional Business, CEO of International, Eaton Vance | |
| | | Management (investment management firm) (2005 – 2010); Director of Amundi |
| | | Holdings US, Inc. (since 2017) | |
| Kenneth J. Taubes (64)** | Trustee since 2014. | Director and Executive Vice President (since 2008) and Chief Investment | None |
| Trustee | Serves until a successor | Officer, U.S. (since 2010) of Amundi US, Inc. (investment management firm); | |
| | trustee is elected or | Director and Executive Vice President and Chief Investment Officer, U.S. of | |
| | earlier retirement | Amundi US (since 2008); Executive Vice President and Chief Investment | |
| | or removal | Officer, U.S. of Amundi Asset Management US, Inc. (since 2009); Portfolio | |
| | | Manager of Amundi US (since 1999); Director of Amundi Holdings US, Inc. | |
| | | (since 2017) | |
| ** | | Ms. Jones and Mr. Taubes are Interested Trustees because they are officers or directors of the Fund’s investment adviser and certain of its affiliates. |
Pioneer Balanced ESG Fund | Annual Report | 7/31/22 95
Fund Officers
| | | | |
| Name, Age and Position | Term of Office and | Principal Occupation(s) During At Least | Other Directorships Held by Trustee |
| Held With the Fund | Length of Service | The Past Five Years | During At Least The Past Five Years |
| Christopher J. Kelley (57) | Since 2005. Serves at the | Vice President and Associate General Counsel of Amundi US since | None |
| Secretary and Chief | discretion of the Board | January 2008; Secretary and Chief Legal Officer of all of the Pioneer Funds | |
| Legal Officer | | since June 2010; Assistant Secretary of all of the Pioneer Funds from | |
| | | September 2003 to May 2010; Vice President and Senior Counsel of | |
| | | Amundi US from July 2002 to December 2007 | |
| Thomas Reyes (59) | Since 2010. Serves at the | Assistant General Counsel of Amundi US since May 2013 and Assistant | None |
| Assistant Secretary | discretion of the Board | Secretary of all the Pioneer Funds since June 2010; Counsel of Amundi US | |
| | | from June 2007 to May 2013 | |
| Anthony J. Koenig, Jr. (58) | Since 2021. Serves at the | Managing Director, Chief Operations Officer and Fund Treasurer of | None |
| Treasurer and | discretion of the Board | Amundi US since May 2021; Treasurer of all of the Pioneer Funds since | |
| Chief Financial and | | May 2021; Assistant Treasurer of all of the Pioneer Funds from January 2021 | |
| Accounting Officer | | to May 2021; and Chief of Staff, US Investment Management of Amundi US | |
| | | from May 2008 to January 2021 | |
| Luis I. Presutti (57) | Since 2005. Serves at the | Director – Fund Treasury of Amundi US since 1999; and Assistant Treasurer | None |
| Assistant Treasurer | discretion of the Board | of all of the Pioneer Funds since 1999 | |
| Gary Sullivan (64) | Since 2005. Serves at the | Senior Manager – Fund Treasury of Amundi US since 2012; and Assistant | None |
| Assistant Treasurer | discretion of the Board | Treasurer of all of the Pioneer Funds since 2002 | |
| Antonio Furtado (40) | Since 2020. Serves at the | Fund Oversight Manager – Fund Treasury of Amundi US since 2020; | None |
| Assistant Treasurer | discretion of the Board | Assistant Treasurer of all of the Pioneer Funds since 2020; and Senior Fund | |
| | | Treasury Analyst from 2012 - 2020 | |
96 Pioneer Balanced ESG Fund | Annual Report | 7/31/22
| Name, Age and Position | Term of Office and | Principal Occupation(s) During At Least | Other Directorships Held by Trustee |
| Held With the Fund | Length of Service | The Past Five Years | During At Least The Past Five Years |
| Michael Melnick (51) | Since 2021. Serves at the | Vice President - Deputy Fund Treasurer of Amundi US since May 2021; | None |
| Assistant Treasurer | discretion of the Board | Assistant Treasurer of all of the Pioneer Funds since July 2021; Director of | |
| | | Regulatory Reporting of Amundi US from 2001 – 2021; and Director of Tax | |
| | | of Amundi US from 2000 - 2001 | |
| John Malone (51) | Since 2018. Serves at the | Managing Director, Chief Compliance Officer of Amundi US Asset | None |
| Chief Compliance Officer | discretion of the Board | Management; Amundi Asset Management US, Inc.; and the Pioneer Funds | |
| | | since September 2018; Chief Compliance Officer of Amundi Distributor US, Inc. | |
| | | since January 2014. | |
| Brandon Austin (50) | Since March 2022. Serves | Director, Financial Security – Amundi Asset Management; Anti-Money | None |
| Anti-Money | at the discretion of | Laundering Officer of all the Pioneer Funds since March 2022 Director of | |
| Laundering Officer | the Board | Financial Security of Amundi US since July 2021; Vice President, Head of | |
| | | BSA, AML and OFAC, Deputy Compliance Manager, Crédit Agricole Indosuez | |
| | | Wealth Management (investment management firm) (2013 – 2021) | |
Pioneer Balanced ESG Fund | Annual Report | 7/31/22 97
This page was intentionally left blank.
98 Pioneer Balanced ESG Fund | Annual Report | 7/31/22
This page was intentionally left blank.
Pioneer Balanced ESG Fund | Annual Report | 7/31/22 99
This page was intentionally left blank.
100 Pioneer Balanced ESG Fund | Annual Report | 7/31/22
How to Contact Amundi
We are pleased to offer a variety of convenient ways for you to contact us for assistance or information.
| | |
| Call us for: | |
| Account Information, including existing accounts, | |
| new accounts, prospectuses, applications | |
| and service forms | 1-800-225-6292 |
| FactFoneSM for automated fund yields, prices, | |
| account information and transactions | 1-800-225-4321 |
| Retirement plans information | 1-800-622-0176 |
Write to us:
Amundi
P.O. Box 9897
Providence, R.I. 02940-8097
| | |
| Our toll-free fax | 1-800-225-4240 |
| Our internet e-mail address | us.askamundi@amundi.com/us |
| (for general questions about Amundi only) | |
| |
| Visit our web site: www.amundi.com/us. | |
This report must be preceded or accompanied by a prospectus.
The Fund files a complete schedule of portfolio holdings with the Securities and Exchange Commission for the first and third quarters of each fiscal year as an exhibit to its reports on Form N-PORT. Shareholders may view the filed Form N-PORT by visiting the Commission’s web site at https://www.sec.gov.

Amundi Asset Management US, Inc.
60 State Street
Boston, MA 02109
www.amundi.com/us
Securities offered through Amundi Distributor US, Inc.,
60 State Street, Boston, MA 02109
Underwriter of Pioneer Mutual Funds, Member SIPC
© 2022 Amundi Asset Management US, Inc. 19418-16-0922
Pioneer Securitized Income Fund
Annual Report | July 31, 2022

visit us: www.amundi.com/us
Pioneer Securitized Income Fund | Annual Report | 7/31/22 1
President’s Letter
Dear Shareholders,
Since early 2020, investors have faced unprecedented challenges. The onset of the COVID-19 pandemic in March 2020 was the most significant development, as the pandemic affected the everyday lives of millions and led to significant changes in government and central-bank policies. Central banks, including the US Federal Reserve (Fed), enacted very accommodative monetary policies in the form of extremely low interest rates and quantitative easing (bond purchase) programs, while governments around the globe, including the US government, passed large spending packages in 2020 and in early 2021, in order help citizens navigate the challenging environment caused by the pandemic. The widespread distribution of COVID-19 vaccines approved for emergency use in late 2020 led to a general decline in virus-related hospitalizations in the US and had a positive effect on overall market sentiment during most of the 2021 calendar year. Eventually, however, the easier monetary and fiscal policies enacted during the height of the pandemic as well as ongoing supply chain issues, which were, at least in part, an outgrowth of certain virus-containment measures, were among the numerous factors that combined to drive inflation levels higher in the latter part of 2021.
With rising inflation already a concern as 2021 drew to a close, investor sentiment sharply deteriorated in the first quarter of 2022, with the negativity driven largely by Russia’s invasion of Ukraine in February as well as signs that inflation was more entrenched than transitory in many regions of the world. The war and the resulting economic sanctions placed on Russia by the US and European governments also contributed to a spike in energy prices, given that Russia is a major exporter of natural gas as well as other resources, particularly to Europe.
The persistently high inflation readouts led key central banks, including the Fed, to signal a tightening of monetary policy. The Fed had already announced that it would taper its bond purchases and eventually end its pandemic-era quantitative easing program by the spring of 2022; and, with US inflation hitting 40-year highs, the Fed began aggressively raising its benchmark federal funds rate target range, while indicating that more rate hikes were likely. The magnitude of the rate increases heightened investors’ concerns about the ability of the Fed and other central banks to cool inflation without triggering a recession.
Due to what has been, so far, a tumultuous year for investors, the performance of most asset classes, especially riskier assets such as equities and corporate bonds, has turned negative, as market participants have tried to ascertain the direction and progression of Fed policy, economic growth, the war in Ukraine, and other factors. In the US, the upcoming mid-term
2 Pioneer Securitized Income Fund | Annual Report | 7/31/22
elections in November of this year are another important benchmark that investors are closely monitoring, as political uncertainty has often contributed to increased market volatility.
While the economic news, on balance, has been negative in recent months, one positive development has been the slow, steady transition of COVID-19 from an acute public health crisis and pandemic to a more manageable and perhaps endemic disease, driven by vaccine distributions as well as the development of effective therapeutics to treat the virus.
Since 1928, Amundi US’s investment process has been built on a foundation of fundamental research and active management, principles which have guided our investment decisions for more than 90 years. We believe active management – that is, making active investment decisions – can help mitigate the risks during periods of market volatility.
At Amundi US, active management begins with our own fundamental, bottom-up research process. Our team of dedicated research analysts and portfolio managers analyzes each security under consideration, communicating frequently with the management teams of the companies and other entities issuing the securities, and working together to identify those securities that best meet our investment criteria for our family of funds. Our risk management approach begins with each security under consideration, as we strive to develop a deep understanding of the potential opportunity, while considering any potential risk factors.
Today, as investors, we have many options. It is our view that active management can serve shareholders well, not only when markets are thriving, but also during periods of market stress. As you consider your long-term investment goals, we encourage you to work with your financial professional to develop an investment plan that paves the way for you to pursue both your short-term and long-term goals.
We greatly appreciate the trust you have placed in us and look forward to continuing to serve you in the future.

Lisa M. Jones
Head of the Americas,
President and CEO of US Amundi Asset Management US, Inc.
September 2022
Any information in this shareowner report regarding market or economic trends or the factors influencing the Fund’s historical or future performance are statements of opinion as of the date of this report. Past performance is no guarantee of future results.
Pioneer Securitized Income Fund | Annual Report | 7/31/22 3
Portfolio Management Discussion | 7/31/22
In the following interview, portfolio managers Noah Funderburk and Nicolas Pauwels discuss the market environment and the factors that affected the performance of Pioneer Securitized Income Fund during the 12-month period ended July 31, 2022. Mr. Funderburk, CFA, a Senior Vice President, Director of Securitized Credit, and a portfolio manager at Amundi Asset Management US, Inc. (Amundi US), and Mr. Pauwels, CFA, a Vice President and portfolio manager at Amundi US, are responsible for the day-to-day management of the Fund.
| Q | | How did the Fund perform during the 12-month period ended July 31, 2022? |
| A | | Pioneer Securitized Income Fund’s Class A shares returned -1.03% at net asset value during the 12-month period ended July 31, 2022, while the Fund’s benchmark, the Bloomberg US Securitized MBS/ABS/CMBS Index (the Bloomberg Index), returned -6.76%. During the same period, the average return of the 334 mutual funds in Morningstar’s Multisector Bond Fund Category was -5.51%. |
| Q | | What factors drove the performance of securitized assets during the 12-month period ended July 31, 2022? |
| A | | All major segments of the fixed-income market lost ground over the 12-month period, as steadily increasing inflation prompted the US Federal Reserve (Fed) to end its pandemic-era quantitative easing policy and begin raising interest rates. The Fed hiked the target range for its benchmark federal funds rate by 25 basis points (bps) at its March 2022 meeting, then followed up with increases to the federal funds target range of 50 bps, 75 bps, and 75 bps, respectively, in May, June, and July. (A basis point is equal to 1/100th of a percentage point.) Those factors contributed to an across-the-board rise in government bond yields during the period. In addition, futures markets indicated that several more Fed rate hikes were likely to occur before the end of 2022. The 10-year US Treasury note, which stood at 1.24% coming into the period in August 2021, rose to a peak of 3.49% in mid-June 2022, before retreating to 2.67% by the end of July. (Bond prices and yield typically have moved in opposite directions.) |
In that environment, mortgage-backed securities (MBS), commercial mortgage-backed securities (CMBS), and asset-backed securities (ABS) all posted losses for the 12-month period, returning -6.69%, -8.08% and -4.00%, respectively. MBS are typically the primary driver of performance for the Fund’s benchmark, the Bloomberg Index, as MBS usually have represented more than 90% of the benchmark’s components. The
4 Pioneer Securitized Income Fund | Annual Report | 7/31/22
performance of MBS struggled during the period, due in part to the Fed’s ending its quantitative easing program, which reduced a source of demand for the asset class. In addition, concerns that the Fed would eventually begin to sell its mortgage holdings drove negative market sentiment for MBS. On the other end of the spectrum, ABS outperformed other securitized asset classes during the period, thanks to the resilience of the US consumer and the shorter average maturities of securities in the ABS category. Results in the CMBS space were mixed, with fixed-rate (and thus more rate-sensitive) securities lagging, while floating-rate issues outperformed.
| Q | | What elements of the Fund’s positioning played the largest role in its benchmark-relative results during the 12-month period ended July 31, 2022? |
| A | | During the period, the Fund’s benchmark-relative returns benefited from our approach of investing the portfolio in what we saw as the most compelling risk/return opportunities within the securitized asset categories, rather than attempting to mirror the make-up of the benchmark Bloomberg Index. The investment strategy worked well over the past 12 months, as the Fund outperformed the Bloomberg Index, despite generating a negative total return in a difficult market environment. Wide dispersion in returns across the securitized asset categories was a key factor in the Fund’s benchmark-relative outperformance. |
Most notably, the Fund’s lower duration versus the Bloomberg Index during a period that saw rising yields aided benchmark-relative performance. (Duration is a measure of the sensitivity of the price, or the value of principal, of a fixed-income investment to a change in interest rates, expressed as a number of years.) We achieved this, in part, by having a large portfolio weighting (nearly 50% of invested assets) in floating-rate issues. Our preference for holding higher-yielding, lower-duration securities in the portfolio also proved helpful in offsetting the effects of the rising-rate environment that characterized most of the 12-month period.
The Fund’s hedge positions also aided relative results during the 12-month period. We maintained short positions in US Treasury futures for the majority of the period, with various weightings across the two-, five- and 10-year Treasury rates. Since those holdings typically rise in value as bond prices across the market decline, the positions made a sizable positive contribution to the Fund’s benchmark-relative returns over the 12-month period. We eliminated the short Treasury futures positions in May, representing the first time since the Fund’s inception that the portfolio has not had hedges against at least a portion of its investments. With rates having risen so much over the past year, we no longer saw a meaningful benefit from holding the futures positions.
Pioneer Securitized Income Fund | Annual Report | 7/31/22 5
Positioning in non-agency MBS, where we emphasized investments in seasoned (older) issues that have typically been less volatile than the market as a whole, was another positive contributor to the Fund’s benchmark-relative performance during the 12-month period. Holdings in ABS backed by auto loans further aided the Fund’s relative returns. Although the auto category was sensitive to concerns about the economy, the Fund saw positive relative performance through our focus on investments in securities designed to de-risk as they age. Finally, the portfolio’s allocation to CMBS was a positive contributor to the Fund’s benchmark-relative results. Within CMBS, we avoided investing the portfolio in what we viewed as the most vulnerable areas of the category, instead focusing on securities backed by a single asset from a single borrower (“SASB”), where we could rigorously analyze the resiliency of each asset’s cash flow.
During a period featuring positive relative performance for the Fund, few aspects of the portfolio’s positioning stood out as significant detractors. However, the portfolio’s positions in aircraft ABS detracted from relative returns, as spreads in the subsector widened on worries related to the Russia/Ukraine crisis. (Credit spreads are commonly defined as the differences in yield between Treasuries and other types of fixed-income securities with similar maturities.) Holdings of single-family rental securities, which struggled during the period due to rising rates, also detracted modestly from the Fund’s benchmark-relative performance.
| Q | | Did the Fund have any exposure to derivative investments during the 12-month period ended July 31, 2022? If so, did the use of derivatives have an effect on performance? |
| A | | Yes, as noted earlier, we invested the Fund in US Treasury futures in an attempt to manage the portfolio’s duration. The use of Treasury futures aided the Fund’s relative returns for the 12-month period, as duration positioning benefited performance. |
| Q | | How would you characterize the Fund’s distributions* to shareholders during the 12-month period ended July 31, 2022? |
| A | | The Fund’s monthly distribution rate increased during a 12-month period featuring steadily rising yields. |
* Distributions are not guaranteed.
6 Pioneer Securitized Income Fund | Annual Report | 7/31/22
| Q | | What is your current view on each segment of the securitized market in which the Fund invests, and how have you positioned the portfolio heading into the Fund’s new fiscal year? |
| A | | Questions about future Fed policy and the likelihood of recession have been the primary focus of investors in recent months. While we have been keeping a careful eye on these developments, due to their potential effects on consumers and the housing market, we have continued to emphasize individual security selection as the main driver of Fund performance. We believe securitized assets may offer us the opportunity to add value to the Fund through intensive research, and may provide the latitude to offset interest-rate risks through portfolio holdings of floating-rate securities. We would also note that, although risks are higher now than they were a year ago, higher yields have been offering investors greater compensation for taking on those risks. For our part, we believe the most compelling ideas may exist among securities where we have seen a divergence between market prices and underlying fundamentals. In addition, we seek to invest the Fund in issues that we believe have attractive collateral and structures, while avoiding investments with above-average risk - a particularly important consideration when investing in CMBS. We believe this investment approach, rather than one that strives to match the make-up of the benchmark Bloomberg Index, is the best way to pursue longer-term performance. |
At the end of July 2022, the Fund had weightings of 46%, 36%, and 14% in MBS, ABS, and CMBS, respectively, with 4% allocated to collateralized loan obligations. In our view, we have been seeing better investment opportunities in MBS compared with the past year, as we believe current market pricing already reflects the risk of Fed policy changes. In addition, the supply pressures that have posed an economic headwind for the past several months finally appear to be declining. Although there has been less mortgage origination in 2022 as rates have risen, it has taken time for that trend to feed through to the market in terms of new issuance. We believe that could indicate a more favorable supply-and-demand balance in that segment of the market.
Please refer to the Schedule of Investments on pages 15–20 for a full listing of Fund securities.
All investments are subject to risk, including the possible loss of principal. In the past several years, financial markets have experienced increased volatility and heightened uncertainty. The market prices of securities may go up or down, sometimes rapidly or unpredictably, due to general market conditions, such as real or perceived adverse economic, political, or regulatory conditions, recessions, inflation, changes in interest or currency rates, lack of liquidity in the bond markets, the spread of infectious illness or other public health issues,
Pioneer Securitized Income Fund | Annual Report | 7/31/22 7
armed conflict including Russia's military invasion of Ukraine, sanctions against Russia, other nations or individuals or companies and possible countermeasures, or adverse investor sentiment. These conditions may continue, recur, worsen or spread.
The Fund invests primarily in securitized asset instruments, including mortgage-backed securities, asset-backed securities and other securities.
A substantial portion of the Fund’s assets ordinarily will consist of high yield debt securities that involve substantial risk of loss.
Investments in the Fund are subject to possible loss due to the financial failure of issuers of underlying securities and their inability to meet their debt obligations.
Investments in high yield or lower-rated securities are subject to greater-than-average price volatility, illiquidity and possibility of default. The market price of securities may fluctuate when interest rates change. When interest rates rise, the prices of fixed-income securities in the Fund will generally fall. Conversely, when interest rates fall, the prices of fixed-income securities in the Fund will generally rise.
The Fund’s investments, payment obligations and financing terms may be based on floating rates, such as LIBOR (London Interbank Offered Rate). Plans are underway to phase out the use of LIBOR. There remains uncertainty regarding the nature of any replacement rate and the impact of the transition from LIBOR on the Fund, issuers of instruments in which the Fund invests, and financial markets generally.
The value of mortgage-related and asset backed securities will be influenced by factors affecting the real estate market and the assets underlying those securities. These securities are also subject to prepayment and extension risks and risk of default.
The Fund may employ leverage, which increases the volatility of investment returns and subjects the Fund to magnified losses if an underlying investment declines in value. Certain securities and derivatives held by the Fund may be impossible or difficult to purchase, sell or unwind. Such securities may also be difficult to value.
The use of interest rate futures and options and other derivatives can increase fund losses and reduce opportunities for gain. The Fund may invest in credit default swaps, inverse floating rate obligations, and other derivative instruments. Derivatives may have a leveraging effect on the Fund.
The Fund is non-diversified, which means that it can invest a large percentage of its assets in the securities of any one or more issuers. Being non-diversified may magnify the Fund’s losses from adverse events affecting a particular issuer. Please see a prospectus for a complete discussion of the Fund’s risks.
Before investing, consider the product’s investment objectives, risks, charges and expenses. Contact your financial professional or Amundi Asset Management US, Inc., for a prospectus or summary prospectus containing this information. Read it carefully.
Any information in this shareowner report regarding market or economic trends or the factors influencing the Fund’s historical or future performance are statements of opinion as of the date of this report. Past performance is no guarantee of future results.
8 Pioneer Securitized Income Fund | Annual Report | 7/31/22
Portfolio Summary | 7/31/22
Sector Distribution
(As a percentage of total investments)*

| | | |
| 10 Largest Holdings | |
| (As a percentage of total investments)* | |
| 1. | Fannie Mae, 4.50%, 8/1/52 (TBA) | 2.71% |
| 2. | Santander Bank Auto Credit-Linked Notes, Series 2022-A, Class E, | |
| | 12.662%, 5/15/32 (144A) | 2.46 |
| 3. | Santander Bank N.A. - SBCLN, Series 2021-1A, Class E, 6.171%, 12/15/31 (144A) | 2.43 |
| 4. | Conn's Receivables Funding LLC, Series 2021-A, Class B, 2.87%, 5/15/26 (144A) | 2.40 |
| 5. | Fannie Mae, 4.00%, 8/1/52 (TBA) | 2.29 |
| 6. | Foursight Capital Automobile Receivables Trust, Series 2020-1, Class F, 4.62%, | |
| | 6/15/27 (144A) | 2.25 |
| 7. | Continental Credit Card ABS LLC, Series 2019-1A, Class C, 6.16%, 8/15/26 (144A) | 2.23 |
| 8. | JPMorgan Chase Bank N.A. - CACLN, Series 2021-2, Class F, 4.393%, | |
| | 12/26/28 (144A) | 2.16 |
| 9. | Cascade Funding Mortgage Trust, Series 2018-RM2, Class D, 4.00%, | |
| | 10/25/68 (144A) | 2.12 |
| 10. | STACR Trust, Series 2018-HRP2, Class B2, 12.759% (1 Month USD LIBOR + | |
| | 1,050 bps), 2/25/47 (144A) | 2.08 |
| * | | Excludes short term investments and all derivative contracts except for options purchased. The Fund is actively managed, and current holdings may be different. The holdings listed should not be considered recommendations to buy or sell any securities. |
Pioneer Securitized Income Fund | Annual Report | 7/31/22 9
Prices and Distributions | 7/31/22
Net Asset Value per Share
| Class | 7/31/22 | 7/31/21* |
| A | $9.43 | $10.11 |
| Y | $9.44 | $10.11 |
Distributions per Share: 8/1/21 - 7/31/22
| | | | |
| | Net | | |
| | Investment | Short-Term | Long-Term |
| Class | Income | Capital Gains | Capital Gains |
| A | $0.4500 | $0.0956 | $0.0377 |
| Y | $0.4758 | $0.0956 | $0.0377 |
Index Definitions
Bloomberg US Securitized MBS/ABS/CMBS Index tracks agency mortgage backed pass-through securities (both fixed-rate and hybrid ARM) guaranteed by Ginnie Mae (GNMA), Fannie Mae (FNMA), and Freddie Mac (FHLMC); investment-grade debt asset-backed securities; and investment-grade commercial mortgage backed securities. The index is constructed by grouping individual pools into aggregates or generics based on program, coupon, and vintage. Index returns are calculated monthly, assume reinvestment of dividends and, unlike Fund returns, do not reflect any fees, expenses or sales charges. It is not possible to invest directly in an index.
The indices defined here pertains to the “Value of $10,000 Investment” and “Value of $1 Million Investment” charts on pages 11–12.
| * | | Class A commenced operations on July 2, 2021. |
10 Pioneer Securitized Income Fund | Annual Report | 7/31/22
| Performance Update | 7/31/22 | Class A Shares |
Investment Returns
The mountain chart on the right shows the change in market value, plus reinvested dividends and distributions, of a $10,000 investment made in Class A shares of Pioneer Securitized Income Fund during the periods shown, compared to that of the Bloomberg US Securitized MBS/ABS/CMBS Index.*
| Average Annual Total Returns | |
| (As of July 31, 2022) | | |
| | | | Bloomberg |
| | Net | Public | US |
| | Asset | Offering | Securitized |
| | Value | Price | MBS/ABS/ |
| Period | (NAV) | (POP) | CMBS Index |
| Life of Class | | | |
| (7/2/21) | -0.70% | -4.87% | -5.68% |
| 1 Year | -1.03 | -5.52 | -6.76 |
| Expense Ratio | |
| (Per prospectus dated December 1, 2021) |
| Gross | Net |
| 2.28% | 0.90% |
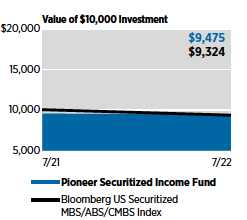
* Performance of Class A shares shown in the graph above is from the inception of Class A shares on 7/2/21 through 7/31/22. Index information shown in the graph above is from 7/31/21 through 7/31/22.
Call 1-800-225-6292 or visit www.amundi.com/us for the most recent month-end performance results. Current performance may be lower or higher than the performance data quoted.
Performance data shown represents past performance. Past performance is no guarantee of future results. Investment return and market price will fluctuate, and shares, when redeemed, may be worth more or less than their original cost.
NAV results represent the percent change in net asset value per share. POP returns reflect deduction of maximum 4.50% sales charge. NAV returns would have been lower had sales charges been reflected. All results are historical and assume the reinvestment of dividends and capital gains. Other share classes are available for which performance and expenses will differ.
Performance results reflect any applicable expense waivers in effect during the periods shown. Without such waivers Fund performance would be lower. Waivers may not be in effect for all funds. Certain fee waivers are contractual through a specified period. Otherwise, fee waivers can be rescinded at any time. See the prospectus and financial statements for more information.
The net expense ratio reflects the contractual expense limitation currently in effect through December 1, 2022. There can be no assurance that Amundi US will extend the expense limitation beyond such time. Please see the prospectus and financial statements for more information.
The performance table and graph do not reflect the deduction of fees and taxes that a shareowner would pay on Fund distributions.
Please refer to the financial highlights for more current expense ratios.
Pioneer Securitized Income Fund | Annual Report | 7/31/22 11
| Performance Update | 7/31/22 | Class Y Shares |
Investment Returns
The mountain chart on the right shows the change in market value, plus reinvested dividends and distributions, of a $5 million investment made in Class Y shares of Pioneer Securitized Income Fund during the periods shown, compared to that of the Bloomberg US Securitized MBS/ABS/CMBS Index.
| Average Annual Total Returns |
| (As of July 31, 2022) | |
| | Net | Bloomberg |
| | Asset | US Securitized |
| | Value | MBS/ABS/CMBS |
| Period | (NAV) | Index |
| Since | | |
| Inception | | |
| (12/10/19) | 3.96% | -1.02% |
| 1 Year | -0.68 | -6.76 |
| Expense Ratio | |
| (Per prospectus dated December 1, 2021) |
| Gross | Net |
| 1.77% | 0.65% |
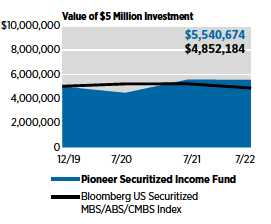
Call 1-800-225-6292 or visit www.amundi.com/us for the most recent month-end performance results. Current performance may be lower or higher than the performance data quoted.
Performance data shown represents past performance. Past performance is no guarantee of future results. Investment return and market price will fluctuate, and shares, when redeemed, may be worth more or less than their original cost.
Class Y shares are not subject to sales charges and are available for limited groups of eligible investors, including institutional investors. All results are historical and assume the reinvestment of dividends and capital gains. Other share classes are available for which performance and expenses will differ.
Performance results reflect any applicable expense waivers in effect during the periods shown. Without such waivers Fund performance would be lower. Waivers may not be in effect for all funds. Certain fee waivers are contractual through a specified period. Otherwise, fee waivers can be rescinded at any time. See the prospectus and financial statements for more information.
The net expense ratio reflects the contractual expense limitation currently in effect through December 1, 2022. There can be no assurance that Amundi US will extend the expense limitation beyond such time. Please see the prospectus and financial statements for more information.
The performance table and graph do not reflect the deduction of fees and taxes that a shareowner would pay on Fund distributions.
The Fund acquired the assets and liabilities of Pioneer Securitized Income Fund (“the Predecessor Fund”) on June 30, 2021 (the “Reorganization”). As a result of the Reorganization, the Predecessor Fund’s performance and financial history became the performance and financial history of the Fund. The performance of Class Y shares of the Fund is the performance of the common shares of the Predecessor Fund for periods prior to the Reorganization, and has not been restated to reflect any differences in expenses.
Please refer to the financial highlights for more current expense ratios.
12 Pioneer Securitized Income Fund | Annual Report | 7/31/22
Comparing Ongoing Fund Expenses
As a shareowner in the Fund, you incur two types of costs:
| (1) | | ongoing costs, including management fees, distribution and/or service (12b-1) fees, and other Fund expenses; and |
| (2) | | transaction costs, including sales charges (loads) on purchase payments. |
This example is intended to help you understand your ongoing expenses (in dollars) of investing in the Fund and to compare these costs with the ongoing costs of investing in other mutual funds. The example is based on an investment of $1,000 at the beginning of the Fund’s latest six-month period and held throughout the six months.
Using the Tables
Actual Expenses
The first table below provides information about actual account values and actual expenses. You may use the information in this table, together with the amount you invested, to estimate the expenses that you paid over the period as follows:
| (1) | | Divide your account value by $1,000 |
Example: an $8,600 account value ÷ $1,000 = 8.6
| (2) | | Multiply the result in (1) above by the corresponding share class’s number in the third row under the heading entitled “Expenses Paid During Period” to estimate the expenses you paid on your account during this period. |
Expenses Paid on a $1,000 Investment in Pioneer Securitized Income Fund
Based on actual returns from February 1, 2022 through July 31, 2022.
| | | |
| Share Class | A | Y |
| Beginning Account | $1,000.00 | $1,000.00 |
| Value on 2/1/22 | | |
| Ending Account Value | $974.60 | $976.70 |
| (after expenses) on 7/31/22 | | |
| Expenses Paid | $4.31 | $3.19 |
| During Period* | | |
| * | | Expenses are equal to the Fund’s annualized expense ratio of 0.88% and 0.65% for Class A and Y shares, respectively, multiplied by the average account value over the period, multiplied by 181/365 (to reflect the partial year period). |
Pioneer Securitized Income Fund | Annual Report | 7/31/22 13
Hypothetical Example for Comparison Purposes
The table below provides information about hypothetical account values and hypothetical expenses based on the Fund’s actual expense ratio and an assumed rate of return of 5% per year before expenses, which is not the Fund’s actual return. The hypothetical account values and expenses may not be used to estimate the actual ending account balance or expenses you paid for the period.
You may use this information to compare the ongoing costs of investing in the Fund and other funds. To do so, compare this 5% hypothetical example with the 5% hypothetical examples that appear in the shareholder reports of the other funds.
Please note that the expenses shown in the tables are meant to highlight your ongoing costs only and do not reflect any transaction costs, such as sales charges (loads) that are charged at the time of the transaction. Therefore, the table below is useful in comparing ongoing costs only and will not help you determine the relative total costs of owning different funds. In addition, if these transaction costs were included, your costs would have been higher.
Expenses Paid on a $1,000 Investment in Pioneer Securitized Income Fund
Based on a hypothetical 5% per year return before expenses, reflecting the period from February 1, 2022 through July 31, 2022.
| Share Class | A | Y |
| Beginning Account | $1,000.00 | $1,000.00 |
| Value on 2/1/22 | | |
| Ending Account Value | $1,020.43 | $1,021.57 |
| (after expenses) on 7/31/22 | | |
| Expenses Paid | $4.41 | $3.26 |
| During Period* | | |
| * | | Expenses are equal to the Fund’s annualized expense ratio of 0.88% and 0.65% for Class A and Y shares, respectively, multiplied by the average account value over the period, multiplied by 181/365 (to reflect the partial year period). |
14 Pioneer Securitized Income Fund | Annual Report | 7/31/22
Schedule of Investments | 7/31/22
| | | |
| Principal | | |
| Amount | | |
| USD ($) | | Value |
| | UNAFFILIATED ISSUERS — 101.8% | |
| | ASSET BACKED SECURITIES — 39.0% of |
| | Net Assets | |
| 250,000(a) | AIG CLO LLC, Series 2020-1A, Class ER, 8.812% (3 Month | |
| | USD LIBOR + 630 bps), 4/15/34 (144A) | $ 217,270 |
| 400,000 | Arivo Acceptance Auto Loan Receivables Trust, Series | |
| | 2021-1A, Class D, 5.83%, 1/18/28 (144A) | 381,685 |
| 400,000 | Arivo Acceptance Auto Loan Receivables Trust, Series | |
| | 2022-1A, Class D, 7.38%, 9/17/29 (144A) | 392,936 |
| 350,000 | Avid Automobile Receivables Trust, Series 2021-1, | |
| | Class F, 5.16%, 10/16/28 (144A) | 317,867 |
| 281,574 | Blackbird Capital Aircraft, Series 2021-1A, Class B, | |
| | 3.446%, 7/15/46 (144A) | 229,870 |
| 650,000 | Conn’s Receivables Funding LLC, Series 2021-A, Class B, | |
| | 2.87%, 5/15/26 (144A) | 631,543 |
| 600,000 | Continental Credit Card ABS LLC, Series 2019-1A, | |
| | Class C, 6.16%, 8/15/26 (144A) | 586,337 |
| 400,000 | Crossroads Asset Trust, Series 2021-A, Class E, 5.48%, | |
| | 1/20/28 (144A) | 378,305 |
| 172,233 | Diamond Resorts Owner Trust, Series 2018-1, Class D, | |
| | 5.90%, 1/21/31 (144A) | 169,910 |
| 104,561 | Diamond Resorts Owner Trust, Series 2019-1A, Class D, | |
| | 5.25%, 2/20/32 (144A) | 101,084 |
| 250,000 | Exeter Automobile Receivables Trust, Series 2022-2A, | |
| | Class D, 4.56%, 7/17/28 | 241,073 |
| 500,000 | First Investors Auto Owner Trust, Series 2021-1A, | |
| | Class F, 5.37%, 4/17/28 (144A) | 474,563 |
| 600,000 | Foursight Capital Automobile Receivables Trust, Series | |
| | 2020-1, Class F, 4.62%, 6/15/27 (144A) | 589,999 |
| 400,000(a) | GRACIE POINT INTERNATIONAL FUNDING, Series 2022-1A, | |
| | Class E, 6.814% (SOFR30A + 575 bps), 4/1/24 (144A) | 398,800 |
| 200,000 | HOA Funding LLC - HOA, Series 2021-1A, Class B, 7.432%, | |
| | 8/20/51 (144A) | 172,775 |
| 300,000(a) | ICG US CLO, Ltd., Series 2016-1A, Class DRR, 10.246% | |
| | (3 Month USD LIBOR + 744 bps),4/29/34 (144A) | 259,267 |
| 600,000 | JPMorgan Chase Bank N.A. - CACLN, Series 2021-2, | |
| | Class F, 4.393%, 12/26/28 (144A) | 566,203 |
| 250,000(a) | Madison Park Funding XLV, Ltd., Series 2020-45A, | |
| | Class ER, 8.862% (3 Month USD LIBOR + 635 bps), | |
| | 7/15/34 (144A) | 214,796 |
| 400,000 | NMEF Funding LLC, Series 2021-A, Class D, 5.78%, | |
| | 12/15/27 (144A) | 384,977 |
| 250,000(a) | Ocean Trails CLO IX, Series 2020-9A, Class ER, 9.962% | |
| | (3 Month USD LIBOR + 745 bps), 10/15/34 (144A) | 219,297 |
| 400,000 | Oportun Funding XIV LLC, Series 2021-A, Class C, 3.44%, | |
| | 3/8/28 (144A) | 376,604 |
| 400,000 | Pawneee Equipment Receivables Series LLC, Series | |
| | 2021-1, Class E, 5.21%, 5/15/28 (144A) | 362,979 |
| 200,000 | Progress Residential Trust, Series 2021-SFR8, Class G, | |
| | 4.005%, 10/17/38 (144A) | 174,980 |
The accompanying notes are an integral part of these financial statements.
Pioneer Securitized Income Fund | Annual Report | 7/31/22 15
Schedule of Investments | 7/31/22 (continued)
| Principal | | |
| Amount | | |
| USD ($) | | Value |
| | ASSET BACKED SECURITIES — (continued) |
| 100,000 | Progress Residential Trust, Series 2021-SFR9, Class F, | |
| | 4.053%, 11/17/40 (144A) | $ 84,004 |
| 650,000 | Santander Bank Auto Credit-Linked Notes, Series 2022-A, | |
| | Class E, 12.662%, 5/15/32 (144A) | 645,888 |
| 700,000 | Santander Bank N.A. - SBCLN, Series 2021-1A, Class E, | |
| | 6.171%, 12/15/31 (144A) | 637,197 |
| 500,000 | Tricolor Auto Securitization Trust, Series 2021-1A, | |
| | Class F, 5.08%, 5/15/28 (144A) | 473,945 |
| 500,000 | Tricolor Auto Securitization Trust, Series 2022-1A, | |
| | Class F, 9.80%, 7/16/29 (144A) | 492,342 |
| 150,000 | Westlake Automobile Receivables Trust, Series 2022-2A, | |
| | Class C, 4.85%, 9/15/27 (144A) | 149,726 |
| | TOTAL ASSET BACKED SECURITIES | |
| | (Cost $10,942,047) | $10,326,222 |
| | COLLATERALIZED MORTGAGE OBLIGATIONS — | |
| | 40.6% of Net Assets | |
| 206,000(a) | Bellemeade Re, Ltd., Series 2021-3A, Class B1, 5.364% | |
| | (SOFR30A + 385 bps), 9/25/31 (144A) | $ 183,371 |
| 577,372(b) | Cascade Funding Mortgage Trust, Series 2018-RM2, | |
| | Class D, 4.00%, 10/25/68 (144A) | 558,188 |
| 480,000(b) | CFMT LLC, Series 2020-HB4, Class M5, 6.00%, | |
| | 12/26/30 (144A) | 467,422 |
| 250,000(a) | Connecticut Avenue Securities Trust, Series 2021-R01, | |
| | Class 1B2, 7.514% (SOFR30A + | |
| | 600 bps), 10/25/41 (144A) | 220,598 |
| 190,000(a) | Connecticut Avenue Securities Trust, Series 2022-R01, | |
| | Class 1B2, 7.514% (SOFR30A + 600 bps), 12/25/41 (144A) | 166,558 |
| 280,000(a) | Connecticut Avenue Securities Trust, Series 2022-R02, | |
| | Class 2M2, 4.514% (SOFR30A + 300 bps), 1/25/42 (144A) | 265,855 |
| 150,000(a) | Connecticut Avenue Securities Trust, Series 2022-R04, | |
| | Class 1B2, 11.014% (SOFR30A + 950 bps), 3/25/42 (144A) | 144,834 |
| 400,000(a) | Eagle Re, Ltd., Series 2020-2, Class B1, 9.259% (1 Month | |
| | USD LIBOR + 700 bps), 10/25/30 (144A) | 403,402 |
| 290,000(a) | Eagle Re, Ltd., Series 2021-2, Class M2, 5.764% | |
| | (SOFR30A + 425 bps), 4/25/34 (144A) | 267,369 |
| 100,000(a) | Fannie Mae Connecticut Avenue Securities, Series | |
| | 2021-R02, Class 2B2, 7.714% (SOFR30A + 620 bps), | |
| | 11/25/41 (144A) | 85,566 |
| 90,387(b) | FARM 21-1 Mortgage Trust, Series 2021-1, Class B, | |
| | 3.235%, 7/25/51 (144A) | 64,482 |
| 6,648,378(b)(c) | Flagstar Mortgage Trust, Series 2021-4, Class AX1, | |
| | 0.211%, 6/1/51 (144A) | 62,555 |
| 150,000(a) | Freddie Mac Stacr Remic Trust, Series 2020-DNA3, | |
| | Class B2, 11.609% (1 Month USD LIBOR + 935 bps), | |
| | 6/25/50 (144A) | 171,787 |
| 220,000(a) | Freddie Mac Stacr Remic Trust, Series 2020-HQA4, | |
| | Class B2, 11.659% (1 Month USD LIBOR + 940 bps), | |
| | 9/25/50 (144A) | 255,487 |
The accompanying notes are an integral part of these financial statements.
16 Pioneer Securitized Income Fund | Annual Report | 7/31/22
| | | |
| Principal | | |
| Amount | | |
| USD ($) | | Value |
| | COLLATERALIZED MORTGAGE | |
| | OBLIGATIONS — (continued) | |
| 350,000(a) | Freddie Mac Stacr Remic Trust, Series 2021-DNA7, | |
| | Class B2, 9.314% (SOFR30A + 780 bps), 11/25/41 (144A) | $ 296,123 |
| 96,290(a) | Freddie Mac Stacr Remic Trust, Series 2021-HQA1, | |
| | Class B1, 4.514% (SOFR30A + 300 bps), 8/25/33 (144A) | 78,958 |
| 510,000(a) | Freddie Mac Stacr Remic Trust, Series 2021-HQA1, | |
| | Class B2, 6.514% (SOFR30A + 500 bps), 8/25/33 (144A) | 404,188 |
| 200,000(a) | Freddie Mac Stacr Remic Trust, Series 2021-HQA3, | |
| | Class B2, 7.764% (SOFR30A + 625 bps), 9/25/41 (144A) | 167,692 |
| 290,000(a) | Freddie Mac Stacr Remic Trust, Series 2021-HQA4, | |
| | Class B1, 5.264% (SOFR30A + 375 bps), 12/25/41 (144A) | 248,592 |
| 100,000(a) | Freddie Mac Stacr Remic Trust, Series 2021-HQA4, | |
| | Class B2, 8.514% (SOFR30A + 700 bps), 12/25/41 (144A) | 83,809 |
| 280,000(a) | Freddie Mac Stacr Remic Trust, Series 2022-DNA1, | |
| | Class B2, 8.614% (SOFR30A + 710 bps), 1/25/42 (144A) | 234,702 |
| 280,000(a) | Freddie Mac Stacr Remic Trust, Series 2022-DNA2, | |
| | Class B1, 6.264% (SOFR30A + 475 bps), 2/25/42 (144A) | 257,998 |
| 230,000(a) | Freddie Mac Stacr Remic Trust, Series 2022-DNA2, | |
| | Class B2, 10.014% (SOFR30A + 850 bps), 2/25/42 (144A) | 204,944 |
| 500,000(a) | Freddie Mac Stacr Trust, Series 2018-HQA2, Class B2, | |
| | 13.259% (1 Month USD LIBOR + 1,100 bps), |
| | 10/25/48 (144A) | 541,982 |
| 500,000(a) | Freddie Mac Stacr Trust, Series 2019-FTR2, Class B1, | |
| | 5.259% (1 Month USD LIBOR + 300 bps), | |
| | 11/25/48 (144A) | 468,457 |
| 400,000(a) | Freddie Mac Stacr Trust, Series 2019-FTR3, Class B2, | |
| | 6.424% (1 Month USD LIBOR + 480 bps), | |
| | 9/25/47 (144A) | 333,897 |
| 100,000(a) | Freddie Mac Structured Agency Credit Risk Debt Notes, | |
| | Series 2022-HQA2, Class M2, 7.524% (SOFR30A + | |
| | 600 bps), 7/25/42 (144A) | 100,875 |
| 200,000(b) | GS Mortgage-Backed Securities Trust, Series 2020-NQM1, | |
| | Class B1, 5.143%, 9/27/60 (144A) | 189,032 |
| 300,000(a) | Home Re, Ltd., Series 2020-1, Class B1, 9.259% (1 Month | |
| | USD LIBOR + 700 bps), 10/25/30 (144A) | 301,567 |
| 500,000(a) | Home Re, Ltd., Series 2021-2, Class B1, 5.664% | |
| | (SOFR30A + 415 bps), 1/25/34 (144A) | 446,367 |
| 175,000(a) | Home Re, Ltd., Series 2022-1, Class B1, 10.514% | |
| | (SOFR30A + 900 bps), 10/25/34 (144A) | 163,100 |
| 4,391,523(b)(c) | Hundred Acre Wood Trust, Series 2021-INV1, Class AX1, | |
| | 0.226%, 7/25/51 (144A) | 45,627 |
| 205,000(b) | Imperial Fund Mortgage Trust, Series 2021-NQM2, | |
| | Class B2, 4.316%, 9/25/56 (144A) | 145,394 |
| 8,584,070(b)(c) | JP Morgan Mortgage Trust, Series 2021-10, Class AX1, | |
| | 0.124%, 12/25/51 (144A) | 47,776 |
| 7,365,026(b)(c) | JP Morgan Mortgage Trust, Series 2021-8, Class AX1, | |
| | 0.126%, 12/25/51 (144A) | 40,988 |
| 150,000(a) | Oaktown Re VII, Ltd., Series 2021-2, Class B1, 5.914% | |
| | (SOFR30A + 440 bps), 4/25/34 (144A) | 137,456 |
The accompanying notes are an integral part of these financial statements.
Pioneer Securitized Income Fund | Annual Report | 7/31/22 17
Schedule of Investments | 7/31/22 (continued)
| | | |
| Principal | | |
| Amount | | |
| USD ($) | | Value |
| | COLLATERALIZED MORTGAGE | |
| | OBLIGATIONS — (continued) | |
| 500,000(a) | Radnor Re, Ltd., Series 2020-1, Class B1, 5.259% | |
| | (1 Month USD LIBOR + 300 bps), 1/25/30 (144A) | $ 442,776 |
| 180,000(a) | Radnor Re, Ltd., Series 2020-2, Class B1, 9.859% | |
| | (1 Month USD LIBOR + 760 bps), 10/25/30 (144A) | 180,244 |
| 450,000(b) | RMF Buyout Issuance Trust, Series 2022-HB1, Class M5, | |
| | 4.50%, 4/25/32 (144A) | 355,500 |
| 500,000(a) | STACR Trust, Series 2018-HRP2, Class B1, 6.459% | |
| | (1 Month USD LIBOR + 420 bps), 2/25/47 (144A) | 505,972 |
| 500,000(a) | STACR Trust, Series 2018-HRP2, Class B2, 12.759% | |
| | (1 Month USD LIBOR + 1,050 bps), 2/25/47 (144A) | 546,339 |
| 150,000(a) | Traingle Re, Ltd., Series 2020-1, Class B1, 10.009% | |
| | (1 Month USD LIBOR + 775 bps), 10/25/30 (144A) | 151,116 |
| 150,000(a) | Triangle Re, Ltd., Series 2021-3, Class B1, 6.464% | |
| | (SOFR30A + 495 bps), 2/25/34 (144A) | 135,582 |
| 200,000(a) | Triangle Re, Ltd., Series 2021-3, Class M2, 5.264% | |
| | (SOFR30A + 375 bps), 2/25/34 (144A) | 181,060 |
| | TOTAL COLLATERALIZED MORTGAGE OBLIGATIONS | |
| | (Cost $11,654,761) | $10,755,587 |
| | COMMERCIAL MORTGAGE-BACKED SECURITIES — | |
| | 14.1% of Net Assets | |
| 100,000(a) | BX Commercial Mortgage Trust, Series 2021-VOLT, | |
| | Class F, 4.399% (1 Month USD LIBOR + 240 bps), | |
| | 9/15/36 (144A) | $ 94,159 |
| 500,000(b) | COMM Mortgage Trust, Series 2020-CBM, Class F, | |
| | 3.633%, 2/10/37 (144A) | 437,765 |
| 250,000(a) | Freddie Mac Multifamily Structured Credit Risk, Series | |
| | 2021-MN1, Class B1, 9.264% (SOFR30A + 775 bps), | |
| | 1/25/51 (144A) | 243,797 |
| 250,000(a) | Freddie Mac Multifamily Structured Credit Risk, Series | |
| | 2021-MN3, Class B1, 8.364% (SOFR30A + 685 bps), | |
| | 11/25/51 (144A) | 227,127 |
| 250,000(a) | Freddie Mac Multifamily Structured Credit Risk, Series | |
| | 2021-MN3, Class M2, 5.514% (SOFR30A + 400 bps), | |
| | 11/25/51 (144A) | 218,944 |
| 500,000(a) | GS Mortgage Securities Corp. Trust, Series 2020-DUNE, | |
| | Class G, 5.999% (1 Month USD LIBOR + 400 bps), | |
| | 12/15/36 (144A) | 462,580 |
| 500,000(a) | Multifamily Connecticut Avenue Securities Trust, Series | |
| | 2020-01, Class M10, 6.009% (1 Month USD LIBOR + | |
| | 375 bps), 3/25/50 (144A) | 462,500 |
| 500,000(b) | Natixis Commercial Mortgage Securities Trust, Series | |
| | 2019-FAME, Class E, 4.398%, 8/15/36 (144A) | 424,795 |
| 500,000(a) | Natixis Commercial Mortgage Securities Trust, Series | |
| | 2019-MILE, Class E, 5.499% (1 Month USD LIBOR + | |
| | 350 bps), 7/15/36 (144A) | 476,206 |
The accompanying notes are an integral part of these financial statements.
18 Pioneer Securitized Income Fund | Annual Report | 7/31/22
| Principal | | |
| Amount | | |
| USD ($) | | Value |
| | COMMERCIAL MORTGAGE-BACKED | |
| | SECURITIES — (continued) | |
| 260,000(a) | Ready Capital Mortgage Financing LLC, Series 2021-FL6, | |
| | Class AS, 3.459% (1 Month USD LIBOR + | |
| | 120 bps), 7/25/36 (144A) | $ 246,606 |
| 479,591(b) | Velocity Commercial Capital Loan Trust, Series 2020-1, | |
| | Class M6, 5.69%, 2/25/50 (144A) | 423,185 |
| | TOTAL COMMERCIAL MORTGAGE-BACKED SECURITIES | |
| | (Cost $3,947,052) | $ 3,717,664 |
| | CORPORATE BONDS — 0.6% of Net Assets | |
| | Airlines — 0.6% | |
| 90,743 | British Airways 2020-1 Class B Pass Through Trust, | |
| | 8.375%, 11/15/28 (144A) | $ 96,045 |
| 62,088 | United Airlines 2020-1 Class B Pass Through Trust, | |
| | 4.875%, 1/15/26 | 58,938 |
| | Total Airlines | $ 154,983 |
| | TOTAL CORPORATE BONDS | |
| | (Cost $152,831) | $ 154,983 |
| | U.S. GOVERNMENT AND AGENCY | |
| | OBLIGATIONS — 5.0% of Net Assets | |
| 600,000 | Fannie Mae, 4.000%, 8/1/52 (TBA) | $ 602,976 |
| 700,000 | Fannie Mae, 4.500%, 8/1/52 (TBA) | 712,168 |
| | TOTAL U.S. GOVERNMENT AND AGENCY OBLIGATIONS | |
| | (Cost $1,288,692) | $ 1,315,144 |
| | SHORT TERM INVESTMENTS — 2.5% of |
| | Net Assets | |
| | Open-End Fund — 2.5% | |
| 667,123(d) | Dreyfus Government Cash Management, Institutional | |
| | Shares, 1.83% | $ 667,123 |
| | | $ 667,123 |
| | TOTAL SHORT TERM INVESTMENTS | |
| | (Cost $667,123) | $ 667,123 |
| | TOTAL INVESTMENTS IN UNAFFILIATED ISSUERS — 101.8% | |
| | (Cost $28,652,506) | $26,936,723 |
| | OTHER ASSETS AND LIABILITIES — (1.8)% | $ (478,216) |
| | NET ASSETS — 100.0% | $26,458,507 |
| (TBA) | | “To Be Announced” Securities. |
| LIBOR | | London Interbank Offered Rate. |
| SOFR30A | | Secured Overnight Financing Rate 30 Day Average. |
| (144A) | | Security is exempt from registration under Rule 144A of the Securities Act of 1933. Such securities may be resold normally to qualified institutional buyers in a transaction exempt from registration. At July 31, 2022, the value of these securities amounted to $24,654,445, or 93.2% of net assets. |
The accompanying notes are an integral part of these financial statements.
Pioneer Securitized Income Fund | Annual Report | 7/31/22 19
Schedule of Investments | 7/31/22 (continued)
| (a) | | Floating rate note. Coupon rate, reference index and spread shown at July 31, 2022. |
| (b) | | The interest rate is subject to change periodically. The interest rate and/or reference index and spread shown at July 31, 2022. |
| (c) | | Security represents the interest-only portion payments on a pool of underlying mortgages or mortgage-backed securities. |
| (d) | | Rate periodically changes. Rate disclosed is the 7-day yield at July 31, 2022. |
Purchases and sales of securities (excluding short-term investments) for the year ended July 31, 2022, aggregated $14,325,032 and $8,202,390, respectively.
The Fund is permitted to engage in purchase and sale transactions (“cross trades”) with certain funds and accounts for which Amundi Asset Management US, Inc. (the “Adviser”) serves as the Fund’s investment adviser, as set forth in Rule 17a-7 under the Investment Company Act of 1940, pursuant to procedures adopted by the Board of Trustees. Under these procedures, cross trades are effected at current market prices. During the year ended July 31, 2022, the Fund did not engage in any cross trade activity.
At July 31, 2022, the net unrealized depreciation on investments based on cost for federal tax purposes of $28,652,506 was as follows:
| | |
| Aggregate gross unrealized appreciation for all investments in which | |
| there is an excess of value over tax cost | $ 156,492 |
| Aggregate gross unrealized depreciation for all investments in which | |
| there is an excess of tax cost over value | (1,872,275) |
| Net unrealized depreciation | $(1,715,783) |
Various inputs are used in determining the value of the Fund’s investments. These inputs are summarized in the three broad levels below.
Level 1 – unadjusted quoted prices in active markets for identical securities.
Level 2 – other significant observable inputs (including quoted prices for similar securities, interest rates, prepayment speeds, credit risks, etc.). See Notes to Financial Statements — Note 1A.
Level 3 – significant unobservable inputs (including the Fund’s own assumptions in determining fair value of investments). See Notes to Financial Statements — Note 1A.
The following is a summary of the inputs used as of July 31, 2022, in valuing the Fund’s investments:
| | | | | |
| | Level 1 | Level 2 | Level 3 | Total |
| Asset Backed Securities | $ — | $10,326,222 | $ — | $10,326,222 |
| Collateralized Mortgage Obligations | — | 10,755,587 | — | 10,755,587 |
| Commercial Mortgage-Backed Securities | — | 3,717,664 | — | 3,717,664 |
| Corporate Bonds | — | 154,983 | — | 154,983 |
| U.S. Government and Agency Obligations | — | 1,315,144 | — | 1,315,144 |
| Open-End Fund | 667,123 | — | — | 667,123 |
| Total Investments in Securities | $667,123 | $26,269,600 | $ — | $26,936,723 |
During the year ended July 31, 2022, there were no transfers in or out of Level 3.
The accompanying notes are an integral part of these financial statements.
20 Pioneer Securitized Income Fund | Annual Report | 7/31/22
Statement of Assets and Liabilities | 7/31/22
| ASSETS: | |
| Investments in unaffiliated issuers, at value (cost $28,652,506) | $26,936,723 |
| Cash | 8,974 |
| Due from broker for futures | 837,775 |
| Receivables — | |
| Fund shares sold | 8,574 |
| Interest | 67,609 |
| Due from the Adviser | 10,683 |
| Other assets | 23,729 |
| Total assets | $27,894,067 |
| LIABILITIES: | |
| Payables — | |
| Investment securities purchased | $ 1,289,362 |
| Fund shares repurchased | 6,381 |
| Distributions | 23,542 |
| Trustees’ fees | 693 |
| Professional fees | 95,863 |
| Due to affiliates | 747 |
| Accrued expenses | 18,972 |
| Total liabilities | $ 1,435,560 |
| NET ASSETS: | |
| Paid-in capital | $27,751,080 |
| Distributable earnings (loss) | (1,292,573) |
| Net assets | $26,458,507 |
| NET ASSET VALUE PER SHARE: | |
| No par value (unlimited number of shares authorized) | |
| Class A (based on $2,030,782/215,295 shares) | $ 9.43 |
| Class Y (based on $24,427,725/2,588,950 shares) | $ 9.44 |
| MAXIMUM OFFERING PRICE PER SHARE: | |
| Class A (based on $9.43 net asset value per share/100%-4.50% | |
| maximum sales charge) | $ 9.87 |
The accompanying notes are an integral part of these financial statements.
Pioneer Securitized Income Fund | Annual Report | 7/31/22 21
Statement of Operations
FOR THE YEAR ENDED 7/31/22
| INVESTMENT INCOME: | | | |
| Interest from unaffiliated issuers | $ 1,356,942 | |
| Total Investment Income | | | $ 1,356,942 |
| EXPENSES: | | | |
| Management fees | $ 135,029 | |
| Administrative expenses | | 24,358 | |
| Transfer agent fees | | | |
| Class Y | | 2,477 | |
| Distribution fees | | | |
| Class A | | 5,089 | |
| Shareowner communications expense | | 2,823 | |
| Custodian fees | | 1,626 | |
| Registration fees | | 64,205 | |
| Professional fees | | 132,019 | |
| Printing expense | | 50,612 | |
| Pricing fees | | 3,492 | |
| Trustees’ fees | | 8,092 | |
| Insurance expense | | 35 | |
| Miscellaneous | | 6,786 | |
| Total expenses | | | $ 436,643 |
| Less fees waived and expenses reimbursed by the Adviser | | | (271,403) |
| Net expenses | | | $ 165,240 |
| Net investment income | | | $ 1,191,702 |
| REALIZED AND UNREALIZED GAIN (LOSS) ON INVESTMENTS: | | |
| Net realized gain (loss) on: | | | |
| Investments in unaffiliated issuers | $ (116,384) | |
| Futures contracts | | 646,920 | |
| Other assets and liabilities denominated in foreign currencies | | 55 | $ 530,591 |
| Change in net unrealized appreciation (depreciation) on: | | | |
| Investments in unaffiliated issuers | $(2,071,239) | |
| Futures contracts | | 94,979 | $(1,976,260) |
| Net realized and unrealized gain (loss) on investments | | | $(1,445,669) |
| Net decrease in net assets resulting from operations | | | $ (253,967) |
The accompanying notes are an integral part of these financial statements.
22 Pioneer Securitized Income Fund | Annual Report | 7/31/22
Statements of Changes in Net Assets
| | | |
| | Year | Year |
| | Ended | Ended |
| | 7/31/22 | 7/31/21 |
| FROM OPERATIONS: | | |
| Net investment income (loss) | $ 1,191,702 | $ 940,641 |
| Net realized gain (loss) on investments | 530,591 | 232,706 |
| Change in net unrealized appreciation (depreciation) | | |
| on investments | (1,976,260) | 3,081,009 |
| Net increase (decrease) in net assets resulting | | |
| from operations | $ (253,967) | $ 4,254,356 |
| DISTRIBUTIONS TO SHAREOWNERS: | | |
| Class A* ($0.58 and $0.04 per share, respectively) | $ (120,348) | $ (7,733) |
| Class Y ($0.61 and $0.61 per share, respectively) | (1,382,353) | (1,266,522) |
| Total distributions to shareowners | $ (1,502,701) | $ (1,274,255) |
| FROM FUND SHARE TRANSACTIONS: | | |
| Net proceeds from sales of shares | $ 6,590,992 | $ 2,594,452 |
| Reinvestment of distributions | 1,399,934 | 1,265,612 |
| Cost of shares repurchased | (1,763,070) | (2,508,461) |
| Net increase in net assets resulting from Fund | | |
| share transactions | $ 6,227,856 | $ 1,351,603 |
| Net increase in net assets | $ 4,471,188 | $ 4,331,704 |
| NET ASSETS: | | |
| Beginning of year | $21,987,319 | $17,655,615 |
| End of year | $26,458,507 | $21,987,319 |
| * Class A commenced operations on July 2, 2021. | | |
The accompanying notes are an integral part of these financial statements.
Pioneer Securitized Income Fund | Annual Report | 7/31/22 23
Statements of Changes in Net Assets
(continued)
| | | | | |
| | Year | Year | Year | Year |
| | Ended | Ended | Ended | Ended |
| | 7/31/22 | 7/31/22 | 7/31/21 | 7/31/21 |
| | Shares | Amount | Shares | Amount |
| Class A* | | | | |
| Shares sold | 2,303 | $ 22,392 | 200,000 | $ 2,024,000 |
| Reinvestment of distributions | 12,248 | 120,139 | 744 | 7,520 |
| Less shares repurchased | — | — | — | — |
| Net increase | 14,551 | $ 142,531 | 200,744 | $ 2,031,520 |
| Class Y | | | | |
| Shares sold | 669,318 | $ 6,568,600 | 58,008 | $ 570,452 |
| Reinvestment of distributions | 130,490 | 1,279,795 | 131,929 | 1,258,092 |
| Less shares repurchased | (184,428) | (1,763,070) | (252,622) | (2,508,461) |
| Net increase (decrease) | 615,380 | $ 6,085,325 | (62,685) | $ (679,917) |
| * Class A commenced operations on July 2, 2021. | | | |
The accompanying notes are an integral part of these financial statements.
24 Pioneer Securitized Income Fund | Annual Report | 7/31/22
Financial Highlights
| | Year | |
| | Ended | 7/2/21 to |
| | 7/31/22 | 7/31/21* |
| Class A | | |
| Net asset value, beginning of period | $ 10.11 | $ 10.12 |
| Increase (decrease) from investment operations: | | |
| Net investment income (loss) (a) | $ 0.45 | $ 0.04 |
| Net realized and unrealized gain (loss) on investments | (0.55) | (0.01) |
| Net increase (decrease) from investment operations | $ (0.10) | $ 0.03 |
| Distributions to shareowners: | | |
| Net investment income | $ (0.45) | $ (0.04) |
| Net realized gain | (0.13) | — |
| Total distributions | $ (0.58) | $ (0.04) |
| Net increase (decrease) in net asset value | $ (0.68) | $ (0.01) |
| Net asset value, end of period | $ 9.43 | $ 10.11 |
| Total return (b) | (1.03)% | 0.27%(c) |
| Ratio of net expenses to average net assets | 0.88% | 0.90%(d) |
| Ratio of net investment income (loss) to average net assets | 4.58% | 4.56%(d) |
| Portfolio turnover rate | 36% | 59%(c) |
| Net assets, end of period (in thousands) | $ 2,031 | $ 2,029 |
| Ratios with no waiver of fees and assumption of expenses | | |
| by the Adviser and no reduction for fees paid indirectly: | | |
| Total expenses to average net assets | 1.97% | 5.42%(d) |
| Net investment income (loss) to average net assets | 3.49% | 0.04%(d) |
| * | | Class A commenced operations on July 2, 2021. |
| (a) | | The per-share data presented above is based on the average shares outstanding for the period presented. |
| (b) | | Assumes initial investment at net asset value at the beginning of each period, reinvestment of all distributions, the complete redemption of the investment at net asset value at the end of each period and no sales charges. Total return would be reduced if sales charges were taken into account. |
The accompanying notes are an integral part of these financial statements.
Pioneer Securitized Income Fund | Annual Report | 7/31/22 25
Financial Highlights (continued)
| | | | |
| | Year | Year | |
| | Ended | Ended | 12/10/19 to |
| | 7/31/22 | 7/31/21 | 7/31/20* |
| Class Y | | | |
| Net asset value, beginning of period | $ 10.11 | $ 8.67 | $ 10.00 |
| Increase (decrease) from investment | | | |
| operations: | | | |
| Net investment income (loss) (a) | $ 0.48 | $ 0.45 | $ 0.28 |
| Net realized and unrealized gain (loss) | | | |
| on investments | (0.54) | 1.60 | (1.33) |
| Net increase (decrease) from investment | | | |
| operations | $ (0.06) | $ 2.05 | $ (1.05) |
| Distributions to shareowners: | | | |
| Net investment income | $ (0.48) | $ (0.45) | $ (0.28) |
| Net realized gain | (0.13) | (0.16) | — |
| Total distributions | $ (0.61) | $ (0.61) | $ (0.28) |
| Net increase (decrease) in net asset value | $ (0.67) | $ 1.44 | $ (1.33) |
| Net asset value, end of period | $ 9.44 | $ 10.11 | $ 8.67 |
| Total return (b) | (0.68)% | 24.32% | (10.30)%(c) |
| Ratio of net expenses to average net assets | 0.65% | 0.96% | 0.99%(d) |
| Ratio of net investment income (loss) to | | | |
| average net assets | 4.88% | 4.69% | 5.06%(d) |
| Portfolio turnover rate | 36% | 59% | 82%(c) |
| Net assets, end of period (in thousands) | $ 24,428 | $ 19,958 | $ 17,656 |
| Ratios with no waiver of fees and assumption | | | |
| of expenses by the Adviser and no reduction | | | |
| for fees paid indirectly: | | | |
| Total expenses to average net assets | 1.76% | 2.50% | 2.62%(d) |
| Net investment income (loss) to average | | | |
| net assets | 3.77% | 3.15% | 3.43%(d) |
| * | | Class Y commenced operations on December 10, 2019. |
| (a) | | The per-share data presented above is based on the average shares outstanding for the period presented. |
| (b) | | Assumes initial investment at net asset value at the beginning of each period, reinvestment of all distributions, the complete redemption of the investment at net asset value at the end of each period and no sales charges. Total return would be reduced if sales charges were taken into account. |
26 Pioneer Securitized Income Fund | Annual Report | 7/31/22
Notes to Financial Statements | 7/31/22
1. Organization and Significant Accounting Policies
Pioneer Securitized Income Fund (the “Fund”) is one of three portfolios comprising Pioneer Series Trust IV (the “Trust”), a Delaware statutory trust. The Fund is registered under the Investment Company Act of 1940 as a non-diversified, open-end management investment company. The Fund, which commenced operations on June 30, 2021, is the successor to Pioneer Securitized Income Fund, a closed-end interval fund (the “Predecessor Fund”). The Predecessor Fund transferred all of the net assets of common shares of the Predecessor Fund in exchange for Class Y shares of the Fund on June 30, 2021, in a one-to-one exchange ratio, pursuant to an agreement and plan of reorganization (the “Reorganization”) approved by the Board of Trustees of the Fund and the Predecessor Fund and by the majority shareholder of the Predecessor Fund. Accordingly, the Reorganization, which was a tax-free event to shareholders, had no effect on the Fund’s operations. As a result of the Reorganization, the Fund is the accounting successor of the Predecessor Fund, and as such, the financial statements, and financial highlights for Class Y shares, reflect the financial information of the Predecessor Fund through June 30, 2021. The investment objective of the Fund is total return.
The Fund offers four classes of shares designated as Class A, Class C, Class K and Class Y shares. As noted above, all of the net assets of common shares of the Predecessor Fund, which commenced operations on December 10, 2019, were transferred in exchange for Class Y shares of the Fund on June 30, 2021. Class A shares commenced operations on July 2, 2021. Class C and Class K shares had not commenced operations as of July 31, 2022. Each class of shares represents an interest in the same portfolio of investments of the Fund and has identical rights (based on relative net asset values) to assets and liquidation proceeds. Share classes can bear different rates of class-specific fees and expenses, such as transfer agent and distribution fees. Differences in class-specific fees and expenses will result in differences in net investment income and, therefore, the payment of different dividends from net investment income earned by each class. The Amended and Restated Declaration of Trust of the Trust gives the Board of Trustees the flexibility to specify either per-share voting or dollar-weighted voting when submitting matters for shareowner approval. Under per-share voting, each share of a class of the Fund is entitled to one vote. Under dollar-weighted voting, a shareowner’s voting power is determined not by the number of shares owned, but by the dollar value of the shares on the record date. Each share class has exclusive voting rights with respect to matters affecting only that class, including with respect to the distribution plan for that class. There is no distribution plan for Class K or Class Y shares.
Pioneer Securitized Income Fund | Annual Report | 7/31/22 27
Amundi Asset Management US, Inc., an indirect, wholly owned subsidiary of Amundi and Amundi’s wholly owned subsidiary, Amundi USA, Inc., serves as the Fund’s investment adviser (the “Adviser”). Amundi Distributor US, Inc., an affiliate of the Adviser, serves as the Fund’s distributor (the “Distributor”).
In March 2020, FASB issued an Accounting Standard Update, ASU 2020-04, Reference Rate Reform (Topic 848) — Facilitation of the Effects of Reference Rate Reform on Financial Reporting (“ASU 2020-04”), which provides optional, temporary relief with respect to the financial reporting of contracts subject to certain types of modifications due to the planned discontinuation of the London Interbank Offered Rate (“LIBOR”) and other LIBOR-based reference rates at the end of 2021. The temporary relief provided by ASU 2020-04 is effective for certain reference rate-related contract modifications that occur during the period from March 12, 2020 through December 31, 2023. Management is evaluating the impact of ASU 2020-04 on the Fund’s investments, derivatives, debt and other contracts, if applicable, that will undergo reference rate-related modifications as a result of the reference rate reform.
Effective August 19, 2022, the Fund is required to comply with Rule 18f-4 under the 1940 Act, which governs the use of derivatives by registered investment companies. Rule 18f-4 permits funds to enter into derivatives transactions (as defined in Rule 18f-4) and certain other transactions notwithstanding the restrictions on the issuance of “senior securities” under Section 18 of the 1940 Act. Rule 18f-4 requires a fund, to establish and maintain a comprehensive derivatives risk management program, appoint a derivatives risk manager and comply with a relative or absolute limit on fund leverage risk calculated based on value-at-risk (“VaR”), unless the fund uses derivatives in only a limited manner. Management anticipates Rule 18f-4 will not have a material impact on the Fund.
The Fund is an investment company and follows investment company accounting and reporting guidance under U.S. Generally Accepted Accounting Principles (“U.S. GAAP”). U.S. GAAP requires the management of the Fund to make estimates and assumptions that affect the reported amounts of assets and liabilities, the disclosure of contingent assets and liabilities at the date of the financial statements, and the reported amounts of income, expenses and gain or loss on investments during the reporting period. Actual results could differ from those estimates.
The following is a summary of significant accounting policies followed by the Fund in the preparation of its financial statements:
A. Security Valuation
The net asset value of the Fund is computed once daily, on each day the New York Stock Exchange (“NYSE”) is open, as of the close of regular trading on the NYSE.
28 Pioneer Securitized Income Fund | Annual Report | 7/31/22
Fixed-income securities are valued by using prices supplied by independent pricing services, which consider such factors as market prices, market events, quotations from one or more brokers, Treasury spreads, yields, maturities and ratings, or may use a pricing matrix or other fair value methods or techniques to provide an estimated value of the security or instrument. A pricing matrix is a means of valuing a debt security on the basis of current market prices for other debt securities, historical trading patterns in the market for fixed-income securities and/or other factors. Non-U.S. debt securities that are listed on an exchange will be valued at the bid price obtained from an independent third party pricing service. When independent third party pricing services are unable to supply prices, or when prices or market quotations are considered to be unreliable, the value of that security may be determined using quotations from one or more broker-dealers.
Futures contracts are generally valued at the closing settlement price established by the exchange on which they are traded.
Shares of open-end registered investment companies (including money market mutual funds) are valued at such funds’ net asset value.
Securities or loan interests for which independent pricing services or broker-dealers are unable to supply prices or for which market prices and/or quotations are not readily available or are considered to be unreliable are valued by a fair valuation team comprised of certain personnel of the Adviser. Effective September 8, 2022, the Adviser is designated as the valuation designee for the Fund pursuant to Rule 2a-5 under the 1940 Act. The Adviser’s fair valuation team is responsible for monitoring developments that may impact fair valued securities.
Inputs used when applying fair value methods to value a security may include credit ratings, the financial condition of the company, current market conditions and comparable securities. The Fund may use fair value methods if it is determined that a significant event has occurred after the close of the exchange or market on which the security trades and prior to the determination of the Fund’s net asset value. Examples of a significant event might include political or economic news, corporate restructurings, natural disasters, terrorist activity or trading halts. Thus, the valuation of the Fund’s securities may differ significantly from exchange prices, and such differences could be material.
At July 31, 2022, no securities were valued using fair value methods (other than securities valued using prices supplied by independent pricing services broker-dealers).
Pioneer Securitized Income Fund | Annual Report | 7/31/22 29
B. Investment Income and Transactions
Interest income, including interest on income-bearing cash accounts, is recorded on the accrual basis. Dividend and interest income are reported net of unrecoverable foreign taxes withheld at the applicable country rates and net of income accrued on defaulted securities.
Interest and dividend income payable by delivery of additional shares is reclassified as PIK (payment-in-kind) income upon receipt and is included in interest and dividend income, respectively.
Principal amounts of mortgage-backed securities are adjusted for monthly paydowns. Premiums and discounts related to certain mortgage-backed securities are amortized or accreted in proportion to the monthly paydowns. All discounts/premiums on purchase prices of debt securities are accreted/amortized for financial reporting purposes over the life of the respective securities, and such accretion/amortization is included in interest income.
Security transactions are recorded as of trade date. Gains and losses on sales of investments are calculated on the identified cost method for both financial reporting and federal income tax purposes.
C. Federal Income Taxes
It is the Fund’s policy to comply with the requirements of the Internal Revenue Code applicable to regulated investment companies and to distribute all of its net taxable income and net realized capital gains, if any, to its shareowners. Therefore, no provision for federal income taxes is required. As of July 31, 2022, the Fund did not accrue any interest or penalties with respect to uncertain tax positions, which, if applicable, would be recorded as an income tax expense on the Statement of Operations. Tax returns filed within the prior three years remain subject to examination by federal and state tax authorities.
The amount and character of income and capital gain distributions to shareowners are determined in accordance with federal income tax rules, which may differ from U.S. GAAP. Distributions in excess of net investment income or net realized gains are temporary over distributions for financial statement purposes resulting from differences in the recognition or classification of income or distributions for financial statement and tax purposes. Capital accounts within the financial statements are adjusted for permanent book/tax differences to reflect tax character, but are not adjusted for temporary differences.
30 Pioneer Securitized Income Fund | Annual Report | 7/31/22
The tax character of distributions paid during the years ended July 31, 2022 and July 31, 2021, were as follows:
| | 2022 | 2021 |
| Distributions paid from: | | |
| Ordinary income | $1,419,855 | $1,274,255 |
| Long-term capital gains | 82,846 | — |
| Total | $1,502,701 | $1,274,255 |
The following shows the components of distributable earnings (losses) on a federal income tax basis at July 31, 2022:
| | |
| | 2022 |
| Distributable earnings/(losses): | |
| Undistributed ordinary income | $ 18,304 |
| Undistributed long-term capital gains | 428,448 |
| Current year dividend payable | (23,542) |
| Net unrealized depreciation | (1,715,783) |
| Total | $(1,292,573) |
The difference between book-basis and tax-basis net unrealized depreciation is attributable to the mark to market of futures contracts.
D. Fund Shares
The Fund records sales and repurchases of its shares as of trade date. The Distributor earned $0 in underwriting commissions on the sale of Class A shares during the year ended July 31, 2022.
E. Class Allocations
Income, common expenses and realized and unrealized gains and losses are calculated at the Fund level and allocated daily to each class of shares based on its respective percentage of adjusted net assets at the beginning of the day.
Distribution fees are calculated based on the average daily net asset value attributable to Class A shares of the Fund (see Note 5). All expenses and fees paid to the Fund’s transfer agent for its services are allocated among the classes of shares based on the number of accounts in each class and the ratable allocation of related out-of-pocket expenses (see Note 4).
Distributions to shareowners are recorded as of the ex-dividend date. Distributions paid by the Fund with respect to each class of shares are calculated in the same manner and at the same time, except that net investment income dividends to Class A and Class Y shares can reflect different transfer agent and distribution expense rates.
Pioneer Securitized Income Fund | Annual Report | 7/31/22 31
F. Risks
The value of securities held by the Fund may go up or down, sometimes rapidly or unpredictably, due to general market conditions, such as real or perceived adverse economic, political or regulatory conditions, recessions, the spread of infectious illness or other public health issues, inflation, changes in interest rates, armed conflict including Russia’s military invasion of Ukraine, sanctions against Russia, other nations or individuals or companies and possible countermeasures, lack of liquidity in the bond markets or adverse investor sentiment. In the past several years, financial markets have experienced increased volatility, depressed valuations, decreased liquidity and heightened uncertainty. These conditions may continue, recur, worsen or spread. Interest rates are very low, which means there is more risk that they may go up. The U.S. Federal Reserve has recently started to raise certain interest rates. A general rise in interest rates could adversely affect the price and liquidity of fixed-income securities and could also result in increased redemptions from the Fund. Rates of inflation have recently risen. The value of assets or income from an investment may be worth less in the future as inflation decreases the value of money. As inflation increases, the real value of the Fund’s assets can decline as can the value of the Fund’s distributions.
The global pandemic of the novel coronavirus respiratory disease designated COVID-19 has resulted in major disruption to economies and markets around the world, including the United States. Global financial markets have experienced extreme volatility and severe losses, and trading in many instruments has been disrupted. Liquidity for many instruments has been greatly reduced for periods of time. Some sectors of the economy and individual issuers have experienced particularly large losses. These circumstances may continue for an extended period of time, and may continue to affect adversely the value and liquidity of the Fund’s investments. Following Russia’s invasion of Ukraine, Russian securities have lost all, or nearly all, their market value. Other securities or markets could be similarly affected by past or future geopolitical or other events or conditions.
Governments and central banks, including the U.S. Federal Reserve, have taken extraordinary and unprecedented actions to support local and global economies and the financial markets. These actions have resulted in significant expansion of public debt, including in the U.S. The consequences of high public debt, including its future impact on the economy and securities markets, may not be known for some time.
At times, the Fund’s investments may represent industries or industry sectors that are interrelated or have common risks, making the Fund more susceptible to any economic, political, or regulatory developments or other risks affecting those industries and sectors.
32 Pioneer Securitized Income Fund | Annual Report | 7/31/22
The Fund’s investments in foreign markets and countries with limited developing markets may subject the Fund to a greater degree of risk than investments in a developed market. These risks include disruptive political or economic conditions, military conflicts and sanctions, terrorism, sustained economic downturns, financial instability, less liquid trading markets, extreme price volatility, currency risks, reduction of government or central bank support, inadequate accounting standards, tariffs, tax disputes or other tax burdens, nationalization or expropriation of assets, and the imposition of adverse governmental laws, arbitrary application of laws and regulations or lack of rule of law and investment and repatriation restrictions. Lack of information and less market regulation also may affect the value of these securities. Withholding and other non-U.S. taxes may decrease the Fund’s return. Non-U.S. issuers may be located in parts of the world that have historically been prone to natural disasters. Investing in depositary receipts is subject to many of the same risks as investing directly in non-U.S. issuers. Depositary receipts may involve higher expenses and may trade at a discount (or premium) to the underlying security.
The Fund invests in below-investment-grade (high-yield) debt securities and preferred stocks. Some of these high-yield securities may be convertible into equity securities of the issuer. Debt securities rated below-investment-grade are commonly referred to as “junk bonds” and are considered speculative with respect to the issuer’s capacity to pay interest and repay principal. These securities involve greater risk of loss, are subject to greater price volatility, may be less liquid and more difficult to value, especially during periods of economic uncertainty or change, than higher rated debt securities.
The Fund may invest in mortgage-related and asset-backed securities. The value of mortgage-related and asset-backed securities will be influenced by factors affecting the assets underlying such securities. As a result, during periods of declining asset value, difficult or frozen credit markets, swings in interest rates, or deteriorating economic conditions, mortgage-related and asset-backed securities may decline in value, face valuation difficulties, become more volatile and/or become illiquid. Mortgage-backed securities tend to be more sensitive to changes in interest rate than other types of debt securities. These securities are also subject to prepayment and extension risks. Some of these securities may receive little or no collateral protection from the underlying assets and are thus subject to the risk of default. The risk of such defaults is generally higher in the case of mortgage-backed investments offered by non-governmental issuers and those that include so-called “sub-prime” mortgages. The structure of some of these securities may be complex and there may be less available information than for other types of debt securities. Upon the occurrence of
Pioneer Securitized Income Fund | Annual Report | 7/31/22 33
certain triggering events or defaults, the Fund may become the holder of underlying assets at a time when those assets may be difficult to sell or may be sold only at a loss.
The Fund may invest in credit risk transfer securities. Credit risk transfer securities are unguaranteed and unsecured debt securities issued by government sponsored enterprises and therefore are not directly linked to or backed by the underlying mortgage loans. As a result, in the event that a government sponsored enterprise fails to pay principal or interest on its credit risk transfer securities or goes through a bankruptcy, insolvency or similar proceeding, holders of such credit risk transfer securities have no direct recourse to the underlying mortgage loans and will generally receive recovery on par with other unsecured note holders in such a scenario. The risks associated with an investment in credit risk transfer securities are different than the risks associated with an investment in mortgage-backed securities issued by Fannie Mae and Freddie Mac, or other government sponsored enterprise or issued by a private issuer, because some or all of the mortgage default or credit risk associated with the underlying mortgage loans is transferred to investors. As a result, investors in these securities could lose some or all of their investment in these securities if the underlying mortgage loans default.
The Fund’s investments, payment obligations and financing terms may be based on floating rates, such as LIBOR (London Interbank Offered Rate) or SOFR (Secured Overnight Financing Rate). ICE Benchmark Administration, the administrator of LIBOR, ceased publication of most LIBOR settings on a representative basis at the end of 2021 and is expected to cease publication of a majority of U.S. dollar LIBOR settings on a representative basis after June 30, 2023. In addition, global regulators have announced that, with limited exceptions, no new LIBOR-based contracts should be entered into after 2021. Actions by regulators have resulted in the establishment of alternative reference rates to LIBOR in most major currencies. Markets are developing in response to these new rates, but questions around liquidity in these rates and how to appropriately adjust these rates to eliminate any economic value transfer at the time of transition remain a significant concern. The effect of any changes to - or discontinuation of - LIBOR on the fund will vary depending on, among other things, existing fallback provisions in individual contracts and whether, how, and when industry participants develop and widely adopt new reference rates and fallbacks for both legacy and new products and instruments. In March 2022, the U.S. federal government enacted legislation to establish a process for replacing LIBOR in existing contracts that do not already provide for the use of a clearly defined or practicable replacement benchmark rate as described in the legislation. Generally speaking, for contracts that do not contain a fallback provision as described in the legislation, a benchmark replacement
34 Pioneer Securitized Income Fund | Annual Report | 7/31/22
recommended by the Federal Reserve Board will effectively automatically replace the USD LIBOR benchmark in the contract after June 30, 2023. The recommended benchmark replacement will be based on the SOFR published by the Federal Reserve Bank of New York, including any recommended spread adjustment and benchmark replacement conforming changes. The process of transitioning from LIBOR may involve, among other things, increased volatility or illiquidity in markets for instruments that rely on LIBOR. The transition may also result in a reduction in the value of certain LIBOR based investments held by the Fund or reduce the effectiveness of related transactions such as hedges. Any such effects of the transition away from LIBOR, as well as other unforeseen effects, could result in losses for the Fund. Because the usefulness of LIBOR as a benchmark may deteriorate during the transition period, these effects could occur at any time.
Russia launched a large-scale invasion of Ukraine on February 24, 2022. In response to the military action by Russia, various countries, including the U.S., the United Kingdom, and European Union issued broad-ranging economic sanctions against Russia and Belarus and certain companies and individuals. Since then, Russian securities have lost all, or nearly all, their market value, and many other issuers, securities and markets have been adversely affected. The United States and other countries may impose sanctions on other countries, companies and individuals in light of Russia’s military invasion. The extent and duration of the military action or future escalation of such hostilities, the extent and impact of existing and future sanctions, market disruptions and volatility, and the result of any diplomatic negotiations cannot be predicted. These and any related events could have a significant impact on the value and liquidity of certain Fund investments, on Fund performance and the value of an investment in the Fund, particularly with respect to securities and commodities, such as oil, natural gas and food commodities, with respect to the issuer’s capacity to pay interest and repay principal, as well as other sectors with exposure to Russian issuers or issuers in other countries affected by the invasion, and are likely to have collateral impacts on market sectors globally.
With the increased use of technologies such as the Internet to conduct business, the Fund is susceptible to operational, information security and related risks. While the Fund’s Adviser has established business continuity plans in the event of, and risk management systems to prevent, limit or mitigate, such cyber-attacks, there are inherent limitations in such plans and systems, including the possibility that certain risks have not been identified. Furthermore, the Fund cannot control the cybersecurity plans and systems put in place by service providers to the Fund such as the Fund’s custodian and accounting agent, and the Fund’s transfer agent. In addition, many beneficial owners of Fund shares hold them through accounts at broker-dealers, retirement platforms and other financial market
Pioneer Securitized Income Fund | Annual Report | 7/31/22 35
participants over which neither the Fund nor the Adviser exercises control. Each of these may in turn rely on service providers to them, which are also subject to the risk of cyber-attacks. Cybersecurity failures or breaches at the Adviser or the Fund’s service providers or intermediaries have the ability to cause disruptions and impact business operations, potentially resulting in financial losses, interference with the Fund’s ability to calculate its net asset value, impediments to trading, the inability of Fund shareowners to effect share purchases, redemptions or exchanges or receive distributions, loss of or unauthorized access to private shareowner information and violations of applicable privacy and other laws, regulatory fines, penalties, reputational damage, or additional compliance costs. Such costs and losses may not be covered under any insurance. In addition, maintaining vigilance against cyber-attacks may involve substantial costs over time, and system enhancements may themselves be subject to cyber-attacks.
The Fund’s prospectus contains unaudited information regarding the Fund’s principal risks. Please refer to that document when considering the Fund’s principal risks.
G. Futures Contracts
All futures contracts entered into by the Fund are traded on a futures exchange. Upon entering into a futures contract, the Fund is required to deposit with a broker an amount of cash or securities equal to the minimum “initial margin” requirements of the associated futures exchange. The amount of cash deposited with the broker as collateral at July 31, 2022, is recorded as “Futures collateral” on the Statement of Assets and Liabilities.
Subsequent payments for futures contracts (“variation margin”) are paid or received by the Fund, depending on the daily fluctuation in the value of the contracts, and are recorded by the Fund as unrealized appreciation or depreciation. Cash received from or paid to the broker related to previous margin movement is held in a segregated account at the broker and is recorded as either “Due from broker for futures” or “Due to broker for futures” on the Statement of Assets and Liabilities. When the contract is closed, the Fund realizes a gain or loss equal to the difference between the opening and closing value of the contract as well as any fluctuation in foreign currency exchange rates where applicable. Futures contracts are subject to market risk, interest rate risk and currency exchange rate risk. Changes in value of the contracts may not directly correlate to the changes in value of the underlying securities. With futures, there is reduced counterparty credit risk to the Fund since futures are exchange-traded and the exchange’s clearinghouse, as counterparty to all exchange-traded futures, guarantees the futures against default.
36 Pioneer Securitized Income Fund | Annual Report | 7/31/22
The average market value of futures contracts open during the year ended July 31, 2022, was $(4,635,890). There were no open futures contracts outstanding at July 31, 2022.
2. Management Agreement
The Adviser manages the Fund’s portfolio. Management fees payable under the Fund’s Investment Management Agreement with the Adviser are calculated daily and paid monthly at the annual rate of 0.55% of the fund’s average daily net assets up to $1 billion and 0.50% of the fund’s average daily net assets over $1 billion. For the year ended July 31, 2022, the effective management fee (excluding waivers and/or assumption of expenses) was equivalent to 0.55% of the Fund’s average daily net assets.
The Adviser has contractually agreed to limit ordinary operating expenses (ordinary operating expenses means all fund expenses other than taxes, brokerage commissions, acquired fund fees and expenses, and extraordinary expenses, such as litigation) to the extent required to reduce Fund expenses to 0.90% and 0.65% of the average daily net assets attributable to Class A and Class Y shares, respectively. These expense limitations are in effect through December 1, 2022. There can be no assurance that the Adviser will extend the expense limitations beyond the date referred to above. Fees waived and expenses reimbursed during the year ended July 31, 2022 are reflected in the Statement of Operations.
In addition, under the management and administration agreements, certain other services and costs, including accounting, regulatory reporting and insurance premiums, are paid by the Fund as administrative reimbursements. Included in “Due to affiliates” reflected on the Statement of Assets and Liabilities is $678 in management fees, administrative costs and certain other reimbursements payable to the Adviser at July 31, 2022.
3. Compensation of Trustees and Officers
The Fund pays an annual fee to its Trustees. The Adviser reimburses the Fund for fees paid to the Interested Trustees. The Fund does not pay any salary or other compensation to its officers. For the year ended July 31, 2022, the Fund paid $8,092 in Trustees’ compensation, which is reflected on the Statement of Operations as Trustees’ fees. At July 31, 2022, the Fund had a payable for Trustees’ fees on its Statement of Assets and Liabilities of $693.
4. Transfer Agent
For the period from August 1, 2021 to November 21, 2021, DST Asset Manager Solutions, Inc. served as the transfer agent to the Fund at negotiated rates. Effective November 22, 2021, BNY Mellon Investment Servicing (US) Inc. serves as the transfer agent to the Fund at negotiated rates. Transfer agent fees and payables shown on the Statement of
Pioneer Securitized Income Fund | Annual Report | 7/31/22 37
Operations and the Statement of Assets and Liabilities, respectively, include sub-transfer agent expenses incurred through the Fund’s omnibus relationship contracts.
In addition, the Fund reimbursed the transfer agent for out-of-pocket expenses incurred by the transfer agent related to shareowner communications activities such as proxy and statement mailings, and outgoing phone calls. For the year ended July 31, 2022, such out-of-pocket expenses by class of shares were as follows:
| Shareowner Communications: | |
| Class A | $ 47 |
| Class Y | 2,776 |
| Total | $2,823 |
5. Distribution Plan
The Fund has adopted a distribution plan (the “Plan”) pursuant to Rule 12b-1 of the Investment Company Act of 1940 with respect to its Class A shares. Pursuant to the Plan, the Fund pays the Distributor 0.25% of the average daily net assets attributable to Class A shares as compensation for personal services and/or account maintenance services or distribution services with regard to Class A shares. Included in “Due to affiliates” reflected on the Statement of Assets and Liabilities is $69 in distribution fees payable to the Distributor at July 31, 2022.
In addition, redemptions of Class A shares may be subject to a contingent deferred sales charge (“CDSC”). A CDSC of 1.00% may be imposed on redemptions of certain net asset value purchases of Class A shares within 12 months of purchase. Shares purchased as part of an exchange remain subject to any CDSC that applied to the original purchase of those shares. There is no CDSC for Class Y shares. Proceeds from the CDSCs are paid to the Distributor. For the year ended July 31, 2022, CDSCs in the amount of $0 were paid to the Distributor.
6. Additional Disclosures about Derivative Instruments and Hedging Activities
The Fund’s use of derivatives may enhance or mitigate the Fund’s exposure to the following risks:
Interest rate risk relates to the fluctuations in the value of interest-bearing securities due to changes in the prevailing levels of market interest rates.
Credit risk relates to the ability of the issuer of a financial instrument to make further principal or interest payments on an obligation or commitment that it has to the Fund.
38 Pioneer Securitized Income Fund | Annual Report | 7/31/22
Foreign exchange rate risk relates to fluctuations in the value of an asset or liability due to changes in currency exchange rates.
Equity risk relates to the fluctuations in the value of financial instruments as a result of changes in market prices (other than those arising from interest rate risk or foreign exchange rate risk), whether caused by factors specific to an individual investment, its issuer, or all factors affecting all instruments traded in a market or market segment.
Commodity risk relates to the risk that the value of a commodity or commodity index will fluctuate based on increases or decreases in the commodities market and factors specific to a particular industry or commodity.
The effect of derivative instruments (not considered to be hedging instruments for accounting disclosure purposes) on the Statement of Operations by risk exposure at July 31, 2022 was as follows:
| | | | | | |
| | | | Foreign | | |
| Statement of | Interest | Credit | Exchange | Equity | Commodity |
| Operations | Rate Risk | Risk | Rate Risk | Risk | Risk |
| Net Realized Gain | | | | | |
| (Loss) on | | | | | |
| Futures contracts | $646,920 | $— | $— | $— | $— |
| Total Value | $646,920 | $— | $— | $— | $— |
| Change in Net | | | | | |
| Unrealized | | | | | |
| Appreciation | | | | | |
| (Depreciation) on | | | | | |
| Futures contracts | $94,979 | $— | $— | $— | $— |
| Total Value | $94,979 | $— | $— | $— | $— |
7. Changes in Custodian and Sub-Administrator, and Transfer Agent
Effective November 22, 2021, The Bank of New York Mellon Corporation (“BNY Mellon”) serves as the Fund’s Custodian and Sub-Administrator.
Effective November 22, 2021, BNY Mellon Investment Servicing (US) Inc. serves as the Fund’s shareholder servicing and transfer agent.
Pioneer Securitized Income Fund | Annual Report | 7/31/22 39
Report of Independent Registered Public Accounting Firm
To the Board of Trustees of Pioneer Series Trust IV and the Shareholders of Pioneer Securitized Income Fund:
Opinion on the Financial Statements
We have audited the accompanying statement of assets and liabilities of Pioneer Securitized Income Fund (the “Fund”) (one of the funds constituting Pioneer Series Trust IV (the “Trust”)), including the schedule of investments, as of July 31, 2022, and the related statement of operations for the year then ended, the statements of changes in net assets for each of the two years in the period then ended, the financial highlights for each of the two years in the period ended July 31, 2022 and the period from December 10, 2019 (commencement of operations) through July 31, 2020 and the related notes (collectively referred to as the “financial statements”). In our opinion, the financial statements present fairly, in all material respects, the financial position of Pioneer Securitized Income Fund at July 31, 2022, the results of its operations for the year then ended, the changes in its net assets for each of the two years in the period then ended, and its financial highlights for each of the two years in the period ended July 31, 2022 and the period from December 10, 2019 (commencement of operations) through July 31, 2020, in conformity with U.S. generally accepted accounting principles.
Basis for Opinion
These financial statements are the responsibility of the Trust’s management. Our responsibility is to express an opinion on the Fund’s financial statements based on our audits. We are a public accounting firm registered with the Public Company Accounting Oversight Board (United States) ("PCAOB") and are required to be independent with respect to the Trust in accordance with the U.S. federal securities laws and the applicable rules and regulations of the Securities and Exchange Commission and the PCAOB.
We conducted our audits in accordance with the standards of the PCAOB. Those standards require that we plan and perform the audit to obtain reasonable assurance about whether the financial statements are free of material misstatement, whether due to error or fraud. The Trust is not required to have, nor were we engaged to perform, an audit of the Trust’s internal control over financial reporting. As part of our audits, we are required to obtain an understanding of internal control over financial reporting, but not for the purpose of expressing an opinion on the effectiveness of the Trust’s internal control over financial reporting. Accordingly, we express no such opinion.
40 Pioneer Securitized Income Fund | Annual Report | 7/31/22
Our audits included performing procedures to assess the risks of material misstatement of the financial statements, whether due to error or fraud, and performing procedures that respond to those risks. Such procedures included examining, on a test basis, evidence regarding the amounts and disclosures in the financial statements. Our procedures included confirmation of securities owned as of July 31, 2022, by correspondence with the custodian and brokers or by other appropriate auditing procedures where replies from brokers were not received. Our audits also included evaluating the accounting principles used and significant estimates made by management, as well as evaluating the overall presentation of the financial statements. We believe that our audits provide a reasonable basis for our opinion.

We have served as the auditor of one or more investment companies in the Pioneer family of funds since 2017.
Boston, Massachusetts
September 28, 2022
Pioneer Securitized Income Fund | Annual Report | 7/31/22 41
Additional Information (unaudited)
Qualified interest income is exempt from nonresident alien (NRA) tax withholding. The percentage of the Fund’s ordinary income distributions derived from qualified interest income was 81%.
The Fund designated $471,689 as long-term capital gains distributions during the year ended July 31, 2022. Distributable long-term gains are based on net realized long-term gains determined on a tax basis and may differ from such amounts for financial reporting purposes.
42 Pioneer Securitized Income Fund | Annual Report | 7/31/22
Statement Regarding Liquidity Risk Management Program
As required by law, the Fund has adopted and implemented a liquidity risk management program (the “Program”) that is designed to assess and manage liquidity risk. Liquidity risk is the risk that the Fund could not meet requests to redeem its shares without significant dilution of remaining investors’ interests in the Fund. The Fund’s Board of Trustees designated a liquidity risk management committee (the “Committee”) consisting of employees of Amundi Asset Management US, Inc. (the “Adviser”) to administer the Program.
The Committee provided the Board of Trustees with a report that addressed the operation of the Program and assessed its adequacy and effectiveness of implementation (the “Report”). The Report covered the period from January 1, 2021 through December 31, 2021 (the “Reporting Period”).
The Report confirmed that, throughout the Reporting Period, the Committee had monitored the Fund’s portfolio liquidity and liquidity risk on an ongoing basis, as described in the Program and in Board reporting throughout the Reporting Period.
The Report discussed the Committee’s annual review of the Program, which addressed, among other things, the following elements of the Program:
The Committee reviewed the Fund’s investment strategy and liquidity of portfolio investments during both normal and reasonably foreseeable stressed conditions. The Committee noted that the Fund’s investment strategy continues to be appropriate for an open-end fund, taking into account, among other things, whether and to what extent the Fund held less liquid and illiquid assets and the extent to which any such investments affected the Fund’s ability to meet redemption requests. In managing and reviewing the Fund’s liquidity risk, the Committee also considered the extent to which the Fund’s investment strategy involves a relatively concentrated portfolio or large positions in particular issuers, the extent to which the Fund uses borrowing for investment purposes, and the extent to which the Fund uses derivatives (including for hedging purposes). The Committee also reviewed the Fund’s short-term and long-term cash flow projections during both normal and reasonably foreseeable stressed conditions. In assessing the Fund’s cash flow projections, the Committee considered, among other factors, historical net redemption activity, redemption policies, ownership concentration, distribution channels, and the degree of certainty associated with the Fund’s short-term and long-term cash flow projections. The Committee also considered the Fund’s
Pioneer Securitized Income Fund | Annual Report | 7/31/22 43
holdings of cash and cash equivalents, as well as borrowing arrangements and other funding sources, including, if applicable, the Fund’s participation in a credit facility, as components of the Fund’s ability to meet redemption requests. The Fund has adopted an in-kind redemption policy which may be utilized to meet larger redemption requests.
The Committee reviewed the Program’s liquidity classification methodology for categorizing the Fund’s investments into one of four liquidity buckets. In reviewing the Fund’s investments, the Committee considered, among other factors, whether trading varying portions of a position in a particular portfolio investment or asset class in sizes the Fund would reasonably anticipate trading, would be reasonably expected to significantly affect liquidity.
The Committee performed an analysis to determine whether the Fund is required to maintain a Highly Liquid Investment Minimum, and determined that no such minimum is required because the Fund primarily holds highly liquid investments.
The Report stated that the Committee concluded the Program operates adequately and effectively, in all material respects, to assess and manage the Fund’s liquidity risk throughout the Reporting Period.
44 Pioneer Securitized Income Fund | Annual Report | 7/31/22
Trustees, Officers and Service Providers
Investment Adviser and Administrator
Amundi Asset Management US, Inc.
Custodian and Sub-Administrator
The Bank of New York Mellon Corporation
Independent Registered Public Accounting Firm
Ernst & Young LLP
Principal Underwriter
Amundi Distributor US, Inc.
Legal Counsel
Morgan, Lewis & Bockius LLP
Transfer Agent
BNY Mellon Investment Servicing (US) Inc.
Proxy Voting Policies and Procedures of the Fund are available without charge, upon request, by calling our toll free number (1-800-225-6292). Information regarding how the Fund voted proxies relating to portfolio securities during the most recent 12-month period ended June 30 is publicly available to shareowners at www.amundi.com/us. This information is also available on the Securities and Exchange Commission’s web site at www.sec.gov.
Trustees and Officers
The Fund’s Trustees and officers are listed below, together with their principal occupations and other directorships they have held during at least the past five years. Trustees who are interested persons of the Fund within the meaning of the 1940 Act are referred to as Interested Trustees. Trustees who are not interested persons of the Fund are referred to as Independent Trustees. Each of the Trustees serves as a Trustee of each of the 49 U.S. registered investment portfolios for which Amundi US serves as investment adviser (the “Pioneer Funds”). The address for all Trustees and all officers of the Fund is 60 State Street, Boston, Massachusetts 02109.
The Statement of Additional Information of the Fund includes additional information about the Trustees and is available, without charge, upon request, by calling 1-800-225-6292.
Pioneer Securitized Income Fund | Annual Report | 7/31/22 45
Independent Trustees
| | | | |
| Name, Age and Position | Term of Office and | Principal Occupation(s) During At Least | Other Directorships Held by Trustee |
| Held With the Fund | Length of Service | The Past Five Years | During At Least The Past Five Years |
| Thomas J. Perna (71) | Trustee since 2006. | Private investor (2004 – 2008 and 2013 – present); Chairman (2008 – 2013) | Director, Broadridge Financial |
| Chairman of the Board | Serves until a successor | and Chief Executive Officer (2008 – 2012), Quadriserv, Inc. (technology | Solutions, Inc. (investor |
| and Trustee | trustee is elected or | products for securities lending industry); and Senior Executive Vice President, | communications and securities |
| | earlier retirement | The Bank of New York (financial and securities services) (1986 – 2004) | processing provider for financial |
| | or removal. | | services industry) (2009 – present); |
| | | | Director, Quadriserv, Inc. (2005 – |
| | | | 2013); and Commissioner, New |
| | | | Jersey State Civil Service |
| | | | Commission (2011 – 2015) |
| John E. Baumgardner, | Trustee since 2019. | Of Counsel (2019 – present), Partner (1983-2018), Sullivan & | Chairman, The Lakeville Journal |
| Jr. (71)* | Serves until a successor | Cromwell LLP (law firm). | Company, LLC, (privately-held |
| Trustee | trustee is elected or | | community newspaper group) |
| | earlier retirement | | (2015-present) |
| | or removal. | | |
| Diane Durnin (65) | Trustee since 2019. | Managing Director - Head of Product Strategy and Development, BNY | None |
| Trustee | Serves until a successor | Mellon Investment Management (investment management firm) (2012-2018); | |
| | trustee is elected or | Vice Chairman – The Dreyfus Corporation (2005 – 2018): Executive Vice | |
| | earlier retirement | President Head of Product, BNY Mellon Investment Management | |
| | or removal. | (2007-2012); Executive Director- Product Strategy, Mellon Asset Management | |
| | | (2005-2007); Executive Vice President Head of Products, Marketing and | |
| | | Client Service, Dreyfus Corporation (investment management firm) | |
| | | (2000-2005); Senior Vice President Strategic Product and Business | |
| | | Development, Dreyfus Corporation (1994-2000) | |
| * | | Mr. Baumgardner is Of Counsel to Sullivan & Cromwell LLP, which acts as counsel to the Independent Trustees of each Pioneer Fund. |
46 Pioneer Securitized Income Fund | Annual Report | 7/31/22
| | | | |
| Name, Age and Position | Term of Office and | Principal Occupation(s) During At Least | Other Directorships Held by Trustee |
| Held With the Fund | Length of Service | The Past Five Years | During At Least The Past Five Years |
| Benjamin M. Friedman (78) | Trustee since 2008. | William Joseph Maier Professor of Political Economy, Harvard University | Trustee, Mellon Institutional Funds |
| Trustee | Serves until a successor | (1972 – present) | Investment Trust and Mellon |
| | trustee is elected or | | Institutional Funds Master Portfolio |
| | earlier retirement | | (oversaw 17 portfolios in fund |
| | or removal. | | complex) (1989 - 2008) |
| Craig C. MacKay (59) | Trustee since 2021. | Partner, England & Company, LLC (advisory firm) (2012 – present); Group | Director, Equitable Holdings, Inc. |
| Trustee | Serves until a successor | Head – Leveraged Finance Distribution, Oppenheimer & Company | (financial services holding company) |
| | trustee is elected or | (investment bank) (2006 – 2012); Group Head – Private Finance & High Yield | (2022 – present); Board Member of |
| | earlier retirement | Capital Markets Origination, SunTrust Robinson Humphrey (investment | Carver Bancorp, Inc. (holding |
| | or removal. | bank) (2003 – 2006); and Founder and Chief Executive Officer, HNY | company) and Carver Federal |
| | | Associates, LLC (investment bank) (1996 – 2003) | Savings Bank, NA (2017 – present); |
| | | | Advisory Council Member, |
| | | | MasterShares ETF (2016 – 2017); |
| | | | Advisory Council Member, The Deal |
| | | | (financial market information |
| | | | publisher) (2015 – 2016); Board Co- |
| | | | Chairman and Chief Executive |
| | | | Officer, Danis Transportation |
| | | | Company (privately-owned |
| | | | commercial carrier) (2000 – 2003); |
| | | | Board Member and Chief Financial |
| | | | Officer, Customer Access Resources |
| | | | (privately-owned teleservices |
| | | | company) (1998 – 2000); Board |
| | | | Member, Federation of Protestant |
| | | | Welfare Agencies (human services |
| | | | agency) (1993 – present); and Board |
| | | | Treasurer, Harlem Dowling Westside |
| | | | Center (foster care agency) |
| | | | (1999 – 2018) |
Pioneer Securitized Income Fund | Annual Report | 7/31/22 47
Independent Trustees (continued)
| | | | |
| Name, Age and Position | Term of Office and | Principal Occupation(s) During At Least | Other Directorships Held by Trustee |
| Held With the Fund | Length of Service | The Past Five Years | During At Least The Past Five Years |
| Lorraine H. Monchak (66) | Trustee since 2017. | Chief Investment Officer, 1199 SEIU Funds (healthcare workers union | None |
| Trustee | (Advisory Trustee from | pension funds) (2001 – present); Vice President – International Investments | |
| | 2014 - 2017). Serves until | Group, American International Group, Inc. (insurance company) | |
| | a successor trustee is | (1993 – 2001); Vice President – Corporate Finance and Treasury Group, | |
| | elected or earlier | Citibank, N.A. (1980 – 1986 and 1990 – 1993); Vice President – Asset/Liability | |
| | retirement or removal. | Management Group, Federal Farm Funding Corporation (government- | |
| | | sponsored issuer of debt securities) (1988 – 1990); Mortgage Strategies | |
| | | Group, Shearson Lehman Hutton, Inc. (investment bank) (1987 – 1988); | |
| | | Mortgage Strategies Group, Drexel Burnham Lambert, Ltd. (investment bank) | |
| | | (1986 – 1987) | |
| Marguerite A. Piret (74) | Trustee since 2005. | Chief Financial Officer, American Ag Energy, Inc. (controlled environment | Director of New America High |
| Trustee | Serves until a successor | and agriculture company) (2016 – present); President and Chief Executive | Income Fund, Inc. (closed-end |
| | trustee is elected or | Officer, Metric Financial Inc. (formerly known as Newbury Piret Company) | investment company) |
| | earlier retirement | (investment banking firm) (1981 – 2019) | (2004 – present); and Member, |
| | or removal. | | Board of Governors, Investment |
| | | | Company Institute (2000 – 2006) |
| Fred J. Ricciardi (75) | Trustee since 2014. | Private investor (2020 – present); Consultant (investment company services) | None |
| Trustee | Serves until a successor | (2012 – 2020); Executive Vice President, BNY Mellon (financial and investment | |
| | trustee is elected or | company services) (1969 – 2012); Director, BNY International Financing Corp. | |
| | earlier retirement | (financial services) (2002 – 2012); Director, Mellon Overseas Investment Corp. | |
| | or removal. | (financial services) (2009 – 2012); Director, Financial Models (technology) | |
| | | (2005-2007); Director, BNY Hamilton Funds, Ireland (offshore investment | |
| | | companies) (2004-2007); Chairman/Director, AIB/BNY Securities Services, Ltd., |
| | | Ireland (financial services) (1999-2006); Chairman, BNY Alternative Investment | |
| | | Services, Inc. (financial services) (2005-2007) | |
48 Pioneer Securitized Income Fund | Annual Report | 7/31/22
Interested Trustees
| | | | |
| Name, Age and Position | Term of Office and | Principal Occupation(s) During At Least | Other Directorships Held by Trustee |
| Held With the Fund | Length of Service | The Past Five Years | During At Least The Past Five Years |
| Lisa M. Jones (60)** | Trustee since 2017. | Director, CEO and President of Amundi US, Inc. (investment management | None |
| Trustee, President and Chief | Serves until a successor | firm) (since September 2014); Director, CEO and President of Amundi Asset | |
| Executive Officer | trustee is elected or | Management US, Inc. (since September 2014); Director, CEO and President | |
| | earlier retirement | of Amundi Distributor US, Inc. (since September 2014); Director, CEO and | |
| | or removal | President of Amundi Asset Management US, Inc. (since September 2014); | |
| | | Chair, Amundi US, Inc., Amundi Distributor US, Inc. and Amundi Asset | |
| | | Management US, Inc. (September 2014 – 2018); Managing Director, Morgan | |
| | | Stanley Investment Management (investment management firm) (2010 – 2013); |
| | | Director of Institutional Business, CEO of International, Eaton Vance | |
| | | Management (investment management firm) (2005 – 2010); Director of Amundi |
| | | Holdings US, Inc. (since 2017) | |
| Kenneth J. Taubes (64)** | Trustee since 2014. | Director and Executive Vice President (since 2008) and Chief Investment | None |
| Trustee | Serves until a successor | Officer, U.S. (since 2010) of Amundi US, Inc. (investment management firm); | |
| | trustee is elected or | Director and Executive Vice President and Chief Investment Officer, U.S. of | |
| | earlier retirement | Amundi US (since 2008); Executive Vice President and Chief Investment | |
| | or removal | Officer, U.S. of Amundi Asset Management US, Inc. (since 2009); Portfolio | |
| | | Manager of Amundi US (since 1999); Director of Amundi Holdings US, Inc. | |
| | | (since 2017) | |
| ** | | Ms. Jones and Mr. Taubes are Interested Trustees because they are officers or directors of the Fund’s investment adviser and certain of its affiliates. |
Pioneer Securitized Income Fund | Annual Report | 7/31/22 49
Fund Officers
| | | | |
| Name, Age and Position | Term of Office and | Principal Occupation(s) During At Least | Other Directorships Held by Trustee |
| Held With the Fund | Length of Service | The Past Five Years | During At Least The Past Five Years |
| Christopher J. Kelley (57) | Since 2005. Serves at the | Vice President and Associate General Counsel of Amundi US since | None |
| Secretary and Chief | discretion of the Board | January 2008; Secretary and Chief Legal Officer of all of the Pioneer Funds | |
| Legal Officer | | since June 2010; Assistant Secretary of all of the Pioneer Funds from | |
| | | September 2003 to May 2010; Vice President and Senior Counsel of | |
| | | Amundi US from July 2002 to December 2007 | |
| Thomas Reyes (59) | Since 2010. Serves at the | Assistant General Counsel of Amundi US since May 2013 and Assistant | None |
| Assistant Secretary | discretion of the Board | Secretary of all the Pioneer Funds since June 2010; Counsel of Amundi US | |
| | | from June 2007 to May 2013 | |
| Anthony J. Koenig, Jr. (58) | Since 2021. Serves at the | Managing Director, Chief Operations Officer and Fund Treasurer of | None |
| Treasurer and | discretion of the Board | Amundi US since May 2021; Treasurer of all of the Pioneer Funds since | |
| Chief Financial and | | May 2021; Assistant Treasurer of all of the Pioneer Funds from January 2021 | |
| Accounting Officer | | to May 2021; and Chief of Staff, US Investment Management of Amundi US | |
| | | from May 2008 to January 2021 | |
| Luis I. Presutti (57) | Since 2005. Serves at the | Director – Fund Treasury of Amundi US since 1999; and Assistant Treasurer | None |
| Assistant Treasurer | discretion of the Board | of all of the Pioneer Funds since 1999 | |
| Gary Sullivan (64) | Since 2005. Serves at the | Senior Manager – Fund Treasury of Amundi US since 2012; and Assistant | None |
| Assistant Treasurer | discretion of the Board | Treasurer of all of the Pioneer Funds since 2002 | |
| Antonio Furtado (40) | Since 2020. Serves at the | Fund Oversight Manager – Fund Treasury of Amundi US since 2020; | None |
| Assistant Treasurer | discretion of the Board | Assistant Treasurer of all of the Pioneer Funds since 2020; and Senior Fund | |
| | | Treasury Analyst from 2012 - 2020 | |
50 Pioneer Securitized Income Fund | Annual Report | 7/31/22
| | | | |
| Name, Age and Position | Term of Office and | Principal Occupation(s) During At Least | Other Directorships Held by Trustee |
| Held With the Fund | Length of Service | The Past Five Years | During At Least The Past Five Years |
| Michael Melnick (51) | Since 2021. Serves at the | Vice President - Deputy Fund Treasurer of Amundi US since May 2021; | None |
| Assistant Treasurer | discretion of the Board | Assistant Treasurer of all of the Pioneer Funds since July 2021; Director of | |
| | | Regulatory Reporting of Amundi US from 2001 – 2021; and Director of Tax | |
| | | of Amundi US from 2000 - 2001 | |
| John Malone (51) | Since 2018. Serves at the | Managing Director, Chief Compliance Officer of Amundi US Asset | None |
| Chief Compliance Officer | discretion of the Board | Management; Amundi Asset Management US, Inc.; and the Pioneer Funds | |
| | | since September 2018; Chief Compliance Officer of Amundi Distributor US, Inc. | |
| | | since January 2014. | |
| Brandon Austin (50) | Since March 2022. Serves | Director, Financial Security – Amundi Asset Management; Anti-Money | None |
| Anti-Money | at the discretion of | Laundering Officer of all the Pioneer Funds since March 2022 Director of | |
| Laundering Officer | the Board | Financial Security of Amundi US since July 2021; Vice President, Head of | |
| | | BSA, AML and OFAC, Deputy Compliance Manager, Crédit Agricole Indosuez | |
| | | Wealth Management (investment management firm) (2013 – 2021) | |
Pioneer Securitized Income Fund | Annual Report | 7/31/22 51
This page was intentionally left blank.
52 Pioneer Securitized Income Fund | Annual Report | 7/31/22
How to Contact Amundi
We are pleased to offer a variety of convenient ways for you to contact us for assistance or information.
| | |
| Call us for: | |
| Account Information, including existing accounts, | |
| new accounts, prospectuses, applications | |
| and service forms | 1-800-225-6292 |
| FactFoneSM for automated fund yields, prices, | |
| account information and transactions | 1-800-225-4321 |
| Retirement plans information | 1-800-622-0176 |
Write to us:
Amundi
P.O. Box 9897
Providence, RI 02940-8097
| | |
| Our toll-free fax | 1-800-225-4240 |
| Our internet e-mail address | us.askamundi@amundi.com |
| (for general questions about Amundi only) | |
| |
| Visit our web site: www.amundi.com/us | |
This report must be preceded or accompanied by a prospectus.
The Fund files a complete schedule of portfolio holdings with the Securities and Exchange Commission for the first and third quarters of each fiscal year as an exhibit to its reports on Form N-PORT. Shareholders may view the filed Form N-PORT by visiting the Commission’s web site at https://www.sec.gov.

Amundi Asset Management US, Inc.
60 State Street
Boston, MA 02109
www.amundi.com/us
Securities offered through Amundi Distributor US, Inc.,
60 State Street, Boston, MA 02109
Underwriter of Pioneer Mutual Funds, Member SIPC
© 2022 Amundi Asset Management US, Inc. 32216-02-0922
ITEM 2. CODE OF ETHICS.
(a) Disclose whether, as of the end of the period covered by the report, the registrant has adopted a code of ethics that applies to the registrant’s principal executive officer, principal financial officer, principal accounting officer or controller, or persons performing similar functions, regardless of whether these individuals are employed by the registrant or a third party. If the registrant has not adopted such a code of ethics, explain why it has not done so.
The registrant has adopted, as of the end of the period covered by this report, a code of ethics that applies to the registrant’s principal executive officer, principal financial officer, principal accounting officer and controller.
(b) For purposes of this Item, the term “code of ethics” means written standards that are reasonably designed to deter wrongdoing and to promote:
(1) Honest and ethical conduct, including the ethical handling of actual or apparent conflicts of interest between personal and professional relationships;
(2) Full, fair, accurate, timely, and understandable disclosure in reports and documents that a registrant files with, or submits to, the Commission and in other public communications made by the registrant;
(3) Compliance with applicable governmental laws, rules, and regulations;
(4) The prompt internal reporting of violations of the code to an appropriate person or persons identified in the code; and
(5) Accountability for adherence to the code.
(c) The registrant must briefly describe the nature of any amendment, during the period covered by the report, to a provision of its code of ethics that applies to the registrant’s principal executive officer, principal financial officer, principal accounting officer or controller, or persons performing similar functions, regardless of whether these individuals are employed by the registrant or a third party, and that relates to any element of the code of ethics definition enumerated in paragraph (b) of this Item. The registrant must file a copy of any such amendment as an exhibit pursuant to Item 10(a), unless the registrant has elected to satisfy paragraph (f) of this Item by posting its code of ethics on its website pursuant to paragraph (f)(2) of this Item, or by undertaking to provide its code of ethics to any person without charge, upon request, pursuant to paragraph (f)(3) of this Item.
The registrant has made no amendments to the code of ethics during the period covered by this report.
(d) If the registrant has, during the period covered by the report, granted a waiver, including an implicit waiver, from a provision of the code of ethics to the registrant’s principal executive officer, principal financial officer, principal accounting officer or controller, or persons performing similar functions, regardless of whether these individuals are employed by the registrant or a third party, that relates to one or more of the items set forth in paragraph (b) of this Item, the registrant must briefly describe the nature of the waiver, the name of the person to whom the waiver was granted, and the date of the waiver.
Not applicable.
(e) If the registrant intends to satisfy the disclosure requirement under paragraph (c) or (d) of this Item regarding an amendment to, or a waiver from, a provision of its code of ethics that applies to the registrant’s principal executive officer, principal financial officer, principal accounting officer or controller, or persons performing similar functions and that relates to any element of the code of ethics definition
enumerated in paragraph (b) of this Item by posting such information on its Internet website, disclose the registrant’s Internet address and such intention.
Not applicable.
(f) The registrant must:
(1) File with the Commission, pursuant to Item 12(a)(1), a copy of its code of ethics that applies to the registrant’s principal executive officer, principal financial officer, principal accounting officer or controller, or persons performing similar functions, as an exhibit to its annual report on this Form N-CSR (see attachment);
(2) Post the text of such code of ethics on its Internet website and disclose, in its most recent report on this Form N-CSR, its Internet address and the fact that it has posted such code of ethics on its Internet website; or
(3) Undertake in its most recent report on this Form N-CSR to provide to any person without charge, upon request, a copy of such code of ethics and explain the manner in which such request may be made. See Item 10(2)
ITEM 3. AUDIT COMMITTEE FINANCIAL EXPERT.
(a) (1) Disclose that the registrant’s Board of Trustees has determined that the registrant either:
(i) Has at least one audit committee financial expert serving on its audit committee; or
(ii) Does not have an audit committee financial expert serving on its audit committee.
The registrant’s Board of Trustees has determined that the registrant has at least one audit committee financial expert.
(2) If the registrant provides the disclosure required by paragraph (a)(1)(i) of this Item, it must disclose the name of the audit committee financial expert and whether that person is “independent.” In order to be considered “independent” for purposes of this Item, a member of an audit committee may not, other than in his or her capacity as a member of the audit committee, the Board of Trustees, or any other board committee:
(i) Accept directly or indirectly any consulting, advisory, or other compensatory fee from the issuer; or
(ii) Be an “interested person” of the investment company as defined in Section 2(a)(19) of the Act (15 U.S.C. 80a-2(a)(19)).
Mr. Fred J. Ricciardi, an independent Trustee, is such an audit committee financial expert.
(3) If the registrant provides the disclosure required by paragraph (a)(1) (ii) of this Item, it must explain why it does not have an audit committee financial expert.
Not applicable.
ITEM 4. PRINCIPAL ACCOUNTANT FEES AND SERVICES.
(a) Disclose, under the caption AUDIT FEES, the aggregate fees billed for each of the last two fiscal years for professional services rendered by the principal accountant for the audit of the registrant’s annual financial statements or services that are normally provided by the accountant in connection with statutory and regulatory filings or engagements for those fiscal years.
The audit fees for the Trust were $167,808 payable to Ernst & Young LLP for the year ended July 31, 2022 and $156,100 for the year ended July 31, 2021.
(b) Disclose, under the caption AUDIT-RELATED FEES, the aggregate fees billed in each of the last two fiscal years for assurance and related services by the principal accountant that are reasonably related to the performance of the audit of the registrant’s financial statements and are not reported under paragraph (a) of this Item. Registrants shall describe the nature of the services comprising the fees disclosed under this category.
There were no audit-related services in 2022 or 2021.
(c) Disclose, under the caption TAX FEES, the aggregate fees billed in each of the last two fiscal years for professional services rendered by the principal accountant for tax compliance, tax advice, and tax planning. Registrants shall describe the nature of the services comprising the fees disclosed under this category.
The Trust paid aggregate non-audit fees to Ernst & Young LLP for tax services of $29,234 and $27,195 during the fiscal years ended July 31, 2022 and 2021, respectively.
(d) Disclose, under the caption ALL OTHER FEES, the aggregate fees billed in each of the last two fiscal years for products and services provided by the principal accountant, other than the services reported in paragraphs (a) through (c) of this Item. Registrants shall describe the nature of the services comprising the fees disclosed under this category.
There were no other fees in 2022 or 2021.
(e) (1) Disclose the audit committee’s pre-approval policies and procedures described in paragraph (c)(7) of Rule 2-01 of Regulation S-X.
PIONEER FUNDS
APPROVAL OF AUDIT, AUDIT-RELATED, TAX AND OTHER SERVICES
PROVIDED BY THE INDEPENDENT AUDITOR
SECTION I - POLICY PURPOSE AND APPLICABILITY
The Pioneer Funds recognize the importance of maintaining the independence of their outside auditors. Maintaining independence is a shared responsibility involving Amundi Asset Management US, Inc., the audit committee and the independent auditors.
The Funds recognize that a Fund’s independent auditors: 1) possess knowledge of the Funds, 2) are able to incorporate certain services into the scope of the audit, thereby avoiding redundant work, cost and disruption of Fund personnel and processes, and 3) have expertise that has value to the Funds. As a result, there are situations where it is desirable to use the Fund’s independent auditors for services in addition to the annual audit and where the potential for conflicts of interests are minimal. Consequently, this policy, which is intended to comply with Rule 210.2-01(C)(7), sets forth guidelines and procedures to be followed by the Funds when retaining the independent audit firm to perform audit, audit-related tax and other services under those circumstances, while also maintaining independence.
Approval of a service in accordance with this policy for a Fund shall also constitute approval for any other Fund whose pre-approval is required pursuant to Rule 210.2-01(c)(7)(ii).
In addition to the procedures set forth in this policy, any non-audit services that may be provided consistently with Rule 210.2-01 may be approved by the Audit Committee itself and any pre-approval that may be waived in accordance with Rule 210.2-01(c)(7)(i)(C) is hereby waived.
Selection of a Fund’s independent auditors and their compensation shall be determined by the Audit Committee and shall not be subject to this policy.
| | | |
| SECTION II - POLICY |
| |
| SERVICE CATEGORY | SERVICE CATEGORY DESCRIPTION | SPECIFIC PRE-APPROVED SERVICE SUBCATEGORIES |
| | | |
| I. AUDIT SERVICES | Services that are directly | o Accounting research assistance |
| | related to performing the | o SEC consultation, registration |
| | independent audit of the Funds | statements, and reporting |
| | | o Tax accrual related matters |
| | | o Implementation of new accounting standards |
| | | o Compliance letters (e.g. rating agency letters) |
| | | o Regulatory reviews and assistance |
| | | regarding financial matters |
| | | o Semi-annual reviews (if requested) |
| | | o Comfort letters for closed end offerings |
| II. AUDIT-RELATED | Services which are not | o AICPA attest and agreed-upon procedures |
| SERVICES | prohibited under Rule | o Technology control assessments |
| | 210.2-01(C)(4) (the “Rule”) | o Financial reporting control assessments |
| | and are related extensions of | o Enterprise security architecture |
| | the audit services support the | assessment |
| | audit, or use the knowledge/expertise | |
| | gained from the audit procedures as a | |
| | foundation to complete the project. | |
| | In most cases, if the Audit-Related | |
| | Services are not performed by the | |
| | Audit firm, the scope of the Audit | |
| | Services would likely increase. | |
| | The Services are typically well-defined | |
| | and governed by accounting | |
| | professional standards (AICPA, | |
| | SEC, etc.) | |
| | |
| AUDIT COMMITTEE APPROVAL POLICY | AUDIT COMMITTEE REPORTING POLICY |
| o “One-time” pre-approval | o A summary of all such |
| for the audit period for all | services and related fees |
| pre-approved specific service | reported at each regularly |
| subcategories. Approval of the | scheduled Audit Committee |
| independent auditors as | meeting. |
| auditors for a Fund shall | |
| constitute pre approval for | |
| these services. | |
| |
| o “One-time” pre-approval | o A summary of all such |
| for the fund fiscal year within | services and related fees |
| a specified dollar limit | (including comparison to |
| for all pre-approved | specified dollar limits) |
| specific service subcategories | reported quarterly. |
| |
| o Specific approval is | |
| needed to exceed the | |
| pre-approved dollar limit for | |
| these services (see general | |
| Audit Committee approval policy | |
| below for details on obtaining | |
| specific approvals) | |
| |
| o Specific approval is | |
| needed to use the Fund’s | |
| auditors for Audit-Related | |
| Services not denoted as | |
| “pre-approved”, or | |
| to add a specific service | |
| subcategory as “pre-approved” | |
| | | | |
SECTION III - POLICY DETAIL, CONTINUED
| | |
| SERVICE CATEGORY | SERVICE CATEGORY DESCRIPTION | SPECIFIC PRE-APPROVED SERVICE |
| | | SUBCATEGORIES |
| III. TAX SERVICES | Services which are not | o Tax planning and support |
| | prohibited by the Rule, | o Tax controversy assistance |
| | if an officer of the Fund | o Tax compliance, tax returns, excise |
| | determines that using the | tax returns and support |
| | Fund’s auditor to provide | o Tax opinions |
| | these services creates | |
| | significant synergy in | |
| | the form of efficiency, | |
| | minimized disruption, or | |
| | the ability to maintain a | |
| | desired level of | |
| | confidentiality. | |
| | |
| AUDIT COMMITTEE APPROVAL POLICY | AUDIT COMMITTEE REPORTING POLICY |
| o “One-time” pre-approval | o A summary of |
| for the fund fiscal year | all such services and |
| within a specified dollar limit | related fees |
| | (including comparison |
| | to specified dollar |
| | limits) reported |
| | quarterly. |
| |
| o Specific approval is | |
| needed to exceed the | |
| pre-approved dollar limits for | |
| these services (see general | |
| Audit Committee approval policy | |
| below for details on obtaining | |
| specific approvals) | |
| |
| o Specific approval is | |
| needed to use the Fund’s | |
| auditors for tax services not | |
| denoted as pre-approved, or to | |
| add a specific service subcategory as | |
| “pre-approved” | |
SECTION III - POLICY DETAIL, CONTINUED
| |
| SERVICE CATEGORY | SERVICE CATEGORY DESCRIPTION | SPECIFIC PRE-APPROVED SERVICE |
| | | SUBCATEGORIES |
| IV. OTHER SERVICES | Services which are not | o Business Risk Management support |
| | prohibited by the Rule, | o Other control and regulatory |
| A. SYNERGISTIC, | if an officer of the Fund | compliance projects |
| UNIQUE QUALIFICATIONS | determines that using the | |
| | Fund’s auditor to provide | |
| | these services creates | |
| | significant synergy in | |
| | the form of efficiency, | |
| | minimized disruption, | |
| | the ability to maintain a | |
| | desired level of | |
| | confidentiality, or where | |
| | the Fund’s auditors | |
| | posses unique or superior | |
| | qualifications to provide | |
| | these services, resulting | |
| | in superior value and | |
| | results for the Fund. | |
| | |
| AUDIT COMMITTEE APPROVAL POLICY | AUDIT COMMITTEE REPORTING POLICY |
| o “One-time” pre-approval | o A summary of |
| for the fund fiscal year within | all such services and |
| a specified dollar limit | related fees |
| | (including comparison |
| | to specified dollar |
| | limits) reported |
| | quarterly. |
| o Specific approval is | |
| needed to exceed the | |
| pre-approved dollar limits for | |
| these services (see general | |
| Audit Committee approval policy | |
| below for details on obtaining | |
| specific approvals) | |
| |
| o Specific approval is | |
| needed to use the Fund’s | |
| auditors for “Synergistic” or | |
| “Unique Qualifications” Other | |
| Services not denoted as | |
| pre-approved to the left, or to | |
| add a specific service | |
| subcategory as “pre-approved” | |
SECTION III - POLICY DETAIL, CONTINUED
| |
| SERVICE CATEGORY | SERVICE CATEGORY DESCRIPTION | SPECIFIC PROHIBITED SERVICE |
| | | SUBCATEGORIES |
| PROHIBITED SERVICES | Services which result | 1. Bookkeeping or other services |
| | in the auditors losing | related to the accounting records or |
| | independence status | financial statements of the audit |
| | under the Rule. | client* |
| | | 2. Financial information systems design |
| | | and implementation* |
| | | 3. Appraisal or valuation services, |
| | | fairness* opinions, or |
| | | contribution-in-kind reports |
| | | 4. Actuarial services (i.e., setting |
| | | actuarial reserves versus actuarial |
| | | audit work)* |
| | | 5. Internal audit outsourcing services* |
| | | 6. Management functions or human |
| | | resources |
| | | 7. Broker or dealer, investment |
| | | advisor, or investment banking services |
| | | 8. Legal services and expert services |
| | | unrelated to the audit |
| | | 9. Any other service that the Public |
| | | Company Accounting Oversight Board |
| | | determines, by regulation, is |
| | | impermissible |
| | |
| AUDIT COMMITTEE APPROVAL POLICY | AUDIT COMMITTEE REPORTING POLICY |
| o These services are not to be | o A summary of all |
| performed with the exception of the(*) | services and related |
| services that may be permitted | fees reported at each |
| if they would not be subject to audit | regularly scheduled |
| procedures at the audit client (as | Audit Committee meeting |
| defined in rule 2-01(f)(4)) level | will serve as continual |
| the firm providing the service. | confirmation that has |
| | not provided any |
| | restricted services. |
GENERAL AUDIT COMMITTEE APPROVAL POLICY:
o For all projects, the officers of the Funds and the Fund’s auditors will each make an assessment to determine that any proposed projects will not impair independence.
o Potential services will be classified into the four non-restricted service categories and the “Approval of Audit, Audit-Related, Tax and Other Services” Policy above will be applied. Any services outside the specific pre-approved service subcategories set forth above must be specifically approved by the Audit Committee.
o At least quarterly, the Audit Committee shall review a report summarizing the services by service category, including fees, provided by the Audit firm as set forth in the above policy.
(2) Disclose the percentage of services described in each of paragraphs (b) through (d) of this Item that were approved by the audit committee pursuant to paragraph (c)(7)(i)(C) of Rule 2-01 of Regulation S-X.
Non-Audit Services
Beginning with non-audit service contracts entered into on or after May 6, 2003, the effective date of the
new SEC pre-approval rules, the Trust's audit committee is required to pre-approve services to
affiliates defined by SEC rules to the extent that the services are determined to have a direct impact on the operations or financial reporting of the Trust. For the years ended July 31, 2022 and 2021, there were no services provided to an affiliate that required the Trust's audit committee pre-approval.
(f) If greater than 50 percent, disclose the percentage of hours expended on the principal accountants engagement to audit the registrant’s financial statements for the most recent fiscal year that were attributed to work performed by persons other than the principal accountant’s full-time, permanent employees.
N/A
(g) Disclose the aggregate non-audit fees billed by the registrants accountant for services rendered to the registrant, and rendered to the registrants investment adviser (not including any sub-adviser whose role is primarily portfolio management and is subcontracted with or overseen by another investment adviser), and any entity controlling, controlled by, or under common control with the adviser that provides ongoing services to the registrant for each of the last two fiscal years of the registrant.
The Trust paid aggregate non-audit fees to Ernst & Young LLP for tax services of $29,234 and $27,195 during the fiscal years ended July 31, 2022 and 2021, respectively.
(h) Disclose whether the registrants audit committee of the Board of Trustees has considered whether the provision of non-audit services that were rendered to the registrants investment adviser (not including any subadviser whose role is primarily portfolio management and is subcontracted with or overseen by another investment adviser), and any entity controlling, controlled by, or under common control with the investment adviser that provides ongoing services to the registrant that were not pre-approved pursuant to paragraph (c)(7)(ii) of Rule 2-01 of Regulation S-X is compatible with maintaining the principal accountant’s independence.
The Fund’s audit committee of the Board of Trustees has considered whether the provision of non-audit services that were rendered to the Affiliates (as defined) that were not pre- approved pursuant to paragraph (c)(7)(ii) of Rule 2-01 of Regulation S-X is compatible with maintaining the principal accountant’s independence.
ITEM 5. AUDIT COMMITTEE OF LISTED REGISTRANTS
(a) If the registrant is a listed issuer as defined in Rule 10A-3 under the Exchange Act (17 CFR 240.10A-3), state whether or not the registrant has a separately-designated standing audit committee established in accordance with Section 3(a)(58)(A) of the Exchange Act (15 U.S.C. 78c(a)(58)(A)). If the registrant has such a committee, however designated, identify each committee member. If the entire board of directors is acting as the registrant’s audit committee as specified in Section 3(a)(58)(B) of the Exchange Act (15 U.S.C. 78c(a)(58)(B)), so state.
N/A
(b) If applicable, provide the disclosure required by Rule 10A-3(d) under the Exchange Act (17 CFR 240.10A-3(d)) regarding an exemption from the listing standards for audit committees.
N/A
ITEM 6. SCHEDULE OF INVESTMENTS.
File Schedule of Investments in securities of unaffiliated issuers as of the close of the reporting period as set forth in 210.1212 of Regulation S-X [17 CFR 210.12-12], unless the schedule is included as part of the report to shareholders filed under Item 1 of this Form.
Included in Item 1
ITEM 7. DISCLOSURE OF PROXY VOTING POLICIES AND PROCEDURES FOR CLOSED-END MANAGEMENT INVESTMENT COMPANIES.
A closed-end management investment company that is filing an annual report on this Form N-CSR must, unless it invests exclusively in non-voting securities, describe the policies and procedures that it uses to determine how to vote proxies relating to portfolio securities, including the procedures that the company uses when a vote presents a conflict between the interests of its shareholders, on the one hand, and those of the company’s investment adviser; principal underwriter; or any affiliated person (as defined in Section 2(a)(3) of the Investment Company Act of 1940 (15 U.S.C. 80a-2(a)(3)) and the rules thereunder) of the company, its investment adviser, or its principal underwriter, on the other. Include any policies and procedures of the company’s investment adviser, or any other third party, that the company uses, or that are used on the company’s behalf, to determine how to vote proxies relating to portfolio securities.
Not applicable to open-end management investment companies.
ITEM 8. PORTFOLIO MANAGERS OF CLOSED-END MANAGEMENT INVESTMENT COMPANIES.
(a) If the registrant is a closed-end management investment company that is filing an annual report on this Form N-CSR, provide the following information:
(1) State the name, title, and length of service of the person or persons employed by or associated with the registrant or an investment adviser of the registrant who are primarily responsible for the day-to-day management of the registrant’s portfolio (“Portfolio Manager”). Also state each Portfolio Manager’s business experience during the past 5 years.
Not applicable to open-end management investment companies.
ITEM 9. PURCHASES OF EQUITY SECURITIES BY CLOSED-END MANAGEMENT INVESTMENT COMPANY AND AFFILIATED PURCHASERS.
(a) If the registrant is a closed-end management investment company, in the following tabular format, provide the information specified in paragraph (b) of this Item with respect to any purchase made by or on behalf of the registrant or any affiliated purchaser, as defined in Rule 10b-18(a)(3) under the Exchange Act (17 CFR 240.10b-18(a)(3)), of shares or other units of any class of the registrant’s equity securities that is registered by the registrant pursuant to Section 12 of the Exchange Act (15 U.S.C. 781).
Not applicable to open-end management investment companies.
ITEM 10. SUBMISSION OF MATTERS TO A VOTE OF SECURITY HOLDERS.
Describe any material changes to the procedures by which shareholders may recommend nominees to the registrant’s board of directors, where those changes were implemented after the registrant last provided disclosure in response to the requirements of Item 407(c)(2)(iv) of Regulation S-R(17 CFR 229.407)(as required by Item 22(b)(15)) of Schedule 14A (17 CFR 240.14a-101), or this Item.
There have been no material changes to the procedures by which the shareholders may recommend nominees to the registrant’s board of directors since the registrant last provided disclosure in response to the requirements of Item 407(c)(2)(iv) of Regulation S-R of Schedule 14(A) in its definitive proxy statement, or this item.
ITEM 11. CONTROLS AND PROCEDURES.
(a) Disclose the conclusions of the registrant’s principal executive and principal financials officers, or persons performing similar functions, regarding the effectiveness of the registrant’s disclosure controls and procedures (as defined in Rule 30a-3(c) under the Act (17 CFR 270.30a-3(c))) as of a date within 90 days of the filing date of the report that includes the disclosure required by this paragraph, based on the evaluation of these controls and procedures required by Rule 30a-3(b) under the Act (17 CFR 270.30(a)-3(b) and Rules 13a-15(b) or 15d-15(b) under the Exchange Act (17 CFR 240.13a-15(b) or 240.15d-15(b)).
The registrant’s principal executive officer and principal financial officer have concluded that the registrant’s disclosure controls and procedures are effective based on the evaluation of these controls and procedures as of a date within 90 days of the filing date of this report.
(b) Disclose any change in the registrant’s internal control over financial reporting (as defined in Rule 30a-3(d) under the Act (17CFR 270.30a-3(d)) that occured during the period covered by this report that has materially affected, or is reasonably likely to materially affect, the registrant’s internal control over financial reporting.
There were no significant changes in the registrant’s internal control over financial reporting that occurred during the period covered by this report that have materially affected, or are reasonably likely to materially affect, the registrant’s internal control over financial reporting.
Item 12. Disclosure of Securities Lending Activities for Closed-End Management Investment Companies.
(a) If the registrant is a closed-end management investment company, provide the following dollar amounts of income and compensation related to the securities lending activities of the registrant during its most recent fiscal year:
N/A
(1) Gross income from securities lending activities;
N/A
(2) All fees and/or compensation for each of the following securities lending activities and related services: any share of revenue generated by the securities lending program paid to the securities lending agent(s) (revenue split); fees paid for cash collateral management services (including fees deducted from a pooled cash collateral reinvestment vehicle) that are not included in the revenue split; administrative fees that are not included in the revenue split; fees for indemnification that are not included in the revenue split; rebates paid to borrowers; and any other fees relating to the securities lending program that are not included in the revenue split, including a description of those other fees;
N/A
(3) The aggregate fees/compensation disclosed pursuant to paragraph (2); and
N/A
(4) Net income from securities lending activities (i.e., the dollar amount in paragraph (1) minus the dollar amount in paragraph (3)).
If a fee for a service is included in the revenue split, state that the fee is included in the revenue split.
N/A
(b) If the registrant is a closed-end management investment company, describe the services provided to the registrant by the securities lending agent in the registrants most recent fiscal year.
N/A
ITEM 13. EXHIBITS.
(a) File the exhibits listed below as part of this Form. Letter or number the exhibits in the sequence indicated.
(1) Any code of ethics, or amendment thereto, that is the subject of the disclosure required by Item 2, to the extent that the registrant intends to satisfy the Item 2 requirements through filing of an exhibit.
(2) A separate certification for each principal executive officer and principal financial officer of the registrant as required by Rule 30a-2(a) under the Act (17 CFR 270.30a-2(a)) , exactly as set forth below:
Filed herewith.
SIGNATURES
[See General Instruction F]
Pursuant to the requirements of the Securities Exchange Act of 1934 and the Investment Company Act of 1940, the registrant has duly caused this report to be signed on its behalf by the undersigned, thereunto duly authorized.
(Registrant) Pioneer Series Trust IV
By (Signature and Title)* /s/ Lisa M. Jones
Lisa M. Jones, President and Chief Executive Officer
Date October 5, 2022
Pursuant to the requirements of the Securities Exchange Act of 1934 and the Investment Company Act of 1940, this report has been signed below by the following persons on behalf of the registrant and in the capacities and on the dates indicated.
By (Signature and Title)* /s/ Lisa M. Jones
Lisa M. Jones, President and Chief Executive Officer
Date October 5, 2022
By (Signature and Title)* /s/ Anthony J. Koenig, Jr.
Anthony J. Koenig, Jr., Managing Director, Chief Operations Officer & Treasurer of the Funds
Date October 5, 2022
* Print the name and title of each signing officer under his or her signature.