UNITED STATES
SECURITIES AND EXCHANGE COMMISSION
Washington, D.C. 20549
FORM N-CSR
CERTIFIED SHAREHOLDER REPORT OF REGISTERED MANAGEMENT INVESTMENT COMPANIES
Investment Company Act file number
(Exact name of registrant as specified in charter)
60 State Street, Boston, MA 02109
(Address of principal executive offices) (ZIP code)
Christopher J. Kelley, Amundi Asset Management, Inc.,
60 State Street, Boston, MA 02109
(Name and address of agent for service)
Registrant's telephone number, including area code:
Date of reporting period:
Item 1. Report to Stockholders.
(a) The registrant’s annual report transmitted to shareholders pursuant to Rule 30e-1 under the Investment Company Act of 1940 is as follows:
Pioneer Securitized Income Fund
Class A / SIFFX
ANNUAL SHAREHOLDER REPORT | July 31, 2024
This annual shareholder report contains important information about Pioneer Securitized Income Fund (“Fund”) for the period of August 1, 2023 to July 31, 2024. You can find additional information about the Fund at https://www.amundi.com/usinvestors/Resources/Shareholder-Reports. You can also request this information by contacting us at 1-800-225-6292. This report describes changes to the Fund that occurred during the reporting period.
What were the Fund costs for the last year?
(Based on a hypothetical $10,000 investment)
| Class Name | Costs of a $10,000 investment | Costs paid as a percentage of a $10,000 investment |
| Class A | $95 | 0.90% |
How did the Fund perform last year and what affected the Fund performance?
For the fiscal year ended July 31, 2024, the Fund’s Class A shares at NAV returned 11.88%. For the same period, the Fund’s broad-based benchmark, the Bloomberg U.S. Aggregate Bond Index, returned 5.10%. The performance benchmark, the Bloomberg U.S. Securitized MBS/ABS/CMBS Index, returned 5.07% over the period.
The Fund’s returns relative to the performance benchmark benefited from allocations to non-agency mortgage-backed securities (RMBS), collateralized loan obligations (CLO), asset-backed securities, U.S. government agency mortgage-backed securities, and commercial mortgage-backed securities (CMBS).
Both sector allocation and security selection contributed to the Fund’s returns relative to the performance benchmark.
Residential mortgage credit generated positive returns for the year and was the strongest performing sector as US housing prices remained resilient despite still-elevated mortgage rates. The portfolio’s allocation to residential credit-risk-transfer securities was the strongest contributing subsector.
Asset-backed securities (ABS) were an overall contributor to total return and relative returns versus the performance benchmark for the year led by a strong showing from the portfolio’s auto ABS exposure. As corporate spreads tightened during the year, so did auto ABS spreads. The elevated short-end of the yield curve benefited many of the ABS subsector’s short duration exposure.
The portfolio’s exposure to CMBS contributed over the year to returns relative to the performance benchmark, with the securities’ high coupons and discount prices leading to gains despite broadly waning investor appetite for CMBS securities with any collateral tied to retail or office.
The only notable detractor from performance was the Fund's U.S. Treasury futures (derivatives held in the Fund to hedge against interest rate risk) which decreased in value as rates rallied during the period.
Fund Performance
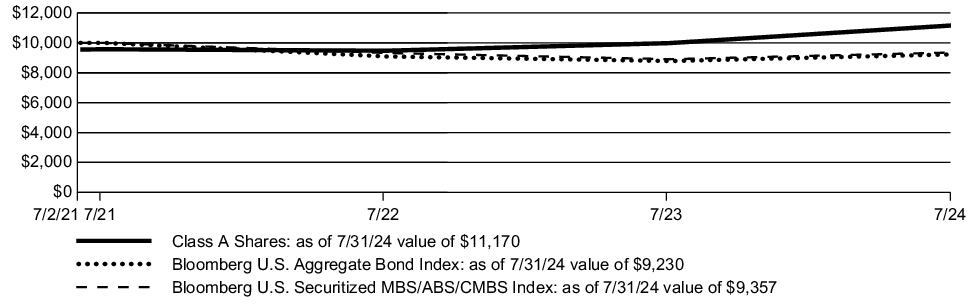
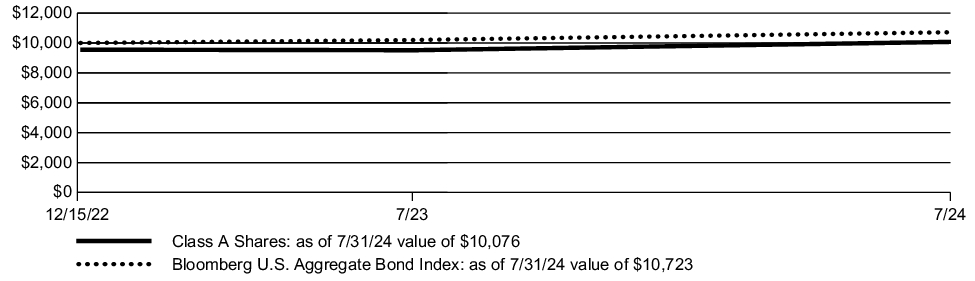
The line graph below shows the change in value of a $10,000 investment made in Class A shares of the Fund at public offering price during the periods shown, compared to that of the Bloomberg U.S. Aggregate Bond Index and the Bloomberg U.S. Securitized MBS/ABS/CMBS Index.
| AVERAGE ANNUAL TOTAL RETURN | 1 Year | Since Inception* |
| Class A (with sales charge) | 6.85% | 3.66%) |
| Class A (without sales charge) | 11.88% | 5.23%) |
| Bloomberg U.S. Aggregate Bond Index | 5.10% | (2.26)% |
| Bloomberg U.S. Securitized MBS/ABS/CMBS Index | 5.07% | (1.95)% |
* | Performance of Class A shares shown in the graph above is from the inception of Class A shares on 7/2/21 through 7/31/24. Index information shown in the graph above is from 7/31/21 through 7/31/24. |
Call 1-800-225-6292 or visit https://www.amundi.com/usinvestors/Resources/Shareholder-Reports for the most recent month-end performance results. Current performance may be lower or higher than the performance data quoted.
The performance data quoted represents past performance, which is no guarantee of future results.
The graph and table do not reflect the deduction of taxes that a shareholder would pay on fund distributions or redemption of fund shares.
KEY FUND STATISTICS
(as of July 31, 2024)
| Fund net assets | $86,676,905% |
| Total number of portfolio holdings | $194%^^ |
| Total advisory fee paid | $4,736% |
| Portfolio turnover rate | $30% |
^^ | Excluding short-term investments and all derivative contracts except for options purchased. |
PORTFOLIO DIVERSIFICATION
(as of July 31, 2024)*
| Asset Backed Securities | 38.6% |
| Collateralized Mortgage Obligations | 33.1% |
| U.S. Government and Agency Obligations | 17.4% |
| Commercial Mortgage-Backed Securities | 10.8% |
| Corporate Bonds | 0.1% |
* | As a percentage of total investments excluding short‑term investments and all derivative contracts except for options purchased. |
Material Fund Changes
Amundi Asset Management US, Inc. (the “Adviser”), the Fund’s investment adviser, is currently an indirect, wholly-owned subsidiary of Amundi. On July 9, 2024, Amundi announced that it had entered into a definitive agreement with Victory Capital Holdings, Inc. (“Victory Capital”) to combine the Adviser with Victory Capital, and for Amundi to become a strategic shareholder of Victory Capital (the “Transaction”). Victory Capital is headquartered in San Antonio, Texas. The closing of the Transaction is subject to certain regulatory approvals and other conditions. There is no assurance that the Transaction will close.
The closing of the Transaction would cause the Fund’s current investment advisory agreement with the Adviser to terminate. Under the terms of the Transaction, the Fund’s Board of Trustees will be asked to approve a reorganization of the Fund into a corresponding, newly established Victory Fund advised by Victory Capital Management Inc., an affiliate of Victory Capital. The proposed reorganization of the Fund would be sought in connection with the closing of the Transaction. If approved by the Board, the proposal to reorganize the Fund will be submitted to the shareholders of the Fund for their approval. There is no assurance that the Board or the shareholders of the Fund will approve the proposal to reorganize the Fund.
For more complete information, you may review the Fund's next prospectus, which we expect to be available by December 1, 2024 at https://www.amundi.com/usinvestors/Products/Mutual-Funds or upon request at 1-800-225-6292.
Changes in Accountants
On March 25, 2024, Ernst & Young LLP (the “Prior Auditor”) resigned as the independent registered public accounting firm of the Fund. There were no disagreements with the Prior Auditor during the two most recent fiscal years and the subsequent interim period through March 25, 2024.
On March 25, 2024, the Audit Committee of the Board approved, and on March 25, 2024, the Board approved, Deloitte & Touche LLP as the independent registered accounting firm of the Fund for fiscal periods ending after March 25, 2024.
Availability of Additional Information
You can find additional information about the Fund, including the Fund's prospectus, financial information, holdings and proxy voting information, at https://www.amundi.com/usinvestors/Resources/Shareholder-Reports. You can also request this information by contacting us at 1‑800‑225‑6292.
Important notice to shareholders
In order to reduce expenses, we will deliver a single copy of prospectuses, proxies, financial reports and other communications to shareholders with the same residential address, provided they have the same last name or we reasonably believe them to be members of the same family. Unless we are notified otherwise, we will continue to send recipients only one copy of these materials for as long as they remain a shareholder of the Fund. If you would like to receive individual mailings, please call 1-800-225-6292 and we will begin sending you separate copies of these materials within 30 days after receiving your request.
Pioneer Securitized Income Fund
Class Y / SYFFX
ANNUAL SHAREHOLDER REPORT | July 31, 2024
This annual shareholder report contains important information about Pioneer Securitized Income Fund (“Fund”) for the period of August 1, 2023 to July 31, 2024. You can find additional information about the Fund at https://www.amundi.com/usinvestors/Resources/Shareholder-Reports. You can also request this information by contacting us at 1-800-225-6292. This report describes changes to the Fund that occurred during the reporting period.
What were the Fund costs for the last year?
(Based on a hypothetical $10,000 investment)
| Class Name | Costs of a $10,000 investment | Costs paid as a percentage of a $10,000 investment |
| Class Y | $69 | 0.65% |
How did the Fund perform last year and what affected the Fund performance?
For the fiscal year ended July 31, 2024, the Fund’s Class Y shares at NAV returned 12.16%. For the same period, the Fund’s broad-based benchmark, the Bloomberg U.S. Aggregate Bond Index, returned 5.10%. The performance benchmark, the Bloomberg U.S. Securitized MBS/ABS/CMBS Index, returned 5.07% over the period.
The Fund’s returns relative to the performance benchmark benefited from allocations to non-agency mortgage-backed securities (RMBS), collateralized loan obligations (CLO), asset-backed securities, U.S. government agency mortgage-backed securities, and commercial mortgage-backed securities (CMBS).
Both sector allocation and security selection contributed to the Fund’s returns relative to the performance benchmark.
Residential mortgage credit generated positive returns for the year and was the strongest performing sector as US housing prices remained resilient despite still-elevated mortgage rates. The portfolio’s allocation to residential credit-risk-transfer securities was the strongest contributing subsector.
Asset-backed securities (ABS) were an overall contributor to total return and relative returns versus the performance benchmark for the year led by a strong showing from the portfolio’s auto ABS exposure. As corporate spreads tightened during the year, so did auto ABS spreads. The elevated short-end of the yield curve benefited many of the ABS subsector’s short duration exposure.
The portfolio’s exposure to CMBS contributed over the year to returns relative to the performance benchmark, with the securities’ high coupons and discount prices leading to gains despite broadly waning investor appetite for CMBS securities with any collateral tied to retail or office.
The only notable detractor from performance was the Fund's U.S. Treasury futures (derivatives held in the Fund to hedge against interest rate risk) which decreased in value as rates rallied during the period.
Fund Performance
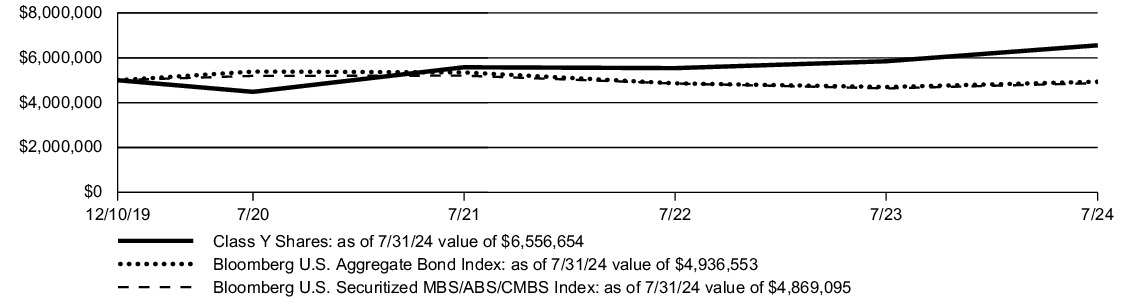
The line graph below shows the change in value of a $5 Million investment made in Class Y shares of the Fund during the periods shown, compared to that of the Bloomberg U.S. Aggregate Bond Index and the Bloomberg U.S. Securitized MBS/ABS/CMBS Index.
| AVERAGE ANNUAL TOTAL RETURN | 1 Year | Since Inception* |
| Class Y | 12.16% | 6.01%) |
| Bloomberg U.S. Aggregate Bond Index | 5.10% | (0.26)% |
| Bloomberg U.S. Securitized MBS/ABS/CMBS Index | 5.07% | (0.51)% |
* | Performance of Class Y shares shown in the graph above is from the inception of Class Y shares on 12/10/19 through 7/31/24. Index information shown in the graph above is from 12/31/19 through 7/31/24. |
The Fund acquired the assets and liabilities of Pioneer Securitized Income Fund (the “Predecessor Fund”) on June 30, 2021 (the “Reorganization”). As a result of the Reorganization, the Predecessor Fund’s performance and financial history became the performance and financial history of the Fund. The performance of Class Y shares of the Fund is the performance of the common shares of the Predecessor Fund for periods prior to the Reorganization, and has not been restated to reflect any differences in expenses.
Call 1-800-225-6292 or visit https://www.amundi.com/usinvestors/Resources/Shareholder-Reports for the most recent month-end performance results. Current performance may be lower or higher than the performance data quoted.
The performance data quoted represents past performance, which is no guarantee of future results.
The graph and table do not reflect the deduction of taxes that a shareholder would pay on fund distributions or redemption of fund shares.
KEY FUND STATISTICS
(as of July 31, 2024)
| Fund net assets | $86,676,905% |
| Total number of portfolio holdings | $194%^^ |
| Total advisory fee paid | $4,736% |
| Portfolio turnover rate | $30% |
^^ | Excluding short-term investments and all derivative contracts except for options purchased. |
PORTFOLIO DIVERSIFICATION
(as of July 31, 2024)*
| Asset Backed Securities | 38.6% |
| Collateralized Mortgage Obligations | 33.1% |
| U.S. Government and Agency Obligations | 17.4% |
| Commercial Mortgage-Backed Securities | 10.8% |
| Corporate Bonds | 0.1% |
* | As a percentage of total investments excluding short‑term investments and all derivative contracts except for options purchased. |
Material Fund Changes
Amundi Asset Management US, Inc. (the “Adviser”), the Fund’s investment adviser, is currently an indirect, wholly-owned subsidiary of Amundi. On July 9, 2024, Amundi announced that it had entered into a definitive agreement with Victory Capital Holdings, Inc. (“Victory Capital”) to combine the Adviser with Victory Capital, and for Amundi to become a strategic shareholder of Victory Capital (the “Transaction”). Victory Capital is headquartered in San Antonio, Texas. The closing of the Transaction is subject to certain regulatory approvals and other conditions. There is no assurance that the Transaction will close.
The closing of the Transaction would cause the Fund’s current investment advisory agreement with the Adviser to terminate. Under the terms of the Transaction, the Fund’s Board of Trustees will be asked to approve a reorganization of the Fund into a corresponding, newly established Victory Fund advised by Victory Capital Management Inc., an affiliate of Victory Capital. The proposed reorganization of the Fund would be sought in connection with the closing of the Transaction. If approved by the Board, the proposal to reorganize the Fund will be submitted to the shareholders of the Fund for their approval. There is no assurance that the Board or the shareholders of the Fund will approve the proposal to reorganize the Fund.
For more complete information, you may review the Fund's next prospectus, which we expect to be available by December 1, 2024 at https://www.amundi.com/usinvestors/Products/Mutual-Funds or upon request at 1-800-225-6292.
Changes in Accountants
On March 25, 2024, Ernst & Young LLP (the “Prior Auditor”) resigned as the independent registered public accounting firm of the Fund. There were no disagreements with the Prior Auditor during the two most recent fiscal years and the subsequent interim period through March 25, 2024.
On March 25, 2024, the Audit Committee of the Board approved, and on March 25, 2024, the Board approved, Deloitte & Touche LLP as the independent registered accounting firm of the Fund for fiscal periods ending after March 25, 2024.
Availability of Additional Information
You can find additional information about the Fund, including the Fund's prospectus, financial information, holdings and proxy voting information, at https://www.amundi.com/usinvestors/Resources/Shareholder-Reports. You can also request this information by contacting us at 1‑800‑225‑6292.
Important notice to shareholders
In order to reduce expenses, we will deliver a single copy of prospectuses, proxies, financial reports and other communications to shareholders with the same residential address, provided they have the same last name or we reasonably believe them to be members of the same family. Unless we are notified otherwise, we will continue to send recipients only one copy of these materials for as long as they remain a shareholder of the Fund. If you would like to receive individual mailings, please call 1-800-225-6292 and we will begin sending you separate copies of these materials within 30 days after receiving your request.
Pioneer Multi-Asset Income Fund
Class A / PMAIX
ANNUAL SHAREHOLDER REPORT | July 31, 2024
This annual shareholder report contains important information about Pioneer Multi-Asset Income Fund (“Fund”) for the period of August 1, 2023 to July 31, 2024. You can find additional information about the Fund at https://www.amundi.com/usinvestors/Resources/Shareholder-Reports. You can also request this information by contacting us at 1-800-225-6292. This report describes changes to the Fund that occurred during the reporting period.
What were the Fund costs for the last year?
(Based on a hypothetical $10,000 investment)
| Class Name | Costs of a $10,000 investment | Costs paid as a percentage of a $10,000 investment |
| Class A | $88 | 0.83% |
How did the Fund perform last year and what affected the Fund performance?
For the fiscal year ended July 31, 2024, the Fund’s Class A shares at NAV returned 11.56%. For the same period, the Fund’s broad-based benchmarks, the MSCI All Country World NR Index (MSCI ACWI) and the Bloomberg U.S. Aggregate Bond Index, returned 17.02% and 5.10%, respectively. The performance benchmark, a blended benchmark (35% MSCI All Country World NR Index and 65% Bloomberg U.S. Aggregate Bond Index), returned 9.22% over the period.
Security selection and sector allocation both contributed positively to benchmark relative performance in the period, mainly due to positions in several international bank stocks as well as individual opportunities in industrials, energy, and information technology stocks. Fixed income selection and allocations to U.S. Treasury securities, securitized investments, and investment grade corporate bonds also contributed positively to benchmark relative performance.
The largest detractor from performance were positions in index futures, as a result of the positive performance of the equity markets during the period. The Fund maintains a significant position in equity-linked notes. The Fund holds positions in index futures in an effort to reduce risk associated with the equity-linked notes. Within fixed income, the Fund's overweight allocation to U.S. government agency bonds detracted from benchmark relative performance.
Fund Performance
The line graph below shows the change in value of a $10,000 investment made in Class A shares of the Fund at public offering price during the periods shown, compared to that of the MSCI All Country World NR Index, the Bloomberg U.S. Aggregate Bond Index, and the blended benchmark (65% MSCI All Country World NR Index and 35% Bloomberg U.S. Aggregate Bond Index).
| AVERAGE ANNUAL TOTAL RETURN | 1 Year | 5 Years | 10 Years |
| Class A (with sales charge) | 6.57% | 6.98% | 5.35% |
| Class A (without sales charge) | 11.56% | 7.98% | 5.84% |
| MSCI All Country World NR Index | 17.02% | 11.05% | 8.74% |
| Bloomberg U.S. Aggregate Bond Index | 5.10% | 0.19% | 1.61% |
| 35% MSCI All Country World NR Index / 65% Bloomberg U.S. Aggregate Bond Index | 9.22% | 4.13% | 4.27% |
Call 1-800-225-6292 or visit https://www.amundi.com/usinvestors/Resources/Shareholder-Reports for the most recent month-end performance results. Current performance may be lower or higher than the performance data quoted.
The performance data quoted represents past performance, which is no guarantee of future results.
The graph and table do not reflect the deduction of taxes that a shareholder would pay on fund distributions or redemption of fund shares.
KEY FUND STATISTICS
(as of July 31, 2024)
| Fund net assets | $3,623,720,285% |
| Total number of portfolio holdings | $491%^^ |
| Total advisory fee paid | $13,905,080% |
| Portfolio turnover rate | $62% |
^^ | Excluding short‑term investments and all derivative contracts except for options purchased. |
SECTOR DISTRIBUTION
(as of July 31, 2024)*
| Financials | 27.3% |
| U.S. Government | 12.2% |
| Energy | 10.3% |
| Information Technology | 9.8% |
| Basic Materials | 7.8% |
| Health Care | 6.3% |
| Consumer Discretionary | 4.6% |
| Industrials | 4.6% |
| Mortgage Securities | 3.9% |
| Asset Backed Securities | 2.8% |
| Utilities | 2.6% |
| Communication Services | 2.6% |
| Consumer, Cyclical | 1.3% |
| Consumer, Non-cyclical | 1.2% |
| Consumer Staples | 1.2% |
| Foreign Government | 1.0% |
| Closed-End Funds | 0.3% |
| Real Estate | 0.2% |
* | As a percentage of total investments excluding short‑term investments and all derivative contracts except for options purchased. |
Material Fund Changes
Amundi Asset Management US, Inc. (the “Adviser”), the Fund’s investment adviser, is currently an indirect, wholly-owned subsidiary of Amundi. On July 9, 2024, Amundi announced that it had entered into a definitive agreement with Victory Capital Holdings, Inc. (“Victory Capital”) to combine the Adviser with Victory Capital, and for Amundi to become a strategic shareholder of Victory Capital (the “Transaction”). Victory Capital is headquartered in San Antonio, Texas. The closing of the Transaction is subject to certain regulatory approvals and other conditions. There is no assurance that the Transaction will close.
The closing of the Transaction would cause the Fund’s current investment advisory agreement with the Adviser to terminate. Under the terms of the Transaction, the Fund’s Board of Trustees will be asked to approve a reorganization of the Fund into a corresponding, newly established Victory Fund advised by Victory Capital Management Inc., an affiliate of Victory Capital. The proposed reorganization of the Fund would be sought in connection with the closing of the Transaction. If approved by the Board, the proposal to reorganize the Fund will be submitted to the shareholders of the Fund for their approval. There is no assurance that the Board or the shareholders of the Fund will approve the proposal to reorganize the Fund.
For more complete information, you may review the Fund's next prospectus, which we expect to be available by December 1, 2024 at https://www.amundi.com/usinvestors/Products/Mutual-Funds or upon request at 1-800-225-6292.
Changes in Accountants
On March 25, 2024, Ernst & Young LLP (the “Prior Auditor”) resigned as the independent registered public accounting firm of the Fund. There were no disagreements with the Prior Auditor during the two most recent fiscal years and the subsequent interim period through March 25, 2024.
On March 25, 2024, the Audit Committee of the Board approved, and on March 25, 2024, the Board approved, Deloitte & Touche LLP as the independent registered accounting firm of the Fund for fiscal periods ending after March 25, 2024.
Availability of Additional Information
You can find additional information about the Fund, including the Fund's prospectus, financial information, holdings and proxy voting information, at https://www.amundi.com/usinvestors/Resources/Shareholder-Reports. You can also request this information by contacting us at 1‑800‑225‑6292.
Important notice to shareholders
In order to reduce expenses, we will deliver a single copy of prospectuses, proxies, financial reports and other communications to shareholders with the same residential address, provided they have the same last name or we reasonably believe them to be members of the same family. Unless we are notified otherwise, we will continue to send recipients only one copy of these materials for as long as they remain a shareholder of the Fund. If you would like to receive individual mailings, please call 1-800-225-6292 and we will begin sending you separate copies of these materials within 30 days after receiving your request.
Pioneer Multi-Asset Income Fund
Class C / PMACX
ANNUAL SHAREHOLDER REPORT | July 31, 2024
This annual shareholder report contains important information about Pioneer Multi-Asset Income Fund (“Fund”) for the period of August 1, 2023 to July 31, 2024. You can find additional information about the Fund at https://www.amundi.com/usinvestors/Resources/Shareholder-Reports. You can also request this information by contacting us at 1-800-225-6292. This report describes changes to the Fund that occurred during the reporting period.
What were the Fund costs for the last year?
(Based on a hypothetical $10,000 investment)
| Class Name | Costs of a $10,000 investment | Costs paid as a percentage of a $10,000 investment |
| Class C | $169 | 1.60% |
How did the Fund perform last year and what affected the Fund performance?
For the fiscal year ended July 31, 2024, the Fund’s Class C shares at NAV returned 10.64%. For the same period, the Fund’s broad-based benchmarks, the MSCI All Country World NR Index (MSCI ACWI) and the Bloomberg U.S. Aggregate Bond Index, returned 17.02% and 5.10%, respectively. The performance benchmark, a blended benchmark (35% MSCI All Country World NR Index and 65% Bloomberg U.S. Aggregate Bond Index), returned 9.22% over the period.
Security selection and sector allocation both contributed positively to benchmark relative performance in the period, mainly due to positions in several international bank stocks as well as individual opportunities in industrials, energy, and information technology stocks. Fixed income selection and allocations to U.S. Treasury securities, securitized investments, and investment grade corporate bonds also contributed positively to benchmark relative performance.
The largest detractor from performance were positions in index futures, as a result of the positive performance of the equity markets during the period. The Fund maintains a significant position in equity-linked notes. The Fund holds positions in index futures in an effort to reduce risk associated with the equity-linked notes. Within fixed income, the Fund's overweight allocation to U.S. government agency bonds detracted from benchmark relative performance.
Fund Performance
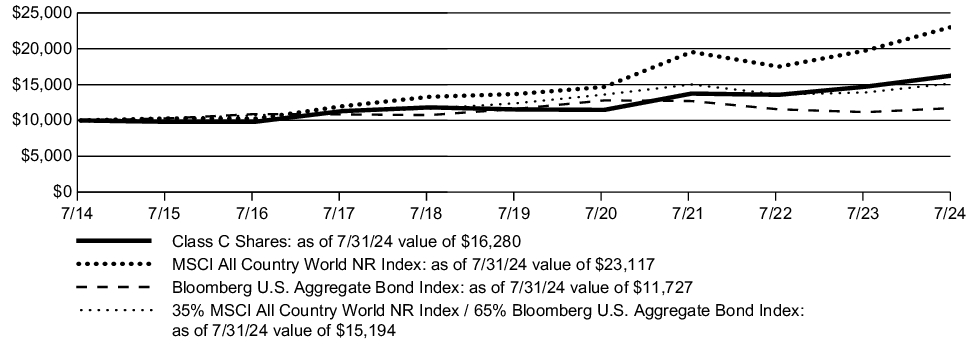
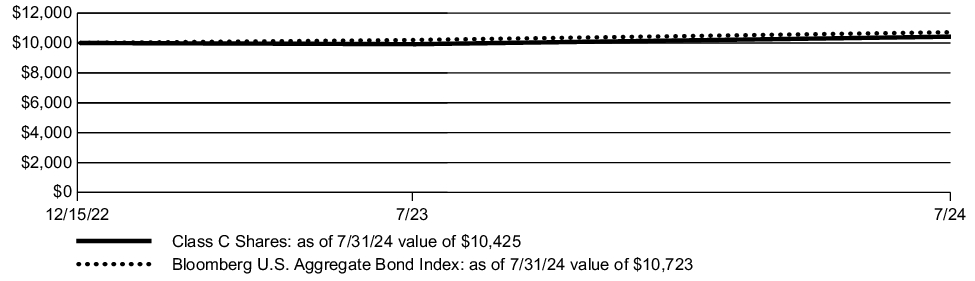
The line graph below shows the change in value of a $10,000 investment made in Class C shares of the Fund during the periods shown, compared to that of the MSCI All Country World NR Index, the Bloomberg U.S. Aggregate Bond Index, and the blended benchmark (65% MSCI All Country World NR Index and 35% Bloomberg U.S. Aggregate Bond Index).
| AVERAGE ANNUAL TOTAL RETURN | 1 Year | 5 Years | 10 Years |
| Class C (with contingent deferred sales charge) | 9.64% | 7.14% | 4.99% |
| Class C (without contingent deferred sales charge) | 10.64% | 7.14% | 4.99% |
| MSCI All Country World NR Index | 17.02% | 11.05% | 8.74% |
| Bloomberg U.S. Aggregate Bond Index | 5.10% | 0.19% | 1.61% |
| 35% MSCI All Country World NR Index / 65% Bloomberg U.S. Aggregate Bond Index | 9.22% | 4.13% | 4.27% |
Call 1-800-225-6292 or visit https://www.amundi.com/usinvestors/Resources/Shareholder-Reports for the most recent month-end performance results. Current performance may be lower or higher than the performance data quoted.
The performance data quoted represents past performance, which is no guarantee of future results.
The graph and table do not reflect the deduction of taxes that a shareholder would pay on fund distributions or redemption of fund shares.
KEY FUND STATISTICS
(as of July 31, 2024)
| Fund net assets | $3,623,720,285% |
| Total number of portfolio holdings | $491%^^ |
| Total advisory fee paid | $13,905,080% |
| Portfolio turnover rate | $62% |
^^ | Excluding short‑term investments and all derivative contracts except for options purchased. |
SECTOR DISTRIBUTION
(as of July 31, 2024)*
| Financials | 27.3% |
| U.S. Government | 12.2% |
| Energy | 10.3% |
| Information Technology | 9.8% |
| Basic Materials | 7.8% |
| Health Care | 6.3% |
| Consumer Discretionary | 4.6% |
| Industrials | 4.6% |
| Mortgage Securities | 3.9% |
| Asset Backed Securities | 2.8% |
| Utilities | 2.6% |
| Communication Services | 2.6% |
| Consumer, Cyclical | 1.3% |
| Consumer, Non-cyclical | 1.2% |
| Consumer Staples | 1.2% |
| Foreign Government | 1.0% |
| Closed-End Funds | 0.3% |
| Real Estate | 0.2% |
* | As a percentage of total investments excluding short‑term investments and all derivative contracts except for options purchased. |
Material Fund Changes
Amundi Asset Management US, Inc. (the “Adviser”), the Fund’s investment adviser, is currently an indirect, wholly-owned subsidiary of Amundi. On July 9, 2024, Amundi announced that it had entered into a definitive agreement with Victory Capital Holdings, Inc. (“Victory Capital”) to combine the Adviser with Victory Capital, and for Amundi to become a strategic shareholder of Victory Capital (the “Transaction”). Victory Capital is headquartered in San Antonio, Texas. The closing of the Transaction is subject to certain regulatory approvals and other conditions. There is no assurance that the Transaction will close.
The closing of the Transaction would cause the Fund’s current investment advisory agreement with the Adviser to terminate. Under the terms of the Transaction, the Fund’s Board of Trustees will be asked to approve a reorganization of the Fund into a corresponding, newly established Victory Fund advised by Victory Capital Management Inc., an affiliate of Victory Capital. The proposed reorganization of the Fund would be sought in connection with the closing of the Transaction. If approved by the Board, the proposal to reorganize the Fund will be submitted to the shareholders of the Fund for their approval. There is no assurance that the Board or the shareholders of the Fund will approve the proposal to reorganize the Fund.
For more complete information, you may review the Fund's next prospectus, which we expect to be available by December 1, 2024 at https://www.amundi.com/usinvestors/Products/Mutual-Funds or upon request at 1-800-225-6292.
Changes in Accountants
On March 25, 2024, Ernst & Young LLP (the “Prior Auditor”) resigned as the independent registered public accounting firm of the Fund. There were no disagreements with the Prior Auditor during the two most recent fiscal years and the subsequent interim period through March 25, 2024.
On March 25, 2024, the Audit Committee of the Board approved, and on March 25, 2024, the Board approved, Deloitte & Touche LLP as the independent registered accounting firm of the Fund for fiscal periods ending after March 25, 2024.
Availability of Additional Information
You can find additional information about the Fund, including the Fund's prospectus, financial information, holdings and proxy voting information, at https://www.amundi.com/usinvestors/Resources/Shareholder-Reports. You can also request this information by contacting us at 1‑800‑225‑6292.
Important notice to shareholders
In order to reduce expenses, we will deliver a single copy of prospectuses, proxies, financial reports and other communications to shareholders with the same residential address, provided they have the same last name or we reasonably believe them to be members of the same family. Unless we are notified otherwise, we will continue to send recipients only one copy of these materials for as long as they remain a shareholder of the Fund. If you would like to receive individual mailings, please call 1-800-225-6292 and we will begin sending you separate copies of these materials within 30 days after receiving your request.
Pioneer Multi-Asset Income Fund
Class K / PMFKX
ANNUAL SHAREHOLDER REPORT | July 31, 2024
This annual shareholder report contains important information about Pioneer Multi-Asset Income Fund (“Fund”) for the period of August 1, 2023 to July 31, 2024. You can find additional information about the Fund at https://www.amundi.com/usinvestors/Resources/Shareholder-Reports. You can also request this information by contacting us at 1-800-225-6292. This report describes changes to the Fund that occurred during the reporting period.
What were the Fund costs for the last year?
(Based on a hypothetical $10,000 investment)
| Class Name | Costs of a $10,000 investment | Costs paid as a percentage of a $10,000 investment |
| Class K | $57 | 0.54% |
How did the Fund perform last year and what affected the Fund performance?
For the fiscal year ended July 31, 2024, the Fund’s Class K shares at NAV returned 11.84%. For the same period, the Fund’s broad-based benchmarks, the MSCI All Country World NR Index (MSCI ACWI) and the Bloomberg U.S. Aggregate Bond Index, returned 17.02% and 5.10%, respectively. The performance benchmark, a blended benchmark (35% MSCI All Country World NR Index and 65% Bloomberg U.S. Aggregate Bond Index), returned 9.22% over the period.
Security selection and sector allocation both contributed positively to benchmark relative performance in the period, mainly due to positions in several international bank stocks as well as individual opportunities in industrials, energy, and information technology stocks. Fixed income selection and allocations to U.S. Treasury securities, securitized investments, and investment grade corporate bonds also contributed positively to benchmark relative performance.
The largest detractor from performance were positions in index futures, as a result of the positive performance of the equity markets during the period. The Fund maintains a significant position in equity-linked notes. The Fund holds positions in index futures in an effort to reduce risk associated with the equity-linked notes. Within fixed income, the Fund's overweight allocation to U.S. government agency bonds detracted from benchmark relative performance.
Fund Performance
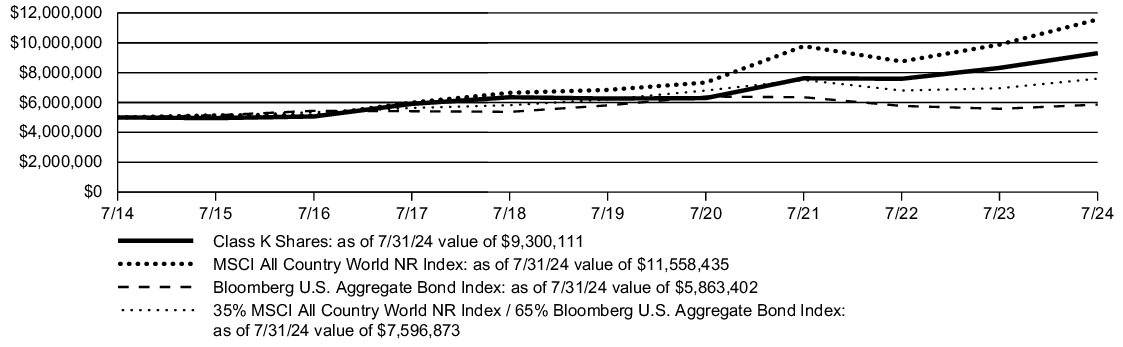
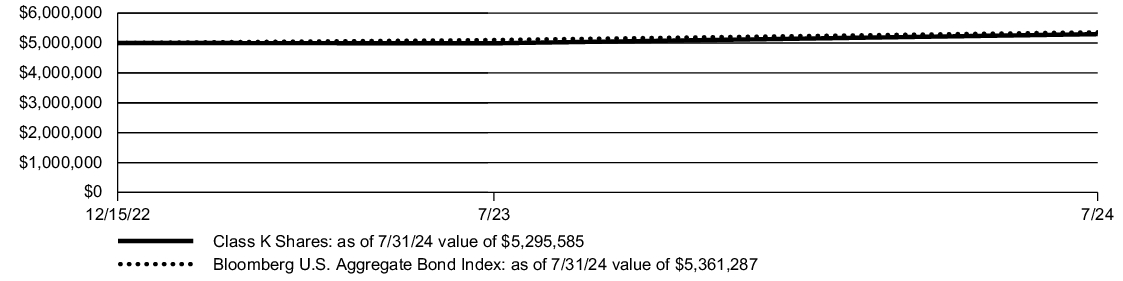
The line graph below shows the change in value of a $5 Million investment made in Class K shares of the Fund during the periods shown, compared to that of the MSCI All Country World NR Index, the Bloomberg U.S. Aggregate Bond Index, and the blended benchmark (65% MSCI All Country World NR Index and 35% Bloomberg U.S. Aggregate Bond Index).
| AVERAGE ANNUAL TOTAL RETURN | 1 Year | 5 Years | 10 Years |
| Class K | 11.84% | 8.21% | 6.40% |
| MSCI All Country World NR Index | 17.02% | 11.05% | 8.74% |
| Bloomberg U.S. Aggregate Bond Index | 5.10% | 0.19% | 1.61% |
| 35% MSCI All Country World NR Index / 65% Bloomberg U.S. Aggregate Bond Index | 9.22% | 4.13% | 4.27% |
Call 1-800-225-6292 or visit https://www.amundi.com/usinvestors/Resources/Shareholder-Reports for the most recent month-end performance results. Current performance may be lower or higher than the performance data quoted.
The performance shown for Class K shares for the period prior to the commencement of operations of Class K shares on December 1, 2014, is the net asset value performance of the Fund’s Class A shares, which has not been restated to reflect any differences in expenses, including Rule 12b-1 fees applicable to Class A shares. Since fees for Class A shares generally are higher than those of Class K shares, the performance of Class K shares prior to their inception on December 1, 2014, would have been higher than the performance shown. For the period beginning December 1, 2014, the actual performance of Class K shares is reflected.
The performance data quoted represents past performance, which is no guarantee of future results.
The graph and table do not reflect the deduction of taxes that a shareholder would pay on fund distributions or redemption of fund shares.
KEY FUND STATISTICS
(as of July 31, 2024)
| Fund net assets | $3,623,720,285% |
| Total number of portfolio holdings | $491%^^ |
| Total advisory fee paid | $13,905,080% |
| Portfolio turnover rate | $62% |
^^ | Excluding short‑term investments and all derivative contracts except for options purchased. |
SECTOR DISTRIBUTION
(as of July 31, 2024)*
| Financials | 27.3% |
| U.S. Government | 12.2% |
| Energy | 10.3% |
| Information Technology | 9.8% |
| Basic Materials | 7.8% |
| Health Care | 6.3% |
| Consumer Discretionary | 4.6% |
| Industrials | 4.6% |
| Mortgage Securities | 3.9% |
| Asset Backed Securities | 2.8% |
| Utilities | 2.6% |
| Communication Services | 2.6% |
| Consumer, Cyclical | 1.3% |
| Consumer, Non-cyclical | 1.2% |
| Consumer Staples | 1.2% |
| Foreign Government | 1.0% |
| Closed-End Funds | 0.3% |
| Real Estate | 0.2% |
* | As a percentage of total investments excluding short‑term investments and all derivative contracts except for options purchased. |
Material Fund Changes
Amundi Asset Management US, Inc. (the “Adviser”), the Fund’s investment adviser, is currently an indirect, wholly-owned subsidiary of Amundi. On July 9, 2024, Amundi announced that it had entered into a definitive agreement with Victory Capital Holdings, Inc. (“Victory Capital”) to combine the Adviser with Victory Capital, and for Amundi to become a strategic shareholder of Victory Capital (the “Transaction”). Victory Capital is headquartered in San Antonio, Texas. The closing of the Transaction is subject to certain regulatory approvals and other conditions. There is no assurance that the Transaction will close.
The closing of the Transaction would cause the Fund’s current investment advisory agreement with the Adviser to terminate. Under the terms of the Transaction, the Fund’s Board of Trustees will be asked to approve a reorganization of the Fund into a corresponding, newly established Victory Fund advised by Victory Capital Management Inc., an affiliate of Victory Capital. The proposed reorganization of the Fund would be sought in connection with the closing of the Transaction. If approved by the Board, the proposal to reorganize the Fund will be submitted to the shareholders of the Fund for their approval. There is no assurance that the Board or the shareholders of the Fund will approve the proposal to reorganize the Fund.
For more complete information, you may review the Fund's next prospectus, which we expect to be available by December 1, 2024 at https://www.amundi.com/usinvestors/Products/Mutual-Funds or upon request at 1-800-225-6292.
Changes in Accountants
On March 25, 2024, Ernst & Young LLP (the “Prior Auditor”) resigned as the independent registered public accounting firm of the Fund. There were no disagreements with the Prior Auditor during the two most recent fiscal years and the subsequent interim period through March 25, 2024.
On March 25, 2024, the Audit Committee of the Board approved, and on March 25, 2024, the Board approved, Deloitte & Touche LLP as the independent registered accounting firm of the Fund for fiscal periods ending after March 25, 2024.
Availability of Additional Information
You can find additional information about the Fund, including the Fund's prospectus, financial information, holdings and proxy voting information, at https://www.amundi.com/usinvestors/Resources/Shareholder-Reports. You can also request this information by contacting us at 1‑800‑225‑6292.
Important notice to shareholders
In order to reduce expenses, we will deliver a single copy of prospectuses, proxies, financial reports and other communications to shareholders with the same residential address, provided they have the same last name or we reasonably believe them to be members of the same family. Unless we are notified otherwise, we will continue to send recipients only one copy of these materials for as long as they remain a shareholder of the Fund. If you would like to receive individual mailings, please call 1-800-225-6292 and we will begin sending you separate copies of these materials within 30 days after receiving your request.
Pioneer Multi-Asset Income Fund
Class R / PMFRX
ANNUAL SHAREHOLDER REPORT | July 31, 2024
This annual shareholder report contains important information about Pioneer Multi-Asset Income Fund (“Fund”) for the period of August 1, 2023 to July 31, 2024. You can find additional information about the Fund at https://www.amundi.com/usinvestors/Resources/Shareholder-Reports. You can also request this information by contacting us at 1-800-225-6292. This report describes changes to the Fund that occurred during the reporting period.
What were the Fund costs for the last year?
(Based on a hypothetical $10,000 investment)
| Class Name | Costs of a $10,000 investment | Costs paid as a percentage of a $10,000 investment |
| Class R | $122 | 1.16% |
How did the Fund perform last year and what affected the Fund performance?
For the fiscal year ended July 31, 2024, the Fund’s Class R shares at NAV returned 11.10%. For the same period, the Fund’s broad-based benchmarks, the MSCI All Country World NR Index (MSCI ACWI) and the Bloomberg U.S. Aggregate Bond Index, returned 17.02% and 5.10%, respectively. The performance benchmark, a blended benchmark (35% MSCI All Country World NR Index and 65% Bloomberg U.S. Aggregate Bond Index), returned 9.22% over the period.
Security selection and sector allocation both contributed positively to benchmark relative performance in the period, mainly due to positions in several international bank stocks as well as individual opportunities in industrials, energy, and information technology stocks. Fixed income selection and allocations to U.S. Treasury securities, securitized investments, and investment grade corporate bonds also contributed positively to benchmark relative performance.
The largest detractor from performance were positions in index futures, as a result of the positive performance of the equity markets during the period. The Fund maintains a significant position in equity-linked notes. The Fund holds positions in index futures in an effort to reduce risk associated with the equity-linked notes. Within fixed income, the Fund's overweight allocation to U.S. government agency bonds detracted from benchmark relative performance.
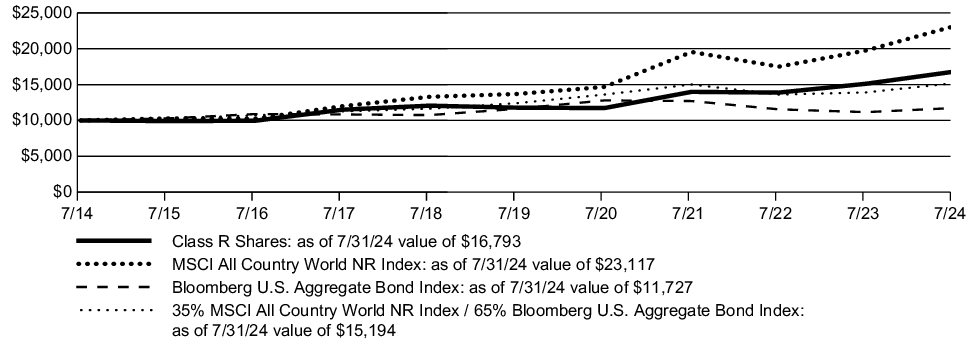
Fund Performance
The line graph below shows the change in value of a $10,000 investment made in Class R shares of the Fund during the periods shown, compared to that of the MSCI All Country World NR Index, the Bloomberg U.S. Aggregate Bond Index, and the blended benchmark (65% MSCI All Country World NR Index and 35% Bloomberg U.S. Aggregate Bond Index).
| AVERAGE ANNUAL TOTAL RETURN | 1 Year | 5 Years | 10 Years |
| Class R | 11.10% | 7.35% | 5.32% |
| MSCI All Country World NR Index | 17.02% | 11.05% | 8.74% |
| Bloomberg U.S. Aggregate Bond Index | 5.10% | 0.19% | 1.61% |
| 35% MSCI All Country World NR Index / 65% Bloomberg U.S. Aggregate Bond Index | 9.22% | 4.13% | 4.27% |
Call 1-800-225-6292 or visit https://www.amundi.com/usinvestors/Resources/Shareholder-Reports for the most recent month-end performance results. Current performance may be lower or higher than the performance data quoted.
The performance shown for Class R shares for the period prior to the commencement of operations of Class R shares on December 1, 2014, is based on the performance of Class A shares, reduced to reflect the higher distribution and service fees of Class R shares. For the period beginning December 1, 2014, the actual performance of Class R shares is reflected.
The performance data quoted represents past performance, which is no guarantee of future results.
The graph and table do not reflect the deduction of taxes that a shareholder would pay on fund distributions or redemption of fund shares.
KEY FUND STATISTICS
(as of July 31, 2024)
| Fund net assets | $3,623,720,285% |
| Total number of portfolio holdings | $491%^^ |
| Total advisory fee paid | $13,905,080% |
| Portfolio turnover rate | $62% |
^^ | Excluding short‑term investments and all derivative contracts except for options purchased. |
SECTOR DISTRIBUTION
(as of July 31, 2024)*
| Financials | 27.3% |
| U.S. Government | 12.2% |
| Energy | 10.3% |
| Information Technology | 9.8% |
| Basic Materials | 7.8% |
| Health Care | 6.3% |
| Consumer Discretionary | 4.6% |
| Industrials | 4.6% |
| Mortgage Securities | 3.9% |
| Asset Backed Securities | 2.8% |
| Utilities | 2.6% |
| Communication Services | 2.6% |
| Consumer, Cyclical | 1.3% |
| Consumer, Non-cyclical | 1.2% |
| Consumer Staples | 1.2% |
| Foreign Government | 1.0% |
| Closed-End Funds | 0.3% |
| Real Estate | 0.2% |
* | As a percentage of total investments excluding short‑term investments and all derivative contracts except for options purchased. |
Material Fund Changes
Amundi Asset Management US, Inc. (the “Adviser”), the Fund’s investment adviser, is currently an indirect, wholly-owned subsidiary of Amundi. On July 9, 2024, Amundi announced that it had entered into a definitive agreement with Victory Capital Holdings, Inc. (“Victory Capital”) to combine the Adviser with Victory Capital, and for Amundi to become a strategic shareholder of Victory Capital (the “Transaction”). Victory Capital is headquartered in San Antonio, Texas. The closing of the Transaction is subject to certain regulatory approvals and other conditions. There is no assurance that the Transaction will close.
The closing of the Transaction would cause the Fund’s current investment advisory agreement with the Adviser to terminate. Under the terms of the Transaction, the Fund’s Board of Trustees will be asked to approve a reorganization of the Fund into a corresponding, newly established Victory Fund advised by Victory Capital Management Inc., an affiliate of Victory Capital. The proposed reorganization of the Fund would be sought in connection with the closing of the Transaction. If approved by the Board, the proposal to reorganize the Fund will be submitted to the shareholders of the Fund for their approval. There is no assurance that the Board or the shareholders of the Fund will approve the proposal to reorganize the Fund.
For more complete information, you may review the Fund's next prospectus, which we expect to be available by December 1, 2024 at https://www.amundi.com/usinvestors/Products/Mutual-Funds or upon request at 1-800-225-6292.
Changes in Accountants
On March 25, 2024, Ernst & Young LLP (the “Prior Auditor”) resigned as the independent registered public accounting firm of the Fund. There were no disagreements with the Prior Auditor during the two most recent fiscal years and the subsequent interim period through March 25, 2024.
On March 25, 2024, the Audit Committee of the Board approved, and on March 25, 2024, the Board approved, Deloitte & Touche LLP as the independent registered accounting firm of the Fund for fiscal periods ending after March 25, 2024.
Availability of Additional Information
You can find additional information about the Fund, including the Fund's prospectus, financial information, holdings and proxy voting information, at https://www.amundi.com/usinvestors/Resources/Shareholder-Reports. You can also request this information by contacting us at 1‑800‑225‑6292.
Important notice to shareholders
In order to reduce expenses, we will deliver a single copy of prospectuses, proxies, financial reports and other communications to shareholders with the same residential address, provided they have the same last name or we reasonably believe them to be members of the same family. Unless we are notified otherwise, we will continue to send recipients only one copy of these materials for as long as they remain a shareholder of the Fund. If you would like to receive individual mailings, please call 1-800-225-6292 and we will begin sending you separate copies of these materials within 30 days after receiving your request.
Pioneer Multi-Asset Income Fund
Class Y / PMFYX
ANNUAL SHAREHOLDER REPORT | July 31, 2024
This annual shareholder report contains important information about Pioneer Multi-Asset Income Fund (“Fund”) for the period of August 1, 2023 to July 31, 2024. You can find additional information about the Fund at https://www.amundi.com/usinvestors/Resources/Shareholder-Reports. You can also request this information by contacting us at 1-800-225-6292. This report describes changes to the Fund that occurred during the reporting period.
What were the Fund costs for the last year?
(Based on a hypothetical $10,000 investment)
| Class Name | Costs of a $10,000 investment | Costs paid as a percentage of a $10,000 investment |
| Class Y | $68 | 0.64% |
How did the Fund perform last year and what affected the Fund performance?
For the fiscal year ended July 31, 2024, the Fund’s Class Y shares at NAV returned 11.80%. For the same period, the Fund’s broad-based benchmarks, the MSCI All Country World NR Index (MSCI ACWI) and the Bloomberg U.S. Aggregate Bond Index, returned 17.02% and 5.10%, respectively. The performance benchmark, a blended benchmark (35% MSCI All Country World NR Index and 65% Bloomberg U.S. Aggregate Bond Index), returned 9.22% over the period.
Security selection and sector allocation both contributed positively to benchmark relative performance in the period, mainly due to positions in several international bank stocks as well as individual opportunities in industrials, energy, and information technology stocks. Fixed income selection and allocations to U.S. Treasury securities, securitized investments, and investment grade corporate bonds also contributed positively to benchmark relative performance.
The largest detractor from performance were positions in index futures, as a result of the positive performance of the equity markets during the period. The Fund maintains a significant position in equity-linked notes. The Fund holds positions in index futures in an effort to reduce risk associated with the equity-linked notes. Within fixed income, the Fund's overweight allocation to U.S. government agency bonds detracted from benchmark relative performance.
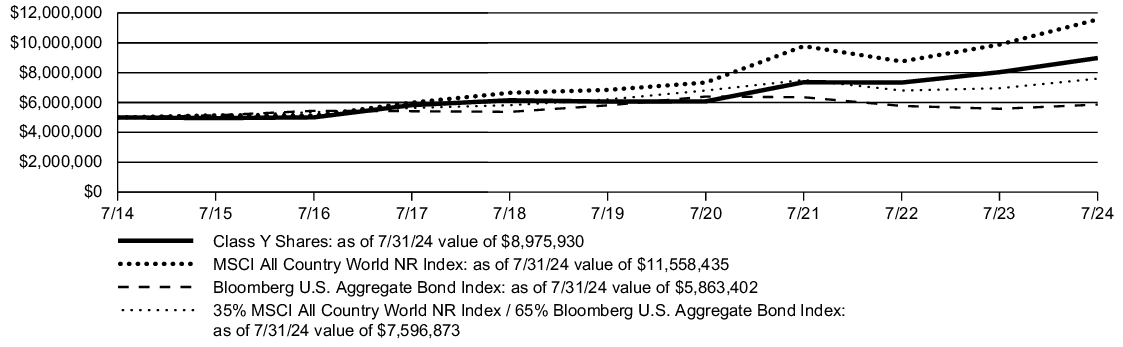
Fund Performance
The line graph below shows the change in value of a $5 Million investment made in Class Y shares of the Fund during the periods shown, compared to that of the MSCI All Country World NR Index, the Bloomberg U.S. Aggregate Bond Index, and the blended benchmark (65% MSCI All Country World NR Index and 35% Bloomberg U.S. Aggregate Bond Index).
| AVERAGE ANNUAL TOTAL RETURN | 1 Year | 5 Years | 10 Years |
| Class Y | 11.80% | 8.16% | 6.03% |
| MSCI All Country World NR Index | 17.02% | 11.05% | 8.74% |
| Bloomberg U.S. Aggregate Bond Index | 5.10% | 0.19% | 1.61% |
| 35% MSCI All Country World NR Index / 65% Bloomberg U.S. Aggregate Bond Index | 9.22% | 4.13% | 4.27% |
Call 1-800-225-6292 or visit https://www.amundi.com/usinvestors/Resources/Shareholder-Reports for the most recent month-end performance results. Current performance may be lower or higher than the performance data quoted.
The performance data quoted represents past performance, which is no guarantee of future results.
The graph and table do not reflect the deduction of taxes that a shareholder would pay on fund distributions or redemption of fund shares.
KEY FUND STATISTICS
(as of July 31, 2024)
| Fund net assets | $3,623,720,285% |
| Total number of portfolio holdings | $491%^^ |
| Total advisory fee paid | $13,905,080% |
| Portfolio turnover rate | $62% |
^^ | Excluding short‑term investments and all derivative contracts except for options purchased. |
SECTOR DISTRIBUTION
(as of July 31, 2024)*
| Financials | 27.3% |
| U.S. Government | 12.2% |
| Energy | 10.3% |
| Information Technology | 9.8% |
| Basic Materials | 7.8% |
| Health Care | 6.3% |
| Consumer Discretionary | 4.6% |
| Industrials | 4.6% |
| Mortgage Securities | 3.9% |
| Asset Backed Securities | 2.8% |
| Utilities | 2.6% |
| Communication Services | 2.6% |
| Consumer, Cyclical | 1.3% |
| Consumer, Non-cyclical | 1.2% |
| Consumer Staples | 1.2% |
| Foreign Government | 1.0% |
| Closed-End Funds | 0.3% |
| Real Estate | 0.2% |
* | As a percentage of total investments excluding short‑term investments and all derivative contracts except for options purchased. |
Material Fund Changes
Amundi Asset Management US, Inc. (the “Adviser”), the Fund’s investment adviser, is currently an indirect, wholly-owned subsidiary of Amundi. On July 9, 2024, Amundi announced that it had entered into a definitive agreement with Victory Capital Holdings, Inc. (“Victory Capital”) to combine the Adviser with Victory Capital, and for Amundi to become a strategic shareholder of Victory Capital (the “Transaction”). Victory Capital is headquartered in San Antonio, Texas. The closing of the Transaction is subject to certain regulatory approvals and other conditions. There is no assurance that the Transaction will close.
The closing of the Transaction would cause the Fund’s current investment advisory agreement with the Adviser to terminate. Under the terms of the Transaction, the Fund’s Board of Trustees will be asked to approve a reorganization of the Fund into a corresponding, newly established Victory Fund advised by Victory Capital Management Inc., an affiliate of Victory Capital. The proposed reorganization of the Fund would be sought in connection with the closing of the Transaction. If approved by the Board, the proposal to reorganize the Fund will be submitted to the shareholders of the Fund for their approval. There is no assurance that the Board or the shareholders of the Fund will approve the proposal to reorganize the Fund.
For more complete information, you may review the Fund's next prospectus, which we expect to be available by December 1, 2024 at https://www.amundi.com/usinvestors/Products/Mutual-Funds or upon request at 1-800-225-6292.
Changes in Accountants
On March 25, 2024, Ernst & Young LLP (the “Prior Auditor”) resigned as the independent registered public accounting firm of the Fund. There were no disagreements with the Prior Auditor during the two most recent fiscal years and the subsequent interim period through March 25, 2024.
On March 25, 2024, the Audit Committee of the Board approved, and on March 25, 2024, the Board approved, Deloitte & Touche LLP as the independent registered accounting firm of the Fund for fiscal periods ending after March 25, 2024.
Availability of Additional Information
You can find additional information about the Fund, including the Fund's prospectus, financial information, holdings and proxy voting information, at https://www.amundi.com/usinvestors/Resources/Shareholder-Reports. You can also request this information by contacting us at 1‑800‑225‑6292.
Important notice to shareholders
In order to reduce expenses, we will deliver a single copy of prospectuses, proxies, financial reports and other communications to shareholders with the same residential address, provided they have the same last name or we reasonably believe them to be members of the same family. Unless we are notified otherwise, we will continue to send recipients only one copy of these materials for as long as they remain a shareholder of the Fund. If you would like to receive individual mailings, please call 1-800-225-6292 and we will begin sending you separate copies of these materials within 30 days after receiving your request.
Pioneer Balanced ESG Fund
Class A / AOBLX
ANNUAL SHAREHOLDER REPORT | July 31, 2024
This annual shareholder report contains important information about Pioneer Balanced ESG Fund (“Fund”) for the period of August 1, 2023 to July 31, 2024. You can find additional information about the Fund at https://www.amundi.com/usinvestors/Resources/Shareholder-Reports. You can also request this information by contacting us at 1-800-225-6292. This report describes changes to the Fund that occurred during the reporting period.
What were the Fund costs for the last year?
(Based on a hypothetical $10,000 investment)
| Class Name | Costs of a $10,000 investment | Costs paid as a percentage of a $10,000 investment |
| Class A | $99 | 0.93% |
How did the Fund perform last year and what affected the Fund performance?
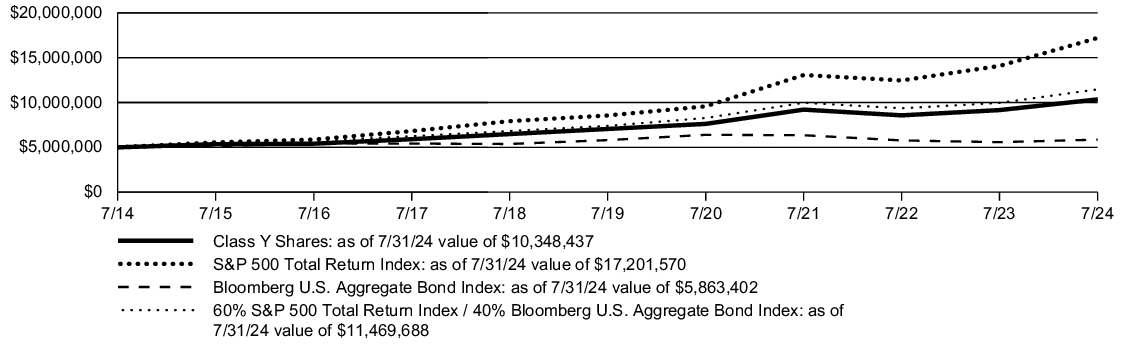
For the fiscal year ended July 31, 2024, the Fund’s Class A shares at NAV returned 12.85%. For the same period, the Fund’s broad-based benchmarks, the Standard & Poor's 500 (S&P 500) Total Return Index and the Bloomberg U.S. Aggregate Bond Index, returned 22.15% and 5.10%, respectively. The performance benchmark, a blended benchmark (60% S&P 500 Total Return Index and 40% Bloomberg U.S. Aggregate Bond Index), returned 15.16% over the period.
Security selection in the equity portfolio was the primary detractor from benchmark relative performance in the period, mainly due to weaker relative selection in the information technology sector. An overweight to Asset Backed Securities and Collateralized Mortgage Obligations also detracted from relative returns.
Sector allocation decisions contributed to Fund performance overall due to an underweight to U.S. Treasury Securities and U.S. Government Agency-issued Mortgage-Backed Securities. Additionally, security selection in corporate bonds was additive to relative returns.
Fund Performance
The line graph below shows the change in value of a $10,000 investment made in Class A shares of the Fund at public offering price during the periods shown, compared to that of the S&P 500 Total Return Index, the Bloomberg U.S. Aggregate Bond Index, and the blended benchmark (60% S&P 500 Total Return Index and 40% Bloomberg U.S. Aggregate Bond Index).
| AVERAGE ANNUAL TOTAL RETURN | 1 Year | 5 Years | 10 Years |
| Class A (with sales charge) | 7.76% | 6.67% | 6.76% |
| Class A (without sales charge) | 12.85% | 7.66% | 7.25% |
| S&P 500 Total Return Index | 22.15% | 15.00% | 13.15% |
| Bloomberg U.S. Aggregate Bond Index | 5.10% | 0.19% | 1.61% |
| 60% S&P 500 Total Return Index / 40% Bloomberg U.S. Aggregate Bond Index | 15.16% | 9.16% | 8.66% |
Call 1-800-225-6292 or visit https://www.amundi.com/usinvestors/Resources/Shareholder-Reports for the most recent month-end performance results. Current performance may be lower or higher than the performance data quoted.
The performance data quoted represents past performance, which is no guarantee of future results.
The graph and table do not reflect the deduction of taxes that a shareholder would pay on fund distributions or redemption of fund shares.
KEY FUND STATISTICS
(as of July 31, 2024)
| Fund net assets | $426,709,956% |
| Total number of portfolio holdings | $678%^^ |
| Total advisory fee paid | $2,043,303% |
| Portfolio turnover rate | $33% |
^^ | Excluding short-term investments, TBA sale commitments and all derivative contracts except for options purchased. |
SECTOR DISTRIBUTION
(as of July 31, 2024)*
| Information Technology | 17.7% |
| U.S. Government | 17.0% |
| Financials | 14.1% |
| Health Care | 9.6% |
| Industrials | 8.0% |
| Communication Services | 6.7% |
| Energy | 4.5% |
| Basic Materials | 4.0% |
| Mortgage Securities | 3.9% |
| Consumer Discretionary | 3.5% |
| Consumer Staples | 3.0% |
| Asset Backed Securities | 2.9% |
| Real Estate | 1.5% |
| Consumer, Cyclical | 1.2% |
| Consumer, Non-cyclical | 0.9% |
| Utilities | 0.9% |
| Affiliated Closed-End Fund∞ | 0.3% |
| Foreign Government | 0.2% |
| Government | 0.1% |
* | As a percentage of total investments excluding short‑term investments, TBA sale commitments and all derivative contracts except for options purchased. |
∞ | Pioneer ILS Interval Fund is an affiliated closed-end fund managed by Amundi Asset Management US, Inc. |
Material Fund Changes
Amundi Asset Management US, Inc. (the “Adviser”), the Fund’s investment adviser, is currently an indirect, wholly-owned subsidiary of Amundi. On July 9, 2024, Amundi announced that it had entered into a definitive agreement with Victory Capital Holdings, Inc. (“Victory Capital”) to combine the Adviser with Victory Capital, and for Amundi to become a strategic shareholder of Victory Capital (the “Transaction”). Victory Capital is headquartered in San Antonio, Texas. The closing of the Transaction is subject to certain regulatory approvals and other conditions. There is no assurance that the Transaction will close.
The closing of the Transaction would cause the Fund’s current investment advisory agreement with the Adviser to terminate. Under the terms of the Transaction, the Fund’s Board of Trustees will be asked to approve a reorganization of the Fund into a corresponding, newly established Victory Fund advised by Victory Capital Management Inc., an affiliate of Victory Capital. The proposed reorganization of the Fund would be sought in connection with the closing of the Transaction. If approved by the Board, the proposal to reorganize the Fund will be submitted to the shareholders of the Fund for their approval. There is no assurance that the Board or the shareholders of the Fund will approve the proposal to reorganize the Fund.
For more complete information, you may review the Fund's next prospectus, which we expect to be available by December 1, 2024 at https://www.amundi.com/usinvestors/Products/Mutual-Funds or upon request at 1-800-225-6292.
Changes in Accountants
On March 25, 2024, Ernst & Young LLP (the “Prior Auditor”) resigned as the independent registered public accounting firm of the Fund. There were no disagreements with the Prior Auditor during the two most recent fiscal years and the subsequent interim period through March 25, 2024.
On March 25, 2024, the Audit Committee of the Board approved, and on March 25, 2024, the Board approved, Deloitte & Touche LLP as the independent registered accounting firm of the Fund for fiscal periods ending after March 25, 2024.
Availability of Additional Information
You can find additional information about the Fund, including the Fund's prospectus, financial information, holdings and proxy voting information, at https://www.amundi.com/usinvestors/Resources/Shareholder-Reports. You can also request this information by contacting us at 1‑800‑225‑6292.
Important notice to shareholders
In order to reduce expenses, we will deliver a single copy of prospectuses, proxies, financial reports and other communications to shareholders with the same residential address, provided they have the same last name or we reasonably believe them to be members of the same family. Unless we are notified otherwise, we will continue to send recipients only one copy of these materials for as long as they remain a shareholder of the Fund. If you would like to receive individual mailings, please call 1-800-225-6292 and we will begin sending you separate copies of these materials within 30 days after receiving your request.
Pioneer Balanced ESG Fund
Class C / PCBCX
ANNUAL SHAREHOLDER REPORT | July 31, 2024
This annual shareholder report contains important information about Pioneer Balanced ESG Fund (“Fund”) for the period of August 1, 2023 to July 31, 2024. You can find additional information about the Fund at https://www.amundi.com/usinvestors/Resources/Shareholder-Reports. You can also request this information by contacting us at 1-800-225-6292. This report describes changes to the Fund that occurred during the reporting period.
What were the Fund costs for the last year?
(Based on a hypothetical $10,000 investment)
| Class Name | Costs of a $10,000 investment | Costs paid as a percentage of a $10,000 investment |
| Class C | $178 | 1.68% |
How did the Fund perform last year and what affected the Fund performance?
For the fiscal year ended July 31, 2024, the Fund’s Class C shares at NAV returned 11.95%. For the same period, the Fund’s broad-based benchmarks, the Standard & Poor's 500 (S&P 500) Total Return Index and the Bloomberg U.S. Aggregate Bond Index, returned 22.15% and 5.10%, respectively. The performance benchmark, a blended benchmark (60% S&P 500 Total Return Index and 40% Bloomberg U.S. Aggregate Bond Index), returned 15.16% over the period.
Security selection in the equity portfolio was the primary detractor from benchmark relative performance in the period, mainly due to weaker relative selection in the information technology sector. An overweight to Asset Backed Securities and Collateralized Mortgage Obligations also detracted from relative returns.
Sector allocation decisions contributed to Fund performance overall due to an underweight to U.S. Treasury Securities and U.S. Government Agency-issued Mortgage-Backed Securities. Additionally, security selection in corporate bonds was additive to relative returns.
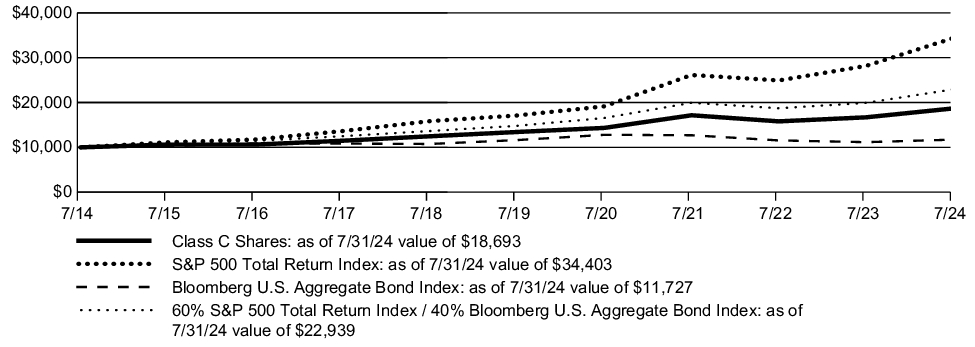
Fund Performance
The line graph below shows the change in value of a $10,000 investment made in Class C shares of the Fund during the periods shown, compared to that of the S&P 500 Total Return Index, the Bloomberg U.S. Aggregate Bond Index, and the blended benchmark (60% S&P 500 Total Return Index and 40% Bloomberg U.S. Aggregate Bond Index).
| AVERAGE ANNUAL TOTAL RETURN | 1 Year | 5 Years | 10 Years |
| Class C (with contingent deferred sales charge) | 10.95% | 6.84% | 6.45% |
| Class C (without contingent deferred sales charge) | 11.95% | 6.84% | 6.45% |
| S&P 500 Total Return Index | 22.15% | 15.00% | 13.15% |
| Bloomberg U.S. Aggregate Bond Index | 5.10% | 0.19% | 1.61% |
| 60% S&P 500 Total Return Index / 40% Bloomberg U.S. Aggregate Bond Index | 15.16% | 9.16% | 8.66% |
Call 1-800-225-6292 or visit https://www.amundi.com/usinvestors/Resources/Shareholder-Reports for the most recent month-end performance results. Current performance may be lower or higher than the performance data quoted.
The performance data quoted represents past performance, which is no guarantee of future results.
The graph and table do not reflect the deduction of taxes that a shareholder would pay on fund distributions or redemption of fund shares.
KEY FUND STATISTICS
(as of July 31, 2024)
| Fund net assets | $426,709,956% |
| Total number of portfolio holdings | $678%^^ |
| Total advisory fee paid | $2,043,303% |
| Portfolio turnover rate | $33% |
^^ | Excluding short-term investments, TBA sale commitments and all derivative contracts except for options purchased. |
SECTOR DISTRIBUTION
(as of July 31, 2024)*
| Information Technology | 17.7% |
| U.S. Government | 17.0% |
| Financials | 14.1% |
| Health Care | 9.6% |
| Industrials | 8.0% |
| Communication Services | 6.7% |
| Energy | 4.5% |
| Basic Materials | 4.0% |
| Mortgage Securities | 3.9% |
| Consumer Discretionary | 3.5% |
| Consumer Staples | 3.0% |
| Asset Backed Securities | 2.9% |
| Real Estate | 1.5% |
| Consumer, Cyclical | 1.2% |
| Consumer, Non-cyclical | 0.9% |
| Utilities | 0.9% |
| Affiliated Closed-End Fund∞ | 0.3% |
| Foreign Government | 0.2% |
| Government | 0.1% |
* | As a percentage of total investments excluding short‑term investments, TBA sale commitments and all derivative contracts except for options purchased. |
∞ | Pioneer ILS Interval Fund is an affiliated closed-end fund managed by Amundi Asset Management US, Inc. |
Material Fund Changes
Amundi Asset Management US, Inc. (the “Adviser”), the Fund’s investment adviser, is currently an indirect, wholly-owned subsidiary of Amundi. On July 9, 2024, Amundi announced that it had entered into a definitive agreement with Victory Capital Holdings, Inc. (“Victory Capital”) to combine the Adviser with Victory Capital, and for Amundi to become a strategic shareholder of Victory Capital (the “Transaction”). Victory Capital is headquartered in San Antonio, Texas. The closing of the Transaction is subject to certain regulatory approvals and other conditions. There is no assurance that the Transaction will close.
The closing of the Transaction would cause the Fund’s current investment advisory agreement with the Adviser to terminate. Under the terms of the Transaction, the Fund’s Board of Trustees will be asked to approve a reorganization of the Fund into a corresponding, newly established Victory Fund advised by Victory Capital Management Inc., an affiliate of Victory Capital. The proposed reorganization of the Fund would be sought in connection with the closing of the Transaction. If approved by the Board, the proposal to reorganize the Fund will be submitted to the shareholders of the Fund for their approval. There is no assurance that the Board or the shareholders of the Fund will approve the proposal to reorganize the Fund.
For more complete information, you may review the Fund's next prospectus, which we expect to be available by December 1, 2024 at https://www.amundi.com/usinvestors/Products/Mutual-Funds or upon request at 1-800-225-6292.
Changes in Accountants
On March 25, 2024, Ernst & Young LLP (the “Prior Auditor”) resigned as the independent registered public accounting firm of the Fund. There were no disagreements with the Prior Auditor during the two most recent fiscal years and the subsequent interim period through March 25, 2024.
On March 25, 2024, the Audit Committee of the Board approved, and on March 25, 2024, the Board approved, Deloitte & Touche LLP as the independent registered accounting firm of the Fund for fiscal periods ending after March 25, 2024.
Availability of Additional Information
You can find additional information about the Fund, including the Fund's prospectus, financial information, holdings and proxy voting information, at https://www.amundi.com/usinvestors/Resources/Shareholder-Reports. You can also request this information by contacting us at 1‑800‑225‑6292.
Important notice to shareholders
In order to reduce expenses, we will deliver a single copy of prospectuses, proxies, financial reports and other communications to shareholders with the same residential address, provided they have the same last name or we reasonably believe them to be members of the same family. Unless we are notified otherwise, we will continue to send recipients only one copy of these materials for as long as they remain a shareholder of the Fund. If you would like to receive individual mailings, please call 1-800-225-6292 and we will begin sending you separate copies of these materials within 30 days after receiving your request.
Pioneer Balanced ESG Fund
Class K / PCBKX
ANNUAL SHAREHOLDER REPORT | July 31, 2024
This annual shareholder report contains important information about Pioneer Balanced ESG Fund (“Fund”) for the period of August 1, 2023 to July 31, 2024. You can find additional information about the Fund at https://www.amundi.com/usinvestors/Resources/Shareholder-Reports. You can also request this information by contacting us at 1-800-225-6292. This report describes changes to the Fund that occurred during the reporting period.
What were the Fund costs for the last year?
(Based on a hypothetical $10,000 investment)
| Class Name | Costs of a $10,000 investment | Costs paid as a percentage of a $10,000 investment |
| Class K | $66 | 0.62% |
How did the Fund perform last year and what affected the Fund performance?
For the fiscal year ended July 31, 2024, the Fund’s Class K shares at NAV returned 13.19%. For the same period, the Fund’s broad-based benchmarks, the Standard & Poor's 500 (S&P 500) Total Return Index and the Bloomberg U.S. Aggregate Bond Index, returned 22.15% and 5.10%, respectively. The performance benchmark, a blended benchmark (60% S&P 500 Total Return Index and 40% Bloomberg U.S. Aggregate Bond Index), returned 15.16% over the period.
Security selection in the equity portfolio was the primary detractor from benchmark relative performance in the period, mainly due to weaker relative selection in the information technology sector. An overweight to Asset Backed Securities and Collateralized Mortgage Obligations also detracted from relative returns.
Sector allocation decisions contributed to Fund performance overall due to an underweight to U.S. Treasury Securities and U.S. Government Agency-issued Mortgage-Backed Securities. Additionally, security selection in corporate bonds was additive to relative returns.
Fund Performance
The line graph below shows the change in value of a $5 Million investment made in Class K shares of the Fund during the periods shown, compared to that of the S&P 500 Total Return Index, the Bloomberg U.S. Aggregate Bond Index, and the blended benchmark (60% S&P 500 Total Return Index and 40% Bloomberg U.S. Aggregate Bond Index).
| AVERAGE ANNUAL TOTAL RETURN | 1 Year | 5 Years | 10 Years |
| Class K | 13.19% | 7.98% | 7.51% |
| S&P 500 Total Return Index | 22.15% | 15.00% | 13.15% |
| Bloomberg U.S. Aggregate Bond Index | 5.10% | 0.19% | 1.61% |
| 60% S&P 500 Total Return Index / 40% Bloomberg U.S. Aggregate Bond Index | 15.16% | 9.16% | 8.66% |
Call 1-800-225-6292 or visit https://www.amundi.com/usinvestors/Resources/Shareholder-Reports for the most recent month-end performance results. Current performance may be lower or higher than the performance data quoted.
The performance shown for Class K shares for the period prior to the commencement of operations of Class K shares on December 1, 2015, is the net asset value performance of the Fund’s Class A shares, which has not been restated to reflect any differences in expenses, including Rule 12b-1 fees applicable to Class A shares. Since fees for Class A shares generally are higher than those of Class K shares, the performance of Class K shares prior to their inception on December 1, 2015, would have been higher than the performance shown. For the period beginning December 1, 2015, the actual performance of Class K shares is reflected.
The performance data quoted represents past performance, which is no guarantee of future results.
The graph and table do not reflect the deduction of taxes that a shareholder would pay on fund distributions or redemption of fund shares.
KEY FUND STATISTICS
(as of July 31, 2024)
| Fund net assets | $426,709,956% |
| Total number of portfolio holdings | $678%^^ |
| Total advisory fee paid | $2,043,303% |
| Portfolio turnover rate | $33% |
^^ | Excluding short-term investments, TBA sale commitments and all derivative contracts except for options purchased. |
SECTOR DISTRIBUTION
(as of July 31, 2024)*
| Information Technology | 17.7% |
| U.S. Government | 17.0% |
| Financials | 14.1% |
| Health Care | 9.6% |
| Industrials | 8.0% |
| Communication Services | 6.7% |
| Energy | 4.5% |
| Basic Materials | 4.0% |
| Mortgage Securities | 3.9% |
| Consumer Discretionary | 3.5% |
| Consumer Staples | 3.0% |
| Asset Backed Securities | 2.9% |
| Real Estate | 1.5% |
| Consumer, Cyclical | 1.2% |
| Consumer, Non-cyclical | 0.9% |
| Utilities | 0.9% |
| Affiliated Closed-End Fund∞ | 0.3% |
| Foreign Government | 0.2% |
| Government | 0.1% |
* | As a percentage of total investments excluding short‑term investments, TBA sale commitments and all derivative contracts except for options purchased. |
∞ | Pioneer ILS Interval Fund is an affiliated closed-end fund managed by Amundi Asset Management US, Inc. |
Material Fund Changes
Amundi Asset Management US, Inc. (the “Adviser”), the Fund’s investment adviser, is currently an indirect, wholly-owned subsidiary of Amundi. On July 9, 2024, Amundi announced that it had entered into a definitive agreement with Victory Capital Holdings, Inc. (“Victory Capital”) to combine the Adviser with Victory Capital, and for Amundi to become a strategic shareholder of Victory Capital (the “Transaction”). Victory Capital is headquartered in San Antonio, Texas. The closing of the Transaction is subject to certain regulatory approvals and other conditions. There is no assurance that the Transaction will close.
The closing of the Transaction would cause the Fund’s current investment advisory agreement with the Adviser to terminate. Under the terms of the Transaction, the Fund’s Board of Trustees will be asked to approve a reorganization of the Fund into a corresponding, newly established Victory Fund advised by Victory Capital Management Inc., an affiliate of Victory Capital. The proposed reorganization of the Fund would be sought in connection with the closing of the Transaction. If approved by the Board, the proposal to reorganize the Fund will be submitted to the shareholders of the Fund for their approval. There is no assurance that the Board or the shareholders of the Fund will approve the proposal to reorganize the Fund.
For more complete information, you may review the Fund's next prospectus, which we expect to be available by December 1, 2024 at https://www.amundi.com/usinvestors/Products/Mutual-Funds or upon request at 1-800-225-6292.
Changes in Accountants
On March 25, 2024, Ernst & Young LLP (the “Prior Auditor”) resigned as the independent registered public accounting firm of the Fund. There were no disagreements with the Prior Auditor during the two most recent fiscal years and the subsequent interim period through March 25, 2024.
On March 25, 2024, the Audit Committee of the Board approved, and on March 25, 2024, the Board approved, Deloitte & Touche LLP as the independent registered accounting firm of the Fund for fiscal periods ending after March 25, 2024.
Availability of Additional Information
You can find additional information about the Fund, including the Fund's prospectus, financial information, holdings and proxy voting information, at https://www.amundi.com/usinvestors/Resources/Shareholder-Reports. You can also request this information by contacting us at 1‑800‑225‑6292.
Important notice to shareholders
In order to reduce expenses, we will deliver a single copy of prospectuses, proxies, financial reports and other communications to shareholders with the same residential address, provided they have the same last name or we reasonably believe them to be members of the same family. Unless we are notified otherwise, we will continue to send recipients only one copy of these materials for as long as they remain a shareholder of the Fund. If you would like to receive individual mailings, please call 1-800-225-6292 and we will begin sending you separate copies of these materials within 30 days after receiving your request.
Pioneer Balanced ESG Fund
Class R / CBPRX
ANNUAL SHAREHOLDER REPORT | July 31, 2024
This annual shareholder report contains important information about Pioneer Balanced ESG Fund (“Fund”) for the period of August 1, 2023 to July 31, 2024. You can find additional information about the Fund at https://www.amundi.com/usinvestors/Resources/Shareholder-Reports. You can also request this information by contacting us at 1-800-225-6292. This report describes changes to the Fund that occurred during the reporting period.
What were the Fund costs for the last year?
(Based on a hypothetical $10,000 investment)
| Class Name | Costs of a $10,000 investment | Costs paid as a percentage of a $10,000 investment |
| Class R | $136 | 1.28% |
How did the Fund perform last year and what affected the Fund performance?
For the fiscal year ended July 31, 2024, the Fund’s Class R shares at NAV returned 12.43%. For the same period, the Fund’s broad-based benchmarks, the Standard & Poor's 500 (S&P 500) Total Return Index and the Bloomberg U.S. Aggregate Bond Index, returned 22.15% and 5.10%, respectively. The performance benchmark, a blended benchmark (60% S&P 500 Total Return Index and 40% Bloomberg U.S. Aggregate Bond Index), returned 15.16% over the period.
Security selection in the equity portfolio was the primary detractor from benchmark relative performance in the period, mainly due to weaker relative selection in the information technology sector. An overweight to Asset Backed Securities and Collateralized Mortgage Obligations also detracted from relative returns.
Sector allocation decisions contributed to Fund performance overall due to an underweight to U.S. Treasury Securities and U.S. Government Agency-issued Mortgage-Backed Securities. Additionally, security selection in corporate bonds was additive to relative returns.
Fund Performance
The line graph below shows the change in value of a $10,000 investment made in Class R shares of the Fund during the periods shown, compared to that of the S&P 500 Total Return Index, the Bloomberg U.S. Aggregate Bond Index, and the blended benchmark (60% S&P 500 Total Return Index and 40% Bloomberg U.S. Aggregate Bond Index).
| AVERAGE ANNUAL TOTAL RETURN | 1 Year | 5 Years | 10 Years |
| Class R | 12.43% | 7.33% | 7.01% |
| S&P 500 Total Return Index | 22.15% | 15.00% | 13.15% |
| Bloomberg U.S. Aggregate Bond Index | 5.10% | 0.19% | 1.61% |
| 60% S&P 500 Total Return Index / 40% Bloomberg U.S. Aggregate Bond Index | 15.16% | 9.16% | 8.66% |
Call 1-800-225-6292 or visit https://www.amundi.com/usinvestors/Resources/Shareholder-Reports for the most recent month-end performance results. Current performance may be lower or higher than the performance data quoted.
The performance shown for Class R shares for the period prior to the commencement of operations of Class R shares on July 1, 2015, is the net asset value performance of the Fund’s Class A shares, which has not been restated to reflect any differences in expenses, including Rule 12b-1 fees applicable to Class A shares. Since fees for Class A shares generally are higher than those of Class R shares, the performance of Class R shares prior to their inception would have been higher than the performance shown. For the period beginning July 1, 2015, the actual performance of Class R shares is reflected.
The performance data quoted represents past performance, which is no guarantee of future results.
The graph and table do not reflect the deduction of taxes that a shareholder would pay on fund distributions or redemption of fund shares.
KEY FUND STATISTICS
(as of July 31, 2024)
| Fund net assets | $426,709,956% |
| Total number of portfolio holdings | $678%^^ |
| Total advisory fee paid | $2,043,303% |
| Portfolio turnover rate | $33% |
^^ | Excluding short-term investments, TBA sale commitments and all derivative contracts except for options purchased. |
SECTOR DISTRIBUTION
(as of July 31, 2024)*
| Information Technology | 17.7% |
| U.S. Government | 17.0% |
| Financials | 14.1% |
| Health Care | 9.6% |
| Industrials | 8.0% |
| Communication Services | 6.7% |
| Energy | 4.5% |
| Basic Materials | 4.0% |
| Mortgage Securities | 3.9% |
| Consumer Discretionary | 3.5% |
| Consumer Staples | 3.0% |
| Asset Backed Securities | 2.9% |
| Real Estate | 1.5% |
| Consumer, Cyclical | 1.2% |
| Consumer, Non-cyclical | 0.9% |
| Utilities | 0.9% |
| Affiliated Closed-End Fund∞ | 0.3% |
| Foreign Government | 0.2% |
| Government | 0.1% |
* | As a percentage of total investments excluding short‑term investments, TBA sale commitments and all derivative contracts except for options purchased. |
∞ | Pioneer ILS Interval Fund is an affiliated closed-end fund managed by Amundi Asset Management US, Inc. |
Material Fund Changes
Amundi Asset Management US, Inc. (the “Adviser”), the Fund’s investment adviser, is currently an indirect, wholly-owned subsidiary of Amundi. On July 9, 2024, Amundi announced that it had entered into a definitive agreement with Victory Capital Holdings, Inc. (“Victory Capital”) to combine the Adviser with Victory Capital, and for Amundi to become a strategic shareholder of Victory Capital (the “Transaction”). Victory Capital is headquartered in San Antonio, Texas. The closing of the Transaction is subject to certain regulatory approvals and other conditions. There is no assurance that the Transaction will close.
The closing of the Transaction would cause the Fund’s current investment advisory agreement with the Adviser to terminate. Under the terms of the Transaction, the Fund’s Board of Trustees will be asked to approve a reorganization of the Fund into a corresponding, newly established Victory Fund advised by Victory Capital Management Inc., an affiliate of Victory Capital. The proposed reorganization of the Fund would be sought in connection with the closing of the Transaction. If approved by the Board, the proposal to reorganize the Fund will be submitted to the shareholders of the Fund for their approval. There is no assurance that the Board or the shareholders of the Fund will approve the proposal to reorganize the Fund.
For more complete information, you may review the Fund's next prospectus, which we expect to be available by December 1, 2024 at https://www.amundi.com/usinvestors/Products/Mutual-Funds or upon request at 1-800-225-6292.
Changes in Accountants
On March 25, 2024, Ernst & Young LLP (the “Prior Auditor”) resigned as the independent registered public accounting firm of the Fund. There were no disagreements with the Prior Auditor during the two most recent fiscal years and the subsequent interim period through March 25, 2024.
On March 25, 2024, the Audit Committee of the Board approved, and on March 25, 2024, the Board approved, Deloitte & Touche LLP as the independent registered accounting firm of the Fund for fiscal periods ending after March 25, 2024.
Availability of Additional Information
You can find additional information about the Fund, including the Fund's prospectus, financial information, holdings and proxy voting information, at https://www.amundi.com/usinvestors/Resources/Shareholder-Reports. You can also request this information by contacting us at 1‑800‑225‑6292.
Important notice to shareholders
In order to reduce expenses, we will deliver a single copy of prospectuses, proxies, financial reports and other communications to shareholders with the same residential address, provided they have the same last name or we reasonably believe them to be members of the same family. Unless we are notified otherwise, we will continue to send recipients only one copy of these materials for as long as they remain a shareholder of the Fund. If you would like to receive individual mailings, please call 1-800-225-6292 and we will begin sending you separate copies of these materials within 30 days after receiving your request.
Pioneer Balanced ESG Fund
Class Y / AYBLX
ANNUAL SHAREHOLDER REPORT | July 31, 2024
This annual shareholder report contains important information about Pioneer Balanced ESG Fund (“Fund”) for the period of August 1, 2023 to July 31, 2024. You can find additional information about the Fund at https://www.amundi.com/usinvestors/Resources/Shareholder-Reports. You can also request this information by contacting us at 1-800-225-6292. This report describes changes to the Fund that occurred during the reporting period.
What were the Fund costs for the last year?
(Based on a hypothetical $10,000 investment)
| Class Name | Costs of a $10,000 investment | Costs paid as a percentage of a $10,000 investment |
| Class Y | $77 | 0.72% |
How did the Fund perform last year and what affected the Fund performance?
For the fiscal year ended July 31, 2024, the Fund’s Class Y shares at NAV returned 13.03%. For the same period, the Fund’s broad-based benchmarks, the Standard & Poor's 500 (S&P 500) Total Return Index and the Bloomberg U.S. Aggregate Bond Index, returned 22.15% and 5.10%, respectively. The performance benchmark, a blended benchmark (60% S&P 500 Total Return Index and 40% Bloomberg U.S. Aggregate Bond Index), returned 15.16% over the period.
Security selection in the equity portfolio was the primary detractor from benchmark relative performance in the period, mainly due to weaker relative selection in the information technology sector. An overweight to Asset Backed Securities and Collateralized Mortgage Obligations also detracted from relative returns.
Sector allocation decisions contributed to Fund performance overall due to an underweight to U.S. Treasury Securities and U.S. Government Agency-issued Mortgage-Backed Securities. Additionally, security selection in corporate bonds was additive to relative returns.
Fund Performance
The line graph below shows the change in value of a $5 Million investment made in Class Y shares of the Fund during the periods shown, compared to that of the S&P 500 Total Return Index, the Bloomberg U.S. Aggregate Bond Index, and the blended benchmark (60% S&P 500 Total Return Index and 40% Bloomberg U.S. Aggregate Bond Index).
| AVERAGE ANNUAL TOTAL RETURN | 1 Year | 5 Years | 10 Years |
| Class Y | 13.03% | 7.98% | 7.55% |
| S&P 500 Total Return Index | 22.15% | 15.00% | 13.15% |
| Bloomberg U.S. Aggregate Bond Index | 5.10% | 0.19% | 1.61% |
| 60% S&P 500 Total Return Index / 40% Bloomberg U.S. Aggregate Bond Index | 15.16% | 9.16% | 8.66% |
Call 1-800-225-6292 or visit https://www.amundi.com/usinvestors/Resources/Shareholder-Reports for the most recent month-end performance results. Current performance may be lower or higher than the performance data quoted.
The performance data quoted represents past performance, which is no guarantee of future results.
The graph and table do not reflect the deduction of taxes that a shareholder would pay on fund distributions or redemption of fund shares.
KEY FUND STATISTICS
(as of July 31, 2024)
| Fund net assets | $426,709,956% |
| Total number of portfolio holdings | $678%^^ |
| Total advisory fee paid | $2,043,303% |
| Portfolio turnover rate | $33% |
^^ | Excluding short-term investments, TBA sale commitments and all derivative contracts except for options purchased. |
SECTOR DISTRIBUTION
(as of July 31, 2024)*
| Information Technology | 17.7% |
| U.S. Government | 17.0% |
| Financials | 14.1% |
| Health Care | 9.6% |
| Industrials | 8.0% |
| Communication Services | 6.7% |
| Energy | 4.5% |
| Basic Materials | 4.0% |
| Mortgage Securities | 3.9% |
| Consumer Discretionary | 3.5% |
| Consumer Staples | 3.0% |
| Asset Backed Securities | 2.9% |
| Real Estate | 1.5% |
| Consumer, Cyclical | 1.2% |
| Consumer, Non-cyclical | 0.9% |
| Utilities | 0.9% |
| Affiliated Closed-End Fund∞ | 0.3% |
| Foreign Government | 0.2% |
| Government | 0.1% |
* | As a percentage of total investments excluding short‑term investments, TBA sale commitments and all derivative contracts except for options purchased. |
∞ | Pioneer ILS Interval Fund is an affiliated closed-end fund managed by Amundi Asset Management US, Inc. |
Material Fund Changes
Amundi Asset Management US, Inc. (the “Adviser”), the Fund’s investment adviser, is currently an indirect, wholly-owned subsidiary of Amundi. On July 9, 2024, Amundi announced that it had entered into a definitive agreement with Victory Capital Holdings, Inc. (“Victory Capital”) to combine the Adviser with Victory Capital, and for Amundi to become a strategic shareholder of Victory Capital (the “Transaction”). Victory Capital is headquartered in San Antonio, Texas. The closing of the Transaction is subject to certain regulatory approvals and other conditions. There is no assurance that the Transaction will close.
The closing of the Transaction would cause the Fund’s current investment advisory agreement with the Adviser to terminate. Under the terms of the Transaction, the Fund’s Board of Trustees will be asked to approve a reorganization of the Fund into a corresponding, newly established Victory Fund advised by Victory Capital Management Inc., an affiliate of Victory Capital. The proposed reorganization of the Fund would be sought in connection with the closing of the Transaction. If approved by the Board, the proposal to reorganize the Fund will be submitted to the shareholders of the Fund for their approval. There is no assurance that the Board or the shareholders of the Fund will approve the proposal to reorganize the Fund.
For more complete information, you may review the Fund's next prospectus, which we expect to be available by December 1, 2024 at https://www.amundi.com/usinvestors/Products/Mutual-Funds or upon request at 1-800-225-6292.
Changes in Accountants
On March 25, 2024, Ernst & Young LLP (the “Prior Auditor”) resigned as the independent registered public accounting firm of the Fund. There were no disagreements with the Prior Auditor during the two most recent fiscal years and the subsequent interim period through March 25, 2024.
On March 25, 2024, the Audit Committee of the Board approved, and on March 25, 2024, the Board approved, Deloitte & Touche LLP as the independent registered accounting firm of the Fund for fiscal periods ending after March 25, 2024.
Availability of Additional Information
You can find additional information about the Fund, including the Fund's prospectus, financial information, holdings and proxy voting information, at https://www.amundi.com/usinvestors/Resources/Shareholder-Reports. You can also request this information by contacting us at 1‑800‑225‑6292.
Important notice to shareholders
In order to reduce expenses, we will deliver a single copy of prospectuses, proxies, financial reports and other communications to shareholders with the same residential address, provided they have the same last name or we reasonably believe them to be members of the same family. Unless we are notified otherwise, we will continue to send recipients only one copy of these materials for as long as they remain a shareholder of the Fund. If you would like to receive individual mailings, please call 1-800-225-6292 and we will begin sending you separate copies of these materials within 30 days after receiving your request.
Amundi Climate Transition Core Bond Fund
Class A / CTBAX
ANNUAL SHAREHOLDER REPORT | July 31, 2024
This annual shareholder report contains important information about Amundi Climate Transition Core Bond Fund (“Fund”) for the period of August 1, 2023 to July 31, 2024. You can find additional information about the Fund at https://www.amundi.com/usinvestors/Resources/Shareholder-Reports. You can also request this information by contacting us at 1-800-225-6292. This report describes changes to the Fund that occurred during the reporting period.
What were the Fund costs for the last year?
(Based on a hypothetical $10,000 investment)
| Class Name | Costs of a $10,000 investment | Costs paid as a percentage of a $10,000 investment |
| Class A | $73 | 0.71% |
How did the Fund perform last year and what affected the Fund performance?
For the fiscal year ended July 31, 2024, the Fund’s Class A shares at NAV returned 5.87%. For the same period, the Bloomberg U.S. Aggregate Bond Index (the "Index") returned 5.10%.
The Fund’s benchmark relative performance benefited from allocations to commercial mortgage-backed securities, non-agency mortgage-backed securities, asset backed securities and to the financial sector, and a significant Fund underweight to U.S. Treasuries relative to the Index.
Security selection in the financials and industrials sectors and in agency mortgage-backed securities contributed to the Fund’s benchmark relative performance.
The Fund's average duration position of 6.8 years was long relative to the Index duration by 0.7 years, which detracted from the Fund's benchmark relative performance, as yields moved higher during the first three months of the period and, again, during the first quarter of 2024.
The Fund’s underweight exposure to utilities relative to the Index modestly detracted from the Fund's benchmark relative performance.
Fund Performance
The line graph below shows the change in value of a $10,000 investment made in Class A shares of the Fund at public offering price during the periods shown, compared to that of the Bloomberg U.S. Aggregate Bond Index.
| AVERAGE ANNUAL TOTAL RETURN | 1 Year | Since Inception* |
| Class A (with sales charge) | 1.10% | 0.46% |
| Class A (without sales charge) | 5.87% | 3.35% |
| Bloomberg U.S. Aggregate Bond Index | 5.10% | 2.87% |
* | Performance of Class A shares of the Fund shown in the graph above is from the inception of Class A shares on 12/15/22 through 7/31/24. Index information shown in the graph above is from 12/31/22 through 7/31/24. |
Call 1-800-225-6292 or visit https://www.amundi.com/usinvestors/Resources/Shareholder-Reports for the most recent month-end performance results. Current performance may be lower or higher than the performance data quoted.
The performance data quoted represents past performance, which is no guarantee of future results.
The graph and table do not reflect the deduction of taxes that a shareholder would pay on fund distributions or redemption of fund shares.
KEY FUND STATISTICS
(as of July 31, 2024)
| Fund net assets | $21,004,636% |
| Total number of portfolio holdings | $174%^^ |
| Total advisory fee paid | $0% |
| Portfolio turnover rate | $31% |
^^ | Excluding short-term investments and all derivative contracts except for options purchased. |
PORTFOLIO DIVERSIFICATION
(as of July 31, 2024)*
| Corporate Bonds | 45.4% |
| U.S. Government and Agency Obligations | 32.0% |
| Asset Backed Securities | 6.5% |
| Commercial Mortgage-Backed Securities | 6.4% |
| Foreign Government Bond | 3.9% |
| Insurance-Linked Securities | 3.5% |
| Collateralized Mortgage Obligations | 2.2% |
| Senior Secured Floating Rate Loan Interests | 0.1% |
* | As a percentage of total investments excluding short‑term investments and all derivative contracts except for options purchased. |
Material Fund Changes
Amundi Asset Management US, Inc. (the “Adviser”), the Fund’s investment adviser, is currently an indirect, wholly-owned subsidiary of Amundi. On July 9, 2024, Amundi announced that it had entered into a definitive agreement with Victory Capital Holdings, Inc. (“Victory Capital”) to combine the Adviser with Victory Capital, and for Amundi to become a strategic shareholder of Victory Capital (the “Transaction”). Victory Capital is headquartered in San Antonio, Texas. The closing of the Transaction is subject to certain regulatory approvals and other conditions. There is no assurance that the Transaction will close.
The closing of the Transaction would cause the Fund’s current investment advisory agreement with the Adviser to terminate. Under the terms of the Transaction, the Fund’s Board of Trustees will be asked to approve a reorganization of the Fund into a corresponding, newly established Victory Fund advised by Victory Capital Management Inc., an affiliate of Victory Capital. The proposed reorganization of the Fund would be sought in connection with the closing of the Transaction. If approved by the Board, the proposal to reorganize the Fund will be submitted to the shareholders of the Fund for their approval. There is no assurance that the Board or the shareholders of the Fund will approve the proposal to reorganize the Fund.
For more complete information, you may review the Fund's next prospectus, which we expect to be available by December 1, 2024 at https://www.amundi.com/usinvestors/Products/Mutual-Funds or upon request at 1-800-225-6292.
Changes in Accountants
On March 25, 2024, Ernst & Young LLP (the “Prior Auditor”) resigned as the independent registered public accounting firm of the Fund. There were no disagreements with the Prior Auditor the period from December 15, 2022 (commencement of operations) through July 31, 2023, and the subsequent interim period through March 25, 2024.
On March 25, 2024, the Audit Committee of the Board approved, and on March 25, 2024, the Board approved, Deloitte & Touche LLP as the independent registered accounting firm of the Fund for fiscal periods ending after March 25, 2024.
Availability of Additional Information
You can find additional information about the Fund, including the Fund's prospectus, financial information, holdings and proxy voting information, at https://www.amundi.com/usinvestors/Resources/Shareholder-Reports. You can also request this information by contacting us at 1‑800‑225‑6292.
Important notice to shareholders
In order to reduce expenses, we will deliver a single copy of prospectuses, proxies, financial reports and other communications to shareholders with the same residential address, provided they have the same last name or we reasonably believe them to be members of the same family. Unless we are notified otherwise, we will continue to send recipients only one copy of these materials for as long as they remain a shareholder of the Fund. If you would like to receive individual mailings, please call 1-800-225-6292 and we will begin sending you separate copies of these materials within 30 days after receiving your request.
Amundi Climate Transition Core Bond Fund
Class C / ACTCX
ANNUAL SHAREHOLDER REPORT | July 31, 2024
This annual shareholder report contains important information about Amundi Climate Transition Core Bond Fund (“Fund”) for the period of August 1, 2023 to July 31, 2024. You can find additional information about the Fund at https://www.amundi.com/usinvestors/Resources/Shareholder-Reports. You can also request this information by contacting us at 1-800-225-6292. This report describes changes to the Fund that occurred during the reporting period.
What were the Fund costs for the last year?
(Based on a hypothetical $10,000 investment)
| Class Name | Costs of a $10,000 investment | Costs paid as a percentage of a $10,000 investment |
| Class C | $150 | 1.46% |
How did the Fund perform last year and what affected the Fund performance?
For the fiscal year ended July 31, 2024, the Fund’s Class C shares at NAV returned 5.09%. For the same period, the Bloomberg U.S. Aggregate Bond Index (the "Index") returned 5.10%.
The Fund’s benchmark relative performance benefited from allocations to commercial mortgage-backed securities, non-agency mortgage-backed securities, asset backed securities and to the financial sector, and a significant Fund underweight to U.S. Treasuries relative to the Index.
Security selection in the financials and industrials sectors and in agency mortgage-backed securities contributed to the Fund’s benchmark relative performance.
The Fund's average duration position of 6.8 years was long relative to the Index duration by 0.7 years, which detracted from the Fund's benchmark relative performance, as yields moved higher during the first three months of the period and, again, during the first quarter of 2024.
The Fund’s underweight exposure to utilities relative to the Index modestly detracted from the Fund's benchmark relative performance.
Fund Performance
The line graph below shows the change in value of a $10,000 investment made in Class C shares of the Fund during the periods shown, compared to that of the Bloomberg U.S. Aggregate Bond Index.
| AVERAGE ANNUAL TOTAL RETURN | 1 Year | Since Inception* |
| Class C (with contingent deferred sales charge) | 4.09% | 2.60% |
| Class C (without contingent deferred sales charge) | 5.09% | 2.60% |
| Bloomberg U.S. Aggregate Bond Index | 5.10% | 2.87% |
* | Performance of Class C shares of the Fund shown in the graph above is from the inception of Class A shares on 12/15/22 through 7/31/24. Index information shown in the graph above is from 12/31/22 through 7/31/24. |
Call 1-800-225-6292 or visit https://www.amundi.com/usinvestors/Resources/Shareholder-Reports for the most recent month-end performance results. Current performance may be lower or higher than the performance data quoted.
The performance data quoted represents past performance, which is no guarantee of future results.
The graph and table do not reflect the deduction of taxes that a shareholder would pay on fund distributions or redemption of fund shares.
KEY FUND STATISTICS
(as of July 31, 2024)
| Fund net assets | $21,004,636% |
| Total number of portfolio holdings | $174%^^ |
| Total advisory fee paid | $0% |
| Portfolio turnover rate | $31% |
^^ | Excluding short-term investments and all derivative contracts except for options purchased. |
PORTFOLIO DIVERSIFICATION
(as of July 31, 2024)*
| Corporate Bonds | 45.4% |
| U.S. Government and Agency Obligations | 32.0% |
| Asset Backed Securities | 6.5% |
| Commercial Mortgage-Backed Securities | 6.4% |
| Foreign Government Bond | 3.9% |
| Insurance-Linked Securities | 3.5% |
| Collateralized Mortgage Obligations | 2.2% |
| Senior Secured Floating Rate Loan Interests | 0.1% |
* | As a percentage of total investments excluding short‑term investments and all derivative contracts except for options purchased. |
Material Fund Changes
Amundi Asset Management US, Inc. (the “Adviser”), the Fund’s investment adviser, is currently an indirect, wholly-owned subsidiary of Amundi. On July 9, 2024, Amundi announced that it had entered into a definitive agreement with Victory Capital Holdings, Inc. (“Victory Capital”) to combine the Adviser with Victory Capital, and for Amundi to become a strategic shareholder of Victory Capital (the “Transaction”). Victory Capital is headquartered in San Antonio, Texas. The closing of the Transaction is subject to certain regulatory approvals and other conditions. There is no assurance that the Transaction will close.
The closing of the Transaction would cause the Fund’s current investment advisory agreement with the Adviser to terminate. Under the terms of the Transaction, the Fund’s Board of Trustees will be asked to approve a reorganization of the Fund into a corresponding, newly established Victory Fund advised by Victory Capital Management Inc., an affiliate of Victory Capital. The proposed reorganization of the Fund would be sought in connection with the closing of the Transaction. If approved by the Board, the proposal to reorganize the Fund will be submitted to the shareholders of the Fund for their approval. There is no assurance that the Board or the shareholders of the Fund will approve the proposal to reorganize the Fund.
For more complete information, you may review the Fund's next prospectus, which we expect to be available by December 1, 2024 at https://www.amundi.com/usinvestors/Products/Mutual-Funds or upon request at 1-800-225-6292.
Changes in Accountants
On March 25, 2024, Ernst & Young LLP (the “Prior Auditor”) resigned as the independent registered public accounting firm of the Fund. There were no disagreements with the Prior Auditor the period from December 15, 2022 (commencement of operations) through July 31, 2023, and the subsequent interim period through March 25, 2024.
On March 25, 2024, the Audit Committee of the Board approved, and on March 25, 2024, the Board approved, Deloitte & Touche LLP as the independent registered accounting firm of the Fund for fiscal periods ending after March 25, 2024.
Availability of Additional Information
You can find additional information about the Fund, including the Fund's prospectus, financial information, holdings and proxy voting information, at https://www.amundi.com/usinvestors/Resources/Shareholder-Reports. You can also request this information by contacting us at 1‑800‑225‑6292.
Important notice to shareholders
In order to reduce expenses, we will deliver a single copy of prospectuses, proxies, financial reports and other communications to shareholders with the same residential address, provided they have the same last name or we reasonably believe them to be members of the same family. Unless we are notified otherwise, we will continue to send recipients only one copy of these materials for as long as they remain a shareholder of the Fund. If you would like to receive individual mailings, please call 1-800-225-6292 and we will begin sending you separate copies of these materials within 30 days after receiving your request.
Amundi Climate Transition Core Bond Fund
Class K / ACTKX
ANNUAL SHAREHOLDER REPORT | July 31, 2024
This annual shareholder report contains important information about Amundi Climate Transition Core Bond Fund (“Fund”) for the period of August 1, 2023 to July 31, 2024. You can find additional information about the Fund at https://www.amundi.com/usinvestors/Resources/Shareholder-Reports. You can also request this information by contacting us at 1-800-225-6292. This report describes changes to the Fund that occurred during the reporting period.
What were the Fund costs for the last year?
(Based on a hypothetical $10,000 investment)
| Class Name | Costs of a $10,000 investment | Costs paid as a percentage of a $10,000 investment |
| Class K | $46 | 0.45% |
How did the Fund perform last year and what affected the Fund performance?
For the fiscal year ended July 31, 2024, the Fund’s Class K shares at NAV returned 6.14%. For the same period, the Bloomberg U.S. Aggregate Bond Index (the "Index") returned 5.10%.
The Fund’s benchmark relative performance benefited from allocations to commercial mortgage-backed securities, non-agency mortgage-backed securities, asset backed securities and to the financial sector, and a significant Fund underweight to U.S. Treasuries relative to the Index.
Security selection in the financials and industrials sectors and in agency mortgage-backed securities contributed to the Fund’s benchmark relative performance.
The Fund's average duration position of 6.8 years was long relative to the Index duration by 0.7 years, which detracted from the Fund's benchmark relative performance, as yields moved higher during the first three months of the period and, again, during the first quarter of 2024.
The Fund’s underweight exposure to utilities relative to the Index modestly detracted from the Fund's benchmark relative performance.
Fund Performance
The line graph below shows the change in value of a $5 Million investment made in Class K shares of the Fund during the periods shown, compared to that of the Bloomberg U.S. Aggregate Bond Index.
| AVERAGE ANNUAL TOTAL RETURN | 1 Year | Since Inception* |
| Class K | 6.14% | 3.61% |
| Bloomberg U.S. Aggregate Bond Index | 5.10% | 2.87% |
* | Performance of Class K shares of the Fund shown in the graph above is from the inception of Class A shares on 12/15/22 through 7/31/24. Index information shown in the graph above is from 12/31/22 through 7/31/24. |
Call 1-800-225-6292 or visit https://www.amundi.com/usinvestors/Resources/Shareholder-Reports for the most recent month-end performance results. Current performance may be lower or higher than the performance data quoted.
The performance data quoted represents past performance, which is no guarantee of future results.
The graph and table do not reflect the deduction of taxes that a shareholder would pay on fund distributions or redemption of fund shares.
KEY FUND STATISTICS
(as of July 31, 2024)
| Fund net assets | $21,004,636% |
| Total number of portfolio holdings | $174%^^ |
| Total advisory fee paid | $0% |
| Portfolio turnover rate | $31% |
^^ | Excluding short-term investments and all derivative contracts except for options purchased. |
PORTFOLIO DIVERSIFICATION
(as of July 31, 2024)*
| Corporate Bonds | 45.4% |
| U.S. Government and Agency Obligations | 32.0% |
| Asset Backed Securities | 6.5% |
| Commercial Mortgage-Backed Securities | 6.4% |
| Foreign Government Bond | 3.9% |
| Insurance-Linked Securities | 3.5% |
| Collateralized Mortgage Obligations | 2.2% |
| Senior Secured Floating Rate Loan Interests | 0.1% |
* | As a percentage of total investments excluding short‑term investments and all derivative contracts except for options purchased. |
Material Fund Changes
Amundi Asset Management US, Inc. (the “Adviser”), the Fund’s investment adviser, is currently an indirect, wholly-owned subsidiary of Amundi. On July 9, 2024, Amundi announced that it had entered into a definitive agreement with Victory Capital Holdings, Inc. (“Victory Capital”) to combine the Adviser with Victory Capital, and for Amundi to become a strategic shareholder of Victory Capital (the “Transaction”). Victory Capital is headquartered in San Antonio, Texas. The closing of the Transaction is subject to certain regulatory approvals and other conditions. There is no assurance that the Transaction will close.
The closing of the Transaction would cause the Fund’s current investment advisory agreement with the Adviser to terminate. Under the terms of the Transaction, the Fund’s Board of Trustees will be asked to approve a reorganization of the Fund into a corresponding, newly established Victory Fund advised by Victory Capital Management Inc., an affiliate of Victory Capital. The proposed reorganization of the Fund would be sought in connection with the closing of the Transaction. If approved by the Board, the proposal to reorganize the Fund will be submitted to the shareholders of the Fund for their approval. There is no assurance that the Board or the shareholders of the Fund will approve the proposal to reorganize the Fund.
For more complete information, you may review the Fund's next prospectus, which we expect to be available by December 1, 2024 at https://www.amundi.com/usinvestors/Products/Mutual-Funds or upon request at 1-800-225-6292.
Changes in Accountants
On March 25, 2024, Ernst & Young LLP (the “Prior Auditor”) resigned as the independent registered public accounting firm of the Fund. There were no disagreements with the Prior Auditor the period from December 15, 2022 (commencement of operations) through July 31, 2023, and the subsequent interim period through March 25, 2024.
On March 25, 2024, the Audit Committee of the Board approved, and on March 25, 2024, the Board approved, Deloitte & Touche LLP as the independent registered accounting firm of the Fund for fiscal periods ending after March 25, 2024.
Availability of Additional Information
You can find additional information about the Fund, including the Fund's prospectus, financial information, holdings and proxy voting information, at https://www.amundi.com/usinvestors/Resources/Shareholder-Reports. You can also request this information by contacting us at 1‑800‑225‑6292.
Important notice to shareholders
In order to reduce expenses, we will deliver a single copy of prospectuses, proxies, financial reports and other communications to shareholders with the same residential address, provided they have the same last name or we reasonably believe them to be members of the same family. Unless we are notified otherwise, we will continue to send recipients only one copy of these materials for as long as they remain a shareholder of the Fund. If you would like to receive individual mailings, please call 1-800-225-6292 and we will begin sending you separate copies of these materials within 30 days after receiving your request.
Amundi Climate Transition Core Bond Fund
Class Y / CTCYX
ANNUAL SHAREHOLDER REPORT | July 31, 2024
This annual shareholder report contains important information about Amundi Climate Transition Core Bond Fund (“Fund”) for the period of August 1, 2023 to July 31, 2024. You can find additional information about the Fund at https://www.amundi.com/usinvestors/Resources/Shareholder-Reports. You can also request this information by contacting us at 1-800-225-6292. This report describes changes to the Fund that occurred during the reporting period.
What were the Fund costs for the last year?
(Based on a hypothetical $10,000 investment)
| Class Name | Costs of a $10,000 investment | Costs paid as a percentage of a $10,000 investment |
| Class Y | $46 | 0.45% |
How did the Fund perform last year and what affected the Fund performance?
For the fiscal year ended July 31, 2024, the Fund’s Class Y shares at NAV returned 6.14%. For the same period, the Bloomberg U.S. Aggregate Bond Index (the "Index") returned 5.10%.
The Fund’s benchmark relative performance benefited from allocations to commercial mortgage-backed securities, non-agency mortgage-backed securities, asset backed securities and to the financial sector, and a significant Fund underweight to U.S. Treasuries relative to the Index.
Security selection in the financials and industrials sectors and in agency mortgage-backed securities contributed to the Fund’s benchmark relative performance.
The Fund's average duration position of 6.8 years was long relative to the Index duration by 0.7 years, which detracted from the Fund's benchmark relative performance, as yields moved higher during the first three months of the period and, again, during the first quarter of 2024.
The Fund’s underweight exposure to utilities relative to the Index modestly detracted from the Fund's benchmark relative performance.
Fund Performance
The line graph below shows the change in value of a $5 Million investment made in Class Y shares of the Fund during the periods shown, compared to that of the Bloomberg U.S. Aggregate Bond Index.
| AVERAGE ANNUAL TOTAL RETURN | 1 Year | Since Inception* |
| Class Y | 6.14% | 3.61% |
| Bloomberg U.S. Aggregate Bond Index | 5.10% | 2.87% |
* | Performance of Class Y shares of the Fund shown in the graph above is from the inception of Class A shares on 12/15/22 through 7/31/24. Index information shown in the graph above is from 12/31/22 through 7/31/24. |
Call 1-800-225-6292 or visit https://www.amundi.com/usinvestors/Resources/Shareholder-Reports for the most recent month-end performance results. Current performance may be lower or higher than the performance data quoted.
The performance data quoted represents past performance, which is no guarantee of future results.
The graph and table do not reflect the deduction of taxes that a shareholder would pay on fund distributions or redemption of fund shares.
KEY FUND STATISTICS
(as of July 31, 2024)
| Fund net assets | $21,004,636% |
| Total number of portfolio holdings | $174%^^ |
| Total advisory fee paid | $0% |
| Portfolio turnover rate | $31% |
^^ | Excluding short-term investments and all derivative contracts except for options purchased. |
PORTFOLIO DIVERSIFICATION
(as of July 31, 2024)*
| Corporate Bonds | 45.4% |
| U.S. Government and Agency Obligations | 32.0% |
| Asset Backed Securities | 6.5% |
| Commercial Mortgage-Backed Securities | 6.4% |
| Foreign Government Bond | 3.9% |
| Insurance-Linked Securities | 3.5% |
| Collateralized Mortgage Obligations | 2.2% |
| Senior Secured Floating Rate Loan Interests | 0.1% |
* | As a percentage of total investments excluding short‑term investments and all derivative contracts except for options purchased. |
Material Fund Changes
Amundi Asset Management US, Inc. (the “Adviser”), the Fund’s investment adviser, is currently an indirect, wholly-owned subsidiary of Amundi. On July 9, 2024, Amundi announced that it had entered into a definitive agreement with Victory Capital Holdings, Inc. (“Victory Capital”) to combine the Adviser with Victory Capital, and for Amundi to become a strategic shareholder of Victory Capital (the “Transaction”). Victory Capital is headquartered in San Antonio, Texas. The closing of the Transaction is subject to certain regulatory approvals and other conditions. There is no assurance that the Transaction will close.
The closing of the Transaction would cause the Fund’s current investment advisory agreement with the Adviser to terminate. Under the terms of the Transaction, the Fund’s Board of Trustees will be asked to approve a reorganization of the Fund into a corresponding, newly established Victory Fund advised by Victory Capital Management Inc., an affiliate of Victory Capital. The proposed reorganization of the Fund would be sought in connection with the closing of the Transaction. If approved by the Board, the proposal to reorganize the Fund will be submitted to the shareholders of the Fund for their approval. There is no assurance that the Board or the shareholders of the Fund will approve the proposal to reorganize the Fund.
For more complete information, you may review the Fund's next prospectus, which we expect to be available by December 1, 2024 at https://www.amundi.com/usinvestors/Products/Mutual-Funds or upon request at 1-800-225-6292.
Changes in Accountants
On March 25, 2024, Ernst & Young LLP (the “Prior Auditor”) resigned as the independent registered public accounting firm of the Fund. There were no disagreements with the Prior Auditor the period from December 15, 2022 (commencement of operations) through July 31, 2023, and the subsequent interim period through March 25, 2024.
On March 25, 2024, the Audit Committee of the Board approved, and on March 25, 2024, the Board approved, Deloitte & Touche LLP as the independent registered accounting firm of the Fund for fiscal periods ending after March 25, 2024.
Availability of Additional Information
You can find additional information about the Fund, including the Fund's prospectus, financial information, holdings and proxy voting information, at https://www.amundi.com/usinvestors/Resources/Shareholder-Reports. You can also request this information by contacting us at 1‑800‑225‑6292.
Important notice to shareholders
In order to reduce expenses, we will deliver a single copy of prospectuses, proxies, financial reports and other communications to shareholders with the same residential address, provided they have the same last name or we reasonably believe them to be members of the same family. Unless we are notified otherwise, we will continue to send recipients only one copy of these materials for as long as they remain a shareholder of the Fund. If you would like to receive individual mailings, please call 1-800-225-6292 and we will begin sending you separate copies of these materials within 30 days after receiving your request.
ITEM 2. CODE OF ETHICS.
(a) Disclose whether, as of the end of the period covered by the report, the registrant has adopted a code of ethics that applies to the registrant’s principal executive officer, principal financial officer, principal accounting officer or controller, or persons performing similar functions, regardless of whether these individuals are employed by the registrant or a third party. If the registrant has not adopted such a code of ethics, explain why it has not done so.
The registrant has adopted, as of the end of the period covered by this report, a code of ethics that applies to the registrant’s principal executive officer, principal financial officer, principal accounting officer and controller.
(b) For purposes of this Item, the term “code of ethics” means written standards that are reasonably designed to deter wrongdoing and to promote:
(1) Honest and ethical conduct, including the ethical handling of actual or apparent conflicts of interest between personal and professional relationships;
(2) Full, fair, accurate, timely, and understandable disclosure in reports and documents that a registrant files with, or submits to, the Commission and in other public communications made by the registrant;
(3) Compliance with applicable governmental laws, rules, and regulations;
(4) The prompt internal reporting of violations of the code to an appropriate person or persons identified in the code; and
(5) Accountability for adherence to the code.
(c) The registrant must briefly describe the nature of any amendment, during the period covered by the report, to a provision of its code of ethics that applies to the registrant’s principal executive officer, principal financial officer, principal accounting officer or controller, or persons performing similar functions, regardless of whether these individuals are employed by the registrant or a third party, and that relates to any element of the code of ethics definition enumerated in paragraph (b) of this Item. The registrant must file a copy of any such amendment as an exhibit pursuant to Item 19(a), unless the registrant has elected to satisfy paragraph (f) of this Item by posting its code of ethics on its website pursuant to paragraph (f)(2) of this Item, or by undertaking to provide its code of ethics to any person without charge, upon request, pursuant to paragraph (f)(3) of this Item.
The registrant has made no amendments to the code of ethics during the period covered by this report.
(d) If the registrant has, during the period covered by the report, granted a waiver, including an implicit waiver, from a provision of the code of ethics to the registrant’s principal executive officer, principal financial officer, principal accounting officer or controller, or persons performing similar functions, regardless of whether these individuals are employed by the registrant or a third party, that relates to one or more of the items set forth in paragraph (b) of this Item, the registrant must briefly describe the nature of the waiver, the name of the person to whom the waiver was granted, and the date of the waiver.
Not applicable.
(e) If the registrant intends to satisfy the disclosure requirement under paragraph (c) or (d) of this Item regarding an amendment to, or a waiver from, a provision of its code of ethics that applies to the registrant’s principal executive officer, principal financial officer, principal accounting officer or controller, or persons performing similar functions and that relates to any element of the code of ethics definition enumerated in paragraph (b) of this Item by posting such information on its Internet website, disclose the registrant’s Internet address and such intention.
Not applicable.
(f) The registrant must:
(1) File with the Commission, pursuant to Item 19(a)(1), a copy of its code of ethics that applies to the registrant’s principal executive officer, principal financial officer, principal accounting officer or controller, or persons performing similar functions, as an exhibit to its annual report on this Form N-CSR (see attachment);
(2) Post the text of such code of ethics on its Internet website and disclose, in its most recent report on this Form N-CSR, its Internet address and the fact that it has posted such code of ethics on its Internet website; or
(3) Undertake in its most recent report on this Form N-CSR to provide to any person without charge, upon request, a copy of such code of ethics and explain the manner in which such request may be made. See Item 19(2)
ITEM 3. AUDIT COMMITTEE FINANCIAL EXPERT.
(a) (1) Disclose that the registrant’s Board of Trustees has determined that the registrant either:
(i) Has at least one audit committee financial expert serving on its audit committee; or
(ii) Does not have an audit committee financial expert serving on its audit committee.
The registrant’s Board of Trustees has determined that the registrant has at least one audit committee financial expert.
(2) If the registrant provides the disclosure required by paragraph (a)(1)(i) of this Item, it must disclose the name of the audit committee financial expert and whether that person is “independent.” In order to be considered “independent” for purposes of this Item, a member of an audit committee may not, other than in his or her capacity as a member of the audit committee, the Board of Trustees, or any other board committee:
(i) Accept directly or indirectly any consulting, advisory, or other compensatory fee from the issuer; or
(ii) Be an “interested person” of the investment company as defined in Section 2(a)(19) of the Act (15 U.S.C. 80a-2(a)(19)).
Mr. Fred J. Ricciardi, an independent Trustee, is such an audit committee financial expert.
(3) If the registrant provides the disclosure required by paragraph (a)(1) (ii) of this Item, it must explain why it does not have an audit committee financial expert.
Not applicable.
ITEM 4. PRINCIPAL ACCOUNTANT FEES AND SERVICES.
(a) Disclose, under the caption AUDIT FEES, the aggregate fees billed for each of the last two fiscal years for professional services rendered by the principal accountant for the audit of the registrant’s annual financial statements or services that are normally provided by the accountant in connection with statutory and regulatory filings or engagements for those fiscal years.
The audit fees for the Trust were $219,500 billed by Deloitte & Touche LLP for the year ended July 31, 2024 and $219,520 billed by Ernst & Young LLP for the year ended July 31, 2023.
(b) Disclose, under the caption AUDIT-RELATED FEES, the aggregate fees billed in each of the last two fiscal years for assurance and related services by the principal accountant that are reasonably related to the performance of the audit of the registrant’s financial statements and are not reported under paragraph (a) of this Item. Registrants shall describe the nature of the services comprising the fees disclosed under this category.
The audit-related services fees for the Trust were $0 billed by Deloitte & Touche LLP and $2,886 billed by Ernst & Young for the year ended July 31, 2024 and $14,991 billed by Ernst & Young LLP for the year ended July 31, 2023.
(c) Disclose, under the caption TAX FEES, the aggregate fees billed in each of the last two fiscal years for professional services rendered by the principal accountant for tax compliance, tax advice, and tax planning. Registrants shall describe the nature of the services comprising the fees disclosed under this category.
The aggregate non-audit fees for the Trust were billed by Deloitte & Touche LLP for tax services of $45,500 and $45,403 by Ernst & Young LLP for during the fiscal years ended July 31, 2024 and 2023, respectively.
(d) Disclose, under the caption ALL OTHER FEES, the aggregate fees billed in each of the last two fiscal years for products and services provided by the principal accountant, other than the services reported in paragraphs (a) through (c) of this Item. Registrants shall describe the nature of the services comprising the fees disclosed under this category.
There were no other fees in 2024 or 2023.
(e) (1) Disclose the audit committee’s pre-approval policies and procedures described in paragraph (c)(7) of Rule 2-01 of Regulation S-X.
PIONEER FUNDS
APPROVAL OF AUDIT, AUDIT-RELATED, TAX AND OTHER SERVICES
PROVIDED BY THE INDEPENDENT AUDITOR
SECTION I - POLICY PURPOSE AND APPLICABILITY
The Pioneer Funds recognize the importance of maintaining the independence of their outside auditors. Maintaining independence is a shared responsibility involving Amundi Asset Management US, Inc., the audit committee and the independent auditors.
The Funds recognize that a Fund’s independent auditors: 1) possess knowledge of the Funds, 2) are able to incorporate certain services into the scope of the audit, thereby avoiding redundant work, cost and disruption of Fund personnel and processes, and 3) have expertise that has value to the Funds. As a result, there are situations where it is desirable to use the Fund’s independent auditors for services in addition to the annual audit and where the potential for conflicts of interests are minimal. Consequently, this policy, which is intended to comply with Rule 210.2-01(C)(7), sets forth guidelines and procedures to be followed by the Funds when retaining the independent audit firm to perform audit, audit-related tax and other services under those circumstances, while also maintaining independence.
Approval of a service in accordance with this policy for a Fund shall also constitute approval for any other Fund whose pre-approval is required pursuant to Rule 210.2-01(c)(7)(ii).
In addition to the procedures set forth in this policy, any non-audit services that may be provided consistently with Rule 210.2-01 may be approved by the Audit Committee itself and any pre-approval that may be waived in accordance with Rule 210.2-01(c)(7)(i)(C) is hereby waived.
Selection of a Fund’s independent auditors and their compensation shall be determined by the Audit Committee and shall not be subject to this policy.
SECTION II - POLICY
| | | | |
SERVICE CATEGORY | | SERVICE CATEGORY DESCRIPTION | | SPECIFIC PRE-APPROVED SERVICE SUBCATEGORIES |
| I. AUDIT SERVICES | | Services that are directly related to performing the independent audit of the Funds | | • Accounting research assistance • SEC consultation, registration statements, and reporting • Tax accrual related matters • Implementation of new accounting standards • Compliance letters (e.g. rating agency letters) • Regulatory reviews and assistance regarding financial matters • Semi-annual reviews (if requested) • Comfort letters for closed end offerings |
| | |
| II. AUDIT-RELATED SERVICES | | Services which are not prohibited under Rule 210.2-01(C)(4) (the “Rule”) and are related extensions of the audit services support the audit, or use the knowledge/expertise gained from the audit procedures as a foundation to complete the project. In most cases, if the Audit-Related Services are not performed by the Audit firm, the scope of the Audit Services would likely increase. The Services are typically well-defined and governed by accounting professional standards (AICPA, SEC, etc.) | | • AICPA attest and agreed-upon procedures • Technology control assessments • Financial reporting control assessments • Enterprise security architecture assessment |
| | |
AUDIT COMMITTEE APPROVAL POLICY | | AUDIT COMMITTEE REPORTING POLICY |
• “One-time” pre-approval for the audit period for all pre-approved specific service subcategories. Approval of the independent auditors as auditors for a Fund shall constitute pre approval for these services. | | • A summary of all such services and related fees reported at each regularly scheduled Audit Committee meeting. |
| |
• “One-time” pre-approval for the fund fiscal year within a specified dollar limit for all pre-approved specific service subcategories | | • A summary of all such services and related fees (including comparison to specified dollar limits) reported quarterly. |
| | |
• Specific approval is needed to exceed the pre-approved dollar limit for these services (see general Audit Committee approval policy below for details on obtaining specific approvals) • Specific approval is needed to use the Fund’s auditors for Audit-Related Services not denoted as “pre-approved”, or to add a specific service subcategory as “pre-approved” | | |
SECTION III - POLICY DETAIL, CONTINUED
| | | | |
SERVICE CATEGORY | | SERVICE CATEGORY DESCRIPTION | | SPECIFIC PRE-APPROVED SERVICE SUBCATEGORIES |
| III. TAX SERVICES | | Services which are not prohibited by the Rule, if an officer of the Fund determines that using the Fund’s auditor to provide these services creates significant synergy in the form of efficiency, minimized disruption, or the ability to maintain a desired level of confidentiality. | | • Tax planning and support • Tax controversy assistance • Tax compliance, tax returns, excise tax returns and support • Tax opinions |
| | |
AUDIT COMMITTEE APPROVAL POLICY | | AUDIT COMMITTEE REPORTING POLICY |
• “One-time” pre-approval for the fund fiscal year within a specified dollar limit • Specific approval is needed to exceed the pre-approved dollar limits for these services (see general Audit Committee approval policy below for details on obtaining specific approvals) • Specific approval is needed to use the Fund’s auditors for tax services not denoted as pre-approved, or to add a specific service subcategory as “pre-approved” | | • A summary of all such services and related fees (including comparison to specified dollar limits) reported quarterly. |
SECTION III - POLICY DETAIL, CONTINUED
| | | | |
SERVICE CATEGORY | | SERVICE CATEGORY DESCRIPTION | | SPECIFIC PRE-APPROVED SERVICE SUBCATEGORIES |
IV. OTHER SERVICES A. SYNERGISTIC, UNIQUE QUALIFICATIONS | | Services which are not prohibited by the Rule, if an officer of the Fund determines that using the Fund’s auditor to provide these services creates significant synergy in the form of efficiency, minimized disruption, the ability to maintain a desired level of confidentiality, or where the Fund’s auditors posses unique or superior qualifications to provide these services, resulting in superior value and results for the Fund. | | • Business Risk Management support • Other control and regulatory compliance projects |
| | |
AUDIT COMMITTEE APPROVAL POLICY | | AUDIT COMMITTEE REPORTING POLICY |
• “One-time” pre-approval for the fund fiscal year within a specified dollar limit • Specific approval is needed to exceed the pre-approved dollar limits for these services (see general Audit Committee approval policy below for details on obtaining specific approvals) • Specific approval is needed to use the Fund’s auditors for “Synergistic” or “Unique Qualifications” Other Services not denoted as pre-approved to the left, or to add a specific service subcategory as “pre-approved” | | • A summary of all such services and related fees (including comparison to specified dollar limits) reported quarterly. |
SECTION III - POLICY DETAIL, CONTINUED
| | | | |
SERVICE CATEGORY | | SERVICE CATEGORY DESCRIPTION | | SPECIFIC PROHIBITED SERVICE SUBCATEGORIES |
| PROHIBITED SERVICES | | Services which result in the auditors losing independence status under the Rule. | | 1. Bookkeeping or other services related to the accounting records or financial statements of the audit client* 2. Financial information systems design and implementation* 3. Appraisal or valuation services, fairness* opinions, or contribution-in-kind reports 4. Actuarial services (i.e., setting actuarial reserves versus actuarial audit work)* 5. Internal audit outsourcing services* 6. Management functions or human resources 7. Broker or dealer, investment advisor, or investment banking services 8. Legal services and expert services unrelated to the audit 9. Any other service that the Public Company Accounting Oversight Board determines, by regulation, is impermissible |
| | |
AUDIT COMMITTEE APPROVAL POLICY | | AUDIT COMMITTEE REPORTING POLICY |
• These services are not to be performed with the exception of the(*) services that may be permitted if they would not be subject to audit procedures at the audit client (as defined in rule 2-01(f)(4)) level the firm providing the service. | | • A summary of all services and related fees reported at each regularly scheduled Audit Committee meeting will serve as continual confirmation that has not provided any restricted services. |
GENERAL AUDIT COMMITTEE APPROVAL POLICY:
| | • | | For all projects, the officers of the Funds and the Fund’s auditors will each make an assessment to determine that any proposed projects will not impair independence. |
| | • | | Potential services will be classified into the four non-restricted service categories and the “Approval of Audit, Audit-Related, Tax and Other Services” Policy above will be applied. Any services outside the specific pre-approved service subcategories set forth above must be specifically approved by the Audit Committee. |
| | • | | At least quarterly, the Audit Committee shall review a report summarizing the services by service category, including fees, provided by the Audit firm as set forth in the above policy. |
(2) Disclose the percentage of services described in each of paragraphs (b) through (d) of this Item that were approved by the audit committee pursuant to paragraph (c)(7)(i)(C) of Rule 2-01 of Regulation S-X.
Non-Audit Services
Beginning with non-audit service contracts entered into on or after May 6, 2003, the effective date of the new SEC pre-approval rules, the Trust’s audit committee is required to pre-approve services to affiliates defined by SEC rules to the extent that the services are determined to have a direct impact on the operations or financial reporting of the Trust. For the years ended July 31, 2024 and 2023, there were no services provided to an affiliate that required the Trust’s audit committee pre-approval.
(f) If greater than 50 percent, disclose the percentage of hours expended on the principal accountants engagement to audit the registrant’s financial statements for the most recent fiscal year that were attributed to work performed by persons other than the principal accountant’s full-time, permanent employees.
N/A
(g) Disclose the aggregate non-audit fees billed by the registrants accountant for services rendered to the registrant, and rendered to the registrants investment adviser (not including any sub-adviser whose role is primarily portfolio management and is subcontracted with or overseen by another investment adviser), and any entity controlling, controlled by, or under common control with the adviser that provides ongoing services to the registrant for each of the last two fiscal years of the registrant.
The aggregate non-audit fees for the Trust were billed by Deloitte & Touche LLP for tax services of $45,500 and $45,403 by Ernst & Young LLP for during the fiscal years ended July 31, 2024 and 2023, respectively.
(h) Disclose whether the registrants audit committee of the Board of Trustees has considered whether the provision of non-audit services that were rendered to the registrants investment adviser (not including any subadviser whose role is primarily portfolio management and is subcontracted with or overseen by another investment adviser), and any entity controlling, controlled by, or under common control with the investment adviser that provides ongoing services to the registrant that were not pre-approved pursuant to paragraph (c)(7)(ii) of Rule 2-01 of Regulation S-X is compatible with maintaining the principal accountant’s independence.
The Fund’s audit committee of the Board of Trustees has considered whether the provision of non-audit services that were rendered to the Affiliates (as defined) that were not pre- approved pursuant to paragraph (c)(7)(ii) of Rule 2-01 of Regulation S-X is compatible with maintaining the principal accountant’s independence.
(i) A registrant identified by the Commission pursuant to Section 104(i)(2)(A) of the Sarbanes-Oxley Act of 2002 (15 U.S.C. 7214(i)(2)(A)), as having retained, for the preparation of the audit report on its financial statements included in the Form NCSR, a registered public accounting firm that has a branch or office that is located in a foreign jurisdiction and that the Public Company Accounting Oversight Board has determined it is unable to inspect or investigate completely because of a position taken by an authority in the foreign jurisdiction must electronically submit to the Commission on a supplemental basis documentation that establishes that the registrant is not owned or controlled by a governmental entity in the foreign jurisdiction. The registrant must submit this documentation on or before the due date for this form. A registrant that is owned or controlled by a foreign governmental entity is not required to submit such documentation.
N/A
(j) A registrant that is a foreign issuer, as defined in 17 CFR 240.3b-4, identified by the Commission pursuant to Section 104(i)(2)(A) of the Sarbanes-Oxley Act of 2002 (15 U.S.C. 7214(i)(2)(A)), as having retained, for the preparation of the audit report on its financial statements included in the Form N-CSR, a registered public accounting firm that has a branch or office that is located in a foreign jurisdiction and that the Public Company Accounting Oversight Board has determined it is unable to inspect or investigate completely because of a position taken by an authority in the foreign jurisdiction, for each year in which the registrant is so identified, must provide the below disclosures. Also, any such identified foreign issuer that uses a variable-interest entity or any similar structure that results in additional foreign entities being consolidated in the financial statements of the registrant is required to provide the below disclosures for itself and its consolidated foreign operating entity or entities. A registrant must disclose:
(1) That, for the immediately preceding annual financial statement period, a registered public accounting firm that the PCAOB was unable to inspect or investigate completely, because of a position taken by an authority in the foreign jurisdiction, issued an audit report for the registrant;
N/A
(2) The percentage of shares of the registrant owned by governmental entities in the foreign jurisdiction in which the registrant is incorporated or otherwise organized;
N/A
(3) Whether governmental entities in the applicable foreign jurisdiction with respect to that registered public accounting firm have a controlling financial interest with respect to the registrant; N/A
(4) The name of each official of the Chinese Communist Party who is a member of the board of directors of the registrant or the operating entity with respect to the registrant;
N/A
(5) Whether the articles of incorporation of the registrant (or equivalent organizing document) contains any charter of the Chinese Communist Party, including the text of any such charter.
N/A
ITEM 5. AUDIT COMMITTEE OF LISTED REGISTRANTS
(a) If the registrant is a listed issuer as defined in Rule 10A-3 under the Exchange Act (17 CFR 240.10A-3), state whether or not the registrant has a separately-designated standing audit committee established in accordance with Section 3(a)(58)(A) of the Exchange Act (15 U.S.C. 78c(a)(58)(A)). If the registrant has such a committee, however designated, identify each committee member. If the entire board of directors is acting as the registrant’s audit committee as specified in Section 3(a)(58)(B) of the Exchange Act (15 U.S.C. 78c(a)(58)(B)), so state.
N/A
(b) If applicable, provide the disclosure required by Rule 10A-3(d) under the Exchange Act (17 CFR 240.10A-3(d)) regarding an exemption from the listing standards for audit committees.
N/A
ITEM 6. SCHEDULE OF INVESTMENTS.
File Schedule of Investments in securities of unaffiliated issuers as of the close of the reporting period as set forth in 210.1212 of Regulation S-X [17 CFR 210.12-12], unless the schedule is included as part of the report to shareholders filed under Item 1 of this Form.
Included in Item 7
ITEM 7. FINANCIAL STATEMENTS AND FINANCIAL HIGHLIGHTS FOR OPEN-END MANAGEMENT INVESTMENT COMPANIES.
Pioneer Securitized Income Fund
Annual Report | July 31, 2024
visit us: www.amundi.com/us
Pioneer Securitized Income Fund | Annual Report | 7/31/241
Schedule of Investments | 7/31/24
Principal
Amount
USD ($) | | | | | | Value |
| | UNAFFILIATED ISSUERS — 108.6% | |
| | Asset Backed Securities — 41.9% of Net
Assets | |
| 259,535 | ACM Auto Trust, Series 2024-1A, Class A, 7.71%, 1/21/31 (144A) | $ 260,298 |
| 360,000 | Affirm Asset Securitization Trust, Series 2023-A, Class B, 7.18%, 1/18/28 (144A) | 361,905 |
| 561,462 | Ally Bank Auto Credit-Linked Notes, Series 2024-A, Class G, 12.748%, 5/17/32 (144A) | 567,840 |
| 400,000 | Amur Equipment Finance Receivables XIV LLC, Series 2024-2A, Class E, 8.88%, 10/20/32 (144A) | 400,575 |
| 550,000 | Arivo Acceptance Auto Loan Receivables Trust, Series 2021-1A, Class D, 5.83%, 1/18/28 (144A) | 538,067 |
| 400,000 | Arivo Acceptance Auto Loan Receivables Trust, Series 2022-1A, Class D, 7.38%, 9/17/29 (144A) | 372,101 |
| 200,000 | Arivo Acceptance Auto Loan Receivables Trust, Series 2022-2A, Class C, 9.84%, 3/15/29 (144A) | 194,060 |
| 125,000 | Auxilior Term Funding LLC, Series 2023-1A, Class D, 7.27%, 12/16/30 (144A) | 129,040 |
| 200,000 | Auxilior Term Funding LLC, Series 2023-1A, Class E, 10.97%, 12/15/32 (144A) | 204,247 |
| 350,000 | Avid Automobile Receivables Trust, Series 2021-1, Class F, 5.16%, 10/16/28 (144A) | 334,567 |
| 186,769(a) | Bayview Opportunity Master Fund VII LLC, Series 2024-EDU1, Class D, 8.097% (SOFR30A + 275 bps), 6/25/47 (144A) | 188,772 |
| 444,819 | Bayview Opportunity Master Fund VII Trust, Series 2024-CAR1F, Class A, 6.971%, 7/29/32 (144A) | 447,259 |
| 235,000 | BHG Securitization Trust, Series 2023-A, Class B, 6.35%, 4/17/36 (144A) | 237,923 |
| 150,000 | BHG Securitization Trust, Series 2023-B, Class C, 8.15%, 12/17/36 (144A) | 157,581 |
| 250,000 | BHG Securitization Trust, Series 2024-1CON, Class C, 6.86%, 4/17/35 (144A) | 253,300 |
| 402,011 | Blackbird Capital II Aircraft Lease, Ltd., Series 2021-1A, Class B, 3.446%, 7/15/46 (144A) | 359,639 |
| 734,507 | Carvana Auto Receivables Trust, Series 2022-N1, Class D, 4.13%, 12/11/28 (144A) | 720,689 |
| 200,000(b) | CFMT LLC, Series 2023-HB12, Class M3, 4.25%, 4/25/33 (144A) | 181,327 |
| 600,000(b) | CFMT LLC, Series 2024-HB13, Class M3, 3.00%, 5/25/34 (144A) | 503,544 |
| 44,673 | Conn's Receivables Funding LLC, Series 2024-A, Class A, 7.05%, 1/16/29 (144A) | 44,460 |
| 200,000 | Continental Finance Credit Card ABS Master Trust, Series 2022-A, Class C, 9.33%, 10/15/30 (144A) | 205,466 |
The accompanying notes are an integral part of these financial statements.
2Pioneer Securitized Income Fund | Annual Report | 7/31/24
Principal
Amount
USD ($) | | | | | | Value |
| | Asset Backed Securities — (continued) | |
| 400,000 | Crossroads Asset Trust, Series 2021-A, Class E, 5.48%, 1/20/28 (144A) | $ 395,504 |
| 1,070,000 | Exeter Automobile Receivables Trust, Series 2022-1A, Class E, 5.02%, 10/15/29 (144A) | 1,024,425 |
| 200,000 | Exeter Automobile Receivables Trust, Series 2022-5A, Class D, 7.40%, 2/15/29 | 205,196 |
| 1,105,000 | Exeter Automobile Receivables Trust, Series 2022-6A, Class E, 11.61%, 6/17/30 (144A) | 1,220,794 |
| 1,393,000 | Exeter Automobile Receivables Trust, Series 2024-3A, Class E, 7.84%, 10/15/31 (144A) | 1,406,626 |
| 1,480,000 | Exeter Automobile Receivables Trust, Series 2024-4A, Class E, 7.65%, 2/17/32 (144A) | 1,484,549 |
| 173,405(b) | FIGRE Trust, Series 2023-HE3, Class A, 6.436%, 11/25/53 (144A) | 177,402 |
| 1,290,000(b) | FIGRE Trust, Series 2024-HE3, Class A, 5.937%, 7/25/54 (144A) | 1,296,450 |
| 500,000 | First Investors Auto Owner Trust, Series 2021-1A, Class F, 5.37%, 4/17/28 (144A) | 484,790 |
| 175,000 | GLS Auto Receivables Issuer Trust, Series 2023-1A, Class D, 7.01%, 1/16/29 (144A) | 179,385 |
| 65,000 | GLS Auto Receivables Issuer Trust, Series 2023-2A, Class D, 6.31%, 3/15/29 (144A) | 65,834 |
| 350,000 | GLS Auto Receivables Issuer Trust, Series 2023-4A, Class D, 7.18%, 8/15/29 (144A) | 364,558 |
| 205,000 | GLS Auto Receivables Issuer Trust, Series 2024-2A, Class D, 6.19%, 2/15/30 (144A) | 209,400 |
| 1,170,000 | GLS Auto Receivables Issuer Trust, Series 2024-2A, Class E, 7.98%, 5/15/31 (144A) | 1,197,560 |
| 1,270,000 | GLS Auto Select Receivables Trust, Series 2024-1A, Class D, 6.43%, 1/15/31 (144A) | 1,300,501 |
| 250,000(a) | Golub Capital Partners Short Duration, Series 2022-1A, Class DR, 9.945% (3 Month Term SOFR + 460 bps), 7/25/33 (144A) | 249,041 |
| 294,667 | Hilton Grand Vacations Trust, Series 2024-2A, Class D, 6.91%, 3/25/38 (144A) | 299,610 |
| 200,000 | HOA Funding LLC - HOA, Series 2021-1A, Class B, 7.432%, 8/20/51 (144A) | 150,635 |
| 320,455 | Home Partners of America Trust, Series 2019-1, Class E, 3.604%, 9/17/39 (144A) | 298,376 |
| 232,501(a) | Huntington Bank Auto Credit-Linked Notes Series, Series 2024-1, Class C, 8.494% (SOFR30A + 315 bps), 5/20/32 (144A) | 233,001 |
| 300,000(a) | ICG US CLO, Ltd., Series 2016-1A, Class DRR, 12.965% (3 Month Term SOFR + 770 bps), 4/29/34 (144A) | 266,747 |
The accompanying notes are an integral part of these financial statements.
Pioneer Securitized Income Fund | Annual Report | 7/31/243
Schedule of Investments | 7/31/24 (continued)
Principal
Amount
USD ($) | | | | | | Value |
| | Asset Backed Securities — (continued) | |
| 349,477(a) | JP Morgan Mortgage Trust, Series 2023-HE2, Class A1, 7.044% (SOFR30A + 170 bps), 3/25/54 (144A) | $ 352,371 |
| 600,000 | JPMorgan Chase Bank N.A. - CACLN, Series 2021-2, Class F, 4.393%, 12/26/28 (144A) | 596,133 |
| 565,000(a) | Kinetic Advantage Master Owner Trust, Series 2024-1A, Class A, 7.987% (SOFR30A + 265 bps), 11/15/27 (144A) | 566,555 |
| 400,000 | Lendbuzz Securitization Trust, Series 2024-2A, Class B, 6.52%, 7/16/29 (144A) | 407,907 |
| 58,559 | Libra Solutions LLC, Series 2022-2A, Class B, 8.85%, 10/15/34 (144A) | 58,559 |
| 250,000(a) | Madison Park Funding XLV, Ltd., Series 2020-45A, Class ER, 11.913% (3 Month Term SOFR + 661 bps), 7/15/34 (144A) | 250,387 |
| 380,000 | Mercury Financial Credit Card Master Trust, Series 2024-2A, Class B, 7.43%, 7/20/29 (144A) | 384,488 |
| 500,000 | Mission Lane Credit Card Master Trust, Series 2023-B, Class A, 7.69%, 11/15/28 (144A) | 506,689 |
| 35,602(a) | Newtek Small Business Loan Trust, Series 2018-1, Class A, 7.95% (PRIME - 55 bps), 2/25/44 (144A) | 35,363 |
| 125,672(a) | Newtek Small Business Loan Trust, Series 2019-1, Class B, 8.75% (PRIME + 25 bps), 12/25/44 (144A) | 124,429 |
| 414,723(a) | Newtek Small Business Loan Trust, Series 2022-1, Class A, 7.80% (PRIME - 70 bps), 10/25/49 (144A) | 411,992 |
| 210,000 | NMEF Funding LLC, Series 2022-B, Class C, 8.54%, 6/15/29 (144A) | 210,104 |
| 150,000 | NMEF Funding LLC, Series 2023-A, Class C, 8.04%, 6/17/30 (144A) | 150,920 |
| 250,000(a) | Ocean Trails CLO IX, Series 2020-9A, Class ER, 13.013% (3 Month Term SOFR + 771 bps), 10/15/34 (144A) | 250,959 |
| 200,000 | Octane Receivables Trust, Series 2020-1A, Class D, 5.45%, 3/20/28 (144A) | 199,822 |
| 410,000 | Octane Receivables Trust, Series 2022-2A, Class D, 7.70%, 2/20/30 (144A) | 426,338 |
| 310,000 | Octane Receivables Trust, Series 2023-1A, Class D, 7.76%, 3/20/30 (144A) | 324,645 |
| 105,727 | Oportun Funding XIV LLC, Series 2021-A, Class C, 3.44%, 3/8/28 (144A) | 102,737 |
| 201,425 | Oxford Finance Funding LLC, Series 2022-1A, Class B, 4.096%, 2/15/30 (144A) | 192,963 |
| 95,418 | Pagaya AI Debt Trust, Series 2023-1, Class A, 7.556%, 7/15/30 (144A) | 95,731 |
| 159,418 | Pagaya AI Debt Trust, Series 2023-3, Class A, 7.60%, 12/16/30 (144A) | 160,278 |
| 96,900 | Pagaya AI Debt Trust, Series 2023-5, Class A, 7.179%, 4/15/31 (144A) | 97,076 |
The accompanying notes are an integral part of these financial statements.
4Pioneer Securitized Income Fund | Annual Report | 7/31/24
Principal
Amount
USD ($) | | | | | | Value |
| | Asset Backed Securities — (continued) | |
| 400,000 | Pawneee Equipment Receivables Series LLC, Series 2021-1, Class E, 5.21%, 5/15/28 (144A) | $ 387,644 |
| 156,963 | PEAR LLC, Series 2023-1, Class A, 7.42%, 7/15/35 (144A) | 159,524 |
| 250,000 | Post Road Equipment Finance LLC, Series 2024-1A, Class E, 8.50%, 12/15/31 (144A) | 243,206 |
| 175,000 | Prestige Auto Receivables Trust, Series 2022-1A, Class D, 8.08%, 8/15/28 (144A) | 180,205 |
| 180,000 | Prestige Auto Receivables Trust, Series 2023-2A, Class D, 7.71%, 8/15/29 (144A) | 187,349 |
| 200,000 | Progress Residential Trust, Series 2021-SFR8, Class G, 4.005%, 10/17/38 (144A) | 181,625 |
| 100,000 | Progress Residential Trust, Series 2021-SFR9, Class F, 4.053%, 11/17/40 (144A) | 89,883 |
| 280,000 | Purchasing Power Funding LLC, Series 2024-A, Class D, 7.26%, 8/15/28 (144A) | 283,372 |
| 300,000 | Purchasing Power Funding LLC, Series 2024-A, Class E, 10.18%, 8/15/28 (144A) | 304,803 |
| 450,000(b)+ | RMF Buyout Issuance Trust, Series 2022-HB1, Class M5, 4.50%, 4/25/32 (144A) | 45,000 |
| 366,983(b) | Saluda Grade Alternative Mortgage Trust, Series 2023-FIG4, Class A, 6.718%, 11/25/53 (144A) | 375,433 |
| 650,000 | Santander Bank Auto Credit-Linked Notes, Series 2022-A, Class E, 12.662%, 5/15/32 (144A) | 694,913 |
| 650,000 | Santander Bank Auto Credit-Linked Notes, Series 2023-B, Class E, 8.408%, 12/15/33 (144A) | 655,314 |
| 810,000 | Santander Bank Auto Credit-Linked Notes, Series 2024-A, Class F, 10.171%, 6/15/32 (144A) | 818,507 |
| 700,000 | Santander Bank N.A. - SBCLN, Series 2021-1A, Class E, 6.171%, 12/15/31 (144A) | 696,317 |
| 100,000 | Santander Drive Auto Receivables Trust, Series 2024-1, Class C, 5.45%, 3/15/30 | 100,757 |
| 144,000 | Santander Revolving Auto Loan Trust, Series 2019-A, Class D, 3.45%, 1/26/32 (144A) | 142,508 |
| 560,000 | SCF Equipment Leasing LLC, Series 2022-1A, Class E, 5.26%, 7/20/32 (144A) | 539,682 |
| 230,000 | SCF Equipment Leasing LLC, Series 2024-1A, Class D, 6.58%, 6/21/33 (144A) | 235,523 |
| 400,000(a) | STAR Trust, Series 2022-SFR3, Class D, 7.879% (1 Month Term SOFR + 255 bps), 5/17/39 (144A) | 397,432 |
| 360,000 | Stream Innovations Issuer Trust, Series 2024-1A, Class B, 7.89%, 7/15/44 (144A) | 366,548 |
| 250,000(a) | STWD, Ltd., Series 2021-SIF1, Class D, 9.463% (3 Month Term SOFR + 416 bps), 4/15/32 (144A) | 249,233 |
The accompanying notes are an integral part of these financial statements.
Pioneer Securitized Income Fund | Annual Report | 7/31/245
Schedule of Investments | 7/31/24 (continued)
Principal
Amount
USD ($) | | | | | | Value |
| | Asset Backed Securities — (continued) | |
| 390,000 | Trafigura Securitisation Finance Plc, Series 2024-1A, Class B, 7.29%, 11/15/27 (144A) | $ 395,555 |
| 500,000 | Tricolor Auto Securitization Trust, Series 2021-1A, Class F, 5.08%, 5/15/28 (144A) | 499,434 |
| 500,000 | Tricolor Auto Securitization Trust, Series 2022-1A, Class F, 9.80%, 7/16/29 (144A) | 491,513 |
| 240,000 | Tricolor Auto Securitization Trust, Series 2024-2A, Class D, 7.61%, 8/15/28 (144A) | 243,269 |
| 500,000 | Veros Auto Receivables Trust, Series 2024-1, Class C, 7.57%, 12/15/28 (144A) | 508,028 |
| 763,729(c) | Vista Point Securitization Trust, Series 2024-CES1, Class A1, 6.676%, 5/25/54 (144A) | 772,321 |
| 488,960 | Westgate Resorts LLC, Series 2024-1A, Class D, 9.26%, 1/20/38 (144A) | 491,435 |
| 330,000 | Westlake Automobile Receivables Trust, Series 2023-1A, Class D, 6.79%, 11/15/28 (144A) | 336,934 |
| 175,000 | Westlake Automobile Receivables Trust, Series 2023-2A, Class D, 7.01%, 11/15/28 (144A) | 179,155 |
| | Total Asset Backed Securities
(Cost $36,519,065) | $36,331,912 |
|
|
| | Collateralized Mortgage
Obligations—35.9% of Net Assets | |
| 460,000(b) | A&D Mortgage Trust, Series 2023-NQM4, Class B1, 8.098%, 9/25/68 (144A) | $ 461,056 |
| 206,000(a) | Bellemeade Re, Ltd., Series 2021-3A, Class B1, 9.197% (SOFR30A + 385 bps), 9/25/31 (144A) | 205,998 |
| 620,000 | Bravo Residential Funding Trust, 7.379%, 6/1/64 (144A) | 619,998 |
| 625,376(b) | Cascade Funding Mortgage Trust, Series 2018-RM2, Class D, 4.00%, 10/25/68 (144A) | 556,089 |
| 610,000(b) | CFMT LLC, Series 2024-HB14, Class M3, 3.00%, 6/25/34 (144A) | 515,313 |
| 660,000(b) | COLT Mortgage Loan Trust, Series 2024-4, Class B1, 7.883%, 7/25/69 (144A) | 662,219 |
| 1,240,000(a) | Connecticut Avenue Securities Trust, Series 2020-R02, Class 2B1, 8.462% (SOFR30A + 311 bps), 1/25/40 (144A) | 1,276,227 |
| 720,000(a) | Connecticut Avenue Securities Trust, Series 2021-R01, Class 1B2, 11.347% (SOFR30A + 600 bps), 10/25/41 (144A) | 760,500 |
| 800,000(a) | Connecticut Avenue Securities Trust, Series 2021-R03, Class 1B2, 10.847% (SOFR30A + 550 bps), 12/25/41 (144A) | 837,504 |
| 1,180,000(a) | Connecticut Avenue Securities Trust, Series 2022-R01, Class 1B2, 11.347% (SOFR30A + 600 bps), 12/25/41 (144A) | 1,248,593 |
The accompanying notes are an integral part of these financial statements.
6Pioneer Securitized Income Fund | Annual Report | 7/31/24
Principal
Amount
USD ($) | | | | | | Value |
| | Collateralized Mortgage
Obligations—(continued) | |
| 500,000(a) | Connecticut Avenue Securities Trust, Series 2022-R05, Class 2B1, 9.847% (SOFR30A + 450 bps), 4/25/42 (144A) | $ 532,500 |
| 510,000(a) | Connecticut Avenue Securities Trust, Series 2024-R02, Class 1B1, 7.847% (SOFR30A + 250 bps), 2/25/44 (144A) | 521,104 |
| 540,000(a) | Connecticut Avenue Securities Trust, Series 2024-R02, Class 1B2, 9.047% (SOFR30A + 370 bps), 2/25/44 (144A) | 553,124 |
| 430,000(a) | Connecticut Avenue Securities Trust, Series 2024-R03, Class 2M2, 7.298% (SOFR30A + 195 bps), 3/25/44 (144A) | 433,448 |
| 1,825,000(a) | Connecticut Avenue Securities Trust, Series 2024-R04, Class 1B1, 7.547% (SOFR30A + 220 bps), 5/25/44 (144A) | 1,840,683 |
| 1,000,000(a) | Connecticut Avenue Securities Trust, Series 2024-R04, Class 1M2, 6.997% (SOFR30A + 165 bps), 5/25/44 (144A) | 1,003,988 |
| 220,000(a) | Connecticut Avenue Securities Trust, Series 2024-R05, Class 2B1, 7.336% (SOFR30A + 200 bps), 7/25/44 (144A) | 220,034 |
| 250,000(a) | Connecticut Avenue Securities Trust, Series 2024-R05, Class 2M2, 7.036% (SOFR30A + 170 bps), 7/25/44 (144A) | 250,313 |
| 290,000(a) | Eagle Re, Ltd., Series 2021-2, Class M2, 9.597% (SOFR30A + 425 bps), 4/25/34 (144A) | 302,183 |
| 240,000(a) | Eagle Re, Ltd., Series 2023-1, Class M1B, 9.297% (SOFR30A + 395 bps), 9/26/33 (144A) | 248,898 |
| 82,057(b) | FARM 21-1 Mortgage Trust, Series 2021-1, Class B, 3.242%, 7/25/51 (144A) | 59,744 |
| 183,514(b) | Federal Home Loan Mortgage Corp. Seasoned Credit Risk Transfer Trust, Series 2018-1, Class M, 4.75%, 5/25/57 | 176,684 |
| 277,161(b) | Federal Home Loan Mortgage Corp. Seasoned Credit Risk Transfer Trust, Series 2019-1, Class M, 4.75%, 7/25/58 (144A) | 263,997 |
| 290,000(b) | Federal Home Loan Mortgage Corp. Seasoned Credit Risk Transfer Trust, Series 2019-2, Class M, 4.75%, 8/25/58 (144A) | 276,705 |
| 303,244(b) | Federal Home Loan Mortgage Corp. Seasoned Credit Risk Transfer Trust, Series 2019-3, Class M, 4.75%, 10/25/58 | 291,677 |
| 1,000,000(a) | Federal Home Loan Mortgage Corp. STACR REMIC Trust, Series 2020-HQA1, Class B2, 10.562% (SOFR30A + 521 bps), 1/25/50 (144A) | 1,082,331 |
The accompanying notes are an integral part of these financial statements.
Pioneer Securitized Income Fund | Annual Report | 7/31/247
Schedule of Investments | 7/31/24 (continued)
Principal
Amount
USD ($) | | | | | | Value |
| | Collateralized Mortgage
Obligations—(continued) | |
| 650,000(a) | Federal Home Loan Mortgage Corp. STACR REMIC Trust, Series 2021-DNA1, Class B2, 10.097% (SOFR30A + 475 bps), 1/25/51 (144A) | $ 700,173 |
| 720,000(a) | Federal Home Loan Mortgage Corp. STACR REMIC Trust, Series 2021-HQA1, Class B2, 10.347% (SOFR30A + 500 bps), 8/25/33 (144A) | 780,722 |
| 260,000(a) | Federal Home Loan Mortgage Corp. STACR REMIC Trust, Series 2021-HQA2, Class B2, 10.797% (SOFR30A + 545 bps), 12/25/33 (144A) | 290,813 |
| 480,000(a) | Federal Home Loan Mortgage Corp. STACR REMIC Trust, Series 2022-DNA1, Class M2, 7.847% (SOFR30A + 250 bps), 1/25/42 (144A) | 489,841 |
| 500,000(a) | Federal Home Loan Mortgage Corp. STACR Trust, Series 2018-HQA2, Class B2, 16.462% (SOFR30A + 1,111 bps), 10/25/48 (144A) | 632,105 |
| 434,000(a) | Federal Home Loan Mortgage Corp. STACR Trust, Series 2019-DNA3, Class B2, 13.612% (SOFR30A + 826 bps), 7/25/49 (144A) | 497,446 |
| 350,000(a) | Federal Home Loan Mortgage Corp. STACR Trust, Series 2019-DNA4, Class B2, 11.712% (SOFR30A + 636 bps), 10/25/49 (144A) | 387,953 |
| 550,000(a) | Federal Home Loan Mortgage Corp. STACR Trust, Series 2019-FTR3, Class B2, 10.25% (SOFR30A + 491 bps), 9/25/47 (144A) | 586,039 |
| 580,000(a) | Federal Home Loan Mortgage Corp. STACR Trust, Series 2019-FTR4, Class B2, 10.462% (SOFR30A + 511 bps), 11/25/47 (144A) | 622,344 |
| 790,000(a) | Federal National Mortgage Association Connecticut Avenue Securities, Series 2021-R02, Class 2B2, 11.547% (SOFR30A + 620 bps), 11/25/41 (144A) | 833,450 |
| 5,989,297(b)(d) | Flagstar Mortgage Trust, Series 2021-4, Class AX1, 0.205%, 6/1/51 (144A) | 67,181 |
| 110,000(b) | GCAT Trust, Series 2021-CM1, Class M1, 3.276%, 4/25/65 (144A) | 93,432 |
| 175,000(a) | Home Re, Ltd., Series 2022-1, Class B1, 14.347% (SOFR30A + 900 bps), 10/25/34 (144A) | 199,818 |
| 825,000(b) | HOMES Trust, Series 2024-NQM1, Class B1A, 7.352%, 7/25/69 (144A) | 825,147 |
| 3,901,863(b)(d) | Hundred Acre Wood Trust, Series 2021-INV1, Class AX1, 0.23%, 7/25/51 (144A) | 48,621 |
| 205,000(b) | Imperial Fund Mortgage Trust, Series 2021-NQM2, Class B2, 4.285%, 9/25/56 (144A) | 154,019 |
| 7,692,934(b)(d) | JP Morgan Mortgage Trust, Series 2021-10, Class AX1, 0.117%, 12/25/51 (144A) | 48,369 |
The accompanying notes are an integral part of these financial statements.
8Pioneer Securitized Income Fund | Annual Report | 7/31/24
Principal
Amount
USD ($) | | | | | | Value |
| | Collateralized Mortgage
Obligations—(continued) | |
| 742,261(b) | JP Morgan Mortgage Trust, Series 2021-10, Class B4, 2.827%, 12/25/51 (144A) | $ 553,611 |
| 6,546,428(b)(d) | JP Morgan Mortgage Trust, Series 2021-8, Class AX1, 0.118%, 12/25/51 (144A) | 41,191 |
| 250,875(a) | JPMorgan Chase Bank N.A. - JPMWM, Series 2021-CL1, Class M3, 7.147% (SOFR30A + 180 bps), 3/25/51 (144A) | 236,408 |
| 350,000(c) | LHOME Mortgage Trust, Series 2024-RTL1, Class A1, 7.017%, 1/25/29 (144A) | 354,691 |
| 510,000(c) | LHOME Mortgage Trust, Series 2024-RTL2, Class A1, 7.128%, 3/25/29 (144A) | 517,231 |
| 300,000(c) | MFA Trust, Series 2023-RTL2, Class A1, 8.498%, 11/25/28 (144A) | 305,433 |
| 153,534(b) | New Residential Mortgage Loan Trust, Series 2017-4A, Class B4, 5.216%, 5/25/57 (144A) | 141,009 |
| 150,000(a) | Oaktown Re VII, Ltd., Series 2021-2, Class B1, 9.747% (SOFR30A + 440 bps), 4/25/34 (144A) | 153,642 |
| 260,000(a) | Radnor Re, Ltd., Series 2023-1, Class M1A, 8.047% (SOFR30A + 270 bps), 7/25/33 (144A) | 263,241 |
| 300,000(a) | Radnor Re, Ltd., Series 2023-1, Class M1B, 9.697% (SOFR30A + 435 bps), 7/25/33 (144A) | 313,277 |
| 375,000(c) | Saluda Grade Alternative Mortgage Trust, Series 2024-RTL4, Class A1, 7.50%, 2/25/30 (144A) | 378,078 |
| 350,000(c) | Saluda Grade Alternative Mortgage Trust, Series 2024-RTL5, Class A1, 7.762%, 4/25/30 (144A) | 354,331 |
| 600,000(a) | STACR Trust, Series 2018-HRP2, Class B2, 15.962% (SOFR30A + 1,061 bps), 2/25/47 (144A) | 744,303 |
| 250,000(b) | Towd Point Mortgage Trust, Series 2022-SJ1, Class B1, 5.25%, 3/25/62 (144A) | 228,692 |
| 200,000(a) | Triangle Re, Ltd., Series 2021-3, Class M2, 9.097% (SOFR30A + 375 bps), 2/25/34 (144A) | 204,581 |
| 290,000(a) | Triangle Re, Ltd., Series 2023-1, Class M1B, 10.597% (SOFR30A + 525 bps), 11/25/33 (144A) | 311,586 |
| 1,030,000(b) | Verus Securitization Trust, Series 2023-4, Class B1, 8.158%, 5/25/68 (144A) | 1,033,908 |
| 440,000(b) | Verus Securitization Trust, Series 2023-5, Class B2, 8.107%, 6/25/68 (144A) | 434,885 |
| 620,000(b) | Verus Securitization Trust, Series 2023-6, Class B1, 7.821%, 9/25/68 (144A) | 625,668 |
| 686,000(b) | Verus Securitization Trust, Series 2024-3, Class B1, 8.028%, 4/25/69 (144A) | 698,476 |
| 510,000(b) | Verus Securitization Trust, Series 2024-5, Class B1, 7.793%, 6/25/69 (144A) | 517,656 |
The accompanying notes are an integral part of these financial statements.
Pioneer Securitized Income Fund | Annual Report | 7/31/249
Schedule of Investments | 7/31/24 (continued)
Principal
Amount
USD ($) | | | | | | Value |
| | Collateralized Mortgage
Obligations—(continued) | |
| 100,000 | Visio Trust, Series 2020-1R, Class M1, 2.926%, 11/25/55 (144A) | $ 91,467 |
| 170,000(b) | Vista Point Securitization Trust, Series 2020-2, Class M1, 3.401%, 4/25/65 (144A) | 160,073 |
| | Total Collateralized Mortgage Obligations
(Cost $30,725,333) | $31,121,821 |
|
|
| | Commercial Mortgage-Backed
Securities—11.8% of Net Assets | |
| 520,000(a) | AREIT, Ltd., Series 2024-CRE9, Class A, 7.021% (1 Month Term SOFR + 169 bps), 5/17/41 (144A) | $ 520,326 |
| 685,000(a) | BAMLL Commercial Mortgage Securities Trust, Series 2024-NASH, Class B, 8.079% (1 Month Term SOFR + 275 bps), 5/15/39 (144A) | 679,894 |
| 660,000(a)(e) | BX Commercial Mortgage Trust, Series 2024-AIRC, Class A, 6.991% (1 Month Term SOFR + 169 bps), 8/15/39 (144A) | 659,173 |
| 764,000(a) | BX Trust, Series 2021-ARIA, Class D, 7.339% (1 Month Term SOFR + 201 bps), 10/15/36 (144A) | 749,207 |
| 500,000(b) | COMM Mortgage Trust, Series 2020-CBM, Class F, 3.633%, 2/10/37 (144A) | 480,286 |
| 250,000(a) | Federal Home Loan Mortgage Corp. Multifamily Structured Credit Risk, Series 2021-MN1, Class B1, 13.097% (SOFR30A + 775 bps), 1/25/51 (144A) | 271,536 |
| 250,000(a) | Federal Home Loan Mortgage Corp. Multifamily Structured Credit Risk, Series 2021-MN3, Class M2, 9.347% (SOFR30A + 400 bps), 11/25/51 (144A) | 252,842 |
| 150,000(a) | HILT Commercial Mortgage Trust, Series 2024-ORL, Class D, 8.518% (1 Month Term SOFR + 319 bps), 5/15/37 (144A) | 149,438 |
| 140,000(b) | HTL Commercial Mortgage Trust, Series 2024-T53, Class C, 7.088%, 5/10/39 (144A) | 141,720 |
| 1,030,000(b) | HTL Commercial Mortgage Trust, Series 2024-T53, Class D, 8.198%, 5/10/39 (144A) | 1,048,613 |
| 650,000 | MCR Mortgage Trust, Series 2024-TWA, Class D, 7.402%, 6/12/39 (144A) | 654,530 |
| 500,000 | MCR Mortgage Trust, Series 2024-TWA, Class F, 10.382%, 6/12/39 (144A) | 504,440 |
| 1,150,000(a) | MF1, Series 2024-FL15, Class A, 6.988% (1 Month Term SOFR + 169 bps), 8/18/41 (144A) | 1,148,080 |
| 250,000(a) | MF1 Multifamily Housing Mortgage Loan Trust, Series 2021-FL5, Class D, 7.949% (1 Month Term SOFR + 261 bps), 7/15/36 (144A) | 245,441 |
The accompanying notes are an integral part of these financial statements.
10Pioneer Securitized Income Fund | Annual Report | 7/31/24
Principal
Amount
USD ($) | | | | | | Value |
| | Commercial Mortgage-Backed
Securities—(continued) | |
| 301,268(a) | Multifamily Connecticut Avenue Securities Trust, Series 2019-01, Class M10, 8.712% (SOFR30A + 336 bps), 10/25/49 (144A) | $ 301,730 |
| 488,904(a) | Multifamily Connecticut Avenue Securities Trust, Series 2020-01, Class M10, 9.212% (SOFR30A + 386 bps), 3/25/50 (144A) | 491,466 |
| 500,000(b) | Natixis Commercial Mortgage Securities Trust, Series 2019-FAME, Class E, 4.398%, 8/15/36 (144A) | 202,500 |
| 500,000(a) | Natixis Commercial Mortgage Securities Trust, Series 2019-MILE, Class E, 8.908% (1 Month Term SOFR + 358 bps), 7/15/36 (144A) | 357,659 |
| 170,000(a)(e) | PFP, Ltd., Series 2024-11, Class A, 7.172% (1 Month Term SOFR + 183 bps), 9/17/39 (144A) | 169,575 |
| 260,000(a) | Ready Capital Mortgage Financing LLC, Series 2021-FL6, Class AS, 6.664% (1 Month Term SOFR + 131 bps), 7/25/36 (144A) | 255,396 |
| 210,000(a) | Ready Capital Mortgage Financing LLC, Series 2023-FL11, Class B, 8.882% (1 Month Term SOFR + 353 bps), 10/25/39 (144A) | 210,249 |
| 174,000 | SLG Office Trust, Series 2021-OVA, Class F, 2.851%, 7/15/41 (144A) | 130,090 |
| 300,000(b) | THPT Mortgage Trust, Series 2023-THL, Class C, 8.534%, 12/10/34 (144A) | 309,176 |
| 295,182(b) | Velocity Commercial Capital Loan Trust, Series 2020-1, Class M5, 4.29%, 2/25/50 (144A) | 231,598 |
| | Total Commercial Mortgage-Backed Securities
(Cost $10,451,266) | $10,164,965 |
|
|
| | Corporate Bonds — 0.1% of Net Assets | |
| | Airlines — 0.1% | |
| 65,050 | British Airways 2020-1 Class B Pass Through Trust, 8.375%, 11/15/28 (144A) | $ 68,487 |
| 35,256 | United Airlines 2020-1 Class B Pass Through Trust, 4.875%, 1/15/26 | 34,789 |
| | Total Airlines | $103,276 |
|
|
| | Total Corporate Bonds
(Cost $100,306) | $103,276 |
|
|
| | U.S. Government and Agency Obligations
— 18.9% of Net Assets | |
| 200,000 | Federal National Mortgage Association, 5.500%, 8/1/54 (TBA) | $ 200,306 |
| 2,300,000 | Federal National Mortgage Association, 6.000%, 8/1/54 (TBA) | 2,332,615 |
The accompanying notes are an integral part of these financial statements.
Pioneer Securitized Income Fund | Annual Report | 7/31/2411
Schedule of Investments | 7/31/24 (continued)
Principal
Amount
USD ($) | | | | | | Value |
| | U.S. Government and Agency Obligations —
(continued) | |
| 4,250,000 | Federal National Mortgage Association, 6.500%, 8/1/54 (TBA) | $ 4,358,294 |
| 5,150,000(f) | U.S. Treasury Bills, 8/6/24 | 5,146,234 |
| 900,000(f) | U.S. Treasury Bills, 8/13/24 | 898,415 |
| 1,050,000(f) | U.S. Treasury Bills, 8/20/24 | 1,047,072 |
| 2,400,000(f) | U.S. Treasury Bills, 8/27/24 | 2,390,843 |
| | Total U.S. Government and Agency Obligations
(Cost $16,334,898) | $16,373,779 |
|
|
| | TOTAL INVESTMENTS IN UNAFFILIATED ISSUERS — 108.6%
(Cost $94,130,868) | $94,095,753 |
| | OTHER ASSETS AND LIABILITIES — (8.6)% | $(7,418,848) |
| | net assets — 100.0% | $86,676,905 |
| | | | | | | |
| (TBA) | “To Be Announced” Securities. |
| bps | Basis Points. |
| PRIME | U.S. Federal Funds Rate. |
| SOFR | Secured Overnight Financing Rate. |
| SOFR30A | Secured Overnight Financing Rate 30 Day Average. |
| (144A) | The resale of such security is exempt from registration under Rule 144A of the Securities Act of 1933. Such securities may be resold normally to qualified institutional buyers. At July 31, 2024, the value of these securities amounted to $76,912,871, or 88.7% of net assets. |
| (a) | Floating rate note. Coupon rate, reference index and spread shown at July 31, 2024. |
| (b) | The interest rate is subject to change periodically. The interest rate and/or reference index and spread shown at July 31, 2024. |
| (c) | Debt obligation initially issued at one coupon which converts to a higher coupon at a specific date. The rate shown is the rate at July 31, 2024. |
| (d) | Security represents the interest-only portion payments on a pool of underlying mortgages or mortgage-backed securities. |
| (e) | Securities purchased on a when-issued basis. Rates do not take effect until settlement date. |
| (f) | Security issued with a zero coupon. Income is recognized through accretion of discount. |
| + | Security is valued using significant unobservable inputs (Level 3). |
The accompanying notes are an integral part of these financial statements.
12Pioneer Securitized Income Fund | Annual Report | 7/31/24
FUTURES CONTRACTS
FIXED INCOME INDEX FUTURES CONTRACTS
Number of
Contracts
Long | Description | Expiration
Date | Notional
Amount | Market
Value | Unrealized
Appreciation |
| 75 | U.S. 2 Year Note (CBT) | 9/30/24 | $15,300,150 | $15,402,539 | $102,389 |
| 60 | U.S. 5 Year Note (CBT) | 9/30/24 | 6,403,433 | 6,473,438 | 70,005 |
| TOTAL FUTURES CONTRACTS | $21,703,583 | $21,875,977 | $172,394 |
| CBT | Chicago Board of Trade. |
Purchases and sales of securities (excluding short-term investments and all derivative contracts except for options purchased) for the year ended July 31, 2024, aggregated $64,201,536 and $10,403,302, respectively.
At July 31, 2024, the net unrealized depreciation on investments based on cost for federal tax purposes of $94,130,868 was as follows:
| Aggregate gross unrealized appreciation for all investments in which there is an excess of value over tax cost | $1,092,765 |
| Aggregate gross unrealized depreciation for all investments in which there is an excess of tax cost over value | (1,127,880) |
| Net unrealized depreciation | $(35,115) |
The accompanying notes are an integral part of these financial statements.
Pioneer Securitized Income Fund | Annual Report | 7/31/2413
Schedule of Investments | 7/31/24 (continued)
Various inputs are used in determining the value of the Fund’s investments. These inputs are summarized in the three broad levels below.
| Level 1 | – | unadjusted quoted prices in active markets for identical securities. |
| Level 2 | – | other significant observable inputs (including quoted prices for similar securities, interest rates, prepayment speeds, credit risks, etc.). See Notes to Financial Statements — Note 1A. |
| Level 3 | – | significant unobservable inputs (including the Adviser’s own assumptions in determining fair value of investments). See Notes to Financial Statements — Note 1A. |
The following is a summary of the inputs used as of July 31, 2024 in valuing the Fund’s investments:
| | Level 1 | Level 2 | Level 3 | Total |
| Asset Backed Securities | $— | $36,286,912 | $45,000 | $36,331,912 |
| Collateralized Mortgage Obligations | — | 31,121,821 | — | 31,121,821 |
| Commercial Mortgage-Backed Securities | — | 10,164,965 | — | 10,164,965 |
| Corporate Bonds | — | 103,276 | — | 103,276 |
| U.S. Government and Agency Obligations | — | 16,373,779 | — | 16,373,779 |
| Total Investments in Securities | $— | $94,050,753 | $45,000 | $94,095,753 |
| Other Financial Instruments | | | | |
| Net unrealized appreciation on futures contracts | $172,394 | $— | $— | $172,394 |
| Total Other Financial Instruments | $172,394 | $— | $— | $172,394 |
Transfers are calculated on the beginning of period values. During the year ended July 31, 2024, a security valued at $50,063 was transferred from Level 2 to Level 3, due to valuing the security using unobservable inputs. There were no other transfers in or out of Level 3 during the period.
The accompanying notes are an integral part of these financial statements.
14Pioneer Securitized Income Fund | Annual Report | 7/31/24
Statement of Assets and Liabilities | 7/31/24
| ASSETS: | |
| Investments in unaffiliated issuers, at value (cost $94,130,868) | $94,095,753 |
| Cash | 648,492 |
| Futures collateral | 568,447 |
| Variation margin for futures contracts | 20,399 |
| Receivables — | |
| Fund shares sold | 286,684 |
| Interest | 269,718 |
| Due from the Adviser | 2,288 |
| Other assets | 32,533 |
| Total assets | $95,924,314 |
| LIABILITIES: | |
| Due to broker for futures | $20,399 |
| Payables — | |
| Investment securities purchased | 8,859,028 |
| Fund shares repurchased | 198,462 |
| Distributions | 15,959 |
| Trustees’ fees | 733 |
| Management fees | 6,424 |
| Administrative expenses | 1,048 |
| Distribution fees | 42 |
| Accrued expenses | 145,314 |
| Total liabilities | $9,247,409 |
| NET ASSETS: | |
| Paid-in capital | $87,130,283 |
| Distributable earnings (loss) | (453,378) |
| Net assets | $86,676,905 |
| NET ASSET VALUE PER SHARE: | |
| No par value (unlimited number of shares authorized) | |
| Class A (based on $1,220,615/128,426 shares) | $9.50 |
| Class Y (based on $85,456,290/8,992,305 shares) | $9.50 |
| MAXIMUM OFFERING PRICE PER SHARE: | |
| Class A (based on $9.50 net asset value per share/100%-4.50% maximum sales charge) | $9.95 |
The accompanying notes are an integral part of these financial statements.
Pioneer Securitized Income Fund | Annual Report | 7/31/2415
Statement of Operations FOR THE YEAR ENDED 7/31/24
| INVESTMENT INCOME: | | |
| Interest from unaffiliated issuers | $2,962,957 | |
| Total Investment Income | | $2,962,957 |
| EXPENSES: | | |
| Management fees | $204,944 | |
| Administrative expenses | 22,447 | |
| Transfer agent fees | | |
| Class A | 149 | |
| Class Y | 24,785 | |
| Distribution fees | | |
| Class A | 5,464 | |
| Shareholder communications expense | 1,163 | |
| Custodian fees | 252 | |
| Registration fees | 62,448 | |
| Professional fees | 109,423 | |
| Printing expense | 15,223 | |
| Officers’ and Trustees’ fees | 8,479 | |
| Insurance expense | 570 | |
| Miscellaneous | 18,815 | |
| Total expenses | | $474,162 |
| Less fees waived and expenses reimbursed by the Adviser | | (226,311) |
| Net expenses | | $247,851 |
| Net investment income | | $2,715,106 |
| REALIZED AND UNREALIZED GAIN (LOSS) ON INVESTMENTS: | | |
| Net realized gain (loss) on: | | |
| Investments in unaffiliated issuers | $119,303 | |
| Futures contracts | (300,054) | $(180,751) |
| Change in net unrealized appreciation (depreciation) on: | | |
| Investments in unaffiliated issuers | $1,521,490 | |
| Futures contracts | 342,708 | $1,864,198 |
| Net realized and unrealized gain (loss) on investments | | $1,683,447 |
| Net increase in net assets resulting from operations | | $4,398,553 |
The accompanying notes are an integral part of these financial statements.
16Pioneer Securitized Income Fund | Annual Report | 7/31/24
Statement of Changes in Net Assets
| | Year
Ended
7/31/24 | Year
Ended
7/31/23 |
| FROM OPERATIONS: | | |
| Net investment income (loss) | $2,715,106 | $1,900,482 |
| Net realized gain (loss) on investments | (180,751) | (521,958) |
| Change in net unrealized appreciation (depreciation) on investments | 1,864,198 | (11,136) |
| Net increase in net assets resulting from operations | $4,398,553 | $1,367,388 |
| DISTRIBUTIONS TO SHAREHOLDERS: | | |
| Class A ($0.66 and $0.78 per share, respectively) | $(158,696) | $(174,407) |
| Class Y ($0.69 and $0.81 per share, respectively) | (2,490,330) | (2,103,313) |
| Total distributions to shareholders | $(2,649,026) | $(2,277,720) |
| FROM FUND SHARE TRANSACTIONS: | | |
| Net proceeds from sales of shares | $82,350,845 | $3,189,419 |
| Reinvestment of distributions | 2,322,764 | 1,844,746 |
| Cost of shares repurchased | (23,407,215) | (6,921,356) |
| Net increase (decrease) in net assets resulting from Fund share transactions | $61,266,394 | $(1,887,191) |
| Net increase (decrease) in net assets | $63,015,921 | $(2,797,523) |
| NET ASSETS: | | |
| Beginning of year | $23,660,984 | $26,458,507 |
| End of year | $86,676,905 | $23,660,984 |
| | Year
Ended
7/31/24
Shares | Year
Ended
7/31/24
Amount | Year
Ended
7/31/23
Shares | Year
Ended
7/31/23
Amount |
| Class A | | | | |
| Shares sold | 71,848 | $667,232 | 2,560 | $23,158 |
| Reinvestment of distributions | 14,198 | 131,443 | 17,642 | 160,249 |
| Less shares repurchased | (190,989) | (1,791,065) | (2,128) | (19,031) |
Net increase
(decrease) | (104,943) | $(992,390) | 18,074 | $164,376 |
| Class Y | | | | |
| Shares sold | 8,710,180 | $81,683,613 | 347,347 | $3,166,261 |
| Reinvestment of distributions | 234,722 | 2,191,321 | 185,375 | 1,684,497 |
| Less shares repurchased | (2,313,557) | (21,616,150) | (760,712) | (6,902,325) |
Net increase
(decrease) | 6,631,345 | $62,258,784 | (227,990) | $(2,051,567) |
The accompanying notes are an integral part of these financial statements.
Pioneer Securitized Income Fund | Annual Report | 7/31/2417
| | Year
Ended
7/31/24 | Year
Ended
7/31/23 | Year
Ended
7/31/22 | 7/2/21 to
7/31/21* |
| Class A | | | | |
| Net asset value, beginning of period | $9.12 | $9.43 | $10.11 | $10.12 |
| Increase (decrease) from investment operations: | | | | |
| Net investment income (loss) (a) | $0.67 | $0.66 | $0.45 | $0.04 |
| Net realized and unrealized gain (loss) on investments | 0.37 | (0.19) | (0.55) | (0.01) |
| Net increase (decrease) from investment operations | $1.04 | $0.47 | $(0.10) | $0.03 |
| Distributions to shareholders: | | | | |
| Net investment income | $(0.66) | $(0.63) | $(0.45) | $(0.04) |
| Net realized gain | — | (0.15) | (0.13) | — |
| Total distributions | $(0.66) | $(0.78) | $(0.58) | $(0.04) |
| Net increase (decrease) in net asset value | $0.38 | $(0.31) | $(0.68) | $(0.01) |
| Net asset value, end of period | $9.50 | $9.12 | $9.43 | $10.11 |
| Total return (b) | 11.88% | 5.36% | (1.03)% | 0.27%(c) |
| Ratio of net expenses to average net assets | 0.90% | 0.90% | 0.88% | 0.90%(d) |
| Ratio of net investment income (loss) to average net assets | 7.22% | 7.19% | 4.58% | 4.56%(d) |
| Portfolio turnover rate | 30% | 38% | 36% | 59%(c) |
| Net assets, end of period (in thousands) | $1,221 | $2,127 | $2,031 | $2,029 |
| Ratios with no waiver of fees and assumption of expenses by the Adviser and no reduction for fees paid indirectly: | | | | |
| Total expenses to average net assets | 1.45% | 1.87% | 1.97% | 5.42%(d) |
| Net investment income (loss) to average net assets | 6.67% | 6.22% | 3.49% | 0.04%(d) |
| * | Class A commenced operations on July 2, 2021. |
| (a) | The per-share data presented above is based on the average shares outstanding for the period presented. |
| (b) | Assumes initial investment at net asset value at the beginning of each period, reinvestment of all distributions, the complete redemption of the investment at net asset value at the end of each period and no sales charges. Total return would be reduced if sales charges were taken into account. |
| (c) | Not annualized. |
| (d) | Annualized. |
The accompanying notes are an integral part of these financial statements.
18Pioneer Securitized Income Fund | Annual Report | 7/31/24
| | Year
Ended
7/31/24 | Year
Ended
7/31/23 | Year
Ended
7/31/22 | Year
Ended
7/31/21 | 12/10/19 to
7/31/20* |
| Class Y | | | | | |
| Net asset value, beginning of period | $9.12 | $9.44 | $10.11 | $8.67 | $10.00 |
| Increase (decrease) from investment operations: | | | | | |
| Net investment income (loss) (a) | $0.68 | $0.67 | $0.48 | $0.45 | $0.28 |
| Net realized and unrealized gain (loss) on investments | 0.39 | (0.18) | (0.54) | 1.60 | (1.33) |
| Net increase (decrease) from investment operations | $1.07 | $0.49 | $(0.06) | $2.05 | $(1.05) |
| Distributions to shareholders: | | | | | |
| Net investment income | $(0.69) | $(0.66) | $(0.48) | $(0.45) | $(0.28) |
| Net realized gain | — | (0.15) | (0.13) | (0.16) | — |
| Total distributions | $(0.69) | $(0.81) | $(0.61) | $(0.61) | $(0.28) |
| Net increase (decrease) in net asset value | $0.38 | $(0.32) | $(0.67) | $1.44 | $(1.33) |
| Net asset value, end of period | $9.50 | $9.12 | $9.44 | $10.11 | $8.67 |
| Total return (b) | 12.16% | 5.51% | (0.68)% | 24.32% | (10.30)%(c) |
| Ratio of net expenses to average net assets | 0.65% | 0.65% | 0.65% | 0.96% | 0.99%(d) |
| Ratio of net investment income (loss) to average net assets | 7.29% | 7.39% | 4.88% | 4.69% | 5.06%(d) |
| Portfolio turnover rate | 30% | 38% | 36% | 59% | 82%(c) |
| Net assets, end of period (in thousands) | $85,456 | $21,534 | $24,428 | $19,958 | $17,656 |
| Ratios with no waiver of fees and assumption of expenses by the Adviser and no reduction for fees paid indirectly: | | | | | |
| Total expenses to average net assets | 1.26% | 1.64% | 1.76% | 2.50% | 2.62%(d) |
| Net investment income (loss) to average net assets | 6.68% | 6.40% | 3.77% | 3.15% | 3.43%(d) |
| * | Class Y commenced operations on December 10, 2019. |
| (a) | The per-share data presented above is based on the average shares outstanding for the period presented. |
| (b) | Assumes initial investment at net asset value at the beginning of each period, reinvestment of all distributions and the complete redemption of the investment at net asset value at the end of each period. |
| (c) | Not annualized. |
| (d) | Annualized. |
The accompanying notes are an integral part of these financial statements.
Pioneer Securitized Income Fund | Annual Report | 7/31/2419
Notes to Financial Statements | 7/31/24
1. Organization and Significant Accounting Policies
Pioneer Securitized Income Fund (the “Fund”) is one of four portfolios comprising Pioneer Series Trust IV (the “Trust”), a Delaware statutory trust. The Fund is registered under the Investment Company Act of 1940, as amended (the “1940 Act”) as a non-diversified, open-end management investment company. The Fund, which commenced operations on June 30, 2021, is the successor to Pioneer Securitized Income Fund, a closed-end interval fund (the “Predecessor Fund”). The Predecessor Fund transferred all of the net assets of common shares of the Predecessor Fund in exchange for Class Y shares of the Fund on June 30, 2021, in a one-to-one exchange ratio, pursuant to an agreement and plan of reorganization (the “Reorganization”) approved by the Board of Trustees of the Fund and the Predecessor Fund and by the majority shareholder of the Predecessor Fund. Accordingly, the Reorganization, which was a tax-free event to shareholders, had no effect on the Fund’s operations. As a result of the Reorganization, the Fund is the accounting successor of the Predecessor Fund, and as such, the financial statements, and financial highlights for Class Y shares, reflect the financial information of the Predecessor Fund through June 30, 2021. The investment objective of the Fund is total return.
The Fund offers four classes of shares designated as Class A, Class C, Class K and Class Y shares. As noted above, all of the net assets of common shares of the Predecessor Fund, which commenced operations on December 10, 2019, were transferred in exchange for Class Y shares of the Fund on June 30, 2021. Class A shares commenced operations on July 2, 2021. Class C and Class K shares had not commenced operations as of July 31, 2024. Each class of shares represents an interest in the same portfolio of investments of the Fund and has identical rights (based on relative net asset values) to assets and liquidation proceeds. Share classes can bear different rates of class-specific fees and expenses, such as transfer agent and distribution fees. Differences in class-specific fees and expenses will result in differences in net investment income and, therefore, the payment of different dividends from net investment income earned by each class. The Amended and Restated Declaration of Trust of the Trust gives the Board of Trustees the flexibility to specify either per-share voting or dollar-weighted voting when submitting matters for shareholder approval. Under per-share voting, each share of a class of the Fund is entitled to one vote. Under dollar-weighted voting, a shareholder’s voting power is determined not by the number of shares owned, but by the dollar value of the shares on the record date. Each share class has exclusive voting rights
20Pioneer Securitized Income Fund | Annual Report | 7/31/24
with respect to matters affecting only that class, including with respect to the distribution plan for that class. There is no distribution plan for Class K or Class Y shares.
Amundi Asset Management US, Inc., an indirect, wholly owned subsidiary of Amundi and Amundi’s wholly owned subsidiary, Amundi USA, Inc., serves as the Fund’s investment adviser (the “Adviser”). Amundi Distributor US, Inc., an affiliate of the Adviser, serves as the Fund’s distributor (the “Distributor”).
The Fund is required to comply with Rule 18f-4 under the 1940 Act, which governs the use of derivatives by registered investment companies. Rule 18f-4 permits funds to enter into derivatives transactions (as defined in Rule 18f-4) and certain other transactions notwithstanding the restrictions on the issuance of “senior securities” under Section 18 of the 1940 Act. In accordance with Rule 18f-4, the fund has established and maintains a comprehensive derivatives risk management program, has appointed a derivatives risk manager and complies with a relative or absolute limit on fund leverage risk calculated based on value-at-risk (“VaR”).
The Fund is an investment company and follows investment company accounting and reporting guidance under U.S. Generally Accepted Accounting Principles (“U.S. GAAP”). U.S. GAAP requires the management of the Fund to make estimates and assumptions that affect the reported amounts of assets and liabilities, the disclosure of contingent assets and liabilities at the date of the financial statements, and the reported amounts of income, expenses and gain or loss on investments during the reporting period. Actual results could differ from those estimates.
The following is a summary of significant accounting policies followed by the Fund in the preparation of its financial statements:
| A. | Security Valuation |
| | The net asset value of the Fund is computed once daily, on each day the New York Stock Exchange (“NYSE”) is open, as of the close of regular trading on the NYSE. |
| | Fixed income securities are valued by using prices supplied by independent pricing services, which consider such factors as market prices, market events, quotations from one or more brokers, Treasury spreads, yields, maturities and ratings, or may use a pricing matrix or other fair value methods or techniques to provide an estimated value of the security or instrument. A pricing matrix is a means of valuing a debt security on the basis of current market prices for other debt securities, |
Pioneer Securitized Income Fund | Annual Report | 7/31/2421
| | historical trading patterns in the market for fixed income securities and/or other factors. Non-U.S. debt securities that are listed on an exchange will be valued at the bid price obtained from an independent third party pricing service. When independent third party pricing services are unable to supply prices, or when prices or market quotations are considered to be unreliable, the value of that security may be determined using quotations from one or more broker-dealers. |
| | Futures contracts are generally valued at the closing settlement price established by the exchange on which they are traded. |
| | Securities or loan interests for which independent pricing services or broker-dealers are unable to supply prices or for which market prices and/or quotations are not readily available or are considered to be unreliable are valued by a fair valuation team comprised of certain personnel of the Adviser. The Adviser is designated as the valuation designee for the Fund pursuant to Rule 2a-5 under the 1940 Act. The Adviser’s fair valuation team is responsible for monitoring developments that may impact fair valued securities. |
| | Inputs used when applying fair value methods to value a security may include credit ratings, the financial condition of the company, current market conditions and comparable securities. The Fund may use fair value methods if it is determined that a significant event has occurred after the close of the exchange or market on which the security trades and prior to the determination of the Fund’s net asset value. Examples of a significant event might include political or economic news, corporate restructurings, natural disasters, terrorist activity or trading halts. Thus, the valuation of the Fund’s securities may differ significantly from exchange prices, and such differences could be material. |
| B. | Investment Income and Transactions |
| | Interest income, including interest on income-bearing cash accounts, is recorded on the accrual basis. Dividend and interest income are reported net of unrecoverable foreign taxes withheld at the applicable country rates and net of income accrued on defaulted securities. |
| | Interest and dividend income payable by delivery of additional shares is reclassified as PIK (payment-in-kind) income upon receipt and is included in interest and dividend income, respectively. |
| | Principal amounts of mortgage-backed securities are adjusted for monthly paydowns. Premiums and discounts related to certain mortgage-backed securities are amortized or accreted in proportion to the monthly paydowns. All discounts/premiums on purchase prices of |
22Pioneer Securitized Income Fund | Annual Report | 7/31/24
| | debt securities are accreted/amortized for financial reporting purposes over the life of the respective securities, and such accretion/amortization is included in interest income. |
| | Security transactions are recorded as of trade date. Gains and losses on sales of investments are calculated on the identified cost method for both financial reporting and federal income tax purposes. |
| C. | Federal Income Taxes |
| | It is the Fund’s policy to comply with the requirements of the Internal Revenue Code applicable to regulated investment companies and to distribute all of its net taxable income and net realized capital gains, if any, to its shareholders. Therefore, no provision for federal income taxes is required. As of July 31, 2024, the Fund did not accrue any interest or penalties with respect to uncertain tax positions, which, if applicable, would be recorded as an income tax expense on the Statement of Operations. Tax returns filed within the prior three years remain subject to examination by federal and state tax authorities. |
| | The amount and character of income and capital gain distributions to shareholders are determined in accordance with federal income tax rules, which may differ from U.S. GAAP. Distributions in excess of net investment income or net realized gains are temporary over distributions for financial statement purposes resulting from differences in the recognition or classification of income or distributions for financial statement and tax purposes. Capital accounts within the financial statements are adjusted for permanent book/tax differences to reflect tax character, but are not adjusted for temporary differences. |
| | At July 31, 2024, the Fund was permitted to carry forward indefinitely $108,887 of short-term losses and $361,273 of long-term losses. |
| | The tax character of distributions paid during the years ended July 31, 2024 and July 31, 2023, was as follows: |
| | 2024 | 2023 |
| Distributions paid from: | | |
| Ordinary income | $2,649,026 | $1,849,272 |
| Long-term capital gains | — | 428,448 |
| Total | $2,649,026 | $2,277,720 |
Pioneer Securitized Income Fund | Annual Report | 7/31/2423
The following shows the components of distributable earnings (losses) on a federal income tax basis at July 31, 2024:
| | 2024 |
| Distributable earnings/(losses): | |
| Undistributed ordinary income | $67,856 |
| Capital loss carryforward | (470,160) |
| Other book/tax temporary differences | (15,959) |
| Net unrealized depreciation | (35,115) |
| Total | $(453,378) |
The difference between book-basis and tax-basis net unrealized depreciation is attributable to the mark to market of futures contracts.
During the year ended July 31, 2024, the Fund utilized $199,511 of its capital loss carryover from the prior year.
| D. | Fund Shares |
| | The Fund records sales and repurchases of its shares as of trade date. The Distributor did not earn underwriting commissions on the sale of Class A shares during the year ended July 31, 2024. |
| E. | Class Allocations |
| | Income, common expenses and realized and unrealized gains and losses are calculated at the Fund level and allocated daily to each class of shares based on its respective percentage of adjusted net assets at the beginning of the day. |
| | Distribution fees are calculated based on the average daily net asset value attributable to Class A shares of the Fund (see Note 5). All expenses and fees paid to the Fund’s transfer agent for its services are allocated among the classes of shares based on the number of accounts in each class and the ratable allocation of related out-of-pocket expenses (see Note 4). |
| | Distributions to shareholders are recorded as of the ex-dividend date. Distributions paid by the Fund with respect to each class of shares are calculated in the same manner and at the same time, except that net investment income dividends to Class A and Class Y shares can reflect different transfer agent and distribution expense rates. |
| F. | Risks |
| | The value of securities held by the Fund may go up or down, sometimes rapidly or unpredictably, due to general market conditions, such as real or perceived adverse economic, political or regulatory conditions, |
24Pioneer Securitized Income Fund | Annual Report | 7/31/24
| | recessions, the spread of infectious illness or other public health issues, inflation, changes in interest rates, armed conflict such as between Russia and Ukraine or in the Middle East, sanctions against Russia, other nations or individuals or companies and possible countermeasures, lack of liquidity in the bond markets or adverse investor sentiment. In the past several years, financial markets have experienced increased volatility, depressed valuations, decreased liquidity and heightened uncertainty. These conditions may continue, recur, worsen or spread. Inflation and interest rates have increased and may rise further. These circumstances could adversely affect the value and liquidity of the Fund’s investments and negatively impact the Fund’s performance. |
| | The long-term impact of the COVID-19 pandemic and its subsequent variants on economies, markets, industries and individual issuers, are not known. Some sectors of the economy and individual issuers have experienced or may experience particularly large losses. Periods of extreme volatility in the financial markets, reduced liquidity of many instruments, increased government debt, inflation, and disruptions to supply chains, consumer demand and employee availability, may continue for some time. Following Russia’s invasion of Ukraine, Russian securities lost all, or nearly all, their market value. Other securities or markets could be similarly affected by past or future political, geopolitical or other events or conditions. |
| | Governments and central banks, including the U.S. Federal Reserve, have taken extraordinary and unprecedented actions to support local and global economies and the financial markets. These actions have resulted in significant expansion of public debt, including in the U.S. The consequences of high public debt, including its future impact on the economy and securities markets, may not be known for some time. |
| | The U.S. and other countries are periodically involved in disputes over trade and other matters, which may result in tariffs, investment restrictions and adverse impacts on affected companies and securities. For example, the U.S. has imposed tariffs and other trade barriers on Chinese exports, has restricted sales of certain categories of goods to China, and has established barriers to investments in China. Trade disputes may adversely affect the economies of the U.S. and its trading partners, as well as companies directly or indirectly affected and financial markets generally. If the political climate between the U.S. and China does not improve or continues to deteriorate, if China were to attempt unification of Taiwan by force, or if other geopolitical conflicts develop or get worse, economies, markets and individual securities may be severely affected both regionally and globally, and the value of the Fund’s assets may go down. |
Pioneer Securitized Income Fund | Annual Report | 7/31/2425
| | At times, the Fund’s investments may represent industries or industry sectors that are interrelated or have common risks, making the Fund more susceptible to any economic, political, or regulatory developments or other risks affecting those industries and sectors. |
| | The market prices of the Fund’s fixed income securities may fluctuate significantly when interest rates change. The value of your investment will generally go down when interest rates rise. A rise in rates tends to have a greater impact on the prices of longer term or duration securities. For example, if interest rates increase by 1%, the value of a Fund’s portfolio with a portfolio duration of ten years would be expected to decrease by 10%, all other things being equal. In recent years interest rates and credit spreads in the U.S. have been at historic lows. The U.S. Federal Reserve has raised certain interest rates, and interest rates may continue to go up. A general rise in interest rates could adversely affect the price and liquidity of fixed income securities. The maturity of a security may be significantly longer than its effective duration. A security’s maturity and other features may be more relevant than its effective duration in determining the security’s sensitivity to other factors affecting the issuer or markets generally, such as changes in credit quality or in the yield premium that the market may establish for certain types of securities (sometimes called “credit spread”). In general, the longer its maturity the more a security may be susceptible to these factors. When the credit spread for a fixed income security goes up, or “widens”, the value of the security will generally go down. |
| | If an issuer or guarantor of a security held by the Fund or a counterparty to a financial contract with the Fund defaults on its obligation to pay principal and/or interest, has its credit rating downgraded or is perceived to be less creditworthy, or the credit quality or value of any underlying assets declines, the value of your investment will typically decline. Changes in actual or perceived creditworthiness may occur quickly. The Fund could be delayed or hindered in its enforcement of rights against an issuer, guarantor or counterparty. |
| | The Fund’s investments in foreign markets and countries with limited developing markets may subject the Fund to a greater degree of risk than investments in a developed market. These risks include disruptive political or economic conditions, military conflicts and sanctions, terrorism, sustained economic downturns, financial instability, less liquid trading markets, extreme price volatility, currency risks, reduction of government or central bank support, inadequate accounting standards, tariffs, tax disputes or other tax burdens, nationalization or expropriation of assets and the imposition of adverse governmental laws, arbitrary application of laws and regulations or lack of rule of law |
26Pioneer Securitized Income Fund | Annual Report | 7/31/24
| | and investment and repatriation restrictions. Lack of information and less market regulation also may affect the value of these securities. Withholding and other non-U.S. taxes may decrease the Fund’s return. Non-U.S. issuers may be located in parts of the world that have historically been prone to natural disasters. Investing in depositary receipts is subject to many of the same risks as investing directly in non-U.S. issuers. Depositary receipts may involve higher expenses and may trade at a discount (or premium) to the underlying security. |
| | Russia launched a large-scale invasion of Ukraine on February 24, 2022. In response to the military action by Russia, various countries, including the U.S., the United Kingdom, and European Union issued broad-ranging economic sanctions against Russia and Belarus and certain companies and individuals. Since then, Russian securities lost all, or nearly all, their market value, and many other issuers, securities and markets have been adversely affected. The United States and other countries may impose sanctions on other countries, companies and individuals in light of Russia’s military invasion. The extent and duration of the military action or future escalation of such hostilities, the extent and impact of existing and future sanctions, market disruptions and volatility, and the result of any diplomatic negotiations cannot be predicted. These and any related events could have a significant impact on the value and liquidity of certain Fund investments, on Fund performance and the value of an investment in the Fund, particularly with respect to securities and commodities, such as oil, natural gas and food commodities, as well as other sectors with exposure to Russian issuers or issuers in other countries affected by the invasion, and are likely to have collateral impacts on market sectors globally. |
| | The Fund invests in below-investment-grade (high-yield) debt securities and preferred stocks. Some of these high-yield securities may be convertible into equity securities of the issuer. Debt securities rated below-investment-grade are commonly referred to as “junk bonds” and are considered speculative with respect to the issuer’s capacity to pay interest and repay principal. These securities involve greater risk of loss, are subject to greater price volatility, and may be less liquid and more difficult to value, especially during periods of economic uncertainty or change, than higher rated debt securities. |
| | Normally, the Fund invests at least 80% of its net assets in securitized asset instruments. The Fund invests in mortgage-related and asset-backed securities. The value of mortgage-related and asset-backed securities will be influenced by factors affecting the assets underlying such securities. As a result, during periods of declining asset value, difficult or frozen credit markets, swings in interest rates, or |
Pioneer Securitized Income Fund | Annual Report | 7/31/2427
| | deteriorating economic conditions, mortgage-related and asset-backed securities may decline in value, face valuation difficulties, become more volatile and/or become illiquid. Mortgage-backed securities tend to be more sensitive to changes in interest rate than other types of debt securities. These securities are also subject to prepayment and extension risks. Some of these securities may receive little or no collateral protection from the underlying assets and are thus subject to the risk of default. The risk of such defaults is generally higher in the case of mortgage-backed investments offered by non-governmental issuers and those that include so-called “sub-prime” mortgages. The structure of some of these securities may be complex and there may be less available information than for other types of debt securities. Upon the occurrence of certain triggering events or defaults, the Fund may become the holder of underlying assets at a time when those assets may be difficult to sell or may be sold only at a loss. |
| | The Fund may invest in credit risk transfer securities. Credit risk transfer securities are unguaranteed and unsecured debt securities issued by government sponsored enterprises and therefore are not directly linked to or backed by the underlying mortgage loans. As a result, in the event that a government sponsored enterprise fails to pay principal or interest on its credit risk transfer securities or goes through a bankruptcy, insolvency or similar proceeding, holders of such credit risk transfer securities have no direct recourse to the underlying mortgage loans and will generally receive recovery on par with other unsecured note holders in such a scenario. The risks associated with an investment in credit risk transfer securities are different than the risks associated with an investment in mortgage-backed securities issued by Fannie Mae and Freddie Mac, or other government sponsored enterprise or issued by a private issuer, because some or all of the mortgage default or credit risk associated with the underlying mortgage loans is transferred to investors. As a result, investors in these securities could lose some or all of their investment in these securities if the underlying mortgage loans default. |
| | The Fund’s investments, payment obligations and financing terms may be based on floating rates, such as LIBOR (London Interbank Offered Rate) or SOFR (Secured Overnight Financing Rate). ICE Benchmark Administration, the administrator of LIBOR, has ceased publication of most LIBOR settings on a representative basis. Actions by regulators have resulted in the establishment of alternative reference rates to LIBOR in most major currencies. In the U.S., a common benchmark replacement is based on the SOFR published by the Federal Reserve Bank of New York, including certain spread adjustments and benchmark |
28Pioneer Securitized Income Fund | Annual Report | 7/31/24
| | replacement conforming changes, although other benchmark replacements (without or without spread adjustments) may be used in certain transactions. The impact of the transition from LIBOR on the Fund’s transactions and financial markets generally cannot yet be determined. The transition away from LIBOR may lead to increased volatility and illiquidity in markets for instruments that have relied on LIBOR and may adversely affect the Fund’s performance. |
| | With the increased use of technologies such as the Internet to conduct business, the Fund is susceptible to operational, information security and related risks. While the Fund’s Adviser has established business continuity plans in the event of, and risk management systems to prevent, limit or mitigate, such cyber-attacks, there are inherent limitations in such plans and systems, including the possibility that certain risks have not been identified. Furthermore, the Fund cannot control the cybersecurity plans and systems put in place by service providers to the Fund such as the Fund’s custodian and accounting agent, and the Fund’s transfer agent. In addition, many beneficial owners of Fund shares hold them through accounts at broker-dealers, retirement platforms and other financial market participants over which neither the Fund nor the Adviser exercises control. Each of these may in turn rely on service providers to them, which are also subject to the risk of cyber-attacks. Cybersecurity failures or breaches at the Adviser or the Fund’s service providers or intermediaries have the ability to cause disruptions and impact business operations, potentially resulting in financial losses, interference with the Fund’s ability to calculate its net asset value, impediments to trading, the inability of Fund shareholders to effect share purchases, redemptions or exchanges or receive distributions, loss of or unauthorized access to private shareholder information and violations of applicable privacy and other laws, regulatory fines, penalties, reputational damage, or additional compliance costs. Such costs and losses may not be covered under any insurance. In addition, maintaining vigilance against cyber-attacks may involve substantial costs over time, and system enhancements may themselves be subject to cyber-attacks. |
| | The Fund’s prospectus contains unaudited information regarding the Fund’s principal risks. Please refer to that document when considering the Fund’s principal risks. |
| G. | TBA Purchases and Sales Commitments |
| | The Fund may enter into to-be-announced (TBA) purchases or sales commitments (collectively, TBA transactions), pursuant to which it agrees to purchase or sell, respectively, mortgage-backed securities for a |
Pioneer Securitized Income Fund | Annual Report | 7/31/2429
| | fixed unit price, with payment and delivery at a scheduled future date beyond the customary settlement period for such securities. With TBA transactions, the particular securities to be received or delivered by the Fund are not identified at the trade date; however, the securities must meet specified terms, including issuer, rate, and mortgage term, and be within industry-accepted “good delivery” standards. The Fund may enter into TBA transactions with the intention of taking possession of or relinquishing the underlying securities, may elect to extend the settlement by “rolling” the transaction, and/or may use TBA transactions to gain or reduce interim exposure to underlying securities. Until settlement, the Fund maintains liquid assets sufficient to settle its commitment to purchase a TBA or, in the case of a sale commitment, the Fund maintains an entitlement to the security to be sold. |
| | To mitigate counterparty risk, the Fund has entered into agreements with TBA counterparties that provide for collateral and the right to offset amounts due to or from those counterparties under specified conditions. Subject to minimum transfer amounts, collateral requirements are determined and transfers made based on the net aggregate unrealized gain or loss on all TBA commitments with a particular counterparty. At any time, the Fund’s risk of loss from a particular counterparty related to its TBA commitments is the aggregate unrealized gain on appreciated TBAs in excess of unrealized loss on depreciated TBAs and collateral received, if any, from such counterparty. As of July 31, 2024, no collateral was pledged by the Fund. Collateral received from counterparties totaled $0 for TBAs. |
| H. | Futures Contracts |
| | The Fund may enter into futures transactions in order to attempt to hedge against changes in interest rates, securities prices and currency exchange rates or to seek to increase total return. Futures contracts are types of derivatives. |
| | All futures contracts entered into by the Fund are traded on a futures exchange. Upon entering into a futures contract, the Fund is required to deposit with a broker an amount of cash or securities equal to the minimum “initial margin” requirements of the associated futures exchange. The amount of cash deposited with the broker as collateral at July 31, 2024 is recorded as “Futures collateral” on the Statement of Assets and Liabilities. |
| | Subsequent payments for futures contracts (“variation margin”) are paid or received by the Fund, depending on the daily fluctuation in the value of the contracts, and are recorded by the Fund as unrealized appreciation or depreciation. Cash received from or paid to the broker related to |
30Pioneer Securitized Income Fund | Annual Report | 7/31/24
| | previous margin movement is held in a segregated account at the broker and is recorded as either “Due from broker for futures” or “Due to broker for futures” on the Statement of Assets and Liabilities. When the contract is closed, the Fund realizes a gain or loss equal to the difference between the opening and closing value of the contract as well as any fluctuation in foreign currency exchange rates where applicable. Futures contracts are subject to market risk, interest rate risk and currency exchange rate risk. Changes in value of the contracts may not directly correlate to the changes in value of the underlying securities. With futures, there is reduced counterparty credit risk to the Fund since futures are exchange-traded and the exchange’s clearinghouse, as counterparty to all exchange-traded futures, guarantees the futures against default. |
| | The average notional value of long position futures contracts during the year ended July 31, 2024 was $10,906,158. Open futures contracts outstanding at July 31, 2024 are listed in the Schedule of Investments. |
2. Management Agreement
The Adviser manages the Fund’s portfolio. Management fees payable under the Fund’s Investment Management Agreement with the Adviser are calculated daily and paid monthly at the annual rate of 0.55% of the Fund’s average daily net assets up to $1 billion and 0.50% of the Fund’s average daily net assets over $1 billion. For the year ended July 31, 2024, the effective management fee (excluding waivers and/or assumption of expenses) was equivalent to 0.55% of the Fund’s average daily net assets.
The Adviser has contractually agreed to limit ordinary operating expenses (ordinary operating expenses means all fund expenses other than taxes, brokerage commissions, acquired fund fees and expenses, and extraordinary expenses, such as litigation) to the extent required to reduce Fund expenses to 0.90% and 0.65% of the average daily net assets attributable to Class A and Class Y shares, respectively. These expense limitations are in effect through December 1, 2024. There can be no assurance that the Adviser will extend the expense limitations beyond the date referred to above. Fees waived and expenses reimbursed during the year ended July 31, 2024 are reflected in the Statement of Operations.
In addition, under the management and administration agreements, certain other services and costs, including accounting, regulatory reporting and insurance premiums, are paid by the Fund as administrative reimbursements. Reflected on the Statement of Assets and Liabilities is $6,424 in management fees payable to the Adviser at July 31, 2024.
Pioneer Securitized Income Fund | Annual Report | 7/31/2431
3. Compensation of Officers and Trustees
The Fund pays an annual fee to its Trustees. The Adviser reimburses the Fund for fees paid to the Interested Trustees. Except for the chief compliance officer, the Fund does not pay any salary or other compensation to its officers. The Fund pays a portion of the chief compliance officer’s compensation for his services as the Fund’s chief compliance officer. Amundi US pays the remaining portion of the chief compliance officer’s compensation. For the year ended July 31, 2024, the Fund paid $8,479 in Officers’ and Trustees’ compensation, which is reflected on the Statement of Operations as Officers’ and Trustees’ fees. At July 31, 2024, on its Statement of Assets and Liabilities, the Fund had a payable for Trustees’ fees of $733 and a payable for administrative expenses of $1,048, which includes the payable for Officers’ compensation.
4. Transfer Agent
BNY Mellon Investment Servicing (US) Inc. serves as the transfer agent to the Fund at negotiated rates. Transfer agent fees and payables shown on the Statement of Operations and the Statement of Assets and Liabilities, respectively, include sub-transfer agent expenses incurred through the Fund’s omnibus relationship contracts.
In addition, the Fund reimbursed the transfer agent for out-of-pocket expenses incurred by the transfer agent related to shareholder communications activities such as proxy and statement mailings, and outgoing phone calls. For the year ended July 31, 2024, such out-of-pocket expenses by class of shares were as follows:
| Shareholder Communications: | |
| Class A | $159 |
| Class Y | 1,004 |
| Total | $1,163 |
5. Distribution Plan
The Fund has adopted a distribution plan (the “Plan”) pursuant to Rule 12b-1 under the 1940 Act with respect to its Class A shares. Pursuant to the Plan, the Fund pays the Distributor 0.25% of the average daily net assets attributable to Class A shares as compensation for personal services and/or account maintenance services or distribution services with regard to Class A shares. Reflected on the Statement of Assets and Liabilities is $42 in distribution fees payable to the Distributor at July 31, 2024.
In addition, redemptions of each Class A shares may be subject to a contingent deferred sales charge (“CDSC”). A CDSC of 1.00% may be imposed on redemptions of certain net asset value purchases of Class A
32Pioneer Securitized Income Fund | Annual Report | 7/31/24
shares within 12 months of purchase. Shares purchased as part of an exchange remain subject to any CDSC that applied to the original purchase of those shares. There is no CDSC for Class Y shares. Proceeds from the CDSCs are paid to the Distributor. For the year ended July 31, 2024, no CDSCs were paid to the Distributor.
6. Line of Credit Facility
Effective January 31, 2024, the Fund, along with certain other funds in the Pioneer Family of Funds, participates in a committed, unsecured revolving line of credit (“credit facility”). Borrowings are used solely for temporary or emergency purposes. The Fund may borrow up to the lesser of the amount available under the credit facility or the limits set for borrowing by the Fund’s prospectus and the 1940 Act. The Fund participates in a credit facility in the amount of $250 million. Under such credit facility, depending on the type of loan, interest on borrowings is payable at the Secured Overnight Financing Rate (“SOFR”) plus a credit spread. The Fund also pays both an upfront fee and an annual commitment fee to participate in the credit facility. The upfront fee in the amount of 0.05% of the total credit facility and the commitment fee in the amount of 0.20% of the daily unused portion of each lender's commitment is allocated among participating funds based on an allocation schedule set forth in the credit facility. For the year ended July 31, 2024, the Fund had no borrowings under the credit facility.
7. Additional Disclosures about Derivative Instruments and Hedging Activities
The Fund’s use of derivatives may enhance or mitigate the Fund’s exposure to the following risks:
Interest rate risk relates to the fluctuations in the value of interest-bearing securities due to changes in the prevailing levels of market interest rates.
Credit risk relates to the ability of the issuer of a financial instrument to make further principal or interest payments on an obligation or commitment that it has to the Fund.
Foreign exchange rate risk relates to fluctuations in the value of an asset or liability due to changes in currency exchange rates.
Equity risk relates to the fluctuations in the value of financial instruments as a result of changes in market prices (other than those arising from interest rate risk or foreign exchange rate risk), whether caused by factors specific to an individual investment, its issuer, or all factors affecting all instruments traded in a market or market segment.
Pioneer Securitized Income Fund | Annual Report | 7/31/2433
Commodity risk relates to the risk that the value of a commodity or commodity index will fluctuate based on increases or decreases in the commodities market and factors specific to a particular industry or commodity.
The fair value of open derivative instruments (not considered to be hedging instruments for accounting disclosure purposes) by risk exposure at July 31, 2024, was as follows:
Statement of Assets
and Liabilities | Interest
Rate Risk | Credit
Risk | Foreign
Exchange
Rate Risk | Equity
Risk | Commodity
Risk |
| Assets | | | | | |
| Net unrealized appreciation on futures contracts* | $172,394 | $— | $— | $— | $— |
| Total Value | $172,394 | $— | $— | $— | $— |
| | |
| * | Includes cumulative unrealized appreciation (depreciation) of futures contracts as reported in the Schedule of Investments. Only net variation margin is reported within the assets and/or liabilities on the Statement of Assets and Liabilities. |
The effect of derivative instruments (not considered to be hedging instruments for accounting disclosure purposes) on the Statement of Operations by risk exposure at July 31, 2024 was as follows:
| Statement of Operations | Interest
Rate Risk | Credit
Risk | Foreign
Exchange
Rate Risk | Equity
Risk | Commodity
Risk |
| Net Realized Gain (Loss) on | | | | | |
| Futures contracts | $(300,054) | $— | $— | $— | $— |
| Total Value | $(300,054) | $— | $— | $— | $— |
| Change in Net Unrealized Appreciation (Depreciation) on | | | | | |
| Futures contracts | $342,708 | $— | $— | $— | $— |
| Total Value | $342,708 | $— | $— | $— | $— |
8. Definitive Agreement
The Fund’s Adviser is currently an indirect, wholly-owned subsidiary of Amundi. On July 9, 2024, Amundi announced that it had entered into a definitive agreement with Victory Capital Holdings, Inc. (“Victory Capital”) to combine the Adviser with Victory Capital, and for Amundi to become a strategic shareholder of Victory Capital (the “Transaction”). Victory Capital is headquartered in San Antonio, Texas. The closing of the Transaction is subject to certain regulatory approvals and other conditions. There is no assurance that the Transaction will close.
The closing of the Transaction would cause the Fund’s current investment advisory agreement with the Adviser to terminate. Under the terms of the Transaction, the Fund’s Board of Trustees will be asked to approve a
34Pioneer Securitized Income Fund | Annual Report | 7/31/24
reorganization of the Fund into a corresponding, newly established Victory Fund advised by Victory Capital Management Inc., an affiliate of Victory Capital. The proposed reorganization of the Fund would be sought in connection with the closing of the Transaction. If approved by the Board, the proposal to reorganize the Fund will be submitted to the shareholders of the Fund for their approval. There is no assurance that the Board or the shareholders of the Fund will approve the proposal to reorganize the Fund.
Pioneer Securitized Income Fund | Annual Report | 7/31/2435
Report of Independent Registered Public Accounting Firm
To the Board of Trustees of Pioneer Series Trust IV and the Shareholders of Pioneer Securitized Income Fund:
Opinion on the Financial Statements and Financial Highlights
We have audited the accompanying statement of assets and liabilities of Pioneer Securitized Income Fund (the “Fund”) (one of the funds constituting Pioneer Series Trust IV), including the schedule of investments, as of July 31, 2024, the related statements of operations, changes in net assets, and the financial highlights for the year then ended and the related notes. The statements of changes in net assets for the year ended July 31, 2023 and the financial highlights for the years ended July 31, 2023, 2022, 2021, and the period from December 10, 2019 (commencement of operations) through July 31, 2020 were audited by other auditors. Those auditors expressed an unqualified opinion on those financial statements and financial highlights in their report dated September 29, 2023. In our opinion, the financial statements and financial highlights present fairly, in all material respects, the financial position of the Fund as of July 31, 2024 and the results of its operations, the changes in its net assets, and the financial highlights for the year then ended, in conformity with accounting principles generally accepted in the United States of America.
Basis for Opinion
These financial statements and financial highlights are the responsibility of the Fund's management. Our responsibility is to express an opinion on the Fund's financial statements and financial highlights based on our audits. We are a public accounting firm registered with the Public Company Accounting Oversight Board (United States) (PCAOB) and are required to be independent with respect to the Fund in accordance with the U.S. federal securities laws and the applicable rules and regulations of the Securities and Exchange Commission and the PCAOB.
We conducted our audits in accordance with the standards of the PCAOB. Those standards require that we plan and perform the audit to obtain reasonable assurance about whether the financial statements and financial highlights are free of material misstatement, whether due to error or fraud. The Fund is not required to have, nor were we engaged to perform, an audit of its internal control over financial reporting. As part of our audits we are required to obtain an understanding of internal control over financial reporting but not for the purpose of expressing an opinion on the
36Pioneer Securitized Income Fund | Annual Report | 7/31/24
effectiveness of the Fund’s internal control over financial reporting. Accordingly, we express no such opinion.
Our audits included performing procedures to assess the risks of material misstatement of the financial statements and financial highlights, whether due to error or fraud, and performing procedures that respond to those risks. Such procedures included examining, on a test basis, evidence regarding the amounts and disclosures in the financial statements and financial highlights. Our audits also included evaluating the accounting principles used and significant estimates made by management, as well as evaluating the overall presentation of the financial statements and financial highlights. Our procedures included confirmation of securities owned as of July 31, 2024, by correspondence with the custodian and brokers; when replies were not received from brokers, we performed other auditing procedures. We believe that our audits provide a reasonable basis for our opinion.
DELOITTE & TOUCHE LLP
Boston, Massachusetts
September 27, 2024
We have served as the auditor of one or more of the Pioneer investment companies since 2024.
Pioneer Securitized Income Fund | Annual Report | 7/31/2437
Additional Information (unaudited)
On March 25, 2024, Ernst & Young LLP (the “Prior Auditor”) resigned as the independent registered public accounting firm of the Fund due to the independence considerations resulting from a change of the independent registered public accounting firm of a related party. The Prior Auditor’s reports on the financial statements of the Fund for the past two fiscal years, the years ended July 31, 2023 and July 31, 2022, did not contain an adverse opinion or disclaimer of opinion, and were not qualified or modified as to uncertainty, audit scope or accounting principles.
During the last two fiscal year-ends and the subsequent interim period through March 25, 2024, there were no (1) disagreements with the Prior Auditor on any matter of accounting principles or practices, financial statement disclosure, or auditing scope or procedure, which disagreements, if not resolved to the Prior Auditor’s satisfaction, would have caused it to make reference to that matter in connection with its reports on the Fund’s financial statements for such periods; or (2) “reportable events” related to the Fund, as that term is defined in Item 304 (a)(1)(v) of Regulation S-K under the Securities Exchange Act of 1934.
On March 25, 2024, the Audit Committee of the Board approved, and on March 25, 2024, the Board approved, Deloitte & Touche LLP as the independent registered accounting firm of the Fund for fiscal periods ending after March 25, 2024.
Qualified interest income is exempt from nonresident alien (NRA) tax withholding. The percentage of the Fund’s ordinary income distributions derived from qualified interest income was 88.40%.
38Pioneer Securitized Income Fund | Annual Report | 7/31/24
How to Contact Amundi
We are pleased to offer a variety of convenient ways for you to contact us for assistance or information.
Call us for:
Account Information, including existing accounts,
new accounts, prospectuses, applications
and service forms
1-800-225-6292
FactFoneSM for automated fund yields, prices,
account information and transactions
1-800-225-4321
| Retirement plans information | 1-800-622-0176 |
Write to us:
Amundi
P.O. Box 534427
Pittsburgh, PA 15253-4427
| Our toll-free fax | 1-800-225-4240 |
| Our internet e-mail address | us.askamundi@amundi.com
(for general questions about Amundi only) |
Visit our web site: www.amundi.com/us
This report must be preceded or accompanied by a prospectus.
The Fund files a complete schedule of portfolio holdings with the Securities and Exchange Commission for the first and third quarters of each fiscal year as an exhibit to its reports on Form N-PORT. Shareholders may view the filed Form N-PORT by visiting the Commission’s web site at https://www.sec.gov.
Amundi Asset Management US, Inc.
60 State Street
Boston, MA 02109
www.amundi.com/us
Securities offered through Amundi Distributor US, Inc.
60 State Street, Boston, MA 02109
Underwriter of Pioneer Mutual Funds, Member SIPC
© 2024 Amundi Asset Management US, Inc. 32216-04-0924
Pioneer Multi-Asset Income Fund
Annual Report | July 31, 2024
| | | | | |
| A: PMAIX | C: PMACX | K: PMFKX | R: PMFRX | Y: PMFYX |
visit us: www.amundi.com/us
Pioneer Multi-Asset Income Fund | Annual Report | 7/31/241
Schedule of Investments | 7/31/24
Principal
Amount
USD ($) | | | | | | Value |
| | UNAFFILIATED ISSUERS — 98.6% | |
| | Senior Secured Floating Rate
Loan Interests — 0.3% of Net Assets*(a) | |
| | Advanced Materials — 0.0%† | |
| 955,814 | Groupe Solmax, Inc., Initial Term Loan, 10.21% (Term SOFR + 475 bps), 5/29/28 | $ 933,796 |
| | Total Advanced Materials | $933,796 |
|
|
| | Advertising Sales — 0.0%† | |
| 498,439 | Clear Channel Outdoor Holdings, Inc., 2024 Refinancing Term Loan, 9.458% (Term SOFR + 400 bps), 8/21/28 | $ 500,931 |
| | Total Advertising Sales | $500,931 |
|
|
| | Auto Parts & Equipment — 0.0%† | |
| 967,500 | First Brands Group LLC, First Lien 2021 Term Loan, 10.514% (Term SOFR + 500 bps), 3/30/27 | $ 962,738 |
| | Total Auto Parts & Equipment | $962,738 |
|
|
| | Building-Maintenance & Service — 0.0%† | |
| 486,250 | ArchKey Holdings, Inc., First Lien Initial Term Loan, 10.708% (Term SOFR + 525 bps), 6/29/28 | $ 488,985 |
| | Total Building-Maintenance & Service | $488,985 |
|
|
| | Casino Services — 0.0%† | |
| 14,138 | Lucky Bucks LLC, Priority First Out Exit Term Loan, 12.982% (Term SOFR + 750 bps), 10/2/28 | $ 13,007 |
| 28,360 | Lucky Bucks LLC, Priority Second Out Term Loan, 12.982% (Term SOFR + 750 bps), 10/2/29 | 23,114 |
| | Total Casino Services | $36,121 |
|
|
| | Chemicals-Specialty — 0.0%† | |
| 432,515 | Mativ Holdings, Inc., Term B Loan, 9.208% (Term SOFR + 375 bps), 4/20/28 | $ 433,056 |
| | Total Chemicals-Specialty | $433,056 |
|
|
| | Diagnostic Equipment — 0.0%† | |
| 485,000 | Curia Global, Inc., First Lien 2021 Term Loan, 9.194% (Term SOFR + 375 bps), 8/30/26 | $ 460,880 |
| | Total Diagnostic Equipment | $460,880 |
|
|
The accompanying notes are an integral part of these financial statements.
2Pioneer Multi-Asset Income Fund | Annual Report | 7/31/24
Principal
Amount
USD ($) | | | | | | Value |
| | Dialysis Centers — 0.0%† | |
| 822,274 | U.S. Renal Care, Inc., Closing Date Term Loan, 10.458% (Term SOFR + 500 bps), 6/20/28 | $ 709,725 |
| | Total Dialysis Centers | $709,725 |
|
|
| | Distribution & Wholesale — 0.1% | |
| 1,932,989 | Patriot Container Corp. (aka Wastequip), First Lien Closing Date Term Loan, 9.194% (Term SOFR + 375 bps), 3/20/25 | $ 1,885,873 |
| | Total Distribution & Wholesale | $1,885,873 |
|
|
| | Electric-Generation — 0.0%† | |
| 358,380 | Eastern Power LLC (Eastern Covert Midco LLC), Term Loan, 10.593% (Term SOFR + 525 bps), 4/3/28 | $ 358,977 |
| | Total Electric-Generation | $358,977 |
|
|
| | Investment Management & Advisory
Services — 0.1% | |
| 1,529,509 | Russell Investments US Institutional Holdco, Inc., 2027 Term Loan, 10.252% (Term SOFR + 500 bps), 5/30/27 | $ 1,362,537 |
| | Total Investment Management & Advisory Services | $1,362,537 |
|
|
| | Medical-Biomedical & Generation — 0.1% | |
| 1,218,750 | ANI Pharmaceuticals, Inc., Initial Term Loan, 11.458% (Term SOFR + 600 bps), 11/19/27 | $ 1,221,417 |
| | Total Medical-Biomedical & Generation | $1,221,417 |
|
|
| | Protection-Safety — 0.0%† | |
| 486,250 | APX Group, Inc., Initial Term Loan, 8.296% (Term SOFR + 275 bps), 7/10/28 | $ 487,769 |
| | Total Protection-Safety | $487,769 |
|
|
| | Retail — 0.0%† | |
| 437,500 | Torrid LLC, Closing Date Term Loan, 10.946% (Term SOFR + 550 bps), 6/14/28 | $ 408,516 |
| | Total Retail | $408,516 |
|
|
| | Total Senior Secured Floating Rate Loan Interests
(Cost $10,505,791) | $10,251,321 |
|
|
The accompanying notes are an integral part of these financial statements.
Pioneer Multi-Asset Income Fund | Annual Report | 7/31/243
Schedule of Investments | 7/31/24 (continued)
| Shares | | | | | | Value |
| | Common Stocks — 45.7% of Net
Assets | |
| | Aerospace & Defense — 0.8% | |
| 736,329 | Hensoldt AG | $ 27,285,584 |
| | Total Aerospace & Defense | $27,285,584 |
|
|
| | Air Freight & Logistics — 0.3% | |
| 337,254 | Cia de Distribucion Integral Logista Holdings S.A. | $ 9,971,613 |
| | Total Air Freight & Logistics | $9,971,613 |
|
|
| | Automobile Components — 0.3% | |
| 255,600 | Bridgestone Corp. | $ 10,552,959 |
| | Total Automobile Components | $10,552,959 |
|
|
| | Automobiles — 1.1% | |
| 17,513 | Hyundai Motor Co. | $ 3,167,414 |
| 38,054 | Kia Corp. | 3,098,495 |
| 1,595,000 | Subaru Corp. | 31,797,787 |
| | Total Automobiles | $38,063,696 |
|
|
| | Banks — 10.8% | |
| 5,094,458 | ABN AMRO Bank NV (C.V.A.) (144A) | $ 88,849,685 |
| 266,732 | Bank of America Corp. | 10,751,967 |
| 1,581,160 | Bank of Ireland Group Plc | 17,924,929 |
| 126,810 | Citigroup, Inc. | 8,227,433 |
| 176,656 | Danske Bank A/S | 5,405,693 |
| 172,354 | DNB Bank ASA | 3,562,208 |
| 1,142,789 | FinecoBank Banca Fineco S.p.A. | 19,417,499 |
| 984,822 | Hana Financial Group, Inc. | 46,281,448 |
| 4,942,185 | Intesa Sanpaolo S.p.A. | 20,060,223 |
| 1,202,611 | KB Financial Group, Inc. | 76,781,919 |
| 114,289 | KeyCorp. | 1,843,482 |
| 88,776 | Komercni Banka AS | 3,069,048 |
| 1,049,315 | Regions Financial Corp. | 23,473,176 |
| 3,086,861 | Standard Chartered Plc | 30,444,906 |
| 867,226 | UniCredit S.p.A. | 35,622,868 |
| | Total Banks | $391,716,484 |
|
|
| | Broadline Retail — 0.3% | |
| 1,106,700 | Alibaba Group Holding, Ltd. | $ 10,949,642 |
| | Total Broadline Retail | $10,949,642 |
|
|
| | Capital Markets — 1.6% | |
| 122,587 | Brightsphere Investment Group, Inc. | $ 3,210,553 |
| 654,700 | State Street Corp. | 55,629,859 |
| | Total Capital Markets | $58,840,412 |
|
|
The accompanying notes are an integral part of these financial statements.
4Pioneer Multi-Asset Income Fund | Annual Report | 7/31/24
| Shares | | | | | | Value |
| | Chemicals — 0.8% | |
| 1,552,813 | Chevron Lubricants Lanka Plc | $ 619,842 |
| 286,285 | LyondellBasell Industries NV, Class A | 28,473,906 |
| | Total Chemicals | $29,093,748 |
|
|
| | Construction & Engineering — 0.0%† | |
| 4,081(b) | LB New Holdco | $ 16,324 |
| | Total Construction & Engineering | $16,324 |
|
|
| | Construction Materials — 0.8% | |
| 346,491 | CRH Plc | $ 29,694,279 |
| | Total Construction Materials | $29,694,279 |
|
|
| | Consumer Staples Distribution & Retail —
0.0%† | |
| 195,032+# | Magnit PJSC | $ — |
| 48,325(b)+# | X5 Retail Group NV (G.D.R.) | — |
| | Total Consumer Staples Distribution & Retail | $— |
|
|
| | Containers & Packaging — 0.1% | |
| 77,750 | International Paper Co. | $ 3,613,820 |
| | Total Containers & Packaging | $3,613,820 |
|
|
| | Diversified Telecommunication Services —
0.9% | |
| 1,231,810 | Deutsche Telekom AG | $ 32,221,664 |
| | Total Diversified Telecommunication Services | $32,221,664 |
|
|
| | Electric Utilities — 2.5% | |
| 238,796 | American Electric Power Co., Inc. | $ 23,430,664 |
| 846,684 | Eversource Energy | 54,958,258 |
| 297,785 | FirstEnergy Corp. | 12,480,169 |
| | Total Electric Utilities | $90,869,091 |
|
|
| | Electrical Equipment — 0.2% | |
| 152,400 | Fuji Electric Co., Ltd. | $ 8,679,796 |
| | Total Electrical Equipment | $8,679,796 |
|
|
| | Financial Services — 1.2% | |
| 435,345 | Edenred SE | $ 18,144,068 |
| 366,071(b) | PayPal Holdings, Inc. | 24,080,151 |
| | Total Financial Services | $42,224,219 |
|
|
| | Food Products — 0.4% | |
| 423,927 | Kraft Heinz Co. | $ 14,926,470 |
| | Total Food Products | $14,926,470 |
|
|
The accompanying notes are an integral part of these financial statements.
Pioneer Multi-Asset Income Fund | Annual Report | 7/31/245
Schedule of Investments | 7/31/24 (continued)
| Shares | | | | | | Value |
| | Health Care Equipment & Supplies — 0.5% | |
| 226,764 | Medtronic Plc | $ 18,213,684 |
| | Total Health Care Equipment & Supplies | $18,213,684 |
|
|
| | Health Care Providers & Services — 0.5% | |
| 185,623 | Cardinal Health, Inc. | $ 18,716,367 |
| | Total Health Care Providers & Services | $18,716,367 |
|
|
| | Household Durables — 1.3% | |
| 2,320,156 | Persimmon Plc | $ 47,379,817 |
| | Total Household Durables | $47,379,817 |
|
|
| | Industrial Conglomerates — 0.1% | |
| 85,133(b) | SK Square Co., Ltd. | $ 5,330,281 |
| | Total Industrial Conglomerates | $5,330,281 |
|
|
| | Insurance — 1.0% | |
| 65,006 | American International Group, Inc. | $ 5,150,425 |
| 967,727 | Hiscox, Ltd. | 15,812,021 |
| 13,025 | Old Republic International Corp. | 450,926 |
| 52,040 | Willis Towers Watson Plc | 14,689,851 |
| | Total Insurance | $36,103,223 |
|
|
| | IT Services — 2.9% | |
| 537,852 | International Business Machines Corp. | $ 103,342,883 |
| | Total IT Services | $103,342,883 |
|
|
| | Leisure Products — 0.1% | |
| 5,134,000 | Honma Golf, Ltd. (144A) | $ 2,201,361 |
| | Total Leisure Products | $2,201,361 |
|
|
| | Marine Transportation — 0.4% | |
| 243,171 | Golden Ocean Group, Ltd. | $ 3,020,184 |
| 523,614 | Star Bulk Carriers Corp. | 11,802,259 |
| | Total Marine Transportation | $14,822,443 |
|
|
| | Metals & Mining — 1.6% | |
| 1,518,388 | Barrick Gold Corp. | $ 28,105,362 |
| 589,758 | Newmont Corp. | 28,939,425 |
| 30,112 | Rio Tinto Plc | 1,945,589 |
| | Total Metals & Mining | $58,990,376 |
|
|
| | Mortgage Real Estate Investment Trusts
(REITs) — 1.0% | |
| 730,230 | AGNC Investment Corp. | $ 7,309,602 |
| 297,120 | Angel Oak Mortgage, Inc. | 3,743,712 |
| 528,740 | Ladder Capital Corp. | 6,344,880 |
The accompanying notes are an integral part of these financial statements.
6Pioneer Multi-Asset Income Fund | Annual Report | 7/31/24
| Shares | | | | | | Value |
| | Mortgage Real Estate Investment Trusts
(REITs) — (continued) | |
| 906,673 | Rithm Capital Corp. | $ 10,526,474 |
| 491,717 | Two Harbors Investment Corp. | 6,623,428 |
| | Total Mortgage Real Estate Investment Trusts (REITs) | $34,548,096 |
|
|
| | Oil, Gas & Consumable Fuels — 7.8% | |
| 835,639 | BW LPG, Ltd. (144A) | $ 13,579,344 |
| 157,180 | BW LPG, Ltd. (144A) | 2,587,183 |
| 76,544 | Chesapeake Energy Corp. | 5,842,604 |
| 404,429 | Coterra Energy, Inc. | 10,434,268 |
| 3,859,188 | Energy Transfer LP | 62,788,989 |
| 388,578 | Eni S.p.A. | 6,223,129 |
| 154,689 | Exxon Mobil Corp. | 18,344,569 |
| 567,649(b) | Kosmos Energy, Ltd. | 3,139,099 |
| 47,954+# | LUKOIL PJSC | — |
| 1,410,705 | MPLX LP | 60,406,388 |
| 627,089 | Permian Resources Corp. | 9,619,545 |
| 194,305 | Plains All American Pipeline LP | 3,534,408 |
| 1,271,403+# | Rosneft Oil Co. PJSC | — |
| 1,199,714 | Shell Plc (A.D.R.) | 87,843,059 |
| | Total Oil, Gas & Consumable Fuels | $284,342,585 |
|
|
| | Pharmaceuticals — 4.5% | |
| 2,688,664(b) | Pfizer, Inc. | $ 82,111,799 |
| 788,194 | Sanofi S.A. | 81,318,678 |
| | Total Pharmaceuticals | $163,430,477 |
|
|
| | Real Estate Management & Development —
0.0%† | |
| 664,000 | Sino Land Co., Ltd. | $ 686,705 |
| | Total Real Estate Management & Development | $686,705 |
|
|
| | Software — 0.3% | |
| 153,062(b) | Zoom Video Communications, Inc., Class A | $ 9,244,945 |
| | Total Software | $9,244,945 |
|
|
| | Specialized REITs — 0.2% | |
| 67,401 | Crown Castle, Inc. | $ 7,419,502 |
| | Total Specialized REITs | $7,419,502 |
|
|
The accompanying notes are an integral part of these financial statements.
Pioneer Multi-Asset Income Fund | Annual Report | 7/31/247
Schedule of Investments | 7/31/24 (continued)
| Shares | | | | | | Value |
| | Technology Hardware, Storage &
Peripherals — 1.4% | |
| 848,446 | Samsung Electronics Co., Ltd. | $ 51,704,826 |
| | Total Technology Hardware, Storage & Peripherals | $51,704,826 |
|
|
| | Total Common Stocks
(Cost $1,359,710,516) | $1,655,197,372 |
|
|
Principal
Amount
USD ($) | | | | | | |
| | Asset Backed Securities — 2.7% of
Net Assets | |
| 2,000,000 | ACC Auto Trust, Series 2022-A, Class D, 10.07%, 3/15/29 (144A) | $ 1,956,119 |
| 6,000,000 | ACM Auto Trust, Series 2024-1A, Class B, 11.40%, 1/21/31 (144A) | 6,230,416 |
| 1,150,000 | American Credit Acceptance Receivables Trust, Series 2021-3, Class F, 3.64%, 5/15/28 (144A) | 1,125,198 |
| 575,000 | AMSR Trust, Series 2020-SFR2, Class G, 4.00%, 7/17/37 (144A) | 558,440 |
| 4,250,000 | Auxilior Term Funding LLC, Series 2023-1A, Class E, 10.97%, 12/15/32 (144A) | 4,340,242 |
| 2,500,000 | Avid Automobile Receivables Trust, Series 2023-1, Class C, 7.35%, 12/15/27 (144A) | 2,513,073 |
| 929,136(c) | Blackbird Capital Aircraft Lease Securitization, Ltd., Series 2016-1A, Class B, 5.682%, 12/16/41 (144A) | 918,980 |
| 2,770,911(a) | CAL Receivables LLC, Series 2022-1, Class B, 9.687% (SOFR30A + 435 bps), 10/15/26 (144A) | 2,768,779 |
| 1,400,000 | Cartiga Asset Finance Trust LLC, Series 2023-1, Class C, 10.00%, 3/15/35 (144A) | 1,353,436 |
| 4,350,000(d) | CFMT LLC, Series 2023-HB12, Class M2, 4.25%, 4/25/33 (144A) | 4,098,674 |
| 1,600,000(d) | CFMT LLC, Series 2023-HB12, Class M3, 4.25%, 4/25/33 (144A) | 1,450,615 |
| 852,000 | Crossroads Asset Trust, Series 2021-A, Class E, 5.48%, 1/20/28 (144A) | 842,423 |
| 4,517,000(d) | Finance of America HECM Buyout, Series 2022-HB1, Class M5, 7.87%, 2/25/32 (144A) | 4,153,793 |
The accompanying notes are an integral part of these financial statements.
8Pioneer Multi-Asset Income Fund | Annual Report | 7/31/24
Principal
Amount
USD ($) | | | | | | Value |
| | Asset Backed Securities — (continued) | |
| 4,198,000 | Granite Park Equipment Leasing LLC, Series 2023-1A, Class F, 7.00%, 6/20/35 (144A) | $ 3,649,002 |
| 2,400,000 | JPMorgan Chase Bank NA - CACLN, Series 2021-2, Class G, 8.482%, 12/26/28 (144A) | 2,435,450 |
| 1,326,183 | Libra Solutions LLC, Series 2023-1A, Class B, 10.25%, 2/15/35 (144A) | 1,333,478 |
| 2,000,000 | LL ABS Trust, Series 2022-1A, Class D, 7.83%, 11/15/29 (144A) | 1,938,550 |
| 2,000,000 | Merchants Fleet Funding LLC, Series 2023-1A, Class E, 10.80%, 5/20/36 (144A) | 2,053,439 |
| 3,500,000 | Mercury Financial Credit Card Master Trust, Series 2023-1A, Class A, 8.04%, 9/20/27 (144A) | 3,522,712 |
| 10,220,000 | Mercury Financial Credit Card Master Trust, Series 2024-2A, Class C, 10.42%, 7/20/29 (144A) | 10,299,756 |
| 5,470,000 | NMEF Funding LLC, Series 2023-A, Class C, 8.04%, 6/17/30 (144A) | 5,503,538 |
| 1,664,000 | Octane Receivables Trust 2022-1, Series 2022-1A, Class E, 7.33%, 12/20/29 (144A) | 1,625,858 |
| 1,569,628 | PEAR LLC, Series 2023-1, Class C, 10.00%, 7/15/35 (144A) | 1,507,796 |
| 1,800,000(d)+ | RMF Buyout Issuance Trust, Series 2022-HB1, Class M5, 4.50%, 4/25/32 (144A) | 180,000 |
| 500,000 | Rosy Blue Carat SCS, Series 2018-1, Class A1R, 8.481%, 3/15/30 (144A) | 508,750 |
| 4,475,000 | Santander Bank Auto Credit-Linked Notes, Series 2022-A, Class D, 9.965%, 5/15/32 (144A) | 4,644,663 |
| 1,200,000 | Santander Bank Auto Credit-Linked Notes, Series 2022-A, Class E, 12.662%, 5/15/32 (144A) | 1,282,917 |
| 3,500,000 | Santander Bank Auto Credit-Linked Notes, Series 2022-B, Class F, 11.91%, 8/16/32 (144A) | 3,654,291 |
| 5,100,000 | Santander Bank N.A. - SBCLN, Series 2021-1A, Class E, 6.171%, 12/15/31 (144A) | 5,073,166 |
| 4,500,000 | SCF Equipment Leasing LLC, Series 2022-1A, Class F, 6.00%, 7/20/32 (144A) | 4,351,051 |
| 1,338,000 | SCF Equipment Leasing LLC, Series 2022-2A, Class E, 6.50%, 6/20/35 (144A) | 1,305,561 |
The accompanying notes are an integral part of these financial statements.
Pioneer Multi-Asset Income Fund | Annual Report | 7/31/249
Schedule of Investments | 7/31/24 (continued)
Principal
Amount
USD ($) | | | | | | Value |
| | Asset Backed Securities — (continued) | |
| 2,500,000 | Tricolor Auto Securitization Trust, Series 2022-1A, Class F, 9.80%, 7/16/29 (144A) | $ 2,457,567 |
| 5,000,000 | Tricolor Auto Securitization Trust, Series 2023-1A, Class E, 13.45%, 6/15/28 (144A) | 5,300,516 |
| 2,627,192 | Westgate Resorts LLC, Series 2023-1A, Class D, 10.14%, 12/20/37 (144A) | 2,682,339 |
| | Total Asset Backed Securities
(Cost $96,224,742) | $97,620,588 |
|
|
| | Collateralized Mortgage
Obligations—2.9% of Net Assets | |
| 2,400,000(a) | Bellemeade Re, Ltd., Series 2022-1, Class B1, 10.847% (SOFR30A + 550 bps), 1/26/32 (144A) | $ 2,469,663 |
| 4,020,000(a) | Connecticut Avenue Securities Trust, Series 2020-R01, Class 1B1, 8.712% (SOFR30A + 336 bps), 1/25/40 (144A) | 4,175,032 |
| 8,501,543(a) | Connecticut Avenue Securities Trust, Series 2020-R02, Class 2B1, 8.462% (SOFR30A + 311 bps), 1/25/40 (144A) | 8,749,916 |
| 2,860,000(a) | Connecticut Avenue Securities Trust, Series 2021-R01, Class 1B2, 11.347% (SOFR30A + 600 bps), 10/25/41 (144A) | 3,020,875 |
| 3,270,000(a) | Connecticut Avenue Securities Trust, Series 2021-R03, Class 1B2, 10.847% (SOFR30A + 550 bps), 12/25/41 (144A) | 3,423,298 |
| 5,360,000(a) | Connecticut Avenue Securities Trust, Series 2022-R01, Class 1B2, 11.347% (SOFR30A + 600 bps), 12/25/41 (144A) | 5,671,577 |
| 2,675,000(a) | Federal Home Loan Mortgage Corp. STACR REMIC Trust, Series 2020-DNA6, Class B2, 10.997% (SOFR30A + 565 bps), 12/25/50 (144A) | 3,044,793 |
| 1,900,000(a) | Federal Home Loan Mortgage Corp. STACR REMIC Trust, Series 2020-HQA5, Class B2, 12.747% (SOFR30A + 740 bps), 11/25/50 (144A) | 2,304,673 |
| 2,765,000(a) | Federal Home Loan Mortgage Corp. STACR REMIC Trust, Series 2021-DNA1, Class B2, 10.097% (SOFR30A + 475 bps), 1/25/51 (144A) | 2,978,430 |
The accompanying notes are an integral part of these financial statements.
10Pioneer Multi-Asset Income Fund | Annual Report | 7/31/24
Principal
Amount
USD ($) | | | | | | Value |
| | Collateralized Mortgage
Obligations—(continued) | |
| 795,000(a) | Federal Home Loan Mortgage Corp. STACR REMIC Trust, Series 2021-DNA2, Class B2, 11.347% (SOFR30A + 600 bps), 8/25/33 (144A) | $ 938,346 |
| 2,170,000(a) | Federal Home Loan Mortgage Corp. STACR REMIC Trust, Series 2021-DNA3, Class B2, 11.597% (SOFR30A + 625 bps), 10/25/33 (144A) | 2,564,965 |
| 3,530,000(a) | Federal Home Loan Mortgage Corp. STACR REMIC Trust, Series 2021-DNA5, Class B2, 10.847% (SOFR30A + 550 bps), 1/25/34 (144A) | 3,983,007 |
| 3,480,000(a) | Federal Home Loan Mortgage Corp. STACR REMIC Trust, Series 2021-DNA7, Class B2, 13.147% (SOFR30A + 780 bps), 11/25/41 (144A) | 3,773,759 |
| 5,405,000(a) | Federal Home Loan Mortgage Corp. STACR REMIC Trust, Series 2021-HQA1, Class B2, 10.347% (SOFR30A + 500 bps), 8/25/33 (144A) | 5,860,835 |
| 1,310,000(a) | Federal Home Loan Mortgage Corp. STACR REMIC Trust, Series 2021-HQA2, Class B2, 10.797% (SOFR30A + 545 bps), 12/25/33 (144A) | 1,465,252 |
| 1,970,000(a) | Federal Home Loan Mortgage Corp. STACR REMIC Trust, Series 2021-HQA3, Class B2, 11.597% (SOFR30A + 625 bps), 9/25/41 (144A) | 2,058,874 |
| 3,450,000(a) | Federal Home Loan Mortgage Corp. STACR REMIC Trust, Series 2022-DNA1, Class B2, 12.447% (SOFR30A + 710 bps), 1/25/42 (144A) | 3,707,516 |
| 2,650,000(a) | Federal Home Loan Mortgage Corp. STACR REMIC Trust, Series 2022-DNA2, Class B2, 13.847% (SOFR30A + 850 bps), 2/25/42 (144A) | 2,936,877 |
| 6,608,000(a) | Federal Home Loan Mortgage Corp. STACR Trust, Series 2019-DNA3, Class B2, 13.612% (SOFR30A + 826 bps), 7/25/49 (144A) | 7,574,010 |
| 3,150,000(a) | Federal Home Loan Mortgage Corp. STACR Trust, Series 2019-DNA4, Class B2, 11.712% (SOFR30A + 636 bps), 10/25/49 (144A) | 3,491,579 |
| 6,635,000(a) | Federal Home Loan Mortgage Corp. STACR Trust, Series 2019-FTR3, Class B2, 10.25% (SOFR30A + 491 bps), 9/25/47 (144A) | 7,069,757 |
The accompanying notes are an integral part of these financial statements.
Pioneer Multi-Asset Income Fund | Annual Report | 7/31/2411
Schedule of Investments | 7/31/24 (continued)
Principal
Amount
USD ($) | | | | | | Value |
| | Collateralized Mortgage
Obligations—(continued) | |
| 3,020,000(a) | Federal Home Loan Mortgage Corp. STACR Trust, Series 2019-FTR4, Class B2, 10.462% (SOFR30A + 511 bps), 11/25/47 (144A) | $ 3,240,482 |
| 3,688,000(a) | Federal National Mortgage Association Connecticut Avenue Securities, Series 2021-R02, Class 2B2, 11.547% (SOFR30A + 620 bps), 11/25/41 (144A) | 3,890,840 |
| 13,609 | Global Mortgage Securitization, Ltd., Series 2004-A, Class B1, 5.25%, 11/25/32 (144A) | 5,841 |
| 176,418 | Global Mortgage Securitization, Ltd., Series 2004-A, Class B2, 5.25%, 11/25/32 (144A) | 2 |
| 1,270,000(a) | Home Re, Ltd., Series 2023-1, Class M1B, 9.947% (SOFR30A + 460 bps), 10/25/33 (144A) | 1,327,530 |
| 433,287(a) | Oaktown Re V, Ltd., Series 2020-2A, Class M2, 10.712% (SOFR30A + 536 bps), 10/25/30 (144A) | 438,897 |
| 5,880,000(a) | STACR Trust, Series 2018-HRP2, Class B2, 15.962% (SOFR30A + 1,061 bps), 2/25/47 (144A) | 7,294,167 |
| 8,230,000(a) | Triangle Re, Ltd., Series 2023-1, Class M1A, 8.747% (SOFR30A + 340 bps), 11/25/33 (144A) | 8,391,926 |
| | Total Collateralized Mortgage Obligations
(Cost $98,286,193) | $105,852,719 |
|
|
| | Commercial Mortgage-Backed
Securities—0.8% of Net Assets | |
| 4,311,000(d) | Benchmark Mortgage Trust, Series 2024-V8, Class AM, 6.859%, 7/15/57 | $ 4,533,228 |
| 899,000(a) | Federal Home Loan Mortgage Corp. Multifamily Structured Credit Risk, Series 2021-MN1, Class B1, 13.097% (SOFR30A + 775 bps), 1/25/51 (144A) | 976,445 |
| 3,014,220(a) | Freddie Mac Multifamily Structured Credit Risk, Series 2021-MN3, Class M1, 7.647% (SOFR30A + 230 bps), 11/25/51 (144A) | 2,964,245 |
| 6,310,000 | MCR Mortgage Trust, Series 2024-TWA, Class F, 10.382%, 6/12/39 (144A) | 6,366,039 |
| 5,750,000(a) | Multifamily Connecticut Avenue Securities Trust, Series 2019-01, Class CE, 14.212% (SOFR30A + 886 bps), 10/25/49 (144A) | 5,722,238 |
The accompanying notes are an integral part of these financial statements.
12Pioneer Multi-Asset Income Fund | Annual Report | 7/31/24
Principal
Amount
USD ($) | | | | | | Value |
| | Commercial Mortgage-Backed
Securities—(continued) | |
| 1,949,111(a) | Multifamily Connecticut Avenue Securities Trust, Series 2019-01, Class M10, 8.712% (SOFR30A + 336 bps), 10/25/49 (144A) | $ 1,952,098 |
| 2,444,518(a) | Multifamily Connecticut Avenue Securities Trust, Series 2020-01, Class M10, 9.212% (SOFR30A + 386 bps), 3/25/50 (144A) | 2,457,328 |
| 6,440,000 | SLG Office Trust, Series 2021-OVA, Class D, 2.851%, 7/15/41 (144A) | 5,152,781 |
| | Total Commercial Mortgage-Backed Securities
(Cost $29,404,241) | $30,124,402 |
|
|
| | Convertible Corporate Bonds —
0.8% of Net Assets | |
| | REITs — 0.8% | |
| 4,895,000 | PennyMac Corp., 5.50%, 3/15/26 | $ 4,701,737 |
| 24,685,100 | Redwood Trust, Inc., 7.75%, 6/15/27 | 24,253,111 |
| | Total REITs | $28,954,848 |
|
|
| | Total Convertible Corporate Bonds
(Cost $27,236,746) | $28,954,848 |
|
|
| | Corporate Bonds — 6.5% of Net
Assets | |
| | Advertising — 0.1% | |
| 1,860,000 | Clear Channel Outdoor Holdings, Inc., 7.50%, 6/1/29 (144A) | $ 1,597,125 |
| 570,000 | Clear Channel Outdoor Holdings, Inc., 7.75%, 4/15/28 (144A) | 503,414 |
| | Total Advertising | $2,100,539 |
|
|
| | Aerospace & Defense — 0.2% | |
| 5,000,000 | Boeing Co., 5.15%, 5/1/30 | $ 4,923,978 |
| 1,663,000 | Bombardier, Inc., 7.875%, 4/15/27 (144A) | 1,665,521 |
| | Total Aerospace & Defense | $6,589,499 |
|
|
| | Airlines — 0.3% | |
| 4,100,000 | American Airlines 2021-1 Class B Pass Through Trust, 3.95%, 7/11/30 | $ 3,811,901 |
| 303,566 | British Airways 2020-1 Class B Pass Through Trust, 8.375%, 11/15/28 (144A) | 319,608 |
| 6,549,695(a) | Gol Finance S.A., 15.844% (1 Month Term SOFR + 1,050 bps), 1/29/25 (144A) | 7,008,174 |
| | Total Airlines | $11,139,683 |
|
|
The accompanying notes are an integral part of these financial statements.
Pioneer Multi-Asset Income Fund | Annual Report | 7/31/2413
Schedule of Investments | 7/31/24 (continued)
Principal
Amount
USD ($) | | | | | | Value |
| | Auto Parts & Equipment — 0.0%† | |
| 616,000 | American Axle & Manufacturing, Inc., 6.25%, 3/15/26 | $ 611,334 |
| | Total Auto Parts & Equipment | $611,334 |
|
|
| | Banks — 3.8% | |
| EUR4,700,000(d)(e) | ABN AMRO Bank NV, 4.375% (5 Year EUR Swap + 467 bps) | $ 4,997,560 |
| EUR5,300,000(d)(e) | ABN AMRO Bank NV, 4.75% (5 Year EUR Swap + 390 bps) | 5,446,972 |
| 5,000,000(d) | Banco Santander S.A., 3.225% (1 Year CMT Index + 160 bps), 11/22/32 | 4,249,736 |
| 5,000,000(d) | BPCE S.A., 3.116% (SOFR + 173 bps), 10/19/32 (144A) | 4,186,455 |
| 4,000,000 | BPCE S.A., 4.875%, 4/1/26 (144A) | 3,960,555 |
| 8,650,000(d)(e) | ING Groep NV, 6.50% (5 Year USD Swap Rate + 445 bps) | 8,618,645 |
| 4,917,000(d) | Intesa Sanpaolo S.p.A., 7.778% (1 Year CMT Index + 390 bps), 6/20/54 (144A) | 5,281,819 |
| 5,857,000(d)(e) | Lloyds Banking Group Plc, 7.50% (5 Year USD Swap Rate + 450 bps) | 5,877,611 |
| 8,700,000(d) | Morgan Stanley, 5.297% (SOFR + 262 bps), 4/20/37 | 8,535,356 |
| 8,125,000(d)(e) | NatWest Group Plc, 8.00% (5 Year USD Swap Rate + 572 bps) | 8,214,277 |
| 6,220,000(d) | Societe Generale S.A., 6.221% (1 Year CMT Index + 320 bps), 6/15/33 (144A) | 6,301,252 |
| 9,300,000(d) | Standard Chartered Plc, 3.603% (1 Year CMT Index + 190 bps), 1/12/33 (144A) | 8,086,363 |
| 31,703,000(d)(e) | UBS Group AG, 3.875% (5 Year CMT Index + 310 bps) (144A) | 29,632,008 |
| 29,708,000(d)(e) | UBS Group AG, 4.875% (5 Year CMT Index + 340 bps) (144A) | 27,978,267 |
| 7,425,000(d)(e) | UBS Group AG, 5.125% (5 Year CMT Index + 486 bps) | 7,137,653 |
| | Total Banks | $138,504,529 |
|
|
| | Chemicals — 0.1% | |
| 3,487,000 | LSF11 A5 HoldCo LLC, 6.625%, 10/15/29 (144A) | $ 3,336,621 |
| | Total Chemicals | $3,336,621 |
|
|
| | Commercial Services — 0.1% | |
| 2,255,000 | Allied Universal Holdco LLC/Allied Universal Finance Corp., 9.75%, 7/15/27 (144A) | $ 2,253,096 |
| | Total Commercial Services | $2,253,096 |
|
|
The accompanying notes are an integral part of these financial statements.
14Pioneer Multi-Asset Income Fund | Annual Report | 7/31/24
Principal
Amount
USD ($) | | | | | | Value |
| | Distribution/Wholesale — 0.0%† | |
| 1,773,000 | Dealer Tire LLC/DT Issuer LLC, 8.00%, 2/1/28 (144A) | $ 1,768,796 |
| | Total Distribution/Wholesale | $1,768,796 |
|
|
| | Diversified Financial Services — 0.3% | |
| 8,630,000(d) | Capital One Financial Corp., 5.268% (SOFR + 237 bps), 5/10/33 | $ 8,510,128 |
| 2,920,000 | Provident Funding Associates LP/PFG Finance Corp., 6.375%, 6/15/25 (144A) | 2,839,278 |
| | Total Diversified Financial Services | $11,349,406 |
|
|
| | Food — 0.1% | |
| 3,232,000 | JBS USA Holding Lux S.a.r.l./JBS USA Food Co./JBS Lux Co. S.a.r.l., 5.75%, 4/1/33 | $ 3,247,321 |
| | Total Food | $3,247,321 |
|
|
| | Oil & Gas — 0.1% | |
| 5,000,000 | Aker BP ASA, 3.10%, 7/15/31 (144A) | $ 4,340,803 |
| | Total Oil & Gas | $4,340,803 |
|
|
| | Pipelines — 0.1% | |
| 3,328,000 | EnLink Midstream Partners LP, 5.60%, 4/1/44 | $ 2,987,051 |
| | Total Pipelines | $2,987,051 |
|
|
| | Telecommunications — 1.2% | |
| 41,014,000 | Level 3 Financing, Inc., 10.50%, 5/15/30 (144A) | $ 41,916,308 |
| 3,364,000 | Windstream Escrow LLC/Windstream Escrow Finance Corp., 7.75%, 8/15/28 (144A) | 3,244,962 |
| | Total Telecommunications | $45,161,270 |
|
|
| | Transportation — 0.1% | |
| 2,065,000 | Danaos Corp., 8.50%, 3/1/28 (144A) | $ 2,125,628 |
| | Total Transportation | $2,125,628 |
|
|
| | Total Corporate Bonds
(Cost $223,791,244) | $235,515,576 |
|
|
The accompanying notes are an integral part of these financial statements.
Pioneer Multi-Asset Income Fund | Annual Report | 7/31/2415
Schedule of Investments | 7/31/24 (continued)
| Shares | | | | | | Value |
| | Rights/Warrants — 0.0%† of Net
Assets | |
| | Financial Services — 0.0%† | |
| 13,333,333(b) | Citigroup Global Markets Holdings, Inc., | $ 244,000 |
| 13,333,333(b) | Citigroup Global Markets Holdings, Inc., | 226,667 |
| | Total Financial Services | $470,667 |
|
|
| | Total Rights/Warrants
(Cost $2,920,000) | $470,667 |
|
|
Principal
Amount
USD ($) | | | | | | |
| | Insurance-Linked Securities —
3.2% of Net Assets# | |
| | Event Linked Bonds — 1.8% | |
| | Earthquakes – California — 0.0%† | |
| 500,000(a) | Sutter Re, 12.032%, (3 Month U.S. Treasury Bill + 675 bps), 6/19/26 (144A) | $ 514,500 |
| 250,000(a) | Torrey Pines Re, 11.277%, (1 Month U.S. Treasury Bill + 600 bps), 6/7/27 (144A) | 254,225 |
| 250,000(a) | Torrey Pines Re, 12.527%, (1 Month U.S. Treasury Bill + 725 bps), 6/7/27 (144A) | 255,750 |
| | | | | | | $1,024,475 |
|
|
| | Earthquakes – U.S. — 0.0%† | |
| 1,000,000(a) | Ursa Re, 10.78%, (3 Month U.S. Treasury Bill + 550 bps), 12/6/25 (144A) | $ 1,013,000 |
| | Flood – U.S. — 0.1% | |
| 1,500,000(a) | FloodSmart Re, 19.282%, (3 Month U.S. Treasury Bill + 1,400 bps), 3/12/27 (144A) | $ 1,494,000 |
| 1,000,000(a) | FloodSmart Re, 22.434%, (1 Month U.S. Treasury Bill + 1,715 bps), 3/11/26 (144A) | 988,840 |
| | | | | | | $2,482,840 |
|
|
| | Health – U.S. — 0.2% | |
| 1,750,000(a) | Vitality Re XIII, 7.284%, (3 Month U.S. Treasury Bill + 200 bps), 1/6/26 (144A) | $ 1,738,450 |
| 3,250,000(a) | Vitality Re XIV, 8.784%, (3 Month U.S. Treasury Bill + 350 bps), 1/5/27 (144A) | 3,298,750 |
| 600,000(a) | Vitality Re XIV, 9.784%, (3 Month U.S. Treasury Bill + 450 bps), 1/5/27 (144A) | 612,360 |
| | | | | | | $5,649,560 |
|
|
The accompanying notes are an integral part of these financial statements.
16Pioneer Multi-Asset Income Fund | Annual Report | 7/31/24
Principal
Amount
USD ($) | | | | | | Value |
| | Multiperil – Florida — 0.0%† | |
| 650,000(a) | Sanders Re, 13.42%, (3 Month U.S. Treasury Bill + 814 bps), 6/5/26 (144A) | $ 666,835 |
| | Multiperil – U.S. — 0.5% | |
| 500,000(a) | Aquila Re, 10.777%, (3 Month U.S. Treasury Bill + 550 bps), 6/7/27 (144A) | $ 497,252 |
| 250,000(a) | Four Lakes Re, 11.03%, (3 Month U.S. Treasury Bill + 575 bps), 1/7/27 (144A) | 247,950 |
| 250,000(a) | Four Lakes Re, 11.74%, (3 Month U.S. Treasury Bill + 646 bps), 1/7/26 (144A) | 254,475 |
| 250,000(a) | Four Lakes Re, 14.78%, (3 Month U.S. Treasury Bill + 950 bps), 1/7/27 (144A) | 254,100 |
| 500,000(a) | Herbie Re, 15.00%, (3 Month U.S. Treasury Bill + 972 bps), 1/8/25 (144A) | 472,200 |
| 2,000,000(a) | High Point Re, 11.032%, (3 Month U.S. Treasury Bill + 575 bps), 1/6/27 (144A) | 2,004,400 |
| 750,000(a) | Merna Re II, 12.534%, (3 Month U.S. Treasury Bill + 725 bps), 7/7/27 (144A) | 750,225 |
| 1,300,000(a) | Merna Re II, 13.03%, (3 Month U.S. Treasury Bill + 775 bps), 7/7/26 (144A) | 1,322,750 |
| 1,500,000(a) | Merna Re II, 13.78%, (3 Month U.S. Treasury Bill + 850 bps), 7/7/27 (144A) | 1,488,750 |
| 1,750,000(a) | Mystic Re, 17.284%, (3 Month U.S. Treasury Bill + 1,200 bps), 1/8/27 (144A) | 1,754,200 |
| 750,000(a) | Residential Re, 11.202%, (3 Month U.S. Treasury Bill + 592 bps), 12/6/27 (144A) | 751,725 |
| 500,000(a) | Residential Re, 11.33%, (3 Month U.S. Treasury Bill + 605 bps), 12/6/25 (144A) | 462,100 |
| 1,000,000(a) | Residential Re, 11.574%, (3 Month U.S. Treasury Bill + 629 bps), 12/6/24 (144A) | 962,600 |
| 500,000(a) | Residential Re, 12.974%, (3 Month U.S. Treasury Bill + 769 bps), 12/6/26 (144A) | 499,800 |
| 250,000(a) | Residential Re, 13.41%, (3 Month U.S. Treasury Bill + 813 bps), 12/6/24 (144A) | 238,525 |
| 1,250,000(a) | Residential Re, 13.702%, (1 Month U.S. Treasury Bill + 842 bps), 12/6/27 (144A) | 1,206,125 |
| 750,000(a) | Residential Re, 17.30%, (3 Month U.S. Treasury Bill + 1,202 bps), 12/6/25 (144A) | 699,675 |
The accompanying notes are an integral part of these financial statements.
Pioneer Multi-Asset Income Fund | Annual Report | 7/31/2417
Schedule of Investments | 7/31/24 (continued)
Principal
Amount
USD ($) | | | | | | Value |
| | Multiperil – U.S. — (continued) | |
| 750,000(a) | Sanders Re, 11.03%, (3 Month U.S. Treasury Bill + 575 bps), 4/7/28 (144A) | $ 763,500 |
| 1,250,000(a) | Sanders Re II, 8.53%, (3 Month U.S. Treasury Bill + 325 bps), 4/7/25 (144A) | 1,226,125 |
| 800,000(a) | Sanders Re III, 8.69%, (3 Month U.S. Treasury Bill + 341 bps), 4/7/26 (144A) | 772,480 |
| 1,600,000(a) | Sanders Re III, 10.834%, (3 Month U.S. Treasury Bill + 555 bps), 4/7/27 (144A) | 1,608,320 |
| 250,000(a) | Solomon Re, 10.797%, (3 Month U.S. Treasury Bill + 552 bps), 6/8/26 (144A) | 251,950 |
| 300,000(a) | Sussex Re, 13.64%, (3 Month U.S. Treasury Bill + 836 bps), 1/8/25 (144A) | 291,600 |
| 250,000(a) | Topanga Re, 10.332%, (3 Month U.S. Treasury Bill + 505 bps), 1/8/26 (144A) | 239,975 |
| | | | | | | $19,020,802 |
|
|
| | Multiperil – U.S. & Canada — 0.2% | |
| 750,000(a) | Atlas Re, 17.869%, (SOFR + 1,250 bps), 6/8/27 (144A) | $ 795,000 |
| 500,000(a) | Easton Re, 12.78%, (3 Month U.S. Treasury Bill + 750 bps), 1/8/27 (144A) | 489,250 |
| 250,000(a) | Galileo Re, 12.282%, (3 Month U.S. Treasury Bill + 700 bps), 1/8/26 (144A) | 251,100 |
| 1,250,000(a) | Galileo Re, 12.282%, (3 Month U.S. Treasury Bill + 700 bps), 1/7/28 (144A) | 1,260,375 |
| 250,000(a) | Kilimanjaro II Re, 11.53%, (3 Month U.S. Treasury Bill + 625 bps), 6/30/28 (144A) | 252,050 |
| 750,000(a) | Kilimanjaro II Re, 12.53%, (3 Month U.S. Treasury Bill + 725 bps), 6/30/28 (144A) | 757,200 |
| 250,000(a) | Kilimanjaro III Re, 10.142%, (3 Month U.S. Treasury Bill + 486 bps), 4/21/25 (144A) | 244,900 |
| 250,000(a) | Kilimanjaro III Re, 17.642%, (3 Month U.S. Treasury Bill + 1,236 bps), 4/21/25 (144A) | 236,150 |
| 250,000(a) | Kilimanjaro III Re, 17.642%, (3 Month U.S. Treasury Bill + 1,236 bps), 4/20/26 (144A) | 230,060 |
| 500,000(a) | Mona Lisa Re, 12.284%, (3 Month U.S. Treasury Bill + 700 bps), 7/8/25 (144A) | 482,650 |
| 1,000,000(a) | Mona Lisa Re, 17.78%, (3 Month U.S. Treasury Bill + 1,250 bps), 1/8/26 (144A) | 1,026,100 |
The accompanying notes are an integral part of these financial statements.
18Pioneer Multi-Asset Income Fund | Annual Report | 7/31/24
Principal
Amount
USD ($) | | | | | | Value |
| | Multiperil – U.S. & Canada — (continued) | |
| 1,750,000(a) | Mystic Re IV, 11.384%, (3 Month U.S. Treasury Bill + 610 bps), 1/8/25 (144A) | $ 1,717,625 |
| 500,000(a) | Mystic Re IV, 16.974%, (3 Month U.S. Treasury Bill + 1,169 bps), 1/8/25 (144A) | 479,850 |
| | | | | | | $8,222,310 |
|
|
| | Multiperil – U.S. Regional — 0.1% | |
| 500,000(a) | Aquila Re, 13.552%, (3 Month U.S. Treasury Bill + 827 bps), 6/8/26 (144A) | $ 510,000 |
| 250,000(a) | Aquila Re, 14.464%, (3 Month U.S. Treasury Bill + 918 bps), 6/8/26 (144A) | 256,250 |
| 1,300,000(a) | Locke Tavern Re, 10.059%, (3 Month U.S. Treasury Bill + 478 bps), 4/9/26 (144A) | 1,292,460 |
| | | | | | | $2,058,710 |
|
|
| | Multiperil – Worldwide — 0.1% | |
| 1,250,000(a) | Atlas Capital, 13.083%, (SOFR + 772 bps), 6/5/26 (144A) | $ 1,251,375 |
| 750,000(a) | Cat Re 2001, 17.78%, (3 Month U.S. Treasury Bill + 1,250 bps), 1/8/27 (144A) | 739,125 |
| 1,000,000(a) | Kendall Re, 11.534%, (3 Month U.S. Treasury Bill + 625 bps), 4/30/27 (144A) | 1,020,000 |
| | | | | | | $3,010,500 |
|
|
| | Windstorm – Florida — 0.1% | |
| 1,000,000(a) | First Coast Re, 9.00%, (3 Month U.S. Treasury Bill + 952 bps), 4/7/26 (144A) | $ 1,008,600 |
| 1,250,000(a) | First Coast Re III Pte, 12.024%, (3 Month U.S. Treasury Bill + 674 bps), 4/7/25 (144A) | 1,198,250 |
| 250,000(a) | Marlon Re, 12.284%, (3 Month U.S. Treasury Bill + 700 bps), 6/7/27 (144A) | 249,750 |
| 750,000(a) | Merna Re II, 14.027%, (3 Month U.S. Treasury Bill + 875 bps), 7/7/27 (144A) | 744,825 |
| 250,000(a) | Palm Re, 14.784%, (1 Month U.S. Treasury Bill + 950 bps), 6/7/27 (144A) | 248,400 |
| | | | | | | $3,449,825 |
|
|
| | Windstorm – Japan — 0.0%† | |
| 500,000(a) | Sakura Re, 7.69%, (3 Month U.S. Treasury Bill + 241 bps), 4/7/25 (144A) | $ 497,600 |
| | Windstorm – Massachusetts — 0.0%† | |
| 1,000,000(a) | Mayflower Re, 4.50%, (1 Month U.S. Treasury Bill + 450 bps), 7/8/27 (144A) | $ 1,000,400 |
The accompanying notes are an integral part of these financial statements.
Pioneer Multi-Asset Income Fund | Annual Report | 7/31/2419
Schedule of Investments | 7/31/24 (continued)
Principal
Amount
USD ($) | | | | | | Value |
| | Windstorm – Mexico — 0.0%† | |
| 250,000(a) | International Bank for Reconstruction & Development, 17.565%, (SOFR + 1,222 bps), 4/24/28 (144A) | $ 253,175 |
| 250,000(a) | International Bank for Reconstruction & Development, 19.065%, (SOFR + 1,372 bps), 6/26/28 (144A) | 246,525 |
| | | | | | | $499,700 |
|
|
| | Windstorm – North Carolina — 0.1% | |
| 750,000(a) | Blue Ridge Re, 10.53%, (3 Month U.S. Treasury Bill + 525 bps), 1/8/27 (144A) | $ 742,500 |
| 1,250,000(a) | Blue Ridge Re, 13.28%, (1 Month U.S. Treasury Bill + 800 bps), 1/8/27 (144A) | 1,254,263 |
| 500,000(a) | Cape Lookout Re, 13.28%, (1 Month U.S. Treasury Bill + 800 bps), 4/5/27 (144A) | 500,575 |
| | | | | | | $2,497,338 |
|
|
| | Windstorm – Texas — 0.0%† | |
| 500,000(a) | Alamo Re, 6.00%, (1 Month U.S. Treasury Bill + 600 bps), 6/7/27 (144A) | $ 506,005 |
| 250,000(a) | Alamo Re, 13.032%, (1 Month U.S. Treasury Bill + 775 bps), 6/7/27 (144A) | 250,723 |
| | | | | | | $756,728 |
|
|
| | Windstorm – U.S. — 0.3% | |
| 1,500,000(a) | Alamo Re, 13.672%, (1 Month U.S. Treasury Bill + 839 bps), 6/7/26 (144A) | $ 1,501,500 |
| 500,000(a) | Bonanza Re, 10.21%, (3 Month U.S. Treasury Bill + 493 bps), 12/23/24 (144A) | 486,225 |
| 250,000(a) | Bonanza Re, 10.904%, (3 Month U.S. Treasury Bill + 562 bps), 3/16/25 (144A) | 229,477 |
| 250,000(a) | Bonanza Re, 13.73%, (3 Month U.S. Treasury Bill + 845 bps), 1/8/26 (144A) | 252,000 |
| 1,750,000(a) | Cape Lookout Re, 13.704%, (1 Month U.S. Treasury Bill + 842 bps), 4/28/26 (144A) | 1,767,500 |
| 600,000(a) | Gateway Re, 19.24%, (1 Month U.S. Treasury Bill + 1,396 bps), 2/24/26 (144A) | 617,796 |
| 1,600,000(a) | Merna Re II, 15.53%, (3 Month U.S. Treasury Bill + 1,025 bps), 7/7/26 (144A) | 1,611,360 |
The accompanying notes are an integral part of these financial statements.
20Pioneer Multi-Asset Income Fund | Annual Report | 7/31/24
Principal
Amount
USD ($) | | | | | | Value |
| | Windstorm – U.S. — (continued) | |
| 500,000(a) | Purple Re, 14.284%, (1 Month U.S. Treasury Bill + 900 bps), 6/7/27 (144A) | $ 494,500 |
| 1,500,000(a) | Queen Street Re, 12.78%, (3 Month U.S. Treasury Bill + 750 bps), 12/8/25 (144A) | 1,504,800 |
| | | | | | | $8,465,158 |
| |
| |
| | Windstorm – U.S. Multistate — 0.0%† | | |
| 250,000(a) | Gateway Re, 5.265%, (1 Month U.S. Treasury Bill + 0 bps), 12/23/24 (144A) | $ 234,250 | |
| 250,000(a) | Gateway Re, 5.265%, (1 Month U.S. Treasury Bill + 0 bps), 1/8/25 (144A) | 216,134 | |
| 250,000(a) | Gateway Re, 10.78%, (1 Month U.S. Treasury Bill + 550 bps), 7/8/27 (144A) | 249,775 | |
| | | | | | | $700,159 | |
| |
| |
| | Windstorm – U.S. Regional — 0.0%† | | |
| 1,000,000(a) | Citrus Re, 11.874%, (3 Month U.S. Treasury Bill + 659 bps), 6/7/26 (144A) | $ 1,010,900 | |
| | Winterstorm – Florida — 0.1% | | |
| 2,000,000(a) | Integrity Re, 18.144%, (1 Month U.S. Treasury Bill + 1,286 bps), 6/6/25 (144A) | $ 2,011,860 | |
| 2,000,000(a) | Lightning Re, 16.284%, (3 Month U.S. Treasury Bill + 1,100 bps), 3/31/26 (144A) | 2,021,000 | |
| | | | | | | $4,032,860 | |
| |
| |
| | Total Event Linked Bonds | $66,059,700 | |
| |
| |
Face
Amount
USD ($) | | | | | | |
| | Collateralized Reinsurance — 0.6% | |
| | Multiperil – U.S. — 0.2% | |
| 3,750,000(f)+ | Gamboge Re, 3/31/29 | $ 35,402 |
| 250,000(b)(f)+ | Mangrove Risk Solutions, 5/10/25 (144A) | 230,675 |
| 5,272,146(b)(f)+ | PI0047 2024-1, 12/31/29 | 5,561,560 |
| 1,000,000(b)(f)+ | PI0051-Cheltenham Re 2024, 5/31/30 | 827,651 |
| | | | | | | $6,655,288 |
|
|
| | Multiperil – Worldwide — 0.2% | |
| 700,000(b)(f)+ | Cypress Re 2017, 1/31/25 | $ 70 |
| 4,000,000(b)(f)+ | Gamboge Re, 3/31/30 | 3,725,442 |
| 1,000,000(b)(f)+ | Merion Re 2024-1, 12/31/29 | 939,532 |
The accompanying notes are an integral part of these financial statements.
Pioneer Multi-Asset Income Fund | Annual Report | 7/31/2421
Schedule of Investments | 7/31/24 (continued)
Face
Amount
USD ($) | | | | | | Value |
| | Multiperil – Worldwide — (continued) | |
| 250,000(b)(f)+ | Old Head Re 2024, 12/31/29 | $ 229,764 |
| 500,000(b)(f)+ | Pine Valley Re 2024, 12/31/28 | 465,390 |
| 300,000(b)(f)+ | Walton Health Re 2019, 6/30/25 | 62,964 |
| 250,000(b)(f)+ | Walton Heath Re 2021, 1/15/25 | 19 |
| | | | | | | $5,423,181 |
|
|
| | Windstorm – North Carolina — 0.1% | |
| 1,000,000(b)(f)+ | Isosceles Re 2024, 4/30/30 | $ 951,300 |
| 500,000(b)(f)+ | Isosceles Re 2024, 4/30/30 | 479,250 |
| 250,000(b)(f)+ | Isosceles Re 2024, 4/30/30 | 241,075 |
| | | | | | | $1,671,625 |
|
|
| | Windstorm – U.S. — 0.1% | |
| 3,000,000(b)(f)+ | PI0048 RE 2024, 11/30/27 | $ 2,745,704 |
| 2,250,000(b)(f)+ | PI0049 Aberystwyth, 11/30/27 | 2,034,086 |
| | | | | | | $4,779,790 |
|
|
| | Windstorm – U.S. Multistate — 0.0%† | |
| 2,500,000(f)+ | White Heron Re, 5/31/29 | $ 65,071 |
| | Windstorm – U.S. Regional — 0.0%† | |
| 1,500,000(b)(f)+ | Oakmont Re 2024, 4/1/30 | $ 1,428,306 |
| | Total Collateralized Reinsurance | $20,023,261 |
|
|
| | Reinsurance Sidecars — 0.8% | |
| | Multiperil – U.S. — 0.0%† | |
| 2,500,000(f)+ | Carnoustie Re 2023, 12/31/28 | $ 187,207 |
| 1,500,000(g)+ | Harambee Re 2019, 12/31/24 | 3,150 |
| | | | | | | $190,357 |
|
|
| | Multiperil – Worldwide — 0.8% | |
| 1,000,000(b)(g)+ | Alturas Re 2021-3, 7/31/25 | $ 44,900 |
| 24,956(g)+ | Alturas Re 2022-2, 12/31/27 | 1,967 |
| 750,000(f)+ | Bantry Re 2021, 12/31/24 | 7,500 |
| 4,000,000(b)(f)+ | Bantry Re 2024, 12/31/29 | 4,317,930 |
| 1,500,000(b)(f)+ | Berwick Re 2024-1, 12/31/29 | 1,591,224 |
| 2,500,000(b)(f)+ | Carnoustie Re 2024, 12/31/29 | 2,666,891 |
| 3,000,000(f)+ | Eccleston Re 2023, 11/30/28 | 231,800 |
| 74,892(b)(f)+ | Eden Re II, 3/21/25 (144A) | 15,188 |
| 54,774(b)(f)+ | Eden Re II, 3/21/25 (144A) | 8,873 |
| 500,000(b)(f)+ | Gleneagles Re 2021, 12/31/24 | 50 |
| 3,000,000(b)(f)+ | Gullane Re 2024, 12/31/29 | 3,058,124 |
| 250,000(b)(g)+ | Lion Rock Re 2021, 12/31/24 | 11,000 |
| 2,000,000(b)(f)+ | Merion Re 2021-2, 12/31/24 | 120,000 |
| 2,500,000(b)(f)+ | Pangaea Re 2024-1, 12/31/29 | 2,697,478 |
| 3,000,000(b)(f)+ | Pangaea Re 2024-3, 7/1/28 | 3,045,000 |
The accompanying notes are an integral part of these financial statements.
22Pioneer Multi-Asset Income Fund | Annual Report | 7/31/24
Face
Amount
USD ($) | | | | | | Value |
| | Multiperil – Worldwide — (continued) | |
| 3,000,000(b)(f)+ | Sector Re V, 12/1/28 (144A) | $ 3,567,585 |
| 1,000,000(b)(g)+ | Thopas Re 2020, 12/31/24 | 200 |
| 1,500,000(g)+ | Thopas Re 2021, 12/31/24 | 15,600 |
| 2,500,000(g)+ | Thopas Re 2023, 12/31/28 | — |
| 2,500,000(b)(g)+ | Thopas Re 2024, 12/31/29 | 2,831,000 |
| 1,500,000(g)+ | Torricelli Re 2021, 7/31/25 | 7,500 |
| 2,500,000(g)+ | Torricelli Re 2023, 6/30/29 | 33,250 |
| 3,000,000(b)(f)+ | Torricelli Re 2024, 6/30/30 | 3,077,430 |
| 1,500,000(g)+ | Viribus Re 2019, 12/31/24 | — |
| 1,000,000(b)(g)+ | Viribus Re 2020, 12/31/24 | 33,200 |
| 2,000,000(g)+ | Viribus Re 2023, 12/31/28 | 409,800 |
| 333,333(b)(g)+ | Viribus Re 2024, 12/31/29 | 401,766 |
| 600,000(b)(f)+ | Woburn Re 2019, 12/31/24 | 82,591 |
| | | | | | | $28,277,847 |
|
|
| | Total Reinsurance Sidecars | $28,468,204 |
|
|
| | Total Insurance-Linked Securities
(Cost $110,942,446) | $114,551,165 |
|
|
Principal
Amount
USD ($) | | | | | | |
| | Foreign Government Bonds —
0.9% of Net Assets | |
| | Hungary — 0.1% | |
| HUF1,441,490,000 | Hungary Government Bond, 4.500%, 5/27/32 | $ 3,545,565 |
| | Total Hungary | $3,545,565 |
|
|
| | Indonesia — 0.3% | |
| IDR161,493,000,000 | Indonesia Treasury Bond, 6.875%, 4/15/29 | $ 9,980,089 |
| | Total Indonesia | $9,980,089 |
|
|
| | Philippines — 0.3% | |
| PHP576,400,000 | Philippine Government Bond, 6.750%, 9/15/32 | $ 10,217,580 |
| | Total Philippines | $10,217,580 |
|
|
| | Russia — 0.0%† | |
| RUB61,885,000(h)+# | Russian Federal Bond - OFZ, 7.700%, 3/23/33 | $ — |
| RUB59,074,000(h)+# | Russian Federal Bond - OFZ, 8.150%, 2/3/27 | — |
| | Total Russia | $— |
|
|
The accompanying notes are an integral part of these financial statements.
Pioneer Multi-Asset Income Fund | Annual Report | 7/31/2423
Schedule of Investments | 7/31/24 (continued)
Principal
Amount
USD ($) | | | | | | Value |
| | South Africa — 0.2% | |
| ZAR153,782,964 | Republic of South Africa Government Bond, 8.250%, 3/31/32 | $ 7,585,922 |
| | Total South Africa | $7,585,922 |
|
|
| | Trinidad — 0.0%† | |
| 2,113,000 | Trinidad & Tobago Government International Bond, 4.500%, 8/4/26 (144A) | $ 2,066,514 |
| | Total Trinidad | $2,066,514 |
|
|
| | Total Foreign Government Bonds
(Cost $36,153,495) | $33,395,670 |
|
|
| Shares | | | | | | |
| | Closed-End Fund — 0.3% of Net
Assets | |
| 3,897,472 | Aberdeen Asia-Pacific Income Fund, Inc. | $ 10,912,922 |
| | Total Closed-End Fund
(Cost $10,596,156) | $10,912,922 |
|
|
Principal
Amount
USD ($) | | | | | | |
| | Equity Linked Notes — 19.8% of Net
Assets | |
| | Air Freight & Logistics — 0.1% | |
| 40,700 | Mizuho Markets Cayman LP (United Parcel Service, Inc.), 10.05%, 2/7/25 | $ 5,430,581 |
| | Total Air Freight & Logistics | $5,430,581 |
|
|
| | Apparel Retail — 0.2% | |
| 13,600 | Mizuho Markets Cayman LP (Lululemon Athletica, Inc.), 12.10%, 4/30/25 | $ 3,848,922 |
| 8,200 | Wells Fargo Bank NA (Lululemon Athletica, Inc.), 11.03%, 4/10/25 | 2,349,874 |
| | Total Apparel Retail | $6,198,796 |
|
|
| | Banks — 2.3% | |
| 170,500 | BNP Paribas Issuance BV (Truist Financial Corp.), 14.02%, 11/26/24 (144A) | $ 5,986,765 |
| 63,200 | Canadian Imperial Bank of Commerce (eBay, Inc.), 9.80%, 6/17/25 | 3,410,872 |
| 102,200 | Canadian Imperial Bank of Commerce (Gilead Sciences, Inc.), 9.00%, 7/1/25 | 7,404,487 |
| 488,100 | Canadian Imperial Bank of Commerce (Lyft, Inc.), 21.85%, 7/1/25 | 6,437,697 |
The accompanying notes are an integral part of these financial statements.
24Pioneer Multi-Asset Income Fund | Annual Report | 7/31/24
Principal
Amount
USD ($) | | | | | | Value |
| | Banks — (continued) | |
| 82,100 | Canadian Imperial Bank of Commerce (Newmont Corp.), 12.92%, 6/17/25 | $ 3,707,472 |
| 205,900 | Canadian Imperial Bank of Commerce (Pinterest, Inc.), 14.80%, 5/12/25 | 7,123,975 |
| 25,300 | Royal Bank of Canada (Advanced Micro De), 9/24/24 (144A) | 3,642,315 |
| 602,700 | Royal Bank of Canada (Barrick Gold Corp.), 8/6/25 (144A) | 11,029,410 |
| 230,700 | Royal Bank of Canada (Newmont Corp.), 8/6/25 (144A) | 11,094,363 |
| 49,400 | Toronto-Dominion Bank (Advanced Micro Devices, Inc.), 16.43%, 6/6/25 | 7,750,366 |
| 236,800 | Toronto-Dominion Bank (PayPal Holdings, Inc.), 12.95%, 7/11/25 | 14,728,960 |
| | Total Banks | $82,316,682 |
|
|
| | Beverages — 0.6% | |
| 39,000 | BNP Paribas Issuance BV (Celsius Holdings, Inc.), 25.25%, 10/18/24 (144A) | $ 5,513,040 |
| 61,400 | Citigroup Global Markets Holdings, Inc. (Celsius Holdings), 23.44%, 7/9/25 (144A) | 3,133,549 |
| 54,500 | Citigroup Global Markets Holdings, Inc. (Celsius Holdings, Inc.), 21.55%, 1/30/25 (144A) | 2,548,965 |
| 54,500 | Goldman Sachs International (Celsius Holdings), 22.87%, 7/1/25 | 2,881,143 |
| 24,300 | Toronto-Dominion Bank (Celsius Holdings, Inc.), 21.30%, 10/22/24 | 3,449,871 |
| 170,600 | Toronto-Dominion Bank (DraftKings, Inc.), 18.43%, 10/27/25 | 6,044,358 |
| | Total Beverages | $23,570,926 |
|
|
| | Biotechnology — 0.1% | |
| 43,800 | Bank of America NA (Vaxcyte Ltd.), 21.37%, 3/25/25 | $ 2,917,956 |
| | Total Biotechnology | $2,917,956 |
|
|
| | Broadline Retail — 0.9% | |
| 81,900 | BNP Paribas Issuance BV (Alibaba Group Holding Ltd.), 14.24%, 2/7/25 (144A) | $ 6,312,033 |
| 101,200 | Canadian Imperial Bank of Commerce (Alibaba Group Holding Ltd.), 15.25%, 8/20/24 | 8,144,475 |
| 134,800 | Mizuho Markets Cayman LP (eBay, Inc.), 11.13%, 11/26/24 | 5,943,938 |
The accompanying notes are an integral part of these financial statements.
Pioneer Multi-Asset Income Fund | Annual Report | 7/31/2425
Schedule of Investments | 7/31/24 (continued)
Principal
Amount
USD ($) | | | | | | Value |
| | Broadline Retail — (continued) | |
| 78,500 | Wells Fargo Bank NA (Alibaba Group Holding Ltd.), 14.61%, 2/3/25 | $ 6,130,065 |
| 37,400 | Wells Fargo Bank NA (Amazon.com, Inc.), 10.07%, 1/30/25 | 6,151,178 |
| | Total Broadline Retail | $32,681,689 |
|
|
| | Communications Equipment — 0.0%† | |
| 106,500 | Mizuho Markets Cayman LP (Netgear, Inc.), 14.00%, 3/18/25 | $ 1,570,662 |
| | Total Communications Equipment | $1,570,662 |
|
|
| | Computer Hardware — 0.2% | |
| 102,700 | Wells Fargo Bank NA (Western Digital Corp.), 14.08%, 3/25/25 | $ 6,348,914 |
| | Total Computer Hardware | $6,348,914 |
|
|
| | Consumer Finance — 0.3% | |
| 78,900 | Mizuho Markets Cayman LP (Aercap Holdings NV), 9.28%, 11/26/24 | $ 5,896,236 |
| 79,200 | Mizuho Markets Cayman LP (Aercap Holdings NV), 9.65%, 8/8/24 | 5,636,664 |
| | Total Consumer Finance | $11,532,900 |
|
|
| | Containers & Packaging — 0.2% | |
| 132,000 | Mizuho Markets Cayman LP (Campbell Soup Company), 9.77%, 11/26/24 | $ 5,776,980 |
| | Total Containers & Packaging | $5,776,980 |
|
|
| | Credit Services — 2.1% | |
| 59,700 | Canadian Imperial Bank of Commerce (PayPal Holdings, Inc.), 14.15%, 8/14/24 | $ 3,962,349 |
| 70,700(i) | JP Morgan Structured Products BV (PayPal Holdings, Inc.), 13.47%, 12/11/24 | 4,337,452 |
| 143,000(i) | JP Morgan Structured Products BV (PayPal Holdings, Inc.), 14.13%, 11/13/24 | 8,449,269 |
| 96,000(i) | JP Morgan Structured Products BV (PayPal Holdings, Inc.), 14.43%, 2/13/25 | 6,118,051 |
| 95,000 | Mizuho Markets Cayman LP (PayPal Holdings, Inc.), 13.80%, 11/19/24 | 5,712,350 |
| 460,200 | Toronto-Dominion Bank (PayPal Holdings, Inc.), 14.97%, 10/22/24 | 28,571,517 |
| 104,000 | Wells Fargo Bank NA (PayPal Holdings, Inc.), 13.86%, 2/19/25 | 6,281,600 |
The accompanying notes are an integral part of these financial statements.
26Pioneer Multi-Asset Income Fund | Annual Report | 7/31/24
Principal
Amount
USD ($) | | | | | | Value |
| | Credit Services — (continued) | |
| 94,400 | Wells Fargo Bank NA (PayPal Holdings, Inc.), 14.28%, 2/7/25 | $ 6,055,760 |
| 86,000 | Wells Fargo Bank NA (PayPal Holdings, Inc.), 14.73%, 1/30/25 | 5,620,960 |
| | Total Credit Services | $75,109,308 |
|
|
| | Electrical Equipment — 0.1% | |
| 40,800 | Toronto-Dominion Bank (Generac Holdings, Inc.), 17.31%, 8/12/24 | $ 5,244,355 |
| | Total Electrical Equipment | $5,244,355 |
|
|
| | Electronic Equipment, Instruments &
Components — 0.2% | |
| 83,700 | Mizuho Markets Cayman LP (Vertiv Holdings Co.), 21.00%, 7/30/25 | $ 6,946,012 |
| | Total Electronic Equipment, Instruments & Components | $6,946,012 |
|
|
| | Footwear & Accessories — 0.1% | |
| 60,300 | BNP Paribas Issuance BV (Crocs, Inc.), 18.17%, 10/22/24 (144A) | $ 5,708,857 |
| | Total Footwear & Accessories | $5,708,857 |
|
|
| | Healthcare-Services — 0.9% | |
| 15,900 | Citigroup Global Markets Holdings, Inc. (Humana, Inc.), 9.58%, 2/11/25 (144A) | $ 5,673,518 |
| 67,200 | Merrill Lynch BV (The Cigna Group), 9.50%, 11/26/24 | 20,723,472 |
| 15,800 | Royal Bank of Canada (Humana, Inc.), 8.45%, 10/3/24 (144A) | 5,790,384 |
| | Total Healthcare-Services | $32,187,374 |
|
|
| | Household Products — 0.2% | |
| 76,100 | Mizuho Markets Cayman LP (The Estee Lauder Companies, Inc.), 15.50%, 11/12/24 | $ 7,634,352 |
| | Total Household Products | $7,634,352 |
|
|
| | Internet & Direct Marketing Retail — 0.7% | |
| 79,700 | Citigroup Global Markets Holdings, Inc. (Alibaba Group Holding Ltd.), 15.45%, 8/20/24 (144A) | $ 6,324,593 |
| 35,000 | Citigroup Global Markets Holdings, Inc. (Amazon.com, Inc.), 9.64%, 2/12/25 (144A) | 6,102,600 |
The accompanying notes are an integral part of these financial statements.
Pioneer Multi-Asset Income Fund | Annual Report | 7/31/2427
Schedule of Investments | 7/31/24 (continued)
Principal
Amount
USD ($) | | | | | | Value |
| | Internet & Direct Marketing Retail —
(continued) | |
| 130,800 | Mizuho Markets Cayman LP (eBay, Inc.), 10.97%, 3/10/25 | $ 6,637,054 |
| 34,400 | Toronto-Dominion Bank (Amazon.com, Inc.), 10.07%, 2/20/25 | 6,117,180 |
| | Total Internet & Direct Marketing Retail | $25,181,427 |
|
|
| | Internet Content & Information — 0.0%† | |
| 51,100 | Toronto-Dominion Bank (Trump Media & Technology Group), 122.50%, 8/20/24 | $ 1,629,835 |
| | Total Internet Content & Information | $1,629,835 |
|
|
| | IT Services — 0.2% | |
| 55,200 | Russian Commercial Bank (Advanced Micro Devices, Inc.), 17.40%, 11/8/24 (144A) | $ 5,887,908 |
| | Total IT Services | $5,887,908 |
|
|
| | Leisure Products — 0.2% | |
| 163,200 | BNP Paribas Issuance BV (Yeti Holdings, Inc.), 14.85%, 5/22/25 (144A) | $ 6,462,720 |
| | Total Leisure Products | $6,462,720 |
|
|
| | Machinery — 0.5% | |
| 117,800 | Citigroup Global Markets Holdings, Inc. (Generac Holdings, Inc.), 18.72%, 11/12/24 (144A) | $ 12,395,764 |
| 51,500 | Wells Fargo Bank NA (Generac Holdings, Inc.), 15.36%, 2/7/25 | 6,568,310 |
| | Total Machinery | $18,964,074 |
|
|
| | Medical Distribution — 0.2% | |
| 57,900 | Citigroup Global Markets Holdings, Inc. (Cardinal Health, Inc.), 7.79%, 2/11/25 (144A) | $ 5,812,581 |
| | Total Medical Distribution | $5,812,581 |
|
|
| | Metals & Mining — 2.9% | |
| 276,700 | Citigroup Global Markets Holdings, Inc. (Teck Resources Ltd.), 12.40%, 4/10/25 (144A) | $ 13,015,968 |
| 146,200 | Citigroup Global Markets Holdings, Inc. (Teck Resources Ltd.), 12.94%, 4/8/25 (144A) | 6,877,248 |
| 151,900 | Citigroup Global Markets Holdings, Inc. (Teck Resources Ltd.), 13.95%, 1/30/25 (144A) | 6,332,711 |
The accompanying notes are an integral part of these financial statements.
28Pioneer Multi-Asset Income Fund | Annual Report | 7/31/24
Principal
Amount
USD ($) | | | | | | Value |
| | Metals & Mining — (continued) | |
| 150,900 | Citigroup Global Markets Holdings, Inc. (Teck Resources Ltd.), 14.01%, 11/26/24 (144A) | $ 6,009,668 |
| 233,700(i) | JP Morgan Structured Products BV (Barrick Gold Corp.), 11.86%, 12/11/24 | 4,115,878 |
| 1,260,400(i) | JP Morgan Structured Products BV (Barrick Gold Corp.), 12.49%, 12/4/24 | 21,192,870 |
| 394,500 | Merrill Lynch BV (Barrick Gold Corp.), 11.83%, 6/5/25 | 6,996,457 |
| 401,300 | Merrill Lynch BV (Newmont Corp.), 12.96%, 6/5/25 | 18,168,857 |
| 150,600 | Merrill Lynch BV (Teck Resources Ltd.), 11.60%, 3/21/25 | 6,785,283 |
| 1,011,800 | Wells Fargo Bank NA (Barrick Gold Corp.), 11.98%, 3/21/25 | 17,180,364 |
| | Total Metals & Mining | $106,675,304 |
|
|
| | Oil, Gas & Consumable Fuels — 1.8% | |
| 573,400 | Canadian Imperial Bank of Commerce (Kosmos Energy Ltd.), 15.90%, 3/18/25 | $ 3,124,457 |
| 476,900 | Canadian Imperial Bank of Commerce (Marathon Oil Corp.), 13.40%, 9/24/24 | 13,398,792 |
| 160,900 | Canadian Imperial Bank of Commerce (Range Resources Corp.), 14.80%, 9/24/24 | 5,158,293 |
| 468,500 | Citigroup Global Markets Holdings, Inc. (Marathon Oil Corp.), 11.76%, 3/31/25 (144A) | 12,979,792 |
| 245,000 | Goldman Sachs International (Range Resources Corp.), 14.65%, 3/6/25 | 7,876,750 |
| 270,700(i) | JP Morgan Structured Products BV (Marathon Oil Corp.), 13.10%, 12/4/24 | 7,146,155 |
| 565,600 | Toronto-Dominion Bank (Kosmos Energy Ltd.), 16.70%, 3/25/25 | 3,192,812 |
| 79,000 | Toronto-Dominion Bank (Occidental Petroleum Corp.), 10.53%, 9/24/24 | 4,884,965 |
| 123,600 | Toronto-Dominion Bank (Occidental Petroleum Corp.), 12.15%, 10/22/24 | 7,713,876 |
| | Total Oil, Gas & Consumable Fuels | $65,475,892 |
|
|
| | Rental & Leasing Services — 0.5% | |
| 113,400 | Mizuho Markets Cayman LP (AerCap Holdings NV), 8.11%, 3/25/25 | $ 9,886,099 |
| 72,200 | Mizuho Markets Cayman LP (AerCap Holdings NV), 8.72%, 7/25/25 | 6,804,308 |
| | Total Rental & Leasing Services | $16,690,407 |
|
|
The accompanying notes are an integral part of these financial statements.
Pioneer Multi-Asset Income Fund | Annual Report | 7/31/2429
Schedule of Investments | 7/31/24 (continued)
Principal
Amount
USD ($) | | | | | | Value |
| | Semiconductors & Semiconductor
Equipment — 2.1% | |
| 219,000 | BNP Paribas Issuance BV (Allegro Microsystems, Inc.), 15.91%, 3/25/25 (144A) | $ 5,266,950 |
| 113,600 | BNP Paribas Issuance BV (Micron Technology, Inc.), 13.72%, 10/22/24 (144A) | 8,695,841 |
| 37,700 | BNP Paribas Issuance BV (Qualcomm, Inc.), 12.54%, 3/25/25 | 6,162,065 |
| 61,900 | Goldman Sachs International (Advanced Micro Devices, Inc.), 16.67%, 5/8/25 | 9,326,164 |
| 91,400 | HSBC Bank Plc (On Semiconductor Corp.), 8/7/25 | 7,216,487 |
| 88,500(i) | JP Morgan Structured Products BV (Advanced Micro Devices, Inc.), 15.36%, 12/5/24 | 11,186,435 |
| 48,700 | Merrill Lynch BV (Axcelis Technologies, Inc.), 15.81%, 7/11/25 | 6,461,760 |
| 71,000 | Mizuho Markets Cayman LP (Microchip Technology Incorporated), 12.53%, 4/30/25 | 6,185,662 |
| 51,800 | Wells Fargo Bank NA (Advanced Micro Devices, Inc.), 16.15%, 1/28/25 | 7,747,208 |
| 56,000 | Wells Fargo Bank NA (Qualcomm Incorporated), 12.16%, 4/10/25 | 9,492,560 |
| | Total Semiconductors & Semiconductor Equipment | $77,741,132 |
|
|
| | Software — 1.5% | |
| 102,000 | BNP Paribas Issuance BV (Uber Technologies, Inc.), 13.77%, 5/22/25 (144A) | $ 6,508,620 |
| 84,700 | Canadian Imperial Bank of Commerce (Zoom Video Communications, Inc.), 14.20% (N/A + 0 bps), 12/4/24 | 5,331,509 |
| 76,400 | Citigroup Global Markets Holdings, Inc. (Uber Technologies, Inc.), 13.89%, 2/25/25 (144A) | 5,194,818 |
| 112,600 | Goldman Sachs International (Affirm Holdings, Inc.), 27.61%, 7/1/25 | 3,258,644 |
| 217,200 | Goldman Sachs International (Affirm Holdings, Inc.), 28.05%, 6/2/25 | 6,416,088 |
| 161,600(i) | JP Morgan Structured Products BV (Zoom Video Communications, Inc.), 13.02%, 3/7/25 | 10,307,915 |
| 57,300 | Mizuho Markets Cayman LP (Zoom Video Communications, Inc.), 7/30/25 | 3,293,976 |
The accompanying notes are an integral part of these financial statements.
30Pioneer Multi-Asset Income Fund | Annual Report | 7/31/24
Principal
Amount
USD ($) | | | | | | Value |
| | Software — (continued) | |
| 111,500 | Wells Fargo Bank NA (Zoom Video Communications, Inc.), 11.58%, 6/10/25 | $ 6,741,290 |
| 93,100 | Wells Fargo Bank NA (Zoom Video Communications, Inc.), 12.36%, 3/18/25 | 5,848,542 |
| | Total Software | $52,901,402 |
|
|
| | Speciality Chemicals — 0.2% | |
| 27,600 | Goldman Sachs International (Air Products and Chemicals, Inc.), 9.96%, 4/29/25 | $ 6,778,146 |
| | Total Speciality Chemicals | $6,778,146 |
|
|
| | Speciality Industrial Machinery — 0.5% | |
| 78,200 | Wells Fargo Bank NA (Generac Holdings Inc.), 15.00%, 2/25/25 | $ 10,284,864 |
| 51,000 | Wells Fargo Bank NA (Generac Holdings, Inc.), 15.50%, 4/10/25 | 7,021,680 |
| | Total Speciality Industrial Machinery | $17,306,544 |
|
|
| | Total Equity Linked Notes
(Cost $713,934,029) | $718,683,716 |
|
|
| | U.S. Government and Agency
Obligations — 11.7% of Net Assets | |
| 3,351,636 | Federal Home Loan Mortgage Corp., 2.500%, 2/1/51 | $ 2,873,244 |
| 3,979,274 | Federal Home Loan Mortgage Corp., 2.500%, 7/1/51 | 3,406,872 |
| 1,682,555 | Federal Home Loan Mortgage Corp., 2.500%, 11/1/51 | 1,439,967 |
| 492,791 | Federal Home Loan Mortgage Corp., 2.500%, 2/1/52 | 421,544 |
| 585,843 | Federal Home Loan Mortgage Corp., 3.000%, 8/1/50 | 521,701 |
| 1,754,230 | Federal Home Loan Mortgage Corp., 3.000%, 8/1/50 | 1,567,262 |
| 2,154,375 | Federal Home Loan Mortgage Corp., 3.000%, 8/1/52 | 1,915,912 |
| 8,574,369 | Federal Home Loan Mortgage Corp., 4.500%, 10/1/53 | 8,352,206 |
| 7,560,153 | Federal Home Loan Mortgage Corp., 5.000%, 5/1/53 | 7,458,800 |
| 7,037,108 | Federal Home Loan Mortgage Corp., 5.500%, 8/1/52 | 7,069,553 |
| 8,299,796 | Federal Home Loan Mortgage Corp., 5.500%, 4/1/53 | 8,317,899 |
| 2,460,839 | Federal Home Loan Mortgage Corp., 5.500%, 4/1/53 | 2,468,275 |
The accompanying notes are an integral part of these financial statements.
Pioneer Multi-Asset Income Fund | Annual Report | 7/31/2431
Schedule of Investments | 7/31/24 (continued)
Principal
Amount
USD ($) | | | | | | Value |
| | U.S. Government and Agency
Obligations — (continued) | |
| 17,642,519 | Federal Home Loan Mortgage Corp., 5.500%, 6/1/53 | $ 17,704,407 |
| 19,714,769 | Federal Home Loan Mortgage Corp., 5.500%, 6/1/53 | 19,768,332 |
| 17,149,631 | Federal Home Loan Mortgage Corp., 5.500%, 7/1/53 | 17,176,170 |
| 13,475,702 | Federal Home Loan Mortgage Corp., 5.500%, 9/1/53 | 13,530,035 |
| 23,388,731 | Federal Home Loan Mortgage Corp., 5.500%, 10/1/53 | 23,480,315 |
| 4,719,765 | Federal Home Loan Mortgage Corp., 5.500%, 12/1/53 | 4,735,068 |
| 2,220,400 | Federal Home Loan Mortgage Corp., 6.500%, 9/1/53 | 2,293,041 |
| 1,402,007 | Federal Home Loan Mortgage Corp., 6.500%, 9/1/53 | 1,452,033 |
| 7,912,350 | Federal Home Loan Mortgage Corp., 6.500%, 10/1/53 | 8,134,804 |
| 7,756,773 | Federal Home Loan Mortgage Corp., 6.500%, 10/1/53 | 8,032,066 |
| 6,661,075 | Federal National Mortgage Association, 2.500%, 8/1/50 | 5,731,732 |
| 7,740,731 | Federal National Mortgage Association, 2.500%, 5/1/51 | 6,635,405 |
| 15,960,747 | Federal National Mortgage Association, 2.500%, 11/1/51 | 13,704,202 |
| 7,108,561 | Federal National Mortgage Association, 2.500%, 11/1/51 | 6,100,698 |
| 316,112 | Federal National Mortgage Association, 2.500%, 1/1/52 | 270,535 |
| 9,513,479 | Federal National Mortgage Association, 2.500%, 2/1/52 | 8,127,762 |
| 347,328 | Federal National Mortgage Association, 3.000%, 4/1/51 | 308,679 |
| 10,498,962 | Federal National Mortgage Association, 3.000%, 11/1/51 | 9,291,773 |
| 11,666,205 | Federal National Mortgage Association, 4.500%, 5/1/53 | 11,295,600 |
| 14,350,641 | Federal National Mortgage Association, 5.000%, 4/1/53 | 14,135,721 |
| 12,216,543 | Federal National Mortgage Association, 5.000%, 8/1/53 | 12,184,437 |
| 6,174,576 | Federal National Mortgage Association, 5.500%, 8/1/52 | 6,185,510 |
The accompanying notes are an integral part of these financial statements.
32Pioneer Multi-Asset Income Fund | Annual Report | 7/31/24
Principal
Amount
USD ($) | | | | | | Value |
| | U.S. Government and Agency
Obligations — (continued) | |
| 845,933 | Federal National Mortgage Association, 5.500%, 4/1/53 | $ 847,091 |
| 20,298,187 | Federal National Mortgage Association, 5.500%, 8/1/53 | 20,352,590 |
| 10,677,872 | Federal National Mortgage Association, 5.500%, 8/1/53 | 10,708,688 |
| 7,926,239 | Federal National Mortgage Association, 5.500%, 9/1/53 | 7,940,221 |
| 28,598,747 | Federal National Mortgage Association, 5.500%, 9/1/53 | 28,671,348 |
| 34,186,783 | Federal National Mortgage Association, 5.500%, 9/1/53 | 34,295,875 |
| 28,446,372 | Federal National Mortgage Association, 5.500%, 10/1/53 | 28,513,092 |
| 1,884,911 | Federal National Mortgage Association, 5.500%, 1/1/54 | 1,891,835 |
| 2,575,403 | Federal National Mortgage Association, 5.500%, 2/1/54 | 2,587,018 |
| 224,956 | Federal National Mortgage Association, 6.500%, 2/1/53 | 230,743 |
| 3,303,655 | Federal National Mortgage Association, 6.500%, 7/1/53 | 3,442,030 |
| 3,614,314 | Federal National Mortgage Association, 6.500%, 7/1/53 | 3,769,176 |
| 5,010,741 | Federal National Mortgage Association, 6.500%, 9/1/53 | 5,217,198 |
| 4,967,028 | Federal National Mortgage Association, 6.500%, 9/1/53 | 5,160,921 |
| 4,283,114 | Federal National Mortgage Association, 6.500%, 9/1/53 | 4,476,404 |
| 7,318,564 | Federal National Mortgage Association, 6.500%, 10/1/53 | 7,582,604 |
| | Total U.S. Government and Agency Obligations
(Cost $414,885,670) | $421,778,394 |
|
|
The accompanying notes are an integral part of these financial statements.
Pioneer Multi-Asset Income Fund | Annual Report | 7/31/2433
Schedule of Investments | 7/31/24 (continued)
Principal
Amount
USD ($) | | | | | | Value |
|
| | SHORT TERM INVESTMENTS — 3.0% of
Net Assets | |
| | Repurchase Agreements — 2.5% | |
| 67,500,000 | Bank of America, 5.33%, dated 7/31/2024,
to be purchased on 8/1/2024 for $67,509,994,
collateralized by the following:
$66,360,665, U.S. Treasury Bond,
2.75%, 11/15/2042,
$1,268,437, U.S. Treasury Strip Coupon, 5/15/2045,
$1,220,899, U.S. Treasury Strip Principal, 11/15/2042 | $ 67,500,000 |
| 25,810,000 | Bank of America, 5.34%, dated 7/31/2024,
to be purchased on 8/1/2024 for $25,813,828,
collateralized by the following:
$24,815,019, Federal Home Loan Mortgage Corporation, 4.51%–6.27%, 4/1/2046-5/1/2054,
$1,511,183, Federal National Mortgage Association, 3.70%, 9/1/2034 | 25,810,000 |
| | | | | | | $93,310,000 |
|
|
| | Foreign Treasury Obligations — 0.3% | |
| EGP605,475,000(i)(j) | Egypt Treasury Bills, 25.951%, 6/3/25 | $ 10,224,481 |
| | | | | | | $10,224,481 |
|
|
| Shares | | | | | | |
| | Open-End Fund — 0.2% | |
| 7,130,754(k) | Dreyfus Government Cash Management,
Institutional Shares, 5.21% | $ 7,130,754 |
| | | | | | | $7,130,754 |
|
|
| | TOTAL SHORT TERM INVESTMENTS
(Cost $111,033,867) | $110,665,235 |
|
|
| | TOTAL INVESTMENTS IN UNAFFILIATED ISSUERS — 98.6%
(Cost $3,245,625,136) | $3,573,974,595 |
| | OTHER ASSETS AND LIABILITIES — 1.4% | $49,745,690 |
| | net assets — 100.0% | $3,623,720,285 |
| | | | | | | |
The accompanying notes are an integral part of these financial statements.
34Pioneer Multi-Asset Income Fund | Annual Report | 7/31/24
| (A.D.R.) | American Depositary Receipts. |
| (C.V.A.) | Certificaaten van aandelen (Share Certificates). |
| (G.D.R.) | Global Depositary Receipts. |
| bps | Basis Points. |
| CMT | Constant Maturity Treasury Index. |
| REIT | Real Estate Investment Trust. |
| SOFR | Secured Overnight Financing Rate. |
| SOFR30A | Secured Overnight Financing Rate 30 Day Average. |
| (144A) | The resale of such security is exempt from registration under Rule 144A of the Securities Act of 1933. Such securities may be resold normally to qualified institutional buyers. At July 31, 2024, the value of these securities amounted to $746,877,623, or 20.6% of net assets. |
| (a) | Floating rate note. Coupon rate, reference index and spread shown at July 31, 2024. |
| (b) | Non-income producing security. |
| (c) | Debt obligation initially issued at one coupon which converts to a higher coupon at a specific date. The rate shown is the rate at July 31, 2024. |
| (d) | The interest rate is subject to change periodically. The interest rate and/or reference index and spread shown at July 31, 2024. |
| (e) | Security is perpetual in nature and has no stated maturity date. |
| (f) | Issued as participation notes. |
| (g) | Issued as preference shares. |
| (h) | Security is in default. |
| (i) | Security issued with a zero coupon. Income is recognized through accretion of discount. |
| (j) | Rate shown represents yield-to-maturity. |
| (k) | Rate periodically changes. Rate disclosed is the 7-day yield at July 31, 2024. |
| * | Senior secured floating rate loan interests in which the Fund invests generally pay interest at rates that are periodically re-determined by reference to a base lending rate plus a premium. These base lending rates are generally (i) the lending rate offered by one or more major European banks, such as LIBOR or SOFR, (ii) the prime rate offered by one or more major United States banks, (iii) the rate of a certificate of deposit or (iv) other base lending rates used by commercial lenders. The interest rate shown is the rate accruing at July 31, 2024. |
| + | Security is valued using significant unobservable inputs (Level 3). |
| † | Amount rounds to less than 0.1%. |
| # | Securities are restricted as to resale. |
| Restricted Securities | Acquisition date | Cost | Value |
| Alamo Re | 4/12/2023 | $1,500,000 | $1,501,500 |
| Alamo Re | 4/4/2024 | 500,000 | 506,005 |
| Alamo Re | 4/4/2024 | 250,000 | 250,723 |
| Alturas Re 2021-3 | 7/1/2021 | 104,510 | 44,900 |
| Alturas Re 2022-2 | 4/11/2023 | — | 1,967 |
The accompanying notes are an integral part of these financial statements.
Pioneer Multi-Asset Income Fund | Annual Report | 7/31/2435
Schedule of Investments | 7/31/24 (continued)
| Restricted Securities | Acquisition date | Cost | Value |
| Aquila Re | 5/10/2023 | $500,000 | $510,000 |
| Aquila Re | 5/10/2023 | 250,000 | 256,250 |
| Aquila Re | 4/26/2024 | 500,000 | 497,252 |
| Atlas Capital | 5/17/2023 | 1,250,000 | 1,251,375 |
| Atlas Re | 5/24/2024 | 750,000 | 795,000 |
| Bantry Re 2021 | 1/11/2021 | — | 7,500 |
| Bantry Re 2024 | 2/1/2024 | 3,952,974 | 4,317,930 |
| Berwick Re 2024-1 | 1/10/2024 | 1,500,000 | 1,591,224 |
| Blue Ridge Re | 11/14/2023 | 750,000 | 742,500 |
| Blue Ridge Re | 11/14/2023 | 1,250,000 | 1,254,263 |
| Bonanza Re | 12/15/2020 | 500,000 | 486,225 |
| Bonanza Re | 1/6/2023 | 250,000 | 252,000 |
| Bonanza Re | 7/25/2023 | 232,003 | 229,477 |
| Cape Lookout Re | 4/14/2023 | 1,752,749 | 1,767,500 |
| Cape Lookout Re | 3/12/2024 | 500,000 | 500,575 |
| Carnoustie Re 2023 | 2/15/2023 | — | 187,207 |
| Carnoustie Re 2024 | 1/17/2024 | 2,500,000 | 2,666,891 |
| Cat Re 2001 | 11/14/2023 | 750,000 | 739,125 |
| Citrus Re | 4/27/2023 | 1,000,000 | 1,010,900 |
| Cypress Re 2017 | 1/24/2017 | 2,353 | 70 |
| Easton Re | 5/16/2024 | 493,012 | 489,250 |
| Eccleston Re 2023 | 7/13/2023 | — | 231,800 |
| Eden Re II | 12/14/2020 | 27,554 | 8,873 |
| Eden Re II | 1/25/2021 | 39,873 | 15,188 |
| First Coast Re | 3/24/2023 | 1,000,000 | 1,008,600 |
| First Coast Re III Pte | 3/4/2021 | 1,250,000 | 1,198,250 |
| FloodSmart Re | 2/23/2023 | 1,000,000 | 988,840 |
| FloodSmart Re | 2/29/2024 | 1,500,000 | 1,494,000 |
| Four Lakes Re | 12/22/2022 | 250,000 | 254,475 |
| Four Lakes Re | 12/8/2023 | 250,000 | 247,950 |
| Four Lakes Re | 12/8/2023 | 250,000 | 254,100 |
| Galileo Re | 12/4/2023 | 1,254,714 | 1,260,375 |
| Galileo Re | 12/4/2023 | 250,000 | 251,100 |
| Gamboge Re | 4/20/2023 | — | 35,402 |
| Gamboge Re | 5/9/2024 | 3,490,628 | 3,725,442 |
| Gateway Re | 2/3/2023 | 600,000 | 617,796 |
| Gateway Re | 3/11/2024 | 250,000 | 249,775 |
| Gateway Re | 3/11/2024 | 239,903 | 234,250 |
| Gateway Re | 6/24/2024 | 216,659 | 216,134 |
| Gleneagles Re 2021 | 1/13/2021 | 9,150 | 50 |
| Gullane Re 2024 | 2/14/2024 | 2,907,777 | 3,058,124 |
| Harambee Re 2019 | 12/20/2018 | — | 3,150 |
| Herbie Re | 10/19/2020 | 500,000 | 472,200 |
| High Point Re | 12/1/2023 | 2,000,000 | 2,004,400 |
| Integrity Re | 3/23/2023 | 2,000,000 | 2,011,860 |
The accompanying notes are an integral part of these financial statements.
36Pioneer Multi-Asset Income Fund | Annual Report | 7/31/24
| Restricted Securities | Acquisition date | Cost | Value |
| International Bank for Reconstruction & Development | 4/3/2024 | $250,000 | $246,525 |
| International Bank for Reconstruction & Development | 5/1/2024 | 250,000 | 253,175 |
| Isosceles Re 2024 | 7/9/2024 | 927,062 | 951,300 |
| Isosceles Re 2024 | 7/9/2024 | 469,761 | 479,250 |
| Isosceles Re 2024 | 7/9/2024 | 237,105 | 241,075 |
| Kendall Re | 4/22/2024 | 1,000,000 | 1,020,000 |
| Kilimanjaro II Re | 6/24/2024 | 250,000 | 252,050 |
| Kilimanjaro II Re | 6/24/2024 | 750,000 | 757,200 |
| Kilimanjaro III Re | 4/8/2021 | 250,000 | 236,150 |
| Kilimanjaro III Re | 4/8/2021 | 250,000 | 230,060 |
| Kilimanjaro III Re | 4/8/2021 | 250,000 | 244,900 |
| Lightning Re | 3/20/2023 | 2,022,690 | 2,021,000 |
| Lion Rock Re 2021 | 12/30/2020 | 65,784 | 11,000 |
| Locke Tavern Re | 3/23/2023 | 1,300,000 | 1,292,460 |
| LUKOIL PJSC | 4/3/2020 | 3,354,083 | — |
| Magnit PJSC | 4/15/2020 | 12,536,598 | — |
| Mangrove Risk Solutions | 6/17/2024 | 224,653 | 230,675 |
| Marlon Re | 5/24/2024 | 250,000 | 249,750 |
| Mayflower Re | 6/21/2024 | 1,000,000 | 1,000,400 |
| Merion Re 2021-2 | 12/28/2020 | 544,188 | 120,000 |
| Merion Re 2024-1 | 1/11/2024 | 843,568 | 939,532 |
| Merna Re II | 4/5/2023 | 1,300,000 | 1,322,750 |
| Merna Re II | 4/5/2023 | 1,600,000 | 1,611,360 |
| Merna Re II | 5/8/2024 | 750,000 | 750,225 |
| Merna Re II | 5/8/2024 | 750,000 | 744,825 |
| Merna Re II | 5/8/2024 | 1,500,000 | 1,488,750 |
| Mona Lisa Re | 6/22/2021 | 500,000 | 482,650 |
| Mona Lisa Re | 12/30/2022 | 1,000,000 | 1,026,100 |
| Mystic Re | 12/12/2023 | 1,747,541 | 1,754,200 |
| Mystic Re IV | 6/9/2021 | 1,749,722 | 1,717,625 |
| Mystic Re IV | 6/9/2021 | 500,000 | 479,850 |
| Oakmont Re 2024 | 5/23/2024 | 1,331,036 | 1,428,306 |
| Old Head Re 2024 | 1/5/2024 | 183,891 | 229,764 |
| Palm Re | 4/4/2024 | 250,000 | 248,400 |
| Pangaea Re 2024-1 | 2/27/2024 | 2,500,000 | 2,697,478 |
| Pangaea Re 2024-3 | 7/26/2024 | 3,000,000 | 3,045,000 |
| PI0047 2024-1 | 1/26/2024 | 5,232,987 | 5,561,560 |
| PI0048 RE 2024 | 6/12/2024 | 2,527,350 | 2,745,704 |
| PI0049 Aberystwyth | 7/1/2024 | 1,968,187 | 2,034,086 |
| PI0051-Cheltenham Re 2024 | 7/1/2024 | 786,503 | 827,651 |
| Pine Valley Re 2024 | 1/17/2024 | 414,596 | 465,390 |
| Purple Re | 4/2/2024 | 500,000 | 494,500 |
| Queen Street Re | 5/12/2023 | 1,500,000 | 1,504,800 |
| Residential Re | 10/30/2020 | 1,000,742 | 962,600 |
The accompanying notes are an integral part of these financial statements.
Pioneer Multi-Asset Income Fund | Annual Report | 7/31/2437
Schedule of Investments | 7/31/24 (continued)
| Restricted Securities | Acquisition date | Cost | Value |
| Residential Re | 10/28/2021 | $500,000 | $462,100 |
| Residential Re | 10/28/2021 | 750,000 | 699,675 |
| Residential Re | 11/22/2022 | 500,000 | 499,800 |
| Residential Re | 1/17/2023 | 246,778 | 238,525 |
| Residential Re | 11/7/2023 | 1,250,000 | 1,206,125 |
| Residential Re | 11/7/2023 | 750,000 | 751,725 |
| Rosneft Oil Co. PJSC | 12/6/2019 | 9,625,119 | — |
| Russian Federal Bond - OFZ | 9/14/2021 | 836,485 | — |
| Russian Federal Bond - OFZ | 9/14/2021 | 888,826 | — |
| Sakura Re | 3/24/2021 | 500,000 | 497,600 |
| Sanders Re | 5/24/2023 | 650,000 | 666,835 |
| Sanders Re | 1/16/2024 | 750,000 | 763,500 |
| Sanders Re II | 5/24/2021 | 1,250,000 | 1,226,125 |
| Sanders Re III | 2/14/2023 | 766,584 | 772,480 |
| Sanders Re III | 3/24/2023 | 1,600,000 | 1,608,320 |
| Sector Re V | 12/4/2023 | 3,000,000 | 3,567,585 |
| Solomon Re | 6/12/2023 | 250,000 | 251,950 |
| Sussex Re | 1/27/2023 | 292,281 | 291,600 |
| Sutter Re | 6/6/2023 | 500,000 | 514,500 |
| Thopas Re 2020 | 2/5/2020 | — | 200 |
| Thopas Re 2021 | 12/30/2020 | — | 15,600 |
| Thopas Re 2023 | 2/13/2023 | — | — |
| Thopas Re 2024 | 2/2/2024 | 2,500,000 | 2,831,000 |
| Topanga Re | 10/5/2023 | 234,468 | 239,975 |
| Torrey Pines Re | 5/17/2024 | 250,000 | 254,225 |
| Torrey Pines Re | 5/17/2024 | 250,000 | 255,750 |
| Torricelli Re 2021 | 7/1/2021 | — | 7,500 |
| Torricelli Re 2023 | 7/19/2023 | — | 33,250 |
| Torricelli Re 2024 | 7/25/2024 | 3,000,000 | 3,077,430 |
| Ursa Re | 4/12/2023 | 1,000,000 | 1,013,000 |
| Viribus Re 2019 | 12/27/2018 | — | — |
| Viribus Re 2020 | 3/12/2020 | 101,920 | 33,200 |
| Viribus Re 2023 | 1/8/2023 | — | 409,800 |
| Viribus Re 2024 | 3/19/2024 | 333,333 | 401,766 |
| Vitality Re XIII | 3/6/2023 | 1,708,190 | 1,738,450 |
| Vitality Re XIV | 1/25/2023 | 3,250,000 | 3,298,750 |
| Vitality Re XIV | 1/25/2023 | 600,000 | 612,360 |
| Walton Health Re 2019 | 7/18/2019 | — | 62,964 |
| Walton Heath Re 2021 | 6/28/2021 | 39,019 | 19 |
| White Heron Re | 8/30/2023 | — | 65,071 |
| Woburn Re 2019 | 1/30/2019 | 68,648 | 82,591 |
| X5 Retail Group NV (G.D.R.) | 9/17/2020 | 1,738,218 | — |
| Total Restricted Securities | | | $114,551,165 |
| % of Net assets | | | 3.2% |
The accompanying notes are an integral part of these financial statements.
38Pioneer Multi-Asset Income Fund | Annual Report | 7/31/24
FORWARD FOREIGN CURRENCY EXCHANGE CONTRACTS
Currency
Purchased | In
Exchange for | Currency
Sold | Deliver | Counterparty | Settlement
Date | Unrealized
Appreciation |
| TRY | 455,000,000 | USD | 10,520,447 | Goldman Sachs & Co. | 1/30/25 | $765,070 |
| USD | 31,082,227 | CNY | 220,000,000 | JPMorgan Chase Bank NA | 8/22/24 | 355,836 |
| USD | 66,096,314 | EUR | 60,573,468 | State Street Bank & Trust Co. | 10/25/24 | 270,634 |
| TOTAL FORWARD FOREIGN CURRENCY EXCHANGE CONTRACTS | $1,391,540 |
FUTURES CONTRACTS
INDEX FUTURES CONTRACTS
Number of
Contracts
Long | Description | Expiration
Date | Notional
Amount | Market
Value | Unrealized
Appreciation |
| 1,663 | U.S. 2 Year Note (CBT) | 9/30/24 | $341,464,697 | $341,525,634 | $60,937 |
Number of
Contracts
Short | Description | Expiration
Date | Notional
Amount | Market
Value | Unrealized
Appreciation
(Depreciation) |
| 280 | NASDAQ 100 E-Mini | 9/20/24 | $(111,699,678) | $(109,229,400) | $2,470,278 |
| 1,706 | S&P500 E-Mini | 9/20/24 | (469,383,893) | (474,097,400) | (4,713,507) |
| | | | $(581,083,571) | $(583,326,800) | $(2,243,229) |
| TOTAL FUTURES CONTRACTS | $(239,618,874) | $(241,801,166) | $(2,182,292) |
| CBT | Chicago Board of Trade. |
Principal amounts are denominated in U.S. dollars (“USD”) unless otherwise noted.
| CNY | — China Yuan Renminbi |
| EGP | — Egypt Pound |
| EUR | — Euro |
| HUF | — Hungary Forint |
| IDR | — Indonesian Rupiah |
| PHP | — Philippines Peso |
| RUB | — Russia Ruble |
| TRY | — Turkish Lira |
| USD | — United States Dollar |
| ZAR | — South Africa Rand |
The accompanying notes are an integral part of these financial statements.
Pioneer Multi-Asset Income Fund | Annual Report | 7/31/2439
Schedule of Investments | 7/31/24 (continued)
Purchases and sales of securities (excluding short-term investments and all derivative contracts except for options purchased) for the year ended July 31, 2024 were as follows:
| | Purchases | Sales |
| Long-Term U.S. Government Securities | $120,561,677 | $335,372,407 |
| Other Long-Term Securities | $2,426,218,645 | $1,447,931,747 |
At July 31, 2024, the net unrealized appreciation on investments based on cost for federal tax purposes of $3,276,863,901 was as follows:
| Aggregate gross unrealized appreciation for all investments in which there is an excess of value over tax cost | $438,491,135 |
| Aggregate gross unrealized depreciation for all investments in which there is an excess of tax cost over value | (141,208,763) |
| Net unrealized appreciation | $297,282,372 |
Various inputs are used in determining the value of the Fund’s investments. These inputs are summarized in the three broad levels below.
| Level 1 | – | unadjusted quoted prices in active markets for identical securities. |
| Level 2 | – | other significant observable inputs (including quoted prices for similar securities, interest rates, prepayment speeds, credit risks, etc.). See Notes to Financial Statements — Note 1A. |
| Level 3 | – | significant unobservable inputs (including the Adviser’s own assumptions in determining fair value of investments). See Notes to Financial Statements — Note 1A. |
The following is a summary of the inputs used as of July 31, 2024 in valuing the Fund’s investments:
| | Level 1 | Level 2 | Level 3 | Total |
| Senior Secured Floating Rate Loan Interests | $— | $10,251,321 | $— | $10,251,321 |
| Common Stocks | | | | |
| Construction & Engineering | — | 16,324 | — | 16,324 |
| Consumer Staples Distribution & Retail | — | — | —* | —* |
| Oil, Gas & Consumable Fuels | 284,342,585 | — | —* | 284,342,585 |
| All Other Common Stocks | 1,370,838,463 | — | — | 1,370,838,463 |
| Asset Backed Securities | — | 97,440,588 | 180,000 | 97,620,588 |
| Collateralized Mortgage Obligations | — | 105,852,719 | — | 105,852,719 |
| Commercial Mortgage-Backed Securities | — | 30,124,402 | — | 30,124,402 |
| Convertible Corporate Bonds | — | 28,954,848 | — | 28,954,848 |
The accompanying notes are an integral part of these financial statements.
40Pioneer Multi-Asset Income Fund | Annual Report | 7/31/24
| | Level 1 | Level 2 | Level 3 | Total |
| Corporate Bonds | $— | $235,515,576 | $— | $235,515,576 |
| Rights/Warrants | — | 470,667 | — | 470,667 |
| Insurance-Linked Securities | | | | |
| Collateralized Reinsurance | | | | |
| Multiperil – U.S. | — | — | 6,655,288 | 6,655,288 |
| Multiperil – Worldwide | — | — | 5,423,181 | 5,423,181 |
| Windstorm – North Carolina | — | — | 1,671,625 | 1,671,625 |
| Windstorm – U.S. | — | — | 4,779,790 | 4,779,790 |
| Windstorm – U.S. Multistate | — | — | 65,071 | 65,071 |
| Windstorm – U.S. Regional | — | — | 1,428,306 | 1,428,306 |
| Reinsurance Sidecars | | | | |
| Multiperil – U.S. | — | — | 190,357 | 190,357 |
| Multiperil – Worldwide | — | — | 28,277,847 | 28,277,847 |
| All Other Insurance-Linked Securities | — | 66,059,700 | — | 66,059,700 |
| Foreign Government Bonds | | | | |
| Russia | — | — | —* | —* |
| All Other Foreign Government Bonds | — | 33,395,670 | — | 33,395,670 |
| Closed-End Fund | 10,912,922 | — | — | 10,912,922 |
| Equity Linked Notes | — | 718,683,716 | — | 718,683,716 |
| U.S. Government and Agency Obligations | — | 421,778,394 | — | 421,778,394 |
| Repurchase Agreements | — | 93,310,000 | — | 93,310,000 |
| Foreign Treasury Obligations | — | 10,224,481 | — | 10,224,481 |
| Open-End Fund | 7,130,754 | — | — | 7,130,754 |
| Total Investments in Securities | $1,673,224,724 | $1,852,078,406 | $48,671,465 | $3,573,974,595 |
| Other Financial Instruments | | | | |
| Net unrealized appreciation on forward foreign currency exchange contracts | $— | $1,391,540 | $— | $1,391,540 |
| Net unrealized depreciation on futures contracts | (2,182,292) | — | — | (2,182,292) |
| Total Other Financial Instruments | $(2,182,292) | $1,391,540 | $— | $(790,752) |
| * | Securities valued at $0. |
Transfers are calculated on the beginning of period values. During the year ended July 31, 2024, a security valued at $200,250 was transferred from Level 2 to Level 3, due to valuing the security using unobservable inputs. There were no other transfers in or out of Level 3 during the period.
The accompanying notes are an integral part of these financial statements.
Pioneer Multi-Asset Income Fund | Annual Report | 7/31/2441
Statement of Assets and Liabilities | 7/31/24
| ASSETS: | |
| Investments in unaffiliated issuers, at value (cost $3,245,625,136) | $3,573,974,595 |
| Foreign currencies, at value (cost $3,400,723) | 3,406,729 |
| Futures collateral | 23,182,470 |
| Due from broker for futures | 12,132,624 |
| Unrealized appreciation on forward foreign currency exchange contracts | 1,391,540 |
| Receivables — | |
| Investment securities sold | 22,311,815 |
| Fund shares sold | 11,570,620 |
| Dividends | 5,230,108 |
| Interest | 12,841,722 |
| Other assets | 49,085 |
| Total assets | $3,666,091,308 |
| LIABILITIES: | |
| Overdraft due to custodian | $943,266 |
| Payables — | |
| Investment securities purchased | 18,010,912 |
| Fund shares repurchased | 10,386,111 |
| Distributions | 239,481 |
| Trustees’ fees | 15,500 |
| Collateral due to broker for forward foreign currency exchange contracts | 1,100,000 |
| Variation margin for futures contracts | 10,362,621 |
| Management fees | 226,708 |
| Administrative expenses | 51,590 |
| Distribution fees | 66,760 |
| Accrued expenses | 968,074 |
| Total liabilities | $42,371,023 |
| NET ASSETS: | |
| Paid-in capital | $3,627,942,488 |
| Distributable earnings (loss) | (4,222,203) |
| Net assets | $3,623,720,285 |
| NET ASSET VALUE PER SHARE: | |
| No par value (unlimited number of shares authorized) | |
| Class A (based on $639,409,645/54,461,362 shares) | $11.74 |
| Class C (based on $334,211,091/28,580,224 shares) | $11.69 |
| Class K (based on $132,610,097/10,986,803 shares) | $12.07 |
| Class R (based on $1,069,543/91,148 shares) | $11.73 |
| Class Y (based on $2,516,419,909/215,168,035 shares) | $11.70 |
| MAXIMUM OFFERING PRICE PER SHARE: | |
| Class A (based on $11.74 net asset value per share/100%-4.50% maximum sales charge) | $12.29 |
The accompanying notes are an integral part of these financial statements.
42Pioneer Multi-Asset Income Fund | Annual Report | 7/31/24
Statement of Operations FOR THE YEAR ENDED 7/31/24
| INVESTMENT INCOME: | | |
| Interest from unaffiliated issuers (net of foreign taxes withheld $(25,565)) | $153,680,209 | |
| Dividends from unaffiliated issuers (net of foreign taxes withheld $4,341,612) | 65,041,012 | |
| Total Investment Income | | $218,721,221 |
| EXPENSES: | | |
| Management fees | $13,905,080 | |
| Administrative expenses | 634,381 | |
| Transfer agent fees | | |
| Class A | 217,856 | |
| Class C | 160,578 | |
| Class K | 77 | |
| Class R | 946 | |
| Class Y | 2,071,100 | |
| Distribution fees | | |
| Class A | 1,357,435 | |
| Class C | 2,872,860 | |
| Class R | 5,201 | |
| Shareholder communications expense | 115,731 | |
| Custodian fees | 164,227 | |
| Registration fees | 351,081 | |
| Professional fees | 256,882 | |
| Printing expense | 53,174 | |
| Officers’ and Trustees’ fees | 186,861 | |
| Insurance expense | 39,610 | |
| Miscellaneous | 425,022 | |
| Total expenses | | $22,818,102 |
| Net investment income | | $195,903,119 |
| REALIZED AND UNREALIZED GAIN (LOSS) ON INVESTMENTS: | | |
| Net realized gain (loss) on: | | |
| Investments in unaffiliated issuers | $25,211,311 | |
| Class actions | 243,368 | |
| Forward foreign currency exchange contracts | (793,894) | |
| Futures contracts | (91,319,988) | |
| Other assets and liabilities denominated in foreign currencies | (203,391) | $(66,862,594) |
| Change in net unrealized appreciation (depreciation) on: | | |
| Investments in unaffiliated issuers | $201,532,474 | |
| Forward foreign currency exchange contracts | 1,391,540 | |
| Futures contracts | 16,085,793 | |
| Other assets and liabilities denominated in foreign currencies | (189,848) | $218,819,959 |
| Net realized and unrealized gain (loss) on investments | | $151,957,365 |
| Net increase in net assets resulting from operations | | $347,860,484 |
The accompanying notes are an integral part of these financial statements.
Pioneer Multi-Asset Income Fund | Annual Report | 7/31/2443
Statements of Changes in Net Assets
| | Year
Ended
7/31/24 | Year
Ended
7/31/23 |
| FROM OPERATIONS: | | |
| Net investment income (loss) | $195,903,119 | $146,615,483 |
| Net realized gain (loss) on investments | (66,862,594) | (101,301,896) |
| Change in net unrealized appreciation (depreciation) on investments | 218,819,959 | 153,218,797 |
| Net increase in net assets resulting from operations | $347,860,484 | $198,532,384 |
| DISTRIBUTIONS TO SHAREHOLDERS: | | |
| Class A ($0.83 and $0.63 per share, respectively) | $(39,611,131) | $(25,497,137) |
| Class C ($0.74 and $0.55 per share, respectively) | (18,783,070) | (12,769,214) |
| Class K ($0.88 and $0.68 per share, respectively) | (9,211,437) | (6,960,933) |
| Class R ($0.79 and $0.60 per share, respectively) | (72,410) | (50,189) |
| Class Y ($0.85 and $0.65 per share, respectively) | (151,839,491) | (82,359,534) |
| Total distributions to shareholders | $(219,517,539) | $(127,637,007) |
| FROM FUND SHARE TRANSACTIONS: | | |
| Net proceeds from sales of shares | $1,440,148,206 | $1,255,867,301 |
| Reinvestment of distributions | 217,389,056 | 126,852,760 |
| Cost of shares repurchased | (722,971,113) | (651,211,343) |
| Net increase in net assets resulting from Fund share transactions | $934,566,149 | $731,508,718 |
| Net increase in net assets | $1,062,909,094 | $802,404,095 |
| NET ASSETS: | | |
| Beginning of year | $2,560,811,191 | $1,758,407,096 |
| End of year | $3,623,720,285 | $2,560,811,191 |
The accompanying notes are an integral part of these financial statements.
44Pioneer Multi-Asset Income Fund | Annual Report | 7/31/24
| | Year
Ended
7/31/24
Shares | Year
Ended
7/31/24
Amount | Year
Ended
7/31/23
Shares | Year
Ended
7/31/23
Amount |
| Class A | | | | |
| Shares sold | 16,404,204 | $185,859,536 | 13,614,271 | $150,475,084 |
| Reinvestment of distributions | 3,453,096 | 39,085,826 | 2,296,769 | 25,299,143 |
| Less shares repurchased | (8,874,471) | (100,352,108) | (9,220,100) | (101,358,676) |
| Net increase | 10,982,829 | $124,593,254 | 6,690,940 | $74,415,551 |
| Class C | | | | |
| Shares sold | 9,465,486 | $106,825,813 | 5,901,728 | $65,091,251 |
| Reinvestment of distributions | 1,658,481 | 18,697,055 | 1,163,826 | 12,765,742 |
| Less shares repurchased | (6,312,772) | (71,100,436) | (6,403,436) | (70,277,889) |
| Net increase | 4,811,195 | $54,422,432 | 662,118 | $7,579,104 |
| Class K | | | | |
| Shares sold | 1,162,226 | $13,518,636 | 403,320 | $4,615,552 |
| Reinvestment of distributions | 777,644 | 9,047,403 | 609,865 | 6,900,872 |
| Less shares repurchased | (1,226,713) | (14,282,092) | (1,256,261) | (14,155,284) |
Net increase
(decrease) | 713,157 | $8,283,947 | (243,076) | $(2,638,860) |
| Class R | | | | |
| Shares sold | 23,477 | $263,136 | 51,848 | $568,684 |
| Reinvestment of distributions | 6,389 | 72,256 | 4,534 | 49,942 |
| Less shares repurchased | (39,471) | (443,494) | (27,662) | (304,868) |
Net increase
(decrease) | (9,605) | $(108,102) | 28,720 | $313,758 |
| Class Y | | | | |
| Shares sold | 100,662,446 | $1,133,681,085 | 94,190,114 | $1,035,116,730 |
| Reinvestment of distributions | 13,333,554 | 150,486,516 | 7,445,204 | 81,837,061 |
| Less shares repurchased | (47,730,938) | (536,792,983) | (42,488,849) | (465,114,626) |
| Net increase | 66,265,062 | $747,374,618 | 59,146,469 | $651,839,165 |
The accompanying notes are an integral part of these financial statements.
Pioneer Multi-Asset Income Fund | Annual Report | 7/31/2445
| | Year
Ended
7/31/24 | Year
Ended
7/31/23 | Year
Ended
7/31/22 | Year
Ended
7/31/21 | Year
Ended
7/31/20 |
| Class A | | | | | |
| Net asset value, beginning of period | $11.32 | $10.98 | $11.67 | $10.17 | $10.79 |
| Increase (decrease) from investment operations: | | | | | |
| Net investment income (loss) (a) | $0.73 | $0.73 | $0.63 | $0.65 | $0.62 |
| Net realized and unrealized gain (loss) on investments | 0.52 | 0.24 | (0.67) | 1.41 | (0.60) |
| Net increase (decrease) from investment operations | $1.25 | $0.97 | $(0.04) | $2.06 | $0.02 |
| Distributions to shareholders: | | | | | |
| Net investment income | $(0.83) | $(0.63) | $(0.65) | $(0.56) | $(0.64) |
| Total distributions | $(0.83) | $(0.63) | $(0.65) | $(0.56) | $(0.64) |
| Net increase (decrease) in net asset value | $0.42 | $0.34 | $(0.69) | $1.50 | $(0.62) |
| Net asset value, end of period | $11.74 | $11.32 | $10.98 | $11.67 | $10.17 |
| Total return (b) | 11.56%(c) | 9.19% | (0.43)% | 20.66% | 0.28% |
| Ratio of net expenses to average net assets | 0.83% | 0.85% | 0.85% | 0.85% | 0.85% |
| Ratio of net investment income (loss) to average net assets | 6.50% | 6.62% | 5.51% | 5.82% | 6.01% |
| Portfolio turnover rate | 62% | 74% | 73% | 106% | 126% |
| Net assets, end of period (in thousands) | $639,410 | $492,295 | $403,985 | $356,626 | $310,126 |
| Ratios with no waiver of fees and assumption of expenses by the Adviser and no reduction for fees paid indirectly: | | | | | |
| Total expenses to average net assets | 0.83% | 0.86% | 0.85% | 0.88% | 0.89% |
| Net investment income (loss) to average net assets | 6.50% | 6.61% | 5.51% | 5.79% | 5.97% |
| (a) | The per-share data presented above is based on the average shares outstanding for the period presented. |
| (b) | Assumes initial investment at net asset value at the beginning of each period, reinvestment of all distributions, the complete redemption of the investment at net asset value at the end of each period and no sales charges. Total return would be reduced if sales charges were taken into account. |
| (c) | For the year ended July 31, 2024, the Fund's total return includes gains in settlement of class action lawsuits. The impact on Class A's total return was less than 0.005%. |
The accompanying notes are an integral part of these financial statements.
46Pioneer Multi-Asset Income Fund | Annual Report | 7/31/24
| | Year
Ended
7/31/24 | Year
Ended
7/31/23 | Year
Ended
7/31/22 | Year
Ended
7/31/21 | Year
Ended
7/31/20 |
| Class C | | | | | |
| Net asset value, beginning of period | $11.28 | $10.94 | $11.63 | $10.13 | $10.76 |
| Increase (decrease) from investment operations: | | | | | |
| Net investment income (loss) (a) | $0.64 | $0.64 | $0.54 | $0.56 | $0.54 |
| Net realized and unrealized gain (loss) on investments | 0.51 | 0.25 | (0.67) | 1.41 | (0.61) |
| Net increase (decrease) from investment operations | $1.15 | $0.89 | $(0.13) | $1.97 | $(0.07) |
| Distributions to shareholders: | | | | | |
| Net investment income | $(0.74) | $(0.55) | $(0.56) | $(0.47) | $(0.56) |
| Total distributions | $(0.74) | $(0.55) | $(0.56) | $(0.47) | $(0.56) |
| Net increase (decrease) in net asset value | $0.41 | $0.34 | $(0.69) | $1.50 | $(0.63) |
| Net asset value, end of period | $11.69 | $11.28 | $10.94 | $11.63 | $10.13 |
| Total return (b) | 10.64%(c) | 8.38% | (1.20)% | 19.78% | (0.62)% |
| Ratio of net expenses to average net assets | 1.60% | 1.62% | 1.61% | 1.64% | 1.65% |
| Ratio of net investment income (loss) to average net assets | 5.73% | 5.85% | 4.72% | 5.04% | 5.20% |
| Portfolio turnover rate | 62% | 74% | 73% | 106% | 126% |
| Net assets, end of period (in thousands) | $334,211 | $268,091 | $252,795 | $296,575 | $312,559 |
| Ratios with no waiver of fees and assumption of expenses by the Adviser and no reduction for fees paid indirectly: | | | | | |
| Total expenses to average net assets | 1.60% | 1.62% | 1.61% | 1.64% | 1.66% |
| Net investment income (loss) to average net assets | 5.73% | 5.85% | 4.72% | 5.04% | 5.19% |
| (a) | The per-share data presented above is based on the average shares outstanding for the period presented. |
| (b) | Assumes initial investment at net asset value at the beginning of each period, reinvestment of all distributions, the complete redemption of the investment at net asset value at the end of each period and no sales charges. Total return would be reduced if sales charges were taken into account. |
| (c) | For the year ended July 31, 2024, the Fund's total return includes gains in settlement of class action lawsuits. The impact on Class C's total return was less than 0.005%. |
The accompanying notes are an integral part of these financial statements.
Pioneer Multi-Asset Income Fund | Annual Report | 7/31/2447
Financial Highlights (continued)
| | Year
Ended
7/31/24 | Year
Ended
7/31/23 | Year
Ended
7/31/22 | Year
Ended
7/31/21 | Year
Ended
7/31/20 |
| Class K | | | | | |
| Net asset value, beginning of period | $11.64 | $11.28 | $12.02 | $10.47 | $11.12 |
| Increase (decrease) from investment operations: | | | | | |
| Net investment income (loss) (a) | $0.79 | $0.78 | $0.69 | $0.70 | $0.67 |
| Net realized and unrealized gain (loss) on investments | 0.52 | 0.26 | (0.73) | 1.46 | (0.63) |
| Net increase (decrease) from investment operations | $1.31 | $1.04 | $(0.04) | $2.16 | $0.04 |
| Distributions to shareholders: | | | | | |
| Net investment income | $(0.88) | $(0.68) | $(0.70) | $(0.61) | $(0.69) |
| Total distributions | $(0.88) | $(0.68) | $(0.70) | $(0.61) | $(0.69) |
| Net increase (decrease) in net asset value | $0.43 | $0.36 | $(0.74) | $1.55 | $(0.65) |
| Net asset value, end of period | $12.07 | $11.64 | $11.28 | $12.02 | $10.47 |
| Total return (b) | 11.84%(c) | 9.58% | (0.42)% | 21.05% | 0.44% |
| Ratio of net expenses to average net assets | 0.54% | 0.56% | 0.55% | 0.57% | 0.58% |
| Ratio of net investment income (loss) to average net assets | 6.79% | 6.92% | 5.79% | 6.07% | 6.30% |
| Portfolio turnover rate | 62% | 74% | 73% | 106% | 126% |
| Net assets, end of period (in thousands) | $132,610 | $119,558 | $118,667 | $139,556 | $121,281 |
| Ratios with no waiver of fees and assumption of expenses by the Adviser and no reduction for fees paid indirectly: | | | | | |
| Total expenses to average net assets | 0.54% | 0.56% | 0.55% | 0.57% | 0.58% |
| Net investment income (loss) to average net assets | 6.79% | 6.92% | 5.79% | 6.07% | 6.30% |
| (a) | The per-share data presented above is based on the average shares outstanding for the period presented. |
| (b) | Assumes initial investment at net asset value at the beginning of each period, reinvestment of all distributions and the complete redemption of the investment at net asset value at the end of each period. |
| (c) | For the year ended July 31, 2024, the Fund's total return includes gains in settlement of class action lawsuits. The impact on Class K's total return was less than 0.005%. |
The accompanying notes are an integral part of these financial statements.
48Pioneer Multi-Asset Income Fund | Annual Report | 7/31/24
| | Year
Ended
7/31/24 | Year
Ended
7/31/23 | Year
Ended
7/31/22 | Year
Ended
7/31/21 | Year
Ended
7/31/20 |
| Class R | | | | | |
| Net asset value, beginning of period | $11.32 | $10.98 | $11.64 | $10.19 | $10.83 |
| Increase (decrease) from investment operations: | | | | | |
| Net investment income (loss) (a) | $0.70 | $0.69 | $0.59 | $0.53 | $0.53 |
| Net realized and unrealized gain (loss) on investments | 0.50 | 0.25 | (0.66) | 1.40 | (0.60) |
| Net increase (decrease) from investment operations | $1.20 | $0.94 | $(0.07) | $1.93 | $(0.07) |
| Distributions to shareholders: | | | | | |
| Net investment income | $(0.79) | $(0.60) | $(0.59) | $(0.48) | $(0.57) |
| Total distributions | $(0.79) | $(0.60) | $(0.59) | $(0.48) | $(0.57) |
| Net increase (decrease) in net asset value | $0.41 | $0.34 | $(0.66) | $1.45 | $(0.64) |
| Net asset value, end of period | $11.73 | $11.32 | $10.98 | $11.64 | $10.19 |
| Total return (b) | 11.10%(c) | 8.84% | (0.71)% | 19.27% | 0.57% |
| Ratio of net expenses to average net assets | 1.16% | 1.20% | 1.18% | 1.80% | 1.63% |
| Ratio of net investment income (loss) to average net assets | 6.20% | 6.26% | 5.18% | 4.82% | 5.13% |
| Portfolio turnover rate | 62% | 74% | 73% | 106% | 126% |
| Net assets, end of period (in thousands) | $1,070 | $1,140 | $791 | $643 | $1,470 |
| Ratios with no waiver of fees and assumption of expenses by the Adviser and no reduction for fees paid indirectly: | | | | | |
| Total expenses to average net assets | 1.16% | 1.20% | 1.18% | 1.80% | 1.63% |
| Net investment income (loss) to average net assets | 6.20% | 6.26% | 5.18% | 4.82% | 5.13% |
| (a) | The per-share data presented above is based on the average shares outstanding for the period presented. |
| (b) | Assumes initial investment at net asset value at the beginning of each period, reinvestment of all distributions and the complete redemption of the investment at net asset value at the end of each period. |
| (c) | For the year ended July 31, 2024, the Fund's total return includes gains in settlement of class action lawsuits. The impact on Class R's total return was less than 0.005%. |
The accompanying notes are an integral part of these financial statements.
Pioneer Multi-Asset Income Fund | Annual Report | 7/31/2449
Financial Highlights (continued)
| | Year
Ended
7/31/24 | Year
Ended
7/31/23 | Year
Ended
7/31/22 | Year
Ended
7/31/21 | Year
Ended
7/31/20 |
| Class Y | | | | | |
| Net asset value, beginning of period | $11.28 | $10.94 | $11.63 | $10.13 | $10.77 |
| Increase (decrease) from investment operations: | | | | | |
| Net investment income (loss) (a) | $0.76 | $0.75 | $0.65 | $0.67 | $0.64 |
| Net realized and unrealized gain (loss) on investments | 0.51 | 0.24 | (0.67) | 1.41 | (0.62) |
| Net increase (decrease) from investment operations | $1.27 | $0.99 | $(0.02) | $2.08 | $0.02 |
| Distributions to shareholders: | | | | | |
| Net investment income | $(0.85) | $(0.65) | $(0.67) | $(0.58) | $(0.66) |
| Total distributions | $(0.85) | $(0.65) | $(0.67) | $(0.58) | $(0.66) |
| Net increase (decrease) in net asset value | $0.42 | $0.34 | $(0.69) | $1.50 | $(0.64) |
| Net asset value, end of period | $11.70 | $11.28 | $10.94 | $11.63 | $10.13 |
| Total return (b) | 11.80%(c) | 9.42% | (0.24)% | 20.97% | 0.27% |
| Ratio of net expenses to average net assets | 0.64% | 0.65% | 0.65% | 0.65% | 0.65% |
| Ratio of net investment income (loss) to average net assets | 6.70% | 6.80% | 5.71% | 6.01% | 6.20% |
| Portfolio turnover rate | 62% | 74% | 73% | 106% | 126% |
| Net assets, end of period (in thousands) | $2,516,420 | $1,679,726 | $982,169 | $779,755 | $586,958 |
| Ratios with no waiver of fees and assumption of expenses by the Adviser and no reduction for fees paid indirectly: | | | | | |
| Total expenses to average net assets | 0.64% | 0.66% | 0.66% | 0.67% | 0.68% |
| Net investment income (loss) to average net assets | 6.70% | 6.79% | 5.70% | 5.99% | 6.17% |
| (a) | The per-share data presented above is based on the average shares outstanding for the period presented. |
| (b) | Assumes initial investment at net asset value at the beginning of each period, reinvestment of all distributions and the complete redemption of the investment at net asset value at the end of each period. |
| (c) | If the Fund had not recognized gains in settlement of class action lawsuits during the year ended July 31, 2024, the total return would have been 11.71%. |
The accompanying notes are an integral part of these financial statements.
50Pioneer Multi-Asset Income Fund | Annual Report | 7/31/24
Notes to Financial Statements | 7/31/24
1. Organization and Significant Accounting Policies
Pioneer Multi-Asset Income Fund (the “Fund”) is one of four portfolios comprising Pioneer Series Trust IV (the “Trust”), a Delaware statutory trust. The Fund is registered under the Investment Company Act of 1940, as amended (the “1940 Act”), as a diversified, open-end management investment company. The investment objective of the Fund is to seek a high level of current income to the extent consistent with a relatively high level of stability of principal.
The Fund offers five classes of shares designated as Class A, Class C, Class K, Class R and Class Y shares. Each class of shares represents an interest in the same portfolio of investments of the Fund and has identical rights (based on relative net asset values) to assets and liquidation proceeds. Share classes can bear different rates of class-specific fees and expenses, such as transfer agent and distribution fees. Differences in class-specific fees and expenses will result in differences in net investment income and, therefore, the payment of different dividends from net investment income earned by each class. The Amended and Restated Declaration of Trust of the Trust gives the Board of Trustees the flexibility to specify either per-share voting or dollar-weighted voting when submitting matters for shareholder approval. Under per-share voting, each share of a class of the Fund is entitled to one vote. Under dollar-weighted voting, a shareholder’s voting power is determined not by the number of shares owned, but by the dollar value of the shares on the record date. Each share class has exclusive voting rights with respect to matters affecting only that class, including with respect to the distribution plan for that class. There is no distribution plan for Class K or Class Y shares.
Amundi Asset Management US, Inc., an indirect, wholly owned subsidiary of Amundi and Amundi’s wholly owned subsidiary, Amundi USA, Inc., serves as the Fund’s investment adviser (the “Adviser”). Amundi Distributor US, Inc., an affiliate of the Adviser, serves as the Fund’s distributor (the “Distributor”).
The Fund is required to comply with Rule 18f-4 under the 1940 Act, which governs the use of derivatives by registered investment companies. Rule 18f-4 permits funds to enter into derivatives transactions (as defined in Rule 18f-4) and certain other transactions notwithstanding the restrictions on the issuance of “senior securities” under Section 18 of the 1940 Act. In accordance with Rule 18f-4, the Fund has established and maintains a comprehensive derivatives risk management program, has
Pioneer Multi-Asset Income Fund | Annual Report | 7/31/2451
appointed a derivatives risk manager and complies with a relative or absolute limit on fund leverage risk calculated based on value-at-risk ("VaR").
The Fund is an investment company and follows investment company accounting and reporting guidance under U.S. Generally Accepted Accounting Principles (“U.S. GAAP”). U.S. GAAP requires the management of the Fund to make estimates and assumptions that affect the reported amounts of assets and liabilities, the disclosure of contingent assets and liabilities at the date of the financial statements, and the reported amounts of income, expenses and gain or loss on investments during the reporting period. Actual results could differ from those estimates.
The following is a summary of significant accounting policies followed by the Fund in the preparation of its financial statements:
| A. | Security Valuation |
| | The net asset value of the Fund is computed once daily, on each day the New York Stock Exchange (“NYSE”) is open, as of the close of regular trading on the NYSE. |
| | Equity securities that have traded on an exchange are valued by using the last sale price on the principal exchange where they are traded. Equity securities that have not traded on the date of valuation, or securities for which sale prices are not available, generally are valued using the mean between the last bid and asked prices or, if both last bid and asked prices are not available, at the last quoted bid price. Last sale and bid and asked prices are provided by independent third party pricing services. In the case of equity securities not traded on an exchange, prices are typically determined by independent third party pricing services using a variety of techniques and methods. |
| | The value of foreign securities is translated into U.S. dollars based on foreign currency exchange rate quotations supplied by a third party pricing source. Trading in non-U.S. equity securities is substantially completed each day at various times prior to the close of the NYSE. The values of such securities used in computing the net asset value of the Fund’s shares are determined as of such times. The Adviser may use a fair value model developed by an independent pricing service to value non-U.S. equity securities. |
| | Equity-linked notes are valued by using market prices or quotations from one or more brokers or other sources, a pricing matrix, or other fair value methods or techniques to provide an estimated value of the security or instrument. Fixed-income securities are valued by using |
52Pioneer Multi-Asset Income Fund | Annual Report | 7/31/24
| | prices supplied by independent pricing services, which consider such factors as market prices, market events, quotations from one or more brokers, Treasury spreads, yields, maturities and ratings, or may use a pricing matrix or other fair value methods or techniques to provide an estimated value of the security or instrument. A pricing matrix is a means of valuing a debt security on the basis of current market prices for other debt securities, historical trading patterns in the market for fixed-income securities and/or other factors. Non-U.S. debt securities that are listed on an exchange will be valued at the bid price obtained from an independent third party pricing service. When independent third party pricing services are unable to supply prices, or when prices or market quotations are considered to be unreliable, the value of that security may be determined using quotations from one or more broker-dealers. |
| | Loan interests are valued at the mean between the last available bid and asked prices from one or more brokers or dealers as obtained from Loan Pricing Corporation, an independent third party pricing service. If price information is not available from Loan Pricing Corporation, or if the price information is deemed to be unreliable, price information will be obtained from an alternative loan interest pricing service. If no reliable price quotes are available from either the primary or alternative pricing service, broker quotes will be solicited. |
| | Event-linked bonds are valued at the bid price obtained from an independent third party pricing service. Other insurance-linked securities (including reinsurance sidecars, collateralized reinsurance and industry loss warranties) may be valued at the bid price obtained from an independent pricing service, or through a third party using a pricing matrix, insurance valuation models, or other fair value methods or techniques to provide an estimated value of the instrument. |
| | Options contracts are generally valued at the mean between the last bid and ask prices on the principal exchange where they are traded. Over-the-counter (“OTC”) options and options on swaps (“swaptions”) are valued using prices supplied by independent pricing services, which consider suchfactors as market prices, market events, quotations from one or more brokers, Treasury spreads, yields, maturities and ratings, or may use a pricing matrix or other fair value methods or techniques to provide an estimated value of the security or instrument. |
| | Forward foreign currency exchange contracts are valued daily using the foreign exchange rate or, for longer term forward contract positions, the spot currency rate and the forward points on a daily basis, in each case |
Pioneer Multi-Asset Income Fund | Annual Report | 7/31/2453
| | provided by a third party pricing service. Contracts whose forward settlement date falls between two quoted days are valued by interpolation. |
| | Futures contracts are generally valued at the closing settlement price established by the exchange on which they are traded. |
| | Shares of open-end registered investment companies (including money market mutual funds) are valued at such funds’ net asset value. Shares of exchange-listed closed-end funds are valued by using the last sale price on the principal exchange where they are traded. |
| | Repurchase agreements are valued at par. Cash may include overnight time deposits at approved financial institutions. |
| | Securities or loan interests for which independent pricing services or broker-dealers are unable to supply prices or for which market prices and/or quotations are not readily available or are considered to be unreliable are valued by a fair valuation team comprised of certain personnel of the Adviser. The Adviser is designated as the valuation designee for the Fund pursuant to Rule 2a-5 under the 1940 Act. The Adviser’s fair valuation team is responsible for monitoring developments that may impact fair valued securities. |
| | Inputs used when applying fair value methods to value a security may include credit ratings, the financial condition of the company, current market conditions and comparable securities. The Adviser may use fair value methods if it is determined that a significant event has occurred after the close of the exchange or market on which the security trades and prior to the determination of the Fund’s net asset value. Examples of a significant event might include political or economic news, corporate restructurings, natural disasters, terrorist activity or trading halts. Thus, the valuation of the Fund’s securities may differ significantly from exchange prices, and such differences could be material. |
| B. | Investment Income and Transactions |
| | Dividend income is recorded on the ex-dividend date, except that certain dividends from foreign securities where the ex-dividend date may have passed are recorded as soon as the Fund becomes aware of the ex-dividend data in the exercise of reasonable diligence. |
| | Interest income, including interest on income-bearing cash accounts, is recorded on the accrual basis. Dividend and interest income are reported net of unrecoverable foreign taxes withheld at the applicable country rates and net of income accrued on defaulted securities. |
54Pioneer Multi-Asset Income Fund | Annual Report | 7/31/24
| | Interest and dividend income payable by delivery of additional shares is reclassified as PIK (payment-in-kind) income upon receipt and is included in interest and dividend income, respectively. |
| | Principal amounts of mortgage-backed securities are adjusted for monthly paydowns. Premiums and discounts related to certain mortgage-backed securities are amortized or accreted in proportion to the monthly paydowns. All discounts/premiums on purchase prices of debt securities are accreted/amortized for financial reporting purposes over the life of the respective securities, and such accretion/amortization is included in interest income. |
| | Security transactions are recorded as of trade date. Gains and losses on sales of investments are calculated on the identified cost method for both financial reporting and federal income tax purposes. |
| C. | Foreign Currency Translation |
| | The books and records of the Fund are maintained in U.S. dollars. Amounts denominated in foreign currencies are translated into U.S. dollars using current exchange rates. |
| | Net realized gains and losses on foreign currency transactions, if any, represent, among other things, the net realized gains and losses on foreign currency exchange contracts, disposition of foreign currencies and the difference between the amount of income accrued and the U.S. dollars actually received. Further, the effects of changes in foreign currency exchange rates on investments are not segregated on the Statement of Operations from the effects of changes in the market prices of those securities, but are included with the net realized and unrealized gain or loss on investments. |
| D. | Federal Income Taxes |
| | It is the Fund’s policy to comply with the requirements of the Internal Revenue Code applicable to regulated investment companies and to distribute all of its net taxable income and net realized capital gains, if any, to its shareholders. Therefore, no provision for federal income taxes is required. As of July 31, 2024, the Fund did not accrue any interest or penalties with respect to uncertain tax positions, which, if applicable, would be recorded as an income tax expense on the Statement of Operations. Tax returns filed within the prior three years remain subject to examination by federal and state tax authorities. |
| | In determining the daily net asset value, the Fund estimates the reserve for the repatriation of taxes, if any, associated with its investments in certain countries. The estimated reserve for capital gains is based on the |
Pioneer Multi-Asset Income Fund | Annual Report | 7/31/2455
| | net unrealized appreciation on certain portfolio securities, the holding period of such securities and the related tax rates, tax loss carryforwards (if applicable) and other such factors. As of July 31, 2024, the Fund has not accrued any reserve for repatriation taxes related to capital gains. |
| | A portion of the dividend income recorded by the Fund is from distributions by publicly traded real estate investment trusts (“REITs”), and such distributions for tax purposes may also consist of capital gains and return of capital. The actual return of capital and capital gains portions of such distributions will be determined by formal notifications from the REITs subsequent to the calendar year-end. Distributions received from the REITs that are determined to be a return of capital are recorded by the Fund as a reduction of the cost basis of the securities held and those determined to be capital gain are reflected as such on the Statement of Operations. |
| | The amount and character of income and capital gain distributions to shareholders are determined in accordance with federal income tax rules, which may differ from U.S. GAAP. Distributions in excess of net investment income or net realized gains are temporary over distributions for financial statement purposes resulting from differences in the recognition or classification of income or distributions for financial statement and tax purposes. Capital accounts within the financial statements are adjusted for permanent book/tax differences to reflect tax character, but are not adjusted for temporary differences. |
| | At July 31, 2024, the Fund reclassified $1,249,275 to decrease distributable earnings and $1,249,275 to increase paid-in capital to reflect permanent book/tax differences. These adjustments have no impact on net assets or the results of operations. |
| | At July 31, 2024, the Fund was permitted to carry forward indefinitely $165,456,232 of short-term losses and $173,044,795 of long-term losses. |
| | The tax character of distributions paid during the years ended July 31, 2024 and July 31, 2023, was as follows: |
| | 2024 | 2023 |
| Distributions paid from: | | |
| Ordinary income | $219,517,539 | $127,637,007 |
| Total | $219,517,539 | $127,637,007 |
56Pioneer Multi-Asset Income Fund | Annual Report | 7/31/24
The following shows the components of distributable earnings (losses) on a federal income tax basis at July 31, 2024:
| | 2024 |
| Distributable earnings/(losses): | |
| Undistributed ordinary income | $20,779,713 |
| Capital loss carryforward | (338,501,027) |
| Other book/tax temporary differences | 16,216,739 |
| Net unrealized appreciation | 297,282,372 |
| Total | $(4,222,203) |
The difference between book-basis and tax-basis net unrealized appreciation is attributable to the tax deferral of losses on wash sales, realization for tax purposes of unrealized gains on investments in passive foreign investment companies and the book/tax differences in the adjustments relating to insurance-linked securities, the tax treatment of premium and amortization, accrual of income on securities in default, tax basis adjustments on perpetual bonds, the mark to market of futures contracts, and tax basis adjustments on partnership holdings.
| E. | Fund Shares |
| | The Fund records sales and repurchases of its shares as of trade date. The Distributor earned $260,494 in underwriting commissions on the sale of Class A shares during the year ended July 31, 2024. |
| F. | Class Allocations |
| | Income, common expenses and realized and unrealized gains and losses are calculated at the Fund level and allocated daily to each class of shares based on its respective percentage of adjusted net assets at the beginning of the day. |
| | Distribution fees are calculated based on the average daily net asset value attributable to Class A, Class C and Class R shares of the Fund, respectively (see Note 5). Class K and Class Y shares do not pay distribution fees. All expenses and fees paid to the Fund’s transfer agent for its services are allocated among the classes of shares based on the number of accounts in each class and the ratable allocation of related out-of-pocket expenses (see Note 4). |
| | The Fund declares as daily dividends substantially all of its net investment income. All dividends are paid on a monthly basis. Short-term capital gain distributions, if any, may be declared with the daily dividends. |
Pioneer Multi-Asset Income Fund | Annual Report | 7/31/2457
| | Distributions to shareholders are recorded as of the ex-dividend date. Distributions paid by the Fund with respect to each class of shares are calculated in the same manner and at the same time, except that net investment income dividends to Class A, Class C, Class K, Class R and Class Y shares can reflect different transfer agent and distribution expense rates. |
| G. | Risks |
| | The value of securities held by the Fund may go up or down, sometimes rapidly or unpredictably, due to general market conditions, such as real or perceived adverse economic, political or regulatory conditions, recessions, the spread of infectious illness or other public health issues, inflation, changes in interest rates, armed conflict such as between Russia and Ukraine or in the Middle East, sanctions against Russia, other nations or individuals or companies and possible countermeasures, lack of liquidity in the bond markets or adverse investor sentiment. In the past several years, financial markets have experienced increased volatility, depressed valuations, decreased liquidity and heightened uncertainty. These conditions may continue, recur, worsen or spread. Inflation and interest rates have increased and may rise further. These circumstances could adversely affect the value and liquidity of the Fund’s investments and negatively impact the Fund’s performance. |
| | The long-term impact of the COVID-19 pandemic and its subsequent variants on economies, markets, industries and individual issuers, are not known. Some sectors of the economy and individual issuers have experienced or may experience particularly large losses. Periods of extreme volatility in the financial markets, reduced liquidity of many instruments, increased government debt, inflation, and disruptions to supply chains, consumer demand and employee availability, may continue for some time. Following Russia’s invasion of Ukraine, Russian securities lost all, or nearly all, their market value. Other securities or markets could be similarly affected by past or future political, geopolitical or other events or conditions. |
| | Governments and central banks, including the U.S. Federal Reserve, have taken extraordinary and unprecedented actions to support local and global economies and the financial markets. These actions have resulted in significant expansion of public debt, including in the U.S. The consequences of high public debt, including its future impact on the economy and securities markets, may not be known for some time. |
| | The U.S. and other countries are periodically involved in disputes over trade and other matters, which may result in tariffs, investment restrictions and adverse impacts on affected companies and securities. |
58Pioneer Multi-Asset Income Fund | Annual Report | 7/31/24
| | For example, the U.S. has imposed tariffs and other trade barriers on Chinese exports, has restricted sales of certain categories of goods to China, and has established barriers to investments in China. Trade disputes may adversely affect the economies of the U.S. and its trading partners, as well as companies directly or indirectly affected and financial markets generally. If the political climate between the U.S. and China does not improve or continues to deteriorate, if China were to attempt unification of Taiwan by force, or if other geopolitical conflicts develop or get worse, economies, markets and individual securities may be severely affected both regionally and globally, and the value of the Fund’s assets may go down. |
| | At times, the Fund’s investments may represent industries or industry sectors that are interrelated or have common risks, making the Fund more susceptible to any economic, political, or regulatory developments or other risks affecting those industries and sectors. |
| | The Fund’s investments in foreign markets and countries with limited developing markets may subject the Fund to a greater degree of risk than investments in a developed market. These risks include disruptive political or economic conditions, military conflicts and sanctions, terrorism, sustained economic downturns, financial instability, less liquid trading markets, extreme price volatility, currency risks, reduction of government or central bank support, inadequate accounting standards, tariffs, tax disputes or other tax burdens, nationalization or expropriation of assets and the imposition of adverse governmental laws, arbitrary application of laws and regulations or lack of rule of law and investment and repatriation restrictions. Lack of information and less market regulation also may affect the value of these securities. Withholding and other non-U.S. taxes may decrease the Fund’s return. Non-U.S. issuers may be located in parts of the world that have historically been prone to natural disasters. Investing in depositary receipts is subject to many of the same risks as investing directly in non-U.S. issuers. Depositary receipts may involve higher expenses and may trade at a discount (or premium) to the underlying security. |
| | Russia launched a large-scale invasion of Ukraine on February 24, 2022. In response to the military action by Russia, various countries, including the U.S., the United Kingdom, and European Union issued broad-ranging economic sanctions against Russia and Belarus and certain companies and individuals. Since then, Russian securities lost all, or nearly all, their market value, and many other issuers, securities and markets have been adversely affected. The United States and other countries may impose sanctions on other countries, companies and individuals in light of Russia’s military invasion. The extent and duration of the military |
Pioneer Multi-Asset Income Fund | Annual Report | 7/31/2459
| | action or future escalation of such hostilities, the extent and impact of existing and future sanctions, market disruptions and volatility, and the result of any diplomatic negotiations cannot be predicted. These and any related events could have a significant impact on the value and liquidity of certain Fund investments, on Fund performance and the value of an investment in the Fund, particularly with respect to securities and commodities, such as oil, natural gas and food commodities, as well as other sectors with exposure to Russian issuers or issuers in other countries affected by the invasion, and are likely to have collateral impacts on market sectors globally. |
| | The Fund has the flexibility to invest in a broad range of income-producing investments, including both debt securities and equity securities. The Fund may invest in the securities of issuers located throughout the world, including in emerging markets. |
| | The Fund may invest in below-investment-grade (high-yield) debt securities. Some of these high-yield securities may be convertible into equity securities of the issuer. Debt securities rated below-investment-grade are commonly referred to as “junk bonds” and are considered speculative with respect to the issuer’s capacity to pay interest and repay principal. These securities involve greater risk of loss, are subject to greater price volatility, and may be less liquid and more difficult to value, especially during periods of economic uncertainty or change, than higher rated debt securities. |
| | The Fund’s investments, payment obligations and financing terms may be based on floating rates, such as LIBOR (London Interbank Offered Rate) or SOFR (Secured Overnight Financing Rate). ICE Benchmark Administration, the administrator of LIBOR, has ceased publication of most LIBOR settings on a representative basis. Actions by regulators have resulted in the establishment of alternative reference rates to LIBOR in most major currencies. In the U.S., a common benchmark replacement is based on the SOFR published by the Federal Reserve Bank of New York, including certain spread adjustments and benchmark replacement conforming changes, although other benchmark replacements (without or without spread adjustments) may be used in certain transactions. The impact of the transition from LIBOR on the Fund’s transactions and financial markets generally cannot yet be determined. The transition away from LIBOR may lead to increased volatility and illiquidity in markets for instruments that have relied on LIBOR and may adversely affect the Fund’s performance. |
| | The Fund may invest in equity-linked notes (ELNs). ELNs are structured products that consist of two main components: a fixed income |
60Pioneer Multi-Asset Income Fund | Annual Report | 7/31/24
| | component in the form of a bond or note paying a stated interest rate (premium), and an equity-linked component tied to the performance of one or more underlying reference securities (usually a single stock, a basket of stocks or a stock index). Under the structure, current payments typically are made in exchange for a limit on the capital appreciation potential of the reference securities during the term of the note. The ELN retains the downside risk associated with the reference securities. ELNs may not perform as expected and could cause the fund to realize significant losses including its entire principal investment. Investments in ELNs often have risks similar to their underlying reference securities, which may include market risk and, as applicable, risks of non-U.S. investments and currency risks. In addition, since ELNs are in note form, ELNs are also subject to certain risks of fixed income securities, such as interest rate and credit risks. Investments in ELNs are also subject to liquidity risk, which may make ELNs difficult to sell and value. In addition, ELNs may exhibit price behavior that does not correlate with the underlying reference securities or a fixed income investment. |
| | The Fund may invest in REIT securities, the value of which can fall for a variety of reasons, such as declines in rental income, fluctuating interest rates, poor property management, environmental liabilities, uninsured damage, increased competition, or changes in real estate tax laws. |
| | With the increased use of technologies such as the Internet to conduct business, the Fund is susceptible to operational, information security and related risks. While the Fund’s Adviser has established business continuity plans in the event of, and risk management systems to prevent, limit or mitigate, such cyber-attacks, there are inherent limitations in such plans and systems, including the possibility that certain risks have not been identified. Furthermore, the Fund cannot control the cybersecurity plans and systems put in place by service providers to the Fund such as the Fund’s custodian and accounting agent, and the Fund’s transfer agent. In addition, many beneficial owners of Fund shares hold them through accounts at broker-dealers, retirement platforms and other financial market participants over which neither the Fund nor the Adviser exercises control. Each of these may in turn rely on service providers to them, which are also subject to the risk of cyber-attacks. Cybersecurity failures or breaches at the Adviser or the Fund’s service providers or intermediaries have the ability to cause disruptions and impact business operations, potentially resulting in financial losses, interference with the Fund’s ability to calculate its net asset value, impediments to trading, the inability of Fund shareholders to effect share purchases, redemptions or exchanges or receive |
Pioneer Multi-Asset Income Fund | Annual Report | 7/31/2461
| | distributions, loss of or unauthorized access to private shareholder information and violations of applicable privacy and other laws, regulatory fines, penalties, reputational damage, or additional compliance costs. Such costs and losses may not be covered under any insurance. In addition, maintaining vigilance against cyber-attacks may involve substantial costs over time, and system enhancements may themselves be subject to cyber-attacks. |
| | The Fund’s prospectus contains unaudited information regarding the Fund’s principal risks. Please refer to that document when considering the Fund’s principal risks. |
| H. | Restricted Securities |
| | Restricted Securities are subject to legal or contractual restrictions on resale. Restricted securities generally are resold in transactions exempt from registration under the Securities Act of 1933. Private placement securities are generally considered to be restricted except for those securities traded between qualified institutional investors under the provisions of Rule 144A of the Securities Act of 1933. |
| | Disposal of restricted investments may involve negotiations and expenses, and prompt sale at an acceptable price may be difficult to achieve. Restricted investments held by the Fund at July 31, 2024 are listed in the Schedule of Investments. |
| I. | Insurance-Linked Securities (“ILS”) |
| | The Fund invests in ILS. The Fund could lose a portion or all of the principal it has invested in an ILS, and the right to additional interest or dividend payments with respect to the security, upon the occurrence of one or more trigger events, as defined within the terms of an insurance-linked security. Trigger events, generally, are hurricanes, earthquakes, or other natural events of a specific size or magnitude that occur in a designated geographic region during a specified time period, and/or that involve losses or other metrics that exceed a specific amount. There is no way to accurately predict whether a trigger event will occur, and accordingly, ILS carry significant risk. The Fund is entitled to receive principal, and interest and/or dividend payments so long as no trigger event occurs of the description and magnitude specified by the instrument. In addition to the specified trigger events, ILS may expose the Fund to other risks, including but not limited to issuer (credit) default, adverse regulatory or jurisdictional interpretations and adverse tax consequences. |
62Pioneer Multi-Asset Income Fund | Annual Report | 7/31/24
| | The Fund’s investments in ILS may include event-linked bonds. ILS also may include special purpose vehicles (“SPVs”) or similar instruments structured to comprise a portion of a reinsurer’s catastrophe-oriented business, known as quota share instruments (sometimes referred to as reinsurance sidecars), or to provide reinsurance relating to specific risks to insurance or reinsurance companies through a collateralized instrument, known as collateralized reinsurance. Structured reinsurance investments also may include industry loss warranties (“ILWs”). A traditional ILW takes the form of a bilateral reinsurance contract, but there are also products that take the form of derivatives, collateralized structures, or exchange-traded instruments. |
| | Where the ILS are based on the performance of underlying reinsurance contracts, the Fund has limited transparency into the individual underlying contracts, and therefore must rely upon the risk assessment and sound underwriting practices of the issuer. Accordingly, it may be more difficult for the Adviser to fully evaluate the underlying risk profile of the Fund’s structured reinsurance investments, and therefore the Fund’s assets are placed at greater risk of loss than if the Adviser had more complete information. Structured reinsurance instruments generally will be considered illiquid securities by the Fund. These securities may be difficult to purchase, sell or unwind. Illiquid securities also may be difficult to value. If the Fund is forced to sell an illiquid asset, the Fund may be forced to sell at a loss. |
| J. | Repurchase Agreements |
| | Repurchase agreements are arrangements under which the Fund purchases securities from a broker-dealer or a bank, called the counterparty, upon the agreement of the counterparty to repurchase the securities from the Fund at a later date, and at a specific price, which is typically higher than the purchase price paid by the Fund. The securities purchased serve as the Fund’s collateral for the obligation of the counterparty to repurchase the securities. The value of the collateral, including accrued interest, is required to be equal to or in excess of the repurchase price. The collateral for all repurchase agreements is held in safekeeping in the customer-only account of the Fund’s custodian or a sub-custodian of the Fund. The Adviser is responsible for determining that the value of the collateral remains at least equal to the repurchase price. In the event of a default by the counterparty, the Fund is entitled to sell the securities, but the Fund may not be able to sell them for the price at which they were purchased, thus causing a loss to the Fund. Additionally, if the counterparty becomes insolvent, there is some risk that the Fund will not have a right to the securities, or the immediate right to sell the securities. |
Pioneer Multi-Asset Income Fund | Annual Report | 7/31/2463
| | Open repurchase agreements at July 31, 2024 are disclosed in the Schedule of Investments. |
| K. | Purchased Options |
| | The Fund may purchase put and call options to seek to increase total return. Purchased call and put options entitle the Fund to buy and sell a specified number of shares or units of a particular security, currency or index at a specified price at a specific date or within a specific period of time. Upon the purchase of a call or put option, the premium paid by the Fund is included on the Statement of Assets and Liabilities as an investment. All premiums are marked-to-market daily, and any unrealized appreciation or depreciation is recorded on the Fund’s Statement of Operations. As the purchaser of an index option, the Fund has the right to receive a cash payment equal to any depreciation in the value of the index below the strike price of the option (in the case of a put) or equal to any appreciation in the value of the index over the strike price of the option (in the case of a call) as of the valuation date of the option. Premiums paid for purchased call and put options which have expired are treated as realized losses on investments on the Statement of Operations. Upon the exercise or closing of a purchased put option, the premium is offset against the proceeds on the sale of the underlying security or financial instrument in order to determine the realized gain or loss on investments. Upon the exercise or closing of a purchased call option, the premium is added to the cost of the security or financial instrument. The risk associated with purchasing options is limited to the premium originally paid. |
| | The average market value of purchased options contracts open during the year ended July 31, 2024 was $1,304,370. There were no open purchased options contracts at July 31, 2024. |
| L. | Forward Foreign Currency Exchange Contracts |
| | The Fund may enter into forward foreign currency exchange contracts (“contracts”) for the purchase or sale of a specific foreign currency at a fixed price on a future date. All contracts are marked-to-market daily at the applicable exchange rates, and any resulting unrealized appreciation or depreciation is recorded in the Fund’s financial statements. The Fund records realized gains and losses at the time a contract is offset by entry into a closing transaction or extinguished by delivery of the currency. Risks may arise upon entering into these contracts from the potential inability of counterparties to meet the terms of the contract and from unanticipated movements in the value of foreign currencies relative to the U.S. dollar (see Note 8). |
64Pioneer Multi-Asset Income Fund | Annual Report | 7/31/24
| | During the year ended July 31, 2024, the Fund had entered into various forward foreign currency exchange contracts that obligated the Fund to deliver or take delivery of currencies at specified future maturity dates. Alternatively, prior to the settlement date of a forward foreign currency exchange contract, the Fund may close out such contract by entering into an offsetting contract. |
| | The average market value of forward foreign currency exchange contracts open during the year ended July 31, 2024 was $6,456,495 and $38,473,029 for buys and sells, respectively. Open forward foreign currency exchange contracts outstanding at July 31, 2024 are listed in the Schedule of Investments. |
| M. | Futures Contracts |
| | The Fund may enter into futures transactions in order to attempt to hedge against changes in interest rates, securities prices and currency exchange rates or to seek to increase total return. Futures contracts are types of derivatives. All futures contracts entered into by the Fund are traded on a futures exchange. Upon entering into a futures contract, the Fund is required to deposit with a broker an amount of cash or securities equal to the minimum “initial margin” requirements of the associated futures exchange. The amount of cash deposited with the broker as collateral at July 31, 2024, is recorded as “Futures collateral” on the Statement of Assets and Liabilities. |
| | Subsequent payments for futures contracts (“variation margin”) are paid or received by the Fund, depending on the daily fluctuation in the value of the contracts, and are recorded by the Fund as unrealized appreciation or depreciation. Cash received from or paid to the broker related to previous margin movement is held in a segregated account at the broker and is recorded as either “Due from broker for futures” or “Due to broker for futures” on the Statement of Assets and Liabilities. When the contract is closed, the Fund realizes a gain or loss equal to the difference between the opening and closing value of the contract as well as any fluctuation in foreign currency exchange rates where applicable. Futures contracts are subject to market risk, interest rate risk and currency exchange rate risk. Changes in value of the contracts may not directly correlate to the changes in value of the underlying securities. With futures, there is reduced counterparty credit risk to the Fund since futures are exchange-traded and the exchange’s clearinghouse, as counterparty to all exchange-traded futures, guarantees the futures against default. |
| | The average notional values of long position and short position futures contracts during the year ended July 31, 2024 were $78,397,186 and |
Pioneer Multi-Asset Income Fund | Annual Report | 7/31/2465
| | $623,546,313, respectively. Open futures contracts outstanding at July 31, 2024 are listed in the Schedule of Investments. |
| N. | Equity-Linked Notes |
| | Equity-linked notes seek to generate income and provide exposure to the performance of an underlying security, group of securities or exchange-traded funds (the “underlying reference instrument”). In an equity-linked note, the Fund purchases a note from a bank or broker-dealer and in return, the issuer provides for interest payments during the term of the note. At maturity or when the security is sold, the Fund will either settle by taking physical delivery of the underlying reference instrument or by receipt of a cash settlement amount equal to the value of the note at termination or maturity. The use of equity-linked notes involves the risk that the value of the note changes unfavorably due to movements in the value of the underlying reference instrument. Equity-linked notes are considered general unsecured contractual obligations of the bank or broker-dealer. The Fund must rely on the creditworthiness of the issuer for its investment returns. |
2. Management Agreement
The Adviser manages the Fund’s portfolio. Management fees payable under the Fund's Investment Management Agreement with the Adviser are calculated daily and paid monthly at the annual rate of 0.50% of the Fund’s average daily net assets up to $1 billion, 0.45% of the next $4 billion and 0.40% on assets over $5 billion. For the year ended July 31, 2024, the effective management fee (excluding waivers and/or assumption of expenses) was equivalent to 0.47% of the Fund’s average daily net assets.
The Adviser has contractually agreed to limit ordinary operating expenses (ordinary operating expenses means all fund expenses other than taxes, brokerage commissions, acquired fund fees and expenses and extraordinary expenses, such as litigation) of the Fund to the extent required to reduce Fund expenses to 0.85% and 0.65% of the average daily net assets attributable to Class A and Class Y shares, respectively. These expense limitations are in effect through December 1, 2024. There can be no assurance that the Adviser will extend the expense limitation agreement for a class of shares beyond the date referred to above.
In addition, under the management and administration agreements, certain other services and costs, including accounting, regulatory reporting and insurance premiums, are paid by the Fund as administrative reimbursements. Reflected on the Statement of Assets and Liabilities is $226,708 in management fees payable to the Adviser at July 31, 2024.
66Pioneer Multi-Asset Income Fund | Annual Report | 7/31/24
3. Compensation of Officers and Trustees
The Fund pays an annual fee to its Trustees. The Adviser reimburses the Fund for fees paid to the Interested Trustees. Except for the chief compliance officer, the Fund does not pay any salary or other compensation to its officers. The Fund pays a portion of the chief compliance officer’s compensation for his services as the Fund’s chief compliance officer. Amundi US pays the remaining portion of the chief compliance officer’s compensation. For the year ended July 31, 2024, the Fund paid $186,861 in Officers’ and Trustees’ compensation, which is reflected on the Statement of Operations as Officers’ and Trustees’ fees. At July 31, 2024, on its Statement of Assets and Liabilities, the Fund had a payable for Trustees’ fees of $15,500 and a payable for administrative expenses of $51,590, which includes the payable for Officers’ compensation.
4. Transfer Agent
BNY Mellon Investment Servicing (US) Inc. serves as the transfer agent to the Fund at negotiated rates. Transfer agent fees and payables shown on the Statement of Operations and the Statement of Assets and Liabilities, respectively, include sub-transfer agent expenses incurred through the Fund’s omnibus relationship contracts.
In addition, the Fund reimbursed the transfer agent for out-of-pocket expenses incurred by the transfer agent related to shareholder communications activities such as proxy and statement mailings, and outgoing phone calls. For the year ended July 31, 2024, such out-of-pocket expenses by class of shares were as follows:
| Shareholder Communications: | |
| Class A | $24,997 |
| Class C | 13,044 |
| Class K | 276 |
| Class R | 329 |
| Class Y | 77,085 |
| Total | $115,731 |
5. Distribution and Service Plans
The Fund has adopted a distribution plan (the “Plan”) pursuant to Rule 12b-1 under the 1940 Act with respect to its Class A, Class C and Class R shares. Pursuant to the Plan, the Fund pays the Distributor 0.25% of the Fund's average daily net assets attributable to Class A shares as compensation for personal services and/or account maintenance services or distribution services with regard to Class A shares. Pursuant to the Plan, the Fund also pays the Distributor 1.00% of the average daily net assets attributable to Class C shares. The fee for Class C shares consists of a
Pioneer Multi-Asset Income Fund | Annual Report | 7/31/2467
0.25% service fee and a 0.75% distribution fee paid as compensation for personal services and/or account maintenance services or distribution services with regard to Class C shares. Pursuant to the Plan, the Fund further pays the Distributor 0.50% of the average daily net assets attributable to Class R shares for distribution services. Reflected on the Statement of Assets and Liabilities is $66,760 in distribution fees payable to the Distributor at July 31, 2024.
The Fund also has adopted a separate service plan for Class R shares (the “Service Plan”). The Service Plan authorizes the Fund to pay securities dealers, plan administrators or other service organizations that agree to provide certain services to retirement plans or plan participants holding shares of the Fund a service fee of up to 0.25% of the Fund’s average daily net assets attributable to Class R shares held by such plans.
In addition, redemptions of Class A and Class C shares may be subject to a contingent deferred sales charge (“CDSC”). A CDSC of 1.00% may be imposed on redemptions of certain net asset value purchases of Class A shares within 12 months of purchase. Redemptions of Class C shares within 12 months of purchase are subject to a CDSC of 1.00% based on the lower of cost or market value of shares being redeemed. Shares purchased as part of an exchange remain subject to any CDSC that applied to the original purchase of those shares. There is no CDSC for Class K, Class R or Class Y shares. Proceeds from the CDSCs are paid to the Distributor. For the year ended July 31, 2024, CDSCs in the amount of $48,455 were paid to the Distributor.
6. Line of Credit Facility
The Fund, along with certain other funds in the Pioneer Family of Funds, participates in a committed, unsecured revolving line of credit (“credit facility”). Borrowings are used solely for temporary or emergency purposes. The Fund may borrow up to the lesser of the amount available under the credit facility or the limits set for borrowing by the Fund’s prospectus and the 1940 Act. Until January 31, 2024, the Fund participated in a credit facility in the amount of $380 million. Under such credit facility, depending on the type of loan, interest on borrowings was payable at the Secured Overnight Financing Rate (“SOFR”) plus a credit spread. The Fund also paid both an upfront fee and an annual commitment fee to participate in the credit facility. The upfront fee in the amount of 0.15% of the total credit facility and the commitment fee in the amount of 0.30% of the daily unused portion of each lender’s commitment were allocated among participating funds based on an allocation schedule set forth in the credit facility. Effective January 31, 2024, the Fund participates in a credit facility in the amount of $250 million, the upfront fee with respect to the credit
68Pioneer Multi-Asset Income Fund | Annual Report | 7/31/24
facility is 0.05% of the total credit facility, and the commitment fee with respect to the credit facility is 0.20% of the daily unused portion of each lender’s commitment. For the year ended July 31, 2024, the Fund had no borrowings under the credit facility.
7. Master Netting Agreements
The Fund has entered into an International Swaps and Derivatives Association, Inc. Master Agreement (“ISDA Master Agreement”) or similar agreement with substantially all of its derivative counterparties. An ISDA Master Agreement is a bilateral agreement between the Fund and a counterparty that governs the trading of certain Over the Counter (“OTC”) derivatives and typically contains, among other things, close-out and set- off provisions which apply upon the occurrence of an event of default and/or a termination event as defined under the relevant ISDA Master Agreement. The ISDA Master Agreement may also give a party the right to terminate all transactions traded under such agreement if, among other things, there is deterioration in the credit quality of the other party.
Upon an event of default or a termination of the ISDA Master Agreement, the non-defaulting party has the right to close-out all transactions under such agreement and to net amounts owed under each transaction to determine one net amount payable by one party to the other. The right to close out and net payments across all transactions under the ISDA Master Agreement could result in a reduction of the Fund’s credit risk to its counterparty equal to any amounts payable by the Fund under the applicable transactions, if any. However, the Fund’s right to set-off may be restricted or prohibited by the bankruptcy or insolvency laws of the particular jurisdiction to which each specific ISDA Master Agreement of each counterparty is subject.
The collateral requirements for derivatives transactions under an ISDA Master Agreement are governed by a credit support annex to the ISDA Master Agreement. Collateral requirements are generally determined at the close of business each day and are typically based on changes in market values for each transaction under an ISDA Master Agreement and netted into one amount for such agreement. Generally, the amount of collateral due from or to a counterparty is subject to threshold (a “minimum transfer amount”) before a transfer is required, which may vary by counterparty. Collateral pledged for the benefit of the Fund and/or counterparty is held in segregated accounts by the Fund’s custodian and cannot be sold, re- pledged, assigned or otherwise used while pledged. Cash that has been segregated to cover the Fund’s collateral obligations, if any, will be reported separately on the Statement of Assets and Liabilities as “Swaps collateral”.
Pioneer Multi-Asset Income Fund | Annual Report | 7/31/2469
Securities pledged by the Fund as collateral, if any, are identified as such in the Schedule of Investments.
Financial instruments subject to an enforceable master netting agreement, such as an ISDA Master Agreement, have been offset on the Statement of Assets and Liabilities. The following charts show gross assets and liabilities of the Fund as of July 31, 2024.
| Counterparty | Derivative
Assets
Subject to
Master Netting
Agreement | Derivatives
Available
for Offset | Non-Cash
Collateral
Received(a) | Cash
Collateral
Received(a) | Net Amount
of Derivative
Assets(b) |
Goldman Sachs
& Co. | $765,070 | $— | $— | $$(765,070) | $— |
JPMorgan Chase
Bank NA | 355,836 | — | — | (260,000) | 95,836 |
State Street Bank
& Trust Co. | 270,634 | — | — | — | 270,634 |
| Total | $1,391,540 | $— | $— | $(1,025,070) | $366,470 |
| Counterparty | Derivative
Liabilities
Subject to
Master Netting
Agreement | Derivatives
Available for
Offset | Non-Cash
Collateral
Pledged(a) | Cash
Collateral
Pledged(a) | Net Amount
of Derivative
Liabilities(c) |
Goldman Sachs
& Co. | $— | $— | $— | $— | $— |
JPMorgan Chase
Bank NA | — | — | — | — | — |
State Street Bank
& Trust Co. | — | — | — | — | — |
| Total | $— | $— | $— | $— | $— |
(a) The amount presented here may be less than the total amount of collateral received/pledged as the net amount of derivative assets and liabilities cannot be less than $0.
(b) Represents the net amount due from the counterparty in the event of default.
(c) Represents the net amount payable to the counterparty in the event of default.
70Pioneer Multi-Asset Income Fund | Annual Report | 7/31/24
8. Additional Disclosures about Derivative Instruments and Hedging Activities
The Fund’s use of derivatives may enhance or mitigate the Fund’s exposure to the following risks:
Interest rate risk relates to the fluctuations in the value of interest-bearing securities due to changes in the prevailing levels of market interest rates.
Credit risk relates to the ability of the issuer of a financial instrument to make further principal or interest payments on an obligation or commitment that it has to the Fund.
Foreign exchange rate risk relates to fluctuations in the value of an asset or liability due to changes in currency exchange rates.
Equity risk relates to the fluctuations in the value of financial instruments as a result of changes in market prices (other than those arising from interest rate risk or foreign exchange rate risk), whether caused by factors specific to an individual investment, its issuer, or all factors affecting all instruments traded in a market or market segment.
Commodity risk relates to the risk that the value of a commodity or commodity index will fluctuate based on increases or decreases in the commodities market and factors specific to a particular industry or commodity.
Pioneer Multi-Asset Income Fund | Annual Report | 7/31/2471
The fair value of open derivative instruments (not considered to be hedging instruments for accounting disclosure purposes) by risk exposure at July 31, 2024, was as follows:
Statement of Assets
and Liabilities | Interest
Rate Risk | Credit
Risk | Foreign
Exchange
Rate Risk | Equity
Risk | Commodity
Risk |
| Assets | | | | | |
| Unrealized appreciation on forward foreign currency exchange contracts | $— | $— | $1,391,540 | $— | $— |
| Net unrealized appreciation on futures contracts^ | 60,937 | — | — | — | — |
| Total Value | $60,937 | $— | $1,391,540 | $— | $— |
| Liabilities | | | | | |
| Net unrealized depreciation on futures contracts^ | $— | $— | $— | $2,243,229 | $— |
| Total Value | $— | $— | $— | $2,243,229 | $— |
| | |
| ^ | Includes cumulative unrealized appreciation (depreciation) of futures contracts as reported in the Schedule of Investments. Only net variation margin is reported within the assets and/or liabilities on the Statement of Assets and Liabilities. |
The effect of derivative instruments (not considered to be hedging instruments for accounting disclosure purposes) on the Statement of Operations by risk exposure at July 31, 2024 was as follows:
| Statement of Operations | Interest
Rate Risk | Credit
Risk | Foreign
Exchange
Rate Risk | Equity
Risk | Commodity
Risk |
| Net Realized Gain (Loss) on | | | | | |
| Futures contracts | $992,570 | $— | $— | $(92,312,558) | $— |
| Forward foreign currency exchange contracts | — | — | (793,894) | — | — |
| Options purchased* | — | — | — | (9,036,288) | — |
| Total Value | $992,570 | $— | $(793,894) | $(101,348,846) | $— |
| Change in Net Unrealized Appreciation (Depreciation) on | | | | | |
| Futures contracts | $(1,322,177) | $— | $— | $17,407,970 | $— |
| Forward foreign currency exchange contracts | — | — | 1,391,540 | — | — |
| Options purchased** | — | — | — | 3,352,335 | — |
| Total Value | $(1,322,177) | $— | $1,391,540 | $20,760,305 | $— |
| | |
| * | Reflects the net realized gain (loss) on purchased option contracts (see Note 1K). These amounts are included in net realized gain (loss) on investments in unaffiliated issuers, on the Statement of Operations. |
| ** | Reflects the change in net unrealized appreciation (depreciation) on purchased option contracts (see Note 1K). These amounts are included in change in net unrealized appreciation (depreciation) on investments in unaffiliated issuers, on the Statement of Operations. |
72Pioneer Multi-Asset Income Fund | Annual Report | 7/31/24
9. Definitive Agreement
The Fund’s Adviser is currently an indirect, wholly-owned subsidiary of Amundi. On July 9, 2024, Amundi announced that it had entered into a definitive agreement with Victory Capital Holdings, Inc. (“Victory Capital”) to combine the Adviser with Victory Capital, and for Amundi to become a strategic shareholder of Victory Capital (the “Transaction”). Victory Capital is headquartered in San Antonio, Texas. The closing of the Transaction is subject to certain regulatory approvals and other conditions. There is no assurance that the Transaction will close.
The closing of the Transaction would cause the Fund’s current investment advisory agreement with the Adviser to terminate. Under the terms of the Transaction, the Fund’s Board of Trustees will be asked to approve a reorganization of the Fund into a corresponding, newly established Victory Fund advised by Victory Capital Management Inc., an affiliate of Victory Capital. The proposed reorganization of the Fund would be sought in connection with the closing of the Transaction. If approved by the Board, the proposal to reorganize the Fund will be submitted to the shareholders of the Fund for their approval. There is no assurance that the Board or the shareholders of the Fund will approve the proposal to reorganize the Fund.
Pioneer Multi-Asset Income Fund | Annual Report | 7/31/2473
Report of Independent Registered Public Accounting Firm
To the Board of Trustees of Pioneer Series Trust IV and the Shareholders of Pioneer Multi-Asset Income Fund:
Opinion on the Financial Statements and Financial Highlights
We have audited the accompanying statement of assets and liabilities of Pioneer Multi-Asset Income Fund (the “Fund”) (one of the funds constituting Pioneer Series Trust IV), including the schedule of investments, as of July 31, 2024, the related statements of operations, changes in net assets, and the financial highlights for the year then ended and the related notes. The statements of changes in net assets for the year ended July 31, 2023 and the financial highlights for the years ended July 31, 2023, 2022, 2021, and 2020 were audited by other auditors. Those auditors expressed an unqualified opinion on those financial statements and financial highlights in their report dated September 29, 2023. In our opinion, the financial statements and financial highlights present fairly, in all material respects, the financial position of the Fund as of July 31, 2024 and the results of its operations, the changes in its net assets, and the financial highlights for the year then ended, in conformity with accounting principles generally accepted in the United States of America.
Basis for Opinion
These financial statements and financial highlights are the responsibility of the Fund's management. Our responsibility is to express an opinion on the Fund's financial statements and financial highlights based on our audits. We are a public accounting firm registered with the Public Company Accounting Oversight Board (United States) (PCAOB) and are required to be independent with respect to the Fund in accordance with the U.S. federal securities laws and the applicable rules and regulations of the Securities and Exchange Commission and the PCAOB.
We conducted our audits in accordance with the standards of the PCAOB. Those standards require that we plan and perform the audit to obtain reasonable assurance about whether the financial statements and financial highlights are free of material misstatement, whether due to error or fraud. The Fund is not required to have, nor were we engaged to perform, an audit of its internal control over financial reporting. As part of our audits we are required to obtain an understanding of internal control over financial reporting but not for the purpose of expressing an opinion on the effectiveness of the Fund’s internal control over financial reporting. Accordingly, we express no such opinion.
74Pioneer Multi-Asset Income Fund | Annual Report | 7/31/24
Our audits included performing procedures to assess the risks of material misstatement of the financial statements and financial highlights, whether due to error or fraud, and performing procedures that respond to those risks. Such procedures included examining, on a test basis, evidence regarding the amounts and disclosures in the financial statements and financial highlights. Our audits also included evaluating the accounting principles used and significant estimates made by management, as well as evaluating the overall presentation of the financial statements and financial highlights. Our procedures included confirmation of securities owned as of July 31, 2024, by correspondence with the custodian and brokers; when replies were not received from brokers, we performed other auditing procedures. We believe that our audits provide a reasonable basis for our opinion.
DELOITTE & TOUCHE LLP
Boston, Massachusetts
September 30, 2024
We have served as the auditor of one or more of the Pioneer investment companies since 2024.
Pioneer Multi-Asset Income Fund | Annual Report | 7/31/2475
Additional Information (unaudited)
On March 25, 2024, Ernst & Young LLP (the “Prior Auditor”) resigned as the independent registered public accounting firm of the Fund due to the independence considerations resulting from a change of the independent registered public accounting firm of a related party. The Prior Auditor’s reports on the financial statements of the Fund for the past two fiscal years, the years ended July 31, 2023 and July 31, 2022, did not contain an adverse opinion or disclaimer of opinion, and were not qualified or modified as to uncertainty, audit scope or accounting principles.
During the last two fiscal year-ends and the subsequent interim period through March 25, 2024, there were no (1) disagreements with the Prior Auditor on any matter of accounting principles or practices, financial statement disclosure, or auditing scope or procedure, which disagreements, if not resolved to the Prior Auditor’s satisfaction, would have caused it to make reference to that matter in connection with its reports on the Fund’s financial statements for such periods; or (2) “reportable events” related to the Fund, as that term is defined in Item 304 (a)(1)(v) of Regulation S-K under the Securities Exchange Act of 1934.
On March 25, 2024, the Audit Committee of the Board approved, and on March 25, 2024, the Board approved, Deloitte & Touche LLP as the independent registered accounting firm of the Fund for fiscal periods ending after March 25, 2024.
For the year ended July 31, 2024, certain dividends paid by the Fund may be subject to a maximum tax rate of 20%. The Fund intends to designate up to the maximum amount of such dividends allowable, as taxed at a maximum rate of 20%. Complete information will be computed and reported in conjunction with our 2024 Form 1099-DIV.
The qualifying percentage of the Fund’s ordinary income dividends for the purpose of the corporate dividends received deduction was 6.95%.
Qualified interest income is exempt from nonresident alien (NRA) tax withholding. The percentage of the Fund’s ordinary income distributions derived from qualified interest income was 56.77%.
76Pioneer Multi-Asset Income Fund | Annual Report | 7/31/24
How to Contact Amundi
We are pleased to offer a variety of convenient ways for you to contact us for assistance or information.
Call us for:
Account Information, including existing accounts,
new accounts, prospectuses, applications
and service forms
1-800-225-6292
FactFoneSM for automated fund yields, prices,
account information and transactions
1-800-225-4321
| Retirement plans information | 1-800-622-0176 |
Write to us:
Amundi
P.O. Box 534427
Pittsburgh, PA 15253-4427
| Our toll-free fax | 1-800-225-4240 |
| Our internet e-mail address | us.askamundi@amundi.com
(for general questions about Amundi only) |
Visit our web site: www.amundi.com/us
This report must be preceded or accompanied by a prospectus.
The Fund files a complete schedule of portfolio holdings with the Securities and Exchange Commission for the first and third quarters of each fiscal year as an exhibit to its reports on Form N-PORT. Shareholders may view the filed Form N-PORT by visiting the Commission’s web site at https://www.sec.gov.
Amundi Asset Management US, Inc.
60 State Street
Boston, MA 02109
www.amundi.com/us
Securities offered through Amundi Distributor US, Inc.
60 State Street, Boston, MA 02109
Underwriter of Pioneer Mutual Funds, Member SIPC
© 2024 Amundi Asset Management US, Inc. 25962-12-0924
Pioneer Balanced ESG Fund
Annual Report | July 31, 2024
| | | | | |
| A: AOBLX | C: PCBCX | K: PCBKX | R: CBPRX | Y: AYBLX |
visit us: www.amundi.com/us
Pioneer Balanced ESG Fund | Annual Report | 7/31/241
Schedule of Investments | 7/31/24
Principal
Amount
USD ($) | | | | | | Value |
| | UNAFFILIATED ISSUERS — 102.0% | |
| | Senior Secured Floating Rate Loan
Interests — 0.1% of Net Assets*(a) | |
| | Building & Construction Products — 0.0%† | |
| 25,000 | MI Windows and Doors LLC, 2024 Incremental Term Loan, 8.844% (Term SOFR + 350 bps), 3/28/31 | $ 25,109 |
| | Total Building & Construction Products | $25,109 |
|
|
| | Chemicals-Diversified — 0.0%† | |
| 39,100 | LSF11 A5 Holdco LLC, 2024 Refinancing Term Loan, 8.958% (Term SOFR + 350 bps), 10/15/28 | $ 39,222 |
| | Total Chemicals-Diversified | $39,222 |
|
|
| | Computer Services — 0.0%† | |
| 110,000(b) | Amazon Holdco, Inc., Seven-Year Term Loan, 7/30/31 | $ 110,413 |
| | Total Computer Services | $110,413 |
|
|
| | Cruise Lines — 0.0%† | |
| 35,000 | LC Ahab US Bidco LLC, Initial Term Loan, 8.844% (Term SOFR + 350 bps), 5/1/31 | $ 35,175 |
| | Total Cruise Lines | $35,175 |
|
|
| | Data Processing & Management — 0.1% | |
| 164,063 | Iron Mountain Information Management LLC, Incremental Term B Loan , 7.344% (LIBOR + 175 bps), 1/2/26 | $ 163,994 |
| | Total Data Processing & Management | $163,994 |
|
|
| | Electric-Generation — 0.0%† | |
| 58,677 | Generation Bridge Northeast LLC, Term Loan B, 8.844% (Term SOFR + 350 bps), 8/22/29 | $ 59,214 |
| | Total Electric-Generation | $59,214 |
|
|
| | Finance-Leasing Company — 0.0%† | |
| 71,118 | Avolon TLB Borrower 1 (US) LLC, Term B-4 Loan, 6.945% (Term SOFR + 150 bps), 2/12/27 | $ 71,201 |
| | Total Finance-Leasing Company | $71,201 |
|
|
| | Medical-Wholesale Drug Distribution — 0.0%† | |
| 55,683 | Owens & Minor, Inc., Term B-1 Loan, 9.194% (Term SOFR + 375 bps), 3/29/29 | $ 55,736 |
| | Total Medical-Wholesale Drug Distribution | $55,736 |
|
|
| | Total Senior Secured Floating Rate Loan Interests
(Cost $556,734) | $560,064 |
|
|
The accompanying notes are an integral part of these financial statements.
2Pioneer Balanced ESG Fund | Annual Report | 7/31/24
| Shares | | | | | | Value |
| | Common Stocks — 63.6% of Net Assets | |
| | Automobiles — 0.4% | |
| 59,481 | Honda Motor Co., Ltd. (A.D.R.) | $ 1,921,236 |
| | Total Automobiles | $1,921,236 |
|
|
| | Beverages — 0.8% | |
| 19,155 | PepsiCo., Inc. | $ 3,307,494 |
| | Total Beverages | $3,307,494 |
|
|
| | Biotechnology — 2.6% | |
| 30,973 | AbbVie, Inc. | $ 5,739,917 |
| 10,513(c) | Vertex Pharmaceuticals, Inc. | 5,211,504 |
| | Total Biotechnology | $10,951,421 |
|
|
| | Building Products — 0.7% | |
| 41,236 | Johnson Controls International Plc | $ 2,950,023 |
| | Total Building Products | $2,950,023 |
|
|
| | Capital Markets — 2.8% | |
| 58,811 | Bank of New York Mellon Corp. | $ 3,826,832 |
| 20,663 | CME Group, Inc. | 4,002,630 |
| 46,550 | State Street Corp. | 3,955,353 |
| | Total Capital Markets | $11,784,815 |
|
|
| | Chemicals — 0.8% | |
| 12,301 | Air Products and Chemicals, Inc. | $ 3,245,619 |
| | Total Chemicals | $3,245,619 |
|
|
| | Communications Equipment — 2.9% | |
| 124,848 | Cisco Systems, Inc. | $ 6,048,885 |
| 15,764 | Motorola Solutions, Inc. | 6,288,575 |
| | Total Communications Equipment | $12,337,460 |
|
|
| | Construction Materials — 1.2% | |
| 59,567 | CRH Plc | $ 5,104,892 |
| | Total Construction Materials | $5,104,892 |
|
|
| | Electrical Equipment — 3.1% | |
| 17,505 | Eaton Corp. Plc | $ 5,335,349 |
| 82,204 | Prysmian S.p.A. | 5,652,854 |
| 30,381 | Vertiv Holdings Co., Class A | 2,390,984 |
| | Total Electrical Equipment | $13,379,187 |
|
|
The accompanying notes are an integral part of these financial statements.
Pioneer Balanced ESG Fund | Annual Report | 7/31/243
Schedule of Investments | 7/31/24 (continued)
| Shares | | | | | | Value |
| | Electronic Equipment, Instruments & Components —
1.4% | |
| 24,456(c) | Keysight Technologies, Inc. | $ 3,413,324 |
| 17,225 | TE Connectivity, Ltd. | 2,658,334 |
| | Total Electronic Equipment, Instruments & Components | $6,071,658 |
|
|
| | Entertainment — 0.7% | |
| 32,701 | Walt Disney Co. | $ 3,063,757 |
| | Total Entertainment | $3,063,757 |
|
|
| | Financial Services — 2.4% | |
| 42,809(c) | PayPal Holdings, Inc. | $ 2,815,976 |
| 27,520 | Visa, Inc., Class A | 7,311,238 |
| | Total Financial Services | $10,127,214 |
|
|
| | Food Products — 1.8% | |
| 118,659 | Glanbia Plc | $ 2,374,462 |
| 79,092 | Kraft Heinz Co. | 2,784,829 |
| 39,585 | Lamb Weston Holdings, Inc. | 2,375,892 |
| | Total Food Products | $7,535,183 |
|
|
| | Health Care Equipment & Supplies — 0.8% | |
| 8,075(c) | Intuitive Surgical, Inc. | $ 3,590,226 |
| | Total Health Care Equipment & Supplies | $3,590,226 |
|
|
| | Health Care Providers & Services — 2.7% | |
| 62,955 | Cardinal Health, Inc. | $ 6,347,753 |
| 14,855 | Cigna Group | 5,179,493 |
| | Total Health Care Providers & Services | $11,527,246 |
|
|
| | Insurance — 1.5% | |
| 14,241 | Chubb, Ltd. | $ 3,925,674 |
| 49,393 | Sun Life Financial, Inc. | 2,450,387 |
| | Total Insurance | $6,376,061 |
|
|
| | Interactive Media & Services — 5.9% | |
| 145,852 | Alphabet, Inc., Class A | $ 25,019,452 |
| | Total Interactive Media & Services | $25,019,452 |
|
|
| | Life Sciences Tools & Services — 0.5% | |
| 9,063(c) | IQVIA Holdings, Inc. | $ 2,231,582 |
| | Total Life Sciences Tools & Services | $2,231,582 |
|
|
| | Machinery — 0.7% | |
| 8,022 | Deere & Co. | $ 2,984,024 |
| | Total Machinery | $2,984,024 |
|
|
The accompanying notes are an integral part of these financial statements.
4Pioneer Balanced ESG Fund | Annual Report | 7/31/24
| Shares | | | | | | Value |
| | Metals & Mining — 1.8% | |
| 9,458 | Reliance, Inc. | $ 2,880,528 |
| 102,274 | Teck Resources, Ltd., Class B | 5,012,449 |
| | Total Metals & Mining | $7,892,977 |
|
|
| | Office REITs — 0.3% | |
| 77,968 | Piedmont Office Realty Trust, Inc., Class A | $ 674,423 |
| 10,179 | SL Green Realty Corp. | 678,329 |
| | Total Office REITs | $1,352,752 |
|
|
| | Oil, Gas & Consumable Fuels — 3.9% | |
| 28,028 | Phillips 66 | $ 4,077,513 |
| 57,291 | Shell Plc (A.D.R.) | 4,194,847 |
| 60,570 | Targa Resources Corp. | 8,193,910 |
| | Total Oil, Gas & Consumable Fuels | $16,466,270 |
|
|
| | Personal Care Products — 0.5% | |
| 112,006 | Kenvue, Inc. | $ 2,070,991 |
| | Total Personal Care Products | $2,070,991 |
|
|
| | Pharmaceuticals — 3.2% | |
| 12,544 | Eli Lilly & Co. | $ 10,088,763 |
| 19,479 | Merck KGaA | 3,495,254 |
| | Total Pharmaceuticals | $13,584,017 |
|
|
| | Professional Services — 0.7% | |
| 11,383 | Automatic Data Processing, Inc. | $ 2,989,403 |
| | Total Professional Services | $2,989,403 |
|
|
| | Semiconductors & Semiconductor Equipment — 4.7% | |
| 28,081(c) | Advanced Micro Devices, Inc. | $ 4,057,143 |
| 12,083 | Analog Devices, Inc. | 2,795,765 |
| 109,505 | Intel Corp. | 3,366,184 |
| 4,130 | Lam Research Corp. | 3,804,721 |
| 23,708 | Microchip Technology, Inc. | 2,104,796 |
| 21,541 | QUALCOMM, Inc. | 3,897,844 |
| | Total Semiconductors & Semiconductor Equipment | $20,026,453 |
|
|
| | Software — 6.3% | |
| 10,420(c) | Adobe, Inc. | $ 5,748,193 |
| 41,154 | Microsoft Corp. | 17,216,776 |
| 29,762 | Oracle Corp. | 4,150,311 |
| | Total Software | $27,115,280 |
|
|
| | Specialized REITs — 1.2% | |
| 20,196 | Crown Castle, Inc. | $ 2,223,176 |
| 19,074 | Digital Realty Trust, Inc. | 2,851,372 |
| | Total Specialized REITs | $5,074,548 |
|
|
The accompanying notes are an integral part of these financial statements.
Pioneer Balanced ESG Fund | Annual Report | 7/31/245
Schedule of Investments | 7/31/24 (continued)
| Shares | | | | | | Value |
| | Specialty Retail — 2.0% | |
| 48,736 | TJX Cos., Inc. | $ 5,508,143 |
| 8,019(c) | Ulta Beauty, Inc. | 2,926,053 |
| | Total Specialty Retail | $8,434,196 |
|
|
| | Technology Hardware, Storage & Peripherals — 2.2% | |
| 100,356(c) | Pure Storage, Inc., Class A | $ 6,014,335 |
| 2,295 | Samsung Electronics Co., Ltd. (G.D.R.) (144A) | 3,532,005 |
| | Total Technology Hardware, Storage & Peripherals | $9,546,340 |
|
|
| | Textiles, Apparel & Luxury Goods — 0.7% | |
| 11,938(c) | Lululemon Athletica, Inc. | $ 3,087,883 |
| | Total Textiles, Apparel & Luxury Goods | $3,087,883 |
|
|
| | Trading Companies & Distributors — 2.4% | |
| 54,840 | AerCap Holdings NV | $ 5,152,218 |
| 23,955 | Ferguson Plc | 5,333,581 |
| | Total Trading Companies & Distributors | $10,485,799 |
|
|
| | Total Common Stocks
(Cost $162,232,742) | $271,635,459 |
|
|
Principal
Amount
USD ($) | | | | | | |
| | Asset Backed Securities — 3.0% of Net
Assets | |
| 53,268 | Accelerated LLC, Series 2021-1H, Class C, 2.35%, 10/20/40 (144A) | $ 49,399 |
| 209,170 | Affirm Asset Securitization Trust, Series 2024-X1, Class A, 6.27%, 5/15/29 (144A) | 209,523 |
| 100,000 | American Credit Acceptance Receivables Trust, Series 2024-3, Class D, 6.04%, 7/12/30 (144A) | 100,932 |
| 300,000 | Amur Equipment Finance Receivables XI LLC, Series 2022-2A, Class D, 7.25%, 5/21/29 (144A) | 307,481 |
| 100,000 | Amur Equipment Finance Receivables XII LLC, Series 2023-1A, Class C, 6.36%, 12/20/29 (144A) | 102,721 |
| 230,000 | Amur Equipment Finance Receivables XIV LLC, Series 2024-2A, Class D, 5.97%, 10/20/31 (144A) | 230,331 |
| 300,000(a) | Arbor Realty Commercial Real Estate Notes, Ltd., Series 2021-FL3, Class C, 7.293% (1 Month Term SOFR + 196 bps), 8/15/34 (144A) | 297,027 |
| 250,000(a) | Arbor Realty Commercial Real Estate Notes, Ltd., Series 2022-FL1, Class C, 7.637% (SOFR30A + 230 bps), 1/15/37 (144A) | 244,040 |
| 400,000(a) | Arbor Realty Commercial Real Estate Notes, Ltd., Series 2022-FL2, Class C, 8.779% (1 Month Term SOFR + 345 bps), 5/15/37 (144A) | 395,296 |
The accompanying notes are an integral part of these financial statements.
6Pioneer Balanced ESG Fund | Annual Report | 7/31/24
Principal
Amount
USD ($) | | | | | | Value |
| | Asset Backed Securities — (continued) | |
| 100,000 | Avis Budget Rental Car Funding AESOP LLC, Series 2024-1A, Class B, 5.85%, 6/20/30 (144A) | $ 101,497 |
| 120,000 | Avis Budget Rental Car Funding AESOP LLC, Series 2024-1A, Class C, 6.48%, 6/20/30 (144A) | 123,459 |
| 181,223 | Blackbird Capital II Aircraft Lease, Ltd., Series 2021-1A, Class A, 2.443%, 7/15/46 (144A) | 162,335 |
| 160,000(a) | BSPRT Issuer, Ltd., Series 2022-FL8, Class C, 7.637% (SOFR30A + 230 bps), 2/15/37 (144A) | 155,002 |
| 90,723 | BXG Receivables Note Trust, Series 2018-A, Class C, 4.44%, 2/2/34 (144A) | 89,036 |
| 250,000(a) | Carlyle US CLO, Ltd., Series 2019-4A, Class CR, 8.501% (3 Month Term SOFR + 320 bps), 4/15/35 (144A) | 248,992 |
| 118,835(d) | Cascade MH Asset Trust, Series 2019-MH1, Class A, 4.00%, 11/25/44 (144A) | 111,508 |
| 150,000 | Cascade MH Asset Trust, Series 2021-MH1, Class M1, 2.992%, 2/25/46 (144A) | 116,066 |
| 130,000(d) | CFMT LLC, Series 2022-HB9, Class M3, 3.25%, 9/25/37 (144A) | 113,200 |
| 166,575(d) | CFMT LLC, Series 2024-HB13, Class A, 3.00%, 5/25/34 (144A) | 160,546 |
| 100,000(d) | CFMT LLC, Series 2024-HB13, Class M2, 3.00%, 5/25/34 (144A) | 88,489 |
| 200,000 | Commercial Equipment Finance LLC, Series 2021-A, Class C, 3.55%, 12/15/28 (144A) | 195,408 |
| 400,000 | Continental Finance Credit Card ABS Master Trust, Series 2022-A, Class A, 6.19%, 10/15/30 (144A) | 401,165 |
| 78,737 | CoreVest American Finance Trust, Series 2020-3, Class A, 1.358%, 8/15/53 (144A) | 74,926 |
| 171,043 | Crossroads Asset Trust, Series 2021-A, Class D, 2.52%, 1/20/26 (144A) | 170,178 |
| 100,000 | DataBank Issuer, Series 2021-1A, Class B, 2.65%, 2/27/51 (144A) | 92,612 |
| 350,000 | DataBank Issuer, Series 2024-1A, Class A2, 5.30%, 1/26/54 (144A) | 338,564 |
| 100,000 | Dell Equipment Finance Trust, Series 2024-1, Class D, 6.12%, 9/23/30 (144A) | 101,493 |
| 400,000 | Exeter Automobile Receivables Trust, Series 2023-5A, Class D, 7.13%, 2/15/30 | 415,978 |
| 230,000 | Exeter Automobile Receivables Trust, Series 2024-3A, Class D, 5.98%, 9/16/30 | 232,952 |
| 780,000 | Exeter Automobile Receivables Trust, Series 2024-4A, Class D, 5.81%, 12/16/30 | 784,812 |
| 480,000(d) | FIGRE Trust, Series 2024-HE3, Class A, 5.937%, 7/25/54 (144A) | 482,400 |
The accompanying notes are an integral part of these financial statements.
Pioneer Balanced ESG Fund | Annual Report | 7/31/247
Schedule of Investments | 7/31/24 (continued)
Principal
Amount
USD ($) | | | | | | Value |
| | Asset Backed Securities — (continued) | |
| 400,000(d) | Finance of America HECM Buyout, Series 2022-HB1, Class M3, 5.084%, 2/25/32 (144A) | $ 390,741 |
| 30,229 | Foundation Finance Trust, Series 2021-1A, Class A, 1.27%, 5/15/41 (144A) | 27,790 |
| 160,000 | GLS Auto Receivables Issuer Trust, Series 2023-4A, Class D, 7.18%, 8/15/29 (144A) | 166,655 |
| 160,000 | GLS Auto Receivables Issuer Trust, Series 2024-2A, Class D, 6.19%, 2/15/30 (144A) | 163,434 |
| 100,000 | Hertz Vehicle Financing III LLC, Series 2024-1A, Class C, 6.70%, 1/25/29 (144A) | 100,571 |
| 110,000 | Hertz Vehicle Financing III LLC, Series 2024-2A, Class C, 6.70%, 1/27/31 (144A) | 111,150 |
| 125,000(a) | HGI CRE CLO, Ltd., Series 2021-FL2, Class C, 7.242% (1 Month Term SOFR + 191 bps), 9/17/36 (144A) | 122,244 |
| 194,500 | HOA Funding LLC - HOA, Series 2021-1A, Class A2, 4.723%, 8/20/51 (144A) | 150,411 |
| 114,327 | Home Partners of America Trust, Series 2019-1, Class D, 3.406%, 9/17/39 (144A) | 107,043 |
| 165,116 | Home Partners of America Trust, Series 2019-2, Class E, 3.32%, 10/19/39 (144A) | 154,477 |
| 100,000 | HPEFS Equipment Trust, Series 2023-2A, Class D, 6.97%, 7/21/31 (144A) | 102,395 |
| 460,000 | HPEFS Equipment Trust, Series 2024-1A, Class D, 5.82%, 11/20/31 (144A) | 465,010 |
| 100,000 | HPEFS Equipment Trust, Series 2024-2A, Class D, 5.82%, 4/20/32 (144A) | 101,269 |
| 240,000 | Merchants Fleet Funding LLC, Series 2024-1A, Class C, 6.18%, 4/20/37 (144A) | 243,269 |
| 120,000 | Merchants Fleet Funding LLC, Series 2024-1A, Class D, 6.85%, 4/20/37 (144A) | 121,696 |
| 33,363 | Mosaic Solar Loan Trust, Series 2019-2A, Class A, 2.88%, 9/20/40 (144A) | 29,585 |
| 80,562 | Mosaic Solar Loan Trust, Series 2020-1A, Class A, 2.10%, 4/20/46 (144A) | 70,495 |
| 150,000 | Nelnet Student Loan Trust, Series 2021-A, Class B1, 2.85%, 4/20/62 (144A) | 128,419 |
| 85,378 | NMEF Funding LLC, Series 2021-A, Class C, 2.58%, 12/15/27 (144A) | 84,914 |
| 100,000 | NMEF Funding LLC, Series 2022-B, Class C, 8.54%, 6/15/29 (144A) | 100,050 |
| 52,864 | Oportun Funding XIV LLC, Series 2021-A, Class C, 3.44%, 3/8/28 (144A) | 51,369 |
| 214,443(a) | ReadyCap Lending Small Business Loan Trust, Series 2023-3, Class A, 8.57% (PRIME + 7 bps), 4/25/48 (144A) | 216,380 |
The accompanying notes are an integral part of these financial statements.
8Pioneer Balanced ESG Fund | Annual Report | 7/31/24
Principal
Amount
USD ($) | | | | | | Value |
| | Asset Backed Securities — (continued) | |
| 250,000 | Republic Finance Issuance Trust, Series 2021-A, Class A, 2.30%, 12/22/31 (144A) | $ 242,715 |
| 100,000 | Republic Finance Issuance Trust, Series 2021-A, Class C, 3.53%, 12/22/31 (144A) | 93,488 |
| 250,000 | Santander Bank Auto Credit-Linked Notes Series, Series 2024-A, Class E, 7.762%, 6/15/32 (144A) | 251,950 |
| 160,000 | Santander Drive Auto Receivables Trust, Series 2024-2, Class D, 6.28%, 8/15/31 | 164,483 |
| 250,000 | SCF Equipment Leasing LLC, Series 2021-1A, Class D, 1.93%, 9/20/30 (144A) | 238,543 |
| 100,000 | SCF Equipment Leasing LLC, Series 2024-1A, Class D, 6.58%, 6/21/33 (144A) | 102,401 |
| 55,138 | SpringCastle America Funding LLC, Series 2020-AA, Class A, 1.97%, 9/25/37 (144A) | 50,908 |
| 325,000(a) | STWD, Ltd., Series 2022-FL3, Class B, 7.287% (SOFR30A + 195 bps), 11/15/38 (144A) | 314,512 |
| 200,000 | Switch ABS Issuer LLC, Series 2024-1A, Class A2, 6.28%, 3/25/54 (144A) | 203,238 |
| 100,000 | Tricolor Auto Securitization Trust, Series 2024-2A, Class C, 6.93%, 4/17/28 (144A) | 101,299 |
| 120,000 | Tricon American Homes Trust, Series 2020-SFR2, Class E1, 2.73%, 11/17/39 (144A) | 108,568 |
| 105,000 | VFI ABS LLC, Series 2023-1A, Class C, 9.26%, 12/24/29 (144A) | 107,073 |
| 372,318(e) | Vista Point Securitization Trust, Series 2024-CES1, Class A1, 6.676%, 5/25/54 (144A) | 376,507 |
| 88,607 | Welk Resorts LLC, Series 2019-AA, Class C, 3.34%, 6/15/38 (144A) | 84,556 |
| 146,173 | Westgate Resorts LLC, Series 2022-1A, Class C, 2.488%, 8/20/36 (144A) | 140,747 |
| 280,000 | Westlake Automobile Receivables Trust, Series 2024-2A, Class D, 5.91%, 4/15/30 (144A) | 282,481 |
| | Total Asset Backed Securities
(Cost $12,919,439) | $12,770,204 |
|
|
| | Collateralized Mortgage
Obligations—2.5% of Net Assets | |
| 425,000(d) | BINOM Securitization Trust, Series 2022-RPL1, Class M2, 3.00%, 2/25/61 (144A) | $ 326,415 |
| 100,000(d) | Bunker Hill Loan Depositary Trust, Series 2020-1, Class A3, 3.253%, 2/25/55 (144A) | 90,514 |
| 100,000(d) | CFMT LLC, Series 2024-HB14, Class M1, 3.00%, 6/25/34 (144A) | 92,016 |
| 100,000(d) | CFMT LLC, Series 2024-HB14, Class M2, 3.00%, 6/25/34 (144A) | 89,456 |
The accompanying notes are an integral part of these financial statements.
Pioneer Balanced ESG Fund | Annual Report | 7/31/249
Schedule of Investments | 7/31/24 (continued)
Principal
Amount
USD ($) | | | | | | Value |
| | Collateralized Mortgage
Obligations—(continued) | |
| 500,000(d) | Citigroup Mortgage Loan Trust, Series 2018-RP3, Class M3, 3.25%, 3/25/61 (144A) | $ 426,449 |
| 649,820(d) | Citigroup Mortgage Loan Trust, Series 2021-INV2, Class B1W, 2.987%, 5/25/51 (144A) | 532,152 |
| 150,000(a) | Connecticut Avenue Securities Trust, Series 2022-R02, Class 2M2, 8.347% (SOFR30A + 300 bps), 1/25/42 (144A) | 154,401 |
| 100,000(a) | Connecticut Avenue Securities Trust, Series 2024-R03, Class 2M2, 7.298% (SOFR30A + 195 bps), 3/25/44 (144A) | 100,802 |
| 100,000(a) | Connecticut Avenue Securities Trust, Series 2024-R05, Class 2M2, 7.036% (SOFR30A + 170 bps), 7/25/44 (144A) | 100,125 |
| 210,000(a) | Eagle Re, Ltd., Series 2023-1, Class M1B, 9.297% (SOFR30A + 395 bps), 9/26/33 (144A) | 217,786 |
| 92,368 | Federal Home Loan Mortgage Corp. REMICs, Series 3816, Class HA, 3.50%, 11/15/25 | 91,198 |
| 11,545(a) | Federal Home Loan Mortgage Corp. REMICs, Series 3868, Class FA, 5.852% (SOFR30A + 51 bps), 5/15/41 | 11,383 |
| 95,067(a)(f) | Federal Home Loan Mortgage Corp. REMICs, Series 4091, Class SH, 1.098% (SOFR30A + 644 bps), 8/15/42 | 12,782 |
| 75,969(f) | Federal Home Loan Mortgage Corp. REMICs, Series 4999, Class QI, 4.00%, 5/25/50 | 15,402 |
| 99,668(f) | Federal Home Loan Mortgage Corp. REMICs, Series 5067, Class GI, 4.00%, 12/25/50 | 20,771 |
| 485,000(a) | Federal Home Loan Mortgage Corp. STACR REMIC Trust, Series 2021-HQA3, Class B1, 8.697% (SOFR30A + 335 bps), 9/25/41 (144A) | 499,805 |
| 400,000(a) | Federal Home Loan Mortgage Corp. STACR REMIC Trust, Series 2021-HQA3, Class M2, 7.447% (SOFR30A + 210 bps), 9/25/41 (144A) | 403,440 |
| 12,476(a) | Federal National Mortgage Association REMICs, Series 2006-104, Class GF, 5.782% (SOFR30A + 43 bps), 11/25/36 | 12,316 |
| 17,154(a) | Federal National Mortgage Association REMICs, Series 2006-23, Class FP, 5.762% (SOFR30A + 41 bps), 4/25/36 | 16,887 |
| 6,507(a) | Federal National Mortgage Association REMICs, Series 2007-93, Class FD, 6.012% (SOFR30A + 66 bps), 9/25/37 | 6,439 |
| 41,322(a) | Federal National Mortgage Association REMICs, Series 2011-63, Class FG, 5.912% (SOFR30A + 56 bps), 7/25/41 | 40,808 |
The accompanying notes are an integral part of these financial statements.
10Pioneer Balanced ESG Fund | Annual Report | 7/31/24
Principal
Amount
USD ($) | | | | | | Value |
| | Collateralized Mortgage
Obligations—(continued) | |
| 64,125(f) | Federal National Mortgage Association REMICs, Series 2020-83, Class EI, 4.00%, 11/25/50 | $ 13,148 |
| 278,963(f) | Government National Mortgage Association, Series 2019-159, Class CI, 3.50%, 12/20/49 | 47,341 |
| 236,077(a)(f) | Government National Mortgage Association, Series 2020-9, Class SA, 0.000% (1 Month Term SOFR + 324 bps), 1/20/50 | 4,848 |
| 160,000(d) | GS Mortgage-Backed Securities Corp. Trust, Series 2022-PJ4, Class A33, 3.00%, 9/25/52 (144A) | 114,176 |
| 284,442(d) | GS Mortgage-Backed Securities Trust, Series 2022-PJ1, Class A4, 2.50%, 5/28/52 (144A) | 228,843 |
| 68,968(a) | Home Re, Ltd., Series 2019-1, Class M1, 7.112% (SOFR30A + 176 bps), 5/25/29 (144A) | 69,000 |
| 100,000(d) | Homeward Opportunities Fund I Trust, Series 2020-2, Class A3, 3.196%, 5/25/65 (144A) | 95,904 |
| 100,000(d) | Imperial Fund Mortgage Trust, Series 2021-NQM2, Class B1, 3.295%, 9/25/56 (144A) | 71,311 |
| 100,000(d) | Imperial Fund Mortgage Trust, Series 2021-NQM2, Class M1, 2.489%, 9/25/56 (144A) | 69,042 |
| 294,927 | IMS Ecuadorian Mortgage Trust, Series 2021-1, Class GA, 3.40%, 8/18/43 (144A) | 275,019 |
| 122,256(d) | JP Morgan Mortgage Trust, Series 2021-13, Class B1, 3.14%, 4/25/52 (144A) | 101,136 |
| 277,377(d) | JP Morgan Mortgage Trust, Series 2021-7, Class B2, 2.797%, 11/25/51 (144A) | 219,758 |
| 119,887(d) | JP Morgan Mortgage Trust, Series 2021-INV1, Class B1, 2.978%, 10/25/51 (144A) | 98,250 |
| 800,000(d) | JP Morgan Mortgage Trust, Series 2022-2, Class A5A, 2.50%, 8/25/52 (144A) | 524,356 |
| 210,000(d) | JP Morgan Mortgage Trust, Series 2022-4, Class A5, 3.00%, 10/25/52 (144A) | 149,359 |
| 657,316(d) | JP Morgan Mortgage Trust, Series 2022-8, Class B2, 4.683%, 1/25/53 (144A) | 595,802 |
| 250,000(d) | JP Morgan Mortgage Trust, Series 2022-LTV1, Class M1, 3.521%, 7/25/52 (144A) | 164,697 |
| 325,882(d) | Mello Mortgage Capital Acceptance, Series 2021-INV2, Class A15, 2.50%, 8/25/51 (144A) | 262,166 |
| 300,000(d) | Mello Mortgage Capital Acceptance, Series 2021-INV2, Class A5, 2.50%, 8/25/51 (144A) | 197,557 |
| 37,473(d) | MFA Trust, Series 2020-NQM1, Class A3, 2.30%, 8/25/49 (144A) | 34,663 |
| 300,000(d) | Mill City Mortgage Loan Trust, Series 2019-GS2, Class M3, 3.25%, 8/25/59 (144A) | 251,237 |
The accompanying notes are an integral part of these financial statements.
Pioneer Balanced ESG Fund | Annual Report | 7/31/2411
Schedule of Investments | 7/31/24 (continued)
Principal
Amount
USD ($) | | | | | | Value |
| | Collateralized Mortgage
Obligations—(continued) | |
| 41,931(a) | Oaktown Re V, Ltd., Series 2020-2A, Class M2, 10.712% (SOFR30A + 536 bps), 10/25/30 (144A) | $ 42,474 |
| 548,983(d) | PRMI Securitization Trust, Series 2021-1, Class B1, 2.478%, 4/25/51 (144A) | 433,511 |
| 259,824(d) | Provident Funding Mortgage Trust, Series 2021-2, Class A9, 2.25%, 4/25/51 (144A) | 209,517 |
| 150,000(a) | Radnor Re, Ltd., Series 2023-1, Class M1A, 8.047% (SOFR30A + 270 bps), 7/25/33 (144A) | 151,870 |
| 296,691(d) | RCKT Mortgage Trust, Series 2021-3, Class A25, 2.50%, 7/25/51 (144A) | 239,068 |
| 270,604(d) | RCKT Mortgage Trust, Series 2021-4, Class B1A, 3.007%, 9/25/51 (144A) | 222,586 |
| 385,000(d) | RCKT Mortgage Trust, Series 2022-3, Class A17, 3.00%, 5/25/52 (144A) | 272,084 |
| 33,609(d) | RMF Proprietary Issuance Trust, Series 2019-1, Class A, 2.75%, 10/25/63 (144A) | 29,771 |
| 289,079(d) | RMF Proprietary Issuance Trust, Series 2021-2, Class A, 2.125%, 9/25/61 (144A) | 252,749 |
| 150,000(d) | Sequoia Mortgage Trust, Series 2022-1, Class A7, 2.50%, 2/25/52 (144A) | 98,761 |
| 140,000(a) | Towd Point Mortgage Trust, Series 2019-HY1, Class B2, 7.614% (1 Month Term SOFR + 226 bps), 10/25/48 (144A) | 139,965 |
| 270,000(a) | Triangle Re, Ltd., Series 2023-1, Class M1A, 8.747% (SOFR30A + 340 bps), 11/25/33 (144A) | 275,312 |
| 400,000(d) | UWM Mortgage Trust, Series 2021-INV1, Class A5, 2.50%, 8/25/51 (144A) | 264,930 |
| 675,000(d) | UWM Mortgage Trust, Series 2021-INV2, Class A5, 2.50%, 9/25/51 (144A) | 447,563 |
| 44,943(d) | Visio Trust, Series 2019-2, Class A1, 2.722%, 11/25/54 (144A) | 43,252 |
| 359,324(d) | Wells Fargo Mortgage Backed Securities Trust, Series 2020-5, Class B2, 2.911%, 9/25/50 (144A) | 302,838 |
| 100,000(d) | Wells Fargo Mortgage Backed Securities Trust, Series 2022-2, Class A5, 3.00%, 12/25/51 (144A) | 71,184 |
| 335,000(d) | Wells Fargo Mortgage Backed Securities Trust, Series 2022-2, Class A6, 2.50%, 12/25/51 (144A) | 219,646 |
| | Total Collateralized Mortgage Obligations
(Cost $11,875,339) | $10,566,041 |
|
|
| | Commercial Mortgage-Backed
Securities—1.5% of Net Assets | |
| 300,000 | Benchmark Mortgage Trust, Series 2018-B8, Class A4, 3.963%, 1/15/52 | $ 288,396 |
The accompanying notes are an integral part of these financial statements.
12Pioneer Balanced ESG Fund | Annual Report | 7/31/24
Principal
Amount
USD ($) | | | | | | Value |
| | Commercial Mortgage-Backed
Securities—(continued) | |
| 200,000(d) | Benchmark Mortgage Trust, Series 2022-B34, Class AM, 3.83%, 4/15/55 | $ 176,430 |
| 207,730 | Citigroup Commercial Mortgage Trust, Series 2018-C5, Class A3, 3.963%, 6/10/51 | 200,271 |
| 350,000(a) | COMM Mortgage Trust, Series 2024-WCL1, Class A, 7.169% (1 Month Term SOFR + 184 bps), 6/15/41 (144A) | 346,172 |
| 377 | Credit Suisse First Boston Mortgage Securities Corp., Series 2005-C2, Class AMFX, 4.877%, 4/15/37 | 374 |
| 250,000(d) | CSAIL Commercial Mortgage Trust, Series 2015-C4, Class AS, 4.174%, 11/15/48 | 242,257 |
| 12,058(a) | Federal Home Loan Mortgage Corp. Multifamily Structured Credit Risk, Series 2021-MN1, Class M1, 7.347% (SOFR30A + 200 bps), 1/25/51 (144A) | 11,986 |
| 550,000(a) | Federal Home Loan Mortgage Corp. Multifamily Structured Credit Risk, Series 2021-MN3, Class M2, 9.347% (SOFR30A + 400 bps), 11/25/51 (144A) | 556,252 |
| 213,177 | Freddie Mac Multifamily Structured Pass Through Certificates, Series K729, Class A2, 3.136%, 10/25/24 | 211,584 |
| 100,000(d) | FREMF Mortgage Trust, Series 2017-KW03, Class B, 4.074%, 7/25/27 (144A) | 93,815 |
| 109,745(a) | FREMF Mortgage Trust, Series 2019-KF64, Class B, 7.751% (SOFR30A + 241 bps), 6/25/26 (144A) | 106,483 |
| 105,511(a) | FREMF Mortgage Trust, Series 2019-KF66, Class B, 7.851% (SOFR30A + 251 bps), 7/25/29 (144A) | 98,278 |
| 250,000(d) | FREMF Trust, Series 2018-KW04, Class B, 3.925%, 9/25/28 (144A) | 222,249 |
| 811,748(d)(f) | Government National Mortgage Association, Series 2017-21, Class IO, 0.632%, 10/16/58 | 29,364 |
| 400,000(a) | GS Mortgage Securities Corportation Trust, Series 2021-IP, Class D, 7.543% (1 Month Term SOFR + 221 bps), 10/15/36 (144A) | 388,841 |
| 220,000(a) | HILT Commercial Mortgage Trust, Series 2024-ORL, Class A, 6.87% (1 Month Term SOFR + 154 bps), 5/15/37 (144A) | 219,175 |
| 100,000(d) | HTL Commercial Mortgage Trust, Series 2024-T53, Class B, 6.555%, 5/10/39 (144A) | 100,994 |
| 375,000 | JP Morgan Chase Commercial Mortgage Securities Trust, Series 2018-WPT, Class AFX, 4.248%, 7/5/33 (144A) | 343,315 |
| 250,000 | JPMDB Commercial Mortgage Securities Trust, Series 2018-C8, Class A4, 4.211%, 6/15/51 | 239,299 |
| 2,450,000(d)(f) | JPMDB Commercial Mortgage Securities Trust, Series 2018-C8, Class XB, 0.119%, 6/15/51 | 11,360 |
The accompanying notes are an integral part of these financial statements.
Pioneer Balanced ESG Fund | Annual Report | 7/31/2413
Schedule of Investments | 7/31/24 (continued)
Principal
Amount
USD ($) | | | | | | Value |
| | Commercial Mortgage-Backed
Securities—(continued) | |
| 250,000 | Key Commercial Mortgage Securities Trust, Series 2019-S2, Class A3, 3.469%, 6/15/52 (144A) | $ 232,962 |
| 250,000(a) | MF1 Multifamily Housing Mortgage Loan Trust, Series 2021-FL5, Class D, 7.949% (1 Month Term SOFR + 261 bps), 7/15/36 (144A) | 245,441 |
| 300,000(d) | Morgan Stanley Capital I Trust, Series 2018-MP, Class A, 4.276%, 7/11/40 (144A) | 267,449 |
| 150,000(a) | ORL Trust, Series 2023-GLKS, Class A, 7.679% (1 Month Term SOFR + 235 bps), 10/19/36 (144A) | 150,187 |
| 50,000 | Palisades Center Trust, Series 2016-PLSD, Class A, 2.713%, 4/13/33 (144A) | 31,000 |
| 500,000(a) | Ready Capital Mortgage Financing LLC, Series 2021-FL7, Class D, 8.414% (1 Month Term SOFR + 306 bps), 11/25/36 (144A) | 487,953 |
| 125,000(d) | Soho Trust, Series 2021-SOHO, Class A, 2.697%, 8/10/38 (144A) | 89,357 |
| 325,000(a) | Taubman Centers Commercial Mortgage Trust, Series 2022-DPM, Class B, 8.261% (1 Month Term SOFR + 293 bps), 5/15/37 (144A) | 326,219 |
| 210,000(d) | THPT Mortgage Trust, Series 2023-THL, Class A, 6.994%, 12/10/34 (144A) | 214,339 |
| 308,631(a) | TTAN, Series 2021-MHC, Class B, 6.543% (1 Month Term SOFR + 121 bps), 3/15/38 (144A) | 305,544 |
| 980,845(d)(f) | Wells Fargo Commercial Mortgage Trust, Series 2015-NXS3, Class XA, 0.867%, 9/15/57 | 6,811 |
| 2,998,538(d)(f) | Wells Fargo Commercial Mortgage Trust, Series 2016-LC24, Class XA, 1.60%, 10/15/49 | 78,151 |
| | Total Commercial Mortgage-Backed Securities
(Cost $6,770,476) | $6,322,308 |
|
|
| | Convertible Corporate Bonds — 0.7% of
Net Assets | |
| | REITs — 0.7% | |
| 3,227,000 | Redwood Trust, Inc., 7.75%, 6/15/27 | $ 3,170,527 |
| | Total REITs | $3,170,527 |
|
|
| | Total Convertible Corporate Bonds
(Cost $2,999,652) | $3,170,527 |
|
|
| | Corporate Bonds — 11.7% of Net Assets | |
| | Advertising — 0.1% | |
| 375,000(g) | Omnicom Group, Inc., 5.30%, 11/1/34 | $ 374,806 |
| | Total Advertising | $374,806 |
|
|
The accompanying notes are an integral part of these financial statements.
14Pioneer Balanced ESG Fund | Annual Report | 7/31/24
Principal
Amount
USD ($) | | | | | | Value |
| | Airlines — 0.1% | |
| 110,156 | Air Canada 2017-1 Class AA Pass Through Trust, 3.30%, 1/15/30 (144A) | $ 102,090 |
| 60,000 | Delta Air Lines, Inc./SkyMiles IP, Ltd., 4.75%, 10/20/28 (144A) | 59,399 |
| 120,000(g) | United Airlines, Inc. Pass-Through Trust, 5.45%, 2/15/37 | 122,308 |
| | Total Airlines | $283,797 |
|
|
| | Auto Manufacturers — 0.5% | |
| 345,000 | American Honda Finance Corp., 5.05%, 7/10/31 | $ 349,351 |
| 85,000 | Cummins, Inc., 5.15%, 2/20/34 | 87,113 |
| 150,000 | Cummins, Inc., 5.45%, 2/20/54 | 150,833 |
| 165,000 | General Motors Financial Co., Inc., 3.10%, 1/12/32 | 142,074 |
| 90,000 | General Motors Financial Co., Inc., 5.75%, 2/8/31 | 92,093 |
| 440,000 | General Motors Financial Co., Inc., 6.10%, 1/7/34 | 453,259 |
| 285,000 | Hyundai Capital America, 5.80%, 4/1/30 (144A) | 295,646 |
| 125,000 | Hyundai Capital America, 6.20%, 9/21/30 (144A) | 132,547 |
| 325,000 | Mercedes-Benz Finance North America LLC, 4.85%, 1/11/29 (144A) | 328,041 |
| | Total Auto Manufacturers | $2,030,957 |
|
|
| | Banks — 4.4% | |
| 400,000(d) | ABN AMRO Bank NV, 3.324% (5 Year CMT Index + 190 bps), 3/13/37 (144A) | $ 336,361 |
| 200,000 | ABN AMRO Bank NV, 4.80%, 4/18/26 (144A) | 198,087 |
| 285,000(d) | Australia & New Zealand Banking Group, Ltd., 5.731% (5 Year CMT Index + 162 bps), 9/18/34 (144A) | 289,485 |
| 200,000 | Banco Bilbao Vizcaya Argentaria S.A., 5.381%, 3/13/29 | 204,423 |
| 200,000 | Banco Santander Chile, 2.70%, 1/10/25 (144A) | 197,508 |
| 600,000(d) | Banco Santander S.A., 3.225% (1 Year CMT Index + 160 bps), 11/22/32 | 509,968 |
| 200,000(d)(g)(h) | Banco Santander S.A., 8.00% (5 Year CMT Index + 391 bps) | 202,067 |
| 335,000(d) | Bank of America Corp., 2.572% (SOFR + 121 bps), 10/20/32 | 284,619 |
| 55,000(d) | Bank of New York Mellon Corp., 5.606% (SOFR + 177 bps), 7/21/39 | 55,873 |
| 565,000(d) | Bank of Nova Scotia, 4.588% (5 Year CMT Index + 205 bps), 5/4/37 | 521,787 |
| 445,000(d) | Barclays Plc, 5.746% (1 Year CMT Index + 300 bps), 8/9/33 | 455,305 |
| 225,000(d) | BNP Paribas S.A., 2.159% (SOFR + 122 bps), 9/15/29 (144A) | 200,571 |
The accompanying notes are an integral part of these financial statements.
Pioneer Balanced ESG Fund | Annual Report | 7/31/2415
Schedule of Investments | 7/31/24 (continued)
Principal
Amount
USD ($) | | | | | | Value |
| | Banks — (continued) | |
| 260,000(d) | BNP Paribas S.A., 5.176% (SOFR + 152 bps), 1/9/30 (144A) | $ 262,780 |
| 270,000(d) | CaixaBank S.A., 6.84% (SOFR + 277 bps), 9/13/34 (144A) | 293,445 |
| 220,000(d) | Citigroup, Inc., 2.52% (SOFR + 118 bps), 11/3/32 | 185,359 |
| 205,000(d) | Citigroup, Inc., 4.91% (SOFR + 209 bps), 5/24/33 | 201,372 |
| 225,000(d) | Citizens Financial Group, Inc., 5.718% (SOFR + 191 bps), 7/23/32 | 227,771 |
| 135,000(d) | Citizens Financial Group, Inc., 5.841% (SOFR + 201 bps), 1/23/30 | 137,232 |
| 375,000(d) | Comerica Bank, 5.332% (SOFR + 261 bps), 8/25/33 | 343,486 |
| 275,000(d) | Danske Bank A/S, 5.427% (1 Year CMT Index + 95 bps), 3/1/28 (144A) | 278,393 |
| 630,000 | Federation des Caisses Desjardins du Quebec, 5.25%, 4/26/29 (144A) | 639,601 |
| 210,000(d) | Goldman Sachs Group, Inc., 2.65% (SOFR + 126 bps), 10/21/32 | 178,836 |
| 195,000(d) | Goldman Sachs Group, Inc., 3.272% (3 Month Term SOFR + 146 bps), 9/29/25 | 194,219 |
| 140,000(d) | Goldman Sachs Group, Inc., 4.223% (3 Month Term SOFR + 156 bps), 5/1/29 | 136,768 |
| 225,000(d) | Goldman Sachs Group, Inc., 5.33% (SOFR + 155 bps), 7/23/35 | 226,671 |
| 305,000(d) | HSBC Holdings Plc, 2.206% (SOFR + 129 bps), 8/17/29 | 273,840 |
| 335,000(d) | HSBC Holdings Plc, 2.871% (SOFR + 141 bps), 11/22/32 | 285,386 |
| 200,000(d) | HSBC Holdings Plc, 6.161% (SOFR + 197 bps), 3/9/29 | 207,681 |
| 200,000(d) | ING Groep NV, 4.252% (SOFR + 207 bps), 3/28/33 | 189,650 |
| 585,000(d)(h) | ING Groep NV, 4.25% (5 Year CMT Index + 286 bps) | 463,793 |
| 250,000(d) | Intesa Sanpaolo S.p.A., 7.778% (1 Year CMT Index + 390 bps), 6/20/54 (144A) | 268,549 |
| 380,000 | Intesa Sanpaolo S.p.A., 7.80%, 11/28/53 (144A) | 431,550 |
| 275,000(d) | JPMorgan Chase & Co., 2.545% (SOFR + 118 bps), 11/8/32 | 234,323 |
| 90,000(d) | JPMorgan Chase & Co., 4.586% (SOFR + 180 bps), 4/26/33 | 87,466 |
| 300,000(d) | JPMorgan Chase & Co., 5.04% (SOFR + 119 bps), 1/23/28 | 301,359 |
| 215,000(d) | JPMorgan Chase & Co., 5.766% (SOFR + 149 bps), 4/22/35 | 225,335 |
| 500,000 | KeyBank N.A./Cleveland OH, 4.15%, 8/8/25 | 493,526 |
| 105,000(d) | KeyCorp, 6.401% (SOFR + 242 bps), 3/6/35 | 109,527 |
| 205,000(d)(h) | Lloyds Banking Group Plc, 8.00% (5 Year CMT Index + 391 bps) | 212,856 |
The accompanying notes are an integral part of these financial statements.
16Pioneer Balanced ESG Fund | Annual Report | 7/31/24
Principal
Amount
USD ($) | | | | | | Value |
| | Banks — (continued) | |
| 300,000(d) | Macquarie Group, Ltd., 2.691% (SOFR + 144 bps), 6/23/32 (144A) | $ 254,523 |
| 175,000(d) | Macquarie Group, Ltd., 2.871% (SOFR + 153 bps), 1/14/33 (144A) | 147,951 |
| 200,000(d) | Mitsubishi UFJ Financial Group, Inc., 2.494% (1 Year CMT Index + 97 bps), 10/13/32 | 169,571 |
| 210,000(d) | Mitsubishi UFJ Financial Group, Inc., 5.426% (1 Year CMT Index + 100 bps), 4/17/35 | 214,763 |
| 175,000(d) | Morgan Stanley, 5.173% (SOFR + 145 bps), 1/16/30 | 177,068 |
| 290,000(d) | Morgan Stanley, 5.297% (SOFR + 262 bps), 4/20/37 | 284,512 |
| 150,000(d) | Morgan Stanley, 5.32% (SOFR + 156 bps), 7/19/35 | 151,236 |
| 70,000(d) | Morgan Stanley, 5.652% (SOFR + 101 bps), 4/13/28 | 71,321 |
| 180,000(d) | Morgan Stanley, 5.942% (5 Year CMT Index + 180 bps), 2/7/39 | 183,098 |
| 65,000(d) | Morgan Stanley, 5.948% (5 Year CMT Index + 243 bps), 1/19/38 | 66,400 |
| 210,000(d) | NatWest Group Plc, 6.475% (5 Year CMT Index + 220 bps), 6/1/34 | 217,725 |
| 355,000(a) | NatWest Markets Plc, 6.505% (SOFR + 114 bps), 5/17/29 (144A) | 356,324 |
| 585,000(d)(h) | Nordea Bank Abp, 3.75% (5 Year CMT Index + 260 bps) (144A) | 494,968 |
| 65,000(d) | PNC Financial Services Group, Inc., 5.30% (SOFR + 134 bps), 1/21/28 | 65,598 |
| 190,000(d) | PNC Financial Services Group, Inc., 6.875% (SOFR + 228 bps), 10/20/34 | 211,453 |
| 195,000(d) | Santander Holdings USA, Inc., 2.49% (SOFR + 125 bps), 1/6/28 | 181,739 |
| 65,000(d) | Santander Holdings USA, Inc., 6.124% (SOFR + 123 bps), 5/31/27 | 65,855 |
| 425,000(d) | Standard Chartered Plc, 6.296% (1 Year CMT Index + 258 bps), 7/6/34 (144A) | 450,615 |
| 225,000(d) | Toronto-Dominion Bank, 7.25% (5 Year CMT Index + 298 bps), 7/31/84 | 226,083 |
| 60,000(d) | Truist Financial Corp., 5.435% (SOFR + 162 bps), 1/24/30 | 60,925 |
| 200,000(d) | Truist Financial Corp., 7.161% (SOFR + 245 bps), 10/30/29 | 215,428 |
| 385,000(d) | UBS Group AG, 2.746% (1 Year CMT Index + 110 bps), 2/11/33 (144A) | 323,548 |
| 2,500,000(d)(h) | UBS Group AG, 4.875% (5 Year CMT Index + 340 bps) (144A) | 2,354,439 |
| 200,000(d) | UBS Group AG, 4.988% (1 Year CMT Index + 240 bps), 8/5/33 (144A) | 195,252 |
The accompanying notes are an integral part of these financial statements.
Pioneer Balanced ESG Fund | Annual Report | 7/31/2417
Schedule of Investments | 7/31/24 (continued)
Principal
Amount
USD ($) | | | | | | Value |
| | Banks — (continued) | |
| 350,000(d) | UniCredit S.p.A., 2.569% (1 Year CMT Index + 230 bps), 9/22/26 (144A) | $ 338,507 |
| 230,000(d) | UniCredit S.p.A., 5.459% (5 Year CMT Index + 475 bps), 6/30/35 (144A) | 220,795 |
| 200,000(d) | UniCredit S.p.A., 7.296% (5 Year USD Swap Rate + 491 bps), 4/2/34 (144A) | 207,676 |
| 530,000(d) | US Bancorp, 2.491% (5 Year CMT Index + 95 bps), 11/3/36 | 427,310 |
| 80,000(d) | US Bancorp, 5.384% (SOFR + 156 bps), 1/23/30 | 81,570 |
| | Total Banks | $18,963,081 |
|
|
| | Beverages — 0.1% | |
| 215,000 | Coca-Cola Co., 5.00%, 5/13/34 | $ 221,278 |
| | Total Beverages | $221,278 |
|
|
| | Biotechnology — 0.1% | |
| 165,000 | Amgen, Inc., 5.25%, 3/2/33 | $ 167,688 |
| 115,000 | Royalty Pharma Plc, 5.15%, 9/2/29 | 115,781 |
| 145,000 | Royalty Pharma Plc, 5.40%, 9/2/34 | 144,883 |
| | Total Biotechnology | $428,352 |
|
|
| | Building Materials — 0.0%† | |
| 60,000 | Miter Brands Acquisition Holdco, Inc./MIWD Borrower LLC, 6.75%, 4/1/32 (144A) | $ 60,876 |
| 140,000 | Owens Corning, 5.70%, 6/15/34 | 144,761 |
| | Total Building Materials | $205,637 |
|
|
| | Commercial Services — 0.3% | |
| 200,000 | Ashtead Capital, Inc., 5.50%, 8/11/32 (144A) | $ 199,884 |
| 200,000 | Ashtead Capital, Inc., 5.95%, 10/15/33 (144A) | 205,416 |
| 55,000 | Element Fleet Management Corp., 5.643%, 3/13/27 (144A) | 55,748 |
| 235,000 | Element Fleet Management Corp., 6.319%, 12/4/28 (144A) | 246,539 |
| 170,000 | S&P Global, Inc., 5.25%, 9/15/33 (144A) | 175,833 |
| 280,000 | Verisk Analytics, Inc., 5.25%, 6/5/34 | 282,657 |
| | Total Commercial Services | $1,166,077 |
|
|
| | Distribution/Wholesale — 0.0%† | |
| 30,000 | Velocity Vehicle Group LLC, 8.00%, 6/1/29 (144A) | $ 30,900 |
| | Total Distribution/Wholesale | $30,900 |
|
|
| | Diversified Financial Services — 1.0% | |
| 850,000 | AerCap Ireland Capital DAC/AerCap Global Aviation Trust, 3.30%, 1/30/32 | $ 748,257 |
| 120,000(d) | Ally Financial, Inc., 6.184% (SOFR + 229 bps), 7/26/35 | 120,548 |
The accompanying notes are an integral part of these financial statements.
18Pioneer Balanced ESG Fund | Annual Report | 7/31/24
Principal
Amount
USD ($) | | | | | | Value |
| | Diversified Financial Services — (continued) | |
| 245,000 | Ameriprise Financial, Inc., 5.15%, 5/15/33 | $ 248,753 |
| 30,000 | Avolon Holdings Funding, Ltd., 5.75%, 11/15/29 (144A) | 30,549 |
| 570,000 | Avolon Holdings Funding, Ltd., 6.375%, 5/4/28 (144A) | 589,381 |
| 100,000 | BlackRock Funding, Inc., 5.35%, 1/8/55 | 100,243 |
| 290,000(d) | Capital One Financial Corp., 2.359% (SOFR + 134 bps), 7/29/32 | 230,695 |
| 40,000(d) | Capital One Financial Corp., 5.268% (SOFR + 237 bps), 5/10/33 | 39,444 |
| 165,000(d) | Capital One Financial Corp., 5.884% (SOFR + 199 bps), 7/26/35 | 167,390 |
| 220,000(d) | Charles Schwab Corp., 5.853% (SOFR + 250 bps), 5/19/34 | 228,198 |
| 185,000 | Freedom Mortgage Holdings LLC, 9.125%, 5/15/31 (144A) | 181,994 |
| 185,000 | Freedom Mortgage Holdings LLC, 9.25%, 2/1/29 (144A) | 186,325 |
| 120,000 | LPL Holdings, Inc., 5.70%, 5/20/27 | 121,271 |
| 140,000(g) | Nationstar Mortgage Holdings, Inc., 6.50%, 8/1/29 (144A) | 139,793 |
| 445,000 | Nomura Holdings, Inc., 2.999%, 1/22/32 | 381,122 |
| 225,000 | Nomura Holdings, Inc., 5.605%, 7/6/29 | 230,261 |
| 305,000 | OneMain Finance Corp., 4.00%, 9/15/30 | 266,983 |
| 110,000(d)(g) | Synchrony Financial, 5.935% (SOFR + 213 bps), 8/2/30 | 110,678 |
| 163,000 | United Wholesale Mortgage LLC, 5.50%, 4/15/29 (144A) | 157,159 |
| | Total Diversified Financial Services | $4,279,044 |
|
|
| | Electric — 0.5% | |
| 115,000 | AEP Texas, Inc., 5.45%, 5/15/29 | $ 117,480 |
| 195,000(d) | Algonquin Power & Utilities Corp., 4.75% (5 Year CMT Index + 325 bps), 1/18/82 | 178,258 |
| 50,000(e) | Algonquin Power & Utilities Corp., 5.365%, 6/15/26 | 50,122 |
| 125,000 | American Electric Power Co., Inc., 4.30%, 12/1/28 | 122,303 |
| 220,000 | Consolidated Edison Co. of New York, Inc., 4.625%, 12/1/54 | 191,573 |
| 76,000(e) | Dominion Energy, Inc., 3.071%, 8/15/24 | 75,919 |
| 250,000 | Duke Energy Carolinas LLC, 3.95%, 3/15/48 | 198,554 |
| 350,000 | Entergy Louisiana LLC, 5.35%, 3/15/34 | 356,734 |
| 170,000 | ITC Holdings Corp., 5.65%, 5/9/34 (144A) | 174,324 |
| 185,000 | NextEra Energy Capital Holdings, Inc., 6.051%, 3/1/25 | 185,763 |
| 205,000 | Puget Energy, Inc., 2.379%, 6/15/28 | 185,212 |
| 133,000 | Puget Energy, Inc., 4.10%, 6/15/30 | 125,614 |
The accompanying notes are an integral part of these financial statements.
Pioneer Balanced ESG Fund | Annual Report | 7/31/2419
Schedule of Investments | 7/31/24 (continued)
Principal
Amount
USD ($) | | | | | | Value |
| | Electric — (continued) | |
| 120,000 | Puget Energy, Inc., 4.224%, 3/15/32 | $ 110,088 |
| 85,000 | Southern California Edison Co., 5.45%, 6/1/31 | 87,763 |
| 200,000 | Virginia Electric and Power Co., 4.45%, 2/15/44 | 174,334 |
| | Total Electric | $2,334,041 |
|
|
| | Energy-Alternate Sources — 0.0%† | |
| 34,987 | Alta Wind Holdings LLC, 7.00%, 6/30/35 (144A) | $ 35,054 |
| | Total Energy-Alternate Sources | $35,054 |
|
|
| | Food — 0.1% | |
| 215,000 | Smithfield Foods, Inc., 2.625%, 9/13/31 (144A) | $ 175,688 |
| 155,000 | Smithfield Foods, Inc., 3.00%, 10/15/30 (144A) | 134,757 |
| 4,000 | Smithfield Foods, Inc., 5.20%, 4/1/29 (144A) | 3,954 |
| | Total Food | $314,399 |
|
|
| | Gas — 0.3% | |
| 515,000 | Atmos Energy Corp., 5.90%, 11/15/33 | $ 549,502 |
| 325,000 | Boston Gas Co., 3.15%, 8/1/27 (144A) | 307,645 |
| 60,000 | CenterPoint Energy Resources Corp., 5.40%, 7/1/34 | 60,645 |
| 375,000 | KeySpan Gas East Corp., 5.994%, 3/6/33 (144A) | 385,475 |
| | Total Gas | $1,303,267 |
|
|
| | Hand & Machine Tools — 0.0%† | |
| 125,000 | Regal Rexnord Corp., 6.30%, 2/15/30 | $ 130,372 |
| | Total Hand & Machine Tools | $130,372 |
|
|
| | Healthcare-Products — 0.1% | |
| 48,000 | Edwards Lifesciences Corp., 4.30%, 6/15/28 | $ 47,033 |
| 244,000 | Smith & Nephew Plc, 2.032%, 10/14/30 | 207,068 |
| 95,000 | Smith & Nephew Plc, 5.40%, 3/20/34 | 96,097 |
| 120,000 | Sotera Health Holdings LLC, 7.375%, 6/1/31 (144A) | 122,406 |
| | Total Healthcare-Products | $472,604 |
|
|
| | Healthcare-Services — 0.2% | |
| 100,000 | Elevance Health, Inc., 5.15%, 6/15/29 | $ 102,014 |
| 70,000 | Elevance Health, Inc., 5.375%, 6/15/34 | 71,815 |
| 80,000 | Health Care Service Corp. A Mutual Legal Reserve Co., 5.20%, 6/15/29 (144A) | 81,108 |
| 135,000 | Health Care Service Corp. A Mutual Legal Reserve Co., 5.45%, 6/15/34 (144A) | 136,453 |
| 75,000 | Humana, Inc., 5.375%, 4/15/31 | 76,165 |
| 125,000 | UnitedHealth Group, Inc., 5.625%, 7/15/54 | 128,165 |
| 100,000 | UnitedHealth Group, Inc., 5.75%, 7/15/64 | 102,705 |
| | Total Healthcare-Services | $698,425 |
|
|
The accompanying notes are an integral part of these financial statements.
20Pioneer Balanced ESG Fund | Annual Report | 7/31/24
Principal
Amount
USD ($) | | | | | | Value |
| | Insurance — 0.7% | |
| 185,000 | Brown & Brown, Inc., 4.20%, 3/17/32 | $ 172,131 |
| 290,000 | Brown & Brown, Inc., 5.65%, 6/11/34 | 293,600 |
| 75,000 | CNO Financial Group, Inc., 6.45%, 6/15/34 | 76,781 |
| 435,000 | CNO Global Funding, 2.65%, 1/6/29 (144A) | 389,094 |
| 250,000(d) | Farmers Exchange Capital III, 5.454% (3 Month USD LIBOR + 345 bps), 10/15/54 (144A) | 210,399 |
| 385,000(d) | Farmers Insurance Exchange, 4.747% (3 Month USD LIBOR + 323 bps), 11/1/57 (144A) | 290,109 |
| 508,000 | Liberty Mutual Insurance Co., 7.697%, 10/15/97 (144A) | 586,526 |
| 160,000 | Metropolitan Life Global Funding I, 5.15%, 3/28/33 (144A) | 161,811 |
| 270,000(d) | Nippon Life Insurance Co., 2.75% (5 Year CMT Index + 265 bps), 1/21/51 (144A) | 227,759 |
| 200,000(d) | Nippon Life Insurance Co., 2.90% (5 Year CMT Index + 260 bps), 9/16/51 (144A) | 168,495 |
| 79,000 | Primerica, Inc., 2.80%, 11/19/31 | 67,701 |
| 305,000 | Prudential Financial, Inc., 3.00%, 3/10/40 | 232,475 |
| 163,000 | Prudential Financial, Inc., 3.878%, 3/27/28 | 158,772 |
| 20,000 | Teachers Insurance & Annuity Association of America, 6.85%, 12/16/39 (144A) | 22,951 |
| 40,000 | Willis North America, Inc., 2.95%, 9/15/29 | 36,453 |
| | Total Insurance | $3,095,057 |
|
|
| | Iron & Steel — 0.0%† | |
| 165,000 | Steel Dynamics, Inc., 5.375%, 8/15/34 | $ 167,256 |
| | Total Iron & Steel | $167,256 |
|
|
| | Leisure Time — 0.0%† | |
| 160,000(g) | Royal Caribbean Cruises, Ltd., 6.00%, 2/1/33 (144A) | $ 161,049 |
| | Total Leisure Time | $161,049 |
|
|
| | Lodging — 0.2% | |
| 55,000 | Choice Hotels International, Inc., 5.85%, 8/1/34 | $ 55,268 |
| 150,000 | Hilton Grand Vacations Borrower Escrow LLC/Hilton Grand Vacations Borrower Esc, 6.625%, 1/15/32 (144A) | 151,470 |
| 405,000 | Marriott International, Inc., 4.90%, 4/15/29 | 407,514 |
| 120,000 | Marriott International, Inc., 5.30%, 5/15/34 | 120,954 |
| | Total Lodging | $735,206 |
|
|
| | Machinery-Diversified — 0.3% | |
| 500,000 | CNH Industrial Capital LLC, 1.875%, 1/15/26 | $ 478,226 |
| 280,000 | John Deere Capital Corp., 5.05%, 6/12/34 | 284,668 |
The accompanying notes are an integral part of these financial statements.
Pioneer Balanced ESG Fund | Annual Report | 7/31/2421
Schedule of Investments | 7/31/24 (continued)
Principal
Amount
USD ($) | | | | | | Value |
| | Machinery-Diversified — (continued) | |
| 297,000 | John Deere Capital Corp., 5.10%, 4/11/34 | $ 303,452 |
| 105,000 | Nordson Corp., 5.80%, 9/15/33 | 110,620 |
| | Total Machinery-Diversified | $1,176,966 |
|
|
| | Mining — 0.2% | |
| 200,000 | Anglo American Capital Plc, 5.75%, 4/5/34 (144A) | $ 203,923 |
| 290,000 | AngloGold Ashanti Holdings Plc, 3.75%, 10/1/30 | 258,963 |
| 250,000 | Corp. Nacional del Cobre de Chile, 5.625%, 10/18/43 (144A) | 235,288 |
| 270,000 | First Quantum Minerals, Ltd., 8.625%, 6/1/31 (144A) | 268,647 |
| | Total Mining | $966,821 |
|
|
| | Multi-National — 0.1% | |
| 370,000 | Banque Ouest Africaine de Developpement, 4.70%, 10/22/31 (144A) | $ 325,681 |
| | Total Multi-National | $325,681 |
|
|
| | Oil & Gas — 0.3% | |
| 600,000 | Aker BP ASA, 3.10%, 7/15/31 (144A) | $ 520,896 |
| 215,000 | Hilcorp Energy I LP/Hilcorp Finance Co., 6.875%, 5/15/34 (144A) | 213,893 |
| 400,000 | Phillips 66 Co., 3.75%, 3/1/28 | 387,168 |
| 162,000 | Valero Energy Corp., 6.625%, 6/15/37 | 177,431 |
| | Total Oil & Gas | $1,299,388 |
|
|
| | Pharmaceuticals — 0.2% | |
| 117,000 | AbbVie, Inc., 4.05%, 11/21/39 | $ 104,514 |
| 335,000 | Cencora, Inc., 5.125%, 2/15/34 | 337,714 |
| 40,000 | CVS Health Corp., 5.25%, 1/30/31 | 40,421 |
| 250,000 | CVS Health Corp., 5.25%, 2/21/33 | 249,452 |
| | Total Pharmaceuticals | $732,101 |
|
|
| | Pipelines — 0.4% | |
| 150,000 | Enbridge, Inc., 5.625%, 4/5/34 | $ 153,562 |
| 120,000(d) | Enbridge, Inc., 7.20% (5 Year CMT Index + 297 bps), 6/27/54 | 122,123 |
| 120,000(d) | Enbridge, Inc., 7.375% (5 Year CMT Index + 312 bps), 3/15/55 | 121,596 |
| 165,000(d) | Enbridge, Inc., 8.50% (5 Year CMT Index + 443 bps), 1/15/84 | 180,455 |
| 245,000 | MPLX LP, 5.50%, 6/1/34 | 246,790 |
| 180,000 | NGPL PipeCo LLC, 3.25%, 7/15/31 (144A) | 157,257 |
| 20,000 | Venture Global LNG, Inc., 8.125%, 6/1/28 (144A) | 20,829 |
| 120,000 | Venture Global LNG, Inc., 8.375%, 6/1/31 (144A) | 126,104 |
| 45,000 | Venture Global LNG, Inc., 9.50%, 2/1/29 (144A) | 50,062 |
The accompanying notes are an integral part of these financial statements.
22Pioneer Balanced ESG Fund | Annual Report | 7/31/24
Principal
Amount
USD ($) | | | | | | Value |
| | Pipelines — (continued) | |
| 45,000 | Williams Cos., Inc., 5.15%, 3/15/34 | $ 44,878 |
| 205,000 | Williams Cos., Inc., 5.75%, 6/24/44 | 204,445 |
| 242,000 | Williams Cos., Inc., 7.75%, 6/15/31 | 271,532 |
| | Total Pipelines | $1,699,633 |
|
|
| | REITs — 0.3% | |
| 19,000 | Highwoods Realty LP, 2.60%, 2/1/31 | $ 15,608 |
| 18,000 | Highwoods Realty LP, 3.05%, 2/15/30 | 15,672 |
| 394,000 | MPT Operating Partnership LP/MPT Finance Corp., 3.50%, 3/15/31 | 258,872 |
| 490,000 | Simon Property Group LP , 5.50%, 3/8/33 | 505,195 |
| 205,000 | UDR, Inc., 1.90%, 3/15/33 | 159,362 |
| 140,000 | UDR, Inc., 4.40%, 1/26/29 | 137,341 |
| | Total REITs | $1,092,050 |
|
|
| | Retail — 0.4% | |
| 50,000 | AutoNation, Inc., 1.95%, 8/1/28 | $ 44,283 |
| 50,000 | AutoNation, Inc., 2.40%, 8/1/31 | 41,294 |
| 140,000 | AutoNation, Inc., 3.85%, 3/1/32 | 127,013 |
| 250,000 | AutoNation, Inc., 4.75%, 6/1/30 | 244,457 |
| 565,000 | Best Buy Co., Inc., 1.95%, 10/1/30 | 481,587 |
| 330,000 | Darden Restaurants, Inc., 6.30%, 10/10/33 | 348,739 |
| 335,000 | Dollar Tree, Inc., 2.65%, 12/1/31 | 284,609 |
| 280,000 | Lowe's Cos., Inc., 3.75%, 4/1/32 | 259,661 |
| | Total Retail | $1,831,643 |
|
|
| | Savings & Loans — 0.1% | |
| 355,000 | Nationwide Building Society, 5.127%, 7/29/29 (144A) | $ 358,995 |
| | Total Savings & Loans | $358,995 |
|
|
| | Semiconductors — 0.3% | |
| 391,000 | Broadcom, Inc., 3.187%, 11/15/36 (144A) | $ 318,909 |
| 125,000 | Broadcom, Inc., 4.15%, 4/15/32 (144A) | 117,932 |
| 60,000 | Broadcom, Inc., 4.30%, 11/15/32 | 57,259 |
| 210,000 | Broadcom, Inc., 5.05%, 7/12/29 | 212,586 |
| 200,000 | Foundry JV Holdco LLC, 5.875%, 1/25/34 (144A) | 204,126 |
| 292,000 | SK Hynix, Inc., 5.50%, 1/16/29 (144A) | 296,487 |
| 269,000 | Skyworks Solutions, Inc., 3.00%, 6/1/31 | 235,075 |
| | Total Semiconductors | $1,442,374 |
|
|
| | Software — 0.1% | |
| 379,000 | Autodesk, Inc., 2.40%, 12/15/31 | $ 322,149 |
| 175,000 | Infor, Inc., 1.75%, 7/15/25 (144A) | 168,526 |
| | Total Software | $490,675 |
|
|
The accompanying notes are an integral part of these financial statements.
Pioneer Balanced ESG Fund | Annual Report | 7/31/2423
Schedule of Investments | 7/31/24 (continued)
Principal
Amount
USD ($) | | | | | | Value |
| | Telecommunications — 0.2% | |
| 174,000 | Motorola Solutions, Inc., 5.60%, 6/1/32 | $ 179,228 |
| 350,000 | T-Mobile USA, Inc., 2.55%, 2/15/31 | 304,106 |
| 170,000 | T-Mobile USA, Inc., 5.05%, 7/15/33 | 170,255 |
| 120,000 | T-Mobile USA, Inc., 5.75%, 1/15/34 | 126,157 |
| | Total Telecommunications | $779,746 |
|
|
| | Trucking & Leasing — 0.1% | |
| 98,000 | Penske Truck Leasing Co. LP/PTL Finance Corp., 4.40%, 7/1/27 (144A) | $ 96,581 |
| 255,000 | Penske Truck Leasing Co. LP/PTL Finance Corp., 5.55%, 5/1/28 (144A) | 260,523 |
| 35,000 | Penske Truck Leasing Co. LP/PTL Finance Corp., 6.05%, 8/1/28 (144A) | 36,425 |
| | Total Trucking & Leasing | $393,529 |
|
|
| | Total Corporate Bonds
(Cost $51,210,070) | $50,020,261 |
|
|
| | Municipal Bonds — 0.1% of Net Assets(i) | |
| | Massachusetts — 0.0%† | |
| 100,000 | Massachusetts Development Finance Agency, Phillips Academy, Series B, 4.844%, 9/1/43 | $ 94,614 |
| | Total Massachusetts | $94,614 |
|
|
| | Missouri — 0.0%† | |
| 100,000 | Health & Educational Facilities Authority of the State of Missouri, Washington University, Series A, 3.685%, 2/15/47 | $ 81,748 |
| | Total Missouri | $81,748 |
|
|
| | Texas — 0.1% | |
| 100,000(j) | Central Texas Regional Mobility Authority, 1/1/25 | $ 98,439 |
| | Total Texas | $98,439 |
|
|
| | Total Municipal Bonds
(Cost $297,755) | $274,801 |
|
|
| Shares | | | | | | |
| | Preferred Stock — 0.4% of Net Assets | |
| | Automobiles — 0.4% | |
| 22,881(k) | Porsche AG (144A) | $ 1,727,464 |
| | Total Automobiles | $1,727,464 |
|
|
| | Total Preferred Stock
(Cost $1,938,538) | $1,727,464 |
|
|
The accompanying notes are an integral part of these financial statements.
24Pioneer Balanced ESG Fund | Annual Report | 7/31/24
Principal
Amount
USD ($) | | | | | | Value |
| | Insurance-Linked Securities — 0.5% of Net
Assets# | |
| | Event Linked Bonds — 0.5% | |
| | Multiperil – U.S. — 0.3% | |
| 250,000(a) | Four Lakes Re, 11.03%, (3 Month U.S. Treasury Bill + 575 bps), 1/7/27 (144A) | $ 247,950 |
| 250,000(a) | High Point Re, 11.032%, (3 Month U.S. Treasury Bill + 575 bps), 1/6/27 (144A) | 250,550 |
| 250,000(a) | Mystic Re, 17.284%, (3 Month U.S. Treasury Bill + 1,200 bps), 1/8/27 (144A) | 250,600 |
| 250,000(a) | Residential Re, 11.202%, (3 Month U.S. Treasury Bill + 592 bps), 12/6/27 (144A) | 250,575 |
| 250,000(a) | Sanders Re, 11.03%, (3 Month U.S. Treasury Bill + 575 bps), 4/7/28 (144A) | 254,500 |
| | | | | | | $1,254,175 |
|
|
| | Multiperil – U.S. & Canada — 0.1% | |
| 250,000(a) | Galileo Re, 12.282%, (3 Month U.S. Treasury Bill + 700 bps), 1/7/28 (144A) | $ 252,075 |
| | Windstorm – North Carolina — 0.1% | |
| 250,000(a) | Blue Ridge Re, 10.53%, (3 Month U.S. Treasury Bill + 525 bps), 1/8/27 (144A) | $ 247,500 |
| | Windstorm – U.S. — 0.0%† | |
| 250,000(a) | Bonanza Re, 10.21%, (3 Month U.S. Treasury Bill + 493 bps), 12/23/24 (144A) | $ 243,113 |
| | Total Event Linked Bonds | $1,996,863 |
|
|
| | Total Insurance-Linked Securities
(Cost $2,000,000) | $1,996,863 |
|
|
| | Foreign Government Bonds — 0.2% of Net
Assets | |
| | Philippines — 0.1% | |
| 200,000 | Philippine Government International Bond, 5.000%, 1/13/37 | $ 199,000 |
| | Total Philippines | $199,000 |
|
|
| | United Arab Emirates — 0.1% | |
| 575,000 | UAE International Government Bond, 4.857%, 7/2/34 (144A) | $ 580,644 |
| | Total United Arab Emirates | $580,644 |
|
|
| | Total Foreign Government Bonds
(Cost $835,250) | $779,644 |
|
|
| | U.S. Government and Agency
Obligations — 17.3% of Net Assets | |
| 1,352,231 | Federal Home Loan Mortgage Corp., 1.500%, 3/1/42 | $ 1,116,726 |
The accompanying notes are an integral part of these financial statements.
Pioneer Balanced ESG Fund | Annual Report | 7/31/2425
Schedule of Investments | 7/31/24 (continued)
Principal
Amount
USD ($) | | | | | | Value |
| | U.S. Government and Agency Obligations —
(continued) | |
| 87,984 | Federal Home Loan Mortgage Corp., 2.000%, 3/1/52 | $ 70,905 |
| 676,606 | Federal Home Loan Mortgage Corp., 2.500%, 5/1/51 | 575,614 |
| 174,088 | Federal Home Loan Mortgage Corp., 2.500%, 4/1/52 | 147,165 |
| 87,175 | Federal Home Loan Mortgage Corp., 3.000%, 12/1/46 | 78,175 |
| 7,473 | Federal Home Loan Mortgage Corp., 3.000%, 11/1/47 | 6,720 |
| 44,778 | Federal Home Loan Mortgage Corp., 3.000%, 8/1/50 | 40,005 |
| 246,607 | Federal Home Loan Mortgage Corp., 3.000%, 9/1/51 | 215,239 |
| 91,854 | Federal Home Loan Mortgage Corp., 3.000%, 11/1/51 | 81,592 |
| 488,108 | Federal Home Loan Mortgage Corp., 3.000%, 6/1/52 | 425,946 |
| 346,410 | Federal Home Loan Mortgage Corp., 3.000%, 6/1/52 | 302,293 |
| 54,485 | Federal Home Loan Mortgage Corp., 3.000%, 8/1/52 | 48,454 |
| 99,557 | Federal Home Loan Mortgage Corp., 3.000%, 9/1/52 | 88,278 |
| 78,477 | Federal Home Loan Mortgage Corp., 3.500%, 12/1/46 | 72,840 |
| 81,031 | Federal Home Loan Mortgage Corp., 3.500%, 3/1/48 | 75,043 |
| 76,057 | Federal Home Loan Mortgage Corp., 3.500%, 4/1/52 | 69,532 |
| 226,845 | Federal Home Loan Mortgage Corp., 3.500%, 4/1/52 | 208,190 |
| 200,596 | Federal Home Loan Mortgage Corp., 3.500%, 7/1/52 | 182,264 |
| 409,338 | Federal Home Loan Mortgage Corp., 4.000%, 10/1/42 | 395,252 |
| 11,521 | Federal Home Loan Mortgage Corp., 4.000%, 4/1/47 | 10,992 |
| 12,996 | Federal Home Loan Mortgage Corp., 4.500%, 3/1/47 | 12,843 |
| 8,261 | Federal Home Loan Mortgage Corp., 5.000%, 5/1/40 | 8,368 |
| 18,528 | Federal Home Loan Mortgage Corp., 5.000%, 3/1/44 | 18,768 |
| 6,383 | Federal Home Loan Mortgage Corp., 5.500%, 1/1/39 | 6,501 |
| 165,311 | Federal Home Loan Mortgage Corp., 5.500%, 7/1/49 | 168,083 |
| 89,091 | Federal Home Loan Mortgage Corp., 5.500%, 7/1/53 | 89,888 |
| 3,284 | Federal Home Loan Mortgage Corp., 6.000%, 1/1/38 | 3,398 |
| 6,798 | Federal Home Loan Mortgage Corp., 6.000%, 10/1/38 | 7,034 |
| 98,512 | Federal Home Loan Mortgage Corp., 6.000%, 4/1/53 | 100,594 |
| 213,583 | Federal Home Loan Mortgage Corp., 6.000%, 2/1/54 | 216,572 |
| 99,319 | Federal Home Loan Mortgage Corp., 6.000%, 2/1/54 | 102,832 |
| 3,202 | Federal Home Loan Mortgage Corp., 6.500%, 10/1/33 | 3,346 |
| 24,199 | Federal Home Loan Mortgage Corp., 6.500%, 1/1/53 | 25,050 |
| 162,403 | Federal Home Loan Mortgage Corp., 6.500%, 2/1/53 | 170,789 |
| 90,421 | Federal Home Loan Mortgage Corp., 6.500%, 8/1/53 | 93,684 |
| 291,978 | Federal Home Loan Mortgage Corp., 6.500%, 8/1/53 | 305,011 |
| 2,933,779 | Federal Home Loan Mortgage Corp., 6.500%, 5/1/54 | 3,007,986 |
| 105,000 | Federal Home Loan Mortgage Corp., 6.500%, 7/1/54 | 108,122 |
| 100,000 | Federal Home Loan Mortgage Corp., 6.500%, 7/1/54 | 103,042 |
| 159,000 | Federal Home Loan Mortgage Corp., 6.500%, 7/1/54 | 163,497 |
| 135,000 | Federal Home Loan Mortgage Corp., 6.500%, 7/1/54 | 138,905 |
| 100,000 | Federal Home Loan Mortgage Corp., 6.500%, 7/1/54 | 103,353 |
| 70,000 | Federal Home Loan Mortgage Corp., 6.500%, 8/1/54 | 72,453 |
The accompanying notes are an integral part of these financial statements.
26Pioneer Balanced ESG Fund | Annual Report | 7/31/24
Principal
Amount
USD ($) | | | | | | Value |
| | U.S. Government and Agency Obligations —
(continued) | |
| 100,000(g) | Federal Home Loan Mortgage Corp., 6.500%, 8/1/54 | $ 102,787 |
| 30,000 | Federal Home Loan Mortgage Corp., 7.000%, 8/1/54 | 31,131 |
| 1,608,967 | Federal National Mortgage Association, 1.500%, 3/1/42 | 1,329,296 |
| 100,000 | Federal National Mortgage Association, 2.000%, 9/1/39 (TBA) | 89,809 |
| 173,203 | Federal National Mortgage Association, 2.000%, 3/1/52 | 139,605 |
| 4,100,000 | Federal National Mortgage Association, 2.000%, 8/1/54 (TBA) | 3,297,776 |
| 100,000 | Federal National Mortgage Association, 2.500%, 8/1/39 (TBA) | 91,924 |
| 15,857 | Federal National Mortgage Association, 2.500%, 3/1/43 | 13,776 |
| 11,801 | Federal National Mortgage Association, 2.500%, 4/1/43 | 10,252 |
| 5,042 | Federal National Mortgage Association, 2.500%, 8/1/43 | 4,380 |
| 11,907 | Federal National Mortgage Association, 2.500%, 4/1/45 | 10,314 |
| 18,448 | Federal National Mortgage Association, 2.500%, 4/1/45 | 15,979 |
| 9,460 | Federal National Mortgage Association, 2.500%, 8/1/45 | 8,194 |
| 374,549 | Federal National Mortgage Association, 2.500%, 8/1/50 | 322,292 |
| 748,403 | Federal National Mortgage Association, 2.500%, 5/1/51 | 641,166 |
| 251,335 | Federal National Mortgage Association, 2.500%, 5/1/51 | 215,446 |
| 504,404 | Federal National Mortgage Association, 2.500%, 11/1/51 | 432,889 |
| 100,268 | Federal National Mortgage Association, 2.500%, 12/1/51 | 85,443 |
| 837,703 | Federal National Mortgage Association, 2.500%, 1/1/52 | 712,735 |
| 80,752 | Federal National Mortgage Association, 2.500%, 2/1/52 | 68,989 |
| 751,630 | Federal National Mortgage Association, 2.500%, 4/1/52 | 635,062 |
| 247,174 | Federal National Mortgage Association, 2.500%, 4/1/52 | 211,452 |
| 1,270,881 | Federal National Mortgage Association, 2.500%, 4/1/52 | 1,073,784 |
The accompanying notes are an integral part of these financial statements.
Pioneer Balanced ESG Fund | Annual Report | 7/31/2427
Schedule of Investments | 7/31/24 (continued)
Principal
Amount
USD ($) | | | | | | Value |
| | U.S. Government and Agency Obligations —
(continued) | |
| 1,800,000 | Federal National Mortgage Association, 2.500%, 8/1/54 (TBA) | $ 1,509,211 |
| 24,493 | Federal National Mortgage Association, 3.000%, 10/1/30 | 23,566 |
| 2,530 | Federal National Mortgage Association, 3.000%, 5/1/46 | 2,271 |
| 3,947 | Federal National Mortgage Association, 3.000%, 10/1/46 | 3,543 |
| 2,177 | Federal National Mortgage Association, 3.000%, 1/1/47 | 1,954 |
| 9,316 | Federal National Mortgage Association, 3.000%, 2/1/47 | 8,454 |
| 73,881 | Federal National Mortgage Association, 3.000%, 3/1/47 | 66,349 |
| 37,771 | Federal National Mortgage Association, 3.000%, 4/1/47 | 33,917 |
| 181,813 | Federal National Mortgage Association, 3.000%, 8/1/50 | 161,758 |
| 289,861 | Federal National Mortgage Association, 3.000%, 2/1/51 | 257,623 |
| 52,477 | Federal National Mortgage Association, 3.000%, 8/1/51 | 45,883 |
| 269,835 | Federal National Mortgage Association, 3.000%, 11/1/51 | 238,809 |
| 259,323 | Federal National Mortgage Association, 3.000%, 11/1/51 | 226,326 |
| 393,134 | Federal National Mortgage Association, 3.000%, 1/1/52 | 348,350 |
| 174,782 | Federal National Mortgage Association, 3.000%, 2/1/52 | 155,097 |
| 530,940 | Federal National Mortgage Association, 3.000%, 3/1/52 | 471,643 |
| 157,553 | Federal National Mortgage Association, 3.000%, 4/1/52 | 137,515 |
| 90,104 | Federal National Mortgage Association, 3.000%, 5/1/52 | 79,846 |
| 383,523 | Federal National Mortgage Association, 3.000%, 6/1/52 | 335,163 |
| 216,962 | Federal National Mortgage Association, 3.000%, 6/1/52 | 189,370 |
| 100,000 | Federal National Mortgage Association, 3.000%, 8/1/54 (TBA) | 87,254 |
| 83,303 | Federal National Mortgage Association, 3.000%, 2/1/57 | 72,349 |
The accompanying notes are an integral part of these financial statements.
28Pioneer Balanced ESG Fund | Annual Report | 7/31/24
Principal
Amount
USD ($) | | | | | | Value |
| | U.S. Government and Agency Obligations —
(continued) | |
| 5,476 | Federal National Mortgage Association, 3.500%, 2/1/49 | $ 5,061 |
| 198,873 | Federal National Mortgage Association, 3.500%, 5/1/49 | 185,961 |
| 134,648 | Federal National Mortgage Association, 3.500%, 5/1/49 | 125,703 |
| 18,064 | Federal National Mortgage Association, 3.500%, 4/1/52 | 16,470 |
| 73,344 | Federal National Mortgage Association, 3.500%, 4/1/52 | 66,979 |
| 152,046 | Federal National Mortgage Association, 3.500%, 4/1/52 | 139,541 |
| 156,045 | Federal National Mortgage Association, 3.500%, 5/1/52 | 142,661 |
| 2,200,000 | Federal National Mortgage Association, 3.500%, 8/1/54 (TBA) | 1,995,932 |
| 65,332 | Federal National Mortgage Association, 4.000%, 10/1/40 | 63,083 |
| 286,191 | Federal National Mortgage Association, 4.000%, 4/1/44 | 276,344 |
| 139,547 | Federal National Mortgage Association, 4.000%, 7/1/51 | 131,599 |
| 31,472 | Federal National Mortgage Association, 4.000%, 9/1/51 | 29,831 |
| 200,001 | Federal National Mortgage Association, 4.000%, 10/1/52 | 187,484 |
| 500,000 | Federal National Mortgage Association, 4.000%, 8/1/54 (TBA) | 468,543 |
| 89,602 | Federal National Mortgage Association, 4.500%, 9/1/43 | 88,849 |
| 162,688 | Federal National Mortgage Association, 4.500%, 12/1/43 | 159,751 |
| 57,259 | Federal National Mortgage Association, 4.500%, 1/1/44 | 56,778 |
| 600,000 | Federal National Mortgage Association, 4.500%, 8/1/54 (TBA) | 577,932 |
| 37,294 | Federal National Mortgage Association, 5.000%, 5/1/31 | 37,587 |
| 266,241 | Federal National Mortgage Association, 5.000%, 8/1/52 | 262,456 |
| 93,878 | Federal National Mortgage Association, 5.000%, 4/1/53 | 92,529 |
| 300,000 | Federal National Mortgage Association, 5.000%, 8/1/54 (TBA) | 295,414 |
The accompanying notes are an integral part of these financial statements.
Pioneer Balanced ESG Fund | Annual Report | 7/31/2429
Schedule of Investments | 7/31/24 (continued)
Principal
Amount
USD ($) | | | | | | Value |
| | U.S. Government and Agency Obligations —
(continued) | |
| 1,891 | Federal National Mortgage Association, 5.500%, 3/1/34 | $ 1,913 |
| 3,812 | Federal National Mortgage Association, 5.500%, 12/1/34 | 3,876 |
| 20,953 | Federal National Mortgage Association, 5.500%, 10/1/35 | 21,240 |
| 7,914 | Federal National Mortgage Association, 5.500%, 12/1/35 | 8,060 |
| 9,409 | Federal National Mortgage Association, 5.500%, 12/1/35 | 9,583 |
| 5,279 | Federal National Mortgage Association, 5.500%, 5/1/37 | 5,377 |
| 61,131 | Federal National Mortgage Association, 5.500%, 5/1/38 | 62,266 |
| 300,000 | Federal National Mortgage Association, 5.500%, 8/15/39 (TBA) | 303,093 |
| 90,287 | Federal National Mortgage Association, 5.500%, 4/1/50 | 91,765 |
| 171,342 | Federal National Mortgage Association, 5.500%, 4/1/50 | 174,216 |
| 86,238 | Federal National Mortgage Association, 5.500%, 4/1/53 | 86,552 |
| 91,663 | Federal National Mortgage Association, 5.500%, 4/1/53 | 91,997 |
| 91,591 | Federal National Mortgage Association, 5.500%, 7/1/53 | 92,635 |
| 165 | Federal National Mortgage Association, 6.000%, 9/1/29 | 169 |
| 597 | Federal National Mortgage Association, 6.000%, 8/1/32 | 616 |
| 4,841 | Federal National Mortgage Association, 6.000%, 12/1/33 | 4,937 |
| 4,404 | Federal National Mortgage Association, 6.000%, 10/1/37 | 4,552 |
| 3,102 | Federal National Mortgage Association, 6.000%, 12/1/37 | 3,206 |
| 46,429 | Federal National Mortgage Association, 6.000%, 1/1/53 | 47,851 |
| 18,595 | Federal National Mortgage Association, 6.000%, 1/1/53 | 19,038 |
| 92,276 | Federal National Mortgage Association, 6.000%, 4/1/53 | 93,835 |
| 94,209 | Federal National Mortgage Association, 6.000%, 5/1/53 | 97,099 |
The accompanying notes are an integral part of these financial statements.
30Pioneer Balanced ESG Fund | Annual Report | 7/31/24
Principal
Amount
USD ($) | | | | | | Value |
| | U.S. Government and Agency Obligations —
(continued) | |
| 84,842 | Federal National Mortgage Association, 6.000%, 5/1/53 | $ 86,813 |
| 83,742 | Federal National Mortgage Association, 6.000%, 6/1/53 | 85,707 |
| 91,725 | Federal National Mortgage Association, 6.000%, 7/1/53 | 93,848 |
| 86,662 | Federal National Mortgage Association, 6.000%, 7/1/53 | 89,913 |
| 92,916 | Federal National Mortgage Association, 6.000%, 7/1/53 | 96,725 |
| 191,884 | Federal National Mortgage Association, 6.000%, 8/1/53 | 196,131 |
| 368,552 | Federal National Mortgage Association, 6.000%, 9/1/53 | 373,999 |
| 75,855 | Federal National Mortgage Association, 6.000%, 2/1/54 | 76,916 |
| 700,000 | Federal National Mortgage Association, 6.000%, 8/1/54 (TBA) | 709,926 |
| 3,362 | Federal National Mortgage Association, 6.500%, 4/1/29 | 3,394 |
| 2,087 | Federal National Mortgage Association, 6.500%, 7/1/29 | 2,148 |
| 5,624 | Federal National Mortgage Association, 6.500%, 5/1/32 | 5,821 |
| 5,399 | Federal National Mortgage Association, 6.500%, 9/1/32 | 5,535 |
| 2,712 | Federal National Mortgage Association, 6.500%, 10/1/32 | 2,781 |
| 87,053 | Federal National Mortgage Association, 6.500%, 3/1/53 | 90,289 |
| 92,805 | Federal National Mortgage Association, 6.500%, 8/1/53 | 95,983 |
| 95,358 | Federal National Mortgage Association, 6.500%, 8/1/53 | 98,798 |
| 39,780 | Federal National Mortgage Association, 6.500%, 8/1/53 | 40,866 |
| 181,657 | Federal National Mortgage Association, 6.500%, 9/1/53 | 188,058 |
| 88,539 | Federal National Mortgage Association, 6.500%, 9/1/53 | 91,621 |
| 370,736 | Federal National Mortgage Association, 6.500%, 5/1/54 | 380,114 |
| 1,183,580 | Federal National Mortgage Association, 6.500%, 6/1/54 | 1,213,517 |
The accompanying notes are an integral part of these financial statements.
Pioneer Balanced ESG Fund | Annual Report | 7/31/2431
Schedule of Investments | 7/31/24 (continued)
Principal
Amount
USD ($) | | | | | | Value |
| | U.S. Government and Agency Obligations —
(continued) | |
| 134,000 | Federal National Mortgage Association, 6.500%, 7/1/54 | $ 138,077 |
| 140,000 | Federal National Mortgage Association, 6.500%, 7/1/54 | 144,162 |
| 126,000 | Federal National Mortgage Association, 6.500%, 7/1/54 | 130,022 |
| 7,951 | Federal National Mortgage Association, 7.000%, 1/1/36 | 8,226 |
| 200,000 | Government National Mortgage Association, 2.000%, 8/20/54 (TBA) | 165,742 |
| 300,000 | Government National Mortgage Association, 2.500%, 8/20/54 (TBA) | 258,145 |
| 200,000 | Government National Mortgage Association, 3.000%, 8/20/54 (TBA) | 178,476 |
| 100,000 | Government National Mortgage Association, 3.500%, 8/20/54 (TBA) | 91,927 |
| 100,000 | Government National Mortgage Association, 5.000%, 8/20/54 (TBA) | 98,882 |
| 100,000 | Government National Mortgage Association, 6.000%, 8/20/54 (TBA) | 101,172 |
| 100,000 | Government National Mortgage Association, 6.500%, 8/20/54 (TBA) | 101,867 |
| 59,289 | Government National Mortgage Association I, 3.500%, 11/15/41 | 55,999 |
| 7,133 | Government National Mortgage Association I, 3.500%, 10/15/42 | 6,712 |
| 102,760 | Government National Mortgage Association I, 4.000%, 9/15/41 | 98,685 |
| 17,136 | Government National Mortgage Association I, 4.000%, 4/15/45 | 16,445 |
| 30,012 | Government National Mortgage Association I, 4.000%, 6/15/45 | 28,925 |
| 17,194 | Government National Mortgage Association I, 4.500%, 5/15/39 | 17,054 |
| 3,643 | Government National Mortgage Association I, 5.500%, 8/15/33 | 3,715 |
| 7,103 | Government National Mortgage Association I, 5.500%, 9/15/33 | 7,304 |
| 4,447 | Government National Mortgage Association I, 6.000%, 10/15/33 | 4,619 |
| 7,743 | Government National Mortgage Association I, 6.000%, 9/15/34 | 7,965 |
| 20,400 | Government National Mortgage Association I, 6.000%, 9/15/38 | 21,191 |
The accompanying notes are an integral part of these financial statements.
32Pioneer Balanced ESG Fund | Annual Report | 7/31/24
Principal
Amount
USD ($) | | | | | | Value |
| | U.S. Government and Agency Obligations —
(continued) | |
| 918 | Government National Mortgage Association I, 6.500%, 10/15/28 | $ 930 |
| 3,514 | Government National Mortgage Association I, 6.500%, 5/15/31 | 3,561 |
| 4,761 | Government National Mortgage Association I, 6.500%, 6/15/32 | 4,889 |
| 6,514 | Government National Mortgage Association I, 6.500%, 12/15/32 | 6,717 |
| 10,136 | Government National Mortgage Association I, 6.500%, 5/15/33 | 10,248 |
| 83 | Government National Mortgage Association I, 7.000%, 8/15/28 | 84 |
| 1,751 | Government National Mortgage Association I, 8.000%, 2/15/30 | 1,744 |
| 24,260 | Government National Mortgage Association II, 4.500%, 9/20/44 | 24,002 |
| 11,610 | Government National Mortgage Association II, 4.500%, 10/20/44 | 11,475 |
| 22,744 | Government National Mortgage Association II, 4.500%, 11/20/44 | 22,478 |
| 105,120 | Government National Mortgage Association II, 4.500%, 9/20/52 | 101,964 |
| 8,227 | Government National Mortgage Association II, 5.500%, 2/20/34 | 8,513 |
| 90,209 | Government National Mortgage Association II, 5.500%, 9/20/52 | 90,800 |
| 9,808 | Government National Mortgage Association II, 6.500%, 11/20/28 | 9,996 |
| 630 | Government National Mortgage Association II, 7.500%, 9/20/29 | 645 |
| 3,000,000(j) | U.S. Treasury Bills, 8/27/24 | 2,988,554 |
| 1,982,900 | U.S. Treasury Bonds, 3.000%, 2/15/48 | 1,557,506 |
| 7,578,200 | U.S. Treasury Bonds, 3.125%, 5/15/48 | 6,082,394 |
| 2,720,400 | U.S. Treasury Bonds, 4.375%, 8/15/43 | 2,707,117 |
| 5,039,000 | U.S. Treasury Notes, 1.125%, 2/15/31 | 4,230,201 |
| 2,500,000 | U.S. Treasury Notes, 1.500%, 2/15/30 | 2,196,680 |
| 2,090,000 | U.S. Treasury Notes, 2.875%, 5/15/32 | 1,932,923 |
| 353,000 | U.S. Treasury Notes, 3.375%, 5/15/33 | 335,764 |
| 1,530,000 | U.S. Treasury Notes, 3.500%, 2/15/33 | 1,471,071 |
| 1,800,000 | U.S. Treasury Notes, 3.875%, 8/15/33 | 1,776,375 |
| 1,130,000 | U.S. Treasury Notes, 4.250%, 2/28/29 | 1,144,787 |
The accompanying notes are an integral part of these financial statements.
Pioneer Balanced ESG Fund | Annual Report | 7/31/2433
Schedule of Investments | 7/31/24 (continued)
Principal
Amount
USD ($) | | | | | | Value |
| | U.S. Government and Agency Obligations —
(continued) | |
| 3,000,000 | U.S. Treasury Notes, 4.625%, 9/30/28 | $ 3,074,297 |
| 8,034,600 | U.S. Treasury Notes, 4.625%, 9/30/30 | 8,321,460 |
| | Total U.S. Government and Agency Obligations
(Cost $75,722,695) | $73,703,830 |
|
|
| Shares | | | | | | |
| | SHORT TERM INVESTMENTS — 0.4% of Net
Assets | |
| | Open-End Fund — 0.4% | |
| 1,741,118(l) | Dreyfus Government Cash Management,
Institutional Shares, 5.21% | $ 1,741,118 |
| | | | | | | $1,741,118 |
|
|
| | TOTAL SHORT TERM INVESTMENTS
(Cost $1,741,118) | $1,741,118 |
|
|
| | TOTAL INVESTMENTS IN UNAFFILIATED ISSUERS — 102.0%
(Cost $331,099,808) | $435,268,584 |
| | | Net
Realized
Gain (Loss)
for the year
ended
7/31/24 | Change in
Unrealized
Appreciation
(Depreciation)
for the year
ended
7/31/24 | Capital
Gain
Distributions
for the year
ended
7/31/24 | Dividend
Income
for the year
ended
7/31/24 | Value |
| | Affiliated Issuer — 0.3% | |
| | Closed-End Fund — 0.3% of Net Assets | |
| 130,805(m) | Pioneer ILS
Interval Fund | $— | $63,964 | $— | $126,210 | $ 1,213,872 |
| | Total Investments in Affiliated Issuer — 0.3%
(Cost $1,292,999) | $1,213,872 |
|
|
The accompanying notes are an integral part of these financial statements.
34Pioneer Balanced ESG Fund | Annual Report | 7/31/24
Principal
Amount
USD ($) | | | | | | Value |
| | TBA Sales Commitments — (0.8)% of Net
Assets | |
| | U.S. Government and Agency Obligations —
(0.8)% | |
| (3,100,000) | Federal National Mortgage Association, 6.500%, 8/1/54 (TBA) | $ (3,178,991) |
| (100,000) | Government National Mortgage Association, 4.500%, 8/20/54 (TBA) | (96,880) |
| | TOTAL TBA SALES COMMITMENTS
(Proceeds $3,258,737) | $(3,275,871) |
|
|
| | OTHER ASSETS AND LIABILITIES — (1.5)% | $(6,496,629) |
| | net assets — 100.0% | $426,709,956 |
| | | | | | | |
| (A.D.R.) | American Depositary Receipts. |
| (G.D.R.) | Global Depositary Receipts. |
| (TBA) | “To Be Announced” Securities. |
| bps | Basis Points. |
| CMT | Constant Maturity Treasury Index. |
| FREMF | Freddie Mac Multifamily Fixed-Rate Mortgage Loans. |
| LIBOR | London Interbank Offered Rate. |
| PRIME | U.S. Federal Funds Rate. |
| REIT | Real Estate Investment Trust. |
| REMICs | Real Estate Mortgage Investment Conduits. |
| SOFR | Secured Overnight Financing Rate. |
| SOFR30A | Secured Overnight Financing Rate 30 Day Average. |
| (144A) | The resale of such security is exempt from registration under Rule 144A of the Securities Act of 1933. Such securities may be resold normally to qualified institutional buyers. At July 31, 2024, the value of these securities amounted to $53,946,343, or 12.6% of net assets. |
| (a) | Floating rate note. Coupon rate, reference index and spread shown at July 31, 2024. |
| (b) | All or a portion of this senior loan position has not settled. Rates do not take effect until settlement date. Rates shown, if any, are for the settled portion. |
| (c) | Non-income producing security. |
| (d) | The interest rate is subject to change periodically. The interest rate and/or reference index and spread shown at July 31, 2024. |
| (e) | Debt obligation initially issued at one coupon which converts to a higher coupon at a specific date. The rate shown is the rate at July 31, 2024. |
| (f) | Security represents the interest-only portion payments on a pool of underlying mortgages or mortgage-backed securities. |
The accompanying notes are an integral part of these financial statements.
Pioneer Balanced ESG Fund | Annual Report | 7/31/2435
Schedule of Investments | 7/31/24 (continued)
| (g) | Securities purchased on a when-issued basis. Rates do not take effect until settlement date. |
| (h) | Security is perpetual in nature and has no stated maturity date. |
| (i) | Consists of Revenue Bonds unless otherwise indicated. |
| (j) | Security issued with a zero coupon. Income is recognized through accretion of discount. |
| (k) | Issued as preference shares. |
| (l) | Rate periodically changes. Rate disclosed is the 7-day yield at July 31, 2024. |
| (m) | Pioneer ILS Interval Fund is an affiliated closed-end fund managed by the Adviser. |
| * | Senior secured floating rate loan interests in which the Fund invests generally pay interest at rates that are periodically re-determined by reference to a base lending rate plus a premium. These base lending rates are generally (i) the lending rate offered by one or more major European banks, such as LIBOR or SOFR, (ii) the prime rate offered by one or more major United States banks, (iii) the rate of a certificate of deposit or (iv) other base lending rates used by commercial lenders. The interest rate shown is the rate accruing at July 31, 2024. |
| † | Amount rounds to less than 0.1%. |
| # | Securities are restricted as to resale. |
| Restricted Securities | Acquisition date | Cost | Value |
| Blue Ridge Re | 11/14/2023 | $250,000 | $247,500 |
| Bonanza Re | 12/15/2020 | 250,000 | 243,113 |
| Four Lakes Re | 12/8/2023 | 250,000 | 247,950 |
| Galileo Re | 12/4/2023 | 250,000 | 252,075 |
| High Point Re | 12/1/2023 | 250,000 | 250,550 |
| Mystic Re | 12/12/2023 | 250,000 | 250,600 |
| Residential Re | 11/7/2023 | 250,000 | 250,575 |
| Sanders Re | 1/16/2024 | 250,000 | 254,500 |
| Total Restricted Securities | | | $1,996,863 |
| % of Net assets | | | 0.5% |
FUTURES CONTRACTS
FIXED INCOME INDEX FUTURES CONTRACTS
Number of
Contracts
Long | Description | Expiration
Date | Notional
Amount | Market
Value | Unrealized
Appreciation |
| 46 | U.S. 2 Year Note (CBT) | 9/30/24 | $9,373,455 | $9,446,891 | $73,436 |
| 272 | U.S. 5 Year Note (CBT) | 9/30/24 | 28,822,667 | 29,346,251 | 523,584 |
The accompanying notes are an integral part of these financial statements.
36Pioneer Balanced ESG Fund | Annual Report | 7/31/24
Number of
Contracts
Long | Description | Expiration
Date | Notional
Amount | Market
Value | Unrealized
Appreciation |
| 56 | U.S. 10 Year Note (CBT) | 9/19/24 | $6,093,441 | $6,261,500 | $168,059 |
| 5 | U.S. Ultra Bond (CBT) | 9/19/24 | 634,795 | 639,844 | 5,049 |
| | | | $44,924,358 | $45,694,486 | $770,128 |
Number of
Contracts
Short | Description | Expiration
Date | Notional
Amount | Market
Value | Unrealized
(Depreciation) |
| 24 | U.S. 10 Year Ultra Bond (CBT) | 9/19/24 | $(2,741,138) | $(2,773,875) | $(32,737) |
| 4 | U.S. Long Bond (CBT) | 9/19/24 | (467,782) | (483,125) | (15,343) |
| | | | $(3,208,920) | $(3,257,000) | $(48,080) |
| TOTAL FUTURES CONTRACTS | $41,715,438 | $42,437,486 | $722,048 |
| CBT | Chicago Board of Trade. |
Principal amounts are denominated in U.S. dollars (“USD”) unless otherwise noted.
Purchases and sales of securities (excluding short-term investments, TBA sale commitments and all derivative contracts except for options purchased) for the year ended July 31, 2024 were as follows:
| | Purchases | Sales |
| Long-Term U.S. Government Securities | $18,980,628 | $10,123,609 |
| Other Long-Term Securities | $111,531,511 | $129,650,494 |
At July 31, 2024, the net unrealized appreciation on investments based on cost for federal tax purposes of $332,833,936 was as follows:
| Aggregate gross unrealized appreciation for all investments in which there is an excess of value over tax cost | $117,532,398 |
| Aggregate gross unrealized depreciation for all investments in which there is an excess of tax cost over value | (13,901,961) |
| Net unrealized appreciation | $103,630,437 |
The accompanying notes are an integral part of these financial statements.
Pioneer Balanced ESG Fund | Annual Report | 7/31/2437
Schedule of Investments | 7/31/24 (continued)
Various inputs are used in determining the value of the Fund’s investments. These inputs are summarized in the three broad levels below.
| Level 1 | – | unadjusted quoted prices in active markets for identical securities. |
| Level 2 | – | other significant observable inputs (including quoted prices for similar securities, interest rates, prepayment speeds, credit risks, etc.). See Notes to Financial Statements — Note 1A. |
| Level 3 | – | significant unobservable inputs (including the Adviser’s own assumptions in determining fair value of investments). See Notes to Financial Statements — Note 1A. |
The following is a summary of the inputs used as of July 31, 2024 in valuing the Fund’s investments:
| | Level 1 | Level 2 | Level 3 | Total |
| Senior Secured Floating Rate Loan Interests | $— | $560,064 | $— | $560,064 |
| Common Stocks | 271,635,459 | — | — | 271,635,459 |
| Asset Backed Securities | — | 12,770,204 | — | 12,770,204 |
| Collateralized Mortgage Obligations | — | 10,566,041 | — | 10,566,041 |
| Commercial Mortgage-Backed Securities | — | 6,322,308 | — | 6,322,308 |
| Convertible Corporate Bonds | — | 3,170,527 | — | 3,170,527 |
| Corporate Bonds | — | 50,020,261 | — | 50,020,261 |
| Municipal Bonds | — | 274,801 | — | 274,801 |
| Preferred Stock | 1,727,464 | — | — | 1,727,464 |
| Insurance-Linked Securities | | | | |
| Event Linked Bonds | — | 1,996,863 | — | 1,996,863 |
| Foreign Government Bonds | — | 779,644 | — | 779,644 |
| U.S. Government and Agency Obligations | — | 73,703,830 | — | 73,703,830 |
| Open-End Fund | 1,741,118 | — | — | 1,741,118 |
| Affiliated Closed-End Fund | 1,213,872 | — | — | 1,213,872 |
| Total Investments in Securities | $276,317,913 | $160,164,543 | $— | $436,482,456 |
| Liabilities | | | | |
| TBA Sales Commitments | $— | $(3,275,871) | $— | $(3,275,871) |
| Total Liabilities | $— | $(3,275,871) | $— | $(3,275,871) |
| Other Financial Instruments | | | | |
| Net unrealized appreciation on futures contracts | $722,048 | $— | $— | $722,048 |
| Total Other Financial Instruments | $722,048 | $— | $— | $722,048 |
During the year ended July 31, 2024, there were no transfers in or out of Level 3.
The accompanying notes are an integral part of these financial statements.
38Pioneer Balanced ESG Fund | Annual Report | 7/31/24
Statement of Assets and Liabilities | 7/31/24
| ASSETS: | |
| Investments in unaffiliated issuers, at value (cost $331,099,808) | $435,268,584 |
| Investments in affiliated issuers, at value (cost $1,292,999) | 1,213,872 |
| Cash | 970 |
| Futures collateral | 1,928,239 |
| Variation margin for futures contracts | 48,611 |
| Receivables — | |
| Investment securities sold | 3,708,409 |
| Fund shares sold | 160,145 |
| Dividends | 267,990 |
| Interest | 1,280,714 |
| Due from the Adviser | 295 |
| Other assets | 19,244 |
| Total assets | $443,897,073 |
| LIABILITIES: | |
| Overdraft due to custodian | $219 |
| Due to broker for futures | 48,611 |
| Payables — | |
| Investment securities purchased | 13,423,002 |
| Fund shares repurchased | 201,396 |
| Trustees’ fees | 1,755 |
| TBA sales commitments at value (net proceeds received $3,258,737) | 3,275,871 |
| Management fees | 28,499 |
| Administrative expenses | 7,879 |
| Distribution fees | 14,441 |
| Accrued expenses | 185,444 |
| Total liabilities | $17,187,117 |
| NET ASSETS: | |
| Paid-in capital | $327,985,785 |
| Distributable earnings | 98,724,171 |
| Net assets | $426,709,956 |
| NET ASSET VALUE PER SHARE: | |
| No par value (unlimited number of shares authorized) | |
| Class A (based on $281,324,539/25,559,275 shares) | $11.01 |
| Class C (based on $33,542,774/3,084,394 shares) | $10.87 |
| Class K (based on $40,010,021/3,645,783 shares) | $10.97 |
| Class R (based on $5,431,709/493,385 shares) | $11.01 |
| Class Y (based on $66,400,913/5,986,495 shares) | $11.09 |
| MAXIMUM OFFERING PRICE PER SHARE: | |
| Class A (based on $11.01 net asset value per share/100%-4.50% maximum sales charge) | $11.53 |
The accompanying notes are an integral part of these financial statements.
Pioneer Balanced ESG Fund | Annual Report | 7/31/2439
Statement of Operations FOR THE YEAR ENDED 7/31/24
| INVESTMENT INCOME: | | |
| Interest from unaffiliated issuers (net of foreign taxes withheld $1,927) | $7,441,386 | |
| Dividends from unaffiliated issuers (net of foreign taxes withheld $75,087) | 4,574,411 | |
| Dividends from affiliated issuers | 126,210 | |
| Total Investment Income | | $12,142,007 |
| EXPENSES: | | |
| Management fees | $2,062,971 | |
| Administrative expenses | 152,027 | |
| Transfer agent fees | | |
| Class A | 124,659 | |
| Class C | 16,014 | |
| Class K | 270 | |
| Class R | 6,819 | |
| Class Y | 75,251 | |
| Distribution fees | | |
| Class A | 681,686 | |
| Class C | 335,389 | |
| Class R | 22,860 | |
| Shareholder communications expense | 50,387 | |
| Custodian fees | 5,995 | |
| Registration fees | 100,399 | |
| Professional fees | 59,089 | |
| Printing expense | 44,694 | |
| Officers’ and Trustees’ fees | 20,994 | |
| Insurance expense | 6,651 | |
| Miscellaneous | 114,866 | |
| Total expenses | | $3,881,021 |
| Less fees waived and expenses reimbursed by the Adviser | | (34,017) |
| Net expenses | | $3,847,004 |
| Net investment income | | $8,295,003 |
| REALIZED AND UNREALIZED GAIN (LOSS) ON INVESTMENTS: | | |
| Net realized gain (loss) on: | | |
| Reimbursement by the Adviser | $824 | |
| Investments in unaffiliated issuers | 4,318,938 | |
| TBA sales commitments | 1,035 | |
| Futures contracts | (1,528,966) | |
| Other assets and liabilities denominated in foreign currencies | 15,400 | $2,807,231 |
| Change in net unrealized appreciation (depreciation) on: | | |
| Investments in unaffiliated issuers | $37,282,422 | |
| Investments in affiliated issuers | 63,964 | |
| TBA sales commitments | (17,134) | |
| Futures contracts | 1,256,156 | |
| Other assets and liabilities denominated in foreign currencies | 91 | $38,585,499 |
| Net realized and unrealized gain (loss) on investments | | $41,392,730 |
| Net increase in net assets resulting from operations | | $49,687,733 |
The accompanying notes are an integral part of these financial statements.
40Pioneer Balanced ESG Fund | Annual Report | 7/31/24
Statements of Changes in Net Assets
| | Year
Ended
7/31/24 | Year
Ended
7/31/23 |
| FROM OPERATIONS: | | |
| Net investment income (loss) | $8,295,003 | $7,970,004 |
| Net realized gain (loss) on investments | 2,807,231 | (9,048,624) |
| Change in net unrealized appreciation (depreciation) on investments | 38,585,499 | 25,700,270 |
| Net increase in net assets resulting from operations | $49,687,733 | $24,621,650 |
| DISTRIBUTIONS TO SHAREHOLDERS: | | |
| Class A ($0.21 and $0.31 per share, respectively) | $(5,433,199) | $(8,818,454) |
| Class C ($0.14 and $0.25 per share, respectively) | (450,617) | (1,055,140) |
| Class K ($0.24 and $0.34 per share, respectively) | (850,617) | (619,119) |
| Class R ($0.19 and $0.28 per share, respectively) | (82,560) | (100,787) |
| Class Y ($0.24 and $0.33 per share, respectively) | (1,512,672) | (2,421,250) |
| Total distributions to shareholders | $(8,329,665) | $(13,014,750) |
| FROM FUND SHARE TRANSACTIONS: | | |
| Net proceeds from sales of shares | $53,345,220 | $79,317,089 |
| Reinvestment of distributions | 8,204,257 | 12,781,779 |
| Cost of shares repurchased | (91,765,773) | (96,329,928) |
| Net decrease in net assets resulting from Fund share transactions | $(30,216,296) | $(4,231,060) |
| Net increase in net assets | $11,141,772 | $7,375,840 |
| NET ASSETS: | | |
| Beginning of year | $415,568,184 | $408,192,344 |
| End of year | $426,709,956 | $415,568,184 |
The accompanying notes are an integral part of these financial statements.
Pioneer Balanced ESG Fund | Annual Report | 7/31/2441
Statements of Changes in Net Assets
(continued)
| | Year
Ended
7/31/24
Shares | Year
Ended
7/31/24
Amount | Year
Ended
7/31/23
Shares | Year
Ended
7/31/23
Amount |
| Class A | | | | |
| Shares sold | 1,792,550 | $18,486,137 | 2,865,557 | $26,869,048 |
| Reinvestment of distributions | 509,442 | 5,323,776 | 934,805 | 8,615,109 |
| Less shares repurchased | (3,964,687) | (40,939,136) | (5,555,638) | (51,920,689) |
| Net decrease | (1,662,695) | $(17,129,223) | (1,755,276) | $(16,436,532) |
| Class C | | | | |
| Shares sold | 329,756 | $3,408,134 | 302,886 | $2,798,958 |
| Reinvestment of distributions | 43,859 | 450,617 | 115,665 | 1,054,662 |
| Less shares repurchased | (941,006) | (9,474,429) | (1,339,715) | (12,410,536) |
| Net decrease | (567,391) | $(5,615,678) | (921,164) | $(8,556,916) |
| Class K | | | | |
| Shares sold | 890,679 | $9,324,166 | 3,547,274 | $33,238,329 |
| Reinvestment of distributions | 81,711 | 850,617 | 66,599 | 619,119 |
| Less shares repurchased | (1,191,760) | (12,093,143) | (550,872) | (5,126,715) |
Net increase
(decrease) | (219,370) | $(1,918,360) | 3,063,001 | $28,730,733 |
| Class R | | | | |
| Shares sold | 168,724 | $1,763,693 | 136,795 | $1,266,678 |
| Reinvestment of distributions | 7,866 | 82,560 | 10,923 | 100,787 |
| Less shares repurchased | (79,282) | (820,605) | (49,484) | (463,625) |
| Net increase | 97,308 | $1,025,648 | 98,234 | $903,840 |
| Class Y | | | | |
| Shares sold | 1,937,045 | $20,363,090 | 1,603,646 | $15,144,076 |
| Reinvestment of distributions | 142,100 | 1,496,687 | 257,110 | 2,392,102 |
| Less shares repurchased | (2,720,557) | (28,438,460) | (2,809,314) | (26,408,363) |
| Net decrease | (641,412) | $(6,578,683) | (948,558) | $(8,872,185) |
The accompanying notes are an integral part of these financial statements.
42Pioneer Balanced ESG Fund | Annual Report | 7/31/24
| | Year
Ended
7/31/24 | Year
Ended
7/31/23 | Year
Ended
7/31/22 | Year
Ended
7/31/21 | Year
Ended
7/31/20 |
| Class A | | | | | |
| Net asset value, beginning of period | $9.95 | $9.66 | $11.31 | $9.72 | $9.57 |
| Increase (decrease) from investment operations: | | | | | |
| Net investment income (loss) (a) | $0.21 | $0.19 | $0.11 | $0.12 | $0.15 |
| Net realized and unrealized gain (loss) on investments | 1.06 | 0.41 | (0.85) | 1.84 | 0.54 |
| Net increase (decrease) from investment operations | $1.27 | $0.60 | $(0.74) | $1.96 | $0.69 |
| Distributions to shareholders: | | | | | |
| Net investment income | $(0.21) | $(0.18) | $(0.13) | $(0.11) | $(0.15) |
| Net realized gain | — | (0.13) | (0.78) | (0.26) | (0.39) |
| Total distributions | $(0.21) | $(0.31) | $(0.91) | $(0.37) | $(0.54) |
| Net increase (decrease) in net asset value | $1.06 | $0.29 | $(1.65) | $1.59 | $0.15 |
| Net asset value, end of period | $11.01 | $9.95 | $9.66 | $11.31 | $9.72 |
| Total return (b) | 12.85%(c) | 6.51% | (7.23)% | 20.60% | 7.55% |
| Ratio of net expenses to average net assets | 0.93% | 0.94% | 0.95% | 0.99% | 0.99% |
| Ratio of net investment income (loss) to average net assets | 2.01% | 2.02% | 1.07% | 1.12% | 1.65% |
| Portfolio turnover rate | 33% | 44% | 40% | 54% | 65% |
| Net assets, end of period (in thousands) | $281,325 | $270,804 | $279,982 | $301,068 | $233,421 |
| Ratios with no waiver of fees and assumption of expenses by the Adviser and no reduction for fees paid indirectly: | | | | | |
| Total expenses to average net assets | 0.93% | 0.96% | 0.95% | 1.00% | 1.04% |
| Net investment income (loss) to average net assets | 2.01% | 2.00% | 1.07% | 1.11% | 1.60% |
| (a) | The per-share data presented above is based on the average shares outstanding for the period presented. |
| (b) | Assumes initial investment at net asset value at the beginning of each period, reinvestment of all distributions, the complete redemption of the investment at net asset value at the end of each period and no sales charges. Total return would be reduced if sales charges were taken into account. |
| (c) | For the year ended July 31, 2024, the Fund’s total return includes a voluntary reimbursement by the Adviser (see Notes to the Financial Statements — Note 1B). The impact on Class A’s total return was less than 0.005%. |
The accompanying notes are an integral part of these financial statements.
Pioneer Balanced ESG Fund | Annual Report | 7/31/2443
Financial Highlights (continued)
| | Year
Ended
7/31/24 | Year
Ended
7/31/23 | Year
Ended
7/31/22 | Year
Ended
7/31/21 | Year
Ended
7/31/20 |
| Class C | | | | | |
| Net asset value, beginning of period | $9.84 | $9.57 | $11.21 | $9.65 | $9.50 |
| Increase (decrease) from investment operations: | | | | | |
| Net investment income (loss) (a) | $0.13 | $0.12 | $0.03 | $0.04 | $0.09 |
| Net realized and unrealized gain (loss) on investments | 1.04 | 0.40 | (0.84) | 1.82 | 0.54 |
| Net increase (decrease) from investment operations | $1.17 | $0.52 | $(0.81) | $1.86 | $0.63 |
| Distributions to shareholders: | | | | | |
| Net investment income | $(0.14) | $(0.12) | $(0.05) | $(0.04) | $(0.09) |
| Net realized gain | — | (0.13) | (0.78) | (0.26) | (0.39) |
| Total distributions | $(0.14) | $(0.25) | $(0.83) | $(0.30) | $(0.48) |
| Net increase (decrease) in net asset value | $1.03 | $0.27 | $(1.64) | $1.56 | $0.15 |
| Net asset value, end of period | $10.87 | $9.84 | $9.57 | $11.21 | $9.65 |
| Total return (b) | 11.95%(c) | 5.69% | (7.92)% | 19.63% | 6.82% |
| Ratio of net expenses to average net assets | 1.68% | 1.69% | 1.68% | 1.72% | 1.72% |
| Ratio of net investment income (loss) to average net assets | 1.27% | 1.28% | 0.33% | 0.41% | 0.92% |
| Portfolio turnover rate | 33% | 44% | 40% | 54% | 65% |
| Net assets, end of period (in thousands) | $33,543 | $35,936 | $43,776 | $55,342 | $56,387 |
| Ratios with no waiver of fees and assumption of expenses by the Adviser and no reduction for fees paid indirectly: | | | | | |
| Total expenses to average net assets | 1.68% | 1.70% | 1.69% | 1.73% | 1.76% |
| Net investment income (loss) to average net assets | 1.27% | 1.27% | 0.32% | 0.40% | 0.88% |
| (a) | The per-share data presented above is based on the average shares outstanding for the period presented. |
| (b) | Assumes initial investment at net asset value at the beginning of each period, reinvestment of all distributions, the complete redemption of the investment at net asset value at the end of each period and no sales charges. Total return would be reduced if sales charges were taken into account. |
| (c) | For the year ended July 31, 2024, the Fund’s total return includes a voluntary reimbursement by the Adviser (see Notes to the Financial Statements — Note 1B). The impact on Class C’s total return was less than 0.005%. |
The accompanying notes are an integral part of these financial statements.
44Pioneer Balanced ESG Fund | Annual Report | 7/31/24
| | Year
Ended
7/31/24 | Year
Ended
7/31/23 | Year
Ended
7/31/22 | Year
Ended
7/31/21 | Year
Ended
7/31/20 |
| Class K | | | | | |
| Net asset value, beginning of period | $9.92 | $9.64 | $11.29 | $9.71 | $9.56 |
| Increase (decrease) from investment operations: | | | | | |
| Net investment income (loss) (a) | $0.24 | $0.22 | $0.15 | $0.15 | $0.18 |
| Net realized and unrealized gain (loss) on investments | 1.05 | 0.40 | (0.85) | 1.84 | 0.54 |
| Net increase (decrease) from investment operations | $1.29 | $0.62 | $(0.70) | $1.99 | $0.72 |
| Distributions to shareholders: | | | | | |
| Net investment income | $(0.24) | $(0.21) | $(0.17) | $(0.15) | $(0.18) |
| Net realized gain | — | (0.13) | (0.78) | (0.26) | (0.39) |
| Total distributions | $(0.24) | $(0.34) | $(0.95) | $(0.41) | $(0.57) |
| Net increase (decrease) in net asset value | $1.05 | $0.28 | $(1.65) | $1.58 | $0.15 |
| Net asset value, end of period | $10.97 | $9.92 | $9.64 | $11.29 | $9.71 |
| Total return (b) | 13.19%(c) | 6.72% | (6.90)% | 20.96% | 7.93% |
| Ratio of net expenses to average net assets | 0.62% | 0.65% | 0.65% | 0.65% | 0.65% |
| Ratio of net investment income (loss) to average net assets | 2.32% | 2.35% | 1.44% | 1.43% | 1.95% |
| Portfolio turnover rate | 33% | 44% | 40% | 54% | 65% |
| Net assets, end of period (in thousands) | $40,010 | $38,360 | $7,732 | $2,575 | $606 |
| Ratios with no waiver of fees and assumption of expenses by the Adviser and no reduction for fees paid indirectly: | | | | | |
| Total expenses to average net assets | 0.63% | 0.66% | 0.65% | 0.70% | 0.71% |
| Net investment income (loss) to average net assets | 2.31% | 2.34% | 1.44% | 1.38% | 1.89% |
| (a) | The per-share data presented above is based on the average shares outstanding for the period presented. |
| (b) | Assumes initial investment at net asset value at the beginning of each period, reinvestment of all distributions and the complete redemption of the investment at net asset value at the end of each period. |
| (c) | For the year ended July 31, 2024, the Fund’s total return includes a voluntary reimbursement by the Adviser (see Notes to the Financial Statements — Note 1B). The impact on Class K’s total return was less than 0.005%. |
The accompanying notes are an integral part of these financial statements.
Pioneer Balanced ESG Fund | Annual Report | 7/31/2445
Financial Highlights (continued)
| | Year
Ended
7/31/24 | Year
Ended
7/31/23 | Year
Ended
7/31/22 | Year
Ended
7/31/21 | Year
Ended
7/31/20 |
| Class R | | | | | |
| Net asset value, beginning of period | $9.97 | $9.68 | $11.33 | $9.75 | $9.59 |
| Increase (decrease) from investment operations: | | | | | |
| Net investment income (loss) (a) | $0.17 | $0.16 | $0.09 | $0.09 | $0.12 |
| Net realized and unrealized gain (loss) on investments | 1.06 | 0.41 | (0.86) | 1.83 | 0.56 |
| Net increase (decrease) from investment operations | $1.23 | $0.57 | $(0.77) | $1.92 | $0.68 |
| Distributions to shareholders: | | | | | |
| Net investment income | $(0.19) | $(0.15) | $(0.10) | $(0.08) | $(0.13) |
| Net realized gain | — | (0.13) | (0.78) | (0.26) | (0.39) |
| Total distributions | $(0.19) | $(0.28) | $(0.88) | $(0.34) | $(0.52) |
| Net increase (decrease) in net asset value | $1.04 | $0.29 | $(1.65) | $1.58 | $0.16 |
| Net asset value, end of period | $11.01 | $9.97 | $9.68 | $11.33 | $9.75 |
| Total return (b) | 12.43%(c) | 6.19% | (7.45)% | 20.12% | 7.32% |
| Ratio of net expenses to average net assets | 1.28% | 1.25% | 1.20% | 1.30% | 1.30% |
| Ratio of net investment income (loss) to average net assets | 1.65% | 1.73% | 0.84% | 0.81% | 1.32% |
| Portfolio turnover rate | 33% | 44% | 40% | 54% | 65% |
| Net assets, end of period (in thousands) | $5,432 | $3,948 | $2,884 | $2,383 | $2,047 |
| Ratios with no waiver of fees and assumption of expenses by the Adviser and no reduction for fees paid indirectly: | | | | | |
| Total expenses to average net assets | 1.29% | 1.26% | 1.20% | 1.45% | 1.59% |
| Net investment income (loss) to average net assets | 1.64% | 1.72% | 0.84% | 0.66% | 1.03% |
| (a) | The per-share data presented above is based on the average shares outstanding for the period presented. |
| (b) | Assumes initial investment at net asset value at the beginning of each period, reinvestment of all distributions and the complete redemption of the investment at net asset value at the end of each period. |
| (c) | For the year ended July 31, 2024, the Fund's total return includes a voluntary reimbursement by the Adviser (see Notes to the Financial Statements — Note 1B). The impact on Class R's total return was less than 0.005%. |
The accompanying notes are an integral part of these financial statements.
46Pioneer Balanced ESG Fund | Annual Report | 7/31/24
| | Year
Ended
7/31/24 | Year
Ended
7/31/23 | Year
Ended
7/31/22 | Year
Ended
7/31/21 | Year
Ended
7/31/20 |
| Class Y | | | | | |
| Net asset value, beginning of period | $10.04 | $9.74 | $11.39 | $9.79 | $9.64 |
| Increase (decrease) from investment operations: | | | | | |
| Net investment income (loss) (a) | $0.23 | $0.22 | $0.14 | $0.15 | $0.19 |
| Net realized and unrealized gain (loss) on investments | 1.06 | 0.41 | (0.85) | 1.86 | 0.54 |
| Net increase (decrease) from investment operations | $1.29 | $0.63 | $(0.71) | $2.01 | $0.73 |
| Distributions to shareholders: | | | | | |
| Net investment income | $(0.24) | $(0.20) | $(0.16) | $(0.15) | $(0.19) |
| Net realized gain | — | (0.13) | (0.78) | (0.26) | (0.39) |
| Total distributions | $(0.24) | $(0.33) | $(0.94) | $(0.41) | $(0.58) |
| Net increase (decrease) in net asset value | $1.05 | $0.30 | $(1.65) | $1.60 | $0.15 |
| Net asset value, end of period | $11.09 | $10.04 | $9.74 | $11.39 | $9.79 |
| Total return (b) | 13.03%(c) | 6.85% | (6.95)% | 20.99% | 7.95% |
| Ratio of net expenses to average net assets | 0.72% | 0.65% | 0.65% | 0.65% | 0.65% |
| Ratio of net investment income (loss) to average net assets | 2.23% | 2.32% | 1.37% | 1.46% | 1.99% |
| Portfolio turnover rate | 33% | 44% | 40% | 54% | 65% |
| Net assets, end of period (in thousands) | $66,401 | $66,521 | $73,819 | $71,290 | $53,142 |
| Ratios with no waiver of fees and assumption of expenses by the Adviser and no reduction for fees paid indirectly: | | | | | |
| Total expenses to average net assets | 0.74% | 0.75% | 0.75% | 0.77% | 0.82% |
| Net investment income (loss) to average net assets | 2.21% | 2.22% | 1.27% | 1.34% | 1.82% |
| (a) | The per-share data presented above is based on the average shares outstanding for the period presented. |
| (b) | Assumes initial investment at net asset value at the beginning of each period, reinvestment of all distributions and the complete redemption of the investment at net asset value at the end of each period. |
| (c) | For the year ended July 31, 2024, the Fund’s total return includes a voluntary reimbursement by the Adviser (see Notes to the Financial Statements — Note 1B). The impact on Class Y’s total return was less than 0.005%. |
The accompanying notes are an integral part of these financial statements.
Pioneer Balanced ESG Fund | Annual Report | 7/31/2447
Notes to Financial Statements | 7/31/24
1. Organization and Significant Accounting Policies
Pioneer Balanced ESG Fund (the “Fund”) is one of four portfolios comprising Pioneer Series Trust IV (the “Trust”), a Delaware statutory trust. The Fund is registered under the Investment Company Act of 1940, as amended (the “1940 Act”), as a diversified, open-end management investment company. The Fund’s investment objective is to seek capital growth and current income through a diversified portfolio of equity securities and bonds.
The Fund offers five classes of shares designated as Class A, Class C, Class K, Class R and Class Y shares. Each class of shares represents an interest in the same portfolio of investments of the Fund and has identical rights (based on relative net asset values) to assets and liquidation proceeds. Share classes can bear different rates of class-specific fees and expenses, such as transfer agent and distribution fees. Differences in class-specific fees and expenses will result in differences in net investment income and, therefore, the payment of different dividends from net investment income earned by each class. The Amended and Restated Declaration of Trust of the Fund gives the Board of Trustees the flexibility to specify either per-share voting or dollar-weighted voting when submitting matters for shareholder approval. Under per-share voting, each share of a class of the Fund is entitled to one vote. Under dollar-weighted voting, a shareholder’s voting power is determined not by the number of shares owned, but by the dollar value of the shares on the record date. Each share class has exclusive voting rights with respect to matters affecting only that class, including with respect to the distribution plan for that class. There is no distribution plan for Class K or Class Y shares.
Amundi Asset Management US, Inc., an indirect, wholly owned subsidiary of Amundi and Amundi’s wholly owned subsidiary, Amundi USA, Inc., serves as the Fund’s investment adviser (the “Adviser”). Amundi Distributor US, Inc., an affiliate of the Adviser, serves as the Fund’s distributor (the “Distributor”).
The Fund is required to comply with Rule 18f-4 under the 1940 Act, which governs the use of derivatives by registered investment companies. Rule 18f-4 permits funds to enter into derivatives transactions (as defined in Rule 18f-4) and certain other transactions notwithstanding the restrictions on the issuance of “senior securities” under Section 18 of the 1940 Act. In accordance with Rule 18f-4, the fund has established and maintains a comprehensive derivatives risk management program, has
48Pioneer Balanced ESG Fund | Annual Report | 7/31/24
appointed a derivatives risk manager and complies with a relative or absolute limit on fund leverage risk calculated based on value-at-risk ("VaR").
The Fund is an investment company and follows investment company accounting and reporting guidance under U.S. Generally Accepted Accounting Principles (“U.S. GAAP”). U.S. GAAP requires the management of the Fund to make estimates and assumptions that affect the reported amounts of assets and liabilities, the disclosure of contingent assets and liabilities at the date of the financial statements, and the reported amounts of income, expenses and gain or loss on investments during the reporting period. Actual results could differ from those estimates.
The following is a summary of significant accounting policies followed by the Fund in the preparation of its financial statements:
| A. | Security Valuation |
| | The net asset value of the Fund is computed once daily, on each day the New York Stock Exchange (“NYSE”) is open, as of the close of regular trading on the NYSE. |
| | Equity securities that have traded on an exchange are valued by using the last sale price on the principal exchange where they are traded. Equity securities that have not traded on the date of valuation, or securities for which sale prices are not available, generally are valued using the mean between the last bid and asked prices or, if both last bid and asked prices are not available, at the last quoted bid price. Last sale and bid and asked prices are provided by independent third party pricing services. In the case of equity securities not traded on an exchange, prices are typically determined by independent third party pricing services using a variety of techniques and methods. |
| | The value of foreign securities is translated into U.S. dollars based on foreign currency exchange rate quotations supplied by a third party pricing source. Trading in non-U.S. equity securities is substantially completed each day at various times prior to the close of the NYSE. The values of such securities used in computing the net asset value of the Fund’s shares are determined as of such times. The Adviser may use a fair value model developed by an independent pricing service to value non-U.S. equity securities. |
| | Fixed income securities are valued by using prices supplied by independent pricing services, which consider such factors as market prices, market events, quotations from one or more brokers, Treasury spreads, yields, maturities and ratings, or may use a pricing matrix or |
Pioneer Balanced ESG Fund | Annual Report | 7/31/2449
| | other fair value methods or techniques to provide an estimated value of the security or instrument. A pricing matrix is a means of valuing a debt security on the basis of current market prices for other debt securities, historical trading patterns in the market for fixed income securities and/or other factors. Non-U.S. debt securities that are listed on an exchange will be valued at the bid price obtained from an independent third party pricing service. When independent third party pricing services are unable to supply prices, or when prices or market quotations are considered to be unreliable, the value of that security may be determined using quotations from one or more broker-dealers. |
| | Loan interests are valued at the mean between the last available bid and asked prices from one or more brokers or dealers as obtained from Loan Pricing Corporation, an independent third party pricing service. If price information is not available from Loan Pricing Corporation, or if the price information is deemed to be unreliable, price information will be obtained from an alternative loan interest pricing service. If no reliable price quotes are available from either the primary or alternative pricing service, broker quotes will be solicited. |
| | Event-linked bonds are valued at the bid price obtained from an independent third party pricing service. Other insurance-linked securities (including reinsurance sidecars, collateralized reinsurance and industry loss warranties) may be valued at the bid price obtained from an independent pricing service, or through a third party using a pricing matrix, insurance valuation models, or other fair value methods or techniques to provide an estimated value of the instrument. |
| | Futures contracts are generally valued at the closing settlement price established by the exchange on which they are traded. |
| | Shares of open-end registered investment companies (including money market mutual funds) are valued at such funds’ net asset value. |
| | Shares of closed-end interval funds that offer their shares at net asset value are valued at such funds’ net asset value. |
| | Repurchase agreements are valued at par. Cash may include overnight time deposits at approved financial institutions. |
| | Securities or loan interests for which independent pricing services or broker-dealers are unable to supply prices or for which market prices and/or quotations are not readily available or are considered to be unreliable are valued by a fair valuation team comprised of certain personnel of the Adviser. The Adviser is designated as the valuation designee for the Fund pursuant to Rule 2a-5 under the 1940 Act. The |
50Pioneer Balanced ESG Fund | Annual Report | 7/31/24
| | Adviser’s fair valuation team is responsible for monitoring developments that may impact fair valued securities. |
| | Inputs used when applying fair value methods to value a security may include credit ratings, the financial condition of the company, current market conditions and comparable securities. The Adviser may use fair value methods if it is determined that a significant event has occurred after the close of the exchange or market on which the security trades and prior to the determination of the Fund’s net asset value. Examples of a significant event might include political or economic news, corporate restructurings, natural disasters, terrorist activity or trading halts. Thus, the valuation of the Fund’s securities may differ significantly from exchange prices, and such differences could be material. |
| B. | Investment Income and Transactions |
| | Dividend income is recorded on the ex-dividend date, except that certain dividends from foreign securities where the ex-dividend date may have passed are recorded as soon as the Fund becomes aware of the ex-dividend data in the exercise of reasonable diligence. |
| | Interest income, including interest on income-bearing cash accounts, is recorded on the accrual basis. Dividend and interest income are reported net of unrecoverable foreign taxes withheld at the applicable country rates and net of income accrued on defaulted securities. |
| | Interest and dividend income payable by delivery of additional shares is reclassified as PIK (payment-in-kind) income upon receipt and is included in interest and dividend income, respectively. |
| | Principal amounts of mortgage-backed securities are adjusted for monthly paydowns. Premiums and discounts related to certain mortgage-backed securities are amortized or accreted in proportion to the monthly paydowns. All discounts/premiums on purchase prices of debt securities are accreted/amortized for financial reporting purposes over the life of the respective securities, and such accretion/amortization is included in interest income. |
| | Security transactions are recorded as of trade date. Gains and losses on sales of investments are calculated on the identified cost method for both financial reporting and federal income tax purposes. |
| | During the year ended July 31, 2024, the Fund realized a loss of $824 due to an operational error. The Adviser voluntarily reimbursed the Fund for this loss, which is reflected on the Statement of Operations as Reimbursement by the Adviser. |
Pioneer Balanced ESG Fund | Annual Report | 7/31/2451
| C. | Foreign Currency Translation |
| | The books and records of the Fund are maintained in U.S. dollars. Amounts denominated in foreign currencies are translated into U.S. dollars using current exchange rates. |
| | Net realized gains and losses on foreign currency transactions, if any, represent, among other things, the net realized gains and losses on foreign currency exchange contracts, disposition of foreign currencies and the difference between the amount of income accrued and the U.S. dollars actually received. Further, the effects of changes in foreign currency exchange rates on investments are not segregated on the Statement of Operations from the effects of changes in the market prices of those securities, but are included with the net realized and unrealized gain or loss on investments. |
| D. | Federal Income Taxes |
| | It is the Fund’s policy to comply with the requirements of the Internal Revenue Code applicable to regulated investment companies and to distribute all of its net taxable income and net realized capital gains, if any, to its shareholders. Therefore, no provision for federal income taxes is required. As of July 31, 2024, the Fund did not accrue any interest or penalties with respect to uncertain tax positions, which, if applicable, would be recorded as an income tax expense on the Statement of Operations. Tax returns filed within the prior three years remain subject to examination by federal and state tax authorities. |
| | The amount and character of income and capital gain distributions to shareholders are determined in accordance with federal income tax rules, which may differ from U.S. GAAP. Distributions in excess of net investment income or net realized gains are temporary over distributions for financial statement purposes resulting from differences in the recognition or classification of income or distributions for financial statement and tax purposes. Capital accounts within the financial statements are adjusted for permanent book/tax differences to reflect tax character, but are not adjusted for temporary differences. |
| | A portion of the dividend income recorded by the Fund is from distributions by publicly traded real estate investment trusts (“REITs”), and such distributions for tax purposes may also consist of capital gains and return of capital. The actual return of capital and capital gains portions of such distributions will be determined by formal notifications from the REITs subsequent to the calendar year-end. Distributions received from the REITs that are determined to be a return of capital are recorded by the Fund as a reduction of the cost basis of the securities |
52Pioneer Balanced ESG Fund | Annual Report | 7/31/24
| | held and those determined to be capital gain are reflected as such on the Statement of Operations. |
| | At July 31, 2024, the Fund reclassified $25,424 to increase distributable earnings and $25,424 to decrease paid-in capital to reflect permanent book/tax differences. These adjustments have no impact on net assets or the results of operations. |
| | At July 31, 2024, the Fund was permitted to carry forward indefinitely $5,186,923 of short-term losses and $107,640 of long-term losses. |
| | The tax character of distributions paid during the years ended July 31, 2024 and July 31, 2023, was as follows: |
| | 2024 | 2023 |
| Distributions paid from: | | |
| Ordinary income | $8,329,665 | $7,519,615 |
| Long-term capital gains | — | 5,495,135 |
| Total | $8,329,665 | $13,014,750 |
The following shows the components of distributable earnings (losses) on a federal income tax basis at July 31, 2024:
| | 2024 |
| Distributable earnings/(losses): | |
| Undistributed ordinary income | $388,297 |
| Capital loss carryforward | (5,294,563) |
| Net unrealized appreciation | 103,630,437 |
| Total | $98,724,171 |
The difference between book-basis and tax-basis net unrealized appreciation is attributable to the tax deferral of losses on wash sales, the tax treatment of premium and amortization, the mark to market of futures contracts, adjustments related to insurance-linked securities and adjustments related to perpetual bonds.
During the year ended July 31, 2024, the Fund utilized $4,503,502 of its capital loss carryover from the prior year.
| E. | Fund Shares |
| | The Fund records sales and repurchases of its shares as of trade date. The Distributor earned $18,267 in underwriting commissions on the sale of Class A shares during the year ended July 31, 2024. |
Pioneer Balanced ESG Fund | Annual Report | 7/31/2453
| F. | Class Allocations |
| | Income, common expenses and realized and unrealized gains and losses are calculated at the Fund level and allocated daily to each class of shares based on its respective percentage of adjusted net assets at the beginning of the day. |
| | Distribution fees are calculated based on the average daily net asset value attributable to Class A, Class C and Class R shares of the Fund, respectively (see Note 5). Class K and Class Y shares do not pay distribution fees. All expenses and fees paid to the Fund’s transfer agent for its services are allocated among the classes of shares based on the number of accounts in each class and the ratable allocation of related out-of-pocket expenses (see Note 4). |
| | Distributions to shareholders are recorded as of the ex-dividend date. Distributions paid by the Fund with respect to each class of shares are calculated in the same manner and at the same time, except that net investment income dividends to Class A, Class C, Class K, Class R and Class Y shares can reflect different transfer agent and distribution expense rates. |
| G. | Risks |
| | The value of securities held by the Fund may go up or down, sometimes rapidly or unpredictably, due to general market conditions, such as real or perceived adverse economic, political or regulatory conditions, recessions, the spread of infectious illness or other public health issues, inflation, changes in interest rates, armed conflict such as between Russia and Ukraine or in the Middle East, sanctions against Russia, other nations or individuals or companies and possible countermeasures, lack of liquidity in the bond markets or adverse investor sentiment. In the past several years, financial markets have experienced increased volatility, depressed valuations, decreased liquidity and heightened uncertainty. These conditions may continue, recur, worsen or spread. Inflation and interest rates have increased and may rise further. These circumstances could adversely affect the value and liquidity of the Fund’s investments and negatively impact the Fund’s performance. |
| | The long-term impact of the COVID-19 pandemic and its subsequent variants on economies, markets, industries and individual issuers, are not known. Some sectors of the economy and individual issuers have experienced or may experience particularly large losses. Periods of extreme volatility in the financial markets, reduced liquidity of many instruments, increased government debt, inflation, and disruptions to supply chains, consumer demand and employee availability, may |
54Pioneer Balanced ESG Fund | Annual Report | 7/31/24
| | continue for some time. Following Russia’s invasion of Ukraine, Russian securities lost all, or nearly all, their market value. Other securities or markets could be similarly affected by past or future political, geopolitical or other events or conditions. |
| | Governments and central banks, including the U.S. Federal Reserve, have taken extraordinary and unprecedented actions to support local and global economies and the financial markets. These actions have resulted in significant expansion of public debt, including in the U.S. The consequences of high public debt, including its future impact on the economy and securities markets, may not be known for some time. |
| | The U.S. and other countries are periodically involved in disputes over trade and other matters, which may result in tariffs, investment restrictions and adverse impacts on affected companies and securities. For example, the U.S. has imposed tariffs and other trade barriers on Chinese exports, has restricted sales of certain categories of goods to China, and has established barriers to investments in China. Trade disputes may adversely affect the economies of the U.S. and its trading partners, as well as companies directly or indirectly affected and financial markets generally. If the political climate between the U.S. and China does not improve or continues to deteriorate, if China were to attempt unification of Taiwan by force, or if other geopolitical conflicts develop or get worse, economies, markets and individual securities may be severely affected both regionally and globally, and the value of the Fund’s assets may go down. |
| | At times, the Fund’s investments may represent industries or industry sectors that are interrelated or have common risks, making the Fund more susceptible to any economic, political, or regulatory developments or other risks affecting those industries and sectors. |
| | The Adviser allocates the Fund’s assets between equity and debt securities based on its assessment of current business, economic and market conditions. Normally, equity and debt securities each represent 35% to 65% of the Fund’s net assets. The Fund’s investments in foreign markets and countries with limited developing markets may subject the Fund to a greater degree of risk than investments in a developed market. These risks include disruptive political or economic conditions, military conflicts and sanctions, terrorism, sustained economic downturns, financial instability, less liquid trading markets, extreme price volatility, currency risks, reduction of government or central bank support, inadequate accounting standards, tariffs, tax disputes or other tax burdens, nationalization or expropriation of assets and the imposition of adverse governmental laws, arbitrary application of laws and regulations |
Pioneer Balanced ESG Fund | Annual Report | 7/31/2455
| | or lack of rule of law and investment and repatriation restrictions. Lack of information and less market regulation also may affect the value of these securities. Withholding and other non-U.S. taxes may decrease the Fund’s return. Non-U.S. issuers may be located in parts of the world that have historically been prone to natural disasters. Investing in depositary receipts is subject to many of the same risks as investing directly in non-U.S. issuers. Depositary receipts may involve higher expenses and may trade at a discount (or premium) to the underlying security. |
| | Russia launched a large-scale invasion of Ukraine on February 24, 2022. In response to the military action by Russia, various countries, including the U.S., the United Kingdom, and European Union issued broad-ranging economic sanctions against Russia and Belarus and certain companies and individuals. Since then, Russian securities lost all, or nearly all, their market value, and many other issuers, securities and markets have been adversely affected. The United States and other countries may impose sanctions on other countries, companies and individuals in light of Russia’s military invasion. The extent and duration of the military action or future escalation of such hostilities, the extent and impact of existing and future sanctions, market disruptions and volatility, and the result of any diplomatic negotiations cannot be predicted. These and any related events could have a significant impact on the value and liquidity of certain Fund investments, on Fund performance and the value of an investment in the Fund, particularly with respect to securities and commodities, such as oil, natural gas and food commodities, as well as other sectors with exposure to Russian issuers or issuers in other countries affected by the invasion, and are likely to have collateral impacts on market sectors globally. |
| | The Fund may invest in REIT securities, the value of which can fall for a variety of reasons, such as declines in rental income, fluctuating interest rates, poor property management, environmental liabilities, uninsured damage, increased competition, or changes in real estate tax laws. |
| | The Fund invests in below-investment-grade (high-yield) debt securities and preferred stocks. Some of these high-yield securities may be convertible into equity securities of the issuer. Debt securities rated below-investment-grade are commonly referred to as “junk bonds” and are considered speculative with respect to the issuer’s capacity to pay interest and repay principal. These securities involve greater risk of loss, are subject to greater price volatility, and may be less liquid and more difficult to value, especially during periods of economic uncertainty or change, than higher rated debt securities. |
56Pioneer Balanced ESG Fund | Annual Report | 7/31/24
| | The Fund’s ESG criteria exclude securities of issuers in certain industries, and the Adviser considers ESG factors in making investment decisions. Excluding specific issuers limits the universe of investments available to the Fund as compared with other funds that do not consider ESG criteria or ESG factors, which may mean forgoing some investment opportunities available to funds that do not consider ESG criteria or ESG factors. Accordingly, the Fund may underperform other funds that do not utilize an investment strategy that considers ESG criteria or ESG factors. However, the strategy of seeking to identify companies with sustainable business models is believed to provide potential return and risk benefits, including the selection of issuers with fewer ESG-related risks. In considering ESG factors, the Adviser may use third party ESG ratings information that it believes to be reliable, but such information may not be accurate or complete, or may be biased. |
| | The Fund’s investments, payment obligations and financing terms may be based on floating rates, such as LIBOR (London Interbank Offered Rate) or SOFR (Secured Overnight Financing Rate). ICE Benchmark Administration, the administrator of LIBOR, has ceased publication of most LIBOR settings on a representative basis. Actions by regulators have resulted in the establishment of alternative reference rates to LIBOR in most major currencies. In the U.S., a common benchmark replacement is based on the SOFR published by the Federal Reserve Bank of New York, including certain spread adjustments and benchmark replacement conforming changes, although other benchmark replacements (without or without spread adjustments) may be used in certain transactions. The impact of the transition from LIBOR on the Fund’s transactions and financial markets generally cannot yet be determined. The transition away from LIBOR may lead to increased volatility and illiquidity in markets for instruments that have relied on LIBOR and may adversely affect the Fund’s performance. |
| | With the increased use of technologies such as the Internet to conduct business, the Fund is susceptible to operational, information security and related risks. While the Fund’s Adviser has established business continuity plans in the event of, and risk management systems to prevent, limit or mitigate, such cyber-attacks, there are inherent limitations in such plans and systems, including the possibility that certain risks have not been identified. Furthermore, the Fund cannot control the cybersecurity plans and systems put in place by service providers to the Fund such as the Fund’s custodian and accounting agent, and the Fund’s transfer agent. In addition, many beneficial owners of Fund shares hold them through accounts at broker-dealers, retirement platforms and other financial market participants over which |
Pioneer Balanced ESG Fund | Annual Report | 7/31/2457
| | neither the Fund nor the Adviser exercises control. Each of these may in turn rely on service providers to them, which are also subject to the risk of cyber-attacks. Cybersecurity failures or breaches at the Adviser or the Fund’s service providers or intermediaries have the ability to cause disruptions and impact business operations, potentially resulting in financial losses, interference with the Fund’s ability to calculate its net asset value, impediments to trading, the inability of Fund shareholders to effect share purchases, redemptions or exchanges or receive distributions, loss of or unauthorized access to private shareholder information and violations of applicable privacy and other laws, regulatory fines, penalties, reputational damage, or additional compliance costs. Such costs and losses may not be covered under any insurance. In addition, maintaining vigilance against cyber-attacks may involve substantial costs over time, and system enhancements may themselves be subject to cyber-attacks. |
| | The Fund’s prospectus contains unaudited information regarding the Fund’s principal risks. Please refer to that document when considering the Fund’s principal risks. |
| H. | TBA Purchases and Sales Commitments |
| | The Fund may enter into to-be-announced (TBA) purchases or sales commitments (collectively, TBA transactions), pursuant to which it agrees to purchase or sell, respectively, mortgage-backed securities for a fixed unit price, with payment and delivery at a scheduled future date beyond the customary settlement period for such securities. With TBA transactions, the particular securities to be received or delivered by the Fund are not identified at the trade date; however, the securities must meet specified terms, including issuer, rate, and mortgage term, and be within industry-accepted “good delivery” standards. The Fund may enter into TBA transactions with the intention of taking possession of or relinquishing the underlying securities, may elect to extend the settlement by “rolling” the transaction, and/or may use TBA transactions to gain or reduce interim exposure to underlying securities. Until settlement, the Fund maintains liquid assets sufficient to settle its commitment to purchase a TBA or, in the case of a sale commitment, the Fund maintains an entitlement to the security to be sold. |
| | To mitigate counterparty risk, the Fund has entered into agreements with TBA counterparties that provide for collateral and the right to offset amounts due to or from those counterparties under specified conditions. Subject to minimum transfer amounts, collateral requirements are determined and transfers made based on the net aggregate unrealized gain or loss on all TBA commitments with a |
58Pioneer Balanced ESG Fund | Annual Report | 7/31/24
| | particular counterparty. At any time, the Fund’s risk of loss from a particular counterparty related to its TBA commitments is the aggregate unrealized gain on appreciated TBAs in excess of unrealized loss on depreciated TBAs and collateral received, if any, from such counterparty. As of July 31, 2024, no collateral was pledged by the Fund. Collateral received from counterparties totaled $0 for TBAs. |
| I. | Restricted Securities |
| | Restricted Securities are subject to legal or contractual restrictions on resale. Restricted securities generally are resold in transactions exempt from registration under the Securities Act of 1933. Private placement securities are generally considered to be restricted except for those securities traded between qualified institutional investors under the provisions of Rule 144A of the Securities Act of 1933. |
| | Disposal of restricted investments may involve negotiations and expenses, and prompt sale at an acceptable price may be difficult to achieve. Restricted investments held by the Fund at July 31, 2024 are listed in the Schedule of Investments. |
| J. | Insurance-Linked Securities (“ILS”) |
| | The Fund invests in ILS. The Fund could lose a portion or all of the principal it has invested in an ILS, and the right to additional interest or dividend payments with respect to the security, upon the occurrence of one or more trigger events, as defined within the terms of an insurance-linked security. Trigger events, generally, are hurricanes, earthquakes, or other natural events of a specific size or magnitude that occur in a designated geographic region during a specified time period, and/or that involve losses or other metrics that exceed a specific amount. There is no way to accurately predict whether a trigger event will occur, and accordingly, ILS carry significant risk. The Fund is entitled to receive principal, and interest and/or dividend payments so long as no trigger event occurs of the description and magnitude specified by the instrument. In addition to the specified trigger events, ILS may expose the Fund to other risks, including but not limited to issuer (credit) default, adverse regulatory or jurisdictional interpretations and adverse tax consequences. |
| | The Fund’s investments in ILS may include event-linked bonds. ILS also may include special purpose vehicles (“SPVs”) or similar instruments structured to comprise a portion of a reinsurer’s catastrophe-oriented business, known as quota share instruments (sometimes referred to as reinsurance sidecars), or to provide reinsurance relating to specific risks to insurance or reinsurance companies through a collateralized |
Pioneer Balanced ESG Fund | Annual Report | 7/31/2459
| | instrument, known as collateralized reinsurance. Structured reinsurance investments also may include industry loss warranties (“ILWs”). A traditional ILW takes the form of a bilateral reinsurance contract, but there are also products that take the form of derivatives, collateralized structures, or exchange-traded instruments. |
| | Where the ILS are based on the performance of underlying reinsurance contracts, the Fund has limited transparency into the individual underlying contracts, and therefore must rely upon the risk assessment and sound underwriting practices of the issuer. Accordingly, it may be more difficult for the Adviser to fully evaluate the underlying risk profile of the Fund’s structured reinsurance investments, and therefore the Fund’s assets are placed at greater risk of loss than if the Adviser had more complete information. Structured reinsurance instruments generally will be considered illiquid securities by the Fund. These securities may be difficult to purchase, sell or unwind. Illiquid securities also may be difficult to value. If the Fund is forced to sell an illiquid asset, the Fund may be forced to sell at a loss. |
| | Additionally, the Fund may gain exposure to ILS by investing in a closed-end interval fund, Pioneer ILS Interval Fund, an affiliate of the Adviser. The Fund’s investment in Pioneer ILS Interval Fund at July 31, 2024 is listed in the Schedule of Investments. |
| K. | Repurchase Agreements |
| | Repurchase agreements are arrangements under which the Fund purchases securities from a broker-dealer or a bank, called the counterparty, upon the agreement of the counterparty to repurchase the securities from the Fund at a later date, and at a specific price, which is typically higher than the purchase price paid by the Fund. The securities purchased serve as the Fund’s collateral for the obligation of the counterparty to repurchase the securities. The value of the collateral, including accrued interest, is required to be equal to or in excess of the repurchase price. The collateral for all repurchase agreements is held in safekeeping in the customer-only account of the Fund’s custodian or a sub-custodian of the Fund. The Adviser is responsible for determining that the value of the collateral remains at least equal to the repurchase price. In the event of a default by the counterparty, the Fund is entitled to sell the securities, but the Fund may not be able to sell them for the price at which they were purchased, thus causing a loss to the Fund. Additionally, if the counterparty becomes insolvent, there is some risk that the Fund will not have a right to the securities, or the immediate right to sell the securities. |
60Pioneer Balanced ESG Fund | Annual Report | 7/31/24
| | As of and for the year ended July 31, 2024, the Fund had no open repurchase agreements. |
| L. | Futures Contracts |
| | The Fund may enter into futures transactions in order to attempt to hedge against changes in interest rates, securities prices and currency exchange rates or to seek to increase total return. Futures contracts are types of derivatives. |
| | All futures contracts entered into by the Fund are traded on a futures exchange. Upon entering into a futures contract, the Fund is required to deposit with a broker an amount of cash or securities equal to the minimum “initial margin” requirements of the associated futures exchange. The amount of cash deposited with the broker as collateral at July 31, 2024 is recorded as “Futures collateral” on the Statement of Assets and Liabilities. |
| | Subsequent payments for futures contracts (“variation margin”) are paid or received by the Fund, depending on the daily fluctuation in the value of the contracts, and are recorded by the Fund as unrealized appreciation or depreciation. Cash received from or paid to the broker related to previous margin movement is held in a segregated account at the broker and is recorded as either “Due from broker for futures” or “Due to broker for futures” on the Statement of Assets and Liabilities. When the contract is closed, the Fund realizes a gain or loss equal to the difference between the opening and closing value of the contract as well as any fluctuation in foreign currency exchange rates where applicable. Futures contracts are subject to market risk, interest rate risk and currency exchange rate risk. Changes in value of the contracts may not directly correlate to the changes in value of the underlying securities. With futures, there is reduced counterparty credit risk to the Fund since futures are exchange-traded and the exchange’s clearinghouse, as counterparty to all exchange-traded futures, guarantees the futures against default. |
| | The average notional values of long position and short position futures contracts during the year ended July 31, 2024 were $44,532,387 and $1,354,263, respectively. Open futures contracts outstanding at July 31, 2024 are listed in the Schedule of Investments. |
2. Management Agreement
The Adviser manages the Fund’s portfolio. Management fees payable under the Fund’s Investment Management Agreement with the Adviser are calculated daily and paid monthly at the annual rate of 0.50% of the
Pioneer Balanced ESG Fund | Annual Report | 7/31/2461
Fund’s average daily net assets up to $1 billion and 0.45% of the Fund’s average daily net assets over $1 billion. For the year ended July 31, 2024, the effective management fee (excluding waivers and/or assumption of expenses) was equivalent to 0.50% of the Fund’s average daily net assets.
The Adviser has agreed to waive its management fee with respect to any portion of the Fund’s assets invested in Pioneer ILS Interval Fund, an affiliated fund managed by the Adviser. For the year ended July 31, 2024, the Adviser waived $19,668 in management fees with respect to the Fund, which is reflected on the Statement of Operations as a fee waiver.
Effective December 1, 2023, the Adviser has contractually agreed to waive and/or reimburse ordinary operating expenses (ordinary operating expenses means all fund expenses other than taxes, brokerage, acquired fund fees and expenses and extraordinary expenses, such as litigation) of the Fund to the extent required to reduce Fund expenses to 0.99%, 0.75%, 1.30% and 0.75% of the average daily net assets attributable to Class A, Class K, Class R and Class Y shares, respectively. These expense limitations are in effect through December 1, 2024. There can be no assurance that the Adviser will extend the expense limitation agreement for a class of shares beyond the date referred to above. Prior to December 1, 2023, the Adviser has contractually agreed to waive and/or reimburse ordinary operating expenses to 0.99%, 0.65%, 1.30% and 0.65% of the average daily net assets attributable to Class A, Class K, Class R and Class Y shares, respectively. Fees waived and expenses reimbursed during the year ended July 31, 2024 are reflected on the Statement of Operations.
In addition, under the management and administration agreements, certain other services and costs, including accounting, regulatory reporting and insurance premiums, are paid by the Fund as administrative reimbursements. Reflected on the Statement of Assets and Liabilities is $28,499 in management fees payable to the Adviser at July 31, 2024.
3. Compensation of Officers and Trustees
The Fund pays an annual fee to its Trustees. The Adviser reimburses the Fund for fees paid to the Interested Trustees. Except for the chief compliance officer, the Fund does not pay any salary or other compensation to its officers. The Fund pays a portion of the chief compliance officer’s compensation for his services as the Fund’s chief compliance officer. Amundi US pays the remaining portion of the chief compliance officer’s compensation. For the year ended July 31, 2024, the Fund paid $20,994 in Officers’ and Trustees’ compensation, which is reflected on the Statement of Operations as Officers’ and Trustees’ fees. At July 31, 2024, on its Statement of Assets and Liabilities, the Fund had a payable for Trustees’
62Pioneer Balanced ESG Fund | Annual Report | 7/31/24
fees of $1,755 and a payable for administrative expenses of $7,879, which includes the payable for Officers’ compensation.
4. Transfer Agent
BNY Mellon Investment Servicing (US) Inc. serves as the transfer agent to the Fund at negotiated rates. Transfer agent fees and payables shown on the Statement of Operations and the Statement of Assets and Liabilities, respectively, include sub-transfer agent expenses incurred through the Fund’s omnibus relationship contracts.
In addition, the Fund reimbursed the transfer agent for out-of-pocket expenses incurred by the transfer agent related to shareholder communications activities such as proxy and statement mailings, and outgoing phone calls. For the year ended July 31, 2024, such out-of-pocket expenses by class of shares were as follows:
| Shareholder Communications: | |
| Class A | $40,372 |
| Class C | 4,038 |
| Class K | 1,268 |
| Class R | 817 |
| Class Y | 3,892 |
| Total | $50,387 |
5. Distribution and Service Plans
The Fund has adopted a distribution plan (the “Plan”) pursuant to Rule 12b-1 under the 1940 Act with respect to its Class A, Class C and Class R shares. Pursuant to the Plan, the Fund pays the Distributor 0.25% of the Fund's average daily net assets attributable to Class A shares as compensation for personal services and/or account maintenance services or distribution services with regard to Class A shares. Pursuant to the Plan, the Fund also pays the Distributor 1.00% of the average daily net assets attributable to Class C shares. The fee for Class C shares consists of a 0.25% service fee and a 0.75% distribution fee paid as compensation for personal services and/or account maintenance services or distribution services with regard to Class C shares. Pursuant to the Plan, the Fund further pays the Distributor 0.50% of the average daily net assets attributable to Class R shares for distribution services. Reflected on the Statement of Assets and Liabilities is $14,441 in distribution fees payable to the Distributor at July 31, 2024.
The Fund also has adopted a separate service plan for Class R shares (the “Service Plan”). The Service Plan authorizes the Fund to pay securities dealers, plan administrators or other service organizations that agree to provide certain services to retirement plans or plan participants holding
Pioneer Balanced ESG Fund | Annual Report | 7/31/2463
shares of the Fund a service fee of up to 0.25% of the Fund’s average daily net assets attributable to Class R shares held by such plans.
In addition, redemptions of Class A and Class C shares may be subject to a contingent deferred sales charge (“CDSC”). A CDSC of 1.00% may be imposed on redemptions of certain net asset value purchases of Class A shares within 12 months of purchase. Redemptions of Class C shares within 12 months of purchase are subject to a CDSC of 1.00% based on the lower of cost or market value of shares being redeemed. Shares purchased as part of an exchange remain subject to any CDSC that applied to the original purchase of those shares. There is no CDSC for Class K, Class R or Class Y shares. Proceeds from the CDSCs are paid to the Distributor. For the year ended July 31, 2024, CDSCs in the amount of $3,799 were paid to the Distributor.
6. Line of Credit Facility
The Fund, along with certain other funds in the Pioneer Family of Funds, participates in a committed, unsecured revolving line of credit (“credit facility”). Borrowings are used solely for temporary or emergency purposes. The Fund may borrow up to the lesser of the amount available under the credit facility or the limits set for borrowing by the Fund’s prospectus and the 1940 Act. Until January 31, 2024, the Fund participated in a credit facility in the amount of $380 million. Under such credit facility, depending on the type of loan, interest on borrowings was payable at the Secured Overnight Financing Rate (“SOFR”) plus a credit spread. The Fund also paid both an upfront fee and an annual commitment fee to participate in the credit facility. The upfront fee in the amount of 0.15% of the total credit facility and the commitment fee in the amount of 0.30% of the daily unused portion of each lender’s commitment were allocated among participating funds based on an allocation schedule set forth in the credit facility. Effective January 31, 2024, the Fund participates in a credit facility in the amount of $250 million, the upfront fee with respect to the credit facility is 0.05% of the total credit facility, and the commitment fee with respect to the credit facility is 0.20% of the daily unused portion of each lender’s commitment. For the year ended July 31, 2024, the Fund had no borrowings under the credit facility.
64Pioneer Balanced ESG Fund | Annual Report | 7/31/24
7. Transactions in Underlying Funds
An affiliated issuer is a company in which the Fund has a direct or indirect ownership of, control of, or voting power of 5 percent or more of the outstanding voting shares, or a company which is under common ownership or control. At July 31, 2024, the value of the Fund’s investments in affiliated issuers was $1,213,872, which represents 0.3% of the Fund’s net assets.
Transactions in affiliated issuers by the Fund for the year ended July 31, 2024 were as follows:
Name of the
Affiliated Issuer | Value at
July 31,
2023 | Purchases
Costs | Change in
Net Unrealized
Appreciation/
(Depreciation) | Net
Realized
Gain/(Loss) | Dividends
Received
and
Reinvested | Sales
Proceeds | Shares
held at
July 31,
2024 | Value at
July 31,
2024 |
Pioneer ILS
Interval Fund | $1,023,698 | $— | $63,964 | $— | $126,210 | $— | 130,805 | $1,213,872 |
| Total | $1,023,698 | $— | $63,964 | $— | $126,210 | $— | 130,805 | $1,213,872 |
Annual and semi-annual reports for the Pioneer ILS Interval Fund are available on the funds’ web page(s) at www.amundi.com/us.
Pioneer Balanced ESG Fund | Annual Report | 7/31/2465
8. Additional Disclosures about Derivative Instruments and Hedging Activities
The Fund’s use of derivatives may enhance or mitigate the Fund’s exposure to the following risks:
Interest rate risk relates to the fluctuations in the value of interest-bearing securities due to changes in the prevailing levels of market interest rates.
Credit risk relates to the ability of the issuer of a financial instrument to make further principal or interest payments on an obligation or commitment that it has to the Fund.
Foreign exchange rate risk relates to fluctuations in the value of an asset or liability due to changes in currency exchange rates.
Equity risk relates to the fluctuations in the value of financial instruments as a result of changes in market prices (other than those arising from interest rate risk or foreign exchange rate risk), whether caused by factors specific to an individual investment, its issuer, or all factors affecting all instruments traded in a market or market segment.
Commodity risk relates to the risk that the value of a commodity or commodity index will fluctuate based on increases or decreases in the commodities market and factors specific to a particular industry or commodity.
The fair value of open derivative instruments (not considered to be hedging instruments for accounting disclosure purposes) by risk exposure at July 31, 2024, was as follows:
Statement of Assets
and Liabilities | Interest
Rate Risk | Credit
Risk | Foreign
Exchange
Rate Risk | Equity
Risk | Commodity
Risk |
| Assets | | | | | |
| Net unrealized appreciation on futures contracts* | $722,048 | $— | $— | $— | $— |
| Total Value | $722,048 | $— | $— | $— | $— |
| | |
| * | Includes cumulative unrealized appreciation (depreciation) of futures contracts as reported in the Schedule of Investments. Only net variation margin is reported within the assets and/or liabilities on the Statement of Assets and Liabilities. |
66Pioneer Balanced ESG Fund | Annual Report | 7/31/24
The effect of derivative instruments (not considered to be hedging instruments for accounting disclosure purposes) on the Statement of Operations by risk exposure at July 31, 2024 was as follows:
| Statement of Operations | Interest
Rate Risk | Credit
Risk | Foreign
Exchange
Rate Risk | Equity
Risk | Commodity
Risk |
| Net Realized Gain (Loss) on | | | | | |
| Futures contracts | $(1,528,966) | $— | $— | $— | $— |
| Total Value | $(1,528,966) | $— | $— | $— | $— |
| Change in Net Unrealized Appreciation (Depreciation) on | | | | | |
| Futures contracts | $1,256,156 | $— | $— | $— | $— |
| Total Value | $1,256,156 | $— | $— | $— | $— |
9. Unfunded Loan Commitments
The Fund may enter into unfunded loan commitments. Unfunded loan commitments may be partially or wholly unfunded. During the contractual period, the Fund is obliged to provide funding to the borrower upon demand. A fee is earned by the Fund on the unfunded loan commitment and is recorded as interest income on the Statement of Operations. Unfunded loan commitments are fair valued in accordance with the valuation policy described in Note 1A and unrealized appreciation or depreciation, if any, is recorded on the Statement of Assets and Liabilities.
As of July 31, 2024, the Fund had no unfunded loan commitments outstanding.
10. Definitive Agreement
The Fund’s Adviser is currently an indirect, wholly-owned subsidiary of Amundi. On July 9, 2024, Amundi announced that it had entered into a definitive agreement with Victory Capital Holdings, Inc. (“Victory Capital”) to combine the Adviser with Victory Capital, and for Amundi to become a strategic shareholder of Victory Capital (the “Transaction”). Victory Capital is headquartered in San Antonio, Texas. The closing of the Transaction is subject to certain regulatory approvals and other conditions. There is no assurance that the Transaction will close.
The closing of the Transaction would cause the Fund’s current investment advisory agreement with the Adviser to terminate. Under the terms of the Transaction, the Fund’s Board of Trustees will be asked to approve a reorganization of the Fund into a corresponding, newly established Victory Fund advised by Victory Capital Management Inc., an affiliate of Victory Capital. The proposed reorganization of the Fund would be sought in connection with the closing of the Transaction. If approved by the Board, the proposal to reorganize the Fund will be submitted to the shareholders of
Pioneer Balanced ESG Fund | Annual Report | 7/31/2467
the Fund for their approval. There is no assurance that the Board or the shareholders of the Fund will approve the proposal to reorganize the Fund.
68Pioneer Balanced ESG Fund | Annual Report | 7/31/24
Report of Independent Registered Public Accounting Firm
To the Board of Trustees of Pioneer Series Trust IV and the Shareholders of Pioneer Balanced ESG Fund:
Opinion on the Financial Statements and Financial Highlights
We have audited the accompanying statement of assets and liabilities of Pioneer Balanced ESG Fund (the “Fund”) (one of the funds constituting Pioneer Series Trust IV), including the schedule of investments, as of July 31, 2024, the related statements of operations, changes in net assets, and the financial highlights for the year then ended and the related notes. The statements of changes in net assets for the year ended July 31, 2023 and the financial highlights for the years ended July 31, 2023, 2022, 2021, and 2020 were audited by other auditors. Those auditors expressed an unqualified opinion on those financial statements and financial highlights in their report dated September 29, 2023. In our opinion, the financial statements and financial highlights present fairly, in all material respects, the financial position of the Fund as of July 31, 2024 and the results of its operations, the changes in its net assets, and the financial highlights for the year then ended, in conformity with accounting principles generally accepted in the United States of America.
Basis for Opinion
These financial statements and financial highlights are the responsibility of the Fund's management. Our responsibility is to express an opinion on the Fund's financial statements and financial highlights based on our audits. We are a public accounting firm registered with the Public Company Accounting Oversight Board (United States) (PCAOB) and are required to be independent with respect to the Fund in accordance with the U.S. federal securities laws and the applicable rules and regulations of the Securities and Exchange Commission and the PCAOB.
We conducted our audits in accordance with the standards of the PCAOB. Those standards require that we plan and perform the audit to obtain reasonable assurance about whether the financial statements and financial highlights are free of material misstatement, whether due to error or fraud. The Fund is not required to have, nor were we engaged to perform, an audit of its internal control over financial reporting. As part of our audits we are required to obtain an understanding of internal control over financial reporting but not for the purpose of expressing an opinion on the effectiveness of the Fund’s internal control over financial reporting. Accordingly, we express no such opinion.
Pioneer Balanced ESG Fund | Annual Report | 7/31/2469
Our audits included performing procedures to assess the risks of material misstatement of the financial statements and financial highlights, whether due to error or fraud, and performing procedures that respond to those risks. Such procedures included examining, on a test basis, evidence regarding the amounts and disclosures in the financial statements and financial highlights. Our audits also included evaluating the accounting principles used and significant estimates made by management, as well as evaluating the overall presentation of the financial statements and financial highlights. Our procedures included confirmation of securities owned as of July 31, 2024, by correspondence with the custodian and brokers; when replies were not received from brokers, we performed other auditing procedures. We believe that our audits provide a reasonable basis for our opinion.
DELOITTE & TOUCHE LLP
Boston, Massachusetts
September 27, 2024
We have served as the auditor of one or more of the Pioneer investment companies since 2024.
70Pioneer Balanced ESG Fund | Annual Report | 7/31/24
Additional Information (unaudited)
On March 25, 2024, Ernst & Young LLP (the “Prior Auditor”) resigned as the independent registered public accounting firm of the Fund due to the independence considerations resulting from a change of the independent registered public accounting firm of a related party. The Prior Auditor’s reports on the financial statements of the Fund for the past two fiscal years, the years ended July 31, 2023 and July 31, 2022, did not contain an adverse opinion or disclaimer of opinion, and were not qualified or modified as to uncertainty, audit scope or accounting principles.
During the last two fiscal year-ends and the subsequent interim period through March 25, 2024, there were no (1) disagreements with the Prior Auditor on any matter of accounting principles or practices, financial statement disclosure, or auditing scope or procedure, which disagreements, if not resolved to the Prior Auditor’s satisfaction, would have caused it to make reference to that matter in connection with its reports on the Fund’s financial statements for such periods; or (2) “reportable events” related to the Fund, as that term is defined in Item 304 (a)(1)(v) of Regulation S-K under the Securities Exchange Act of 1934.
On March 25, 2024, the Audit Committee of the Board approved, and on March 25, 2024, the Board approved, Deloitte & Touche LLP as the independent registered accounting firm of the Fund for fiscal periods ending after March 25, 2024.
For the year ended July 31, 2024, certain dividends paid by the Fund may be subject to a maximum tax rate of 20%. The Fund intends to designate up to the maximum amount of such dividends allowable, as taxed at a maximum rate of 20%. Complete information will be computed and reported in conjunction with our 2024 Form 1099-DIV.
The qualifying percentage of the Fund’s ordinary income dividends for the purpose of the corporate dividends received deduction was 35.44%.
Qualified interest income is exempt from nonresident alien (NRA) tax withholding. The percentage of the Fund’s ordinary income distributions derived from qualified interest income was 95.31%.
Pioneer Balanced ESG Fund | Annual Report | 7/31/2471
How to Contact Amundi
We are pleased to offer a variety of convenient ways for you to contact us for assistance or information.
Call us for:
Account Information, including existing accounts,
new accounts, prospectuses, applications
and service forms
1-800-225-6292
FactFoneSM for automated fund yields, prices,
account information and transactions
1-800-225-4321
| Retirement plans information | 1-800-622-0176 |
Write to us:
Amundi
P.O. Box 534427
Pittsburgh, PA 15253-4427
| Our toll-free fax | 1-800-225-4240 |
| Our internet e-mail address | us.askamundi@amundi.com
(for general questions about Amundi only) |
Visit our web site: www.amundi.com/us
This report must be preceded or accompanied by a prospectus.
The Fund files a complete schedule of portfolio holdings with the Securities and Exchange Commission for the first and third quarters of each fiscal year as an exhibit to its reports on Form N-PORT. Shareholders may view the filed Form N-PORT by visiting the Commission’s web site at https://www.sec.gov.
Amundi Asset Management US, Inc.
60 State Street
Boston, MA 02109
www.amundi.com/us
Securities offered through Amundi Distributor US, Inc.
60 State Street, Boston, MA 02109
Underwriter of Pioneer Mutual Funds, Member SIPC
© 2024 Amundi Asset Management US, Inc. 19418-18-0924
Amundi Climate Transition Core Bond Fund
Annual Report | July 31, 2024
| | | | |
| A: CTBAX | C: ACTCX | K: ACTKX | Y: CTCYX |
visit us: www.amundi.com/us
Amundi Climate Transition Core Bond Fund | Annual Report | 7/31/241
Schedule of Investments | 7/31/24
Principal
Amount
USD ($) | | | | | | Value |
| | UNAFFILIATED ISSUERS — 99.1% | |
| | Senior Secured Floating Rate Loan
Interests — 0.1% of Net Assets(a)* | |
| | Building & Construction Products — 0.0%† | |
| 5,000 | MI Windows and Doors LLC, 2024 Incremental Term Loan, 8.844% ( Term SOFR + 350 bps ), 3/28/31 | $ 5,022 |
| | Total Building & Construction Products | $5,022 |
|
|
| | Computer Services — 0.1% | |
| 15,000(b) | Amazon Holdco, Inc., Seven-Year Term Loan, 7/30/31 | $ 15,056 |
| | Total Computer Services | $15,056 |
|
|
| | Cruise Lines — 0.0%† | |
| 5,000 | LC Ahab US Bidco LLC, Initial Term Loan, 8.844% ( Term SOFR + 350 bps ), 5/1/31 | $ 5,025 |
| | Total Cruise Lines | $5,025 |
|
|
| | Total Senior Secured Floating Rate Loan Interests
(Cost $24,914) | $25,103 |
|
|
| | Asset Backed Securities — 6.5% of Net Assets | |
| 100,000 | Amur Equipment Finance Receivables XII LLC, Series 2023-1A, Class C, 6.36%, 12/20/29 (144A) | $ 102,721 |
| 100,000 | Avis Budget Rental Car Funding AESOP LLC, Series 2022-5A, Class C, 6.24%, 4/20/27 (144A) | 100,061 |
| 100,000(c) | B2R Mortgage Trust, Series 2015-2, Class E, 5.779%, 11/15/48 (144A) | 98,663 |
| 62,083 | BOF VII AL Funding Trust I, Series 2023-CAR3, Class A2, 6.291%, 7/26/32 (144A) | 62,692 |
| 100,000 | Dell Equipment Finance Trust, Series 2024-1, Class D, 6.12%, 9/23/30 (144A) | 101,493 |
| 100,000 | Exeter Automobile Receivables Trust, Series 2023-5A, Class D, 7.13%, 2/15/30 | 103,994 |
| 30,000 | Exeter Automobile Receivables Trust, Series 2024-3A, Class D, 5.98%, 9/16/30 | 30,385 |
| 110,000 | Exeter Automobile Receivables Trust, Series 2024-4A, Class D, 5.81%, 12/16/30 | 110,679 |
| 21,000 | GLS Auto Receivables Issuer Trust, Series 2023-4A, Class D, 7.18%, 8/15/29 (144A) | 21,873 |
| 100,000 | HPEFS Equipment Trust, Series 2024-1A, Class D, 5.82%, 11/20/31 (144A) | 101,089 |
| 99,629 | Progress Residential Trust, Series 2021-SFR7, Class A, 1.692%, 8/17/40 (144A) | 88,711 |
| 85,777(a) | ReadyCap Lending Small Business Loan Trust, Series 2023-3, Class A, 8.57% (PRIME + 7 bps), 4/25/48 (144A) | 86,552 |
The accompanying notes are an integral part of these financial statements.
2Amundi Climate Transition Core Bond Fund | Annual Report | 7/31/24
Principal
Amount
USD ($) | | | | | | Value |
| | Asset Backed Securities — (continued) | |
| 145,492(a) | STAR Trust, Series 2021-SFR1, Class A, 6.043% (1 Month Term SOFR + 71 bps), 4/17/38 (144A) | $ 144,234 |
| 100,000 | Switch ABS Issuer LLC, Series 2024-1A, Class A2, 6.28%, 3/25/54 (144A) | 101,619 |
| 95,466(d) | Vista Point Securitization Trust, Series 2024-CES1, Class A1, 6.676%, 5/25/54 (144A) | 96,540 |
| | Total Asset Backed Securities
(Cost $1,323,707) | $1,351,306 |
|
|
| | Collateralized Mortgage Obligations—2.1%
of Net Assets | |
| 25,768(a) | Connecticut Avenue Securities Trust, Series 2021-R03, Class 1M1, 6.197% (SOFR30A + 85 bps), 12/25/41 (144A) | $ 25,736 |
| 50,000(a) | Connecticut Avenue Securities Trust, Series 2024-R03, Class 2M2, 7.298% (SOFR30A + 195 bps), 3/25/44 (144A) | 50,401 |
| 65,979(c) | Federal Home Loan Mortgage Corp. Seasoned Credit Risk Transfer Trust, Series 2016-1, Class M2, 3.75%, 9/25/55 (144A) | 60,689 |
| 97,821(c) | Federal Home Loan Mortgage Corp. Seasoned Credit Risk Transfer Trust, Series 2019-3, Class M, 4.75%, 10/25/58 | 94,089 |
| 100,000(a) | Federal Home Loan Mortgage Corp. STACR REMIC Trust, Series 2021-DNA7, Class M2, 7.147% (SOFR30A + 180 bps), 11/25/41 (144A) | 100,932 |
| 44,165(c) | JP Morgan Mortgage Trust, Series 2016-3, Class 2AM, 2.968%, 10/25/46 (144A) | 41,037 |
| 87,214(c) | Towd Point Mortgage Trust, Series 2021-R1, Class A1, 2.918%, 11/30/60 (144A) | 72,736 |
| | Total Collateralized Mortgage Obligations
(Cost $429,730) | $445,620 |
|
|
| | Commercial Mortgage-Backed
Securities—6.3% of Net Assets | |
| 100,000(a) | Arbor Realty Commercial Real Estate Notes, Ltd., Series 2021-FL3, Class C, 7.293% (1 Month Term SOFR + 196 bps), 8/15/34 (144A) | $ 99,009 |
| 100,000 | BX Trust, Series 2019-OC11, Class A, 3.202%, 12/9/41 (144A) | 90,707 |
| 476,000 | Freddie Mac Multifamily Structured Pass Through Certificates, Series KG04, Class A2, 1.487%, 11/25/30 | 402,515 |
| 500,000 | Freddie Mac Multifamily Structured Pass Through Certificates, Series KG06, Class A2, 1.777%, 10/25/31 | 422,438 |
The accompanying notes are an integral part of these financial statements.
Amundi Climate Transition Core Bond Fund | Annual Report | 7/31/243
Schedule of Investments | 7/31/24 (continued)
Principal
Amount
USD ($) | | | | | | Value |
| | Commercial Mortgage-Backed
Securities—(continued) | |
| 100,000(a) | HILT Commercial Mortgage Trust, Series 2024-ORL, Class A, 6.87% (1 Month Term SOFR + 154 bps), 5/15/37 (144A) | $ 99,625 |
| 250,000 | SLG Office Trust, Series 2021-OVA, Class A, 2.585%, 7/15/41 (144A) | 208,983 |
| | Total Commercial Mortgage-Backed Securities
(Cost $1,354,940) | $1,323,277 |
|
|
| | Corporate Bonds — 45.0% of Net Assets | |
| | Advertising — 0.3% | |
| 55,000(e) | Omnicom Group, Inc., 5.30%, 11/1/34 | $ 54,972 |
| | Total Advertising | $54,972 |
|
|
| | Aerospace & Defense — 0.6% | |
| 100,000 | Boeing Co., 5.805%, 5/1/50 | $ 93,186 |
| 20,000 | Boeing Co., 6.858%, 5/1/54 (144A) | 21,173 |
| 15,000 | Boeing Co., 7.008%, 5/1/64 (144A) | 15,899 |
| | Total Aerospace & Defense | $130,258 |
|
|
| | Airlines — 0.1% | |
| 20,000(e) | United Airlines, Inc. Pass-Through Trust, 5.45%, 2/15/37 | $ 20,385 |
| | Total Airlines | $20,385 |
|
|
| | Auto Manufacturers — 5.0% | |
| 15,000 | American Honda Finance Corp., 5.05%, 7/10/31 | $ 15,189 |
| 50,000 | American Honda Finance Corp., 5.65%, 11/15/28 | 52,023 |
| 20,000 | Cummins, Inc., 5.15%, 2/20/34 | 20,497 |
| 30,000 | Cummins, Inc., 5.45%, 2/20/54 | 30,167 |
| 150,000 | Daimler Truck Finance North America LLC, 5.125%, 1/19/28 (144A) | 151,517 |
| 105,000 | Ford Motor Co., 6.10%, 8/19/32 | 106,261 |
| 105,000 | General Motors Co., 5.60%, 10/15/32 | 107,101 |
| 45,000 | General Motors Financial Co., Inc., 6.10%, 1/7/34 | 46,356 |
| 40,000 | Hyundai Capital America, 5.80%, 6/26/25 (144A) | 40,177 |
| 120,000 | Hyundai Capital America, 6.375%, 4/8/30 (144A) | 127,654 |
| 150,000 | Mercedes-Benz Finance North America LLC, 4.85%, 1/11/29 (144A) | 151,403 |
| 200,000 | Volkswagen Group of America Finance LLC, 5.90%, 9/12/33 (144A) | 207,954 |
| | Total Auto Manufacturers | $1,056,299 |
|
|
| | Banks — 18.6% | |
| 200,000 | Banco Bilbao Vizcaya Argentaria S.A., 5.381%, 3/13/29 | $ 204,423 |
| 300,000(c) | Bank of America Corp., 1.658% (SOFR + 91 bps), 3/11/27 | 284,222 |
| 120,000(c) | Bank of America Corp., 2.687% (SOFR + 132 bps), 4/22/32 | 103,760 |
The accompanying notes are an integral part of these financial statements.
4Amundi Climate Transition Core Bond Fund | Annual Report | 7/31/24
Principal
Amount
USD ($) | | | | | | Value |
| | Banks — (continued) | |
| 300,000(c) | Bank of New York Mellon Corp., 4.543% (SOFR + 117 bps), 2/1/29 | $ 298,448 |
| 150,000 | Bank of Nova Scotia, 4.75%, 2/2/26 | 149,671 |
| 200,000(c) | Barclays Plc, 6.224% (SOFR + 298 bps), 5/9/34 | 210,474 |
| 200,000(c) | BNP Paribas S.A., 5.125% (1 Year CMT Index + 145 bps), 1/13/29 (144A) | 201,604 |
| 100,000 | Citigroup, Inc., 4.45%, 9/29/27 | 98,726 |
| 30,000(c) | Citizens Financial Group, Inc., 5.718% (SOFR + 191 bps), 7/23/32 | 30,369 |
| 26,000(c) | Citizens Financial Group, Inc., 5.841% (SOFR + 201 bps), 1/23/30 | 26,430 |
| 200,000 | Federation des Caisses Desjardins du Quebec, 5.25%, 4/26/29 (144A) | 203,048 |
| 100,000(c) | Goldman Sachs Group, Inc., 4.223% (3 Month Term SOFR + 156 bps), 5/1/29 | 97,691 |
| 30,000(c) | Goldman Sachs Group, Inc., 5.33% (SOFR + 155 bps), 7/23/35 | 30,223 |
| 200,000 | Intesa Sanpaolo S.p.A., 7.80%, 11/28/53 (144A) | 227,132 |
| 100,000(c) | JPMorgan Chase & Co., 5.336% (SOFR + 162 bps), 1/23/35 | 101,583 |
| 15,000(c) | JPMorgan Chase & Co., 5.766% (SOFR + 149 bps), 4/22/35 | 15,721 |
| 250,000 | KeyBank N.A./Cleveland OH, 5.00%, 1/26/33 | 236,687 |
| 130,000(c) | Morgan Stanley, 2.484% (SOFR + 136 bps), 9/16/36 | 105,419 |
| 10,000(c) | Morgan Stanley, 5.652% (SOFR + 101 bps), 4/13/28 | 10,189 |
| 30,000(c) | Morgan Stanley, 5.948% (5 Year CMT Index + 243 bps), 1/19/38 | 30,646 |
| 200,000(c) | NatWest Group Plc, 5.847% (1 Year CMT Index + 135 bps), 3/2/27 | 202,014 |
| 15,000(c) | Santander Holdings USA, Inc., 6.124% (SOFR + 123 bps), 5/31/27 | 15,197 |
| 200,000(c) | Standard Chartered Plc, 6.097% (1 Year CMT Index + 210 bps), 1/11/35 (144A) | 208,719 |
| 200,000 | Sumitomo Mitsui Financial Group, Inc., 5.52%, 1/13/28 | 204,704 |
| 20,000(c) | Truist Financial Corp., 5.435% (SOFR + 162 bps), 1/24/30 | 20,308 |
| 200,000(c) | UBS Group AG, 5.711% (1 Year CMT Index + 155 bps), 1/12/27 (144A) | 201,294 |
| 300,000(c) | US Bancorp, 4.653% (SOFR + 123 bps), 2/1/29 | 297,669 |
| 100,000(c) | Wells Fargo & Co., 3.526% (SOFR + 151 bps), 3/24/28 | 96,508 |
| | Total Banks | $3,912,879 |
|
|
| | Beverages — 0.7% | |
| 30,000 | Coca-Cola Co., 5.00%, 5/13/34 | $ 30,876 |
The accompanying notes are an integral part of these financial statements.
Amundi Climate Transition Core Bond Fund | Annual Report | 7/31/245
Schedule of Investments | 7/31/24 (continued)
Principal
Amount
USD ($) | | | | | | Value |
| | Beverages — (continued) | |
| 25,000 | Coca-Cola Consolidated, Inc., 5.25%, 6/1/29 | $ 25,568 |
| 80,000 | PepsiCo, Inc., 4.80%, 7/17/34 | 80,725 |
| | Total Beverages | $137,169 |
|
|
| | Biotechnology — 0.3% | |
| 35,000 | Amgen, Inc., 5.25%, 3/2/33 | $ 35,570 |
| 15,000 | Royalty Pharma Plc, 5.15%, 9/2/29 | 15,102 |
| 20,000 | Royalty Pharma Plc, 5.40%, 9/2/34 | 19,984 |
| | Total Biotechnology | $70,656 |
|
|
| | Building Materials — 0.2% | |
| 10,000 | Miter Brands Acquisition Holdco, Inc./MIWD Borrower LLC, 6.75%, 4/1/32 (144A) | $ 10,146 |
| 20,000 | Owens Corning, 5.70%, 6/15/34 | 20,680 |
| | Total Building Materials | $30,826 |
|
|
| | Commercial Services — 1.3% | |
| 40,000 | Block, Inc., 6.50%, 5/15/32 (144A) | $ 40,648 |
| 5,000 | Brink's Co., 6.50%, 6/15/29 (144A) | 5,095 |
| 40,000 | Element Fleet Management Corp., 5.643%, 3/13/27 (144A) | 40,544 |
| 130,000 | S&P Global, Inc., 5.25%, 9/15/33 (144A) | 134,460 |
| 40,000 | Verisk Analytics, Inc., 5.25%, 6/5/34 | 40,380 |
| | Total Commercial Services | $261,127 |
|
|
| | Distribution/Wholesale — 0.0%† | |
| 5,000 | Velocity Vehicle Group LLC, 8.00%, 6/1/29 (144A) | $ 5,150 |
| | Total Distribution/Wholesale | $5,150 |
|
|
| | Diversified Financial Services — 3.9% | |
| 150,000 | AerCap Ireland Capital DAC/AerCap Global Aviation Trust, 2.45%, 10/29/26 | $ 141,703 |
| 155,000 | AerCap Ireland Capital DAC/AerCap Global Aviation Trust, 3.30%, 1/30/32 | 136,447 |
| 20,000(c) | Ally Financial, Inc., 6.184% (SOFR + 229 bps), 7/26/35 | 20,091 |
| 100,000(c) | Ally Financial, Inc., 6.848% (SOFR + 282 bps), 1/3/30 | 104,540 |
| 50,000 | Ameriprise Financial, Inc., 5.15%, 5/15/33 | 50,766 |
| 150,000 | Avolon Holdings Funding, Ltd., 6.375%, 5/4/28 (144A) | 155,100 |
| 15,000 | BlackRock Funding, Inc., 5.35%, 1/8/55 | 15,036 |
| 25,000(c) | Capital One Financial Corp., 5.884% (SOFR + 199 bps), 7/26/35 | 25,362 |
| 30,000(c) | Charles Schwab Corp., 5.853% (SOFR + 250 bps), 5/19/34 | 31,118 |
| 30,000 | Freedom Mortgage Holdings LLC, 9.125%, 5/15/31 (144A) | 29,513 |
| 25,000 | Freedom Mortgage Holdings LLC, 9.25%, 2/1/29 (144A) | 25,179 |
| 35,000 | Jefferies Financial Group, Inc., 6.20%, 4/14/34 | 36,323 |
| 15,000 | LPL Holdings, Inc., 5.70%, 5/20/27 | 15,159 |
The accompanying notes are an integral part of these financial statements.
6Amundi Climate Transition Core Bond Fund | Annual Report | 7/31/24
Principal
Amount
USD ($) | | | | | | Value |
| | Diversified Financial Services — (continued) | |
| 20,000(e) | Nationstar Mortgage Holdings, Inc., 6.50%, 8/1/29 (144A) | $ 19,971 |
| 15,000(c)(e) | Synchrony Financial, 5.935% (SOFR + 213 bps), 8/2/30 | 15,092 |
| | Total Diversified Financial Services | $821,400 |
|
|
| | Electric — 1.6% | |
| 100,000 | Ameren Corp., 5.70%, 12/1/26 | $ 101,717 |
| 100,000 | Duke Energy Progress LLC, 5.10%, 3/15/34 | 101,531 |
| 100,000 | Eversource Energy, 5.45%, 3/1/28 | 101,729 |
| 25,000 | ITC Holdings Corp., 5.65%, 5/9/34 (144A) | 25,636 |
| 10,000 | Southern California Edison Co., 5.45%, 6/1/31 | 10,325 |
| | Total Electric | $340,938 |
|
|
| | Gas — 0.4% | |
| 75,000 | Atmos Energy Corp., 5.90%, 11/15/33 | $ 80,025 |
| 10,000 | CenterPoint Energy Resources Corp., 5.40%, 7/1/34 | 10,107 |
| | Total Gas | $90,132 |
|
|
| | Hand & Machine Tools — 0.4% | |
| 85,000 | Regal Rexnord Corp., 6.30%, 2/15/30 | $ 88,653 |
| | Total Hand & Machine Tools | $88,653 |
|
|
| | Healthcare-Products — 0.4% | |
| 45,000 | Medtronic Global Holdings SCA, 4.50%, 3/30/33 | $ 44,250 |
| 20,000 | Smith & Nephew Plc, 5.40%, 3/20/34 | 20,231 |
| 15,000 | Sotera Health Holdings LLC, 7.375%, 6/1/31 (144A) | 15,301 |
| | Total Healthcare-Products | $79,782 |
|
|
| | Healthcare-Services — 0.5% | |
| 15,000 | Elevance Health, Inc., 5.15%, 6/15/29 | $ 15,302 |
| 10,000 | Elevance Health, Inc., 5.375%, 6/15/34 | 10,259 |
| 10,000 | Health Care Service Corp. A Mutual Legal Reserve Co., 5.20%, 6/15/29 (144A) | 10,139 |
| 20,000 | Health Care Service Corp. A Mutual Legal Reserve Co., 5.45%, 6/15/34 (144A) | 20,215 |
| 10,000 | Humana, Inc., 5.375%, 4/15/31 | 10,155 |
| 20,000 | UnitedHealth Group, Inc., 5.625%, 7/15/54 | 20,506 |
| 15,000 | UnitedHealth Group, Inc., 5.75%, 7/15/64 | 15,406 |
| | Total Healthcare-Services | $101,982 |
|
|
| | Insurance — 1.5% | |
| 60,000 | Brown & Brown, Inc., 5.65%, 6/11/34 | $ 60,745 |
| 45,000 | CNO Financial Group, Inc., 6.45%, 6/15/34 | 46,069 |
| 40,000(c) | Farmers Exchange Capital III, 5.454% (3 Month USD LIBOR + 345 bps), 10/15/54 (144A) | 33,664 |
The accompanying notes are an integral part of these financial statements.
Amundi Climate Transition Core Bond Fund | Annual Report | 7/31/247
Schedule of Investments | 7/31/24 (continued)
Principal
Amount
USD ($) | | | | | | Value |
| | Insurance — (continued) | |
| 80,000 | New York Life Global Funding, 4.55%, 1/28/33 (144A) | $ 78,248 |
| 100,000 | New York Life Global Funding, 4.85%, 1/9/28 (144A) | 100,547 |
| | Total Insurance | $319,273 |
|
|
| | Leisure Time — 0.1% | |
| 25,000(e) | Royal Caribbean Cruises, Ltd., 6.00%, 2/1/33 (144A) | $ 25,164 |
| | Total Leisure Time | $25,164 |
|
|
| | Lodging — 0.2% | |
| 10,000 | Choice Hotels International, Inc., 5.85%, 8/1/34 | $ 10,049 |
| 30,000 | Hilton Grand Vacations Borrower Escrow LLC/Hilton Grand Vacations Borrower Esc, 6.625%, 1/15/32 (144A) | 30,294 |
| 5,000 | Las Vegas Sands Corp., 6.00%, 8/15/29 | 5,093 |
| | Total Lodging | $45,436 |
|
|
| | Machinery-Diversified — 0.8% | |
| 40,000 | CNH Industrial Capital LLC, 4.55%, 4/10/28 | $ 39,635 |
| 45,000 | CNH Industrial Capital LLC, 5.50%, 1/12/29 | 46,185 |
| 40,000 | John Deere Capital Corp., 5.05%, 6/12/34 | 40,667 |
| 43,000 | John Deere Capital Corp., 5.10%, 4/11/34 | 43,934 |
| | Total Machinery-Diversified | $170,421 |
|
|
| | Oil & Gas — 1.0% | |
| 175,000 | Aker BP ASA, 6.00%, 6/13/33 (144A) | $ 180,722 |
| 30,000 | Hilcorp Energy I LP/Hilcorp Finance Co., 6.875%, 5/15/34 (144A) | 29,846 |
| | Total Oil & Gas | $210,568 |
|
|
| | Packaging & Containers — 0.1% | |
| 15,000 | Sealed Air Corp., 6.50%, 7/15/32 (144A) | $ 15,204 |
| | Total Packaging & Containers | $15,204 |
|
|
| | Pharmaceuticals — 2.2% | |
| 100,000 | Cencora, Inc., 5.125%, 2/15/34 | $ 100,810 |
| 300,000 | Cigna Group, 4.375%, 10/15/28 | 295,836 |
| 5,000 | CVS Health Corp., 5.25%, 1/30/31 | 5,053 |
| 55,000 | CVS Health Corp., 5.25%, 2/21/33 | 54,879 |
| | Total Pharmaceuticals | $456,578 |
|
|
| | Pipelines — 1.1% | |
| 25,000(c) | Enbridge, Inc., 7.20% (5 Year CMT Index + 297 bps), 6/27/54 | $ 25,442 |
| 25,000(c) | Enbridge, Inc., 7.375% (5 Year CMT Index + 312 bps), 3/15/55 | 25,332 |
The accompanying notes are an integral part of these financial statements.
8Amundi Climate Transition Core Bond Fund | Annual Report | 7/31/24
Principal
Amount
USD ($) | | | | | | Value |
| | Pipelines — (continued) | |
| 70,000 | Energy Transfer LP, 5.60%, 9/1/34 | $ 71,026 |
| 100,000 | EnLink Midstream LLC, 6.50%, 9/1/30 (144A) | 104,207 |
| | Total Pipelines | $226,007 |
|
|
| | REITs — 2.1% | |
| 10,000 | Essex Portfolio LP, 5.50%, 4/1/34 | $ 10,170 |
| 41,000 | MPT Operating Partnership LP/MPT Finance Corp., 3.50%, 3/15/31 | 26,938 |
| 100,000 | Simon Property Group LP , 5.50%, 3/8/33 | 103,101 |
| 170,000 | Sun Communities Operating LP, 5.50%, 1/15/29 | 172,560 |
| 35,000 | Sun Communities Operating LP , 5.70%, 1/15/33 | 35,239 |
| 100,000 | Weyerhaeuser Co., 4.75%, 5/15/26 | 99,783 |
| | Total REITs | $447,791 |
|
|
| | Retail — 0.7% | |
| 100,000 | AutoZone, Inc., 4.50%, 2/1/28 | $ 99,205 |
| 50,000 | O'Reilly Automotive, Inc., 5.75%, 11/20/26 | 50,983 |
| | Total Retail | $150,188 |
|
|
| | Semiconductors — 0.6% | |
| 120,000 | Broadcom, Inc., 3.469%, 4/15/34 (144A) | $ 104,799 |
| 15,000 | Broadcom, Inc., 5.05%, 7/12/29 | 15,185 |
| | Total Semiconductors | $119,984 |
|
|
| | Telecommunications — 0.3% | |
| 60,000 | Verizon Communications, Inc., 5.05%, 5/9/33 | $ 60,449 |
| | Total Telecommunications | $60,449 |
|
|
| | Total Corporate Bonds
(Cost $9,260,701) | $9,449,671 |
|
|
| | Insurance-Linked Securities — 3.5% of Net
Assets# | |
| | Event Linked Bonds — 3.5% | |
| | Multiperil – U.S. — 2.3% | |
| 250,000(a) | Merna Re II, 13.78%, (3 Month U.S. Treasury Bill + 850 bps), 7/7/27 (144A) | $ 248,125 |
| 250,000(a) | Sanders Re III, 8.69%, (3 Month U.S. Treasury Bill + 341 bps), 4/7/26 (144A) | 241,400 |
| | | | | | | $489,525 |
|
|
The accompanying notes are an integral part of these financial statements.
Amundi Climate Transition Core Bond Fund | Annual Report | 7/31/249
Schedule of Investments | 7/31/24 (continued)
Principal
Amount
USD ($) | | | | | | Value |
| | Windstorm – U.S. Multistate — 1.2% | |
| 250,000(a) | Gateway Re, 15.282%, (1 Month U.S. Treasury Bill + 1,000 bps), 7/8/26 (144A) | $ 246,225 |
| | Total Event Linked Bonds | $735,750 |
|
|
| | Total Insurance-Linked Securities
(Cost $740,798) | $735,750 |
|
|
| | Foreign Government Bond — 3.9% of Net
Assets | |
| | Supranational — 3.9% | |
| 850,000 | European Investment Bank, 2.125%, 4/13/26 | $ 818,479 |
| | Total Supranational | $818,479 |
|
|
| | Total Foreign Government Bond
(Cost $826,394) | $818,479 |
|
|
| | U.S. Government and Agency Obligations —
31.7% of Net Assets | |
| 739,540 | Federal Home Loan Mortgage Corp., 1.500%, 3/1/37 | $ 646,208 |
| 242,441 | Federal Home Loan Mortgage Corp., 2.500%, 8/1/51 | 205,556 |
| 787,094 | Federal Home Loan Mortgage Corp., 2.500%, 3/1/52 | 665,498 |
| 752,876 | Federal Home Loan Mortgage Corp., 3.000%, 4/1/42 | 676,749 |
| 750,579 | Federal Home Loan Mortgage Corp., 3.500%, 6/1/52 | 681,916 |
| 670,614 | Federal Home Loan Mortgage Corp., 5.000%, 2/1/53 | 661,021 |
| 703,660 | Federal Home Loan Mortgage Corp., 5.500%, 2/1/53 | 706,588 |
| 835,175 | Federal National Mortgage Association, 2.000%, 2/1/52 | 673,260 |
| 485,937 | Federal National Mortgage Association, 2.500%, 7/1/37 | 446,677 |
| 718,427 | Federal National Mortgage Association, 2.500%, 4/1/52 | 607,922 |
| 250,000 | Federal National Mortgage Association, 3.010%, 8/1/34 | 218,327 |
| 499,284 | Federal National Mortgage Association, 3.190%, 6/1/29 | 474,610 |
| | Total U.S. Government and Agency Obligations
(Cost $6,868,243) | $6,664,332 |
|
|
| | TOTAL INVESTMENTS IN UNAFFILIATED ISSUERS — 99.1%
(Cost $20,829,427) | $20,813,538 |
| | OTHER ASSETS AND LIABILITIES — 0.9% | $191,098 |
| | net assets — 100.0% | $21,004,636 |
| | | | | | | |
| bps | Basis Points. |
| CMT | Constant Maturity Treasury Index. |
| LIBOR | London Interbank Offered Rate. |
| PRIME | U.S. Federal Funds Rate. |
| REIT | Real Estate Investment Trust. |
| SOFR | Secured Overnight Financing Rate. |
The accompanying notes are an integral part of these financial statements.
10Amundi Climate Transition Core Bond Fund | Annual Report | 7/31/24
| SOFR30A | Secured Overnight Financing Rate 30 Day Average. |
| (144A) | The resale of such security is exempt from registration under Rule 144A of the Securities Act of 1933. Such securities may be resold normally to qualified institutional buyers. At July 31, 2024, the value of these securities amounted to $5,689,219, or 27.1% of net assets. |
| (a) | Floating rate note. Coupon rate, reference index and spread shown at July 31, 2024. |
| (b) | All or a portion of this senior loan position has not settled. Rates do not take effect until settlement date. Rates shown, if any, are for the settled portion. |
| (c) | The interest rate is subject to change periodically. The interest rate and/or reference index and spread shown at July 31, 2024. |
| (d) | Debt obligation initially issued at one coupon which converts to a higher coupon at a specific date. The rate shown is the rate at July 31, 2024. |
| (e) | Securities purchased on a when-issued basis. Rates do not take effect until settlement date. |
| * | Senior secured floating rate loan interests in which the Fund invests generally pay interest at rates that are periodically re-determined by reference to a base lending rate plus a premium. These base lending rates are generally (i) the lending rate offered by one or more major European banks, such as LIBOR or SOFR, (ii) the prime rate offered by one or more major United States banks, (iii) the rate of a certificate of deposit or (iv) other base lending rates used by commercial lenders. The interest rate shown is the rate accruing at July 31, 2024. |
| † | Amount rounds to less than 0.1%. |
| # | Securities are restricted as to resale. |
| Restricted Securities | Acquisition date | Cost | Value |
| Gateway Re | 7/14/2023 | $250,000 | $246,225 |
| Merna Re II | 5/8/2024 | 250,000 | 248,125 |
| Sanders Re III | 10/2/2023 | 240,798 | 241,400 |
| Total Restricted Securities | | | $735,750 |
| % of Net assets | | | 3.5% |
FUTURES CONTRACTS
FIXED INCOME INDEX FUTURES CONTRACTS
Number of
Contracts
Long | Description | Expiration
Date | Notional
Amount | Market
Value | Unrealized
Appreciation |
| 2 | U.S. 2 Year Note (CBT) | 9/30/24 | $408,661 | $410,734 | $2,073 |
| 45 | U.S. 5 Year Note (CBT) | 9/30/24 | 4,776,577 | 4,855,078 | 78,501 |
| 11 | U.S. Ultra Bond (CBT) | 9/19/24 | 1,362,999 | 1,407,656 | 44,657 |
| | | | $6,548,237 | $6,673,468 | $125,231 |
The accompanying notes are an integral part of these financial statements.
Amundi Climate Transition Core Bond Fund | Annual Report | 7/31/2411
Schedule of Investments | 7/31/24 (continued)
Number of
Contracts
Short | Description | Expiration
Date | Notional
Amount | Market
Value | Unrealized
(Depreciation) |
| 1 | U.S. 10 Year Ultra Bond (CBT) | 9/19/24 | $(114,466) | $(115,578) | $(1,112) |
| TOTAL FUTURES CONTRACTS | $6,433,771 | $6,557,890 | $124,119 |
| CBT | Chicago Board of Trade. |
Purchases and sales of securities (excluding short-term investments and all derivative contracts except for options purchased.) for the year ended July 31, 2024 were as follows:
| | Purchases | Sales |
| Long-Term U.S. Government Securities | $209,792 | $763,945 |
| Other Long-Term Securities | $6,832,072 | $5,160,786 |
At July 31, 2024, the net unrealized depreciation on investments based on cost for federal tax purposes of $20,830,029 was as follows:
| Aggregate gross unrealized appreciation for all investments in which there is an excess of value over tax cost | $139,544 |
| Aggregate gross unrealized depreciation for all investments in which there is an excess of tax cost over value | (156,035) |
| Net unrealized depreciation | $(16,491) |
The accompanying notes are an integral part of these financial statements.
12Amundi Climate Transition Core Bond Fund | Annual Report | 7/31/24
Various inputs are used in determining the value of the Fund’s investments. These inputs are summarized in the three broad levels below.
| Level 1 | – | unadjusted quoted prices in active markets for identical securities. |
| Level 2 | – | other significant observable inputs (including quoted prices for similar securities, interest rates, prepayment speeds, credit risks, etc.). See Notes to Financial Statements — Note 1A. |
| Level 3 | – | significant unobservable inputs (including the Adviser’s own assumptions in determining fair value of investments). See Notes to Financial Statements — Note 1A. |
The following is a summary of the inputs used as of July 31, 2024 in valuing the Fund’s investments:
| | Level 1 | Level 2 | Level 3 | Total |
| Senior Secured Floating Rate Loan Interests | $— | $25,103 | $— | $25,103 |
| Asset Backed Securities | — | 1,351,306 | — | 1,351,306 |
| Collateralized Mortgage Obligations | — | 445,620 | — | 445,620 |
| Commercial Mortgage-Backed Securities | — | 1,323,277 | — | 1,323,277 |
| Corporate Bonds | — | 9,449,671 | — | 9,449,671 |
| Insurance-Linked Securities | | | | |
| Event Linked Bonds | — | 735,750 | — | 735,750 |
| Foreign Government Bond | — | 818,479 | — | 818,479 |
| U.S. Government and Agency Obligations | — | 6,664,332 | — | 6,664,332 |
| Total Investments in Securities | $— | $20,813,538 | $— | $20,813,538 |
| Other Financial Instruments | | | | |
| Net unrealized appreciation on futures contracts | $124,119 | $— | $— | $124,119 |
| Total Other Financial Instruments | $124,119 | $— | $— | $124,119 |
During the year ended July 31, 2024, there were no transfers in or out of Level 3.
The accompanying notes are an integral part of these financial statements.
Amundi Climate Transition Core Bond Fund | Annual Report | 7/31/2413
Statement of Assets and Liabilities | 7/31/24
| ASSETS: | |
| Investments in unaffiliated issuers, at value (cost $20,829,427) | $20,813,538 |
| Futures collateral | 252,089 |
| Due from broker for futures | 25,625 |
| Variation margin for futures contracts | 14,375 |
| Receivables — | |
| Interest | 152,103 |
| Due from the Adviser | 2,276 |
| Other assets | 15,053 |
| Total assets | $21,275,059 |
| LIABILITIES: | |
| Overdraft due to custodian | $24,499 |
| Payables — | |
| Investment securities purchased | 149,781 |
| Fund shares repurchased | 46 |
| Distributions | 11,944 |
| Trustees’ fees | 680 |
| Professional fees | 74,513 |
| Management fees | 993 |
| Administrative expenses | 270 |
| Distribution fees | 177 |
| Accrued expenses | 7,520 |
| Total liabilities | $270,423 |
| NET ASSETS: | |
| Paid-in capital | $21,323,264 |
| Distributable earnings | (318,628) |
| Net assets | $21,004,636 |
| NET ASSET VALUE PER SHARE: | |
| No par value (unlimited number of shares authorized) | |
| Class A (based on $1,089,570/110,821 shares) | $9.83 |
| Class C (based on $1,033,878/105,196 shares) | $9.83 |
| Class K (based on $1,048,292/106,620 shares) | $9.83 |
| Class Y (based on $17,832,896/1,813,756 shares) | $9.83 |
| MAXIMUM OFFERING PRICE PER SHARE: | |
| Class A (based on $9.83 net asset value per share/100%-4.50% maximum sales charge) | $10.29 |
The accompanying notes are an integral part of these financial statements.
14Amundi Climate Transition Core Bond Fund | Annual Report | 7/31/24
Statement of Operations FOR THE YEAR ENDED 7/31/24
| INVESTMENT INCOME: | | |
| Interest from unaffiliated issuers | $1,099,150 | |
| Total Investment Income | | $1,099,150 |
| EXPENSES: | | |
| Management fees | $69,939 | |
| Administrative expenses | 15,289 | |
| Transfer agent fees | | |
| Class A | 19 | |
| Class C | 7 | |
| Class K | 6 | |
| Class Y | 17 | |
| Distribution fees | | |
| Class A | 2,535 | |
| Class C | 9,892 | |
| Shareholder communications expense | 109 | |
| Custodian fees | 189 | |
| Registration fees | 89,606 | |
| Professional fees | 82,196 | |
| Printing expense | 17,386 | |
| Officers’ and Trustees’ fees | 8,215 | |
| Insurance expense | 332 | |
| Miscellaneous | 15,483 | |
| Total expenses | | $311,220 |
| Less fees waived and expenses reimbursed by the Adviser | | (207,923) |
| Net expenses | | $103,297 |
| Net investment income | | $995,853 |
| REALIZED AND UNREALIZED GAIN (LOSS) ON INVESTMENTS: | | |
| Net realized gain (loss) on: | | |
| Investments in unaffiliated issuers | $(308,991) | |
| Futures contracts | (70,918) | $(379,909) |
| Change in net unrealized appreciation (depreciation) on: | | |
| Investments in unaffiliated issuers | $395,717 | |
| Futures contracts | 186,833 | $582,550 |
| Net realized and unrealized gain (loss) on investments | | $202,641 |
| Net increase in net assets resulting from operations | | $1,198,494 |
The accompanying notes are an integral part of these financial statements.
Amundi Climate Transition Core Bond Fund | Annual Report | 7/31/2415
Statements of Changes in Net Assets
| | Year
Ended to
7/31/24 | Period From
12/15/22* to
7/31/23 |
| FROM OPERATIONS: | | |
| Net investment income (loss) | $995,853 | $565,610 |
| Net realized gain (loss) on investments | (379,909) | (133,890) |
| Change in net unrealized appreciation (depreciation) on investments | 582,550 | (474,320) |
| Net increase in net assets resulting from operations | $1,198,494 | $(42,600) |
| DISTRIBUTIONS TO SHAREHOLDERS: | | |
| Class A ($0.47 and $0.21 per share, respectively) | $(49,869) | $(22,065) |
| Class C ($0.40 and $0.17 per share, respectively) | (41,254) | (17,208) |
| Class K ($0.50 and $0.23 per share, respectively) | (51,627) | (23,093) |
| Class Y ($0.50 and $0.23 per share, respectively) | (878,063) | (392,579) |
| Total distributions to shareholders | $(1,020,813) | $(454,945) |
| FROM FUND SHARE TRANSACTIONS: | | |
| Net proceeds from sales of shares | $54,581 | $20,075,696 |
| Reinvestment of distributions | 882,321 | 386,710 |
| Cost of shares repurchased | (392) | (74,416) |
| Net increase in net assets resulting from Fund share transactions | $936,510 | $20,387,990 |
| Net increase in net assets | $1,114,191 | $19,890,445 |
| NET ASSETS: | | |
| Beginning of period | $19,890,445 | $— |
| End of period | $21,004,636 | $19,890,445 |
| * | The Fund commenced operations on December 15, 2022. |
The accompanying notes are an integral part of these financial statements.
16Amundi Climate Transition Core Bond Fund | Annual Report | 7/31/24
| | Year
Ended to
7/31/24
Shares | Year
Ended to
7/31/24
Amount | Period From
12/15/22* to
7/31/23
Shares | Period From
12/15/22* to
7/31/23
Amount |
| Class A | | | | |
| Shares sold | 4,472 | $42,581 | 107,585 | $1,075,696 |
| Reinvestment of distributions | 4,488 | 43,236 | 1,901 | 18,753 |
| Less shares repurchased | — | — | (7,625) | (74,416) |
| Net increase | 8,960 | $85,817 | 101,861 | $1,020,033 |
| Class C | | | | |
| Shares sold | — | $— | 100,000 | $1,000,000 |
| Reinvestment of distributions | 3,713 | 35,781 | 1,483 | 14,627 |
| Less shares repurchased | — | — | — | — |
| Net increase | 3,713 | $35,781 | 101,483 | $1,014,627 |
| Class K | | | | |
| Shares sold | — | $— | 100,000 | $1,000,000 |
| Reinvestment of distributions | 4,631 | 44,606 | 1,989 | 19,630 |
| Less shares repurchased | — | — | — | — |
| Net increase | 4,631 | $44,606 | 101,989 | $1,019,630 |
| Class Y | | | | |
| Shares sold | 1,211 | $12,000 | 1,700,000 | $17,000,000 |
| Reinvestment of distributions | 78,767 | 758,698 | 33,818 | 333,700 |
| Less shares repurchased | (40) | (392) | — | — |
| Net increase | 79,938 | $770,306 | 1,733,818 | $17,333,700 |
| * | The Fund commenced operations on December 15, 2022. |
The accompanying notes are an integral part of these financial statements.
Amundi Climate Transition Core Bond Fund | Annual Report | 7/31/2417
| | Year
Ended
7/31/24 | 12/15/22* to
7/31/23 |
| Class A | | |
| Net asset value, beginning of period | $9.75 | $10.00 |
| Increase (decrease) from investment operations: | | |
| Net investment income (loss) (a) | $0.46 | $0.27 |
| Net realized and unrealized gain (loss) on investments | 0.09 | (0.31) |
| Net increase (decrease) from investment operations | $0.55 | $(0.04) |
| Distributions to shareholders: | | |
| Net investment income | $(0.47) | $(0.21) |
| Total distributions | $(0.47) | $(0.21) |
| Net increase (decrease) in net asset value | $0.08 | $(0.25) |
| Net asset value, end of period | $9.83 | $9.75 |
| Total return (b) | 5.87% | (0.36)%(c) |
| Ratio of net expenses to average net assets | 0.71% | 0.46%(d) |
| Ratio of net investment income (loss) to average net assets | 4.79% | 4.36%(d) |
| Portfolio turnover rate | 31% | 34%(c) |
| Net assets, end of period (in thousands) | $1,090 | $994 |
| Ratios with no waiver of fees and assumption of expenses by the Adviser and no reduction for fees paid indirectly: | | |
| Total expenses to average net assets | 1.75% | 2.56%(d) |
| Net investment income (loss) to average net assets | 3.75% | 2.26%(d) |
| * | Class A commenced operations on December 15, 2022. |
| (a) | The per-share data presented above is based on the average shares outstanding for the period presented. |
| (b) | Assumes initial investment at net asset value at the beginning of the period, reinvestment of all distributions, the complete redemption of the investment at net asset value at the end of the period and no sales charges. Total return would be reduced if sales charges were taken into account. |
| (c) | Not annualized. |
| (d) | Annualized. |
The accompanying notes are an integral part of these financial statements.
18Amundi Climate Transition Core Bond Fund | Annual Report | 7/31/24
| | Year
Ended
7/31/24 | 12/15/22* to
7/31/23 |
| Class C | | |
| Net asset value, beginning of period | $9.75 | $10.00 |
| Increase (decrease) from investment operations: | | |
| Net investment income (loss) (a) | $0.39 | $0.22 |
| Net realized and unrealized gain (loss) on investments | 0.09 | (0.30) |
| Net increase (decrease) from investment operations | $0.48 | $(0.08) |
| Distributions to shareholders: | | |
| Net investment income | $(0.40) | $(0.17) |
| Total distributions | $(0.40) | $(0.17) |
| Net increase (decrease) in net asset value | $0.08 | $(0.25) |
| Net asset value, end of period | $9.83 | $9.75 |
| Total return (b) | 5.09% | (0.80)%(c) |
| Ratio of net expenses to average net assets | 1.46% | 1.21%(d) |
| Ratio of net investment income (loss) to average net assets | 4.04% | 3.61%(d) |
| Portfolio turnover rate | 31% | 34%(c) |
| Net assets, end of period (in thousands) | $1,034 | $990 |
| Ratios with no waiver of fees and assumption of expenses by the Adviser and no reduction for fees paid indirectly: | | |
| Total expenses to average net assets | 2.50% | 3.31%(d) |
| Net investment income (loss) to average net assets | 3.00% | 1.51%(d) |
| * | Class C commenced operations on December 15, 2022. |
| (a) | The per-share data presented above is based on the average shares outstanding for the period presented. |
| (b) | Assumes initial investment at net asset value at the beginning of the period, reinvestment of all distributions, the complete redemption of the investment at net asset value at the end of the period and no sales charges. Total return would be reduced if sales charges were taken into account. |
| (c) | Not annualized. |
| (d) | Annualized. |
The accompanying notes are an integral part of these financial statements.
Amundi Climate Transition Core Bond Fund | Annual Report | 7/31/2419
Financial Highlights (continued)
| | Year
Ended
7/31/24 | 12/15/22* to
7/31/23 |
| Class K | | |
| Net asset value, beginning of period | $9.75 | $10.00 |
| Increase (decrease) from investment operations: | | |
| Net investment income (loss) (a) | $0.48 | $0.28 |
| Net realized and unrealized gain (loss) on investments | 0.10 | (0.30) |
| Net increase (decrease) from investment operations | $0.58 | $(0.02) |
| Distributions to shareholders: | | |
| Net investment income | $(0.50) | $(0.23) |
| Total distributions | $(0.50) | $(0.23) |
| Net increase (decrease) in net asset value | $0.08 | $(0.25) |
| Net asset value, end of period | $9.83 | $9.75 |
| Total return (b) | 6.14% | (0.21)%(c) |
| Ratio of net expenses to average net assets | 0.45% | 0.21%(d) |
| Ratio of net investment income (loss) to average net assets | 5.05% | 4.61%(d) |
| Portfolio turnover rate | 31% | 34%(c) |
| Net assets, end of period (in thousands) | $1,048 | $995 |
| Ratios with no waiver of fees and assumption of expenses by the Adviser and no reduction for fees paid indirectly: | | |
| Total expenses to average net assets | 1.50% | 2.31%(d) |
| Net investment income (loss) to average net assets | 4.00% | 2.51%(d) |
| * | Class K commenced operations on December 15, 2022. |
| (a) | The per-share data presented above is based on the average shares outstanding for the period presented. |
| (b) | Assumes initial investment at net asset value at the beginning of the period, reinvestment of all distributions and the complete redemption of the investment at net asset value at the end of the period. |
| (c) | Not annualized. |
| (d) | Annualized. |
The accompanying notes are an integral part of these financial statements.
20Amundi Climate Transition Core Bond Fund | Annual Report | 7/31/24
| | Year
Ended
7/31/24 | 12/15/22* to
7/31/23 |
| Class Y | | |
| Net asset value, beginning of period | $9.75 | $10.00 |
| Increase (decrease) from investment operations: | | |
| Net investment income (loss) (a) | $0.48 | $0.28 |
| Net realized and unrealized gain (loss) on investments | 0.10 | (0.30) |
| Net increase (decrease) from investment operations | $0.58 | $(0.02) |
| Distributions to shareholders: | | |
| Net investment income | $(0.50) | $(0.23) |
| Total distributions | $(0.50) | $(0.23) |
| Net increase (decrease) in net asset value | $0.08 | $(0.25) |
| Net asset value, end of period | $9.83 | $9.75 |
| Total return (b) | 6.14% | (0.21)%(c) |
| Ratio of net expenses to average net assets | 0.45% | 0.21%(d) |
| Ratio of net investment income (loss) to average net assets | 5.05% | 4.61%(d) |
| Portfolio turnover rate | 31% | 34%(c) |
| Net assets, end of period (in thousands) | $17,833 | $16,912 |
| Ratios with no waiver of fees and assumption of expenses by the Adviser and no reduction for fees paid indirectly: | | |
| Total expenses to average net assets | 1.49% | 2.31%(d) |
| Net investment income (loss) to average net assets | 4.01% | 2.51%(d) |
| * | Class Y commenced operations on December 15, 2022. |
| (a) | The per-share data presented above is based on the average shares outstanding for the period presented. |
| (b) | Assumes initial investment at net asset value at the beginning of the period, reinvestment of all distributions and the complete redemption of the investment at net asset value at the end of the period. |
| (c) | Not annualized. |
| (d) | Annualized. |
The accompanying notes are an integral part of these financial statements.
Amundi Climate Transition Core Bond Fund | Annual Report | 7/31/2421
Notes to Financial Statements | 7/31/24
1. Organization and Significant Accounting Policies
Amundi Climate Transition Core Bond Fund (the “Fund”) is one of four portfolios comprising Pioneer Series Trust IV (the “Trust”), a Delaware statutory trust. The Fund is registered under the Investment Company Act of 1940, as amended (the “1940 Act”) as a diversified, open-end management investment company. The Fund’s investment objective is to seek a combination of income and capital appreciation.
The Fund offers four classes of shares designated as Class A, Class C, Class K and Class Y shares. Class A, Class C, Class K and Class Y commenced operations on December 15, 2022. Each class of shares represents an interest in the same portfolio of investments of the Fund and has identical rights (based on relative net asset values) to assets and liquidation proceeds. Share classes can bear different rates of class-specific fees and expenses, such as transfer agent and distribution fees. Differences in class-specific fees and expenses will result in differences in net investment income and, therefore, the payment of different dividends from net investment income earned by each class. The Amended and Restated Declaration of Trust of the Trust gives the Board of Trustees the flexibility to specify either per-share voting or dollar-weighted voting when submitting matters for shareholder approval. Under per-share voting, each share of a class of the Fund is entitled to one vote. Under dollar-weighted voting, a shareholder’s voting power is determined not by the number of shares owned, but by the dollar value of the shares on the record date. Each share class has exclusive voting rights with respect to matters affecting only that class, including with respect to the distribution plan for that class. There is no distribution plan for Class K or Class Y shares.
Amundi Asset Management US, Inc., an indirect, wholly owned subsidiary of Amundi and Amundi’s wholly owned subsidiary, Amundi USA, Inc., serves as the Fund’s investment adviser (the “Adviser”). Amundi Distributor US, Inc., an affiliate of the Adviser, serves as the Fund’s distributor (the “Distributor”).
The Fund is required to comply with Rule 18f-4 under the 1940 Act, which governs the use of derivatives by registered investment companies. Rule 18f-4 permits funds to enter into derivatives transactions (as defined in Rule 18f-4) and certain other transactions notwithstanding the restrictions on the issuance of “senior securities” under Section 18 of the 1940 Act. Rule 18f-4 requires a fund to establish and maintain a comprehensive derivatives risk management program, appoint a derivatives risk manager and comply with a relative or absolute limit on fund leverage
22Amundi Climate Transition Core Bond Fund | Annual Report | 7/31/24
risk calculated based on value-at-risk (“VaR”), unless the fund uses derivatives in only a limited manner (a “limited derivatives user”). The Fund is currently a limited derivatives user for purposes of Rule 18f-4.
The Fund is an investment company and follows investment company accounting and reporting guidance under U.S. Generally Accepted Accounting Principles (“U.S. GAAP”). U.S. GAAP requires the management of the Fund to make estimates and assumptions that affect the reported amounts of assets and liabilities, the disclosure of contingent assets and liabilities at the date of the financial statements, and the reported amounts of income, expenses and gain or loss on investments during the reporting period. Actual results could differ from those estimates.
The following is a summary of significant accounting policies followed by the Fund in the preparation of its financial statements:
| A. | Security Valuation |
| | The net asset value of the Fund is computed once daily, on each day the New York Stock Exchange (“NYSE”) is open, as of the close of regular trading on the NYSE. |
| | Fixed income securities are valued by using prices supplied by independent pricing services, which consider such factors as market prices, market events, quotations from one or more brokers, Treasury spreads, yields, maturities and ratings, or may use a pricing matrix or other fair value methods or techniques to provide an estimated value of the security or instrument. A pricing matrix is a means of valuing a debt security on the basis of current market prices for other debt securities, historical trading patterns in the market for fixed income securities and/or other factors. Non-U.S. debt securities that are listed on an exchange will be valued at the bid price obtained from an independent third party pricing service. When independent third party pricing services are unable to supply prices, or when prices or market quotations are considered to be unreliable, the value of that security may be determined using quotations from one or more broker-dealers. |
| | Loan interests are valued at the mean between the last available bid and asked prices from one or more brokers or dealers as obtained from Loan Pricing Corporation, an independent third party pricing service. If price information is not available from Loan Pricing Corporation, or if the price information is deemed to be unreliable, price information will be obtained from an alternative loan interest pricing service. If no reliable price quotes are available from either the primary or alternative pricing service, broker quotes will be solicited. |
Amundi Climate Transition Core Bond Fund | Annual Report | 7/31/2423
| | Event-linked bonds are valued at the bid price obtained from an independent third party pricing service. Other insurance-linked securities (including reinsurance sidecars, collateralized reinsurance and industry loss warranties) may be valued at the bid price obtained from an independent pricing service, or through a third party using a pricing matrix, insurance valuation models, or other fair value methods or techniques to provide an estimated value of the instrument. |
| | Equity securities that have traded on an exchange are valued by using the last sale price on the principal exchange where they are traded. Equity securities that have not traded on the date of valuation, or securities for which sale prices are not available, generally are valued using the mean between the last bid and asked prices or, if both last bid and asked prices are not available, at the last quoted bid price. Last sale and bid and asked prices are provided by independent third party pricing services. In the case of equity securities not traded on an exchange, prices are typically determined by independent third party pricing services using a variety of techniques and methods. |
| | The value of foreign securities is translated into U.S. dollars based on foreign currency exchange rate quotations supplied by a third party pricing source. Trading in non-U.S. equity securities is substantially completed each day at various times prior to the close of the NYSE. The values of such securities used in computing the net asset value of the Fund’s shares are determined as of such times. The Adviser may use a fair value model developed by an independent pricing service to value non-U.S. equity securities. |
| | Futures contracts are generally valued at the closing settlement price established by the exchange on which they are traded. |
| | Securities or loan interests for which independent pricing services or broker-dealers are unable to supply prices or for which market prices and/or quotations are not readily available or are considered to be unreliable are valued by a fair valuation team comprised of certain personnel of the Adviser. The Adviser is designated as the valuation designee for the Fund pursuant to Rule 2a-5 under the 1940 Act. The Adviser’s fair valuation team is responsible for monitoring developments that may impact fair valued securities. |
| | Inputs used when applying fair value methods to value a security may include credit ratings, the financial condition of the company, current market conditions and comparable securities. The Adviser may use fair value methods if it is determined that a significant event has occurred after the close of the exchange or market on which the security trades and prior to the determination of the Fund’s net asset value. Examples |
24Amundi Climate Transition Core Bond Fund | Annual Report | 7/31/24
| | of a significant event might include political or economic news, corporate restructurings, natural disasters, terrorist activity or trading halts. Thus, the valuation of the Fund’s securities may differ significantly from exchange prices, and such differences could be material. |
| B. | Investment Income and Transactions |
| | Dividend income is recorded on the ex-dividend date, except that certain dividends from foreign securities where the ex-dividend date may have passed are recorded as soon as the Fund becomes aware of the ex-dividend data in the exercise of reasonable diligence. |
| | Interest income, including interest on income-bearing cash accounts, is recorded on the accrual basis. Dividend and interest income are reported net of unrecoverable foreign taxes withheld at the applicable country rates and net of income accrued on defaulted securities. |
| | Interest and dividend income payable by delivery of additional shares is reclassified as PIK (payment-in-kind) income upon receipt and is included in interest and dividend income, respectively. |
| | Principal amounts of mortgage-backed securities are adjusted for monthly paydowns. Premiums and discounts related to certain mortgage-backed securities are amortized or accreted in proportion to the monthly paydowns. All discounts/premiums on purchase prices of debt securities are accreted/amortized for financial reporting purposes over the life of the respective securities, and such accretion/amortization is included in interest income. |
| | Security transactions are recorded as of trade date. Gains and losses on sales of investments are calculated on the identified cost method for both financial reporting and federal income tax purposes. |
| C. | Foreign Currency Translation |
| | The books and records of the Fund are maintained in U.S. dollars. Amounts denominated in foreign currencies are translated into U.S. dollars using current exchange rates. |
| | Net realized gains and losses on foreign currency transactions, if any, represent, among other things, the net realized gains and losses on foreign currency exchange contracts, disposition of foreign currencies and the difference between the amount of income accrued and the U.S. dollars actually received. Further, the effects of changes in foreign currency exchange rates on investments are not segregated on the Statement of Operations from the effects of changes in the market prices |
Amundi Climate Transition Core Bond Fund | Annual Report | 7/31/2425
| | of those securities, but are included with the net realized and unrealized gain or loss on investments. |
| D. | Federal Income Taxes |
| | It is the Fund’s policy to comply with the requirements of the Internal Revenue Code applicable to regulated investment companies and to distribute all of its net taxable income and net realized capital gains, if any, to its shareholders. Therefore, no provision for federal income taxes is required. As of July 31, 2024, the Fund did not accrue any interest or penalties with respect to uncertain tax positions, which, if applicable, would be recorded as an income tax expense on the Statement of Operations. Tax returns filed within the prior three years remain subject to examination by federal and state tax authorities. |
| | The amount and character of income and capital gain distributions to shareholders are determined in accordance with federal income tax rules, which may differ from U.S. GAAP. Distributions in excess of net investment income or net realized gains are temporary over distributions for financial statement purposes resulting from differences in the recognition or classification of income or distributions for financial statement and tax purposes. Capital accounts within the financial statements are adjusted for permanent book/tax differences to reflect tax character, but are not adjusted for temporary differences. |
| | At July 31, 2024, the Fund was permitted to carry forward indefinitely $266,452 of short-term losses and $53,664 of long-term losses. |
| | The tax character of distributions paid during the year ended July 31, 2024 and July 31, 2023, was as follows: |
| | 2024 | 2023 |
| Distributions paid from: | | |
| Ordinary income | $1,020,813 | $454,945 |
| Total | $1,020,813 | $454,945 |
| | 2024 |
| Distributable earnings/(losses): | |
| Undistributed ordinary income | $29,924 |
| Capital loss carryforward | (320,116) |
| Other book/tax temporary differences | (11,944) |
| Net unrealized depreciation | (16,492) |
| Total | $(318,628) |
The difference between book-basis and tax-basis net unrealized depreciation is attributable to the mark to market of futures contracts and adjustments related to insurance-linked securities.
26Amundi Climate Transition Core Bond Fund | Annual Report | 7/31/24
| E. | Fund Shares |
| | The Fund records sales and repurchases of its shares as of trade date. The Distributor did not earn underwriting commissions on the sale of Class A shares during the year ended July 31, 2024. |
| F. | Class Allocations |
| | Income, common expenses and realized and unrealized gains and losses are calculated at the Fund level and allocated daily to each class of shares based on its respective percentage of adjusted net assets at the beginning of the day. |
| | Distribution fees are calculated based on the average daily net asset value attributable to Class A and Class C shares of the Fund, respectively (see Note 5). Class K and Class Y shares do not pay distribution fees. All expenses and fees paid to the Fund’s transfer agent for its services are allocated among the classes of shares based on the number of accounts in each class and the ratable allocation of related out-of-pocket expenses (see Note 4). |
| | The Fund declares as daily dividends substantially all of its net investment income. All dividends are paid on a monthly basis. Short-term capital gain distributions, if any, may be declared with the daily dividends. |
| | Distributions to shareholders are recorded as of the ex-dividend date. Distributions paid by the Fund with respect to each class of shares are calculated in the same manner and at the same time, except that net investment income dividends to Class A, Class C, Class K and Class Y shares can reflect different transfer agent and distribution expense rates. |
| G. | Risks |
| | The value of securities held by the Fund may go up or down, sometimes rapidly or unpredictably, due to general market conditions, such as real or perceived adverse economic, political or regulatory conditions, recessions, the spread of infectious illness or other public health issues, inflation, changes in interest rates, armed conflict such as between Russia and Ukraine or in the Middle East, sanctions against Russia, other nations or individuals or companies and possible countermeasures, lack of liquidity in the bond markets or adverse investor sentiment. In the past several years, financial markets have experienced increased volatility, depressed valuations, decreased liquidity and heightened uncertainty. These conditions may continue, recur, worsen or spread. Inflation and interest rates have increased and may rise further. These |
Amundi Climate Transition Core Bond Fund | Annual Report | 7/31/2427
| | circumstances could adversely affect the value and liquidity of the Fund’s investments and negatively impact the Fund’s performance. |
| | The long-term impact of the COVID-19 pandemic and its subsequent variants on economies, markets, industries and individual issuers, are not known. Some sectors of the economy and individual issuers have experienced or may experience particularly large losses. Periods of extreme volatility in the financial markets, reduced liquidity of many instruments, increased government debt, inflation, and disruptions to supply chains, consumer demand and employee availability, may continue for some time. Following Russia’s invasion of Ukraine, Russian securities lost all, or nearly all, their market value. Other securities or markets could be similarly affected by past or future political, geopolitical or other events or conditions. |
| | Governments and central banks, including the U.S. Federal Reserve, have taken extraordinary and unprecedented actions to support local and global economies and the financial markets. These actions have resulted in significant expansion of public debt, including in the U.S. The consequences of high public debt, including its future impact on the economy and securities markets, may not be known for some time. |
| | The U.S. and other countries are periodically involved in disputes over trade and other matters, which may result in tariffs, investment restrictions and adverse impacts on affected companies and securities. For example, the U.S. has imposed tariffs and other trade barriers on Chinese exports, has restricted sales of certain categories of goods to China, and has established barriers to investments in China. Trade disputes may adversely affect the economies of the U.S. and its trading partners, as well as companies directly or indirectly affected and financial markets generally. If the political climate between the U.S. and China does not improve or continues to deteriorate, if China were to attempt unification of Taiwan by force, or if other geopolitical conflicts develop or get worse, economies, markets and individual securities may be severely affected both regionally and globally, and the value of the Fund’s assets may go down. |
| | At times, the Fund’s investments may represent industries or industry sectors that are interrelated or have common risks, making the Fund more susceptible to any economic, political, or regulatory developments or other risks affecting those industries and sectors. |
| | The market prices of the Fund’s fixed income securities may fluctuate significantly when interest rates change. The value of your investment will generally go down when interest rates rise. A rise in rates tends to have a greater impact on the prices of longer term or duration securities. |
28Amundi Climate Transition Core Bond Fund | Annual Report | 7/31/24
| | For example, if interest rates increase by 1%, the value of a Fund’s portfolio with a portfolio duration of ten years would be expected to decrease by 10%, all other things being equal. In recent years interest rates and credit spreads in the U.S. have been at historic lows. The U.S. Federal Reserve has raised certain interest rates, and interest rates may continue to go up. A general rise in interest rates could adversely affect the price and liquidity of fixed income securities. The maturity of a security may be significantly longer than its effective duration. A security’s maturity and other features may be more relevant than its effective duration in determining the security’s sensitivity to other factors affecting the issuer or markets generally, such as changes in credit quality or in the yield premium that the market may establish for certain types of securities (sometimes called “credit spread”). In general, the longer its maturity the more a security may be susceptible to these factors. When the credit spread for a fixed income security goes up, or “widens”, the value of the security will generally go down. |
| | If an issuer or guarantor of a security held by the Fund or a counterparty to a financial contract with the Fund defaults on its obligation to pay principal and/or interest, has its credit rating downgraded or is perceived to be less creditworthy, or the credit quality or value of any underlying assets declines, the value of your investment will typically decline. Changes in actual or perceived creditworthiness may occur quickly. The Fund could be delayed or hindered in its enforcement of rights against an issuer, guarantor or counterparty. |
| | Russia launched a large-scale invasion of Ukraine on February 24, 2022. In response to the military action by Russia, various countries, including the U.S., the United Kingdom, and European Union issued broad-ranging economic sanctions against Russia and Belarus and certain companies and individuals. Since then, Russian securities lost all, or nearly all, their market value, and many other issuers, securities and markets have been adversely affected. The United States and other countries may impose sanctions on other countries, companies and individuals in light of Russia’s military invasion. The extent and duration of the military action or future escalation of such hostilities, the extent and impact of existing and future sanctions, market disruptions and volatility, and the result of any diplomatic negotiations cannot be predicted. These and any related events could have a significant impact on the value and liquidity of certain Fund investments, on Fund performance and the value of an investment in the Fund, particularly with respect to securities and commodities, such as oil, natural gas and food commodities, as well as other sectors with exposure to Russian issuers or issuers in other |
Amundi Climate Transition Core Bond Fund | Annual Report | 7/31/2429
| | countries affected by the invasion, and are likely to have collateral impacts on market sectors globally. |
| | Under normal circumstances, the Fund invests at least 80% of its net assets in fixed income investments that meet Amundi US's climate transition criteria (the “Climate Transition Criteria”). Amundi US’s consideration of the Climate Transition Criteria in making investment decisions will result in the exclusion of investments the issuers of which do not meet the Climate Transition Criteria. To the extent other ESG information is considered in making investment decisions, such other ESG information also may result in the exclusion of investments. Excluding specific issuers limits the universe of investments available to the Fund as compared with other funds that do not consider the Climate Transition Criteria or ESG information, which may mean forgoing some investment opportunities available to funds that do not consider these criteria or information or having a portfolio with fewer holdings and/or less issuer diversification. Accordingly, the Fund may underperform other funds that do not utilize an investment strategy that considers the Climate Transition Criteria or ESG information. Amundi US may use third party climate information (such as pertaining to carbon-related issuer characteristics or whether an issuer has a viable sustainability plan) or ESG ratings information that it believes to be reliable, but such information may not be accurate or complete, or may be biased. |
| | Amundi US’s focus on the carbon and climate-related characteristics of issuers may increase the Fund’s exposure to certain investments. The Fund is more susceptible to events or factors adversely affecting such investments, such as a decrease in governmental or other support for climate-related or environmental initiatives or an increase in the cost of implementing climate-related initiatives. The Fund’s relative performance also may be affected, depending on whether such investments are in or out of favor with the market. Under certain market conditions, the Fund may underperform funds that invest in a broader array of investments. |
| | The Fund invests in below-investment-grade (high-yield) debt securities and preferred stocks. Some of these high-yield securities may be convertible into equity securities of the issuer. Debt securities rated below-investment-grade are commonly referred to as “junk bonds” and are considered speculative with respect to the issuer’s capacity to pay interest and repay principal. These securities involve greater risk of loss, are subject to greater price volatility, and may be less liquid and more difficult to value, especially during periods of economic uncertainty or change, than higher rated debt securities. |
30Amundi Climate Transition Core Bond Fund | Annual Report | 7/31/24
| | The Fund’s investments, payment obligations and financing terms may be based on floating rates, such as LIBOR (London Interbank Offered Rate) or SOFR (Secured Overnight Financing Rate). ICE Benchmark Administration, the administrator of LIBOR, has ceased publication of most LIBOR settings on a representative basis. Actions by regulators have resulted in the establishment of alternative reference rates to LIBOR in most major currencies. In the U.S., a common benchmark replacement is based on the SOFR published by the Federal Reserve Bank of New York, including certain spread adjustments and benchmark replacement conforming changes, although other benchmark replacements (without or without spread adjustments) may be used in certain transactions. The impact of the transition from LIBOR on the Fund’s transactions and financial markets generally cannot yet be determined. The transition away from LIBOR may lead to increased volatility and illiquidity in markets for instruments that have relied on LIBOR and may adversely affect the Fund’s performance. |
| | With the increased use of technologies such as the Internet to conduct business, the Fund is susceptible to operational, information security and related risks. While the Fund’s Adviser has established business continuity plans in the event of, and risk management systems to prevent, limit or mitigate, such cyber-attacks, there are inherent limitations in such plans and systems, including the possibility that certain risks have not been identified. Furthermore, the Fund cannot control the cybersecurity plans and systems put in place by service providers to the Fund such as the Fund’s custodian and accounting agent, and the Fund’s transfer agent. In addition, many beneficial owners of Fund shares hold them through accounts at broker-dealers, retirement platforms and other financial market participants over which neither the Fund nor the Adviser exercises control. Each of these may in turn rely on service providers to them, which are also subject to the risk of cyber-attacks. Cybersecurity failures or breaches at the Adviser or the Fund’s service providers or intermediaries have the ability to cause disruptions and impact business operations, potentially resulting in financial losses, interference with the Fund’s ability to calculate its net asset value, impediments to trading, the inability of Fund shareholders to effect share purchases, redemptions or exchanges or receive distributions, loss of or unauthorized access to private shareholder information and violations of applicable privacy and other laws, regulatory fines, penalties, reputational damage, or additional compliance costs. Such costs and losses may not be covered under any insurance. In addition, maintaining vigilance against cyber-attacks may involve substantial costs over time, and system enhancements may themselves be subject to cyber-attacks. |
Amundi Climate Transition Core Bond Fund | Annual Report | 7/31/2431
| | The Fund’s prospectus contains unaudited information regarding the Fund’s principal risks. Please refer to that document when considering the Fund’s principal risks. |
| H. | Restricted Securities |
| | Restricted Securities are subject to legal or contractual restrictions on resale. Restricted securities generally are resold in transactions exempt from registration under the Securities Act of 1933. Private placement securities are generally considered to be restricted except for those securities traded between qualified institutional investors under the provisions of Rule 144A of the Securities Act of 1933. |
| | Disposal of restricted investments may involve negotiations and expenses, and prompt sale at an acceptable price may be difficult to achieve. Restricted investments held by the Fund at July 31, 2024 are listed in the Schedule of Investments. |
| I. | Insurance-Linked Securities (“ILS”) |
| | The Fund invests in ILS. The Fund could lose a portion or all of the principal it has invested in an ILS, and the right to additional interest or dividend payments with respect to the security, upon the occurrence of one or more trigger events, as defined within the terms of an insurance-linked security. Trigger events, generally, are hurricanes, earthquakes, or other natural events of a specific size or magnitude that occur in a designated geographic region during a specified time period, and/or that involve losses or other metrics that exceed a specific amount. There is no way to accurately predict whether a trigger event will occur, and accordingly, ILS carry significant risk. The Fund is entitled to receive principal, and interest and/or dividend payments so long as no trigger event occurs of the description and magnitude specified by the instrument. In addition to the specified trigger events, ILS may expose the Fund to other risks, including but not limited to issuer (credit) default, adverse regulatory or jurisdictional interpretations and adverse tax consequences. |
| | The Fund’s investments in ILS may include event-linked bonds. ILS also may include special purpose vehicles (“SPVs”) or similar instruments structured to comprise a portion of a reinsurer’s catastrophe-oriented business, known as quota share instruments (sometimes referred to as reinsurance sidecars), or to provide reinsurance relating to specific risks to insurance or reinsurance companies through a collateralized instrument, known as collateralized reinsurance. Structured reinsurance investments also may include industry loss warranties (“ILWs”). A traditional ILW takes the form of a bilateral reinsurance contract, but |
32Amundi Climate Transition Core Bond Fund | Annual Report | 7/31/24
| | there are also products that take the form of derivatives, collateralized structures, or exchange-traded instruments. |
| | Where the ILS are based on the performance of underlying reinsurance contracts, the Fund has limited transparency into the individual underlying contracts, and therefore must rely upon the risk assessment and sound underwriting practices of the issuer. Accordingly, it may be more difficult for the Adviser to fully evaluate the underlying risk profile of the Fund’s structured reinsurance investments, and therefore the Fund’s assets are placed at greater risk of loss than if the Adviser had more complete information. Structured reinsurance instruments generally will be considered illiquid securities by the Fund. These securities may be difficult to purchase, sell or unwind. Illiquid securities also may be difficult to value. If the Fund is forced to sell an illiquid asset, the Fund may be forced to sell at a loss. |
| J. | Futures Contracts |
| | The Fund may enter into futures transactions in order to attempt to hedge against changes in interest rates, securities prices and currency exchange rates or to seek to increase total return. Futures contracts are types of derivatives. |
| | All futures contracts entered into by the Fund are traded on a futures exchange. Upon entering into a futures contract, the Fund is required to deposit with a broker an amount of cash or securities equal to the minimum “initial margin” requirements of the associated futures exchange. The amount of cash deposited with the broker as collateral at July 31, 2024 is recorded as “Futures collateral” on the Statement of Assets and Liabilities. |
| | Subsequent payments for futures contracts (“variation margin”) are paid or received by the Fund, depending on the daily fluctuation in the value of the contracts, and are recorded by the Fund as unrealized appreciation or depreciation. Cash received from or paid to the broker related to previous margin movement is held in a segregated account at the broker and is recorded as either “Due from broker for futures” or “Due to broker for futures” on the Statement of Assets and Liabilities. When the contract is closed, the Fund realizes a gain or loss equal to the difference between the opening and closing value of the contract as well as any fluctuation in foreign currency exchange rates where applicable. Futures contracts are subject to market risk, interest rate risk and currency exchange rate risk. Changes in value of the contracts may not directly correlate to the changes in value of the underlying securities. With futures, there is reduced counterparty credit risk to the Fund since |
Amundi Climate Transition Core Bond Fund | Annual Report | 7/31/2433
| | futures are exchange-traded and the exchange’s clearinghouse, as counterparty to all exchange-traded futures, guarantees the futures against default. |
| | The average notional values of long position and short position futures contracts during the year ended July 31, 2024 were $6,255,007 and $418,789, respectively. Open futures contracts outstanding at July 31, 2024 are listed in the Schedule of Investments. |
2. Management Agreement
The Adviser manages the Fund’s portfolio. Management fees payable under the Fund's Investment Management Agreement with the Adviser are calculated daily and paid monthly at the annual rate of 0.35% of the Fund’s average daily net assets up to $1 billion, 0.30% of the next $5 billion of the Fund’s average daily net assets and 0.25% of the Fund’s average daily net assets over $6 billion. For the year ended July 31, 2024, the effective management fee (excluding waivers and/or assumption of expenses) was equivalent to 0.35% of the Fund’s average daily net assets.
The Adviser has contractually agreed to limit ordinary operating expenses (ordinary operating expenses means all fund expenses other than taxes, brokerage commissions, acquired fund fees and expenses and extraordinary expenses, such as litigation) to the extent required to reduce Fund expenses to 0.73%, 1.48%, 0.45% and 0.45%, of the average daily net assets attributable to Class A, Class C, Class K and Class Y shares, respectively. These expense limitations will be in effect through December 1, 2025. There can be no assurance that the Adviser will extend the expense limitation agreement for a class of shares beyond the date referred to above. Fees waived and expenses reimbursed during the year ended July 31, 2024 are reflected on the Statement of Operations.
In addition, under the management and administration agreements, certain other services and costs, including accounting, regulatory reporting and insurance premiums, are paid by the Fund as administrative reimbursements. Reflected on the Statement of Assets and Liabilities is $993 in management fees payable to the Adviser at July 31, 2024.
3. Compensation of Officers and Trustees
The Fund pays an annual fee to its Trustees. The Adviser reimburses the Fund for fees paid to the Interested Trustees. Except for the chief compliance officer, the Fund does not pay any salary or other compensation to its officers. The Fund pays a portion of the chief compliance officer’s compensation for his services as the Fund’s chief compliance officer. Amundi US pays the remaining portion of the chief compliance officer’s compensation. For the year ended July 31, 2024, the Fund paid $8,215 in
34Amundi Climate Transition Core Bond Fund | Annual Report | 7/31/24
Officers’ and Trustees’ compensation, which is reflected on the Statement of Operations as Officers’ and Trustees’ fees. At July 31, 2024, on its Statement of Assets and Liabilities, the Fund had a payable for Trustees’ fees of $680 and a payable for administrative expenses of $270, which includes the payable for Officers’ compensation.
4. Transfer Agent
BNY Mellon Investment Servicing (US) Inc. serves as the transfer agent to the Fund at negotiated rates. Transfer agent fees and payables shown on the Statement of Operations and the Statement of Assets and Liabilities, respectively, include sub-transfer agent expenses incurred through the Fund’s omnibus relationship contracts.
In addition, the Fund reimbursed the transfer agent for out-of-pocket expenses incurred by the transfer agent related to shareholder communications activities such as proxy and statement mailings, and outgoing phone calls. For the year ended July 31, 2024, such out-of-pocket expenses by class of shares were as follows:
| Shareholder Communications: | |
| Class A | $22 |
| Class C | 11 |
| Class K | 11 |
| Class Y | 65 |
| Total | $109 |
5. Distribution Plan
The Fund has adopted a distribution plan (the “Plan”) pursuant to Rule 12b-1 under the 1940 Act with respect to its Class A and Class C shares. Pursuant to the Plan, the Fund pays the Distributor 0.25% of the average daily net assets attributable to Class A shares as compensation for personal services and/or account maintenance services or distribution services with regard to Class A shares. Pursuant to the Plan, the Fund also pays the Distributor 1.00% of the average daily net assets attributable to Class C shares. The fee for Class C shares consists of a 0.25% service fee and a 0.75% distribution fee paid as compensation for personal services and/or account maintenance services or distribution services with regard to Class C shares. Reflected on the Statement of Assets and Liabilities is $177 in distribution fees payable to the Distributor at July 31, 2024.
In addition, redemptions of Class A and Class C shares may be subject to a contingent deferred sales charge (“CDSC”). A CDSC of 1.00% may be imposed on redemptions of certain net asset value purchases of Class A shares within 12 months of purchase. Redemptions of Class C shares within 12 months of purchase are subject to a CDSC of 1.00%, based on the lower
Amundi Climate Transition Core Bond Fund | Annual Report | 7/31/2435
of cost or market value of shares being redeemed. Shares purchased as part of an exchange remain subject to any CDSC that applied to the original purchase of those shares. There is no CDSC for Class K or Class Y shares. Proceeds from the CDSCs are paid to the Distributor. For the year ended July 31, 2024, no CDSCs were paid to the Distributor.
6. Additional Disclosures about Derivative Instruments and Hedging Activities
The Fund’s use of derivatives may enhance or mitigate the Fund’s exposure to the following risks:
Interest rate risk relates to the fluctuations in the value of interest-bearing securities due to changes in the prevailing levels of market interest rates.
Credit risk relates to the ability of the issuer of a financial instrument to make further principal or interest payments on an obligation or commitment that it has to the Fund.
Foreign exchange rate risk relates to fluctuations in the value of an asset or liability due to changes in currency exchange rates.
Equity risk relates to the fluctuations in the value of financial instruments as a result of changes in market prices (other than those arising from interest rate risk or foreign exchange rate risk), whether caused by factors specific to an individual investment, its issuer, or all factors affecting all instruments traded in a market or market segment.
Commodity risk relates to the risk that the value of a commodity or commodity index will fluctuate based on increases or decreases in the commodities market and factors specific to a particular industry or commodity.
The fair value of open derivative instruments (not considered to be hedging instruments for accounting disclosure purposes) by risk exposure at July 31, 2024, was as follows:
Statement of Assets
and Liabilities | Interest
Rate Risk | Credit
Risk | Foreign
Exchange
Rate Risk | Equity
Risk | Commodity
Risk |
| Assets | | | | | |
| Net unrealized appreciation on futures contracts* | $124,119 | $— | $— | $— | $— |
| Total Value | $124,119 | $— | $— | $— | $— |
| | |
| * | Includes cumulative unrealized appreciation (depreciation) of futures contracts as reported in the Schedule of Investments. Only net variation margin is reported within the assets and/or liabilities on the Statement of Assets and Liabilities. |
36Amundi Climate Transition Core Bond Fund | Annual Report | 7/31/24
The effect of derivative instruments (not considered to be hedging instruments for accounting disclosure purposes) on the Statement of Operations by risk exposure at July 31, 2024 was as follows:
| Statement of Operations | Interest
Rate Risk | Credit
Risk | Foreign
Exchange
Rate Risk | Equity
Risk | Commodity
Risk |
| Net Realized Gain (Loss) on | | | | | |
| Futures contracts | $(70,918) | $— | $— | $— | $— |
| Total Value | $(70,918) | $— | $— | $— | $— |
| Change in Net Unrealized Appreciation (Depreciation) on | | | | | |
| Futures contracts | $186,833 | $— | $— | $— | $— |
| Total Value | $186,833 | $— | $— | $— | $— |
7. Definitive Agreement
The Fund’s Adviser is currently an indirect, wholly-owned subsidiary of Amundi. On July 9, 2024, Amundi announced that it had entered into a definitive agreement with Victory Capital Holdings, Inc. (“Victory Capital”) to combine the Adviser with Victory Capital, and for Amundi to become a strategic shareholder of Victory Capital (the “Transaction”). Victory Capital is headquartered in San Antonio, Texas. The closing of the Transaction is subject to certain regulatory approvals and other conditions. There is no assurance that the Transaction will close.
The closing of the Transaction would cause the Fund’s current investment advisory agreement with the Adviser to terminate. Under the terms of the Transaction, the Fund’s Board of Trustees will be asked to approve a reorganization of the Fund into a corresponding, newly established Victory Fund advised by Victory Capital Management Inc., an affiliate of Victory Capital. The proposed reorganization of the Fund would be sought in connection with the closing of the Transaction. If approved by the Board, the proposal to reorganize the Fund will be submitted to the shareholders of the Fund for their approval. There is no assurance that the Board or the shareholders of the Fund will approve the proposal to reorganize the Fund.
Amundi Climate Transition Core Bond Fund | Annual Report | 7/31/2437
Report of Independent Registered Public Accounting Firm
To the Board of Trustees of Pioneer Series Trust IV and the Shareholders of Amundi Climate Transition Core Bond Fund:
Opinion on the Financial Statements and Financial Highlights
We have audited the accompanying statement of assets and liabilities of Amundi Climate Transition Core Bond Fund (the “Fund”) (one of the funds constituting Pioneer Series Trust IV), including the schedule of investments, as of July 31, 2024, the related statements of operations, changes in net assets, and the financial highlights for the year then ended and the related notes. The statements of changes in net assets and financial highlights for the period from December 15, 2022 (commencement of operations) through July 31, 2023 were audited by other auditors. Those auditors expressed an unqualified opinion on those financial statements and financial highlights in their report dated September 29, 2023. In our opinion, the financial statements and financial highlights present fairly, in all material respects, the financial position of the Fund as of July 31, 2024 and the results of its operations, the changes in its net assets, and the financial highlights for the year then ended, in conformity with accounting principles generally accepted in the United States of America.
Basis for Opinion
These financial statements and financial highlights are the responsibility of the Fund's management. Our responsibility is to express an opinion on the Fund's financial statements and financial highlights based on our audits. We are a public accounting firm registered with the Public Company Accounting Oversight Board (United States) (PCAOB) and are required to be independent with respect to the Fund in accordance with the U.S. federal securities laws and the applicable rules and regulations of the Securities and Exchange Commission and the PCAOB.
We conducted our audits in accordance with the standards of the PCAOB. Those standards require that we plan and perform the audit to obtain reasonable assurance about whether the financial statements and financial highlights are free of material misstatement, whether due to error or fraud. The Fund is not required to have, nor were we engaged to perform, an audit of its internal control over financial reporting. As part of our audits we are required to obtain an understanding of internal control over financial reporting but not for the purpose of expressing an opinion on the effectiveness of the Fund’s internal control over financial reporting. Accordingly, we express no such opinion.
38Amundi Climate Transition Core Bond Fund | Annual Report | 7/31/24
Our audits included performing procedures to assess the risks of material misstatement of the financial statements and financial highlights, whether due to error or fraud, and performing procedures that respond to those risks. Such procedures included examining, on a test basis, evidence regarding the amounts and disclosures in the financial statements and financial highlights. Our audits also included evaluating the accounting principles used and significant estimates made by management, as well as evaluating the overall presentation of the financial statements and financial highlights. Our procedures included confirmation of securities owned as of July 31, 2024, by correspondence with the custodian and brokers; when replies were not received from brokers, we performed other auditing procedures. We believe that our audits provide a reasonable basis for our opinion.
DELOITTE & TOUCHE LLP
Boston, Massachusetts
September 27, 2024
We have served as the auditor of one or more of the Pioneer investment companies since 2024.
Amundi Climate Transition Core Bond Fund | Annual Report | 7/31/2439
Additional Information (unaudited)
On March 25, 2024, Ernst & Young LLP (the “Prior Auditor”) resigned as the independent registered public accounting firm of the Fund due to the independence considerations resulting from a change of the independent registered public accounting firm of a related party. The Prior Auditor’s reports on the financial statements of the Fund for the period from December 15, 2022 (commencement of operations) through July 31, 2023, did not contain an adverse opinion or disclaimer of opinion, and were not qualified or modified as to uncertainty, audit scope or accounting principles.
During the period from December 15, 2022 (commencement of operations) through July 31, 2023 and the subsequent interim period through March 25, 2024, there were no (1) disagreements with the Prior Auditor on any matter of accounting principles or practices, financial statement disclosure, or auditing scope or procedure, which disagreements, if not resolved to the Prior Auditor’s satisfaction, would have caused it to make reference to that matter in connection with its reports on the Fund’s financial statements for such periods; or (2) “reportable events” related to the Fund, as that term is defined in Item 304 (a)(1)(v) of Regulation S-K under the Securities Exchange Act of 1934.
On March 25, 2024, the Audit Committee of the Board approved, and on March 25, 2024, the Board approved, Deloitte & Touche LLP as the independent registered accounting firm of the Fund for fiscal periods ending after March 25, 2024.
Qualified interest income is exempt from nonresident alien (NRA) tax withholding. The percentage of the Fund’s ordinary income distributions derived from qualified interest income was 97.85%.
40Amundi Climate Transition Core Bond Fund | Annual Report | 7/31/24
How to Contact Amundi
We are pleased to offer a variety of convenient ways for you to contact us for assistance or information.
Call us for:
Account Information, including existing accounts,
new accounts, prospectuses, applications
and service forms
1-800-225-6292
FactFoneSM for automated fund yields, prices,
account information and transactions
1-800-225-4321
| Retirement plans information | 1-800-622-0176 |
Write to us:
Amundi
P.O. Box 534427
Pittsburgh, PA 15253-4427
| Our toll-free fax | 1-800-225-4240 |
| Our internet e-mail address | us.askamundi@amundi.com
(for general questions about Amundi only) |
Visit our web site: www.amundi.com/us
This report must be preceded or accompanied by a prospectus.
The Fund files a complete schedule of portfolio holdings with the Securities and Exchange Commission for the first and third quarters of each fiscal year as an exhibit to its reports on Form N-PORT. Shareholders may view the filed Form N-PORT by visiting the Commission’s web site at https://www.sec.gov.
Amundi Asset Management US, Inc.
60 State Street
Boston, MA 02109
www.amundi.com/us
Securities offered through Amundi Distributor US, Inc.
60 State Street, Boston, MA 02109
Underwriter of Pioneer Mutual Funds, Member SIPC
© 2024 Amundi Asset Management US, Inc. 33458-01-0924
ITEM 8. CHANGES IN AND DISAGREEMENTS WITH ACCOUNTANTS FOR OPEN-END MANAGEMENT INVESTMENT COMPANIES.
Included in Item 1
ITEM 9. DISCLOSURE OF PROXY VOTING POLICIES AND PROCEDURES FOR OPEN-END MANAGEMENT INVESTMENT COMPANIES. (Unaudited)
Introduction
This Proxy Voting policy and the procedures set forth below are designed to complement Amundi US’ investment policies and procedures regarding its general responsibility to monitor the performance and/or corporate events of companies that are issuers of securities held in accounts managed by Amundi US. This policy sets forth Amundi US’ position on a number of issues for which proxies may be solicited but it does not include all potential voting scenarios or proxy events. Furthermore, because of the special issues associated with proxy solicitations by closed-end Funds, Amundi US will vote shares of closed-end Funds on a case- by-case basis.
Purpose
The purpose of this policy is to ensure that proxies for United States (“US”) and non-US companies that are received in a timely manner will be voted in accordance with the principles stated above. Unless the Proxy Voting Oversight Group (as described below) specifically determines otherwise, all shares in a company held by Amundi US-managed accounts for which Amundi US has proxy-voting authority will be voted alike, unless a client has given specific voting instructions on an issue.
Scope
Amundi US does not delegate the authority to vote proxies relating to securities held by its clients to any of its affiliates. Any questions about this policy should be directed to Amundi US’ Chief of Staff U.S. Investments (the “Proxy Coordinator”).
Oversight and Governance
Administration
The development, implementation, and management, to this Policy is the responsibility of the Policy Contact, in conjunction with the Policy Owner and relevant stakeholders.
Policy Exceptions
Temporary deviation from the requirements of this Policy is deemed an Exception. Exceptions are expected to be infrequent but may be justified to address and/or resolve specific internal business needs. Exceptions are to be raised to the Policy Owner for approval.
Policy Requirements
Roles and Responsibility
The below table outlines the roles and responsibilities applicable to this policy:
| | |
Individual Role | | Responsibility |
| |
| Policy Owner and Contact | | Reviews and updates of this Policy as necessary. |
| |
| Pioneer Funds Board of Trustees and US Compliance Committee | | Provides final approval of material updates to this Policy, as necessary. |
Policy
Each of the Pioneer Funds and certain other clients of Amundi Asset Management US, Inc. (“Amundi US”) have delegated responsibility to vote proxies related to portfolio holdings to Amundi US. Amundi US is a fiduciary that owes each of its clients the duties of care and loyalty with respect to all services undertaken on the client’s behalf, including voting proxies for securities held by the client. When Amundi US has been delegated proxy-voting authority for a client, the duty of care requires Amundi US to monitor corporate events and to vote the proxies. To satisfy its duty of loyalty, Amundi US must place the client’s interests ahead of its own and must cast proxy votes in a manner consistent with the best interest of the client. It is Amundi US’ policy to vote proxies presented to Amundi US in a timely manner in accordance with these principles.
Amundi US’ fundamental concern in voting proxies is the economic effect of the proposal on the value of portfolio holdings, considering both the short- and long-term impact. In many instances, Amundi US believes that supporting the company’s strategy and voting “for” management’s proposals builds portfolio value. In other cases, however, proposals set forth by management may have a negative effect on that value, while some shareholder proposals may hold the best prospects for enhancing it. Amundi US monitors developments in the proxy voting arena and will revise this policy as needed.
Amundi US believes that environmental, social and governance (ESG) factors can affect companies’ long-term prospects for success and the sustainability of their business models. Since ESG factors that may affect corporate performance and economic value are considered by our investment professionals as part of the investment management process, Amundi US also considers these factors when reviewing proxy proposals. This approach is consistent with the stated investment objectives and policies of funds and investment strategies.
It should be noted that the proxy voting guidelines below are guidelines, not rules, and Amundi US reserves the right in all cases to vote contrary to guidelines where doing so is determined to represent the best economic interests of our clients. Further, the Pioneer Funds or other clients of Amundi US may direct Amundi US to vote contrary to guidelines.
Amundi US’ clients may request copies of their proxy voting records and of Amundi US’ proxy voting policies and procedures by either sending a written request to Amundi US’ Proxy Coordinator, or clients may review Amundi US’ proxy voting policies and procedures on-line at amundi.com/usinvestors. Amundi US may describe to clients its proxy voting policies and procedures by delivering a copy of Amundi US’ Form ADV (Part II), by separate notice to the client or by other means.
Procedures
Proxy Voting Service
Amundi US has engaged an independent proxy voting service to assist in the voting of proxies. The proxy voting service works with custodians to ensure that all proxy materials are received by the custodians and are processed in a timely fashion. The proxy voting service votes all proxies in accordance with the proxy voting guidelines established by Amundi US and set forth herein, to the extent applicable. The proxy voting service will refer proxy questions to the Proxy Coordinator (described below) for instructions under circumstances where: (1) the application of the proxy voting guidelines is unclear; (2) a particular proxy question is not covered by the guidelines; or (3) the guidelines call for specific instructions on a case-by-case basis. The proxy voting service is also requested to call to the Proxy Coordinator’s attention specific proxy questions that, while governed by a guideline, appear to involve unusual or controversial issues. Amundi US reserves the right to attend a meeting in person and may do so when it determines that the company or the matters to be voted on at the meeting are strategically important to its clients.
To supplement its own research and analysis in determining how to vote on a particular proxy proposal, Amundi US may utilize research, analysis or recommendations provided by the proxy voting service on a case-by-case basis. Amundi US does not, as a policy, follow the assessments or recommendations provided by the proxy voting service without its own analysis and determination.
Proxy Coordinator
The Proxy Coordinator coordinates the voting, procedures and reporting of proxies on behalf of Amundi US’ clients. The Proxy Coordinator will deal directly with the proxy voting service and, in the case of proxy questions referred by the proxy voting service, will solicit voting recommendations and instructions from the Portfolio Management Group, or, to the extent applicable, investment sub-advisers. The Proxy Coordinator is responsible for ensuring that these questions and referrals are responded to in a timely fashion and for transmitting appropriate voting instructions to the proxy voting service. The Proxy Coordinator is responsible for verifying with the General Counsel or his or her designee whether Amundi US’ voting power is subject to any limitations or guidelines issued by the client (or in the case of an employee benefit plan, the plan’s trustee or other fiduciaries).
Referral Items
The proxy voting service will refer proxy questions to the Proxy Coordinator or his or her designee that are described by Amundi US’ proxy voting guidelines as to be voted on a case- by-case basis, that are not covered by Amundi US’ guidelines or where Amundi US’ guidelines may be unclear with respect to the matter to be voted on. Under such circumstances, the Proxy Coordinator will seek a written voting recommendation from the Chief Investment Officer, U.S or his or her designated equity portfolio-management representative. Any such recommendation will include: (i) the manner in which the proxies should be voted; (ii) the rationale underlying any such decision; and (iii) the disclosure of any contacts or communications made between Amundi US and any outside parties concerning the proxy proposal prior to the time that the voting instructions are provided.
Securities Lending
In accordance with industry standards, proxies are not available to be voted when the shares are out on loan through either Amundi US’ lending program or a client’s managed security lending program. However, Amundi US will reserve the right to recall lent securities so that they may be voted according to Amundi US’ instructions. If a portfolio manager would like to vote a block of previously lent shares, the Proxy Coordinator will work with the portfolio manager and Investment Operations to recall the security, to the extent possible, to facilitate the vote on the entire block of shares. Certain clients participate in securities lending programs. Although such programs allow for the recall of securities for any reason, Amundi US may determine not to vote securities on loan and it may not always be possible for securities on loan to be recalled in time to be voted.
Share-Blocking
“Share-blocking” is a market practice whereby shares are sent to a custodian (which may be different than the account custodian) for record keeping and voting at the general meeting. The shares are unavailable for sale or delivery until the end of the blocking period (typically the day after general meeting date).
Amundi US will vote in those countries with “share-blocking.” In the event a manager would like to sell a security with “share-blocking”, the Proxy Coordinator will work with the Portfolio Manager and Investment Operations Department to recall the shares (as allowable within the market time-frame and practices) and/or communicate with executing brokerage firm. A list of countries with “share-blocking” is available from the Investment Operations Department upon request.
Proxy Voting Oversight Group
The members of the Proxy Voting Oversight Group include Amundi US’ Chief Investment Officer, U.S. or his or her designated equity portfolio management representative, the Chief of Staff, U.S., and the Chief Compliance Officer of the Adviser and Funds. Other members of Amundi US will be invited to attend meetings and otherwise participate as necessary. The Chief of Staff, U.S. will chair the Proxy Voting Oversight Group.
The Proxy Voting Oversight Group is responsible for developing, evaluating, and changing (when necessary) Amundi US’ proxy voting policies and procedures. The Group meets at least annually to evaluate and review this policy and the services of its third-party proxy voting service. In addition, the Proxy Voting Oversight Group will meet as necessary to vote on referral items and address other business as necessary.
Amendments
Amundi US may not amend this policy without the prior approval of the Proxy Voting Oversight Group. Amendments to this policy with respect to votes to be cast on behalf of any of the Pioneer Funds also shall be presented to the Board of Trustees of the Pioneer Funds for its review and advance approval.
Form N-PX
The Proxy Coordinator and the Director of Regulatory Reporting are responsible for ensuring that Form NP-X documents receive the proper review by a member of the Proxy Voting Oversight Group prior to a Fund officer signing the forms.
The Proxy Coordinator will provide the Compliance department with a copy of each Form N-PX filing prepared by the proxy voting service.
Compliance files N-PX. The Compliance department will ensure that a corresponding Form N- PX exists for each Amundi US registered investment company.
Following this review, each Form N-PX is formatted for public dissemination via the EDGAR system.
Prior to submission, each Form N-PX is to be presented to the Fund officer for a final review and signature.
Copies of the Form N-PX filings and their submission receipts are maintained according to Amundi US record keeping policies.
Proxy Voting Guidelines
Administrative
While administrative items appear infrequently in U.S. issuer proxies, they are quite common in non-U.S. proxies.
We will generally support these and similar management proposals:
| | • | | A change of corporate headquarters. |
| | • | | Stock exchange listing. |
| | • | | Establishment of time and place of annual meeting. |
| | • | | Adjournment or postponement of annual meeting. |
| | • | | Acceptance/approval of financial statements. |
| | • | | Approval of dividend payments, dividend reinvestment plans and other dividend-related proposals. |
| | • | | Approval of minutes and other formalities. |
| | • | | Authorization of the transferring of reserves and allocation of income. |
| | • | | Amendments to authorized signatories. |
| | • | | Approval of accounting method changes or change in fiscal year-end. |
| | • | | Acceptance of labor agreements. |
| | • | | Appointment of internal auditors. |
Amundi US will vote on a case-by-case basis on other routine administrative items; however, Amundi US will oppose any routine proposal if insufficient information is presented in advance to allow Amundi US to judge the merit of the proposal. Amundi US has also instructed its proxy voting service to inform Amundi US of its analysis of any administrative items that may be inconsistent, in its view, with Amundi US’ goal of supporting the value of its clients’ portfolio holdings so that Amundi US may consider and vote on those items on a case-by-case basis in its discretion.
Auditors
We normally vote for proposals to:
| | • | | Ratify the auditors. We will consider a vote against if we are concerned about the auditors’ independence or their past work for the company. Specifically, we will oppose the ratification of auditors and withhold votes for audit committee members if non-audit fees paid by the company to the auditing firm exceed the sum of audit fees plus audit-related fees plus permissible tax fees according to the disclosure categories proposed by the Securities and Exchange Commission. |
| | • | | Restore shareholder rights to ratify the auditors. |
We will normally oppose proposals that require companies to:
| | • | | Seek bids from other auditors. |
| | • | | Rotate auditing firms, except where the rotation is statutorily required or where rotation would demonstrably strengthen financial disclosure. |
| | • | | Prohibit auditors from engaging in non-audit services for the company. |
Board of Directors
On issues related to the board of directors, Amundi US normally supports management. We will, however, consider a vote against management in instances where corporate performance has been poor or where the board appears to lack independence. We also believe that a well balanced board with diverse perspectives is conducive to sound corporate governance. In our view, diversity of expertise, skill, gender, ethnicity, and race may contribute to the overall quality of decision making and risk management.
General Board Issues
Amundi US will vote for:
| | • | | Audit, compensation and nominating committees composed of independent directors exclusively. |
| | • | | Indemnification for directors for actions taken in good faith in accordance with the business judgment rule. We will vote against proposals for broader indemnification. |
| | • | | Changes in board size that appear to have a legitimate business purpose and are not primarily for anti-takeover reasons. |
| | • | | Election of an honorary director. |
We will vote against:
| | • | | Minimum stock ownership by directors. |
| | • | | Term limits for directors. Companies benefit from experienced directors, and shareholder control is better achieved through annual votes. |
| | • | | Requirements for union or special interest representation on the board. |
| | • | | Requirements to provide two candidates for each board seat. |
We will vote on a case-by case basis on these issues:
| | • | | Separate chairman and CEO positions. We will consider voting with shareholders on these issues in cases of poor corporate performance. |
Elections of Directors
In uncontested elections of directors we will vote against:
| | • | | Individual directors with absenteeism above 25% without valid reason. We support proposals that require disclosure of director attendance. |
| | • | | Insider directors and affiliated outsiders who sit on the audit, compensation, stock option or nominating committees. For the purposes of our policy, we use the definition of affiliated directors provided by our proxy voting service. |
We will also vote against:
| | • | | Directors who have failed to act on a takeover offer where the majority of shareholders have tendered their shares. |
| | • | | Directors who appear to lack independence or are associated with poor corporate or governance performance. |
We will vote on a case-by case basis on these issues:
| | • | | Re-election of directors who have implemented or renewed a dead hand or modified dead-hand poison pill (a “dead-hand poison pill” is a shareholder rights plan that may be altered only by incumbent or “dead” directors. These plans prevent a potential acquirer from disabling a poison pill by obtaining control of the board through a proxy vote). |
| | • | | Contested election of directors. |
| | • | | Election of a greater number of independent directors (in order to move closer to a majority of independent directors) in cases of poor performance. |
| | • | | Mandatory retirement policies. |
| | • | | Directors who have ignored a shareholder proposal that has been approved by shareholders for two consecutive years. |
We will vote for:
| | • | | Precatory and binding resolutions requesting that the board changes the company’s bylaws to stipulate that directors need to be elected with affirmative majority of votes cast, provided that the resolutions allow for plurality voting in cases of contested elections. |
Takeover-Related Measures
Amundi US is generally opposed to proposals that may discourage takeover attempts. We believe that the potential for a takeover helps ensure that corporate performance remains high.
Amundi US will vote for:
| | • | | Increasing the ability for shareholders to call special meetings. |
| | • | | Increasing the ability for shareholders to act by written consent. |
| | • | | Restrictions on the ability to make greenmail payments. |
| | • | | Submitting rights plans to shareholder vote. |
| | • | | Rescinding shareholder rights plans (“poison pills”). |
| | • | | Opting out of the following state takeover statutes: |
| | • | | Control share acquisition statutes, which deny large holders voting rights on holdings over a specified threshold. |
| | • | | Control share cash-out provisions, which require large holders to acquire shares from other holders. |
| | • | | Freeze-out provisions, which impose a waiting period on large holders before they can attempt to gain control. |
| | • | | Stakeholder laws, which permit directors to consider interests of non-shareholder constituencies. |
| | • | | Disgorgement provisions, which require acquirers to disgorge profits on purchases made before gaining control. |
| | • | | Authorization of shareholder rights plans. |
| | • | | Labor protection provisions. |
| | • | | Mandatory classified boards. |
We will vote on a case-by-case basis on the following issues:
| | • | | Fair price provisions. We will vote against provisions requiring supermajority votes to approve takeovers. We will also consider voting against proposals that require a supermajority vote to repeal or amend the provision. Finally, we will consider the mechanism used to determine the fair price; we are generally opposed to complicated formulas or requirements to pay a premium. |
| | • | | Opting out of state takeover statutes regarding fair price provisions. We will use the criteria used for fair price provisions in general to determine our vote on this issue. |
| | • | | Proposals that allow shareholders to nominate directors. |
We will vote against:
| | • | | Classified boards, except in the case of closed-end funds, where we shall vote on a case-by-case basis. |
| | • | | Limiting shareholder ability to remove or appoint directors. We will support proposals to restore shareholder authority in this area. We will review on case-by-case basis proposals that authorize the board to make interim appointments. |
| | • | | Classes of shares with unequal voting rights. |
| | • | | Supermajority vote requirements. |
| | • | | Severance packages (“golden” and “tin” parachutes). We will support proposals to put these packages to shareholder vote. |
| | • | | Reimbursement of dissident proxy solicitation expenses. While we ordinarily support measures that encourage takeover bids, we believe that management should have full control over corporate funds. |
| | • | | Extension of advance notice requirements for shareholder proposals. |
| | • | | Granting board authority normally retained by shareholders, particularly the right to amend the corporate charter. |
| | • | | Shareholder rights plans (“poison pills”). These plans generally allow shareholders to buy additional shares at a below-market price in the event of a change in control and may deter some bids. |
Capital Structure
Managements need considerable flexibility in determining the company’s financial structure, and Amundi US normally supports managements’ proposals in this area. We will, however, reject proposals that impose high barriers to potential takeovers.
Amundi US will vote for:
| | • | | Reverse splits, if accompanied by a reduction in number of shares. |
| | • | | Shares repurchase programs, if all shareholders may participate on equal terms. |
| | • | | Increases in “ordinary” preferred stock. |
| | • | | Proposals to have blank-check common stock placements (other than shares issued in the normal course of business) submitted for shareholder approval. |
| | • | | Cancellation of company treasury shares. |
We will vote on a case-by-case basis on the following issues:
| | • | | Reverse splits not accompanied by a reduction in number of shares, considering the risk of delisting. |
| | • | | Increase in authorized common stock. We will make a determination considering, among other factors: |
| | • | | Number of shares currently available for issuance; |
| | • | | Size of requested increase (we would normally approve increases of up to 100% of current authorization); |
| | • | | Proposed use of the proceeds from the issuance of additional shares; and |
| | • | | Potential consequences of a failure to increase the number of shares outstanding (e.g., delisting or bankruptcy). |
| | • | | Blank-check preferred. We will normally oppose issuance of a new class of blank-check preferred, but may approve an increase in a class already outstanding if the company has demonstrated that it uses this flexibility appropriately. |
| | • | | Proposals to submit private placements to shareholder vote. |
We will vote against preemptive rights that we believe limit a company’s financing flexibility.
Compensation
Amundi US supports compensation plans that link pay to shareholder returns and believes that management has the best understanding of the level of compensation needed to attract and retain qualified people. At the same time, stock-related compensation plans have a significant economic impact and a direct effect on the balance sheet. Therefore, while we do not want to micromanage a company’s compensation programs, we place limits on the potential dilution these plans may impose.
Amundi US will vote for:
| | • | | Employee stock ownership plans (ESOPs), as long as shares allocated to ESOPs are less than 5% of outstanding shares. Larger blocks of stock in ESOPs can serve as a takeover defense. We will support proposals to submit ESOPs to shareholder vote. |
| | • | | Various issues related to the Omnibus Budget and Reconciliation Act of 1993 (OBRA), including: |
| | • | | Amendments to performance plans to conform with OBRA; |
| | • | | Caps on annual grants or amendments of administrative features; |
| | • | | Adding performance goals; and |
| | • | | Cash or cash-and-stock bonus plans. |
| | • | | Establish a process to link pay, including stock-option grants, to performance, leaving specifics of implementation to the company. |
| | • | | Require that option repricing be submitted to shareholders. |
| | • | | Require the expensing of stock-option awards. |
| | • | | Require reporting of executive retirement benefits (deferred compensation, split dollar life insurance, SERPs, and pension benefits). |
| | • | | Employee stock purchase plans where the purchase price is equal to at least 85% of the market price, where the offering period is no greater than 27 months and where potential dilution (as defined below) is no greater than 10%. |
We will vote on a case-by-case basis on the following issues:
| | • | | Shareholder proposals seeking additional disclosure of executive and director pay information. |
| | • | | Executive and director stock-related compensation plans. We will consider the following factors when reviewing these plans: |
| | • | | The program must be of a reasonable size. We will approve plans where the combined employee and director plans together would generate less than 15% dilution. We will reject plans with 15% or more potential dilution. |
Dilution = (A + B + C) / (A + B + C + D), where
A = Shares reserved for plan/amendment,
B = Shares available under continuing plans,
C = Shares granted but unexercised and
D = Shares outstanding.
| | • | | Explicitly permit unlimited option repricing authority or have allowed option repricing in the past without shareholder approval. |
| | • | | Be a self-replenishing “evergreen” plan or a plan that grants discount options and tax offset payments. |
| | • | | We are generally in favor of proposals that increase participation beyond executives. |
| | • | | We generally support proposals asking companies to adopt rigorous vesting provisions for stock option plans such as those that vest incrementally over, at least, a three- or four-year period with a pro rata portion of the shares becoming exercisable on an annual basis following grant date. |
| | • | | We generally support proposals asking companies to disclose their window period policies for stock transactions. Window period policies ensure that employees do not exercise options based on insider information contemporaneous with quarterly earnings releases and other material corporate announcements. |
| | • | | We generally support proposals asking companies to adopt stock holding periods for their executives. |
| | • | | All other employee stock purchase plans. |
| | • | | All other compensation-related proposals, including deferred compensation plans, employment agreements, loan guarantee programs and retirement plans. |
| | • | | All other proposals regarding stock compensation plans, including extending the life of a plan, changing vesting restrictions, repricing options, lengthening exercise periods or accelerating distribution of awards and pyramiding and cashless exercise programs. |
We will vote against:
| | • | | Pensions for non-employee directors. We believe these retirement plans reduce director objectivity. |
| | • | | Elimination of stock option plans. |
We will vote on a case-by case basis on these issues:
| | • | | Limits on executive and director pay. |
| | • | | Stock in lieu of cash compensation for directors. |
Corporate Governance
Amundi US will vote for:
| | • | | Equal access provisions, which allow shareholders to contribute their opinions to proxy materials. |
| | • | | Proposals requiring directors to disclose their ownership of shares in the company. |
We will vote on a case-by-case basis on the following issues:
| | • | | Change in the state of incorporation. We will support reincorporations supported by valid business reasons. We will oppose those that appear to be solely for the purpose of strengthening takeover defenses. |
| | • | | Bundled proposals. We will evaluate the overall impact of the proposal. |
| | • | | Adopting or amending the charter, bylaws or articles of association. |
| | • | | Shareholder appraisal rights, which allow shareholders to demand judicial review of an acquisition price. |
We will vote against:
| | • | | Shareholder advisory committees. While management should solicit shareholder input, we prefer to leave the method of doing so to management’s discretion. |
| | • | | Limitations on stock ownership or voting rights. |
| | • | | Reduction in share ownership disclosure guidelines. |
Mergers and Restructurings
Amundi US will vote on the following and similar issues on a case-by-case basis:
| | • | | Mergers and acquisitions. |
| | • | | Corporate restructurings, including spin-offs, liquidations, asset sales, joint ventures, conversions to holding company and conversions to self-managed REIT structure. |
| | • | | Conversion of securities. |
| | • | | Issuance of shares to facilitate a merger. |
| | • | | Private placements, warrants, convertible debentures. |
| | • | | Proposals requiring management to inform shareholders of merger opportunities. |
We will normally vote against shareholder proposals requiring that the company be put up for sale.
Investment Companies
Many of our portfolios may invest in shares of closed-end funds or open-end funds (including exchange-traded funds). The non-corporate structure of these investments raises several unique proxy voting issues.
Amundi US will vote for:
| | • | | Establishment of new classes or series of shares. |
| | • | | Establishment of a master-feeder structure. |
Amundi US will vote on a case-by-case basis on:
| | • | | Changes in investment policy. We will normally support changes that do not affect the investment objective or overall risk level of the fund. We will examine more fundamental changes on a case-by-case basis. |
| | • | | Approval of new or amended advisory contracts. |
| | • | | Changes from closed-end to open-end format. |
| | • | | Election of a greater number of independent directors. |
| | • | | Authorization for, or increase in, preferred shares. |
| | • | | Disposition of assets, termination, liquidation, or mergers. |
| | • | | Classified boards of closed-end funds, but will typically support such proposals. |
In general, business development companies (BDCs) are not considered investment companies for these purposes but are treated as corporate issuers.
Environmental and Social Issues
Amundi US believes that environmental and social issues may influence corporate performance and economic return. Indeed, by analyzing all of a company’s risks and opportunities, Amundi US can better assess its intrinsic value and long-term economic prospects.
When evaluating proxy proposals relating to environmental or social issues, decisions are made on a case-by-case basis. We consider each of these proposals based on the impact to the company’s shareholders and economic return, the specific circumstances at each individual company, any potentially adverse economic concerns, and the current policies and practices of the company.
For example, shareholder proposals relating to environmental and social issues, and on which we will vote on a base-by-case basis, may include those seeking that a company:
| | • | | Conduct studies regarding certain environmental or social issues; |
| | • | | Study the feasibility of the company taking certain actions with regard to such issues; or |
| | • | | Take specific action, including adopting or ceasing certain behavior and adopting company standards and principles, in relation to such issues. |
In general, Amundi US believes these issues are important and should receive management attention.
Amundi US will support proposals where we believe the proposal, if implemented, would improve the prospects for the long-term success of the business and would provide value to the company and its shareholders. Amundi US may abstain on shareholder proposals with regard to environmental and social issues in cases where we believe the proposal, if implemented, would not be in the economic interests of the company, or where implementing the proposal would constrain management flexibility or would be unduly difficult, burdensome or costly.
When evaluating proxy proposals relating to environmental or social issues, Amundi US may consider the following factors or other factors deemed relevant, given such weight as deemed appropriate:
| | • | | approval of the proposal helps improve the company’s practices; |
| | • | | approval of the proposal can improve shareholder value; |
| | • | | the company’s current stance on the topic is likely to have negative effects on its business position or reputation in the short, medium, or long term; |
| | • | | the company has already put appropriate action in place to respond to the issue contained in the proposal; |
| | • | | the company’s reasoning against approving the proposal responds appropriately to the various points mentioned by the shareholder when the proposal was presented; |
| | • | | the solutions recommended in the proposal are relevant and appropriate, and if the topic of the proposal would not be better addressed through another means. |
In the event of failures in risk management relating to environmental and social issues, Amundi US may vote against the election of directors responsible for overseeing those areas. Issues of special concern to Amundi US include corporate commitments to mitigating climate effects; achieving a diverse board of directors and employee base; And maintaining sound and safe working conditions, equitable compensation practices, and opportunities for career advancement. Amundi US will vote against proposals calling for substantial changes in the company’s business or activities. We will also normally vote against proposals with regard to contributions, believing that management should control the routine disbursement of funds. In each case, fundamental consideration governing votes cast on behalf of any of the Pioneer Funds in these areas is Amundi US’ assessment of the potential impact on shareholder value.
Conflicts of Interest
Amundi US recognizes that in certain circumstances a conflict of interest may arise when Amundi US votes a proxy.
A conflict of interest occurs when Amundi US’ interests interfere, or appear to interfere, with the interests of Amundi US’ clients.
A conflict may be actual or perceived and may exist, for example, when the matter to be voted on concerns:
| | • | | An affiliate of Amundi US, such as another company belonging to the Credit Agricole banking group ( “Credit Agricole Affiliate”); |
| | • | | An issuer of a security for which Amundi US acts as a sponsor, advisor, manager, custodian, distributor, underwriter, broker, or other similar capacity (including those securities specifically declared by its parent Amundi to present a conflict of interest for Amundi US); |
| | • | | An issuer of a security for which Amundi has informed Amundi US that a Credit Agricole Affiliate acts as a sponsor, advisor, manager, custodian, distributor, underwriter, broker, or other similar capacity; or |
| | • | | A person with whom Amundi US (or any of its affiliates) has an existing, material contract or business relationship. |
Any member of the Proxy Voting Oversight Group and any other associate involved in the proxy voting process with knowledge of any apparent or actual conflict of interest must disclose such conflict to the Proxy Coordinator and the Chief Compliance Officer of Amundi US and the Funds. If any associate is lobbied or pressured with respect to any voting decision, whether within or outside of Amundi US, he or she should contact a member of the Proxy Voting Oversight Group or Amundi US’ Chief Compliance Officer.
The Proxy Voting Oversight Group will review each item referred to Amundi US by the proxy voting service to determine whether an actual or potential conflict of interest exists in connection with the proposal(s) to be voted upon. The review will be conducted by comparing the apparent parties affected by the proxy proposal being voted upon against the Controller’s and Compliance Department’s internal list of interested persons and, for any matches found, evaluating the anticipated magnitude and possible probability of any conflict of interest being present. The Proxy Voting Oversight Group may cause any of the following actions to be taken when a conflict of interest is present:
| | • | | Vote the proxy in accordance with the vote indicated under “Voting Guidelines,” if a vote is indicated, or |
| | • | | Direct the independent proxy voting service to vote the proxy in accordance with its independent assessment or that of another independent adviser appointed by Amundi US or the applicable client for this purpose. |
If the Proxy Voting Oversight Group perceives a material conflict of interest, the Group may also choose to disclose the conflict to the affected clients and solicit their consent to proceed with the vote or their direction (including through a client’s fiduciary or other adviser), or may take such other action in good faith (in consultation with counsel) that would protect the interests of clients.
For each referral item, the determination regarding the presence or absence of any actual or potential conflict of interest will be documented in a Conflicts of Interest Report prepared by the Proxy Coordinator.
The Proxy Voting Oversight Group will review periodically the independence of the proxy voting service. This may include a review of the service’s conflict management procedures and other documentation and an evaluation as to whether the service continues to have the competency and capacity to vote proxies.
Decisions Not to Vote Proxies
Although it is Amundi US’ general policy to vote all proxies in accordance with the principles set forth in this policy, there may be situations in which the Proxy Voting Oversight Group does not vote a proxy referred to it. For example, because of the potential conflict of interest inherent in voting shares of a Credit Agricole Affiliate, Amundi US will abstain from voting the shares unless otherwise directed by a client. In such a case, the Proxy Coordinator will inform Amundi Compliance before exercising voting rights.
There exist other situations in which the Proxy Voting Oversight Group may refrain from voting a proxy. For example, if the cost of voting a foreign security outweighs the benefit of voting, the Group may not vote the proxy. The Group may not be given enough time to process a vote, perhaps because its receives a meeting notice too late or it cannot obtain a translation of the agenda in the time available. If Amundi US has outstanding “sell” orders, the proxies for shares subject to the order may not be voted to facilitate the sale. Although Amundi US may hold shares on a company’s record date, if the shares are sold prior to the meeting date the Group may decide not to vote those shares.
Recordkeeping
The Proxy Coordinator shall ensure that Amundi US’ proxy voting service:
| | • | | Retains a copy of each proxy statement received (unless the proxy statement is available from the SEC’s Electronic Data Gathering, Analysis, and Retrieval (EDGAR) system); |
| | • | | Retains a record of the vote cast; |
| | • | | Prepares Form N-PX for filing on behalf of each client that is a registered investment company; and |
| | • | | Is able to promptly provide Amundi US with a copy of the voting record upon its request. |
The Proxy Coordinator shall ensure that for those votes that may require additional documentation (i.e. conflicts of interest, exception votes and case-by-case votes) the following records are maintained:
| | • | | A record memorializing the basis for each referral vote cast; |
| | • | | A copy of any document created by Amundi US that was material in making the decision on how to vote the subject proxy; |
| | • | | A copy of any recommendation or analysis furnished by the proxy voting service; and |
| | • | | A copy of any conflict notice, conflict consent or any other written communication (including emails or other electronic communications) to or from the client (or in the case of an employee benefit plan, the plan’s trustee or other fiduciaries) regarding the subject proxy vote cast by, or the vote recommendation of, Amundi US. |
Amundi US shall maintain the above records in the client’s file in accordance with applicable regulations.
Copies of this policy, and copies of records related to this policy shall be kept in accordance with Amundi US’ Books and Records Policy. This policy and procedure shall be periodically reviewed and updated consistent with the requirements and standards established by Amundi US.
Escalation and Management Reporting
Escalation
It is each associate’s responsibility to contact his or her business unit head, the Proxy Coordinator, a member of the Proxy Voting Oversight Group or Amundi US’ Chief Compliance Officer if he or she becomes aware of any possible noncompliance with this policy.
Management Reporting
Reporting is done to senior leadership on an as needed basis.
Training
Amundi US will conduct periodic training regarding proxy voting and this policy. It is the responsibility of the business line policy owner and the applicable Compliance Department to coordinate and conduct such training.
Review and Approval
Review
This Policy must be reviewed and validated annually (12-months) by the Policy Contact or designee, in conjunction with the Policy Owner and relevant stakeholders.
Approval
Material Updates to this Policy must be approved by the Pioneer Funds’ Board of Trustees and/or US Compliance Committee, as necessary.
Related regulations
| | • | | Rule 30b1-4, Rule 31a1-3, and Rule 38a-1 under the Investment Company Act of 1940 |
| | • | | Rule 206(4)-6 and Rule 204-2 under the Investment Advisers Act of 1940 |
Item 10. REMUNERATION PAID TO DIRECTORS, OFFICERS, AND OTHERS OF OPEN-END MANAGEMENT INVESTMENT COMPANIES. (Unaudited)
Each Board Member also serves as a Board Member of other Funds in the Pioneer Family of Funds complex. Annual retainer fees and attendance fees are allocated to each Fund based on net assets. Trustees’ fees paid by the Fund are within Item 7. Statement of Operations as Trustees’ fees and expenses.
Item 11. STATEMENT REGARDING BASIS FOR APPROVAL OF INVESMENT ADVISORY CONTRACT. (Unaudited)
N/A
ITEM 12. DISCLOSURE OF PROXY VOTING POLICIES AND PROCEDURES FOR CLOSED-END MANAGEMENT INVESTMENT COMPANIES. (Unaudited)
A closed-end management investment company that is filing an annual report on this Form N-CSR must, unless it invests exclusively in non-voting securities, describe the policies and procedures that it uses to determine how to vote proxies relating to portfolio securities, including the procedures that the company uses when a vote presents a conflict between the interests of its shareholders, on the one hand, and those of the company’s investment adviser; principal underwriter; or any affiliated person (as defined in Section 2(a)(3) of the Investment Company Act of 1940 (15 U.S.C. 80a-2(a)(3)) and the rules thereunder) of the company, its investment adviser, or its principal underwriter, on the other. Include any policies and procedures of the company’s investment adviser, or any other third party, that the company uses, or that are used on the company’s behalf, to determine how to vote proxies relating to portfolio securities.
Not applicable to open-end management investment companies.
ITEM 13. PORTFOLIO MANAGERS OF CLOSED-END MANAGEMENT INVESTMENT COMPANIES.
(a) If the registrant is a closed-end management investment company that is filing an annual report on this Form N-CSR, provide the following information:
(1) State the name, title, and length of service of the person or persons employed by or associated with the registrant or an investment adviser of the registrant who are primarily responsible for the day-to-day management of the registrant’s portfolio (“Portfolio Manager”). Also state each Portfolio Manager’s business experience during the past 5 years.
Not applicable to open-end management investment companies.
ITEM 14. PURCHASES OF EQUITY SECURITIES BY CLOSED-END MANAGEMENT INVESTMENT COMPANY AND AFFILIATED PURCHASERS.
(a) If the registrant is a closed-end management investment company, in the following tabular format, provide the information specified in paragraph (b) of this Item with respect to any purchase made by or on behalf of the registrant or any affiliated purchaser, as defined in Rule 10b-18(a)(3) under the Exchange Act (17 CFR 240.10b-18(a)(3)), of shares or other units of any class of the registrant’s equity securities that is registered by the registrant pursuant to Section 12 of the Exchange Act (15 U.S.C. 781).
Not applicable to open-end management investment companies.
ITEM 15. SUBMISSION OF MATTERS TO A VOTE OF SECURITY HOLDERS.
Describe any material changes to the procedures by which shareholders may recommend nominees to the registrant’s board of directors, where those changes were implemented after the registrant last provided disclosure in response to the requirements of Item 407(c)(2)(iv) of Regulation S-R(17 CFR 229.407)(as required by Item 22(b)(15)) of Schedule 14A (17 CFR 240.14a-101), or this Item.
There have been no material changes to the procedures by which the shareholders may recommend nominees to the registrant’s board of directors since the registrant last provided disclosure in response to the requirements of Item 407(c)(2)(iv) of Regulation S-R of Schedule 14(A) in its definitive proxy statement, or this item.
ITEM 16. CONTROLS AND PROCEDURES.
(a) Disclose the conclusions of the registrant’s principal executive and principal financials officers, or persons performing similar functions, regarding the effectiveness of the registrant’s disclosure controls and procedures (as defined in Rule 30a-3(c) under the Act (17 CFR 270.30a-3(c))) as of a date within 90 days of the filing date of the report that includes the disclosure required by this paragraph, based on the evaluation of these controls and procedures required by Rule 30a-3(b) under the Act (17 CFR 270.30(a)-3(b) and Rules 13a-15(b) or 15d-15(b) under the Exchange Act (17 CFR 240.13a-15(b) or 240.15d-15(b)).
The registrant’s principal executive officer and principal financial officer have concluded that the registrant’s disclosure controls and procedures are effective based on the evaluation of these controls and procedures as of a date within 90 days of the filing date of this report.
(b) Disclose any change in the registrant’s internal control over financial reporting (as defined in Rule 30a-3(d) under the Act (17CFR 270.30a-3(d)) that occurred during the period covered by this report that has materially affected, or is reasonably likely to materially affect, the registrant’s internal control over financial reporting.
There were no significant changes in the registrant’s internal control over financial reporting that occurred during the period covered by this report that have materially affected, or are reasonably likely to materially affect, the registrant’s internal control over financial reporting.
Item 17. DISCLOSURE OF SECURITIES LENDING ACTIVITIES FOR CLOSED-END MANAGEMENT INVESTMENT COMPANIES.
(a) If the registrant is a closed-end management investment company, provide the following dollar amounts of income and compensation related to the securities lending activities of the registrant during its most recent fiscal year:
N/A
(1) Gross income from securities lending activities;
N/A
(2) All fees and/or compensation for each of the following securities lending activities and related services: any share of revenue generated by the securities lending program paid to the securities lending agent(s) (revenue split); fees paid for cash collateral management services (including fees deducted from a pooled cash collateral reinvestment vehicle) that are not included in the revenue split; administrative fees that are not included in the revenue split; fees for indemnification that are not included in the revenue split; rebates paid to borrowers; and any other fees relating to the securities lending program that are not included in the revenue split, including a description of those other fees;
N/A
(3) The aggregate fees/compensation disclosed pursuant to paragraph (2); and
N/A
(4) Net income from securities lending activities (i.e., the dollar amount in paragraph (1) minus the dollar amount in paragraph (3)).
If a fee for a service is included in the revenue split, state that the fee is included in the revenue split.
N/A
(b) If the registrant is a closed-end management investment company, describe the services provided to the registrant by the securities lending agent in the registrants most recent fiscal year.
N/A
Item 18. RECOVERY OF ERRONEOUSLY AWARDED COMPENSATION.
N/A
ITEM 19. EXHIBITS.
(a) File the exhibits listed below as part of this Form. Letter or number the exhibits in the sequence indicated.
(1) Any code of ethics, or amendment thereto, that is the subject of the disclosure required by Item 2, to the extent that the registrant intends to satisfy the Item 2 requirements through filing of an exhibit.
(2) A separate certification for each principal executive officer and principal financial officer of the registrant as required by Rule 30a-2(a) under the Act (17 CFR 270.30a-2(a)) , exactly as set forth below:
Filed herewith.
(b) Certifications pursuant to Rule 30a-2(b) under the 1940 Act and Section 906 of the Sarbanes-Oxley Act of 2002 are attached hereto.
(3) Not applicable.
(4) Registrant’s Independent Public Accountant, attached as Exhibit 99.ACCT.
SIGNATURES
[See General Instruction F]
Pursuant to the requirements of the Securities Exchange Act of 1934 and the Investment Company Act of 1940, the registrant has duly caused this report to be signed on its behalf by the undersigned, thereunto duly authorized.
|
| (Registrant) Pioneer Series Trust IV |
|
| By (Signature and Title)* /s/ Lisa M. Jones |
| Lisa M. Jones, Principal Executive Officer |
|
| Date October 8, 2024 |
Pursuant to the requirements of the Securities Exchange Act of 1934 and the Investment Company Act of 1940, this report has been signed below by the following persons on behalf of the registrant and in the capacities and on the dates indicated.
|
| By (Signature and Title)* /s/ Lisa M. Jones |
| Lisa M. Jones, Principal Executive Officer |
|
| Date October 8, 2024 |
|
| By (Signature and Title)* /s/ Anthony J. Koenig, Jr. |
| Anthony J. Koenig, Jr., Principal Financial Officer |
|
| Date October 8, 2024 |
| * | Print the name and title of each signing officer under his or her signature. |