| |
| UNITED STATES |
| SECURITIES AND EXCHANGE COMMISSION |
| Washington, D.C. 20549 |
| |
| FORM N-CSR |
| |
| CERTIFIED SHAREHOLDER REPORT OF REGISTERED MANAGEMENT INVESTMENT |
| COMPANIES |
| Investment Company Act file number 811-21779 |
| |
| JOHN HANCOCK FUNDS II |
| --------------------------------------------------------- |
| (Exact name of registrant as specified in charter) |
| |
| 601 CONGRESS STREET, BOSTON, MA 02210-2805 |
| ------------------------------------------------------------- |
| (Address of principal executive offices) (Zip code) |
| |
| MICHAEL J. LEARY, 601 CONGRESS STREET, BOSTON, MA 02210-2805 |
| ------------------------------------------------------------------------------------------ |
| (Name and address of agent for service) |
| |
| Registrant's telephone number, including area code: (617) 663-4490 |
| -------------- |
| Date of fiscal year end: 8/31 | |
| ------ | |
| |
| Date of reporting period: 2/28/11 | |
| ------- |
ITEM 1. REPORTS TO STOCKHOLDERS.
The Registrant prepared six semiannual reports to shareholders for the period ended February 28, 2011. The first report applies to the Floating Rate Income Fund, the second report applies to the Natural Resources Fund, the third report applies to the Strategic Income Opportunities Fund, the fourth report applies to the Alternative Asset Allocation Fund, the fifth report applies to the 8 Lifecycle Portfolios and the sixth report applies to 68 of the Registrant’s Funds.

A look at performance
For the period ended February 28, 2011
| | | | | | | | | | | | | | |
| | | | | | | | | | | | | SEC 30-day | | SEC 30-day |
| | Average annual total returns (%) | | Cumulative total returns (%) | | yield (%) | | yield (%) |
| | with maximum sales charge (POP) | | with maximum sales charge (POP) | | subsidized | | unsubsidized1 |
|
| | | | | Since | | | | | | Since | | as of | | as of |
| | 1-year | 5-year | 10-year | inception2 | | 6-months | 1-year | 5-year | 10-year | inception2 | | 2-28-11 | | 2-28-11 |
|
| Class A | 7.22 | — | — | 4.83 | | 4.84 | 7.22 | — | — | 16.09 | | 3.19 | | 3.16 |
|
| Class B | 4.83 | — | — | 4.24 | | 2.79 | 4.83 | — | — | 14.02 | | 2.52 | | 2.42 |
|
| Class C | 8.84 | — | — | 5.16 | | 6.78 | 8.84 | — | — | 17.23 | | 2.53 | | 2.52 |
|
| Class I3 | 11.10 | — | — | 6.28 | | 8.41 | 11.10 | — | — | 21.24 | | 3.74 | | 3.74 |
|
| Class 13 | 11.13 | — | — | 6.31 | | 8.43 | 11.13 | — | — | 21.33 | | 3.73 | | 3.72 |
|
| Class NAV 3 | 11.18 | — | — | 6.37 | | 8.45 | 11.18 | — | — | 21.56 | | 3.78 | | 3.78 |
|
Performance figures assume all distributions are reinvested. Public offering price (POP) figures reflect maximum sales charges on Class A shares of 3%, and the applicable contingent deferred sales charge (CDSC) on Class B shares and Class C shares. The Class B shares’ CDSC declines annually between years 1 to 6 according to the following schedule: 5, 4, 3, 3, 2, 1%. No sales charge will be assessed after the sixth year. Class C shares held for less than one year are subject to a 1% CDSC. Sales charges are not applicable for Class I, Class 1 and Class NAV shares.
The expense ratios of the Fund, both net (including any fee waivers or expense limitations) and gross (excluding any fee waivers or expense limitations), are set forth according to the most recent publicly available prospectuses for the Fund and may differ from the expense ratios disclosed in the Financial Highlights tables in this report. The waivers and expense limitations are contractual at least until 12-31-11. The net expenses are as follows: Class A — 1.20%, Class B — 1.95% and Class C — 1.95%. Had the fee waivers and expense limitations not been in place, the gross expenses would be as follows: Class A — 1.29%, Class B — 2.10% and Class C — 1.99%. For the other classes, the net expenses equal the gross expenses and are as follows: Class I — 0.81%, Class 1 — 0.78%, Class NAV — 0.73%.
The returns reflect past results and should not be considered indicative of future performance. The return and principal value of an investment will fluctuate so that shares, when redeemed, may be worth more or less than their original cost. Due to market volatility, the Fund’s current performance may be higher or lower than the performance shown. For current to the most recent month end performance data, please call 1–800–225–5291 or visit the Fund’s Web site at www.jhfunds.com.
The performance table above and the chart on the next page do not reflect the deduction of taxes that a shareholder would pay on fund distributions or the redemption of fund shares.
The Fund’s performance results reflect any applicable expense reductions, without which the expenses increase and results would have been less favorable.
1 Unsubsidized yields reflect what the yields would have been without the effect of reimbursements and waivers.
2 From 1-2-08.
3 For certain types of investors, as described in the Fund’s Class I, Class 1 and Class NAV shares prospectuses.
| |
| 6 | Floating Rate Income Fund | Semiannual report |
| | | | |
| | Period | Without | With maximum | |
| | beginning | sales charge | sales charge | Index |
|
| Class B | 1-2-08 | $11,692 | $11,402 | $12,193 |
|
| Class C2 | 1-2-08 | 11,723 | 11,723 | 12,193 |
|
| Class I3 | 1-2-08 | 12,124 | 12,124 | 12,193 |
|
| Class 13 | 1-2-08 | 12,133 | 12,133 | 12,193 |
|
| Class NAV3 | 1-2-08 | 12,156 | 12,156 | 12,193 |
|
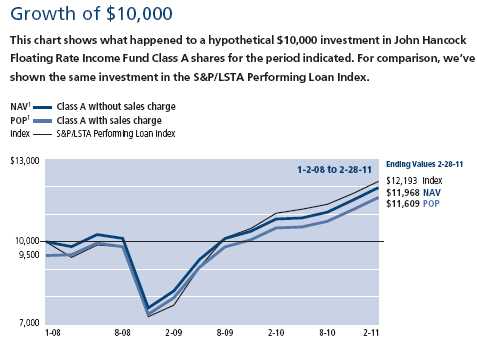
Assuming all distributions were reinvested for the period indicated, the table above shows the value of a $10,000 investment in the fund’s Class B, Class C, Class I, Class 1 and Class NAV shares, respectively, as of 2-28-11. Performance of the classes will vary based on the difference in sales charges paid by shareholders investing in the different classes and the fee structure of those classes.
S&P/LSTA Performing Loan Index is a subset of the S&P/LSTA Leveraged Loan Index tracking returns in the leveraged loan market and capturing a broad cross-section of the U.S. leveraged loan market, including dollar-denominated, U.S.-syndicated loans to overseas issuers and excluding those in default.
It is not possible to invest directly in an index. Index figures do not reflect sales charges, which would have resulted in lower values if they did.
1 NAV represents net asset value and POP represents public offering price.
2 The contingent deferred sales charge, if any, is not applicable.
3 For certain types of investors, as described in the Fund’s Class I, Class 1 and Class NAV shares prospectuses.
| | |
| | Semiannual report | Floating Rate Income Fund | 7 |
Your expenses
These examples are intended to help you understand your ongoing operating expenses.
Understanding fund expenses
As a shareholder of the Fund, you incur two types of costs:
■ Transaction costs which include sales charges (loads) on purchases or redemptions (varies by share class), minimum account fee charge, etc.
■ Ongoing operating expenses including management fees, distribution and service fees (if applicable), and other fund expenses.
We are going to present only your ongoing operating expenses here.
Actual expenses/actual returns
This example is intended to provide information about the Fund’s actual ongoing operating expenses, and is based on the Fund’s actual return. It assumes an account value of $1,000.00 on September 1, 2010 with the same investment held until February 28, 2011.
| | | |
| | Account value | Ending value | Expenses paid during |
| | on 9-1-10 | on 2-28-11 | period ended 2-28-111 |
|
| Class A | $1,000.00 | $1,080.80 | $6.19 |
|
| Class B | 1,000.00 | 1,077.90 | 10.05 |
|
| Class C | 1,000.00 | 1,077.80 | 9.94 |
|
| Class I | 1,000.00 | 1,084.10 | 4.08 |
|
| Class 1 | 1,000.00 | 1,084.30 | 3.98 |
|
| Class NAV | 1,000.00 | 1,084.50 | 3.72 |
|
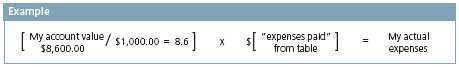
Together with the value of your account, you may use this information to estimate the operating expenses that you paid over the period. Simply divide your account value at February 28, 2011, by $1,000.00, then multiply it by the “expenses paid” for your share class from the table above. For example, for an account value of $8,600.00, the operating expenses should be calculated as follows:
| |
| 8 | Floating Rate Income Fund | Semiannual report |
Hypothetical example for comparison purposes
This table allows you to compare the Fund’s ongoing operating expenses with those of any other fund. It provides an example of the Fund’s hypothetical account values and hypothetical expenses based on each class’s actual expense ratio and an assumed 5% annualized return before expenses (which is not the Fund’s actual return). It assumes an account value of $1,000.00 on September 1, 2010, with the same investment held until February 28, 2011. Look in any other fund shareholder report to find its hypothetical example and you will be able to compare these expenses.
| | | |
| | Account value | Ending value | Expenses paid during |
| | on 9-1-10 | on 2-28-11 | period ended 2-28-111 |
|
| Class A | $1,000.00 | $1,018.80 | $6.01 |
|
| Class B | 1,000.00 | 1,015.10 | 9.74 |
|
| Class C | 1,000.00 | 1,015.20 | 9.64 |
|
| Class I | 1,000.00 | 1,020.90 | 3.96 |
|
| Class 1 | 1,000.00 | 1,021.00 | 3.86 |
|
| Class NAV | 1,000.00 | 1,021.20 | 3.61 |
|
Remember, these examples do not include any transaction costs, therefore, these examples will not help you to determine the relative total costs of owning different funds. If transaction costs were included, your expenses would have been higher. See the prospectus for details regarding transaction costs.
1 Expenses are equal to the Fund’s annualized expense ratio of 1.20%, 1.95%, 1.93%, 0.79%, 0.77% and 0.72% for Class A, Class B, Class C, Class I, Class 1 and Class NAV shares, respectively, multiplied by the average account value over the period, multiplied by 181/365 (to reflect the one-half year period).
| | |
| | Semiannual report | Floating Rate Income Fund | 9 |
Portfolio summary
| | | | |
| Top 10 Issuers1 | | | | |
|
| Visant Corp. | 2.7% | | Freescale Semiconductor, Inc. | 1.9% |
| |
|
| Texas Competitive Electric Holdings | | | First Data Corp. | 1.9% |
| Company LLC | 2.6% | |
|
| | Charter Communications | |
| Harrah’s Operating Company, Inc. | 2.5% | | Operating LLC | 1.6% |
| |
|
| Community Health Systems, Inc. | 2.2% | | Cengage Learning, Inc. | 1.6% |
| |
|
| Univision Communications, Inc. | 2.0% | | Intelsat Jackson Holdings SA | 1.6% |
| |
|
| |
| Sector Composition2,3 | | | | |
|
| Consumer Discretionary | 33% | | Financials | 6% |
| |
|
| Health Care | 14% | | Consumer Staples | 5% |
| |
|
| Industrials | 9% | | Telecommunication Services | 5% |
| |
|
| Information Technology | 7% | | Energy | 2% |
| |
|
| Materials | 6% | | Short-Term Investments & Other | 7% |
| |
|
| Utilities | 6% | | | |
| | |
| |
| Quality Composition2,4 | | | | |
|
| A | 1% | | CCC & Below | 7% |
| |
|
| BBB | 3% | | Equity | 2% |
| |
|
| BB | 27% | | Not Rated | 3% |
| |
|
| B | 50% | | Short-Term Investments & Other | 7% |
| |
|
1 As a percentage of net assets on 2-28-11. Cash and cash equivalents are not included in Top 10 Issuers.
2 As a percentage of net assets on 2-28-11.
3 Sector investing is subject to greater risks than the market as a whole. Because the Fund may focus on particular sectors of the economy, its performance may depend on the performance of those sectors.
4 Ratings are from Moody’s Investor Services, Inc. If not available, we have used S&P ratings. In the absence of ratings from these agencies, we have used Fitch, Inc. ratings. “Not Rated” securities are those with no ratings available. They may have internal ratings similar to those shown. All are as of 2-28-11 and do not reflect subsequent downgrades, if any.
| |
| 10 | Floating Rate Income Fund | Semiannual report |
Fund’s investments
As of 2-28-11 (unaudited)
| | | | | |
| | | | Maturity | | |
| | Rate (%) | | date | Par value | Value |
| Term Loans (M) 81.10% | | | | $1,635,913,820 |
|
| (Cost $1,591,269,266) | | | | | |
| | | | | | |
| Consumer Discretionary 31.54% | | | | | 636,312,477 |
| | | | | | |
| Auto Components 1.49% | | | | | |
|
| Allison Transmission, Inc. | 3.020 | | 08-07-14 | $25,125,728 | 25,031,506 |
|
| UCI International, Inc. | 5.500 | | 07-26-17 | 5,000,000 | 5,017,190 |
| | | | | | |
| Automobiles 0.25% | | | | | |
|
| Ford Motor Company | 3.020 | | 12-16-13 | 5,105,461 | 5,103,307 |
| | | | | | |
| Diversified Consumer Services 1.58% | | | | | |
|
| Cengage Learning, Inc. | 2.550 | | 07-03-14 | 33,041,906 | 31,794,574 |
| | | | | | |
| Hotels, Restaurants & Leisure 10.19% | | | | | |
|
| Burger King Corp. | 4.500 | | 10-19-16 | 9,500,000 | 9,543,539 |
|
| CCM Merger, Inc. | 8.500 | | 07-13-12 | 19,264,376 | 19,384,778 |
|
| CCM Merger, Inc. (T) | — | | 02-11-17 | 2,844,839 | 2,879,512 |
|
| CityCenter Holdings LLC (T) | — | | 01-13-15 | 17,540,778 | 17,719,834 |
|
| Denny’s, Inc. | 6.500 | | 09-20-16 | 7,200,000 | 7,258,320 |
|
| DineEquity, Inc. (T) | — | | 10-19-17 | 18,500,000 | 18,638,750 |
|
| Dunkin Brands, Inc. | 4.250 | | 11-23-17 | 15,000,000 | 15,093,750 |
|
| Golden Nugget, Inc. | 3.270 | | 06-30-14 | 1,725,726 | 1,489,876 |
|
| Harrah’s Operating Company, Inc. | 9.500 | | 10-31-16 | 21,273,659 | 22,544,165 |
|
| Harrah’s Operating Company, Inc. | 3.303 | | 01-28-15 | 29,119,753 | 26,977,384 |
|
| Las Vegas Sands LLC | 3.040 | | 11-23-16 | 17,259,183 | 17,175,977 |
|
| Quiznos Corp. | 5.010 | | 05-05-13 | 18,010,747 | 17,050,180 |
|
| Sugarhouse HSP Gaming Prop. Mezz. LP | 11.250 | | 09-23-14 | 9,027,375 | 9,170,305 |
|
| VML US Finance LLC | 4.790 | | 05-25-12 | 2,292,777 | 2,295,629 |
|
| VML US Finance LLC | 4.790 | | 05-27-13 | 5,934,425 | 5,941,807 |
|
| Wynn Las Vegas LLC | 3.270 | | 08-17-15 | 12,500,000 | 12,427,088 |
| | | | | | |
| Leisure Equipment & Products 1.00% | | | | | |
|
| Amscan Holdings, Inc. | 6.750 | | 12-04-17 | 19,950,000 | 20,134,338 |
| | | | | | |
| Media 12.80% | | | | | |
|
| Acosta, Inc. (T) | — | | 02-15-18 | 7,500,000 | 7,556,250 |
|
| Advantage Sales & Marketing LLC | 5.250 | | 12-18-17 | 5,500,000 | 5,534,337 |
|
| Affinion Group, Inc. | 5.000 | | 10-09-16 | 5,000,000 | 5,025,000 |
|
| AMC Entertainment Holdings, Inc. | 3.510 | | 12-16-16 | 13,000,000 | 13,077,194 |
|
| Carmike Cinemas, Inc. | 5.500 | | 01-27-16 | 12,198,571 | 12,310,395 |
|
| Charter Communications Operating LLC | 3.560 | | 09-06-16 | 30,189,254 | 30,260,017 |
|
| Charter Communications Operating LLC | 2.270 | | 03-06-14 | 2,440,273 | 2,460,405 |
| | |
| See notes to financial statements | Semiannual report | Floating Rate Income Fund | 11 |
| | | | | |
| | | | Maturity | | |
| | Rate (%) | | date | Par value | Value |
| Media (continued) | | | | | |
|
| Citadel Broadcasting Corp. | 4.250 | | 12-30-16 | $6,930,000 | $6,951,656 |
|
| Dex Media West, Inc. | 7.000 | | 10-24-14 | 10,699,117 | 9,801,150 |
|
| Getty Images, Inc. | 5.250 | | 11-07-16 | 7,980,000 | 8,077,260 |
|
| Insight Midwest Holdings LLC | 2.024 | | 04-07-14 | 2,068,519 | 2,060,089 |
|
| Newsday LLC | 10.500 | | 08-01-13 | 10,000,000 | 10,631,250 |
|
| Nielsen Finance LLC | 3.764 | | 05-02-16 | 14,536,565 | 14,575,930 |
|
| Regal Cinemas Corp. (T) | — | | 08-23-17 | 15,000,000 | 15,075,000 |
|
| Sinclair Television Group, Inc. | 5.500 | | 10-29-15 | 11,904,620 | 12,033,583 |
|
| Tribune Company (H) | 3.230 | | 06-07-11 | 2,462,857 | 1,728,106 |
|
| Tribune Company (H) | 3.460 | | 06-04-14 | 10,000,000 | 7,142,860 |
|
| Univision Communications, Inc. | 4.512 | | 03-31-17 | 36,699,189 | 35,797,012 |
|
| UPC Broadband Holding BV | 2.010 | | 12-31-14 | 3,565,583 | 3,538,841 |
|
| Visant Corp. | 7.000 | | 12-22-16 | 54,190,625 | 54,675,631 |
| | | | | | |
| Multiline Retail 2.29% | | | | | |
|
| Michaels Stores, Inc. | 4.834 | | 07-31-16 | 24,317,193 | 24,514,770 |
|
| Savers, Inc. | 5.750 | | 03-11-16 | 2,481,250 | 2,493,656 |
|
| The Neiman Marcus Group, Inc. | 4.303 | | 04-06-16 | 19,135,439 | 19,223,041 |
| | | | | | |
| Specialty Retail 1.94% | | | | | |
|
| Bass Pro Group LLC | 5.006 | | 04-09-15 | 6,942,563 | 6,979,449 |
|
| General Nutrition Centers, Inc. | 3.296 | | 09-16-13 | 5,868,534 | 5,839,191 |
|
| Gymboree Corp. | 5.000 | | 02-23-18 | 26,200,000 | 26,278,595 |
| | | | | | |
| Consumer Staples 5.19% | | | | | 104,655,494 |
| | | | | | |
| Food Products 2.98% | | | | | |
|
| Bolthouse Farms, Inc. | 7.500 | | 08-11-16 | 17,500,000 | 17,718,750 |
|
| Bolthouse Farms, Inc. | 5.501 | | 02-11-16 | 2,937,370 | 2,955,728 |
|
| Brickman Group Holdings, Inc. | 7.250 | | 10-14-16 | 6,500,000 | 6,635,415 |
|
| Del Monte Corp. (T) | — | | 02-26-18 | 25,000,000 | 25,156,250 |
|
| Dole Food Company, Inc. | 5.059 | | 03-02-17 | 2,193,953 | 2,208,433 |
|
| Dole Food Company, Inc. | 5.039 | | 03-02-17 | 5,449,231 | 5,485,196 |
| | | | | | |
| Household Products 1.77% | | | | | |
|
| Reynolds Group Holdings, Inc. | 4.250 | | 02-09-18 | 27,000,000 | 27,140,616 |
|
| Spectrum Brands, Inc. | 5.013 | | 06-17-16 | 8,434,953 | 8,515,786 |
| | | | | | |
| Personal Products 0.44% | | | | | |
|
| NBTY, Inc. | 6.250 | | 10-02-17 | 8,750,000 | 8,839,320 |
| | | | | | |
| Energy 0.60% | | | | | 12,101,470 |
| | | | | | |
| Energy Equipment & Services 0.46% | | | | | |
|
| Cie Generale de Geophysique-Veritas | 4.500 | | 01-12-14 | 1,065,222 | 1,058,565 |
|
| Hercules Offshore, Inc. | 6.000 | | 07-11-13 | 8,227,563 | 8,164,145 |
| | | | | | |
| Oil, Gas & Consumable Fuels 0.14% | | | | | |
|
| SemGroup Corp. | 0.572 | | 11-30-12 | 2,866,814 | 2,878,760 |
| | | | | | |
| Financials 3.92% | | | | | 78,959,415 |
| | | | | | |
| Capital Markets 0.60% | | | | | |
|
| Pinafore LLC | 4.250 | | 09-29-15 | 4,933,107 | 4,933,107 |
|
| Pinafore LLC | 4.250 | | 09-26-16 | 7,029,678 | 7,056,039 |
| | |
| 12 | Floating Rate Income Fund | Semiannual report | See notes to financial statements |
| | | | | |
| | | | Maturity | | |
| | Rate (%) | | date | Par value | Value |
| Diversified Financial Services 1.42% | | | | | |
|
| BLB Management Services, Inc. (T) | — | | 11-05-15 | $6,004,660 | $6,039,685 |
|
| Fifth Third Processing Solutions | 5.500 | | 11-03-16 | 16,000,000 | 16,124,000 |
|
| International Lease Finance Corp. | 6.750 | | 03-17-15 | 6,409,615 | 6,449,675 |
| | | | | | |
| Insurance 0.85% | | | | | |
|
| Asurion Corp. | 6.750 | | 03-31-15 | 5,000,000 | 5,063,395 |
|
| Asurion Corp. | 3.271 | | 07-03-14 | 8,421,237 | 8,283,079 |
|
| First American Corp. | 4.750 | | 04-12-16 | 3,731,250 | 3,754,570 |
| | | | | | |
| Real Estate Management & Development 1.05% | | | | |
|
| Realogy Corp. | 4.562 | | 10-10-16 | 20,267,348 | 19,442,183 |
|
| Realogy Corp. | 3.260 | | 10-10-16 | 1,890,658 | 1,813,682 |
| | | | | | |
| Health Care 14.20% | | | | | 286,498,420 |
| | | | | | |
| Biotechnology - 0.95% | | | | | |
|
| Grifols SA (T) | — | | 11-23-16 | 19,000,000 | 19,221,673 |
| | | | | | |
| Health Care Equipment & Supplies 1.64% | | | | | |
|
| Bausch & Lomb, Inc. | 3.543 | | 04-24-15 | 11,710,771 | 11,630,259 |
|
| Bausch & Lomb, Inc. | 3.512 | | 04-24-15 | 16,364,886 | 16,385,342 |
|
| ConvaTec, Ltd. | 5.750 | | 12-22-16 | 5,000,000 | 5,022,915 |
| | | | | | |
| Health Care Providers & Services 9.50% | | | | | |
|
| Alliance Healthcare Services, Inc. | 5.500 | | 06-01-16 | 4,950,000 | 4,974,750 |
|
| Cardinal Health, Inc. | 2.512 | | 04-10-14 | 10,382,281 | 10,252,502 |
|
| Community Health Systems, Inc. | 3.810 | | 01-25-17 | 15,323,984 | 15,357,405 |
|
| Community Health Systems, Inc. | 2.560 | | 07-25-14 | 28,432,461 | 28,201,448 |
|
| CRC Health Corp. | 4.803 | | 11-16-15 | 22,168,928 | 22,113,506 |
|
| Hanger Orthopedic Group, Inc. | 5.250 | | 11-17-16 | 8,400,000 | 8,494,500 |
|
| HCA, Inc. | 2.553 | | 11-18-13 | 18,207,967 | 18,147,280 |
|
| Health Management Associates, Inc. | 2.053 | | 02-28-14 | 4,377,000 | 4,342,956 |
|
| IASIS Healthcare LLC | 2.266 | | 03-14-14 | 477,216 | 474,979 |
|
| IASIS Healthcare LLC | 2.262 | | 03-14-14 | 9,725,664 | 9,680,079 |
|
| Manor Care, Inc. | 2.762 | | 12-22-14 | 4,920,010 | 4,901,511 |
|
| MultiPlan, Inc. | 4.750 | | 07-16-17 | 19,962,132 | 20,055,715 |
|
| National Mentor Holdings, Inc. | 7.000 | | 01-18-17 | 14,000,000 | 13,784,162 |
|
| Renal Advantage Holdings, Inc. | 5.750 | | 12-16-16 | 3,000,000 | 3,041,250 |
|
| Universal Health Services, Inc. | 5.500 | | 11-15-16 | 16,000,000 | 16,140,000 |
|
| Vanguard Health Holding Company I LLC | 5.000 | | 01-29-16 | 11,562,843 | 11,638,002 |
| | | | | | |
| Health Care Technology 0.91% | | | | | |
|
| MedAssets, Inc. | 5.250 | | 11-16-16 | 18,200,000 | 18,336,500 |
| | | | | | |
| Pharmaceuticals 1.20% | | | | | |
|
| Warner Chilcott Company LLC | 6.500 | | 02-22-16 | 2,489,804 | 2,508,089 |
|
| Warner Chilcott Company LLC | 6.250 | | 04-30-15 | 14,090,452 | 14,174,468 |
|
| Warner Chilcott Company LLC | 6.000 | | 10-30-14 | 7,615,954 | 7,619,129 |
| | | | | | |
| Industrials 7.89% | | | | | 159,159,739 |
| | | | | |
| Aerospace & Defense 2.38% | | | | | |
|
| DAE Aviation Holdings, Inc. | 5.310 | | 07-31-14 | 16,450,066 | 16,573,442 |
|
| Delos Aircraft, Inc. | 7.000 | | 03-17-16 | 22,700,385 | 22,894,950 |
| | |
| See notes to financial statements | Semiannual report | Floating Rate Income Fund | 13 |
| | | | | |
| | | | Maturity | | |
| | Rate (%) | | date | Par value | Value |
| Aerospace & Defense (continued) | | | | | |
|
| Hawker Beechcraft Acquisition Company LLC | 2.303 | | 03-26-14 | $434,187 | $387,987 |
|
| Hawker Beechcraft Acquisition Company LLC | 2.273 | | 03-26-14 | 5,243,689 | 4,685,729 |
|
| Transdigm, Inc. | 5.250 | | 02-14-17 | 3,500,000 | 3,519,250 |
| | | | | | |
| Airlines 0.55% | | | | | |
|
| Delta Air Lines, Inc. | 8.750 | | 09-27-13 | 9,137,757 | 9,170,388 |
|
| Delta Air Lines, Inc. | 2.254 | | 04-30-12 | 2,075,698 | 2,060,130 |
| | | | | | |
| Building Products 1.05% | | | | | |
|
| Goodman Global, Inc. | 5.750 | | 10-28-16 | 20,967,425 | 21,121,410 |
| | | | | | |
| Commercial Services & Supplies 2.25% | | | | | |
|
| Affinion Group, Inc. | 5.000 | | 10-10-16 | 4,950,031 | 4,974,782 |
|
| ARAMARK Corp. | 3.553 | | 07-26-16 | 8,766,291 | 8,788,207 |
|
| ARAMARK Corp. | 3.511 | | 07-26-16 | 576,513 | 577,954 |
|
| ARAMARK Corp. | 2.178 | | 01-27-14 | 1,171,857 | 1,170,027 |
|
| ARAMARK Corp. | 2.136 | | 01-27-14 | 64,096 | 63,996 |
|
| Brand Energy Services | 2.563 | | 02-07-14 | 2,503,880 | 2,452,758 |
|
| Language Line LLC | 6.250 | | 06-20-16 | 8,000,000 | 8,095,000 |
|
| U.S. Investigations Services, Inc. | 7.750 | | 02-21-15 | 5,970,000 | 6,089,400 |
|
| U.S. Investigations Services, Inc. | 3.054 | | 02-21-15 | 13,296,906 | 13,163,937 |
| | | | | | |
| Machinery 0.59% | | | | | |
|
| Intelligrated, Inc. | 7.500 | | 02-16-17 | 12,000,000 | 11,880,000 |
| | | | | | |
| Marine 0.04% | | | | | |
|
| Trico Shipping AS | 13.500 | | 09-21-11 | 763,841 | 763,841 |
| | | | | | |
| Professional Services 1.03% | | | | | |
|
| Fenwal, Inc. | 2.544 | | 02-28-14 | 22,049,523 | 20,726,551 |
| | | | | | |
| Information Technology 6.22% | | | | | 125,439,984 |
| | | | | | |
| Communications Equipment 0.15% | | | | | |
|
| CommScope, Inc. | 5.000 | | 01-14-18 | 3,000,000 | 3,043,749 |
| | | | | | |
| IT Services 0.61% | | | | | |
|
| Fidelity National Information Services, Inc. | 5.250 | | 07-18-16 | 8,948,163 | 9,024,517 |
|
| Global Cash Access Holdings, Inc. (T) | — | | 02-17-16 | 3,250,000 | 3,274,375 |
| | | | | | |
| Semiconductors & Semiconductor Equipment 2.01% | | | | |
|
| Freescale Semiconductor, Inc. | 4.510 | | 12-01-16 | 38,586,797 | 38,510,742 |
|
| Sensata Technologies | 2.054 | | 04-26-13 | 1,962,205 | 1,956,687 |
| | | | | | |
| Software 3.45% | | | | | |
|
| Aspect Software, Inc. | 6.250 | | 04-19-16 | 7,940,000 | 7,979,700 |
|
| Dealer Computer Services, Inc. | 5.250 | | 04-21-17 | 10,434,066 | 10,494,062 |
|
| First Data Corp. | 3.012 | | 09-24-14 | 40,302,578 | 38,159,206 |
|
| SunGard Data Systems, Inc. | 3.933 | | 02-26-16 | 12,971,470 | 12,996,946 |
| | | | | | |
| Materials 3.01% | | | | | 60,763,263 |
| | | | | | |
| Chemicals 0.30% | | | | | |
|
| Nalco Company | 4.500 | | 10-05-17 | 5,985,000 | 6,037,369 |
| | | | | | |
| Containers & Packaging 1.22% | | | | | |
|
| Berry Plastics Corp. | 2.314 | | 04-03-15 | 12,551,593 | 12,201,190 |
|
| Graham Packaging Company LP | 6.750 | | 04-05-14 | 8,489,524 | 8,542,584 |
|
| Graham Packaging Company LP | 6.000 | | 09-23-16 | 1,995,000 | 2,010,320 |
|
| Graphic Packaging International Corp. | 2.303 | | 05-16-14 | 1,917,389 | 1,912,862 |
| | |
| 14 | Floating Rate Income Fund | Semiannual report | See notes to financial statements |
| | | | | |
| | | | Maturity | | |
| | Rate (%) | | date | Par value | Value |
| Metals & Mining 1.48% | | | | | |
|
| Fairmount Minerals, Ltd. | 6.253 | | 08-05-16 | $13,312,075 | $13,456,285 |
|
| Global Brass and Copper, Inc. | 10.251 | | 07-29-15 | 7,979,048 | 8,298,210 |
|
| Novelis, Inc. | 5.250 | | 12-19-16 | 8,000,000 | 8,094,288 |
| | | | | | |
| Paper & Forest Products 0.01% | | | | | |
|
| Georgia-Pacific Corp. | 2.302 | | 12-21-12 | 210,107 | 210,155 |
| | | | | | |
| Telecommunication Services 3.82% | | | | | 77,127,775 |
| | | | | | |
| Diversified Telecommunication Services 3.38% | | | | |
|
| FairPoint Communications, Inc. | 6.500 | | 01-22-16 | 15,000,000 | 14,802,090 |
|
| Intelsat Jackson Holdings SA | 5.250 | | 04-02-18 | 31,000,000 | 31,208,289 |
|
| Level 3 Financing, Inc. | 11.500 | | 03-13-14 | 4,000,000 | 4,290,000 |
|
| Level 3 Financing, Inc. | 2.553 | | 03-13-14 | 13,000,000 | 12,675,000 |
|
| Telesat Canada | 3.270 | | 10-31-14 | 5,337,193 | 5,327,187 |
| | | | | | |
| Wireless Telecommunication Services 0.44% | | | | |
|
| MetroPCS Wireless, Inc. | 3.813 | | 11-04-16 | 6,687,364 | 6,713,833 |
|
| MetroPCS Wireless, Inc. | 2.563 | | 11-04-13 | 90,818 | 90,542 |
|
| Syniverse Technologies, Inc. | 5.250 | | 12-21-17 | 2,000,000 | 2,020,834 |
| | | | | | |
| Utilities 4.71% | | | | | 94,895,783 |
| | | | | | |
| Electric Utilities 2.95% | | | | | |
|
| EquiPower Resources Corp. | 5.750 | | 01-26-18 | 7,000,000 | 7,052,500 |
|
| Texas Competitive Electric Holdings | | | | | |
| Company LLC | 3.787 | | 10-10-14 | 18,428,090 | 15,530,273 |
|
| Texas Competitive Electric Holdings | | | | | |
| Company LLC | 3.766 | | 10-10-14 | 43,890,314 | 36,900,782 |
| | | | | | |
| Independent Power Producers & Energy Traders 1.76% | | | | |
|
| GenOn Energy, Inc. | 6.000 | | 09-08-17 | 11,221,875 | 11,352,801 |
|
| New Development Holdings, Inc. | 7.000 | | 07-03-17 | 11,376,775 | 11,483,432 |
|
| NRG Energy, Inc. | 3.553 | | 08-31-15 | 10,841,515 | 10,909,275 |
|
| NRG Energy, Inc. | 2.053 | | 02-01-13 | 1,103 | 1,098 |
|
| NRG Energy, Inc. | 2.039 | | 02-01-13 | 1,672,792 | 1,665,622 |
| |
| Corporate Bonds 9.70% | | | | | $195,749,890 |
|
| (Cost $181,588,403) | | | | | |
| | | | | | |
| Consumer Discretionary 0.96% | | | | | 19,422,082 |
| | | | | | |
| Hotels, Restaurants & Leisure 0.08% | | | | | |
|
| Caesars Entertainment Operating | | | | | |
| Company, Inc. | 11.250 | | 06-01-17 | $1,500,000 | 1,702,500 |
| | | | | | |
| Media 0.83% | | | | | |
|
| CCO Holdings LLC/CCO Holdings Capital Corp. | 8.125 | | 04-30-20 | 2,300,000 | 2,481,125 |
|
| CCO Holdings LLC/CCO Holdings Capital Corp. | 7.875 | | 04-30-18 | 2,970,000 | 3,170,475 |
|
| CCO Holdings LLC/CCO Holdings Capital Corp. | 7.000 | | 01-15-19 | 6,000,000 | 6,105,000 |
|
| Univision Communications, Inc. (S) | 7.875 | | 11-01-20 | 4,720,000 | 5,062,200 |
| | | | | | |
| Multiline Retail 0.05% | | | | | |
|
| The Neiman Marcus Group, Inc., PIK | 9.000 | | 10-15-15 | 859,935 | 900,782 |
| | | | | | |
| Consumer Staples 0.05% | | | | | 1,011,850 |
| | | | | | |
| Tobacco 0.05% | | | | | |
|
| Alliance One International, Inc. | 10.000 | | 07-15-16 | 980,000 | 1,011,850 |
| | |
| See notes to financial statements | Semiannual report | Floating Rate Income Fund | 15 |
| | | | | |
| | | | Maturity | | |
| | Rate (%) | | date | Par value | Value |
| Energy 1.03% | | | | | $20,814,018 |
| | | | | | |
| Energy Equipment & Services 0.30% | | | | | |
|
| Hercules Offshore, Inc. (S) | 10.500 | | 10-15-17 | $6,151,000 | 6,104,868 |
| | | | | | |
| Oil, Gas & Consumable Fuels 0.73% | | | | | |
|
| Murray Energy Corp. (S) | 10.250 | | 10-15-15 | 8,580,000 | 9,159,150 |
|
| SandRidge Energy, Inc. (S) | 9.875 | | 05-15-16 | 5,000,000 | 5,550,000 |
| | | | | | |
| Financials 1.53% | | | | | 30,892,256 |
| | | | | | |
| Consumer Finance 0.59% | | | | | |
|
| SLM Corp. | 8.000 | | 03-25-20 | 11,210,000 | 11,896,613 |
| | | | | | |
| Diversified Financial Services 0.59% | | | | | |
|
| Citigroup, Inc. | 6.375 | | 08-12-14 | 7,500,000 | 8,368,268 |
|
| International Lease Finance Corp. (S) | 7.125 | | 09-01-18 | 3,300,000 | 3,601,125 |
| | | | | | |
| Real Estate Management & Development 0.35% | | | | |
|
| Realogy Corp. (S) | 7.875 | | 02-15-19 | 7,000,000 | 7,026,250 |
| | | | | | |
| Industrials 1.57% | | | | | 31,723,642 |
| | | | | | |
| Airlines 0.45% | | | | | |
|
| Continental Airlines, Inc. | 9.250 | | 05-10-17 | 2,374,652 | 2,517,132 |
|
| Continental Airlines, Inc. | 6.900 | | 01-02-18 | 1,053,027 | 1,121,474 |
|
| Continental Airlines, Inc. | 6.545 | | 02-02-19 | 304,417 | 321,160 |
|
| Continental Airlines, Inc. | 6.503 | | 06-15-11 | 1,030,000 | 1,040,300 |
|
| United Air Lines, Inc. | 9.750 | | 01-15-17 | 3,534,522 | 4,073,536 |
| | | | | | |
| Electrical Equipment 0.62% | | | | | |
|
| NXP BV/NXP Funding LLC (P) | 3.053 | | 10-15-13 | 12,655,000 | 12,591,725 |
| | | | | | |
| Road & Rail 0.50% | | | | | |
|
| RailAmerica, Inc. | 9.250 | | 07-01-17 | 9,082,000 | 10,058,315 |
| | | | | | |
| Information Technology 0.29% | | | | | 5,878,800 |
| | | | | | |
| Software 0.29% | | | | | |
|
| Aspect Software, Inc. (S) | 10.625 | | 05-15-17 | 5,520,000 | 5,878,800 |
| | | | | | |
| Materials 2.22% | | | | | 44,761,987 |
| | | | | | |
| Chemicals 1.04% | | | | | |
|
| Georgia Gulf Corp. (S) | 9.000 | | 01-15-17 | 5,000,000 | 5,562,500 |
|
| Lyondell Chemical Company | 11.000 | | 05-01-18 | 7,730,049 | 8,870,231 |
|
| Lyondell Chemical Company (S) | 8.000 | | 11-01-17 | 5,850,000 | 6,584,906 |
| | | | | | |
| Containers & Packaging 0.16% | | | | | |
|
| Ardagh Packaging Finance PLC (S) | 7.375 | | 10-15-17 | 3,000,000 | 3,195,000 |
| | | | | | |
| Metals & Mining 0.36% | | | | | |
|
| Midwest Vanadium Pty, Ltd. (S) | 11.500 | | 02-15-18 | 7,000,000 | 7,210,000 |
| | | | | | |
| Paper & Forest Products 0.66% | | | | | |
|
| Appleton Papers, Inc. (S) | 10.500 | | 06-15-15 | 5,660,000 | 5,858,100 |
|
| NewPage Corp. | 11.375 | | 12-31-14 | 7,500,000 | 7,481,250 |
| | | | | | |
| Telecommunication Services 0.77% | | | | | 15,430,625 |
| | | | | | |
| Diversified Telecommunication Services 0.42% | | | | |
|
| Wind Acquisition Finance SA (S) | 7.250 | | 02-15-18 | 8,250,000 | 8,518,125 |
| | | | | | |
| Wireless Telecommunication Services 0.35% | | | | |
|
| iPCS, Inc. (P) | 2.429 | | 05-01-13 | 7,000,000 | 6,912,500 |
| | |
| 16 | Floating Rate Income Fund | Semiannual report | See notes to financial statements |
| | | | | |
| | | | Maturity | | |
| | Rate (%) | | date | Par value | Value |
| Utilities 1.28% | | | | | $25,814,630 |
| | | | | | |
| Independent Power Producers & Energy Traders 1.28% | | | | |
|
| Calpine Construction Finance Company LP (S) | 8.000 | | 06-01-16 | $7,000,000 | 7,595,000 |
|
| Calpine Corp. (S) | 7.875 | | 07-31-20 | 3,000,000 | 3,172,500 |
|
| Calpine Corp. (S) | 7.500 | | 02-15-21 | 6,000,000 | 6,135,000 |
|
| Calpine Corp. (S) | 7.250 | | 10-15-17 | 8,508,000 | 8,912,130 |
| |
| | | | | Shares | Value |
| | |
| Common Stocks 1.92% | | $38,700,157 |
|
| (Cost $17,773,402) | | |
| | | |
| Consumer Discretionary 0.72% | | 14,576,450 |
| | |
| Hotels, Restaurants & Leisure 0.06% | | |
|
| Tropicana Entertainment, Inc. (I) | 72,338 | 1,220,704 |
| | | |
| Media 0.66% | | |
|
| Citadel Broadcasting Corp., Class A (I) | 53,412 | 1,856,067 |
|
| Citadel Broadcasting Corp., Class B (I) | 330,926 | 11,499,679 |
| | | |
| Energy 0.14% | | 2,884,018 |
| | | |
| Oil, Gas & Consumable Fuels 0.14% | | |
|
| Express Energy Services LLC (I) | 117,715 | 2,884,018 |
| | | |
| Industrials 0.01% | | 111,250 |
| | |
| Building Products 0.01% | | |
|
| Nortek, Inc. (I) | 2,500 | 111,250 |
| | |
| Materials 1.05% | | 21,128,439 |
| | | |
| Chemicals 1.05% | | |
|
| Georgia Gulf Corp. (I) | 74,111 | 2,365,623 |
|
| LyondellBasell Industries, Class A (I) | 492,721 | 18,762,816 |
| |
| Preferred Securities 0.39% | | $7,936,775 |
|
| (Cost $7,460,535) | | |
| | |
| Financials 0.39% | | 7,936,775 |
| | | |
| Diversified Financial Services 0.39% | | |
|
| Citigroup Capital XII (8.500% to 03-30-15, then 3 month LIBOR + 5.870%) | 298,375 | 7,936,775 |
| | | |
| | Par value | Value |
|
| Short-Term Investments 15.54% | | $313,469,994 |
|
| (Cost $313,469,994) | | |
| | | |
| Repurchase Agreement 15.54% | | $313,469,994 |
| Bank of America Tri-Party Repurchase Agreement dated 2-28-11 at | | |
| 0.150% to be repurchased at $136,229,568 on 3-1-11, collateralized | | |
| by $132,242,000 U.S. Treasury Notes, 3.375% due 11-15-19 (valued at | | |
| $51,777,344, including interest) and U.S. Treasury Notes, 4.875% due | | |
| 6-30-12 (valued at $87,176,653, including interest) | $136,229,000 | 136,229,000 |
|
| Deutsche Bank Tri-Party Repurchase Agreement dated 2-28-11 at | | |
| 0.160% to be repurchased at $84,708,376 on 3-1-11, | | |
collateralized by $89,330,000 Federal Home Loan Mortgage Corp., | | |
| 3.500% due 8-17-20 (valued at $86,402,156, including interest) | 84,708,000 | 84,708,000 |
| | |
| See notes to financial statements | Semiannual report | Floating Rate Income Fund | 17 |
| | |
| | Par value | Value |
| Repurchase Agreement (continued) | | |
| Goldman Sachs Tri-Party Repurchase Agreement dated 2-28-11 at | | |
| 0.180% to be repurchased at $91,963,460 on 3-1-11, collateralized by | | |
| $93,945,000 Federal Home Loan Mortgage Corp., 0.850% due 2-8-13 | | |
| (valued at $93,827,569, including interest) | $91,963,000 | $91,963,000 |
|
| Repurchase Agreement with State Street Corp. dated 2-28-11 at 0.010% | | |
| to be repurchased at $569,994 on 3-1-11, collateralized by $575,000 | | |
| U.S. Treasury Notes, 1.375% due 5-15-13 (valued at $582,504, | | |
| including interest) | 569,994 | 569,994 |
| |
| Total investments (Cost $2,111,561,600)† 108.65% | $2,191,770,636 |
|
| |
| Other assets and liabilities, net (8.65%) | | ($174,543,014) |
|
| |
| Total net assets 100.00% | $2,017,227,622 |
|
The percentage shown for each investment category is the total value of that category as a percentage of the net assets of the Fund.
LIBOR London Interbank Offered Rate
PIK Paid in Kind
(H) Non-income producing — Issuer is in default.
(I) Non-income producing security.
(M) Term loans are variable rate obligations. The coupon rate shown represents the rate at period end unless the investment is unsettled.
(P) Variable rate obligation. The coupon rate shown represents the rate at period end.
(S) These securities are exempt from registration under Rule 144A of the Securities Act of 1933. Such securities may be resold, normally to qualified institutional buyers, in transactions exempt from registration.
(T) All or a portion of this position represents unsettled loan commitment. The coupon rate will be determined at time of settlement.
† At 2-28-11, the aggregate cost of investment securities for federal income tax purposes was $2,114,966,497. Net unrealized appreciation aggregated $76,804,139, of which $81,605,429 related to appreciated investment securities and $4,801,290 related to depreciated investment securities.
| | |
| 18 | Floating Rate Income Fund | Semiannual report | See notes to financial statements |
F I N A N C I A L S T A T E M E N T S
Financial statements
Statement of assets and liabilities 2-28-11 (unaudited)
This Statement of Assets and Liabilities is the Fund’s balance sheet. It shows the value of what the Fund owns, is due and owes. You’ll also find the net asset value and the maximum offering price per share.
| |
| Assets | |
|
| Investments, at value (Cost $1,798,091,606) | $1,878,300,642 |
| Repurchase agreements, at value (Cost $313,469,994) (Note 2) | 313,469,994 |
| | |
| Total investments, at value (Cost $2,111,561,600) | 2,191,770,636 |
| Cash | 36,384,480 |
| Receivable for investments sold | 101,155,823 |
| Receivable for fund shares sold | 16,774,724 |
| Interest receivable | 9,892,811 |
| Receivable for securities lending income | 149 |
| Receivable due from adviser | 412 |
| Other receivables and prepaid expenses | 93,997 |
| | |
| Total assets | 2,356,073,032 |
| |
| Liabilities | |
|
| Payable for investments purchased | 336,552,873 |
| Payable for fund shares repurchased | 1,379,705 |
| Distributions payable | 496,763 |
| Payable to affiliates | |
| Accounting and legal services fees | 41,905 |
| Transfer agent fees | 188,346 |
| Trustees’ fees | 1,919 |
| Other liabilities and accrued expenses | 183,899 |
| | |
| Total liabilities | 338,845,410 |
| |
| Net assets | |
|
| Capital paid-in | $1,924,420,958 |
| Undistributed net investment income | (3,191,217) |
| Accumulated net realized gain (loss) on investments and investments | 15,788,845 |
| Net unrealized appreciation (depreciation) on investments | 80,209,036 |
| | |
| Net assets | $2,017,227,622 |
| | |
| See notes to financial statements | Semiannual report | Floating Rate Income Fund | 19 |
F I N A N C I A L S T A T E M E N T S
Statement of assets and liabilities (continued)
| |
| Net asset value per share | |
|
| Based on net asset values and shares outstanding — the Fund has an | |
| unlimited number of shares authorized with no par value | |
| Class A ($481,568,254 ÷ 49,940,727 shares) | $9.64 |
| Class B ($15,677,587 ÷ 1,625,887 shares)1 | $9.64 |
| Class C ($164,514,587 ÷ 16,995,790 shares)1 | $9.68 |
| Class I ($188,430,504 ÷ 19,552,875 shares) | $9.64 |
| Class 1 ($121,330 ÷ 12,603 shares) | $9.63 |
| Class NAV ($1,166,915,360 ÷ 121,064,557 shares) | $9.64 |
| |
| Maximum offering price per share | |
|
| Class A (net asset value per share ÷ 97%)2 | $9.94 |
1 Redemption price is equal to net asset value less any applicable contingent deferred sales charge.
2 On single retail sales of less than $100,000. On sales of $100,000 or more and on group sales the offering price is reduced.
| | |
| 20 | Floating Rate Income Fund | Semiannual report | See notes to financial statements |
F I N A N C I A L S T A T E M E N T S
Statement of operations For the six-month period ended 2-28-11 (unaudited)
This Statement of Operations summarizes the Fund’s investment income earned and expenses incurred in operating the Fund. It also shows net gains (losses) for the period stated.
| |
| Investment income | |
|
| Interest | $53,042,454 |
| Dividends | 317,023 |
| Securities lending | 1,392 |
| | |
| Total investment income | 53,360,869 |
| |
| Expenses | |
|
| Investment management fees (Note 4) | 5,830,012 |
| Distribution and service fees (Note 4) | 1,128,091 |
| Accounting and legal services fees (Note 4) | 121,821 |
| Transfer agent fees (Note 4) | 440,978 |
| Trustees’ fees (Note 4) | 7,880 |
| State registration fees (Note 4) | 53,258 |
| Printing and postage (Note 4) | 16,346 |
| Professional fees | 36,015 |
| Custodian fees | 104,048 |
| Registration and filing fees | 17,665 |
| Other | 9,314 |
| | |
| Total expenses | 7,765,428 |
| Less expense reductions (Note 4) | (62,049) |
| | |
| Net expenses | 7,703,379 |
| |
| Net investment income | 45,657,490 |
|
| Realized and unrealized gain (loss) | |
|
| Net realized gain (loss) on | |
| Investments in unaffiliated issuers | 36,782,693 |
| Investments in affiliated issuers | (886) |
| | 36,781,807 |
| Change in net unrealized appreciation (depreciation) of | |
| Investments in unaffiliated issuers | 51,967,708 |
| Investments in affiliated issuers | (65) |
| | 51,967,643 |
| | |
| Net realized and unrealized gain | 88,749,450 |
| | |
| Increase in net assets from operations | $134,406,940 |
| | |
| See notes to financial statements | Semiannual report | Floating Rate Income Fund | 21 |
F I N A N C I A L S T A T E M E N T S
Statements of changes in net assets
These Statements of Changes in Net Assets show how the value of the Fund’s net assets has changed during the last two periods. The difference reflects earnings less expenses, any investment gains and losses, distributions, if any, paid to shareholders and the net of Fund share transactions.
| | |
| | Six months | |
| | ended | Year |
| | 2-28-11 | ended |
| | (unaudited) | 8-31-10 |
|
| |
| Increase (decrease) in net assets | | |
| |
| From operations | | |
| Net investment income | $45,657,490 | $85,484,540 |
| Net realized gain | 36,781,807 | 45,380,345 |
| Change in net unrealized appreciation (depreciation) | 51,967,643 | (9,389,879) |
| | | |
| Increase in net assets resulting from operations | 134,406,940 | 121,475,006 |
| | |
| Distributions to shareholders | | |
| From net investment income | | |
| Class A | (9,508,274) | (10,427,556) |
| Class B | (274,651) | (274,644) |
| Class C | (2,870,117) | (2,665,145) |
| Class I | (3,332,837) | (4,335,325) |
| Class 1 | (3,579) | (6,792) |
| Class NAV | (34,860,569) | (69,768,491) |
| From net realized gain | | |
| Class A | (9,189,596) | — |
| Class B | (301,900) | — |
| Class C | (3,109,546) | — |
| Class I | (2,717,408) | — |
| Class 1 | (3,165) | — |
| Class NAV | (30,510,487) | — |
| Total distributions | (96,682,129) | (87,477,953) |
| | | |
| From Fund share transactions (Note 6) | 403,677,792 | 403,913,148 |
| | | |
| Total increase | 441,402,603 | 437,910,201 |
| |
| Net assets | | |
|
| Beginning of period | 1,575,825,019 | 1,137,914,818 |
| | | |
| End of period | $2,017,227,622 | $1,575,825,019 |
| | | |
| Undistributed net investment income | ($3,191,217) | $2,001,320 |
| | |
| 22 | Floating Rate Income Fund | Semiannual report | See notes to financial statements |
Financial highlights
The Financial Highlights show how the Fund’s net asset value for a share has changed since the beginning of the period.
| | | | |
| CLASS A SHARES Period ended | 2-28-111 | 8-31-10 | 8-31-09 | 8-31-082 |
| | | | | |
| Per share operating performance | | | | |
|
| Net asset value, beginning of period | $9.43 | $9.13 | $9.79 | $10.00 |
| Net investment income3 | 0.25 | 0.52 | 0.56 | 0.37 |
| Net realized and unrealized gain (loss) on investments | 0.50 | 0.33 | (0.66) | (0.25) |
| Total from investment operations | 0.75 | 0.85 | (0.10) | 0.12 |
| Less distributions | | | | |
| From net investment income | (0.28) | (0.55) | (0.56) | (0.33) |
| From net realized gain | (0.26) | — | —4 | — |
| Total distributions | (0.54) | (0.55) | (0.56) | (0.33) |
| Net asset value, end of period | $9.64 | $9.43 | $9.13 | $9.79 |
| Total return (%)5,6 | 8.087 | 9.47 | (0.07) | 1.237 |
| |
| Ratios and supplemental data | | | | |
|
| Net assets, end of period (in millions) | $482 | $267 | $110 | $11 |
| Ratios (as a percentage of average net assets): | | | | |
| Expenses before reductions and amounts recaptured | 1.238 | 1.20 | 1.23 | 1.528 |
| Expenses including reductions and amounts recaptured | 1.208 | 1.209 | 1.20 | 1.188 |
| Net investment income | 5.218 | 5.58 | 6.16 | 5.708 |
| Portfolio turnover (%) | 44 | 57 | 36 | 11 |
| |
|
| 1 Semiannual period from 9-1-10 to 2-28-11. Unaudited. |
| 2 The inception date for Class A shares is 1-2-08. |
| 3 Based on the average daily shares outstanding. |
| 4 Less than ($0.005) per share. |
| 5 Total returns would have been lower had certain expenses not been reduced during the periods shown. |
| 6 Does not reflect the effect of sales charges, if any. |
| 7 Not annualized. |
| 8 Annualized. |
| 9 Includes the impact of expense recapture which amounted to 0.01% of average net assets. See Note 4. |
| | |
| See notes to financial statements | Semiannual report | Floating Rate Income Fund | 23 |
| | | | |
| CLASS B SHARES Period ended | 2-28-111 | 8-31-10 | 8-31-09 | 8-31-082 |
| | | | | |
| Per share operating performance | | | | |
|
| Net asset value, beginning of period | $9.42 | $9.13 | $9.79 | $10.00 |
| Net investment income3 | 0.21 | 0.45 | 0.49 | 0.31 |
| Net realized and unrealized gain (loss) on investments | 0.51 | 0.32 | (0.65) | (0.24) |
| Total from investment operations | 0.72 | 0.77 | (0.16) | 0.07 |
| Less distributions | | | | |
| From net investment income | (0.24) | (0.48) | (0.50) | (0.28) |
| From net realized gain | (0.26) | — | —4 | — |
| Total distributions | (0.50) | (0.48) | (0.50) | (0.28) |
| Net asset value, end of period | $9.64 | $9.42 | $9.13 | $9.79 |
| Total return (%)5,6 | 7.797 | 8.52 | (0.80) | 0.767 |
| |
| Ratios and supplemental data | | | | |
|
| Net assets, end of period (in millions) | $16 | $9 | $3 | $1 |
| Ratios (as a percentage of average net assets): | | | | |
| Expense before reductions and amounts recaptured | 2.078 | 2.08 | 3.86 | 4.768 |
| Expenses including reductions and amounts recaptured | 1.958 | 1.959 | 1.95 | 1.938 |
| Net investment income | 4.438 | 4.77 | 5.53 | 4.788 |
| Portfolio turnover (%) | 44 | 57 | 36 | 11 |
| |
1 Semiannual period from 9-1-10 to 2-28-11. Unaudited.
2 The inception date for Class B shares is 1-2-08.
3 Based on the average daily shares outstanding.
4 Less than ($0.005) per share.
5 Total returns would have been lower had certain expenses not been reduced during the periods shown.
6 Does not reflect the effect of sales charges, if any.
7 Not annualized.
8 Annualized.
9 Includes the impact of expense recapture which amounted to less than 0.005% of average net assets. See Note 4.
| | | | |
| CLASS C SHARES Period ended | 2-28-111 | 8-31-10 | 8-31-09 | 8-31-082 |
| | | | | |
| Per share operating performance | | | | |
|
| Net asset value, beginning of period | $9.46 | $9.16 | $9.80 | $10.00 |
| Net investment income3 | 0.21 | 0.45 | 0.47 | 0.32 |
| Net realized and unrealized gain (loss) on investments | 0.51 | 0.33 | (0.62) | (0.24) |
| Total from investment operations | 0.72 | 0.78 | (0.15) | 0.08 |
| Less distributions | | | | |
| From net investment income | (0.24) | (0.48) | (0.49) | (0.28) |
| From net realized gain | (0.26) | — | —4 | — |
| Total distributions | (0.50) | (0.48) | (0.49) | (0.28) |
| Net asset value, end of period | $9.68 | $9.46 | $9.16 | $9.80 |
| Total return (%)5,6 | 7.787 | 8.65 | (0.69) | 0.817 |
| |
| Ratios and supplemental data | | | | |
|
| Net assets, end of period (in millions) | $165 | $95 | $23 | $2 |
| Ratios (as a percentage of average net assets): | | | | |
| Expenses before reductions | 1.938 | 1.91 | 2.09 | 2.328 |
| Expenses net of fee waivers and credits | 1.938 | 1.939 | 1.95 | 1.958 |
| Net investment income | 4.468 | 4.77 | 5.39 | 4.968 |
| Portfolio turnover (%) | 44 | 57 | 36 | 11 |
| |
1 Semiannual period from 9-1-10 to 2-28-11. Unaudited.
2 The inception date for Class C shares is 1-2-08.
3 Based on the average daily shares outstanding.
4 Less than ($0.005) per share.
5 Total returns would have been lower had certain expenses not been reduced during the periods shown.
6 Does not reflect the effect of sales charges, if any.
7 Not annualized.
8 Annualized.
9 Includes the impact of expense recapture which amounted to 0.02% of average net assets. See Note 4.
| | |
| 24 | Floating Rate Income Fund | Semiannual report | See notes to financial statements |
| | | | |
| CLASS I SHARES Period ended | 2-28-111 | 8-31-10 | 8-31-09 | 8-31-082 |
| | | | | |
| Per share operating performance | | | | |
|
| Net asset value, beginning of period | $9.42 | $9.12 | $9.79 | $10.00 |
| Net investment income3 | 0.27 | 0.56 | 0.60 | 0.37 |
| Net realized and unrealized gain (loss) on investments | 0.51 | 0.32 | (0.68) | (0.22) |
| Total from investment operations | 0.78 | 0.88 | (0.08) | 0.15 |
| Less distributions | | | | |
| From net investment income | (0.30) | (0.58) | (0.59) | (0.36) |
| From net realized gain | (0.26) | — | —4 | — |
| Total distributions | (0.56) | (0.58) | (0.59) | (0.36) |
| Net asset value, end of period | $9.64 | $9.42 | $9.12 | $9.79 |
| Total return (%)5,6 | 8.417 | 9.88 | 0.25 | 1.527 |
| |
| Ratios and supplemental data | | | | |
|
| Net assets, end of period (in millions) | $188 | $86 | $40 | $1 |
| Ratios (as a percentage of average net assets): | | | | |
| Expenses before reductions | 0.798 | 0.81 | 0.95 | 4.488 |
| Expenses net of fee waivers and credits | 0.798 | 0.829 | 0.85 | 0.828 |
| Net investment income | 5.738 | 5.94 | 6.36 | 5.788 |
| Portfolio turnover (%) | 44 | 57 | 36 | 11 |
| |
1 Semiannual period from 9-1-10 to 2-28-11. Unaudited.
2 The inception date for Class I shares is 1-2-08.
3 Based on the average daily shares outstanding.
4 Less than ($0.005) per share.
5 Total returns would have been lower had certain expenses not been reduced during the periods shown.
6 Assumes dividend reinvestment (if applicable).
7 Not annualized.
8 Annualized.
9 Includes the impact of expense recapture which amounted to 0.01% of average net assets. See Note 4.
| | | | |
| CLASS 1 SHARES Period ended | 2-28-111 | 8-31-10 | 8-31-09 | 8-31-082 |
| | | | | |
| Per share operating performance | | | | |
|
| Net asset value, beginning of period | $9.41 | $9.12 | $9.78 | $10.00 |
| Net investment income3 | 0.26 | 0.57 | 0.59 | 0.38 |
| Net realized and unrealized gain (loss) on investments | 0.52 | 0.31 | (0.65) | (0.23) |
| Total from investment operations | 0.78 | 0.88 | (0.06) | (0.15) |
| Less distributions | | | | |
| From net investment income | (0.30) | (0.59) | (0.60) | (0.37) |
| From net realized gain | (0.26) | — | —4 | — |
| Total distributions | (0.56) | (0.59) | (0.60) | (0.37) |
| Net asset value, end of period | $9.63 | $9.41 | $9.12 | $9.78 |
| Total return (%)5 | 8.436,7 | 9.827 | 0.40 | 1.486 |
| |
| Ratios and supplemental data | | | | |
|
| Net assets, end of period (in thousands) | $121 | $112 | $102 | $102 |
| Ratios (as a percentage of average net assets): | | | | |
Expenses before reductions | 0.778 | 0.78 | 0.80 | 0.788 |
| Expenses net of all fee waivers and credits | 0.778 | 0.78 | 0.80 | 0.788 |
| Net investment income | 5.508 | 6.11 | 7.13 | 5.838 |
| Portfolio turnover (%) | 44 | 57 | 36 | 11 |
| |
1 Semiannual period from 9-1-10 to 2-28-11. Unaudited.2 The inception date for Class I shares is 1-2-08.3 Based on the average daily shares outstanding.4 Less than ($0.005) per share.5 Assumes dividend reinvestment (if applicable).6 Not annualized.7 Total returns would have been lower had certain expenses not been reduced during the periods shown.8 Annualized. | | |
| See notes to financial statements | Semiannual report | Floating Rate Income Fund | 25 |
| | | | |
| CLASS NAV SHARES Period ended | 2-28-111 | 8-31-10 | 8-31-09 | 8-31-082 |
| | | | | |
| Per share operating performance | | | | |
|
| Net asset value, beginning of period | $9.42 | $9.12 | $9.79 | $10.00 |
| Net investment income3 | 0.26 | 0.58 | 0.60 | 0.40 |
| Net realized and unrealized gain (loss) on investments | 0.52 | 0.31 | (0.67) | (0.24) |
| Total from investment operations | 0.78 | 0.89 | (0.07) | 0.16 |
| Less distributions | | | | |
| From net investment income | (0.30) | (0.59) | (0.60) | (0.37) |
| From net realized gain | (0.26) | — | —4 | — |
| Total distributions | (0.56) | (0.59) | (0.60) | (0.37) |
| Net asset value, end of period | $9.64 | $9.42 | $9.12 | $9.79 |
| Total return (%) | 8.455,6 | 9.996 | 0.31 | 1.595 |
| |
| Ratios and supplemental data | | | | |
|
| Net assets, end of period (in millions) | $1,167 | $1,119 | $962 | $510 |
| Ratios (as a percentage of average net assets): | | | | |
| Expenses before reductions | 0.727 | 0.73 | 0.75 | 0.757 |
| Expenses net of fee waivers and credits | 0.727 | 0.73 | 0.75 | 0.757 |
| Net investment income | 5.547 | 6.16 | 7.08 | 6.167 |
| Portfolio turnover (%) | 44 | 57 | 36 | 11 |
| |
1 Semiannual period from 9-1-10 to 2-28-11. Unaudited.2 The inception date for Class NAV shares is 1-2-08.3 Based on the average daily shares outstanding.4 Less than $0.005 per share.5 Not annualized.6 Total returns would have been lower had certain expenses not been reduced during the periods shown.7 Annualized. | | |
| 26 | Floating Rate Income Fund | Semiannual report | See notes to financial statements |
Notes to financial statements
(unaudited)
Note 1 — Organization
John Hancock Floating Rate Income Fund (the Fund) is a non-diversified series of John Hancock Funds II (the Trust), an open-end management investment company organized as a Massachusetts business trust and registered under the Investment Company Act of 1940, as amended (the 1940 Act). The investment objective of the Fund is to seek a high level of current income.
The Fund may offer multiple classes of shares. The shares currently offered are detailed in the Statement of Assets and Liabilities. Class A, Class B and Class C shares are offered to all investors. Class I shares are offered to institutions and certain investors. Class 1 shares are offered only to certain affiliates of Manulife Financial Corporation (MFC). Class NAV shares are offered to the John Hancock Lifestyle and Lifecycle Funds, and other affiliated John Hancock funds. Shareholders of each class have exclusive voting rights to matters that affect that class. The distribution and service fees, transfer agent fees, printing and postage and state registration fees for each class may differ. Class B shares convert to Class A shares eight years after purchase.
Note 2 — Significant accounting policies
The financial statements have been prepared in conformity with accounting principles generally accepted in the United States of America, which require management to make certain estimates and assumptions at the date of the financial statements. Actual results could differ from those estimates. Events or transactions occurring after the end of the fiscal period through the date that the financial statements were issued have been evaluated in the preparation of the financial statements. The following summarizes the significant accounting policies of the Fund:
Security valuation. Investments are stated at value as of the close of regular trading on the New York Stock Exchange (NYSE), normally at 4:00 p.m., Eastern Time. The Fund uses a three-tier hierarchy to prioritize the pricing assumptions, referred to as inputs, used in valuation techniques to measure fair value. Level 1 includes securities valued using quoted prices in active markets for identical securities. Level 2 includes securities valued using significant observable inputs. Observable inputs may include quoted prices for similar securities, interest rates, prepayment speeds and credit risk. Prices for securities valued using these inputs are received from independent pricing vendors and brokers and are based on an evaluation of the inputs described. Level 3 includes securities valued using significant unobservable inputs when market prices are not readily available or reliable, including the Fund’s own assumptions in determining the fair value of investments. Factors used in determining value may include market or issuer specific events, changes in interest rates and credit quality. The inputs or methodology used for valuing securities are not necessarily an indication of the risk associated with investing in those securities.
| | |
| | Semiannual report | Floating Rate Income Fund | 27 |
The following is a summary of the values by input classification of the Fund’s investments as of February 28, 2011, by major security category or type:
| | | | |
| | | | | LEVEL 3 |
| | | | LEVEL 2 | SIGNIFICANT |
| | TOTAL MARKET | LEVEL 1 | SIGNIFICANT | UNOBSERVABLE |
| | VALUE AT 2-28-11 | QUOTED PRICE | OBSERVABLE INPUTS | INPUTS |
|
| Term Loans | | | | |
| Consumer Discretionary | $636,312,477 | — | $636,312,477 | — |
| Consumer Staples | 104,655,494 | — | 104,655,494 | — |
| Energy | 12,101,470 | — | 12,101,470 | — |
| Financials | 78,959,415 | — | 78,959,415 | — |
| Health Care | 286,498,420 | — | 286,498,420 | — |
| Industrials | 159,159,739 | — | 159,159,739 | — |
| Information Technology | 125,439,984 | — | 125,439,984 | — |
| Materials | 60,763,263 | — | 60,763,263 | — |
| Telecommunication | | | | |
| Services | 77,127,775 | — | 77,127,775 | — |
| Utilities | 94,895,783 | — | 94,895,783 | — |
| Corporate Bonds | | | | |
| Consumer Discretionary | 19,422,082 | — | 19,422,082 | — |
| Consumer Staples | 1,011,850 | — | 1,011,850 | — |
| Energy | 20,814,018 | — | 20,814,018 | — |
| Financials | 30,892,256 | — | 30,892,256 | — |
| Industrials | 31,723,642 | — | 31,723,642 | — |
| Information Technology | 5,878,800 | — | 5,878,800 | — |
| Materials | 44,761,987 | — | 44,761,987 | — |
| Telecommunication | | | | |
| Services | 15,430,625 | — | 15,430,625 | — |
| Utilities | 25,814,630 | — | 25,814,630 | — |
| Common Stocks | | | | |
| Consumer Discretionary | 14,576,450 | — | 14,576,450 | — |
| Energy | 2,884,018 | — | 2,884,018 | — |
| Industrials | 111,250 | $111,250 | — | — |
| Materials | 21,128,439 | 21,128,439 | — | — |
| Preferred Securities | | | | |
| Financials | 7,936,775 | 7,936,775 | — | — |
| Short-Term Investments | | | | |
| Repurchase Agreement | 313,469,994 | — | 313,469,994 | — |
|
| Total Investments in | | | | |
| Securities | $2,191,770,636 | $29,176,464 | $2,162,594,172 | — |
Changes in valuation techniques may result in transfers in or out of an assigned level within the disclosure hierarchy. During the six months ended February 28, 2011, there were no significant transfers in or out of Level 1 or Level 2 assets.
In order to value the securities, the Fund uses the following valuation techniques. Equity securities held by the Fund are valued at the last sale price or official closing price on the principal securities exchange on which they trade. In the event there were no sales during the day or closing prices are not available, then securities are valued using the last quoted bid or evaluated price. Debt obligations are valued based on the evaluated prices provided by an independent pricing service, which utilizes both dealer-supplied and electronic data processing techniques, taking into account factors such as institutional-size trading in similar groups of securities, yield, quality, coupon rate, maturity, type of issue, trading characteristics and other market data. Investments in open-end mutual funds, including John Hancock Collateral Investment Trust (JHCIT), are valued at their
| |
| 28 | Floating Rate Income Fund | Semiannual report |
closing net asset values each day. Foreign securities and currencies are valued in U.S. dollars, based on foreign currency exchange rates supplied by an independent pricing service. Certain securities traded only in the over-the-counter market are valued at the last bid price quoted by brokers making markets in the securities at the close of trading. Certain short-term securities are valued at amortized cost.
Other portfolio securities and assets, where market quotations are not readily available, are valued at fair value, as determined in good faith by the Fund’s Pricing Committee, following procedures established by the Board of Trustees.
Repurchase agreements. The Fund may enter into repurchase agreements. When a Fund enters into a repurchase agreement, it receives collateral which is held in a segregated account by the Fund’s custodian. The collateral amount is marked-to-market and monitored on a daily basis to ensure that the collateral held is in an amount not less than the principal amount of the repurchase agreement plus any accrued interest. In the event of a default by the counterparty, realization of the collateral proceeds could be delayed, during which time the collateral value may decline. Collateral for certain tri-party repurchase agreements is held at a third-party custodian bank in a segregated account for the benefit of the Fund.
Term loans (Floating rate loans). The Fund may invest in term loans, which often include debt securities that are rated below investment grade at the time of purchase. Term loans are generally subject to legal or contractual restrictions on resale. The liquidity of term loans, including the volume and frequency of secondary market trading in such loans, varies significantly over time and among individual loans. During periods of infrequent trading, valuing a term loan can be more difficult and buying and selling a term loan at an acceptable price can be more difficult and delayed, which could result in a loss.
A Fund’s ability to receive payments of principal, interest and other amounts in connection with term loans will depend primarily on the financial condition of the borrower. A Fund’s failure to receive scheduled payments on a term loan due to a default, bankruptcy or other reason, would adversely affect the Fund’s income and would likely reduce the value of its assets. Because many term loans are not rated by independent credit rating agencies, a decision to invest in a particular loan could depend exclusively on the subadviser’s credit analysis of the borrower and/or term loan agents. A Fund may have limited rights to enforce the terms of an underlying loan.
Security transactions and related investment income. Investment security transactions are accounted for on a trade date plus one basis for daily net asset value calculations. However, for financial reporting purposes, investment transactions are reported on trade date. Interest income is accrued as earned. Gains and losses on securities sold are determined on the basis of identified cost and may include proceeds from litigation. Dividend income is recorded on the ex-date, except for dividends of foreign securities where the dividend may not be known until after the ex-date. In those cases, dividend income is recorded when the Fund becomes aware of the dividends. Interest income includes coupon interest and amortization/accretion of premiums/discounts on debt securities. Debt obligations may be placed in a non-accrual status and related interest income may be reduced by stopping current accruals and writing off interest receivable when the collection of all or a portion of interest has become doubtful.
Securities lending. The Fund may lend its securities to earn additional income. It receives and maintains cash collateral received from the borrower in an amount not less than the market value of the loaned securities. The Fund will invest its collateral in John Hancock Collateral Investment Trust (JHCIT), an affiliate of the Fund, which has a floating net asset value (NAV) and invests in short term investments as part of the securities lending program. Although risk of the loss of the securities lent is mitigated by holding the collateral, the Fund could experience a delay in recovering its securities and a possible loss of income or value if the borrower fails to return the
| | |
| | Semiannual report | Floating Rate Income Fund | 29 |
securities or if collateral investments decline in value. The Fund may receive compensation for lending its securities by retaining a portion of the return on the investment of the collateral and compensation from fees earned from borrowers of the securities. Income received from JHCIT is a component of securities lending income as recorded on the Statement of Operations.
Line of credit. The Fund may borrow from banks for temporary or emergency purposes, including meeting redemption requests that otherwise might require the untimely sale of securities. Pursuant to the custodian agreement, the custodian may loan money to a Fund to make properly authorized payments. The Fund is obligated to repay the custodian for any overdraft, including any related costs or expenses. The custodian has a lien, security interest or security entitlement in any Fund property that is not segregated, to the maximum extent permitted by law for any overdraft.
In addition, the Fund and other affiliated funds have entered into an agreement with State Street Bank and Trust Company (SSBT) which enables them to participate in a $200 million unsecured committed line of credit. Prior to March 31, 2010, the amount of the line of credit was $300 million. A commitment fee, payable at the end of each calendar quarter, based on the average daily unused portion of the line of credit, is charged to each participating fund on a pro rata basis and is reflected in other expenses on the Statement of Operations. For the six months ended February 28, 2011, the Fund had no borrowings under the line of credit.
Effective March 30, 2011, the line of credit with SSBT expired, and a similar arrangement was established with Citibank N.A.
Expenses. The majority of expenses are directly attributable to an individual fund. Expenses that are not readily attributable to a specific fund are allocated among all funds in an equitable manner, taking into consideration, among other things, the nature and type of expense and the fund’s relative assets. Expense estimates are accrued in the period to which they relate and adjustments are made when actual amounts are known.
Class allocations. Income, common expenses and realized and unrealized gains (losses) are determined at the fund level and allocated daily to each class of shares based on the net asset value of the class. Class-specific expenses, such as distribution and service fees, if any, transfer agent fees, state registration fees and printing and postage, for all classes, are calculated daily at the class level based on the appropriate net asset value of each class and the specific expense rates applicable to each class.
Federal income taxes. The Fund intends to continue to qualify as a regulated investment company by complying with the applicable provisions of the Internal Revenue Code and will not be subject to federal income tax on taxable income that is distributed to shareholders. Therefore, no federal income tax provision is required.
As of August 31, 2010, the Fund had no uncertain tax positions that would require financial statement recognition, de-recognition or disclosure. The Fund’s federal tax return is subject to examination by the Internal Revenue Service for a period of three years.
Distribution of income and gains. Distributions to shareholders from net investment income and net realized gains, if any, are recorded on the ex-date. The Fund generally declares dividends daily and pays them monthly. Capital gain distributions, if any, are paid annually.
Distributions paid by the Fund with respect to each class of shares are calculated in the same manner, at the same time and are in the same amount, except for the effect of expenses that may be applied differently to each class.
Such distributions, on a tax basis, are determined in conformity with income tax regulations, which may differ from accounting principles generally accepted in the United States of America.
| |
| 30 | Floating Rate Income Fund | Semiannual report |
Capital accounts within financial statements are adjusted for permanent book-tax differences. These adjustments have no impact on net assets or the results of operations. Temporary book-tax differences, if any, will reverse in a subsequent period. Permanent book-tax differences are primarily attributable to defaulted bonds.
Note 3 — Guarantees and indemnifications
Under the Fund’s organizational documents, its Officers and Trustees are indemnified against certain liabilities arising out of the performance of their duties to the Fund. Additionally, in the normal course of business, the Fund enters into contracts with service providers that contain general indemnification clauses. The Fund’s maximum exposure under these arrangements is unknown, as this would involve future claims that may be made against the Fund that have not yet occurred. The risk of material loss from such claims is considered remote.
Note 4 — Fees and transactions with affiliates
John Hancock Investment Management Services, LLC (the Adviser), serves as investment adviser for the Funds. John Hancock Funds, LLC (the Distributor), an affiliate of the Adviser, serves as principal underwriter of the Funds. The Adviser and the Distributor are indirect wholly owned subsidiaries of Manulife Financial Corporation (MFC).
Management fee. The Fund has an investment management contract with the Adviser under which the Fund pays a daily management fee to the Adviser equivalent, on an annual basis, to the sum of: (a) 0.70% of the first $1,100,000,000 of the Fund’s aggregate daily net assets, (b) 0.675% of the next $900,000,000 and (c) 0.65% of the Fund’s aggregate net assets in excess of $2,000,000,000. Aggregate net assets include the net assets of the Fund and Floating Rate Income Trust, a series of John Hancock Trust. The Adviser has a subadvisory agreement with Western Asset Management Company. The Fund is not responsible for payment of the subadvisory fees.
The investment management fees incurred for the six months ended February 28, 2011 were equivalent to an annual effective rate of 0.69% of the Fund’s average daily net assets.
Expense reimbursements. The Adviser has voluntarily agreed to waive a portion of its management fee if certain expenses of the Fund exceed 0.15% of average net assets. Expenses excluded from this waiver are taxes, portfolio brokerage commissions, interest, litigation and indemnification expenses, and extraordinary expenses not incurred in the ordinary course of the Fund’s business, advisory fees, Rule 12b-1 fees, service fees, transfer agency fees, blue sky fees, printing and postage and fees under any agreements or plans of the Fund dealing with services for shareholders and others with beneficial interests in shares of the Fund. This expense reduction will continue in effect until terminated by the Adviser.
The Adviser has contractually agreed to limit the Fund’s total expenses, excluding interest and other extraordinary expenses not incurred in the ordinary course of the Fund’s business, to 1.20% for Class A, 1.95% for Class B, 1.95% for Class C and 0.85% for Class I shares of the Fund’s average daily net asset value, on an annual basis. Accordingly, these expense reductions amounted to $40,969 and $6,219 for Class A and Class B shares, respectively, for the period ended February 28, 2011. The expense reimbursements and limits will continue in effect until December 31, 2011, and thereafter until terminated by the Adviser on notice to the Trust.
The Adviser has voluntarily agreed to waive a portion of its management fee for certain Funds of the Trust and JHT (the Participating Funds), including Floating Rate Income Fund. The waiver equals, on an annualized basis, 0.01% of that portion of the aggregate net assets of all the Participating Funds that exceeds $85 billion. The amount of the reimbursement is calculated daily and allocated among all the Participating Funds in proportion to the daily net assets of each Fund. Accordingly, the expense reduction related to this agreement was $17,750.
| | |
| | Semiannual report | Floating Rate Income Fund | 31 |
Expense recapture. The Adviser may recapture operating expenses reimbursed or fees waived under previous expense limitation or waiver arrangements made subsequent to January 1, 2009, for a period of three years following the beginning of the month in which such reimbursements or waivers originally occurred. The table below outlines the amounts recovered during the six months ended February 28, 2011, and the amount of waived or reimbursed expenses subject to potential recovery and the respective expiration dates. Certain reimbursements or waivers are not subject to recapture.
| | | |
| AMOUNTS ELIGIBLE | AMOUNTS ELIGIBLE | AMOUNTS ELIGIBLE | AMOUNT RECOVERED |
| FOR RECOVERY | FOR RECOVERY | FOR RECOVERY | DURING THE PERIOD |
| THROUGH 8-1-12 | THROUGH 8-1-13 | THROUGH 2-1-14 | ENDED 2-28-11 |
|
| $14,199 | $7,453 | $47,188 | $2,889 |
Accounting and legal services. Pursuant to a service agreement, the Fund reimburses the Adviser for all expenses associated with providing the administrative, financial, legal, accounting and recordkeeping services of the Fund, including the preparation of all tax returns, periodic reports to shareholders and regulatory reports, among other services. These expenses are allocated to each share class based on its relative net assets at the time the expense was incurred. These accounting and legal services fees incurred for the six months ended February 28, 2011 amounted to an annual rate of 0.01% of the Fund’s average daily net assets.
Distribution and service plans. The Fund has a distribution agreement with the Distributor. The Fund has adopted distribution and service plans with respect to Class A, Class B, Class C and Class 1 shares pursuant to Rule 12b-1 under the 1940 Act, to pay the Distributor for services provided as the distributor of shares of the Fund. The Fund may pay up to the following contractual rates of distribution and service fees under these arrangements, expressed as an annual percentage of average daily net assets for each class of the Fund’s shares.
| | | |
| CLASS | 12b–1 FEE | | |
| | |
| Class A | 0.30% | | |
| Class B | 1.00% | | |
| Class C | 1.00% | | |
| Class 1 | 0.05% | | |
Sales charges. Class A shares are assessed up-front sales charges, which resulted in payments to the Distributor amounting to $482,780 for the six months ended February 28, 2011. Of this amount, $91,694 was retained and used for printing prospectuses, advertising, sales literature and other purposes, $387,650 was paid as sales commissions to broker-dealers and $3,436 was paid as sales commissions to sales personnel of Signator Investors, Inc. (Signator Investors), a broker-dealer affiliate of the Adviser.
Class B and Class C shares are subject to contingent deferred sales charges (CDSC). Class B shares that are redeemed within six years of purchase are subject to CDSC, at declining rates, beginning at 5.00% of the lesser of the current market value at the time of redemption or the original purchase cost of the shares being redeemed. Class C shares that are redeemed within one year of purchase are subject to a 1.00% CDSC on the lesser of the current market value at the time of redemption or the original purchase cost of the shares being redeemed. Proceeds from CDSCs are used to compensate the Distributor for providing distribution-related services in connection with the sale of these shares. During the six months ended February 28, 2011, CDSCs received by the Distributor amounted to $13,693 and $24,709 for Class B and Class C shares, respectively.
Transfer agent fees. The Fund has a transfer agent agreement with John Hancock Signature Services, Inc. (Signature Services or Transfer Agent), an affiliate of the Adviser. The transfer agent fees paid to Signature Services are determined based on the cost to Signature Services (Signature
| |
| 32 | Floating Rate Income Fund | Semiannual report |
Services Cost) of providing recordkeeping services. The Signature Services Cost includes a component of allocated John Hancock corporate overhead for providing transfer agent services to the Fund and to all other John Hancock affiliated funds. It also includes out-of-pocket expenses that are comprised of payments made to third-parties for recordkeeping services provided to their clients who invest in one or more John Hancock funds. In addition, Signature Services Cost may be reduced by certain revenues that Signature Services receives in connection with the service it provides to the funds. Signature Services Cost is calculated monthly and allocated, as applicable, to four categories of share classes: Institutional Share Classes, Retirement Share Classes, Municipal Bond Classes and all other Retail Share Classes. Within each of these categories, the applicable costs are allocated to the affected John Hancock affiliated funds and/or classes, based on the relative average daily net assets. Additionally, Class 1 and Class NAV shares do not pay transfer agent fees.
Class level expenses. Class level expenses for the six months ended February 28, 2011 were:
| | | | |
| | DISTRIBUTION | TRANSFER | STATE | PRINTING AND |
| CLASS | AND SERVICE FEES | AGENT FEES | REGISTRATION FEES | POSTAGE |
|
| Class A | $496,511 | $298,741 | $22,479 | $8,677 |
| Class B | 55,005 | 9,923 | 8,308 | 469 |
| Class C | 576,546 | 103,888 | 12,503 | 3,366 |
| Class I | — | 28,426 | 9,968 | 3,834 |
| Class 1 | 29 | — | — | — |
| Total | $1,128,091 | $440,978 | $53,258 | $16,346 |
Trustee expenses. The Trust compensates each Trustee who is not an employee of the Adviser or its affiliates. The costs of paying Trustee compensation and expenses are allocated to each Fund based on its average daily net assets.
Note 5 — Fund share transactions
Transactions in Fund shares for the six months ended February 28, 2011 and for the year ended August 31, 2010 were as follows:
| | | | |
| | Six months ended 2-28-11 | Year ended 8-31-10 |
| | Shares | Amount | Shares | Amount |
| Class A shares | | | | |
|
| Sold | 25,522,065 | $246,112,122 | 23,743,723 | $225,255,985 |
| Distributions reinvested | 1,734,274 | 16,537,287 | 966,159 | 9,120,106 |
| Repurchased | (5,677,616) | (54,664,246) | (8,376,626) | (79,041,571) |
| | | | | |
| Net increase | 21,578,723 | $207,985,163 | 16,333,256 | $155,334,520 |
| |
| Class B shares | | | | |
|
| Sold | 775,554 | $7,471,298 | 823,756 | $7,798,559 |
| Distributions reinvested | 43,011 | 409,781 | 19,662 | 185,396 |
| Repurchased | (143,290) | (1,380,944) | (175,670) | (1,656,948) |
| | | | | |
| Net increase | 675,275 | $6,500,135 | 667,748 | $6,327,007 |
| |
| Class C shares | | | | |
|
| Sold | 7,479,028 | $72,305,045 | 8,204,079 | $78,184,629 |
| Distributions reinvested | 463,637 | 4,432,691 | 203,854 | 1,930,673 |
| Repurchased | (982,306) | (9,488,296) | (909,045) | (8,586,389) |
| | | | |
| Net increase | 6,960,359 | $67,249,440 | 7,498,888 | $71,528,913 |
| | |
| | Semiannual report | Floating Rate Income Fund | 33 |
| | | | |
| | Six months ended 2-28-11 | Year ended 8-31-10 |
| | Shares | Amount | Shares | Amount |
| Class I shares | | | | |
|
| Sold | 12,287,669 | $117,944,275 | 10,084,734 | $95,565,532 |
| Distributions reinvested | 443,071 | 4,225,604 | 338,995 | 3,201,997 |
| Repurchased | (2,262,387) | (21,753,684) | (5,756,424) | (54,676,611) |
| | | | | |
| Net increase | 10,468,353 | $100,416,195 | 4,667,305 | $44,090,918 |
| |
| Class 1 shares | | | | |
|
| Distributions reinvested | 708 | $6,743 | 722 | $6,792 |
| | | | |
| Net increase | 708 | $6,743 | 722 | $6,792 |
| |
| Class NAV shares | | | | |
|
| Sold | 3,499,425 | $33,694,781 | 17,453,696 | $163,858,535 |
| Distributions reinvested | 6,858,107 | 65,371,057 | 7,405,238 | 69,762,722 |
| Repurchased | (8,116,840) | (77,545,722) | (11,442,754) | (106,996,259) |
| | | | | |
| Net increase | 2,240,692 | $21,520,116 | 13,416,180 | $126,624,998 |
| |
| Net increase | 41,924,110 | $403,677,792 | 42,584,099 | $403,913,148 |
|
Affiliates of the Fund owned 100% of shares of beneficial interest of Class 1 and Class NAV on February 28, 2011.
Note 6 — Purchase and sale of securities
Purchases and sales of securities, other than short-term securities, aggregate $1,258,903,294 and $718,938,050, respectively, for the six months ended February 28, 2011.
Note 7 — Investment by affiliated funds
Certain investors in the Fund are affiliated funds and are managed by the Adviser and its affiliates. The affiliated funds do not invest in the Fund for the purpose of exercising management or control; however, this investment may represent a significant portion of the Fund’s net assets. At February 28, 2011, the following funds had an affiliate ownership concentration of 5% or more of the Fund’s net assets:
| | | |
| | AFFILIATE | | |
| FUND | CONCENTRATION | | |
| | |
| Lifestyle Balanced Portfolio | 19.4% | | |
| | |
| Lifestyle Conservative Portfolio | 7.2% | | |
| | |
| Lifestyle Growth Portfolio | 16.7% | | |
| | |
| Lifestyle Moderate Portfolio | 8.9% | | |
| |
| 34 | Floating Rate Income Fund | Semiannual report |
More information
| | |
| Trustees | Investment adviser | |
| James M. Oates, Chairman | John Hancock Investment Management | |
| James R. Boyle† | Services, LLC | |
| Charles L. Bardelis* | | |
| Peter S. Burgess* | Subadviser | |
| Grace K. Fey | Western Asset Management Company | |
| Theron S. Hoffman | | |
| Hassell H. McClellan | Principal distributor | |
| Steven M. Roberts* | John Hancock Funds, LLC | |
| | | |
| Officers | Custodian | |
| Hugh McHaffie | State Street Bank and Trust Company | |
| President | | |
| | Transfer agent | |
| Thomas M. Kinzler | John Hancock Signature Services, Inc. | |
| Secretary and Chief Legal Officer | | |
| Legal counsel | |
| Francis V. Knox, Jr. | K&L Gates LLP | |
| Chief Compliance Officer | | |
| |
| |
| Michael J. Leary | The report is certified under the Sarbanes-Oxley | |
| Treasurer | Act, which requires mutual funds and other public | |
| companies to affirm that, to the best of their | |
| Charles A. Rizzo | knowledge, the information in their financial reports | |
| Chief Financial Officer | is fairly and accurately stated in all material respects. | |
| |
| |
| John G. Vrysen | | |
| Chief Operating Officer | | |
| | |
| *Member of the Audit Committee | | |
| †Non-Independent Trustee | | |
The Fund’s proxy voting policies and procedures, as well as the Fund’s proxy voting record for the most recent twelve-month period ended June 30, are available free of charge on the Securities and Exchange Commission (SEC) Web site at www.sec.gov or on our Web site.
The Fund’s complete list of portfolio holdings, for the first and third fiscal quarters, is filed with the SEC on Form N-Q. The Fund’s Form N-Q is available on our Web site and the SEC’s Web site, www.sec.gov, and can be reviewed and copied (for a fee) at the SEC’s Public Reference Room in Washington, DC. Call 1-800-SEC-0330 to receive information on the operation of the SEC’s Public Reference Room.
We make this information on your fund, as well as monthly portfolio holdings, and other fund details available on our Web site www.jhfunds.com or by calling 1-800-225-5291.
| | |
| You can also contact us: | | |
| 1-800-225-5291 | Regular mail: | Express mail: |
| jhfunds.com | John Hancock Signature Services, Inc. | John Hancock Signature Services, Inc. |
| | P.O. Box 55913 | Mutual Fund Image Operations |
| | Boston, MA 02205-5913 | 30 Dan Road |
| | | Canton, MA 02021 |
| | |
| | Semiannual report | Floating Rate Income Fund | 35 |

1-800-225-5291
1-800-554-6713 TDD
1-800-338-8080 EASI-Line
www.jhfunds.com
Now available: electronic delivery
www.jhfunds.com/edelivery
| |
| This report is for the information of the shareholders of John Hancock Floating Rate Income Fund. | 328SA 2/11 |
| It is not authorized for distribution to prospective investors unless preceded or accompanied by a prospectus. | 4/11 |

A look at performance
For the period ended February 28, 2011
| | | | | | | | | | |
| | Average annual total returns (%) | | Cumulative total returns (%) | | |
| | with maximum sales charge (POP) | | with maximum sales charge (POP) | |
|
| | | | | Since | | | | | | Since |
| | 1-year | 5-year | 10-year | inception1 | | 6-months | 1-year | 5-year | 10-year | inception1 |
|
| Class A2 | 24.15 | 7.09 | — | 9.50 | | 31.61 | 24.15 | 40.84 | — | 62.85 |
|
| Class I2,3 | 31.03 | 8.91 | — | 11.29 | | 38.81 | 31.03 | 53.21 | — | 77.73 |
|
| Class 13 | 31.30 | 8.99 | — | 11.37 | | 38.96 | 31.30 | 53.80 | — | 78.42 |
|
| Class NAV 3 | 31.36 | 9.04 | — | 11.42 | | 39.00 | 31.36 | 54.13 | — | 78.86 |
|
Performance figures assume all distributions are reinvested. Public offering price (POP) figures reflect maximum sales charges on Class A shares of 5%. Sales charges are not applicable for Class I, Class 1 and Class NAV shares.
The expense ratios of the Fund, both net (including any fee waivers or expense limitations) and gross (excluding any fee waivers or expense limitations), are set forth according to the most recent publicly available prospectuses for the Fund and may differ from the expense ratios disclosed in the Financial Highlights tables in this report. The waivers and expense limitations are contractual at least until 12-31-11. The net expenses are as follows: Class A — 1.60% and Class I — 1.30%. Had the fee waivers and expense limitations not been in place, the gross expenses would be as follows: Class A — 1.70% and Class I — 1.43%. The net expenses equal the gross expenses and are as follows: Class 1 — 1.11%, Class NAV — 1.06%.
The returns reflect past results and should not be considered indicative of future performance. The return and principal value of an investment will fluctuate so that shares, when redeemed, may be worth more or less than their original cost. Due to market volatility, the Fund’s current performance may be higher or lower than the performance shown. For current to the most recent month end performance data, please call 1–800–225–5291 or visit the Fund’s Web site at www.jhfunds.com.
The performance table above and the chart on the next page do not reflect the deduction of taxes that a shareholder would pay on fund distributions or the redemption of fund shares.
The Fund’s performance results reflect any applicable expense reductions, without which the expenses increase and results would have been less favorable.
1 From 10-15-05.
2 10-15-05 is the inception date for the oldest class of shares, Class NAV shares. The inception date for Class A shares and Class I shares is 1-4-10. The returns prior to this date are those of Class NAV shares that have been recalculated to apply the gross fees and expenses of Class A and Class I shares.
3 For certain types of investors, as described in the Fund’s Class I, Class 1 and Class NAV share prospectuses.
| |
| 6 | Natural Resources Fund | Semiannual report |

| | | | | | | |
| | | | With | | | | |
| | Period | Without | maximum | | | | |
| | beginning | sales charge | sales charge | Index 14 | Index 24 | Index 34 | Index 44 |
|
| Class A3 | 10-15-05 | $17,145 | $16,285 | $16,382 | $14,544 | $21,417 | $10,518 |
|
| Class I2,3 | 10-15-05 | 17,773 | 17,773 | 16,382 | 14,544 | 21,417 | 10,518 |
|
| Class 12 | 10-15-05 | 17,842 | 17,842 | 16,382 | 14,544 | 21,417 | 10,518 |
|
Performance figures assume all distributions are reinvested. Figures reflect maximum sales charges on Class A shares of 5%. Sales charges are not applicable for Class I, Class 1 and Class NAV shares.
60% MSCI World Energy/30% MSCI World Metals & Mining/10% MSCI Paper & Forest Products Combined Index (gross of foreign withholding tax on dividends) — Index 1 — is comprised of 60% MSCI World Energy Index, 30% MSCI World Metals & Mining Index and 10% MSCI World Paper & Forest Products Index.
MSCI World Energy Index (gross of foreign withholding tax on dividends) — Index 2 — consists of all the companies in the Energy sector of the MSCI World Index.
MSCI World Metals & Mining Index (gross of foreign withholding tax on dividends) — Index 3 — consists of all the companies in the Metals & Mining industry of the MSCI World Index.
MSCI World Paper & Forest Products Index (gross of foreign withholding tax on dividends) — Index 4 —consists of all the companies in the Paper & Forest industry of the MSCI World Index.
It is not possible to invest directly in an index. Index figures do not reflect sales charges or foreign currency impact, which would have resulted in different values if they did.
1 NAV represents net asset value.
2 For certain types of investors, as described in the Fund’s Class I, Class 1 and Class NAV share prospectuses.
3 10-15-05 is the inception date for the oldest class of shares, Class NAV shares. The inception date for Class A shares and Class I shares is 1-4-10. The returns prior to this date are those of Class NAV shares that have been recalculated to apply the gross fees and expenses of Class A and Class I shares.
4 Since inception returns for the index begin on the month end closest to the actual inception date of the fund.
| |
| Semiannual report | Natural Resources Fund | 7 |
Your expenses
These examples are intended to help you understand your ongoing operating expenses.
Understanding fund expenses
As a shareholder of the Fund, you incur two types of costs:
■ Transaction costs which include sales charges (loads) on purchases or redemptions (varies by share class), minimum account fee charge, etc.
■ Ongoing operating expenses including management fees, distribution and service fees (if applicable), and other fund expenses.
We are going to present only your ongoing operating expenses here.
Actual expenses/actual returns
This example is intended to provide information about the Fund’s actual ongoing operating expenses, and is based on the Fund’s actual return. It assumes an account value of $1,000.00 on September 1, 2010 with the same investment held until February 28, 2011.
| | | |
| | Account value | Ending value | Expenses paid during |
| | on 9-1-10 | on 2-28-11 | period ended 2-28-111 |
|
| Class A | $1,000.00 | $1,385.70 | $9.46 |
|
| Class I | 1,000.00 | 1,388.10 | 7.70 |
|
| Class 1 | 1,000.00 | 1,389.60 | 6.58 |
|
| Class NAV | 1,000.00 | 1,390.00 | 6.28 |
|
Together with the value of your account, you may use this information to estimate the operating expenses that you paid over the period. Simply divide your account value at February 28, 2011, by $1,000.00, then multiply it by the “expenses paid” for your share class from the table above. For example, for an account value of $8,600.00, the operating expenses should be calculated as follows:
| |
| 8 | Natural Resources Fund | Semiannual report |
Hypothetical example for comparison purposes
This table allows you to compare the Fund’s ongoing operating expenses with those of any other fund. It provides an example of the Fund’s hypothetical account values and hypothetical expenses based on each class’s actual expense ratio and an assumed 5% annualized return before expenses (which is not the Fund’s actual return). It assumes an account value of $1,000.00 on September 1, 2010, with the same investment held until February 28, 2011. Look in any other fund shareholder report to find its hypothetical example and you will be able to compare these expenses.
| | | |
| | Account value | Ending value | Expenses paid during |
| | on 9-1-10 | on 2-28-11 | period ended 2-28-111 |
|
| Class A | $1,000.00 | $1,016.90 | $8.00 |
|
| Class I | 1,000.00 | 1,018.30 | 6.51 |
|
| Class 1 | 1,000.00 | 1,019.30 | 5.56 |
|
| Class NAV | 1,000.00 | 1,019.50 | 5.31 |
|
Remember, these examples do not include any transaction costs, therefore, these examples will not help you to determine the relative total costs of owning different funds. If transaction costs were included, your expenses would have been higher. See the prospectus for details regarding transaction costs.
1 Expenses are equal to the Fund’s annualized expense ratio of 1.60%, 1.30%, 1.11% and 1.06% for Class A, Class I, Class 1 and Class NAV, respectively, multiplied by the average account value over the period, multiplied by 181/365 (to reflect the one-half year period).
| |
| Semiannual report | Natural Resources Fund | 9 |
Portfolio summary
| | | | |
| Top 10 Holdings1 | | | | |
|
| BG Group PLC | 4.1% | | Chesapeake Energy Corp. | 3.2% |
| |
|
| EOG Resources, Inc. | 4.0% | | Canadian Natural Resources, Ltd. | 3.1% |
| |
|
| ENI SpA | 3.8% | | Suncor Energy, Inc. | 3.0% |
| |
|
| Anglo American PLC | 3.6% | | Vedanta Resources PLC | 3.0% |
| |
|
| Exxon Mobil Corp. | 3.3% | | BHP Billiton PLC | 2.9% |
| |
|
|
| |
| Sector Composition2,3 | | | | |
|
| Energy | 61% | | Industrials | 1% |
| |
|
| Materials | 36% | | Short-Term Investments & Other | 2% |
| |
|
|
| | | | |
| Country Concentration2,4 | | | | |
|
| United States | 39% | | Italy | 4% |
| |
|
| United Kingdom | 18% | | Russia | 3% |
| |
|
| Canada | 18% | | Japan | 3% |
| |
|
| South Africa | 5% | | Other Countries | 3% |
| |
|
| Brazil | 5% | | Short-Term Investments & Other | 2% |
| |
|
|
1 As a percentage of net assets on 2-28-11. Cash and cash equivalents are not included in the Top 10 Holdings.
2 As a percentage of net assets on 2-28-11.
3 Sector investing is subject to greater risks than the market as a whole. Because the Fund may focus on particular sectors of the economy, its performance may depend on the performance of those sectors.
4 International investing involves special risks, such as political, economic and currency and differences in accounting standards and financial reporting.
| |
| 10 | Natural Resources Fund | Semiannual report |
Fund’s investments
As of 2-28-11 (unaudited)
| | |
| | Shares | Value |
|
| Common Stocks 96.75% | | $939,934,687 |
|
| (Cost $744,407,461) | | |
| | | |
| Energy 61.35% | | 596,020,468 |
| | | |
| Energy Equipment & Services 2.20% | | |
|
| Tidewater, Inc. | 105,300 | 6,550,713 |
|
| Transocean, Ltd. (I)(L) | 175,400 | 14,844,102 |
| | | |
| Oil, Gas & Consumable Fuels 59.15% | | |
|
| BG Group PLC | 1,639,825 | 40,006,727 |
|
| BP PLC, SADR | 572,127 | 27,730,996 |
|
| Bumi Resources Tbk PT | 38,525,000 | 13,194,849 |
|
| Cameco Corp. (Toronto Stock Exchange) | 538,922 | 21,955,682 |
|
| Canadian Natural Resources, Ltd. | 606,966 | 30,568,521 |
|
| Chesapeake Energy Corp. (L) | 871,400 | 31,030,554 |
|
| China Shenhua Energy Company, Ltd., Class H | 2,228,500 | 9,271,717 |
|
| CONSOL Energy, Inc. | 485,286 | 24,608,853 |
|
| Devon Energy Corp. | 186,100 | 17,016,984 |
|
| EnCana Corp. | 576,154 | 18,727,748 |
|
| ENI SpA, SADR (L) | 746,500 | 36,466,525 |
|
| EOG Resources, Inc. (L) | 349,069 | 39,203,939 |
|
| EQT Corp. (L) | 98,160 | 4,839,288 |
|
| Exxon Mobil Corp. | 375,505 | 32,116,943 |
|
| Gazprom OAO, SADR | 649,186 | 19,034,134 |
|
| Imperial Oil, Ltd. | 472,600 | 24,546,844 |
|
| Oil Search, Ltd. | 1,377,570 | 9,849,470 |
|
| PetroChina Company, Ltd., ADR (L) | 87,600 | 11,942,508 |
|
| Petroleo Brasileiro SA, ADR | 680,896 | 27,120,088 |
|
| Reliance Industries, Ltd. | 536,785 | 11,462,501 |
|
| Reliance Industries, Ltd., GDR (S) | 22,144 | 943,113 |
|
| Reliance Industries, Ltd., GDR | 247,949 | 10,554,371 |
|
| Rosneft Oil Company, GDR | 26,673 | 251,145 |
|
| Rosneft Oil Company, GDR (London Exchange) | 1,482,889 | 14,027,841 |
|
| Sasol, Ltd., SADR (L) | 177,300 | 9,728,451 |
|
| Southwestern Energy Company (I)(L) | 637,200 | 25,156,656 |
|
| StatoilHydro ASA, SADR (L) | 510,200 | 13,464,178 |
|
| Suncor Energy, Inc. | 622,141 | 29,238,802 |
|
| Ultra Petroleum Corp. (I)(L) | 453,500 | 20,566,225 |
| | |
| See notes to financial statements | Semiannual report | Natural Resources Fund | 11 |
| | | |
| | | Shares | Value |
| Industrials 0.25% | | | $2,452,617 |
| | | | |
| Industrial Conglomerates 0.25% | | | |
|
| Beijing Enterprises Holdings, Ltd. | | 441,500 | 2,452,617 |
| | | | |
| Materials 35.15% | | | 341,461,602 |
| | | | |
| Chemicals 1.51% | | | |
|
| Sumitomo Chemical Company, Ltd. (L) | | 2,716,000 | 14,664,071 |
| | | | |
| Construction Materials 1.58% | | | |
|
| CRH PLC (London Exchange) | | 666,408 | 15,388,267 |
| | | | |
| Metals & Mining 32.06% | | | |
|
| Alumina, Ltd. | | 8,549,291 | 20,918,028 |
|
| Anglo American PLC | | 649,083 | 35,156,731 |
|
| Anglo Platinum, Ltd. | | 231,399 | 22,500,035 |
|
| AngloGold Ashanti, Ltd., SADR (L) | | 210,041 | 10,258,402 |
|
| ArcelorMittal (L) | | 506,100 | 18,558,687 |
|
| BHP Billiton PLC | | 702,935 | 27,849,352 |
|
| Compania de Minas Buenaventura SA, ADR | | 271,100 | 12,652,237 |
|
| First Quantum Minerals, Ltd. | | 135,500 | 17,642,684 |
|
| Gold Fields, Ltd. | | 515,204 | 9,237,740 |
|
| Kazakhmys PLC | | 554,147 | 13,000,498 |
|
| Kinross Gold Corp. | | 873,800 | 13,858,468 |
|
| Lundin Mining Corp. (I)(L) | | 1,835,500 | 14,452,756 |
|
| Mongolian Mining Corp. (I) | | 10,129,500 | 12,904,184 |
|
| Nucor Corp. (L) | | 309,300 | 14,834,028 |
|
| Sumitomo Metal Industries, Ltd. | | 6,607,000 | 16,781,432 |
|
| Vale SA, SADR (L) | | 732,304 | 21,947,151 |
|
| Vedanta Resources PLC (L) | | 737,146 | 28,856,851 |
|
| |
| Warrants 1.09% | | | $10,609,331 |
|
| (Cost $12,054,327) | | | |
| | | | |
| Materials 1.09% | | | 10,609,331 |
| NMDC, Ltd. (Expiration date: 03-25-15, Strike Price: INR 0.00001) (I) | 1,825,930 | 10,609,331 |
| |
| | Yield | Shares | Value |
| Securities Lending Collateral 17.09% | | | $165,998,459 |
|
| (Cost $165,999,864) | | | |
| John Hancock Collateral Investment Trust (W) | 0.2855% (Y) | 16,587,571 | 165,998,459 |
| | |
| 12 | Natural Resources Fund | Semiannual report | See notes to financial statements |
| | |
| Short-Term Investments 4.07% | | $39,500,000 |
|
| (Cost $39,500,000) | | |
| | Par value | Value |
| Repurchase Agreement 4.07% | | 39,500,000 |
| Bank of New York Tri-Party Repurchase Agreement dated 2-28-11 at | | |
| 0.200% to be repurchased at $39,500,219 on 3-1-11, collateralized | | |
| by $17,102,613 U.S. Treasury Notes, 2.000% due 1-15-14 (valued at | | |
| $17,140,868, including interest) and $23,115,080 U.S. Treasury Notes, | | |
| 1.250% due 7-15-20 (valued at $23,149,170, including interest) | $39,500,000 | 39,500,000 |
| |
| Total investments (Cost $961,961,652)† 119.00% | $1,156,042,477 |
|
| |
| Other assets and liabilities, net (19.00%) | | ($184,580,200) |
|
| |
| Total net assets 100.00% | | $971,462,277 |
|
The percentage shown for each investment category is the total value of the category as a percentage of the net assets of the Fund.
ADR American Depositary Receipts
GDR Global Depositary Receipt
INR Indian Rupee
SADR Sponsored American Depositary Receipts
(I) Non-income producing security.
(L) All or a portion of this security is on loan as of 2-28-11.
(S) These securities are exempt from registration under Rule 144A of the Securities Act of 1933. Such securities may be resold, normally to qualified institutional buyers, in transactions exempt from registration.
(W) Investment is an affiliate of the Fund, the adviser and/or subadviser. Also, it represents the investment of securities lending collateral received.
(Y) The rate shown is the annualized seven-day yield as of 2-28-11.
† At 2-28-11, the aggregate cost of investment securities for federal income tax purposes was $972,777,259. Net unrealized appreciation aggregated $183,265,218, of which $186,860,231 related to appreciated investment securities and $3,595,013 related to depreciated investment securities.
| | | |
| The Fund had the following country concentration as a percentage of net assets on 2-28-11: | | |
| United States | 39% | | |
| United Kingdom | 18% | | |
| Canada | 18% | | |
| South Africa | 5% | | |
| Brazil | 5% | | |
| Italy | 4% | | |
| Russia | 3% | | |
| Japan | 3% | | |
| Other Countries | 3% | | |
| Short-Term Investments & Other | 2% | | |
| | |
| See notes to financial statements | Semiannual report | Natural Resources Fund | 13 |
F I N A N C I A L S T A T E M E N T S
Financial statements
Statement of assets and liabilities 2-28-11 (unaudited)
This Statement of Assets and Liabilities is the Fund’s balance sheet. It shows the value of what the Fund owns, is due and owes. You’ll also find the net asset value and the maximum offering price per share.
| |
| Assets | |
|
| Investments in unaffiliated issuers, at value (Cost $795,961,788) including | |
| $164,179,070 of securities loaned (Note 2) | $990,044,018 |
| Investments in affiliated issuers, at value (Cost $165,999,864) (Note 2) | 165,998,459 |
| | |
| Total investments, at value (Cost $961,961,652) | 1,156,042,477 |
| Cash | 58,946 |
| Foreign currency, at value (Cost $17) | 17 |
| Receivable for fund shares sold | 125,131 |
| Dividends and interest receivable | 1,051,443 |
| Receivable for securities lending income | 26,706 |
| Receivable due from adviser | 1,196 |
| Other receivables and prepaid expenses | 25,984 |
| | |
| Total assets | 1,157,331,900 |
| |
| Liabilities | |
|
| Payable for investments purchased | 6,747,644 |
| Payable for fund shares repurchased | 12,903,427 |
| Payable upon return of securities loaned (Note 2) | 165,998,358 |
| Payable to affiliates | |
| Accounting and legal services fees | 20,900 |
| Transfer agent fees | 2,819 |
| Trustees’ fees | 958 |
| Other liabilities and accrued expenses | 195,517 |
| | |
| Total liabilities | 185,869,623 |
| |
| Net assets | |
|
| Capital paid-in | $731,864,703 |
| Accumulated distributions in excess of net investment income | (736,343) |
| Accumulated net realized gain on investments and foreign | |
| currency transactions | 46,246,702 |
| Net unrealized appreciation (depreciation) on investments and translation | |
| of assets and liabilities in foreign currencies | 194,087,215 |
| | |
| Net assets | $971,462,277 |
| |
| Net asset value per share | |
|
| Based on net asset values and shares outstanding — the Fund has an | |
| unlimited number of shares authorized with no par value | |
| Class A ($10,216,461 ÷ 402,630 shares) | $25.37 |
| Class I ($2,363,209 ÷ 93,070 shares) | $25.39 |
| Class 1 ($243,491,825 ÷ 9,522,888 shares) | $25.57 |
| Class NAV ($715,390,782 ÷ 28,163,016 shares) | $25.40 |
| |
| Maximum offering price per share | |
|
| Class A (net asset value per share ÷ 95%) | $26.71 |
| | |
| 14 | Natural Resources Fund | Semiannual report | See notes to financial statements |
F I N A N C I A L S T A T E M E N T S
Statement of operations For the six-month period ended 2-28-11
(unaudited)
This Statement of Operations summarizes the Fund’s investment income earned and expenses incurred in operating the Fund. It also shows net gains (losses) for the period stated.
| |
| Investment income | |
|
| Dividends | $4,992,604 |
| Securities lending | 214,009 |
| Interest | 25,500 |
| Less foreign taxes withheld | (350,407) |
| | |
| Total investment income | 4,881,706 |
| |
| Expenses | |
|
| Investment management fees (Note 4) | 4,203,311 |
| Distribution and service fees (Note 4) | 57,503 |
| Accounting and legal services fees (Note 4) | 60,436 |
| Transfer agent fees (Note 4) | 5,886 |
| Trustees’ fees (Note 4) | 3,919 |
| State registration fees (Note 4) | 10,509 |
| Printing and postage (Note 4) | 1,783 |
| Professional fees | 23,017 |
| Custodian fees | 183,035 |
| Registration and filing fees | 6,361 |
| Other | 5,303 |
| | |
| Total expenses | 4,561,063 |
| Less expense reductions and amount recaptured (Note 4) | (18,031) |
| | |
| Net expenses | 4,543,032 |
| | |
| Net investment income | 338,674 |
| |
| Realized and unrealized gain (loss) | |
|
| Net realized gain (loss) on | |
| Investments in unaffiliated issuers | 71,957,778 |
| Investments in affiliated issuers | (32,738) |
| Foreign currency transactions | (51,175) |
| | 71,873,865 |
| Change in net unrealized appreciation (depreciation) of | |
| Investments in unaffiliated issuers | 200,767,767 |
| Investments in affiliated issuers | (344) |
| Translation of assets and liabilities in foreign currencies | 17,843 |
| | 200,785,266 |
| Net realized and unrealized gain | 272,659,131 |
| | |
| Increase in net assets from operations | $272,997,805 |
| | |
| See notes to financial statements | Semiannual report | Natural Resources Fund | 15 |
F I N A N C I A L S T A T E M E N T S
Statements of changes in net assets
These Statements of Changes in Net Assets show how the value of the Fund’s net assets has changed during the last two periods. The difference reflects earnings less expenses, any investment gains and losses, distributions, if any, paid to shareholders and the net of Fund share transactions.
| | |
| | Six months | |
| | ended | Year |
| | 2-28-11 | ended |
| | (unaudited) | 8-31-10 |
| Increase (decrease) in net assets | | |
|
| From operations | | |
| Net investment income | $338,674 | $4,376,194 |
| Net realized gain | 71,873,865 | 20,688,948 |
| Change in net unrealized appreciation (depreciation) | 200,785,266 | 11,532,946 |
| | | |
| Increase in net assets resulting from operations | 272,997,805 | 36,598,088 |
| | | |
| Distributions to shareholders | | |
| From net investment income | | |
| Class I | (4,520) | — |
| Class 1 | (861,433) | (998,904) |
| Class NAV | (3,098,884) | (3,812,968) |
| From net realized gain | | |
| Class A | (12,086) | — |
| Class I | (3,001) | — |
| Class 1 | (347,749) | — |
| Class NAV | (1,133,433) | — |
| | | |
| Total distributions | (5,461,106) | (4,811,872) |
| | | |
| From Fund share transactions (Note 5) | (2,357,925) | 6,008,992 |
| | | |
| Total increase | 265,178,774 | 37,795,208 |
| |
| Net assets | | |
|
| Beginning of period | 706,283,503 | 668,488,295 |
| | | |
| End of period | $971,462,277 | $706,283,503 |
| | | |
| Undistributed (accumulated distribution in excess of) | | |
| net investment income | ($736,343) | $2,889,820 |
| | |
| 16 | Natural Resources Fund | Semiannual report | See notes to financial statements |
Financial highlights
The Financial Highlights show how the Fund’s net asset value for a share has changed during the period.
| | | | | | |
| CLASS A SHARES Period ended | | | | | 2-28-111 | 8-31-102 |
| |
| Per share operating performance | | | | | | |
|
| Net asset value, beginning of period | | | | | $18.34 | $20.70 |
| Net investment income (loss)3 | | | | | (0.06) | 0.05 |
| Net realized and unrealized gain (loss) on investments | | | | | 7.13 | (2.41) |
| Total from investment operations | | | | | 7.07 | (2.36) |
| Less distributions | | | | | | |
| From net realized gain | | | | | (0.04) | — |
| Net asset value, end of period | | | | | $25.37 | $18.34 |
| Total return (%)4 | | | | | 38.575,6 | (11.40)5,6 |
| |
| Ratios and supplemental data | | | | | | |
|
| Net assets, end of period (in millions) | | | | | $10 | $3 |
| Ratios (as a percentage of average net assets): | | | | | | |
| Expenses before reductions and amounts recaptured | | | | | 1.787 | 1.817 |
| Expenses including reductions and amounts recaptured | | | | | 1.607 | 1.607 |
| Net investment income (loss) | | | | | (0.53)7 | 0.417 |
| Portfolio turnover (%) | | | | | 50 | 708 |
| | | | | |
1 Semiannual period from 9-1-10 to 2-28-11. Unaudited.
2 The inception date for Class A shares is 1-4-10.
3 Based on the average daily shares outstanding.
4 Does not reflect the effect of sales charges, if any.
5 Not annualized.
6 Total returns would have been lower had certain expenses not been reduced during the periods shown.
7 Annualized.
8 Portfolio turnover is shown for the period from 9-1-09 to 8-31-10.
| | |
| See notes to financial statements | Semiannual report | Natural Resources Fund | 17 |
| | | | | | |
| CLASS I SHARES Period ended | | | | | 2-28-111 | 8-31-102 |
| |
| Per share operating performance | | | | | | |
|
| Net asset value, beginning of period | | | | | $18.37 | $20.70 |
| Net investment income (loss)3 | | | | | (0.02) | 0.10 |
| Net realized and unrealized gain (loss) on investments | | | | | 7.14 | (2.43) |
| Total from investment operations | | | | | 7.12 | (2.33) |
| Less distributions | | | | | | |
| From net investment income | | | | | (0.06) | — |
| From net realized gain | | | | | (0.04) | — |
| Total distributions | | | | | (0.10) | — |
| Net asset value, end of period | | | | | $25.39 | $18.37 |
| Total return (%) | | | | | 38.814,5 | (11.26)4,5 |
| |
| Ratios and supplemental data | | | | | | |
|
| Net assets, end of period (in millions) | | | | | $2 | $1 |
| Ratios (as a percentage of average net assets): | | | | | | |
| Expenses before reductions and amounts recaptured | | | | | 1.786 | 1.546 |
| Expenses including reductions and amounts recaptured | | | | | 1.306 | 1.306 |
| Net investment income (loss) | | | | | (0.18)6 | 0.826 |
| Portfolio turnover (%) | | | | | 50 | 707 |
| | | | | |
1 Semiannual period from 9-1-10 to 2-28-11. Unaudited.
2 The inception date for Class I shares is 1-4-10.
3 Based on the average daily shares outstanding.
4 Not annualized.
5 Total returns would have been lower had certain expenses not been reduced during the periods shown.
6 Annualized.
7 Portfolio turnover is shown for the period from 9-1-09 to 8-31-10.
| | | | | | |
| CLASS 1 SHARES Period ended | 2-28-111 | 8-31-10 | 8-31-09 | 8-31-08 | 8-31-07 | 8-31-062 |
| |
| Per share operating performance | | | | | | |
|
| Net asset value, beginning of period | $18.51 | $17.66 | $35.15 | $42.52 | $35.71 | $28.70 |
| Net investment income3 | —4 | 0.10 | 0.18 | 0.18 | 0.22 | 0.34 |
| Net realized and unrealized gain (loss) | | | | | | |
| on investments | 7.20 | 0.87 | (11.42) | 3.88 | 8.52 | 6.70 |
| Total from investment operations | 7.20 | 0.97 | (11.24) | 4.06 | 8.74 | 7.04 |
| Less distributions | | | | | | |
| From net investment income | (0.10) | (0.12) | (0.19) | (0.23) | (0.34) | (0.03) |
| From net realized gain | (0.04) | — | (6.06) | (11.20) | (1.59) | — |
| Total distributions | (0.14) | (0.12) | (6.25) | (11.43) | (1.93) | (0.03) |
| Net asset value, end of period | $25.57 | $18.51 | $17.66 | $35.15 | $42.52 | $35.71 |
| Total return (%) | 38.965,6 | 5.435 | (27.25) | 7.02 | 25.57 | 24.556 |
| |
| Ratios and supplemental data | | | | | | |
|
| Net assets, end of period (in millions) | $243 | $154 | $139 | $171 | $111 | $81 |
| Ratios (as a percentage of average net assets): | | | | | | |
| Expenses before reductions and | | | | | | |
| amounts recaptured | 1.117 | 1.11 | 1.11 | 1.11 | 1.14 | 1.127 |
| Expenses including reductions and | | | | | | |
| amounts recaptured | 1.117 | 1.11 | 1.11 | 1.11 | 1.14 | 1.127 |
| Net investment income | 0.037 | 0.52 | 1.06 | 0.44 | 0.58 | 1.137 |
| Portfolio turnover (%) | 50 | 70 | 22 | 34 | 54 | 71 |
| |
1 Semiannual period from 9-1-10 to 2-28-11. Unaudited.
2 The inception date for Class 1 shares is 10-15-05.
3 Based on the average daily shares outstanding.
4 Less than $0.005 per share.
5 Total returns would have been lower had certain expenses not been reduced during the periods shown.
6 Not annualized.
7 Annualized.
| | |
| 18 | Natural Resources Fund | Semiannual report | See notes to financial statements |
| | | | | | |
| CLASS NAV SHARES Period ended | 2-28-111 | 8-31-10 | 8-31-09 | 8-31-08 | 8-31-07 | 8-31-062 |
| |
| Per share operating performance | | | | | | |
|
| Net asset value, beginning of period | $18.39 | $17.55 | $35.01 | $42.39 | $35.60 | $28.60 |
| Net investment income3 | 0.01 | 0.11 | 0.18 | 0.19 | 0.24 | 0.33 |
| Net realized and unrealized gain (loss) | | | | | | |
| on investments | 7.15 | 0.86 | (11.37) | 3.88 | 8.48 | 6.71 |
| Total from investment operations | 7.16 | 0.97 | (11.19) | 4.07 | 8.72 | 7.04 |
| Less distributions | | | | | | |
| From net investment income | (0.11) | (0.13) | (0.21) | (0.25) | (0.34) | (0.04) |
| From net realized gain | (0.04) | — | (6.06) | (11.20) | (1.59) | — |
| Total distributions | (0.15) | (0.13) | (6.27) | (11.45) | (1.93) | (0.04) |
| Net asset value, end of period | $25.40 | $18.39 | $17.55 | $35.01 | $42.39 | $35.60 |
| Total return (%) | 39.004,5 | 5.454 | (27.20) | 7.08 | 25.61 | 24.625 |
| |
| Ratios and supplemental data | | | | | | |
|
| Net assets, end of period (in millions) | $715 | $548 | $529 | $500 | $731 | $692 |
| Ratios (as a percentage of average net assets): | | | | | | |
| Expenses before reductions and | | | | | | |
| amounts recaptured | 1.066 | 1.06 | 1.06 | 1.06 | 1.09 | 1.076 |
| Expenses including reductions and | | | | | | |
| amounts recaptured | 1.066 | 1.06 | 1.06 | 1.06 | 1.09 | 1.076 |
| Net investment income | 0.106 | 0.58 | 1.10 | 0.45 | 0.64 | 1.116 |
| Portfolio turnover (%) | 50 | 70 | 22 | 34 | 54 | 71 |
| |
1 Semiannual period from 9-1-10 to 2-28-11. Unaudited.
2 The inception date for Class NAV shares is 10-15-05.
3 Based on the average daily shares outstanding.
4 Total returns would have been lower had certain expenses not been reduced during the periods shown.
5 Not annualized.
6 Annualized.
| | |
| See notes to financial statements | Semiannual report | Natural Resources Fund | 19 |
Notes to financial statements
(unaudited)
Note 1 — Organization
John Hancock Natural Resources Fund (the Fund) is a diversified series of John Hancock Funds II (the Trust), an open-end management investment company organized as a Massachusetts business trust and registered under the Investment Company Act of 1940, as amended (the 1940 Act). The investment objective of the Fund is to seek long-term total return.
The Fund may offer multiple classes of shares. The shares currently offered are detailed in the Statement of Assets and Liabilities. Class A shares are offered to all investors. Class I shares are offered to institutions and certain investors. Class 1 shares are offered only to certain affiliates of Manulife Financial Corporation (MFC). Class NAV shares are sold to John Hancock affiliated funds of funds. Shareholders of each class have exclusive voting rights to matters that affect that class. The distribution and service fees, if any, printing and postage, state registration and transfer agent fees for each class may differ.
Note 2 — Significant accounting policies
The financial statements have been prepared in conformity with accounting principles generally accepted in the United States of America, which require management to make certain estimates and assumptions at the date of the financial statements. Actual results could differ from those estimates. Events or transactions occurring after the end of the fiscal period through the date that the financial statements were issued have been evaluated in the preparation of the financial statements. The following summarizes the significant accounting policies of the Fund:
Security valuation. Investments are stated at value as of the close of regular trading on the New York Stock Exchange (NYSE), normally at 4:00 P.M., Eastern Time. The Fund uses a three-tier hierarchy to prioritize the pricing assumptions, referred to as inputs, used in valuation techniques to measure fair value. Level 1 includes securities valued using quoted prices in active markets for identical securities. Level 2 includes securities valued using significant observable inputs. Observable inputs may include quoted prices for similar securities, interest rates, prepayment speeds and credit risk. Prices for securities valued using these inputs are received from independent pricing vendors and brokers and are based on an evaluation of the inputs described. Level 3 includes securities valued using significant unobservable inputs when market prices are not readily available or reliable, including the Fund’s own assumptions in determining the fair value of investments. Factors used in determining value may include market or issuer specific events, changes in interest rates and credit quality. The inputs or methodology used for valuing securities are not necessarily an indication of the risk associated with investing in those securities.
| |
| 20 | Natural Resources Fund | Semiannual report |
The following is a summary of the values by input classification of the Fund’s investments as of February 28, 2011, by major security category or type:
| | | | |
| | | | | LEVEL 3 |
| | | | LEVEL 2 | SIGNIFICANT |
| | TOTAL MARKET | LEVEL 1 | SIGNIFICANT | UNOBSERVABLE |
| | VALUE AT 2-28-11 | QUOTED PRICE | OBSERVABLE INPUTS | INPUTS |
|
| Common Stocks | | | | |
| Energy | $596,020,468 | $487,401,847 | $108,618,621 | — |
| Industrials | 2,452,617 | — | 2,452,617 | — |
| Materials | 341,461,602 | 124,204,413 | 217,257,189 | — |
| Warrants | 10,609,331 | — | 10,609,331 | — |
| Securities Lending | | | | |
| Collateral | 165,998,459 | 165,998,459 | — | — |
| Short-Term Investments | 39,500,000 | — | 39,500,000 | — |
| Total Investments in | | | | |
| Securities | $1,156,042,477 | $777,604,719 | $378,437,758 | — |
Changes in valuation techniques may result in transfers in or out of an assigned level within the disclosure hierarchy. During the six months ended February 28, 2011, there were no significant transfers in or out of Level 1 or Level 2 assets.
In order to value the securities, the Fund uses the following valuation techniques. Equity securities held by the Fund are valued at the last sale price or official closing price on the principal securities exchange on which they trade. In the event there were no sales during the day or closing prices are not available, then securities are valued using the last quoted bid or evaluated price. Investments in open-end mutual funds, including John Hancock Collateral Investment Trust (JHCIT), are valued at their closing net asset values each day. Foreign securities and currencies are valued in U.S. dollars, based on foreign currency exchange rates supplied by an independent pricing service. Certain securities traded only in the over-the-counter market are valued at the last bid price quoted by brokers making markets in the securities at the close of trading. Certain short-term securities are valued at amortized cost.
Other portfolio securities and assets, where market quotations are not readily available, are valued at fair value, as determined in good faith by the Fund’s Pricing Committee, following procedures established by the Board of Trustees. Generally, trading in non-U.S. securities is substantially completed each day at various times prior to the close of trading on the NYSE. Significant market events that affect the values of non-U.S. securities may occur between the time when the valuation of the securities is generally determined and the close of the NYSE. During significant market events, these securities will be valued at fair value, as determined in good faith, following procedures established by the Board of Trustees. The Fund may use a fair valuation model to value non-U.S. securities in order to adjust for events which may occur between the close of foreign exchanges and the close of the NYSE.
Repurchase agreements. The Fund may enter into repurchase agreements. When a Fund enters into a repurchase agreement, it receives collateral which is held in a segregated account by the Fund’s custodian. The collateral amount is marked-to-market and monitored on a daily basis to ensure that the collateral held is in an amount not less than the principal amount of the repurchase agreement plus any accrued interest. In the event of a default by the counterparty, realization of the collateral proceeds could be delayed, during which time the collateral value may decline. Collateral for certain tri-party repurchase agreements is held at a third-party custodian bank in a segregated account for the benefit of the Fund.
| |
| Semiannual report | Natural Resources Fund | 21 |
Security transactions and related investment income. Investment security transactions are accounted for on a trade date plus one basis for daily net asset value calculations. However, for financial reporting purposes, investment transactions are reported on trade date. Interest income is accrued as earned. Gains and losses on securities sold are determined on the basis of identified cost and may include proceeds from litigation. Dividend income is recorded on the ex-date, except for dividends of foreign securities where the dividend may not be known until after the ex-date. In those cases, dividend income is recorded when the Fund becomes aware of the dividends.
Securities lending. The Fund may lend its securities to earn additional income. It receives and maintains cash collateral received from the borrower in an amount not less than the market value of the loaned securities. The Fund will invest its collateral in JHCIT, an affiliate of the Fund, and as a result, the Fund will receive the benefit of any gains and bear any losses generated by JHCIT. Although risk of the loss of the securities lent is mitigated by holding the collateral, the Fund could experience a delay in recovering its securities and a possible loss of income or value if the borrower fails to return the securities or if collateral investments decline in value. The Fund may receive compensation for lending its securities by retaining a portion of the return on the investment of the collateral and compensation from fees earned from borrowers of the securities. Income received from JHCIT is a component of securities lending income as recorded on the Statement of Operations.
Foreign currency translation. Assets, including investments and liabilities denominated in foreign currencies, are translated into U.S. dollar values each day at the prevailing exchange rate. Purchases and sales of securities, income and expenses are translated into U.S. dollars at the prevailing exchange rate on the date of the transaction. The effect of changes in foreign currency exchange rates on securities is reflected as a component of the realized and unrealized gains (losses) on investments.
Funds that invest internationally generally carry more risk than funds that invest strictly in U.S. securities. Risks can result from differences in economic and political conditions, regulations, market practices (including higher transaction costs) and accounting standards. Foreign investments are also subject to a decline in the value of a foreign currency versus the U.S. dollar, which reduces the dollar value of securities denominated in that currency.
The Fund may be subject to capital gains and repatriation taxes as imposed by certain countries in which it invests. Such taxes are generally based upon income and/or capital gains earned or repatriated. Taxes are accrued based upon net investment income, net realized gains and net unrealized appreciation.
Line of credit. The Fund may borrow from banks for temporary or emergency purposes, including meeting redemption requests that otherwise might require the untimely sale of securities. Pursuant to the custodian agreement, the custodian may loan money to a Fund to make properly authorized payments. The Fund is obligated to repay the custodian for any overdraft, including any related costs or expenses. The custodian has a lien, security interest or security entitlement in any Fund property that is not segregated, to the maximum extent permitted by law for any overdraft.
In addition, the Fund and other affiliated funds have entered into an agreement with State Street Bank and Trust Company (SSBT) which enables them to participate in a $200 million unsecured committed line of credit. A commitment fee, payable at the end of each calendar quarter, based on the average daily unused portion of the line of credit, is charged to each participating fund on a pro rata basis and is reflected in other expenses on the Statement of Operations. For the six months ended February 28, 2011, the Fund had no borrowings under the line of credit.
Effective March 30, 2011, the line of credit with SSBT expired and a similar arrangement was established with Citibank N.A.
| |
| 22 | Natural Resources Fund | Semiannual report |
Expenses. The majority of expenses are directly attributable to an individual fund. Expenses that are not readily attributable to a specific fund are allocated among all funds in an equitable manner, taking into consideration, among other things, the nature and type of expense and the fund’s relative assets. Expense estimates are accrued in the period to which they relate and adjustments are made when actual amounts are known.
Class allocations. Income, common expenses and realized and unrealized gains (losses) are determined at the fund level and allocated daily to each class of shares based on the net asset value of the class. Class-specific expenses, such as distribution and service fees, if any, transfer agent fees, state registration fees and printing and postage, for all classes, are calculated daily at the class level based on the appropriate net asset value of each class and the specific expense rates applicable to each class.
Federal income taxes. The Fund intends to continue to qualify as a regulated investment company by complying with the applicable provisions of the Internal Revenue Code and will not be subject to federal income tax on taxable income that is distributed to shareholders. Therefore, no federal income tax provision is required.
For federal income tax purposes, the Fund has a capital loss carryforward of $10,883,164 available to offset future net realized capital gains as of August 31, 2010. The loss carryforward expires as follows: August 31, 2017 — $3,213,814 and August 31, 2018 — $7,669,350.
Under the recently enacted Regulated Investment Company Modernization Act of 2010, the Fund will be permitted to carry forward capital losses incurred in taxable years beginning after December 22, 2010 for an unlimited period. However, any losses incurred during those future taxable years will be required to be utilized prior to the losses incurred in pre-enactment taxable years. As a result of this ordering rule, pre-enactment capital loss carryforwards may be more likely to expire unused. Additionally, post-enactment capital losses that are carried forward will retain their character as either short-term or long-term capital losses rather than being considered all short-term as under previous law.
As of August 31, 2010, the Fund had no uncertain tax positions that would require financial statement recognition, de-recognition or disclosure. The Fund’s federal tax return is subject to examination by the Internal Revenue Service for a period of three years.
Distribution of income and gains. Distributions to shareholders from net investment income and net realized gains, if any, are recorded on the ex-date. The Fund generally declares and pays dividends and capital gain distributions, if any, annually.
Distributions paid by the Fund with respect to each class of shares are calculated in the same manner, at the same time and are in the same amount, except for the effect of expenses that may be applied differently to each class.
Such distributions, on a tax basis, are determined in conformity with income tax regulations, which may differ from accounting principles generally accepted in the United States of America.
Capital accounts within financial statements are adjusted for permanent book-tax differences. These adjustments have no impact on net assets or the results of operations. Temporary book-tax differences, if any, will reverse in a subsequent period. Permanent book-tax differences are primarily attributable to foreign currency transactions.
Note 3 — Guarantees and indemnifications
Under the Fund’s organizational documents, its Officers and Trustees are indemnified against certain liabilities arising out of the performance of their duties to the Fund. Additionally, in the normal course of business, the Fund enters into contracts with service providers that contain
| |
| Semiannual report | Natural Resources Fund | 23 |
general indemnification clauses. The Fund’s maximum exposure under these arrangements is unknown, as this would involve future claims that may be made against the Fund that have not yet occurred. The risk of material loss from such claims is considered remote.
Note 4 — Fees and transactions with affiliates
John Hancock Investment Management Services, LLC (the Adviser) serves as investment adviser for the Fund. John Hancock Funds, LLC (the Distributor), an affiliate of the Adviser, serves as principal underwriter of the Trust. The Adviser and the Distributor are indirect wholly owned subsidiaries of MFC.
Management fee. The Fund has an investment management contract with the Adviser under which the Fund pays a daily management fee to the Adviser equivalent, on an annual basis, to the sum of: (a) 1.000% of the first $1,000,000,000 of the Fund’s aggregate net assets; (b) 0.975% of the next $1,000,000,000; and (c) 0.950% of the Fund’s aggregate net assets in excess of $2,000,000,000. Aggregate net assets include the net assets of the Fund and the Natural Resources Trust, a series of John Hancock Trust, an affiliate of the Trust. The Adviser has a subadvisory agreement with Wellington Management Company, LLP. The Fund is not responsible for payment of the subadvisory fees.
The investment management fees incurred for the six months ended February 28, 2011 were equivalent to an annual effective rate of 1.00% of the Fund’s average daily net assets.
The Adviser has voluntarily agreed to waive a portion of its management fee if certain expenses of the Fund exceed 0.20% of average net assets. Expenses excluded from this waiver are taxes, portfolio brokerage commissions, interest, litigation and indemnification expenses and extraordinary expenses not incurred in the ordinary course of the Fund’s business, advisory fees, Rule 12b-1 fees, service fees, transfer agency fees, blue sky fees, printing and postage, and fees under any agreements or plans of the Fund dealing with services for shareholders and others with beneficial interests in shares of the Fund. This expense reduction will continue in effect until terminated by the Adviser.
The Adviser contractually has agreed to waive a portion of the management fee for certain funds of the Trust. The waiver equals, on an annualized basis 0.01% of that portion of the aggregate net assets of all the participating funds that exceeds $85 billion. The amount of the reimbursement is calculated daily and allocated among all the funds in proportion of the daily net assets of each Fund. This expense reduction will continue in effect until terminated by the Adviser.
The Adviser has contractually agreed to waive fees and/or reimburse certain expenses for Class A and Class I shares. This agreement excluded taxes, portfolio brokerage commissions, interest, overdraft, litigation and other extraordinary expenses not incurred in the ordinary course of the Fund’s business. The fee waivers and/or reimbursements are such that these expenses will not exceed 1.60% and 1.30% for Class A and Class I shares, respectively. The fee waivers and/or reimbursements will continue in effect until December 31, 2011.
Accordingly, these expense reductions amounted to $5,306, $3,935, $2,050 and $6,740 for Class A, Class I, Class 1 and Class NAV shares, respectively, for the six months ended February 28, 2011.
Expense recapture. The Adviser may recapture operating expenses reimbursed or fees waived under previous expense limitation or waiver arrangements for a period of three years following the beginning of the month in which such reimbursements or waivers originally occurred. The table below outlines the amounts recovered during the six months ended February 28, 2011, and the amount of waived or reimbursed expenses subject to potential recovery and the respective expiration dates. Certain reimbursements or waivers are not subject to recapture.
| |
| 24 | Natural Resources Fund | Semiannual report |
| | | |
| AMOUNT ELIGIBLE FOR | AMOUNT ELIGIBLE | AMOUNT RECOVERED DURING | |
| RECOVERY THROUGH | FOR RECOVERY THROUGH | THE SIX MONTHS ENDED | |
| AUGUST 1, 2013 | FEBRUARY 1, 2014 | FEBRUARY 28, 2011 | |
| |
| | |
| $3,278 | $9,160 | — | |
Accounting and legal services. Pursuant to the service agreement, the Fund reimburses the Adviser for all expenses associated with providing the administrative, financial, legal, accounting and recordkeeping services of the Fund, including the preparation of all tax returns, periodic reports to shareholders and regulatory reports, among other services. These expenses are allocated to each share class based on its relative net assets at the time the expense was incurred. The accounting and legal services fees incurred for the six months ended February 28, 2011 amounted to an annual rate of 0.01% of the Fund’s average daily net assets.
Distribution and service plans. The Fund has a distribution agreement with the Distributor. The Fund has adopted distribution and service plans with respect to Class A and Class 1 shares pursuant to Rule 12b-1 under the 1940 Act, to pay the Distributor for services provided as the distributor of shares of the Fund. The Fund may pay up to 0.30% and 0.05% for Class A and Class 1 shares, respectively, for distribution and service fees under these arrangements, expressed as an annual percentage of average daily net assets.
Sales charges. Class A shares are assessed up-front sales charges, which resulted in payments to the Distributor amounting to $50,140 for the six months ended February 28, 2011. Of this amount, $6,457 was retained and used for printing prospectuses, advertising, sales literature and other purposes, $43,278 was paid as sales commissions to broker-dealers and $405 was paid as sales commissions to sales personnel of Signator Investors, Inc. (Signator Investors), a broker-dealer affiliate of the Adviser.
Transfer agent fees. The Fund has a transfer agent agreement with John Hancock Signature Services, Inc. (Signature Services or Transfer Agent), an affiliate of the Adviser. Class 1 and Class NAV shares do not pay transfer agent fees. The transfer agent fees paid to Signature Services are determined based on the cost to Signature Services (Signature Services Cost) of providing recordkeeping services. The Signature Services Cost includes a component of allocated John Hancock corporate overhead for providing transfer agent services to the Fund and to all other John Hancock affiliated funds. It also includes out-of-pocket expenses that are comprised of payments made to third-parties for recordkeeping services provided to their clients who invest in one or more John Hancock funds. In addition, Signature Services Cost may be reduced by certain revenues that Signature Services receive in connection with the service they provide to the funds. Signature Services Cost is calculated monthly and allocated, as applicable, to four categories of share classes: Institutional Share Classes, Retirement Share Classes, Municipal Bond Classes and all other Retail Share Classes. Within each of these categories, the applicable costs are allocated to the affected John Hancock affiliated funds and/or classes, based on the relative average daily net assets.
Class level expenses. Class level expenses for the six months ended February 28, 2011 were:
| | | | |
| | DISTRIBUTION | TRANSFER | STATE | PRINTING AND |
| CLASS | AND SERVICE FEES | AGENT FEES | REGISTRATION FEES | POSTAGE |
|
| Class A | $8,914 | $5,465 | $5,434 | $1,327 |
|
| Class I | — | 421 | 5,075 | 456 |
| Class 1 | 48,589 | — | — | — |
| Total | $57,503 | $5,886 | $10,509 | $1,783 |
Trustee expenses. The Trust compensates each Trustee who is not an employee of the Adviser or its affiliates. The costs of paying Trustee compensation and expenses are allocated to each Fund based on its average daily net assets.
| |
| Semiannual report | Natural Resources Fund | 25 |
Note 5 — Fund share transactions
Transactions in Fund shares for the six months ended February 28, 2011 and for the year ended
August 31, 2010 were as follows:
| | | | |
| | Six months ended 2-28-11 | Year ended 8-31-101 |
| | Shares | Amount | Shares | Amount |
| Class A shares | | | | |
|
| Sold | 289,739 | $6,588,246 | 187,368 | $3,755,265 |
| Distributions reinvested | 499 | 11,642 | — | — |
| Repurchased | (55,608) | (1,183,813) | (19,368) | (367,536) |
| Net increase | 234,630 | $5,416,075 | 168,000 | $3,387,729 |
| |
| Class I shares | | | | |
|
| Sold | 37,687 | $847,867 | 58,426 | $1,216,167 |
| Distributions reinvested | 323 | 7,521 | — | — |
| Repurchased | (3,366) | (72,079) | — | (8) |
| Net increase | 34,644 | $783,309 | 58,426 | $1,216,159 |
| |
| Class 1 shares | | | | |
|
| Sold | 1,436,520 | $33,734,672 | 1,591,445 | $32,465,155 |
| Distributions reinvested | 51,520 | 1,209,182 | 48,775 | 998,904 |
| Repurchased | (266,681) | (5,806,510) | (1,211,785) | (23,348,764) |
| Net increase | 1,221,359 | $29,137,344 | 428,435 | $10,115,295 |
| |
| Class NAV shares | | | | |
|
| Sold | 1,232,720 | $27,715,826 | 5,546,181 | $106,543,381 |
| Distributions reinvested | 181,489 | 4,232,317 | 187,461 | 3,812,968 |
| Repurchased | (3,074,410) | (69,642,796) | (6,072,363) | (119,066,540) |
| Net decrease | (1,660,201) | ($37,694,653) | (338,721) | ($8,710,191) |
| |
| Net increase (decrease) | (169,568) | ($2,357,925) | 316,140 | $6,008,992 |
|
1 The inception date for Class A and Class I shares is 1-4-10.
Affiliates of the Fund owned 100% of shares of beneficial interest of Class 1 and Class NAV shares on February 28, 2011.
Note 6 — Purchase and sale of securities
Purchases and sales of securities, other than short-term securities, aggregated $405,250,664 and $407,803,491, respectively, for the six months ended February 28, 2011.
Note 7 — Investment by affiliated funds
Certain investors in the Fund are affiliated funds and are managed by the Adviser and its affiliates. The affiliated funds do not invest in the Fund for the purpose of exercising management or control; however, this investment may represent a significant portion of the Fund’s net assets. At February 28, 2011, the following funds had an affiliate ownership concentration of 5% or more of the Fund’s net assets:
| | | | |
| | AFFILIATE | | | |
| FUND | CONCENTRATION | | | |
| | | |
| Lifestyle Aggressive Portfolio | 12.6% | | | |
| Lifestyle Balanced Portfolio | 19.8% | | | |
| Lifestyle Growth Portfolio | 26.3% | | | |
| |
| 26 | Natural Resources Fund | Semiannual report |
More information
| | |
| Trustees | Investment adviser |
| James M. Oates, Chairman | John Hancock Investment Management |
| James R. Boyle† | Services, LLC |
| Charles L. Bardelis* | |
| Peter S. Burgess* | Subadviser |
| Grace K. Fey | Wellington Management Company, LLP |
| Theron S. Hoffman | |
| Hassell H. McClellan | Principal distributor |
| Steven M. Roberts* | John Hancock Funds, LLC |
| | |
| Officers | Custodian |
| Hugh McHaffie | State Street Bank and Trust Company |
| President | |
| | Transfer agent |
| Thomas M. Kinzler | John Hancock Signature Services, Inc. |
| Secretary and Chief Legal Officer | |
| | Legal counsel |
| Francis V. Knox, Jr. | K&L Gates LLP |
| Chief Compliance Officer | |
| |
| |
| Michael J. Leary | The report is certified under the Sarbanes-Oxley |
| Treasurer | Act, which requires mutual funds and other public |
| | companies to affirm that, to the best of their |
| Charles A. Rizzo | knowledge, the information in their financial reports |
| Chief Financial Officer | is fairly and accurately stated in all material respects. |
| |
| |
| John G. Vrysen | |
| Chief Operating Officer | |
| |
| *Member of the Audit Committee | |
| †Non-Independent Trustee | |
The Fund’s proxy voting policies and procedures, as well as the Fund’s proxy voting record for the most recent twelve-month period ended June 30, are available free of charge on the Securities and Exchange Commission (SEC) Web site at www.sec.gov or on our Web site.
The Fund’s complete list of portfolio holdings, for the first and third fiscal quarters, is filed with the SEC on Form N-Q. The Fund’s Form N-Q is available on our Web site and the SEC’s Web site, www.sec.gov, and can be reviewed and copied (for a fee) at the SEC’s Public Reference Room in Washington, DC. Call 1-800-SEC-0330 to receive information on the operation of the SEC’s Public Reference Room.
We make this information on your fund, as well as monthly portfolio holdings, and other fund details available on our Web site www.jhfunds.com or by calling 1-800-225-5291.
| | |
| You can also contact us: | | |
| 1-800-225-5291 | Regular mail: | Express mail: |
| jhfunds.com | John Hancock Signature Services, Inc. | John Hancock Signature Services, Inc. |
| | P.O. Box 55913 | Mutual Fund Image Operations |
| | Boston, MA 02205-5913 | 30 Dan Road |
| | | Canton, MA 02021 |
| |
| Semiannual report | Natural Resources Fund | 27 |

1-800-225-5291
1-800-554-6713 TDD
1-800-338-8080 EASI-Line
www.jhfunds.com
Now available: electronic delivery
www.jhfunds.com/edelivery
| |
| This report is for the information of the shareholders of John Hancock Natural Resources Fund. | 354SA 2/11 |
| It is not authorized for distribution to prospective investors unless preceded or accompanied by a prospectus. | 4/11 |

A look at performance
For the period ended February 28, 2011
| | | | | | | | | | | | | | |
| | | | | | | | | | | | | SEC 30-day | | SEC 30-day |
| | Average annual total returns (%) | | Cumulative total returns (%) | | yield (%) | | yield (%) |
| | with maximum sales charge (POP) | | with maximum sales charge (POP) | | subsidized | | unsubsidized1 |
|
| | | | | Since | | | | | | Since | | as of | | as of |
| | 1-year | 5-year | 10-year | inception2 | | 6-months | 1-year | 5-year | 10-year | inception2 | | 2-28-11 | | 2-28-11 |
|
| Class A3 | 9.51 | — | — | 7.44 | | 3.83 | 9.51 | — | — | 41.54 | | 4.53 | | 4.44 |
|
| Class C3 | 12.96 | — | — | 7.14 | | 7.34 | 12.96 | — | — | 39.58 | | 4.03 | | 3.91 |
|
| Class I3,4 | 15.05 | — | — | 9.20 | | 8.81 | 15.05 | — | — | 53.06 | | 5.12 | | 5.12 |
|
| Class NAV 4 | 15.18 | — | — | 9.26 | | 8.86 | 15.18 | — | — | 53.47 | | 5.19 | | 5.19 |
|
Performance figures assume all distributions are reinvested. Public offering price (POP) figures reflect maximum sales charges on Class A shares of 4.5%, and the applicable contingent deferred sales charge (CDSC) on Class C shares. Sales charges are not applicable for Class I and Class NAV shares.
The expense ratios of the Fund, both net (including any fee waivers or expense limitations) and gross (excluding any fee waivers or expense limitations), are set forth according to the most recent publicly available prospectuses for the Fund and may differ from the expense ratios disclosed in the Financial Highlights tables in this report. The waivers and expense limitations are contractual at least until 12-31-11. The net expenses are as follows: Class A — 1.19% and Class C — 1.89%. Had the fee waivers and expense limitations not been in place, the gross expenses would be as follows: Class A — 1.23% and Class C — 1.94%. For all other classes, the net expenses equal the gross expenses and are as follows: Class I — 0.83% and Class NAV — 0.77%.
The returns reflect past results and should not be considered indicative of future performance. The return and principal value of an investment will fluctuate so that shares, when redeemed, may be worth more or less than their original cost. Due to market volatility, the Fund’s current performance may be higher or lower than the performance shown. For current to the most recent month end performance data, please call 1–800–225–5291 or visit the Fund’s Web site at www.jhfunds.com.
The performance table above and the chart on the next page do not reflect the deduction of taxes that a shareholder would pay on fund distributions or the redemption of fund shares.
The Fund’s performance results reflect any applicable expense reductions, without which the expenses increase and results would have been less favorable.
1 Unsubsidized yields reflect what the yields would have been without the effect of reimbursements and waivers.
2 From 4-28-06.
3 4-28-06 is the inception date for the oldest class of shares, Class NAV shares. The inception date for Class A shares, Class C shares and Class I shares is 1-4-10. The returns prior to this date are those of Class NAV shares that have been recalculated to apply the gross fees and expenses of Class A, Class C and Class I shares, respectively.
4 For certain types of investors, as described in the Fund’s Class I and Class NAV shares prospectuses.
| |
| 6 | Strategic Income Opportunities Fund | Semiannual report |
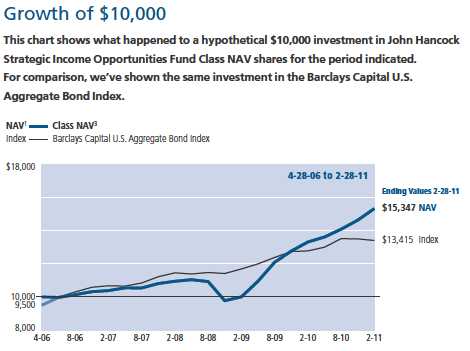
| | | | |
| | Period | Without | With maximum | |
| | beginning | sales charge | sales charge | Index |
|
| Class A2 | 4-28-06 | $14,821 | $14,154 | $13,415 |
|
| Class C2 | 4-28-06 | 13,958 | 13,958 | 13,415 |
|
| Class I2,3 | 4-28-06 | 15,306 | 15,306 | 13,415 |
|
Assuming all distributions were reinvested for the period indicated, the table above shows the value of $10,000 investment in the Fund’s Class A, Class C and Class I shares, respectively, as of 2-28-11. Performance of the classes will vary based on the difference in sales charges paid by shareholders investing in different classes and the fee structure of those classes.
Barclays Capital U.S. Aggregate Bond Index is an unmanaged index of dollar-denominated and non-convertible investment grade debt issue.
It is not possible to invest directly in an index. Index figures do not reflect sales charges or foreign currency impact, which would have resulted in different values if they did.
1 NAV represents net asset value.
2 4-28-06 is the inception date for the oldest class of shares, Class NAV shares. The inception date for Class A shares, Class C shares and Class I shares is 1-4-10. The returns prior to this date are those of Class NAV shares that have been recalculated to apply the gross fees and expenses of Class A, Class C and Class I shares, respectively.
3 For certain types of investors, as described in the Fund’s Class I and Class NAV shares prospectuses.
| |
| Semiannual report | Strategic Income Opportunities Fund | 7 |
Your expenses
These examples are intended to help you understand your ongoing operating expenses.
Understanding fund expenses
As a shareholder of the Fund, you incur two types of costs:
▪ Transaction costs which include sales charges (loads) on purchases or redemptions (varies by share class), minimum account fee charge, etc.
▪ Ongoing operating expenses including management fees, distribution and service fees (if applicable), and other fund expenses.
We are going to present only your ongoing operating expenses here.
Actual expenses/actual returns
This example is intended to provide information about the Fund’s actual ongoing operating expenses, and is based on the Fund’s actual return. It assumes an account value of $1,000.00 on September 1, 2010 with the same investment held until February 28, 2011.
| | | |
| | Account value | Ending value | Expenses paid during |
| | on 9-1-10 | on 2-28-11 | period ended 2-28-111 |
|
| Class A | $1,000.00 | $1,086.20 | $6.05 |
|
| Class C | 1,000.00 | 1,082.40 | 9.66 |
|
| Class I | 1,000.00 | 1,087.10 | 4.14 |
|
| Class NAV | 1,000.00 | 1,088.60 | 3.83 |
|
Together with the value of your account, you may use this information to estimate the operating expenses that you paid over the period. Simply divide your account value at February 28, 2011, by $1,000.00, then multiply it by the “expenses paid” for your share class from the table above. For example, for an account value of $8,600.00, the operating expenses should be calculated as follows:
| |
| 8 | Strategic Income Opportunities Fund | Semiannual report |
Hypothetical example for comparison purposes
This table allows you to compare the Fund’s ongoing operating expenses with those of any other fund. It provides an example of the Fund’s hypothetical account values and hypothetical expenses based on each class’s actual expense ratio and an assumed 5% annualized return before expenses (which is not the Fund’s actual return). It assumes an account value of $1,000.00 on September 1, 2010, with the same investment held until February 28, 2011. Look in any other fund shareholder report to find its hypothetical example and you will be able to compare these expenses.
| | | |
| | Account value | Ending value | Expenses paid during |
| | on 9-1-10 | on 2-28-11 | period ended 2-28-111 |
|
| Class A | $1,000.00 | $1,019.00 | $5.86 |
|
| Class C | 1,000.00 | 1,015.50 | 9.35 |
|
| Class I | 1,000.00 | 1,020.80 | 4.01 |
|
| Class NAV | 1,000.00 | 1,021.10 | 3.71 |
|
Remember, these examples do not include any transaction costs, therefore, these examples will not help you to determine the relative total costs of owning different funds. If transaction costs were included, your expenses would have been higher. See the prospectus for details regarding transaction costs.
1 Expenses are equal to the Fund’s annualized expense ratio of 1.17%, 1.87%, 0.80% and 0.74% for Class A, Class C, Class I and Class NAV shares, respectively, multiplied by the average account value over the period, multiplied by 181/365 (to reflect the one-half year period).
| |
| Semiannual report | Strategic Income Opportunities Fund | 9 |
Portfolio summary
| | | | |
| Portfolio Composition1 | | | | |
|
| Corporate Bonds | 46% | | Collateralized Mortgage Obligations | 3% |
| |
|
| Foreign Government Obligations | 26% | | Common Stocks | 2% |
| |
|
| Term Loans | 4% | | Capital Preferred Securities | 2% |
| |
|
| Municipal Bonds | 4% | | Asset-Backed Securities | 1% |
| |
|
| Convertible Bonds | 4% | | Short-Term Investments & Other | 5% |
| |
|
| Preferred Securities | 3% | | | |
| | | |
| |
| Sector Composition1,2 | | | | |
|
| Foreign Government Obligations | 26% | | Collateralized Mortgage Obligations | 3% |
| |
|
| Financials | 23% | | Consumer Staples | 2% |
| |
|
| Consumer Discretionary | 13% | | Health Care | 2% |
| |
|
| Materials | 6% | | Information Technology | 1% |
| |
|
| Industrials | 5% | | Utilities | 1% |
| |
|
| Telecommunication Services | 4% | | Asset-Backed Securities | 1% |
| |
|
| Energy | 4% | | Short-Term Investments & Other | 5% |
| |
|
| Municipal Bonds | 4% | | | |
| | | |
| |
| Quality Composition1,3 | | | | |
|
| AAA | 25% | | B | 18% |
| |
|
| AA | 7% | | CCC & Below | 5% |
| |
|
| A | 7% | | Not Rated | 7% |
| |
|
| BBB | 8% | | Equity | 2% |
| |
|
| BB | 16% | | Short-Term Investments & Other | 5% |
| |
|
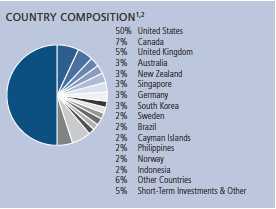
1 As a percentage of net assets on 2-28-11.
2 Sector investing is subject to greater risks than the market as a whole. Because the Fund may focus on particular sectors of the economy, its performance may depend on the performance of these sectors. International investing involves special risks such as political, economic and currency risks and differences in accounting standards and financial reporting.
3 Ratings are from Moody’s Investor Services, Inc. If not available, we have used S&P ratings. In the absence of ratings from these agencies, we have used Fitch, Inc. ratings. “Not Rated” securities are those with no ratings available. They may have internal ratings similar to those shown. All are as of 2-28-11 and do not reflect subsequent downgrades, if any.
| |
| 10 | Strategic Income Opportunities Fund | Semiannual report |
Fund’s investments
As of 2-28-11 (unaudited)
| | | | | |
| | | | Maturity | | |
| | Rate (%) | | date | Par value | Value |
| Corporate Bonds 46.83% | | | | | $737,267,699 |
|
| (Cost $693,445,686) | | | | | |
| | | | | | |
| Consumer Discretionary 8.88% | | | | | 139,861,755 |
| | | | | | |
| Auto Components 1.27% | | | | | |
|
| Allison Transmission, Inc. (S) | 11.000 | | 11-01-15 | $6,340,000 | 6,894,794 |
|
| Allison Transmission, Inc., PIK (S) | 11.250 | | 11-01-15 | 5,140,400 | 5,603,036 |
|
| Exide Technologies (S) | 8.625 | | 02-01-18 | 2,200,000 | 2,345,750 |
|
| Lear Corp. | 8.125 | | 03-15-20 | 2,500,000 | 2,800,000 |
|
| Lear Corp., Series B, Escrow Certificates (I) | 8.750 | | 12-01-16 | 940,000 | 21,150 |
|
| Tenneco, Inc. (S) | 6.875 | | 12-15-20 | 1,600,000 | 1,660,000 |
|
| The Goodyear Tire & Rubber Company | 10.500 | | 05-15-16 | 325,000 | 370,500 |
|
| TRW Automotive, Inc. (S) | 8.875 | | 12-01-17 | 340,000 | 384,625 |
| | | | | | |
| Auto Manufacturers 0.06% | | | | | |
|
| Volvo Treasury AB (S) | 5.950 | | 04-01-15 | 850,000 | 928,708 |
| | | | | | |
| Automobiles 0.06% | | | | | |
|
| Hyundai Capital America (S) | 3.750 | | 04-06-16 | 955,000 | 938,332 |
| | | | | | |
| Food Products 0.19% | | | | | |
|
| Simmons Foods, Inc. (S) | 10.500 | | 11-01-17 | 2,735,000 | 2,946,963 |
| | | | | | |
| Hotels, Restaurants & Leisure 2.76% | | | | | |
|
| Choctaw Resort Development Enterprise (S) | 7.250 | | 11-15-19 | 218,000 | 164,590 |
|
| Fontainebleau Las Vegas Holdings LLC (H)(S) | 10.250 | | 06-15-15 | 1,295,000 | 6,475 |
|
| Great Canadian Gaming Corp. (S) | 7.250 | | 02-15-15 | 1,570,000 | 1,605,325 |
|
| HRP Myrtle Beach Operations LLC (H)(S) | Zero | | 04-01-12 | 1,685,000 | 0 |
|
| Jacobs Entertainment, Inc. | 9.750 | | 06-15-14 | 5,110,000 | 5,186,650 |
|
| Landry’s Restaurants, Inc. (S) | 11.625 | | 12-01-15 | 620,000 | 672,700 |
|
| Landry’s Restaurants, Inc. | 11.625 | | 12-01-15 | 1,385,000 | 1,502,725 |
|
| Little Traverse Bay Bands of Odawa Indians (S) | 9.000 | | 08-31-20 | 464,000 | 417,600 |
|
| Majestic Star Casino LLC (H) | 9.500 | | 10-15-10 | 1,360,000 | 725,900 |
|
| Mandalay Resort Group | 6.375 | | 12-15-11 | 1,595,000 | 1,610,950 |
|
| Mashantucket Western Pequot Tribe, Series A | | | | | |
| (H)(S) | 8.500 | | 11-15-15 | 2,015,000 | 201,500 |
|
| MGM Resorts International (S) | 9.000 | | 03-15-20 | 540,000 | 589,950 |
|
| Midwest Gaming Borrower LLC/Midwest | | | | | |
| Finance Corp. (S) | 11.625 | | 04-15-16 | 205,000 | 218,325 |
|
| Mohegan Tribal Gaming Authority (S) | 11.500 | | 11-01-17 | 255,000 | 258,188 |
|
| Mohegan Tribal Gaming Authority | 8.000 | | 04-01-12 | 3,355,000 | 2,876,913 |
|
| Mohegan Tribal Gaming Authority | 7.125 | | 08-15-14 | 6,100,000 | 4,468,250 |
|
| MTR Gaming Group, Inc. | 12.625 | | 07-15-14 | 4,565,000 | 4,861,725 |
| | |
| See notes to financial statements | Semiannual report | Strategic Income Opportunities Fund | 11 |
| | | | | |
| | | | Maturity | | |
| | Rate (%) | | date | Par value | Value |
| Hotels, Restaurants & Leisure (continued) | | | | | |
|
| MTR Gaming Group, Inc., Series B | 9.000 | | 06-01-12 | $4,745,000 | $4,400,988 |
|
| Pokagon Gaming Authority (S) | 10.375 | | 06-15-14 | 1,934,000 | 2,016,195 |
|
| Seminole Indian Tribe of Florida (S) | 7.750 | | 10-01-17 | 635,000 | 673,894 |
|
| Snoqualmie Entertainment Authority (S) | 9.125 | | 02-01-15 | 2,985,000 | 2,985,000 |
|
| Turning Stone Resort Casino Enterprises (S) | 9.125 | | 09-15-14 | 5,365,000 | 5,512,538 |
|
| Waterford Gaming LLC (S) | 8.625 | | 09-15-14 | 1,876,000 | 877,030 |
|
| Yonkers Racing Corp. (S) | 11.375 | | 07-15-16 | 1,524,000 | 1,710,690 |
| | | | | | |
| Household Durables 0.09% | | | | | |
|
| Beazer Homes USA, Inc. (S) | 9.125 | | 05-15-19 | 980,000 | 1,010,625 |
|
| Standard Pacific Corp. | 8.375 | | 05-15-18 | 385,000 | 408,100 |
| | | | | | |
| Household Products 0.19% | | | | | |
|
| Reynolds Group Issuer, Inc. (S) | 8.500 | | 05-15-18 | 2,070,000 | 2,142,450 |
|
| Reynolds Group Issuer, Inc. (S) | 8.250 | | 02-15-21 | 870,000 | 872,175 |
| | | | | | |
| Media 3.53% | | | | | |
|
| AMC Entertainment Holdings, Inc. (S) | 9.750 | | 12-01-20 | 3,290,000 | 3,528,525 |
|
| AMC Entertainment, Inc. | 8.750 | | 06-01-19 | 1,465,000 | 1,573,044 |
|
| AMC Entertainment, Inc. | 8.000 | | 03-01-14 | 5,255,000 | 5,333,825 |
|
| Cablevision Systems Corp. | 8.625 | | 09-15-17 | 1,630,000 | 1,825,600 |
|
| Cablevision Systems Corp. | 8.000 | | 04-15-20 | 1,300,000 | 1,417,000 |
|
| Canadian Satellite Radio Holdings, Inc. (P) | 1.500 | | 02-14-16 | 132,650 | 115,708 |
|
| CCH II LLC/CCH II Capital Corp. | 13.500 | | 11-30-16 | 5,418,017 | 6,562,573 |
|
| CCO Holdings LLC/CCO Holdings Capital | | | | | |
| Corp. (S) | 7.000 | | 01-15-19 | 780,000 | 791,700 |
|
| CCO Holdings LLC/CCO Holdings Capital Corp. | 7.000 | | 01-15-19 | 1,235,000 | 1,256,613 |
|
| Cinemark USA, Inc. | 8.625 | | 06-15-19 | 500,000 | 545,000 |
|
| Citadel Broadcasting Corp. (S) | 7.750 | | 12-15-18 | 335,000 | 359,288 |
|
| Clear Channel Communications, Inc. | 10.750 | | 08-01-16 | 5,305,000 | 5,172,375 |
|
| Clear Channel Communications, Inc. (S) | 9.000 | | 03-01-21 | 1,690,000 | 1,717,463 |
|
| Clear Channel Communications, Inc., PIK | 11.000 | | 08-01-16 | 2,759,203 | 2,641,937 |
|
| Comcast Corp. | 4.950 | | 06-15-16 | 805,000 | 859,896 |
|
| CSC Holdings LLC | 8.500 | | 06-15-15 | 1,450,000 | 1,587,750 |
|
| Nexstar Broadcasting, Inc. | 7.000 | | 01-15-14 | 230,000 | 224,250 |
|
| Nexstar Broadcasting, Inc., PIK | 7.000 | | 01-15-14 | 699,997 | 678,997 |
|
| Radio One, Inc., PIK (S) | 12.500 | | 05-24-16 | 422,128 | 440,068 |
|
| Regal Cinemas Corp. | 8.625 | | 07-15-19 | 295,000 | 316,388 |
|
| Regal Entertainment Group | 9.125 | | 08-15-18 | 1,210,000 | 1,294,700 |
|
| Shaw Communications, Inc. (CAD)(D) | 6.500 | | 06-02-14 | 1,110,000 | 1,249,694 |
|
| Shaw Communications, Inc. (CAD)(D) | 5.700 | | 03-02-17 | 610,000 | 671,217 |
|
| Shaw Communications, Inc. (CAD)(D) | 5.500 | | 12-07-20 | 1,580,000 | 1,644,807 |
|
| Sirius XM Radio, Inc. (S) | 8.750 | | 04-01-15 | $5,055,000 | 5,604,731 |
|
| SuperMedia, Inc., Escrow Certificates (I) | 8.000 | | 11-15-16 | 2,015,000 | 0 |
|
| Videotron Ltee (CAD)(D)(S) | 7.125 | | 01-15-20 | 1,475,000 | 1,602,164 |
|
| XM Satellite Radio, Inc. (S) | 13.000 | | 08-01-13 | $5,495,000 | 6,552,788 |
|
| Young Broadcasting, Inc. (H) | 10.000 | | 03-01-11 | 680,000 | 7 |
| | | | | | |
| Multiline Retail 0.15% | | | | | |
|
| Michaels Stores, Inc. | 11.375 | | 11-01-16 | 2,100,000 | 2,294,250 |
| | |
| 12 | Strategic Income Opportunities Fund | Semiannual report | See notes to financial statements |
| | | | | |
| | | | Maturity | | |
| | Rate (%) | | date | Par value | Value |
| Personal Products 0.06% | | | | | |
|
| Diversey, Inc. | 8.250 | | 11-15-19 | $440,000 | $479,050 |
|
| Revlon Consumer Products Corp. | 9.750 | | 11-15-15 | 400,000 | 434,000 |
| | | | | | |
| Specialty Retail 0.43% | | | | | |
|
| Empire Today LLC/Empire Today | | | | | |
| Finance Corp. (S) | 11.375 | | 02-01-17 | 2,565,000 | 2,680,425 |
|
| Giraffe Acquisition Corp. (S) | 9.125 | | 12-01-18 | 1,265,000 | 1,290,300 |
|
| Hillman Group, Inc. | 10.875 | | 06-01-18 | 1,770,000 | 1,947,000 |
|
| Sonic Automotive, Inc. | 9.000 | | 03-15-18 | 350,000 | 374,500 |
|
| Toys R Us Property Company LLC | 8.500 | | 12-01-17 | 495,000 | 538,313 |
| | | | | | |
| Textiles, Apparel & Luxury Goods 0.09% | | | | | |
|
| Phillips-Van Heusen Corp. | 7.375 | | 05-15-20 | 1,300,000 | 1,384,500 |
| | | | | | |
| Consumer Staples 2.04% | | | | | 32,101,564 |
| | | | | | |
| Beverages 0.19% | | | | | |
|
| Anheuser-Busch InBev Worldwide, Inc. (BRL)(D) | 9.750 | | 11-17-15 | 4,848,000 | 2,979,373 |
| | | | | | |
| Commercial Services & Supplies 0.19% | | | | | |
|
| ARAMARK Corp. | 8.500 | | 02-01-15 | $2,855,000 | 2,983,475 |
| | | | | | |
| Food Products 1.34% | | | | | |
|
| Arcor (S) | 7.250 | | 11-09-17 | 785,000 | 821,503 |
|
| B&G Foods, Inc. | 7.625 | | 01-15-18 | 1,345,000 | 1,435,788 |
|
| Blue Merger Sub, Inc. (S) | 7.625 | | 02-15-19 | 1,265,000 | 1,277,650 |
|
| Corp. Pesquera Inca SAC (S) | 9.000 | | 02-10-17 | 2,070,000 | 2,189,025 |
|
| Cosan SA Industria e Comercio (S) | 8.250 | | — (Q) | 5,230,000 | 5,230,000 |
|
| Grupo Bimbo SAB de CV (S) | 4.875 | | 06-30-20 | 1,765,000 | 1,741,100 |
|
| JBS Finance II, Ltd. (S) | 8.250 | | 01-29-18 | 3,370,000 | 3,403,700 |
|
| TreeHouse Foods, Inc. | 7.750 | | 03-01-18 | 1,000,000 | 1,082,500 |
|
| Viterra, Inc. (CAD)(D) | 8.500 | | 07-07-14 | 3,460,000 | 3,903,206 |
| | | | | | |
| Household Products 0.32% | | | | | |
|
| Yankee Candle Company, Inc. | 8.500 | | 02-15-15 | $3,515,000 | 3,677,569 |
|
| Yankee Candle Company, Inc., Series B | 9.750 | | 02-15-17 | 730,000 | 779,275 |
|
| YCC Holdings LLC/Yankee Finance, Inc., PIK (S) | 10.250 | | 02-15-16 | 580,000 | 597,400 |
| | | | | | |
| Energy 3.61% | | | | | 56,909,425 |
| | | | | | |
| Energy Equipment & Services 0.51% | | | | | |
|
| Calfrac Holdings LP (S) | 7.500 | | 12-01-20 | 2,405,000 | 2,465,125 |
|
| PHI, Inc. | 8.625 | | 10-15-18 | 3,150,000 | 3,299,625 |
|
| Trinidad Drilling, Ltd. (S) | 7.875 | | 01-15-19 | 1,250,000 | 1,307,813 |
|
| Weatherford International, Ltd. | 9.625 | | 03-01-19 | 800,000 | 1,047,556 |
| | | | | | |
| Oil, Gas & Consumable Fuels 3.10% | | | | | |
|
| Anadarko Petroleum Corp. | 6.375 | | 09-15-17 | 1,030,000 | 1,148,032 |
|
| Arch Coal, Inc. | 8.750 | | 08-01-16 | 2,000,000 | 2,232,500 |
|
| Atlas Pipeline Partners LP | 8.125 | | 12-15-15 | 1,120,000 | 1,169,000 |
|
| Bumi Investment Pte, Ltd. (S) | 10.750 | | 10-06-17 | 1,110,000 | 1,222,388 |
|
| Drummond Company, Inc. | 7.375 | | 02-15-16 | 5,610,000 | 5,806,350 |
|
| Ecopetrol SA | 7.625 | | 07-23-19 | 1,165,000 | 1,348,488 |
|
| Energy Partners, Ltd. (S) | 8.250 | | 02-15-18 | 1,325,000 | 1,318,375 |
|
| Enterprise Products Operating LLC, Series G | 5.600 | | 10-15-14 | 980,000 | 1,086,765 |
|
| Gibson Energy ULC/GEP Midstream | | | | | |
| Finance Corp. | 10.000 | | 01-15-18 | 930,000 | 971,850 |
| | |
| See notes to financial statements | Semiannual report | Strategic Income Opportunities Fund | 13 |
| | | | | |
| | | | Maturity | | |
| | Rate (%) | | date | Par value | Value |
| Oil, Gas & Consumable Fuels (continued) | | | | | |
|
| Harvest Operations Corp. (S) | 6.875 | | 10-01-17 | $240,000 | $249,600 |
|
| Linn Energy LLC/Linn Energy Finance Corp. (S) | 8.625 | | 04-15-20 | 1,875,000 | 2,090,625 |
|
| MarkWest Energy Partners LP/MarkWest | | | | | |
| Energy Finance Corp. | 6.500 | | 08-15-21 | 1,745,000 | 1,742,819 |
|
| MarkWest Energy Partners LP/MarkWest | | | | | |
| Energy Finance Corp., Series B | 8.750 | | 04-15-18 | 520,000 | 569,400 |
|
| McMoRan Exploration Company | 11.875 | | 11-15-14 | 4,545,000 | 4,988,138 |
|
| Niska Gas Storage US LLC/Niska Gas Storage | | | | | |
| Canada ULC (S) | 8.875 | | 03-15-18 | 1,350,000 | 1,471,500 |
|
| Overseas Shipholding Group, Inc. | 8.125 | | 03-30-18 | 1,820,000 | 1,820,000 |
|
| Pan American Energy LLC (S) | 7.875 | | 05-07-21 | 2,895,000 | 3,083,175 |
|
| Petrobras International Finance Company | 5.375 | | 01-27-21 | 2,660,000 | 2,669,371 |
|
| Petroleos Mexicanos | 6.000 | | 03-05-20 | 850,000 | 888,250 |
|
| RDS Ultra-Deepwater, Ltd. (S) | 11.875 | | 03-15-17 | 3,905,000 | 4,324,788 |
|
| Regency Energy Partners LP/Regency Energy | | | | | |
| Finance Corp. | 9.375 | | 06-01-16 | 2,510,000 | 2,808,063 |
|
| Reliance Holdings USA, Inc. (S) | 4.500 | | 10-19-20 | 840,000 | 794,638 |
|
| Targa Resources Partners LP | 8.250 | | 07-01-16 | 760,000 | 805,600 |
|
| Valero Energy Corp. | 6.125 | | 02-01-20 | 485,000 | 522,900 |
|
| Valero Energy Corp. | 4.500 | | 02-01-15 | 485,000 | 512,773 |
|
| Westmoreland Coal Company/ | | | | | |
| Westmoreland Partners (S) | 10.750 | | 02-01-18 | 2,660,000 | 2,606,800 |
|
| Williams Partners LP | 7.250 | | 02-01-17 | 460,000 | 537,118 |
| | | | | | |
| Financials 16.91% | | | | | 266,217,234 |
| | | | | | |
| Capital Markets 1.91% | | | | | |
|
| Ameriprise Financial, Inc. (7.518% to 6-1-16, | | | | | |
| then 3 month LIBOR + 2.905%) | 7.518 | | 06-01-66 | 355,000 | 376,300 |
|
| Hongkong Land Treasury Services (Singapore) | | | | | |
| Pte, Ltd. (SGD)(D) | 3.860 | | 12-29-17 | 2,500,000 | 1,999,120 |
|
| Macquarie Group, Ltd. (S) | 7.300 | | 08-01-14 | $595,000 | 663,753 |
|
| Morgan Stanley (BRL)(D)(S) | 10.090 | | 05-03-17 | 19,600,000 | 11,250,150 |
|
| Morgan Stanley & Company, Inc. (BRL)(D)(S) | 11.500 | | 10-22-20 | 5,006,000 | 3,023,819 |
|
| Offshore Group Investments, Ltd. (S) | 11.500 | | 08-01-15 | $7,705,000 | 8,629,600 |
|
| Temasek Financial I, Ltd. (SGD)(D) | 3.265 | | 02-19-20 | 5,250,000 | 4,176,516 |
| | | | | | |
| Commercial Banks 2.14% | | | | | |
|
| ANZ National International, Ltd. (SGD)(D) | 2.950 | | 07-27-15 | 2,750,000 | 2,186,094 |
|
| BOM Capital PLC (S) | 6.699 | | 03-11-15 | $860,000 | 896,550 |
|
| Citizens Republic Bancorp, Inc. | 5.750 | | 02-01-13 | 3,500,000 | 3,041,724 |
|
| First Tennessee Bank NA | 5.050 | | 01-15-15 | 508,000 | 519,690 |
|
| Huntington Bancshares, Inc. | 7.000 | | 12-15-20 | 740,000 | 810,042 |
|
| M&I Marshall & Ilsley Bank | 5.000 | | 01-17-17 | 5,754,000 | 5,997,227 |
|
| Regions Financial Corp. | 7.375 | | 12-10-37 | 2,885,000 | 2,798,450 |
|
| Royal Bank of Scotland PLC (SGD)(D)(P) | 2.049 | | 03-31-14 | 7,500,000 | 5,767,947 |
|
| Santander Issuances SA (6.500% to 11-15-14, | | | | | |
| then 3 month LIBOR + 3.920%) (S) | 6.500 | | 08-11-19 | $1,000,000 | 1,019,500 |
|
| Standard Chartered Bank (SGD)(D) | 2.220 | | 07-05-13 | 6,000,000 | 4,742,467 |
|
| State Bank of India/London (S) | 4.500 | | 07-27-15 | $1,400,000 | 1,419,302 |
|
| Synovus Financial Corp. | 5.125 | | 06-15-17 | 760,000 | 718,202 |
|
| The South Financial Group, Inc. (P) | 1.715 | | 09-01-37 | 490,000 | 387,100 |
| | |
| 14 | Strategic Income Opportunities Fund | Semiannual report | See notes to financial statements |
| | | | | |
| | | | Maturity | | |
| | Rate (%) | | date | Par value | Value |
| Commercial Banks (continued) | | | | | |
|
| Western Alliance Bancorp | 10.000 | | 09-01-15 | $2,155,000 | $2,262,750 |
|
| Wilmington Trust Corp. | 8.500 | | 04-02-18 | 938,000 | 1,086,614 |
| | | | | | |
| Consumer Finance 0.08% | | | | | |
|
| Ford Motor Credit Company LLC | 8.700 | | 10-01-14 | 1,100,000 | 1,254,524 |
| | | | | | |
| Diversified Financial Services 9.15% | | | | | |
|
| CCM Merger, Inc. (S) | 8.000 | | 08-01-13 | 4,765,000 | 4,812,650 |
|
| Continental Trustees Cayman, Ltd. (7.375% to | | | | | |
| 10-7-20, then 3 month LIBOR + 6.802%) (S) | 7.375 | | 10-07-40 | 1,625,000 | 1,661,563 |
|
| Corp. Andina de Fomento | 3.750 | | 01-15-16 | 2,010,000 | 1,992,025 |
|
| Council of Europe Development Bank (AUD)(D) | 5.250 | | 05-27-13 | 2,760,000 | 2,794,589 |
|
| Crown Castle Towers LLC (S) | 4.883 | | 08-15-20 | $2,200,000 | 2,205,823 |
|
| Eurofima (AUD)(D) | 6.000 | | 01-28-14 | 3,190,000 | 3,270,080 |
|
| European Bank for Reconstruction | | | | | |
| & Development (BRL)(D) | 9.250 | | 09-10-12 | 14,910,000 | 8,953,348 |
|
| European Investment Bank (NZD)(D) | 7.000 | | 01-18-12 | 2,550,000 | 1,980,106 |
|
| European Investment Bank (AUD)(D) | 5.375 | | 05-20-14 | 6,465,000 | 6,528,539 |
|
| European Investment Bank (NOK)(D) | 4.250 | | 02-04-15 | 60,300,000 | 10,941,540 |
|
| Export-Import Bank of Korea (INR)(D)(S) | 6.500 | | 01-25-12 | 111,800,000 | 2,462,984 |
|
| General Electric Capital Australia Funding | | | | | |
| Pty, Ltd. (AUD)(D) | 7.000 | | 10-08-15 | 5,300,000 | 5,473,957 |
|
| General Electric Capital Australia Funding | | | | | |
| Pty, Ltd. (AUD)(D) | 6.500 | | 11-15-11 | 2,870,000 | 2,937,965 |
|
| General Electric Capital Corp., Series A (NZD)(D) | 7.625 | | 12-10-14 | 14,055,000 | 11,456,181 |
|
| Inter-American Development Bank (AUD)(D) | 5.375 | | 05-27-14 | 5,000,000 | 5,064,530 |
|
| Inter-American Development Bank (INR)(D) | 4.750 | | 01-10-14 | 166,600,000 | 3,608,409 |
|
| Inter-American Development Bank, Series INTL | | | | | |
| (NZD)(D) | 7.250 | | 05-24-12 | 9,930,000 | 7,819,094 |
|
| Inter-American Development Bank, Series MPLE | | | | | |
| (CAD)(D) | 4.250 | | 12-02-12 | 495,000 | 529,309 |
|
| International Bank for Reconstruction | | | | | |
| & Development (NZD)(D) | 5.375 | | 12-15-14 | 7,930,000 | 6,167,616 |
|
| International Finance Corp. (AUD)(D) | 7.500 | | 02-28-13 | 2,515,000 | 2,664,311 |
|
| Kreditanstalt fuer Wiederaufbau (IDR)(D) | 7.000 | | 10-22-12 | 47,700,000,000 | 5,371,497 |
|
| Kreditanstalt fuer Wiederaufbau (AUD)(D) | 6.000 | | 08-20-20 | 18,700,000 | 18,413,857 |
|
| Kreditanstalt fuer Wiederaufbau (AUD)(D) | 5.750 | | 05-13-15 | 15,350,000 | 15,560,283 |
|
| Kreditanstalt fuer Wiederaufbau (NOK)(D) | 4.000 | | 12-15-14 | 13,000,000 | 2,344,694 |
|
| Lancer Finance Company SPV, Ltd. (S) | 5.850 | | 12-12-16 | $489,576 | 476,841 |
|
| Landry’s Holdings, Inc. (S) | 11.500 | | 06-01-14 | 3,945,000 | 3,915,413 |
|
| Local TV Finance LLC, PIK (S) | 9.250 | | 06-15-15 | 291,721 | 282,969 |
|
| Nationstar Mortgage/Nationstar Capital Corp. (S) | 10.875 | | 04-01-15 | 925,000 | 952,750 |
|
| Odebrecht Finance, Ltd. (S) | 7.500 | | 10-18-17 | 970,000 | 1,052,450 |
|
| Ono Finance II PLC (S) | 10.875 | | 07-15-19 | 395,000 | 424,625 |
|
| Orascom Telecom Finance SCA (S) | 7.875 | | 02-08-14 | 755,000 | 728,575 |
|
| TAM Capital, Inc. | 7.375 | | 04-25-17 | 1,205,000 | 1,223,075 |
| | | | | | |
| Insurance 2.06% | | | | | |
|
| American International Group, Inc. (8.175% to | | | | | |
| 5-15-38, then 3 month LIBOR + 4.195%) | 8.175 | | 05-15-58 | 12,370,000 | 13,576,075 |
|
| Chubb Corp. (6.375% until 4-15-17, then | | | | | |
| 3 month LIBOR + 2.250%) | 6.375 | | 03-29-67 | 2,235,000 | 2,363,513 |
| | |
| See notes to financial statements | Semiannual report | Strategic Income Opportunities Fund | 15 |
| | | | | |
| | | | Maturity | | |
| | Rate (%) | | date | Par value | Value |
| Insurance (continued) | | | | | |
|
| CNO Financial Group, Inc. (S) | 9.000 | | 01-15-18 | $2,930,000 | $3,120,450 |
|
| Glen Meadow Pass-through Trust (6.505% to | | | | | |
| 2-15-17, then 3 month LIBOR +2.125%) (S) | 6.505 | | 02-12-67 | 6,530,000 | 5,795,375 |
|
| Liberty Mutual Group, Inc. (10.750% to | | | | | |
| 6-15-38, then 3 month LIBOR + 7.120%) (S) | 10.750 | | 06-15-58 | 1,930,000 | 2,513,825 |
|
| MetLife, Inc. | 6.400 | | 12-15-36 | 4,300,000 | 4,110,370 |
|
| Symetra Financial Corp. (8.300% to 10-15-17, | | | | | |
| then 3 month LIBOR + 4.177%) (S) | 8.300 | | 10-15-37 | 905,000 | 895,950 |
| | | | | | |
| Real Estate Investment Trusts 0.05% | | | | | |
|
| Dupont Fabros Technology LP | 8.500 | | 12-15-17 | 790,000 | 870,975 |
| | | | | | |
| Real Estate Management & Development 1.52% | | | | |
|
| CapitaMalls Asia Treasury, Ltd. (SGD)(D) | 3.950 | | 08-24-17 | 7,750,000 | 6,193,394 |
|
| Country Garden Holdings Company (S) | 11.125 | | 02-23-18 | $1,190,000 | 1,187,620 |
|
| Realogy Corp. (S) | 12.000 | | 04-15-17 | 6,051,484 | 6,414,573 |
|
| Realogy Corp. (S) | 11.500 | | 04-15-17 | 5,955,000 | 6,342,075 |
|
| Realogy Corp. (S) | 7.875 | | 02-15-19 | 3,720,000 | 3,733,950 |
| | | | | | |
| Health Care 1.08% | | | | | 16,948,440 |
| | | | | | |
| Biotechnology 0.07% | | | | | |
|
| Giant Funding Corp. (S) | 8.250 | | 02-01-18 | 1,005,000 | 1,032,638 |
| | | | | | |
| Health Care Equipment & Supplies 0.15% | | | | | |
|
| Alere, Inc. | 8.625 | | 10-01-18 | 2,160,000 | 2,289,600 |
| | | | | | |
| Health Care Providers & Services 0.57% | | | | | |
|
| BioScrip, Inc. | 10.250 | | 10-01-15 | 700,000 | 738,500 |
|
| Community Health Systems, Inc. | 8.875 | | 07-15-15 | 2,240,000 | 2,374,400 |
|
| HCA, Inc. | 9.125 | | 11-15-14 | 460,000 | 482,425 |
|
| HCA, Inc. | 8.500 | | 04-15-19 | 3,500,000 | 3,920,000 |
|
| LifePoint Hospitals, Inc. (S) | 6.625 | | 10-01-20 | 480,000 | 491,400 |
|
| Vanguard Health Systems, Inc. (S) | Zero | | 02-01-16 | 1,550,000 | 999,750 |
| | | | | | |
| Pharmaceuticals 0.29% | | | | | |
|
| Catalent Pharma Solutions, Inc., PIK | 9.500 | | 04-15-15 | 2,908,018 | 2,987,989 |
|
| PharmaNet Development Group, Inc. (S) | 10.875 | | 04-15-17 | 1,255,000 | 1,383,638 |
|
| Valeant Pharmaceuticals International (S) | 7.000 | | 10-01-20 | 240,000 | 248,100 |
| | | | | | |
| Industrials 4.03% | | | | | 63,419,876 |
| | | | | | |
| Aerospace & Defense 0.48% | | | | | |
|
| Bombardier, Inc. (S) | 7.750 | | 03-15-20 | 730,000 | 792,050 |
|
| Colt Defense LLC/Colt Finance Corp. (S) | 8.750 | | 11-15-17 | 425,000 | 337,875 |
|
| Hawker Beechcraft Acquisition Company LLC | 8.500 | | 04-01-15 | 2,025,000 | 1,625,063 |
|
| Kratos Defense & Security Solutions, Inc. | 10.000 | | 06-01-17 | 2,010,000 | 2,266,275 |
|
| TransDigm, Inc. (S) | 7.750 | | 12-15-18 | 2,315,000 | 2,494,413 |
| | | | | | |
| Airlines 0.96% | | | | | |
|
| Delta Air Lines, Inc. (S) | 12.250 | | 03-15-15 | 1,595,000 | 1,826,275 |
|
| Delta Air Lines, Inc. (S) | 9.500 | | 09-15-14 | 1,967,000 | 2,144,030 |
|
| Delta Air Lines, Inc. | 6.821 | | 08-10-22 | 1,279,382 | 1,349,748 |
|
| Global Aviation Holdings, Inc. | 14.000 | | 08-15-13 | 3,015,000 | 3,474,788 |
|
| United Air Lines, Inc. | 12.750 | | 07-15-12 | 726,739 | 812,131 |
|
| United Air Lines, Inc. (S) | 12.000 | | 11-01-13 | 2,400,000 | 2,646,000 |
| | |
| 16 | Strategic Income Opportunities Fund | Semiannual report | See notes to financial statements |
| | | | | |
| | | | Maturity | | |
| | Rate (%) | | date | Par value | Value |
| Airlines (continued) | | | | | |
|
| United Air Lines, Inc. | 10.400 | | 11-01-16 | $741,281 | $859,886 |
|
| United Air Lines, Inc. (S) | 9.875 | | 08-01-13 | 347,000 | 377,363 |
|
| United Air Lines, Inc. | 9.750 | | 01-15-17 | 1,444,263 | 1,664,513 |
| | | | | | |
| Building Materials 0.05% | | | | | |
|
| Rearden G Holdings EINS GmbH (S) | 7.875 | | 03-30-20 | 490,000 | 516,950 |
|
| Voto-Votorantim Overseas Trading | | | | | |
| Operations NV (S) | 6.625 | | 09-25-19 | 330,000 | 344,025 |
| | | | | | |
| Building Products 0.17% | | | | | |
|
| Nortek, Inc. (S) | 10.000 | | 12-01-18 | 2,535,000 | 2,706,113 |
| | | | | | |
| Commercial Services & Supplies 0.44% | | | | | |
|
| Avis Budget Car Rental LLC | 9.625 | | 03-15-18 | 825,000 | 921,938 |
|
| Covanta Holding Corp. | 7.250 | | 12-01-20 | 3,780,000 | 3,969,049 |
|
| Garda World Security Corp. (S) | 9.750 | | 03-15-17 | 1,820,000 | 1,956,500 |
| | | | | | |
| Construction & Engineering 0.28% | | | | | |
|
| Aeropuertos Argentina 2000 SA (S) | 10.750 | | 12-01-20 | 2,230,550 | 2,397,841 |
|
| Tutor Perini Corp. (S) | 7.625 | | 11-01-18 | 1,960,000 | 2,031,050 |
| | | | | | |
| Electrical Equipment 0.41% | | | | | |
|
| Coleman Cable, Inc. | 9.000 | | 02-15-18 | 1,700,000 | 1,772,250 |
|
| WPE International Cooperatief UA (S) | 10.375 | | 09-30-20 | 4,495,000 | 4,629,850 |
| | | | | | |
| Industrial Conglomerates 0.42% | | | | | |
|
| Grupo KUO SAB de CV (S) | 9.750 | | 10-17-17 | 3,315,000 | 3,613,350 |
|
| Hutchison Whampoa International, Ltd. (S) | 4.625 | | 09-11-15 | 850,000 | 901,240 |
|
| Odebrecht Finance, Ltd. (S) | 7.500 | | 09-14-15 | 1,815,000 | 1,837,688 |
|
| Smiths Group PLC (S) | 7.200 | | 05-15-19 | 190,000 | 210,830 |
| | | | | | |
| Machinery 0.15% | | | | | |
|
| American Railcar Industries, Inc. | 7.500 | | 03-01-14 | 1,125,000 | 1,153,125 |
|
| Thermadyne Holdings Corp. (S) | 9.000 | | 12-15-17 | 1,195,000 | 1,262,219 |
| | | | | | |
| Marine 0.13% | | | | | |
|
| Navios Maritime Holdings, Inc./Navios Maritime | | | | | |
| Finance II U.S., Inc. (S) | 8.125 | | 02-15-19 | 2,075,000 | 2,075,000 |
| | | | | | |
| Road & Rail 0.48% | | | | | |
|
| Kansas City Southern de Mexico SA de CV | 8.000 | | 02-01-18 | 945,000 | 1,032,413 |
|
| RailAmerica, Inc. | 9.250 | | 07-01-17 | 972,000 | 1,076,490 |
|
| Swift Services Holdings, Inc. (S) | 10.000 | | 11-15-18 | 2,205,000 | 2,414,475 |
|
| Western Express, Inc. (S) | 12.500 | | 04-15-15 | 3,145,000 | 3,050,650 |
| | | | | | |
| Transportation Infrastructure 0.06% | | | | | |
|
| SCF Capital, Ltd. (S) | 5.375 | | 10-27-17 | 900,000 | 876,420 |
| | | | | | |
| Information Technology 0.67% | | | | | 10,592,438 |
| | | | | | |
| Communications Equipment 0.07% | | | | | |
|
| CommScope, Inc. (S) | 8.250 | | 01-15-19 | 995,000 | 1,032,313 |
| | | | | | |
| Electronic Equipment, Instruments & Components 0.12% | | | | |
|
| Freescale Semiconductor, Inc. (S) | 9.250 | | 04-15-18 | 1,745,000 | 1,945,675 |
| | | | | | |
| IT Services 0.20% | | | | | |
|
| Brightstar Corp. (S) | 9.500 | | 12-01-16 | 2,415,000 | 2,584,050 |
|
| Equinix, Inc. | 8.125 | | 03-01-18 | 555,000 | 602,175 |
| | |
| See notes to financial statements | Semiannual report | Strategic Income Opportunities Fund | 17 |
| | | | | |
| | | | Maturity | | |
| | Rate (%) | | date | Par value | Value |
| Software 0.28% | | | | | |
|
| First Data Corp. (S) | 8.875 | | 08-15-20 | $2,175,000 | $2,381,625 |
|
| Vangent, Inc. | 9.625 | | 02-15-15 | 2,160,000 | 2,046,600 |
| | | | | | |
| Materials 5.33% | | | | | 83,833,181 |
| | | | | | |
| Chemicals 0.53% | | | | | |
|
| American Pacific Corp. | 9.000 | | 02-01-15 | 2,340,000 | 2,299,050 |
|
| Braskem Finance, Ltd. (S) | 7.375 | | — (Q) | 1,220,000 | 1,210,843 |
|
| Braskem Finance, Ltd. (S) | 7.000 | | 05-07-20 | 1,605,000 | 1,657,163 |
|
| Ferro Corp. | 7.875 | | 08-15-18 | 1,665,000 | 1,773,225 |
|
| Nova Chemicals Corp. | 6.500 | | 01-15-12 | 125,000 | 128,750 |
|
| Rhodia SA (S) | 6.875 | | 09-15-20 | 1,245,000 | 1,274,569 |
| | | | | | |
| Containers & Packaging 1.27% | | | | | |
|
| Ball Corp. | 6.750 | | 09-15-20 | 580,000 | 607,550 |
|
| Ball Corp. | 6.625 | | 03-15-18 | 195,000 | 201,094 |
|
| Berry Plastics Corp. (S) | 9.750 | | 01-15-21 | 1,255,000 | 1,258,138 |
|
| Berry Plastics Corp. | 8.250 | | 11-15-15 | 2,680,000 | 2,870,950 |
|
| Cascades, Inc. | 7.875 | | 01-15-20 | 545,000 | 568,844 |
|
| Graham Packaging Company LP/GPC Capital | | | | | |
| Corp. I | 9.875 | | 10-15-14 | 375,000 | 388,125 |
|
| Graham Packaging Company LP/GPC Capital | | | | | |
| Corp. I | 8.250 | | 01-01-17 | 1,455,000 | 1,556,850 |
|
| Graham Packaging Company LP/GPC Capital | | | | | |
| Corp. I | 8.250 | | 10-01-18 | 490,000 | 527,975 |
|
| Graphic Packaging International, Inc. | 9.500 | | 06-15-17 | 1,505,000 | 1,670,550 |
|
| Graphic Packaging International, Inc. | 7.875 | | 10-01-18 | 283,000 | 304,225 |
|
| Owens-Brockway Glass Container, Inc. | 7.375 | | 05-15-16 | 4,700,000 | 5,123,000 |
|
| Packaging Dynamics Corp. (S) | 8.750 | | 02-01-16 | 1,320,000 | 1,351,350 |
|
| Polymer Group, Inc. (S) | 7.750 | | 02-01-19 | 480,000 | 499,800 |
|
| Sealed Air Corp. | 7.875 | | 06-15-17 | 2,065,000 | 2,298,808 |
|
| U.S. Corrugated, Inc. | 10.000 | | 06-12-13 | 715,000 | 700,700 |
| | | | | | |
| Metals & Mining 2.08% | | | | | |
|
| China Oriental Group Company, Ltd. (S) | 7.000 | | 11-17-17 | 1,750,000 | 1,706,250 |
|
| CSN Islands XI Corp. (S) | 6.875 | | 09-21-19 | 510,000 | 561,000 |
|
| CSN Islands XII Corp. (S) | 7.000 | | — (Q) | 1,950,000 | 1,906,125 |
|
| Essar Steel Algoma, Inc. (S) | 9.375 | | 03-15-15 | 1,935,000 | 1,935,000 |
|
| Gerdau Holdings, Inc. (S) | 7.000 | | 01-20-20 | 790,000 | 872,950 |
|
| Gerdau Trade, Inc. (S) | 5.750 | | 01-30-21 | 3,615,000 | 3,615,000 |
|
| Metinvest BV (S) | 8.750 | | 02-14-18 | 3,315,000 | 3,381,300 |
|
| Midwest Vanadium Pty, Ltd. (S) | 11.500 | | 02-15-18 | 5,400,000 | 5,562,000 |
|
| Rain CII Carbon LLC (S) | 8.000 | | 12-01-18 | 7,890,000 | 8,422,575 |
|
| Rio Tinto Finance USA, Ltd. | 9.000 | | 05-01-19 | 1,150,000 | 1,519,724 |
|
| Rio Tinto Finance USA, Ltd. | 7.125 | | 07-15-28 | 1,465,000 | 1,788,447 |
|
| Teck Resources, Ltd. | 10.750 | | 05-15-19 | 505,000 | 650,592 |
|
| Vale Overseas, Ltd. | 4.625 | | 09-15-20 | 855,000 | 839,289 |
| | | | | | |
| Paper & Forest Products 1.45% | | | | | |
|
| ABI Escrow Corp. (S) | 10.250 | | 10-15-18 | 2,300,000 | 2,576,000 |
|
| Celulosa Arauco y Constitucion SA (S) | 5.000 | | 01-21-21 | 1,110,000 | 1,066,578 |
|
| Clearwater Paper Corp. | 10.625 | | 06-15-16 | 195,000 | 222,788 |
|
| Grupo Papelero Scribe SA (S) | 8.875 | | 04-07-20 | 940,000 | 907,100 |
| | |
| 18 | Strategic Income Opportunities Fund | Semiannual report | See notes to financial statements |
| | | | | |
| | | | Maturity | | |
| | Rate (%) | | date | Par value | Value |
| Paper & Forest Products (continued) | | | | | |
|
| Mercer International, Inc. (S) | 9.500 | | 12-01-17 | $1,605,000 | $1,733,400 |
|
| NewPage Corp. | 11.375 | | 12-31-14 | 5,995,000 | 5,980,013 |
|
| PE Paper Escrow GmbH (S) | 12.000 | | 08-01-14 | 515,000 | 594,825 |
|
| Pope & Talbot, Inc. (H) | 8.375 | | 06-01-13 | 1,000,000 | 100 |
|
| Pope & Talbot, Inc. (H) | 8.375 | | 06-01-13 | 500,000 | 50 |
|
| Sappi Papier Holding AG (S) | 7.500 | | 06-15-32 | 3,280,000 | 2,960,633 |
|
| Suzano Trading, Ltd. (S) | 5.875 | | 01-23-21 | 3,645,000 | 3,511,958 |
|
| Verso Paper Holdings LLC/Verso Paper, Inc. | 11.500 | | 07-01-14 | 510,000 | 562,275 |
|
| Verso Paper Holdings LLC/Verso Paper, Inc. (S) | 8.750 | | 02-01-19 | 2,570,000 | 2,685,650 |
| | | | | | |
| Telecommunication Services 3.77% | | | | | 59,283,936 |
| | | | | | |
| Communications Equipment 0.09% | | | | | |
|
| Sable International Finance, Ltd. (S) | 7.750 | | 02-15-17 | 585,000 | 623,025 |
|
| SingTel Group Treasury Pte, Ltd. (SGD)(D) | 3.488 | | 04-08-20 | 1,000,000 | 791,707 |
| | | | | | |
| Diversified Telecommunication Services 2.01% | | | | |
|
| Affinion Group Holdings, Inc. (S) | 11.625 | | 11-15-15 | $3,125,000 | 3,242,188 |
|
| AT&T, Inc. | 6.700 | | 11-15-13 | 1,240,000 | 1,403,320 |
|
| Axtel SAB de CV (S) | 9.000 | | 09-22-19 | 3,000,000 | 2,887,500 |
|
| Axtel SAB de CV (S) | 7.625 | | 02-01-17 | 2,715,000 | 2,579,250 |
|
| Broadview Networks Holdings, Inc. | 11.375 | | 09-01-12 | 2,345,000 | 2,336,206 |
|
| Cincinnati Bell, Inc. | 8.750 | | 03-15-18 | 2,305,000 | 2,209,919 |
|
| Frontier Communications Corp. | 8.500 | | 04-15-20 | 1,245,000 | 1,381,950 |
|
| Frontier Communications Corp. | 7.125 | | 03-15-19 | 710,000 | 738,400 |
|
| GXS Worldwide, Inc. | 9.750 | | 06-15-15 | 2,345,000 | 2,386,038 |
|
| Intelsat Bermuda, Ltd. | 11.250 | | 02-04-17 | 4,060,000 | 4,491,375 |
|
| Level 3 Financing, Inc. | 10.000 | | 02-01-18 | 280,000 | 285,250 |
|
| Virgin Media Secured Finance PLC (S) | 5.250 | | 01-15-21 | 1,260,000 | 1,274,625 |
|
| West Corp. | 11.000 | | 10-15-16 | 4,895,000 | 5,329,431 |
|
| Wind Acquisition Finance SA (S) | 7.250 | | 02-15-18 | 1,060,000 | 1,094,450 |
| | | | | | |
| Wireless Telecommunication Services 1.67% | | | | |
|
| American Tower Corp. | 7.000 | | 10-15-17 | 1,310,000 | 1,478,598 |
|
| Bakrie Telecom Pte, Ltd. (S) | 11.500 | | 05-07-15 | 3,160,000 | 3,428,600 |
|
| CC Holdings GS V LLC/Crown Castle | | | | | |
| GS III Corp. (S) | 7.750 | | 05-01-17 | 870,000 | 960,263 |
|
| Digicel Group, Ltd. (S) | 8.875 | | 01-15-15 | 1,680,000 | 1,747,200 |
|
| Digicel, Ltd. (S) | 8.250 | | 09-01-17 | 3,180,000 | 3,323,100 |
|
| Nextel Communications, Inc., Series D | 7.375 | | 08-01-15 | 4,940,000 | 4,952,350 |
|
| NII Capital Corp. | 10.000 | | 08-15-16 | 695,000 | 787,088 |
|
| NII Capital Corp. | 8.875 | | 12-15-19 | 910,000 | 1,005,550 |
|
| SBA Tower Trust (S) | 5.101 | | 04-15-17 | 1,495,000 | 1,581,122 |
|
| Sprint Capital Corp. | 8.750 | | 03-15-32 | 3,325,000 | 3,458,000 |
|
| Sprint Capital Corp. | 8.375 | | 03-15-12 | 3,305,000 | 3,507,431 |
| | | | | | |
| Utilities 0.51% | | | | | 8,099,850 |
| | | | | | |
| Electric Utilities 0.24% | | | | | |
|
| Appalachian Power Company | 5.000 | | 06-01-17 | 900,000 | 943,513 |
|
| Dubai Electricity & Water Authority (S) | 7.375 | | 10-21-20 | 1,910,000 | 1,785,850 |
|
| United Maritime Group LLC | 11.750 | | 06-15-15 | 1,100,000 | 1,133,000 |
| | |
| See notes to financial statements | Semiannual report | Strategic Income Opportunities Fund | 19 |
| | | | | |
| | | | Maturity | | |
| | Rate (%) | | date | Par value | Value |
| Independent Power Producers & Energy Traders 0.17% | | | | |
|
| AES Andres Dominicana/Itabo Dominicana (S) | 9.500 | | 11-12-20 | $1,985,000 | $2,128,913 |
|
| Listrindo Capital BV (S) | 9.250 | | 01-29-15 | 455,000 | 509,586 |
| | | | | | |
| Water Utilities 0.10% | | | | | |
|
| Cia de Saneamento Basico do Estado de | | | | | |
| Sao Paulo (S) | 6.250 | | 12-16-20 | 1,595,000 | 1,598,988 |
| |
| Foreign Government Obligations 26.05% | | | | $410,196,420 |
|
| (Cost $398,229,573) | | | | | |
| | | | | | |
| Argentina 0.71% | | | | | 11,197,677 |
| | | | | | |
| Provincia de Buenos Aires (S) | 11.750 | | 10-05-15 | $2,960,000 | 3,041,400 |
|
| Provincia de Buenos Aires (S) | 10.875 | | 01-26-21 | 2,095,000 | 1,958,289 |
|
| Provincia de Cordoba (S) | 12.375 | | 08-17-17 | 2,245,000 | 2,329,188 |
|
| Republic of Argentina | 8.750 | | 06-02-17 | 3,840,000 | 3,868,800 |
| | | | | | |
| Australia 1.01% | | | | | 15,947,282 |
| | | | | | |
| New South Wales Treasury Corp. (AUD)(D) | 6.000 | | 04-01-16 | 4,915,000 | 5,064,956 |
|
| New South Wales Treasury Corp., Series 12 | | | | | |
| (AUD)(D) | 6.000 | | 05-01-12 | 10,571,000 | 10,882,326 |
| | | | | | |
| Brazil 0.37% | | | | | 5,799,693 |
| | | | | | |
| Federative Republic of Brazil (BRL)(D) | 10.250 | | 01-10-28 | 9,405,000 | 5,799,693 |
| | | | | | |
| Canada 5.01% | | | | | 78,936,254 |
| | | | | | |
| Canada Housing Trust (CAD)(D) | 4.600 | | 09-15-11 | 5,545,000 | 5,810,621 |
|
| Government of Canada (CAD)(D) | 4.000 | | 06-01-16 | 12,390,000 | 13,553,057 |
|
| Government of Canada (CAD)(D) | 3.000 | | 12-01-15 | 14,455,000 | 15,131,218 |
|
| Government of Canada (CAD)(D) | 2.500 | | 06-01-15 | 11,710,000 | 12,053,267 |
|
| Ontario School Boards Financing Corp., | | | | | |
| Series 01A2 (CAD)(D) | 6.250 | | 10-19-16 | 3,815,000 | 4,464,871 |
|
| Province of Ontario (NZD)(D) | 6.250 | | 06-16-15 | 12,870,000 | 10,229,119 |
|
| Province of Ontario (CAD)(D) | 4.750 | | 06-02-13 | 4,610,000 | 5,017,643 |
|
| Province of Ontario (CAD)(D) | 4.500 | | 03-08-15 | 6,000,000 | 6,586,074 |
|
| Province of Ontario | 3.150 | | 12-15-17 | $3,495,000 | 3,468,931 |
|
| Province of Quebec (CAD)(D) | 5.250 | | 10-01-13 | 2,370,000 | 2,621,453 |
| | | | | | |
| Chile 0.07% | | | | | 1,092,938 |
| | | | | | |
| Republic of Chile | 3.875 | | 08-05-20 | $1,125,000 | 1,092,938 |
| | | | | | |
| Colombia 0.01% | | | | | 118,085 |
| | | | | | |
| Republic of Colombia | 10.000 | | 01-23-12 | 110,000 | 118,085 |
| | | | | | |
| Indonesia 1.53% | | | | | 24,029,500 |
| | | | | | |
| Republic of Indonesia (IDR)(D) | 14.250 | | 06-15-13 | 12,500,000,000 | 1,623,205 |
|
| Republic of Indonesia (IDR)(D) | 12.500 | | 03-15-13 | 23,855,000,000 | 2,981,741 |
|
| Republic of Indonesia (IDR)(D) | 10.000 | | 07-15-17 | 36,360,000,000 | 4,430,512 |
|
| Republic of Indonesia (IDR)(D) | 9.500 | | 06-15-15 | 92,970,000,000 | 11,047,174 |
|
| Republic of Indonesia (IDR)(D) | 9.500 | | 07-15-31 | 22,900,000,000 | 2,484,612 |
|
| Republic of Indonesia (S) | 5.875 | | 03-13-20 | $1,365,000 | 1,462,256 |
| | | | | | |
| Malaysia 0.53% | | | | | 8,406,748 |
| | | | | | |
| Government of Malaysia (MYR)(D) | 3.835 | | 08-12-15 | 25,250,000 | 8,406,748 |
| | |
| 20 | Strategic Income Opportunities Fund | Semiannual report | See notes to financial statements |
| | | | | |
| | | | Maturity | | |
| | Rate (%) | | date | Par value | Value |
| Mexico 0.60% | | | | | $9,422,742 |
| | | | | | |
| Government of Mexico | 8.125 | | 12-30-19 | $360,000 | 462,600 |
|
| Government of Mexico (MXN)(D) | 7.500 | | 06-21-12 | 84,827,300 | 7,245,292 |
|
| Government of Mexico | 5.875 | | 02-17-14 | $550,000 | 605,000 |
|
| Government of Mexico | 5.625 | | 01-15-17 | 520,000 | 573,300 |
|
| Government of Mexico, Series A | 6.375 | | 01-16-13 | 490,000 | 536,550 |
| | | | | | |
| New Zealand 2.16% | | | | | 34,008,423 |
| | | | | | |
| Government of New Zealand, Series 1217 | | | | | |
| (NZD)(D) | 6.000 | | 12-15-17 | 42,960,000 | 34,008,423 |
| | | | | | |
| Norway 1.16% | | | | | 18,197,579 |
| | | | | | |
| Government of Norway (NOK)(D) | 5.000 | | 05-15-15 | 53,377,000 | 10,231,672 |
|
| Government of Norway (NOK)(D) | 4.500 | | 05-22-19 | 42,073,000 | 7,965,907 |
| | | | | | |
| Philippines 1.98% | | | | | 31,159,502 |
| | | | | | |
| Republic of Philippines (PHP)(D) | 8.125 | | 12-16-35 | 653,520,160 | 14,999,734 |
|
| Republic of Philippines (PHP)(D) | 6.250 | | 01-14-36 | 72,000,000 | 1,486,662 |
|
| Republic of Philippines (PHP)(D) | 5.875 | | 12-16-20 | 321,278,240 | 6,968,495 |
|
| Republic of Philippines (PHP)(D) | 4.950 | | 01-15-21 | 342,000,000 | 7,704,611 |
| | | | | | |
| Singapore 1.69% | | | | | 26,607,731 |
| | | | | | |
| Republic of Singapore (SGD)(D) | 3.250 | | 09-01-20 | 17,560,000 | 14,551,231 |
|
| Republic of Singapore (SGD)(D) | 1.375 | | 10-01-14 | 14,975,000 | 12,056,500 |
| | | | | | |
| South Korea 2.60% | | | | | 40,984,652 |
| | | | | | |
| Korea Development Bank | 4.375 | | 08-10-15 | $485,000 | 497,810 |
|
| Korea Development Bank (SGD)(D) | 2.440 | | 05-25-12 | 2,500,000 | 1,991,313 |
|
| Republic of Korea (KRW)(D) | 5.000 | | 06-10-20 | 14,205,000,000 | 12,900,403 |
|
| Republic of Korea, Series 1212 (KRW)(D) | 4.250 | | 12-10-12 | 6,535,000,000 | 5,847,802 |
|
| Republic of Korea, Series 1809 (KRW)(D) | 5.750 | | 09-10-18 | 20,780,000,000 | 19,747,324 |
| | | | | | |
| Sweden 2.43% | | | | | 38,292,232 |
| | | | | | |
| Kingdom of Sweden (SEK)(D) | 3.750 | | 08-12-17 | 120,075,000 | 19,553,706 |
|
| Kingdom of Sweden, Series 1047 (SEK)(D) | 5.000 | | 12-01-20 | 67,615,000 | 12,127,485 |
|
| Swedish Export Credit Company (NZD)(D) | 7.625 | | 06-30-14 | 8,075,000 | 6,611,041 |
| | | | | | |
| Turkey 0.09% | | | | | 1,435,000 |
| | | | | | |
| Republic of Turkey | 6.750 | | 05-30-40 | $1,435,000 | 1,435,000 |
| | | | | | |
| Ukraine 0.18% | | | | | 2,855,890 |
| | | | | | |
| Government of Ukraine (S) | 7.950 | | 02-23-21 | 1,365,000 | 1,366,937 |
|
| Government of Ukraine (S) | 7.750 | | 09-23-20 | 980,000 | 982,450 |
|
| Government of Ukraine (S) | 6.580 | | 11-21-16 | 515,000 | 506,503 |
| | | | | | |
| United Kingdom 3.92% | | | | | 61,704,492 |
| | | | | | |
| Government of United Kingdom (GBP)(D) | 4.750 | | 03-07-20 | 30,035,000 | 53,095,252 |
|
| Government of United Kingdom (GBP)(D) | 3.750 | | 09-07-20 | 5,271,000 | 8,609,240 |
| | |
| See notes to financial statements | Semiannual report | Strategic Income Opportunities Fund | 21 |
| | | | | |
| | | | Maturity | | |
| | Rate (%) | | date | Par value | Value |
| Capital Preferred Securities 1.75% | | | | | $27,610,863 |
|
| (Cost $26,028,997) | | | | | |
| | | | | | |
| Financials 1.75% | | | | | 27,610,863 |
| | | | | | |
| Commercial Banks 1.72% | | | | | |
|
| Banponce Trust I, Series A | 8.327 | | 02-01-27 | $750,000 | 544,276 |
|
| BB&T Capital Trust IV (6.820% to 6-12-37 | | | | | |
| then 3 month LIBOR + 2.110% quarterly or | | | | | |
| 1 month LIBOR + 2.108%) | 6.820 | | 06-12-57 | 1,175,000 | 1,195,082 |
|
| Fifth Third Capital Trust IV (6.500% to 4-15-17 | | | | | |
| then 3 month LIBOR + 1.368%) | 6.500 | | 04-15-37 | 3,345,000 | 3,261,375 |
|
| First Midwest Capital Trust I, Series B | 6.950 | | 12-01-33 | 1,155,000 | 975,975 |
|
| Keycorp Capital VII | 5.700 | | 06-15-35 | 2,515,000 | 2,145,589 |
|
| SunTrust Capital VIII (6.100% to 12-15-36, | | | | | |
| then 1 month LIBOR + 1.965%) | 6.100 | | 12-01-66 | 4,070,000 | 3,892,141 |
|
| Wachovia Capital Trust III (5.800% to 3-15-11, | | | | | |
| then greater of 3 month LIBOR + 0.93% or | | | | | |
| 5.570% quarterly) | 5.800 | | 03-29-49 | 16,635,000 | 15,137,850 |
| | | | | | |
| Diversified Financial Services 0.03% | | | | | |
|
| Susquehanna Capital II | 11.000 | | 03-23-40 | 415,000 | 458,575 |
| |
| Convertible Bonds 3.64% | | | | | $57,369,268 |
|
| (Cost $46,829,780) | | | | | |
| | | | | | |
| Consumer Discretionary 1.42% | | | | | 22,395,888 |
| | | | | | |
| Automobiles 0.71% | | | | | |
|
| Ford Motor Company | 4.250 | | 11-15-16 | $6,125,000 | 11,193,438 |
| | | | | | |
| Household Durables 0.23% | | | | | |
|
| D.R. Horton, Inc. | 2.000 | | 05-15-14 | 660,000 | 754,050 |
|
| Lennar Corp. (S) | 2.750 | | 12-15-20 | 2,500,000 | 2,887,500 |
| | | | | | |
| Media 0.48% | | | | | |
|
| XM Satellite Radio, Inc. (S) | 7.000 | | 12-01-14 | 5,580,000 | 7,560,900 |
| | | | | | |
| Consumer Staples 0.07% | | | | | 1,152,200 |
| | | | | | |
| Tobacco 0.07% | | | | | |
|
| Alliance One International, Inc. | 5.500 | | 07-15-14 | 1,120,000 | 1,152,200 |
| | | | | | |
| Energy 0.16% | | | | | 2,453,325 |
| | | | | | |
| Energy Equipment & Services 0.05% | | | | | |
|
| Newpark Resources, Inc. | 4.000 | | 10-01-17 | 750,000 | 757,500 |
| | | | | | |
| Oil, Gas & Consumable Fuels 0.11% | | | | | |
|
| Chesapeake Energy Corp. | 2.500 | | 05-15-37 | 660,000 | 735,075 |
|
| Chesapeake Energy Corp. | 2.250 | | 12-15-38 | 1,050,000 | 960,750 |
| | | | | | |
| Financials 0.69% | | | | | 10,911,301 |
| | | | | | |
| Capital Markets 0.37% | | | | | |
|
| Ares Capital Corp. (S) | 5.750 | | 02-01-16 | 3,550,000 | 3,816,250 |
|
| Janus Capital Group, Inc. | 3.250 | | 07-15-14 | 955,000 | 1,166,294 |
|
| MF Global Holdings, Ltd. | 1.875 | | 02-01-16 | 775,000 | 814,719 |
| | | | | | |
| Real Estate Investment Trusts 0.32% | | | | | |
|
| Annaly Capital Management, Inc. | 4.000 | | 02-15-15 | 1,440,000 | 1,677,600 |
|
| Developers Diversified Realty Corp. | 1.750 | | 11-15-40 | 2,500,000 | 2,675,000 |
|
| ProLogis | 3.250 | | 03-15-15 | 600,000 | 700,500 |
| | |
| 22 | Strategic Income Opportunities Fund | Semiannual report | See notes to financial statements |
| | | | | |
| | | | Maturity | | |
| | Rate (%) | | date | Par value | Value |
| Thrifts & Mortgage Finance 0.00% | | | | | |
|
| The PMI Group, Inc. | 4.500 | | 04-15-20 | $75,000 | $60,938 |
| | | | | | |
| Health Care 0.27% | | | | | 4,263,723 |
| | | | | | |
| Biotechnology 0.22% | | | | | |
|
| Dendreon Corp. | 2.875 | | 01-15-16 | 3,029,000 | 3,007,191 |
|
| Gilead Sciences, Inc. (S) | 1.000 | | 05-01-14 | 455,000 | 482,869 |
| | | | | | |
| Health Care Equipment & Supplies 0.05% | | | | | |
|
| Teleflex, Inc. | 3.875 | | 08-01-17 | 690,000 | 773,663 |
| | | | | | |
| Industrials 0.47% | | | | | 7,293,905 |
| | | | | | |
| Airlines 0.32% | | | | | |
|
| Continental Airlines, Inc. | 4.500 | | 01-15-15 | 910,000 | 1,351,350 |
|
| UAL Corp. | 4.500 | | 06-30-21 | 3,465,000 | 3,564,792 |
| | | | | | |
| Trading Companies & Distributors 0.15% | | | | | |
|
| United Rentals, Inc. | 4.000 | | 11-15-15 | 815,000 | 2,377,763 |
| | | | | | |
| Information Technology 0.24% | | | | | 3,805,338 |
| | | | | | |
| Internet Software & Services 0.24% | | | | | |
|
| Equinix, Inc. | 4.750 | | 06-15-16 | 2,930,000 | 3,805,338 |
| | | | | | |
| Materials 0.06% | | | | | 970,188 |
| | | | | | |
| Containers & Packaging 0.06% | | | | | |
|
| Owens-Brockway Glass Container, Inc. (S) | 3.000 | | 06-01-15 | 950,000 | 970,188 |
| | | | | | |
| Telecommunication Services 0.26% | | | | | 4,123,400 |
| | | | | | |
| Wireless Telecommunication Services 0.26% | | | | |
|
| Clearwire Communications LLC/Clearwire | | | | | |
| Finance, Inc. (S) | 8.250 | | 12-01-40 | 3,890,000 | 4,123,400 |
| |
| Municipal Bonds 3.70% | | | | | $58,216,981 |
|
| (Cost $58,159,276) | | | | | |
| | | | | | |
| California 1.02% | | | | | 16,098,295 |
| | | | | | |
| Bay Area Toll Authority | 7.043 | | 04-01-50 | $1,110,000 | 1,148,217 |
|
| California State Public Works Board, Series G2 | 8.361 | | 10-01-34 | 1,965,000 | 2,085,906 |
|
| City of Long Beach | 7.282 | | 11-01-30 | 480,000 | 456,970 |
|
| County of Siskiyou | 6.100 | | 06-01-37 | 760,000 | 710,805 |
|
| Los Angeles County Public Works | | | | | |
| Financing Authority | 7.488 | | 08-01-33 | 1,880,000 | 1,839,542 |
|
| Los Angeles Department of Water & Power | 6.603 | | 07-01-50 | 2,030,000 | 2,134,241 |
|
| Los Angeles Department of Water & Power | 5.516 | | 07-01-27 | 3,000,000 | 2,825,730 |
|
| Modesto Irrigation District Financing Authority | 7.204 | | 10-01-40 | 1,220,000 | 1,246,169 |
|
| Palo Alto Unified School District | 5.862 | | 07-01-27 | 500,000 | 514,475 |
|
| San Diego County Regional Airport Authority | 6.628 | | 07-01-40 | 480,000 | 473,712 |
|
| State of California | 7.300 | | 10-01-39 | 1,690,000 | 1,778,100 |
|
| State of California | 6.200 | | 10-01-19 | 845,000 | 884,428 |
| | | | | | |
| District of Columbia 0.22% | | | | | 3,471,341 |
| | | | | | |
| District of Columbia Water & Sewer Authority | 5.522 | | 10-01-44 | 2,035,000 | 2,014,019 |
|
| Metropolitan Washington Airports Authority, | | | | | |
| Series D | 8.000 | | 10-01-47 | 1,505,000 | 1,457,322 |
| | |
| See notes to financial statements | Semiannual report | Strategic Income Opportunities Fund | 23 |
| | | | | |
| | | | Maturity | | |
| | Rate (%) | | date | Par value | Value |
| Florida 0.28% | | | | | $4,377,260 |
| | | | | | |
| County of Sarasota | 7.401 | | 10-01-40 | $3,130,000 | 3,389,070 |
|
| Florida Governmental Utility Authority | 7.084 | | 10-01-40 | 1,000,000 | 988,190 |
| | | | | | |
| Georgia 0.14% | | | | | 2,212,945 |
| | | | | | |
| Municipal Electric Authority of Georgia | 7.055 | | 04-01-57 | 2,280,000 | 2,212,945 |
| | | | | | |
| Hawaii 0.04% | | | | | 677,902 |
| | | | | | |
| University of Hawaii | 6.034 | | 10-01-40 | 720,000 | 677,902 |
| | | | | | |
| Illinois 0.21% | | | | | 3,312,550 |
| | | | | | |
| City of Chicago | 7.168 | | 01-01-41 | 1,275,000 | 1,257,533 |
|
| Northern Illinois Municipal Power Agency | 7.820 | | 01-01-40 | 1,850,000 | 2,055,017 |
| | | | | | |
| Massachusetts 0.03% | | | | | 509,977 |
| | | | | | |
| Commonwealth of Massachusetts | 5.731 | | 06-01-40 | 490,000 | 509,977 |
| | | | | | |
| Michigan 0.08% | | | | | 1,298,634 |
| | | | | | |
| County of Wayne | 10.000 | | 12-01-40 | 1,230,000 | 1,298,634 |
| | | | | | |
| Nevada 0.03% | | | | | 518,780 |
| | | | | | |
| County of Clark | 6.000 | | 07-01-28 | 530,000 | 518,780 |
| | | | | | |
| New Jersey 0.16% | | | | | 2,493,868 |
| | | | | | |
| New Jersey Transportation Trust | | | | | |
| Fund Authority | 6.104 | | 12-15-28 | 2,520,000 | 2,493,868 |
| | | | | | |
| New York 0.34% | | | | | 5,310,782 |
| | | | | | |
| City of New York | 6.271 | | 12-01-37 | 1,230,000 | 1,287,478 |
|
| City of New York | 5.517 | | 10-01-37 | 1,995,000 | 1,887,849 |
|
| City of New York | 5.206 | | 10-01-31 | 990,000 | 925,175 |
|
| Port Authority of New York & New Jersey | 5.647 | | 11-01-40 | 1,260,000 | 1,210,280 |
| | | | | | |
| Ohio 0.31% | | | | | 4,853,113 |
| | | | | | |
| American Municipal Power-Ohio, Inc. | 8.084 | | 02-15-50 | 2,450,000 | 2,774,209 |
|
| American Municipal Power-Ohio, Inc. | 5.939 | | 02-15-47 | 2,400,000 | 2,078,904 |
| | | | | | |
| Oklahoma 0.13% | | | | | 2,073,863 |
| | | | | | |
| Grand River Dam Authority | 7.155 | | 06-01-40 | 2,025,000 | 2,073,863 |
| | | | | | |
| Pennsylvania 0.10% | | | | | 1,569,136 |
| | | | | | |
| Pennsylvania Turnpike Commission | 5.511 | | 12-01-45 | 1,775,000 | 1,569,136 |
| | | | | | |
| Texas 0.29% | | | | | 4,475,874 |
| | | | | | |
| City of San Antonio | 5.808 | | 02-01-41 | 2,140,000 | 2,210,492 |
|
| Dallas Area Rapid Transit | 5.022 | | 12-01-48 | 1,390,000 | 1,249,276 |
|
| Dallas-Fort Worth International Airport | | | | | |
| Facilities Improvement | 7.000 | | 01-01-16 | 1,015,000 | 1,016,106 |
| | | | | | |
| Virginia 0.14% | | | | | 2,176,327 |
| | | | | | |
| Virginia Resources Authority | 6.290 | | 11-01-40 | 2,175,000 | 2,176,327 |
| | | | | | |
| Washington 0.18% | | | | | 2,786,334 |
| | | | | | |
| King County Public Hospital District No. 1 | 8.000 | | 06-15-40 | 2,250,000 | 2,290,838 |
|
| Washington State Convention Center Public | | | | | |
| Facilities District | 6.790 | | 07-01-40 | 505,000 | 495,496 |
| | |
| 24 | Strategic Income Opportunities Fund | Semiannual report | See notes to financial statements |
| | | | | |
| | | | Maturity | | |
| | Rate (%) | | date | Par value | Value |
| Term Loans (M) 4.29% | | | | | $67,459,690 |
|
| (Cost $65,683,047) | | | | | |
| | | | | | |
| Consumer Discretionary 1.35% | | | | | 21,220,492 |
| | | | | | |
| Hotels, Restaurants & Leisure 0.83% | | | | | |
|
| CCM Merger, Inc. (T) | — | | 02-11-17 | $985,000 | 997,005 |
|
| Harrah’s Operating Company, Inc. | 3.303 | | 01-28-15 | 6,775,000 | 6,276,556 |
|
| Kalispel Tribal Economic Authority (T) | — | | 02-22-17 | 3,900,000 | 3,822,000 |
|
| Las Vegas Sands LLC (T) | — | | 11-23-16 | 1,623,666 | 1,615,838 |
|
| Las Vegas Sands LLC (T) | — | | 11-23-16 | 332,991 | 331,386 |
| | | | | | |
| Media 0.40% | | | | | |
|
| Clear Channel Communications, Inc. (T) | — | | 01-28-16 | 4,635,000 | 4,243,343 |
|
| Dex Media West, Inc. | 7.000 | | 10-24-14 | 589,693 | 540,201 |
|
| Vertis, Inc. | 12.000 | | 12-31-15 | 1,585,000 | 1,585,000 |
| | | | | | |
| Multiline Retail 0.12% | | | | | |
|
| Michaels Stores, Inc. | 2.584 | | 10-31-13 | 1,815,129 | 1,809,163 |
| | | | | | |
| Consumer Staples 0.32% | | | | | 4,925,000 |
| | | | | | |
| Food Products 0.32% | | | | | |
|
| Del Monte Foods Company (T) | — | | 03-01-12 | 4,925,000 | 4,925,000 |
| | | | | | |
| Financials 0.27% | | | | | 4,239,328 |
| | | | | | |
| Real Estate Management & Development 0.27% | | | | |
|
| Realogy Corp. | 13.500 | | 10-15-17 | 365,000 | 402,184 |
|
| Realogy Corp. (T) | — | | 10-10-13 | 3,552,539 | 3,407,901 |
|
| Realogy Corp. (T) | — | | 10-10-13 | 447,461 | 429,243 |
| | | | | | |
| Health Care 0.35% | | | | | 5,549,902 |
| | | | | | |
| Health Care Equipment & Supplies 0.03% | | | | | |
|
| Bausch & Lomb, Inc. (EUR)(D) | 4.122 | | 04-24-15 | 397,700 | 547,434 |
| | | | | | |
| Health Care Providers & Services 0.32% | | | | | |
|
| Cardinal Health, Inc. | 2.512 | | 04-10-14 | $3,106,455 | 3,067,624 |
|
| Community Health Systems, Inc. | 2.560 | | 07-25-14 | 1,832,483 | 1,817,594 |
|
| Community Health Systems, Inc. | 2.560 | | 07-25-14 | 118,211 | 117,250 |
| | | | | | |
| Industrials 0.79% | | | | | 12,437,888 |
| | | | | | |
| Aerospace & Defense 0.25% | | | | | |
|
| Hawker Beechcraft Acquisition Company LLC | 2.303 | | 03-26-14 | 247,421 | 221,094 |
|
| Hawker Beechcraft Acquisition Company LLC | 2.273 | | 03-26-14 | 4,127,815 | 3,688,590 |
| | | | | | |
| Airlines 0.45% | | | | | |
|
| Delta Airlines, Inc. | 3.514 | | 04-30-14 | 3,409,875 | 3,353,043 |
|
| US Airways Group, Inc. | 2.762 | | 03-21-14 | 4,120,000 | 3,791,871 |
| | | | | | |
| Trading Companies & Distributors 0.09% | | | | | |
|
| Bourland & Leverich Supply Company LLC | 11.000 | | 08-13-15 | 1,343,000 | 1,383,290 |
| | | | | | |
| Information Technology 0.25% | | | | | 3,881,954 |
| | | | | | |
| Software 0.25% | | | | | |
|
| First Data Corp. | 3.012 | | 09-24-14 | 4,100,000 | 3,881,954 |
| | | | | | |
| Materials 0.25% | | | | | 3,977,188 |
| | | | | | |
| Containers & Packaging 0.25% | | | | | |
|
| Consolidated Container Company LLC (T) | — | | 09-28-14 | 4,450,000 | 3,977,188 |
| | |
| See notes to financial statements | Semiannual report | Strategic Income Opportunities Fund | 25 |
| | | | | |
| | | | Maturity | | |
| | Rate (%) | | date | Par value | Value |
| Telecommunication Services 0.41% | | | | | $6,487,469 |
| | | | | | |
| Diversified Telecommunication Services 0.41% | | | | |
|
| Intelsat Jackson Holdings SA | 5.250 | | 04-02-18 | $2,600,000 | 2,617,469 |
|
| Intelsat Jackson Holdings SA | 3.303 | | 02-02-14 | 4,000,000 | 3,870,000 |
| | | | | | |
| Utilities 0.30% | | | | | 4,740,469 |
| | | | | | |
| Electric Utilities 0.30% | | | | | |
|
| Texas Competitive Electric Holdings | | | | | |
| Company LLC (T) | — | | 10-10-14 | 5,625,000 | 4,740,469 |
| |
| Collateralized Mortgage Obligations 2.74% | | | | $43,159,308 |
|
| (Cost $36,216,833) | | | | | |
| | | | | | |
| Commercial & Residential 2.48% | | | | | 39,108,393 |
| | | | | | |
| American Home Mortgage Assets | | | | | |
| Series 2006-6, Class XP IO | 2.372 | | 12-25-46 | $14,294,906 | 930,901 |
|
| American Tower Trust | | | | | |
| Series 2007-1A, Class C (S) | 5.615 | | 04-15-37 | 430,000 | 456,219 |
|
| Countrywide Alternative Loan Trust | | | | | |
| Series 2006-OA12, Class X IO | 2.828 | | 09-20-46 | 8,757,417 | 583,765 |
|
| Downey Savings & Loan Association Mortgage | | | | | |
| Loan Trust | | | | | |
| Series 2005-AR2, Class X2 IO | 2.418 | | 03-19-45 | 29,081,198 | 1,224,301 |
|
| Global Tower Partners Acquisition Partners LLC | | | | | |
| Series 2007-1A, Class G (S) | 7.873 | | 05-15-37 | 3,130,000 | 3,235,367 |
|
| Greenwich Capital Commercial Funding Corp. | | | | | |
| Series 2006-GG7, Class A4 (P) | 5.882 | | 07-10-38 | 3,310,000 | 3,635,230 |
|
| GSR Mortgage Loan Trust | | | | | |
| Series 2005-AR6, Class 3A1 (P) | 2.762 | | 09-25-35 | 3,524,526 | 3,227,416 |
|
| Harborview Mortgage Loan Trust | | | | | |
| Series 2005-8, Class 1X IO | 2.345 | | 09-19-35 | 9,197,250 | 488,280 |
|
| Harborview Mortgage Loan Trust | | | | | |
| Series 2007-3, Class ES IO | 0.349 | | 05-19-47 | 18,831,143 | 123,344 |
|
| Harborview Mortgage Loan Trust | | | | | |
| Series 2007-4, Class ES IO | 0.350 | | 07-19-47 | 22,573,771 | 122,124 |
|
| Harborview Mortgage Loan Trust | | | | | |
| Series 2007-6, Class ES IO (S) | 0.342 | | 08-19-37 | 15,634,991 | 98,500 |
|
| IndyMac Index Mortgage Loan Trust | | | | | |
| Series 2005-AR18, Class 1X IO | 2.217 | | 10-25-36 | 24,807,787 | 1,116,350 |
|
| IndyMac Index Mortgage Loan Trust | | | | | |
| Series 2005-AR18, Class 2X IO | 1.917 | | 10-25-36 | 25,805,470 | 1,161,246 |
|
| JPMorgan Chase Commercial Mortgage | | | | | |
| Securities Corp. | | | | | |
| Series 2006-LDP7, Class AM (P) | 5.875 | | 04-15-45 | 4,461,000 | 4,749,212 |
|
| LB–UBS Commercial Mortgage Trust | | | | | |
| Series 2006-C6, Class AM | 5.413 | | 09-15-39 | 2,925,000 | 3,062,194 |
|
| Morgan Stanley Capital I | | | | | |
| Series 2007-IQ13, Class A4 | 5.364 | | 03-15-44 | 2,725,000 | 2,844,401 |
|
| Morgan Stanley Mortgage Loan Trust | | | | | |
| Series 2004-8AR, Class 4A1 (P) | 2.705 | | 10-25-34 | 2,360,691 | 2,220,955 |
|
| Morgan Stanley Mortgage Loan Trust | | | | | |
| Series 2004-9, Class 1A (P) | 5.994 | | 11-25-34 | 1,722,112 | 1,759,708 |
|
| Washington Mutual, Inc. | | | | | |
| Series 2005-AR13, Class X IO | 1.561 | | 10-25-45 | 93,709,236 | 4,662,972 |
| | |
| 26 | Strategic Income Opportunities Fund | Semiannual report | See notes to financial statements |
| | | | | |
| | | | Maturity | | |
| | Rate (%) | | date | Par value | Value |
| Commercial & Residential (continued) | | | | | |
| | | | | | |
| Washington Mutual, Inc. | | | | | |
| Series 2005-AR13, Class B1 (P) | 0.861 | | 10-25-45 | $1,879,815 | $330,810 |
|
| Washington Mutual, Inc. | | | | | |
| Series 2005-AR6, Class B1 (P) | 0.861 | | 04-25-45 | 3,055,076 | 510,925 |
|
| Wells Fargo Mortgage Backed Securities Trust | | | | | |
| Series 2005-AR5, Class 1A1 (P) | 5.089 | | 04-25-35 | 2,672,121 | 2,564,173 |
| | | | | | |
| U.S. Government Agency 0.26% | | | | | 4,050,915 |
| | | | | | |
| Federal National Mortgage Association | | | | | |
| Series 398, Class C3 IO | 4.500 | | 05-25-39 | 3,733,516 | 851,183 |
|
| Federal National Mortgage Association | | | | | |
| Series 402, Class 3 IO | 4.000 | | 11-25-39 | 2,822,044 | 628,059 |
|
| Federal National Mortgage Association | | | | | |
| Series 402, Class 4 IO | 4.000 | | 10-25-39 | 4,916,372 | 1,045,886 |
|
| Federal National Mortgage Association | | | | | |
| Series 402, Class 7 IO | 4.500 | | 11-25-39 | 6,816,506 | 1,525,787 |
| |
| Asset Backed Securities 0.70% | | | | | $10,972,041 |
|
| (Cost $9,881,744) | | | | | |
| | | | | | |
| Asset Backed Securities 0.70% | | | | | 10,972,041 |
| | | | | | |
| Dominos Pizza Master Issuer LLC | | | | | |
| Series 2007-1, Class M1 (S) | 7.629 | | 04-25-37 | $3,545,000 | 3,655,781 |
|
| Dominos Pizza Master Issuer LLC | | | | | |
| Series 2007-1, Class A2 (S) | 5.261 | | 04-25-37 | 4,818,000 | 4,962,540 |
|
| Ford Auto Securitization Trust | | | | | |
| Series 2010-R3A, Class A1 (CAD)(D)(S) | 1.926 | | 06-15-13 | 2,285,728 | 2,353,720 |
| |
| | | | | Shares | Value |
| Preferred Securities 3.32% | | | | | $52,252,408 |
|
| (Cost $49,292,549) | | | | | |
| | | | | | |
| Consumer Discretionary 0.45% | | | | | 7,062,625 |
| | | | | | |
| Automobiles 0.08% | | | | | |
|
| General Motors Company, Series B, 4.750% | | | | 24,778 | 1,260,705 |
| | | | | | |
| Hotels, Restaurants & Leisure 0.37% | | | | | |
|
| Greektown Superholdings, Inc. (I) | | | | 58,712 | 5,801,920 |
| | | | | | |
| Energy 0.09% | | | | | 1,479,703 |
| | | | | | |
| Oil, Gas & Consumable Fuels 0.09% | | | | | |
|
| Apache Corp., Series D, 6.000% | | | | 21,722 | 1,479,703 |
| | | | | | |
| Financials 2.78% | | | | | 43,710,080 |
| | | | | | |
| Commercial Banks 1.31% | | | | | |
|
| Wells Fargo & Company, Series L, 7.500% | | | | 7,435 | 7,658,050 |
|
| Zions Bancorporation, Series C, 9.500% | | | | 498,200 | 12,998,038 |
| | | | | | |
| Diversified Financial Services 1.28% | | | | | |
|
| Bank of America Corp., Series L, 7.250% | | | | 5,062 | 5,082,248 |
|
| Citigroup Capital XIII (7.875% to 10-30-15, | | | | | |
| then 3 month LIBOR + 6.370%) | | | | 257,710 | 6,971,056 |
|
| Citigroup, Inc., 7.500% | | | | 60,480 | 8,134,560 |
| | |
| See notes to financial statements | Semiannual report | Strategic Income Opportunities Fund | 27 |
| | |
| | Shares | Value |
| Insurance 0.14% | | |
|
| Hartford Financial Services Group, Inc., Series F, 7.250% | 75,800 | $2,097,386 |
| | | |
| Real Estate Investment Trusts 0.05% | | |
|
| FelCor Lodging Trust, Inc., Series A, 1.950% | 29,108 | 768,742 |
| |
| Common Stocks 2.09% | | $32,950,871 |
|
| (Cost $27,734,634) | | |
| | | |
| Consumer Discretionary 0.48% | | 7,525,196 |
| | | |
| Auto Components 0.00% | | |
|
| Lear Corp. | 15 | 1,587 |
| | | |
| Hotels, Restaurants & Leisure 0.02% | | |
|
| Greektown Superholdings, Inc. (I) | 3,048 | 301,203 |
| | | |
| Media 0.46% | | |
|
| Charter Communications, Inc., Class A (I) | 84,100 | 3,849,257 |
|
| Citadel Broadcasting Corp., Class A (I) | 3,927 | 136,463 |
|
| Citadel Broadcasting Corp., Class B (I) | 26,708 | 928,103 |
|
| Dex One Corp. (I) | 5,821 | 30,677 |
|
| SuperMedia, Inc. (I) | 11,050 | 93,041 |
|
| Vertis Holdings, Inc. (I) | 110,794 | 2,184,865 |
| | | |
| Financials 1.11% | | 17,451,089 |
| | | |
| Capital Markets 0.23% | | |
|
| Apollo Investment Corp. | 82,797 | 1,024,199 |
|
| Ares Capital Corp. | 146,967 | 2,620,422 |
| | | |
| Commercial Banks 0.16% | | |
|
| Ameris Bancorp (I) | 45,098 | 455,039 |
|
| First Michigan Bank (I)(R) | 372,222 | 2,050,922 |
| | | |
| Real Estate Investment Trusts 0.68% | | |
|
| Chimera Investment Corp. | 285,470 | 1,230,376 |
|
| Homburg Invest, Inc., Class A | 294,126 | 3,454,251 |
|
| Invesco Mortgage Capital, Inc. | 78,817 | 1,839,589 |
|
| MFA Financial, Inc. | 141,850 | 1,201,470 |
|
| Plum Creek Timber Company, Inc. | 31,969 | 1,341,419 |
|
| Weyerhaeuser Company | 65,914 | 1,608,961 |
| | | |
| Thrifts & Mortgage Finance 0.04% | | |
|
| Capitol Federal Financial, Inc. | 49,402 | 624,441 |
| | | |
| Health Care 0.18% | | 2,906,961 |
| | | |
| Health Care Providers & Services 0.03% | | |
|
| Laboratory Corp. of America Holdings (I) | 4,863 | 438,302 |
| | | |
| Pharmaceuticals 0.15% | | |
|
| Johnson & Johnson | 40,180 | 2,468,659 |
| | | |
| Materials 0.31% | | 4,930,108 |
| | | |
| Chemicals 0.15% | | |
|
| LyondellBasell Industries, Class A (I) | 62,290 | 2,372,003 |
| | | |
| Containers & Packaging 0.16% | | |
|
| Smurfit-Stone Container Corp. (I) | 66,548 | 2,558,105 |
| | |
| 28 | Strategic Income Opportunities Fund | Semiannual report | See notes to financial statements |
| | | | | |
| | | | | Shares | Value |
| Telecommunication Services 0.01% | | | | | $137,517 |
| | | | | | |
| Diversified Telecommunication Services 0.01% | | | | |
|
| Chunghwa Telecom Company, Ltd., ADR | | | | 4,660 | 137,517 |
| |
| Warrants 0.11% | | | | | $1,747,300 |
|
| (Cost $1,156,486) | | | | | |
| Citadel Broadcasting Corp. (Expiration Date: 6-3-30; Strike Price $0.001) (I) | 50,282 | 1,747,300 |
| |
| | | | | Notional Par | Value |
| |
| Options Purchased 0.17% | | | | | $2,728,315 |
|
| (Cost $5,239,701) | | | | | |
| | | | | | |
| Call Options 0.10% | | | | | 1,605,113 |
| | | | | | |
| Over the Counter Purchase Call on the AUD vs. USD | | | | |
| (Expiration Date: 7-7-11; Strike Price $1.05; Counterparty: | | | | |
| Royal Bank of Scotland) (I) | | | | 150,000,000 | 1,605,113 |
| | | | | | |
| Put Options 0.07% | | | | | 1,123,202 |
| | | | | | |
| Over the Counter Purchase Put on the EUR vs. USD | | | | |
| (Expiration Date: 5-19-11; Strike Price $1.10; Counterparty: | | | | |
| RBC Dominion Securities) (I) | | | | 27,500,000 | 21,972 |
|
| Over the Counter Purchase Put on the GBP vs. USD | | | | |
| (Expiration Date: 4-7-11; Strike Price $1.49; Counterparty: | | | | |
| UBS Securities, Inc.) (I) | | | | 75,000,000 | 76,934 |
|
| Over the Counter Purchase Put on the USD vs. CAD | | | | |
| (Expiration Date: 9-30-11; Strike Price $0.94; Counterparty: | | | | |
| Goldman Sachs & Company) (I) | | | | 78,000,000 | 1,024,296 |
| |
| | | | Maturity | | |
| | Yield (%)* | | date | Par value | Value |
| Short-Term Investments 7.88% | | | | | $124,100,000 |
|
| (Cost $124,100,000) | | | | | |
| | | | | | |
| Short-Term Securities 7.88% | | | | | 124,100,000 |
| | | | | | |
| Federal Home Loan Bank Discount Notes | 0.070 | | 03-01-11 | $124,100,000 | 124,100,000 |
| |
| Total investments (Cost $1,541,998,306)† 103.27% | $1,626,031,164 |
|
| |
| Other assets and liabilities, net (3.27%) | | | | ($51,529,125) |
|
| |
| Total net assets 100.00% | | | | $1,574,502,039 |
|
The percentage shown for each investment category is the total value of that category as a percentage of the net assets of the Fund. All par values are denominated in U.S. Dollars unless otherwise indicated.
| | |
| See notes to financial statements | Semiannual report | Strategic Income Opportunities Fund | 29 |
Notes to Schedule of Investments
| |
| Currency abbreviations | |
| AUD — Australian Dollar | MYR — Malaysian Ringgit |
| BRL — Brazilian Real | MXN — Mexican Peso |
| CAD — Canadian Dollar | NOK — Norwegian Krone |
| EUR — Euro | NZD — New Zealand Dollar |
| GBP — Pound Sterling | PHP — Philippino Peso |
| IDR — Indonesian Rupiah | SEK — Swedish Krona |
| INR — Indian Rupee | SGD — Singapore Dollar |
| KRW — Korean Won | |
ADR American Depositary Receipts
IO Interest Only Security — Interest Tranche of Stripped Mortgage Pool
LIBOR London Interbank Offered Rate
PIK Payment-in-kind
(D) Par value of foreign bonds is expressed in local currency as shown parenthetically in security description.
(H) Non-income producing — Issuer is in default.
(I) Non-income producing security.
(M) Term loans are variable rate obligations. The coupon rate shown represents the rate at period end unless the investment is unsettled.
(P) Variable rate obligation. The coupon rate shown represents the rate at period end.
(Q) Perpetual bonds have no stated maturity date.
(R) Direct placement securities are restricted to resale and the Fund has limited rights to registration under the Securities Act of 1933.
| | | | |
| | | | Value as a percentage | Value as of |
| Issuer, description | Acquisition date | Acquisition cost | of Fund’s net assets | 2-28-11 |
|
| First Michigan Bank | 4-30-10 | $2,233,332 | 0.13% | $2,050,922 |
(S) These securities are exempt from registration under Rule 144A of the Securities Act of 1933. Such securities may be resold, normally to qualified institutional buyers, in transactions exempt from registration. Rule 144A securities amounted to $360,089,770 or 22.87% of the Fund’s net assets as of 02-28-11.
(T) All or a portion of this position represents unsettled loan commitment. The coupon rate will be determined at time of settlement.
* Yield represents the annualized yield at the date of purchase.
† At 2-28-11, the aggregate cost of investment securities for federal income tax purposes was $1,544,910,647. Net unrealized appreciation aggregated $81,120,517, of which $102,463,259 related to appreciated investment securities and $21,342,742 related to depreciated investment securities.
The Fund had the following country concentration as a percentage of net assets on 2-28-11:
| | | | |
| United States | 50% | | | |
| Canada | 7% | | | |
| United Kingdom | 5% | | | |
| Australia | 3% | | | |
| New Zealand | 3% | | | |
| Singapore | 3% | | | |
| Germany | 3% | | | |
| South Korea | 3% | | | |
| Sweden | 2% | | | |
| Brazil | 2% | | | |
| Cayman Islands | 2% | | | |
| Philippines | 2% | | | |
| Norway | 2% | | | |
| Indonesia | 2% | | | |
| Other Countries | 6% | | | |
| Short-Term Investments & Other | 5% | | | |
| | |
| 30 | Strategic Income Opportunities Fund | Semiannual report | See notes to financial statements |
F I N A N C I A L S T A T E M E N T S
Financial statements
Statement of assets and liabilities 2-28-11 (unaudited)
This Statement of Assets and Liabilities is the Fund’s balance sheet. It shows the value of what the Fund owns, is due and owes. You’ll also find the net asset value and the maximum offering price per share.
| |
| Assets | |
|
| Investments, at value (Cost $1,541,998,306) | $1,626,031,164 |
| Cash | 63,112 |
| Foreign currency, at value (Cost $2,727,836) | 2,770,189 |
| Cash held at broker for futures contracts | 3,266,400 |
| Receivable for forward foreign currency exchange contracts (Note 3) | 10,996,169 |
| Receivable for fund shares sold | 19,498,327 |
| Dividends and interest receivable | 23,805,810 |
| Receivable due from adviser | 5,315 |
| Other receivables and prepaid expenses | 70,746 |
| | |
| Total assets | 1,686,507,232 |
| |
| Liabilities | |
|
| Payable for investments purchased | 93,616,041 |
| Payable for forward foreign currency exchange contracts (Note 3) | 15,381,003 |
| Payable for fund shares repurchased | 2,137,798 |
| Payable for futures variation margin (Note 3) | 148,866 |
| Distributions payable | 249,168 |
| Payable to affiliates | |
| Accounting and legal services fees | 30,969 |
| Transfer agent fees | 114,808 |
| Trustees’ fees | 784 |
| Other liabilities and accrued expenses | 325,756 |
| | |
| Total liabilities | 112,005,193 |
| |
| Net assets | |
|
| Capital paid-in | $1,504,081,135 |
| Accumulated distributions in excess of net investment income | (2,344,824) |
| Accumulated net realized loss on investments, futures contracts and | |
| foreign currency transactions | (6,464,079) |
| Net unrealized appreciation on investments, futures contracts and | |
| translation of assets and liabilities in foreign currencies | 79,229,807 |
| | |
| Net assets | $1,574,502,039 |
| | |
| See notes to financial statements | Semiannual report | Strategic Income Opportunities Fund | 31 |
F I N A N C I A L S T A T E M E N T S
Statement of assets and liabilities (continued)
| |
| Net asset value per share | |
|
| Based on net asset values and shares outstanding — the Fund has an | |
| unlimited number of shares authorized with no par value | |
| Class A ($320,906,722 ÷ 29,144,862 shares) | $11.01 |
| Class C ($80,360,371 ÷ 7,298,291 shares)1 | $11.01 |
| Class I ($191,493,037 ÷ 17,389,320 shares) | $11.01 |
| Class NAV ($981,741,909 ÷ 89,199,640 shares) | $11.01 |
| |
| Maximum offering price per share | |
|
| Class A (net asset value per share ÷ 95.5%)2 | $11.53 |
1 Redemption price per share is equal to the net asset value less any applicable contingent deferred sales charge.
2 On single retail sales of less than $100,000. On sales of $100,000 or more and on group sales the offering price is reduced.
| | |
| 32 | Strategic Income Opportunities Fund | Semiannual report | See notes to financial statements |
F I N A N C I A L S T A T E M E N T S
Statement of operations For the six-month period ended 2-28-11
(unaudited)
This Statement of Operations summarizes the Fund’s investment income earned and expenses incurred in operating the Fund. It also shows net gains (losses) for the period stated.
| |
| Investment income | |
|
| Interest | $39,151,785 |
| Dividends | 1,787,631 |
| Less foreign taxes withheld | (281,919) |
| | |
| Total investment income | 40,657,497 |
| |
| Expenses | |
|
| Investment management fees (Note 5) | 3,925,567 |
| Distribution and service fees (Note 5) | 573,585 |
| Accounting and legal services fees (Note 5) | 83,968 |
| Transfer agent fees (Note 5) | 251,896 |
| Trustees’ fees (Note 5) | 4,660 |
| State registration fees (Note 5) | 27,136 |
| Printing and postage (Note 5) | 10,093 |
| Professional fees | 41,592 |
| Custodian fees | 289,794 |
| Registration and filing fees | 24,187 |
| Other | 5,439 |
| | |
| Total expenses before reductions and amounts recaptured | 5,237,917 |
| Net expense reductions and amounts recaptured (Note 5) | (108,384) |
| | |
| Total expenses | 5,129,533 |
| | |
| Net investment income | 35,527,964 |
| |
| Realized and unrealized gain (loss) | |
|
| Net realized gain (loss) on | |
| Investments | 9,989,990 |
| Futures contracts (Note 3) | 2,939,536 |
| Foreign currency transactions | (12,480,478) |
| | |
| | 449,048 |
| Change in net unrealized appreciation (depreciation) of | |
| Investments | 56,361,993 |
| Futures contracts (Note 3) | (561,565) |
| Translation of assets and liabilities in foreign currencies | 1,116,808 |
| | |
| | 56,917,236 |
| | |
| Net realized and unrealized gain | 57,366,284 |
| | |
| Increase in net assets from operations | $92,894,248 |
| | |
| See notes to financial statements | Semiannual report | Strategic Income Opportunities Fund | 33 |
F I N A N C I A L S T A T E M E N T S
Statements of changes in net assets
These Statements of Changes in Net Assets show how the value of the Fund’s net assets has changed during the last two periods. The difference reflects earnings less expenses, any investment gains and losses, distributions, if any, paid to shareholders and the net of Fund share transactions.
| | | | |
| | | | Six months | |
| | | | ended | Year |
| | | | 2-28-11 | ended |
| | | | (Unaudited) | 8-31-10 |
| |
| Increase (decrease) in net assets | | | | |
|
| From operations | | | | |
| Net investment income | | | $35,527,964 | $44,265,017 |
| Net realized gain | | | 449,048 | 7,084,957 |
| Change in net unrealized appreciation (depreciation) | | | 56,917,236 | 30,914,245 |
| | | | | |
| Increase in net assets resulting from operations | | | 92,894,248 | 82,264,219 |
| | | | | |
| Distributions to shareholders | | | | |
| From net investment income | | | | |
| Class A | | | (7,538,605) | (1,559,010) |
| Class C | | | (1,985,084) | (463,422) |
| Class I | | | (3,522,156) | (767,957) |
| Class NAV | | | (34,040,573) | (41,644,611) |
| | | | | |
| Total distributions | | | (47,086,418) | (44,435,000) |
| | | | | |
| From Fund share transactions (Note 6) | | | 698,780,909 | 341,592,467 |
| | | | | |
| Total increase | | | 744,588,739 | 379,421,686 |
| |
| Net assets | | | | |
|
| Beginning of period | | | 829,913,300 | 450,491,614 |
| | | | | |
| End of period | | | $1,574,502,039 | $829,913,300 |
| | | | | |
| Undistributed (accumulated distributions in excess of) | | | | |
| net investment income | | | ($2,344,824) | $9,213,630 |
| | |
| 34 | Strategic Income Opportunities Fund | Semiannual report | See notes to financial statements |
Financial highlights
The Financial Highlights show how the Fund’s net asset value for a share has changed since the beginning of the period.
| | | | | | |
| CLASS A SHARES Period ended | | | | | 2-28-111 | 8-31-102 |
| |
| Per share operating performance | | | | | | |
|
| Net asset value, beginning of period | | | | | $10.53 | $10.25 |
| Net investment income3 | | | | | 0.31 | 0.43 |
| Net realized and unrealized gain on investments | | | | | 0.59 | 0.33 |
| Total from investment operations | | | | | 0.90 | 0.76 |
| Less distributions | | | | | | |
| From net investment income | | | | | (0.42) | (0.48) |
| Net asset value, end of period | | | | | $11.01 | $10.53 |
| Total return (%)4 | | | | | 8.625,6 | 7.535,6 |
| |
| Ratios and supplemental data | | | | | | |
|
| Net assets, end of period (in millions) | | | | | $321 | $120 |
| Ratios (as a percentage of average net assets): | | | | | | |
| Expenses before reductions and amounts recaptured | | | | | 1.257 | 1.267 |
| Expenses including reductions and amounts recaptured | | | | | 1.177 | 1.177 |
| Net investment income | | | | | 5.707 | 6.337 |
| Portfolio turnover (%) | | | | | 16 | 498 |
1 Semiannual period from 9-1-10 to 2-28-11. Unaudited.
2 The inception date for Class A shares is 1-4-10.
3 Based on the average daily shares outstanding.
4 Does not reflect the effect of sales charges, if any.
5 Total returns would have been lower had certain expenses not been reduced during the periods shown.
6 Not annualized.
7 Annualized.
8 Portfolio turnover is shown for the period from 9-1-09 to 8-31-10.
| | | | | | |
| CLASS C SHARES Period ended | | | | | 2-28-111 | 8-31-102 |
| |
| Per share operating performance | | | | | | |
|
| Net asset value, beginning of period | | | | | $10.53 | $10.25 |
| Net investment income3 | | | | | 0.27 | 0.38 |
| Net realized and unrealized gain on investments | | | | | 0.59 | 0.33 |
| Total from investment operations | | | | | 0.86 | 0.71 |
| Less distributions | | | | | | |
| From net investment income | | | | | (0.38) | (0.43) |
| Net asset value, end of period | | | | | $11.01 | $10.53 |
| Total return (%)4 | | | | | 8.245,6 | 6.995,6 |
| |
| Ratios and supplemental data | | | | | | |
|
| Net assets, end of period (in millions) | | | | | $80 | $38 |
| Ratios (as a percentage of average net assets): | | | | | | |
| Expenses before reductions and amounts recaptured | | | | | 1.967 | 1.997 |
| Expenses including reductions and amounts recaptured | | | | | 1.877 | 1.877 |
| Net investment income | | | | | 4.997 | 5.637 |
| Portfolio turnover (%) | | | | | 16 | 498 |
1 Semiannual period from 9-1-10 to 2-28-11. Unaudited.
2 The inception date for Class C shares is 1-4-10.
3 Based on the average daily shares outstanding.
4 Does not reflect the effect of sales charges, if any.
5 Total returns would have been lower had certain expenses not been reduced during the periods shown.
6 Not annualized.
7 Annualized.
8 Portfolio turnover is shown for the period from 9-1-09 to 8-31-10.
| | |
| See notes to financial statements | Semiannual report | Strategic Income Opportunities Fund | 35 |
| | | | | | |
| CLASS I SHARES Period ended | | | | | 2-28-111 | 8-31-102 |
| |
| Per share operating performance | | | | | | |
|
| Net asset value, beginning of period | | | | | $10.54 | $10.25 |
| Net investment income3 | | | | | 0.32 | 0.46 |
| Net realized and unrealized gain on investments | | | | | 0.59 | 0.33 |
| Total from investment operations | | | | | 0.91 | 0.79 |
| Less distributions | | | | | | |
| From net investment income | | | | | (0.44) | (0.50) |
| Net asset value, end of period | | | | | $11.01 | $10.54 |
| Total return (%) | | | | | 8.714,5 | 7.834,5 |
| |
| Ratios and supplemental data | | | | | | |
|
| Net assets, end of period (in millions) | | | | | $191 | $40 |
| Ratios (as a percentage of average net assets): | | | | | | |
| Expenses before reductions and amounts recaptured | | | | | 0.816 | 0.856 |
| Expenses including reductions and amounts recaptured | | | | | 0.806 | 0.856 |
| Net investment income | | | | | 5.996 | 6.696 |
| Portfolio turnover (%) | | | | | 16 | 497 |
1 Semiannual period from 9-1-10 to 2-28-11. Unaudited.
2 The inception date for Class I shares is 1-4-10.
3 Based on the average daily shares outstanding.
4 Total returns would have been lower had certain expenses not been reduced during the periods shown.
5 Not annualized.
6 Annualized.
7 Portfolio turnover is shown for the period from 9-1-09 to 8-31-10.
| | | | | | |
| CLASS NAV SHARES Period ended | 2-28-111 | 8-31-10 | 8-31-09 | 8-31-08 | 8-31-07 | 8-31-062 |
| |
| Per share operating performance | | | | | | |
|
| Net asset value, beginning of period | $10.53 | $9.76 | $10.02 | $10.06 | $10.06 | $10.00 |
| Net investment income3 | 0.33 | 0.80 | 0.694 | 0.62 | 0.51 | 0.14 |
| Net realized and unrealized gain (loss) | | | | | | |
| on investments | 0.59 | 0.77 | 0.17 | (0.25) | (0.12) | (0.01) |
| Total from investment operations | 0.92 | 1.57 | 0.86 | 0.37 | 0.39 | 0.13 |
| Less distributions | | | | | | |
| From net investment income | (0.44) | (0.80) | (1.04) | (0.41) | (0.39) | (0.07) |
| From net realized gain | — | — | (0.08) | — | — | — |
| Total distributions | (0.44) | (0.80) | (1.12) | (0.41) | (0.39) | (0.07) |
| Net asset value, end of period | $11.01 | $10.53 | $9.76 | $10.02 | $10.06 | $10.06 |
| Total return (%) | 8.865,6 | 16.555 | 10.67 | 3.67 | 4.01 | 1.376 |
| |
| Ratios and supplemental data | | | | | | |
|
| Net assets, end of period (in millions) | $982 | $633 | $450 | $463 | $423 | $281 |
| Ratios (as a percentage of average net assets): | | | | | | |
| Expenses before reductions and | | | | | | |
| amounts recaptured | 0.757 | 0.79 | 0.834 | 0.76 | 0.78 | 0.867 |
| Expenses including reductions and | | | | | | |
| amounts recaptured | 0.747 | 0.79 | 0.834 | 0.76 | 0.78 | 0.867 |
| Net investment income | 6.217 | 7.75 | 7.814 | 6.03 | 5.15 | 4.187 |
| Portfolio turnover (%) | 16 | 49 | 55 | 558 | 978 | 658 |
1 Semiannual period from 9-1-10 to 2-28-11. Unaudited.
2 The inception date for Class NAV shares is 4-28-06.
3 Based on the average daily shares outstanding.
4 Includes tax expense, which was 0.07% of average net assets. This expense decreased the net investment income by $0.01 per share and the net investment income ratio by 0.07%.
5 Total returns would have been lower had certain expenses not been reduced during the periods shown.
6 Not annualized.
7 Annualized.
8 The Portfolio turnover rates including the effect of “TBA” (to be announced) for the periods ended were as follows: 61% for the year ended 8-31-08 and 106% for the year ended 8-31-07. The year ended 8-31-06 includes the effect of TBA transactions.
| | |
| 36 | Strategic Income Opportunities Fund | Semiannual report | See notes to financial statements |
Notes to financial statements
(unaudited)
Note 1 — Organization
John Hancock Strategic Income Opportunities Fund (the Fund) is a diversified series of John Hancock Funds II (the Trust), an open-end management investment company organized as a Massachusetts business trust and registered under the Investment Company Act of 1940, as amended (the 1940 Act). The investment objective of the Fund is to seek to maximize total return consisting of current income and capital appreciation.
The Fund may offer multiple classes of shares. The shares currently offered are detailed in the Statements of Assets and Liabilities. Class A and Class C shares are open to all investors. Class I shares are offered to institutions and certain investors. Class NAV shares are offered to the John Hancock Lifestyle and Lifecycle Portfolios, and other affiliated John Hancock funds. Shareholders of each class have exclusive voting rights to matters that affect that class. The distribution and service fees, transfer agent fees, state registration fees and printing and postage for each class may differ.
Note 2 — Significant accounting policies
The financial statements have been prepared in conformity with accounting principles generally accepted in the United States of America, which require management to make certain estimates and assumptions at the date of the financial statements. Actual results could differ from those estimates. Events or transactions occurring after the end of the fiscal period through the date that the financial statements were issued have been evaluated in the preparation of the financial statements. The following summarizes the significant accounting policies of the Fund:
Security valuation. Investments are stated at value as of the close of regular trading on the New York Stock Exchange (NYSE), normally at 4:00 P.M., Eastern Time. The Fund uses a three-tier hierarchy to prioritize the pricing assumptions, referred to as inputs, used in valuation techniques to measure fair value. Level 1 includes securities valued using quoted prices in active markets for identical securities. Level 2 includes securities valued using significant observable inputs. Observable inputs may include quoted prices for similar securities, interest rates, prepayment speeds and credit risk. Prices for securities valued using these inputs are received from independent pricing vendors and brokers and are based on an evaluation of the inputs described. Level 3 includes securities valued using significant unobservable inputs when market prices are not readily available or reliable, including the Fund’s own assumptions in determining the fair value of investments. Factors used in determining value may include market or issuer specific events, changes in interest rates and credit quality. The inputs or methodology used for valuing securities are not necessarily an indication of the risk associated with investing in those securities.
The following is a summary of the values by input classification of the Fund’s investments as of February 28, 2011, by major security category or type:
| |
| Semiannual report | Strategic Income Opportunities Fund | 37 |
| | | | |
| | | | | LEVEL 3 |
| | | | LEVEL 2 | SIGNIFICANT |
| | TOTAL MARKET | LEVEL 1 | SIGNIFICANT | UNOBSERVABLE |
| INVESTMENTS IN SECURITIES | VALUE AT 2-28-11 | QUOTED PRICE | OBSERVABLE INPUTS | INPUTS |
|
| Corporate Bonds | $737,267,699 | — | $718,325,342 | $18,942,357 |
| Foreign Government | | | | |
| Obligations | 410,196,420 | — | 410,196,420 | — |
| Capital Preferred Securities | 27,610,863 | — | 27,610,863 | — |
| Convertible Bonds | 57,369,268 | — | 57,369,268 | — |
| Municipal Bonds | 58,216,981 | — | 58,216,981 | — |
| Term Loans | 67,459,690 | — | 62,534,690 | 4,925,000 |
| Collateralized Mortgage | | | | |
| Obligations | 43,159,308 | — | 40,758,368 | 2,400,940 |
| Asset Backed Securities | 10,972,041 | — | 10,972,041 | — |
| Preferred Securities | 52,252,408 | $46,450,488 | — | 5,801,920 |
| Common Stocks | 32,950,871 | 27,349,315 | 1,064,566 | 4,536,990 |
| Warrants | 1,747,300 | 1,747,300 | — | — |
| Options Purchased | 2,728,315 | — | 2,728,315 | — |
| Short-Term Investments | 124,100,000 | — | 124,100,000 | — |
|
|
| Total Investments in | | | | |
| Securities | $1,626,031,164 | $75,547,103 | $1,513,876,854 | $36,607,207 |
| Other Financial Instruments | | | | |
| Futures | ($660,692) | ($660,692) | — | — |
| Forward Foreign Currency | | | | |
| Contracts | ($4,384,834) | — | ($4,384,834) | — |
The following is a reconciliation of Level 3 assets for which significant unobservable inputs were used to determine fair value. Transfers in or out of Level 3 represent the beginning value of any security or instrument where a change in the level has occurred from the beginning to the end of the period.
| | | | | | |
| | | | COLLATERALIZED | | | |
| | CORPORATE | | MORTGAGE | PREFERRED | COMMON | |
| | BONDS | TERM LOANS | OBLIGATIONS | SECURITIES | STOCK | TOTALS |
|
| Balance as of 8-31-10 | $10,694,981 | — | $2,257,307 | $9,326,879 | $337,044 | $22,616,211 |
| Accrued discounts/premiums | 24,691 | — | 12,037 | — | — | 36,728 |
| Realized gain (loss) | 3,095 | — | (12,037) | — | — | (8,942) |
| Change in unrealized | | | | | | |
| appreciation (depreciation) | 426,871 | — | 525,810 | (428,281) | 660,058 | 1,184,458 |
| Net purchases (sales) | 7,792,726 | $4,925,000 | (12,284) | (3,096,678) | 3,539,888 | 13,148,652 |
| Net transfers in and/out of | | | | | | |
| Level 3 | (7) | — | (369,893) | — | — | (369,900) |
| Balance as of 2–28–11 | $18,942,357 | $4,925,000 | $2,400,940 | $5,801,920 | $4,536,990 | $36,607,207 |
| Change in unrealized at | | | | | | |
| period end* | $426,871 | — | $525,810 | (690,378) | $660,058 | $922,361 |
*Change in unrealized appreciation (depreciation) attributable to level 3 securities held at the period end.
Changes in valuation techniques may result in transfers in or out of an assigned level within the disclosure hierarchy. During the six-month period ended February 28, 2011, there were no significant transfers in or out of Level 1 or Level 2 assets.
In order to value the securities, the Fund uses the following valuation techniques. Equity securities held by the Fund are valued at the last sale price or official closing price on the principal securities exchange on which they trade. In the event there were no sales during the day or closing prices are not available, then securities are valued using the last quoted bid or evaluated price. Debt obligations are valued based on the evaluated prices provided by an independent pricing service, which utilizes both dealer-supplied and electronic data processing techniques, taking into account
| |
| 38 | Strategic Income Opportunities Fund | Semiannual report |
factors such as institutional-size trading in similar groups of securities, yield, quality, coupon rate, maturity, type of issue, trading characteristics and other market data. Foreign securities and currencies, including forward foreign currency contracts, are valued in U.S. dollars, based on foreign currency exchange rates supplied by an independent pricing service. Certain securities and forward foreign currency contracts traded only in the over-the-counter market are valued at the last bid price quoted by brokers making markets in the securities at the close of trading. Certain short-term securities are valued at amortized cost.
Other portfolio securities and assets, where market quotations are not readily available, are valued at fair value, as determined in good faith by the Fund’s Pricing Committee, following procedures established by the Board of Trustees. Generally, trading in non-U.S. securities is substantially completed each day at various times prior to the close of trading on the NYSE. Significant market events that affect the values of non-U.S. securities may occur between the time when the valuation of the securities is generally determined and the close of the NYSE. During significant market events, these securities will be valued at fair value, as determined in good faith, following procedures established by the Board of Trustees. The Fund may use a fair valuation model to value non-U.S. securities in order to adjust for events which may occur between the close of foreign exchanges and the close of the NYSE.
Term loans (Floating rate loans). The Fund may invest in term loans, which often include debt securities that are rated below investment grade at the time of purchase. Term loans are generally subject to legal or contractual restrictions on resale. The liquidity of term loans, including the volume and frequency of secondary market trading in such loans, varies significantly over time and among individual loans. During years of infrequent trading, valuing a term loan can be more difficult and buying and selling a term loan at an acceptable price can be more difficult and delayed, which could result in a loss.
The Fund’s ability to receive payments of principal, interest and other amounts in connection with term loans will depend primarily on the financial condition of the borrower. The Fund’s failure to receive scheduled payments on a term loan due to a default, bankruptcy or other reason, would adversely affect the Fund’s income and would likely reduce the value of its assets. Because many term loans are not rated by independent credit rating agencies, a decision to invest in a particular loan could depend exclusively on the subadviser’s credit analysis of the borrower and/or term loan agents. The Fund may have limited rights to enforce the terms of an underlying loan.
Security transactions and related investment income. Investment security transactions are accounted for on a trade date plus one basis for daily net asset value calculations. However, for financial reporting purposes, investment transactions are reported on trade date. Interest income is accrued as earned. Gains and losses on securities sold are determined on the basis of identified cost and may include proceeds from litigation. Dividend income is recorded on the ex-date, except for dividends of foreign securities where the dividend may not be known until after the ex-date. In those cases, dividend income is recorded when the Fund becomes aware of the dividends. Interest income includes coupon interest and amortization/accretion of premiums/discounts on debt securities. Debt obligations may be placed in a non-accrual status and related interest income may be reduced by stopping current accruals and writing off interest receivable when the collection of all or a portion of interest has become doubtful.
Foreign currency translation. Assets, including investments and liabilities denominated in foreign currencies, are translated into U.S. dollar values each day at the prevailing exchange rate. Purchases and sales of securities, income, and expenses are translated into U.S. dollars at the prevailing exchange rate on the date of the transaction. The effect of changes in foreign currency exchange rates on securities is reflected as a component of the realized and unrealized gains (losses) on investments.
| |
| Semiannual report | Strategic Income Opportunities Fund | 39 |
Funds that invest internationally generally carry more risk than funds that invest strictly in U.S. securities. Risks can result from differences in economic and political conditions, regulations, market practices (including higher transaction costs) and accounting standards. Foreign investments are also subject to a decline in the value of a foreign currency versus the U.S. dollar, which reduces the dollar value of securities denominated in that currency.
The Fund may be subject to capital gains and repatriation taxes as imposed by certain countries in which it invests. Such taxes are generally based upon income and/or capital gains earned or repatriated. Taxes are accrued based upon net investment income, net realized gains and net unrealized appreciation.
Stripped securities. Stripped mortgage backed securities are financial instruments structured to separate principal and interest cash flows so that one class receives the entire principal from the underlying mortgage assets (PO or principal only), while the other class receives the interest cash flows (IO or interest only). Both PO and IO investments represent an interest in the cash flows of an underlying stripped mortgage backed security. If the underlying mortgage assets experience greater than anticipated prepayments of principal, the Fund may fail to fully receive its initial investment in an IO security. The market value of these securities can be extremely volatile in response to changes in interest rates. In addition, these securities present additional credit risk such that the Fund may not receive all or part of its principal or interest payments because the borrower or issuer has defaulted on its obligation.
Line of credit. The Fund may borrow from banks for temporary or emergency purposes, including meeting redemption requests that otherwise might require the untimely sale of securities. Pursuant to the custodian agreement, the custodian may loan money to the Fund to make properly authorized payments. The Fund is obligated to repay the custodian for any overdraft, including any related costs or expenses. The custodian has a lien, security interest or security entitlement in any Fund property that is not segregated, to the maximum extent permitted by law for any overdraft.
In addition, the Fund and other affiliated funds have entered into an agreement with State Street Bank and Trust Company (SSBT) which enables them to participate in a $200 million unsecured committed line of credit. A commitment fee, payable at the end of each calendar quarter, based on the average daily unused portion of the line of credit, is charged to each participating fund on a pro rata basis and is reflected in other expenses on the Statement of Operations. For the six-month period ended February 28, 2011, the Fund had no significant borrowings under the line of credit.
Effective March 30, 2011, the line of credit with SSBT expired and a similar arrangement was established with Citibank N.A.
Expenses. The majority of expenses are directly attributable to an individual fund. Expenses that are not readily attributable to a specific fund are allocated among all funds in an equitable manner, taking into consideration, among other things, the nature and type of expense and the fund’s relative assets. Expense estimates are accrued in the period to which they relate and adjustments are made when actual amounts are known.
Class allocations. Income, common expenses, and realized and unrealized gains (losses) are determined at the fund level and allocated daily to each class of shares based on the net asset value of the class. Class-specific expenses, such as distribution and service fees, if any, transfer agent fees, state registration fees and printing and postage, for all classes, are calculated daily at the class level based on the appropriate net asset value of each class and the specific expense rates applicable to each class.
Federal income taxes. The Fund intends to continue to qualify as a regulated investment company by complying with the applicable provisions of the Internal Revenue Code and will not be subject
| |
| 40 | Strategic Income Opportunities Fund | Semiannual report |
to federal income tax on taxable income that is distributed to shareholders. Therefore, no federal income tax provision is required.
For federal income tax purposes, the Fund has a capital loss carryforward of $7,801,949 available to offset future net realized capital gains. The following table details the capital loss carryforward available as of August 31, 2010.
| | | |
| CAPITAL LOSS CARRYFORWARD EXPIRING AT AUGUST 31: | | |
| 2015 | 2016 | 2017 | 2018 |
|
| $570,632 | $1,198,513 | $3,209,592 | $2,823,212 |
Under the recently enacted Regulated Investment Company Modernization Act of 2010, the Fund will be permitted to carry forward capital losses incurred in taxable years beginning after December 22, 2010 for an unlimited period. However, any losses incurred during those future taxable years will be required to be utilized prior to the losses incurred in pre-enactment taxable years. As a result of this ordering rule, pre-enactment capital loss carryforwards may be more likely to expire unused. Additionally, post-enactment capital losses that are carried forward will retain their character as either short-term or long-term capital losses rather than being considered all short-term as under previous law.
As of August 31, 2010, the Fund had no uncertain tax positions that would require financial statement recognition, de-recognition or disclosure. The Fund’s federal tax return is subject to examination by the Internal Revenue Service for a period of three years.
Distribution of income and gains. Distributions to shareholders from net investment income and net realized gains, if any, are recorded on the ex-date. The Fund generally declares dividends daily and pays them monthly. Capital gain distributions, if any, are paid annually.
Distributions paid by the Fund with respect to each class of shares are calculated in the same manner, at the same time and are in the same amount, except for the effect of expenses that may be applied differently to each class.
Such distributions, on a tax basis, are determined in conformity with income tax regulations, which may differ from accounting principles generally accepted in the United States of America.
Capital accounts within financial statements are adjusted for permanent book-tax differences. These adjustments have no impact on net assets or the results of operations. Temporary book-tax differences, if any, will reverse in a subsequent period. Permanent book-tax differences are primarily attributable to foreign currency transactions and amortization and accretion on debt securities.
Note 3 — Derivative instruments
The Fund may invest in derivatives in order to meet its investment objectives. The use of derivatives may involve risks different from, or potentially greater than, the risks associated with investing directly in securities. Specifically, derivatives expose the Fund to the risk that the counterparty to an over-the-counter (OTC) derivatives contract will be unable or unwilling to make timely settlement payments or otherwise honor its obligations. OTC derivatives transactions typically can only be closed out with the other party to the transaction. If the counterparty defaults, the Fund will have contractual remedies, but there is no assurance that the counterparty will meet its contractual obligations or that the Fund will succeed in enforcing them.
Futures. A futures contract is a contractual agreement to buy or sell a particular commodity, currency, or financial instrument at a pre-determined price in the future. Risks related to the use of futures contracts include possible illiquidity of the futures markets, contract prices that can be highly volatile and imperfectly correlated to movements in hedged security values and/or
| |
| Semiannual report | Strategic Income Opportunities Fund | 41 |
interest rates and potential losses in excess of the amounts recognized on the Statement of Assets and Liabilities.
Futures contracts are valued at the quoted daily settlement prices established by the exchange on which they trade. Upon entering into a futures contract, the Fund is required to deposit initial margin with the broker in the form of cash or securities. The amount of required margin is generally based on a percentage of the contract value; this amount is the initial margin for the trade. The margin deposit must then be maintained at the established level over the life of the contract. Futures contracts are marked-to-market daily and an appropriate payable or receivable for the change in value (variation margin) is recorded by the Fund.
During the six-month period ended February 28, 2011, the Fund used futures contracts to manage duration. The following table summarizes the contracts held at February 28, 2011. During the six-month period ended February 28, 2011, the Fund held futures contracts with total absolute values ranging from $50.9 million to $162.0 million, as measured at each quarter end.
| | | | | | |
| OPEN | NUMBER OF | | | | | UNREALIZED |
| CONTRACTS | CONTRACTS | | POSITION | EXPIRATION DATE | VALUE | DEPRECIATION |
|
| U.S. Treasury 10-Year | 1,361 | | Short | Jun 2011 | ($162,022,797) | ($660,692) |
| Note Futures | | | | | | |
Forward foreign currency contracts. A forward foreign currency contract is an agreement between two parties to buy and sell a specific currency at a price that is set on the date of the contract. The forward contract calls for delivery of the currency on a future date that is specified in the contract. Risks related to the use of forwards include the possible failure of counterparties to meet the terms of the forward agreement, the risk that currency movements will not occur thereby reducing the Fund’s total return, and the potential for losses in excess of the amounts recognized on the Statement of Assets and Liabilities.
The market value of a forward foreign currency contract fluctuates with changes in foreign currency exchange rates. Forward foreign currency contracts are marked-to-market daily and the change in value is recorded by the Fund as an unrealized gain or loss. Realized gains or losses, equal to the difference between the value of the contract at the time it was opened and the value at the time it was closed, are recorded upon delivery or receipt of the currency.
During the six-month period ended February 28, 2011, the Fund used forward foreign currency contracts to manage against anticipated currency exchange rate changes. The following table summarizes the contracts held at February 28, 2011. During the six-month period ended February 28, 2011, the Fund held forward foreign currency contracts with total USD notional absolute values ranging from $1.5 billion to $2.8 billion, as measured at each quarter end.
| | | | | | |
| | | PRINCIPAL | | | | |
| | PRINCIPAL | AMOUNT | | | | UNREALIZED |
| | AMOUNT COVERED | COVERED BY | | | SETTLEMENT | APPRECIATION |
| CURRENCY | BY CONTRACT | CONTRACT (USD) | | COUNTERPARTY | DATE | (DEPRECIATION) |
|
| Buys | | | | | | |
| AUD | 10,953,080 | $10,757,019 | | Bank of Montreal | 3-31-11 | $355,081 |
| AUD | 15,000,000 | 15,076,500 | | Royal Bank of Scotland PLC | 3-31-11 | 141,275 |
| CAD | 42,242,663 | 42,590,308 | | Bank of Montreal | 3-31-11 | 864,246 |
| CAD | 75,920,025 | 76,526,048 | | Royal Bank of Canada | 3-31-11 | 1,572,032 |
| CAD | 157,121,148 | 158,597,693 | | Toronto Dominion Bank | 3-31-11 | 3,031,073 |
| CHF | 14,259,750 | 15,347,917 | | Royal Bank of Canada | 3-31-11 | 3,921 |
| EUR | 7,400,000 | 9,825,942 | | Bank of Montreal | 3-31-11 | 381,915 |
| EUR | 7,400,000 | 9,827,200 | | Royal Bank of Canada | 3-31-11 | 380,657 |
| EUR | 15,400,000 | 20,863,458 | | Royal Bank of Scotland PLC | 3-31-11 | 379,920 |
| |
| 42 | Strategic Income Opportunities Fund | Semiannual report |
| | | | | | |
| | | PRINCIPAL | | | | |
| | PRINCIPAL | AMOUNT | | | | UNREALIZED |
| | AMOUNT COVERED | COVERED BY | | | SETTLEMENT | APPRECIATION |
| CURRENCY | BY CONTRACT | CONTRACT (USD) | | COUNTERPARTY | DATE | (DEPRECIATION) |
|
| EUR | 7,400,000 | $9,825,128 | | State Street Bank & Trust | 3-31-11 | $382,729 |
| | | | | Company | | |
| EUR | 7,500,000 | 10,267,868 | | UBS AG | 3-31-11 | 77,933 |
| GBP | 15,000,000 | 24,000,000 | | Bank of Montreal | 3-31-11 | 378,932 |
| GBP | 7,700,000 | 12,255,859 | | Canadian Imperial Bank | 3-31-11 | 258,660 |
| | | | of Commerce | | |
| GBP | 16,200,000 | 26,008,857 | | Morgan Stanley & | 3-31-11 | 320,390 |
| | | | Company, Inc. | | |
| GBP | 30,000,000 | 48,197,627 | | Royal Bank of Canada | 3-31-11 | 560,237 |
| GBP | 18,750,000 | 30,078,750 | | Royal Bank of Scotland PLC | 3-31-11 | 394,916 |
| GBP | 7,700,000 | 12,168,110 | | State Street Bank & Trust | 3-31-11 | 346,409 |
| | | | | Company | | |
| NOK | 90,000,000 | 15,755,199 | | State Street Bank & Trust | 3-31-11 | 291,558 |
| | | | | Company | | |
| NZD | 31,200,000 | 23,421,060 | | Canadian Imperial Bank of | 3-31-11 | 4,806 |
| | | | Commerce | | |
| SEK | 117,028,125 | 18,230,526 | | Royal Bank of Canada | 3-31-11 | 221,271 |
| SEK | 169,514,850 | 26,116,912 | | State Street Bank & Trust | 3-31-11 | 610,453 |
| | | | | Company | | |
| Total | | $615,737,981 | | | | $10,958,414 |
| Sells | | | | | | |
| AUD | 25,953,000 | $26,245,548 | | Royal Bank of Scotland PLC | 3-31-11 | ($84,247) |
| CAD | 23,575,800 | 24,000,000 | | Bank of Montreal | 3-31-11 | (252,162) |
| CAD | 52,016,625 | 52,847,917 | | Royal Bank of Canada | 3-31-11 | (661,002) |
| CHF | 14,201,250 | 15,326,453 | | Royal Bank of Canada | 3-31-11 | 37,596 |
| EUR | 7,600,000 | 10,167,280 | | Bank of Montreal | 3-31-11 | (316,465) |
| EUR | 14,630,000 | 19,992,130 | | Canadian Imperial Bank of | 3-31-11 | (189,080) |
| | | | Commerce | | |
| EUR | 15,400,000 | 20,923,364 | | Royal Bank of Scotland PLC | 3-31-11 | (320,014) |
| EUR | 15,100,000 | 20,292,430 | | State Street Bank & Trust | 3-31-11 | (537,117) |
| | | | | Company | | |
| EUR | 76,489,255 | 102,016,014 | | UBS AG | 3-31-11 | (3,496,336) |
| GBP | 15,000,000 | 23,840,308 | | Bank of Montreal | 3-31-11 | (538,624) |
| GBP | 7,900,000 | 12,613,022 | | Bank of Nova Scotia | 3-31-11 | (226,550) |
| GBP | 16,200,000 | 26,137,728 | | Morgan Stanley & | 3-31-11 | (191,519) |
| | | | Company, Inc. | | |
| GBP | 45,000,000 | 72,111,901 | | Royal Bank of Canada | 3-31-11 | (1,024,896) |
| GBP | 176,190,957 | 281,641,710 | | Royal Bank of Scotland PLC | 3-31-11 | (4,714,785) |
| GBP | 23,100,000 | 36,630,594 | | Standard Chartered Bank | 3-31-11 | (912,962) |
| GBP | 39,500,000 | 63,321,172 | | State Street Bank & Trust | 3-31-11 | (876,683) |
| | | | | Company | | |
| GBP | 7,700,000 | 12,217,590 | | UBS AG | 3-31-11 | (296,929) |
| NOK | 90,000,000 | 16,019,502 | | State Street Bank & Trust | 3-31-11 | (27,254) |
| | | | | Company | | |
| SEK | 615,000 | 97,126 | | Bank of Montreal | 3-31-11 | 159 |
| SEK | 117,028,125 | 18,243,813 | | Royal Bank of Canada | 3-31-11 | (207,983) |
| SEK | 101,617,200 | 15,755,199 | | State Street Bank & Trust | 3-31-11 | (266,760) |
| | | | | Company | | |
| SEK | 67,282,650 | 10,368,805 | | UBS AG | 3-31-11 | (239,635) |
| Total | | $880,809,606 | | | | ($15,343,248) |
| |
| Semiannual report | Strategic Income Opportunities Fund | 43 |
| |
| Currency Abbreviations |
| AUD | Australian Dollar |
| CAD | Canadian Dollar |
| CHF | Swiss Franc |
| EUR | Euro |
| GBP | Pound Sterling |
| NOK | Norwegian Krone |
| NZD | New Zealand Dollar |
| SEK | Swedish Krona |
Options. There are two types of options, a put option and a call option. Options are traded either over-the-counter or on an exchange. A call option gives the purchaser of the option the right to buy (and the seller the obligation to sell) the underlying instrument at the exercise price. A put option gives the purchaser of the option the right to sell (and the writer the obligation to buy) the underlying instrument at the exercise price. Writing puts and buying calls may increase the Fund’s exposure to changes in the value of the underlying instrument. Buying puts and writing calls may decrease the Fund’s exposure to such changes. Risks related to the use of options include the loss of the premium, possible illiquidity of the options markets, trading restrictions imposed by an exchange, movements in underlying security values, and for written options, potential losses in excess of the amounts recognized on the Statement of Assets and Liabilities.
Options listed on an exchange are valued at their closing price. If no closing price is available, then they are valued at the mean between the last bid and ask prices from the exchange on which they are principally traded. For options not listed on an exchange, an independent pricing source is used to value the options at the mean between the last bid and ask prices. When the Fund purchases an option, the premium paid by the Fund is included in the Portfolio of Investments and subsequently “marked-to-market” to reflect current market value. If the purchased option expires, the Fund realizes a loss equal to the cost of the option. If the Fund exercises a call option, the cost of the securities acquired by exercising the call is increased by the premium paid to buy the call. If the Fund exercises a put option, it realizes a gain or loss from the sale of the underlying security and the proceeds from such sale are decreased by the premium paid.
During the six-month period ended February 28, 2011, the Fund used purchased options to manage against anticipated currency exchange rate changes. During the six-month period ended February 28, 2011, the Fund held purchased options with markets values ranging from approximately $250,000 to $2.7 million, as measured at each quarter end.
Fair value of derivative instruments by risk category
The table below summarizes the fair value of derivatives held by the Fund at February 28, 2011 by risk category:
| | | | |
| | | FINANCIAL | ASSET | LIABILITY |
| | STATEMENT OF ASSETS AND | INSTRUMENTS | DERIVATIVES | DERIVATIVES |
| RISK | LIABILITIES LOCATION | LOCATION | FAIR VALUE | FAIR VALUE |
|
| Interest rate contracts | Receivable/payable for | Futures | — | ($660,692)† |
| | futures | | | |
| |
| Foreign exchange | Receivable/payable for | Forward foreign | $13,724,484 | (15,381,003) |
| contracts | forward foreign cur- | currency contracts/ | | |
| | rency exchange contracts; | Purchased options | | |
| | Investments at value* | | | |
| Total | | | $13,724,484 | ($16,041,695) |
* Purchased options are included in the Fund’s investments.
† Reflects cumulative appreciation/depreciation of futures as disclosed in Note 3. Only the period end variation margin is separately disclosed in the Statement of Assets and Liabilities.
| |
| 44 | Strategic Income Opportunities Fund | Semiannual report |
Effect of derivative instruments on the Statement of Operations
The table below summarizes the net realized gain (loss) included in the net increase (decrease) in net assets from operations, classified by derivative instrument and risk category, for the six-month period ended February 28, 2011:
| | | | | |
| | | | | FOREIGN | |
| | STATEMENT OF | | FUTURES | CURRENCY | |
| RISK | OPERATIONS LOCATION | INVESTMENTS1 | CONTRACTS | TRANSACTIONS2 | TOTAL |
|
| |
| Interest rate | Net realized | — | $2,939,536 | — | $2,939,536 |
| contracts | gain (loss) | | | | |
| Foreign currency Net realized | $694,135 | — | ($15,469,098) | (14,774,963) |
| contracts | gain (loss) | | | | |
| Total | | $694,135 | $2,939,536 | ($15,469,098) | ($11,835,427) |
1 Realized gain/loss associated with purchased options is included in this caption on the Statement of Operations.
2 Realized gain/loss associated with forward foreign currency contracts is included in this caption on the Statement of Operations.
The table below summarizes the net change in unrealized appreciation (depreciation) included in the net increase (decrease) in net assets from operations, classified by derivative instrument and risk category, for the six-month period ended February 28, 2011:
| | | | | |
| | | | | TRANSLATION | |
| | | | | OF ASSETS | |
| | | | | AND LIABILITIES | |
| | STATEMENT OF | | FUTURES | IN FOREIGN | |
| RISK | OPERATIONS LOCATION | INVESTMENTS1 | CONTRACTS | CURRENCIES2 | TOTAL |
|
| |
| Interest rate | Change in unreal- | — | ($561,565) | — | ($561,565) |
| contracts | ized appreciation | | | | |
| | (depreciation) | | | | |
| Foreign currency | Change in unreal- | $299,186 | — | ($814,205) | (515,019) |
| contracts | ized appreciation | | | | |
| | (depreciation) | | | | |
| Total | | $299,186 | ($561,565) | ($814,205) | ($1,076,584) |
1 Change in unrealized appreciation/depreciation associated with purchased options is included in this caption on the Statement of Operations.
2 Change in unrealized appreciation/depreciation associated with forward foreign currency contracts is included in this caption on the Statement of Operations.
Note 4 — Guarantees and indemnifications
Under the Fund’s organizational documents, its Officers and Trustees are indemnified against certain liabilities arising out of the performance of their duties to the Fund. Additionally, in the normal course of business, the Fund enters into contracts with service providers that contain general indemnification clauses. The Fund’s maximum exposure under these arrangements is unknown, as this would involve future claims that may be made against the Fund that have not yet occurred. The risk of material loss from such claims is considered remote.
Note 5 — Fees and transactions with affiliates
John Hancock Investment Management Services, LLC (the Adviser), serves as investment adviser for the Fund. John Hancock Funds, LLC (the Distributor), an affiliate of the Adviser, serves as principal underwriter of the Fund. The Adviser and the Distributor are indirect wholly owned subsidiaries of Manulife Financial Corporation (MFC).
Management fee. The Fund has an investment management contract with the Adviser under which the Fund pays a daily management fee to the Adviser equivalent, on an annual basis, to the sum of: (a) 0.700% of the first $500,000,000 of the Fund’s aggregate daily net assets and
| |
| Semiannual report | Strategic Income Opportunities Fund | 45 |
(b) 0.650% of the Fund’s aggregate net assets in excess of $500,000,000. Prior to November 6, 2010, the advisory fees were as follows: a) 0.725% of the first $500 million of the Fund’s aggregate daily net assets and b) 0.65% of the excess over $500 million of the Fund’s aggregate daily net assets. Aggregate net assets include the net assets of the Fund and Strategic Income Opportunities Trust, a series of John Hancock Trust (JHT). The Adviser has a subadvisory agreement with John Hancock Asset Management a division of Manulife Asset Management (US) LLC (formerly, MFC Global Investment Management (U.S.), LLC), an indirectly owned subsidiary of MFC and an affiliate of the Adviser. Manulife Asset Management (U.S.) is doing business as John Hancock Asset Management. The Fund is not responsible for payment of the subadvisory fees.
The investment management fees incurred for the six-month period ended February 28, 2011 were equivalent to an annual effective rate of 0.67% of the Fund’s average daily net assets.
Expense reimbursements. The Adviser has voluntarily agreed to waive a portion of its management fee if certain expenses of the Fund exceed 0.15% of average net assets. Expenses excluded from this waiver are taxes, portfolio brokerage commissions, interest, litigation and indemnification expenses, extraordinary expenses not incurred in the ordinary course of the Fund’s business, advisory fees, Rule 12b-1 fees, service fees, transfer agency fees, blue sky fees, printing and postage, and fees under any agreements or plans of the Fund dealing with services for shareholders and others with beneficial interests in shares of the Fund. This expense reduction will continue in effect until terminated by the Adviser.
The Adviser has contractually agreed to limit the Fund’s total expenses, excluding brokerage commissions, interest and other extraordinary expenses not incurred in the ordinary course of the Fund’s business, to 1.17% for Class A shares, 1.87% for Class C shares and 0.90% for Class I shares, of the Fund’s average daily net asset value, on an annual basis. Accordingly, these expense reductions amounted to $71,688 and $24,214 for Class A shares and Class C shares, respectively, for the six-month period ended February 28, 2011. The expense reimbursements and limits will continue in effect until December 31, 2011, and thereafter until terminated by the Adviser.
The Adviser has voluntarily agreed to waive a portion of its management fee for certain funds of the Trust and JHT (the Participating Funds), including Strategic Income Opportunities Fund. The waiver equals, on an annualized basis, 0.01% of that portion of the aggregate net assets of all the Participating Funds that exceeds $85 billion. The amount of the reimbursement is calculated daily and allocated among all the Participating Funds in proportion to the daily net assets of each Fund. Accordingly, the expense reduction related to this agreement was $12,482.
Expense recapture. The Adviser may recapture operating expenses reimbursed or fees waived under previous expense limitation or waiver arrangements made subsequent to January 1, 2009, for a period of three years following the beginning of the month in which such reimbursements or waivers originally occurred. The table below outlines the amounts recovered during the six-month period ended February 28, 2011, and the amount of waived or reimbursed expenses subject to potential recovery and the respective expiration dates. Certain reimbursements or waivers are not subject to recapture.
| | | |
| AMOUNTS ELIGIBLE | AMOUNTS ELIGIBLE | AMOUNTS ELIGIBLE | AMOUNT RECOVERED |
| FOR RECOVERY | FOR RECOVERY | FOR RECOVERY | DURING THE PERIOD |
| THROUGH 8-1-12 | THROUGH 8-1-13 | THROUGH 2-1-14 | ENDED 2-28-11 |
|
| |
| — | $32,298 | $95,902 | — |
Accounting and legal services. Pursuant to a service agreement the Fund reimburses the Adviser for all expenses associated with providing the administrative, financial, legal, accounting and recordkeeping services of the Fund, including the preparation of all tax returns, periodic reports to shareholders and regulatory reports, among other services. These expenses are allocated to each
| |
| 46 | Strategic Income Opportunities Fund | Semiannual report |
share class based on its relative net assets at the time the expense was incurred. These accounting and legal services fees incurred for the six-month period ended February 28, 2011, amounted to an annual rate of 0.01% of the Fund’s average daily net assets.
Distribution plans. The Fund has a distribution agreement with the Distributor. The Fund has adopted distribution plans with respect to Class A and Class C shares pursuant to Rule 12b-1 under the 1940 Act, to pay the Distributor for services provided as the distributor of shares of the Fund. The Fund may pay up to the following contractual rates of distribution fees under these arrangements, expressed as an annual percentage of average daily net assets for each class of the Fund’s shares: 0.30% for Class A shares and 1.00% for Class C shares.
Sales charges. Class A shares are assessed up-front sales charges, which resulted in payments to the Distributor amounting to $735,905 for the six-month period ended February 28, 2011. Of this amount, $90,599 was retained and used for printing prospectuses, advertising, sales literature and other purposes, $642,031 was paid as sales commissions to broker-dealers and $3,275 was paid as sales commissions to sales personnel of Signator Investors, Inc. (Signator Investors), a broker-dealer affiliate of the Adviser.
Class C shares are subject to contingent deferred sales charges (CDSC). Class C shares that are redeemed within one year of purchase are subject to a 1.00% CDSC on the lesser of the current market value at the time of redemption or the original purchase cost of the shares being redeemed. Proceeds from CDSCs are used to compensate the Distributor for providing distribution-related services in connection with the sale of these shares. During the six-month period ended February 28, 2011, CDSCs received by the Distributor amounted to $13,505 for Class C shares.
Transfer agent fees. The Fund has a transfer agent agreement with John Hancock Signature Services, Inc. (Signature Services or Transfer Agent), an affiliate of the Adviser. The transfer agent fees paid to Signature Services are determined based on the cost to Signature Services (Signature Services Cost) of providing recordkeeping services. The Signature Services Cost includes a component of allocated John Hancock corporate overhead for providing transfer agent services to the Fund and to all other John Hancock affiliated funds. It also includes out-of-pocket expenses that are comprised of payments made to third-parties for recordkeeping services provided to their clients who invest in one or more John Hancock funds. In addition, Signature Services Cost may be reduced by certain revenues that Signature Services receive in connection with the service they provide to the funds. Signature Services Cost is calculated monthly and allocated, as applicable, to four categories of share classes: Institutional Share Classes, Retirement Share Classes, Municipal Bond Classes and all other Retail Share Classes. Within each of these categories, the applicable costs are allocated to the affected John Hancock affiliated funds and/or classes, based on the relative average daily net assets.
Class level expenses. Class level expenses for the six-month period ended February 28, 2011 were:
| | | | |
| | DISTRIBUTION | TRANSFER | STATE | PRINTING AND |
| CLASS | AND SERVICE FEES | AGENT FEES | REGISTRATION FEES | POSTAGE |
|
| Class A | $292,471 | $177,975 | $11,491 | $5,792 |
| Class C | 281,114 | 51,120 | 7,086 | 1,791 |
| Class I | — | 22,801 | 8,559 | 2,510 |
| Total | $573,585 | $251,896 | $27,136 | $10,093 |
Trustee expenses. The Trust compensates each Trustee who is not an employee of the Adviser or its affiliates. The costs of paying Trustee compensation and expenses are allocated to each Fund based on its average daily net assets.
| |
| Semiannual report | Strategic Income Opportunities Fund | 47 |
Note 6 — Fund share transactions
Transactions in Fund shares for the six-month period ended February 28, 2011, and for the year ended August 31, 2010, were as follows:
| | | | | | |
| | | | Six months ended 2-28-11 | Year ended 8-31-10 |
| | | | Shares | Amount | Shares | Amount |
| Class A shares1 | | | | | | |
|
| Sold | | | 19,334,848 | $210,846,055 | 11,884,462 | $124,922,370 |
| Distributions reinvested | | | 598,987 | 6,536,720 | 122,745 | 1,289,419 |
| Repurchased | | | (2,172,255) | (23,691,599) | (623,925) | (6,586,345) |
| | | | | | | |
| Net increase | | | 17,761,580 | $193,691,176 | 11,383,282 | $119,625,444 |
| |
| Class C shares1 | | | | | | |
|
| Sold | | | 4,121,696 | $44,915,058 | 3,719,926 | $39,098,609 |
| Distributions reinvested | | | 161,791 | 1,764,993 | 39,240 | 412,276 |
| Repurchased | | | (570,806) | (6,223,457) | (173,556) | (1,827,161) |
| | | | | | | |
| Net increase | | | 3,712,681 | $40,456,594 | 3,585,610 | $37,683,724 |
| |
| Class I shares1 | | | | | | |
|
| Sold | | | 15,163,447 | $165,598,947 | 4,503,364 | $47,506,161 |
| Distributions reinvested | | | 274,956 | 3,002,668 | 65,422 | 686,826 |
| Repurchased | | | (1,811,794) | (19,738,407) | (806,075) | (8,446,399) |
| | | | | | | |
| Net increase | | | 13,626,609 | $148,863,208 | 3,762,711 | $39,746,588 |
| |
| Class NAV shares | | | | | | |
|
| Sold | | | 26,175,776 | $283,580,980 | 11,439,481 | $118,864,611 |
| Distributions reinvested | | | 3,123,544 | 34,040,573 | 4,025,102 | 41,644,611 |
| Repurchased | | | (170,507) | (1,851,622) | (1,565,272) | (15,972,511) |
| | | | | | | |
| Net increase | | | 29,128,813 | $315,769,931 | 13,899,311 | $144,536,711 |
| |
| Net increase | | | 64,229,683 | $698,780,909 | 32,630,914 | $341,592,467 |
|
1The inception date for Class A, Class C and Class I shares is 1-4-10.
Affiliates of the Fund owned 100% of shares of beneficial interest of Class NAV shares on February 28, 2011.
Note 7 — Purchase and sale of securities
Purchases and sales of securities, other than short-term securities, aggregated $823,095,703 and $180,167,106, respectively, for the six-month period ended February 28, 2011.
Note 8 — Investment by affiliated funds
Certain investors in the Fund are affiliated funds and are managed by the Adviser and its affiliates. The affiliated funds do not invest in the Fund for the purpose of exercising management or control; however, this investment may represent a significant portion of the Fund’s net assets. For the six-month period ended February 28, 2011, the following funds had an affiliate ownership concentration of 5% or more of the Fund’s net assets:
| | | |
| | AFFILIATE | | |
| FUND | CONCENTRATION | | |
| | |
| Lifestyle Conservative Portfolio | 10.26% | | |
| Lifestyle Moderate Portfolio | 11.37% | | |
| Lifestyle Growth Portfolio | 11.45% | | |
| Lifestyle Balanced Portfolio | 23.86% | | |
| |
| 48 | Strategic Income Opportunities Fund | Semiannual report |
More information
| | |
| Trustees | Investment adviser | |
| James M. Oates, Chairman | John Hancock Investment Management | |
| James R. Boyle† | Services, LLC | |
| Charles L. Bardelis* | | |
| Peter S. Burgess* | Subadviser | |
| Grace K. Fey | John Hancock Asset Management | |
| Theron S. Hoffman | | |
| Hassell H. McClellan | Principal distributor | |
| Steven M. Roberts* | John Hancock Funds, LLC | |
| | | |
| Officers | Custodian | |
| Hugh McHaffie | State Street Bank and Trust Company | |
| President | | |
| | Transfer agent | |
| Thomas M. Kinzler | John Hancock Signature Services, Inc. | |
| Secretary and Chief Legal Officer | | |
| Legal counsel | |
| Francis V. Knox, Jr. | K&L Gates LLP | |
| Chief Compliance Officer | | |
|
| |
| Michael J. Leary | The report is certified under the Sarbanes-Oxley | |
| Treasurer | Act, which requires mutual funds and other public | |
| | companies to affirm that, to the best of their | |
| Charles A. Rizzo | knowledge, the information in their financial reports | |
| Chief Financial Officer | is fairly and accurately stated in all material respects. | |
| |
| |
| John G. Vrysen | | |
| Chief Operating Officer | | |
| | |
| *Member of the Audit Committee | | |
| †Non-Independent Trustee | | |
The Fund’s proxy voting policies and procedures, as well as the Fund’s proxy voting record for the most recent twelve-month period ended June 30, are available free of charge on the Securities and Exchange Commission (SEC) Web site at www.sec.gov or on our Web site.
The Fund’s complete list of portfolio holdings, for the first and third fiscal quarters, is filed with the SEC on Form N-Q. The Fund’s Form N-Q is available on our Web site and the SEC’s Web site, www.sec.gov, and can be reviewed and copied (for a fee) at the SEC’s Public Reference Room in Washington, DC. Call 1-800-SEC-0330 to receive information on the operation of the SEC’s Public Reference Room.
We make this information on your fund, as well as monthly portfolio holdings, and other fund details available on our Web site www.jhfunds.com or by calling 1-800-225-5291.
| | |
| You can also contact us: | | |
| 1-800-225-5291 | Regular mail: | Express mail: |
| jhfunds.com | John Hancock Signature Services, Inc. | John Hancock Signature Services, Inc. |
| | P.O. Box 55913 | Mutual Fund Image Operations |
| | Boston, MA 02205-5913 | 30 Dan Road |
| | | Canton, MA 02021 |
| |
| Semiannual report | Strategic Income Opportunities Fund | 49 |

1-800-225-5291
1-800-554-6713 TDD
1-800-338-8080 EASI-Line
www.jhfunds.com
Now available: electronic delivery
www.jhfunds.com/edelivery
| |
| This report is for the information of the shareholders of John Hancock Strategic Income Opportunities Fund. | 356SA 2/11 |
| It is not authorized for distribution to prospective investors unless preceded or accompanied by a prospectus. | 4/11 |

A look at performance
For the period ended February 28, 2011
| | | | | | | | | | |
| | Average annual total returns (%) | | Cumulative total returns (%) | | |
| | with maximum sales charge (POP) | | with maximum sales charge (POP) | |
|
| | | | | Since | | | | | | Since |
| | 1-year | 5-year | 10-year | inception1 | | 6-months | 1-year | 5-year | 10-year | inception1 |
|
| Class A4 | 11.37 | — | — | 22.50 | | 7.88 | 11.37 | — | — | 55.06 |
|
| Class I2,3,4 | 16.74 | — | — | 24.99 | | 13.43 | 16.74 | — | — | 61.95 |
Performance figures assume all distributions are reinvested. Public offering price (POP) figures reflect maximum sales charges on Class A shares of 5%. Sales charges are not applicable for Class I shares.
The expense ratios of the Fund, both net (including any fee waivers or expense limitations) and gross (excluding any fee waivers or expense limitations), are set forth according to the most recent publicly available prospectuses for the Fund and may differ from the expense ratios disclosed in the Financial Highlights tables in this report. The waivers and expense limitations are contractual at least until 12-31-11. The net expenses are as follows: Class A — 1.73% and Class I — 1.25%. Had the fee waivers and expense limitations not been in place, the gross expenses would be as follows: Class A — 6.12% and Class I — 5.64%.
The returns reflect past results and should not be considered indicative of future performance. The return and principal value of an investment will fluctuate so that shares, when redeemed, may be worth more or less than their original cost. Due to market volatility, the Fund’s current performance may be higher or lower than the performance shown. For current to the most recent month end performance data, please call 1–800–225–5291 or visit the Fund’s Web site at www.jhfunds.com.
The performance table above and the chart on the next page do not reflect the deduction of taxes that a shareholder would pay on fund distributions or the redemption of fund shares.
The Fund’s performance results reflect any applicable expense reductions, without which the expenses increase and results would have been less favorable.
1 From 1-2-09.
2 1-2-09 is the inception date for the oldest class of shares, Class A shares. The inception date for Class I shares is 12-31-10. The returns prior to this date are those of Class A shares that have been recalculated to apply the gross fees and expenses of Class I shares.
3 For certain types of investors, as described in the Fund’s Class I share prospectus.
4 Performance information prior to 12-20-10 reflects an allocation to a different mix of underlying funds, and would have been different if the Fund’s investments had been allocated to its current mix of underlying funds.
| |
| 6 | Alternative Asset Allocation Fund | Semiannual report |
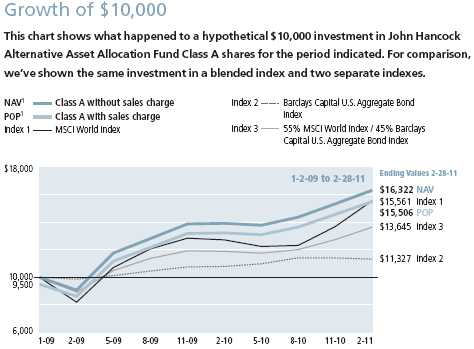
| | | | | | |
| | | | With | | | |
| | Period | Without | maximum | | | |
| | beginning | sales charge | sales charge | Index 1 | Index 2 | Index 3 |
|
| Class I2,3 | 1-2-09 | $16,195 | $16,195 | $15,561 | $11,327 | $13,645 |
|
Assuming all distributions were reinvested for the period indicated, the table above shows the value of $10,000 investment in the Fund’s Class A, and Class I shares, respectively, as of 2-28-11. Performance of the classes will vary based on the difference in sales charges paid by shareholders investing in different classes and the fee structure of those classes.
MSCI World Index (gross of foreign withholding tax on dividends) — Index 1 — is a free float-adjusted market capitalization weighted index that is designed to measure the equity market performance of developed markets.
Barclays Capital U.S. Aggregate Bond Index — Index 2 — is an unmanaged index of dollar-denominated and non-convertible investment grade debt issue.
55% MSCI World/45% Barclays Capital U.S. Aggregate Bond Index — Index 3 — is comprised of 55% MSCI World Index and 45% Barclays Capital U.S. Aggregate Bond Index.
The fund has added the returns of separate indexes to show the individual returns of broad-based securities market indexes.
It is not possible to invest directly in an index. Index figures do not reflect sales charges or foreign currency impact, which would have resulted in different values if they did.
1 NAV represents net asset value and POP represents public offering price.
2 1-2-09 is the inception date for the oldest class of shares, Class A shares. The inception date for Class I shares is 12-31-10. The returns prior to this date are those of Class A shares that have been recalculated to apply the gross fees and expenses of Class I shares.
3 For certain types of investors, as described in the Fund’s Class I share prospectus.
| |
| Semiannual report | Alternative Asset Allocation Fund | 7 |
Your expenses
These examples are intended to help you understand your ongoing operating expenses.
Understanding fund expenses
As a shareholder of the Fund, you incur two types of costs:
■ Transaction costs which include sales charges (loads) on purchases or redemptions (varies by share class), minimum account fee charge, etc.
■ Ongoing operating expenses including management fees, distribution and service fees (if applicable), and other fund expenses.
We are going to present only your ongoing operating expenses here.
Actual expenses/actual returns
This example is intended to provide information about the Fund’s actual ongoing operating expenses, and is based on the Fund’s actual return. It assumes an account value of $1,000.00 on September 1, 2010 with the same investment held until February 28, 2011.
| | | |
| | Account value | Ending value | Expenses paid during |
| | on 9-1-10 | on 2-28-11 | period ended 2-28-111 |
|
| |
| Class A | $1,000.00 | $1,135.60 | $3.81 |
|
For the class noted below, the example assumes an account value of $1,000 on December 31, 2010 (inception date for Class I) with the same investment held until February 28, 2011.
| | | |
| | Account value | Ending value | Expenses paid during |
| | on 12-31-10 | on 2-28-11 | period ended 2-28-112 |
|
| |
| Class I | $1,000.00 | $1,036.60 | $0.32 |
|
Together with the value of your account, you may use this information to estimate the operating expenses that you paid over the period. Simply divide your account value at February 28, 2011, by $1,000.00, then multiply it by the “expenses paid” for your share class from the table above. For example, for an account value of $8,600.00, the operating expenses should be calculated as follows:
| |
| 8 | Alternative Asset Allocation Fund | Semiannual report |
Hypothetical example for comparison purposes
This table allows you to compare the Fund’s ongoing operating expenses with those of any other fund. It provides an example of the Fund’s hypothetical account values and hypothetical expenses based on each class’s actual expense ratio and an assumed 5% annualized return before expenses (which is not the Fund’s actual return). It assumes an account value of $1,000.00 on September 1, 2010, with the same investment held until February 28, 2011. Look in any other fund shareholder report to find its hypothetical example and you will be able to compare these expenses.
| | | |
| | Account value | Ending value | Expenses paid during |
| | on 9-1-10 | on 2-28-11 | period ended 2-28-113 |
|
| Class A | $1,000.00 | $1,021.20 | $3.61 |
|
| Class I | 1,000.00 | 1,023.90 | 0.95 |
|
Remember, these examples do not include any transaction costs, therefore, these examples will not help you to determine the relative total costs of owning different funds. If transaction costs were included, your expenses would have been higher. See the prospectus for details regarding transaction costs.
1 Expenses are equal to the Fund’s annualized expense ratio of 0.72% for Class A shares, multiplied by the average account value over the period, multiplied by 181/365 (to reflect the one-half year period).
2 Expenses are equal to the Fund’s annualized expense ratio of 0.19% for Class I shares, multiplied by the average account value over the period, multiplied by 60/365 (to reflect the period).
3 Expenses are equal to the Fund’s annualized expense ratio multiplied by the average account value over the period, multiplied by 181/365 (to reflect the one-half year period).
| |
| Semiannual report | Alternative Asset Allocation Fund | 9 |
Asset allocation
| | | | |
| Asset Allocation1 | | | | |
|
| Fixed Income | 39% | | Currency | 23% |
| |
|
| Equity | 33% | | Other Assets | 5% |
| |
|
|
1 As a percentage of net assets on 2-28-11.
| |
| 10 | Alternative Asset Allocation Fund | Semiannual report |
Fund’s investments
| | | |
| Investment companies | | | |
| | | | |
| Underlying Funds’ Subadvisers | | | |
| | | | |
| Deutsche Asset Management | | (Deutsche) | |
| Dimensional Fund Advisors, Inc. | | (DFA) | |
| First Quadrant L.P. | | (First Quadrant) | |
| John Hancock Asset Management* | | (John Hancock) | |
| Pacific Investment Management Company | | (PIMCO) | |
| Stone Harbor Investment Partners, LP | | (Stone Harbor) | |
| Wellington Management Company, LLP | | (Wellington) | |
| *Manulife Asset Management (US) LLC and Manulife Asset Management (North America) Limited are doing business as | |
| John Hancock Asset Management. | | | |
As of 2-28-11 (unaudited)
| | |
| | Shares | Value |
|
| Affiliated Investment Companies 90.33% | | $2,968,745 |
|
| (Cost $2,813,683) | | |
| | | |
| EQUITY 28.52% | | |
| | | |
| John Hancock Funds II (G) | | |
|
| Emerging Markets, Class NAV (DFA) | 13,424 | $156,250 |
|
| Global Real Estate, Class NAV (Deutsche) | 20,084 | 156,250 |
|
| Natural Resources, Class NAV (Wellington) | 6,152 | 156,250 |
|
| Technical Opportunities, Class NAV (Wellington) (I) | 39,524 | 468,749 |
| | | |
| FIXED INCOME 61.81% | | |
| | | |
| John Hancock Funds II (G) | | |
|
| Currency Strategies, Class NAV (First Quadrant) (I) | 80,791 | 781,249 |
|
| Global High Yield, Class NAV (Stone Harbor) | 29,621 | 312,499 |
|
| Multi-Sector Bond, Class NAV (Stone Harbor) | 29,933 | 312,499 |
|
| Real Return Bond, Class NAV (PIMCO) | 25,263 | 312,499 |
|
| Strategic Income Opportunities, Class NAV | | |
| (John Hancock1) (A) | 28,383 | 312,500 |
| |
| Unaffiliated Investment Companies 4.66% | | $153,058 |
|
| (Cost $127,135) | | |
| | | |
| EQUITY 4.66% | | |
| | | |
| PowerShares DB Commodity Index Tracking Fund (I) | 5,150 | 153,058 |
|
| Total Investments (Cost $2,940,818)† 94.99% | | $3,121,803 |
|
| |
| Other assets and liabilities, net 5.01% | | 164,668 |
|
| |
| Total net assets 100.00% | | $3,286,471 |
|
| | |
| See notes to financial statements | Semiannual report | Alternative Asset Allocation Fund | 11 |
Notes to Schedule of Investments
Percentages are based upon net assets.
(A) The subadviser is an affiliate of the adviser.
(G) The underlying fund’s subadviser is shown parenthetically.
(I) Non-income producing
1 Manulife Asset Management (US) LLC and Manulife Asset Management (North America) Limited are doing business as John Hancock Asset Management.
† At 2-28-11, the aggregate cost of investment securities for federal income tax purposes was $2,957,718. Net unrealized appreciation aggregated $164,085, of which $181,674 related to appreciated investment securities and $17,589 related to depreciated investment securities.
| | |
| 12 | Alternative Asset Allocation Fund | Semiannual report | See notes to financial statements |
F I N A N C I A L S T A T E M E N T S
Financial statements
Statement of assets and liabilities 2-28-11 (unaudited)
This Statement of Assets and Liabilities is the Fund’s balance sheet. It shows the value of what the Fund owns, is due and owes. You’ll also find the net asset value and the maximum offering price per share.
| |
| Assets | |
|
| Investments, at value (Cost $127,135) | $153,058 |
| Investments in affiliated funds, at value (Cost $2,813,683) (Note 9) | 2,968,745 |
| | |
| Total investments, at value (Cost $2,940,818) | 3,121,803 |
| Cash | 35,453 |
| Receivable for fund shares sold | 231,130 |
| Dividends receivable | 3,075 |
| Receivable due from adviser | 902 |
| Other receivables and prepaid expenses | 148 |
| | |
| Total assets | 3,392,511 |
| |
| Liabilities | |
|
| Payable for investments purchased | 71,365 |
| Payable to affiliates | |
| Accounting and legal services fees | 48 |
| Transfer agent fees | 600 |
| Trustees’ fees | 10 |
| Other liabilities and accrued expenses | 34,017 |
| |
| Total liabilities | 106,040 |
| |
| Net assets | |
|
| Capital paid-in | $2,789,401 |
| Undistributed net investment income | 4,047 |
| Accumulated net realized gain on investments | 312,038 |
| Net unrealized appreciation on investments | 180,985 |
| | |
| Net assets | $3,286,471 |
| |
| Net asset value per share | |
|
| Based on net asset values and shares outstanding — the Fund has an | |
| unlimited number of shares authorized with no par value | |
| Class A ($2,884,830 ÷ 195,945 shares) | $14.72 |
| Class I ($401,641 ÷ 27,264 shares) | $14.73 |
| |
| Maximum offering price per share | |
|
| Class A (net asset value per share ÷ 95%)1 | $15.49 |
1 On single retail sales of less than $50,000. On sales of $50,000 or more and on group sales the offering price is reduced.
| | |
| See notes to financial statements | Semiannual report | Alternative Asset Allocation Fund | 13 |
F I N A N C I A L S T A T E M E N T S
Statement of operations For the six-month period ended 2-28-11
(unaudited)
This Statement of Operations summarizes the Fund’s investment income earned and expenses incurred in operating the Fund. It also shows net gains (losses) for the period stated.
| |
| Investment income | |
|
| Income distributions received from affiliated underlying funds | $22,590 |
| |
| Expenses | |
|
| Investment management fees (Note 4) | 1,590 |
| Distribution and service fees (Note 4) | 2,455 |
| Accounting and legal services fees (Note 4) | 124 |
| Transfer agent fees (Note 4) | 1,490 |
| Trustees’ fees (Note 4) | 6 |
| State registration fees (Note 4) | 226 |
| Printing and postage (Note 4) | 182 |
| Professional fees | 23,173 |
| Custodian fees | 5,970 |
| Registration and filing fees | 2,318 |
| Other | 599 |
| | |
| Total expenses before reductions and amounts recaptured | 38,133 |
| Less expense reductions and amounts recaptured (Note 4) | (32,192) |
| | |
| Net expenses | 5,941 |
| | |
| Net investment income | 16,649 |
| |
| Realized and unrealized gain (loss) | |
|
| Net realized gain on | |
| Investments in unaffiliated issuers | 10,581 |
| Investments in affiliated issuers | 315,068 |
| Capital gain distributions received from underlying funds | 14,562 |
| | 340,211 |
| Change in net unrealized appreciation (depreciation) of | |
| Investments in unaffiliated issuers | 23,328 |
| Investments in affiliated issuers | (171,110) |
| | (147,782) |
| Net realized and unrealized gain | 192,429 |
|
| Increase in net assets from operations | $209,078 |
| | |
| 14 | Alternative Asset Allocation Fund | Semiannual report | See notes to financial statements |
F I N A N C I A L S T A T E M E N T S
Statements of changes in net assets
These Statements of Changes in Net Assets show how the value of the Fund’s net assets has changed during the last two periods. The difference reflects earnings less expenses, any investment gains and losses, distributions, if any, paid to shareholders and the net of Fund share transactions.
| | |
| | Six months | |
| | ended | Year |
| | 2-28-11 | ended |
| | (unaudited) | 8-31-10 |
| Increase (decrease) in net assets | | |
|
| From operations | | |
| Net investment income | $16,649 | $45,455 |
| Net realized gain | 340,211 | 48,894 |
| Change in net unrealized appreciation (depreciation) | (147,782) | 61,092 |
| | | |
| Increase in net assets resulting from operations | 209,078 | 155,441 |
| | | |
| Distributions to shareholders | | |
| From net investment income | | |
| Class A | (20,910) | (47,301) |
| From net realized gain | | |
| Class A | (65,750) | (16,354) |
| | | |
| Total distributions | (86,660) | (63,655) |
| | | |
| From Fund share transactions (Note 5) | 1,727,064 | 63,655 |
| | | |
| Total increase | 1,849,482 | 155,441 |
| |
| Net assets | | |
|
| Beginning of period | 1,436,989 | 1,281,548 |
| | | |
| End of period | $3,286,471 | $1,436,989 |
| | | |
| Undistributed net investment income | $4,047 | $8,308 |
| | |
| See notes to financial statements | Semiannual report | Alternative Asset Allocation Fund | 15 |
Financial highlights
The Financial Highlights show how the Fund’s net asset value for a share has changed since the beginning of the period.
| | | |
| CLASS A SHARES Period ended | 2-28-111 | 8-31-10 | 8-31-092 |
| |
| Per share operating performance | | | |
|
| Net asset value, beginning of period | $13.72 | $12.82 | $10.00 |
| Net investment income3,4 | 0.14 | 0.445 | 0.10 |
| Net realized and unrealized gain on investments | 1.69 | 1.10 | 2.72 |
| Total from investment operations | 1.83 | 1.54 | 2.82 |
| Less distributions | | | |
| From net investment income | (0.20) | (0.47) | — |
| From net realized gain | (0.63) | (0.17) | — |
| Total distributions | (0.83) | (0.64) | — |
| Net asset value, end of period | $14.72 | $13.72 | $12.82 |
| Total return (%)6,7 | 13.568 | 12.12 | 28.208 |
| |
| Ratios and supplemental data | | | |
|
| Net assets, end of period (in millions) | $3 | $1 | $1 |
| Ratios (as a percentage of average net assets): | | | |
| Expenses before reductions and amounts recaptured | 4.429 | 5.03 | 6.789 |
| Expenses including reductions and amounts recaptured10 | 0.729 | 0.71 | 0.559 |
| Net investment income4 | 1.969 | 3.255 | 1.339 |
| Portfolio turnover (%) | 59 | 9 | 1 |
| |
1 Semiannual period from 9-1-10 to 2-28-11. Unaudited.2 The inception date for Class A shares is 1-2-09.3 Based on the average daily shares outstanding.4 Recognition of net investment income by the Fund is affected by the timing of the declaration of dividends by the underlying funds in which the Fund invests.5 All expenses have been annualized except Tax expense, which was 0.01% of average net assets. This expense decreased the net investment income (loss) by $0.01 and the net investment income (loss) ratio by 0.05%.6 Total returns would have been lower had certain expenses not been reduced during the periods shown.7 Does not reflect the effect of sales charges, if any.8 Not annualized.9 Annualized.10 Ratios do not include expense indirectly incurred from underlying funds whose expense ratios can vary based on the mix of underlying funds held by the Fund. The range of expense ratios of the underlying funds held by the Fund was as follows: 0.74% to 1.38% for 2-28-11, 0.70% to 1.17% for 8-31-10 and 0.71% to 1.18% for 8-31-09.
| | |
| 16 | Alternative Asset Allocation Fund | Semiannual report | See notes to financial statements |
| |
| CLASS I SHARES Period ended | 2-28-111,2 |
| |
| Per share operating performance | |
|
| Net asset value, beginning of period | $14.21 |
| Net investment income | 0.033,4 |
| Net realized and unrealized gain on investments | 0.49 |
| Total from investment operations | 0.52 |
| Net asset value, end of period | $14.73 |
| Total return (%) | 3.665,6 |
| |
| Ratios and supplemental data | |
|
| Net assets, end of period (in thousands) | 402 |
| Ratios (as a percentage of average net assets): | |
| Expenses before reductions and amounts recaptured | 4.357 |
| Expenses including reductions and amounts recaptured8 | 0.197 |
| Net investment income | 1.394,7 |
| Portfolio turnover (%) | 59 |
| |
1 Period from 12-31-10 to 2-28-11. Unaudited.
2 The inception date for Class I shares is 12-31-10.
3 Based on the average daily shares outstanding.
4 Recognition of net investment income by the Fund is affected by the timing of the declaration of dividends by the underlying funds in which the Fund invests.
5 Not annualized.
6 Total returns would have been lower had certain expenses not been reduced during the periods shown.
7 Annualized.
8 Ratios do not include expense indirectly incurred from underlying funds whose expense ratios can vary based on the mix of underlying funds held by the Fund. The range of expense ratios of the underlying funds held by the Fund was as follows: 0.74% to 1.38% for 2-28-11.
| | |
| See notes to financial statements | Semiannual report | Alternative Asset Allocation Fund | 17 |
Notes to financial statements
(unaudited)
Note 1 — Organization
John Hancock Alternative Asset Allocation Fund (the Fund) is a diversified series of John Hancock Funds II (the Trust), an open-end management investment company organized as a Massachusetts business trust and registered under the Investment Company Act of 1940, as amended (the 1940 Act). The investment objective of the Fund is to seek long term growth of capital.
The Fund operates as a “fund of funds”, investing in Class NAV shares of affiliated underlying funds of the Trust, the John Hancock Funds complex and other permitted investments.
The Funds may offer multiple classes of shares. The shares currently offered are detailed in the Statements of Assets and Liabilities. Class A shares are open to all investors. Class I shares are offered to institutions and certain investors. Shareholders of each class have exclusive voting rights to matters that affect that class. The distribution and service fees, transfer agent fees, state registration fees and printing and postage for each class may differ.
The accounting policies of the underlying funds of the Fund are outlined in the underlying funds’ shareholder reports, available without charge by calling 1-800-344-1029 and jhfunds.com, on the Securities and Exchange Commission (SEC) Web site at www.sec.gov or at the SEC’s public reference room in Washington, D.C. The underlying funds are not covered by this report.
Note 2 — Significant accounting policies
The financial statements have been prepared in conformity with accounting principles generally accepted in the United States of America, which require management to make certain estimates and assumptions at the date of the financial statements. Actual results could differ from those estimates. Events or transactions occurring after the end of the fiscal period through the date that the financial statements were issued have been evaluated in the preparation of the financial statements. The following summarizes the significant accounting policies of the Fund:
Security valuation. Investments are stated at value as of the close of regular trading on the New York Stock Exchange (NYSE), normally at 4:00 P.M., Eastern Time. The Fund uses a three-tier hierarchy to prioritize the pricing assumptions, referred to as inputs, used in valuation techniques to measure fair value. Level 1 includes securities valued using quoted prices in active markets for identical securities. Level 2 includes securities valued using significant observable inputs. Observable inputs may include quoted prices for similar securities, interest rates, prepayment speeds and credit risk. Prices for securities valued using these inputs are received from independent pricing vendors and brokers and are based on an evaluation of the inputs described. Level 3 includes securities valued using significant unobservable inputs when market prices are not readily available or reliable, including the Fund’s own assumptions in determining the fair value of investments. Factors used in determining value may include market or issuer specific events, changes in interest rates and credit quality. The inputs or methodology used for valuing securities are not necessarily an indication of the risk associated with investing in those securities.
As of February 28, 2011, all investments are categorized as Level 1 under the hierarchy described above. Changes in valuation techniques may result in transfers in or out of an assigned level within the disclosure hierarchy. During the six months ended February 28, 2011, there were no significant transfers in or out of Level 1 and Level 2 assets.
In order to value the securities, the Fund uses the following valuation techniques. Equity securities, including exchange-traded funds, held by the Fund are valued at the last sale price or official closing
| |
| 18 | Alternative Asset Allocation Fund | Semiannual report |
price on the principal securities exchange on which they trade. In the event there were no sales during the day or closing prices are not available, then securities are valued using the last quoted bid or evaluated price. Investments by the fund in underlying affiliated funds and/or other investment companies are valued at their respective net asset values each business day. Certain securities traded only in the over-the-counter market are valued at the last bid price quoted by brokers making markets in the securities at the close of trading. Other portfolio securities and assets, where market quotations are not readily available, are valued at fair value, as determined in good faith by the Fund’s Pricing Committee, following procedures established by the Board of Trustees.
Security transactions and related investment income. Investment security transactions are accounted for on a trade date plus one basis for daily net asset value calculations. However, for financial reporting purposes, investment transactions are reported on trade date. Gains and losses on securities sold are determined on the basis of identified cost and may include proceeds from litigation. Dividend income is recorded on the ex-date.
Line of credit. The Fund may borrow from banks for temporary or emergency purposes, including meeting redemption requests that otherwise might require the untimely sale of securities. Pursuant to the custodian agreement, the custodian may loan money to a Fund to make properly authorized payments. The Fund is obligated to repay the custodian for any overdraft, including any related costs or expenses. The custodian has a lien, security interest or security entitlement in any Fund property that is not segregated, to the maximum extent permitted by law for any overdraft.
In addition, the Fund and other affiliated funds have entered into an agreement with State Street Bank and Trust Company (SSBT) which enables them to participate in a $200 million unsecured committed line of credit. A commitment fee, payable at the end of each calendar quarter, based on the average daily unused portion of the line of credit, is charged to each participating fund on a pro rata basis and is reflected in other expenses on the Statement of Operations. For the six months ended February 28, 2011, the Fund had no significant borrowings under the line of credit.
Effective March 30, 2011, the line of credit with SSBT expired and a similar arrangement was established with Citibank N.A.
Expenses. The majority of expenses are directly attributable to an individual fund. Expenses that are not readily attributable to a specific fund are allocated among all funds in an equitable manner, taking into consideration, among other things, the nature and type of expense and the fund’s relative assets. Expense estimates are accrued in the period to which they relate and adjustments are made when actual amounts are known.
Class allocations. Income, common expenses, and realized and unrealized gains (losses) are determined at the fund level and allocated daily to each class of shares based on the net asset value of the class. Class-specific expenses, such as distribution and service fees, if any, transfer agent fees, state registration fees and printing and postage, for all classes, are calculated daily at the class level based on the appropriate net asset value of each class and the specific expense rates applicable to each class.
Federal income taxes. The Fund intends to continue to qualify as a regulated investment company by complying with the applicable provisions of the Internal Revenue Code and will not be subject to federal income tax on taxable income that is distributed to shareholders. Therefore, no federal income tax provision is required.
As of August 31, 2010, the Fund had no uncertain tax positions that would require financial statement recognition, de-recognition or disclosure. The Fund’s federal tax return is subject to examination by the Internal Revenue Service for a period of three years.
| |
| Semiannual report | Alternative Asset Allocation Fund | 19 |
Distribution of income and gains. Distributions to shareholders from net investment income and net realized gains, if any, are recorded on the ex-date. The Fund generally declares and pays dividends and capital gain distributions, if any, at least annually.
Distributions paid by the Fund with respect to each class of shares are calculated in the same manner, at the same time and are in the same amount, except for the effect of expenses that may be applied differently to each class.
Such distributions, on a tax basis, are determined in conformity with income tax regulations, which may differ from accounting principles generally accepted in the United States of America.
Capital accounts within financial statements are adjusted for permanent book-tax differences. These adjustments have no impact on net assets or the results of operations. Temporary book-tax differences, if any, will reverse in a subsequent period. Permanent book-tax differences are primarily attributable to partnerships and excise taxes paid.
Note 3 — Guarantees and indemnifications
Under the Fund’s organizational documents, its Officers and Trustees are indemnified against certain liabilities arising out of the performance of their duties to the Fund. Additionally, in the normal course of business, the Fund enters into contracts with service providers that contain general indemnification clauses. The Fund’s maximum exposure under these arrangements is unknown, as this would involve future claims that may be made against the Fund that have not yet occurred. The risk of material loss from such claims is considered remote.
Note 4 — Fees and transactions with affiliates
John Hancock Investment Management Services, LLC (the Adviser), serves as investment adviser for the Fund. John Hancock Funds, LLC (the Distributor), an affiliate of the Adviser, serves as principal underwriter of the Fund. The Adviser and the Distributor are indirect wholly owned subsidiaries of Manulife Financial Corporation (MFC).
Management fee. The Fund has an investment management contract with the Adviser under which the Fund pays a monthly management fee to the Adviser. The management fee has two components: (a) a fee on assets invested in a fund of the Trust, John Hancock Trust (JHT) or John Hancock Funds III (JHF III) excluding John Hancock Money Market Trust B, John Hancock 500 Index Trust B, John Hancock International Equity Index Trust B and John Hancock Total Bond Market Trust B (affiliated assets); and (b) a fee on assets invested in investments other than a fund of the Trust or JHF III (other assets). The fee on affiliated assets is 0.150% on an annual basis of the current value of the net assets of the fund (together with the assets of any other applicable fund identified in the advisory agreement) (aggregate net assets). The fee on other assets is 0.600% on an annual basis of aggregate net assets. The Adviser has a subadvisory agreement with John Hancock Asset Management a division of Manulife Asset Management (US) LLC (formerly, MFC Global Investment Management (U.S.), LLC) and John Hancock Asset Management a division of Manulife Asset Management (North America) Limited (formerly, MFC Global Investment Management (U.S.A.) Limited), an indirectly owned subsidiaries of MFC and affiliates of the Adviser. Manulife Asset Management (US), LLC and Manulife Asset Management (North America) Limited are doing business as John Hancock Asset Management. The Fund is not responsible for payment of the subadvisory fees.
The investment management fees incurred for the six months ended February 28, 2011 were equivalent to an annual effective rate of 0.18% of the Fund’s average daily net assets.
Expense reimbursements. The Adviser has contractually agreed to reimburse the Fund for certain Fund expenses that exceed 0.04% of the Fund’s average net assets. Expenses excluded from this
| |
| 20 | Alternative Asset Allocation Fund | Semiannual report |
waiver are advisory, transfer agent fee, Rule 12b-1 fees, portfolio brokerage commissions, interest, blue sky, printing and postage, service fees, acquired fees and other extraordinary expenses not incurred in the ordinary course of the Fund’s business. The Adviser has contractually agreed to waive 0.10% of the Fund’s average net assets. The current expense limitation agreements expire on December 31, 2011 unless renewed by mutual agreement of the Fund and the Adviser based upon a determination that this is appropriate under the circumstances at that time.
Effective January 1, 2011, the Adviser has contractually agreed to waive fees and/or reimburse certain class specific expenses, including 12b-1 fees, transfer agent fees, service fees, state registration fees and printing and postage for Class A and Class I shares, to the extent that the above expenses for each class exceed 0.66% and 0.20%, of the average daily net assets attributable to the classes. This expense fee waiver and/or reimbursement will continue in effect until December 31, 2011.
Accordingly, the expense reduction related to the agreement above amounted to $30,301 and $1,891 for Class A and Class I shares, respectively, for the six months ended February 28, 2011.
Expense recapture. The Adviser may recapture operating expenses reimbursed or fees waived under previous expense limitation or waiver arrangements for a period of three years following the beginning of the month in which such reimbursements or waivers originally occurred. The table below outlines the amounts of waived or reimbursed expenses subject to potential recovery and the respective expiration dates. Certain reimbursements or waivers are not subject to recapture.
| | | |
| AMOUNTS ELIGIBLE | AMOUNTS ELIGIBLE | AMOUNTS ELIGIBLE | AMOUNT RECOVERED |
| FOR RECOVERY THROUGH | FOR RECOVERY THROUGH | FOR RECOVERY THROUGH | DURING PERIOD ENDED |
| AUGUST 1, 2012 | AUGUST 1, 2013 | FEBRUARY 1, 2014 | FEBRUARY 28, 2011 |
|
| |
| $44,590 | $60,119 | $31,846 | — |
Accounting and legal services. Pursuant to a service agreement the Fund reimburses the Adviser for all expenses associated with providing the administrative, financial, legal, accounting and recordkeeping services of the Fund, including the preparation of all tax returns, periodic reports to shareholders and regulatory reports, among other services. These expenses are allocated to each share class based on its relative net assets at the time the expense was incurred. These accounting and legal services fees incurred for the six months ended February 28, 2011, amounted to an annual rate of 0.01% of the Fund’s average daily net assets.
Distribution plans. The Fund has a distribution agreement with the Distributor. The Fund has adopted distribution plans with respect to Class A shares pursuant to Rule 12b-1 under the 1940 Act, to pay the Distributor for services provided as the distributor of shares of the Fund. The Fund may pay up to the following contractual rates of distribution fees under these arrangements, expressed as an annual percentage of average daily net assets of 0.30% for Class A shares.
Sales charges. Class A shares are assessed up-front sales charges, which resulted in payments to the Distributor amounting to $28,660 for the six months ended February 28, 2011. Of this amount, $4,716 was retained and used for printing prospectuses, advertising, sales literature and other purposes and $23,944 was paid as sales commissions to broker-dealers.
Transfer agent fees. The Fund has a transfer agent agreement with John Hancock Signature Services, Inc. (Signature Services or Transfer Agent), an affiliate of the Adviser. The transfer agent fees paid to Signature Services are determined based on the cost to Signature Services (Signature Services Cost) of providing recordkeeping services. The Signature Services Cost includes a component of allocated John Hancock corporate overhead for providing transfer agent services to the Fund and to all other John Hancock affiliated funds. It also includes out-of-pocket expenses that are comprised of payments made to third-parties for recordkeeping services provided to their clients who invest in one or more John Hancock funds. In addition, Signature Services Cost may
| |
| Semiannual report | Alternative Asset Allocation Fund | 21 |
be reduced by certain revenues that Signature Services receive in connection with the service they provide to the funds. Signature Services Cost is calculated monthly and allocated, as applicable, to four categories of share classes: Institutional Share Classes, Retirement Share Classes, Municipal Bond Classes and all other Retail Share Classes. Within each of these categories, the applicable costs are allocated to the affected John Hancock affiliated funds and/or classes, based on the relative average daily net assets.
Class level expenses. Class level expenses for the six months ended February 28, 2011 were:
| | | | |
| | DISTRIBUTION | TRANSFER | STATE | PRINTING AND |
| CLASS | AND SERVICE FEES | AGENT FEES | REGISTRATION FEES | POSTAGE |
|
| Class A | $2,455 | $1,467 | $226 | $170 |
| Class I | — | 23 | — | 12 |
| Total | $2,455 | $1,490 | $226 | $182 |
Trustee expenses. The Trust compensates each Trustee who is not an employee of the Adviser or its affiliates. The costs of paying Trustee compensation and expenses are allocated to each Fund based on its average daily net assets.
Note 5 — Fund share transactions
Transactions in Fund shares for the six months ended February 28, 2011, and for the year ended August 31, 2010, were as follows:
| | | | |
| | Six months ended 2-28-11 | Year ended 8-31-10 |
| | Shares | Amount | Shares | Amount |
| Class A shares | | | | |
|
| Sold | 105,244 | $1,536,522 | — | — |
| Distributions reinvested | 6,124 | 86,659 | 4,761 | $63,655 |
| Repurchased | (20,184) | (287,717) | — | — |
| Net increase | 91,184 | $1,335,464 | 4,761 | $63,655 |
| |
| Class I shares1 | | | | |
|
| Sold | 27,264 | $391,600 | — | — |
| Net increase | 27,264 | $391,600 | — | — |
| |
| Net increase | 118,448 | $1,727,064 | — | — |
|
1 Period from 12-31-10 (inception date) to 2-28-11.
Note 6 — Purchase and sale of securities
Purchases and sales of securities, other than short-term securities, aggregated $2,609,791 and $1,054,967, respectively, for the six months ended February 28, 2011.
Note 7 – Investment in affiliated underlying funds
Alternative Asset Allocation Fund invests primarily in affiliated underlying funds that are managed by the Adviser and affiliates. The Fund does not invest in the affiliated underlying funds for the purpose of exercising management or control; however, the Fund’s investment may represent a significant portion of each underlying Fund’s net assets. For the six months ended February 28, 2011, the Fund does not hold 5% or more of an underlying Funds’ net assets.
| |
| 22 | Alternative Asset Allocation Fund | Semiannual report |
Evaluation of Subadvisory Agreement by the Board of Trustees
At its meeting on December 17, 2010, the Board of Trustees (the Board) of John Hancock Funds II (the Trust), including all of the Independent Trustees, approved the appointment of John Hancock Asset Management a division of Manulife Asset Management (US) LLC (John Hancock Asset Management or the Subadviser) as an additional subadviser to the Alternative Asset Allocation Fund (the Portfolio), a series of the Trust.
This section describes the evaluation by the Board of Trustees of the amendment to the subadvisory agreement between John Hancock Investment Management Services, LLC (the Adviser), the adviser to the Portfolio, and the Subadviser relating to the Portfolio (the Subadvisory Agreement Amendment).
Evaluation of Subadvisory Agreement by the Board of Trustees
The Board, including the Independent Trustees, is responsible for approving the Adviser’s selection of fund subadvisers and approving the funds’ subadvisory agreements, their periodic continuation and any amendments. Consistent with SEC rules, the Board regularly evaluates the Trust’s subadvisory arrangements, including consideration of the factors listed below. The Board may also consider other factors (including conditions and trends prevailing generally in the economy, the securities markets and the industry) and does not treat any single factor as determinative, and each Trustee may attribute different weights to different factors. The Board is furnished with an analysis of its fiduciary obligations in connection with its evaluation and, throughout the evaluation process, the Board is assisted by counsel for the Trust and the Independent Trustees are also separately assisted by independent legal counsel. The factors considered by the Board with respect to each fund are:
1. the nature, extent and quality of the services to be provided by the subadviser to the fund;
2. the investment performance of the fund and its subadviser;
3. the extent to which economies of scale would be realized as a fund grows and whether fee levels reflect these economies of scale for the benefit of fund shareholders;
4. the costs of the services to be provided and the profits to be realized by the subadviser and its affiliates (including the Adviser with respect to affiliated subadvisers) from the relationship with the Trust; and
5. comparative services rendered and comparative subadvisory fee rates.
In making its determination and with reference to the factors that it considers, the Board reviews:
1. information relating to the subadviser’s business, including current subadvisory services to the Trust (and other funds in the John Hancock family of funds);
2. the performance of the fund and the performance of other John Hancock funds managed by the subadviser; and
3. the subadvisory fee for the fund, including any breakpoints.
The Board approved the Subadvisory Agreement Amendment with the Subadviser for the Portfolio at its meeting on December 17, 2010. Particular considerations of the Board in approving the Subadvisory Agreement Amendment included the following:
1. The subadvisory fees for the Portfolio are paid by the Adviser, not the Portfolio, and are reasonable, and approval of the Subadvisory Agreement Amendment will not result in any change in the advisory fees for the Portfolio.
| |
| Semiannual report | Alternative Asset Allocation Fund | 23 |
2. Approval of the Subadvisory Agreement Amendment reflects the re-allocation of subadvisory services between the Subadviser and John Hancock Asset Management a division of Manulife Asset Management (North America) Limited (John Hancock Asset Management (North America)), the current subadviser to the Portfolio, each of which is affiliated with the Adviser.
3. The personnel of John Hancock Asset Management (North America) and the Adviser who have currently and previously managed the assets of the Portfolio, with John Hancock Asset Management (North America) and the Subadviser, are expected to continue to manage the Portfolios and the Board is generally satisfied with their skill and experience and with the performance of the Portfolio.
4. The performance of the Portfolio as noted below and management’s discussion of the same:
a. The Alternative Asset Allocation Fund has outperformed its peer group and benchmark index for the one year and since inception periods ended September 30, 2010.
5. John Hancock Asset Management has demonstrated skill as a manager, is currently the subadviser to multiple funds of the Trust and John Hancock Trust and may be expected to provide a high quality of investment management services and personnel to the Portfolio.
In addition, the Board reviewed the subadvisory fees to be paid to the Subadviser with respect to the Portfolio, which operates as a fund of funds and invests in underlying funds. The Board concluded, with respect to the Portfolio, that the subadvisory fee is based on services provided that are in addition to, rather than duplicative of, the services provided pursuant to the advisory agreements for the underlying funds. The Board also concluded that the additional services are necessary because of the differences between the investment policies, strategies and techniques of the Portfolio and those of its underlying funds.
| |
| 24 | Alternative Asset Allocation Fund | Semiannual report |
More information
| | |
| Trustees | Investment adviser |
| James M. Oates, Chairman | John Hancock Investment Management |
| James R. Boyle† | Services, LLC |
| Charles L. Bardelis* | |
| Peter S. Burgess* | Subadviser |
| Grace K. Fey | John Hancock Asset Management |
| Theron S. Hoffman | |
| Hassell H. McClellan | Principal distributor |
| Steven M. Roberts* | John Hancock Funds, LLC |
| | |
| Officers | Custodian |
| Hugh McHaffie | State Street Bank and Trust Company |
| President | |
| | Transfer agent |
| Thomas M. Kinzler | John Hancock Signature Services, Inc. |
| Secretary and Chief Legal Officer | |
| | Legal counsel |
| Francis V. Knox, Jr. | K&L Gates LLP |
| Chief Compliance Officer | |
|
| |
| Michael J. Leary | The report is certified under the Sarbanes-Oxley |
| Treasurer | companies to affirm that, to the best of their |
| | knowledge, the information in their financial reports |
| Charles A. Rizzo | is fairly and accurately stated in all material respects. |
| Chief Financial Officer |
| |
| | |
| John G. Vrysen | |
| Chief Operating Officer | |
| |
| *Member of the Audit Committee | |
| †Non-Independent Trustee | |
The Fund’s proxy voting policies and procedures, as well as the Fund’s proxy voting record for the most recent twelve-month period ended June 30, are available free of charge on the Securities and Exchange Commission (SEC) Web site at www.sec.gov or on our Web site.
The Fund’s complete list of portfolio holdings, for the first and third fiscal quarters, is filed with the SEC on Form N-Q. The Fund’s Form N-Q is available on our Web site and the SEC’s Web site, www.sec.gov, and can be reviewed and copied (for a fee) at the SEC’s Public Reference Room in Washington, DC. Call 1-800-SEC-0330 to receive information on the operation of the SEC’s Public Reference Room.
We make this information on your fund, as well as monthly portfolio holdings, and other fund details available on our Web site www.jhfunds.com or by calling 1-800-225-5291.
| | |
| You can also contact us: | | |
| 1-800-225-5291 | Regular mail: | Express mail: |
| jhfunds.com | John Hancock Signature Services, Inc. | John Hancock Signature Services, Inc. |
| | P.O. Box 55913 | Mutual Fund Image Operations |
| | Boston, MA 02205-5913 | 30 Dan Road |
| | | Canton, MA 02021 |
| |
| Semiannual report | Alternative Asset Allocation Fund | 25 |

1-800-225-5291
1-800-554-6713 TDD
1-800-338-8080 EASI-Line
www.jhfunds.com
Now available: electronic delivery
www.jhfunds.com/edelivery
| |
| This report is for the information of the shareholders of John Hancock Alternative Asset Allocation. | 345SA 2/11 |
| It is not authorized for distribution to prospective investors unless preceded or accompanied by a prospectus. | 4/11 |

John Hancock
Lifecycle 2045 Portfolio
Goal and strategy
To seek high total return until the Portfolio’s target retirement date. Under normal market conditions, the Portfolio invests substantially all of its assets in underlying funds using an asset allocation strategy designed for investors expected to retire around the year 2045.
| |
| Asset Allocation | |
| | |
| Equity | 93% of Total |
|
| U.S. Large Cap | 46% |
|
| International Large Cap | 11% |
|
| Emerging Markets | 9% |
|
| U.S. Mid Cap | 9% |
|
| U.S. Small Cap | 5% |
|
| International Small Cap | 4% |
|
| Large Blend | 3% |
|
| Natural Resources | 3% |
|
| Real Estate | 1% |
|
| Small Growth | 1% |
|
| Small Value | 1% |
|
| Fixed Income | 7% of Total |
|
| Currency | 2% |
|
| Bank Loan | 1% |
|
| Global Bond | 1% |
|
| High-Yield Bond | 1% |
|
| Intermediate Bond | 1% |
|
| Multi-Sector Bond | 1% |
|
As a percentage of net assets on 2-28-11.
Portfolio results
For the six months ended February 28, 2011, John Hancock Lifecycle 2045 Portfolio’s Class A, Class R1, Class R3, Class R4, Class R5 and Class 1 shares returned 25.63%, 25.49%, 25.73%, 25.79%, 25.91%, and 26.01%, respectively, at net asset value. In comparison, the S&P 500 Index returned 27.73% over the same period and the Barclays Capital U.S. Aggregate Bond Index returned –0.83%. A blended index, which rolls down in its equities weighting to match the Portfolio’s glidepath, returned 26.17%.1 The Morningstar, Inc. Target-Date 2041–2045 category average returned 24.62%.2
Performance review
The Portfolio outperformed the Morningstar average (based on Class A shares), but modestly underperformed the blended benchmark. Asset allocation detracted slightly from relative performance, with positive results from allocations in sectors such as small- and mid-cap equities, global natural resources, bank loans, multi-sector and high-yield bonds outweighed by underperformance principally in emerging and international developed equities and currency.
Manager selection also hurt performance slightly relative to the blended benchmark. Fundamental Value Fund (Davis), for example, was hindered by weak stock selection in the energy and industrials sectors. Mutual Shares Fund (Franklin) was hurt by an underweight position in energy and poor stock selection in the tech sector. International Small Cap Fund (Franklin) detracted from performance, hurt by its positions in cash, selection in sectors such as consumer discretionary, and its overweight position to Hong Kong. We remain fully confident in these fine managers, who we believe have enjoyed long-term success with excellent risk-adjusted performance.
Conversely, there were a number of bright spots among manager performance. Value & Restructuring Fund (Columbia) had success with overweight positions and strong stock selection in industrials and materials. Blue Chip Growth Fund (T. Rowe Price) contributed positively, buoyed by overweight positions and good stock selection in technology, while underweighting the consumer staples sector. Alpha Opportunities Fund (Wellington) had strong stock selection in the technology and financials sectors.
The Portfolio had a number of important additions during the period. We continued to increase our allocation to Currency Strategies Fund (First Quadrant), which now stands at 2.0% of the Portfolio’s assets, up from less than 0.5% six months ago. The Currency Strategies Fund seeks consistent returns in all market environments, through long/short positions in the currency markets. With the addition of Mutual Shares Fund, the Portfolio gains one of the most well-respected large-cap value managers in the industry. We also established a new position in Capital Appreciation Value Fund (T. Rowe Price), which has a more conservative and flexible mandate that seeks to outperform the broad equity market with less risk over a full market cycle.
1The blended index is comprised of the S&P 500 Index (S&P) and the Barclays Capital U.S. Aggregate Bond Index (BarCap) and it adjusts over time: from inception to 11-30-07 blend was 100% S&P/0% BarCap and from 12-1-07 to 2-28-11, blend is 95% S&P/5% BarCap.
2Figures from Morningstar, Inc. include reinvested dividends and do not take into account sales charges. Actual load-adjusted performance is lower.
Past performance is no guarantee of future results.
This commentary reflects the views of the portfolio management team through the end of the Portfolio’s period discussed in this report. The team’s statements reflect their own opinions. As such, they are in no way guarantees of future events and are not intended to be used as investment advice or a recommendation regarding any specific security. They are also subject to change at any time as market and other conditions warrant.
| |
4 | Lifecycle 2045 Portfolio | Semiannual report |

| | | | | |
| | Class R12 | Class R32 | Class R42 | Class R52 | Class 12 |
|
| Period beginning | 10-30-06 | 10-30-06 | 10-30-06 | 10-30-06 | 10-30-06 |
|
| Ending balance | $10,991 | $11,039 | $11,172 | $11,315 | $11,315 |
|
| Index 1 | 10,586 | 10,586 | 10,586 | 10,586 | 10,586 |
|
| Index 2 | 12,872 | 12,872 | 12,872 | 12,872 | 12,872 |
|
| Index 3 | 10,738 | 10,738 | 10,738 | 10,738 | 10,738 |
|
Assuming all distributions were reinvested for the period indicated, the table above shows the value of a $10,000 investment in the Portfolio’s Class R1, Class R3, Class R4, Class R5 and Class 1 shares, respectively, as of 2-28-11. Performance of the classes will vary based on the difference in sales charges paid by shareholders investing in the different classes and the fee structure of those classes.
Index 1 — S&P 500 Index is an unmanaged index that includes 500 widely traded common stocks.
Index 2 — Barclays Capital U.S. Aggregate Bond Index is an unmanaged index of dollar-denominated and non-convertible investment grade debt issues.
Index 3 — Blend of Index 1 & 2 that adjusts over time: from inception to 11-30-07 blend is 100% Index 1 / 0% Index 2, and from 12-1-07 to 2-28-11 blend is 95% Index 1 / 5% Index 2.
Performance chart
Total returns with maximum sales charge for the period ended February 28, 2011.
| | | | | | |
| | Class A | Class R12 | Class R32 | Class R42 | Class R52 | Class 12 |
|
| Inception | 10-30-06 | 10-30-06 | 10-30-06 | 10-30-06 | 10-30-06 | 10-30-06 |
|
| Average annual total returns — 1 year | 16.04% | 21.88% | 22.11% | 22.33% | 22.75% | 22.70% |
|
| Average annual total returns — Since inception3 | 1.20% | 2.20% | 2.30% | 2.59% | 2.89% | 2.89% |
|
| Cumulative returns — 6 months | 19.30% | 25.49% | 25.73% | 25.79% | 25.91% | 26.01% |
|
| Cumulative returns — 1 year | 16.04% | 21.88% | 22.11% | 22.33% | 22.75% | 22.70% |
|
| Cumulative returns — Since inception3 | 5.31% | 9.91% | 10.39% | 11.72% | 13.15% | 13.15% |
|
Performance figures assume all distributions are reinvested. Returns at public offering price (POP) reflect a sales charge on Class A shares of 5%. Sales charges are not applicable for Class R1, Class R3, Class R4, Class R5 and Class 1 shares.
The expense ratios of the Portfolio, both net (including any fee waivers or expense limitations) and gross (excluding any fee waivers or expense limitations), are set forth according to the most recent publicly available prospectuses for the Portfolio and may differ from the expense ratios disclosed in the Financial Highlights tables in this report. The waivers and expense limitations are contractual at least until 12-31-11. The following expense ratios include expenses of the underlying affiliated funds in which the Portfolio invests. The net expenses are as follows: Class A —1.35%, Class R1 — 1.50%, Class R3 — 1.40%, Class R4 — 1.15% and Class R5 — 0.85%. Had the fee waivers and expense limitations not been in place, the gross expenses would be as follows: Class A — 1.46%, Class R1 — 2.22%, Class R3 — 3.07%, Class R4 — 4.38% and Class R5 —4.06%. For Class 1, the net expenses equal the gross expenses and are as follows: Class 1 — 0.90%.
The returns reflect past results and should not be considered indicative of future performance. The return and principal value of an investment will fluctuate so that shares, when redeemed, may be worth more or less than their original cost. Due to market volatility, the Portfolio’s current performance may be higher or lower than the performance shown. For performance data current to the most recent month end, please call 1-800-225-5291 or visit the Portfolio’s Web site at www.jhfunds.com.
The performance table and chart do not reflect the deduction of taxes that a shareholder may pay on Portfolio distributions or the redemption of Portfolio shares.
The Portfolio’s performance results reflect any applicable expense reductions, without which the expenses would increase and results would have been less favorable.
It is not possible to invest directly in an index. Index figures do not reflect sales charges and would be lower if they did.
1 NAV represents net asset value and POP represents public offering price.
2 For certain types of investors as described in the Portfolio’s Class R1, Class R3, Class R4, Class R5 and Class 1 share prospectuses.
3 From 10-30-06.
| | |
| | Semiannual report | Lifecycle 2045 Portfolio | 5 |
John Hancock
Lifecycle 2040 Portfolio
Goal and strategy
To seek high total return until the Portfolio’s target retirement date. Under normal market conditions, the Portfolio invests substantially all of its assets in underlying funds using an asset allocation strategy designed for investors expected to retire around the year 2040.
| |
| Asset Allocation | |
| | |
| Equity | 93% of Total |
|
| U.S. Large Cap | 46% |
|
| International Large Cap | 11% |
|
| Emerging Markets | 9% |
|
| U.S. Mid Cap | 9% |
|
| U.S. Small Cap | 5% |
|
| International Small Cap | 4% |
|
| Large Blend | 3% |
|
| Natural Resources | 3% |
|
| Real Estate | 1% |
|
| Small Growth | 1% |
|
| Small Value | 1% |
|
| Fixed Income | 7% of Total |
|
| Currency | 2% |
|
| Bank Loan | 1% |
|
| Global Bond | 1% |
|
| High-Yield Bond | 1% |
|
| Intermediate Bond | 1% |
|
| Multi-Sector Bond | 1% |
|
As a percentage of net assets on 2-28-11.
Portfolio results
For the six months ended February 28, 2011, John Hancock Lifecycle 2040 Portfolio’s Class A, Class R1, Class R3, Class R4, Class R5 and Class 1 shares returned 25.60%, 25.61%, 25.60%, 25.67%, 25.91%, and 25.89%, respectively, at net asset value. In comparison, the S&P 500 Index returned 27.73% over the same period and the Barclays Capital U.S. Aggregate Bond Index returned –0.83%. A blended index, which rolls down in its equities weighting to match the Portfolio’s glidepath, returned 26.17%.1 The Morningstar, Inc. Target-Date 2036–2040 category average returned 22.50%.2
Performance review
The Portfolio handily outperformed the Morningstar average (based on Class A shares), but modestly underperformed the blended benchmark. Asset allocation detracted slightly from relative performance, with positive results from allocations in sectors such as small- and mid-cap equities, global natural resources, banks loans and multi-sector and high-yield bonds outweighed by underperformance principally in emerging and international developed equities, and currency.
Manager selection also hurt performance slightly relative to the blended benchmark. Fundamental Value Fund (Davis), for example, was hindered by weak stock selection in the energy and industrials sectors. Mutual Shares Fund (Franklin) was hurt by an underweight position in energy and poor stock selection in the tech sector. International Small Cap Fund (Franklin) detracted from performance, hurt by its positions in cash, and stock selection in sectors such as consumer discretionary. We remain fully confident in these fine managers, who we believe have enjoyed long-term success with excellent risk-adjusted performance.
Conversely, there were a number of bright spots among manager performance. Value & Restructuring Fund (Columbia) had success with overweight positions and strong stock selection in industrials and materials. Blue Chip Growth Fund (T. Rowe Price) contributed positively, buoyed by overweight positions and good stock selection in technology, while underweighting the consumer staples sector. Alpha Opportunities Fund (Wellington) had strong stock selection in the technology and financials sectors. All Cap Value Fund (Lord Abbett) was boosted by selections in consumer staples, industrials and consumer discretionary.
The Portfolio had a number of important additions during the period. We continued to increase our allocation to Currency Strategies Fund (First Quadrant), which now stands at 2.0% of the Portfolio’s assets, up from less than 0.5% six months ago. Currency Strategies Fund seeks consistent returns in all market environments, through long/short positions in the currency markets. With the addition of Mutual Shares Fund, the Portfolio gains one of the most well-respected large-cap managers in the industry. We also established a new position in Capital Appreciation Value Fund (T. Rowe Price,) which has a more conservative and flexible mandate that seeks to outperform the broad equity market with less risk over a full market cycle.
1The blended index is comprised of the S&P 500 Index (S&P) and the Barclays Capital U.S. Aggregate Bond Index (BarCap) and it adjusts over time: from inception to 11-30-07 blend was 100% S&P/0% BarCap and from 12-1-07 to 2-28-11, blend is 95% S&P/5% BarCap.
2Figures from Morningstar, Inc. include reinvested dividends and do not take into account sales charges. Actual load-adjusted performance is lower.
Past performance is no guarantee of future results.
This commentary reflects the views of the portfolio management team through the end of the Portfolio’s period discussed in this report. The team’s statements reflect their own opinions. As such, they are in no way guarantees of future events and are not intended to be used as investment advice or a recommendation regarding any specific security. They are also subject to change at any time as market and other conditions warrant.
| |
| 6 | Lifecycle 2040 Portfolio | Semiannual report |
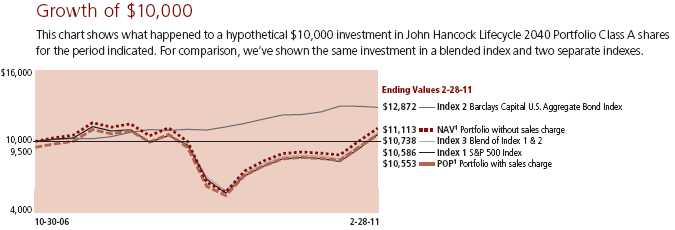
| | | | | |
| | Class R12 | Class R32 | Class R42 | Class R52 | Class 12 |
|
| Period beginning | 10-30-06 | 10-30-06 | 10-30-06 | 10-30-06 | 10-30-06 |
|
| Ending balance | $11,014 | $11,041 | $11,173 | $11,327 | $11,316 |
|
| Index 1 | 10,586 | 10,586 | 10,586 | 10,586 | 10,586 |
|
| Index 2 | 12,872 | 12,872 | 12,872 | 12,872 | 12,872 |
|
| Index 3 | 10,738 | 10,738 | 10,738 | 10,738 | 10,738 |
|
Assuming all distributions were reinvested for the period indicated, the table above shows the value of a $10,000 investment in the Portfolio’s Class R1, Class R3, Class R4, Class R5 and Class 1 shares, respectively, as of 2-28-11. Performance of the classes will vary based on the difference in sales charges paid by shareholders investing in the different classes and the fee structure of those classes.
Index 1 — S&P 500 Index is an unmanaged index that includes 500 widely traded common stocks.
Index 2 — Barclays Capital U.S. Aggregate Bond Index is an unmanaged index of dollar-denominated and non-convertible investment grade debt issues.
Index 3 — Blend of Index 1 & 2 that adjusts over time: from inception to 11-30-07 blend is 100% Index 1 / 0% Index 2, and from 12-1-07 to 2-28-11 blend is 95% Index 1 / 5% Index 2.
Performance chart
Total returns with maximum sales charge for the period ended February 28, 2011.
| | | | | | |
| | Class A | Class R12 | Class R32 | Class R42 | Class R52 | Class 12 |
|
| Inception | 10-30-06 | 10-30-06 | 10-30-06 | 10-30-06 | 10-30-06 | 10-30-06 |
|
| Average annual total returns — 1 year | 16.03% | 22.00% | 22.14% | 22.36% | 22.75% | 22.58% |
|
| Average annual total returns — Since inception3 | 1.25% | 2.25% | 2.31% | 2.59% | 2.91% | 2.89% |
|
| Cumulative returns — 6 months | 19.28% | 25.61% | 25.60% | 25.67% | 25.91% | 25.89% |
|
| Cumulative returns — 1 year | 16.03% | 22.00% | 22.14% | 22.36% | 22.75% | 22.58% |
|
| Cumulative returns — Since inception3 | 5.53% | 10.14% | 10.41% | 11.73% | 13.27% | 13.16% |
|
Performance figures assume all distributions are reinvested. Returns at public offering price (POP) reflect a sales charge on Class A shares of 5%. Sales charges are not applicable for Class R1, Class R3, Class R4, Class R5 and Class 1 shares.
The expense ratios of the Portfolio, both net (including any fee waivers or expense limitations) and gross (excluding any fee waivers or expense limitations), are set forth according to the most recent publicly available prospectuses for the Portfolio and may differ from the expense ratios disclosed in the Financial Highlights tables in this report. The waivers and expense limitations are contractual at least until 12-31-11. The following expense ratios include expenses of the underlying affiliated funds in which the Portfolio invests. The net expenses are as follows: Class A —1.35%, Class R1 — 1.50%, Class R3 — 1.40%, Class R4 — 1.15% and Class R5 — 0.85%. Had the fee waivers and expense limitations not been in place, the gross expenses would be as follows: Class A — 1.44%, Class R1 — 1.98%, Class R3 — 1.96%, Class R4 — 7.01% and Class R5 — 2.19%. For Class 1, the net expenses equal the gross expenses and are as follows: Class 1 — 0.90%.
The returns reflect past results and should not be considered indicative of future performance. The return and principal value of an investment will fluctuate so that shares, when redeemed, may be worth more or less than their original cost. Due to market volatility, the Portfolio’s current performance may be higher or lower than the performance shown. For performance data current to the most recent month end, please call 1-800-225-5291 or visit the Portfolio’s Web site at www.jhfunds.com.
The performance table and chart do not reflect the deduction of taxes that a shareholder may pay on Portfolio distributions or the redemption of Portfolio shares.
The Portfolio’s performance results reflect any applicable expense reductions, without which the expenses would increase and results would have been less favorable.
It is not possible to invest directly in an index. Index figures do not reflect sales charges and would be lower if they did.
1 NAV represents net asset value and POP represents public offering price.
2 For certain types of investors as described in the Portfolio’s Class R1, Class R3, Class R4, Class R5 and Class 1 share prospectuses.
3 From 10-30-06.
| | |
| | Semiannual report | Lifecycle 2040 Portfolio | 7 |
John Hancock
Lifecycle 2035 Portfolio
Goal and strategy
To seek high total return until the Portfolio’s target retirement date. Under normal market conditions, the Portfolio invests substantially all of its assets in underlying funds using an asset allocation strategy designed for investors expected to retire around the year 2035.
| |
| Asset Allocation | |
| | |
| Equity | 93% of Total |
|
| U.S. Large Cap | 46% |
|
| International Large Cap | 11% |
|
| Emerging Markets | 9% |
|
| U.S. Mid Cap | 9% |
|
| U.S. Small Cap | 5% |
|
| International Small Cap | 4% |
|
| Large Blend | 3% |
|
| Natural Resources | 3% |
|
| Real Estate | 1% |
|
| Small Growth | 1% |
|
| Small Value | 1% |
|
| Fixed Income | 7% of Total |
|
| Currency | 2% |
|
| Bank Loan | 1% |
|
| Global Bond | 1% |
|
| High-Yield Bond | 1% |
|
| Intermediate Bond | 1% |
|
| Multi-Sector Bond | 1% |
|
As a percentage of net assets on 2-28-11.
Portfolio results
For the six months ended February 28, 2011, John Hancock Lifecycle 2035 Portfolio’s Class A, Class R1, Class R3, Class R4, Class R5 and Class 1 shares returned 25.67%, 25.53%, 25.56%, 25.77%, 25.96%, and 26.06%, respectively, at net asset value. In comparison, the S&P 500 Index returned 27.73% over the same period and the Barclays Capital U.S. Aggregate Bond Index returned –0.83%. A blended index, which rolls down in its equities weighting to match the Portfolio’s glidepath, returned 26.17%.1 The Morningstar, Inc. Target-Date 2031–2035 category average returned 23.28%.2
Performance review
The Portfolio outperformed the Morningstar average (based on Class A shares), but modestly underperformed the blended benchmark. Asset allocation detracted slightly from relative performance, with positive results from allocations in sectors such as small- and mid-cap equities, global natural resources, bank loans and multi-sector and high-yield bonds outweighed by underperformance principally in emerging and international developed equities, and currency.
Manager selection also hurt performance slightly relative to the blended benchmark. Fundamental Value Fund (Davis), for example, was hindered by weak stock selection in the energy and industrials sectors. Mutual Shares Fund (Franklin) was hurt by an underweight position in energy and poor stock selection in the tech sector. International Small Cap Fund (Franklin) detracted from performance, hurt by its positions in cash, and stock selection in sectors such as consumer discretionary. We remain fully confident in these fine managers, who we believe have enjoyed long-term success with excellent risk-adjusted performance.
Conversely, there were a number of bright spots among manager performance. Value & Restructuring Fund (Columbia) had success with overweight positions and strong stock selection in industrials and materials. Blue Chip Growth Fund (T. Rowe Price) contributed positively, buoyed by overweight positions and good stock selection in technology. Alpha Opportunities Fund (Wellington) had strong stock selection in the technology and financials sectors. All Cap Value Fund (Lord Abbett) was boosted by selections in consumer staples, industrials and consumer discretionary.
The Portfolio had a number of important additions during the period. We continued to increase our allocation to Currency Strategies Fund (First Quadrant), which now stands at 2.0% of the Portfolio’s assets, up from less than 0.5% six months ago. Currency Strategies Fund seeks consistent returns in all market environments, through long/short positions in the currency markets. With the addition of Mutual Shares Fund, the Portfolio gains one of the most well-respected large-cap managers in the industry. We also established a new position in Capital Appreciation Value Fund (T. Rowe Price), which has a more conservative and flexible mandate that seeks to outperform the broad equity market with less risk over a full market cycle.
1The blended index is comprised of the S&P 500 Index (S&P) and the Barclays Capital U.S. Aggregate Bond Index (BarCap) and it adjusts over time: from inception to 11-30-07 blend was 98% S&P/2% BarCap and from 12-1-07 to 2-28-11, blend is 95% S&P/5% BarCap.
2Figures from Morningstar, Inc. include reinvested dividends and do not take into account sales charges. Actual load-adjusted performance is lower.
Past performance is no guarantee of future results.
This commentary reflects the views of the portfolio management team through the end of the Portfolio’s period discussed in this report. The team’s statements reflect their own opinions. As such, they are in no way guarantees of future events and are not intended to be used as investment advice or a recommendation regarding any specific security. They are also subject to change at any time as market and other conditions warrant.
| |
| 8 | Lifecycle 2035 Portfolio | Semiannual report |
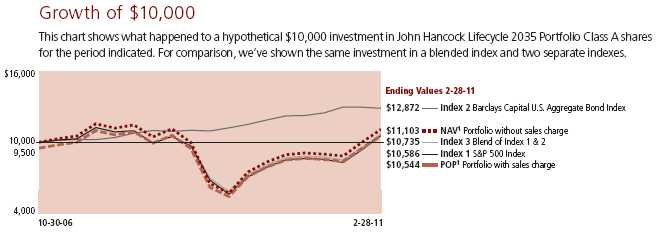
| | | | | |
| | Class R12 | Class R32 | Class R42 | Class R52 | Class 12 |
|
| Period beginning | 10-30-06 | 10-30-06 | 10-30-06 | 10-30-06 | 10-30-06 |
|
| Ending balance | $11,003 | $11,041 | $11,205 | $11,327 | $11,328 |
|
| Index 1 | 10,586 | 10,586 | 10,586 | 10,586 | 10,586 |
|
| Index 2 | 12,872 | 12,872 | 12,872 | 12,872 | 12,872 |
|
| Index 3 | 10,735 | 10,735 | 10,735 | 10,735 | 10,735 |
|
Assuming all distributions were reinvested for the period indicated, the table above shows the value of a $10,000 investment in the Portfolio’s Class R1, Class R3, Class R4, Class R5 and Class 1 shares, respectively, as of 2-28-11. Performance of the classes will vary based on the difference in sales charges paid by shareholders investing in the different classes and the fee structure of those classes.
Index 1 — S&P 500 Index is an unmanaged index that includes 500 widely traded common stocks.
Index 2 — Barclays Capital U.S. Aggregate Bond Index is an unmanaged index of dollar-denominated and non-convertible investment grade debt issues.
Index 3 — Blend of Index 1 & 2 that adjusts over time: from inception to 11-30-07 blend is 98% Index 1 / 2% Index 2, and from 12-1-07 to 2-28-11 blend is 95% Index 1 / 5% Index 2.
Performance chart
Total returns with maximum sales charge for the period ended February 28, 2011.
| | | | | | |
| | Class A | Class R12 | Class R32 | Class R42 | Class R52 | Class 12 |
|
| Inception | 10-30-06 | 10-30-06 | 10-30-06 | 10-30-06 | 10-30-06 | 10-30-06 |
|
| Average annual total returns — 1 year | 15.98% | 21.93% | 21.96% | 22.63% | 22.81% | 22.76% |
|
| Average annual total returns — Since inception3 | 1.23% | 2.23% | 2.31% | 2.66% | 2.91% | 2.91% |
|
| Cumulative returns — 6 months | 19.37% | 25.53% | 25.56% | 25.77% | 25.96% | 26.06% |
|
| Cumulative returns — 1 year | 15.98% | 21.93% | 21.96% | 22.63% | 22.81% | 22.76% |
|
| Cumulative returns — Since inception3 | 5.44% | 10.03% | 10.41% | 12.05% | 13.27% | 13.28% |
|
Performance figures assume all distributions are reinvested. Returns at public offering price (POP) reflect a sales charge on Class A shares of 5%. Sales charges are not applicable for Class R1, Class R3, Class R4, Class R5 and Class 1 shares.
The expense ratios of the Portfolio, both net (including any fee waivers or expense limitations) and gross (excluding any fee waivers or expense limitations), are set forth according to the most recent publicly available prospectuses for the Portfolio and may differ from the expense ratios disclosed in the Financial Highlights tables in this report. The waivers and expense limitations are contractual at least until 12-31-11. The following expense ratios include expenses of the underlying affiliated funds in which the Portfolio invests. The net expenses are as follows: Class A —1.35%, Class R1 — 1.50%, Class R3 — 1.45%, Class R4 — 1.15% and Class R5 — 0.85%. Had the fee waivers and expense limitations not been in place, the gross expenses would be as follows: Class A — 1.42%, Class R1 — 1.97%, Class R3 — 2.21%, Class R4 — 3.30% and Class R5 — 3.15%. For Class 1, the net expenses equal the gross expenses and are as follows: Class 1 — 0.90%.
The returns reflect past results and should not be considered indicative of future performance. The return and principal value of an investment will fluctuate so that shares, when redeemed, may be worth more or less than their original cost. Due to market volatility, the Portfolio’s current performance may be higher or lower than the performance shown. For performance data current to the most recent month end, please call 1-800-225-5291 or visit the Portfolio’s Web site at www.jhfunds.com.
The performance table and chart above do not reflect the deduction of taxes that a shareholder may pay on Portfolio distributions or the redemption of Portfolio shares.
The Portfolio’s performance results reflect any applicable expense reductions, without which the expenses would increase and results would have been less favorable.
It is not possible to invest directly in an index. Index figures do not reflect sales charges and would be lower if they did.
1 NAV represents net asset value and POP represents public offering price.
2 For certain types of investors as described in the Portfolio’s Class R1, Class R3, Class R4, Class R5 and Class 1 share prospectuses.
3 From 10-30-06.
| | |
| | Semiannual report | Lifecycle 2035 Portfolio | 9 |
John Hancock
Lifecycle 2030 Portfolio
Goal and strategy
To seek high total return until the Portfolio’s target retirement date. Under normal market conditions, the Portfolio invests substantially all of its assets in underlying funds using an asset allocation strategy designed for investors expected to retire around the year 2030.
| |
| Asset Allocation | |
| | |
| Equity | 89% of Total |
|
| U.S. Large Cap | 44% |
|
| International Large Cap | 11% |
|
| U.S. Mid Cap | 9% |
|
| Emerging Markets | 8% |
|
| International Small Cap | 4% |
|
| U.S. Small Cap | 4% |
|
| Large Blend | 3% |
|
| Natural Resources | 3% |
|
| Real Estate | 2% |
|
| Small Value | 1% |
|
| Fixed Income | 11% of Total |
|
| Intermediate Bond | 3% |
|
| Multi-Sector Bond | 2% |
|
| Currency | 2% |
|
| Treasury Inflation- | |
| Protected Securities | 1% |
|
| High-Yield Bond | 1% |
|
| Global Bond | 1% |
|
| Bank Loan | 1% |
|
As a percentage of net assets on 2-28-11.
Portfolio results
For the six months ended February 28, 2011, John Hancock Lifecycle 2030 Portfolio’s Class A, Class R1, Class R3, Class R4, Class R5 and Class 1 shares returned 24.71%, 24.63%, 24.66%, 24.84%, 25.03%, and 25.00%, respectively, at net asset value. In comparison, the S&P 500 Index returned 27.73% over the same period and the Barclays Capital U.S. Aggregate Bond Index returned –0.83%. A blended index, which rolls down in its equities weighting to match the Portfolio’s glidepath, returned 25.08%.1 The Morningstar, Inc. Target-Date 2026–2030 category average returned 19.76%.2
Performance review
The Portfolio outperformed the Morningstar average (based on Class A shares), but modestly underperformed the blended benchmark. Asset allocation detracted slightly from relative performance, with positive results from allocations in sectors such as small- and mid-cap equities, global natural resources, bank loans, and multi-sector and high-yield bonds outweighed by underperformance principally in emerging and international developed equities, and REITs.
Manager selection also hurt performance slightly relative to the blended benchmark. Fundamental Value Fund (Davis), for example, was hindered by weak stock selection in the energy and industrials sectors. Mutual Shares Fund (Franklin) was hurt by an underweight position in energy and poor stock selection in the tech sector. International Small Cap Fund (Franklin) detracted from performance, hurt by its positions in cash, and stock selection in sectors such as consumer discretionary. We remain fully confident in these fine managers, who we believe have enjoyed long-term success with excellent risk-adjusted performance.
Conversely, there were a number of bright spots among manager performance. Value & Restructuring Fund (Columbia) had success with overweight positions and strong stock selection in industrials and materials. Blue Chip Growth Fund (T. Rowe Price) contributed positively, buoyed by overweight positions and good stock selection in technology. Alpha Opportunities Fund (Wellington) had strong stock selection in the technology and financials sectors. All Cap Value Fund (Lord Abbett) was boosted by selections in consumer staples, industrials and consumer discretionary.
The Portfolio had a number of important additions during the period. We continued to increase our allocation to Currency Strategies Fund (First Quadrant), which now stands at 2.0% of the Portfolio’s assets, up from less than 0.5% six months ago. Currency Strategies Fund seeks consistent returns in all market environments, through long/short positions in the currency markets. With the addition of Mutual Shares Fund, the Portfolio gains one of the most well-respected large-cap managers in the industry. We also established a new position in Capital Appreciation Value Fund (T. Rowe Price), which has a more conservative and flexible mandate that seeks to outperform the broad equity market with less risk over a full market cycle.
1The blended index is comprised of the S&P 500 Index (S&P) and the Barclays Capital U.S. Aggregate Bond Index (BarCap) and it adjusts over time: from inception to 11-30-07 blend was 95% S&P/5% BarCap, from 12-1-07 to 11-30-08, blend was 94% S&P/6% BarCap, from 12-1-08 to 11-30-09, blend was 93% S&P/7% BarCap, from 12-1-09 to 11-30-10, blend was 92% S&P/8% BarCap and from 12-1-10 to 2-28-11, blend is 91% S&P/9% BarCap.
2Figures from Morningstar, Inc. include reinvested dividends and do not take into account sales charges. Actual load-adjusted performance is lower.
Past performance is no guarantee of future results.
This commentary reflects the views of the portfolio management team through the end of the Portfolio’s period discussed in this report. The team’s statements reflect their own opinions. As such, they are in no way guarantees of future events and are not intended to be used as investment advice or a recommendation regarding any specific security. They are also subject to change at any time as market and other conditions warrant.
| |
| 10 | Lifecycle 2030 Portfolio | Semiannual report |
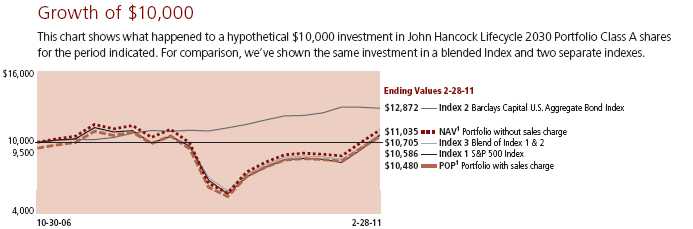
| | | | | |
| | Class R12 | Class R32 | Class R42 | Class R52 | Class 12 |
|
| Period beginning | 10-30-06 | 10-30-06 | 10-30-06 | 10-30-06 | 10-30-06 |
|
| Ending balance | $10,910 | $10,948 | $11,087 | $11,228 | $11,220 |
|
| Index 1 | 10,586 | 10,586 | 10,586 | 10,586 | 10,586 |
|
| Index 2 | 12,872 | 12,872 | 12,872 | 12,872 | 12,872 |
|
| Index 3 | 10,705 | 10,705 | 10,705 | 10,705 | 10,705 |
|
Assuming all distributions were reinvested for the period indicated, the table above shows the value of a $10,000 investment in the Portfolio’s Class R1, Class R3, Class R4, Class R5 and Class 1 shares, respectively, as of 2-28-11. Performance of the classes will vary based on the difference in sales charges paid by shareholders investing in the different classes and the fee structure of those classes.
Index 1 — S&P 500 Index is an unmanaged index that includes 500 widely traded common stocks.
Index 2 — Barclays Capital U.S. Aggregate Bond Index is an unmanaged index of dollar-denominated and non-convertible investment grade debt issues.
Index 3 — Blend of Index 1 & 2 that adjusts over time: from inception to 11-30-07 blend is 95% Index 1 / 5% Index 2, from 12-1-07 to 11-30-08 blend is 94% Index 1 / 6% Index 2, from 12-1-08 to 11-30-09 blend is 93% Index 1 / 7% Index 2, from 12-1-09 to 11-30-10 blend is 92% Index 1 / 8% Index 2 and from 12-1-10 to 2-28-11 blend is 91% Index 1 / 9% Index 2.
Performance chart
Total returns with maximum sales charge for the period ended February 28, 2011.
| | | | | | |
| | Class A | Class R12 | Class R32 | Class R42 | Class R52 | Class 12 |
|
| Inception | 10-30-06 | 10-30-06 | 10-30-06 | 10-30-06 | 10-30-06 | 10-30-06 |
|
| Average annual total returns — 1 year | 15.48% | 21.34% | 21.51% | 21.84% | 22.17% | 22.00% |
|
| Average annual total returns — Since inception3 | 1.09% | 2.03% | 2.11% | 2.41% | 2.71% | 2.69% |
|
| Cumulative returns — 6 months | 18.45% | 24.63% | 24.66% | 24.84% | 25.03% | 25.00% |
|
| Cumulative returns — 1 year | 15.48% | 21.34% | 21.51% | 21.84% | 22.17% | 22.00% |
|
| Cumulative returns — Since inception3 | 4.80% | 9.10% | 9.48% | 10.87% | 12.28% | 12.20% |
|
Performance figures assume all distributions are reinvested. Returns at public offering price (POP) reflect a sales charge on Class A shares of 5%. Sales charges are not applicable for Class R1, Class R3, Class R4, Class R5 and Class 1 shares.
The expense ratios of the Portfolio, both net (including any fee waivers or expense limitations) and gross (excluding any fee waivers or expense limitations), are set forth according to the most recent publicly available prospectuses for the Portfolio and may differ from the expense ratios disclosed in the Financial Highlights tables in this report. The waivers and expense limitations are contractual at least until 12-31-11. The following expense ratios include expenses of the underlying affiliated funds in which the Portfolio invests. The net expenses are as follows: Class A —1.33%, Class R1 — 1.48%, Class R3 — 1.43%, Class R4 — 1.13% and Class R5 — 0.83%. Had the fee waivers and expense limitations not been in place, the gross expenses would be as follows: Class A — 1.41%, Class R1 — 1.84%, Class R3 — 2.06%, Class R4 — 5.59% and Class R5 — 1.66%. For Class 1, the net expenses equal the gross expenses and are as follows: Class 1 — 0.88%.
The returns reflect past results and should not be considered indicative of future performance. The return and principal value of an investment will fluctuate so that shares, when redeemed, may be worth more or less than their original cost. Due to market volatility, the Portfolio’s current performance may be higher or lower than the performance shown. For performance data current to the most recent month end, please call 1-800-225-5291 or visit the Portfolio’s Web site at www.jhfunds.com.
The performance table and chart above do not reflect the deduction of taxes that a shareholder may pay on Portfolio distributions or the redemption of Portfolio shares.
The Portfolio’s performance results reflect any applicable expense reductions, without which the expenses would increase and results would have been less favorable.
It is not possible to invest directly in an index. Index figures do not reflect sales charges and would be lower if they did.
1 NAV represents net asset value and POP represents public offering price.
2 For certain types of investors as described in the Portfolio’s Class R1, Class R3, Class R4, Class R5 and Class 1 share prospectuses.
3 From 10-30-06.
| | |
| | Semiannual report | Lifecycle 2030 Portfolio | 11 |
John Hancock
Lifecycle 2025 Portfolio
Goal and strategy
To seek high total return until the Portfolio’s target retirement date. Under normal market conditions, the Portfolio invests substantially all of its assets in underlying funds using an asset allocation strategy designed for investors expected to retire around the year 2025.
| |
| Asset Allocation | |
| | |
| Equity | 81% of Total |
|
| U.S. Large Cap | 42% |
|
| International Large Cap | 9% |
|
| U.S. Mid Cap | 8% |
|
| Emerging Markets | 7% |
|
| International Small Cap | 4% |
|
| Large Blend | 3% |
|
| U.S. Small Cap | 3% |
|
| Natural Resources | 2% |
|
| Real Estate | 2% |
|
| Small Value | 1% |
|
| Fixed Income | 19% of Total |
|
| Intermediate Bond | 5% |
|
| Multi-Sector Bond | 4% |
|
| Bank Loan | 3% |
|
| High-Yield Bond | 3% |
|
| Currency | 2% |
|
| Global Bond | 1% |
|
| Treasury Inflation- | |
| Protected Securities | 1% |
|
As a percentage of net assets on 2-28-11.
Portfolio results
For the six months ended February 28, 2011, John Hancock Lifecycle 2025 Portfolio’s Class A, Class R1, Class R3, Class R4, Class R5 and Class 1 shares returned 22.58%, 22.50%, 22.67%, 22.83%, 22.92%, and 22.87%, respectively, at net asset value. In comparison, the S&P 500 Index returned 27.73% over the same period and the Barclays Capital U.S. Aggregate Bond Index returned –0.83%. A blended index, which rolls down in its equities weighting to match the Portfolio’s glidepath, returned 22.78%.1 The Morningstar, Inc. Target-Date 2021–2025 category average returned 19.72%.2
Performance review
The Portfolio outperformed the Morningstar average (based on Class A shares), and slightly trailed the blended benchmark. Asset allocation contributed modestly to relative performance, with positive results from allocations in sectors such as small- and mid-cap equities, global natural resources, bank loans and multi-sector and high-yield bonds outweighing underperformance principally in emerging and international developed equities.
Manager selection hurt performance slightly relative to the blended benchmark. Fundamental Value Fund (Davis), for example, was hindered by weak stock selection in the energy and industrials sectors. Mutual Shares Fund (Franklin) was hurt by an underweight position in energy and poor stock selection in the tech sector. International Small Cap Fund (Franklin) detracted from performance, hurt by its positions in cash, stock selection in sectors such as consumer discretionary and its overweight position to Hong Kong. We remain fully confident in these fine managers who we believe have enjoyed long-term success with excellent risk-adjusted performance.
Conversely, there were a number of bright spots among manager performance. Value & Restructuring Fund (Columbia) had success with overweight positions and strong stock selection in industrials and materials. Blue Chip Growth Fund (T. Rowe Price) contributed positively, buoyed by overweight positions and good stock selection in technology, while underweighting the consumer staples sector. Alpha Opportunities Fund (Wellington) had strong stock selection in the technology and financials sectors. Strategic Income Opportunities Fund (John Hancock) added value through its overweight to high-yield bonds and exposure to the Canadian dollar.
The Portfolio had a number of important additions during the period. We continued to increase our allocation to Currency Strategies Fund (First Quadrant), which now stands at 2.0% of the Portfolio’s assets, up from less than 0.5% six months ago. Currency Strategies Fund seeks consistent returns in all market environments, through long/short positions in the currency markets. With the addition of Mutual Shares Fund, the Portfolio gains one of the most well-respected large-cap managers in the industry. We also established a new position in Capital Appreciation Value Fund (T. Rowe Price), which has a more conservative and flexible mandate that seeks to outperform the broad equity market with less risk over a full market cycle.
1The blended index is comprised of the S&P 500 Index (S&P) and the Barclays Capital U.S. Aggregate Bond Index (BarCap) and it adjusts over time: from inception to 11-30-07 blend was 89% S&P/11% BarCap from 12-1-07 to 11-30-08, blend was 88% S&P/12% BarCap, from 12-1-08 to 11-30-09, blend was 86% S&P/14% BarCap, from 12-1-09 to 11-30-10, blend was 85% S&P/15% BarCap and from 12-1-10 to 2-28-11, blend is 83% S&P/17% BarCap.
2Figures from Morningstar, Inc. include reinvested dividends and do not take into account sales charges. Actual load-adjusted performance is lower.
Past performance is no guarantee of future results.
This commentary reflects the views of the portfolio management team through the end of the Portfolio’s period discussed in this report. The team’s statements reflect their own opinions. As such, they are in no way guarantees of future events and are not intended to be used as investment advice or a recommendation regarding any specific security. They are also subject to change at any time as market and other conditions warrant.
| |
| 12 | Lifecycle 2025 Portfolio | Semiannual report |
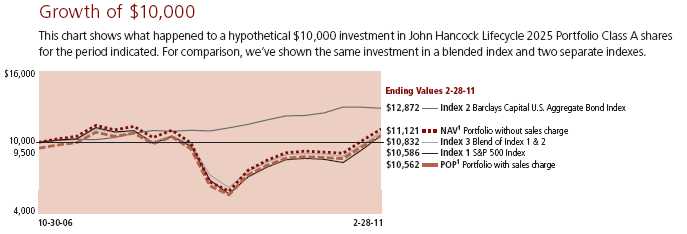
| | | | | |
| | Class R12 | Class R32 | Class R42 | Class R52 | Class 12 |
|
| Period beginning | 10-30-06 | 10-30-06 | 10-30-06 | 10-30-06 | 10-30-06 |
|
| Ending balance | $10,995 | $11,033 | $11,184 | $11,304 | $11,308 |
|
| Index 1 | 10,586 | 10,586 | 10,586 | 10,586 | 10,586 |
|
| Index 2 | 12,872 | 12,872 | 12,872 | 12,872 | 12,872 |
|
| Index 3 | 10,832 | 10,832 | 10,832 | 10,832 | 10,832 |
|
Assuming all distributions were reinvested for the period indicated, the table above shows the value of a $10,000 investment in the Portfolio’s Class R1, Class R3, Class R4, Class R5 and Class 1 shares, respectively, as of 2-28-11. Performance of the classes will vary based on the difference in sales charges paid by shareholders investing in the different classes and the fee structure of those classes.
Index 1 — S&P 500 Index is an unmanaged index that includes 500 widely traded common stocks.
Index 2 — Barclays Capital U.S. Aggregate Bond Index is an unmanaged index of dollar-denominated and non-convertible investment grade debt issues.
Index 3 — Blend of Index 1 & 2 that adjusts over time: from inception to 11-30-07 blend is 89% Index 1 / 11% Index 2, from 12-1-07 to 11-30-08 blend is 88% Index 1 / 12% Index 2, from 12-1-08 to 11-30-09 blend is 86% Index 1 / 14% Index 2, from 12-1-09 to 11-30-10 blend is 85% Index 1 / 15% Index 2 and from 12-1-10 to 2-28-11 blend is 83% Index 1 / 17% Index 2.
Performance chart
Total returns with maximum sales charge for the period ended February 28, 2011.
| | | | | | |
| | Class A | Class R12 | Class R32 | Class R42 | Class R52 | Class 12 |
|
| Inception | 10-30-06 | 10-30-06 | 10-30-06 | 10-30-06 | 10-30-06 | 10-30-06 |
|
| Average annual total returns — 1 year | 14.30% | 20.17% | 20.20% | 20.65% | 20.88% | 20.82% |
|
| Average annual total returns — Since inception3 | 1.27% | 2.21% | 2.29% | 2.61% | 2.86% | 2.87% |
|
| Cumulative returns — 6 months | 16.39% | 22.50% | 22.67% | 22.83% | 22.92% | 22.87% |
|
| Cumulative returns — 1 year | 14.30% | 20.17% | 20.20% | 20.65% | 20.88% | 20.82% |
|
| Cumulative returns — Since inception3 | 5.62% | 9.95% | 10.33% | 11.84% | 13.04% | 13.08% |
|
Performance figures assume all distributions are reinvested. Returns at public offering price (POP) reflect a sales charge on Class A shares of 5%. Sales charges are not applicable for Class R1, Class R3, Class R4, Class R5 and Class 1 shares.
The expense ratios of the Portfolio, both net (including any fee waivers or expense limitations) and gross (excluding any fee waivers or expense limitations), are set forth according to the most recent publicly available prospectuses for the Portfolio and may differ from the expense ratios disclosed in the Financial Highlights tables in this report. The waivers and expense limitations are contractual at least until 12-31-11. The following expense ratios include expenses of the underlying affiliated funds in which the Portfolio invests. The net expenses are as follows: Class A —1.32%, Class R1 — 1.47%, Class R3 — 1.42%, Class R4 — 1.12% and Class R5 — 0.82%. Had the fee waivers and expense limitations not been in place, the gross expenses would be as follows: Class A — 1.39%, Class R1 — 1.87%, Class R3 — 1.92%, Class R4 — 2.75% and Class R5 — 1.88%. For Class 1, the net expenses equal the gross expenses and are as follows: Class 1 — 0.87%.
The returns reflect past results and should not be considered indicative of future performance. The return and principal value of an investment will fluctuate so that shares, when redeemed, may be worth more or less than their original cost. Due to market volatility, the Portfolio’s current performance may be higher or lower than the performance shown. For performance data current to the most recent month end, please call 1-800-225-5291 or visit the Portfolio’s Web site at www.jhfunds.com.
The performance table and chart above do not reflect the deduction of taxes that a shareholder may pay on Portfolio distributions or the redemption of Portfolio shares.
The Portfolio’s performance results reflect any applicable expense reductions, without which the expenses would increase and results would have been less favorable.
It is not possible to invest directly in an index. Index figures do not reflect sales charges and would be lower if they did.
1 NAV represents net asset value and POP represents public offering price.
2 For certain types of investors as described in the Portfolio’s Class R1, Class R3, Class R4, Class R5 and Class 1 share prospectuses.
3 From 10-30-06.
| | |
| | Semiannual report | Lifecycle 2025 Portfolio | 13 |
John Hancock
Lifecycle 2020 Portfolio
Goal and strategy
To seek high total return until the Portfolio’s target retirement date. Under normal market conditions, the Portfolio invests substantially all of its assets in underlying funds using an asset allocation strategy designed for investors expected to retire around the year 2020.
| |
| Asset Allocation | |
| | |
| Equity | 70% of Total |
|
| U.S. Large Cap | 38% |
|
| International Large Cap | 8% |
|
| Emerging Markets | 6% |
|
| U.S. Mid Cap | 6% |
|
| International Small Cap | 3% |
|
| U.S. Small Cap | 3% |
|
| Large Blend | 2% |
|
| Natural Resources | 2% |
|
| Real Estate | 2% |
|
| Fixed Income | 30% of Total |
|
| Intermediate Bond | 9% |
|
| Multi-Sector Bond | 7% |
|
| High-Yield Bond | 5% |
|
| Bank Loan | 3% |
|
| Currency | 2% |
|
| Global Bond | 2% |
|
| Treasury Inflation- | |
| Protected Securities | 2% |
|
As a percentage of net assets on 2-28-11.
Portfolio results
For the six months ended February 28, 2011, John Hancock Lifecycle 2020 Portfolio’s Class A, Class R1, Class R3, Class R4, Class R5 and Class 1 shares returned 19.96%, 19.82%, 19.88%, 20.09%, 20.37%, and 20.20%, respectively, at net asset value. In comparison, the S&P 500 Index returned 27.73% over the same period and the Barclays Capital U.S. Aggregate Bond Index returned –0.83%. A blended index, which rolls down in its equities weighting to match the Portfolio’s glidepath, returned 19.47%.1 The Morningstar, Inc Target-Date 2016–2020 category average returned 15.53%.2
Performance review
The Portfolio outperformed the Morningstar average and the blended benchmark (based on Class A shares). Asset allocation drove most of the positive relative performance, with strong results from allocations in sectors such as small- and mid-cap equities, global natural resources, bank loans and multi-sector and high-yield bonds outweighing underperformance principally in emerging and international developed equities and REITs.
Manager selection also added to positive performance relative to the blended benchmark. Value & Restructuring Fund (Columbia) had success with overweight positions and strong stock selection in industrials and materials. Blue Chip Growth Fund (T. Rowe Price) contributed positively, buoyed by overweight positions, and good stock selection, in technology, while underweighting the consumer staples sector. Alpha Opportunities Fund (Wellington) had strong stock selection in the technology and financials sectors. Strategic Income Opportunities Fund (John Hancock) added value through its overweighting of high-yield bonds and exposure to the Canadian dollar.
Conversely, there were a few managers who detracted from relative performance. Fundamental Value Fund (Davis), for example, was hindered by weak stock selection in the energy and industrials sectors. Mutual Shares Fund (Franklin) was hurt by an underweight position in energy and poor stock selection in the tech sector. International Small Cap Fund (Franklin) detracted from performance, hurt by its positions in cash, stock selection in sectors such as consumer discretionary, and its overweight position to Hong Kong. We remain fully confident in these fine managers, who we believe have enjoyed long-term success with excellent risk-adjusted performance.
The Portfolio had a number of important additions during the period. We continued to increase our allocation to Currency Strategies Fund (First Quadrant), which now stands at 2.0% of the Portfolio’s assets, up from less than 0.5% six months ago. Currency Strategies Fund seeks consistent returns in all market environments, through long/short positions in the currency markets. With the addition of Mutual Shares Fund, the Portfolio gains one of the most well-respected large-cap managers in the industry. We also established a new position in Capital Appreciation Value Fund (T. Rowe Price), which has a more conservative and flexible mandate that seeks to outperform the broad equity market with less risk over a full market cycle.
1The blended index is comprised of the S&P 500 Index (S&P) and the Barclays Capital U.S. Aggregate Bond Index (BarCap) and it adjusts over time: from inception to 11-30-07 blend was 81% S&P/19% BarCap from 12-1-07 to 11-30-08, blend was 79% S&P/21% BarCap, from 12-1-08 to 11-30-09, blend was 77% S&P/23% BarCap, from 12-1-09 to 11-30-10, blend was 74% S&P/26% BarCap and from 12-1-10 to 2-28-11, blend is 72% S&P/28% BarCap.
2Figures from Morningstar, Inc. include reinvested dividends and do not take into account sales charges. Actual load-adjusted performance is lower.
Past performance is no guarantee of future results.
This commentary reflects the views of the portfolio management team through the end of the Portfolio’s period discussed in this report. The team’s statements reflect their own opinions. As such, they are in no way guarantees of future events and are not intended to be used as investment advice or a recommendation regarding any specific security. They are also subject to change at any time as market and other conditions warrant.
| |
| 14 | Lifecycle 2020 Portfolio | Semiannual report |
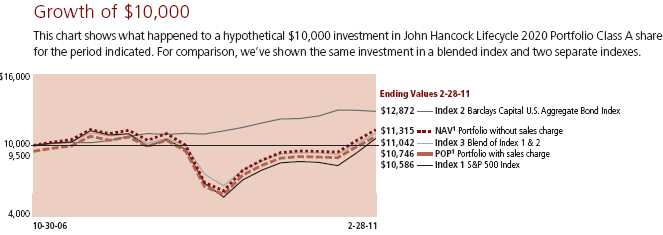
| | | | | |
| | Class R12 | Class R32 | Class R42 | Class R52 | Class 12 |
|
| Period beginning | 10-30-06 | 10-30-06 | 10-30-06 | 10-30-06 | 10-30-06 |
|
| Ending balance | $11,209 | $11,236 | $11,367 | $11,533 | $11,525 |
|
| Index 1 | 10,586 | 10,586 | 10,586 | 10,586 | 10,586 |
|
| Index 2 | 12,872 | 12,872 | 12,872 | 12,872 | 12,872 |
|
| Index 3 | 11,042 | 11,042 | 11,042 | 11,042 | 11,042 |
|
Assuming all distributions were reinvested for the period indicated, the table above shows the value of a $10,000 investment in the Portfolio’s Class R1, Class R3, Class R4, Class R5 and Class 1 shares, respectively, as of 2-28-11. Performance of the classes will vary based on the difference in sales charges paid by shareholders investing in the different classes and the fee structure of those classes.
Index 1 — S&P 500 Index is an unmanaged index that includes 500 widely traded common stocks.
Index 2 — Barclays Capital U.S. Aggregate Bond Index is an unmanaged index of dollar-denominated and non-convertible investment grade debt issues.
Index 3 — Blend of Index 1 & 2 that adjusts over time: from inception to 11-30-07 blend is 81% Index 1 / 19% Index 2, from 12-1-07 to 11-30-08 blend is 79% Index 1 / 21% Index 2, from 12-1-08 to 11-30-09 blend is 77% Index 1 / 23% Index 2, from 12-1-09 to 11-30-10 blend is 74% Index 1 / 26% Index 2 and from 12-1-10 to 2-28-11 blend is 72% Index 1 / 28% Index 2.
Performance chart
Total returns with maximum sales charge for the period ended February 28, 2011.
| | | | | | |
| | Class A | Class R12 | Class R32 | Class R42 | Class R52 | Class 12 |
|
| Inception | 10-30-06 | 10-30-06 | 10-30-06 | 10-30-06 | 10-30-06 | 10-30-06 |
|
| Average annual total returns — 1 year | 12.81% | 18.57% | 18.62% | 18.97% | 19.39% | 19.22% |
|
| Average annual total returns — Since inception3 | 1.67% | 2.66% | 2.72% | 3.00% | 3.34% | 3.33% |
|
| Cumulative returns — 6 months | 13.94% | 19.82% | 19.88% | 20.09% | 20.37% | 20.20% |
|
| Cumulative returns — 1 year | 12.81% | 18.57% | 18.62% | 18.97% | 19.39% | 19.22% |
|
| Cumulative returns — Since inception3 | 7.46% | 12.09% | 12.36% | 13.67% | 15.33% | 15.25% |
|
Performance figures assume all distributions are reinvested. Returns at public offering price (POP) reflect a sales charge on Class A shares of 5%. Sales charges are not applicable for Class R1, Class R3, Class R4, Class R5 and Class 1 shares.
The expense ratios of the Portfolio, both net (including any fee waivers or expense limitations) and gross (excluding any fee waivers or expense limitations), are set forth according to the most recent publicly available prospectuses for the Portfolio and may differ from the expense ratios disclosed in the Financial Highlights tables in this report. The waivers and expense limitations are contractual at least until 12-31-11. The follow ing expense ratios include expenses of the underlying affiliated funds in which the Portfolio invests. The net expenses are as follows: Class A —1.31%, Class R1 — 1.46%, Class R3 — 1.41%, Class R4 — 1.11% and Class R5 — 0.81%. Had the fee waivers and expense limitations not been in place, the gross expenses would be as follows: Class A — 1.38%, Class R1 — 1.79%, Class R3 — 1.84%, Class R4 — 5.77% and Class R5 — 1.62%. For Class 1, the net expenses equal the gross expenses and are as follows: Class 1 — 0.86%.
The returns reflect past results and should not be considered indicative of future performance. The return and principal value of an investment will fluctuate so that shares, when redeemed, may be worth more or less than their original cost. Due to market volatility, the Portfolio’s current performance may be higher or lower than the performance shown. For performance data current to the most recent month end, please call 1-800-225-5291 or visit the Portfolio’s Web site at www.jhfunds.com.
The performance table and chart above do not reflect the deduction of taxes that a shareholder may pay on Portfolio distributions or the redemption of Portfolio shares.
The Portfolio’s performance results reflect any applicable expense reductions, without which the expenses would increase and results would have been less favorable.
It is not possible to invest directly in an index. Index figures do not reflect sales charges and would be lower if they did.
1 NAV represents net asset value and POP represents public offering price.
2 For certain types of investors as described in the Portfolio’s Class R1, Class R3, Class R4, Class R5 and Class 1 share prospectuses.
3 From 10-30-06.
| | |
| | Semiannual report | Lifecycle 2020 Portfolio | 15 |
John Hancock
Lifecycle 2015 Portfolio
Goal and strategy
To seek high total return until the Portfolio’s target retirement date. Under normal market conditions, the Portfolio invests substantially all of its assets in underlying funds using an asset allocation strategy designed for investors expected to retire around the year 2015.
| |
| Asset Allocation | |
| |
| Equity | 58% of Total |
|
| U.S. Large Cap | 34% |
|
| International Large Cap | 6% |
|
| Emerging Markets | 5% |
|
| U.S. Mid Cap | 4% |
|
| International Small Cap | 2% |
|
| Large Blend | 2% |
|
| Natural Resources | 2% |
|
| Real Estate | 2% |
|
| U.S. Small Cap | 1% |
|
| Fixed Income | 42% of Total |
|
| Intermediate Bond | 13% |
|
| Multi-Sector Bond | 10% |
|
| High-Yield Bond | 7% |
|
| Bank Loan | 4% |
|
| Global Bond | 3% |
|
| Treasury Inflation- | |
| Protected Securities | 3% |
|
| Currency | 2% |
|
As a percentage of net assets on 2-28-11.
Portfolio results
For the six months ended February 28, 2011, John Hancock Lifecycle 2015 Portfolio’s Class A, Class R1, Class R3, Class R4, Class R5 and Class 1 shares returned 17.00%, 16.88%, 16.93%, 17.12%, 17.29%, and 17.24%, respectively, at net asset value. In comparison, the S&P 500 Index returned 27.73% over the same period and the Barclays Capital U.S. Aggregate Bond Index returned –0.83%. A blended index, which rolls down in its equities weighting to match the Portfolio’s glidepath, returned 15.93%.1 The Morningstar, Inc. Target-Date 2011–2015 category average returned 14.60%.2
Performance review
The Portfolio outperformed the Morningstar average and the blended benchmark (based on Class A shares). Asset allocation drove most of the positive relative performance, with strong results from allocations in sectors such as mid- and small-cap equities, global natural resources, bank loans, and multi-sector and high-yield bonds outweighing underperformance principally in emerging and international developed equities, and REITs.
Manager selection also added to positive performance relative to the blended benchmark. Strategic Income Opportunities Fund (John Hancock) added value through its overweighting of high-yield bonds and exposure to the Canadian dollar. Value & Restructuring Fund (Columbia) had success with overweight positions and strong stock selection in industrials and materials. Alpha Opportunities Fund (Wellington) had strong stock selection in the technology and financials sectors. High Yield Fund (Western Asset Management) gained through its overweighting in lower quality issues, and strong selection in that sector.
Conversely, there were a few managers who detracted from relative performance. Fundamental Value Fund (Davis), for example, was hindered by weak stock selection in the energy and industrials sectors. U.S. High Yield Fund (Wells Capital) lost ground due to overweighting higher-quality securities. Mutual Shares Fund (Franklin) was hurt by an underweight position in energy and poor stock selection in the tech sector. International Small Cap Fund (Franklin) detracted from performance, hurt by its positions in cash, stock selection in sectors such as consumer discretionary, and its overweight position to Hong Kong. We remain fully confident in these fine managers, who we believe have enjoyed long-term success with excellent risk-adjusted performance.
The Portfolio had a number of important additions during the period. We continued to increase our allocation to Currency Strategies Fund (First Quadrant), which now stands at 2.0% of the Portfolio’s assets, up from less than 0.5% six months ago. Currency Strategies Fund seeks consistent returns in all market environments, through long/short positions in the currency markets. With the addition of Mutual Shares Fund, the Portfolio gains one of the most well-respected large-cap managers in the industry. We also established a new position in Capital Appreciation Value (T. Rowe Price), which has a more conservative and flexible mandate that seeks to outperform the broad equity market with less risk over a full market cycle.
1The blended index is comprised of the S&P 500 Index (S&P) and the Barclays Capital U.S. Aggregate Bond Index (BarCap) and it adjusts over time: from inception to 11-30-07 blend was 70% S&P/30% BarCap from 12-1-07 to 11-30-08, blend was 67% S&P/33% BarCap, from 12-1-08 to 11-30-09, blend was 65% S&P/35% BarCap, from 12-1-09 to 11-30-10, blend was 62% S&P/38% BarCap and from 12-1-10 to 2-28-11, blend is 60% S&P/40% BarCap.
2Figures from Morningstar, Inc. include reinvested dividends and do not take into account sales charges. Actual load-adjusted performance is lower.
Past performance is no guarantee of future results.
This commentary reflects the views of the portfolio management team through the end of the Portfolio’s period discussed in this report. The team’s statements reflect their own opinions. As such, they are in no way guarantees of future events and are not intended to be used as investment advice or a recommendation regarding any specific security. They are also subject to change at any time as market and other conditions warrant.
| |
| 16 | Lifecycle 2015 Portfolio | Semiannual report |

| | | | | |
| | Class R12 | Class R32 | Class R42 | Class R52 | Class 12 |
|
| Period beginning | 10-30-06 | 10-30-06 | 10-30-06 | 10-30-06 | 10-30-06 |
|
| Ending balance | $11,295 | $11,322 | $11,465 | $11,621 | $11,622 |
|
| Index 1 | 10,586 | 10,586 | 10,586 | 10,586 | 10,586 |
|
| Index 2 | 12,872 | 12,872 | 12,872 | 12,872 | 12,872 |
|
| Index 3 | 11,351 | 11,351 | 11,351 | 11,351 | 11,351 |
|
Assuming all distributions were reinvested for the period indicated, the table above shows the value of a $10,000 investment in the Portfolio’s Class R1, Class R3, Class R4, Class R5 and Class 1 shares, respectively, as of 2-28-11. Performance of the classes will vary based on the difference in sales charges paid by shareholders investing in the different classes and the fee structure of those classes.
Index 1 — S&P 500 Index is an unmanaged index that includes 500 widely traded common stocks.
Index 2 — Barclays Capital U.S. Aggregate Bond Index is an unmanaged index of dollar-denominated and non-convertible investment grade debt issues.
Index 3 — Blend of Index 1 & 2 that adjusts over time: from inception to 11-30-07 blend is 70% Index 1 / 30% Index 2, from 12-1-07 to 11-30-08 blend is 67% Index 1 / 33% Index 2, from 12-1-08 to 11-30-09 blend is 65% Index 1 / 35% Index 2, from 12-1-09 to 11-30-10 blend is 62% Index 1 / 38% Index 2 and from 12-1-10 to 2-28-11 blend is 60% Index 1 / 40% Index 2.
Performance chart
Total returns with maximum sales charge for the period ended February 28, 2011.
| | | | | | |
| | Class A | Class R12 | Class R32 | Class R42 | Class R52 | Class 12 |
|
| Inception | 10-30-06 | 10-30-06 | 10-30-06 | 10-30-06 | 10-30-06 | 10-30-06 |
|
| Average annual total returns — 1 year | 11.22% | 16.88% | 16.93% | 17.39% | 17.70% | 17.65% |
|
| Average annual total returns — Since inception3 | 1.87% | 2.85% | 2.90% | 3.20% | 3.52% | 3.52% |
|
| Cumulative returns — 6 months | 11.10% | 16.88% | 16.93% | 17.12% | 17.29% | 17.24% |
|
| Cumulative returns — 1 year | 11.22% | 16.88% | 16.93% | 17.39% | 17.70% | 17.65% |
|
| Cumulative returns — Since inception3 | 8.38% | 12.95% | 13.22% | 14.65% | 16.21% | 16.22% |
|
Performance figures assume all distributions are reinvested. Returns at public offering price (POP) reflect a sales charge on Class A shares of 5%. Sales charges are not applicable for Class R1, Class R3, Class R4, Class R5 and Class 1 shares.
The expense ratios of the Portfolio, both net (including any fee waivers or expense limitations) and gross (excluding any fee waivers or expense limitations), are set forth according to the most recent publicly available prospectuses for the Portfolio and may differ from the expense ratios disclosed in the Financial Highlights tables in this report. The waivers and expense limitations are contractual at least until 12-31-11. The following expense ratios include expenses of the underlying affiliated funds in which the Portfolio invests. The net expenses are as follows: Class A —1.30%, Class R1 — 1.45%, Class R3 — 1.40%, Class R4 — 1.10% and Class R5 — 0.80%. Had the fee waivers and expense limitations not been in place, the gross expenses would be as follows: Class A — 1.38%, Class R1 — 1.96%, Class R3 — 1.95%, Class R4 — 7.52% and Class R5 — 3.96%. For Class 1, the net expenses equal the gross expenses and are as follows: Class 1 — 0.85%.
The returns reflect past results and should not be considered indicative of future performance. The return and principal value of an investment will fluctuate so that shares, when redeemed, may be worth more or less than their original cost. Due to market volatility, the Portfolio’s current performance may be higher or lower than the performance shown. For performance data current to the most recent month end, please call 1-800-225-5291 or visit the Portfolio’s Web site at www.jhfunds.com.
The performance table and chart above do not reflect the deduction of taxes that a shareholder may pay on Portfolio distributions or the redemption of Portfolio shares.
The Portfolio’s performance results reflect any applicable expense reductions, without which the expenses would increase and results would have been less favorable.
It is not possible to invest directly in an index. Index figures do not reflect sales charges and would be lower if they did.
1 NAV represents net asset value and POP represents public offering price.
2 For certain types of investors as described in the Portfolio’s Class R1, Class R3, Class R4, Class R5 and Class 1 share prospectuses.
3 From 10-30-06.
| | |
| | Semiannual report | Lifecycle 2015 Portfolio | 17 |
John Hancock
Lifecycle 2010 Portfolio
Goal and strategy
To seek high total return until the Portfolio’s target retirement date. Under normal market conditions, the Portfolio invests substantially all of its assets in underlying funds using an asset allocation strategy designed for investors expected to retire around the year 2010.
| |
| Asset Allocation | |
| | |
| Equity | 47% of Total |
|
| U.S. Large Cap | 28% |
|
| International Large Cap | 5% |
|
| Emerging Markets | 3% |
|
| Real Estate | 3% |
|
| U.S. Mid Cap | 3% |
|
| Large Blend | 2% |
|
| International Small Cap | 1% |
|
| Natural Resources | 1% |
|
| U.S. Small Cap | 1% |
|
| Fixed Income | 53% of Total |
|
| Intermediate Bond | 19% |
|
| Multi-Sector Bond | 13% |
|
| High-Yield Bond | 8% |
|
| Bank Loan | 4% |
|
| Global Bond | 4% |
|
| Treasury Inflation- | |
| Protected Securities | 3% |
|
| Currency | 2% |
|
As a percentage of net assets on 2-28-11.
Portfolio results
For the six months ended February 28, 2011, John Hancock Lifecycle 2010 Portfolio’s Class A, Class R1, Class R3, Class R4, Class R5 and Class 1 shares returned 14.35%, 14.35%, 14.39%, 14.57%, 14.64%, and 14.71%, respectively, at net asset value. In comparison, the S&P 500 Index returned 27.73% over the same period and the Barclays Capital U.S. Aggregate Bond Index returned –0.83%. A blended index, which rolls down in its equities weighting to match the Portfolio’s glidepath, returned 13.05%.1 The Morningstar, Inc. Target-Date 2000–2010 category average returned 11.59%.2
Performance review
The Portfolio outperformed the Morningstar average (based on Class A shares) and the blended benchmark. Asset allocation drove most of the positive relative performance, with strong results from allocations in sectors such as mid- and small-cap equities, global natural resources, bank loans, and multi-sector and high-yield bonds outweighing underperformance principally in emerging and international developed equities and REITs.
Manager selection also added to positive performance relative to the blended benchmark. Strategic Income Opportunities Fund (John Hancock) added value through its overweighting of high-yield bonds and exposure to the Canadian dollar. Value & Restructuring Fund (Columbia) had success with overweight positions and strong stock selection in industrials and materials. Alpha Opportunities Fund (Wellington) had strong stock selection in the technology and financials sectors. High Yield Fund (Western Asset Management) gained through its overweighting in lower quality issues, and strong stock selection in that sector.
Conversely, there were a few managers who detracted from relative performance. Fundamental Value Fund (Davis), for example, was hindered by weak stock selection in the energy and industrials sectors. U.S. High Yield Fund (Wells Capital) lost ground due to overweighting higher-quality securities. Mutual Shares Fund (Franklin) was hurt by an underweight position in energy and poor stock selection in the tech sector. We remain fully confident in these fine managers, who we believe have enjoyed long-term success with excellent risk-adjusted performance.
The Portfolio had a number of important additions during the period. We continued to increase our allocation to Currency Strategies Fund (First Quadrant), which now stands at 2.0% of Portfolio assets, up from less than 0.5% six months ago. Currency Strategies Fund seeks consistent returns in all market environments, through long/short positions in the currency markets. With the addition of Mutual Shares Fund, the Portfolio gains one of the most well-respected large-cap managers in the industry. We also established a new position in Capital Appreciation Value Fund (T. Rowe Price,) which has a more conservative and flexible mandate that seeks to outperform the broad equity market with less risk over a full market cycle.
1The blended index is comprised of the S&P 500 Index (S&P) and the Barclays Capital U.S. Aggregate Bond Index (BarCap) and it adjusts over time: from inception to 11-30-07 blend was 58% S&P/42% BarCap from 12-1-07 to 11-30-08, blend was 56% S&P/44% BarCap, from 12-1-08 to 11-30-09, blend was 54% S&P/46% BarCap, from 12-1-09 to 11-30-10, blend was 52% S&P/48% BarCap and from 12-1-10 to 2-28-11, blend is 50% S&P/50% BarCap.
2Figures from Morningstar, Inc. include reinvested dividends and do not take into account sales charges. Actual load-adjusted performance is lower.
Past performance is no guarantee of future results.
This commentary reflects the views of the portfolio management team through the end of the Portfolio’s period discussed in this report. The team’s statements reflect their own opinions. As such, they are in no way guarantees of future events and are not intended to be used as investment advice or a recommendation regarding any specific security. They are also subject to change at any time as market and other conditions warrant.
| |
| 18 | Lifecycle 2010 Portfolio | Semiannual report |
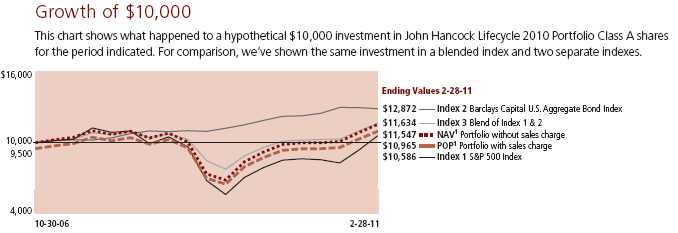
| | | | | |
| | Class R12 | Class R32 | Class R42 | Class R52 | Class 12 |
|
| Period beginning | 10-30-06 | 10-30-06 | 10-30-06 | 10-30-06 | 10-30-06 |
|
| Ending balance | $11,433 | $11,471 | $11,627 | $11,761 | $11,771 |
|
| Index 1 | 10,586 | 10,586 | 10,586 | 10,586 | 10,586 |
|
| Index 2 | 12,872 | 12,872 | 12,872 | 12,872 | 12,872 |
|
| Index 3 | 11,634 | 11,634 | 11,634 | 11,634 | 11,634 |
|
Assuming all distributions were reinvested for the period indicated, the table above shows the value of a $10,000 investment in the Portfolio’s Class R1, Class R3, Class R4, Class R5 and Class 1 shares, respectively, as of 2-28-11. Performance of the classes will vary based on the difference in sales charges paid by shareholders investing in the different classes and the fee structure of those classes.
Index 1 — S&P 500 Index is an unmanaged index that includes 500 widely traded common stocks.
Index 2 — Barclays Capital U.S. Aggregate Bond Index is an unmanaged index of dollar-denominated and non-convertible investment grade debt issues.
Index 3 — Blend of Index 1 & 2 that adjusts over time: from inception to 11-30-07 blend is 58% Index 1 / 42% Index 2, from 12-1-07 to 11-30-08 blend is 56% Index 1 / 44% Index 2, from 12-1-08 to 11-30-09 blend is 54% Index 1 / 46% Index 2, from 12-1-09 to 11-30-10 blend is 52% Index 1 / 48% Index 2 and from 12-1-10 to 2-28-11 blend is 50% Index 1 / 50% Index 2.
Performance chart
Total returns with maximum sales charge for the period ended February 28, 2011.
| | | | | | |
| | Class A | Class R12 | Class R32 | Class R42 | Class R52 | Class 12 |
|
| Inception | 10-30-06 | 10-30-06 | 10-30-06 | 10-30-06 | 10-30-06 | 10-30-06 |
|
| Average annual total returns — 1 year | 9.83% | 15.38% | 15.55% | 15.86% | 16.19% | 16.13% |
|
| Average annual total returns — Since inception3 | 2.15% | 3.13% | 3.21% | 3.54% | 3.81% | 3.83% |
|
| Cumulative returns — 6 months | 8.66% | 14.35% | 14.39% | 14.57% | 14.64% | 14.71% |
|
| Cumulative returns — 1 year | 9.83% | 15.38% | 15.55% | 15.86% | 16.19% | 16.13% |
|
| Cumulative returns — Since inception3 | 9.65% | 14.33% | 14.71% | 16.27% | 17.61% | 17.71% |
|
Performance figures assume all distributions are reinvested. Returns at public offering price (POP) reflect a sales charge on Class A shares of 5%. Sales charges are not applicable for Class R1, Class R3, Class R4, Class R5 and Class 1 shares.
The expense ratios of the Portfolio, both net (including any fee waivers or expense limitations) and gross (excluding any fee waivers or expense limitations), are set forth according to the most recent publicly available prospectuses for the Portfolio and may differ from the expense ratios disclosed in the Financial Highlights tables in this report. The waivers and expense limitations are contractual at least until 12-31-11. The following expense ratios include expenses of the underlying affiliated funds in which the Portfolio invests. The net expenses are as follows: Class A —1.28%, Class R1 — 1.43%, Class R3 — 1.38%, Class R4 — 1.08% and Class R5 — 0.78%. Had the fee waivers and expense limitations not been in place, the gross expenses would be as follows: Class A — 1.35%, Class R1 — 2.30%, Class R3 — 1.96%, Class R4 — 8.90% and Class R5 — 3.68%. For Class 1, the net expenses equal the gross expenses and are as follows: Class 1 — 0.83%.
The returns reflect past results and should not be considered indicative of future performance. The return and principal value of an investment will fluctuate so that shares, when redeemed, may be worth more or less than their original cost. Due to market volatility, the Portfolio’s current performance may be higher or lower than the performance shown. For performance data current to the most recent month end, please call 1-800-225-5291 or visit the Portfolio’s Web site at www.jhfunds.com.
The performance table and chart above do not reflect the deduction of taxes that a shareholder may pay on Portfolio distributions or the redemption of Portfolio shares.
The Portfolio’s performance results reflect any applicable expense reductions, without which the expenses would increase and results would have been less favorable.
It is not possible to invest directly in an index. Index figures do not reflect sales charges and would be lower if they did.
1 NAV represents net asset value and POP represents public offering price.
2 For certain types of investors as described in the Portfolio’s Class R1, Class R3, Class R4, Class R5 and Class 1 share prospectuses.
3 From 10-30-06.
| | |
| | Semiannual report | Lifecycle 2010 Portfolio | 19 |
Your expenses
As a shareholder of a John Hancock Funds II Lifecycle Portfolio, you incur two types of costs: (1) transaction costs, including sales charges (loads) on certain purchase and redemption fees on certain exchanges and redemptions, and (2) ongoing costs, including management fees, distribution and service (12b-1) fees and other Portfolio expenses. In addition to the operating expenses which the Portfolio bears directly, the Portfolio indirectly bears a pro rata share of the operating expenses of the affiliated underlying funds in which the Portfolio invests. Because the affiliated underlying funds have varied operating expenses and transaction costs and the Portfolio may own different proportions of the underlying funds at different times, the amount of expenses incurred indirectly by the Portfolio will vary. Had these indirect expenses been reflected in the following analysis, total expenses would have been higher than the amounts shown.
This example is intended to help you understand your ongoing costs (in dollars) of investing in the Portfolio so you can compare these costs with the ongoing costs of investing in other mutual funds. The example is based on an investment of $1,000 at the beginning of the period and held for the entire period (September 1, 2010 through February 28, 2011).
Actual expenses:
The first line of each share class in the table below and on the following pages provides information about actual account values and actual expenses. You may use the information in this line, together with the amount you invested, to estimate the expenses that you paid over the period. Simply divide your account value by $1,000 (for example, an $8,600 account value divided by $1,000 = 8.6), then multiply the result by the number in the first line under the heading entitled “Expenses paid during period” to estimate the expenses you paid on your account during this period.
Hypothetical example for comparison purposes:
The second line of each share class in the table on the following pages provides information about hypothetical account values and hypothetical expenses based on the actual expense ratio for the share class and an assumed annualized rate of return of 5% per year before expenses, which is not the actual return of the share class. The hypothetical account values and expenses may not be used to estimate the actual ending account balance or expenses you paid for the period. You may use this information to compare the ongoing costs of investing in the Portfolio and other funds. To do so, compare this 5% hypothetical example with the 5% hypothetical examples that appear in the shareholder reports of the other funds.
Please note that the expenses shown in the table are meant to highlight your ongoing costs only and do not reflect any transactional costs and insurance-related charges. Therefore, the second line of each share class in the table is useful in comparing ongoing costs only, and will not help you determine the relative total costs of owning different funds. In addition, if these transactional costs were included, your costs would have been higher.
| |
| 20 | Lifecycle Portfolios | Semiannual report |
Shareholder expense example chart
| | | | | |
| | | Beginning | Ending | Expenses Paid | |
| | | Account Value | Account Value | During Period1 | Annualized |
| | | 9-1-10 | 2-28-11 | 9-1-10–2-28-11 | Expense Ratio2 |
| Lifecycle 2045 Portfolio | | | | |
|
| Class A | Actual | $1,000.00 | $1,256.30 | $3.30 | 0.59% |
| | Hypothetical (5% annualized return before expenses) | 1,000.00 | 1,021.90 | 2.96 | 0.59% |
|
| Class R1 | Actual | 1,000.00 | 1,254.90 | 4.14 | 0.74% |
| | Hypothetical (5% annualized return before expenses) | 1,000.00 | 1,021.10 | 3.71 | 0.74% |
|
| Class R3 | Actual | 1,000.00 | 1,257.30 | 3.58 | 0.64% |
| | Hypothetical (5% annualized return before expenses) | 1,000.00 | 1,021.60 | 3.21 | 0.64% |
|
| Class R4 | Actual | 1,000.00 | 1,257.90 | 2.18 | 0.39% |
| | Hypothetical (5% annualized return before expenses) | 1,000.00 | 1,022.90 | 1.96 | 0.39% |
|
| Class R5 | Actual | 1,000.00 | 1,259.10 | 0.50 | 0.09% |
| | Hypothetical (5% annualized return before expenses) | 1,000.00 | 1,024.30 | 0.45 | 0.09% |
|
| Class 1 | Actual | 1,000.00 | 1,260.10 | 0.78 | 0.14% |
| | Hypothetical (5% annualized return before expenses) | 1,000.00 | 1,024.10 | 0.70 | 0.14% |
| Lifecycle 2040 Portfolio | | | | |
|
| Class A | Actual | $1,000.00 | $1,256.00 | $3.30 | 0.59% |
| | Hypothetical (5% annualized return before expenses) | 1,000.00 | 1,021.90 | 2.96 | 0.59% |
|
| Class R1 | Actual | 1,000.00 | 1,256.10 | 4.14 | 0.74% |
| | Hypothetical (5% annualized return before expenses) | 1,000.00 | 1,021.10 | 3.71 | 0.74% |
|
| Class R3 | Actual | 1,000.00 | 1,256.00 | 3.58 | 0.64% |
| | Hypothetical (5% annualized return before expenses) | 1,000.00 | 1,021.60 | 3.21 | 0.64% |
|
| Class R4 | Actual | 1,000.00 | 1,256.70 | 2.18 | 0.39% |
| | Hypothetical (5% annualized return before expenses) | 1,000.00 | 1,022.90 | 1.96 | 0.39% |
|
| Class R5 | Actual | 1,000.00 | 1,259.10 | 0.50 | 0.09% |
| | Hypothetical (5% annualized return before expenses) | 1,000.00 | 1,024.30 | 0.45 | 0.09% |
|
| Class 1 | Actual | 1,000.00 | 1,258.90 | 0.78 | 0.14% |
| | Hypothetical (5% annualized return before expenses) | 1,000.00 | 1,024.10 | 0.70 | 0.14% |
| Lifecycle 2035 Portfolio | | | | |
|
| Class A | Actual | $1,000.00 | $1,256.70 | $3.30 | 0.59% |
| | Hypothetical (5% annualized return before expenses) | 1,000.00 | 1,021.90 | 2.96 | 0.59% |
|
| Class R1 | Actual | 1,000.00 | 1,255.30 | 4.14 | 0.74% |
| | Hypothetical (5% annualized return before expenses) | 1,000.00 | 1,021.10 | 3.71 | 0.74% |
|
| Class R3 | Actual | 1,000.00 | 1,255.60 | 3.86 | 0.69% |
| | Hypothetical (5% annualized return before expenses) | 1,000.00 | 1,021.40 | 3.46 | 0.69% |
|
| Class R4 | Actual | 1,000.00 | 1,257.70 | 2.18 | 0.39% |
| | Hypothetical (5% annualized return before expenses) | 1,000.00 | 1,022.90 | 1.96 | 0.39% |
|
| Class R5 | Actual | 1,000.00 | 1,259.60 | 0.50 | 0.09% |
| | Hypothetical (5% annualized return before expenses) | 1,000.00 | 1,024.30 | 0.45 | 0.09% |
|
| Class 1 | Actual | 1,000.00 | 1,260.60 | 0.78 | 0.14% |
| | Hypothetical (5% annualized return before expenses) | 1,000.00 | 1,024.10 | 0.70 | 0.14% |
|
| | |
| | Semiannual report | Lifecycle Portfolios | 21 |
Shareholder expense example chart, continued
| | | | | |
| | | Beginning | Ending | Expenses Paid | |
| | | Account Value | Account Value | During Period1 | Annualized |
| | | 9-1-10 | 2-28-11 | 9-1-10–2-28-11 | Expense Ratio2 |
| Lifecycle 2030 Portfolio | | | | |
|
| Class A | Actual | $1,000.00 | $1,247.10 | $3.29 | 0.59% |
| | Hypothetical (5% annualized return before expenses) | 1,000.00 | 1,021.90 | 2.96 | 0.59% |
|
| Class R1 | Actual | 1,000.00 | 1,246.30 | 4.12 | 0.74% |
| | Hypothetical (5% annualized return before expenses) | 1,000.00 | 1,021.10 | 3.71 | 0.74% |
|
| Class R3 | Actual | 1,000.00 | 1,246.60 | 3.84 | 0.69% |
| | Hypothetical (5% annualized return before expenses) | 1,000.00 | 1,021.40 | 3.46 | 0.69% |
|
| Class R4 | Actual | 1,000.00 | 1,248.40 | 2.17 | 0.39% |
| | Hypothetical (5% annualized return before expenses) | 1,000.00 | 1,022.90 | 1.96 | 0.39% |
|
| Class R5 | Actual | 1,000.00 | 1,250.30 | 0.50 | 0.09% |
| | Hypothetical (5% annualized return before expenses) | 1,000.00 | 1,024.30 | 0.45 | 0.09% |
|
| Class 1 | Actual | 1,000.00 | 1,250.00 | 0.78 | 0.14% |
| | Hypothetical (5% annualized return before expenses) | 1,000.00 | 1,024.10 | 0.70 | 0.14% |
| Lifecycle 2025 Portfolio | | | | |
|
| Class A | Actual | $1,000.00 | $1,225.80 | $3.20 | 0.58% |
| | Hypothetical (5% annualized return before expenses) | 1,000.00 | 1,021.90 | 2.91 | 0.58% |
|
| Class R1 | Actual | 1,000.00 | 1,225.00 | 4.03 | 0.73% |
| | Hypothetical (5% annualized return before expenses) | 1,000.00 | 1,021.20 | 3.66 | 0.73% |
|
| Class R3 | Actual | 1,000.00 | 1,226.70 | 3.75 | 0.68% |
| | Hypothetical (5% annualized return before expenses) | 1,000.00 | 1,021.40 | 3.41 | 0.68% |
|
| Class R4 | Actual | 1,000.00 | 1,228.30 | 2.10 | 0.38% |
| | Hypothetical (5% annualized return before expenses) | 1,000.00 | 1,022.90 | 1.91 | 0.38% |
|
| Class R5 | Actual | 1,000.00 | 1,229.20 | 0.50 | 0.09% |
| | Hypothetical (5% annualized return before expenses) | 1,000.00 | 1,024.30 | 0.45 | 0.09% |
|
| Class 1 | Actual | 1,000.00 | 1,228.70 | 0.72 | 0.13% |
| | Hypothetical (5% annualized return before expenses) | 1,000.00 | 1,024.10 | 0.65 | 0.13% |
| Lifecycle 2020 Portfolio | | | | |
|
| Class A | Actual | $1,000.00 | $1,199.60 | $3.16 | 0.58% |
| | Hypothetical (5% annualized return before expenses) | 1,000.00 | 1,021.90 | 2.91 | 0.58% |
|
| Class R1 | Actual | 1,000.00 | 1,198.20 | 3.98 | 0.73% |
| | Hypothetical (5% annualized return before expenses) | 1,000.00 | 1,021.20 | 3.66 | 0.73% |
|
| Class R3 | Actual | 1,000.00 | 1,198.80 | 3.71 | 0.68% |
| | Hypothetical (5% annualized return before expenses) | 1,000.00 | 1,021.40 | 3.41 | 0.68% |
|
| Class R4 | Actual | 1,000.00 | 1,200.90 | 2.13 | 0.39% |
| | Hypothetical (5% annualized return before expenses) | 1,000.00 | 1,022.90 | 1.96 | 0.39% |
|
| Class R5 | Actual | 1,000.00 | 1,203.70 | 0.49 | 0.09% |
| | Hypothetical (5% annualized return before expenses) | 1,000.00 | 1,024.30 | 0.45 | 0.09% |
|
| Class 1 | Actual | 1,000.00 | 1,202.00 | 0.71 | 0.13% |
| | Hypothetical (5% annualized return before expenses) | 1,000.00 | 1,024.10 | 0.65 | 0.13% |
|
| |
| 22 | Lifecycle Portfolios | Semiannual report |
Shareholder expense example chart, continued
| | | | | |
| | | Beginning | Ending | Expenses Paid | |
| | | Account Value | Account Value | During Period1 | Annualized |
| | | 9-1-10 | 2-28-11 | 9-1-10–2-28-11 | Expense Ratio2 |
| Lifecycle 2015 Portfolio | | | | |
|
| Class A | Actual | $1,000.00 | $1,170.00 | $3.17 | 0.59% |
| | Hypothetical (5% annualized return before expenses) | 1,000.00 | 1,021.90 | 2.96 | 0.59% |
|
| Class R1 | Actual | 1,000.00 | 1,168.80 | 3.98 | 0.74% |
| | Hypothetical (5% annualized return before expenses) | 1,000.00 | 1,021.10 | 3.71 | 0.74% |
|
| Class R3 | Actual | 1,000.00 | 1,169.30 | 3.71 | 0.69% |
| | Hypothetical (5% annualized return before expenses) | 1,000.00 | 1,021.40 | 3.46 | 0.69% |
|
| Class R4 | Actual | 1,000.00 | 1,171.20 | 2.05 | 0.38% |
| | Hypothetical (5% annualized return before expenses) | 1,000.00 | 1,022.90 | 1.91 | 0.38% |
|
| Class R5 | Actual | 1,000.00 | 1,172.90 | 0.48 | 0.09% |
| | Hypothetical (5% annualized return before expenses) | 1,000.00 | 1,024.30 | 0.45 | 0.09% |
|
| Class 1 | Actual | 1,000.00 | 1,172.40 | 0.75 | 0.14% |
| | Hypothetical (5% annualized return before expenses) | 1,000.00 | 1,024.10 | 0.70 | 0.14% |
| Lifecycle 2010 Portfolio | | | | |
|
| Class A | Actual | $1,000.00 | $1,143.50 | $3.14 | 0.59% |
| | Hypothetical (5% annualized return before expenses) | 1,000.00 | 1,021.90 | 2.96 | 0.59% |
|
| Class R1 | Actual | 1,000.00 | 1,143.50 | 3.93 | 0.74% |
| | Hypothetical (5% annualized return before expenses) | 1,000.00 | 1,021.10 | 3.71 | 0.74% |
|
| Class R3 | Actual | 1,000.00 | 1,143.90 | 3.67 | 0.69% |
| | Hypothetical (5% annualized return before expenses) | 1,000.00 | 1,021.40 | 3.46 | 0.69% |
|
| Class R4 | Actual | 1,000.00 | 1,145.70 | 2.07 | 0.39% |
| | Hypothetical (5% annualized return before expenses) | 1,000.00 | 1,022.90 | 1.96 | 0.39% |
|
| Class R5 | Actual | 1,000.00 | 1,146.40 | 0.48 | 0.09% |
| | Hypothetical (5% annualized return before expenses) | 1,000.00 | 1,024.30 | 0.45 | 0.09% |
|
| Class 1 | Actual | 1,000.00 | 1,147.10 | 0.75 | 0.14% |
| | Hypothetical (5% annualized return before expenses) | 1,000.00 | 1,024.10 | 0.70 | 0.14% |
|
1 Expenses are equal to the annualized expense ratio, multiplied by the average account value over the period, multiplied by the number of days in the period (181) and divided by 365 (to reflect the one-half year period)
2 The Portfolios’ expense ratios do not include fees and expenses indirectly incurred by the underlying funds whose expense ratios can vary based on the mix of underlying funds held by the Portfolios. The range of expense ratios of the underlying funds held by the Portfolios was as follows:
| | | | | | | | |
| Period | Lifecycle | Lifecycle | Lifecycle | Lifecycle | Lifecycle | Lifecycle | Lifecycle | Lifecycle |
| ended | 2045 | 2040 | 2035 | 2030 | 2025 | 2020 | 2015 | 2010 |
| | | | | | | | | |
| 2-28-11 | 0.48%–1.14% | 0.48%–1.14% | 0.48%–1.14% | 0.48%–1.14% | 0.48%–1.14% | 0.48%–1.14% | 0.48%–1.14% | 0.48%–1.11% |
| | |
| | Semiannual report | Lifecycle Portfolios | 23 |
Portfolios’ investments
| | | |
| Investment companies | | | |
| | | |
| Underlying Funds’ Subadvisers | | | |
| American Century Management, Inc. | (American Century) | | |
| Columbia Management Investment | | | |
| Advisers, LLC | (Columbia) | | |
| Davis Selected Advisors, L.P. | (Davis) | | |
| Declaration Management & | (Declaration) | | |
| Research LLC | | | |
| Deutsche Asset Management | (Deutsche) | | |
| Dimensional Fund Advisors, Inc. | (DFA) | | |
| First Quadrant L.P. | (First Quadrant) | | |
| Franklin Mutual Advisers | | | |
| Franklin Templeton Investment Corp. | (Franklin) | | |
| Templeton Investment Counsel, LLC | | | |
| Frontier Capital Management Company | (Frontier) | | |
| Grantham, Mayo, Van Otterloo & Co. LLC | (GMO) | | |
| Invesco Advisers, Inc. | (Invesco) | | |
| Jennison Associates LLC | (Jennison) | | |
| John Hancock Asset Management* | (John Hancock) | | |
| Lord Abbett | (Lord Abbett) | | |
| Marsico Capital Management, LLC | (Marsico) | | |
| Pacific Investment Management Company LLC | (PIMCO) | | |
| Perimeter Capital Management LLC | (Perimeter) | | |
| SSgA Funds Management, Inc. | (SSgA) | | |
| Stone Harbor Investment Partners LP | (Stone Harbor) | | |
| T. Rowe Price Associates, Inc. | (T. Rowe Price) | | |
| Wellington Management Company, LLP | (Wellington) | | |
| Wells Capital Management, Incorporated | (Wells Capital) | | |
| Western Asset Management Company | (WAMCO) | | |
*Manulife Asset Management (US) LLC and Manulife Asset Management
(North America) Limited are doing business as John Hancock Asset Management.
Lifecycle 2045 Portfolio
As of 2-28-11 (Unaudited)
| | |
| | Shares | Value |
| Affiliated Investment Companies — 100.00% | |
|
| EQUITY 92.90% | | |
| | | |
| John Hancock Funds II (G) 90.90% | | |
|
| All Cap Value, Class NAV (Lord Abbett) | 368,714 | $4,516,749 |
|
| Alpha Opportunities, Class NAV (Wellington) | 1,053,456 | 13,073,392 |
|
| Blue Chip Growth, Class NAV (T. Rowe Price) | 1,006,110 | 21,862,779 |
|
| Capital Appreciation, Class NAV (Jennison) | 1,855,923 | 21,862,782 |
|
| Capital Appreciation Value, Class NAV | | |
| (T.Rowe Price) (I) | 847,706 | 8,790,712 |
|
| Emerging Markets, Class NAV (DFA) | 3,446,677 | 40,119,326 |
|
| Equity-Income, Class NAV (T. Rowe Price) | 585,232 | 8,790,189 |
|
| Fundamental Value, Class NAV (Davis) | 834,243 | 13,072,589 |
|
| Global Real Estate, Class NAV (Deutsche) | 442,484 | 3,442,525 |
|
| Heritage, Class NAV (American Century) (I) | 468,099 | 4,507,789 |
|
| Index 500, Class NAV (John Hancock2) (A) | 11,728,515 | 115,174,019 |
|
| International Equity Index, Class NAV (SSgA) | 1,856,781 | 34,146,196 |
|
| International Growth Stock , Class NAV (Invesco) | 201,367 | 2,261,349 |
|
| International Opportunities, Class NAV (Marsico) | 236,327 | 3,388,924 |
|
| International Small Cap, Class NAV (Franklin) | 299,793 | 4,958,568 |
|
| International Small Company, Class NAV (DFA) | 553,869 | 4,979,285 |
|
| International Value, Class NAV (Franklin) | 364,814 | 5,665,560 |
|
| Mid Cap Growth Index, Class NAV (SSgA) | 558,192 | 6,765,292 |
|
| Mid Cap Stock, Class NAV (Wellington) (I) | 506,427 | 9,495,515 |
|
| Mid Cap Value Equity, Class NAV (Columbia) | 348,444 | 3,609,880 |
|
| Mid Cap Value Index, Class NAV (SSgA) | 615,722 | 6,779,099 |
|
| Mid Value, Class NAV (T. Rowe Price) | 438,998 | 6,764,962 |
|
| Mutual Shares, Class NAV (Franklin) (I) | 774,466 | 8,790,189 |
|
| Natural Resources, Class NAV (Wellington) | 503,742 | 12,795,042 |
|
| Real Estate Equity, Class NAV (T. Rowe Price) | 331,220 | 2,775,627 |
|
| Small Cap Growth, Class NAV (Wellington) (I) | 282,806 | 3,201,360 |
|
| Small Cap Index, Class NAV (John Hancock2) (A) | 516,796 | 7,276,481 |
|
| Small Cap Value, Class NAV (Wellington) | 239,686 | 4,057,892 |
|
| Small Company Growth, Class NAV (Invesco) (I) | 223,235 | 3,219,043 |
|
| Small Company Value, Class NAV (T. Rowe Price) | 202,328 | 5,462,857 |
|
| Smaller Company Growth, Class NAV | | |
| (Frontier/John Hancock2 (A)/Perimeter) (I) | 266,564 | 3,166,778 |
|
| Value & Restructuring, Class NAV (Columbia) | 1,076,882 | 12,868,739 |
|
| Value, Class NAV (Invesco) | 343,130 | 3,613,156 |
| | | |
| John Hancock Funds III (G) 1.25% | | |
|
| International Core, Class NAV (GMO) | 182,560 | 5,655,722 |
| | | |
| John Hancock Investment Trust (G) 0.75% | |
|
| Small Cap Intrinsic Value, Class NAV | | |
| (John Hancock1) (A) | 240,458 | 3,380,842 |
| | | |
| FIXED INCOME 7.10% | | |
| | | |
| John Hancock Funds II (G) 7.10% | | |
|
| Active Bond, Class NAV | | |
| (John Hancock1/Declaration) (A) | 163,069 | 1,673,084 |
|
| Currency Strategies, Class NAV (First Quadrant) (I) | 960,632 | 9,289,309 |
|
| Floating Rate Income, Class NAV (WAMCO) | 353,547 | 3,408,194 |
|
| Global Bond, Class NAV (PIMCO) | 186,794 | 2,291,965 |
|
| Global High Yield, Class NAV (Stone Harbor) | 94,269 | 994,537 |
|
| High Yield, Class NAV (WAMCO) | 154,692 | 1,447,921 |
|
| Multi Sector Bond, Class NAV (Stone Harbor) | 156,085 | 1,629,525 |
|
| Real Return Bond, Class NAV (PIMCO) | 130,434 | 1,613,470 |
|
| Spectrum Income, Class NAV (T. Rowe Price) | 172,568 | 1,868,911 |
|
| Strategic Income Opportunities, Class NAV | | |
| (John Hancock1) (A) | 169,674 | 1,868,111 |
|
| Total Bond Market, Class NAV (Declaration) (A) | 81,411 | 836,901 |
|
| Total Return, Class NAV (PIMCO) | 302,253 | 4,195,273 |
|
| U.S. High Yield Bond, Class NAV (Wells Capital) | 78,365 | 1,023,448 |
| | | |
| Total investments | | |
| (Cost $362,838,386) 100.00% | | $452,431,858 |
| | | |
| Other assets and liabilities, net 0.00% | | 8,226 |
|
| TOTAL NET ASSETS 100.00% | | $452,440,084 |
| Percentages are based upon net assets. | | |
| | |
| 24 | Lifecycle Portfolios | Semiannual report | See notes to financial statements |
| | | |
Lifecycle 2040 Portfolio
As of 2-28-11 (Unaudited)
| | |
| | Shares | Value |
| Affiliated Investment Companies — 100.00% | |
|
| EQUITY 92.93% | | |
| | | |
| John Hancock Funds II (G) 90.94% | | |
|
| All Cap Value, Class NAV (Lord Abbett) | 364,079 | $4,459,967 |
|
| Alpha Opportunities, Class NAV (Wellington) | 1,043,726 | 12,952,645 |
|
| Blue Chip Growth, Class NAV (T. Rowe Price) | 995,805 | 21,638,833 |
|
| Capital Appreciation, Class NAV (Jennison) | 1,836,299 | 21,631,596 |
|
| Capital Appreciation Value, Class NAV | | |
| (T.Rowe Price) (I) | 838,766 | 8,698,007 |
|
| Emerging Markets, Class NAV (DFA) | 3,410,112 | 39,693,706 |
|
| Equity-Income, Class NAV (T. Rowe Price) | 579,024 | 8,696,936 |
|
| Fundamental Value, Class NAV (Davis) | 825,393 | 12,933,904 |
|
| Global Real Estate, Class NAV (Deutsche) | 437,818 | 3,406,221 |
|
| Heritage, Class NAV (American Century) (I) | 463,827 | 4,466,659 |
|
| Index 500, Class NAV (John Hancock2) (A) | 11,604,089 | 113,952,156 |
|
| International Equity Index, Class NAV (SSgA) | 1,834,416 | 33,734,914 |
|
| International Growth Stock , Class NAV (Invesco) | 199,243 | 2,237,501 |
|
| International Opportunities, Class NAV (Marsico) | 233,339 | 3,346,078 |
|
| International Small Cap, Class NAV (Franklin) | 296,612 | 4,905,964 |
|
| International Small Company, Class NAV (DFA) | 546,799 | 4,915,725 |
|
| International Value, Class NAV (Franklin) | 359,663 | 5,585,573 |
|
| Mid Cap Growth Index, Class NAV (SSgA) | 553,906 | 6,713,346 |
|
| Mid Cap Stock, Class NAV (Wellington) (I) | 502,213 | 9,416,498 |
|
| Mid Cap Value Equity, Class NAV (Columbia) | 344,399 | 3,567,974 |
|
| Mid Cap Value Index, Class NAV (SSgA) | 607,967 | 6,693,715 |
|
| Mid Value, Class NAV (T. Rowe Price) | 435,070 | 6,704,422 |
|
| Mutual Shares, Class NAV (Franklin) (I) | 766,250 | 8,696,936 |
|
| Natural Resources, Class NAV (Wellington) | 498,429 | 12,660,107 |
|
| Real Estate Equity, Class NAV (T. Rowe Price) | 328,453 | 2,752,436 |
|
| Small Cap Growth, Class NAV (Wellington) (I) | 280,656 | 3,177,031 |
|
| Small Cap Index, Class NAV (John Hancock2) (A) | 511,941 | 7,208,135 |
|
| Small Cap Value, Class NAV (Wellington) | 237,092 | 4,013,970 |
|
| Small Company Growth, Class NAV (Invesco) (I) | 221,879 | 3,199,490 |
|
| Small Company Value, Class NAV (T. Rowe Price) | 200,638 | 5,417,215 |
|
| Smaller Company Growth, Class NAV | | |
| (Frontier/John Hancock2 (A)/Perimeter) (I) | 264,346 | 3,140,426 |
|
| Value & Restructuring, Class NAV (Columbia) | 1,063,674 | 12,710,906 |
|
| Value, Class NAV (Invesco) | 340,050 | 3,580,732 |
| | | |
| John Hancock Funds III (G) 1.25% | | |
|
| International Core, Class NAV (GMO) | 180,369 | 5,587,846 |
| | | |
| John Hancock Investment Trust (G) 0.74% | |
|
| Small Cap Intrinsic Value, Class NAV | | |
| (John Hancock1) (A) | 237,907 | 3,344,975 |
| | |
| FIXED INCOME 7.07% | | |
| | | |
| John Hancock Funds II (G) 7.07% | | |
|
| Active Bond, Class NAV | | |
| (John Hancock1/Declaration) (A) | 161,928 | 1,661,378 |
|
| Currency Strategies, Class NAV (First Quadrant) (I) | 952,377 | 9,209,482 |
|
| Floating Rate Income, Class NAV (WAMCO) | 349,819 | 3,372,252 |
|
| Global Bond, Class NAV (PIMCO) | 185,506 | 2,276,163 |
|
| Global High Yield, Class NAV (Stone Harbor) | 94,130 | 993,074 |
|
| High Yield, Class NAV (WAMCO) | 154,701 | 1,448,000 |
|
| Multi Sector Bond, Class NAV (Stone Harbor) | 154,744 | 1,615,522 |
|
| Real Return Bond, Class NAV (PIMCO) | 128,592 | 1,590,679 |
|
| Spectrum Income, Class NAV (T. Rowe Price) | 171,057 | 1,852,548 |
|
| Strategic Income Opportunities, Class NAV | | |
| (John Hancock1) (A) | 168,216 | 1,852,058 |
|
| Total Bond Market, Class NAV (Declaration) (A) | 71,501 | 735,034 |
|
| Total Return, Class NAV (PIMCO) | 287,326 | 3,988,082 |
|
| U.S. High Yield Bond, Class NAV (Wells Capital) | 78,173 | 1,020,945 |
| | | |
| Total investments | | |
| (Cost $361,191,245) 100.00% | | $447,457,762 |
| | | |
| Other assets and liabilities, net (0.00%) | (4,685) |
|
| TOTAL NET ASSETS 100.00% | | $447,453,077 |
| | | |
| Percentages are based upon net assets. | | |
Lifecycle 2035 Portfolio
As of 2-28-11 (Unaudited)
| | |
| | Shares | Value |
| Affiliated Investment Companies — 100.00% | |
|
| EQUITY 92.93% | | |
| | | |
| John Hancock Funds II (G) 90.93% | | |
|
| All Cap Value, Class NAV (Lord Abbett) | 484,342 | $5,933,188 |
|
| Alpha Opportunities, Class NAV (Wellington) | 1,385,591 | 17,195,187 |
|
| Blue Chip Growth, Class NAV (T. Rowe Price) | 1,323,099 | 28,750,935 |
|
| Capital Appreciation, Class NAV (Jennison) | 2,439,960 | 28,742,727 |
|
| Capital Appreciation Value, Class NAV | | |
| (T.Rowe Price) (I) | 1,114,859 | 11,561,092 |
|
| Emerging Markets, Class NAV (DFA) | 4,531,304 | 52,744,379 |
|
| Equity-Income, Class NAV (T. Rowe Price) | 769,677 | 11,560,545 |
|
| Fundamental Value, Class NAV (Davis) | 1,097,567 | 17,198,873 |
|
| Global Real Estate, Class NAV (Deutsche) | 581,932 | 4,527,432 |
|
| Heritage, Class NAV (American Century) (I) | 615,751 | 5,929,679 |
|
| Index 500, Class NAV (John Hancock2) (A) | 15,419,333 | 151,417,853 |
|
| International Equity Index, Class NAV (SSgA) | 2,442,051 | 44,909,323 |
|
| International Growth Stock , Class NAV (Invesco) | 265,209 | 2,978,299 |
|
| International Opportunities, Class NAV (Marsico) | 310,602 | 4,454,033 |
|
| International Small Cap, Class NAV (Franklin) | 394,134 | 6,518,968 |
|
| International Small Company, Class NAV (DFA) | 727,856 | 6,543,422 |
|
| International Value, Class NAV (Franklin) | 480,254 | 7,458,347 |
|
| Mid Cap Growth Index, Class NAV (SSgA) | 734,844 | 8,906,314 |
|
| Mid Cap Stock, Class NAV (Wellington) (I) | 666,709 | 12,500,801 |
|
| Mid Cap Value Equity, Class NAV (Columbia) | 457,715 | 4,741,927 |
|
| Mid Cap Value Index, Class NAV (SSgA) | 808,810 | 8,905,003 |
|
| Mid Value, Class NAV (T. Rowe Price) | 578,908 | 8,920,973 |
|
| Mutual Shares, Class NAV (Franklin) (I) | 1,018,181 | 11,556,353 |
|
| Natural Resources, Class NAV (Wellington) | 662,495 | 16,827,380 |
|
| Real Estate Equity, Class NAV (T. Rowe Price) | 436,602 | 3,658,726 |
|
| Small Cap Growth, Class NAV (Wellington) (I) | 369,115 | 4,178,377 |
|
| Small Cap Index, Class NAV (John Hancock2) (A) | 678,902 | 9,558,945 |
|
| Small Cap Value, Class NAV (Wellington) | 315,044 | 5,333,701 |
|
| Small Company Growth, Class NAV (Invesco) (I) | 292,053 | 4,211,399 |
|
| Small Company Value, Class NAV (T. Rowe Price) | 266,454 | 7,194,254 |
|
| Smaller Company Growth, Class NAV | | |
| (Frontier/John Hancock2 (A)/Perimeter) (I) | 350,930 | 4,169,048 |
|
| Value & Restructuring, Class NAV (Columbia) | 1,414,589 | 16,904,335 |
|
| Value, Class NAV (Invesco) | 453,413 | 4,774,435 |
| | | |
| John Hancock Funds III (G) 1.25% | | |
|
| International Core, Class NAV (GMO) | 240,094 | 7,438,097 |
| | | |
| John Hancock Investment Trust (G) 0.75% | |
|
| Small Cap Intrinsic Value, Class NAV | | |
| (John Hancock1) (A) | 316,127 | 4,444,751 |
| | | |
| FIXED INCOME 7.07% | | |
| | | |
| John Hancock Funds II (G) 7.07 | | |
|
| Active Bond, Class NAV | | |
| (John Hancock1/Declaration) (A) | 215,913 | 2,215,271 |
|
| Currency Strategies, Class NAV (First Quadrant) (I) | 1,268,013 | 12,261,682 |
|
| Floating Rate Income, Class NAV (WAMCO) | 464,967 | 4,482,281 |
|
| Global Bond, Class NAV (PIMCO) | 245,662 | 3,014,274 |
|
| Global High Yield, Class NAV (Stone Harbor) | 124,960 | 1,318,325 |
|
| High Yield, Class NAV (WAMCO) | 203,984 | 1,909,291 |
|
| Multi Sector Bond, Class NAV (Stone Harbor) | 206,028 | 2,150,937 |
|
| Real Return Bond, Class NAV (PIMCO) | 171,540 | 2,121,953 |
|
| Spectrum Income, Class NAV (T. Rowe Price) | 227,749 | 2,466,518 |
|
| Strategic Income Opportunities, Class NAV | | |
| (John Hancock1) (A) | 223,966 | 2,465,866 |
|
| Total Bond Market, Class NAV (Declaration) (A) | 98,516 | 1,012,749 |
|
| Total Return, Class NAV (PIMCO) | 380,965 | 5,287,792 |
|
| U.S. High Yield Bond, Class NAV (Wells Capital) | 102,978 | 1,344,893 |
| | | |
| Total investments | | |
| (Cost $481,906,323) 100.00% | | $594,700,933 |
| | | |
| Other assets and liabilities, net (0.00%) | (8,358) |
|
| TOTAL NET ASSETS 100.00% | | $594,692,575 |
| | | |
| Percentages are based upon net assets. | | |
| | |
| See notes to financial statements | Semiannual report | Lifecycle Portfolios | 25 |
| | |
Lifecycle 2030 Portfolio
As of 2-28-11 (Unaudited)
| | |
| | Shares | Value |
| Affiliated Investment Companies — 100.00% | |
|
| EQUITY 88.90% | | |
| | | |
| John Hancock Funds II (G) 87.02% | | |
|
| All Cap Value, Class NAV (Lord Abbett) | 611,889 | $7,495,644 |
|
| Alpha Opportunities, Class NAV (Wellington) | 1,716,512 | 21,301,910 |
|
| Blue Chip Growth, Class NAV (T. Rowe Price) | 1,640,193 | 35,641,397 |
|
| Capital Appreciation, Class NAV (Jennison) | 3,013,853 | 35,503,183 |
|
| Capital Appreciation Value, Class NAV | | |
| (T.Rowe Price) (I) | 1,409,217 | 14,613,583 |
|
| Emerging Markets, Class NAV (DFA) | 5,467,150 | 63,637,623 |
|
| Equity-Income, Class NAV (T. Rowe Price) | 972,942 | 14,613,584 |
|
| Fundamental Value, Class NAV (Davis) | 1,363,132 | 21,360,275 |
|
| Global Real Estate, Class NAV (Deutsche) | 881,934 | 6,861,448 |
|
| Heritage, Class NAV (American Century) (I) | 776,566 | 7,478,330 |
|
| Index 500, Class NAV (John Hancock2) (A) | 19,050,088 | 187,071,861 |
|
| International Equity Index, Class NAV (SSgA) | 3,004,601 | 55,254,607 |
|
| International Growth Stock , Class NAV (Invesco) | 331,454 | 3,722,234 |
|
| International Opportunities, Class NAV (Marsico) | 338,516 | 4,854,314 |
|
| International Small Cap, Class NAV (Franklin) | 475,228 | 7,860,268 |
|
| International Small Company, Class NAV (DFA) | 878,904 | 7,901,351 |
|
| International Value, Class NAV (Franklin) | 559,834 | 8,694,230 |
|
| Mid Cap Growth Index, Class NAV (SSgA) | 864,124 | 10,473,185 |
|
| Mid Cap Stock, Class NAV (Wellington) (I) | 801,574 | 15,029,511 |
|
| Mid Cap Value Equity, Class NAV (Columbia) | 539,562 | 5,589,863 |
|
| Mid Cap Value Index, Class NAV (SSgA) | 947,037 | 10,426,875 |
|
| Mid Value, Class NAV (T. Rowe Price) | 733,357 | 11,301,033 |
|
| Mutual Shares, Class NAV (Franklin) (I) | 1,284,627 | 14,580,521 |
|
| Natural Resources, Class NAV (Wellington) | 784,303 | 19,921,289 |
|
| Real Estate Equity, Class NAV (T. Rowe Price) | 640,963 | 5,371,269 |
|
| Small Cap Growth, Class NAV (Wellington) (I) | 400,409 | 4,532,627 |
|
| Small Cap Index, Class NAV (John Hancock2) (A) | 832,564 | 11,722,507 |
|
| Small Cap Value, Class NAV (Wellington) | 352,484 | 5,967,556 |
|
| Small Company Growth, Class NAV (Invesco) (I) | 315,318 | 4,546,890 |
|
| Small Company Value, Class NAV (T. Rowe Price) | 280,885 | 7,583,886 |
|
| Smaller Company Growth, Class NAV | | |
| (Frontier/John Hancock2 (A)/Perimeter) (I) | 378,566 | 4,497,370 |
|
| Value & Restructuring, Class NAV (Columbia) | 1,660,156 | 19,838,864 |
|
| Value, Class NAV (Invesco) | 533,825 | 5,621,176 |
| | | |
| John Hancock Funds III (G) 0.74% | | |
|
| International Core, Class NAV (GMO) | 279,660 | 8,663,880 |
| | | |
| John Hancock Investment Trust (G) | | |
|
| Small Cap Intrinsic Value, Class NAV | | |
| (John Hancock1) (A) | 397,572 | 5,589,863 |
| | |
| FIXED INCOME 11.10% | | |
| | | |
| John Hancock Funds II (G) 11.10% | | |
|
| Active Bond, Class NAV | | |
| (John Hancock1/Declaration)(A) | 483,735 | 4,963,118 |
|
| Currency Strategies, Class NAV (First Quadrant) (I) | 1,632,497 | 15,786,245 |
|
| Floating Rate Income, Class NAV (WAMCO) | 1,057,855 | 10,197,723 |
|
| Global Bond, Class NAV (PIMCO) | 418,633 | 5,136,631 |
|
| Global High Yield, Class NAV (Stone Harbor) | 297,804 | 3,141,833 |
|
| High Yield, Class NAV (WAMCO) | 523,015 | 4,895,417 |
|
| Multi Sector Bond, Class NAV (Stone Harbor) | 506,411 | 5,286,932 |
|
| Real Return Bond, Class NAV (PIMCO) | 415,249 | 5,136,631 |
|
| Spectrum Income, Class NAV (T. Rowe Price) | 535,388 | 5,798,247 |
|
| Strategic Income Opportunities, Class NAV | | |
| (John Hancock1) (A) | 524,400 | 5,773,649 |
|
| Total Bond Market, Class NAV (Declaration) (A) | 223,269 | 2,295,204 |
|
| Total Return, Class NAV (PIMCO) | 915,092 | 12,701,480 |
|
| U.S. High Yield Bond, Class NAV (Wells Capital) | 244,560 | 3,193,953 |
| | | |
| Total investments | | |
| (Cost $617,859,766) 100.00% | | $759,431,070 |
| | | |
| Other assets and liabilities, net (0.00%) | (8,159) |
|
| TOTAL NET ASSETS 100.00% | | $759,422,911 |
| | | |
| Percentages are based upon net assets. | | |
Lifecycle 2025 Portfolio
As of 2-28-11 (Unaudited)
| | |
| | Shares | Value |
| Affiliated Investment Companies — 100.00% | |
| EQUITY 80.94% | | |
|
| | | |
| John Hancock Funds II (G) 79.34% | | |
|
| All Cap Value, Class NAV (Lord Abbett) | 703,577 | $8,618,816 |
|
| Alpha Opportunities, Class NAV (Wellington) | 1,859,753 | 23,079,537 |
|
| Blue Chip Growth, Class NAV (T. Rowe Price) | 1,780,694 | 38,694,476 |
|
| Capital Appreciation, Class NAV (Jennison) | 3,262,333 | 38,430,285 |
|
| Capital Appreciation Value, Class NAV | | |
| (T.Rowe Price) (I) | 1,521,193 | 15,774,770 |
|
| Emerging Markets, Class NAV (DFA) | 5,545,484 | 64,549,430 |
|
| Equity-Income, Class NAV (T. Rowe Price) | 1,050,836 | 15,783,563 |
|
| Fundamental Value, Class NAV (Davis) | 1,461,555 | 22,902,560 |
|
| Global Real Estate, Class NAV (Deutsche) | 1,382,511 | 10,755,933 |
|
| Heritage, Class NAV (American Century) (I) | 751,263 | 7,234,664 |
|
| Index 500, Class NAV (John Hancock2) (A) | 20,717,543 | 203,446,275 |
|
| International Equity Index, Class NAV (SSgA) | 3,114,651 | 57,278,436 |
|
| International Growth Stock , Class NAV (Invesco) | 380,347 | 4,271,295 |
|
| International Opportunities, Class NAV (Marsico) | 297,965 | 4,272,819 |
|
| International Small Cap, Class NAV (Franklin) | 446,538 | 7,385,731 |
|
| International Small Company, Class NAV (DFA) | 825,844 | 7,424,334 |
|
| International Value, Class NAV (Franklin) | 551,194 | 8,560,039 |
|
| Mid Cap Growth Index, Class NAV (SSgA) | 894,727 | 10,844,096 |
|
| Mid Cap Stock, Class NAV (Wellington) (I) | 806,237 | 15,116,940 |
|
| Mid Cap Value Equity, Class NAV (Columbia) | 537,624 | 5,569,787 |
|
| Mid Cap Value Index, Class NAV (SSgA) | 977,295 | 10,760,015 |
|
| Mid Value, Class NAV (T. Rowe Price) | 728,955 | 11,233,190 |
|
| Mutual Shares, Class NAV (Franklin) (I) | 1,385,408 | 15,724,376 |
|
| Natural Resources, Class NAV (Wellington) | 763,620 | 19,395,944 |
|
| Real Estate Equity, Class NAV (T. Rowe Price) | 925,821 | 7,758,378 |
|
| Small Cap Growth, Class NAV (Wellington) (I) | 333,691 | 3,777,378 |
|
| Small Cap Index, Class NAV (John Hancock2) (A) | 726,346 | 10,226,952 |
|
| Small Cap Value, Class NAV (Wellington) | 273,699 | 4,633,729 |
|
| Small Company Growth, Class NAV (Invesco) (I) | 262,901 | 3,791,025 |
|
| Small Company Value, Class NAV (T. Rowe Price) | 251,429 | 6,788,580 |
|
| Smaller Company Growth, Class NAV | | |
| (Frontier/John Hancock2 (A)/Perimeter) (I) | 319,110 | 3,791,025 |
|
| Value & Restructuring, Class NAV (Columbia) | 1,741,069 | 20,805,779 |
|
| Value, Class NAV (Invesco) | 535,703 | 5,640,948 |
| | | |
| John Hancock Funds III (G) 0.98% | | |
|
| International Core, Class NAV (GMO) | 276,390 | 8,562,572 |
| | | |
| John Hancock Investment Trust (G) 0.62% | |
|
| Small Cap Intrinsic Value, Class NAV | | |
| (John Hancock1) (A) | 387,283 | 5,445,206 |
| | | |
| FIXED INCOME 19.06% | | |
| | | |
| John Hancock Funds II (G) 19.06% | | |
|
| Active Bond, Class NAV | | |
| (John Hancock1/Declaration) (A) | 966,058 | 9,911,758 |
|
| Currency Strategies, Class NAV (First Quadrant) (I) | 1,856,909 | 17,956,314 |
|
| Floating Rate Income, Class NAV (WAMCO) | 2,305,785 | 22,227,764 |
|
| Global Bond, Class NAV (PIMCO) | 925,867 | 11,360,384 |
|
| Global High Yield, Class NAV (Stone Harbor) | 656,132 | 6,922,193 |
|
| High Yield, Class NAV (WAMCO) | 1,124,200 | 10,522,513 |
|
| Multi Sector Bond, Class NAV (Stone Harbor) | 1,120,649 | 11,699,578 |
|
| Real Return Bond, Class NAV (PIMCO) | 916,863 | 11,341,597 |
|
| Spectrum Income, Class NAV (T. Rowe Price) | 1,133,971 | 12,280,906 |
|
| Strategic Income Opportunities, Class NAV | | |
| (John Hancock1) (A) | 1,115,137 | 12,277,656 |
|
| Total Bond Market, Class NAV (Declaration) (A) | 390,165 | 4,010,898 |
|
| Total Return, Class NAV (PIMCO) | 2,103,429 | 29,195,595 |
|
| U.S. High Yield Bond, Class NAV (Wells Capital) | 540,293 | 7,056,221 |
| | | |
| Total investments | | |
| (Cost $720,877,990) 100.00% | | $875,092,260 |
| | | |
| Other assets and liabilities, net (0.00%) | (26,661) |
|
| TOTAL NET ASSETS 100.00% | | $875,065,599 |
| | | |
| Percentages are based upon net assets. | | |
| | |
| 26 | Lifecycle Portfolios | Semiannual report | See notes to financial statements |
| | | |
Lifecycle 2020 Portfolio
As of 2-28-11 (Unaudited)
| | |
| | Shares | Value |
| Affiliated Investment Companies — 100.02% | |
|
| EQUITY 69.98% | | |
| | | |
| John Hancock Funds II (G) 68.72% | | |
|
| All Cap Value, Class NAV (Lord Abbett) | 679,788 | $8,327,409 |
|
| Alpha Opportunities, Class NAV (Wellington) | 1,592,713 | 19,765,574 |
|
| Blue Chip Growth, Class NAV (T. Rowe Price) | 1,537,407 | 33,407,845 |
|
| Capital Appreciation, Class NAV (Jennison) | 2,830,552 | 33,343,905 |
|
| Capital Appreciation Value, Class NAV | | |
| (T.Rowe Price) (I) | 1,304,408 | 13,526,708 |
|
| Emerging Markets Class NAV (DFA) | 4,445,371 | 51,744,113 |
|
| Equity-Income, Class NAV (T. Rowe Price) | 903,802 | 13,575,110 |
|
| Fundamental Value, Class NAV (Davis) | 1,255,126 | 19,667,828 |
|
| Global Real Estate, Class NAV (Deutsche) | 1,605,228 | 12,488,678 |
|
| Heritage, Class NAV (American Century) (I) | 604,816 | 5,824,378 |
|
| Index 500, Class NAV (John Hancock2) (A) | 18,253,203 | 179,246,451 |
|
| International Equity Index, Class NAV (SSgA) | 2,547,245 | 46,843,829 |
|
| International Opportunities, Class NAV (Marsico) | 459,618 | 6,590,926 |
|
| International Small Cap, Class NAV (Franklin) | 296,001 | 4,895,854 |
|
| International Small Company, Class NAV (DFA) | 544,589 | 4,895,854 |
|
| International Value, Class NAV (Franklin) | 424,979 | 6,599,930 |
|
| Mid Cap Growth Index, Class NAV (SSgA) | 683,715 | 8,286,621 |
|
| Mid Cap Stock, Class NAV (Wellington) (I) | 594,333 | 11,143,742 |
|
| Mid Cap Value Equity, Class NAV (Columbia) | 399,677 | 4,140,652 |
|
| Mid Cap Value Index, Class NAV (SSgA) | 756,079 | 8,324,425 |
|
| Mid Value, Class NAV (T. Rowe Price) | 568,128 | 8,754,859 |
|
| Mutual Shares, Class NAV (Franklin) (I) | 1,190,492 | 13,512,087 |
|
| Natural Resources, Class NAV (Wellington) | 606,629 | 15,408,380 |
|
| Real Estate Equity, Class NAV (T. Rowe Price) | 1,000,252 | 8,382,109 |
|
| Small Cap Growth, Class NAV (Wellington) (I) | 499,607 | 5,655,556 |
|
| Small Cap Index, Class NAV (John Hancock2) (A) | 776,363 | 10,931,191 |
|
| Small Company Value, Class NAV (T. Rowe Price) | 210,451 | 5,682,179 |
|
| Value & Restructuring, Class NAV (Columbia) | 1,476,314 | 17,641,957 |
|
| Value, Class NAV (Invesco) | 394,977 | 4,159,110 |
| |
| John Hancock Funds III (G) 0.78% | | |
|
| International Core, Class NAV (GMO) | 212,823 | 6,593,255 |
| |
| John Hancock Investment Trust (G) 0.48% | |
|
| Small Cap Intrinsic Value, Class NAV | | |
| (John Hancock1) (A) | 288,175 | 4,051,741 |
| |
| FIXED INCOME 30.04% | | |
| | | |
| John Hancock Funds II (G) 30.04% | | |
|
| Active Bond, Class NAV | | |
| (John Hancock1/Declaration) (A) | 2,431,403 | 24,946,192 |
|
| Currency Strategies, Class NAV (First Quadrant) (I) | 1,782,759 | 17,239,283 |
|
| Floating Rate Income, Class NAV (WAMCO) | 2,968,405 | 28,615,423 |
|
| Global Bond, Class NAV (PIMCO) | 1,554,764 | 19,076,949 |
|
| Global High Yield, Class NAV (Stone Harbor) | 1,105,748 | 11,665,645 |
|
| High Yield, Class NAV (WAMCO) | 1,899,989 | 17,783,893 |
|
| Multi Sector Bond, Class NAV (Stone Harbor) | 1,845,582 | 19,267,871 |
|
| Real Return Bond, Class NAV (PIMCO) | 1,433,013 | 17,726,368 |
|
| Spectrum Income, Class NAV (T. Rowe Price) | 1,785,130 | 19,332,962 |
|
| Strategic Income Opportunities, Class NAV | | |
| (John Hancock1) (A) | 1,755,481 | 19,327,844 |
|
| Total Bond Market, Class NAV (Declaration) (A) | 450,018 | 4,626,184 |
|
| Total Return, Class NAV (PIMCO) | 3,118,922 | 43,290,633 |
|
| U.S. High Yield Bond, Class NAV (Wells Capital) | 908,126 | 11,860,125 |
| | | |
| Total investments | | |
| (Cost $704,077,853) 100.02% | | $848,171,628 |
| | | |
| Other assets and liabilities, net (0.02%) | (185,613) |
|
| |
| TOTAL NET ASSETS 100.00% | | $847,986,015 |
| | | |
| Percentages are based upon net assets. | | |
Lifecycle 2015 Portfolio
As of 2-28-11 (Unaudited)
| | |
| | Shares | Value |
|
| Affiliated Investment Companies — 100.01% | |
|
| EQUITY 57.99% | | |
| | | |
| John Hancock Funds II (G) 57.41% | | |
|
| All Cap Value, Class NAV (Lord Abbett) | 455,923 | $5,585,054 |
|
| Alpha Opportunities, Class NAV (Wellington) | 962,935 | 11,950,025 |
|
| Blue Chip Growth, Class NAV (T. Rowe Price) | 895,559 | 19,460,490 |
|
| Capital Appreciation, Class NAV (Jennison) | 1,645,619 | 19,385,391 |
|
| Capital Appreciation Value, Class NAV | | |
| (T.Rowe Price) (I) | 769,774 | 7,982,560 |
|
| Emerging Markets, Class NAV (DFA) | 2,264,962 | 26,364,161 |
|
| Equity-Income, Class NAV (T. Rowe Price) | 533,491 | 8,013,039 |
|
| Fundamental Value, Class NAV (Davis) | 756,403 | 11,852,833 |
|
| Global Real Estate, Class NAV (Deutsche) | 1,078,957 | 8,394,288 |
|
| Heritage, Class NAV (American Century) (I) | 285,299 | 2,747,430 |
|
| Index 500, Class NAV (John Hancock2) (A) | 10,630,337 | 104,389,912 |
|
| International Equity Index, Class NAV (SSgA) | 1,386,700 | 25,501,418 |
|
| International Opportunities, Class NAV (Marsico) | 231,937 | 3,325,976 |
|
| International Small Cap, Class NAV (Franklin) | 99,813 | 1,650,902 |
|
| International Small Company, Class NAV (DFA) | 184,525 | 1,658,881 |
|
| International Value, Class NAV (Franklin) | 214,295 | 3,328,003 |
|
| Mid Cap Growth Index, Class NAV (SSgA) | 341,088 | 4,133,984 |
|
| Mid Cap Stock, Class NAV (Wellington) (I) | 281,273 | 5,273,874 |
|
| Mid Cap Value Equity, Class NAV (Columbia) | 188,205 | 1,949,804 |
|
| Mid Cap Value Index, Class NAV (SSgA) | 375,381 | 4,132,950 |
|
| Mid Value, Class NAV (T. Rowe Price) | 272,183 | 4,194,343 |
|
| Mutual Shares, Class NAV (Franklin) (I) | 702,743 | 7,976,131 |
|
| Natural Resources, Class NAV (Wellington) | 341,880 | 8,683,746 |
|
| Real Estate Equity, Class NAV (T. Rowe Price) | 670,106 | 5,615,489 |
|
| Small Cap Growth, Class NAV (Wellington) (I) | 293,664 | 3,324,280 |
|
| Small Cap Index, Class NAV (John Hancock2) (A) | 551,688 | 7,767,770 |
|
| Small Company Value, Class NAV (T. Rowe Price) | 123,706 | 3,340,050 |
|
| Value & Restructuring, Class NAV (Columbia) | 766,373 | 9,158,159 |
|
| Value, Class NAV (Invesco) | 185,838 | 1,956,873 |
| |
| John Hancock Funds III (G) 0.58% | | |
|
| International Core, Class NAV (GMO) | 107,336 | 3,325,263 |
| |
| FIXED INCOME 42.02% | | |
| | | |
| John Hancock Funds II (G) 42.02 | | |
|
| Active Bond, Class NAV | | |
| (John Hancock1 /Declaration)(A) | 3,005,611 | 30,837,565 |
|
| Currency Strategies, Class NAV (First Quadrant) (I) | 1,205,469 | 11,656,882 |
|
| Floating Rate Income, Class NAV (WAMCO) | 2,131,851 | 20,551,046 |
|
| Global Bond, Class NAV (PIMCO) | 1,602,310 | 19,660,348 |
|
| Global High Yield, Class NAV (Stone Harbor) | 1,084,334 | 11,439,722 |
|
| High Yield, Class NAV (WAMCO) | 1,893,150 | 17,719,883 |
|
| Multi Sector Bond, Class NAV (Stone Harbor) | 1,771,109 | 18,490,377 |
|
| Real Return Bond, Class NAV (PIMCO) | 1,369,268 | 16,937,850 |
|
| Spectrum Income, Class NAV (T. Rowe Price) | 1,712,877 | 18,550,453 |
|
| Strategic Income Opportunities, Class NAV | | |
| (John Hancock1) (A) | 1,683,174 | 18,531,745 |
|
| Total Bond Market, Class NAV (Declaration) (A) | 627,879 | 6,454,591 |
|
| Total Return, Class NAV (PIMCO) | 2,764,222 | 38,367,407 |
|
| U.S. High Yield Bond, Class NAV (Wells Capital) | 893,422 | 11,668,096 |
| | | |
| Total investments | | |
| (Cost $483,583,959) 100.01% | | $573,289,044 |
| | | |
| Other assets and liabilities, net (0.01%) | (34,315) |
|
| TOTAL NET ASSETS 100.00% | | $573,254,729 |
| | | |
| Percentages are based upon net assets. | | |
| | |
| See notes to financial statements | Semiannual report | Lifecycle Portfolios | 27 |
| | |
Lifecycle 2010 Portfolio
As of 2-28-11 (Unaudited)
| | |
| | Shares | Value |
| Affiliated Investment Companies — 100.01% | |
|
| EQUITY 47.56% | | |
| | | |
| John Hancock Funds II (G) 47.13% | | |
|
| All Cap Value, Class NAV (Lord Abbett) | 386,130 | $4,730,094 |
|
| Alpha Opportunities, Class NAV (Wellington) | 685,713 | 8,509,702 |
|
| Blue Chip Growth, Class NAV (T. Rowe Price) | 637,848 | 13,860,436 |
|
| Capital Appreciation, Class NAV (Jennison) | 1,176,549 | 13,859,743 |
|
| Capital Appreciation Value, Class NAV | | |
| (T.Rowe Price) (I) | 544,994 | 5,651,592 |
|
| Emerging Markets, Class NAV (DFA) | 1,433,775 | 16,689,137 |
|
| Equity-Income, Class NAV (T. Rowe Price) | 377,916 | 5,676,297 |
|
| Fundamental Value, Class NAV (Davis) | 544,982 | 8,539,869 |
|
| Global Real Estate, Class NAV (Deutsche) | 915,729 | 7,124,375 |
|
| Index 500, Class NAV (John Hancock2) (A) | 7,766,509 | 76,267,118 |
|
| International Equity Index, Class NAV (SSgA) | 1,008,028 | 18,537,635 |
|
| International Opportunities, Class NAV (Marsico) | 148,264 | 2,126,102 |
|
| International Small Company, Class NAV (DFA) | 159,596 | 1,434,770 |
|
| International Value, Class NAV (Franklin) | 136,726 | 2,123,351 |
|
| Mid Cap Growth Index, Class NAV (SSgA) | 505,677 | 6,128,810 |
|
| Mid Cap Stock, Class NAV (Wellington) (I) | 125,318 | 2,349,704 |
|
| Mid Cap Value Index, Class NAV (SSgA) | 559,154 | 6,156,280 |
|
| Mid Value, Class NAV (T. Rowe Price) | 153,520 | 2,365,745 |
|
| Mutual Shares, Class NAV (Franklin) (I) | 498,983 | 5,663,455 |
|
| Natural Resources, Class NAV (Wellington) | 214,261 | 5,442,231 |
|
| Real Estate Equity, Class NAV (T. Rowe Price) | 566,776 | 4,749,583 |
|
| Small Cap Growth, Class NAV (Wellington) (I) | 207,536 | 2,349,312 |
|
| Small Cap Index, Class NAV (John Hancock2) (A) | 383,869 | 5,404,869 |
|
| Small Company Value, Class NAV (T. Rowe Price) | 87,424 | 2,360,457 |
|
| Value & Restructuring, Class NAV (Columbia) | 516,328 | 6,170,117 |
| | | |
| John Hancock Funds III (G) 0.43% | | |
|
| International Core, Class NAV (GMO) | 68,671 | 2,127,418 |
| | | |
| FIXED INCOME 52.45% | | |
| | | |
| John Hancock Funds II (G) 52.45% | | |
|
| Active Bond, Class NAV | | |
| (John Hancock1/Declaration)(A) | 3,746,362 | 38,437,669 |
|
| Currency Strategies, Class NAV (First Quadrant) (I) | 1,113,216 | 10,764,803 |
|
| Floating Rate Income, Class NAV (WAMCO) | 2,132,019 | 20,552,664 |
|
| Global Bond, Class NAV (PIMCO) | 1,537,169 | 18,861,065 |
|
| Global High Yield, Class NAV (Stone Harbor) | 1,036,414 | 10,934,167 |
|
| High Yield, Class NAV (WAMCO) | 1,735,250 | 16,241,937 |
|
| Multi Sector Bond, Class NAV (Stone Harbor) | 1,970,677 | 20,573,870 |
|
| Real Return Bond, Class NAV (PIMCO) | 1,380,972 | 17,082,626 |
|
| Spectrum Income, Class NAV (T. Rowe Price) | 1,917,206 | 20,763,341 |
|
| Strategic Income Opportunities, Class NAV | | |
| (John Hancock1) (A) | 1,911,038 | 21,040,533 |
|
| Total Bond Market, Class NAV (Declaration) (A) | 960,647 | 9,875,446 |
|
| Total Return, Class NAV (PIMCO) | 3,215,705 | 44,633,980 |
|
| U.S. High Yield Bond, Class NAV (Wells Capital) | 836,055 | 10,918,883 |
| | | |
| Total investments | | |
| (Cost $434,738,096) 100.01% | | $497,079,186 |
| | | |
| Other assets and liabilities, net (0.01%) | (38,795) |
|
| TOTAL NET ASSETS 100.00% | | $497,040,391 |
| | | |
| Percentages are based upon net assets. | | |
| |
| Footnote Legend: |
| (A) | The subadviser is an affiliate of the adviser. |
| | |
| (G) | The underlying fund’s subadviser is shown parenthetically. |
| | |
| (I) | Non-income producing. |
| | |
| 1 | Manulife Asset Management (US) LLC is doing business as John Hancock |
| Asset Management. |
| | |
| 2 | Manulife Asset Management (North America) Limited is doing business as |
| John Hancock Asset Management. |
| | |
| 28 | Lifecycle Portfolios | Semiannual report | See notes to financial statements |
| | | |
Financial statements
Statements of assets and liabilities 2-28-11 (Unaudited)
These Statements of Assets and Liabilities are the Portfolios’ balance sheets. They show the value of what each Portfolio owns, is due and owes. You’ll also find the net asset value and the maximum public offering price per share for each Portfolio. Net asset value is calculated by dividing the net assets of each class of shares by the number of outstanding shares in the class.
| | | | |
| | | Lifecycle | Lifecycle | Lifecycle |
| | | 2045 Portfolio | 2040 Portfolio | 2035 Portfolio |
| Assets | | | | |
|
| Investments in affiliated funds, at value (Note 7) | | $452,431,858 | $447,457,762 | $594,700,933 |
| Receivable for investments sold | | 750,000 | 750,000 | 1,000,000 |
| Receivable for fund shares sold | | 313,599 | 430,216 | 145,030 |
| Dividends and interest receivable | | 29,080 | 28,868 | 38,380 |
| Receivable due from adviser | | 775 | 835 | 899 |
| Other assets | | 44,865 | 45,224 | 44,921 |
| Total assets | | 453,570,177 | 448,712,905 | 595,930,163 |
| | | | | |
| Liabilities | | | | |
|
| Payable for investments purchased | | 1,077,306 | 1,203,225 | 1,176,765 |
| Payable for fund shares repurchased | | 2,998 | 7,256 | 3,035 |
| Payable to affiliates (Note 4) | | | | |
| Accounting and legal services fees | | 9,830 | 9,746 | 12,962 |
| Transfer agent fees | | 2,806 | 3,176 | 4,237 |
| Trustees’ fees | | 329 | 341 | 447 |
| Distribution and service fees | | 1,378 | 1,787 | 2,798 |
| Other liabilities and accrued expenses | | 35,446 | 34,297 | 37,344 |
| Total liabilities | | 1,130,093 | 1,259,828 | 1,237,588 |
| | | | |
| Net assets | | | | |
|
| Capital paid-in | | $379,312,613 | $378,080,320 | $506,870,079 |
| Accumulated distributions in excess of net investment income | | (36,041) | (35,529) | (44,324) |
| Accumulated net realized loss on investments | | (16,429,960) | (16,858,231) | (24,927,790) |
| Net unrealized appreciation (depreciation) on investments | | 89,593,472 | 86,266,517 | 112,794,610 |
| Net assets | | $452,440,084 | $447,453,077 | $594,692,575 |
| Investments in affiliated funds, at cost | | $362,838,386 | $361,191,245 | $481,906,323 |
| | | | |
| Net asset value per share | | | | |
|
| The Portfolios have an unlimited number of shares authorized with no par value. | | | | |
| Net asset value is calculated by dividing the net assets of each class of shares by the | | | | |
| number of outstanding shares in the class. | | | | |
| Class A: Net assets | | $9,008,086 | $10,024,160 | $13,480,996 |
| Shares outstanding | | 896,949 | 997,491 | 1,337,105 |
| Net asset value and redemption price per share | | $10.04 | $10.05 | $10.08 |
| Class R1: Net assets | | $1,011,239 | $1,183,118 | $1,991,995 |
| Shares outstanding | | 100,779 | 117,847 | 197,723 |
| Net asset value, offering price and redemption price per share | | $10.03 | $10.04 | $10.07 |
| Class R3: Net assets | | $731,353 | $2,166,030 | $1,719,294 |
| Shares outstanding | | 72,867 | 215,966 | 170,553 |
| Net asset value, offering price and redemption price per share | | $10.04 | $10.03 | $10.08 |
| Class R4: Net assets | | $370,791 | $200,742 | $984,061 |
| Shares outstanding | | 36,865 | 19,965 | 97,282 |
| Net asset value, offering price and redemption price per share | | $10.06 | $10.05 | $10.12 |
| Class R5: Net assets | | $629,813 | $885,104 | $1,128,234 |
| Shares outstanding | | 62,453 | 87,767 | 111,512 |
| Net asset value, offering price and redemption price per share | | $10.08 | $10.08 | $10.12 |
| Class 1: Net assets | | $440,688,802 | $432,993,923 | $575,387,995 |
| Shares outstanding | | 43,734,862 | 42,981,163 | 56,873,622 |
| Net asset value, offering price and redemption price per share | | $10.08 | $10.07 | $10.12 |
| | | | | |
| Maximum public offering price per share | | | | |
|
| Class A (net asset value per share ÷ 95%)1 | | $10.57 | $10.58 | $10.61 |
1 On single retail sales of less than $50,000. On sales of $50,000 or more and on group sales, the offering price is reduced.
| | |
| See notes to financial statements | Semiannual report | Lifecycle Portfolios | 29 |
| | |
F I N A N C I A L S T A T E M EN T S
Statements of assets and liabilities 2-28-11 (Unaudited)
Continued
| | | | |
| | | Lifecycle | Lifecycle | Lifecycle |
| | | 2030 Portfolio | 2025 Portfolio | 2020 Portfolio |
| Assets | | | | |
|
| Investments in affiliated funds, at value (Note 7) | | $759,431,070 | $875,092,260 | $848,171,628 |
| Receivable for investments sold | | 2,360,000 | 4,625,763 | 4,670,000 |
| Receivable for fund shares sold | | 311,048 | 24,901 | 857,645 |
| Dividends and interest receivable | | 90,273 | 195,827 | 293,430 |
| Receivable due from adviser | | 1,059 | 1,041 | 1,194 |
| Other assets | | 45,477 | 46,733 | 48,664 |
| Total assets | | 762,238,927 | 879,986,525 | 854,042,561 |
| | | | | |
| Liabilities | | | | |
|
| Payable for investments purchased | | 2,715,052 | 4,299,472 | 5,832,342 |
| Payable for fund shares repurchased | | 33,281 | 548,404 | 150,720 |
| Payable to affiliates (Note 4) | | | | |
| Accounting and legal services fees | | 16,627 | 19,207 | 18,709 |
| Transfer agent fees | | 6,775 | 6,750 | 8,456 |
| Trustees’ fees | | 588 | 682 | 692 |
| Distribution and service fees | | 3,102 | 4,302 | 3,707 |
| Other liabilities and accrued expenses | | 40,591 | 42,109 | 41,920 |
| Total liabilities | | 2,816,016 | 4,920,926 | 6,056,546 |
| | | | | |
| Net assets | | | | |
|
| Capital paid-in | | $653,924,579 | $768,602,281 | $752,768,921 |
| Undistributed net investment income | | 39,820 | 271,240 | 509,915 |
| Accumulated net realized loss on investments | | (36,112,792) | (48,022,192) | (49,386,596) |
| Net unrealized appreciation (depreciation) on investments | | 141,571,304 | 154,214,270 | 144,093,775 |
| Net assets | | $759,422,911 | $875,065,599 | $847,986,015 |
| Investments in affiliated funds, at cost | | $617,859,766 | $720,877,990 | $704,077,853 |
| | | | | |
| Net asset value per share | | | | |
|
| The Portfolios have an unlimited number of shares authorized with no par value. | | | | |
| Net asset value is calculated by dividing the net assets of each class of shares by the | | | | |
| number of outstanding shares in the class. | | | | |
| Class A: Net assets | | $21,521,529 | $21,141,515 | $25,822,236 |
| Shares outstanding | | 2,156,069 | 2,121,601 | 2,586,594 |
| Net asset value and redemption price per share | | $9.98 | $9.96 | $9.98 |
| Class R1: Net assets | | $2,282,329 | $2,123,372 | $2,257,179 |
| Shares outstanding | | 229,306 | 213,732 | 226,475 |
| Net asset value, offering price and redemption price per share | | $9.95 | $9.93 | $9.97 |
| Class R3: Net assets | | $2,360,852 | $2,688,155 | $3,818,025 |
| Shares outstanding | | 237,093 | 270,475 | 382,918 |
| Net asset value, offering price and redemption price per share | | $9.96 | $9.94 | $9.97 |
| Class R4: Net assets | | $211,947 | $1,029,170 | $176,068 |
| Shares outstanding | | 21,289 | 103,486 | 17,674 |
| Net asset value, offering price and redemption price per share | | $9.96 | $9.95 | $9.96 |
| Class R5: Net assets | | $2,141,819 | $3,574,401 | $3,258,944 |
| Shares outstanding | | 215,081 | 359,784 | 326,613 |
| Net asset value, offering price and redemption price per share | | $9.96 | $9.93 | $9.98 |
| Class 1: Net assets | | $730,904,435 | $844,508,986 | $812,653,563 |
| Shares outstanding | | 73,430,876 | 85,007,781 | 81,512,169 |
| Net asset value, offering price and redemption price per share | | $9.95 | $9.93 | $9.97 |
| | | | | |
| Maximum public offering price per share | | | | |
|
| Class A (net asset value per share ÷ 95%)1 | | $10.51 | $10.48 | $10.51 |
1 On single retail sales of less than $50,000. On sales of $50,000 or more and on group sales, the offering price is reduced.
| | |
| 30 | Lifecycle Portfolios | Semiannual report | See notes to financial statements |
| | | |
F I N A N C I A L S T A T E M EN T S
Statements of assets and liabilities 2-28-11 (Unaudited)
| | | | |
| Continued | | | | |
| | | | Lifecycle | Lifecycle |
| | | | 2015 Portfolio | 2010 Portfolio |
| Assets | | | | |
|
| Investments in affiliated funds, at value (Note 7) | | | $573,289,044 | $497,079,186 |
| Receivable for investments sold | | | 6,714,267 | 10,189,438 |
| Receivable for fund shares sold | | | 14,058 | 116,106 |
| Dividends and interest receivable | | | 260,180 | 278,555 |
| Receivable due from adviser | | | 945 | 855 |
| Other assets | | | 46,099 | 47,122 |
| Total assets | | | 580,324,593 | 507,711,262 |
| | | | | |
| Liabilities | | | | |
|
| Payable for investments purchased | | | 6,861,653 | 10,321,735 |
| Payable for fund shares repurchased | | | 148,700 | 290,255 |
| Payable to affiliates (Note 4) | | | | |
| Accounting and legal services fees | | | 12,670 | 11,564 |
| Transfer agent fees | | | 5,919 | 4,344 |
| Trustees’ fees | | | 475 | 533 |
| Distribution and service fees | | | 3,413 | 1,905 |
| Other liabilities and accrued expenses | | | 37,034 | 40,535 |
| Total liabilities | | | 7,069,864 | 10,670,871 |
| | | | | |
| Net assets | | | | |
|
| Capital paid-in | | | $524,910,256 | $452,839,331 |
| Undistributed net investment income | | | 493,707 | 569,366 |
| Accumulated net realized loss on investments | | | (41,854,319) | (18,709,396) |
| Net unrealized appreciation (depreciation) on investments | | | 89,705,085 | 62,341,090 |
| Net assets | | | $573,254,729 | $497,040,391 |
| Investments in affiliated funds, at cost | | | $483,583,959 | $434,738,096 |
| | | | | |
| Net asset value per share | | | | |
|
| The Portfolios have an unlimited number of shares authorized with no par value. | | | | |
| Net asset value is calculated by dividing the net assets of each class of shares by the | | | | |
| number of outstanding shares in the class. | | | | |
| Class A: Net assets | | | $18,754,390 | $14,057,908 |
| Shares outstanding | | | 1,904,749 | 1,413,935 |
| Net asset value and redemption price per share | | | $9.85 | $9.94 |
| Class R1: Net assets | | | $1,599,332 | $466,483 |
| Shares outstanding | | | 162,624 | 47,018 |
| Net asset value, offering price and redemption price per share | | | $9.83 | $9.92 |
| Class R3: Net assets | | | $2,429,118 | $1,738,463 |
| Shares outstanding | | | 247,051 | 175,066 |
| Net asset value, offering price and redemption price per share | | | $9.83 | $9.93 |
| Class R4: Net assets | | | $82,206 | $82,674 |
| Shares outstanding | | | 8,362 | 8,319 |
| Net asset value, offering price and redemption price per share | | | $9.83 | $9.94 |
| Class R5: Net assets | | | $1,589,725 | $2,953,085 |
| Shares outstanding | | | 161,520 | 297,260 |
| Net asset value, offering price and redemption price per share | | | $9.84 | $9.93 |
| Class 1: Net assets | | | $548,799,958 | $477,741,778 |
| Shares outstanding | | | 55,784,937 | 48,061,210 |
| Net asset value, offering price and redemption price per share | | | $9.84 | $9.94 |
| | | | | |
| Maximum public offering price per share | | | | |
|
| Class A (net asset value per share ÷ 95%)1 | | | $10.37 | $10.46 |
1 On single retail sales of less than $50,000. On sales of $50,000 or more and on group sales, the offering price is reduced.
| | |
| See notes to financial statements | Semiannual report | Lifecycle Portfolios | 31 |
| | |
F I N A N C I A L S T A T E M EN T S
Statements of operations For the six months ended 2-28-11 (Unaudited)
These Statements of Operations summarize the Portfolios’ investment income earned and expenses directly incurred in operating each Portfolio. They also show net gains (losses) for the period stated.
| | | | |
| | | Lifecycle | Lifecycle | Lifecycle |
| | | 2045 Portfolio | 2040 Portfolio | 2035 Portfolio |
| Investment income | | | | |
|
| Income distributions received from affiliated underlying funds | | $4,673,344 | $4,641,555 | $6,181,844 |
| | | | | |
| Expenses | | | | |
|
| Investment management fees (Note 4) | | 124,818 | 124,601 | 165,522 |
| Distribution and service fees (Note 4) | | 113,202 | 118,305 | 155,341 |
| Transfer agent fees (Note 4) | | 7,220 | 8,221 | 10,969 |
| Accounting and legal services fees (Note 4) | | 28,293 | 28,201 | 37,441 |
| State registration fees (Note 4) | | 32,883 | 33,213 | 32,875 |
| Professional fees | | 16,711 | 16,700 | 17,841 |
| Printing and postage (Note 4) | | 1,063 | 1,223 | 1,402 |
| Custodian fees | | 5,970 | 5,970 | 5,970 |
| Trustees’ fees (Note 4) | | 1,751 | 1,770 | 2,347 |
| Registration and filing fees | | 5,537 | 6,122 | 5,790 |
| Other | | 2,591 | 2,606 | 2,892 |
| Total expenses before reductions and amounts recaptured | | 340,039 | 346,932 | 438,390 |
| | | | | |
| Net expense reductions and amounts recaptured (Note 4) | | (41,463) | (42,818) | (44,454) |
| Total expenses | | 298,576 | 304,114 | 393,936 |
| | | | | |
| Net investment income | | 4,374,768 | 4,337,441 | 5,787,908 |
| | | | | |
| Realized and unrealized gain (loss) | | | | |
|
| Net realized gain on | | | | |
| Investments in affiliated underlying funds | | 530,219 | 355,505 | 194,854 |
| Capital gain distributions received from affiliated underlying funds | | 5,631,736 | 5,614,275 | 7,458,665 |
| | | 6,161,955 | 5,969,780 | 7,653,519 |
| Change in net unrealized appreciation (depreciation) of | | | | |
| Investments in affiliated underlying funds | | 75,719,453 | 76,062,865 | 101,308,225 |
| Net realized and unrealized gain | | 81,881,408 | 82,032,645 | 108,961,744 |
| | | | | |
| Increase in net assets from operations | | $86,256,176 | $86,370,086 | $114,749,652 |
| | |
| 32 | Lifecycle Portfolios | Semiannual report | See notes to financial statements |
| | | |
F I N A N C I A L S T A T E M EN T S
Statements of operations For the six months ended 2-28-11 (Unaudited)
Continued
| | | | |
| | | Lifecycle | Lifecycle | Lifecycle |
| | | 2030 Portfolio | 2025 Portfolio | 2020 Portfolio |
| Investment income | | | | |
|
| Income distributions received from affiliated underlying funds | | $8,453,624 | $11,166,259 | $12,994,605 |
| | | | |
| Expenses | | | | |
|
| Investment management fees (Note 4) | | 212,749 | 244,360 | 238,001 |
| Distribution and service fees (Note 4) | | 203,507 | 231,220 | 236,035 |
| Transfer agent fees (Note 4) | | 17,446 | 17,513 | 21,519 |
| Accounting and legal services fees (Note 4) | | 48,278 | 55,802 | 55,011 |
| State registration fees (Note 4) | | 33,123 | 33,278 | 33,447 |
| Professional fees | | 19,175 | 20,102 | 19,963 |
| Printing and postage (Note 4) | | 2,044 | 2,097 | 2,583 |
| Custodian fees | | 5,970 | 5,970 | 5,970 |
| Trustees’ fees (Note 4) | | 3,052 | 3,543 | 3,539 |
| Registration and filing fees | | 6,486 | 7,150 | 6,844 |
| Other | | 3,464 | 3,767 | 3,767 |
| | | | | |
| Total expenses before reductions and amounts recaptured | | 555,294 | 624,802 | 626,679 |
| Net expense reductions and amounts recaptured (Note 4) | | (47,163) | (48,449) | (45,538) |
| | | | | |
| Total expenses | | 508,131 | 576,353 | 581,141 |
| | | | | |
| Net investment income | | 7,945,493 | 10,589,906 | 12,413,464 |
| | | | | |
| Realized and unrealized gain (loss) | | | | |
|
| Net realized gain (loss) on | | | | |
| Investments in affiliated underlying funds | | (301,983) | (339,939) | 1,812,566 |
| Capital gain distributions received from affiliated underlying funds | | 9,349,693 | 10,509,796 | 9,849,905 |
| | | 9,047,710 | 10,169,857 | 11,662,471 |
| Change in net unrealized appreciation (depreciation) of | | | | |
| Investments in affiliated underlying funds | | 126,534,165 | 133,486,084 | 111,965,288 |
| Net realized and unrealized gain | | 135,581,875 | 143,655,941 | 123,627,759 |
| | | | | |
| Increase in net assets from operations | | $143,527,368 | $154,245,847 | $136,041,223 |
| | |
| | Semiannual report | Lifecycle Portfolios | 33 |
| See notes to financial statements | | |
F I N A N C I A L S T A T E M EN T S
Statements of operations For the six months ended 2-28-11 (Unaudited)
Continued
| | |
| | Lifecycle | Lifecycle |
| | 2015 Portfolio | 2010 Portfolio |
| Investment income | | |
|
| Income distributions received from affiliated underlying funds | $10,042,276 | $10,345,163 |
| | | |
| Expenses | | |
|
| Investment management fees (Note 4) | 156,464 | 148,195 |
| Distribution and service fees (Note 4) | 162,029 | 143,833 |
| Transfer agent fees (Note 4) | 15,080 | 10,784 |
| Accounting and legal services fees (Note 4) | 37,546 | 35,716 |
| State registration fees (Note 4) | 33,167 | 33,273 |
| Professional fees | 17,800 | 17,607 |
| Printing and postage (Note 4) | 1,757 | 1,155 |
| Custodian fees | 5,970 | 5,970 |
| Trustees’ fees (Note 4) | 2,437 | 2,441 |
| Registration and filing fees | 5,780 | 4,812 |
| Other | 3,206 | 2,814 |
| | | |
| Total expenses before reductions and amounts recaptured | 441,236 | 406,600 |
| | | |
| Net expense reductions and amounts recaptured (Note 4) | (35,728) | (34,970) |
| Total expenses | 405,508 | 371,630 |
| | | |
| Net investment income | 9,636,768 | 9,973,533 |
| | | |
| Realized and unrealized gain (loss) | | |
|
| Net realized gain on | | |
| Investments in affiliated underlying funds | 474,967 | 5,148,285 |
| Capital gain distributions received from affiliated underlying funds | 6,328,340 | 5,551,082 |
| | 6,803,307 | 10,699,367 |
| Change in net unrealized appreciation (depreciation) of | | |
| Investments in affiliated underlying funds | 64,131,966 | 46,242,058 |
| Net realized and unrealized gain | 70,935,273 | 56,941,425 |
| | | |
| Increase in net assets from operations | $80,572,041 | $66,914,958 |
| | |
| 34 | Lifecycle Portfolios | Semiannual report | See notes to financial statements |
| | | |
F I N A N C I A L S T A T E M EN T S
Statements of changes in net assets
These Statements of Changes in Net Assets show how the value of the Portfolios’ net assets have changed during the last two periods. They reflect income less expenses, any investment gains and losses, distributions, if any, paid to shareholders and the net of Portfolio share transactions.
| | | | |
| | Lifecycle 2045 Portfolio | Lifecycle 2040 Portfolio |
| | Six months ended | | Six months ended | |
| | 2-28-11 (Unaudited) | Year ended 8-31-10 | 2-28-11 (Unaudited) | Year ended 8-31-10 |
| Increase (decrease) in net assets | | | | |
|
| From operations | | | | |
| | | | | |
| Net investment income | $4,374,768 | $3,536,133 | $4,337,441 | $3,709,414 |
| Net realized gain (loss) | 6,161,955 | (2,291,284) | 5,969,780 | (2,941,995) |
| Change in net unrealized appreciation | 75,719,453 | 7,646,002 | 76,062,865 | 9,004,898 |
| (depreciation) | | | | |
| Increase in net assets resulting | | | | |
| from operations | 86,256,176 | 8,890,851 | 86,370,086 | 9,772,317 |
| |
| Distributions to shareholders | | | | |
| | | | | |
| From net investment income | | | | |
| Class A | (55,685) | (46,943) | (62,031) | (61,244) |
| Class R1 | (5,093) | (5,561) | (6,192) | (9,129) |
| Class R3 | (4,419) | (3,590) | (12,677) | (13,716) |
| Class R4 | (2,925) | (1,521) | (1,673) | (518) |
| Class R5 | (5,796) | (2,586) | (8,720) | (7,740) |
| Class 1 | (4,453,329) | (3,415,896) | (4,398,789) | (3,556,663) |
| From net realized gain | | | | |
| Class A | (59,552) | (16,183) | (66,473) | (21,053) |
| Class R1 | (6,741) | (2,179) | (8,213) | (3,564) |
| Class R3 | (5,045) | (1,290) | (14,514) | (4,910) |
| Class R4 | (2,487) | (451) | (1,428) | (153) |
| Class R5 | (3,787) | (635) | (5,700) | (1,903) |
| Class 1 | (3,021,240) | (865,520) | (2,991,844) | (900,289) |
| | | | | |
| Total distributions | (7,626,099) | (4,362,355) | (7,578,254) | (4,580,882) |
| | | | | |
| From Portfolio share transactions | | | | |
| (Note 5) | 56,205,673 | 117,893,478 | 47,294,027 | 111,915,589 |
| | | | |
| Total increase | 134,835,750 | 122,421,974 | 126,085,859 | 117,107,024 |
| | | | |
| Net assets | | | | |
|
| Beginning of period | 317,604,334 | 195,182,360 | 321,367,218 | 204,260,194 |
| | | | | |
| End of period | $452,440,084 | $317,604,334 | $447,453,077 | $321,367,218 |
| | | | |
| Undistributed (accumulated | | | | |
| distributions in excess of) net | | | | |
| investment income | ($36,041) | $116,438 | ($35,529) | $117,112 |
| | |
| See notes to financial statements | Semiannual report | Lifecycle Portfolios | 35 |
| | |
F I N A N C I A L S T A T E M EN T S
Statements of changes in net assets
Continued
| | | | |
| | Lifecycle 2035 Portfolio | Lifecycle 2030 Portfolio |
| | Six months ended | | Six months ended | |
| | 2-28-11 (Unaudited) | Year ended 8-31-10 | 2-28-11 (Unaudited) | Year ended 8-31-10 |
| Increase (decrease) in net assets | | | | |
|
| From operations | | | | |
| | | | | |
| Net investment income | $5,787,908 | $5,075,830 | $7,945,493 | $7,196,632 |
| Net realized gain (loss) | 7,653,519 | (4,994,913) | 9,047,710 | (7,251,391) |
| Change in net unrealized appreciation | | | | |
| (depreciation) | 101,308,225 | 13,677,597 | 126,534,165 | 19,429,008 |
| | | | | |
| Increase in net assets resulting | | | | |
| from operations | 114,749,652 | 13,758,514 | 143,527,368 | 19,374,249 |
| |
| Distributions to shareholders | | | | |
| | | | | |
| From net investment income | | | | |
| Class A | (85,254) | (77,692) | (158,609) | (131,642) |
| Class R1 | (10,397) | (9,922) | (14,893) | (14,717) |
| Class R3 | (8,973) | (6,502) | (14,386) | (7,729) |
| Class R4 | (7,363) | (1,545) | (1,523) | (816) |
| Class R5 | (11,729) | (5,264) | (24,341) | (14,368) |
| Class 1 | (5,881,665) | (4,898,225) | (8,400,670) | (6,495,521) |
| From net realized gain | | | | |
| Class A | (90,510) | (26,515) | (139,995) | (44,054) |
| Class R1 | (13,634) | (3,841) | (15,683) | (5,562) |
| Class R3 | (10,910) | (2,409) | (14,235) | (2,799) |
| Class R4 | (6,235) | (455) | (1,106) | (236) |
| Class R5 | (7,618) | (1,287) | (13,958) | (3,476) |
| Class 1 | (3,974,505) | (1,233,609) | (4,992,230) | (1,616,531) |
| | | | | |
| Total distributions | (10,108,793) | (6,267,266) | (13,791,629) | (8,337,451) |
| | | | | |
| From Portfolio share transactions | | | | |
| (Note 5) | 64,405,133 | 137,948,628 | 72,762,239 | 182,686,736 |
| | | | | |
| Total increase | 169,045,992 | 145,439,876 | 202,497,978 | 193,723,534 |
| | | | | |
| Net assets | | | | |
|
| Beginning of period | 425,646,583 | 280,206,707 | 556,924,933 | 363,201,399 |
| | | | | |
| End of period | $594,692,575 | $425,646,583 | $759,422,911 | $556,924,933 |
| | | | | |
| Undistributed (accumulated | | | | |
| distributions in excess of) net | | | | |
| investment income | ($44,324) | $173,149 | $39,820 | $708,749 |
| | |
| 36 | Lifecycle Portfolios | Semiannual report | |
| | | See notes to financial statements |
F I N A N C I A L S T A T E M EN T S
Statements of changes in net assets
Continued
| | | | |
| | Lifecycle 2025 Portfolio | Lifecycle 2020 Portfolio |
| | Six months ended | | Six months ended | |
| | 2-28-11 (Unaudited) | Year ended 8-31-10 | 2-28-11 (Unaudited) | Year ended 8-31-10 |
| Increase (decrease) in net assets | | | | |
|
| From operations | | | | |
| | | | | |
| Net investment income | $10,589,906 | $10,596,589 | $12,413,464 | $13,170,918 |
| Net realized gain (loss) | 10,169,857 | (7,995,101) | 11,662,471 | (12,571,924) |
| Change in net unrealized appreciation | | | | |
| (depreciation) | 133,486,084 | 26,121,187 | 111,965,288 | 34,423,179 |
| | | | | |
| Increase in net assets resulting | | | | |
| from operations | 154,245,847 | 28,722,675 | 136,041,223 | 35,022,173 |
| |
| Distributions to shareholders | | | | |
| | | | | |
| From net investment income | | | | |
| Class A | (217,659) | (167,876) | (382,737) | (265,885) |
| Class R1 | (20,104) | (19,923) | (32,194) | (35,124) |
| Class R3 | (24,331) | (12,254) | (51,036) | (16,382) |
| Class R4 | (10,866) | (4,099) | (3,004) | (1,576) |
| Class R5 | (51,292) | (11,407) | (63,619) | (18,259) |
| Class 1 | (12,082,965) | (9,127,164) | (15,220,906) | (10,678,662) |
| From net realized gain | | | | |
| Class A | (141,903) | (46,480) | (184,096) | (57,599) |
| Class R1 | (14,892) | (6,092) | (16,948) | (8,230) |
| Class R3 | (17,241) | (3,619) | (26,047) | (3,738) |
| Class R4 | (6,108) | (1,008) | (1,296) | (310) |
| Class R5 | (23,891) | (2,401) | (23,761) | (3,165) |
| Class 1 | (5,793,623) | (1,968,640) | (5,814,859) | (1,887,701) |
| | | | | |
| Total distributions | (18,404,875) | (11,370,963) | (21,820,503) | (12,976,631) |
| | | | | |
| From Portfolio share transactions | | | | |
| (Note 5) | 88,191,876 | 192,468,570 | 78,071,379 | 196,721,121 |
| | | | |
| Total increase | 224,032,848 | 209,820,282 | 192,292,099 | 218,766,663 |
| | | | | |
| Net assets | | | | |
|
| Beginning of period | 651,032,751 | 441,212,469 | 655,693,916 | 436,927,253 |
| | | | | |
| End of period | $875,065,599 | $651,032,751 | $847,986,015 | $655,693,916 |
| | | | | |
| Undistributed net investment | | | | |
| income | $271,240 | $2,088,551 | $509,915 | $3,849,947 |
| | |
| See notes to financial statements | Semiannual report | Lifecycle Portfolios | 37 |
| | |
F I N A N C I A L S T A T E M EN T S
Statements of changes in net assets
Continued
| | | | |
| | Lifecycle 2015 Portfolio | Lifecycle 2010 Portfolio |
| | Six months ended | | Six months ended | |
| | 2-28-11 (Unaudited) | Year ended 8-31-10 | 2-28-11 (Unaudited) | Year ended 8-31-10 |
| Increase (decrease) in net assets | | | | |
|
| From operations | | | | |
| | | | | |
| Net investment income | $9,636,768 | $11,546,411 | $9,973,533 | $14,138,979 |
| Net realized gain (loss) | 6,803,307 | (10,908,815) | 10,699,367 | (6,466,504) |
| Change in net unrealized appreciation | | | | |
| (depreciation) | 64,131,966 | 28,937,745 | 46,242,058 | 18,381,694 |
| | | | | |
| Increase in net assets resulting | | | | |
| from operations | 80,572,041 | 29,575,341 | 66,914,958 | 26,054,169 |
| |
| Distributions to shareholders | | | | |
| | | | | |
| From net investment income | | | | |
| Class A | (351,388) | (244,190) | (289,292) | (140,404) |
| Class R1 | (29,776) | (20,263) | (10,254) | (8,771) |
| Class R3 | (46,495) | (28,413) | (41,261) | (20,105) |
| Class R4 | (1,727) | (860) | (2,183) | (1,430) |
| Class R5 | (28,645) | (4,495) | (59,950) | (4,780) |
| Class 1 | (12,767,901) | (9,397,695) | (14,508,343) | (9,970,848) |
| From net realized gain | | | | |
| Class A | (122,542) | (47,258) | (73,096) | (24,119) |
| Class R1 | (11,132) | (4,166) | (2,740) | (1,619) |
| Class R3 | (16,975) | (5,723) | (10,819) | (3,621) |
| Class R4 | (553) | (154) | (513) | (225) |
| Class R5 | (8,163) | (727) | (12,848) | (667) |
| Class 1 | (3,705,993) | (1,546,352) | (3,148,858) | (1,415,580) |
| | | | | |
| Total distributions | (17,091,290) | (11,300,296) | (18,160,157) | (11,592,169) |
| | | | | |
| From Portfolio share transactions | | | | |
| (Note 5) | 53,140,458 | 122,608,205 | (10,730,652) | 286,012,763 |
| | | | |
| Total increase | 116,621,209 | 140,883,250 | 38,024,149 | 300,474,763 |
| | | | | |
| Net assets | | | | |
|
| Beginning of period | 456,633,520 | 315,750,270 | 459,016,242 | 158,541,479 |
| | | | | |
| End of period | $573,254,729 | $456,633,520 | $497,040,391 | $459,016,242 |
| | | | |
| Undistributed net investment | | | | |
| income | $493,707 | $4,082,871 | $569,366 | $5,507,116 |
| | |
38 | Lifecycle Portfolios | Semiannual report | See notes to financial statements |
| | | |
Financial highlights
These Financial Highlights show how each Portfolio’s net asset value for a share has changed since the end of the previous period.
| | | | | | | | | | | | | | | |
| Lifecycle 2045 Portfolio | | | | | | | | | | | | | |
| Per share operating performance for a share outstanding throughout each period | | Ratios and supplemental data | |
|
| | | Income (loss) from | | | | | | | | | | | | |
| | | investment operations | | | Less distributions | | | | Ratios to average net assets | | |
| | |
| |
| |
| |
| |
| | | | Net | | | | | | | | Expenses | | | | |
| | | | realized | Total | | | | | | | before | Expenses | | Net | |
| | Net asset | Net | and | from | From net | | | | | | reduc- | including | | assets, | |
| | value, | invest- | unrealized | invest- | invest- | | | | Net asset | | tions and | reductions | Net | end of | |
| | beginning | ment in- | gain (loss) | ment | ment | From net | From | Total value, | end | Total | amounts | and amounts | investment | period (in | Portfolio |
| | of period | come (loss) | on invest- | operations | income | realized | capital | distribu- | of period | return | recaptured | recaptured | income | thousands) | turnover |
| Period ended | ($) | ($)1,2 | ments ($) | ($) | ($) | gain ($) | paid-in ($) | tions ($) | ($) | (%)3 | (%) | (%) | (loss) (%)1 | ($) | (%) |
|
| CLASS A | | | | | | | | | | | | | | | |
|
| 02-28-20114 | 8.11 | 0.08 | 1.99 | 2.07 | (0.07) | (0.07) | — | (0.14) | 10.04 | 25.635,6 | 0.807,8 | 0.597,8 | 1.767 | 9,008 | 9 |
| 08-31-2010 | 7.76 | 0.07 | 0.40 | 0.47 | (0.09) | (0.03) | — | (0.12) | 8.11 | 6.005 | 0.858 | 0.608,9 | 0.87 | 6,026 | 19 |
| 08-31-2009 | 9.56 | 0.06 | (1.69) | (1.63) | (0.08) | (0.09) | — | (0.17) | 7.76 | (16.60)5 | 1.908 | 0.638 | 0.86 | 3,488 | 22 |
| 08-31-2008 | 10.94 | 0.05 | (1.21) | (1.16) | (0.06) | (0.16) | — | (0.22) | 9.56 | (10.83)5 | 1.618 | 0.668,10 | 0.44 | 1,874 | 16 |
| 08-31-200711 | 10.00 | (0.04) | 1.22 | 1.18 | (0.06) | (0.18) | — | (0.24) | 10.94 | 11.975,6 | 1.947,12 | 0.627,12 | (0.45)7 | 1,348 | 5 |
|
| CLASS R1 | | | | | | | | | | | | | | | |
|
| 02-28-20114 | 8.10 | 0.07 | 1.99 | 2.06 | (0.06) | (0.07) | — | (0.13) | 10.03 | 25.495,6 | 2.367,8 | 0.747,8 | 1.557 | 1,011 | 9 |
| 08-31-2010 | 7.75 | 0.07 | 0.39 | 0.46 | (0.08) | (0.03) | — | (0.11) | 8.10 | 5.885 | 1.658 | 0.758,13 | 0.78 | 721 | 19 |
| 08-31-2009 | 9.52 | 0.06 | (1.69) | (1.63) | (0.05) | (0.09) | — | (0.14) | 7.75 | (16.72)5 | 5.278 | 0.868 | 0.87 | 616 | 22 |
| 08-31-2008 | 10.92 | 0.01 | (1.19) | (1.18) | (0.06) | (0.16) | — | (0.22) | 9.52 | (11.05)5 | 12.478 | 0.898,10 | 0.08 | 181 | 16 |
| 08-31-200711 | 10.00 | (0.01) | 1.16 | 1.15 | (0.05) | (0.18) | — | (0.23) | 10.92 | 11.685,6 | 16.687,12 | 0.877,12 | (0.09)7 | 113 | 5 |
|
| CLASS R3 | | | | | | | | | | | | | | | |
|
| 02-28-20114 | 8.10 | 0.08 | 2.00 | 2.08 | (0.07) | (0.07) | — | (0.14) | 10.04 | 25.735,6 | 2.717,8 | 0.647,8 | 1.687 | 731 | 9 |
| 08-31-2010 | 7.76 | 0.07 | 0.39 | 0.46 | (0.09) | (0.03) | — | (0.12) | 8.10 | 5.835 | 2.478 | 0.658,13 | 0.84 | 570 | 19 |
| 08-31-2009 | 9.53 | 0.06 | (1.68) | (1.62) | (0.06) | (0.09) | — | (0.15) | 7.76 | (16.58)5 | 6.518 | 0.768 | 0.95 | 259 | 22 |
| 08-31-2008 | 10.93 | 0.03 | (1.21) | (1.18) | (0.06) | (0.16) | — | (0.22) | 9.53 | (11.04)5 | 10.488 | 0.818,10 | 0.28 | 283 | 16 |
| 08-31-200711 | 10.00 | —14 | 1.16 | 1.16 | (0.05) | (0.18) | — | (0.23) | 10.93 | 11.805,6 | 16.457,12 | 0.807,12 | (0.03)7 | 118 | 5 |
|
| CLASS R4 | | | | | | | | | | | | | | | |
|
| 02-28-20114 | 8.13 | 0.09 | 2.00 | 2.09 | (0.09) | (0.07) | — | (0.16) | 10.06 | 25.795,6 | 4.447,8 | 0.397,8 | 1.987 | 371 | 9 |
| 08-31-2010 | 7.78 | 0.07 | 0.42 | 0.49 | (0.11) | (0.03) | — | (0.14) | 8.13 | 6.175 | 3.798 | 0.408,13 | 0.82 | 283 | 19 |
| 08-31-2009 | 9.57 | 0.08 | (1.70) | (1.62) | (0.08) | (0.09) | — | (0.17) | 7.78 | (16.35)5 | 6.098 | 0.488 | 1.10 | 324 | 22 |
| 08-31-2008 | 10.95 | 0.06 | (1.21) | (1.15) | (0.07) | (0.16) | — | (0.23) | 9.57 | (10.76)5 | 14.158 | 0.528,10 | 0.55 | 142 | 16 |
| 08-31-200711 | 10.00 | 0.02 | 1.17 | 1.19 | (0.06) | (0.18) | — | (0.24) | 10.95 | 12.065,6 | 16.327,12 | 0.527,12 | 0.267 | 112 | 5 |
|
| CLASS R5 | | | | | | | | | | | | | | | |
|
| 02-28-20114 | 8.16 | 0.12 | 1.99 | 2.11 | (0.12) | (0.07) | — | (0.19) | 10.08 | 25.915,6 | 3.127,8 | 0.097,8 | 2.517 | 630 | 9 |
| 08-31-2010 | 7.80 | 0.13 | 0.39 | 0.52 | (0.13) | (0.03) | — | (0.16) | 8.16 | 6.555 | 3.498 | 0.108,13 | 1.50 | 218 | 19 |
| 08-31-2009 | 9.61 | 0.11 | (1.72) | (1.61) | (0.11) | (0.09) | — | (0.20) | 7.80 | (16.12)5 | 7.408 | 0.198 | 1.60 | 216 | 22 |
| 08-31-2008 | 10.97 | 0.08 | (1.20) | (1.12) | (0.08) | (0.16) | — | (0.24) | 9.61 | (10.47)5 | 12.028 | 0.248,10 | 0.72 | 161 | 16 |
| 08-31-200711 | 10.00 | 0.05 | 1.16 | 1.21 | (0.06) | (0.18) | — | (0.24) | 10.97 | 12.325,6 | 16.027,12 | 0.237,12 | 0.557 | 112 | 5 |
|
| CLASS 1 | | | | | | | | | | | | | | | |
|
| 02-28-20114 | 8.15 | 0.11 | 2.00 | 2.11 | (0.11) | (0.07) | — | (0.18) | 10.08 | 26.015,6 | 0.147,8 | 0.147,8 | 2.247 | 440,689 | 9 |
| 08-31-2010 | 7.80 | 0.11 | 0.39 | 0.50 | (0.12) | (0.03) | — | (0.15) | 8.15 | 6.385 | 0.168 | 0.158 | 1.32 | 309,787 | 19 |
| 08-31-2009 | 9.61 | 0.10 | (1.70) | (1.60) | (0.12) | (0.09) | — | (0.21) | 7.80 | (16.06)5 | 0.198 | 0.198 | 1.40 | 190,278 | 22 |
| 08-31-2008 | 10.97 | 0.06 | (1.18) | (1.12) | (0.08) | (0.16) | — | (0.24) | 9.61 | (10.47)5 | 0.248 | 0.208 | 0.59 | 97,667 | 16 |
| 08-31-200711 | 10.00 | (0.01) | 1.23 | 1.22 | (0.07) | (0.18) | — | (0.25) | 10.97 | 12.325,6 | 0.647,12 | 0.207,12 | (0.15)7 | 23,187 | 5 |
|
| | |
| See notes to financial statements | Semiannual report | Lifecycle Portfolios | 39 |
| | |
Financial highlights
Continued
Lifecycle 2045 Portfolio continued
1 Recognition of net investment income by the Portfolio is affected by the timing of the declaration of dividends by the underlying funds in which the Portfolio invests.
2 Based on the average daily shares outstanding.
3 Does not reflect the effect of sales charges, if any.
4 Unaudited.
5 Total returns would have been lower had certain expenses not been reduced during the periods shown.
6 Not annualized.
7 Annualized.
8 Ratios do not include expenses indirectly incurred from underlying funds whose expense ratios can vary based on the mix of underlying funds held by the Portfolio. The
range of expense ratios of the underlying funds held by the Portfolio was as follows: 0.48%–1.14%, 0.48%–1.17%, 0.49%–1.31% and 0.49%–1.13% for the peri-
ods ended 2-28-11, 8-31-10, 8-31-09 and 8-31-08, respectively.
9 Includes small account fee credits of 0.02% of average net assets.
10 Includes transfer agent fee earned credits of less than 0.01% of average net assets.
11 The inception date for Class A, Class R1, Class R3, Class R4, Class R5 and Class 1 shares is 10-30-06.
12 Does not include expenses of the underlying affiliated funds in which the Portfolio invests.
13 Includes the impact of expense recapture for the following period ended 8-31-10: 0.08%, 0.07%, 0.17% and 0.17% of average net assets for Class R1, Class R3,
Class R4 and Class R5 shares, respectively. See Note 4.
14 Less than ($0.005) per share.
| | | | | | | | | | | | | | | |
| Lifecycle 2040 Portfolio | | | | | | | | | | | | | |
| Per share operating performance for a share outstanding throughout each period | | Ratios and supplemental data | |
|
| | | Income (loss) from | | | | | | | | | | | | |
| | | investment operations | | | Less distributions | | | | Ratios to average net assets | | |
| | |
| |
| |
| |
| |
| | | | Net | | | | | | | | Expenses | Expenses | | | |
| | | | realized | Total | | | | | | | before | including | | Net | |
| | Net asset | Net | and | from | From net | | | | | | reduc- | reduc- | | assets, | |
| | value, | invest- | unrealized | invest- | invest- | | | | Net asset | | tions and | tions and | Net | end of | |
| | beginning | ment in- | gain (loss) | ment | ment | From net | From | Total value, | end | Total | amounts | amounts | investment | period (in | Portfolio |
| | of period | come (loss) | on invest- | operations | income | realized | capital | distribu- | of period | return | recaptured | recaptured | income | thousands) | turnover |
| Period ended | ($) | ($)1,2 | ments ($) | ($) | ($) | gain ($) | paid-in ($) | tions ($) | ($) | (%)3 | (%) | (%) | (loss) (%)1 | ($) | (%) |
|
| CLASS A | | | | | | | | | | | | | | | |
|
| 02-28-20114 | 8.12 | 0.08 | 1.99 | 2.07 | (0.07) | (0.07) | — | (0.14) | 10.05 | 25.605,6 | 0.787,8 | 0.597,8 | 1.777 | 10,024 | 9 |
| 08-31-2010 | 7.77 | 0.08 | 0.39 | 0.47 | (0.09) | (0.03) | — | (0.12) | 8.12 | 6.005 | 0.748 | 0.608,9,10 | 0.91 | 6,843 | 20 |
| 08-31-2009 | 9.56 | 0.06 | (1.67) | (1.61) | (0.08) | (0.10) | — | (0.18) | 7.77 | (16.33)5 | 1.618 | 0.638 | 0.90 | 4,434 | 20 |
| 08-31-2008 | 10.96 | 0.05 | (1.22) | (1.17) | (0.07) | (0.16) | — | (0.23) | 9.56 | (10.92)5 | 2.158 | 0.658,11 | 0.49 | 1,257 | 16 |
| 08-31-200712 | 10.00 | (0.02) | 1.20 | 1.18 | (0.05) | (0.17) | — | (0.22) | 10.96 | 11.995,6 | 3.157,13 | 0.627,13 | (0.18)7 | 584 | 3 |
|
| CLASS R1 | | | | | | | | | | | | | | | |
|
| 02-28-20114 | 8.10 | 0.06 | 2.01 | 2.07 | (0.06) | (0.07) | — | (0.13) | 10.04 | 25.615,6 | 1.987,8 | 0.747,8 | 1.337 | 1,183 | 9 |
| 08-31-2010 | 7.76 | 0.06 | 0.39 | 0.45 | (0.08) | (0.03) | — | (0.11) | 8.10 | 5.75 | 1.348 | 0.758,9 | 0.70 | 1,190 | 20 |
| 08-31-2009 | 9.53 | 0.07 | (1.69) | (1.62) | (0.05) | (0.10) | — | (0.15) | 7.76 | (16.54)5 | 4.578 | 0.858 | 0.98 | 728 | 20 |
| 08-31-2008 | 10.94 | 0.01 | (1.20) | (1.19) | (0.06) | (0.16) | — | (0.22) | 9.53 | (11.05)5 | 9.488 | 0.898,11 | 0.09 | 200 | 16 |
| 08-31-200712 | 10.00 | (0.01) | 1.17 | 1.16 | (0.05) | (0.17) | — | (0.22) | 10.94 | 11.705,6 | 16.617,13 | 0.877,13 | (0.09)7 | 112 | 3 |
|
| CLASS R3 | | | | | | | | | | | | | | | |
|
| 02-28-20114 | 8.10 | 0.08 | 1.99 | 2.07 | (0.07) | (0.07) | — | (0.14) | 10.03 | 25.605,6 | 1.467,8 | 0.647,8 | 1.717 | 2,166 | 9 |
| 08-31-2010 | 7.75 | 0.08 | 0.39 | 0.47 | (0.09) | (0.03) | — | (0.12) | 8.10 | 5.975 | 1.258 | 0.658,9 | 0.90 | 1,547 | 20 |
| 08-31-2009 | 9.53 | 0.08 | (1.70) | (1.62) | (0.06) | (0.10) | — | (0.16) | 7.75 | (16.52)5 | 1.968 | 0.768 | 1.14 | 1,271 | 20 |
| 08-31-2008 | 10.95 | 0.01 | (1.21) | (1.20) | (0.06) | (0.16) | — | (0.22) | 9.53 | (11.14)5 | 5.488 | 0.838,11 | 0.06 | 1,181 | 16 |
| 08-31-200712 | 10.00 | (0.01) | 1.18 | 1.17 | (0.05) | (0.17) | — | (0.22) | 10.95 | 11.825,6 | 15.597,13 | 0.807,13 | (0.07)7 | 141 | 3 |
|
| CLASS R4 | | | | | | | | | | | | | | | |
|
| 02-28-20114 | 8.13 | 0.09 | 1.99 | 2.08 | (0.09) | (0.07) | — | (0.16) | 10.05 | 25.675,6 | 7.237,8 | 0.397,8 | 1.917 | 201 | 9 |
| 08-31-2010 | 7.78 | 0.04 | 0.45 | 0.49 | (0.11) | (0.03) | — | (0.14) | 8.13 | 6.185 | 6.628 | 0.408,9 | 0.53 | 156 | 20 |
| 08-31-2009 | 9.58 | 0.08 | (1.69) | (1.61) | (0.09) | (0.10) | — | (0.19) | 7.78 | (16.28)5 | 6.798 | 0.488 | 1.21 | 253 | 20 |
| 08-31-2008 | 10.97 | 0.04 | (1.20) | (1.16) | (0.07) | (0.16) | — | (0.23) | 9.58 | (10.76)5 | 11.688 | 0.538,11 | 0.40 | 173 | 16 |
| 08-31-200712 | 10.00 | 0.02 | 1.17 | 1.19 | (0.05) | (0.17) | — | (0.22) | 10.97 | 12.075,6 | 16.237,13 | 0.527,13 | 0.267 | 112 | 3 |
|
| | |
| 40 | Lifecycle Portfolios | Semiannual report | See notes to financial statements |
| | | |
Financial highlights
Continued
| | | | | | | | | | | | | | | |
| Lifecycle 2040 Portfolio continued | | | | | | | | | | | |
| Per share operating performance for a share outstanding throughout each period | | Ratios and supplemental data | |
|
| | | Income (loss) from | | | | | | | | | | | | |
| | | investment operations | | | Less distributions | | | | Ratios to average net assets | | |
| | |
| |
| |
| |
| |
| | | | Net | | | | | | | | Expenses | Expenses | | | |
| | | | realized | Total | | | | | | | before | including | | Net | |
| | Net asset | Net | and | from | From net | | | | | | reduc- | reduc- | | assets, | |
| | value, | invest- | unrealized | invest- | invest- | | | | Net asset | | tions and | tions and | Net | end of | |
| | beginning | ment in- | gain (loss) | ment | ment | From net | From | Total | value, end | Total | amounts | amounts | investment | period (in | Portfolio |
| | of period | come (loss) | on invest- | operations | income | realized | capital | distribu- | of period | return | recaptured | recaptured | income | thousands) | turnover |
| Period ended | ($) | ($)1,2 | ments ($) | ($) | ($) | gain ($) | paid-in ($) | tions ($) | ($) | (%)3 | (%) | (%) | (loss) (%)1 | ($) | (%) |
|
| CLASS R5 | | | | | | | | | | | | | | | |
|
| 02-28-20114 | 8.16 | 0.11 | 2.00 | 2.11 | (0.12) | (0.07) | — | (0.19) | 10.08 | 25.915,6 | 2.067,8 | 0.097,8 | 2.427 | 885 | 9 |
| 08-31-2010 | 7.80 | 0.14 | 0.38 | 0.52 | (0.13) | (0.03) | — | (0.16) | 8.16 | 6.565 | 1.528 | 0.108,9 | 1.64 | 456 | 20 |
| 08-31-2009 | 9.62 | 0.12 | (1.73) | (1.61) | (0.11) | (0.10) | — | (0.21) | 7.80 | (16.05)5 | 2.548 | 0.198 | 1.80 | 561 | 20 |
| 08-31-2008 | 10.99 | 0.05 | (1.18) | (1.13) | (0.08) | (0.16) | — | (0.24) | 9.62 | (10.48)5 | 7.958 | 0.248,11 | 0.48 | 633 | 16 |
| 08-31-200712 | 10.00 | 0.05 | 1.17 | 1.22 | (0.06) | (0.17) | — | (0.23) | 10.99 | 12.335,6 | 15.717,13 | 0.237,13 | 0.537 | 115 | 3 |
|
| CLASS 1 | | | | | | | | | | | | | | | |
|
| 02-28-20114 | 8.15 | 0.10 | 2.00 | 2.10 | (0.11) | (0.07) | — | (0.18) | 10.07 | 25.895,6 | 0.147,8 | 0.147,8 | 2.237 | 432,994 | 9 |
| 08-31-2010 | 7.79 | 0.11 | 0.40 | 0.51 | (0.12) | (0.03) | — | (0.15) | 8.15 | 6.525 | 0.168 | 0.158 | 1.34 | 311,176 | 20 |
| 08-31-2009 | 9.62 | 0.10 | (1.71) | (1.61) | (0.12) | (0.10) | — | (0.22) | 7.79 | (16.09)5 | 0.188 | 0.188 | 1.46 | 197,012 | 20 |
| 08-31-2008 | 10.99 | 0.06 | (1.19) | (1.13) | (0.08) | (0.16) | — | (0.24) | 9.62 | (10.48)5 | 0.228 | 0.208 | 0.61 | 111,814 | 16 |
| 08-31-200712 | 10.00 | (0.01) | 1.23 | 1.22 | (0.06) | (0.17) | — | (0.23) | 10.99 | 12.345,6 | 0.627,13 | 0.207,13 | (0.16)7 | 25,954 | 3 |
|
1 Recognition of net investment income by the Portfolio is affected by the timing of the declaration of dividends by the underlying funds in which the Portfolio invests.
2 Based on the average daily shares outstanding.
3 Does not reflect the effect of sales charges, if any.
4 Unaudited.
5 Total returns would have been lower had certain expenses not been reduced during the periods shown.
6 Not annualized.
7 Annualized.
8 Ratios do not include expenses indirectly incurred from underlying funds whose expense ratios can vary based on the mix of underlying funds held by the Portfolio. The
range of expense ratios of the underlying funds held by the Portfolio was as follows: 0.48%–1.14%, 0.48%–1.17%, 0.49%–1.31% and 0.49%–1.13% for the peri-
ods ended 2-28-11, 8-31-10, 8-31-09 and 8-31-08, respectively.
9 Includes the impact of expense recapture for the following period ended 8-31-10: 0.01%, 0.03%, less than 0.005%, 0.31% and 0.05% of average net assets for
Class A, Class R1, Class R3, Class R4 and Class R5 shares, respectively. See Note 4.
10 Includes small account fee credits of 0.01% of average net assets.
11 Includes transfer agent fee earned credits of less than 0.01% of average net assets.
12 The inception date for Class A, Class R1, Class R3, Class R4, Class R5 and Class 1 shares is 10-30-06.
13 Does not include expenses of the underlying affiliated funds in which the Portfolio invests.
| | | | | | | | | | | | | | | |
| Lifecycle 2035 Portfolio | | | | | | | | | | | | | |
| Per share operating performance for a share outstanding throughout each period | | Ratios and supplemental data | |
|
| | | Income (loss) from | | | | | | | | | | | | |
| | | investment operations | | | Less distributions | | | | Ratios to average net assets | | |
| | |
| |
| |
| |
| |
| | | | Net | | | | | | | | Expenses | | | | |
| | | | realized | Total | | | | | | | before | Expenses | | Net | |
| | Net asset | Net | and | from | From net | | | | | | reduc- | including | | assets, | |
| | value, | invest- | unrealized | invest- | invest- | | | | Net asset | | tions and | reductions | Net | end of | |
| | beginning | ment in- | gain (loss) | ment | ment | From net | From | Total value, | end | Total | amounts | and amounts | investment | period (in | Portfolio |
| | of period | come (loss) on | invest- | operations | income | realized | capital | distribu- | of period | return | recaptured | recaptured | income | thousands) | turnover |
| Period ended | ($) | ($)1,2 | ments ($) | ($) | ($) | gain ($) | paid-in ($) | tions ($) | ($) | (%)3 | (%) | (%) | (loss) (%)1 | ($) | (%) |
|
| CLASS A | | | | | | | | | | | | | | | |
|
| 02-28-20114 | 8.14 | 0.09 | 1.99 | 2.08 | (0.07) | (0.07) | — | (0.14) | 10.08 | 25.675,6 | 0.737,8 | 0.597,8 | 1.817 | 13,481 | 9 |
| 08-31-2010 | 7.79 | 0.07 | 0.40 | 0.47 | (0.09) | (0.03) | — | (0.12) | 8.14 | 6.006 | 0.708 | 0.608,9 | 0.88 | 8,883 | 20 |
| 08-31-2009 | 9.61 | 0.07 | (1.70) | (1.63) | (0.08) | (0.11) | — | (0.19) | 7.79 | (16.39)6 | 1.298 | 0.628 | 1.06 | 5,950 | 20 |
| 08-31-2008 | 11.02 | 0.02 | (1.20) | (1.18) | (0.08) | (0.15) | — | (0.23) | 9.61 | (10.93)6 | 1.808 | 0.648,10 | 0.20 | 2,132 | 14 |
| 08-31-200711 | 10.00 | (0.02) | 1.20 | 1.18 | (0.04) | (0.12) | — | (0.16) | 11.02 | 11.926,5 | 2.477,12 | 0.627,12 | (0.20)7 | 610 | 4 |
|
| | |
| See notes to financial statements | Semiannual report | Lifecycle Portfolios | 41 |
| | | |
Financial highlights
Continued
| | | | | | | | | | | | | | | |
| Lifecycle 2035 Portfolio continued | | | | | | | | | | | |
| Per share operating performance for a share outstanding throughout each period | | Ratios and supplemental data | |
|
| | | Income (loss) from | | | | | | | | | | | | |
| | | investment operations | | | Less distributions | | | | Ratios to average net assets | | |
| | |
| |
| |
| |
| |
| | | | Net | | | | | | | | Expenses | | | | |
| | | | realized | Total | | | | | | | before | Expenses | | Net | |
| | Net asset | Net | and | from | From net | | | | | | reduc- | including | | assets, | |
| | value, | invest- | unrealized | invest- | invest- | | | | Net asset | | tions and | reductions | Net | end of | |
| | beginning | ment in- | gain (loss) | ment | ment | From net | From | Total value, | end | Total | amounts | and amounts | investment | period (in | Portfolio |
| | of period | come (loss) | on invest- | operations | income | realized | capital | distribu- | of period | return | recaptured | recaptured | income | thousands) | turnover |
| Period ended | ($) | ($)1,2 | ments ($) | ($) | ($) | gain ($) | paid-in ($) | tions ($) | ($) | (%)3 | (%) | (%) | (loss) (%)1 | ($) | (%) |
|
| CLASS R1 | | | | | | | | | | | | | | | |
|
| 02-28-20114 | 8.13 | 0.07 | 2.00 | 2.07 | (0.06) | (0.07) | — | (0.13) | 10.07 | 25.535,6 | 1.627,8 | 0.747,8 | 1.557 | 1,992 | 9 |
| 08-31-2010 | 7.79 | 0.06 | 0.39 | 0.45 | (0.08) | (0.03) | — | (0.11) | 8.13 | 5.746 | 1.328 | 0.758,9 | 0.75 | 1,453 | 20 |
| 08-31-2009 | 9.58 | 0.08 | (1.71) | (1.63) | (0.05) | (0.11) | — | (0.16) | 7.79 | (16.50)6 | 4.498 | 0.848 | 1.13 | 647 | 20 |
| 08-31-2008 | 11.00 | —13 | (1.19) | (1.19) | (0.08) | (0.15) | — | (0.23) | 9.58 | (11.06)6 | 10.408 | 0.888,10 | (0.02) | 177 | 14 |
| 08-31-200711 | 10.00 | —13 | 1.15 | 1.15 | (0.03) | (0.12) | — | (0.15) | 11.00 | 11.626,5 | 16.297,12 | 0.867,12 | 0.017 | 112 | 4 |
|
| CLASS R3 | | | | | | | | | | | | | | | |
|
| 02-28-20114 | 8.14 | 0.08 | 1.99 | 2.07 | (0.06) | (0.07) | — | (0.13) | 10.08 | 25.565,6 | 1.657,8 | 0.697,8 | 1.687 | 1,719 | 9 |
| 08-31-2010 | 7.79 | 0.05 | 0.42 | 0.47 | (0.09) | (0.03) | — | (0.12) | 8.14 | 5.916 | 1.538 | 0.708,9 | 0.59 | 1,167 | 20 |
| 08-31-2009 | 9.59 | 0.06 | (1.69) | (1.63) | (0.06) | (0.11) | — | (0.17) | 7.79 | (16.47)6 | 4.478 | 0.778 | 0.84 | 451 | 20 |
| 08-31-2008 | 11.01 | 0.02 | (1.21) | (1.19) | (0.08) | (0.15) | — | (0.23) | 9.59 | (11.05)6 | 9.948 | 0.818,10 | 0.24 | 278 | 14 |
| 08-31-200711 | 10.00 | 0.01 | 1.15 | 1.16 | (0.03) | (0.12) | — | (0.15) | 11.01 | 11.746,5 | 16.227,12 | 0.797,12 | 0.087 | 112 | 4 |
|
| CLASS R4 | | | | | | | | | | | | | | | |
|
| 02-28-20114 | 8.18 | 0.10 | 2.00 | 2.10 | (0.09) | (0.07) | — | (0.16) | 10.12 | 25.775,6 | 2.057,8 | 0.397,8 | 2.027 | 984 | 9 |
| 08-31-2010 | 7.81 | 0.04 | 0.47 | 0.51 | (0.11) | (0.03) | — | (0.14) | 8.18 | 6.436 | 2.658 | 0.408,9 | 0.47 | 574 | 20 |
| 08-31-2009 | 9.63 | 0.07 | (1.69) | (1.62) | (0.09) | (0.11) | — | (0.20) | 7.81 | (16.24)6 | 9.278 | 0.478 | 1.06 | 182 | 20 |
| 08-31-2008 | 11.03 | 0.04 | (1.20) | (1.16) | (0.09) | (0.15) | — | (0.24) | 9.63 | (10.77)6 | 11.028 | 0.528,10 | 0.41 | 219 | 14 |
| 08-31-200711 | 10.00 | 0.03 | 1.16 | 1.19 | (0.04) | (0.12) | — | (0.16) | 11.03 | 12.006,5 | 15.927,12 | 0.507,12 | 0.367 | 112 | 4 |
|
| CLASS R5 | | | | | | | | | | | | | | | |
|
| 02-28-20114 | 8.19 | 0.13 | 1.99 | 2.12 | (0.12) | (0.07) | — | (0.19) | 10.12 | 25.965,6 | 1.767,8 | 0.097,8 | 2.727 | 1,128 | 9 |
| 08-31-2010 | 7.83 | 0.16 | 0.36 | 0.52 | (0.13) | (0.03) | — | (0.16) | 8.19 | 6.556 | 2.528 | 0.108,9 | 1.93 | 281 | 20 |
| 08-31-2009 | 9.67 | 0.11 | (1.72) | (1.61) | (0.12) | (0.11) | — | (0.23) | 7.83 | (16.01)6 | 7.188 | 0.178 | 1.61 | 199 | 20 |
| 08-31-2008 | 11.05 | 0.08 | (1.21) | (1.13) | (0.10) | (0.15) | — | (0.25) | 9.67 | (10.49)6 | 11.078 | 0.238,10 | 0.78 | 149 | 14 |
| 08-31-200711 | 10.00 | 0.06 | 1.15 | 1.21 | (0.04) | (0.12) | — | (0.16) | 11.05 | 12.266,5 | 15.087,12 | 0.227,12 | 0.627 | 119 | 4 |
|
| CLASS 1 | | | | | | | | | | | | | | | |
|
| 02-28-20114 | 8.18 | 0.11 | 2.01 | 2.12 | (0.11) | (0.07) | — | (0.18) | 10.12 | 26.065,6 | 0.147,8 | 0.147,8 | 2.247 | 575,388 | 9 |
| 08-31-2010 | 7.83 | 0.12 | 0.39 | 0.51 | (0.13) | (0.03) | — | (0.16) | 8.18 | 6.386 | 0.158 | 0.158,9 | 1.36 | 413,289 | 20 |
| 08-31-2009 | 9.68 | 0.10 | (1.72) | (1.62) | (0.12) | (0.11) | — | (0.23) | 7.83 | (16.02)6 | 0.178 | 0.178 | 1.49 | 272,778 | 20 |
| 08-31-2008 | 11.05 | 0.07 | (1.19) | (1.12) | (0.10) | (0.15) | — | (0.25) | 9.68 | (10.40)6 | 0.198 | 0.198 | 0.66 | 161,263 | 14 |
| 08-31-200711 | 10.00 | (0.01) | 1.23 | 1.22 | (0.05) | (0.12) | — | (0.17) | 11.05 | 12.276,5 | 0.457,12 | 0.207,12 | (0.06)7 | 39,674 | 4 |
|
1 Recognition of net investment income by the Portfolio is affected by the timing of the declaration of dividends by the underlying funds in which the Portfolio invests.2 Based on the average daily shares outstanding.3 Does not reflect the effect of sales charges, if any.4 Unaudited.5 Not annualized.6 Total returns would have been lower had certain expenses not been reduced during the periods shown.7 Annualized.8 Ratios do not include expenses indirectly incurred from underlying funds whose expense ratios can vary based on the mix of underlying funds held by the Portfolio. Therange of expense ratios of the underlying funds held by the Portfolio was as follows: 0.48%–1.14%, 0.48%–1.17%, 0.49%–1.31% and 0.49%–1.13% for the peri-ods ended 2-28-11, 8-31-10, 8-31-09 and 8-31-08, respectively.9 Includes the impact of expense recapture for the following period ended 8-31-10: 0.01%, 0.03%, 0.03%, 0.12% and 0.12% of average net assets for Class A,Class R1, Class R3, Class R4 and Class R5 shares, respectively. See Note 4.10 Includes transfer agent fee earned credits of less than 0.01% of average net assets.11 The inception date for Class A, Class R1, Class R3, Class R4, Class R5 and Class 1 shares is 10-30-06.12 Does not include expenses of the underlying affiliated funds in which the Portfolio invests.13 Less than $0.005 per share. | | |
| 42 | Lifecycle Portfolios | Semiannual report | See notes to financial statements |
| | | |
Financial highlights
Continued
| | | | | | | | | | | | | | | |
| Lifecycle 2030 Portfolio | | | | | | | | | | | | | |
| Per share operating performance for a share outstanding throughout each period | | Ratios and supplemental data | |
|
| | | Income (loss) from | | | | | | | | | | | | |
| | | investment operations | | | Less distributions | | | | Ratios to average net assets | | |
| | |
| |
| |
| |
| |
| | | | Net | | | | | | | | Expenses | Expenses | | | |
| | | | realized | Total | | | | | | | before | including | | Net | |
| | Net asset | Net | and | from | From net | | | | | | reduc- | reduc- | | assets, | |
| | value, | invest- | unrealized | invest- | invest- | | | | Net asset | | tions and | tions and | Net | end of | |
| | beginning | ment in- | gain (loss) | ment | ment | From net | From | Total value, | end | Total | amounts | amounts | investment | period (in | Portfolio |
| | of period | come (loss) | on invest- | operations | income | realized | capital | distribu- | of period | return | recaptured | recaptured | income | thousands) | turnover |
| Period ended | ($) | ($)1,2 | ments ($) | ($) | ($) | gain ($) | paid-in ($) | tions ($) | ($) | (%)3 | (%) | (%) | (loss) (%)1 | ($) | (%) |
|
| CLASS A | | | | | | | | | | | | | | | |
|
| 02-28-20114 | 8.13 | 0.09 | 1.91 | 2.00 | (0.08) | (0.07) | — | (0.15) | 9.98 | 24.715,6 | 0.677,8 | 0.597,8 | 1.917 | 21,522 | 11 |
| 08-31-2010 | 7.76 | 0.09 | 0.40 | 0.49 | (0.09) | (0.03) | — | (0.12) | 8.13 | 6.315 | 0.668 | 0.598,12 | 1.04 | 14,723 | 21 |
| 08-31-2009 | 9.57 | 0.08 | (1.70) | (1.62) | (0.08) | (0.11) | — | (0.19) | 7.76 | (16.36)5 | 1.068 | 0.618 | 1.13 | 9,351 | 23 |
| 08-31-2008 | 10.91 | 0.04 | (1.18) | (1.14) | (0.07) | (0.13) | — | (0.20) | 9.57 | (10.66)5 | 1.338 | 0.638,9 | 0.43 | 3,345 | 10 |
| 08-31-200710 | 10.00 | (0.02) | 1.14 | 1.12 | (0.06) | (0.15) | — | (0.21) | 10.91 | 11.385,6 | 2.027,11 | 0.637,11 | (0.23)7 | 1,135 | 3 |
|
| CLASS R1 | | | | | | | | | | | | | | | |
|
| 02-28-20114 | 8.10 | 0.08 | 1.91 | 1.99 | (0.07) | (0.07) | — | (0.14) | 9.95 | 24.635,6 | 1.507,8 | 0.747,8 | 1.687 | 2,282 | 11 |
| 08-31-2010 | 7.74 | 0.07 | 0.40 | 0.47 | (0.08) | (0.03) | — | (0.11) | 8.10 | 6.065 | 1.168 | 0.748,12 | 0.81 | 1,812 | 21 |
| 08-31-2009 | 9.52 | 0.07 | (1.69) | (1.62) | (0.05) | (0.11) | — | (0.16) | 7.74 | (16.52)5 | 3.048 | 0.838 | 1.04 | 1,245 | 23 |
| 08-31-2008 | 10.88 | —13 | (1.17) | (1.17) | (0.06) | (0.13) | — | (0.19) | 9.52 | (10.92)5 | 8.408 | 0.888,9 | 0.02 | 320 | 10 |
| 08-31-200710 | 10.00 | 0.01 | 1.08 | 1.09 | (0.06) | (0.15) | — | (0.21) | 10.88 | 10.985,6 | 16.247,11 | 0.867,11 | 0.127 | 112 | 3 |
|
| CLASS R3 | | | | | | | | | | | | | | | |
|
| 02-28-20114 | 8.11 | 0.08 | 1.91 | 1.99 | (0.07) | (0.07) | — | (0.14) | 9.96 | 24.665,6 | 1.407,8 | 0.697,8 | 1.787 | 2,361 | 11 |
| 08-31-2010 | 7.75 | 0.06 | 0.42 | 0.48 | (0.09) | (0.03) | — | (0.12) | 8.11 | 6.105 | 1.398 | 0.698,12 | 0.67 | 1,615 | 21 |
| 08-31-2009 | 9.53 | 0.08 | (1.69) | (1.61) | (0.06) | (0.11) | — | (0.17) | 7.75 | (16.38)5 | 3.098 | 0.768 | 1.12 | 609 | 23 |
| 08-31-2008 | 10.88 | 0.08 | (1.24) | (1.16) | (0.06) | (0.13) | — | (0.19) | 9.53 | (10.83)5 | 4.248 | 0.788,9 | 0.76 | 676 | 10 |
| 08-31-200710 | 10.00 | 0.02 | 1.07 | 1.09 | (0.06) | (0.15) | — | (0.21) | 10.88 | 11.005,6,14 | 16.187,11 | 0.797,11 | 0.197 | 112 | 3 |
|
| CLASS R4 | | | | | | | | | | | | | | | |
|
| 02-28-20114 | 8.12 | 0.10 | 1.91 | 2.01 | (0.10) | (0.07) | — | (0.17) | 9.96 | 24.845,6 | 8.927,8 | 0.397,8 | 2.047 | 212 | 11 |
| 08-31-2010 | 7.76 | 0.06 | 0.44 | 0.50 | (0.11) | (0.03) | — | (0.14) | 8.12 | 6.375 | 5.088 | 0.398,12 | 0.76 | 106 | 21 |
| 08-31-2009 | 9.55 | 0.10 | (1.69) | (1.59) | (0.09) | (0.11) | — | (0.20) | 7.76 | (16.08)5 | 5.438 | 0.458 | 1.52 | 360 | 23 |
| 08-31-2008 | 10.91 | 0.08 | (1.22) | (1.14) | (0.09) | (0.13) | — | (0.22) | 9.55 | (10.66)5 | 14.838 | 0.498,9 | 0.79 | 115 | 10 |
| 08-31-200710 | 10.00 | 0.04 | 1.08 | 1.12 | (0.06) | (0.15) | — | (0.21) | 10.91 | 11.365,6,14 | 15.887,11 | 0.507,11 | 0.477 | 111 | 3 |
|
| CLASS R5 | | | | | | | | | | | | | | | |
|
| 02-28-20114 | 8.13 | 0.13 | 1.90 | 2.03 | (0.13) | (0.07) | — | (0.20) | 9.96 | 25.035,6 | 1.007,8 | 0.097,8 | 2.757 | 2,142 | 11 |
| 08-31-2010 | 7.76 | 0.15 | 0.38 | 0.53 | (0.13) | (0.03) | — | (0.16) | 8.13 | 6.765 | 0.968 | 0.098,12 | 1.82 | 724 | 21 |
| 08-31-2009 | 9.57 | 0.12 | (1.71) | (1.59) | (0.11) | (0.11) | — | (0.22) | 7.76 | (15.88)5 | 1.618 | 0.178 | 1.77 | 979 | 23 |
| 08-31-2008 | 10.93 | 0.04 | (1.15) | (1.11) | (0.12) | (0.13) | — | (0.25) | 9.57 | (10.41)5 | 6.188 | 0.248,9 | 0.42 | 1,002 | 10 |
| 08-31-200710 | 10.00 | 0.07 | 1.08 | 1.15 | (0.07) | (0.15) | — | (0.22) | 10.93 | 11.625,6,14 | 15.577,11 | 0.227,11 | 0.767 | 112 | 3 |
|
| CLASS 1 | | | | | | | | | | | | | | | |
|
| 02-28-20114 | 8.12 | 0.11 | 1.91 | 2.02 | (0.12) | (0.07) | — | (0.19) | 9.95 | 25.005,6 | 0.147,8 | 0.147,8 | 2.387 | 730,904 | 11 |
| 08-31-2010 | 7.75 | 0.12 | 0.41 | 0.53 | (0.13) | (0.03) | — | (0.16) | 8.12 | 6.725 | 0.158 | 0.148 | 1.48 | 537,945 | 21 |
| 08-31-2009 | 9.57 | 0.11 | (1.70) | (1.59) | (0.12) | (0.11) | — | (0.23) | 7.75 | (15.90) | 0.168 | 0.168 | 1.58 | 350,658 | 23 |
| 08-31-2008 | 10.93 | 0.08 | (1.19) | (1.11) | (0.12) | (0.13) | — | (0.25) | 9.57 | (10.41) | 0.188 | 0.188 | 0.75 | 219,711 | 10 |
| 08-31-200710 | 10.00 | 0.01 | 1.14 | 1.15 | (0.07) | (0.15) | — | (0.22) | 10.93 | 11.635,6 | 0.387,11 | 0.207,11 | 0.127 | 50,070 | 3 |
|
1 Recognition of net investment income by the Portfolio is affected by the timing of the declaration of dividends by the underlying funds in which the Portfolio invests.2 Based on the average daily shares outstanding.3 Does not reflect the effect of sales charges, if any.4 Unaudited.5 Total returns would have been lower had certain expenses not been reduced during the periods shown.6 Not annualized.7 Annualized.8 Ratios do not include expenses indirectly incurred from underlying funds whose expense ratios can vary based on the mix of underlying funds held by the Portfolio. Therange of expense ratios of the underlying funds held by the Portfolio was as follows: 0.48%–1.14%, 0.48%–1.17%, 0.49%–1.31% and 0.49%–1.13% for the peri-ods ended 2-28-11, 8-31-10, 8-31-09 and 8-31-08, respectively.9 Includes transfer agent fee earned credits of less than 0.01% of average net assets.10 The inception date for Class A, Class R1, Class R3, Class R4, Class R5 and Class 1 shares is 10-30-06. | | |
| See notes to financial statements | Semiannual report | Lifecycle Portfolios | 43 |
| | |
Financial highlights
Continued
Lifecycle 2030 Portfolio continued
11 Does not include expenses of the underlying affiliated funds in which the Portfolio invests.
12 Includes the impact of expense recapture for the following period ended 8-31-10: 0.01%, 0.01%, 0.02%, 0.22% and 0.02% of average net assets for Class A,
Class R1, Class R3, Class R4 and Class R5 shares, respectively. See Note 4.
13 Less than $0.005 per share.
14 The Adviser made a payment to the Portfolio of $1,696. Excluding this payment, total returns would have been 11.00%, 11.26% and 11.52% for Class R3, Class R4
and Class R5, respectively. There was no effect to the total returns for Class A, Class R1 and Class 1.
| | | | | | | | | | | | | | | |
| Lifecycle 2025 Portfolio | | | | | | | | | | | | | |
| Per share operating performance for a share outstanding throughout each period | | Ratios and supplemental data | |
|
| | | Income (loss) from | | | | | | | | | | | | |
| | | investment operations | | | Less distributions | | | | Ratios to average net assets | | |
| | |
| |
| |
| |
| |
| | | | Net | | | | | | | | Expenses | | | | |
| | | | realized | Total | | | | | | | before | Expenses | | Net | |
| | Net asset | Net | and | from | From net | | | | | | reduc- | including re- | | assets, | |
| | value, | invest- | unrealized | invest- | invest- | | | | Net asset | | tions and | ductions and | Net | end of | |
| | beginning | ment in- | gain (loss) | ment | ment | From net | From | Total value, | end | Total | amounts | amounts | investment | period (in | Portfolio |
| | of period | come (loss) | on invest- | operations | income | realized | capital | distribu- | of period | return | recaptured | recaptured | income | thousands) | turnover |
| Period ended | ($) | ($)1,2 | ments ($) | ($) | ($) | gain ($) | paid-in ($) | tions ($) | ($) | (%)3 | (%) | (%) | (loss) (%)1 | ($) | (%) |
|
| CLASS A | | | | | | | | | | | | | | | |
|
| 02-28-20114 | 8.28 | 0.11 | 1.75 | 1.86 | (0.11) | (0.07) | — | (0.18) | 9.96 | 22.585,6 | 0.677 | 0.587,8 | 2.307 | 21,142 | 13 |
| 08-31-2010 | 7.87 | 0.12 | 0.44 | 0.56 | (0.12) | (0.03) | — | (0.15) | 8.28 | 7.026 | 0.64 | 0.598,9 | 1.37 | 14,515 | 22 |
| 08-31-2009 | 9.57 | 0.11 | (1.58) | (1.47) | (0.12) | (0.11) | — | (0.23) | 7.87 | (14.74)6 | 0.98 | 0.618 | 1.59 | 9,419 | 25 |
| 08-31-2008 | 10.85 | 0.05 | (1.12) | (1.07) | (0.08) | (0.13) | — | (0.21) | 9.57 | (10.08)6 | 1.49 | 0.628,10 | 0.52 | 3,604 | 9 |
| 08-31-200711 | 10.00 | 0.02 | 1.03 | 1.05 | (0.07) | (0.13) | — | (0.20) | 10.85 | 10.576,5 | 2.257,12 | 0.637,12 | 0.197 | 661 | 3 |
|
| CLASS R1 | | | | | | | | | | | | | | | |
|
| 02-28-20114 | 8.25 | 0.10 | 1.75 | 1.85 | (0.10) | (0.07) | — | (0.17) | 9.93 | 22.505,6 | 1.567 | 0.737,8 | 2.097 | 2,123 | 13 |
| 08-31-2010 | 7.84 | 0.11 | 0.44 | 0.55 | (0.11) | (0.03) | — | (0.14) | 8.25 | 6.916 | 1.21 | 0.748,9 | 1.33 | 1,771 | 22 |
| 08-31-2009 | 9.52 | 0.09 | (1.57) | (1.48) | (0.09) | (0.11) | — | (0.20) | 7.84 | (15.01)6 | 3.27 | 0.828 | 1.40 | 1,197 | 25 |
| 08-31-2008 | 10.83 | 0.03 | (1.14) | (1.11) | (0.07) | (0.13) | — | (0.20) | 9.52 | (10.42)6 | 8.37 | 0.878,10 | 0.27 | 285 | 9 |
| 08-31-200711 | 10.00 | 0.03 | 0.99 | 1.02 | (0.06) | (0.13) | — | (0.19) | 10.83 | 10.286,5 | 16.147,12 | 0.877,12 | 0.357 | 111 | 3 |
|
| CLASS R3 | | | | | | | | | | | | | | | |
|
| 02-28-20114 | 8.25 | 0.10 | 1.76 | 1.86 | (0.10) | (0.07) | — | (0.17) | 9.94 | 22.675,6 | 1.337 | 0.687,8 | 2.137 | 2,688 | 13 |
| 08-31-2010 | 7.85 | 0.08 | 0.46 | 0.54 | (0.11) | (0.03) | — | (0.14) | 8.25 | 6.826 | 1.26 | 0.698,9 | 0.97 | 1,937 | 22 |
| 08-31-2009 | 9.53 | 0.06 | (1.53) | (1.47) | (0.10) | (0.11) | — | (0.21) | 7.85 | (14.87)6 | 2.11 | 0.758 | 0.87 | 1,381 | 25 |
| 08-31-2008 | 10.84 | 0.13 | (1.24) | (1.11) | (0.07) | (0.13) | — | (0.20) | 9.53 | (10.41)6 | 5.37 | 0.788,10 | 1.22 | 456 | 9 |
| 08-31-200711 | 10.00 | 0.03 | 1.00 | 1.03 | (0.06) | (0.13) | — | (0.19) | 10.84 | 10.406,5 | 14.437,12 | 0.817,12 | 0.347 | 186 | 3 |
|
| CLASS R4 | | | | | | | | | | | | | | | |
|
| 02-28-20114 | 8.27 | 0.11 | 1.77 | 1.88 | (0.13) | (0.07) | — | (0.20) | 9.95 | 22.835,6 | 2.017 | 0.387,8 | 2.427 | 1,029 | 13 |
| 08-31-2010 | 7.85 | 0.11 | 0.47 | 0.58 | (0.13) | (0.03) | — | (0.16) | 8.27 | 7.356 | 2.10 | 0.398,9 | 1.32 | 660 | 22 |
| 08-31-2009 | 9.55 | 0.11 | (1.58) | (1.47) | (0.12) | (0.11) | — | (0.23) | 7.85 | (14.68)6 | 7.64 | 0.458 | 1.56 | 260 | 25 |
| 08-31-2008 | 10.86 | 0.09 | (1.17) | (1.08) | (0.10) | (0.13) | — | (0.23) | 9.55 | (10.16)6 | 11.76 | 0.498,10 | 0.90 | 207 | 9 |
| 08-31-200711 | 10.00 | 0.06 | 0.99 | 1.05 | (0.06) | (0.13) | — | (0.19) | 10.86 | 10.656,5 | 15.777,12 | 0.527,12 | 0.707 | 111 | 3 |
|
| CLASS R5 | | | | | | | | | | | | | | | |
|
| 02-28-20114 | 8.27 | 0.15 | 1.74 | 1.89 | (0.16) | (0.07) | — | (0.23) | 9.93 | 22.925,6 | 0.717 | 0.097,8 | 3.187 | 3,574 | 13 |
| 08-31-2010 | 7.86 | 0.17 | 0.42 | 0.59 | (0.15) | (0.03) | — | (0.18) | 8.27 | 7.486 | 1.20 | 0.098,9 | 1.97 | 831 | 22 |
| 08-31-2009 | 9.57 | 0.14 | (1.59) | (1.45) | (0.15) | (0.11) | — | (0.26) | 7.86 | (14.38)6 | 4.27 | 0.168 | 2.08 | 339 | 25 |
| 08-31-2008 | 10.88 | 0.09 | (1.14) | (1.05) | (0.13) | (0.13) | — | (0.26) | 9.57 | (9.91)6 | 7.87 | 0.218,10 | 0.92 | 285 | 9 |
| 08-31-200711 | 10.00 | 0.09 | 0.99 | 1.08 | (0.07) | (0.13) | — | (0.20) | 10.88 | 10.916,5,13 | 15.347,12 | 0.237,12 | 0.987 | 113 | 3 |
|
| CLASS 1 | | | | | | | | | | | | | | | |
|
| 02-28-20114 | 8.27 | 0.13 | 1.75 | 1.88 | (0.15) | (0.07) | — | (0.22) | 9.93 | 22.875,6 | 0.147 | 0.137,8 | 2.747 | 844,509 | 13 |
| 08-31-2010 | 7.86 | 0.16 | 0.43 | 0.59 | (0.15) | (0.03) | — | (0.18) | 8.27 | 7.446 | 0.14 | 0.148 | 1.83 | 631,319 | 22 |
| 08-31-2009 | 9.58 | 0.14 | (1.59) | (1.45) | (0.16) | (0.11) | — | (0.27) | 7.86 | (14.37)6 | 0.16 | 0.168 | 2.08 | 428,618 | 25 |
| 08-31-2008 | 10.88 | 0.11 | (1.15) | (1.04) | (0.13) | (0.13) | — | (0.26) | 9.58 | (9.81)6 | 0.17 | 0.178,10 | 1.08 | 280,532 | 9 |
| 08-31-200711 | 10.00 | 0.04 | 1.04 | 1.08 | (0.07) | (0.13) | — | (0.20) | 10.88 | 10.935,6 | 0.317,12 | 0.207,12 | 0.397 | 67,149 | 3 |
|
| | |
| 44 | Lifecycle Portfolios | Semiannual report | See notes to financial statements |
| | | |
Financial highlights
Continued
Lifecycle 2025 Portfolio continued
1 Recognition of net investment income by the Portfolio is affected by the timing of the declaration of dividends by the underlying funds in which the Portfolio invests.
2 Based on the average daily shares outstanding.
3 Does not reflect the effect of sales charges, if any.
4 Unaudited.
5 Not annualized.
6 Total returns would have been lower had certain expenses not been reduced during the periods shown.
7 Annualized.
8 Ratios do not include expenses indirectly incurred from underlying funds whose expense ratios can vary based on the mix of underlying funds held by the Portfolio. The
range of expense ratios of the underlying funds held by the Portfolio was as follows: 0.48%–1.14%, 0.48%–1.17%, 0.49%–1.31% and 0.49%–1.13% for the peri-
ods ended 2-28-11, 8-31-10, 8-31-09 and 8-31-08, respectively.
9 Includes the impact of expense recapture for the following period ended 8-31-10: 0.01%, 0.01%, 0.01%, 0.08% and 0.04% of average net assets for Class A,
Class R1, Class R3, Class R4 and Class R5 shares, respectively. See Note 4.
10 Includes transfer agent fee earned credits of less than 0.01% of average net assets.
11 The inception date for Class A, Class R1, Class R3, Class R4, Class R5 and Class 1 shares is 10-30-06.
12 Does not include expenses of the underlying affiliated funds in which the Portfolio invests.
13 The Adviser made a payment to the Portfolio of $2,707. Excluding this payment, total returns would have been 10.91% for Class R5. There was no effect to the total
returns for Class A, Class R1, Class R3, Class R4 and Class 1.
| | | | | | | | | | | | | | | |
| Lifecycle 2020 Portfolio | | | | | | | | | | | | | |
| Per share operating performance for a share outstanding throughout each period | | Ratios and supplemental data | |
|
| | | Income (loss) from | | | | | | | | | | | | |
| | | investment operations | | | Less distributions | | | | Ratios to average net assets | | |
| | |
| |
| |
| |
| |
| | | | Net | | | | | | | | Expenses | Expenses | | | |
| | | | realized | Total | | | | | | | before | including | | Net | |
| | Net asset | Net | and | from | From net | | | | | | reduc- | reduc- | | assets, | |
| | value, | invest- | unrealized | invest- | invest- | | | | Net asset | | tions and | tions and | Net | end of | |
| | beginning | ment in- | gain (loss) | ment | ment | From net | From | Total value, | end | Total | amounts | amounts | investment | period (in | Portfolio |
| | of period | come (loss) | on invest- | operations | income | realized | capital | distribu- | of period | return | recaptured | recaptured | income | thousands) | turnover |
| Period ended | ($) | ($)1,2 | ments ($) | ($) | ($) | gain ($) | paid-in ($) | tions ($) | ($) | (%)3 | (%) | (%) | (loss) (%)1 | ($) | (%) |
|
| CLASS A | | | | | | | | | | | | | | | |
|
| 02-28-20114 | 8.52 | 0.14 | 1.55 | 1.69 | (0.15) | (0.08) | — | (0.23) | 9.98 | 19.965,6 | 0.667,8 | 0.587,8 | 2.877 | 25,822 | 15 |
| 08-31-2010 | 8.06 | 0.17 | 0.47 | 0.64 | (0.15) | (0.03) | — | (0.18) | 8.52 | 7.915 | 0.638 | 0.598,9 | 1.92 | 18,528 | 23 |
| 08-31-2009 | 9.65 | 0.14 | (1.45) | (1.31) | (0.16) | (0.12) | — | (0.28) | 8.06 | (12.75)5 | 0.868 | 0.618 | 2.06 | 13,067 | 26 |
| 08-31-2008 | 10.80 | 0.12 | (1.05) | (0.93) | (0.11) | (0.11) | — | (0.22) | 9.65 | (8.82)5 | 1.158 | 0.628,10 | 1.18 | 4,285 | 10 |
| 08-31-200711 | 10.00 | 0.04 | 0.94 | 0.98 | (0.07) | (0.11) | — | (0.18) | 10.80 | 9.875,6,12 | 1.597,13 | 0.647,13 | 0.497 | 1,491 | 7 |
|
| CLASS R1 | | | | | | | | | | | | | | | |
|
| 02-28-20114 | 8.51 | 0.13 | 1.55 | 1.68 | (0.14) | (0.08) | — | (0.22) | 9.97 | 19.825,6 | 1.507,8 | 0.737 | 2.657 | 2,257 | 15 |
| 08-31-2010 | 8.04 | 0.15 | 0.49 | 0.64 | (0.14) | (0.03) | — | (0.17) | 8.51 | 7.925 | 1.128 | 0.748,9 | 1.77 | 1,859 | 23 |
| 08-31-2009 | 9.61 | 0.15 | (1.47) | (1.32) | (0.13) | (0.12) | — | (0.25) | 8.04 | (13.00)5 | 2.118 | 0.838 | 2.14 | 1,675 | 26 |
| 08-31-2008 | 10.78 | 0.08 | (1.04) | (0.96) | (0.10) | (0.11) | — | (0.21) | 9.61 | (9.07)5 | 9.718 | 0.868,10 | 0.77 | 250 | 10 |
| 08-31-200711 | 10.00 | 0.07 | 0.88 | 0.95 | (0.06) | (0.11) | — | (0.17) | 10.78 | 9.585,6,12 | 16.147,13 | 0.877,13 | 0.747 | 110 | 7 |
|
| CLASS R3 | | | | | | | | | | | | | | | |
|
| 02-28-20114 | 8.51 | 0.13 | 1.55 | 1.68 | (0.14) | (0.08) | — | (0.22) | 9.97 | 19.885,6 | 1.127,8 | 0.687,8 | 2.667 | 3,818 | 15 |
| 08-31-2010 | 8.04 | 0.12 | 0.52 | 0.64 | (0.14) | (0.03) | — | (0.17) | 8.51 | 7.965 | 1.178 | 0.698,9 | 1.38 | 2,817 | 23 |
| 08-31-2009 | 9.62 | 0.16 | (1.48) | (1.32) | (0.14) | (0.12) | — | (0.26) | 8.04 | (12.97)5 | 2.298 | 0.768 | 2.37 | 895 | 26 |
| 08-31-2008 | 10.78 | 0.15 | (1.10) | (0.95) | (0.10) | (0.11) | — | (0.21) | 9.62 | (8.98)5 | 3.978 | 0.788,10 | 1.48 | 825 | 10 |
| 08-31-200711 | 10.00 | 0.07 | 0.88 | 0.95 | (0.06) | (0.11) | — | (0.17) | 10.78 | 9.595,6,12 | 15.587,13 | 0.807,13 | 0.807 | 126 | 7 |
|
| CLASS R4 | | | | | | | | | | | | | | | |
|
| 02-28-20114 | 8.51 | 0.15 | 1.55 | 1.70 | (0.17) | (0.08) | — | (0.25) | 9.96 | 20.095,6 | 8.237,8 | 0.387,8 | 3.077 | 176 | 15 |
| 08-31-2010 | 8.05 | 0.16 | 0.50 | 0.66 | (0.17) | (0.03) | — | (0.20) | 8.51 | 8.115 | 5.268 | 0.398,9 | 1.90 | 151 | 23 |
| 08-31-2009 | 9.64 | 0.16 | (1.46) | (1.30) | (0.17) | (0.12) | — | (0.29) | 8.05 | (12.68)5 | 7.258 | 0.458 | 2.24 | 255 | 26 |
| 08-31-2008 | 10.80 | 0.16 | (1.08) | (0.92) | (0.13) | (0.11) | — | (0.24) | 9.64 | (8.72)5 | 13.878 | 0.488,10 | 1.50 | 138 | 10 |
| 08-31-200711 | 10.00 | 0.10 | 0.88 | 0.98 | (0.07) | (0.11) | — | (0.18) | 10.80 | 9.855,6,12 | 15.757,13 | 0.527,13 | 1.097 | 110 | 7 |
|
| | |
| See notes to financial statements | Semiannual report | Lifecycle Portfolios | 45 |
| | |
Financial highlights
Continued
| | | | | | | | | | | | | | | |
| Lifecycle 2020 Portfolio continued | | | | | | | | | | | |
| Per share operating performance for a share outstanding throughout each period | | Ratios and supplemental data | |
|
| | | Income (loss) from | | | | | | | | | | | | |
| | | investment operations | | | Less distributions | | | | Ratios to average net assets | | |
| | |
| |
| |
| |
| |
| | | | Net | | | | | | | | Expenses | Expenses | | | |
| | | | realized | Total | | | | | | | before | including | | Net | |
| | Net asset | Net | and | from | From net | | | | | | reduc- | reduc- | | assets, | |
| | value, | invest- | unrealized | invest- | invest- | | | | Net asset | | tions and | tions and | Net | end of | |
| | beginning | ment in- | gain (loss) | ment | ment | From net | From | Total value, | end | Total | amounts | amounts | investment | period (in | Portfolio |
| | of period | come (loss) on | invest- | operations | income | realized | capital | distribu- | of period | return | recaptured | recaptured | income | thousands) | turnover |
| Period ended | ($) | ($)1,2 | ments ($) | ($) | ($) | gain ($) | paid-in ($) | tions ($) | ($) | (%)3 | (%) | (%) | (loss) (%)1 | ($) | (%) |
|
| CLASS R5 | | | | | | | | | | | | | | | |
|
| 02-28-20114 | 8.53 | 0.18 | 1.55 | 1.73 | (0.20) | (0.08) | — | (0.28) | 9.98 | 20.375,6 | 0.757,8 | 0.097,8 | 3.717 | 3,259 | 15 |
| 08-31-2010 | 8.06 | 0.21 | 0.48 | 0.69 | (0.19) | (0.03) | — | (0.22) | 8.53 | 8.505 | 0.938 | 0.098,9 | 2.44 | 668 | 23 |
| 08-31-2009 | 9.66 | 0.20 | (1.48) | (1.28) | (0.20) | (0.12) | — | (0.32) | 8.06 | (12.38)5 | 1.968 | 0.168 | 2.92 | 759 | 26 |
| 08-31-2008 | 10.82 | 0.19 | (1.08) | (0.89) | (0.16) | (0.11) | — | (0.27) | 9.66 | (8.47)5 | 6.468 | 0.218,10 | 1.83 | 758 | 10 |
| 08-31-200711 | 10.00 | 0.10 | 0.90 | 1.00 | (0.07) | (0.11) | — | (0.18) | 10.82 | 10.115,6,12 | 8.227,13 | 0.237,13 | 1.087 | 272 | 7 |
|
| CLASS 1 | | | | | | | | | | | | | | | |
|
| 02-28-20114 | 8.53 | 0.15 | 1.56 | 1.71 | (0.19) | (0.08) | — | (0.27) | 9.97 | 20.205,6 | 0.147,8 | 0.137,8 | 3.267 | 812,654 | 15 |
| 08-31-2010 | 8.06 | 0.20 | 0.49 | 0.69 | (0.19) | (0.03) | — | (0.22) | 8.53 | 8.455 | 0.148 | 0.148 | 2.30 | 631,670 | 23 |
| 08-31-2009 | 9.67 | 0.19 | (1.48) | (1.29) | (0.20) | (0.12) | — | (0.32) | 8.06 | (12.38)5 | 0.168 | 0.168 | 2.67 | 420,276 | 26 |
| 08-31-2008 | 10.82 | 0.15 | (1.03) | (0.88) | (0.16) | (0.11) | — | (0.27) | 9.67 | (8.38)5 | 0.178 | 0.178,10 | 1.49 | 276,252 | 10 |
| 08-31-200711 | 10.00 | 0.07 | 0.93 | 1.00 | (0.07) | (0.11) | — | (0.18) | 10.82 | 10.225,6,12 | 0.327,13 | 0.207,13 | 0.787 | 64,901 | 7 |
|
1 Recognition of net investment income by the Portfolio is affected by the timing of the declaration of dividends by the underlying funds in which the Portfolio invests.2 Based on the average daily shares outstanding.3 Does not reflect the effect of sales charges, if any.4 Unaudited.5 Total returns would have been lower had certain expenses not been reduced during the periods shown.6 Not annualized.7 Annualized.8 Ratios do not include expenses indirectly incurred from underlying funds whose expense ratios can vary based on the mix of underlying funds held by the Portfolio. Therange of expense ratios of the underlying funds held by the Portfolio was as follows: 0.48%–1.14%, 0.48%–1.17%, 0.49%–1.25% and 0.49%–1.13% for the peri-ods ended 2-28-11, 8-31-10, 8-31-09 and 8-31-08, respectively.9 Includes the impact of expense recapture for the following period ended 8-31-10: 0.02%, less than 0.005%, 0.01%, 0.28% and 0.02% of average net assets forClass A, Class R1, Class R3, Class R4 and Class R5 shares, respectively. See Note 4.10 Includes transfer agent fee earned credits of less than 0.01% of average net assets.11 The inception date for Class A, Class R1, Class R3, Class R4, Class R5 and Class 1 shares is 10-30-06.12 The Adviser made a payment to the Portfolio of $2,881. Excluding this payment, total returns would have been 9.48% for Class R1 shares. There was no effect to thetotal returns for Class A, Class R3, Class R4, Class R5 and Class 1.13 Does not include expenses of the underlying affiliated funds in which the Portfolio invests. | | | | | | | | | | | | | | | |
| Lifecycle 2015 Portfolio | | | | | | | | | | | | | |
| Per share operating performance for a share outstanding throughout each period | | Ratios and supplemental data | |
|
| | | Income (loss) from | | | | | | | | | | | | |
| | | investment operations | | | Less distributions | | | | Ratios to average net assets | | |
| | |
| |
| |
| |
| |
| | | | Net | | | | | | | | Expenses | Expenses | | | |
| | | | realized | Total | | | | | | | before | including | | Net | |
| | Net asset | Net | and | from | From net | | | | | | reduc- | reduc- | | assets, | |
| | value, | invest- | unrealized | invest- | invest- | | | | Net asset | | tions and | tions and | Net | end of | |
| | beginning | ment in- | gain (loss) | ment | ment | From net | From | Total value, | end | Total | amounts | amounts | investment | period (in | Portfolio |
| | of period | come (loss) | on invest- | operations | income | realized | capital | distribu- | of period | return | recaptured | recaptured | income | thousands) | turnover |
| Period ended | ($) | ($)1,2 | ments ($) | ($) | ($) | gain ($) | paid-in ($) | tions ($) | ($) | (%)3 | (%) | (%) (loss) | (%)1 | ($) | (%) |
|
| CLASS A | | | | | | | | | | | | | | | |
|
| 02-28-20114 | 8.66 | 0.15 | 1.31 | 1.46 | (0.20) | (0.07) | — | (0.27) | 9.85 | 17.005,6 | 0.697,8 | 0.597,8 | 3.257 | 18,754 | 19 |
| 08-31-2010 | 8.17 | 0.22 | 0.50 | 0.72 | (0.19) | (0.04) | — | (0.23) | 8.66 | 8.825 | 0.648 | 0.598,12 | 2.49 | 13,255 | 26 |
| 08-31-2009 | 9.66 | 0.21 | (1.36) | (1.15) | (0.21) | (0.13) | — | (0.34) | 8.17 | (10.91)5 | 1.038 | 0.618 | 2.96 | 8,596 | 28 |
| 08-31-2008 | 10.65 | 0.18 | (0.92) | (0.74) | (0.14) | (0.11) | — | (0.25) | 9.66 | (7.16)5 | 1.438 | 0.638,9 | 1.74 | 2,776 | 10 |
| 08-31-200710 | 10.00 | 0.07 | 0.76 | 0.83 | (0.09) | (0.09) | — | (0.18) | 10.65 | 8.375,6 | 2.197,11 | 0.637,11 | 0.867 | 836 | 9 |
|
| | |
| 46 | Lifecycle Portfolios | Semiannual report | See notes to financial statements |
| | | |
Financial highlights
Continued
| | | | | | | | | | | | | | | |
| Lifecycle 2015 Portfolio continued | | | | | | | | | | | |
| Per share operating performance for a share outstanding throughout each period | | Ratios and supplemental data | |
|
| | | Income (loss) from | | | | | | | | | | | | |
| | | investment operations | | | Less distributions | | | | Ratios to average net assets | | |
| | |
| |
| |
| |
| |
| | | | Net | | | | | | | | Expenses | Expenses | | | |
| | | | realized | Total | | | | | | | before | including | | Net | |
| | Net asset | Net | and | from | From net | | | | | | reduc- | reduc- | | assets, | |
| | value, | invest- | unrealized | invest- | invest- | | | | Net asset | | tions and | tions and | Net | end of | |
| | beginning | ment in- | gain (loss) | ment | ment | From net | From | Total value, | end | Total | amounts | amounts | investment | period (in | Portfolio |
| | of period | come (loss) | on invest- | operations | income | realized | capital | distribu- | of period | return | recaptured | recaptured | income | thousands) | turnover |
| Period ended | ($) | ($)1,2 | ments ($) | ($) | ($) | gain ($) | paid-in ($) | tions ($) | ($) | (%)3 | (%) | (%) | (loss) (%)1 | ($) | (%) |
|
| CLASS R1 | | | | | | | | | | | | | | | |
|
| 02-28-20114 | 8.64 | 0.15 | 1.30 | 1.45 | (0.19) | (0.07) | — | (0.26) | 9.83 | 16.885,6 | 1.787,8 | 0.747,8 | 3.167 | 1,599 | 19 |
| 08-31-2010 | 8.15 | 0.20 | 0.51 | 0.71 | (0.18) | (0.04) | — | (0.22) | 8.64 | 8.695 | 1.368 | 0.748,12 | 2.32 | 1,267 | 26 |
| 08-31-2009 | 9.62 | 0.20 | (1.35) | (1.15) | (0.19) | (0.13) | — | (0.32) | 8.15 | (11.15)5 | 5.138 | 0.838 | 2.79 | 762 | 28 |
| 08-31-2008 | 10.63 | 0.16 | (0.93) | (0.77) | (0.13) | (0.11) | — | (0.24) | 9.62 | (7.41)5 | 8.848 | 0.868,9 | 1.61 | 207 | 10 |
| 08-31-200710 | 10.00 | 0.11 | 0.69 | 0.80 | (0.08) | (0.09) | — | (0.17) | 10.63 | 8.085,6,13 | 16.477,11 | 0.877,11 | 1.217 | 108 | 9 |
|
| CLASS R3 | | | | | | | | | | | | | | | |
|
| 02-28-20114 | 8.64 | 0.15 | 1.30 | 1.45 | (0.19) | (0.07) | — | (0.26) | 9.83 | 16.935,6 | 1.357,8 | 0.697,8 | 3.277 | 2,429 | 19 |
| 08-31-2010 | 8.15 | 0.21 | 0.50 | 0.71 | (0.18) | (0.04) | — | (0.22) | 8.64 | 8.745 | 1.298 | 0.698,12 | 2.40 | 1,780 | 26 |
| 08-31-2009 | 9.63 | 0.20 | (1.36) | (1.16) | (0.19) | (0.13) | — | (0.32) | 8.15 | (11.12)5 | 2.598 | 0.778 | 2.81 | 763 | 28 |
| 08-31-2008 | 10.63 | 0.15 | (0.91) | (0.76) | (0.13) | (0.11) | — | (0.24) | 9.63 | (7.32)5 | 6.208 | 0.818,9 | 1.48 | 693 | 10 |
| 08-31-200710 | 10.00 | 0.11 | 0.69 | 0.80 | (0.08) | (0.09) | — | (0.17) | 10.63 | 8.105,6 | 16.387,11 | 0.807,11 | 1.287 | 108 | 9 |
|
| CLASS R4 | | | | | | | | | | | | | | | |
|
| 02-28-20114 | 8.65 | 0.16 | 1.31 | 1.47 | (0.22) | (0.07) | — | (0.29) | 9.83 | 17.125,6 | 17.397,8 | 0.397,8 | 3.497 | 82 | 19 |
| 08-31-2010 | 8.16 | 0.24 | 0.50 | 0.74 | (0.21) | (0.04) | — | (0.25) | 8.65 | 9.015 | 7.118 | 0.398,12 | 2.74 | 64 | 26 |
| 08-31-2009 | 9.65 | 0.21 | (1.35) | (1.14) | (0.22) | (0.13) | — | (0.35) | 8.16 | (10.83)5 | 5.348 | 0.468 | 3.00 | 355 | 28 |
| 08-31-2008 | 10.65 | 0.21 | (0.94) | (0.73) | (0.16) | (0.11) | — | (0.27) | 9.65 | (7.06)5 | 12.648 | 0.508,9 | 2.02 | 172 | 10 |
| 08-31-200710 | 10.00 | 0.14 | 0.69 | 0.83 | (0.09) | (0.09) | — | (0.18) | 10.65 | 8.355,6 | 16.087,11 | 0.527,11 | 1.567 | 108 | 9 |
|
| CLASS R5 | | | | | | | | | | | | | | | |
|
| 02-28-20114 | 8.67 | 0.17 | 1.32 | 1.49 | (0.25) | (0.07) | — | (0.32) | 9.84 | 17.295,6 | 1.497,8 | 0.097,8 | 3.617 | 1,590 | 19 |
| 08-31-2010 | 8.17 | 0.25 | 0.52 | 0.77 | (0.23) | (0.04) | — | (0.27) | 8.67 | 9.415 | 3.428 | 0.098,12 | 2.81 | 273 | 26 |
| 08-31-2009 | 9.67 | 0.36 | (1.48) | (1.12) | (0.25) | (0.13) | — | (0.38) | 8.17 | (10.53)5 | 5.048 | 0.208 | 4.98 | 103 | 28 |
| 08-31-2008 | 10.67 | 0.18 | (0.88) | (0.70) | (0.19) | (0.11) | — | (0.30) | 9.67 | (6.81)5 | 5.098 | 0.228,9 | 1.81 | 464 | 10 |
| 08-31-200710 | 10.00 | 0.16 | 0.69 | 0.85 | (0.09) | (0.09) | — | (0.18) | 10.67 | 8.615,6 | 15.777,11 | 0.237,11 | 1.847 | 109 | 9 |
|
| CLASS 1 | | | | | | | | | | | | | | | |
|
| 02-28-20114 | 8.67 | 0.18 | 1.30 | 1.48 | (0.24) | (0.07) | — | (0.31) | 9.84 | 17.246 | 0.147,8 | 0.147,8 | 3.717 | 548,800 | 19 |
| 08-31-2010 | 8.17 | 0.25 | 0.52 | 0.77 | (0.23) | (0.04) | — | (0.27) | 8.67 | 9.365 | 0.148 | 0.148 | 2.88 | 439,994 | 26 |
| 08-31-2009 | 9.68 | 0.25 | (1.37) | (1.12) | (0.26) | (0.13) | — | (0.39) | 8.17 | (10.54)5 | 0.168 | 0.168 | 3.51 | 305,171 | 28 |
| 08-31-2008 | 10.68 | 0.21 | (0.91) | (0.70) | (0.19) | (0.11) | — | (0.30) | 9.68 | (6.80)5 | 0.188 | 0.188 | 2.12 | 216,679 | 10 |
| 08-31-200710 | 10.00 | 0.10 | 0.76 | 0.86 | (0.09) | (0.09) | — | (0.18) | 10.68 | 8.725,6 | 0.367,11 | 0.207,11 | 1.197 | 55,723 | 9 |
|
1 Recognition of net investment income by the Portfolio is affected by the timing of the declaration of dividends by the underlying funds in which the Portfolio invests.2 Based on the average daily shares outstanding.3 Does not reflect the effect of sales charges, if any.4 Unaudited.5 Total returns would have been lower had certain expenses not been reduced during the periods shown.6 Not annualized.7 Annualized.8 Ratios do not include expenses indirectly incurred from underlying funds whose expense ratios can vary based on the mix of underlying funds held by the Portfolio.The range of expense ratios of the underlying funds held by the Portfolio was as follows: 0.48%–1.14%, 0.48%–1.17%, 0.49%–1.18% and 0.49%–1.13% for theperiods ended 2-28-11, 8-31-10, 8-31-09 and 8-31-08, respectively.9 Includes transfer agent fee earned credits of less than 0.01% of average net assets.10 The inception date for Class A, Class R1, Class R3, Class R4, Class R5 and Class 1 shares is 10-30-06.11 Does not include expenses of the underlying affiliated funds in which the Portfolio invests.12 Includes the impact of expense recapture for the following period ended 8-31-10: 0.02%, 0.03%, 0.02%, 0.34% and 0.17% of average net assets for Class A,Class R1, Class R3, Class R4 and Class R5 shares, respectively. See Note 4.13 The Adviser made a payment to the Portfolio of $6,640. Excluding this payment, total return would have been 7.98% for Class R1. There was no effect to the totalreturns for Class A, Class R3, Class R4, Class R5 and Class 1. | | |
| See notes to financial statements | Semiannual report | Lifecycle Portfolios | 47 |
| | |
Financial highlights
Continued
| | | | | | | | | | | | | | | |
| Lifecycle 2010 Portfolio | | | | | | | | | | | | | |
| Per share operating performance for a share outstanding throughout each period | | Ratios and supplemental data | |
|
| | | Income (loss) from | | | | | | | | | | | | |
| | | investment operations | | | Less distributions | | | | Ratios to average net assets | | |
| | |
| |
| |
| |
| |
| | | | Net | | | | | | | | Expenses | Expenses | | | |
| | | | realized | Total | | | | | | | before | including | | Net | |
| | Net asset | Net | and | from | From net | | | | | | reduc- | reduc- | | assets, | |
| | value, | invest- | unrealized | invest- | invest- | | | | Net asset | | tions and | tions and | Net | end of | |
| | beginning | ment in- | gain (loss) | ment | ment | From net | From | Total value, | end | Total | amounts | amounts | investment | period (in | Portfolio |
| | of period | come (loss) | on invest- | operations | income | realized | capital | distribu- | of period | return | recaptured | recaptured | income | thousands) | turnover |
| Period ended | ($) | ($)1,2 | ments ($) | ($) | ($) | gain ($) | paid-in ($) | tions ($) | ($) | (%)3 | (%) | (%) | (loss) (%)1 | ($) | (%) |
|
| CLASS A | | | | | | | | | | | | | | | |
|
| 02-28-20114 | 8.98 | 0.17 | 1.11 | 1.28 | (0.26) | (0.06) | — | (0.32) | 9.94 | 14.355,6 | 0.727,8 | 0.597,8 | 3.447 | 14,058 | 31 |
| 08-31-2010 | 8.38 | 0.26 | 0.54 | 0.80 | (0.17) | (0.03) | — | (0.20) | 8.98 | 9.605 | 0.638 | 0.608,9 | 2.89 | 9,538 | 48 |
| 08-31-2009 | 9.69 | 0.28 | (1.20) | (0.92) | (0.26) | (0.13) | — | (0.39) | 8.38 | (8.53)5 | 1.228 | 0.648 | 3.75 | 5,637 | 31 |
| 08-31-2008 | 10.54 | 0.23 | (0.83) | (0.60) | (0.16) | (0.09) | — | (0.25) | 9.69 | (5.87)5 | 1.618 | 0.658,10 | 2.28 | 2,050 | 14 |
| 08-31-200711 | 10.00 | 0.12 | 0.57 | 0.69 | (0.09) | (0.06) | — | (0.15) | 10.54 | 6.995,6 | 2.457,12 | 0.637,12 | 1.427 | 665 | 17 |
|
| CLASS R1 | | | | | | | | | | | | | | | |
|
| 02-28-20114 | 8.95 | 0.18 | 1.09 | 1.27 | (0.24) | (0.06) | — | (0.30) | 9.92 | 14.355,6 | 4.347,8 | 0.747,8 | 3.837 | 466 | 31 |
| 08-31-2010 | 8.36 | 0.26 | 0.52 | 0.78 | (0.16) | (0.03) | — | (0.19) | 8.95 | 9.365 | 1.808 | 0.758,9 | 2.95 | 411 | 48 |
| 08-31-2009 | 9.66 | 0.25 | (1.19) | (0.94) | (0.23) | (0.13) | — | (0.36) | 8.36 | (8.82)5 | 9.948 | 0.878 | 3.39 | 286 | 31 |
| 08-31-2008 | 10.52 | 0.23 | (0.85) | (0.62) | (0.15) | (0.09) | — | (0.24) | 9.66 | (6.02)5 | 14.928 | 0.878,10 | 2.30 | 126 | 14 |
| 08-31-200711 | 10.00 | 0.15 | 0.52 | 0.67 | (0.09) | (0.06) | — | (0.15) | 10.52 | 6.705,6 | 16.897,12 | 0.877,12 | 1.707 | 107 | 17 |
|
| CLASS R3 | | | | | | | | | | | | | | | |
|
| 02-28-20114 | 8.96 | 0.17 | 1.11 | 1.28 | (0.25) | (0.06) | — | (0.31) | 9.93 | 14.395,6 | 1.577,8 | 0.697,8 | 3.517 | 1,738 | 31 |
| 08-31-2010 | 8.37 | 0.25 | 0.54 | 0.79 | (0.17) | (0.03) | — | (0.20) | 8.96 | 9.395 | 1.328 | 0.708,9 | 2.79 | 1,441 | 48 |
| 08-31-2009 | 9.67 | 0.26 | (1.19) | (0.93) | (0.24) | (0.13) | — | (0.37) | 8.37 | (8.69)5 | 2.348 | 0.798 | 3.48 | 1,260 | 31 |
| 08-31-2008 | 10.53 | 0.26 | (0.88) | (0.62) | (0.15) | (0.09) | — | (0.24) | 9.67 | (6.02)5 | 3.958 | 0.828,10 | 2.64 | 795 | 14 |
| 08-31-200711 | 10.00 | 0.16 | 0.52 | 0.68 | (0.09) | (0.06) | — | (0.15) | 10.53 | 6.825,6,13 | 16.817,12 | 0.807,12 | 1.777 | 107 | 17 |
|
| CLASS R4 | | | | | | | | | | | | | | | |
|
| 02-28-20114 | 8.98 | 0.18 | 1.12 | 1.30 | (0.28) | (0.06) | — | (0.34) | 9.94 | 14.575,6 | 16.657,8 | 0.397,8 | 3.797 | 83 | 31 |
| 08-31-2010 | 8.38 | 0.30 | 0.52 | 0.82 | (0.19) | (0.03) | — | (0.22) | 8.98 | 9.795 | 8.528 | 0.398,9 | 3.31 | 71 | 48 |
| 08-31-2009 | 9.69 | 0.29 | (1.20) | (0.91) | (0.27) | (0.13) | — | (0.40) | 8.38 | (8.40)5 | 11.938 | 0.498 | 3.82 | 116 | 31 |
| 08-31-2008 | 10.55 | 0.26 | (0.85) | (0.59) | (0.18) | (0.09) | — | (0.27) | 9.69 | (5.76)5 | 12.388 | 0.538,10 | 2.56 | 205 | 14 |
| 08-31-200711 | 10.00 | 0.18 | 0.52 | 0.70 | (0.09) | (0.06) | — | (0.15) | 10.55 | 7.085,6,13 | 16.517,12 | 0.527,12 | 2.067 | 107 | 17 |
|
| CLASS R5 | | | | | | | | | | | | | | | |
|
| 02-28-20114 | 8.99 | 0.18 | 1.12 | 1.30 | (0.30) | (0.06) | — | (0.36) | 9.93 | 14.645,6 | 0.967,8 | 0.097,8 | 3.747 | 2,953 | 31 |
| 08-31-2010 | 8.39 | 0.32 | 0.52 | 0.84 | (0.21) | (0.03) | — | (0.24) | 8.99 | 10.085 | 3.138 | 0.098,9 | 3.54 | 261 | 48 |
| 08-31-2009 | 9.71 | 0.31 | (1.20) | (0.89) | (0.30) | (0.13) | — | (0.43) | 8.39 | (8.11)5 | 5.868 | 0.208 | 4.12 | 207 | 31 |
| 08-31-2008 | 10.57 | 0.24 | (0.80) | (0.56) | (0.21) | (0.09) | — | (0.30) | 9.71 | (5.51)5 | 10.308 | 0.258,10 | 2.41 | 498 | 14 |
| 08-31-200711 | 10.00 | 0.21 | 0.52 | 0.73 | (0.10) | (0.06) | — | (0.16) | 10.57 | 7.335,6,13 | 16.207,12 | 0.237,12 | 2.347 | 107 | 17 |
|
| CLASS 1 | | | | | | | | | | | | | | | |
|
| 02-28-20114 | 8.99 | 0.20 | 1.11 | 1.31 | (0.30) | (0.06) | — | (0.36) | 9.94 | 14.716 | 0.147,8 | 0.147,8 | 4.067 | 477,742 | 31 |
| 08-31-2010 | 8.39 | 0.31 | 0.53 | 0.84 | (0.21) | (0.03) | — | (0.24) | 8.99 | 10.045 | 0.158 | 0.158 | 3.45 | 447,295 | 48 |
| 08-31-2009 | 9.72 | 0.30 | (1.20) | (0.90) | (0.30) | (0.13) | — | (0.43) | 8.39 | (8.15)5 | 0.198 | 0.198 | 4.10 | 151,035 | 31 |
| 08-31-2008 | 10.57 | 0.26 | (0.81) | (0.55) | (0.21) | (0.09) | — | (0.30) | 9.72 | (5.41)5 | 0.218 | 0.208 | 2.61 | 121,337 | 14 |
| 08-31-200711 | 10.00 | 0.16 | 0.57 | 0.73 | (0.10) | (0.06) | — | (0.16) | 10.57 | 7.345,6 | 0.567,12 | 0.207,12 | 1.787 | 25,428 | 17 |
|
1 Recognition of net investment income by the Portfolio is affected by the timing of the declaration of dividends by the underlying funds in which the Portfolio invests.2 Based on the average daily shares outstanding.3 Does not reflect the effect of sales charges, if any.4 Unaudited.5 Total returns would have been lower had certain expenses not been reduced during the periods shown.6 Not annualized.7 Annualized.8 Ratios do not include expenses indirectly incurred from underlying funds whose expense ratios can vary based on the mix of underlying funds held by the Portfolio. Therange of expense ratios of the underlying funds held by the Portfolio was as follows: 0.48%–1.11%, 0.48%–1.13%, 0.49%–1.09% and 0.49%–1.13% for the periodsended 2-28-11, 8-31-10, 8-31-09 and 8-31-08, respectively.9 Includes the impact of expense recapture for the following period ended 8-31-10: 0.02%, 0.14%, 0.02%, 0.46% and 0.16% of average net assets for Class A,Class R1, Class R3, Class R4 and Class R5 shares, respectively. See Note 4.10 Includes transfer agent fee earned credits of less than 0.01% of average net assets.11 The inception date for Class A, Class R1, Class R3, Class R4, Class R5 and Class 1 shares is 10-30-06.12 Does not include expenses of the underlying affiliated funds in which the Portfolio invests.13 The Adviser made a payment to the Portfolio of $4,286. Excluding this payment, total returns would have been 6.72%, 6.97% and 7.23% for Class R3, Class R4 andClass R5, respectively. There was no effect to the total returns for Class A, Class R1 and Class 1. | | |
| 48 | Lifecycle Portfolios | Semiannual report | See notes to financial statements |
| | | |
Notes to financial statements
(Unaudited)
Note 1 — Organization
John Hancock Funds II (the Trust) is an open-end management investment company organized as a Massachusetts business trust. The Trust is a series company which means it has several funds, each with a stated investment objective that it pursues through separate investment policies. The Trust currently offers multiple investment funds, eight of which (collectively, Lifecycle Portfolios or the Portfolios, and individually the Portfolio) are presented in this report. The Lifecycle Portfolios are series of the Trust and operate as “funds of funds” that invest in shares of underlying funds of the Trust, John Hancock Funds III (JHF III) and also in other affiliated funds of the John Hancock funds complex. Each Portfolio is diversified for purposes of the Investment Company Act of 1940, as amended (1940 Act).
The Portfolios may offer multiple classes of shares. The shares currently offered by the Trust are detailed in the Statements of Assets and Liabilities. Class A shares are open to all investors. Class R1, Class R3, Class R4 and Class R5 shares are available only to certain retirement plans. Class 1 shares are offered only to certain affiliates of Manulife Financial Corporation (MFC). Shareholders of each class have exclusive voting rights to matters that affect that class. The distribution and service fees, if any, and transfer agent fees for each class may differ.
The accounting policies of the underlying funds of the Portfolios are outlined in the underlying funds’ shareholder reports, available without charge by calling 1-800-344-1029, at jhfunds.com and on the Securities and Exchange Commission (SEC) Web site at www.sec.gov or at the SEC’s public reference room in Washington, D.C. The underlying funds are not covered by this report.
Note 2 — Significant accounting policies
The financial statements have been prepared in conformity with accounting principles generally accepted in the United States of America, which require management to make certain estimates and assumptions at the date of the financial statements. Actual results could differ from those estimates. Events or transactions occurring after the end of the fiscal period through the date that the financial statements were issued have been evaluated in the preparation of the financial statements. The following summarizes the significant accounting policies of the Portfolios:
Security valuation. Investments are stated at value as of the close of regular trading on the New York Stock Exchange (NYSE), normally at 4:00 P.M., Eastern Time. The Portfolios use a three-tier hierarchy to prioritize the pricing assumptions, referred to as inputs, used in valuation techniques to measure fair value. Level 1 includes securities valued using quoted prices in active markets for identical securities. Level 2 includes securities valued using significant observable inputs. Observable inputs may include quoted prices for similar securities, interest rates, prepayment speeds and credit risk. Prices for securities valued using these inputs are received from independent pricing vendors and brokers and are based on an evaluation of the inputs described. Level 3 includes securities valued using significant unobservable inputs when market prices are not readily available or reliable, including the Portfolios’ own assumptions in determining the fair value of investments. Factors used in determining value may include market or issuer specific events, changes in interest rates and credit quality. The inputs or methodology used for valuing securities are not necessarily an indication of the risk associated with investing in those securities.
As of February 28, 2011, all investments for the Portfolios are categorized as Level 1 under the hierarchy discussed above. Changes in valuation techniques may result in transfers in or out of an assigned level within the disclosure hierarchy. During the six months ended February 28, 2011, there were no significant transfers in or out of Level 1 assets.
Investments by the Portfolios in underlying affiliated funds and/or other investment companies are valued at their respective net asset values each business day.
Security transactions and related investment income. Investment security transactions are accounted for on a trade date plus one basis for daily net asset value calculations. However, for financial reporting purposes, investment transactions are reported on trade date. Gains and losses on securities sold are determined on the basis of identified cost and may include proceeds from litigation. Income and capital gain distributions from underlying funds are recorded on ex-date.
Line of credit. The Portfolios may borrow from banks for temporary or emergency purposes, including meeting redemption requests that otherwise might require the untimely sale of securities. Pursuant to the custodian agreement, the custodian may loan money to a Portfolio to make properly authorized payments. The Portfolios are obligated to repay the custodian for any overdraft, including any related costs or expenses. The custodian has a lien, security interest or security entitlement in any Portfolio property that is not segregated, to the maximum extent permitted by law for any overdraft.
In addition, the Portfolios and other affiliated funds have entered into an agreement with State Street Bank and Trust Company (SSBT) which enables them to participate in a $200 million unsecured committed line of credit. A commitment fee, payable at the end of each calendar quarter, based on the average daily unused portion of the line of credit, is charged to each participating fund on a pro
| | |
| | Semiannual report | Lifecycle Portfolios | 49 |
rata basis and is reflected in other expenses on the Statements of Operations. For the six months ended February 28, 2011, the Portfolios had no borrowings under the line of credit.
Effective March 30, 2011, the line of credit with SSBT expired and a similar arrangement was established with Citibank N.A.
Expenses. The majority of expenses are directly attributable to an individual portfolio. Expenses that are not readily attributable to a specific portfolio are allocated among all portfolios in an equitable manner, taking into consideration, among other things, the nature and type of expense and the portfolio’s relative assets. Expense estimates are accrued in the period to which they relate and adjustments are made when actual amounts are known.
Class allocations. Income, common expenses and realized and unrealized gains (losses) are determined at the Portfolio level and allocated daily to each class of shares based on the net asset value of the class. Class-specific expenses, such as distribution and service fees, if any, and transfer agent fees, are calculated daily for each class, based on the net asset value and the specific expense rates applicable to each class.
Federal income taxes. The Portfolios intend to continue to qualify as regulated investment companies by complying with the applicable provisions of the Internal Revenue Code and will not be subject to federal income tax on taxable income that is distributed to shareholders. Therefore, no federal income tax provisions are required.
For federal income tax purposes, the Portfolios had capital loss carryforwards available to offset future net realized capital gains. The following table details the capital loss carryforwards available as of August 31, 2010:
| | | |
| Capital Loss Carryforwards | |
| Expiring at August 31 | |
| | |
| Portfolio | 2017 | 2018 | |
| |
| Lifecycle 2045 | $699,374 | $4,989,470 | |
| Lifecycle 2040 | 825,392 | 5,318,488 | |
| Lifecycle 2035 | 1,230,606 | 8,731,058 | |
| Lifecycle 2030 | 1,619,728 | 14,237,264 | |
| Lifecycle 2025 | 1,882,836 | 22,990,976 | |
| Lifecycle 2020 | 1,054,048 | 23,229,183 | |
| Lifecycle 2015 | 562,494 | 22,163,126 | |
| Lifecycle 2010 | 176,244 | 10,481,813 | |
Under the recently enacted Regulated Investment Company Modernization Act of 2010, the Portfolios will be permitted to carry forward capital losses incurred in taxable years beginning after December 22, 2010 for an unlimited period. However, any losses incurred during those future taxable years will be required to be utilized prior to the losses incurred in pre-enactment taxable years. As a result of this ordering rule, pre-enactment capital loss carryforwards may be more likely to expire unused. Additionally, post-enactment capital losses that are carried forward will retain their character as either short-term or long-term capital losses rather than being considered all short-term as under previous law.
As of August 31, 2010, the Portfolios had no uncertain tax positions that would require financial statement recognition, de-recognition or disclosure. The Portfolios’ federal tax returns are subject to examination by the Internal Revenue Service for a period of three years.
The cost of investments owned on February 28, 2011, including short-term investments, for federal income tax purposes, was as follows:
| | | | |
| | | Unrealized | Unrealized | Net Unrealized |
| Portfolio | Aggregate Cost | Appreciation | Depreciation | Appreciation |
|
| Lifecycle 2045 | $374,909,997 | $77,599,309 | ($77,448) | $77,521,861 |
| Lifecycle 2040 | 372,495,879 | 75,037,928 | (76,045) | 74,961,883 |
| Lifecycle 2035 | 496,655,514 | 98,138,015 | (92,596) | 98,045,419 |
| Lifecycle 2030 | 638,490,261 | 121,161,650 | (220,841) | 120,940,809 |
| Lifecycle 2025 | 743,786,641 | 131,443,055 | (137,436) | 131,305,619 |
| Lifecycle 2020 | 729,387,580 | 118,993,351 | (209,303) | 118,784,048 |
| Lifecycle 2015 | 500,778,390 | 72,576,650 | (65,996) | 72,510,654 |
| Lifecycle 2010 | 447,121,689 | 50,036,325 | (78,828) | 49,957,497 |
Distribution of income and gains. Distributions to shareholders from net investment income and net realized gains, if any, are recorded on the ex-date. The Portfolios generally declare and pay dividends and capital gain distributions, if any, at least annually.
Distributions paid by the Portfolios with respect to each class of shares are calculated in the same manner, at the same time and are in the same amount, except for the effect of expenses that may be applied differently to each class.
Such distributions, on a tax basis, are determined in conformity with income tax regulations, which may differ from accounting principles generally accepted in the United States of America. Short term gains from underlying funds are treated as ordinary income for tax purposes.
| |
| 50 | Lifecycle Portfolios | Semiannual report |
Capital accounts within financial statements are adjusted for permanent book-tax differences. These adjustments have no impact on net assets or the results of operations. Temporary book-tax differences, if any, will reverse in a subsequent period.
Note 3 — Guarantees and indemnifications
Under the Trust’s organizational documents, its Officers and Trustees are indemnified against certain liabilities arising out of the performance of their duties to the Portfolios. Additionally, in the normal course of business, the Portfolios enter into contracts with service providers that contain general indemnification clauses. The Portfolios’ maximum exposure under these arrangements is unknown, as this would involve future claims that may be made against the Portfolios that have not yet occurred. The risk of material loss from such claims is considered remote.
Note 4 — Fees and transactions with affiliates
John Hancock Investment Management Services, LLC (the Adviser) serves as investment adviser for the Trust. John Hancock Funds, LLC (the Distributor), an affiliate of the Adviser, serves as principal underwriter of the Trust. The Adviser and the Distributor are indirect wholly owned subsidiaries of MFC.
Management fee. The Portfolios pay the Adviser a management fee for its services to the Portfolios. The management fee has two components: (a) a fee on net assets invested in affiliated funds (Affiliated Fund Assets) and (b) a fee on net assets not invested in affiliated funds (Other Assets). Affiliated funds are any funds of the Trust, JHF III and John Hancock Trust (JHT), excluding John Hancock Money Market Trust B, John Hancock 500 Index Trust B, John Hancock International Equity Index Trust B and John Hancock Total Bond Market Trust B. The fee on assets invested in Affiliated Fund Assets is stated as an annual percentage of the current value of the aggregate net assets of all the Portfolios and is equivalent to the sum of: (a) 0.06% of the first $7.5 billion of aggregate net assets and (b) 0.05% of the excess over $7.5 billion of aggregate net assets. The fee on Other Assets is stated as an annual percentage of the current value of the aggregate net assets of all the Portfolios and is equivalent to the sum of: (a) 0.51% of the first $7.5 billion of aggregate net assets and (b) 0.50% of the excess over $7.5 billion of aggregate net assets and is applied to the Other Assets of the Portfolios.
John Hancock Asset Management a division of Manulife Asset Management (North America) Limited (formerly MFC Global Investment Management (U.S.A.) Limited), an indirect owned subsidiary of MFC and an affiliate of the Adviser, John Hancock Asset Management a division of Manulife Asset Management (US) LLC (formerly MFC Global Investment Management (U.S.) LLC), an indirect owned subsidiary of MFC and an affiliate of the Adviser and QS Investors, LLC act as subadvisers to the Lifecycle Portfolios. The Portfolios are not responsible for the payment of subadvisory fees. The investment management fees incurred for the six months ended February 28, 2011 were equivalent to an annual effective rate of 0.06% each Portfolio’s average daily net assets.
Expense reimbursements. The Adviser voluntarily agreed to waive a portion of its management fee if certain expenses of the Lifecycle Portfolios exceed 0.10% of average net assets. Expenses excluded from this waiver are taxes, brokerage commissions, interest, litigation and indemnification expenses, advisory fees, Rule 12b-1 fees, printing and postage, transfer agent fees, state registration fees, service fees, underlying fund expenses and other extraordinary expenses not incurred in the ordinary course of the Portfolios’ business. This expense reduction will continue in effect until terminated by the Adviser.
The Adviser has voluntarily agreed to waive its advisory fee or reimburse the Portfolios so that the aggregate advisory fee retained by the Adviser with respect to both the Portfolios and the underlying investments does not exceed 0.51% of the Lifecycle Portfolios’ first $7.5 billion of average daily net assets and 0.50% of the Portfolios’ average daily net assets in excess of $7.5 billion. This voluntary waiver may terminate at any time.
The Adviser has contractually agreed to waive fees and/or reimburse certain class specific expenses, including 12b-1 fees, transfer agent fees, service fees, state registration fees, and printing and postage for Class A, Class R1, Class R3, Class R4 and Class R5, to the extent that the above expenses for each class exceed 0.50%, 0.65%, 0.60% (0.55% for Lifecycle 2045 and Lifecycle 2040), 0.30% and 0.00%, respectively, of the average daily net assets attributable to the classes. This expense fee waiver and/or reimbursement will continue in effect until at least December 31, 2011.
Prior to December 31, 2010, the Adviser waived class specific fees over 0.05% on Class 1.
For the six months ended February 28, 2011, the expense reductions related to these plans amounted to the following and are reflected as a reduction of total expenses in the Statements of Operations:
| | | | | | | |
| | | | Expense Reimbursement by Class | | |
|
| |
| Portfolio | Class A | Class R1 | Class R3 | Class R4 | Class R5 | Class 1 | Total |
|
| Lifecycle 2045 | $7,896 | $7,147 | $6,764 | $6,404 | $6,494 | $6,758 | $41,463 |
| Lifecycle 2040 | 7,909 | 7,517 | 7,539 | 6,413 | 6,669 | 6,771 | 42,818 |
| Lifecycle 2035 | 7,841 | 7,863 | 6,650 | 6,475 | 6,627 | 8,998 | 44,454 |
| Lifecycle 2030 | 7,979 | 8,124 | 6,758 | 6,324 | 7,057 | 10,921 | 47,163 |
| Lifecycle 2025 | 7,765 | 8,000 | 7,315 | 6,597 | 7,749 | 11,023 | 48,449 |
| Lifecycle 2020 | 7,890 | 8,170 | 7,223 | 6,364 | 7,608 | 8,283 | 45,538 |
| Lifecycle 2015 | 7,748 | 7,586 | 7,364 | 6,279 | 6,751 | — | 35,728 |
| Lifecycle 2010 | 7,511 | 6,809 | 7,110 | 6,322 | 7,218 | — | 34,970 |
| | |
| | Semiannual report | Lifecycle Portfolios | 51 |
Expense recapture. The Adviser may recapture operating expenses reimbursed or fees waived under previous expense limitation or waiver arrangements made subsequent to January 1, 2009, for a period of three years following the beginning of the month in which such reimbursements or waivers originally occurred. The table below outlines the amounts recovered during the six months ended February 28, 2011 and the amount of waived or reimbursed expenses subject to potential recovery and the respective expiration dates. Certain reimbursements or waivers are not subject to recapture.
| | | | |
| | Amounts eligible for | Amounts eligible for | Amounts eligible for | Amount recovered |
| | recovery through | recovery through | recovery through | during the six months |
| Portfolio | August 1, 2012 | August 1, 2013 | February 1, 2014 | ended February 28, 2011 |
|
| Lifecycle 2045 | $39,472 | $38,266 | $34,531 | — |
| Lifecycle 2040 | 40,457 | 37,444 | 35,829 | — |
| Lifecycle 2035 | 39,028 | 36,422 | 35,171 | — |
| Lifecycle 2030 | 40,527 | 38,713 | 35,837 | — |
| Lifecycle 2025 | 38,568 | 38,062 | 37,052 | — |
| Lifecycle 2020 | 36,400 | 39,458 | 36,913 | — |
| Lifecycle 2015 | 36,659 | 35,135 | 35,728 | — |
| Lifecycle 2010 | 34,858 | 31,092 | 34,970 | — |
Accounting and legal services. Pursuant to the service agreement, the Portfolios reimburse the Adviser for all expenses associated with providing the administrative, financial, legal, accounting and recordkeeping services of the Portfolios, including the preparation of all tax returns, periodic reports to shareholders and regulatory reports, among other services. These expenses are allocated to each share class based on its relative net assets at the time the expense was incurred. The accounting and legal services fees incurred for the six months ended February 28, 2011 amounted to an annual rate of 0.01% of each Portfolio’s average daily net assets.
Distribution and service plans. The Trust has a distribution agreement with the Distributor. The Portfolios have adopted distribution and service plans with respect Class A, Class R1, Class R3, Class R4 and Class 1 shares pursuant to Rule 12b-1 under the 1940 Act, to pay the Distributor for services provided as the distributor of shares of the Portfolios. In addition, under a service plan for Class R1, Class R3, Class R4 and Class R5 shares, the Portfolios pay for certain other services. The Portfolios may pay up to the following contractual rates of distribution and service fees under these arrangements, expressed as an annual percentage of average daily net assets for each class of the Portfolios’ shares:
| | | | |
| Class | 12b-1 Fee | Service Fee | | |
| | |
| A | 0.30% | — | | |
| R1 | 0.50% | 0.25% | | |
| R3 | 0.50% | 0.15% | | |
| R4 | 0.25% | 0.10% | | |
| R5 | — | 0.05% | | |
| 1 | 0.05% | — | | |
Sales charges. Class A shares are assessed up-front sales charges of up to 5% of the net asset value of such shares. The following summarizes the net up-front sales charges received by the Distributor during the six months ended February 28, 2011:
| | | | | | | | |
| | Lifecycle | Lifecycle | Lifecycle | Lifecycle | Lifecycle | Lifecycle | Lifecycle | Lifecycle |
| | 2045 | 2040 | 2035 | 2030 | 2025 | 2020 | 2015 | 2010 |
|
| Net sales charges | $16,202 | $11,135 | $12,622 | $24,343 | $13,557 | $47,503 | $10,550 | $6,471 |
| Retained for printing | | | | | | | | |
| prospectuses, advertising | | | | | | | | |
| and sales literature | 2,232 | 1,416 | 1,837 | 3,442 | 1,969 | 7,919 | 1,476 | 854 |
| Sales commission to | | | | | | | | |
| unrelated broker-dealers | 12,974 | 9,436 | 10,761 | 20,774 | 11,475 | 39,516 | 9,050 | 5,617 |
| Sales commission to | | | | | | | | |
| affiliated sales personnel | 996 | 283 | 24 | 127 | 113 | 68 | 24 | — |
Transfer agent fees. The Portfolios have a transfer agent agreement with John Hancock Signature Services, Inc. (Signature Services or Transfer Agent), an affiliate of the Adviser. Class 1 shares do not pay transfer agent fees. The transfer agent fees paid to Signature Services are determined based on the cost to Signature Services (Signature Services Cost) of providing recordkeeping services. The Signature Services Cost includes a component of allocated John Hancock corporate overhead for providing transfer agent services to the Portfolios and to all other John Hancock affiliated funds. It also includes out-of-pocket expenses that are comprised of payments made to third-parties for recordkeeping services provided to their clients who invest in one or more John Hancock funds. In addition, Signature Services Cost may be reduced by certain revenues that Signature Services receive in connection with the service they provide to the funds. Signature Services Cost is calculated monthly and allocated, as applicable, to four categories of share classes: Institutional Share Classes, Retirement Share Classes, Municipal Bond Classes and all other Retail Share Classes. Within each of these categories, the applicable costs are allocated to the affected John Hancock affiliated funds and/or classes, based on the relative average daily net assets.
| |
| 52 | Lifecycle Portfolios | Semiannual report |
| | | | | |
| Class level expenses. Class level expenses for the six months ended February 28, 2011 were: | | |
| | | |
| | | Distribution and | Transfer | State registration | Printing and |
| Portfolio | Class | service fees | agent fees | fees | postage |
|
| |
| Lifecycle 2045 | A | $11,352 | $6,807 | $7,651 | $872 |
| | R1 | 3,313 | 160 | 6,451 | 80 |
| | R3 | 2,120 | 119 | 6,249 | 58 |
| | R4 | 534 | 57 | 6,249 | 33 |
| | R5 | 107 | 77 | 6,283 | 20 |
| | 1 | 95,776 | — | — | — |
| | Total | $113,202 | $7,220 | $32,883 | $1,063 |
|
| |
| Lifecycle 2040 | A | $12,541 | $7,512 | $7,712 | $896 |
| | R1 | 4,567 | 221 | 6,526 | 140 |
| | R3 | 5,770 | 332 | 6,325 | 132 |
| | R4 | 318 | 34 | 6,325 | 13 |
| | R5 | 169 | 122 | 6,325 | 42 |
| | 1 | 94,940 | — | — | — |
| | Total | $118,305 | $8,221 | $33,213 | $1,223 |
|
| |
| Lifecycle 2035 | A | $16,862 | $10,115 | $7,673 | $1,095 |
| | R1 | 6,699 | 324 | 6,451 | 163 |
| | R3 | 4,156 | 249 | 6,251 | 106 |
| | R4 | 1,220 | 140 | 6,250 | 16 |
| | R5 | 198 | 141 | 6,250 | 22 |
| | 1 | 126,206 | — | — | — |
| | Total | $155,341 | $10,969 | $32,875 | $1,402 |
|
| |
| Lifecycle 2030 | A | $27,377 | $16,415 | $7,866 | $1,640 |
| | R1 | 7,959 | 385 | 6,450 | 192 |
| | R3 | 5,662 | 342 | 6,249 | 145 |
| | R4 | 259 | 27 | 6,249 | 9 |
| | R5 | 387 | 277 | 6,309 | 58 |
| | 1 | 161,863 | — | — | — |
| | Total | $203,507 | $17,446 | $33,123 | $2,044 |
|
| |
| Lifecycle 2025 | A | $26,948 | $16,160 | $7,700 | $1,607 |
| | R1 | 7,283 | 352 | 6,464 | 193 |
| | R3 | 7,271 | 412 | 6,264 | 172 |
| | R4 | 1,333 | 146 | 6,264 | 61 |
| | R5 | 620 | 443 | 6,586 | 64 |
| | 1 | 187,765 | — | — | — |
| | Total | $231,220 | $17,513 | $33,278 | $2,097 |
|
| |
| Lifecycle 2020 | A | $33,530 | $20,095 | $7,865 | $2,031 |
| | R1 | 8,003 | 386 | 6,496 | 224 |
| | R3 | 10,070 | 603 | 6,280 | 235 |
| | R4 | 284 | 30 | 6,279 | 13 |
| | R5 | 570 | 405 | 6,527 | 80 |
| | 1 | 183,578 | — | — | — |
| | Total | $236,035 | $21,519 | $33,447 | $2,583 |
|
| |
| Lifecycle 2015 | A | $23,726 | $14,229 | $7,910 | $1,426 |
| | R1 | 5,461 | 264 | 6,448 | 146 |
| | R3 | 7,220 | 403 | 6,247 | 159 |
| | R4 | 128 | 13 | 6,247 | 2 |
| | R5 | 240 | 171 | 6,315 | 24 |
| | 1 | 125,254 | — | — | — |
| | Total | $162,029 | $15,080 | $33,167 | $1,757 |
|
| |
| Lifecycle 2010 | A | $16,896 | $10,117 | $7,692 | $965 |
| | R1 | 1,418 | 68 | 6,491 | 61 |
| | R3 | 5,222 | 291 | 6,293 | 124 |
| | R4 | 133 | 14 | 6,290 | 2 |
| | R5 | 414 | 294 | 6,507 | 3 |
| | 1 | 119,750 | — | — | — |
| | Total | $143,833 | $10,784 | $33,273 | $1,155 |
|
Trustee expenses. The Trust compensates each Trustee who is not an employee of the Adviser or its affiliates. The costs of paying Trustee compensation and expenses are allocated to each Portfolio based on its average daily net assets.
| | |
| | Semiannual report | Lifecycle Portfolios | 53 |
Note 5 — Portfolio share transactions
Transactions in Portfolio shares for the six months ended February 28, 2011 and year ended August 31, 2010 were as follows:
| | | | |
| Lifecycle 2045 Portfolio | | �� | | |
| | Six months ended 2-28-11 | | Year ended 8-31-10 |
| | Shares | Amount | Shares | Amount |
| Class A shares | | | | |
|
| Sold | 304,516 | $2,868,311 | 615,309 | $5,200,175 |
| Distributions reinvested | 11,744 | 112,738 | 6,800 | 57,727 |
| Repurchased | (162,253) | (1,515,435) | (328,646) | (2,768,708) |
| | | | | |
| Net increase | 154,007 | $1,465,614 | 293,463 | $2,489,194 |
| |
| Class R1 shares | | | | |
|
| Sold | 22,962 | $217,198 | 47,140 | $399,030 |
| Distributions reinvested | 1,071 | 10,273 | 851 | 7,224 |
| Repurchased | (12,282) | (117,649) | (38,444) | (322,049) |
| | | | | |
| Net increase | 11,751 | $109,822 | 9,547 | $84,205 |
| |
| Class R3 shares | | | | |
|
| Sold | 9,740 | $92,889 | 48,669 | $410,489 |
| Distributions reinvested | 987 | 9,464 | 575 | 4,880 |
| Repurchased | (8,147) | (76,179) | (12,379) | (105,218) |
| | | | | |
| Net increase | 2,580 | $26,174 | 36,865 | $310,151 |
| |
| Class R4 shares | | | | |
|
| Sold | 9,644 | $92,508 | 34,149 | $285,691 |
| Distributions reinvested | 563 | 5,412 | 232 | 1,972 |
| Repurchased | (8,194) | (75,677) | (41,238) | (350,111) |
| | | | | |
| Net increase (decrease) | 2,013 | $22,243 | (6,857) | ($62,448) |
| |
| Class R5 shares | | | | |
|
| Sold | 39,845 | $376,349 | 15,636 | $132,820 |
| Distributions reinvested | 995 | 9,583 | 378 | 3,221 |
| Repurchased | (5,069) | (46,645) | (17,088) | (145,151) |
| | | | | |
| Net increase (decrease) | 35,771 | $339,287 | (1,074) | ($9,110) |
| |
| Class 1 shares | | | | |
|
| Sold | 5,428,102 | $51,277,479 | 13,333,976 | $112,872,892 |
| Distributions reinvested | 776,982 | 7,474,569 | 503,104 | 4,281,416 |
| Repurchased | (468,830) | (4,509,515) | (243,726) | (2,072,822) |
| | | | | |
| Net increase | 5,736,254 | $54,242,533 | 13,593,354 | $115,081,486 |
| |
| Net increase | 5,942,376 | $56,205,673 | 13,925,298 | $117,893,478 |
|
| |
| Lifecycle 2040 Portfolio | | | | |
| | Six months ended 2-28-11 | | Year ended 8-31-10 |
| | Shares | Amount | Shares | Amount |
| Class A shares | | | | |
|
| Sold | 317,890 | $3,025,597 | 553,478 | $4,696,018 |
| Distributions reinvested | 13,043 | 125,209 | 9,078 | 77,167 |
| Repurchased | (176,550) | (1,652,541) | (290,352) | (2,444,233) |
| | | | | |
| Net increase | 154,383 | $1,498,265 | 272,204 | $2,328,952 |
| |
| Class R1 shares | | | | |
|
| Sold | 13,899 | $131,294 | 84,668 | $710,905 |
| Distributions reinvested | 1,426 | 13,685 | 1,204 | 10,222 |
| Repurchased | (44,310) | (415,603) | (32,932) | (280,281) |
| | | | | |
| Net increase (decrease) | (28,985) | ($270,624) | 52,940 | $440,846 |
| |
| Class R3 shares | | | | |
|
| Sold | 47,654 | $457,429 | 64,175 | $548,337 |
| Distributions reinvested | 2,835 | 27,191 | 2,197 | 18,626 |
| Repurchased | (25,480) | (238,070) | (39,426) | (333,861) |
| | | | | |
| Net increase | 25,009 | $246,550 | 26,946 | $233,102 |
| |
| Class R4 shares | | | | |
|
| Sold | 2,890 | $27,243 | 19,356 | $161,950 |
| Distributions reinvested | 321 | 3,086 | 79 | 671 |
| Repurchased | (2,477) | (24,232) | (32,682) | (278,122) |
| | | | | |
| Net increase (decrease) | 734 | $6,097 | (13,247) | ($115,501) |
| |
| 54 | Lifecycle Portfolios | Semiannual report |
| | | | |
| Lifecycle 2040 Portfolio continued | | | | |
| | Six months ended 2-28-11 | | Year ended 8-31-10 |
| | Shares | Amount | Shares | Amount |
| Class R5 shares | | | | |
|
| Sold | 36,822 | $349,075 | 16,133 | $136,205 |
| Distributions reinvested | 1,497 | 14,420 | 1,133 | 9,643 |
| Repurchased | (6,441) | (61,298) | (33,309) | (284,648) |
| | | | |
| Net increase (decrease) | 31,878 | $302,197 | (16,043) | ($138,800) |
| |
| Class 1 shares | | | | |
|
| Sold | 4,412,861 | $41,750,679 | 12,737,782 | $107,770,765 |
| Distributions reinvested | 768,257 | 7,390,633 | 523,731 | 4,456,952 |
| Repurchased | (378,213) | (3,629,770) | (358,387) | (3,060,727) |
| | | | | |
| Net increase | 4,802,905 | $45,511,542 | 12,903,126 | $109,166,990 |
| |
| Net increase | 4,985,924 | $47,294,027 | 13,225,926 | $111,915,589 |
|
| |
| Lifecycle 2035 Portfolio | | | | |
| | Six months ended 2-28-11 | | Year ended 8-31-10 |
| | Shares | Amount | Shares | Amount |
| Class A shares | | | | |
|
| Sold | 455,047 | $4,323,610 | 682,001 | $5,784,280 |
| Distributions reinvested | 17,912 | 172,676 | 11,496 | 97,951 |
| Repurchased | (226,818) | (2,155,700) | (366,084) | (3,082,871) |
| | | | | |
| Net increase | 246,141 | $2,340,586 | 327,413 | $2,799,360 |
| |
| Class R1 shares | | | | |
|
| Sold | 40,712 | $377,697 | 115,678 | $974,919 |
| Distributions reinvested | 1,932 | 18,603 | 1,208 | 10,295 |
| Repurchased | (23,657) | (224,064) | (21,235) | (180,033) |
| | | | | |
| Net increase | 18,987 | $172,236 | 95,651 | $805,181 |
| |
| Class R3 shares | | | | |
|
| Sold | 37,984 | $372,087 | 103,934 | $920,694 |
| Distributions reinvested | 2,063 | 19,883 | 1,046 | 8,911 |
| Repurchased | (12,853) | (119,257) | (19,511) | (161,512) |
| | | | | |
| Net increase | 27,194 | $272,713 | 85,469 | $768,093 |
| |
| Class R4 shares | | | | |
|
| Sold | 32,040 | $305,424 | 64,666 | $543,914 |
| Distributions reinvested | 1,408 | 13,598 | 234 | 2,000 |
| Repurchased | (6,329) | (57,957) | (18,081) | (154,540) |
| | | | | |
| Net increase | 27,119 | $261,065 | 46,819 | $391,374 |
| |
| Class R5 shares | | | | |
|
| Sold | 87,939 | $823,580 | 21,746 | $184,911 |
| Distributions reinvested | 2,003 | 19,347 | 767 | 6,551 |
| Repurchased | (12,772) | (122,082) | (13,528) | (117,952) |
| | | | | |
| Net increase | 77,170 | $720,845 | 8,985 | $73,510 |
| |
| Class 1 shares | | | | |
|
| Sold | 6,026,467 | $57,193,190 | 15,642,153 | $132,953,340 |
| Distributions reinvested | 1,020,307 | 9,856,170 | 718,013 | 6,131,834 |
| Repurchased | (667,874) | (6,411,672) | (709,259) | (5,974,064) |
| | | | | |
| Net increase | 6,378,900 | $60,637,688 | 15,650,907 | $133,111,110 |
| |
| Net increase | 6,775,511 | $64,405,133 | 16,215,244 | $137,948,628 |
|
| | |
| | Semiannual report | Lifecycle Portfolios | 55 |
| | | | |
| Lifecycle 2030 Portfolio | | | | |
| | Six months ended 2-28-11 | | Year ended 8-31-10 |
| | Shares | Amount | Shares | Amount |
| Class A shares | | | | |
|
| Sold | 554,419 | $5,227,314 | 1,039,354 | $8,780,466 |
| Distributions reinvested | 30,161 | 288,034 | 19,967 | 169,321 |
| Repurchased | (239,305) | (2,242,263) | (452,839) | (3,801,415) |
| | | | | |
| Net increase | 345,275 | $3,273,085 | 606,482 | $5,148,372 |
| |
| Class R1 shares | | | | |
|
| Sold | 63,825 | $606,394 | 138,227 | $1,167,552 |
| Distributions reinvested | 2,689 | 25,602 | 2,364 | 19,999 |
| Repurchased | (60,819) | (582,724) | (77,739) | (647,135) |
| | | | | |
| Net increase | 5,695 | $49,272 | 62,852 | $540,416 |
| |
| Class R3 shares | | | | |
|
| Sold | 52,325 | $503,884 | 144,501 | $1,289,717 |
| Distributions reinvested | 3,003 | 28,621 | 1,244 | 10,528 |
| Repurchased | (17,449) | (158,322) | (25,209) | (209,507) |
| | | | | |
| Net increase | 37,879 | $374,183 | 120,536 | $1,090,738 |
| |
| Class R4 shares | | | | |
|
| Sold | 8,623 | $82,556 | 24,351 | $200,278 |
| Distributions reinvested | 276 | 2,629 | 125 | 1,052 |
| Repurchased | (697) | (6,706) | (57,773) | (490,394) |
| | | | | |
| Net increase (decrease) | 8,202 | $78,479 | (33,297) | ($289,064) |
| |
| Class R5 shares | | | | |
|
| Sold | 130,346 | $1,213,209 | 18,700 | $158,417 |
| Distributions reinvested | 4,023 | 38,299 | 2,112 | 17,844 |
| Repurchased | (8,344) | (78,529) | (57,940) | (482,361) |
| | | | | |
| Net increase (decrease) | 126,025 | $1,172,979 | (37,128) | ($306,100) |
| |
| Class 1 shares | | | | |
|
| Sold | 6,876,136 | $64,673,405 | 20,763,933 | $174,430,494 |
| Distributions reinvested | 1,408,297 | 13,392,900 | 960,006 | 8,112,052 |
| Repurchased | (1,078,919) | (10,252,064) | (719,662) | (6,040,172) |
| | | | | |
| Net increase | 7,205,514 | $67,814,241 | 21,004,277 | $176,502,374 |
| |
| Net increase | 7,728,590 | $72,762,239 | 21,723,722 | $182,686,736 |
|
| |
| Lifecycle 2025 Portfolio | | | | |
| | Six months ended 2-28-11 | | Year ended 8-31-10 |
| | Shares | Amount | Shares | Amount |
| Class A shares | | | | |
|
| Sold | 551,810 | $5,241,204 | 1,031,898 | $8,786,408 |
| Distributions reinvested | 36,662 | 350,121 | 24,161 | 206,578 |
| Repurchased | (220,745) | (2,097,235) | (499,056) | (4,254,465) |
| | | | | |
| Net increase | 367,727 | $3,494,090 | 557,003 | $4,738,521 |
| |
| Class R1 shares | | | | |
|
| Sold | 43,993 | $412,083 | 121,272 | $1,013,931 |
| Distributions reinvested | 2,922 | 27,817 | 2,426 | 20,696 |
| Repurchased | (47,993) | (441,176) | (61,427) | (514,339) |
| | | | | |
| Net increase (decrease) | (1,078) | ($1,276) | 62,271 | $520,288 |
| |
| Class R3 shares | | | | |
|
| Sold | 53,008 | $504,672 | 153,167 | $1,372,116 |
| Distributions reinvested | 4,367 | 41,572 | 1,861 | 15,873 |
| Repurchased | (21,632) | (198,224) | (96,177) | (806,005) |
| | | | | |
| Net increase | 35,743 | $348,020 | 58,851 | $581,984 |
| |
| Class R4 shares | | | | |
|
| Sold | 23,696 | $227,442 | 74,305 | $623,508 |
| Distributions reinvested | 1,783 | 16,974 | 599 | 5,107 |
| Repurchased | (1,886) | (16,935) | (28,067) | (240,673) |
| | | | | |
| Net increase | 23,593 | $227,481 | 46,837 | $387,942 |
| |
| 56 | Lifecycle Portfolios | Semiannual report |
| | | | |
| Lifecycle 2025 Portfolio continued | | | | |
| | Six months ended 2-28-11 | | Year ended 8-31-10 |
| | Shares | Amount | Shares | Amount |
| Class R5 shares | | | | |
|
| Sold | 288,974 | $2,709,281 | 65,484 | $562,114 |
| Distributions reinvested | 7,901 | 75,136 | 1,621 | 13,808 |
| Repurchased | (37,533) | (353,701) | (9,738) | (84,129) |
| | | | | |
| Net increase | 259,342 | $2,430,716 | 57,367 | $491,793 |
| |
| Class 1 shares | | | | |
|
| Sold | 8,036,083 | $75,932,887 | 21,764,113 | $185,303,827 |
| Distributions reinvested | 1,879,767 | 17,876,588 | 1,302,324 | 11,095,804 |
| Repurchased | (1,280,223) | (12,116,630) | (1,253,189) | (10,651,589) |
| | | | | |
| Net increase | 8,635,627 | $81,692,845 | 21,813,248 | $185,748,042 |
| |
| Net increase | 9,320,954 | $88,191,876 | 22,595,577 | $192,468,570 |
|
| |
| Lifecycle 2020 Portfolio | | | | |
| | Six months ended 2-28-11 | | Year ended 8-31-10 |
| | Shares | Amount | Shares | Amount |
| Class A shares | | | | |
|
| Sold | 608,394 | $5,854,753 | 1,106,502 | $9,631,140 |
| Distributions reinvested | 55,990 | 536,381 | 36,016 | 313,343 |
| Repurchased | (251,252) | (2,414,063) | (591,138) | (5,166,543) |
| | | | | |
| Net increase | 413,132 | $3,977,071 | 551,380 | $4,777,940 |
| |
| Class R1 shares | | | | |
|
| Sold | 43,476 | $413,419 | 149,086 | $1,297,068 |
| Distributions reinvested | 4,330 | 41,438 | 4,412 | 38,336 |
| Repurchased | (39,935) | (382,393) | (143,206) | (1,235,213) |
| | | | | |
| Net increase | 7,871 | $72,464 | 10,292 | $100,191 |
| |
| Class R3 shares | | | | |
|
| Sold | 76,017 | $732,971 | 242,749 | $2,189,044 |
| Distributions reinvested | 8,055 | 77,082 | 2,315 | 20,120 |
| Repurchased | (32,203) | (316,153) | (25,340) | (222,329) |
| | | | | |
| Net increase | 51,869 | $493,900 | 219,724 | $1,986,835 |
| |
| Class R4 shares | | | | |
|
| Sold | 3,458 | $33,307 | 15,427 | $131,350 |
| Distributions reinvested | 450 | 4,300 | 218 | 1,886 |
| Repurchased | (4,006) | (38,119) | (29,567) | (257,564) |
| | | | | |
| Net decrease | (98) | ($512) | (13,922) | ($124,328) |
| |
| Class R5 shares | | | | |
|
| Sold | 329,904 | $3,171,523 | 19,493 | $170,180 |
| Distributions reinvested | 9,131 | 87,380 | 2,468 | 21,424 |
| Repurchased | (90,692) | (877,881) | (37,846) | (323,919) |
| | | | | |
| Net increase (decrease) | 248,343 | $2,381,022 | (15,885) | ($132,315) |
| |
| Class 1 shares | | | | |
|
| Sold | 7,172,458 | $68,453,593 | 21,928,840 | $190,462,834 |
| Distributions reinvested | 2,200,394 | 21,035,765 | 1,447,738 | 12,566,363 |
| Repurchased | (1,915,263) | (18,341,924) | (1,489,992) | (12,916,399) |
| | | | | |
| Net increase | 7,457,589 | $71,147,434 | 21,886,586 | $190,112,798 |
| |
| Net increase | 8,178,706 | $78,071,379 | 22,638,175 | $196,721,121 |
|
| | |
| | Semiannual report | Lifecycle Portfolios | 57 |
| | | | |
| Lifecycle 2015 Portfolio | | | | |
| | Six months ended 2-28-11 | | Year ended 8-31-10 |
| | Shares | Amount | Shares | Amount |
| Class A shares | | | | |
|
| Sold | 570,100 | $5,462,086 | 982,395 | $8,620,078 |
| Distributions reinvested | 48,943 | 463,976 | 32,236 | 280,452 |
| Repurchased | (245,019) | (2,319,327) | (536,500) | (4,704,780) |
| | | | | |
| Net increase | 374,024 | $3,606,735 | 478,131 | $4,195,750 |
| |
| Class R1 shares | | | | |
|
| Sold | 37,291 | $355,096 | 73,160 | $637,498 |
| Distributions reinvested | 3,848 | 36,442 | 2,544 | 22,131 |
| Repurchased | (25,091) | (239,391) | (22,528) | (200,099) |
| | | | | |
| Net increase | 16,048 | $152,147 | 53,176 | $459,530 |
| |
| Class R3 shares | | | | |
|
| Sold | 78,015 | $724,469 | 152,720 | $1,340,981 |
| Distributions reinvested | 6,702 | 63,470 | 3,928 | 34,136 |
| Repurchased | (43,589) | (411,751) | (44,318) | (392,219) |
| | | | | |
| Net increase | 41,128 | $376,188 | 112,330 | $982,898 |
|
| Class R4 shares | | | | |
| Sold | 904 | $8,561 | 10,366 | $88,218 |
| Distributions reinvested | 241 | 2,280 | 117 | 1,014 |
| Repurchased | (230) | (2,130) | (46,506) | (408,668) |
| Net increase (decrease) | 915 | $8,711 | (36,023) | ($319,436) |
| |
| Class R5 shares | | | | |
|
| Sold | 146,729 | $1,399,041 | 41,145 | $358,609 |
| Distributions reinvested | 3,887 | 36,808 | 601 | 5,222 |
| Repurchased | (20,522) | (195,987) | (22,979) | (195,788) |
| | | | | |
| Net increase | 130,094 | $1,239,862 | 18,767 | $168,043 |
| |
| Class 1 shares | | | | |
|
| Sold | 4,788,203 | $45,622,987 | 14,323,995 | $125,315,257 |
| Distributions reinvested | 1,741,426 | 16,473,894 | 1,259,384 | 10,944,047 |
| Repurchased | (1,496,505) | (14,340,066) | (2,179,027) | (19,137,884) |
| | | | | |
| Net increase | 5,033,124 | $47,756,815 | 13,404,352 | $117,121,420 |
| |
| Net increase | 5,595,333 | $53,140,458 | 14,030,733 | $122,608,205 |
|
| |
| |
| Lifecycle 2010 Portfolio | | | | |
| | Six months ended 2-28-11 | | Year ended 8-31-10 |
| | Shares | Amount | Shares | Amount |
| Class A shares | | | | |
|
| Sold | 519,369 | $5,033,238 | 750,166 | $6,743,177 |
| Distributions reinvested | 36,743 | 352,730 | 17,738 | 158,050 |
| Repurchased | (204,513) | (1,976,176) | (378,130) | (3,410,476) |
| | | | | |
| Net increase | 351,599 | $3,409,792 | 389,774 | $3,490,751 |
| |
| Class R1 shares | | | | |
|
| Sold | 18,450 | $179,814 | 38,909 | $339,193 |
| Distributions reinvested | 1,012 | 9,693 | 1,166 | 10,364 |
| Repurchased | (18,319) | (173,566) | (28,389) | (259,365) |
| | | | | |
| Net increase | 1,143 | $15,941 | 11,686 | $90,192 |
| |
| Class R3 shares | | | | |
|
| Sold | 20,171 | $195,978 | 61,960 | $554,425 |
| Distributions reinvested | 5,431 | 52,080 | 2,666 | 23,726 |
| Repurchased | (11,300) | (109,738) | (54,421) | (474,078) |
| | | | | |
| Net increase | 14,302 | $138,320 | 10,205 | $104,073 |
| |
| 58 | Lifecycle Portfolios | Semiannual report |
| | | | |
| Lifecycle 2010 Portfolio continued | | | |
| | Six months ended 2-28-11 | | Year ended 8-31-10 |
| | Shares | Amount | Shares | Amount |
| Class R4 shares | | | | |
|
| Sold | 172 | $1,653 | 1,389 | $11,991 |
| Distributions reinvested | 281 | 2,696 | 186 | 1,655 |
| Repurchased | (50) | (480) | (7,488) | (67,079) |
| | | | | |
| Net increase (decrease) | 403 | $3,869 | (5,913) | ($53,433) |
| |
| Class R5 shares | | | | |
|
| Sold | 459,894 | $4,438,044 | 14,502 | $130,065 |
| Distributions reinvested | 7,599 | 72,798 | 613 | 5,447 |
| Repurchased | (199,278) | (1,915,864) | (10,749) | (96,077) |
| | | | | |
| Net increase | 268,215 | $2,594,978 | 4,366 | $39,435 |
| |
| Class 1 shares | | | | |
|
| Sold | 3,372,134 | $32,443,921 | 40,808,353 | $364,072,860 |
| Distributions reinvested | 1,841,210 | 17,657,201 | 1,280,813 | 11,386,428 |
| Repurchased | (6,883,937) | (66,994,674) | (10,356,889) | (93,117,543) |
| | | | | |
| Net increase (decrease) | (1,670,593) | ($16,893,552) | 31,732,277 | $282,341,745 |
| |
| Net increase (decrease) | (1,034,931) | ($10,730,652) | 32,142,395 | $286,012,763 |
|
Note 6 — Purchase and sale of securities
The following summarizes the purchases and sales of the affiliated underlying funds for the six months ended February 28, 2011:
| | | | |
| | Purchases | Sales and Maturities | | |
| | | |
| Portfolio | Other Issuers | Other Issuers | | |
| Lifecycle 2045 | $94,103,082 | $35,508,336 | | |
| Lifecycle 2040 | 84,113,381 | 34,484,114 | | |
| Lifecycle 2035 | 115,000,777 | 47,487,880 | | |
| Lifecycle 2030 | 151,037,096 | 74,805,376 | | |
| Lifecycle 2025 | 194,463,482 | 103,598,407 | | |
| Lifecycle 2020 | 194,039,875 | 115,395,801 | | |
| Lifecycle 2015 | 151,541,580 | 99,540,521 | | |
| Lifecycle 2010 | 154,521,829 | 167,998,724 | | |
Note 7 — Investment in affiliated underlying funds
The Portfolios invest primarily in affiliated underlying funds that are managed by the Adviser and affiliates. The Portfolios do not invest in the affiliated underlying funds for the purpose of exercising management or control; however, the Portfolios’ investments may represent a significant portion of each underlying fund’s net assets. For the six months ended February 28, 2011, the following Portfolios held 5% or more of an affiliated underlying fund’s net assets:
| | | |
| | | Percent of Underlying | |
| Portfolio | Affiliate-Class NAV | Funds’ Net Assets | |
| |
| Lifecycle 2045 | John Hancock Funds II Index 500 | 5.07% | |
| | John Hancock Funds II International Equity Index | 7.04% | |
| | John Hancock Funds II Mid Cap Growth Index | 10.52% | |
| | John Hancock Funds II Mid Cap Value Index | 10.44% | |
| | John Hancock Funds II Small Cap Index | 7.76% | |
| Lifecycle 2040 | John Hancock Funds II Index 500 | 5.02% | |
| | John Hancock Funds II International Equity Index | 6.96% | |
| | John Hancock Funds II Mid Cap Growth Index | 10.44% | |
| | John Hancock Funds II Mid Cap Value Index | 10.30% | |
| | John Hancock Funds II Small Cap Index | 7.69% | |
| Lifecycle 2035 | John Hancock Funds II Index 500 | 6.67% | |
| | John Hancock Funds II International Equity Index | 9.26% | |
| | John Hancock Funds II Mid Cap Growth Index | 13.85% | |
| | John Hancock Funds II Mid Cap Value Index | 13.71% | |
| | John Hancock Funds II Small Cap Index | 10.19% | |
| Lifecycle 2030 | John Hancock Funds II Index 500 | 8.24% | |
| | John Hancock Funds II International Equity Index | 11.40% | |
| | John Hancock Funds II Mid Cap Growth Index | 16.28% | |
| | John Hancock Funds II Mid Cap Value Index | 16.05% | |
| | John Hancock Funds II Small Cap Index | 12.50% | |
| | |
| | Semiannual report | Lifecycle Portfolios | 59 |
| | | |
| | | Percent of Underlying | |
| Portfolio | Affiliate-Class NAV | Funds’ Net Assets | |
| |
| Lifecycle 2025 | John Hancock Funds II Index 500 | 8.96% | |
| | John Hancock Funds II International Equity Index | 11.81% | |
| | John Hancock Funds II Mid Cap Growth Index | 16.86% | |
| | John Hancock Funds II Mid Cap Value Index | 16.56% | |
| | John Hancock Funds II Small Cap Index | 10.90% | |
| Lifecycle 2020 | John Hancock Funds II Index 500 | 7.90% | |
| | John Hancock Funds II International Equity Index | 9.66% | |
| | John Hancock Funds II Mid Cap Growth Index | 12.88% | |
| | John Hancock Funds II Mid Cap Value Index | 12.82% | |
| | John Hancock Funds II Small Cap Index | 11.66% | |
| Lifecycle 2015 | John Hancock Funds II International Equity Index | 5.26% | |
| | John Hancock Funds II Mid Cap Growth Index | 6.43% | |
| | John Hancock Funds II Mid Cap Value Index | 6.36% | |
| | John Hancock Funds II Small Cap Index | 8.28% | |
| Lifecycle 2010 | John Hancock Funds II Mid Cap Growth Index | 9.53% | |
| | John Hancock Funds II Mid Cap Value Index | 9.48% | |
| | John Hancock Funds II Small Cap Index | 5.76% | |
| 60 | Lifecycle Portfolios | Semiannual report |
Evaluation of Subadvisory Agreement by the Board of Trustees
At its meeting on December 17, 2010, the Board of Trustees (the “Board”) of John Hancock Funds II (the “Trust”), including all of the Independent Trustees, approved the appointment of John Hancock Asset Management a division of Manulife Asset Management (US) LLC (“John Hancock Asset Management” or the “Subadviser”) as an additional subadviser to the following funds (the “Portfolios”), each a series of the Trust.
|
Portfolios |
| a. Lifecycle 2045 Portfolio |
| b. Lifecycle 2040 Portfolio |
| c. Lifecycle 2035 Portfolio |
| d. Lifecycle 2030 Portfolio |
| e. Lifecycle 2025 Portfolio |
| f. Lifecycle 2020 Portfolio |
| g. Lifecycle 2015 Portfolio |
| h. Lifecycle 2010 Portfolio |
This section describes the evaluation by the Board of Trustees of the amendment to the subadvisory agreement between John Hancock Investment Management Services, LLC (the “Adviser”), the adviser to the Portfolios, and the Subadviser relating to each of the Portfolios (the “Subadvisory Agreement Amendment”).
Evaluation of Subadvisory Agreement by the Board of Trustees
The Board, including the Independent Trustees, is responsible for approving the Adviser’s selection of fund subadvisers and approving the funds’ subadvisory agreements, their periodic continuation and any amendments. Consistent with SEC rules, the Board regularly evaluates the Trust’s subadvisory arrangements, including consideration of the factors listed below. The Board may also consider other factors (including conditions and trends prevailing generally in the economy, the securities markets and the industry) and does not treat any single factor as determinative, and each Trustee may attribute different weights to different factors. The Board is furnished with an analysis of its fiduciary obligations in connection with its evaluation and, throughout the evaluation process, the Board is assisted by counsel for the Trust and the Independent Trustees are also separately assisted by independent legal counsel. The factors considered by the Board with respect to each fund are:
1. the nature, extent and quality of the services to be provided by the subadviser to the fund;
2. the investment performance of the fund and its subadviser;
3. the extent to which economies of scale would be realized as a fund grows and whether fee levels reflect these economies of scale for the benefit of fund shareholders;
4. the costs of the services to be provided and the profits to be realized by the subadviser and its affiliates (including the Adviser with respect to affiliated subadvisers) from the relationship with the Trust; and
5. comparative services rendered and comparative subadvisory fee rates.
In making its determination and with reference to the factors that it considers, the Board reviews:
1. information relating to the subadviser’s business, including current subadvisory services to the Trust (and other funds in the John Hancock family of funds);
2. the performance of the fund and the performance of other John Hancock funds managed by the subadviser; and
3. the subadvisory fee for the fund, including any breakpoints.
The Board approved the Subadvisory Agreement Amendment with the Subadviser for each of the Portfolios at its meeting on December 17, 2010. Particular considerations of the Board in approving the Subadvisory Agreement Amendment included the following:
1. The subadvisory fees for the Portfolios are paid by the Adviser, not the Portfolios, and are reasonable, and approval of the Subadvisory Agreement Amendment will not result in any change in the advisory fees for any of the Portfolios.
2. Approval of the Subadvisory Agreement Amendment reflects the re-allocation of subadvisory services between the Subadviser and John Hancock Asset Management a division of Manulife Asset Management (North America) Limited (“John Hancock Asset Management (North America)”), the current subadviser to the Portfolios, each of which is affiliated with the Adviser.
3. The personnel of John Hancock Asset Management (North America) and the Adviser who have currently and previously managed the assets of the Portfolios, with John Hancock Asset Management (North America) and the Subadviser, are expected to continue to manage the Portfolios and the Board is generally satisfied with their skill and experience and with the performance of the Portfolios.
| | |
| | Semiannual report | Lifecycle Portfolios | 61 |
4. The performance of each Portfolio as noted below and management’s discussion of the same:
a. The Lifecycle 2045 Portfolio has outperformed its peer group and benchmark index for the one year and since inception periods ended September 30, 2010;
b. The Lifecycle 2040 Portfolio has outperformed its peer group and benchmark index for the one year and since inception periods ended September 30, 2010;
c. The Lifecycle 2035 Portfolio has outperformed its peer group and benchmark index for the one year and since inception periods ended September 30, 2010;
d. The Lifecycle 2030 Portfolio has outperformed its peer group and benchmark index for the one year and since inception periods ended September 30, 2010;
e. The Lifecycle 2025 Portfolio has outperformed its peer group and benchmark index for the one year and since inception periods ended September 30, 2010;
f. The Lifecycle 2020 Portfolio has outperformed its peer group and benchmark index for the one year and since inception periods ended September 30, 2010;
g. The Lifecycle 2015 Portfolio has outperformed its peer group and benchmark index for the one year and since inception periods ended September 30, 2010; and
h. The Lifecycle 2010 Portfolio has outperformed its peer group and benchmark index for the one year and since inception periods ended September 30, 2010.
5. John Hancock Asset Management has demonstrated skill as a manager, is currently the subadviser to multiple funds of the Trust and John Hancock Trust and may be expected to provide a high quality of investment management services and personnel to each of the Portfolios.
In addition, the Board reviewed the subadvisory fees to be paid to the Subadviser with respect to the Portfolios, each of which operates as a fund of funds and invests in underlying funds. The Board concluded, with respect to each such fund of funds, that the subadvisory fee is based on services provided that are in addition to, rather than duplicative of, the services provided pursuant to the advisory agreements for the underlying funds. The Board also concluded that the additional services are necessary because of the differences between the investment policies, strategies and techniques of the fund of funds and those of its underlying funds.
| |
| 62 | Lifecycle Portfolios | Semiannual report |
More information
| | |
| Trustees | Investment adviser | |
| James M. Oates, Chairman | John Hancock Investment Management Services, LLC | |
| James R. Boyle† | | |
| Charles L. Bardelis* | Subadviser | |
| Peter S. Burgess* | John Hancock Asset Management | |
| Grace K. Fey | | |
| Theron S. Hoffman | Principal distributor | |
| Hassell H. McClellan | John Hancock Funds, LLC | |
| Steven M. Roberts* | | |
| | Custodian | |
| Officers | State Street Bank and Trust Company | |
| Hugh McHaffie | | |
| President | Transfer agent | |
| | John Hancock Signature Services, Inc. | |
| Thomas M. Kinzler | | |
| Secretary and Chief Legal Officer | Legal counsel | |
| | K&L Gates LLP | |
| Francis V. Knox, Jr. | | |
| Chief Compliance Officer |
| |
| The report is certified under the Sarbanes-Oxley Act, which | |
| Michael J. Leary | requires mutual funds and other public companies to affirm | |
| Treasurer | that, to the best of their knowledge, the information in | |
| their financial reports is fairly and accurately stated in all | |
| Charles A. Rizzo | material respects. | |
| Chief Financial Officer |
| |
| | | |
| John G. Vrysen | | |
| Chief Operating Officer | | |
| | | |
| *Member of the Audit Committee | | |
| †Non-Independent Trustee | | |
The Fund’s proxy voting policies and procedures, as well as the Fund’s proxy voting record for the most recent twelvemonth period ended June 30, are available free of charge on the Securities and Exchange Commission (SEC) Web site at www.sec.gov or on our Web site.
The Fund’s complete list of portfolio holdings, for the first and third fiscal quarters, is filed with the SEC on Form N-Q. The Fund’s Form N-Q is available on our Web site and the SEC’s Web site, www.sec.gov, and can be reviewed and copied (for a fee) at the SEC’s Public Reference Room in Washington, DC. Call 1-800-SEC-0330 to receive information on the operation of the SEC’s Public Reference Room.
We make this information on your fund, as well as monthly portfolio holdings, and other fund details available on our Web site www.jhfunds.com or by calling 1-800-225-5291.
| | |
| You can also contact us: | | |
| 1-800-225-5291 | Regular mail: | Express mail: |
| jhfunds.com | John Hancock Signature Services, Inc. | John Hancock Signature Services, Inc. |
| | P.O. Box 55913 | Mutual Fund Image Operations |
| | Boston, MA 02205-5913 | 30 Dan Road |
| | | Canton, MA 02021 |
| |
| 63 | Semiannual report | Lifecycle Portfolios |


John Hancock Funds II
Semiannual Report — Table of Contents
| |
| Sector Weightings | 3 |
| Shareholder Expense Example | 9 |
| Portfolio of Investments (See below for each Fund’s page #) | 15–302 |
| Statements of Assets and Liabilities | 303 |
| Statements of Operations | 320 |
| Statements of Changes in Net Assets | 337 |
| Financial Highlights | 349 |
| Notes to Financial Statements | 366 |
| Evaluation of Advisory and Subadvisory Agreements by the Board of Trustees | 441 |
| For More Information | 447 |
| | | | |
| | Portfolio of | | | Portfolio of |
| Fund | Investments | | Fund | Investments |
| | | | |
| Active Bond Fund | 15 | | Mid Cap Growth Index Fund | 165 |
| All Cap Core Fund | 31 | | Mid Cap Index Fund | 168 |
| All Cap Value Fund | 35 | | Mid Cap Stock Fund | 173 |
| Alpha Opportunities Fund | 37 | | Mid Cap Value Equity Fund | 175 |
| Blue Chip Growth Fund | 41 | | Mid Cap Value Index Fund | 177 |
| Capital Appreciation Fund | 43 | | Mid Value Fund | 181 |
| Capital Appreciation Value Fund | 45 | | Mutual Shares Fund | 183 |
| Core Bond Fund | 48 | | Optimized Value Fund | 185 |
| Core Diversified Growth & Income Portfolio | 55 | | Real Estate Equity Fund | 186 |
| Core Fundamental Holdings Portfolio | 55 | | Real Estate Securities Fund | 187 |
| Core Global Diversification Portfolio | 56 | | Real Return Bond Fund | 188 |
| Emerging Markets Fund (formerly, Emerging | | | Retirement 2010 Portfolio | 191 |
| Markets Value Fund) | 56 | | Retirement 2015 Portfolio | 192 |
| Emerging Markets Debt Fund | 72 | | Retirement 2020 Portfolio | 192 |
| Equity-Income Fund | 74 | | Retirement 2025 Portfolio | 192 |
| Fundamental Value Fund | 76 | | Retirement 2030 Portfolio | 192 |
| Global Agribusiness Fund | 78 | | Retirement 2035 Portfolio | 192 |
| Global Bond Fund | 79 | | Retirement 2040 Portfolio | 193 |
| Global Infrastructure Fund | 86 | | Retirement 2045 Portfolio | 193 |
| Global Real Estate Fund | 87 | | Short Term Government Income Fund | 193 |
| Global Timber Fund | 88 | | Small Cap Growth Fund | 194 |
| Heritage Fund | 89 | | Small Cap Index Fund | 196 |
| High Income Fund | 91 | | Small Cap Opportunities Fund | 212 |
| High Yield Fund | 93 | | Small Cap Value Fund | 223 |
| Index 500 Fund | 100 | | Small Company Growth Fund | 225 |
| International Equity Index Fund | 106 | | Small Company Value Fund | 227 |
| International Growth Stock Fund | 121 | | Smaller Company Growth Fund | 229 |
| International Opportunities Fund | 123 | | Spectrum Income Fund | 240 |
| International Small Cap Fund | 124 | | Total Bond Market Fund | 268 |
| International Small Company Fund | 125 | | Total Return Fund | 277 |
| International Value Fund | 149 | | U.S. High Yield Bond Fund | 284 |
| Investment Quality Bond Fund | 151 | | U.S. Multi-Sector Fund | 289 |
| Large Cap Fund | 161 | | Value Fund | 295 |
| Large Cap Value Fund | 163 | | Value & Restructuring Fund | 297 |
John Hancock Funds II
Sector Weightings
| | | | | | | |
| Active Bond Fund | | Alpha Opportunities Fund | | Capital Appreciation Value Fund |
| | % of | | | % of | | | % of |
| Sector Weighting* | Total | | Sector Weighting* | Total | | Sector Weighting* | Total |
| |
| |
|
| Mortgage Securities | 34.64 | | Information Technology | 18.99 | | Consumer Discretionary | 15.86 |
| Financials | 22.22 | | Consumer Discretionary | 17.20 | | Financials | 14.47 |
| Government** | 11.23 | | Financials | 12.81 | | Consumer Staples | 11.38 |
| Energy | 5.37 | | Industrials | 11.16 | | Information Technology | 11.20 |
| Consumer Discretionary | 4.15 | | Energy | 11.08 | | Industrials | 10.17 |
| Industrials | 3.44 | | Health Care | 9.99 | | Health Care | 9.09 |
| Utilities | 3.15 | | Materials | 8.76 | | Energy | 6.32 |
| Asset Backed Securities | 2.36 | | Consumer Staples | 6.77 | | Telecommunication Services | 2.60 |
| Materials | 2.20 | | Telecommunication Services | 0.50 | | Materials | 2.33 |
| Consumer Staples | 2.03 | | Utilities | 0.33 | | Utilities | 1.98 |
| Telecommunication Services | 1.95 | | Investment Companies | 0.29 | | Short-Term Investments & Other | 14.60 |
| Health Care | 0.91 | | Short-Term Investments & Other | 2.12 | | | |
| Information Technology | 0.49 | | | | | Core Bond Fund |
| Short-Term Investments & Other | 5.86 | | Blue Chip Growth Fund | | | % of |
| | | | | % of | | Sector Weighting* | Total |
| All Cap Core Fund | | Sector Weighting* | Total | |
|
| | % of | |
| | Mortgage Securities | 66.79 |
| Sector Weighting* | Total | | Information Technology | 30.16 | | Government** | 13.90 |
| | Consumer Discretionary | 20.65 | | Financials | 9.77 |
| Information Technology | 19.96 | | Industrials | 14.78 | | Asset Backed Securities | 6.95 |
| Financials | 17.16 | | Financials | 11.13 | | Energy | 2.54 |
| Energy | 12.60 | | Energy | 9.10 | | Telecommunication Services | 2.47 |
| Industrials | 12.57 | | Health Care | 7.19 | | Utilities | 1.98 |
| Consumer Discretionary | 11.12 | | Materials | 4.02 | | Health Care | 1.53 |
| Health Care | 10.76 | | Telecommunication Services | 1.63 | | Materials | 1.03 |
| Consumer Staples | 5.99 | | Consumer Staples | 0.73 | | Consumer Staples | 0.67 |
| Materials | 3.49 | | Short-Term Investments & Other | 0.61 | | Consumer Discretionary | 0.67 |
| Utilities | 2.51 | | | | | Industrials | 0.66 |
| Telecommunication Services | 2.24 | | Capital Appreciation Fund | | Information Technology | 0.35 |
| Short-Term Investments & Other | 1.60 | | | % of | | Short-Term Investments & Other | (9.31) |
| | | | Sector Weighting* | Total | | | |
| All Cap Value Fund | |
| | Core Diversified Growth & Income |
| % of | | Information Technology | 34.43 | | Portfolio |
| Sector Weighting* | Total | | Consumer Discretionary | 22.42 | | | % of |
| | Health Care | 12.50 | | Sector Weighting* | Total |
| Financials | 21.34 | | Industrials | 9.97 | |
|
| Energy | 19.37 | | Energy | 6.21 | | American Funds Insurance Series | 60.05 |
| Health Care | 16.03 | | Consumer Staples | 5.31 | | U.S. Large Cap | 23.54 |
| Industrials | 11.22 | | Financials | 3.95 | | Intermediate Bond | 12.05 |
| Information Technology | 10.53 | | Materials | 3.70 | | International Large Cap | 4.43 |
| Consumer Discretionary | 9.54 | | Telecommunication Services | 1.17 | | Other | (0.07) |
| Materials | 5.08 | | Short-Term Investments & Other | 0.34 | | | |
| Consumer Staples | 4.53 | | | | | Core Fundamental Holdings Portfolio |
| Utilities | 1.07 | | | | | | % of |
| Short-Term Investments & Other | 1.29 | | | | | Sector Weighting* | Total |
| | | | | |
|
| | | | | | | American Funds Insurance Series | 60.10 |
| | | | | | | U.S. Large Cap | 18.86 |
| | | | | | | Intermediate Bond | 15.97 |
| | | | | | | International Large Cap | 5.23 |
| | | | | | | Other | (0.16) |
John Hancock Funds II
Sector Weightings
| | | | | | | |
| Core Global Diversification Portfolio | | Fundamental Value Fund | | Global Timber Fund |
| | % of | | | % of | | | % of |
| Sector Weighting* | Total | | Sector Weighting* | Total | | Sector Weighting* | Total |
| |
| |
|
| American Funds Insurance Series | 60.03 | | Financials | 26.73 | | Materials | 78.22 |
| International Large Cap | 17.05 | | Energy | 17.16 | | Financials | 21.20 |
| Intermediate Bond | 13.99 | | Consumer Staples | 15.90 | | Net Other Assets and Liabilities | 0.58 |
| U.S. Large Cap | 9.00 | | Health Care | 12.28 | | | |
| Other | (0.07) | | Materials | 7.89 | | Heritage Fund |
| | | | Information Technology | 5.40 | | | % of |
| Emerging Markets Fund (formerly, | | Industrials | 5.32 | | Sector Weighting* | Total |
| Emerging Markets Value Fund) | | Consumer Discretionary | 5.13 | |
|
| | % of | | Telecommunication Services | 0.33 | | Information Technology | 23.67 |
| Sector Weighting* | Total | | Short-Term Investments & Other | 3.86 | | Consumer Discretionary | 19.72 |
| | | | | Industrials | 17.20 |
| Financials | 30.86 | | Global Agribusiness Fund | | Health Care | 12.94 |
| Materials | 16.06 | | | % of | | Energy | 7.34 |
| Energy | 15.08 | | Sector Weighting* | Total | | Financials | 5.83 |
| Industrials | 11.04 | |
| | Consumer Staples | 4.64 |
| Consumer Discretionary | 8.47 | | Materials | 54.43 | | Materials | 4.58 |
| Information Technology | 7.24 | | Consumer Staples | 29.47 | | Telecommunication Services | 3.15 |
| Consumer Staples | 5.93 | | Industrials | 16.59 | | Utilities | 0.70 |
| Telecommunication Services | 1.79 | | Net Other Assets and Liabilities | (0.49) | | Short-Term Investments & Other | 0.23 |
| Utilities | 1.35 | | | | | | |
| Health Care | 0.54 | | Global Bond Fund | | High Income Fund |
| Short-Term Investments & Other | 1.64 | | | % of | | | % of |
| | | | Sector Weighting* | Total | | Sector Weighting* | Total |
| Emerging Markets Debt Fund | |
| |
|
| | % of | | Financials | 35.71 | | Consumer Discretionary | 57.42 |
| Sector Weighting* | Total | | Mortgage Securities | 29.47 | | Industrials | 25.45 |
| | Government** | 26.10 | | Financials | 8.62 |
| Government** | 26.60 | | Asset Backed Securities | 3.40 | | Materials | 2.73 |
| Energy | 14.02 | | Consumer Discretionary | 2.62 | | Telecommunication Services | 1.12 |
| Industrials | 11.71 | | Energy | 1.57 | | Information Technology | 0.79 |
| Consumer Staples | 9.83 | | Materials | 0.75 | | Energy | 0.57 |
| Materials | 9.69 | | Industrials | 0.71 | | Consumer Staples | 0.36 |
| Financials | 7.61 | | Health Care | 0.49 | | Mortgage Securities | 0.17 |
| Telecommunication Services | 7.37 | | Consumer Staples | 0.48 | | Short-Term Investments & Other | 2.77 |
| Utilities | 4.95 | | Telecommunication Services | 0.41 | | | |
| Consumer Discretionary | 2.97 | | Information Technology | 0.24 | | High Yield Fund |
| Health Care | 1.31 | | Short-Term Investments & Other | (1.95) | | | % of |
| Information Technology | 0.68 | | | | | Sector Weighting* | Total |
| Short-Term Investments & Other | 3.26 | | Global Infrastructure Fund | |
|
| | | | | % of | | Consumer Discretionary | 20.82 |
| Equity-Income Fund | | Sector Weighting* | Total | | Energy | 15.97 |
| | % of | |
| | Financials | 13.07 |
| Sector Weighting* | Total | | Industrials | 36.07 | | Industrials | 12.65 |
| | Utilities | 32.20 | | Telecommunication Services | 8.82 |
| Financials | 19.65 | | Energy | 30.01 | | Materials | 8.03 |
| Consumer Discretionary | 14.84 | | Materials | 1.39 | | Utilities | 4.97 |
| Energy | 14.14 | | Net Other Assets and Liabilities | 0.33 | | Health Care | 4.20 |
| Industrials | 12.66 | | | | | Government** | 3.52 |
| Utilities | 7.26 | | Global Real Estate Fund | | Consumer Staples | 2.35 |
| Information Technology | 6.79 | | | % of | | Information Technology | 2.08 |
| Consumer Staples | 6.18 | | Sector Weighting* | Total | | Short-Term Investments & Other | 3.52 |
| Materials | 5.85 | |
| | | |
| Health Care | 4.82 | | Financials | 97.39 | | | |
| Telecommunication Services | 3.68 | | Health Care | 1.02 | | | |
| Short-Term Investments & Other | 4.13 | | Industrials | 0.07 | | | |
| | | Short-Term Investments & Other | 1.52 | | | |
John Hancock Funds II
Sector Weightings
| | | | | | | |
| Index 500 Fund | | International Small Cap Fund | | Investment Quality Bond Fund |
| | % of | | | % of | | | % of |
| Sector Weighting* | Total | | Sector Weighting* | Total | | Sector Weighting* | Total |
| |
| |
|
| Information Technology | 18.01 | | Consumer Discretionary | 29.23 | | Government** | 24.16 |
| Financials | 15.42 | | Industrials | 19.91 | | Financials | 22.37 |
| Energy | 12.64 | | Financials | 19.14 | | Mortgage Securities | 18.71 |
| Industrials | 10.69 | | Information Technology | 7.95 | | Consumer Discretionary | 6.47 |
| Health Care | 10.46 | | Consumer Staples | 5.42 | | Consumer Staples | 5.97 |
| Consumer Discretionary | 10.17 | | Energy | 4.45 | | Telecommunication Services | 4.82 |
| Consumer Staples | 9.75 | | Materials | 2.57 | | Energy | 4.42 |
| Materials | 3.49 | | Health Care | 1.89 | | Utilities | 4.22 |
| Utilities | 3.06 | | Utilities | 1.02 | | Health Care | 2.70 |
| Telecommunication Services | 2.78 | | Telecommunication Services | 0.56 | | Materials | 1.90 |
| Short-Term Investments & Other | 3.53 | | Short-Term Investments & Other | 7.86 | | Asset Backed Securities | 1.29 |
| | | | | | | Industrials | 1.00 |
| International Equity Index Fund | | International Small Company Fund | | Information Technology | 0.62 |
| | % of | | | % of | | Short-Term Investments & Other | 1.35 |
| Sector Weighting* | Total | | Sector Weighting* | Total | | | |
| |
| | Large Cap Fund |
| Financials | 23.72 | | Industrials | 24.28 | | | % of |
| Materials | 12.18 | | Consumer Discretionary | 18.75 | | Sector Weighting* | Total |
| Energy | 11.26 | | Materials | 14.35 | |
|
| Industrials | 10.32 | | Financials | 12.64 | | Information Technology | 18.44 |
| Consumer Discretionary | 8.46 | | Information Technology | 8.85 | | Consumer Discretionary | 15.42 |
| Consumer Staples | 7.78 | | Energy | 6.76 | | Financials | 14.79 |
| Information Technology | 6.45 | | Consumer Staples | 5.72 | | Health Care | 13.05 |
| Health Care | 5.59 | | Health Care | 5.42 | | Energy | 12.30 |
| Telecommunication Services | 5.47 | | Utilities | 1.87 | | Industrials | 11.79 |
| Utilities | 4.16 | | Telecommunication Services | 0.80 | | Consumer Staples | 7.05 |
| Short-Term Investments & Other | 4.61 | | Short-Term Investments & Other | 0.56 | | Utilities | 3.32 |
| | | | | | | Telecommunication Services | 1.91 |
| International Growth Stock Fund | | International Value Fund | | Materials | 0.94 |
| | % of | | | % of | | Short-Term Investments & Other | 0.99 |
| Sector Weighting* | Total | | Sector Weighting* | Total | | | |
| |
| | Large Cap Value Fund |
| Consumer Discretionary | 17.22 | | Financials | 21.55 | | | % of |
| Health Care | 12.54 | | Information Technology | 14.28 | | Sector Weighting* | Total |
| Consumer Staples | 11.99 | | Telecommunication Services | 14.18 | |
|
| Energy | 11.61 | | Industrials | 10.53 | | Financials | 19.59 |
| Information Technology | 10.79 | | Health Care | 10.40 | | Consumer Discretionary | 15.03 |
| Financials | 9.32 | | Energy | 9.84 | | Energy | 14.21 |
| Industrials | 7.90 | | Consumer Discretionary | 9.64 | | Industrials | 12.66 |
| Telecommunication Services | 5.53 | | Utilities | 2.92 | | Utilities | 7.32 |
| Materials | 3.63 | | Consumer Staples | 2.59 | | Information Technology | 6.52 |
| Utilities | 2.69 | | Materials | 1.59 | | Consumer Staples | 5.93 |
| Short-Term Investments & Other | 6.78 | | Short-Term Investments & Other | 2.48 | | Materials | 5.88 |
| | | | | | | Health Care | 4.78 |
| International Opportunities Fund | | | | | Telecommunication Services | 3.69 |
| | % of | | | | | Short-Term Investments & Other | 4.39 |
| Sector Weighting* | Total | | | | | | |
| | | | | | |
| Consumer Discretionary | 21.28 | | | | | | |
| Financials | 17.98 | | | | | | |
| Industrials | 17.52 | | | | | | |
| Consumer Staples | 10.44 | | | | | | |
| Materials | 10.33 | | | | | | |
| Information Technology | 7.73 | | | | | | |
| Energy | 6.92 | | | | | | |
| Health Care | 2.59 | | | | | | |
| Telecommunication Services | 1.52 | | | | | | |
| Short-Term Investments & Other | 3.69 | | | | | | |
John Hancock Funds II
Sector Weightings
| | | | | | | |
| Mid Cap Growth Index Fund | | Mid Cap Value Index Fund | | Real Estate Equity Fund |
| | % of | | | % of | | | % of |
| Sector Weighting* | Total | | Sector Weighting* | Total | | Sector Weighting* | Total |
| |
| |
|
| Consumer Discretionary | 20.53 | | Financials | 28.28 | | Financials | 91.36 |
| Information Technology | 17.77 | | Information Technology | 11.63 | | Consumer Discretionary | 3.78 |
| Health Care | 14.71 | | Consumer Discretionary | 11.51 | | Short-Term Investments & Other | 4.86 |
| Energy | 14.56 | | Utilities | 11.35 | | | |
| Industrials | 13.91 | | Industrials | 9.71 | | Real Estate Securities Fund |
| Financials | 7.22 | | Materials | 8.01 | | | % of |
| Materials | 5.30 | | Energy | 5.59 | | Sector Weighting* | Total |
| Consumer Staples | 3.03 | | Consumer Staples | 5.29 | |
|
| Telecommunication Services | 1.24 | | Health Care | 4.80 | | Financials | 96.65 |
| Utilities | 0.43 | | Telecommunication Services | 1.53 | | Health Care | 2.60 |
| Short-Term Investments & Other | 1.30 | | Short-Term Investments & Other | 2.30 | | Short-Term Investments & Other | 0.75 |
| | | | | | | |
| Mid Cap Index Fund | | Mid Value Fund | | Real Return Bond Fund |
| % of | | | % of | | | % of |
| Sector Weighting* | Total | | Sector Weighting* | Total | | Sector Weighting* | Total |
| |
| |
|
| Financials | 19.51 | | Financials | 21.92 | | Government** | 89.52 |
| Information Technology | 15.82 | | Consumer Discretionary | 15.23 | | Financials | 18.91 |
| Industrials | 14.70 | | Energy | 10.24 | | Mortgage Securities | 12.99 |
| Consumer Discretionary | 13.71 | | Consumer Staples | 9.06 | | Asset Backed Securities | 3.70 |
| Health Care | 11.13 | | Utilities | 8.12 | | Energy | 1.82 |
| Materials | 6.58 | | Industrials | 8.11 | | Consumer Discretionary | 0.77 |
| Energy | 6.46 | | Information Technology | 6.65 | | Health Care | 0.73 |
| Utilities | 5.72 | | Health Care | 5.97 | | Information Technology | 0.50 |
| Consumer Staples | 3.49 | | Materials | 5.69 | | Industrials | 0.13 |
| Telecommunication Services | 0.49 | | Telecommunication Services | 1.79 | | Materials | 0.12 |
| Short-Term Investments & Other | 2.39 | | Short-Term Investments & Other | 7.22 | | Short-Term Investments & Other | (29.19) |
| | | | | | | |
| Mid Cap Stock Fund | | Mutual Shares Fund | | Retirement 2010 Portfolio |
| | % of | | | % of | | | % of |
| Sector Weighting* | Total | | Sector Weighting* | Total | | Sector Weighting* | Total |
| |
| |
|
| Information Technology | 29.92 | | Consumer Staples | 23.05 | | Intermediate Bond | 92.01 |
| Consumer Discretionary | 27.45 | | Health Care | 14.80 | | U.S. Large Cap | 6.00 |
| Industrials | 13.91 | | Financials | 12.92 | | International Large Cap | 2.00 |
| Health Care | 13.72 | | Information Technology | 10.42 | | Other | (0.01) |
| Materials | 3.74 | | Energy | 7.86 | | | |
| Consumer Staples | 3.68 | | Consumer Discretionary | 7.30 | | Retirement 2015 Portfolio |
| Energy | 2.61 | | Industrials | 4.71 | | | % of |
| Financials | 2.56 | | Materials | 4.49 | | Sector Weighting* | Total |
| Short-Term Investments & Other | 2.41 | | Utilities | 3.94 | |
|
| | | | Telecommunication Services | 3.09 | | Intermediate Bond | 77.01 |
| Mid Cap Value Equity Fund | | Short-Term Investments & Other | 7.42 | | U.S. Large Cap | 16.65 |
| | % of | | | | | International Large Cap | 5.60 |
| Sector Weighting* | Total | | Optimized Value Fund | | U.S. Mid Cap | 0.45 |
| | | % of | | U.S. Small Cap | 0.30 |
| Financials | 18.24 | | Sector Weighting* | Total | | Other | (0.01) |
| Industrials | 16.69 | |
| | | |
| Consumer Discretionary | 12.55 | | Financials | 23.75 | | Retirement 2020 Portfolio |
| Energy | 10.68 | | Health Care | 15.93 | | | % of |
| Health Care | 10.64 | | Consumer Discretionary | 15.89 | | Sector Weighting* | Total |
| Materials | 8.86 | | Consumer Staples | 11.55 | |
|
| Information Technology | 7.45 | | Energy | 11.41 | | Intermediate Bond | 56.01 |
| Utilities | 6.84 | | Industrials | 9.51 | | U.S. Large Cap | 28.80 |
| Consumer Staples | 3.17 | | Information Technology | 8.54 | | International Large Cap | 9.80 |
| Telecommunication Services | 1.95 | | Utilities | 1.08 | | U.S. Mid Cap | 3.40 |
| Short-Term Investments & Other | 2.93 | | Short-Term Investments & Other | 2.34 | | U.S. Small Cap | 2.00 |
| | | | | | Other | (0.01) |
John Hancock Funds II
Sector Weightings
| | | | | | | |
| Retirement 2025 Portfolio | | Small Cap Growth Fund | | Small Company Growth Fund |
| | % of | | | % of | | | % of |
| Sector Weighting* | Total | | Sector Weighting* | Total | | Sector Weighting* | Total |
| |
| |
|
| U.S. Large Cap | 41.13 | | Information Technology | 31.82 | | Information Technology | 30.68 |
| Intermediate Bond | 37.50 | | Consumer Discretionary | 19.75 | | Consumer Discretionary | 15.86 |
| International Large Cap | 13.50 | | Industrials | 19.41 | | Industrials | 15.08 |
| U.S. Mid Cap | 4.63 | | Health Care | 15.02 | | Health Care | 14.98 |
| U.S. Small Cap | 3.25 | | Energy | 6.08 | | Energy | 8.53 |
| Other | (0.01) | | Consumer Staples | 2.55 | | Financials | 5.46 |
| | | | Materials | 1.78 | | Materials | 4.50 |
| Retirement 2030 Portfolio | | Financials | 1.16 | | Consumer Staples | 1.77 |
| | % of | | Short-Term Investments & Other | 2.43 | | Telecommunication Services | 0.96 |
| Sector Weighting* | Total | | | | | Utilities | 0.74 |
| | Small Cap Index Fund | | Short-Term Investments & Other | 1.44 |
| U.S. Large Cap | 47.81 | | | % of | | | |
| Intermediate Bond | 27.00 | | Sector Weighting* | Total | | Small Company Value Fund |
| International Large Cap | 15.80 | |
| | | % of |
| U.S. Mid Cap | 5.20 | | Financials | 19.31 | | Sector Weighting* | Total |
| U.S. Small Cap | 4.20 | | Information Technology | 18.39 | |
|
| Other | (0.01) | | Industrials | 14.73 | | Industrials | 25.07 |
| | | | Consumer Discretionary | 12.61 | | Financials | 22.00 |
| Retirement 2035 Portfolio | | Health Care | 11.55 | | Consumer Discretionary | 10.87 |
| | % of | | Energy | 6.70 | | Information Technology | 10.87 |
| Sector Weighting* | Total | | Materials | 5.36 | | Materials | 9.98 |
| | Utilities | 2.84 | | Energy | 7.15 |
| U.S. Large Cap | 51.46 | | Consumer Staples | 2.74 | | Health Care | 5.84 |
| Intermediate Bond | 20.93 | | Telecommunication Services | 0.80 | | Utilities | 3.98 |
| International Large Cap | 17.45 | | Short-Term Investments & Other | 4.97 | | Consumer Staples | 0.90 |
| U.S. Mid Cap | 5.58 | | | | | Investment Companies | 0.89 |
| U.S. Small Cap | 4.59 | | Small Cap Opportunities Fund | | Telecommunication Services | 0.35 |
| Other | (0.01) | | | % of | | Short-Term Investments & Other | 2.10 |
| | | | Sector Weighting* | Total | | | |
| Retirement 2040 Portfolio | |
| | Smaller Company Growth Fund |
| | % of | | Financials | 19.33 | | | % of |
| Sector Weighting* | Total | | Industrials | 16.30 | | Sector Weighting* | Total |
| | Information Technology | 15.79 | |
|
| U.S. Large Cap | 53.21 | | Consumer Discretionary | 15.31 | | Information Technology | 26.72 |
| International Large Cap | 18.20 | | Energy | 10.37 | | Industrials | 21.15 |
| Intermediate Bond | 18.00 | | Health Care | 8.48 | | Health Care | 14.38 |
| U.S. Mid Cap | 5.80 | | Materials | 7.54 | | Consumer Discretionary | 12.36 |
| U.S. Small Cap | 4.80 | | Consumer Staples | 3.56 | | Energy | 10.22 |
| Other | (0.01) | | Utilities | 0.91 | | Financials | 5.13 |
| | | Telecommunication Services | 0.89 | | Materials | 3.30 |
| Retirement 2045 Portfolio | | Short-Term Investments & Other | 1.52 | | Telecommunication Services | 2.58 |
| | % of | | | | | Consumer Staples | 1.14 |
| Sector Weighting* | Total | | Small Cap Value Fund | | Utilities | 0.26 |
| | | % of | | Short-Term Investments & Other | 2.76 |
| U.S. Large Cap | 53.21 | | Sector Weighting* | Total | | | |
| International Large Cap | 18.20 | |
| | | |
| Intermediate Bond | 18.00 | | Financials | 23.52 | | | |
| U.S. Mid Cap | 5.80 | | Industrials | 22.21 | | | |
| U.S. Small Cap | 4.80 | | Consumer Discretionary | 17.18 | | | |
| Other | (0.01) | | Information Technology | 8.77 | | | |
| | | | Health Care | 7.88 | | | |
| Short Term Government Income Fund | | Utilities | 5.21 | | | |
| | % of | | Materials | 5.11 | | | |
| Sector Weighting* | Total | | Energy | 4.18 | | | |
| | Consumer Staples | 2.49 | | | |
| Government** | 71.76 | | Short-Term Investments & Other | 3.45 | | | |
| Mortgage Securities | 26.25 | | | | | | |
| Short-Term Investments & Other | 1.99 | | | | | | |
| | | | | | | | |
| | | | | | | |
| | | | | | | | |
| | | | | | | |
John Hancock Funds II
Sector Weightings
| | | | | | | |
| Spectrum Income Fund | | Total Return Fund | | Value Fund |
| | % of | | | % of | | | % of |
| Sector Weighting* | Total | | Sector Weighting* | Total | | Sector Weighting* | Total |
| |
| |
|
| Mortgage Securities | 20.39 | | Mortgage Securities | 39.43 | | Financials | 18.59 |
| Government** | 18.41 | | Financials | 24.39 | | Consumer Discretionary | 12.67 |
| Financials | 15.71 | | Government** | 14.03 | | Industrials | 11.46 |
| Consumer Discretionary | 8.14 | | Energy | 2.08 | | Energy | 9.70 |
| Energy | 7.21 | | Materials | 1.72 | | Information Technology | 8.34 |
| Industrials | 4.78 | | Asset Backed Securities | 1.67 | | Health Care | 7.76 |
| Telecommunication Services | 4.57 | | Industrials | 1.26 | | Materials | 7.75 |
| Materials | 3.91 | | Telecommunication Services | 0.87 | | Utilities | 7.42 |
| Utilities | 3.42 | | Health Care | 0.54 | | Consumer Staples | 6.61 |
| Consumer Staples | 2.95 | | Consumer Staples | 0.26 | | Telecommunication Services | 2.02 |
| Health Care | 2.65 | | Consumer Discretionary | 0.14 | | Short-Term Investments & Other | 7.68 |
| Information Technology | 2.11 | | Utilities | 0.08 | | | |
| Asset Backed Securities | 1.48 | | Short-Term Investments & Other | 13.53 | | Value & Restructuring Fund |
| Short-Term Investments & Other | 4.27 | | | | | | % of |
| | | | U.S. High Yield Bond Fund | | Sector Weighting* | Total |
| Total Bond Market Fund | | | % of | |
|
| | % of | | Sector Weighting* | Total | | Energy | 23.67 |
| Sector Weighting* | Total | |
| | Industrials | 17.07 |
| | Consumer Discretionary | 30.02 | | Financials | 16.45 |
| Mortgage Securities | 40.19 | | Financials | 14.11 | | Materials | 14.67 |
| Government** | 30.16 | | Energy | 12.21 | | Information Technology | 7.61 |
| Financials | 11.86 | | Telecommunication Services | 9.83 | | Consumer Discretionary | 5.72 |
| Energy | 4.41 | | Utilities | 9.21 | | Health Care | 5.42 |
| Consumer Staples | 2.85 | | Health Care | 6.85 | | Consumer Staples | 4.86 |
| Utilities | 2.70 | | Information Technology | 4.90 | | Telecommunication Services | 4.28 |
| Telecommunication Services | 2.20 | | Materials | 3.21 | | Short-Term Investments & Other | 0.25 |
| Industrials | 1.97 | | Industrials | 2.96 | | | |
| Health Care | 1.96 | | Consumer Staples | 1.97 | | | |
| Consumer Discretionary | 1.64 | | Short-Term Investments & Other | 4.73 | | | |
| Materials | 0.95 | | | | | | |
| Information Technology | 0.94 | | U.S. Multi-Sector Fund | | | |
| Asset Backed Securities | 0.29 | | | % of | | | |
| Short-Term Investments & Other | (2.12) | | Sector Weighting* | Total | | | |
| | |
| | | |
| | | | Health Care | 27.65 | | | |
| | | | Information Technology | 26.84 | | | |
| | | | Consumer Staples | 22.83 | | | |
| | | | Consumer Discretionary | 7.30 | | | |
| | | | Industrials | 5.03 | | | |
| | | | Financials | 2.94 | | | |
| | | | Energy | 2.26 | | | |
| | | | Telecommunication Services | 1.79 | | | |
| | | | Materials | 0.87 | | | |
| | | | Utilities | 0.18 | | | |
| | | | Short-Term Investments & Other | 2.31 | | | |
| |
| * | Top Sectors as a percentage of net assets. |
| ** | Includes foreign government obligations. |
John Hancock Funds II
Shareholder Expense Example
As a shareholder of John Hancock Funds II, you incur ongoing costs, such as management fees, distribution (12b-1) fees and other expenses. In the case of Core Diversified Growth & Income Portfolio, Core Fundamental Holdings Portfolio, Core Global Diversifi-cation Portfolio and Retirement 2010 Portfolio, Retirement 2015 Portfolio, Retirement 2020 Portfolio, Retirement 2025 Portfolio, Retirement 2030 Portfolio, Retirement 2035 Portfolio, Retirement 2040 Portfolio and Retirement 2045 Portfolio (Retirement Portfolios), in addition to the operating expenses which the Fund bears directly, the Fund indirectly bears a pro rata share of the operating expenses of the underlying funds in which the Fund invests. Because the underlying funds have varied operating expenses and transaction costs and the Fund may own different proportions of the underlying funds at different times, the amount of expenses incurred indirectly by the Fund will vary. If these indirect expenses were included, your expenses paid during the period would have been higher.
This example is intended to help you understand your ongoing costs (in dollars) of investing in the funds so you can compare these costs with the ongoing costs of investing in other mutual funds. The example is based on an investment of $1,000 invested at the beginning of the period and held for the entire period (September 1, 2010 through February 28, 2011).
Actual expenses:
The first line of each share class in the table below and on the following pages provides information about actual account values and actual expenses. You may use the information in this line, together with the amount you invested, to estimate the expenses that you paid over the period. Simply divide your account value by $1,000 (for example, an $8,600 account value divided by $1,000 = 8.6), then multiply the result by the number in the first line under the heading entitled “Expenses paid during period” to estimate the expenses you paid on your account during this period.
Hypothetical example for comparison purposes:
The second line of each share class in the table below and on the following pages provides information about hypothetical account values and hypothetical expenses based on the actual expense ratio for the share class and an assumed annualized rate of return of 5% per year before expenses, which is not the actual return of the share class. The hypothetical account values and expenses may not be used to estimate the actual ending account balance or expenses you paid for the period. You may use this information to compare the ongoing costs of investing in the portfolio and other portfolios. To do so, compare this 5% hypothetical example with the 5% hypothetical examples that appear in the shareholder reports of the other funds.
Please note that the expenses shown in the table are meant to highlight your ongoing costs only and do not reflect any transactional costs and insurance-related charges. Therefore, the second line of each share class in the table is useful in comparing ongoing costs only, and will not help you determine the relative total costs of owning different funds. In addition, if these transactional costs were included, your costs would have been higher.
| | | | |
| | | | Expenses Paid | |
| | Beginning | Ending | During Period1 | Annualized |
| | Account Value | Account Value | 9/1/2010– | Expense |
| | 9/1/2010 | 2/28/2011 | 2/28/2011 | Ratio |
| |
| Active Bond Fund | | | | |
|
| Class 1 — Actual | $1,000.00 | $1,031.80 | $3.48 | 0.69% |
| Class 1 — Hypothetical (5% annualized return before expenses) | 1,000.00 | 1,021.40 | 3.46 | 0.69% |
| Class NAV — Actual | 1,000.00 | 1,032.10 | 3.22 | 0.64% |
| Class NAV — Hypothetical (5% annualized return before expenses) | 1,000.00 | 1,021.60 | 3.21 | 0.64% |
| |
| All Cap Core Fund | | | | |
|
| Class NAV — Actual | $1,000.00 | $1,294.20 | $4.55 | 0.80% |
| Class NAV — Hypothetical (5% annualized return before expenses) | 1,000.00 | 1,020.80 | 4.01 | 0.80% |
| |
| All Cap Value Fund | | | | |
|
| Class 1 — Actual | $1,000.00 | $1,323.70 | $5.01 | 0.87% |
| Class 1 — Hypothetical (5% annualized return before expenses) | 1,000.00 | 1,020.50 | 4.36 | 0.87% |
| Class NAV — Actual | 1,000.00 | 1,323.60 | 4.72 | 0.82% |
| Class NAV — Hypothetical (5% annualized return before expenses) | 1,000.00 | 1,020.70 | 4.11 | 0.82% |
| |
| Alpha Opportunities Fund | | | | |
|
| Class NAV — Actual | $1,000.00 | $1,330.80 | $5.84 | 1.01% |
| Class NAV — Hypothetical (5% annualized return before expenses) | 1,000.00 | 1,019.80 | 5.06 | 1.01% |
John Hancock Funds II
Shareholder Expense Example
| | | | |
| | | | Expenses Paid | |
| | Beginning | Ending | During Period1 | Annualized |
| | Account Value | Account Value | 9/1/2010– | Expense |
| | 9/1/2010 | 2/28/2011 | 2/28/2011 | Ratio |
| |
| Blue Chip Growth Fund | | | | |
|
| Class 1 — Actual | $1,000.00 | $1,333.70 | $4.80 | 0.83% |
| Class 1 — Hypothetical (5% annualized return before expenses) | 1,000.00 | 1,020.70 | 4.16 | 0.83% |
| Class NAV — Actual | 1,000.00 | 1,333.90 | 4.51 | 0.78% |
| Class NAV — Hypothetical (5% annualized return before expenses) | 1,000.00 | 1,020.90 | 3.91 | 0.78% |
| |
| Capital Appreciation Fund | | | | |
|
| Class 1 — Actual | $1,000.00 | $1,293.20 | $4.43 | 0.78% |
| Class 1 — Hypothetical (5% annualized return before expenses) | 1,000.00 | 1,020.90 | 3.91 | 0.78% |
| Class NAV — Actual | 1,000.00 | 1,293.40 | 4.15 | 0.73% |
| Class NAV — Hypothetical (5% annualized return before expenses) | 1,000.00 | 1,021.20 | 3.66 | 0.73% |
| |
| Capital Appreciation Value Fund | | | | |
|
| Class NAV — Actual | $1,000.00 | $1,037.00 | $1.31 | 0.87%2 |
| Class NAV — Hypothetical (5% annualized return before expenses) | 1,000.00 | 1,020.50 | 4.36 | 0.87%2 |
| |
| Core Bond Fund | | | | |
|
| Class 1 — Actual | $1,000.00 | $995.40 | $3.36 | 0.68% |
| Class 1 — Hypothetical (5% annualized return before expenses) | 1,000.00 | 1,021.40 | 3.41 | 0.68% |
| Class NAV — Actual | 1,000.00 | 995.70 | 3.12 | 0.63% |
| Class NAV — Hypothetical (5% annualized return before expenses) | 1,000.00 | 1,021.70 | 3.16 | 0.63% |
| |
| Core Diversified Growth & Income Portfolio | | | | |
|
| Class 1 — Actual | $1,000.00 | $1,164.50 | $0.64 | 0.12%3 |
| Class 1 — Hypothetical (5% annualized return before expenses) | 1,000.00 | 1,024.20 | 0.60 | 0.12%3 |
| |
| Core Fundamental Holdings Portfolio | | | | |
|
| Class 1 — Actual | $1,000.00 | $1,136.60 | $0.64 | 0.12%3 |
| Class 1 — Hypothetical (5% annualized return before expenses) | 1,000.00 | 1,024.20 | 0.60 | 0.12%3 |
| |
| Core Global Diversification Portfolio | | | | |
|
| Class 1 — Actual | $1,000.00 | $1,136.80 | $0.64 | 0.12%3 |
| Class 1 — Hypothetical (5% annualized return before expenses) | 1,000.00 | 1,024.20 | 0.60 | 0.12%3 |
| |
| Emerging Markets Fund (formerly, Emerging Markets Value Fund) | | | | |
|
| Class NAV — Actual | $1,000.00 | $1,156.70 | $5.72 | 1.07% |
| Class NAV — Hypothetical (5% annualized return before expenses) | 1,000.00 | 1,019.50 | 5.36 | 1.07% |
| |
| Emerging Markets Debt Fund | | | | |
|
| Class A — Actual | $1000.00 | $1,043.70 | $6.84 | 1.35% |
| Class A — Hypothetical (5% annualized return before expenses) | 1000.00 | 1,018.10 | 6.76 | 1.35% |
| Class I — Actual | 1000.00 | 1,046.10 | 4.46 | 0.88% |
| Class I — Hypothetical (5% annualized return before expenses) | 1000.00 | 1,020.40 | 4.41 | 0.88% |
| |
| Equity-Income Fund | | | | |
|
| Class 1 — Actual | $1,000.00 | $1,265.90 | $4.72 | 0.84% |
| Class 1 — Hypothetical (5% annualized return before expenses) | 1,000.00 | 1,020.60 | 4.21 | 0.84% |
| Class NAV — Actual | 1,000.00 | 1,265.80 | 4.44 | 0.79% |
| Class NAV — Hypothetical (5% annualized return before expenses) | 1,000.00 | 1,020.90 | 3.96 | 0.79% |
| |
| Fundamental Value Fund | | | | |
|
| Class NAV — Actual | $1,000.00 | $1,251.20 | $4.47 | 0.80% |
| Class NAV — Hypothetical (5% annualized return before expenses) | 1,000.00 | 1,020.80 | 4.01 | 0.80% |
| |
| Global Agribusiness Fund | | | | |
|
| Class A — Actual | $1000.00 | $1,301.00 | $8.22 | 1.44% |
| Class A — Hypothetical (5% annualized return before expenses) | 1000.00 | 1,017.70 | 7.20 | 1.44% |
| Class I — Actual | 1000.00 | 1,303.70 | 5.77 | 1.01% |
| Class I — Hypothetical (5% annualized return before expenses) | 1000.00 | 1,019.80 | 5.06 | 1.01% |
| |
| Global Bond Fund | | | | |
|
| Class 1 — Actual | $1,000.00 | $1,018.30 | $4.25 | 0.85% |
| Class 1 — Hypothetical (5% annualized return before expenses) | 1,000.00 | 1,020.60 | 4.26 | 0.85% |
| Class NAV — Actual | 1,000.00 | 1,018.80 | 4.00 | 0.80% |
| Class NAV — Hypothetical (5% annualized return before expenses) | 1,000.00 | 1,020.80 | 4.01 | 0.80% |
John Hancock Funds II
Shareholder Expense Example
| | | | |
| | | | Expenses Paid | |
| | Beginning | Ending | During Period1 | Annualized |
| | Account Value | Account Value | 9/1/2010– | Expense |
| | 9/1/2010 | 2/28/2011 | 2/28/2011 | Ratio |
| |
| Global Infrastructure Fund | | | | |
|
| Class A — Actual | $1000.00 | $1,241.70 | $8.00 | 1.44% |
| Class A — Hypothetical (5% annualized return before expenses) | 1000.00 | 1,017.70 | 7.20 | 1.44% |
| Class I — Actual | 1000.00 | 1,245.10 | 5.62 | 1.01% |
| Class I — Hypothetical (5% annualized return before expenses) | 1000.00 | 1,019.80 | 5.06 | 1.01% |
| |
| Global Real Estate Fund | | | | |
|
| Class NAV — Actual | $1,000.00 | $1,195.20 | $5.55 | 1.02% |
| Class NAV — Hypothetical (5% annualized return before expenses) | 1,000.00 | 1,019.70 | 5.11 | 1.02% |
| |
| Global Timber Fund | | | | |
|
| Class A — Actual | $1000.00 | $1,245.30 | $8.02 | 1.44% |
| Class A — Hypothetical (5% annualized return before expenses) | 1000.00 | 1,017.70 | 7.20 | 1.44% |
| Class I — Actual | 1000.00 | 1,247.70 | 5.63 | 1.01% |
| Class I — Hypothetical (5% annualized return before expenses) | 1000.00 | 1,019.80 | 5.06 | 1.01% |
| |
| Heritage Fund | | | | |
|
| Class NAV — Actual | $1,000.00 | $1,358.80 | $5.26 | 0.90% |
| Class NAV — Hypothetical (5% annualized return before expenses) | 1,000.00 | 1,020.30 | 4.51 | 0.90% |
| |
| High Income Fund | | | | |
|
| Class NAV — Actual | $1,000.00 | $1,158.50 | $3.85 | 0.72% |
| Class NAV — Hypothetical (5% annualized return before expenses) | 1,000.00 | 1,021.20 | 3.61 | 0.72% |
| |
| High Yield Fund | | | | |
|
| Class 1 — Actual | $1,000.00 | $1,117.40 | $3.99 | 0.76% |
| Class 1 — Hypothetical (5% annualized return before expenses) | 1,000.00 | 1,021.00 | 3.81 | 0.76% |
| Class NAV — Actual | 1,000.00 | 1,118.50 | 3.73 | 0.71% |
| Class NAV — Hypothetical (5% annualized return before expenses) | 1,000.00 | 1,021.30 | 3.56 | 0.71% |
| |
| Index 500 Fund | | | | |
|
| Class NAV — Actual | $1,000.00 | $1,274.70 | $2.71 | 0.48% |
| Class NAV — Hypothetical (5% annualized return before expenses) | 1,000.00 | 1,022.40 | 2.41 | 0.48% |
| |
| International Equity Index Fund | | | | |
|
| Class NAV — Actual | $1,000.00 | $1,226.30 | $3.09 | 0.56% |
| Class NAV — Hypothetical (5% annualized return before expenses) | 1,000.00 | 1,022.00 | 2.81 | 0.56% |
| |
| International Growth Stock Fund | | | | |
|
| Class NAV — Actual | $1,000.00 | $1,124.10 | $4.88 | 1.01%4 |
| Class NAV — Hypothetical (5% annualized return before expenses) | 1,000.00 | 1,019.80 | 5.06 | 1.01%4 |
| |
| International Opportunities Fund | | | | |
|
| Class 1 — Actual | $1,000.00 | $1,227.30 | $5.63 | 1.02% |
| Class 1 — Hypothetical (5% annualized return before expenses) | 1,000.00 | 1,019.70 | 5.11 | 1.02% |
| Class NAV — Actual | 1,000.00 | 1,227.20 | 5.36 | 0.97% |
| Class NAV — Hypothetical (5% annualized return before expenses) | 1,000.00 | 1,020.00 | 4.86 | 0.97% |
| |
| International Small Cap Fund | | | | |
|
| Class 1 — Actual | $1,000.00 | $1,215.80 | $6.54 | 1.19% |
| Class 1 — Hypothetical (5% annualized return before expenses) | 1,000.00 | 1,018.90 | 5.96 | 1.19% |
| Class NAV — Actual | 1,000.00 | 1,217.20 | 6.27 | 1.14% |
| Class NAV — Hypothetical (5% annualized return before expenses) | 1,000.00 | 1,019.10 | 5.71 | 1.14% |
| |
| International Small Company Fund | | | | |
|
| Class NAV — Actual | $1,000.00 | $1,291.80 | $6.14 | 1.08% |
| Class NAV — Hypothetical (5% annualized return before expenses) | 1,000.00 | 1,019.40 | 5.41 | 1.08% |
| |
| International Value Fund | | | | |
|
| Class 1 — Actual | $1,000.00 | $1,254.40 | $5.37 | 0.96% |
| Class 1 — Hypothetical (5% annualized return before expenses) | 1,000.00 | 1,020.00 | 4.81 | 0.96% |
| Class NAV — Actual | 1,000.00 | 1,254.60 | 5.09 | 0.91% |
| Class NAV — Hypothetical (5% annualized return before expenses) | 1,000.00 | 1,020.30 | 4.56 | 0.91% |
| |
| Investment Quality Bond Fund | | | | |
|
| Class 1 — Actual | $1,000.00 | $985.70 | $3.35 | 0.68% |
| Class 1 — Hypothetical (5% annualized return before expenses) | 1,000.00 | 1,021.40 | 3.41 | 0.68% |
| Class NAV — Actual | 1,000.00 | 985.10 | 3.10 | 0.63% |
| Class NAV — Hypothetical (5% annualized return before expenses) | 1,000.00 | 1,021.70 | 3.16 | 0.63% |
John Hancock Funds II
Shareholder Expense Example
| | | | |
| | | | Expenses Paid | |
| | Beginning | Ending | During Period1 | Annualized |
| | Account Value | Account Value | 9/1/2010– | Expense |
| | 9/1/2010 | 2/28/2011 | 2/28/2011 | Ratio |
| |
| Large Cap Fund | | | | |
|
| Class 1 — Actual | $1,000.00 | $1,267.50 | $4.72 | 0.84% |
| Class 1 — Hypothetical (5% annualized return before expenses) | 1,000.00 | 1,020.60 | 4.21 | 0.84% |
| Class NAV — Actual | 1,000.00 | 1,267.10 | 4.44 | 0.79% |
| Class NAV — Hypothetical (5% annualized return before expenses) | 1,000.00 | 1,020.90 | 3.96 | 0.79% |
| |
| Large Cap Value Fund | | | | |
|
| Class 1 — Actual | $1,000.00 | $1,286.20 | $5.04 | 0.89% |
| Class 1 — Hypothetical (5% annualized return before expenses) | 1,000.00 | 1,020.40 | 4.46 | 0.89% |
| Class NAV — Actual | 1,000.00 | 1,286.30 | 4.76 | 0.84% |
| Class NAV — Hypothetical (5% annualized return before expenses) | 1,000.00 | 1,020.60 | 4.21 | 0.84% |
| |
| Mid Cap Growth Index Fund | | | | |
|
| Class 1 — Actual | $1,000.00 | $1,376.60 | $3.83 | 0.65% |
| Class 1 — Hypothetical (5% annualized return before expenses) | 1,000.00 | 1,021.60 | 3.26 | 0.65% |
| Class NAV — Actual | 1,000.00 | 1,377.00 | 3.54 | 0.60% |
| Class NAV — Hypothetical (5% annualized return before expenses) | 1,000.00 | 1,021.80 | 3.01 | 0.60% |
| |
| Mid Cap Index Fund | | | | |
|
| Class NAV — Actual | $1,000.00 | $1,345.40 | $2.91 | 0.50% |
| Class NAV — Hypothetical (5% annualized return before expenses) | 1,000.00 | 1,022.30 | 2.51 | 0.50% |
| |
| Mid Cap Stock Fund | | | | |
|
| Class 1 — Actual | $1,000.00 | $1,374.00 | $5.47 | 0.93% |
| Class 1 — Hypothetical (5% annualized return before expenses) | 1,000.00 | 1,020.20 | 4.66 | 0.93% |
| Class NAV — Actual | 1,000.00 | 1,374.60 | 5.18 | 0.88% |
| Class NAV — Hypothetical (5% annualized return before expenses) | 1,000.00 | 1,020.40 | 4.41 | 0.88% |
| |
| Mid Cap Value Equity Fund | | | | |
|
| Class NAV — Actual | $1,000.00 | $1,322.30 | $5.30 | 0.92% |
| Class NAV — Hypothetical (5% annualized return before expenses) | 1,000.00 | 1,020.20 | 4.61 | 0.92% |
| |
| Mid Cap Value Index Fund | | | | |
|
| Class 1 — Actual | $1,000.00 | $1,289.30 | $3.69 | 0.65% |
| Class 1 — Hypothetical (5% annualized return before expenses) | 1,000.00 | 1,021.60 | 3.26 | 0.65% |
| Class NAV — Actual | 1,000.00 | 1,289.70 | 3.41 | 0.60% |
| Class NAV — Hypothetical (5% annualized return before expenses) | 1,000.00 | 1,021.80 | 3.01 | 0.60% |
| |
| Mid Value Fund | | | | |
|
| Class NAV — Actual | $1,000.00 | $1,273.70 | $5.58 | 0.99% |
| Class NAV — Hypothetical (5% annualized return before expenses) | 1,000.00 | 1,019.90 | 4.96 | 0.99% |
| |
| Mutual Shares Fund | | | | |
|
| Class NAV — Actual | $1,000.00 | $1,136.00 | $5.10 | 1.05%4 |
| Class NAV — Hypothetical (5% annualized return before expenses) | 1,000.00 | 1,019.90 | 5.26 | 1.05%4 |
| |
| Optimized Value Fund | | | | |
|
| Class 1 — Actual | $1,000.00 | $1,285.00 | $4.36 | 0.77% |
| Class 1 — Hypothetical (5% annualized return before expenses) | 1,000.00 | 1,021.00 | 3.86 | 0.77% |
| Class NAV — Actual | 1,000.00 | 1,284.40 | 4.08 | 0.72% |
| Class NAV — Hypothetical (5% annualized return before expenses) | 1,000.00 | 1,021.20 | 3.61 | 0.72% |
| |
| Real Estate Equity Fund | | | | |
|
| Class NAV — Actual | $1,000.00 | $1,218.10 | $4.78 | 0.87% |
| Class NAV — Hypothetical (5% annualized return before expenses) | 1,000.00 | 1,020.50 | 4.36 | 0.87% |
| |
| Real Estate Securities Fund | | | | |
|
| Class 1 — Actual | $1,000.00 | $1,232.90 | $4.37 | 0.79% |
| Class 1 — Hypothetical (5% annualized return before expenses) | 1,000.00 | 1,020.90 | 3.96 | 0.79% |
| |
| Real Return Bond Fund | | | | |
|
| Class 1 — Actual | $1,000.00 | $1,017.20 | $3.95 | 0.79% |
| Class 1 — Hypothetical (5% annualized return before expenses) | 1,000.00 | 1,020.90 | 3.96 | 0.79% |
| Class NAV — Actual | 1,000.00 | 1,016.80 | 3.70 | 0.74% |
| Class NAV — Hypothetical (5% annualized return before expenses) | 1,000.00 | 1,021.10 | 3.71 | 0.74% |
| |
| Retirement 2010 Portfolio | | | | |
|
| Class 1 — Actual | $1,000.00 | $1,009.90 | $0.80 | 0.16%3 |
| Class 1 — Hypothetical (5% annualized return before expenses) | 1,000.00 | 1,024.00 | 0.80 | 0.16%3 |
John Hancock Funds II
Shareholder Expense Example
| | | | |
| | | | Expenses Paid | |
| | Beginning | Ending | During Period1 | Annualized |
| | Account Value | Account Value | 9/1/2010– | Expense |
| | 9/1/2010 | 2/28/2011 | 2/28/2011 | Ratio |
| |
| Retirement 2015 Portfolio | | | | |
|
| Class 1 — Actual | $1,000.00 | $1,056.30 | $0.82 | 0.16%3 |
| Class 1 — Hypothetical (5% annualized return before expenses) | 1,000.00 | 1,024.00 | 0.80 | 0.16%3 |
| |
| Retirement 2020 Portfolio | | | | |
|
| Class 1 — Actual | $1,000.00 | $1,109.60 | $0.84 | 0.16%3 |
| Class 1 — Hypothetical (5% annualized return before expenses) | 1,000.00 | 1,024.00 | 0.80 | 0.16%3 |
| |
| Retirement 2025 Portfolio | | | | |
|
| Class 1 — Actual | $1,000.00 | $1,162.40 | $0.86 | 0.16%3 |
| Class 1 — Hypothetical (5% annualized return before expenses) | 1,000.00 | 1,024.00 | 0.80 | 0.16%3 |
| |
| Retirement 2030 Portfolio | | | | |
|
| Class 1 — Actual | $1,000.00 | $1,191.60 | $0.87 | 0.16%3 |
| Class 1 — Hypothetical (5% annualized return before expenses) | 1,000.00 | 1,024.00 | 0.80 | 0.16%3 |
| |
| Retirement 2035 Portfolio | | | | |
|
| Class 1 — Actual | $1,000.00 | $1,209.10 | $0.88 | 0.16%3 |
| Class 1 — Hypothetical (5% annualized return before expenses) | 1,000.00 | 1,024.00 | 0.80 | 0.16%3 |
| |
| Retirement 2040 Portfolio | | | | |
|
| Class 1 — Actual | $1,000.00 | $1,216.20 | $0.88 | 0.16%3 |
| Class 1 — Hypothetical (5% annualized return before expenses) | 1,000.00 | 1,024.00 | 0.80 | 0.16%3 |
| |
| Retirement 2045 Portfolio | | | | |
|
| Class 1 — Actual | $1,000.00 | $1,216.80 | $0.88 | 0.16%3 |
| Class 1 — Hypothetical (5% annualized return before expenses) | 1,000.00 | 1,024.00 | 0.80 | 0.16%3 |
| |
| Short Term Government Income Fund | | | | |
|
| Class NAV — Actual | $1,000.00 | $997.80 | $3.17 | 0.64% |
| Class NAV — Hypothetical (5% annualized return before expenses) | 1,000.00 | 1,021.60 | 3.21 | 0.64% |
| |
| Small Cap Growth Fund | | | | |
|
| Class NAV — Actual | $1,000.00 | $1,400.90 | $6.61 | 1.11% |
| Class NAV — Hypothetical (5% annualized return before expenses) | 1,000.00 | 1,019.30 | 5.56 | 1.11% |
| |
| Small Cap Index Fund | | | | |
|
| Class NAV — Actual | $1,000.00 | $1,371.10 | $3.17 | 0.54% |
| Class NAV — Hypothetical (5% annualized return before expenses) | 1,000.00 | 1,022.10 | 2.71 | 0.54% |
| |
| Small Cap Opportunities Fund | | | | |
|
| Class 1 — Actual | $1,000.00 | $1,419.60 | $6.12 | 1.02% |
| Class 1 — Hypothetical (5% annualized return before expenses) | 1,000.00 | 1,019.70 | 5.11 | 1.02% |
| Class NAV — Actual | 1,000.00 | 1,419.50 | 5.82 | 0.97% |
| Class NAV — Hypothetical (5% annualized return before expenses) | 1,000.00 | 1,020.00 | 4.86 | 0.97% |
| |
| Small Cap Value Fund | | | | |
|
| Class NAV — Actual | $1,000.00 | $1,290.80 | $6.30 | 1.11% |
| Class NAV — Hypothetical (5% annualized return before expenses) | 1,000.00 | 1,019.30 | 5.56 | 1.11% |
| |
| Small Company Growth Fund | | | | |
|
| Class NAV — Actual | $1,000.00 | $1,378.60 | $6.31 | 1.07% |
| Class NAV — Hypothetical (5% annualized return before expenses) | 1,000.00 | 1,019.50 | 5.36 | 1.07% |
| |
| Small Company Value Fund | | | | |
|
| Class 1 — Actual | $1,000.00 | $1,345.50 | $6.22 | 1.07% |
| Class 1 — Hypothetical (5% annualized return before expenses) | 1,000.00 | 1,019.50 | 5.36 | 1.07% |
| Class NAV — Actual | 1,000.00 | 1,345.70 | 5.93 | 1.02% |
| Class NAV — Hypothetical (5% annualized return before expenses) | 1,000.00 | 1,019.70 | 5.11 | 1.02% |
| |
| Smaller Company Growth Fund | | | | |
|
| Class NAV — Actual | $1,000.00 | $1,376.70 | $5.95 | 1.01% |
| Class NAV — Hypothetical (5% annualized return before expenses) | 1,000.00 | 1,019.80 | 5.06 | 1.01% |
| |
| Spectrum Income Fund | | | | |
|
| Class NAV — Actual | $1,000.00 | $1,059.10 | $3.88 | 0.76% |
| Class NAV — Hypothetical (5% annualized return before expenses) | 1,000.00 | 1,021.00 | 3.81 | 0.76% |
| |
| Total Bond Market Fund | | | | |
|
| Class NAV — Actual | $1,000.00 | $991.80 | $2.57 | 0.52% |
| Class NAV — Hypothetical (5% annualized return before expenses) | 1,000.00 | 1,022.20 | 2.61 | 0.52% |
John Hancock Funds II
Shareholder Expense Example
| | | | |
| | | | Expenses Paid | |
| | Beginning | Ending | During Period1 | Annualized |
| | Account Value | Account Value | 9/1/2010– | Expense |
| | 9/1/2010 | 2/28/2011 | 2/28/2011 | Ratio |
| |
| Total Return Fund | | | | |
|
| Class 1 — Actual | $1,000.00 | $1,000.10 | $3.82 | 0.77% |
| Class 1 — Hypothetical (5% annualized return before expenses) | 1,000.00 | 1,021.00 | 3.86 | 0.77% |
| Class NAV — Actual | 1,000.00 | 1,000.40 | 3.57 | 0.72% |
| Class NAV — Hypothetical (5% annualized return before expenses) | 1,000.00 | 1,021.20 | 3.61 | 0.72% |
| |
| U.S. High Yield Bond Fund | | | | |
|
| Class 1 — Actual | $1,000.00 | $1,079.30 | $4.23 | 0.82% |
| Class 1 — Hypothetical (5% annualized return before expenses) | 1,000.00 | 1,020.70 | 4.11 | 0.82% |
| Class NAV — Actual | 1,000.00 | 1,078.80 | 3.97 | 0.77% |
| Class NAV — Hypothetical (5% annualized return before expenses) | 1,000.00 | 1,021.00 | 3.86 | 0.77% |
| |
| U.S. Multi-Sector Fund | | | | |
|
| Class NAV — Actual | $1,000.00 | $1,214.90 | $4.34 | 0.79% |
| Class NAV — Hypothetical (5% annualized return before expenses) | 1,000.00 | 1,020.90 | 3.96 | 0.79% |
| |
| Value Fund | | | | |
|
| Class NAV — Actual | $1,000.00 | $1,308.40 | $4.52 | 0.79% |
| Class NAV — Hypothetical (5% annualized return before expenses) | 1,000.00 | 1,020.90 | 3.96 | 0.79% |
| |
| Value & Restructuring Fund | | | | |
|
| Class NAV — Actual | $1,000.00 | $1,325.10 | $4.90 | 0.85% |
| Class NAV — Hypothetical (5% annualized return before expenses) | 1,000.00 | 1,020.60 | 4.26 | 0.85% |
1 Expenses are equal to the annualized expense ratio, multiplied by the average account value over the period, multiplied by the number of days in the period (181), and divided by 365 (to reflect the one-half year period).
2 The inception date for Capital Appreciation Value Fund is 1-6-11. Expenses are equal to the annualized expense ratio, multiplied by the average account value over the period, multiplied by the number of days in the period (54), and divided by 365 (to reflect the period).
3 Ratios do not include expenses indirectly incurred from underlying funds whose expense ratios can vary based on the mix of underlying funds held by the Portfolio. The range of expense ratios of the underlying funds held by the Portfolios was as follows:
| | |
| Fund | Range | |
| |
| Core Diversified Growth & Income Portfolio | 0.36% – 0.56% | |
| Core Fundamental Holdings Portfolio | 0.35% – 0.56% | |
| Core Global Diversification Portfolio | 0.36% – 0.56% | |
| Retirement Portfolios | 0.48% – 0.56% | |
4 The inception date for International Growth Stock Fund and Mutual Shares Fund is 9-16-10. Expenses are equal to the annualized expense ratio, multiplied by the average account value over the period, multiplied by the number of days in the period (166), and divided by 365 (to reflect the period).
John Hancock Funds II
Portfolio of Investments — February 28, 2011 (Unaudited) (showing percentage of total net assets)
| | | | |
| Active Bond Fund | | | | |
| | | Shares or | | |
| | | Principal | | |
| | | Amount | | Value |
| |
|
| |
| U.S. GOVERNMENT & AGENCY | | | | |
| OBLIGATIONS - 26.09% | | | | |
| U.S. Government - 10.75% | | | | |
| U.S. Treasury, Note | | | | |
| 1.250%, 09/30/2015 (L) | $ | 19,000,000 | $ | 18,418,125 |
| U.S. Treasury Notes | | | | |
| 0.375%, 08/31/2012 to 10/31/2012 | | 26,000,000 | | 25,954,532 |
| 0.750%, 09/15/2013 | | 15,000,000 | | 14,929,680 |
| 1.250%, 02/15/2014 to 08/31/2015 | | 14,700,000 | | 14,684,023 |
| 2.000%, 01/31/2016 | | 20,355,000 | | 20,259,551 |
| 2.625%, 01/31/2018 to 11/15/2020 | | 9,500,000 | | 8,939,496 |
| 3.625%, 02/15/2021 (L) | | 12,073,000 | | 12,282,394 |
| 4.250%, 11/15/2040 | | 15,395,000 | | 14,764,759 |
| | |
|
| | | | | 130,232,560 |
| U.S. Government Agency - 15.34% | | | | |
| Federal Home Loan Mortgage Corp. | | | | |
| 4.000%, 09/01/2040 | | 3,600,005 | | 3,548,864 |
| 6.500%, 06/01/2037 to 09/01/2039 | | 3,644,964 | | 4,065,933 |
| Federal National Mortgage Association | | | | |
| 2.255%, 05/01/2035 (P) | | 917,675 | | 950,132 |
| 2.377%, 01/01/2036 (P) | | 613,156 | | 640,801 |
| 2.621%, 07/01/2033 (P) | | 1,905 | | 1,998 |
| 4.000%, 06/01/2024 to 11/01/2040 | | 37,121,919 | | 37,261,638 |
| 4.375%, 03/15/2013 | | 20,000 | | 21,448 |
| 4.500%, 03/01/2026 | | 3,705,000 | | 3,885,073 |
| 5.000%, 05/01/2018 to 09/01/2040 | | 24,788,479 | | 26,088,874 |
| 5.500%, 02/01/2018 to 03/01/2039 | | 66,951,549 | | 71,978,075 |
| 5.762%, 04/01/2036 (P) | | 399,192 | | 412,394 |
| 6.000%, 09/01/2022 to 02/01/2036 | | 11,120,557 | | 12,198,844 |
| 6.250%, 05/15/2029 | | 157,000 | | 188,000 |
| 6.500%, 02/01/2036 to 06/01/2039 | | 19,045,826 | | 21,252,147 |
| 7.000%, 12/01/2012 to 06/01/2032 | | 24,014 | | 26,480 |
| 7.500%, 09/01/2029 to 08/01/2031 | | 3,092 | | 3,521 |
| Government National | | | | |
| Mortgage Association | | | | |
| 4.500%, 04/15/2039 | | 2,967,792 | | 3,070,748 |
| 5.000%, 04/15/2035 | | 57,264 | | 61,166 |
| 5.500%, 03/15/2035 | | 52,881 | | 57,672 |
| 6.000%, 03/15/2033 to 06/15/2033 | | 23,477 | | 25,949 |
| 6.500%, 09/15/2028 to 08/15/2031 | | 4,518 | | 5,103 |
| 7.000%, 04/15/2029 | | 1,806 | | 2,057 |
| 8.000%, 10/15/2026 | | 1,738 | | 1,990 |
| | |
|
| | | | | 185,748,907 |
|
| TOTAL U.S. GOVERNMENT & AGENCY | | | |
| OBLIGATIONS (Cost $312,851,209) | | | $ | 315,981,467 |
|
| |
| FOREIGN GOVERNMENT | | | | |
| OBLIGATIONS - 0.26% | | | | |
| Argentina - 0.01% | | | | |
| Republic of Argentina | | | | |
| 1.180%, 12/31/2038 (P) | ARS | 177,218 | | 27,552 |
| 5.830%, 12/31/2033 (P) | | 72,870 | | 29,771 |
| 12/15/2035 (B)(I) | | 393,449 | | 15,087 |
| | |
|
| | | | | 72,410 |
| Honduras - 0.00% | | | | |
| Central American Bank for Economic | | | | |
| Integration | | | | |
| 6.750%, 04/15/2013 (S) | $ | 12,000 | | 12,970 |
| Japan - 0.00% | | | | |
| Government of Japan | | | | |
| 1.500%, 09/20/2014 | JPY | 1,350,000 | | 17,126 |
| Mexico - 0.00% | | | | |
| Government of Mexico | | | | |
| 8.000%, 12/19/2013 to 12/07/2023 | MXN | 406,700 | | 34,833 |
| | | | |
| Active Bond Fund (continued) | | | |
| | | Shares or | | |
| | | Principal | | |
| | | Amount | | Value |
| |
|
| |
| FOREIGN GOVERNMENT | | | | |
| OBLIGATIONS (continued) | �� | | | |
| Panama - 0.00% | | | | |
| Republic of Panama | | | | |
| 8.875%, 09/30/2027 | $ | 6,000 | $ | 8,091 |
| 9.375%, 04/01/2029 | | 1,000 | | 1,400 |
| | |
|
| | | | | 9,491 |
| Sweden - 0.00% | | | | |
| Kingdom of Sweden | | | | |
| 5.250%, 03/15/2011 | SEK | 30,000 | | 4,741 |
| United Kingdom - 0.25% | | | | |
| Government of United Kingdom | | | | |
| 4.750%, 03/07/2020 | GBP | 1,705,000 | | 3,014,064 |
|
| TOTAL FOREIGN GOVERNMENT | | | | |
| OBLIGATIONS (Cost $3,207,254) | | | $ | 3,165,635 |
|
| |
| CORPORATE BONDS - 43.21% | | | | |
| Consumer Discretionary - 3.91% | | | | |
| Allison Transmission, Inc. | | | | |
| 11.000%, 11/01/2015 (S) | $ | 1,310,000 | | 1,424,625 |
| AMC Entertainment, Inc. | | | | |
| 8.000%, 03/01/2014 | | 1,165,000 | | 1,182,475 |
| 8.750%, 06/01/2019 | | 310,000 | | 332,863 |
| American Standard Americas | | | | |
| 10.750%, 01/15/2016 (S) | | 180,000 | | 191,250 |
| Burlington Coat Factory | | | | |
| Warehouse Corp. | | | | |
| 10.000%, 02/15/2019 (S) | | 1,365,000 | | 1,378,650 |
| Cablevision Systems Corp. | | | | |
| 8.625%, 09/15/2017 | | 320,000 | | 358,400 |
| CBS Corp. | | | | |
| 5.900%, 10/15/2040 | | 555,000 | | 526,035 |
| 7.875%, 07/30/2030 | | 900,000 | | 1,049,591 |
| CCH II LLC/CCH II Capital Corp. | | | | |
| 13.500%, 11/30/2016 | | 708,588 | | 858,277 |
| CCO Holdings LLC/CCO Holdings | | | | |
| Capital Corp. | | | | |
| 8.125%, 04/30/2020 | | 305,000 | | 329,019 |
| Cinemark USA, Inc. | | | | |
| 8.625%, 06/15/2019 | | 395,000 | | 430,550 |
| Clear Channel Worldwide Holdings, Inc. | | | | |
| 9.250%, 12/15/2017 | | 1,000,000 | | 1,110,000 |
| COX Communications, Inc. | | | | |
| 4.625%, 06/01/2013 | | 340,000 | | 363,072 |
| 5.450%, 12/15/2014 | | 218,000 | | 240,755 |
| 6.750%, 03/15/2011 | | 209,000 | | 209,439 |
| CSC Holdings, Inc. | | | | |
| 7.875%, 02/15/2018 | | 890,000 | | 992,350 |
| Darden Restaurants, Inc. | | | | |
| 6.800%, 10/15/2037 | | 835,000 | | 924,369 |
| Delphi Corp. | | | | |
| 6.197%, 11/15/2033 (H) | | 2,000 | | 0 |
| DIRECTV Holdings LLC | | | | |
| 6.350%, 03/15/2040 | | 600,000 | | 611,951 |
| Empire Today LLC/Empire Today | | | | |
| Finance Corp. | | | | |
| 11.375%, 02/01/2017 (S) | | 365,000 | | 381,425 |
| Exide Technologies | | | | |
| 8.625%, 02/01/2018 (S) | | 610,000 | | 650,413 |
| Expedia, Inc. | | | | |
| 5.950%, 08/15/2020 | | 1,160,000 | | 1,173,050 |
| Greektown Superholdings, Inc. | | | | |
| 13.000%, 07/01/2015 | | 1,115,000 | | 1,265,525 |
| Grupo Televisa SA | | | | |
| 6.625%, 01/15/2040 | | 755,000 | | 803,091 |
| |
| The accompanying notes are an integral part of the financial statements. | 15 |
John Hancock Funds II
Portfolio of Investments — February 28, 2011 (Unaudited) (showing percentage of total net assets)
| | | | |
| Active Bond Fund (continued) | | | |
| | | Shares or | | |
| | | Principal | | |
| | | Amount | | Value |
| |
|
| |
| CORPORATE BONDS (continued) | | | | |
| Consumer Discretionary (continued) | | | | |
| Hillman Group, Inc. | | | | |
| 10.875%, 06/01/2018 | $ | 380,000 | $ | 418,000 |
| HRP Myrtle Beach Operations LLC | | | | |
| 04/01/2012 (H)(S) | | 140,000 | | 0 |
| Hyundai Capital Services, Inc. | | | | |
| 4.375%, 07/27/2016 (S) | | 680,000 | | 682,963 |
| 6.000%, 05/05/2015 (S) | | 890,000 | | 956,197 |
| Jacobs Entertainment, Inc. | | | | |
| 9.750%, 06/15/2014 | | 1,165,000 | | 1,182,475 |
| Levi Strauss & Company | | | | |
| 7.625%, 05/15/2020 | | 1,155,000 | | 1,195,425 |
| Little Traverse Bay Bands of Odawa | | | | |
| Indians | | | | |
| 9.000%, 08/31/2020 (S) | | 151,000 | | 135,900 |
| Marriott International, Inc. | | | | |
| 4.625%, 06/15/2012 | | 26,000 | | 26,895 |
| MGM Resorts International | | | | |
| 9.000%, 03/15/2020 | | 345,000 | | 376,913 |
| Mohegan Tribal Gaming Authority | | | | |
| 7.125%, 08/15/2014 | | 555,000 | | 406,538 |
| MTR Gaming Group, Inc. | | | | |
| 12.625%, 07/15/2014 | | 475,000 | | 505,875 |
| MTR Gaming Group, Inc., Series B | | | | |
| 9.000%, 06/01/2012 | | 585,000 | | 542,588 |
| News America Holdings, Inc. | | | | |
| 6.750%, 01/09/2038 | | 2,000 | | 2,154 |
| 7.750%, 12/01/2045 | | 9,000 | | 10,844 |
| News America, Inc. | | | | |
| 6.150%, 02/15/2041 (S) | | 615,000 | | 625,122 |
| 6.650%, 11/15/2037 | | 865,000 | | 927,210 |
| Palace Entertainment | | | | |
| Holdings LLC/Palace Entertainment | | | | |
| Holdings Corp. | | | | |
| 8.875%, 04/15/2017 (S) | | 540,000 | | 550,800 |
| Pokagon Gaming Authority | | | | |
| 10.375%, 06/15/2014 (S) | | 1,015,000 | | 1,058,138 |
| Regal Cinemas Corp. | | | | |
| 8.625%, 07/15/2019 | | 270,000 | | 289,575 |
| Regal Entertainment Group | | | | |
| 9.125%, 08/15/2018 | | 275,000 | | 294,250 |
| Revlon Consumer Products Corp. | | | | |
| 9.750%, 11/15/2015 | | 790,000 | | 857,150 |
| Reynolds Group Issuer, Inc./Reynolds | | | | |
| Group Issuer LLC | | | | |
| 6.875%, 02/15/2021 (S) | | 280,000 | | 280,700 |
| Royal Caribbean Cruises, Ltd. | | | | |
| 7.000%, 06/15/2013 | | 835,000 | | 895,538 |
| Sears Holdings Corp. | | | | |
| 6.625%, 10/15/2018 (S) | | 490,000 | | 477,750 |
| Seminole Indian Tribe of Florida | | | | |
| 6.535%, 10/01/2020 (S) | | 1,005,000 | | 989,945 |
| 7.750%, 10/01/2017 (S) | | 270,000 | | 286,538 |
| Simmons Foods, Inc. | | | | |
| 10.500%, 11/01/2017 (S) | | 545,000 | | 587,238 |
| Target Corp. | | | | |
| 7.000%, 01/15/2038 | | 500,000 | | 606,286 |
| Tenneco, Inc. | | | | |
| 6.875%, 12/15/2020 (S) | | 635,000 | | 658,813 |
| Time Warner Cable, Inc. | | | | |
| 5.000%, 02/01/2020 | | 1,000,000 | | 1,014,465 |
| 6.550%, 05/01/2037 | | 550,000 | | 570,990 |
| 6.750%, 07/01/2018 | | 1,770,000 | | 2,031,820 |
| Time Warner Companies, Inc. | | | | |
| 7.570%, 02/01/2024 | | 34,000 | | 40,450 |
| | | | |
| Active Bond Fund (continued) | | | |
| | | Shares or | | |
| | | Principal | | |
| | | Amount | | Value |
| |
|
| |
| CORPORATE BONDS (continued) | | | | |
| Consumer Discretionary (continued) | | | | |
| Time Warner Entertainment Company LP | | | | |
| 8.375%, 07/15/2033 | $ | 535,000 | $ | 664,066 |
| Time Warner, Inc. | | | | |
| 7.625%, 04/15/2031 | | 9,000 | | 10,635 |
| Toys R Us Property Company LLC | | | | |
| 8.500%, 12/01/2017 | | 275,000 | | 299,063 |
| Turning Stone Resort Casino Enterprises | | | | |
| 9.125%, 09/15/2014 (S) | | 915,000 | | 940,163 |
| United Business Media, Ltd. | | | | |
| 5.750%, 11/03/2020 (S) | | 630,000 | | 599,882 |
| Viacom, Inc. | | | | |
| 6.875%, 04/30/2036 | | 760,000 | | 845,597 |
| Videotron Ltee | | | | |
| 7.125%, 01/15/2020 (S) | CAD | 600,000 | | 651,728 |
| Vivendi SA | | | | |
| 5.750%, 04/04/2013 (S) | $ | 2,515,000 | | 2,712,722 |
| Volvo Treasury AB | | | | |
| 5.950%, 04/01/2015 (S) | | 1,310,000 | | 1,431,303 |
| Waterford Gaming LLC | | | | |
| 8.625%, 09/15/2014 (S) | | 174,000 | | 81,345 |
| XM Satellite Radio, Inc. | | | | |
| 13.000%, 08/01/2013 (S) | | 1,035,000 | | 1,234,238 |
| Yum! Brands, Inc. | | | | |
| 6.250%, 03/15/2018 | | 405,000 | | 457,400 |
| 6.875%, 11/15/2037 | | 965,000 | | 1,094,849 |
| |
|
|
| | | | | 47,295,711 |
| Consumer Staples - 2.00% | | | | |
| Alliance One International, Inc. | | | | |
| 10.000%, 07/15/2016 | | 1,335,000 | | 1,378,388 |
| Anheuser-Busch Companies, Inc. | | | | |
| 6.500%, 02/01/2043 | | 10,000 | | 11,043 |
| Anheuser-Busch InBev Worldwide, Inc. | | | | |
| 9.750%, 11/17/2015 | BRL | 1,125,000 | | 691,377 |
| ARAMARK Corp. | | | | |
| 8.500%, 02/01/2015 | $ | 1,310,000 | | 1,368,950 |
| Arcor | | | | |
| 7.250%, 11/09/2017 (S) | | 630,000 | | 659,295 |
| B&G Foods, Inc. | | | | |
| 7.625%, 01/15/2018 | | 575,000 | | 613,813 |
| Blue Merger Sub, Inc. | | | | |
| 7.625%, 02/15/2019 (S) | | 520,000 | | 525,200 |
| Bunge Ltd. Finance Corp. | | | | |
| 5.100%, 07/15/2015 | | 345,000 | | 354,067 |
| 5.350%, 04/15/2014 | | 1,075,000 | | 1,125,959 |
| 8.500%, 06/15/2019 | | 825,000 | | 979,467 |
| Cargill, Inc. | | | | |
| 6.125%, 09/15/2036 (S) | | 665,000 | | 718,762 |
| Clorox Company | | | | |
| 5.000%, 03/01/2013 | | 600,000 | | 638,531 |
| 5.950%, 10/15/2017 | | 500,000 | | 558,631 |
| Corp. Pesquera Inca SAC | | | | |
| 9.000%, 02/10/2017 (S) | | 760,000 | | 803,700 |
| CVS Caremark Corp. | | | | |
| 6.125%, 08/15/2016 | | 515,000 | | 584,223 |
| CVS Caremark Corp. (6.302% to | | | | |
| 06/01/2012, then 3 month | | | | |
| LIBOR + 2.065%) | | | | |
| 06/01/2037 | | 1,900,000 | | 1,871,500 |
| CVS Pass-Through Trust | | | | |
| 8.353%, 07/10/2031 (S) | | 359,957 | | 435,372 |
| General Mills, Inc. | | | | |
| 5.650%, 09/10/2012 | | 421,000 | | 450,456 |
| 5.700%, 02/15/2017 | | 245,000 | | 276,977 |
| |
| The accompanying notes are an integral part of the financial statements. | 16 |
John Hancock Funds II
Portfolio of Investments — February 28, 2011 (Unaudited) (showing percentage of total net assets)
| | | | |
| Active Bond Fund (continued) | | | |
| | | Shares or | | |
| | | Principal | | |
| | | Amount | | Value |
| |
|
| |
| CORPORATE BONDS (continued) | | | | |
| Consumer Staples (continued) | | | | |
| JBS Finance II, Ltd. | | | | |
| 8.250%, 01/29/2018 (S) | $ | 860,000 | $ | 868,600 |
| Kraft Foods, Inc. | | | | |
| 5.625%, 11/01/2011 | | 28,000 | | 28,888 |
| 6.125%, 02/01/2018 | | 580,000 | | 651,732 |
| Kroger Company | | | | |
| 6.800%, 12/15/2018 | | 920,000 | | 1,068,774 |
| 7.000%, 05/01/2018 | | 580,000 | | 672,034 |
| Lorillard Tobacco Company | | | | |
| 6.875%, 05/01/2020 | | 1,185,000 | | 1,227,576 |
| McCormick & Company, Inc. | | | | |
| 5.750%, 12/15/2017 | | 1,000,000 | | 1,135,288 |
| Nabisco, Inc. | | | | |
| 7.550%, 06/15/2015 | | 229,000 | | 266,865 |
| Philip Morris International, Inc. | | | | |
| 4.875%, 05/16/2013 | | 300,000 | | 322,970 |
| 5.650%, 05/16/2018 | | 850,000 | | 955,386 |
| SABMiller PLC | | | | |
| 6.500%, 07/15/2018 (S) | | 470,000 | | 545,510 |
| SUPERVALU, Inc. | | | | |
| 7.500%, 11/15/2014 | | 500,000 | | 501,250 |
| Tate & Lyle International Finance PLC | | | | |
| 5.000%, 11/15/2014 (S) | | 208,000 | | 215,917 |
| Tesco PLC | | | | |
| 6.150%, 11/15/2037 (S) | | 570,000 | | 627,360 |
| Yankee Candle Company, Inc. | | | | |
| 8.500%, 02/15/2015 | | 1,035,000 | | 1,082,869 |
| | |
|
| | | | | 24,216,730 |
| Energy - 5.33% | | | | |
| Anadarko Finance Company | | | | |
| 7.500%, 05/01/2031 | | 1,500,000 | | 1,661,621 |
| Anadarko Petroleum Corp. | | | | |
| 6.375%, 09/15/2017 | | 1,120,000 | | 1,248,345 |
| 6.450%, 09/15/2036 | | 1,600,000 | | 1,611,958 |
| 8.700%, 03/15/2019 | | 500,000 | | 617,046 |
| Apache Corp. | | | | |
| 6.900%, 09/15/2018 | | 455,000 | | 546,822 |
| Arch Coal, Inc. | | | | |
| 8.750%, 08/01/2016 | | 315,000 | | 351,619 |
| BJ Services Company | | | | |
| 6.000%, 06/01/2018 | | 880,000 | | 1,006,460 |
| BP Capital Markets PLC | | | | |
| 4.750%, 03/10/2019 | | 1,000,000 | | 1,040,509 |
| Bumi Investment Pte, Ltd. | | | | |
| 10.750%, 10/06/2017 (S) | | 420,000 | | 462,525 |
| Chesapeake Energy Corp. | | | | |
| 6.125%, 02/15/2021 | | 540,000 | | 550,800 |
| CNOOC Finance 2003, Ltd. | | | | |
| 5.500%, 05/21/2033 (S) | | 10,000 | | 10,049 |
| ConocoPhillips Canada Funding | | | | |
| Company | | | | |
| 5.950%, 10/15/2036 | | 1,000,000 | | 1,067,092 |
| DCP Midstream LLC | | | | |
| 9.750%, 03/15/2019 (S) | | 1,095,000 | | 1,417,237 |
| Devon Energy Corp. | | | | |
| 5.625%, 01/15/2014 | | 400,000 | | 444,801 |
| Devon Financing Corp. | | | | |
| 6.875%, 09/30/2011 | | 205,000 | | 212,370 |
| 7.875%, 09/30/2031 | | 1,060,000 | | 1,364,655 |
| Drummond Company, Inc. | | | | |
| 7.375%, 02/15/2016 | | 775,000 | | 802,125 |
| Duke Capital LLC | | | | |
| 6.750%, 02/15/2032 | | 511,000 | | 548,095 |
| | | | |
| Active Bond Fund (continued) | | | |
| | | Shares or | | |
| | | Principal | | |
| | | Amount | | Value |
| |
|
| |
| CORPORATE BONDS (continued) | | | | |
| Energy (continued) | | | | |
| El Paso Pipeline Partners Operating | | | | |
| Company LLC | | | | |
| 6.500%, 04/01/2020 | $ | 540,000 | $ | 595,683 |
| Enbridge Energy Partners LP | | | | |
| 6.500%, 04/15/2018 | | 600,000 | | 680,627 |
| 7.500%, 04/15/2038 | | 600,000 | | 716,908 |
| EnCana Corp. | | | | |
| 6.500%, 08/15/2034 | | 1,000,000 | | 1,075,511 |
| Energy Transfer Partners LP | | | | |
| 5.950%, 02/01/2015 | | 305,000 | | 335,976 |
| 6.700%, 07/01/2018 | | 1,000,000 | | 1,139,824 |
| 7.500%, 07/01/2038 | | 3,185,000 | | 3,712,430 |
| 9.700%, 03/15/2019 | | 655,000 | | 859,826 |
| Enersis SA | | | | |
| 7.375%, 01/15/2014 | | 12,000 | | 13,322 |
| Enterprise Products Operating LLC | | | | |
| (7.034% to 01/15/2018, then higher of | | | | |
| 7.034% or 3 month LIBOR + 2.680%) | | | | |
| 01/15/2068 | | 1,045,000 | | 1,089,413 |
| Enterprise Products Operating LLC | | | | |
| 6.125%, 10/15/2039 | | 1,000,000 | | 1,001,934 |
| 6.300%, 09/15/2017 | | 820,000 | | 926,918 |
| 6.875%, 03/01/2033 | | 209,000 | | 229,816 |
| Enterprise Products Operating LLC | | | | |
| (7.000% to 06/01/2017, then 3 month | | | | |
| LIBOR + 2.778%) | | | | |
| 06/01/2067 | | 1,470,000 | | 1,464,488 |
| Gibson Energy ULC/GEP Midstream | | | | |
| Finance Corp. | | | | |
| 10.000%, 01/15/2018 | | 650,000 | | 679,250 |
| Kerr-McGee Corp. | | | | |
| 6.950%, 07/01/2024 | | 730,000 | | 817,953 |
| Kinder Morgan Energy Partners LP | | | | |
| 5.800%, 03/15/2035 | | 208,000 | | 199,421 |
| 6.950%, 01/15/2038 | | 540,000 | | 579,990 |
| 7.300%, 08/15/2033 | | 212,000 | | 235,095 |
| 7.750%, 03/15/2032 | | 200,000 | | 232,762 |
| Linn Energy LLC/Linn Energy | | | | |
| Finance Corp. | | | | |
| 8.625%, 04/15/2020 (S) | | 505,000 | | 563,075 |
| Marathon Oil Corp. | | | | |
| 6.800%, 03/15/2032 | | 760,000 | | 866,747 |
| Marathon Petroleum Corp. | | | | |
| 6.500%, 03/01/2041 (S) | | 615,000 | | 623,052 |
| MarkWest Energy Partners LP/MarkWest | | | | |
| Energy Finance Corp. | | | | |
| 6.500%, 08/15/2021 | | 785,000 | | 784,019 |
| McMoRan Exploration Company | | | | |
| 11.875%, 11/15/2014 | | 530,000 | | 581,675 |
| Motiva Enterprises LLC | | | | |
| 6.850%, 01/15/2040 (S) | | 530,000 | | 614,097 |
| Nabors Industries, Inc. | | | | |
| 5.000%, 09/15/2020 | | 1,000,000 | | 994,740 |
| Nexen, Inc. | | | | |
| 5.875%, 03/10/2035 | | 212,000 | | 192,870 |
| 6.400%, 05/15/2037 | | 625,000 | | 598,131 |
| NGPL PipeCo LLC | | | | |
| 7.119%, 12/15/2017 (S) | | 1,000,000 | | 1,124,628 |
| Niska Gas Storage US LLC/Niska Gas | | | | |
| Storage Canada ULC | | | | |
| 8.875%, 03/15/2018 (S) | | 920,000 | | 1,002,800 |
| Noble Holding International, Ltd. | | | | |
| 6.200%, 08/01/2040 | | 500,000 | | 519,292 |
| NuStar Logistics LP | | | | |
| 4.800%, 09/01/2020 | | 505,000 | | 492,966 |
| |
| The accompanying notes are an integral part of the financial statements. | 17 |
John Hancock Funds II
Portfolio of Investments — February 28, 2011 (Unaudited) (showing percentage of total net assets)
| | | | |
| Active Bond Fund (continued) | | | |
| | | Shares or | | |
| | | Principal | | |
| | | Amount | | Value |
| |
|
| |
| CORPORATE BONDS (continued) | | | | |
| Energy (continued) | | | | |
| NuStar Logistics LP (continued) | | | | |
| 7.650%, 04/15/2018 | $ | 1,110,000 | $ | 1,294,479 |
| ONEOK Partners LP | | | | |
| 6.650%, 10/01/2036 | | 1,245,000 | | 1,332,865 |
| Petro-Canada | | | | |
| 6.050%, 05/15/2018 | | 396,000 | | 449,291 |
| Plains All American Pipeline LP | | | | |
| 8.750%, 05/01/2019 | | 500,000 | | 627,392 |
| Precision Drilling Corp. | | | | |
| 6.625%, 11/15/2020 (S) | | 675,000 | | 696,938 |
| Ras Laffan Liquefied Natural Gas | | | | |
| Company, Ltd. III | | | | |
| 5.838%, 09/30/2027 (S) | | 605,000 | | 621,982 |
| Regency Energy Partners LP/Regency | | | | |
| Energy Finance Corp. | | | | |
| 9.375%, 06/01/2016 | | 615,000 | | 688,031 |
| San Diego Gas & Electric Company, | | | | |
| Series FFF | | | | |
| 6.125%, 09/15/2037 | | 1,000,000 | | 1,124,348 |
| Southern Union Company (7.200% to | | | | |
| 11/01/2011, then 3 month | | | | |
| LIBOR + 3.018%) | | | | |
| 11/01/2066 | | 610,000 | | 573,400 |
| Spectra Energy Capital LLC | | | | |
| 6.200%, 04/15/2018 | | 1,515,000 | | 1,686,875 |
| Suncor Energy, Inc. | | | | |
| 6.100%, 06/01/2018 | | 760,000 | | 864,686 |
| Talisman Energy, Inc. | | | | |
| 6.250%, 02/01/2038 | | 1,150,000 | | 1,213,348 |
| Texas Eastern Transmission LP | | | | |
| 6.000%, 09/15/2017 (S) | | 685,000 | | 763,441 |
| Texas Gas Transmission LLC | | | | |
| 5.500%, 04/01/2013 (S) | | 460,000 | | 491,985 |
| Thermon Industries, Inc. | | | | |
| 9.500%, 05/01/2017 | | 155,000 | | 167,788 |
| TransCanada Pipelines, Ltd. | | | | |
| 7.125%, 01/15/2019 | | 400,000 | | 484,590 |
| TransCanada Pipelines, Ltd. (6.350% to | | | | |
| 05/15/2017, then 3 month | | | | |
| LIBOR + 2.210%) | | | | |
| 05/15/2067 | | 2,565,000 | | 2,607,048 |
| Transocean, Inc. | | | | |
| 6.800%, 03/15/2038 | | 4,050,000 | | 4,256,352 |
| Trinidad Drilling, Ltd. | | | | |
| 7.875%, 01/15/2019 (S) | | 565,000 | | 591,131 |
| Valero Logistics Operations LP | | | | |
| 6.050%, 03/15/2013 | | 248,000 | | 262,301 |
| Weatherford International, Ltd. | | | | |
| 6.500%, 08/01/2036 | | 1,100,000 | | 1,143,306 |
| Williams Partners LP | | | | |
| 7.250%, 02/01/2017 | | 1,770,000 | | 2,066,735 |
| | |
|
| | | | | 64,517,680 |
| Financials - 19.89% | | | | |
| Aflac, Inc. | | | | |
| 6.900%, 12/17/2039 | | 535,000 | | 589,389 |
| 8.500%, 05/15/2019 | | 925,000 | | 1,144,076 |
| Allied World Assurance Holdings, Ltd. | | | | |
| 7.500%, 08/01/2016 | | 990,000 | | 1,109,808 |
| AMB Property LP | | | | |
| 6.125%, 12/01/2016 | | 1,367,000 | | 1,513,660 |
| American Express Bank FSB | | | | |
| 6.000%, 09/13/2017 | | 805,000 | | 894,912 |
| American Express Company | | | | |
| 7.000%, 03/19/2018 | | 2,545,000 | | 2,988,428 |
| | | | |
| Active Bond Fund (continued) | | | |
| | | Shares or | | |
| | | Principal | | |
| | | Amount | | Value |
| |
|
| |
| CORPORATE BONDS (continued) | | | | |
| Financials (continued) | | | | |
| American International Group, Inc. | | | | |
| 5.450%, 05/18/2017 | $ | 1,000,000 | $ | 1,041,379 |
| 6.400%, 12/15/2020 | | 3,000,000 | | 3,251,961 |
| American International Group, Inc. | | | | |
| (8.175% to 05/15/2038, then 3 month | | | | |
| LIBOR + 4.195%) | | | | |
| 05/15/2058 | | 700,000 | | 768,250 |
| AON Corp. | | | | |
| 8.205%, 01/01/2027 | | 320,000 | | 357,808 |
| Assurant, Inc. | | | | |
| 5.625%, 02/15/2014 | | 209,000 | | 221,565 |
| 6.750%, 02/15/2034 | | 550,000 | | 547,476 |
| Assured Guaranty Municipal | | | | |
| Holdings, Inc. (6.400% to 12/15/2036, | | | | |
| then 1 month LIBOR + 2.215%) | | | | |
| 12/15/2066 (S) | | 795,000 | | 500,850 |
| Astoria Depositor Corp., Series B | | | | |
| 8.144%, 05/01/2021 (S) | | 3,335,000 | | 3,268,300 |
| Australia & New Zealand Banking | | | | |
| Group, Ltd. | | | | |
| 4.875%, 01/12/2021 (S) | | 1,145,000 | | 1,164,397 |
| AvalonBay Communities, Inc. | | | | |
| 5.500%, 01/15/2012 | | 319,000 | | 330,832 |
| AXA SA (6.379% to 12/13/2036, then | | | | |
| 3 month LIBOR + 2.256%) | | | | |
| (Q)(S) | | 985,000 | | 892,656 |
| AXA SA (6.463% to 12/14/2018, then | | | | |
| 3 month LIBOR + 1.449%) | | | | |
| (Q)(S) | | 1,000,000 | | 883,750 |
| Banco Santander Chile | | | | |
| 5.375%, 12/09/2014 (S) | | 5,000 | | 5,214 |
| Bank of America Corp. | | | | |
| 5.625%, 07/01/2020 | | 4,500,000 | | 4,677,539 |
| 5.650%, 05/01/2018 | | 565,000 | | 597,043 |
| 5.750%, 12/01/2017 | | 849,000 | | 907,667 |
| 6.500%, 08/01/2016 | | 690,000 | | 774,408 |
| 7.625%, 06/01/2019 | | 685,000 | | 800,383 |
| Bank of America NA | | | | |
| 5.300%, 03/15/2017 | | 320,000 | | 333,485 |
| 6.000%, 10/15/2036 | | 880,000 | | 858,583 |
| Barclays Bank PLC | | | | |
| 5.140%, 10/14/2020 | | 720,000 | | 683,375 |
| BB&T Corp. | | | | |
| 3.200%, 03/15/2016 | | 500,000 | | 499,305 |
| Beaver Valley Funding | | | | |
| 9.000%, 06/01/2017 | | 1,920,000 | | 2,146,714 |
| BioMed Realty LP | | | | |
| 6.125%, 04/15/2020 | | 280,000 | | 297,236 |
| Blackstone Holdings Finance | | | | |
| Company LLC | | | | |
| 5.875%, 03/15/2021 (S) | | 2,000,000 | | 1,963,612 |
| BNP Paribas | | | | |
| 5.000%, 01/15/2021 | | 920,000 | | 927,595 |
| Bosphorus Financial Services, Ltd. | | | | |
| 2.113%, 02/15/2012 (P)(S) | | 93,750 | | 92,589 |
| Boston Properties LP | | | | |
| 6.250%, 01/15/2013 | | 52,000 | | 56,385 |
| BPCE SA (12.500% to 09/30/2019, then | | | | |
| 3 month LIBOR + 12.980%) | | | | |
| (Q)(S) | | 255,000 | | 287,015 |
| Brandywine Operating Partnership LP | | | | |
| 7.500%, 05/15/2015 | | 870,000 | | 984,903 |
| BRE Properties, Inc. | | | | |
| 5.500%, 03/15/2017 | | 1,430,000 | | 1,538,793 |
| |
| The accompanying notes are an integral part of the financial statements. | 18 |
John Hancock Funds II
Portfolio of Investments — February 28, 2011 (Unaudited) (showing percentage of total net assets)
| | | | |
| Active Bond Fund (continued) | | | |
| | | Shares or | | |
| | | Principal | | |
| | | Amount | | Value |
| |
|
| |
| CORPORATE BONDS (continued) | | | | |
| Financials (continued) | | | | |
| BTA Bank JSC | | | | |
| 07/01/2020 (P)(S) | $ | 7,264 | $ | 625 |
| 7.200%, 07/01/2025 (S) | | 796 | | 551 |
| BTA Bank JSC (10.750% to 01/01/2013, | | | | |
| then 12.500%) | | | | |
| 07/01/2018 (S) | | 3,516 | | 3,753 |
| Camden Property Trust | | | | |
| 5.000%, 06/15/2015 | | 216,000 | | 229,046 |
| Capital One Bank USA NA | | | | |
| 8.800%, 07/15/2019 | | 425,000 | | 536,441 |
| Capital One Financial Corp. | | | | |
| 6.150%, 09/01/2016 | | 1,480,000 | | 1,597,867 |
| 6.750%, 09/15/2017 | | 550,000 | | 634,819 |
| Capmark Financial Group, Inc. | | | | |
| 5.875%, 05/10/2012 (H) | | 1,300,000 | | 610,120 |
| Chubb Corp. (6.375% until 04/15/2017, | | | | |
| then 3 month LIBOR + 2.250%) | | | | |
| 03/29/2067 | | 690,000 | | 729,675 |
| Chuo Mitsui Trust & Banking | | | | |
| Company, Ltd. (5.506% to 04/15/2015, | | | | |
| then 3 month LIBOR + 2.490%) | | | | |
| (Q)(S) | | 500,000 | | 510,000 |
| Citigroup, Inc. | | | | |
| 5.000%, 09/15/2014 | | 1,500,000 | | 1,577,298 |
| 5.375%, 08/09/2020 | | 1,500,000 | | 1,553,876 |
| 5.625%, 08/27/2012 | | 219,000 | | 230,376 |
| 5.850%, 12/11/2034 | | 970,000 | | 952,115 |
| 6.125%, 11/21/2017 to 05/15/2018 | | 3,565,000 | | 3,927,159 |
| 6.375%, 08/12/2014 | | 1,710,000 | | 1,907,965 |
| 8.500%, 05/22/2019 | | 1,030,000 | | 1,277,243 |
| CNA Financial Corp. | | | | |
| 6.000%, 08/15/2011 | | 280,000 | | 286,196 |
| 6.500%, 08/15/2016 | | 2,005,000 | | 2,208,479 |
| 7.250%, 11/15/2023 | | 1,210,000 | | 1,343,623 |
| CNO Financial Group, Inc. | | | | |
| 9.000%, 01/15/2018 (S) | | 820,000 | | 873,300 |
| Colonial Properties Trust | | | | |
| 6.250%, 06/15/2014 | | 211,000 | | 222,995 |
| Commonwealth Bank of Australia | | | | |
| 5.000%, 03/19/2020 (S) | | 925,000 | | 961,963 |
| CommonWealth REIT | | | | |
| 6.650%, 01/15/2018 | | 750,000 | | 799,677 |
| Corporacion Andina de Fomento | | | | |
| 5.200%, 05/21/2013 | | 214,000 | | 231,058 |
| 6.875%, 03/15/2012 | | 20,000 | | 20,904 |
| Country Garden Holdings Company | | | | |
| 11.125%, 02/23/2018 (S) | | 565,000 | | 563,870 |
| Credit Suisse AG/Guernsey (3 month | | | | |
| LIBOR + 0.690% to 05/29/17, then | | | | |
| 3 month LIBOR + 1.690%) | | | | |
| 1.003%, (P)(Q) | | 1,265,000 | | 962,576 |
| Credit Suisse First Boston USA, Inc. | | | | |
| 6.500%, 01/15/2012 | | 209,000 | | 219,655 |
| Credit Suisse New York | | | | |
| 4.375%, 08/05/2020 | | 885,000 | | 861,934 |
| 5.300%, 08/13/2019 | | 755,000 | | 795,298 |
| Crown Castle Towers LLC | | | | |
| 4.174%, 08/15/2017 (S) | | 2,000,000 | | 1,964,440 |
| 4.883%, 08/15/2020 (S) | | 1,210,000 | | 1,213,203 |
| 6.113%, 01/15/2020 (S) | | 920,000 | | 998,875 |
| Developers Diversified Realty Corp. | | | | |
| 5.375%, 10/15/2012 | | 500,000 | | 517,802 |
| 7.500%, 04/01/2017 | | 1,100,000 | | 1,257,904 |
| Dexus Property Group | | | | |
| 7.125%, 10/15/2014 (S) | | 1,110,000 | | 1,248,172 |
| | | | |
| Active Bond Fund (continued) | | | |
| | | Shares or | | |
| | | Principal | | |
| | | Amount | | Value |
| |
|
| |
| CORPORATE BONDS (continued) | | | | |
| Financials (continued) | | | | |
| Discover Bank | | | | |
| 7.000%, 04/15/2020 | $ | 695,000 | $ | 766,472 |
| Discover Financial Services | | | | |
| 10.250%, 07/15/2019 | | 1,380,000 | | 1,786,761 |
| Dresdner Bank AG | | | | |
| 7.250%, 09/15/2015 | | 281,000 | | 308,406 |
| Duke Realty LP | | | | |
| 5.950%, 02/15/2017 | | 1,505,000 | | 1,612,335 |
| 6.250%, 05/15/2013 | | 1,000,000 | | 1,070,014 |
| 6.750%, 03/15/2020 | | 785,000 | | 876,866 |
| 8.250%, 08/15/2019 | | 680,000 | | 819,318 |
| Endurance Specialty Holdings, Ltd. | | | | |
| 7.000%, 07/15/2034 | | 800,000 | | 794,110 |
| ERAC USA Finance LLC | | | | |
| 6.375%, 10/15/2017 (S) | | 750,000 | | 842,258 |
| ERP Operating LP | | | | |
| 5.125%, 03/15/2016 | | 670,000 | | 723,512 |
| 5.750%, 06/15/2017 | | 775,000 | | 853,022 |
| 6.625%, 03/15/2012 | | 748,000 | | 790,005 |
| First Tennessee Bank NA | | | | |
| 5.050%, 01/15/2015 | | 900,000 | | 920,711 |
| General Electric Capital Corp. | | | | |
| 0.793%, 08/15/2036 (P) | | 1,270,000 | | 979,726 |
| 5.300%, 02/11/2021 | | 485,000 | | 497,869 |
| 5.450%, 01/15/2013 | | 261,000 | | 279,919 |
| 5.625%, 05/01/2018 | | 1,225,000 | | 1,332,163 |
| 6.000%, 08/07/2019 | | 810,000 | | 895,034 |
| Genworth Financial, Inc. | | | | |
| 6.515%, 05/22/2018 | | 600,000 | | 602,805 |
| 7.700%, 06/15/2020 | | 2,000,000 | | 2,084,046 |
| Genworth Financial, Inc. (6.150% to | | | | |
| 11/15/2016, then 3 month | | | | |
| LIBOR + 2.003%) | | | | |
| 11/15/2066 | | 500,000 | | 393,125 |
| Glen Meadow Pass-Through Trust | | | | |
| (6.505% to 02/15/2017, then 3 month | | | | |
| LIBOR +2.125%) | | | | |
| 02/12/2067 (S) | | 4,000,000 | | 3,550,000 |
| GTP Towers Issuer LLC | | | | |
| 4.436%, 02/15/2015 (S) | | 645,000 | | 662,598 |
| 8.112%, 02/15/2015 (S) | | 1,625,000 | | 1,686,573 |
| Harley-Davidson Funding Corp. | | | | |
| 5.750%, 12/15/2014 (S) | | 470,000 | | 500,041 |
| 6.800%, 06/15/2018 (S) | | 1,570,000 | | 1,712,781 |
| Hartford Financial Services Group, Inc. | | | | |
| 4.625%, 07/15/2013 | | 8,000 | | 8,379 |
| 6.300%, 03/15/2018 | | 1,920,000 | | 2,070,169 |
| 6.625%, 03/30/2040 | | 560,000 | | 581,036 |
| HBOS PLC (5.375% to 11/01/2013, then | | | | |
| 3 month LIBOR + 1.703%) | | | | |
| (Q)(S) | | 22,000 | | 15,840 |
| HCP, Inc. | | | | |
| 5.375%, 02/01/2021 | | 1,545,000 | | 1,577,976 |
| 6.300%, 09/15/2016 | | 1,000,000 | | 1,105,656 |
| Health Care REIT, Inc. | | | | |
| 4.700%, 09/15/2017 | | 500,000 | | 507,026 |
| 4.950%, 01/15/2021 | | 905,000 | | 883,828 |
| 6.000%, 11/15/2013 | | 215,000 | | 235,870 |
| 6.200%, 06/01/2016 | | 810,000 | | 894,492 |
| Healthcare Realty Trust, Inc. | | | | |
| 6.500%, 01/17/2017 | | 962,000 | | 1,070,743 |
| Hospitality Properties Trust | | | | |
| 6.750%, 02/15/2013 | | 1,212,000 | | 1,285,453 |
| Host Hotels & Resorts, Inc. | | | | |
| 6.000%, 11/01/2020 | | 595,000 | | 595,744 |
| |
| The accompanying notes are an integral part of the financial statements. | 19 |
John Hancock Funds II
Portfolio of Investments — February 28, 2011 (Unaudited) (showing percentage of total net assets)
| | | | |
| Active Bond Fund (continued) | | | |
| | | Shares or | | |
| | | Principal | | |
| | | Amount | | Value |
| |
|
| |
| CORPORATE BONDS (continued) | | | | |
| Financials (continued) | | | | |
| HRPT Properties Trust | | | | |
| 6.250%, 06/15/2017 | $ | 275,000 | $ | 287,690 |
| HSBC Finance Corp. | | | | |
| 6.676%, 01/15/2021 (S) | | 1,834,000 | | 1,917,324 |
| HSBC Holdings PLC | | | | |
| 6.500%, 09/15/2037 | | 1,070,000 | | 1,109,296 |
| Huntington Bancshares, Inc. | | | | |
| 7.000%, 12/15/2020 | | 195,000 | | 213,457 |
| ICICI Bank, Ltd. | | | | |
| 5.750%, 11/16/2020 (S) | | 1,080,000 | | 1,040,430 |
| International Lease Finance Corp. | | | | |
| 6.375%, 03/25/2013 | | 540,000 | | 562,950 |
| 7.125%, 09/01/2018 (S) | | 650,000 | | 709,313 |
| Jefferies Group, Inc. | | | | |
| 6.875%, 04/15/2021 | | 570,000 | | 610,997 |
| 8.500%, 07/15/2019 | | 3,015,000 | | 3,565,844 |
| JPMorgan Chase & Company | | | | |
| 3.700%, 01/20/2015 | | 641,000 | | 663,411 |
| 4.250%, 10/15/2020 | | 1,810,000 | | 1,743,919 |
| 6.000%, 01/15/2018 | | 1,750,000 | | 1,946,469 |
| 6.300%, 04/23/2019 | | 1,267,000 | | 1,423,657 |
| JPMorgan Chase & Company, Series 1 | | | | |
| (7.900% to 04/30/2018, then 3 month | | | | |
| LIBOR + 3.470%) | | | | |
| (Q) | | 980,000 | | 1,066,740 |
| Kimco Realty Corp. | | | | |
| 5.700%, 05/01/2017 | | 690,000 | | 759,356 |
| 6.875%, 10/01/2019 | | 545,000 | | 635,673 |
| Lehman Brothers Holdings, Inc. | | | | |
| 01/26/2017 (H) | | 1,120,000 | | 281,400 |
| Liberty Mutual Group, Inc. | | | | |
| 6.500%, 03/15/2035 (S) | | 683,000 | | 621,486 |
| 7.500%, 08/15/2036 (S) | | 2,645,000 | | 2,718,042 |
| 7.800%, 03/15/2037 (S) | | 1,555,000 | | 1,555,000 |
| Liberty Property LP | | | | |
| 5.500%, 12/15/2016 | | 1,565,000 | | 1,695,454 |
| Lincoln National Corp. | | | | |
| 7.000%, 06/15/2040 | | 355,000 | | 406,350 |
| 8.750%, 07/01/2019 | | 3,605,000 | | 4,538,677 |
| Lincoln National Corp. (6.050% to | | | | |
| 04/20/17, then 3 month | | | | |
| LIBOR + 2.040%) | | | | |
| 04/20/2067 | | 1,430,000 | | 1,367,509 |
| Lincoln National Corp. (7.000% to | | | | |
| 5/17/2016, then 3 month | | | | |
| LIBOR + 2.358%) | | | | |
| 05/17/2066 | | 1,263,000 | | 1,256,685 |
| Lloyds TSB Bank PLC | | | | |
| 5.800%, 01/13/2020 (S) | | 270,000 | | 268,723 |
| 6.375%, 01/21/2021 | | 975,000 | | 1,008,640 |
| Lloyds TSB Group PLC (6.267% to | | | | |
| 11/01/2016, then 3 month LIBOR | | | | |
| +1.035%) | | | | |
| (H)(Q)(S) | | 545,000 | | 418,288 |
| Lloyds TSB Group PLC (6.413% to | | | | |
| 10/01/2035, then 3 month | | | | |
| LIBOR + 1.496%) | | | | |
| (H)(Q)(S) | | 1,585,000 | | 1,208,563 |
| Mack-Cali Realty LP | | | | |
| 7.750%, 08/15/2019 | | 680,000 | | 816,930 |
| Macquarie Group, Ltd. | | | | |
| 6.000%, 01/14/2020 (S) | | 645,000 | | 651,208 |
| 7.300%, 08/01/2014 (S) | | 625,000 | | 697,219 |
| Markel Corp. | | | | |
| 6.800%, 02/15/2013 | | 325,000 | | 350,539 |
| | | | |
| Active Bond Fund (continued) | | | |
| | | Shares or | | |
| | | Principal | | |
| | | Amount | | Value |
| |
|
| |
| CORPORATE BONDS (continued) | | | | |
| Financials (continued) | | | | |
| Massachusetts Mutual Life Insurance | | | | |
| Company | | | | |
| 8.875%, 06/01/2039 (S) | $ | 350,000 | $ | 471,094 |
| Merrill Lynch & Company, Inc. | | | | |
| 0.540%, 06/05/2012 (P) | | 472,000 | | 469,353 |
| 0.854%, 05/02/2017 (P) | | 1,000,000 | | 866,746 |
| 6.875%, 04/25/2018 | | 3,000,000 | | 3,374,721 |
| 7.750%, 05/14/2038 | | 1,695,000 | | 1,920,304 |
| MetLife, Inc. | | | | |
| 6.400%, 12/15/2036 | | 2,000,000 | | 1,911,800 |
| 10.750%, 08/01/2039 | | 340,000 | | 470,050 |
| Metropolitan Life Global Funding I | | | | |
| 5.125%, 04/10/2013 (S) | | 405,000 | | 433,661 |
| Morgan Stanley | | | | |
| 0.753%, 10/18/2016 (P) | | 830,000 | | 774,299 |
| 5.500%, 07/24/2020 | | 4,200,000 | | 4,240,790 |
| 5.625%, 09/23/2019 | | 1,000,000 | | 1,026,561 |
| 5.950%, 12/28/2017 | | 290,000 | | 309,550 |
| 6.000%, 04/28/2015 | | 1,000,000 | | 1,095,219 |
| 6.625%, 04/01/2018 | | 140,000 | | 154,754 |
| 7.300%, 05/13/2019 | | 965,000 | | 1,098,978 |
| 10.090%, 05/03/2017 (S) | BRL | 4,195,000 | | 2,407,877 |
| National City Bank | | | | |
| 0.680%, 06/07/2017 (P) | $ | 1,005,000 | | 908,099 |
| Nationstar Mortgage/Nationstar | | | | |
| Capital Corp. | | | | |
| 10.875%, 04/01/2015 (S) | | 720,000 | | 741,600 |
| Nelnet, Inc. (7.400% to 09/29/2011, then | | | | |
| 3 month LIBOR + 3.375%) | | | | |
| 09/29/2036 | | 1,420,000 | | 1,258,192 |
| New York Life Insurance Company | | | | |
| 6.750%, 11/15/2039 (S) | | 770,000 | | 896,176 |
| Oil Casualty Insurance, Ltd. | | | | |
| 8.000%, 09/15/2034 (S) | | 873,000 | | 792,064 |
| Pacific Life Insurance Company | | | | |
| 9.250%, 06/15/2039 (S) | | 940,000 | | 1,238,712 |
| Pinafore LLC/Pinafore, Inc. | | | | |
| 9.000%, 10/01/2018 (S) | | 275,000 | | 305,938 |
| Post Apartment Homes LP | | | | |
| 4.750%, 10/15/2017 | | 405,000 | | 388,304 |
| ProLogis | | | | |
| 5.625%, 11/15/2016 | | 1,075,000 | | 1,153,484 |
| 5.750%, 04/01/2016 | | 755,000 | | 814,548 |
| 6.625%, 05/15/2018 | | 1,350,000 | | 1,492,973 |
| 7.625%, 08/15/2014 | | 760,000 | | 874,850 |
| Prudential Financial, Inc. | | | | |
| 4.750%, 04/01/2014 | | 227,000 | | 239,497 |
| 5.375%, 06/21/2020 | | 700,000 | | 738,526 |
| 6.200%, 01/15/2015 to 11/15/2040 | | 1,365,000 | | 1,472,070 |
| 7.375%, 06/15/2019 | | 975,000 | | 1,158,439 |
| Rabobank Nederland NV (11.000% to | | | | |
| 06/30/2019, then 3 month | | | | |
| LIBOR + 10.868%) | | | | |
| (Q)(S) | | 1,862,000 | | 2,420,600 |
| Realogy Corp. | | | | |
| 7.875%, 02/15/2019 (S) | | 470,000 | | 471,763 |
| Realty Income Corp. | | | | |
| 5.950%, 09/15/2016 | | 560,000 | | 611,796 |
| Reckson Operating Partnership LP | | | | |
| 7.750%, 03/15/2020 | | 415,000 | | 467,597 |
| Regions Bank/Birmingham AL | | | | |
| 6.450%, 06/26/2037 | | 1,500,000 | | 1,374,450 |
| Regions Financial Corp. | | | | |
| 0.473%, 06/26/2012 (P) | | 575,000 | | 547,359 |
| 4.875%, 04/26/2013 | | 500,000 | | 502,560 |
| |
| The accompanying notes are an integral part of the financial statements. | 20 |
John Hancock Funds II
Portfolio of Investments — February 28, 2011 (Unaudited) (showing percentage of total net assets)
| | | | |
| Active Bond Fund (continued) | | | |
| | | Shares or | | |
| | | Principal | | |
| | | Amount | | Value |
| |
|
| |
| CORPORATE BONDS (continued) | | | | |
| Financials (continued) | | | | |
| Regions Financial Corp. (continued) | | | | |
| 7.750%, 11/10/2014 | $ | 1,140,000 | $ | 1,216,950 |
| Santander Issuances SA (6.500% to | | | | |
| 11/15/2014, then 3 month | | | | |
| LIBOR + 3.920%) | | | | |
| 08/11/2019 (S) | | 400,000 | | 407,800 |
| Silicon Valley Bank | | | | |
| 6.050%, 06/01/2017 | | 1,575,000 | | 1,656,624 |
| Simon Property Group LP | | | | |
| 5.750%, 12/01/2015 | | 530,000 | | 593,483 |
| 5.875%, 03/01/2017 | | 595,000 | | 665,312 |
| 10.350%, 04/01/2019 | | 480,000 | | 658,946 |
| SLM Corp. | | | | |
| 0.603%, 01/27/2014 (P) | | 1,840,000 | | 1,737,050 |
| StanCorp Financial Group, Inc. (6.900% | | | | |
| to 06/01/2017, then 3 month | | | | |
| LIBOR + 0.251%) | | | | |
| 06/01/2067 | | 650,000 | | 623,843 |
| Standard Chartered PLC | | | | |
| 6.400%, 09/26/2017 (S) | | 1,000,000 | | 1,088,375 |
| State Bank of India/London | | | | |
| 4.500%, 07/27/2015 (S) | | 755,000 | | 765,409 |
| Symetra Financial Corp. | | | | |
| 6.125%, 04/01/2016 (S) | | 350,000 | | 365,875 |
| Teachers Insurance & Annuity | | | | |
| Association of America | | | | |
| 6.850%, 12/16/2039 (S) | | 1,355,000 | | 1,559,138 |
| Textron Financial Corp. (6.000% to | | | | |
| 02/15/2017, then 3 month | | | | |
| LIBOR + 1.735%) | | | | |
| 02/15/2067 (S) | | 2,670,000 | | 2,249,475 |
| The Bear Stearns Companies LLC | | | | |
| 0.501%, 11/28/2011 (P) | | 640,000 | | 640,939 |
| 7.250%, 02/01/2018 | | 1,325,000 | | 1,561,082 |
| The Goldman Sachs Group, Inc. | | | | |
| 5.375%, 03/15/2020 | | 300,000 | | 308,006 |
| 5.500%, 11/15/2014 | | 447,000 | | 490,555 |
| 5.950%, 01/18/2018 | | 1,500,000 | | 1,628,445 |
| 6.000%, 05/01/2014 to 06/15/2020 | | 2,145,000 | | 2,321,361 |
| 6.150%, 04/01/2018 | | 1,830,000 | | 2,004,725 |
| 6.450%, 05/01/2036 | | 2,000,000 | | 1,974,854 |
| 6.750%, 10/01/2037 | | 2,140,000 | | 2,193,406 |
| 7.500%, 02/15/2019 | | 460,000 | | 541,883 |
| The Royal Bank of Scotland Group PLC | | | | |
| 4.875%, 03/16/2015 | | 780,000 | | 808,637 |
| Transatlantic Holdings, Inc. | | | | |
| 5.750%, 12/14/2015 | | 575,000 | | 601,963 |
| UBS AG/Stamford CT | | | | |
| 5.875%, 12/20/2017 | | 550,000 | | 602,141 |
| Unum Group | | | | |
| 7.125%, 09/30/2016 | | 785,000 | | 889,579 |
| UnumProvident Finance Company PLC | | | | |
| 6.850%, 11/15/2015 (S) | | 1,340,000 | | 1,497,004 |
| USB Realty Corp. (6.091% to | | | | |
| 01/15/2012, then 3 month | | | | |
| LIBOR + 1.147%) | | | | |
| (Q)(S) | | 825,000 | | 663,094 |
| Vornado Realty LP | | | | |
| 4.250%, 04/01/2015 | | 2,500,000 | | 2,566,705 |
| W.R. Berkley Corp. | | | | |
| 5.600%, 05/15/2015 | | 795,000 | | 840,229 |
| 6.150%, 08/15/2019 | | 14,000 | | 14,704 |
| Wachovia Bank NA | | | | |
| 5.850%, 02/01/2037 | | 835,000 | | 858,851 |
| 6.600%, 01/15/2038 | | 735,000 | | 830,016 |
| | | | |
| Active Bond Fund (continued) | | | |
| | | Shares or | | |
| | | Principal | | |
| | | Amount | | Value |
| |
|
| |
| CORPORATE BONDS (continued) | | | | |
| Financials (continued) | | | | |
| WCI Finance LLC/WEA Finance LLC | | | | |
| 5.400%, 10/01/2012 (S) | $ | 610,000 | $ | 643,824 |
| 5.700%, 10/01/2016 (S) | | 1,000,000 | | 1,090,305 |
| WEA Finance LLC/WT Finance | | | | |
| Australia Pty, Ltd. | | | | |
| 6.750%, 09/02/2019 (S) | | 575,000 | | 657,316 |
| Wells Fargo & Company | | | | |
| 3.676%, 06/15/2016 | | 845,000 | | 863,360 |
| Wells Fargo Bank NA | | | | |
| 5.750%, 05/16/2016 | | 910,000 | | 1,005,926 |
| White Mountains Re Group, Ltd. | | | | |
| (7.506% to 06/30/2017, then 3 month | | | | |
| LIBOR + 3.200%) | | | | |
| (Q)(S) | | 3,940,000 | | 3,774,717 |
| Willis North America, Inc. | | | | |
| 7.000%, 09/29/2019 | | 1,195,000 | | 1,310,218 |
| Woodside Finance, Ltd. | | | | |
| 4.500%, 11/10/2014 (S) | | 977,941 | | 1,033,496 |
| XL Group PLC. (6.500% to 4/15/2017, | | | | |
| then 3 month LIBOR + 2.458%) | | | | |
| (Q) | | 1,275,000 | | 1,179,375 |
| | |
|
| | | | | 240,902,465 |
| Health Care - 0.91% | | | | |
| Alere, Inc. | | | | |
| 7.875%, 02/01/2016 | | 795,000 | | 825,806 |
| 8.625%, 10/01/2018 | | 465,000 | | 492,900 |
| Allergan, Inc. | | | | |
| 5.750%, 04/01/2016 | | 400,000 | | 455,251 |
| Bio-Rad Laboratories, Inc. | | | | |
| 4.875%, 12/15/2020 | | 480,000 | | 472,800 |
| BioScrip, Inc. | | | | |
| 10.250%, 10/01/2015 | | 730,000 | | 770,150 |
| Catalent Pharma Solutions, Inc., PIK | | | | |
| 9.500%, 04/15/2015 | | 961,137 | | 987,568 |
| Cigna Corp. | | | | |
| 6.150%, 11/15/2036 | | 500,000 | | 525,442 |
| Coventry Health Care, Inc. | | | | |
| 5.875%, 01/15/2012 | | 225,000 | | 233,613 |
| 6.300%, 08/15/2014 | | 420,000 | | 448,689 |
| Covidien International Finance SA | | | | |
| 6.000%, 10/15/2017 | | 610,000 | | 692,298 |
| Gentiva Health Services, Inc. | | | | |
| 11.500%, 09/01/2018 | | 120,000 | | 135,150 |
| HCA, Inc. | | | | |
| 8.500%, 04/15/2019 | | 440,000 | | 492,800 |
| Medco Health Solutions, Inc. | | | | |
| 7.125%, 03/15/2018 | | 1,010,000 | | 1,185,420 |
| Merck & Company, Inc. | | | | |
| 5.300%, 12/01/2013 | | 218,000 | | 240,882 |
| Teva Pharmaceutical | | | | |
| Finance Company LLC | | | | |
| 5.550%, 02/01/2016 | | 170,000 | | 189,547 |
| 6.150%, 02/01/2036 | | 170,000 | | 187,315 |
| UnitedHealth Group, Inc. | | | | |
| 4.875%, 02/15/2013 | | 225,000 | | 239,400 |
| 5.375%, 03/15/2016 | | 15,000 | | 16,516 |
| 5.800%, 03/15/2036 | | 115,000 | | 114,997 |
| Valeant | | | | |
| Pharmaceuticals International, Inc. | | | | |
| 6.750%, 10/01/2017 (S) | | 185,000 | | 191,475 |
| 6.875%, 12/01/2018 (S) | | 715,000 | | 743,600 |
| WellPoint, Inc. | | | | |
| 5.000%, 12/15/2014 | | 208,000 | | 225,729 |
| 6.375%, 06/15/2037 | | 415,000 | | 446,941 |
| |
| The accompanying notes are an integral part of the financial statements. | 21 |
John Hancock Funds II
Portfolio of Investments — February 28, 2011 (Unaudited) (showing percentage of total net assets)
| | | | |
| Active Bond Fund (continued) | | | |
| | | Shares or | | |
| | | Principal | | |
| | | Amount | | Value |
| |
|
| |
| CORPORATE BONDS (continued) | | | | |
| Health Care (continued) | | | | |
| Wyeth | | | | |
| 5.500%, 03/15/2013 | $ | 670,000 | $ | 729,666 |
| | | |
|
| | | | | 11,043,955 |
| Industrials - 3.40% | | | | |
| ACCO Brands Corp. | | | | |
| 10.625%, 03/15/2015 | | 200,000 | | 226,000 |
| Aircastle, Ltd. | | | | |
| 9.750%, 08/01/2018 | | 480,000 | | 535,200 |
| Altra Holdings, Inc. | | | | |
| 8.125%, 12/01/2016 | | 385,000 | | 410,988 |
| America West Airlines | | | | |
| 8.057%, 07/02/2020 | | 503,674 | | 531,376 |
| Asciano Finance, Ltd. | | | | |
| 4.625%, 09/23/2020 (S) | | 1,205,000 | | 1,128,428 |
| BAE Systems Asset Trust | | | | |
| 6.664%, 09/15/2013 (S) | | 25,966 | | 27,825 |
| BE Aerospace, Inc. | | | | |
| 8.500%, 07/01/2018 | | 720,000 | | 795,600 |
| Bombardier, Inc. | | | | |
| 7.750%, 03/15/2020 (S) | | 610,000 | | 661,850 |
| Briggs & Stratton Corp. | | | | |
| 6.875%, 12/15/2020 | | 495,000 | | 522,225 |
| Caterpillar Financial Services Corp. | | | | |
| 5.450%, 04/15/2018 | | 870,000 | | 973,665 |
| 5.500%, 03/15/2016 | | 405,000 | | 453,923 |
| 7.150%, 02/15/2019 | | 450,000 | | 551,254 |
| Coleman Cable, Inc. | | | | |
| 9.000%, 02/15/2018 | | 540,000 | | 562,950 |
| Colt Defense LLC/Colt Finance Corp. | | | | |
| 8.750%, 11/15/2017 (S) | | 500,000 | | 397,500 |
| Continental Airlines, Inc. | | | | |
| 5.983%, 04/19/2022 | | 834,397 | | 869,859 |
| 6.545%, 02/02/2019 | | 429,364 | | 452,979 |
| 6.648%, 09/15/2017 | | 146,078 | | 154,843 |
| 8.307%, 04/02/2018 | | 78,982 | | 81,351 |
| Covanta Holding Corp. | | | | |
| 7.250%, 12/01/2020 | | 1,030,000 | | 1,081,513 |
| CSX Corp. | | | | |
| 7.375%, 02/01/2019 | | 727,000 | | 880,964 |
| Delta Air Lines, Inc. | | | | |
| 6.200%, 07/02/2018 | | 336,019 | | 355,340 |
| 6.718%, 01/02/2023 | | 1,649,111 | | 1,690,339 |
| 6.821%, 08/10/2022 | | 922,254 | | 972,978 |
| 9.500%, 09/15/2014 (S) | | 543,000 | | 591,870 |
| Eaton Corp. | | | | |
| 4.900%, 05/15/2013 | | 450,000 | | 483,950 |
| Embraer Overseas, Ltd. | | | | |
| 6.375%, 01/15/2020 | | 890,000 | | 938,950 |
| Garda World Security Corp. | | | | |
| 9.750%, 03/15/2017 (S) | | 240,000 | | 258,000 |
| GATX Corp. | | | | |
| 8.750%, 05/15/2014 | | 930,000 | | 1,069,582 |
| General Electric Company | | | | |
| 5.000%, 02/01/2013 | | 247,000 | | 264,585 |
| 5.250%, 12/06/2017 | | 845,000 | | 925,659 |
| Interactive Data Corp. | | | | |
| 10.250%, 08/01/2018 (S) | | 305,000 | | 341,600 |
| Kansas City Southern de Mexico SA | | | | |
| de CV | | | | |
| 8.000%, 02/01/2018 | | 735,000 | | 802,988 |
| Kratos Defense & Security | | | | |
| Solutions, Inc. | | | | |
| 10.000%, 06/01/2017 | | 575,000 | | 648,313 |
| | | | |
| Active Bond Fund (continued) | | | |
| | | Shares or | | |
| | | Principal | | |
| | | Amount | | Value |
| |
|
| |
| CORPORATE BONDS (continued) | | | | |
| Industrials (continued) | | | | |
| Masco Corp. | | | | |
| 5.850%, 03/15/2017 | $ | 705,000 | $ | 713,727 |
| 7.125%, 03/15/2020 | | 750,000 | | 780,585 |
| Navios Maritime Holdings, Inc./Navios | | | | |
| Maritime Finance II U.S., Inc. | | | | |
| 8.125%, 02/15/2019 (S) | | 500,000 | | 500,000 |
| Northwest Airlines, Inc. | | | | |
| 6.264%, 11/20/2021 | | 1,217,384 | | 1,263,036 |
| 7.027%, 11/01/2019 | | 532,795 | | 554,107 |
| Odebrecht Finance, Ltd. | | | | |
| 7.000%, 04/21/2020 (S) | | 695,000 | | 750,600 |
| 7.500%, (Q)(S) | | 160,000 | | 162,000 |
| Parker Hannifin Corp. | | | | |
| 5.500%, 05/15/2018 | | 1,000,000 | | 1,117,879 |
| RailAmerica, Inc. | | | | |
| 9.250%, 07/01/2017 | | 518,000 | | 573,685 |
| Steelcase, Inc. | | | | |
| 6.375%, 02/15/2021 | | 1,050,000 | | 1,071,622 |
| Terex Corp. | | | | |
| 10.875%, 06/01/2016 | | 615,000 | | 719,550 |
| Textron, Inc. | | | | |
| 5.600%, 12/01/2017 | | 1,076,000 | | 1,125,717 |
| TransDigm, Inc. | | | | |
| 7.750%, 12/15/2018 (S) | | 1,195,000 | | 1,287,613 |
| Trimas Corp. | | | | |
| 9.750%, 12/15/2017 | | 300,000 | | 333,000 |
| Tutor Perini Corp. | | | | |
| 7.625%, 11/01/2018 (S) | | 730,000 | | 756,463 |
| Tyco International Finance SA | | | | |
| 8.500%, 01/15/2019 | | 400,000 | | 517,357 |
| Union Pacific Corp. | | | | |
| 5.700%, 08/15/2018 | | 785,000 | | 882,660 |
| United Air Lines, Inc. | | | | |
| 9.750%, 01/15/2017 | | 1,028,980 | | 1,185,899 |
| 9.875%, 08/01/2013 (S) | | 189,000 | | 205,538 |
| 10.400%, 11/01/2016 | | 325,786 | | 377,911 |
| United Rentals North America, Inc. | | | | |
| 10.875%, 06/15/2016 | | 415,000 | | 482,438 |
| US Airways 2010-1 Class A Pass | | | | |
| Through Trust | | | | |
| 6.250%, 04/22/2023 | | 905,000 | | 907,263 |
| USG Corp. | | | | |
| 6.300%, 11/15/2016 | | 1,000,000 | | 947,500 |
| Voto-Votorantim Overseas Trading | | | | |
| Operations NV | | | | |
| 6.625%, 09/25/2019 (S) | | 1,070,000 | | 1,115,475 |
| Voto-Votorantim, Ltd. | | | | |
| 6.750%, 04/05/2021 (S) | | 1,065,000 | | 1,118,250 |
| Western Express, Inc. | | | | |
| 12.500%, 04/15/2015 (S) | | 1,170,000 | | 1,134,900 |
| | |
|
| | | | | 41,229,222 |
| Information Technology - 0.49% | | | | |
| Brightstar Corp. | | | | |
| 9.500%, 12/01/2016 (S) | | 1,045,000 | | 1,118,150 |
| Equinix, Inc. | | | | |
| 8.125%, 03/01/2018 | | 465,000 | | 504,525 |
| Fiserv, Inc. | | | | |
| 6.800%, 11/20/2017 | | 830,000 | | 927,547 |
| Science Applications International Corp. | | | | |
| 5.500%, 07/01/2033 | | 825,000 | | 803,547 |
| Tyco Electronics Group SA | | | | |
| 6.550%, 10/01/2017 | | 730,000 | | 841,120 |
| 7.125%, 10/01/2037 | | 501,000 | | 579,003 |
| |
| The accompanying notes are an integral part of the financial statements. | 22 |
John Hancock Funds II
Portfolio of Investments — February 28, 2011 (Unaudited) (showing percentage of total net assets)
| | | | |
| Active Bond Fund (continued) | | | |
| | | Shares or | | |
| | | Principal | | |
| | | Amount | | Value |
| |
|
| |
| CORPORATE BONDS (continued) | | | | |
| Information Technology (continued) | | | | |
| Vangent, Inc. | | | | |
| 9.625%, 02/15/2015 | $ | 1,245,000 | $ | 1,179,638 |
| | |
|
| | | | | 5,953,530 |
| Materials - 2.20% | | | | |
| Alcan, Inc. | | | | |
| 5.000%, 06/01/2015 | | 6,000 | | 6,487 |
| Alcoa, Inc. | | | | |
| 5.720%, 02/23/2019 | | 150,000 | | 157,403 |
| Allegheny Technologies, Inc. | | | | |
| 5.950%, 01/15/2021 | | 310,000 | | 327,738 |
| 9.375%, 06/01/2019 | | 625,000 | | 779,943 |
| American Pacific Corp. | | | | |
| 9.000%, 02/01/2015 | | 530,000 | | 520,725 |
| ArcelorMittal | | | | |
| 6.750%, 03/01/2041 | | 660,000 | | 654,562 |
| 9.850%, 06/01/2019 | | 800,000 | | 1,028,190 |
| Ball Corp. | | | | |
| 6.750%, 09/15/2020 | | 880,000 | | 921,800 |
| Boise Paper Holdings LLC/Boise Co- | | | | |
| Issuer Company | | | | |
| 8.000%, 04/01/2020 | | 300,000 | | 330,750 |
| Braskem Finance, Ltd. | | | | |
| 7.000%, 05/07/2020 (S) | | 995,000 | | 1,027,338 |
| Commercial Metals Company | | | | |
| 7.350%, 08/15/2018 | | 650,000 | | 672,172 |
| Corporacion Nacional del Cobre | | | | |
| 5.500%, 10/15/2013 (S) | | 209,000 | | 225,287 |
| FMG Resources August 2006 Pty, Ltd. | | | | |
| 7.000%, 11/01/2015 (S) | | 135,000 | | 140,063 |
| Georgia-Pacific LLC | | | | |
| 5.400%, 11/01/2020 (S) | | 1,335,000 | | 1,326,966 |
| 7.125%, 01/15/2017 (S) | | 1,030,000 | | 1,094,375 |
| Gerdau Trade, Inc. | | | | |
| 5.750%, 01/30/2021 (S) | | 660,000 | | 660,000 |
| Graphic Packaging International, Inc. | | | | |
| 7.875%, 10/01/2018 | | 220,000 | | 236,500 |
| 9.500%, 06/15/2017 | | 495,000 | | 549,450 |
| Incitec Pivot Finance LLC | | | | |
| 6.000%, 12/10/2019 (S) | | 875,000 | | 913,193 |
| International Paper Company | | | | |
| 9.375%, 05/15/2019 | | 935,000 | | 1,219,075 |
| Mercer International, Inc. | | | | |
| 9.500%, 12/01/2017 (S) | | 240,000 | | 259,200 |
| Metinvest BV | | | | |
| 8.750%, 02/14/2018 (S) | | 970,000 | | 989,400 |
| Nalco Company | | | | |
| 6.625%, 01/15/2019 (S) | | 395,000 | | 408,331 |
| PE Paper Escrow GmbH | | | | |
| 12.000%, 08/01/2014 (S) | | 115,000 | | 132,825 |
| Polymer Group, Inc. | | | | |
| 7.750%, 02/01/2019 (S) | | 210,000 | | 218,663 |
| Rain CII Carbon LLC | | | | |
| 8.000%, 12/01/2018 (S) | | 1,235,000 | | 1,318,363 |
| Rio Tinto Alcan, Inc. | | | | |
| 6.125%, 12/15/2033 | | 705,000 | | 741,032 |
| Rio Tinto Finance USA, Ltd. | | | | |
| 7.125%, 07/15/2028 | | 485,000 | | 592,080 |
| Severstal Columbus LLC | | | | |
| 10.250%, 02/15/2018 | | 225,000 | | 245,250 |
| Solo Cup Company | | | | |
| 10.500%, 11/01/2013 | | 370,000 | | 377,400 |
| Solutia, Inc. | | | | |
| 7.875%, 03/15/2020 | | 560,000 | | 616,000 |
| | | | |
| Active Bond Fund (continued) | | | |
| | | Shares or | | |
| | | Principal | | |
| | | Amount | | Value |
| |
|
| |
| CORPORATE BONDS (continued) | | | | |
| Materials (continued) | | | | |
| Sterling Chemicals, Inc. | | | | |
| 10.250%, 04/01/2015 | $ | 655,000 | $ | 677,925 |
| Teck Resources, Ltd. | | | | |
| 10.750%, 05/15/2019 | | 2,335,000 | | 3,008,181 |
| Temple-Inland, Inc. | | | | |
| 6.875%, 01/15/2018 | | 1,205,000 | | 1,306,169 |
| The Dow Chemical Company | | | | |
| 5.700%, 05/15/2018 | | 700,000 | | 760,862 |
| U.S. Corrugated, Inc. | | | | |
| 10.000%, 06/12/2013 | | 110,000 | | 107,800 |
| Vale Overseas, Ltd. | | | | |
| 6.875%, 11/10/2039 | | 695,000 | | 749,588 |
| Verso Paper Holdings LLC/Verso | | | | |
| Paper, Inc. | | | | |
| 8.750%, 02/01/2019 (S) | | 225,000 | | 235,125 |
| Westvaco Corp. | | | | |
| 7.950%, 02/15/2031 | | 1,025,000 | | 1,074,534 |
| | |
|
| | | | | 26,610,745 |
| Telecommunication Services - 1.93% | | | | |
| Affinion Group Holdings, Inc. | | | | |
| 11.625%, 11/15/2015 (S) | | 515,000 | | 534,313 |
| America Movil SAB de CV | | | | |
| 5.000%, 03/30/2020 | | 1,005,000 | | 1,036,171 |
| AT&T, Inc. | | | | |
| 5.100%, 09/15/2014 | | 16,000 | | 17,607 |
| 5.350%, 09/01/2040 (S) | | 257,000 | | 235,647 |
| 5.600%, 05/15/2018 | | 500,000 | | 552,286 |
| 5.625%, 06/15/2016 | | 12,000 | | 13,445 |
| 6.300%, 01/15/2038 | | 500,000 | | 519,097 |
| 6.450%, 06/15/2034 | | 580,000 | | 610,125 |
| Axtel SAB de CV | | | | |
| 9.000%, 09/22/2019 (S) | | 400,000 | | 385,000 |
| Bakrie Telecom Pte, Ltd. | | | | |
| 11.500%, 05/07/2015 (S) | | 900,000 | | 976,500 |
| BellSouth Corp. | | | | |
| 6.000%, 11/15/2034 | | 820,000 | | 819,810 |
| 6.550%, 06/15/2034 | | 420,000 | | 440,546 |
| British Telecommunications PLC | | | | |
| 5.950%, 01/15/2018 | | 10,000 | | 11,098 |
| Citizens Communications Company | | | | |
| 9.000%, 08/15/2031 | | 900,000 | | 947,250 |
| Deutsche Telekom | | | | |
| International Finance BV | | | | |
| 6.750%, 08/20/2018 | | 870,000 | | 1,017,061 |
| 7.125%, 07/11/2011 | EUR | 1,000 | | 1,406 |
| 8.750%, 06/15/2030 | $ | 227,000 | | 297,699 |
| Digicel Group, Ltd. | | | | |
| 8.875%, 01/15/2015 (S) | | 1,230,000 | | 1,279,200 |
| Embarq Corp. | | | | |
| 7.995%, 06/01/2036 | | 1,270,000 | | 1,443,134 |
| Frontier Communications Corp. | | | | |
| 8.250%, 05/01/2014 | | 460,000 | | 516,925 |
| 8.500%, 04/15/2020 | | 1,005,000 | | 1,115,550 |
| Intelsat Jackson Holdings SA | | | | |
| 11.500%, 06/15/2016 | | 935,000 | | 998,113 |
| NII Capital Corp. | | | | |
| 8.875%, 12/15/2019 | | 885,000 | | 977,925 |
| 10.000%, 08/15/2016 | | 560,000 | | 634,200 |
| SBA Telecommunications, Inc. | | | | |
| 8.000%, 08/15/2016 | | 305,000 | | 332,450 |
| SBA Tower Trust | | | | |
| 5.101%, 04/15/2017 (S) | | 940,000 | | 994,150 |
| Singapore Telecommunications, Ltd. | | | | |
| 6.375%, 12/01/2011 (S) | | 9,000 | | 9,328 |
| |
| The accompanying notes are an integral part of the financial statements. | 23 |
John Hancock Funds II
Portfolio of Investments — February 28, 2011 (Unaudited) (showing percentage of total net assets)
| | | | |
| Active Bond Fund (continued) | | | |
| | | Shares or | | |
| | | Principal | | |
| | | Amount | | Value |
| |
|
| |
| CORPORATE BONDS (continued) | | | | |
| Telecommunication Services (continued) | | | | |
| Sprint Capital Corp. | | | | |
| 6.875%, 11/15/2028 | $ | 900,000 | $ | 811,125 |
| 8.375%, 03/15/2012 | | 207,000 | | 219,679 |
| 8.750%, 03/15/2032 | | 685,000 | | 712,400 |
| Telcordia Technologies, Inc. | | | | |
| 11.000%, 05/01/2018 (S) | | 340,000 | | 380,800 |
| Telecom Italia Capital SA | | | | |
| 6.175%, 06/18/2014 | | 695,000 | | 739,727 |
| 7.200%, 07/18/2036 | | 650,000 | | 635,060 |
| Verizon Communications, Inc. | | | | |
| 6.100%, 04/15/2018 | | 910,000 | | 1,024,416 |
| 6.900%, 04/15/2038 | | 450,000 | | 510,403 |
| Verizon of New York, Inc. | | | | |
| 6.875%, 04/01/2012 | | 15,000 | | 15,911 |
| West Corp. | | | | |
| 11.000%, 10/15/2016 | | 1,465,000 | | 1,595,019 |
| | |
|
| | | | | 23,360,576 |
| Utilities - 3.15% | | | | |
| AES Gener SA | | | | |
| 7.500%, 03/25/2014 | | 218,000 | | 238,370 |
| Allegheny Energy Supply Company LLC | | | | |
| 5.750%, 10/15/2019 (S) | | 1,215,000 | | 1,250,824 |
| American Electric Power Company, Inc. | | | | |
| 5.250%, 06/01/2015 | | 210,000 | | 228,838 |
| American Water Capital Corp. | | | | |
| 6.085%, 10/15/2017 | | 600,000 | | 675,782 |
| Appalachian Power Company | | | | |
| 5.800%, 10/01/2035 | | 39,000 | | 39,248 |
| 7.000%, 04/01/2038 | | 425,000 | | 494,141 |
| Arizona Public Service Company | | | | |
| 5.500%, 09/01/2035 | | 222,000 | | 214,726 |
| BVPS II Funding Corp. | | | | |
| 8.890%, 06/01/2017 | | 242,000 | | 270,234 |
| CenterPoint Energy Houston | | | | |
| Electric LLC | | | | |
| 6.950%, 03/15/2033 | | 10,000 | | 11,556 |
| CenterPoint Energy Resources Corp. | | | | |
| 4.500%, 01/15/2021 (S) | | 202,000 | | 199,803 |
| 6.000%, 05/15/2018 | | 1,000,000 | | 1,119,468 |
| CenterPoint Energy, Inc. | | | | |
| 6.500%, 05/01/2018 | | 1,000,000 | | 1,126,549 |
| Cia de Saneamento Basico do Estado de | | | | |
| Sao Paulo | | | | |
| 6.250%, 12/16/2020 (S) | | 725,000 | | 726,813 |
| CMS Energy Corp. | | | | |
| 6.250%, 02/01/2020 | | 1,325,000 | | 1,392,473 |
| Commonwealth Edison Company | | | | |
| 5.800%, 03/15/2018 | | 2,235,000 | | 2,491,366 |
| Constellation Energy Group, Inc. | | | | |
| 7.600%, 04/01/2032 | | 246,000 | | 282,979 |
| Dominion Resources, Inc. | | | | |
| 5.000%, 03/15/2013 | | 575,000 | | 614,099 |
| 5.700%, 09/17/2012 | | 207,000 | | 221,364 |
| Dominion Resources, Inc. (6.300% to | | | | |
| 09/30/2011, then 3 month | | | | |
| LIBOR + 2.300%) | | | | |
| 09/30/2066 | | 1,800,000 | | 1,759,500 |
| Enel Finance International SA | | | | |
| 6.250%, 09/15/2017 (S) | | 565,000 | | 616,650 |
| Exelon Generation Company LLC | | | | |
| 6.250%, 10/01/2039 | | 575,000 | | 574,887 |
| FirstEnergy Corp. | | | | |
| 6.450%, 11/15/2011 | | 9,000 | | 9,306 |
| 7.375%, 11/15/2031 | | 676,000 | | 736,922 |
| | | | |
| Active Bond Fund (continued) | | | |
| | | Shares or | | |
| | | Principal | | |
| | | Amount | | Value |
| |
|
| |
| CORPORATE BONDS (continued) | | | | |
| Utilities (continued) | | | | |
| FirstEnergy Solutions Corp. | | | | |
| 4.800%, 02/15/2015 | $ | 910,000 | $ | 957,288 |
| FPL Group Capital, Inc. (6.350% to | | | | |
| 10/31/2016, then 3 month | | | | |
| LIBOR + 2.068%) | | | | |
| 10/01/2066 | | 650,000 | | 636,188 |
| Integrys Energy Group, Inc. (6.110% to | | | | |
| 12/01/2016, then 3 month | | | | |
| LIBOR + 2.120%) | | | | |
| 12/01/2066 | | 1,425,000 | | 1,385,813 |
| Israel Electric Corp., Ltd. | | | | |
| 7.250%, 01/15/2019 (S) | | 2,220,000 | | 2,357,773 |
| ITC Holdings Corp. | | | | |
| 5.500%, 01/15/2020 (S) | | 710,000 | | 744,563 |
| KCP&L Greater Missouri Operations | | | | |
| Company | | | | |
| 11.875%, 07/01/2012 | | 720,000 | | 807,170 |
| Michigan Consolidated Gas Company | | | | |
| 5.700%, 03/15/2033 | | 14,000 | | 14,085 |
| Midwest Generation LLC, Series B | | | | |
| 8.560%, 01/02/2016 | | 861,166 | | 891,307 |
| National Grid PLC | | | | |
| 6.300%, 08/01/2016 | | 485,000 | | 553,116 |
| Nevada Power Company | | | | |
| 6.650%, 04/01/2036 | | 530,000 | | 602,051 |
| NRG Energy, Inc. | | | | |
| 7.625%, 01/15/2018 (S) | | 815,000 | | 848,619 |
| 8.250%, 09/01/2020 (S) | | 910,000 | | 957,775 |
| NV Energy, Inc. | | | | |
| 6.250%, 11/15/2020 | | 535,000 | | 546,168 |
| Pacific Gas & Electric Company | | | | |
| 4.200%, 03/01/2011 | | 246,000 | | 246,000 |
| 8.250%, 10/15/2018 | | 455,000 | | 588,908 |
| Peco Energy Company | | | | |
| 5.350%, 03/01/2018 | | 1,000,000 | | 1,106,186 |
| PNPP II Funding Corp. | | | | |
| 9.120%, 05/30/2016 | | 178,000 | | 190,298 |
| PPL Capital Funding, Inc. (6.700% to | | | | |
| 03/30/2017, then 3 month | | | | |
| LIBOR + 2.665%) | | | | |
| 03/30/2067 | | 1,055,000 | | 1,036,538 |
| PSEG Power LLC | | | | |
| 5.000%, 04/01/2014 | | 214,000 | | 229,658 |
| 8.625%, 04/15/2031 | | 214,000 | | 271,687 |
| Public Service Company of New Mexico | | | | |
| 7.950%, 05/15/2018 | | 1,000,000 | | 1,128,213 |
| Salton Sea Funding Corp., Series F | | | | |
| 7.475%, 11/30/2018 | | 177,420 | | 188,207 |
| Sierra Pacific Power Company, Series M | | | | |
| 6.000%, 05/15/2016 | | 840,000 | | 948,239 |
| SPI Electricity & Gas Australia | | | | |
| Holdings Pty, Ltd. | | | | |
| 6.150%, 11/15/2013 (S) | | 16,000 | | 17,389 |
| Teco Finance, Inc. | | | | |
| 6.572%, 11/01/2017 | | 822,000 | | 932,527 |
| Texas Competitive Electric Holdings | | | | |
| Company LLC, Series A | | | | |
| 10.250%, 11/01/2015 | | 1,110,000 | | 624,375 |
| TransAlta Corp. | | | | |
| 6.650%, 05/15/2018 | | 580,000 | | 649,561 |
| United Energy Distribution Property, Ltd. | | | | |
| 4.700%, 04/15/2011 (S) | | 96,000 | | 96,314 |
| Veolia Environnement | | | | |
| 6.000%, 06/01/2018 | | 600,000 | | 668,086 |
| |
| The accompanying notes are an integral part of the financial statements. | 24 |
John Hancock Funds II
Portfolio of Investments — February 28, 2011 (Unaudited) (showing percentage of total net assets)
| | | | |
| Active Bond Fund (continued) | | | |
| | | Shares or | | |
| | | Principal | | |
| | | Amount | | Value |
| |
|
| |
| CORPORATE BONDS (continued) | | | | |
| Utilities (continued) | | | | |
| Virginia Electric and Power Company | | | | |
| 6.000%, 01/15/2036 | $ | 620,000 | $ | 668,659 |
| Waterford 3 Funding Corp. | | | | |
| 8.090%, 01/02/2017 | | 1,311,249 | | 1,321,713 |
| Wisconsin Energy Corp. (6.250% to | | | | |
| 05/15/2017, then 3 month | | | | |
| LIBOR + 2.113%) | | | | |
| 05/15/2067 | | 650,000 | | 649,188 |
| | |
|
| | | | | 38,159,560 |
|
| TOTAL CORPORATE BONDS (Cost $490,534,668) | | $ | 523,290,174 |
|
| |
| CAPITAL PREFERRED SECURITIES - 2.16% | | | |
| Financials - 2.16% | | | | |
| Allfirst Preferred Capital Trust | | | | |
| 1.803%, 07/15/2029 (P) | | 310,000 | | 238,951 |
| BAC Capital Trust XIII (0.937% to | | | | |
| 03/15/2012, then 3 month | | | | |
| LIBOR + 0.400%) | | | | |
| (Q) | | 640,000 | | 442,612 |
| BAC Capital Trust XIV (5.630% to | | | | |
| 03/15/2012, then 3 month | | | | |
| LIBOR + 0.400%) | | | | |
| (Q) | | 1,275,000 | | 949,875 |
| BAC Capital Trust XV | | | | |
| 1.111%, 06/01/2056 (P) | | 925,000 | | 629,643 |
| Fifth Third Capital Trust IV (6.500% to | | | | |
| 04/15/2017 then 3 month | | | | |
| LIBOR + 1.368%) | | | | |
| 04/15/2037 | | 1,870,000 | | 1,823,250 |
| ILFC E-Capital Trust II (6.25% to | | | | |
| 12/21/2015, then 1.80% + Highest of | | | | |
| 3 month LIBOR, 10 year CMT and | | | | |
| 30 year CMT) | | | | |
| 12/21/2065 (S) | | 2,250,000 | | 1,957,500 |
| JPMorgan Chase Capital XX | | | | |
| 6.550%, 09/29/2036 | | 250,000 | | 256,885 |
| JPMorgan Chase Capital XXIII (1.250% | | | | |
| to 05/15/2047, then 3 month | | | | |
| LIBOR + 2.030%) | | | | |
| 05/15/2047 | | 915,000 | | 714,730 |
| MBNA Capital | | | | |
| 1.104%, 02/01/2027 (P) | | 23,000 | | 17,031 |
| Mellon Capital IV (6.244% to | | | | |
| 06/20/2012, then 3 month | | | | |
| LIBOR + 0.565%) | | | | |
| (Q) | | 400,000 | | 368,000 |
| Metlife Capital Trust X (9.250% to | | | | |
| 04/08/2038 then 3 month | | | | |
| LIBOR + 5.540%) | | | | |
| 9.250%, 04/08/2038 (S) | | 395,000 | | 477,950 |
| PNC Financial Services Group, Inc. | | | | |
| (8.250% to 05/21/2013 then 3 month | | | | |
| LIBOR + 4.220%) | | | | |
| (Q) | | 760,000 | | 804,605 |
| PNC Preferred Funding Trust I (6.113% | | | | |
| to 03/15/2012, then 3 month | | | | |
| LIBOR + 1.223%) | | | | |
| (Q)(S) | | 1,200,000 | | 948,000 |
| PNC Preferred Funding Trust III | | | | |
| (8.700% to 03/15/2013 then 3 month | | | | |
| LIBOR + 5.226%) | | | | |
| (Q)(S) | | 1,820,000 | | 1,954,443 |
| | | | |
| Active Bond Fund (continued) | | | |
| | | Shares or | | |
| | | Principal | | |
| | | Amount | | Value |
| |
|
| |
| CAPITAL PREFERRED SECURITIES (continued) | | |
| Financials (continued) | | | | |
| Schwab Capital Trust I (7.500% to | | | | |
| 11/15/2017, then 3 month | | | | |
| LIBOR + 2.375%) | | | | |
| 11/15/2037 | | 1,435,000 | $ | 1,510,151 |
| Sovereign Capital Trust VI | | | | |
| 7.908%, 06/13/2036 | | 1,125,000 | | 1,167,219 |
| Standard Chartered PLC (6.409% to | | | | |
| 01/30/2017, then 3 month | | | | |
| LIBOR + 1.510%) | | | | |
| (Q)(S) | | 715,000 | | 678,188 |
| State Street Capital Trust III (8.250% to | | | | |
| 03/15/2011, then 3 month | | | | |
| LIBOR + 4.990%) | | | | |
| (Q) | | 1,120,000 | | 1,122,386 |
| State Street Capital Trust IV | | | | |
| 1.302%, 06/15/2037 (P) | | 2,120,000 | | 1,719,714 |
| SunTrust Capital VIII (6.100% to | | | | |
| 12/15/2036, then 1 month | | | | |
| LIBOR + 1.965%) | | | | |
| 12/15/2036 | | 414,000 | | 395,908 |
| SunTrust Preferred Capital I (5.853% to | | | | |
| 12/15/2011, then 3 month | | | | |
| LIBOR + 0.645%) | | | | |
| (Q) | | 102,000 | | 79,560 |
| The Goldman Sachs Capital I | | | | |
| 6.345%, 02/15/2034 | | 2,000,000 | | 1,958,540 |
| The Goldman Sachs Capital II (5.793% | | | | |
| to 06/01/2012, then 3 month | | | | |
| LIBOR + 0.768%) | | | | |
| (Q) | | 2,760,000 | | 2,373,600 |
| USB Capital IX (6.189% to 04/15/2011, | | | | |
| then 3 month LIBOR + 1.020%) | | | | |
| (Q) | | 2,025,000 | | 1,653,008 |
| Wachovia Capital Trust III (5.800% to | | | | |
| 03/15/2011, then greater of 3 month | | | | |
| LIBOR + 0.93% or 5.570% quarterly) | | | | |
| (Q) | | 1,000,000 | | 910,000 |
| Wells Fargo Capital XIII (7.700% to | | | | |
| 03/26/2013, then 3 month | | | | |
| US LIBOR + 3.890%) | | | | |
| (Q) | | 1,000,000 | | 1,027,500 |
| | |
|
| | | | | 26,179,249 |
|
| TOTAL CAPITAL PREFERRED | | | | |
| SECURITIES (Cost $25,940,127) | | | $ | 26,179,249 |
|
| |
| CONVERTIBLE BONDS - 0.11% | | | | |
| Industrials - 0.03% | | | | |
| US Airways Group, Inc. | | | | |
| 7.250%, 05/15/2014 | $ | 190,000 | $ | 399,713 |
| Consumer Discretionary - 0.08% | | | | |
| XM Satellite Radio, Inc. | | | | |
| 7.000%, 12/01/2014 (S) | | 710,000 | | 962,050 |
|
| TOTAL CONVERTIBLE BONDS (Cost $955,422) | | $ | 1,361,763 |
|
| |
| TERM LOANS (M) - 0.14% | | | | |
| Consumer Discretionary - 0.14% | | | | |
| CCM Merger, Inc. | | | | |
| - 02/11/2017 (T) | | 435,000 | | 440,302 |
| Sugerhouse HSP Gaming | | | | |
| 11.250%, 09/23/2014 | | 500,000 | | 507,917 |
| |
| The accompanying notes are an integral part of the financial statements. | 25 |
John Hancock Funds II
Portfolio of Investments — February 28, 2011 (Unaudited) (showing percentage of total net assets)
| | | | |
| Active Bond Fund (continued) | | | |
| | | Shares or | | |
| | | Principal | | |
| | | Amount | | Value |
| |
|
| |
| TERM LOANS (M) (continued) | | | | |
| Consumer Discretionary (continued) | | | | |
| Vertis, Inc. | | | | |
| 11.750%, 12/31/2015 | $ | 775,000 | $ | 775,000 |
| | |
|
| | | | | 1,723,219 |
|
| TOTAL TERM LOANS (Cost $1,700,505) | | | $ | 1,723,219 |
|
| |
| MUNICIPAL BONDS - 0.20% | | | | |
| California - 0.05% | | | | |
| State of California | | | | |
| 7.600%, 11/01/2040 | | 510,000 | | 554,069 |
| District of Columbia - 0.10% | | | | |
| George Washington University | | | | |
| 5.095%, 09/15/2032 (P) | | 1,155,000 | | 1,213,073 |
| New Jersey - 0.05% | | | | |
| New Jersey State Turnpike Authority | | | | |
| 7.414%, 01/01/2040 | | 540,000 | | 605,394 |
|
| TOTAL MUNICIPAL BONDS (Cost $2,262,539) | | $ | 2,372,536 |
|
| |
| COLLATERALIZED MORTGAGE | | | | |
| OBLIGATIONS - 19.32% | | | | |
| Commercial & Residential - 18.75% | | | | |
| American Home Mortgage Assets | | | | |
| Series 2006-6, Class A1A, | | | | |
| 0.452%, 12/25/2046 (P) | | 425,189 | | 238,483 |
| Series 2006-6, Class XP IO, | | | | |
| 2.373%, 12/25/2046 | | 6,266,467 | | 408,080 |
| American Home Mortgage | | | | |
| Investment Trust, Series 2004-4, | | | | |
| Class 5A | | | | |
| 2.262%, 02/25/2045 (P) | | 395,828 | | 368,129 |
| American Tower Trust | | | | |
| Series 2007-1A, Class C, | | | | |
| 5.615%, 04/15/2037 | | 1,540,000 | | 1,633,900 |
| Series 2007-1A, Class D, | | | | |
| 5.957%, 04/15/2037 (S) | | 1,345,000 | | 1,424,476 |
| Americold LLC Trust, | | | | |
| Series 2010-ARTA, Class D | | | | |
| 7.443%, 01/14/2029 (S) | | 1,550,000 | | 1,729,004 |
| Banc of America | | | | |
| Commercial Mortgage, Inc. | | | | |
| Series 2005-5, Class XC IO, | | | | |
| 0.064%, 10/10/2045 (S) | | 72,370,543 | | 285,581 |
| Series 2005-2, Class A4, | | | | |
| 4.783%, 07/10/2043 (P) | | 1,691,510 | | 1,746,552 |
| Series 2005-2, Class AJ, | | | | |
| 4.953%, 07/10/2043 (P) | | 50,846 | | 52,397 |
| Series 2006-1, Class AM, | | | | |
| 5.421%, 09/10/2045 (P) | | 1,600,000 | | 1,684,044 |
| Series 2006-4, Class AM, | | | | |
| 5.675%, 07/10/2046 | | 1,355,000 | | 1,422,854 |
| Series 2006-2, Class AM, | | | | |
| 5.775%, 05/10/2045 (P) | | 1,390,000 | | 1,490,410 |
| Series 2006-3, Class A4, | | | | |
| 5.889%, 07/10/2044 (P) | | 3,040,000 | | 3,322,545 |
| Banc of America Large Loan, Inc. | | | | |
| Series 2006-BIX1, Class C, | | | | |
| 0.446%, 10/15/2019 (P)(S) | | 1,000,000 | | 944,473 |
| Series 2005-MIB1, Class B, | | | | |
| 0.526%, 03/15/2022 (P)(S) | | 895,000 | | 843,719 |
| Series 2005-MIB1, Class E, | | | | |
| 0.666%, 03/15/2022 (P)(S) | | 490,000 | | 455,399 |
| Bear Stearns Alt-A Trust, Series 2005-3, | | | | |
| Class B2 | | | | |
| 2.613%, 04/25/2035 (P) | | 175,956 | | 10,312 |
| | | | |
| Active Bond Fund (continued) | | | |
| | | Shares or | | |
| | | Principal | | |
| | | Amount | | Value |
| |
|
| |
| COLLATERALIZED MORTGAGE | | | | |
| OBLIGATIONS (continued) | | | | |
| Commercial & Residential (continued) | | | | |
| Bear Stearns Asset Backed | | | | |
| Securities, Inc., Series 2003-AC4, | | | | |
| Class A | | | | |
| 5.500%, 09/25/2033 | $ | 6,213 | $ | 6,313 |
| Bear Stearns Commercial | | | | |
| Mortgage Securities, Inc. | | | | |
| Series 2005-PWR8, Class X1 IO, | | | | |
| 0.198%, 06/11/2041 (S) | | 62,197,782 | | 946,905 |
| Series 2004-T16, Class X1 IO, | | | | |
| 0.277%, 02/13/2046 (S) | | 490,130 | | 7,708 |
| Series 2004-PWR6, Class X1 IO, | | | | |
| 0.318%, 11/11/2041 (S) | | 54,466,908 | | 776,834 |
| Series 2004-PWR5, Class X1 IO, | | | | |
| 0.397%, 07/11/2042 (S) | | 401,499 | | 6,477 |
| Series 2006-T24, Class AY IO, | | | | |
| 0.426%, 10/12/2041 (S) | | 21,955,456 | | 253,258 |
| Series 2006-BBA7, Class G, | | | | |
| 0.706%, 03/15/2019 (P)(S) | | 1,700,000 | | 1,421,000 |
| Series 2004-PWR5, Class X2 IO, | | | | |
| 0.803%, 07/11/2042 | | 141,486,806 | | 1,916,128 |
| Series 2005-PWR8, Class E, | | | | |
| 4.997%, 06/11/2041 (P)(S) | | 665,000 | | 463,744 |
| Series 2005-T20, Class AJ, | | | | |
| 5.149%, 10/12/2042 (P) | | 2,800,000 | | 2,893,875 |
| Series 2005-T18, Series G, | | | | |
| 5.298%, 02/13/2042 (P)(S) | | 1,000,000 | | 467,886 |
| Series 2006-PW14, Class D, | | | | |
| 5.412%, 12/11/2038 (S) | | 1,075,000 | | 398,380 |
| Series 2002-TOP6, Class G, | | | | |
| 6.000%, 10/15/2036 (P)(S) | | 1,257,500 | | 1,027,199 |
| Bear Stearns Mortgage Funding Trust, | | | | |
| Series 2006-AR4, Class A1 | | | | |
| 0.472%, 12/25/2036 (P) | | 1,527,805 | | 980,081 |
| Citigroup Commercial Mortgage Trust, | | | | |
| Series 2006-C4, Class A3 | | | | |
| 5.727%, 03/15/2049 (P) | | 1,395,000 | | 1,532,890 |
| Citigroup/Deutsche Bank | | | | |
| Commercial Mortgage Trust | | | | |
| Series 2005-CD1, Class C, | | | | |
| 5.222%, 07/15/2044 (P) | | 245,000 | | 221,563 |
| Series 2006-CD2, Class AM, | | | | |
| 5.391%, 01/15/2046 (P) | | 1,000,000 | | 1,048,098 |
| Commercial Mortgage Pass | | | | |
| Through Certificates | | | | |
| Series 2003-LB1A, Class A2, | | | | |
| 4.084%, 06/10/2038 | | 424,859 | | 440,250 |
| Series 2007-C9, Class A4, | | | | |
| 5.815%, 12/10/2049 (P) | | 3,325,000 | | 3,632,527 |
| Countrywide Home Loan Mortgage Pass | | | | |
| Through Trust, Series 2004-HYB2, | | | | |
| Class 4A | | | | |
| 2.741%, 07/20/2034 (P) | | 890,908 | | 920,227 |
| Credit Suisse First Boston | | | | |
| Mortgage Securities Corp. | | | | |
| Series 2005-C1, Class AX IO, | | | | |
| 0.139%, 02/15/2038 (S) | | 80,383,142 | | 750,457 |
| Series 2004-C4, Class A4, | | | | |
| 4.283%, 10/15/2039 | | 118,598 | | 119,044 |
| Series 2005-C1, Class A3, | | | | |
| 4.813%, 02/15/2038 | | 611,329 | | 627,609 |
| Series 2005-C5, Class AJ, | | | | |
| 5.100%, 08/15/2038 (P) | | 2,000,000 | | 2,049,345 |
| Series 2005-C4, Class AJ, | | | | |
| 5.190%, 08/15/2038 (P) | | 2,000,000 | | 2,017,274 |
| |
| The accompanying notes are an integral part of the financial statements. | 26 |
John Hancock Funds II
Portfolio of Investments — February 28, 2011 (Unaudited) (showing percentage of total net assets)
| | | | |
| Active Bond Fund (continued) | | | |
| | | Shares or | | |
| | | Principal | | |
| | | Amount | | Value |
| |
|
| |
| COLLATERALIZED MORTGAGE | | | | |
| OBLIGATIONS (continued) | | | | |
| Commercial & Residential (continued) | | | | |
| Credit Suisse First Boston Mortgage | | | | |
| Securities Corp. (continued) | | | | |
| Series 2001-CKN5, Class A4, | | | | |
| 5.435%, 09/15/2034 | $ | 174,308 | $ | 175,757 |
| Series 2002-CKN2, Class A3, | | | | |
| 6.133%, 04/15/2037 | | 142,586 | | 147,703 |
| Series 2001-CP4, Class A4, | | | | |
| 6.180%, 12/15/2035 | | 429,935 | | 432,416 |
| Credit Suisse Mortgage | | | | |
| Capital Certificates | | | | |
| Series 2006-TFLA, Class A2, | | | | |
| 0.426%, 04/15/2021 (P)(S) | | 1,231,984 | | 1,219,499 |
| Series 2006-TFLA, Class B, | | | | |
| 0.496%, 04/15/2021 (P)(S) | | 870,000 | | 857,992 |
| Series 2006-C1, Class A3, | | | | |
| 5.541%, 02/15/2039 (P) | | 3,201,000 | | 3,384,999 |
| DBUBS Mortgage Trust | | | | |
| Series 2011-LC1A, Class A1, | | | | |
| 3.742%, 11/10/2046 (S) | | 3,000,000 | | 3,054,975 |
| Series 2011-LC1A, Class C, | | | | |
| 5.557%, 11/10/2046 (P)(S) | | 2,000,000 | | 2,063,839 |
| Extended Stay America Trust, | | | | |
| Series 2010-ESHA, Class B | | | | |
| 4.221%, 11/05/2027 (S) | | 2,500,000 | | 2,557,349 |
| First Horizon Alternative | | | | |
| Mortgage Securities | | | | |
| Series 2004-AA2, Class 2A1, | | | | |
| 2.325%, 08/25/2034 (P) | | 1,357,928 | | 1,204,291 |
| Series 2004-AA5, Class B1, | | | | |
| 2.382%, 12/25/2034 (P) | | 125,330 | | 12,012 |
| FREMF Mortgage Trust | | | | |
| Series 2011-K701, Class B, | | | | |
| 4.437%, 11/25/2017 (P)(S) | | 2,000,000 | | 1,915,922 |
| Series 2011-K10, Class B, | | | | |
| 4.598%, 11/25/2049 (P)(S) | | 1,000,000 | | 943,264 |
| GE Capital Commercial Mortgage Corp. | | | | |
| Series 2005-C1, Class XC IO, | | | | |
| 0.248%, 06/10/2048 (S) | | 1,346,968 | | 16,568 |
| Series 2005-C1, Class XP IO, | | | | |
| 0.468%, 06/10/2048 | | 33,008,611 | | 189,806 |
| Series 2005-C1, Class AJ, | | | | |
| 4.826%, 06/10/2048 (P) | | 1,175,000 | | 1,180,633 |
| Series 2005-C3, Class AJ, | | | | |
| 5.065%, 07/10/2045 (P) | | 5,500,000 | | 5,661,698 |
| Series 2005-C2, Class C, | | | | |
| 5.133%, 05/10/2043 (P) | | 43,737 | | 42,100 |
| Series 2002-2A, Class A3, | | | | |
| 5.349%, 08/11/2036 | | 164,809 | | 171,749 |
| Series 2001-3, Class A2, | | | | |
| 6.070%, 06/10/2038 | | 22,214 | | 22,662 |
| Global Tower Partners Acquisition | | | | |
| Partners LLC, Series 2007-1A, Class F | | | | |
| 7.050%, 05/15/2037 (S) | | 210,000 | | 216,486 |
| GMAC Mortgage Corp Loan Trust, | | | | |
| Series 2004-AR2, Class 3A | | | | |
| 3.410%, 08/19/2034 (P) | | 2,081,229 | | 1,975,965 |
| Greenwich Capital | | | | |
| Commercial Funding Corp. | | | | |
| Series 2005-GG3, Class XC IO, | | | | |
| 0.381%, 08/10/2042 (S) | | 52,461,589 | | 633,757 |
| Series 2002-C1, Class A2, | | | | |
| 4.112%, 01/11/2017 | | 80,426 | | 81,288 |
| Series 2007-GG9, Class A4, | | | | |
| 5.444%, 03/10/2039 | | 2,485,000 | | 2,654,747 |
| | | | |
| Active Bond Fund (continued) | | | |
| | | Shares or | | |
| | | Principal | | |
| | | Amount | | Value |
| |
|
| |
| COLLATERALIZED MORTGAGE | | | | |
| OBLIGATIONS (continued) | | | | |
| Commercial & Residential (continued) | | | | |
| Greenwich Capital Commercial | | | | |
| Funding Corp. (continued) | | | | |
| Series 2007-GG9, Class C, | | | | |
| 5.554%, 03/10/2039 (P) | $ | 730,000 | $ | 537,739 |
| Series 2006-GG7, Class AM, | | | | |
| 5.883%, 07/10/2038 (P) | | 1,360,000 | | 1,434,908 |
| GS Mortgage Securities Corp. II | | | | |
| Series 2005-GG4, Class XC IO, | | | | |
| 0.288%, 07/10/2039 (S) | | 1,838,541 | | 31,498 |
| Series 2010-C2, Class XA IO, | | | | |
| 0.699%, 12/10/2043 (S) | | 62,522,780 | | 2,031,990 |
| Series 2010, Class C2, | | | | |
| 5.231%, 12/10/2043 (P)(S) | | 2,580,000 | | 2,604,265 |
| Series 2004-GG2, Class E, | | | | |
| 5.575%, 08/10/2038 (P) | | 800,000 | | 735,744 |
| Series 2007-GG10, Class A4, | | | | |
| 5.804%, 08/10/2045 (P) | | 5,060,000 | | 5,405,245 |
| Series 2010-C1, Class D, | | | | |
| 6.006%, 08/10/2043 (P)(S) | | 2,000,000 | | 2,071,271 |
| GSR Mortgage Loan Trust | | | | |
| Series 2005-AR6, Class 3A1, | | | | |
| 2.763%, 09/25/2035 (P) | | 2,409,691 | | 2,206,559 |
| Series 2004-14, Class 3A2, | | | | |
| 3.145%, 12/25/2034 (P) | | 281,987 | | 214,275 |
| Series 2004-9, Class B1, | | | | |
| 3.575%, 08/25/2034 (P) | | 277,619 | | 121,289 |
| Series 2006-AR1, Class 3A1, | | | | |
| 5.141%, 01/25/2036 (P) | | 547,868 | | 492,211 |
| Harborview Mortgage Loan Trust | | | | |
| Series 2007-6, Class ES IO, | | | | |
| 0.342%, 08/19/2037 (S) | | 7,817,496 | | 49,250 |
| Series 2007-3, Class ES IO, | | | | |
| 0.349%, 05/19/2047 | | 9,415,572 | | 61,672 |
| Series 2007-4, Class ES IO, | | | | |
| 0.350%, 07/19/2047 | | 11,286,885 | | 61,062 |
| Series 2005-11, Class X IO, | | | | |
| 2.188%, 08/19/2045 | | 3,072,914 | | 141,101 |
| Series 2005-8, Class 1X IO, | | | | |
| 2.266%, 09/19/2035 | | 3,847,984 | | 204,289 |
| IndyMac Index Mortgage Loan Trust | | | | |
| Series 2005-AR18, Class 2X IO, | | | | |
| 1.917%, 10/25/2036 | | 10,852,737 | | 488,373 |
| Series 2005-AR18, Class 1X IO, | | | | |
| 2.217%, 10/25/2036 | | 8,681,676 | | 390,675 |
| Series 2005-AR5, Class B1, | | | | |
| 2.749%, 05/25/2035 (P) | | 285,449 | | 6,037 |
| Series 2004-AR13, Class B1, | | | | |
| 5.296%, 01/25/2035 | | 176,515 | | 21,204 |
| JPMorgan Chase Commercial | | | | |
| Mortgage Securities Corp. | | | | |
| Series 2005-LDP2, Class A3, | | | | |
| 4.697%, 07/15/2042 | | 2,043,764 | | 2,092,592 |
| Series 2005-LDP2, Class A4, | | | | |
| 4.738%, 07/15/2042 | | 1,830,000 | | 1,928,851 |
| Series 2005-LDP3, Class AJ, | | | | |
| 4.967%, 08/15/2042 (P) | | 2,000,000 | | 2,060,930 |
| Series 2005-LDP3, Class A4B, | | | | |
| 4.996%, 08/15/2042 (P) | | 2,120,000 | | 2,216,141 |
| Series 2005-IDP4, Class AJ, | | | | |
| 5.040%, 10/15/2042 (P) | | 1,000,000 | | 1,013,354 |
| Series 2005-LDP4, Class B, | | | | |
| 5.129%, 10/15/2042 (P) | | 215,000 | | 197,959 |
| Series 2005-CB11, Class A3, | | | | |
| 5.197%, 08/12/2037 | | 1,175,000 | | 1,206,087 |
| |
| The accompanying notes are an integral part of the financial statements. | 27 |
John Hancock Funds II
Portfolio of Investments — February 28, 2011 (Unaudited) (showing percentage of total net assets)
| | | | |
| Active Bond Fund (continued) | | | |
| | | Shares or | | |
| | | Principal | | |
| | | Amount | | Value |
| |
|
| |
| COLLATERALIZED MORTGAGE | | | | |
| OBLIGATIONS (continued) | | | | |
| Commercial & Residential (continued) | | | | |
| JPMorgan Chase Commercial Mortgage | | | | |
| Securities Corp. (continued) | | | | |
| Series 2005-LDP5, Class A4, | | | | |
| 5.229%, 12/15/2044 (P) | $ | 2,025,000 | $ | 2,182,268 |
| Series 2005-LDP5, Class A3, | | | | |
| 5.258%, 12/15/2044 | | 5,100,000 | | 5,357,121 |
| Series 2007-LDPX, Class A2S, | | | | |
| 5.305%, 01/15/2049 | | 670,000 | | 685,266 |
| Series 2005-LDP5, Class AJ, | | | | |
| 5.350%, 12/15/2044 (P) | | 1,225,000 | | 1,275,236 |
| Series 2002-C1, Class A3, | | | | |
| 5.376%, 07/12/2037 | | 421,734 | | 438,740 |
| Series 2005-LDP5, Class G, | | | | |
| 5.384%, 12/15/2044 (P)(S) | | 600,000 | | 383,316 |
| Series 2006-LDP8, Class A4, | | | | |
| 5.399%, 05/15/2045 | | 2,440,000 | | 2,624,437 |
| Series 2006-LDP8, Class AM, | | | | |
| 5.440%, 05/15/2045 | | 5,870,000 | | 6,176,960 |
| Series 2007-CB18, Class A4, | | | | |
| 5.440%, 06/12/2047 | | 2,275,000 | | 2,417,600 |
| Series 2006-LDP8, Class A3B, | | | | |
| 5.447%, 05/15/2045 | | 845,000 | | 882,272 |
| Series 2007-LDPX Class AM, | | | | |
| 5.464%, 01/15/2049 (P) | | 5,000,000 | | 5,030,900 |
| Series 2006-LDP8, Class AJ, | | | | |
| 5.480%, 05/15/2045 (P) | | 3,000,000 | | 2,925,715 |
| Series 2007-LD11, Class A4, | | | | |
| 5.818%, 06/15/2049 (P) | | 1,650,000 | | 1,777,183 |
| Series 2006-LDP7, Class AM, | | | | |
| 5.875%, 04/15/2045 | | 2,630,000 | | 2,799,917 |
| JPMorgan Mortgage Trust, | | | | |
| Series 2006-A7, Class 2A5 | | | | |
| 5.710%, 01/25/2037 (P) | | 384,952 | | 33,593 |
| LB Commercial Conduit Mortgage Trust, | | | | |
| Series 2007-C3, Class AM | | | | |
| 5.950%, 07/15/2044 (P) | | 2,000,000 | | 2,038,423 |
| LB-UBS Commercial Mortgage Trust | | | | |
| Series 2005-C1, Class XCL IO, | | | | |
| 0.408%, 02/15/2040 (S) | | 580,691 | | 11,453 |
| Series 2004-C1, Class XCL IO, | | | | |
| 0.883%, 01/15/2036 (S) | | 22,663,430 | | 528,525 |
| Series 2005-C1, Class A2, | | | | |
| 4.310%, 02/15/2030 | | 102,780 | | 102,892 |
| Series 2005-C5, Class A2, | | | | |
| 4.885%, 09/15/2030 | | 50,848 | | 51,552 |
| Series 2005-C5, Class AJ, | | | | |
| 5.057%, 09/15/2040 (P) | | 1,000,000 | | 1,036,600 |
| Series 2005-C2, Class E, | | | | |
| 5.345%, 04/15/2040 (P) | | 740,000 | | 639,375 |
| Series 2006-C6, Class AM, | | | | |
| 5.413%, 09/15/2039 | | 4,070,000 | | 4,260,899 |
| Series 2007-C2, Class A3, | | | | |
| 5.430%, 02/15/2040 | | 2,430,000 | | 2,593,294 |
| Series 2006-C4, Class A4, | | | | |
| 5.883%, 06/15/2038 (P) | | 1,713,000 | | 1,887,160 |
| Series 2002-C1, Class A4, | | | | |
| 6.462%, 03/15/2031 | | 28,854 | | 29,895 |
| Mastr Adjustable Rate Mortgages Trust | | | | |
| Series 2004-13, Class 2A1, | | | | |
| 2.826%, 04/21/2034 (P) | | 755,810 | | 738,810 |
| Series 2004-8, Class 5A1, | | | | |
| 2.842%, 08/25/2034 (P) | | 509,330 | | 493,541 |
| | | | |
| Active Bond Fund (continued) | | | |
| | | Shares or | | |
| | | Principal | | |
| | | Amount | | Value |
| |
|
| |
| COLLATERALIZED MORTGAGE | | | | |
| OBLIGATIONS (continued) | | | | |
| Commercial & Residential (continued) | | | | |
| Merrill Lynch Floating Trust | | | | |
| Series 2006-1, Class A2, | | | | |
| 0.396%, 06/15/2022 (P)(S) | $ | 1,670,000 | $ | 1,545,086 |
| Series 2006-1, Class D, | | | | |
| 0.466%, 06/15/2022 (P)(S) | | 1,750,000 | | 1,490,300 |
| Merrill Lynch Mortgage Trust | | | | |
| Series 2005-CIP1, Class XC IO, | | | | |
| 0.091%, 07/12/2038 (S) | | 195,426,278 | | 980,063 |
| Series 2006-C2, Class X IO, | | | | |
| 0.363%, 08/12/2043 (S) | | 20,246,130 | | 321,596 |
| Series 2008-C1, Class X IO, | | | | |
| 0.553%, 02/12/2051 (S) | | 32,886,097 | | 707,666 |
| Series 2004-KEY2, Class A4, | | | | |
| 4.864%, 08/12/2039 (P) | | 31,988 | | 33,609 |
| Series 2005-LC1, Class AJ, | | | | |
| 5.331%, 01/12/2044 (P) | | 4,800,000 | | 4,861,308 |
| Series 2006-C1, Class AM, | | | | |
| 5.659%, 05/12/2039 (P) | | 1,000,000 | | 1,072,902 |
| Series 2008-C1, Class A4, | | | | |
| 5.690%, 02/12/2051 | | 1,080,000 | | 1,156,585 |
| Series 2007-C1, ClassAM, | | | | |
| 5.827%, 06/12/2050 (P) | | 2,000,000 | | 2,055,065 |
| Merrill Lynch/Countrywide | | | | |
| Commercial Mortgage Trust | | | | |
| Series 2007-5, Class A4, | | | | |
| 5.378%, 08/12/2048 | | 2,070,000 | | 2,176,812 |
| Series 2006-1, Class AJ, | | | | |
| 5.530%, 02/12/2039 (P) | | 505,000 | | 517,841 |
| Series 2006-2, Class A4, | | | | |
| 5.904%, 06/12/2046 (P) | | 2,865,000 | | 3,162,451 |
| MLCC Mortgage Investors, Inc. | | | | |
| Series 2007-3, Class M1, | | | | |
| 5.481%, 09/25/2037 (P) | | 228,151 | | 130,799 |
| Series 2007-3, Class M2, | | | | |
| 5.481%, 09/25/2037 (P) | | 133,744 | | 66,544 |
| Series 2007-3, Class M3, | | | | |
| 5.481%, 09/25/2037 (P) | | 55,072 | | 24,634 |
| Series 2006-3, Class 2A1, | | | | |
| 5.967%, 10/25/2036 (P) | | 2,522,575 | | 2,358,290 |
| Morgan Stanley Capital I | | | | |
| Series 2005-T17, Class X1 IO, | | | | |
| 0.220%, 12/13/2041 (S) | | 1,332,961 | | 17,116 |
| Series 2005-IQ9, Class X1 IO, | | | | |
| 0.312%, 07/15/2056 (S) | | 596,120 | | 17,594 |
| Series 2007-SRR3, Class A, | | | | |
| 0.562%, 12/20/2049 (P)(S) | | 1,000,000 | | 29,600 |
| Series 2007-SRR3, Class B, | | | | |
| 0.662%, 12/20/2049 (P)(S) | | 1,000,000 | | 22,500 |
| Series 2005-IQ9, Class A3, | | | | |
| 4.540%, 07/15/2056 | | 2,940,000 | | 3,016,596 |
| Series 2005-HQ6, Class A2A, | | | | |
| 4.882%, 08/13/2042 | | 1,472,194 | | 1,490,500 |
| Series 2005-HQ7, Class A2, | | | | |
| 5.202%, 11/14/2042 (P) | | 365,821 | | 378,809 |
| Series 2005-HQ7, Class AJ, | | | | |
| 5.202%, 11/14/2042 (P) | | 1,500,000 | | 1,547,600 |
| Series 2011-C1, Class B, | | | | |
| 5.256%, 09/15/2047 (P)(S) | | 2,500,000 | | 2,611,345 |
| Series 2011-C1, Class C, | | | | |
| 5.256%, 09/15/2047 (P)(S) | | 1,500,000 | | 1,525,931 |
| Series 2011-C1, Class D, | | | | |
| 5.256%, 09/15/2047 (P)(S) | | 1,500,000 | | 1,487,833 |
| Series 2007-IQ13, Class A4, | | | | |
| 5.364%, 03/15/2044 | | 2,375,000 | | 2,479,065 |
| |
| The accompanying notes are an integral part of the financial statements. | 28 |
John Hancock Funds II
Portfolio of Investments — February 28, 2011 (Unaudited) (showing percentage of total net assets)
| | | | |
| Active Bond Fund (continued) | | | |
| | | Shares or | | |
| | | Principal | | |
| | | Amount | | Value |
| |
|
| |
| COLLATERALIZED MORTGAGE | | | | |
| OBLIGATIONS (continued) | | | | |
| Commercial & Residential (continued) | | | | |
| Morgan Stanley Capital I (continued) | | | | |
| Series 2008-HQ8, Class AM, | | | | |
| 5.436%, 03/12/2044 (P) | $ | 2,080,000 | $ | 2,214,703 |
| Series 2007-T27, Class A4, | | | | |
| 5.650%, 06/11/2042 (P) | | 275,000 | | 299,586 |
| Series 2006-IQ11, Class AJ, | | | | |
| 5.735%, 10/15/2042 (P) | | 5,300,000 | | 5,506,087 |
| Series 2006-IQ11, Class AM, | | | | |
| 5.735%, 10/15/2042 (P) | | 1,300,000 | | 1,387,058 |
| Series 2006-T23, Class A4, | | | | |
| 5.806%, 08/12/2041 (P) | | 630,000 | | 696,487 |
| Morgan Stanley Capital IMSC, | | | | |
| Series 2006-IQ11, Class B | | | | |
| 5.735%, 10/15/2042 (P) | | 1,230,000 | | 1,193,578 |
| Provident Funding Mortgage Loan Trust, | | | | |
| Series 2005-1, Class B1 | | | | |
| 2.764%, 05/25/2035 (P) | | 297,955 | | 69,131 |
| Residential Accredit Loans, Inc. | | | | |
| Series 2005-QO4, Class X IO, | | | | |
| 2.394%, 12/25/2045 | | 8,996,795 | | 459,573 |
| Series 2004-QS16, Class 1A1, | | | | |
| 5.500%, 12/25/2034 | | 9,608 | | 9,515 |
| Salomon Brothers Mortgage | | | | |
| Securities VII, | | | | |
| Series 2001-C1, Class A3, | | | | |
| 6.428%, 12/18/2035 | | 2,382 | | 2,381 |
| Sequoia Mortgage Trust, | | | | |
| Series 2005-3, Class A1, | | | | |
| 0.462%, 05/20/2035 (P) | | 4,426 | | 3,959 |
| Structured Asset Securities Corp., | | | | |
| Series 2003-6A, Class B1 | | | | |
| 2.843%, 03/25/2033 (P) | | 421,629 | | 298,979 |
| Thornburg Mortgage Securities Trust, | | | | |
| Series 2004-1, Class II2A | | | | |
| 1.819%, 03/25/2044 (P) | | 2,155,211 | | 2,019,077 |
| Timberstar Trust, | | | | |
| Series 2006-1A, Class A, | | | | |
| 5.668%, 10/15/2036 (S) | | 900,000 | | 965,093 |
| Wachovia Bank | | | | |
| Commercial Mortgage Trust | | | | |
| Series 2005-C17, Class XC IO, | | | | |
| 0.119%, 03/15/2042 (S) | | 70,480,268 | | 533,966 |
| Series 2005-C19, Class AJ, | | | | |
| 4.793%, 05/15/2044 | | 37,517 | | 37,815 |
| Series 2005-C16, Class C, | | | | |
| 4.985%, 10/15/2041 (P) | | 1,700,000 | | 1,656,106 |
| Series 2006-C29, Class AM, | | | | |
| 5.339%, 11/15/2048 | | 1,000,000 | | 1,021,659 |
| Series 2006-C29, Class AJ, | | | | |
| 5.368%, 11/15/2048 (P) | | 2,000,000 | | 1,920,190 |
| WaMu Commercial | | | | |
| Mortgage Securities Trust | | | | |
| Series 2006-SL1, Class A, | | | | |
| 5.303%, 11/23/2043 (P)(S) | | 684,696 | | 684,068 |
| Series 2007-SL3, Class A, | | | | |
| 5.939%, 03/23/2045 (P)(S) | | 474,624 | | 477,254 |
| WaMu Mortgage Pass | | | | |
| Through Certificates | | | | |
| Series 2005-AR6, Class B1, | | | | |
| 0.862%, 04/25/2045 (P) | | 916,523 | | 153,277 |
| Series 2005-AR13, Class B1, | | | | |
| 0.862%, 10/25/2045 (P) | | 807,466 | | 142,098 |
| Series 2005-AR19, Class B1, | | | | |
| 0.962%, 12/25/2045 (P) | | 486,451 | | 63,134 |
| | | | |
| Active Bond Fund (continued) | | | |
| | | Shares or | | |
| | | Principal | | |
| | | Amount | | Value |
| |
|
| |
| COLLATERALIZED MORTGAGE | | | | |
| OBLIGATIONS (continued) | | | | |
| Commercial & Residential (continued) | | | | |
| WaMu Mortgage Pass Through | | | | |
| Certificates (continued) | | | | |
| Series 2006-AR4, Class 1A1B, | | | | |
| 1.232%, 05/25/2046 (P) | $ | 436,982 | $ | 268,179 |
| Series 2004-AR13, Class X IO, | | | | |
| 1.505%, 11/25/2034 | | 30,198,253 | | 1,476,900 |
| Series 2005-AR13, Class X IO, | | | | |
| 1.561%, 10/25/2045 | | 96,743,714 | | 4,813,967 |
| Series 2005-AR1, Class X IO, | | | | |
| 1.582%, 01/25/2045 | | 17,417,322 | | 780,333 |
| Series 2005-AR8, Class X IO, | | | | |
| 1.710%, 07/25/2045 | | 54,299,558 | | 2,784,623 |
| Series 2005-AR12, Class 1A2, | | | | |
| 2.722%, 10/25/2035 (P) | | 489,748 | | 479,398 |
| Washington Mutual Mortgage Pass- | | | | |
| Through, Series 2005-1, Class 6A1 | | | | |
| 6.500%, 03/25/2035 | | 13,770 | | 13,757 |
| Wells Fargo Mortgage | | | | |
| Backed Securities Trust | | | | |
| Series 2005-AR5, Class 1A1, | | | | |
| 5.088%, 04/25/2035 | | 2,141,358 | | 2,054,851 |
| Series 2006-AR15, Class A3, | | | | |
| 5.416%, 10/25/2036 (P) | | 470,155 | | 147,211 |
| WF-RBS Commercial Mortgage Trust, | | | | |
| Series 2011-C2, Class B | | | | |
| 5.174%, 02/15/2044 (P)(S) | | 1,850,000 | | 1,886,974 |
| | |
|
| | | | | 227,039,428 |
| U.S. Government Agency - 0.57% | | | | |
| Federal Home Loan Mortgage Corp. | | | | |
| Series K010, Class X1 IO, | | | | |
| 0.419%, 10/25/2020 | | 41,000,000 | | 1,049,830 |
| Series 3630, Class BI IO, | | | | |
| 4.000%, 05/15/2027 | | 641,336 | | 71,802 |
| Series 3623, Class LI IO, | | | | |
| 4.500%, 01/15/2025 | | 970,155 | | 107,753 |
| Series 3794, Class PI IO, | | | | |
| 4.500%, 02/15/2038 | | 2,650,132 | | 482,098 |
| Series 2005-3019, Class MD, | | | | |
| 4.750%, 01/15/2031 | | 164,485 | | 167,278 |
| Series 3581, Class IO, | | | | |
| 6.000%, 10/15/2039 | | 963,627 | | 183,371 |
| Series T-41, Class 3A, | | | | |
| 7.283%, 07/25/2032 (P) | | 2,757 | | 3,156 |
| Federal National Mortgage Association | | | | |
| Series 2003-18, Class EX, | | | | |
| 4.000%, 06/25/2017 | | 365,981 | | 373,431 |
| Series 2010-14, Class AI IO, | | | | |
| 4.000%, 08/25/2027 | | 1,837,099 | | 204,117 |
| Series 2010-36, Class BI IO, | | | | |
| 4.000%, 03/25/2028 | | 1,937,719 | | 224,934 |
| Series 402, Class 4 IO, | | | | |
| 4.000%, 10/25/2039 | | 2,770,603 | | 589,405 |
| Series 402, Class 3 IO, | | | | |
| 4.000%, 11/25/2039 | | 1,589,690 | | 353,793 |
| Series 2009-109, Class IW IO, | | | | |
| 4.500%, 04/25/2038 | | 1,463,635 | | 249,284 |
| Series 398, Class C3 IO, | | | | |
| 4.500%, 05/25/2039 | | 2,109,915 | | 481,027 |
| Series 401, Class C2 IO, | | | | |
| 4.500%, 06/25/2039 | | 1,423,335 | | 290,770 |
| Series 402, Class 7 IO, | | | | |
| 4.500%, 11/25/2039 | | 2,659,186 | | 595,225 |
| |
| The accompanying notes are an integral part of the financial statements. | 29 |
John Hancock Funds II
Portfolio of Investments — February 28, 2011 (Unaudited) (showing percentage of total net assets)
| | | | |
| Active Bond Fund (continued) | | | |
| | | Shares or | | |
| | | Principal | | |
| | | Amount | | Value |
| |
|
| |
| COLLATERALIZED MORTGAGE | | | | |
| OBLIGATIONS (continued) | | | | |
| U.S. Government Agency (continued) | | | | |
| Federal National Mortgage | | | | |
| Association (continued) | | | | |
| Series 2009-47, Class EI IO, | | | | |
| 5.000%, 08/25/2019 | $ | 1,477,205 | $ | 158,340 |
| Series 2009-50, Class GI IO, | | | | |
| 5.000%, 05/25/2039 | | 2,561,974 | | 407,823 |
| Series 2009-78, Class IB IO, | | | | |
| 5.000%, 06/25/2039 | | 3,433,237 | | 509,057 |
| Series 2001-50, Class BA, | | | | |
| 7.000%, 10/25/2041 | | 852 | | 938 |
| Series 2002-W3, Class A5, | | | | |
| 7.500%, 11/25/2041 | | 28,232 | | 32,418 |
| Government National Mortgage | | | | |
| Association, Series 2010-78, Class AI | | | | |
| IO | | | | |
| 4.500%, 04/20/2039 | | 2,673,897 | | 359,113 |
| | |
|
| | | | | 6,894,963 |
|
| TOTAL COLLATERALIZED MORTGAGE | | | |
| OBLIGATIONS (Cost $218,643,034) | | | $ | 233,934,391 |
|
| |
| ASSET BACKED SECURITIES - 2.36% | | | | |
| Aegis Asset Backed Securities Trust, | | | | |
| Series 2004-3, Class A1 | | | | |
| 0.622%, 09/25/2034 (P) | | 607,263 | | 541,309 |
| Amresco Residential Securities Mortgage | | | | |
| Loan Trust, Series 1998-1, Class A6 | | | | |
| 6.510%, 08/25/2027 | | 345 | | 349 |
| Anthracite, Ltd. | | | | |
| Series 2002-CIBA, Class A, | | | | |
| 0.712%, 05/24/2017 (P)(S) | | 525,826 | | 499,534 |
| Series 2002-2A, Class B, | | | | |
| 5.488%, 12/24/2037 (S) | | 600,000 | | 551,442 |
| Arbor Realty Mortgage Securities | | | | |
| Series 2006-1A, Class C, | | | | |
| 0.903%, 01/26/2042 (P)(S) | | 370,000 | | 92,500 |
| Series 2006-1A, Class F, | | | | |
| 1.353%, 01/26/2042 (P)(S) | | 615,000 | | 44,963 |
| Argent Securities, Inc., Series 2004-W1, | | | | |
| Class M3 | | | | |
| 1.712%, 03/25/2034 (P) | | 7,816 | | 2,940 |
| Asset Backed Funding Certificates, | | | | |
| Series 2005-HE1, Class M1 | | | | |
| 0.682%, 03/25/2035 (P) | | 800,108 | | 703,316 |
| Bayview Financial Acquisition Trust, | | | | |
| Series 2006-A, Class 2A3 | | | | |
| 0.612%, 02/28/2041 (P) | | 487,890 | | 420,092 |
| Bravo Mortgage Asset Trust, | | | | |
| Series 2006-1A, Class A2 | | | | |
| 0.502%, 07/25/2036 (P)(S) | | 1,476,014 | | 1,278,770 |
| Carrington Mortgage Loan Trust, | | | | |
| Series 2006-NC4, Class A5 | | | | |
| 0.322%, 10/25/2036 (P) | | 175,142 | | 142,673 |
| Cedarwoods Credit CDO, Ltd., | | | | |
| Series 2007-2A, Class B | | | | |
| 0.642%, 02/25/2052 (P)(S) | | 1,000,000 | | 140,600 |
| Countrywide Asset-Backed Certificates, | | | | |
| Series 2006-3, Class 2A2 | | | | |
| 0.442%, 06/25/2036 (P) | | 2,604,313 | | 2,282,159 |
| Credit-Based Asset Servicing | | | | |
| and Securitization | | | | |
| Series 2006-CB2, Class AF2, | | | | |
| 5.501%, 12/25/2036 | | 3,197 | | 2,291 |
| | | | |
| Active Bond Fund (continued) | | | |
| | | Shares or | | |
| | | Principal | | |
| | | Amount | | Value |
| |
|
| |
| ASSET BACKED SECURITIES (continued) | | | |
| Credit-Based Asset Servicing and | | | | |
| Securitization (continued) | | | | |
| Series 2006-MH1, Class B1, | | | | |
| 6.250%, 10/25/2036 (S) | $ | 460,000 | $ | 294,813 |
| Credit-Based Asset Servicing and | | | | |
| Securitization LLC, Series 2005-CB2, | | | | |
| Class M1 | | | | |
| 0.702%, 04/25/2036 (P) | | 1,910,484 | | 1,772,396 |
| Crest, Ltd. | | | | |
| Series 2002-IGA, Class A, | | | | |
| 0.754%, 07/28/2017 (P)(S) | | 378,466 | | 375,404 |
| Series 2003-1A, Class B1, | | | | |
| 1.261%, 05/28/2038 (P)(S) | | 600,000 | | 471,438 |
| CW Capital Cobalt, Ltd., | | | | |
| Series 2005-1A, Class A1 | | | | |
| 0.592%, 05/25/2045 (P)(S) | | 262,646 | | 188,229 |
| Dillon Read CMBS CDO, Ltd., | | | | |
| Series 2006-1A, Class A3 | | | | |
| 1.003%, 12/05/2046 (H)(I)(P)(S) | | 975,000 | | 0 |
| Dominos Pizza Master Issuer LLC | | | | |
| Series 2007-1, Class A2, | | | | |
| 5.261%, 04/25/2037 (S) | | 2,265,000 | | 2,332,950 |
| Series 2007-1, Class M1, | | | | |
| 7.629%, 04/25/2037 | | 3,085,000 | | 3,181,406 |
| Hertz Vehicle Financing LLC, | | | | |
| Series 2009-2A, Class A2 | | | | |
| 5.290%, 03/25/2016 (S) | | 860,000 | | 943,884 |
| Highland Park CDO, Ltd., | | | | |
| Series 2006-1A, Class A2 | | | | |
| 0.712%, 11/25/2051 (P)(S) | | 1,230,000 | | 135,300 |
| JER CDO, Series 2006-2A, Class AFL | | | | |
| 0.592%, 03/25/2045 (P)(S) | | 637,087 | | 117,861 |
| Leaf II Receivables Funding LLC, | | | | |
| Series 2011-1, Class A | | | | |
| 1.700%, 12/20/2018 (S) | | 1,279,545 | | 1,245,616 |
| LNR CDO, Ltd., Series 2006-1A, | | | | |
| Class BFL | | | | |
| 0.812%, 05/28/2043 (H)(I)(P)(S) | | 700,000 | | 0 |
| Merrill Lynch Mortgage Investors, Inc., | | | | |
| Series 2005-HE2, Class A2C | | | | |
| 0.632%, 09/25/2036 (P) | | 1,415,000 | | 1,284,836 |
| N-Star Real Estate CDO, Ltd. | | | | |
| Series 2005-4A, Class A, | | | | |
| 0.612%, 07/27/2040 (P)(S) | | 694,190 | | 618,232 |
| Series 2006-7A, Class B, | | | | |
| 0.642%, 06/22/2051 (P)(S) | | 900,000 | | 36,000 |
| Series 2006-8A, Class E, | | | | |
| 1.011%, 02/01/2041 (P)(S) | | 475,000 | | 118,750 |
| New Century Home Equity Loan Trust, | | | | |
| Series 2005-1, Class M1 | | | | |
| 0.712%, 03/25/2035 (P) | | 840,000 | | 659,932 |
| Newcastle CDO, Ltd., Series 2005-7A, | | | | |
| Class 2FL | | | | |
| 0.762%, 12/24/2050 (P)(S) | | 570,000 | | 1,425 |
| Novastar Home Equity Loan, | | | | |
| Series 2004-4, Class M3 | | | | |
| 1.342%, 03/25/2035 (P) | | 1,650,000 | | 1,525,575 |
| Park Place Securities, Inc. | | | | |
| Series 2005-WCH1, Class M2, | | | | |
| 0.782%, 01/25/2036 (P) | | 1,890,000 | | 1,752,357 |
| Series 2004-WHQ2, Class M2, | | | | |
| 0.892%, 02/25/2035 (P) | | 1,325,000 | | 1,210,450 |
| Prima Capital, Ltd., Series 2006-CR1A, | | | | |
| Class A1 | | | | |
| 7.000%, 12/25/2048 | | 570,576 | | 539,685 |
| |
| The accompanying notes are an integral part of the financial statements. | 30 |
John Hancock Funds II
Portfolio of Investments — February 28, 2011 (Unaudited) (showing percentage of total net assets)
| | | | |
| Active Bond Fund (continued) | | | |
| | | Shares or | | |
| | | Principal | | |
| | | Amount | | Value |
| |
|
| |
| ASSET BACKED SECURITIES (continued) | | | |
| RAIT Preferred Funding, Ltd., | | | | |
| Series 2007-2A, Class B | | | | |
| 1.062%, 06/25/2045 (P)(S) | $ | 685,000 | $ | 245,648 |
| Renaissance Home Equity Loan Trust | | | | |
| Series 2005-2, Class AF3, | | | | |
| 4.499%, 08/25/2035 | | 430,632 | | 429,553 |
| Series 2005-2, Class AF4, | | | | |
| 4.934%, 08/25/2035 | | 1,895,000 | | 1,616,642 |
| Residential Asset Securities Corp., | | | | |
| Series 2005-KS4, Class M1 | | | | |
| 0.672%, 05/25/2035 (P) | | 845,000 | | 792,114 |
| Wells Fargo Home Equity Trust, | | | | |
| Series 2004-2, Class AI5 | | | | |
| 4.890%, 05/25/2034 (P) | | 33,232 | | 33,566 |
|
| TOTAL ASSET BACKED SECURITIES (Cost $35,347,705) | | $ | 28,627,000 |
|
| |
| COMMON STOCKS - 0.00% | | | | |
| Consumer Discretionary - 0.00% | | | | |
| Greektown Superholdings, Inc. (I) | | 166 | | 16,404 |
| Financials - 0.00% | | | | |
| BTA Bank JSC (I)(S) | | 17 | | 344 |
|
| TOTAL COMMON STOCKS (Cost $18,799) | | $ | 16,748 |
|
| |
| PREFERRED SECURITIES - 0.29% | | | | |
| Consumer Discretionary - 0.03% | | | | |
| Greektown | | | | |
| Superholdings, Inc., Series A (I) | | 3,249 | $ | 321,066 |
| Consumer Staples - 0.03% | | | | |
| Ocean Spray Cranberries, Inc., | | | | |
| Series A, 6.250% (S) | | 5,034 | | 404,922 |
| Energy - 0.04% | | | | |
| Apache Corp., Series D, 6.000% (L) | | 7,312 | | 498,093 |
| Financials - 0.17% | | | | |
| Bank of America Corp., | | | | |
| Series MER, 8.625% | | 70,775 | | 1,847,228 |
| Citigroup Capital XIII (7.875% to | | | | |
| 10-30-2015, then | | | | |
| 3 month LIBOR + 6.370%) | | 8,200 | | 221,810 |
| | |
|
| | | | | 2,069,038 |
| Telecommunication Services - 0.02% | | | | |
| Telephone & Data Systems, Inc., | | | | |
| Series A, 7.600% | | 9,040 | | 229,074 |
|
| TOTAL PREFERRED SECURITIES (Cost $3,332,895) | | $ | 3,522,193 |
|
| |
| SECURITIES LENDING COLLATERAL - 0.54% | | | |
| John Hancock Collateral | | | | |
| Investment Trust, 0.2855% (W)(Y) | | 656,937 | | 6,574,232 |
|
| TOTAL SECURITIES LENDING | | | | |
| COLLATERAL (Cost $6,574,193) | | | $ | 6,574,232 |
|
| |
| SHORT-TERM INVESTMENTS - 5.27% | | | |
| Short-Term Securities* - 5.27% | | | | |
| Federal Home Loan Bank Discount | | | | |
| Notes, 0.0702%, 03/01/2011 | $ | 26,600,000 | $ | 26,600,000 |
| | | | |
| Active Bond Fund (continued) | | | |
| | | Shares or | | |
| | | Principal | | |
| | | Amount | | Value |
| |
|
| |
| SHORT-TERM INVESTMENTS (continued) | | | |
| Short-Term Securities* (continued) | | | | |
| State Street Institutional | | | | |
| U.S. Government Money Market | | | | |
| Fund, 0.0647% | $ | 37,166,630 | $ | 37,166,630 |
| | |
|
| | | | | 63,766,630 |
|
| TOTAL SHORT-TERM INVESTMENTS (Cost $63,766,630) | $ | 63,766,630 |
|
| Total Investments (Active Bond Fund) | | | | |
| (Cost $1,165,134,980) - 99.95% | | | $ | 1,210,515,237 |
| Other assets and liabilities, net - 0.05% | | | | 587,332 |
| | |
|
| TOTAL NET ASSETS - 100.00% | | | $ | 1,211,102,569 |
| | |
|
| |
| |
| |
| All Cap Core Fund | | | | |
| | | Shares or | | |
| | | Principal | | |
| | | Amount | | Value |
| |
|
| |
| COMMON STOCKS - 98.40% | | | | |
| Consumer Discretionary - 11.12% | | | | |
| Auto Components - 1.03% | | | | |
| Autoliv, Inc. (L) | | 74,300 | $ | 5,564,327 |
| Dana Holding Corp. (I) | | 19,000 | | 358,720 |
| Standard Motor Products, Inc. | | 11,900 | | 138,397 |
| TRW Automotive Holdings Corp. (I) | | 13,900 | | 789,520 |
| | |
|
| | | | | 6,850,964 |
| Distributors - 0.07% | | | | |
| Core-Mark Holding Company, Inc. (I)(L) | | 13,300 | | 451,535 |
| Diversified Consumer Services - 0.62% | | | | |
| Apollo Group, Inc., Class A (I) | | 49,900 | | 2,258,474 |
| Career Education Corp. (I) | | 4,300 | | 103,673 |
| Corinthian Colleges, Inc. (I)(L) | | 150,300 | | 787,572 |
| DeVry, Inc. | | 6,100 | | 330,925 |
| ITT Educational Services, Inc. (I)(L) | | 8,500 | | 644,725 |
| | |
|
| | | | | 4,125,369 |
| Hotels, Restaurants & Leisure - 2.11% | | | | |
| Brinker International, Inc. | | 47,200 | | 1,115,808 |
| Domino’s Pizza, Inc. (I) | | 20,500 | | 345,835 |
| International Speedway Corp., Class A (L) | 19,500 | | 540,540 |
| Marcus Corp. | | 8,800 | | 114,576 |
| Marriott International, Inc., Class A | | 11,000 | | 431,310 |
| McDonald’s Corp. | | 39,100 | | 2,959,088 |
| Ruby Tuesday, Inc. (I) | | 10,300 | | 137,608 |
| Starwood Hotels & | | | | |
| Resorts Worldwide, Inc. (L) | | 57,000 | | 3,482,700 |
| Wynn Resorts, Ltd. | | 39,400 | | 4,843,442 |
| | |
|
| | | | | 13,970,907 |
| Household Durables - 0.15% | | | | |
| Blyth, Inc. | | 11,900 | | 409,003 |
| Tupperware Brands Corp. | | 10,300 | | 552,595 |
| | |
|
| | | | | 961,598 |
| Internet & Catalog Retail - 0.10% | | | | |
| Liberty Media Corp. - Interactive, Series A (I) | 41,500 | | 666,490 |
| Leisure Equipment & Products - 0.11% | | | | |
| Jakks Pacific, Inc. (I)(L) | | 40,000 | | 745,600 |
| Media - 3.64% | | | | |
| Comcast Corp., Class A | | 185,200 | | 4,770,752 |
| Dex One Corp. (I) | | 20,500 | | 108,035 |
| Madison Square Garden, Inc., Class A (I) | | 8,100 | | 231,336 |
| The Walt Disney Company | | 188,400 | | 8,240,616 |
| |
| The accompanying notes are an integral part of the financial statements. | 31 |
John Hancock Funds II
Portfolio of Investments — February 28, 2011 (Unaudited) (showing percentage of total net assets)
| | | | |
| All Cap Core Fund (continued) | | | | |
| | | Shares or | | |
| | | Principal | | |
| | | Amount | | Value |
| | |
|
| |
| COMMON STOCKS (continued) | | | | |
| Media (continued) | | | | |
| Time Warner, Inc. | | 180,900 | $ | 6,910,380 |
| Viacom, Inc., Class B | | 86,400 | | 3,858,624 |
| | |
|
| | | | | 24,119,743 |
| Multiline Retail - 0.63% | | | | |
| Dillard’s, Inc., Class A (L) | | 89,900 | | 3,806,366 |
| Tuesday Morning Corp. (I) | | 80,600 | | 376,402 |
| | |
|
| | | | | 4,182,768 |
| Specialty Retail - 2.19% | | | | |
| American Eagle Outfitters, Inc. | | 85,400 | | 1,310,890 |
| Brown Shoe Company, Inc. (L) | | 7,400 | | 114,700 |
| DSW, Inc., Class A (I)(L) | | 4,500 | | 182,745 |
| Hot Topic, Inc. | | 124,000 | | 663,400 |
| Pep Boys - Manny, Moe & Jack | | 9,500 | | 119,035 |
| Shoe Carnival, Inc. (I) | | 11,600 | | 300,904 |
| Stage Stores, Inc. | | 29,800 | | 519,712 |
| The Gap, Inc. (L) | | 245,900 | | 5,540,127 |
| TJX Companies, Inc. | | 93,100 | | 4,642,897 |
| Williams-Sonoma, Inc. | | 30,500 | | 1,100,745 |
| | |
|
| | | | | 14,495,155 |
| Textiles, Apparel & Luxury Goods - 0.47% | | | | |
| Perry Ellis International, Inc. (I)(L) | | 8,800 | | 255,552 |
| The Timberland Company, Class A (I) | | 15,500 | | 572,570 |
| VF Corp. (L) | | 23,800 | | 2,276,946 |
| | |
|
| | | | | 3,105,068 |
| | | |
|
| | | | | 73,675,197 |
| Consumer Staples - 5.99% | | | | |
| Beverages - 1.17% | | | | |
| Molson Coors Brewing Company | | 71,800 | | 3,283,414 |
| The Coca-Cola Company | | 70,000 | | 4,474,400 |
| | |
|
| | | | | 7,757,814 |
| Food & Staples Retailing - 0.91% | | | | |
| Casey’s General Stores, Inc. | | 12,000 | | 492,840 |
| Costco Wholesale Corp. | | 18,900 | | 1,413,531 |
| Walgreen Company | | 95,300 | | 4,130,302 |
| | |
|
| | | | | 6,036,673 |
| Food Products - 1.32% | | | | |
| Chiquita Brands International, Inc. (I)(L) | | 14,900 | | 256,131 |
| Fresh Del Monte Produce, Inc. | | 4,500 | | 128,610 |
| Smart Balance, Inc. (I) | | 66,900 | | 290,346 |
| The Hershey Company | | 18,100 | | 946,992 |
| The J.M. Smucker Company | | 16,400 | | 1,128,976 |
| Tyson Foods, Inc., Class A | | 320,400 | | 5,969,052 |
| | |
|
| | | | | 8,720,107 |
| Household Products - 0.58% | | | | |
| Central Garden & Pet Company, Class A (I) | | 23,600 | | 217,356 |
| Colgate-Palmolive Company | | 46,500 | | 3,651,180 |
| | |
|
| | | | | 3,868,536 |
| Personal Products - 0.47% | | | | |
| Elizabeth Arden, Inc. (I) | | 8,400 | | 244,356 |
| The Estee Lauder Companies, Inc., Class A | | 30,100 | | 2,841,741 |
| | |
|
| | | | | 3,086,097 |
| Tobacco - 1.54% | | | | |
| Lorillard, Inc. | | 67,500 | | 5,181,975 |
| Philip Morris International, Inc. | | 76,500 | | 4,802,670 |
| Universal Corp. (L) | | 5,600 | | 234,192 |
| | |
|
| | | | | 10,218,837 |
| | | |
|
| | | | | 39,688,064 |
| | | | |
| All Cap Core Fund (continued) | | | | |
| | | Shares or | | |
| | | Principal | | |
| | | Amount | | Value |
| | |
|
| |
| COMMON STOCKS (continued) | | | | |
| Energy - 12.60% | | | | |
| Energy Equipment & Services - 2.38% | | | | |
| Complete Production Services, Inc. (I)(L) | | 38,000 | $ | 1,094,780 |
| Helmerich & Payne, Inc. (L) | | 58,400 | | 3,795,416 |
| Nabors Industries, Ltd. (I) | | 23,200 | | 660,504 |
| National Oilwell Varco, Inc. | | 50,700 | | 4,034,199 |
| Oceaneering International, Inc. (I) | | 14,900 | | 1,246,087 |
| Oil States International, Inc. (I) | | 25,424 | | 1,850,613 |
| Patterson-UTI Energy, Inc. | | 70,800 | | 1,935,672 |
| SEACOR Holdings, Inc. | | 12,000 | | 1,137,240 |
| | |
|
| | | | | 15,754,511 |
| Oil, Gas & Consumable Fuels - 10.22% | | | | |
| Chevron Corp. | | 169,400 | | 17,575,250 |
| ConocoPhillips | | 127,500 | | 9,928,425 |
| Contango Oil & Gas Company (I) | | 2,100 | | 128,688 |
| Devon Energy Corp. | | 41,300 | | 3,776,472 |
| Exxon Mobil Corp. | | 293,300 | | 25,085,949 |
| GMX Resources, Inc. (I)(L) | | 46,400 | | 240,816 |
| Noble Energy, Inc. | | 49,400 | | 4,577,404 |
| Valero Energy Corp. | | 110,800 | | 3,122,344 |
| W&T Offshore, Inc. | | 27,600 | | 704,628 |
| Whiting Petroleum Corp. (I) | | 39,000 | | 2,548,260 |
| | |
|
| | | | | 67,688,236 |
| | |
|
| | | | | 83,442,747 |
| Financials - 17.16% | | | | |
| Capital Markets - 2.27% | | | | |
| American Capital, Ltd. (I)(L) | | 152,634 | | 1,425,602 |
| BlackRock, Inc. | | 35,800 | | 7,302,842 |
| Franklin Resources, Inc. | | 23,900 | | 3,002,318 |
| Invesco, Ltd. | | 85,300 | | 2,289,452 |
| Legg Mason, Inc. | | 28,800 | | 1,044,000 |
| | |
|
| | | | | 15,064,214 |
| Commercial Banks - 3.30% | | | | |
| Cathay General Bancorp (L) | | 15,100 | | 267,572 |
| Fifth Third Bancorp | | 263,600 | | 3,848,560 |
| Huntington Bancshares, Inc. | | 104,100 | | 712,044 |
| International Bancshares Corp. | | 4,300 | | 82,087 |
| KeyCorp | | 399,200 | | 3,648,688 |
| M&T Bank Corp. (L) | | 20,600 | | 1,813,830 |
| MB Financial, Inc. | | 7,000 | | 143,990 |
| Pinnacle Financial Partners, Inc. (I) | | 6,900 | | 110,055 |
| Prosperity Bancshares, Inc. (L) | | 6,600 | | 269,412 |
| Signature Bank (I)(L) | | 5,700 | | 295,773 |
| SunTrust Banks, Inc. | | 274,500 | | 8,281,665 |
| Susquehanna Bancshares, Inc. (L) | | 29,300 | | 280,108 |
| Texas Capital Bancshares, Inc. (I)(L) | | 11,200 | | 282,688 |
| Webster Financial Corp. | | 16,300 | | 377,834 |
| Wells Fargo & Company | | 37,800 | | 1,219,428 |
| Wintrust Financial Corp. | | 6,700 | | 224,986 |
| | |
|
| | | | | 21,858,720 |
| Consumer Finance - 1.07% | | | | |
| Capital One Financial Corp. | | 142,200 | | 7,077,294 |
| Diversified Financial Services - 3.22% | | | | |
| JPMorgan Chase & Company | | 349,286 | | 16,308,163 |
| PHH Corp. (I)(L) | | 97,400 | | 2,403,832 |
| The NASDAQ OMX Group, Inc. (I)(L) | | 91,900 | | 2,629,259 |
| | |
|
| | | | | 21,341,254 |
| Insurance - 3.59% | | | | |
| Aflac, Inc. | | 10,900 | | 641,574 |
| Allied World Assurance | | | | |
| Company Holdings, Ltd. | | 48,023 | | 2,963,499 |
| |
| The accompanying notes are an integral part of the financial statements. | 32 |
John Hancock Funds II
Portfolio of Investments — February 28, 2011 (Unaudited) (showing percentage of total net assets)
| | | | |
| All Cap Core Fund (continued) | | | | |
| | | Shares or | | |
| | | Principal | | |
| | | Amount | | Value |
| | |
|
| |
| COMMON STOCKS (continued) | | | | |
| Insurance (continued) | | | | |
| American National Insurance Company | | 2,300 | $ | 186,921 |
| Aspen Insurance Holdings, Ltd. | | 13,300 | | 393,015 |
| Axis Capital Holdings, Ltd. | | 9,800 | | 355,936 |
| Chubb Corp. (L) | | 62,900 | | 3,816,772 |
| Endurance Specialty Holdings, Ltd. (L) | | 4,200 | | 208,278 |
| Everest Re Group, Ltd. | | 5,100 | | 452,115 |
| Fidelity National Financial, Inc., Class A | | 39,500 | | 547,075 |
| Hartford Financial Services Group, Inc. | | 16,100 | | 476,560 |
| Lincoln National Corp. (L) | | 71,900 | | 2,280,668 |
| Markel Corp. (I) | | 500 | | 207,825 |
| Reinsurance Group of America, Inc. | | 13,200 | | 797,148 |
| Stewart Information Services Corp. | | 14,800 | | 165,020 |
| The Travelers Companies, Inc. | | 159,700 | | 9,570,821 |
| Validus Holdings, Ltd. | | 18,300 | | 566,385 |
| Wesco Financial Corp. | | 402 | | 157,246 |
| | |
|
| | | | | 23,786,858 |
| Real Estate Investment Trusts - 3.43% | | | | |
| Agree Realty Corp. (L) | | 2,900 | | 74,037 |
| Ashford Hospitality Trust, Inc. (I)(L) | | 128,100 | | 1,320,711 |
| Capstead Mortage Corp. | | 10,300 | | 135,342 |
| CommonWealth | | 19,300 | | 554,103 |
| Getty Realty Corp. (L) | | 2,700 | | 79,434 |
| HCP, Inc. (L) | | 233,700 | | 8,880,600 |
| Hospitality Properties Trust (L) | | 89,300 | | 2,053,900 |
| Lexington Realty Trust | | 52,600 | | 498,122 |
| Nationwide Health Properties, Inc. | | 20,100 | | 859,074 |
| Parkway Properties, Inc. | | 7,400 | | 119,954 |
| Piedmont Office | | | | |
| Realty Trust, Inc., Class A (L) | | 53,800 | | 1,076,000 |
| Public Storage | | 16,600 | | 1,863,350 |
| Rayonier, Inc. | | 84,400 | | 5,176,252 |
| | |
|
| | | | | 22,690,879 |
| Thrifts & Mortgage Finance - 0.28% | | | | |
| Federal Agricultural | | | | |
| Mortgage Corp., Class C (L) | | 18,200 | | 362,726 |
| People’s United Financial, Inc. (L) | | 111,300 | | 1,466,934 |
| | |
|
| | | | | 1,829,660 |
| | | |
|
| | | | | 113,648,879 |
| Health Care - 10.76% | | | | |
| Biotechnology - 2.51% | | | | |
| Biogen Idec, Inc. (I)(L) | | 120,000 | | 8,208,000 |
| Celgene Corp. (I) | | 45,200 | | 2,400,120 |
| Cephalon, Inc. (I)(L) | | 107,000 | | 6,025,170 |
| | |
|
| | | | | 16,633,290 |
| Health Care Equipment & Supplies - 0.78% | | | | |
| C.R. Bard, Inc. (L) | | 14,100 | | 1,378,416 |
| Stryker Corp. (L) | | 59,300 | | 3,751,318 |
| | |
|
| | | | | 5,129,734 |
| Health Care Providers & Services - 4.56% | | | | |
| Aetna, Inc. | | 13,800 | | 515,568 |
| AMERIGROUP Corp. (I)(L) | | 33,100 | | 1,898,285 |
| AmerisourceBergen Corp. | | 51,700 | | 1,959,947 |
| Cardinal Health, Inc. | | 134,500 | | 5,600,580 |
| Coventry Health Care, Inc. (I) | | 174,127 | | 5,258,635 |
| Health Net, Inc. (I)(L) | | 21,700 | | 638,414 |
| Kindred Healthcare, Inc. (I)(L) | | 63,800 | | 1,589,896 |
| Magellan Health Services, Inc. (I) | | 7,500 | | 359,850 |
| McKesson Corp. | | 12,000 | | 951,360 |
| PharMerica Corp. (I) | | 6,000 | | 70,500 |
| Quest Diagnostics, Inc. | | 12,400 | | 703,700 |
| UnitedHealth Group, Inc. | | 241,900 | | 10,300,102 |
| | | | |
| All Cap Core Fund (continued) | | | | |
| | | Shares or | | |
| | | Principal | | |
| | | Amount | | Value |
| | |
|
| |
| COMMON STOCKS (continued) | | | | |
| Health Care Providers & Services (continued) | | | | |
| Universal American Financial Corp. | | 16,900 | $ | 347,802 |
| | |
|
| | | | | 30,194,639 |
| Life Sciences Tools & Services - 0.58% | | | | |
| Affymetrix, Inc. (I) | | 14,900 | | 73,159 |
| Agilent Technologies, Inc. (I) | | 11,100 | | 467,088 |
| Thermo Fisher Scientific, Inc. (I) | | 59,100 | | 3,298,962 |
| | |
|
| | | | | 3,839,209 |
| Pharmaceuticals - 2.33% | | | | |
| Eli Lilly & Company | | 28,900 | | 998,784 |
| Endo Pharmaceuticals Holdings, Inc. (I)(L) | | 31,100 | | 1,104,672 |
| Forest Laboratories, Inc. (I) | | 198,400 | | 6,428,160 |
| Medicis Pharmaceutical Corp., Class A | | 33,900 | | 1,087,851 |
| Merck & Company, Inc. | | 10,000 | | 325,700 |
| Par Pharmaceutical Companies, Inc. (I) | | 69,200 | | 2,136,896 |
| Viropharma, Inc. (I)(L) | | 188,400 | | 3,378,012 |
| | |
|
| | | | | 15,460,075 |
| | |
|
| | | | | 71,256,947 |
| Industrials - 12.57% | | | | |
| Aerospace & Defense - 3.96% | | | | |
| Ceradyne, Inc. (I)(L) | | 27,300 | | 1,043,679 |
| Ducommun, Inc. | | 9,000 | | 201,330 |
| General Dynamics Corp. | | 112,800 | | 8,586,336 |
| Honeywell International, Inc. | | 174,100 | | 10,082,131 |
| Northrop Grumman Corp. | | 94,709 | | 6,315,196 |
| | |
|
| | | | | 26,228,672 |
| Air Freight & Logistics - 1.05% | | | | |
| United Parcel Service, Inc., Class B (L) | | 94,100 | | 6,944,580 |
| Airlines - 0.25% | | | | |
| Alaska Air Group, Inc. (I) | | 6,500 | | 386,425 |
| Republic Airways Holdings, Inc. (I)(L) | | 19,300 | | 122,362 |
| Skywest, Inc. (L) | | 69,200 | | 1,141,800 |
| | |
|
| | | | | 1,650,587 |
| Building Products - 0.02% | | | | |
| Gibraltar Industries, Inc. (I) | | 13,100 | | 141,873 |
| Commercial Services & Supplies - 0.09% | | | | |
| Consolidated Graphics, Inc. (I) | | 5,200 | | 283,608 |
| M&F Worldwide Corp. (I)(L) | | 13,800 | | 342,378 |
| | |
|
| | | | | 625,986 |
| Construction & Engineering - 0.39% | | | | |
| Dycom Industries, Inc. (I)(L) | | 17,400 | | 300,324 |
| EMCOR Group, Inc. (I) | | 23,700 | | 755,082 |
| Great Lakes Dredge & Dock Corp. | | 21,000 | | 165,270 |
| Layne Christensen Company (I) | | 17,700 | | 590,649 |
| MasTec, Inc. (I) | | 7,800 | | 145,236 |
| Northwest Pipe Company (I)(L) | | 10,300 | | 244,522 |
| Tutor Perini Corp. | | 14,700 | | 350,154 |
| | |
|
| | | | | 2,551,237 |
| Electrical Equipment - 0.01% | | | | |
| EnerSys (I) | | 2,000 | | 71,000 |
| Industrial Conglomerates - 1.13% | | | | |
| 3M Company | | 11,600 | | 1,069,868 |
| Carlisle Companies, Inc. | | 29,600 | | 1,273,096 |
| General Electric Company | | 241,900 | | 5,060,548 |
| Seaboard Corp. | | 38 | | 88,168 |
| | |
|
| | | | | 7,491,680 |
| Machinery - 3.47% | | | | |
| Alamo Group, Inc. | | 5,500 | | 160,270 |
| Caterpillar, Inc. (L) | | 107,400 | | 11,054,682 |
| |
| The accompanying notes are an integral part of the financial statements. | 33 |
John Hancock Funds II
Portfolio of Investments — February 28, 2011 (Unaudited) (showing percentage of total net assets)
| | | | |
| All Cap Core Fund (continued) | | | | |
| | | Shares or | | |
| | | Principal | | |
| | | Amount | | Value |
| | |
|
| |
| COMMON STOCKS (continued) | | | | |
| Machinery (continued) | | | | |
| Danaher Corp. | | 37,300 | $ | 1,887,380 |
| Dover Corp. | | 51,700 | | 3,321,725 |
| Eaton Corp. | | 28,500 | | 3,157,230 |
| NACCO Industries, Inc., Class A | | 1,500 | | 186,825 |
| Parker Hannifin Corp. | | 31,400 | | 2,800,252 |
| Watts Water Technologies, Inc., Class A (L) | | 9,800 | | 383,278 |
| | |
|
| | | | | 22,951,642 |
| Road & Rail - 1.56% | | | | |
| CSX Corp. | | 57,800 | | 4,315,348 |
| Norfolk Southern Corp. | | 32,600 | | 2,137,908 |
| Union Pacific Corp. | | 40,700 | | 3,883,187 |
| | |
|
| | | | | 10,336,443 |
| Trading Companies & Distributors - 0.64% | | | | |
| Aircastle, Ltd. | | 112,900 | | 1,363,832 |
| WW Grainger, Inc. (L) | | 21,600 | | 2,877,336 |
| | |
|
| | | | | 4,241,168 |
| | | |
|
| | | | | 83,234,868 |
| Information Technology - 19.96% | | | | |
| Communications Equipment - 0.56% | | | | |
| Comtech Telecommunications Corp. (L) | | 43,700 | | 1,182,085 |
| EchoStar Corp., Class A (I) | | 34,300 | | 1,190,210 |
| Emulex Corp. (I) | | 32,100 | | 353,100 |
| F5 Networks, Inc. (I)(L) | | 4,200 | | 495,642 |
| Harris Corp. | | 9,800 | | 457,268 |
| | |
|
| | | | | 3,678,305 |
| Computers & Peripherals - 3.73% | | | | |
| Apple, Inc. (I) | | 21,839 | | 7,713,753 |
| EMC Corp. (I) | | 398,800 | | 10,851,348 |
| Imation Corp. (I) | | 13,000 | | 149,240 |
| Lexmark International, Inc., Class A (I)(L) | | 73,700 | | 2,765,961 |
| QLogic Corp. (I)(L) | | 99,700 | | 1,800,582 |
| Western Digital Corp. (I) | | 46,900 | | 1,434,202 |
| | |
|
| | | | | 24,715,086 |
| Electronic Equipment, Instruments & Components - 3.51% | | |
| Anixter International, Inc. (L) | | 5,700 | | 408,234 |
| Arrow Electronics, Inc. (I) | | 37,856 | | 1,483,955 |
| AVX Corp. | | 33,200 | | 529,540 |
| Brightpoint, Inc. (I) | | 7,800 | | 98,280 |
| Corning, Inc. | | 337,500 | | 7,782,750 |
| Ingram Micro, Inc., Class A (I) | | 113,331 | | 2,258,687 |
| Molex, Inc. (L) | | 24,000 | | 670,320 |
| Multi-Fineline Electronix, Inc. (I) | | 19,900 | | 569,538 |
| Sanmina-SCI Corp. (I) | | 14,400 | | 224,928 |
| Tech Data Corp. (I) | | 126,394 | | 6,266,615 |
| Vishay Intertechnology, Inc. (I)(L) | | 168,300 | | 2,936,835 |
| | |
|
| | | | | 23,229,682 |
| Internet Software & Services - 1.93% | | | | |
| AOL, Inc. (I) | | 134,900 | | 2,815,363 |
| Earthlink, Inc. (L) | | 71,600 | | 589,268 |
| Google, Inc., Class A (I) | | 2,500 | | 1,533,500 |
| IAC/InterActiveCorp (I) | | 252,400 | | 7,842,068 |
| | |
|
| | | | | 12,780,199 |
| IT Services - 5.05% | | | | |
| CACI International, Inc., Class A (I) | | 5,100 | | 302,532 |
| Computer Sciences Corp. (L) | | 132,661 | | 6,384,974 |
| Fiserv, Inc. (I) | | 20,700 | | 1,309,689 |
| International Business Machines Corp. | | 104,406 | | 16,901,243 |
| Visa, Inc., Class A | | 117,000 | | 8,546,850 |
| | |
|
| | | | | 33,445,288 |
| | | | |
| All Cap Core Fund (continued) | | | | |
| | | Shares or | | |
| | | Principal | | |
| | | Amount | | Value |
| | |
|
| |
| COMMON STOCKS (continued) | | | | |
| Semiconductors & Semiconductor Equipment - 2.89% | | |
| Analog Devices, Inc. | | 54,900 | $ | 2,189,412 |
| Applied Materials, Inc. | | 231,300 | | 3,800,259 |
| Fairchild Semiconductor International, Inc. (I) | | 13,300 | | 234,213 |
| International Rectifier Corp. (I) | | 13,200 | | 424,248 |
| KLA-Tencor Corp. | | 63,900 | | 3,119,598 |
| Lam Research Corp. (I) | | 29,800 | | 1,636,020 |
| Maxim Integrated Products, Inc. | | 42,000 | | 1,158,360 |
| ON Semiconductor Corp. (I)(L) | | 103,700 | | 1,156,255 |
| Photronics, Inc. (I)(L) | | 106,700 | | 953,898 |
| SunPower Corp., Class A (I)(L) | | 18,500 | | 315,795 |
| Teradyne, Inc. (I)(L) | | 103,700 | | 1,931,931 |
| Texas Instruments, Inc. | | 63,300 | | 2,254,113 |
| | |
|
| | | | | 19,174,102 |
| Software - 2.29% | | | | |
| CA, Inc. | | 78,300 | | 1,940,274 |
| Microsoft Corp. | | 357,493 | | 9,502,164 |
| Symantec Corp. (I) | | 193,300 | | 3,485,199 |
| Websense, Inc. (I) | | 12,100 | | 259,182 |
| | |
|
| | | | | 15,186,819 |
| | |
|
| | | | | 132,209,481 |
| Materials - 3.49% | | | | |
| Chemicals - 2.38% | | | | |
| E.I. du Pont de Nemours & Company | | 153,700 | | 8,433,519 |
| Ferro Corp. (I) | | 33,400 | | 531,728 |
| Lubrizol Corp. | | 3,000 | | 326,610 |
| Minerals Technologies, Inc. | | 6,100 | | 395,768 |
| Monsanto Company | | 11,400 | | 819,546 |
| OM Group, Inc. (I) | | 56,700 | | 1,995,273 |
| Stepan Company | | 2,600 | | 182,494 |
| The Dow Chemical Company | | 83,000 | | 3,084,280 |
| | |
|
| | | | | 15,769,218 |
| Containers & Packaging - 0.17% | | | | |
| Boise, Inc. (L) | | 129,900 | | 1,166,502 |
| Metals & Mining - 0.55% | | | | |
| Alcoa, Inc. (L) | | 48,800 | | 822,280 |
| Freeport-McMoRan Copper & Gold, Inc. | | 21,500 | | 1,138,425 |
| Newmont Mining Corp. | | 30,200 | | 1,669,154 |
| | |
|
| | | | | 3,629,859 |
| Paper & Forest Products - 0.39% | | | | |
| Clearwater Paper Corp. (I)(L) | | 13,500 | | 1,070,550 |
| Domtar Corp. | | 6,800 | | 594,320 |
| KapStone Paper and Packaging Corp. (I) | | 27,300 | | 468,195 |
| MeadWestvaco Corp. | | 15,300 | | 449,055 |
| | |
|
| | | | | 2,582,120 |
| | |
|
| | | | | 23,147,699 |
| Telecommunication Services - 2.24% | | | | |
| Diversified Telecommunication Services - 1.94% | | | | |
| Neutral Tandem, Inc. (I) | | 6,600 | | 113,520 |
| Verizon Communications, Inc. | | 346,000 | | 12,774,320 |
| | |
|
| | | | | 12,887,840 |
| Wireless Telecommunication Services - 0.30% | | | | |
| Telephone & Data Systems, Inc. | | 49,400 | | 1,662,310 |
| USA Mobility, Inc. | | 20,900 | | 311,828 |
| | |
|
| | | | | 1,974,138 |
| | |
|
| | | | | 14,861,978 |
| Utilities - 2.51% | | | | |
| Electric Utilities - 0.64% | | | | |
| Duke Energy Corp. | | 94,300 | | 1,696,457 |
| |
| The accompanying notes are an integral part of the financial statements. | 34 |
John Hancock Funds II
Portfolio of Investments — February 28, 2011 (Unaudited) (showing percentage of total net assets)
| | | | |
| All Cap Core Fund (continued) | | | |
| | | Shares or | | |
| | | Principal | | |
| | | Amount | | Value |
| |
|
| | |
| COMMON STOCKS (continued) | | | | |
| Electric Utilities (continued) | | | | |
| Exelon Corp. (L) | | 57,700 | $ | 2,409,552 |
| PNM Resources, Inc. (L) | | 10,900 | | 145,079 |
| | |
|
| | | | | 4,251,088 |
| Independent Power Producers & Energy Traders - 0.88% | | |
| GenOn Energy, Inc. (I) | | 161,900 | | 655,695 |
| NRG Energy, Inc. (I) | | 258,100 | | 5,159,419 |
| | |
|
| | | | | 5,815,114 |
| Multi-Utilities - 0.99% | | | | |
| Ameren Corp. | | 235,200 | | 6,576,193 |
| | |
|
| | | | | 16,642,395 |
|
| TOTAL COMMON STOCKS (Cost $569,446,328) | | $ | 651,808,255 |
|
| SECURITIES LENDING COLLATERAL - 13.61% | | |
| John Hancock Collateral | | | | |
| Investment Trust, 0.2855% (W)(Y) | | 9,008,724 | | 90,153,900 |
|
| TOTAL SECURITIES LENDING | | | | |
| COLLATERAL (Cost $90,143,292) | | | $ | 90,153,900 |
|
| SHORT-TERM INVESTMENTS - 1.10% | | | |
| Short-Term Securities* - 1.10% | | | | |
| State Street Institutional Liquid Reserves | | | | |
| Fund, 0.2053% | $ | 7,278,943 | $ | 7,278,943 |
|
| TOTAL SHORT-TERM INVESTMENTS (Cost $7,278,943) | $ | 7,278,943 |
|
| Total Investments (All Cap Core Fund) | | | | |
| (Cost $666,868,563) - 113.11% | | | $ | 749,241,098 |
| Other assets and liabilities, net - (13.11%) | | | (86,860,816) |
| | |
|
| TOTAL NET ASSETS - 100.00% | | | $ | 662,380,282 |
| | | |
|
| |
| |
| All Cap Value Fund | | | | |
| | | Shares or | | |
| | | Principal | | |
| | | Amount | | Value |
| |
|
| COMMON STOCKS - 98.71% | | | | |
| Consumer Discretionary - 9.54% | | | | |
| Automobiles - 1.19% | | | | |
| Ford Motor Company (I)(L) | | 451,045 | $ | 6,788,227 |
| Hotels, Restaurants & Leisure - 1.18% | | | | |
| Carnival Corp. | | 61,276 | | 2,614,647 |
| Las Vegas Sands Corp. (I) | | 58,700 | | 2,737,768 |
| Marriott International, Inc., Class A (L) | | 35,817 | | 1,404,385 |
| | |
|
| | | | | 6,756,800 |
| Household Durables - 0.96% | | | | |
| Fortune Brands, Inc. | | 88,667 | | 5,484,941 |
| Media - 5.72% | | | | |
| Omnicom Group, Inc. | | 307,788 | | 15,666,409 |
| The Interpublic Group of Companies, Inc. | | 831,923 | | 10,981,384 |
| The Walt Disney Company | | 75,617 | | 3,307,488 |
| Time Warner, Inc. | | 70,300 | | 2,685,460 |
| | |
|
| | | | | 32,640,741 |
| Specialty Retail - 0.43% | | | | |
| Penske Automotive Group, Inc. (I)(L) | | 120,500 | | 2,454,585 |
| Textiles, Apparel & Luxury Goods - 0.06% | | | |
| VF Corp. (L) | | 3,549 | | 339,533 |
| | |
|
| | | | | 54,464,827 |
| | | | |
| All Cap Value Fund (continued) | | |
| | | Shares or | | |
| | | Principal | | |
| | | Amount | | Value |
| | |
|
| |
| COMMON STOCKS (continued) | | | | |
| Consumer Staples - 4.53% | | | | |
| Beverages - 0.68% | | | | |
| Diageo PLC, SADR (L) | | 49,800 | $ | 3,897,348 |
| Food Products - 3.85% | | | | |
| Archer-Daniels-Midland Company | | 307,798 | | 11,443,930 |
| Bunge, Ltd. | | 146,177 | | 10,549,594 |
| | |
|
| | | | | 21,993,524 |
| | |
|
| | | | | 25,890,872 |
| Energy - 19.37% | | | | |
| Energy Equipment & Services - 3.88% | | | | |
| Gulfmark Offshore, Inc., Class A (I) | | 32,834 | | 1,457,173 |
| Halliburton Company | | 162,825 | | 7,643,006 |
| Superior Energy Services, Inc. (I)(L) | | 73,247 | | 2,806,093 |
| Tidewater, Inc. | | 32,900 | | 2,046,709 |
| Weatherford International, Ltd. (I) | | 339,078 | | 8,198,906 |
| | |
|
| | | | | 22,151,887 |
| Oil, Gas & Consumable Fuels - 15.49% | | | | |
| Anadarko Petroleum Corp. | | 137,700 | | 11,267,991 |
| Apache Corp. | | 29,027 | | 3,617,345 |
| Chevron Corp. | | 73,159 | | 7,590,246 |
| Devon Energy Corp. | | 69,200 | | 6,327,648 |
| El Paso Corp. | | 503,735 | | 9,369,471 |
| EQT Corp. | | 103,576 | | 5,106,297 |
| Exxon Mobil Corp. | | 359,450 | | 30,743,759 |
| Forest Oil Corp. (I)(L) | | 16,371 | | 581,007 |
| Imperial Oil, Ltd. | | 56,200 | | 2,919,028 |
| QEP Resources, Inc. | | 84,241 | | 3,331,732 |
| Range Resources Corp. | | 52,200 | | 2,834,460 |
| Southwestern Energy Company (I) | | 120,963 | | 4,775,619 |
| | |
|
| | | | | 88,464,603 |
| | |
|
| | | | | 110,616,490 |
| Financials - 21.34% | | | | |
| Capital Markets - 9.01% | | | | |
| Affiliated Managers Group, Inc. (I)(L) | | 64,576 | | 6,893,488 |
| Invesco, Ltd. | | 181,426 | | 4,869,474 |
| Lazard, Ltd., Class A | | 241,049 | | 10,606,156 |
| LPL Investment Holdings, Inc. (I) | | 115,600 | | 3,885,316 |
| State Street Corp. | | 272,714 | | 12,195,770 |
| The Charles Schwab Corp. | | 164,463 | | 3,119,863 |
| The Goldman Sachs Group, Inc. | | 60,317 | | 9,878,718 |
| | |
|
| | | | | 51,448,785 |
| Commercial Banks - 7.65% | | | | |
| City National Corp. (L) | | 91,509 | | 5,390,795 |
| Commerce Bancshares, Inc. | | 82,566 | | 3,315,851 |
| Cullen/Frost Bankers, Inc. (L) | | 95,476 | | 5,591,075 |
| KeyCorp | | 444,515 | | 4,062,867 |
| PNC Financial Services Group, Inc. | | 140,800 | | 8,687,360 |
| Signature Bank (I)(L) | | 49,700 | | 2,578,933 |
| TCF Financial Corp. (L) | | 354,992 | | 5,761,520 |
| Wells Fargo & Company | | 258,172 | | 8,328,629 |
| | |
|
| | | | | 43,717,030 |
| Diversified Financial Services - 1.45% | | | | |
| Bank of America Corp. | | 26,170 | | 373,969 |
| Citigroup, Inc. (I) | | 587,200 | | 2,748,096 |
| JPMorgan Chase & Company | | 110,240 | | 5,147,106 |
| | |
|
| | | | | 8,269,171 |
| Insurance - 3.23% | | | | |
| Aflac, Inc. | | 96,200 | | 5,662,332 |
| Berkshire Hathaway, Inc., Class B (I) | | 101,046 | | 8,819,295 |
| |
| The accompanying notes are an integral part of the financial statements. | 35 |
John Hancock Funds II
Portfolio of Investments — February 28, 2011 (Unaudited) (showing percentage of total net assets)
| | | | |
| All Cap Value Fund (continued) | | |
| | | Shares or | | |
| | | Principal | | |
| | | Amount | | Value |
| | |
|
| |
| COMMON STOCKS (continued) | | | | |
| Insurance (continued) | | | | |
| Marsh & McLennan Companies, Inc. | | 130,400 | $ | 3,969,376 |
| | | |
|
| | | | | 18,451,003 |
| | | |
|
| | | | | 121,885,989 |
| Health Care - 16.03% | | | | |
| Biotechnology - 3.31% | | | | |
| Amgen, Inc. (I) | | 198,988 | | 10,214,054 |
| Celgene Corp. (I) | | 113,570 | | 6,030,567 |
| Human Genome Sciences, Inc. (I)(L) | | 80,463 | | 2,013,989 |
| Onyx Pharmaceuticals, Inc. (I)(L) | | 18,392 | | 648,134 |
| | |
|
| | | | | 18,906,744 |
| Health Care Equipment & Supplies - 2.33% | | | | |
| Kinetic Concepts, Inc. (I)(L) | | 129,921 | | 6,362,231 |
| St. Jude Medical, Inc. (I) | | 5,900 | | 282,492 |
| The Cooper Companies, Inc. | | 32,131 | | 1,986,338 |
| Zimmer Holdings, Inc. (I) | | 75,334 | | 4,696,322 |
| | |
|
| | | | | 13,327,383 |
| Health Care Providers & Services - 5.76% | | | | |
| Express Scripts, Inc. (I) | | 124,500 | | 6,999,390 |
| Humana, Inc. (I) | | 124,196 | | 8,073,982 |
| McKesson Corp. | | 77,713 | | 6,161,087 |
| UnitedHealth Group, Inc. | | 246,300 | | 10,487,454 |
| Universal Health Services, Inc., Class B | | 25,805 | | 1,179,547 |
| | |
|
| | | | | 32,901,460 |
| Life Sciences Tools & Services - 0.58% | | | | |
| Thermo Fisher Scientific, Inc. (I) | | 59,600 | | 3,326,872 |
| Pharmaceuticals - 4.05% | | | | |
| Teva Pharmaceutical Industries, Ltd., SADR | | 199,727 | | 10,006,323 |
| Warner Chilcott PLC, Class A | | 281,526 | | 6,666,536 |
| Watson Pharmaceuticals, Inc. (I) | | 115,062 | | 6,442,321 |
| | |
|
| | | | | 23,115,180 |
| | | |
|
| | | | | 91,577,639 |
| Industrials - 11.22% | | | | |
| Aerospace & Defense - 2.32% | | | | |
| Rockwell Collins, Inc. (L) | | 87,600 | | 5,644,944 |
| United Technologies Corp. | | 90,726 | | 7,579,250 |
| | |
|
| | | | | 13,224,194 |
| Airlines - 0.75% | | | | |
| Southwest Airlines Company | | 360,800 | | 4,268,264 |
| Industrial Conglomerates - 0.30% | | | | |
| 3M Company (L) | | 18,698 | | 1,724,517 |
| Machinery - 7.38% | | | | |
| Dover Corp. | | 81,500 | | 5,236,375 |
| Eaton Corp. | | 54,748 | | 6,064,983 |
| EnPro Industries, Inc. (I)(L) | | 69,604 | | 2,761,887 |
| Kennametal, Inc. | | 98,029 | | 3,770,195 |
| Pall Corp. | | 101,780 | | 5,532,761 |
| Parker Hannifin Corp. | | 55,564 | | 4,955,198 |
| RBC Bearings, Inc. (I)(L) | | 17,983 | | 650,805 |
| Robbins & Myers, Inc. | | 45,722 | | 1,949,129 |
| Trinity Industries, Inc. (L) | | 198,500 | | 6,183,275 |
| WABCO Holdings, Inc. (I) | | 86,263 | | 5,040,347 |
| | |
|
| | | | | 42,144,955 |
| Road & Rail - 0.47% | | | | |
| Kansas City Southern (I) | | 50,034 | | 2,693,831 |
| | |
|
| | | | | 64,055,761 |
| | | | |
| All Cap Value Fund (continued) | | |
| | | Shares or | | |
| | | Principal | | |
| | | Amount | | Value |
| | |
|
| |
| COMMON STOCKS (continued) | | | | |
| Information Technology - 10.53% | | | | |
| Computers & Peripherals - 0.28% | | | | |
| EMC Corp. (I) | | 58,200 | $ | 1,583,622 |
| Electronic Equipment, Instruments & Components - 1.35% | | |
| Corning, Inc. | | 334,000 | | 7,702,040 |
| IT Services - 4.31% | | | | |
| Accenture PLC, Class A | | 114,415 | | 5,890,084 |
| Fiserv, Inc. (I) | | 32,500 | | 2,056,275 |
| MasterCard, Inc., Class A | | 24,470 | | 5,886,503 |
| The Western Union Company | | 246,478 | | 5,420,051 |
| VeriFone Systems, Inc. (I)(L) | | 118,650 | | 5,391,456 |
| | |
|
| | | | | 24,644,369 |
| Semiconductors & Semiconductor Equipment - 2.27% | | |
| Intel Corp. | | 391,959 | | 8,415,360 |
| Texas Instruments, Inc. (L) | | 127,600 | | 4,543,836 |
| | |
|
| | | | | 12,959,196 |
| Software - 2.32% | | | | |
| Adobe Systems, Inc. (I) | | 218,132 | | 7,525,554 |
| Intuit, Inc. (I) | | 65,400 | | 3,438,732 |
| Microsoft Corp. | | 86,858 | | 2,308,686 |
| | |
|
| | | | | 13,272,972 |
| | |
|
| | | | | 60,162,199 |
| Materials - 5.08% | | | | |
| Chemicals - 2.11% | | | | |
| Air Products & Chemicals, Inc. | | 83,549 | | 7,686,508 |
| LyondellBasell Industries, Class A (I) | | 114,300 | | 4,352,544 |
| | |
|
| | | | | 12,039,052 |
| Metals & Mining - 2.97% | | | | |
| Agnico Eagle Mines, Ltd. (L) | | 42,112 | | 2,962,579 |
| Barrick Gold Corp. | | 148,749 | | 7,856,922 |
| Reliance Steel & Aluminum Company | | 111,172 | | 6,151,147 |
| | |
|
| | | | | 16,970,648 |
| | |
|
| | | | | 29,009,700 |
| Utilities - 1.07% | | | | |
| Electric Utilities - 1.07% | | | | |
| Nextera Energy, Inc. | | 110,240 | | 6,115,007 |
|
| TOTAL COMMON STOCKS (Cost $435,169,218) | | | $ | 563,778,484 |
|
| |
| SECURITIES LENDING COLLATERAL - 11.49% | | |
| John Hancock Collateral | | | | |
| Investment Trust, 0.2855% (W)(Y) | | 6,561,055 | | 65,659,104 |
|
| TOTAL SECURITIES LENDING | | | | |
| COLLATERAL (Cost $65,651,109) | | | $ | 65,659,104 |
|
| |
| The accompanying notes are an integral part of the financial statements. | 36 |
John Hancock Funds II
Portfolio of Investments — February 28, 2011 (Unaudited) (showing percentage of total net assets)
| | | | |
| All Cap Value Fund (continued) | | |
| | | Shares or | | |
| | | Principal | | |
| | | Amount | | Value |
| |
|
| |
| SHORT-TERM INVESTMENTS - 1.89% | | | |
| Repurchase Agreement - 1.89% | | | | |
| Repurchase Agreement with State Street Corp. | | | |
| dated 02/28/2011 at 0.010% to be | | | | |
| repurchased at $10,772,003 on 03/01/2011, | | | |
| collateralized by $10,950,000 Federal | | | | |
| National Mortgage Association, 0.625% due | | | |
| 09/24/2012 (valued at $10,991,063, | | | | |
| including interest) | $ | 10,772,000 | $ | 10,772,000 |
|
| TOTAL SHORT-TERM INVESTMENTS (Cost $10,772,000) | $ | 10,772,000 |
|
| Total Investments (All Cap Value Fund) | | | | |
| (Cost $511,592,327) - 112.09% | | | $ | 640,209,588 |
| Other assets and liabilities, net - (12.09%) | | | (69,047,925) |
| | |
|
| TOTAL NET ASSETS - 100.00% | | | $ | 571,161,663 |
| | | |
|
| |
| |
| |
| Alpha Opportunities Fund | | | |
| | | Shares or | | |
| | | Principal | | |
| | | Amount | | Value |
| |
|
| |
| COMMON STOCKS - 97.59% | | | | |
| Consumer Discretionary - 17.20% | | | | |
| Auto Components - 2.02% | | | | |
| BorgWarner, Inc. (I)(L) | | 21,920 | $ | 1,701,211 |
| Dana Holding Corp. (I) | | 93,870 | | 1,772,266 |
| Johnson Controls, Inc. | | 193,790 | | 7,906,632 |
| Lear Corp. | | 14,270 | | 1,509,766 |
| Magna International, Inc., Class A (L) | | 26,720 | | 1,318,899 |
| Modine Manufacturing Company (I) | | 576,819 | | 8,536,921 |
| Stoneridge, Inc. (I) | | 134,470 | | 2,027,808 |
| Tenneco, Inc. (I)(L) | | 96,530 | | 3,849,616 |
| Visteon Corp. (I) | | 17,790 | | 1,315,571 |
| | |
|
| | | | | 29,938,690 |
| Automobiles - 0.62% | | | | |
| Daimler AG (I) | | 14,551 | | 1,024,907 |
| Dongfeng Motor Group Company, Ltd. | | 354,000 | | 619,746 |
| Fiat SpA | | 283,268 | | 2,633,612 |
| Ford Motor Company (I)(L) | | 273,200 | | 4,111,660 |
| Hyundai Motor Company, Ltd. | | 5,687 | | 901,687 |
| | |
|
| | | | | 9,291,612 |
| Distributors - 0.17% | | | | |
| Jardine Cycle and Carriage, Ltd. | | 12,000 | | 318,764 |
| LKQ Corp. (I)(L) | | 92,130 | | 2,189,009 |
| | |
|
| | | | | 2,507,773 |
| Diversified Consumer Services - 1.06% | | | | |
| Capella Education Company (I)(L) | | 45,728 | | 2,637,134 |
| Coinstar, Inc. (I)(L) | | 73,500 | | 3,136,980 |
| DeVry, Inc. | | 106,510 | | 5,778,168 |
| Estacio Participacoes SA | | 156,300 | | 2,282,780 |
| ITT Educational Services, Inc. (I)(L) | | 12,750 | | 967,088 |
| Strayer Education, Inc. (L) | | 6,504 | | 893,910 |
| | |
|
| | | | | 15,696,060 |
| Hotels, Restaurants & Leisure - 0.85% | | | | |
| Accor SA | | 60,124 | | 2,831,189 |
| Chipotle Mexican Grill, Inc. (I)(L) | | 10,570 | | 2,589,650 |
| Las Vegas Sands Corp. (I) | | 29,300 | | 1,366,552 |
| McDonald’s Corp. | | 33,650 | | 2,546,632 |
| Starbucks Corp. | | 39,800 | | 1,312,604 |
| Wynn Macau, Ltd. | | 141,200 | | 382,629 |
| | | | |
| Alpha Opportunities Fund (continued) | | |
| | | Shares or | | |
| | | Principal | | |
| | | Amount | | Value |
| | |
|
| |
| COMMON STOCKS (continued) | | | | |
| Hotels, Restaurants & Leisure (continued) | | | | |
| Wynn Resorts, Ltd. | | 13,300 | $ | 1,634,969 |
| | |
|
| | | | | 12,664,225 |
| Household Durables - 1.85% | | | | |
| Lennar Corp., Class A (L) | | 176,970 | | 3,567,715 |
| PDG Realty SA Empreendimentos | | | | |
| e Participacoes | | 146,000 | | 797,656 |
| Skyworth Digital Holdings, Ltd. | | 1,320,000 | | 841,741 |
| SodasStream International, Ltd. (I)(L) | | 34,600 | | 1,530,358 |
| Stanley Black & Decker, Inc. | | 107,730 | | 8,169,166 |
| Tempur-Pedic International, Inc. (I)(L) | | 267,640 | | 12,563,022 |
| | |
|
| | | | | 27,469,658 |
| Internet & Catalog Retail - 0.64% | | | | |
| Amazon.com, Inc. (I) | | 26,900 | | 4,661,501 |
| Dena Company, Ltd. | | 19,400 | | 748,983 |
| Netflix, Inc. (I)(L) | | 9,190 | | 1,899,297 |
| priceline.com, Inc. (I) | | 4,700 | | 2,133,236 |
| | |
|
| | | | | 9,443,017 |
| Leisure Equipment & Products - 1.67% | | | | |
| Brunswick Corp. (L) | | 670,759 | | 15,447,580 |
| Mattel, Inc. | | 370,514 | | 9,285,081 |
| | |
|
| | | | | 24,732,661 |
| Media - 2.54% | | | | |
| CBS Corp., Class B | | 145,633 | | 3,474,803 |
| Comcast Corp., Class A | | 415,999 | | 10,716,134 |
| Comcast Corp., Special Class A | | 257,010 | | 6,250,483 |
| DIRECTV, Class A (I) | | 25,440 | | 1,169,477 |
| Sirius XM Radio, Inc. (I)(L) | | 923,100 | | 1,670,811 |
| The Interpublic Group of Companies, Inc. | | 80,100 | | 1,057,320 |
| The Walt Disney Company | | 226,500 | | 9,907,110 |
| Virgin Media, Inc. (L) | | 123,920 | | 3,375,581 |
| | |
|
| | | | | 37,621,719 |
| Multiline Retail - 0.88% | | | | |
| Maoye International Holdings, Ltd. | | 1,481,000 | | 578,776 |
| Nordstrom, Inc. | | 26,000 | | 1,176,760 |
| Target Corp. | | 216,073 | | 11,354,636 |
| | |
|
| | | | | 13,110,172 |
| Specialty Retail - 3.68% | | | | |
| Advance Auto Parts, Inc. (L) | | 24,600 | | 1,541,928 |
| Home Depot, Inc. | | 169,711 | | 6,359,071 |
| Lowe’s Companies, Inc. | | 877,139 | | 22,954,728 |
| Ross Stores, Inc. (L) | | 86,500 | | 6,231,460 |
| Staples, Inc. | | 600,027 | | 12,780,575 |
| Talbots, Inc. (I)(L) | | 504,660 | | 3,154,125 |
| Ulta Salon, Cosmetics & Fragrance, Inc. (I) | | 36,500 | | 1,523,145 |
| | |
|
| | | | | 54,545,032 |
| Textiles, Apparel & Luxury Goods - 1.22% | | | | |
| Hanesbrands, Inc. (I) | | 518,060 | | 13,422,935 |
| Lululemon Athletica, Inc. (I)(L) | | 59,660 | | 4,629,019 |
| | |
|
| | | | | 18,051,954 |
| | |
|
| | | | | 255,072,573 |
| Consumer Staples - 6.77% | | | | |
| Beverages - 1.22% | | | | |
| Anheuser-Busch InBev NV | | 31,307 | | 1,749,555 |
| Hansen Natural Corp. (I) | | 9,200 | | 529,460 |
| PepsiCo, Inc. | | 249,559 | | 15,827,032 |
| | |
|
| | | | | 18,106,047 |
| Food & Staples Retailing - 1.55% | | | | |
| CVS Caremark Corp. | | 248,653 | | 8,220,468 |
| |
| The accompanying notes are an integral part of the financial statements. | 37 |
John Hancock Funds II
Portfolio of Investments — February 28, 2011 (Unaudited) (showing percentage of total net assets)
| | | | |
| Alpha Opportunities Fund (continued) | | |
| | | Shares or | | |
| | | Principal | | |
| | | Amount | | Value |
| | |
|
| |
| COMMON STOCKS (continued) | | | | |
| Food & Staples Retailing (continued) | | | | |
| Sysco Corp. (L) | | 510,693 | $ | 14,192,158 |
| X5 Retail Group NV, GDR (I) | | 13,724 | | 551,705 |
| | |
|
| | | | | 22,964,331 |
| Food Products - 2.97% | | | | |
| Asian Bamboo AG (L) | | 35,126 | | 1,742,517 |
| China Agri-Industries Holdings, Ltd. | | 1,913,976 | | 1,947,005 |
| China Green Holdings, Ltd. (L) | | 3,209,540 | | 2,527,065 |
| China Minzhong Food Corp. Ltd. (I) | | 1,233,000 | | 1,802,225 |
| General Mills, Inc. | | 90,648 | | 3,366,667 |
| Golden Agri-Resources, Ltd. | | 1,462,000 | | 753,371 |
| Green Mountain Coffee Roasters, Inc. (I)(L) | | 530,872 | | 21,648,960 |
| Kraft Foods, Inc., Class A | | 185,170 | | 5,895,813 |
| PureCircle, Ltd. (I)(L) | | 1,523,126 | | 3,691,302 |
| Tyson Foods, Inc., Class A | | 38,600 | | 719,118 |
| | |
|
| | | | | 44,094,043 |
| Household Products - 0.70% | | | | |
| Colgate-Palmolive Company | | 133,003 | | 10,443,396 |
| Tobacco - 0.33% | | | | |
| Philip Morris International, Inc. | | 77,650 | | 4,874,867 |
| | |
|
| | | | | 100,482,684 |
| Energy - 11.08% | | | | |
| Energy Equipment & Services - 0.90% | | | | |
| Cameron International Corp. (I) | | 10,800 | | 638,604 |
| Ensco International PLC, ADR (L) | | 90,790 | | 5,093,319 |
| Hornbeck Offshore Services, Inc. (I) | | 55,810 | | 1,585,562 |
| Noble Corp. | | 22,000 | | 983,620 |
| Sevan Marine ASA (I) | | 2,619,192 | | 2,727,030 |
| Tidewater, Inc. | | 36,800 | | 2,289,328 |
| | |
|
| | | | | 13,317,463 |
| Oil, Gas & Consumable Fuels - 10.18% | | | | |
| Alpha Natural Resources, Inc. (I)(L) | | 66,271 | | 3,593,214 |
| Anadarko Petroleum Corp. | | 260,713 | | 21,334,145 |
| BG Group PLC | | 298,994 | | 7,294,541 |
| BP PLC | | 320,500 | | 2,582,792 |
| BP PLC, SADR | | 19,500 | | 945,165 |
| Bumi Resources Tbk PT | | 12,661,650 | | 4,336,627 |
| Cabot Oil & Gas Corp. (L) | | 65,200 | | 2,977,032 |
| Cameco Corp. (Toronto Stock Exchange) | | 114,124 | | 4,649,412 |
| Canadian Natural Resources, Ltd. | | 14,700 | | 739,410 |
| Cheniere Energy, Inc. (I)(L) | | 130,590 | | 1,355,524 |
| Chesapeake Energy Corp. | | 137,089 | | 4,881,739 |
| Chevron Corp. | | 64,800 | | 6,723,000 |
| Cobalt International Energy, Inc. (I)(L) | | 284,552 | | 4,456,084 |
| ConocoPhillips | | 41,300 | | 3,216,031 |
| CONSOL Energy, Inc. | | 72,100 | | 3,656,191 |
| Continental Resources, Inc. (I) | | 4,100 | | 285,073 |
| Denbury Resources, Inc. (I) | | 57,000 | | 1,381,110 |
| EOG Resources, Inc. (L) | | 37,400 | | 4,200,394 |
| Exxon Mobil Corp. | | 91,250 | | 7,804,613 |
| Gazprom OAO, SADR | | 219,447 | | 6,434,186 |
| Imperial Oil, Ltd. | | 88,292 | | 4,597,491 |
| Karoon Gas Australia, Ltd. (I) | | 493,346 | | 3,538,431 |
| Massey Energy Company | | 39,200 | | 2,482,536 |
| Occidental Petroleum Corp. | | 50,481 | | 5,147,548 |
| OGX Petroleo e Gas Participacoes SA (I) | | 52,600 | | 614,900 |
| Paladin Resources, Ltd. (I)(L) | | 715,720 | | 3,639,220 |
| Peabody Energy Corp. | | 58,800 | | 3,850,812 |
| Petroleo Brasileiro SA, ADR | | 316,688 | | 12,613,683 |
| Royal Dutch Shell PLC, ADR, Class B (L) | | 43,900 | | 3,166,068 |
| StatoilHydro ASA, SADR (L) | | 128,100 | | 3,380,559 |
| Ultra Petroleum Corp. (I)(L) | | 223,884 | | 10,153,139 |
| | | | |
| Alpha Opportunities Fund (continued) | | |
| | | Shares or | | |
| | | Principal | | |
| | | Amount | | Value |
| | |
|
| |
| COMMON STOCKS (continued) | | | | |
| Oil, Gas & Consumable Fuels (continued) | | | | |
| Uranium One, Inc. | | 93,600 | $ | 618,509 |
| Venoco, Inc. (I)(L) | | 133,653 | | 2,465,898 |
| Whiting Petroleum Corp. (I) | | 29,500 | | 1,927,530 |
| | |
|
| | | | | 151,042,607 |
| | |
|
| | | | | 164,360,070 |
| Financials - 12.81% | | | | |
| Capital Markets - 3.17% | | | | |
| Ameriprise Financial, Inc. | | 91,000 | | 5,762,120 |
| BlackRock, Inc. | | 39,880 | | 8,135,121 |
| Credit Suisse Group AG | | 26,483 | | 1,224,378 |
| Credit Suisse Group AG, SADR (L) | | 58,200 | | 2,690,586 |
| Invesco, Ltd. | | 258,940 | | 6,949,950 |
| TD Ameritrade Holding Corp. (L) | | 167,940 | | 3,661,092 |
| The Goldman Sachs Group, Inc. | | 12,250 | | 2,006,305 |
| UBS AG (I) | | 633,992 | | 12,584,741 |
| UBS AG (Swiss Exchange) (I) | | 203,855 | | 4,050,923 |
| | |
|
| | | | | 47,065,216 |
| Commercial Banks - 3.49% | | | | |
| Banco Bradesco SA, ADR (L) | | 34,700 | | 679,426 |
| Barclays PLC | | 603,150 | | 3,131,959 |
| PNC Financial Services Group, Inc. | | 74,863 | | 4,619,047 |
| U.S. Bancorp | | 145,100 | | 4,023,623 |
| UCO Bank | | 399,700 | | 867,209 |
| Wells Fargo & Company | | 1,190,956 | | 38,420,241 |
| | |
|
| | | | | 51,741,505 |
| Diversified Financial Services - 2.65% | | | | |
| Bank of America Corp. | | 320,644 | | 4,582,003 |
| Great American Group, Inc. (I) | | 471,600 | | 160,344 |
| ING Groep NV (I) | | 196,305 | | 2,461,764 |
| JPMorgan Chase & Company | | 474,596 | | 22,158,887 |
| Justice Holdings, Ltd. (I) | | 388,695 | | 6,224,034 |
| PHH Corp. (I)(L) | | 152,720 | | 3,769,130 |
| | |
|
| | | | | 39,356,162 |
| Insurance - 2.65% | | | | |
| ACE, Ltd. | | 153,401 | | 9,702,613 |
| Ageas | | 1,126,393 | | 3,573,354 |
| Assured Guaranty, Ltd. | | 62,213 | | 903,955 |
| Brasil Insurance Participacoes | | | | |
| e Administracao SA (I) | | 300 | | 342,589 |
| Fidelity National Financial, Inc., Class A | | 217,600 | | 3,013,760 |
| Genworth Financial, Inc., Class A (I) | | 95,500 | | 1,263,465 |
| Hartford Financial Services Group, Inc. | | 36,800 | | 1,089,280 |
| Marsh & McLennan Companies, Inc. | | 260,800 | | 7,938,752 |
| MetLife, Inc. | | 20,300 | | 961,408 |
| Principal Financial Group, Inc. (L) | | 121,110 | | 4,149,229 |
| Unum Group (L) | | 236,400 | | 6,271,692 |
| | |
|
| | | | | 39,210,097 |
| Real Estate Investment Trusts - 0.24% | | | | |
| Weyerhaeuser Company | | 142,800 | | 3,485,741 |
| Real Estate Management & Development - 0.15% | | | | |
| CB Richard Ellis Group, Inc., Class A (I) | | 46,500 | | 1,164,360 |
| City Developments, Ltd. | | 58,000 | | 510,688 |
| Wheelock and Company, Ltd. | | 153,000 | | 558,604 |
| | |
|
| | | | | 2,233,652 |
| Thrifts & Mortgage Finance - 0.46% | | | | |
| BankUnited, Inc. (I) | | 58,100 | | 1,647,135 |
| MGIC Investment Corp. (I)(L) | | 165,591 | | 1,422,427 |
| |
| The accompanying notes are an integral part of the financial statements. | 38 |
John Hancock Funds II
Portfolio of Investments — February 28, 2011 (Unaudited) (showing percentage of total net assets)
| | | | |
| Alpha Opportunities Fund (continued) | | |
| | | Shares or | | |
| | | Principal | | |
| | | Amount | | Value |
| | |
|
| |
| COMMON STOCKS (continued) | | | | |
| Thrifts & Mortgage Finance (continued) | | | | |
| Radian Group, Inc. (L) | | 539,378 | $ | 3,808,009 |
| | | |
|
| | | | | 6,877,571 |
| | | |
|
| | | | | 189,969,944 |
| Health Care - 9.99% | | | | |
| Biotechnology - 0.88% | | | | |
| Celgene Corp. (I) | | 127,240 | | 6,756,444 |
| Gilead Sciences, Inc. (I) | | 37,800 | | 1,473,444 |
| Momenta Pharmaceuticals, Inc. (I)(L) | | 65,241 | | 905,545 |
| Novavax, Inc. (I)(L) | | 1,500,988 | | 3,902,569 |
| | |
|
| | | | | 13,038,002 |
| Health Care Equipment & Supplies - 2.37% | | | | |
| Covidien PLC | | 26,100 | | 1,342,845 |
| Edwards Lifesciences Corp. (I) | | 135,860 | | 11,553,534 |
| Gen-Probe, Inc. (I)(L) | | 155,350 | | 9,768,408 |
| Medtronic, Inc. | | 259,987 | | 10,378,681 |
| Zoll Medical Corp. (I)(L) | | 44,000 | | 2,036,320 |
| | |
|
| | | | | 35,079,788 |
| Health Care Providers & Services - 2.51% | | | | |
| CIGNA Corp. | | 222,830 | | 9,374,458 |
| Express Scripts, Inc. (I) | | 159,000 | | 8,938,980 |
| UnitedHealth Group, Inc. | | 445,907 | | 18,986,720 |
| | |
|
| | | | | 37,300,158 |
| Health Care Technology - 0.47% | | | | |
| SXC Health Solutions Corp. (I) | | 140,164 | | 6,917,093 |
| Life Sciences Tools & Services - 1.17% | | | | |
| Agilent Technologies, Inc. (I) | | 164,800 | | 6,934,784 |
| Pharmaceutical Product Development, Inc. (L) | | 334,650 | | 9,192,836 |
| Thermo Fisher Scientific, Inc. (I) | | 21,700 | | 1,211,294 |
| | |
|
| | | | | 17,338,914 |
| Pharmaceuticals - 2.59% | | | | |
| Elan Corp. PLC (I) | | 490,472 | | 3,114,497 |
| Johnson & Johnson | | 79,603 | | 4,890,808 |
| Merck & Company, Inc. | | 143,221 | | 4,664,708 |
| Pfizer, Inc. | | 1,038,297 | | 19,976,834 |
| Salix Pharmaceuticals, Ltd. (I) | | 44,080 | | 1,469,627 |
| Teva Pharmaceutical Industries, Ltd., SADR | | 17,800 | | 891,780 |
| UCB SA | | 93,332 | | 3,472,736 |
| | |
|
| | | | | 38,480,990 |
| | | |
|
| | | | | 148,154,945 |
| Industrials - 11.16% | | | | |
| Aerospace & Defense - 3.05% | | | | |
| BE Aerospace, Inc. (I) | | 107,180 | | 3,614,110 |
| Esterline Technologies Corp. (I) | | 23,180 | | 1,658,993 |
| European Aeronautic Defence & | | | | |
| Space Company (I) | | 71,380 | | 2,064,179 |
| General Dynamics Corp. | | 152,397 | | 11,600,460 |
| Goodrich Corp. | | 21,990 | | 1,896,198 |
| Honeywell International, Inc. | | 36,180 | | 2,095,184 |
| Northrop Grumman Corp. | | 154,738 | | 10,317,930 |
| Precision Castparts Corp. | | 11,324 | | 1,605,177 |
| Raytheon Company | | 20,000 | | 1,024,200 |
| Safran SA | | 115,259 | | 4,104,784 |
| The Boeing Company | | 8,700 | | 626,487 |
| TransDigm Group, Inc. (I) | | 31,790 | | 2,555,280 |
| Triumph Group, Inc. (L) | | 23,230 | | 2,011,486 |
| | |
|
| | | | | 45,174,468 |
| Air Freight & Logistics - 0.16% | | | | |
| United Parcel Service, Inc., Class B (L) | | 31,700 | | 2,339,460 |
| | | | |
| Alpha Opportunities Fund (continued) | | |
| | | Shares or | | |
| | | Principal | | |
| | | Amount | | Value |
| | |
|
| |
| COMMON STOCKS (continued) | | | | |
| Airlines - 0.95% | | | | |
| AirAsia BHD (I) | | 4,524,837 | $ | 3,742,186 |
| Copa Holdings SA, Class A | | 34,860 | | 1,859,084 |
| Delta Air Lines, Inc. (I) | | 402,647 | | 4,525,752 |
| United Continental Holdings, Inc. (I)(L) | | 167,470 | | 4,025,979 |
| | |
|
| | | | | 14,153,001 |
| Building Products - 0.14% | | | | |
| Assa Abloy AB, Series B | | 31,956 | | 894,348 |
| JS Group Corp. | | 49,900 | | 1,215,423 |
| | |
|
| | | | | 2,109,771 |
| Commercial Services & Supplies - 0.65% | | | | |
| Corrections Corp. of America (I) | | 114,132 | | 2,835,039 |
| Sykes Enterprises, Inc. (I) | | 128,650 | | 2,392,890 |
| The Geo Group, Inc. (I) | | 90,300 | | 2,296,329 |
| Waste Management, Inc. (L) | | 58,683 | | 2,174,792 |
| | |
|
| | | | | 9,699,050 |
| Construction & Engineering - 0.83% | | | | |
| Aecom Technology Corp. (I) | | 356,610 | | 10,213,310 |
| Fluor Corp. | | 15,600 | | 1,103,856 |
| Skanska AB, Series B | | 45,464 | | 933,668 |
| | |
|
| | | | | 12,250,834 |
| Electrical Equipment - 0.09% | | | | |
| Schneider Electric SA | | 8,444 | | 1,396,638 |
| Industrial Conglomerates - 0.94% | | | | |
| 3M Company | | 71,804 | | 6,622,483 |
| General Electric Company | | 94,800 | | 1,983,216 |
| Tyco International, Ltd. | | 117,950 | | 5,347,853 |
| | |
|
| | | | | 13,953,552 |
| Machinery - 3.36% | | | | |
| AGCO Corp. (I) | | 23,430 | | 1,283,495 |
| ArvinMeritor, Inc. (I)(L) | | 510,393 | | 9,146,243 |
| Chart Industries, Inc. (I) | | 64,250 | | 2,916,308 |
| Fiat Industrial SpA (I) | | 242,210 | | 3,382,485 |
| Flowserve Corp. | | 10,700 | | 1,337,179 |
| Illinois Tool Works, Inc. | | 111,100 | | 6,010,510 |
| Ingersoll-Rand PLC (L) | | 144,950 | | 6,566,235 |
| Joy Global, Inc. | | 16,800 | | 1,635,984 |
| Navistar International Corp. (I) | | 131,563 | | 8,154,275 |
| Pall Corp. | | 21,400 | | 1,163,304 |
| SKF AB, B Shares | | 16,612 | | 463,474 |
| Tata Motors, Ltd., SADR | | 34,600 | | 851,852 |
| United Tractors Tbk PT | | 142,000 | | 374,319 |
| Volvo AB, Series B (I) | | 135,330 | | 2,341,026 |
| Wabash National Corp. (I)(L) | | 164,940 | | 1,718,675 |
| WABCO Holdings, Inc. (I) | | 40,530 | | 2,368,168 |
| Weichai Power Compnay, Ltd. | | 20,000 | | 133,728 |
| | |
|
| | | | | 49,847,260 |
| Road & Rail - 0.45% | | | | |
| Avis Budget Group, Inc. (I) | | 127,190 | | 1,948,551 |
| Con-way, Inc. (L) | | 19,200 | | 625,152 |
| J.B. Hunt Transport Services, Inc. (L) | | 97,670 | | 4,064,049 |
| | |
|
| | | | | 6,637,752 |
| Trading Companies & Distributors - 0.54% | | | | |
| United Rentals, Inc. (I)(L) | | 221,470 | | 6,861,141 |
| WESCO International, Inc. (I)(L) | | 18,700 | | 1,088,714 |
| | |
|
| | | | | 7,949,855 |
| | |
|
| | | | | 165,511,641 |
| |
| The accompanying notes are an integral part of the financial statements. | 39 |
John Hancock Funds II
Portfolio of Investments — February 28, 2011 (Unaudited) (showing percentage of total net assets)
| | | | |
| Alpha Opportunities Fund (continued) | | |
| | | Shares or | | |
| | | Principal | | |
| | | Amount | | Value |
| | |
|
| |
| COMMON STOCKS (continued) | | | | |
| Information Technology - 18.99% | | | | |
| Communications Equipment - 4.56% | | | | |
| Acme Packet, Inc. (I) | | 77,600 | $ | 5,838,624 |
| ADTRAN, Inc. | | 160,550 | | 7,301,814 |
| Alcatel-Lucent, SADR (I)(L) | | 171,100 | | 838,390 |
| Aruba Networks, Inc. (I) | | 80,350 | | 2,446,658 |
| Cisco Systems, Inc. (I) | | 284,230 | | 5,275,309 |
| F5 Networks, Inc. (I)(L) | | 18,350 | | 2,165,484 |
| HUGHES Telematics, Inc. (I)(L) | | 28,605 | | 117,281 |
| JDS Uniphase Corp. (I) | | 108,250 | | 2,670,528 |
| Juniper Networks, Inc. (I) | | 50,960 | | 2,242,240 |
| Polycom, Inc. (I) | | 279,445 | | 13,357,471 |
| QUALCOMM, Inc. | | 365,910 | | 21,800,918 |
| Research In Motion, Ltd. (I) | | 53,900 | | 3,564,946 |
| | |
|
| | | | | 67,619,663 |
| Computers & Peripherals - 2.95% | | | | |
| Apple, Inc. (I) | | 79,600 | | 28,115,516 |
| EMC Corp. (I) | | 571,330 | | 15,545,889 |
| | |
|
| | | | | 43,661,405 |
| Electronic Equipment, Instruments & Components - 0.45% | | |
| Hon Hai Precision Industry Company, Ltd. | | 295,000 | | 1,086,374 |
| Jabil Circuit, Inc. | | 260,980 | | 5,592,801 |
| | |
|
| | | | | 6,679,175 |
| Internet Software & Services - 2.32% | | | | |
| Baidu, Inc., SADR (I) | | 9,700 | | 1,175,252 |
| E-Access, Ltd. (L) | | 1,511 | | 956,009 |
| eBay, Inc. (I) | | 514,497 | | 17,238,222 |
| Google, Inc., Class A (I) | | 13,330 | | 8,176,622 |
| KIT Digital, Inc. (I)(L) | | 272,008 | | 3,538,824 |
| Quepasa Corpquepasa Corp. (I)(L) | | 97,480 | | 849,051 |
| Support.com, Inc. (I) | | 267,230 | | 1,491,143 |
| Tencent Holdings, Ltd. | | 35,800 | | 957,267 |
| | |
|
| | | | | 34,382,390 |
| IT Services - 2.07% | | | | |
| Automatic Data Processing, Inc. | | 165,566 | | 8,278,300 |
| Teradata Corp. (I) | | 65,470 | | 3,130,775 |
| The Western Union Company | | 877,120 | | 19,287,869 |
| | |
|
| | | | | 30,696,944 |
| Semiconductors & Semiconductor Equipment - 5.10% | | |
| Altera Corp. (L) | | 103,250 | | 4,322,045 |
| Analog Devices, Inc. | | 154,800 | | 6,173,424 |
| ARM Holdings PLC | | 415,148 | | 4,178,917 |
| ASML Holding NV -New York | | | | |
| Registered Shares (L) | | 11,900 | | 518,840 |
| Atmel Corp. (I) | | 146,770 | | 2,154,584 |
| Avago Technologies, Ltd. | | 27,600 | | 938,124 |
| AXT, Inc. (I)(L) | | 68,670 | | 509,531 |
| Broadcom Corp., Class A | | 301,330 | | 12,420,823 |
| Cavium Networks, Inc. (I)(L) | | 131,060 | | 5,659,171 |
| Cirrus Logic, Inc. (I)(L) | | 114,900 | | 2,682,915 |
| Cree, Inc. (I)(L) | | 35,871 | | 1,889,326 |
| GT Solar International, Inc. (I)(L) | | 375,870 | | 4,018,050 |
| Intel Corp. | | 95,000 | | 2,039,650 |
| Lam Research Corp. (I) | | 23,900 | | 1,312,110 |
| Maxim Integrated Products, Inc. | | 141,100 | | 3,891,538 |
| Micron Technology, Inc. (I)(L) | | 238,577 | | 2,655,362 |
| MIPS Technologies, Inc. (I)(L) | | 123,620 | | 1,504,455 |
| NVIDIA Corp. (I) | | 92,550 | | 2,097,183 |
| Samsung Electronics Company, Ltd. | | 1,922 | | 1,579,707 |
| Skyworks Solutions, Inc. (I) | | 328,000 | | 11,788,320 |
| Ultratech, Inc. (I) | | 32,500 | | 803,400 |
| | | | |
| Alpha Opportunities Fund (continued) | | |
| | | Shares or | | |
| | | Principal | | |
| | | Amount | | Value |
| | |
|
| |
| COMMON STOCKS (continued) | | | | |
| Semiconductors & Semiconductor Equipment (continued) | | |
| Xilinx, Inc. (L) | | 75,500 | $ | 2,510,375 |
| | |
|
| | | | | 75,647,850 |
| Software - 1.54% | | | | |
| Ariba, Inc. (I) | | 92,540 | | 2,864,113 |
| BMC Software, Inc. (I) | | 32,800 | | 1,623,600 |
| Citrix Systems, Inc. (I) | | 14,800 | | 1,038,368 |
| Glu Mobile Inc. (I)(L) | | 123,260 | | 558,368 |
| Microsoft Corp. | | 94,073 | | 2,500,460 |
| Quest Software, Inc. (I) | | 41,010 | | 1,098,658 |
| Rovi Corp. (I) | | 38,300 | | 2,122,586 |
| Salesforce.com, Inc. (I)(L) | | 5,700 | | 753,939 |
| SuccessFactors, Inc. (I)(L) | | 79,030 | | 2,837,967 |
| TIBCO Software, Inc. (I) | | 66,700 | | 1,642,154 |
| TiVo, Inc. (I)(L) | | 179,255 | | 1,842,741 |
| VMware, Inc., Class A (I) | | 47,920 | | 4,008,508 |
| | |
|
| | | | | 22,891,462 |
| | |
|
| | | | | 281,578,889 |
| Materials - 8.76% | | | | |
| Chemicals - 3.48% | | | | |
| Agrium, Inc. | | 31,400 | | 2,985,512 |
| CF Industries Holdings, Inc. | | 91,060 | | 12,864,957 |
| Huabao International Holdings, Ltd. | | 1,169,000 | | 1,478,639 |
| Incitec Pivot, Ltd. | | 915,270 | | 4,119,957 |
| Methanex Corp. | | 142,531 | | 4,147,652 |
| Monsanto Company | | 84,070 | | 6,043,792 |
| Potash Corp. of Saskatchewan, Inc. | | 8,200 | | 505,120 |
| PTT Chemical PCL | | 179,140 | | 843,701 |
| Sociedad Quimica y Minera de | | | | |
| Chile SA, ADR (L) | | 24,590 | | 1,303,024 |
| The Mosaic Company | | 200,900 | | 17,247,265 |
| | |
|
| | | | | 51,539,619 |
| Construction Materials - 0.07% | | | | |
| Anhui Conch Cement Company, Ltd. | | 216,000 | | 1,038,473 |
| Containers & Packaging - 0.91% | | | | |
| Owens-Illinois, Inc. (I) | | 440,337 | | 13,425,875 |
| Metals & Mining - 3.81% | | | | |
| Agnico Eagle Mines, Ltd. | | 15,900 | | 1,118,565 |
| Allegheny Technologies, Inc. (L) | | 32,200 | | 2,159,976 |
| Allied Nevada Gold Corp. (I)(L) | | 66,420 | | 2,015,183 |
| AngloGold Ashanti, Ltd. (L) | | 89,530 | | 4,372,645 |
| CGA Mining, Ltd. (I) | | 589,079 | | 1,855,367 |
| China Metal Recycling Holdings, Ltd. | | 730,200 | | 845,169 |
| Cliffs Natural Resources, Inc. | | 16,900 | | 1,640,483 |
| Detour Gold Corp. (I) | | 116,080 | | 3,777,932 |
| Freeport-McMoRan Copper & Gold, Inc. | | 22,400 | | 1,186,080 |
| IAMGOLD Corp. | | 172,280 | | 3,652,336 |
| Ivanhoe Mines, Ltd. (I) | | 60,400 | | 1,710,883 |
| Kumba Iron Ore, Ltd. | | 11,617 | | 786,160 |
| Lynas Corp., Ltd. (I) | | 660,378 | | 1,330,189 |
| Mechel, SADR (L) | | 24,500 | | 745,535 |
| Medusa Mining, Ltd. | | 315,534 | | 2,284,648 |
| Molycorp, Inc. (I) | | 23,280 | | 1,117,207 |
| Mongolian Mining Corp. (I) | | 678,200 | | 863,973 |
| Nucor Corp. | | 64,300 | | 3,083,828 |
| Perseus Mining, Ltd. (I) | | 462,850 | | 1,406,596 |
| Rare Element Resources, Ltd. (I)(L) | | 97,870 | | 1,189,121 |
| Rio Tinto PLC | | 42,872 | | 3,024,081 |
| Rio Tinto PLC, SADR (L) | | 22,700 | | 1,613,516 |
| Romarco Minerals, Inc. (I) | | 671,970 | | 1,632,288 |
| Silver Wheaton Corp. (I) | | 52,530 | | 2,235,152 |
| Vallar PLC (I) | | 112,126 | | 2,376,878 |
| |
| The accompanying notes are an integral part of the financial statements. | 40 |
John Hancock Funds II
Portfolio of Investments — February 28, 2011 (Unaudited) (showing percentage of total net assets)
| | | | |
| Alpha Opportunities Fund (continued) | | |
| | | Shares or | | |
| | | Principal | | |
| | | Amount | | Value |
| |
|
| COMMON STOCKS (continued) | | | | |
| Metals & Mining (continued) | | | | |
| Vedanta Resources PLC | | 151,276 | $ | 5,921,960 |
| Walter Energy, Inc. | | 10,200 | | 1,234,302 |
| Xstrata PLC | | 58,894 | | 1,344,231 |
| | |
|
| | | | | 56,524,284 |
| Paper & Forest Products - 0.49% | | | | |
| Louisiana-Pacific Corp. (I)(L) | | 271,083 | | 2,797,577 |
| Norbord, Inc. (I) | | 172,225 | | 2,694,478 |
| Sino-Forest Corp. (I) | | 81,800 | | 1,827,881 |
| | |
|
| | | | | 7,319,936 |
| | | |
|
| | | | | 129,848,187 |
| Telecommunication Services - 0.50% | | | | |
| Diversified Telecommunication Services - 0.23% | | | | |
| AT&T, Inc. | | 118,900 | | 3,374,382 |
| Wireless Telecommunication Services - 0.27% | | | | |
| American Tower Corp., Class A (I) | | 16,900 | | 911,924 |
| Sprint Nextel Corp. (I) | | 723,751 | | 3,162,792 |
| | |
|
| | | | | 4,074,716 |
| | | |
|
| | | | | 7,449,098 |
| Utilities - 0.33% | | | | |
| Gas Utilities - 0.33% | | | | |
| UGI Corp. | | 152,550 | | 4,864,820 |
|
| TOTAL COMMON STOCKS (Cost $1,252,864,188) | | | $ | 1,447,292,851 |
|
| PREFERRED SECURITIES - 0.00% | | | | |
| Financials - 0.00% | | | | |
| Banco do Estado do Rio Grande do Sul SA | | 2,300 | | 25,159 |
|
| TOTAL PREFERRED SECURITIES (Cost $24,348) | | | $ | 25,159 |
|
| INVESTMENT COMPANIES - 0.29% | | | | |
| SPDR S&P Midcap 400 ETF Trust | | 24,200 | | 4,246,374 |
|
| TOTAL INVESTMENT COMPANIES (Cost $3,238,487) | | $ | 4,246,374 |
|
| SECURITIES LENDING COLLATERAL - 12.87% | | | |
| Securities Lending Collateral - 12.87% | | | | |
| John Hancock Collateral | | | | |
| Investment Trust, 0.2855% (W)(Y) | 19,072,005 | | 190,861,182 |
|
| TOTAL SECURITIES LENDING | | | | |
| COLLATERAL (Cost $190,856,681) | | | $ | 190,861,182 |
|
| | | | |
| Alpha Opportunities Fund (continued) | | |
| | | Shares or | | |
| | | Principal | | |
| | | Amount | | Value |
| |
|
| |
| SHORT-TERM INVESTMENTS - 2.93% | | | |
| Repurchase Agreement - 2.93% | | | | |
| Bank of New York Tri-Party Repurchase | | | | |
| Agreement dated 02/28/2011 at 0.200% to | | | |
| be repurchased at $43,500,242 on | | | | |
| 03/01/2011 collateralized by $19,499,760 | | | |
| U.S. Treasury Bond, 7.500% due 11/15/2024 | | | |
| (valued at $19,805,834 including interest), | | | |
| $24,439,648 U.S. Treasury Bond, 2.375% | | | |
| due 01/15/2027 (valued at $24,503,554, | | | | |
| including interest), and $60,656 | | | | |
| U.S. Treasury Notes, 0.500% due | | | | |
| 10/15/2013 (valued at $60,670, | | | | |
| including interest) | $ | 43,500,000 | $ | 43,500,000 |
|
| TOTAL SHORT-TERM INVESTMENTS (Cost $43,500,000) | $ | 43,500,000 |
|
| Total Investments (Alpha Opportunities Fund) | | | |
| (Cost $1,490,483,704) - 113.68% | | | $ | 1,685,925,566 |
| Other assets and liabilities, net - (13.68%) | | | (202,907,395) |
| | |
|
| TOTAL NET ASSETS - 100.00% | | | $ | 1,483,018,171 |
| | | |
|
| |
| |
| |
| Blue Chip Growth Fund | | | | |
| | | Shares or | | |
| | | Principal | | |
| | | Amount | | Value |
| |
|
| |
| COMMON STOCKS - 99.39% | | | | |
| Consumer Discretionary - 20.65% | | | | |
| Auto Components - 0.57% | | | | |
| Johnson Controls, Inc. | | 338,500 | $ | 13,810,800 |
| Automobiles - 0.18% | | | | |
| General Motors Company (I) | | 127,300 | | 4,268,369 |
| Hotels, Restaurants & Leisure - 6.65% | | | | |
| Carnival Corp. | | 699,000 | | 29,826,330 |
| Chipotle Mexican Grill, Inc. (I)(L) | | 5,700 | | 1,396,500 |
| Las Vegas Sands Corp. (I) | | 389,000 | | 18,142,960 |
| Marriott International, Inc., Class A (L) | | 805,485 | | 31,583,068 |
| McDonald’s Corp. | | 218,900 | | 16,566,352 |
| Starbucks Corp. | | 1,092,400 | | 36,027,352 |
| Starwood Hotels & | | | | |
| Resorts Worldwide, Inc. (L) | | 342,600 | | 20,932,860 |
| Wynn Resorts, Ltd. | | 45,600 | | 5,605,608 |
| | |
|
| | | | | 160,081,030 |
| Household Durables - 0.35% | | | | |
| Stanley Black & Decker, Inc. | | 110,300 | | 8,364,049 |
| Internet & Catalog Retail - 5.67% | | | | |
| Amazon.com, Inc. (I) | | 545,811 | | 94,583,588 |
| Liberty Media Corp. - Interactive, Series A (I) | 928,600 | | 14,913,316 |
| priceline.com, Inc. (I) | | 59,300 | | 26,915,084 |
| | |
|
| | | | | 136,411,988 |
| Leisure Equipment & Products - 0.15% | | | | |
| Mattel, Inc. | | 139,000 | | 3,483,340 |
| Media - 3.06% | | | | |
| Discovery Communications, Inc., Series C (I) | 432,300 | | 16,457,661 |
| Omnicom Group, Inc. | | 303,500 | | 15,448,150 |
| The Walt Disney Company | | 795,200 | | 34,782,048 |
| Time Warner, Inc. | | 179,533 | | 6,858,161 |
| | |
|
| | | | | 73,546,020 |
| Multiline Retail - 0.06% | | | | |
| Dollar Tree, Inc. (I) | | 9,450 | | 475,524 |
| |
| The accompanying notes are an integral part of the financial statements. | 41 |
John Hancock Funds II
Portfolio of Investments — February 28, 2011 (Unaudited) (showing percentage of total net assets)
| | | | |
| Blue Chip Growth Fund (continued) | | |
| | | Shares or | | |
| | | Principal | | |
| | | Amount | | Value |
| | |
|
| |
| COMMON STOCKS (continued) | | | | |
| Multiline Retail (continued) | | | | |
| Kohl’s Corp. | | 19,470 | $ | 1,049,238 |
| | | |
|
| | | | | 1,524,762 |
| Specialty Retail - 1.71% | | | | |
| Bed Bath & Beyond, Inc. (I)(L) | | 361,700 | | 17,415,855 |
| CarMax, Inc. (I) | | 108,700 | | 3,844,719 |
| O’Reilly Automotive, Inc. (I) | | 298,700 | | 16,601,746 |
| Tiffany & Company | | 54,700 | | 3,366,785 |
| | |
|
| | | | | 41,229,105 |
| Textiles, Apparel & Luxury Goods - 2.25% | | | | |
| Coach, Inc. (L) | | 373,600 | | 20,518,112 |
| NIKE, Inc., Class B | | 254,000 | | 22,613,620 |
| Polo Ralph Lauren Corp. | | 86,200 | | 10,922,402 |
| | |
|
| | | | | 54,054,134 |
| | | |
|
| | | | | 496,773,597 |
| Consumer Staples - 0.73% | | | | |
| Beverages - 0.12% | | | | |
| Anheuser-Busch InBev NV | | 23,200 | | 1,296,505 |
| PepsiCo, Inc. | | 10,366 | | 657,412 |
| The Coca-Cola Company | | 17,000 | | 1,086,640 |
| | |
|
| | | | | 3,040,557 |
| Food & Staples Retailing - 0.18% | | | | |
| Costco Wholesale Corp. | | 51,100 | | 3,821,769 |
| Whole Foods Market, Inc. | | 7,700 | | 450,912 |
| | |
|
| | | | | 4,272,681 |
| Household Products - 0.43% | | | | |
| The Procter & Gamble Company | | 162,928 | | 10,272,610 |
| | |
|
| | | | | 17,585,848 |
| Energy - 9.10% | | | | |
| Energy Equipment & Services - 5.43% | | | | |
| Cameron International Corp. (I)(L) | | 375,500 | | 22,203,315 |
| FMC Technologies, Inc. (I)(L) | | 180,800 | | 17,004,240 |
| Halliburton Company | | 225,500 | | 10,584,970 |
| McDermott International, Inc. (I) | | 193,100 | | 4,431,645 |
| National Oilwell Varco, Inc. | | 58,500 | | 4,654,845 |
| Schlumberger, Ltd. | | 768,508 | | 71,794,017 |
| | |
|
| | | | | 130,673,032 |
| Oil, Gas & Consumable Fuels - 3.67% | | | | |
| Cimarex Energy Company | | 33,800 | | 3,925,194 |
| Concho Resources, Inc. (I) | | 99,600 | | 10,609,392 |
| EOG Resources, Inc. | | 195,200 | | 21,922,912 |
| Exxon Mobil Corp. | | 31,662 | | 2,708,051 |
| Occidental Petroleum Corp. | | 130,000 | | 13,256,100 |
| Peabody Energy Corp. | | 310,600 | | 20,341,194 |
| Range Resources Corp. (L) | | 173,400 | | 9,415,620 |
| Suncor Energy, Inc. | | 131,300 | | 6,173,726 |
| | |
|
| | | | | 88,352,189 |
| | | |
|
| | | | | 219,025,221 |
| Financials - 11.13% | | | | |
| Capital Markets - 5.33% | | | | |
| Ameriprise Financial, Inc. | | 238,489 | | 15,101,123 |
| BlackRock, Inc. | | 20,800 | | 4,242,992 |
| Credit Suisse Group AG | | 21,900 | | 1,012,494 |
| Franklin Resources, Inc. | | 441,135 | | 55,415,379 |
| Invesco, Ltd. | | 746,300 | | 20,030,692 |
| Northern Trust Corp. | | 163,011 | | 8,406,477 |
| State Street Corp. | | 110,829 | | 4,956,273 |
| TD Ameritrade Holding Corp. | | 134,000 | | 2,921,200 |
| The Charles Schwab Corp. | | 227,114 | | 4,308,353 |
| | | | |
| Blue Chip Growth Fund (continued) | | |
| | | Shares or | | |
| | | Principal | | |
| | | Amount | | Value |
| | |
|
| |
| COMMON STOCKS (continued) | | | | |
| Capital Markets (continued) | | | | |
| The Goldman Sachs Group, Inc. | | 72,824 | $ | 11,927,115 |
| | |
|
| | | | | 128,322,098 |
| Commercial Banks - 1.31% | | | | |
| PNC Financial Services Group, Inc. | | 200 | | 12,340 |
| U.S. Bancorp | | 489,900 | | 13,584,927 |
| Wells Fargo & Company | | 556,600 | | 17,955,916 |
| | |
|
| | | | | 31,553,183 |
| Consumer Finance - 0.93% | | | | |
| American Express Company | | 512,248 | | 22,318,645 |
| Diversified Financial Services - 2.79% | | | | |
| CME Group, Inc. | | 3,600 | | 1,120,608 |
| IntercontinentalExchange, Inc. (I) | | 166,750 | | 21,377,350 |
| JPMorgan Chase & Company | | 814,300 | | 38,019,667 |
| NYSE Euronext | | 176,100 | | 6,515,700 |
| | |
|
| | | | | 67,033,325 |
| Insurance - 0.40% | | | | |
| Prudential Financial, Inc. | | 146,500 | | 9,644,095 |
| Real Estate Management & Development - 0.37% | | | | |
| CB Richard Ellis Group, Inc., Class A (I) | | 360,600 | | 9,029,424 |
| | |
|
| | | | | 267,900,770 |
| Health Care - 7.19% | | | | |
| Biotechnology - 1.13% | | | | |
| Amgen, Inc. (I) | | 7,400 | | 379,842 |
| Celgene Corp. (I) | | 453,900 | | 24,102,090 |
| Vertex Pharmaceuticals, Inc. (I)(L) | | 58,800 | | 2,744,196 |
| | |
|
| | | | | 27,226,128 |
| Health Care Equipment & Supplies - 1.23% | | | | |
| Edwards Lifesciences Corp. (I) | | 60,100 | | 5,110,904 |
| Intuitive Surgical, Inc. (I)(L) | | 2,350 | | 770,683 |
| Stryker Corp. (L) | | 373,021 | | 23,597,308 |
| | |
|
| | | | | 29,478,895 |
| Health Care Providers & Services - 3.72% | | | | |
| Cardinal Health, Inc. | | 188,200 | | 7,836,648 |
| Express Scripts, Inc. (I) | | 831,800 | | 46,763,796 |
| McKesson Corp. | | 440,000 | | 34,883,200 |
| Medco Health Solutions, Inc. (I) | | 200 | | 12,328 |
| | |
|
| | | | | 89,495,972 |
| Health Care Technology - 0.04% | | | | |
| Cerner Corp. (I)(L) | | 10,000 | | 1,004,500 |
| Life Sciences Tools & Services - 0.04% | | | | |
| Thermo Fisher Scientific, Inc. (I) | | 15,800 | | 881,956 |
| Pharmaceuticals - 1.03% | | | | |
| Allergan, Inc. | | 260,000 | | 19,284,200 |
| Shire PLC, ADR (L) | | 64,700 | | 5,500,147 |
| | |
|
| | | | | 24,784,347 |
| | |
|
| | | | | 172,871,798 |
| Industrials - 14.78% | | | | |
| Aerospace & Defense - 2.84% | | | | |
| Honeywell International, Inc. | | 220,800 | | 12,786,528 |
| Precision Castparts Corp. | | 225,800 | | 32,007,150 |
| The Boeing Company | | 34,400 | | 2,477,144 |
| United Technologies Corp. | | 252,000 | | 21,052,080 |
| | |
|
| | | | | 68,322,902 |
| Air Freight & Logistics - 1.57% | | | | |
| Expeditors International of Washington, Inc. | | 300,400 | | 14,359,120 |
| |
| The accompanying notes are an integral part of the financial statements. | 42 |
John Hancock Funds II
Portfolio of Investments — February 28, 2011 (Unaudited) (showing percentage of total net assets)
| | | | |
| Blue Chip Growth Fund (continued) | | |
| | | Shares or | | |
| | | Principal | | |
| | | Amount | | Value |
| | |
|
| |
| COMMON STOCKS (continued) | | | | |
| Air Freight & Logistics (continued) | | | | |
| FedEx Corp. | | 259,200 | $ | 23,333,184 |
| | | |
|
| | | | | 37,692,304 |
| Electrical Equipment - 2.11% | | | | |
| Emerson Electric Company | | 481,700 | | 28,738,222 |
| Rockwell Automation, Inc. (L) | | 193,500 | | 16,975,755 |
| Roper Industries, Inc. (L) | | 61,000 | | 5,131,930 |
| | |
|
| | | | | 50,845,907 |
| Industrial Conglomerates - 1.13% | | | | |
| 3M Company | | 295,300 | | 27,235,519 |
| Machinery - 4.35% | | | | |
| Cummins, Inc. | | 200 | | 20,224 |
| Danaher Corp. | | 1,626,174 | | 82,284,404 |
| Deere & Company | | 102,700 | | 9,258,405 |
| Eaton Corp. | | 40,100 | | 4,442,278 |
| Illinois Tool Works, Inc. | | 24,600 | | 1,330,860 |
| Joy Global, Inc. | | 75,300 | | 7,332,714 |
| | |
|
| | | | | 104,668,885 |
| Road & Rail - 1.24% | | | | |
| CSX Corp. | | 48,500 | | 3,621,010 |
| Union Pacific Corp. | | 274,300 | | 26,170,963 |
| | |
|
| | | | | 29,791,973 |
| Trading Companies & Distributors - 1.54% | | | | |
| Fastenal Company (L) | | 398,000 | | 24,727,740 |
| WW Grainger, Inc. (L) | | 92,300 | | 12,295,283 |
| | |
|
| | | | | 37,023,023 |
| | | |
|
| | | | | 355,580,513 |
| Information Technology - 30.16% | | | | |
| Communications Equipment - 4.23% | | | | |
| Juniper Networks, Inc. (I) | | 915,179 | | 40,267,876 |
| QUALCOMM, Inc. | | 1,030,423 | | 61,392,602 |
| | |
|
| | | | | 101,660,478 |
| Computers & Peripherals - 8.51% | | | | |
| Apple, Inc. (I) | | 497,200 | | 175,616,012 |
| EMC Corp. (I) | | 883,800 | | 24,048,198 |
| Hewlett-Packard Company | | 5,800 | | 253,054 |
| NetApp, Inc. (I) | | 92,100 | | 4,757,886 |
| | |
|
| | | | | 204,675,150 |
| Electronic Equipment, Instruments & Components - 0.95% | | |
| Corning, Inc. | | 986,900 | | 22,757,914 |
| Internet Software & Services - 8.92% | | | | |
| Baidu, Inc., SADR (I) | | 343,000 | | 41,557,880 |
| eBay, Inc. (I) | | 545,462 | | 18,275,704 |
| Google, Inc., Class A (I) | | 205,084 | | 125,798,536 |
| Tencent Holdings, Ltd. | | 1,080,300 | | 28,886,475 |
| | |
|
| | | | | 214,518,595 |
| IT Services - 4.97% | | | | |
| Accenture PLC, Class A | | 423,600 | | 21,806,928 |
| Automatic Data Processing, Inc. | | 19,767 | | 988,350 |
| Fiserv, Inc. (I) | | 133,000 | | 8,414,910 |
| International Business Machines Corp. | | 68,100 | | 11,024,028 |
| MasterCard, Inc., Class A | | 138,760 | | 33,380,106 |
| The Western Union Company | | 578,100 | | 12,712,419 |
| Visa, Inc., Class A (L) | | 429,500 | | 31,374,975 |
| | |
|
| | | | | 119,701,716 |
| Semiconductors & Semiconductor Equipment - 2.17% | | |
| Altera Corp. (L) | | 195,500 | | 8,183,630 |
| Broadcom Corp., Class A | | 507,200 | | 20,906,784 |
| | | | |
| Blue Chip Growth Fund (continued) | | |
| | | Shares or | | |
| | | Principal | | |
| | | Amount | | Value |
| |
|
| COMMON STOCKS (continued) | | | | |
| Semiconductors & Semiconductor Equipment (continued) | | |
| Intel Corp. | | 200 | $ | 4,294 |
| Marvell Technology Group, Ltd. (I) | | 368,090 | | 6,728,685 |
| Xilinx, Inc. (L) | | 494,775 | | 16,451,269 |
| | |
|
| | | | | 52,274,662 |
| Software - 0.41% | | | | |
| Autodesk, Inc. (I) | | 70,200 | | 2,951,910 |
| Intuit, Inc. (I) | | 69,100 | | 3,633,278 |
| Microsoft Corp. | | 75,166 | | 1,997,912 |
| Salesforce.com, Inc. (I) | | 10,500 | | 1,388,835 |
| | |
|
| | | | | 9,971,935 |
| | |
|
| | | | | 725,560,450 |
| Materials - 4.02% | | | | |
| Chemicals - 3.55% | | | | |
| Air Products & Chemicals, Inc. | | 114,800 | | 10,561,600 |
| Monsanto Company | | 65,404 | | 4,701,894 |
| Potash Corp. of Saskatchewan, Inc. | | 216,500 | | 13,336,400 |
| Praxair, Inc. | | 483,600 | | 48,060,168 |
| The Mosaic Company | | 100,100 | | 8,593,585 |
| The Sherwin-Williams Company | | 2,000 | | 164,240 |
| | |
|
| | | | | 85,417,887 |
| Metals & Mining - 0.47% | | | | |
| Freeport-McMoRan Copper & Gold, Inc. | | 211,200 | | 11,183,040 |
| | |
|
| | | | | 96,600,927 |
| Telecommunication Services - 1.63% | | | | |
| Wireless Telecommunication Services - 1.63% | | | |
| American Tower Corp., Class A (I) | | 727,162 | | 39,237,662 |
|
| TOTAL COMMON STOCKS (Cost $1,567,982,369) | | $ | 2,391,136,786 |
|
| SECURITIES LENDING COLLATERAL - 6.14% | | |
| Securities Lending Collateral - 6.14% | | | | |
| John Hancock Collateral | | | | |
| Investment Trust, 0.2855% (W)(Y) | | 14,772,982 | | 147,839,143 |
|
| TOTAL SECURITIES LENDING | | | | |
| COLLATERAL (Cost $147,810,606) | | | $ | 147,839,143 |
|
| SHORT-TERM INVESTMENTS - 0.51% | | | |
| Short-Term Securities* - 0.51% | | | | |
| State Street Institutional U.S. Government | | | | |
| Money Market Fund, 0.0647% | $ | 1,135,888 | $ | 1,135,888 |
| T. Rowe Price Prime Reserve Fund, 0.2212% | 11,175,890 | | 11,175,890 |
| | |
|
| | | | | 12,311,778 |
|
| TOTAL SHORT-TERM INVESTMENTS (Cost $12,311,778) | $ | 12,311,778 |
|
| Total Investments (Blue Chip Growth Fund) | | | |
| (Cost $1,728,104,753) - 106.04% | | | $ | 2,551,287,707 |
| Other assets and liabilities, net - (6.04%) | | | | (145,399,867) |
| | |
|
| TOTAL NET ASSETS - 100.00% | | | $ | 2,405,887,840 |
| | | |
|
| |
| |
| Capital Appreciation Fund | | | |
| | | Shares or | | |
| | | Principal | | |
| | | Amount | | Value |
| |
|
| COMMON STOCKS - 99.66% | | | | |
| Consumer Discretionary - 22.42% | | | | |
| Auto Components - 0.76% | | | | |
| BorgWarner, Inc. (I)(L) | | 186,227 | $ | 14,453,077 |
| |
| The accompanying notes are an integral part of the financial statements. | 43 |
John Hancock Funds II
Portfolio of Investments — February 28, 2011 (Unaudited) (showing percentage of total net assets)
| | | | |
| Capital Appreciation Fund (continued) | | |
| | | Shares or | | |
| | | Principal | | |
| | | Amount | | Value |
| | |
|
| |
| COMMON STOCKS (continued) | | | | |
| Automobiles - 1.07% | | | | |
| Bayerische Motoren Werke (BMW) AG | | 249,791 | $ | 20,258,554 |
| Hotels, Restaurants & Leisure - 4.59% | | | | |
| Chipotle Mexican Grill, Inc. (I)(L) | | 44,290 | | 10,851,050 |
| Marriott International, Inc., Class A (L) | | 680,574 | | 26,685,307 |
| McDonald’s Corp. | | 292,650 | | 22,147,752 |
| Starbucks Corp. | | 838,140 | | 27,641,857 |
| | |
|
| | | | | 87,325,966 |
| Internet & Catalog Retail - 4.44% | | | | |
| Amazon.com, Inc. (I) | | 424,665 | | 73,590,198 |
| priceline.com, Inc. (I) | | 24,068 | | 10,923,984 |
| | |
|
| | | | | 84,514,182 |
| Media - 2.54% | | | | |
| The Walt Disney Company | | 1,104,897 | | 48,328,195 |
| Specialty Retail - 2.55% | | | | |
| Bed Bath & Beyond, Inc. (I) | | 392,845 | | 18,915,487 |
| Tiffany & Company (L) | | 322,595 | | 19,855,722 |
| Urban Outfitters, Inc. (I) | | 253,899 | | 9,744,644 |
| | |
|
| | | | | 48,515,853 |
| Textiles, Apparel & Luxury Goods - 6.47% | | | | |
| Burberry Group PLC | | 487,728 | | 9,504,758 |
| Coach, Inc. | | 416,333 | | 22,865,008 |
| LVMH Moet Hennessy Louis Vuitton SA | | 68,847 | | 10,852,089 |
| NIKE, Inc., Class B | | 509,947 | | 45,400,581 |
| Phillips-Van Heusen Corp. (L) | | 13,160 | | 789,732 |
| Polo Ralph Lauren Corp. | | 264,544 | | 33,520,370 |
| | |
|
| | | | | 122,932,538 |
| | |
|
| | | | | 426,328,365 |
| Consumer Staples - 5.31% | | | | |
| Food & Staples Retailing - 3.09% | | | | |
| Costco Wholesale Corp. | | 378,224 | | 28,287,373 |
| Whole Foods Market, Inc. | | 519,948 | | 30,448,155 |
| | |
|
| | | | | 58,735,528 |
| Food Products - 0.98% | | | | |
| Mead Johnson Nutrition Company | | 312,382 | | 18,696,063 |
| Personal Products - 1.24% | | | | |
| The Estee Lauder Companies, Inc., Class A | | 249,282 | | 23,534,714 |
| | |
|
| | | | | 100,966,305 |
| Energy - 6.21% | | | | |
| Energy Equipment & Services - 4.03% | | | | |
| Schlumberger, Ltd. | | 819,631 | | 76,569,928 |
| Oil, Gas & Consumable Fuels - 2.18% | | | | |
| Occidental Petroleum Corp. | | 407,281 | | 41,530,444 |
| | |
|
| | | | | 118,100,372 |
| Financials - 3.95% | | | | |
| Capital Markets - 2.77% | | | | |
| The Charles Schwab Corp. | | 1,203,730 | | 22,834,758 |
| The Goldman Sachs Group, Inc. | | 182,694 | | 29,921,623 |
| | |
|
| | | | | 52,756,381 |
| Consumer Finance - 1.18% | | | | |
| American Express Company | | 513,585 | | 22,376,898 |
| | |
|
| | | | | 75,133,279 |
| Health Care - 12.50% | | | | |
| Biotechnology - 2.05% | | | | |
| Alexion Pharmaceuticals, Inc. (I) | | 55,406 | | 5,334,490 |
| Celgene Corp. (I) | | 377,225 | | 20,030,648 |
| | | | |
| Capital Appreciation Fund (continued) | | |
| | | Shares or | | |
| | | Principal | | |
| | | Amount | | Value |
| | |
|
| |
| COMMON STOCKS (continued) | | | | |
| Biotechnology (continued) | | | | |
| Vertex Pharmaceuticals, Inc. (I)(L) | | 291,006 | $ | 13,581,250 |
| | |
|
| | | | | 38,946,388 |
| Health Care Providers & Services - 2.83% | | | | |
| Express Scripts, Inc. (I) | | 536,416 | | 30,157,308 |
| Medco Health Solutions, Inc. (I) | | 385,378 | | 23,754,700 |
| | |
|
| | | | | 53,912,008 |
| Life Sciences Tools & Services - 2.70% | | | | |
| Agilent Technologies, Inc. (I) | | 741,688 | | 31,210,231 |
| Illumina, Inc. (I)(L) | | 291,410 | | 20,223,854 |
| | |
|
| | | | | 51,434,085 |
| Pharmaceuticals - 4.92% | | | | |
| Allergan, Inc. | | 358,657 | | 26,601,590 |
| Novo Nordisk A/S (L) | | 123,000 | | 15,579,180 |
| Shire PLC, ADR (L) | | 368,634 | | 31,337,576 |
| Teva Pharmaceutical Industries, Ltd., SADR | | 398,372 | | 19,958,437 |
| | |
|
| | | | | 93,476,783 |
| | |
|
| | | | | 237,769,264 |
| Industrials - 9.97% | | | | |
| Aerospace & Defense - 4.28% | | | | |
| Precision Castparts Corp. | | 232,499 | | 32,956,733 |
| The Boeing Company | | 284,354 | | 20,476,332 |
| United Technologies Corp. | | 333,863 | | 27,890,915 |
| | |
|
| | | | | 81,323,980 |
| Air Freight & Logistics - 1.86% | | | | |
| C.H. Robinson Worldwide, Inc. (L) | | 117,659 | | 8,517,335 |
| Expeditors International of Washington, Inc. | | 175,868 | | 8,406,490 |
| United Parcel Service, Inc., Class B (L) | | 251,347 | | 18,549,409 |
| | |
|
| | | | | 35,473,234 |
| Machinery - 2.78% | | | | |
| Deere & Company | | 290,949 | | 26,229,052 |
| Ingersoll-Rand PLC (L) | | 586,536 | | 26,570,081 |
| | |
|
| | | | | 52,799,133 |
| Road & Rail - 1.05% | | | | |
| Union Pacific Corp. | | 208,755 | | 19,917,315 |
| | |
|
| | | | | 189,513,662 |
| Information Technology - 34.43% | | | | |
| Communications Equipment - 3.76% | | | | |
| Juniper Networks, Inc. (I) | | 891,391 | | 39,221,204 |
| QUALCOMM, Inc. | | 543,395 | | 32,375,474 |
| | |
|
| | | | | 71,596,678 |
| Computers & Peripherals - 8.05% | | | | |
| Apple, Inc. (I) | | 261,831 | | 92,481,328 |
| EMC Corp. (I) | | 848,611 | | 23,090,705 |
| NetApp, Inc. (I) | | 725,763 | | 37,492,917 |
| | |
|
| | | | | 153,064,950 |
| Internet Software & Services - 6.04% | | | | |
| Baidu, Inc., SADR (I) | | 273,861 | | 33,180,999 |
| Google, Inc., Class A (I) | | 86,112 | | 52,821,101 |
| Mail.ru Group, Ltd., GDR (I)(S) | | 253,672 | | 9,195,610 |
| Tencent Holdings, Ltd. | | 693,894 | | 18,554,246 |
| Tencent Holdings, Ltd., ADR | | 41,993 | | 1,123,733 |
| | |
|
| | | | | 114,875,689 |
| IT Services - 6.21% | | | | |
| Cognizant Technology | | | | |
| Solutions Corp., Class A (I) | | 248,772 | | 19,123,104 |
| International Business Machines Corp. | | 370,138 | | 59,917,939 |
| |
| The accompanying notes are an integral part of the financial statements. | 44 |
John Hancock Funds II
Portfolio of Investments — February 28, 2011 (Unaudited) (showing percentage of total net assets)
| | | | |
| Capital Appreciation Fund (continued) | | |
| | | Shares or | | |
| | | Principal | | |
| | | Amount | | Value |
| |
|
| | |
| COMMON STOCKS (continued) | | | | |
| IT Services (continued) | | | | |
| MasterCard, Inc., Class A | | 161,948 | $ | 38,958,211 |
| | | |
|
| | | | | 117,999,254 |
| Semiconductors & Semiconductor Equipment - 3.53% | | |
| Altera Corp. | | 554,700 | | 23,219,742 |
| Atmel Corp. (I) | | 753,435 | | 11,060,426 |
| Avago Technologies, Ltd. | | 290,014 | | 9,857,576 |
| Broadcom Corp., Class A | | 557,446 | | 22,977,924 |
| | |
|
| | | | | 67,115,668 |
| Software - 6.84% | | | | |
| Oracle Corp. | | 1,440,920 | | 47,406,268 |
| Red Hat, Inc. (I) | | 514,828 | | 21,252,100 |
| Salesforce.com, Inc. (I)(L) | | 248,158 | | 32,823,859 |
| VMware, Inc., Class A (I) | | 342,245 | | 28,628,794 |
| | |
|
| | | | | 130,111,021 |
| | | |
|
| | | | | 654,763,260 |
| Materials - 3.70% | | | | |
| Chemicals - 3.70% | | | | |
| E.I. du Pont de Nemours & Company | | 562,813 | | 30,881,549 |
| Monsanto Company | | 550,247 | | 39,557,257 |
| | |
|
| | | | | 70,438,806 |
| | | |
|
| | | | | 70,438,806 |
| Telecommunication Services - 1.17% | | | | |
| Wireless Telecommunication Services - 1.17% | | | |
| American Tower Corp., Class A (I) | | 410,718 | | 22,162,339 |
|
| TOTAL COMMON STOCKS (Cost $1,366,190,311) | | $ | 1,895,175,652 |
|
| SECURITIES LENDING COLLATERAL - 5.64% | | |
| John Hancock Collateral | | | | |
| Investment Trust, 0.2855% (W)(Y) | | 10,717,757 | | 107,256,885 |
|
| TOTAL SECURITIES LENDING | | | | |
| COLLATERAL (Cost $107,232,101) | | | $ | 107,256,885 |
|
| SHORT-TERM INVESTMENTS - 0.35% | | | |
| Short-Term Securities* - 0.35% | | | | |
| State Street Institutional Treasury Money | | | | |
| Market Fund, 0.0453% | $ | 6,655,728 | $ | 6,655,728 |
|
| TOTAL SHORT-TERM INVESTMENTS (Cost $6,655,728) | $ | 6,655,728 |
|
| Total Investments (Capital Appreciation Fund) | | | |
| (Cost $1,480,078,140) - 105.65% | | | $ | 2,009,088,265 |
| Other assets and liabilities, net - (5.65%) | | | | (107,425,574) |
| | | |
|
| TOTAL NET ASSETS - 100.00% | | | $ | 1,901,662,691 |
| | | |
|
| |
| |
| Capital Appreciation Value Fund | | |
| | | Shares or | | |
| | | Principal | | |
| | | Amount | | Value |
| |
|
| | |
| COMMON STOCKS - 63.76% | | | | |
| Consumer Discretionary - 6.36% | | | | |
| Automobiles - 0.30% | | | | |
| General Motors Company (I) | | 28,700 | $ | 962,311 |
| Hotels, Restaurants & Leisure - 0.83% | | | | |
| McDonald’s Corp. | | 34,900 | | 2,641,232 |
| Media - 3.69% | | | | |
| Cablevision Systems Corp., Class A | | 21,100 | | 777,535 |
| | | | |
| Capital Appreciation Value Fund (continued) |
| | | Shares or | | |
| | | Principal | | |
| | | Amount | | Value |
| | |
|
| COMMON STOCKS (continued) | | | | |
| Media (continued) | | | | |
| Time Warner, Inc. | | 286,000 | $ | 10,925,200 |
| | |
|
| | | | | 11,702,735 |
| Multiline Retail - 0.99% | | | | |
| Dollar General Corp. (I) | | 111,500 | | 3,149,875 |
| Specialty Retail - 0.55% | | | | |
| Lowe’s Companies, Inc. | | 67,000 | | 1,753,390 |
| | |
|
| | | | | 20,209,543 |
| Consumer Staples - 10.92% | | | | |
| Beverages - 3.25% | | | | |
| PepsiCo, Inc. | | 162,700 | | 10,318,434 |
| Food Products - 3.99% | | | | |
| General Mills, Inc. | | 178,900 | | 6,644,346 |
| Kellogg Company | | 112,600 | | 6,030,856 |
| | |
|
| | | | | 12,675,202 |
| Household Products - 3.42% | | | | |
| Colgate-Palmolive Company | | 33,300 | | 2,614,716 |
| The Procter & Gamble Company | | 131,000 | | 8,259,550 |
| | |
|
| | | | | 10,874,266 |
| Tobacco - 0.26% | | | | |
| Philip Morris International, Inc. | | 13,000 | | 816,140 |
| | |
|
| | | | | 34,684,042 |
| Energy - 4.88% | | | | |
| Oil, Gas & Consumable Fuels - 4.88% | | | | |
| Chevron Corp. | | 8,200 | | 850,750 |
| El Paso Corp. | | 94,400 | | 1,755,840 |
| Nexen, Inc. | | 268,100 | | 7,321,811 |
| Spectra Energy Corp. | | 106,200 | | 2,840,850 |
| Total SA | | 44,439 | | 2,726,564 |
| | |
|
| | | | | 15,495,815 |
| | |
|
| | | | | 15,495,815 |
| Financials - 11.05% | | | | |
| Capital Markets - 0.32% | | | | |
| Franklin Resources, Inc. | | 8,200 | | 1,030,084 |
| Commercial Banks - 5.26% | | | | |
| PNC Financial Services Group, Inc. | | 20,800 | | 1,283,360 |
| U.S. Bancorp | | 351,000 | | 9,733,230 |
| Wells Fargo & Company | | 176,300 | | 5,687,438 |
| | |
|
| | | | | 16,704,028 |
| Diversified Financial Services - 1.83% | | | | |
| JPMorgan Chase & Company | | 105,300 | | 4,916,457 |
| Moody’s Corp. (L) | | 27,700 | | 883,630 |
| | |
|
| | | | | 5,800,087 |
| Insurance - 3.64% | | | | |
| AON Corp. | | 119,500 | | 6,290,480 |
| Principal Financial Group, Inc. | | 130,300 | | 4,464,078 |
| The Allstate Corp. | | 25,800 | | 819,924 |
| | |
|
| | | | | 11,574,482 |
| | |
|
| | | | | 35,108,681 |
| Health Care - 7.66% | | | | |
| Health Care Equipment & Supplies - 0.60% | | | | |
| Covidien PLC | | 37,000 | | 1,903,650 |
| Health Care Providers & Services - 0.96% | | | | |
| Henry Schein, Inc. (I) | | 14,800 | | 1,020,904 |
| Laboratory Corp. of America Holdings (I) | | 20,700 | | 1,865,691 |
| |
| The accompanying notes are an integral part of the financial statements. | 45 |
John Hancock Funds II
Portfolio of Investments — February 28, 2011 (Unaudited) (showing percentage of total net assets)
| | | | |
| Capital Appreciation Value Fund (continued) |
| | | Shares or | | |
| | | Principal | | |
| | | Amount | | Value |
| | |
|
| COMMON STOCKS (continued) | | | | |
| Health Care Providers & Services (continued) | | | | |
| McKesson Corp. | | 1,900 | $ | 150,632 |
| | | |
|
| | | | | 3,037,227 |
| Life Sciences Tools & Services - 2.97% | | | | |
| Thermo Fisher Scientific, Inc. (I) | | 169,300 | | 9,450,326 |
| Pharmaceuticals - 3.13% | | | | |
| Pfizer, Inc. | | 516,800 | | 9,943,232 |
| | |
|
| | | | | 24,334,435 |
| Industrials - 8.85% | | | | |
| Aerospace & Defense - 2.66% | | | | |
| The Boeing Company | | 10,900 | | 784,909 |
| United Technologies Corp. | | 91,800 | | 7,668,972 |
| | |
|
| | | | | 8,453,881 |
| Commercial Services & Supplies - 0.35% | | | | |
| Republic Services, Inc. | | 36,900 | | 1,092,609 |
| Electrical Equipment - 0.61% | | | | |
| Cooper Industries PLC | | 30,300 | | 1,949,805 |
| Machinery - 4.01% | | | | |
| Danaher Corp. | | 198,800 | | 10,059,280 |
| Illinois Tool Works, Inc. | | 49,300 | | 2,667,130 |
| | |
|
| | | | | 12,726,410 |
| Trading Companies & Distributors - 1.22% | | | | |
| Mitsubishi Corp. | | 140,000 | | 3,885,713 |
| | |
|
| | | | | 28,108,418 |
| Information Technology - 9.70% | | | | |
| Communications Equipment - 0.29% | | | | |
| Cisco Systems, Inc. (I) | | 50,500 | | 937,280 |
| Computers & Peripherals - 1.09% | | | | |
| Hewlett-Packard Company | | 79,300 | | 3,459,859 |
| Electronic Equipment, Instruments & Components - 1.88% | | |
| Tyco Electronics, Ltd. | | 165,800 | | 5,975,432 |
| IT Services - 5.48% | | | | |
| Accenture PLC, Class A | | 59,600 | | 3,068,208 |
| Amdocs, Ltd. (I) | | 53,700 | | 1,602,408 |
| Fiserv, Inc. (I) | | 45,100 | | 2,853,477 |
| International Business Machines Corp. | | 61,000 | | 9,874,680 |
| | |
|
| | | | | 17,398,773 |
| Semiconductors & Semiconductor Equipment - 0.96% | | |
| Texas Instruments, Inc. | | 85,400 | | 3,041,094 |
| | |
|
| | | | | 30,812,438 |
| Materials - 1.43% | | | | |
| Chemicals - 1.43% | | | | |
| Air Products & Chemicals, Inc. | | 40,600 | | 3,735,200 |
| Monsanto Company | | 11,100 | | 797,979 |
| | |
|
| | | | | 4,533,179 |
| | | |
|
| | | | | 4,533,179 |
| Telecommunication Services - 1.68% | | | | |
| Diversified Telecommunication Services - 1.68% | | | | |
| AT&T, Inc. | | 188,000 | | 5,335,440 |
| Utilities - 1.23% | | | | |
| Electric Utilities - 0.65% | | | | |
| Entergy Corp. | | 11,900 | | 847,280 |
| NV Energy, Inc. | | 83,600 | | 1,228,084 |
| | |
|
| | | | | 2,075,364 |
| | | | |
| Capital Appreciation Value Fund (continued) |
| | | Shares or | | |
| | | Principal | | |
| | | Amount | | Value |
| |
|
| | |
| |
| COMMON STOCKS (continued) | | | | |
| Multi-Utilities - 0.58% | | | | |
| OGE Energy Corp. | | 31,200 | $ | 1,500,720 |
| PG&E Corp. | | 7,400 | | 340,844 |
| | |
|
| | | | | 1,841,564 |
| | |
|
| | | | | 3,916,928 |
|
| TOTAL COMMON STOCKS (Cost $193,355,746) | | $ | 202,538,919 |
|
| |
| PREFERRED SECURITIES - 2.00% | | | | |
| Consumer Discretionary - 1.02% | | | | |
| General Motors Company, Series B, | | | | |
| 4.750% 4.750% | | 41,000 | | 2,086,080 |
| Newell Financial Trust I 5.250% | | 24,300 | | 1,165,185 |
| | |
|
| | | | | 3,251,265 |
| Financials - 0.98% | | | | |
| AMG Capital Trust I 5.100% | | 30,600 | | 1,552,950 |
| Aspen Insurance Holdings, Ltd., | | | | |
| Series AHL 5.625% | | 18,400 | | 1,041,256 |
| Citigroup, Inc. 7.500% | | 2,200 | | 295,900 |
| Wells Fargo & Company, Series L 7.500% | | 200 | | 206,000 |
| | |
|
| | | | | 3,096,106 |
|
| TOTAL PREFERRED SECURITIES (Cost $6,452,407) | | $ | 6,347,371 |
|
| |
| CORPORATE BONDS - 6.52% | | | | |
| Consumer Discretionary - 1.85% | | | | |
| Dollar General Corp. | | | | |
| 10.625%, 07/15/2015 | $ | 690,000 | $ | 745,200 |
| Home Depot, Inc. | | | | |
| 5.400%, 03/01/2016 | | 480,000 | | 534,438 |
| Hyatt Hotels Corp | | | | |
| 6.875%, 08/15/2019 (S) | | 220,000 | | 241,463 |
| Lamar Media Corp. | | | | |
| 9.750%, 04/01/2014 | | 730,000 | | 848,625 |
| Time Warner Cable, Inc. | | | | |
| 7.500%, 04/01/2014 | | 75,000 | | 86,610 |
| Time Warner, Inc. | | | | |
| 5.875%, 11/15/2016 | | 175,000 | | 195,790 |
| Turner Broadcasting System, Inc. | | | | |
| 8.375%, 07/01/2013 | | 2,820,000 | | 3,231,083 |
| | |
|
| | | | | 5,883,209 |
| Consumer Staples - 0.14% | | | | |
| General Mills, Inc. | | | | |
| 5.200%, 03/17/2015 | | 400,000 | | 439,142 |
| Energy - 0.40% | | | | |
| Consol Energy, Inc. | | | | |
| 8.000%, 03/01/2017 (S) | | 840,000 | | 911,400 |
| Peabody Energy Corp. | | | | |
| 6.500%, 09/15/2020 | | 160,000 | | 171,200 |
| 7.375%, 11/01/2016 | | 160,000 | | 180,800 |
| | |
|
| | | | | 1,263,400 |
| Financials - 1.60% | | | | |
| International Lease Finance Corp. | | | | |
| 6.500%, 09/01/2014 (S) | | 2,500,000 | | 2,696,250 |
| 6.750%, 09/01/2016 (S) | | 1,900,000 | | 2,056,750 |
| Kreditanstalt Fuer Wiederaufbau | | | | |
| 2.750%, 09/08/2020 | | 176,000 | | 163,256 |
| National Rural Utilities Cooperative | | | | |
| Finance Corp. | | | | |
| 3.050%, 03/01/2016 | | 175,000 | | 176,757 |
| | |
|
| | | | | 5,093,013 |
| |
| The accompanying notes are an integral part of the financial statements. | 46 |
John Hancock Funds II
Portfolio of Investments — February 28, 2011 (Unaudited) (showing percentage of total net assets)
| | | | |
| Capital Appreciation Value Fund (continued) |
| | | Shares or | | |
| | | Principal | | |
| | | Amount | | Value |
| |
|
| |
| CORPORATE BONDS (continued) | | | | |
| |
| Health Care - 0.22% | | | | |
| Thermo Fisher Scientific, Inc. | | | | |
| 3.200%, 03/01/2016 | $ | 350,000 | $ | 354,800 |
| 4.500%, 03/01/2021 | | 350,000 | | 356,550 |
| | |
|
| | | | | 711,350 |
| Industrials - 1.06% | | | | |
| American Airlines Pass | | | | |
| Through Trust 2009-1A | | | | |
| 10.375%, 07/02/2019 | | 78,362 | | 94,034 |
| Continental Airlines 2009-1 Pass | | | | |
| Through Trust | | | | |
| 9.000%, 07/08/2016 | | 1,690,867 | | 1,944,497 |
| Continental Airlines 2009-2 Class A Pass | | | | |
| Through Trust | | | | |
| 7.250%, 11/10/2019 | | 87,514 | | 96,703 |
| Continental Airlines, Inc. | | | | |
| 6.750%, 09/15/2015 (S) | | 170,000 | | 174,675 |
| Honeywell International, Inc. | | | | |
| 4.250%, 03/01/2021 | | 880,000 | | 889,264 |
| Waste Management, Inc. | | | | |
| 6.375%, 03/11/2015 | | 80,000 | | 90,840 |
| 7.375%, 03/11/2019 | | 70,000 | | 84,421 |
| | |
|
| | | | | 3,374,434 |
| Information Technology - 0.20% | | | | |
| International Business Machines Corp. | | | | |
| 7.625%, 10/15/2018 | | 350,000 | | 442,327 |
| Juniper Networks Inc. | | | | |
| 4.600%, 03/15/2021 | | 175,000 | | 174,774 |
| | |
|
| | | | | 617,101 |
| Telecommunication Services - 0.63% | | | | |
| AT&T, Inc. | | | | |
| 5.800%, 02/15/2019 | | 400,000 | | 446,936 |
| Nextel Communications, Inc. | | | | |
| 5.950%, 03/15/2014 | | 300,000 | | 301,500 |
| Sprint Capital Corp. | | | | |
| 8.375%, 03/15/2012 | | 540,000 | | 573,075 |
| Telefonica Emisiones SAU | | | | |
| 3.992%, 02/16/2016 | | 315,000 | | 316,246 |
| 5.462%, 02/16/2021 | | 350,000 | | 355,197 |
| | |
|
| | | | | 1,992,954 |
| Utilities - 0.42% | | | | |
| Calpine Construction Finance Company LP | | | | |
| 8.000%, 06/01/2016 (S) | | 580,000 | | 629,300 |
| E.CL SA | | | | |
| 5.625%, 01/15/2021 (S) | | 140,000 | | 137,365 |
| The Cleveland Electric Illuminating Company | | | |
| 8.875%, 11/15/2018 | | 450,000 | | 571,223 |
| | |
|
| | | | | 1,337,888 |
|
| TOTAL CORPORATE BONDS (Cost $20,620,137) | | $ | 20,712,491 |
|
| |
| CONVERTIBLE BONDS - 4.26% | | | | |
| Consumer Discretionary - 0.63% | | | | |
| Group 1 Automotive, Inc. | | | | |
| 3.000%, 03/15/2020 (S) | | 354,000 | | 450,465 |
| Group 1 Automotive, Inc. (2.250% Steps down | | | |
| to 2.000% on 6/15/2016) | | | | |
| 06/15/2036 | | 1,535,000 | | 1,558,025 |
| | |
|
| | | | | 2,008,490 |
| Energy - 1.04% | | | | |
| Oil States International, Inc. | | | | |
| 2.375%, 07/01/2025 | | 521,000 | | 1,203,510 |
| | | | |
| Capital Appreciation Value Fund (continued) |
| | | Shares or | | |
| | | Principal | | |
| | | Amount | | Value |
| | |
|
| |
| CONVERTIBLE BONDS (continued) | | | | |
| Energy (continued) | | | | |
| Peabody Energy Corp. | | | | |
| 4.750%, 12/15/2041 | $ | 1,641,000 | $ | 2,108,685 |
| | |
|
| | | | | 3,312,195 |
| Financials - 0.37% | | | | |
| Host Hotels & Resorts LP | | | | |
| 2.625%, 04/15/2027 (S) | | 1,160,000 | | 1,158,550 |
| Health Care - 0.23% | | | | |
| Lifepoint Hospitals, Inc. | | | | |
| 3.250%, 08/15/2025 | | 706,000 | | 725,415 |
| Industrials - 0.26% | | | | |
| Actuant Corp. | | | | |
| 2.000%, 11/15/2023 | | 575,000 | | 829,438 |
| Information Technology - 0.78% | | | | |
| Liberty Media LLC | | | | |
| 3.125%, 03/30/2023 | | 866,000 | | 1,067,345 |
| Linear Technology Corp. | | | | |
| 3.000%, 05/01/2027 | | 205,000 | | 223,194 |
| Xilinx, Inc. | | | | |
| 3.125%, 03/15/2037 | | 1,021,000 | | 1,200,951 |
| | |
|
| | | | | 2,491,490 |
| Materials - 0.66% | | | | |
| Newmont Mining Corp. | | | | |
| 1.250%, 07/15/2014 | | 212,000 | | 282,755 |
| 1.625%, 07/15/2017 | | 588,000 | | 796,005 |
| United States Steel Corp. | | | | |
| 4.000%, 05/15/2014 | | 527,000 | | 1,014,475 |
| | |
|
| | | | | 2,093,235 |
| Telecommunication Services - 0.29% | | | | |
| Alcatel-Lucent USA, Inc. | | | | |
| 2.875%, 06/15/2025 | | 729,000 | | 708,953 |
| SBA Communications Corp. | | | | |
| 1.875%, 05/01/2013 | | 185,000 | | 212,056 |
| | |
|
| | | | | 921,009 |
|
| TOTAL CONVERTIBLE BONDS (Cost $13,100,194) | | $ | 13,539,822 |
|
| |
| TERM LOANS (M) - 8.86% | | | | |
| Consumer Discretionary - 6.00% | | | | |
| Bausch & Lomb, Inc. | | | | |
| 3.510%, 04/24/2015 | | 800,000 | | 794,500 |
| Cedar Fair LP | | | | |
| - 12/31/2017 (T) | | 250,000 | | 251,250 |
| Charter Communications Operating LLC | | | | |
| 3.560%, 09/06/2016 | | 800,000 | | 801,875 |
| CSC Holdings, Inc. | | | | |
| - 03/29/2016 (T) | | 775,000 | | 779,263 |
| Dineequity, Inc. | | | | |
| - 10/31/2017 (T) | | 150,000 | | 151,125 |
| Dollar General Corp. | | | | |
| 3.054%, 07/07/2014 | | 2,800,000 | | 2,801,896 |
| Dunkin Brands, Inc. | | | | |
| - 11/23/2017 (T) | | 1,250,000 | | 1,258,586 |
| 5.750%, 10/25/2017 | | 2,900,000 | | 2,919,920 |
| Federal Mogul Corp. | | | | |
| 2.197%, 06/27/2015 | | 4,875,000 | | 4,734,080 |
| Intelsat Jackson Holdings SA | | | | |
| 5.250%, 04/03/2018 | | 3,075,000 | | 3,095,661 |
| Univision Communications, Inc. | | | | |
| 4.510%, 03/31/2017 | | 1,525,000 | | 1,487,511 |
| | |
|
| | | | | 19,075,667 |
| |
| The accompanying notes are an integral part of the financial statements. | 47 |
John Hancock Funds II
Portfolio of Investments — February 28, 2011 (Unaudited) (showing percentage of total net assets)
| | | | |
| Capital Appreciation Value Fund (continued) |
| | | Shares or | | |
| | | Principal | | |
| | | Amount | | Value |
| |
|
| |
| TERM LOANS (M) (continued) | | | | |
| Consumer Staples - 0.32% | | | | |
| Reynolds Group Holdings, Inc. | | | | |
| - 02/09/2018 (T) | $ | 1,000,000 | $ | 1,003,611 |
| Financials - 0.47% | | | | |
| MSCI International | | | | |
| - 06/01/2016 (T) | | 1,500,000 | | 1,507,500 |
| Health Care - 0.98% | | | | |
| HCA, Inc. | | | | |
| 1.553%, 11/16/2012 | | 3,125,000 | | 3,107,941 |
| Information Technology - 0.52% | | | | |
| Fidelity National Information Services, Inc. | | | | |
| 5.250%, 07/18/2016 | | 600,000 | | 605,120 |
| First Data Corp. | | | | |
| 3.011%, 09/24/2014 | | 1,100,000 | | 1,041,376 |
| | |
|
| | | | | 1,646,496 |
| Materials - 0.24% | | | | |
| Nalco Holding Company | | | | |
| - 05/13/2016 (T) | | 750,000 | | 748,594 |
| Utilities - 0.33% | | | | |
| Calpine Corp. | | | | |
| 7.000%, 07/03/2017 | | 1,050,000 | | 1,059,844 |
|
| TOTAL TERM LOANS (Cost $28,198,458) | | | $ | 28,149,653 |
|
| |
| SECURITIES LENDING COLLATERAL - 0.24% | | |
| John Hancock Collateral | | | | |
| Investment Trust, 0.2855% (W)(Y) | | 76,737 | | 767,943 |
|
| TOTAL SECURITIES LENDING | | | | |
| COLLATERAL (Cost $767,925) | | | $ | 767,943 |
|
| |
| SHORT-TERM INVESTMENTS - 16.15% | | | | |
| Short-Term Securities* - 16.15% | | | | |
| State Street Institutional U.S. Government | | | | |
| Money Market Fund, 0.0647% | $ | 4,408,674 | $ | 4,408,674 |
| T. Rowe Price Prime Reserve Fund, 0.2212% | 46,893,532 | | 46,893,532 |
| | |
|
| | | | | 51,302,206 |
|
| TOTAL SHORT-TERM INVESTMENTS (Cost $51,302,206) | $ | 51,302,206 |
|
| Total Investments (Capital Appreciation Value Fund) | | |
| (Cost $313,797,073) - 101.79% | | | $ | 323,358,405 |
| Other assets and liabilities, net - (1.79%) | | | | (5,673,733) |
| | | |
|
| TOTAL NET ASSETS - 100.00% | | | $ | 317,684,672 |
| | | |
|
| |
| |
| |
| Core Bond Fund | | | | |
| | | Shares or | | |
| | | Principal | | |
| | | Amount | | Value |
| |
|
| |
| U.S. GOVERNMENT & AGENCY | | | | |
| OBLIGATIONS - 54.31% | | | | |
| U.S. Government - 10.65% | | | | |
| U.S. Treasury Bonds | | | | |
| 4.250%, 11/15/2040 | $ | 1,690,000 | $ | 1,620,815 |
| 4.375%, 05/15/2040 | | 3,806,000 | | 3,730,489 |
| 4.500%, 02/15/2036 | | 5,106,000 | | 5,173,016 |
| 4.750%, 02/15/2041 | | 3,343,000 | | 3,485,599 |
| U.S. Treasury Notes | | | | |
| 0.625%, 01/31/2013 | | 3,977,000 | | 3,974,980 |
| 1.250%, 02/15/2014 | | 4,982,000 | | 4,994,455 |
| 2.000%, 01/31/2016 | | 3,612,000 | | 3,595,067 |
| 2.125%, 05/31/2015 to 02/29/2016 | | 13,991,000 | | 14,067,396 |
| | | | |
| Core Bond Fund (continued) | | | |
| | | Shares or | | |
| | | Principal | | |
| | | Amount | | Value |
| |
|
| |
| U.S. GOVERNMENT & AGENCY | | | | |
| OBLIGATIONS (continued) | | | | |
| U.S. Government (continued) | | | | |
| U.S. Treasury Notes (continued) | | | | |
| 2.375%, 10/31/2014 | $ | 2,392,000 | $ | 2,466,004 |
| 2.625%, 01/31/2018 | | 15,757,000 | | 15,578,505 |
| 3.625%, 02/15/2021 | | 4,396,000 | | 4,472,244 |
| | |
|
| | | | | 63,158,570 |
| U.S. Government Agency - 43.66% | | | | |
| Federal Home Loan Mortgage Corp. | | | | |
| 4.500%, TBA | | 7,400,000 | | 7,521,545 |
| 4.500%, 10/01/2030 | | 327,406 | | 339,083 |
| 5.000%, 01/01/2041 to 02/01/2041 | | 5,778,000 | | 6,030,788 |
| 5.500%, 11/01/2018 to 08/01/2037 | | 7,793,033 | | 8,418,383 |
| 5.560%, 10/01/2038 (P) | | 186,514 | | 199,395 |
| 5.662%, 03/01/2036 (P) | | 135,026 | | 144,352 |
| 5.698%, 03/01/2036 (P) | | 21,070 | | 22,525 |
| 5.765%, 07/01/2038 (P) | | 1,586,986 | | 1,696,588 |
| 5.866%, 11/01/2037 (P) | | 70,078 | | 74,050 |
| 5.878%, 12/01/2036 (P) | | 736,123 | | 786,962 |
| 5.889%, 03/01/2037 (P) | | 219,048 | | 233,836 |
| 5.918%, 05/01/2037 (P) | | 3,393,518 | | 3,627,883 |
| 5.935%, 06/01/2036 (P) | | 534,327 | | 571,229 |
| 5.942%, 01/01/2037 (P) | | 44,830 | | 47,926 |
| 5.979%, 06/01/2038 (P) | | 896,925 | | 958,869 |
| 6.000%, 05/01/2020 to 10/01/2038 | | 12,975,490 | | 14,261,595 |
| 6.000%, 10/01/2037 (P) | | 1,376,269 | | 1,471,317 |
| 6.055%, 11/01/2036 (P) | | 708,620 | | 757,559 |
| 6.073%, 04/01/2037 (P) | | 256,692 | | 274,420 |
| 6.130%, 06/01/2037 (P) | | 100,635 | | 107,585 |
| 6.500%, 07/01/2034 to 08/01/2038 | | 3,666,768 | | 4,090,507 |
| 7.500%, 07/25/2043 | | 277,976 | | 314,018 |
| Federal National Mortgage Association | | | | |
| 3.000%, TBA | | 10,800,000 | | 10,510,754 |
| 3.500%, TBA | | 4,800,000 | | 4,800,979 |
| 3.500%, 07/01/2025 to 02/01/2041 | | 49,970,297 | | 48,809,163 |
| 4.000%, 09/25/2039 | | 2,472,590 | | 2,544,236 |
| 4.500%, TBA | | 16,000,000 | | 16,757,406 |
| 4.500%, TBA | | 5,400,000 | | 5,503,379 |
| 4.500%, 11/01/2019 to 12/01/2030 | | 651,699 | | 671,397 |
| 5.000%, 10/01/2040 to 02/01/2041 | | 17,992,133 | | 18,779,306 |
| 5.500%, 10/01/2020 to 09/01/2034 | | 5,038,992 | | 5,420,205 |
| 5.531%, 02/01/2039 (P) | | 438,518 | | 467,461 |
| 5.689%, 10/01/2037 (P) | | 151,705 | | 160,378 |
| 5.845%, 02/01/2037 (P) | | 139,189 | | 148,801 |
| 5.848%, 10/01/2037 (P) | | 113,421 | | 121,254 |
| 5.857%, 09/01/2037 (P) | | 482,842 | | 513,520 |
| 5.867%, 01/01/2037 (P) | | 146,838 | | 156,979 |
| 5.911%, 01/01/2037 to 04/01/2037 (P) | | 348,005 | | 372,039 |
| 5.917%, 07/01/2037 (P) | | 338,476 | | 361,852 |
| 5.935%, 09/01/2037 (P) | | 144,906 | | 154,914 |
| 5.936%, 03/01/2037 (P) | | 221,643 | | 236,950 |
| 5.997%, 12/01/2036 (P) | | 93,687 | | 100,157 |
| 6.000%, TBA | | 1,500,000 | | 1,630,355 |
| 6.000%, 11/01/2023 to 08/01/2037 | | 51,345,596 | | 56,485,679 |
| 6.016%, 07/01/2037 (P) | | 189,726 | | 202,829 |
| 6.038%, 10/01/2037 (P) | | 96,864 | | 103,554 |
| 6.042%, 09/01/2037 (P) | | 88,581 | | 94,699 |
| 6.048%, 10/01/2037 (P) | | 139,893 | | 149,007 |
| 6.063%, 11/01/2037 (P) | | 167,110 | | 178,651 |
| 6.267%, 09/01/2037 (P) | | 167,853 | | 182,616 |
| 6.342%, 10/01/2036 (P) | | 118,346 | | 126,519 |
| 6.500%, 12/01/2030 to 10/01/2036 | | 1,065,525 | | 1,192,156 |
| 7.000%, 06/01/2035 to 01/01/2039 | | 1,616,495 | | 1,838,211 |
| Government National Mortgage Association | | | | |
| 3.000%, 02/20/2041 (P) | | 518,000 | | 513,831 |
| |
| The accompanying notes are an integral part of the financial statements. | 48 |
John Hancock Funds II
Portfolio of Investments — February 28, 2011 (Unaudited) (showing percentage of total net assets)
| | | | |
| Core Bond Fund (continued) | | | |
| | | Shares or | | |
| | | Principal | | |
| | | Amount | | Value |
| |
|
| |
| U.S. GOVERNMENT & AGENCY | | | | |
| OBLIGATIONS (continued) | | | | |
| U.S. Government Agency (continued) | | | | |
| Government National Mortgage | | | | |
| Association (continued) | | | | |
| 3.500%, TBA | $ | 20,861,000 | $ | 19,998,622 |
| 3.500%, 10/20/2040 to 12/20/2040 | | 5,375,426 | | 5,133,685 |
| 3.500%, 01/20/2041 (P) | | 1,506,632 | | 1,558,570 |
| 6.500%, 12/15/2032 | | 876,044 | | 988,675 |
| | |
|
| | | | | 258,919,204 |
|
| TOTAL U.S. GOVERNMENT & AGENCY | | | | |
| OBLIGATIONS (Cost $320,994,175) | | | $ | 322,077,774 |
|
| |
| FOREIGN GOVERNMENT | | | | |
| OBLIGATIONS - 2.13% | | | | |
| Canada - 0.23% | | | | |
| Province of Ontario | | | | |
| 3.150%, 12/15/2017 | | 1,380,000 | | 1,369,707 |
| Chile - 0.24% | | | | |
| Republic of Chile | | | | |
| 3.875%, 08/05/2020 | | 1,445,000 | | 1,403,818 |
| Mexico - 0.34% | | | | |
| Government of Mexico | | | | |
| 5.125%, 01/15/2020 | | 1,312,000 | | 1,374,320 |
| 6.050%, 01/11/2040 | | 652,000 | | 665,040 |
| | |
|
| | | | | 2,039,360 |
| Norway - 0.12% | | | | |
| Kommunalbanken AS | | | | |
| 1.750%, 10/05/2015 (S) | | 725,000 | | 702,080 |
| Poland - 0.15% | | | | |
| Republic of Poland | | | | |
| 3.875%, 07/16/2015 | | 870,000 | | 881,922 |
| Qatar - 0.46% | | | | |
| Government of Qatar | | | | |
| 4.000%, 01/20/2015 (S) | | 2,680,000 | | 2,747,000 |
| South Korea - 0.28% | | | | |
| Export-Import Bank of Korea | | | | |
| 5.875%, 01/14/2015 | | 360,000 | | 391,134 |
| Korea Development Bank | | | | |
| 3.250%, 03/09/2016 | | 1,306,000 | | 1,263,427 |
| | |
|
| | | | | 1,654,561 |
| Sweden - 0.31% | | | | |
| Svensk Exportkredit AB | | | | |
| 3.250%, 09/16/2014 | | 1,766,000 | | 1,847,524 |
|
| TOTAL FOREIGN GOVERNMENT | | | | |
| OBLIGATIONS (Cost $12,715,317) | | | $ | 12,645,972 |
|
| |
| CORPORATE BONDS - 21.46% | | | | |
| Consumer Discretionary - 0.67% | | | | |
| British Sky Broadcasting Group PLC | | | | |
| 9.500%, 11/15/2018 (S) | | 785,000 | | 1,045,939 |
| Comcast Cable Communications | | | | |
| Holdings, Inc. | | | | |
| 8.375%, 03/15/2013 | | 1,154,000 | | 1,308,843 |
| News America, Inc. | | | | |
| 6.150%, 02/15/2041 (S) | | 980,000 | | 996,129 |
| Thomson Reuters Corp. | | | | |
| 5.950%, 07/15/2013 | | 555,000 | | 613,737 |
| | |
|
| | | | | 3,964,648 |
| Consumer Staples - 0.67% | | | | |
| Altria Group, Inc. | | | | |
| 10.200%, 02/06/2039 | | 525,000 | | 742,550 |
| | | | |
| Core Bond Fund (continued) | | | |
| | | Shares or | | |
| | | Principal | | |
| | | Amount | | Value |
| |
|
| |
| CORPORATE BONDS (continued) | | | | |
| Consumer Staples (continued) | | | | |
| Anheuser-Busch InBev Worldwide, Inc. | | | | |
| 4.125%, 01/15/2015 | $ | 1,455,000 | $ | 1,546,738 |
| Centros Comerciales Sudamericanos SA | | | | |
| 5.500%, 01/20/2021 (S) | | 645,000 | | 626,406 |
| Dr Pepper Snapple Group, Inc. | | | | |
| 2.900%, 01/15/2016 | | 65,000 | | 64,735 |
| Kraft Foods, Inc. | | | | |
| 6.500%, 02/09/2040 | | 785,000 | | 845,357 |
| Woolworths, Ltd. | | | | |
| 4.000%, 09/22/2020 (S) | | 180,000 | | 175,554 |
| | |
|
| | | | | 4,001,340 |
| Energy - 2.54% | | | | |
| Anadarko Petroleum Corp. | | | | |
| 5.950%, 09/15/2016 | | 525,000 | | 575,866 |
| 6.200%, 03/15/2040 | | 875,000 | | 856,536 |
| 6.375%, 09/15/2017 | | 859,000 | | 957,436 |
| CNOOC Finance 2011, Ltd. | | | | |
| 4.250%, 01/26/2021 (S) | | 965,000 | | 942,248 |
| 5.750%, 01/26/2041 (S) | | 420,000 | | 425,331 |
| El Paso Pipeline Partners Operating | | | | |
| Company LLC | | | | |
| 7.500%, 11/15/2040 | | 405,000 | | 457,870 |
| Energy Transfer Partners LP | | | | |
| 9.000%, 04/15/2019 | | 590,000 | | 751,712 |
| Husky Energy, Inc. | | | | |
| 5.900%, 06/15/2014 | | 545,000 | | 604,238 |
| 7.250%, 12/15/2019 | | 617,000 | | 733,107 |
| Kerr-McGee Corp. | | | | |
| 6.950%, 07/01/2024 | | 875,000 | | 980,424 |
| Kinder Morgan Energy Partners LP | | | | |
| 6.375%, 03/01/2041 | | 985,000 | | 990,930 |
| Marathon Petroleum Corp. | | | | |
| 6.500%, 03/01/2041 (S) | | 985,000 | | 997,896 |
| Occidental Petroleum Corp. | | | | |
| 4.100%, 02/01/2021 | | 390,000 | | 385,595 |
| Petrobras International Finance Company | | | | |
| 5.375%, 01/27/2021 | | 1,135,000 | | 1,138,999 |
| Rockies Express Pipeline LLC | | | | |
| 3.900%, 04/15/2015 (S) | | 1,341,000 | | 1,334,401 |
| Schlumberger Oilfield UK PLC | | | | |
| 4.200%, 01/15/2021 (S) | | 965,000 | | 968,988 |
| Transocean, Inc. | | | | |
| 4.950%, 11/15/2015 | | 1,835,000 | | 1,941,711 |
| | |
|
| | | | | 15,043,288 |
| Financials - 9.57% | | | | |
| Achmea Hypotheekbank NV | | | | |
| 3.200%, 11/03/2014 (S) | | 2,865,000 | | 2,959,811 |
| American Express Credit Corp. | | | | |
| 2.750%, 09/15/2015 | | 620,000 | | 610,066 |
| 5.125%, 08/25/2014 | | 1,640,000 | | 1,772,553 |
| American International Group, Inc. | | | | |
| 6.400%, 12/15/2020 | | 1,432,000 | | 1,552,269 |
| Bank of America Corp. | | | | |
| 3.700%, 09/01/2015 | | 850,000 | | 859,070 |
| 5.625%, 07/01/2020 | | 1,250,000 | | 1,299,316 |
| 5.875%, 01/05/2021 | | 490,000 | | 519,834 |
| 6.000%, 09/01/2017 | | 915,000 | | 987,136 |
| 7.375%, 05/15/2014 | | 1,115,000 | | 1,269,472 |
| Barclays Bank PLC | | | | |
| 2.500%, 09/21/2015 (S) | | 1,865,000 | | 1,829,893 |
| 5.140%, 10/14/2020 | | 977,000 | | 927,302 |
| BNP Paribas Home Loan Covered Bonds SA | | | |
| 2.200%, 11/02/2015 (S) | | 2,025,000 | | 1,941,868 |
| |
| The accompanying notes are an integral part of the financial statements. | 49 |
John Hancock Funds II
Portfolio of Investments — February 28, 2011 (Unaudited) (showing percentage of total net assets)
| | | | |
| Core Bond Fund (continued) | | | |
| | | Shares or | | |
| | | Principal | | |
| | | Amount | | Value |
| |
|
| |
| CORPORATE BONDS (continued) | | | | |
| Financials (continued) | | | | |
| Canadian Imperial Bank of Commerce | | | | |
| 2.750%, 01/27/2016 (S) | $ | 2,440,000 | $ | 2,438,519 |
| Capital One Bank USA NA | | | | |
| 8.800%, 07/15/2019 | | 795,000 | | 1,003,461 |
| Citigroup Funding, Inc. | | | | |
| 1.875%, 10/22/2012 | | 1,735,000 | | 1,770,300 |
| Citigroup, Inc. | | | | |
| 4.750%, 05/19/2015 | | 1,080,000 | | 1,140,407 |
| 5.375%, 08/09/2020 | | 330,000 | | 341,853 |
| 6.375%, 08/12/2014 | | 733,000 | | 817,859 |
| CNA Financial Corp. | | | | |
| 5.750%, 08/15/2021 | | 620,000 | | 635,871 |
| 6.500%, 08/15/2016 | | 165,000 | | 181,745 |
| Credit Suisse New York | | | | |
| 6.000%, 02/15/2018 | | 945,000 | | 1,009,044 |
| DnB Nor Boligkreditt | | | | |
| 2.100%, 10/14/2015 (S) | | 1,100,000 | | 1,056,190 |
| FIH Erhvervsbank A/S | | | | |
| 2.000%, 06/12/2013 (S) | | 1,060,000 | | 1,076,859 |
| General Electric Capital Corp. | | | | |
| 4.625%, 01/07/2021 | | 980,000 | | 973,871 |
| HCP, Inc. | | | | |
| 3.750%, 02/01/2016 | | 685,000 | | 691,498 |
| 5.375%, 02/01/2021 | | 970,000 | | 990,704 |
| 5.650%, 12/15/2013 | | 1,080,000 | | 1,179,871 |
| 6.750%, 02/01/2041 | | 720,000 | | 776,763 |
| HSBC Bank PLC | | | | |
| 3.500%, 06/28/2015 (S) | | 990,000 | | 1,008,447 |
| 4.750%, 01/19/2021 (S) | | 890,000 | | 890,330 |
| HSBC Holdings PLC | | | | |
| 6.800%, 06/01/2038 | | 1,080,000 | | 1,152,695 |
| Itau Unibanco Holding SA | | | | |
| 6.200%, 04/15/2020 (S) | | 1,080,000 | | 1,089,029 |
| JPMorgan Chase & Company | | | | |
| 3.450%, 03/01/2016 | | 1,315,000 | | 1,321,495 |
| JPMorgan Chase Bank NA | | | | |
| 6.000%, 10/01/2017 | | 897,000 | | 988,627 |
| Kilroy Realty LP | | | | |
| 5.000%, 11/03/2015 | | 360,000 | | 360,123 |
| 6.625%, 06/01/2020 | | 515,000 | | 529,432 |
| Lazard Group LLC | | | | |
| 6.850%, 06/15/2017 | | 1,500,000 | | 1,597,755 |
| 7.125%, 05/15/2015 | | 1,125,000 | | 1,238,030 |
| Liberty Mutual Group, Inc. | | | | |
| 7.500%, 08/15/2036 (S) | | 677,000 | | 695,695 |
| Lloyds TSB Bank PLC | | | | |
| 6.375%, 01/21/2021 | | 715,000 | | 739,670 |
| 6.500%, 09/14/2020 (S) | | 509,000 | | 490,883 |
| Morgan Stanley | | | | |
| 3.450%, 11/02/2015 | | 510,000 | | 503,890 |
| 5.750%, 01/25/2021 | | 1,150,000 | | 1,181,201 |
| 5.950%, 12/28/2017 | | 575,000 | | 613,764 |
| Nordea Bank AB | | | | |
| 3.700%, 11/13/2014 (S) | | 695,000 | | 721,397 |
| 4.875%, 01/14/2021 (S) | | 335,000 | | 338,828 |
| Prudential Financial, Inc. | | | | |
| 4.500%, 11/15/2020 | | 350,000 | | 345,573 |
| 6.200%, 11/15/2040 | | 395,000 | | 417,797 |
| Qatari Diar Finance QSC | | | | |
| 5.000%, 07/21/2020 (S) | | 1,050,000 | | 1,028,555 |
| Tanger Properties LP | | | | |
| 6.125%, 06/01/2020 | | 535,000 | | 578,659 |
| The Goldman Sachs Group, Inc. | | | | |
| 3.625%, 02/07/2016 | | 1,220,000 | | 1,218,288 |
| 6.250%, 02/01/2041 | | 1,150,000 | | 1,170,309 |
| | | | |
| Core Bond Fund (continued) | | | |
| | | Shares or | | |
| | | Principal | | |
| | | Amount | | Value |
| |
|
| |
| CORPORATE BONDS (continued) | | | | |
| Financials (continued) | | | | |
| The Goldman Sachs Group, Inc. (continued) | | | | |
| 6.750%, 10/01/2037 | $ | 618,000 | $ | 633,423 |
| US Bank NA | | | | |
| 5.920%, 05/25/2012 | | 567,792 | | 599,844 |
| WCI Finance LLC/WEA Finance LLC | | | | |
| 5.400%, 10/01/2012 (S) | | 786,000 | | 829,583 |
| WEA Finance LLC | | | | |
| 7.125%, 04/15/2018 (S) | | 660,000 | | 765,856 |
| WEA Finance LLC/WT Finance | | | | |
| Australia Pty, Ltd. | | | | |
| 7.500%, 06/02/2014 (S) | | 571,000 | | 652,489 |
| WR Berkley Corp. | | | | |
| 5.375%, 09/15/2020 | | 460,000 | | 465,292 |
| | |
|
| | | | | 56,780,364 |
| Health Care - 1.53% | | | | |
| Allergan, Inc. | | | | |
| 3.375%, 09/15/2020 | | 1,460,000 | | 1,371,641 |
| Amgen, Inc. | | | | |
| 3.450%, 10/01/2020 | | 1,550,000 | | 1,460,229 |
| Boston Scientific Corp. | | | | |
| 5.125%, 01/12/2017 | | 610,000 | | 626,706 |
| 6.400%, 06/15/2016 | | 595,000 | | 650,119 |
| Coventry Health Care, Inc. | | | | |
| 5.950%, 03/15/2017 | | 880,000 | | 913,561 |
| Life Technologies Corp. | | | | |
| 3.500%, 01/15/2016 | | 1,405,000 | | 1,403,034 |
| McKesson Corp. | | | | |
| 3.250%, 03/01/2016 | | 525,000 | | 527,607 |
| Merck & Company, Inc. | | | | |
| 3.875%, 01/15/2021 | | 830,000 | | 812,645 |
| UnitedHealth Group, Inc. | | | | |
| 5.950%, 02/15/2041 | | 1,255,000 | | 1,277,967 |
| | |
|
| | | | | 9,043,509 |
| Industrials - 0.66% | | | | |
| Burlington Northern Santa Fe LLC | | | | |
| 5.750%, 05/01/2040 | | 823,000 | | 857,556 |
| Hutchison Whampoa International, Ltd. | | | | |
| 4.625%, 09/11/2015 (S) | | 1,925,000 | | 2,041,043 |
| L-3 Communications Corp. | | | | |
| 4.950%, 02/15/2021 | | 530,000 | | 537,558 |
| Northrop Grumman Corp. | | | | |
| 3.500%, 03/15/2021 | | 530,000 | | 491,415 |
| | |
|
| | | | | 3,927,572 |
| Information Technology - 0.35% | | | | |
| Adobe Systems, Inc. | | | | |
| 4.750%, 02/01/2020 | | 735,000 | | 748,880 |
| Arrow Electronics, Inc. | | | | |
| 5.125%, 03/01/2021 | | 520,000 | | 512,216 |
| Juniper Networks Inc. | | | | |
| 3.100%, 03/15/2016 | | 230,000 | | 229,604 |
| 4.600%, 03/15/2021 | | 165,000 | | 164,787 |
| 5.950%, 03/15/2041 | | 395,000 | | 394,822 |
| | |
|
| | | | | 2,050,309 |
| Materials - 1.03% | | | | |
| ArcelorMittal | | | | |
| 5.500%, 03/01/2021 | | 985,000 | | 978,666 |
| 6.750%, 03/01/2041 | | 655,000 | | 649,603 |
| Corp. Nacional del Cobre de Chile | | | | |
| 3.750%, 11/04/2020 (S) | | 370,000 | | 349,308 |
| The Dow Chemical Company | | | | |
| 4.850%, 08/15/2012 | | 1,190,000 | | 1,252,970 |
| 5.900%, 02/15/2015 | | 605,000 | | 674,760 |
| |
| The accompanying notes are an integral part of the financial statements. | 50 |
John Hancock Funds II
Portfolio of Investments — February 28, 2011 (Unaudited) (showing percentage of total net assets)
| | | | |
| Core Bond Fund (continued) | | | |
| | | Shares or | | |
| | | Principal | | |
| | | Amount | | Value |
| |
|
| |
| CORPORATE BONDS (continued) | | | | |
| Materials (continued) | | | | |
| The Dow Chemical Company (continued) | | | | |
| 8.550%, 05/15/2019 | $ | 1,139,000 | $ | 1,443,320 |
| Vale Overseas, Ltd. | | | | |
| 6.875%, 11/10/2039 | | 685,000 | | 738,803 |
| | |
|
| | | | | 6,087,430 |
| Telecommunication Services - 2.47% | | | | |
| America Movil SAB de CV | | | | |
| 5.000%, 10/16/2019 | | 1,153,000 | | 1,185,620 |
| American Tower Corp. | | | | |
| 4.500%, 01/15/2018 | | 1,285,000 | | 1,273,756 |
| 5.050%, 09/01/2020 | | 367,000 | | 360,491 |
| British Telecommunications PLC | | | | |
| 9.875%, 12/15/2030 | | 370,000 | | 513,004 |
| Frontier Communications Corp. | | | | |
| 8.125%, 10/01/2018 | | 185,000 | | 205,581 |
| 8.250%, 04/15/2017 | | 660,000 | | 729,300 |
| 8.500%, 04/15/2020 | | 360,000 | | 399,600 |
| NBC Universal Media LLC | | | | |
| 2.875%, 04/01/2016 (S) | | 1,052,000 | | 1,016,335 |
| NBCUniversal Media LLC | | | | |
| 4.375%, 04/01/2021 (S) | | 553,000 | | 531,810 |
| 5.950%, 04/01/2041 (S) | | 643,000 | | 633,230 |
| Qwest Corp. | | | | |
| 7.500%, 10/01/2014 | | 655,000 | | 749,975 |
| Rogers Communications, Inc. | | | | |
| 6.375%, 03/01/2014 | | 1,135,000 | | 1,278,842 |
| Telefonica Emisiones SAU | | | | |
| 3.992%, 02/16/2016 | | 1,140,000 | | 1,144,511 |
| 5.462%, 02/16/2021 | | 1,140,000 | | 1,156,927 |
| 5.984%, 06/20/2011 | | 820,000 | | 832,791 |
| Telefonica Moviles Chile SA | | | | |
| 2.875%, 11/09/2015 (S) | | 585,000 | | 558,742 |
| Telemar Norte Leste SA | | | | |
| 5.500%, 10/23/2020 (S) | | 1,360,000 | | 1,311,040 |
| Verizon Wireless Capital LLC | | | | |
| 8.500%, 11/15/2018 | | 585,000 | | 758,018 |
| | |
|
| | | | | 14,639,573 |
| Utilities - 1.97% | | | | |
| Ameren Corp. | | | | |
| 8.875%, 05/15/2014 | | 770,000 | | 885,023 |
| CMS Energy Corp. | | | | |
| 5.050%, 02/15/2018 | | 805,000 | | 810,510 |
| Constellation Energy Group, Inc. | | | | |
| 5.150%, 12/01/2020 | | 100,000 | | 100,235 |
| Dominion Resources, Inc. | | | | |
| 8.875%, 01/15/2019 | | 1,850,000 | | 2,378,515 |
| DPL, Inc. | | | | |
| 6.875%, 09/01/2011 | | 1,110,000 | | 1,141,028 |
| FirstEnergy Solutions Corp. | | | | |
| 6.050%, 08/15/2021 | | 560,000 | | 585,664 |
| 6.800%, 08/15/2039 | | 330,000 | | 325,854 |
| Korea Hydro & Nuclear Power Company, Ltd. | | | |
| 3.125%, 09/16/2015 (S) | | 815,000 | | 799,492 |
| Midamerican Energy Holdings Company | | | | |
| 6.500%, 09/15/2037 | | 500,000 | | 555,764 |
| Nevada Power Company | | | | |
| 8.250%, 06/01/2011 | | 2,045,000 | | 2,082,755 |
| PacifiCorp | | | | |
| 6.250%, 10/15/2037 | | 510,000 | | 566,853 |
| Progress Energy, Inc. | | | | |
| 4.400%, 01/15/2021 | | 880,000 | | 875,225 |
| | | | |
| Core Bond Fund (continued) | | | |
| | | Shares or | | |
| | | Principal | | |
| | | Amount | | Value |
| |
|
| | |
| |
| CORPORATE BONDS (continued) | | | | |
| Utilities (continued) | | | | |
| Progress Energy, Inc. (continued) | | | | |
| 6.850%, 04/15/2012 | $ | 570,000 | $ | 605,355 |
| | |
|
| | | | | 11,712,273 |
|
| TOTAL CORPORATE BONDS (Cost $124,501,709) | | $ | 127,250,306 |
|
| |
| MUNICIPAL BONDS - 1.13% | | | | |
| California - 0.44% | | | | |
| Los Angeles Community College District | | | | |
| 6.750%, 08/01/2049 | | 710,000 | | 757,499 |
| Los Angeles Department of Water & Power | | | |
| 6.574%, 07/01/2045 | | 790,000 | | 828,228 |
| State of California | | | | |
| 7.600%, 11/01/2040 | | 915,000 | | 994,065 |
| | |
|
| | | | | 2,579,792 |
| Illinois - 0.27% | | | | |
| State of Illinois | | | | |
| 5.365%, 03/01/2017 | | 525,000 | | 526,208 |
| 5.665%, 03/01/2018 | | 525,000 | | 526,124 |
| 5.877%, 03/01/2019 | | 525,000 | | 526,365 |
| | |
|
| | | | | 1,578,697 |
| Nevada - 0.12% | | | | |
| County of Clark | | | | |
| 6.820%, 07/01/2045 | | 735,000 | | 729,127 |
| New Jersey - 0.17% | | | | |
| New Jersey State Turnpike Authority | | | | |
| 7.102%, 01/01/2041 | | 920,000 | | 995,026 |
| Texas - 0.13% | | | | |
| North Texas Tollway Authority | | | | |
| 6.718%, 01/01/2049 | | 795,000 | | 794,682 |
|
| TOTAL MUNICIPAL BONDS (Cost $6,526,123) | | $ | 6,677,324 |
|
| |
| CAPITAL PREFERRED SECURITIES - 0.19% | | | |
| Financials - 0.19% | | | | |
| JPMorgan Chase Capital XXV | | | | |
| 6.800%, 10/01/2037 | | 1,085,000 | | 1,135,602 |
|
| TOTAL CAPITAL PREFERRED SECURITIES (Cost $948,037) $ | | 1,135,602 |
|
| |
| COLLATERALIZED MORTGAGE | | | | |
| OBLIGATIONS - 23.14% | | | | |
| Commercial & Residential - 11.81% | | | | |
| Americold LLC Trust, Series 2010-ARTA, | | | | |
| Class A1 | | | | |
| 3.847%, 01/14/2029 (S) | | 1,387,984 | | 1,410,742 |
| Asset Securitization Corp., Series 1996-D3, | | | |
| Class A2 | | | | |
| 7.774%, 10/13/2026 (P) | | 205,053 | | 207,875 |
| Banc of America Commercial Mortgage, Inc. | | | |
| Series 2004-6, Class A3, | | | | |
| 4.512%, 12/10/2042 | | 264,000 | | 267,071 |
| Series 2005-4, Class A5A, | | | | |
| 4.933%, 07/10/2045 | | 1,808,000 | | 1,921,485 |
| Series 2002-2, Class B, | | | | |
| 5.271%, 07/11/2043 | | 229,000 | | 236,981 |
| Series 2006-6, Class A4, | | | | |
| 5.356%, 10/10/2045 | | 1,204,000 | | 1,282,795 |
| Series 2006-3, Class A4, | | | | |
| 5.889%, 07/10/2044 (P) | | 656,000 | | 716,970 |
| Series 2002-PB2, Class B, | | | | |
| 6.309%, 06/11/2035 | | 143,000 | | 147,848 |
| Series 2002-2, Class E, | | | | |
| 7.634%, 09/15/2032 (P) | | 208,000 | | 207,644 |
| |
| The accompanying notes are an integral part of the financial statements. | 51 |
John Hancock Funds II
Portfolio of Investments — February 28, 2011 (Unaudited) (showing percentage of total net assets)
| | | | |
| Core Bond Fund (continued) | | | | |
| | | Shares or | | |
| | | Principal | | |
| | | Amount | | Value |
| | |
|
| |
| COLLATERALIZED MORTGAGE | | | | |
| OBLIGATIONS (continued) | | | | |
| Commercial & Residential (continued) | | | | |
| Bear Stearns Commercial | | | | |
| Mortgage Securities, Inc. | | | | |
| Series 2003-T12, Class A3, | | | | |
| 4.240%, 08/13/2039 (P) | | 52,828 | $ | 53,719 |
| Series 2002-PBW1, Class A2, | | | | |
| 4.720%, 11/11/2035 (P) | | 246,000 | | 254,537 |
| Series 2007-PW6, Class A1, | | | | |
| 5.593%, 06/11/2040 | | 297,349 | | 301,560 |
| Citigroup/Deutsche Bank Commercial | | | | |
| Mortgage Trust, Series 2005-CD1, | | | | |
| Class AM | | | | |
| 5.222%, 07/15/2044 (P) | | 674,000 | | 710,871 |
| Commercial Mortgage Asset Trust, | | | | |
| Series 1999-C1, Class A4 | | | | |
| 6.975%, 01/17/2032 (P) | | 1,083,000 | | 1,137,346 |
| Commercial Mortgage Pass Through | | | | |
| Certificates, Series 2001-J2A, Class B | | | | |
| 6.304%, 07/16/2034 (S) | | 854,000 | | 866,075 |
| Credit Suisse First Boston | | | | |
| Mortgage Securities Corp. | | | | |
| Series 2002-CKS4, Class A4, | | | | |
| 4.485%, 11/15/2036 | | 1,474 | | 1,474 |
| Series 2003-CPN1, Class A2, | | | | |
| 4.597%, 03/15/2035 | | 841,000 | | 878,112 |
| Series 2003-CPN1, Class B, | | | | |
| 4.723%, 03/15/2035 | | 345,000 | | 358,169 |
| Series 2005-C3, Class AM, | | | | |
| 4.730%, 07/15/2037 | | 489,000 | | 508,287 |
| Series 2005-C1, Class A3, | | | | |
| 4.813%, 02/15/2038 | | 546,547 | | 561,101 |
| Series 2005-C2, Class A4, | | | | |
| 4.832%, 04/15/2037 | | 713,000 | | 751,785 |
| Series 2002-CP5, Class A2, | | | | |
| 4.940%, 12/15/2035 | | 959,000 | | 1,003,510 |
| Series 2002-CKS4, Class A2, | | | | |
| 5.183%, 11/15/2036 | | 739,000 | | 768,257 |
| Series 2003-C4, Class B, | | | | |
| 5.253%, 08/15/2036 (P) | | 597,000 | | 620,371 |
| Credit Suisse Mortgage Capital Certificates, | | | | |
| Series 2007-C2, Class A2 | | | | |
| 5.448%, 01/15/2049 (P) | | 505,792 | | 514,341 |
| Developers Diversified Realty Corp., | | | | |
| Series 2009-DDR1, Class A | | | | |
| 3.807%, 10/14/2022 (S) | | 1,175,243 | | 1,219,989 |
| Extended Stay America Trust, | | | | |
| Series 2010-ESHA, Class A | | | | |
| 2.951%, 11/05/2027 (S) | | 533,717 | | 529,391 |
| First Union National Bank Commercial | | | | |
| Mortgage, Series 2001-C4, Class B | | | | |
| 6.417%, 12/12/2033 | | 188,000 | | 193,343 |
| GE Capital Commercial Mortgage Corp. | | | | |
| Series 2001-3, Class A1, | | | | |
| 5.560%, 06/10/2038 | | 26,601 | | 26,596 |
| Series 2002-1A, Class A3, | | | | |
| 6.269%, 12/10/2035 | | 243,079 | | 251,800 |
| GMAC Commercial Mortgage Securities, Inc. | | | | |
| Series 2004-C2, Class A4, | | | | |
| 5.301%, 08/10/2038 (P) | | 409,000 | | 436,572 |
| Series 2003-C2, Class A2, | | | | |
| 5.471%, 05/10/2040 (P) | | 1,067,000 | | 1,146,938 |
| Series 2003-C2, Class B, | | | | |
| 5.487%, 05/10/2040 (P) | | 590,000 | | 626,970 |
| Series 2003-C2, Class D, | | | | |
| 5.487%, 05/10/2040 (P) | | 233,000 | | 243,380 |
| | | | |
| Core Bond Fund (continued) | | | | |
| | | Shares or | | |
| | | Principal | | |
| | | Amount | | Value |
| | |
|
| |
| COLLATERALIZED MORTGAGE | | | | |
| OBLIGATIONS (continued) | | | | |
| Commercial & Residential (continued) | | | | |
| GMAC Commercial Mortgage | | | | |
| Securities, Inc. (continued) | | | | |
| Series 2001-C2, Class A2, | | | | |
| 6.700%, 04/15/2034 | | 164,700 | $ | 165,013 |
| Series 2001-C2, Class B, | | | | |
| 6.790%, 04/15/2034 | | 128,000 | | 129,160 |
| Greenwich Capital Commercial Funding Corp. | | | | |
| Series 2003-C1, Class B, | | | | |
| 4.229%, 07/05/2035 | | 432,000 | | 445,364 |
| Series 2005-GG5, Class A5, | | | | |
| 5.224%, 04/10/2037 (P) | | 2,778,000 | | 2,962,388 |
| Series 2006-GG7, Class A4, | | | | |
| 5.883%, 07/10/2038 (P) | | 1,161,000 | | 1,275,076 |
| GS Mortgage Securities Corp. II | | | | |
| Series 2010, Class C2, | | | | |
| 3.849%, 12/10/2043 (S) | | 756,224 | | 771,940 |
| Series 2005-GG4, Class A4A, | | | | |
| 4.751%, 07/10/2039 | | 1,347,000 | | 1,424,429 |
| Series 2010, Class C2, | | | | |
| 5.162%, 12/10/2043 (P)(S) | | 565,000 | | 593,004 |
| Series 2004-GG2, Class A6, | | | | |
| 5.396%, 08/10/2038 (P) | | 657,000 | | 707,401 |
| Impac Funding LLC, Series 2010-1, Class A1 | | | | |
| 5.314%, 01/25/2051 (S) | | 1,573,871 | | 1,570,424 |
| JPMorgan Chase Commercial | | | | |
| Mortgage Securities Corp. | | | | |
| Series 2010-C1, Class A1, | | | | |
| 3.853%, 06/15/2043 (S) | | 1,211,062 | | 1,248,869 |
| Series 2003-C1, Class A1, | | | | |
| 4.275%, 01/12/2037 | | 342,123 | | 349,611 |
| Series 2010-CNTR, Class A2, | | | | |
| 4.311%, 08/05/2032 (S) | | 1,330,000 | | 1,284,697 |
| Series 2003-CB6, Class A1, | | | | |
| 4.393%, 07/12/2037 | | 154,172 | | 158,663 |
| Series 2003-CB7, Class A4, | | | | |
| 4.879%, 01/12/2038 (P) | | 606,000 | | 640,915 |
| Series 2005-LDP4, Class A4, | | | | |
| 4.918%, 10/15/2042 (P) | | 223,000 | | 236,892 |
| Series 2002-C2, Class A2, | | | | |
| 5.050%, 12/12/2034 | | 500,000 | | 524,470 |
| Series 2004-CB9, Class A2, | | | | |
| 5.108%, 06/12/2041 (P) | | 368,737 | | 370,477 |
| Series 2004-IN2, Class A2, | | | | |
| 5.115%, 07/15/2041 | | 577,000 | | 606,880 |
| Series 2006-LDP9, Class A2, | | | | |
| 5.134%, 05/15/2047 | | 344,000 | | 356,024 |
| Series 2002-CIB5, Class A2, | | | | |
| 5.161%, 10/12/2037 | | 149,000 | | 156,331 |
| Series 2002-C2, Class B, | | | | |
| 5.211%, 12/12/2034 (P) | | 170,000 | | 177,326 |
| Series 2005-LDP5, Class A4, | | | | |
| 5.229%, 12/15/2044 (P) | | 440,000 | | 474,172 |
| Series 2005-CB13, Class A4, | | | | |
| 5.280%, 01/12/2043 (P) | | 722,000 | | 772,651 |
| Series 2007-LDPX, Class A3S, | | | | |
| 5.317%, 01/15/2049 | | 1,107,000 | | 1,125,615 |
| Series 2003-PM1A, Class A4, | | | | |
| 5.326%, 08/12/2040 (P) | | 455,000 | | 485,166 |
| Series 2006-LDP9, Class A3, | | | | |
| 5.336%, 05/15/2047 | | 351,000 | | 373,033 |
| Series 2002-C1, Class A3, | | | | |
| 5.376%, 07/12/2037 | | 362,000 | | 376,597 |
| Series 2006-CB14, Class A4, | | | | |
| 5.481%, 12/12/2044 (P) | | 664,000 | | 711,215 |
| |
| The accompanying notes are an integral part of the financial statements. | 52 |
John Hancock Funds II
Portfolio of Investments — February 28, 2011 (Unaudited) (showing percentage of total net assets)
| | | | |
| Core Bond Fund (continued) | | | | |
| | | Shares or | | |
| | | Principal | | |
| | | Amount | | Value |
| | |
|
| |
| COLLATERALIZED MORTGAGE | | | | |
| OBLIGATIONS (continued) | | | | |
| Commercial & Residential (continued) | | | | |
| JPMorgan Chase Commercial Mortgage | | | | |
| Securities Corp. (continued) | | | | |
| Series 2009-IWST, Class A2, | | | | |
| 5.633%, 12/05/2027 (S) | | 1,400,000 | $ | 1,518,607 |
| Series 2007-LD11, Class ASB, | | | | |
| 5.818%, 06/15/2049 (P) | | 722,000 | | 764,786 |
| Series 2007-LD12, Class A3, | | | | |
| 5.989%, 02/15/2051 (P) | | 927,000 | | 979,620 |
| Series 2002-CIB4, Class C, | | | | |
| 6.450%, 05/12/2034 (P) | | 448,000 | | 462,457 |
| Series 2001-CIB3, Class A3, | | | | |
| 6.465%, 11/15/2035 | | 429,987 | | 436,919 |
| Series 2001-CIB2, Class D, | | | | |
| 6.847%, 04/15/2035 (P) | | 301,000 | | 303,456 |
| JPMorgan Commercial Mortgage | | | | |
| Finance Corp., Series 2000-C10, Class C | | | | |
| 7.717%, 08/15/2032 (P) | | 55,348 | | 55,346 |
| LB Commercial Conduit Mortgage Trust | | | | |
| Series 2007-C3, Class A3, | | | | |
| 5.940%, 07/15/2044 (P) | | 300,000 | | 318,284 |
| Series 2007-C3, Class A4, | | | | |
| 5.950%, 07/15/2044 (P) | | 906,000 | | 977,570 |
| LB-UBS Commercial Mortgage Trust | | | | |
| Series 2002-C4, Class A4, | | | | |
| 4.563%, 09/15/2026 | | 161,813 | | 165,215 |
| Series 2004-C7, Class A5, | | | | |
| 4.628%, 10/15/2029 | | 232,000 | | 240,648 |
| Series 2005-C1, Class A4, | | | | |
| 4.742%, 02/15/2030 | | 326,000 | | 344,116 |
| Series 2002-C4, Class A5, | | | | |
| 4.853%, 09/15/2031 | | 3,236,000 | | 3,378,547 |
| Series 2002-C7, Class A4, | | | | |
| 4.960%, 12/15/2031 | | 744,000 | | 782,438 |
| Series 2005-C2, Class A4, | | | | |
| 4.998%, 04/15/2030 | | 1,032,000 | | 1,058,317 |
| Series 2003-C8, Class A4, | | | | |
| 5.124%, 11/15/2032 (P) | | 983,000 | | 1,048,255 |
| Series 2007-C1, Class AAB, | | | | |
| 5.403%, 02/15/2040 | | 161,000 | | 171,200 |
| Series 2002-C2, Class A4, | | | | |
| 5.594%, 06/15/2031 | | 295,000 | | 307,300 |
| Series 2007-C6, Class A3, | | | | |
| 5.933%, 07/15/2040 | | 1,325,000 | | 1,400,134 |
| Series 2008-C1, Class A2, | | | | |
| 6.098%, 04/15/2041 (P) | | 636,000 | | 704,960 |
| Series 2001-C2, Class A2, | | | | |
| 6.653%, 11/15/2027 | | 44,707 | | 44,791 |
| Merrill Lynch Mortgage Trust | | | | |
| Series 2004-KEY2, Class A4, | | | | |
| 4.864%, 08/12/2039 (P) | | 1,036,000 | | 1,088,509 |
| Series 2005-CIP1, Class A3A, | | | | |
| 4.949%, 07/12/2038 (P) | | 338,000 | | 341,490 |
| Series 2003-KEY1, Class A4, | | | | |
| 5.236%, 11/12/2035 (P) | | 38,000 | | 40,549 |
| Series 2005-CKI1, Class A6, | | | | |
| 5.241%, 11/12/2037 (P) | | 643,000 | | 691,083 |
| Morgan Stanley Capital I | | | | |
| Series 2005-T17, Class A4, | | | | |
| 4.520%, 12/13/2041 | | 57,318 | | 58,132 |
| Series 2004-HQ3, Class A4, | | | | |
| 4.800%, 01/13/2041 | | 354,000 | | 373,216 |
| Series 2004-IQ8, Class A4, | | | | |
| 4.900%, 06/15/2040 | | 703,000 | | 720,661 |
| | | | |
| Core Bond Fund (continued) | | | | |
| | | Shares or | | |
| | | Principal | | |
| | | Amount | | Value |
| | |
|
| |
| COLLATERALIZED MORTGAGE | | | | |
| OBLIGATIONS (continued) | | | | |
| Commercial & Residential (continued) | | | | |
| Morgan Stanley Capital I (continued) | | | | |
| Series 2003-IQ6, Class A4, | | | | |
| 4.970%, 12/15/2041 | | 659,000 | $ | 701,833 |
| Series 2005-HQ6, Class A4A, | | | | |
| 4.989%, 08/13/2042 | | 2,473,000 | | 2,640,488 |
| Series 2003-T11, Class A4, | | | | |
| 5.150%, 06/13/2041 | | 814,000 | | 864,567 |
| Series 2006-IQ12, Class ANM, | | | | |
| 5.310%, 12/15/2043 | | 856,000 | | 864,485 |
| Series 2007-HQ13, Class A1, | | | | |
| 5.357%, 12/15/2044 | | 309,232 | | 320,193 |
| Series 2008-HQ8, Class AM, | | | | |
| 5.436%, 03/12/2044 (P) | | 343,000 | | 365,213 |
| Series 2007-IQ14, Class AAB, | | | | |
| 5.654%, 04/15/2049 (P) | | 228,000 | | 241,343 |
| Morgan Stanley Dean Witter Capital I | | | | |
| Series 2003-HQ2, Class A2, | | | | |
| 4.920%, 03/12/2035 | | 223,000 | | 234,383 |
| Series 2003-HQ2, Class B, | | | | |
| 5.040%, 03/12/2035 | | 274,000 | | 286,462 |
| Series 2001, Class A4, | | | | |
| 6.390%, 07/15/2033 | | 536,301 | | 539,964 |
| Series 2002-HQ, Class B, | | | | |
| 6.640%, 04/15/2034 | | 232,000 | | 242,279 |
| Morgan Stanley Mortgage Loan Trust, | | | | |
| Series 2007-6XS, Class 2A1S | | | | |
| 0.372%, 02/25/2047 (P) | | 48,553 | | 43,291 |
| Nomura Asset Securities Corp., | | | | |
| Series 1998-D6, Class A2 | | | | |
| 7.265%, 03/15/2030 (P) | | 1,035,000 | | 1,130,151 |
| PNC Mortgage Acceptance Corp., | | | | |
| Series 2001-C1, Class A2 | | | | |
| 6.360%, 03/12/2034 | | 44,639 | | 44,652 |
| Prudential Mortgage Capital Funding LLC, | | | | |
| Series 2001-ROCK, Class B | | | | |
| 6.760%, 05/10/2034 | | 234,000 | | 234,890 |
| Salomon Brothers | | | | |
| Mortgage Securities VII, Inc. | | | | |
| Series 2001-C2, Class A3, | | | | |
| 6.499%, 11/13/2036 | | 709,083 | | 721,384 |
| Series 2000-C2, Class C, | | | | |
| 7.727%, 07/18/2033 (P) | | 61,649 | | 61,838 |
| Sequoia Mortgage Trust | | | | |
| Series 2010-H1, Class A1, | | | | |
| 3.750%, 02/25/2040 (P) | | 331,927 | | 339,450 |
| Series 2011-1, Class A1, | | | | |
| 4.125%, 02/25/2041 (P) | | 329,000 | | 329,000 |
| Wachovia Bank Commercial Mortgage Trust, | | | | |
| Series 2003-C8, Class A3 | | | | |
| 4.445%, 11/15/2035 | | 197,000 | | 199,697 |
| | |
|
| | | | | 70,019,877 |
| U.S. Government Agency - 11.33% | | | | |
| Federal Home Loan Mortgage Corp. | | | | |
| Series K008, Class A1, | | | | |
| 2.746%, 12/25/2019 | | 1,470,926 | | 1,444,433 |
| Series K010, Class A1, | | | | |
| 3.320%, 07/25/2020 | | 2,246,000 | | 2,268,107 |
| Series K007, Class A1, | | | | |
| 3.342%, 12/25/2019 | | 1,017,203 | | 1,029,266 |
| Series 2727, Class PW, | | | | |
| 3.570%, 06/15/2029 | | 20,991 | | 21,365 |
| Series 3704, Class CA, | | | | |
| 4.000%, 12/15/2036 | | 17,056,176 | | 17,504,107 |
| |
| The accompanying notes are an integral part of the financial statements. | 53 |
John Hancock Funds II
Portfolio of Investments — February 28, 2011 (Unaudited) (showing percentage of total net assets)
| | | | |
| Core Bond Fund (continued) | | | | |
| | | Shares or | | |
| | | Principal | | |
| | | Amount | | Value |
| | |
|
| |
| COLLATERALIZED MORTGAGE | | | | |
| OBLIGATIONS (continued) | | | | |
| U.S. Government Agency (continued) | | | | |
| Federal Home Loan Mortgage Corp. (continued) | | | | |
| Series 3631, Class PA, | | | | |
| 4.000%, 02/15/2040 | | 1,618,727 | $ | 1,665,636 |
| Series K005, Class A2, | | | | |
| 4.317%, 11/25/2019 | | 1,687,000 | | 1,710,308 |
| Series 3598, Class MA, | | | | |
| 4.500%, 11/15/2038 | | 842,272 | | 871,646 |
| Series 2009-K003, Class AAB, | | | | |
| 4.768%, 05/25/2018 | | 648,000 | | 687,485 |
| Series 2590, Class BY, | | | | |
| 5.000%, 03/15/2018 | | 73,000 | | 79,030 |
| Series 3455, Class A, | | | | |
| 5.000%, 06/15/2038 | | 7,895,232 | | 8,234,493 |
| Series 2005-3035, Class PA, | | | | |
| 5.500%, 09/15/2035 | | 174,606 | | 188,743 |
| Series 2005-3028, Class PG, | | | | |
| 5.500%, 09/15/2035 | | 128,305 | | 138,030 |
| Series 3325, Class JL, | | | | |
| 5.500%, 06/15/2037 | | 422,439 | | 447,793 |
| Series 2479, Class PG, | | | | |
| 6.000%, 08/15/2032 | | 822,105 | | 888,656 |
| Series 2980, Class QA, | | | | |
| 6.000%, 05/15/2035 | | 272,029 | | 295,038 |
| Series T-59, Class 1A3, | | | | |
| 7.500%, 10/25/2043 | | 357,096 | | 414,615 |
| Series T-60, Class 1A3, | | | | |
| 7.500%, 03/25/2044 | | 388,100 | | 444,227 |
| Federal National Mortgage Association | | | | |
| Series 2010-15, Class KA, | | | | |
| 4.000%, 03/25/2039 | | 1,155,694 | | 1,186,724 |
| Series 2009-M2, Class A3, | | | | |
| 4.001%, 01/25/2019 | | 1,147,000 | | 1,145,831 |
| Series 2007-30, Class MA, | | | | |
| 4.250%, 02/25/2037 | | 2,689 | | 2,789 |
| Series 2009-M1, Class A2, | | | | |
| 4.287%, 07/25/2019 | | 1,064,000 | | 1,078,686 |
| Series 2010-M3, Class A3, | | | | |
| 4.332%, 03/25/2020 (P) | | 4,300,000 | | 4,350,529 |
| Series 2010-M1, Class A2, | | | | |
| 4.450%, 09/25/2019 | | 371,000 | | 382,845 |
| Series 3652, Class AP, | | | | |
| 4.500%, 03/15/2040 | | 3,378,481 | | 3,542,157 |
| Series 2010-54, Class EA, | | | | |
| 4.500%, 06/25/2040 | | 2,527,993 | | 2,667,497 |
| Series 2009-78, Class J, | | | | |
| 5.000%, 09/25/2019 | | 1,132,557 | | 1,209,005 |
| Series 2005-58, Class MA, | | | | |
| 5.500%, 07/25/2035 | | 177,644 | | 192,430 |
| Series 2009-71, Class JT, | | | | |
| 6.000%, 06/25/2036 | | 569,915 | | 618,282 |
| Series 2007-77, Class MH, | | | | |
| 6.000%, 12/25/2036 | | 5,377,694 | | 5,647,162 |
| Series 2001-81, Class HE, | | | | |
| 6.500%, 01/25/2032 | | 4,548,689 | | 5,030,687 |
| Series 2002-33, Class A2, | | | | |
| 7.500%, 06/25/2032 | | 274,585 | | 310,399 |
| Series 2001-T7, Class A1, | | | | |
| 7.500%, 02/25/2041 | | 258,528 | | 292,035 |
| Series 2002-T6, Class A2, | | | | |
| 7.500%, 10/25/2041 | | 383,580 | | 436,661 |
| Series 2002-W4, Class A5, | | | | |
| 7.500%, 05/25/2042 | | 271,340 | | 308,208 |
| Series 2002-T16, Class A3, | | | | |
| 7.500%, 07/25/2042 | | 212,961 | | 238,654 |
| | | | |
| Core Bond Fund (continued) | | | | |
| | | Shares or | | |
| | | Principal | | |
| | | Amount | | Value |
| | |
|
| |
| COLLATERALIZED MORTGAGE | | | | |
| OBLIGATIONS (continued) | | | | |
| U.S. Government Agency (continued) | | | | |
| Federal National Mortgage | | | | |
| Association (continued) | | | | |
| Series 2002-T18, Class A4, | | | | |
| 7.500%, 08/25/2042 | | 213,010 | $ | 245,235 |
| | |
|
| | | | | 67,218,794 |
|
| TOTAL COLLATERALIZED MORTGAGE | | | | |
| OBLIGATIONS (Cost $137,378,101) | | | $ | 137,238,671 |
|
| |
| ASSET BACKED SECURITIES - 6.95% | | | | |
| Ally Master Owner Trust, Series 2011-1 A2 | | | | |
| 2.150%, 01/15/2016 | | 2,806,000 | | 2,801,050 |
| Capital One Multi-Asset Execution Trust | | | | |
| Series 2006-A5, Class A5, | | | | |
| 0.326%, 01/15/2016 (P) | | 1,721,000 | | 1,710,729 |
| Series 2005-A9, Class A, | | | | |
| 0.356%, 08/15/2018 (P) | | 2,725,000 | | 2,675,832 |
| Series 2007-A8, Class A8, | | | | |
| 0.602%, 10/15/2015 (P) | | 1,350,000 | | 1,349,038 |
| Citibank Credit Card Issuance Trust, | | | | |
| Series 2009-A5, Class A5 | | | | |
| 2.250%, 12/23/2014 | | 489,000 | | 499,575 |
| Citigroup Mortgage Loan Trust, Inc., | | | | |
| Series 2007-AHL1, Class A2A | | | | |
| 0.302%, 12/25/2036 (P) | | 56,479 | | 54,009 |
| Discover Card Master Trust, Series 2011-A1, | | | | |
| Class A1 | | | | |
| 0.612%, 08/15/2016 (P) | | 2,131,000 | | 2,131,000 |
| Ford Credit Auto Owner Trust, Series 2009-D, | | | | |
| Class A3 | | | | |
| 2.170%, 10/15/2013 | | 700,470 | | 708,275 |
| Ford Credit Floorplan Master Owner Trust, | | | | |
| Series 2010-1, Class A | | | | |
| 1.916%, 12/15/2014 (P)(S) | | 2,204,000 | | 2,247,571 |
| GE Capital Credit Card Master Note Trust, | | | | |
| Series 2011-1, Class A | | | | |
| 0.810%, 01/17/2017 (P) | | 1,503,000 | | 1,503,001 |
| Morgan Stanley ABS Capital I, | | | | |
| Series 2007-HE2, Class A2A | | | | |
| 0.302%, 01/25/2037 (P) | | 24,724 | | 24,030 |
| Morgan Stanley Home Equity Loan Trust, | | | | |
| Series 2007-1, Class A1 | | | | |
| 0.312%, 12/25/2036 (P) | | 16,956 | | 16,502 |
| Nelnet Student Loan Trust | | | | |
| Series 2004-3, Class A5, | | | | |
| 0.483%, 10/27/2036 (P) | | 1,285,000 | | 1,197,498 |
| Series 2008-3, Class A4, | | | | |
| 1.962%, 11/25/2024 (P) | | 2,921,000 | | 3,032,486 |
| SLC Student Loan Trust, Series 2008-1, | | | | |
| Class A4A | | | | |
| 1.902%, 12/15/2032 (P) | | 2,599,000 | | 2,689,699 |
| SLM Student Loan Trust | | | | |
| Series 2007-4, Class A3, | | | | |
| 0.363%, 01/25/2022 (P) | | 1,783,000 | | 1,762,786 |
| Series 2006-3, Class A4, | | | | |
| 0.383%, 07/25/2019 (P) | | 1,383,000 | | 1,370,986 |
| Series 2005-6, Class A5A, | | | | |
| 0.413%, 07/27/2026 (P) | | 3,283,000 | | 3,177,721 |
| Series 2005-7, Class A4, | | | | |
| 0.453%, 10/25/2029 (P) | | 956,000 | | 884,885 |
| Series 2004-7, Class A5, | | | | |
| 0.473%, 01/27/2020 (P) | | 1,268,000 | | 1,259,790 |
| Series 2010-1, Class A, | | | | |
| 0.662%, 03/25/2025 (P) | | 898,018 | | 897,983 |
| |
| The accompanying notes are an integral part of the financial statements. | 54 |
John Hancock Funds II
Portfolio of Investments — February 28, 2011 (Unaudited) (showing percentage of total net assets)
| | | | |
| Core Bond Fund (continued) | | | |
| | | Shares or | | |
| | | Principal | | |
| | | Amount | | Value |
| |
|
| |
| ASSET BACKED SECURITIES (continued) | | | | |
| SLM Student Loan Trust (continued) | | | | |
| Series 2008-6, Class A2, | | | | |
| 0.853%, 10/25/2017 (P) | | 2,079,000 | $ | 2,082,896 |
| Series 2008-4, Class A2, | | | | |
| 1.353%, 07/25/2016 (P) | | 729,000 | | 739,240 |
| Series 2008-5, Class A2, | | | | |
| 1.403%, 10/25/2016 (P) | | 1,603,444 | | 1,623,364 |
| Series 2008-5, Class A3, | | | | |
| 1.603%, 01/25/2018 (P) | | 462,000 | | 474,814 |
| Series 2008-4, Class A4, | | | | |
| 1.953%, 07/25/2022 (P) | | 1,100,000 | | 1,145,972 |
| Series 2008-5, Class A4, | | | | |
| 2.003%, 07/25/2023 (P) | | 1,765,000 | | 1,845,917 |
| World Financial Network Credit Card | | | | |
| Master Trust, Series 2009-A, Class A | | | | |
| 4.600%, 09/15/2015 | | 1,264,000 | | 1,293,654 |
|
| TOTAL ASSET BACKED SECURITIES (Cost $41,158,082) | $ | 41,200,303 |
|
| |
| SHORT-TERM INVESTMENTS - 2.04% | | | | |
| Short-Term Securities* - 2.04% | | | | |
| State Street Institutional Liquid Reserves | | | | |
| Fund, 0.2053% | | 12,088,615 | | 12,088,615 |
|
| TOTAL SHORT-TERM INVESTMENTS (Cost $12,088,615) | $ | 12,088,615 |
|
| Total Investments (Core Bond Fund) | | | | |
| (Cost $656,310,159) - 111.35% | | | $ | 660,314,567 |
| Other assets and liabilities, net - (11.35%) | | | | (67,302,765) |
| | | |
|
| TOTAL NET ASSETS - 100.00% | | | $ | 593,011,802 |
| | | |
|
| |
| TBA SALE COMMITMENTS OUTSTANDING | | | |
| |
| |
| | | Principal | | |
| | | Amount | | Value |
| |
|
| |
| Federal National Mortgage Association - (4.13)% | | | |
| 4.500%, TBA | $ | (18,300,000) | $ | (19,166,284) |
| 6.000%, TBA | $ | (4,900,000) | | (5,297,882) |
| | | |
|
| | | | | (24,464,166) |
|
| TOTAL TBA SALE COMMITMENTS | | | | |
| OUTSTANDING (Cost $(24,185,672)) | | | $ | (24,464,166) |
|
| |
| |
| |
| Core Diversified Growth & Income Portfolio |
| | | Shares or | | |
| | | Principal | | |
| | | Amount | | Value |
| |
|
| |
| INVESTMENT COMPANIES - 100.07% | | | | |
| Affiliated Investment Companies - 40.02% | | | | |
| Equity - 27.97% | | | | |
| John Hancock Funds II (G) - 27.97% | | | | |
| Index 500, Class NAV (John Hancock) (2)(A) | | 678,186 | $ | 6,659,798 |
| International Equity Index, Class NAV (SSgA) | | 68,005 | | 1,250,617 |
| Fixed Income - 12.05% | | | | |
| John Hancock Funds II (G) - 12.05% | | | | |
| Total Bond Market, | | | | |
| Class NAV (Declaration) (A) | | 331,668 | | 3,409,544 |
| | | | |
| Core Diversified Growth & Income | | |
| Portfolio (continued) | | | | |
| | Shares or | | |
| Principal | | |
| Amount | | Value |
|
| |
| INVESTMENT COMPANIES (continued) | | | | |
| Unaffiliated Investment Companies - 60.05% | | | | |
| Equity - 41.94% | | | | |
| American Funds Capital World Growth and | | | | |
| Income Fund, Class R5 | | 28,759 | $ | 1,062,658 |
| American Funds EuroPacific Growth | | | | |
| Fund, Class R5 | | 19,028 | | 810,224 |
| American Funds New Perspective | | | | |
| Fund, Class R5 | | 35,583 | | 1,058,231 |
| American Funds The Growth Fund of | | | | |
| America, Class R5 | | 71,498 | | 2,285,778 |
| American Funds The Investment Company of | | | | |
| America, Class R5 | | 147,944 | | 4,359,910 |
| American Funds Washington Mutual Investors | | | | |
| Fund, Class R5 | | 79,970 | | 2,287,937 |
| Fixed Income - 18.11% | | | | |
| American Funds U.S. Government Securities | | | | |
| Fund, Class R5 | | 369,630 | | 5,123,065 |
|
| TOTAL INVESTMENT COMPANIES (Cost $24,446,114) | | | $ | 28,307,762 |
|
| Total Investments (Core Diversified Growth & Income | | | | |
| Portfolio) (Cost $24,446,114) - 100.07% | | | $ | 28,307,762 |
| Other assets and liabilities, net - (0.07%) | | | | (19,394) |
| | |
|
| TOTAL NET ASSETS - 100.00% | | | $ | 28,288,368 |
| | | |
|
| |
| |
| |
| Core Fundamental Holdings Portfolio | | |
| Shares or | | |
| Principal | | |
| Amount | | Value |
|
| |
| INVESTMENT COMPANIES - 100.16% | | | | |
| Affiliated Investment Companies - 40.06% | | | | |
| Equity - 24.09% | | | | |
| John Hancock Funds II (G) - 24.09% | | | | |
| Index 500, Class NAV (John Hancock) (2)(A) | | 251,057 | $ | 2,465,379 |
| International Equity Index, Class NAV (SSgA) | | 37,155 | | 683,283 |
| Fixed Income - 15.97% | | | | |
| John Hancock Funds II (G) - 15.97% | | | | |
| Total Bond Market, | | | | |
| Class NAV (Declaration) (A) | | 203,055 | | 2,087,405 |
| Unaffiliated Investment Companies - 60.10% | | | | |
| Equity - 36.14% | | | | |
| American Funds EuroPacific Growth | | | | |
| Fund, Class R5 | | 24,071 | | 1,024,926 |
| American Funds The Growth Fund of | | | | |
| America, Class R5 | | 28,886 | | 923,490 |
| American Funds The Investment Company of | | | | |
| America, Class R5 | | 62,725 | | 1,848,509 |
| American Funds Washington Mutual Investors | | | | |
| Fund, Class R5 | | 32,356 | | 925,714 |
| Fixed Income - 23.96% | | | | |
| American Funds U.S. Government Securities | | | | |
| Fund, Class R5 | | 225,926 | | 3,131,330 |
|
| TOTAL INVESTMENT COMPANIES (Cost $11,302,168) | | | $ | 13,090,036 |
|
| Total Investments (Core Fundamental Holdings Portfolio) | | |
| (Cost $11,302,168) - 100.16% | | | $ | 13,090,036 |
| Other assets and liabilities, net - (0.16%) | | | | (21,081) |
| | |
|
| TOTAL NET ASSETS - 100.00% | | | $ | 13,068,955 |
| | | |
|
| |
| The accompanying notes are an integral part of the financial statements. | 55 |
John Hancock Funds II
Portfolio of Investments — February 28, 2011 (Unaudited) (showing percentage of total net assets)
| | | | |
| Core Global Diversification Portfolio | | |
| | | Shares or | | |
| | | Principal | | |
| | | Amount | | Value |
| | |
|
| |
| INVESTMENT COMPANIES - 100.07% | | | | |
| Affiliated Investment Companies - 40.04% | | | | |
| Equity - 26.05% | | | | |
| John Hancock Funds II (G) - 26.05% | | | | |
| Index 500, Class NAV (John Hancock) (2)(A) | | 276,853 | $ | 2,718,699 |
| International Equity Index, Class NAV (SSgA) | | 280,144 | | 5,151,855 |
| Fixed Income - 13.99% | | | | |
| John Hancock Funds II (G) - 13.99% | | | | |
| Total Bond Market, | | | | |
| Class NAV (Declaration) (A) | | 411,162 | | 4,226,743 |
| Unaffiliated Investment Companies - 60.03% | | | | |
| Equity - 39.05% | | | | |
| American Funds Capital World Growth and | | | | |
| Income Fund, Class R5 | | 70,655 | | 2,610,698 |
| American Funds EuroPacific Growth | | | | |
| Fund, Class R5 | | 120,057 | | 5,112,038 |
| American Funds New Perspective | | | | |
| Fund, Class R5 | | 87,602 | | 2,605,269 |
| American Funds The Investment Company of | | | | |
| America, Class R5 | | 49,970 | | 1,472,626 |
| Fixed Income - 20.98% | | | | |
| American Funds U.S. Government Securities | | | | |
| Fund, Class R5 | | 457,440 | | 6,340,115 |
|
| TOTAL INVESTMENT COMPANIES (Cost $27,460,249) | | | $ | 30,238,043 |
|
| Total Investments (Core Global Diversification Portfolio) | | |
| (Cost $27,460,249) - 100.07% | | | $ | 30,238,043 |
| Other assets and liabilities, net - (0.07%) | | | | (20,544) |
| | | |
|
| TOTAL NET ASSETS - 100.00% | | | $ | 30,217,499 |
| | | |
|
| |
| |
| |
| Emerging Markets Fund (formerly Emerging |
| Markets Value Fund) | | | | |
| | | Shares or | | |
| | | Principal | | |
| | | Amount | | Value |
| | |
|
| |
| COMMON STOCKS - 95.82% | | | | |
| Bermuda - 0.07% | | | | |
| Central European Media Enterprises, Ltd. (I) | | 76,522 | $ | 1,497,902 |
| Brazil - 12.11% | | | | |
| Banco ABC Brasil SA | | 101,700 | | 784,847 |
| Banco Alfa de Investimento SA | | 10,300 | | 45,749 |
| Banco do Brasil SA | | 126,094 | | 2,254,656 |
| Banco Santander Brasil SA, ADR | | 2,491,873 | | 30,351,013 |
| Bematech SA | | 120,875 | | 565,943 |
| BHG SA - Brazil Hospitality Group (I) | | 1,400 | | 16,534 |
| BM&F Bovespa SA | | 5,349,700 | | 36,365,613 |
| BR Malls Participacoes SA | | 1,088,919 | | 10,373,462 |
| Brasil Ecodiesel Industria e Comercio de | | | | |
| Biocombustiveis e Oleos Vegetais SA (I) | | 1,152,700 | | 575,034 |
| Braskem SA (L) | | 50,629 | | 1,234,335 |
| BRF - Brasil Foods SA (L) | | 923,550 | | 16,448,426 |
| Brookfield Incorporacoes SA | | 537,100 | | 2,498,590 |
| Camargo Correa | | | | |
| Desenvolvimento Imobiliario SA (I) | | 184,200 | | 791,580 |
| Cia Brasileira de Distribuicao Grupo Pao de | | | | |
| Acucar, ADR (L) | | 66,560 | | 2,509,978 |
| Cia Providencia Industria e Comercio SA | | 47,500 | | 199,844 |
| Cosan SA Industria e Comercio | | 312,500 | | 4,881,521 |
| CR2 Empreendimentos Imobiliarios SA | | 28,000 | | 102,657 |
| Embraer SA, ADR | | 175,929 | | 5,992,142 |
| | | | |
| Emerging Markets Fund (formerly Emerging |
| Markets Value Fund) (continued) | | |
| | | Shares or | | |
| | | Principal | | |
| | | Amount | | Value |
| | |
|
| |
| COMMON STOCKS (continued) | | | | |
| Brazil (continued) | | | | |
| Empresa Brasileira de Aeronautica SA | | 32,692 | $ | 275,282 |
| Even Construtora e Incorporadora SA | | 245,300 | | 1,105,752 |
| EZ Tec Empreendimentos e Participacoes SA | | 107,600 | | 878,235 |
| Fertilizantes Heringer SA (I) | | 61,700 | | 381,963 |
| Fibria Celulose SA, SADR (I)(L) | | 437,951 | | 6,310,874 |
| Gafisa SA | | 521,522 | | 3,209,752 |
| Gafisa SA, ADR (L) | | 393,000 | | 4,963,590 |
| General Shopping Brasil SA (I) | | 61,820 | | 401,284 |
| Gerdau SA | | 234,900 | | 2,407,167 |
| Gerdau SA, SADR | | 1,192,088 | | 16,093,188 |
| Grendene SA | | 240,600 | | 1,359,322 |
| Helbor Empreendimentos SA | | 40,000 | | 456,786 |
| Iguatemi Empresa de Shopping Centers SA | | 73,200 | | 1,585,164 |
| Industrias Romi SA | | 138,700 | | 916,164 |
| Inepar SA Industria E Construcoes (I) | | 12,100 | | 39,053 |
| Inpar SA (I) | | 751,517 | | 1,382,163 |
| JBS SA | | 2,389,479 | | 8,961,623 |
| JHSF Participacoes SA | | 335,500 | | 647,286 |
| Kroton Educacional SA (I) | | 81,713 | | 982,245 |
| Log-in Logistica Intermodal SA (I) | | 90,600 | | 493,895 |
| Magnesita Refratarios SA (I) | | 540,565 | | 2,693,403 |
| Marfrig Frigorificos e Comercio | | | | |
| de Alimentos SA | | 478,865 | | 4,176,182 |
| Metalfrio Solutions SA | | 16,800 | | 108,042 |
| Minerva SA | | 94,800 | | 366,938 |
| MPX Energia SA (I) | | 68,000 | | 1,463,157 |
| Paranapanema SA (I) | | 668,200 | | 2,088,376 |
| Perdigao SA | | 18,975 | | 329,593 |
| Petroleo Brasileiro SA | | 97,783 | | 1,915,931 |
| Petroleo Brasileiro SA, ADR | | 671,572 | | 26,748,713 |
| Petroleo Brasileiro SA, SADR (L) | | 837,292 | | 29,447,560 |
| Porto Seguro SA | | 186,076 | | 2,963,706 |
| Positivo Informatica SA | | 97,500 | | 582,492 |
| Profarma Distribuidora de | | | | |
| Produtos Farmaceuticos SA | | 48,000 | | 437,072 |
| Rodobens Negocios Imobiliarios SA | | 67,800 | | 588,431 |
| Rossi Residencial SA | | 121,400 | | 941,255 |
| Santos Brasil Participacoes SA | | 16,157 | | 236,946 |
| Sao Carlos Empreendimentos | | | | |
| e Participacoes SA | | 79,700 | | 1,015,052 |
| Sao Martinho SA | | 113,000 | | 1,560,049 |
| SLC Agricola SA | | 49,500 | | 643,815 |
| Springs Global Participacoes SA | | 135,767 | | 408,003 |
| Sul America SA | | 269,700 | | 3,087,982 |
| Tecnisa SA | | 41,600 | | 241,029 |
| TPI - Triunfo Participacoes e Investimentos SA | | 75,690 | | 389,414 |
| TRISUL SA | | 30,607 | | 109,087 |
| Ultrapar Participacoes SA, ADR (L) | | 190,080 | | 3,039,379 |
| Usinas Siderurgicas de Minas Gerais SA | | 418,144 | | 6,740,367 |
| | |
|
| | | | | 261,164,686 |
| Chile - 1.89% | | | | |
| Almendral SA | | 744,630 | | 90,761 |
| Cementos Bio-Bio SA | | 2,795 | | 6,843 |
| Cia General de Electricidad | | 330,742 | | 1,876,649 |
| Cintac SA | | 78,352 | | 55,983 |
| Companhia Sudamericana de Vapores SA (I) | | 1,952,202 | | 1,538,459 |
| CorpBanca SA, SADR (L) | | 11,487 | | 256,612 |
| Cristalerias de Chile SA | | 62,943 | | 796,427 |
| Empresas CMPC SA | | 228,825 | | 10,218,141 |
| Empresas Copec SA | | 371,453 | | 6,229,263 |
| Empresas Iansa SA (I) | | 6,866,987 | | 891,835 |
| Empresas La Polar SA | | 478,900 | | 2,782,723 |
| Enersis SA, SADR | | 459,633 | | 9,335,146 |
| |
| The accompanying notes are an integral part of the financial statements. | 56 |
John Hancock Funds II
Portfolio of Investments — February 28, 2011 (Unaudited) (showing percentage of total net assets)
| | | | |
| Emerging Markets Fund (formerly Emerging |
| Markets Value Fund) (continued) | | |
| | | Shares or | | |
| | | Principal | | |
| | | Amount | | Value |
| | |
|
| |
| COMMON STOCKS (continued) | | | | |
| Chile (continued) | | | | |
| GASCO SA | | 227,676 | $ | 1,363,616 |
| Grupo Security SA | | 593,749 | | 251,437 |
| Industrias Forestales SA | | 150,246 | | 36,310 |
| Inversiones Aguas Metropolitanas SA | | 1,022,683 | | 1,558,149 |
| Madeco SA | | 7,062,002 | | 415,543 |
| Masisa SA (I) | | 5,033,332 | | 766,873 |
| Paz Corp., SA (I) | | 424,627 | | 439,931 |
| Ripley Corp SA | | 887,837 | | 1,072,830 |
| Socovesa SA | | 954,921 | | 672,268 |
| Vina San Pedro Tarapaca SA | | 16,425,632 | | 138,764 |
| | |
|
| | | | | 40,794,563 |
| China - 8.99% | | | | |
| Agile Property Holdings, Ltd. | | 844,000 | | 1,067,847 |
| Angang Steel Company, Ltd., Class H (L) | | 1,894,000 | | 2,622,024 |
| Anhui Tianda Oil Pipe Company, Ltd. | | 523,000 | | 212,174 |
| Anton Oilfield Services Group | | 1,466,000 | | 215,221 |
| Asia Cement China Holdings Corp. | | 780,500 | | 409,987 |
| Bank of China, Ltd., Class H | | 113,232,075 | | 59,649,895 |
| Bank of Communications | | | | |
| Company, Ltd., Class H | | 9,720,871 | | 9,422,533 |
| Baoye Group Company, Ltd. | | 538,000 | | 379,804 |
| Beijing Capital International Airport | | | | |
| Company, Ltd., Class H | | 3,480,415 | | 1,745,888 |
| Beijing Capital Land, Ltd. | | 1,718,000 | | 539,971 |
| Beijing Jingkelong Company, Ltd. | | 10,000 | | 12,567 |
| Beijing North Star Company (L) | | 1,284,000 | | 313,973 |
| BYD Electronic International Company, Ltd. | | 1,475,483 | | 944,328 |
| Catic Shenzhen Holdings, Ltd. (I) | | 140,000 | | 54,597 |
| China Aoyuan Property Group, Ltd. | | 1,834,000 | | 307,280 |
| China BlueChemical, Ltd. | | 1,596,000 | | 1,240,305 |
| China Citic Bank Corp, Ltd. | | 10,083,962 | | 6,649,675 |
| China Coal Energy Company, Series H | | 4,250,000 | | 6,077,023 |
| China Communications | | | | |
| Construction Company, Ltd. | | 7,434,202 | | 5,560,934 |
| China Communications | | | | |
| Services Corp., Ltd., Class H | | 3,168,000 | | 2,030,432 |
| China Construction Bank Corp. | | 282,000 | | 247,013 |
| China Huiyuan Juice Group, Ltd. (L) | | 768,000 | | 470,753 |
| China Minsheng Banking Corp. Ltd. | | 5,384,000 | | 4,709,412 |
| China Molybdenum Company, Ltd. | | 1,743,000 | | 1,579,794 |
| China Nickel Resources | | | | |
| Holding Company, Ltd. | | 886,000 | | 142,127 |
| China Petroleum & Chemical Corp. | | 1,200,000 | | 1,225,866 |
| China Petroleum & Chemical Corp., ADR (L) | | 275,976 | | 28,315,138 |
| China Qinfa Group, Ltd. (I) | | 472,000 | | 313,101 |
| China Railway Construction Corp. | | 3,303,335 | | 3,696,991 |
| China Rare Earth Holdings, Ltd. (I)(L) | | 1,272,000 | | 570,837 |
| China Resources Microelectronics Ltd (I) | | 5,453,668 | | 285,026 |
| China Shanshui Cement Group, Ltd. | | 378,000 | | 285,427 |
| China Shipping Container | | | | |
| Lines Company, Ltd. (I) | | 5,404,850 | | 2,356,913 |
| China Shipping Development Company, Ltd. | | 2,260,000 | | 2,481,563 |
| China Singyes Solar | | | | |
| Technologies Holdings, Ltd. | | 10,000 | | 8,033 |
| China Sunshine Paper Holdings Company, Ltd. | | 41,500 | | 10,045 |
| China Unicom, Ltd. (L) | | 3,078,000 | | 5,137,463 |
| China Zhongwang Holdings, Ltd. (L) | | 3,017,400 | | 1,234,239 |
| Chongqing Iron & Steel Company, Ltd. (I) | | 1,034,000 | | 267,913 |
| Chongqing Machinery & | | | | |
| Electric Company, Ltd. | | 1,016,000 | | 326,829 |
| Country Garden Holdings Company | | 7,198,933 | | 2,876,144 |
| DaChan Food Asia, Ltd. | | 655,000 | | 124,515 |
| Dalian Port PDA Company, Ltd. | | 1,572,621 | | 608,712 |
| | | | |
| Emerging Markets Fund (formerly Emerging |
| Markets Value Fund) (continued) | | |
| | | Shares or | | |
| | | Principal | | |
| | | Amount | | Value |
| | |
|
| |
| COMMON STOCKS (continued) | | | | |
| China (continued) | | | | |
| Dongyue Group | | 822,000 | $ | 537,818 |
| First Tractor Company | | 712,750 | | 741,403 |
| Golden Meditech Holdings, Ltd. (I) | | 2,376,000 | | 428,142 |
| Great Wall Motor Company, Ltd. (L) | | 1,580,000 | | 2,476,792 |
| Great Wall Technology Company, Ltd. | | 826,000 | | 386,380 |
| Greentown China Holdings, Ltd. | | 1,123,500 | | 1,127,996 |
| Guangshen Railway Company, Ltd. | | 398,000 | | 150,558 |
| Guangshen Railway Company, Ltd., ADR (L) | | 44,505 | | 842,035 |
| Guangzhou Automobile Group Company, Ltd. | | 1,412,857 | | 1,830,915 |
| Guangzhou Pharmaceutical Company, Ltd. | | 276,000 | | 393,681 |
| Guangzhou R&F Properties | | | | |
| Company, Ltd., Class H | | 1,715,399 | | 2,297,072 |
| Hainan Meilan International | | | | |
| Airport Company, Ltd. | | 235,000 | | 239,255 |
| Hidili Industry International Development, Ltd. | | 1,922,000 | | 1,595,223 |
| Honghua Group, Ltd. (I) | | 1,762,000 | | 234,629 |
| Hunan Non Ferrous Metal Corp., Ltd. (I) | | 2,694,000 | | 962,268 |
| Jingwei Textile Machinery Company, Ltd. (I) | | 168,000 | | 155,786 |
| Kasen International Holdings, Ltd. (I) | | 240,000 | | 44,249 |
| KWG Property Holding, Ltd. | | 2,257,012 | | 1,464,879 |
| Lingbao Gold Company, Ltd. | | 446,000 | | 347,345 |
| Maanshan Iron & Steel Company, Ltd. (L) | | 2,990,000 | | 1,537,043 |
| NetDragon Websoft, Inc. | | 282,000 | | 149,792 |
| Powerlong Real Estate Holdings, Ltd. | | 248,000 | | 77,491 |
| Qingling Motors Company, Ltd. | | 1,294,000 | | 372,561 |
| Qunxing Paper Holdings Company, Ltd. (I) | | 969,268 | | 280,485 |
| Regent Manner International, Ltd. (I) | | 484,000 | | 190,791 |
| Scud Group, Ltd. | | 306,000 | | 31,123 |
| Semiconductor Manufacturing | | | | |
| International Corp., SADR (I)(L) | | 366,793 | | 1,470,840 |
| Semiconductor | | | | |
| Manufacturing International Corp. (I) | | 15,600,000 | | 1,261,302 |
| Shandong Chenming Paper Holdings, Ltd. | | 614,084 | | 504,974 |
| Shandong Molong Petroleum | | | | |
| Machinery Company, Ltd. (I) | | 100,400 | | 143,283 |
| Shandong Xinhua | | | | |
| Pharmaceutical Company, Ltd. | | 238,000 | | 96,892 |
| Shanghai Forte Land Company (L) | | 1,321,405 | | 584,451 |
| Shanghai Jin Jiang International Hotels | | | | |
| Group Company, Ltd. | | 2,296,000 | | 484,374 |
| Shanghai Prime Machinery Company, Ltd. | | 1,294,000 | | 311,881 |
| Shimao Property Holdings, Ltd., GDR | | 2,839,000 | | 3,883,674 |
| Shui On Land, Ltd. (L) | | 4,939,003 | | 2,337,140 |
| Sichuan Xinhua Winshare | | | | |
| Chainstore Company, Ltd. | | 755,650 | | 417,968 |
| SinoCom Software Group, Ltd. | | 157,000 | | 16,184 |
| Sinotrans Shipping, Ltd. | | 2,579,000 | | 884,325 |
| Sinotrans, Ltd., Class H | | 2,802,574 | | 764,936 |
| SPG Land Holdings, Ltd. | | 544,925 | | 273,612 |
| Sunny Optical Technology | | | | |
| Group Company, Ltd. | | 446,000 | | 149,386 |
| Tiangong International Company, Ltd. | | 388,891 | | 330,375 |
| Tianneng Power International, Ltd. | | 948,700 | | 401,612 |
| Travelsky Technology, Ltd. | | 994,000 | | 905,838 |
| Weiqiao Textile Company | | 768,000 | | 705,110 |
| Wuyi International | | | | |
| Pharmaceutical Company, Ltd. | | 525,000 | | 43,188 |
| Xiamen International Port Company, Ltd. | | 1,658,662 | | 329,260 |
| Xingda International Holdings, Ltd. | | 1,029,000 | | 929,136 |
| Xinjiang Xinxin Mining | | | | |
| Industry Company, Ltd. | | 1,262,000 | | 746,746 |
| Zhejiang Glass Company, Ltd. (I) | | 172,000 | | 54,771 |
| |
| The accompanying notes are an integral part of the financial statements. | 57 |
John Hancock Funds II
Portfolio of Investments — February 28, 2011 (Unaudited) (showing percentage of total net assets)
| | | | |
| Emerging Markets Fund (formerly Emerging |
| Markets Value Fund) (continued) | | |
| | | Shares or | | |
| | | Principal | | |
| | | Amount | | Value |
| | |
|
| |
| COMMON STOCKS (continued) | | | | |
| China (continued) | | | | |
| Zhong An Real Estate, Ltd. (I) | | 793,200 | $ | 161,131 |
| | |
|
| | | | | 193,818,413 |
| Czech Republic - 0.26% | | | | |
| Pegas Nonwovens SA (L) | | 36,290 | | 901,871 |
| Telefonica O2 Czech Republic AS | | 85,666 | | 1,942,555 |
| Unipetrol AS (I) | | 280,226 | | 2,779,196 |
| | |
|
| | | | | 5,623,622 |
| Hong Kong - 5.30% | | | | |
| AMVIG Holdings, Ltd. | | 755,333 | | 596,068 |
| Asian Union New Media Group, Ltd. (I) | | 19,881,250 | | 86,829 |
| Avic International Holding HK, Ltd. (I) | | 4,740,000 | | 223,219 |
| Beijing Development Hong Kong, Ltd. (I) | | 482,000 | | 84,303 |
| Beijing Enterprises Holdings, Ltd. | | 915,430 | | 5,085,389 |
| Bosideng International Holdings, Ltd. | | 1,282,000 | | 341,956 |
| Brilliance China Automotive Holdings, Ltd. (I) | | 2,906,000 | | 2,389,378 |
| C C Land Holdings, Ltd. | | 379,039 | | 126,713 |
| Central China Real Estate, Ltd. | | 839,000 | | 232,909 |
| Centron Telecom International Holdings, Ltd. | | 544,400 | | 125,303 |
| Chaoda Modern Agriculture Holdings, Ltd. | | 5,027,312 | | 3,252,519 |
| China Aerospace | | | | |
| International Holdings, Ltd. (L) | | 3,580,755 | | 451,370 |
| China Agri-Industries Holdings, Ltd. | | 2,101,000 | | 2,137,257 |
| China Chengtong Development Group, Ltd. (I) | | 1,905,216 | | 101,657 |
| China Energine International Holdings, Ltd. (I) | | 2,025,589 | | 140,976 |
| China Everbright, Ltd. | | 1,527,000 | | 3,205,948 |
| China Grand Forestry | | | | |
| Resources Group, Ltd. (I) | | 15,261,800 | | 486,598 |
| China Green Holdings, Ltd. (L) | | 852,000 | | 670,831 |
| China Haidian Holdings, Ltd. | | 2,821,800 | | 358,724 |
| China Merchants Holdings | | | | |
| International Company, Ltd. | | 1,724,294 | | 7,345,707 |
| China Mining Resources Group, Ltd. (I) | | 8,324,000 | | 160,923 |
| China Oil and Gas Group, Ltd. (I) | | 2,768,219 | | 292,976 |
| China Pharmaceutical Group, Ltd. | | 1,376,000 | | 867,473 |
| China Properties Group, Ltd. (I) | | 1,107,000 | | 359,715 |
| China Resources Enterprises, Ltd. | | 780,000 | | 2,874,025 |
| China Resources Land, Ltd. | | 384,000 | | 626,480 |
| China South City Holdings Ltd. | | 944,000 | | 150,774 |
| China Starch Holdings, Ltd. | | 2,495,000 | | 141,227 |
| China State Construction | | | | |
| International Holdings, Ltd. | | 356,000 | | 327,467 |
| China Travel International Investment | | | | |
| Hong Kong, Ltd. (I) | | 5,090,000 | | 1,042,299 |
| China Unicom Hong Kong, Ltd. (L) | | 726,010 | | 12,117,107 |
| China Zenith Chemical Group, Ltd. (I) | | 2,710,000 | | 63,221 |
| Cimc Enric Holdings, Ltd. (I) | | 96,000 | | 40,221 |
| Citic Pacific, Ltd. | | 1,934,923 | | 5,080,965 |
| CITIC Resources Holdings, Ltd. (I) | | 4,270,000 | | 827,129 |
| Clear Media, Ltd. (I) | | 57,000 | | 35,160 |
| Coastal Greenland, Ltd. (I) | | 2,228,000 | | 160,879 |
| Cosco International Holdings, Ltd. | | 1,195,040 | | 709,755 |
| COSCO Pacific, Ltd. | | 2,836,000 | | 5,487,584 |
| Coslight Technology | | | | |
| International Group, Ltd. (L) | | 190,000 | | 109,587 |
| Dynasty Fine Wines Group, Ltd. | | 242,000 | | 101,541 |
| Embry Holdings, Ltd. | | 80,000 | | 61,461 |
| Fosun International | | 2,863,059 | | 2,075,110 |
| Franshion Properties China, Ltd. | | 6,326,000 | | 1,774,135 |
| FU JI Food & Catering | | | | |
| Services Holdings, Ltd. (I) | | 410,000 | | 0 |
| Fushan International Energy Group, Ltd. | | 5,138,000 | | 3,809,075 |
| GCL Poly Energy Holdings, Ltd. (I) | | 1,276,000 | | 649,853 |
| | | | |
| Emerging Markets Fund (formerly Emerging |
| Markets Value Fund) (continued) | | |
| | | Shares or | | |
| | | Principal | | |
| | | Amount | | Value |
| | |
|
| |
| COMMON STOCKS (continued) | | | | |
| Hong Kong (continued) | | | | |
| Global Bio-Chem Technology | | | | |
| Group Company, Ltd. (I) | | 3,077,200 | $ | 435,718 |
| Global Sweeteners Holdings, Ltd. | | 318,000 | | 60,710 |
| Goldbond Group Holdings, Ltd. | | 100,000 | | 5,142 |
| Goldlion Holdings, Ltd. | | 345,000 | | 141,150 |
| Harbin Power Equipment Company, Ltd. | | 1,260,000 | | 1,501,416 |
| Heng Tai Consumables Group, Ltd. | | 5,107,000 | | 598,625 |
| HKC Holdings, Ltd. (I) | | 4,638,423 | | 241,497 |
| Hong Kong Energy Holdings, Ltd. (I) | | 54,637 | | 3,409 |
| Hopson Development Holdings, Ltd. (I) | | 1,210,000 | | 1,343,636 |
| Hua Han Bio-Pharmaceutical Holdings Ltd | | 1,387,200 | | 441,468 |
| Huscoke Resources Holdings, Ltd. (I) | | 1,612,200 | | 76,758 |
| Inspur International, Ltd. | | 4,175,000 | | 274,507 |
| Ju Teng International Holdings, Ltd. | | 1,525,722 | | 580,540 |
| Kai Yuan Holdings, Ltd. (I) | | 9,820,000 | | 334,014 |
| Kingboard Chemical Holdings, Ltd. | | 1,053,290 | | 5,609,529 |
| Kingway Brewery Holdings, Ltd. (I) | | 988,000 | | 252,287 |
| Lai Fung Holdings, Ltd. | | 5,139,000 | | 218,428 |
| Loudong General Nice Resources | | | | |
| China Holdings, Ltd. | | 2,544,000 | | 287,594 |
| MIN XIN Holdings, Ltd. | | 188,000 | | 93,571 |
| Minmetals Land, Ltd. (I) | | 2,582,000 | | 465,381 |
| Minmetals Resources, Ltd. (I)(L) | | 1,240,000 | | 820,251 |
| Nan Hai Corp., Ltd. (I) | | 28,150,000 | | 202,447 |
| Neo-China Land Group Holdings, Ltd. (I) | | 917,500 | | 305,412 |
| New World China Land, Ltd. | | 2,995,487 | | 1,140,872 |
| Petroasian Energy Holdings, Ltd. (I) | | 6,588,000 | | 351,625 |
| Poly Hong Kong Investment, Ltd. (L) | | 3,425,944 | | 2,743,077 |
| Pou Sheng International Holdings, Ltd. (I) | | 2,508,000 | | 399,470 |
| Prosperity International Holdings HK, Ltd. | | 2,520,000 | | 147,699 |
| Qin Jia Yuan Media Services Company, Ltd. | | 849,176 | | 158,525 |
| REXLot Holdings, Ltd. | | 8,975,000 | | 1,019,236 |
| Samson Holding, Ltd. | | 1,383,915 | | 304,585 |
| Shanghai Industrial Holdings, Ltd. | | 995,041 | | 3,560,016 |
| Shanghai Zendai Property, Ltd. | | 4,790,000 | | 181,532 |
| Shenzhen International Holdings, Ltd. | | 15,907,500 | | 1,393,314 |
| Shenzhen Investment, Ltd. | | 3,978,000 | | 1,241,535 |
| Shougang Concord Century Holdings, Ltd. | | 1,282,000 | | 128,683 |
| Shougang Concord International | | | | |
| Enterprises Company, Ltd. (I) | | 6,444,000 | | 973,522 |
| Silver Grant International | | 2,494,334 | | 902,955 |
| Sim Technology Group, Ltd. | | 1,114,000 | | 204,675 |
| Sino Prosper State Gold | | | | |
| Resources Holdings Ltd. (I) | | 3,490,000 | | 189,082 |
| Sino Union Petroleum & | | | | |
| Chemical International, Ltd. (I) | | 5,462,273 | | 463,356 |
| Sino-Ocean Land Holdings, Ltd. | | 5,514,639 | | 3,313,387 |
| Sinofert Holdings, Ltd. (I) | | 2,892,000 | | 1,555,028 |
| Sinolink Worldwide Holdings, Ltd. | | 3,422,000 | | 418,307 |
| Sinomedia Holding, Ltd. | | 391,000 | | 130,958 |
| Sinopec Kantons Holdings, Ltd. | | 620,000 | | 359,177 |
| Sinotruk Hong Kong, Ltd. | | 1,286,555 | | 1,235,021 |
| Skyworth Digital Holdings, Ltd. (L) | | 1,304,000 | | 831,538 |
| Soho China, Ltd. | | 3,636,500 | | 2,629,413 |
| Solargiga Energy Holdings, Ltd. (I) | | 997,000 | | 218,303 |
| SRE Group, Ltd. | | 4,512,000 | | 405,665 |
| TAK Sing Alliance Holdings, Ltd. | | 734,000 | | 94,568 |
| TCC International Holdings, Ltd. | | 1,753,417 | | 640,025 |
| TCL Multimedia Technology Holdings, Ltd. | | 971,200 | | 331,873 |
| Tian An China Investment, Ltd. | | 1,004,000 | | 685,749 |
| Tomson Group, Ltd. | | 881,443 | | 339,668 |
| TPV Technology, Ltd. | | 1,208,588 | | 711,528 |
| Truly International Holdings, Ltd. | | 2,463,000 | | 666,157 |
| |
| The accompanying notes are an integral part of the financial statements. | 58 |
John Hancock Funds II
Portfolio of Investments — February 28, 2011 (Unaudited) (showing percentage of total net assets)
| | | | |
| Emerging Markets Fund (formerly Emerging |
| Markets Value Fund) (continued) | | |
| | | Shares or | | |
| | | Principal | | |
| | | Amount | | Value |
| | |
|
| |
| COMMON STOCKS (continued) | | | | |
| Hong Kong (continued) | | | | |
| United Energy Group, Ltd. (I) | | 2,000 | $ | 295 |
| Wasion Group Holdings, Ltd. | | 620,000 | | 337,946 |
| Xiwang Sugar Holdings Company, Ltd. | | 951,020 | | 247,019 |
| Yip’s Chemical Holdings, Ltd. | | 210,000 | | 228,319 |
| Yorkey Optical International Cayman, Ltd. | | 44,000 | | 7,685 |
| Yuexiu Property Company, Ltd. (I) | | 8,013,200 | | 1,683,543 |
| | |
|
| | | | | 114,258,217 |
| Hungary - 0.39% | | | | |
| Danubius Hotel and Spa PLC (I) | | 951 | | 19,115 |
| Egis Gyogyszergyar | | 12,949 | | 1,357,231 |
| Fotex Holding SE Company, Ltd. (I) | | 125,334 | | 239,171 |
| OTP Bank (I)(L) | | 229,203 | | 6,842,253 |
| Raba Jarmuipari Holding Nyilvanosan | | | | |
| Mukodo Reszvenytarsasag (I) | | 7,058 | | 29,033 |
| | |
|
| | | | | 8,486,803 |
| India - 8.58% | | | | |
| 3i Infotech, Ltd. | | 91,350 | | 81,937 |
| Aban Offshore, Ltd. | | 21,138 | | 257,827 |
| ABG Shipyard, Ltd. | | 16,236 | | 124,370 |
| Aditya Birla Nuvo, Ltd. | | 56,676 | | 969,650 |
| Ador Welding, Ltd. | | 5,167 | | 19,219 |
| Aftek, Ltd. (I) | | 28,741 | | 8,137 |
| Alembic, Ltd. | | 38,000 | | 55,282 |
| Allahabad Bank | | 213,488 | | 939,614 |
| Alok Industries, Ltd. | | 676,920 | | 308,165 |
| Ambuja Cements, Ltd. | | 172,046 | | 454,700 |
| Amtek Auto, Ltd. | | 149,007 | | 376,373 |
| Anant Raj Industries, Ltd. | | 151,998 | | 258,209 |
| Andhra Bank | | 215,172 | | 646,839 |
| Ansal Properties & Infrastructure, Ltd. | | 83,467 | | 69,675 |
| Apollo Hospitals Enterprise, Ltd. | | 44,250 | | 455,524 |
| Apollo Tyres, Ltd. | | 154,850 | | 179,311 |
| Aptech, Ltd. | | 18,472 | | 41,046 |
| Arvind, Ltd. (I) | | 213,458 | | 262,365 |
| Ashapura Minechem, Ltd. (I) | | 5,400 | | 3,631 |
| Ashok Leyland, Ltd. | | 1,067,780 | | 1,103,376 |
| Avaya Global Connect, Ltd. | | 148 | | 522 |
| Bajaj Auto Finance, Ltd. | | 15,115 | | 206,320 |
| Bajaj Finserv, Ltd. | | 24,676 | | 234,701 |
| Bajaj Hindusthan, Ltd. | | 135,981 | | 205,573 |
| Bajaj Holdings and Investment, Ltd. | | 56,364 | | 956,580 |
| Balaji Telefilms, Ltd. | | 11,528 | | 9,169 |
| Balkrishna Industries, Ltd. | | 16,580 | | 50,148 |
| Ballarpur Industries, Ltd. | | 487,134 | | 327,999 |
| Balmer Lawrie & Company, Ltd. | | 7,980 | | 94,677 |
| Balrampur Chini Mills, Ltd. (I) | | 348,925 | | 511,169 |
| Bank of Baroda | | 60,136 | | 1,230,641 |
| Bank of India | | 202,535 | | 1,979,534 |
| Bank of Maharashtra | | 218,538 | | 274,243 |
| BASF India, Ltd. | | 1,501 | | 15,813 |
| BEML, Ltd. | | 27,755 | | 380,943 |
| Bharati Shipyard, Ltd. | | 19,195 | | 61,968 |
| Birla Corp., Ltd. | | 41,760 | | 286,458 |
| Bl Kashyap & Sons, Ltd. | | 33,652 | | 15,859 |
| Bombay Rayon Fashions, Ltd. | | 91,929 | | 501,870 |
| Brigade Enterprises, Ltd. | | 22,407 | | 47,740 |
| Cairn India, Ltd. (I) | | 638,212 | | 4,819,544 |
| Canara Bank | | 150,054 | | 2,043,028 |
| Central Bank of India | | 196,267 | | 671,439 |
| Century Textile & Industries, Ltd. | | 32,699 | | 219,310 |
| Chambal Fertilizers & Chemicals, Ltd. | | 224,870 | | 334,780 |
| Cholamandalam DBS Finance, Ltd. | | 8,951 | | 30,522 |
| | | | |
| Emerging Markets Fund (formerly Emerging |
| Markets Value Fund) (continued) | | |
| | | Shares or | | |
| | | Principal | | |
| | | Amount | | Value |
| | |
|
| |
| COMMON STOCKS (continued) | | | | |
| India (continued) | | | | |
| City Union Bank, Ltd. | | 128,137 | $ | 125,556 |
| Corporation Bank | | 30,114 | | 365,219 |
| Cranes Software International, Ltd. (I) | | 3,000 | | 316 |
| Dalmia Bharat Enterprises, Ltd. (I) | | 18,693 | | 68,140 |
| Dalmia Bharat Sugar & Industries, Ltd. | | 18,693 | | 10,613 |
| DCM Shriram Consolidated, Ltd. | | 26,804 | | 25,495 |
| Deepak Fertilizers | | | | |
| & Petrochemicals Corp., Ltd. | | 55,776 | | 187,839 |
| Development Credit Bank, Ltd. (I) | | 184,559 | | 174,785 |
| Dhanlaxmi Bank, Ltd. | | 65,879 | | 150,143 |
| Dishman Pharmaceuticals & Chemicals, Ltd. | | 25,451 | | 50,775 |
| DLF, Ltd. | | 509,876 | | 2,399,216 |
| Dredging Corp. of India, Ltd. | | 15,333 | | 112,706 |
| Edelweiss Capital, Ltd. | | 221,050 | | 179,107 |
| Eicher Motors, Ltd. | | 8,358 | | 196,070 |
| EID Parry India, Ltd. | | 81,890 | | 353,868 |
| Elder Pharmaceuticals, Ltd. | | 8,295 | | 67,579 |
| Electrosteel Castings, Ltd. | | 166,782 | | 115,160 |
| Escorts, Ltd. | | 108,529 | | 274,112 |
| Essar Shipping Ports & Logistics, Ltd. (I) | | 178,409 | | 289,400 |
| Essel Propack, Ltd. | | 89,057 | | 90,484 |
| Eveready Industries India, Ltd. | | 21,000 | | 22,955 |
| Everest Kanto Cylinder, Ltd. | | 53,022 | | 79,430 |
| Federal Bank, Ltd. | | 229,410 | | 1,778,735 |
| Federal-Mogul Goetze India, Ltd. (I) | | 8,130 | | 25,599 |
| Finolex Cables, Ltd. | | 89,396 | | 87,970 |
| Finolex Industries, Ltd. | | 73,666 | | 136,353 |
| Firstsource Solutions, Ltd. (I) | | 198,131 | | 72,094 |
| Fortis Healthcare, Ltd. (I) | | 99,267 | | 320,638 |
| Future Capital Holdings, Ltd. | | 9,269 | | 29,252 |
| Future Mall Management, Ltd. (I) | | 40 | | 40 |
| Gammon India, Ltd. | | 77,691 | | 196,276 |
| Ganesh Housing Corp. Ltd. | | 241 | | 876 |
| Gateway Distriparks, Ltd. | | 70,842 | | 187,960 |
| Geodesic, Ltd. | | 109,287 | | 187,368 |
| Geojit BNP Paribas Financial Services, Ltd. | | 135,780 | | 72,035 |
| Gic Housing Finance, Ltd. | | 25,033 | | 55,200 |
| Gitanjali Gems, Ltd. | | 50,394 | | 242,236 |
| Graphite India, Ltd. | | 81,467 | | 154,703 |
| Grasim Industries, Ltd. | | 50,797 | | 2,642,954 |
| Great Eastern Shipping Company, Ltd. | | 124,722 | | 704,656 |
| Great Offshore, Ltd. | | 45,068 | | 228,240 |
| Gujarat Alkalies & Chemicals, Ltd. | | 54,680 | | 140,843 |
| Gujarat Ambuja Exports, Ltd. | | 15,000 | | 10,525 |
| Gujarat Flourochemicals, Ltd. | | 32,948 | | 195,259 |
| Gujarat Narmada Valley | | | | |
| Fertilizers Company, Ltd. | | 70,214 | | 154,414 |
| Gujarat State Fertilisers & Chemicals, Ltd. | | 41,832 | | 313,248 |
| Gulf Oil Corp, Ltd. | | 44,106 | | 71,320 |
| HBL Power Systems, Ltd. | | 104,569 | | 46,266 |
| HCL Infosystems, Ltd. | | 185,657 | | 422,322 |
| HCL Technologies, Ltd. | | 14,553 | | 142,305 |
| HEG, Ltd. | | 17,873 | | 80,255 |
| Heidelbergcement India, Ltd. (I) | | 87,352 | | 63,765 |
| Hexaware Technologies, Ltd. | | 327,232 | | 385,521 |
| Hikal, Ltd. | | 2,160 | | 13,489 |
| Himatsingka Seide, Ltd. | | 4,000 | | 3,226 |
| Hindalco Industries, Ltd. | | 1,895,804 | | 8,510,096 |
| Hinduja TMT, Ltd. | | 5,652 | | 32,398 |
| Hotel Leela Venture, Ltd. | | 161,732 | | 130,383 |
| Housing Development | | | | |
| & Infrastructure, Ltd. (I) | | 335,502 | | 1,180,822 |
| Hsil, Ltd. | | 27,538 | | 76,128 |
| |
| The accompanying notes are an integral part of the financial statements. | 59 |
John Hancock Funds II
Portfolio of Investments — February 28, 2011 (Unaudited) (showing percentage of total net assets)
| | | | |
| Emerging Markets Fund (formerly Emerging |
| Markets Value Fund) (continued) | | |
| | | Shares or | | |
| | | Principal | | |
| | | Amount | | Value |
| | |
|
| |
| COMMON STOCKS (continued) | | | | |
| India (continued) | | | | |
| ICICI Bank, Ltd. | | 10,162 | $ | 219,947 |
| ICICI Bank, Ltd., SADR (L) | | 656,721 | | 28,475,423 |
| ICSA India, Ltd. | | 42,707 | | 121,898 |
| Idea Cellular, Ltd. (I) | | 1,096,879 | | 1,395,929 |
| IFCI, Ltd. | | 799,536 | | 891,071 |
| India Cements, Ltd. | | 374,280 | | 716,404 |
| India Glycols, Ltd. | | 14,305 | | 33,310 |
| India Infoline, Ltd. | | 254,359 | | 424,376 |
| Indiabulls Financial Services, Ltd. | | 341,835 | | 1,119,695 |
| Indiabulls Real Estate, Ltd. (I) | | 474,148 | | 1,095,543 |
| Indian Bank | | 92,080 | | 415,913 |
| Indian Hotels Company, Ltd. | | 502,469 | | 874,955 |
| Indian Overseas Bank | | 261,467 | | 774,596 |
| Indo Rama Synthetics | | 20,354 | | 26,838 |
| Industrial Development Bank of India, Ltd. | | 320,037 | | 938,589 |
| Infomedia 18, Ltd. (I) | | 19,250 | | 8,642 |
| Infotech Enterprises, Ltd. | | 17,414 | | 60,861 |
| Infrastructure Development | | | | |
| Finance Company, Ltd. | | 249,633 | | 807,177 |
| ING Vysya Bank, Ltd. | | 77,939 | | 509,130 |
| Ingersoll-Rand India, Ltd. | | 9,856 | | 88,744 |
| ISMT, Ltd. | | 54,250 | | 58,035 |
| Ispat Industries, Ltd. (I) | | 585,760 | | 289,562 |
| IVRCL Assets & Holdings, Ltd. (I) | | 19,557 | | 22,686 |
| IVRCL Infrastructures & Projects, Ltd. | | 344,812 | | 531,737 |
| Jammu & Kashmir Bank, Ltd. | | 33,817 | | 565,935 |
| JB Chemicals & Pharmaceuticals, Ltd. | | 44,422 | | 111,313 |
| JBF Industries, Ltd. | | 49,341 | | 180,931 |
| Jindal Poly Films, Ltd. | | 15,538 | | 150,458 |
| Jindal Saw, Ltd. | | 213,210 | | 940,120 |
| Jindal Stainless, Ltd. (I) | | 78,009 | | 148,647 |
| JK Cement, Ltd. | | 22,552 | | 66,539 |
| JK Lakshmi Cement, Ltd. | | 70,257 | | 68,382 |
| JK Tyre & Industries, Ltd. | | 14,533 | | 28,009 |
| JM Financial, Ltd. | | 368,362 | | 184,609 |
| JSW Energy, Ltd. | | 163,311 | | 270,905 |
| JSW Steel, Ltd. | | 146,919 | | 2,836,377 |
| Jubilant Life Sciences, Ltd. | | 3,234 | | 13,675 |
| Jubilant Organosys, Ltd. | | 64,699 | | 232,238 |
| Jyoti Structures, Ltd. | | 51,869 | | 93,294 |
| Kalpataru Power Transmission, Ltd. | | 22,050 | | 59,758 |
| Karnataka Bank, Ltd. | | 155,196 | | 366,396 |
| Karur Vysya Bank, Ltd. | | 35,673 | | 315,183 |
| Karuturi Global, Ltd. | | 51,255 | | 16,755 |
| Kesoram Industries, Ltd. | | 33,435 | | 138,471 |
| Kirloskar Brothers, Ltd. | | 4,757 | | 14,185 |
| Krbl, Ltd. | | 55,453 | | 26,571 |
| KS Oils, Ltd. | | 43,956 | | 31,299 |
| KSB Pumps, Ltd. | | 3,942 | | 41,102 |
| KSK Energy Ventures, Ltd. (I) | | 23,584 | | 55,100 |
| Lakshmi Vilas Bank, Ltd. | | 49,297 | | 102,631 |
| Madhucon Projects, Ltd. | | 34,342 | | 71,562 |
| Madras Cements, Ltd. | | 106,301 | | 217,085 |
| Mahanagar Telephone Nigam, Ltd. (I) | | 97,727 | | 87,780 |
| Mahanagar Telephone Nigam, Ltd. ADR (I)(L) | | 81,577 | | 150,102 |
| Maharashtra Seamless, Ltd. | | 62,316 | | 474,695 |
| Mahindra Lifespace Developers, Ltd. | | 22,771 | | 172,233 |
| Manaksia, Ltd. | | 35,648 | | 63,819 |
| Mangalam Cement, Ltd. | | 14,461 | | 35,137 |
| Mastek, Ltd. | | 17,963 | | 55,436 |
| McLeod Russel India, Ltd. | | 51,666 | | 238,763 |
| Mercator Lines, Ltd. | | 212,137 | | 168,873 |
| Merck, Ltd. | | 2,868 | | 36,460 |
| | | | |
| Emerging Markets Fund (formerly Emerging |
| Markets Value Fund) (continued) | | |
| | | Shares or | | |
| | | Principal | | |
| | | Amount | | Value |
| | |
|
| |
| COMMON STOCKS (continued) | | | | |
| India (continued) | | | | |
| Monnet Ispat & Energy, Ltd. | | 32,137 | $ | 404,925 |
| Moser Baer India, Ltd. | | 222,508 | | 187,589 |
| MRF, Ltd. | | 1,922 | | 242,691 |
| Mukand, Ltd. | | 28,732 | | 28,224 |
| Nagarjuna Construction Company, Ltd. | | 246,877 | | 559,273 |
| Nagarjuna Fertilizers & Chemicals, Ltd. | | 229,114 | | 136,506 |
| Nahar Spinning Mills, Ltd. | | 6,600 | | 13,608 |
| National Aluminium Company, Ltd. | | 143,551 | | 1,352,707 |
| National Organic Chemical Industries, Ltd. | | 80,241 | | 28,061 |
| Nava Bharat Ventures, Ltd. | | 43,984 | | 221,715 |
| NIIT Technologies, Ltd. | | 45,471 | | 201,836 |
| NIIT, Ltd. | | 136,918 | | 151,843 |
| Noida Toll Bridge Company, Ltd. | | 193,534 | | 112,390 |
| OCL India, Ltd. | | 1,500 | | 3,331 |
| Omaxe, Ltd. (I) | | 105,584 | | 312,642 |
| Onmobile Global, Ltd. (I) | | 24,158 | | 107,941 |
| Orbit Corp., Ltd. | | 63,959 | | 67,294 |
| Orchid Chemicals & Pharmaceuticals, Ltd. | | 56,302 | | 312,020 |
| Orient Paper & Industries, Ltd. | | 82,674 | | 85,084 |
| Oriental Bank of Commerce | | 105,448 | | 763,986 |
| Panacea Biotec, Ltd. | | 26,548 | | 105,785 |
| Parsvnath Developers, Ltd. (I) | | 129,259 | | 84,443 |
| Patel Engineering Ltd (I) | | 24,567 | | 75,786 |
| Patni Computer Systems, Ltd. | | 70,484 | | 697,781 |
| Patni Computer Systems, Ltd., ADR (L) | | 28,382 | | 556,287 |
| Peninsula Land, Ltd. | | 89,370 | | 115,471 |
| Phillips Carbon Black, Ltd. | | 9,196 | | 27,668 |
| Piramal Healthcare, Ltd. | | 117,033 | | 1,187,456 |
| Plethico Pharmaceuticals, Ltd. | | 5,976 | | 48,788 |
| Polaris Software Lab, Ltd. | | 39,735 | | 160,070 |
| Polyplex Corp., Ltd. | | 18,044 | | 93,069 |
| Praj Industries, Ltd. (I) | | 57,344 | | 81,813 |
| Prism Cement, Ltd. | | 71,827 | | 82,597 |
| Provogue India, Ltd. | | 90,931 | | 81,429 |
| PSL, Ltd. | | 15,269 | | 23,490 |
| PTC India, Ltd. | | 316,575 | | 566,858 |
| Punj Lloyd, Ltd. | | 224,909 | | 297,354 |
| Punjab National Bank, Ltd. (I) | | 5,000 | | 124,777 |
| Rain Commodities Ltd. | | 22,875 | | 78,550 |
| Rajesh Exports, Ltd. | | 43,299 | | 119,848 |
| Raymond, Ltd. (I) | | 43,363 | | 257,889 |
| REI Agro, Ltd. | | 164,589 | | 104,380 |
| REI Six Ten Retail, Ltd. | | 7,790 | | 8,661 |
| Reliance Capital, Ltd. | | 122,106 | | 1,287,634 |
| Reliance Communications, Ltd. | | 947,600 | | 1,814,086 |
| Reliance Industries, Ltd. | | 1,114,389 | | 23,796,651 |
| Reliance Industries, Ltd., GDR | | 34,905 | | 1,486,604 |
| Reliance Industries, Ltd., GDR - | | | | |
| London Exchange | | 242,076 | | 10,304,377 |
| Reliance Mediaworks, Ltd. (I) | | 19,015 | | 56,884 |
| Reliance Power, Ltd. (I) | | 843,721 | | 2,067,250 |
| Resurgere Mines & Minerals India, Ltd. (I) | | 1,074,180 | | 20,189 |
| Rolta India, Ltd. | | 153,518 | | 480,552 |
| RPG Itochu Finance, Ltd. | | 1,085 | | 2,500 |
| Ruchi Soya Industries, Ltd. | | 127,227 | | 287,530 |
| Rural Electrification Corp. Ltd. | | 370,755 | | 1,909,436 |
| S Kumars Nationwide, Ltd. (I) | | 142,150 | | 174,282 |
| SEAMEC, Ltd. | | 14,000 | | 30,510 |
| Shiv-Vani Oil & Gas | | | | |
| Exploration Services, Ltd. | | 20,192 | | 108,484 |
| Shree Renuka Sugars, Ltd. | | 616,529 | | 970,341 |
| Sicagen India, Ltd. (I) | | 4,881 | | 2,196 |
| Sical Logistics, Ltd. (I) | | 4,881 | | 7,908 |
| |
| The accompanying notes are an integral part of the financial statements. | 60 |
John Hancock Funds II
Portfolio of Investments — February 28, 2011 (Unaudited) (showing percentage of total net assets)
| | | | |
| Emerging Markets Fund (formerly Emerging |
| Markets Value Fund) (continued) | | |
| | | Shares or | | |
| | | Principal | | |
| | | Amount | | Value |
| | |
|
| |
| COMMON STOCKS (continued) | | | | |
| India (continued) | | | | |
| Sobha Developers, Ltd. | | 72,439 | $ | 398,681 |
| Sonata Software, Ltd. | | 23,000 | | 17,367 |
| South Indian Bank, Ltd. | | 1,282,635 | | 589,331 |
| SREI Infrastructure Finance, Ltd. | | 294,220 | | 267,409 |
| SRF, Ltd. | | 37,385 | | 251,171 |
| State Bank of Bikaner & Jaipur | | 13,175 | | 170,055 |
| State Bank of India | | 112,351 | | 6,596,644 |
| State Bank of India, GDR | | 4,501 | | 531,568 |
| Steel Authority of India, Ltd. | | 467,960 | | 1,576,838 |
| Sterling Biotech, Ltd. | | 96,778 | | 211,734 |
| Sterlite Industries India, Ltd., ADR | | 556,079 | | 8,196,604 |
| Sundaram Finance, Ltd. | | 8,650 | | 95,456 |
| Suzlon Energy, Ltd. (I) | | 534,875 | | 554,389 |
| Syndicate Bank, Ltd. | | 230,001 | | 581,408 |
| Tamilnadu Newsprint & Papers, Ltd. | | 39,187 | | 106,159 |
| Tanla Solutions, Ltd. | | 86,834 | | 37,818 |
| Tata Chemicals, Ltd. | | 121,519 | | 881,424 |
| Tata Communications, Ltd. (I) | | 33,200 | | 155,726 |
| Tata Communications, Ltd., ADR (I)(L) | | 63,885 | | 574,965 |
| Tata Investment Corp., Ltd. | | 15,423 | | 174,690 |
| Tata Steel, Ltd. | | 477,124 | | 6,455,012 |
| Tata Tea, Ltd. | | 607,990 | | 1,195,432 |
| Teledata Marine Solutions Pte, Ltd. | | 23,607 | | 17,862 |
| Teledata Technology Solutions (I) | | 23,607 | | 471 |
| Til, Ltd. | | 1,016 | | 12,345 |
| Time Technoplast, Ltd. | | 110,114 | | 132,803 |
| Titagarh Wagons, Ltd. | | 8,719 | | 65,257 |
| Triveni Engineering & Industries, Ltd. | | 25,986 | | 52,402 |
| Tube Investments of India, Ltd. | | 4,049 | | 11,308 |
| UCO Bank | | 198,438 | | 430,541 |
| Uflex, Ltd. | | 34,032 | | 103,949 |
| Ultratech Cement, Ltd. | | 23,329 | | 483,210 |
| Union Bank of India, Ltd. | | 213,838 | | 1,514,522 |
| Unitech, Ltd. | | 747,580 | | 562,224 |
| Unity Infraprojects, Ltd. | | 31,689 | | 41,469 |
| Usha Martin, Ltd. | | 176,167 | | 197,552 |
| UTV Software Communications, Ltd. (I) | | 20,932 | | 235,057 |
| Vardhman Textiles, Ltd. | | 8,267 | | 45,708 |
| Varun Shipping Company, Ltd. | | 62,246 | | 37,309 |
| Videocon Industries, Ltd. | | 139,150 | | 581,826 |
| Vijaya Bank | | 167,219 | | 280,683 |
| Vimta Labs, Ltd. | | 7,251 | | 3,840 |
| Walchandnagar Industrie | | 28,717 | | 81,523 |
| Wockhardt, Ltd. (I) | | 1,863 | | 14,394 |
| Zuari Industries, Ltd. | | 9,847 | | 136,378 |
| Zylog Systems, Ltd. | | 9,565 | | 84,525 |
| | |
|
| | | | | 185,120,796 |
| Indonesia - 2.84% | | | | |
| Adhi Karya Tbk PT | | 312,000 | | 29,488 |
| AKR Corporindo Tbk PT | | 2,347,500 | | 416,741 |
| Aneka Tambang Tbk PT | | 6,343,000 | | 1,585,848 |
| Asahimas Flat Glass Tbk PT | | 113,500 | | 60,020 |
| Astra Graphia Tbk PT | | 606,500 | | 45,514 |
| Bakrie & Brothers Tbk PT (I) | | 136,839,261 | | 1,025,637 |
| Bakrie Sumatera Plantations Tbk PT | | 20,885,000 | | 829,438 |
| Bakrie Telecom Tbk PT (I) | | 34,369,000 | | 1,150,614 |
| Bakrieland Development Tbk PT | | 61,993,000 | | 1,006,142 |
| Bank Bukopin Tbk PT | | 4,762,666 | | 302,451 |
| Bank Danamon Indonesia Tbk PT | | 5,629,500 | | 4,089,893 |
| Bank Mandiri Tbk PT | | 5,872,646 | | 3,868,321 |
| Bank Negara Indonesia Persero Tbk PT | | 9,092,103 | | 3,666,120 |
| Bank Pan Indonesia Tbk PT (I) | | 10,992,500 | | 1,496,725 |
| Bank Permata Tbk Pt (I) | | 25,500 | | 4,836 |
| | | | |
| Emerging Markets Fund (formerly Emerging |
| Markets Value Fund) (continued) | | |
| | | Shares or | | |
| | | Principal | | |
| | | Amount | | Value |
| | |
|
| |
| COMMON STOCKS (continued) | | | | |
| Indonesia (continued) | | | | |
| Barito Pacific Tbk PT (I) | | 3,118,500 | $ | 350,369 |
| Berlian Laju Tanker Tbk PT (I) | | 11,916,666 | | 474,343 |
| Bhakti Investama Tbk PT (I) | | 22,152,800 | | 452,380 |
| Budi Acid Jaya Tbk PT | | 2,039,000 | | 52,078 |
| Bumi Resources Tbk PT | | 36,653,430 | | 12,553,834 |
| Central Proteinaprima Tbk PT (I) | | 30,464,500 | | 183,032 |
| Charoen Pokphand Indonesia Tbk PT | | 3,572,920 | | 618,815 |
| Ciputra Development Tbk PT (I) | | 19,442,500 | | 684,543 |
| Ciputra Surya Tbk PT (I) | | 1,437,500 | | 86,341 |
| Darma Henwa Tbk PT (I) | | 20,860,500 | | 149,137 |
| Davomas Abadi Tbk PT (I) | | 8,435,500 | | 69,967 |
| Elnusa Tbk PT | | 2,863,500 | | 96,082 |
| Energi Mega Persada Tbk PT (I) | | 40,739,638 | | 502,013 |
| Gajah Tunggal Tbk PT | | 2,601,000 | | 608,257 |
| Global Mediacom Tbk PT | | 10,614,000 | | 1,072,552 |
| Gozco Plantations Tbk PT | | 4,676,000 | | 199,280 |
| Gudang Garam Tbk PT | | 952,743 | | 3,957,739 |
| Indah Kiat Pulp and Paper Corp. Tbk PT (I) | | 5,628,500 | | 983,738 |
| Indika Energy Tbk PT | | 1,908,000 | | 824,119 |
| Indofood Sukses Makmur Tbk PT | | 6,924,000 | | 3,744,708 |
| International Nickel Indonesia Tbk PT | | 4,720,000 | | 2,720,187 |
| Intiland Development Tbk PT (I) | | 3,553,500 | | 129,306 |
| Japfa Comfeed Indonesia Tbk PT | | 675,500 | | 229,981 |
| Kawasan Industri Jababeka Tbk PT (I) | | 15,626,500 | | 216,356 |
| Lippo Karawaci Tbk PT | | 25,745,625 | | 1,573,037 |
| Matahari Putra Prima Tbk PT | | 3,680,000 | | 735,134 |
| Medco Energi Internasional Tbk PT | | 3,153,500 | | 1,051,050 |
| Media Nusantara Citra Tbk PT | | 6,522,000 | | 816,279 |
| Mitra Adiperkasa Tbk PT | | 1,203,500 | | 330,350 |
| Mitra International Resources Tbk PT (I) | | 5,235,500 | | 139,724 |
| Pabrik Kertas Tjiwi Kimia Tbk PT | | 321,000 | | 94,728 |
| Panin Financial Tbk PT (I) | | 30,756,000 | | 612,082 |
| Panin Insurance Tbk PT (I) | | 1,443,000 | | 80,243 |
| Perusahaan Perkebunan London Sumatra | | | | |
| Indonesia Tbk PT | | 5,000,000 | | 1,222,706 |
| Polychem Indonesia Tbk PT (I) | | 1,930,000 | | 41,993 |
| Ramayana Lestari Sentosa Tbk PT | | 4,070,000 | | 361,138 |
| Sampoerna Agro PT | | 1,330,000 | | 393,272 |
| Samudera Indonesia Tbk PT (I) | | 74,500 | | 33,359 |
| Selamat Sempurna Tbk PT | | 1,188,000 | | 173,787 |
| Sentul City Tbk PT (I) | | 14,266,000 | | 168,402 |
| Sorini Agro Asia Corporindo Tbk PT | | 659,500 | | 254,216 |
| Summarecon Agung Tbk PT | | 12,822,500 | | 1,458,570 |
| Suryainti Permata Tbk PT (I) | | 1,802,000 | | 18,180 |
| Timah Tbk PT | | 238,000 | | 73,304 |
| Trias Sentosa Tbk PT | | 1,000,000 | | 32,505 |
| Trimegah Securities Tbk PT | | 1,540,500 | | 16,587 |
| Truba Alam Manunggal Engineering PT (I) | | 19,436,000 | | 138,913 |
| Tunas Baru Lampung Tbk PT | | 1,536,000 | | 68,934 |
| Tunas Ridean Tbk PT | | 6,050,000 | | 398,746 |
| Wijaya Karya PT | | 4,669,000 | | 350,130 |
| | |
|
| | | | | 61,174,314 |
| Israel - 0.01% | | | | |
| Mivtach Shamir Holdings, Ltd. | | 6,548 | | 203,979 |
| Union Bank of Israel, Ltd. | | 1 | | 1 |
| | |
|
| | | | | 203,980 |
| Korea - 0.01% | | | | |
| Daewon Pharmaceutical Company, Ltd. | | 7,450 | | 44,058 |
| Sunjin Company, Ltd. (I) | | 10,386 | | 63,218 |
| Teemsteems Inc (I) | | 179 | | 6,582 |
| Visang Education, Inc. | | 360 | | 2,805 |
| | |
|
| | | | | 116,663 |
| |
| The accompanying notes are an integral part of the financial statements. | 61 |
John Hancock Funds II
Portfolio of Investments — February 28, 2011 (Unaudited) (showing percentage of total net assets)
| | | | |
| Emerging Markets Fund (formerly Emerging |
| Markets Value Fund) (continued) | | |
| | | Shares or | | |
| | | Principal | | |
| | | Amount | | Value |
| | |
|
| |
| COMMON STOCKS (continued) | | | | |
| Luxembourg - 0.01% | | | | |
| Brait SA | | 73,750 | $ | 238,605 |
| Malaysia - 3.18% | | | | |
| Adventa BHD | | 25,200 | | 19,566 |
| Affin Holdings BHD | | 847,500 | | 900,472 |
| AirAsia BHD (I) | | 1,519,200 | | 1,256,427 |
| Al Aqar KPJ | | 29,082 | | 11,365 |
| Alam Maritim Resources BHD | | 267,200 | | 87,778 |
| Alliance Financial Group BHD | | 1,817,500 | | 1,868,357 |
| AMDB BHD (I) | | 180,000 | | 24,220 |
| AMMB Holdings BHD | | 3,884,450 | | 7,924,375 |
| Ann Joo Resources BHD | | 587,100 | | 545,674 |
| APM Automotive Holdings BHD | | 194,200 | | 318,374 |
| Asas Dunia BHD (I) | | 94,000 | | 26,469 |
| Asia Pacific Land BHD (I) | | 282,100 | | 40,172 |
| Bandar Raya Developments BHD | | 1,147,200 | | 756,966 |
| Berjaya Assets BHD | | 458,500 | | 116,140 |
| Berjaya Corp. BHD | | 200,000 | | 26,234 |
| Berjaya Corp. BHD (Kuala Lumpur Exchange) | | 3,517,900 | | 1,205,473 |
| Berjaya Land BHD | | 846,900 | | 319,458 |
| Berjaya Media BHD (I) | | 79,700 | | 12,082 |
| BIMB Holdings BHD | | 743,200 | | 325,392 |
| Bolton BHD | | 81,500 | | 30,770 |
| Boustead Holdings BHD | | 741,260 | | 1,308,303 |
| Cahya Mata Sarawak BHD | | 290,900 | | 249,941 |
| CB Industrial Product Holding BHD | | 11,700 | | 15,350 |
| Coastal Contracts BHD | | 183,200 | | 151,421 |
| CSC Steel Holdings BHD | | 241,400 | | 137,800 |
| Dijaya Corp. BHD | | 16,900 | | 5,925 |
| DNP Holdings BHD | | 529,900 | | 293,876 |
| DRB-Hicom BHD | | 1,777,900 | | 1,093,505 |
| Eastern & Oriental BHD | | 1,323,700 | | 484,782 |
| Eastern Pacific Industrial Corp. BHD | | 155,700 | | 114,437 |
| ECM Libra Financial Group BHD | | 1,230,619 | | 310,100 |
| Encorp BHD | | 114,800 | | 30,878 |
| EON Capital BHD (I) | | 633,500 | | 1,482,589 |
| Esso Malaysia BHD | | 110,500 | | 115,444 |
| Evergreen Fibreboard BHD | | 570,300 | | 256,202 |
| Faber Group BHD | | 261,800 | | 166,136 |
| Globetronics Technology BHD | | 172,980 | | 61,293 |
| Glomac BHD | | 205,700 | | 115,379 |
| Goldis BHD (I) | | 335,625 | | 162,646 |
| Green Packet BHD (I) | | 127,800 | | 27,665 |
| Guocoland Malaysia BHD | | 37,100 | | 15,225 |
| Hap Seng Consolidated BHD | | 676,700 | | 1,435,430 |
| Hap Seng Plantations Holdings BHD | | 477,800 | | 470,389 |
| Hong Leong Credit BHD | | 490,900 | | 1,398,891 |
| Hong Leong Industries BHD | | 55,300 | | 103,712 |
| Hunza Properties BHD | | 102,400 | | 51,433 |
| Hwang-DBS Malaysia BHD | | 69,400 | | 58,059 |
| IGB Corp. BHD | | 1,694,000 | | 1,206,081 |
| IJM Corp. BHD | | 2,707,180 | | 5,372,251 |
| IJM Land BHD | | 437,700 | | 386,645 |
| Insas BHD (I) | | 478,504 | | 80,925 |
| Integrated Logistics BHD | | 175,560 | | 57,013 |
| Integrax BHD | | 74,400 | | 35,897 |
| Jaks Resources BHD (I) | | 413,200 | | 91,114 |
| Jaya Tiasa Holdings BHD | | 56,700 | | 89,377 |
| Jerneh Asia BHD | | 51,300 | | 51,634 |
| K&N Kenanga Holdings BHD | | 154,200 | | 35,448 |
| Karambunai Corp. BHD (I) | | 1,224,300 | | 80,545 |
| Keck Seng BHD | | 219,800 | | 471,148 |
| Kian Joo Can Factory BHD | | 332,000 | | 208,030 |
| Kim Loong Resources BHD | | 37,800 | | 27,402 |
| | | | |
| Emerging Markets Fund (formerly Emerging |
| Markets Value Fund) (continued) | | |
| | | Shares or | | |
| | | Principal | | |
| | | Amount | | Value |
| | |
|
| |
| COMMON STOCKS (continued) | | | | |
| Malaysia (continued) | | | | |
| Kinsteel BHD | | 706,200 | $ | 192,355 |
| KLCC Property Holdings BHD | | 1,014,500 | | 1,131,600 |
| KNM Group BHD (I) | | 1,300,625 | | 1,096,086 |
| KSL Holdings BHD | | 194,366 | | 110,879 |
| KUB Malaysia BHD | | 592,900 | | 136,099 |
| Kulim Malaysia BHD | | 1,216,000 | | 1,381,749 |
| Kumpulan Fima BHD | | 93,300 | | 49,932 |
| Kumpulan Hartanah Selangor BHD (I) | | 410,900 | | 51,307 |
| Kumpulan Perangsang Selangor BHD | | 164,000 | | 66,875 |
| Landmarks BHD | | 819,100 | | 403,044 |
| LBS Bina Group BHD (I) | | 210,000 | | 40,277 |
| Leader Universal Holdings BHD | | 490,700 | | 135,221 |
| Lingui Development BHD | | 2,200 | | 969 |
| Lion Corp. BHD (I) | | 812,793 | | 84,082 |
| Lion Diversified Holdings BHD | | 863,200 | | 131,778 |
| Lion Forest Industries BHD | | 136,500 | | 84,610 |
| Lion Industries Corp. BHD | | 1,413,000 | | 886,293 |
| MAA Holdings BHD (I) | | 139,500 | | 36,623 |
| Malaysian Bulk Carriers BHD | | 58,000 | | 50,616 |
| MBM Resources BHD | | 75,500 | | 80,383 |
| Mega First Corp. BHD | | 193,700 | | 109,023 |
| Melewar Industrial Group BHD | | 62,200 | | 15,307 |
| Metro Kajang Holdings BHD | | 94,100 | | 56,194 |
| MISC BHD | | 557,850 | | 1,390,834 |
| MK Land Holdings BHD (I) | | 894,300 | | 109,001 |
| MMC Corp. BHD | | 1,630,300 | | 1,454,778 |
| MNRB Holdings BHD (I) | | 18,000 | | 15,944 |
| MTD ACPI Engineering BHD | | 88,100 | | 15,245 |
| Muhibbah Engineering M BHD | | 859,000 | | 403,069 |
| Mulpha International BHD (I) | | 4,066,000 | | 676,538 |
| Naim Holdings BHD | | 228,400 | | 246,482 |
| NCB Holdings BHD | | 29,600 | | 36,511 |
| Nylex Malaysia BHD (I) | | 57,244 | | 12,036 |
| Oriental Holdings BHD | | 510,720 | | 853,927 |
| OSK Holdings BHD | | 1,295,625 | | 702,023 |
| OSK Property Holdings BHD | | 80,236 | | 17,955 |
| OSK Ventures International BHD (I) | | 157,045 | | 19,058 |
| Panasonic Manufacturing Malaysia BHD | | 8,100 | | 48,642 |
| Paramount Corp. BHD | | 24,400 | | 40,106 |
| Pelikan International Corp. BHD | | 415,200 | | 152,640 |
| Perisai Petroleum Teknologi BHD (I) | | 233,300 | | 42,391 |
| Perwaja Holdings BHD (I) | | 10,600 | | 3,254 |
| PJ Development Holdings BHD | | 297,900 | | 75,250 |
| PPB Group BHD | | 898,200 | | 4,870,561 |
| Press Metal BHD | | 154,200 | | 108,924 |
| Protasco BHD | | 141,500 | | 50,175 |
| Proton Holdings BHD | | 548,500 | | 694,505 |
| QSR Brands BHD | | 83,100 | | 141,019 |
| Ranhill BHD | | 561,000 | | 133,503 |
| RCE Capital BHD | | 327,700 | | 55,353 |
| Resorts World BHD | | 2,976,400 | | 3,242,013 |
| RHB Capital BHD | | 929,300 | | 2,395,402 |
| Scomi Group BHD (I) | | 2,062,900 | | 224,485 |
| Scomi Marine BHD (I) | | 128,700 | | 24,163 |
| Selangor Dredging BHD | | 328,000 | | 83,856 |
| Selangor Properties BHD | | 18,300 | | 22,563 |
| Shangri-La Hotels BHD | | 24,100 | | 20,861 |
| Shell Refining Company Federation of | | | | |
| Malaya BHD | | 150,600 | | 532,449 |
| SHL Consolidated BHD | | 185,100 | | 80,703 |
| Sino Hua-An International BHD (I) | | 659,200 | | 72,752 |
| Sunway City BHD | | 519,300 | | 701,384 |
| Sunway Holdings, Inc. BHD | | 370,700 | | 261,905 |
| |
| The accompanying notes are an integral part of the financial statements. | 62 |
John Hancock Funds II
Portfolio of Investments — February 28, 2011 (Unaudited) (showing percentage of total net assets)
| | | | |
| Emerging Markets Fund (formerly Emerging |
| Markets Value Fund) (continued) | | |
| | | Shares or | | |
| | | Principal | | |
| | | Amount | | Value |
| | |
|
| |
| COMMON STOCKS (continued) | | | | |
| Malaysia (continued) | | | | |
| Suria Capital Holdings BHD | | 286,100 | $ | 187,851 |
| TA Ann Holdings BHD | | 295,320 | | 484,388 |
| TA Enterprise BHD | | 2,443,400 | | 569,269 |
| TA Global BHD | | 1,466,040 | | 195,386 |
| Talam Corp. BHD (I) | | 1,080,000 | | 32,099 |
| Tanjung Offshore BHD (I) | | 159,900 | | 86,628 |
| TDM BHD | | 316,483 | | 285,483 |
| Tebrau Teguh BHD (I) | | 548,034 | | 133,880 |
| TH Plantations BHD (I) | | 2,500 | | 1,608 |
| Time.com BHD (I) | | 2,836,700 | | 704,856 |
| Tradewinds Corp. BHD (I) | | 660,000 | | 187,097 |
| Tradewinds Malaysia BHD | | 143,900 | | 389,724 |
| TSH Resources BHD | | 65,800 | | 58,747 |
| UEM Land Holdings BHD (I) | | 660,866 | | 586,209 |
| Unico-Desa Plantations BHD | | 149,600 | | 52,531 |
| Unisem M BHD | | 894,920 | | 581,977 |
| United Malacca BHD | | 147,850 | | 333,656 |
| VS Industry BHD | | 166,897 | | 101,281 |
| Wah Seong Corp. BHD | | 213,200 | | 143,287 |
| WTK Holdings BHD | | 477,500 | | 195,842 |
| YNH Property BHD | | 881,196 | | 592,139 |
| YTL Cement BHD | | 53,800 | | 83,967 |
| YTL Corp. BHD | | 813,600 | | 1,895,762 |
| Zelan BHD (I) | | 600,800 | | 97,982 |
| | |
|
| | | | | 68,471,296 |
| Mexico - 5.36% | | | | |
| Alfa SAB de CV | | 650,420 | | 8,093,100 |
| Alsea SAB de CV | | 483,850 | | 516,533 |
| Axtel SAB de CV (I) | | 1,028,937 | | 592,579 |
| Bolsa Mexicana de Valores SAB de CV | | 731,140 | | 1,442,042 |
| Carso Infraestructura y Construccion | | | | |
| SAB de CV (I) | | 1,270,680 | | 796,898 |
| Cemex SAB de CV, SADR (I)(L) | | 1,925,458 | | 17,309,867 |
| Coca-Cola Femsa SAB de CV, SADR | | 43,421 | | 3,172,338 |
| Coca-Cola Femsa SAB de CV, Series L | | 73,868 | | 540,773 |
| Consorcio ARA SAB de CV | | 1,847,685 | | 1,090,062 |
| Controladora Comercial Mexicana | | | | |
| SAB De CV (I) | | 1,190,210 | | 1,655,132 |
| Corporacion GEO SAB de CV (I) | | 842,752 | | 2,373,841 |
| Desarrolladora Homex SAB de CV (I) | | 235,000 | | 1,064,078 |
| Desarrolladora Homex SAB de CV, ADR (I) | | 29,608 | | 806,226 |
| Dine SAB DE CV (I) | | 103,700 | | 47,127 |
| Embotelladoras Arca SAB de CV | | 1,114,481 | | 6,072,206 |
| Empresas ICA SAB de CV (I) | | 25,600 | | 58,974 |
| Empresas ICA SAB de CV, ADR (I)(L) | | 326,441 | | 3,022,844 |
| Fomento Economico Mexicano SAB de CV | | 248,723 | | 13,985,694 |
| GMD Resorts SAB de CV (I) | | 69,300 | | 22,904 |
| Gruma SAB de CV, Class B (I) | | 526,074 | | 1,075,403 |
| Gruma SAB de CV, SADR (I) | | 14,776 | | 120,572 |
| Grupo Aeroportuario del Centro Norte | | | | |
| SAB de CV | | 334,400 | | 594,059 |
| Grupo Aeroportuario del Centro Norte SAB | | | | |
| de CV, ADR (L) | | 14,736 | | 211,020 |
| Grupo Aeroportuario del Pacifico | | | | |
| SAB de CV (L) | | 119,006 | | 4,526,988 |
| Grupo Aeroportuario del Sureste SAB | | | | |
| de CV, ADR (L) | | 59,550 | | 3,256,194 |
| Grupo Aeroportuario del Sureste SAB | | | | |
| de CV, Class B | | 27,200 | | 148,333 |
| Grupo Carso SAB de CV | | 1,533,145 | | 4,927,853 |
| Grupo Cementos de Chihuahua SAB de CV (I) | | 57,000 | | 226,069 |
| Grupo Famsa SAB de CV (I) | | 543,338 | | 985,438 |
| Grupo Financiero Banorte SAB de CV | | 2,782,670 | | 12,622,895 |
| | | | |
| Emerging Markets Fund (formerly Emerging |
| Markets Value Fund) (continued) | | |
| | | Shares or | | |
| | | Principal | | |
| | | Amount | | Value |
| | |
|
| |
| COMMON STOCKS (continued) | | | | |
| Mexico (continued) | | | | |
| Grupo Financiero Inbursa SA | | 40,100 | $ | 168,253 |
| Grupo Gigante SAB de CV | | 168,900 | | 279,116 |
| Grupo Industrial Maseca SAB de CV | | 2,600 | | 2,739 |
| Grupo Industrial Saltillo SAB de CV (I) | | 100,600 | | 132,997 |
| Grupo Kuo SAB de CV (I) | | 164,700 | | 273,536 |
| Grupo Mexicano de Desarrollo SAB de CV (I) | | 69,300 | | 58,120 |
| Grupo Simec SAB de CV (I) | | 333,600 | | 871,867 |
| Industrias Bachoco SAB de CV | | 1,900 | | 49,647 |
| Industrias Bachoco SAB de CV - Series B | | 24,800 | | 54,262 |
| Industrias CH SAB de CV (I) | | 437,160 | | 1,733,830 |
| Inmuebles Carso SAB de CV, Class B1 (I) | | 1,533,145 | | 1,621,504 |
| Maxcom Telecomunicaciones SAB de CV (I) | | 105,143 | | 53,256 |
| Minera Frisco SAB de CV, Class A1 (I) | | 1,533,145 | | 6,486,017 |
| Organizacion Soriana SAB de CV | | 2,848,359 | | 9,472,956 |
| Qualitas Compania de Seguros SA de CV | | 364,900 | | 316,583 |
| Sare Holding SAB de CV, Class B (I) | | 595,900 | | 146,236 |
| Urbi Desarrollos Urbanos SAB de CV (I) | | 1,101,900 | | 2,430,963 |
| | |
|
| | | | | 115,509,924 |
| Philippines - 0.56% | | | | |
| Alsons Consolidated Resources, Inc. | | 629,000 | | 19,201 |
| Banco De Oro | | 709,370 | | 766,593 |
| China Banking Corp. | | 19,518 | | 188,565 |
| Empire East Land Holdings, Inc. (I) | | 5,890,000 | | 100,856 |
| Filinvest Development Corp. | | 404,000 | | 40,750 |
| Filinvest Land, Inc. | | 29,242,750 | | 710,029 |
| First Philippine Holdings Corp. | | 546,800 | | 642,407 |
| JG Summit Holdings Inc. | | 33,600 | | 15,151 |
| Lopez Holdings Corp. (I) | | 4,119,000 | | 456,568 |
| Megaworld Corp. | | 23,809,000 | | 1,135,734 |
| Metropolitan Bank & Trust Company | | 2,784,259 | | 3,685,029 |
| Pepsi-Cola Products Philippines, Inc. | | 1,098,000 | | 54,500 |
| Philippine National Bank (I) | | 732,400 | | 753,352 |
| Rizal Commercial Banking Corp. | | 553,700 | | 330,382 |
| Robinsons Land Corp. | | 3,450,500 | | 928,187 |
| Security Bank Corp. | | 197,018 | | 353,064 |
| Union Bank of Philippines | | 416,700 | | 555,730 |
| Universal Robina Corp. | | 1,120,400 | | 862,122 |
| Vista Land & Lifescapes, Inc. | | 9,526,000 | | 505,975 |
| | |
|
| | | | | 12,104,195 |
| Poland - 1.69% | | | | |
| Agora SA | | 92,656 | | 868,171 |
| Amica SA (I) | | 4,543 | | 75,295 |
| Asseco Poland SA PDA (L) | | 132,158 | | 2,360,925 |
| ATM SA (I) | | 1,309 | | 5,635 |
| Bank BPH SA (I) | | 23,715 | | 592,773 |
| Bank Handlowy w Warszawie SA | | 33,968 | | 1,106,938 |
| Bank Millennium SA (I) | | 1,003,735 | | 1,959,302 |
| Bioton SA (I) | | 6,393,772 | | 401,078 |
| Bomi SA (I) | | 24,339 | | 62,612 |
| Ciech SA (I) | | 42,888 | | 405,946 |
| Comarch SA (I) | | 2,909 | | 96,333 |
| Dom Maklerski IDM SA (I) | | 306,873 | | 320,167 |
| Echo Investment SA (I) | | 619,495 | | 1,061,630 |
| Emperia Holding SA | | 4,908 | | 195,035 |
| Enea SA | | 27,632 | | 210,966 |
| Fabryki Mebli Forte SA | | 23,417 | | 98,502 |
| Firma Oponiarska Debica SA | | 7,943 | | 173,904 |
| Gant Development SA (I) | | 26,941 | | 147,818 |
| Grupa Kety SA | | 23,810 | | 1,037,795 |
| Grupa Lotos SA (I) | | 130,306 | | 1,828,716 |
| Hydrobudowa Polska SA (I) | | 13,528 | | 12,653 |
| Impexmetal SA (I) | | 161,596 | | 274,323 |
| |
| The accompanying notes are an integral part of the financial statements. | 63 |
John Hancock Funds II
Portfolio of Investments — February 28, 2011 (Unaudited) (showing percentage of total net assets)
| | | | |
| Emerging Markets Fund (formerly Emerging |
| Markets Value Fund) (continued) | | |
| | | Shares or | | |
| | | Principal | | |
| | | Amount | | Value |
| | |
|
| |
| COMMON STOCKS (continued) | | | | |
| Poland (continued) | | | | |
| Kopex SA (I) | | 75,475 | $ | 549,519 |
| Kredyt Bank SA (I) | | 62,243 | | 364,585 |
| LC Corp. SA (I) | | 425,367 | | 249,094 |
| MCI Management SA (I) | | 26,839 | | 79,521 |
| MNI SAMNI SA (I) | | 38,291 | | 46,346 |
| Mostostal-Export SA (I) | | 22,387 | | 9,520 |
| Netia SA (I) | | 469,271 | | 852,472 |
| Orbis SA (I) | | 61,821 | | 789,623 |
| Pekaes SA (I) | | 6,381 | | 18,499 |
| Pfleiderer Grajewo SA (I) | | 6,153 | | 42,449 |
| Pol-Aqua SA (I) | | 4,966 | | 33,962 |
| Polimex-Mostostal SA | | 505,319 | | 632,371 |
| Polnord SA | | 21,527 | | 239,399 |
| Polska Grupa Energetyczna SA | | 626,914 | | 4,951,206 |
| Polska Grupa Farmaceutyczna SA (I) | | 8,974 | | 160,787 |
| Polski Koncern Naftowy Orlen SA (I) | | 666,021 | | 10,601,990 |
| Sygnity SA (I) | | 28,494 | | 179,295 |
| Synthos SA (I) | | 1,964,944 | | 2,897,672 |
| Zaklady Azotowe Pulawy SA | | 5,593 | | 221,138 |
| Zaklady Azotowe w | | | | |
| Tarnowie-Moscicach SA (I) | | 13,390 | | 172,793 |
| | |
|
| | | | | 36,388,758 |
| Russia - 5.98% | | | | |
| Gazprom OAO, SADR | | 2,058,521 | | 60,355,836 |
| Gazprom OAO, SADR (London Exchange) | | 1,621,321 | | 47,802,913 |
| Lukoil OAO | | 288,612 | | 20,455,911 |
| Surgutneftegaz, SADR | | 28,932 | | 336,141 |
| | |
|
| | | | | 128,950,801 |
| South Africa - 8.19% | | | | |
| ABSA Group, Ltd. | | 659,044 | | 12,274,375 |
| Adcorp Holdings, Ltd. | | 80,455 | | 311,847 |
| Aeci, Ltd. | | 182,131 | | 2,199,788 |
| Afgri, Ltd. | | 753,725 | | 768,749 |
| African Bank Investments, Ltd. | | 837,075 | | 4,303,031 |
| Allied Electronics Corp., Ltd. | | 105,838 | | 398,399 |
| Argent Industrial, Ltd. | | 106,615 | | 137,820 |
| Aveng, Ltd. | | 760,240 | | 3,992,110 |
| Avusa, Ltd. | | 73,650 | | 221,312 |
| Barloworld, Ltd. | | 470,120 | | 4,879,235 |
| Basil Read Holdings, Ltd. | | 164,211 | | 247,979 |
| Bell Equipment, Ltd. (I) | | 83,308 | | 143,683 |
| Blue Label Telecoms, Ltd. | | 146,160 | | 119,653 |
| Business Connexion Group, Ltd. | | 107,367 | | 90,200 |
| Cadiz Holdings, Ltd. | | 77,052 | | 35,085 |
| Caxton & CTP Publishers & Printers, Ltd. | | 251,225 | | 541,264 |
| Ceramic Industries, Ltd. | | 1,781 | | 36,323 |
| Cipla Medpro South Africa, Ltd. | | 724,354 | | 758,457 |
| DataTec, Ltd. | | 423,074 | | 2,171,595 |
| Distribution And | | | | |
| Warehousing Network, Ltd. (I) | | 10,512 | | 12,839 |
| Drdgold, Ltd. | | 349,787 | | 170,308 |
| Eqstra Holdings, Ltd. (I) | | 263,667 | | 246,206 |
| Esorfranki, Ltd. | | 180,540 | | 46,688 |
| Freeworld Coatings, Ltd. | | 139,531 | | 223,909 |
| Gijima Group Ltd. | | 297,567 | | 35,056 |
| Gold Fields, Ltd. | | 1,756,418 | | 31,457,446 |
| Gold Reef Resorts, Ltd. | | 77,615 | | 196,243 |
| Grindrod, Ltd. | | 791,033 | | 1,744,146 |
| Group Five, Ltd. | | 159,016 | | 648,705 |
| Harmony Gold Mining Company, Ltd. (L) | | 849,954 | | 10,012,458 |
| Hulamin, Ltd. (I) | | 227,519 | | 252,329 |
| Iliad Africa, Ltd. | | 288,559 | | 342,842 |
| | | | |
| Emerging Markets Fund (formerly Emerging |
| Markets Value Fund) (continued) | | |
| | | Shares or | | |
| | | Principal | | |
| | | Amount | | Value |
| | |
|
| |
| COMMON STOCKS (continued) | | | | |
| South Africa (continued) | | | | |
| Imperial Holdings, Ltd. | | 219,928 | $ | 3,546,410 |
| Investec, Ltd. | | 487,037 | | 3,795,527 |
| JD Group, Ltd. | | 346,296 | | 2,596,430 |
| Kap International Holdings, Ltd. | | 90,584 | | 29,273 |
| Keaton Energy Holdings, Ltd. (I) | | 23,640 | | 13,197 |
| Lewis Group, Ltd. | | 218,533 | | 2,237,639 |
| Liberty Holdings, Ltd. | | 149,169 | | 1,636,117 |
| Life Healthcare Group Holdings, Ltd. | | 218,165 | | 470,043 |
| Merafe Resources, Ltd. | | 3,735,910 | | 858,226 |
| Metair Investments, Ltd. | | 160,261 | | 285,626 |
| Metorex, Ltd. (I) | | 1,603,864 | | 1,313,681 |
| Mittal Steel South Africa, Ltd. | | 356,602 | | 4,616,312 |
| MMI Holdings, Ltd. | | 1,462,236 | | 3,413,694 |
| Mondi, Ltd. | | 317,597 | | 2,826,578 |
| Mustek, Ltd. | | 29,272 | | 20,600 |
| Mvelaphanda Group, Ltd. (I) | | 942,413 | | 426,502 |
| Mvelaserve, Ltd. (I) | | 221,612 | | 404,199 |
| Nampak, Ltd. | | 494,663 | | 1,604,354 |
| Nedbank Group, Ltd. | | 333,641 | | 6,121,341 |
| Northam Platinum, Ltd. (L) | | 225,205 | | 1,601,848 |
| Nu-World Holdings, Ltd. | | 9,429 | | 37,908 |
| Omnia Holdings, Ltd. (I) | | 118,364 | | 1,274,790 |
| Peregrine Holdings, Ltd. | | 219,538 | | 342,132 |
| Petmin, Ltd. | | 263,825 | | 116,959 |
| Pioneer Foods, Ltd. (I) | | 22,647 | | 172,319 |
| PSG Group, Ltd. | | 176,627 | | 1,096,309 |
| Raubex Group, Ltd. | | 281,281 | | 778,445 |
| Sanlam, Ltd. | | 4,143,508 | | 16,094,283 |
| Sappi, Ltd. (I) | | 717,635 | | 3,814,386 |
| Sappi, Ltd., SADR (I)(L) | | 441,134 | | 2,360,067 |
| Sentula Mining, Ltd. (I) | | 634,323 | | 259,002 |
| Simmer and Jack Mines, Ltd. (I) | | 2,217,691 | | 273,910 |
| Standard Bank Group, Ltd. | | 1,333,664 | | 19,117,696 |
| Stefanutti Stocks Holdings, Ltd. | | 40,382 | | 60,313 |
| Steinhoff International Holdings, Ltd. (I) | | 2,507,966 | | 8,923,959 |
| Super Group, Ltd. (I) | | 5,675,917 | | 611,519 |
| Telkom SA, Ltd. | | 568,485 | | 2,894,911 |
| Tiger Wheels, Ltd. (I) | | 14,267 | | 0 |
| Trans Hex Group, Ltd. (I) | | 25,075 | | 9,422 |
| Trencor, Ltd. | | 226,468 | | 1,140,238 |
| Value Group, Ltd. | | 267,946 | | 148,091 |
| Zeder Investments, Ltd. | | 449,540 | | 169,110 |
| | |
|
| | | | | 176,533,446 |
| South Korea - 13.53% | | | | |
| Aekyung Petrochemical Company, Ltd. | | 7,270 | | 198,079 |
| Artone Paper Manufacturing Company, Ltd. (I) | | 3,004 | | 7,042 |
| Asia Cement Company, Ltd. | | 5,510 | | 216,960 |
| Asia Paper Manufacturing Company, Ltd. | | 2,000 | | 16,670 |
| Asiana Airlines, Inc. (I) | | 14,070 | | 127,805 |
| BNG Steel Company, Ltd. (I) | | 15,790 | | 166,825 |
| Boryung Pharmaceutical Company, Ltd. | | 8,354 | | 187,174 |
| Busan Bank | | 248,170 | | 2,988,023 |
| Byucksan Engineering & | | | | |
| Construction Company, Ltd. (I) | | 6,140 | | 8,663 |
| Charm Engineering Company, Ltd. | | 19,130 | | 63,199 |
| Chin Hung International, Inc. (I) | | 156,375 | | 32,209 |
| Chokwang Leather Company, Ltd. | | 2,300 | | 28,000 |
| Chong Kun Dang Pharm Corp. | | 16,740 | | 342,098 |
| Choongwae Pharma Corp. | | 12,111 | | 143,004 |
| Chosun Refractories Company, Ltd. | | 1,489 | | 79,087 |
| CJ CheilJedang Corp. | | 9,125 | | 1,612,906 |
| CJ Corp. | | 32,407 | | 2,049,589 |
| Crown Confectionery Company, Ltd. | | 442 | | 46,792 |
| |
| The accompanying notes are an integral part of the financial statements. | 64 |
John Hancock Funds II
Portfolio of Investments — February 28, 2011 (Unaudited) (showing percentage of total net assets)
| | | | |
| Emerging Markets Fund (formerly Emerging |
| Markets Value Fund) (continued) | | |
| | | Shares or | | |
| | | Principal | | |
| | | Amount | | Value |
| | |
|
| |
| COMMON STOCKS (continued) | | | | |
| South Korea (continued) | | | | |
| D.I. Corp | | 8,700 | $ | 13,864 |
| Dae Chang Industrial Company, Ltd. | | 105,580 | | 152,407 |
| Dae Dong Industrial Company, Ltd. | | 25,600 | | 110,255 |
| Dae Han Flour Mills Company, Ltd. | | 2,254 | | 310,671 |
| Dae Won Kang Up Company, Ltd. | | 53,489 | | 204,010 |
| Dae-Il Corp. | | 20,210 | | 141,969 |
| Daeduck Electronics Company, Ltd. | | 58,880 | | 484,571 |
| Daeduck GDS Company, Ltd. | | 32,980 | | 235,867 |
| Daegu Bank | | 209,680 | | 2,844,855 |
| Daehan Steel Company, Ltd. | | 20,010 | | 170,423 |
| Daehan Synthetic Fiber Company, Ltd. | | 755 | | 59,720 |
| Daekyo Company, Ltd. | | 62,070 | | 324,954 |
| Daelim Industrial Company, Ltd. | | 62,103 | | 5,427,416 |
| Daesang Corp. | | 40,920 | | 255,885 |
| Daesang Holdings Company, Ltd. | | 20,610 | | 51,569 |
| Daesung Group Holdings Company, Ltd. | | 1,019 | | 68,118 |
| Daesung Holdings Company, Ltd. | | 15,056 | | 168,899 |
| Daesung Industrial Company, Ltd. | | 1,393 | | 51,406 |
| Daewoo Engineering & | | | | |
| Construction Company, Ltd. (I) | | 198,010 | | 1,895,058 |
| Daewoo Shipbuilding & Marine | | | | |
| Engineering Company, Ltd. | | 75,405 | | 2,315,570 |
| Daewoong Company, Ltd. | | 620 | | 9,368 |
| Daishin Securities Company, Ltd. | | 82,560 | | 1,141,451 |
| Daiyang Metal Company, Ltd. (I) | | 6,490 | | 6,124 |
| Daou Technology, Inc. | | 52,350 | | 406,760 |
| DCM Corp. | | 5,310 | | 58,951 |
| Digital Power Communications Company, Ltd. | | 14,000 | | 20,248 |
| Dong Ah Tire & Rubber Company, Ltd. | | 14,930 | | 111,919 |
| Dong Wha Pharmaceutical Company, Ltd. | | 37,210 | | 147,978 |
| Dong-Il Corp. | | 2,373 | | 127,150 |
| Dongbang Transport Logistics Company, Ltd. | | 5,650 | | 10,046 |
| Dongbu Corp. | | 16,730 | | 102,114 |
| Dongbu HiTek Company, Ltd. (I) | | 44,480 | | 624,489 |
| Dongbu Securities Company, Ltd. | | 37,619 | | 223,470 |
| Dongbu Steel Company, Ltd. | | 41,073 | | 351,689 |
| Dongil Industries Company, Ltd. | | 2,532 | | 157,371 |
| Dongil Paper Manufacturing Company, Ltd. | | 13,000 | | 14,483 |
| Dongil Rubber Belt Company, Ltd. | | 26,968 | | 132,543 |
| Dongkuk Steel Mill Company, Ltd. | | 69,340 | | 2,202,419 |
| Dongwon F&B Company, Ltd. | | 2,185 | | 86,577 |
| Dongwon Industries Company, Ltd. | | 99 | | 14,327 |
| Dongyang Engineering & Construction Corp. | | 1,469 | | 14,433 |
| Doosan Industrial Development Company, Ltd. | | 64,178 | | 309,016 |
| Eagon Industries Company, Ltd. (I) | | 480 | | 2,816 |
| Eugene Investment & | | | | |
| Securities Company, Ltd. (I) | | 761,320 | | 459,434 |
| F&F Company, Ltd. | | 5,100 | | 27,768 |
| Fursys, Inc. | | 2,060 | | 42,532 |
| Gaon Cable Company, Ltd. | | 2,496 | | 43,462 |
| Global & Yuasa Battery Company, Ltd. | | 11,350 | | 370,889 |
| Golden Bridge Investment & | | | | |
| Securities Company, Ltd. | | 47,060 | | 65,058 |
| GS Engineering & Construction Corp. | | 27,346 | | 2,420,286 |
| GS Holdings Corp. | | 118,506 | | 7,330,696 |
| Gwangju Shinsegae Company, Ltd. | | 981 | | 158,868 |
| Hae In Corp. | | 1,846 | | 12,427 |
| Halla Engineering & Construction Corp. | | 26,571 | | 448,975 |
| Han Kuk Carbon Company, Ltd. | | 36,610 | | 150,515 |
| Hana Financial Group, Inc. | | 417,370 | | 16,725,611 |
| Handok Pharmaceuticals Company, Ltd. | | 1,000 | | 11,223 |
| Handsome Company, Ltd. | | 30,148 | | 480,595 |
| Hanil Cement Manufacturing Company, Ltd. | | 8,549 | | 412,597 |
| | | | |
| Emerging Markets Fund (formerly Emerging |
| Markets Value Fund) (continued) | | |
| | | Shares or | | |
| | | Principal | | |
| | | Amount | | Value |
| | |
|
| |
| COMMON STOCKS (continued) | | | | |
| South Korea (continued) | | | | |
| Hanil Construction Company, Ltd. (I) | | 700 | $ | 2,397 |
| Hanil E-Wha Company, Ltd. | | 17,760 | | 106,354 |
| Hanjin Heavy Industries & | | | | |
| Construction Company, Ltd. (I) | | 67,029 | | 1,822,863 |
| Hanjin Heavy Industries & Construction | | | | |
| Holdings Company, Ltd. | | 23,700 | | 244,683 |
| Hanjin Shipping Company, Ltd. | | 21,932 | | 688,015 |
| Hanjin Transportation Company, Ltd. | | 16,660 | | 444,407 |
| Hankook Cosmetices | | | | |
| Manufacturing Company, Ltd. | | 1,386 | | 5,466 |
| Hankook Cosmetics Company, Ltd. (I) | | 4,914 | | 10,957 |
| Hankuk Glass Industries, Inc. | | 1,820 | | 48,556 |
| Hankuk Paper Manufacturing Company, Ltd. | | 5,180 | | 104,760 |
| Hanmi Pharm Company, Ltd. (I) | | 3,937 | | 108,539 |
| Hanshin Construction Company, Ltd. | | 3,010 | | 23,329 |
| Hansol CSN Company, Ltd. | | 62,840 | | 88,979 |
| Hansol Homedeco Company, Ltd. (I) | | 45,930 | | 44,643 |
| Hansol Paper Company, Inc. | | 74,620 | | 517,262 |
| Hanwha Chemical Corp. | | 115,780 | | 3,466,440 |
| Hanwha Securities Company, Ltd. | | 105,821 | | 722,980 |
| Hanwha Timeworld Company, Ltd. | | 3,640 | | 59,446 |
| Hanyang Securities Company, Ltd. | | 15,390 | | 122,672 |
| Heung-A Shipping Company, Ltd. | | 51,105 | | 52,234 |
| Hite Brewery Company, Ltd. | | 2,808 | | 252,896 |
| Hite Holdings Company, Ltd. | | 12,240 | | 193,699 |
| HMC Investment Securities Company, Ltd. (I) | | 32,450 | | 583,040 |
| HS R&A Company, Ltd. | | 5,860 | | 106,669 |
| Husteel Company, Ltd. | | 7,730 | | 120,633 |
| Hwacheon Machine Tool Company, Ltd. | | 730 | | 24,041 |
| HwaSung Industrial Company, Ltd. (I) | | 3,530 | | 12,512 |
| Hyosung Corp. | | 22,896 | | 1,584,594 |
| Hyundai Cement Company, Ltd. (I) | | 2,370 | | 12,731 |
| Hyundai Development Company | | 119,225 | | 3,239,984 |
| Hyundai DSF Company, Ltd. | | 10,060 | | 86,739 |
| Hyundai Elevator Company, Ltd. | | 5,134 | | 459,294 |
| Hyundai H & S Company, Ltd. | | 9,480 | | 92,044 |
| Hyundai Hysco Company, Ltd. | | 41,680 | | 1,021,649 |
| Hyundai Mipo Dockyard Company, Ltd. | | 14,146 | | 2,178,859 |
| Hyundai Motor Company, Ltd. | | 143,884 | | 22,813,131 |
| Hyundai Pharmaceutical | | | | |
| Industrial Company, Ltd. | | 9,400 | | 11,418 |
| Hyundai Securities Company, Ltd. | | 255,827 | | 2,971,945 |
| Hyundai Steel Company | | 48,430 | | 5,575,612 |
| Il Dong Pharmaceutical Company, Ltd. | | 4,520 | | 159,163 |
| Iljin Electric Company, Ltd. | | 33,420 | | 229,215 |
| Iljin Holdings Company, Ltd. | | 23,248 | | 78,439 |
| Ilshin Spinning Company, Ltd. | | 1,370 | | 116,035 |
| Ilsung Pharmaceutical Company, Ltd. | | 1,886 | | 130,483 |
| Industrial Bank of Korea | | 355,040 | | 5,329,623 |
| Inzi Controls Company, Ltd. | | 6,490 | | 26,204 |
| IS Dongseo Company, Ltd. | | 13,050 | | 221,992 |
| ISU Chemical Company, Ltd. | | 17,700 | | 263,561 |
| Isupetasys Company, Ltd. | | 51,990 | | 210,021 |
| Jahwa Electronics Company, Ltd. | | 18,810 | | 84,972 |
| Jeil Mutual Savings Bank (I) | | 1,850 | | 6,758 |
| Jeil Pharmaceutical Company | | 10,190 | | 114,353 |
| Jeonbuk Bank, Ltd. | | 81,032 | | 474,202 |
| Joongang Construction Company, Ltd. (I) | | 2,700 | | 4,617 |
| KB Financial Group, Inc. | | 5,793 | | 283,931 |
| KB Financial Group, Inc., ADR (I)(L) | | 578,968 | | 28,224,690 |
| KC Green Holdings Company, Ltd. | | 14,780 | | 42,574 |
| KC Tech Company, Ltd. | | 13,521 | | 84,597 |
| KCC Corp. | | 10,408 | | 2,897,517 |
| |
| The accompanying notes are an integral part of the financial statements. | 65 |
John Hancock Funds II
Portfolio of Investments — February 28, 2011 (Unaudited) (showing percentage of total net assets)
| | | | |
| Emerging Markets Fund (formerly Emerging |
| Markets Value Fund) (continued) | | |
| | | Shares or | | |
| | | Principal | | |
| | | Amount | | Value |
| | |
|
| |
| COMMON STOCKS (continued) | | | | |
| South Korea (continued) | | | | |
| KCTC | | 1,100 | $ | 19,045 |
| Keangnam Enterprises, Ltd. (I) | | 16,288 | | 144,199 |
| Keyang Electric Machinery Company, Ltd. | | 34,010 | | 69,653 |
| KG Chemical Corp. | | 13,120 | | 93,711 |
| KIC, Ltd. (I) | | 6,540 | | 21,795 |
| KISCO Corp. | | 7,076 | | 194,867 |
| KISCO Holdings Company, Ltd. | | 1,771 | | 59,657 |
| Kishin Corp. | | 36,006 | | 157,119 |
| KISWIRE, Ltd. | | 10,179 | | 320,038 |
| Kolon Corp. | | 7,040 | | 170,672 |
| Kolon Engineering & | | | | |
| Construction Company, Ltd. (I) | | 33,760 | | 141,037 |
| Korea Airport Service Company, Ltd. | | 3,760 | | 142,318 |
| Korea Cast Iron Pipe Industries Company, Ltd. | | 6,600 | | 22,280 |
| Korea Circuit Company, Ltd. (I) | | 10,520 | | 69,399 |
| Korea Development Corp. (I) | | 24,985 | | 96,052 |
| Korea Development Financing Corp. | | 2,940 | | 54,462 |
| Korea Electric Terminal Company, Ltd. | | 8,690 | | 146,535 |
| Korea Exchange Bank | | 550,190 | | 4,469,106 |
| Korea Express Company, Ltd. (I) | | 14,564 | | 1,390,608 |
| Korea Flange Company, Ltd. | | 5,690 | | 69,886 |
| Korea Green Paper | | | | |
| Manufacturing Company, Ltd. (I) | | 2,524 | | 4,178 |
| Korea Investment Holdings Company, Ltd. | | 74,357 | | 2,767,178 |
| Korea Line Corp. (I) | | 22,715 | | 228,210 |
| Korea Mutual Savings Bank (I) | | 1,019 | | 6,345 |
| Korean Petrochemical | | | | |
| Industrial Company, Ltd. | | 4,131 | | 336,803 |
| KP Chemical Corp. | | 14,370 | | 292,529 |
| KPX Chemcial Company, Ltd. | | 2,618 | | 127,535 |
| KTB Network Corp. (I) | | 101,030 | | 385,532 |
| Kukdo Chemical Company, Ltd. | | 3,388 | | 150,114 |
| Kumho Electric Company, Ltd. | | 6,620 | | 211,670 |
| Kumho Industrial Company, Ltd. (I) | | 8,211 | | 88,280 |
| Kumho Investment Bank | | 99,870 | | 70,998 |
| Kumkang Industrial Company, Ltd. | | 1,400 | | 14,835 |
| Kunsul Chemical Industrial Company, Ltd. | | 3,660 | | 46,284 |
| Kwang Dong Pharmaceutical Company, Ltd. | | 78,330 | | 207,187 |
| Kyeryong Construction | | | | |
| Industrial Company, Ltd. | | 11,120 | | 157,113 |
| Kyobo Securities Company, Ltd. | | 35,708 | | 247,665 |
| Kyung Nong Corp. | | 11,060 | | 34,480 |
| Kyung-in Synthetic Corp. | | 37,370 | | 112,218 |
| Kyungbang, Ltd. | | 1,052 | | 104,458 |
| Lee Ku Industrial Company, Ltd. | | 8,740 | | 13,904 |
| LG Display Company, Ltd., ADR (I)(L) | | 817,143 | | 13,057,945 |
| LG Electronics, Inc. | | 194,009 | | 19,201,743 |
| LG Hausys, Ltd. | | 681 | | 44,538 |
| LG Uplus Corp. | | 492,750 | | 2,479,025 |
| Livart Furniture Company, Ltd. | | 4,180 | | 25,120 |
| Lotte Chilsung Beverage Company, Ltd. | | 1,318 | | 1,072,254 |
| Lotte Confectionery Company, Ltd. | | 1,277 | | 1,571,445 |
| Lotte Midopa Company, Ltd. | | 34,850 | | 501,052 |
| Lotte Samkang Company, Ltd. | | 1,523 | | 341,352 |
| Lotte Shopping Company, Ltd. | | 21,999 | | 7,664,945 |
| Manho Rope & Wire, Ltd. | | 1,400 | | 19,393 |
| Meritz Securities Company, Ltd. (I) | | 343,593 | | 314,381 |
| Mi Chang Oil Industrial Company, Ltd. | | 724 | | 30,016 |
| Moorim P&P Company, Ltd. | | 14,240 | | 144,232 |
| Moorim Paper Company, Ltd. | | 21,300 | | 144,958 |
| Motonic Corp. | | 17,805 | | 113,757 |
| Namkwang Engineering & | | | | |
| Construction Company, Ltd. (I) | | 43,700 | | 91,399 |
| | | | |
| Emerging Markets Fund (formerly Emerging |
| Markets Value Fund) (continued) | | |
| | | Shares or | | |
| | | Principal | | |
| | | Amount | | Value |
| | |
|
| |
| COMMON STOCKS (continued) | | | | |
| South Korea (continued) | | | | |
| Namyang Dairy Products Company, Ltd. | | 919 | $ | 561,806 |
| National Information & Credit Evaluation, Inc. | | 297 | | 16,301 |
| Nexen Corp. | | 2,328 | | 120,328 |
| NH Investment & Securities Company, Ltd. | | 51,010 | | 408,801 |
| Nice Information Service Company, Ltd. (I) | | 377 | | 9,597 |
| NK Company, Ltd. | | 16,960 | | 97,054 |
| Nong Shim Company, Ltd. | | 5,631 | | 1,035,508 |
| Nong Shim Holdings Company, Ltd. | | 3,444 | | 162,408 |
| On*Media Corp. (I) | | 92,630 | | 463,953 |
| Ottogi Corp. | | 2,691 | | 293,754 |
| Pacific Corp. | | 6,067 | | 921,701 |
| Pang Rim Company, Ltd. | | 950 | | 10,277 |
| PaperCorea, Inc. (I) | | 10,470 | | 86,318 |
| Poonglim Industrial Company, Ltd. (I) | | 5,520 | | 9,063 |
| Poongsan Corp. | | 27,049 | | 994,659 |
| Poongsan Holdings Corp. | | 7,510 | | 248,491 |
| POSCO | | 4,550 | | 1,863,281 |
| POSCO Coated & Color Steel Company, Ltd. | | 4,270 | | 96,873 |
| POSCO, ADR (L) | | 46,665 | | 4,810,228 |
| Pulmuone Company, Ltd. | | 1,122 | | 35,139 |
| Pumyang Construction Company, Ltd. | | 2,342 | | 8,269 |
| Pusan City Gas Company, Ltd. | | 8,930 | | 156,322 |
| S&T Daewoo Company, Ltd. | | 12,150 | | 308,449 |
| S&T Dynamics Company, Ltd. | | 26,579 | | 393,949 |
| S&T Holdings Company, Ltd. | | 10,110 | | 128,553 |
| Saehan Media Company, Ltd. (I) | | 6,266 | | 30,495 |
| Saeron Automotive Corp. | | 22,270 | | 96,625 |
| Sajo Industries Company, Ltd. | | 300 | | 16,150 |
| Sajodaerim Corp. (I) | | 2,420 | | 60,362 |
| Sam Lip General Foods Company, Ltd. | | 3,850 | | 46,412 |
| Sam Young Electronics Company, Ltd. | | 17,300 | | 157,449 |
| Sam Yung Trading Company, Ltd. | | 4,666 | | 21,116 |
| Sambu Construction Company, Ltd. | | 8,859 | | 122,604 |
| Samho International Company, Ltd. (I) | | 6,780 | | 18,427 |
| Samick Musical Instruments Company, Ltd. | | 59,990 | | 59,726 |
| Samick THK Company, Ltd. | | 7,060 | | 38,858 |
| Samjin Pharmaceutical Company, Ltd. | | 14,550 | | 124,029 |
| Samsung Corp. | | 132,369 | | 7,930,688 |
| Samsung SDI Company, Ltd. | | 52,136 | | 7,724,908 |
| Samwhan Corp. | | 15,100 | | 120,760 |
| Samyang Corp. | | 10,789 | | 546,118 |
| Samyang Foods Company, Ltd. | | 130 | | 2,234 |
| Samyang Genex Company, Ltd. | | 2,837 | | 141,741 |
| Samyang Tongsang Company, Ltd. | | 690 | | 14,217 |
| Savezone I&C Corp. (I) | | 16,880 | | 35,288 |
| SBS Media Holdings Company, Ltd. (I) | | 66,090 | | 130,803 |
| Seah Besteel Corp. | | 18,210 | | 662,464 |
| SeAH Holdings Corp. | | 1,403 | | 145,854 |
| SeAH Steel Corp. | | 4,144 | | 256,011 |
| Sebang Company, Ltd. | | 19,040 | | 269,435 |
| Sejong Industrial Company, Ltd. | | 5,230 | | 55,421 |
| Seowon Company, Ltd. | | 38,840 | | 111,187 |
| SGWICUS Corp. (I) | | 48,000 | | 17,696 |
| SH Chemical Company, Ltd. (I) | | 31,743 | | 9,939 |
| Shin Poong Pharmaceutical Company, Ltd. | | 1,936 | | 57,601 |
| Shinhan Engineering & | | | | |
| Construction Company, Ltd. (I) | | 3,177 | | 14,698 |
| Shinhan Financial Group | | | | |
| Company, Ltd., SADR (I)(L) | | 254,807 | | 21,355,375 |
| Shinhan Financial Group Company, Ltd. | | 78,890 | | 3,301,230 |
| Shinsegae Engineering & | | | | |
| Construction Company, Ltd. | | 1,110 | | 13,744 |
| |
| The accompanying notes are an integral part of the financial statements. | 66 |
John Hancock Funds II
Portfolio of Investments — February 28, 2011 (Unaudited) (showing percentage of total net assets)
| | | | |
| Emerging Markets Fund (formerly Emerging |
| Markets Value Fund) (continued) | | |
| | | Shares or | | |
| | | Principal | | |
| | | Amount | | Value |
| | |
|
| |
| COMMON STOCKS (continued) | | | | |
| South Korea (continued) | | | | |
| Shinsegae Information & | | | | |
| Communication Company, Ltd. | | 484 | $ | 26,422 |
| Shinsung FA Company, Ltd. | | 3,222 | | 12,556 |
| Shinwon Corp. | | 43,430 | | 50,857 |
| Shinyoung Securities Company, Ltd. | | 8,030 | | 253,659 |
| Silla Company, Ltd. | | 12,407 | | 158,214 |
| Sindoh Company, Ltd. | | 7,532 | | 336,157 |
| SJM Company, Ltd. | | 4,204 | | 14,462 |
| SJM Holdings Company, Ltd. | | 3,925 | | 21,839 |
| SK Chemicals Company, Ltd. | | 937 | | 48,918 |
| SK Gas Company, Ltd. | | 4,822 | | 160,262 |
| SK Holdings Company, Ltd. | | 55,628 | | 6,557,186 |
| SK Networks Company, Ltd. | | 192,240 | | 1,976,571 |
| SKC Company, Ltd. | | 11,190 | | 405,868 |
| Solomon Mutual Savings Bank (I) | | 3,600 | | 8,417 |
| Songwon Industrial Company, Ltd. | | 2,710 | | 34,924 |
| Ssangyong Cement | | | | |
| Industrial Company, Ltd. (I) | | 34,830 | | 194,623 |
| STX Corp. | | 29,023 | | 749,144 |
| STX Pan Ocean Company, Ltd. | | 228,240 | | 1,928,638 |
| STX Shipbuilding Company, Ltd. | | 81,850 | | 1,988,337 |
| Suheung Capsule Company, Ltd. | | 9,580 | | 62,836 |
| Sung Bo Chemicals Company, Ltd. | | 410 | | 8,803 |
| Sungjee Construction Company, Ltd. (I) | | 2,210 | | 1,614 |
| Sungshin Cement Company, Ltd. (I) | | 5,760 | | 18,704 |
| Sunjin Company, Ltd. (I) | | 1,768 | | 36,504 |
| Tae Kyung Industrial Company, Ltd. | | 14,930 | | 57,674 |
| Taegu Department Store Company, Ltd. | | 12,550 | | 132,950 |
| Taekwang Industrial Company, Ltd. | | 722 | | 745,751 |
| Taeyoung Engineering & Construction, Ltd. | | 83,610 | | 380,967 |
| Taihan Electric Wire Company, Ltd. (I) | | 139,080 | | 684,540 |
| Tailim Packaging Industrial Company, Ltd. | | 59,700 | | 71,214 |
| Tec & Company (I) | | 57,230 | | 8,303 |
| Telcoware Company, Ltd. | | 4,000 | | 26,844 |
| Tong Yang Investment Bank | | 151,090 | | 1,037,826 |
| Tong Yang Major Corp. (I) | | 44,740 | | 105,797 |
| Trybrands, Inc. (I) | | 30,360 | | 16,158 |
| TS Corp. | | 3,611 | | 133,933 |
| Uangel Corp. | | 7,990 | | 28,273 |
| Unid Company, Ltd. | | 6,039 | | 307,809 |
| Union Steel Company, Ltd. | | 5,560 | | 103,218 |
| Wiscom Company, Ltd. | | 3,680 | | 13,482 |
| Woongjin Holdings Company, Ltd. (I) | | 73,910 | | 620,511 |
| Woori Finance Holdings Company, Ltd. | | 221,190 | | 2,693,556 |
| Woori Finance Holdings | | | | |
| Company, Ltd., ADR (I)(L) | | 7,867 | | 288,562 |
| Woori Financial Company, Ltd. | | 15,810 | | 226,420 |
| Woori Investment & Securities Company, Ltd. | | 156,460 | | 2,853,217 |
| YESCO Company, Ltd. | | 1,480 | | 31,814 |
| Yoosung Enterprise Company, Ltd. | | 10,176 | | 21,133 |
| Youlchon Chemical Company, Ltd. | | 21,790 | | 159,905 |
| Young Poong Corp. | | 528 | | 340,975 |
| Youngone Corp. | | 18,824 | | 200,896 |
| Youngone Holdings Company, Ltd. | | 6,286 | | 169,892 |
| YuHwa Securities Company, Ltd. | | 3,240 | | 43,366 |
| | |
|
| | | | | 291,836,467 |
| Taiwan - 12.88% | | | | |
| Acbel Polytech, Inc. | | 312,000 | | 233,119 |
| Accton Technology Corp. | | 834,000 | | 512,049 |
| Achem Technology Corp. | | 282,000 | | 179,904 |
| Action Electronics Company, Ltd. (I) | | 426,000 | | 150,571 |
| AGV Products Corp. (I) | | 753,505 | | 336,125 |
| Allis Electric Company, Ltd. | | 240,000 | | 87,432 |
| | | | |
| Emerging Markets Fund (formerly Emerging |
| Markets Value Fund) (continued) | | |
| | | Shares or | | |
| | | Principal | | |
| | | Amount | | Value |
| | |
|
| |
| COMMON STOCKS (continued) | | | | |
| Taiwan (continued) | | | | |
| Alpha Networks, Inc. | | 440,000 | $ | 363,882 |
| Altek Corp. | | 357,089 | | 485,794 |
| Ampoc Far-East Co., Ltd. (I) | | 132,000 | | 88,801 |
| AmTRAN Technology Company, Ltd. | | 1,078,000 | | 926,848 |
| APCB, Inc. | | 143,000 | | 131,755 |
| Apex Science & Engineering | | 240,640 | | 99,952 |
| Arima Communication Corp. (I) | | 523,000 | | 283,245 |
| Arima Optoelectronics Corp. (I) | | 464,134 | | 141,319 |
| Asia Cement Corp. | | 3,865,162 | | 3,892,725 |
| Asia Optical Company, Inc. (I) | | 392,710 | | 900,453 |
| Asia Polymer Corp. | | 404,400 | | 589,754 |
| Asustek Computer, Inc. | | 366,827 | | 3,345,678 |
| AU Optronics Corp. (I)(L) | | 1,575,935 | | 14,151,896 |
| Audix Corp. | | 173,200 | | 186,104 |
| Aurora Systems Corp. | | 169,000 | | 202,983 |
| Avision, Inc. | | 277,916 | | 199,367 |
| Awea Mechantronic Company, Ltd. | | 6,000 | | 7,276 |
| Bank of Kaohsiung, Ltd. (I) | | 564,680 | | 248,168 |
| BES Engineering Corp. | | 2,721,200 | | 866,639 |
| Biostar Microtech International Corp. | | 227,000 | | 122,544 |
| C Sun Manufacturing, Ltd. | | 175,729 | | 157,950 |
| Cameo Communications, Inc. | | 331,090 | | 146,871 |
| Capital Securities Corp. | | 2,450,612 | | 1,125,173 |
| Carnival Industrial Corp. (I) | | 512,000 | | 180,899 |
| Catcher Technology Company, Ltd. | | 258,000 | | 1,082,169 |
| Cathay Chemical Works, Inc. | | 116,000 | | 57,112 |
| Cathay Real Estate | | | | |
| Development Company, Ltd. | | 1,529,000 | | 759,738 |
| Central Reinsurance Company, Ltd. | | 330,535 | | 188,059 |
| Chain Qui Development Company, Ltd. | | 216,000 | | 178,152 |
| Champion Building Materials Company, Ltd. | | 512,852 | | 387,277 |
| Chang Hwa Commercial Bank, Ltd. | | 3,782,000 | | 2,808,148 |
| Charoen Pokphand Enterprise. | | 300,000 | | 181,125 |
| Cheng Loong Corp. | | 1,712,000 | | 778,041 |
| Cheng Uei Precision Industry Company, Ltd. | | 660,103 | | 1,266,821 |
| Chia Hsin Cement Corp. | | 869,611 | | 467,141 |
| Chien Kuo Construction Company, Ltd. | | 396,160 | | 202,802 |
| Chien Shing Stainless Steel Company, Ltd. (I) | | 319,000 | | 84,477 |
| Chimei Innolux Corp. (I) | | 10,988,758 | | 11,719,262 |
| Chin-Poon Industrial Company, Ltd. | | 678,642 | | 564,814 |
| China Airlines, Ltd. (I) | | 306,961 | | 200,021 |
| China Chemical & | | | | |
| Pharmaceutical Company, Ltd. | | 84,000 | | 75,149 |
| China Development Financial Holdings Corp. | | 18,375,087 | | 7,072,841 |
| China Electric Manufacturing Corp. | | 147,000 | | 119,460 |
| China General Plastics Corp. | | 588,000 | | 246,595 |
| China Manmade Fibers Corp. (I) | | 2,062,000 | | 1,130,980 |
| China Metal Products Company, Ltd. | | 446,248 | | 455,901 |
| China Motor Company, Ltd. | | 1,144,905 | | 962,743 |
| China Petrochemical Development Corp. (I) | | 3,005,780 | | 3,470,335 |
| China Steel Structure Company, Ltd. | | 204,000 | | 194,785 |
| China Synthetic Rubber Corp. | | 926,937 | | 865,416 |
| China Wire & Cable Company, Ltd. (I) | | 483,000 | | 183,550 |
| Chinatrust Financial Holding Company, Ltd. | | 87,823 | | 68,942 |
| Ching Feng Home Fashions Company, Ltd. (I) | | 108,780 | | 28,981 |
| Chun Yu Works & Company, Ltd. (I) | | 405,000 | | 132,834 |
| Chun Yuan Steel Industrial Company, Ltd. | | 652,980 | | 330,847 |
| Chung Hsin Electric & | | | | |
| Machinery Manufacturing Corp. | | 623,000 | | 353,018 |
| Chung Hung Steel Corp. (I) | | 1,491,564 | | 893,407 |
| Chung Hwa Pulp Corp. (I) | | 843,000 | | 436,313 |
| Chunghwa Picture Tubes, Ltd. (I) | | 5,416,320 | | 729,642 |
| Chuwa Wool Industry Company, Ltd. (I) | | 99,000 | | 116,776 |
| |
| The accompanying notes are an integral part of the financial statements. | 67 |
John Hancock Funds II
Portfolio of Investments — February 28, 2011 (Unaudited) (showing percentage of total net assets)
| | | | |
| Emerging Markets Fund (formerly Emerging |
| Markets Value Fund) (continued) | | |
| | | Shares or | | |
| | | Principal | | |
| | | Amount | | Value |
| | |
|
| |
| COMMON STOCKS (continued) | | | | |
| Taiwan (continued) | | | | |
| Chyang Sheng Dyeing & | | | | |
| Finishing Company, Ltd. (I) | | 46,000 | $ | 19,256 |
| CMC Magnetics Corp. (I) | | 5,157,000 | | 1,219,706 |
| Collins Company, Ltd. | | 276,400 | | 124,619 |
| Compal Communications, Inc. | | 315,000 | | 301,077 |
| Compal Electronics, Inc. | | 2,102,895 | | 2,471,027 |
| Compeq Manufactuing Company, Ltd. (I) | | 1,703,000 | | 1,024,246 |
| Continental Holdings Corp. (I) | | 875,000 | | 359,024 |
| Coxon Precise Industrial Company, Ltd. | | 152,231 | | 286,416 |
| CSBC Corp. Taiwan | | 7,197 | | 6,335 |
| D-Link Corp. | | 1,083,627 | | 945,407 |
| Da Cin Construction Company, Ltd. | | 287,000 | | 163,693 |
| Darfon Electronics Corp. | | 351,950 | | 394,167 |
| De Licacy Industrial Company | | 150,000 | | 51,682 |
| Delpha Construction Company, Ltd. | | 316,005 | | 154,817 |
| Depo Auto Parts Industrial Company, Ltd. | | 48,000 | | 113,236 |
| DFI, Inc. | | 56,000 | | 49,816 |
| Dynamic Electronics Company, Ltd. | | 339,000 | | 193,345 |
| E.Sun Financial Holding Company, Ltd. | | 6,676,120 | | 4,107,709 |
| Eastern Media International Corp. (I) | | 1,374,053 | | 304,425 |
| Eclat Textile Company, Ltd. | | 182,384 | | 203,451 |
| Edom Technology Company, Ltd. | | 201,000 | | 102,955 |
| Elitegroup Computer Systems Company, Ltd. | | 1,162,576 | | 416,239 |
| Enlight Corp. (I) | | 49,439 | | 8,403 |
| Entie Commercial Bank (I) | | 360,000 | | 188,611 |
| Eternal Chemical Company, Ltd. | | 283,471 | | 303,302 |
| EVA Airways Corp. (I) | | 368,419 | | 333,097 |
| Everest Textile Company, Ltd. (I) | | 588,000 | | 182,188 |
| Evergreen International Storage | | | | |
| & Transport Corp. | | 959,320 | | 795,087 |
| Evergreen Marine Corp. (I) | | 2,679,000 | | 2,370,705 |
| Everspring Industry Company, Ltd. (I) | | 277,000 | | 93,229 |
| Evertop Wire Cable Corp. (I) | | 98,275 | | 23,387 |
| Excel Cell Electronic Company, Ltd. | | 103,000 | | 70,253 |
| Far Eastern Department Stores Company, Ltd. | | 544,100 | | 824,730 |
| Far Eastern International Bank | | 2,561,017 | | 1,145,793 |
| Federal Corp. | | 682,049 | | 450,182 |
| First Copper Technology Company, Ltd. | | 476,000 | | 216,154 |
| First Financial Holding Company, Ltd. | | 10,514,483 | | 8,625,196 |
| First Hotel | | 31,040 | | 28,595 |
| First Insurance Company, Ltd. | | 364,165 | | 218,794 |
| Forhouse Corp. | | 575,894 | | 553,309 |
| Formosa Oilseed Processing (I) | | 191,225 | | 95,076 |
| Formosa Taffeta Company, Ltd. | | 1,616,000 | | 1,500,452 |
| Formosan Rubber Group, Inc. | | 767,000 | | 668,849 |
| Formosan Union Chemical (I) | | 452,485 | | 247,210 |
| Founding Construction & | | | | |
| Development Company, Ltd. | | 196,367 | | 159,101 |
| Froch Enterprise Company, Ltd. (I) | | 292,000 | | 191,997 |
| FSP Technology, Inc. | | 359,637 | | 437,126 |
| FU I Industrial Company, Ltd. (I) | | 159,000 | | 51,495 |
| Fullerton Technology Company, Ltd. | | 142,563 | | 167,922 |
| Fwusow Industry Company, Ltd. | | 378,290 | | 181,383 |
| G Shank Enterprise Company, Ltd. | | 205,000 | | 158,674 |
| Gamma Optical Company, Ltd. | | 129,800 | | 95,394 |
| Gem Terminal Industrial Company, Ltd. | | 47,500 | | 30,635 |
| Getac Technology Corp. | | 623,000 | | 352,857 |
| Giantplus Technology Company, Ltd. (I) | | 345,000 | | 257,480 |
| Gigabyte Technology Company, Ltd. | | 1,041,719 | | 1,043,753 |
| Global Brands Manufacture, Ltd. | | 279,886 | | 173,630 |
| Gold Circuit Electronics, Ltd. (I) | | 822,071 | | 378,598 |
| Goldsun Development & | | | | |
| Construction Company, Ltd. | | 2,482,184 | | 1,117,380 |
| | | | |
| Emerging Markets Fund (formerly Emerging |
| Markets Value Fund) (continued) | | |
| | | Shares or | | |
| | | Principal | | |
| | | Amount | | Value |
| | |
|
| |
| COMMON STOCKS (continued) | | | | |
| Taiwan (continued) | | | | |
| Gordon Auto Body Parts Company, Ltd. (I) | | 134,184 | $ | 44,967 |
| Grand Pacific Petrochemical Corp. | | 1,580,000 | | 960,073 |
| Great China Metal Industry Company, Ltd. | | 303,000 | | 318,333 |
| Great Wall Enterprise Company, Ltd. | | 448,650 | | 436,269 |
| Greatek Electronics, Inc. | | 654,158 | | 626,173 |
| GTM Corp. (I) | | 263,000 | | 183,217 |
| Hannstar Board Corp. | | 399,294 | | 257,197 |
| HannStar Display Corp. (I) | | 9,541,000 | | 1,730,201 |
| Hey Song Corp. | | 927,000 | | 733,096 |
| Hitron Technology, Inc. | | 154,000 | | 112,251 |
| Ho Tung Chemical Corp. (I) | | 892,201 | | 475,669 |
| Hocheng Group Corp. (I) | | 444,000 | | 165,623 |
| Hold-Key Electric Wire & | | | | |
| Cable Company, Ltd. (I) | | 282,640 | | 188,353 |
| Holystone Enterprise Company, Ltd. | | 310,478 | | 364,199 |
| Hong Ho Precision Textile Company (I) | | 39,000 | | 25,131 |
| Hong TAI Electric Industrial Company, Ltd. | | 409,000 | | 195,451 |
| Hong Yi Fiber Industry Co. | | 142,000 | | 78,795 |
| Hota Industrial | | | | |
| Manufacturing Company, Ltd. (I) | | 5,000 | | 2,450 |
| Hsin Kuang Steel Company, Ltd. | | 420,153 | | 468,759 |
| Hsing TA Cement Company, Ltd. | | 227,000 | | 74,928 |
| Hua Eng Wire & Cable Company, Ltd. | | 1,053,000 | | 400,289 |
| Hua Nan Financial Holdings Company, Ltd. | | 3,683,361 | | 2,621,555 |
| Hung Ching Development Company, Ltd. | | 203,000 | | 126,480 |
| Hung Sheng Construction Company, Ltd. | | 935,008 | | 544,598 |
| Hwa Fong Rubber Company, Ltd. (I) | | 584,770 | | 178,752 |
| I-Chiun Precision Industry Company, Ltd. | | 33,000 | | 37,722 |
| Ichia Technologies, Inc. | | 512,300 | | 345,206 |
| Inotera Memories, Inc. (I) | | 4,137,165 | | 2,186,132 |
| Inventec Appliances Corp. | | 339,000 | | 260,646 |
| Inventec Company, Ltd. | | 3,910,089 | | 2,016,337 |
| Jui Li Enterprise Company, Ltd. (I) | | 66,950 | | 20,452 |
| K Laser Technology, Inc. | | 193,214 | | 107,720 |
| Kang Na Hsiung Enterprise Company, Ltd. | | 241,000 | | 161,028 |
| Kaulin Manufacturing Company, Ltd. | | 234,490 | | 226,211 |
| KEE TAI Properties Company, Ltd. | | 612,719 | | 365,165 |
| Kindom Construction Company, Ltd. | | 561,000 | | 437,253 |
| King Yuan Electronics Company, Ltd. (I) | | 2,299,762 | | 1,352,216 |
| King’s Town Bank (I) | | 1,683,000 | | 978,341 |
| Kinko Optical Company, Ltd. (I) | | 56,648 | | 97,381 |
| Kinpo Electronics, Inc. (I) | | 2,091,724 | | 708,141 |
| Kwong Fong Industries Corp. (I) | | 653,100 | | 278,512 |
| KYE System Corp. | | 89,000 | | 65,950 |
| L&K Engineering Company, Ltd. | | 245,952 | | 264,568 |
| Lan Fa Textile Company, Ltd. (I) | | 353,874 | | 213,356 |
| Lead Data, Inc. (I) | | 428,173 | | 67,683 |
| Leader Electronics, Inc. | | 167,000 | | 110,641 |
| Lealea Enterprise Company, Ltd. | | 1,165,435 | | 625,963 |
| LEE CHI Enterprises Company, Ltd. | | 287,000 | | 139,022 |
| Lelon Electronics Corp. (I) | | 162,000 | | 110,159 |
| Leofoo Development Company, Ltd. (I) | | 370,197 | | 247,598 |
| Li Peng Enterprise Company, Ltd. (I) | | 580,864 | | 328,679 |
| Lian Hwa Food Corp. | | 137,000 | | 112,487 |
| Lien Hwa Industrial Corp. | | 927,954 | | 630,878 |
| Lingsen Precision Industries, Ltd. | | 562,101 | | 467,838 |
| Lite-on It Corp. | | 701,764 | | 701,302 |
| Lite-On Semiconductor Corp. (I) | | 463,080 | | 321,283 |
| Lite-On Technology Corp. | | 4,219,072 | | 5,257,146 |
| Long Bon International Company, Ltd. | | 492,000 | | 199,097 |
| Long Chen Paper Company, Ltd. | | 730,476 | | 284,089 |
| Lucky Cement Corp. | | 272,000 | | 66,155 |
| Macronix International Company, Ltd. | | 4,896,694 | | 3,559,356 |
| |
| The accompanying notes are an integral part of the financial statements. | 68 |
John Hancock Funds II
Portfolio of Investments — February 28, 2011 (Unaudited) (showing percentage of total net assets)
| | | | |
| Emerging Markets Fund (formerly Emerging |
| Markets Value Fund) (continued) | | |
| | | Shares or | | |
| | | Principal | | |
| | | Amount | | Value |
| | |
|
| |
| COMMON STOCKS (continued) | | | | |
| Taiwan (continued) | | | | |
| Marketech International Corp. | | 207,000 | $ | 131,025 |
| Masterlink Securities Corp | | 1,915,780 | | 821,242 |
| Maxtek Technology Company, Ltd. | | 76,000 | | 86,757 |
| Mayer Steel Pipe Corp. | | 231,859 | | 179,335 |
| Maywufa Company, Ltd. | | 18,000 | | 9,572 |
| Mega Financial Holding Company, Ltd. | | 17,250,000 | | 12,485,506 |
| Meiloon Industrial Company, Ltd. | | 299,231 | | 159,979 |
| Mercuries & Associates, Ltd. | | 502,150 | | 366,464 |
| Mercuries Data Systems, Ltd. (I) | | 148,000 | | 72,180 |
| Micro-Star International Company, Ltd. | | 1,832,488 | | 1,000,150 |
| Microelectronics Technology (I) | | 554,000 | | 321,928 |
| Mitac International | | 2,247,466 | | 1,008,850 |
| Mobiletron Electronics Company, Ltd. | | 67,000 | | 49,501 |
| Mosel Vitelic, Inc. (I) | | 1,023,109 | | 518,907 |
| Mustek Systems, Inc. (I) | | 40,151 | | 6,168 |
| Nantex Industry Company, Ltd. | | 292,520 | | 238,585 |
| New Asia Construction | | | | |
| & Development Corp. (I) | | 252,000 | | 107,287 |
| Nien Hsing Textile Company, Ltd. | | 642,520 | | 492,677 |
| Optimax Technology Corp. (I) | | 170,816 | | 27,263 |
| Opto Technology Corp. | | 140,000 | | 97,653 |
| Orient Semiconductor Electronics, Ltd. (I) | | 720,000 | | 190,927 |
| Oriental Union Chemical Corp. | | 183,000 | | 256,032 |
| Pacific Construction Company, Ltd. (I) | | 267,000 | | 43,863 |
| Paragon Technologies Company, Ltd. | | 116,000 | | 195,242 |
| Pegatron Corp. (I) | | 987,321 | | 1,169,173 |
| Phihong Technology Company, Ltd. | | 46,416 | | 78,040 |
| Plotech Company, Ltd. | | 146,000 | | 112,718 |
| Polaris Securities Company, Ltd. | | 3,956,238 | | 2,440,460 |
| Pou Chen Corp. | | 4,233,448 | | 3,700,404 |
| Power Quotient International Company, Ltd. | | 131,000 | | 78,032 |
| President Securities Corp. | | 1,435,960 | | 906,244 |
| Prince Housing Development Corp. | | 567,000 | | 393,727 |
| Prodisc Technology, Inc. (I) | | 540,000 | | 6,598 |
| Promate Electronic Company, Ltd. | | 222,000 | | 170,539 |
| Qisda Corp. (I) | | 1,091,000 | | 657,778 |
| Quintain Steel Company, Ltd. (I) | | 427,750 | | 171,773 |
| Radiant Opto-Electronics Corp. | | 813,254 | | 1,813,843 |
| Ralec Electronic Corp. | | 80,259 | | 163,970 |
| Rechi Precision Company, Ltd. (I) | | 354,000 | | 211,881 |
| Rexon Industrial Corp., Ltd. (I) | | 291,000 | | 80,183 |
| Ritek Corp. (I) | | 4,925,428 | | 1,439,837 |
| Sampo Corp. (I) | | 1,206,997 | | 405,162 |
| Sanyang Industrial Company, Ltd. (I) | | 1,248,481 | | 734,783 |
| Sesoda Corp. | | 10,000 | | 12,028 |
| Shan-Loong Transportation Company, Ltd. | | 4,000 | | 2,479 |
| Sheng Yu Steel Company, Ltd. | | 188,000 | | 133,200 |
| Shih Wei Navigation Company, Ltd. | | 54,000 | | 68,811 |
| Shihlin Electric & Engineering Corp. | | 624,213 | | 756,337 |
| Shin Kong Financial | | | | |
| Holding Company, Ltd. (I) | | 11,255,017 | | 4,756,241 |
| Shin Zu Shing Company, Ltd. | | 142,933 | | 357,770 |
| Shinkong Insurance Company, Ltd. | | 310,000 | | 280,664 |
| Shinkong Synthetic Fibers Corp. | | 2,450,450 | | 1,085,076 |
| Shuttle, Inc. (I) | | 204,985 | | 113,666 |
| Sigurd Microelectronics Corp. | | 541,887 | | 510,853 |
| Silicon Integrated Systems Corp. | | 1,181,000 | | 733,084 |
| Sinbon Electronics Company, Ltd. | | 291,000 | | 209,332 |
| Sincere Navigation Corp. | | 282,000 | | 312,120 |
| Sinkang Industries, Ltd. | | 111,000 | | 71,920 |
| Sinon Corp. | | 625,150 | | 287,372 |
| SinoPac Holdings Company, Ltd. | | 11,278,000 | | 4,683,781 |
| Siward Crystal Technology Company, Ltd. (I) | | 217,301 | | 145,147 |
| | | | |
| Emerging Markets Fund (formerly Emerging |
| Markets Value Fund) (continued) | | |
| | | Shares or | | |
| | | Principal | | |
| | | Amount | | Value |
| | |
|
| |
| COMMON STOCKS (continued) | | | | |
| Taiwan (continued) | | | | |
| Solelytex Industrial Corp. (I) | | 115,758 | $ | 75,959 |
| Solomon Technology Corp. (I) | | 235,036 | | 106,026 |
| Southeast Cement Company, Ltd. | | 390,000 | | 150,672 |
| Spirox Corp. | | 172,369 | | 123,335 |
| Springsoft, Inc. | | 348,000 | | 410,994 |
| Stark Technology, Inc. | | 164,000 | | 146,577 |
| Sunplus Technology Company, Ltd. (I) | | 858,000 | | 530,091 |
| Sunspring Metal Corp. | | 17,000 | | 21,343 |
| Supreme Electronics Company, Ltd. | | 322,000 | | 258,725 |
| Sweeten Construction Company, Ltd. | | 103,100 | | 61,392 |
| Ta Chen Stainless Pipe Company, Ltd. | | 887,407 | | 618,943 |
| Ta Chong Bank Company, Ltd. (I) | | 2,940,000 | | 1,100,441 |
| Ta Ya Electric Wire & Cable Company, Ltd. | | 983,571 | | 281,586 |
| TA-I Technology Company, Ltd. | | 84,000 | | 90,312 |
| Tah Hsin Industrial Company, Ltd. | | 125,000 | | 111,438 |
| Tai Roun Products Company, Ltd. (I) | | 111,000 | | 49,147 |
| Taichung Commercial Bank (I) | | 2,361,120 | | 1,079,315 |
| Tainan Enterprises Company, Ltd. | | 201,467 | | 245,536 |
| Tainan Spinning Company, Ltd. | | 2,023,680 | | 1,212,801 |
| Taishin Financial Holdings Company, Ltd. (I) | | 9,128,326 | | 4,763,616 |
| Taisun Enterprise Company, Ltd. | | 397,800 | | 216,765 |
| Taita Chemical Company, Ltd. (I) | | 410,790 | | 178,201 |
| Taiwan Business Bank (I) | | 4,962,920 | | 1,954,295 |
| Taiwan Cement Corp. | | 6,978,726 | | 6,932,778 |
| Taiwan Cogeneration Corp. | | 563,680 | | 351,396 |
| Taiwan Cooperative Bank | | 7,238,402 | | 5,487,885 |
| Taiwan Fu Hsing Industrial Company, Ltd. | | 212,000 | | 166,766 |
| Taiwan Glass Industrial Corp. | | 900,334 | | 1,100,681 |
| Taiwan Kolin Company, Ltd. (I) | | 400,000 | | 0 |
| Taiwan Land Development Corp. (I) | | 631,276 | | 293,609 |
| Taiwan Mask Corp. | | 442,850 | | 179,808 |
| Taiwan Navigation Co., Ltd. | | 18,000 | | 20,095 |
| Taiwan Paiho, Ltd. | | 456,395 | | 451,967 |
| Taiwan Pulp & Paper Corp. (I) | | 544,000 | | 303,725 |
| Taiwan Sakura Corp. | | 57,016 | | 40,671 |
| Taiwan Sogo Shin Kong | | 372,000 | | 295,342 |
| Taiwan Styrene Monomer Corp. | | 1,000,479 | | 464,954 |
| Taiwan Tea Corp. | | 967,723 | | 580,750 |
| Taiyen Biotech Company, Ltd. | | 395,000 | | 289,471 |
| Tatung Company, Ltd. (I) | | 9,628,863 | | 2,234,058 |
| Teapo Electronic Corp. (I) | | 248,512 | | 70,467 |
| Teco Electric & Machinery Company, Ltd. | | 3,422,109 | | 2,012,101 |
| Tecom Company, Ltd. (I) | | 41,000 | | 12,174 |
| Tex-Ray Industrial Company, Ltd. (I) | | 90,000 | | 32,883 |
| Ton Yi Industrial Corp. | | 1,390,000 | | 702,625 |
| Tong Yang Industry Company, Ltd. | | 295,780 | | 372,589 |
| Tong-Tai Machine & Tool Company, Ltd. | | 60,000 | | 83,417 |
| Topco Scientific Company, Ltd. | | 208,720 | | 320,780 |
| Topoint Technology Company, Ltd. | | 169,000 | | 161,141 |
| Tsann Kuen Enterprise Company, Ltd. | | 3,220 | | 6,421 |
| Tung Ho Steel Enterprise Corp. | | 1,512,138 | | 1,600,073 |
| Tung Ho Textile Company, Ltd. (I) | | 247,000 | | 137,661 |
| Twinhead International Corp. (I) | | 224,000 | | 34,288 |
| TYC Brother Industrial Company, Ltd. | | 327,052 | | 188,723 |
| Tycoons Group Enterprise Company, Ltd. (I) | | 594,536 | | 183,402 |
| TZE Shin International Company, Ltd. | | 222,141 | | 105,307 |
| U-Tech Media Corp. (I) | | 301,000 | | 98,818 |
| Unimicron Technology Corp. | | 176,855 | | 328,198 |
| Union Bank of Taiwan (I) | | 1,256,642 | | 467,558 |
| Unitech Electronics Company, Ltd. | | 211,039 | | 113,145 |
| Unitech Printed Circuit Board Corp. (I) | | 617,950 | | 395,904 |
| United Microelectronics Corp. | | 24,273,468 | | 12,624,551 |
| Universal Cement Corp. | | 929,808 | | 555,031 |
| |
| The accompanying notes are an integral part of the financial statements. | 69 |
John Hancock Funds II
Portfolio of Investments — February 28, 2011 (Unaudited) (showing percentage of total net assets)
| | | | |
| Emerging Markets Fund (formerly Emerging |
| Markets Value Fund) (continued) | | |
| | | Shares or | | |
| | | Principal | | |
| | | Amount | | Value |
| | |
|
| |
| COMMON STOCKS (continued) | | | | |
| Taiwan (continued) | | | | |
| Universal Microelectronics Company, Ltd. (I) | | 143,000 | $ | 93,425 |
| Unizyx Holding Corp. (I) | | 699,000 | | 545,435 |
| UPC Technology Corp. | | 1,110,357 | | 822,990 |
| USI Corp. | | 1,084,160 | | 1,375,259 |
| Ve Wong Corp. | | 218,450 | | 170,728 |
| Wah Lee Industrial Corp. | | 12,000 | | 23,748 |
| Walsin Lihwa Corp. (I) | | 6,333,000 | | 3,364,584 |
| Walsin Technology Corp. (I) | | 864,262 | | 536,949 |
| Walton Advanced Engineering, Inc. | | 383,661 | | 210,827 |
| Wan Hai Lines, Ltd. (I) | | 378,920 | | 259,396 |
| Waterland Financial Holding Company | | 4,113,318 | | 2,205,529 |
| WEI Chih Steel Industrial Company, Ltd. (I) | | 255,000 | | 83,314 |
| Weikeng Industrial Company, Ltd. | | 258,000 | | 230,494 |
| Well Shin Technology Company, Ltd. | | 54,000 | | 94,330 |
| Wellypower Optronics Corp. | | 235,000 | | 272,555 |
| Winbond Electronics Corp. (I) | | 5,386,000 | | 1,795,797 |
| Wintek Corp. (I) | | 1,838,000 | | 3,552,632 |
| WT Microelectronics Company, Ltd. | | 167,000 | | 256,132 |
| WUS Printed Circuit Company, Ltd. (I) | | 556,000 | | 392,688 |
| Yageo Corp. | | 3,968,000 | | 1,969,237 |
| Yang Ming Marine Transport Corp. (I) | | 2,239,015 | | 1,897,078 |
| Yem Chio Company, Ltd. | | 128,000 | | 124,650 |
| Yeun Chyang Industrial Company, Ltd. | | 496,000 | | 424,293 |
| Yi Jinn Industrial Company, Ltd. (I) | | 403,508 | | 159,503 |
| Yieh Phui Enterprise Company, Ltd. | | 1,857,602 | | 696,268 |
| Yuanta Financial Holdings Company, Ltd. | | 11,737,608 | | 8,084,259 |
| Yuen Foong Yu Paper | | | | |
| Manufacturing Company, Ltd. | | 2,163,167 | | 918,604 |
| Yulon Motor Company, Ltd. | | 1,730,900 | | 3,422,035 |
| Yung Chi Paint & Varnish | | | | |
| Manufacturing Company, Ltd. | | 92,850 | | 142,838 |
| Yungtay Engineering Company, Ltd. | | 608,000 | | 798,768 |
| Zenitron Corp. | | 256,000 | | 182,446 |
| Zig Sheng Industrial Company, Ltd. | | 565,536 | | 375,116 |
| | |
|
| | | | | 277,748,896 |
| Thailand - 1.97% | | | | |
| Asia Plus Securities PCL | | 1,679,600 | | 154,913 |
| Asian Property Development PCL | | 540,400 | | 109,582 |
| Bangchak Petroleum PCL | | 1,001,000 | | 595,853 |
| Bangkok Bank PCL | | 1,741,600 | | 9,336,891 |
| Bangkok Expressway PCL | | 708,800 | | 435,828 |
| Bangkok Insurance PCL | | 8,050 | | 66,085 |
| Bangkokland PCL (I) | | 16,323,800 | | 331,014 |
| Bank of Ayudhya PCL | | 5,079,200 | | 4,149,918 |
| Cal-Comp Electronics Thailand PCL | | 3,042,400 | | 326,380 |
| Central Plaza Hotel PCL | | 1,632,600 | | 246,692 |
| Delta Electronics Thailand PCL | | 188,400 | | 169,452 |
| Eastern Water Resources Development & | | | | |
| Management PCL | | 140,000 | | 28,160 |
| Esso Thailand PCL | | 2,335,900 | | 641,752 |
| G J Steel PCL (I) | | 24,328,200 | | 214,836 |
| G Steel PCL (I) | | 12,662,700 | | 289,906 |
| Hana Microelectronics PCL | | 568,100 | | 473,804 |
| Hemaraj Land & Development PCL | | 674,700 | | 39,279 |
| IRPC PCL | | 14,785,900 | | 2,683,949 |
| Italian-Thai Development PCL (I) | | 3,859,370 | | 464,513 |
| Jasmine International PCL | | 6,601,900 | | 408,098 |
| Kang Yong Electric PCl | | 2,800 | | 18,865 |
| KGI Securities Thailand PCL | | 2,669,900 | | 253,237 |
| Kiatnakin Finance PCL | | 530,400 | | 568,131 |
| Krung Thai Bank PCL | | 7,486,900 | | 4,015,868 |
| Krungthai Card PCL (I) | | 126,000 | | 64,700 |
| Loxley PCL (I) | | 988,200 | | 80,801 |
| | | | |
| Emerging Markets Fund (formerly Emerging |
| Markets Value Fund) (continued) | | |
| | | Shares or | | |
| | | Principal | | |
| | | Amount | | Value |
| | |
|
| |
| COMMON STOCKS (continued) | | | | |
| Thailand (continued) | | | | |
| MBK PCL | | 86,100 | $ | 281,603 |
| Padaeng Industry PCL | | 183,200 | | 134,816 |
| Polyplex PCL | | 275,000 | | 211,365 |
| Power Line Engineering PCL (I) | | 492,400 | | 23,030 |
| Pranda Jewelry PCL | | 214,300 | | 46,259 |
| Precious Shipping PCL | | 882,400 | | 510,825 |
| PTT Aromatics & Refining PCL | | 2,525,300 | | 3,055,964 |
| PTT Chemical PCL | | 41,900 | | 197,338 |
| Quality House PCL | | 5,687,200 | | 386,897 |
| Regional Container Lines PCL (I) | | 829,300 | | 282,084 |
| Saha-Union PCL | | 266,600 | | 326,983 |
| Sahaviriya Steel Industries PCL (I) | | 13,343,880 | | 567,360 |
| Sansiri PCL (I) | | 1,342,100 | | 267,762 |
| SC Asset Corp. PCL | | 168,200 | | 102,323 |
| Seamico Securities PCL (I) | | 421,400 | | 23,017 |
| Tata Steel Thailand PCL (I) | | 7,517,600 | | 331,930 |
| Thai Airways International PCL | | 1,531,011 | | 1,927,847 |
| Thai Carbon Black PCL | | 174,100 | | 180,791 |
| Thai Oil PCL | | 1,737,300 | | 4,190,544 |
| Thai Plastic & Chemical PCL | | 691,800 | | 563,396 |
| Thai Stanley Electric PCL | | 14,200 | | 77,560 |
| Thaicom PCL (I) | | 811,700 | | 151,323 |
| Thanachart Captial PCL | | 1,114,500 | | 1,084,428 |
| Thoresen Thai Agencies PCL | | 608,670 | | 362,315 |
| Ticon Industrial Connection PCL | | 133,100 | | 54,851 |
| Total Access Communication PCL | | 128,500 | | 172,314 |
| TPI Polene PCL | | 1,778,440 | | 639,831 |
| Vanachai Group PCL | | 1,124,200 | | 166,929 |
| Vinythai PCL | | 100,000 | | 40,229 |
| | |
|
| | | | | 42,530,421 |
| Turkey - 2.02% | | | | |
| Adana Cimento Sanayi AS | | 183,047 | | 87,006 |
| Adana Cimento Sanayii Turk Anonim Sirketi | | | | |
| AS, Class A | | 99,918 | | 330,747 |
| Advansa Sasa Polyester Sanayi AS (I) | | 140,873 | | 122,519 |
| Akcansa Cimento AS | | 113,818 | | 486,821 |
| Aksa Akrilik Kimya Sanayi AS | | 173,463 | | 398,037 |
| Aksigorta AS | | 290,218 | | 346,529 |
| Alarko Holding AS | | 207,987 | | 425,547 |
| Altinyildiz Mensucat Ve Konfeksiyon | | | | |
| Fabrikalari AS (I) | | 29,490 | | 224,981 |
| Anadolu Cam Sanayi AS (I) | | 205,846 | | 382,272 |
| Anadolu Isuzu Otomotiv Sanayi AS (I) | | 7,282 | | 34,421 |
| Anadolu Sigorta AS | | 549,997 | | 416,168 |
| Arcelik AS | | 369,761 | | 1,716,651 |
| Ayen Enerji AS | | 20,072 | | 37,275 |
| Aygaz AS | | 201,651 | | 1,066,067 |
| Bati Cimento AS | | 21,536 | | 108,263 |
| BatiSoke AS (I) | | 24,824 | | 26,080 |
| Bolu Cimento Sanayii AS | | 137,486 | | 134,985 |
| Borusan Mannesmann Boru Sanayi AS | | 15,924 | | 154,323 |
| Cemtas Celik Makina AS | | 81,516 | | 49,433 |
| Cimsa Cimento Sanayi ve Ticaret AS | | 125,463 | | 705,491 |
| Deva Holding AS (I) | | 174,734 | | 295,007 |
| Dogan Gazetecilik AS (I) | | 62,235 | | 116,721 |
| Dogan Sirketler Grubu Holdings AS (I) | | 1,991,109 | | 1,471,031 |
| Dogus Otomotiv Servis ve Ticaret AS (I) | | 210,506 | | 707,857 |
| Eczacibasi Ilac Sanayi AS | | 368,380 | | 497,529 |
| Eczacibasi Yatirim Holding Ortakligi AS | | 7,623 | | 23,452 |
| EGE Seramik Sanayi ve Ticaret AS (I) | | 103,309 | | 154,373 |
| Eregli Demir ve Celik Fabrikalari AS (I) | | 889,271 | | 2,746,606 |
| Gentas Genel Metal Sanayi ve Ticaret AS | | 90,149 | | 112,810 |
| Global Yatirim Holding AS (I) | | 508,853 | | 353,052 |
| |
| The accompanying notes are an integral part of the financial statements. | 70 |
John Hancock Funds II
Portfolio of Investments — February 28, 2011 (Unaudited) (showing percentage of total net assets)
| | | | |
| Emerging Markets Fund (formerly Emerging |
| Markets Value Fund) (continued) | | |
| | | Shares or | | |
| | | Principal | | |
| | | Amount | | Value |
| | |
|
| |
| COMMON STOCKS (continued) | | | | |
| Turkey (continued) | | | | |
| Goldas Kuyumculuk Sanayi AS (I) | | 54,847 | $ | 29,854 |
| Goltas Goller Bolgesi Cimento Sanayi Ve | | | | |
| Ticaret AS | | 400 | | 25,388 |
| Goodyear Lastikleri Turk AS (I) | | 17,513 | | 378,842 |
| GSD Holding AS (I) | | 559,767 | | 314,965 |
| Gunes Sigorta AS (I) | | 31,526 | | 38,217 |
| Hurriyet Gazetecilik AS | | 513,859 | | 613,131 |
| Ihlas EV Aletleri AS (I) | | 221,809 | | 148,481 |
| Ihlas Holding AS (I) | | 798,884 | | 758,327 |
| Ipek Matbacilik Sanayi Ve Ticaret AS (I) | | 23,316 | | 45,420 |
| Is Yatirim Menkul Degerler AS | | 36,146 | | 60,815 |
| Isiklar Yatirim Holding Asisiklar | | | | |
| Ambalaj AS (I) | | 170,167 | | 95,693 |
| Izmir Demir Celik Sanayi AS (I) | | 107,008 | | 326,953 |
| Kardemir Karabuk Demir Celik Sanayi ve | | | | |
| Ticaret AS (I) | | 418,488 | | 269,703 |
| Kardemir Karabuk Demir Celik Sanayi Ve | | | | |
| Ticaret AS, Class B (I) | | 111,391 | | 80,083 |
| Kardemir Karabuk Demir Celik Sanayi Ve | | | | |
| Ticaret AS, Class D (I) | | 905,876 | | 435,461 |
| KOC Holdings AS | | 1,312,745 | | 5,499,305 |
| Kordsa Global Endustriyel Iplik ve Kord Bezi | | | | |
| Sanayi ve Ticaret Anonim Sirketi AS (I) | | 316,320 | | 769,603 |
| Koza Anadolu Metal Madencilik | | | | |
| Isletmeleri AS (I) | | 170,561 | | 464,398 |
| Marmaris Marti Otel Isletmeleri AS (I) | | 159,875 | | 106,977 |
| Menderes Tekstil Sanayi ve Ticaret AS (I) | | 162,507 | | 69,130 |
| Mutlu Aku ve Malzemeleri Sanayi AS (I) | | 28,331 | | 76,480 |
| Net Holding AS (I) | | 220,281 | | 185,946 |
| Net Turizm Ticaret ve Sanayi AS (I) | | 231,636 | | 149,100 |
| Nortel Networks Netas Telekomunikasyon AS | | 9,770 | | 937,794 |
| Park Elektrik Uretim Madencilik Sanayi Ve | | | | |
| Ticaret AS (I) | | 129,175 | | 285,088 |
| Parsan Makina Parcalari Sanayi AS (I) | | 28,857 | | 32,317 |
| Petkim Petrokimya Holding AS (I) | | 952,737 | | 1,376,075 |
| Pinar Entegre Et ve Un Sanayi AS | | 36,324 | | 144,509 |
| Pinar Sut Mamulleri Sanayii AS | | 40,679 | | 329,586 |
| Sanko Pazarlama Ithalat Ihracat AS (I) | | 20,076 | | 52,643 |
| Sarkuysan Elektrolitik Bakir AS | | 91,563 | | 225,042 |
| Sekerbank AS | | 474,925 | | 466,150 |
| Selcuk Ecza Deposu Ticaret ve Sanayi AS | | 255,745 | | 371,023 |
| Soda Sanayii AS (I) | | 76,481 | | 109,051 |
| Tekfen Holding AS | | 207,445 | | 694,625 |
| Tekstil Bankasi AS (I) | | 140,973 | | 80,198 |
| Trakya Cam Sanayi AS (I) | | 460,146 | | 830,246 |
| Turcas Petrolculuk AS | | 154,284 | | 353,091 |
| Turk Ekonomi Bankasi AS | | 521,636 | | 554,375 |
| Turk Hava Yollari AS (I) | | 902,472 | | 2,527,911 |
| Turk Sise ve Cam Fabrikalari AS (I) | | 820,847 | | 1,422,637 |
| Turkiye Is Bankasi AS | | 612,613 | | 1,906,902 |
| Turkiye Sinai Kalkinma Bankasi AS | | 681,196 | | 1,119,995 |
| Turkiye Vakiflar Bankasi Tao | | 1,574,428 | | 3,807,954 |
| Ulker Gida Sanayi ve Ticaret AS | | 213,853 | | 690,393 |
| Usas Ucak Servisi AS (I) | | 18,304 | | 23,692 |
| Vestel Beyaz Esya Sanayi ve Ticaret AS | | 121,350 | | 232,276 |
| Vestel Elektronik Sanayi ve Tracaret AS (I) | | 239,841 | | 351,106 |
| | |
|
| | | | | 43,599,005 |
|
| TOTAL COMMON STOCKS (Cost $1,626,853,559) | | | $ | 2,066,171,773 |
|
| |
| PREFERRED SECURITIES - 2.53% | | | | |
| Brazil - 2.52% | | | | |
| Banco Daycoval SA | | 101,100 | | 726,136 |
| Banco do Estado do Rio Grande do Sul SA | | 294,300 | | 3,219,293 |
| | | | |
| Emerging Markets Fund (formerly Emerging |
| Markets Value Fund) (continued) | | | | |
| | | Shares or | | |
| | | Principal | | |
| | | Amount | | Value |
| | |
|
| |
| PREFERRED SECURITIES (continued) | | | | |
| Brazil (continued) | | | | |
| Banco Industrial e Comercial SA | | 171,700 | $ | 1,238,370 |
| Banco Panamericano SA | | 166,300 | | 574,724 |
| Banco Pine SA | | 63,900 | | 533,460 |
| Banco Sofisa SA | | 85,500 | | 258,484 |
| Bardella SA Industrias Mecanicas | | 916 | | 79,279 |
| Companhia de Ferro Ligas Da Bahia | | 143,176 | | 1,032,643 |
| Companhia de Tecidos Norte de Minas SA | | 172,700 | | 508,613 |
| Confab Industrial SA | | 518,387 | | 1,554,725 |
| Eucatex SA Industria E Comercio | | 24,300 | | 119,762 |
| Forjas Taurus SA | | 27,486 | | 69,384 |
| Inepar SA Industria E Construcoes (I) | | 122,505 | | 393,919 |
| Klabin SA | | 1,587,210 | | 5,876,436 |
| Marcopolo SA | | 16,100 | | 55,157 |
| Metalurgica Gerdau SA | | 325,100 | | 5,049,035 |
| Parana Banco SA | | 21,100 | | 164,610 |
| Petroleo Brasileiro SA | | 357,356 | | 6,138,499 |
| Sao Paulo Alpargatas SA | | 88,700 | | 567,236 |
| Suzano Papel e Celulose SA | | 785,253 | | 6,706,602 |
| Telemar Norte Leste SA | | 126,668 | | 3,676,402 |
| Uniao de Industrias Petroquimicas SA (I) | | 1,223,810 | | 367,776 |
| Universo Online SA | | 87,100 | | 819,278 |
| Usinas Siderurgicas de Minas Gerais SA | | 1,275,900 | | 14,570,321 |
| | |
|
| | | | | 54,300,144 |
| Malaysia - 0.01% | | | | |
| TA Global BHD (I) | | 1,466,040 | | 158,595 |
|
| TOTAL PREFERRED SECURITIES (Cost $42,955,519) | | | $ | 54,458,739 |
|
| |
| RIGHTS - 0.01% | | | | |
| BHG SA - Brazil Hospitality Group | | | | |
| (Expiration Date: 03/11/2011, Strike Price: | | | | |
| BRL 0.60) (I) | | 180 | | 95 |
| Ciech SA (Expiration Date: 03/22/2011, Strike | | | | |
| Price: PLN 3.55) (I) | | 42,888 | | 53,082 |
| CR2 Empreendimentos Imobiliarios SA | | | | |
| (Expiration Date: 03/29/2011, Strike Price: | | | | |
| BRL 9.50) (I) | | 1,400 | | 0 |
| Encorp BHD (Expiration Date: 03/09/2011, | | | | |
| Strike Price: MYR 0.05) (I) | | 28,700 | | 423 |
| Esorfranki, Ltd. (Expiration Date: 03/04/2011, | | | | |
| Strike Price: ZAR 1.00) (I) | | 55,581 | | 0 |
| Karnataka Bank, Ltd. (Expiration Date: | | | | |
| 03/22/2011, Strike Price: INR 85.00) (I) | | 62,078 | | 29,692 |
| Karur Vysya Bank, Ltd. (Expiration Date: | | | | |
| 03/17/2011, Strike Price: INR 150.00) (I) | | 14,269 | | 78,477 |
| Telemar Norte Leste SA (Expiration Date: | | | | |
| 3/22/11, Strike Price: BRL 1000.00) (I) | | 238 | | 0 |
| Telemar Norte Leste SA (Expiration Date: | | | | |
| 3/24/11, Strike Price: BRL 50.71) (I) | | 112,584 | | 5,413 |
| Tong Yang Major Corp. (Expiration Date: | | | | |
| 03/09/2011, Strike Price: KRW 1550.00 (I) | | 73,547 | | 65 |
|
| TOTAL RIGHTS (Cost $158,796) | | | $ | 167,247 |
|
| |
| WARRANTS - 0.00% | | | | |
| HKC Holdings, Ltd. (Expiration Date: | | | | |
| 05/21/2011, Strike Price: HKD 0.313) (I) | | 25,556 | | 69 |
| Kulim Malaysia BHD (Expiration Date: | | | | |
| 03/22/2011, Strike Price: MYR 0.02) (I) | | 152,000 | | 30,483 |
| Xiwang Sugar Holdings Company, Ltd. | | | | |
| (Expiration Date: 02/22/2012, Strike Price: | | | | |
| HKD 2.55) (I) | | 133,170 | | 3,131 |
|
| TOTAL WARRANTS (Cost $0) | | | $ | 33,683 |
|
| |
| The accompanying notes are an integral part of the financial statements. | 71 |
John Hancock Funds II
Portfolio of Investments — February 28, 2011 (Unaudited) (showing percentage of total net assets)
| | | | |
| Emerging Markets Fund (formerly Emerging |
| Markets Value Fund) (continued) | | |
| | | Shares or | | |
| | | Principal | | |
| | | Amount | | Value |
| |
|
| |
| SECURITIES LENDING COLLATERAL - 6.92% | | |
| John Hancock Collateral | | | | |
| Investment Trust, 0.2855% (W)(Y) | | 14,900,824 | $ | 149,118,509 |
|
| TOTAL SECURITIES LENDING | | | | |
| COLLATERAL (Cost $149,080,011) | | | $ | 149,118,509 |
|
| |
| SHORT-TERM INVESTMENTS - 1.61% | | | |
| Short-Term Securities* - 1.61% | | | | |
| State Street Institutional Liquid Reserves | | | | |
| Fund, 0.2053% | $ | 34,784,519 | $ | 34,784,519 |
|
| TOTAL SHORT-TERM INVESTMENTS (Cost $34,784,519) | $ | 34,784,519 |
|
| Total Investments (Emerging Markets Fund (formerly | | |
| Emerging Markets Value Fund)) | | | | |
| (Cost $1,853,832,404) - 106.89% | | | $ | 2,304,734,470 |
| Other assets and liabilities, net - (6.89%) | | | (148,520,919) |
| | |
|
| TOTAL NET ASSETS - 100.00% | | | $ | 2,156,213,551 |
| | | |
|
| |
| |
| |
| Emerging Markets Debt Fund | | | |
| | | Shares or | | |
| | | Principal | | |
| | | Amount | | Value |
| |
|
| |
| FOREIGN GOVERNMENT | | | | |
| OBLIGATIONS - 24.14% | | | | |
| Argentina - 4.52% | | | | |
| City of Buenos Aires, | | | | |
| 12.500%, 04/06/2015 (S) | $ | 300,000 | $ | 328,500 |
| Republic of Argentina | | | | |
| 7.000%, 10/03/2015 | | 250,000 | | 236,875 |
| 8.750%, 06/02/2017 | | 150,000 | | 151,125 |
| | |
|
| | | | | 716,500 |
| Brazil - 0.75% | | | | |
| Federative Republic of Brazil, | | | | |
| 10.250%, 06/17/2013 | | 100,000 | | 119,500 |
| | |
|
| | | | | 119,500 |
| Chile - 0.92% | | | | |
| Republic of Chile, | | | | |
| 3.875%, 08/05/2020 | | 150,000 | | 145,725 |
| | |
|
| | | | | 145,725 |
| Colombia - 3.80% | | | | |
| Republic of Colombia | | | | |
| 6.125%, 01/18/2041 | | 150,000 | | 151,875 |
| 8.250%, 12/22/2014 | | 380,000 | | 450,300 |
| | |
|
| | | | | 602,175 |
| Indonesia - 4.83% | | | | |
| Republic of Indonesia | | | | |
| 5.875%, 03/13/2020 (S) | | 200,000 | | 214,250 |
| 6.625%, 02/17/2037 (S) | | 250,000 | | 266,875 |
| 7.250%, 04/20/2015 (S) | | 250,000 | | 284,375 |
| | |
|
| | | | | 765,500 |
| Mexico - 0.95% | | | | |
| Government of Mexico, | | | | |
| 7.500%, 06/21/2012 | MXN | 1,756,600 | | 150,035 |
| | |
|
| | | | | 150,035 |
| | | | |
| Emerging Markets Debt Fund (continued) | | |
| | | Shares or | | |
| | | Principal | | |
| | | Amount | | Value |
| |
|
| |
| FOREIGN GOVERNMENT | | | | |
| OBLIGATIONS (continued) | | | | |
| Peru - 1.87% | | | | |
| Republic of Peru, | | | | |
| 7.125%, 03/30/2019 | $ | 250,000 | $ | 296,875 |
| | |
|
| | | | | 296,875 |
| Philippines - 3.29% | | | | |
| Republic of Philippines | | | | |
| 4.950%, 01/15/2021 | PHP | 13,000,000 | | 292,865 |
| 6.500%, 01/20/2020 | $ | 200,000 | | 228,500 |
| | |
|
| | | | | 521,365 |
| South Africa - 1.26% | | | | |
| Eskom Holdings, Ltd., | | | | |
| 5.750%, 01/26/2021 (S) | | 200,000 | | 199,500 |
| | |
|
| | | | | 199,500 |
| Uruguay - 1.95% | | | | |
| Republic of Uruguay, | | | | |
| 8.000%, 11/18/2022 | | 250,000 | | 308,375 |
| | |
|
| | | | | 308,375 |
|
| TOTAL FOREIGN GOVERNMENT | | | | |
| OBLIGATIONS (Cost $3,720,147) | | | $ | 3,825,550 |
|
| |
| U.S. GOVERNMENT & AGENCY | | | | |
| OBLIGATIONS - 2.46% | | | | |
| U.S. Government - 2.46% | | | | |
| U.S. Treasury Notes | | | | |
| 0.625%, 01/31/2013 | | 390,000 | | 389,801 |
| | |
|
| | | | | 389,801 |
|
| TOTAL U.S. GOVERNMENT & AGENCY | | | |
| OBLIGATIONS (Cost $388,773) | | | $ | 389,801 |
|
| |
| CORPORATE BONDS - 69.11% | | | | |
| Argentina - 5.04% | | | | |
| Aeropuertos Argentina 2000 SA | | | | |
| 10.750%, 12/01/2020 (S) | | 250,000 | | 268,750 |
| Arcor | | | | |
| 7.250%, 11/09/2017 (S) | | 150,000 | | 156,975 |
| Pan American Energy LLC | | | | |
| 7.875%, 05/07/2021 (S) | | 350,000 | | 372,750 |
| | |
|
| | | | | 798,475 |
| Australia - 0.65% | | | | |
| Midwest Vanadium Pty, Ltd. | | | | |
| 11.500%, 02/15/2018 (S) | | 100,000 | | 103,000 |
| | |
|
| | | | | 103,000 |
| Bermuda - 0.66% | | | | |
| Digicel, Ltd. | | | | |
| 8.250%, 09/01/2017 (S) | | 100,000 | | 104,500 |
| | |
|
| | | | | 104,500 |
| Brazil - 6.42% | | | | |
| BFF International, Ltd. | | | | |
| 7.250%, 01/28/2020 (S) | | 250,000 | | 265,000 |
| Cia de Saneamento Basico do Estado de | | | | |
| Sao Paulo | | | | |
| 6.250%, 12/16/2020 (S) | | 250,000 | | 250,625 |
| Cosan SA Industria e Comercio | | | | |
| 8.250%, (Q) (S) | | 250,000 | | 250,000 |
| JBS Finance II, Ltd. | | | | |
| 8.250%, 01/29/2018 (S) | | 250,000 | | 252,500 |
| | |
|
| | | | | 1,018,125 |
| |
| The accompanying notes are an integral part of the financial statements. | 72 |
John Hancock Funds II
Portfolio of Investments — February 28, 2011 (Unaudited) (showing percentage of total net assets)
| | | | |
| Emerging Markets Debt Fund (continued) | | |
| | | Shares or | | |
| | | Principal | | |
| | | Amount | | Value |
| |
|
| |
| CORPORATE BONDS (continued) | | | | |
| Canada - 1.36% | | | | |
| Bombardier, Inc. | | | | |
| 7.750%, 03/15/2020 (S) | $ | 100,000 | $ | 108,500 |
| Garda World Security Corp. | | | | |
| 9.750%, 03/15/2017 (S) | | 100,000 | | 107,500 |
| | |
|
| | | | | 216,000 |
| Cayman Islands - 21.01% | | | | |
| AES Andres Dominicana/Itabo | | | | |
| Dominicana | | | | |
| 9.500%, 11/12/2020 (S) | | 150,000 | | 160,875 |
| Braskem Finance, Ltd. | | | | |
| 7.000%, 05/07/2020 (S) | | 150,000 | | 154,875 |
| Continental Trustees Cayman, Ltd. | | | | |
| (7.375% to 10/07/2020, then 3 month | | | | |
| LIBOR + 6.802%) | | | | |
| 10/07/2040 (S) | | 150,000 | | 153,375 |
| Cosan Finance, Ltd. | | | | |
| 7.000%, 02/01/2017 (S) | | 250,000 | | 267,500 |
| Country Garden Holdings Company | | | | |
| 11.125%, 02/23/2018 (S) | | 200,000 | | 199,600 |
| CSN Islands XII Corp. | | | | |
| 7.000%, (Q) (S) | | 100,000 | | 97,750 |
| Gol Finance | | | | |
| 7.500%, 04/03/2017 | | 250,000 | | 247,500 |
| Odebrecht Finance, Ltd. | | | | |
| 7.500%, (Q) (S) | | 250,000 | | 253,125 |
| Offshore Group Investments, Ltd. | | | | |
| 11.500%, 08/01/2015 (S) | | 300,000 | | 336,000 |
| Petrobras International Finance Company | | | | |
| 5.375%, 01/27/2021 | | 100,000 | | 100,352 |
| RDS Ultra-Deepwater, Ltd. | | | | |
| 11.875%, 03/15/2017 (S) | | 250,000 | | 276,875 |
| Sable International Finance, Ltd. | | | | |
| 7.750%, 02/15/2017 (S) | | 300,000 | | 319,500 |
| Suzano Trading, Ltd. | | | | |
| 5.875%, 01/23/2021 (S) | | 250,000 | | 240,875 |
| TAM Capital 2, Inc. | | | | |
| 9.500%, 01/29/2020 (S) | | 250,000 | | 275,000 |
| Vale Overseas, Ltd. | | | | |
| 4.625%, 09/15/2020 | | 250,000 | | 245,406 |
| | |
|
| | | | | 3,328,608 |
| Chile - 0.91% | | | | |
| Celulosa Arauco y Constitucion SA | | | | |
| 5.000%, 01/21/2021 (S) | | 150,000 | | 144,132 |
| | |
|
| | | | | 144,132 |
| Ireland - 0.68% | | | | |
| Ono Finance II PLC | | | | |
| 10.875%, 07/15/2019 (S) | | 100,000 | | 107,500 |
| | |
|
| | | | | 107,500 |
| Korea - 0.32% | | | | |
| Export-Import Bank of Korea | | | | |
| 6.500%, 01/25/2012 (S) | INR | 2,300,000 | | 50,670 |
| | |
|
| | | | | 50,670 |
| Luxembourg - 1.66% | | | | |
| Mobile Telesystems Finance SA | | | | |
| 8.000%, 01/28/2012 (S) | $ | 250,000 | | 263,425 |
| | |
|
| | | | | 263,425 |
| Mexico - 5.78% | | | | |
| Desarrolladora Homex SAB de CV | | | | |
| 9.500%, 12/11/2019 (S) | | 250,000 | | 285,625 |
| Grupo KUO SAB de CV | | | | |
| 9.750%, 10/17/2017 (S) | | 250,000 | | 272,500 |
| | | | |
| Emerging Markets Debt Fund (continued) | | |
| | | Shares or | | |
| | | Principal | | |
| | | Amount | | Value |
| |
|
| |
| CORPORATE BONDS (continued) | | | | |
| Mexico (continued) | | | | |
| Grupo Papelero Scribe SA | | | | |
| 8.875%, 04/07/2020 (S) | $ | 100,000 | $ | 96,500 |
| Petroleos Mexicanos | | | | |
| 6.000%, 03/05/2020 | | 250,000 | | 261,250 |
| | |
|
| | | | | 915,875 |
| Netherlands - 4.03% | | | | |
| Listrindo Capital BV | | | | |
| 9.250%, 01/29/2015 (S) | | 250,000 | | 279,993 |
| Metinvest BV | | | | |
| 8.750%, 02/14/2018 (S) | | 200,000 | | 204,000 |
| WPE International Cooperatief UA | | | | |
| 10.375%, 09/30/2020 (S) | | 150,000 | | 154,500 |
| | |
|
| | | | | 638,493 |
| Peru - 1.33% | | | | |
| Corp. Pesquera Inca SAC | | | | |
| 9.000%, 02/10/2017 (S) | | 200,000 | | 211,500 |
| | |
|
| | | | | 211,500 |
| Russia - 1.64% | | | | |
| BOM Capital PLC | | | | |
| 6.699%, 03/11/2015 (S) | | 250,000 | | 260,625 |
| | |
|
| | | | | 260,625 |
| Singapore - 4.58% | | | | |
| Bakrie Telecom Pte, Ltd. | | | | |
| 11.500%, 05/07/2015 (S) | | 250,000 | | 271,250 |
| Bumi Capital Pte, Ltd. | | | | |
| 12.000%, 11/10/2016 (S) | | 250,000 | | 288,750 |
| Bumi Investment Pte, Ltd. | | | | |
| 10.750%, 10/06/2017 (S) | | 150,000 | | 165,188 |
| | |
|
| | | | | 725,188 |
| United Arab Emirates - 0.59% | | | | |
| Dubai Electricity & Water Authority | | | | |
| 7.375%, 10/21/2020 (S) | | 100,000 | | 93,500 |
| | |
|
| | | | | 93,500 |
| United States - 9.85% | | | | |
| Affinion Group Holdings, Inc. | | | | |
| 11.625%, 11/15/2015 (S) | | 150,000 | | 155,625 |
| Anheuser-Busch InBev Worldwide, Inc. | | | | |
| 9.750%, 11/17/2015 | BRL | 250,000 | | 153,639 |
| BioScrip, Inc. | | | | |
| 10.250%, 10/01/2015 | $ | 100,000 | | 105,500 |
| Equinix, Inc. | | | | |
| 8.125%, 03/01/2018 | | 100,000 | | 108,500 |
| Giant Funding Corp. | | | | |
| 8.250%, 02/01/2018 (S) | | 100,000 | | 102,750 |
| Inter-American Development Bank | | | | |
| 4.750%, 01/10/2014 | INR | 4,500,000 | | 97,466 |
| Interactive Data Corp. | | | | |
| 10.250%, 08/01/2018 (S) | $ | 150,000 | | 168,000 |
| NewPage Corp. | | | | |
| 11.375%, 12/31/2014 | | 250,000 | | 249,375 |
| Niska Gas Storage US LLC/Niska Gas | | | | |
| Storage Canada ULC | | | | |
| 8.875%, 03/15/2018 (S) | | 150,000 | | 163,500 |
| Overseas Shipholding Group, Inc. | | | | |
| 8.125%, 03/30/2018 | | 150,000 | | 150,000 |
| Regal Entertainment Group | | | | |
| 9.125%, 08/15/2018 | | 100,000 | | 107,000 |
| | |
|
| | | | | 1,561,355 |
| |
| The accompanying notes are an integral part of the financial statements. | 73 |
John Hancock Funds II
Portfolio of Investments — February 28, 2011 (Unaudited) (showing percentage of total net assets)
| | | | |
| Emerging Markets Debt Fund (continued) | | |
| | | Shares or | | |
| | | Principal | | |
| | | Amount | | Value |
| |
|
| CORPORATE BONDS (continued) | | | | |
| Venezuela - 2.60% | | | | |
| Petroleos de Venezuela SA | | | | |
| 5.000%, 10/28/2015 | $ | 250,000 | $ | 153,500 |
| 5.125%, 10/28/2016 | | 250,000 | | 143,125 |
| 5.375%, 04/12/2027 | | 250,000 | | 114,750 |
| | |
|
| | | | | 411,375 |
|
| TOTAL CORPORATE BONDS (Cost $10,322,923) | | $ | 10,952,346 |
|
| CONVERTIBLE BONDS - 0.34% | | | | |
| United States - 0.34% | | | | |
| Clearwire | | | | |
| Communications LLC/Clearwire | | | | |
| Finance, Inc., | | | | |
| 8.250%, 12/01/2040 (S) | | 50,000 | | 53,000 |
| | |
|
| | | | | 53,000 |
|
| TOTAL CONVERTIBLE BONDS (Cost $50,000) | | $ | 53,000 |
|
| PREFERRED SECURITIES - 0.69% | | | | |
| Netherlands - 0.17% | | | | |
| Nielsen Holdings NV 6.250% | | 50,000 | | 27,594 |
| | |
|
| | | | | 27,594 |
| United States - 0.52% | | | | |
| Apache Corp., Series D 6.000% | | 455 | | 30,995 |
| General Motors Company, | | | | |
| Series B 4.750% | | 1,000 | | 50,880 |
| | |
|
| | | | | 81,875 |
|
| TOTAL PREFERRED SECURITIES (Cost $97,750) | | $ | 109,469 |
|
| SHORT-TERM INVESTMENTS - 1.89% | | | |
| Short-Term Securities* - 1.89% | | | | |
| Federal Home Loan Bank Discount | | | | |
| Notes, | | | | |
| 0.070%, 03/01/2011 | $ | 300,000 | $ | 300,000 |
| | | |
|
| | | | | 300,000 |
|
| TOTAL SHORT-TERM INVESTMENTS (Cost $300,000) | | $ | 300,000 |
|
| Total Investments (Emerging Markets Debt Fund) | | | |
| (Cost $14,879,593) - 98.63% | | | $ | 15,630,166 |
| Other assets and liabilities, net - 1.37% | | | | 216,802 |
| | | |
|
| TOTAL NET ASSETS - 100.00% | | | $ | 15,846,968 |
| | | |
|
| |
| |
| Equity-Income Fund | | | | |
| | | Shares or | | |
| | | Principal | | |
| | | Amount | | Value |
| |
|
| COMMON STOCKS - 95.35% | | | | |
| Consumer Discretionary - 14.32% | | | | |
| Automobiles - 0.82% | | | | |
| General Motors Company (I) | | 126,200 | $ | 4,231,486 |
| Harley-Davidson, Inc. (L) | | 183,600 | | 7,494,552 |
| | |
|
| | | | | 11,726,038 |
| Distributors - 0.48% | | | | |
| Genuine Parts Company (L) | | 131,450 | | 6,926,101 |
| Diversified Consumer Services - 0.22% | | | | |
| H&R Block, Inc. (L) | | 204,400 | | 3,104,836 |
| Hotels, Restaurants & Leisure - 0.71% | | | | |
| Marriott International, Inc., Class A (L) | | 197,940 | | 7,761,227 |
| | | | |
| Equity-Income Fund (continued) | | |
| | | Shares or | | |
| | | Principal | | |
| | | Amount | | Value |
| | |
|
| |
| COMMON STOCKS (continued) | | | | |
| Hotels, Restaurants & Leisure (continued) | | | | |
| MGM Resorts International (I) | | 179,100 | $ | 2,496,654 |
| | |
|
| | | | | 10,257,881 |
| Household Durables - 2.46% | | | | |
| D.R. Horton, Inc. (L) | | 173,000 | | 2,048,320 |
| Fortune Brands, Inc. | | 313,500 | | 19,393,110 |
| Whirlpool Corp. (L) | | 167,700 | | 13,835,250 |
| | |
|
| | | | | 35,276,680 |
| Leisure Equipment & Products - 0.84% | | | | |
| Mattel, Inc. | | 479,100 | | 12,006,246 |
| Media - 6.03% | | | | |
| Cablevision Systems Corp., Class A | | 309,100 | | 11,390,335 |
| Comcast Corp., Class A | | 325,900 | | 8,395,184 |
| DISH Network Corp. (I) | | 49,300 | | 1,146,225 |
| Madison Square Garden, Inc., Class A (I) | | 64,625 | | 1,845,690 |
| The McGraw-Hill Companies, Inc. | | 370,500 | | 14,330,940 |
| The New York Times Company, Class A (I)(L) | | 480,300 | | 4,995,120 |
| The Walt Disney Company | | 405,700 | | 17,745,318 |
| Time Warner, Inc. | | 565,966 | | 21,619,901 |
| WPP PLC | | 355,123 | | 4,885,433 |
| | |
|
| | | | | 86,354,146 |
| Multiline Retail - 0.39% | | | | |
| Macy’s, Inc. | | 232,000 | | 5,544,800 |
| Specialty Retail - 2.37% | | | | |
| Bed Bath & Beyond, Inc. (I)(L) | | 207,900 | | 10,010,385 |
| Home Depot, Inc. | | 571,500 | | 21,414,105 |
| Tiffany & Company (L) | | 41,900 | | 2,578,945 |
| | |
|
| | | | | 34,003,435 |
| | |
|
| | | | | 205,200,163 |
| Consumer Staples - 6.18% | | | | |
| Beverages - 0.36% | | | | |
| PepsiCo, Inc. | | 81,900 | | 5,194,098 |
| Food Products - 3.06% | | | | |
| Archer-Daniels-Midland Company | | 118,500 | | 4,405,830 |
| Campbell Soup Company (L) | | 204,400 | | 6,880,104 |
| ConAgra Foods, Inc. | | 344,300 | | 7,973,988 |
| McCormick & Company, Inc., Class B (L) | | 124,000 | | 5,908,600 |
| The Hershey Company (L) | | 355,600 | | 18,604,992 |
| | |
|
| | | | | 43,773,514 |
| Household Products - 2.00% | | | | |
| Clorox Company (L) | | 217,700 | | 14,751,352 |
| Kimberly-Clark Corp. | | 211,100 | | 13,911,490 |
| | |
|
| | | | | 28,662,842 |
| Personal Products - 0.76% | | | | |
| Avon Products, Inc. | | 393,300 | | 10,937,673 |
| | |
|
| | | | | 88,568,127 |
| Energy - 14.14% | | | | |
| Energy Equipment & Services - 1.82% | | | | |
| Baker Hughes, Inc. | | 100,700 | | 7,154,735 |
| Schlumberger, Ltd. | | 202,700 | | 18,936,234 |
| | |
|
| | | | | 26,090,969 |
| Oil, Gas & Consumable Fuels - 12.32% | | | | |
| Anadarko Petroleum Corp. | | 213,400 | | 17,462,522 |
| BP PLC, SADR | | 231,492 | | 11,220,417 |
| Chevron Corp. | | 388,060 | | 40,261,224 |
| ConocoPhillips | | 126,700 | | 9,866,129 |
| Exxon Mobil Corp. | | 401,224 | | 34,316,689 |
| Murphy Oil Corp. | | 282,000 | | 20,735,460 |
| |
| The accompanying notes are an integral part of the financial statements. | 74 |
John Hancock Funds II
Portfolio of Investments — February 28, 2011 (Unaudited) (showing percentage of total net assets)
| | | | |
| Equity-Income Fund (continued) | | |
| | | Shares or | | |
| | | Principal | | |
| | | Amount | | Value |
| | |
|
| |
| COMMON STOCKS (continued) | | | | |
| Oil, Gas & Consumable Fuels (continued) | | | | |
| Royal Dutch Shell PLC, ADR (L) | | 385,000 | $ | 27,816,250 |
| Spectra Energy Corp. | | 253,500 | | 6,781,125 |
| Sunoco, Inc. (L) | | 190,500 | | 7,974,330 |
| | |
|
| | | | | 176,434,146 |
| | |
|
| | | | | 202,525,115 |
| Financials - 19.65% | | | | |
| Capital Markets - 2.07% | | | | |
| Legg Mason, Inc. (L) | | 373,800 | | 13,550,250 |
| Morgan Stanley | | 148,800 | | 4,416,384 |
| The Bank of New York Mellon Corp. (L) | | 385,600 | | 11,718,384 |
| | |
|
| | | | | 29,685,018 |
| Commercial Banks - 5.25% | | | | |
| KeyCorp | | 642,000 | | 5,867,880 |
| PNC Financial Services Group, Inc. | | 98,300 | | 6,065,110 |
| Regions Financial Corp. | | 708,000 | | 5,409,120 |
| SunTrust Banks, Inc. | | 344,000 | | 10,378,480 |
| U.S. Bancorp | | 777,700 | | 21,565,621 |
| Wells Fargo & Company | | 801,800 | | 25,866,068 |
| | |
|
| | | | | 75,152,279 |
| Consumer Finance - 3.16% | | | | |
| American Express Company | | 601,300 | | 26,198,641 |
| Capital One Financial Corp. | | 189,700 | | 9,441,369 |
| SLM Corp. (I) | | 653,500 | | 9,684,870 |
| | |
|
| | | | | 45,324,880 |
| Diversified Financial Services - 5.15% | | | | |
| Bank of America Corp. | | 1,634,122 | | 23,351,603 |
| JPMorgan Chase & Company | | 898,514 | | 41,951,618 |
| NYSE Euronext | | 229,100 | | 8,476,700 |
| | |
|
| | | | | 73,779,921 |
| Insurance - 3.67% | | | | |
| Chubb Corp. | | 101,600 | | 6,165,088 |
| Lincoln National Corp. (L) | | 328,198 | | 10,410,441 |
| Marsh & McLennan Companies, Inc. | | 511,500 | | 15,570,060 |
| Sun Life Financial, Inc. (L) | | 262,300 | | 8,718,852 |
| The Allstate Corp. | | 370,600 | | 11,777,668 |
| | |
|
| | | | | 52,642,109 |
| Real Estate Investment Trusts - 0.35% | | | | |
| Weyerhaeuser Company | | 204,513 | | 4,992,162 |
| | |
|
| | | | | 281,576,369 |
| Health Care - 4.82% | | | | |
| Biotechnology - 0.43% | | | | |
| Amgen, Inc. (I) | | 119,200 | | 6,118,536 |
| Pharmaceuticals - 4.39% | | | | |
| Bristol-Myers Squibb Company | | 397,400 | | 10,256,894 |
| Eli Lilly & Company | | 224,600 | | 7,762,176 |
| Johnson & Johnson | | 290,600 | | 17,854,464 |
| Merck & Company, Inc. | | 371,100 | | 12,086,727 |
| Pfizer, Inc. | | 780,988 | | 15,026,209 |
| | |
|
| | | | | 62,986,470 |
| | |
|
| | | | | 69,105,006 |
| Industrials - 12.66% | | | | |
| Aerospace & Defense - 3.27% | | | | |
| Honeywell International, Inc. | | 299,200 | | 17,326,672 |
| ITT Corp. | | 166,900 | | 9,668,517 |
| Lockheed Martin Corp. | | 100,200 | | 7,931,832 |
| The Boeing Company | | 166,300 | | 11,975,263 |
| | |
|
| | | | | 46,902,284 |
| | | | |
| Equity-Income Fund (continued) | | |
| | | Shares or | | |
| | | Principal | | |
| | | Amount | | Value |
| | |
|
| COMMON STOCKS (continued) | | | | |
| Air Freight & Logistics - 1.06% | | | | |
| United Parcel Service, Inc., Class B (L) | | 205,500 | $ | 15,165,900 |
| Building Products - 0.74% | | | | |
| Masco Corp. | | 535,100 | | 7,272,009 |
| USG Corp. (I)(L) | | 196,800 | | 3,373,152 |
| | |
|
| | | | | 10,645,161 |
| Commercial Services & Supplies - 0.57% | | | | |
| Avery Dennison Corp. | | 203,600 | | 8,127,712 |
| Electrical Equipment - 1.20% | | | | |
| Cooper Industries PLC | | 173,700 | | 11,177,595 |
| Emerson Electric Company | | 100,600 | | 6,001,796 |
| | |
|
| | | | | 17,179,391 |
| Industrial Conglomerates - 4.30% | | | | |
| 3M Company | | 242,600 | | 22,374,998 |
| General Electric Company | | 1,878,000 | | 39,287,760 |
| | |
|
| | | | | 61,662,758 |
| Machinery - 1.52% | | | | |
| Eaton Corp. | | 34,800 | | 3,855,144 |
| Illinois Tool Works, Inc. | | 330,000 | | 17,853,000 |
| | |
|
| | | | | 21,708,144 |
| | |
|
| | | | | 181,391,350 |
| Information Technology - 6.79% | | | | |
| Communications Equipment - 1.26% | | | | |
| Cisco Systems, Inc. (I) | | 392,900 | | 7,292,224 |
| Harris Corp. | | 229,400 | | 10,703,804 |
| | |
|
| | | | | 17,996,028 |
| Computers & Peripherals - 1.29% | | | | |
| Dell, Inc. (I) | | 470,900 | | 7,454,347 |
| Hewlett-Packard Company | | 254,500 | | 11,103,835 |
| | |
|
| | | | | 18,558,182 |
| Internet Software & Services - 0.05% | | | | |
| eBay, Inc. (I) | | 22,000 | | 737,110 |
| IT Services - 0.96% | | | | |
| Computer Sciences Corp. | | 284,500 | | 13,692,985 |
| Semiconductors & Semiconductor Equipment - 1.83% | | |
| Analog Devices, Inc. | | 279,100 | | 11,130,508 |
| Applied Materials, Inc. | | 701,000 | | 11,517,430 |
| Texas Instruments, Inc. | | 100,700 | | 3,585,927 |
| | |
|
| | | | | 26,233,865 |
| Software - 1.40% | | | | |
| Electronic Arts, Inc. (I)(L) | | 245,700 | | 4,619,160 |
| Microsoft Corp. | | 582,400 | | 15,480,192 |
| | |
|
| | | | | 20,099,352 |
| | |
|
| | | | | 97,317,522 |
| Materials - 5.85% | | | | |
| Chemicals - 2.35% | | | | |
| E.I. du Pont de Nemours & Company | | 156,900 | | 8,609,103 |
| International Flavors & Fragrances, Inc. | | 167,000 | | 9,510,650 |
| Monsanto Company | | 216,100 | | 15,535,429 |
| | |
|
| | | | | 33,655,182 |
| Construction Materials - 0.78% | | | | |
| Vulcan Materials Company (L) | | 243,400 | | 11,159,890 |
| Metals & Mining - 1.03% | | | | |
| Nucor Corp. (L) | | 309,600 | | 14,848,416 |
| Paper & Forest Products - 1.69% | | | | |
| International Paper Company | | 588,725 | | 16,354,781 |
| |
| The accompanying notes are an integral part of the financial statements. | 75 |
John Hancock Funds II
Portfolio of Investments — February 28, 2011 (Unaudited) (showing percentage of total net assets)
| | | | |
| Equity-Income Fund (continued) | | | | |
| | | Shares or | | |
| | | Principal | | |
| | | Amount | | Value |
| |
|
| | |
| |
| COMMON STOCKS (continued) | | | | |
| Paper & Forest Products (continued) | | | | |
| MeadWestvaco Corp. (L) | | 267,300 | $ | 7,845,255 |
| | | |
|
| | | | | 24,200,036 |
| | | |
|
| | | | | 83,863,524 |
| Telecommunication Services - 3.68% | | | | |
| Diversified Telecommunication Services - 3.27% | | | | |
| AT&T, Inc. | | 864,473 | | 24,533,744 |
| Qwest Communications International, Inc. | | 1,485,400 | | 10,130,428 |
| Verizon Communications, Inc. | | 331,252 | | 12,229,824 |
| | |
|
| | | | | 46,893,996 |
| Wireless Telecommunication Services - 0.41% | | | | |
| Vodafone Group PLC | | 2,065,783 | | 5,861,676 |
| | |
|
| | | | | 52,755,672 |
| Utilities - 7.26% | | | | |
| Electric Utilities - 4.49% | | | | |
| Duke Energy Corp. | | 419,100 | | 7,539,609 |
| Entergy Corp. | | 195,400 | | 13,912,480 |
| Exelon Corp. (L) | | 337,600 | | 14,098,176 |
| FirstEnergy Corp. (L) | | 153,975 | | 5,897,243 |
| Pinnacle West Capital Corp. | | 165,100 | | 6,972,173 |
| PPL Corp. | | 250,800 | | 6,377,844 |
| Progress Energy, Inc. | | 210,200 | | 9,608,242 |
| | |
|
| | | | | 64,405,767 |
| Independent Power Producers & Energy Traders - 0.78% | | |
| Constellation Energy Group, Inc. | | 273,200 | | 8,488,324 |
| NRG Energy, Inc. (I) | | 131,800 | | 2,634,682 |
| | |
|
| | | | | 11,123,006 |
| Multi-Utilities - 1.99% | | | | |
| CenterPoint Energy, Inc. | | 206,400 | | 3,273,504 |
| NiSource, Inc. (L) | | 676,400 | | 12,959,824 |
| TECO Energy, Inc. (L) | | 162,700 | | 2,946,497 |
| Xcel Energy, Inc. | | 388,000 | | 9,288,720 |
| | |
|
| | | | | 28,468,545 |
| | | |
|
| | | | | 103,997,318 |
|
| TOTAL COMMON STOCKS (Cost $1,132,704,650) | | | $ | 1,366,300,166 |
|
| |
| PREFERRED SECURITIES - 0.52% | | | | |
| Consumer Discretionary - 0.52% | | | | |
| General Motors Company, Series B, | | | | |
| 4.750% 4.750% (I) | | 146,700 | | 7,464,096 |
|
| TOTAL PREFERRED SECURITIES (Cost $7,444,035) | | $ | 7,464,096 |
|
| |
| SECURITIES LENDING COLLATERAL - 10.86% | | | |
| John Hancock Collateral | | | | |
| Investment Trust, 0.2855% (W)(Y) | 15,544,194 | | 155,556,967 |
|
| TOTAL SECURITIES LENDING | | | | |
| COLLATERAL (Cost $155,549,243) | | | $ | 155,556,967 |
|
| |
| SHORT-TERM INVESTMENTS - 4.20% | | | | |
| Short-Term Securities* - 4.20% | | | | |
| State Street Institutional U.S. Government | | | | |
| Money Market Fund, 0.0647% | | 1,202,917 | $ | 1,202,917 |
| | | | |
| Equity-Income Fund (continued) | | |
| | | Shares or | | |
| | | Principal | | |
| | | Amount | | Value |
| |
|
| SHORT-TERM INVESTMENTS (continued) | | | |
| Short-Term Securities* (continued) | | | | |
| T. Rowe Price Prime Reserve Investment | | | | |
| Fund, 0.2212% | $ | 59,019,485 | $ | 59,019,485 |
| |
|
| | | | | 60,222,402 |
|
| TOTAL SHORT-TERM INVESTMENTS (Cost $60,222,402) | $ | 60,222,402 |
|
| Total Investments (Equity-Income Fund) | | | | |
| (Cost $1,355,920,330) - 110.93% | | | $ | 1,589,543,631 |
| Other assets and liabilities, net - (10.93%) | | | (156,654,834) |
| |
|
| TOTAL NET ASSETS - 100.00% | | | $ | 1,432,888,797 |
| | | |
|
| | |
| |
| |
| Fundamental Value Fund | | | | |
| | | Shares or | | |
| | | Principal | | |
| | | Amount | | Value |
| |
|
| COMMON STOCKS - 95.98% | | | | |
| Consumer Discretionary - 5.13% | | | | |
| Automobiles - 1.77% | | | | |
| Harley-Davidson, Inc. (L) | | 724,846 | $ | 29,588,214 |
| Household Durables - 0.17% | | | | |
| Hunter Douglas NV | | 59,727 | | 2,813,720 |
| Internet & Catalog Retail - 0.35% | | | | |
| Liberty Media Corp. - Interactive, Series A (I) | 367,434 | | 5,900,990 |
| Media - 0.45% | | | | |
| Grupo Televisa SA, SADR (I) | | 231,099 | | 5,458,558 |
| Liberty Media Corp. - Starz, Series A (I) | | 27,801 | | 1,951,630 |
| |
|
| | | | | 7,410,188 |
| Specialty Retail - 2.39% | | | | |
| Bed Bath & Beyond, Inc. (I)(L) | | 572,427 | | 27,562,360 |
| CarMax, Inc. (I) | | 347,545 | | 12,292,667 |
| |
|
| | | | | 39,855,027 |
| |
|
| | | | | 85,568,139 |
| Consumer Staples - 15.90% | | | | |
| Beverages - 3.90% | | | | |
| Diageo PLC, SADR (L) | | 269,841 | | 21,117,757 |
| Heineken Holding NV | | 445,915 | | 20,506,295 |
| The Coca-Cola Company | | 365,635 | | 23,371,389 |
| |
|
| | | | | 64,995,441 |
| Food & Staples Retailing - 8.81% | | | | |
| Costco Wholesale Corp. | | 1,185,310 | | 88,649,335 |
| CVS Caremark Corp. | | 1,763,356 | | 58,296,549 |
| |
|
| | | | | 146,945,884 |
| Food Products - 1.20% | | | | |
| Kraft Foods, Inc., Class A | | 370,700 | | 11,803,088 |
| Nestle SA | | 44,285 | | 2,506,757 |
| Unilever NV - NY Shares | | 186,246 | | 5,632,079 |
| |
|
| | | | | 19,941,924 |
| Household Products - 0.67% | | | | |
| The Procter & Gamble Company | | 177,854 | | 11,213,695 |
| Personal Products - 0.15% | | | | |
| Natura Cosmeticos SA | | 99,200 | | 2,516,668 |
| Tobacco - 1.17% | | | | |
| Philip Morris International, Inc. | | 310,756 | | 19,509,262 |
| |
|
| | | | | 265,122,874 |
| |
| The accompanying notes are an integral part of the financial statements. | 76 |
John Hancock Funds II
Portfolio of Investments — February 28, 2011 (Unaudited) (showing percentage of total net assets)
| | | | |
| Fundamental Value Fund (continued) | | |
| | | Shares or | | |
| | | Principal | | |
| | | Amount | | Value |
| |
|
| |
| COMMON STOCKS (continued) | | | | |
| Energy - 17.16% | | | | |
| Energy Equipment & Services - 1.11% | | | | |
| Schlumberger, Ltd. | | 37,600 | $ | 3,512,592 |
| Transocean, Ltd. (I)(L) | | 177,891 | | 15,054,915 |
| | |
|
| | | | | 18,567,507 |
| Oil, Gas & Consumable Fuels - 16.05% | | | | |
| Canadian Natural Resources, Ltd. | | 980,570 | | 49,322,671 |
| China Coal Energy Company, Series H | | 7,543,189 | | 10,785,913 |
| Devon Energy Corp. | | 692,361 | | 63,309,490 |
| EOG Resources, Inc. | | 624,878 | | 70,180,048 |
| Occidental Petroleum Corp. | | 616,777 | | 62,892,751 |
| OGX Petroleo e Gas Participacoes SA (I) | | 960,000 | | 11,222,503 |
| | |
|
| | | | | 267,713,376 |
| | | |
|
| | | | | 286,280,883 |
| Financials - 26.73% | | | | |
| Capital Markets - 6.82% | | | | |
| Ameriprise Financial, Inc. | | 291,606 | | 18,464,492 |
| GAM Holding, Ltd. (I) | | 391,366 | | 7,080,698 |
| Julius Baer Group, Ltd. | | 734,372 | | 32,941,310 |
| The Bank of New York Mellon Corp. | | 1,475,828 | | 44,850,413 |
| The Charles Schwab Corp. | | 48,500 | | 920,045 |
| The Goldman Sachs Group, Inc. | | 57,991 | | 9,497,766 |
| | |
|
| | | | | 113,754,724 |
| Commercial Banks - 4.87% | | | | |
| Wells Fargo & Company | | 2,518,861 | | 81,258,456 |
| Consumer Finance - 4.23% | | | | |
| American Express Company | | 1,621,204 | | 70,635,858 |
| Diversified Financial Services - 0.12% | | | | |
| JPMorgan Chase & Company | | 42,526 | | 1,985,539 |
| Insurance - 9.19% | | | | |
| ACE, Ltd. | | 41,650 | | 2,634,363 |
| AON Corp. | | 40,250 | | 2,118,760 |
| Berkshire Hathaway, Inc. Class A (I) | | 192 | | 25,209,600 |
| Fairfax Financial Holdings, Ltd. | | 16,819 | | 6,527,286 |
| Fairfax Financial Holdings, Ltd. | | | | |
| (Toronto Exchange) | | 7,153 | | 2,771,820 |
| Loews Corp. | | 1,255,337 | | 54,293,325 |
| Markel Corp. (I) | | 4,459 | | 1,853,383 |
| The Progressive Corp. | | 1,998,185 | | 41,622,194 |
| Transatlantic Holdings, Inc. | | 319,309 | | 16,262,407 |
| | |
|
| | | | | 153,293,138 |
| Real Estate Management & Development - 1.50% | | | | |
| Brookfield Asset Management, Inc., Class A | | 357,630 | | 12,123,657 |
| Hang Lung Group, Ltd. | | 2,093,000 | | 12,838,707 |
| | |
|
| | | | | 24,962,364 |
| | | |
|
| | | | | 445,890,079 |
| Health Care - 12.28% | | | | |
| Health Care Equipment & Supplies - 1.63% | | | | |
| Baxter International, Inc. | | 196,236 | | 10,429,943 |
| Becton, Dickinson & Company | | 208,976 | | 16,718,080 |
| | |
|
| | | | | 27,148,023 |
| Health Care Providers & Services - 1.80% | | | | |
| Express Scripts, Inc. (I) | | 535,472 | | 30,104,236 |
| Life Sciences Tools & Services - 0.92% | | | | |
| Agilent Technologies, Inc. (I) | | 366,660 | | 15,429,053 |
| Pharmaceuticals - 7.93% | | | | |
| Johnson & Johnson | | 656,880 | | 40,358,707 |
| Merck & Company, Inc. | | 1,411,971 | | 45,987,895 |
| | | | |
| Fundamental Value Fund (continued) | | |
| | | Shares or | | |
| | | Principal | | |
| | | Amount | | Value |
| | |
|
| COMMON STOCKS (continued) | | | | |
| Pharmaceuticals (continued) | | | | |
| Pfizer, Inc. | | 1,697,525 | $ | 32,660,381 |
| Roche Holdings AG | | 87,600 | | 13,208,071 |
| | |
|
| | | | | 132,215,054 |
| | |
|
| | | | | 204,896,366 |
| Industrials - 5.32% | | | | |
| Aerospace & Defense - 0.67% | | | | |
| Lockheed Martin Corp. (L) | | 140,680 | | 11,136,229 |
| Commercial Services & Supplies - 1.70% | | | | |
| Iron Mountain, Inc. | | 1,090,476 | | 28,352,376 |
| Industrial Conglomerates - 0.41% | | | | |
| Tyco International, Ltd. | | 150,611 | | 6,828,703 |
| Marine - 1.07% | | | | |
| China Shipping Development Company, Ltd. | | 3,670,700 | | 4,030,564 |
| Kuehne & Nagel International AG | | 102,869 | | 13,825,149 |
| | |
|
| | | | | 17,855,713 |
| Professional Services - 0.11% | | | | |
| Dun & Bradstreet Corp. | | 23,786 | | 1,921,909 |
| Transportation Infrastructure - 1.36% | | | | |
| China Merchants Holdings | | | | |
| International Company, Ltd. | | 5,074,691 | | 21,618,815 |
| LLX Logistica SA (I) | | 202,800 | | 553,379 |
| PortX Operacoes Portuarias SA (I) | | 202,800 | | 471,713 |
| | |
|
| | | | | 22,643,907 |
| | |
|
| | | | | 88,738,837 |
| Information Technology - 5.40% | | | | |
| Computers & Peripherals - 0.78% | | | | |
| Hewlett-Packard Company | | 298,760 | | 13,034,899 |
| Internet Software & Services - 1.04% | | | | |
| Google, Inc., Class A (I) | | 28,145 | | 17,264,143 |
| IT Services - 0.26% | | | | |
| Visa, Inc., Class A | | 60,050 | | 4,386,653 |
| Semiconductors & Semiconductor Equipment - 1.97% | | |
| Texas Instruments, Inc. | | 921,065 | | 32,799,125 |
| Software - 1.35% | | | | |
| Activision Blizzard, Inc. (I) | | 745,567 | | 8,290,705 |
| Microsoft Corp. | | 535,330 | | 14,229,071 |
| | |
|
| | | | | 22,519,776 |
| | |
|
| | | | | 90,004,596 |
| Materials - 7.73% | | | | |
| Chemicals - 1.88% | | | | |
| Air Products & Chemicals, Inc. | | 58,710 | | 5,401,320 |
| Monsanto Company | | 235,644 | | 16,940,447 |
| Potash Corp. of Saskatchewan, Inc. | | 90,189 | | 5,555,642 |
| Praxair, Inc. | | 34,600 | | 3,438,548 |
| | |
|
| | | | | 31,335,957 |
| Construction Materials - 0.67% | | | | |
| Martin Marietta Materials, Inc. (L) | | 75,686 | | 6,725,458 |
| Vulcan Materials Company (L) | | 96,188 | | 4,410,220 |
| | |
|
| | | | | 11,135,678 |
| Containers & Packaging - 2.53% | | | | |
| Sealed Air Corp. | | 1,533,218 | | 42,194,159 |
| Metals & Mining - 1.28% | | | | |
| BHP Billiton PLC | | 273,885 | | 10,850,960 |
| Rio Tinto PLC | | 148,946 | | 10,506,269 |
| | |
|
| | | | | 21,357,229 |
| |
| The accompanying notes are an integral part of the financial statements. | 77 |
John Hancock Funds II
Portfolio of Investments — February 28, 2011 (Unaudited) (showing percentage of total net assets)
| | | | |
| Fundamental Value Fund (continued) | | |
| | | Shares or | | |
| | | Principal | | |
| | | Amount | | Value |
| | |
|
| |
| COMMON STOCKS (continued) | | | | |
| Paper & Forest Products - 1.37% | | | | |
| Sino-Forest Corp. (I)(S) | | 24,905 | $ | 556,521 |
| Sino-Forest Corp. (I)(L) | 998,576 | | 22,313,914 |
| | |
|
| | | | | 22,870,435 |
| | | |
|
| | | | | 128,893,458 |
| Telecommunication Services - 0.33% | | | | |
| Wireless Telecommunication Services - 0.33% | | | | |
| America Movil SAB de CV, Series L, ADR | 94,763 | | 5,441,291 |
|
| TOTAL COMMON STOCKS (Cost $1,197,598,483) | | | $ | 1,600,836,523 |
|
| |
| CONVERTIBLE BONDS - 0.16% | | | | |
| Materials - 0.16% | | | | |
| Sino-Forest Corp. | | | | |
| 5.000%, 08/01/2013 (S) | $ | 2,107,900 | $ | 2,658,589 |
|
| TOTAL CONVERTIBLE BONDS (Cost $2,096,865) | | | $ | 2,658,589 |
|
| |
| SECURITIES LENDING COLLATERAL - 3.10% | | | |
| John Hancock Collateral | | | | |
| Investment Trust, 0.2855% (W)(Y) | 5,162,728 | | 51,665,488 |
|
| TOTAL SECURITIES LENDING | | | | |
| COLLATERAL (Cost $51,662,616) | | | $ | 51,665,488 |
|
| |
| SHORT-TERM INVESTMENTS - 3.75% | | | | |
| Short-Term Securities* - 3.75% | | | | |
| Intesa Funding LLC, 0.1900%, 03/01/2011 | | 42,498,000 | | 42,498,000 |
| Societe Generale North America, Inc., | | | | |
| 0.2000%, 03/02/2011 | | 20,000,000 | | 19,999,889 |
|
| TOTAL SHORT-TERM INVESTMENTS (Cost $62,497,889) | | $ | 62,497,889 |
|
| Total Investments (Fundamental Value Fund) | | | | |
| (Cost $1,313,855,853) - 102.99% | | | $ | 1,717,658,489 |
| Other assets and liabilities, net - (2.99%) | | | | (49,786,187) |
| | | |
|
| TOTAL NET ASSETS - 100.00% | | | $ | 1,667,872,302 |
| | | |
|
| |
| |
| Global Agribusiness Fund | | | | |
| | | Shares or | | |
| | | Principal | | |
| | | Amount | | Value |
| |
|
| |
| COMMON STOCKS - 100.46% | | | | |
| Australia - 0.24% | | | | |
| GrainCorp., Ltd. | | 1,000 | $ | 7,523 |
| Brazil - 1.72% | | | | |
| BRF - Brasil Foods SA | | 600 | | 10,686 |
| Cosan Ltd. | 3,200 | | 44,032 |
| | |
|
| | | | | 54,718 |
| Canada - 23.69% | | | | |
| AG Growth International, Inc. | | 900 | | 49,328 |
| Agrium, Inc. | 1,550 | | 147,374 |
| Asia Bio-chem Group Corp. (I) | 11,000 | | 16,191 |
| BioExx Specialty Proteins, Ltd. (I) | 4,000 | | 9,140 |
| Fortress Paper, Ltd. (I) | | 350 | | 19,994 |
| GLG Life Tech Corp. (I) | | 750 | | 7,720 |
| Mbac Fertilizer Corp. (I) | 11,500 | | 39,061 |
| Potash Corp. of Saskatchewan, Inc. | 6,000 | | 369,599 |
| Stonegate Agricom, Ltd. (I) | 7,000 | | 12,681 |
| SunOpta, Inc. (I) | 3,700 | | 25,419 |
| Viterra, Inc. | 2,000 | | 24,497 |
| | | | |
| Global Agribusiness Fund (continued) | | |
| | | Shares or | | |
| | | Principal | | |
| | | Amount | | Value |
| | |
|
| |
| COMMON STOCKS (continued) | | | | |
| Canada (continued) | | | | |
| Western Potash Corp. (I) | | 21,000 | $ | 31,990 |
| | |
|
| | | | | 752,994 |
| Chile - 1.17% | | | | |
| Sociedad Quimica y Minera de Chile SA, ADR | | 700 | | 37,093 |
| Germany - 0.73% | | | | |
| K&S AG | | 300 | | 23,157 |
| Indonesia - 2.54% | | | | |
| Charoen Pokphand Indonesia Tbk PT (I) | | 60,000 | | 10,392 |
| Perusahaan Perkebunan London Sumatra | | | | |
| Indonesia Tbk PT (I) | | 288,000 | | 70,428 |
| | |
|
| | | | | 80,820 |
| Ireland - 1.38% | | | | |
| Glanbia PLC (Dublin Exchange) | | 2,500 | | 14,674 |
| Glanbia PLC (London Exchange) | | 5,000 | | 29,146 |
| | |
|
| | | | | 43,820 |
| Japan - 0.87% | | | | |
| Komatsu, Ltd. | | 900 | | 27,570 |
| Malaysia - 2.14% | | | | |
| IOI Corp. BHD | | 20,000 | | 36,136 |
| Kuala Lumpur Kepong BHD | | 4,000 | | 26,491 |
| PPB Group BHD (I) | | 1,000 | | 5,423 |
| | |
|
| | | | | 68,050 |
| Netherlands - 3.05% | | | | |
| CNH Global NV (I) | | 2,000 | | 96,900 |
| Norway - 4.52% | | | | |
| Yara International ASA, ADR | | 2,700 | | 143,694 |
| Singapore - 10.30% | | | | |
| Golden Agri-Resources, Ltd. | | 153,250 | | 78,970 |
| Indofood Agri Resources, Ltd. (I) | | 23,000 | | 41,536 |
| Olam International, Ltd. | | 39,300 | | 86,413 |
| Wilmar International, Ltd. | | 30,000 | | 120,595 |
| | |
|
| | | | | 327,514 |
| Switzerland - 7.83% | | | | |
| Syngenta AG, ADR | | 3,700 | | 249,084 |
| United Kingdom - 0.83% | | | | |
| Tate & Lyle PLC | | 2,800 | | 26,422 |
| United States - 39.45% | | | | |
| AGCO Corp. (I) | | 600 | | 32,868 |
| Archer-Daniels-Midland Company | | 3,300 | | 122,694 |
| Bunge, Ltd. | | 900 | | 64,953 |
| CF Industries Holdings, Inc. | | 1,040 | | 146,931 |
| Corn Products International, Inc. | | 1,000 | | 48,820 |
| Deere & Company | | 3,400 | | 306,509 |
| Intrepid Potash, Inc. (I) | | 1,300 | | 50,180 |
| Lindsay Corp. | | 200 | | 14,122 |
| Monsanto Company | | 2,450 | | 176,131 |
| The Mosaic Company | | 3,300 | | 283,305 |
| Tyson Foods, Inc., Class A | | 400 | | 7,452 |
| | |
|
| | | | | 1,253,965 |
|
| TOTAL COMMON STOCKS (Cost $2,171,186) | | | $ | 3,193,324 |
|
| |
| The accompanying notes are an integral part of the financial statements. | 78 |
John Hancock Funds II
Portfolio of Investments — February 28, 2011 (Unaudited) (showing percentage of total net assets)
| | | | |
| Global Agribusiness Fund (continued) | | |
| | | Shares or | | |
| | | Principal | | |
| | | Amount | | Value |
| |
|
| |
| WARRANTS - 0.03% | | | | |
| Golden Agri-Resources, Ltd. (Expiration Date: | | | |
| 07/23/2012, Strike Price: SGD 0.54) (I) | | 8,500 | | 1,036 |
|
| TOTAL WARRANTS (Cost $0) | | | $ | 1,036 |
|
| Total Investments (Global Agribusiness Fund) | | | |
| (Cost $2,171,186) - 100.49% | | | $ | 3,194,360 |
| Other assets and liabilities, net - (0.49%) | | | (15,532) |
| | |
|
| TOTAL NET ASSETS - 100.00% | | | $ | 3,178,828 |
| | | |
|
| | |
| |
| |
| |
| Global Bond Fund | | | | |
| | | Shares or | | |
| | | Principal | | |
| | | Amount | | Value |
| |
|
| |
| FOREIGN GOVERNMENT | | | | |
| OBLIGATIONS - 23.06% | | | | |
| Canada - 1.12% | | | | |
| Canada Housing Trust No. 1 | | | | |
| 4.050%, 03/15/2011 | CAD | 6,900,000 | $ | 7,110,860 |
| 4.600%, 09/15/2011 | | 2,700,000 | | 2,829,338 |
| Province of Ontario | | | | |
| 4.100%, 06/16/2014 | $ | 200,000 | | 215,247 |
| | |
|
| | | | | 10,155,445 |
| France - 0.70% | | | | |
| Government of France | | | | |
| 3.750%, 01/12/2013 | EUR | 300,000 | | 430,114 |
| Societe Financement de | | | | |
| l’Economie Francaise | | | | |
| 2.125%, 05/20/2012 | | 200,000 | | 278,280 |
| 2.250%, 06/11/2012 (S) | $ | 5,500,000 | | 5,614,961 |
| | |
|
| | | | | 6,323,355 |
| Germany - 5.05% | | | | |
| Federal Republic of Germany | | | | |
| 1.250%, 03/11/2011 | EUR | 14,500,000 | | 20,010,474 |
| 3.500%, 04/12/2013 | | 300,000 | | 430,987 |
| 3.750%, 01/04/2015 | | 6,600,000 | | 9,665,787 |
| 4.000%, 01/04/2018 | | 2,800,000 | | 4,150,519 |
| 5.000%, 07/04/2011 | | 2,600,000 | | 3,637,813 |
| FMS Wertmanagement | | | | |
| 1.012%, 01/20/2014 (P) | | 5,700,000 | | 7,865,714 |
| | |
|
| | | | | 45,761,294 |
| Italy - 3.00% | | | | |
| Government of Italy | | | | |
| 4.750%, 02/01/2013 | | 19,000,000 | | 27,178,665 |
| | |
|
| | | | | 27,178,665 |
| Japan - 7.55% | | | | |
| Government of Japan | | | | |
| zero coupon 03/25/2011 to 04/27/2011 | JPY | 5,600,000,000 | | 68,445,512 |
| | |
|
| | | | | 68,445,512 |
| Netherlands - 0.40% | | | | |
| Kingdom of Netherlands | | | | |
| 4.500%, 07/15/2017 | EUR | 2,400,000 | | 3,614,817 |
| | |
|
| | | | | 3,614,817 |
| United Kingdom - 5.24% | | | | |
| Government of United Kingdom | | | | |
| 2.000%, 01/22/2016 | GBP | 2,400,000 | | 3,787,007 |
| 4.000%, 09/07/2016 | | 5,600,000 | | 9,680,622 |
| 4.250%, 06/07/2032 to 03/07/2036 | | 1,800,000 | | 2,868,166 |
| 4.500%, 03/07/2019 to 09/07/2034 | | 4,000,000 | | 6,878,535 |
| | | | |
| Global Bond Fund (continued) | | | |
| | | Shares or | | |
| | | Principal | | |
| | | Amount | | Value |
| |
|
| | |
| |
| FOREIGN GOVERNMENT | | | | |
| OBLIGATIONS (continued) | | | | |
| United Kingdom (continued) | | | | |
| Government of United Kingdom (continued) | | | |
| 4.750%, 09/07/2015 | $ | 13,600,000 | $ | 24,258,244 |
| | |
|
| | | | | 47,472,574 |
|
| TOTAL FOREIGN GOVERNMENT | | | | |
| OBLIGATIONS (Cost $205,708,024) | | | $ | 208,951,662 |
|
| |
| CORPORATE BONDS - 41.40% | | | | |
| Australia - 4.31% | | | | |
| Bank of Scotland PLC/Australia | | | | |
| 5.622%, 07/24/2012 (P) | AUD | 2,900,000 | | 2,960,397 |
| Commonwealth Bank of Australia | | | | |
| 0.581%, 09/17/2014 (P) (S) | $ | 4,200,000 | | 4,202,923 |
| 0.682%, 12/10/2012 (P) (S) | | 3,000,000 | | 3,014,796 |
| 0.723%, 07/12/2013 (P) (S) | | 5,400,000 | | 5,410,006 |
| 2.500%, 12/10/2012 (S) | | 3,400,000 | | 3,494,768 |
| Macquarie Bank, Ltd. | | | | |
| 3.300%, 07/17/2014 (S) | | 5,200,000 | | 5,453,334 |
| National Australia Bank, Ltd. | | | | |
| 3.375%, 07/08/2014 (S) | | 3,400,000 | | 3,567,032 |
| Suncorp-Metway, Ltd., Series TD | | | | |
| 5.460%, 09/11/2013 (P) | AUD | 6,100,000 | | 6,227,910 |
| Westpac Banking Corp. | | | | |
| 2.700%, 12/09/2014 (S) | $ | 1,200,000 | | 1,220,071 |
| 2.900%, 09/10/2014 (S) | | 3,400,000 | | 3,518,269 |
| | |
|
| | | | | 39,069,506 |
| Canada - 0.47% | | | | |
| Citigroup Finance Canada, Inc. | | | | |
| 5.500%, 05/21/2013 | CAD | 300,000 | | 323,943 |
| Falconbridge, Ltd. | | | | |
| 7.350%, 06/05/2012 | $ | 3,000,000 | | 3,210,033 |
| Rio Tinto Alcan, Inc. | | | | |
| 6.450%, 03/15/2011 | | 700,000 | | 701,380 |
| | |
|
| | | | | 4,235,356 |
| Cayman Islands - 1.12% | | | | |
| IPIC, Ltd. | | | | |
| 5.000%, 11/15/2020 (S) | | 1,000,000 | | 957,788 |
| Odebrecht Drilling Norbe VIII/IX, Ltd. | | | | |
| 6.350%, 06/30/2021 (S) | | 2,900,000 | | 3,034,125 |
| Petrobras International Finance Company | | | | |
| 3.875%, 01/27/2016 | | 3,000,000 | | 3,029,550 |
| 5.375%, 01/27/2021 | | 1,100,000 | | 1,103,875 |
| UPCB Finance, Ltd. | | | | |
| 7.625%, 01/15/2020 | EUR | 1,400,000 | | 2,047,846 |
| | |
|
| | | | | 10,173,184 |
| France - 6.89% | | | | |
| BNP Paribas | | | | |
| 5.000%, 01/15/2021 | $ | 4,400,000 | | 4,436,322 |
| BNP Paribas Home Loan | | | | |
| Covered Bonds SA | | | | |
| 3.000%, 07/23/2013 | EUR | 2,100,000 | | 2,927,665 |
| 4.750%, 05/28/2013 | | 1,700,000 | | 2,459,025 |
| Cie de Financement Foncier | | | | |
| 1.625%, 07/23/2012 (S) | $ | 5,300,000 | | 5,331,789 |
| 2.000%, 02/17/2012 | EUR | 4,200,000 | | 5,806,210 |
| 2.125%, 04/22/2013 (S) | $ | 4,000,000 | | 4,036,488 |
| 2.500%, 09/16/2015 (S) | | 3,900,000 | | 3,788,288 |
| 4.500%, 01/09/2013 | EUR | 2,600,000 | | 3,726,900 |
| Dexia Credit Local | | | | |
| 0.553%, 01/12/2012 (P) (S) | $ | 1,900,000 | | 1,893,346 |
| 2.625%, 01/21/2014 | EUR | 2,500,000 | | 3,432,798 |
| 2.750%, 01/10/2014 (S) | $ | 12,500,000 | | 12,489,800 |
| |
| The accompanying notes are an integral part of the financial statements. | 79 |
John Hancock Funds II
Portfolio of Investments — February 28, 2011 (Unaudited) (showing percentage of total net assets)
| | | | |
| Global Bond Fund (continued) | | | |
| | | Shares or | | |
| | | Principal | | |
| | | Amount | | Value |
| |
|
| |
| CORPORATE BONDS (continued) | | | | |
| France (continued) | | | | |
| Dexia Municipal Agency | | | | |
| 4.750%, 06/06/2011 | EUR | 600,000 | $ | 834,973 |
| Lafarge SA | | | | |
| 6.500%, 07/15/2016 | $ | 2,000,000 | | 2,121,874 |
| Societe Generale Societe de Credit | | | | |
| Fonciere | | | | |
| 4.000%, 07/07/2016 | EUR | 2,000,000 | | 2,847,576 |
| Valeo SA | | | | |
| 3.750%, 06/24/2013 | | 1,200,000 | | 1,672,267 |
| Vivendi SA | | | | |
| 5.750%, 04/04/2013 (S) | $ | 4,300,000 | | 4,638,053 |
| | |
|
| | | | | 62,443,374 |
| Germany - 0.70% | | | | |
| Kreditanstalt Fuer Wiederaufbau | | | | |
| 1.250%, 06/17/2013 | EUR | 200,000 | | 272,535 |
| 5.500%, 06/05/2014 | AUD | 4,200,000 | | 4,260,248 |
| Unitymedia Hessen GmbH & Company | | | | |
| KG / Unitymedia NRW GmbH | | | | |
| 8.125%, 12/01/2017 | EUR | 1,200,000 | | 1,782,205 |
| | |
|
| | | | | 6,314,988 |
| India - 0.13% | | | | |
| ICICI Bank, Ltd. | | | | |
| 2.063%, 02/24/2014 (P) (S) | $ | 1,200,000 | | 1,197,780 |
| | |
|
| | | | | 1,197,780 |
| Italy - 0.76% | | | | |
| Intesa Sanpaolo SpA | | | | |
| 2.713%, 02/24/2014 (P) (S) | | 2,100,000 | | 2,097,020 |
| 6.500%, 02/24/2021 (S) | | 4,600,000 | | 4,781,870 |
| | |
|
| | | | | 6,878,890 |
| Luxembourg - 0.21% | | | | |
| Sunrise Communications International SA | | | | |
| 7.000%, 12/31/2017 | EUR | 1,300,000 | | 1,906,056 |
| | |
|
| | | | | 1,906,056 |
| Netherlands - 3.97% | | | | |
| ABN Amro Bank NV | | | | |
| 3.250%, 01/18/2013 | | 2,500,000 | | 3,503,914 |
| 3.750%, 01/12/2012 | | 200,000 | | 280,919 |
| Achmea Hypotheekbank NV | | | | |
| 0.661%, 11/03/2014 (P) (S) | $ | 2,300,000 | | 2,287,433 |
| 3.200%, 11/03/2014 (S) | | 700,000 | | 723,165 |
| Fortis Bank Nederland Holding NV | | | | |
| 3.375%, 05/19/2014 | EUR | 2,400,000 | | 3,402,158 |
| Gazprom via White Nights Finance BV | | | | |
| 10.500%, 03/08/2014 | $ | 2,300,000 | | 2,748,500 |
| ING Bank NV | | | | |
| 2.500%, 01/14/2016 (S) | | 2,300,000 | | 2,199,594 |
| 3.375%, 03/03/2014 | EUR | 1,800,000 | | 2,548,722 |
| 3.900%, 03/19/2014 (S) | $ | 1,100,000 | | 1,170,078 |
| LeasePlan Corp. NV | | | | |
| 3.000%, 05/07/2012 (S) | | 1,400,000 | | 1,432,059 |
| 3.250%, 05/22/2014 | EUR | 1,100,000 | | 1,551,127 |
| NIBC Bank NV | | | | |
| 3.500%, 04/07/2014 | | 4,000,000 | | 5,694,093 |
| Rabobank Nederland NV (11.000% to | | | | |
| 06/30/2019, then 3 month | | | | |
| LIBOR + 10.868%) | | | | |
| (Q) (S) | $ | 3,275,000 | | 4,257,500 |
| Scotland International Finance No 2 BV | | | | |
| 4.250%, 05/23/2013 (S) | | 4,200,000 | | 4,152,637 |
| | |
|
| | | | | 35,951,899 |
| | | | |
| Global Bond Fund (continued) | | | |
| | | Shares or | | |
| | | Principal | | |
| | | Amount | | Value |
| |
|
| | |
| CORPORATE BONDS (continued) | | | | |
| New Zealand - 0.35% | | | | |
| Westpac Securities NZ, Ltd. | | | | |
| 3.450%, 07/28/2014 (S) | $ | 3,000,000 | $ | 3,146,007 |
| | |
|
| | | | | 3,146,007 |
| Norway - 0.68% | | | | |
| DnB NOR Boligkreditt | | | | |
| 4.500%, 05/16/2011 | EUR | 1,700,000 | | 2,360,856 |
| Kommunalbanken AS | | | | |
| 2.000%, 01/14/2013 | $ | 3,700,000 | | 3,778,570 |
| | |
|
| | | | | 6,139,426 |
| South Korea - 0.18% | | | | |
| Export-Import Bank of Korea | | | | |
| 5.750%, 05/22/2013 | EUR | 1,100,000 | | 1,599,595 |
| | |
|
| | | | | 1,599,595 |
| Sweden - 1.24% | | | | |
| Stadshypotek AB | | | | |
| 0.853%, 09/30/2013 (P) (S) | $ | 4,300,000 | | 4,294,466 |
| 1.450%, 09/30/2013 (S) | | 4,300,000 | | 4,325,202 |
| 2.750%, 04/30/2015 | EUR | 1,300,000 | | 1,776,988 |
| Swedbank Hypotek AB | | | | |
| 4.625%, 05/23/2011 | | 600,000 | | 833,892 |
| | |
|
| | | | | 11,230,548 |
| Switzerland - 0.48% | | | | |
| Transocean, Inc. | | | | |
| 4.950%, 11/15/2015 | $ | 4,100,000 | | 4,338,427 |
| | |
|
| | | | | 4,338,427 |
| United Kingdom - 6.78% | | | | |
| Abbey National Treasury Services PLC | | | | |
| 3.125%, 06/30/2014 | EUR | 6,400,000 | | 8,689,463 |
| Bank of Scotland PLC | | | | |
| 4.500%, 10/23/2013 | | 100,000 | | 141,839 |
| Barclays Bank PLC | | | | |
| 2.700%, 03/05/2012 (S) | $ | 100,000 | | 102,165 |
| 10.179%, 06/12/2021 (S) | | 800,000 | | 1,021,336 |
| BP Capital Markets PLC | | | | |
| 0.442%, 04/11/2011 (P) | | 300,000 | | 299,999 |
| 2.375%, 12/14/2011 | | 100,000 | | 100,889 |
| 3.125%, 10/01/2015 | | 2,600,000 | | 2,638,129 |
| LBG Capital No.1 PLC | | | | |
| 7.375%, 03/12/2020 | EUR | 200,000 | | 249,771 |
| 11.040%, 03/19/2020 | GBP | 2,800,000 | | 4,938,721 |
| LBG Capital No.2 PLC | | | | |
| 7.625%, 12/09/2019 | | 2,700,000 | | 3,994,219 |
| Lloyds TSB Bank PLC | | | | |
| 1.303%, 04/02/2012 (P) (S) | $ | 1,900,000 | | 1,918,415 |
| 2.653%, 01/24/2014 (P) | | 1,600,000 | | 1,641,853 |
| 4.875%, 01/21/2016 | | 4,400,000 | | 4,478,549 |
| Lloyds TSB Bank PLC (12.000% to | | | | |
| 12/16/2024, then 3 month | | | | |
| LIBOR + 11.750%) | | | | |
| (Q) (S) | | 2,600,000 | | 2,976,619 |
| Nationwide Building Society | | | | |
| 2.875%, 09/14/2015 | EUR | 800,000 | | 1,069,220 |
| 4.625%, 09/13/2012 | | 4,600,000 | | 6,536,837 |
| 5.500%, 07/18/2012 (S) | $ | 4,300,000 | | 4,530,833 |
| 5.500%, 07/18/2012 | | 2,200,000 | | 2,312,396 |
| Pearson Dollar Finance Two PLC | | | | |
| 6.250%, 05/06/2018 (S) | | 1,000,000 | | 1,111,528 |
| Royal Bank of Scotland PLC | | | | |
| 2.650%, 04/23/2012 | | 7,800,000 | | 7,950,290 |
| Tate & Lyle International Finance PLC | | | | |
| 5.000%, 11/15/2014 (S) | | 300,000 | | 311,418 |
| |
| The accompanying notes are an integral part of the financial statements. | 80 |
John Hancock Funds II
Portfolio of Investments — February 28, 2011 (Unaudited) (showing percentage of total net assets)
| | | | |
| Global Bond Fund (continued) | | | |
| | | Shares or | | |
| | | Principal | | |
| | | Amount | | Value |
| |
|
| |
| CORPORATE BONDS (continued) | | | | |
| United Kingdom (continued) | | | | |
| The Royal Bank of Scotland PLC | | | | |
| 2.625%, 05/11/2012 (S) | $ | 2,400,000 | $ | 2,456,381 |
| Virgin Media Secured Finance PLC | | | | |
| 7.000%, 01/15/2018 | GBP | 900,000 | | 1,576,473 |
| XL Capital Finance Europe PLC | | | | |
| 6.500%, 01/15/2012 | $ | 400,000 | | 418,135 |
| | |
|
| | | | | 61,465,478 |
| United States - 13.13% | | | | |
| Ally Financial, Inc. | | | | |
| 6.625%, 05/15/2012 | | 2,000,000 | | 2,086,250 |
| 6.875%, 09/15/2011 to 08/28/2012 | | 5,900,000 | | 6,104,000 |
| Altria Group, Inc. | | | | |
| 9.250%, 08/06/2019 | | 2,000,000 | | 2,596,124 |
| American International Group, Inc. | | | | |
| 0.413%, 10/18/2011 (P) | | 200,000 | | 199,128 |
| 8.250%, 08/15/2018 | | 1,800,000 | | 2,149,198 |
| American International Group, Inc. | | | | |
| (8.175% to 05/15/2038, then 3 month | | | | |
| LIBOR + 4.195%) | | | | |
| 05/15/2058 | | 2,600,000 | | 2,853,500 |
| American International Group, Inc., | | | | |
| Series A3 (4.875% to 03/15/2017, then | | | | |
| 3 month EURIBOR + 1.730%) | | | | |
| 03/15/2067 | EUR | 200,000 | | 233,212 |
| American International Group, Inc., | | | | |
| Series REGS (8.000% to 05/22/2018, | | | | |
| then 3 month EURIBOR + 4.450%) | | | | |
| 05/22/2038 (S) | | 1,150,000 | | 1,618,681 |
| Autozone, Inc. | | | | |
| 5.875%, 10/15/2012 | $ | 500,000 | | 535,866 |
| BA Covered Bond Issuer | | | | |
| 4.125%, 04/05/2012 | EUR | 5,000,000 | | 7,016,134 |
| Capital One Financial Corp. | | | | |
| 5.700%, 09/15/2011 | $ | 600,000 | | 615,840 |
| CBS Corp. | | | | |
| 8.875%, 05/15/2019 | | 1,800,000 | | 2,268,448 |
| Citigroup, Inc. | | | | |
| 0.572%, 06/09/2016 (P) | | 3,100,000 | | 2,889,405 |
| 1.939%, 03/05/2014 | EUR | 3,500,000 | | 4,640,447 |
| 6.000%, 08/15/2017 | $ | 2,800,000 | | 3,068,251 |
| 6.125%, 11/21/2017 | | 3,400,000 | | 3,750,798 |
| CNA Financial Corp. | | | | |
| 6.000%, 08/15/2011 | | 1,000,000 | | 1,022,127 |
| D.R. Horton, Inc. | | | | |
| 5.250%, 02/15/2015 | | 1,800,000 | | 1,818,000 |
| 6.000%, 04/15/2011 | | 800,000 | | 804,000 |
| Ford Motor Credit Company LLC | | | | |
| 9.875%, 08/10/2011 | | 4,300,000 | | 4,441,969 |
| GMAC International Finance BV | | | | |
| 5.375%, 06/06/2011 | EUR | 1,900,000 | | 2,621,905 |
| HCA, Inc. | | | | |
| 7.875%, 02/15/2020 | $ | 2,000,000 | | 2,197,500 |
| 9.125%, 11/15/2014 | | 2,100,000 | | 2,202,375 |
| International Lease Finance Corp. | | | | |
| 6.375%, 03/25/2013 | | 800,000 | | 834,000 |
| 6.750%, 09/01/2016 (S) | | 4,100,000 | | 4,438,250 |
| Intuit, Inc. | | | | |
| 5.750%, 03/15/2017 | | 2,000,000 | | 2,200,016 |
| Jones Apparel Group, Inc. | | | | |
| 5.125%, 11/15/2014 | | 600,000 | | 603,000 |
| JPMorgan Chase & Company | | | | |
| 3.450%, 03/01/2016 | | 100,000 | | 100,494 |
| 6.000%, 01/15/2018 | | 1,500,000 | | 1,668,402 |
| | | | |
| Global Bond Fund (continued) | | | |
| | | Shares or | | |
| | | Principal | | |
| | | Amount | | Value |
| |
|
| |
| CORPORATE BONDS (continued) | | | | |
| United States (continued) | | | | |
| Lehman Brothers Holdings, Inc. | | | | |
| 5.625%, 01/24/2013 (H) | $ | 3,600,000 | $ | 931,500 |
| 6.875%, 05/02/2018 (H) | | 4,200,000 | | 1,097,250 |
| Loews Corp. | | | | |
| 5.250%, 03/15/2016 | | 200,000 | | 216,164 |
| Masco Corp. | | | | |
| 6.125%, 10/03/2016 | | 700,000 | | 716,428 |
| Merrill Lynch & Company, Inc. | | | | |
| 1.268%, 09/14/2018 | EUR | 1,900,000 | | 2,211,946 |
| 1.387%, 08/25/2014 (P) | | 1,900,000 | | 2,504,672 |
| 2.148%, 05/30/2014 | | 600,000 | | 782,281 |
| 6.750%, 05/21/2013 | | 2,800,000 | | 4,114,628 |
| 6.875%, 04/25/2018 | $ | 5,700,000 | | 6,411,970 |
| Morgan Stanley | | | | |
| 0.753%, 10/18/2016 (P) | | 600,000 | | 559,734 |
| 1.357%, 03/01/2013 (P) | EUR | 1,100,000 | | 1,486,437 |
| 1.377%, 04/13/2016 (P) | | 200,000 | | 256,395 |
| 1.426%, 01/16/2017 (P) | | 200,000 | | 253,734 |
| 1.903%, 01/24/2014 (P) | $ | 5,800,000 | | 5,885,266 |
| Nationwide Health Properties, Inc. | | | | |
| 6.500%, 07/15/2011 | | 600,000 | | 611,721 |
| Norfolk Southern Corp. | | | | |
| 5.257%, 09/17/2014 | | 2,000,000 | | 2,205,628 |
| Sabre Holdings Corp. | | | | |
| 7.350%, 08/01/2011 | | 700,000 | | 710,500 |
| Sealed Air Corp. | | | | |
| 5.625%, 07/15/2013 (S) | | 700,000 | | 736,438 |
| SLM Corp. | | | | |
| 0.502%, 03/15/2011 (P) | | 1,300,000 | | 1,298,348 |
| Southwest Airlines Company | | | | |
| 5.125%, 03/01/2017 | | 500,000 | | 520,469 |
| Springleaf Finance Corp. | | | | |
| 6.900%, 12/15/2017 | | 2,000,000 | | 1,795,000 |
| Sprint Capital Corp. | | | | |
| 8.750%, 03/15/2032 | | 200,000 | | 208,000 |
| The Bear Stearns Companies LLC | | | | |
| 7.250%, 02/01/2018 | | 4,400,000 | | 5,183,970 |
| Wal-Mart Stores, Inc. | | | | |
| 5.000%, 10/25/2040 | | 1,100,000 | | 1,039,887 |
| 6.200%, 04/15/2038 | | 400,000 | | 445,258 |
| WM Covered Bond Program | | | | |
| 3.875%, 09/27/2011 | EUR | 6,600,000 | | 9,185,185 |
| | |
|
| | | | | 118,946,129 |
|
| TOTAL CORPORATE BONDS (Cost $363,600,655) | | $ | 375,036,643 |
|
| |
| U.S. GOVERNMENT & AGENCY | | | | |
| OBLIGATIONS - 14.25% | | | | |
| U.S. Government Agency - 14.25% | | | | |
| Federal Home Loan Mortgage Corp. | | | | |
| 0.372%, 03/09/2011 (F) (P) | $ | 286,000 | | 286,006 |
| Federal National Mortgage Association | | | | |
| 1.525%, 11/01/2042 to 10/01/2044 (P) | | 2,630,920 | | 2,630,457 |
| 2.295%, 11/01/2035 (P) | | 316,560 | | 321,771 |
| 3.730%, 01/01/2018 | | 5,000,000 | | 5,082,800 |
| 4.000%, TBA | | 106,000,000 | | 104,523,176 |
| 4.000%, 11/01/2040 to 01/01/2041 | | 15,973,155 | | 15,771,203 |
| 5.104%, 09/01/2035 (P) | | 241,813 | | 258,514 |
| 5.167%, 07/01/2035 (P) | | 228,011 | | 243,758 |
| | |
|
| | | | | 129,117,685 |
|
| TOTAL U.S. GOVERNMENT & AGENCY | | | |
| OBLIGATIONS (Cost $128,045,579) | | | $ | 129,117,685 |
|
| |
| The accompanying notes are an integral part of the financial statements. | 81 |
John Hancock Funds II
Portfolio of Investments — February 28, 2011 (Unaudited) (showing percentage of total net assets)
| | | | |
| Global Bond Fund (continued) | | | |
| | | Shares or | | |
| | | Principal | | |
| | | Amount | | Value |
| |
|
| MUNICIPAL BONDS - 3.00% | | | | |
| California - 1.67% | | | | |
| Bay Area Toll Authority | | | | |
| 6.907%, 10/01/2050 | $ | 1,700,000 | $ | 1,727,064 |
| Golden State | | | | |
| Tobacco Securitization Corp. | | | | |
| 5.000%, 06/01/2038 | | 4,300,000 | | 3,561,389 |
| 5.125%, 06/01/2047 | | 300,000 | | 179,154 |
| Los Angeles Community College District | | | |
| 6.750%, 08/01/2049 | | 1,900,000 | | 2,027,110 |
| Los Angeles County Public Works | | | | |
| Financing Authority | | | | |
| 7.488%, 08/01/2033 | | 100,000 | | 97,848 |
| 7.618%, 08/01/2040 | | 2,100,000 | | 2,070,243 |
| State of California | | | | |
| 5.700%, 11/01/2021 | | 2,200,000 | | 2,219,052 |
| 7.600%, 11/01/2040 | | 2,200,000 | | 2,390,102 |
| 7.700%, 11/01/2030 | | 800,000 | | 844,520 |
| | |
|
| | | | | 15,116,482 |
| Georgia - 0.05% | | | | |
| Municipal Electric Authority of Georgia | | | |
| 6.655%, 04/01/2057 | | 500,000 | | 495,680 |
| | |
|
| | | | | 495,680 |
| New York - 0.31% | | | | |
| City Of New York | | | | |
| 5.237%, 12/01/2021 | | 2,300,000 | | 2,327,554 |
| New York City Municipal Water Finance | | | |
| Authority, Series 1289 | | | | |
| 11.613%, 12/15/2013 (P) | | 130,000 | | 108,334 |
| Triborough Bridge & Tunnel Authority | | | | |
| 5.550%, 11/15/2040 | | 400,000 | | 360,164 |
| | |
|
| | | | | 2,796,052 |
| Ohio - 0.74% | | | | |
| American Municipal Power-Ohio, Inc. | | | | |
| 7.734%, 02/15/2033 | | 1,400,000 | | 1,485,022 |
| 8.084%, 02/15/2050 | | 3,600,000 | | 4,076,388 |
| Buckeye Tobacco Settlement Financing | | | | |
| Authority | | | | |
| 5.875%, 06/01/2047 | | 1,700,000 | | 1,127,406 |
| | |
|
| | | | | 6,688,816 |
| Puerto Rico - 0.00% | | | | |
| Puerto Rico Sales Tax Financing Corp. | | | | |
| Zero Coupon 08/01/2054 | | 500,000 | | 24,780 |
| | |
|
| | | | | 24,780 |
| Texas - 0.23% | | | | |
| Northside Independent School District | | | | |
| 5.741%, 08/15/2035 | | 700,000 | | 660,632 |
| 5.891%, 08/15/2040 | | 1,500,000 | | 1,424,175 |
| | |
|
| | | | | 2,084,807 |
|
| TOTAL MUNICIPAL BONDS (Cost $27,966,492) | | | 27,206,617 |
|
| |
| TERM LOANS (M) - 0.37% | | | | |
| United States - 0.08% | | | | |
| Ford Motor Company | | | | |
| 3.010%, 12/15/2013 | | 742,872 | | 742,559 |
| Germany - 0.29% | | | | |
| Kabel Deutschland Holding AG | | | | |
| 4.860%, 12/20/2016 | EUR | 1,900,000 | | 2,632,830 |
| | |
|
| | | | | 2,632,830 |
|
| TOTAL TERM LOANS (Cost $3,249,987) | | $ | 3,375,389 |
|
| | | | |
| Global Bond Fund (continued) | | | |
| | | Shares or | | |
| | | Principal | | |
| | | Amount | | Value |
| |
|
| |
| CAPITAL PREFERRED SECURITIES - 0.28% | | | |
| Cayman Islands - 0.26% | | | | |
| MUFG Capital Finance 5, Ltd. (6.299% | | | | |
| to 01/25/2017, then 6 month GBP | | | | |
| LIBOR + 2.060%) | | | | |
| (Q) | GBP | 1,513,000 | | 2,391,968 |
| United States - 0.02% | | | | |
| State Street Capital Trust IV | | | | |
| 1.301%, 06/15/2037 | $ | 200,000 | | 162,237 |
|
| TOTAL CAPITAL PREFERRED | | | | |
| SECURITIES (Cost $1,413,943) | | | $ | 2,554,205 |
|
| |
| COLLATERALIZED MORTGAGE | | | | |
| OBLIGATIONS - 15.25% | | | | |
| Commercial & Residential - 14.47% | | | | |
| Adjustable Rate Mortgage Trust, | | | | |
| Series 2005-5, Class 2A1 | | | | |
| 2.993%, 09/25/2035 (P) | $ | 124,165 | $ | 97,034 |
| American Home | | | | |
| Mortgage Investment Trust | | | | |
| Series 2007-1, Class GA2, | | | | |
| 0.502%, 05/25/2047 (P) | | 381,908 | | 51,677 |
| Series 2004-3, Class 5A, | | | | |
| 2.282%, 10/25/2034 (P) | | 345,329 | | 314,858 |
| Atomium Mortgage Finance BV, | | | | |
| Series 2003-I, Class A | | | | |
| 1.087%, 07/01/2034 (P) | EUR | 307,620 | | 412,883 |
| Banc of America Funding Corp. | | | | |
| Series 2006-A, Class 1A1, | | | | |
| 2.793%, 02/20/2036 (P) | $ | 1,255,559 | | 1,207,920 |
| Series 2006-J, Class 4A1, | | | | |
| 5.884%, 01/20/2047 (P) | | 187,738 | | 136,715 |
| BCAP LLC Trust, Series 2006-AA2, | | | | |
| Class A1 | | | | |
| 0.432%, 01/25/2037 (P) | | 2,047,108 | | 1,294,042 |
| Bear Stearns Adjustable | | | | |
| Rate Mortgage Trust | | | | |
| Series 2005-5, Class A2, | | | | |
| 2.440%, 08/25/2035 (P) | | 1,017,672 | | 976,039 |
| Series 2005-9, Class A1, | | | | |
| 2.560%, 10/25/2035 (P) | | 2,188,999 | | 1,978,927 |
| Series 2003-5, Class 1A2, | | | | |
| 2.685%, 08/25/2033 (P) | | 63,891 | | 63,990 |
| Series 2005-2, Class A1, | | | | |
| 2.710%, 03/25/2035 (P) | | 1,629,641 | | 1,562,731 |
| Series 2003-9, Class 2A1, | | | | |
| 2.886%, 02/25/2034 (P) | | 23,673 | | 21,621 |
| Series 2003-7, Class 6A, | | | | |
| 2.900%, 10/25/2033 (P) | | 138,211 | | 141,875 |
| Series 2004-2, Class 22A, | | | | |
| 2.934%, 05/25/2034 (P) | | 244,894 | | 234,630 |
| Series 2005-2, Class A2, | | | | |
| 2.934%, 03/25/2035 (P) | | 406,330 | | 390,642 |
| Series 2004-2, Class 23A, | | | | |
| 4.479%, 05/25/2034 (P) | | 86,938 | | 86,371 |
| Series 2005-4, Class 3A1, | | | | |
| 5.301%, 08/25/2035 (P) | | 570,616 | | 505,213 |
| Bear Stearns Alt-A Trust | | | | |
| Series 2006-8, Class 3A1, | | | | |
| 0.422%, 02/25/2034 (P) | | 80,309 | | 66,042 |
| Series 2005-9, Class 24A1, | | | | |
| 2.950%, 11/25/2035 (P) | | 846,358 | | 523,769 |
| Series 2005-7, Class 22A1, | | | | |
| 2.961%, 09/25/2035 (P) | | 1,682,631 | | 1,328,112 |
| Series 2006-6, Class 31A1, | | | | |
| 5.066%, 11/25/2036 (P) | | 2,000,573 | | 1,283,760 |
| |
| The accompanying notes are an integral part of the financial statements. | 82 |
John Hancock Funds II
Portfolio of Investments — February 28, 2011 (Unaudited) (showing percentage of total net assets)
| | | | |
| Global Bond Fund (continued) | | | |
| | | Shares or | | |
| | | Principal | | |
| | | Amount | | Value |
| |
|
| | |
| |
| COLLATERALIZED MORTGAGE | | | | |
| OBLIGATIONS (continued) | | | | |
| Commercial & Residential (continued) | | | | |
| Bear Stearns Alt-A Trust (continued) | | | | |
| Series 2006-6, Class 32A1, | | | | |
| 5.182%, 11/25/2036 (P) | $ | 1,504,589 | $ | 956,559 |
| Bear Stearns Structured Products, Inc., | | | | |
| Series 2007-R6, Class 1A1 | | | | |
| 2.726%, 01/26/2036 (P) | | 889,241 | | 591,116 |
| Bella Vista Mortgage Trust, | | | | |
| Series 2005-2, Class 2A1 | | | | |
| 0.512%, 05/20/2045 (P) | | 668,890 | | 409,352 |
| Citigroup Mortgage Loan Trust, Inc. | | | | |
| Series 2005-12, Class 2A1, | | | | |
| 1.062%, 08/25/2035 (P) (S) | | 1,110,966 | | 869,107 |
| Series 2005-6, Class A1, | | | | |
| 2.510%, 08/25/2035 (P) | | 563,573 | | 533,988 |
| Series 2005-6, Class A2, | | | | |
| 2.560%, 08/25/2035 (P) | | 591,145 | | 534,963 |
| Series 2005-11, Class 1A1, | | | | |
| 2.640%, 12/25/2035 (P) | | 327,202 | | 301,145 |
| Series 2005-11, Class A2A, | | | | |
| 2.690%, 12/25/2035 (P) | | 1,504,354 | | 1,449,491 |
| Commercial Mortgage Pass Through | | | | |
| Certificates, Series 2006-CN2A, | | | | |
| Class A2FL | | | | |
| 0.483%, 02/05/2019 (P) (S) | | 2,600,000 | | 2,552,902 |
| Countrywide Alternative Loan Trust | | | | |
| Series 2007-OA7, Class A1A, | | | | |
| 0.442%, 05/25/2047 (P) | | 2,046,803 | | 1,211,056 |
| Series 2006-OA19, Class A1, | | | | |
| 0.443%, 02/20/2047 (P) | | 2,087,883 | | 1,092,065 |
| Series 2006-OA1, Class 2A1, | | | | |
| 0.472%, 03/20/2046 (P) | | 1,280,749 | | 757,124 |
| Series 2005-81, Class A1, | | | | |
| 0.542%, 02/25/2037 (P) | | 3,878,642 | | 2,379,039 |
| Series 2007-11T1, Class A12, | | | | |
| 0.612%, 05/25/2037 (P) | | 511,520 | | 305,749 |
| Series 2005-56, Class 2A3, | | | | |
| 1.792%, 11/25/2035 (P) | | 105,918 | | 66,492 |
| Series 2005-56, Class 2A2, | | | | |
| 2.332%, 11/25/2035 (P) | | 105,991 | | 66,532 |
| Series 2005-21CB, Class A3, | | | | |
| 5.250%, 06/25/2035 | | 183,797 | | 164,453 |
| Series 2007-7T2, Class A9, | | | | |
| 6.000%, 04/25/2037 | | 273,204 | | 184,496 |
| Series 2007-16CB, Class 5A1, | | | | |
| 6.250%, 08/25/2037 | | 227,728 | | 152,417 |
| Countrywide Home Loan Mortgage | | | | |
| Pass Through Trust | | | | |
| Series 2004-25, Class 1A1, | | | | |
| 0.592%, 02/25/2035 (P) | | 237,351 | | 183,769 |
| Series 2004-25, Class 2A1, | | | | |
| 0.602%, 02/25/2035 (P) | | 283,096 | | 218,260 |
| Series 2005-R2, Class 1AF1, | | | | |
| 0.602%, 06/25/2035 (P) (S) | | 100,429 | | 84,981 |
| Series 2004-12, Class 12A1, | | | | |
| 2.945%, 08/25/2034 (P) | | 742,704 | | 640,448 |
| Series 2004-12, Class 11A1, | | | | |
| 2.984%, 08/25/2034 (P) | | 70,939 | | 53,389 |
| Series 2005-HYB9, Class 3A2A, | | | | |
| 3.017%, 02/20/2036 (P) | | 522,175 | | 439,194 |
| Series 2004-22, Class A3, | | | | |
| 3.121%, 11/25/2034 (P) | | 250,045 | | 221,716 |
| Series 2005-HYB9, Class 5A1, | | | | |
| 5.250%, 02/20/2036 (P) | | 535,516 | | 380,423 |
| | | | |
| Global Bond Fund (continued) | | | |
| | | Shares or | | |
| | | Principal | | |
| | | Amount | | Value |
| |
|
| |
| COLLATERALIZED MORTGAGE | | | | |
| OBLIGATIONS (continued) | | | | |
| Commercial & Residential (continued) | | | | |
| Credit Suisse First Boston | | | | |
| Mortgage Securities Corp. | | | | |
| Series 2003-AR18, Class 2A3, | | | | |
| 2.496%, 07/25/2033 (P) | $ | 24,002 | $ | 23,360 |
| Series 2003-AR20, Class 2A1, | | | | |
| 2.675%, 08/25/2033 (P) | | 244,735 | | 250,426 |
| Credit Suisse Mortgage | | | | |
| Capital Certificates | | | | |
| Series 2007-C3, Class A2, | | | | |
| 5.716%, 06/15/2039 (P) | | 1,882,705 | | 1,930,768 |
| Series 2010-UD1, Class A, | | | | |
| 5.737%, 12/18/2049 (P) | | 300,000 | | 326,779 |
| Crusade Global Trust | | | | |
| Series 2004-2, Class A2, | | | | |
| 1.218%, 11/19/2037 (P) | EUR | 640,553 | | 863,120 |
| Series 2005-2, Class A2, | | | | |
| 5.092%, 08/14/2037 (P) | AUD | 3,080,056 | | 3,056,996 |
| Delphinus BV, Series 2001-II, Class A1 | | | | |
| 1.378%, 11/28/2031 (P) | EUR | 356,088 | | 488,141 |
| Dutch Mortgage Portfolio Loans BV, | | | | |
| Series III, Class A | | | | |
| 1.336%, 11/20/2035 (P) | | 837,447 | | 1,128,537 |
| First Flexible PLC, Series 7, Class A | | | | |
| 0.869%, 09/15/2033 (P) | GBP | 574,450 | | 845,133 |
| First Horizon Asset Securities, Inc. | | | | |
| Series 2003-AR4, Class 2A1, | | | | |
| 2.708%, 12/25/2033 (P) | $ | 135,188 | | 133,167 |
| Series 2005-AR3, Class 2A1, | | | | |
| 2.922%, 08/25/2035 (P) | | 122,498 | | 100,130 |
| First Republic Mortgage Loan Trust, | | | | |
| Series 2001-FRB1, Class A | | | | |
| 0.616%, 11/15/2031 (P) | | 366,802 | | 335,573 |
| German Residential Asset | | | | |
| Note Distributor PLC, Series 2006-1, | | | | |
| Class A | | | | |
| 1.252%, 07/20/2016 (P) | EUR | 1,161,552 | | 1,498,600 |
| GMAC Mortgage Corp. Loan Trust, | | | | |
| Series 2004-AR1, Class 22A | | | | |
| 3.037%, 06/25/2034 (P) | $ | 19,021 | | 16,689 |
| Great Hall Mortgages PLC | | | | |
| Series 2007-1, Class A2A, | | | | |
| 0.882%, 03/18/2039 (P) | GBP | 1,133,028 | | 1,589,130 |
| Series 2007-1, Class A2B, | | | | |
| 1.154%, 03/18/2039 (P) | EUR | 1,888,381 | | 2,247,949 |
| Series 2006-1, Class A2B, | | | | |
| 1.174%, 06/18/2038 (P) | | 1,797,090 | | 2,165,394 |
| Greenpoint Mortgage Funding Trust, | | | | |
| Series 2006-AR6, Class A1A | | | | |
| 0.342%, 10/25/2046 (P) | $ | 452,839 | | 418,700 |
| Greenpoint Mortgage Pass-Through | | | | |
| Certificates, Series 2003-1, Class A1 | | | | |
| 3.064%, 10/25/2033 (P) | | 16,788 | | 14,590 |
| GS Mortgage Securities Corp. II | | | | |
| 4.592%, 08/10/2043 (S) | | 1,100,000 | | 1,113,635 |
| GSR Mortgage Loan Trust, | | | | |
| Series 2003-1, Class A2 | | | | |
| 2.020%, 03/25/2033 (P) | | 114,116 | | 114,475 |
| GSRPM Mortgage Loan Trust, | | | | |
| Series 2003-1, Class A2 | | | | |
| 0.962%, 01/25/2032 (P) | | 125,509 | | 116,609 |
| Harborview Mortgage Loan Trust | | | | |
| Series 2006-12, Class 2A2A, | | | | |
| 0.452%, 01/19/2038 (P) | | 1,868,608 | | 1,247,406 |
| |
| The accompanying notes are an integral part of the financial statements. | 83 |
John Hancock Funds II
Portfolio of Investments — February 28, 2011 (Unaudited) (showing percentage of total net assets)
| | | | |
| Global Bond Fund (continued) | | | |
| | | Shares or | | |
| | | Principal | | |
| | | Amount | | Value |
| |
|
| | | | |
| |
| COLLATERALIZED MORTGAGE | | | | |
| OBLIGATIONS (continued) | | | | |
| Commercial & Residential (continued) | | | | |
| Harborview Mortgage Loan Trust (continued) | | | |
| Series 2006-1, Class 2A1A, | | | | |
| 0.503%, 03/19/2036 (P) | $ | 1,304,280 | $ | 813,666 |
| Series 2005-4, Class 3A1, | | | | |
| 2.954%, 07/19/2035 (P) | | 40,202 | | 32,963 |
| Series 2003-1, Class A, | | | | |
| 3.066%, 05/19/2033 (P) | | 237,759 | | 242,519 |
| Holmes Master Issuer PLC | | | | |
| Series 2011-1A, Class A3, | | | | |
| 2.339%, 10/15/2054 (P) (S) | EUR | 2,700,000 | | 3,716,116 |
| Series 2010-1A, Class A3, | | | | |
| 2.406%, 10/15/2054 (P) (S) | | 3,800,000 | | 5,254,816 |
| Immeo Residential Finance PLC, | | | | |
| Series 2007-2, Class A | | | | |
| 1.186%, 12/15/2016 (P) | | 997,663 | | 1,307,637 |
| Indymac Index Mortgage Loan Trust, | | | | |
| Series 2004-AR11, Class 2A | | | | |
| 2.681%, 12/25/2034 (P) | $ | 75,137 | | 57,444 |
| JPMorgan Alternative Loan Trust, | | | | |
| Series 2006-A6, Class 2A1 | | | | |
| 5.500%, 11/25/2036 (P) | | 365,474 | | 345,174 |
| JPMorgan Mortgage Trust | | | | |
| Series 2003-A2, Class 3A1, | | | | |
| 2.181%, 11/25/2033 (P) | | 152,932 | | 153,678 |
| Series 2007-A1, Class 5A6, | | | | |
| 2.968%, 07/25/2035 (P) | | 475,215 | | 383,993 |
| Series 2006-A1, Class 3A2, | | | | |
| 5.380%, 02/25/2036 (P) | | 1,117,634 | | 1,039,559 |
| Mansard Mortgages PLC, | | | | |
| Series 2007-2X, Class A1 | | | | |
| 1.399%, 12/15/2049 (P) | GBP | 4,614,412 | | 6,402,869 |
| Mellon Residential Funding Corp., | | | | |
| Series 2000-TBC3, Class A1 | | | | |
| 0.706%, 12/15/2030 (P) | $ | 648,614 | | 618,188 |
| Merrill Lynch Mortgage Investors, Inc. | | | | |
| Series 2005-A8, Class A3A2, | | | | |
| 0.512%, 08/25/2036 (P) | | 152,853 | | 125,902 |
| Series 2003-C, Class A1, | | | | |
| 0.922%, 06/25/2028 (P) | | 519,014 | | 502,534 |
| Series 2003-A2, Class 1A1, | | | | |
| 2.305%, 02/25/2033 (P) | | 108,760 | | 103,697 |
| Merrill Lynch/Countrywide Commercial | | | | |
| Mortgage Trust, Series 2007-8, | | | | |
| Class A3 | | | | |
| 5.965%, 08/12/2049 (P) | | 2,000,000 | | 2,165,380 |
| MLCC Mortgage Investors, Inc., | | | | |
| Series 2005-2, Class 1A | | | | |
| 1.707%, 10/25/2035 (P) | | 812,039 | | 741,559 |
| NCUA Guaranteed Notes | | | | |
| Series 2010-R1, Class 1A, | | | | |
| 0.713%, 10/07/2020 (P) | | 4,146,397 | | 4,152,865 |
| Series 2010-R2, Class 2A, | | | | |
| 0.733%, 11/05/2020 (P) | | 21,525,272 | | 21,430,561 |
| Newgate Funding PLC | | | | |
| Series 2007-3X, Class A1, | | | | |
| 1.349%, 12/15/2050 (P) | GBP | 1,341,971 | | 2,131,040 |
| Series 2007-3X, Class A3, | | | | |
| 1.749%, 12/15/2050 (P) | | 4,200,000 | | 5,129,328 |
| Puma Finance, Ltd. | | | | |
| Series 2006-G5, Class A1, | | | | |
| 0.384%, 02/21/2038 (P) (S) | $ | 950,516 | | 929,180 |
| Series 2005-P11, Class BA, | | | | |
| 5.000%, 08/22/2037 (P) | AUD | 270,985 | | 266,922 |
| | | | |
| Global Bond Fund (continued) | | | |
| | | Shares or | | |
| | | Principal | | |
| | | Amount | | Value |
| |
|
| | |
| |
| COLLATERALIZED MORTGAGE | | | | |
| OBLIGATIONS (continued) | | | | |
| Commercial & Residential (continued) | | | | |
| Puma Finance, Ltd. (continued) | | | | |
| Series 2004-P10, Class BA, | | | | |
| 5.355%, 07/12/2036 (P) | AUD | 315,742 | $ | 314,732 |
| Residential Accredit Loans, Inc. | | | | |
| Series 2007-QO2, Class A1, | | | | |
| 0.412%, 02/25/2047 (P) | $ | 467,251 | | 244,400 |
| Series 2006-QO6, Class A1, | | | | |
| 0.442%, 06/25/2046 (P) | | 2,096,046 | | 847,440 |
| Series 2006-QO3, Class A1, | | | | |
| 0.472%, 04/25/2046 (P) | | 1,294,156 | | 570,768 |
| Residential Asset Securitization Trust | | | | |
| Series 2006-R1, Class A2, | | | | |
| 0.662%, 01/25/2046 (P) | | 570,116 | | 262,752 |
| Series 2005-A15, Class 5A1, | | | | |
| 5.750%, 02/25/2036 | | 260,200 | | 193,845 |
| Residential Funding Mortgage | | | | |
| Securities I, Series 2005-SA4, | | | | |
| Class 1A21 | | | | |
| 3.268%, 09/25/2035 (P) | | 162,687 | | 118,210 |
| RMAC Securities PLC, | | | | |
| Series 2006-NS1X, Class A2A | | | | |
| 0.898%, 06/12/2044 (P) | GBP | 1,073,095 | | 1,455,419 |
| Sequoia Mortgage Trust, Series 5, | | | | |
| Class A | | | | |
| 0.612%, 10/19/2026 (P) | $ | 206,199 | | 184,696 |
| Structured Adjustable Rate | | | | |
| Mortgage Loan Trust | | | | |
| Series 2004-19, Class 2A1, | | | | |
| 1.728%, 01/25/2035 (P) | | 704,738 | | 416,414 |
| Series 2004-1, Class 4A2, | | | | |
| 2.591%, 02/25/2034 (P) | | 814,935 | | 777,525 |
| Series 2004-1, Class 4A1, | | | | |
| 2.591%, 02/25/2034 (P) | | 148,170 | | 142,255 |
| Series 2004-4, Class 3A2, | | | | |
| 2.719%, 04/25/2034 (P) | | 339,510 | | 311,155 |
| Series 2004-12, Class 7A1, | | | | |
| 5.210%, 09/25/2034 (P) | | 460,751 | | 436,461 |
| Structured Asset Mortgage | | | | |
| Investments, Inc., Series 2006-AR3, | | | | |
| Class 12A1 | | | | |
| 0.482%, 05/25/2036 (P) | | 1,671,779 | | 1,013,763 |
| Structured Asset Securities Corp., | | | | |
| Series 2006-11, Class A1 | | | | |
| 2.784%, 10/25/2035 (P) (S) | | 413,731 | | 339,072 |
| Superannuation Members Home Loans | | | | |
| Global Fund, Series 2004-7, Class A1 | | | | |
| 0.582%, 03/09/2036 (P) | | 665,392 | | 659,782 |
| Swan | | | | |
| Series 2006-1E, Class A1, | | | | |
| 0.392%, 05/12/2037 (P) | | 1,138,925 | | 1,107,733 |
| Series 2006-1E, Class A2, | | | | |
| 5.062%, 05/12/2037 (P) | AUD | 1,025,033 | | 1,017,358 |
| Series 2010-1, Class A, | | | | |
| 6.128%, 04/25/2041 (P) | | 2,308,033 | | 2,313,240 |
| Thornburg Mortgage Securities Trust, | | | | |
| Series 2006-5, Class A1 | | | | |
| 0.382%, 10/25/2046 (P) | $ | 1,123,257 | | 1,111,141 |
| Torrens Trust, Series 2007-1, Class A | | | | |
| 5.220%, 10/19/2038 (P) | AUD | 1,568,124 | | 1,552,827 |
| WaMu Mortgage Pass- | | | | |
| Through Certificates | | | | |
| Series 2005-AR6, Class 2A1A, | | | | |
| 0.492%, 04/25/2045 (P) | $ | 461,138 | | 385,456 |
| |
| The accompanying notes are an integral part of the financial statements. | 84 |
John Hancock Funds II
Portfolio of Investments — February 28, 2011 (Unaudited) (showing percentage of total net assets)
| | | | |
| Global Bond Fund (continued) | | | |
| | | Shares or | | |
| | | Principal | | |
| | | Amount | | Value |
| |
|
| |
| COLLATERALIZED MORTGAGE | | | | |
| OBLIGATIONS (continued) | | | | |
| Commercial & Residential (continued) | | | |
| WaMu Mortgage Pass-Through | | | | |
| Certificates (continued) | | | | |
| Series 2005-AR13, Class A1A1, | | | | |
| 0.552%, 10/25/2045 (P) | $ | 162,704 | $ | 136,679 |
| Series 2005-AR2, Class 2A1A, | | | | |
| 0.572%, 01/25/2045 (P) | | 259,426 | | 221,886 |
| Series 2006-AR19, Class 1A, | | | | |
| 1.032%, 01/25/2047 (P) | | 549,440 | | 338,395 |
| Series 2006-AR17, Class 1A1A, | | | | |
| 1.102%, 12/25/2046 (P) | | 420,173 | | 304,751 |
| Series 2006-AR3, Class A1A, | | | | |
| 1.292%, 02/25/2046 (P) | | 909,434 | | 728,895 |
| Series 2002-AR17, Class 1A, | | | | |
| 1.492%, 11/25/2042 (P) | | 294,284 | | 263,764 |
| Series 2003-AR5, Class A7, | | | | |
| 2.697%, 06/25/2033 (P) | | 96,111 | | 91,964 |
| Series 2003-AR9, Class 1A6, | | | | |
| 2.712%, 09/25/2033 (P) | | 3,203,146 | | 3,178,062 |
| Washington Mutual Alternative Mortgage | | | |
| Pass-Through Certificates, | | | | |
| Series 2006-AR5, Class 3A | | | | |
| 1.232%, 07/25/2046 (P) | | 394,379 | | 185,017 |
| Wells Fargo Mortgage | | | | |
| Backed Securities Trust | | | | |
| Series 2006-AR2, Class 2A1, | | | | |
| 2.802%, 03/25/2036 (P) | | 2,293,368 | | 2,022,587 |
| Series 2004-S, Class A1, | | | | |
| 2.883%, 09/25/2034 (P) | | 272,259 | | 278,257 |
| | |
|
| | | | | 131,078,675 |
| U.S. Government Agency - 0.78% | | | | |
| Federal Home Loan Mortgage Corp. | | | | |
| Series 2004-2895, Class F, | | | | |
| 0.616%, 06/15/2031 (P) | | 126,001 | | 126,270 |
| Series T-63, Class 1A1, | | | | |
| 1.525%, 02/25/2045 (P) | | 245,315 | | 237,111 |
| Federal National Mortgage Association | | | | |
| Series 2005-120, Class NF, | | | | |
| 0.362%, 01/25/2021 (P) | | 162,422 | | 162,322 |
| Series 2006-15, Class FC, | | | | |
| 0.403%, 03/25/2036 (P) | | 453,156 | | 425,594 |
| Series 2006-16, Class FC, | | | | |
| 0.562%, 03/25/2036 (P) | | 1,603,062 | | 1,602,975 |
| Series 2003-W6, Class F, | | | | |
| 0.612%, 09/25/2042 (P) | | 546,511 | | 537,556 |
| Series 2004-W2, Class 5AF, | | | | |
| 0.612%, 03/25/2044 (P) | | 355,312 | | 337,914 |
| Series 2010-136, Class FA, | | | | |
| 0.762%, 12/25/2040 (P) | | 3,185,431 | | 3,139,435 |
| Series 2006-5, Class 3A2, | | | | |
| 2.624%, 05/25/2035 (P) | | 497,224 | | 515,671 |
| | |
|
| | | | | 7,084,848 |
|
| TOTAL COLLATERALIZED MORTGAGE | | | |
| OBLIGATIONS (Cost $148,879,144) | | | $ | 138,163,523 |
|
| |
| ASSET BACKED SECURITIES - 3.40% | | | |
| Access Group, Series 2008-1, Class A | | | | |
| 1.603%, 10/27/2025 (P) | | 2,151,725 | | 2,173,435 |
| Aquilae CLO PLC, Series 2006-1X, | | | | |
| Class A | | | | |
| 1.469%, 01/17/2023 (P) | EUR | 3,028,787 | | 3,782,628 |
| Bumper 2 SA, Series 2009-3, Class A | | | | |
| 2.524%, 06/20/2022 (P) | | 745,841 | | 1,031,693 |
| | | | |
| Global Bond Fund (continued) | | | |
| | | Shares or | | |
| | | Principal | | |
| | | Amount | | Value |
| |
|
| |
| ASSET BACKED SECURITIES (continued) | | | |
| Countrywide Asset-Backed Certificates | | | | |
| Series 2007-2, Class 2A1, | | | | |
| 0.312%, 08/25/2037 (P) | $ | 214,267 | $ | 207,973 |
| Series 2006-25, Class 2A1, | | | | |
| 0.332%, 06/25/2047 (P) | | 169,916 | | 167,575 |
| Duane Street CLC, Series 2005-1A, | | | | |
| Class A2 | | | | |
| 0.562%, 11/08/2017 (P) (S) | | 1,358,526 | | 1,299,676 |
| First Franklin Mortgage Loan Asset | | | | |
| Backed Certificates, Series 2006-FF15, | | | | |
| Class A3 | | | | |
| 0.312%, 11/25/2036 (P) | | 153,072 | | 151,768 |
| Ford Auto Securitization Trust, | | | | |
| Series 2009-R1A, Class A2 | | | | |
| 4.817%, 10/15/2012 (S) | CAD | 1,000,000 | | 1,049,653 |
| Globaldrive BV, Series 2009-A, Class A | | | | |
| 3.000%, 07/20/2015 | EUR | 1,725,740 | | 2,382,578 |
| Gulf Stream Compass CLO, Ltd., | | | | |
| Series 2003-1A, Class A | | | | |
| 0.841%, 08/27/2015 (P) (S) | $ | 784,189 | | 770,338 |
| Harvest CLO SA, Series IX, Class A1 | | | | |
| 1.628%, 03/29/2017 (P) | EUR | 1,192,344 | | 1,497,291 |
| Landmark CDO, Ltd., Series 2005-1A, | | | | |
| Class A1L | | | | |
| 0.611%, 06/01/2017 (P) (S) | $ | 4,041,602 | | 3,886,474 |
| Long Beach Mortgage Loan Trust, | | | | |
| Series 2004-4, Class 1A1 | | | | |
| 0.542%, 10/25/2034 (P) | | 134,514 | | 111,606 |
| Magnolia Funding, Ltd. | | | | |
| Series 2010-1A, Class A1, | | | | |
| 3.000%, 04/20/2017 (P) (S) | EUR | 734,354 | | 1,005,001 |
| Series 2010-1A, Class A2, | | | | |
| 3.000%, 04/20/2017 (P) | | 600,000 | | 803,131 |
| Mid-State Trust, Series 1995-4, Class A | | | | |
| 8.330%, 04/01/2030 | $ | 1,015,743 | | 1,050,588 |
| Penta CLO SA, Series 2007-1X, | | | | |
| Class A1 | | | | |
| 1.478%, 06/04/2024 (P) | EUR | 871,477 | | 1,094,225 |
| SACO I, Inc., Series 2005-10, Class 1A | | | | |
| 0.522%, 06/25/2036 (P) | $ | 270,694 | | 129,625 |
| SC Germany Auto, Series 2007-1, | | | | |
| Class A | | | | |
| 0.996%, 08/11/2015 (P) | EUR | 91,701 | | 126,543 |
| SLM Student Loan Trust | | | | |
| Series 2003-6, Class A4, | | | | |
| 0.502%, 12/17/2018 (P) | $ | 290,746 | | 289,745 |
| Series 2009-B, Class A1, | | | | |
| 6.266%, 07/15/2042 (P) (S) | | 3,875,745 | | 3,734,904 |
| The Plymouth Rock CLO, Ltd., | | | | |
| Series 2010-1A, Class A | | | | |
| 1.920%, 02/16/2019 (P) (S) | | 2,200,000 | | 2,195,374 |
| Wells Fargo Home Equity Trust, | | | | |
| Series 2005-2, Class AI1A | | | | |
| 0.492%, 10/25/2035 (P) | | 41,631 | | 41,493 |
| Whitney CLO, Ltd., Series 2004-1A, | | | | |
| Class A1LA | | | | |
| 0.601%, 03/01/2017 (P) (S) | | 1,899,244 | | 1,823,747 |
|
| TOTAL ASSET BACKED SECURITIES (Cost $30,524,775) | $ | 30,807,064 |
|
| |
| PREFERRED SECURITIES - 0.02% | | | | |
| United States - 0.02% | | | | |
| SLM Corp. 4.158% | | 6,200 | $ | 129,332 |
|
| TOTAL PREFERRED SECURITIES (Cost $69,750) | | $ | 129,332 |
|
| |
| The accompanying notes are an integral part of the financial statements. | 85 |
John Hancock Funds II
Portfolio of Investments — February 28, 2011 (Unaudited) (showing percentage of total net assets)
| | | | |
| Global Bond Fund (continued) | | | |
| | | Shares or | | |
| | | Principal | | |
| | | Amount | | Value |
| |
|
| |
| CERTIFICATE OF DEPOSIT - 0.92% | | | | |
| Brazil - 0.92% | | | | |
| Banco do Brasil SA | | | | |
| 1.572%, 02/15/2012 | | 5,100,000 | $ | 5,019,589 |
| Itau Unibanco Participacoes SA | | | | |
| 1.350%, 07/19/2011 | | 3,300,000 | | 3,282,791 |
| | |
|
| | | | | 8,302,380 |
|
| TOTAL CERTIFICATE OF DEPOSIT (Cost $8,302,380) | $ | 8,302,380 |
|
| |
| SHORT-TERM INVESTMENTS - 7.18% | | | |
| Repurchase Agreement - 6.07% | | | | |
| Morgan Stanley Tri-Party Repurchase | | | | |
| Agreement dated 02/28/2011 at | | | | |
| 0.180% to be repurchased at | | | | |
| $52,700,264 on 03/01/2011, | | | | |
| collateralized by $52,795,800 | | | | |
| U.S. Treasury Notes, 1.375% due | | | | |
| 09/15/2012 (valued at $53,871,132, | | | | |
| including interest) | $ | 52,700,000 | $ | 52,700,000 |
| Repurchase Agreement with State | | | | |
| Street Corp. dated 02/28/2011 at | | | | |
| 0.010% to be repurchased at | | | | |
| $2,324,001 on 03/01/2011, | | | | |
| collateralized by $2,365,000 Federal | | | | |
| National Mortgage Association, | | | | |
| 0.625% due 09/24/2012 (valued at | | | | |
| $2,373,869, including interest) | | 2,324,000 | | 2,324,000 |
| | |
|
| | | | | 55,024,000 |
| Short-Term Securities* - 1.11% | | | | |
| U.S. Treasury Bill | | | | |
| 0.157%, 08/11/2011 (F) | | 1,030,000 | | 2,128,328 |
| 0.160%, 07/28/2011 (F) | | 281,000 | | 640,498 |
| 0.170%, 08/04/2011 (F) | | 633,000 | | 632,456 |
| 0.173%, 07/14/2011 (F) | | 241,000 | | 3,253,219 |
| 0.178%, 07/07/2011 (F) | | 3,384,903 | | 3,384,903 |
| | |
|
| | | | | 10,039,404 |
|
| TOTAL SHORT-TERM INVESTMENTS (Cost $65,063,404) | $ | 65,063,404 |
|
| Total Investments (Global Bond Fund) | | | | |
| (Cost $982,824,133) - 109.13% | | | $ | 988,707,904 |
| Other assets and liabilities, net - (9.13%) | | | (82,723,329) |
| | |
|
| TOTAL NET ASSETS - 100.00% | | | $ | 905,984,575 |
| | | |
|
| |
| |
| |
| Global Infrastructure Fund | | | |
| | | Shares or | | |
| | | Principal | | |
| | | Amount | | Value |
| |
|
| |
| COMMON STOCKS - 99.67% | | | | |
| Australia - 1.21% | | | | |
| Transurban Group, Ltd. | | 6,000 | $ | 32,657 |
| Belgium - 0.94% | | | | |
| Elia System Operator SA/NV | | 647 | | 25,401 |
| Bermuda - 0.45% | | | | |
| Knightsbridge Tankers, Ltd. | | 500 | | 12,195 |
| Brazil - 3.08% | | | | |
| Cia de Saneamento de Minas Gerais (I) | | 1,575 | | 27,452 |
| Cia Energetica de Minas Gerais, ADR | | 1,755 | | 29,589 |
| Companhia de Saneamento Basico de Estado de | | | |
| Sao Paulo, ADR | | 516 | | 25,769 |
| | |
|
| | | | | 82,810 |
| | | | |
| Global Infrastructure Fund (continued) | | |
| | | Shares or | | |
| | | Principal | | |
| | | Amount | | Value |
| | |
|
| |
| COMMON STOCKS (continued) | | | | |
| Canada - 17.48% | | | | |
| ATCO, Ltd. | | 700 | $ | 41,760 |
| Bonterra Energy Corp. | | 300 | | 19,123 |
| Calfrac Well Services, Ltd. | | 300 | | 10,730 |
| Cameco Corp. (Toronto Stock Exchange) | | 300 | | 12,222 |
| Canyon Services Group, Inc. | | 3,400 | | 42,660 |
| Cline Mining Corp. (I) | | 9,500 | | 37,353 |
| Enbridge, Inc. | | 1,200 | | 71,880 |
| Midway Energy, Ltd. (I) | | 8,000 | | 40,430 |
| Pacific Rubiales Energy Corp. | | 700 | | 23,459 |
| SNC-Lavalin Group, Inc. | | 800 | | 46,310 |
| TransCanada Corp. | | 2,400 | | 96,504 |
| Trican Well Service, Ltd. | | 1,200 | | 27,964 |
| | |
|
| | | | | 470,395 |
| China - 0.99% | | | | |
| China Qinfa Group, Ltd. (I) | | 17,000 | | 11,277 |
| Jiangsu Expressway, Ltd. | | 14,000 | | 15,279 |
| | |
|
| | | | | 26,556 |
| France - 4.62% | | | | |
| Aeroports de Paris | | 400 | | 35,450 |
| GDF Suez | | 1,396 | | 56,761 |
| Groupe Eurotunnel SA | | 2,000 | | 20,140 |
| Vinci SA | | 200 | | 12,035 |
| | |
|
| | | | | 124,386 |
| Germany - 7.70% | | | | |
| Bilfinger Berger AG | | 500 | | 41,913 |
| E.ON AG, SADR | | 3,318 | | 108,997 |
| Fraport AG, ADR | | 600 | | 42,735 |
| RWE AG | | 200 | | 13,498 |
| | |
|
| | | | | 207,143 |
| Hong Kong - 4.29% | | | | |
| China Merchants Holdings | | | | |
| International Company, Ltd. | | 13,000 | | 55,382 |
| COSCO Pacific, Ltd. | | 25,000 | | 48,374 |
| GZI Transportation, Ltd. | | 22,000 | | 11,672 |
| | |
|
| | | | | 115,428 |
| Indonesia - 0.20% | | | | |
| Jasa Marga PT | | 15,000 | | 5,406 |
| Italy - 8.85% | | | | |
| Autostrade SpA | | 3,900 | | 89,330 |
| Enel SpA | | 25,000 | | 148,959 |
| | |
|
| | | | | 238,289 |
| Japan - 0.82% | | | | |
| Kyowa Exeo Corp. | | 900 | | 8,603 |
| Nippon Densetsu Kogyo Company, Ltd. | | 1,400 | | 13,502 |
| | |
|
| | | | | 22,105 |
| Netherlands - 4.72% | | | | |
| Imtech NV | | 700 | | 25,289 |
| Koninklijke Vopak NV | | 2,100 | | 101,645 |
| | |
|
| | | | | 126,934 |
| Portugal - 0.86% | | | | |
| EDP - Energias de Portugal SA, SADR | | 608 | | 23,092 |
| Singapore - 0.96% | | | | |
| Sia Engineering Company, Ltd. | | 8,000 | | 25,927 |
| Spain - 2.01% | | | | |
| Abertis Infraestructuras SA | | 2,700 | | 54,245 |
| Sweden - 0.58% | | | | |
| NCC AB (I) | | 600 | | 15,681 |
| |
| The accompanying notes are an integral part of the financial statements. | 86 |
John Hancock Funds II
Portfolio of Investments — February 28, 2011 (Unaudited) (showing percentage of total net assets)
| | | | |
| Global Infrastructure Fund (continued) | | |
| | | Shares or | | |
| | | Principal | | |
| | | Amount | | Value |
| | |
|
| |
| COMMON STOCKS (continued) | | | | |
| Thailand - 3.33% | | | | |
| Bangkok Expressway PCL | | 26,000 | $ | 15,987 |
| Electricity Generating PCL | | 10,141 | | 33,079 |
| Ratchaburi Electricity Generating Holding PCL | | 32,442 | | 40,586 |
| | |
|
| | | | | 89,652 |
| United Kingdom - 7.64% | | | | |
| Balfour Beatty PLC | | 7,500 | | 42,658 |
| BBA Aviation PLC | | 16,000 | | 57,986 |
| Centrica PLC | | 8,739 | | 48,375 |
| Scottish & Southern Energy PLC | | 2,774 | | 56,534 |
| | |
|
| | | | | 205,553 |
| United States - 28.94% | | | | |
| Aecom Technology Corp. (I) | | 500 | | 14,320 |
| Chevron Corp. | | 400 | | 41,500 |
| Cleco Corp. | | 1,200 | | 38,820 |
| ConocoPhillips | | 300 | | 23,361 |
| CSX Corp. | | 300 | | 22,398 |
| DTE Energy Company | | 465 | | 21,892 |
| El Paso Corp. | | 3,000 | | 55,800 |
| El Paso Electric Company (I) | | 1,741 | | 48,922 |
| Fluor Corp. | | 500 | | 35,380 |
| Foster Wheeler AG (I) | | 700 | | 25,312 |
| Gran Tierra Energy, Inc. (I) | | 5,500 | | 51,176 |
| IDACORP, Inc. | | 500 | | 18,870 |
| KBR, Inc. | | 1,100 | | 36,080 |
| Macquarie Infrastructure Company LLC (I) | | 800 | | 19,136 |
| Public Service Enterprise Group, Inc. | | 600 | | 19,620 |
| Southwest Gas Corp. | | 1,000 | | 38,870 |
| Spectra Energy Corp. | | 4,300 | | 115,026 |
| Swift Energy Company (I) | | 300 | | 12,885 |
| The Williams Companies, Inc. | | 4,600 | | 139,657 |
| | |
|
| | | | | 779,025 |
|
| TOTAL COMMON STOCKS (Cost $2,208,836) | | | $ | 2,682,880 |
|
| Total Investments (Global Infrastructure Fund) | | | | |
| (Cost $2,208,836) - 99.67% | | | $ | 2,682,880 |
| Other assets and liabilities, net - 0.33% | | | | 8,788 |
| | | |
|
| TOTAL NET ASSETS - 100.00% | | | $ | 2,691,668 |
| | | |
|
| | | |
| |
| |
| |
| Global Real Estate Fund | | | | |
| | | Shares or | | |
| | | Principal | | |
| | | Amount | | Value |
| | |
|
| |
| COMMON STOCKS - 98.43% | | | | |
| Australia - 7.69% | | | | |
| CFS Gandel Retail Trust | | 220,148 $ | | 422,125 |
| Charter Hall Group, Ltd. (I) | | 225,442 | | 565,560 |
| Dexus Property Group | | 4,309,235 | | 3,763,919 |
| General Property Trust, Ltd. | | 1,599,668 | | 5,063,655 |
| Goodman Group | | 5,744,927 | | 4,113,376 |
| Macquarie Office Trust | | 334,810 | | 1,093,893 |
| Mirvac Group, Ltd. | | 2,253,300 | | 2,992,580 |
| Stockland (I) | | 1,226,397 | | 4,757,265 |
| Westfield Group | | 1,319,718 | | 13,146,597 |
| Westfield Retail Trust (I) | | 1,785,779 | | 4,864,969 |
| | |
|
| | | | | 40,783,939 |
| Austria - 0.00% | | | | |
| Immofinanz AG - Escrow Shares (I)(L) | | 140,000 | | 0 |
| | | | |
| Global Real Estate Fund (continued) | | |
| | | Shares or | | |
| | | Principal | | |
| | | Amount | | Value |
| | |
|
| |
| COMMON STOCKS (continued) | | | | |
| Canada - 4.03% | | | | |
| Brookfield Properties Corp. (L) | | 331,300 | $ | 5,807,689 |
| Canadian Real Estate Investment Trust | | 95,150 | | 3,248,547 |
| Chartwell Seniors Housing Real | | | | |
| Estate Investment Trust | | 533,100 | | 4,795,733 |
| H&R Real Estate Investment Trust | | 220,650 | | 4,851,098 |
| Innvest Real Estate Investment Trust | | 371,300 | | 2,663,745 |
| | |
|
| | | | | 21,366,812 |
| Cayman Islands - 0.37% | | | | |
| Longfor Properties | | 1,400,000 | | 1,980,516 |
| China - 0.64% | | | | |
| Agile Property Holdings, Ltd. | | 2,702,000 | | 3,418,629 |
| Finland - 0.20% | | | | |
| Technopolis OYJ (I) | | 190,000 | | 1,036,889 |
| France - 4.28% | | | | |
| ICADE | | 35,500 | | 3,981,805 |
| Klepierre SA | | 132,000 | | 5,151,057 |
| Unibail-Rodamco SE | | 67,500 | | 13,577,772 |
| | |
|
| | | | | 22,710,634 |
| Germany - 0.20% | | | | |
| Alstria Office Real Estate Investment Trust | | 69,000 | | 1,057,023 |
| Guernsey, C.I. - 0.07% | | | | |
| Camper & Nicholsons | | | | |
| Marina Investments, Ltd. (I) | | 1,200,000 | | 390,156 |
| Hong Kong - 15.39% | | | | |
| China Overseas Land & Investment, Ltd. | | 5,401,452 | | 8,998,012 |
| Hang Lung Properties, Ltd. | | 1,952,592 | | 8,322,482 |
| Hong Kong Land Holdings, Ltd. | | 1,676,000 | | 11,500,621 |
| Hysan Development Company, Ltd. | | 1,404,000 | | 6,363,438 |
| Kerry Properties, Ltd. | | 677,803 | | 3,291,799 |
| New World Development Company, Ltd. | | 1,808,000 | | 3,274,825 |
| Sino Land Company, Ltd. | | 3,172,000 | | 5,803,214 |
| Sun Hung Kai Properties, Ltd. | | 1,727,173 | | 27,906,910 |
| Wharf Holdings, Ltd. | | 939,000 | | 6,174,007 |
| | |
|
| | | | | 81,635,308 |
| Italy - 0.36% | | | | |
| BGP Holdings PLC (I) | | 4,606,148 | | 6 |
| Immobiliare Grande Distribuzione (I) | | 907,103 | | 1,902,551 |
| | |
|
| | | | | 1,902,557 |
| Japan - 10.90% | | | | |
| Daikyo, Inc. (I)(L) | | 1,283,000 | | 2,494,541 |
| Mitsubishi Estate Company, Ltd. | | 799,000 | | 16,358,431 |
| Mitsui Fudosan Company, Ltd. | | 690,000 | | 14,689,553 |
| Nippon Building Fund, Inc. | | 853 | | 8,950,448 |
| Sumitomo Realty & | | | | |
| Development Company, Ltd. | | 422,000 | | 11,343,652 |
| Tokyu Land Corp. | | 689,000 | | 3,957,037 |
| | |
|
| | | | | 57,793,662 |
| Jersey, C.I. - 0.63% | | | | |
| LXB Retail Properties PLC (I) | | 1,350,000 | | 2,337,158 |
| Max Property Group PLC (I) | | 574,355 | | 1,013,438 |
| | |
|
| | | | | 3,350,596 |
| Netherlands - 1.37% | | | | |
| Eurocommercial Properties NV | | 67,000 | | 3,212,415 |
| Wereldhave NV | | 40,000 | | 4,059,368 |
| | |
|
| | | | | 7,271,783 |
| Norway - 0.35% | | | | |
| Norwegian Property ASA | | 1,025,000 | | 1,828,874 |
| |
| The accompanying notes are an integral part of the financial statements. | 87 |
John Hancock Funds II
Portfolio of Investments — February 28, 2011 (Unaudited) (showing percentage of total net assets)
| | | | |
| Global Real Estate Fund (continued) | | |
| | | Shares or | | |
| | | Principal | | |
| | | Amount | | Value |
| | |
|
| |
| COMMON STOCKS (continued) | | | | |
| Philippines - 0.46% | | | | |
| Megaworld Corp. | | 51,167,300 | $ | 2,440,775 |
| Singapore - 2.57% | | | | |
| Capitaland, Ltd. | | 1,201,500 | | 3,084,974 |
| CDL Hospitality Trusts | | 1,787,000 | | 2,730,505 |
| Keppel Land, Ltd. | | 1,537,000 | | 5,118,272 |
| Suntec Real Estate Investment Trust | | 2,306,000 | | 2,685,357 |
| | |
|
| | | | | 13,619,108 |
| South Africa - 0.19% | | | | |
| South African Property Opportunities PLC (I) | | 905,000 | | 1,029,849 |
| Sweden - 0.48% | | | | |
| Fastighets Ab Balderfastighets Ab Balder - | | | | |
| B Shares (I) | | 155,000 | | 1,099,564 |
| Kungsleden Abkungsleden AB | | 145,000 | | 1,420,500 |
| | |
|
| | | | | 2,520,064 |
| United Kingdom - 5.20% | | | | |
| Big Yellow Group PLC | | 25,202 | | 132,432 |
| Capital & Regional PLC | | 1,100,000 | | 652,909 |
| Conygar Investment Company PLC | | 400,000 | | 770,688 |
| Derwent Valley Holdings PLC | | 109,000 | | 3,009,229 |
| Development Securities PLC | | 420,000 | | 1,406,035 |
| Land Securities Group PLC | | 600,000 | | 7,488,477 |
| Metric Property Investments PLC (I) | | 385,000 | | 695,139 |
| Primary Health Properties PLC | | 126,893 | | 681,951 |
| Quintain Estates & Development PLC (I) | | 800,000 | | 562,930 |
| Safestore Holdings, Ltd. | | 1,023,000 | | 2,395,677 |
| Segro PLC | | 940,000 | | 4,919,353 |
| Songbird Estates PLC (I) | | 466,738 | | 1,069,894 |
| Terrace Hill Group PLC | | 1,800,000 | | 745,737 |
| Unite Group PLC | | 930,000 | | 3,033,011 |
| | |
|
| | | | | 27,563,462 |
| United States - 43.05% | | | | |
| AMB Property Corp. | | 51,700 | | 1,880,846 |
| American Assets Trust, Inc. (I) | | 77,350 | | 1,667,666 |
| Apartment Investment & Management | | | | |
| Company, Class A | | 208,400 | | 5,345,460 |
| AvalonBay Communities, Inc. (L) | | 134,506 | | 16,279,260 |
| Boston Properties, Inc. (L) | | 183,450 | | 17,596,522 |
| Brandywine Realty Trust | | 356,750 | | 4,388,025 |
| BRE Properties, Inc. | | 176,700 | | 8,395,017 |
| Brookdale Senior Living, Inc. (I) | | 200,500 | | 5,391,445 |
| Campus Crest Communities, Inc. | | 60,650 | | 868,508 |
| Cogdell Spencer, Inc. | | 229,200 | | 1,469,172 |
| Colonial Properties Trust | | 348,450 | | 6,867,950 |
| CommonWealth | | 141,987 | | 4,076,447 |
| DCT Industrial Trust, Inc. (L) | | 142,200 | | 799,164 |
| Developers Diversified Realty Corp. (L) | | 411,800 | | 5,888,740 |
| Digital Realty Trust, Inc. (L) | | 150,000 | | 8,823,000 |
| Douglas Emmett, Inc. | | 204,600 | | 3,836,250 |
| Equity Lifestyle Properties, Inc. | | 72,300 | | 4,196,292 |
| Extra Space Storage, Inc. | | 243,150 | | 4,802,213 |
| Federal Realty Investment Trust | | 8,200 | | 690,276 |
| General Growth Properties, Inc. (I) | | 328,757 | | 5,233,811 |
| Glimcher Realty Trust | | 184,500 | | 1,697,400 |
| HCP, Inc. | | 151,150 | | 5,743,700 |
| Host Hotels & Resorts, Inc. (L) | | 587,254 | | 10,805,474 |
| Hudson Pacific Properties, Inc. | | 46,700 | | 702,835 |
| Kimco Realty Corp. (L) | | 506,950 | | 9,824,691 |
| LTC Properties, Inc. | | 96,700 | | 2,825,574 |
| Pebblebrook Hotel Trust | | 138,500 | | 3,038,690 |
| Post Properties, Inc. | | 121,900 | | 4,754,100 |
| ProLogis | | 675,000 | | 10,975,500 |
| PS Business Parks, Inc. | | 28,750 | | 1,812,400 |
| | | | |
| Global Real Estate Fund (continued) | | |
| | | Shares or | | |
| | | Principal | | |
| | | Amount | | Value |
| |
|
| |
| COMMON STOCKS (continued) | | | | |
| United States (continued) | | | | |
| Public Storage (L) | | 59,300 | $ | 6,656,425 |
| Ramco-Gershenson Properties Trust | | 148,550 | | 2,006,911 |
| Sabra Healthcare, Inc. | | 49,900 | | 919,158 |
| Senior Housing Properties Trust | | 266,063 | | 6,529,186 |
| Simon Property Group, Inc. | | 229,173 | | 25,218,195 |
| SL Green Realty Corp. | | 151,175 | | 11,448,482 |
| Strategic Hotels & Resorts, Inc. (I) | | 487,800 | | 3,170,700 |
| Tanger Factory Outlet Centers, Inc. | | 187,800 | | 5,004,870 |
| Taubman Centers, Inc. | | 120,200 | | 6,668,696 |
| | |
|
| | | | | 228,299,051 |
|
| TOTAL COMMON STOCKS (Cost $404,635,164) | | $ | 521,999,687 |
|
| |
| RIGHTS - 0.05% | | | | |
| BHG SA - Brazil Hospitality Group | | | | |
| (Expiration Date: 03/11/2011, Strike Price: | | | |
| BRL 0.60) (I) | | 141,327 | | 74,749 |
| Wharf Holdings, Ltd. (Expiration Date: | | | | |
| 03/11/11, Strike Price: HKD 36.50) (I) | | 93,900 | | 175,430 |
|
| TOTAL RIGHTS (Cost $0) | | | $ | 250,179 |
|
| |
| SECURITIES LENDING COLLATERAL - 5.71% | | | |
| John Hancock Collateral | | | | |
| Investment Trust, 0.2855% (W)(Y) | | 3,026,647 | | 30,288,864 |
|
| TOTAL SECURITIES LENDING | | | | |
| COLLATERAL (Cost $30,282,863) | | | $ | 30,288,864 |
|
| |
| SHORT-TERM INVESTMENTS - 0.88% | | | |
| Repurchase Agreement - 0.88% | | | | |
| Repurchase Agreement with State Street Corp. | | | |
| dated 02/28/2011 at 0.010% to be | | | | |
| repurchased at $4,681,001 on 03/01/2011, | | | |
| collateralized by $4,760,000 Federal Home | | | |
| Loan Mortgage Corp., 1.250% due | | | | |
| 09/30/2013 (valued at $4,777,850, | | | | |
| including interest) | $ | 4,681,000 | $ | 4,681,000 |
|
| TOTAL SHORT-TERM INVESTMENTS (Cost $4,681,000) | | $ | 4,681,000 |
|
| Total Investments (Global Real Estate Fund) | | | |
| (Cost $439,599,027) - 105.07% | | | $ | 557,219,730 |
| Other assets and liabilities, net - (5.07%) | | | | (26,887,989) |
| | |
|
| TOTAL NET ASSETS - 100.00% | | | $ | 530,331,741 |
| | | |
|
| |
| |
| Global Timber Fund | | | | |
| | | Shares or | | |
| | | Principal | | |
| | | Amount | | Value |
| |
|
| |
| COMMON STOCKS - 95.23% | | | | |
| Brazil - 3.09% | | | | |
| Duratex SA | | 3,161 | $ | 31,728 |
| Fibria Celulose SA, SADR (I) | | 4,440 | | 63,980 |
| | |
|
| | | | | 95,708 |
| Canada - 18.95% | | | | |
| Acadian Timber Corp. (I) | | 2,400 | | 24,579 |
| Canfor Corp. (I) | | 9,031 | | 111,453 |
| Canfor Pulp Products, Inc. | | 1,000 | | 17,580 |
| Domtar Corp. | | 949 | | 82,943 |
| Fortress Paper, Ltd. (I) | | 1,769 | | 101,055 |
| Mercer International, Inc. (I) | | 4,200 | | 58,254 |
| |
| The accompanying notes are an integral part of the financial statements. | 88 |
John Hancock Funds II
Portfolio of Investments — February 28, 2011 (Unaudited) (showing percentage of total net assets)
| | | | |
| Global Timber Fund (continued) | | |
| Shares or | | |
| Principal | | |
| | | Amount | | Value |
| | |
|
| |
| COMMON STOCKS (continued) | | | | |
| Canada (continued) | | | | |
| West Fraser Timber Company, Ltd. | | 3,992 | $ | 191,064 |
| | | |
|
| | | | | 586,928 |
| China - 1.30% | | | | |
| Shandong Chenming Paper Holdings, Ltd. | | 48,761 | | 40,097 |
| Finland - 11.16% | | | | |
| Stora Enso OYJ, Series R | | 12,226 | | 137,986 |
| UPM-Kymmene OYJ | | 10,440 | | 207,614 |
| | |
|
| | | | | 345,600 |
| Hong Kong - 8.48% | | | | |
| Nine Dragons Paper Holdings, Ltd. | | 15,000 | | 16,746 |
| Sino-Forest Corp. (I) | | 11,000 | | 245,803 |
| | |
|
| | | | | 262,549 |
| Japan - 5.27% | | | | |
| Nippon Paper Group, Inc. | | 3,500 | | 96,171 |
| Oji Paper Company, Ltd. | | 13,452 | | 66,945 |
| | |
|
| | | | | 163,116 |
| South Africa - 1.40% | | | | |
| Sappi, Ltd., SADR (I) | | 8,087 | | 43,265 |
| South Korea - 1.10% | | | | |
| Moorim Paper Company, Ltd. | | 5,010 | | 34,096 |
| Sweden - 2.35% | | | | |
| Billerud Aktibolag AB (I) | | 2,000 | | 21,651 |
| Svenska Cellulosa AB | | 3,095 | | 51,182 |
| | |
|
| | | | | 72,833 |
| United States - 42.13% | | | | |
| Boise, Inc. | | 10,400 | | 93,392 |
| Buckeye Technologies, Inc. | | 2,700 | | 70,740 |
| Clearwater Paper Corp. (I) | | 400 | | 31,720 |
| International Paper Company | | 5,600 | | 155,568 |
| KapStone Paper and Packaging Corp. (I) | | 4,599 | | 78,873 |
| MeadWestvaco Corp. | | 1,505 | | 44,172 |
| Packaging Corp. of America | | 2,191 | | 63,079 |
| Plum Creek Timber Company, Inc. | | 3,250 | | 136,370 |
| Potlatch Corp. | | 918 | | 35,251 |
| Rayonier, Inc. | | 5,000 | | 306,649 |
| Sonoco Products Company | | 3,064 | | 110,549 |
| Weyerhaeuser Company | | 7,300 | | 178,193 |
| | |
|
| | | | | 1,304,556 |
|
| TOTAL COMMON STOCKS (Cost $2,148,583) | | | $ | 2,948,748 |
|
| |
| PREFERRED SECURITIES - 4.19% | | | | |
| Brazil - 4.19% | | | | |
| Suzano Papel e Celulose SA | | 15,189 | | 129,725 |
|
| TOTAL PREFERRED SECURITIES (Cost $122,722) | | | $ | 129,725 |
|
| Total Investments (Global Timber Fund) | | | | |
| (Cost $2,271,305) - 99.42% | | | $ | 3,078,473 |
| Other assets and liabilities, net - 0.58% | | | | 18,026 |
| | | |
|
| TOTAL NET ASSETS - 100.00% | | | $ | 3,096,499 |
| | | |
|
| | | | |
| Heritage Fund | | | | |
| | | Shares or | | |
| | | Principal | | |
| | | Amount | | Value |
| | |
|
| |
| COMMON STOCKS - 99.77% | | | | |
| Consumer Discretionary - 19.72% | | | | |
| Auto Components - 0.94% | | | | |
| BorgWarner, Inc. (I)(L) | | 29,900 | $ | 2,320,539 |
| Automobiles - 0.53% | | | | |
| Harley-Davidson, Inc. | | 32,200 | | 1,314,404 |
| Diversified Consumer Services - 0.45% | | | | |
| Weight Watchers International, Inc. | | 18,039 | | 1,102,724 |
| Hotels, Restaurants & Leisure - 5.39% | | | | |
| Panera Bread Company, Class A (I) | | 16,093 | | 1,878,858 |
| Chipotle Mexican Grill, Inc. (I)(L) | | 10,400 | | 2,548,000 |
| Royal Caribbean Cruises, Ltd. (I) | | 152,900 | | 6,695,491 |
| Las Vegas Sands Corp. (I) | | 48,200 | | 2,248,048 |
| | |
|
| | | | | 13,370,397 |
| Internet & Catalog Retail - 4.62% | | | | |
| Netflix, Inc. (I)(L) | | 31,900 | | 6,592,773 |
| priceline.com, Inc. (I) | | 10,700 | | 4,856,516 |
| | |
|
| | | | | 11,449,289 |
| Media - 1.04% | | | | |
| Imax Corp. (I) | | 97,100 | | 2,574,121 |
| Multiline Retail - 0.50% | | | | |
| Dollar Tree, Inc. | | 24,800 | | 1,247,936 |
| Specialty Retail - 4.31% | | | | |
| O’Reilly Automotive, Inc. (I) | | 84,800 | | 4,713,184 |
| PetSmart, Inc. | | 73,700 | | 3,012,119 |
| Williams-Sonoma, Inc. | | 82,300 | | 2,970,207 |
| | |
|
| | | | | 10,695,510 |
| Textiles, Apparel & Luxury Goods - 1.94% | | | | |
| Lululemon Athletica, Inc. (I)(L) | | 32,400 | | 2,513,916 |
| Fossil, Inc. (I) | | 30,000 | | 2,302,200 |
| | |
|
| | | | | 4,816,116 |
| | |
|
| | | | | 48,891,036 |
| Consumer Staples - 4.64% | | | | |
| Beverages - 0.40% | | | | |
| Hansen Natural Corp. (I) | | 17,200 | | 989,860 |
| Food & Staples Retailing - 2.42% | | | | |
| Whole Foods Market, Inc. | | 80,200 | | 4,696,512 |
| Costco Wholesale Corp. | | 17,300 | | 1,293,867 |
| | |
|
| | | | | 5,990,379 |
| Food Products - 1.23% | | | | |
| The J.M. Smucker Company | | 9,000 | | 619,560 |
| Mead Johnson Nutrition Company | | 40,500 | | 2,423,925 |
| | |
|
| | | | | 3,043,485 |
| Household Products - 0.59% | | | | |
| Church & Dwight Company, Inc. | | 19,500 | | 1,471,080 |
| | |
|
| | | | | 11,494,804 |
| Energy - 7.34% | | | | |
| Energy Equipment & Services - 4.60% | | | | |
| National Oilwell Varco, Inc. | | 53,400 | | 4,249,038 |
| Dril-Quip, Inc. (I) | | 20,200 | | 1,549,340 |
| McDermott International, Inc. (I) | | 81,000 | | 1,858,950 |
| Atwood Oceanics, Inc. (I)(L) | | 31,100 | | 1,415,672 |
| FMC Technologies, Inc. (I) | | 24,700 | | 2,323,035 |
| | |
|
| | | | | 11,396,035 |
| Oil, Gas & Consumable Fuels - 2.74% | | | | |
| Pioneer Natural Resources Company | | 19,500 | | 1,995,630 |
| SandRidge Energy, Inc. (I) | | 58,800 | | 635,628 |
| |
| The accompanying notes are an integral part of the financial statements. | 89 |
John Hancock Funds II
Portfolio of Investments — February 28, 2011 (Unaudited) (showing percentage of total net assets)
| | | | |
| Heritage Fund (continued) | | | | |
| | | Shares or | | |
| | | Principal | | |
| | | Amount | | Value |
| | |
|
| COMMON STOCKS (continued) | | | | |
| Oil, Gas & Consumable Fuels (continued) | | | | |
| Concho Resources, Inc. (I) | | 39,200 | $ | 4,175,584 |
| | | |
|
| | | | | 6,806,842 |
| | | |
|
| | | | | 18,202,877 |
| Financials - 5.83% | | | | |
| Capital Markets - 2.22% | | | | |
| Raymond James Financial, Inc. | | 32,500 | | 1,245,400 |
| Lazard, Ltd., Class A | | 66,600 | | 2,930,400 |
| KKR & Company LP | | 79,700 | | 1,327,802 |
| | |
|
| | | | | 5,503,602 |
| Commercial Banks - 0.25% | | | | |
| East West Bancorp, Inc. | | 26,900 | | 624,618 |
| Consumer Finance - 1.29% | | | | |
| Discover Financial Services | | 146,800 | | 3,192,900 |
| Real Estate Management & Development - 2.07% | | | | |
| Jones Lang LaSalle, Inc. | | 13,400 | | 1,318,828 |
| CB Richard Ellis Group, Inc., Class A (I) | | 152,200 | | 3,811,088 |
| | |
|
| | | | | 5,129,916 |
| | | |
|
| | | | | 14,451,036 |
| Health Care - 12.94% | | | | |
| Biotechnology - 3.31% | | | | |
| United Therapeutics Corp. (I) | | 35,300 | | 2,380,279 |
| Vertex Pharmaceuticals, Inc. (I)(L) | | 34,600 | | 1,614,782 |
| Alexion Pharmaceuticals, Inc. (I)(L) | | 43,900 | | 4,226,692 |
| | |
|
| | | | | 8,221,753 |
| Health Care Equipment & Supplies - 2.66% | | | | |
| Varian Medical Systems, Inc. (I) | | 47,000 | | 3,256,160 |
| C.R. Bard, Inc. | | 34,100 | | 3,333,616 |
| | |
|
| | | | | 6,589,776 |
| Health Care Providers & Services - 1.43% | | | | |
| Express Scripts, Inc. (I) | | 62,900 | | 3,536,238 |
| Health Care Technology - 1.90% | | | | |
| SXC Health Solutions Corp. (I) | | 95,410 | | 4,708,484 |
| Life Sciences Tools & Services - 2.93% | | | | |
| Mettler-Toledo International, Inc. (I) | | 7,300 | | 1,251,001 |
| Agilent Technologies, Inc. (I) | | 32,000 | | 1,346,560 |
| Life Technologies Corp. (I) | | 27,200 | | 1,451,664 |
| Illumina, Inc. (I)(L) | | 46,500 | | 3,227,100 |
| | |
|
| | | | | 7,276,325 |
| Pharmaceuticals - 0.71% | | | | |
| Shire PLC, ADR | | 20,600 | | 1,751,206 |
| | |
|
| | | | | 32,083,782 |
| Industrials - 17.20% | | | | |
| Aerospace & Defense - 3.36% | | | | |
| TransDigm Group, Inc. (I) | | 34,400 | | 2,765,072 |
| BE Aerospace, Inc. (I) | | 164,681 | | 5,553,043 |
| | |
|
| | | | | 8,318,115 |
| Air Freight & Logistics - 0.17% | | | | |
| Expeditors International of Washington, Inc. | | 9,037 | | 431,969 |
| Airlines - 0.44% | | | | |
| United Continental Holdings, Inc. (I)(L) | | 45,100 | | 1,084,204 |
| Commercial Services & Supplies - 0.98% | | | | |
| Stericycle, Inc. (I) | | 28,200 | | 2,437,044 |
| Construction & Engineering - 1.12% | | | | |
| Foster Wheeler AG (I) | | 42,800 | | 1,547,648 |
| | | | |
| Heritage Fund (continued) | | | | |
| | | Shares or | | |
| | | Principal | | |
| | | Amount | | Value |
| | |
|
| |
| COMMON STOCKS (continued) | | | | |
| Construction & Engineering (continued) | | | | |
| KBR, Inc. | | 37,600 | $ | 1,233,280 |
| | |
|
| | | | | 2,780,928 |
| Electrical Equipment - 2.20% | | | | |
| Rockwell Automation, Inc. | | 28,400 | | 2,491,532 |
| Cooper Industries PLC | | 46,100 | | 2,966,535 |
| | |
|
| | | | | 5,458,067 |
| Machinery - 5.62% | | | | |
| AGCO Corp. (I) | | 57,200 | | 3,133,416 |
| ArvinMeritor, Inc. (I) | | 75,700 | | 1,356,544 |
| WABCO Holdings, Inc. (I) | | 19,500 | | 1,139,385 |
| The Manitowoc Company, Inc. | | 50,600 | | 1,002,386 |
| Deere & Company | | 11,000 | | 991,650 |
| Chart Industries, Inc. (I) | | 8,203 | | 372,334 |
| Joy Global, Inc. | | 25,800 | | 2,512,404 |
| Cummins, Inc. | | 33,800 | | 3,417,856 |
| | |
|
| | | | | 13,925,975 |
| Road & Rail - 1.48% | | | | |
| Kansas City Southern (I) | | 37,000 | | 1,992,080 |
| J.B. Hunt Transport Services, Inc. | | 40,300 | | 1,676,883 |
| | |
|
| | | | | 3,668,963 |
| Trading Companies & Distributors - 1.83% | | | | |
| MSC Industrial Direct Company, Inc., Class A | | 7,900 | | 499,201 |
| Fastenal Company (L) | | 65,000 | | 4,038,450 |
| | |
|
| | | | | 4,537,651 |
| | |
|
| | | | | 42,642,916 |
| Information Technology - 23.67% | | | | |
| Communications Equipment - 2.50% | | | | |
| Motorola Mobility Holdings, Inc. (I) | | 37,400 | | 1,129,480 |
| F5 Networks, Inc. (I) | | 42,900 | | 5,062,629 |
| | |
|
| | | | | 6,192,109 |
| Computers & Peripherals - 2.98% | | | | |
| NetApp, Inc. (I) | | 47,000 | | 2,428,020 |
| Apple, Inc. (I) | | 14,000 | | 4,944,940 |
| | |
|
| | | | | 7,372,960 |
| Electronic Equipment, Instruments & Components - 2.17% | | |
| Trimble Navigation, Ltd. (I) | | 42,000 | | 2,064,300 |
| Jabil Circuit, Inc. | | 74,900 | | 1,605,107 |
| Amphenol Corp., Class A | | 29,800 | | 1,712,904 |
| | |
|
| | | | | 5,382,311 |
| Internet Software & Services - 5.32% | | | | |
| WebMD Health Corp. (I) | | 29,633 | | 1,718,714 |
| SAVVIS, Inc. (I) | | 37,800 | | 1,228,122 |
| Monster Worldwide, Inc. (I) | | 63,700 | | 1,092,455 |
| OpenTable, Inc. (I)(L) | | 14,800 | | 1,315,276 |
| Akamai Technologies, Inc. (I) | | 47,300 | | 1,775,169 |
| VeriSign, Inc. | | 102,700 | | 3,624,283 |
| Baidu, Inc., SADR (I) | | 20,000 | | 2,423,200 |
| | |
|
| | | | | 13,177,219 |
| IT Services - 1.59% | | | | |
| Cognizant Technology | | | | |
| Solutions Corp., Class A (I) | | 51,400 | | 3,951,118 |
| Semiconductors & Semiconductor Equipment - 4.48% | | |
| ARM Holdings PLC | | 162,200 | | 1,632,720 |
| Skyworks Solutions, Inc. (I) | | 47,300 | | 1,699,962 |
| OmniVision Technologies, Inc. (I) | | 46,000 | | 1,408,520 |
| Broadcom Corp., Class A | | 26,100 | | 1,075,842 |
| Cavium Networks, Inc. (I)(L) | | 60,900 | | 2,629,662 |
| Veeco Instruments, Inc. (I)(L) | | 24,600 | | 1,170,468 |
| |
| The accompanying notes are an integral part of the financial statements. | 90 |
John Hancock Funds II
Portfolio of Investments — February 28, 2011 (Unaudited) (showing percentage of total net assets)
| | | | |
| Heritage Fund (continued) | | | |
| | | Shares or | | |
| | | Principal | | |
| | | Amount | | Value |
| |
|
| COMMON STOCKS (continued) | | | | |
| Semiconductors & Semiconductor Equipment (continued) | | |
| Cypress Semiconductor Corp. (I) | | 71,100 | $ | 1,490,256 |
| |
|
| | | | | 11,107,430 |
| Software - 4.63% | | | | |
| Salesforce.com, Inc. (I) | | 28,700 | | 3,796,149 |
| Check Point Software Technologies, Ltd. (I) | 25,400 | | 1,265,936 |
| Intuit, Inc. (I) | | 44,800 | | 2,355,584 |
| Citrix Systems, Inc. (I) | | 37,403 | | 2,624,194 |
| Rovi Corp. (I) | | 26,100 | | 1,446,462 |
| |
|
| | | | | 11,488,325 |
| | | |
|
| | | | | 58,671,472 |
| Materials - 4.58% | | | | |
| Chemicals - 2.15% | | | | |
| CF Industries Holdings, Inc. | | 13,300 | | 1,879,024 |
| Albemarle Corp. | | 60,100 | | 3,459,356 |
| |
|
| | | | | 5,338,380 |
| Containers & Packaging - 1.51% | | | | |
| Rock-Tenn Company, Class A (L) | | 18,100 | | 1,242,565 |
| Crown Holdings, Inc. (I) | | 64,900 | | 2,497,352 |
| |
|
| | | | | 3,739,917 |
| Metals & Mining - 0.92% | | | | |
| Cliffs Natural Resources, Inc. | | 23,500 | | 2,281,145 |
| |
|
| | | | | 11,359,442 |
| Telecommunication Services - 3.15% | | | | |
| Wireless Telecommunication Services - 3.15% | | | |
| SBA Communications Corp., Class A (I) | | 119,388 | | 5,025,041 |
| NII Holdings, Inc. (I) | | 68,200 | | 2,793,472 |
| |
|
| | | | | 7,818,513 |
| | | |
|
| | | | | 7,818,513 |
| Utilities - 0.70% | | | | |
| Gas Utilities - 0.70% | | | | |
| National Fuel Gas Company | | 23,800 | | 1,735,020 |
|
| TOTAL COMMON STOCKS (Cost $184,187,133) | | $ | 247,350,898 |
|
| SECURITIES LENDING COLLATERAL - 9.70% | | |
| John Hancock Collateral | | | | |
| Investment Trust, 0.2855% (W)(Y) | | 2,404,436 | | 24,062,154 |
|
| TOTAL SECURITIES LENDING | | | | |
| COLLATERAL (Cost $24,054,446) | | | $ | 24,062,154 |
|
| SHORT-TERM INVESTMENTS - 1.32% | | | |
| Short-Term Securities* - 1.32% | | | | |
| State Street Institutional U.S. Government | | | | |
| Money Market Fund, 0.0647% | $ | 3,267,969 | $ | 3,267,969 |
|
| TOTAL SHORT-TERM INVESTMENTS (Cost $3,267,969) | $ | 3,267,969 |
|
| Total Investments (Heritage Fund) | | | | |
| (Cost $211,509,548) - 110.79% | | | $ | 274,681,021 |
| Other assets and liabilities, net - (10.79%) | | | (26,755,927) |
| | |
|
| TOTAL NET ASSETS - 100.00% | | | $ | 247,925,094 |
| | | |
|
| | |
| | | | |
| High Income Fund | | | | |
| | | Shares or | | |
| | | Principal | | |
| | | Amount | | Value |
| |
|
| |
| CORPORATE BONDS - 33.57% | | | | |
| Consumer Discretionary - 24.07% | | | | |
| Adelphia Communications Corp., | | | | |
| Escrow Certificates | | | | |
| 7.750%, 01/15/2049 (I) | $ | 3,000,000 | $ | 45,300 |
| 9.875%, 03/01/2049 (I) | | 1,965,000 | | 29,672 |
| 10.250%, 11/01/2049 (I) | | 985,000 | | 14,874 |
| Allison Transmission, Inc., PIK | | | | |
| 11.250%, 11/01/2015 (S) | | 3,525,500 | | 3,842,795 |
| Canadian Satellite Radio Holdings, Inc. | | | | |
| 0.180%, 09/14/2014 | | 535,800 | | 587,390 |
| 1.500%, 02/14/2016 (P) | | 534,184 | | 465,961 |
| 8.000%, 09/10/2014 | CAD | 1,700,000 | | 1,447,530 |
| 12.750%, 02/15/2014 | $ | 4,980,000 | | 5,054,700 |
| Clear Channel Communications, Inc. | | | | |
| 9.000%, 03/01/2021 (S) | | 1,005,000 | | 1,021,331 |
| Clear Channel Communications, Inc., PIK | | | | |
| 11.000%, 08/01/2016 | | 9,754,396 | | 9,339,834 |
| Exide Technologies | | | | |
| 8.625%, 02/01/2018 (S) | | 5,900,000 | | 6,290,875 |
| Fontainebleau Las Vegas Holdings LLC | | | | |
| 10.250%, 06/15/2015 (H)(S) | | 20,530,000 | | 102,650 |
| Fontainebleau Las Vegas Holdings LLC, | | | | |
| PIK | | | | |
| 12.500%, 06/01/2022 (H) | | 3,813,380 | | 0 |
| Greektown Superholdings, Inc. | | | | |
| 13.000%, 07/01/2015 | | 14,804,000 | | 16,802,540 |
| Little Traverse Bay Bands of Odawa | | | | |
| Indians | | | | |
| 9.000%, 08/31/2020 (S) | | 5,580,000 | | 5,022,000 |
| Majestic Star Casino LLC | | | | |
| 9.500%, 10/15/2010 (H) | | 25,769,000 | | 13,754,204 |
| 9.750%, 01/15/2012 (H) | | 4,515,000 | | 982,013 |
| Mashantucket Western Pequot Tribe, | | | | |
| Series A | | | | |
| 8.500%, 11/15/2015 (H)(S) | | 25,082,000 | | 2,508,200 |
| Mohegan Tribal Gaming Authority | | | | |
| 6.125%, 02/15/2013 | | 7,650,000 | | 6,674,625 |
| 6.875%, 02/15/2015 | | 2,170,000 | | 1,578,675 |
| 7.125%, 08/15/2014 | | 7,370,000 | | 5,398,525 |
| 8.000%, 04/01/2012 | | 2,295,000 | | 1,967,963 |
| 11.500%, 11/01/2017 (S) | | 3,560,000 | | 3,604,500 |
| MTR Gaming Group, Inc. | | | | |
| 12.625%, 07/15/2014 | | 4,810,000 | | 5,122,650 |
| MTR Gaming Group, Inc., Series B | | | | |
| 9.000%, 06/01/2012 | | 17,664,000 | | 16,383,360 |
| Revel AC, Inc. PIK | | | | |
| 12.000%, 03/15/2018 (S) | | 2,682,000 | | 2,601,540 |
| SuperMedia, Inc., Escrow Certificates | | | | |
| 8.000%, 11/15/2016 (I) | | 18,405,000 | | 0 |
| Waterford Gaming LLC | | | | |
| 8.625%, 09/15/2014 (S) | | 2,137,000 | | 999,048 |
| Young Broadcasting, Inc. | | | | |
| 10.000%, 03/01/2011 (H) | | 4,745,000 | | 47 |
| | |
|
| | | | | 111,642,802 |
| Energy - 0.22% | | | | |
| Dominion Petroleum Acquisitions | | | | |
| 8.500%, 10/01/2011 (R) | | 996,635 | | 1,035,850 |
| Financials - 2.31% | | | | |
| MBIA Insurance Corp. (14.00% to | | | | |
| 01/15/2013, then 3 month | | | | |
| LIBOR + 11.26%) | | | | |
| 01/15/2033 (S) | | 4,220,000 | | 2,658,600 |
| Nationstar Mortgage/Nationstar | | | | |
| Capital Corp. | | | | |
| 10.875%, 04/01/2015 (S) | | 1,570,000 | | 1,617,100 |
| |
| The accompanying notes are an integral part of the financial statements. | 91 |
John Hancock Funds II
Portfolio of Investments — February 28, 2011 (Unaudited) (showing percentage of total net assets)
| | | | |
| High Income Fund (continued) | | | |
| | | Shares or | | |
| | | Principal | | |
| | | Amount | | Value |
| |
|
| |
| CORPORATE BONDS (continued) | | | | |
| Financials (continued) | | | | |
| Realogy Corp. | | | | |
| 11.500%, 04/15/2017 (S) | $ | 1,200,000 | $ | 1,278,000 |
| 12.000%, 04/15/2017 (S) | | 4,853,607 | | 5,144,823 |
| | |
|
| | | | | 10,698,523 |
| Industrials - 4.15% | | | | |
| American Airlines Pass Through Trust | | | | |
| 7.379%, 05/23/2016 | | 2,672,692 | | 2,512,331 |
| Colt Defense LLC/Colt Finance Corp. | | | | |
| 8.750%, 11/15/2017 (S) | | 6,690,000 | | 5,318,550 |
| GOL Finance | | | | |
| 8.750%, (Q)(S) | | 3,470,000 | | 3,400,600 |
| MSX International, Inc. | | | | |
| 12.500%, 04/01/2012 (S) | | 1,185,000 | | 1,019,100 |
| Northwest Airlines, Inc., | | | | |
| Escrow Certificates | | | | |
| 6.625%, 02/15/2023 (I) | | 15,690,000 | | 0 |
| 7.625%, 11/15/2023 (I) | | 8,745,000 | | 10,931 |
| 8.700%, 03/15/2049 (I) | | 2,055,000 | | 1,439 |
| 8.875%, 06/01/2049 (H) | | 6,360,000 | | 4,452 |
| 9.875%, 03/15/2037 (I) | | 7,045,000 | | 4,932 |
| 10.000%, 02/01/2049 (I) | | 3,115,000 | | 2,181 |
| 01/16/2017 (I) | | 4,470,000 | | 0 |
| Quebecor World, Inc., Escrow Certificates | | | | |
| 4.875%, 11/15/2049 (I) | | 365,000 | | 18,250 |
| 6.125%, 11/15/2013 (I) | | 3,255,000 | | 162,750 |
| 6.500%, 08/01/2049 (I) | | 560,000 | | 28,000 |
| 9.750%, 01/15/2049 (I) | | 3,155,000 | | 157,750 |
| USG Corp. | | | | |
| 9.750%, 08/01/2014 (S) | | 195,000 | | 212,063 |
| Western Express, Inc. | | | | |
| 12.500%, 04/15/2015 (S) | | 6,590,000 | | 6,392,300 |
| | |
|
| | | | | 19,245,629 |
| Information Technology - 0.31% | | | | |
| Friendfinder Networks, Inc. | | | | |
| 14.000%, 09/30/2013 (S) | | 1,343,078 | | 1,423,663 |
| Materials - 2.17% | | | | |
| American Pacific Corp. | | | | |
| 9.000%, 02/01/2015 | | 7,485,000 | | 7,354,013 |
| NewPage Corp. | | | | |
| 11.375%, 12/31/2014 | | 2,105,000 | | 2,099,738 |
| NewPage Holding Corp., PIK | | | | |
| 7.450%, 11/01/2013 | | 1,660,000 | | 178,450 |
| Pope & Talbot, Inc. | | | | |
| 8.375%, 06/01/2013 (H) | | 2,200,000 | | 220 |
| Verso Paper Holdings LLC | | | | |
| 11.500%, 07/01/2014 | | 385,000 | | 424,463 |
| | |
|
| | | | | 10,056,884 |
| Telecommunication Services - 0.34% | | | | |
| Muzak LLC, PIK | | | | |
| 15.000%, 07/31/2014 | | 1,993,594 | | 1,587,399 |
|
| TOTAL CORPORATE BONDS (Cost $185,463,408) | | $ | 155,690,750 |
|
| |
| CONVERTIBLE BONDS - 25.80% | | | | |
| Consumer Discretionary - 13.59% | | | | |
| Exide Technologies | | | | |
| Zero Coupon 09/18/2013 (P) | | 1,095,000 | | 1,053,390 |
| Ford Motor Company | | | | |
| 4.250%, 11/15/2016 | | 9,235,000 | | 16,876,963 |
| Saks, Inc. | | | | |
| 7.500%, 12/01/2013 (S) | | 1,075,000 | | 2,500,719 |
| | | | |
| High Income Fund (continued) | | | |
| | | Shares or | | |
| | | Principal | | |
| | | Amount | | Value |
| |
|
| |
| CONVERTIBLE BONDS (continued) | | | | |
| Consumer Discretionary (continued) | | | | |
| XM Satellite Radio, Inc. | | | | |
| 7.000%, 12/01/2014 (S) | $ | 31,445,000 | $ | 42,607,975 |
| | |
|
| | | | | 63,039,047 |
| Consumer Staples - 0.14% | | | | |
| Alliance One International, Inc. | | | | |
| 5.500%, 07/15/2014 | | 650,000 | | 668,688 |
| Financials - 2.02% | | | | |
| Janus Capital Group, Inc. | | | | |
| 3.250%, 07/15/2014 | | 4,760,000 | | 5,813,150 |
| The PMI Group, Inc. | | | | |
| 4.500%, 04/15/2020 | | 4,345,000 | | 3,530,313 |
| | |
|
| | | | | 9,343,463 |
| Industrials - 9.56% | | | | |
| AMR Corp. | | | | |
| 6.250%, 10/15/2014 | | 13,200,000 | | 14,272,500 |
| UAL Corp. | | | | |
| 6.000%, 10/15/2029 | | 7,125,000 | | 20,974,219 |
| US Airways Group, Inc. | | | | |
| 7.250%, 05/15/2014 | | 4,330,000 | | 9,109,238 |
| | |
|
| | | | | 44,355,957 |
| Information Technology - 0.49% | | | | |
| Equinix, Inc. | | | | |
| 4.750%, 06/15/2016 | | 1,735,000 | | 2,253,331 |
|
| TOTAL CONVERTIBLE BONDS (Cost $88,584,590) | | $ | 119,660,486 |
|
| |
| TERM LOANS (M) - 5.52% | | | | |
| Consumer Discretionary - 4.41% | | | | |
| East Valley Tourist Development | | | | |
| Authority | | | | |
| 12.000%, 08/06/2012 | | 812,048 | | 678,060 |
| Fontainebleau Las Vegas Resorts LLC | | | | |
| - 06/06/2014 (H) | | 1,618,638 | | 380,380 |
| Fontainebleau Las Vegas Resorts LLC | | | | |
| - 06/06/2014 (H) | | 757,938 | | 178,116 |
| Revel Entertainment LLC | | | | |
| 9.000%, 02/16/2018 | | 9,000,000 | | 8,994,375 |
| RH Donnelley, Inc. | | | | |
| 9.000%, 10/24/2014 | | 3,244,471 | | 2,510,410 |
| SuperMedia, Inc. | | | | |
| 11.000%, 12/31/2015 | | 5,382,651 | | 3,507,696 |
| The Star Tribune Company | | | | |
| 8.000%, 09/28/2014 | | 327,342 | | 310,157 |
| 8.000%, 09/29/2014 | | 290,971 | | 275,695 |
| Vertis, Inc. | | | | |
| 12.000%, 12/31/2015 | | 3,610,000 | | 3,610,000 |
| | |
|
| | | | | 20,444,889 |
| Consumer Staples - 0.21% | | | | |
| Great Atlantic & Pacific Tea Company | | | | |
| 8.750%, 06/15/2012 | | 988,611 | | 1,005,912 |
| Financials - 0.16% | | | | |
| Realogy Corp. | | | | |
| 13.500%, 10/15/2017 | | 675,000 | | 743,766 |
| Telecommunication Services - 0.74% | | | | |
| Muzak Holdings LLC | | | | |
| 12.750%, 02/01/2014 | | 3,351,563 | | 3,418,594 |
|
| TOTAL TERM LOANS (Cost $28,055,974) | | $ | 25,613,161 |
|
| |
| The accompanying notes are an integral part of the financial statements. | 92 |
John Hancock Funds II
Portfolio of Investments — February 28, 2011 (Unaudited) (showing percentage of total net assets)
| | | | |
| High Income Fund (continued) | | | |
| | | Shares or | | |
| | | Principal | | |
| | | Amount | | Value |
| |
|
| | |
| |
| COLLATERALIZED MORTGAGE | | | | |
| OBLIGATIONS - 0.17% | | | | |
| Commercial & Residential - 0.17% | | | | |
| Harborview Mortgage Loan Trust | | | | |
| Series 2007-6, Class ES IO, | | | | |
| 0.342%, 08/19/2037 (S) | $ | 35,178,730 | $ | 221,626 |
| Series 2007-4, Class ES IO, | | | | |
| 0.350%, 07/19/2047 | | 50,790,983 | | 274,779 |
| Series 2007-3, Class ES IO, | | | | |
| 0.349%, 05/19/2047 | | 42,370,073 | | 277,524 |
| | |
|
| | | | | 773,929 |
|
| TOTAL COLLATERALIZED MORTGAGE | | | |
| OBLIGATIONS (Cost $648,377) | | | $ | 773,929 |
|
| |
| COMMON STOCKS - 20.26% | | | | |
| Consumer Discretionary - 11.47% | | | | |
| Canadian Satellite | | | | |
| Radio Holdings, Inc. (I) | | 356,076 | $ | 1,264,435 |
| Canadian Satellite Radio | | | | |
| Holdings, Inc., Class A (I) | | 577,161 | | 2,049,514 |
| Charter | | | | |
| Communications, Inc., Class A (I) | | 368,879 | | 16,883,592 |
| Citadel Broadcasting Corp., Class B (I) | | 45,098 | | 1,567,156 |
| Comcast Corp., Special Class A | | 172,469 | | 4,194,446 |
| Dex One Corp. (I) | | 63,334 | | 333,770 |
| Federal Mogul Corp. (I) | | 31,002 | | 651,352 |
| Fontainebleau Resorts LLC, Class A (I) | | 65,203 | | 0 |
| Greektown Superholdings, Inc. (I)(V) | | 7,894 | | 780,085 |
| Lear Corp. | | 54,104 | | 5,724,203 |
| Sirius XM Radio, Inc. (I) | | 6,726,931 | | 12,175,745 |
| SuperMedia, Inc. (I) | | 42,791 | | 360,300 |
| The Star Tribune Company (I) | | 11,462 | | 237,837 |
| Time Warner Cable, Inc. | | 29,999 | | 2,165,328 |
| Trump Entertainment Resorts, Inc. (I) | | 175,054 | | 787,743 |
| Vertis Holdings, Inc. (I) | | 203,071 | | 4,004,560 |
| | |
|
| | | | | 53,180,066 |
| Energy - 0.35% | | | | |
| Dominion Petroleum, Ltd., GDR (I) | | 15,339,792 | | 1,627,845 |
| Financials - 0.33% | | | | |
| First Michigan Bank (I)(R) | | 279,167 | | 1,538,194 |
| Industrials - 7.55% | | | | |
| Delta Air Lines, Inc. (I) | | 2,394,071 | | 26,909,358 |
| Quad/Graphics, Inc. (I) | | 11,119 | | 482,787 |
| United Continental Holdings, Inc. (I) | | 316,324 | | 7,604,429 |
| | |
|
| | | | | 34,996,574 |
| Materials - 0.56% | | | | |
| AbitibiBowater, Inc. (I) | | 73,217 | | 2,049,344 |
| American Pacific Corp. (I) | | 70,200 | | 422,604 |
| Tembec, Inc. (I) | | 25,800 | | 135,321 |
| | |
|
| | | | | 2,607,269 |
| Telecommunication Services - 0.00% | | | | |
| Muzak Holdings LLC (I) | | 28,560 | | 0 |
|
| TOTAL COMMON STOCKS (Cost $111,981,619) | | $ | 93,949,948 |
|
| |
| PREFERRED SECURITIES - 11.32% | | | | |
| Consumer Discretionary - 3.29% | | | | |
| Greektown | | | | |
| Superholdings, Inc., Series A (I)(V) | | 154,240 | $ | 15,241,997 |
| Financials - 3.80% | | | | |
| 2010 Swift Mandatory Common | | | | |
| Exchange Security Trust 6.000% (S) | | 33,144 | | 453,907 |
| iStar Financial, Inc., Series E 7.875% | | 310,545 | | 6,592,870 |
| | | | |
| High Income Fund (continued) | | | |
| | | Shares or | | |
| | | Principal | | |
| | | Amount | | Value |
| |
|
| |
| PREFERRED SECURITIES (continued) | | | | |
| Financials (continued) | | | | |
| iStar Financial, Inc., Series F 7.800% | | 198,032 | $ | 4,156,692 |
| iStar Financial, Inc., Series G 7.650% | | 79,317 | | 1,658,518 |
| iStar Financial, Inc., Series I 7.500% | | 232,232 | | 4,783,979 |
| Pliant Corp., PIK, 13.000% 13.000% (I) | | 685 | | 0 |
| | |
|
| | | | | 17,645,966 |
| Industrials - 4.18% | | | | |
| Continental Airlines Finance Trust II, | | | | |
| 6.000% 6.000% | | 515,074 | | 19,411,851 |
| Telecommunication Services - 0.05% | | | | |
| Muzak Holdings LLC, PIK | | 838,409 | | 209,602 |
|
| TOTAL PREFERRED SECURITIES (Cost $35,017,558) | | $ | 52,509,416 |
|
| |
| WARRANTS - 0.59% | | | | |
| Charter Communications, Inc., Class A | | | | |
| (Expiration Date: 11/30/2014; Strike | | | | |
| Price: $46.86) (I) | | 43,795 | | 514,591 |
| Citadel Broadcasting Corp. (Expiration | | | | |
| Date: 06/03/2030; Strike | | | | |
| Price: $0.001) (I) | | 64,279 | | 2,233,695 |
| The Star Tribune Company (Expiration | | | | |
| Date: 09/28/2013; Strike | | | | |
| Price $151.23) (I) | | 4,835 | | 0 |
|
| TOTAL WARRANTS (Cost $1,653,579) | | | $ | 2,748,286 |
|
| |
| SHORT-TERM INVESTMENTS - 2.03% | | | |
| Repurchase Agreement - 0.01% | | | | |
| Repurchase Agreement with State | | | | |
| Street Corp. dated 02/28/2011 at | | | | |
| 0.010% to be repurchased at $35,120 | | | | |
| on 03/01/2011, collateralized by | | | | |
| $40,000 US Treasury Notes, 1.375% | | | | |
| due 05/15/13 (valued at $40,522, | | | | |
| including interest) | $ | 35,120 | $ | 35,120 |
| Short-Term Securities* - 2.02% | | | | |
| Federal Home Loan Bank Discount | | | | |
| Notes, 0.0702%, 03/01/2011 | | 9,400,000 | | 9,400,000 |
|
| TOTAL SHORT-TERM INVESTMENTS (Cost $9,435,120) | | $ | 9,435,120 |
|
| Total Investments (High Income Fund) | | | | |
| (Cost $460,840,225) - 99.26% | | | $ | 460,381,096 |
| Other assets and liabilities, net - 0.74% | | | | 3,444,201 |
| | |
|
| TOTAL NET ASSETS - 100.00% | | | $ | 463,825,297 |
| | | |
|
| | |
| |
| |
| |
| High Yield Fund | | | | |
| | | Shares or | | |
| | | Principal | | |
| | | Amount | | Value |
| |
|
| |
| FOREIGN GOVERNMENT | | | | |
| OBLIGATIONS - 3.52% | | | | |
| Argentina - 1.12% | | | | |
| Republic of Argentina | | | | |
| 2.260%, 12/31/2038 | EUR | 508,123 | $ | 247,167 |
| 7.000%, 09/12/2013 to 10/03/2015 | | 2,347,000 | | 2,233,107 |
| 7.820%, 12/31/2033 | EUR | 3,203,262 | | 3,160,544 |
| 8.000%, 02/26/2008 (H) | | 137 | | 73 |
| 8.750%, 06/02/2017 | $ | 1,595,914 | | 1,607,883 |
| 12/15/2035 (B) (I) | EUR | 12,603,351 | | 2,217,479 |
| 12/15/2035 (B) (I) | ARS | 1,938,355 | | 74,328 |
| |
| The accompanying notes are an integral part of the financial statements. | 93 |
John Hancock Funds II
Portfolio of Investments — February 28, 2011 (Unaudited) (showing percentage of total net assets)
| | | | |
| High Yield Fund (continued) | | | |
| | | Shares or | | |
| | | Principal | | |
| | | Amount | | Value |
| |
|
| |
| FOREIGN GOVERNMENT | | | | |
| OBLIGATIONS (continued) | | | | |
| Argentina (continued) | | | | |
| Republic of Argentina (continued) | | | | |
| 12/15/2035 (B) (I) | $ | 48,000 | $ | 7,104 |
| | | |
|
| | | | | 9,547,685 |
| Brazil - 0.55% | | | | |
| Federative Republic of Brazil | | | | |
| 10.000%, 01/01/2014 to 01/01/2017 | BRL | 8,449,000 | | 4,683,573 |
| | |
|
| | | | | 4,683,573 |
| Indonesia - 0.64% | | | | |
| Republic of Indonesia | | | | |
| 9.750%, 05/15/2037 | IDR | 11,122,000,000 | | 1,196,691 |
| 10.250%, 07/15/2022 to 07/15/2027 | | 24,033,000,000 | | 2,896,297 |
| 11.000%, 09/15/2025 | | 11,174,000,000 | | 1,408,179 |
| | |
|
| | | | | 5,501,167 |
| Russia - 0.02% | | | | |
| Government of Russia | | | | |
| 7.500%, 03/31/2030 | $ | 170,050 | | 196,663 |
| Turkey - 0.73% | | | | |
| Republic of Turkey | | | | |
| 6.750%, 05/30/2040 | | 1,010,000 | | 1,010,000 |
| 6.875%, 03/17/2036 | | 4,326,000 | | 4,423,335 |
| 7.000%, 09/26/2016 to 06/05/2020 | | 681,000 | | 759,072 |
| | |
|
| | | | | 6,192,407 |
| Venezuela - 0.46% | | | | |
| Republic of Venezuela | | | | |
| 5.750%, 02/26/2016 | | 3,607,000 | | 2,588,023 |
| 7.650%, 04/21/2025 | | 949,000 | | 566,079 |
| 8.500%, 10/08/2014 | | 339,000 | | 297,812 |
| 9.375%, 01/13/2034 | | 568,000 | | 379,140 |
| 04/15/2020 | | 305,000 | | 83,113 |
| | |
|
| | | | | 3,914,167 |
|
| TOTAL FOREIGN GOVERNMENT | | | | |
| OBLIGATIONS (Cost $29,107,498) | | | $ | 30,035,662 |
|
| |
| CORPORATE BONDS - 82.80% | | | | |
| Consumer Discretionary - 18.78% | | | | |
| Affinity Group, Inc. | | | | |
| 11.500%, 12/01/2016 (S) | | 1,230,000 | | 1,269,975 |
| American Greetings Corp. | | | | |
| 7.375%, 06/01/2016 | | 6,270,000 | | 6,465,576 |
| Bankrate, Inc. | | | | |
| 11.750%, 07/15/2015 (S) | | 1,650,000 | | 1,883,063 |
| Boyd Gaming Corp. | | | | |
| 7.125%, 02/01/2016 | | 1,470,000 | | 1,407,525 |
| 9.125%, 12/01/2018 (S) | | 590,000 | | 619,500 |
| Burlington Coat Factory Warehouse Corp. | | | | |
| 10.000%, 02/15/2019 (S) | | 1,560,000 | | 1,575,600 |
| CCO Holdings LLC/CCO | | | | |
| Holdings Capital Corp. | | | | |
| 7.000%, 01/15/2019 | | 900,000 | | 915,750 |
| 7.875%, 04/30/2018 | | 400,000 | | 427,000 |
| 8.125%, 04/30/2020 | | 3,420,000 | | 3,689,325 |
| Choctaw Resort Development Enterprise | | | | |
| 7.250%, 11/15/2019 (S) | | 807,000 | | 609,285 |
| CityCenter Holdings LLC/CityCenter | | | | |
| Finance Corp. PIK | | | | |
| 10.750%, 01/15/2017 (S) | | 3,650,000 | | 3,814,250 |
| DAE Aviation Holdings, Inc. | | | | |
| 11.250%, 08/01/2015 (S) | | 4,360,000 | | 4,588,900 |
| Directbuy Holdings, Inc. | | | | |
| 12.000%, 02/01/2017 (S) | | 1,620,000 | | 1,514,700 |
| | | | |
| High Yield Fund (continued) | | | |
| | | Shares or | | |
| | | Principal | | |
| | | Amount | | Value |
| |
|
| |
| CORPORATE BONDS (continued) | | | | |
| Consumer Discretionary (continued) | | | | |
| DISH DBS Corp. | | | | |
| 7.875%, 09/01/2019 | $ | 2,205,000 | $ | 2,389,669 |
| Downstream Development Authority of | | | | |
| the Quapaw Tribe of Oklahoma | | | | |
| 12.000%, 10/15/2015 (S) | | 3,185,000 | | 3,344,250 |
| Edcon Proprietary, Ltd. | | | | |
| 9.500%, 03/01/2018 (S) | | 3,470,000 | | 3,443,975 |
| El Pollo Loco, Inc. | | | | |
| 11.750%, 12/01/2012 to 11/15/2013 | | 5,990,000 | | 5,598,225 |
| Empire Today LLC/Empire Today | | | | |
| Finance Corp. | | | | |
| 11.375%, 02/01/2017 (S) | | 580,000 | | 606,100 |
| Express LLC/Express Finance Corp. | | | | |
| 8.750%, 03/01/2018 | | 1,830,000 | | 1,969,538 |
| Fontainebleau Las Vegas Holdings LLC | | | | |
| 10.250%, 06/15/2015 (H) (S) | | 3,000,000 | | 15,000 |
| Giraffe Acquisition Corp. | | | | |
| 9.125%, 12/01/2018 (S) | | 3,050,000 | | 3,111,000 |
| Globo Comunicacoes e Participacoes SA | | | | |
| 7.250%, 04/26/2022 (S) | | 1,028,000 | | 1,105,100 |
| Harrah’s Operating Company, Inc. | | | | |
| 5.625%, 06/01/2015 | | 6,688,000 | | 5,559,400 |
| 10.750%, 02/01/2016 | | 3,574,000 | | 3,529,325 |
| Inn of The Mountain Gods Resort & | | | | |
| Casino | | | | |
| 8.750%, 11/30/2020 (S) | | 2,509,000 | | 2,383,550 |
| Inn of The Mountain Gods Resort & | | | | |
| Casino, PIK | | | | |
| 1.250%, 11/30/2020 (S) | | 5,647,000 | | 2,936,440 |
| Landry’s Restaurants, Inc. | | | | |
| 11.625%, 12/01/2015 | | 3,760,000 | | 4,079,600 |
| MGM Mirage, Inc. | | | | |
| 5.875%, 02/27/2014 | | 3,570,000 | | 3,418,275 |
| MGM Resorts International | | | | |
| 6.625%, 07/15/2015 | | 1,800,000 | | 1,710,000 |
| 10.375%, 05/15/2014 | | 460,000 | | 515,200 |
| Michaels Stores, Inc. | | | | |
| 11.375%, 11/01/2016 | | 1,800,000 | | 1,966,500 |
| Michaels Stores, Inc. (Zero Coupon Steps | | | | |
| up to 13.000% on 11/01/2011) | | | | |
| 11/01/2016 | | 5,800,000 | | 5,901,500 |
| Midwest Gaming Borrower LLC/Midwest | | | | |
| Finance Corp. | | | | |
| 11.625%, 04/15/2016 (S) | | 770,000 | | 820,050 |
| Mohegan Tribal Gaming Authority | | | | |
| 7.125%, 08/15/2014 | | 2,900,000 | | 2,124,250 |
| 8.000%, 04/01/2012 | | 5,163,000 | | 4,427,273 |
| Motors Liquidation Company | | | | |
| 7.200%, 01/15/2011 (H) | | 6,825,000 | | 2,149,875 |
| 8.375%, 07/15/2033 (H) | | 10,025,000 | | 3,333,313 |
| NCL Corp. Ltd. | | | | |
| 9.500%, 11/15/2018 (S) | | 2,140,000 | | 2,316,550 |
| 11.750%, 11/15/2016 | | 4,470,000 | | 5,280,188 |
| Net Servicos De Comunicacao SA | | | | |
| 7.500%, 01/27/2020 | | 1,380,000 | | 1,600,800 |
| NetFlix, Inc. | | | | |
| 8.500%, 11/15/2017 | | 2,855,000 | | 3,233,288 |
| Nielsen Finance LLC/Nielsen Finance | | | | |
| Company | | | | |
| 7.750%, 10/15/2018 (S) | | 6,130,000 | | 6,628,063 |
| Oxford Industries, Inc. | | | | |
| 11.375%, 07/15/2015 | | 5,525,000 | | 6,215,625 |
| Petco Animal Supplies, Inc. | | | | |
| 9.250%, 12/01/2018 (S) | | 3,990,000 | | 4,309,200 |
| |
| The accompanying notes are an integral part of the financial statements. | 94 |
John Hancock Funds II
Portfolio of Investments — February 28, 2011 (Unaudited) (showing percentage of total net assets)
| | | | |
| High Yield Fund (continued) | | | |
| | | Shares or | | |
| | | Principal | | |
| | | Amount | | Value |
| |
|
| |
| CORPORATE BONDS (continued) | | | | |
| Consumer Discretionary (continued) | | | | |
| Phillips-Van Heusen Corp. | | | | |
| 7.375%, 05/15/2020 | $ | 1,620,000 | $ | 1,725,300 |
| Pinnacle Entertainment, Inc. | | | | |
| 7.500%, 06/15/2015 | | 140,000 | | 142,100 |
| 8.625%, 08/01/2017 | | 425,000 | | 466,438 |
| QVC, Inc. | | | | |
| 7.375%, 10/15/2020 (S) | | 3,125,000 | | 3,312,500 |
| Reynolds Group Issuer, Inc. | | | | |
| 8.250%, 02/15/2021 (S) | | 2,860,000 | | 2,867,150 |
| 9.000%, 04/15/2019 (S) | | 3,410,000 | | 3,554,925 |
| Sbarro, Inc. | | | | |
| 10.375%, 02/01/2015 | | 3,120,000 | | 873,600 |
| Service Corp. International | | | | |
| 7.500%, 04/01/2027 | | 1,320,000 | | 1,290,300 |
| Simmons Foods, Inc. | | | | |
| 10.500%, 11/01/2017 (S) | | 3,580,000 | | 3,857,450 |
| Snoqualmie Entertainment Authority | | | | |
| 4.204%, 02/01/2014 (P) (S) | | 1,785,000 | | 1,628,813 |
| 9.125%, 02/01/2015 (S) | | 230,000 | | 230,000 |
| Sotheby’s | | | | |
| 7.750%, 06/15/2015 | | 2,710,000 | | 2,987,775 |
| Standard Pacific Corp. | | | | |
| 8.375%, 01/15/2021 (S) | | 1,860,000 | | 1,962,300 |
| Station Casinos, Inc. | | | | |
| 6.000%, 04/01/2012 (H) | | 5,610,000 | | 561 |
| 6.500%, 02/01/2014 (H) | | 500,000 | | 50 |
| 6.625%, 03/15/2018 (H) | | 1,705,000 | | 171 |
| 7.750%, 08/15/2016 (H) | | 6,180,000 | | 618 |
| Stonemor Operating LLC/Cornerstone | | | | |
| Family Services | | | | |
| 10.250%, 12/01/2017 | | 1,430,000 | | 1,497,925 |
| SuperMedia, Inc., Escrow Certificates | | | | |
| 8.000%, 11/15/2016 (I) | | 6,615,000 | | 0 |
| The Neiman Marcus Group, Inc. | | | | |
| 7.125%, 06/01/2028 | | 3,885,000 | | 3,574,200 |
| Univision Communications, Inc. | | | | |
| 7.875%, 11/01/2020 (S) | | 2,220,000 | | 2,380,950 |
| 8.500%, 05/15/2021 (S) | | 2,980,000 | | 3,106,650 |
| | |
|
| | | | | 160,261,347 |
| Consumer Staples - 2.35% | | | | |
| Alliance One International, Inc. | | | | |
| 10.000%, 07/15/2016 | | 1,230,000 | | 1,269,975 |
| Blue Merger Sub, Inc. | | | | |
| 7.625%, 02/15/2019 (S) | | 3,700,000 | | 3,737,000 |
| Bumble Bee Acquisition Corp. | | | | |
| 9.000%, 12/15/2017 (S) | | 1,380,000 | | 1,490,400 |
| Ceridian Corp., PIK | | | | |
| 12.250%, 11/15/2015 | | 2,758,350 | | 2,930,747 |
| NES Rentals Holdings, Inc. | | | | |
| 12.250%, 04/15/2015 (S) | | 2,870,000 | | 2,798,250 |
| Smithfield Foods, Inc. | | | | |
| 10.000%, 07/15/2014 | | 689,000 | | 813,020 |
| Viskase Companies, Inc. | | | | |
| 9.875%, 01/15/2018 (S) | | 4,760,000 | | 5,093,200 |
| YCC Holdings LLC/Yankee Finance, Inc., | | | | |
| PIK | | | | |
| 10.250%, 02/15/2016 (S) | | 1,830,000 | | 1,884,900 |
| | |
|
| | | | | 20,017,492 |
| Energy - 15.84% | | | | |
| Adaro Indonesia PT | | | | |
| 7.625%, 10/22/2019 (S) | | 920,000 | | 1,009,700 |
| Belden & Blake Corp. | | | | |
| 8.750%, 07/15/2012 | | 6,790,000 | | 6,722,100 |
| | | | |
| High Yield Fund (continued) | | | |
| | | Shares or | | |
| | | Principal | | |
| | | Amount | | Value |
| |
|
| |
| CORPORATE BONDS (continued) | | | | |
| Energy (continued) | | | | |
| Berry Petroleum Company | | | | |
| 6.750%, 11/01/2020 | $ | 330,000 | $ | 339,900 |
| 10.250%, 06/01/2014 | | 1,840,000 | | 2,134,400 |
| Calfrac Holdings LP | | | | |
| 7.500%, 12/01/2020 (S) | | 1,400,000 | | 1,435,000 |
| Chesapeake Energy Corp. | | | | |
| 6.625%, 08/15/2020 | | 620,000 | | 651,000 |
| 7.250%, 12/15/2018 | | 1,960,000 | | 2,160,900 |
| Cie Generale de Geophysique-Veritas | | | | |
| 7.750%, 05/15/2017 | | 530,000 | | 560,475 |
| 9.500%, 05/15/2016 | | 1,560,000 | | 1,751,100 |
| Concho Resources, Inc. | | | | |
| 7.000%, 01/15/2021 | | 2,260,000 | | 2,367,350 |
| Consol Energy, Inc. | | | | |
| 8.250%, 04/01/2020 (S) | | 2,290,000 | | 2,524,725 |
| Corral Petroleum Holdings AB, PIK | | | | |
| 2.000%, 09/18/2011 (S) | | 5,856,660 | | 5,622,394 |
| Crosstex Energy LP/Crosstex Energy | | | | |
| Finance Corp. | | | | |
| 8.875%, 02/15/2018 | | 1,860,000 | | 2,050,650 |
| Denbury Resources, Inc. | | | | |
| 8.250%, 02/15/2020 | | 2,690,000 | | 2,992,625 |
| El Paso Corp. | | | | |
| 7.375%, 12/15/2012 | | 116,000 | | 123,514 |
| Energy Future Holdings Corp., PIK | | | | |
| 11.250%, 11/01/2017 | | 5,871,768 | | 4,800,170 |
| Energy Future Intermediate | | | | |
| Holding Company LLC | | | | |
| 9.750%, 10/15/2019 | | 2,080,000 | | 2,149,037 |
| 10.000%, 12/01/2020 | | 7,604,000 | | 7,937,025 |
| Energy Transfer Equity LP | | | | |
| 7.500%, 10/15/2020 | | 2,070,000 | | 2,243,363 |
| Enterprise Products Operating LLC | | | | |
| (7.034% to 01/15/2018, then higher of | | | | |
| 7.034% or 3 month LIBOR + 2.680%) | | | | |
| 01/15/2068 | | 2,550,000 | | 2,658,375 |
| Enterprise Products Operating LLC | | | | |
| (8.375% to 08/01/2016, then 3 month | | | | |
| LIBOR + 3.708%) | | | | |
| 08/01/2066 | | 1,140,000 | | 1,229,775 |
| Exco Resources, Inc. | | | | |
| 7.500%, 09/15/2018 | | 3,890,000 | | 3,860,825 |
| Goodrich Petroleum Corp. | | | | |
| 8.875%, 03/15/2019 (S) | | 1,260,000 | | 1,256,850 |
| Gulfmark Offshore, Inc. | | | | |
| 7.750%, 07/15/2014 | | 3,610,000 | | 3,664,150 |
| Hercules Offshore, Inc. | | | | |
| 10.500%, 10/15/2017 (S) | | 4,040,000 | | 4,009,700 |
| KazMunaiGaz Finance Sub BV | | | | |
| 8.375%, 07/02/2013 (S) | | 1,460,000 | | 1,607,898 |
| Key Energy Services, Inc. | | | | |
| 8.375%, 12/01/2014 | | 3,757,000 | | 4,085,738 |
| Laredo Petroleum, Inc. | | | | |
| 9.500%, 02/15/2019 (S) | | 2,120,000 | | 2,220,700 |
| Linn Energy LLC/Linn | | | | |
| Energy Finance Corp. | | | | |
| 7.750%, 02/01/2021 (S) | | 1,120,000 | | 1,190,000 |
| 8.625%, 04/15/2020 (S) | | 2,890,000 | | 3,222,350 |
| Lukoil International Finance BV | | | | |
| 6.356%, 06/07/2017 | | 2,350,000 | | 2,473,375 |
| MarkWest Energy Partners LP/MarkWest | | | | |
| Energy Finance Corp. | | | | |
| 6.500%, 08/15/2021 | | 2,160,000 | | 2,157,300 |
| |
| The accompanying notes are an integral part of the financial statements. | 95 |
John Hancock Funds II
Portfolio of Investments — February 28, 2011 (Unaudited) (showing percentage of total net assets)
| | | | |
| High Yield Fund (continued) | | | |
| | | Shares or | | |
| | | Principal | | |
| | | Amount | | Value |
| |
|
| |
| CORPORATE BONDS (continued) | | | | |
| Energy (continued) | | | | |
| MarkWest Energy Partners LP/MarkWest | | | | |
| Energy Finance Corp., Series B | | | | |
| 8.750%, 04/15/2018 | $ | 1,640,000 | $ | 1,795,800 |
| Murray Energy Corp. | | | | |
| 10.250%, 10/15/2015 (S) | | 3,540,000 | | 3,778,950 |
| Novatek Finance, Ltd. | | | | |
| 6.604%, 02/03/2021 (S) | | 1,650,000 | | 1,702,665 |
| Overseas Shipholding Group, Inc. | | | | |
| 8.125%, 03/30/2018 | | 2,190,000 | | 2,190,000 |
| Parker Drilling Company | | | | |
| 9.125%, 04/01/2018 | | 2,110,000 | | 2,268,250 |
| Peabody Energy Corp. | | | | |
| 7.875%, 11/01/2026 | | 2,610,000 | | 2,923,200 |
| Petrobras International Finance Company | | | | |
| 6.750%, 01/27/2041 | | 250,000 | | 255,803 |
| 6.875%, 01/20/2040 | | 1,175,000 | | 1,216,334 |
| Petrohawk Energy Corp. | | | | |
| 7.875%, 06/01/2015 | | 1,390,000 | | 1,473,400 |
| Petroplus Finance, Ltd. | | | | |
| 6.750%, 05/01/2014 (S) | | 2,445,000 | | 2,432,775 |
| 7.000%, 05/01/2017 (S) | | 830,000 | | 811,325 |
| Plains Exploration & | | | | |
| Production Company | | | | |
| 8.625%, 10/15/2019 | | 1,690,000 | | 1,888,575 |
| 10.000%, 03/01/2016 | | 2,175,000 | | 2,468,625 |
| Precision Drilling Corp. | | | | |
| 6.625%, 11/15/2020 (S) | | 1,900,000 | | 1,961,750 |
| Quicksilver Resources, Inc. | | | | |
| 9.125%, 08/15/2019 | | 120,000 | | 127,200 |
| 11.750%, 01/01/2016 | | 4,429,000 | | 5,170,858 |
| Range Resources Corp. | | | | |
| 8.000%, 05/15/2019 | | 510,000 | | 561,638 |
| Regency Energy Partners LP/Regency | | | | |
| Energy Finance Corp. | | | | |
| 6.875%, 12/01/2018 | | 1,760,000 | | 1,848,000 |
| SandRidge Energy, Inc., PIK | | | | |
| 8.625%, 04/01/2015 | | 2,315,000 | | 2,407,600 |
| SemGroup LP, Escrow Certificates | | | | |
| 8.750%, 11/15/2049 (I) | | 10,803,000 | | 0 |
| Stone Energy Corp. | | | | |
| 6.750%, 12/15/2014 | | 3,855,000 | | 3,835,725 |
| Teekay Corp. | | | | |
| 8.500%, 01/15/2020 | | 4,600,000 | | 4,950,750 |
| Trico Shipping AS | | | | |
| 13.875%, 11/01/2014 (H) (S) | | 3,410,000 | | 2,851,613 |
| Venoco, Inc. | | | | |
| 8.875%, 02/15/2019 (S) | | 1,200,000 | | 1,218,000 |
| Whiting Petroleum Corp. | | | | |
| 6.500%, 10/01/2018 | | 1,670,000 | | 1,732,625 |
| 7.000%, 02/01/2014 | | 133,000 | | 141,645 |
| | |
|
| | | | | 135,225,570 |
| Financials - 8.47% | | | | |
| Ally Financial, Inc. | | | | |
| zero coupon 12/01/2012 to 06/15/2015 | | 12,080,000 | | 9,852,100 |
| Ashton Woods USA LLC (Zero Coupon | | | | |
| steps up to 11.000% on 06/30/2012) | | | | |
| 06/30/2015 (S) | | 1,638,000 | | 1,064,700 |
| Astoria Depositor Corp., Series B | | | | |
| 8.144%, 05/01/2021 (S) | | 3,250,000 | | 3,185,000 |
| Aviv Healthcare Properties LP | | | | |
| 7.750%, 02/15/2019 (S) | | 570,000 | | 594,225 |
| | | | |
| High Yield Fund (continued) | | | |
| | | Shares or | | |
| | | Principal | | |
| | | Amount | | Value |
| |
|
| |
| CORPORATE BONDS (continued) | | | | |
| Financials (continued) | | | | |
| Bank of America Corp., (8.125% to | | | | |
| 05/15/2018, then 3 month | | | | |
| LIBOR + 3.640%) | | | | |
| (Q) | $ | 1,000,000 | $ | 1,055,690 |
| CCM Merger, Inc. | | | | |
| 8.000%, 08/01/2013 (S) | | 2,315,000 | | 2,338,150 |
| CIT Group, Inc. | | | | |
| 7.000%, 05/01/2017 | | 2,373,599 | | 2,391,401 |
| Credit Agricole SA (8.375% to | | | | |
| 10/13/2019, then 3 month | | | | |
| LIBOR + 6.982%) | | | | |
| (Q) (S) | | 1,260,000 | | 1,338,750 |
| Dunkin Finance Corp. | | | | |
| 9.625%, 12/01/2018 (S) | | 850,000 | | 860,625 |
| Ford Motor Credit Company LLC | | | | |
| 12.000%, 05/15/2015 | | 6,010,000 | | 7,592,469 |
| GMAC International Finance BV | | | | |
| 7.500%, 04/21/2015 | EUR | 1,650,000 | | 2,427,763 |
| ICICI Bank, Ltd. (6.375% to 04/30/2017, | | | | |
| then 6 month LIBOR + 2.280%) | | | | |
| 04/30/2022 (S) | $ | 454,000 | | 451,039 |
| ICICI Bank, Ltd. (6.375% to 04/30/2017, | | | | |
| then 6 month LIBOR + 2.280%) | | | | |
| 04/30/2022 | | 1,573,000 | | 1,559,315 |
| International Lease Finance Corp. | | | | |
| 5.625%, 09/20/2013 | | 3,720,000 | | 3,799,050 |
| 8.250%, 12/15/2020 | | 2,040,000 | | 2,269,500 |
| 8.750%, 03/15/2017 (S) | | 2,060,000 | | 2,353,550 |
| 8.875%, 09/01/2017 | | 110,000 | | 125,400 |
| Landry’s Holdings, Inc. | | | | |
| 11.500%, 06/01/2014 (S) | | 820,000 | | 813,850 |
| Leucadia National Corp. | | | | |
| 8.125%, 09/15/2015 | | 2,100,000 | | 2,310,000 |
| Odebrecht Finance, Ltd. | | | | |
| 7.500%, 10/18/2017 (S) | | 2,490,000 | | 2,701,650 |
| Offshore Group Investments, Ltd. | | | | |
| 11.500%, 08/01/2015 (S) | | 4,860,000 | | 5,443,200 |
| Ono Finance II PLC | | | | |
| 10.875%, 07/15/2019 (S) | | 870,000 | | 935,250 |
| Realogy Corp. | | | | |
| 7.875%, 02/15/2019 (S) | | 1,190,000 | | 1,194,463 |
| Residential Capital LLC | | | | |
| 9.625%, 05/15/2015 | | 2,030,000 | | 2,050,300 |
| Royal Bank of Scotland Group PLC | | | | |
| (7.648% to 09/30/2031, then 3 month | | | | |
| LIBOR + 2.500%) | | | | |
| (Q) | | 1,390,000 | | 1,271,850 |
| RSHB Capital SA for OJSC Russian | | | | |
| Agricultural Bank | | | | |
| 6.299%, 05/15/2017 (S) | | 944,000 | | 971,187 |
| 6.299%, 05/15/2017 | | 760,000 | | 781,888 |
| 7.175%, 05/16/2013 (S) | | 519,000 | | 557,614 |
| SLM Corp. | | | | |
| 8.000%, 03/25/2020 | | 640,000 | | 679,200 |
| TNK-BP Finance SA | | | | |
| 6.625%, 03/20/2017 | | 1,690,000 | | 1,804,075 |
| 6.625%, 03/20/2017 (S) | | 96,000 | | 102,480 |
| 7.875%, 03/13/2018 (S) | | 1,128,000 | | 1,278,926 |
| UPCB Finance III, Ltd. | | | | |
| 6.625%, 07/01/2020 (S) | | 2,230,000 | | 2,221,638 |
| Wind Acquisition Holdings Finance SA, | | | | |
| PIK | | | | |
| 12.250%, 07/15/2017 (S) | | 3,330,667 | | 3,896,880 |
| | |
|
| | | | | 72,273,178 |
| |
| The accompanying notes are an integral part of the financial statements. | 96 |
John Hancock Funds II
Portfolio of Investments — February 28, 2011 (Unaudited) (showing percentage of total net assets)
| | | | |
| High Yield Fund (continued) | | | |
| | | Shares or | | |
| | | Principal | | |
| | | Amount | | Value |
| |
|
| |
| CORPORATE BONDS (continued) | | | | |
| Health Care - 4.20% | | | | |
| American Renal Holdings Company, Inc. | | | | |
| 8.375%, 05/15/2018 | $ | 1,910,000 | $ | 1,998,338 |
| Biomet, Inc. | | | | |
| 10.000%, 10/15/2017 | | 160,000 | | 178,200 |
| Biomet, Inc., PIK | | | | |
| 10.375%, 10/15/2017 | | 1,140,000 | | 1,275,375 |
| CRC Health Corp. | | | | |
| 10.750%, 02/01/2016 | | 9,970,000 | | 9,994,925 |
| FMC Finance III SA | | | | |
| 6.875%, 07/15/2017 | | 900,000 | | 948,375 |
| Fresenius US Finance II, Inc. | | | | |
| 9.000%, 07/15/2015 (S) | | 3,285,000 | | 3,765,431 |
| Giant Funding Corp. | | | | |
| 8.250%, 02/01/2018 (S) | | 2,080,000 | | 2,137,200 |
| HCA Holdings, Inc. | | | | |
| 7.750%, 05/15/2021 (S) | | 4,330,000 | | 4,557,325 |
| Tenet Healthcare Corp. | | | | |
| 6.875%, 11/15/2031 | | 2,310,000 | | 1,865,325 |
| 10.000%, 05/01/2018 | | 1,861,000 | | 2,186,675 |
| Universal Hospital Services, Inc. | | | | |
| 3.834%, 06/01/2015 (P) | | 1,335,000 | | 1,281,600 |
| Universal Hospital Services, Inc., PIK | | | | |
| 8.500%, 06/01/2015 | | 1,855,000 | | 1,938,475 |
| Vanguard Health Holding | | | | |
| Company II LLC | | | | |
| 8.000%, 02/01/2018 | | 1,400,000 | | 1,438,500 |
| Vanguard Health Systems, Inc. | | | | |
| Zero Coupon 02/01/2016 (S) | | 3,540,000 | | 2,283,300 |
| | |
|
| | | | | 35,849,044 |
| Industrials - 10.85% | | | | |
| Abengoa Finance SAU | | | | |
| 8.875%, 11/01/2017 (S) | | 2,060,000 | | 2,039,400 |
| ACCO Brands Corp. | | | | |
| 10.625%, 03/15/2015 | | 3,160,000 | | 3,570,800 |
| Aguila 3 SA | | | | |
| 7.875%, 01/31/2018 (S) | | 950,000 | | 985,625 |
| Altegrity, Inc. | | | | |
| 11.750%, 05/01/2016 (S) | | 4,180,000 | | 4,493,500 |
| American Airlines Pass Through Trust | | | | |
| 7.000%, 01/31/2018 (S) | | 1,370,000 | | 1,370,000 |
| American Reprographics Company | | | | |
| 10.500%, 12/15/2016 (S) | | 2,250,000 | | 2,452,500 |
| Ardagh Packaging Finance PLC | | | | |
| 7.375%, 10/15/2017 (S) | EUR | 750,000 | | 1,068,599 |
| 9.125%, 10/15/2020 (S) | $ | 2,770,000 | | 3,040,075 |
| Boise Cascade LLC | | | | |
| 7.125%, 10/15/2014 | | 937,000 | | 935,829 |
| Continental Airlines, Inc. | | | | |
| 6.750%, 09/15/2015 (S) | | 1,150,000 | | 1,181,625 |
| 7.339%, 04/19/2014 | | 4,365,785 | | 4,409,442 |
| Delta Air Lines, Inc. | | | | |
| 8.021%, 08/10/2022 | | 1,332,196 | | 1,396,141 |
| 9.500%, 09/15/2014 (S) | | 1,289,000 | | 1,405,010 |
| 9.750%, 12/17/2016 | | 1,208,405 | | 1,305,077 |
| FGI Operating Company, Inc. | | | | |
| 10.250%, 08/01/2015 | | 2,385,000 | | 2,548,969 |
| Florida East Coast Holdings Corp., PIK | | | | |
| 10.500%, 08/01/2017 (S) | | 2,690,000 | | 2,690,000 |
| Florida East Coast Railway Corp. | | | | |
| 8.125%, 02/01/2017 (S) | | 2,830,000 | | 2,957,350 |
| Garda World Security Corp. | | | | |
| 9.750%, 03/15/2017 (S) | | 1,500,000 | | 1,612,500 |
| GEO Group, Inc. | | | | |
| 7.750%, 10/15/2017 | | 3,355,000 | | 3,577,269 |
| | | | |
| High Yield Fund (continued) | | | |
| | | Shares or | | |
| | | Principal | | |
| | | Amount | | Value |
| |
|
| |
| CORPORATE BONDS (continued) | | | | |
| Industrials (continued) | | | | |
| H&E Equipment Services, Inc. | | | | |
| 8.375%, 07/15/2016 | $ | 2,085,000 | $ | 2,163,188 |
| Hapag-Lloyd AG | | | | |
| 9.750%, 10/15/2017 (S) | | 3,460,000 | | 3,797,350 |
| Hertz Holdings Netherlands BV | | | | |
| 8.500%, 07/31/2015 (S) | EUR | 630,000 | | 945,438 |
| Interactive Data Corp. | | | | |
| 10.250%, 08/01/2018 (S) | $ | 1,800,000 | | 2,016,000 |
| Kansas City Southern de | | | | |
| Mexico SA de CV | | | | |
| 6.625%, 12/15/2020 (S) | | 630,000 | | 644,175 |
| 8.000%, 02/01/2018 | | 7,255,000 | | 7,926,088 |
| Kansas City Southern Railway | | | | |
| 8.000%, 06/01/2015 | | 265,000 | | 287,525 |
| Kratos Defense & Security Solutions, Inc. | | | | |
| 10.000%, 06/01/2017 | | 2,220,000 | | 2,503,050 |
| Navios Maritime | | | | |
| Acquisition Corp./Navios Acquisition | | | | |
| Finance | | | | |
| 8.625%, 11/01/2017 (S) | | 4,180,000 | | 4,357,650 |
| Navios Maritime Holdings, Inc./Navios | | | | |
| Maritime Finance II U.S., Inc. | | | | |
| 8.125%, 02/15/2019 (S) | | 1,310,000 | | 1,310,000 |
| Quality Distribution LLC/QD | | | | |
| Capital Corp. | | | | |
| 9.875%, 11/01/2018 (S) | | 4,080,000 | | 4,284,000 |
| RailAmerica, Inc. | | | | |
| 9.250%, 07/01/2017 | | 4,560,000 | | 5,050,200 |
| Rearden G Holdings EINS GmbH | | | | |
| 7.875%, 03/30/2020 (S) | | 600,000 | | 633,000 |
| RSC Equipment Rental, Inc./RSC | | | | |
| Holdings III LLC | | | | |
| 8.250%, 02/01/2021 (S) | | 2,180,000 | | 2,305,350 |
| Syncreon Global Ireland Ltd./Syncreon | | | | |
| Global Finance US, Inc. | | | | |
| 9.500%, 05/01/2018 (S) | | 3,830,000 | | 3,973,625 |
| Triumph Group, Inc. | | | | |
| 8.625%, 07/15/2018 | | 1,530,000 | | 1,686,825 |
| United Air Lines, Inc. | | | | |
| 9.875%, 08/01/2013 (S) | | 927,000 | | 1,008,113 |
| Wyle Services Corp. | | | | |
| 10.500%, 04/01/2018 (S) | | 4,480,000 | | 4,636,800 |
| | |
|
| | | | | 92,568,088 |
| Information Technology - 2.08% | | | | |
| CDW LLC/CDW Finance Corp. | | | | |
| 11.000%, 10/12/2015 | | 1,260,000 | | 1,370,250 |
| CDW LLC/CDW Finance Corp., PIK | | | | |
| 11.500%, 10/12/2015 | | 1,040,000 | | 1,128,400 |
| First Data Corp. | | | | |
| 11.250%, 03/31/2016 | | 6,660,000 | | 6,426,900 |
| First Data Corp., PIK | | | | |
| 10.550%, 09/24/2015 | | 26,075 | | 27,705 |
| Freescale Semiconductor, Inc. | | | | |
| 9.250%, 04/15/2018 (S) | | 910,000 | | 1,014,650 |
| 10.125%, 12/15/2016 | | 1,222,000 | | 1,319,760 |
| NXP BV/NXP Funding LLC | | | | |
| 9.750%, 08/01/2018 (S) | | 5,680,000 | | 6,489,400 |
| | |
|
| | | | | 17,777,065 |
| Materials - 7.47% | | | | |
| Appleton Papers, Inc. | | | | |
| 11.250%, 12/15/2015 | | 5,533,000 | | 5,201,000 |
| Atkore International, Inc. | | | | |
| 9.875%, 01/01/2018 (S) | | 1,500,000 | | 1,633,125 |
| |
| The accompanying notes are an integral part of the financial statements. | 97 |
John Hancock Funds II
Portfolio of Investments — February 28, 2011 (Unaudited) (showing percentage of total net assets)
| | | | |
| High Yield Fund (continued) | | | |
| | | Shares or | | |
| | | Principal | | |
| | | Amount | | Value |
| |
|
| |
| CORPORATE BONDS (continued) | | | | |
| Materials (continued) | | | | |
| Berry Plastics Corp. | | | | |
| 9.500%, 05/15/2018 | $ | 2,480,000 | $ | 2,486,200 |
| CF Industries, Inc. | | | | |
| 6.875%, 05/01/2018 | | 420,000 | | 463,838 |
| 7.125%, 05/01/2020 | | 1,300,000 | | 1,459,250 |
| Evraz Group SA | | | | |
| 8.250%, 11/10/2015 | | 120,000 | | 130,680 |
| 8.875%, 04/24/2013 (S) | | 320,000 | | 348,800 |
| 8.875%, 04/24/2013 | | 3,330,000 | | 3,629,700 |
| 9.500%, 04/24/2018 (S) | | 260,000 | | 298,350 |
| FMG Resources August 2006 Pty, Ltd. | | | | |
| 6.375%, 02/01/2016 (S) | | 1,510,000 | | 1,532,650 |
| 7.000%, 11/01/2015 (S) | | 1,330,000 | | 1,379,875 |
| Georgia Gulf Corp. | | | | |
| 9.000%, 01/15/2017 (S) | | 1,535,000 | | 1,707,688 |
| GTL Trade Finance, Inc. | | | | |
| 7.250%, 10/20/2017 (S) | | 369,000 | | 410,051 |
| 7.250%, 10/20/2017 | | 1,410,000 | | 1,566,863 |
| Hexion US Finance Corp./Hexion Nova | | | | |
| Scotia Finance ULC | | | | |
| 9.000%, 11/15/2020 (S) | | 1,600,000 | | 1,702,000 |
| Ineos Finance PLC | | | | |
| 9.000%, 05/15/2015 (S) | | 1,680,000 | | 1,843,800 |
| Kerling PLC | | | | |
| 10.625%, 02/01/2017 (S) | EUR | 2,021,000 | | 3,165,377 |
| Lyondell Chemical Company | | | | |
| 8.000%, 11/01/2017 (S) | $ | 2,826,000 | | 3,181,016 |
| 11.000%, 05/01/2018 | | 574,433 | | 659,162 |
| Midwest Vanadium Pty, Ltd. | | | | |
| 11.500%, 02/15/2018 (S) | | 5,440,000 | | 5,603,200 |
| Neenah Paper, Inc. | | | | |
| 7.375%, 11/15/2014 | | 219,000 | | 223,654 |
| NewPage Corp. | | | | |
| 11.375%, 12/31/2014 | | 4,355,000 | | 4,344,113 |
| Novelis, Inc. | | | | |
| 8.750%, 12/15/2020 (S) | | 3,610,000 | | 3,980,025 |
| Packaging Dynamics Finance Corp. | | | | |
| 10.000%, 05/01/2016 (S) | | 2,640,000 | | 2,798,400 |
| Ryerson Holding Corp. | | | | |
| Zero Coupon 02/01/2015 | | 6,000,000 | | 3,180,000 |
| Solutia, Inc. | | | | |
| 7.875%, 03/15/2020 | | 2,420,000 | | 2,662,000 |
| 8.750%, 11/01/2017 | | 1,120,000 | | 1,239,000 |
| TPC Group LLC | | | | |
| 8.250%, 10/01/2017 (S) | | 1,090,000 | | 1,159,488 |
| Vale Overseas, Ltd. | | | | |
| 6.875%, 11/21/2036 | | 46,000 | | 49,396 |
| 8.250%, 01/17/2034 | | 1,442,000 | | 1,759,781 |
| Vedanta Resources PLC | | | | |
| 8.750%, 01/15/2014 (S) | | 2,060,000 | | 2,193,900 |
| Verso Paper Holdings LLC | | | | |
| 11.500%, 07/01/2014 | | 370,000 | | 407,925 |
| Verso Paper Holdings LLC/Verso | | | | |
| Paper, Inc. | | | | |
| 8.750%, 02/01/2019 (S) | | 1,320,000 | | 1,379,400 |
| | |
|
| | | | | 63,779,707 |
| Telecommunication Services - 8.31% | | | | |
| Axtel SAB de CV | | | | |
| 7.625%, 02/01/2017 (S) | | 4,000,000 | | 3,800,000 |
| 9.000%, 09/22/2019 | | 98,000 | | 94,325 |
| Buccaneer Merger Sub, Inc. | | | | |
| 9.125%, 01/15/2019 (S) | | 3,046,000 | | 3,289,680 |
| Cengage Learning Acquisitions, Inc. | | | | |
| 13.250%, 07/15/2015 (S) | | 5,770,000 | | 6,145,050 |
| | | | |
| High Yield Fund (continued) | | | |
| | | Shares or | | |
| | | Principal | | |
| | | Amount | | Value |
| |
|
| |
| CORPORATE BONDS (continued) | | | | |
| Telecommunication Services (continued) | | | | |
| Cincinnati Bell, Inc. | | | | |
| 8.375%, 10/15/2020 | $ | 1,950,000 | $ | 1,925,625 |
| CMP Susquehanna Corp. | | | | |
| 3.622%, 05/15/2014 (S) | | 192,000 | | 135,345 |
| Cogent Communications Group, Inc. | | | | |
| 8.375%, 02/15/2018 (S) | | 2,710,000 | | 2,811,625 |
| Inmarsat Finance PLC | | | | |
| 7.375%, 12/01/2017 (S) | | 3,550,000 | | 3,816,250 |
| Intelsat Jackson Holdings SA | | | | |
| 11.500%, 06/15/2016 | | 10,915,000 | | 11,651,763 |
| MetroPCS Wireless, Inc. | | | | |
| 7.875%, 09/01/2018 | | 1,640,000 | | 1,732,250 |
| Primus Telecommunications IHC, Inc., | | | | |
| PIK | | | | |
| 14.250%, 05/20/2013 | | 520,000 | | 524,550 |
| Sprint Capital Corp. | | | | |
| 6.875%, 11/15/2028 | | 1,000,000 | | 901,250 |
| 8.750%, 03/15/2032 | | 9,285,000 | | 9,656,400 |
| Sunrise Communications Holdings SA | | | | |
| 8.500%, 12/31/2018 (S) | EUR | 274,000 | | 410,245 |
| Sunrise Communications International SA | | | | |
| 7.000%, 12/31/2017 (S) | | 231,000 | | 338,691 |
| True Move Company, Ltd. | | | | |
| 10.750%, 12/16/2013 | $ | 190,000 | | 203,300 |
| 10.750%, 12/16/2013 (S) | | 6,110,000 | | 6,537,700 |
| TW Telecom Holdings, Inc. | | | | |
| 8.000%, 03/01/2018 | | 3,670,000 | | 3,936,075 |
| UBS Luxembourg SA for OJSC Vimpel | | | | |
| Communications | | | | |
| 8.250%, 05/23/2016 | | 2,890,000 | | 3,186,225 |
| UPC Holding BV | | | | |
| 9.875%, 04/15/2018 (S) | | 1,455,000 | | 1,615,050 |
| VIP Fiance Ireland, Ltd. for OJSC Vimpel | | | | |
| Communications | | | | |
| 6.493%, 02/02/2016 (S) | | 610,000 | | 629,093 |
| West Corp. | | | | |
| 7.875%, 01/15/2019 (S) | | 3,230,000 | | 3,314,788 |
| 8.625%, 10/01/2018 (S) | | 1,710,000 | | 1,812,600 |
| Wind Acquisition Finance SA | | | | |
| 7.250%, 02/15/2018 (S) | | 1,370,000 | | 1,414,525 |
| Windstream Corp. | | | | |
| 7.750%, 10/15/2020 | | 1,000,000 | | 1,036,250 |
| | |
|
| | | | | 70,918,655 |
| Utilities - 4.45% | | | | |
| Calpine Corp. | | | | |
| 7.500%, 02/15/2021 (S) | | 180,000 | | 184,050 |
| 7.875%, 07/31/2020 to 01/15/2023 (S) | | 7,970,000 | | 8,218,575 |
| Colbun SA | | | | |
| 6.000%, 01/21/2020 (S) | | 1,060,000 | | 1,065,129 |
| Dynegy-Roseton Danskammer, Series B | | | | |
| 7.670%, 11/08/2016 | | 3,290,000 | | 3,199,525 |
| Edison Mission Energy | | | | |
| 7.625%, 05/15/2027 | | 5,310,000 | | 3,876,300 |
| Energy Future Holdings Corp. | | | | |
| 10.875%, 11/01/2017 | | 586,000 | | 486,380 |
| Ferrellgas LP/Ferrellgas Finance Corp. | | | | |
| 6.500%, 05/01/2021 (S) | | 1,340,000 | | 1,306,500 |
| Foresight Energy LLC/Foresight | | | | |
| Energy Corp. | | | | |
| 9.625%, 08/15/2017 (S) | | 3,680,000 | | 3,956,000 |
| Mirant Americas Generation LLC | | | | |
| 9.125%, 05/01/2031 | | 6,191,000 | | 6,438,640 |
| Mirant Mid Atlantic LLC | | | | |
| 10.060%, 12/30/2028 | | 4,627,898 | | 5,229,525 |
| |
| The accompanying notes are an integral part of the financial statements. | 98 |
John Hancock Funds II
Portfolio of Investments — February 28, 2011 (Unaudited) (showing percentage of total net assets)
| | | | |
| High Yield Fund (continued) | | | |
| | | Shares or | | |
| | | Principal | | |
| | | Amount | | Value |
| |
|
| |
| CORPORATE BONDS (continued) | | | | |
| Utilities (continued) | | | | |
| NRG Energy, Inc. | | | | |
| 7.375%, 01/15/2017 | $ | 1,810,000 | $ | 1,907,288 |
| Suburban Propane Partners LP | | | | |
| 7.375%, 03/15/2020 | | 1,540,000 | | 1,647,800 |
| The AES Corp. | | | | |
| 8.000%, 06/01/2020 | | 460,000 | | 503,700 |
| | |
|
| | | | | 38,019,412 |
|
| TOTAL CORPORATE BONDS (Cost $681,865,364) | | $ | 706,689,558 |
|
| |
| CAPITAL PREFERRED SECURITIES - 1.13% | | | |
| Financials - 1.13% | | | | |
| Capital One Capital V | | | | |
| 10.250%, 08/15/2039 | | 1,840,000 | | 1,998,700 |
| ILFC E-Capital Trust I (3 month | | | | |
| LIBOR + 1.550%) | | | | |
| 5.960%, 12/21/2065 (S) | | 2,880,000 | | 2,430,084 |
| ING Capital Funding Trust III | | | | |
| 3.903%, (P) (Q) | | 720,000 | | 690,862 |
| MBNA Capital A, Series A | | | | |
| 8.278%, 12/01/2026 | | 360,000 | | 365,400 |
| NB Capital Trust II | | | | |
| 7.830%, 12/15/2026 | | 2,430,000 | | 2,454,300 |
| Santander Finance Preferred SA | | | | |
| Unipersonal (10.500% until | | | | |
| 09/29/2014, then 3 month | | | | |
| LIBOR + 7.673%) | | | | |
| (Q) | | 1,500,000 | | 1,700,393 |
| | |
|
| | | | | 9,639,739 |
|
| TOTAL CAPITAL PREFERRED | | | | |
| SECURITIES (Cost $9,137,470) | | | $ | 9,639,739 |
|
| |
| CONVERTIBLE BONDS - 1.27% | | | | |
| Financials - 0.55% | | | | |
| Realogy Corp. | | | | |
| 11.000%, 04/15/2018 (S) | | 4,520,000 | $ | 4,700,800 |
| Industrials - 0.63% | | | | |
| Horizon Lines, Inc. | | | | |
| 4.250%, 08/15/2012 | | 5,775,000 | | 5,356,313 |
| Materials - 0.09% | | | | |
| Cemex SAB de CV | | | | |
| 4.875%, 03/15/2015 (S) | | 215,000 | | 219,031 |
| Hercules, Inc. | | | | |
| 6.500%, 06/30/2029 | | 710,000 | | 559,125 |
| | |
|
| | | | | 778,156 |
|
| TOTAL CONVERTIBLE BONDS (Cost $8,936,139) | | $ | 10,835,269 |
|
| |
| TERM LOANS (M) - 3.33% | | | | |
| Consumer Discretionary - 0.67% | | | | |
| CityCenter Holdings LLC | | | | |
| 7.500%, 01/14/2014 | | 720,000 | | 727,350 |
| Michaels Stores, Inc. | | | | |
| 5.030%, 07/31/2016 | | 751,338 | | 757,442 |
| Newsday LLC | | | | |
| 0.481%, 08/01/2013 | | 4,000,000 | | 4,252,500 |
| Simmons Holdco, Inc., PIK | | | | |
| 6.639%, 02/15/2012 (H) | | 2,827,672 | | 7,069 |
| | |
|
| | | | | 5,744,361 |
| Financials - 0.52% | | | | |
| Realogy Corp. | | | | |
| 13.500%, 10/15/2017 | | 4,000,000 | | 4,407,500 |
| | | | |
| High Yield Fund (continued) | | | |
| | | Shares or | | |
| | | Principal | | |
| | | Amount | | Value |
| |
|
| |
| TERM LOANS (M) (continued) | | | | |
| Industrials - 1.12% | | | | |
| Hawker Beechcraft Acquisition | | | | |
| Company LLC | | | | |
| 2.535%, 03/26/2014 | $ | 2,256,741 | $ | 2,016,610 |
| IASIS Healthcare LLC/IASIS | | | | |
| Capital Corp. | | | | |
| 5.784%, 06/15/2014 | 5,098,789 | | 5,020,181 |
| Turbo Bet, Ltd. | | | | |
| 12.000%, 03/15/2018 | 8,092,474 | | 2,536,529 |
| | |
|
| | | | | 9,573,320 |
| Telecommunication Services - 0.51% | | | | |
| Vodafone Group PLC | | | | |
| 6.875%, 08/31/2015 | 4,320,000 | | 4,341,600 |
| Utilities - 0.51% | | | | |
| Energy Future Holdings Corp. | | | | |
| 3.527%, 10/10/2014 | 3,771,023 | | 3,170,488 |
| NRG Energy, Inc. | | | | |
| 2.001%, 02/01/2013 | | 123,747 | | 123,217 |
| 3.776%, 08/31/2015 | | 493,559 | | 496,644 |
| 3.784%, 08/31/2015 | | 587,971 | | 591,646 |
| | |
|
| | | | | 4,381,995 |
|
| TOTAL TERM LOANS (Cost $35,559,715) | | | $ | 28,448,776 |
|
| |
| COMMON STOCKS - 1.98% | | | | |
| Consumer Discretionary - 1.37% | | | | |
| Charter | | | | |
| Communications, Inc., Class A (I) (L) | | 254,414 | $ | 11,644,529 |
| Citadel Broadcasting Corp., Class A (I) | | 1,441 | | 50,075 |
| | |
|
| | | | | 11,694,604 |
| Energy - 0.11% | | | | |
| SemGroup Corp., Class A (I) | | 27,952 | | 897,539 |
| Industrials - 0.04% | | | | |
| Nortek, Inc. (I) | | 8,230 | | 366,235 |
| Materials - 0.46% | | | | |
| LyondellBasell Industries, Class A (I) | | 103,770 | | 3,951,562 |
| Telecommunication Services - 0.00% | | | | |
| XO Holdings, Inc. (I) | | 821 | | 632 |
|
| TOTAL COMMON STOCKS (Cost $9,338,345) | | | $ | 16,910,572 |
|
| |
| PREFERRED SECURITIES - 2.41% | | | | |
| Financials - 2.41% | | | | |
| Banesto Holdings, Ltd., Series A (S) | | 65,250 | $ | 1,633,292 |
| Bank of America Corp., 8.000% | | 560,000 | | 591,186 |
| Bank of America Corp., Series L | | 9,380 | | 9,417,520 |
| Citigroup Capital XII (8.500% to | | | | |
| 03/30/2015, then | | | | |
| 3 month LIBOR + 5.870%) | | 306,875 | | 8,162,875 |
| Citigroup Capital XIII (7.875% to | | | | |
| 10/30/2015, then | | | | |
| 3 month LIBOR + 6.370%) | | 28,350 | | 766,868 |
| | |
|
| | | | | 20,571,741 |
| Information Technology - 0.00% | | | | |
| CMP Susquehanna Radio | | | | |
| Holdings Corp., Series A (I) (S) | | 44,870 | | 0 |
|
| TOTAL PREFERRED SECURITIES (Cost $19,686,544) | | $ | 20,571,741 |
|
| |
| WARRANTS - 0.04% | | | | |
| Buffets Restaurants Holdings, Inc. | | | | |
| (Expiration Date: 04/28/2014; Strike | | | | |
| Price: $12.00) (I) | | 4,996 | | 0 |
| |
| The accompanying notes are an integral part of the financial statements. | 99 |
John Hancock Funds II
Portfolio of Investments — February 28, 2011 (Unaudited) (showing percentage of total net assets)
| | | | |
| High Yield Fund (continued) | | | | |
| | | Shares or | | |
| | | Principal | | |
| | | Amount | | Value |
| |
|
| |
| WARRANTS (continued) | | | | |
| Charter Communications, Inc., Class A | | | | |
| (Expiration Date: 11/30/2014; Strike | | | | |
| Price: $51.28) (I) | 5,718 | $ | 51,462 |
| CMP Susquehanna Radio Holdings Corp. | | | | |
| (Expiration Date: 03/26/2019; Strike | | | | |
| Price: $0.01) (I) | 51,274 | | 0 |
| Nortek, Inc. (Expiration Date: | | | | |
| 12/17/2014; Strike Price: $52.80) (I) | 12,027 | | 90,203 |
| SemGroup Corp., Class A (Expiration | | | | |
| Date: 11/30/2014; Strike | | | | |
| Price $25.00) (I) | 29,423 | | 228,028 |
|
| TOTAL WARRANTS (Cost $171,865) | | | $ | 369,693 |
|
| |
| SECURITIES LENDING COLLATERAL - 0.74% | | | |
| John Hancock Collateral | | | | |
| Investment Trust, 0.2855% (W) (Y) | 632,863 | | 6,333,316 |
|
| TOTAL SECURITIES LENDING | | | | |
| COLLATERAL (Cost $6,333,295) | | | $ | 6,333,316 |
|
| |
| SHORT-TERM INVESTMENTS - 2.02% | | | | |
| Repurchase Agreement - 2.00% | | | | |
| Deutsche Bank Tri-Party Repurchase | | | | |
| Agreement dated 02/28/2011 at 0.160% | | | | |
| to be repurchased at $17,100,076 on | | | | |
| 03/01/2011, collateralized by | | | | |
| $17,457,000 Federal National Mortgage | | | | |
| Association, 1.000% due 09/20/2013, | | | | |
| (valued at $17,441,999) | $ | 17,100,000 | $ | 17,100,000 |
| Short-Term Securities* - 0.02% | | | | |
| Federal National Mortgage Association | | | | |
| Discount Notes, 0.200% 05/09/2011 (F) | 123,000 | | 122,944 |
|
| TOTAL SHORT-TERM INVESTMENTS (Cost $17,222,944) | | $ | 17,222,944 |
|
| Total Investments (High Yield Fund) | | | | |
| (Cost $817,359,179) - 99.24% | | | $ | 847,057,270 |
| Other assets and liabilities, net - 0.76% | | | | 6,500,291 |
| | | |
|
| TOTAL NET ASSETS - 100.00% | | | $ | 853,557,561 |
| | | |
|
| |
| |
| Index 500 Fund | | | | |
| | | Shares or | | |
| | | Principal | | |
| | | Amount | | Value |
| |
|
| | |
| |
| COMMON STOCKS - 96.47% | | | | |
| Consumer Discretionary - 10.17% | | | | |
| Auto Components - 0.25% | | | | |
| Johnson Controls, Inc. | 122,007 | $ | 4,977,886 |
| The Goodyear Tire & Rubber Company (I) | 43,981 | | 623,651 |
| | |
|
| | | | | 5,601,537 |
| Automobiles - 0.53% | | | | |
| Ford Motor Company (I)(L) | 677,837 | | 10,201,447 |
| Harley-Davidson, Inc. | 42,636 | | 1,740,402 |
| | |
|
| | | | | 11,941,849 |
| Distributors - 0.07% | | | | |
| Genuine Parts Company | 28,536 | | 1,503,562 |
| Diversified Consumer Services - 0.11% | | | | |
| Apollo Group, Inc., Class A (I) | 22,970 | | 1,039,622 |
| DeVry, Inc. | 11,280 | | 611,940 |
| H&R Block, Inc. (L) | 55,854 | | 848,422 |
| | |
|
| | | | | 2,499,984 |
| | | | |
| Index 500 Fund (continued) | | | | |
| | | Shares or | | |
| | | Principal | | |
| | | Amount | | Value |
| | |
|
| |
| COMMON STOCKS (continued) | | | | |
| Hotels, Restaurants & Leisure - 1.56% | | | | |
| Carnival Corp. | | 77,915 | $ | 3,324,633 |
| Darden Restaurants, Inc. | | 25,067 | | 1,181,408 |
| International Game Technology | | 53,969 | | 888,330 |
| Marriott International, Inc., Class A | | 52,060 | | 2,041,273 |
| McDonald’s Corp. | | 191,141 | | 14,465,551 |
| Starbucks Corp. | | 134,079 | | 4,421,925 |
| Starwood Hotels & | | | | |
| Resorts Worldwide, Inc. (L) | | 34,492 | | 2,107,461 |
| Wyndham Worldwide Corp. | | 31,655 | | 990,168 |
| Wynn Resorts, Ltd. | | 13,679 | | 1,681,559 |
| Yum! Brands, Inc. | | 84,775 | | 4,266,726 |
| | |
|
| | | | | 35,369,034 |
| Household Durables - 0.39% | | | | |
| D.R. Horton, Inc. (L) | | 50,713 | | 600,442 |
| Fortune Brands, Inc. | | 27,583 | | 1,706,284 |
| Harman International Industries, Inc. | | 12,591 | | 612,426 |
| Leggett & Platt, Inc. (L) | | 26,513 | | 611,390 |
| Lennar Corp., Class A (L) | | 28,794 | | 580,487 |
| Newell Rubbermaid, Inc. | | 52,520 | | 1,015,737 |
| Pulte Group, Inc. (I)(L) | | 60,971 | | 420,700 |
| Stanley Black & Decker, Inc. | | 29,993 | | 2,274,369 |
| Whirlpool Corp. (L) | | 13,760 | | 1,135,200 |
| | |
|
| | | | | 8,957,035 |
| Internet & Catalog Retail - 0.77% | | | | |
| Amazon.com, Inc. (I) | | 64,150 | | 11,116,554 |
| Expedia, Inc. | | 36,592 | | 726,717 |
| Netflix, Inc. (I)(L) | | 7,847 | | 1,621,739 |
| priceline.com, Inc. (I) | | 8,882 | | 4,031,362 |
| | |
|
| | | | | 17,496,372 |
| Leisure Equipment & Products - 0.12% | | | | |
| Hasbro, Inc. | | 24,640 | | 1,106,336 |
| Mattel, Inc. | | 64,918 | | 1,626,845 |
| | |
|
| | | | | 2,733,181 |
| Media - 3.27% | | | | |
| Cablevision Systems Corp., Class A | | 43,427 | | 1,600,285 |
| CBS Corp., Class B | | 123,245 | | 2,940,626 |
| Comcast Corp., Class A | | 504,782 | | 13,003,184 |
| DIRECTV, Class A (I) | | 150,836 | | 6,933,931 |
| Discovery | | | | |
| Communications, Inc., Series A (I)(L) | | 51,438 | | 2,217,492 |
| Gannett Company, Inc. (L) | | 43,191 | | 713,083 |
| News Corp., Class A | | 413,159 | | 7,176,572 |
| Omnicom Group, Inc. | | 54,500 | | 2,774,050 |
| Scripps Networks Interactive, Inc., Class A | | 16,297 | | 846,466 |
| The Interpublic Group of Companies, Inc. (I) | | 88,499 | | 1,168,187 |
| The McGraw-Hill Companies, Inc. | | 55,542 | | 2,148,365 |
| The Walt Disney Company | | 342,584 | | 14,984,624 |
| The Washington Post Company, Class B (L) | | 993 | | 430,058 |
| Time Warner Cable, Inc. | | 64,359 | | 4,645,433 |
| Time Warner, Inc. | | 200,692 | | 7,666,434 |
| Viacom, Inc., Class B | | 109,372 | | 4,884,554 |
| | |
|
| | | | | 74,133,344 |
| Multiline Retail - 0.74% | | | | |
| Big Lots, Inc. (I) | | 13,678 | | 561,208 |
| Family Dollar Stores, Inc. | | 22,791 | | 1,141,373 |
| J.C. Penney Company, Inc. | | 42,807 | | 1,496,533 |
| Kohl’s Corp. | | 55,721 | | 3,002,805 |
| Macy’s, Inc. | | 76,615 | | 1,831,099 |
| Nordstrom, Inc. | | 30,452 | | 1,378,258 |
| Sears Holdings Corp. (I)(L) | | 7,961 | | 663,231 |
| |
| The accompanying notes are an integral part of the financial statements. | 100 |
John Hancock Funds II
Portfolio of Investments — February 28, 2011 (Unaudited) (showing percentage of total net assets)
| | | | |
| Index 500 Fund (continued) | | | | |
| | | Shares or | | |
| | | Principal | | |
| | | Amount | | Value |
| | |
|
| |
| COMMON STOCKS (continued) | | | | |
| Multiline Retail (continued) | | | | |
| Target Corp. | | 128,105 | $ | 6,731,918 |
| | | |
|
| | | | | 16,806,425 |
| Specialty Retail - 1.83% | | | | |
| Abercrombie & Fitch Company, Class A | | 15,893 | | 911,781 |
| AutoNation, Inc. (I)(L) | | 11,514 | | 387,331 |
| AutoZone, Inc. (I) | | 4,928 | | 1,271,178 |
| Bed Bath & Beyond, Inc. (I) | | 46,878 | | 2,257,176 |
| Best Buy Company, Inc. | | 59,741 | | 1,926,050 |
| CarMax, Inc. (I) | | 40,680 | | 1,438,852 |
| GameStop Corp., Class A (I)(L) | | 27,385 | | 546,331 |
| Home Depot, Inc. | | 296,492 | | 11,109,555 |
| Limited Brands, Inc. | | 47,851 | | 1,532,189 |
| Lowe’s Companies, Inc. | | 249,668 | | 6,533,812 |
| O’Reilly Automotive, Inc. (I) | | 25,263 | | 1,404,118 |
| RadioShack Corp. (L) | | 20,607 | | 304,984 |
| Ross Stores, Inc. | | 21,808 | | 1,571,048 |
| Staples, Inc. | | 130,839 | | 2,786,871 |
| The Gap, Inc. | | 79,553 | | 1,792,329 |
| Tiffany & Company (L) | | 22,860 | | 1,407,033 |
| TJX Companies, Inc. | | 71,608 | | 3,571,091 |
| Urban Outfitters, Inc. (I) | | 23,312 | | 894,715 |
| | |
|
| | | | | 41,646,444 |
| Textiles, Apparel & Luxury Goods - 0.53% | | | | |
| Coach, Inc. | | 53,620 | | 2,944,810 |
| NIKE, Inc., Class B | | 69,165 | | 6,157,760 |
| Polo Ralph Lauren Corp. | | 11,695 | | 1,481,873 |
| VF Corp. (L) | | 15,698 | | 1,501,828 |
| | |
|
| | | | | 12,086,271 |
| | | |
|
| | | | | 230,775,038 |
| Consumer Staples - 9.75% | | | | |
| Beverages - 2.27% | | | | |
| Brown Forman Corp., Class B (L) | | 18,789 | | 1,299,259 |
| Coca-Cola Enterprises, Inc. | | 61,293 | | 1,612,006 |
| Constellation Brands, Inc., Class A (I)(L) | | 32,255 | | 655,422 |
| Dr. Pepper Snapple Group, Inc. | | 41,085 | | 1,481,525 |
| Molson Coors Brewing Company | | 28,611 | | 1,308,381 |
| PepsiCo, Inc. | | 286,726 | | 18,184,163 |
| The Coca-Cola Company | | 420,098 | | 26,852,664 |
| | |
|
| | | | | 51,393,420 |
| Food & Staples Retailing - 2.14% | | | | |
| Costco Wholesale Corp. | | 78,217 | | 5,849,849 |
| CVS Caremark Corp. | | 245,831 | | 8,127,173 |
| Safeway, Inc. | | 67,446 | | 1,471,672 |
| SUPERVALU, Inc. (L) | | 38,407 | | 331,452 |
| Sysco Corp. | | 105,853 | | 2,941,655 |
| The Kroger Company | | 115,377 | | 2,642,133 |
| Wal-Mart Stores, Inc. | | 354,436 | | 18,423,583 |
| Walgreen Company | | 167,488 | | 7,258,930 |
| Whole Foods Market, Inc. | | 26,597 | | 1,557,520 |
| | |
|
| | | | | 48,603,967 |
| Food Products - 1.65% | | | | |
| Archer-Daniels-Midland Company | | 115,587 | | 4,297,525 |
| Campbell Soup Company (L) | | 34,649 | | 1,166,285 |
| ConAgra Foods, Inc. | | 79,598 | | 1,843,490 |
| Dean Foods Company (I) | | 32,967 | | 348,132 |
| General Mills, Inc. | | 115,842 | | 4,302,372 |
| H.J. Heinz Company | | 58,029 | | 2,914,216 |
| Hormel Foods Corp. | | 25,076 | | 687,082 |
| Kellogg Company | | 45,965 | | 2,461,885 |
| Kraft Foods, Inc., Class A | | 316,023 | | 10,062,172 |
| McCormick & Company, Inc., Class B | | 24,052 | | 1,146,078 |
| | | | |
| Index 500 Fund (continued) | | | | |
| | | Shares or | | |
| | | Principal | | |
| | | Amount | | Value |
| | |
|
| |
| COMMON STOCKS (continued) | | | | |
| Food Products (continued) | | | | |
| Mead Johnson Nutrition Company | | 37,031 | $ | 2,216,305 |
| Sara Lee Corp. | | 115,655 | | 1,980,014 |
| The Hershey Company | | 27,960 | | 1,462,867 |
| The J.M. Smucker Company | | 21,636 | | 1,489,422 |
| Tyson Foods, Inc., Class A | | 53,986 | | 1,005,759 |
| | |
|
| | | | | 37,383,604 |
| Household Products - 2.00% | | | | |
| Clorox Company (L) | | 25,227 | | 1,709,382 |
| Colgate-Palmolive Company | | 87,326 | | 6,856,838 |
| Kimberly-Clark Corp. | | 73,777 | | 4,861,904 |
| The Procter & Gamble Company | | 506,424 | | 31,930,032 |
| | |
|
| | | | | 45,358,156 |
| Personal Products - 0.18% | | | | |
| Avon Products, Inc. | | 77,659 | | 2,159,697 |
| The Estee Lauder Companies, Inc., Class A | | 20,544 | | 1,939,559 |
| | |
|
| | | | | 4,099,256 |
| Tobacco - 1.51% | | | | |
| Altria Group, Inc. | | 377,726 | | 9,582,909 |
| Lorillard, Inc. | | 27,067 | | 2,077,934 |
| Philip Morris International, Inc. | | 328,256 | | 20,607,912 |
| Reynolds American, Inc. | | 61,224 | | 2,101,208 |
| | |
|
| | | | | 34,369,963 |
| | |
|
| | | | | 221,208,366 |
| Energy - 12.64% | | | | |
| Energy Equipment & Services - 2.36% | | | | |
| Baker Hughes, Inc. | | 78,047 | | 5,545,239 |
| Cameron International Corp. (I) | | 43,850 | | 2,592,851 |
| Diamond Offshore Drilling, Inc. (L) | | 12,585 | | 984,525 |
| FMC Technologies, Inc. (I) | | 21,658 | | 2,036,935 |
| Halliburton Company | | 164,551 | | 7,724,024 |
| Helmerich & Payne, Inc. | | 19,157 | | 1,245,013 |
| Nabors Industries, Ltd. (I) | | 51,647 | | 1,470,390 |
| National Oilwell Varco, Inc. | | 75,919 | | 6,040,875 |
| Noble Corp. | | 44,243 | | 1,978,105 |
| Rowan Companies, Inc. (I) | | 22,835 | | 974,369 |
| Schlumberger, Ltd. | | 246,841 | | 23,059,886 |
| | |
|
| | | | | 53,652,212 |
| Oil, Gas & Consumable Fuels - 10.28% | | | | |
| Anadarko Petroleum Corp. | | 89,661 | | 7,336,960 |
| Apache Corp. | | 69,142 | | 8,616,476 |
| Cabot Oil & Gas Corp. | | 18,853 | | 860,828 |
| Chesapeake Energy Corp. | | 118,304 | | 4,212,805 |
| Chevron Corp. | | 364,084 | | 37,773,714 |
| ConocoPhillips | | 265,809 | | 20,698,547 |
| CONSOL Energy, Inc. | | 40,879 | | 2,072,974 |
| Denbury Resources, Inc. (I) | | 72,286 | | 1,751,490 |
| Devon Energy Corp. | | 78,139 | | 7,145,030 |
| El Paso Corp. | | 127,450 | | 2,370,570 |
| EOG Resources, Inc. | | 45,956 | | 5,161,318 |
| EQT Corp. | | 26,999 | | 1,331,051 |
| Exxon Mobil Corp. | | 912,290 | | 78,028,163 |
| Hess Corp. | | 54,280 | | 4,723,988 |
| Marathon Oil Corp. | | 128,484 | | 6,372,806 |
| Massey Energy Company | | 18,485 | | 1,170,655 |
| Murphy Oil Corp. | | 34,803 | | 2,559,065 |
| Newfield Exploration Company (I) | | 24,221 | | 1,763,047 |
| Noble Energy, Inc. | | 31,678 | | 2,935,283 |
| Occidental Petroleum Corp. | | 147,011 | | 14,990,712 |
| Peabody Energy Corp. | | 48,782 | | 3,194,733 |
| Pioneer Natural Resources Company (L) | | 21,000 | | 2,149,140 |
| QEP Resources, Inc. | | 31,773 | | 1,256,622 |
| |
| The accompanying notes are an integral part of the financial statements. | 101 |
John Hancock Funds II
Portfolio of Investments — February 28, 2011 (Unaudited) (showing percentage of total net assets)
| | | | |
| Index 500 Fund (continued) | | | | |
| | | Shares or | | |
| | | Principal | | |
| | | Amount | | Value |
| | |
|
| |
| COMMON STOCKS (continued) | | | | |
| Oil, Gas & Consumable Fuels (continued) | | | | |
| Range Resources Corp. (L) | | 28,972 | $ | 1,573,180 |
| Southwestern Energy Company (I) | | 62,739 | | 2,476,936 |
| Spectra Energy Corp. | | 117,320 | | 3,138,310 |
| Sunoco, Inc. | | 21,829 | | 913,762 |
| Tesoro Corp. (I)(L) | | 25,836 | | 614,380 |
| The Williams Companies, Inc. | | 105,851 | | 3,213,636 |
| Valero Energy Corp. | | 102,521 | | 2,889,042 |
| | |
|
| | | | | 233,295,223 |
| | | |
|
| | | |
| | | | | 286,947,435 |
| Financials - 15.42% | | | | |
| Capital Markets - 2.37% | | | | |
| Ameriprise Financial, Inc. | | 44,861 | | 2,840,599 |
| E*TRADE Financial Corp. (I) | | 35,964 | | 574,705 |
| Federated Investors, Inc., Class B (L) | | 16,603 | | 457,579 |
| Franklin Resources, Inc. | | 26,341 | | 3,308,956 |
| Invesco, Ltd. | | 83,594 | | 2,243,663 |
| Janus Capital Group, Inc. (L) | | 33,247 | | 446,507 |
| Legg Mason, Inc. | | 27,681 | | 1,003,436 |
| Morgan Stanley | | 273,706 | | 8,123,594 |
| Northern Trust Corp. | | 43,829 | | 2,260,262 |
| State Street Corp. | | 90,860 | | 4,063,259 |
| T. Rowe Price Group, Inc. | | 46,411 | | 3,108,609 |
| The Bank of New York Mellon Corp. | | 224,420 | | 6,820,124 |
| The Charles Schwab Corp. | | 179,399 | | 3,403,199 |
| The Goldman Sachs Group, Inc. | | 92,493 | | 15,148,504 |
| | |
|
| | | | | 53,802,996 |
| Commercial Banks - 2.80% | | | | |
| BB&T Corp. (L) | | 125,456 | | 3,462,586 |
| Comerica, Inc. | | 31,921 | | 1,241,727 |
| Fifth Third Bancorp | | 144,170 | | 2,104,882 |
| First Horizon National Corp. (I)(L) | | 42,877 | | 493,086 |
| Huntington Bancshares, Inc. | | 129,783 | | 887,716 |
| KeyCorp | | 159,370 | | 1,456,642 |
| M&T Bank Corp. | | 21,597 | | 1,901,616 |
| Marshall & Ilsley Corp. | | 95,523 | | 742,214 |
| PNC Financial Services Group, Inc. | | 95,122 | | 5,869,027 |
| Regions Financial Corp. | | 227,382 | | 1,737,198 |
| SunTrust Banks, Inc. | | 90,511 | | 2,730,717 |
| U.S. Bancorp | | 347,092 | | 9,624,861 |
| Wells Fargo & Company | | 949,594 | | 30,633,901 |
| Zions Bancorporation (L) | | 32,197 | | 752,122 |
| | |
|
| | | | | 63,638,295 |
| Consumer Finance - 0.70% | | | | |
| American Express Company | | 189,471 | | 8,255,251 |
| Capital One Financial Corp. | | 82,697 | | 4,115,830 |
| Discover Financial Services | | 98,495 | | 2,142,266 |
| SLM Corp. (I) | | 87,933 | | 1,303,167 |
| | |
|
| | | | | 15,816,514 |
| Diversified Financial Services - 4.14% | | | | |
| Bank of America Corp. | | 1,824,584 | | 26,073,305 |
| Citigroup, Inc. (I) | | 5,255,698 | | 24,596,667 |
| CME Group, Inc. | | 12,124 | | 3,773,959 |
| IntercontinentalExchange, Inc. (I) | | 13,234 | | 1,696,599 |
| JPMorgan Chase & Company | | 707,241 | | 33,021,081 |
| Leucadia National Corp. | | 35,681 | | 1,182,112 |
| Moody’s Corp. (L) | | 36,904 | | 1,177,238 |
| NYSE Euronext | | 47,177 | | 1,745,549 |
| The NASDAQ OMX Group, Inc. (I) | | 25,413 | | 727,066 |
| | |
|
| | | | | 93,993,576 |
| Insurance - 3.80% | | | | |
| ACE, Ltd. | | 61,402 | | 3,883,677 |
| | | | |
| Index 500 Fund (continued) | | | | |
| | | Shares or | | |
| | | Principal | | |
| | | Amount | | Value |
| | |
|
| |
| COMMON STOCKS (continued) | | | | |
| Insurance (continued) | | | | |
| Aflac, Inc. | | 85,239 | $ | 5,017,168 |
| American International Group, Inc. (I)(L) | | 25,333 | | 938,841 |
| AON Corp. | | 59,688 | | 3,141,976 |
| Assurant, Inc. | | 19,288 | | 783,671 |
| Berkshire Hathaway, Inc., Class B (I) | | 313,064 | | 27,324,226 |
| Chubb Corp. | | 55,168 | | 3,347,594 |
| Cincinnati Financial Corp. (L) | | 29,450 | | 1,002,773 |
| Genworth Financial, Inc., Class A (I) | | 88,592 | | 1,172,072 |
| Hartford Financial Services Group, Inc. | | 80,443 | | 2,381,113 |
| Lincoln National Corp. | | 57,344 | | 1,818,952 |
| Loews Corp. | | 57,228 | | 2,475,111 |
| Marsh & McLennan Companies, Inc. | | 98,321 | | 2,992,891 |
| MetLife, Inc. | | 163,964 | | 7,765,335 |
| Principal Financial Group, Inc. | | 57,991 | | 1,986,772 |
| Prudential Financial, Inc. | | 87,808 | | 5,780,401 |
| The Allstate Corp. | | 97,416 | | 3,095,880 |
| The Progressive Corp. | | 126,118 | | 2,627,038 |
| The Travelers Companies, Inc. | | 83,050 | | 4,977,187 |
| Torchmark Corp. | | 14,484 | | 945,081 |
| Unum Group | | 57,377 | | 1,522,212 |
| XL Group PLC | | 58,477 | | 1,365,438 |
| | |
|
| | | | | 86,345,409 |
| Real Estate Investment Trusts - 1.46% | | | | |
| Apartment Investment & Management | | | | |
| Company, Class A | | 21,186 | | 543,421 |
| AvalonBay Communities, Inc. | | 15,418 | | 1,866,041 |
| Boston Properties, Inc. | | 25,348 | | 2,431,380 |
| Equity Residential | | 51,462 | | 2,836,071 |
| HCP, Inc. | | 58,677 | | 2,229,726 |
| Health Care REIT, Inc. (L) | | 26,256 | | 1,371,088 |
| Host Hotels & Resorts, Inc. (L) | | 120,481 | | 2,216,850 |
| Kimco Realty Corp. | | 73,476 | | 1,423,965 |
| Plum Creek Timber Company, Inc. (L) | | 29,255 | | 1,227,540 |
| ProLogis | | 102,948 | | 1,673,934 |
| Public Storage | | 25,255 | | 2,834,874 |
| Simon Property Group, Inc. | | 52,991 | | 5,831,130 |
| Ventas, Inc. | | 28,439 | | 1,576,089 |
| Vornado Realty Trust | | 29,413 | | 2,745,115 |
| Weyerhaeuser Company | | 96,971 | | 2,367,062 |
| | |
|
| | | | | 33,174,286 |
| Real Estate Management & Development - 0.06% | | | | |
| CB Richard Ellis Group, Inc., Class A (I) | | 52,575 | | 1,316,478 |
| Thrifts & Mortgage Finance - 0.09% | | | | |
| Hudson City Bancorp, Inc. | | 95,337 | | 1,096,376 |
| People’s United Financial, Inc. (L) | | 66,750 | | 879,765 |
| | |
|
| | | | | 1,976,141 |
| | |
|
| | | | | 350,063,695 |
| Health Care - 10.46% | | | | |
| Biotechnology - 1.16% | | | | |
| Amgen, Inc. (I) | | 170,934 | | 8,774,042 |
| Biogen Idec, Inc. (I) | | 43,113 | | 2,948,929 |
| Celgene Corp. (I) | | 85,147 | | 4,521,306 |
| Cephalon, Inc. (I)(L) | | 13,614 | | 766,604 |
| Genzyme Corp. (I) | | 46,856 | | 3,535,285 |
| Gilead Sciences, Inc. (I) | | 146,882 | | 5,725,460 |
| | |
|
| | | | | 26,271,626 |
| Health Care Equipment & Supplies - 1.75% | | | | |
| Baxter International, Inc. | | 105,426 | | 5,603,392 |
| Becton, Dickinson & Company | | 41,604 | | 3,328,320 |
| Boston Scientific Corp. (I)(L) | | 275,009 | | 1,969,064 |
| C.R. Bard, Inc. (L) | | 16,808 | | 1,643,150 |
| |
| The accompanying notes are an integral part of the financial statements. | 102 |
John Hancock Funds II
Portfolio of Investments — February 28, 2011 (Unaudited) (showing percentage of total net assets)
| | | | |
| Index 500 Fund (continued) | | | | |
| | | Shares or | | |
| | | Principal | | |
| | | Amount | | Value |
| | |
|
| |
| COMMON STOCKS (continued) | | | | |
| Health Care Equipment & Supplies (continued) | | | | |
| CareFusion Corp. (I) | | 40,255 | $ | 1,099,767 |
| Covidien PLC | | 86,611 | | 4,456,136 |
| DENTSPLY International, Inc. | | 25,709 | | 960,745 |
| Intuitive Surgical, Inc. (I) | | 7,109 | | 2,331,397 |
| Medtronic, Inc. | | 195,371 | | 7,799,210 |
| St. Jude Medical, Inc. (I) | | 62,025 | | 2,969,757 |
| Stryker Corp. (L) | | 61,803 | | 3,909,658 |
| Varian Medical Systems, Inc. (I)(L) | | 21,527 | | 1,491,391 |
| Zimmer Holdings, Inc. (I) | | 35,721 | | 2,226,847 |
| | |
|
| | | | | 39,788,834 |
| Health Care Providers & Services - 1.97% | | | | |
| Aetna, Inc. | | 72,386 | | 2,704,341 |
| AmerisourceBergen Corp. | | 49,997 | | 1,895,386 |
| Cardinal Health, Inc. | | 63,133 | | 2,628,858 |
| CIGNA Corp. | | 49,015 | | 2,062,061 |
| Coventry Health Care, Inc. (I) | | 26,865 | | 811,323 |
| DaVita, Inc. (I) | | 17,585 | | 1,395,721 |
| Express Scripts, Inc. (I) | | 95,352 | | 5,360,689 |
| Humana, Inc. (I) | | 30,452 | | 1,979,685 |
| Laboratory Corp. of America Holdings (I) | | 18,399 | | 1,658,302 |
| McKesson Corp. | | 45,784 | | 3,629,756 |
| Medco Health Solutions, Inc. (I) | | 76,782 | | 4,732,842 |
| Patterson Companies, Inc. (L) | | 17,507 | | 584,384 |
| Quest Diagnostics, Inc. | | 25,588 | | 1,452,119 |
| Tenet Healthcare Corp. (I) | | 87,841 | | 630,698 |
| UnitedHealth Group, Inc. | | 198,999 | | 8,473,377 |
| WellPoint, Inc. | | 71,211 | | 4,733,395 |
| | |
|
| | | | | 44,732,937 |
| Health Care Technology - 0.06% | | | | |
| Cerner Corp. (I)(L) | | 12,891 | | 1,294,901 |
| Life Sciences Tools & Services - 0.46% | | | | |
| Agilent Technologies, Inc. (I) | | 62,708 | | 2,638,753 |
| Life Technologies Corp. (I) | | 33,782 | | 1,802,945 |
| PerkinElmer, Inc. | | 21,346 | | 565,669 |
| Thermo Fisher Scientific, Inc. (I) | | 71,911 | | 4,014,072 |
| Waters Corp. (I) | | 16,523 | | 1,372,235 |
| | |
|
| | | | | 10,393,674 |
| Pharmaceuticals - 5.06% | | | | |
| Abbott Laboratories | | 279,666 | | 13,451,935 |
| Allergan, Inc. | | 55,634 | | 4,126,374 |
| Bristol-Myers Squibb Company | | 309,675 | | 7,992,712 |
| Eli Lilly & Company | | 183,589 | | 6,344,836 |
| Forest Laboratories, Inc. (I) | | 51,696 | | 1,674,950 |
| Hospira, Inc. (I) | | 30,227 | | 1,597,497 |
| Johnson & Johnson | | 496,847 | | 30,526,279 |
| Merck & Company, Inc. | | 557,387 | | 18,154,095 |
| Mylan, Inc. (I) | | 78,738 | | 1,800,738 |
| Pfizer, Inc. | | 1,449,144 | | 27,881,530 |
| Watson Pharmaceuticals, Inc. (I) | | 22,671 | | 1,269,349 |
| | |
|
| | | | | 114,820,295 |
| | | |
|
| | | | | 237,302,267 |
| Industrials - 10.69% | | | | |
| Aerospace & Defense - 2.66% | | | | |
| General Dynamics Corp. | | 68,341 | | 5,202,117 |
| Goodrich Corp. | | 22,681 | | 1,955,783 |
| Honeywell International, Inc. | | 141,147 | | 8,173,823 |
| ITT Corp. | | 33,204 | | 1,923,508 |
| L-3 Communications Holdings, Inc. | | 20,477 | | 1,623,621 |
| Lockheed Martin Corp. (L) | | 53,426 | | 4,229,202 |
| Northrop Grumman Corp. | | 52,826 | | 3,522,438 |
| Precision Castparts Corp. | | 25,802 | | 3,657,434 |
| | | | |
| Index 500 Fund (continued) | | | | |
| | | Shares or | | |
| | | Principal | | |
| | | Amount | | Value |
| | |
|
| |
| COMMON STOCKS (continued) | | | | |
| Aerospace & Defense (continued) | | | | |
| Raytheon Company | | 65,953 | $ | 3,377,453 |
| Rockwell Collins, Inc. | | 28,377 | | 1,828,614 |
| Textron, Inc. (L) | | 49,734 | | 1,347,294 |
| The Boeing Company | | 132,718 | | 9,557,023 |
| United Technologies Corp. | | 167,061 | | 13,956,276 |
| | |
|
| | | | | 60,354,586 |
| Air Freight & Logistics - 0.98% | | | | |
| C.H. Robinson Worldwide, Inc. | | 30,029 | | 2,173,799 |
| Expeditors International of Washington, Inc. | | 38,414 | | 1,836,189 |
| FedEx Corp. | | 56,924 | | 5,124,298 |
| United Parcel Service, Inc., Class B | | 178,916 | | 13,204,001 |
| | |
|
| | | | | 22,338,287 |
| Airlines - 0.07% | | | | |
| Southwest Airlines Company | | 135,050 | | 1,597,642 |
| Building Products - 0.04% | | | | |
| Masco Corp. | | 64,904 | | 882,045 |
| Commercial Services & Supplies - 0.45% | | | | |
| Avery Dennison Corp. | | 19,533 | | 779,757 |
| Cintas Corp. | | 22,869 | | 643,076 |
| Iron Mountain, Inc. | | 36,207 | | 941,382 |
| Pitney Bowes, Inc. | | 36,790 | | 926,372 |
| R.R. Donnelley & Sons Company (L) | | 37,349 | | 695,438 |
| Republic Services, Inc. | | 55,613 | | 1,646,701 |
| Stericycle, Inc. (I)(L) | | 15,474 | | 1,337,263 |
| Waste Management, Inc. (L) | | 86,081 | | 3,190,162 |
| | |
|
| | | | | 10,160,151 |
| Construction & Engineering - 0.19% | | | | |
| Fluor Corp. | | 32,364 | | 2,290,077 |
| Jacobs Engineering Group, Inc. (I) | | 22,814 | | 1,142,069 |
| Quanta Services, Inc. (I) | | 38,989 | | 889,339 |
| | |
|
| | | | | 4,321,485 |
| Electrical Equipment - 0.52% | | | | |
| Emerson Electric Company | | 136,169 | | 8,123,843 |
| Rockwell Automation, Inc. | | 25,652 | | 2,250,450 |
| Roper Industries, Inc. | | 17,128 | | 1,440,979 |
| | |
|
| | | | | 11,815,272 |
| Industrial Conglomerates - 2.48% | | | | |
| 3M Company | | 129,331 | | 11,928,198 |
| General Electric Company | | 1,927,629 | | 40,325,998 |
| Tyco International, Ltd. | | 88,549 | | 4,014,812 |
| | |
|
| | | | | 56,269,008 |
| Machinery - 2.25% | | | | |
| Caterpillar, Inc. | | 114,829 | | 11,819,349 |
| Cummins, Inc. | | 35,787 | | 3,618,781 |
| Danaher Corp. | | 97,016 | | 4,909,010 |
| Deere & Company | | 76,684 | | 6,913,063 |
| Dover Corp. | | 33,794 | | 2,171,265 |
| Eaton Corp. | | 30,448 | | 3,373,029 |
| Flowserve Corp. | | 10,101 | | 1,262,322 |
| Illinois Tool Works, Inc. | | 89,723 | | 4,854,014 |
| Ingersoll-Rand PLC | | 58,619 | | 2,655,441 |
| Joy Global, Inc. | | 18,686 | | 1,819,643 |
| PACCAR, Inc. | | 65,997 | | 3,308,430 |
| Pall Corp. | | 20,839 | | 1,132,808 |
| Parker Hannifin Corp. | | 29,180 | | 2,602,272 |
| Snap-On, Inc. | | 10,518 | | 604,049 |
| | |
|
| | | | | 51,043,476 |
| Professional Services - 0.10% | | | | |
| Dun & Bradstreet Corp. | | 9,012 | | 728,170 |
| |
| The accompanying notes are an integral part of the financial statements. | 103 |
John Hancock Funds II
Portfolio of Investments — February 28, 2011 (Unaudited) (showing percentage of total net assets)
| | | | |
| Index 500 Fund (continued) | | | | |
| | | Shares or | | |
| | | Principal | | |
| | | Amount | | Value |
| | |
|
| |
| COMMON STOCKS (continued) | | | | |
| Professional Services (continued) | | | | |
| Equifax, Inc. | | 22,325 | $ | 798,119 |
| Robert Half International, Inc. (L) | | 26,623 | | 849,274 |
| | |
|
| | | | | 2,375,563 |
| Road & Rail - 0.81% | | | | |
| CSX Corp. | | 67,697 | | 5,054,258 |
| Norfolk Southern Corp. | | 65,741 | | 4,311,295 |
| Ryder Systems, Inc. | | 9,360 | | 447,689 |
| Union Pacific Corp. | | 89,219 | | 8,512,385 |
| | |
|
| | | | | 18,325,627 |
| Trading Companies & Distributors - 0.14% | | | | |
| Fastenal Company (L) | | 26,692 | | 1,658,374 |
| WW Grainger, Inc. | | 10,495 | | 1,398,039 |
| | |
|
| | | | | 3,056,413 |
| | | |
|
| | | | | 242,539,555 |
| Information Technology - 18.01% | | | | |
| Communications Equipment - 2.13% | | | | |
| Cisco Systems, Inc. (I) | | 1,002,786 | | 18,611,708 |
| F5 Networks, Inc. (I) | | 14,627 | | 1,726,132 |
| Harris Corp. | | 23,208 | | 1,082,885 |
| JDS Uniphase Corp. (I) | | 40,283 | | 993,782 |
| Juniper Networks, Inc. (I) | | 94,657 | | 4,164,908 |
| Motorola Mobility Holdings, Inc. (I) | | 53,131 | | 1,604,556 |
| Motorola Solutions, Inc. (I) | | 60,721 | | 2,346,259 |
| QUALCOMM, Inc. | | 292,673 | | 17,437,457 |
| Tellabs, Inc. | | 66,748 | | 359,772 |
| | |
|
| | | | | 48,327,459 |
| Computers & Peripherals - 4.35% | | | | |
| Apple, Inc. (I) | | 165,957 | | 58,617,671 |
| Dell, Inc. (I) | | 303,826 | | 4,809,566 |
| EMC Corp. (I) | | 372,763 | | 10,142,881 |
| Hewlett-Packard Company | | 410,275 | | 17,900,298 |
| Lexmark International, Inc., Class A (I) | | 14,216 | | 533,526 |
| NetApp, Inc. (I) | | 65,388 | | 3,377,944 |
| SanDisk Corp. (I) | | 42,426 | | 2,104,330 |
| Western Digital Corp. (I) | | 41,518 | | 1,269,620 |
| | |
|
| | | | | 98,755,836 |
| Electronic Equipment, Instruments & Components - 0.47% | | |
| Amphenol Corp., Class A | | 31,591 | | 1,815,851 |
| Corning, Inc. | | 282,726 | | 6,519,662 |
| FLIR Systems, Inc. (L) | | 28,625 | | 924,588 |
| Jabil Circuit, Inc. | | 35,433 | | 759,329 |
| Molex, Inc. (L) | | 24,923 | | 696,099 |
| | |
|
| | | | | 10,715,529 |
| Internet Software & Services - 1.82% | | | | |
| Akamai Technologies, Inc. (I) | | 32,989 | | 1,238,077 |
| eBay, Inc. (I) | | 207,566 | | 6,954,499 |
| Google, Inc., Class A (I) | | 45,125 | | 27,679,674 |
| Monster Worldwide, Inc. (I)(L) | | 23,503 | | 403,076 |
| VeriSign, Inc. | | 33,860 | | 1,194,919 |
| Yahoo!, Inc. (I) | | 235,827 | | 3,867,563 |
| | |
|
| | | | | 41,337,808 |
| IT Services - 2.99% | | | | |
| Automatic Data Processing, Inc. | | 89,232 | | 4,461,600 |
| Cognizant Technology | | | | |
| Solutions Corp., Class A (I) | | 54,905 | | 4,220,547 |
| Computer Sciences Corp. | | 27,951 | | 1,345,282 |
| Fidelity National Information Services, Inc. | | 47,914 | | 1,551,934 |
| Fiserv, Inc. (I) | | 26,906 | | 1,702,343 |
| International Business Machines Corp. | | 224,765 | | 36,384,957 |
| | | | |
| Index 500 Fund (continued) | | | | |
| | | Shares or | | |
| | | Principal | | |
| | | Amount | | Value |
| | |
|
| |
| COMMON STOCKS (continued) | | | | |
| IT Services (continued) | | | | |
| MasterCard, Inc., Class A | | 17,522 | $ | 4,215,092 |
| Paychex, Inc. | | 58,243 | | 1,958,712 |
| SAIC, Inc. (I) | | 53,159 | | 868,618 |
| Teradata Corp. (I) | | 30,289 | | 1,448,420 |
| The Western Union Company | | 118,658 | | 2,609,289 |
| Total Systems Services, Inc. (L) | | 29,533 | | 524,211 |
| Visa, Inc., Class A | | 88,161 | | 6,440,161 |
| | |
|
| | | | | 67,731,166 |
| Office Electronics - 0.12% | | | | |
| Xerox Corp. | | 250,969 | | 2,697,917 |
| Semiconductors & Semiconductor Equipment - 2.49% | | |
| Advanced Micro Devices, Inc. (I)(L) | | 103,608 | | 954,230 |
| Altera Corp. | | 56,548 | | 2,367,099 |
| Analog Devices, Inc. | | 54,032 | | 2,154,796 |
| Applied Materials, Inc. | | 241,719 | | 3,971,443 |
| Broadcom Corp., Class A | | 82,392 | | 3,396,198 |
| First Solar, Inc. (I)(L) | | 9,758 | | 1,438,232 |
| Intel Corp. | | 1,009,161 | | 21,666,687 |
| KLA-Tencor Corp. | | 30,225 | | 1,475,585 |
| Linear Technology Corp. (L) | | 40,779 | | 1,409,322 |
| LSI Corp. (I) | | 111,544 | | 701,612 |
| MEMC Electronic Materials, Inc. (I) | | 41,172 | | 558,704 |
| Microchip Technology, Inc. (L) | | 33,799 | | 1,247,521 |
| Micron Technology, Inc. (I)(L) | | 154,793 | | 1,722,846 |
| National Semiconductor Corp. (L) | | 43,367 | | 672,189 |
| Novellus Systems, Inc. (I) | | 16,317 | | 652,027 |
| NVIDIA Corp. (I) | | 105,113 | | 2,381,861 |
| Teradyne, Inc. (I)(L) | | 32,830 | | 611,623 |
| Texas Instruments, Inc. | | 212,427 | | 7,564,525 |
| Xilinx, Inc. (L) | | 46,860 | | 1,558,095 |
| | |
|
| | | | | 56,504,595 |
| Software - 3.64% | | | | |
| Adobe Systems, Inc. (I) | | 92,036 | | 3,175,242 |
| Autodesk, Inc. (I) | | 41,149 | | 1,730,315 |
| BMC Software, Inc. (I) | | 32,145 | | 1,591,178 |
| CA, Inc. | | 69,422 | | 1,720,277 |
| Citrix Systems, Inc. (I) | | 33,972 | | 2,383,476 |
| Compuware Corp. (I) | | 39,627 | | 446,200 |
| Electronic Arts, Inc. (I)(L) | | 60,035 | | 1,128,658 |
| Intuit, Inc. (I) | | 50,576 | | 2,659,286 |
| McAfee, Inc. (I) | | 27,887 | | 1,337,182 |
| Microsoft Corp. | | 1,362,107 | | 36,204,803 |
| Novell, Inc. (I) | | 63,598 | | 373,956 |
| Oracle Corp. | | 700,311 | | 23,040,232 |
| Red Hat, Inc. (I) | | 34,479 | | 1,423,293 |
| Salesforce.com, Inc. (I) | | 21,395 | | 2,829,917 |
| Symantec Corp. (I) | | 140,439 | | 2,532,115 |
| | |
|
| | | | | 82,576,130 |
| | |
|
| | | | | 408,646,440 |
| Materials - 3.49% | | | | |
| Chemicals - 2.03% | | | | |
| Air Products & Chemicals, Inc. | | 38,766 | | 3,566,472 |
| Airgas, Inc. | | 13,537 | | 847,145 |
| CF Industries Holdings, Inc. | | 12,869 | | 1,818,132 |
| E.I. du Pont de Nemours & Company | | 165,159 | | 9,062,274 |
| Eastman Chemical Company | | 13,049 | | 1,218,907 |
| Ecolab, Inc. | | 41,998 | | 2,042,783 |
| FMC Corp. | | 13,122 | | 1,016,168 |
| International Flavors & Fragrances, Inc. | | 14,457 | | 823,326 |
| Monsanto Company | | 97,043 | | 6,976,421 |
| PPG Industries, Inc. | | 29,493 | | 2,606,591 |
| Praxair, Inc. | | 55,411 | | 5,506,745 |
| |
| The accompanying notes are an integral part of the financial statements. | 104 |
John Hancock Funds II
Portfolio of Investments — February 28, 2011 (Unaudited) (showing percentage of total net assets)
| | | | |
| Index 500 Fund (continued) | | | | |
| | | Shares or | | |
| | | Principal | | |
| | | Amount | | Value |
| | |
|
| |
| COMMON STOCKS (continued) | | | | |
| Chemicals (continued) | | | | |
| Sigma-Aldrich Corp. (L) | | 21,965 | $ | 1,403,344 |
| The Dow Chemical Company | | 209,987 | | 7,803,117 |
| The Sherwin-Williams Company | | 16,208 | | 1,331,001 |
| | |
|
| | | | | 46,022,426 |
| Construction Materials - 0.05% | | | | |
| Vulcan Materials Company (L) | | 23,223 | | 1,064,775 |
| Containers & Packaging - 0.15% | | | | |
| Ball Corp. | | 31,958 | | 1,153,684 |
| Bemis Company, Inc. | | 19,574 | | 643,006 |
| Owens-Illinois, Inc. (I) | | 29,610 | | 902,809 |
| Sealed Air Corp. | | 28,894 | | 795,163 |
| | |
|
| | | | | 3,494,662 |
| Metals & Mining - 1.13% | | | | |
| AK Steel Holding Corp. (L) | | 19,911 | | 318,178 |
| Alcoa, Inc. | | 184,887 | | 3,115,346 |
| Allegheny Technologies, Inc. (L) | | 17,846 | | 1,197,110 |
| Cliffs Natural Resources, Inc. | | 24,521 | | 2,380,253 |
| Freeport-McMoRan Copper & Gold, Inc. | | 171,916 | | 9,102,952 |
| Newmont Mining Corp. | | 89,204 | | 4,930,305 |
| Nucor Corp. | | 57,131 | | 2,740,003 |
| Titanium Metals Corp. (I) | | 16,310 | | 309,727 |
| United States Steel Corp. (L) | | 25,992 | | 1,494,280 |
| | |
|
| | | | | 25,588,154 |
| Paper & Forest Products - 0.13% | | | | |
| International Paper Company | | 79,122 | | 2,198,009 |
| MeadWestvaco Corp. | | 30,441 | | 893,443 |
| | |
|
| | | | | 3,091,452 |
| | | |
|
| | | |
| | | | | 79,261,469 |
| Telecommunication Services - 2.78% | | | | |
| Diversified Telecommunication Services - 2.48% | | | | |
| AT&T, Inc. | | 1,069,225 | | 30,344,605 |
| CenturyLink, Inc. (L) | | 54,861 | | 2,259,176 |
| Frontier Communications Corp. | | 179,808 | | 1,526,570 |
| Qwest Communications International, Inc. | | 315,285 | | 2,150,244 |
| Verizon Communications, Inc. | | 511,416 | | 18,881,479 |
| Windstream Corp. | | 87,469 | | 1,096,861 |
| | |
|
| | | | | 56,258,935 |
| Wireless Telecommunication Services - 0.30% | | | | |
| American Tower Corp., Class A (I) | | 72,201 | | 3,895,966 |
| MetroPCS Communications, Inc. (I)(L) | | 47,412 | | 682,733 |
| Sprint Nextel Corp. (I) | | 540,335 | | 2,361,264 |
| | |
|
| | | | | 6,939,963 |
| | | |
|
| | | | | 63,198,898 |
| Utilities - 3.06% | | | | |
| Electric Utilities - 1.64% | | | | |
| American Electric Power Company, Inc. | | 86,890 | | 3,108,924 |
| Duke Energy Corp. | | 239,635 | | 4,311,034 |
| Edison International | | 58,986 | | 2,189,560 |
| Entergy Corp. | | 32,731 | | 2,330,447 |
| Exelon Corp. | | 119,670 | | 4,997,419 |
| FirstEnergy Corp. (L) | | 75,670 | | 2,898,161 |
| Nextera Energy, Inc. | | 75,233 | | 4,173,175 |
| Northeast Utilities | | 31,891 | | 1,085,570 |
| Pepco Holdings, Inc. | | 40,533 | | 759,183 |
| Pinnacle West Capital Corp. | | 19,668 | | 830,580 |
| PPL Corp. | | 87,395 | | 2,222,455 |
| Progress Energy, Inc. | | 52,970 | | 2,421,259 |
| Southern Company | | 151,731 | | 5,782,468 |
| | |
|
| | | | | 37,110,235 |
| | | | |
| Index 500 Fund (continued) | | | |
| | | Shares or | | |
| | | Principal | | |
| | | Amount | | Value |
| |
|
| |
| COMMON STOCKS (continued) | | | | |
| Gas Utilities - 0.07% | | | | |
| Nicor, Inc. | | 8,237 | $ | 434,419 |
| ONEOK, Inc. | | 19,266 | | 1,244,006 |
| | |
|
| | | | | 1,678,425 |
| Independent Power Producers & Energy Traders - 0.15% | | | |
| Constellation Energy Group, Inc. | | 36,148 | | 1,123,118 |
| NRG Energy, Inc. (I) | | 44,723 | | 894,013 |
| The AES Corp. (I) | | 119,769 | | 1,481,543 |
| | |
|
| | | | | 3,498,674 |
| Multi-Utilities - 1.20% | | | | |
| Ameren Corp. | | 43,389 | | 1,213,156 |
| CenterPoint Energy, Inc. | | 76,559 | | 1,214,226 |
| CMS Energy Corp. | | 44,248 | | 852,216 |
| Consolidated Edison, Inc. (L) | | 52,563 | | 2,627,099 |
| Dominion Resources, Inc. | | 105,025 | | 4,792,291 |
| DTE Energy Company | | 30,559 | | 1,438,718 |
| Integrys Energy Group, Inc. | | 14,035 | | 687,294 |
| NiSource, Inc. (L) | | 50,324 | | 964,208 |
| PG&E Corp. | | 70,932 | | 3,267,128 |
| Public Service Enterprise Group, Inc. | | 91,533 | | 2,993,129 |
| SCANA Corp. | | 20,485 | | 829,233 |
| Sempra Energy | | 43,431 | | 2,311,832 |
| TECO Energy, Inc. | | 38,845 | | 703,483 |
| Wisconsin Energy Corp. | | 21,163 | | 1,252,850 |
| Xcel Energy, Inc. | | 83,216 | | 1,992,191 |
| | |
|
| | | | | 27,139,054 |
| | |
|
| | | | | 69,426,388 |
|
| TOTAL COMMON STOCKS (Cost $1,522,586,543) | | $ | 2,189,369,551 |
|
| |
| SECURITIES LENDING COLLATERAL - 2.83% | | | |
| John Hancock Collateral | | | | |
| Investment Trust, 0.2855% (W)(Y) | | 6,427,662 | | 64,324,186 |
|
| TOTAL SECURITIES LENDING | | | | |
| COLLATERAL (Cost $64,322,017) | | | $ | 64,324,186 |
|
| |
| SHORT-TERM INVESTMENTS - 3.33% | | | |
| Short-Term Securities* - 3.33% | | | | |
| Federal Home Loan Bank Discount Notes, | | | | |
| 0.100%, 03/11/2011 | $ | 30,000,000 | $ | 29,999,167 |
| Federal Home Loan Bank Discount Notes, | | | | |
| 0.120%, 03/01/2011 | | 7,530,000 | | 7,530,000 |
| Federal Home Loan Bank Discount Notes, | | | | |
| 0.120%, 03/25/2011 | | 33,000,000 | | 32,997,360 |
| Federal Home Loan Bank Discount Notes, | | | | |
| 0.140%, 03/16/2011 | | 5,000,000 | | 4,999,708 |
| | |
|
| | | | | 75,526,235 |
|
| TOTAL SHORT-TERM INVESTMENTS (Cost $75,526,235) | | $ | 75,526,235 |
|
| Total Investments (Index 500 Fund) | | | | |
| (Cost $1,662,434,795) - 102.63% | | | $ | 2,329,219,972 |
| Other assets and liabilities, net - (2.63%) | | | | (59,657,118) |
| | |
|
| TOTAL NET ASSETS - 100.00% | | | $ | 2,269,562,854 |
| | | |
|
| |
| The accompanying notes are an integral part of the financial statements. | 105 |
John Hancock Funds II
Portfolio of Investments — February 28, 2011 (Unaudited) (showing percentage of total net assets)
| | | | |
| International Equity Index Fund | | |
| | | Shares or | | |
| | | Principal | | |
| | | Amount | | Value |
| | |
|
| |
| COMMON STOCKS - 93.01% | | | | |
| Australia - 5.44% | | | | |
| AGL Energy, Ltd. | | 11,918 | $ | 177,712 |
| Alumina, Ltd. | | 70,857 | | 173,370 |
| Amcor, Ltd. | | 31,478 | | 222,653 |
| AMP, Ltd. (L) | | 54,340 | | 294,525 |
| Asciano Group | | 70,683 | | 127,133 |
| Australia & New Zealand Banking Group, Ltd. | | 69,335 | | 1,710,575 |
| Australian Stock Exchange, Ltd. | | 4,362 | | 162,434 |
| AXA Asia Pacific Holdings, Ltd. | | 29,931 | | 193,123 |
| Bendigo and Adelaide Bank, Ltd. | | 9,104 | | 87,020 |
| BHP Billiton, Ltd. | | 89,776 | | 4,241,431 |
| Billabong International, Ltd. | | 4,920 | | 42,593 |
| BlueScope Steel, Ltd. | | 45,278 | | 96,572 |
| Boral, Ltd. | | 16,521 | | 92,968 |
| Brambles, Ltd. | | 39,967 | | 289,379 |
| Caltex Australia, Ltd. | | 3,106 | | 50,072 |
| CFS Gandel Retail Trust | | 66,856 | | 128,194 |
| Coca-Cola Amatil, Ltd. | | 13,557 | | 164,109 |
| Cochlear, Ltd. | | 1,479 | | 116,894 |
| Commonwealth Bank of Australia | | 41,860 | | 2,272,970 |
| Computershare, Ltd. | | 10,551 | | 103,405 |
| Crown, Ltd. | | 11,735 | | 100,369 |
| CSL, Ltd. | | 14,236 | | 517,303 |
| Csr, Ltd. (I) | | 11,078 | | 39,368 |
| Dart Energy, Ltd. (I) | | 10,023 | | 10,434 |
| Dexus Property Group | | 117,928 | | 103,005 |
| Duluxgroup, Ltd. | | 11,759 | | 33,376 |
| Fortescue Metals Group, Ltd. | | 31,662 | | 216,404 |
| Foster’s Group, Ltd. | | 49,633 | | 289,864 |
| General Property Trust, Ltd. | | 41,362 | | 130,929 |
| Goodman Fielder, Ltd. | | 27,646 | | 35,190 |
| Goodman Group | | 163,559 | | 117,108 |
| Harvey Norman Holding, Ltd. | | 11,715 | | 36,408 |
| Incitec Pivot, Ltd. | | 41,761 | | 187,981 |
| James Hardie Industries, Ltd. (I) | | 10,488 | | 71,185 |
| John Fairfax Holdings, Ltd. (L) | | 52,429 | | 70,109 |
| Leighton Holdings, Ltd. (L) | | 3,498 | | 110,567 |
| Lend Lease Corp. | | 14,037 | | 131,055 |
| MacArthur Coal, Ltd. | | 5,843 | | 70,675 |
| Macquarie Airports, Ltd. | | 9,706 | | 30,634 |
| Macquarie Group, Ltd. | | 9,117 | | 354,081 |
| Metcash, Ltd. | | 17,690 | | 73,314 |
| Mirvac Group, Ltd. | | 90,112 | | 119,677 |
| National Australia Bank, Ltd. | | 57,452 | | 1,516,295 |
| Newcrest Mining, Ltd. | | 20,172 | | 782,203 |
| NRMA Insurance Group, Ltd. (I) | | 53,126 | | 197,994 |
| OneSteel, Ltd. | | 32,474 | | 89,960 |
| Orica, Ltd. | | 9,374 | | 247,640 |
| Origin Energy, Ltd. | | 24,399 | | 415,822 |
| Oxiana, Ltd. | | 71,949 | | 119,883 |
| Paladin Resources, Ltd. (I)(L) | | 14,622 | | 74,348 |
| Qantas Airways, Ltd. (I) | | 24,543 | | 58,550 |
| QBE Insurance Group, Ltd. (L) | | 27,306 | | 506,768 |
| QR National, Ltd. (I) | | 48,974 | | 159,946 |
| Ramsay Health Care, Ltd. | | 4,322 | | 78,532 |
| Rio Tinto, Ltd. | | 11,877 | | 1,036,630 |
| Santos, Ltd. | | 21,421 | | 313,543 |
| Sims Group, Ltd. | | 3,458 | | 66,104 |
| Sonic Healthcare, Ltd. | | 8,985 | | 103,862 |
| SP Ausnet | | 18,379 | | 16,350 |
| Stockland (I) | | 60,551 | | 234,881 |
| Suncorp-Metway, Ltd. | | 36,243 | | 312,533 |
| TABCORP Holdings, Ltd. | | 18,279 | | 141,947 |
| Tattersall’s, Ltd. | | 31,297 | | 77,719 |
| Telstra Corp., Ltd. | | 109,888 | | 312,932 |
| Toll Holdings, Ltd. | | 16,481 | | 101,020 |
| | | | |
| International Equity Index Fund (continued) |
| | | Shares or | | |
| | | Principal | | |
| | | Amount | | Value |
| | |
|
| |
| COMMON STOCKS (continued) | | | | |
| Australia (continued) | | | | |
| Transurban Group, Ltd. | | 35,060 | $ | 190,829 |
| Wesfarmers, Ltd. | | 4,541 | | 154,721 |
| Wesfarmers, Ltd. | | 27,442 | | 925,620 |
| Westfield Group | | 60,403 | | 601,715 |
| Westfield Retail Trust (I) | | 81,585 | | 222,261 |
| Westpac Banking Corp. | | 80,345 | | 1,934,781 |
| Woodside Petroleum, Ltd. (L) | | 16,345 | | 712,136 |
| Woolworths, Ltd. | | 32,349 | | 887,588 |
| WorleyParsons, Ltd. | | 5,693 | | 175,983 |
| | |
|
| | | | | 26,367,264 |
| Austria - 0.24% | | | | |
| Erste Group Bank AG | | 5,367 | | 283,425 |
| Immoeast AG (I) | | 14,582 | | 0 |
| Immofinanz AG (I)(L) | | 30,022 | | 132,647 |
| Oesterreichische Elektrizitaets | | | | |
| AG, Class A (L) | | 2,358 | | 90,143 |
| OMV AG | | 4,283 | | 182,297 |
| Raiffeisen International Bank Holding AG | | 1,541 | | 92,565 |
| Telekom Austria AG | | 10,175 | | 145,381 |
| Voestalpine AG | | 3,298 | | 152,607 |
| Wiener Staedtische Allgemeine | | | | |
| Versicherung AG | | 1,245 | | 71,538 |
| | |
|
| | | | | 1,150,603 |
| Belgium - 0.62% | | | | |
| Ageas | | 63,923 | | 202,788 |
| Anheuser-Busch InBev NV | | 19,496 | | 1,089,511 |
| Anheuser-Busch InBev NV, VVPR (I) | | 9,984 | | 55 |
| Bekaert SA (I) | | 1,143 | | 124,073 |
| Belgacom SA | | 4,395 | | 164,713 |
| Colruyt SA | | 2,276 | | 114,373 |
| Compagnie Nationale A Portefeuille, ADR | | 1,019 | | 57,110 |
| Delhaize Group SA | | 2,868 | | 221,794 |
| Dexia SA (I) | | 18,603 | | 81,273 |
| Groupe Bruxelles Lambert SA | | 2,303 | | 211,625 |
| KBC Bancassurance Holding NV (I) | | 4,738 | | 198,289 |
| Mobistar SA | | 1,016 | | 64,878 |
| Solvay SA | | 1,745 | | 204,642 |
| UCB SA | | 3,118 | | 116,016 |
| Umicore | | 3,377 | | 170,404 |
| | |
|
| | | | | 3,021,544 |
| Bermuda - 0.06% | | | | |
| Seadrill, Ltd. | | 7,828 | | 298,195 |
| Brazil - 1.63% | | | | |
| All America Latina Logistica | | 13,600 | | 112,720 |
| Anhanguera Educacional Participacoes SA | | 4,014 | | 89,747 |
| B2W Companhia Global Do Varejo | | 2,100 | | 32,299 |
| Banco Bradesco Sa (I) | | 837 | | 16,254 |
| Banco do Brasil SA | | 15,958 | | 285,341 |
| Banco Santander Brasil SA | | 17,579 | | 212,262 |
| BM&F Bovespa SA | | 53,006 | | 360,318 |
| BR Malls Participacoes SA | | 9,624 | | 91,682 |
| Centrais Eletricas Brasileiras SA | | 7,700 | | 108,757 |
| Cia de Concessoes Rodoviarias, ADR | | 5,400 | | 150,595 |
| Cia de Saneamento Basico do Estado de | | | | |
| Sao Paulo | | 4,279 | | 104,853 |
| Cia Hering | | 4,600 | | 68,649 |
| Cielo SA (I) | | 16,611 | | 131,087 |
| Companhia Siderurgica Nacional SA | | 20,732 | | 332,076 |
| Cosan SA Industria e Comercio (I) | | 4,738 | | 74,012 |
| CPFL Energia SA | | 3,700 | | 96,225 |
| Cyrela Brazil Realty SA | | 10,000 | | 99,471 |
| Diagnosticos da America SA (I) | | 7,000 | | 84,565 |
| |
| The accompanying notes are an integral part of the financial statements. | 106 |
John Hancock Funds II
Portfolio of Investments — February 28, 2011 (Unaudited) (showing percentage of total net assets)
| | | | |
| International Equity Index Fund (continued) |
| | | Shares or | | |
| | | Principal | | |
| | | Amount | | Value |
| | |
|
| |
| COMMON STOCKS (continued) | | | | |
| Brazil (continued) | | | | |
| Duratex SA | | 5,419 | $ | 54,392 |
| Ecorodovias Infraestrutura E Logistica Sa | | 4,538 | | 34,912 |
| EDP - Energias do Brasil SA | | 2,700 | | 60,449 |
| Empresa Brasileira de Aeronautica SA (I) | | 13,400 | | 112,834 |
| Fibria Celulose SA (I) | | 3,592 | | 51,814 |
| Gafisa SA | | 12,563 | | 77,320 |
| Hypermarcas SA (I) | | 8,677 | | 99,088 |
| JBS SA | | 18,485 | | 69,327 |
| Localiza Rent A Car SA | | 4,320 | | 61,017 |
| Lojas Renner SA (I) | | 2,900 | | 88,893 |
| Marfrig Frigorificos e Comercio | | | | |
| de Alimentos SA | | 2,646 | | 23,076 |
| MMX Mineracao e Metalicos SA (I) | | 7,493 | | 43,910 |
| MRV Engenharia e Participacoes SA | | 10,285 | | 81,659 |
| Multiplan Empreendimentos Imobiliarios SA | | 2,485 | | 48,481 |
| Natura Cosmeticos SA | | 5,700 | | 144,607 |
| OGX Petroleo e Gas Participacoes SA (I) | | 33,700 | | 393,957 |
| PDG Realty SA Empreendimentos | | | | |
| e Participacoes | | 27,788 | | 151,817 |
| Perdigao SA (I) | | 18,300 | | 317,869 |
| Petroleo Brasileiro SA (I) | | 78,356 | | 1,535,284 |
| Porto Seguro SA | | 5,027 | | 80,067 |
| Redecard SA | | 8,133 | | 105,096 |
| Rossi Residencial SA (I) | | 6,137 | | 47,582 |
| Souza Cruz SA (I) | | 2,700 | | 129,499 |
| Tam SA | | 96 | | 2,014 |
| Tele Norte Leste Participacoes SA | | 2,500 | | 54,469 |
| Totvs SA | | 707 | | 66,693 |
| Tractebel Energia SA | | 5,400 | | 84,385 |
| Ultrapar Participacoes SA (I) | | 10,000 | | 157,411 |
| Usinas Siderurgicas de Minas Gerais SA (I) | | 4,400 | | 70,927 |
| Vale Fertilizantes SA | | 34,906 | | 1,181,156 |
| | |
|
| | | | | 7,880,918 |
| Canada - 7.68% | | | | |
| Agnico-Eagle Mines, Ltd. | | 4,700 | | 330,410 |
| Agrium, Inc. | | 4,300 | | 407,716 |
| Alimentation Couche Tard, Inc. | | 2,700 | | 71,394 |
| Arc Resources, Ltd. | | 3,700 | | 108,157 |
| Athabasca Oil Sands Corp. (I) | | 4,500 | | 76,424 |
| Bank of Montreal (L) | | 15,200 | | 969,371 |
| Bank of Nova Scotia | | 29,100 | | 1,797,128 |
| Barrick Gold Corp. | | 26,508 | | 1,399,136 |
| Baytex Energy Corp. | | 3,200 | | 183,953 |
| BCE, Inc. | | 6,373 | | 236,278 |
| Bombardier, Inc. | | 41,100 | | 264,397 |
| Bonavista Energy Corp. | | 1,200 | | 37,882 |
| Brookfield Asset Management, Inc. | | 13,625 | | 462,230 |
| Brookfield Properties Corp. | | 7,050 | | 123,650 |
| CAE, Inc. (L) | | 5,800 | | 74,086 |
| Cameco Corp. | | 10,900 | | 443,494 |
| Canadian Imperial Bank of Commerce | | 10,600 | | 896,726 |
| Canadian National Railway Company | | 12,600 | | 921,575 |
| Canadian Natural Resources, Ltd. | | 29,300 | | 1,475,631 |
| Canadian Oil Sands, Ltd. | | 6,400 | | 197,952 |
| Canadian Pacific Railway, Ltd. | | 4,300 | | 291,845 |
| Canadian Tire Corp., Ltd. | | 1,800 | | 114,423 |
| Canadian Utilities, Ltd. | | 2,100 | | 108,702 |
| Cenovus Energy, Inc. | | 19,800 | | 769,338 |
| Centerra Gold, Inc. | | 5,000 | | 96,135 |
| CGI Group, Inc. (I) | | 6,100 | | 121,617 |
| Chorus Aviation, Inc. (I) | | 415 | | 2,243 |
| CI Financial Corp. | | 3,400 | | 80,560 |
| Crescent Point Energy Corp. | | 6,200 | | 299,805 |
| Eldorado Gold Corp. | | 14,800 | | 252,113 |
| | | | |
| International Equity Index Fund (continued) |
| | | Shares or | | |
| | | Principal | | |
| | | Amount | | Value |
| | |
|
| |
| COMMON STOCKS (continued) | | | | |
| Canada (continued) | | | | |
| Empire Company, Ltd. | | 600 | $ | 32,274 |
| Enbridge, Inc. | | 9,900 | | 591,524 |
| Encana Corp. | | 20,200 | | 656,596 |
| Enerplus Corp. | | 4,800 | | 156,715 |
| Fairfax Financial Holdings, Ltd. | | | | |
| (Toronto Exchange) | | 500 | | 193,752 |
| Finning International, Inc. | | 4,600 | | 130,915 |
| First Quantum Minerals, Ltd. | | 2,300 | | 299,470 |
| Fortis, Inc. (L) | | 4,100 | | 139,220 |
| Franco-Nevada Corp. | | 2,500 | | 85,070 |
| George Weston, Ltd. | | 1,100 | | 77,092 |
| Gildan Activewear, Inc. | | 2,700 | | 86,429 |
| Goldcorp, Inc. | | 21,153 | | 1,010,458 |
| Great-West Lifeco, Inc. (L) | | 7,100 | | 200,456 |
| Husky Energy, Inc. | | 6,300 | | 194,340 |
| IAMGOLD Corp. | | 8,700 | | 184,379 |
| IGM Financial, Inc. | | 2,800 | | 136,030 |
| Imperial Oil, Ltd. | | 8,300 | | 432,193 |
| Industrial Alliance Insurance and | | | | |
| Financial Services, Inc. | | 1,900 | | 77,169 |
| Inmet Mining Corp. | | 1,100 | | 75,643 |
| Intact Financial Corp. | | 2,800 | | 142,659 |
| Ivanhoe Mines, Ltd. (I) | | 8,715 | | 246,860 |
| Kinross Gold Corp. | | 30,270 | | 479,809 |
| Loblaw Companies, Ltd. | | 2,500 | | 101,719 |
| Magna International, Inc. | | 5,700 | | 280,732 |
| Manulife Financial Corp. (C)(L) | | 47,700 | | 901,417 |
| MEG Energy Corp. (I) | | 1,600 | | 80,696 |
| Metro, Inc. | | 2,600 | | 117,750 |
| National Bank of Canada | | 4,100 | | 315,914 |
| Nexen, Inc. | | 14,700 | | 401,109 |
| Niko Resources, Ltd. | | 1,100 | | 93,962 |
| Onex Corp. | | 2,300 | | 82,194 |
| Open Text Corp. (I) | | 1,300 | | 76,444 |
| Osisko Mining Corp. (I) | | 9,800 | | 135,165 |
| Pacific Rubiales Energy Corp. | | 6,600 | | 221,189 |
| Pan American Silver Corp. | | 2,500 | | 97,705 |
| Pengrowth Energy Trust | | 9,400 | | 120,941 |
| Penn West Petroleum, Ltd. | | 12,515 | | 361,841 |
| PetroBakken Energy, Ltd., Class A | | 1,400 | | 32,134 |
| Petrobank Energy & Resources, Ltd. (I) | | 2,300 | | 59,160 |
| Potash Corp. of Saskatchewan, Inc. | | 24,000 | | 1,478,709 |
| Power Corp. of Canada | | 9,900 | | 299,176 |
| Power Financial Corp. | | 6,200 | | 201,849 |
| Progress Energy Resources Corp. | | 4,300 | | 57,183 |
| Research In Motion, Ltd. (I) | | 13,000 | | 858,371 |
| RioCan Real Estate Investment Trust | | 2,600 | | 64,816 |
| Ritchie Bros. Auctioneers, Inc. (L) | | 1,900 | | 48,324 |
| Rogers Communications, Inc., Class B | | 11,400 | | 402,470 |
| Royal Bank of Canada | | 38,200 | | 2,232,903 |
| Saputo, Inc. | | 3,900 | | 165,225 |
| Shaw Communications, Inc., Class B (L) | | 8,700 | | 185,274 |
| Sherritt International Corp. | | 6,000 | | 56,137 |
| Shoppers Drug Mart Corp. | | 5,500 | | 233,236 |
| Silver Wheaton Corp. (I) | | 8,800 | | 374,083 |
| SNC-Lavalin Group, Inc. | | 3,800 | | 219,970 |
| Sun Life Financial, Inc. | | 15,000 | | 498,224 |
| Suncor Energy, Inc. | | 42,024 | | 1,975,005 |
| Talisman Energy, Inc. | | 26,900 | | 667,551 |
| Teck Resources, Ltd. | | 15,852 | | 876,996 |
| TELUS Corp. | | 3,500 | | 166,075 |
| Telus Corp. | | 1,400 | | 69,384 |
| The Toronto-Dominion Bank | | 23,700 | | 1,983,233 |
| Thomson Corp. | | 10,393 | | 409,922 |
| Tim Hortons, Inc. | | 4,700 | | 207,002 |
| |
| The accompanying notes are an integral part of the financial statements. | 107 |
John Hancock Funds II
Portfolio of Investments — February 28, 2011 (Unaudited) (showing percentage of total net assets)
| | | | |
| International Equity Index Fund (continued) |
| | | Shares or | | |
| | | Principal | | |
| | | Amount | | Value |
| | |
|
| |
| COMMON STOCKS (continued) | | | | |
| Canada (continued) | | | | |
| TMX Group, Inc. | | 2,000 | $ | 83,372 |
| Trans-Canada Corp. (L) | | 18,800 | | 755,444 |
| TransAlta Corp. | | 5,000 | | 105,759 |
| Valeant Pharmaceuticals International, Inc. | | 7,400 | | 296,975 |
| Vermilion Energy, Inc. | | 2,500 | | 131,362 |
| Viterra, Inc. | | 8,600 | | 105,337 |
| Yamana Gold, Inc. | | 18,393 | | 233,805 |
| Yellow Media, Inc. (L) | | 15,500 | | 88,863 |
| | |
|
| | | | | 37,255,531 |
| Cayman Islands - 0.09% | | | | |
| China Dongxiang Group Company | | 70,500 | | 26,828 |
| ENN Energy Holdings, Ltd. | | 24,000 | | 71,479 |
| Longfor Properties | | 44,000 | | 62,245 |
| Sands China, Ltd. (I) | | 72,452 | | 172,910 |
| Wynn Macau, Ltd. | | 40,750 | | 110,426 |
| | |
|
| | | | | 443,888 |
| Chile - 0.31% | | | | |
| Banco Santander Chile SA, ADR (L) | | 1,929 | | 160,396 |
| Cia Cervecerias Unidas SA, ADR | | 1,107 | | 59,944 |
| CorpBanca SA, SADR (L) | | 2,167 | | 48,403 |
| Embotelladora Andina SA, ADR, Series A | | 915 | | 19,718 |
| Embotelladora Andina SA, ADR, Series B | | 1,006 | | 26,780 |
| Empresa Nacional de Electricidad SA, ADR | | 6,621 | | 345,550 |
| Enersis SA, SADR | | 16,311 | | 331,276 |
| Lan Airlines SA, SADR (L) | | 4,620 | | 125,248 |
| Sociedad Quimica y Minera de | | | | |
| Chile SA, ADR (L) | | 6,677 | | 353,814 |
| Vina Concha Y Toro SA, ADR | | 911 | | 37,624 |
| | |
|
| | | | | 1,508,753 |
| China - 2.65% | | | | |
| Agile Property Holdings, Ltd. | | 47,211 | | 59,732 |
| Agricultural Bank of China (I) | | 465,000 | | 231,158 |
| Air China, Ltd. | | 71,466 | | 67,104 |
| Aluminum Corp. of China, Ltd. (I) | | 130,780 | | 128,451 |
| Angang Steel Company, Ltd., Class H | | 37,012 | | 51,239 |
| Anhui Conch Cement Company, Ltd. | | 26,140 | | 125,674 |
| Anta Sports Products, Ltd. | | 26,000 | | 41,943 |
| Bank of China, Ltd., Class H | | 1,684,320 | | 887,289 |
| Bank of Communications | | | | |
| Company, Ltd., Class H | | 176,160 | | 170,754 |
| BBMG Corp. (I) | | 32,000 | | 42,862 |
| Beijing Capital International Airport | | | | |
| Company, Ltd., Class H | | 81,211 | | 40,738 |
| Beijing Datang Power Generation | | | | |
| Company, Ltd., Class H | | 97,136 | | 33,145 |
| BYD Company, Ltd., Class H | | 16,994 | | 67,176 |
| China BlueChemical, Ltd. | | 68,000 | | 52,845 |
| China Citic Bank Corp, Ltd. | | 191,000 | | 125,951 |
| China Coal Energy Company, Series H | | 101,295 | | 144,840 |
| China Communications | | | | |
| Construction Company, Ltd. | | 104,965 | | 78,516 |
| China Communications | | | | |
| Services Corp., Ltd., Class H | | 82,000 | | 52,555 |
| China Construction Bank Corp. | | 1,285,196 | | 1,125,747 |
| China COSCO Holdings Company, Ltd. | | 87,379 | | 93,287 |
| China Life Insurance Company, Ltd. | | 203,376 | | 775,269 |
| China Longyuan Power Group Corp. (I) | | 48,000 | | 43,280 |
| China Merchants Bank Company, Ltd. | | 109,855 | | 264,050 |
| China Minsheng Banking Corp. Ltd. | | 122,500 | | 107,151 |
| China National Building | | | | |
| Material Company, Ltd. | | 36,000 | | 89,039 |
| China National Materials Company, Ltd. | | 43,000 | | 36,863 |
| China Oilfield Services, Ltd. | | 48,000 | | 95,981 |
| | | | |
| International Equity Index Fund (continued) |
| | | Shares or | | |
| | | Principal | | |
| | | Amount | | Value |
| | |
|
| |
| COMMON STOCKS (continued) | | | | |
| China (continued) | | | | |
| China Pacific Insurance | | | | |
| Group Company, Ltd. (I) | | 25,200 | $ | 102,824 |
| China Petroleum & Chemical Corp. | | 436,030 | | 445,429 |
| China Railway Construction Corp. | | 62,300 | | 69,724 |
| China Railway Group, Ltd. | | 121,000 | | 77,120 |
| China Rongsheng Heavy Industry | | | | |
| Group Company, Ltd. (I) | | 59,500 | | 52,844 |
| China Shanshui Cement Group, Ltd. | | 61,000 | | 46,061 |
| China Shenhua Energy Company, Ltd. | | 93,500 | | 389,009 |
| China Shipping Container | | | | |
| Lines Company, Ltd. (I) | | 134,076 | | 58,467 |
| China Shipping Development Company, Ltd. | | 39,568 | | 43,447 |
| China Southern Airlines Company, Ltd. (I) | | 68,000 | | 32,331 |
| China Telecom Corp., Ltd. | | 396,396 | | 234,468 |
| China Unicom, Ltd. | | 168,416 | | 281,102 |
| China Yurun Food Group, Ltd. | | 40,400 | | 128,413 |
| China Zhongwang Holdings, Ltd. | | 66,400 | | 27,160 |
| Country Garden Holdings Company | | 166,301 | | 66,441 |
| CSR Corp., Ltd. | | 63,000 | | 70,253 |
| Dongfang Electric Corp. Ltd. | | 12,000 | | 46,150 |
| Dongfeng Motor Group Company, Ltd. | | 78,780 | | 137,920 |
| Evergrande Real Estate Group, Ltd. | | 163,000 | | 76,983 |
| Foxconn International Holdings, Ltd. (I) | | 56,000 | | 39,809 |
| Golden Eagle Retail Group, Ltd. | | 24,000 | | 54,806 |
| Great Wall Motor Company, Ltd. | | 33,750 | | 52,906 |
| Greentown China Holdings, Ltd. | | 24,500 | | 24,598 |
| Guangdong Investment, Ltd. | | 96,780 | | 49,077 |
| Guangzhou Automobile | | | | |
| Group Company, Ltd. (I) | | 59,219 | | 76,742 |
| Guangzhou R&F Properties | | | | |
| Company, Ltd., Class H | | 28,000 | | 37,495 |
| Hidili Industry International Development, Ltd. | | 36,000 | | 29,879 |
| Huaneng Power International, Inc., Class H | | 90,564 | | 50,594 |
| Industrial & Commercial Bank of China, Ltd. | | 1,624,270 | | 1,249,038 |
| Jiangsu Expressway, Ltd. | | 46,855 | | 51,134 |
| Jiangxi Copper Company, Ltd., Class H | | 44,925 | | 142,039 |
| Lenovo Group, Ltd. | | 156,564 | | 94,710 |
| Maanshan Iron & Steel Company, Ltd. | | 77,925 | | 40,058 |
| Metallurgical Corp of China Ltd (I) | | 81,000 | | 32,841 |
| PetroChina Company, Ltd., Class H | | 577,739 | | 787,950 |
| PICC Property & Casualty | | | | |
| Company, Ltd., Class H (I) | | 74,780 | | 94,424 |
| Ping An Insurance Group Company | | | | |
| of China, Ltd. | | 47,855 | | 493,412 |
| Semiconductor | | | | |
| Manufacturing International Corp. | | 601,000 | | 48,592 |
| Shanghai Electric Group Company, Ltd. | | 91,136 | | 53,580 |
| Shimao Property Holdings, Ltd., GDR | | 49,500 | | 67,715 |
| Shui On Land, Ltd. | | 122,959 | | 58,184 |
| Sinopec Shanghai Petrochemical | | | | |
| Company, Ltd., Class H | | 92,066 | | 49,305 |
| Sinopharm Group Company | | 18,400 | | 67,074 |
| Tencent Holdings, Ltd. | | 27,000 | | 721,961 |
| Tingyi (Cayman Islands) Holding Corp. | | 52,000 | | 117,679 |
| Tsingtao Brewery Company, Ltd., Series H | | 12,000 | | 55,316 |
| Want Want China Holdings, Ltd. | | 156,000 | | 117,041 |
| Weichai Power Compnay, Ltd. | | 13,600 | | 90,935 |
| Wumart Stores, Inc. | | 22,000 | | 45,958 |
| Yanzhou Coal Mining Company, Ltd., Class H | | 59,210 | | 177,291 |
| Zhaojin Mining Industry Company., Ltd. | | 15,000 | | 64,156 |
| Zhejiang Expressway Company, Ltd., Class H | | 54,282 | | 49,061 |
| Zhuzhou CSR Times Electric Company, Ltd. | | 15,000 | | 49,850 |
| Zijin Mining Group, Ltd. | | 127,686 | | 105,147 |
| |
| The accompanying notes are an integral part of the financial statements. | 108 |
John Hancock Funds II
Portfolio of Investments — February 28, 2011 (Unaudited) (showing percentage of total net assets)
| | | | |
| International Equity Index Fund (continued) |
| | | Shares or | | |
| | | Principal | | |
| | | Amount | | Value |
| | |
|
| |
| COMMON STOCKS (continued) | | | | |
| China (continued) | | | | |
| ZTE Corp., Class H | | 19,080 | $ | 88,380 |
| | | |
|
| | | | | 12,847,522 |
| Colombia - 0.15% | | | | |
| BanColombia SA ADR | | 11,892 | | 677,012 |
| Petrominerales, Ltd. | | 1,412 | | 58,773 |
| | |
|
| | | | | 735,785 |
| Czech Republic - 0.09% | | | | |
| CEZ AS | | 4,862 | | 223,290 |
| Komercni Banka AS | | 489 | | 117,841 |
| Telefonica O2 Czech Republic AS | | 3,732 | | 84,627 |
| | |
|
| | | | | 425,758 |
| Denmark - 0.70% | | | | |
| A P Moller Maersk A/S | | 16 | | 154,080 |
| A P Moller Maersk A/S, Series A | | 36 | | 356,890 |
| Carlsberg A/S | | 3,000 | | 318,976 |
| Coloplast A/S | | 715 | | 100,690 |
| Danske Bank A/S (I) | | 12,800 | | 300,233 |
| DSV A/S, ADR | | 6,700 | | 154,730 |
| Novo Nordisk A/S | | 11,650 | | 1,466,877 |
| Novozymes A/S, B Shares | | 1,350 | | 188,734 |
| TrygVesta A/S | | 1,025 | | 53,323 |
| Vestas Wind Systems A/S (I) | | 6,000 | | 206,584 |
| William Demant Holdings A/S (I) | | 900 | | 76,360 |
| | |
|
| | | | | 3,377,477 |
| Egypt - 0.08% | | | | |
| Commercial International Bank (I) | | 14,646 | | 90,670 |
| Egypt Kuwait Holding Company | | 22,410 | | 29,133 |
| Egyptian Company for Mobile Services (I) | | 751 | | 16,262 |
| Egyptian Financial Group- | | | | |
| Hermes Holding (I)(L) | | 7,160 | | 30,385 |
| EL EZZ Steel Company (I) | | 9,469 | | 25,718 |
| National Societe Generale Bank Sae (I) | | 4,147 | | 28,369 |
| Orascom Construction Industries (I) | | 2,165 | | 79,437 |
| Orascom Telecom Holding SAE (I) | | 74,402 | | 45,088 |
| Talaat Moustafa Group (I) | | 21,101 | | 23,461 |
| Telecom Egypt (I) | | 6,820 | | 18,523 |
| | |
|
| | | | | 387,046 |
| Finland - 0.71% | | | | |
| Elisa OYJ, Class A | | 4,100 | | 93,769 |
| Fortum OYJ (I) | | 12,468 | | 386,795 |
| Kesko OYJ | | 2,000 | | 86,228 |
| Kone OYJ (L) | | 4,480 | | 244,388 |
| Metra OYJ | | 2,300 | | 176,761 |
| Metso OYJ | | 3,600 | | 186,033 |
| Neste Oil OYJ | | 4,357 | | 77,331 |
| Nokia OYJ (I) | | 101,150 | | 871,946 |
| Nokian Renkaat OYJ | | 3,210 | | 130,834 |
| Orion OYJ, Series B | | 3,083 | | 70,567 |
| Outokumpu OYJ | | 4,000 | | 71,790 |
| Pohjola Bank OYJ | | 4,484 | | 61,404 |
| Rautaruukki OYJ (L) | | 3,000 | | 69,736 |
| Sampo OYJ | | 11,618 | | 360,400 |
| Sanoma OYJ | | 2,760 | | 60,655 |
| Stora Enso OYJ, Series R | | 17,000 | | 191,866 |
| UPM-Kymmene OYJ | | 14,767 | | 293,663 |
| | |
|
| | | | | 3,434,166 |
| France - 6.19% | | | | |
| Accor SA | | 4,321 | | 203,472 |
| Aeroports de Paris | | 638 | | 56,543 |
| Air France KLM | | 2,565 | | 41,952 |
| Air Liquide SA | | 7,443 | | 963,340 |
| | | | |
| International Equity Index Fund (continued) |
| | | Shares or | | |
| | | Principal | | |
| | | Amount | | Value |
| | |
|
| |
| COMMON STOCKS (continued) | | | | |
| France (continued) | | | | |
| Alcatel-Lucent | | 60,828 | $ | 300,977 |
| Alstom SA | | 5,326 | | 317,418 |
| Atos Origin SA (I) | | 997 | | 57,702 |
| AXA SA | | 45,193 | | 950,108 |
| BioMerieux SA | | 229 | | 24,376 |
| BNP Paribas | | 25,929 | | 2,026,641 |
| Bouygues SA | | 6,510 | | 300,918 |
| Bureau Veritas SA | | 1,080 | | 83,350 |
| Cap Gemini SA | | 4,257 | | 248,661 |
| Carrefour SA | | 16,412 | | 805,761 |
| Casino Guichard Perrachon SA | | 1,338 | | 131,006 |
| Christian Dior SA | | 1,778 | | 256,385 |
| Cie de Saint-Gobain | | 10,555 | | 630,818 |
| Cie Generale de Geophysique-Veritas (I) | | 3,403 | | 126,166 |
| CNP Assurances SA | | 3,718 | | 82,482 |
| Compagnie Generale des Etablissements | | | | |
| Michelin, Class B | | 4,851 | | 395,248 |
| Credit Agricole SA | | 25,829 | | 453,944 |
| Danone SA | | 15,344 | | 961,702 |
| Dassault Systemes SA | | 1,563 | | 119,669 |
| Edenred (I) | | 4,768 | | 125,652 |
| Eiffage SA (I) | | 858 | | 51,072 |
| Electricite de France | | 7,201 | | 321,052 |
| Eramet | | 92 | | 33,222 |
| Essilor International SA | | 5,550 | | 396,352 |
| Eurazeo | | 555 | | 41,242 |
| European Aeronautic Defence & | | | | |
| Space Company (I) | | 11,536 | | 333,600 |
| Eutelsat Communications | | 2,373 | | 94,662 |
| Fonciere Des Regions | | 869 | | 94,353 |
| France Telecom SA | | 50,098 | | 1,110,160 |
| GDF Suez | | 33,606 | | 1,361,920 |
| Gecina SA (I) | | 636 | | 82,372 |
| Groupe Eurotunnel SA | | 11,381 | | 114,610 |
| ICADE | | 515 | | 57,764 |
| Iliad SA | | 310 | | 34,732 |
| Imerys SA | | 1,219 | | 85,635 |
| JC Decaux SA (I) | | 1,422 | | 45,904 |
| Klepierre SA | | 2,919 | | 113,909 |
| L’Oreal SA | | 6,436 | | 748,366 |
| Lafarge SA | | 5,651 | | 342,633 |
| Lagardere S.C.A | | 2,725 | | 122,646 |
| Legrand SA, ADR | | 4,410 | | 184,966 |
| LVMH Moet Hennessy Louis Vuitton SA | | 6,443 | | 1,015,585 |
| M6-Metropole Television | | 1,462 | | 36,946 |
| Natixis (I) | | 22,776 | | 135,831 |
| Neopost SA | | 798 | | 75,690 |
| PagesJaunes Groupe SA (L) | | 2,127 | | 20,744 |
| Pernod-Ricard SA | | 5,447 | | 502,071 |
| Peugeot SA | | 3,575 | | 143,223 |
| PPR | | 2,142 | | 325,181 |
| Publicis Groupe SA | | 3,083 | | 175,878 |
| Renault SA (I) | | 5,221 | | 320,168 |
| Safran SA | | 4,861 | | 173,118 |
| Sanofi-Aventis SA | | 27,923 | | 1,927,569 |
| Schneider Electric SA | | 6,629 | | 1,096,437 |
| SCOR SE | | 5,103 | | 149,931 |
| Societe BIC SA | | 611 | | 52,184 |
| Societe Generale | | 17,281 | | 1,216,568 |
| Societe Television Francaise | | 2,677 | | 51,993 |
| Sodexho Alliance | | 2,266 | | 155,939 |
| STMicroelectronics NV | | 18,270 | | 234,563 |
| Suez Environnement SA | | 8,024 | | 173,857 |
| Technip SA | | 2,761 | | 272,502 |
| Thales SA | | 1,957 | | 74,137 |
| |
| The accompanying notes are an integral part of the financial statements. | 109 |
John Hancock Funds II
Portfolio of Investments — February 28, 2011 (Unaudited) (showing percentage of total net assets)
| | | | |
| International Equity Index Fund (continued) |
| | | Shares or | | |
| | | Principal | | |
| | | Amount | | Value |
| | |
|
| |
| COMMON STOCKS (continued) | | | | |
| France (continued) | | | | |
| Total SA | | 56,568 | $ | 3,470,741 |
| Unibail-Rodamco SE | | 2,483 | | 499,461 |
| Vallourec SA | | 3,013 | | 311,903 |
| Veolia Environnement SA | | 9,683 | | 318,824 |
| Vinci SA | | 11,679 | | 702,800 |
| Vivendi SA | | 33,742 | | 961,697 |
| | |
|
| | | | | 30,031,004 |
| Germany - 5.31% | | | | |
| Adidas AG (I) | | 5,766 | | 369,984 |
| Allianz SE | | 12,496 | | 1,800,705 |
| Axel Springer AG | | 475 | | 77,453 |
| BASF SE | | 25,256 | | 2,100,069 |
| Bayer AG | | 22,786 | | 1,766,827 |
| Bayerische Motoren Werke (BMW) AG | | 8,934 | | 724,565 |
| Beiersdorf AG | | 2,942 | | 176,608 |
| Brenntag AG (I) | | 886 | | 92,603 |
| Celesio AG | | 2,695 | | 74,571 |
| Commerzbank AG (I) | | 24,729 | | 213,113 |
| Continental AG (I) | | 1,532 | | 129,472 |
| Daimler AG (I) | | 24,842 | | 1,749,759 |
| Deutsche Bank AG | | 25,661 | | 1,649,011 |
| Deutsche Boerse AG | | 5,364 | | 411,991 |
| Deutsche Lufthansa AG (I) | | 6,765 | | 138,288 |
| Deutsche Post AG | | 23,249 | | 426,370 |
| Deutsche Telekom AG | | 77,276 | | 1,039,118 |
| E.ON AG | | 49,623 | | 1,628,966 |
| Fraport AG, ADR | | 1,212 | | 86,324 |
| Fresenius AG | | 3,178 | | 289,790 |
| Fresenius Medical Care AG | | 5,349 | | 353,912 |
| GEA Group AG (I) | | 4,939 | | 152,598 |
| Hannover Rueckversicherung AG | | 1,887 | | 109,929 |
| HeidelbergCement AG | | 3,961 | | 277,280 |
| Henkel AG & Company, KGaA | | 3,616 | | 184,640 |
| Hochtief AG | | 1,197 | | 118,100 |
| Infineon Technologies AG | | 30,592 | | 334,617 |
| K&S AG | | 4,027 | | 310,845 |
| Kabel Deutschland Holding AG (I) | | 1,683 | | 91,690 |
| Lanxess AG | | 2,327 | | 173,181 |
| Linde AG | | 4,646 | | 709,307 |
| MAN AG | | 2,918 | | 370,500 |
| Merck KGAA | | 1,840 | | 166,400 |
| Metro AG | | 3,669 | | 268,369 |
| Muenchener Rueckversicherungs - Gesellschaft | | | | |
| AG (MunichRe) | | 5,156 | | 860,959 |
| Puma AG | | 194 | | 57,690 |
| Qiagen AG (I) | | 6,965 | | 144,259 |
| RWE AG | | 11,285 | | 761,605 |
| Salzgitter AG | | 1,324 | | 109,908 |
| SAP AG | | 23,305 | | 1,406,084 |
| Siemens AG | | 22,571 | | 3,039,140 |
| Suedzucker AG | | 2,382 | | 65,432 |
| ThyssenKrupp AG | | 9,200 | | 382,981 |
| TUI AG (I)(L) | | 4,864 | | 63,744 |
| United Internet AG | | 4,193 | | 72,611 |
| Volkswagen AG | | 820 | | 124,548 |
| Wacker Chemie AG | | 484 | | 89,278 |
| | |
|
| | | | | 25,745,194 |
| Greece - 0.20% | | | | |
| Alpha Bank A.E. | | 14,784 | | 98,573 |
| Bank of Cyprus PCL | | 27,657 | | 106,799 |
| Coca-Cola Hellenic Bottling Company SA | | 5,385 | | 147,078 |
| EFG Eurobank Ergasias SA | | 9,415 | | 60,173 |
| | | | |
| International Equity Index Fund (continued) |
| | | Shares or | | |
| | | Principal | | |
| | | Amount | | Value |
| | |
|
| |
| COMMON STOCKS (continued) | | | | |
| Greece (continued) | | | | |
| Hellenic | | | | |
| Telecommunications Organization SA (I) | | 8,670 | $ | 89,166 |
| National Bank of Greece SA | | 26,173 | | 245,073 |
| OPAP SA | | 6,890 | | 143,881 |
| Public Power Corp. SA | | 3,790 | | 58,593 |
| | |
|
| | | | | 949,336 |
| Hong Kong - 2.96% | | | | |
| AIA Group, Ltd. (I) | | 206,200 | | 605,587 |
| Alibaba.com, Ltd. | | 43,000 | | 80,765 |
| ASM Pacific Technology, Ltd. | | 5,000 | | 66,511 |
| Bank of East Asia, Ltd. | | 39,870 | | 173,480 |
| Beijing Enterprises Holdings, Ltd. | | 16,714 | | 92,849 |
| Belle International Holdings, Ltd. | | 121,888 | | 212,585 |
| BOC Hong Kong Holdings, Ltd. | | 96,500 | | 300,393 |
| Bosideng International Holdings, Ltd. | | 88,000 | | 23,473 |
| Brilliance China Automotive Holdings, Ltd. (I) | | 72,000 | | 59,200 |
| Cathay Pacific Airways, Ltd. | | 36,000 | | 84,159 |
| Chaoda Modern Agriculture Holdings, Ltd. | | 73,214 | | 47,367 |
| Cheung Kong Holdings, Ltd. | | 37,000 | | 578,374 |
| Cheung Kong Infrastructure Holdings, Ltd. | | 12,000 | | 59,316 |
| China Agri-Industries Holdings, Ltd. | | 55,784 | | 56,747 |
| China Everbright, Ltd. | | 21,784 | | 45,736 |
| China Gas Holdings, Ltd. | | 96,000 | | 36,064 |
| China High Speed Transmission Equipment | | | | |
| Group Company, Ltd. | | 29,000 | | 40,447 |
| China Mengniu Dairy Company, Ltd. | | 36,498 | | 97,273 |
| China Merchants Holdings | | | | |
| International Company, Ltd. | | 28,565 | | 121,690 |
| China Mobile, Ltd. | | 162,970 | | 1,536,622 |
| China Overseas Land & Investment, Ltd. | | 114,397 | | 190,568 |
| China Resource Power Holdings, Ltd. | | 50,532 | | 84,710 |
| China Resources Cement Holdings, Ltd. (I) | | 68,000 | | 51,931 |
| China Resources Enterprises, Ltd. | | 34,855 | | 128,428 |
| China Resources Land, Ltd. | | 61,211 | | 99,863 |
| China Taiping Insurance | | | | |
| Holdings Company, Ltd. (I) | | 26,000 | | 71,091 |
| China Travel International Investment | | | | |
| Hong Kong, Ltd. | | 139,709 | | 28,609 |
| Citic Pacific, Ltd. | | 36,033 | | 94,620 |
| CLP Holdings, Ltd. | | 50,500 | | 412,525 |
| CNOOC, Ltd. | | 477,716 | | 1,086,829 |
| CNPC Hong Kong, Ltd. (I) | | 80,000 | | 119,198 |
| COSCO Pacific, Ltd. | | 51,508 | | 99,667 |
| Esprit Holdings, Ltd. | | 30,993 | | 152,575 |
| Fosun International | | 65,500 | | 47,474 |
| Franshion Properties China, Ltd. | | 106,000 | | 29,728 |
| Fushan International Energy Group, Ltd. (I) | | 82,000 | | 60,791 |
| GCL Poly Energy Holdings, Ltd. | | 223,000 | | 113,571 |
| Geely Automobile Holdings Company, Ltd. | | 125,000 | | 54,002 |
| GOME Electrical Appliances Holdings, Ltd. | | 309,695 | | 106,191 |
| Hang Lung Group, Ltd. | | 20,000 | | 122,682 |
| Hang Lung Properties, Ltd. | | 71,000 | | 302,621 |
| Hang Seng Bank, Ltd. | | 19,900 | | 318,409 |
| Henderson Land Development Company, Ltd. | | 30,127 | | 191,462 |
| Hengan International Group Company, Ltd. | | 22,000 | | 164,417 |
| Hong Kong & China Gas Company, Ltd. | | 119,257 | | 268,742 |
| Hong Kong Electric Holdings, Ltd. | | 36,500 | | 238,638 |
| Hong Kong Exchanges & Clearing, Ltd. | | 28,000 | | 608,940 |
| Hopewell Holdings, Ltd. | | 15,000 | | 46,771 |
| Hopson Development Holdings, Ltd. | | 24,000 | | 26,651 |
| Huabao International Holdings, Ltd. | | 45,000 | | 56,919 |
| Hutchison Whampoa, Ltd. | | 60,000 | | 709,970 |
| Hysan Development Company, Ltd. | | 13,269 | | 60,140 |
| Kerry Properties, Ltd. | | 17,268 | | 83,863 |
| |
| The accompanying notes are an integral part of the financial statements. | 110 |
John Hancock Funds II
Portfolio of Investments — February 28, 2011 (Unaudited) (showing percentage of total net assets)
| | | | |
| International Equity Index Fund (continued) |
| | | Shares or | | |
| | | Principal | | |
| | | Amount | | Value |
| | |
|
| |
| COMMON STOCKS (continued) | | | | |
| Hong Kong (continued) | | | | |
| Kingboard Chemical Holdings, Ltd. | | 18,000 | $ | 95,863 |
| Lee & Man Paper Manufacturing, Ltd. | | 58,000 | | 37,902 |
| Li & Fung, Ltd. | | 61,600 | | 374,469 |
| Li Ning Company, Ltd. | | 26,949 | | 51,147 |
| Lifestyle International Holdings, Ltd. | | 15,500 | | 38,544 |
| Lonking Holdings, Ltd. | | 72,000 | | 40,522 |
| MTR Corp., Ltd. | | 41,361 | | 153,553 |
| New World Development Company, Ltd. | | 65,771 | | 119,131 |
| Nine Dragons Paper Holdings, Ltd. | | 51,000 | | 56,936 |
| Noble Group, Ltd. | | 80,001 | | 129,208 |
| NWS Holdings, Ltd. | | 23,832 | | 37,014 |
| Orient Overseas International, Ltd. | | 7,000 | | 56,754 |
| Parkson Retail Group, Ltd. | | 42,500 | | 60,264 |
| PCCW, Ltd. | | 148,000 | | 64,301 |
| Poly Hong Kong Investment, Ltd. | | 52,000 | | 41,635 |
| Renhe Commercial Holdings Compnay, Ltd. | | 294,000 | | 44,270 |
| Shandong Weigao Group Medical | | | | |
| Polymer Company, Ltd. | | 24,000 | | 59,349 |
| Shanghai Industrial Holdings, Ltd. | | 18,070 | | 64,650 |
| Shangri-La Asia, Ltd. | | 32,500 | | 76,559 |
| Sino Land Company, Ltd. | | 80,655 | | 147,559 |
| Sino-Forest Corp. (I) | | 6,600 | | 147,482 |
| Sino-Ocean Land Holdings, Ltd. | | 100,365 | | 60,303 |
| Sinofert Holdings, Ltd. | | 76,000 | | 40,865 |
| Sinotruk Hong Kong, Ltd. | | 26,500 | | 25,439 |
| SJM Holdings, Ltd. | | 50,384 | | 74,690 |
| Skyworth Digital Holdings, Ltd. | | 57,763 | | 36,834 |
| Soho China, Ltd. | | 73,500 | | 53,145 |
| Sun Hung Kai Properties, Ltd. | | 37,281 | | 602,370 |
| Swire Pacific, Ltd. | | 20,000 | | 280,465 |
| The Link REIT | | 59,039 | | 182,860 |
| Wharf Holdings, Ltd. | | 37,625 | | 247,388 |
| Wheelock and Company, Ltd. | | 20,000 | | 73,020 |
| Wing Hang Bank, Ltd. | | 4,585 | | 58,669 |
| Xinyu Hengdeli Holdings, Ltd. | | 76,000 | | 41,693 |
| Yue Yuen Industrial Holdings, Ltd. | | 23,500 | | 74,272 |
| Yuexiu Property Company, Ltd. | | 164,000 | | 34,456 |
| | |
|
| | | | | 14,334,815 |
| Hungary - 0.09% | | | | |
| Magyar Telekom Telecommunications PLC | | 18,477 | | 51,804 |
| MOL Magyar Olaj & Gazipari | | 1,036 | | 125,311 |
| OTP Bank (L) | | 7,382 | | 220,370 |
| Richter Gedeon | | 323 | | 62,412 |
| | |
|
| | | | | 459,897 |
| India - 1.49% | | | | |
| Dr. Reddy’s Laboratories, Ltd., ADR (L) | | 11,916 | | 405,740 |
| Grasim Industries, Ltd., ADR (L) | | 2,144 | | 106,816 |
| ICICI Bank, Ltd., SADR | | 26,706 | | 1,157,972 |
| Infosys Technologies, Ltd., ADR (L) | | 32,784 | | 2,186,693 |
| Larsen & Toubro, Ltd. | | 11,995 | | 406,870 |
| Larsen & Toubro, Ltd., GDR | | 2,732 | | 92,221 |
| Ranbaxy Laboratories, Ltd., ADR (I) | | 12,742 | | 119,647 |
| Reliance Communication, Ltd., GDR | | 34,017 | | 64,442 |
| Reliance Industries, Ltd., GDR (L) | | 34,268 | | 1,459,474 |
| Reliance Infrastructure, Ltd., GDR (S)(L) | | 447 | | 18,066 |
| Reliance Natural Resources, Ltd., ADR (I)(L) | | 8,956 | | 10,915 |
| Satyam Computer Services, Ltd., ADR (I)(L) | | 19,591 | | 53,875 |
| State Bank of India, GDR | | 2,697 | | 318,516 |
| Tata Communications, Ltd., ADR (I)(L) | | 2,096 | | 18,864 |
| Tata Motors, Ltd., SADR | | 13,084 | | 322,128 |
| Ultratech Cement, Ltd., GDR (L) | | 612 | | 25,170 |
| Wipro, Ltd., ADR (L) | | 36,394 | | 478,945 |
| | |
|
| | | | | 7,246,354 |
| | | | |
| International Equity Index Fund (continued) |
| | | Shares or | | |
| | | Principal | | |
| | | Amount | | Value |
| | |
|
| |
| COMMON STOCKS (continued) | | | | |
| Indonesia - 0.52% | | | | |
| Adaro Energy Tbk PT | | 310,500 | $ | 86,815 |
| Aneka Tambang Tbk PT | | 82,500 | | 20,626 |
| Astra Agro Lestari Tbk PT | | 10,000 | | 24,834 |
| Astra International Tbk PT | | 58,000 | | 344,501 |
| Bank Central Asia Tbk PT | | 361,000 | | 258,314 |
| Bank Danamon Indonesia Tbk PT | | 76,926 | | 55,888 |
| Bank Mandiri Tbk PT | | 195,588 | | 128,834 |
| Bank Negara Indonesia Persero Tbk PT (I) | | 246,698 | | 99,474 |
| Bank Pan Indonesia Tbk PT (I) | | 25,750 | | 3,506 |
| Bank Rakyat Indonesia Tbk PT | | 333,500 | | 178,836 |
| Bumi Resources Tbk PT | | 530,500 | | 181,697 |
| Gudang Garam Tbk PT | | 17,500 | | 72,696 |
| Indo Tambangraya Megah PT | | 14,000 | | 72,940 |
| Indocement Tunggal Prakarsa Tbk PT | | 38,500 | | 62,948 |
| Indofood Sukses Makmur Tbk PT | | 130,500 | | 70,578 |
| Indosat Tbk PT | | 45,500 | | 26,080 |
| International Nickel Indonesia Tbk PT | | 91,500 | | 52,732 |
| Kalbe Farma Tbk PT | | 176,500 | | 58,650 |
| Perusahaan Gas Negara Tbk PT | | 334,500 | | 135,274 |
| PT Telekomunikiasi Indonesia Tbk PT, SADR | | 1,909 | | 65,269 |
| Semen Gresik Persero Tbk PT | | 98,000 | | 96,206 |
| Tambang Batubara Bukit Asam Tbk PT | | 21,000 | | 47,975 |
| Telekomunikasi Indonesia Tbk PT | | 225,000 | | 190,894 |
| Unilever Indonesia Tbk PT | | 40,000 | | 73,518 |
| United Tractors Tbk PT | | 38,833 | | 102,366 |
| | |
|
| | | | | 2,511,451 |
| Ireland - 0.33% | | | | |
| Allied Irish Banks PLC - London Exchange (I) | | 1,000 | | 366 |
| Anglo Irish Bank Corp. PLC (I) | | 29,183 | | 0 |
| Bank of Ireland (I) | | 125,223 | | 61,111 |
| C&C Group PLC | | 193 | | 942 |
| CRH PLC | | 19,078 | | 441,225 |
| Elan Corp. PLC (I) | | 11,458 | | 73,776 |
| Elan Corp. PLC - Euro Comp Exchange (I) | | 3,097 | | 20,245 |
| Experian PLC | | 27,973 | | 354,651 |
| Greencore Group PLC | | 32 | | 52 |
| Kerry Group PLC | | 4,082 | | 148,342 |
| Ryanair Holdings PLC, SADR (L) | | 1,496 | | 42,666 |
| Shire PLC | | 15,481 | | 438,316 |
| | |
|
| | | | | 1,581,692 |
| Israel - 0.49% | | | | |
| Alvarion, Ltd., ADR (I) | | 649 | | 1,272 |
| Bank Hapoalim, Ltd. (I) | | 28,604 | | 130,384 |
| Bank Leumi Le-Israel, Ltd. | | 33,482 | | 154,975 |
| Bezek Israeli Telecommunications Corp., Ltd. | | 50,097 | | 136,341 |
| Cellcom Israel, Ltd. | | 1,770 | | 54,471 |
| Delek Group, Ltd. | | 167 | | 39,863 |
| Elbit Systems, Ltd. | | 841 | | 42,920 |
| Israel Chemicals, Ltd. | | 12,111 | | 201,345 |
| Israel Corp., Ltd. (I) | | 74 | | 87,857 |
| Israel Discount Bank, Ltd. (I) | | 27,078 | | 54,832 |
| Makhteshim-Agan Industries, Ltd. (I) | | 5,987 | | 29,881 |
| Mizrahi Tefahot Bank, Ltd. | | 4,548 | | 46,294 |
| Nice Systems, Ltd. (I) | | 2,100 | | 72,608 |
| Partner Communications Company, Ltd. (I) | | 3,012 | | 56,154 |
| Teva Pharmaceutical Industries, Ltd. | | 25,214 | | 1,264,736 |
| | |
|
| | | | | 2,373,933 |
| Italy - 1.88% | | | | |
| A2A SpA | | 38,352 | | 61,382 |
| Assicurazioni Generali SpA | | 32,579 | | 737,242 |
| Autogrill SpA (I) | | 4,018 | | 56,820 |
| Autostrade SpA | | 6,902 | | 158,091 |
| Banca Carige SpA | | 21,380 | | 51,558 |
| |
| The accompanying notes are an integral part of the financial statements. | 111 |
John Hancock Funds II
Portfolio of Investments — February 28, 2011 (Unaudited) (showing percentage of total net assets)
| | | | |
| International Equity Index Fund (continued) |
| | | Shares or | | |
| | | Principal | | |
| | | Amount | | Value |
| | |
|
| |
| COMMON STOCKS (continued) | | | | |
| Italy (continued) | | | | |
| Banca Intesa SpA (I) | | 30,190 | $ | 88,377 |
| Banca Monte dei Paschi di Siena SpA (I)(L) | | 70,057 | | 93,362 |
| Banche Popolari Unite SpA | | 17,340 | | 175,131 |
| Banco Popolare Societa Cooperativa | | 47,781 | | 166,743 |
| BGP Holdings PLC (I) | | 181,302 | | 0 |
| Enel Green Power SpA (I) | | 45,681 | | 107,925 |
| Enel SpA (I) | | 182,388 | | 1,086,729 |
| Eni SpA | | 71,689 | | 1,749,428 |
| Exor SpA | | 2,143 | | 65,362 |
| Fiat Industrial SpA (I) | | 21,644 | | 302,260 |
| Fiat SpA | | 21,920 | | 203,796 |
| Finmeccanica SpA | | 11,777 | | 147,397 |
| Intesa Sanpaolo SpA | | 214,841 | | 725,251 |
| Luxottica Group SpA | | 3,512 | | 109,127 |
| Mediaset SpA | | 20,822 | | 133,850 |
| Mediobanca SpA | | 14,209 | | 150,359 |
| Parmalat SpA | | 50,497 | | 154,680 |
| Pirelli & Company SpA (I) | | 7,916 | | 63,781 |
| Prelios SpA (I) | | 4,987 | | 3,735 |
| Prysmian SpA | | 6,244 | | 131,811 |
| Saipem SpA | | 7,368 | | 372,597 |
| Snam Rete Gas SpA | | 40,381 | | 220,880 |
| Telecom Italia SpA | | 261,175 | | 407,925 |
| Telecom Italia SpA | | 175,281 | | 231,920 |
| Terna Rete Elettrica Nazionale SpA (I) | | 39,169 | | 180,628 |
| UniCredit Italiano SpA | | 374,158 | | 962,872 |
| | |
|
| | | | | 9,101,019 |
| Japan - 14.27% | | | | |
| ABC-MART, Inc. (I) | | 700 | | 27,939 |
| Advantest Corp. | | 4,200 | | 87,461 |
| AEON Company, Ltd. (L) | | 15,300 | | 193,085 |
| AEON Credit Service Company, Ltd. | | 1,600 | | 24,427 |
| Aeon Mall Company, Ltd. | | 1,700 | | 45,359 |
| Air Water, Inc. | | 3,000 | | 39,771 |
| Aisin Seiki Company, Ltd. | | 4,800 | | 183,400 |
| Ajinomoto Company, Inc. | | 19,000 | | 218,603 |
| Alfresa Holdings Corp. | | 800 | | 31,068 |
| All Nippon Airways Company, Ltd. (I) | | 20,000 | | 72,283 |
| Amada Company, Ltd. | | 9,000 | | 80,844 |
| Aozora Bank, Ltd. (L) | | 13,000 | | 29,296 |
| Asahi Breweries, Ltd. | | 10,200 | | 197,229 |
| Asahi Glass Company, Ltd. | | 28,000 | | 391,073 |
| Asahi Kasei Corp. | | 36,000 | | 248,969 |
| Asics Corp. | | 4,000 | | 53,683 |
| Astellas Pharma, Inc. | | 12,100 | | 475,195 |
| Bank of Kyoto, Ltd. | | 7,000 | | 67,437 |
| Bank of Yokohama, Ltd. | | 32,000 | | 172,711 |
| Benesse Holdings, Inc. | | 1,800 | | 81,851 |
| Bridgestone Corp. | | 17,100 | | 352,878 |
| Brother Industries, Ltd. | | 6,000 | | 94,796 |
| Canon Sales Company, Inc. | | 1,800 | | 25,237 |
| Canon, Inc. | | 31,300 | | 1,513,812 |
| Casio Computer Company, Ltd. | | 6,300 | | 55,856 |
| Central Japan Railway Company, Ltd. | | 42 | | 376,085 |
| Chiba Bank, Ltd. (I) | | 18,000 | | 123,366 |
| Chiyoda Corp. | | 4,000 | | 36,096 |
| Chubu Electric Power Company, Inc. | | 17,800 | | 469,685 |
| Chugai Pharmaceutical Company, Ltd. | | 6,800 | | 130,820 |
| Chugoku Bank, Ltd. | | 4,000 | | 48,055 |
| Chugoku Electric Power Company, Inc. | | 7,600 | | 162,880 |
| Chuo Mitsui Trust Holdings, Inc. | | 23,000 | | 98,213 |
| Citizen Watch Company, Ltd. | | 7,400 | | 47,870 |
| Coca-Cola West Japan Company, Ltd. | | 900 | | 16,639 |
| Cosmo Oil Company, Ltd. | | 11,000 | | 39,923 |
| | | | |
| International Equity Index Fund (continued) |
| | | Shares or | | |
| | | Principal | | |
| | | Amount | | Value |
| | |
|
| |
| COMMON STOCKS (continued) | | | | |
| Japan (continued) | | | | |
| Credit Saison Company, Ltd. | | 4,000 | $ | 78,505 |
| Dai Nippon Printing Company, Ltd. | | 15,000 | | 202,604 |
| Daicel Chemical Industries, Ltd. | | 7,000 | | 48,048 |
| Daido Steel Company, Ltd. | | 7,000 | | 46,907 |
| Daihatsu Motor Company, Ltd. | | 6,000 | | 94,786 |
| Daiichi Sankyo Company, Ltd. | | 18,700 | | 401,319 |
| Daikin Industries, Ltd. | | 6,900 | | 234,319 |
| Dainippon Sumitomo Pharma Company, Ltd. | | 3,700 | | 36,163 |
| Daito Trust Construction Company, Ltd. | | 2,000 | | 163,908 |
| Daiwa House Industry Company, Ltd. | | 12,000 | | 154,681 |
| Daiwa Securities Group, Inc. | | 47,000 | | 253,910 |
| Dena Company, Ltd. | | 2,100 | | 81,076 |
| Denki Kagaku Kogyo Kabushiki Kaisha | | 12,000 | | 64,484 |
| Denso Corp. | | 13,400 | | 502,201 |
| Dentsu, Inc. | | 4,400 | | 140,743 |
| Dowa Holdings Company, Ltd. | | 7,000 | | 49,379 |
| East Japan Railway Company | | 9,500 | | 661,785 |
| Eisai Company, Ltd. (L) | | 6,600 | | 246,921 |
| Electric Power Development Company, Ltd. | | 3,000 | | 94,721 |
| Elpida Memory, Inc. (I)(L) | | 4,800 | | 72,296 |
| FamilyMart Company, Ltd. | | 1,300 | | 49,207 |
| Fanuc, Ltd. | | 5,200 | | 809,414 |
| Fast Retailing Company, Ltd. | | 1,500 | | 235,414 |
| Fuji Electric Holdings Company, Ltd. | | 15,000 | | 50,826 |
| Fuji Heavy Industries, Ltd. | | 14,000 | | 120,645 |
| Fuji Television Network, Inc. | | 11 | | 18,588 |
| FUJIFILM Holdings Corp. | | 12,100 | | 425,611 |
| Fujitsu, Ltd. | | 52,000 | | 351,897 |
| Fukuoka Financial Group, Inc. | | 19,000 | | 86,273 |
| Furukawa Electric Company, Ltd. | | 16,000 | | 68,179 |
| Gree, Inc. | | 3,500 | | 57,109 |
| GS Yuasa Corp. (L) | | 9,000 | | 65,033 |
| Gunma Bank | | 9,000 | | 55,708 |
| Hakuhodo DY Holdings, Inc. | | 650 | | 41,291 |
| Hamamatsu Photonics KK | | 2,100 | | 80,856 |
| Hankyu Hanshin Holdings, Inc. (I) | | 33,200 | | 160,218 |
| Hino Motors, Ltd. | | 6,000 | | 33,257 |
| Hirose Electric Company, Ltd. | | 1,000 | | 114,654 |
| Hisamitsu Pharmaceutical Company, Inc. | | 1,500 | | 60,591 |
| Hitachi Chemical, Ltd. | | 2,800 | | 65,089 |
| Hitachi Construction | | | | |
| Machinery Company, Ltd. (I) | | 2,700 | | 67,646 |
| Hitachi High-Technologies Corp. | | 2,500 | | 58,285 |
| Hitachi Metals, Ltd. | | 6,000 | | 82,101 |
| Hitachi, Ltd. | | 122,000 | | 740,652 |
| Hokkaido Electric Power Company, Inc. | | 4,300 | | 92,280 |
| Hokuhoku Financial Group, Inc. | | 29,000 | | 66,797 |
| Hokuriku Electric Power Company | | 5,400 | | 136,053 |
| Honda Motor Company, Ltd. | | 44,100 | | 1,922,812 |
| Hoya Corp. | | 11,200 | | 268,054 |
| Ibiden Company, Ltd. | | 3,900 | | 134,897 |
| Idemitsu Kosan Company, Ltd. | | 500 | | 59,180 |
| Inpex Corp. | | 56 | | 393,787 |
| Isetan Mitsukoshi Holdings, Ltd. | | 9,840 | | 119,088 |
| Ishikawajima-Harima Heavy | | | | |
| Industries Company, Ltd. | | 33,000 | | 86,653 |
| Isuzu Motors, Ltd. | | 35,000 | | 157,716 |
| ITO EN, Ltd. | | 900 | | 15,970 |
| Itochu Corp. | | 41,300 | | 428,975 |
| Itochu Techno-Science Corp. | | 800 | | 28,317 |
| Iyo Bank, Ltd. | | 6,000 | | 56,473 |
| J Front Retailing Company, Ltd. | | 12,000 | | 62,705 |
| Japan Petroleum Exploration Company, Ltd. | | 800 | | 39,280 |
| Japan Prime Realty Investment Corp. | | 23 | | 64,098 |
| Japan Real Estate Investment Corp. | | 13 | | 133,891 |
| |
| The accompanying notes are an integral part of the financial statements. | 112 |
John Hancock Funds II
Portfolio of Investments — February 28, 2011 (Unaudited) (showing percentage of total net assets)
| | | | |
| International Equity Index Fund (continued) |
| | | Shares or | | |
| | | Principal | | |
| | | Amount | | Value |
| | |
|
| |
| COMMON STOCKS (continued) | | | | |
| Japan (continued) | | | | |
| Japan Retail Fund Investment Corp. | | 35 | $ | 60,170 |
| Japan Tobacco, Inc. | | 127 | | 528,177 |
| JFE Holdings, Inc. | | 12,100 | | 382,247 |
| JGC Corp. | | 5,000 | | 113,416 |
| Joyo Bank, Ltd. | | 16,000 | | 75,310 |
| JS Group Corp. | | 7,300 | | 177,807 |
| JSR Corp. | | 4,700 | | 100,951 |
| Jupiter Telecommunications Company, Ltd. | | 57 | | 61,360 |
| JX Holdings, Inc. | | 59,100 | | 415,587 |
| Kajima Corp. | | 20,000 | | 53,575 |
| Kamigumi Company, Ltd. | | 7,000 | | 61,672 |
| Kaneka Corp. | | 8,000 | | 58,864 |
| Kansai Electric Power Company, Ltd. | | 20,800 | | 546,035 |
| Kansai Paint Company, Ltd. | | 6,000 | | 57,163 |
| Kao Corp. | | 14,800 | | 399,065 |
| Kawasaki Heavy Industries, Ltd. | | 37,000 | | 149,501 |
| Kawasaki Kisen Kaisha, Ltd. | | 15,000 | | 65,526 |
| KDDI Corp. | | 82 | | 532,305 |
| Keihin Electric Express | | | | |
| Railway Company, Ltd. | | 12,000 | | 99,105 |
| Keio Corp. | | 14,000 | | 93,568 |
| Keisei Electric Railway Company, Ltd. | | 7,000 | | 49,493 |
| Keyence Corp. | | 1,100 | | 300,025 |
| Kikkoman Corp. | | 4,000 | | 44,082 |
| Kinden Corp. | | 4,000 | | 36,281 |
| Kintetsu Corp. (L) | | 44,000 | | 139,089 |
| Kirin Holdings Company, Ltd. | | 22,000 | | 315,735 |
| Kobe Steel Company, Ltd. | | 66,000 | | 180,742 |
| Koito Manufacturing Company, Ltd. | | 2,000 | | 36,093 |
| Komatsu, Ltd. | | 25,600 | | 784,219 |
| Konami Corp. | | 1,700 | | 36,165 |
| Konica Minolta Holdings, Inc. | | 14,000 | | 128,938 |
| Koyo Seiko Company, Ltd. | | 5,300 | | 78,234 |
| Kubota Corp. | | 30,000 | | 309,193 |
| Kuraray Company, Ltd. | | 8,900 | | 125,854 |
| Kurita Water Industries, Ltd. | | 2,800 | | 79,535 |
| Kyocera Corp. | | 4,400 | | 457,985 |
| Kyowa Hakko Kogyo Company, Ltd. | | 6,737 | | 68,799 |
| Kyushu Electric Power Company, Inc. | | 10,000 | | 232,259 |
| Lawson, Inc. | | 1,600 | | 78,825 |
| Mabuchi Motor Company, Ltd. | | 700 | | 35,060 |
| Makita Corp. | | 2,900 | | 122,653 |
| Marubeni Corp. | | 46,000 | | 352,958 |
| Marui Company, Ltd. | | 4,100 | | 36,843 |
| Maruichi Steel Tube, Ltd. | | 1,900 | | 44,026 |
| Matsui Securities Company, Ltd. | | 2,100 | | 15,015 |
| Matsushita Electric Industrial Company, Ltd. | | 52,700 | | 711,781 |
| Mazda Motor Corp. | | 40,000 | | 103,155 |
| McDonald’s Holdings Company, Ltd. | | 1,900 | | 46,616 |
| Mediceo Holdings Company, Ltd. | | 3,700 | | 35,188 |
| MEIJI Holdings Company, Ltd. | | 1,700 | | 80,036 |
| Minebea Company, Ltd. | | 10,000 | | 59,317 |
| Miraca Holdings, Inc. | | 1,800 | | 69,640 |
| Mitsubishi Chemical Holdings Corp. | | 36,500 | | 267,316 |
| Mitsubishi Corp. | | 36,400 | | 1,010,285 |
| Mitsubishi Electric Corp. | | 53,000 | | 628,373 |
| Mitsubishi Estate Company, Ltd. | | 32,000 | | 655,156 |
| Mitsubishi Gas & Chemicals Company, Inc. | | 9,000 | | 69,688 |
| Mitsubishi Heavy Industries, Ltd. | | 85,000 | | 362,123 |
| Mitsubishi Logistics Corp. | | 3,000 | | 39,929 |
| Mitsubishi Materials Corp. (I) | | 35,000 | | 135,719 |
| Mitsubishi Motors Corp. (I) | | 98,000 | | 139,425 |
| Mitsubishi UFJ Financial Group | | 344,700 | | 1,916,105 |
| Mitsubishi UFJ Lease & | | | | |
| Finance Company, Ltd. | | 1,190 | | 52,908 |
| | | | |
| International Equity Index Fund (continued) |
| | | Shares or | | |
| | | Principal | | |
| | | Amount | | Value |
| | |
|
| |
| COMMON STOCKS (continued) | | | | |
| Japan (continued) | | | | |
| Mitsui & Company, Ltd. | | 47,200 | $ | 861,389 |
| Mitsui Chemicals, Inc. | | 22,000 | | 82,332 |
| Mitsui Engineering & | | | | |
| Shipbuilding Company, Ltd. | | 19,000 | | 52,405 |
| Mitsui Fudosan Company, Ltd. | | 22,000 | | 468,363 |
| Mitsui Mining & Smelting Company, Ltd. | | 13,000 | | 51,614 |
| Mitsui O.S.K. Lines, Ltd. | | 30,000 | | 199,192 |
| Mitsui Sumitomo Insurance Group Holdings | | 14,200 | | 374,145 |
| Mitsumi Electric Company, Ltd. | | 1,900 | | 31,561 |
| Mizuho Financial Group, Inc. | | 552,300 | | 1,138,722 |
| Mizuho Trust & Banking Company, Ltd. (I) | | 27,000 | | 29,463 |
| Murata Manufacturing Company, Ltd. | | 5,300 | | 395,453 |
| Nabtesco Corp. | | 3,200 | | 76,090 |
| Namco Bandai Holdings, Inc. | | 5,100 | | 60,321 |
| NEC Corp. | | 77,000 | | 212,622 |
| NGK INSULATORS, Ltd. | | 7,000 | | 127,783 |
| NGK Spark Plug Company, Ltd. | | 5,000 | | 74,811 |
| NHK Spring Company, Ltd. | | 3,000 | | 35,184 |
| Nidec Corp. | | 2,800 | | 260,892 |
| Nikon Corp. | | 8,500 | | 199,991 |
| Nintendo Company, Ltd. | | 2,700 | | 792,821 |
| Nippon Building Fund, Inc. | | 16 | | 167,886 |
| Nippon Electric Glass Company, Ltd. | | 9,000 | | 150,520 |
| Nippon Express Company, Ltd. | | 19,000 | | 82,025 |
| Nippon Meat Packers, Inc. | | 4,000 | | 56,117 |
| Nippon Paper Group, Inc. | | 2,100 | | 57,703 |
| Nippon Sheet Glass Company, Ltd. | | 29,000 | | 83,339 |
| Nippon Steel Corp. | | 140,000 | | 508,917 |
| Nippon Telegraph & Telephone Corp. | | 14,200 | | 694,571 |
| Nippon Yusen Kabushiki Kaisha | | 40,000 | | 176,570 |
| Nishi-Nippon City Bank, Ltd. | | 17,000 | | 56,940 |
| Nissan Chemical Industries, Ltd. | | 4,000 | | 46,585 |
| Nissan Motor Company, Ltd. | | 67,000 | | 687,145 |
| Nisshin Seifun Group, Inc. | | 4,500 | | 59,249 |
| Nisshin Steel Company | | 11,000 | | 24,728 |
| Nisshinbo Holdings, Inc. | | 3,000 | | 32,914 |
| Nissin Food Products Company, Ltd. | | 1,700 | | 61,020 |
| Nitori Company, Ltd. | | 900 | | 79,695 |
| Nitto Denko Corp. | | 4,300 | | 259,923 |
| NKSJ Holdings, Inc. (I) | | 37,000 | | 280,037 |
| NOK Corp. | | 2,500 | | 49,704 |
| Nomura Holdings, Inc. | | 95,300 | | 606,575 |
| Nomura Real Estate Holdings, Inc. | | 2,400 | | 48,761 |
| Nomura Real Estate Office Fund, Inc. | | 6 | | 40,750 |
| Nomura Research Institute, Ltd. | | 2,400 | | 56,321 |
| NSK, Ltd. | | 11,000 | | 105,137 |
| NTN Corp. | | 12,000 | | 64,565 |
| NTT Data Corp. | | 33 | | 117,648 |
| NTT DoCoMo, Inc. | | 412 | | 774,253 |
| NTT Urban Development Corp. | | 31 | | 32,301 |
| Obayashi Corp. | | 15,000 | | 67,293 |
| OBIC Company, Ltd. | | 130 | | 26,174 |
| Odakyu Electric Railway Company, Ltd. | | 19,000 | | 177,026 |
| Oji Paper Company, Ltd. | | 20,000 | | 99,531 |
| Olympus Corp. | | 5,700 | | 167,122 |
| Omron Corp. | | 5,200 | | 144,678 |
| Ono Pharmaceutical Company, Ltd. | | 2,000 | | 104,642 |
| Oracle Corp. | | 1,000 | | 47,210 |
| Oriental Land Company, Ltd. | | 1,300 | | 130,127 |
| ORIX Corp. | | 2,920 | | 328,047 |
| Osaka Gas Company, Ltd. | | 56,000 | | 213,028 |
| Otsuka Corp. | | 400 | | 28,024 |
| Otsuka Holdings Company, Ltd. (I) | | 7,000 | | 175,576 |
| Rakuten, Inc. | | 211 | | 187,795 |
| Resona Holdings, Inc. | | 52,400 | | 286,220 |
| |
| The accompanying notes are an integral part of the financial statements. | 113 |
John Hancock Funds II
Portfolio of Investments — February 28, 2011 (Unaudited) (showing percentage of total net assets)
| | | | |
| International Equity Index Fund (continued) |
| | | Shares or | | |
| | | Principal | | |
| | | Amount | | Value |
| | |
|
| |
| COMMON STOCKS (continued) | | | | |
| Japan (continued) | | | | |
| Ricoh Company, Ltd. | | 18,000 | $ | 238,210 |
| Rinnai Corp. | | 1,000 | | 61,351 |
| Rohm Company, Ltd. | | 2,600 | | 183,680 |
| Sankyo Company, Ltd. | | 1,200 | | 68,064 |
| Santen Pharmaceutical Company, Ltd. | | 1,900 | | 74,295 |
| Sapporo Hokuyo Holdings, Inc. | | 8,200 | | 42,841 |
| Sapporo Holdings, Ltd. | | 7,000 | | 31,729 |
| SBI Holdings, Inc. | | 446 | | 70,762 |
| Secom Company, Ltd. | | 6,100 | | 307,758 |
| Sega Sammy Holdings, Inc. | | 4,700 | | 107,165 |
| Seiko Epson Corp. | | 3,400 | | 57,034 |
| Sekisui Chemical Company, Ltd. | | 11,000 | | 86,782 |
| Sekisui House, Ltd. | | 15,000 | | 155,384 |
| Senshu Ikeda Holdings, Inc. (I) | | 16,000 | | 25,304 |
| Seven & I Holdings Company, Ltd. | | 21,200 | | 591,475 |
| Seven Bank, Ltd. | | 9 | | 19,240 |
| Sharp Corp. (L) | | 26,000 | | 282,585 |
| Shikoku Electric Power Company, Inc. | | 4,300 | | 130,096 |
| Shimadzu Corp. | | 5,000 | | 44,429 |
| Shimamura Company, Ltd. | | 600 | | 58,036 |
| Shimano, Inc. | | 1,600 | | 79,639 |
| Shimizu Corp. | | 16,000 | | 68,660 |
| Shin-Etsu Chemical Company, Ltd. | | 11,100 | | 639,614 |
| Shinko Electric Industries Company, Ltd. (I) | | 1,600 | | 18,625 |
| Shinko Securities Company, Ltd. | | 14,000 | | 43,192 |
| Shinsei Bank, Ltd. (I)(L) | | 19,000 | | 24,295 |
| Shionogi & Company, Ltd. | | 8,700 | | 165,183 |
| Shiseido Company, Ltd. | | 8,800 | | 179,266 |
| Shizuoka Bank, Ltd. (I) | | 18,000 | | 169,635 |
| Showa Denko KK | | 34,000 | | 74,699 |
| Showa Shell Sekiyu KK | | 4,600 | | 41,698 |
| SMC Corp. | | 1,400 | | 239,692 |
| Softbank Corp. | | 22,100 | | 909,615 |
| Sojitz Holdings Corp. | | 40,000 | | 90,171 |
| Sony Corp. | | 27,900 | | 1,025,163 |
| Sony Financial Holdings, Inc. | | 21 | | 89,453 |
| Square Enix Company, Ltd. | | 1,800 | | 33,514 |
| Stanley Electric Company, Ltd. | | 3,100 | | 57,051 |
| Sumco Corp. (I) | | 2,900 | | 53,030 |
| Sumitomo Chemical Company, Ltd. | | 41,000 | | 221,365 |
| Sumitomo Corp. | | 29,600 | | 439,273 |
| Sumitomo Electric Industries, Ltd. | | 19,800 | | 290,575 |
| Sumitomo Heavy Industries, Ltd. | | 14,000 | | 98,504 |
| Sumitomo Metal Industries, Ltd. | | 86,000 | | 218,435 |
| Sumitomo Metal Mining Company, Ltd. | | 15,000 | | 284,147 |
| Sumitomo Mitsui Financial Group | | 37,100 | | 1,404,271 |
| Sumitomo Realty & | | | | |
| Development Company, Ltd. | | 10,000 | | 268,807 |
| Sumitomo Rubber Industries, Inc. | | 3,600 | | 39,085 |
| Suruga Bank, Ltd. | | 5,000 | | 49,900 |
| Suzuken Company, Ltd. | | 1,500 | | 42,847 |
| Suzuki Motor Corp. | | 8,800 | | 208,652 |
| Sysmex Corp. | | 800 | | 51,921 |
| T&D Holdings, Inc. | | 7,100 | | 206,450 |
| Taisei Corp. | | 25,000 | | 59,153 |
| Taisho Pharmaceuticals Company, Ltd. | | 3,000 | | 65,663 |
| Taiyo Nippon Sanso Corp. | | 9,000 | | 80,473 |
| Takashimaya Company, Ltd. | | 6,000 | | 49,304 |
| Takeda Pharmaceutical Company, Ltd. | | 20,300 | | 1,010,122 |
| Tanabe Seiyaku Company, Ltd. | | 7,000 | | 118,758 |
| TDK Corp. | | 3,500 | | 236,081 |
| Teijin, Ltd. | | 28,000 | | 135,678 |
| Terumo Corp. | | 4,400 | | 241,340 |
| The 77th Bank, Ltd. | | 9,000 | | 56,812 |
| The Dai-ichi Life Insurance Company, Ltd. (I) | | 212 | | 382,712 |
| | | | |
| International Equity Index Fund (continued) |
| | | Shares or | | |
| | | Principal | | |
| | | Amount | | Value |
| | |
|
| |
| COMMON STOCKS (continued) | | | | |
| Japan (continued) | | | | |
| The Hachijuni Bank, Ltd. | | 10,000 | $ | 63,477 |
| The Hiroshima Bank, Ltd. | | 13,000 | | 59,441 |
| The Japan Steel Works, Ltd. | | 8,000 | | 83,721 |
| The Sumitomo Trust & | | | | |
| Banking Company, Ltd. | | 37,000 | | 235,583 |
| The Tokyo Electric Power Company, Inc. | | 38,500 | | 995,942 |
| THK Company, Ltd. | | 3,000 | | 79,389 |
| Tobu Railway Company, Ltd. (L) | | 21,000 | | 102,394 |
| Toho Company, Ltd. | | 2,200 | | 35,757 |
| Toho Gas Company, Ltd. | | 10,000 | | 53,712 |
| Tohoku Electric Power Company, Inc. | | 11,200 | | 260,716 |
| Tokio Marine Holdings, Inc. | | 19,500 | | 640,753 |
| Tokuyama Corp. | | 7,000 | | 36,971 |
| Tokyo Electron, Ltd. | | 4,500 | | 295,387 |
| Tokyo Gas Company, Ltd. | | 73,000 | | 326,066 |
| Tokyo Steel Manufacturing Company, Ltd. | | 2,400 | | 26,783 |
| Tokyo Tatemono Company, Ltd. | | 7,000 | | 32,997 |
| Tokyu Corp. | | 31,000 | | 143,839 |
| Tokyu Land Corp. | | 10,000 | | 57,432 |
| TonenGeneral Sekiyu KK | | 9,000 | | 106,123 |
| Toppan Printing Company, Ltd. | | 15,000 | | 137,823 |
| Toray Industries, Inc. | | 42,000 | | 318,677 |
| Toshiba Corp. | | 109,000 | | 714,887 |
| Tosoh Corp. | | 12,000 | | 43,016 |
| Toto, Ltd. | | 7,000 | | 58,564 |
| Toyo Seikan Kaisha, Ltd. | | 3,900 | | 71,783 |
| Toyo Suisan Kaisha, Ltd. | | 2,000 | | 45,338 |
| Toyoda Gosei Company, Ltd. | | 1,600 | | 37,614 |
| Toyota Boshoku Corp. | | 1,800 | | 29,995 |
| Toyota Industries Corp. | | 4,500 | | 155,724 |
| Toyota Motor Corp. | | 75,600 | | 3,526,873 |
| Toyota Tsusho Corp. | | 5,200 | | 98,818 |
| Trend Micro, Inc. | | 2,400 | | 74,612 |
| Tsumura & Company, Ltd. | | 1,300 | | 42,193 |
| Ube Industries, Ltd. | | 22,000 | | 71,297 |
| Unicharm Corp. | | 3,000 | | 116,169 |
| UNY Company, Ltd. | | 3,500 | | 34,938 |
| Ushio, Inc. | | 2,900 | | 59,699 |
| USS Company, Ltd. | | 570 | | 46,146 |
| West Japan Railway Company, Ltd. | | 45 | | 186,626 |
| Yahoo! Japan Corp. | | 384 | | 144,714 |
| Yakult Honsha Company, Ltd. | | 2,400 | | 67,820 |
| Yamada Denki Company, Ltd. | | 2,170 | | 165,668 |
| Yamaguchi Financial Group, Inc. | | 6,000 | | 62,238 |
| Yamaha Corp. | | 3,400 | | 43,804 |
| Yamaha Motor Company, Ltd. (I) | | 6,900 | | 122,364 |
| Yamato Kogyo Company, Ltd. | | 1,200 | | 39,587 |
| Yamato Transport Company, Ltd. | | 10,500 | | 168,802 |
| Yamazaki Baking Company, Ltd. | | 3,000 | | 36,537 |
| Yaskawa Electric Corp. | | 6,000 | | 70,465 |
| Yokogawa Electric Corp. | | 7,600 | | 58,844 |
| | |
|
| | | | | 69,166,893 |
| Korea - 0.01% | | | | |
| Mando Corp. | | 360 | | 46,995 |
| Luxembourg - 0.32% | | | | |
| Aperamaperam | | 1,164 | | 48,132 |
| ArcelorMittal | | 23,285 | | 854,219 |
| Millicom International Cellular SA | | 1,914 | | 167,825 |
| SES SA | | 7,336 | | 188,859 |
| Tenaris SA | | 13,368 | | 302,842 |
| | |
|
| | | | | 1,561,877 |
| Malaysia - 0.65% | | | | |
| AirAsia BHD (I) | | 52,800 | | 43,667 |
| |
| The accompanying notes are an integral part of the financial statements. | 114 |
John Hancock Funds II
Portfolio of Investments — February 28, 2011 (Unaudited) (showing percentage of total net assets)
| | | | |
| International Equity Index Fund (continued) |
| | | Shares or | | |
| | | Principal | | |
| | | Amount | | Value |
| | |
|
| |
| COMMON STOCKS (continued) | | | | |
| Malaysia (continued) | | | | |
| Alliance Financial Group BHD | | 32,900 | $ | 33,821 |
| AMMB Holdings BHD (I) | | 54,500 | | 111,181 |
| Asiatic Development BHD | | 12,400 | | 32,225 |
| Axiata Group BHD (I) | | 63,125 | | 101,086 |
| Berjaya Corp. BHD | | 4,870 | | 639 |
| Berjaya Corp. BHD (Kuala Lumpur Exchange) | | 48,700 | | 16,688 |
| Berjaya Sports Toto BHD | | 14,035 | | 18,878 |
| British American Tobacco Malaysia BHD (I) | | 3,800 | | 59,863 |
| Bursa Malaysia BHD | | 7,600 | | 20,271 |
| Commerce Asset Holdings BHD (I) | | 107,800 | | 285,542 |
| Digi.Com BHD | | 10,400 | | 90,736 |
| Gamuda BHD (I) | | 49,500 | | 59,021 |
| Genting BHD | | 61,500 | | 202,304 |
| Hong Leong Bank BHD (I) | | 11,600 | | 35,387 |
| Hong Leong Credit BHD (I) | | 4,400 | | 12,538 |
| IJM Corp. BHD | | 35,460 | | 70,368 |
| IOI Corp. BHD | | 94,453 | | 170,657 |
| Kuala Lumpur Kepong BHD | | 13,400 | | 88,744 |
| Lafarge Malayan Cement BHD (I) | | 7,380 | | 17,783 |
| Malayan Banking BHD | | 83,726 | | 237,024 |
| Malaysian Airline System BHD (I) | | 14,400 | | 8,955 |
| Maxis BHD | | 70,800 | | 126,085 |
| MISC BHD (I) | | 27,280 | | 68,015 |
| MMC Corp. BHD (I) | | 44,200 | | 39,441 |
| Parkson Holdings BHD | | 19,075 | | 33,044 |
| Petronas Chemicals Group BHD (I) | | 61,000 | | 126,330 |
| Petronas Dagangan BHD (I) | | 5,200 | | 23,080 |
| Petronas Gas BHD | | 16,800 | | 62,167 |
| PLUS Expressways BHD (I) | | 35,400 | | 51,350 |
| PPB Group BHD (I) | | 9,300 | | 50,430 |
| Public Bank BHD | | 27,000 | | 115,810 |
| Resorts World BHD (I) | | 81,800 | | 89,100 |
| RHB Capital BHD | | 20,300 | | 52,326 |
| Sime Darby BHD | | 72,538 | | 213,045 |
| SP Setia BHD | | 15,150 | | 29,381 |
| Telekom Malaysia BHD | | 30,000 | | 38,775 |
| Tenaga Nasional BHD | | 74,975 | | 155,049 |
| UMW Holdings BHD (I) | | 23,600 | | 56,404 |
| YTL Corp. BHD | | 23,246 | | 54,165 |
| YTL Power International BHD | | 81,703 | | 60,851 |
| | |
|
| | | | | 3,162,226 |
| Mauritius - 0.02% | | | | |
| Essar Energy PLC (I) | | 10,162 | | 85,587 |
| Mexico - 1.05% | | | | |
| Alfa SAB de CV | | 10,600 | | 131,895 |
| America Movil SAB de CV, Series L | | 548,433 | | 1,573,814 |
| Cemex SAB de CV (I) | | 261,140 | | 234,546 |
| Coca-Cola Femsa SAB de CV, Series L | | 8,800 | | 64,423 |
| Compartamos Sab De CV (I) | | 33,200 | | 63,670 |
| Desarrolladora Homex SAB de CV (I) | | 8,400 | | 38,035 |
| Embotelladoras Arca SAB de CV | | 13,700 | | 74,644 |
| Fomento Economico Mexicano SA de CV | | 61,900 | | 348,001 |
| Grupo Aeroportuario del Pacifico SA | | | | |
| de CV, Series B | | 15,900 | | 60,276 |
| Grupo Bimbo SA de CV | | 11,000 | | 85,437 |
| Grupo Carso SAB de CV | | 18,283 | | 58,765 |
| Grupo Elektra SA de CV (I) | | 2,400 | | 100,333 |
| Grupo Financiero Banorte SAB de CV | | 47,640 | | 216,107 |
| Grupo Financiero Inbursa SA | | 25,633 | | 107,552 |
| Grupo Mexico SAB de CV, Series B | | 105,587 | | 402,369 |
| Grupo Modelo SA | | 19,300 | | 116,733 |
| Grupo Televisa SA (I) | | 67,400 | | 319,165 |
| Industrias Penoles SA de CV | | 3,400 | | 118,273 |
| Kimberly-Clark de Mexico SA de CV | | 17,100 | | 99,598 |
| | | | |
| International Equity Index Fund (continued) |
| | | Shares or | | |
| | | Principal | | |
| | | Amount | | Value |
| | |
|
| |
| COMMON STOCKS (continued) | | | | |
| Mexico (continued) | | | | |
| Mexichem SAB de CV | | 25,725 | $ | 92,655 |
| Minera Frisco SAB de CV, Class A1 (I) | | 18,283 | | 77,347 |
| Telefonos de Mexico SA de CV | | 164,300 | | 149,333 |
| Urbi Desarrollos Urbanos SAB de CV (I) | | 21,100 | | 46,550 |
| Wal-Mart de Mexico SA de CV, Series V | | 176,676 | | 506,269 |
| | |
|
| | | | | 5,085,790 |
| Netherlands - 1.76% | | | | |
| Aegon NV (I) | | 43,744 | | 336,474 |
| Akzo Nobel NV | | 6,462 | | 438,956 |
| ASML Holding NV | | 12,139 | | 526,598 |
| Corio NV | | 1,808 | | 119,874 |
| Delta Lloyd NV | | 3,271 | | 79,175 |
| Fugro NV | | 1,994 | | 167,928 |
| Heineken Holding NV | | 3,454 | | 158,839 |
| Heineken NV | | 7,394 | | 381,311 |
| ING Groep NV (I) | | 105,824 | | 1,327,087 |
| Koninklijke (Royal) KPN NV | | 44,261 | | 716,704 |
| Koninklijke Ahold NV | | 33,758 | | 453,277 |
| Koninklijke Boskalis Westinster NV | | 2,396 | | 124,560 |
| Koninklijke DSM NV | | 4,345 | | 255,395 |
| Koninklijke Philips Electronics NV | | 27,421 | | 894,961 |
| Koninklijke Vopak NV (I) | | 2,345 | | 113,504 |
| Randstad Holdings NV (I) | | 3,451 | | 185,913 |
| Reed Elsevier NV | | 19,777 | | 261,119 |
| SBM Offshore NV | | 6,096 | | 152,966 |
| TNT NV | | 10,541 | | 276,515 |
| Unilever NV (L) | | 44,998 | | 1,358,094 |
| Wolters Kluwer NV (I) | | 8,843 | | 208,876 |
| | |
|
| | | | | 8,538,126 |
| New Zealand - 0.07% | | | | |
| Auckland International Airport, Ltd. | | 28,867 | | 48,385 |
| Contact Energy, Ltd. (I) | | 11,108 | | 51,525 |
| Fletcher Building, Ltd. | | 18,268 | | 120,943 |
| Sky City Entertainment Group, Ltd. | | 13,600 | | 33,334 |
| Telecom Corp. of New Zealand, Ltd. | | 54,204 | | 85,227 |
| | |
|
| | | | | 339,414 |
| Norway - 0.52% | | | | |
| Aker Solutions ASA | | 5,023 | | 106,566 |
| DnB NOR ASA | | 26,977 | | 417,254 |
| Norsk Hydro ASA (L) | | 30,118 | | 248,485 |
| Orkla ASA | | 24,367 | | 222,234 |
| Renewable Energy Corp. ASA (I)(L) | | 18,178 | | 63,527 |
| Statoil ASA | | 30,340 | | 799,586 |
| Telenor ASA | | 22,600 | | 375,623 |
| Yara International ASA | | 5,400 | | 286,191 |
| | |
|
| | | | | 2,519,466 |
| Peru - 0.10% | | | | |
| Cia Minera Milpo SAA | | 4,000 | | 10,368 |
| Compania de Minas Buenaventura SA (I) | | 1,807 | | 82,729 |
| Compania de Minas Buenaventura SA, ADR | | 2,819 | | 131,563 |
| Credicorp SA | | 840 | | 84,622 |
| Credicorp, Ltd., ADR | | 1,352 | | 135,808 |
| Southern Peru Copper Corp. | | 1,346 | | 56,532 |
| | |
|
| | | | | 501,622 |
| Philippines - 0.13% | | | | |
| Aboitiz Power Corp. (I) | | 75,100 | | 49,983 |
| Alliance Global Group, Inc. | | 172,800 | | 45,511 |
| Ascendas Real Estate Investment Trust | | 46,000 | | 72,372 |
| Ayala Corp. | | 8,363 | | 63,667 |
| Ayala Land, Inc. | | 118,600 | | 39,056 |
| Banco De Oro | | 36,049 | | 38,957 |
| |
| The accompanying notes are an integral part of the financial statements. | 115 |
John Hancock Funds II
Portfolio of Investments — February 28, 2011 (Unaudited) (showing percentage of total net assets)
| | | | |
| International Equity Index Fund (continued) |
| | | Shares or | | |
| | | Principal | | |
| | | Amount | | Value |
| | |
|
| |
| COMMON STOCKS (continued) | | | | |
| Philippines (continued) | | | | |
| Bank of the Philippine Islands | | 51,988 | $ | 66,604 |
| Energy Development Corp. (I) | | 166,001 | | 21,442 |
| Globe Telecommunications, Inc. | | 690 | | 11,240 |
| Jollibee Foods Corp. | | 9,000 | | 14,112 |
| Manila Electric Company (I) | | 9,142 | | 48,721 |
| Metropolitan Bank & Trust Company | | 14,139 | | 18,713 |
| Philippine Long Distance Telephone Company | | 1,100 | | 54,556 |
| SM Investments Corp. | | 6,504 | | 69,015 |
| SM Prime Holdings, Ltd. | | 84,941 | | 19,722 |
| | |
|
| | | | | 633,671 |
| Poland - 0.39% | | | | |
| Asseco Poland SA PDA | | 2,196 | | 39,230 |
| Bank Handlowy w Warszawie SA | | 917 | | 29,883 |
| Bank Millennium SA (I) | | 2,548 | | 4,974 |
| Bank Pekao SA | | 2,870 | | 164,548 |
| Bank Zachodni WBK SA | | 404 | | 31,745 |
| Boryszew SA (I) | | 9,900 | | 6,937 |
| BRE Bank SA (I) | | 481 | | 52,104 |
| Cyfrowy Polsat SA | | 2,783 | | 15,236 |
| Enea SA | | 5,180 | | 39,548 |
| Getin Holding SA (I) | | 12,724 | | 58,090 |
| Globe Trade Centre SA (I) | | 4,447 | | 32,770 |
| Grupa Lotos SA (I) | | 2,585 | | 36,278 |
| ING Bank Slaski SA (I) | | 96 | | 28,567 |
| KGHM Polska Miedz SA | | 4,388 | | 269,152 |
| PBG SA | | 99 | | 6,835 |
| Polish Oil & Gas Company | | 57,728 | | 78,545 |
| Polska Grupa Energetyczna SA | | 18,649 | | 147,285 |
| Polski Koncern Naftowy Orlen SA (I) | | 10,694 | | 170,231 |
| Powszechna Kasa Oszczednosci | | | | |
| Bank Polski SA | | 18,217 | | 266,598 |
| Powszechny Zaklad Ubezpieczen SA | | 1,343 | | 162,715 |
| Sygnity SA (I) | | 160 | | 1,007 |
| Tauron Polska Energia SA (I) | | 33,395 | | 71,866 |
| Telekomunikacja Polska SA | | 20,599 | | 124,341 |
| TVN SA | | 6,487 | | 39,109 |
| | |
|
| | | | | 1,877,594 |
| Portugal - 0.18% | | | | |
| Banco Comercial dos Acores SA (L) | | 88,835 | | 79,297 |
| Banco Espirito Santo SA | | 14,371 | | 65,090 |
| Brisa Auto Estrada SA | | 3,494 | | 25,135 |
| Cimpor-Cimentos De Portugal SA | | 8,622 | | 59,713 |
| Electricidade de Portugal SA | | 53,067 | | 201,197 |
| Galp Energia SGPS SA | | 6,784 | | 141,101 |
| Jeronimo Martins SGPS SA | | 6,845 | | 109,743 |
| Portugal Telecom SGPS SA | | 16,918 | | 197,872 |
| | |
|
| | | | | 879,148 |
| Russia - 1.61% | | | | |
| Comstar United Telesystems, GDR (I) | | 1,827 | | 12,433 |
| Federal Grid Company Unified Energy System | | | | |
| JSC, GDR (I) | | 1,540 | | 10,010 |
| Gazprom Neft, SADR | | 1,417 | | 38,472 |
| Gazprom OAO, SADR | | 95,591 | | 2,802,727 |
| Gazprom OAO, SADR (London Exchange) | | 5,017 | | 147,921 |
| JSC MMC Norilsk Nickel, ADR (L) | | 32,800 | | 792,120 |
| Lukoil OAO, ADR | | 19,996 | | 1,423,515 |
| Mechel, SADR | | 3,503 | | 106,596 |
| Mobile TeleSystems, SADR | | 13,766 | | 259,214 |
| NovaTek OAO, ADR | | 2,460 | | 320,100 |
| Novolipetsk Steel, ADR | | 2,919 | | 133,982 |
| Polyus Gold Company ZAO, SADR | | 3,412 | | 116,520 |
| Rosneft Oil Company, GDR | | | | |
| (London Exchange) | | 49,399 | | 467,305 |
| | | | |
| International Equity Index Fund (continued) |
| | | Shares or | | |
| | | Principal | | |
| | | Amount | | Value |
| | |
|
| |
| COMMON STOCKS (continued) | | | | |
| Russia (continued) | | | | |
| Rostelecom, ADR (L) | | 877 | $ | 28,678 |
| Severstal, ADR | | 4,900 | | 93,443 |
| Sistema JSFC, Reg. S, GDR | | 2,210 | | 56,415 |
| Surgutneftegaz SADR (L) | | 17,331 | | 102,426 |
| Surgutneftegaz, ADR | | 19,977 | | 234,730 |
| Tatneft, ADR | | 6,077 | | 253,715 |
| TMK OAO, GDR (I) | | 742 | | 14,840 |
| Uralkali, SADR | | 4,329 | | 176,841 |
| UralsvyAzinform, ADR | | 1,471 | | 13,975 |
| VolgaTelecom, ADR | | 1,172 | | 11,954 |
| VTB Bank OJSC, GDR | | 20,343 | | 141,179 |
| Wimm-Bill-Dann Foods OJSC, ADR | | 1,099 | | 35,586 |
| | |
|
| | | | | 7,794,697 |
| Singapore - 1.03% | | | | |
| Capitaland, Ltd. | | 66,500 | | 170,746 |
| CapitaMall Trust (I) | | 69,200 | | 98,792 |
| CapitaMalls Asia, Ltd. (I) | | 51,000 | | 69,041 |
| City Developments, Ltd. | | 16,000 | | 140,879 |
| ComfortDelGro Corp., Ltd. | | 63,000 | | 76,903 |
| Cosco Corp. Singapore, Ltd. | | 31,000 | | 48,132 |
| DBS Group Holdings, Ltd. | | 47,147 | | 526,968 |
| Fraser and Neave, Ltd. | | 29,000 | | 128,200 |
| Genting Singapore PLC (I) | | 170,400 | | 257,331 |
| Global Logistic Properties, Ltd. (I) | | 54,000 | | 80,912 |
| Golden Agri-Resources, Ltd. | | 220,240 | | 113,490 |
| Jardine Cycle and Carriage, Ltd. | | 3,254 | | 86,438 |
| Keppel Corp., Ltd. | | 37,210 | | 331,093 |
| Keppel Land, Ltd. | | 22,000 | | 73,261 |
| Neptune Orient Lines, Ltd. (I) | | 29,750 | | 48,058 |
| Olam International, Ltd. | | 35,799 | | 78,715 |
| Oversea-Chinese Banking Corp., Ltd. | | 65,312 | | 474,408 |
| SembCorp Industries, Ltd. | | 31,000 | | 116,191 |
| SembCorp Marine, Ltd. | | 28,600 | | 120,459 |
| Singapore Airlines, Ltd. | | 16,140 | | 173,282 |
| Singapore Exchange, Ltd. | | 26,000 | | 161,632 |
| Singapore Press Holdings, Ltd. (I) | | 40,000 | | 122,086 |
| Singapore Technologies Engineering, Ltd. | | 47,000 | | 118,082 |
| Singapore Telecommunications, Ltd. | | 203,950 | | 526,508 |
| StarHub, Ltd. | | 17,000 | | 35,126 |
| United Overseas Bank, Ltd. | | 33,236 | | 472,811 |
| UOL Group, Ltd. (I) | | 18,000 | | 63,252 |
| Wilmar International, Ltd. | | 52,000 | | 209,031 |
| Yangzijiang Shipbuilding Holdings, Ltd. | | 48,000 | | 67,822 |
| | |
|
| | | | | 4,989,649 |
| South Africa - 1.51% | | | | |
| ABSA Group, Ltd. | | 9,273 | | 172,705 |
| African Bank Investments, Ltd. | | 18,007 | | 92,566 |
| African Rainbow Minerals, Ltd. (I) | | 2,484 | | 75,349 |
| Anglo Platinum, Ltd. | | 1,682 | | 163,549 |
| AngloGold Ashanti, Ltd. | | 10,168 | | 496,515 |
| Aspen Pharmacare Holdings, Ltd. | | 6,108 | | 71,536 |
| Aveng, Ltd. (I) | | 8,562 | | 44,960 |
| Bidvest Group, Ltd. | | 7,254 | | 162,444 |
| Discovery Holdings, Ltd., ADR | | 4,568 | | 25,906 |
| FirstRand, Ltd. | | 67,848 | | 190,887 |
| Foschini, Ltd. (I) | | 4,532 | | 51,128 |
| Gold Fields, Ltd. | | 19,523 | | 350,052 |
| Growthpoint Properties, Ltd. | | 34,366 | | 83,707 |
| Harmony Gold Mining Company, Ltd. | | 9,965 | | 116,928 |
| Impala Platinum Holdings, Ltd. | | 13,786 | | 407,157 |
| Imperial Holdings, Ltd. (I) | | 3,797 | | 61,228 |
| Investec, Ltd. | | 4,018 | | 31,313 |
| Kumba Iron Ore, Ltd. | | 2,445 | | 165,461 |
| |
| The accompanying notes are an integral part of the financial statements. | 116 |
John Hancock Funds II
Portfolio of Investments — February 28, 2011 (Unaudited) (showing percentage of total net assets)
| | | | |
| International Equity Index Fund (continued) |
| | | Shares or | | |
| | | Principal | | |
| | | Amount | | Value |
| | |
|
| |
| COMMON STOCKS (continued) | | | | |
| South Africa (continued) | | | | |
| Kumba Resources, Ltd. | | 2,734 | $ | 59,890 |
| Liberty Holdings, Ltd. (I) | | 1,135 | | 12,449 |
| Massmart Holdings, Ltd. | | 4,757 | | 98,369 |
| Mittal Steel South Africa, Ltd. | | 3,731 | | 48,299 |
| MMI Holdings, Ltd. | | 33,223 | | 77,561 |
| MTN Group, Ltd. | | 46,144 | | 814,849 |
| Murray & Roberts Holdings, Ltd. | | 5,381 | | 19,326 |
| Naspers, Ltd., SADR | | 10,442 | | 600,254 |
| Nedbank Group, Ltd. | | 3,842 | | 70,490 |
| Netcare, Ltd. | | 35,093 | | 73,556 |
| Northam Platinum, Ltd. | | 837 | | 5,953 |
| Pick’n Pay Stores, Ltd. (I) | | 4,684 | | 31,235 |
| Pretoria Portland Cement Company, Ltd. | | 12,055 | | 48,165 |
| Redefine Income Fund, Ltd. | | 53,510 | | 56,476 |
| Remgro, Ltd. | | 10,441 | | 167,801 |
| Reunert, Ltd. (I) | | 3,036 | | 25,196 |
| RMB Holdings, Ltd. | | 18,226 | | 100,601 |
| Sanlam, Ltd. | | 48,622 | | 188,858 |
| Sappi, Ltd. (I) | | 11,239 | | 59,738 |
| Sasol, Ltd. | | 15,498 | | 848,611 |
| Shoprite Holdings, Ltd. | | 10,482 | | 145,074 |
| Spar Group, Ltd. | | 5,380 | | 73,402 |
| Standard Bank Group, Ltd. | | 32,310 | | 463,155 |
| Steinhoff International Holdings, Ltd. (I) | | 28,351 | | 100,880 |
| Telkom SA, Ltd. | | 4,799 | | 24,438 |
| Tiger Brands, Ltd. (I) | | 3,806 | | 99,728 |
| Trans Hex Group, Ltd. (I) | | 611 | | 230 |
| Truworths International, Ltd. | | 11,150 | | 102,108 |
| Vodacom Group, Ltd. | | 9,464 | | 102,083 |
| Woolworths Holdings, Ltd. | | 15,171 | | 58,190 |
| | |
|
| | | | | 7,340,356 |
| South Korea - 2.99% | | | | |
| Amorepacific Corp. | | 96 | | 87,288 |
| Busan Bank (I) | | 5,225 | | 62,910 |
| Celltrion, Inc. (I) | | 1,900 | | 54,156 |
| Cheil Industries, Inc. (I) | | 1,310 | | 139,913 |
| CJ CheilJedang Corp. | | 238 | | 42,068 |
| Daegu Bank | | 4,210 | | 57,120 |
| Daelim Industrial Company, Ltd. (I) | | 860 | | 75,159 |
| Daewoo Engineering & | | | | |
| Construction Company, Ltd. (I) | | 4,529 | | 43,345 |
| Daewoo International Corp. (I) | | 1,795 | | 53,771 |
| Daewoo Securities Company, Ltd. (I) | | 3,960 | | 81,568 |
| Daewoo Shipbuilding & Marine | | | | |
| Engineering Company, Ltd. | | 3,010 | | 92,432 |
| Dongbu Insurance Company, Ltd. (I) | | 1,320 | | 53,842 |
| Dongkuk Steel Mill Company, Ltd. (I) | | 1,380 | | 43,832 |
| Doosan Corp. (I) | | 310 | | 34,526 |
| Doosan Heavy Industries and | | | | |
| Construction Company, Ltd. | | 1,330 | | 81,636 |
| Doosan Infracore Company, Ltd. (I) | | 2,880 | | 65,834 |
| GLOVIS Company, Ltd. | | 390 | | 49,074 |
| GS Engineering & Construction Corp. | | 940 | | 83,196 |
| GS Holdings Corp. | | 1,340 | | 82,891 |
| Hana Financial Group, Inc. | | 5,620 | | 225,215 |
| Hanjin Heavy Industries & | | | | |
| Construction Company, Ltd. (I) | | 826 | | 22,463 |
| Hanjin Shipping Company, Ltd. | | 1,780 | | 55,839 |
| Hankook Tire Company, Ltd. | | 2,600 | | 68,634 |
| Hanwha Chemical Corp. (I) | | 2,214 | | 66,287 |
| Hanwha Corp. | | 1,570 | | 62,018 |
| Honam Petrochemical Corp. | | 430 | | 119,120 |
| Hynix Semiconductor, Inc. | | 14,010 | | 353,296 |
| Hyosung Corp. (I) | | 600 | | 41,525 |
| | | | |
| International Equity Index Fund (continued) |
| | | Shares or | | |
| | | Principal | | |
| | | Amount | | Value |
| | |
|
| |
| COMMON STOCKS (continued) | | | | |
| South Korea (continued) | | | | |
| Hyundai Department Store Company, Ltd. (I) | | 490 | $ | 52,948 |
| Hyundai Development Company | | 1,490 | | 40,491 |
| Hyundai Engineering & | | | | |
| Construction Company, Ltd. (I) | | 1,990 | | 132,267 |
| Hyundai Heavy Industries Company, Ltd. | | 1,080 | | 418,196 |
| Hyundai Merchant Marine Company, Ltd. (I) | | 1,470 | | 37,069 |
| Hyundai Mipo Dockyard Company, Ltd. (I) | | 360 | | 55,450 |
| Hyundai Mobis (I) | | 1,870 | | 437,606 |
| Hyundai Motor Company, Ltd. | | 4,310 | | 683,360 |
| Hyundai Securities Company, Ltd. (I) | | 4,428 | | 51,440 |
| Hyundai Steel Company (I) | | 1,600 | | 184,204 |
| Industrial Bank of Korea (I) | | 5,230 | | 78,509 |
| Kangwon Land, Inc. (I) | | 2,530 | | 56,398 |
| KB Financial Group, Inc. | | 8,589 | | 420,970 |
| KB Financial Group, Inc., ADR (I) | | 2,563 | | 124,946 |
| KCC Corp. | | 160 | | 44,543 |
| Kia Motors Corp. | | 6,400 | | 326,700 |
| Korea Electric Power Corp. (I) | | 6,793 | | 166,445 |
| Korea Exchange Bank | | 7,470 | | 60,678 |
| Korea Gas Corp. (I) | | 780 | | 25,489 |
| Korea Investment Holdings Company, Ltd. | | 1,030 | | 38,331 |
| Korea Life Insurance Company Ltd. | | 6,400 | | 43,125 |
| Korea Zinc Company, Ltd. | | 270 | | 80,325 |
| Korean Air Lines Company, Ltd. (I) | | 1,207 | | 66,147 |
| KT Corp. (I) | | 3,652 | | 126,523 |
| KT&G Corp. | | 2,950 | | 150,097 |
| LG Chem, Ltd. | | 1,309 | | 432,669 |
| LG Corp. | | 2,720 | | 187,688 |
| LG Display Company, Ltd. (I) | | 6,016 | | 191,538 |
| LG Display Company, Ltd., ADR (I) | | 439 | | 7,015 |
| LG Electronics, Inc. | | 2,720 | | 269,208 |
| LG Household & Health Care, Ltd. (I) | | 270 | | 85,680 |
| LG Innotek Company, Ltd. | | 290 | | 32,971 |
| LG Uplus Corp. (I) | | 8,257 | | 41,541 |
| Lotte Confectionery Company, Ltd. | | 20 | | 24,612 |
| Lotte Shopping Company, Ltd. (I) | | 320 | | 111,495 |
| LS Cable, Ltd. (I) | | 610 | | 49,907 |
| LS Industrial Systems Company, Ltd. (I) | | 420 | | 26,383 |
| Mirae Asset Securities Company, Ltd. | | 604 | | 25,330 |
| NCSoft Corp. | | 430 | | 86,206 |
| NHN Corp. (I) | | 1,154 | | 194,049 |
| OCI Company, Ltd. (I) | | 440 | | 145,531 |
| POSCO (I) | | 1,693 | | 693,304 |
| POSCO, ADR | | 575 | | 59,271 |
| S-Oil Corp. (I) | | 1,180 | | 112,534 |
| S1 Corp. (I) | | 450 | | 20,027 |
| Samsung Card Company, Ltd. (I) | | 1,190 | | 55,565 |
| Samsung Corp. | | 3,547 | | 212,513 |
| Samsung Electro-Mechanics Company, Ltd. (I) | | 1,770 | | 202,801 |
| Samsung Electronics Company, Ltd. | | 3,033 | | 2,492,846 |
| Samsung Engineering Company, Ltd. (I) | | 860 | | 137,052 |
| Samsung Fire & Marine | | | | |
| Insurance Company, Ltd. (I) | | 990 | | 196,570 |
| Samsung Heavy Industries Company, Ltd. | | 4,731 | | 153,273 |
| Samsung Life Insurance Company, Ltd. | | 1,460 | | 137,980 |
| Samsung SDI Company, Ltd. (I) | | 980 | | 145,205 |
| Samsung Securities Company, Ltd. (I) | | 1,540 | | 103,967 |
| Samsung Techwin Company, Ltd. (I) | | 932 | | 65,517 |
| Seoul Semiconductor Company, Ltd. | | 980 | | 36,724 |
| Shinhan Financial Group Company, Ltd. (I) | | 11,383 | | 476,333 |
| Shinsegae Company, Ltd. | | 810 | | 179,254 |
| SK Broadband Company, Ltd. (I) | | 6,459 | | 27,157 |
| SK C&C Company, Ltd. | | 460 | | 38,823 |
| SK Energy Company, Ltd. | | 1,646 | | 256,680 |
| SK Holdings Company, Ltd. | | 683 | | 80,509 |
| |
| The accompanying notes are an integral part of the financial statements. | 117 |
John Hancock Funds II
Portfolio of Investments — February 28, 2011 (Unaudited) (showing percentage of total net assets)
| | | | |
| International Equity Index Fund (continued) |
| | | Shares or | | |
| | | Principal | | |
| | | Amount | | Value |
| | |
|
| |
| COMMON STOCKS (continued) | | | | |
| South Korea (continued) | | | | |
| SK Networks Company, Ltd. (I) | | 2,740 | $ | 28,172 |
| SK Telecom Company, Ltd. | | 1,197 | | 172,690 |
| STX Pan Ocean Company, Ltd. | | 4,057 | | 34,282 |
| Tong Yang Investment Bank (I) | | 1,771 | | 12,165 |
| Woongjin Coway Company, Ltd. (I) | | 1,690 | | 49,059 |
| Woori Finance Holdings Company, Ltd. (I) | | 8,980 | | 109,355 |
| Woori Investment & | | | | |
| Securities Company, Ltd. (I) | | 3,040 | | 55,438 |
| Yuhan Corp. (I) | | 315 | | 42,485 |
| | |
|
| | | | | 14,500,589 |
| Spain - 2.33% | | | | |
| Abertis Infraestructuras SA | | 7,900 | | 158,718 |
| Acciona SA | | 599 | | 58,256 |
| Acerinox SA | | 3,620 | | 68,673 |
| ACS Actividades de Construccion | | | | |
| y Servicios SA | | 3,618 | | 165,977 |
| Amadeus IT Holding SA, A Shares (I) | | 5,882 | | 114,308 |
| Banco Bilbao Vizcaya Argentaria SA | | 114,074 | | 1,409,376 |
| Banco de Sabadell SA (L) | | 34,210 | | 148,490 |
| Banco de Valencia SA (I)(L) | | 8,973 | | 45,140 |
| Banco Popular Espanol SA | | 26,171 | | 158,303 |
| Banco Santander SA (I) | | 224,628 | | 2,764,721 |
| Bankinter SA (L) | | 10,123 | | 66,813 |
| Criteria Caixacorp SA | | 21,394 | | 154,837 |
| EDP Renovaveis SA (I) | | 8,841 | | 53,061 |
| Enagas | | 4,541 | | 97,213 |
| Ferrovial SA (I) | | 13,156 | | 158,227 |
| Fomento de Construcciones SA | | 1,979 | | 63,155 |
| Gas Natural SDG SA | | 9,300 | | 158,853 |
| Gestevision Telecinco SA (I) | | 5,829 | | 73,153 |
| Grifols SA | | 4,822 | | 78,502 |
| Iberdrola Renovables SA | | 26,947 | | 101,201 |
| Iberdrola SA | | 108,630 | | 947,658 |
| Inditex SA | | 6,018 | | 435,510 |
| Indra Sistemas SA | | 1,985 | | 38,621 |
| Mapfre SA | | 24,832 | | 92,309 |
| Red Electrica De Espana | | 2,909 | | 156,471 |
| Repsol YPF SA | | 19,890 | | 667,203 |
| Telefonica SA | | 110,863 | | 2,819,656 |
| Zardoya Otis SA | | 3,179 | | 49,561 |
| | |
|
| | | | | 11,303,966 |
| Sweden - 1.96% | | | | |
| Alfa Laval AB | | 8,300 | | 169,686 |
| Assa Abloy AB, Series B | | 7,800 | | 218,298 |
| Atlas Copco AB, Series A | | 16,899 | | 424,370 |
| Atlas Copco AB, Series B | | 9,473 | | 215,125 |
| Boliden AB | | 6,500 | | 138,352 |
| CDON Group AB (I) | | 1,210 | | 5,848 |
| Electrolux AB | | 5,884 | | 147,526 |
| Getinge AB, Series B | | 4,666 | | 113,948 |
| Hennes & Mauritz AB, B Shares | | 29,150 | | 951,256 |
| Hexagon AB | | 7,300 | | 161,193 |
| Holmen AB, Series B | | 900 | | 31,652 |
| Husqvarna AB, B Shares | | 8,502 | | 68,320 |
| Industrivarden AB, C Shares (I) | | 4,000 | | 69,691 |
| Investor AB, B Shares | | 11,000 | | 253,155 |
| Kinnevik Investment AB (I) | | 4,900 | | 109,950 |
| Modern Times Group AB, B Shares | | 1,210 | | 81,040 |
| Nordea Bank AB (I) | | 92,175 | | 1,048,337 |
| Ratos AB | | 2,200 | | 82,188 |
| Sandvik AB | | 25,544 | | 489,732 |
| Scania AB, Series B | | 7,900 | | 176,030 |
| Securitas AB, Series B | | 6,800 | | 79,436 |
| | | | |
| International Equity Index Fund (continued) |
| | | Shares or | | |
| | | Principal | | |
| | | Amount | | Value |
| | |
|
| |
| COMMON STOCKS (continued) | | | | |
| Sweden (continued) | | | | |
| Skandinaviska Enskilda Banken AB, Series A | | 34,680 | $ | 315,572 |
| Skanska AB, Series B | | 9,500 | | 195,096 |
| SKF AB, B Shares | | 9,900 | | 276,209 |
| SSAB AB, Series A | | 4,300 | | 67,469 |
| Svenska Cellulosa AB | | 14,200 | | 234,825 |
| Svenska Handelsbanken AB, Series A | | 12,400 | | 418,501 |
| Swedbank AB, Class A (I) | | 22,950 | | 404,300 |
| Swedish Match AB | | 5,500 | | 173,650 |
| Tele2 AB, Series B | | 7,491 | | 170,638 |
| Telefonaktiebolaget LM Ericsson, B Shares | | 86,000 | | 1,105,119 |
| Teliasonera AB | | 57,500 | | 482,851 |
| Volvo AB, Series B (I) | | 36,300 | | 627,941 |
| | |
|
| | | | | 9,507,304 |
| Switzerland - 5.37% | | | | |
| ABB, Ltd. (I) | | 64,456 | | 1,579,394 |
| Actelion, Ltd. (I) | | 3,193 | | 177,388 |
| Adecco SA | | 3,694 | | 248,631 |
| Aryzta AG | | 2,560 | | 119,557 |
| Baloise Holding AG | | 1,476 | | 159,578 |
| Compagnie Financiere Richemont SA | | 15,015 | | 860,903 |
| Credit Suisse Group AG | | 32,054 | | 1,481,940 |
| GAM Holding, Ltd. (I) | | 7,098 | | 128,419 |
| Geberit AG | | 1,173 | | 253,111 |
| Givaudan AG | | 248 | | 247,117 |
| Holcim, Ltd. | | 6,985 | | 513,884 |
| Julius Baer Group, Ltd. | | 5,999 | | 269,094 |
| Kuehne & Nagel International AG | | 1,655 | | 222,425 |
| Lindt & Spruengli AG | | 29 | | 80,586 |
| Lindt & Spruengli AG (REG) | | 4 | | 125,309 |
| Logitech International SA (I)(L) | | 5,501 | | 104,604 |
| Lonza Group AG | | 1,540 | | 130,468 |
| Nestle SA | | 94,822 | | 5,367,407 |
| Nobel Biocare Holding AG | | 4,707 | | 90,521 |
| Novartis AG | | 57,854 | | 3,249,037 |
| Pargesa Holding SA, ADR | | 1,287 | | 118,794 |
| Roche Holdings AG | | 19,280 | | 2,906,981 |
| Schindler Holding AG | | 1,540 | | 173,487 |
| Schindler Holding AG (REG) | | 700 | | 79,395 |
| SGS SA | | 163 | | 283,547 |
| Sika AG | | 61 | | 130,761 |
| Sonova Holding AG | | 1,608 | | 213,832 |
| Straumann Holding AG | | 338 | | 83,036 |
| Swatch Group AG | | 1,337 | | 104,043 |
| Swiss Life Holding (I) | | 1,102 | | 182,131 |
| Swiss Reinsurance Company, Ltd. | | 9,954 | | 610,011 |
| Swisscom AG | | 731 | | 322,968 |
| Syngenta AG | | 2,635 | | 885,596 |
| Synthes AG | | 1,791 | | 245,744 |
| The Swatch Group AG, BR Shares | | 896 | | 381,995 |
| Transocean, Ltd. (I) | | 8,966 | | 738,057 |
| UBS AG (Swiss Exchange) (I) | | 99,779 | | 1,982,767 |
| Zurich Financial Services AG | | 4,160 | | 1,207,390 |
| | |
|
| | | | | 26,059,908 |
| Taiwan - 1.99% | | | | |
| Acer, Inc. | | 57,177 | | 138,722 |
| Advanced Semiconductor Engineering, Inc. (I) | | 103,723 | | 117,279 |
| Advantech Company, Ltd. (I) | | 1,519 | | 4,198 |
| Asia Cement Corp. (I) | | 29,469 | | 29,679 |
| Asustek Computer, Inc. | | 12,110 | | 110,450 |
| AU Optronics Corp. (I) | | 222,701 | | 202,871 |
| Catcher Technology Company, Ltd. (I) | | 8,657 | | 36,311 |
| Cathay Financial Holdings Company, Ltd. | | 179,137 | | 287,960 |
| Chang Hwa Commercial Bank, Ltd. (I) | | 82,000 | | 60,885 |
| |
| The accompanying notes are an integral part of the financial statements. | 118 |
John Hancock Funds II
Portfolio of Investments — February 28, 2011 (Unaudited) (showing percentage of total net assets)
| | | | |
| International Equity Index Fund (continued) |
| | | Shares or | | |
| | | Principal | | |
| | | Amount | | Value |
| | |
|
| |
| COMMON STOCKS (continued) | | | | |
| Taiwan (continued) | | | | |
| Cheng Shin Rubber Industry Company, Ltd. (I) | | 17,002 | $ | 34,241 |
| Cheng Uei Precision | | | | |
| Industry Company, Ltd. (I) | | 2,690 | | 5,162 |
| Chimei Innolux Corp. (I) | | 93,681 | | 99,909 |
| China Airlines, Ltd. | | 19,577 | | 12,757 |
| China Development | | | | |
| Financial Holdings Corp. (I) | | 181,145 | | 69,725 |
| China Steel Corp. | | 291,239 | | 329,041 |
| Chinatrust Financial | | | | |
| Holding Company, Ltd. (I) | | 193,334 | | 151,769 |
| Chunghwa Picture Tubes, Ltd. (I) | | 53,201 | | 7,167 |
| Chunghwa Telecom Company, Ltd. | | 109,550 | | 324,324 |
| CMC Magnetics Corp. (I) | | 29,000 | | 6,859 |
| Compal Electronics, Inc. (I) | | 127,510 | | 149,832 |
| Delta Electronics, Inc. | | 52,893 | | 220,853 |
| E.Sun Financial Holding Company, Ltd. (I) | | 67,941 | | 41,803 |
| Epistar Corp. | | 8,946 | | 30,897 |
| Eternal Chemical Company, Ltd. | | 3,520 | | 3,766 |
| EVA Airways Corp. (I) | | 17,181 | | 15,534 |
| Evergreen Marine Corp. (I) | | 11,000 | | 9,734 |
| Everlight Electronics Company, Ltd. | | 2,177 | | 6,116 |
| Far Eastern Department | | | | |
| Stores Company, Ltd. (I) | | 6,651 | | 10,081 |
| Far Eastern New Century Corp. (I) | | 57,267 | | 89,438 |
| Far EasTone | | | | |
| Telecommunications Company, Ltd. | | 30,463 | | 43,603 |
| First Financial Holding Company, Ltd. (I) | | 108,235 | | 88,787 |
| Formosa Chemicals & Fibre Corp. (I) | | 82,710 | | 282,428 |
| Formosa Petrochemical Corp. (I) | | 26,780 | | 81,170 |
| Formosa Plastic Corp. (I) | | 106,600 | | 357,928 |
| Formosa Taffeta Company, Ltd. (I) | | 9,000 | | 8,356 |
| Foxconn Technology Company, Ltd. | | 14,580 | | 52,196 |
| Fubon Financial Holding Company, Ltd. | | 122,843 | | 155,992 |
| HannStar Display Corp. (I) | | 63,921 | | 11,592 |
| Hon Hai Precision Industry Company, Ltd. | | 240,110 | | 884,234 |
| HTC Corp. | | 19,905 | | 723,219 |
| Hua Nan Financial Holdings Company, Ltd. (I) | | 66,915 | | 47,625 |
| Inotera Memories, Inc. (I) | | 5,395 | | 2,851 |
| Inventec Company, Ltd. (I) | | 30,748 | | 15,856 |
| KGI Securities Company, Ltd. (I) | | 23,000 | | 11,111 |
| Kinsus Interconnect Technology Corp. (I) | | 527 | | 1,652 |
| Largan Precision Company, Ltd. (I) | | 2,121 | | 58,560 |
| Lite-On Technology Corp. (I) | | 44,537 | | 55,495 |
| Macronix International Company, Ltd. | | 69,453 | | 50,485 |
| MediaTek, Inc. (I) | | 22,132 | | 249,717 |
| Mega Financial Holding Company, Ltd. (I) | | 171,000 | | 123,769 |
| Mitac International | | 8,691 | | 3,901 |
| Mosel Vitelic, Inc. (I) | | 372 | | 189 |
| Motech Industries, Inc. (I) | | 3,524 | | 15,513 |
| Nan Ya Plastics Corp. | | 134,180 | | 389,003 |
| Nan Ya Printed Circuit Board Corp. (I) | | 2,147 | | 7,675 |
| Nanya Technology Corp. (I) | | 26,856 | | 14,403 |
| Novatek Microelectronics Corp., Ltd. (I) | | 10,326 | | 31,642 |
| Pegatron Corp. (I) | | 32,596 | | 38,600 |
| Polaris Securities Company, Ltd. (I) | | 27,990 | | 17,266 |
| Pou Chen Corp. (I) | | 41,568 | | 36,334 |
| Powerchip Semiconductor Corp. (I) | | 105,639 | | 22,636 |
| Powertech Technology, Inc. (I) | | 11,607 | | 40,590 |
| President Chain Store Corp. (I) | | 7,952 | | 33,193 |
| Qisda Corp. (I) | | 12,400 | | 7,476 |
| Quanta Computer, Inc. | | 76,625 | | 150,447 |
| Realtek Semiconductor Corp. (I) | | 5,245 | | 10,306 |
| Richtek Technology Corp. (I) | | 1,212 | | 9,580 |
| Shin Kong Financial | | | | |
| Holding Company, Ltd. (I) | | 98,688 | | 41,704 |
| | | | |
| International Equity Index Fund (continued) |
| | | Shares or | | |
| | | Principal | | |
| | | Amount | | Value |
| | |
|
| |
| COMMON STOCKS (continued) | | | | |
| Taiwan (continued) | | | | |
| Siliconware Precision Industries Company (I) | | 62,665 | $ | 86,598 |
| SinoPac Holdings Company, Ltd. (I) | | 107,000 | | 44,437 |
| Synnex Technology International Corp. (I) | | 23,608 | | 56,106 |
| Taishin Financial Holdings Company, Ltd. (I) | | 73,475 | | 38,343 |
| Taiwan Cement Corp. | | 68,251 | | 67,802 |
| Taiwan Cooperative Bank (I) | | 68,310 | | 51,790 |
| Taiwan Fertilizer Company, Ltd. | | 16,000 | | 50,095 |
| Taiwan Glass Industrial Corp. | | 10,382 | | 12,692 |
| Taiwan Mobile Company, Ltd. (I) | | 41,802 | | 93,494 |
| Taiwan Semiconductor | | | | |
| Manufacturing Company, Ltd. | | 677,788 | | 1,620,370 |
| Tatung Company, Ltd. (I) | | 46,000 | | 10,673 |
| Teco Electric & Machinery Company, Ltd. (I) | | 15,000 | | 8,820 |
| Transcend Information, Inc. (I) | | 2,202 | | 5,795 |
| Tripod Technology Corp. (I) | | 8,542 | | 38,215 |
| Tung Ho Steel Enterprise Corp. (I) | | 6,424 | | 6,798 |
| U-Ming Marine Transport Corp. (I) | | 7,000 | | 13,951 |
| Uni-President Enterprises Corp. | | 81,078 | | 103,561 |
| Unimicron Technology Corp. (I) | | 17,513 | | 32,500 |
| United Microelectronics Corp. | | 366,729 | | 190,735 |
| Vanguard | | | | |
| International Semiconductor Corp. (I) | | 284 | | 157 |
| Wafer Works Corp. (I) | | 33 | | 58 |
| Walsin Lihwa Corp. (I) | | 39,000 | | 20,720 |
| Wan Hai Lines, Ltd. (I) | | 11,400 | | 7,804 |
| Wintek Corp. (I) | | 36,000 | | 69,584 |
| Wistron Corp. | | 40,074 | | 71,492 |
| WPG Holdings Company, Ltd. (I) | | 36,000 | | 61,974 |
| Ya Hsin Industrial Company, Ltd. (I) | | 18,000 | | 0 |
| Yang Ming Marine Transport Corp. (I) | | 7,609 | | 6,447 |
| Yuanta Financial Holdings Company, Ltd. (I) | | 135,825 | | 93,549 |
| Yulon Motor Company, Ltd. (I) | | 8,449 | | 16,704 |
| | |
|
| | | | | 9,665,711 |
| Thailand - 0.36% | | | | |
| Advanced Info Service PLC | | 23,609 | | 61,387 |
| Bangkok Bank PCL | | 18,800 | | 99,093 |
| Bangkok Bank PCL | | 21,500 | | 115,264 |
| Bank of Ayudhya PCL | | 141,800 | | 115,857 |
| Banpu PCL | | 4,600 | | 109,777 |
| BEC World PCL (I) | | 18,400 | | 20,160 |
| C.P. Seven Eleven PCL | | 49,000 | | 62,502 |
| Charoen Pokphand Foods PCL | | 75,000 | | 58,381 |
| Glow Energy PCL | | 32,900 | | 43,849 |
| IRPC PCL | | 254,154 | | 46,134 |
| Kasikornbank PCL | | 20,900 | | 80,930 |
| Kasikornbank PCL (Foreign Shares) | | 31,800 | | 126,419 |
| Krung Thai Bank PCL | | 57,000 | | 30,574 |
| PTT Aromatics & Refining PCL | | 17,600 | | 21,298 |
| PTT Chemical PCL | | 6,700 | | 31,555 |
| PTT Exploration & Production PCL | | 30,706 | | 182,780 |
| PTT PCL, Foreign Shares | | 18,082 | | 199,301 |
| Siam Cement PCL, Foreign Shares | | 8,900 | | 96,592 |
| Siam Commercial Bank PCL | | 51,128 | | 170,566 |
| Thai Oil PCL | | 32,800 | | 79,117 |
| | |
|
| | | | | 1,751,536 |
| Turkey - 0.30% | | | | |
| Akbank AS | | 32,773 | | 153,261 |
| Anadolu Efes Biracilik ve Malt Sanayii AS | | 4,278 | | 57,805 |
| Arcelik AS (I) | | 8,699 | | 40,386 |
| Asya Katilim Bankasi AS | | 6,656 | | 10,737 |
| BIM Birlesik Magazalar AS | | 1,820 | | 57,242 |
| Coca-Cola Icecek AS | | 2,683 | | 29,702 |
| Enka Insaat ve Sanayi AS | | 3,766 | | 12,434 |
| |
| The accompanying notes are an integral part of the financial statements. | 119 |
John Hancock Funds II
Portfolio of Investments — February 28, 2011 (Unaudited) (showing percentage of total net assets)
| | | | |
| International Equity Index Fund (continued) |
| | | Shares or | | |
| | | Principal | | |
| | | Amount | | Value |
| | |
|
| |
| COMMON STOCKS (continued) | | | | |
| Turkey (continued) | | | | |
| Eregli Demir ve Celik Fabrikalari AS | | 14,415 | $ | 44,522 |
| HACI Omer Sabanci Holding AS | | 13,543 | | 54,365 |
| KOC Holdings AS | | 20,858 | | 87,378 |
| Tupras Turkiye Petrol Rafine AS | | 4,261 | | 106,039 |
| Turk Hava Yollari AS | | 14,866 | | 41,641 |
| Turk Telekomunikasyon AS | | 19,775 | | 88,034 |
| Turkcell Iletisim Hizmetleri AS | | 22,046 | | 123,643 |
| Turkiye Garanti Bankasi AS | | 59,070 | | 261,467 |
| Turkiye Halk Bankasi AS | | 7,392 | | 53,605 |
| Turkiye Is Bankasi AS | | 46,664 | | 145,253 |
| Turkiye Vakiflar Bankasi Tao | | 18,789 | | 45,444 |
| Yapi ve Kredi Bankasi AS (I) | | 20,051 | | 55,904 |
| | |
|
| | | | | 1,468,862 |
| Ukraine - 0.01% | | | | |
| Kernel Holding SA (I) | | 1,116 | | 32,247 |
| United Kingdom - 14.12% | | | | |
| 3i Group PLC | | 28,003 | | 142,145 |
| Acergy SA | | 8,206 | | 211,076 |
| Admiral Group PLC | | 5,918 | | 162,458 |
| Aggreko PLC | | 7,665 | | 180,273 |
| AMEC PLC | | 9,715 | | 183,797 |
| Anglo American PLC | | 36,300 | | 1,966,142 |
| Antofagasta PLC | | 11,138 | | 254,597 |
| ARM Holdings PLC | | 37,147 | | 373,925 |
| Associated British Foods PLC (I) | | 10,500 | | 164,946 |
| AstraZeneca PLC (I) | | 39,437 | | 1,922,933 |
| Autonomy Corp. PLC (I) | | 6,492 | | 173,660 |
| Aviva PLC (I) | | 76,145 | | 579,391 |
| Babcock International Group PLC | | 11,127 | | 101,464 |
| BAE Systems PLC (I) | | 94,420 | | 505,475 |
| Balfour Beatty PLC | | 19,634 | | 111,674 |
| Barclays PLC | | 310,335 | | 1,611,467 |
| BG Group PLC (I) | | 92,947 | | 2,267,622 |
| BHP Billiton PLC | | 60,627 | | 2,401,960 |
| BP PLC | | 514,699 | | 4,147,770 |
| British American Tobacco PLC | | 54,892 | | 2,196,710 |
| British Land Company PLC (I) | | 25,516 | | 242,465 |
| British Sky Broadcasting Group PLC | | 31,653 | | 404,930 |
| BT Group PLC | | 209,382 | | 624,131 |
| Bunzl PLC | | 10,066 | | 124,335 |
| Burberry Group PLC | | 12,567 | | 244,903 |
| Cable & Wireless Worldwide | | 83,655 | | 97,843 |
| Cairn Energy PLC (I) | | 39,115 | | 272,322 |
| Capita Group PLC | | 17,738 | | 209,183 |
| Capital Shopping Centres Group PLC | | 14,088 | | 90,526 |
| Carnival PLC | | 5,065 | | 226,721 |
| Centrica PLC | | 138,437 | | 766,319 |
| Cobham PLC | | 35,242 | | 129,177 |
| Compass Group PLC (I) | | 50,278 | | 452,303 |
| Diageo PLC | | 68,047 | | 1,330,418 |
| Eurasian Natural Resources Corp. | | 6,777 | | 106,206 |
| FirstGroup PLC | | 14,769 | | 87,566 |
| Fresnillo PLC | | 5,520 | | 143,643 |
| G4S PLC | | 41,170 | | 176,927 |
| GlaxoSmithKline PLC (I) | | 142,524 | | 2,739,793 |
| Hammerson PLC | | 20,923 | | 158,505 |
| Home Retail Group PLC | | 26,830 | | 96,273 |
| HSBC Holdings PLC (I) | | 481,754 | | 5,302,202 |
| ICAP PLC | | 16,745 | | 141,732 |
| Imperial Tobacco Group PLC (I) | | 28,310 | | 909,683 |
| Inmarsat PLC | | 11,514 | | 125,519 |
| Intercontinental Hotels Group PLC | | 8,230 | | 182,982 |
| International Consolidated | | | | |
| Airlines Group SA (I) | | 16,241 | | 59,122 |
| | | | |
| International Equity Index Fund (continued) |
| | | Shares or | | |
| | | Principal | | |
| | | Amount | | Value |
| | |
|
| |
| COMMON STOCKS (continued) | | | | |
| United Kingdom (continued) | | | | |
| International Consolidated | | | | |
| Airlines Group SA (I) | | 15,178 | $ | 55,369 |
| International Power PLC | | 41,570 | | 225,889 |
| Intertek Group PLC | | 4,576 | | 134,181 |
| Invensys PLC | | 23,595 | | 136,273 |
| Investec PLC | | 14,646 | | 112,554 |
| ITV PLC | | 111,100 | | 157,862 |
| J Sainsbury PLC | | 34,952 | | 215,878 |
| Johnson Matthey PLC | | 6,034 | | 182,248 |
| Kazakhmys PLC | | 6,369 | | 149,419 |
| Kingfisher PLC | | 66,652 | | 275,501 |
| Land Securities Group PLC | | 21,765 | | 271,645 |
| Legal & General Group PLC | | 159,191 | | 307,355 |
| Lloyds Banking Group PLC | | 1,111,761 | | 1,121,949 |
| London Stock Exchange Group PLC (L) | | 3,888 | | 56,868 |
| Lonmin PLC, ADR | | 4,896 | | 146,390 |
| Man Group PLC | | 50,165 | | 234,218 |
| Marks & Spencer Group PLC | | 44,462 | | 250,329 |
| National Grid PLC | | 95,794 | | 890,969 |
| Next PLC | | 5,337 | | 171,665 |
| Old Mutual PLC | | 153,590 | | 328,217 |
| Pearson PLC (I) | | 22,175 | | 379,050 |
| Petrofac, Ltd. | | 7,462 | | 168,951 |
| Pharmstandard (I) | | 1,827 | | 51,521 |
| PIK Group, GDR (I) | | 5,907 | | 26,345 |
| Prudential PLC | | 69,042 | | 797,459 |
| Randgold Resources, Ltd. (I) | | 2,562 | | 207,418 |
| Reckitt Benckiser Group PLC | | 16,696 | | 860,460 |
| Reed Elsevier PLC | | 33,773 | | 301,575 |
| Resolution, Ltd. (I) | | 42,595 | | 200,534 |
| Rexam PLC | | 26,039 | | 154,701 |
| Rio Tinto PLC (I) | | 39,775 | | 2,805,626 |
| Rolls-Royce Group PLC (I) | | 51,316 | | 514,681 |
| Royal Bank of Scotland Group PLC (I) | | 469,398 | | 345,455 |
| Royal Dutch Shell PLC | | 97,197 | | 3,498,697 |
| Royal Dutch Shell PLC, B Shares | | 74,017 | | 2,644,872 |
| RSA Insurance Group PLC (I) | | 93,233 | | 212,550 |
| SABMiller PLC (I) | | 26,416 | | 889,715 |
| Sage Group PLC | | 37,334 | | 172,503 |
| Schroders PLC (I) | | 3,576 | | 104,098 |
| Scottish & Southern Energy PLC | | 25,385 | | 511,230 |
| Segro PLC | | 23,069 | | 120,728 |
| Serco Group PLC | | 14,226 | | 125,906 |
| Severn Trent PLC | | 6,981 | | 168,932 |
| Smith & Nephew PLC (I) | | 24,856 | | 287,854 |
| Smiths Group PLC | | 11,234 | | 244,710 |
| Standard Chartered PLC (I) | | 64,238 | | 1,698,469 |
| Standard Life PLC | | 64,633 | | 251,314 |
| Tesco PLC (I) | | 221,502 | | 1,456,771 |
| The Weir Group PLC | | 5,932 | | 165,214 |
| Thomas Cook Group PLC | | 22,378 | | 68,768 |
| TUI Travel PLC | | 14,575 | | 57,446 |
| Tullow Oil PLC | | 23,760 | | 554,556 |
| Unilever PLC | | 35,581 | | 1,055,784 |
| United Utilities Group PLC | | 19,583 | | 188,649 |
| Vedanta Resources PLC | | 3,138 | | 122,842 |
| Vodafone Group PLC | | 1,442,581 | | 4,093,335 |
| Whitbread PLC | | 5,197 | | 150,530 |
| William Morrison Supermarket PLC | | 60,249 | | 271,304 |
| Wolseley PLC (I) | | 7,975 | | 277,517 |
| WPP PLC | | 34,321 | | 472,155 |
| Xstrata PLC | | 55,914 | | 1,276,214 |
| | |
|
| | | | | 68,486,432 |
| |
| The accompanying notes are an integral part of the financial statements. | 120 |
John Hancock Funds II
Portfolio of Investments — February 28, 2011 (Unaudited) (showing percentage of total net assets)
| | | | |
| International Equity Index Fund (continued) |
| | Shares or | | |
| | Principal | | |
| | Amount | | Value |
| |
|
| |
| COMMON STOCKS (continued) | | | | |
| United States - 0.05% | | | | |
| Southern Copper Corp. | | 5,473 | $ | 231,617 |
|
| TOTAL COMMON STOCKS (Cost $357,785,975) | | | $ | 451,000,428 |
|
| |
| PREFERRED SECURITIES - 2.38% | | | | |
| Brazil - 1.97% | | | | |
| AES Tiete SA | | 3,800 | | 52,530 |
| Banco Bradesco SA | | 51,826 | | 996,774 |
| Banco do Estado do Rio Grande do Sul SA | | 3,499 | | 38,275 |
| Bradespar SA | | 7,300 | | 189,454 |
| Brasil Telecom SA | | 9,780 | | 73,770 |
| Braskem SA, A Shares (I) | | 6,600 | | 80,447 |
| Centrais Eletricas Brasileiras SA | | 5,700 | | 103,668 |
| Cia Paranaense de Energia | | 3,800 | | 95,468 |
| Companhia Brasileira de Distribuicao Grupo | | | | |
| Pao de Acucar (I) | | 2,139 | | 79,451 |
| Companhia de Bebidas das Americas | | 36,215 | | 962,077 |
| Companhia de Transmissao de Energia | | | | |
| Eletrica Paulista | | 1,219 | | 37,351 |
| Companhia Energetica de Minas Gerais | | 9,464 | | 157,278 |
| Companhia Energetica de Sao Paulo | | 3,764 | | 61,761 |
| Eletropaulo Metropolitana Eletricidade de | | | | |
| Sao Paulo SA | | 1,924 | | 37,120 |
| Fertilizantes Fosfatados SA (I) | | 3,600 | | 38,363 |
| Gerdau SA | | 18,260 | | 241,338 |
| Gol Linhas Aereas Inteligentes SA | | 4,300 | | 56,909 |
| Investimentos Itau SA | | 60,330 | | 440,201 |
| Itau Unibanco Holding SA | | 61,981 | | 1,378,349 |
| Klabin SA | | 15,000 | | 55,536 |
| Lojas Americanas SA | | 6,600 | | 53,155 |
| Metalurgica Gerdau SA | | 8,800 | | 136,670 |
| Petroleo Brasileiro SA | | 111,486 | | 1,915,056 |
| Suzano Papel e Celulose SA | | 7,275 | | 62,134 |
| Tam SA | | 2,590 | | 54,562 |
| Tele Norte Leste Participacoes SA | | 7,000 | | 109,178 |
| Telemar Norte Leste SA | | 1,000 | | 29,024 |
| Tim Participacoes SA | | 23,740 | | 90,035 |
| Usinas Siderurgicas de Minas Gerais SA | | 13,484 | | 153,982 |
| Vale SA | | 53,382 | | 1,591,386 |
| Vivo Participacoes SA | | 4,399 | | 157,844 |
| | |
|
| | | | | 9,529,146 |
| Germany - 0.31% | | | | |
| Bayerische Motoren Werke AG | | 1,706 | | 91,923 |
| Henkel AG & Company KGaA | | 4,958 | | 298,859 |
| Porsche Automobil Holding SE | | 2,429 | | 192,417 |
| ProSiebenSat.1 Media AG | | 2,468 | | 79,833 |
| RWE AG | | 1,274 | | 81,924 |
| Volkswagen AG | | 4,583 | | 777,167 |
| | |
|
| | | | | 1,522,123 |
| Korea - 0.01% | | | | |
| LG Chem, Ltd. | | 290 | | 36,386 |
| South Korea - 0.09% | | | | |
| Hyundai Motor Company, Ltd. | | 560 | | 29,515 |
| Hyundai Motor Company, Ltd. | | | | |
| -2nd Preferred (I) | | 1,210 | | 67,570 |
| LG Electronics, Inc. (I) | | 830 | | 30,506 |
| Samsung Electronics Company, Ltd. | | 570 | | 307,479 |
| | |
|
| | | | | 435,070 |
|
| TOTAL PREFERRED SECURITIES (Cost $8,336,632) | | | $ | 11,522,725 |
|
| |
| RIGHTS - 0.00% | | | | |
| Immofinanz AG (Expiration Date: 3/2/11, | | | | |
| Strike Price: EUR 4.12) (I)(L) | | 30,022 | $ | 0 |
| | | | |
| International Equity Index Fund (continued) |
| | | Shares or | | |
| | | Principal | | |
| | | Amount | | Value |
| |
|
| | |
| |
| RIGHTS (continued) | | | | |
| Tele Norte Leste Participacoes SA (Expiration | | | | |
| Date: 3/24/11, Strike Price: BRL 28.27) (I) | | 2,416 | $ | 58 |
| Tele Norte Leste Participacoes SA (Expiration | | | | |
| Date: 3/24/11, Strike Price: BRL 28.27) (I) | | 6,764 | | 122 |
| Telemar Norte Leste SA (Expiration Date: | | | | |
| 3/22/11, Strike Price: BRL 1000.00) (I) | | 1 | | 0 |
| Telemar Norte Leste SA (Expiration Date: | | | | |
| 3/24/11, Strike Price: BRL 50.71) (I) | | 888 | | 43 |
| TeliaSonera AB (Expiration Date: 3/25/11, | | | | |
| Strike Price: SEK 62.00) (I) | 57,500 | | 2,837 |
| Wharf Holdings, Ltd. (Expiration Date: | | | | |
| 03/11/11, Strike Price: HKD 36.50) (I) | | 3,762 | | 7,028 |
|
| TOTAL RIGHTS (Cost $2,692) | | | $ | 10,088 |
|
| |
| WARRANTS - 0.00% | | | | |
| Kinross Gold Corp. (Expiration Date: 9/17/14, | | | | |
| Strike Price: USD $21.30) (I) | | 638 | | 1,819 |
| Mediobanca SPA (Expiration Date: 3/18/11, | | | | |
| Strike Price: EUR 9.00) (I) | | 9,525 | | 28 |
| UBI Banca SCPA (Expiration Date: 6/30/11, | | | | |
| Strike Price: EUR 12.30) (I) | 23,168 | | 61 |
|
| TOTAL WARRANTS (Cost $3,040) | | | $ | 1,908 |
|
| |
| SECURITIES LENDING COLLATERAL - 2.03% | | | |
| John Hancock Collateral | | | | |
| Investment Trust, 0.2855% (W)(Y) | 984,178 | | 9,849,059 |
|
| TOTAL SECURITIES LENDING | | | | |
| COLLATERAL (Cost $9,848,432) | | | $ | 9,849,059 |
|
| |
| SHORT-TERM INVESTMENTS - 2.03% | | | | |
| Short-Term Securities* - 2.03% | | | | |
| AIM Short-Term Investment Trust, 0.140% | 9,837,988 | $ | 9,837,988 |
|
| TOTAL SHORT-TERM INVESTMENTS (Cost $9,837,988) | | $ | 9,837,988 |
|
| Total Investments (International Equity Index Fund) | | | |
| (Cost $385,814,759) - 99.45% | | | $ | 482,222,196 |
| Other assets and liabilities, net - 0.55% | | | | 2,643,999 |
| | |
|
| TOTAL NET ASSETS - 100.00% | | | $ | 484,866,195 |
| | | |
|
| |
| |
| International Growth Stock Fund | | | |
| | | Shares | | Value |
| |
|
| |
| COMMON STOCKS - 93.22% | | | | |
| Australia - 6.12% | | | | |
| BHP Billiton, Ltd. | 76,937 | $ | 3,634,860 |
| Cochlear, Ltd. | 21,899 | | 1,730,799 |
| CSL, Ltd. | 47,720 | | 1,734,034 |
| QBE Insurance Group, Ltd. | 72,560 | | 1,346,631 |
| WorleyParsons, Ltd. | 89,415 | | 2,764,015 |
| | |
|
| | | | | 11,210,339 |
| Belgium - 1.54% | | | | |
| Anheuser-Busch InBev NV | 50,317 | | 2,811,907 |
| Brazil - 2.51% | | | | |
| Banco Bradesco SA, ADR | 150,604 | | 2,948,826 |
| Petroleo Brasileiro SA, SADR | 46,864 | | 1,648,207 |
| | |
|
| | | | | 4,597,033 |
| Canada - 5.64% | | | | |
| Canadian National Railway Company | 12,463 | | 911,555 |
| Canadian Natural Resources, Ltd. | 37,403 | | 1,883,721 |
| Cenovus Energy, Inc. | 47,325 | | 1,838,834 |
| |
| The accompanying notes are an integral part of the financial statements. | 121 |
John Hancock Funds II
Portfolio of Investments — February 28, 2011 (Unaudited) (showing percentage of total net assets)
| | | | |
| International Growth Stock Fund (continued) |
| | | Shares | | Value |
| | |
|
| |
| COMMON STOCKS (continued) | | | | |
| Canada (continued) | | | | |
| EnCana Corp. | | 35,359 | $ | 1,149,336 |
| Fairfax Financial Holdings, Ltd. | | 3,372 | | 1,306,665 |
| Suncor Energy, Inc. | | 43,637 | | 2,050,811 |
| Talisman Energy, Inc. | | 47,712 | | 1,184,022 |
| | |
|
| | | | | 10,324,944 |
| China - 1.43% | | | | |
| Industrial & Commercial Bank of China, Ltd. | | 3,414,000 | | 2,625,311 |
| Denmark - 1.73% | | | | |
| Novo Nordisk A/S | | 25,189 | | 3,171,601 |
| France - 6.53% | | | | |
| BNP Paribas | | 29,959 | | 2,341,631 |
| Cap Gemini SA | | 28,512 | | 1,665,448 |
| Compagnie Generale des Etablissements | | | | |
| Michelin, Class B | | 11,515 | | 938,215 |
| Danone SA | | 33,370 | | 2,091,501 |
| Eutelsat Communications | | 29,081 | | 1,160,079 |
| Lafarge SA | | 14,594 | | 884,866 |
| Publicis Groupe SA | | 18,907 | | 1,078,599 |
| Total SA | | 29,354 | | 1,801,021 |
| | |
|
| | | | | 11,961,360 |
| Germany - 6.04% | | | | |
| Adidas AG | | 34,461 | | 2,211,242 |
| Bayer AG | | 23,945 | | 1,856,695 |
| Bayerische Motoren Werke (BMW) AG | | 28,103 | | 2,279,210 |
| Fresenius Medical Care AG | | 26,862 | | 1,777,300 |
| Puma AG | | 3,299 | | 981,028 |
| SAP AG | | 32,414 | | 1,955,666 |
| | |
|
| | | | | 11,061,141 |
| Hong Kong - 1.87% | | | | |
| Hutchison Whampoa, Ltd. | | 190,000 | | 2,248,238 |
| Li & Fung, Ltd. | | 194,000 | | 1,179,335 |
| | |
|
| | | | | 3,427,573 |
| India - 1.71% | | | | |
| Bharat Heavy Electricals, Ltd. | | 17,240 | | 768,006 |
| Infosys Technologies, Ltd., ADR | | 35,501 | | 2,367,917 |
| | |
|
| | | | | 3,135,923 |
| Ireland - 2.09% | | | | |
| Shire PLC | | 135,507 | | 3,836,636 |
| Israel - 1.76% | | | | |
| Teva Pharmaceutical Industries, Ltd., SADR | | 64,235 | | 3,218,174 |
| Japan - 8.90% | | | | |
| Canon, Inc. | | 32,900 | | 1,591,195 |
| Denso Corp. | | 43,600 | | 1,634,026 |
| Fanuc, Ltd. | | 13,500 | | 2,101,363 |
| Keyence Corp. | | 6,300 | | 1,718,326 |
| Komatsu, Ltd. | | 52,900 | | 1,620,515 |
| Nidec Corp. | | 38,800 | | 3,615,225 |
| Toyota Motor Corp. | | 39,800 | | 1,856,740 |
| Yamada Denki Company, Ltd. | | 28,360 | | 2,165,137 |
| | |
|
| | | | | 16,302,527 |
| Mexico - 3.53% | | | | |
| America Movil SAB de CV, Series L, ADR | | 58,971 | | 3,386,115 |
| Fomento Economico Mexicano SAB de CV | | 24,769 | | 1,392,761 |
| Grupo Televisa SA, SADR (I) | | 71,665 | | 1,692,727 |
| | |
|
| | | | | 6,471,603 |
| Netherlands - 4.18% | | | | |
| Koninklijke (Royal) KPN NV | | 111,863 | | 1,811,361 |
| Koninklijke Ahold NV | | 132,479 | | 1,778,827 |
| TNT NV | | 64,095 | | 1,681,360 |
| Unilever NV | | 53,374 | | 1,610,892 |
| | | | |
| International Growth Stock Fund (continued) |
| | | Shares | | Value |
| | |
|
| |
| COMMON STOCKS (continued) | | | | |
| Netherlands (continued) | | | | |
| Vimpelcom, Ltd., ADR | | 55,132 | $ | 778,464 |
| | |
|
| | | | | 7,660,904 |
| Philippines - 0.81% | | | | |
| Philippine Long Distance Telephone Company | | 30,005 | | 1,488,133 |
| Russia - 1.21% | | | | |
| Gazprom OAO, SADR (London Exchange) | | 75,479 | | 2,225,417 |
| Singapore - 2.76% | | | | |
| Keppel Corp., Ltd. | | 337,000 | | 2,998,612 |
| United Overseas Bank, Ltd. | | 145,000 | | 2,062,750 |
| | |
|
| | | | | 5,061,362 |
| South Korea - 2.11% | | | | |
| Hyundai Mobis (I) | | 10,389 | | 2,431,171 |
| NHN Corp. (I) | | 8,567 | | 1,440,570 |
| | |
|
| | | | | 3,871,741 |
| Sweden - 2.48% | | | | |
| Ericsson (LM), Series B | | 121,342 | | 1,559,272 |
| Kinnevik Investment AB (I) | | 42,270 | | 948,488 |
| Swedbank AB, Class A (I) | | 36,640 | | 645,470 |
| Volvo AB, Series B (I) | | 80,269 | | 1,388,545 |
| | |
|
| | | | | 4,541,775 |
| Switzerland - 6.77% | | | | |
| ABB, Ltd. (I) | | 30,956 | | 758,528 |
| Julius Baer Group, Ltd. | | 35,735 | | 1,602,945 |
| Nestle SA | | 54,978 | | 3,112,035 |
| Novartis AG | | 44,101 | | 2,476,680 |
| Roche Holdings AG | | 15,367 | | 2,316,991 |
| Syngenta AG (I) | | 6,360 | | 2,137,529 |
| | |
|
| | | | | 12,404,708 |
| Taiwan - 2.11% | | | | |
| Hon Hai Precision Industry Company, Ltd. | | 388,000 | | 1,428,857 |
| Taiwan Semiconductor | | | | |
| Manufacturing Company, Ltd. | | 1,017,000 | | 2,431,316 |
| | |
|
| | | | | 3,860,173 |
| Turkey - 0.68% | | | | |
| Akbank T.A.S. | | 267,893 | | 1,252,784 |
| United Kingdom - 18.71% | | | | |
| BG Group PLC (I) | | 112,763 | | 2,751,073 |
| British American Tobacco PLC | | 58,320 | | 2,333,896 |
| Centrica PLC | | 463,201 | | 2,564,051 |
| Compass Group PLC | | 356,385 | | 3,206,057 |
| Imperial Tobacco Group PLC | | 105,452 | | 3,388,482 |
| Informa PLC | | 244,186 | | 1,724,894 |
| International Power PLC | | 434,271 | | 2,359,802 |
| Kingfisher PLC | | 406,000 | | 1,678,172 |
| Next PLC | | 51,113 | | 1,644,053 |
| Reckitt Benckiser Group PLC | | 20,841 | | 1,074,080 |
| Reed Elsevier PLC | | 207,185 | | 1,850,053 |
| Royal Dutch Shell PLC, B Shares | | 55,022 | | 1,966,118 |
| Smith & Nephew PLC | | 73,606 | | 852,421 |
| Tesco PLC | | 360,362 | | 2,370,023 |
| Vodafone Group PLC | | 938,097 | | 2,661,858 |
| WPP PLC | | 134,489 | | 1,850,167 |
| | |
|
| | | | | 34,275,200 |
|
| TOTAL COMMON STOCKS (Cost $156,980,281) | | | $ | 170,798,269 |
|
| |
| The accompanying notes are an integral part of the financial statements. | 122 |
John Hancock Funds II
Portfolio of Investments — February 28, 2011 (Unaudited) (showing percentage of total net assets)
| | | | |
| International Growth Stock Fund (continued) |
| | | Shares | | Value |
| |
|
| | | |
| |
| SHORT-TERM INVESTMENTS - 6.81% | | | | |
| Short-Term Securities* - 6.81% | | | | |
| State Street Institutional Liquid Reserves | | | | |
| Fund, 0.2053% | | 12,474,394 | $ | 12,474,394 |
|
| TOTAL SHORT-TERM INVESTMENTS (Cost $12,474,394) | $ | 12,474,394 |
|
| Total Investments (International Growth Stock Fund) | | |
| (Cost $169,454,675) - 100.03% | | | $ | 183,272,663 |
| Other assets and liabilities, net - (0.03%) | | | | (54,084) |
| | | |
|
| TOTAL NET ASSETS - 100.00% | | | $ | 183,218,579 |
| | | |
|
| | |
| |
| |
| |
| International Opportunities Fund | | |
| | | Shares or | | |
| | | Principal | | |
| | | Amount | | Value |
| | |
|
| |
| COMMON STOCKS - 96.31% | | | | |
| Argentina - 1.07% | | | | |
| MercadoLibre, Inc. (I) | | 125,575 | $ | 8,260,324 |
| Belgium - 2.63% | | | | |
| Anheuser-Busch InBev NV | | 362,867 | | 20,278,399 |
| Brazil - 7.02% | | | | |
| Anhanguera Educacional Participacoes SA | | 227,000 | | 5,075,370 |
| BR Malls Participacoes SA | | 1,642,400 | | 15,646,135 |
| OGX Petroleo e Gas Participacoes SA (I) | | 2,863,838 | | 33,478,572 |
| | |
|
| | | | | 54,200,077 |
| Canada - 3.76% | | | | |
| Canadian National Railway Company | | 271,769 | | 19,912,515 |
| Teck Resources, Ltd. | | 164,170 | | 9,082,536 |
| | |
|
| | | | | 28,995,051 |
| China - 2.29% | | | | |
| Baidu, Inc., SADR (I) | | 60,429 | | 7,321,578 |
| SINA Corp. (I) | | 127,089 | | 10,379,359 |
| | |
|
| | | | | 17,700,937 |
| Denmark - 4.53% | | | | |
| Novo Nordisk A/S | | 159,068 | | 20,028,594 |
| Novozymes A/S, B Shares | | 50,708 | | 7,089,146 |
| Pandora A/S (I) | | 135,146 | | 7,863,673 |
| | |
|
| | | | | 34,981,413 |
| France - 8.15% | | | | |
| Accor SA | | 255,308 | | 12,022,243 |
| BNP Paribas | | 130,532 | | 10,202,536 |
| Pernod-Ricard SA | | 86,239 | | 7,948,984 |
| Publicis Groupe SA | | 218,479 | | 12,463,700 |
| Schneider Electric SA | | 122,644 | | 20,285,326 |
| | |
|
| | | | | 62,922,789 |
| Germany - 8.07% | | | | |
| Adidas AG | | 134,599 | | 8,636,749 |
| BASF SE | | 295,085 | | 24,536,697 |
| Siemens AG | | 116,988 | | 15,752,204 |
| ThyssenKrupp AG | | 322,204 | | 13,412,812 |
| | |
|
| | | | | 62,338,462 |
| Hong Kong - 5.61% | | | | |
| CNOOC, Ltd. | | 3,587,600 | | 8,161,978 |
| Hang Lung Properties, Ltd. | | 2,186,000 | | 9,317,330 |
| Li & Fung, Ltd. | | 4,256,000 | | 25,872,429 |
| | |
|
| | | | | 43,351,737 |
| India - 2.00% | | | | |
| ICICI Bank, Ltd., SADR | | 356,852 | | 15,473,103 |
| | | | |
| International Opportunities Fund (continued) |
| | | Shares or | | |
| | | Principal | | |
| | | Amount | | Value |
| |
|
| | |
| |
| COMMON STOCKS (continued) | | | | |
| Japan - 14.87% | | | | |
| Canon, Inc. | | 232,000 | $ | 11,220,585 |
| Daikin Industries, Ltd. | | 134,005 | | 4,550,709 |
| Dena Company, Ltd. | | 240,400 | | 9,281,218 |
| FamilyMart Company, Ltd. | | 257,500 | | 9,746,705 |
| Fanuc, Ltd. | | 80,000 | | 12,452,524 |
| Honda Motor Company, Ltd. | | 439,600 | | 19,167,079 |
| Komatsu, Ltd. | | 619,700 | | 18,983,614 |
| Marubeni Corp. | | 1,820,000 | | 13,964,865 |
| Sumitomo Realty & | | | | |
| Development Company, Ltd. | | 290,000 | | 7,795,402 |
| Yamada Denki Company, Ltd. | | 100,630 | | 7,682,572 |
| | |
|
| | | | | 114,845,273 |
| Luxembourg - 1.52% | | | | |
| Millicom International Cellular SA | | 134,169 | | 11,753,204 |
| Netherlands - 5.23% | | | | |
| ASML Holding NV | | 308,183 | | 13,369,185 |
| LyondellBasell Industries, Class A (I) | | 374,235 | | 14,250,869 |
| Sensata Technologies Holding NV (I) | | 384,584 | | 12,729,730 |
| | |
|
| | | | | 40,349,784 |
| South Africa - 1.90% | | | | |
| Naspers, Ltd., SADR | | 255,548 | | 14,690,069 |
| Spain - 4.18% | | | | |
| Banco Bilbao Vizcaya Argentaria SA | | 609,337 | | 7,528,317 |
| Criteria Caixacorp SA | | 830,487 | | 6,010,580 |
| Inditex SA | | 259,035 | | 18,745,805 |
| | |
|
| | | | | 32,284,702 |
| Sweden - 1.03% | | | | |
| Assa Abloy AB, Series B | | 283,360 | | 7,930,359 |
| Switzerland - 7.13% | | | | |
| Julius Baer Group, Ltd. | | 264,640 | | 11,870,807 |
| Nestle SA | | 360,664 | | 20,415,420 |
| The Swatch Group AG, BR Shares | | 53,402 | | 22,767,053 |
| | |
|
| | | | | 55,053,280 |
| United Kingdom - 12.85% | | | | |
| ARM Holdings PLC | | 906,795 | | 9,127,880 |
| Barclays PLC | | 3,480,236 | | 18,071,718 |
| HSBC Holdings PLC | | 408,612 | | 4,497,199 |
| Reckitt Benckiser Group PLC | | 166,010 | | 8,555,637 |
| Rolls-Royce Group PLC (I) | | 867,342 | | 8,699,128 |
| Standard Chartered PLC | | 505,786 | | 13,373,113 |
| Tesco PLC | | 2,079,628 | | 13,677,266 |
| Tullow Oil PLC | | 506,394 | | 11,819,187 |
| Xstrata PLC | | 500,073 | | 11,413,958 |
| | |
|
| | | | | 99,235,086 |
| United States - 2.47% | | | | |
| Citigroup, Inc. (I) | | 4,072,691 | | 19,060,194 |
|
| TOTAL COMMON STOCKS (Cost $577,584,709) | | $ | 743,704,243 |
|
| |
| SHORT-TERM INVESTMENTS - 3.18% | | | | |
| Short-Term Securities* - 3.18% | | | | |
| State Street Institutional Investment Treasury | | | |
| Money Market Fund, 0.0453% | $ | 24,591,073 | $ | 24,591,073 |
| |
| The accompanying notes are an integral part of the financial statements. | 123 |
John Hancock Funds II
Portfolio of Investments — February 28, 2011 (Unaudited) (showing percentage of total net assets)
| | | | |
| International Opportunities Fund (continued) |
| | | Shares or | | |
| | | Principal | | |
| | | Amount | | Value |
| |
|
| | |
| |
| SHORT-TERM INVESTMENTS (continued) | | | |
| Short-Term Securities* (continued) | | | | |
| State Street Institutional Treasury Plus Money | | | |
| Market Fund, 0.0447% | $ | 64 | $ | 64 |
| | | |
|
| | | | | 24,591,137 |
|
| TOTAL SHORT-TERM INVESTMENTS (Cost $24,591,137) | $ | 24,591,137 |
|
| Total Investments (International Opportunities Fund) | | |
| (Cost $602,175,846) - 99.49% | | | $ | 768,295,380 |
| Other assets and liabilities, net - 0.51% | | | | 3,902,383 |
| | | |
|
| TOTAL NET ASSETS - 100.00% | | | $ | 772,197,763 |
| | | |
|
| |
| |
| |
| International Small Cap Fund | | | |
| | | Shares or | | |
| | | Principal | | |
| | | Amount | | Value |
| |
|
| |
| COMMON STOCKS - 92.14% | | | | |
| Australia - 7.01% | | | | |
| Billabong International, Ltd. | | 714,567 | $ | 6,186,123 |
| Downer EDI, Ltd. | | 1,276,189 | | 5,103,108 |
| Emeco Holdings, Ltd. | | 6,312,426 | | 7,459,130 |
| Pacific Brands, Ltd. (I) | | 4,747,577 | | 4,319,699 |
| PaperlinX, Ltd. (I) | | 3,944,547 | | 1,819,451 |
| | |
|
| | | | | 24,887,511 |
| Austria - 2.12% | | | | |
| Wienerberger Baustoffindustrie AG (I)(L) | | 362,905 | | 7,506,162 |
| Bahamas - 1.85% | | | | |
| Steiner Leisure, Ltd. (I) | | 138,970 | | 6,553,825 |
| Belgium - 1.84% | | | | |
| Barco NV (I) | | 84,270 | | 6,512,830 |
| Canada - 10.50% | | | | |
| ATS Automation Tooling Systems, Inc. (I) | | 837,060 | | 6,031,002 |
| Canaccord Capital, Inc. | | 676,106 | | 10,703,012 |
| Dorel Industries, Inc., Class B | | 150,200 | | 4,885,307 |
| Genworth MI Canada, Inc. | | 169,400 | | 4,601,375 |
| HudBay Minerals, Inc. | | 212,100 | | 3,678,539 |
| Mullen Group, Ltd. | | 345,300 | | 7,360,571 |
| | |
|
| | | | | 37,259,806 |
| China - 3.08% | | | | |
| People’s Food Holdings, Ltd. | | 7,679,704 | | 4,704,546 |
| Sinotrans, Ltd., Class H | | 17,808,000 | | 4,860,528 |
| Travelsky Technology, Ltd. | | 1,485,539 | | 1,353,780 |
| | |
|
| | | | | 10,918,854 |
| Finland - 2.88% | | | | |
| Amer Sports OYJ | | 495,068 | | 6,578,608 |
| Huhtamaki OYJ | | 260,656 | | 3,625,110 |
| | |
|
| | | | | 10,203,718 |
| Germany - 1.24% | | | | |
| Jenoptik AG (I) | | 552,685 | | 4,402,571 |
| Greece - 1.82% | | | | |
| Alapis Holding Industrial & Commercial SA | 1,302,727 | | 896,598 |
| Athens Stock Exchange SA | | 592,189 | | 5,569,932 |
| | |
|
| | | | | 6,466,530 |
| Hong Kong - 7.73% | | | | |
| Dah Sing Financial Group | | 1,074,374 | | 6,903,026 |
| Fountain SET Holdings, Ltd. | | 8,483,425 | | 1,474,108 |
| Giordano International, Ltd. | | 8,202,365 | | 4,162,392 |
| Lerado Group Holding Company, Ltd. | | 6,547,682 | | 1,095,651 |
| | | | |
| International Small Cap Fund (continued) | | |
| | | Shares or | | |
| | | Principal | | |
| | | Amount | | Value |
| | |
|
| |
| COMMON STOCKS (continued) | | | | |
| Hong Kong (continued) | | | | |
| Stella International Holdings, Ltd. | | 2,648,500 | $ | 5,433,482 |
| Texwinca Holdings, Ltd. | | 3,140,907 | | 3,178,916 |
| Yue Yuen Industrial Holdings, Ltd. | | 1,637,140 | | 5,174,228 |
| | |
|
| | | | | 27,421,803 |
| Japan - 7.24% | | | | |
| Asics Corp. | | 53,000 | | 711,297 |
| Descente, Ltd. | | 807,860 | | 4,149,997 |
| En-Japan, Inc. | | 2,257 | | 3,770,210 |
| Kobayashi Pharmaceutical Company, Ltd. | | 126,800 | | 6,150,741 |
| Meitec Corp. (I) | | 78,111 | | 1,732,042 |
| Shinko Plantech Company, Ltd. | | 469,700 | | 5,036,098 |
| USS Company, Ltd. | | 51,080 | | 4,135,294 |
| | |
|
| | | | | 25,685,679 |
| Liechtenstein - 1.15% | | | | |
| Verwaltungs & Privat Bank AG | | 33,515 | | 4,065,709 |
| Netherlands - 7.57% | | | | |
| Aalberts Industries NV | | 176,091 | | 3,752,963 |
| Arcadis NV (L) | | 150,800 | | 3,605,419 |
| Mediq NV | | 315,085 | | 5,822,437 |
| SBM Offshore NV | | 134,586 | | 3,377,152 |
| TKH Group NV | | 276,579 | | 6,621,062 |
| USG People NV (I) | | 180,304 | | 3,689,161 |
| | |
|
| | | | | 26,868,194 |
| Norway - 1.51% | | | | |
| Tomra Systems ASA | | 758,890 | | 5,351,500 |
| Singapore - 0.11% | | | | |
| Huan Hsin Holdings, Ltd. (I) | | 2,502,298 | | 403,343 |
| South Korea - 4.95% | | | | |
| Binggrae Company, Ltd. | | 58,460 | | 3,169,096 |
| Busan Bank (I) | | 283,930 | | 3,418,581 |
| Daegu Bank | | 200,600 | | 2,721,661 |
| Intops Company, Ltd. (I) | | 86,071 | | 1,563,104 |
| Sindoh Company, Ltd. | | 80,243 | | 3,581,286 |
| Youngone Corp. | | 290,900 | | 3,104,587 |
| | |
|
| | | | | 17,558,315 |
| Spain - 2.62% | | | | |
| Antena 3 de Television SA (I)(L) | | 515,778 | | 5,002,786 |
| Sol Melia SA (L) | | 391,218 | | 4,298,116 |
| | |
|
| | | | | 9,300,902 |
| Sweden - 1.04% | | | | |
| D Carnegie & Company AB (I) | | 739,376 | | 0 |
| Niscayah Group AB | | 1,871,930 | | 3,679,338 |
| | |
|
| | | | | 3,679,338 |
| Switzerland - 3.33% | | | | |
| Panalpina Welttransport Holding AG (I) | | 65,410 | | 8,476,826 |
| Vontobel Holding AG | | 89,146 | | 3,350,028 |
| | |
|
| | | | | 11,826,854 |
| Taiwan - 5.45% | | | | |
| D-Link Corp. | | 1,621,668 | | 1,414,820 |
| Giant Manufacturing Company, Ltd. | | 988,746 | | 3,713,747 |
| KYE System Corp. | | 3,198,066 | | 2,369,813 |
| Ta Chong Bank Company, Ltd. (I) | | 15,644,000 | | 5,855,542 |
| Taiwan Fu Hsing Industrial Company, Ltd. | | 2,164,000 | | 1,702,272 |
| Test-Rite International Company, Ltd. | | 6,015,299 | | 4,269,395 |
| | |
|
| | | | | 19,325,589 |
| Thailand - 3.46% | | | | |
| Bank of Ayudhya PCL | | 8,190,800 | | 6,692,225 |
| Glow Energy PCL | | 2,703,888 | | 3,603,710 |
| |
| The accompanying notes are an integral part of the financial statements. | 124 |
John Hancock Funds II
Portfolio of Investments — February 28, 2011 (Unaudited) (showing percentage of total net assets)
| | | | |
| International Small Cap Fund (continued) | | |
| | | Shares or | | |
| | | Principal | | |
| | | Amount | | Value |
| |
|
| |
| COMMON STOCKS (continued) | | | | |
| Thailand (continued) | | | | |
| Total Access Communication PCL | | 1,520,060 | $ | 1,976,078 |
| | |
|
| | | | | 12,272,013 |
| United Kingdom - 11.73% | | | | |
| Bellway PLC | | 608,356 | | 6,654,152 |
| Bodycote PLC | | 786,785 | | 3,903,487 |
| Bovis Homes Group PLC (I) | | 909,300 | | 6,813,065 |
| Fiberweb PLC | | 3,126,880 | | 5,209,816 |
| Future PLC | | 5,278,067 | | 2,358,162 |
| Game Group PLC | | 2,392,366 | | 2,377,323 |
| Henderson Group PLC (L) | | 2,761,970 | | 7,225,778 |
| Persimmon PLC | | 923,715 | | 7,068,789 |
| | |
|
| | | | | 41,610,572 |
| United States - 1.91% | | | | |
| MF Global Holdings, Ltd. (I)(L) | | 783,700 | | 6,794,679 |
|
| TOTAL COMMON STOCKS (Cost $254,473,202) | | $ | 326,876,297 |
|
| |
| SECURITIES LENDING COLLATERAL - 6.75% | | | |
| John Hancock Collateral | | | | |
| Investment Trust, 0.2855% (W)(Y) | | 2,392,813 | | 23,945,841 |
|
| TOTAL SECURITIES LENDING | | | | |
| COLLATERAL (Cost $23,944,351) | | | $ | 23,945,841 |
|
| |
| SHORT-TERM INVESTMENTS - 7.55% | | | |
| Short-Term Securities* - 7.55% | | | | |
| Bank of Montreal Time Deposit, | | | | |
| 0.130% 03/01/2011 | $ | 6,800,000 | $ | 6,800,000 |
| BNP Paribas Time Deposit, | | | | |
| 0.160%, 03/01/2011 | | 10,000,000 | | 10,000,000 |
| Royal Bank of Canada Time | | | | |
| Deposit, 0.160%,03/01/2020 | | 10,000,000 | | 10,000,000 |
| | |
|
| | | | | 26,800,000 |
|
| TOTAL SHORT-TERM INVESTMENTS (Cost $26,800,000) | | $ | 26,800,000 |
|
| Total Investments (International Small Cap Fund) | | | |
| (Cost $305,217,553) - 106.44% | | | $ | 377,622,138 |
| Other assets and liabilities, net - (6.44%) | | | | (22,839,755) |
| | | |
|
| | |
| TOTAL NET ASSETS - 100.00% | | | $ | 354,782,383 |
| | | |
|
| | |
| |
| |
| |
| International Small Company Fund | | | |
| | | Shares or | | |
| | | Principal | | |
| | | Amount | | Value |
| |
|
| |
| COMMON STOCKS - 99.41% | | | | |
| Australia - 8.34% | | | | |
| Acrux, Ltd. (I) | | 23,000 | $ | 79,899 |
| Adamus Resources, Ltd. (I) | | 26,750 | | 20,178 |
| Adelaide Brighton, Ltd. | | 62,951 | | 212,557 |
| Aditya Birla Minerals, Ltd. (I) | | 40,783 | | 55,951 |
| AED Oil, Ltd. (I) | | 18,722 | | 5,830 |
| AJ Lucas Group, Ltd. | | 6,727 | | 15,938 |
| Alchemia, Ltd. (I) | | 25,636 | | 19,076 |
| Alesco Corp., Ltd. | | 12,775 | | 41,287 |
| Alkane Resources, Ltd. (I) | | 7,000 | | 8,420 |
| Alliance Resources, Ltd. (I) | | 40,937 | | 17,116 |
| Amalgamated Holdings, Ltd. | | 18,031 | | 114,569 |
| Amcom Telecommunications, Ltd. (I) | | 85,249 | | 26,852 |
| Ansell, Ltd. | | 23,019 | | 322,754 |
| Anvil Mining, Ltd. (I) | | 12,049 | | 74,535 |
| APA Group, Ltd. | | 45,473 | | 187,692 |
| | | | |
| International Small Company Fund (continued) |
| | | Shares or | | |
| | | Principal | | |
| | | Amount | | Value |
| | |
|
| |
| COMMON STOCKS (continued) | | | | |
| Australia (continued) | | | | |
| APN News & Media, Ltd. (I) | | 66,903 | $ | 119,828 |
| Arafura Resources, Ltd. (I) | | 12,692 | | 16,238 |
| ARB Corp., Ltd. | | 8,257 | | 64,377 |
| Aristocrat Leisure, Ltd. | | 10,940 | | 35,538 |
| ASG Group, Ltd. (I) | | 7,517 | | 7,838 |
| Atlas Iron, Ltd. (I)(L) | | 92,982 | | 367,831 |
| Aurora Oil and Gas, Ltd. (I) | | 6,740 | | 22,750 |
| Ausdrill, Ltd. | | 9,877 | | 35,629 |
| Ausenco, Ltd. | | 8,453 | | 28,117 |
| Austal, Ltd. | | 12,569 | | 38,207 |
| Austar United Communications, Ltd. (I) | | 82,457 | | 97,163 |
| Austbrokers Holdings, Ltd (I) | | 635 | | 3,805 |
| Austereo Group, Ltd. (I) | | 23,062 | | 48,351 |
| Austin Engineering, Ltd. | | 1,745 | | 8,225 |
| Australian Agricultural Company, Ltd. | | 21,026 | | 35,386 |
| Australian Infrastructure Fund (I) | | 82,078 | | 163,869 |
| Australian Pharmaceutical Industries, Ltd. | | 56,375 | | 23,055 |
| Australian Worldwide Exploration, Ltd. (I) | | 56,285 | | 95,177 |
| Automotive Holdings Group | | 22,990 | | 65,306 |
| AVJennings, Ltd. | | 32,942 | | 18,091 |
| Azumah Resources, Ltd. (I) | | 6,903 | | 4,100 |
| Bc Iron, Ltd. (I) | | 7,691 | | 24,049 |
| Beach Energy, Ltd. | | 162,875 | | 156,681 |
| Becton Property Group (I) | | 11,935 | | 572 |
| Bendigo Mining, Ltd. (I) | | 20,172 | | 3,390 |
| Berkeley Resources, Ltd. (I) | | 4,742 | | 7,129 |
| Biota Holdings, Ltd. (I) | | 39,986 | | 43,950 |
| Blackmores, Ltd. | | 1,614 | | 51,852 |
| Boart Longyear Group | | 78,496 | | 372,088 |
| Boom Logistics, Ltd. | | 42,444 | | 16,696 |
| Bow Energy, Ltd. (I) | | 55,754 | | 64,294 |
| Bradken, Ltd. | | 33,160 | | 279,166 |
| Breville Group, Ltd. | | 19,121 | | 70,231 |
| Brickworks, Ltd. | | 5,184 | | 59,490 |
| Brockman Resources, Ltd. (I) | | 13,981 | | 78,744 |
| Cabcharge Australia, Ltd. (I) | | 20,355 | | 116,480 |
| Campbell Brothers, Ltd. | | 8,374 | | 362,626 |
| Cape Lambert Iron Ore, Ltd. (I) | | 117,043 | | 74,388 |
| Cardno, Ltd. | | 10,710 | | 66,551 |
| Carnarvon Petroleum, Ltd. (I) | | 59,353 | | 21,598 |
| Cash Converters International, Ltd. | | 16,548 | | 14,787 |
| Catalpa Resources, Ltd. (I) | | 31,172 | | 49,264 |
| Cellestis, Ltd. | | 9,557 | | 26,158 |
| Centamin Egypt, Ltd. (I) | | 55,536 | | 107,280 |
| Ceramic Fuel Cells, Ltd. (I) | | 126,217 | | 16,887 |
| Challenger Financial Services Group, Ltd. | | 35,717 | | 185,490 |
| Chemgenex Pharmaceuticals, Ltd. (I) | | 16,902 | | 7,312 |
| Clough, Ltd. | | 23,830 | | 20,771 |
| Coal of Africa, Ltd. (I) | | 39,262 | | 56,615 |
| Coalspur Mines, Ltd. (I) | | 27,065 | | 53,351 |
| Cockatoo Coal, Ltd. (I) | | 87,990 | | 46,540 |
| Codan, Ltd. | | 4,533 | | 6,325 |
| Coffey International, Ltd. (I) | | 17,660 | | 14,405 |
| Comdek, Ltd. (I) | | 9,069 | | 6,747 |
| Compass Resources, Ltd. (I) | | 15,577 | | 2,379 |
| ConnectEast Group | | 482,830 | | 217,431 |
| Conquest Mining, Ltd. (I) | | 63,601 | | 37,020 |
| Consolidated Media Holdings, Ltd. | | 37,958 | | 116,493 |
| Count Financial, Ltd. | | 16,149 | | 20,698 |
| Crane Group, Ltd. (I) | | 17,317 | | 173,794 |
| CuDeco, Ltd. (I) | | 21,846 | | 79,393 |
| Customers, Ltd. | | 9,594 | | 15,126 |
| Decmil Group, Ltd. (I) | | 7,369 | | 20,664 |
| Deep Yellow, Ltd. (I) | | 56,297 | | 17,744 |
| Discovery Metals, Ltd. (I) | | 77,427 | | 99,898 |
| |
| The accompanying notes are an integral part of the financial statements. | 125 |
John Hancock Funds II
Portfolio of Investments — February 28, 2011 (Unaudited) (showing percentage of total net assets)
| | | | |
| International Small Company Fund (continued) |
| | | Shares or | | |
| | | Principal | | |
| | | Amount | | Value |
| | |
|
| |
| COMMON STOCKS (continued) | | | | |
| Australia (continued) | | | | |
| Domino’s Pizza Enterprises, Ltd. | | 456 | $ | 2,910 |
| Dragon Mining, Ltd. (I) | | 2,230 | | 3,378 |
| Duet Group | | 151,201 | | 251,080 |
| Duluxgroup, Ltd. | | 33,091 | | 93,923 |
| Eastern Star Gas, Ltd. (I) | | 95,905 | | 69,262 |
| Elders, Ltd. | | 40,650 | | 21,504 |
| Emeco Holdings, Ltd. | | 73,594 | | 86,963 |
| Energy World Corp., Ltd. (I) | | 112,377 | | 46,158 |
| Envestra, Ltd. | | 83,714 | | 53,066 |
| Extract Resources, Ltd. (I) | | 11,558 | | 109,367 |
| Ferraus, Ltd. (I) | | 6,068 | | 0 |
| Ferraus, Ltd. (I)(L) | | 36,238 | | 34,018 |
| FKP Property Group, Ltd. | | 81,531 | | 71,811 |
| Fleetwood Corp., Ltd. (I) | | 5,897 | | 81,108 |
| FlexiGroup, Ltd. | | 75,857 | | 145,552 |
| Flight Centre, Ltd. | | 8,110 | | 183,308 |
| Forest Enterprises Australia, Ltd. (I) | | 29,109 | | 0 |
| Forge Group, Ltd. | | 8,127 | | 53,131 |
| Galaxy Resources, Ltd. (I) | | 10,898 | | 16,183 |
| Geodynamics, Ltd. (I) | | 31,447 | | 11,251 |
| Gindalbie Metals, Ltd. (I) | | 44,120 | | 50,737 |
| Goodman Fielder, Ltd. | | 238,200 | | 303,203 |
| GrainCorp., Ltd. | | 31,091 | | 233,902 |
| Grange Resources Corp., Ltd. (I) | | 43,931 | | 33,358 |
| Great Southern Plantations, Ltd. (I) | | 47,114 | | 0 |
| GUD Holdings, Ltd. | | 10,707 | | 100,984 |
| Gujarat NRE Coking Coal, Ltd. (I) | | 20,803 | | 14,523 |
| Gunns, Ltd. (I) | | 100,882 | | 54,989 |
| GWA International, Ltd. (I) | | 27,947 | | 95,924 |
| Hastie Group, Ltd. | | 31,448 | | 29,617 |
| Heron Resources, Ltd. (I) | | 9,000 | | 1,795 |
| Hills Industries, Ltd. (I) | | 27,614 | | 48,946 |
| Horizon Oil, Ltd. (I) | | 97,753 | | 34,963 |
| IBA Health, Ltd. | | 53,725 | | 3,178 |
| iiNET, Ltd. (I) | | 9,172 | | 23,439 |
| Imdex, Ltd. | | 25,905 | | 48,800 |
| IMFAustralia, Ltd. (I) | | 16,845 | | 28,563 |
| Independence Group NL | | 14,124 | | 99,008 |
| Indophil Resources NL (I) | | 41,044 | | 30,199 |
| Industrea, Ltd. | | 51,733 | | 70,778 |
| Infigen, Ltd. | | 70,305 | | 25,996 |
| Infomedia, Ltd. | | 45,314 | | 12,013 |
| Inter Citic Minerals, Inc. (I) | | 13,600 | | 26,877 |
| International Ferro Metals, Ltd. (I) | | 582 | | 216 |
| Intrepid Mines, Ltd. (I) | | 43,561 | | 95,688 |
| Invocare, Ltd. | | 12,728 | | 97,448 |
| IOOF Holdings, Ltd. (I) | | 29,308 | | 233,079 |
| Iress Market Technology, Ltd. (L) | | 17,791 | | 163,371 |
| Iron Ore Holdings, Ltd. (I) | | 4,139 | | 7,745 |
| Ivanhoe Australia, Ltd. (I) | | 26,052 | | 86,413 |
| Jabiru Metals, Ltd. (I) | | 30,000 | | 25,604 |
| Kagara Zinc, Ltd. (I) | | 47,616 | | 36,453 |
| Karoon Gas Australia, Ltd. (I) | | 19,998 | | 143,432 |
| Kimberley Metals, Ltd. (I) | | 8,314 | | 2,067 |
| Kingsgate Consolidated, Ltd. | | 21,020 | | 202,803 |
| Kingsrose Mining, Ltd. (I) | | 6,159 | | 8,549 |
| Linc Energy, Ltd. | | 50,055 | | 144,405 |
| Liquefied Natural Gas, Ltd. (I) | | 19,165 | | 11,169 |
| Lynas Corp., Ltd. (I) | | 139,946 | | 281,891 |
| Macmahon Holdings, Ltd. | | 85,483 | | 50,421 |
| Mantra Resources, Ltd. (I) | | 10,258 | | 82,543 |
| Marengo Mining, Ltd. (I) | | 16,138 | | 5,648 |
| Marion Energy, Ltd. (I) | | 61,857 | | 1,963 |
| Mcmillan Shakespeare, Ltd. | | 7,069 | | 68,247 |
| McPherson’s, Ltd. (I) | | 18,009 | | 61,005 |
| | | | |
| International Small Company Fund (continued) |
| | | Shares or | | |
| | | Principal | | |
| | | Amount | | Value |
| | |
|
| |
| COMMON STOCKS (continued) | | | | |
| Australia (continued) | | | | |
| Medusa Mining, Ltd. | | 34,800 | $ | 251,972 |
| Melbourne IT, Ltd. | | 2,200 | | 4,365 |
| MEO Australia, Ltd. (I) | | 24,107 | | 5,327 |
| Mermaid Marine Australia, Ltd. (I) | | 20,302 | | 65,021 |
| Metals X, Ltd. (I) | | 128,000 | | 44,826 |
| Minara Resources, Ltd. | | 40,832 | | 35,134 |
| Mincor Resources NL | | 36,432 | | 63,040 |
| Mineral Deposits, Ltd. (I) | | 1,331 | | 8,013 |
| Mineral Resources, Ltd. | | 12,820 | | 169,202 |
| Mirabela Nickel, Ltd. (I) | | 50,832 | | 111,914 |
| Molopo Australia, Ltd. (I) | | 28,437 | | 28,430 |
| Monadelphous Group, Ltd. | | 12,016 | | 245,925 |
| Mortgage Choice, Ltd. | | 11,340 | | 17,348 |
| Mount Gibson Iron, Ltd. (I) | | 151,507 | | 312,907 |
| Murchison Metals, Ltd. (I)(L) | | 59,669 | | 84,879 |
| Nanosonics, Ltd. (I) | | 8,290 | | 8,222 |
| Navitas, Ltd. | | 35,981 | | 160,689 |
| Neptune Marine Services, Ltd. (I) | | 23,710 | | 4,949 |
| Nexbis, Ltd. (I) | | 42,793 | | 4,406 |
| Nexus Energy, Ltd. (I) | | 69,816 | | 32,400 |
| NIB Holdings, Ltd. | | 31,272 | | 44,837 |
| Northern Iron, Ltd. (I) | | 12,457 | | 24,175 |
| NRW Holdings, Ltd. | | 16,135 | | 38,934 |
| Nucoal Resources Nl (I) | | 12,707 | | 6,606 |
| Nufarm, Ltd. | | 20,622 | | 110,872 |
| Oakton, Ltd. | | 9,591 | | 24,358 |
| OceanaGold Corp. (I) | | 11,783 | | 31,775 |
| Orocobre, Ltd. (I) | | 3,375 | | 10,081 |
| OrotonGroup, Ltd. | | 2,980 | | 28,345 |
| Pacific Brands, Ltd. (I) | | 174,508 | | 158,780 |
| Pan Australian Resources, Ltd. (I) | | 329,305 | | 272,877 |
| Pan Pacific Petroleum NL (I) | | 67,247 | | 10,998 |
| PaperlinX, Ltd. | | 65,071 | | 30,014 |
| Peet & Company, Ltd. (I) | | 33,458 | | 65,801 |
| Perilya, Ltd. | | 30,460 | | 20,244 |
| Perpetual Trust of Australia, Ltd. | | 6,122 | | 202,327 |
| Perseus Mining, Ltd. (I) | | 62,541 | | 190,061 |
| Pharmaxis, Ltd. (I) | | 29,382 | | 74,724 |
| Photon Group, Ltd. | | 155,087 | | 12,060 |
| Platinum Australia, Ltd. (I) | | 36,499 | | 24,395 |
| PMP, Ltd. | | 35,022 | | 29,762 |
| Premier Investments, Ltd. (I) | | 15,519 | | 95,059 |
| Primary Health Care, Ltd. (I) | | 50,418 | | 167,183 |
| Prime Television, Ltd. (I) | | 15,587 | | 11,600 |
| PrimeAG Australia, Ltd. (I) | | 5,345 | | 8,404 |
| Programmed Maintenance Services, Ltd. (I) | | 14,733 | | 23,198 |
| Ramelius Resources, Ltd. | | 58,054 | | 67,794 |
| RCR Tomlinson, Ltd. | | 22,598 | | 37,502 |
| REA Group, Ltd. (I) | | 8,665 | | 103,282 |
| Reckon, Ltd. (I) | | 14,138 | | 36,051 |
| Redflex Holdings, Ltd. | | 5,472 | | 14,233 |
| Regis Resources, Ltd. (I)(L) | | 30,552 | | 64,075 |
| Resolute Mining, Ltd. (I) | | 43,345 | | 58,552 |
| Rex Minerals, Ltd. (I) | | 25,561 | | 71,751 |
| Ridley Corp., Ltd. | | 27,918 | | 36,104 |
| Roc Oil Company, Ltd. (I) | | 81,308 | | 29,578 |
| SAI Global, Ltd. | | 32,266 | | 156,257 |
| Sally Malay Mining, Ltd. | | 27,777 | | 64,899 |
| Salmat, Ltd. | | 15,825 | | 67,559 |
| Sandfire Resources Nl (I) | | 14,137 | | 105,394 |
| Saracen Mineral Holdings, Ltd. (I) | | 13,978 | | 10,421 |
| Sedgman, Ltd. | | 11,316 | | 21,564 |
| ServCorp, Ltd. | | 10,693 | | 32,713 |
| Service Stream, Ltd. | | 8,282 | | 5,340 |
| Seven Network, Ltd. (I) | | 6,952 | | 65,100 |
| |
| The accompanying notes are an integral part of the financial statements. | 126 |
John Hancock Funds II
Portfolio of Investments — February 28, 2011 (Unaudited) (showing percentage of total net assets)
| | | | |
| International Small Company Fund (continued) |
| | | Shares or | | |
| | | Principal | | |
| | | Amount | | Value |
| | |
|
| |
| COMMON STOCKS (continued) | | | | |
| Australia (continued) | | | | |
| Sigma Pharmaceuticals, Ltd. | | 111,268 | $ | 50,441 |
| Silex Systems, Ltd. (I) | | 12,058 | | 64,564 |
| Silver Lake Resources, Ltd. (I) | | 11,183 | | 22,772 |
| Sirtex Medical, Ltd. | | 892 | | 5,122 |
| Slater & Gordon, Ltd. (I) | | 1,921 | | 4,432 |
| SMS Management & Technology, Ltd. | | 12,633 | | 84,838 |
| Southern Cross Media Group, Ltd. (L) | | 47,384 | | 86,711 |
| SP Telemedia, Ltd. (I) | | 63,587 | | 89,886 |
| Spark Infrastructure Group (S) | | 189,679 | | 224,559 |
| Specialty Fashion Group, Ltd. (I) | | 51,331 | | 60,318 |
| Spotless Group, Ltd. | | 25,238 | | 52,302 |
| St. Barbara, Ltd. (I) | | 50,884 | | 105,248 |
| Starpharma Holdings, Ltd. (I) | | 7,424 | | 7,813 |
| Straits Metals, Ltd. (I) | | 26,787 | | 15,546 |
| Straits Resources, Ltd. (I) | | 26,787 | | 46,764 |
| STW Communications Group, Ltd. (I) | | 36,346 | | 47,472 |
| Sundance Energy Australia, Ltd. (I) | | 9,305 | | 8,200 |
| Sundance Resources, Ltd. (I) | | 390,505 | | 199,421 |
| Super Cheap Auto Group, Ltd. | | 13,172 | | 91,412 |
| Swick Mining Services, Ltd. (I) | | 30,800 | | 11,991 |
| Talent2 International, Ltd. (I) | | 6,000 | | 10,067 |
| Tanami Gold Nl (I) | | 7,535 | | 7,319 |
| Tap Oil, Ltd. (I) | | 27,939 | | 26,795 |
| Tassal Group, Ltd. | | 11,577 | | 19,622 |
| Technology One, Ltd. (I) | | 32,670 | | 32,903 |
| Ten Network Holdings, Ltd. (I) | | 157,654 | | 212,058 |
| Terramin Australia, Ltd. (I) | | 16,521 | | 6,736 |
| TFS Corp., Ltd. | | 21,282 | | 21,017 |
| Thakral Holdings Group, Ltd. | | 63,390 | | 32,338 |
| The Reject Shop, Ltd. | | 2,608 | | 33,666 |
| Thorn Group, Ltd. | | 15,982 | | 34,761 |
| Tower Australia Group, Ltd. (I) | | 69,676 | | 280,312 |
| Tox Free Solutions, Ltd. (I) | | 8,234 | | 18,302 |
| Transfield Services Infrastructure Fund | | 22,752 | | 13,245 |
| Transfield Services, Ltd. | | 79,262 | | 268,043 |
| Transpacific Industries Group, Ltd. (I) | | 47,768 | | 60,633 |
| UXC, Ltd. | | 32,540 | | 19,763 |
| Victoria Petroleum Nl (I) | | 18,157 | | 7,398 |
| Village Roadshow, Ltd. (I) | | 20,000 | | 74,472 |
| Virgin Blue Holdings, Ltd. (I) | | 221,987 | | 79,500 |
| Watpac, Ltd. (I) | | 13,238 | | 21,969 |
| WDS, Ltd. | | 18,432 | | 13,218 |
| Webjet, Ltd. | | 3,680 | | 7,742 |
| West Australian Newspapers Holdings, Ltd. (I) | | 1,696 | | 9,689 |
| West Australian | | | | |
| Newspapers Holdings, Ltd. (L) | | 23,865 | | 136,337 |
| Western Areas NL (L) | | 17,246 | | 116,787 |
| White Energy Company, Ltd. (I) | | 29,677 | | 87,976 |
| WHK Group, Ltd. (I) | | 26,888 | | 27,803 |
| Wide Bay Australia, Ltd. | | 4,269 | | 46,189 |
| Windimurra Vanadium, Ltd. (I) | | 26,928 | | 0 |
| Wotif.com Holdings, Ltd. (I) | | 16,900 | | 89,974 |
| | |
|
| | | | | 17,821,061 |
| Austria - 0.72% | | | | |
| A-TEC Industries AG (I)(L) | | 1,566 | | 5,153 |
| Agrana Beteiligungs AG | | 568 | | 62,085 |
| Andritz AG | | 3,509 | | 296,574 |
| Austriamicrosystems AG (I) | | 1,229 | | 60,847 |
| BWIN Interactive Entertainment AG | | 3,814 | | 130,502 |
| BWT AG | | 1,074 | | 29,642 |
| Cat Oil AG | | 197 | | 1,989 |
| EVN AG (I)(L) | | 2,988 | | 49,663 |
| Flughafen Wien AG | | 1,118 | | 75,073 |
| Intercell AG (I) | | 4,221 | | 50,550 |
| | | | |
| International Small Company Fund (continued) |
| | | Shares or | | |
| | | Principal | | |
| | | Amount | | Value |
| | |
|
| |
| COMMON STOCKS (continued) | | | | |
| Austria (continued) | | | | |
| Lenzing AG | | 1,141 | $ | 139,824 |
| Mayr-Melnhof Karton AG (I) | | 705 | | 80,307 |
| Oesterreichische Post AG | | 4,024 | | 124,617 |
| Palfinger AG (I) | | 1,770 | | 65,905 |
| RHI AG (I) | | 2,919 | | 108,701 |
| Rosenbauer International AG (I) | | 395 | | 19,638 |
| S&T System Integration & Technology | | | | |
| Distribution AG (I) | | 487 | | 2,527 |
| Schoeller-Bleckmann Oilfield Equipment AG | | 1,107 | | 94,381 |
| Semperit AG Holding | | 406 | | 21,433 |
| Uniqa Versicherungen AG | | 4,818 | | 101,856 |
| Warimpex Finanz- und Beteiligungs AG | | 3,221 | | 11,956 |
| | |
|
| | | | | 1,533,223 |
| Belgium - 1.03% | | | | |
| Ablynx NV (I) | | 487 | | 5,289 |
| Ackermans & Van Haaren NV (I) | | 3,700 | | 320,967 |
| AGFA Gevaert NV (I) | | 5,388 | | 15 |
| AGFA Gevaert NV | | 21,555 | | 98,656 |
| Arseus NV | | 1,955 | | 31,183 |
| Banque Nationale de Belgique | | 23 | | 106,823 |
| Barco NV (I) | | 1,197 | | 92,510 |
| Compagnie d’Entreprises CFE | | 756 | | 56,630 |
| Compagnie Immobiliere de Belgique SA (I) | | 440 | | 20,642 |
| Compagnie Maritime Belge SA (I) | | 1,734 | | 52,247 |
| D’ieteren SA | | 4,980 | | 337,195 |
| Deceuninck Plastics NV (I) | | 2,954 | | 7,625 |
| Duvel Moortgat SA | | 230 | | 22,978 |
| Econocom Group SA | | 1,728 | | 33,387 |
| Elia System Operator SA (I) | | 576 | | 294 |
| Elia System Operator SA/NV (L) | | 4,268 | | 167,562 |
| Euronav NV | | 3,097 | | 52,296 |
| EVS Broadcast Equipment SA | | 1,071 | | 65,197 |
| Exmar NV | | 2,007 | | 16,364 |
| Gimv NV | | 607 | | 33,673 |
| Image Recognition Integrated Systems | | 78 | | 3,883 |
| Ion Beam Applications SA (I) | | 2,739 | | 32,843 |
| Kinepolis Group NV (I) | | 391 | | 26,977 |
| Lotus Bakeries SA | | 34 | | 19,002 |
| Melexis NV | | 2,366 | | 40,873 |
| Nyrstar (L) | | 11,255 | | 152,733 |
| Omega Pharma SA (I) | | 1,826 | | 88,196 |
| Recticel Sarecticel (I) | | 1,714 | | 16,555 |
| Roularta Media Group NV (I) | | 668 | | 23,780 |
| Sapec SA (I) | | 305 | | 23,485 |
| Sipef SA | | 888 | | 82,488 |
| Tessenderlo Chemie (I) | | 120 | | 83 |
| Tessenderlo Chemie NV (I) | | 2,837 | | 95,947 |
| ThromboGenics NV (I) | | 832 | | 23,875 |
| Van De Velde NV (I) | | 796 | | 42,494 |
| | |
|
| | | | | 2,194,747 |
| Bermuda - 0.50% | | | | |
| Catlin Group, Ltd. | | 56,365 | | 344,736 |
| COL Capital, Ltd. | | 28,000 | | 4,349 |
| CSI Properties, Ltd (I) | | 650,000 | | 17,689 |
| Golden Ocean Group, Ltd. | | 54,737 | | 70,600 |
| Hardy Underwriting Bermuda, Ltd. (I) | | 7,592 | | 34,616 |
| Hiscox, Ltd. | | 53,182 | | 331,130 |
| Katanga Mining, Ltd. (I) | | 88,691 | | 161,580 |
| Lancashire Holdings, Ltd. | | 9,581 | | 93,607 |
| Neway Group Holdings, Ltd. | | 230,000 | | 11,092 |
| Sewco International Holdings, Ltd. (I) | | 104,000 | | 8,135 |
| | |
|
| | | | | 1,077,534 |
| |
| The accompanying notes are an integral part of the financial statements. | 127 |
John Hancock Funds II
Portfolio of Investments — February 28, 2011 (Unaudited) (showing percentage of total net assets)
| | | | |
| International Small Company Fund (continued) |
| | | Shares or | | |
| | | Principal | | |
| | | Amount | | Value |
| | |
|
| |
| COMMON STOCKS (continued) | | | | |
| Canada - 13.15% | | | | |
| 5N Plus, Inc. (I) | | 3,445 | $ | 32,161 |
| Aastra Technologies, Ltd | | 834 | | 20,302 |
| Absolute Software Corp. (I) | | 3,900 | | 14,893 |
| Advantage Oil & Gas, Ltd. (I) | | 23,208 | | 181,785 |
| Aecon Group, Inc. | | 5,499 | | 52,072 |
| AG Growth International, Inc. | | 1,300 | | 71,252 |
| AGF Management, Ltd. | | 13,999 | | 281,118 |
| Ainsworth Lumber Company, Ltd. (I) | | 5,403 | | 17,852 |
| Alacer Gold Corp. (I) | | 28,135 | | 270,476 |
| Alamos Gold, Inc. | | 17,060 | | 291,840 |
| Alexco Resource Corp. (I) | | 5,500 | | 46,704 |
| Algoma Central Corp. | | 160 | | 15,974 |
| Algonquin Power & Utilities Corp. | | 5,704 | | 29,942 |
| Alliance Grain Traders, Inc. | | 1,200 | | 37,017 |
| Altagas, Ltd. | | 12,612 | | 320,898 |
| Altius Minerals Corp. (I) | | 2,400 | | 34,040 |
| Anderson Energy, Ltd. (I) | | 20,300 | | 25,282 |
| Angle Energy, Inc. (I) | | 4,527 | | 40,678 |
| Astral Media, Inc. | | 8,440 | | 340,102 |
| Atlantic Power Corp. | | 7,231 | | 111,343 |
| Atrium Innovations, Inc. (I) | | 3,200 | | 49,406 |
| ATS Automation Tooling Systems, Inc. (I) | | 8,723 | | 62,849 |
| Augusta Resource Corp. (I) | | 13,400 | | 79,996 |
| Aura Minerals, Inc. (I) | | 11,783 | | 41,842 |
| Aurizon Mines, Ltd. (I) | | 23,946 | | 170,805 |
| Avalon Rare Metals, Inc. (I)(L) | | 8,025 | | 59,885 |
| Axia NetMedia Corp. (I) | | 9,200 | | 16,193 |
| Azure Dynamics Corp. (I) | | 27,638 | | 8,961 |
| B2Gold Corp. (I) | | 14,146 | | 36,837 |
| Baja Mining Corp. (I) | | 16,100 | | 17,897 |
| Ballard Power Systems, Inc. (I) | | 9,800 | | 21,284 |
| Bankers Petroleum, Ltd. (I) | | 43,086 | | 418,199 |
| Bellatrix Exploration, Ltd. (I) | | 3,088 | | 18,594 |
| BELLUS Health, Inc. (I) | | 3,500 | | 522 |
| BioExx Specialty Proteins, Ltd. (I) | | 22,280 | | 50,910 |
| Birch Mountain Resources, Ltd. (I) | | 11,200 | | 28 |
| Birchcliff Energy, Ltd. (I) | | 16,253 | | 187,866 |
| Bird Construction, Inc. | | 535 | | 20,397 |
| Black Diamond Group, Ltd. | | 1,816 | | 44,860 |
| BlackPearl Resources, Inc. (I) | | 36,440 | | 301,182 |
| BMTC Group, Inc., Class A (I) | | 3,096 | | 72,146 |
| BNK Petroleum, Inc. (I) | | 12,925 | | 71,440 |
| Bonterra Energy Corp. | | 1,207 | | 76,938 |
| Boralex, Inc. (I) | | 3,000 | | 26,000 |
| Breakwater Resources, Ltd. (I) | | 6,330 | | 41,307 |
| Bridgewater Systems Corp. (I) | | 4,172 | | 36,415 |
| Brigus Gold Corp. (I) | | 4,209 | | 6,845 |
| Burcon NutraScience Corp. (I) | | 1,800 | | 20,528 |
| Calfrac Well Services, Ltd. | | 4,613 | | 164,996 |
| Calian Technologies, Ltd. | | 500 | | 9,521 |
| Calvalley Petroleums, Inc. (I) | | 9,777 | | 41,561 |
| Canaccord Capital, Inc. | | 12,077 | | 191,183 |
| Canada Bread Company, Ltd. | | 2,740 | | 132,833 |
| Canadian Energy Services | | | | |
| & Technology Corp. | | 1,650 | | 54,652 |
| Canadian Western Bank | | 9,597 | | 305,429 |
| Canam Group, Inc. | | 4,070 | | 33,932 |
| Candente Gold Corp. (I) | | 1,720 | | 1,487 |
| Candente Resource Corp. (I) | | 8,600 | | 18,589 |
| Canfor Corp. (I) | | 15,201 | | 187,597 |
| Cangene Corp. (I) | | 3,800 | | 11,890 |
| Capstone Mining Corp. (I) | | 21,310 | | 95,413 |
| Cardero Resource Corp. (I) | | 7,700 | | 14,821 |
| Cardiome Pharma Corp. (I) | | 8,400 | | 48,590 |
| Carpathian Gold, Inc. (I) | | 20,000 | | 11,116 |
| | | | |
| International Small Company Fund (continued) |
| | | Shares or | | |
| | | Principal | | |
| | | Amount | | Value |
| | |
|
| |
| COMMON STOCKS (continued) | | | | |
| Canada (continued) | | | | |
| Cascades, Inc. | | 8,818 | $ | 61,537 |
| Catalyst Paper Corp. (I) | | 54,263 | | 20,940 |
| Cathedral Energy Services, Ltd. | | 3,900 | | 40,945 |
| CCL Industries, Inc. | | 4,178 | | 139,804 |
| CE Franklin, Ltd. (I) | | 2,786 | | 25,378 |
| Celestica, Inc. (I) | | 8,518 | | 100,913 |
| Celtic Exploration, Ltd. (I) | | 10,392 | | 235,319 |
| China Gold | | | | |
| International Resources Corp., Ltd. (I) | | 34,900 | | 191,823 |
| Cineplex, Inc. | | 249 | | 6,161 |
| Claude Resources, Inc. (I) | | 21,200 | | 52,806 |
| Cline Mining Corp. (I) | | 9,200 | | 36,173 |
| Cogeco Cable, Inc. | | 3,652 | | 160,432 |
| Colossus Minerals, Inc. (I) | | 7,150 | | 61,377 |
| COM DEV International, Ltd. (I) | | 7,500 | | 17,138 |
| Computer Modelling Group, Ltd. | | 800 | | 20,544 |
| Connacher Oil and Gas, Ltd. (I) | | 47,523 | | 78,263 |
| Consolidated Thompson Iron Mines, Ltd. (I) | | 26,900 | | 473,460 |
| Constellation Software, Inc. | | 1,700 | | 94,226 |
| Contrans Group, Inc., Class A (I) | | 4,660 | | 46,286 |
| Copper Mountain Mining Corp. (I) | | 5,675 | | 39,545 |
| Corby Distilleries, Ltd. | | 2,222 | | 40,024 |
| Corridor Resources, Inc. (I) | | 11,000 | | 58,762 |
| Corus Entertainment, Inc. | | 12,190 | | 275,531 |
| Corvus Gold, Inc. (I) | | 2,048 | | 1,539 |
| Cott Corp. (I) | | 6,083 | | 50,715 |
| Crew Energy, Inc. (I) | | 12,973 | | 256,108 |
| Crystallex International Corp. (I) | | 43,800 | | 6,762 |
| Daylight Energy, Ltd. | | 14,251 | | 159,151 |
| Delphi Energy Corp. (I) | | 14,600 | | 33,061 |
| Denison Mines Corp. (I) | | 33,697 | | 126,943 |
| Detour Gold Corp. (I) | | 7,000 | | 227,822 |
| Divestco, Inc., Class A | | 2,800 | | 749 |
| Dollarama, Inc. (I) | | 1,795 | | 53,783 |
| Dorel Industries, Inc., Class B | | 5,185 | | 168,644 |
| Dragonwave, Inc. (I) | | 2,598 | | 20,323 |
| Duluth Metals, Ltd. (I) | | 17,000 | | 47,944 |
| Dundee Capital Markets, Inc. (I) | | 10,643 | | 13,803 |
| Dundee Precious Metals | | | | |
| Incdundee Precious Metals Inc (I) | | 14,800 | | 122,476 |
| Eastern Platinum, Ltd. (I) | | 112,023 | | 177,567 |
| Easyhome, Ltd. | | 700 | | 6,593 |
| ECU Silver Mining, Inc. (I)(L) | | 61,000 | | 67,809 |
| Electrovaya, Inc. (I) | | 5,656 | | 16,883 |
| Endeavour Silver Corp. (I) | | 6,200 | | 45,564 |
| Enghouse Systems, Ltd. | | 1,100 | | 10,167 |
| Ensign Energy Services, Inc. (L) | | 21,937 | | 375,721 |
| Entree Gold, Inc. (I) | | 7,500 | | 22,927 |
| Epsilon Energy, Ltd. (I) | | 5,500 | | 22,644 |
| Equal Energy, Ltd. (I) | | 729 | | 5,312 |
| Equinox Minerals, Ltd. (I) | | 17,416 | | 102,717 |
| Equitable Group, Inc. | | 1,700 | | 51,531 |
| European Goldfields, Ltd. (I) | | 20,019 | | 259,214 |
| Evertz Technologies, Ltd. | | 4,539 | | 88,346 |
| Excellon Resources, Inc. (I) | | 14,100 | | 13,932 |
| Exeter Resource Corp. (I) | | 7,379 | | 39,494 |
| Exfo Electro Optical Engineering, Inc. (I) | | 912 | | 10,654 |
| Fairborne Energy, Ltd. (I) | | 8,600 | | 48,597 |
| Far West Mining, Ltd. (I) | | 4,700 | | 34,783 |
| First Majestic Silver Corp (I) | | 100 | | 1,530 |
| FirstService Corp. (I) | | 1,882 | | 58,985 |
| Flint Energy Services, Ltd. (I) | | 5,120 | | 102,237 |
| Formation Metals, Inc. (I) | | 4,142 | | 6,651 |
| Forsys Metals Corp. (I) | | 15,300 | | 47,559 |
| Fortress Paper, Ltd. (I) | | 1,804 | | 103,054 |
| |
| The accompanying notes are an integral part of the financial statements. | 128 |
John Hancock Funds II
Portfolio of Investments — February 28, 2011 (Unaudited) (showing percentage of total net assets)
| | | | |
| International Small Company Fund (continued) |
| | | Shares or | | |
| | | Principal | | |
| | | Amount | | Value |
| | |
|
| |
| COMMON STOCKS (continued) | | | | |
| Canada (continued) | | | | |
| Fortune Minerals, Ltd. (I) | | 3,334 | $ | 6,177 |
| Forzani Group, Ltd. | | 5,528 | | 99,175 |
| Fraser Papers, Inc. (I) | | 4,800 | | 0 |
| Fronteer Gold, Inc. (I) | | 16,280 | | 240,459 |
| Galleon Energy, Inc. (I) | | 11,550 | | 47,315 |
| Gammon Gold, Inc. (I) | | 23,650 | | 209,589 |
| Garda World Security Corp. (I) | | 7,700 | | 77,907 |
| GBS Gold International, Inc. (I) | | 30,800 | | 0 |
| Gennum Corp. | | 4,158 | | 34,238 |
| Geomark Exploration, Inc. (I) | | 5,776 | | 8,918 |
| Glacier Media, Inc. (I) | | 8,800 | | 21,738 |
| Glentel, Inc. | | 1,100 | | 29,777 |
| Gluskin Sheff & Associates, Inc. | | 1,700 | | 37,165 |
| GLV, Inc., Class A (I) | | 1,851 | | 14,499 |
| GMP Capital, Inc. | | 6,154 | | 94,316 |
| Gold Wheaton Gold Corp. (I) | | 303 | | 1,606 |
| Grande Cache Coal Corp. (I) | | 17,700 | | 170,159 |
| Great Canadian Gaming Corp. (I) | | 8,850 | | 74,604 |
| Greystar Resources, Ltd. (I) | | 4,600 | | 17,992 |
| Groupe Aeroplan, Inc. | | 23,768 | | 313,384 |
| Guyana Goldfields, Inc. (I) | | 7,300 | | 68,901 |
| Hanfeng Evergreen, Inc. (I) | | 3,700 | | 18,851 |
| Harry Winston Diamond Corp. (I) | | 10,720 | | 130,862 |
| Hemisphere GPS, Inc. (I) | | 10,400 | | 14,772 |
| Heroux-Devtek, Inc. (I) | | 3,900 | | 31,512 |
| Home Capital Group, Inc. | | 5,312 | | 313,619 |
| HudBay Minerals, Inc. | | 26,092 | | 452,525 |
| IESI-BFC, Ltd. | | 3,500 | | 86,964 |
| Imax Corp. (I) | | 8,449 | | 223,585 |
| Imperial Metals Corp. (I) | | 2,600 | | 63,558 |
| Imris, Inc. (I) | | 2,000 | | 14,842 |
| Innergex Renewable Energy, Inc. | | 6,172 | | 60,478 |
| Intermap Technologies Corp. (I) | | 7,800 | | 4,496 |
| International Forest Products, Ltd. (I) | | 5,150 | | 30,957 |
| International Tower Hill Mines, Ltd. (I) | | 4,097 | | 38,206 |
| Ivanhoe Energy, Inc. (I) | | 32,400 | | 114,386 |
| KAB Distribution, Inc. (I) | | 18,405 | | 21 |
| Keegan Resources, Inc. (I) | | 3,731 | | 28,495 |
| Keyera Corp. | | 207 | | 8,049 |
| Kimber Resources, Inc. (I) | | 1,750 | | 2,450 |
| Kingsway Financial Services, Inc. | | 8,700 | | 10,119 |
| Kirkland Lake Gold, Inc. (I) | | 5,309 | | 79,344 |
| La Mancha Resources, Inc. (I) | | 13,311 | | 34,937 |
| Labrador Iron Mines Holdings, Ltd. (I) | | 2,897 | | 42,700 |
| Lake Shore Gold Corp. (I) | | 39,157 | | 162,424 |
| Laramide Resources, Ltd. (I) | | 11,400 | | 31,681 |
| Laurentian Bank of Canada | | 6,628 | | 365,937 |
| Le Chateau, Inc. | | 2,400 | | 27,568 |
| Legacy Oil & Gas, Inc. (I) | | 16,652 | | 284,861 |
| Leon’s Furniture, Ltd. | | 7,809 | | 114,135 |
| Linamar Corp. | | 12,009 | | 259,821 |
| MacDonald Dettwiler & Associates, Ltd. | | 7,040 | | 379,119 |
| Macquarie Power & Infrastructure Corp. | | 1,702 | | 14,330 |
| MAG Silver Corp. (I) | | 5,100 | | 57,113 |
| Major Drilling Group International | | 4,044 | | 184,312 |
| Manitoba Telecom Services, Inc. | | 1,700 | | 53,788 |
| Maple Leaf Foods, Inc. | | 11,269 | | 136,520 |
| Marsulex, Inc. | | 3,500 | | 53,929 |
| Martinrea International, Inc. (I) | | 11,418 | | 105,184 |
| Maxim Power Corp. (I) | | 6,300 | | 18,805 |
| Medwell Capital Corp. (I) | | 9,900 | | 2,547 |
| Mega Uranium, Ltd. (I) | | 26,600 | | 26,558 |
| Mercator Minerals, Ltd. (I) | | 13,175 | | 58,176 |
| Methanex Corp. | | 14,988 | | 436,118 |
| Midway Energy, Ltd. (I) | | 3,602 | | 18,204 |
| | | | |
| International Small Company Fund (continued) |
| | | Shares or | | |
| | | Principal | | |
| | | Amount | | Value |
| | |
|
| |
| COMMON STOCKS (continued) | | | | |
| Canada (continued) | | | | |
| Migao Corp. (I) | | 3,400 | $ | 28,661 |
| Minefinders Corp. (I) | | 7,000 | | 81,344 |
| Mineral Deposits, Ltd. (I) | | 3,505 | | 9,532 |
| MKS, Inc. | | 1,550 | | 26,643 |
| Mosaid Technologies, Inc. | | 1,500 | | 45,237 |
| Mullen Group, Ltd. | | 11,066 | | 235,888 |
| Nal Energy Corp. | | 461 | | 6,890 |
| Nautilus Minerals, Inc. (I) | | 20,040 | | 61,262 |
| Neo Material Technologies, Inc. (I) | | 10,100 | | 89,611 |
| Nevada Copper Corp. (I) | | 6,158 | | 33,847 |
| Newalta, Inc. | | 2,197 | | 29,804 |
| Norbord, Inc. (I) | | 3,223 | | 50,424 |
| Nordion, Inc. (I) | | 15,568 | | 177,865 |
| North American Energy Partners, Inc. (I) | | 1,632 | | 20,997 |
| North American Palladium, Ltd. (I) | | 8,050 | | 55,929 |
| Northern Dynasty Minerals, Ltd. (I) | | 5,476 | | 97,002 |
| Northgate Minerals Corp. (I) | | 40,567 | | 115,661 |
| NuVista Energy, Ltd. | | 13,002 | | 134,095 |
| Oncolytics Biotech, Inc. (I) | | 3,800 | | 24,289 |
| Open Text Corp. (I) | | 219 | | 12,878 |
| OPTI Canada, Inc. (I)(L) | | 26,100 | | 7,522 |
| Orvana Minerals, Corp. (I) | | 9,998 | | 34,577 |
| Pace Oil And Gas, Ltd. (I) | | 1,158 | | 10,680 |
| Paladin Labs, Inc. (I) | | 1,400 | | 49,080 |
| Paramount Resources, Ltd. (I) | | 6,355 | | 237,115 |
| Pason Systems, Inc. | | 9,795 | | 150,320 |
| Pelangio Exploration, Inc. (I) | | 14,200 | | 11,400 |
| Peregrine Diamonds, Ltd. (I) | | 13,425 | | 30,124 |
| Perpetual Energy, Inc. | | 12,832 | | 57,190 |
| Petaquilla Minerals | | | | |
| Ltdpetaquilla Minerals Ltd. (I) | | 10,038 | | 11,778 |
| Petrobank Energy & Resources, Ltd. (I) | | 204 | | 5,247 |
| Petrolifera Petroleum, Ltd. (I) | | 7,550 | | 8,548 |
| Platinum Group Metals, Ltd. (I) | | 11,200 | | 28,244 |
| Plutonic Power Corp. (I) | | 3,700 | | 8,188 |
| Points International, Ltd. (I) | | 1,650 | | 16,813 |
| Polymet Mining Corp. (I) | | 13,500 | | 29,458 |
| Precision Drilling Corp. (I) | | 28,855 | | 340,065 |
| Premium Brands Holdings Corp. | | 2,145 | | 36,782 |
| Pulse Seismic, Inc. (I) | | 927 | | 2,252 |
| QLT, Inc. (I) | | 8,200 | | 55,367 |
| Quadra FNX Mining, Ltd. (I) | | 4,800 | | 70,255 |
| Quebecor, Inc. | | 7,318 | | 265,513 |
| Queenston Mining, Inc. (I) | | 5,100 | | 30,971 |
| Questerre Energy Corp. (I) | | 23,900 | | 40,590 |
| Ram Power Corp. (I) | | 11,984 | | 16,035 |
| Redcorp Ventures, Ltd. (I) | | 9,000 | | 0 |
| Reitman’s Canada, Ltd. | | 7,751 | | 142,327 |
| Reitmans Canada, Ltd. | | 300 | | 5,110 |
| Resverlogix Corp. (I) | | 5,300 | | 10,256 |
| Richelieu Hardware, Ltd. | | 2,200 | | 68,657 |
| Ritchie Bros. Auctioneers, Inc. (L) | | 16,054 | | 408,311 |
| Rock Energy, Inc. (I) | | 373 | | 2,334 |
| RONA, Inc. | | 15,896 | | 242,150 |
| Rs Technologies, Inc. (I) | | 184 | | 153 |
| Rubicon Minerals Corp. (I) | | 21,100 | | 106,852 |
| Ruggedcom, Inc. (I) | | 900 | | 19,676 |
| Russel Metals, Inc. | | 10,237 | | 267,634 |
| Sabina Gold & Silver Corp. (I) | | 8,968 | | 61,014 |
| San Gold Corp. (I) | | 1,582 | | 4,657 |
| Sandvine Corp. (I) | | 12,400 | | 40,842 |
| Savanna Energy Services Corp. | | 9,568 | | 81,641 |
| Scorpio Mining Corp. (I) | | 500 | | 504 |
| Seabridge Gold, Inc. (I) | | 6,045 | | 201,593 |
| Shawcor, Ltd., Class A | | 9,851 | | 372,625 |
| |
| The accompanying notes are an integral part of the financial statements. | 129 |
John Hancock Funds II
Portfolio of Investments — February 28, 2011 (Unaudited) (showing percentage of total net assets)
| | | | |
| International Small Company Fund (continued) |
| | | Shares or | | |
| | | Principal | | |
| | | Amount | | Value |
| | |
|
| COMMON STOCKS (continued) | | | | |
| Canada (continued) | | | | |
| Sherritt International Corp. | | 40,823 | $ | 381,947 |
| Shore Gold, Inc. (I) | | 400 | | 313 |
| Sierra Wireless, Inc. (I) | | 3,750 | | 39,447 |
| Silver Standard Resources, Inc. (I) | | 11,791 | | 319,184 |
| Silvercorp Metals, Inc. | | 25,295 | | 329,873 |
| Softchoice Corp. (I) | | 2,000 | | 18,136 |
| Southern Pacific Resource Corp. (I) | | 14,210 | | 28,082 |
| SouthGobi Energy Resources, Ltd. (I) | | 4,080 | | 65,890 |
| Sprott Resource Corp. (I) | | 11,715 | | 65,596 |
| Sprott Resource Lending Corp. (I) | | 18,000 | | 33,719 |
| Sprott, Inc. | | 2,900 | | 25,849 |
| St Andrew Goldfields, Ltd. (I) | | 15,500 | | 20,102 |
| Stantec, Inc. (I) | | 8,568 | | 252,926 |
| Stella-Jones, Inc. | | 700 | | 27,004 |
| Storm Ventures International, Inc. (I) | | 4,291 | | 8,745 |
| Stornoway Diamond Corp. (I) | | 2,566 | | 5,916 |
| Student Transportation of America, Ltd. | | 5,410 | | 37,698 |
| SunOpta, Inc. (I) | | 5,771 | | 39,798 |
| Superior Plus Corp. | | 14,000 | | 161,968 |
| Tanzanian Royalty Exploration Corp. (I)(L) | | 10,900 | | 75,505 |
| Taseko Mines, Ltd. (I) | | 19,800 | | 124,724 |
| Tembec, Inc. (I) | | 7,330 | | 38,100 |
| The Cash Store Financial Services, Inc. | | 1,710 | | 23,075 |
| The Churchill Corp. (I) | | 1,700 | | 33,631 |
| The Descartes Systems Group, Inc. (I) | | 4,700 | | 31,686 |
| The Jean Coutu Group (PJC), Inc. | | 14,361 | | 150,624 |
| Theratechnologies Inctheratechnologies Inc (I) | | 6,398 | | 31,741 |
| Thompson Creek Metals Company, Inc. (I)(L) | | 18,972 | | 249,953 |
| TMX Group, Inc. | | 11,500 | | 479,389 |
| Torex Gold Resources, Inc. (I) | | 26,321 | | 56,622 |
| Toromont Industries, Ltd. | | 12,443 | | 400,230 |
| Torstar Corp. | | 7,600 | | 112,410 |
| Total Energy Services, Inc. | | 867 | | 14,635 |
| Transcontinental, Inc. | | 11,675 | | 195,875 |
| TransForce, Inc. | | 11,166 | | 158,028 |
| Transglobe Energy Corp. (I) | | 8,300 | | 121,482 |
| Transition Therapeutics, Inc. (I) | | 3,200 | | 16,304 |
| Trican Well Service, Ltd. | | 18,768 | | 437,350 |
| Trilogy Energy Corp. | | 7,916 | | 164,504 |
| Trinidad Drilling, Ltd. | | 16,500 | | 139,092 |
| Turnkey E&p, Inc. (I) | | 1,100 | | 0 |
| Twin Butte Energy, Ltd. (I) | | 12,900 | | 41,427 |
| U308 Corp. (I) | | 3,303 | | 3,672 |
| UEX Corp. (I) | | 14,600 | | 33,812 |
| Uni-Select, Inc. | | 2,200 | | 66,551 |
| UR-Energy, Inc. (I) | | 10,200 | | 28,766 |
| Vecima Networks, Inc. (I) | | 2,921 | | 10,914 |
| Vector Aerospace Corp. (I) | | 2,300 | | 23,437 |
| Veresen, Inc. | | 486 | | 6,513 |
| Vero Energy, Inc. (I) | | 5,900 | | 38,380 |
| Virginia Mines, Inc. (I) | | 3,063 | | 26,388 |
| Vitran Corp., Inc. (I) | | 300 | | 3,826 |
| Waterfurance Renewable Energy, Inc. | | 1,161 | | 32,468 |
| Wesdome Gold Mines, Ltd. | | 11,600 | | 32,237 |
| West Fraser Timber Company, Ltd. | | 6,481 | | 310,191 |
| Western Coal Corp. (I) | | 25,500 | | 317,060 |
| Westport Innovations, Inc. (I) | | 3,900 | | 71,694 |
| Wi-LAN, Inc. | | 12,200 | | 76,599 |
| Winpak, Ltd. | | 6,500 | | 90,253 |
| Xceed Mortgage Corp. (I) | | 1,800 | | 1,408 |
| Xtreme Coil Drilling Corp. (I) | | 6,548 | | 35,316 |
| Yellow Media, Inc. | | 965 | | 5,532 |
| Zarlink Semiconductor, Inc. (I) | | 9,400 | | 20,125 |
| | |
|
| | | | | 28,093,962 |
| | | | |
| International Small Company Fund (continued) |
| | | Shares or | | |
| | | Principal | | |
| | | Amount | | Value |
| | |
|
| |
| COMMON STOCKS (continued) | | | | |
| Cayman Islands - 0.02% | | | | |
| Siem Offshore, Inc. (I) | | 20,762 | $ | 38,555 |
| China - 0.11% | | | | |
| Aupu Group Holding Company, Ltd. (I) | | 108,000 | | 14,759 |
| Bund Center Investment, Ltd. (I) | | 222,000 | | 35,829 |
| China XLX Fertiliser, Ltd. | | 70,000 | | 23,261 |
| Chinasoft International, Ltd. | | 30,000 | | 7,253 |
| Delong Holdings, Ltd. (I) | | 45,500 | | 17,722 |
| Epure International, Ltd. (I) | | 79,000 | | 37,894 |
| Guangnan Holdings, Ltd. | | 108,000 | | 24,875 |
| Pacific Textile Holdings, Ltd. | | 116,000 | | 66,074 |
| | |
|
| | | | | 227,667 |
| Cyprus - 0.13% | | | | |
| Deep Sea Supply PLC (I) | | 4,703 | | 10,746 |
| Marfin Popular Bank PLC | | 33,278 | | 46,343 |
| ProSafe ASA | | 30,874 | | 232,610 |
| | |
|
| | | | | 289,699 |
| Denmark - 0.97% | | | | |
| ALK-Abello A/S | | 663 | | 41,195 |
| Alm Brand A/S (I) | | 11,260 | | 22,501 |
| Ambu A/S | | 800 | | 21,835 |
| Auriga Industries | | 2,034 | | 32,919 |
| Bang & Olufsen A/S | | 4,791 | | 69,154 |
| Bavarian Nordic A/S (I) | | 1,471 | | 68,695 |
| BoConcept Holding A/S (I) | | 75 | | 2,290 |
| Brodrene Hartmann A/S | | 800 | | 11,842 |
| Capinordic A/S (I) | | 9,300 | | 756 |
| D.S. Norden A/S | | 2,936 | | 104,035 |
| Dalhoff Larsen & Horneman A/S | | 2,500 | | 11,822 |
| DFDS A/S | | 425 | | 35,384 |
| DiBa Bank A/S | | 550 | | 5,604 |
| East Asiatic Company, Ltd. A/S (I) | | 1,821 | | 54,075 |
| Fionia Bank A/S (I) | | 1,250 | | 0 |
| Fluegger A/S (I) | | 225 | | 19,752 |
| Genmab A/S (I) | | 3,921 | | 41,431 |
| GN Store Nord A/S (I) | | 16,699 | | 163,021 |
| Greentech Energy Systems A/S (I) | | 6,004 | | 18,841 |
| Gronlandsbanken (I) | | 20 | | 1,830 |
| Harboes Bryggeri A/S (I) | | 441 | | 10,891 |
| IC Companys A/S | | 3,227 | | 135,248 |
| Jeudan A/S (I) | | 492 | | 38,978 |
| NeuroSearch A/S (I) | | 2,902 | | 45,880 |
| NKT Holding A/S | | 383 | | 21,714 |
| Nordjyske Bank A/S | | 1,190 | | 22,903 |
| Ostjydsk Bank A/S | | 160 | | 8,706 |
| Parken Sport & Entertainment A/S (I) | | 864 | | 15,988 |
| PER Aarsleff A/S (I) | | 420 | | 34,898 |
| Pharmexa A/S (I) | | 10,600 | | 902 |
| Ringkjoebing Landbobank A/S (I) | | 485 | | 65,473 |
| Rockwool International A/S | | 296 | | 34,892 |
| Roskilde Bank A/S (I) | | 495 | | 0 |
| Royal Unibrew A/S (I) | | 778 | | 50,367 |
| Satair A/S (I) | | 591 | | 37,912 |
| Schouw & Company A/S (I) | | 2,506 | | 58,435 |
| SimCorp A/S | | 783 | | 127,501 |
| Sjaelso Gruppen A/S (I) | | 2,935 | | 6,074 |
| Solar Holdings A/S (I) | | 900 | | 77,249 |
| Spar Nord Bank A/S (I) | | 8,152 | | 79,956 |
| Sparbank | | 275 | | 3,569 |
| Sydbank A/S (I) | | 9,657 | | 250,156 |
| Thrane & Thrane A/S (I) | | 800 | | 40,774 |
| TK Development A/S (I) | | 3,786 | | 15,058 |
| Topdanmark A/S (I) | | 786 | | 110,013 |
| TopoTarget A/S (I)(L) | | 15,000 | | 8,652 |
| |
| The accompanying notes are an integral part of the financial statements. | 130 |
John Hancock Funds II
Portfolio of Investments — February 28, 2011 (Unaudited) (showing percentage of total net assets)
| | | | |
| International Small Company Fund (continued) |
| | | Shares or | | |
| | | Principal | | |
| | | Amount | | Value |
| | |
|
| COMMON STOCKS (continued) | | | | |
| Denmark (continued) | | | | |
| Vestjysk Bank A/S | | 3,265 | $ | 35,963 |
| | | |
|
| | | | | 2,065,134 |
| Finland - 2.24% | | | | |
| Ahlstrom OYJ | | 1,578 | | 38,895 |
| Alma Media OYJ (I) | | 7,542 | | 96,059 |
| Amer Sports OYJ | | 17,431 | | 231,628 |
| Aspo OYJ | | 2,534 | | 28,644 |
| Atria PLC (I) | | 1,229 | | 14,421 |
| BasWare OYJ (I) | | 299 | | 10,095 |
| Cargotec Corp. OYJ | | 5,686 | | 254,048 |
| Cramo OYJ (I)(L) | | 3,712 | | 111,808 |
| Digia PLC (I) | | 2,622 | | 17,746 |
| Elektrobit Corp. | | 9,773 | | 9,441 |
| Etteplan OYJ (I) | | 276 | | 1,146 |
| F-Secure OYJ | | 10,255 | | 31,131 |
| Finnair OYJ (I) | | 7,567 | | 46,198 |
| Finnlines OYJ (I) | | 2,378 | | 25,788 |
| Fiskars Corp. | | 7,608 | | 210,577 |
| HK Ruokatalo OYJ | | 5,218 | | 48,886 |
| Huhtamaki OYJ | | 9,309 | | 129,466 |
| Ilkka-Yhtyma OYJ (I) | | 1,877 | | 22,095 |
| KCI Konecranes OYJ | | 8,126 | | 364,537 |
| Kemira OYJ | | 8,209 | | 119,489 |
| Lannen Tehtaat OYJ (I) | | 930 | | 23,132 |
| Lassila & Tikanoja OYJ | | 3,716 | | 65,254 |
| Lemminkainen OYJ (I) | | 775 | | 27,800 |
| M-real OYJ (I) | | 32,204 | | 134,748 |
| Olvi OYJ (I) | | 959 | | 44,661 |
| Oriola-KD OYJ | | 22,667 | | 111,357 |
| Orion OYJ, Series A | | 6,324 | | 144,861 |
| Orion OYJ, Series B | | 15,474 | | 354,187 |
| Outotec OYJ | | 5,585 | | 313,477 |
| Ponsse OYJ | | 1,465 | | 23,148 |
| Poyry OYJ | | 4,503 | | 61,206 |
| Raisio OYJ | | 15,131 | | 57,657 |
| Ramirent OYJ (I) | | 8,097 | | 134,386 |
| Rapala VMC OYJ | | 617 | | 5,903 |
| Rautaruukki OYJ (L) | | 11,470 | | 266,624 |
| Ruukki Group OYJ (I) | | 20,289 | | 53,182 |
| Scanfil OYJ (I) | | 3,082 | | 12,468 |
| Stockmann OYJ Abp, Series A | | 1,949 | | 71,213 |
| Stockmann OYJ Abp, Series B | | 4,072 | | 131,038 |
| Tecnomen OYJ (I) | | 10,173 | | 6,177 |
| Teleste OYJ | | 1,377 | | 8,391 |
| TietoEnator OYJ | | 7,664 | | 147,099 |
| Tikkurila OYJ (I) | | 2,052 | | 46,153 |
| Uponor OYJ | | 6,920 | | 116,291 |
| Vacon OYJ | | 1,063 | | 62,561 |
| Vaisala OYJ | | 1,483 | | 48,296 |
| YIT Oyj (I) | | 17,181 | | 494,979 |
| | |
|
| | | | | 4,778,347 |
| France - 3.64% | | | | |
| Abc Arbitrage | | 183 | | 1,924 |
| Ales Groupe SA (I) | | 435 | | 8,334 |
| Alten SA | | 2,039 | | 74,687 |
| Altran Technologies SA (I) | | 11,249 | | 63,954 |
| April Group SA (I) | | 1,609 | | 50,844 |
| Assystem SA (I) | | 1,674 | | 39,498 |
| Avanquest Software SA (I) | | 1,218 | | 4,992 |
| Beneteau SA (I) | | 4,379 | | 90,258 |
| Boiron SA | | 834 | | 32,421 |
| Bonduelle SCA (I) | | 372 | | 33,636 |
| Bongrain SA | | 645 | | 60,964 |
| | | | |
| International Small Company Fund (continued) |
| | | Shares or | | |
| | | Principal | | |
| | | Amount | | Value |
| | |
|
| COMMON STOCKS (continued) | | | | |
| France (continued) | | | | |
| Bourbon SA (L) | | 4,224 | $ | 202,642 |
| Boursorama (I) | | 374 | | 4,335 |
| Bull SA (I) | | 11,140 | | 57,874 |
| Canal Plus SA | | 6,204 | | 49,577 |
| Carbone Lorraine SA | | 2,631 | | 132,652 |
| Cegedim SA (I) | | 484 | | 32,383 |
| Cegid SA (I) | | 599 | | 18,016 |
| Ciments Francais SA | | 379 | | 36,030 |
| Club Mediterranee SA (I) | | 3,671 | | 88,286 |
| Compagnie Plastic Omnium SA (I) | | 1,369 | | 99,054 |
| Delachaux SA | | 877 | | 80,487 |
| Devoteam SA (I) | | 242 | | 7,126 |
| Electricite de Strasbourg SA | | 142 | | 23,242 |
| Esso SAF | | 269 | | 38,867 |
| Etablissements Maurel et Prom SA | | 8,680 | | 157,282 |
| Euro Disney SCA (I) | | 3,416 | | 42,710 |
| Eurofins Scientific | | 534 | | 43,992 |
| Exel Industries SA (I) | | 185 | | 10,722 |
| Faiveley Transport | | 191 | | 17,483 |
| Faurecia (I) | | 5,887 | | 229,074 |
| Financiere Marc de Lacharriere SA | | 1,072 | | 41,809 |
| Fleury Michon SA (I) | | 344 | | 16,686 |
| Gaumont SA (I) | | 489 | | 32,053 |
| GFI Informatique SA (I) | | 5,737 | | 27,864 |
| GIFI (I) | | 408 | | 34,823 |
| GL Events SA (I) | | 910 | | 30,800 |
| Groupe Steria SA | | 3,594 | | 113,349 |
| Guerbet SA | | 180 | | 17,190 |
| Guyenne & Gascogne SA (I) | | 699 | | 90,085 |
| Haulotte Group (I) | | 1,065 | | 22,043 |
| Havas SA | | 57,577 | | 324,823 |
| IMS International Metal Service | | 913 | | 19,064 |
| Infogrames Entertainment SA (I) | | 3,415 | | 15,083 |
| Ingenico SA | | 4,067 | | 153,960 |
| Inter Parfums | | 176 | | 6,079 |
| Ipsen SA | | 3,435 | | 117,047 |
| Ipsos SA | | 2,291 | | 108,869 |
| Kaufman & Broad SA (I) | | 1,176 | | 39,050 |
| Korian | | 1,887 | | 44,225 |
| Laurent-Perrier SA | | 374 | | 38,547 |
| Lisi SA | | 546 | | 45,147 |
| LVL Medical Groupe SA (I) | | 806 | | 19,138 |
| M6-Metropole Television | | 6,518 | | 164,717 |
| Maisons France Confort SA | | 510 | | 26,357 |
| Manitou BF SA | | 1,754 | | 57,728 |
| Manutan SA (I) | | 963 | | 65,105 |
| Marseill Tunnel Prado-Carena | | 219 | | 8,179 |
| Montupet SA (I) | | 553 | | 6,369 |
| Naturex | | 383 | | 21,971 |
| Neopost SA | | 4,126 | | 391,351 |
| Nexans SA | | 4,933 | | 446,511 |
| Nexity SA | | 4,255 | | 211,320 |
| NicOx SA (I) | | 3,351 | | 10,814 |
| Norbert Dentressangle SA (I) | | 882 | | 93,407 |
| Orpea SA | | 3,018 | | 143,469 |
| PagesJaunes Groupe SA (L) | | 13,290 | | 129,616 |
| Parrot SA (I) | | 453 | | 16,233 |
| Penauille Polyservices SA (I) | | 7,713 | | 63,912 |
| Pierre & Vacances SA (I) | | 562 | | 50,041 |
| Rallye SA (I) | | 2,887 | | 127,637 |
| Recylex SA (I) | | 2,162 | | 23,485 |
| Remy Cointreau SA | | 2,840 | | 190,724 |
| Rhodia SA | | 18,980 | | 547,461 |
| Robertet SA (I) | | 258 | | 40,535 |
| Rubis SA | | 1,086 | | 121,685 |
| |
| The accompanying notes are an integral part of the financial statements. | 131 |
John Hancock Funds II
Portfolio of Investments — February 28, 2011 (Unaudited) (showing percentage of total net assets)
| | | | |
| International Small Company Fund (continued) |
| | | Shares or | | |
| | | Principal | | |
| | | Amount | | Value |
| | |
|
| |
| COMMON STOCKS (continued) | | | | |
| France (continued) | | | | |
| Sa des Ciments Vicat | | 1,229 | $ | 104,357 |
| Saft Groupe SA | | 2,859 | | 109,447 |
| Samse SA | | 285 | | 28,709 |
| Seche Environnement (I) | | 7 | | 644 |
| Sechilienne-Sidec SA | | 1,925 | | 54,462 |
| Sequana Capital | | 1,254 | | 22,679 |
| Societe Industrielle | | | | |
| D’Aviations Latecoere SA (I) | | 350 | | 4,337 |
| SOITEC (I) | | 11,308 | | 145,007 |
| Somfy SA (L) | | 383 | | 97,779 |
| Sopra Group SA | | 529 | | 53,896 |
| SR Teleperformance SA | | 7,329 | | 278,530 |
| Stef-TFE Group (I) | | 993 | | 60,650 |
| Sucriere de Pithiviers-Le-Vieil SA | | 59 | | 66,751 |
| Synergie SA (I) | | 1,224 | | 36,530 |
| Tessi SA (I) | | 206 | | 18,306 |
| Theolia SA (I) | | 6,581 | | 11,532 |
| Toupargel-Agrigel SA (I) | | 936 | | 20,014 |
| Transgene SA (I) | | 1,227 | | 21,542 |
| Trigano SA (I) | | 2,853 | | 96,104 |
| UBISOFT Entertainment SA (I) | | 7,630 | | 84,613 |
| Union Financiere de France Banque SA (I) | | 577 | | 25,310 |
| Viel & Compagnie SA | | 6,221 | | 27,128 |
| Vilmorin & Compagnie SA (I) | | 555 | | 68,570 |
| Virbac SA | | 457 | | 69,772 |
| VM Materiaux SA (I) | | 539 | | 33,583 |
| Vranken-Pommery Monopole Group SA | | 407 | | 20,786 |
| Wendel | | 323 | | 33,330 |
| Zodiac SA | | 633 | | 44,114 |
| | |
|
| | | | | 7,788,189 |
| Germany - 4.77% | | | | |
| Aareal Bank AG (I) | | 4,484 | | 156,400 |
| Adlink Internet Media AG (I) | | 2,151 | | 10,554 |
| Adva AG Optical Networking (I) | | 2,485 | | 22,802 |
| Agennix AG (I) | | 1,121 | | 4,842 |
| Air Berlin PLC (I) | | 2,101 | | 9,834 |
| Aixtron AG, SADR (L) | | 3,360 | | 140,750 |
| Amadeus Fire AG | | 724 | | 34,767 |
| Asian Bamboo AG | | 1,058 | | 52,485 |
| Augusta Technologie AG (I) | | 1,041 | | 26,540 |
| Baader Wertpapierhandelsbank AG (I) | | 4,116 | | 18,861 |
| Balda AG (I) | | 3,189 | | 36,904 |
| Bauer AG | | 995 | | 48,769 |
| BayWa AG | | 399 | | 17,912 |
| Beate Uhse AG (I) | | 8,223 | | 3,962 |
| Bechtle AG (I) | | 1,192 | | 46,218 |
| Bertrandt AG (I) | | 519 | | 38,210 |
| Bilfinger Berger AG | | 3,051 | | 255,753 |
| Biotest AG | | 323 | | 20,817 |
| Boewe Systec AG (I) | | 126 | | 80 |
| Carl Zeiss Meditec AG (I) | | 3,844 | | 77,844 |
| Cenit AG (I) | | 2,140 | | 16,168 |
| CENTROTEC Sustainable AG (I) | | 1,362 | | 36,968 |
| Centrotherm Photovoltaics AG (I) | | 298 | | 13,406 |
| Cewe Color Holding AG (I) | | 730 | | 33,498 |
| Comdirect Bank AG (I) | | 4,577 | | 51,280 |
| Conergy AG (L) | | 12,524 | | 6,747 |
| Constantin Medien AG (I) | | 7,438 | | 20,461 |
| CropEnergies AG | | 1,866 | | 16,021 |
| CTS Eventim AG | | 1,453 | | 91,424 |
| Curanum AG (I) | | 4,385 | | 14,431 |
| D Logistics AG (I) | | 4,397 | | 9,224 |
| DAB Bank AG (I) | | 3,886 | | 24,531 |
| Data Modul AG (I) | | 635 | | 12,335 |
| | | | |
| International Small Company Fund (continued) |
| | | Shares or | | |
| | | Principal | | |
| | | Amount | | Value |
| | |
|
| |
| COMMON STOCKS (continued) | | | | |
| Germany (continued) | | | | |
| Delticom AG | | 193 | $ | 16,990 |
| Demag Cranes AG | | 2,393 | | 115,170 |
| Deutsche Beteiligungs AG | | 222 | | 6,341 |
| Deutsche Wohnen AG (I) | | 8,098 | | 121,644 |
| Deutz AG (I) | | 7,867 | | 64,544 |
| Dialog Semiconductor PLC (I) | | 6,464 | | 132,040 |
| Douglas Holding AG | | 3,417 | | 186,084 |
| Drillisch AG | | 6,749 | | 66,770 |
| Duerr AG (I) | | 839 | | 28,858 |
| DVB Bank AG (I) | | 110 | | 3,856 |
| Elexis AG (I) | | 1,107 | | 21,089 |
| ElringKlinger AG | | 4,637 | | 153,016 |
| Evotec AG (I) | | 25,197 | | 105,584 |
| Fielmann AG | | 16 | | 1,429 |
| Freenet AG | | 15,834 | | 182,661 |
| Fuchs Petrolub AG | | 917 | | 117,608 |
| Gerresheimer AG (I) | | 3,776 | | 167,442 |
| Gerry Weber International AG | | 1,425 | | 78,454 |
| Gesco AG (I) | | 414 | | 33,961 |
| GFK AG (I) | | 2,252 | | 111,622 |
| GFT Technologies AG (I) | | 2,486 | | 14,992 |
| Gildemeister AG (I) | | 4,756 | | 105,119 |
| Grammer AG | | 1,241 | | 29,726 |
| Grenkeleasing AG (I) | | 1,123 | | 62,177 |
| H&R Wasag AG | | 399 | | 10,973 |
| Hamburger Hafen und Logistik AG | | 2,010 | | 91,494 |
| Hawesko Holding AG (I) | | 1,116 | | 50,641 |
| Heidelberger Druckmaschinen AG | | 27,642 | | 135,302 |
| Homag Group AG | | 716 | | 15,808 |
| Indus Holding AG (I) | | 2,697 | | 81,707 |
| Interseroh AG (I) | | 294 | | 19,277 |
| Intershop Communications AG (I)(L) | | 2,654 | | 7,322 |
| IVG Immobilien AG | | 10,586 | | 100,593 |
| IWKA AG | | 3,250 | | 76,251 |
| Jenoptik AG (I) | | 5,019 | | 39,980 |
| KIZOO AG (I) | | 1,380 | | 16,406 |
| Kloeckner & Company SE (I) | | 10,777 | | 350,662 |
| Koenig & Bauer AG | | 819 | | 19,122 |
| Kontron AG | | 6,351 | | 77,682 |
| Krones AG (L) | | 1,743 | | 115,771 |
| KSB AG | | 73 | | 60,995 |
| KWS Saat AG | | 290 | | 57,543 |
| Leoni AG | | 4,631 | | 193,951 |
| Loewe AG (I) | | 772 | | 7,144 |
| Manz Automation AG (I) | | 222 | | 13,912 |
| MasterFlex AG (I) | | 414 | | 2,296 |
| Mediclin AG (I) | | 8,179 | | 48,975 |
| Medigene AG (I) | | 3,374 | | 11,947 |
| Medion AG | | 3,090 | | 51,585 |
| MLP AG | | 6,309 | | 63,384 |
| Mologen AG (I) | | 1,495 | | 17,306 |
| Morphosys AG (I) | | 2,360 | | 64,048 |
| MTU Aero Engines Holding AG | | 31 | | 2,067 |
| MVV Energie AG (I)(L) | | 1,324 | | 49,869 |
| Nemetschek AG (I) | | 1,050 | | 44,464 |
| Norddeutsche Affinerie AG (L) | | 5,430 | | 288,973 |
| Nordex AG (I) | | 3,399 | | 30,525 |
| P&I Personal & Informatik AG | | 20 | | 764 |
| Pfeiffer Vacuum Technology AG | | 1,003 | | 134,233 |
| Pfleiderer AG (I) | | 3,609 | | 7,298 |
| Phoenix Solar AG | | 220 | | 7,167 |
| Plambeck Neue Energien AG (I) | | 5,657 | | 13,976 |
| Praktiker Bau- und Heimwerkermaerkte AG | | 6,704 | | 81,333 |
| Premiere AG (I) | | 41,539 | | 171,220 |
| PVA TePla AG | | 1,400 | | 7,900 |
| |
| The accompanying notes are an integral part of the financial statements. | 132 |
John Hancock Funds II
Portfolio of Investments — February 28, 2011 (Unaudited) (showing percentage of total net assets)
| | | | |
| International Small Company Fund (continued) |
| | | Shares or | | |
| | | Principal | | |
| | | Amount | | Value |
| | |
|
| |
| COMMON STOCKS (continued) | | | | |
| Germany (continued) | | | | |
| Q-Cells AG (I)(L) | | 3,938 | $ | 16,824 |
| QSC AG (I) | | 10,874 | | 48,021 |
| R. Stahl AG (I) | | 574 | | 23,284 |
| Rational AG | | 503 | | 106,816 |
| REpower Systems AG | | 129 | | 22,242 |
| Rheinmetall AG | | 6,290 | | 509,885 |
| Rhoen-Klinikum AG | | 17,907 | | 394,101 |
| Roth & Rau AG (I) | | 1,970 | | 40,105 |
| Sartorius AG | | 997 | | 38,697 |
| Schlott Gruppe AG (I) | | 185 | | 289 |
| SGL Carbon AG (I)(L) | | 7,924 | | 295,442 |
| SHB Stuttgarter Finanz & Beteiligungs AG | | 951 | | 23,629 |
| Singulus Technologies AG (I) | | 4,178 | | 23,533 |
| Sixt AG | | 755 | | 33,808 |
| SKW Stahl-Metallurgie Holding AG (I) | | 296 | | 7,923 |
| Solar Millennium AG (I) | | 1,423 | | 32,398 |
| Solarworld AG (L) | | 11,352 | | 136,487 |
| Solon SE (I)(L) | | 1,838 | | 9,726 |
| Stada Arzneimittel AG | | 10,586 | | 423,512 |
| Stratec Biomedical Systems AG (I) | | 807 | | 35,641 |
| Symrise AG | | 14,466 | | 379,699 |
| Tag Immobilien AG (I) | | 2,920 | | 28,393 |
| Takkt AG | | 2,729 | | 42,031 |
| Technotrans AG (I) | | 258 | | 2,561 |
| Tognum AG | | 11,911 | | 299,367 |
| TUI AG (L) | | 21,877 | | 286,703 |
| United Internet AG | | 4,743 | | 82,135 |
| Versatel AG (I) | | 1,054 | | 10,613 |
| Vossloh AG | | 1,255 | | 161,296 |
| VTG AG | | 676 | | 15,486 |
| Wacker Construction Equipment AG | | 2,519 | | 43,800 |
| Washtec AG (I) | | 1,640 | | 23,933 |
| Wincor Nixdorf AG | | 4,939 | | 414,012 |
| Wire Card AG | | 13,327 | | 221,445 |
| Wuerttembergische Lebensversicherung AG | | 576 | | 14,266 |
| | |
|
| | | | | 10,187,944 |
| Gibraltar - 0.03% | | | | |
| PartyGaming PLC (I)(L) | | 22,321 | | 63,250 |
| Greece - 1.06% | | | | |
| Agricultural Bank of Greece SA (I) | | 21,674 | | 23,055 |
| Alapis Holding Industrial & Commercial SA | | 9,052 | | 6,230 |
| Anek Lines SA (I) | | 14,015 | | 4,452 |
| Athens Stock Exchange SA | | 6,411 | | 60,300 |
| Athens Water Supply and | | | | |
| Sewage Company SA (I) | | 2,918 | | 20,165 |
| Bank of Attica SA (I) | | 9,882 | | 14,274 |
| Bank of Cyprus PCL | | 65,739 | | 253,856 |
| Bank of Greece SA | | 2,525 | | 114,283 |
| Diagnostic & Therapeutic Center of | | | | |
| Athens Hygeia SA | | 12,760 | | 10,928 |
| EFG Eurobank Ergasias SA (I) | | 13,302 | | 85,016 |
| Emporiki Bank SA (I) | | 8,531 | | 19,261 |
| Euromedica SA (I) | | 1,362 | | 3,488 |
| Folli Follie Group (I) | | 2,548 | | 51,693 |
| Forthnet SA (I) | | 14,320 | | 10,878 |
| Fourlis SA | | 4,391 | | 35,776 |
| Frigoglass SA (I) | | 2,954 | | 43,525 |
| GEK Group of Companies SA | | 7,981 | | 37,792 |
| Geniki Bank SA (I) | | 2,122 | | 5,880 |
| Greek Postal Savings Bank SA (I) | | 20,725 | | 97,068 |
| Halcor SA (I) | | 12,007 | | 12,763 |
| Hansard Global PLC | | 11,952 | | 31,669 |
| Hellenic Petroleum SA (I) | | 12,576 | | 128,578 |
| Hellenic Technodomiki Tev SA (I) | | 16,528 | | 78,522 |
| | | | |
| International Small Company Fund (continued) |
| | | Shares or | | |
| | | Principal | | |
| | | Amount | | Value |
| | |
|
| |
| COMMON STOCKS (continued) | | | | |
| Greece (continued) | | | | |
| Heracles General Cement SA (I) | | 5,225 | $ | 32,792 |
| Iaso SA (I) | | 5,049 | | 9,245 |
| Intracom Holdings SA (I) | | 28,550 | | 18,090 |
| Intralot SA-integrated Lottery Systems | | | | |
| & Services (I) | | 5,728 | | 19,762 |
| J&P-Avax SA (I) | | 7,584 | | 12,884 |
| Jumbo SA | | 1,641 | | 12,802 |
| Lambrakis Press SA (I) | | 2,615 | | 1,800 |
| Marfin Investment Group SA (I) | | 74,177 | | 89,995 |
| Metka SA (I) | | 2,434 | | 34,750 |
| Michaniki SA (I) | | 5,586 | | 3,077 |
| Motor Oil Hellas Corinth Refineries SA | | 5,560 | | 66,930 |
| Mytilineos Holdings SA (I) | | 14,916 | | 107,095 |
| Piraeus Bank SA | | 166,005 | | 378,192 |
| Piraeus Port Authority SA (I) | | 881 | | 17,859 |
| Sidenor Steel Products | | | | |
| Manufacturing Company SA (I) | | 4,142 | | 18,174 |
| Teletypos SA Mega Channel (I) | | 4,590 | | 11,019 |
| Terna Energy SA | | 3,843 | | 18,325 |
| Thessaloniki Port Authority SA | | 488 | | 9,614 |
| Titan Cement Company SA | | 7,661 | | 171,541 |
| Viohalco SA | | 12,925 | | 73,812 |
| | |
|
| | | | | 2,257,210 |
| Hong Kong - 2.72% | | | | |
| Alco Holdings, Ltd. | | 54,000 | | 24,455 |
| Allied Group, Ltd. (I) | | 18,000 | | 56,631 |
| Allied Properties HK, Ltd. (I) | | 726,000 | | 146,502 |
| Apac Resources, Ltd. (I) | | 720,000 | | 46,341 |
| Artel Solutions Group Holdings, Ltd. (I) | | 565,000 | | 20,419 |
| Asia Financial Holdings, Ltd. (I) | | 66,000 | | 30,091 |
| Asia Satellite Telecom | | | | |
| Holdings Company, Ltd. | | 26,220 | | 44,575 |
| Associated International Hotels, Ltd. (I) | | 26,000 | | 57,088 |
| Bonjour Holdings, Ltd. | | 272,000 | | 45,942 |
| Bright International Group, Ltd. (I) | | 406,000 | | 14,631 |
| Burwill Holdings Ltd. (I) | | 464,000 | | 28,351 |
| C C Land Holdings, Ltd. | | 420,000 | | 140,406 |
| C Y Foundation Group, Ltd. (I) | | 605,000 | | 9,089 |
| Cafe de Coral Holdings, Ltd. | | 12,000 | | 26,461 |
| Century City International Holdings | | | | |
| Ltdcentury City Intl (I) | | 164,000 | | 12,669 |
| Champion Technology Holdings, Ltd. (I) | | 478,697 | | 9,916 |
| Chen Hsong Holdings, Ltd. | | 40,000 | | 21,481 |
| Chevalier International Holdings, Ltd. (I) | | 24,000 | | 32,131 |
| Chevalier Pacific Holdings, Ltd. | | 125,000 | | 4,431 |
| China Energy Development Holdings, Ltd. (I) | | 658,000 | | 31,718 |
| China Metal International Holdings, Inc. | | 58,000 | | 17,126 |
| China Public Procurement, Ltd. (I) | | 312,000 | | 27,242 |
| China Sci-Tech Holdings, Ltd. (I) | | 2,383,040 | | 70,527 |
| China Solar Energy Holdings, Ltd. (I) | | 1,270,000 | | 21,209 |
| China Sonangol Resources Enterprise, Ltd. (I) | | 94,000 | | 17,138 |
| China Strategic Holdings, Ltd. (I) | | 610,000 | | 16,856 |
| China Ting Group Holdings, Ltd. | | 124,000 | | 18,821 |
| China WindPower Group, Ltd. (I) | | 560,000 | | 53,314 |
| ChinaVision Media Group, Ltd. (I) | | 330,000 | | 20,981 |
| Chong Hing Bank, Ltd. | | 32,000 | | 83,469 |
| Chow Sang Sang Holdings, Ltd. (I) | | 30,000 | | 62,014 |
| Chu Kong Shipping Development | | 22,000 | | 4,989 |
| Chuang’s Consortium International, Ltd. | | 164,021 | | 23,200 |
| Citic 1616 Holdings, Ltd. | | 219,000 | | 69,831 |
| City Telecom HK, Ltd. | | 1,717 | | 25,051 |
| CK Life Sciences | | | | |
| International Holdings, Inc. (I) | | 532,000 | | 38,456 |
| CP Lotus, Corp. (I) | | 280,000 | | 9,894 |
| |
| The accompanying notes are an integral part of the financial statements. | 133 |
John Hancock Funds II
Portfolio of Investments — February 28, 2011 (Unaudited) (showing percentage of total net assets)
| | | | |
| International Small Company Fund (continued) |
| | | Shares or | | |
| | | Principal | | |
| | | Amount | | Value |
| | |
|
| COMMON STOCKS (continued) | | | | |
| Hong Kong (continued) | | | | |
| Cross-Harbour Holdings, Ltd. (I) | | 22,000 | $ | 19,387 |
| Dickson Concepts International, Ltd. | | 37,000 | | 28,505 |
| EganaGoldpfeil Holdings, Ltd. (I) | | 131,750 | | 0 |
| Emperor Entertainment Hotel, Ltd. (I) | | 115,000 | | 29,228 |
| Emperor International Holdings, Ltd. (I) | | 280,000 | | 57,186 |
| Emperor Watch & Jewellery, Ltd. | | 400,000 | | 48,863 |
| Enm Holdings, Ltd. (I) | | 60,000 | | 5,427 |
| eSun Holdings, Ltd. (I) | | 113,000 | | 24,728 |
| Eva Precision Industrial Holdings, Ltd. (I) | | 80,000 | | 61,226 |
| Fairwood, Ltd. | | 4,000 | | 5,809 |
| Far East Consortium International, Ltd. | | 212,992 | | 52,895 |
| First Natural Foods Holdings, Ltd. (I) | | 375,000 | | 0 |
| Fong’s Industries Company, Ltd. | | 14,000 | | 9,156 |
| Fubon Bank, Ltd. | | 46,000 | | 29,212 |
| G-Resources Group, Ltd. (I) | | 2,642,999 | | 193,609 |
| Get Nice Holdings, Ltd. (I) | | 246,000 | | 16,758 |
| Giordano International, Ltd. | | 221,708 | | 112,508 |
| Glorious Sun Enterprises, Ltd. (I) | | 88,000 | | 33,949 |
| Golden Resorts Group, Ltd. (I) | | 1,508,000 | | 96,831 |
| Hang Fung Gold Technology, Ltd. (I) | | 310,000 | | 0 |
| Harbour Centre Development, Ltd. (I) | | 37,500 | | 53,421 |
| HKR International, Ltd. | | 114,400 | | 70,523 |
| Hong Kong Resources | | | | |
| Holdings Company, Ltd. | | 236,000 | | 21,624 |
| Hongkong Chinese, Ltd. | | 126,000 | | 26,913 |
| Hung Hing Printing Group, Ltd. | | 76,216 | | 32,714 |
| Huscoke Resources Holdings, Ltd. (I) | | 574,000 | | 27,329 |
| Hutchison Harbour Ring, Ltd. | | 292,000 | | 37,942 |
| Hybrid Kinetic Group, Ltd. (I) | | 650,000 | | 12,213 |
| HyComm Wireless, Ltd. (I) | | 26,000 | | 7,855 |
| I-CABLE Communications, Ltd. (I) | | 179,000 | | 22,600 |
| I.T, Ltd. (I) | | 126,808 | | 79,299 |
| Imagi International Holdings, Ltd. (I) | | 87,500 | | 3,766 |
| International Luk Fook Holdings, Ltd. (I) | | 42,000 | | 121,288 |
| Ione Holdings, Ltd. | | 720,000 | | 15,188 |
| Jinhui Holdings, Ltd. | | 42,000 | | 10,799 |
| Jlf Investment Company, Ltd. (I) | | 70,000 | | 6,842 |
| K Wah International Holdings, Ltd. | | 291,227 | | 127,653 |
| Keck Seng Investments, Ltd. (I) | | 1,000 | | 480 |
| King Stone Energy Group, Ltd. (I) | | 2,400,000 | | 49,372 |
| Kowloon Development Company, Ltd. | | 84,000 | | 113,192 |
| Lai Sun Development Company, Ltd. (I) | | 632,000 | | 20,764 |
| Le Saunda Holdings | | 102,000 | | 49,870 |
| Lee & Man Holding, Ltd. (I) | | 80,000 | | 89,827 |
| Lippo China Resources, Ltd. (I) | | 666,000 | | 23,536 |
| Lippo, Ltd. (I) | | 31,250 | | 14,749 |
| Liu Chong Hing Investment | | 30,000 | | 42,799 |
| Lung Kee Holdings, Ltd. | | 48,000 | | 31,846 |
| Matsunichi Communication Holdings, Ltd. (I) | | 89,000 | | 49,393 |
| Media Chinese International, Ltd. (I) | | 30,000 | | 8,398 |
| Melco International Development | | 186,000 | | 117,667 |
| Midland Holdings, Ltd. (I) | | 128,000 | | 104,968 |
| Ming Fai International Holdings, Ltd. | | 41,000 | | 14,334 |
| Miramar Hotel & Investment Company, Ltd. | | 8,000 | | 9,746 |
| Natural Beauty Bio-Technology, Ltd. | | 230,000 | | 49,989 |
| Neo-Neon Holdings, Ltd. | | 76,500 | | 31,271 |
| New Times Energy Corp., Ltd. (I) | | 488,000 | | 10,667 |
| NewOcean Energy Holdings, Ltd. (I) | | 196,000 | | 37,027 |
| Norstar Founders Group, Ltd. (I) | | 168,000 | | 15,747 |
| Orange Sky Golden Harvest | | | | |
| Entertainment Holdings, Ltd. (I) | | 295,000 | | 18,754 |
| Pacific Andes International Holdings, Ltd. | | 220,591 | | 35,871 |
| Pacific Basin Shipping, Ltd. | | 279,000 | | 163,112 |
| Pacific Century Premium Developments, Ltd. | | 111,000 | | 22,545 |
| Paliburg Holdings, Ltd. | | 71,380 | | 27,432 |
| | | | |
| International Small Company Fund (continued) |
| | | Shares or | | |
| | | Principal | | |
| | | Amount | | Value |
| | |
|
| |
| COMMON STOCKS (continued) | | | | |
| Hong Kong (continued) | | | | |
| Peace Mark Holdings, Ltd. (I) | | 180,000 | $ | 0 |
| Pearl Oriental Innovation, Ltd. (I) | | 180,000 | | 24,542 |
| Phoenix Satellite Television Holdings, Ltd. | | 174,000 | | 59,700 |
| Pico Far East Holdings, Ltd. (I) | | 126,000 | | 25,426 |
| Pme Group, Ltd. (I) | | 70,000 | | 5,848 |
| Polytec Asset Holdings, Ltd. | | 210,000 | | 34,595 |
| Public Financial Holdings, Ltd. | | 48,000 | | 31,909 |
| PYI Corp., Ltd. (I) | | 801 | | 33 |
| Regal Hotels International Holdings, Ltd. | | 83,200 | | 33,233 |
| Rising Development Holdings (I) | | 104,000 | | 16,894 |
| SA SA International Holdings, Ltd. (I) | | 228,000 | | 115,224 |
| SEA Holdings, Ltd. (I) | | 52,000 | | 32,834 |
| Shenyin Wanguo Hk, Ltd. (I) | | 75,000 | | 30,981 |
| Shui On Construction & Materials, Ltd. | | 54,000 | | 72,486 |
| Shun Tak Holdings, Ltd. | | 254,000 | | 140,922 |
| Sing Tao News Corp., Ltd. | | 58,000 | | 18,525 |
| Singamas Container Holdings, Ltd. (I) | | 180,000 | | 60,480 |
| Sino-Tech International Holdings, Ltd. (I) | | 420,000 | | 13,456 |
| Smartone Telecommunications Holdings, Ltd. | | 35,500 | | 106,349 |
| Sun Hung Kai & Company, Ltd. | | 50,968 | | 35,942 |
| Sun Innovation Holdings, Ltd. (I) | | 400,000 | | 14,115 |
| Superb Summit International | | | | |
| Timber Company, Ltd. (I) | | 378,000 | | 17,709 |
| Tack Fat Group International, Ltd. (I) | | 20,000 | | 0 |
| Tack Hsin Holdings | | 6,000 | | 3,566 |
| TAI Cheung Holdings, Ltd. | | 66,000 | | 51,337 |
| Tai Fook Securities Group, Ltd. (I) | | 36,347 | | 22,264 |
| Tan Chong International, Ltd. | | 63,000 | | 14,971 |
| Texhong Textile Group, Ltd. | | 92,000 | | 87,745 |
| Texwinca Holdings, Ltd. | | 52,000 | | 52,629 |
| Theme International Holdings, Ltd. (I) | | 220,000 | | 18,370 |
| Titan Petrochemicals Group, Ltd. (I) | | 600,000 | | 45,669 |
| Tonic Industries Holdings, Ltd. (I) | | 4,000 | | 520 |
| Transport International Holdings, Ltd. | | 43,200 | | 133,213 |
| Tsc Offshore Group, Ltd. (I) | | 26,000 | | 6,615 |
| Tse Sui Luen Jewellery International, Ltd. (I) | | 36,000 | | 28,962 |
| United Power Investment, Ltd. (I) | | 828,000 | | 17,933 |
| USI Holding Corp. (I) | | 38,000 | | 14,456 |
| Value Partners Group, Ltd. | | 58,000 | | 57,242 |
| Victory City International Holdings, Ltd. | | 153,908 | | 30,185 |
| Vitasoy International Holdings, Ltd. | | 146,000 | | 122,200 |
| VST Holdings Company, Ltd. (I) | | 88,000 | | 29,041 |
| Wai Kee Holdings, Ltd. (I) | | 72,000 | | 15,170 |
| Wing On Company International, Ltd. (I) | | 17,000 | | 34,724 |
| Winteam Pharmaceutical Group, Ltd. | | 212,000 | | 37,924 |
| Ygm Trading, Ltd. (I) | | 10,000 | | 18,887 |
| ZZNode Technologies Company, Ltd. (I) | | 308,000 | | 28,986 |
| | |
|
| | | | | 5,803,860 |
| Ireland - 1.00% | | | | |
| Aer Lingus (I) | | 25,626 | | 32,004 |
| C&C Group PLC | | 42,868 | | 209,130 |
| DCC PLC | | 12,042 | | 386,345 |
| FBD Holdings PLC (I) | | 4,678 | | 50,713 |
| Fyffes PLC | | 29,278 | | 16,718 |
| Glanbia PLC (Dublin Exchange) (I) | | 15,698 | | 92,143 |
| Grafton Group PLC | | 22,961 | | 118,933 |
| IFG Group PLC (I) | | 19,878 | | 36,547 |
| Independent News & Media PLC | | 30,840 | | 25,116 |
| Irish Continental Group PLC (I) | | 2,561 | | 62,541 |
| Irish Life & Permanent Group Holdings PLC | | 30,577 | | 41,556 |
| Kenmare Resources PLC (I) | | 209,013 | | 143,803 |
| Kingspan Group PLC (I) | | 26,276 | | 253,783 |
| McInerney Holdings PLC (I) | | 20,779 | | 1,135 |
| Paddy Power PLC | | 5,516 | | 224,741 |
| |
| The accompanying notes are an integral part of the financial statements. | 134 |
John Hancock Funds II
Portfolio of Investments — February 28, 2011 (Unaudited) (showing percentage of total net assets)
| | | | |
| International Small Company Fund (continued) |
| | | Shares or | | |
| | | Principal | | |
| | | Amount | | Value |
| | |
|
| |
| COMMON STOCKS (continued) | | | | |
| Ireland (continued) | | | | |
| Smurfit Kappa Group PLC | | 28,993 | $ | 360,162 |
| United Drug PLC | | 26,909 | | 87,168 |
| | |
|
| | | | | 2,142,538 |
| Israel - 1.12% | | | | |
| Africa Israel Investments, Ltd. | | 7,871 | | 63,316 |
| AL-ROV Israel, Ltd. (I) | | 370 | | 12,082 |
| Alvarion, Ltd. (I) | | 5,360 | | 10,546 |
| Clal Biotechnology Industries, Ltd. (I) | | 5,223 | | 33,560 |
| Clal Industries & Investments, Ltd. | | 10,617 | | 78,759 |
| Clal Insurance Enterprise Holdings, Ltd. | | 3,648 | | 97,097 |
| Delek Automotive Systems, Ltd. | | 4,929 | | 64,364 |
| Electra Israel, Ltd. | | 114 | | 12,952 |
| Ezchip Semiconductor, Ltd. (I) | | 1,929 | | 58,108 |
| First International Bank of Israel, Ltd. (I) | | 5,079 | | 72,132 |
| Frutarom Industries, Ltd. | | 7,174 | | 67,924 |
| Fundtech, Ltd. (I) | | 498 | | 8,989 |
| Gilat Satellite Networks, Ltd. (I) | | 2,000 | | 10,317 |
| Given Imaging, Ltd. (I) | | 307 | | 5,807 |
| Hadera Paper, Ltd. (I) | | 503 | | 38,908 |
| Harel Insurance Investments, Ltd. | | 1,121 | | 63,467 |
| Hot Telecommunication System, Ltd. (I) | | 2,631 | | 41,515 |
| Ituran Location & Control, Ltd. | | 1,736 | | 27,379 |
| Jerusalem Oil Exploration (I) | | 705 | | 14,186 |
| Makhteshim-Agan Industries, Ltd. (I) | | 51,558 | | 257,312 |
| Matrix IT, Ltd. | | 2,531 | | 14,913 |
| Mellanox Technologies, Ltd. (I) | | 5,397 | | 142,925 |
| Menorah Mivtachim Holdings, Ltd. (I) | | 4,526 | | 58,781 |
| NICE Systems, Ltd., SADR (I) | | 10,299 | | 356,809 |
| Oil Refineries, Ltd. | | 204,443 | | 139,929 |
| Ormat Industries, Ltd. | | 10,674 | | 76,526 |
| Osem Investments, Ltd. (I) | | 5,160 | | 83,415 |
| Paz Oil Company, Ltd. | | 588 | | 100,745 |
| Rami Levi Chain Stores Hashikma | | | | |
| Marketing 2006, Ltd. | | 845 | | 28,720 |
| Retalix, Ltd. (I) | | 3,157 | | 45,964 |
| Shikun & Binu, Ltd. (I) | | 35,668 | | 94,665 |
| Strauss Group, Ltd. | | 4,648 | | 67,831 |
| Super-Sol, Ltd. | | 17,277 | | 100,612 |
| The Phoenix Holdings, Ltd. (I) | | 5,158 | | 17,392 |
| Tower Semiconductor, Ltd. (I) | | 25,831 | | 34,928 |
| | |
|
| | | | | 2,402,875 |
| Italy - 2.99% | | | | |
| ACEA SpA | | 12,237 | | 140,645 |
| Acegas-APS SpA (I) | | 2,167 | | 11,244 |
| Actelios SpA (I) | | 1,929 | | 3,310 |
| Aedes SpA (I) | | 29,353 | | 8,204 |
| Alerion Cleanpower SpA (I) | | 38,537 | | 27,354 |
| Amplifon SpA | | 8,041 | | 43,719 |
| Ansaldo STS SpA | | 12,218 | | 171,613 |
| Astaldi SpA (I) | | 5,883 | | 45,446 |
| Azimut Holding SpA | | 19,417 | | 199,467 |
| Banca Finnat Euramerica SpA (I) | | 10,675 | | 7,098 |
| Banca Generali SpA | | 10,115 | | 142,384 |
| Banca IFIS SpA (I) | | 5,374 | | 38,907 |
| Banca Intermobiliare SpA (I) | | 14,093 | | 81,871 |
| Banca Popolare Dell’emilia | | | | |
| Romagna SCRL (I) | | 22,409 | | 285,344 |
| Banca Popolare dell’Etruria e del | | | | |
| Lazio SpA (I) | | 8,572 | | 37,444 |
| Banca Popolare di Milano SpA | | 41,743 | | 168,834 |
| Banca Popolare di Sondrio SCRL (I) | | 22,917 | | 196,514 |
| Banca Profilo SpA (I) | | 23,984 | | 13,180 |
| Banco di Desio e della Brianza SpA (I) | | 4,149 | | 23,586 |
| | | | |
| International Small Company Fund (continued) |
| | | Shares or | | |
| | | Principal | | |
| | | Amount | | Value |
| | |
|
| |
| COMMON STOCKS (continued) | | | | |
| Italy (continued) | | | | |
| BasicNet SpA | | 1,777 | $ | 6,726 |
| Benetton Group SpA | | 8,658 | | 56,574 |
| Benetton Group SpA, SADR | | 200 | | 2,648 |
| Brembo SpA | | 3,286 | | 37,439 |
| Bulgari SpA | | 25,204 | | 267,052 |
| Buongiorno SpA (I) | | 9,345 | | 16,709 |
| Buzzi Unicem SpA (L) | | 3,449 | | 48,772 |
| Caltagirone Editore SpA (I) | | 5,211 | | 13,705 |
| Caltagirone SpA | | 3,553 | | 9,498 |
| Cementir SpA | | 6,234 | | 19,846 |
| CIR-Compagnie Industriali Riunite SpA | | 56,919 | | 122,340 |
| Credito Artigiano SpA | | 23,255 | | 43,356 |
| Credito Bergamasco SpA (I) | | 711 | | 20,496 |
| Credito Emiliano SpA | | 16,311 | | 112,738 |
| Danieli & C Officine Meccaniche SpA (I) | | 1,785 | | 56,052 |
| Davide Campari Milano SpA | | 10 | | 64 |
| De Longhi SpA (I) | | 18,320 | | 159,620 |
| DeA Capital SpA (I) | | 1,854 | | 3,742 |
| DiaSorin SpA | | 3,295 | | 148,398 |
| Digital Multimedia Technologies SpA (I) | | 1,056 | | 25,007 |
| EEMS Italia SpA (I) | | 5,583 | | 11,169 |
| ERG SpA | | 10,331 | | 144,793 |
| ErgyCapital SpA (I) | | 175 | | 113 |
| Esprinet SpA (I) | | 2,846 | | 23,973 |
| Eurotech SpA (I) | | 3,019 | | 8,038 |
| Fiera Milano SpA (I) | | 2,228 | | 13,481 |
| Gemina SpA (I) | | 51,524 | | 41,123 |
| Geox SpA (L) | | 12,899 | | 69,757 |
| Gruppo Beghelli SpA (I) | | 11,564 | | 11,113 |
| Gruppo Coin SpA (I) | | 8,302 | | 87,511 |
| Gruppo Editoriale L’Espresso SpA (I) | | 19,434 | | 50,393 |
| Hera SpA | | 79,274 | | 178,512 |
| Immsi SpA (L) | | 20,642 | | 23,622 |
| Impregilo SpA (I) | | 47,024 | | 149,524 |
| Indesit Company SpA | | 7,870 | | 90,833 |
| Industria Macchine Automatiche SpA (I) | | 1,088 | | 22,368 |
| Interpump SpA | | 7,154 | | 59,515 |
| Iren SpA | | 58,545 | | 104,855 |
| Italcementi SpA (L) | | 6,288 | | 62,470 |
| Italmobiliare SpA | | 787 | | 30,425 |
| Juventus Football Club SpA (I) | | 8,911 | | 10,938 |
| KME Group SpA (I) | | 26,355 | | 13,079 |
| Landi Renzo Spa | | 9,280 | | 36,185 |
| Lottomatica SpA (L) | | 7,460 | | 105,501 |
| Maire Tecnimont SpA | | 17,000 | | 69,658 |
| Marr SpA (I) | | 3,721 | | 43,078 |
| Mediolanum SpA | | 11,946 | | 61,752 |
| Milano Assicurazioni SpA | | 25,516 | | 42,419 |
| Mondadori (Arnoldo) Editore SpA | | 12,390 | | 43,625 |
| Nice SpA (I) | | 3,458 | | 15,383 |
| Panariagroup Industrie Ceramiche SpA (I) | | 3,544 | | 7,712 |
| Piaggio & C SpA | | 12,658 | | 41,251 |
| Piccolo Credito Valtellinese SCRL (I) | | 24,426 | | 120,661 |
| Prelios SpA | | 55,202 | | 41,339 |
| Premafin Finanziaria SpA (I)(L) | | 26,879 | | 28,136 |
| Prysmian SpA | | 27,161 | | 573,367 |
| Recordati SpA | | 14,919 | | 139,402 |
| Risanamento SpA (I) | | 13,318 | | 4,818 |
| Sabaf SpA (I) | | 962 | | 29,937 |
| Safilo Group SpA (I) | | 2,432 | | 42,436 |
| Saras SpA (I) | | 49,911 | | 128,533 |
| Save SpA (I) | | 3,345 | | 35,541 |
| Seat Pagine Gialle SpA (I) | | 130,315 | | 14,653 |
| Snai SpA (I) | | 8,592 | | 28,382 |
| Societa Iniziative Autostradali e Servizi SpA | | 7,495 | | 82,666 |
| |
| The accompanying notes are an integral part of the financial statements. | 135 |
John Hancock Funds II
Portfolio of Investments — February 28, 2011 (Unaudited) (showing percentage of total net assets)
| | | | |
| International Small Company Fund (continued) |
| | | Shares or | | |
| | | Principal | | |
| | | Amount | | Value |
| | |
|
| |
| COMMON STOCKS (continued) | | | | |
| Italy (continued) | | | | |
| Societa’ Cattolica di Assicurazioni SCRL (I) | | 6,775 | $ | 179,686 |
| Socotherm SpA (I) | | 2,703 | | 5,315 |
| Sogefi SpA (I) | | 7,700 | | 28,806 |
| Sol SpA (I) | | 6,441 | | 46,068 |
| Sorin SpA (I) | | 67,066 | | 170,064 |
| Stefanel SpA (I) | | 11,908 | | 8,821 |
| Telecom Italia Media SpA (I) | | 23,548 | | 6,512 |
| Tod’s SpA | | 1,162 | | 118,566 |
| Trevi Finanziaria SpA | | 2,918 | | 38,400 |
| Vianini Lavori SpA (I) | | 4,074 | | 24,575 |
| Zignago Vetro SpA | | 1,547 | | 10,601 |
| | |
|
| | | | | 6,398,400 |
| Japan - 21.91% | | | | |
| Accordia Golf Company, Ltd. | | 96 | | 80,531 |
| Achilles Corp. | | 20,000 | | 30,682 |
| Adeka Corp. | | 13,391 | | 150,167 |
| Advanex, Inc. | | 2,000 | | 2,341 |
| Aeon Delight Company, Ltd. | | 3,100 | | 57,170 |
| Aeon Fantasy Co., Ltd. | | 300 | | 4,009 |
| Ahresty Corp. | | 800 | | 8,183 |
| AI Holdings Corp. | | 4,300 | | 18,731 |
| Aica Kogyo Company, Ltd. | | 9,000 | | 122,497 |
| Aichi Bank, Ltd. (I) | | 1,600 | | 109,672 |
| Aichi Machine Industry Company, Ltd. | | 7,000 | | 31,339 |
| Aichi Steel Corp. | | 19,000 | | 137,341 |
| Aichi Tokei Denki Company, Ltd. | | 6,000 | | 17,771 |
| Aida Engineering, Ltd. | | 7,500 | | 40,425 |
| Ain Pharmaciez, Inc. | | 900 | | 31,505 |
| Aiphone Company, Ltd. | | 1,900 | | 30,958 |
| Aisan Industry Company, Ltd. (I) | | 3,200 | | 37,104 |
| Akebono Brake Industry Company, Ltd. | | 7,200 | | 44,161 |
| Akita Bank, Ltd. | | 35,000 | | 119,765 |
| Alpen Company, Ltd. | | 2,000 | | 40,667 |
| Alpha Corp. | | 1,000 | | 13,008 |
| Alpha Systems, Inc. | | 600 | | 10,501 |
| Alpine Electronics, Inc. | | 5,815 | | 84,745 |
| Alps Logistics Company, Ltd. | | 2,000 | | 24,412 |
| Amano Corp. | | 11,800 | | 114,256 |
| Amiyaki Tei Company., Ltd. | | 3 | | 10,287 |
| Ando Corp. | | 10,000 | | 13,856 |
| Anest Iwata Corp. | | 6,000 | | 29,695 |
| Anritsu Corp. (L) | | 10,297 | | 96,623 |
| AOC Holdings, Inc. (I) | | 3,400 | | 25,134 |
| AOKI Holdings, Inc. | | 3,200 | | 57,155 |
| Aomori Bank, Ltd. | | 18,000 | | 57,384 |
| Aoyama Trading Company, Ltd. | | 10,800 | | 188,192 |
| Arakawa Chemical Industries, Ltd. | | 1,700 | | 17,750 |
| Arc Land Sakamoto Company, Ltd. (I) | | 2,700 | | 33,596 |
| Arcs Company, Ltd. | | 4,800 | | 76,764 |
| Ariake Japan Company, Ltd. | | 3,200 | | 56,178 |
| Arisawa Manufacturing Company, Ltd. | | 3,200 | | 19,049 |
| Arnest One Corp. | | 6,500 | | 82,114 |
| Aronkasei Company, Ltd. (I) | | 4,000 | | 25,191 |
| Art Corp. (I) | | 1,300 | | 28,506 |
| AS ONE CORP. | | 1,500 | | 34,347 |
| Asahi Company, Ltd. (I) | | 2,600 | | 43,734 |
| Asahi Diamond Industrial Company, Ltd. | | 10,000 | | 194,062 |
| Asahi Holdings, Inc. | | 3,700 | | 82,224 |
| Asahi Organic Chemicals | | | | |
| Industry Company, Ltd. | | 8,000 | | 23,171 |
| Asahi TEC Corp. (I) | | 45,000 | | 18,763 |
| ASATSU-DK, Inc. | | 4,800 | | 137,491 |
| ASKA Pharmaceutical Company, Ltd. | | 3,000 | | 25,223 |
| ASKUL Corp. | | 3,000 | | 60,598 |
| | | | |
| International Small Company Fund (continued) |
| | | Shares or | | |
| | | Principal | | |
| | | Amount | | Value |
| | |
|
| |
| COMMON STOCKS (continued) | | | | |
| Japan (continued) | | | | |
| Asunaro Aoki Construction Company, Ltd. | | 4,000 | $ | 19,847 |
| Atom Corp. (I)(L) | | 16,700 | | 57,071 |
| Atsugi Company, Ltd. | | 22,000 | | 30,187 |
| Autobacs Seven Company, Ltd. | | 4,500 | | 182,808 |
| Avex Group Holdings, Inc. | | 5,000 | | 73,797 |
| Azel Corp. (I) | | 17,000 | | 0 |
| BALS Corp. | | 1 | | 1,091 |
| Bando Chemical Industries, Ltd. | | 9,000 | | 42,851 |
| Bank of Iwate, Ltd. | | 2,500 | | 119,634 |
| Bank of Nagoya, Ltd. | | 22,000 | | 79,553 |
| Bank of Okinawa, Ltd. | | 3,088 | | 131,305 |
| Bank of Saga, Ltd. | | 19,000 | | 54,458 |
| Bank of the Ryukyus, Ltd. | | 5,600 | | 67,429 |
| Belc Company, Ltd. (I) | | 100 | | 1,244 |
| Belluna Co., Ltd. | | 4,950 | | 36,560 |
| Best Denki Company, Ltd. (I) | | 6,500 | | 19,367 |
| BIC Camera, Inc. (I) | | 98 | | 40,953 |
| BML, Inc. | | 1,500 | | 41,919 |
| Bookoff Corp. | | 2,100 | | 18,373 |
| Bunka Shutter Company, Ltd. | | 6,000 | | 17,035 |
| CAC Corp. | | 2,100 | | 17,772 |
| Calsonic Kansei Corp. (I) | | 25,000 | | 124,498 |
| Can Do Company, Ltd. (I) | | 1 | | 901 |
| Canon Electronics, Inc. | | 3,000 | | 92,044 |
| Capcom Company, Ltd. | | 6,700 | | 129,470 |
| Cawachi, Ltd. | | 2,200 | | 47,253 |
| Central Glass Company, Ltd. | | 29,432 | | 131,721 |
| Century Tokyo Leasing Corp. | | 7,200 | | 137,440 |
| Chiyoda Company, Ltd. | | 4,200 | | 59,356 |
| Chiyoda Integre Company, Ltd. (I) | | 1,600 | | 25,043 |
| Chofu Seisakusho Company, Ltd. | | 2,800 | | 67,287 |
| Chori Company, Ltd. | | 23,000 | | 31,601 |
| Chubu Shiryo Company, Ltd. | | 3,000 | | 22,456 |
| Chudenko Corp. | | 6,700 | | 84,558 |
| Chuetsu Pulp & Paper Company, Ltd. | | 10,000 | | 18,871 |
| Chugai Mining Company, Ltd. | | 34,900 | | 14,186 |
| Chugai Ro Company, Ltd. | | 8,000 | | 38,568 |
| Chugoku Marine Paints, Ltd. | | 11,000 | | 97,094 |
| Chukyo Bank, Ltd. | | 18,000 | | 47,198 |
| Chuo Denki Kogyo Company, Ltd. | | 2,000 | | 12,506 |
| Chuo Gyorui Company, Ltd. | | 3,000 | | 6,938 |
| Circle K Sunkus Company, Ltd. | | 6,300 | | 106,494 |
| CKD Corp. | | 5,700 | | 63,363 |
| Clarion Company, Ltd. (I) | | 20,000 | | 43,801 |
| Cleanup Corp. | | 1,000 | | 8,094 |
| CMIC Company, Ltd. (I) | | 70 | | 24,827 |
| CMK Corp. | | 4,000 | | 21,000 |
| Coca-Cola Central Japan Company, Ltd. | | 4,300 | | 58,709 |
| Cocokara Fine Holdings, Inc. | | 2,630 | | 61,331 |
| Colowide Company, Ltd. | | 4,500 | | 27,983 |
| Columbia Music Entertainment, Inc. (I) | | 29,000 | | 15,315 |
| Computer Engineering & Consulting, Ltd. (I) | | 1,500 | | 8,212 |
| COMSYS Holdings Corp. | | 15,100 | | 154,344 |
| Corona Corp. | | 900 | | 9,926 |
| Cosel Company, Ltd. | | 3,100 | | 50,719 |
| Cosmos Pharmaceutical Corp. | | 1,800 | | 75,914 |
| CSK Corp. (I)(L) | | 16,700 | | 60,674 |
| Culture Convenience Club Company, Ltd. (L) | | 10,100 | | 73,946 |
| Cybozu, Inc. (I) | | 45 | | 12,918 |
| D.G. Roland Corp. | | 1,400 | | 21,658 |
| Dai Nippon Toryo Company, Ltd. (I) | | 12,000 | | 17,365 |
| Dai-Dan Company, Ltd. | | 5,000 | | 28,280 |
| Daibiru Corp. | | 10,100 | | 86,390 |
| Daido Metal Company, Ltd. | | 5,000 | | 53,303 |
| Daidoh, Ltd. | | 2,500 | | 24,316 |
| |
| The accompanying notes are an integral part of the financial statements. | 136 |
John Hancock Funds II
Portfolio of Investments — February 28, 2011 (Unaudited) (showing percentage of total net assets)
| | | | |
| International Small Company Fund (continued) |
| | | Shares or | | |
| | | Principal | | |
| | | Amount | | Value |
| | |
|
| |
| COMMON STOCKS (continued) | | | | |
| Japan (continued) | | | | |
| Daiei, Inc. (I) | | 8,300 | $ | 33,814 |
| Daifuku Company, Ltd. | | 12,000 | | 96,939 |
| Daihen Corp. | | 10,000 | | 45,649 |
| Daiho Corp. | | 10,000 | | 10,452 |
| Daiichi Chuo Kisen Kaisha, Ltd. (I)(L) | | 20,000 | | 48,579 |
| Daiichi Jitsugyo Company, Ltd. | | 6,000 | | 27,348 |
| Daiichi Kigenso Kagaku-Kogyo Company, Ltd. | | 900 | | 38,138 |
| Daiken Corp. | | 15,000 | | 45,788 |
| Daiki Aluminium Industry Company, Ltd. (I) | | 5,000 | | 17,162 |
| Daiko Clearing Services Corp. | | 3,000 | | 11,997 |
| Daikoku Denki Company, Ltd. | | 1,600 | | 20,288 |
| Daikyo, Inc. (I)(L) | | 19,144 | | 37,222 |
| Dainichi Company, Ltd. | | 2,100 | | 15,252 |
| Dainichiseika Color & Chemicals | | | | |
| Manufacturing Company, Ltd. | | 6,000 | | 34,177 |
| Daio Paper Corp. | | 13,000 | | 96,303 |
| Daisan Bank, Ltd. | | 28,000 | | 82,163 |
| Daiseki Company, Ltd. (L) | | 5,500 | | 109,473 |
| Daiso Company, Ltd. | | 8,000 | | 27,837 |
| Daisyo Corp. | | 1,100 | | 13,691 |
| Daiwa Industries, Ltd. (I) | | 5,000 | | 25,143 |
| Daiwabo Holdings Company, Ltd. | | 13,000 | | 31,711 |
| DCM Japan Holdings Company, Ltd. | | 9,520 | | 58,227 |
| Denki Kogyo Company, Ltd. | | 7,000 | | 33,072 |
| Denyo Company, Ltd. | | 3,100 | | 27,504 |
| Descente, Ltd. | | 5,000 | | 25,685 |
| Doshisha Company, Ltd. | | 1,000 | | 22,948 |
| Doutor Nichires Holdings Company, Ltd. | | 4,793 | | 64,337 |
| Dr. Ci:Labo Company, Ltd. (I) | | 20 | | 77,927 |
| DTS Corp. | | 2,700 | | 30,801 |
| Duskin Company, Ltd. | | 8,900 | | 179,801 |
| Dwango Company, Ltd. | | 14 | | 40,017 |
| Dydo Drinco, Inc. | | 1,500 | | 62,961 |
| Eagle Industry Company, Ltd. | | 2,000 | | 25,031 |
| Earth Chemical Company, Ltd. (I) | | 1,900 | | 63,752 |
| EDION Corp. | | 11,300 | | 117,111 |
| Ehime Bank, Ltd. | | 20,253 | | 62,884 |
| Eighteenth Bank, Ltd. | | 30,000 | | 96,932 |
| Eiken Chemical Company, Ltd. | | 1,600 | | 20,376 |
| Eizo Nanao Corp. | | 2,800 | | 70,821 |
| Elematec Corp. | | 1,000 | | 14,721 |
| Enplas Corp. | | 1,800 | | 26,968 |
| EPS Company, Ltd. | | 24 | | 56,153 |
| Espec Corp. | | 2,400 | | 21,204 |
| Exedy Corp. | | 4,000 | | 132,319 |
| F&A Aqua Holdings, Inc. (I) | | 2,900 | | 27,049 |
| F-Tech, Inc. | | 100 | | 2,131 |
| Falco Biosystems, Ltd. (I) | | 1,500 | | 14,381 |
| Fancl Corp. | | 5,200 | | 77,120 |
| FCC Company, Ltd. | | 5,700 | | 141,830 |
| FDK Corp. (I) | | 21,000 | | 37,613 |
| Fidea Holdings Company, Ltd. | | 2,600 | | 8,618 |
| Foster Electric Company, Ltd. | | 2,800 | | 75,643 |
| FP Corp. | | 2,000 | | 113,235 |
| France Bed Holdings Company, Ltd. | | 14,000 | | 19,567 |
| Fudo Tetra Corp. (I) | | 13,700 | | 8,907 |
| Fuji Company, Ltd. (I) | | 3,000 | | 61,890 |
| Fuji Corp., Ltd. | | 2,600 | | 13,385 |
| Fuji Electronics Company, Ltd. (I) | | 2,300 | | 41,450 |
| Fuji Kosan Company, Ltd. (I) | | 11,000 | | 12,553 |
| Fuji Kyuko Company, Ltd. | | 8,000 | | 42,823 |
| Fuji Oil Company, Ltd. | | 9,900 | | 141,742 |
| Fuji Seal International, Inc. | | 3,500 | | 77,898 |
| Fuji Software ABC, Inc. | | 4,300 | | 74,004 |
| Fujibo Holdings, Inc. | | 9,000 | | 19,454 |
| | | | |
| International Small Company Fund (continued) |
| | | Shares or | | |
| | | Principal | | |
| | | Amount | | Value |
| | |
|
| |
| COMMON STOCKS (continued) | | | | |
| Japan (continued) | | | | |
| Fujicco Company, Ltd. | | 3,000 | $ | 37,822 |
| Fujikura Kasei Company, Ltd. | | 3,400 | | 26,326 |
| Fujimi, Inc. | | 2,500 | | 38,794 |
| Fujimori Kogyo Company, Ltd. | | 1,700 | | 27,934 |
| Fujita Kanko, Inc. (I) | | 8,000 | | 36,067 |
| Fujitec Company, Ltd. | | 8,000 | | 41,790 |
| Fujitsu Frontech, Ltd. | | 2,000 | | 16,882 |
| Fujitsu General, Ltd. | | 7,000 | | 41,080 |
| Fujiya Company, Ltd. (I) | | 16,000 | | 29,987 |
| Fukui Bank, Ltd. | | 38,188 | | 126,256 |
| Fukushima Bank, Ltd. | | 23,000 | | 17,816 |
| Fukuyama Transporting Company, Ltd. | | 3,000 | | 15,496 |
| Fumakilla, Ltd. | | 3,000 | | 13,840 |
| Funai Consulting Company, Ltd. (I) | | 3,100 | | 20,078 |
| Funai Electric Company, Ltd. | | 3,500 | | 113,902 |
| Furukawa Battery Company, Ltd. | | 1,231 | | 8,634 |
| Furukawa Company, Ltd. (I) | | 26,000 | | 30,951 |
| Furukawa-Sky Aluminum Corp. | | 16,000 | | 50,843 |
| Fuso Pharmaceutical Industries, Ltd. | | 8,000 | | 24,881 |
| Futaba Corp. | | 5,657 | | 112,365 |
| Futaba Industrial Company, Ltd. (I) | | 5,600 | | 39,287 |
| Fuyo General Lease Company, Ltd. | | 3,700 | | 137,514 |
| Gakken Company, Ltd. | | 6,000 | | 13,875 |
| Gecoss Corp. | | 4,000 | | 16,311 |
| Geo Corp. | | 68 | | 90,218 |
| GLOBERIDE, Inc. | | 10,000 | | 12,647 |
| GMO Internet, Inc. | | 5,300 | | 32,181 |
| Godo Steel, Ltd. | | 12,000 | | 25,194 |
| Goldcrest Company, Ltd. | | 3,070 | | 83,838 |
| Green Hospital Supply, Inc. | | 2,100 | | 27,463 |
| GSI Creos Corp. (I) | | 11,000 | | 17,198 |
| Gulliver International Company, Ltd. (I) | | 480 | | 21,327 |
| Gun-Ei Chemical Industry Company, Ltd. | | 6,000 | | 18,396 |
| Gunze, Ltd. (I) | | 21,000 | | 90,390 |
| H20 Retailing Corp. | | 18,000 | | 136,741 |
| Hakuto Company, Ltd. | | 1,500 | | 16,800 |
| Hakuyosha Company, Ltd. (I) | | 5,000 | | 13,958 |
| Hamakyorex Company, Ltd. | | 1,300 | | 41,265 |
| Hanwa Company, Ltd. | | 32,000 | | 149,160 |
| Harashin Narus Holdings Company, Ltd. | | 2,000 | | 31,907 |
| Haruyama Trading Company, Ltd. | | 2,700 | | 16,989 |
| Hayashikane Sangyo Company, Ltd. (I) | | 4,000 | | 4,268 |
| Hazama Corp. (I) | | 10,600 | | 9,739 |
| Heiwa Corp. (L) | | 6,400 | | 113,956 |
| Heiwa Real Estate Company, Ltd. | | 14,500 | | 42,313 |
| Heiwado Company, Ltd. (I) | | 4,500 | | 57,526 |
| Hibiya Engineering, Ltd. | | 3,500 | | 33,364 |
| Higashi-Nippon Bank, Ltd. | | 17,000 | | 44,555 |
| Higo Bank, Ltd. | | 20,000 | | 122,101 |
| Hikari Tsushin, Inc. | | 4,600 | | 112,441 |
| Hioki Ee Corp. (I) | | 400 | | 8,275 |
| HIS Company, Ltd. | | 3,300 | | 86,051 |
| Hisaka Works, Ltd. | | 3,000 | | 42,913 |
| Hitachi Cable, Ltd. | | 30,000 | | 86,500 |
| Hitachi Koki Company, Ltd. | | 8,700 | | 90,573 |
| Hitachi Kokusai Electric, Inc. | | 10,000 | | 96,428 |
| Hitachi Medical Corp. | | 2,000 | | 22,787 |
| Hitachi Tool Engineering, Ltd. | | 2,500 | | 28,995 |
| Hitachi Zosen Corp. (L) | | 91,000 | | 139,287 |
| Hodogaya Chemical Company, Ltd. | | 5,000 | | 21,961 |
| Hogy Medical Company, Ltd. | | 2,500 | | 118,767 |
| Hokkaido Gas Company, Ltd. | | 2,000 | | 6,121 |
| Hokkan Holdings, Ltd. | | 7,000 | | 24,669 |
| Hokuetsu Bank, Ltd. | | 22,000 | | 52,583 |
| Hokuetsu Paper Mills, Ltd. | | 18,000 | | 104,403 |
| |
| The accompanying notes are an integral part of the financial statements. | 137 |
John Hancock Funds II
Portfolio of Investments — February 28, 2011 (Unaudited) (showing percentage of total net assets)
| | | | |
| International Small Company Fund (continued) |
| | | Shares or | | |
| | | Principal | | |
| | | Amount | | Value |
| | |
|
| |
| COMMON STOCKS (continued) | | | | |
| Japan (continued) | | | | |
| Hokuriku Electric Industry Company, Ltd. | | 7,000 | $ | 16,721 |
| Hokuto Corp. | | 4,200 | | 97,286 |
| Honeys Company, Ltd. | | 1,230 | | 16,831 |
| Horiba, Ltd. | | 3,992 | | 125,188 |
| Hoshizaki Electric Company, Ltd. | | 3,800 | | 70,229 |
| Hosiden Corp. | | 8,600 | | 98,657 |
| Howa Machinery, Ltd. (I) | | 20,000 | | 26,695 |
| Hyakujushi Bank, Ltd. | | 11,000 | | 45,512 |
| I Metal Technology Company, Ltd. (I) | | 4,000 | | 12,360 |
| IBJ Leasing Company, Ltd. | | 2,900 | | 75,455 |
| Ichibanya Company, Ltd. | | 700 | | 20,589 |
| Ichikoh Industries, Ltd. (I) | | 6,000 | | 18,217 |
| Ichiyoshi Securities Company, Ltd. | | 4,500 | | 34,319 |
| ICOM, Inc. | | 1,000 | | 27,862 |
| IDEC Corp. | | 2,900 | | 28,632 |
| Ihara Chemical Industry Company, Ltd. | | 7,000 | | 25,918 |
| Iida Home Max | | 5,600 | | 66,822 |
| Iino Kaiun Kaisha, Ltd. | | 12,400 | | 67,533 |
| Ikyu Corp. | | 35 | | 18,087 |
| Imasen Electric Industrial | | 1,300 | | 21,845 |
| Imperial Hotel, Ltd. | | 2,200 | | 63,643 |
| Inaba Denki Sangyo Company, Ltd. | | 3,100 | | 90,759 |
| Inaba Seisakusho Company, Ltd. (I) | | 1,900 | | 20,165 |
| Inabata & Company, Ltd. | | 4,400 | | 31,358 |
| Inageya Company, Ltd. | | 6,000 | | 65,237 |
| Ines Corp. | | 3,700 | | 31,218 |
| Intage, Inc. | | 600 | | 13,704 |
| Inui Steamship Company, Ltd. | | 2,300 | | 16,570 |
| Ise Chemical Corp. (I) | | 3,000 | | 21,092 |
| Iseki & Company, Ltd. (I)(L) | | 21,000 | | 56,966 |
| Ishihara Sangyo Kaisha, Ltd. (I) | | 34,000 | | 45,434 |
| Ishii Hyoki Company, Ltd. (I) | | 1,000 | | 9,995 |
| IT Holdings Corp. | | 8,600 | | 98,613 |
| ITC Networks Corp. | | 4,500 | | 27,900 |
| Itochu Enex Company, Ltd. | | 9,000 | | 52,896 |
| Itochu-Shokuhin Company, Ltd. (I) | | 600 | | 21,288 |
| Itoham Foods, Inc. | | 24,000 | | 91,681 |
| Itoki Corpitoki Corp. (I) | | 4,300 | | 11,390 |
| Iwai Securities Company, Ltd. | | 1,500 | | 10,446 |
| Iwasaki Electric Company, Ltd. (I) | | 6,000 | | 12,363 |
| Iwatani International Corp. | | 26,000 | | 84,602 |
| Izumi Company, Ltd. | | 1,900 | | 27,927 |
| Izumiya Company, Ltd. | | 7,773 | | 36,386 |
| J-Oil Mills, Inc. | | 13,000 | | 40,755 |
| Jalux, Inc. (I) | | 1,500 | | 15,538 |
| Jamco Corp. | | 3,000 | | 21,698 |
| Japan Airport Terminal Company, Ltd. | | 5,800 | | 88,325 |
| Japan Aviation Electronics Industry, Ltd. | | 6,000 | | 50,737 |
| Japan Cash Machine Company, Ltd. | | 1,800 | | 16,155 |
| Japan Digital Laboratory Company, Ltd. | | 2,400 | | 28,643 |
| Japan Pulp & Paper Company, Ltd. | | 14,000 | | 55,077 |
| Japan Pure Chemical Company, Ltd. | | 6 | | 19,030 |
| Japan Transcity Corp., Ltd. | | 8,000 | | 30,173 |
| Japan Vilene Company, Ltd. | | 3,000 | | 16,023 |
| Japan Wool Textile Company, Ltd. | | 10,000 | | 88,509 |
| Jastec Company, Ltd. (I) | | 2,100 | | 12,853 |
| Jeol, Ltd. | | 8,000 | | 26,118 |
| JFE Shoji Holdings, Inc. | | 22,000 | | 105,103 |
| JK Holdings Company, Ltd. | | 3,600 | | 17,633 |
| Joban Kosan Company, Ltd. | | 8,000 | | 12,331 |
| Joshin Denki Company, Ltd. (I) | | 7,000 | | 72,977 |
| JSP Corp. | | 2,800 | | 53,146 |
| Juki Corp. (I) | | 19,000 | | 45,176 |
| Juroku Bank, Ltd. | | 40,000 | | 138,729 |
| JVC KENWOOD Holdings, Ltd. (I) | | 6,428 | | 35,379 |
| | | | |
| International Small Company Fund (continued) |
| | | Shares or | | |
| | | Principal | | |
| | | Amount | | Value |
| | |
|
| |
| COMMON STOCKS (continued) | | | | |
| Japan (continued) | | | | |
| K’s Holding Corp. (I) | | 3,100 | $ | 104,697 |
| kabu.com Securities Company, Ltd. | | 8,500 | | 37,362 |
| Kabuki-Za Company, Ltd. | | 1,000 | | 42,763 |
| Kadokawa Holdings, Inc. | | 3,000 | | 78,216 |
| Kaga Electronics Company, Ltd. | | 2,700 | | 35,517 |
| Kagoshima Bank, Ltd. | | 5,000 | | 35,385 |
| Kakaku.com, Inc. | | 25 | | 146,209 |
| Kaken Pharmaceutical Company, Ltd. (I) | | 7,000 | | 89,431 |
| Kameda Seika Company, Ltd. | | 1,900 | | 35,989 |
| Kamei Corp. | | 3,000 | | 15,507 |
| Kanaden Corp. | | 4,000 | | 25,499 |
| Kanagawa Chuo Kotsu Company, Ltd. | | 6,000 | | 31,715 |
| Kanamoto Company, Ltd. (I) | | 3,000 | | 16,929 |
| Kandenko Company, Ltd. | | 7,000 | | 44,389 |
| Kanematsu Corp. (I) | | 37,000 | | 44,090 |
| Kanematsu Electronics, Ltd. | | 2,300 | | 24,669 |
| Kanto Auto Works, Ltd. | | 9,600 | | 80,206 |
| Kanto Denka Kogyo Company, Ltd. | | 5,000 | | 42,705 |
| Kanto Natural Gas Development, Ltd. | | 4,000 | | 23,611 |
| Kanto Tsukuba Bank, Ltd. (I) | | 8,000 | | 29,996 |
| Kappa Create Company, Ltd. (I) | | 2,600 | | 57,905 |
| Kasai Kogyo Co., Ltd. | | 1,000 | | 7,027 |
| Kasumi Company, Ltd. (I) | | 5,100 | | 28,467 |
| Katakura Industries Company, Ltd. | | 3,100 | | 32,675 |
| Kato Sangyo Company, Ltd. (I) | | 3,100 | | 54,686 |
| Kato Works Company, Ltd. | | 5,000 | | 13,494 |
| Kawai Musical Instruments | | | | |
| Manufacturing Company, Ltd. | | 11,000 | | 27,393 |
| Kawasumi Laboratories, Inc. | | 2,000 | | 13,877 |
| Kayaba Industry Company, Ltd. | | 21,000 | | 183,750 |
| Keihanshin Real Estate Company, Ltd. | | 2,800 | | 13,969 |
| Keihin Company, Ltd. | | 10,000 | | 12,121 |
| Keiyo Company, Ltd. (I)(L) | | 4,600 | | 24,280 |
| Kenedix, Inc. (I) | | 332 | | 90,279 |
| Kentucky Fried Chicken Japan, Ltd. | | 1,000 | | 25,086 |
| KEY Coffee, Inc. | | 2,000 | | 37,655 |
| Kimoto Company, Ltd. | | 3,400 | | 31,863 |
| Kimura Chemical Plants Company, Ltd. | | 1,900 | | 14,438 |
| Kinki Nippon Tourist Company, Ltd. (I) | | 12,000 | | 21,228 |
| Kinki Sharyo Company, Ltd. | | 3,000 | | 15,824 |
| Kintetsu World Express, Inc. | | 2,000 | | 62,620 |
| Kisoji Company, Ltd. | | 2,800 | | 62,476 |
| Kissei Pharmaceutical Company, Ltd. | | 5,100 | | 101,795 |
| Kita-Nippon Bank, Ltd. | | 900 | | 24,572 |
| Kitagawa Iron Works Company, Ltd. (I) | | 12,000 | | 23,838 |
| Kitano Construction Corp. | | 8,000 | | 20,371 |
| Kitz Corp. | | 11,800 | | 53,193 |
| Kiyo Holdings, Inc. | | 71,395 | | 104,970 |
| Koa Corp. | | 4,200 | | 51,936 |
| Koatsu Gas Kogyo Company, Ltd. | | 3,000 | | 18,767 |
| Kohnan Shoji Company, Ltd. | | 3,300 | | 45,271 |
| Koike Sanso Kogyo Company, Ltd. | | 5,000 | | 14,757 |
| Kokuyo Company, Ltd. | | 11,973 | | 98,558 |
| Komatsu Seiren Company, Ltd. | | 1,000 | | 4,545 |
| Komatsu Wall Industry Company, Ltd. | | 1,200 | | 11,873 |
| Komeri Company, Ltd. | | 4,800 | | 120,827 |
| Komori Corp. | | 9,724 | | 103,920 |
| Konaka Company, Ltd. (I) | | 4,600 | | 26,974 |
| Kondotec, Inc. | | 1,600 | | 12,437 |
| Konishi Company, Ltd. | | 2,600 | | 35,963 |
| Kosaido Company, Ltd. (I) | | 2,300 | | 3,470 |
| Kose Corp. | | 2,500 | | 67,919 |
| Kosei Securities Company, Ltd. | | 10,000 | | 11,042 |
| Kourakuen Corp. | | 500 | | 7,712 |
| Kumagai Gumi Company, Ltd. (I) | | 18,000 | | 13,705 |
| |
| The accompanying notes are an integral part of the financial statements. | 138 |
John Hancock Funds II
Portfolio of Investments — February 28, 2011 (Unaudited) (showing percentage of total net assets)
| | | | |
| International Small Company Fund (continued) |
| | | Shares or | | |
| | | Principal | | |
| | | Amount | | Value |
| | |
|
| |
| COMMON STOCKS (continued) | | | | |
| Japan (continued) | | | | |
| Kumiai Chemical Industry Company, Ltd. | | 4,000 | $ | 14,518 |
| Kura Corp. (I) | | 2,000 | | 32,321 |
| Kurabo Industries, Ltd. | | 18,000 | | 35,954 |
| Kureha Corp. | | 16,000 | | 86,222 |
| Kuroda Electric Company, Ltd. | | 3,600 | | 50,082 |
| Kyoden Company, Ltd. | | 7,000 | | 13,857 |
| Kyodo Printing Company, Ltd. | | 9,000 | | 20,945 |
| Kyoei Steel, Ltd. | | 3,800 | | 63,594 |
| Kyoei Tanker Company, Ltd. | | 5,000 | | 11,406 |
| Kyokuto Kaihatsu Kogyo Company, Ltd. | | 3,400 | | 16,084 |
| Kyokuto Securities Company, Ltd. | | 4,500 | | 37,331 |
| Kyokuyo Company, Ltd. | | 11,000 | | 25,908 |
| Kyorin Company, Ltd. | | 8,000 | | 145,831 |
| Kyoritsu Maintenance Company, Ltd. | | 1,500 | | 25,299 |
| Kyosan Electric Manufacturing Company, Ltd. | | 8,000 | | 44,363 |
| Kyoto Kimono Yuzen Company, Ltd. | | 1,500 | | 17,327 |
| Kyowa Exeo Corp. | | 13,600 | | 129,999 |
| Kyowa Leather Cloth Company, Ltd. | | 200 | | 799 |
| Kyudenko Corp. | | 5,000 | | 31,954 |
| Laox Company, Ltd. (I) | | 24,000 | | 20,591 |
| Leopalace21 Corp. (I)(L) | | 15,200 | | 25,758 |
| Life Corp. (I) | | 5,600 | | 89,057 |
| Livedoor Auto Company, Ltd. (I) | | 29,500 | | 10,129 |
| Macnica, Inc. | | 1,200 | | 31,669 |
| Macromill, Inc. | | 2,000 | | 28,979 |
| Maeda Corp. | | 18,000 | | 58,348 |
| Maeda Road Construction Company, Ltd. | | 7,000 | | 59,552 |
| Maezawa Kasei Industries Company, Ltd. | | 2,000 | | 19,222 |
| Maezawa Kyuso Industries Company, Ltd. | | 1,600 | | 21,308 |
| Makino Milling Machine Company, Ltd. (I) | | 15,575 | | 146,374 |
| Mandom Corp. | | 2,970 | | 79,702 |
| Mars Engineering Corp. | | 1,500 | | 29,279 |
| Marubun Corp. | | 2,200 | | 13,026 |
| Marudai Food Company, Ltd. | | 13,000 | | 43,150 |
| Maruei Department Store Company, Ltd. (I) | | 7,000 | | 9,456 |
| Maruetsu, Inc. | | 7,000 | | 28,211 |
| Maruha Group, Inc. | | 46,815 | | 87,790 |
| Marusan Securities Company, Ltd. | | 6,861 | | 39,548 |
| Maruwa Company, Ltd. (I) | | 800 | | 27,493 |
| Maruyama Manufacturing Company, Inc. (I) | | 7,000 | | 16,321 |
| Maruzen Showa Unyu Company, Ltd. | | 7,000 | | 24,122 |
| Maspro Denkoh Corp. | | 1,900 | | 19,289 |
| Matsuda Sangyo Company, Ltd. | | 2,020 | | 35,995 |
| Matsuya Company, Ltd. | | 3,300 | | 25,917 |
| Matsuya Foods Company, Ltd. | | 400 | | 7,724 |
| Max Company, Ltd. | | 9,000 | | 120,884 |
| Maxvalu Tokai Company, Ltd. (I) | | 2,000 | | 27,600 |
| MEC Company, Ltd. | | 2,400 | | 13,030 |
| Megachips Corp. | | 1,900 | | 41,169 |
| Megane Top Company, Ltd. | | 3,000 | | 29,951 |
| Megmilk Snow Brand Company, Ltd. | | 7,600 | | 136,121 |
| Meidensha Corp. (L) | | 17,086 | | 78,897 |
| Meiji Shipping Company, Ltd. | | 3,900 | | 15,864 |
| Meiko Network Japan Company, Ltd. (I) | | 900 | | 7,850 |
| Meitec Corp. (I) | | 4,000 | | 88,696 |
| Meito Sangyo Company, Ltd. | | 900 | | 12,474 |
| Meiwa Estate Company, Ltd. (I) | | 3,300 | | 25,015 |
| Melco Holdings, Inc. | | 2,300 | | 88,138 |
| Michinoku Bank, Ltd. | | 16,000 | | 35,296 |
| Mikuni Coca-Cola Bottling Company, Ltd. | | 4,000 | | 35,898 |
| Mikuni Corp. (I) | | 1,000 | | 3,039 |
| Milbon Company, Ltd. | | 1,100 | | 30,315 |
| Mimasu Semiconductor | | | | |
| Industry Company, Ltd. | | 2,100 | | 25,830 |
| Minato Bank, Ltd. | | 28,000 | | 56,708 |
| | | | |
| International Small Company Fund (continued) |
| | | Shares or | | |
| | | Principal | | |
| | | Amount | | Value |
| | |
|
| |
| COMMON STOCKS (continued) | | | | |
| Japan (continued) | | | | |
| Ministop Company, Ltd. | | 1,900 | $ | 32,957 |
| Mirait Holdings Corp. (I) | | 6,980 | | 52,994 |
| Misawa Homes Company, Ltd. (I) | | 1,200 | | 6,167 |
| Mitani Corp. | | 2,500 | | 26,405 |
| Mito Securities Company, Ltd. | | 6,000 | | 10,601 |
| Mitsuba Corp. (I) | | 2,000 | | 18,044 |
| Mitsubishi Kakoki Kaisha, Ltd. | | 7,000 | | 16,292 |
| Mitsubishi Paper Mills, Ltd. (I) | | 29,387 | | 37,089 |
| Mitsubishi Pencil Company, Ltd. (I) | | 2,300 | | 38,666 |
| Mitsubishi Steel Manufacturing Company, Ltd. | | 20,000 | | 76,843 |
| Mitsuboshi Belting Company, Ltd. | | 9,000 | | 53,097 |
| Mitsui High-Tec, Inc. | | 3,200 | | 18,980 |
| Mitsui Home Company, Ltd. | | 2,000 | | 11,464 |
| Mitsui Knowledge Industry Company, Ltd. | | 104 | | 18,931 |
| Mitsui Mining Company, Ltd. | | 27,500 | | 54,388 |
| Mitsui Sugar Company, Ltd. | | 17,000 | | 71,249 |
| Mitsui-Soko Company, Ltd. | | 11,000 | | 47,149 |
| Mitsumura Printing Company, Ltd. | | 4,000 | | 14,245 |
| Mitsuuroko Company, Ltd. | | 4,000 | | 26,030 |
| Miura Company, Ltd. | | 4,200 | | 117,783 |
| Miyazaki Bank, Ltd. | | 23,000 | | 61,507 |
| Miyoshi Oil & Fat Company, Ltd. (I) | | 7,000 | | 11,413 |
| Mizuho Investors Securities Company, Ltd. (I) | | 64,000 | | 72,285 |
| Mizuno Corp. | | 16,000 | | 77,263 |
| Mochida Pharmaceutical Company, Ltd. | | 11,000 | | 130,852 |
| Modec, Inc. | | 4,100 | | 75,718 |
| Monex Group, Inc. | | 149 | | 41,387 |
| Mori Seiki Company, Ltd. | | 14,600 | | 187,521 |
| Morinaga & Company, Ltd. | | 33,000 | | 80,908 |
| Morinaga Milk Industry Company, Ltd. | | 24,000 | | 101,143 |
| Morita Corp. | | 3,000 | | 19,136 |
| MOS Food Services, Inc. | | 3,600 | | 69,148 |
| Moshi Moshi Hotline, Inc. | | 3,750 | | 83,089 |
| Mr. Max Corp. | | 3,200 | | 11,603 |
| Musashi Seimitsu Industry Company, Ltd. | | 4,000 | | 105,785 |
| Musashino Bank, Ltd. | | 5,600 | | 192,583 |
| Mutoh Holdings Company, Ltd. (I) | | 8,000 | | 24,035 |
| Nachi-Fujikoshi Corp. | | 29,000 | | 162,785 |
| Nagaileben Company, Ltd. (I) | | 700 | | 17,665 |
| Nagano Bank, Ltd. | | 2,000 | | 4,755 |
| Nagatanien Company, Ltd. | | 2,000 | | 21,446 |
| Nakamuraya Company, Ltd. | | 6,000 | | 29,639 |
| Nakayama Steel Works, Ltd. (I) | | 11,000 | | 15,118 |
| NEC Fielding, Ltd. | | 1,900 | | 23,662 |
| NEC Leasing, Ltd. | | 2,000 | | 34,225 |
| NEC Mobiling, Ltd. | | 1,200 | | 40,715 |
| NEC Networks & System Integration Corp. | | 4,200 | | 57,018 |
| Net One Systems Company, Ltd. | | 70 | | 112,524 |
| Neturen Company, Ltd. | | 4,500 | | 43,346 |
| New Tachikawa Aircraft Company, Ltd. | | 700 | | 34,783 |
| Nice Corp. | | 4,000 | | 9,072 |
| Nichia Steel Works, Ltd. | | 4,000 | | 11,330 |
| Nichias Corp. | | 12,000 | | 74,406 |
| Nichicon Corp. | | 8,073 | | 114,821 |
| Nichiden Corp. | | 600 | | 17,486 |
| Nichiha Corp. | | 3,100 | | 30,829 |
| Nichii Gakkan Company, Ltd. | | 7,000 | | 64,368 |
| NICHIREI Corp. | | 31,000 | | 145,929 |
| Nichireki Company, Ltd. | | 1,000 | | 4,126 |
| Nidec Copal Corp. | | 1,800 | | 27,126 |
| Nidec Copal Electronics Corp. | | 2,600 | | 20,688 |
| Nidec Sankyo Corp. | | 2,000 | | 16,481 |
| Nidec Tosok Corp. | | 3,000 | | 30,902 |
| Nifco, Inc. | | 7,104 | | 191,774 |
| Nifty Corp. | | 3 | | 4,697 |
| |
| The accompanying notes are an integral part of the financial statements. | 139 |
John Hancock Funds II
Portfolio of Investments — February 28, 2011 (Unaudited) (showing percentage of total net assets)
| | | | |
| International Small Company Fund (continued) |
| | | Shares or | | |
| | | Principal | | |
| | | Amount | | Value |
| | |
|
| |
| COMMON STOCKS (continued) | | | | |
| Japan (continued) | | | | |
| Nihon Chouzai Company, Ltd. | | 540 | $ | 21,897 |
| Nihon Dempa Kogyo Company, Ltd. | | 2,000 | | 37,669 |
| Nihon Eslead Corp. | | 2,000 | | 22,759 |
| Nihon Kohden Corp. | | 7,000 | | 153,893 |
| Nihon M&A Center, Inc. | | 4 | | 24,301 |
| Nihon Nohyaku Company, Ltd. | | 3,000 | | 16,631 |
| Nihon Parkerizing Company, Ltd. | | 7,000 | | 108,447 |
| Nihon Unisys, Ltd. (I) | | 10,725 | | 85,218 |
| Nihon Yamamura Glass Company, Ltd. | | 13,000 | | 38,445 |
| Nikkiso Company, Ltd. | | 11,000 | | 95,353 |
| Nikko Company, Ltd. | | 5,000 | | 17,996 |
| Nippo Corp. | | 9,000 | | 63,466 |
| Nippon Beet Sugar | | | | |
| Manufacturing Company, Ltd. | | 15,000 | | 38,295 |
| Nippon Carbon Company, Ltd. | | 13,000 | | 40,172 |
| Nippon Ceramic Company, Ltd. (I) | | 2,500 | | 51,705 |
| Nippon Chemi-Con Corp. (I) | | 13,271 | | 94,019 |
| Nippon Chemical Industrial Company, Ltd. | | 8,000 | | 21,572 |
| Nippon Chemiphar Company, Ltd. | | 5,000 | | 17,321 |
| Nippon Denko Company, Ltd. | | 8,000 | | 58,514 |
| Nippon Densetsu Kogyo Company, Ltd. | | 7,000 | | 67,512 |
| Nippon Denwa Shisetsu Company, Ltd. | | 6,000 | | 19,810 |
| Nippon Felt Company, Ltd. | | 2,700 | | 14,287 |
| Nippon Filcon Company, Ltd. (I) | | 3,100 | | 15,987 |
| Nippon Fine Chemical Company, Ltd. | | 3,000 | | 20,129 |
| Nippon Flour Mills Company, Ltd. | | 18,000 | | 89,692 |
| Nippon Gas Company, Ltd. | | 4,800 | | 65,178 |
| Nippon Kanzai Company, Ltd. | | 800 | | 13,763 |
| Nippon Kasei Chemical Company, Ltd. | | 9,000 | | 23,154 |
| Nippon Koei Company, Ltd. | | 9,000 | | 30,303 |
| Nippon Konpo Unyu Soko Company, Ltd. (I) | | 11,000 | | 127,309 |
| Nippon Light Metal Company, Ltd. (I) | | 64,000 | | 137,925 |
| Nippon Metal Industry Company, Ltd. (I) | | 16,000 | | 20,618 |
| Nippon Parking | | | | |
| Development Company, Ltd. (I) | | 293 | | 15,050 |
| Nippon Piston Ring Company, Ltd. (I) | | 13,000 | | 37,011 |
| Nippon Road Company, Ltd. | | 8,000 | | 20,202 |
| Nippon Seiki Company, Ltd. | | 7,000 | | 93,482 |
| Nippon Seisen Company, Ltd. | | 7,000 | | 43,855 |
| Nippon Sharyo, Ltd. | | 11,000 | | 58,673 |
| Nippon Shinyaku Company, Ltd. | | 8,000 | | 105,402 |
| Nippon Signal Company, Ltd. | | 9,100 | | 72,079 |
| Nippon Soda Company, Ltd. | | 21,000 | | 111,645 |
| Nippon Steel Trading Company., Ltd. | | 14,000 | | 47,094 |
| Nippon Suisan Kaisha, Ltd. | | 28,165 | | 95,987 |
| Nippon Synthetic Chemical | | | | |
| Industry Company, Ltd. | | 9,000 | | 64,519 |
| Nippon System Development Company, Ltd. | | 6,015 | | 66,333 |
| Nippon Thompson Company, Ltd. | | 7,000 | | 58,615 |
| Nippon Valqua Industries, Ltd. | | 11,000 | | 35,733 |
| Nippon Yakin Kogyo Company, Ltd. (I)(L) | | 9,500 | | 26,959 |
| Nippon Yusoki Company, Ltd. | | 5,000 | | 13,531 |
| Nipro Corp. | | 7,200 | | 152,067 |
| Nishimatsu Construction Company, Ltd. | | 30,000 | | 41,910 |
| Nishimatsuya Chain Company, Ltd. | | 9,600 | | 87,755 |
| Nissan Shatai Company, Ltd. | | 15,277 | | 129,919 |
| Nissei Corp. | | 3,000 | | 26,250 |
| Nissen Holdings Company, Ltd. | | 4,600 | | 30,543 |
| Nissha Printing Company, Ltd. | | 300 | | 7,680 |
| Nisshin Fudosan Company, Ltd. | | 3,000 | | 23,713 |
| Nisshin Oillio Group, Ltd. | | 15,000 | | 78,095 |
| Nissin Corp. | | 11,000 | | 31,356 |
| Nissin Electric Company, Ltd. | | 4,000 | | 29,200 |
| Nissin Kogyo Company, Ltd. | | 7,300 | | 134,585 |
| Nissui Pharmaceutical Company, Ltd. | | 2,600 | | 23,200 |
| | | | |
| International Small Company Fund (continued) |
| | | Shares or | | |
| | | Principal | | |
| | | Amount | | Value |
| | |
|
| |
| COMMON STOCKS (continued) | | | | |
| Japan (continued) | | | | |
| Nitta Corp. | | 3,100 | $ | 59,348 |
| Nittan Valve Company, Ltd. | | 4,000 | | 17,566 |
| Nittetsu Mining Company, Ltd. | | 7,000 | | 36,323 |
| Nitto Boseki Company, Ltd. | | 25,229 | | 76,502 |
| Nitto Kogyo Corp. | | 3,600 | | 43,027 |
| Nitto Kohki Company, Ltd. | | 1,700 | | 43,556 |
| Nitto Seiko Company, Ltd. | | 4,000 | | 12,582 |
| Noevir Company, Ltd. | | 500 | | 6,076 |
| NOF Corp. | | 29,000 | | 147,358 |
| Nohmi Bosai, Ltd. | | 2,000 | | 13,244 |
| Noritake Company, Ltd. | | 18,000 | | 78,502 |
| Noritsu Koki Company, Ltd. (I) | | 2,000 | | 13,303 |
| Noritz Corp. | | 2,700 | | 45,814 |
| NS Solutions Corp. | | 3,000 | | 67,350 |
| OBIC Business Consultants, Ltd. | | 650 | | 42,982 |
| Oenon Holdings, Inc. (I) | | 4,000 | | 9,990 |
| Ogaki Kyoritsu Bank, Ltd. | | 31,000 | | 110,599 |
| Ohara, Inc. | | 2,000 | | 26,100 |
| Oiles Corp. | | 4,427 | | 89,765 |
| Oita Bank, Ltd. | | 21,000 | | 83,133 |
| Okabe Company, Ltd. | | 4,800 | | 26,004 |
| Okamoto Industries, Inc. | | 7,000 | | 28,143 |
| Okamura Corp. | | 13,000 | | 80,175 |
| Okasan Holdings, Inc. | | 28,000 | | 124,422 |
| Oki Electric Industry Company, Ltd. (I) | | 83,000 | | 71,285 |
| Okinawa Electric Power Company, Inc. | | 3,000 | | 150,450 |
| OKK Corp. (I) | | 10,000 | | 15,432 |
| OKUMA Corp. (I) | | 15,382 | | 144,753 |
| Okumura Corp. | | 25,000 | | 98,601 |
| Okura Industrial Company, Ltd. (I) | | 8,000 | | 27,272 |
| Okuwa Company, Ltd. | | 3,000 | | 33,111 |
| OMC Card, Inc. | | 31,555 | | 70,053 |
| ONO Sokki Company, Ltd. (I) | | 4,000 | | 13,483 |
| Onoken Company, Ltd. | | 1,400 | | 12,643 |
| Onward Kashiyama Company, Ltd. (L) | | 18,000 | | 162,382 |
| Optex Company, Ltd. (I) | | 400 | | 5,923 |
| Organo Corp. | | 3,000 | | 22,721 |
| Osaka Organic Chemical Industry, Ltd. (I) | | 3,200 | | 19,883 |
| Osaka Steel Company, Ltd. | | 2,500 | | 44,113 |
| Osaki Electric Company, Ltd. | | 3,000 | | 28,481 |
| OSG Corp. | | 7,700 | | 112,913 |
| Oyo Corp. (I) | | 2,400 | | 20,476 |
| Pacific Golf Group International Holdings KK | | 68 | | 44,710 |
| Pacific Industrial Company, Ltd. | | 4,000 | | 24,159 |
| Pal Company, Ltd. (I) | | 950 | | 37,656 |
| PanaHome Corp. | | 11,000 | | 76,796 |
| Panasonic Electric Works Information | | | | |
| Systems Company, Ltd. | | 500 | | 13,088 |
| Paramount Bed Company, Ltd. | | 2,500 | | 66,976 |
| Parco Company, Ltd. | | 7,200 | | 71,884 |
| Paris Miki, Inc. (I) | | 2,800 | | 27,991 |
| Pasco Corp. (I) | | 4,000 | | 13,445 |
| Pasona Group, Inc. | | 31 | | 27,110 |
| Penta-Ocean Construction Company, Ltd. | | 23,000 | | 38,672 |
| PIA Corp. (I) | | 1,300 | | 14,419 |
| Pigeon Corp. | | 2,731 | | 81,501 |
| Pilot Corp. (I) | | 22 | | 40,130 |
| Piolax, Inc. | | 1,000 | | 27,186 |
| Pioneer Corp. (I) | | 19,200 | | 103,419 |
| Plenus Company, Ltd. | | 2,800 | | 47,552 |
| Point, Inc. | | 2,780 | | 133,400 |
| Press Kogyo Company, Ltd. (I) | | 8,000 | | 39,404 |
| Prima Meat Packers, Ltd. (I) | | 14,000 | | 19,589 |
| Pronexus, Inc. | | 3,500 | | 18,784 |
| PS Mitsubishi Construction Company, Ltd. (I) | | 4,200 | | 13,160 |
| |
| The accompanying notes are an integral part of the financial statements. | 140 |
John Hancock Funds II
Portfolio of Investments — February 28, 2011 (Unaudited) (showing percentage of total net assets)
| | | | |
| International Small Company Fund (continued) |
| | | Shares or | | |
| | | Principal | | |
| | | Amount | | Value |
| | |
|
| |
| COMMON STOCKS (continued) | | | | |
| Japan (continued) | | | | |
| Raito Kogyo Company, Ltd. | | 7,600 | $ | 21,430 |
| Rasa Industries, Ltd. (I) | | 10,000 | | 19,053 |
| Resorttrust, Inc. | | 5,800 | | 95,546 |
| Rhythm Watch Company, Ltd. | | 14,000 | | 24,693 |
| Ricoh Leasing Company, Ltd. | | 3,200 | | 87,037 |
| Right On Company, Ltd. (I) | | 1,800 | | 10,584 |
| Riken Corp. | | 11,000 | | 54,496 |
| Riken Keiki Company, Ltd. | | 2,500 | | 23,367 |
| Riken Technos Corp. | | 8,000 | | 29,134 |
| Riken Vitamin Company, Ltd. | | 2,000 | | 55,860 |
| Ringer Hut Company, Ltd. | | 1,700 | | 21,384 |
| Riso Kagaku Corp. | | 2,000 | | 36,770 |
| Riso Kyoiku Company, Ltd. (I) | | 338 | | 20,344 |
| Rock Field Company, Ltd. | | 1,000 | | 16,579 |
| Rohto Pharmaceutical Company, Ltd. | | 4,000 | | 46,966 |
| Roland Corp. | | 2,500 | | 29,568 |
| Round One Corp. | | 9,000 | | 59,046 |
| Royal Holdings Company, Ltd. (I) | | 3,300 | | 35,417 |
| Ryobi, Ltd. (I) | | 18,000 | | 78,345 |
| Ryoden Trading Company, Ltd. | | 4,000 | | 28,156 |
| Ryohin Keikaku Company, Ltd. | | 3,500 | | 166,945 |
| Ryosan Company, Ltd. | | 5,929 | | 155,818 |
| Ryoshoku, Ltd. | | 1,000 | | 22,737 |
| Ryoyo Electro Corp. | | 3,200 | | 37,019 |
| Sagami Chain Company, Ltd. (I) | | 2,000 | | 12,100 |
| Saibu Gas Company, Ltd. | | 38,000 | | 98,209 |
| Saizeriya Company, Ltd. | | 3,900 | | 74,456 |
| Sakai Chemical Industry Company, Ltd. | | 14,000 | | 80,150 |
| Sakata INX Corp. | | 5,000 | | 25,779 |
| Sakata Seed Corp. | | 5,400 | | 81,823 |
| Sala Corp. (I) | | 4,500 | | 25,445 |
| San-A Company, Ltd. (I) | | 1,100 | | 42,907 |
| San-Ai Oil Company, Ltd. | | 6,000 | | 33,742 |
| Sanden Corp. | | 11,000 | | 50,490 |
| Sanei-International Company, Ltd. | | 1,700 | | 20,866 |
| Sangetsu Company, Ltd. | | 3,900 | | 96,908 |
| Sankei Building Company, Ltd. | | 3,300 | | 21,364 |
| Sanken Electric Company, Ltd. | | 11,437 | | 76,893 |
| Sanki Engineering Company, Ltd. | | 9,000 | | 57,621 |
| Sankyo Seiko Company, Ltd. | | 7,700 | | 31,630 |
| Sankyo-Tateyama Holdings, Inc. (I) | | 32,000 | | 43,913 |
| Sankyu, Inc. | | 41,000 | | 193,979 |
| Sanoh Industrial Company, Ltd. | | 4,600 | | 46,320 |
| Sanrio Company, Ltd. | | 1,600 | | 52,884 |
| Sanshin Electronics Company, Ltd. | | 3,600 | | 32,001 |
| Sanwa Shutter Corp. | | 26,124 | | 93,173 |
| Sanyo Chemical Industries, Ltd. | | 10,000 | | 82,597 |
| Sanyo Denki Company, Ltd. | | 6,000 | | 47,502 |
| Sanyo Shokai, Ltd. | | 10,000 | | 37,382 |
| Sanyo Special Steel Company, Ltd. (I) | | 16,648 | | 110,073 |
| Sasebo Heavy Industries Company, Ltd. | | 13,000 | | 30,941 |
| Sato Corp. | | 3,000 | | 40,663 |
| Satori Electric Company, Ltd. | | 2,400 | | 18,152 |
| Sawai Pharmaceutical Company, Ltd. | | 1,300 | | 121,933 |
| Seibu Electric Industry Company, Ltd. | | 3,000 | | 13,818 |
| Seika Corp. | | 11,000 | | 30,731 |
| Seikagaku Corp. | | 5,700 | | 65,053 |
| Seiko Holdings Corp. (I) | | 11,000 | | 43,327 |
| Seino Holdings Company, Ltd. | | 8,000 | | 60,882 |
| Seiren Company, Ltd. | | 7,000 | | 52,609 |
| Sekisui Jushi Corp. | | 4,000 | | 39,722 |
| Sekisui Plastics Company, Ltd. | | 5,000 | | 22,063 |
| Senko Company, Ltd. | | 9,000 | | 30,551 |
| Senshu Electric Company, Ltd. (I) | | 1,500 | | 19,654 |
| Senshukai Company, Ltd. (I) | | 4,500 | | 28,994 |
| | | | |
| International Small Company Fund (continued) |
| | | Shares or | | |
| | | Principal | | |
| | | Amount | | Value |
| | |
|
| |
| COMMON STOCKS (continued) | | | | |
| Japan (continued) | | | | |
| Shibaura Mechatronics Corp. (I) | | 5,000 | $ | 19,769 |
| Shibusawa Warehouse Company, Ltd. | | 6,000 | | 20,624 |
| Shibuya Kogyo Company, Ltd. | | 3,300 | | 34,428 |
| Shikibo, Ltd. | | 11,000 | | 15,097 |
| Shikoku Bank, Ltd. (I) | | 29,000 | | 97,389 |
| Shikoku Chemicals Corp. | | 5,000 | | 30,606 |
| Shima Seiki Manufacturing, Ltd. | | 4,700 | | 115,765 |
| Shimachu Company, Ltd. | | 5,800 | | 133,315 |
| Shimizu Bank, Ltd. | | 1,100 | | 52,621 |
| Shimojima Company, Ltd. | | 1,000 | | 12,675 |
| Shin Nippon Air Technologies Company, Ltd. | | 3,100 | | 17,595 |
| Shin-Etsu Polymer Company, Ltd. | | 5,300 | | 33,812 |
| Shin-Keisei Electric Railway Company, Ltd. | | 4,000 | | 17,214 |
| Shin-Kobe Electric | | | | |
| Machinery Company, Ltd. (I) | | 2,000 | | 24,628 |
| Shinagawa Refractories Company, Ltd. | | 5,000 | | 19,576 |
| Shindengen Electric | | | | |
| Manufacturing Company, Ltd. (I) | | 7,000 | | 37,619 |
| Shinkawa, Ltd. | | 1,700 | | 18,825 |
| Shinko Electric Company, Ltd. (I) | | 14,000 | | 46,519 |
| Shinko Plantech Company, Ltd. | | 4,800 | | 51,465 |
| Shinko Shoji Company, Ltd. | | 2,700 | | 24,460 |
| Shinmaywa Industries, Ltd. | | 13,000 | | 57,055 |
| Shinnihon Corp. | | 8,000 | | 25,907 |
| Shinsho Corp. | | 7,000 | | 18,992 |
| Shinwa Kaiun Kaisha, Ltd. | | 11,000 | | 26,843 |
| Shiroki Corpshiroki Corp. | | 19,000 | | 79,670 |
| Shizuki Electric Company, Inc. | | 3,000 | | 12,467 |
| Shizuoka Gas Company, Ltd. | | 9,500 | | 56,291 |
| SHO-BOND Holdings Company, Ltd. | | 4,000 | | 85,048 |
| Shobunsha Publications, Inc. | | 2,400 | | 22,041 |
| Shochiku Company, Ltd. (I) | | 14,000 | | 106,908 |
| Shoko Company, Ltd. (I) | | 11,000 | | 17,390 |
| Showa Aircraft Industry Company, Ltd. | | 3,000 | | 26,563 |
| Showa Corp. (I) | | 4,900 | | 42,078 |
| Showa Sangyo Company, Ltd. | | 13,000 | | 40,116 |
| Siix Corp. | | 2,100 | | 30,711 |
| Simplex Technology, Inc. | | 31 | | 14,817 |
| Sinanen Company, Ltd. | | 5,000 | | 24,109 |
| Sintokogio, Ltd. | | 8,000 | | 88,598 |
| Sky Perfect JSAT Corp. | | 218 | | 86,099 |
| SMK Corp. | | 6,000 | | 33,576 |
| So-net Entertainment Corp. | | 26 | | 93,115 |
| So-net M3, Inc. | | 21 | | 111,328 |
| Sodick Company Ltd. (I) | | 4,200 | | 29,218 |
| Sogo Medical Company, Ltd. | | 900 | | 26,648 |
| Sohgo Security Services Company, Ltd. | | 12,500 | | 151,235 |
| Space Company, Ltd. | | 2,700 | | 18,146 |
| SRI Sports, Ltd. (I) | | 1 | | 1,119 |
| ST Chemical Company, Ltd. | | 1,100 | | 12,927 |
| St. Marc Holdings Company, Ltd. | | 1,100 | | 50,077 |
| Star Micronics Company, Ltd. | | 5,100 | | 58,092 |
| Starzen Company, Ltd. | | 9,000 | | 29,307 |
| Stella Chemifa Corp. | | 900 | | 40,830 |
| Sugi Pharmacy Company, Ltd. | | 3,200 | | 76,895 |
| Sumida Corp. | | 2,600 | | 29,060 |
| Sumikin Bussan Corp. | | 10,000 | | 26,995 |
| Sumiseki Holdings, Inc. (I) | | 9,800 | | 10,806 |
| Sumisho Computer Systems Corp. (L) | | 3,700 | | 57,806 |
| Sumitomo Bakelite Company, Ltd. | | 24,000 | | 158,793 |
| Sumitomo Densetsu Company, Ltd. | | 4,300 | | 17,506 |
| Sumitomo Light Metal Industries, Ltd. (I) | | 35,000 | | 46,396 |
| Sumitomo Mitsui Company, Ltd. (I) | | 31,300 | | 25,427 |
| Sumitomo Osaka Cement Company, Ltd. | | 44,000 | | 114,541 |
| Sumitomo Pipe & Tube Company, Ltd. | | 4,100 | | 36,332 |
| |
| The accompanying notes are an integral part of the financial statements. | 141 |
John Hancock Funds II
Portfolio of Investments — February 28, 2011 (Unaudited) (showing percentage of total net assets)
| | | | |
| International Small Company Fund (continued) |
| | | Shares or | | |
| | | Principal | | |
| | | Amount | | Value |
| | |
|
| |
| COMMON STOCKS (continued) | | | | |
| Japan (continued) | | | | |
| Sumitomo Precision Products Company, Ltd. | | 4,000 | $ | 31,114 |
| Sumitomo Real Estate Sales Company, Ltd. | | 1,690 | | 88,240 |
| Sumitomo Seika Chemicals Company, Ltd. | | 4,000 | | 20,947 |
| Sumitomo Warehouse Company, Ltd. | | 14,952 | | 82,407 |
| Sunx, Ltd. | | 6,100 | | 35,794 |
| SWCC Showa Holdings Company, Ltd. (I) | | 34,000 | | 38,436 |
| SxL Corp. (I) | | 10,000 | | 6,863 |
| SystemPro Company, Ltd. (I) | | 49 | | 63,197 |
| T Rad Company, Ltd. | | 4,000 | | 20,227 |
| T. Hasegawa Company, Ltd. | | 2,900 | | 47,109 |
| Tachi-S Company, Ltd. | | 3,100 | | 63,164 |
| Tachibana Eletech Company, Ltd. | | 1,700 | | 16,371 |
| Tact Home Company, Ltd. | | 17 | | 19,784 |
| Tadano, Ltd. | | 17,000 | | 95,065 |
| Taihei Dengyo Kaisha, Ltd. | | 4,000 | | 31,971 |
| Taihei Kogyo Company, Ltd. | | 11,000 | | 52,080 |
| Taiheiyo Cement Corp. (I) | | 68,000 | | 101,327 |
| Taiho Kogyo Company, Ltd. | | 2,900 | | 31,311 |
| Taikisha, Ltd. | | 5,800 | | 105,631 |
| Taiyo Ink Manufacturing Company, Ltd. | | 2,500 | | 83,376 |
| Takamatsu Corp. | | 1,900 | | 27,389 |
| Takano Company, Ltd. | | 2,000 | | 14,205 |
| Takaoka Electric | | | | |
| Manufacturing Company, Ltd. | | 8,000 | | 45,645 |
| Takara Holdings, Inc. (I) | | 12,000 | | 71,812 |
| Takara Standard Company, Ltd. | | 15,000 | | 104,906 |
| Takasago International Corp. | | 12,000 | | 71,356 |
| Takasago Thermal Engineering Company, Ltd. | | 10,200 | | 91,762 |
| Takihyo Company, Ltd. | | 1,000 | | 4,982 |
| Takiron Company, Ltd. | | 7,000 | | 28,849 |
| Takisawa Machine Tool Company, Ltd. (I) | | 3,000 | | 4,124 |
| Takuma Company, Ltd. (I) | | 10,000 | | 31,753 |
| Tamron Company, Ltd. | | 1,300 | | 27,803 |
| Tamura Corp. | | 7,000 | | 22,070 |
| Tatsuta Electric Wire & Cable Company, Ltd. | | 8,000 | | 36,271 |
| Tayca Corp. | | 1,000 | | 4,170 |
| Teac Corp. (I) | | 35,000 | | 20,639 |
| Tecmo Koei Holdings Company, Ltd. | | 5,200 | | 43,529 |
| Teikoku Electric Manufacturing Company, Ltd. | | 700 | | 15,823 |
| Teikoku Piston Ring Company, Ltd. | | 2,700 | | 29,398 |
| Teikoku Tsushin Kogyo Company, Ltd. | | 6,000 | | 14,671 |
| Tekken Corp. (I) | | 14,000 | | 15,123 |
| Telepark Corp. | | 28 | | 55,257 |
| Temp Holdings Company, Ltd. | | 2,600 | | 24,430 |
| Tenma Corp. | | 2,100 | | 22,715 |
| The Chiba Kogyo Bank, Ltd. (I) | | 3,500 | | 25,282 |
| The Fuji Fire & Marine | | | | |
| Insurance Company, Ltd (I) | | 32,000 | | 56,892 |
| The Hokkoku Bank, Ltd. | | 40,000 | | 156,611 |
| The Hyakugo Bank, Ltd. | | 29,000 | | 137,827 |
| The Mie Bank, Ltd. | | 12,000 | | 35,181 |
| The Pack Corp. (I) | | 1,500 | | 25,338 |
| The San-in Godo Bank, Ltd. | | 21,000 | | 164,653 |
| The Yachiyo Bank, Ltd. | | 200 | | 7,328 |
| Tigers Polymer Corp. | | 2,000 | | 9,695 |
| TKC Corp. | | 2,100 | | 43,079 |
| TOA Corp. | | 22,000 | | 27,479 |
| TOA Oil Company, Ltd. (I) | | 14,000 | | 17,836 |
| Toagosei Company, Ltd. | | 29,000 | | 148,756 |
| Tobishima Corp. (I) | | 48,000 | | 13,015 |
| Tobu Store Company, Ltd. (I) | | 8,000 | | 25,065 |
| TOC Company, Ltd. | | 11,400 | | 50,007 |
| Tocalo Company, Ltd. | | 1,300 | | 24,106 |
| Tochigi Bank, Ltd. | | 16,000 | | 82,713 |
| Toda Corp. | | 39,000 | | 149,595 |
| | | | |
| International Small Company Fund (continued) |
| | | Shares or | | |
| | | Principal | | |
| | | Amount | | Value |
| | |
|
| |
| COMMON STOCKS (continued) | | | | |
| Japan (continued) | | | | |
| Toda Kogyo Corp. | | 5,000 | $ | 52,613 |
| Toei Company, Ltd. | | 6,000 | | 31,803 |
| Toenec Corp. | | 5,000 | | 28,679 |
| Toho Bank, Ltd. | | 28,000 | | 95,536 |
| Toho Company, Ltd. (I) | | 6,000 | | 22,481 |
| Toho Holdings Company, Ltd. | | 7,300 | | 91,099 |
| Toho Zinc Company, Ltd. | | 12,000 | | 68,725 |
| Tohoku Bank, Ltd. | | 9,000 | | 15,543 |
| Tohto Suisan Company, Ltd. | | 5,000 | | 10,721 |
| Tokai Carbon Company, Ltd. | | 20,000 | | 118,648 |
| Tokai Corp. | | 4,000 | | 15,772 |
| Tokai Rubber Industries, Ltd. | | 7,400 | | 102,026 |
| Tokai Tokyo Securities Company, Ltd. | | 32,966 | | 122,166 |
| Token Corp. | | 970 | | 38,942 |
| Toko Electric Corp. | | 6,000 | | 39,581 |
| Toko, Inc. | | 10,000 | | 24,709 |
| Tokushu Tokai Holdings Company, Ltd. | | 11,000 | | 26,065 |
| Tokyo Dome Corp. (I) | | 17,000 | | 42,721 |
| Tokyo Energy & Systems, Inc. | | 3,000 | | 20,694 |
| Tokyo Individualized | | | | |
| Educational Institute, Inc. (I) | | 2,600 | | 7,478 |
| Tokyo Kikai Seisakusho, Ltd. (I) | | 10,000 | | 9,551 |
| Tokyo Ohka Kogyo Company, Ltd. | | 7,200 | | 157,610 |
| Tokyo Rakutenchi Company, Ltd. (I) | | 6,000 | | 21,667 |
| Tokyo Rope Manufacturing Company, Ltd. | | 12,000 | | 41,238 |
| Tokyo Seimitsu Company, Ltd. | | 6,500 | | 129,591 |
| Tokyo Style Company, Ltd. | | 11,000 | | 82,380 |
| Tokyo Tomin Bank, Ltd. | | 4,200 | | 59,926 |
| Tokyotokeiba Company, Ltd. (I) | | 18,000 | | 26,880 |
| Tokyu Community Corp. | | 1,300 | | 40,221 |
| Tokyu Construction Company, Ltd. | | 8,480 | | 25,469 |
| Tokyu Livable, Inc. | | 2,200 | | 26,616 |
| Tokyu Recreation Company, Ltd. | | 4,000 | | 24,722 |
| Toli Corp. | | 7,000 | | 14,239 |
| Tomato Bank, Ltd. | | 10,000 | | 19,379 |
| Tomen Electronics Corp. | | 900 | | 14,829 |
| Tomoe Corp. | | 4,400 | | 13,713 |
| Tomoe Engineering Company, Ltd. (I) | | 400 | | 7,101 |
| Tomoku Company, Ltd. | | 11,000 | | 34,531 |
| TOMONY Holdings, Inc. (I) | | 14,000 | | 58,042 |
| Tomy Company, Ltd. | | 6,100 | | 53,112 |
| Topcon Corp. | | 8,200 | | 44,288 |
| Toppan Forms Company, Ltd. | | 7,900 | | 77,200 |
| Topre Corp. | | 5,000 | | 44,519 |
| Topy Industries, Ltd. | | 21,000 | | 62,611 |
| Tori Holdings Company, Ltd. (I) | | 7,300 | | 1,793 |
| Toridoll Corp. | | 22 | | 30,888 |
| Torigoe Company, Ltd. (I) | | 2,300 | | 20,672 |
| Torii Pharmaceutical Company, Ltd. | | 1,700 | | 36,924 |
| Torishima Pump Manufacturing Company, Ltd. | | 2,300 | | 42,562 |
| Tosei Corp. (I) | | 16 | | 7,775 |
| Toshiba Machine Company, Ltd. | | 15,000 | | 89,990 |
| Toshiba Plant Systems & Services Corp. (I) | | 8,000 | | 109,111 |
| Toshiba TEC Corp. | | 17,000 | | 80,297 |
| Tosho Printing Company, Ltd. (I) | | 3,000 | | 5,479 |
| Totetsu Kogyo Company, Ltd. | | 4,000 | | 33,611 |
| Tottori Bank, Ltd. | | 11,000 | | 25,103 |
| Touei Housing Corptouei Housing Corp. (I) | | 2,500 | | 39,855 |
| Towa Bank, Ltd. (I) | | 28,000 | | 41,472 |
| Towa Pharmaceutical Company, Ltd. | | 1,500 | | 83,125 |
| Toyo Construction Company, Ltd. | | 33,000 | | 19,870 |
| Toyo Corp. | | 3,100 | | 31,967 |
| Toyo Electric Manufacturing Company, Ltd. | | 4,000 | | 22,997 |
| Toyo Engineering Corp. | | 25,000 | | 96,949 |
| Toyo Ink Manufacturing Company, Ltd. | | 30,000 | | 153,065 |
| |
| The accompanying notes are an integral part of the financial statements. | 142 |
John Hancock Funds II
Portfolio of Investments — February 28, 2011 (Unaudited) (showing percentage of total net assets)
| | | | |
| International Small Company Fund (continued) |
| | | Shares or | | |
| | | Principal | | |
| | | Amount | | Value |
| | |
|
| |
| COMMON STOCKS (continued) | | | | |
| Japan (continued) | | | | |
| Toyo Kanetsu KK | | 16,000 | $ | 29,218 |
| Toyo Kohan Company, Ltd. | | 9,000 | | 54,269 |
| Toyo Securities Company, Ltd. | | 7,000 | | 12,578 |
| Toyo Tanso Company, Ltd. | | 1,700 | | 94,706 |
| Toyo Tire & Rubber Company, Ltd. | | 22,000 | | 60,962 |
| Toyobo Company, Ltd. (L) | | 71,064 | | 118,212 |
| Transcosmos, Inc. | | 3,700 | | 38,834 |
| Trusco Nakayama Corp. | | 4,000 | | 72,736 |
| TS Tech Company, Ltd. | | 6,600 | | 140,278 |
| Tsubakimoto Chain Company, Ltd. | | 19,000 | | 117,811 |
| Tsukishima Kikai Company, Ltd. | | 1,000 | | 9,494 |
| Tsuruha Holdings, Inc. | | 2,400 | | 118,127 |
| Tsurumi Manufacturing Company, Ltd. | | 3,000 | | 22,058 |
| Tsutsumi Jewelry Company, Ltd. | | 900 | | 24,217 |
| TV Asahi Corp. | | 4 | | 7,179 |
| U-Shin, Ltd. | | 6,300 | | 54,789 |
| Ube Material Industries, Ltd. | | 9,000 | | 34,320 |
| Uchida Yoko Company, Ltd. (I) | | 5,000 | | 17,357 |
| ULVAC, Inc. | | 7,400 | | 178,237 |
| Uniden Corp. | | 7,000 | | 25,531 |
| Unihair Company, Ltd. | | 4,600 | | 48,903 |
| Union Tool Company, Ltd. | | 1,600 | | 39,934 |
| Unipres Corp. | | 4,300 | | 108,622 |
| United Arrows, Ltd. | | 2,400 | | 41,425 |
| Unitika, Ltd. (I) | | 42,000 | | 40,150 |
| Universe Company, Ltd. | | 900 | | 14,153 |
| Utoc Corp. | | 4,300 | | 13,860 |
| Valor Company, Ltd. | | 4,700 | | 48,236 |
| VANTEC Corp. | | 9 | | 13,086 |
| Venture Link Company, Ltd. (I) | | 9,800 | | 483 |
| Vital KSK Holdings, Inc. | | 7,700 | | 62,968 |
| Wacom Company, Ltd. | | 51 | | 77,124 |
| Wakachiku Construction Company, Ltd. (I) | | 17,000 | | 10,002 |
| Warabeya Nichiyo Company, Ltd. (I) | | 1,500 | | 19,633 |
| Watabe Wedding Corp. | | 800 | | 8,764 |
| Watami Company, Ltd. (I) | | 3,600 | | 75,392 |
| Weathernews, Inc. | | 800 | | 17,816 |
| Wood One Company, Ltd. | | 2,000 | | 7,157 |
| Xebio Company, Ltd. | | 4,700 | | 107,818 |
| Yahagi Construction Company, Ltd. | | 4,000 | | 24,624 |
| Yaizu Suisankagaku Industry Company, Ltd. | | 1,700 | | 18,325 |
| Yamagata Bank, Ltd. | | 29,000 | | 148,336 |
| Yamanashi Chuo Bank, Ltd. | | 25,255 | | 139,038 |
| Yamatane Corp. | | 13,000 | | 19,923 |
| Yamazen Corp. | | 7,500 | | 44,274 |
| Yaoko Company, Ltd. | | 800 | | 24,626 |
| Yasuda Warehouse Company, Ltd. | | 2,600 | | 16,603 |
| Yellow Hat, Ltd. | | 2,000 | | 21,522 |
| Yodogawa Steel Works, Ltd. | | 20,825 | | 93,238 |
| Yokogawa Bridge Corp. | | 3,000 | | 19,671 |
| Yokohama Reito Company, Ltd. (I) | | 4,000 | | 28,735 |
| Yokowo Company, Ltd. | | 2,800 | | 23,207 |
| Yomeishu Seizo Company, Ltd. | | 3,000 | | 30,068 |
| Yomiuri Land Company, Ltd. | | 2,000 | | 7,861 |
| Yondenko Corp. | | 1,000 | | 4,432 |
| Yonekyu Corp. | | 3,000 | | 26,257 |
| Yorozu Corp. | | 1,600 | | 35,613 |
| Yoshinoya D&C Company, Ltd. | | 69 | | 91,044 |
| Yuasa Funashoku Company, Ltd. | | 4,000 | | 10,920 |
| Yuasa Trading Company, Ltd. (I) | | 24,000 | | 27,703 |
| Yukiguni Maitake Company, Ltd. | | 600 | | 3,927 |
| Yurtec Corp. | | 5,000 | | 22,053 |
| Yusen Logistics Company, Ltd. | | 4,000 | | 64,518 |
| Yushin Precision Equipment Company, Ltd. | | 1,400 | | 29,097 |
| Yushiro Chemical Industry Company, Ltd. (L) | | 1,100 | | 16,832 |
| | | | |
| International Small Company Fund (continued) |
| | | Shares or | | |
| | | Principal | | |
| | | Amount | | Value |
| | |
|
| |
| COMMON STOCKS (continued) | | | | |
| Japan (continued) | | | | |
| Zenrin Company, Ltd. | | 2,900 | $ | 34,719 |
| Zensho Company, Ltd. (L) | | 12,300 | | 134,881 |
| Zeria Pharmaceutical Company, Ltd. | | 3,000 | | 36,559 |
| Zuken, Inc. | | 2,300 | | 18,206 |
| | |
|
| | | | | 46,814,934 |
| Liechtenstein - 0.03% | | | | |
| Liechtensteinische Landesbank AG | | 30 | | 2,520 |
| Verwaltungs & Privat Bank AG | | 503 | | 61,019 |
| | |
|
| | | | | 63,539 |
| Luxembourg - 0.06% | | | | |
| Elcoteq SE (I) | | 353 | | 594 |
| Orco Property Group SA | | 1,119 | | 12,877 |
| Regus PLC | | 62,639 | | 108,504 |
| | |
|
| | | | | 121,975 |
| Malaysia - 0.01% | | | | |
| Samling Global, Ltd. | | 380,000 | | 30,458 |
| Monaco - 0.03% | | | | |
| Societe des Bains de Mer & du Cercle des | | | | |
| Etrangers a Monaco SA | | 930 | | 57,729 |
| Netherlands - 1.92% | | | | |
| Aalberts Industries NV | | 14,763 | | 314,638 |
| Accell Group NV | | 775 | | 41,042 |
| AMG Advanced Metallurgical Group N.V. (I) | | 1,512 | | 27,844 |
| Arcadis NV | | 4,659 | | 111,390 |
| ASM International NV (I) | | 4,290 | | 173,762 |
| BE Semiconductor Industries NV (I) | | 9,412 | | 76,583 |
| Beter Bed Holding NV (I) | | 1,715 | | 47,321 |
| BinckBank NV | | 1,233 | | 20,474 |
| Brit Insurance Holdings NV (I) | | 8,566 | | 148,588 |
| Brunel International NV | | 2,644 | | 104,642 |
| Crown Van Gelder NV | | 152 | | 1,248 |
| CSM | | 12,001 | | 426,616 |
| Exact Holdings NV | | 1,691 | | 52,515 |
| Fornix Biosciences NV | | 1,231 | | 4,212 |
| Grontmij NV | | 1,805 | | 40,007 |
| Imtech NV | | 9,405 | | 339,782 |
| KAS Bank NV | | 1,372 | | 22,437 |
| Kendrion NV (I) | | 951 | | 22,034 |
| Koninklijke BAM Groep NV | | 35,322 | | 227,104 |
| Koninklijke Ten Cate NV | | 2,968 | | 107,901 |
| Macintosh Retail Group NV | | 3,190 | | 85,327 |
| Mediq NV | | 4,752 | | 87,812 |
| Nederlandsche Apparatenfabriek NEDAP NV | | 441 | | 14,001 |
| Nutreco Holding NV | | 4,941 | | 365,620 |
| Ordina NV (I) | | 4,821 | | 22,877 |
| SBM Offshore NV | | 22,149 | | 555,782 |
| Sligro Food Group NV | | 4,030 | | 134,019 |
| SNS REAAL NV | | 4,986 | | 25,819 |
| Telegraaf Media Groep NV | | 2,614 | | 50,757 |
| TKH Group NV (I) | | 3,241 | | 77,587 |
| TomTom NV (I) | | 3,112 | | 27,370 |
| Unit 4 Agresso NV | | 2,949 | | 99,122 |
| USG People NV (I) | | 6,455 | | 132,074 |
| Wavin NV (I) | | 7,572 | | 107,713 |
| | |
|
| | | | | 4,096,020 |
| New Zealand - 0.74% | | | | |
| Air New Zealand, Ltd. | | 34,980 | | 35,104 |
| Ebos Group, Ltd. (I) | | 3,312 | | 18,472 |
| Fisher & Paykel Appliances Holdings, Ltd. | | 50,069 | | 21,598 |
| Fisher & Paykel Healthcare Corp. | | 92,865 | | 212,191 |
| Freightways, Ltd. | | 13,503 | | 32,871 |
| |
| The accompanying notes are an integral part of the financial statements. | 143 |
John Hancock Funds II
Portfolio of Investments — February 28, 2011 (Unaudited) (showing percentage of total net assets)
| | | | |
| International Small Company Fund (continued) |
| | | Shares or | | |
| | | Principal | | |
| | | Amount | | Value |
| | |
|
| |
| COMMON STOCKS (continued) | | | | |
| New Zealand (continued) | | | | |
| Hallenstein Glasson Holdings, Ltd. | | 6,230 | $ | 17,061 |
| Infratil, Ltd. (I) | | 111,284 | | 162,726 |
| Mainfreight, Ltd. | | 7,607 | | 46,352 |
| New Zealand Exchange, Ltd. | | 8,304 | | 10,657 |
| New Zealand Oil & Gas, Ltd. | | 43,598 | | 28,922 |
| New Zealand Refining Company, Ltd. | | 20,150 | | 73,037 |
| Nuplex Industries, Ltd. (I) | | 22,627 | | 57,378 |
| PGG Wrightson, Ltd. | | 49,994 | | 19,886 |
| Pike River Coal Company, Ltd. (I) | | 57,122 | | 37,389 |
| Port of Tauranga, Ltd. | | 15,938 | | 94,138 |
| Pumpkin Patch, Ltd. (L) | | 30,500 | | 31,527 |
| Rakon, Ltd. (I) | | 10,503 | | 8,551 |
| Ryman Healthcare, Ltd. (I) | | 28,341 | | 50,422 |
| Sanford, Ltd. | | 6,681 | | 25,205 |
| Sky City Entertainment Group, Ltd. | | 110,681 | | 271,280 |
| Sky Network Television, Ltd. | | 33,191 | | 134,574 |
| Steel & Tube Holdings, Ltd. | | 7,400 | | 14,532 |
| Tower, Ltd. (I) | | 43,309 | | 63,982 |
| Vector, Ltd. | | 43,347 | | 80,605 |
| Warehouse Group, Ltd. | | 16,872 | | 43,770 |
| | |
|
| | | | | 1,592,230 |
| Norway - 1.01% | | | | |
| Acta Holding ASA | | 30,000 | | 15,424 |
| Aktiv Kapital ASA | | 3,800 | | 40,020 |
| Birdstep Technology ASA (I) | | 6,000 | | 1,758 |
| Blom AS (I) | | 7,600 | | 1,209 |
| BW Offshore, Ltd. (I) | | 58,362 | | 148,057 |
| BWG Homes ASA (I) | | 10,828 | | 42,525 |
| Camillo Eitzen & Company ASA | | 5,800 | | 10,360 |
| Cermaq ASA (I) | | 5,902 | | 100,624 |
| Copeinca ASA | | 9,400 | | 87,277 |
| DNO International ASA (I) | | 5 | | 9 |
| DOF ASA | | 6,333 | | 66,137 |
| EDB Business Partner ASA (I) | | 7,241 | | 19,519 |
| Eitzen Chemical ASA (I) | | 8,000 | | 1,656 |
| Ekornes ASA | | 3,813 | | 100,548 |
| Electromagnetic GeoServices ASA (I) | | 2,600 | | 5,153 |
| Eltek ASA (I) | | 14,600 | | 15,010 |
| Ementor ASA (I) | | 10,153 | | 112,163 |
| Farstad Shipping ASA (I) | | 4,400 | | 139,462 |
| Ganger Rolf ASA (I) | | 1,427 | | 38,907 |
| Kongsberg Automotive Holding ASA (I) | | 59,856 | | 46,541 |
| Kverneland Gruppen ASA (I) | | 1,000 | | 1,206 |
| Leroy Seafood Group ASA | | 246 | | 7,688 |
| Nordic Semiconductor ASA (I)(L) | | 28,917 | | 104,422 |
| Norse Energy Corp. ASA (I) | | 42,880 | | 9,736 |
| Norske Skogindustrier ASA | | 18,500 | | 60,101 |
| Norwegian Air Shuttle ASA (I)(L) | | 2,792 | | 57,920 |
| Odfjell ASA (I) | | 6,307 | | 61,885 |
| Opera Software ASA | | 7,301 | | 36,678 |
| Panoro Energy ASA (I) | | 4,287 | | 5,863 |
| PhotoCure ASA (I) | | 1,408 | | 12,239 |
| Pronova Biopharma AS (I) | | 16,346 | | 27,771 |
| Q-Free ASA (I) | | 7,500 | | 25,458 |
| Scana Industrier ASA | | 15,396 | | 22,421 |
| Sevan Marine ASA (I) | | 36,322 | | 37,817 |
| Solstad Offshore ASA (I) | | 3,000 | | 67,004 |
| Songa Offshore SE (I) | | 10,500 | | 63,534 |
| Sparebanken Midt-Norge ASA (I) | | 13,729 | | 134,808 |
| Tomra Systems ASA | | 25,129 | | 177,203 |
| Veidekke ASA | | 14,364 | | 125,751 |
| Wilh Wilhelmsen Holding ASA, Class A | | 4,200 | | 128,584 |
| | |
|
| | | | | 2,160,448 |
| | | | |
| International Small Company Fund (continued) |
| | | Shares or | | |
| | | Principal | | |
| | | Amount | | Value |
| | |
|
| |
| COMMON STOCKS (continued) | | | | |
| Peru - 0.12% | | | | |
| Hochschild Mining PLC | | 26,736 | $ | 257,380 |
| Portugal - 0.33% | | | | |
| Altri SGPS SA (I) | | 18,174 | | 42,774 |
| Banco BPI SA (I)(L) | | 39,413 | | 77,976 |
| BANIF SGPS SA (I) | | 4,673 | | 6,190 |
| Impresa SGPS SA (I) | | 13,622 | | 20,118 |
| Investimentos Participacoes e Gestao SA (I)(L) | | 31,635 | | 15,559 |
| Mota Engil | | 9,080 | | 24,852 |
| Novabase SGPS SA (I) | | 2,054 | | 8,683 |
| Pararede SGPS SA (I) | | 10,834 | | 5,388 |
| Portucel - Empresa Produtora de Pasta | | | | |
| e Papel SA (I) | | 30,403 | | 107,602 |
| Redes Energeticas Nacionais SA | | 6,644 | | 23,147 |
| Semapa-Sociedade de Investimento | | | | |
| & Gestao (I) | | 5,951 | | 72,070 |
| Sonae (I) | | 84,965 | | 95,884 |
| Sonae Industria SGPS SA (I) | | 4,886 | | 11,832 |
| Sonaecom - SGPS SA (I) | | 12,082 | | 23,662 |
| Teixeira Duarte SA | | 37,298 | | 35,494 |
| Zon Multimedia SA (L) | | 24,934 | | 130,734 |
| | |
|
| | | | | 701,965 |
| Singapore - 1.31% | | | | |
| Allgreen Properties, Ltd. (I) | | 164,000 | | 134,213 |
| Asia Food & Properties, Ltd. (I) | | 280,000 | | 75,396 |
| Baker Technology, Ltd. (I) | | 101,000 | | 27,129 |
| Banyan Tree Holdings, Ltd. (I) | | 78,000 | | 62,104 |
| Biosensors International Group, Ltd. (I) | | 50,000 | | 44,081 |
| Bonvests Holdings, Ltd. (I) | | 36,400 | | 30,895 |
| Boustead Singapore, Ltd. (I) | | 7,000 | | 5,143 |
| Bukit Sembawang Estates, Ltd. (I) | | 20,000 | | 69,521 |
| Cerebos Pacific, Ltd. (I) | | 14,000 | | 56,502 |
| CH Offshore, Ltd. (I) | | 50,000 | | 18,680 |
| China Aviation Oil Singapore Corp., Ltd. | | 60,000 | | 63,761 |
| China Merchants Holdings Pacific, Ltd. (I) | | 41,000 | | 21,820 |
| Chip Eng Seng Corp., Ltd. (I) | | 63,000 | | 21,863 |
| Chuan Hup Holdings, Ltd. (I) | | 78,000 | | 14,730 |
| Creative Technology, Ltd. | | 7,050 | | 19,964 |
| CSE Global, Ltd. | | 81,000 | | 78,489 |
| CWT, Ltd. (I) | | 31,000 | | 29,169 |
| Ezion Holdings, Ltd. | | 55,000 | | 27,061 |
| Ezra Holdings, Ltd. | | 100,800 | | 124,178 |
| Falcon Energy Group, Ltd. | | 32,000 | | 8,868 |
| First Resources, Ltd. | | 66,000 | | 66,995 |
| Food Empire Holdings, Ltd. (I) | | 43,800 | | 16,012 |
| Goodpack, Ltd. | | 47,000 | | 72,148 |
| Guocoland, Ltd. | | 7,400 | | 14,126 |
| Healthway Medical Corp, Ltd. | | 299,000 | | 31,885 |
| Hi-p International Ltdhi-p International Ltd. (I) | | 13,000 | | 12,315 |
| Ho Bee Investment, Ltd. (I) | | 71,000 | | 74,469 |
| Hong Fok Corp., Ltd. (I) | | 39,800 | | 16,601 |
| Hong Leong Asia, Ltd. | | 16,000 | | 33,841 |
| Hotel Plaza, Ltd. (I) | | 30,000 | | 37,506 |
| Hotel Properties, Ltd. | | 27,100 | | 50,739 |
| HTL International Holdings, Ltd. | | 24,000 | | 11,261 |
| Hwa Hong Corp., Ltd. (I) | | 55,000 | | 26,517 |
| Hyflux, Ltd. | | 81,000 | | 124,079 |
| Jaya Holdings, Ltd. (I) | | 57,000 | | 24,892 |
| Jurong Technologies Industrial Corp., Ltd. (I) | | 83,200 | | 0 |
| Keppel Telecommunications | | | | |
| & Transportation, Ltd. | | 15,000 | | 15,136 |
| Kim Eng Holdings, Ltd. (I) | | 29,795 | | 71,384 |
| KS Energy Services, Ltd. (I) | | 22,000 | | 15,294 |
| Manhattan Resources, Ltd. (I) | | 34,000 | | 29,588 |
| MediaRing, Ltd. (I) | | 158,000 | | 8,151 |
| |
| The accompanying notes are an integral part of the financial statements. | 144 |
John Hancock Funds II
Portfolio of Investments — February 28, 2011 (Unaudited) (showing percentage of total net assets)
| | | | |
| International Small Company Fund (continued) |
| | | Shares or | | |
| | | Principal | | |
| | | Amount | | Value |
| | |
|
| |
| COMMON STOCKS (continued) | | | | |
| Singapore (continued) | | | | |
| Mercator Lines Singapore, Ltd. | | 70,000 | $ | 13,254 |
| Metro Holdings, Ltd. | | 38,000 | | 23,917 |
| MFS Technology, Ltd. | | 56,000 | | 6,605 |
| Midas Holdings, Ltd. | | 104,000 | | 60,825 |
| MobileOne, Ltd. | | 53,000 | | 99,251 |
| NatSteel, Ltd. (I) | | 29,000 | | 32,835 |
| Oceanus Group, Ltd. (I) | | 142,000 | | 24,745 |
| Orchard Parade Holdings, Ltd. (I) | | 18,000 | | 21,116 |
| Osim International, Ltd. | | 44,000 | | 50,899 |
| Otto Marine, Ltd. | | 149,000 | | 28,185 |
| Petra Foods, Ltd. | | 46,000 | | 58,622 |
| Raffles Education Corp., Ltd. (I) | | 393,085 | | 80,479 |
| Raffles Medical Group, Ltd. | | 27,000 | | 46,013 |
| Rotary Engineering, Ltd. | | 37,000 | | 26,647 |
| SBS Transit, Ltd. (I) | | 20,500 | | 31,280 |
| SC Global Developments, Ltd. | | 34,000 | | 38,330 |
| Sim Lian Group, Ltd. (I) | | 63,000 | | 21,384 |
| Singapore Reinsurance Corp., Ltd. | | 47,000 | | 11,122 |
| Stamford Land Corp., Ltd. (I) | | 100,000 | | 48,056 |
| Super Coffeemix Manufacturing, Ltd. (I) | | 35,000 | | 35,245 |
| Swiber Holdings, Ltd. (I) | | 83,000 | | 51,428 |
| Tat Hong Holdings, Ltd. | | 28,000 | | 17,655 |
| United Engineers, Ltd. (I) | | 29,000 | | 53,799 |
| UOB-Kay Hian Holdings, Ltd. | | 37,000 | | 49,915 |
| WBL Corp., Ltd. | | 14,000 | | 44,138 |
| Wing Tai Holdings, Ltd. | | 95,300 | | 111,010 |
| Yongnam Holdings, Ltd. (I) | | 118,000 | | 23,278 |
| | |
|
| | | | | 2,796,539 |
| South Africa - 0.06% | | | | |
| First Uranium Corp. (I)(L) | | 25,500 | | 27,297 |
| Great Basin Gold, Ltd. (I)(L) | | 41,400 | | 109,088 |
| Platmin, Ltd. (I) | | 537 | | 459 |
| | |
|
| | | | | 136,844 |
| Spain - 2.16% | | | | |
| Abengoa SA (I) | | 5,452 | | 152,982 |
| Adolfo Dominguez SA (I) | | 1,580 | | 20,571 |
| Amper SA (I) | | 2,862 | | 14,534 |
| Antena 3 de Television SA (I) | | 8,128 | | 78,838 |
| Avanzit SA (I) | | 25,467 | | 18,154 |
| Azkoyen SA (I) | | 2,428 | | 7,182 |
| Banco de Sabadell SA | | 5,612 | | 24,359 |
| Banco de Valencia SA (I)(L) | | 19,901 | | 100,116 |
| Banco Pastor SA (L) | | 14,006 | | 71,509 |
| Bankinter SA | | 29,748 | | 196,342 |
| Baron de Ley SA (I) | | 517 | | 28,785 |
| Bolsas y Mercados Espanoles (L) | | 8,689 | | 264,647 |
| Caja de Ahorros del Mediterraneo | | 1,684 | | 14,777 |
| Campofrio Alimentacion SA (I) | | 2,513 | | 28,615 |
| Cementos Portland Valderrivas SA | | 1,810 | | 38,683 |
| Codere SA (I) | | 798 | | 9,857 |
| Construcciones & Auxiliar de Ferrocarriles SA | | 318 | | 175,022 |
| Corporacion Dermoestetica SA (I) | | 898 | | 2,032 |
| Duro Felguera SA | | 8,082 | | 67,099 |
| Ebro Puleva SA | | 12,956 | | 283,995 |
| Elecnor SA | | 5,244 | | 80,128 |
| Ercros SA (I) | | 14,570 | | 17,507 |
| Faes Farma SA | | 20,129 | | 84,172 |
| General de Alquiler de Maquinaria (I) | | 6,496 | | 17,385 |
| Gestevision Telecinco SA (I) | | 19,801 | | 248,501 |
| Grifols SA | | 22,685 | | 369,310 |
| Grupo Catalana Occidente SA (I) | | 7,194 | | 151,985 |
| Grupo Empresarial Ence SA (I) | | 13,567 | | 46,403 |
| Iberpapel Gestion SA (I) | | 1,271 | | 26,969 |
| | | | |
| International Small Company Fund (continued) |
| | | Shares or | | |
| | | Principal | | |
| | | Amount | | Value |
| | |
|
| |
| COMMON STOCKS (continued) | | | | |
| Spain (continued) | | | | |
| Indra Sistemas SA | | 14,890 | $ | 289,705 |
| La Seda de Barcelona SA (I) | | 859,572 | | 120,952 |
| Laboratorios Almirall SA | | 5,422 | | 62,154 |
| Miquel y Costas SA | | 1,078 | | 34,029 |
| Natraceutical SA (I) | | 22,388 | | 11,735 |
| NH Hoteles SA (I) | | 13,111 | | 80,073 |
| Obrascon Huarte Lain SA | | 6,042 | | 200,819 |
| Papeles y Cartones de Europa SA (I) | | 5,661 | | 30,853 |
| Pescanova SA (I) | | 658 | | 25,059 |
| Prim SA | | 1,511 | | 11,384 |
| Promotora de Informaciones SA | | 17,908 | | 49,386 |
| Prosegur Cia de Seguridad SA | | 2,960 | | 166,921 |
| Realia Business SA (I) | | 2,646 | | 6,993 |
| Service Point Solutions SA (I) | | 30,916 | | 25,038 |
| Sociedad Nacional Inds. (I) | | 11,792 | | 25,184 |
| Sol Melia SA | | 6,841 | | 75,159 |
| SOS Cuetara SA | | 13,721 | | 13,457 |
| Tavex Algodonera SA (I) | | 8,440 | | 5,509 |
| Tecnicas Reunidas SA | | 3,090 | | 177,641 |
| Tecnocom (I) | | 4,417 | | 14,319 |
| Tubacex SA | | 10,497 | | 41,182 |
| Tubos Reunidos SA | | 9,612 | | 27,185 |
| Urbas Proyectos Urbanisticos SA (I) | | 10,449 | | 1,210 |
| Vertice Trescientos Sesenta Grados (I) | | 1,265 | | 454 |
| Vidrala SA (I) | | 2,317 | | 67,128 |
| Viscofan SA | | 7,252 | | 257,391 |
| Vocento SA | | 6,333 | | 32,335 |
| Vueling Airlines SA (I) | | 2,475 | | 36,692 |
| Zeltia SA (I)(L) | | 18,631 | | 79,243 |
| | |
|
| | | | | 4,609,649 |
| Sweden - 2.71% | | | | |
| AarhusKarlshamn AB | | 3,985 | | 107,256 |
| Acando AB (I) | | 7,431 | | 15,838 |
| Active Biotech AB (I) | | 6,544 | | 154,372 |
| AddTech AB | | 3,143 | | 87,581 |
| Angpanneforeningen AB | | 4,594 | | 95,001 |
| Avanza Bank Holding AB (I) | | 2,433 | | 86,630 |
| Axfood AB (I) | | 4,116 | | 158,108 |
| Axis Communications AB | | 4,940 | | 104,621 |
| BE Group AB (I) | | 5,044 | | 33,763 |
| Beijer Alma AB (I) | | 2,125 | | 48,230 |
| Beijer Electronics AB (I) | | 232 | | 7,621 |
| Bergman & Beving AB | | 3,668 | | 60,450 |
| Betsson Abbetsson AB (I) | | 4,726 | | 96,341 |
| Bilia AB (I) | | 4,374 | | 97,557 |
| Billerud Aktibolag AB (I) | | 14,115 | | 152,801 |
| BioGaia AB | | 2,335 | | 43,075 |
| BioInvent International AB (I) | | 3,907 | | 17,332 |
| Biovitrum AB (I) | | 19,035 | | 89,858 |
| Bjoern Borg Abbjoern Borg AB | | 1,242 | | 12,648 |
| Bure Equity AB (I) | | 11,904 | | 62,016 |
| Cardo AB | | 2,290 | | 151,150 |
| Clas Ohlson AB (I) | | 5,692 | | 82,898 |
| Cloetta AB | | 6,455 | | 38,713 |
| Concordia Maritime AB (I) | | 748 | | 2,185 |
| D Carnegie & Company AB (I) | | 52,789 | | 0 |
| Diamyd Medical AB (I) | | 1,643 | | 33,325 |
| Duni AB | | 1,441 | | 14,918 |
| East Capital Explorer AB (I) | | 1,176 | | 15,134 |
| Eniro AB (I) | | 3,060 | | 11,178 |
| Etrion Corp. (I) | | 2,686 | | 2,248 |
| Fagerhult AB (I) | | 600 | | 15,388 |
| G & L Beijer AB | | 2,000 | | 77,042 |
| Gunnebo AB (I) | | 11,783 | | 81,122 |
| |
| The accompanying notes are an integral part of the financial statements. | 145 |
John Hancock Funds II
Portfolio of Investments — February 28, 2011 (Unaudited) (showing percentage of total net assets)
| | | | |
| International Small Company Fund (continued) |
| | | Shares or | | |
| | | Principal | | |
| | | Amount | | Value |
| | |
|
| |
| COMMON STOCKS (continued) | | | | |
| Sweden (continued) | | | | |
| Hakon Invest AB | | 2,736 | $ | 45,356 |
| Haldex AB (I) | | 13,150 | | 200,847 |
| Hexpol AB | | 718 | | 15,163 |
| HIQ International AB (I) | | 5,688 | | 31,163 |
| Hoganas AB | | 3,718 | | 130,296 |
| Holmen AB, Series B | | 1,237 | | 43,505 |
| HQ AB (I) | | 1,886 | | 1,069 |
| Industrial & Financial Systems AB | | 3,313 | | 55,182 |
| Indutrade AB | | 2,469 | | 71,922 |
| Intrum Justitia AB | | 9,285 | | 135,718 |
| JM AB | | 14,111 | | 346,916 |
| KappAhl Holding AB (I) | | 6,786 | | 42,823 |
| Lagercrantz AB | | 4,000 | | 36,267 |
| Lindab International AB (I) | | 9,627 | | 113,002 |
| Loomis AB | | 8,473 | | 123,265 |
| Medivir AB (I) | | 2,195 | | 48,333 |
| Mekonomen AB (I) | | 3,500 | | 119,142 |
| Micronic Laser Systems AB (I) | | 11,550 | | 31,648 |
| NCC AB (I) | | 13,610 | | 355,707 |
| Net Entertainment Ne AB | | 1,863 | | 18,309 |
| Net Insight AB (I)(L) | | 50,000 | | 28,208 |
| New Wave Group AB | | 6,000 | | 44,546 |
| Nibe Industrier AB | | 12,042 | | 187,239 |
| Niscayah Group AB | | 23,554 | | 46,296 |
| Nobia AB (I) | | 25,872 | | 227,661 |
| Nolato AB (I) | | 3,557 | | 47,390 |
| Nordnet AB (I) | | 5,328 | | 16,412 |
| OEM International AB | | 8,427 | | 78,089 |
| ORC Software AB (I) | | 1,800 | | 31,474 |
| PA Resources AB (I) | | 78,665 | | 53,759 |
| Peab AB | | 21,831 | | 183,019 |
| Proffice AB (I) | | 10,000 | | 50,360 |
| Q-Med AB | | 7,472 | | 92,798 |
| Rezidor Hotel Group AB (I) | | 13,763 | | 80,133 |
| RNB Retail & Brands AB (I) | | 17,418 | | 19,622 |
| SAS AB (I)(L) | | 12,629 | | 42,867 |
| Seco Tools AB (I) | | 2,291 | | 38,076 |
| Sensys Traffic AB (I) | | 50,268 | | 8,492 |
| SkiStar AB (I) | | 2,852 | | 51,326 |
| Studsvik AB (I) | | 1,200 | | 12,313 |
| Sweco AB | | 5,392 | | 52,783 |
| TradeDoubler AB (I) | | 5,818 | | 39,910 |
| Trelleborg AB, Series B | | 34,490 | | 344,938 |
| | |
|
| | | | | 5,799,744 |
| Switzerland - 5.76% | | | | |
| Advanced Digital Broadcast Holdings SA | | 310 | | 10,864 |
| AFG Arbonia-Forster Holding AG (I) | | 929 | | 34,024 |
| Allreal Holding AG | | 1,292 | | 199,848 |
| Also Holding AG (I) | | 779 | | 45,714 |
| Aryzta AG | | 12,491 | | 583,353 |
| Ascom Holding AG (I) | | 3,992 | | 58,459 |
| Bachem Holding AG | | 525 | | 31,900 |
| Bank Coop AG | | 2,190 | | 159,798 |
| Bank Sarasin & Compagnie AG | | 5,747 | | 248,036 |
| Banque Cantonale de Geneve | | 76 | | 18,119 |
| Banque Privee Edmond de Rothschild SA (I) | | 1 | | 29,606 |
| Barry Callebaut AG (I) | | 226 | | 185,704 |
| Basilea Pharmaceutica AG (I) | | 1,026 | | 77,495 |
| Belimo Holding AG (I) | | 69 | | 131,367 |
| Bell Holding AG (I) | | 23 | | 47,757 |
| Berner Kantonalbank | | 492 | | 128,892 |
| Bobst Group AG (I) | | 1,425 | | 65,951 |
| Bossard Holding AG (I) | | 748 | | 106,729 |
| Bucher Industries AG (I) | | 639 | | 138,644 |
| | | | |
| International Small Company Fund (continued) |
| | | Shares or | | |
| | | Principal | | |
| | | Amount | | Value |
| | |
|
| |
| COMMON STOCKS (continued) | | | | |
| Switzerland (continued) | | | | |
| Burckhardt Compression Holding AG | | 344 | $ | 101,799 |
| Card Guard AG (I) | | 1,457 | | 13,799 |
| Centralschweizerische Kraftwerke AG (I) | | 280 | | 98,786 |
| Charles Voegele Holding AG (I) | | 1,112 | | 65,975 |
| Clariant AG (I) | | 43,556 | | 718,059 |
| Conzzeta Holding AG | | 69 | | 154,032 |
| Daetwyler Holding AG (I) | | 806 | | 72,971 |
| Dufry Group AG | | 2,489 | | 281,277 |
| EFG International | | 8,296 | | 125,424 |
| Emmi AG (I) | | 563 | | 127,863 |
| EMS-Chemie Holding AG | | 1,110 | | 203,103 |
| Energiedienst Holding AG (I) | | 982 | | 55,762 |
| Ferrexpo PLC | | 30,116 | | 205,732 |
| Flughafen Zuerich AG (I) | | 560 | | 227,347 |
| Forbo Holding AG | | 152 | | 101,359 |
| Galenica Holding AG | | 578 | | 332,485 |
| GAM Holding, Ltd. (I) | | 26,212 | | 474,235 |
| Gategroup Holding Ag (I) | | 99 | | 5,183 |
| Georg Fischer AG (I) | | 549 | | 309,329 |
| Gurit Heberlein AG | | 40 | | 24,276 |
| Helvetia Patria Holding AG | | 530 | | 227,305 |
| Huber & Suhner Ag (I) | | 74 | | 4,954 |
| Interroll Holding AG | | 57 | | 25,532 |
| Kaba Holding AG (I) | | 295 | | 127,317 |
| Kardex AG | | 444 | | 13,616 |
| Komax Holding AG (I) | | 335 | | 41,534 |
| Kudelski SA | | 4,963 | | 94,611 |
| Kuoni Reisen Holding AG (I) | | 298 | | 132,463 |
| LEM Holding SA (I) | | 310 | | 198,496 |
| Logitech International SA (I)(L) | | 26,205 | | 498,297 |
| Luzerner Kantonalbank AG (I) | | 283 | | 99,898 |
| Medisize Holding AG (I) | | 524 | | 33,116 |
| Metall Zug AG (I) | | 24 | | 96,855 |
| Meyer Burger Technology AG (I) | | 4,801 | | 165,499 |
| Micronas Semiconductor Holding AG (I) | | 3,027 | | 34,253 |
| Mobilezone Holding AG | | 5,131 | | 59,922 |
| Mobimo Holding AG (I) | | 582 | | 125,591 |
| Nobel Biocare Holding AG | | 22,850 | | 439,430 |
| Orascom Development Holding AG | | 169 | | 8,126 |
| Orell Fuessli Holding AG | | 223 | | 32,203 |
| Panalpina Welttransport Holding AG (I) | | 1,791 | | 232,105 |
| Partners Group Holding AG | | 85 | | 15,236 |
| Petroplus Holdings AG | | 2,950 | | 47,887 |
| Phoenix Mecano AG | | 81 | | 62,602 |
| Precious Woods Holding AG (I) | | 327 | | 7,884 |
| PubliGroupe SA | | 276 | | 31,196 |
| Rieter Holding AG (I) | | 353 | | 143,734 |
| Romande Energie Holding SA (I) | | 43 | | 79,087 |
| Schaffner Holding AG (I) | | 90 | | 31,084 |
| Schulthess Group AG | | 805 | | 40,379 |
| Schweiter Technologies AG (I) | | 117 | | 95,580 |
| Schweizerhall Holding AG | | 305 | | 27,406 |
| Schweizerische National-Versicherungs- | | | | |
| Gesellschaft AG (I) | | 1,491 | | 53,465 |
| Siegfried Holding AG (I) | | 396 | | 43,042 |
| St. Galler Kantonalbank | | 271 | | 138,182 |
| Straumann Holding AG | | 466 | | 114,481 |
| Sulzer AG | | 3,135 | | 486,857 |
| Swiss Life Holding (I) | | 3,036 | | 501,767 |
| Swissfirst AG | | 887 | | 35,807 |
| Swisslog Holding AG | | 60,097 | | 60,819 |
| Swissquote Group Holding SA | | 1,018 | | 65,051 |
| Tamedia AG (I) | | 586 | | 74,735 |
| Tecan Group AG | | 1,142 | | 98,265 |
| Temenos Group AG (I) | | 9,132 | | 346,419 |
| |
| The accompanying notes are an integral part of the financial statements. | 146 |
John Hancock Funds II
Portfolio of Investments — February 28, 2011 (Unaudited) (showing percentage of total net assets)
| | | | |
| International Small Company Fund (continued) |
| | | Shares or | | |
| | | Principal | | |
| | | Amount | | Value |
| | |
|
| |
| COMMON STOCKS (continued) | | | | |
| Switzerland (continued) | | | | |
| Tornos SA (I) | | 2,185 | $ | 30,343 |
| U-Blox AG (I) | | 264 | | 14,149 |
| Unaxis Holding AG (I) | | 6,985 | | 47,715 |
| Valiant Holding AG (I) | | 840 | | 122,236 |
| Valora Holding AG | | 333 | | 120,054 |
| Vaudoise Assurances Holding SA | | 211 | | 62,477 |
| Von Roll Holding AG | | 1,526 | | 7,706 |
| Vontobel Holding AG | | 4,837 | | 181,770 |
| VZ Holding AG (I) | | 879 | | 112,787 |
| Winterthur Technologie AG (I) | | 104 | | 6,885 |
| WMH Walter Meier AG (I) | | 120 | | 30,247 |
| Ypsomed Holding AG (I) | | 908 | | 57,073 |
| Zehnder Group AG | | 36 | | 98,479 |
| Zuger Kantonalbank (I) | | 20 | | 117,210 |
| | |
|
| | | | | 12,302,275 |
| United Arab Emirates - 0.01% | | | | |
| Lamprell PLC | | 2,831 | | 13,878 |
| United Kingdom - 16.51% | | | | |
| 888 Holdings PLC | | 10,776 | | 7,356 |
| A.G. Barr PLC | | 4,530 | | 76,370 |
| Aberdeen Asset Management PLC | | 111,289 | | 380,058 |
| AEA Technology Group PLC (I) | | 18,852 | | 1,541 |
| Aegis Group PLC | | 154,574 | | 358,097 |
| Afren PLC (I) | | 103,281 | | 268,723 |
| Aga Rangemaster Group PLC | | 16,809 | | 34,116 |
| Alphameric PLC (I) | | 33,484 | | 13,616 |
| Amlin PLC | | 4,805 | | 30,286 |
| Anglo Pacific Group PLC | | 13,955 | | 75,604 |
| Anglo-Eastern Plantations PLC | | 3,005 | | 34,477 |
| Anite PLC (I) | | 32,668 | | 36,135 |
| Antisoma PLC (I) | | 100,552 | | 4,692 |
| Ark Therapeutics Group PLC (I) | | 20,122 | | 1,423 |
| Ashmore Group PLC | | 5,973 | | 32,591 |
| Ashtead Group PLC | | 78,654 | | 219,083 |
| Assura Group, Ltd. | | 3,182 | | 84 |
| Assura Group, Ltd. | | 39,777 | | 30,174 |
| Aveva Group PLC | | 8,970 | | 232,427 |
| Avis Europe PLC (I) | | 14,774 | | 49,804 |
| Axis-Shield PLC (I) | | 9,883 | | 50,924 |
| Babcock International Group PLC | | 47,441 | | 432,601 |
| Balfour Beatty PLC | | 108,498 | | 617,113 |
| Barratt Developments PLC (I) | | 137,739 | | 240,411 |
| BBA Aviation PLC (I) | | 48,884 | | 177,162 |
| Beazley PLC | | 61,656 | | 138,048 |
| Bellway PLC | | 15,504 | | 169,582 |
| Berkeley Group Holdings PLC (I) | | 19,444 | | 327,123 |
| Bloomsbury Publishing PLC | | 9,864 | | 19,210 |
| Bodycote PLC | | 25,304 | | 125,541 |
| Booker Group PLC | | 767 | | 712 |
| Bovis Homes Group PLC | | 21,822 | | 163,505 |
| Braemar Seascope Group PLC | | 1,189 | | 8,807 |
| Brewin Dolphin Holdings PLC | | 20,522 | | 59,979 |
| British Polythene Industries PLC (I) | | 4,400 | | 16,797 |
| Britvic PLC | | 40,254 | | 238,681 |
| BTG PLC (I) | | 28,558 | | 100,192 |
| Cable & Wireless Communications PLC | | 420,071 | | 327,798 |
| Capital & Regional PLC | | 10,673 | | 6,335 |
| Carillion PLC | | 68,444 | | 418,271 |
| Carpetright PLC (I) | | 6,037 | | 70,161 |
| Carphone Warehouse Group PLC (I) | | 4,298 | | 28,446 |
| Castings PLC (I) | | 6,764 | | 31,876 |
| Centaur Media PLC | | 19,732 | | 21,587 |
| Charles Stanley Group PLC (I) | | 5,789 | | 28,723 |
| Charles Taylor Consulting PLC | | 5,241 | | 13,660 |
| | | | |
| International Small Company Fund (continued) |
| | | Shares or | | |
| | | Principal | | |
| | | Amount | | Value |
| | |
|
| |
| COMMON STOCKS (continued) | | | | |
| United Kingdom (continued) | | | | |
| Charter International PLC | | 23,693 | $ | 292,199 |
| Chaucer Holdings PLC (I) | | 23,479 | | 23,569 |
| Chemring Group PLC (I) | | 4,296 | | 229,217 |
| Chesnara PLC (I) | | 17,735 | | 72,851 |
| Chime Communications PLC (I) | | 5,000 | | 20,317 |
| Clarkson PLC | | 293 | | 5,191 |
| Clinton Cards PLC (I) | | 33,476 | | 14,353 |
| Close Brothers Group PLC | | 21,899 | | 297,365 |
| Collins Stewart PLC | | 27,764 | | 40,725 |
| Colt Telecom Group SA (I) | | 38,071 | | 94,690 |
| Communisis PLC (I) | | 19,820 | | 10,027 |
| Computacenter PLC | | 11,130 | | 75,617 |
| Connaught PLC | | 12,117 | | 0 |
| Consort Medical PLC | | 7,040 | | 59,534 |
| Cookson Group PLC (I) | | 39,606 | | 420,817 |
| Corin Group PLC | | 4,201 | | 3,176 |
| Costain Group PLC | | 4,761 | | 18,952 |
| Cranswick PLC (I) | | 5,196 | | 71,641 |
| Creston PLC | | 10,587 | | 16,608 |
| Croda International PLC (I) | | 18,931 | | 487,399 |
| CSR PLC (I) | | 27,703 | | 175,417 |
| D.S. Smith PLC (I) | | 37,951 | | 122,740 |
| Daily Mail & General Trust | | 40,524 | | 370,132 |
| Dairy Crest Group PLC | | 14,905 | | 87,843 |
| Davis Service Group PLC | | 19,057 | | 149,213 |
| De La Rue PLC | | 11,851 | | 138,690 |
| Debenhams PLC | | 160,381 | | 163,961 |
| Dechra Pharmaceuticals PLC | | 6,959 | | 57,402 |
| Development Securities PLC (I) | | 19,418 | | 65,006 |
| Devro PLC | | 17,033 | | 72,816 |
| Dicom Group PLC | | 6,393 | | 50,898 |
| Dignity PLC | | 5,242 | | 58,610 |
| Diploma PLC | | 10,843 | | 48,470 |
| Dixons Retail PLC (I) | | 575,734 | | 181,341 |
| Domino Printing Sciences PLC (I) | | 9,846 | | 104,487 |
| Domino’s Pizza UK & IRL PLC | | 7,432 | | 56,106 |
| Drax Group PLC | | 54,749 | | 351,328 |
| DTZ Holdings PLC (I) | | 19,551 | | 12,388 |
| Dunelm Group PLC | | 6,736 | | 43,635 |
| Eaga PLC | | 8,491 | | 16,353 |
| easyJet PLC (I) | | 34,911 | | 203,245 |
| Electrocomponents PLC | | 66,269 | | 298,290 |
| Elementis PLC (I) | | 49,703 | | 101,371 |
| Enquest PLC (I) | | 40,971 | | 94,892 |
| Enterprise Inns PLC | | 57,459 | | 88,905 |
| Euromoney Institutional Investor PLC | | 4,164 | | 47,244 |
| Evolution Group PLC (I) | | 21,877 | | 27,852 |
| F&C Asset Management PLC | | 63,376 | | 88,862 |
| Fenner PLC | | 22,158 | | 114,467 |
| Fidessa Group PLC | | 5,020 | | 134,606 |
| Filtrona PLC | | 20,887 | | 102,053 |
| Findel PLC (I) | | 10,678 | | 1,996 |
| FirstGroup PLC | | 75,809 | | 449,476 |
| Forth Ports PLC | | 4,321 | | 106,998 |
| Fortune Oil PLC (I) | | 205,675 | | 34,320 |
| French Connection Group PLC | | 23,030 | | 45,417 |
| Fuller Smith & Turner PLC (I) | | 8,112 | | 77,834 |
| Future PLC (I) | | 44,714 | | 19,978 |
| Galiform PLC (I) | | 112,844 | | 212,536 |
| Galliford Try PLC | | 10,310 | | 62,333 |
| Game Group PLC | | 48,348 | | 48,044 |
| Gem Diamonds, Ltd. (I) | | 11,000 | | 51,135 |
| Genus PLC (I) | | 6,656 | | 93,158 |
| Go-Ahead Group PLC | | 5,115 | | 117,127 |
| Greene King PLC | | 33,132 | | 249,500 |
| |
| The accompanying notes are an integral part of the financial statements. | 147 |
John Hancock Funds II
Portfolio of Investments — February 28, 2011 (Unaudited) (showing percentage of total net assets)
| | | | |
| International Small Company Fund (continued) |
| | | Shares or | | |
| | | Principal | | |
| | | Amount | | Value |
| | |
|
| |
| COMMON STOCKS (continued) | | | | |
| United Kingdom (continued) | | | | |
| Greggs PLC | | 8,569 | $ | 67,604 |
| Halfords Group PLC (I) | | 31,910 | | 200,910 |
| Halma PLC (I) | | 59,276 | | 325,037 |
| Hampson Industries PLC | | 36,786 | | 22,270 |
| Hardy Oil & Gas PLC (I) | | 7,986 | | 21,817 |
| Hargreaves Lansdown PLC | | 23,328 | | 229,572 |
| Hays PLC | | 208,392 | | 422,722 |
| Headlam Group PLC (I) | | 14,115 | | 69,881 |
| Helical Bar PLC (I) | | 8,701 | | 39,702 |
| Helphire PLC (I) | | 51,338 | | 10,429 |
| Henderson Group PLC | | 116,394 | | 304,506 |
| Henry Boot PLC | | 14,125 | | 25,720 |
| Heritage Oil, Ltd. | | 33,279 | | 143,331 |
| Hikma Pharmaceuticals PLC | | 20,715 | | 257,714 |
| Hill & Smith Holdings PLC | | 14,323 | | 65,895 |
| HMV Group PLC (L) | | 39,707 | | 13,399 |
| Hogg Robinson Group PLC | | 39,788 | | 29,416 |
| Holidaybreak PLC (I) | | 4,105 | | 21,701 |
| Home Retail Group PLC | | 134,021 | | 480,900 |
| Homeserve PLC (I) | | 42,363 | | 311,560 |
| Hunting PLC | | 16,230 | | 210,075 |
| Huntsworth PLC | | 22,389 | | 28,220 |
| Hyder Consulting PLC (I) | | 575 | | 3,681 |
| IG Group Holdings PLC (I) | | 48,173 | | 351,044 |
| Imagination Technologies Group PLC (I) | | 42,827 | | 286,643 |
| Inchcape PLC (I) | | 52,778 | | 332,999 |
| Intermediate Capital Group PLC | | 51,098 | | 266,908 |
| International Personal Finance PLC | | 25,827 | | 139,651 |
| Interserve PLC | | 21,602 | | 84,188 |
| Invensys PLC | | 33,452 | | 193,202 |
| ITE Group PLC (I) | | 42,551 | | 163,585 |
| J.D. Wetherspoon PLC | | 11,284 | | 80,712 |
| James Fisher & Sons PLC (I) | | 4,903 | | 41,806 |
| Jardine Lloyd Thompson Group PLC | | 17,079 | | 180,605 |
| Jazztel PLC (I) | | 27,263 | | 145,197 |
| JD Sports Fashion PLC (I) | | 1,433 | | 20,608 |
| JKX Oil & Gas PLC (I) | | 17,585 | | 86,840 |
| John Menzies PLC (I) | | 7,960 | | 56,232 |
| John Wood Group PLC | | 49,305 | | 529,888 |
| Johnston Press PLC (I) | | 131,792 | | 26,302 |
| Keller Group PLC | | 6,834 | | 69,270 |
| Kesa Electricals PLC | | 50,341 | | 104,809 |
| Kier Group PLC (I) | | 3,821 | | 84,207 |
| Kingston Communications PLC (I) | | 123,424 | | 127,902 |
| Ladbrokes PLC | | 121,469 | | 267,733 |
| Laird Group PLC | | 31,586 | | 82,230 |
| Laura Ashley Holdings PLC | | 68,094 | | 26,759 |
| Lavendon Group PLC | | 13,340 | | 22,456 |
| Liontrust Asset Management PLC (I) | | 5,127 | | 7,091 |
| Logica PLC (I) | | 150,627 | | 338,307 |
| London Stock Exchange Group PLC (L) | | 22,726 | | 332,404 |
| Lookers PLC (I) | | 35,795 | | 35,376 |
| LSL Property Services PLC (I) | | 7,930 | | 31,973 |
| Luminar Group Holdings PLC (I) | | 13,431 | | 2,676 |
| Management Consulting Group PLC | | 82,095 | | 43,025 |
| Manganese Bronze Holdings PLC (I) | | 3,263 | | 2,067 |
| Marshalls PLC (I) | | 29,028 | | 54,595 |
| Marston’s PLC | | 53,984 | | 86,514 |
| McBride PLC (I) | | 17,330 | | 40,616 |
| Mears Group Plcmears Group PLC (I) | | 3,945 | | 19,797 |
| Mecom Group PLC (I) | | 3,580 | | 15,181 |
| Meggitt PLC (I) | | 82,913 | | 455,703 |
| Melrose PLC | | 66,062 | | 326,275 |
| Melrose Resources PLC | | 4,954 | | 19,958 |
| Michael Page International PLC | | 49,381 | | 412,998 |
| | | | |
| International Small Company Fund (continued) |
| | | Shares or | | |
| | | Principal | | |
| | | Amount | | Value |
| | |
|
| |
| COMMON STOCKS (continued) | | | | |
| United Kingdom (continued) | | | | |
| Micro Focus International PLC | | 23,736 | $ | 109,370 |
| Millennium & Copthorne Hotels PLC | | 25,663 | | 240,534 |
| Misys PLC (I) | | 51,674 | | 276,028 |
| Mitchells & Butlers PLC (I) | | 36,713 | | 194,226 |
| Mitie Group PLC (I) | | 40,930 | | 134,369 |
| Moneysupermarket.com Group PLC | | 30,065 | | 44,303 |
| Morgan Crucible Company PLC | | 27,442 | | 129,200 |
| Morgan Sindall PLC | | 5,441 | | 58,308 |
| Mothercare PLC (I) | | 9,403 | | 73,444 |
| Mouchel Parkman PLC | | 10,894 | | 27,307 |
| MWB Group Holdings PLC (I) | | 15,166 | | 10,177 |
| N. Brown Group PLC | | 18,394 | | 80,279 |
| National Express Group PLC (I) | | 56,195 | | 226,398 |
| Northern Foods PLC (I) | | 45,437 | | 54,414 |
| Northgate PLC | | 3,121 | | 15,752 |
| Northumbrian Water Group PLC | | 80,060 | | 424,179 |
| Novae Group PLC | | 7,625 | | 48,984 |
| Oxford Biomedica PLC (I) | | 110,000 | | 11,844 |
| Oxford Instruments PLC | | 5,102 | | 51,013 |
| Pace Micro Technology PLC (I) | | 30,754 | | 107,434 |
| Paypoint PLC (I) | | 5,847 | | 31,801 |
| Pendragon PLC | | 119,021 | | 44,957 |
| Pennon Group PLC | | 2,011 | | 20,698 |
| Persimmon PLC | | 54,373 | | 416,093 |
| Petropavlovsk PLC | | 3,414 | | 60,322 |
| Phoenix IT Group, Ltd. | | 9,852 | | 37,628 |
| Photo-Me International PLC (I) | | 22,753 | | 20,336 |
| Premier Farnell PLC | | 56,405 | | 277,978 |
| Premier Foods PLC (I) | | 256,282 | | 113,959 |
| Premier Oil PLC (I) | | 16,976 | | 575,649 |
| Prostrakan Group PLC (I) | | 2,053 | | 4,416 |
| Provident Financial PLC | | 19,013 | | 319,409 |
| Psion PLC | | 11,459 | | 17,700 |
| Puma Brandenburg, Ltd. (I) | | 82,607 | | 4,029 |
| Puma Brandenburg, Ltd. - Capital (I) | | 82,607 | | 4,029 |
| Punch Taverns PLC (I) | | 73,594 | | 79,642 |
| PV Crystalox Solar PLC | | 29,561 | | 29,106 |
| PZ Cussons PLC | | 25,137 | | 142,413 |
| Qinetiq PLC | | 64,033 | | 131,529 |
| Quintain Estates & Development PLC (I) | | 161,428 | | 113,591 |
| R.E.A. Holdings PLC (I) | | 2,127 | | 25,942 |
| Rank Group PLC | | 26,068 | | 55,603 |
| Rathbone Brothers PLC | | 4,711 | | 89,117 |
| Redrow PLC (I) | | 26,678 | | 58,846 |
| Renishaw PLC | | 3,900 | | 98,315 |
| Rentokil Initial PLC (I) | | 162,363 | | 239,764 |
| Restaurant Group PLC (I) | | 19,119 | | 87,259 |
| Ricardo PLC (I) | | 9,643 | | 57,209 |
| Rightmove PLC | | 14,759 | | 213,915 |
| RM PLC (I) | | 13,737 | | 34,104 |
| Robert Walters PLC | | 8,828 | | 46,738 |
| Robert Wiseman Dairies PLC (I) | | 4,588 | | 22,336 |
| ROK PLC | | 31,236 | | 9,394 |
| Rotork PLC | | 13,424 | | 388,321 |
| RPC Group PLC (I) | | 16,705 | | 68,219 |
| RPS Group PLC (I) | | 23,867 | | 77,324 |
| Salamander Energy PLC (I) | | 16,320 | | 82,131 |
| Savills PLC | | 12,782 | | 78,646 |
| SDL PLC (I) | | 11,260 | | 116,754 |
| Senior PLC | | 55,744 | | 135,825 |
| Severfield Rowen PLC | | 8,148 | | 30,464 |
| Shanks Group PLC | | 46,134 | | 86,221 |
| Shore Capital Group, Ltd. | | 82,607 | | 44,654 |
| SIG PLC | | 85,077 | | 179,313 |
| Smiths News PLC (I) | | 49,558 | | 75,690 |
| |
| The accompanying notes are an integral part of the financial statements. | 148 |
John Hancock Funds II
Portfolio of Investments — February 28, 2011 (Unaudited) (showing percentage of total net assets)
| | | | |
| International Small Company Fund (continued) |
| | | Shares or | | |
| | | Principal | | |
| | | Amount | | Value |
| | |
|
| |
| COMMON STOCKS (continued) | | | | |
| United Kingdom (continued) | | | | |
| Soco International PLC (I) | | 31,687 | $ | 175,097 |
| Southern Cross Healthcare, Ltd. (I) | | 18,768 | | 5,644 |
| Spectris PLC | | 17,534 | | 397,614 |
| Speedy Hire PLC | | 22,025 | | 10,229 |
| Spirax-Sarco Engineering PLC | | 8,194 | | 243,850 |
| Spirent Communications PLC | | 60,889 | | 154,391 |
| Spirent Communications PLC, ADR | | 1,208 | | 12,237 |
| Sports Direct International PLC | | 28,725 | | 85,585 |
| St James’s Place PLC | | 28,640 | | 141,964 |
| St. Ives Group PLC (I) | | 12,932 | | 21,047 |
| St. Modwen Properties PLC (I) | | 18,212 | | 49,195 |
| Stagecoach Group PLC | | 88,630 | | 298,374 |
| Sthree PLC | | 11,092 | | 75,519 |
| Synergy Health PLC | | 6,621 | | 92,993 |
| TalkTalk Telecom Group PLC (I) | | 24,453 | | 59,325 |
| Taylor Woodrow PLC (I) | | 554,501 | | 356,341 |
| Ted Baker PLC (I) | | 5,384 | | 58,929 |
| Telecity Group PLC (I) | | 2,024 | | 15,697 |
| Telecom Plus PLC (I) | | 5,142 | | 39,270 |
| Thomas Cook Group PLC | | 134,786 | | 414,200 |
| Thorntons PLC | | 10,805 | | 16,027 |
| Topps Tiles PLC | | 25,009 | | 30,480 |
| Town Centre Securities PLC (I) | | 4,430 | | 13,237 |
| Travis Perkins PLC (I) | | 32,025 | | 517,870 |
| Tribal Group PLC (I) | | 1,323 | | 898 |
| Trinity Mirror PLC | | 37,867 | | 49,864 |
| TT electronics PLC (I) | | 26,687 | | 73,626 |
| Tullett Prebon PLC | | 25,044 | | 165,750 |
| UK Coal PLC (I) | | 20,780 | | 13,689 |
| UK Mail Group PLC (I) | | 6,109 | | 30,785 |
| Ultra Electronics Holdings PLC (I) | | 7,537 | | 210,704 |
| Umeco PLC (I) | | 6,440 | | 50,507 |
| United Business Media, Ltd. | | 36,361 | | 421,093 |
| UTV Media PLC (I) | | 12,462 | | 25,368 |
| Vectura Group PLC (I) | | 35,006 | | 42,680 |
| Victrex PLC | | 10,789 | | 229,223 |
| Vislink PLC (I) | | 22,958 | | 7,469 |
| Vitec Group PLC (I) | | 3,750 | | 33,222 |
| Volex Group PLC (I) | | 491 | | 2,522 |
| VP PLC (I) | | 664 | | 2,515 |
| W.S. Atkins PLC | | 12,327 | | 139,671 |
| WH Smith PLC | | 15,331 | | 114,795 |
| William Hill PLC | | 118,436 | | 369,717 |
| Wilmington Group PLC (I) | | 8,311 | | 22,103 |
| Wincanton PLC (I) | | 11,768 | | 26,696 |
| Wolfson Microelectronics PLC (I) | | 11,249 | | 52,465 |
| WSP Group PLC (I) | | 7,138 | | 41,808 |
| Xaar PLC (I) | | 20,020 | | 69,977 |
| Xchanging PLC | | 27,038 | | 24,660 |
| Yell Group PLC (I)(L) | | 201,603 | | 23,232 |
| Yule Catto & Company PLC (I) | | 29,330 | | 102,254 |
| | |
|
| | | | | 35,272,379 |
| United States - 0.19% | | | | |
| Golden Star Resources, Ltd. (I) | | 38,298 | | 121,018 |
| Jaguar Mining, Inc. (I)(L) | | 8,155 | | 43,396 |
| Minera Andes, Inc. (I) | | 20,500 | | 57,604 |
| pSivida Corp. (I) | | 2,379 | | 8,558 |
| Storm Cat Energy Corp. (I) | | 2,400 | | 2 |
| Swisher Hygiene, Inc. (I) | | 796 | | 4,801 |
| SXC Health Solutions Corp. (I) | | 3,400 | | 167,594 |
| | |
|
| | | | | 402,973 |
|
| TOTAL COMMON STOCKS (Cost $199,477,155) | | | $ | 212,395,154 |
|
| | | | |
| International Small Company Fund (continued) |
| | | Shares or | | |
| | | Principal | | |
| | | Amount | | Value |
| |
|
| |
| CONVERTIBLE BONDS - 0.00% | | | | |
| Spain - 0.00% | | | | |
| Banco de Sabadell SA, 7.750%, 11/11/2013 | | | | |
| 7.750%, 11/11/2013 | $ | 6,964 | $ | 7,294 |
|
| TOTAL CONVERTIBLE BONDS (Cost $31,442) | | $ | 7,294 |
|
| |
| WARRANTS - 0.01% | | | | |
| AFP Properties, Ltd. (Expiration Date: | | | | |
| 11/18/2015, Strike Price: SGD 0.10) (I) | | 140,000 | $ | 25,318 |
| Management Consulting Group PLC | | | | |
| (Expiration Date 12/31/2011, Strike Price: | | | | |
| GBP 0.22) (I) | | 3,799 | | 625 |
|
| TOTAL WARRANTS (Cost $32,942) | | | $ | 25,943 |
|
| |
| RIGHTS - 0.02% | | | | |
| Anek Lines SA (Expiration Date: 3/18/11, | | | | |
| Strike Price: EUR 0.30) (I) | | 14,015 | | 0 |
| Falck Renewables SpA (Expiration Date: | | | | |
| 3/4/11, Strike Price: EUR 1.00) (I) | | 1,929 | | 484 |
| Hexpol Ab (Expiration Date: 3/16/11, Strike | | | | |
| Price: SEK 83.00) (I) | | 718 | | 1,451 |
| Nyrstar (Expiration Date: 3/11/11, Strike | | | | |
| Price: EUR 7.00) (I) | | 11,255 | | 30,441 |
| SAVE SpA (Expiration Date: 3/11/11, Strike | | | | |
| Price: EUR 6.81) (I) | | 3,345 | | 63 |
|
| TOTAL RIGHTS (Cost $24,794) | | | $ | 32,439 |
|
| |
| SECURITIES LENDING COLLATERAL - 3.20% | | | |
| John Hancock Collateral | | | | |
| Investment Trust, 0.2855% (W)(Y) | | 683,902 | | 6,844,084 |
|
| TOTAL SECURITIES LENDING | | | | |
| COLLATERAL (Cost $6,842,460) | | | $ | 6,844,084 |
|
| |
| SHORT-TERM INVESTMENTS - 0.20% | | | | |
| Short-Term Securities* - 0.20% | | | | |
| State Street Institutional Liquid Reserves | | | | |
| Fund, 0.2053% | $ | 416,486 | $ | 416,486 |
|
| TOTAL SHORT-TERM INVESTMENTS (Cost $416,486) | | $ | 416,486 |
|
| Total Investments (International Small Company Fund) | | |
| (Cost $206,825,279) - 102.84% | | | $ | 219,721,400 |
| Other assets and liabilities, net - (2.84%) | | | | (6,060,177) |
| | |
|
| TOTAL NET ASSETS - 100.00% | | | $ | 213,661,223 |
| | | |
|
| |
| |
| International Value Fund | | | | |
| | | Shares or | | |
| | | Principal | | |
| | | Amount | | Value |
| |
|
| | |
| |
| COMMON STOCKS - 97.52% | | | | |
| Australia - 1.83% | | | | |
| Billabong International, Ltd. | | 835,209 | $ | 7,230,541 |
| Brambles, Ltd. | | 1,636,621 | | 11,849,866 |
| Downer EDI, Ltd. | | 1,376,794 | | 5,505,399 |
| | |
|
| | | | | 24,585,806 |
| Austria - 0.93% | | | | |
| Telekom Austria AG | | 873,300 | | 12,477,755 |
| Bermuda - 0.57% | | | | |
| PartnerRe, Ltd. | | 95,760 | | 7,593,768 |
| Canada - 1.29% | | | | |
| Talisman Energy, Inc. (L) | | 696,840 | | 17,292,792 |
| |
| The accompanying notes are an integral part of the financial statements. | 149 |
John Hancock Funds II
Portfolio of Investments — February 28, 2011 (Unaudited) (showing percentage of total net assets)
| | | | |
| International Value Fund (continued) | | |
| | | Shares or | | |
| | | Principal | | |
| | | Amount | | Value |
| | |
|
| |
| COMMON STOCKS (continued) | | | | |
| China - 0.81% | | | | |
| China Telecom Corp., Ltd. | | 18,363,589 | $ | 10,862,058 |
| France - 10.99% | | | | |
| AXA SA | | 1,170,957 | | 24,617,421 |
| BNP Paribas | | 169,730 | | 13,266,298 |
| France Telecom SA | | 1,489,511 | | 33,007,224 |
| GDF Suez | | 210,400 | | 8,526,691 |
| Sanofi-Aventis SA | | 438,326 | | 30,258,336 |
| Total SA | | 377,362 | | 23,153,126 |
| Vivendi SA | | 521,760 | | 14,870,940 |
| | |
|
| | | | | 147,700,036 |
| Germany - 9.19% | | | | |
| Celesio AG | | 246,790 | | 6,828,717 |
| Deutsche Post AG | | 334,491 | | 6,134,329 |
| E.ON AG | | 515,730 | | 16,929,788 |
| Merck KGAA | | 244,150 | | 22,079,651 |
| Muenchener Rueckversicherungs - Gesellschaft | | | | |
| AG (MunichRe) | | 141,276 | | 23,590,556 |
| SAP AG | | 410,690 | | 24,778,571 |
| Siemens AG | | 171,559 | | 23,100,081 |
| | |
|
| | | | | 123,441,693 |
| Hong Kong - 1.64% | | | | |
| AIA Group, Ltd. (I) | | 1,402,400 | | 4,118,696 |
| Cheung Kong Holdings, Ltd. | | 830,000 | | 12,974,334 |
| China Mobile, Ltd. | | 517,500 | | 4,879,439 |
| | |
|
| | | | | 21,972,469 |
| Ireland - 1.17% | | | | |
| CRH PLC (London Exchange) | | 457,470 | | 10,563,604 |
| Elan Corp. PLC (I) | | 807,130 | | 5,125,276 |
| | |
|
| | | | | 15,688,880 |
| Italy - 2.15% | | | | |
| Autogrill SpA (I) | | 949,325 | | 13,424,692 |
| UniCredit Italiano SpA | | 5,999,554 | | 15,439,473 |
| | |
|
| | | | | 28,864,165 |
| Japan - 7.01% | | | | |
| Mitsubishi UFJ Financial Group | | 1,611,700 | | 8,959,057 |
| Nintendo Company, Ltd. | | 82,394 | | 24,193,961 |
| NKSJ Holdings, Inc. (I) | | 1,841,000 | | 13,933,744 |
| Sony Corp. | | 257,914 | | 9,476,839 |
| Toyota Motor Corp. | | 390,200 | | 18,203,521 |
| Trend Micro, Inc. | | 145,000 | | 4,507,829 |
| USS Company, Ltd. | | 184,100 | | 14,904,222 |
| | |
|
| | | | | 94,179,173 |
| Netherlands - 6.31% | | | | |
| ING Groep NV (I) | | 3,770,598 | | 47,285,211 |
| Koninklijke Philips Electronics NV | | 546,066 | | 17,822,390 |
| Randstad Holdings NV (I) | | 121,640 | | 6,553,003 |
| Reed Elsevier NV | | 997,669 | | 13,172,406 |
| | |
|
| | | | | 84,833,010 |
| Norway - 4.07% | | | | |
| Statoil ASA | | 1,109,010 | | 29,227,040 |
| Telenor ASA | | 1,533,681 | | 25,490,496 |
| | |
|
| | | | | 54,717,536 |
| Russia - 1.49% | | | | |
| Gazprom OAO, SADR | | 684,700 | | 20,075,404 |
| Singapore - 3.45% | | | | |
| Flextronics International, Ltd. (I) | | 2,521,640 | | 20,400,068 |
| Singapore Telecommunications, Ltd. | | 2,372,000 | | 5,509,364 |
| | | | |
| International Value Fund (continued) | | |
| | | Shares or | | |
| | | Principal | | |
| | | Amount | | Value |
| | |
|
| |
| COMMON STOCKS (continued) | | | | |
| Singapore (continued) | | | | |
| Singapore Telecommunications, Ltd. | | 8,715,000 | $ | 20,413,993 |
| | |
|
| | | | | 46,323,425 |
| South Korea - 4.50% | | | | |
| KB Financial Group, Inc., ADR (I)(L) | | 545,318 | | 26,584,253 |
| Samsung Electronics Company, Ltd., GDR (S) | | 82,864 | | 33,941,094 |
| | |
|
| | | | | 60,525,347 |
| Spain - 3.34% | | | | |
| Gamesa Corporacion Tecnologica SA (I) | | 518,645 | | 4,571,005 |
| Iberdrola SA | | 1,579,068 | | 13,775,350 |
| Telefonica SA | | 1,043,457 | | 26,538,981 |
| | |
|
| | | | | 44,885,336 |
| Sweden - 1.55% | | | | |
| Niscayah Group AB | | 2,955,338 | | 5,808,810 |
| Telefonaktiebolaget LM Ericsson, B Shares | | 1,172,114 | | 15,061,928 |
| | |
|
| | | | | 20,870,738 |
| Switzerland - 7.58% | | | | |
| Adecco SA (L) | | 120,130 | | 8,085,564 |
| Basilea Pharmaceutica AG (I) | | 45,060 | | 3,403,428 |
| Lonza Group AG | | 59,760 | | 5,062,821 |
| Nestle SA | | 227,650 | | 12,886,150 |
| Novartis AG | | 127,860 | | 7,180,524 |
| Roche Holdings AG | | 239,398 | | 36,095,728 |
| Swiss Reinsurance Company, Ltd. | | 301,383 | | 18,469,664 |
| UBS AG (Swiss Exchange) (I) | | 532,848 | | 10,588,536 |
| | |
|
| | | | | 101,772,415 |
| Taiwan - 5.13% | | | | |
| Compal Electronics, Inc., GDR (S) | | 2,393,228 | | 13,978,605 |
| Lite-On Technology Corp. (I) | | 6,424,222 | | 8,004,858 |
| Lite-On Technology Corp., GDR | | 446,419 | | 5,552,649 |
| Siliconware Precision Industries Company | | 6,269,000 | | 8,663,231 |
| Taiwan Semiconductor | | | | |
| Manufacturing Company, Ltd. | | 13,692,576 | | 32,734,492 |
| | |
|
| | | | | 68,933,835 |
| United Kingdom - 21.15% | | | | |
| Aviva PLC | | 4,268,500 | | 32,479,220 |
| BAE Systems PLC | | 2,058,400 | | 11,019,589 |
| BP PLC | | 1,889,822 | | 15,229,384 |
| Carillion PLC | | 1,163,610 | | 7,110,981 |
| G4S PLC | | 3,311,780 | | 14,232,295 |
| GlaxoSmithKline PLC | | 1,232,495 | | 23,692,732 |
| Hays PLC | | 9,665,800 | | 19,607,037 |
| HSBC Holdings PLC | | 1,019,450 | | 11,220,105 |
| Kingfisher PLC | | 4,505,730 | | 18,624,112 |
| Marks & Spencer Group PLC | | 1,044,400 | | 5,880,163 |
| Pearson PLC | | 805,596 | | 13,770,510 |
| Premier Foods PLC (I) | | 8,745,586 | | 3,888,845 |
| Rexam PLC | | 1,822,340 | | 10,826,736 |
| Royal Dutch Shell PLC, B Shares | | 759,903 | | 27,153,851 |
| Tesco PLC | | 2,740,610 | | 18,024,403 |
| Vodafone Group PLC | | 18,100,266 | | 51,359,655 |
| | |
|
| | | | | 284,119,618 |
| United States - 1.37% | | | | |
| ACE, Ltd. | | 291,756 | | 18,453,567 |
|
| TOTAL COMMON STOCKS (Cost $1,221,506,162) | | | $ | 1,310,168,826 |
|
| |
| The accompanying notes are an integral part of the financial statements. | 150 |
John Hancock Funds II
Portfolio of Investments — February 28, 2011 (Unaudited) (showing percentage of total net assets)
| | | | |
| International Value Fund (continued) | | |
| | | Shares or | | |
| | | Principal | | |
| | | Amount | | Value |
| |
|
| |
| SECURITIES LENDING COLLATERAL - 1.43% | | |
| John Hancock Collateral | | | | |
| Investment Trust, 0.2855% (W)(Y) | | 1,912,851 | $ | 19,142,667 |
|
| TOTAL SECURITIES LENDING | | | | |
| COLLATERAL (Cost $19,136,978) | | | $ | 19,142,667 |
|
| |
| SHORT-TERM INVESTMENTS - 2.51% | | | | |
| Short-Term Securities* - 2.50% | | | | |
| Bank of Montreal Time Deposit, | | | | |
| 0.130% 03/01/2011 | $ | 11,200,000 | $ | 11,200,000 |
| BNP Paribas Time Deposit, | | | | |
| 0.160% 03/01/2011 | | 11,200,000 | | 11,200,000 |
| Royal Bank of Canada Time | | | | |
| Deposit, 0.160%,03/01/2020 | | 11,200,000 | | 11,200,000 |
| | |
|
| | | | | 33,600,000 |
| Repurchase Agreement - 0.01% | | | | |
| Repurchase Agreement with State Street Corp. | | | | |
| dated 02/28/2011 at 0.010% to be | | | | |
| repurchased at $175,000 on 03/01/2011, | | | | |
| collateralized by $180,000 U.S. Treasury | | | | |
| Notes, 0.875% due 05/31/2011 (valued at | | | | |
| $180,900, including interest) | | 175,000 | | 175,000 |
|
| TOTAL SHORT-TERM INVESTMENTS (Cost $33,775,000) | $ | 33,775,000 |
|
| Total Investments (International Value Fund) | | | | |
| (Cost $1,274,418,140) - 101.46% | | | $ | 1,363,086,493 |
| Other assets and liabilities, net - (1.46%) | | | | (19,584,572) |
| | | |
|
| TOTAL NET ASSETS - 100.00% | | | $ | 1,343,501,921 |
| | | |
|
| |
| |
| |
| Investment Quality Bond Fund | | | | |
| | | Shares or | | |
| | | Principal | | |
| | | Amount | | Value |
| |
|
| |
| U.S. GOVERNMENT & AGENCY | | | | |
| OBLIGATIONS - 30.95% | | | | |
| U.S. Government - 19.45% | | | | |
| Treasury Inflation Protected Securities | | | | |
| 0.500%, 04/15/2015 | $ | 6,639,316 | $ | 6,885,694 |
| 2.625%, 07/15/2017 | | 2,961,734 | | 3,398,821 |
| U.S. Treasury Bonds | | | | |
| 4.375%, 11/15/2039 | | 3,275,000 | | 3,213,594 |
| 4.500%, 02/15/2036 to 08/15/2039 | | 2,175,000 | | 2,193,234 |
| 4.625%, 02/15/2040 | | 2,250,000 | | 2,300,625 |
| 6.000%, 02/15/2026 | | 2,075,000 | | 2,540,254 |
| 6.250%, 08/15/2023 | | 8,150,000 | | 10,167,125 |
| 7.250%, 08/15/2022 | | 1,900,000 | | 2,550,454 |
| 8.125%, 08/15/2019 (F) | | 2,900,000 | | 4,000,414 |
| 8.125%, 08/15/2021 | | 4,300,000 | | 6,072,408 |
| 8.750%, 05/15/2017 (L) | | 2,500,000 | | 3,399,220 |
| 8.750%, 08/15/2020 | | 3,285,000 | | 4,757,091 |
| U.S. Treasury Notes | | | | |
| 2.500%, 04/30/2015 | | 7,020,000 | | 7,235,535 |
| 3.125%, 08/31/2013 to 10/31/2016 | | 13,675,000 | | 14,368,172 |
| 4.750%, 08/15/2017 | | 10,300,000 | | 11,602,785 |
| | |
|
| | | | | 84,685,426 |
| U.S. Government Agency - 11.50% | | | | |
| Federal Home Loan Mortgage Corp. | | | | |
| 4.875%, 06/13/2018 | | 2,000,000 | | 2,224,770 |
| 5.000%, 03/01/2019 to 12/01/2019 | | 331,546 | | 355,719 |
| 6.500%, 04/01/2029 to 08/01/2034 | | 14,904 | | 16,764 |
| 7.500%, 04/01/2011 to 05/01/2028 | | 3,769 | | 4,262 |
| | | | |
| Investment Quality Bond Fund (continued) | | |
| | | Shares or | | |
| | | Principal | | |
| | | Amount | | Value |
| | |
|
| |
| U.S. GOVERNMENT & AGENCY | | | | |
| OBLIGATIONS (continued) | | | | |
| U.S. Government Agency (continued) | | | | |
| Federal National Mortgage Association | | | | |
| 3.500%, TBA | $ | 18,000,000 | $ | 17,016,140 |
| 4.000%, TBA | | 11,500,000 | | 11,339,779 |
| 4.660%, 05/01/2013 | | 96,048 | | 101,539 |
| 4.860%, 01/01/2015 | | 2,720,391 | | 2,937,074 |
| 4.918%, 02/01/2013 | | 248,262 | | 257,622 |
| 5.000%, 03/15/2016 to 06/01/2019 | | 2,700,142 | | 2,995,057 |
| 5.500%, 08/01/2035 to 11/01/2035 | | 647,547 | | 695,696 |
| 5.616%, 12/01/2011 | | 134,377 | | 134,872 |
| 5.867%, 11/01/2011 | | 84,535 | | 84,515 |
| 6.062%, 05/01/2012 | | 112,767 | | 115,452 |
| 6.064%, 03/01/2012 | | 68,762 | | 69,872 |
| 6.500%, 09/01/2031 | | 61 | | 68 |
| 7.000%, 06/01/2029 | | 112 | | 127 |
| Government National | | | | |
| Mortgage Association | | | | |
| 4.000%, TBA | | 11,500,000 | | 11,506,889 |
| 6.000%, 12/15/2013 to 04/15/2035 | | 31,985 | | 35,278 |
| 6.500%, 06/15/2028 to 08/15/2034 | | 21,835 | | 24,668 |
| 7.000%, 11/15/2031 to 11/15/2033 | | 94,779 | | 107,861 |
| 8.000%, 07/15/2030 | | 1,158 | | 1,330 |
| U.S. Department of Housing & Urban | | | | |
| Development | | | | |
| 7.498%, 08/01/2011 | | 33,000 | | 33,194 |
| | |
|
| | | | | 50,058,548 |
|
| TOTAL U.S. GOVERNMENT & AGENCY | | | | |
| OBLIGATIONS (Cost $135,096,708) | | | $ | 134,743,974 |
|
| |
| FOREIGN GOVERNMENT | | | | |
| OBLIGATIONS - 0.84% | | | | |
| Brazil - 0.59% | | | | |
| Federative Republic of Brazil | | | | |
| 5.875%, 01/15/2019 | | 775,000 | | 857,538 |
| 10.000%, 01/01/2012 | BRL | 2,832,000 | | 1,694,546 |
| | |
|
| | | | | 2,552,084 |
| Qatar - 0.09% | | | | |
| Government of Qatar | | | | |
| 4.000%, 01/20/2015 (S) | $ | 380,000 | | 389,500 |
| South Africa - 0.16% | | | | |
| Eskom Holdings, Ltd. | | | | |
| 5.750%, 01/26/2021 (S) | | 720,000 | | 718,200 |
|
| TOTAL FOREIGN GOVERNMENT | | | | |
| OBLIGATIONS (Cost $3,459,799) | | | $ | 3,659,784 |
|
| |
| CORPORATE BONDS - 54.32% | | | | |
| Consumer Discretionary - 6.46% | | | | |
| Affinia Group, Inc. | | | | |
| 9.000%, 11/30/2014 | | 5,000 | | 5,100 |
| AMC Entertainment, Inc. | | | | |
| 8.750%, 06/01/2019 | | 10,000 | | 10,738 |
| ArvinMeritor, Inc. | | | | |
| 8.125%, 09/15/2015 | | 10,000 | | 10,725 |
| 10.625%, 03/15/2018 | | 5,000 | | 5,713 |
| British Sky Broadcasting Group PLC | | | | |
| 5.625%, 10/15/2015 (S) | | 131,000 | | 145,521 |
| Caesars Entertainment Operating | | | | |
| Company, Inc. | | | | |
| 11.250%, 06/01/2017 | | 5,000 | | 5,675 |
| Catalina Marketing Corp. PIK | | | | |
| 10.500%, 10/01/2015 (S) | | 10,000 | | 10,825 |
| |
| The accompanying notes are an integral part of the financial statements. | 151 |
John Hancock Funds II
Portfolio of Investments — February 28, 2011 (Unaudited) (showing percentage of total net assets)
| | | | |
| Investment Quality Bond Fund (continued) | | |
| | | Shares or | | |
| | | Principal | | |
| | | Amount | | Value |
| |
|
| |
| CORPORATE BONDS (continued) | | | | |
| Consumer Discretionary (continued) | | | | |
| CBS Corp. | | | | |
| 5.750%, 04/15/2020 | $ | 1,065,000 | $ | 1,131,659 |
| 8.200%, 05/15/2014 | | 335,000 | | 393,139 |
| CCO Holdings LLC/CCO | | | | |
| Holdings Capital Corp. | | | | |
| 7.875%, 04/30/2018 | | 5,000 | | 5,338 |
| 8.125%, 04/30/2020 | | 5,000 | | 5,394 |
| Clear Channel Worldwide Holdings, Inc., | | | | |
| Series B | | | | |
| 9.250%, 12/15/2017 | | 5,000 | | 5,563 |
| Comcast Corp. | | | | |
| 5.150%, 03/01/2020 | | 600,000 | | 625,519 |
| 5.700%, 05/15/2018 to 07/01/2019 | | 625,000 | | 681,554 |
| 5.850%, 11/15/2015 | | 600,000 | | 668,202 |
| 6.400%, 05/15/2038 | | 615,000 | | 640,028 |
| COX Communications, Inc. | | | | |
| 6.250%, 06/01/2018 (S) | | 500,000 | | 558,522 |
| CSC Holdings, Inc. | | | | |
| 7.625%, 07/15/2018 | | 341,000 | | 375,100 |
| D.R. Horton, Inc. | | | | |
| 7.875%, 08/15/2011 | | 250,000 | | 256,875 |
| Daimler Finance North America LLC | | | | |
| 7.300%, 01/15/2012 | | 1,131,000 | | 1,194,016 |
| 8.500%, 01/18/2031 | | 300,000 | | 403,050 |
| DirectTV Holdings LLC/DirectTV | | | | |
| Financing Company, Inc. | | | | |
| 4.750%, 10/01/2014 | | 220,000 | | 236,649 |
| DIRECTV Holdings LLC | | | | |
| 3.125%, 02/15/2016 | | 1,225,000 | | 1,207,943 |
| 6.000%, 08/15/2040 | | 700,000 | | 684,742 |
| Easton-Bell Sports, Inc. | | | | |
| 9.750%, 12/01/2016 | | 5,000 | | 5,625 |
| ERAC USA Finance LLC | | | | |
| 5.600%, 05/01/2015 (S) | | 500,000 | | 545,287 |
| Ford Motor Company | | | | |
| 7.450%, 07/16/2031 | | 70,000 | | 76,183 |
| Grupo Televisa SA | | | | |
| 6.625%, 01/15/2040 | | 715,000 | | 760,543 |
| HSN, Inc. | | | | |
| 11.250%, 08/01/2016 | | 5,000 | | 5,706 |
| Interpublic Group of Companies, Inc. | | | | |
| 10.000%, 07/15/2017 | | 145,000 | | 171,463 |
| Liberty Media Corp. | | | | |
| 8.250%, 02/01/2030 | | 102,000 | | 98,940 |
| Limited Brands, Inc. | | | | |
| 6.900%, 07/15/2017 | | 50,000 | | 53,625 |
| 7.000%, 05/01/2020 | | 80,000 | | 84,800 |
| Macy’s Retail Holdings, Inc. | | | | |
| 5.875%, 01/15/2013 | | 494,000 | | 526,110 |
| 5.900%, 12/01/2016 | | 395,000 | | 421,663 |
| 6.700%, 09/15/2028 | | 15,000 | | 14,513 |
| 6.900%, 04/01/2029 | | 156,000 | | 156,000 |
| 7.000%, 02/15/2028 | | 15,000 | | 14,963 |
| Mediacom Broadband LLC | | | | |
| 8.500%, 10/15/2015 | | 27,000 | | 28,080 |
| NetFlix, Inc. | | | | |
| 8.500%, 11/15/2017 | | 30,000 | | 33,975 |
| News America Holdings, Inc. | | | | |
| 7.750%, 01/20/2024 | | 453,000 | | 527,623 |
| News America, Inc. | | | | |
| 4.500%, 02/15/2021 (S) | | 505,000 | | 501,514 |
| 6.150%, 02/15/2041 (S) | | 315,000 | | 320,184 |
| 6.900%, 03/01/2019 to 08/15/2039 | | 1,000,000 | | 1,153,108 |
| Peninsula Gaming LLC | | | | |
| 8.375%, 08/15/2015 | | 5,000 | | 5,363 |
| | | | |
| Investment Quality Bond Fund (continued) | | |
| | | Shares or | | |
| | | Principal | | |
| | | Amount | | Value |
| |
|
| |
| CORPORATE BONDS (continued) | | | | |
| Consumer Discretionary (continued) | | | | |
| Phillips-Van Heusen Corp. | | | | |
| 7.375%, 05/15/2020 | $ | 10,000 | $ | 10,650 |
| Quebecor Media, Inc. | | | | |
| 7.750%, 03/15/2016 | | 20,000 | | 20,800 |
| QVC, Inc. | | | | |
| 7.500%, 10/01/2019 (S) | | 80,000 | | 85,400 |
| Revlon Consumer Products Corp. | | | | |
| 9.750%, 11/15/2015 | | 5,000 | | 5,425 |
| Royal Caribbean Cruises, Ltd. | | | | |
| 11.875%, 07/15/2015 | | 5,000 | | 6,200 |
| Service Corp. International | | | | |
| 7.625%, 10/01/2018 | | 10,000 | | 10,875 |
| Staples, Inc. | | | | |
| 9.750%, 01/15/2014 | | 820,000 | | 990,519 |
| Target Corp. | | | | |
| 7.000%, 01/15/2038 | | 600,000 | | 727,543 |
| TCI Communications, Inc. | | | | |
| 7.875%, 02/15/2026 | | 150,000 | | 182,184 |
| 8.750%, 08/01/2015 | | 183,000 | | 223,267 |
| Tenneco, Inc. | | | | |
| 8.125%, 11/15/2015 | | 80,000 | | 85,600 |
| The Neiman Marcus Group, Inc., PIK | | | | |
| 9.000%, 10/15/2015 | | 10,000 | | 10,475 |
| Thomson Reuters Corp. | | | | |
| 4.700%, 10/15/2019 | | 575,000 | | 604,155 |
| Time Warner Cable, Inc. | | | | |
| 5.000%, 02/01/2020 | | 1,180,000 | | 1,197,069 |
| 5.850%, 05/01/2017 | | 815,000 | | 897,358 |
| 6.550%, 05/01/2037 | | 550,000 | | 570,990 |
| 6.750%, 06/15/2039 | | 270,000 | | 287,365 |
| 8.250%, 02/14/2014 | | 440,000 | | 514,675 |
| Time Warner Companies, Inc. | | | | |
| 7.250%, 10/15/2017 | | 60,000 | | 70,310 |
| Time Warner, Inc. | | | | |
| 4.875%, 03/15/2020 | | 1,400,000 | | 1,436,712 |
| 7.625%, 04/15/2031 | | 500,000 | | 590,806 |
| 7.700%, 05/01/2032 | | 602,000 | | 717,892 |
| TRW Automotive, Inc. | | | | |
| 7.250%, 03/15/2017 (S) | | 100,000 | | 110,500 |
| Viacom, Inc. | | | | |
| 4.500%, 03/01/2021 | | 515,000 | | 508,151 |
| 6.125%, 10/05/2017 | | 600,000 | | 678,636 |
| 6.250%, 04/30/2016 | | 902,000 | | 1,034,912 |
| Videotron Ltee | | | | |
| 9.125%, 04/15/2018 | | 120,000 | | 134,700 |
| Volkswagen International Finance NV | | | | |
| 4.000%, 08/12/2020 (S) | | 1,650,000 | | 1,622,188 |
| Wynn Las Vegas LLC/Wynn Las Vegas | | | | |
| Capital Corp. | | | | |
| 7.750%, 08/15/2020 | | 35,000 | | 37,013 |
| | |
|
| | | | | 28,145,228 |
| Consumer Staples - 5.98% | | | | |
| Altria Group, Inc. | | | | |
| 4.125%, 09/11/2015 | | 1,450,000 | | 1,507,274 |
| 9.250%, 08/06/2019 | | 125,000 | | 162,258 |
| 9.700%, 11/10/2018 | | 395,000 | | 520,007 |
| 10.200%, 02/06/2039 | | 200,000 | | 282,876 |
| Anheuser-Busch InBev Worldwide, Inc. | | | | |
| 5.375%, 01/15/2020 | | 485,000 | | 525,305 |
| 6.875%, 11/15/2019 (S) | | 965,000 | | 1,146,773 |
| 7.750%, 01/15/2019 (S) | | 700,000 | | 867,349 |
| BAT International Finance PLC | | | | |
| 9.500%, 11/15/2018 (S) | | 200,000 | | 264,323 |
| |
| The accompanying notes are an integral part of the financial statements. | 152 |
John Hancock Funds II
Portfolio of Investments — February 28, 2011 (Unaudited) (showing percentage of total net assets)
| | | | |
| Investment Quality Bond Fund (continued) | | |
| | | Shares or | | |
| | | Principal | | |
| | | Amount | | Value |
| |
|
| |
| CORPORATE BONDS (continued) | | | | |
| Consumer Staples (continued) | | | | |
| Cargill, Inc. | | | | |
| 4.375%, 06/01/2013 (S) | $ | 500,000 | $ | 530,270 |
| 5.600%, 09/15/2012 (S) | | 635,000 | | 677,760 |
| Companhia de Bebidas das Americas | | | | |
| 8.750%, 09/15/2013 | | 930,000 | | 1,067,175 |
| ConAgra Foods, Inc. | | | | |
| 5.819%, 06/15/2017 | | 74,000 | | 79,902 |
| 6.750%, 09/15/2011 | | 5,000 | | 5,160 |
| Constellation Brands, Inc. | | | | |
| 7.250%, 09/01/2016 to 05/15/2017 | | 95,000 | | 102,125 |
| CVS Caremark Corp. | | | | |
| 4.750%, 05/18/2020 | | 1,650,000 | | 1,690,722 |
| 6.250%, 06/01/2027 | | 325,000 | | 355,707 |
| CVS Pass-Through Trust | | | | |
| 5.880%, 01/10/2028 | | 317,188 | | 328,965 |
| 6.943%, 01/10/2030 | | 46,698 | | 51,716 |
| General Mills, Inc. | | | | |
| 5.200%, 03/17/2015 | | 190,000 | | 208,593 |
| 5.250%, 08/15/2013 | | 440,000 | | 480,656 |
| 5.650%, 02/15/2019 | | 105,000 | | 116,615 |
| International CCE, Inc. | | | | |
| 2.125%, 09/15/2015 | | 1,300,000 | | 1,259,638 |
| Kellogg Company | | | | |
| 4.000%, 12/15/2020 | | 1,350,000 | | 1,326,322 |
| 4.450%, 05/30/2016 | | 400,000 | | 430,782 |
| Kraft Foods, Inc. | | | | |
| 4.125%, 02/09/2016 | | 605,000 | | 630,903 |
| 6.125%, 02/01/2018 | | 850,000 | | 955,124 |
| 6.500%, 11/01/2031 | | 766,000 | | 841,744 |
| 6.875%, 02/01/2038 | | 250,000 | | 280,461 |
| Lorillard Tobacco Company | | | | |
| 6.875%, 05/01/2020 | | 135,000 | | 139,850 |
| PepsiCo, Inc. | | | | |
| 7.900%, 11/01/2018 | | 650,000 | | 824,023 |
| Philip Morris International, Inc. | | | | |
| 5.650%, 05/16/2018 | | 1,450,000 | | 1,629,775 |
| Procter & Gamble | | | | |
| 9.360%, 01/01/2021 | | 242,313 | | 308,792 |
| Reynolds American, Inc. | | | | |
| 7.250%, 06/01/2013 | | 150,000 | | 166,750 |
| Rite Aid Corp. | | | | |
| 10.375%, 07/15/2016 | | 15,000 | | 16,125 |
| Smithfield Foods, Inc. | | | | |
| 10.000%, 07/15/2014 | | 95,000 | | 112,100 |
| Smithfield Foods, Inc., Series B | | | | |
| 7.750%, 05/15/2013 | | 6,000 | | 6,525 |
| The Kroger Company | | | | |
| 4.950%, 01/15/2015 | | 700,000 | | 756,185 |
| 6.150%, 01/15/2020 | | 150,000 | | 169,091 |
| 6.750%, 04/15/2012 | | 1,219,000 | | 1,293,197 |
| Tyson Foods, Inc. | | | | |
| 10.500%, 03/01/2014 | | 5,000 | | 6,038 |
| Wal-Mart Stores, Inc. | | | | |
| 4.875%, 07/08/2040 | | 2,600,000 | | 2,414,381 |
| 6.200%, 04/15/2038 | | 750,000 | | 834,859 |
| WM Wrigley Jr. Company | | | | |
| 3.700%, 06/30/2014 (S) | | 625,000 | | 641,109 |
| | |
|
| | | | | 26,015,305 |
| Energy - 4.42% | | | | |
| Anadarko Petroleum Corp. | | | | |
| 6.375%, 09/15/2017 | | 70,000 | | 78,022 |
| 6.450%, 09/15/2036 | | 1,220,000 | | 1,229,118 |
| Antero Resources Finance Corp. | | | | |
| 9.375%, 12/01/2017 | | 5,000 | | 5,400 |
| | | | |
| Investment Quality Bond Fund (continued) | | |
| | | Shares or | | |
| | | Principal | | |
| | | Amount | | Value |
| |
|
| |
| CORPORATE BONDS (continued) | | | | |
| Energy (continued) | | | | |
| Aquilex Holdings LLC/Aquilex | | | | |
| Finance Corp. | | | | |
| 11.125%, 12/15/2016 | $ | 5,000 | $ | 5,263 |
| BP Capital Markets PLC | | | | |
| 3.125%, 10/01/2015 | | 1,550,000 | | 1,572,731 |
| 4.750%, 03/10/2019 | | 60,000 | | 62,431 |
| Burlington Resources Finance Company | | | | |
| 7.400%, 12/01/2031 | | 309,000 | | 366,493 |
| Canadian Natural Resources, Ltd. | | | | |
| 5.150%, 02/01/2013 | | 150,000 | | 160,193 |
| Chesapeake Energy Corp. | | | | |
| 6.500%, 08/15/2017 | | 70,000 | | 75,075 |
| 6.875%, 11/15/2020 | | 40,000 | | 42,600 |
| 7.625%, 07/15/2013 | | 10,000 | | 11,150 |
| ConocoPhillips | | | | |
| 4.600%, 01/15/2015 | | 330,000 | | 359,236 |
| 6.500%, 02/01/2039 | | 1,050,000 | | 1,218,851 |
| Consol Energy, Inc. | | | | |
| 8.000%, 04/01/2017 (S) | | 15,000 | | 16,275 |
| 8.250%, 04/01/2020 (S) | | 15,000 | | 16,538 |
| El Paso Corp. | | | | |
| 7.000%, 06/15/2017 | | 325,000 | | 363,021 |
| El Paso Natural Gas Company | | | | |
| 5.950%, 04/15/2017 | | 25,000 | | 27,241 |
| EnCana Corp. | | | | |
| 5.900%, 12/01/2017 | | 450,000 | | 511,662 |
| Energy Transfer Equity LP | | | | |
| 7.500%, 10/15/2020 | | 55,000 | | 59,606 |
| Enterprise Products Operating LLC | | | | |
| 5.250%, 01/31/2020 | | 1,565,000 | | 1,613,202 |
| Harvest Operations Corp. | | | | |
| 6.875%, 10/01/2017 (S) | | 50,000 | | 52,000 |
| Kinder Morgan Energy Partners LP | | | | |
| 5.800%, 03/01/2021 | | 490,000 | | 523,322 |
| 6.375%, 03/01/2041 | | 275,000 | | 276,656 |
| 6.500%, 09/01/2039 | | 300,000 | | 306,691 |
| 6.850%, 02/15/2020 | | 530,000 | | 606,621 |
| 7.125%, 03/15/2012 | | 208,000 | | 220,201 |
| Kinder Morgan Finance Company ULC | | | | |
| 6.000%, 01/15/2018 (S) | | 55,000 | | 56,238 |
| Marathon Petroleum Corp. | | | | |
| 5.125%, 03/01/2021 (S) | | 320,000 | | 324,338 |
| Motiva Enterprises LLC | | | | |
| 5.200%, 09/15/2012 (S) | | 148,000 | | 155,907 |
| Newfield Exploration Company | | | | |
| 6.625%, 04/15/2016 | | 10,000 | | 10,325 |
| 7.125%, 05/15/2018 | | 30,000 | | 32,025 |
| Nexen, Inc. | | | | |
| 7.500%, 07/30/2039 | | 40,000 | | 42,858 |
| NGPL PipeCo LLC | | | | |
| 6.514%, 12/15/2012 (S) | | 675,000 | | 727,622 |
| Old Dominion Electric Cooperative | | | | |
| 6.250%, 06/01/2011 | | 141,000 | | 142,898 |
| Peabody Energy Corp. | | | | |
| 6.500%, 09/15/2020 | | 186,000 | | 199,020 |
| 7.375%, 11/01/2016 | | 65,000 | | 73,450 |
| Petrobras International Finance Company | | | | |
| 5.375%, 01/27/2021 | | 1,600,000 | | 1,605,637 |
| Pioneer Natural Resources Company | | | | |
| 5.875%, 07/15/2016 | | 135,000 | | 140,923 |
| 6.875%, 05/01/2018 | | 15,000 | | 16,282 |
| Plains All American Pipeline LP | | | | |
| 5.000%, 02/01/2021 | | 370,000 | | 370,827 |
| 5.750%, 01/15/2020 | | 220,000 | | 236,084 |
| |
| The accompanying notes are an integral part of the financial statements. | 153 |
John Hancock Funds II
Portfolio of Investments — February 28, 2011 (Unaudited) (showing percentage of total net assets)
| | | | |
| Investment Quality Bond Fund (continued) | | |
| | | Shares or | | |
| | | Principal | | |
| | | Amount | | Value |
| |
|
| |
| CORPORATE BONDS (continued) | | | | |
| Energy (continued) | | | | |
| Pride International, Inc. | | | | |
| 6.875%, 08/15/2020 | $ | 10,000 | $ | 11,150 |
| Range Resources Corp. | | | | |
| 7.500%, 05/15/2016 to 10/01/2017 | | 35,000 | | 37,013 |
| San Diego Gas & Electric Company | | | | |
| 4.500%, 08/15/2040 | | 811,000 | | 725,767 |
| Statoil ASA | | | | |
| 3.125%, 08/17/2017 | | 750,000 | | 745,739 |
| TransCanada Pipelines, Ltd. | | | | |
| 7.625%, 01/15/2039 | | 310,000 | | 385,115 |
| Transocean, Inc. | | | | |
| 4.950%, 11/15/2015 | | 1,000,000 | | 1,058,153 |
| Valero Energy Corp. | | | | |
| 4.500%, 02/01/2015 | | 70,000 | | 74,008 |
| 6.625%, 06/15/2037 | | 600,000 | | 613,133 |
| 8.750%, 06/15/2030 | | 162,000 | | 189,245 |
| Williams Partners LP | | | | |
| 5.250%, 03/15/2020 | | 1,450,000 | | 1,509,427 |
| | |
|
| | | | | 19,262,783 |
| Financials - 22.21% | | | | |
| ACE INA Holdings, Inc. | | | | |
| 2.600%, 11/23/2015 | | 685,000 | | 674,963 |
| 5.700%, 02/15/2017 | | 100,000 | | 109,607 |
| 5.875%, 06/15/2014 | | 125,000 | | 138,185 |
| AIG Retirement Services, Inc. | | | | |
| 8.125%, 04/28/2023 | | 135,000 | | 146,874 |
| AIG SunAmerica Global Financing X | | | | |
| 6.900%, 03/15/2032 (S) | | 100,000 | | 112,478 |
| Allied World Assurance Holdings, Ltd. | | | | |
| 7.500%, 08/01/2016 | | 245,000 | | 274,649 |
| AMB Property LP | | | | |
| 4.500%, 08/15/2017 | | 920,000 | | 936,562 |
| 6.125%, 12/01/2016 | | 85,000 | | 94,119 |
| 7.500%, 06/30/2018 | | 106,000 | | 120,908 |
| American Express Centurion Bank | | | | |
| 6.000%, 09/13/2017 | | 875,000 | | 974,322 |
| American Express Company | | | | |
| 7.000%, 03/19/2018 | | 550,000 | | 645,829 |
| American Express Credit Corp. | | | | |
| 5.125%, 08/25/2014 | | 360,000 | | 389,097 |
| American Express Credit Corp., Series C | | | | |
| 7.300%, 08/20/2013 | | 500,000 | | 563,061 |
| American General Finance Corp. | | | | |
| 5.375%, 10/01/2012 | | 154,000 | | 151,498 |
| American International Group, Inc. | | | | |
| 6.250%, 03/15/2037 | | 125,000 | | 114,375 |
| 6.400%, 12/15/2020 | | 200,000 | | 216,797 |
| Ameriprise Financial, Inc. | | | | |
| 5.300%, 03/15/2020 | | 145,000 | | 154,175 |
| AvalonBay Communities, Inc. | | | | |
| 3.950%, 01/15/2021 | | 1,075,000 | | 1,035,391 |
| 5.500%, 01/15/2012 | | 79,000 | | 81,930 |
| AXA Equitable Life Insurance | | | | |
| 7.700%, 12/01/2015 (S) | | 250,000 | | 273,940 |
| AXA Financial, Inc. | | | | |
| 7.000%, 04/01/2028 | | 235,000 | | 247,632 |
| Bank of America Corp. | | | | |
| 5.420%, 03/15/2017 | | 800,000 | | 819,623 |
| 5.625%, 07/01/2020 | | 1,460,000 | | 1,517,601 |
| 5.650%, 05/01/2018 | | 125,000 | | 132,089 |
| 5.750%, 12/01/2017 | | 500,000 | | 534,551 |
| Bank of Tokyo-Mitsubishi UFJ, Ltd. | | | | |
| 7.400%, 06/15/2011 | | 300,000 | | 305,603 |
| | | | |
| Investment Quality Bond Fund (continued) | | |
| | | Shares or | | |
| | | Principal | | |
| | | Amount | | Value |
| |
|
| |
| CORPORATE BONDS (continued) | | | | |
| Financials (continued) | | | | |
| Barclays Bank PLC | | | | |
| 5.140%, 10/14/2020 | $ | 1,110,000 | $ | 1,053,537 |
| 6.050%, 12/04/2017 (S) | | 950,000 | | 983,460 |
| Brandywine Operating Partnership LP | | | | |
| 5.700%, 05/01/2017 | | 835,000 | | 870,318 |
| Buffalo Thunder Development Authority | | | | |
| 9.375%, 12/15/2014 (H)(S) | | 20,000 | | 6,800 |
| Capital One Financial Corp. | | | | |
| 6.150%, 09/01/2016 | | 200,000 | | 215,928 |
| 6.750%, 09/15/2017 | | 675,000 | | 779,096 |
| 7.375%, 05/23/2014 | | 115,000 | | 132,531 |
| CIT Group, Inc. | | | | |
| 7.000%, 05/01/2013 to 05/01/2017 | | 80,389 | | 81,409 |
| Citigroup, Inc. | | | | |
| 4.587%, 12/15/2015 | | 255,000 | | 266,088 |
| 4.875%, 05/07/2015 | | 286,000 | | 296,678 |
| 5.375%, 08/09/2020 | | 2,035,000 | | 2,108,091 |
| 5.500%, 08/27/2012 | | 900,000 | | 952,322 |
| 6.125%, 11/21/2017 | | 975,000 | | 1,075,597 |
| 6.500%, 08/19/2013 | | 420,000 | | 462,895 |
| 6.875%, 03/05/2038 | | 275,000 | | 303,041 |
| Credit Acceptance Corp. | | | | |
| 9.125%, 02/01/2017 | | 5,000 | | 5,388 |
| Credit Agricole SA/London | | | | |
| 3.500%, 04/13/2015 (S) | | 615,000 | | 616,552 |
| Credit Suisse AG | | | | |
| 5.400%, 01/14/2020 | | 1,750,000 | | 1,771,842 |
| Credit Suisse New York | | | | |
| 6.000%, 02/15/2018 | | 500,000 | | 533,886 |
| Discover Financial Services | | | | |
| 6.450%, 06/12/2017 | | 950,000 | | 1,029,996 |
| Dupont Fabros Technology LP | | | | |
| 8.500%, 12/15/2017 | | 75,000 | | 82,688 |
| Equity One, Inc. | | | | |
| 6.000%, 09/15/2017 | | 235,000 | | 241,378 |
| ERAC USA Finance LLC | | | | |
| 5.250%, 10/01/2020 (S) | | 1,130,000 | | 1,165,093 |
| ERP Operating LP | | | | |
| 5.250%, 09/15/2014 | | 975,000 | | 1,068,206 |
| Everest Reinsurance Holdings, Inc., | | | | |
| (6.600% to 05/15/2017, then 3 month | | | | |
| LIBOR + 2.385%) | | | | |
| 05/15/2037 | | 495,000 | | 478,913 |
| Farmers Exchange Capital | | | | |
| 7.050%, 07/15/2028 (S) | | 350,000 | | 349,837 |
| Federal Realty Investment Trust | | | | |
| 5.650%, 06/01/2016 | | 55,000 | | 60,039 |
| Fifth Third Bancorp | | | | |
| 3.625%, 01/25/2016 | | 720,000 | | 722,991 |
| Ford Motor Credit Company LLC | | | | |
| 7.000%, 10/01/2013 | | 21,000 | | 22,805 |
| 8.000%, 12/15/2016 | | 150,000 | | 169,916 |
| 8.125%, 01/15/2020 | | 100,000 | | 114,067 |
| General Electric Capital Corp. | | | | |
| 2.800%, 01/08/2013 | | 1,075,000 | | 1,102,673 |
| 4.625%, 01/07/2021 | | 1,305,000 | | 1,296,839 |
| 5.300%, 02/11/2021 | | 860,000 | | 882,819 |
| 5.500%, 01/08/2020 | | 900,000 | | 959,962 |
| 5.625%, 09/15/2017 | | 1,000,000 | | 1,095,155 |
| 5.875%, 01/14/2038 | | 1,300,000 | | 1,304,267 |
| 6.750%, 03/15/2032 | | 934,000 | | 1,040,995 |
| Harley-Davidson Funding Corp. | | | | |
| 5.750%, 12/15/2014 (S) | | 205,000 | | 218,103 |
| Hartford Financial Services Group, Inc. | | | | |
| 5.500%, 03/30/2020 | | 270,000 | | 277,293 |
| |
| The accompanying notes are an integral part of the financial statements. | 154 |
John Hancock Funds II
Portfolio of Investments — February 28, 2011 (Unaudited) (showing percentage of total net assets)
| | | | |
| Investment Quality Bond Fund (continued) | | |
| | | Shares or | | |
| | | Principal | | |
| | | Amount | | Value |
| |
|
| |
| CORPORATE BONDS (continued) | | | | |
| Financials (continued) | | | | |
| Hartford Financial Services Group, Inc., | | | | |
| (8.125% to 06/15/2018, then 3 month | | | | |
| LIBOR + 4.6025%) | | | | |
| 06/15/2038 | $ | 130,000 | $ | 143,650 |
| HBOS PLC | | | | |
| 6.000%, 11/01/2033 (S) | | 180,000 | | 133,050 |
| HCP, Inc. | | | | |
| 3.750%, 02/01/2016 | | 220,000 | | 222,087 |
| 5.650%, 12/15/2013 | | 200,000 | | 218,495 |
| 5.950%, 09/15/2011 | | 150,000 | | 153,953 |
| 6.000%, 01/30/2017 | | 480,000 | | 521,645 |
| Health Care Property, Inc. | | | | |
| 6.000%, 03/01/2015 | | 175,000 | | 191,860 |
| 7.072%, 06/08/2015 | | 67,000 | | 74,206 |
| Healthcare Realty Trust, Inc. | | | | |
| 8.125%, 05/01/2011 | | 377,000 | | 381,345 |
| Host Hotels & Resorts LP | | | | |
| 6.375%, 03/15/2015 | | 80,000 | | 81,800 |
| 6.750%, 06/01/2016 | | 155,000 | | 160,813 |
| HSBC Bank PLC | | | | |
| 4.750%, 01/19/2021 (S) | | 700,000 | | 700,260 |
| HSBC Bank USA NA | | | | |
| 7.000%, 01/15/2039 | | 250,000 | | 283,990 |
| HSBC Holdings PLC | | | | |
| 0.503%, 10/06/2016 | | 600,000 | | 591,478 |
| 6.800%, 06/01/2038 | | 605,000 | | 645,723 |
| HSBC USA, Inc. | | | | |
| 9.500%, 04/15/2014 | | 135,000 | | 155,441 |
| International Lease Finance Corp. | | | | |
| 5.650%, 06/01/2014 | | 140,000 | | 143,325 |
| 5.875%, 05/01/2013 | | 250,000 | | 257,813 |
| 6.375%, 03/25/2013 | | 145,000 | | 151,163 |
| 6.500%, 09/01/2014 (S) | | 5,000 | | 5,393 |
| 6.750%, 09/01/2016 (S) | | 10,000 | | 10,825 |
| 7.125%, 09/01/2018 (S) | | 140,000 | | 152,775 |
| 8.625%, 09/15/2015 (S) | | 10,000 | | 11,275 |
| Jackson National Life Insurance Company | | | | |
| 8.150%, 03/15/2027 (S) | | 377,000 | | 418,329 |
| JPMorgan Chase & Company | | | | |
| 3.700%, 01/20/2015 | | 575,000 | | 595,104 |
| 4.250%, 10/15/2020 | | 1,750,000 | | 1,686,109 |
| 4.400%, 07/22/2020 | | 1,100,000 | | 1,073,183 |
| 5.150%, 10/01/2015 | | 200,000 | | 215,544 |
| 6.000%, 01/15/2018 | | 1,655,000 | | 1,840,804 |
| Kimco Realty Corp. | | | | |
| 4.300%, 02/01/2018 | | 600,000 | | 605,298 |
| 5.584%, 11/23/2015 | | 425,000 | | 460,374 |
| 6.875%, 10/01/2019 | | 300,000 | | 349,912 |
| Lazard Group LLC | | | | |
| 6.850%, 06/15/2017 | | 650,000 | | 692,361 |
| LBG Capital No.1 PLC | | | | |
| 7.875%, 11/01/2020 | | 200,000 | | 193,000 |
| Liberty Mutual Group, Inc. | | | | |
| 5.750%, 03/15/2014 (S) | | 50,000 | | 53,142 |
| Liberty Mutual Insurance Company | | | | |
| 7.697%, 10/15/2097 (S) | | 925,000 | | 836,562 |
| Liberty Property LP | | | | |
| 6.625%, 10/01/2017 | | 100,000 | | 114,772 |
| 7.250%, 03/15/2011 | | 195,000 | | 195,392 |
| Lincoln National Corp. | | | | |
| 4.300%, 06/15/2015 | | 825,000 | | 860,611 |
| Lloyds TSB Bank PLC | | | | |
| 4.375%, 01/12/2015 (S) | | 520,000 | | 524,237 |
| | | | |
| Investment Quality Bond Fund (continued) | | |
| | | Shares or | | |
| | | Principal | | |
| | | Amount | | Value |
| |
|
| |
| CORPORATE BONDS (continued) | | | | |
| Financials (continued) | | | | |
| Massachusetts Mutual Life Insurance | | | | |
| Company | | | | |
| 8.875%, 06/01/2039 (S) | $ | 630,000 | $ | 847,969 |
| MassMutual Global Funding II | | | | |
| 2.875%, 04/21/2014 (S) | | 118,000 | | 122,248 |
| Merrill Lynch & Company, Inc. | | | | |
| 5.700%, 05/02/2017 | | 200,000 | | 208,081 |
| 6.220%, 09/15/2026 | | 425,000 | | 426,630 |
| 6.400%, 08/28/2017 | | 1,990,000 | | 2,186,628 |
| 6.875%, 04/25/2018 | | 1,825,000 | | 2,052,955 |
| 7.750%, 05/14/2038 | | 135,000 | | 152,945 |
| MetLife, Inc. | | | | |
| 5.375%, 12/15/2012 | | 650,000 | | 696,643 |
| Metropolitan Life Global Funding I | | | | |
| 3.125%, 01/11/2016 (S) | | 1,825,000 | | 1,813,207 |
| 5.125%, 04/10/2013 (S) | | 335,000 | | 358,708 |
| Midamerican Funding LLC | | | | |
| 6.750%, 03/01/2011 | | 260,000 | | 260,000 |
| Mizuho Financial Group Cayman, Ltd. | | | | |
| 5.790%, 04/15/2014 (S) | | 246,000 | | 268,256 |
| Morgan Stanley | | | | |
| 4.200%, 11/20/2014 | | 215,000 | | 223,257 |
| 5.500%, 07/24/2020 | | 1,150,000 | | 1,161,169 |
| 5.550%, 04/27/2017 | | 225,000 | | 237,975 |
| 5.750%, 01/25/2021 | | 565,000 | | 580,329 |
| 6.000%, 04/28/2015 | | 350,000 | | 383,327 |
| 6.250%, 08/28/2017 | | 850,000 | | 928,419 |
| 6.625%, 04/01/2018 | | 1,975,000 | | 2,183,135 |
| 6.750%, 04/15/2011 | | 106,000 | | 106,751 |
| Nationwide Mutual Insurance Company | | | | |
| 8.250%, 12/01/2031 (S) | | 260,000 | | 280,306 |
| Navigators Group, Inc. | | | | |
| 7.000%, 05/01/2016 | | 59,000 | | 61,757 |
| NBD Bancorp | | | | |
| 8.250%, 11/01/2024 | | 270,000 | | 321,356 |
| Nomura Holdings, Inc. | | | | |
| 5.000%, 03/04/2015 | | 350,000 | | 365,684 |
| Ohio National Life Insurance Company | | | | |
| 8.500%, 05/15/2026 (S) | | 155,000 | | 156,271 |
| PacifiCorp | | | | |
| 6.350%, 07/15/2038 | | 110,000 | | 123,969 |
| Petroleum Export, Ltd. | | | | |
| 5.265%, 06/15/2011 (S) | | 20,656 | | 20,628 |
| PNC Funding Corp. | | | | |
| 5.625%, 02/01/2017 | | 1,200,000 | | 1,292,564 |
| Principal Life Global Funding I | | | | |
| 5.125%, 10/15/2013 (S) | | 225,000 | | 240,707 |
| 6.125%, 10/15/2033 (S) | | 108,000 | | 108,452 |
| Provident Funding Associates LP/PFG | | | | |
| Finance Corp. | | | | |
| 10.250%, 04/15/2017 (S) | | 40,000 | | 44,200 |
| Prudential Financial, Inc. | | | | |
| 4.750%, 09/17/2015 | | 1,425,000 | | 1,526,129 |
| 5.150%, 01/15/2013 | | 355,000 | | 376,957 |
| Realty Income Corp. | | | | |
| 5.750%, 01/15/2021 | | 600,000 | | 633,190 |
| 6.750%, 08/15/2019 | | 550,000 | | 632,834 |
| Reinsurance Group of America, Inc. | | | | |
| 6.750%, 12/15/2011 | | 135,000 | | 140,406 |
| Royal Bank of Scotland PLC | | | | |
| 3.950%, 09/21/2015 | | 340,000 | | 338,971 |
| Simon Property Group LP | | | | |
| 4.375%, 03/01/2021 | | 1,200,000 | | 1,187,078 |
| 6.100%, 05/01/2016 | | 150,000 | | 170,459 |
| 6.125%, 05/30/2018 | | 375,000 | | 421,951 |
| |
| The accompanying notes are an integral part of the financial statements. | 155 |
John Hancock Funds II
Portfolio of Investments — February 28, 2011 (Unaudited) (showing percentage of total net assets)
| | | | |
| Investment Quality Bond Fund (continued) | | |
| | | Shares or | | |
| | | Principal | | |
| | | Amount | | Value |
| |
|
| |
| CORPORATE BONDS (continued) | | | | |
| Financials (continued) | | | | |
| SLM Corp. | | | | |
| 6.250%, 01/25/2016 | $ | 1,320,000 | $ | 1,353,000 |
| 8.000%, 03/25/2020 | | 11,000 | | 11,674 |
| 8.450%, 06/15/2018 | | 44,000 | | 48,400 |
| Sovereign Bank | | | | |
| 8.750%, 05/30/2018 | | 250,000 | | 283,305 |
| Standard Chartered PLC | | | | |
| 3.850%, 04/27/2015 (S) | | 185,000 | | 190,482 |
| Sun Canada Financial Company | | | | |
| 7.250%, 12/15/2015 (S) | | 229,000 | | 259,752 |
| The Bank of New York Mellon Corp. | | | | |
| 2.500%, 01/15/2016 | | 2,170,000 | | 2,156,956 |
| The Bear Stearns Companies LLC | | | | |
| 6.400%, 10/02/2017 | | 605,000 | | 687,630 |
| The Charles Schwab Corp. | | | | |
| 4.950%, 06/01/2014 | | 230,000 | | 250,847 |
| The Goldman Sachs Group, Inc. | | | | |
| 3.625%, 02/07/2016 | | 475,000 | | 474,334 |
| 5.375%, 03/15/2020 | | 290,000 | | 297,739 |
| 6.000%, 05/01/2014 | | 270,000 | | 298,980 |
| 6.150%, 04/01/2018 | | 2,350,000 | | 2,574,373 |
| 6.250%, 02/01/2041 | | 610,000 | | 620,773 |
| 6.750%, 10/01/2037 | | 1,405,000 | | 1,440,063 |
| 7.500%, 02/15/2019 | | 635,000 | | 748,034 |
| The Royal Bank of Scotland PLC | | | | |
| 4.875%, 08/25/2014 (S) | | 550,000 | | 571,195 |
| United Dominion Realty Trust, Inc. | | | | |
| 6.050%, 06/01/2013 | | 200,000 | | 212,182 |
| Unitrin, Inc. | | | | |
| 6.000%, 05/15/2017 | | 350,000 | | 359,367 |
| UnumProvident Finance Company PLC | | | | |
| 6.850%, 11/15/2015 (S) | | 125,000 | | 139,646 |
| US Bancorp | | | | |
| 7.500%, 06/01/2026 | | 750,000 | | 830,154 |
| Virgin Media Secured Finance PLC | | | | |
| 6.500%, 01/15/2018 | | 140,000 | | 153,300 |
| W.R. Berkley Corp. | | | | |
| 5.600%, 05/15/2015 | | 313,000 | | 330,807 |
| Wachovia Bank NA | | | | |
| 6.600%, 01/15/2038 | | 700,000 | | 790,492 |
| Wachovia Corp. | | | | |
| 5.500%, 08/01/2035 | | 600,000 | | 587,020 |
| 5.750%, 06/15/2017 | | 385,000 | | 429,332 |
| WCI Finance LLC/WEA Finance LLC | | | | |
| 5.400%, 10/01/2012 (S) | | 250,000 | | 263,862 |
| WEA Finance LLC/WT Finance | | | | |
| Australia Pty, Ltd. | | | | |
| 7.500%, 06/02/2014 (S) | | 130,000 | | 148,553 |
| Wells Fargo & Company | | | | |
| 3.676%, 06/15/2016 | | 400,000 | | 408,691 |
| 4.950%, 10/16/2013 | | 1,820,000 | | 1,956,515 |
| 5.625%, 12/11/2017 | | 900,000 | | 997,483 |
| Wells Fargo & Company, Series K | | | | |
| (7.980% to 03/15/2018, then 3 month | | | | |
| LIBOR + 3.770%) | | | | |
| (Q) | | 20,000 | | 21,400 |
| Weyerhaeuser Company | | | | |
| 7.375%, 10/01/2019 | | 35,000 | | 39,321 |
| 7.950%, 03/15/2025 | | 40,000 | | 44,767 |
| | |
|
| | | | | 96,695,382 |
| Health Care - 2.70% | | | | |
| Alere, Inc. | | | | |
| 9.000%, 05/15/2016 | | 10,000 | | 10,675 |
| | | | |
| Investment Quality Bond Fund (continued) | | |
| | | Shares or | | |
| | | Principal | | |
| | | Amount | | Value |
| |
|
| |
| CORPORATE BONDS (continued) | | | | |
| Health Care (continued) | | | | |
| AmerisourceBergen Corp. | | | | |
| 5.875%, 09/15/2015 | $ | 1,070,000 | $ | 1,189,401 |
| Amgen, Inc. | | | | |
| 3.450%, 10/01/2020 | | 1,225,000 | | 1,154,052 |
| 6.400%, 02/01/2039 | | 245,000 | | 277,402 |
| Biomet, Inc. | | | | |
| 10.000%, 10/15/2017 | | 5,000 | | 5,569 |
| BioScrip, Inc. | | | | |
| 10.250%, 10/01/2015 | | 5,000 | | 5,275 |
| Cardinal Health, Inc. | | | | |
| 5.800%, 10/15/2016 | | 500,000 | | 555,922 |
| Community Health Systems, Inc. | | | | |
| 8.875%, 07/15/2015 | | 10,000 | | 10,600 |
| Express Scripts, Inc. | | | | |
| 6.250%, 06/15/2014 | | 235,000 | | 262,340 |
| 7.500%, 02/15/2019 | | 30,000 | | 36,112 |
| Fresenius US Finance II, Inc. | | | | |
| 9.000%, 07/15/2015 (S) | | 75,000 | | 85,969 |
| HCA, Inc. | | | | |
| 6.375%, 01/15/2015 | | 5,000 | | 5,163 |
| 7.250%, 09/15/2020 | | 110,000 | | 118,663 |
| 8.500%, 04/15/2019 | | 215,000 | | 240,800 |
| HCA, Inc., PIK | | | | |
| 9.625%, 11/15/2016 | | 21,000 | | 22,785 |
| Life Technologies Corp. | | | | |
| 4.400%, 03/01/2015 | | 500,000 | | 521,758 |
| Medco Health Solutions, Inc. | | | | |
| 7.125%, 03/15/2018 | | 190,000 | | 223,000 |
| Merck & Company, Inc. | | | | |
| 4.000%, 06/30/2015 | | 425,000 | | 453,427 |
| Novartis Securities Investment, Ltd. | | | | |
| 5.125%, 02/10/2019 | | 320,000 | | 348,852 |
| Pfizer, Inc. | | | | |
| 6.200%, 03/15/2019 | | 750,000 | | 867,977 |
| 7.200%, 03/15/2039 | | 550,000 | | 689,339 |
| Roche Holdings, Inc. | | | | |
| 6.000%, 03/01/2019 (S) | | 475,000 | | 542,246 |
| Schering Plough Corp. | | | | |
| 6.500%, 12/01/2033 | | 1,000,000 | | 1,186,938 |
| St Jude Medical, Inc. | | | | |
| 2.500%, 01/15/2016 | | 606,000 | | 596,940 |
| Tenet Healthcare Corp. | | | | |
| 8.875%, 07/01/2019 | | 170,000 | | 193,375 |
| 9.000%, 05/01/2015 | | 40,000 | | 44,000 |
| Thermo Fisher Scientific, Inc. | | | | |
| 3.200%, 05/01/2015 | | 125,000 | | 127,526 |
| UnitedHealth Group, Inc. | | | | |
| 5.950%, 02/15/2041 | | 605,000 | | 616,072 |
| WellPoint, Inc. | | | | |
| 4.350%, 08/15/2020 | | 520,000 | | 518,793 |
| 7.000%, 02/15/2019 | | 720,000 | | 855,539 |
| | |
|
| | | | | 11,766,510 |
| Industrials - 1.00% | | | | |
| ACCO Brands Corp. | | | | |
| 7.625%, 08/15/2015 | | 5,000 | | 5,094 |
| BE Aerospace, Inc. | | | | |
| 6.875%, 10/01/2020 | | 30,000 | | 31,275 |
| Bombardier, Inc. | | | | |
| 7.500%, 03/15/2018 (S) | | 70,000 | | 75,250 |
| 7.750%, 03/15/2020 (S) | | 60,000 | | 65,100 |
| Case New Holland, Inc. | | | | |
| 7.875%, 12/01/2017 (S) | | 100,000 | | 111,750 |
| Cenveo Corp. | | | | |
| 7.875%, 12/01/2013 | | 5,000 | | 4,800 |
| |
| The accompanying notes are an integral part of the financial statements. | 156 |
John Hancock Funds II
Portfolio of Investments — February 28, 2011 (Unaudited) (showing percentage of total net assets)
| | | | |
| Investment Quality Bond Fund (continued) | | |
| | | Shares or | | |
| | | Principal | | |
| | | Amount | | Value |
| |
|
| |
| CORPORATE BONDS (continued) | | | | |
| Industrials (continued) | | | | |
| CNH America LLC | | | | |
| 7.250%, 01/15/2016 | $ | 30,000 | $ | 32,775 |
| Continental Airlines, Inc. , Series ERJ1 | | | | |
| 9.798%, 04/01/2021 | | 7,848 | | 8,319 |
| Continental Airlines, Inc., Series 071A | | | | |
| 5.983%, 04/19/2022 | | 28,939 | | 30,169 |
| Continental Airlines, Inc., Series 974A | | | | |
| 6.900%, 01/02/2018 | | 93,024 | | 99,070 |
| Continental Airlines, Inc., Series 981A | | | | |
| 6.648%, 09/15/2017 | | 187,178 | | 198,409 |
| Corrections Corp. of America | | | | |
| 6.750%, 01/31/2014 | | 100,000 | | 101,625 |
| Crown Americas LLC / Crown Americas | | | | |
| Capital Corp. II | | | | |
| 7.625%, 05/15/2017 | | 195,000 | | 212,550 |
| Deluxe Corp. | | | | |
| 7.375%, 06/01/2015 | | 160,000 | | 166,800 |
| Esterline Technologies Corp. | | | | |
| 7.000%, 08/01/2020 | | 35,000 | | 36,663 |
| GATX Financial Corp. | | | | |
| 5.500%, 02/15/2012 | | 200,000 | | 206,099 |
| General Electric Company | | | | |
| 5.250%, 12/06/2017 | | 735,000 | | 805,159 |
| Goodrich Corp. | | | | |
| 7.100%, 11/15/2027 | | 115,000 | | 133,955 |
| Harland Clarke Holdings Corp. | | | | |
| 9.500%, 05/15/2015 | | 10,000 | | 9,825 |
| Marquette Transportation Finance | | | | |
| 10.875%, 01/15/2017 (S) | | 5,000 | | 5,300 |
| Masco Corp. | | | | |
| 6.125%, 10/03/2016 | | 130,000 | | 133,051 |
| 6.500%, 08/15/2032 | | 45,000 | | 41,084 |
| Navios Maritime Holdings, Inc. | | | | |
| 8.875%, 11/01/2017 | | 80,000 | | 86,400 |
| Navistar International Corp. | | | | |
| 8.250%, 11/01/2021 | | 80,000 | | 88,600 |
| Republic Services, Inc. | | | | |
| 5.250%, 11/15/2021 | | 160,000 | | 168,451 |
| 5.500%, 09/15/2019 | | 445,000 | | 482,205 |
| Southwest Airlines Company, | | | | |
| Series 2007-1 | | | | |
| 6.150%, 08/01/2022 | | 268,249 | | 295,074 |
| SPX Corp. | | | | |
| 7.625%, 12/15/2014 | | 10,000 | | 10,950 |
| Textron, Inc. | | | | |
| 7.250%, 10/01/2019 | | 200,000 | | 229,952 |
| US Airways 2010-1 Class A Pass | | | | |
| Through Trust | | | | |
| 6.250%, 04/22/2023 | | 80,000 | | 80,200 |
| Waste Management, Inc. | | | | |
| 6.375%, 03/11/2015 | | 340,000 | | 386,070 |
| | |
|
| | | | | 4,342,024 |
| Information Technology - 0.62% | | | | |
| Avnet, Inc. | | | | |
| 6.625%, 09/15/2016 | | 245,000 | | 271,239 |
| Equinix, Inc. | | | | |
| 8.125%, 03/01/2018 | | 30,000 | | 32,550 |
| Freescale Semiconductor, Inc. | | | | |
| 8.875%, 12/15/2014 | | 15,000 | | 15,694 |
| Jabil Circuit, Inc. | | | | |
| 5.625%, 12/15/2020 | | 35,000 | | 34,213 |
| Mantech International Corp. | | | | |
| 7.250%, 04/15/2018 | | 20,000 | | 20,900 |
| | | | |
| Investment Quality Bond Fund (continued) | | |
| | | Shares or | | |
| | | Principal | | |
| | | Amount | | Value |
| |
|
| |
| CORPORATE BONDS (continued) | | | | |
| Information Technology (continued) | | | | |
| Oracle Corp. | | | | |
| 6.125%, 07/08/2039 | $ | 330,000 | $ | 357,414 |
| Seagate HDD Cayman | | | | |
| 6.875%, 05/01/2020 (S) | | 90,000 | | 88,200 |
| Seagate Technology International | | | | |
| 10.000%, 05/01/2014 (S) | | 40,000 | | 46,300 |
| Xerox Corp. | | | | |
| 6.400%, 03/15/2016 | | 465,000 | | 527,121 |
| 6.750%, 02/01/2017 | | 950,000 | | 1,095,293 |
| 8.250%, 05/15/2014 | | 170,000 | | 198,933 |
| | |
|
| | | | | 2,687,857 |
| Materials - 1.90% | | | | |
| Agrium, Inc. | | | | |
| 7.125%, 05/23/2036 | | 580,000 | | 681,013 |
| Alcoa, Inc. | | | | |
| 5.720%, 02/23/2019 | | 500,000 | | 524,676 |
| ArcelorMittal | | | | |
| 3.750%, 08/05/2015 | | 500,000 | | 505,009 |
| 5.375%, 06/01/2013 | | 150,000 | | 160,922 |
| 6.125%, 06/01/2018 | | 665,000 | | 715,039 |
| Ashland, Inc. | | | | |
| 9.125%, 06/01/2017 | | 10,000 | | 11,631 |
| Ball Corp. | | | | |
| 6.750%, 09/15/2020 | | 155,000 | | 162,363 |
| 7.125%, 09/01/2016 | | 40,000 | | 43,800 |
| Celanese US Holdings LLC | | | | |
| 6.625%, 10/15/2018 (S) | | 21,000 | | 21,945 |
| CF Industries, Inc. | | | | |
| 6.875%, 05/01/2018 | | 40,000 | | 44,175 |
| 7.125%, 05/01/2020 | | 40,000 | | 44,900 |
| Clearwater Paper Corp. | | | | |
| 7.125%, 11/01/2018 (S) | | 30,000 | | 31,125 |
| Corporacion Nacional del Cobre de Chile | | | | |
| 6.375%, 11/30/2012 (S) | | 165,000 | | 177,561 |
| Cytec Industries, Inc. | | | | |
| 4.600%, 07/01/2013 | | 133,000 | | 140,861 |
| 6.000%, 10/01/2015 | | 950,000 | | 1,041,206 |
| Fibria Overseas Finance, Ltd. | | | | |
| 7.500%, 05/04/2020 (S) | | 100,000 | | 106,500 |
| Georgia-Pacific LLC | | | | |
| 5.400%, 11/01/2020 (S) | | 30,000 | | 29,819 |
| 7.125%, 01/15/2017 (S) | | 190,000 | | 201,875 |
| International Paper Company | | | | |
| 7.300%, 11/15/2039 | | 160,000 | | 187,552 |
| Lyondell Chemical Company | | | | |
| 8.000%, 11/01/2017 (S) | | 103,000 | | 115,939 |
| MeadWestvaco Corp. | | | | |
| 7.375%, 09/01/2019 | | 150,000 | | 163,101 |
| Nalco Company | | | | |
| 6.625%, 01/15/2019 (S) | | 70,000 | | 72,363 |
| Neenah Paper, Inc. | | | | |
| 7.375%, 11/15/2014 | | 10,000 | | 10,213 |
| Owens-Brockway Glass Container, Inc. | | | | |
| 7.375%, 05/15/2016 | | 170,000 | | 185,300 |
| Rio Tinto Alcan, Inc. | | | | |
| 6.450%, 03/15/2011 | | 59,000 | | 59,116 |
| Rio Tinto Finance USA, Ltd. | | | | |
| 1.875%, 11/02/2015 | | 415,000 | | 399,501 |
| 6.500%, 07/15/2018 | | 425,000 | | 491,955 |
| Rock-Tenn Company | | | | |
| 9.250%, 03/15/2016 | | 25,000 | | 27,500 |
| Temple-Inland, Inc. | | | | |
| 6.875%, 01/15/2018 | | 125,000 | | 135,495 |
| |
| The accompanying notes are an integral part of the financial statements. | 157 |
John Hancock Funds II
Portfolio of Investments — February 28, 2011 (Unaudited) (showing percentage of total net assets)
| | | | |
| Investment Quality Bond Fund (continued) | | |
| | | Shares or | | |
| | | Principal | | |
| | | Amount | | Value |
| |
|
| |
| CORPORATE BONDS (continued) | | | | |
| Materials (continued) | | | | |
| The Dow Chemical Company | | | | |
| 4.250%, 11/15/2020 | $ | 485,000 | $ | 467,024 |
| 5.900%, 02/15/2015 | | 950,000 | | 1,059,540 |
| Vale Inco, Ltd. | | | | |
| 5.700%, 10/15/2015 | | 233,000 | | 255,918 |
| | |
|
| | | | | 8,274,937 |
| Telecommunication Services - 4.81% | | | | |
| Ameritech Capital Funding Corp. | | | | |
| 6.450%, 01/15/2018 | | 148,000 | | 165,609 |
| AT&T Mobility LLC | | | | |
| 7.125%, 12/15/2031 | | 67,000 | | 79,439 |
| AT&T Wireless Services, Inc. | | | | |
| 8.125%, 05/01/2012 | | 56,000 | | 60,704 |
| AT&T, Inc. | | | | |
| 5.350%, 09/01/2040 (S) | | 989,000 | | 906,830 |
| 5.500%, 02/01/2018 | | 750,000 | | 823,581 |
| 5.625%, 06/15/2016 | | 360,000 | | 403,352 |
| 6.300%, 01/15/2038 | | 1,775,000 | | 1,842,794 |
| British Telecommunications PLC | | | | |
| 5.150%, 01/15/2013 | | 350,000 | | 373,503 |
| 5.950%, 01/15/2018 | | 400,000 | | 443,926 |
| COX Communications, Inc. | | | | |
| 5.875%, 12/01/2016 (S) | | 750,000 | | 835,925 |
| 7.125%, 10/01/2012 | | 458,000 | | 498,536 |
| Cricket Communications, Inc. | | | | |
| 7.750%, 05/15/2016 | | 45,000 | | 47,588 |
| Deutsche Telekom International | | | | |
| Finance BV | | | | |
| 8.750%, 06/15/2030 | | 475,000 | | 622,939 |
| Discovery Communications LLC | | | | |
| 5.050%, 06/01/2020 | | 915,000 | | 959,004 |
| France Telecom SA | | | | |
| 4.375%, 07/08/2014 | | 200,000 | | 215,206 |
| 5.375%, 07/08/2019 | | 500,000 | | 551,415 |
| Frontier Communications Corp. | | | | |
| 7.125%, 03/15/2019 | | 155,000 | | 161,200 |
| 8.125%, 10/01/2018 | | 115,000 | | 127,794 |
| 8.250%, 04/15/2017 | | 20,000 | | 22,100 |
| 8.500%, 04/15/2020 | | 5,000 | | 5,550 |
| Intelsat Jackson Holdings, Ltd. | | | | |
| 8.500%, 11/01/2019 (S) | | 5,000 | | 5,488 |
| Intelsat Subsidiary Holding Company SA | | | | |
| 8.875%, 01/15/2015 (S) | | 25,000 | | 25,625 |
| NBCUniversal Media LLC | | | | |
| 4.375%, 04/01/2021 (S) | | 625,000 | | 601,051 |
| 5.150%, 04/30/2020 (S) | | 1,420,000 | | 1,462,758 |
| Qwest Communications International, Inc. | | | | |
| 7.125%, 04/01/2018 | | 105,000 | | 112,613 |
| 8.000%, 10/01/2015 | | 100,000 | | 109,125 |
| Qwest Corp. | | | | |
| 7.500%, 10/01/2014 | | 15,000 | | 17,175 |
| 8.375%, 05/01/2016 | | 180,000 | | 214,875 |
| Rogers Communications, Inc. | | | | |
| 6.250%, 06/15/2013 | | 130,000 | | 143,999 |
| SBA Telecommunications, Inc. | | | | |
| 8.250%, 08/15/2019 | | 30,000 | | 33,075 |
| SBC Communications, Inc. | | | | |
| 5.875%, 08/15/2012 | | 150,000 | | 160,753 |
| Sitel LLC/Sitel Finance Corp. | | | | |
| 11.500%, 04/01/2018 (S) | | 10,000 | | 9,250 |
| Sorenson Communications, Inc. | | | | |
| 10.500%, 02/01/2015 (S) | | 10,000 | | 7,525 |
| Sprint Capital Corp. | | | | |
| 6.900%, 05/01/2019 | | 135,000 | | 136,181 |
| | | | |
| Investment Quality Bond Fund (continued) | | |
| | | Shares or | | |
| | | Principal | | |
| | | Amount | | Value |
| |
|
| |
| CORPORATE BONDS (continued) | | | | |
| Telecommunication Services (continued) | | | | |
| Sprint Nextel Corp. | | | | |
| 6.000%, 12/01/2016 | $ | 5,000 | $ | 4,988 |
| Telecom Italia Capital SA | | | | |
| 5.250%, 11/15/2013 | | 625,000 | | 653,109 |
| 6.000%, 09/30/2034 | | 146,000 | | 129,237 |
| 6.200%, 07/18/2011 | | 675,000 | | 687,884 |
| Telefonica Emisiones SAU | | | | |
| 3.992%, 02/16/2016 | | 810,000 | | 813,205 |
| 5.134%, 04/27/2020 | | 350,000 | | 348,361 |
| 7.045%, 06/20/2036 | | 475,000 | | 511,142 |
| Verizon Communications, Inc. | | | | |
| 5.550%, 02/15/2016 | | 870,000 | | 969,933 |
| 6.400%, 02/15/2038 | | 1,665,000 | | 1,781,056 |
| 6.900%, 04/15/2038 | | 275,000 | | 311,913 |
| 8.750%, 11/01/2021 | | 285,000 | | 369,210 |
| Verizon Wireless Capital LLC | | | | |
| 5.550%, 02/01/2014 | | 595,000 | | 657,745 |
| 8.500%, 11/15/2018 | | 1,000,000 | | 1,295,757 |
| Windstream Corp. | | | | |
| 7.875%, 11/01/2017 | | 100,000 | | 108,625 |
| 8.125%, 09/01/2018 | | 120,000 | | 128,400 |
| | |
|
| | | | | 20,957,053 |
| Utilities - 4.22% | | | | |
| Appalachian Power Company | | | | |
| 5.000%, 06/01/2017 | | 1,200,000 | | 1,258,018 |
| Atmos Energy Corp. | | | | |
| 6.350%, 06/15/2017 | | 100,000 | | 111,857 |
| Baltimore Gas & Electric Company | | | | |
| 5.900%, 10/01/2016 | | 700,000 | | 781,319 |
| Carolina Power & Light Company | | | | |
| 6.500%, 07/15/2012 | | 671,000 | | 719,641 |
| CenterPoint Energy Resources Corp. | | | | |
| 6.125%, 11/01/2017 | | 125,000 | | 140,522 |
| CenterPoint Energy Resources Corp., | | | | |
| Series B | | | | |
| 5.950%, 01/15/2014 | | 600,000 | | 658,402 |
| CenterPoint Energy, Inc. | | | | |
| 6.500%, 05/01/2018 | | 560,000 | | 630,867 |
| Commonwealth Edison Company | | | | |
| 4.000%, 08/01/2020 | | 1,000,000 | | 975,589 |
| 5.950%, 08/15/2016 | | 125,000 | | 141,510 |
| 6.150%, 03/15/2012 | | 92,000 | | 96,919 |
| Dominion Resources, Inc. | | | | |
| 2.250%, 09/01/2015 | | 345,000 | | 336,568 |
| 6.400%, 06/15/2018 | | 1,295,000 | | 1,488,015 |
| 7.000%, 06/15/2038 | | 215,000 | | 253,394 |
| Duke Energy Corp. | | | | |
| 5.650%, 06/15/2013 | | 600,000 | | 655,842 |
| Edison International | | | | |
| 3.750%, 09/15/2017 | | 475,000 | | 471,380 |
| Ferrellgas LP/Ferrellgas Finance Corp. | | | | |
| 6.500%, 05/01/2021 (S) | | 56,000 | | 54,600 |
| Georgia Power Company | | | | |
| 5.250%, 12/15/2015 | | 600,000 | | 667,260 |
| Idaho Power Company | | | | |
| 4.850%, 08/15/2040 | | 1,000,000 | | 899,000 |
| Intergen NV | | | | |
| 9.000%, 06/30/2017 (S) | | 75,000 | | 81,000 |
| Ipalco Enterprises, Inc. | | | | |
| 7.250%, 04/01/2016 (S) | | 110,000 | | 119,350 |
| MidAmerican Energy Holdings Company | | | | |
| 6.125%, 04/01/2036 | | 250,000 | | 264,730 |
| Nevada Power Company | | | | |
| 6.500%, 08/01/2018 | | 225,000 | | 258,923 |
| |
| The accompanying notes are an integral part of the financial statements. | 158 |
John Hancock Funds II
Portfolio of Investments — February 28, 2011 (Unaudited) (showing percentage of total net assets)
| | | | |
| Investment Quality Bond Fund (continued) | | |
| | | Shares or | | |
| | | Principal | | |
| | | Amount | | Value |
| |
|
| |
| CORPORATE BONDS (continued) | | | | |
| Utilities (continued) | | | | |
| New York State Electric & Gas Corp. | | | | |
| 5.750%, 05/01/2023 | $ | 74,000 | $ | 69,863 |
| NiSource Finance Corp. | | | | |
| 6.400%, 03/15/2018 | | 200,000 | | 224,540 |
| Northern States Power Company | | | | |
| 6.250%, 06/01/2036 | | 125,000 | | 142,342 |
| 6.500%, 03/01/2028 | | 67,000 | | 76,332 |
| NRG Energy, Inc. | | | | |
| 7.375%, 02/01/2016 to 01/15/2017 | | 75,000 | | 78,281 |
| Ohio Edison Company | | | | |
| 6.875%, 07/15/2036 | | 230,000 | | 251,226 |
| Oncor Electric Delivery Company | | | | |
| 7.500%, 09/01/2038 | | 205,000 | | 253,235 |
| Potomac Electric Power Company | | | | |
| 6.500%, 11/15/2037 | | 250,000 | | 288,584 |
| PPL Electric Utilities Corp. | | | | |
| 6.250%, 05/15/2039 | | 80,000 | | 89,145 |
| Progress Energy, Inc. | | | | |
| 4.400%, 01/15/2021 | | 1,240,000 | | 1,233,272 |
| PSEG Power LLC | | | | |
| 8.625%, 04/15/2031 | | 154,000 | | 195,513 |
| Puget Sound Energy, Inc. | | | | |
| 5.757%, 10/01/2039 | | 365,000 | | 367,847 |
| 7.000%, 03/09/2029 | | 54,000 | | 59,214 |
| Sempra Energy | | | | |
| 6.000%, 10/15/2039 | | 600,000 | | 621,665 |
| Sierra Pacific Power Company, Series M | | | | |
| 6.000%, 05/15/2016 | | 225,000 | | 253,993 |
| Southern California Edison Company | | | | |
| 4.500%, 09/01/2040 | | 500,000 | | 443,992 |
| 6.000%, 01/15/2034 | | 326,000 | | 355,968 |
| The AES Corp. | | | | |
| 8.000%, 06/01/2020 | | 155,000 | | 169,725 |
| Union Electric Company | | | | |
| 6.400%, 06/15/2017 | | 1,050,000 | | 1,189,738 |
| 6.700%, 02/01/2019 | | 110,000 | | 127,796 |
| Wisconsin Energy Corp. | | | | |
| 6.200%, 04/01/2033 | | 138,000 | | 144,798 |
| Wisconsin Power and Light Company | | | | |
| 5.000%, 07/15/2019 | | 425,000 | | 457,515 |
| Xcel Energy, Inc. | | | | |
| 4.700%, 05/15/2020 | | 215,000 | | 222,324 |
| | |
|
| | | | | 18,381,614 |
|
| TOTAL CORPORATE BONDS (Cost $230,560,587) | | $ | 236,528,693 |
|
| |
| CAPITAL PREFERRED SECURITIES - 0.16% | | | |
| Financials - 0.16% | | | | |
| ACE Capital Trust II | | | | |
| 9.700%, 04/01/2030 | | 248,000 | | 307,520 |
| AGFC Capital Trust I, (6.000% to | | | | |
| 01/15/2017, then 3 month LIBOR | | | | |
| +1.750%) | | | | |
| 6.000%, 01/15/2067 (S) | | 170,000 | | 102,000 |
| Capital One Capital IV (6.745% to | | | | |
| 02/17/2032, then 1 month | | | | |
| LIBOR + 1.170%) | | | | |
| 6.745%, 02/17/2037 | | 125,000 | | 125,000 |
| NB Capital Trust IV | | | | |
| 04/15/2027 | | 180,000 | | 184,050 |
| | |
|
| | | | | 718,570 |
|
| TOTAL CAPITAL PREFERRED SECURITIES (Cost $806,498) | $ | 718,570 |
|
| | | | |
| Investment Quality Bond Fund (continued) | | |
| | | Shares or | | |
| | | Principal | | |
| | | Amount | | Value |
| |
|
| |
| CONVERTIBLE BONDS - 0.01% | | | | |
| Health Care - 0.00% | | | | |
| Amylin Pharmaceuticals, Inc. | | | | |
| 3.000%, 06/15/2014 | $ | 5,000 | $ | 4,544 |
| Telecommunication Services - 0.01% | | | | |
| Leap Wireless International, Inc. | | | | |
| 4.500%, 07/15/2014 | | 10,000 | | 9,300 |
| Industrials - 0.00% | | | | |
| Continental Airlines, Inc. | | | | |
| 4.500%, 01/15/2015 | | 5,000 | | 7,425 |
| Consumer Discretionary - 0.00% | | | | |
| Ford Motor Company | | | | |
| 4.250%, 11/15/2016 | | 5,000 | | 9,138 |
|
| TOTAL CONVERTIBLE BONDS (Cost $23,636) | | $ | 30,407 |
|
| |
| MUNICIPAL BONDS - 2.84% | | | | |
| Arizona - 0.15% | | | | |
| Salt River Project Agricultural | | | | |
| Improvement & Power District | | | | |
| 4.839%, 01/01/2041 | | 740,000 | | 668,627 |
| California - 1.03% | | | | |
| Bay Area Toll Authority | | | | |
| 6.263%, 04/01/2049 | | 875,000 | | 885,273 |
| Irvine Ranch Water District Joint Powers | | | | |
| Agency | | | | |
| 2.605%, 03/15/2014 | | 455,000 | | 463,286 |
| Los Angeles Unified School District | | | | |
| 5.750%, 07/01/2034 | | 425,000 | | 398,795 |
| State of California | | | | |
| 7.300%, 10/01/2039 | | 1,050,000 | | 1,104,737 |
| 7.550%, 04/01/2039 | | 850,000 | | 920,321 |
| University of California | | | | |
| 5.770%, 05/15/2043 | | 715,000 | | 689,625 |
| | |
|
| | | | | 4,462,037 |
| Florida - 0.03% | | | | |
| Miami Beach Florida Redevelopment | | | | |
| Agency | | | | |
| 8.950%, 12/01/2022 | | 135,000 | | 143,342 |
| Illinois - 0.89% | | | | |
| Chicago Illinois O’Hare International | | | | |
| Airport | | | | |
| 6.845%, 01/01/2038 | | 500,000 | | 489,430 |
| Illinois State Toll Highway Authority | | | | |
| 6.184%, 01/01/2034 | | 415,000 | | 402,820 |
| State of Illinois | | | | |
| 5.365%, 03/01/2017 | | 85,000 | | 85,196 |
| 5.665%, 03/01/2018 | | 1,615,000 | | 1,618,456 |
| 5.877%, 03/01/2019 | | 1,290,000 | | 1,293,354 |
| | |
|
| | | | | 3,889,256 |
| Maryland - 0.04% | | | | |
| Maryland State Transportation Authority | | | | |
| 5.840%, 07/01/2011 | | 40,000 | | 40,586 |
| 5.888%, 07/01/2043 | | 125,000 | | 127,695 |
| | |
|
| | | | | 168,281 |
| Massachusetts - 0.10% | | | | |
| Massachusetts School Building Authority | | | | |
| 5.715%, 08/15/2039 | | 400,000 | | 409,380 |
| Missouri - 0.10% | | | | |
| University of Missouri | | | | |
| 5.960%, 11/01/2039 | | 400,000 | | 428,172 |
| |
| The accompanying notes are an integral part of the financial statements. | 159 |
John Hancock Funds II
Portfolio of Investments — February 28, 2011 (Unaudited) (showing percentage of total net assets)
| | | | |
| Investment Quality Bond Fund (continued) | | |
| | | Shares or | | |
| | | Principal | | |
| | | Amount | | Value |
| |
|
| |
| MUNICIPAL BONDS (continued) | | | | |
| New Jersey - 0.19% | | | | |
| Jersey City Municipal Utilities Authority | | | | |
| 4.550%, 05/15/2012 | $ | 20,000 | $ | 20,279 |
| New Jersey State Turnpike Authority | | | | |
| 7.414%, 01/01/2040 | | 730,000 | | 818,403 |
| | |
|
| | | | | 838,682 |
| New York - 0.19% | | | | |
| New York State Thruway Authority | | | | |
| 5.883%, 04/01/2030 | | 590,000 | | 581,870 |
| Port Authority of New York & New | | | | |
| Jersey | | | | |
| 6.040%, 12/01/2029 | | 180,000 | | 184,052 |
| Sales Tax Asset Receivable Corp., | | | | |
| Series B | | | | |
| 4.250%, 10/15/2011 | | 65,000 | | 66,097 |
| | |
|
| | | | | 832,019 |
| Texas - 0.12% | | | | |
| North Texas Tollway Authority | | | | |
| 6.718%, 01/01/2049 | | 535,000 | | 534,786 |
|
| TOTAL MUNICIPAL BONDS (Cost $12,464,896) | | $ | 12,374,582 |
|
| |
| COLLATERALIZED MORTGAGE | | | | |
| OBLIGATIONS - 8.24% | | | | |
| Commercial & Residential - 8.21% | | | | |
| American Tower Trust, Series 2007-1A, | | | | |
| Class AFX | | | | |
| 5.420%, 04/15/2037 (S) | | 300,000 | | 322,924 |
| Banc of America | | | | |
| Commercial Mortgage, Inc. | | | | |
| Series 2005-6, Class A4, | | | | |
| 5.195%, 09/10/2047 (P) | | 1,000,000 | | 1,078,247 |
| Series 2002-PB2, Class A4, | | | | |
| 6.186%, 06/11/2035 | | 383,030 | | 394,150 |
| Bear Stearns Commercial | | | | |
| Mortgage Securities | | | | |
| Series 2003-T12, Class A4, | | | | |
| 4.680%, 08/13/2039 (P) | | 405,797 | | 427,423 |
| Series 2005-PWR9, Class A4A, | | | | |
| 4.871%, 09/11/2042 | | 560,000 | | 595,199 |
| Series 2005-T20, Class A4A, | | | | |
| 5.149%, 10/12/2042 (P) | | 575,000 | | 619,251 |
| Series 2006-PW 14, Class A4, | | | | |
| 5.201%, 12/11/2038 | | 860,000 | | 913,994 |
| Series 2006-T24, Class A4, | | | | |
| 5.537%, 10/12/2041 | | 1,605,000 | | 1,737,417 |
| Series 2006-PW3, Class A4, | | | | |
| 5.540%, 09/11/2041 | | 2,000,000 | | 2,167,188 |
| Series 2007-PW16, Class A4, | | | | |
| 5.717%, 06/11/2040 (P) | | 2,000,000 | | 2,174,733 |
| Series 2006-PW12, Class A4, | | | | |
| 5.722%, 09/11/2038 (P) | | 1,000,000 | | 1,100,722 |
| Series 2007-T28, Class A4, | | | | |
| 5.742%, 09/11/2042 (P) | | 145,000 | | 157,907 |
| Citigroup/Deutsche Bank | | | | |
| Commercial Mortgage Trust | | | | |
| Series 2005-CD1, Class A4, | | | | |
| 5.222%, 07/15/2044 (P) | | 500,000 | | 539,477 |
| Series 2007-CD4, Class A4, | | | | |
| 5.322%, 12/11/2049 | | 750,000 | | 790,502 |
| Commercial Mortgage Asset Trust, | | | | |
| Series 1999-C1, Class A3 | | | | |
| 6.640%, 01/17/2032 | | 16,450 | | 16,472 |
| | | | |
| Investment Quality Bond Fund (continued) | | |
| | | Shares or | | |
| | | Principal | | |
| | | Amount | | Value |
| |
|
| |
| COLLATERALIZED MORTGAGE | | | | |
| OBLIGATIONS (continued) | | | | |
| Commercial & Residential (continued) | | | | |
| Commercial Mortgage Pass | | | | |
| Through Certificates | | | | |
| Series 2010-C1, Class A3, | | | | |
| 4.205%, 07/10/2046 (S) | $ | 810,000 | $ | 796,666 |
| Series 2005-C6, Class A5A, | | | | |
| 5.116%, 06/10/2044 (P) | | 500,000 | | 535,415 |
| Credit Suisse Mortgage | | | | |
| Capital Certificates | | | | |
| Series 2006-C4, Class A3, | | | | |
| 5.467%, 09/15/2039 | | 1,635,000 | | 1,748,554 |
| Series 2006-C1, Class A4, | | | | |
| 5.541%, 02/15/2039 (P) | | 1,000,000 | | 1,087,452 |
| CS First Boston Mortgage | | | | |
| Securities Corp., Series 2003-C3, | | | | |
| Class A5 | | | | |
| 3.936%, 05/15/2038 | | 500,000 | | 517,451 |
| CW Capital Cobalt, Ltd., Series 2006-C1, | | | | |
| Class A4 | | | | |
| 5.223%, 08/15/2048 | | 1,655,000 | | 1,733,923 |
| General Electric Capital Assurance | | | | |
| Company, Series 2003-1, Class A5 | | | | |
| 5.743%, 05/12/2035 (P)(S) | | 89,275 | | 97,017 |
| GS Mortgage Securities Corp. II, | | | | |
| Series 2006-GG6, Class A4 | | | | |
| 5.553%, 04/10/2038 (P) | | 1,000,000 | | 1,079,269 |
| JPMorgan Chase Commercial | | | | |
| Mortgage Securities Corp. | | | | |
| Series 2004-CBX, Class A6, | | | | |
| 4.899%, 01/12/2037 | | 315,000 | | 334,993 |
| Series 2005-LDP4, Class A4, | | | | |
| 4.918%, 10/15/2042 (P) | | 940,000 | | 998,557 |
| Series 2005-LDP5, Class A4, | | | | |
| 5.229%, 12/15/2044 (P) | | 1,000,000 | | 1,077,663 |
| Series 2007-CB20, Class A4, | | | | |
| 5.794%, 02/12/2051 (P) | | 1,600,000 | | 1,737,646 |
| Series 2008-C2, Series A4, | | | | |
| 6.068%, 02/12/2051 | | 1,200,000 | | 1,286,214 |
| LB-UBS Commercial Mortgage Trust | | | | |
| Series 2001-C7, Class A3, | | | | |
| 5.642%, 12/15/2025 | | 17,113 | | 17,162 |
| Series 2008-C1, Class A2, | | | | |
| 6.098%, 04/15/2041 (P) | | 1,000,000 | | 1,108,427 |
| Merrill Lynch Mortgage Trust | | | | |
| Series 2005-CIP1, Class A4, | | | | |
| 5.047%, 07/12/2038 (P) | | 1,000,000 | | 1,069,682 |
| Series 2005-CIP1, Class AM, | | | | |
| 5.107%, 07/12/2038 (P) | | 1,650,000 | | 1,741,522 |
| Series 2006-C1, Class A4, | | | | |
| 5.659%, 05/12/2039 (P) | | 1,500,000 | | 1,644,812 |
| Morgan Stanley Capital I | | | | |
| Series 2005-T17, Class A5, | | | | |
| 4.780%, 12/13/2041 | | 500,000 | | 530,535 |
| Series 2007-T27, Class A4, | | | | |
| 5.650%, 06/11/2042 (P) | | 1,000,000 | | 1,089,405 |
| Morgan Stanley Dean Witter Capital I | | | | |
| Series 2002-TOP7, Class A2, | | | | |
| 5.980%, 01/15/2039 | | 38,225 | | 39,768 |
| Series 2001, Class A4, | | | | |
| 6.390%, 07/15/2033 | | 72,199 | | 72,692 |
| Prudential Commercial Mortgage Trust | | | | |
| Series 2003-PWR1, Class A1, | | | | |
| 3.669%, 02/11/2036 | | 87,719 | | 87,987 |
| Series 2003-PWR1, Class A2, | | | | |
| 4.493%, 02/11/2036 | | 405,797 | | 423,452 |
| |
| The accompanying notes are an integral part of the financial statements. | 160 |
John Hancock Funds II
Portfolio of Investments — February 28, 2011 (Unaudited) (showing percentage of total net assets)
| | | | |
| Investment Quality Bond Fund (continued) | | |
| | | Shares or | | |
| | | Principal | | |
| | | Amount | | Value |
| |
|
| |
| COLLATERALIZED MORTGAGE | | | | |
| OBLIGATIONS (continued) | | | | |
| Commercial & Residential (continued) | | | | |
| Wachovia Bank Commercial | | | | |
| Mortgage Trust, Series 2005-C20, | | | | |
| Class A7 | | | | |
| 5.118%, 07/15/2042 (P) | $ | 310,000 | $ | 332,357 |
| WF-RBS Commercial Mortgage Trust, | | | | |
| Series 2011-C2, Series A4 | | | | |
| 4.869%, 02/15/2044 (P)(S) | | 1,500,000 | | 1,529,885 |
| | |
|
| | | | | 35,754,112 |
| U.S. Government Agency - 0.03% | | | | |
| Federal Home Loan Mortgage Corp., | | | | |
| Series 2895, Class EK | | | | |
| 4.000%, 11/15/2019 | | 135,265 | | 141,044 |
| Government National Mortgage | | | | |
| Association, Series 2006-38, Class XS | | | | |
| IO | | | | |
| 6.985%, 09/16/2035 (P) | | 49,520 | | 8,371 |
| | |
|
| | | | | 149,415 |
|
| TOTAL COLLATERALIZED MORTGAGE | | | |
| OBLIGATIONS (Cost $34,744,218) | | | $ | 35,903,527 |
|
| |
| ASSET BACKED SECURITIES - 1.29% | | | |
| Ally Master Owner Trust, Series 2010-3, | | | | |
| Class A | | | | |
| 2.880%, 04/15/2015 (S) | | 1,000,000 | | 1,025,446 |
| Avis Budget Car Funding AESOP LLC, | | | | |
| Series 2009-2A, Class A | | | | |
| 5.680%, 02/20/2014 (S) | | 430,000 | | 460,688 |
| Chase Issuance Trust, Series 2008-A4, | | | | |
| Class A4 | | | | |
| 4.650%, 03/15/2015 | | 345,000 | | 370,146 |
| Dominos Pizza Master Issuer LLC, | | | | |
| Series 2007-1, Class A2 | | | | |
| 5.261%, 04/25/2037 (S) | | 300,000 | | 309,000 |
| Hertz Vehicle Financing LLC, | | | | |
| Series 2010-1A, Class A2 | | | | |
| 3.740%, 02/25/2017 (S) | | 1,045,000 | | 1,075,753 |
| John Deere Owner Trust, Series 2010-A, | | | | |
| Class A4 | | | | |
| 2.130%, 10/17/2016 | | 1,000,000 | | 1,018,352 |
| LCP LP, Series 8A, Class A | | | | |
| 1.972%, 01/14/2021 (P)(S) | | 1,300,000 | | 1,300,000 |
| Massachusetts RRB Special | | | | |
| Purpose Trust, Series 2001-1, Class A | | | | |
| 6.530%, 06/01/2015 | | 37,808 | | 40,316 |
|
| TOTAL ASSET BACKED SECURITIES (Cost $5,517,328) | | $ | 5,599,701 |
|
| |
| SECURITIES LENDING COLLATERAL - 0.65% | | | |
| John Hancock Collateral | | | | |
| Investment Trust, 0.2855% (W)(Y) | | 282,094 | | 2,823,028 |
|
| TOTAL SECURITIES LENDING | | | | |
| COLLATERAL (Cost $2,822,999) | | | $ | 2,823,028 |
|
| | | | |
| Investment Quality Bond Fund (continued) | | |
| | | Shares or | | |
| | | Principal | | |
| | | Amount | | Value |
| |
|
| |
| SHORT-TERM INVESTMENTS - 9.93% | | | |
| Repurchase Agreement - 9.93% | | | | |
| Bank of New York Tri-Party Repurchase | | | | |
| Agreement dated 02/28/2011 at 0.200% | | | |
| to be repurchased at $43,100,239 on | | | | |
| 03/01/2011, collateralized by | | | | |
| $12,934,839 U.S. Treasury Note, | | | | |
| 7.500% due 11/15/2024 (valued at | | | | |
| $13,137,869, including interest) and | | | | |
| $30,755,369 U.S. Treasury Note, | | | | |
| 2.000% due 01/15/2014 (valued at | | | | |
| $30,824,162, including interest) | $ | 43,100,000 | $ | 43,100,000 |
| Repurchase Agreement with State | | | | |
| Street Corp. dated 02/28/2011 at | | | | |
| 0.010% to be repurchased at $129,000 | | | | |
| on 03/01/2011, collateralized by | | | | |
| $135,000 U.S. Treasury Note, 0.875% | | | | |
| due 05/31/2011 (valued at $135,675, | | | | |
| including interest) | | 129,000 | | 129,000 |
| | |
|
| | | | | 43,229,000 |
|
| TOTAL SHORT-TERM INVESTMENTS (Cost $43,229,000) | | $ | 43,229,000 |
|
| Total Investments (Investment Quality Bond Fund) | | | |
| (Cost $468,725,669) - 109.23% | | | $ | 475,611,266 |
| Other assets and liabilities, net - (9.23%) | | | (40,206,831) |
| | |
|
| TOTAL NET ASSETS - 100.00% | | | $ | 435,404,435 |
| | | |
|
| |
| |
| |
| Large Cap Fund | | | | |
| | | Shares or | | |
| | | Principal | | |
| | | Amount | | Value |
| |
|
| |
| COMMON STOCKS - 98.61% | | | | |
| Consumer Discretionary - 15.42% | | | | |
| Auto Components - 1.49% | | | | |
| Johnson Controls, Inc. | | 121,100 | $ | 4,940,880 |
| Automobiles - 0.99% | | | | |
| General Motors Company (I) | | 98,500 | | 3,302,705 |
| Diversified Consumer Services - 0.72% | | | | |
| Apollo Group, Inc., Class A (I) | | 53,300 | | 2,412,358 |
| Hotels, Restaurants & Leisure - 2.47% | | | | |
| Carnival Corp. | | 137,699 | | 5,875,616 |
| International Game Technology | | 141,200 | | 2,324,152 |
| | |
|
| | | | | 8,199,768 |
| Household Durables - 1.38% | | | | |
| Fortune Brands, Inc. | | 74,000 | | 4,577,640 |
| Internet & Catalog Retail - 1.47% | | | | |
| Amazon.com, Inc. (I) | | 28,200 | | 4,886,778 |
| Media - 4.84% | | | | |
| Comcast Corp., Class A | | 247,400 | | 6,373,024 |
| Time Warner, Inc. | | 152,700 | | 5,833,140 |
| Viacom, Inc., Class B | | 87,300 | | 3,898,818 |
| | |
|
| | | | | 16,104,982 |
| Specialty Retail - 2.06% | | | | |
| GameStop Corp., Class A (I)(L) | | 126,000 | | 2,513,700 |
| Lowe’s Companies, Inc. | | 165,200 | | 4,323,284 |
| | |
|
| | | | | 6,836,984 |
| | | |
|
| | | | | 51,262,095 |
| |
| The accompanying notes are an integral part of the financial statements. | 161 |
John Hancock Funds II
Portfolio of Investments — February 28, 2011 (Unaudited) (showing percentage of total net assets)
| | | | |
| Large Cap Fund (continued) | | | | |
| | | Shares or | | |
| | | Principal | | |
| | | Amount | | Value |
| | |
|
| |
| COMMON STOCKS (continued) | | | | |
| Consumer Staples - 7.05% | | | | |
| Beverages - 1.73% | | | | |
| PepsiCo, Inc. | | 90,800 | $ | 5,758,536 |
| Food & Staples Retailing - 1.38% | | | | |
| The Kroger Company | | 200,500 | | 4,591,450 |
| Food Products - 1.06% | | | | |
| Kellogg Company | | 65,800 | | 3,524,248 |
| Household Products - 1.66% | | | | |
| The Procter & Gamble Company | | 87,500 | | 5,516,875 |
| Personal Products - 1.22% | | | | |
| Avon Products, Inc. | | 145,300 | | 4,040,793 |
| | |
|
| | | | | 23,431,902 |
| Energy - 12.30% | | | | |
| Energy Equipment & Services - 3.90% | | | | |
| Baker Hughes, Inc. (L) | | 50,100 | | 3,559,605 |
| Ensco International PLC, ADR (L) | | 64,000 | | 3,590,400 |
| Noble Corp. | | 130,300 | | 5,825,713 |
| | |
|
| | | | | 12,975,718 |
| Oil, Gas & Consumable Fuels - 8.40% | | | | |
| EOG Resources, Inc. (L) | | 29,800 | | 3,346,838 |
| Exxon Mobil Corp. | | 181,100 | | 15,489,483 |
| Hess Corp. | | 48,900 | | 4,255,767 |
| Ultra Petroleum Corp. (I)(L) | | 106,200 | | 4,816,170 |
| | |
|
| | | | | 27,908,258 |
| | | |
|
| | | | | 40,883,976 |
| Financials - 14.39% | | | | |
| Capital Markets - 4.08% | | | | |
| Morgan Stanley | | 197,300 | | 5,855,864 |
| The Bank of New York Mellon Corp. (L) | | 120,868 | | 3,673,179 |
| The Goldman Sachs Group, Inc. | | 24,600 | | 4,028,988 |
| | |
|
| | | | | 13,558,031 |
| Commercial Banks - 3.87% | | | | |
| U.S. Bancorp | | 176,000 | | 4,880,480 |
| Wells Fargo & Company | | 247,978 | | 7,999,770 |
| | |
|
| | | | | 12,880,250 |
| Diversified Financial Services - 3.52% | | | | |
| Citigroup, Inc. (I) | | 800,300 | | 3,745,404 |
| JPMorgan Chase & Company | | 170,800 | | 7,974,652 |
| | |
|
| | | | | 11,720,056 |
| Insurance - 2.92% | | | | |
| Aflac, Inc. | | 83,200 | | 4,897,152 |
| MetLife, Inc. | | 101,500 | | 4,807,040 |
| | |
|
| | | | | 9,704,192 |
| | | |
|
| | | | | 47,862,529 |
| Health Care - 13.05% | | | | |
| Biotechnology - 2.06% | | | | |
| Acorda Therapeutics, Inc. (I)(L) | | 34,300 | | 719,271 |
| Alexion Pharmaceuticals, Inc. (I)(L) | | 22,000 | | 2,118,160 |
| Amgen, Inc. (I) | | 49,400 | | 2,535,702 |
| Amylin Pharmaceuticals, Inc. (I) | | 54,900 | | 839,970 |
| Pharmasset, Inc. (I)(L) | | 13,000 | | 650,000 |
| | |
|
| | | | | 6,863,103 |
| Health Care Equipment & Supplies - 3.98% | | | | |
| Baxter International, Inc. | | 57,500 | | 3,056,125 |
| Covidien PLC | | 110,500 | | 5,685,225 |
| Medtronic, Inc. | | 112,434 | | 4,488,365 |
| | |
|
| | | | | 13,229,715 |
| | | | |
| Large Cap Fund (continued) | | | | |
| | | Shares or | | |
| | | Principal | | |
| | | Amount | | Value |
| | |
|
| |
| COMMON STOCKS (continued) | | | | |
| Health Care Providers & Services - 1.83% | | | | |
| UnitedHealth Group, Inc. | | 143,200 | $ | 6,097,456 |
| Health Care Technology - 0.11% | | | | |
| Emdeon, Inc., Class A (I) | | 22,200 | | 348,540 |
| Life Sciences Tools & Services - 0.26% | | | | |
| Bio-Rad Laboratories, Inc., Class A (I) | | 7,600 | | 867,616 |
| Pharmaceuticals - 4.81% | | | | |
| Allergan, Inc. | | 59,626 | | 4,422,460 |
| Johnson & Johnson | | 102,300 | | 6,285,312 |
| Merck & Company, Inc. | | 161,900 | | 5,273,083 |
| | |
|
| | | | | 15,980,855 |
| | |
|
| | | | | 43,387,285 |
| Industrials - 11.79% | | | | |
| Aerospace & Defense - 2.59% | | | | |
| General Dynamics Corp. (L) | | 51,400 | | 3,912,568 |
| The Boeing Company | | 65,200 | | 4,695,052 |
| | |
|
| | | | | 8,607,620 |
| Air Freight & Logistics - 1.29% | | | | |
| FedEx Corp. | | 47,783 | | 4,301,426 |
| Airlines - 0.76% | | | | |
| Southwest Airlines Company | | 214,400 | | 2,536,352 |
| Machinery - 4.37% | | | | |
| Dover Corp. | | 71,100 | | 4,568,175 |
| Illinois Tool Works, Inc. | | 110,148 | | 5,959,007 |
| PACCAR, Inc. | | 27,400 | | 1,373,562 |
| Pall Corp. | | 48,500 | | 2,636,460 |
| | |
|
| | | | | 14,537,204 |
| Road & Rail - 2.78% | | | | |
| Hertz Global Holdings, Inc. (I) | | 180,900 | | 2,751,489 |
| Norfolk Southern Corp. | | 62,900 | | 4,124,982 |
| Ryder Systems, Inc. | | 49,100 | | 2,348,453 |
| | |
|
| | | | | 9,224,924 |
| | |
|
| | | | | 39,207,526 |
| Information Technology - 18.44% | | | | |
| Communications Equipment - 3.59% | | | | |
| Cisco Systems, Inc. (I) | | 313,000 | | 5,809,280 |
| QUALCOMM, Inc. | | 103,000 | | 6,136,740 |
| �� | |
|
| | | | | 11,946,020 |
| Computers & Peripherals - 5.84% | | | | |
| Apple, Inc. (I) | | 31,100 | | 10,984,831 |
| Hewlett-Packard Company | | 137,900 | | 6,016,577 |
| Seagate Technology PLC (I) | | 190,000 | | 2,413,000 |
| | |
|
| | | | | 19,414,408 |
| IT Services - 0.90% | | | | |
| Visa, Inc., Class A (L) | | 40,800 | | 2,980,440 |
| Semiconductors & Semiconductor Equipment - 1.51% | | |
| Intersil Corp., Class A (L) | | 166,800 | | 2,133,372 |
| National Semiconductor Corp. (L) | | 186,600 | | 2,892,300 |
| | |
|
| | | | | 5,025,672 |
| Software - 6.60% | | | | |
| Adobe Systems, Inc. (I) | | 191,700 | | 6,613,650 |
| Autodesk, Inc. (I) | | 92,100 | | 3,872,805 |
| Microsoft Corp. | | 300,500 | | 7,987,290 |
| Symantec Corp. (I) | | 192,400 | | 3,468,972 |
| | |
|
| | | | | 21,942,717 |
| | |
|
| | | | | 61,309,257 |
| |
| The accompanying notes are an integral part of the financial statements. | 162 |
John Hancock Funds II
Portfolio of Investments — February 28, 2011 (Unaudited) (showing percentage of total net assets)
| | | | |
| Large Cap Fund (continued) | | | |
| | | Shares or | | |
| | | Principal | | |
| | | Amount | | Value |
| |
|
| COMMON STOCKS (continued) | | | | |
| Materials - 0.94% | | | | |
| Chemicals - 0.94% | | | | |
| Celanese Corp., Series A | | 75,400 | $ | 3,125,330 |
| Telecommunication Services - 1.91% | | | | |
| Diversified Telecommunication Services - 1.91% | | | |
| AT&T, Inc. | | 223,400 | | 6,340,092 |
| Utilities - 3.32% | | | | |
| Electric Utilities - 3.32% | | | | |
| American Electric Power Company, Inc. | | 146,643 | | 5,246,887 |
| FirstEnergy Corp. (L) | | 78,900 | | 3,021,870 |
| Nextera Energy, Inc. | | 50,300 | | 2,790,141 |
| | |
|
| | | | | 11,058,898 |
| | | |
|
| | | | | 11,058,898 |
|
| TOTAL COMMON STOCKS (Cost $272,061,418) | | $ | 327,868,890 |
|
| INVESTMENT COMPANIES - 0.40% | | | | |
| SPDR S&P 500 ETF Trust (L) | | 10,000 | | 1,331,500 |
|
| TOTAL INVESTMENT COMPANIES (Cost $1,184,412) | | $ | 1,331,500 |
|
| SECURITIES LENDING COLLATERAL - 10.21% | | | |
| John Hancock Collateral | | | | |
| Investment Trust, 0.2855% (W)(Y) | | 3,390,820 | | 33,933,294 |
|
| TOTAL SECURITIES LENDING | | | | |
| COLLATERAL (Cost $33,929,716) | | | $ | 33,933,294 |
|
| SHORT-TERM INVESTMENTS - 0.87% | | | |
| Repurchase Agreement - 0.87% | | | | |
| Repurchase Agreement with State Street Corp. | | | |
| dated 02/28/2011 at 0.010% to be | | | | |
| repurchased at $2,879,001 on 03/01/2011, | | | |
| collateralized by $2,620,000 Federal Home | | | |
| Loan Mortgage Corp., 4.750% due | | | | |
| 11/17/2015 (valued at $2,940,950, | | | | |
| including interest) | $ | 2,879,000 | $ | 2,879,000 |
|
| TOTAL SHORT-TERM INVESTMENTS (Cost $2,879,000) | | $ | 2,879,000 |
|
| Total Investments (Large Cap Fund) | | | | |
| (Cost $310,054,546) - 110.09% | | | $ | 366,012,684 |
| Other assets and liabilities, net - (10.09%) | | | (33,537,439) |
| | |
|
| TOTAL NET ASSETS - 100.00% | | | $ | 332,475,245 |
| | | |
|
| |
| |
| Large Cap Value Fund | | | | |
| | | Shares or | | |
| | | Principal | | |
| | | Amount | | Value |
| |
|
| COMMON STOCKS - 95.03% | | | | |
| Consumer Discretionary - 14.45% | | | | |
| Automobiles - 0.83% | | | | |
| General Motors Company (I) | | 17,000 | $ | 570,010 |
| Harley-Davidson, Inc. | | 25,400 | | 1,036,828 |
| | |
|
| | | | | 1,606,838 |
| Distributors - 0.48% | | | | |
| Genuine Parts Company | | 17,900 | | 943,151 |
| Diversified Consumer Services - 0.22% | | | | |
| H&R Block, Inc. | | 27,800 | | 422,282 |
| Hotels, Restaurants & Leisure - 0.72% | | | | |
| Marriott International, Inc., Class A | | 27,000 | | 1,058,670 |
| | | | |
| Large Cap Value Fund (continued) | | |
| | | Shares or | | |
| | | Principal | | |
| | | Amount | | Value |
| | |
|
| |
| COMMON STOCKS (continued) | | | | |
| Hotels, Restaurants & Leisure (continued) | | | | |
| MGM Resorts International (I) | | 24,400 | $ | 340,136 |
| | |
|
| | | | | 1,398,806 |
| Household Durables - 2.46% | | | | |
| D.R. Horton, Inc. | | 22,200 | | 262,848 |
| Fortune Brands, Inc. | | 42,200 | | 2,610,492 |
| Whirlpool Corp. | | 23,000 | | 1,897,500 |
| | |
|
| | | | | 4,770,840 |
| Leisure Equipment & Products - 0.81% | | | | |
| Mattel, Inc. | | 62,600 | | 1,568,756 |
| Media - 6.00% | | | | |
| Cablevision Systems Corp., Class A | | 42,200 | | 1,555,070 |
| Comcast Corp., Class A | | 43,900 | | 1,130,864 |
| DISH Network Corp. (I) | | 4,500 | | 104,625 |
| Madison Square Garden, Inc., Class A (I) | | 11,500 | | 328,440 |
| The McGraw-Hill Companies, Inc. | | 49,100 | | 1,899,188 |
| The New York Times Company, Class A (I) | | 62,900 | | 654,160 |
| The Walt Disney Company | | 54,700 | | 2,392,578 |
| Time Warner, Inc. | | 76,100 | | 2,907,020 |
| WPP PLC | | 49,200 | | 676,845 |
| | |
|
| | | | | 11,648,790 |
| Multiline Retail - 0.38% | | | | |
| Macy’s, Inc. | | 31,300 | | 748,070 |
| Specialty Retail - 2.55% | | | | |
| Bed Bath & Beyond, Inc. (I) | | 28,000 | | 1,348,200 |
| Lowe’s Companies, Inc. | | 124,000 | | 3,245,080 |
| Tiffany & Company | | 5,700 | | 350,835 |
| | |
|
| | | | | 4,944,115 |
| | |
|
| | | | | 28,051,648 |
| Consumer Staples - 5.93% | | | | |
| Beverages - 0.30% | | | | |
| PepsiCo, Inc. | | 9,200 | | 583,464 |
| Food Products - 2.99% | | | | |
| Archer-Daniels-Midland Company | | 16,700 | | 620,906 |
| Campbell Soup Company | | 25,600 | | 861,696 |
| ConAgra Foods, Inc. | | 43,200 | | 1,000,512 |
| McCormick & Company, Inc., Class B | | 16,900 | | 805,285 |
| The Hershey Company | | 48,000 | | 2,511,360 |
| | |
|
| | | | | 5,799,759 |
| Household Products - 1.94% | | | | |
| Clorox Company | | 28,200 | | 1,910,832 |
| Kimberly-Clark Corp. | | 28,300 | | 1,864,970 |
| | |
|
| | | | | 3,775,802 |
| Personal Products - 0.70% | | | | |
| Avon Products, Inc. | | 48,800 | | 1,357,128 |
| | |
|
| | | | | 11,516,153 |
| Energy - 14.21% | | | | |
| Energy Equipment & Services - 1.83% | | | | |
| Baker Hughes, Inc. | | 13,600 | | 966,280 |
| Schlumberger, Ltd. | | 27,600 | | 2,578,392 |
| | |
|
| | | | | 3,544,672 |
| Oil, Gas & Consumable Fuels - 12.38% | | | | |
| Anadarko Petroleum Corp. | | 28,300 | | 2,315,789 |
| Chevron Corp. | | 90,000 | | 9,337,500 |
| ConocoPhillips | | 39,500 | | 3,075,865 |
| Exxon Mobil Corp. | | 54,000 | | 4,618,620 |
| Murphy Oil Corp. | | 37,000 | | 2,720,610 |
| Spectra Energy Corp. | | 33,500 | | 896,125 |
| |
| The accompanying notes are an integral part of the financial statements. | 163 |
John Hancock Funds II
Portfolio of Investments — February 28, 2011 (Unaudited) (showing percentage of total net assets)
| | | | |
| Large Cap Value Fund (continued) | | |
| | | Shares or | | |
| | | Principal | | |
| | | Amount | | Value |
| |
|
| |
| COMMON STOCKS (continued) | | | | |
| Oil, Gas & Consumable Fuels (continued) | | | | |
| Sunoco, Inc. | | 25,700 | $ | 1,075,802 |
| | | |
|
| | | | | 24,040,311 |
| | | |
|
| | | | | 27,584,983 |
| Financials - 19.59% | | | | |
| Capital Markets - 3.06% | | | | |
| Legg Mason, Inc. | | 47,800 | | 1,732,750 |
| Morgan Stanley | | 88,600 | | 2,629,648 |
| The Bank of New York Mellon Corp. | | 51,900 | | 1,577,241 |
| | |
|
| | | | | 5,939,639 |
| Commercial Banks - 5.12% | | | | |
| KeyCorp | | 86,200 | | 787,868 |
| PNC Financial Services Group, Inc. | | 10,700 | | 660,190 |
| Regions Financial Corp. | | 97,400 | | 744,136 |
| SunTrust Banks, Inc. | | 46,800 | | 1,411,956 |
| U.S. Bancorp | | 102,700 | | 2,847,871 |
| Wells Fargo & Company | | 107,800 | | 3,477,628 |
| | |
|
| | | | | 9,929,649 |
| Consumer Finance - 2.23% | | | | |
| Capital One Financial Corp. | | 25,800 | | 1,284,066 |
| SLM Corp. (I) | | 205,700 | | 3,048,474 |
| | |
|
| | | | | 4,332,540 |
| Diversified Financial Services - 5.13% | | | | |
| Bank of America Corp. | | 219,800 | | 3,140,942 |
| JPMorgan Chase & Company | | 120,800 | | 5,640,152 |
| NYSE Euronext | | 32,000 | | 1,184,000 |
| | |
|
| | | | | 9,965,094 |
| Insurance - 3.64% | | | | |
| Chubb Corp. | | 13,400 | | 813,112 |
| Lincoln National Corp. | | 45,500 | | 1,443,260 |
| Marsh & McLennan Companies, Inc. | | 67,800 | | 2,063,832 |
| Sun Life Financial, Inc. | | 36,200 | | 1,203,288 |
| The Allstate Corp. | | 48,200 | | 1,531,796 |
| | |
|
| | | | | 7,055,288 |
| Real Estate Investment Trusts - 0.41% | | | | |
| Weyerhaeuser Company | | 32,700 | | 798,207 |
| | |
|
| | | | | 38,020,417 |
| Health Care - 4.78% | | | | |
| Biotechnology - 0.42% | | | | |
| Amgen, Inc. (I) | | 16,100 | | 826,413 |
| Pharmaceuticals - 4.36% | | | | |
| Bristol-Myers Squibb Company | | 53,600 | | 1,383,416 |
| Eli Lilly & Company | | 30,300 | | 1,047,168 |
| Johnson & Johnson | | 38,400 | | 2,359,296 |
| Merck & Company, Inc. | | 50,000 | | 1,628,500 |
| Pfizer, Inc. | | 106,000 | | 2,039,440 |
| | |
|
| | | | | 8,457,820 |
| | | |
|
| | | | | 9,284,233 |
| Industrials - 12.66% | | | | |
| Aerospace & Defense - 3.27% | | | | |
| Honeywell International, Inc. | | 39,300 | | 2,275,863 |
| ITT Corp. | | 22,400 | | 1,297,632 |
| Lockheed Martin Corp. | | 13,500 | | 1,068,660 |
| The Boeing Company | | 23,800 | | 1,713,838 |
| | |
|
| | | | | 6,355,993 |
| Air Freight & Logistics - 1.03% | | | | |
| United Parcel Service, Inc., Class B | | 27,000 | | 1,992,600 |
| | | | |
| Large Cap Value Fund (continued) | | |
| | | Shares or | | |
| | | Principal | | |
| | | Amount | | Value |
| | |
|
| COMMON STOCKS (continued) | | | | |
| Building Products - 0.76% | | | | |
| Masco Corp. | | 74,200 | $ | 1,008,378 |
| USG Corp. (I) | | 26,800 | | 459,352 |
| | |
|
| | | | | 1,467,730 |
| Commercial Services & Supplies - 2.02% | | | | |
| Avery Dennison Corp. | | 98,300 | | 3,924,136 |
| Electrical Equipment - 0.77% | | | | |
| Cooper Industries PLC | | 23,200 | | 1,492,920 |
| Industrial Conglomerates - 3.20% | | | | |
| General Electric Company | | 297,300 | | 6,219,516 |
| Machinery - 1.61% | | | | |
| Eaton Corp. | | 28,200 | | 3,123,996 |
| | |
|
| | | | | 24,576,891 |
| Information Technology - 6.52% | | | | |
| Communications Equipment - 1.18% | | | | |
| Cisco Systems, Inc. (I) | | 52,200 | | 968,832 |
| Harris Corp. | | 28,300 | | 1,320,478 |
| | |
|
| | | | | 2,289,310 |
| Computers & Peripherals - 1.28% | | | | |
| Dell, Inc. (I) | | 56,200 | | 889,646 |
| Hewlett-Packard Company | | 36,300 | | 1,583,769 |
| | |
|
| | | | | 2,473,415 |
| Internet Software & Services - 0.05% | | | | |
| eBay, Inc. (I) | | 3,000 | | 100,515 |
| IT Services - 0.89% | | | | |
| Computer Sciences Corp. | | 36,000 | | 1,732,680 |
| Semiconductors & Semiconductor Equipment - 1.74% | | |
| Applied Materials, Inc. | | 96,300 | | 1,582,209 |
| Texas Instruments, Inc. | | 50,600 | | 1,801,866 |
| | |
|
| | | | | 3,384,075 |
| Software - 1.38% | | | | |
| Electronic Arts, Inc. (I) | | 34,200 | | 642,960 |
| Microsoft Corp. | | 76,500 | | 2,033,370 |
| | |
|
| | | | | 2,676,330 |
| | |
|
| | | | | 12,656,325 |
| Materials - 5.88% | | | | |
| Chemicals - 2.35% | | | | |
| E.I. du Pont de Nemours & Company | | 21,400 | | 1,174,218 |
| International Flavors & Fragrances, Inc. | | 22,400 | | 1,275,680 |
| Monsanto Company | | 29,500 | | 2,120,755 |
| | |
|
| | | | | 4,570,653 |
| Construction Materials - 0.78% | | | | |
| Vulcan Materials Company | | 32,800 | | 1,503,880 |
| Metals & Mining - 1.09% | | | | |
| Nucor Corp. | | 44,100 | | 2,115,036 |
| Paper & Forest Products - 1.66% | | | | |
| International Paper Company | | 77,300 | | 2,147,394 |
| MeadWestvaco Corp. | | 36,400 | | 1,068,340 |
| | |
|
| | | | | 3,215,734 |
| | |
|
| | | | | 11,405,303 |
| Telecommunication Services - 3.69% | | | | |
| Diversified Telecommunication Services - 3.69% | | | | |
| AT&T, Inc. | | 116,300 | | 3,300,594 |
| Qwest Communications International, Inc. | | 205,100 | | 1,398,782 |
| |
| The accompanying notes are an integral part of the financial statements. | 164 |
John Hancock Funds II
Portfolio of Investments — February 28, 2011 (Unaudited) (showing percentage of total net assets)
| | | | |
| Large Cap Value Fund (continued) | | |
| | Shares or | | |
| | Principal | | |
| | Amount | | Value |
| |
|
| | | |
| COMMON STOCKS (continued) | | | | |
| Diversified Telecommunication Services (continued) | | | | |
| Verizon Communications, Inc. | | 66,700 | $ | 2,462,564 |
| | | |
|
| | | | | 7,161,940 |
| | | |
|
| | | | | 7,161,940 |
| Utilities - 7.32% | | | | |
| Electric Utilities - 5.04% | | | | |
| Duke Energy Corp. | | 56,400 | | 1,014,635 |
| Entergy Corp. | | 36,100 | | 2,570,320 |
| Exelon Corp. | | 54,600 | | 2,280,096 |
| FirstEnergy Corp. | | 20,600 | | 788,980 |
| Pinnacle West Capital Corp. | | 22,300 | | 941,729 |
| PPL Corp. | | 34,000 | | 864,620 |
| Progress Energy, Inc. | | 29,000 | | 1,325,590 |
| | |
|
| | | | | 9,785,970 |
| Independent Power Producers & Energy Traders - 0.75% | | | | |
| Constellation Energy Group, Inc. | | 34,500 | | 1,071,915 |
| NRG Energy, Inc. (I) | | 19,100 | | 381,809 |
| | |
|
| | | | | 1,453,724 |
| Multi-Utilities - 1.53% | | | | |
| CenterPoint Energy, Inc. | | 29,000 | | 459,940 |
| NiSource, Inc. | | 44,000 | | 843,040 |
| TECO Energy, Inc. | | 21,400 | | 387,554 |
| Xcel Energy, Inc. | | 53,600 | | 1,283,185 |
| | |
|
| | | | | 2,973,719 |
| | | |
|
| | | | | 14,213,413 |
|
| TOTAL COMMON STOCKS (Cost $168,384,436) | | | $ | 184,471,306 |
|
| PREFERRED SECURITIES - 0.58% | | | | |
| Consumer Discretionary - 0.58% | | | | |
| Automobiles - 0.58% | | | | |
| General Motors Company, Series B, 4.750% | | 22,300 | | 1,134,624 |
|
| TOTAL PREFERRED SECURITIES (Cost $1,229,709) | | | $ | 1,134,624 |
|
| SHORT-TERM INVESTMENTS - 3.65% | | | | |
| Short-Term Securities* - 3.65% | | | | |
| State Street Institutional U.S. Government | | | | |
| Money Market Fund, 0.0647% | $ | 955,050 | $ | 955,050 |
| T. Rowe Price Prime Reserve Fund, 0.2212% | | 6,131,938 | | 6,131,938 |
| | |
|
| | | | | 7,086,988 |
|
| TOTAL SHORT-TERM INVESTMENTS (Cost $7,086,988) | | | $ | 7,086,988 |
|
| Total Investments (Large Cap Value Fund) | | | | |
| (Cost $176,701,133) - 99.26% | | | $ | 192,692,918 |
| Other assets and liabilities, net - 0.74% | | | | 1,435,006 |
| | | |
|
| TOTAL NET ASSETS - 100.00% | | | $ | 194,127,924 |
| | | |
|
| |
| |
| Mid Cap Growth Index Fund | | | | |
| | Shares or | | |
| | Principal | | |
| | Amount | | Value |
| |
|
| | | | | |
| COMMON STOCKS - 98.70% | | | | |
| Consumer Discretionary - 20.53% | | | | |
| Auto Components - 1.90% | | | | |
| Autoliv, Inc. (L) | | 2,984 | $ | 223,472 |
| BorgWarner, Inc. (I) (L) | | 5,884 | | 456,657 |
| Lear Corp. | | 1,669 | | 176,580 |
| The Goodyear Tire & Rubber Company (I) | | 11,975 | | 169,806 |
| | | | |
| Mid Cap Growth Index Fund (continued) | | |
| | | Shares or | | |
| | | Principal | | |
| | | Amount | | Value |
| | |
|
| |
| COMMON STOCKS (continued) | | | | |
| Auto Components (continued) | | | | |
| TRW Automotive Holdings Corp. (I) | | 3,491 | $ | 198,289 |
| | |
|
| | | | | 1,224,804 |
| Automobiles - 0.77% | | | | |
| Harley-Davidson, Inc. | | 12,120 | | 494,738 |
| Distributors - 0.26% | | | | |
| LKQ Corp. (I) | | 7,057 | | 167,674 |
| Diversified Consumer Services - 1.12% | | | | |
| Apollo Group, Inc., Class A (I) | | 6,767 | | 306,274 |
| DeVry, Inc. | | 3,303 | | 179,188 |
| ITT Educational Services, Inc. (I) | | 1,776 | | 134,710 |
| Strayer Education, Inc. | | 715 | | 98,270 |
| | |
|
| | | | | 718,442 |
| Hotels, Restaurants & Leisure - 2.77% | | | | |
| Chipotle Mexican Grill, Inc. (I) | | 1,614 | | 395,430 |
| Hyatt Hotels Corp., Class A (I) | | 1,481 | | 67,756 |
| International Game Technology | | 15,268 | | 251,311 |
| MGM Resorts International (I) | | 17,321 | | 241,455 |
| Penn National Gaming, Inc. (I) | | 1,718 | | 61,453 |
| Royal Caribbean Cruises, Ltd. (I) | | 2,497 | | 109,344 |
| Starwood Hotels & Resorts Worldwide, Inc. | | 9,843 | | 601,407 |
| Wendy’s/Arby’s Group, Inc., Class A | | 10,999 | | 52,355 |
| | |
|
| | | | | 1,780,511 |
| Household Durables - 0.38% | | | | |
| Harman International Industries, Inc. | | 1,804 | | 87,747 |
| NVR, Inc. (I) (L) | | 144 | | 104,812 |
| Toll Brothers, Inc. (I) | | 2,494 | | 53,022 |
| | |
|
| | | | | 245,581 |
| Internet & Catalog Retail - 1.07% | | | | |
| Expedia, Inc. | | 10,647 | | 211,449 |
| Netflix, Inc. (I) | | 2,309 | | 477,201 |
| | |
|
| | | | | 688,650 |
| Media - 4.58% | | | | |
| Cablevision Systems Corp., Class A | | 12,896 | | 475,218 |
| Clear Channel Outdoor | | | | |
| Holdings, Inc., Class A (I) | | 1,381 | | 20,356 |
| CTC Media, Inc. | | 2,831 | | 59,564 |
| Lamar Advertising Company, Class A (I) | | 1,952 | | 75,679 |
| Liberty Global, Inc., Series A (I) (L) | | 6,100 | | 256,810 |
| Liberty Global, Inc., Series C (I) | | 5,635 | | 224,780 |
| Liberty Media Corp. - Capital, Series A (I) | | 3,740 | | 271,374 |
| Liberty Media Corp. - Starz, Series A (I) | | 2,538 | | 178,168 |
| Scripps Networks Interactive, Inc., Class A | | 4,725 | | 245,417 |
| Sirius XM Radio, Inc. (I) | | 200,178 | | 362,322 |
| The Interpublic Group of Companies, Inc. | | 25,164 | | 332,165 |
| Virgin Media, Inc. (L) | | 16,261 | | 442,950 |
| | |
|
| | | | | 2,944,803 |
| Multiline Retail - 1.65% | | | | |
| Dollar Tree, Inc. (I) | | 6,549 | | 329,546 |
| Family Dollar Stores, Inc. (L) | | 6,440 | | 322,515 |
| Nordstrom, Inc. | | 8,995 | | 407,114 |
| | |
|
| | | | | 1,059,175 |
| Specialty Retail - 4.82% | | | | |
| Abercrombie & Fitch Company, Class A | | 4,568 | | 262,066 |
| Advance Auto Parts, Inc. | | 4,347 | | 272,470 |
| American Eagle Outfitters, Inc. | | 4,743 | | 72,805 |
| CarMax, Inc. (I) | | 11,509 | | 407,073 |
| Dick’s Sporting Goods, Inc. (I) | | 4,714 | | 175,078 |
| Guess?, Inc. | | 3,144 | | 142,392 |
| O’Reilly Automotive, Inc. (I) | | 7,181 | | 399,120 |
| |
| The accompanying notes are an integral part of the financial statements. | 165 |
John Hancock Funds II
Portfolio of Investments — February 28, 2011 (Unaudited) (showing percentage of total net assets)
| | | | |
| Mid Cap Growth Index Fund (continued) | | |
| | | Shares or | | |
| | | Principal | | |
| | | Amount | | Value |
| | |
|
| |
| COMMON STOCKS (continued) | | | | |
| Specialty Retail (continued) | | | | |
| PetSmart, Inc. | | 6,052 | $ | 247,345 |
| Ross Stores, Inc. | | 6,314 | | 454,861 |
| Tiffany & Company | | 6,575 | | 404,691 |
| Urban Outfitters, Inc. (I) | | 6,878 | | 263,978 |
| | |
|
| | | | | 3,101,879 |
| Textiles, Apparel & Luxury Goods - 1.21% | | | | |
| Fossil, Inc. (I) | | 2,786 | | 213,798 |
| Phillips-Van Heusen Corp. | | 2,237 | | 134,242 |
| Polo Ralph Lauren Corp. | | 3,374 | | 427,520 |
| | |
|
| | | | | 775,560 |
| | | |
|
| | | | | 13,201,817 |
| Consumer Staples - 3.03% | | | | |
| Beverages - 0.69% | | | | |
| Dr. Pepper Snapple Group, Inc. | | 6,097 | | 219,858 |
| Hansen Natural Corp. (I) | | 3,889 | | 223,812 |
| | |
|
| | | | | 443,670 |
| Food & Staples Retailing - 0.69% | | | | |
| Whole Foods Market, Inc. | | 7,580 | | 443,885 |
| Food Products - 0.65% | | | | |
| Flowers Foods, Inc. (L) | | 4,200 | | 111,720 |
| Green Mountain Coffee Roasters, Inc. (I) | | 5,820 | | 237,340 |
| Hormel Foods Corp. | | 2,506 | | 68,664 |
| | |
|
| | | | | 417,724 |
| Household Products - 0.36% | | | | |
| Energizer Holdings, Inc. (I) | | 3,460 | | 231,232 |
| Personal Products - 0.64% | | | | |
| Alberto-Culver Company | | 4,607 | | 171,565 |
| Herbalife, Ltd. | | 3,071 | | 240,797 |
| | |
|
| | | | | 412,362 |
| | | |
|
| | | | | 1,948,873 |
| Energy - 14.56% | | | | |
| Energy Equipment & Services - 4.51% | | | | |
| Cameron International Corp. (I) | | 12,468 | | 737,233 |
| Core Laboratories NV | | 2,318 | | 239,565 |
| Dresser-Rand Group, Inc. (I) | | 4,143 | | 204,167 |
| FMC Technologies, Inc. (I) | | 6,183 | | 581,511 |
| Helmerich & Payne, Inc. (L) | | 5,491 | | 356,860 |
| McDermott International, Inc. (I) | | 11,952 | | 274,298 |
| Nabors Industries, Ltd. (I) | | 9,521 | | 271,063 |
| Oceaneering International, Inc. (I) | | 2,809 | | 234,917 |
| | |
|
| | | | | 2,899,614 |
| Oil, Gas & Consumable Fuels - 10.05% | | | | |
| Alpha Natural Resources, Inc. (L) | | 6,237 | | 338,170 |
| Arch Coal, Inc. | | 8,331 | | 279,338 |
| Cabot Oil & Gas Corp. | | 5,303 | | 242,135 |
| Cobalt International Energy, Inc. (I) | | 4,584 | | 71,785 |
| Concho Resources, Inc. (I) | | 4,527 | | 482,216 |
| CONSOL Energy, Inc. | | 11,616 | | 589,047 |
| Continental Resources, Inc. (I) | | 1,778 | | 123,624 |
| Denbury Resources, Inc. (I) | | 6,790 | | 164,522 |
| El Paso Corp. | | 18,065 | | 336,009 |
| EQT Corp. | | 7,251 | | 357,474 |
| EXCO Resources, Inc. | | 9,379 | | 191,988 |
| Forest Oil Corp. (I) | | 3,631 | | 128,864 |
| Kinder Morgan Management LLC (I) | | 2,123 | | 139,315 |
| Massey Energy Company | | 5,029 | | 318,487 |
| Newfield Exploration Company (I) | | 3,466 | | 252,290 |
| Petrohawk Energy Corp. (I) | | 15,589 | | 336,722 |
| Pioneer Natural Resources Company | | 5,975 | | 611,482 |
| | | | |
| Mid Cap Growth Index Fund (continued) | | |
| | | Shares or | | |
| | | Principal | | |
| | | Amount | | Value |
| | |
|
| |
| COMMON STOCKS (continued) | | | | |
| Oil, Gas & Consumable Fuels (continued) | | | | |
| QEP Resources, Inc. | | 8,988 | $ | 355,475 |
| Quicksilver Resources, Inc. (I) | | 6,049 | | 93,699 |
| Range Resources Corp. | | 8,204 | | 445,477 |
| Sunoco, Inc. (L) | | 6,156 | | 257,690 |
| Whiting Petroleum Corp. (I) | | 5,292 | | 345,779 |
| | |
|
| | | | | 6,461,588 |
| | | |
|
| | | | | 9,361,202 |
| Financials - 7.22% | | | | |
| Capital Markets - 1.32% | | | | |
| Affiliated Managers Group, Inc. (I) | | 2,651 | | 282,994 |
| Eaton Vance Corp. | | 6,130 | | 191,869 |
| Greenhill & Company, Inc. (L) | | 1,300 | | 93,379 |
| Janus Capital Group, Inc. (L) | | 9,301 | | 124,912 |
| SEI Investments Company | | 6,800 | | 156,468 |
| | |
|
| | | | | 849,622 |
| Commercial Banks - 0.74% | | | | |
| CIT Group, Inc. (I) | | 9,772 | | 423,324 |
| First Horizon National Corp. | | 4,586 | | 52,739 |
| | |
|
| | | | | 476,063 |
| Consumer Finance - 0.95% | | | | |
| Discover Financial Services | | 28,029 | | 609,631 |
| Diversified Financial Services - 1.00% | | | | |
| CBOE Holdings, Inc. | | 600 | | 17,754 |
| IntercontinentalExchange, Inc. (I) | | 3,266 | | 418,701 |
| MSCI, Inc. (I) | | 5,855 | | 207,853 |
| | |
|
| | | | | 644,308 |
| Insurance - 0.25% | | | | |
| Brown & Brown, Inc. | | 6,212 | | 162,382 |
| Real Estate Investment Trusts - 1.76% | | | | |
| Alexandria Real Estate Equities, Inc. | | 983 | | 78,837 |
| AvalonBay Communities, Inc. (L) | | 2,209 | | 267,355 |
| Digital Realty Trust, Inc. (L) | | 1,552 | | 91,289 |
| Duke Realty Corp. | | 4,569 | | 64,286 |
| Host Hotels & Resorts, Inc. | | 34,191 | | 629,114 |
| | |
|
| | | | | 1,130,881 |
| Real Estate Management & Development - 1.12% | | | | |
| CB Richard Ellis Group, Inc., Class A (I) | | 14,927 | | 373,772 |
| Jones Lang LaSalle, Inc. | | 2,212 | | 217,705 |
| The St. Joe Company (I) (L) | | 4,756 | | 127,366 |
| | |
|
| | | | | 718,843 |
| Thrifts & Mortgage Finance - 0.08% | | | | |
| TFS Financial Corp. | | 4,799 | | 49,814 |
| | |
|
| | | | | 4,641,544 |
| Health Care - 14.71% | | | | |
| Biotechnology - 2.70% | | | | |
| Alexion Pharmaceuticals, Inc. (I) | | 4,638 | | 446,547 |
| Amylin Pharmaceuticals, Inc. (I) | | 7,400 | | 113,220 |
| Cephalon, Inc. (I) | | 1,951 | | 109,861 |
| Dendreon Corp. (I) | | 7,371 | | 247,592 |
| Human Genome Sciences, Inc. (I) | | 9,663 | | 241,865 |
| Myriad Genetics, Inc. (I) | | 4,850 | | 89,822 |
| Vertex Pharmaceuticals, Inc. (I) (L) | | 10,425 | | 486,535 |
| | |
|
| | | | | 1,735,442 |
| Health Care Equipment & Supplies - 3.08% | | | | |
| CareFusion Corp. (I) | | 5,769 | | 157,609 |
| DENTSPLY International, Inc. | | 6,940 | | 259,348 |
| Edwards Lifesciences Corp. (I) | | 5,842 | | 496,804 |
| Gen-Probe, Inc. (I) | | 2,515 | | 158,143 |
| |
| The accompanying notes are an integral part of the financial statements. | 166 |
John Hancock Funds II
Portfolio of Investments — February 28, 2011 (Unaudited) (showing percentage of total net assets)
| | | | |
| Mid Cap Growth Index Fund (continued) | | |
| | | Shares or | | |
| | | Principal | | |
| | | Amount | | Value |
| | |
|
| |
| COMMON STOCKS (continued) | | | | |
| Health Care Equipment & Supplies (continued) | | | | |
| IDEXX Laboratories, Inc. (I) (L) | | 2,994 | $ | 232,634 |
| ResMed, Inc. (I) (L) | | 7,754 | | 245,026 |
| Varian Medical Systems, Inc. (I) | | 6,281 | | 435,148 |
| | |
|
| | | | | 1,984,712 |
| Health Care Providers & Services - 2.49% | | | | |
| AmerisourceBergen Corp. | | 14,368 | | 544,691 |
| Community Health Systems, Inc. (I) | | 2,449 | | 100,091 |
| DaVita, Inc. (I) | | 5,295 | | 420,264 |
| Henry Schein, Inc. (I) | | 4,730 | | 326,275 |
| Lincare Holdings, Inc. | | 1,781 | | 52,255 |
| Patterson Companies, Inc. | | 4,825 | | 161,059 |
| | |
|
| | | | | 1,604,635 |
| Health Care Technology - 0.57% | | | | |
| Cerner Corp. (I) (L) | | 3,638 | | 365,437 |
| Life Sciences Tools & Services - 3.23% | | | | |
| Bio-Rad Laboratories, Inc., Class A (I) | | 979 | | 111,763 |
| Covance, Inc. (I) | | 3,360 | | 189,605 |
| Illumina, Inc. (I) | | 6,426 | | 445,964 |
| Life Technologies Corp. (I) | | 9,499 | | 506,962 |
| Mettler-Toledo International, Inc. (I) | | 1,733 | | 296,984 |
| Techne Corp. | | 1,821 | | 130,547 |
| Waters Corp. (I) | | 4,738 | | 393,491 |
| | |
|
| | | | | 2,075,316 |
| Pharmaceuticals - 2.64% | | | | |
| Endo Pharmaceuticals Holdings, Inc. (I) | | 2,074 | | 73,668 |
| Hospira, Inc. (I) | | 8,667 | | 458,051 |
| Mylan, Inc. (I) | | 15,952 | | 364,822 |
| Perrigo Company | | 4,260 | | 325,592 |
| Warner Chilcott PLC, Class A | | 3,828 | | 90,647 |
| Watson Pharmaceuticals, Inc. (I) | | 6,871 | | 384,707 |
| | |
|
| | | | | 1,697,487 |
| | | |
|
| | | | | 9,463,029 |
| Industrials - 13.91% | | | | |
| Aerospace & Defense - 1.01% | | | | |
| Alliant Techsystems, Inc. | | 1,700 | | 122,689 |
| Spirit Aerosystems Holdings, Inc., Class A (I) | | 5,545 | | 144,115 |
| Textron, Inc. (L) | | 14,129 | | 382,755 |
| | |
|
| | | | | 649,559 |
| Building Products - 0.12% | | | | |
| Owens Corning, Inc. (I) | | 2,097 | | 74,926 |
| Commercial Services & Supplies - 1.32% | | | | |
| Copart, Inc. (I) | | 3,116 | | 130,903 |
| Covanta Holding Corp. | | 6,840 | | 115,733 |
| Iron Mountain, Inc. | | 9,311 | | 242,086 |
| Stericycle, Inc. (I) | | 4,205 | | 363,396 |
| | |
|
| | | | | 852,118 |
| Construction & Engineering - 1.52% | | | | |
| Foster Wheeler AG (I) | | 6,517 | | 235,655 |
| Jacobs Engineering Group, Inc. (I) | | 6,424 | | 321,585 |
| Quanta Services, Inc. (I) | | 10,825 | | 246,918 |
| The Shaw Group, Inc. (I) | | 4,382 | | 174,053 |
| | |
|
| | | | | 978,211 |
| Electrical Equipment - 2.22% | | | | |
| AMETEK, Inc. | | 8,218 | | 344,745 |
| Rockwell Automation, Inc. | | 3,680 | | 322,846 |
| Roper Industries, Inc. | | 4,851 | | 408,115 |
| Sensata Technologies Holding NV (I) | | 4,449 | | 147,262 |
| | | | |
| Mid Cap Growth Index Fund (continued) | | |
| | | Shares or | | |
| | | Principal | | |
| | | Amount | | Value |
| | |
|
| |
| COMMON STOCKS (continued) | | | | |
| Electrical Equipment (continued) | | | | |
| The Babcock & Wilcox Company (I) | | 6,031 | $ | 203,667 |
| | |
|
| | | | | 1,426,635 |
| Machinery - 3.56% | | | | |
| AGCO Corp. (I) | | 4,827 | | 264,423 |
| Bucyrus International, Inc. | | 3,993 | | 363,603 |
| Donaldson Company, Inc. | | 3,766 | | 212,026 |
| Flowserve Corp. | | 2,903 | | 362,788 |
| Joy Global, Inc. | | 5,310 | | 517,088 |
| Navistar International Corp. (I) | | 3,343 | | 207,199 |
| Pall Corp. | | 3,005 | | 163,352 |
| SPX Corp. | | 1,305 | | 104,087 |
| Terex Corp. (I) | | 2,810 | | 94,838 |
| | |
|
| | | | | 2,289,404 |
| Professional Services - 1.77% | | | | |
| Dun & Bradstreet Corp. | | 2,597 | | 209,838 |
| FTI Consulting, Inc. (I) (L) | | 2,358 | | 77,790 |
| IHS, Inc., Class A (I) | | 2,161 | | 180,876 |
| Manpower, Inc. | | 2,105 | | 133,668 |
| Nielsen Holdings NV (I) | | 4,500 | | 119,655 |
| Robert Half International, Inc. | | 7,175 | | 228,883 |
| Verisk Analytics, Inc., Class A (I) | | 5,867 | | 189,797 |
| | |
|
| | | | | 1,140,507 |
| Road & Rail - 0.85% | | | | |
| Hertz Global Holdings, Inc. (I) (L) | | 4,116 | | 62,604 |
| J.B. Hunt Transport Services, Inc. | | 4,799 | | 199,686 |
| Kansas City Southern (I) | | 5,321 | | 286,483 |
| | |
|
| | | | | 548,773 |
| Trading Companies & Distributors - 1.54% | | | | |
| Fastenal Company (L) | | 6,868 | | 426,709 |
| MSC Industrial Direct Company, Inc., Class A | | 2,315 | | 146,285 |
| WW Grainger, Inc. | | 3,119 | | 415,482 |
| | |
|
| | | | | 988,476 |
| | | |
|
| | | | | 8,948,609 |
| Information Technology - 17.77% | | | | |
| Communications Equipment - 1.23% | | | | |
| Brocade Communications Systems, Inc. (I) | | 22,826 | | 145,402 |
| F5 Networks, Inc. (I) (L) | | 4,175 | | 492,692 |
| Motorola Mobility Holdings, Inc. (I) | | 5,000 | | 151,000 |
| | |
|
| | | | | 789,094 |
| Computers & Peripherals - 1.21% | | | | |
| SanDisk Corp. (I) | | 11,994 | | 594,902 |
| Western Digital Corp. (I) | | 5,950 | | 181,951 |
| | |
|
| | | | | 776,853 |
| Electronic Equipment, Instruments & Components - 1.89% | | |
| Amphenol Corp., Class A | | 9,006 | | 517,665 |
| Dolby Laboratories, Inc., Class A (I) | | 2,757 | | 139,421 |
| FLIR Systems, Inc. (L) | | 8,104 | | 261,759 |
| Trimble Navigation, Ltd. (I) | | 6,083 | | 298,979 |
| | |
|
| | | | | 1,217,824 |
| Internet Software & Services - 1.35% | | | | |
| Akamai Technologies, Inc. (I) | | 9,323 | | 349,892 |
| Equinix, Inc. (I) | | 2,366 | | 204,517 |
| VeriSign, Inc. | | 8,938 | | 315,422 |
| | |
|
| | | | | 869,831 |
| IT Services - 2.59% | | | | |
| Alliance Data Systems Corp. (I) (L) | | 2,731 | | 215,039 |
| Broadridge Financial Solutions, Inc. | | 6,576 | | 150,722 |
| DST Systems, Inc. | | 932 | | 47,532 |
| |
| The accompanying notes are an integral part of the financial statements. | 167 |
John Hancock Funds II
Portfolio of Investments — February 28, 2011 (Unaudited) (showing percentage of total net assets)
| | | | |
| Mid Cap Growth Index Fund (continued) | | |
| | | Shares or | | |
| | | Principal | | |
| | | Amount | | Value |
| | |
|
| |
| COMMON STOCKS (continued) | | | | |
| IT Services (continued) | | | | |
| Fiserv, Inc. (I) | | 7,772 | $ | 491,734 |
| Genpact, Ltd. (I) | | 5,122 | | 71,452 |
| Global Payments, Inc. | | 4,100 | | 196,759 |
| Lender Processing Services, Inc. | | 2,415 | | 82,279 |
| Teradata Corp. (I) | | 8,581 | | 410,343 |
| | |
|
| | | | | 1,665,860 |
| Semiconductors & Semiconductor Equipment - 4.87% | | |
| Advanced Micro Devices, Inc. (I) | | 10,413 | | 95,904 |
| Altera Corp. | | 15,841 | | 663,104 |
| Atmel Corp. (I) | | 23,748 | | 348,621 |
| Avago Technologies, Ltd. | | 8,039 | | 273,246 |
| Cree, Inc. (I) (L) | | 5,301 | | 279,204 |
| Lam Research Corp. (I) | | 2,177 | | 119,517 |
| Linear Technology Corp. | | 11,546 | | 399,030 |
| MEMC Electronic Materials, Inc. (I) | | 11,800 | | 160,126 |
| ON Semiconductor Corp. (I) | | 22,070 | | 246,081 |
| Skyworks Solutions, Inc. (I) | | 9,169 | | 329,534 |
| Xilinx, Inc. (L) | | 6,615 | | 219,949 |
| | |
|
| | | | | 3,134,316 |
| Software - 4.63% | | | | |
| ANSYS, Inc. (I) | | 4,696 | | 264,479 |
| Autodesk, Inc. (I) | | 11,693 | | 491,691 |
| BMC Software, Inc. (I) | | 9,169 | | 453,866 |
| Electronic Arts, Inc. (I) | | 11,140 | | 209,432 |
| FactSet Research Systems, Inc. | | 2,284 | | 239,546 |
| McAfee, Inc. (I) | | 7,791 | | 373,578 |
| Nuance Communications, Inc. (I) | | 12,000 | | 223,920 |
| Red Hat, Inc. (I) | | 9,704 | | 400,581 |
| Rovi Corp. (I) | | 5,740 | | 318,111 |
| | |
|
| | | | | 2,975,204 |
| | | |
|
| | | | | 11,428,982 |
| Materials - 5.30% | | | | |
| Chemicals - 3.19% | | | | |
| Celanese Corp., Series A | | 7,999 | | 331,559 |
| CF Industries Holdings, Inc. | | 3,688 | | 521,041 |
| FMC Corp. | | 1,264 | | 97,884 |
| Lubrizol Corp. | | 3,503 | | 381,372 |
| Nalco Holding Company | | 7,075 | | 180,908 |
| Sigma-Aldrich Corp. (L) | | 6,269 | | 400,526 |
| The Scotts Miracle-Gro Company, Class A | | 2,432 | | 136,605 |
| | |
|
| | | | | 2,049,895 |
| Construction Materials - 0.11% | | | | |
| Martin Marietta Materials, Inc. (L) | | 812 | | 72,154 |
| Containers & Packaging - 1.00% | | | | |
| Ball Corp. | | 8,974 | | 323,961 |
| Crown Holdings, Inc. (I) | | 8,314 | | 319,923 |
| | |
|
| | | | | 643,884 |
| Metals & Mining - 1.00% | | | | |
| Allegheny Technologies, Inc. | | 4,603 | | 308,769 |
| Titanium Metals Corp. (I) | | 3,038 | | 57,692 |
| United States Steel Corp. (L) | | 4,829 | | 277,619 |
| | |
|
| | | | | 644,080 |
| | | |
|
| | | | | 3,410,013 |
| Telecommunication Services - 1.24% | | | | |
| Wireless Telecommunication Services - 1.24% | | | | |
| Clearwire Corp. (I) (L) | | 4,900 | | 24,647 |
| MetroPCS Communications, Inc. (I) | | 12,854 | | 185,098 |
| NII Holdings, Inc. (I) | | 8,639 | | 353,853 |
| | | | |
| Mid Cap Growth Index Fund (continued) | | |
| | Shares or | | |
| | Principal | | |
| | Amount | | Value |
| |
|
| | | | | |
| COMMON STOCKS (continued) | | | | |
| Wireless Telecommunication Services (continued) | | | |
| SBA Communications Corp., Class A (I) | | 5,551 | $ | 233,642 |
| | |
|
| | | | | 797,240 |
| |
|
| | | | | 797,240 |
| Utilities - 0.43% | | | | |
| Independent Power Producers & Energy Traders - 0.43% | | |
| Calpine Corp. (I) | | 18,255 | | 276,191 |
|
| TOTAL COMMON STOCKS (Cost $51,596,505) | | $ | 63,477,500 |
|
| |
| SECURITIES LENDING COLLATERAL - 8.70% | | | |
| John Hancock Collateral | | | | |
| Investment Trust, 0.2855% (W) (Y) | | 558,742 | | 5,591,557 |
|
| TOTAL SECURITIES LENDING | | | | |
| COLLATERAL (Cost $5,591,455) | | | $ | 5,591,557 |
|
| |
| SHORT-TERM INVESTMENTS - 1.44% | | | |
| Short-Term Securities* - 1.44% | | | | |
| AIM Short-Term Investment Trust, STIC | | | | |
| Prime Portfolio, 0.130% | $ | 843,281 | $ | 843,281 |
| AIM Short-Term Investment Trust, STIC | | | | |
| Prime Portfolio, 0.140% | | 70 | | 70 |
| U.S. Treasury Bills, 0.135%, 04/07/2011 (F) | 85,000 | | 84,988 |
| | |
|
| | | | | 928,339 |
|
| TOTAL SHORT-TERM INVESTMENTS (Cost $928,339) | | $ | 928,339 |
|
| Total Investments (Mid Cap Growth Index Fund) | | | |
| (Cost $58,116,299) - 108.84% | | | $ | 69,997,396 |
| Other assets and liabilities, net - (8.84%) | | | | (5,682,639) |
| | | |
|
| TOTAL NET ASSETS - 100.00% | | | $ | 64,314,757 |
| | | |
|
| |
| |
| |
| Mid Cap Index Fund | | | | |
| | Shares or | | |
| | Principal | | |
| | Amount | | Value |
| |
|
| |
| COMMON STOCKS - 97.61% | | | | |
| Consumer Discretionary - 13.71% | | | | |
| Auto Components - 1.08% | | | | |
| BorgWarner, Inc. (I) (L) | | 32,243 | $ | 2,502,379 |
| Gentex Corp. | | 39,782 | | 1,204,599 |
| | |
|
| | | | | 3,706,978 |
| Automobiles - 0.12% | | | | |
| Thor Industries, Inc. | | 12,023 | | 399,645 |
| Distributors - 0.28% | | | | |
| LKQ Corp. (I) | | 40,934 | | 972,592 |
| Diversified Consumer Services - 1.12% | | | | |
| Career Education Corp. (I) | | 18,656 | | 449,796 |
| ITT Educational Services, Inc. (I) (L) | | 7,418 | | 562,655 |
| Matthews International Corp., Class A | | 8,314 | | 308,865 |
| Regis Corp. (L) | | 16,324 | | 286,160 |
| Service Corp. International (L) | | 68,912 | | 751,141 |
| Sotheby’s (L) | | 19,009 | | 935,623 |
| Strayer Education, Inc. (L) | | 3,841 | | 527,907 |
| | |
|
| | | | | 3,822,147 |
| Hotels, Restaurants & Leisure - 2.11% | | | | |
| Bally Technologies, Inc. (I) | | 15,194 | | 586,944 |
| Bob Evans Farms, Inc. | | 8,613 | | 269,931 |
| Boyd Gaming Corp. (I) (L) | | 15,649 | | 167,288 |
| |
| The accompanying notes are an integral part of the financial statements. | 168 |
John Hancock Funds II
Portfolio of Investments — February 28, 2011 (Unaudited) (showing percentage of total net assets)
| | | | |
| Mid Cap Index Fund (continued) | | |
| | | Shares or | | |
| | | Principal | | |
| | | Amount | | Value |
| | |
|
| |
| COMMON STOCKS (continued) | | | | |
| Hotels, Restaurants & Leisure (continued) | | | | |
| Brinker International, Inc. | | 26,166 | $ | 618,564 |
| Chipotle Mexican Grill, Inc. (I) (L) | | 8,771 | | 2,148,895 |
| International Speedway Corp., Class A | | 8,180 | | 226,750 |
| Life Time Fitness, Inc. (I) (L) | | 11,873 | | 455,330 |
| Panera Bread Company, Class A (I) (L) | | 8,601 | | 1,004,167 |
| Scientific Games Corp., Class A (I) | | 17,612 | | 157,804 |
| The Cheesecake Factory, Inc. (I) (L) | | 16,797 | | 487,785 |
| Wendy’s/Arby’s Group, Inc., Class A | | 91,227 | | 434,241 |
| WMS Industries, Inc. (I) (L) | | 16,375 | | 651,561 |
| | |
|
| | | | | 7,209,260 |
| Household Durables - 1.44% | | | | |
| American Greetings Corp., Class A (L) | | 11,359 | | 245,922 |
| KB Home (L) | | 20,159 | | 267,107 |
| MDC Holdings, Inc. (L) | | 10,688 | | 280,560 |
| Mohawk Industries, Inc. (I) | | 15,944 | | 926,506 |
| NVR, Inc. (I) (L) | | 1,599 | | 1,163,848 |
| Ryland Group, Inc. (L) | | 12,315 | | 213,788 |
| Toll Brothers, Inc. (I) (L) | | 40,908 | | 869,704 |
| Tupperware Brands Corp. | | 17,899 | | 960,281 |
| | |
|
| | | | | 4,927,716 |
| Leisure Equipment & Products - 0.29% | | | | |
| Eastman Kodak Company (I) (L) | | 76,212 | | 259,121 |
| Polaris Industries, Inc. (L) | | 9,606 | | 724,773 |
| | |
|
| | | | | 983,894 |
| Media - 0.84% | | | | |
| DreamWorks Animation SKG, Inc. (I) (L) | | 20,299 | | 560,658 |
| Harte-Hanks, Inc. | | 10,836 | | 137,509 |
| John Wiley & Sons, Inc. (L) | | 13,152 | | 628,797 |
| Lamar Advertising Company, Class A (I) (L) | | 16,245 | | 629,819 |
| Meredith Corp. (L) | | 10,431 | | 367,797 |
| Scholastic Corp. | | 6,734 | | 211,448 |
| The New York Times | | | | |
| Company, Class A (I) (L) | | 33,499 | | 348,390 |
| | |
|
| | | | | 2,884,418 |
| Multiline Retail - 0.75% | | | | |
| 99 Cents Only Stores (I) (L) | | 13,046 | | 217,085 |
| Dollar Tree, Inc. (I) | | 35,448 | | 1,783,743 |
| Saks, Inc. (I) (L) | | 45,604 | | 558,649 |
| | |
|
| | | | | 2,559,477 |
| Specialty Retail - 4.01% | | | | |
| Aaron’s, Inc. | | 20,676 | | 486,713 |
| Advance Auto Parts, Inc. | | 23,824 | | 1,493,288 |
| Aeropostale, Inc. (I) (L) | | 26,206 | | 679,784 |
| American Eagle Outfitters, Inc. | | 55,465 | | 851,388 |
| AnnTaylor Stores Corp. (I) (L) | | 16,484 | | 382,594 |
| Ascena Retail Group, Inc. (I) | | 19,642 | | 613,616 |
| Barnes & Noble, Inc. (L) | | 10,886 | | 145,764 |
| Chico’s FAS, Inc. (L) | | 50,026 | | 687,357 |
| Collective Brands, Inc. (I) | | 18,247 | | 416,032 |
| Dick’s Sporting Goods, Inc. (I) | | 25,122 | | 933,031 |
| Foot Locker, Inc. | | 44,124 | | 876,744 |
| Guess?, Inc. (L) | | 17,995 | | 814,994 |
| J. Crew Group, Inc. (I) (L) | | 18,122 | | 781,421 |
| Office Depot, Inc. (I) | | 78,533 | | 417,010 |
| PetSmart, Inc. | | 33,333 | | 1,362,320 |
| Rent-A-Center, Inc. | | 18,187 | | 601,262 |
| Tractor Supply Company | | 20,666 | | 1,076,079 |
| Williams-Sonoma, Inc. (L) | | 30,089 | | 1,085,912 |
| | |
|
| | | | | 13,705,309 |
| Textiles, Apparel & Luxury Goods - 1.67% | | | | |
| Deckers Outdoor Corp. (I) | | 10,925 | | 963,804 |
| | | | |
| Mid Cap Index Fund (continued) | | |
| | | Shares or | | |
| | | Principal | | |
| | | Amount | | Value |
| | |
|
| |
| COMMON STOCKS (continued) | | | | |
| Textiles, Apparel & Luxury Goods (continued) | | | | |
| Fossil, Inc. (I) | | 14,565 | $ | 1,117,718 |
| Hanesbrands, Inc. (I) | | 27,147 | | 703,379 |
| Phillips-Van Heusen Corp. (L) | | 18,812 | | 1,128,908 |
| The Timberland Company, Class A (I) | | 10,940 | | 404,124 |
| The Warnaco Group, Inc. (I) (L) | | 12,614 | | 740,568 |
| Under Armour, Inc., Class A (I) | | 9,974 | | 660,578 |
| | |
|
| | | | | 5,719,079 |
| | |
|
| | | | | 46,890,515 |
| Consumer Staples - 3.49% | | | | |
| Beverages - 0.33% | | | | |
| Hansen Natural Corp. (I) | | 19,583 | | 1,127,002 |
| Food & Staples Retailing - 0.35% | | | | |
| BJ’s Wholesale Club, Inc. (I) | | 15,477 | | 749,396 |
| Ruddick Corp. (L) | | 12,118 | | 444,731 |
| | |
|
| | | | | 1,194,127 |
| Food Products - 1.63% | | | | |
| Corn Products International, Inc. | | 21,433 | | 1,046,359 |
| Flowers Foods, Inc. (L) | | 21,473 | | 571,182 |
| Green Mountain Coffee Roasters, Inc. (I) (L) | | 32,856 | | 1,339,868 |
| Lancaster Colony Corp. (L) | | 5,410 | | 312,265 |
| Ralcorp Holdings, Inc. (I) | | 15,570 | | 1,009,715 |
| Smithfield Foods, Inc. (I) | | 47,055 | | 1,089,323 |
| Tootsie Roll Industries, Inc. (L) | | 6,836 | | 195,510 |
| | |
|
| | | | | 5,564,222 |
| Household Products - 0.84% | | | | |
| Church & Dwight Company, Inc. | | 20,163 | | 1,521,097 |
| Energizer Holdings, Inc. (I) | | 20,007 | | 1,337,068 |
| | |
|
| | | | | 2,858,165 |
| Personal Products - 0.26% | | | | |
| Alberto-Culver Company | | 24,329 | | 906,012 |
| Tobacco - 0.08% | | | | |
| Universal Corp. (L) | | 6,744 | | 282,034 |
| | |
|
| | | | | 11,931,562 |
| Energy - 6.46% | | | | |
| Energy Equipment & Services - 2.72% | | | | |
| Atwood Oceanics, Inc. (I) (L) | | 15,898 | | 723,677 |
| Dril-Quip, Inc. (I) | | 9,715 | | 745,141 |
| Exterran Holdings, Inc. (I) | | 17,919 | | 406,761 |
| Helix Energy Solutions Group, Inc. (I) (L) | | 29,890 | | 460,306 |
| Oceaneering International, Inc. (I) | | 15,338 | | 1,282,717 |
| Patterson-UTI Energy, Inc. | | 43,685 | | 1,194,348 |
| Pride International, Inc. (I) | | 49,808 | | 2,067,530 |
| Superior Energy Services, Inc. (I) | | 22,339 | | 855,807 |
| Tidewater, Inc. (L) | | 14,569 | | 906,337 |
| Unit Corp. (I) (L) | | 11,267 | | 670,387 |
| | |
|
| | | | | 9,313,011 |
| Oil, Gas & Consumable Fuels - 3.74% | | | | |
| Arch Coal, Inc. (L) | | 46,054 | | 1,544,191 |
| Bill Barrett Corp. (I) (L) | | 13,154 | | 511,428 |
| Cimarex Energy Company | | 24,008 | | 2,788,049 |
| Comstock Resources, Inc. (I) (L) | | 13,412 | | 356,089 |
| Forest Oil Corp. (I) | | 32,138 | | 1,140,578 |
| Frontier Oil Corp. (I) | | 29,965 | | 836,024 |
| Northern Oil and Gas, Inc. (I) | | 14,751 | | 468,639 |
| Overseas Shipholding Group, Inc. (L) | | 7,475 | | 252,356 |
| Patriot Coal Corp. (I) (L) | | 22,696 | | 535,626 |
| Plains Exploration & | | | | |
| Production Company (I) (L) | | 39,711 | | 1,555,480 |
| Quicksilver Resources, Inc. (I) | | 33,309 | | 515,956 |
| |
| The accompanying notes are an integral part of the financial statements. | 169 |
John Hancock Funds II
Portfolio of Investments — February 28, 2011 (Unaudited) (showing percentage of total net assets)
| | | | |
| Mid Cap Index Fund (continued) | | |
| | | Shares or | | |
| | | Principal | | |
| | | Amount | | Value |
| | |
|
| |
| COMMON STOCKS (continued) | | | | |
| Oil, Gas & Consumable Fuels (continued) | | | | |
| SM Energy Company | | 17,872 | $ | 1,295,184 |
| Southern Union Company | | 35,287 | | 1,006,385 |
| | |
|
| | | | | 12,805,985 |
| | | |
|
| | | | | 22,118,996 |
| Financials - 19.51% | | | | |
| Capital Markets - 2.24% | | | | |
| Affiliated Managers Group, Inc. (I) | | 14,618 | | 1,560,472 |
| Apollo Investment Corp. | | 55,281 | | 683,826 |
| Eaton Vance Corp. | | 33,537 | | 1,049,708 |
| Greenhill & Company, Inc. | | 7,150 | | 513,585 |
| Jefferies Group, Inc. (L) | | 35,067 | | 843,712 |
| Raymond James Financial, Inc. | | 28,329 | | 1,085,567 |
| SEI Investments Company | | 41,345 | | 951,348 |
| Waddell & Reed Financial, Inc., Class A | | 24,202 | | 977,277 |
| | |
|
| | | | | 7,665,495 |
| Commercial Banks - 3.37% | | | | |
| Associated-Banc Corp. (L) | | 49,053 | | 709,797 |
| BancorpSouth, Inc. (L) | | 20,821 | | 331,887 |
| Bank of Hawaii Corp. | | 13,667 | | 644,536 |
| Cathay General Bancorp (L) | | 22,257 | | 394,394 |
| City National Corp. | | 13,148 | | 774,549 |
| Commerce Bancshares, Inc. | | 21,979 | | 882,677 |
| Cullen/Frost Bankers, Inc. (L) | | 17,273 | | 1,011,507 |
| East West Bancorp, Inc. (L) | | 41,951 | | 974,102 |
| FirstMerit Corp. | | 30,838 | | 525,788 |
| Fulton Financial Corp. | | 56,389 | | 614,076 |
| International Bancshares Corp. | | 14,782 | | 282,188 |
| PacWest Bancorp (L) | | 8,781 | | 181,855 |
| Prosperity Bancshares, Inc. (L) | | 13,226 | | 539,885 |
| SVB Financial Group (I) (L) | | 11,903 | | 644,905 |
| Synovus Financial Corp. (L) | | 222,540 | | 567,477 |
| TCF Financial Corp. (L) | | 35,985 | | 584,037 |
| Trustmark Corp. (L) | | 16,114 | | 377,873 |
| Valley National Bancorp (L) | | 45,711 | | 623,041 |
| Webster Financial Corp. | | 18,693 | | 433,304 |
| Westamerica Bancorp. (L) | | 8,251 | | 425,587 |
| | |
|
| | | | | 11,523,465 |
| Diversified Financial Services - 0.35% | | | | |
| MSCI, Inc. (I) (L) | | 33,666 | | 1,195,143 |
| Insurance - 4.02% | | | | |
| American Financial Group, Inc. | | 22,296 | | 772,110 |
| Arthur J. Gallagher & Company | | 30,044 | | 943,382 |
| Aspen Insurance Holdings, Ltd. | | 21,207 | | 626,667 |
| Brown & Brown, Inc. | | 33,153 | | 866,619 |
| Everest Re Group, Ltd. | | 15,506 | | 1,374,607 |
| Fidelity National Financial, Inc., Class A | | 64,334 | | 891,026 |
| First American Financial Corp. | | 29,545 | | 465,629 |
| HCC Insurance Holdings, Inc. | | 32,681 | | 1,017,686 |
| Mercury General Corp. | | 10,095 | | 415,308 |
| Old Republic International Corp. (L) | | 72,259 | | 903,238 |
| Protective Life Corp. (L) | | 24,281 | | 690,309 |
| Reinsurance Group of America, Inc. | | 20,756 | | 1,253,455 |
| StanCorp Financial Group, Inc. (L) | | 13,047 | | 600,162 |
| The Hanover Insurance Group, Inc. (L) | | 12,786 | | 594,165 |
| Transatlantic Holdings, Inc. | | 17,926 | | 912,971 |
| Unitrin, Inc. | | 14,005 | | 410,206 |
| W.R. Berkley Corp. (L) | | 33,712 | | 1,009,674 |
| | |
|
| | | | | 13,747,214 |
| Real Estate Investment Trusts - 7.86% | | | | |
| Alexandria Real Estate Equities, Inc. (L) | | 15,686 | | 1,258,017 |
| AMB Property Corp. (L) | | 47,728 | | 1,736,345 |
| | | | |
| Mid Cap Index Fund (continued) | | |
| | | Shares or | | |
| | | Principal | | |
| | | Amount | | Value |
| | |
|
| |
| COMMON STOCKS (continued) | | | | |
| Real Estate Investment Trusts (continued) | | | | |
| BRE Properties, Inc. | | 18,167 | $ | 863,114 |
| Camden Property Trust | | 19,466 | | 1,151,803 |
| Corporate Office Properties Trust | | 18,961 | | 680,131 |
| Cousins Properties, Inc. | | 29,490 | | 250,075 |
| Duke Realty Corp. | | 71,461 | | 1,005,456 |
| Equity One, Inc. (L) | | 13,065 | | 250,064 |
| Essex Property Trust, Inc. (L) | | 8,881 | | 1,099,290 |
| Federal Realty Investment Trust | | 17,438 | | 1,467,931 |
| Highwoods Properties, Inc. (L) | | 20,310 | | 689,118 |
| Hospitality Properties Trust (L) | | 34,989 | | 804,747 |
| Liberty Property Trust (L) | | 32,370 | | 1,093,135 |
| Mack-Cali Realty Corp. | | 22,542 | | 765,075 |
| Nationwide Health Properties, Inc. | | 35,784 | | 1,529,408 |
| Omega Healthcare Investors, Inc. (L) | | 27,913 | | 669,075 |
| Potlatch Corp. (L) | | 11,338 | | 435,379 |
| Rayonier, Inc. | | 22,836 | | 1,400,532 |
| Realty Income Corp. | | 33,189 | | 1,193,808 |
| Regency Centers Corp. (L) | | 23,205 | | 1,050,026 |
| Senior Housing Properties Trust | | 39,674 | | 973,600 |
| SL Green Realty Corp. | | 22,183 | | 1,679,919 |
| Taubman Centers, Inc. (L) | | 15,402 | | 854,503 |
| The Macerich Company (L) | | 36,878 | | 1,867,502 |
| UDR, Inc. (L) | | 51,626 | | 1,255,544 |
| Weingarten Realty Investors (L) | | 34,130 | | 882,943 |
| | |
|
| | | | | 26,906,540 |
| Real Estate Management & Development - 0.35% | | | | |
| Jones Lang LaSalle, Inc. | | 12,088 | | 1,189,701 |
| Thrifts & Mortgage Finance - 1.32% | | | | |
| Astoria Financial Corp. (L) | | 23,303 | | 326,708 |
| First Niagara Financial Group, Inc. (L) | | 59,266 | | 858,172 |
| New York Community Bancorp, Inc. (L) | | 123,469 | | 2,303,932 |
| NewAlliance Bancshares, Inc. | | 29,784 | | 465,822 |
| Washington Federal, Inc. (L) | | 31,893 | | 566,739 |
| | |
|
| | | | | 4,521,373 |
| | |
|
| | | | | 66,748,931 |
| Health Care - 11.13% | | | | |
| Biotechnology - 1.07% | | | | |
| United Therapeutics Corp. (I) (L) | | 14,197 | | 957,304 |
| Vertex Pharmaceuticals, Inc. (I) (L) | | 57,594 | | 2,687,912 |
| | |
|
| | | | | 3,645,216 |
| Health Care Equipment & Supplies - 3.94% | | | | |
| Beckman Coulter, Inc. | | 19,628 | | 1,631,676 |
| Edwards Lifesciences Corp. (I) | | 32,363 | | 2,752,150 |
| Gen-Probe, Inc. (I) (L) | | 13,664 | | 859,192 |
| Hill-Rom Holdings, Inc. | | 17,873 | | 680,425 |
| Hologic, Inc. (I) | | 73,663 | | 1,486,519 |
| IDEXX Laboratories, Inc. (I) (L) | | 16,299 | | 1,266,432 |
| Immucor, Inc. (I) (L) | | 19,842 | | 386,324 |
| Kinetic Concepts, Inc. (I) (L) | | 17,745 | | 868,973 |
| Masimo Corp. (L) | | 16,697 | | 503,248 |
| ResMed, Inc. (I) (L) | | 42,855 | | 1,354,218 |
| STERIS Corp. | | 16,764 | | 567,461 |
| Teleflex, Inc. (L) | | 11,333 | | 661,734 |
| Thoratec Corp. (I) (L) | | 16,573 | | 462,055 |
| | |
|
| | | | | 13,480,407 |
| Health Care Providers & Services - 3.14% | | | | |
| Community Health Systems, Inc. (I) | | 26,231 | | 1,072,061 |
| Health Management | | | | |
| Associates, Inc., Class A (I) | | 71,035 | | 710,350 |
| Health Net, Inc. (I) (L) | | 27,084 | | 796,811 |
| Henry Schein, Inc. (I) (L) | | 26,154 | | 1,804,103 |
| |
| The accompanying notes are an integral part of the financial statements. | 170 |
John Hancock Funds II
Portfolio of Investments — February 28, 2011 (Unaudited) (showing percentage of total net assets)
| | | | |
| Mid Cap Index Fund (continued) | | |
| | | Shares or | | |
| | | Principal | | |
| | | Amount | | Value |
| | |
|
| |
| COMMON STOCKS (continued) | | | | |
| Health Care Providers & Services (continued) | | | | |
| Kindred Healthcare, Inc. (I) (L) | | 11,023 | $ | 274,693 |
| LifePoint Hospitals, Inc. (I) (L) | | 14,937 | | 582,244 |
| Lincare Holdings, Inc. (L) | | 27,668 | | 811,779 |
| MEDNAX, Inc. (I) | | 13,517 | | 877,659 |
| Omnicare, Inc. (L) | | 32,862 | | 940,839 |
| Owens & Minor, Inc. | | 17,952 | | 560,102 |
| Universal Health Services, Inc., Class B | | 27,569 | | 1,260,179 |
| VCA Antech, Inc. (I) (L) | | 24,425 | | 611,602 |
| WellCare Health Plans, Inc. (I) | | 12,057 | | 452,740 |
| | |
|
| | | | | 10,755,162 |
| Health Care Technology - 0.33% | | | | |
| Allscripts-Misys Healthcare Solutions, Inc. (I) | | 53,033 | | 1,132,255 |
| Life Sciences Tools & Services - 1.62% | | | | |
| Bio-Rad Laboratories, Inc., Class A (I) | | 5,516 | | 629,707 |
| Charles River | | | | |
| Laboratories International, Inc. (I) | | 16,362 | | 596,231 |
| Covance, Inc. (I) (L) | | 18,382 | | 1,037,296 |
| Mettler-Toledo International, Inc. (I) (L) | | 9,304 | | 1,594,426 |
| Pharmaceutical Product Development, Inc. | | 33,687 | | 925,382 |
| Techne Corp. (L) | | 10,511 | | 753,534 |
| | |
|
| | | | | 5,536,576 |
| Pharmaceuticals - 1.03% | | | | |
| Endo Pharmaceuticals Holdings, Inc. (I) (L) | | 32,763 | | 1,163,742 |
| Medicis Pharmaceutical Corp., Class A | | 17,185 | | 551,467 |
| Perrigo Company (L) | | 23,528 | | 1,798,245 |
| | |
|
| | | | | 3,513,454 |
| | | |
|
| | | | | 38,063,070 |
| Industrials - 14.70% | | | | |
| Aerospace & Defense - 0.48% | | | | |
| Alliant Techsystems, Inc. (I) (L) | | 9,439 | | 681,213 |
| BE Aerospace, Inc. (I) | | 28,984 | | 977,340 |
| | |
|
| | | | | 1,658,553 |
| Airlines - 0.36% | | | | |
| AirTran Holdings, Inc. (I) | | 38,403 | | 280,342 |
| Alaska Air Group, Inc. (I) | | 10,437 | | 620,480 |
| JetBlue Airways Corp. (I) (L) | | 57,157 | | 325,795 |
| | |
|
| | | | | 1,226,617 |
| Building Products - 0.18% | | | | |
| Lennox International, Inc. (L) | | 12,768 | | 619,248 |
| Commercial Services & Supplies - 1.59% | | | | |
| Clean Harbors, Inc. (I) | | 6,499 | | 597,128 |
| Copart, Inc. (I) | | 19,803 | | 831,924 |
| Corrections Corp. of America (I) | | 31,250 | | 776,250 |
| Deluxe Corp. (L) | | 14,540 | | 371,497 |
| Herman Miller, Inc. | | 16,180 | | 435,889 |
| HNI Corp. | | 12,575 | | 399,005 |
| Mine Safety Appliances Company | | 8,751 | | 316,174 |
| Rollins, Inc. | | 17,749 | | 348,235 |
| The Brinks Company | | 13,100 | | 404,397 |
| Waste Connections, Inc. | | 32,635 | | 946,089 |
| | |
|
| | | | | 5,426,588 |
| Construction & Engineering - 1.37% | | | | |
| Aecom Technology Corp. (I) | | 33,598 | | 962,247 |
| Granite Construction, Inc. (L) | | 9,671 | | 275,624 |
| KBR, Inc. | | 42,789 | | 1,403,479 |
| The Shaw Group, Inc. (I) | | 24,082 | | 956,537 |
| URS Corp. (I) | | 23,393 | | 1,088,476 |
| | |
|
| | | | | 4,686,363 |
| | | | |
| Mid Cap Index Fund (continued) | | |
| | | Shares or | | |
| | | Principal | | |
| | | Amount | | Value |
| | |
|
| |
| COMMON STOCKS (continued) | | | | |
| Electrical Equipment - 1.72% | | | | |
| Acuity Brands, Inc. (L) | | 12,158 | $ | 687,170 |
| AMETEK, Inc. | | 45,364 | | 1,903,020 |
| Hubbell, Inc., Class B | | 17,012 | | 1,148,480 |
| Regal-Beloit Corp. (L) | | 10,941 | | 798,146 |
| Thomas & Betts Corp. (I) | | 14,688 | | 813,568 |
| Woodward, Inc. | | 16,799 | | 552,519 |
| | |
|
| | | | | 5,902,903 |
| Industrial Conglomerates - 0.22% | | | | |
| Carlisle Companies, Inc. | | 17,286 | | 743,471 |
| Machinery - 5.56% | | | | |
| AGCO Corp. (I) (L) | | 26,373 | | 1,444,713 |
| Bucyrus International, Inc. | | 22,962 | | 2,090,920 |
| Crane Company | | 13,087 | | 618,230 |
| Donaldson Company, Inc. | | 21,683 | | 1,220,753 |
| Gardner Denver, Inc. | | 14,875 | | 1,087,958 |
| Graco, Inc. (L) | | 16,971 | | 690,889 |
| Harsco Corp. | | 22,818 | | 779,691 |
| IDEX Corp. | | 23,209 | | 957,139 |
| Kennametal, Inc. | | 23,269 | | 894,926 |
| Lincoln Electric Holdings, Inc. | | 11,977 | | 854,918 |
| Nordson Corp. | | 9,624 | | 1,048,150 |
| Oshkosh Corp. (I) | | 25,713 | | 917,183 |
| Pentair, Inc. (L) | | 27,973 | | 1,037,239 |
| SPX Corp. | | 14,229 | | 1,134,905 |
| Terex Corp. (I) | | 30,867 | | 1,041,761 |
| Timken Company | | 22,842 | | 1,112,862 |
| Trinity Industries, Inc. (L) | | 22,604 | | 704,115 |
| Valmont Industries, Inc. | | 6,049 | | 617,482 |
| Wabtec Corp. | | 13,589 | | 771,312 |
| | |
|
| | | | | 19,025,146 |
| Marine - 0.39% | | | | |
| Alexander & Baldwin, Inc. (L) | | 11,696 | | 490,530 |
| Kirby Corp. (I) | | 15,171 | | 839,563 |
| | |
|
| | | | | 1,330,093 |
| Professional Services - 0.98% | | | | |
| FTI Consulting, Inc. (I) (L) | | 13,071 | | 431,212 |
| Korn/Ferry International (I) | | 13,120 | | 299,923 |
| Manpower, Inc. | | 23,119 | | 1,468,057 |
| The Corporate Executive Board Company (L) | | 9,722 | | 389,561 |
| Towers Watson & Company, Class A | | 12,839 | | 754,933 |
| | |
|
| | | | | 3,343,686 |
| Road & Rail - 1.18% | | | | |
| Con-way, Inc. (L) | | 15,523 | | 505,429 |
| J.B. Hunt Transport Services, Inc. | | 25,157 | | 1,046,783 |
| Kansas City Southern (I) | | 29,084 | | 1,565,883 |
| Landstar System, Inc. | | 13,914 | | 618,756 |
| Werner Enterprises, Inc. (L) | | 12,557 | | 295,717 |
| | |
|
| | | | | 4,032,568 |
| Trading Companies & Distributors - 0.67% | | | | |
| GATX Corp. | | 13,122 | | 455,202 |
| MSC Industrial Direct | | | | |
| Company, Inc., Class A (L) | | 12,631 | | 798,153 |
| United Rentals, Inc. (I) (L) | | 17,158 | | 531,555 |
| Watsco, Inc. (L) | | 7,897 | | 509,988 |
| | |
|
| | | | | 2,294,898 |
| | |
|
| | | | | 50,290,134 |
| Information Technology - 15.82% | | | | |
| Communications Equipment - 1.43% | | | | |
| ADTRAN, Inc. (L) | | 17,882 | | 813,273 |
| Ciena Corp. (I) (L) | | 26,522 | | 731,212 |
| |
| The accompanying notes are an integral part of the financial statements. | 171 |
John Hancock Funds II
Portfolio of Investments — February 28, 2011 (Unaudited) (showing percentage of total net assets)
| | | | |
| Mid Cap Index Fund (continued) | | |
| | | Shares or | | |
| | | Principal | | |
| | | Amount | | Value |
| | |
|
| |
| COMMON STOCKS (continued) | | | | |
| Communications Equipment (continued) | | | | |
| Plantronics, Inc. | | 13,501 | $ | 471,050 |
| Polycom, Inc. (I) | | 24,205 | | 1,156,999 |
| Riverbed Technology, Inc. (I) | | 41,666 | | 1,720,389 |
| | |
|
| | | | | 4,892,923 |
| Computers & Peripherals - 0.60% | | | | |
| Diebold, Inc. | | 18,615 | | 654,503 |
| NCR Corp. (I) | | 45,154 | | 862,441 |
| QLogic Corp. (I) | | 29,290 | | 528,977 |
| | |
|
| | | | | 2,045,921 |
| Electronic Equipment, Instruments & Components - 2.40% | | |
| Arrow Electronics, Inc. (I) | | 32,895 | | 1,289,484 |
| Avnet, Inc. (I) | | 43,073 | | 1,473,527 |
| Ingram Micro, Inc., Class A (I) | | 44,446 | | 885,809 |
| Itron, Inc. (I) (L) | | 11,453 | | 649,500 |
| National Instruments Corp. | | 24,936 | | 776,258 |
| Tech Data Corp. (I) | | 13,215 | | 655,200 |
| Trimble Navigation, Ltd. (I) (L) | | 34,036 | | 1,672,869 |
| Vishay Intertechnology, Inc. (I) (L) | | 46,747 | | 815,735 |
| | |
|
| | | | | 8,218,382 |
| Internet Software & Services - 1.02% | | | | |
| AOL, Inc. (I) | | 30,255 | | 631,422 |
| Digital River, Inc. (I) (L) | | 11,251 | | 377,809 |
| Equinix, Inc. (I) (L) | | 13,037 | | 1,126,918 |
| Rackspace Hosting, Inc. (I) (L) | | 27,524 | | 1,015,911 |
| ValueClick, Inc. (I) (L) | | 22,841 | | 341,016 |
| | |
|
| | | | | 3,493,076 |
| IT Services - 2.54% | | | | |
| Acxiom Corp. (I) | | 22,734 | | 389,661 |
| Alliance Data Systems Corp. (I) (L) | | 14,696 | | 1,157,163 |
| Broadridge Financial Solutions, Inc. | | 35,385 | | 811,024 |
| Convergys Corp. (I) | | 34,643 | | 487,427 |
| CoreLogic, Inc. | | 29,518 | | 550,511 |
| DST Systems, Inc. | | 10,049 | | 512,499 |
| Gartner, Inc. (I) | | 24,235 | | 914,144 |
| Global Payments, Inc. | | 22,583 | | 1,083,758 |
| Jack Henry & Associates, Inc. | | 24,267 | | 774,360 |
| Lender Processing Services, Inc. | | 25,884 | | 881,868 |
| ManTech International Corp., Class A (I) (L) | | 6,392 | | 276,134 |
| NeuStar, Inc., Class A (I) | | 20,949 | | 528,962 |
| SRA International, Inc., Class A (I) (L) | | 12,139 | | 330,545 |
| | |
|
| | | | | 8,698,056 |
| Office Electronics - 0.17% | | | | |
| Zebra Technologies Corp., Class A (I) | | 16,022 | | 597,941 |
| Semiconductors & Semiconductor Equipment - 3.48% | | |
| Atmel Corp. (I) | | 129,897 | | 1,906,888 |
| Cree, Inc. (I) (L) | | 30,742 | | 1,619,181 |
| Cypress Semiconductor Corp. (I) | | 46,917 | | 983,380 |
| Fairchild Semiconductor International, Inc. (I) | | 35,103 | | 618,164 |
| Integrated Device Technology, Inc. (I) | | 43,513 | | 337,226 |
| International Rectifier Corp. (I) | | 19,635 | | 631,069 |
| Intersil Corp., Class A | | 35,244 | | 450,771 |
| Lam Research Corp. (I) | | 34,857 | | 1,913,649 |
| RF Micro Devices, Inc. (I) (L) | | 77,900 | | 584,250 |
| Semtech Corp. (I) (L) | | 17,675 | | 418,544 |
| Silicon Laboratories, Inc. (I) | | 12,395 | | 562,733 |
| Skyworks Solutions, Inc. (I) | | 51,951 | | 1,867,119 |
| | |
|
| | | | | 11,892,974 |
| Software - 4.18% | | | | |
| ACI Worldwide, Inc. (I) | | 9,314 | | 291,621 |
| Advent Software, Inc. (I) (L) | | 9,056 | | 262,624 |
| | | | |
| Mid Cap Index Fund (continued) | | |
| | | Shares or | | |
| | | Principal | | |
| | | Amount | | Value |
| | |
|
| |
| COMMON STOCKS (continued) | | | | |
| Software (continued) | | | | |
| ANSYS, Inc. (I) (L) | | 25,792 | $ | 1,452,605 |
| Cadence Design Systems, Inc. (I) | | 75,738 | | 753,593 |
| Concur Technologies, Inc. (I) (L) | | 12,923 | | 672,384 |
| FactSet Research Systems, Inc. (L) | | 13,141 | | 1,378,228 |
| Fair Isaac Corp. | | 11,305 | | 315,975 |
| Informatica Corp. (I) (L) | | 26,599 | | 1,250,419 |
| Mentor Graphics Corp. (I) | | 31,084 | | 494,236 |
| MICROS Systems, Inc. (I) | | 22,839 | | 1,088,050 |
| Parametric Technology Corp. (I) | | 33,405 | | 791,699 |
| Quest Software, Inc. (I) | | 17,144 | | 459,288 |
| Rovi Corp. (I) | | 31,348 | | 1,737,306 |
| Solera Holdings, Inc. | | 19,911 | | 1,017,054 |
| Synopsys, Inc. (I) | | 42,109 | | 1,167,261 |
| TIBCO Software, Inc. (I) | | 47,327 | | 1,165,191 |
| | |
|
| | | | | 14,297,534 |
| | |
|
| | | | | 54,136,807 |
| Materials - 6.58% | | | | |
| Chemicals - 3.24% | | | | |
| Albemarle Corp. | | 25,955 | | 1,493,970 |
| Ashland, Inc. | | 22,350 | | 1,258,305 |
| Cabot Corp. | | 18,533 | | 801,738 |
| Cytec Industries, Inc. | | 13,998 | | 795,506 |
| Intrepid Potash, Inc. (I) | | 12,560 | | 484,816 |
| Lubrizol Corp. | | 18,602 | | 2,025,200 |
| Minerals Technologies, Inc. | | 5,247 | | 340,425 |
| NewMarket Corp. (L) | | 2,772 | | 355,121 |
| Olin Corp. | | 22,548 | | 419,618 |
| RPM International, Inc. (L) | | 36,533 | | 839,163 |
| Sensient Technologies Corp. (L) | | 14,085 | | 470,157 |
| The Scotts Miracle-Gro Company, Class A | | 13,025 | | 731,614 |
| Valspar Corp. | | 27,910 | | 1,061,138 |
| | |
|
| | | | | 11,076,771 |
| Construction Materials - 0.33% | | | | |
| Martin Marietta Materials, Inc. (L) | | 12,905 | | 1,146,738 |
| Containers & Packaging - 1.57% | | | | |
| AptarGroup, Inc. | | 19,010 | | 915,712 |
| Greif, Inc., Class A | | 8,820 | | 570,301 |
| Packaging Corp. of America | | 28,933 | | 832,981 |
| Rock-Tenn Company, Class A (L) | | 11,032 | | 757,347 |
| Silgan Holdings, Inc. | | 14,235 | | 519,293 |
| Sonoco Products Company | | 29,165 | | 1,052,273 |
| Temple-Inland, Inc. | | 30,559 | | 714,775 |
| | |
|
| | | | | 5,362,682 |
| Metals & Mining - 1.33% | | | | |
| Carpenter Technology Corp. | | 12,463 | | 518,212 |
| Commercial Metals Company | | 32,413 | | 540,325 |
| Compass Minerals International, Inc. | | 9,275 | | 866,934 |
| Reliance Steel & Aluminum Company | | 21,146 | | 1,170,008 |
| Steel Dynamics, Inc. | | 61,520 | | 1,135,659 |
| Worthington Industries, Inc. (L) | | 15,740 | | 304,726 |
| | |
|
| | | | | 4,535,864 |
| Paper & Forest Products - 0.11% | | | | |
| Louisiana-Pacific Corp. (I) (L) | | 37,404 | | 386,009 |
| | |
|
| | | | | 22,508,064 |
| Telecommunication Services - 0.49% | | | | |
| Diversified Telecommunication Services - 0.23% | | | | |
| TW Telecom, Inc. (I) (L) | | 42,885 | | 797,661 |
| |
| The accompanying notes are an integral part of the financial statements. | 172 |
John Hancock Funds II
Portfolio of Investments — February 28, 2011 (Unaudited) (showing percentage of total net assets)
| | | | |
| Mid Cap Index Fund (continued) | | | |
| | | Shares or | | |
| | | Principal | | |
| | | Amount | | Value |
| |
|
| |
| COMMON STOCKS (continued) | | | | |
| Wireless Telecommunication Services - 0.26% | | | |
| Telephone & Data Systems, Inc. | | 26,042 | $ | 876,313 |
| | | |
|
| | | | | 1,673,974 |
| Utilities - 5.72% | | | | |
| Electric Utilities - 1.60% | | | | |
| Cleco Corp. (L) | | 17,221 | | 557,099 |
| DPL, Inc. (L) | | 33,714 | | 877,238 |
| Great Plains Energy, Inc. (L) | | 38,449 | | 738,221 |
| Hawaiian Electric Industries, Inc. (L) | | 26,685 | | 644,443 |
| IDACORP, Inc. (L) | | 13,922 | | 525,416 |
| NV Energy, Inc. | | 66,658 | | 979,206 |
| PNM Resources, Inc. (L) | | 24,567 | | 326,987 |
| Westar Energy, Inc. (L) | | 31,573 | | 820,898 |
| | |
|
| | | | | 5,469,508 |
| Gas Utilities - 2.07% | | | | |
| AGL Resources, Inc. (L) | | 22,119 | | 840,743 |
| Atmos Energy Corp. | | 25,628 | | 866,739 |
| Energen Corp. | | 20,375 | | 1,244,913 |
| National Fuel Gas Company | | 23,296 | | 1,698,269 |
| Questar Corp. | | 49,498 | | 884,529 |
| UGI Corp. | | 31,311 | | 998,508 |
| WGL Holdings, Inc. (L) | | 14,477 | | 550,126 |
| | |
|
| | | | | 7,083,827 |
| Independent Power Producers & Energy Traders - 0.05% | | | |
| Dynegy, Inc. (I) | | 28,635 | | 165,797 |
| Multi-Utilities - 1.75% | | | | |
| Alliant Energy Corp. | | 31,421 | | 1,237,359 |
| Black Hills Corp. (L) | | 11,124 | | 342,842 |
| MDU Resources Group, Inc. | | 53,356 | | 1,145,553 |
| NSTAR | | 29,361 | | 1,325,649 |
| OGE Energy Corp. | | 27,628 | | 1,328,907 |
| Vectren Corp. (L) | | 23,141 | | 609,071 |
| | |
|
| | | | | 5,989,381 |
| Water Utilities - 0.25% | | | | |
| Aqua America, Inc. (L) | | 38,985 | | 877,942 |
| | |
|
| | | | | 19,586,455 |
|
| TOTAL COMMON STOCKS (Cost $205,761,304) | | | 333,948,508 |
|
| |
| SECURITIES LENDING COLLATERAL - 26.94% | | | |
| John Hancock Collateral | | | | |
| Investment Trust, 0.2855% (W) (Y) | | 9,210,593 | | 92,174,090 |
|
| TOTAL SECURITIES LENDING | | | | |
| COLLATERAL (Cost $92,171,956) | | | $ | 92,174,090 |
|
| |
| SHORT-TERM INVESTMENTS - 1.57% | | | |
| Short-Term Securities* - 1.57% | | | | |
| Federal Home Loan Bank Discount Notes, | | | | |
| 0.0702%, 03/01/2011 | $ | 5,350,000 | $ | 5,350,000 |
|
| TOTAL SHORT-TERM INVESTMENTS (Cost $5,350,000) | | $ | 5,350,000 |
|
| Total Investments (Mid Cap Index Fund) | | | |
| (Cost $303,283,260) - 126.12% | | | $ | 431,472,598 |
| Other assets and liabilities, net - (26.12%) | | | (89,348,723) |
| | |
|
| TOTAL NET ASSETS - 100.00% | | | $ | 342,123,875 |
| | | |
|
| | | | |
| Mid Cap Stock Fund | | | | |
| | | Shares or | | |
| | | Principal | | |
| | | Amount | | Value |
| | |
|
| |
| COMMON STOCKS - 97.59% | | | | |
| Consumer Discretionary - 27.45% | | | | |
| Auto Components - 0.99% | | | | |
| Gentex Corp. (L) | | 349,500 | $ | 10,582,860 |
| Automobiles - 0.58% | | | | |
| Thor Industries, Inc. | | 187,077 | | 6,218,439 |
| Distributors - 1.13% | | | | |
| LKQ Corp. (I)(L) | | 507,500 | | 12,058,200 |
| Diversified Consumer Services - 2.36% | | | | |
| Anhanguera Educacional Participacoes SA | | 448,700 | | 10,032,239 |
| Estacio Participacoes SA | | 665,600 | | 9,721,168 |
| Xueda Education Group (I) | | 580,122 | | 5,453,147 |
| | |
|
| | | | | 25,206,554 |
| Hotels, Restaurants & Leisure - 2.64% | | | | |
| Accor SA (I) | | 201,350 | | 9,481,405 |
| Domino’s Pizza UK & IRL PLC | | 1,245,845 | | 9,405,203 |
| The Cheesecake Factory, Inc. (I)(L) | | 319,990 | | 9,292,510 |
| | |
|
| | | | | 28,179,118 |
| Household Durables - 2.79% | | | | |
| Jarden Corp. | | 307,768 | | 10,116,334 |
| Tempur-Pedic International, Inc. (I)(L) | | 419,641 | | 19,697,949 |
| | |
|
| | | | | 29,814,283 |
| Internet & Catalog Retail - 2.29% | | | | |
| Netflix, Inc. (I)(L) | | 49,000 | | 10,126,830 |
| priceline.com, Inc. (I) | | 31,630 | | 14,356,224 |
| | |
|
| | | | | 24,483,054 |
| Leisure Equipment & Products - 1.28% | | | | |
| Brunswick Corp. (L) | | 590,310 | | 13,594,839 |
| Media - 0.34% | | | | |
| DreamWorks Animation SKG, Inc. (I)(L) | | 130,039 | | 3,591,677 |
| Multiline Retail - 1.02% | | | | |
| Big Lots, Inc. (I) | | 264,700 | | 10,860,641 |
| Specialty Retail - 5.81% | | | | |
| Advance Auto Parts, Inc. (L) | | 199,210 | | 12,486,483 |
| Dick’s Sporting Goods, Inc. (I)(L) | | 349,700 | | 12,987,858 |
| Ross Stores, Inc. (L) | | 198,500 | | 14,299,940 |
| Ulta Salon, Cosmetics & Fragrance, Inc. (I)(L) | | 270,910 | | 11,305,074 |
| Williams-Sonoma, Inc. (L) | | 303,700 | | 10,960,533 |
| | |
|
| | | | | 62,039,888 |
| Textiles, Apparel & Luxury Goods - 6.22% | | | | |
| Coach, Inc. (L) | | 195,100 | | 10,714,892 |
| Columbia Sportswear Company (L) | | 166,900 | | 10,479,651 |
| CROCS, Inc. (I)(L) | | 517,400 | | 9,132,110 |
| Hanesbrands, Inc. (I)(L) | | 559,900 | | 14,507,009 |
| Pandora A/S (I) | | 162,764 | | 9,470,667 |
| Under Armour, Inc., Class A (I)(L) | | 183,200 | | 12,133,336 |
| | |
|
| | | | | 66,437,665 |
| | |
|
| | | | | 293,067,218 |
| Consumer Staples - 3.68% | | | | |
| Food & Staples Retailing - 1.56% | | | | |
| Fresh Market, Inc. (I) | | 160,600 | | 6,552,480 |
| Whole Foods Market, Inc. (L) | | 172,359 | | 10,093,343 |
| | |
|
| | | | | 16,645,823 |
| Food Products - 2.12% | | | | |
| Green Mountain Coffee Roasters, Inc. (I)(L) | | 556,852 | | 22,708,425 |
| | |
|
| | | | | 39,354,248 |
| |
| The accompanying notes are an integral part of the financial statements. | 173 |
John Hancock Funds II
Portfolio of Investments — February 28, 2011 (Unaudited) (showing percentage of total net assets)
| | | | |
| Mid Cap Stock Fund (continued) | | |
| | | Shares or | | |
| | | Principal | | |
| | | Amount | | Value |
| | |
|
| COMMON STOCKS (continued) | | | | |
| Energy - 2.61% | | | | |
| Energy Equipment & Services - 0.96% | | | | |
| Ensco International PLC, ADR (L) | | 182,100 | $ | 10,215,810 |
| Oil, Gas & Consumable Fuels - 1.65% | | | | |
| Cobalt International Energy, Inc. (I)(L) | | 189,600 | | 2,969,136 |
| CONSOL Energy, Inc. | | 246,000 | | 12,474,660 |
| Karoon Gas Australia, Ltd. (I) | | 308,387 | | 2,211,847 |
| | |
|
| | | | | 17,655,643 |
| | |
|
| | | | | 27,871,453 |
| Financials - 2.56% | | | | |
| Capital Markets - 1.81% | | | | |
| Invesco, Ltd. | | 374,300 | | 10,046,212 |
| SEI Investments Company | | 404,500 | | 9,307,545 |
| | |
|
| | | | | 19,353,757 |
| Diversified Financial Services - 0.75% | | | | |
| Great American Group, Inc. (I) | | 984,000 | | 334,560 |
| Justice Holdings, Ltd. (I) | | 477,600 | | 7,647,637 |
| | |
|
| | | | | 7,982,197 |
| | |
|
| | | | | 27,335,954 |
| Health Care - 13.72% | | | | |
| Biotechnology - 0.54% | | | | |
| Amylin Pharmaceuticals, Inc. (I)(L) | | 162,467 | | 2,485,745 |
| Regeneron Pharmaceuticals, Inc. (I)(L) | | 90,900 | | 3,296,943 |
| | |
|
| | | | | 5,782,688 |
| Health Care Equipment & Supplies - 5.51% | | | | |
| Edwards Lifesciences Corp. (I)(L) | | 222,300 | | 18,904,392 |
| Gen-Probe, Inc. (I)(L) | | 224,700 | | 14,129,136 |
| HeartWare International, Inc. (I)(L) | | 101,500 | | 8,534,120 |
| Hologic, Inc. (I)(L) | | 580,400 | | 11,712,472 |
| Zoll Medical Corp. (I)(L) | | 119,100 | | 5,511,948 |
| | |
|
| | | | | 58,792,068 |
| Health Care Providers & Services - 1.00% | | | | |
| Cardinal Health, Inc. | | 257,200 | | 10,709,808 |
| Health Care Technology - 2.47% | | | | |
| Allscripts-Misys Healthcare Solutions, Inc. (I) | | 634,500 | | 13,546,575 |
| SXC Health Solutions Corp. (I) | | 259,086 | | 12,785,894 |
| | |
|
| | | | | 26,332,469 |
| Life Sciences Tools & Services - 2.38% | | | | |
| Pharmaceutical Product Development, Inc. | | 524,800 | | 14,416,256 |
| Waters Corp. (I)(L) | | 131,900 | | 10,954,295 |
| | |
|
| | | | | 25,370,551 |
| Pharmaceuticals - 1.82% | | | | |
| Auxilium Pharmaceuticals, Inc. (I)(L) | | 271,200 | | 6,093,864 |
| Salix Pharmaceuticals, Ltd. (I) | | 170,200 | | 5,674,468 |
| Watson Pharmaceuticals, Inc. (I) | | 137,980 | | 7,725,500 |
| | |
|
| | | | | 19,493,832 |
| | |
|
| | | | | 146,481,416 |
| Industrials - 13.91% | | | | |
| Aerospace & Defense - 0.47% | | | | |
| DigitalGlobe, Inc. (I) | | 155,800 | | 5,029,224 |
| Air Freight & Logistics - 0.70% | | | | |
| Expeditors International of Washington, Inc. | | 157,300 | | 7,518,940 |
| Commercial Services & Supplies - 2.40% | | | | |
| Corrections Corp. of America (I)(L) | | 400,650 | | 9,952,146 |
| Higher One Holdings, Inc. (I)(L) | | 345,039 | | 6,483,283 |
| | | | |
| Mid Cap Stock Fund (continued) | | |
| | | Shares or | | |
| | | Principal | | |
| | | Amount | | Value |
| | |
|
| |
| COMMON STOCKS (continued) | | | | |
| Commercial Services & Supplies (continued) | | | | |
| The Geo Group, Inc. (I)(L) | | 360,700 | $ | 9,172,601 |
| | |
|
| | | | | 25,608,030 |
| Construction & Engineering - 4.32% | | | | |
| Aecom Technology Corp. (I) | | 561,500 | | 16,081,360 |
| FLS Industries A/S (I) | | 139,319 | | 12,242,878 |
| Fluor Corp. | | 114,800 | | 8,123,248 |
| Foster Wheeler AG (I) | | 266,600 | | 9,640,256 |
| | |
|
| | | | | 46,087,742 |
| Machinery - 2.25% | | | | |
| ArvinMeritor, Inc. (I) | | 52,800 | | 946,176 |
| Ingersoll-Rand PLC (L) | | 223,800 | | 10,138,140 |
| Navistar International Corp. (I) | | 209,700 | | 12,997,206 |
| | |
|
| | | | | 24,081,522 |
| Professional Services - 0.91% | | | | |
| Manpower, Inc. | | 153,600 | | 9,753,600 |
| Road & Rail - 2.11% | | | | |
| Con-way, Inc. | | 69,660 | | 2,268,130 |
| J.B. Hunt Transport Services, Inc. (L) | | 236,500 | | 9,840,765 |
| Localiza Rent A Car SA (I) | | 734,300 | | 10,371,469 |
| | |
|
| | | | | 22,480,364 |
| Trading Companies & Distributors - 0.75% | | | | |
| United Rentals, Inc. (I)(L) | | 257,500 | | 7,977,350 |
| | |
|
| | | | | 148,536,772 |
| Information Technology - 29.92% | | | | |
| Communications Equipment - 8.40% | | | | |
| AAC Acoustic Technologies Holdings, Inc. | | 2,124,000 | | 5,352,992 |
| Acme Packet, Inc. (I)(L) | | 232,300 | | 17,478,252 |
| ADTRAN, Inc. (L) | | 356,300 | | 16,204,524 |
| Aruba Networks, Inc. (I)(L) | | 514,900 | | 15,678,705 |
| Finisar Corp. (I) | | 306,300 | | 12,564,426 |
| Polycom, Inc. (I) | | 469,100 | | 22,422,980 |
| | |
|
| | | | | 89,701,879 |
| Electronic Equipment, Instruments & Components - 1.39% | | |
| Jabil Circuit, Inc. | | 692,220 | | 14,834,275 |
| Internet Software & Services - 2.20% | | | | |
| Akamai Technologies, Inc. (I) | | 291,100 | | 10,924,983 |
| Demand Media, Inc. (I)(L) | | 319,400 | | 7,186,500 |
| GSI Commerce, Inc. (I)(L) | | 259,400 | | 5,392,926 |
| | |
|
| | | | | 23,504,409 |
| IT Services - 4.04% | | | | |
| Cognizant Technology | | | | |
| Solutions Corp., Class A (I) | | 138,370 | | 10,636,502 |
| Genpact, Ltd. (I)(L) | | 527,700 | | 7,361,415 |
| Teradata Corp. (I) | | 217,800 | | 10,415,196 |
| The Western Union Company | | 669,700 | | 14,726,703 |
| | |
|
| | | | | 43,139,816 |
| Semiconductors & Semiconductor Equipment - 7.83% | | |
| Broadcom Corp., Class A | | 296,500 | | 12,221,730 |
| Cavium Networks, Inc. (I)(L) | | 283,600 | | 12,245,848 |
| Cypress Semiconductor Corp. (I) | | 522,400 | | 10,949,504 |
| Marvell Technology Group, Ltd. (I) | | 548,100 | | 10,019,268 |
| NVIDIA Corp. (I) | | 428,400 | | 9,707,544 |
| OmniVision Technologies, Inc. (I) | | 162,600 | | 4,978,812 |
| Skyworks Solutions, Inc. (I)(L) | | 653,500 | | 23,486,791 |
| | |
|
| | | | | 83,609,497 |
| Software - 6.06% | | | | |
| Cadence Design Systems, Inc. (I)(L) | | 1,306,900 | | 13,003,655 |
| Citrix Systems, Inc. (I) | | 68,400 | | 4,798,944 |
| |
| The accompanying notes are an integral part of the financial statements. | 174 |
John Hancock Funds II
Portfolio of Investments — February 28, 2011 (Unaudited) (showing percentage of total net assets)
| | | | |
| Mid Cap Stock Fund (continued) | | | |
| | | Shares or | | |
| | | Principal | | |
| | | Amount | | Value |
| |
|
| |
| COMMON STOCKS (continued) | | | | |
| Software (continued) | | | | |
| Concur Technologies, Inc. (I)(L) | | 163,900 | $ | 8,527,717 |
| Fortinet, Inc. (I)(L) | | 144,400 | | 5,897,296 |
| RealD, Inc. (I)(L) | | 400,500 | | 8,991,224 |
| SuccessFactors, Inc. (I)(L) | | 316,700 | | 11,372,697 |
| TIBCO Software, Inc. (I)(L) | | 490,100 | | 12,066,262 |
| | |
|
| | | | | 64,657,795 |
| | | |
|
| | | | | 319,447,671 |
| Materials - 3.74% | | | | |
| Chemicals - 2.02% | | | | |
| CF Industries Holdings, Inc. | | 78,100 | | 11,033,968 |
| Methanex Corp. | | 362,200 | | 10,540,020 |
| | |
|
| | | | | 21,573,988 |
| Metals & Mining - 1.72% | | | | |
| Vallar PLC (I) | | 278,425 | | 5,902,130 |
| Vedanta Resources PLC | | 318,356 | | 12,462,595 |
| | |
|
| | | | | 18,364,725 |
| | | |
|
| | | | | 39,938,713 |
|
| TOTAL COMMON STOCKS (Cost $806,614,397) | | $ | 1,042,033,445 |
|
| |
| SECURITIES LENDING COLLATERAL - 27.31% | | | |
| John Hancock Collateral | | | | |
| Investment Trust, 0.2855% (W)(Y) | | 29,142,715 | | 291,642,810 |
|
| TOTAL SECURITIES LENDING | | | | |
| COLLATERAL (Cost $291,610,123) | | | $ | 291,642,810 |
|
| |
| SHORT-TERM INVESTMENTS - 2.58% | | | |
| Repurchase Agreement - 2.58% | | | | |
| Bank of New York Tri-Party Repurchase | | | | |
| Agreement dated 02/28/2011 at 0.200% to | | | |
| be repurchased at $27,600,153 on | | | | |
| 03/01/2011, collateralized by $28,110,583 | | | |
| U.S. Treasury Notes, 1.250% due | | | | |
| 07/15/2020 (valued at $28,152,039, | | | | |
| including interest) | $ | 27,600,000 | $ | 27,600,000 |
|
| TOTAL SHORT-TERM INVESTMENTS (Cost $27,600,000) | | $ | 27,600,000 |
|
| Total Investments (Mid Cap Stock Fund) | | | |
| (Cost $1,125,824,520) - 127.48% | | | $ | 1,361,276,255 |
| Other assets and liabilities, net - (27.48%) | | | (293,478,543) |
| | |
|
| TOTAL NET ASSETS - 100.00% | | | $ | 1,067,797,712 |
| | | |
|
| |
| |
| |
| Mid Cap Value Equity Fund | | | |
| | | Shares or | | |
| | | Principal | | |
| | | Amount | | Value |
| |
|
| |
| COMMON STOCKS - 97.07% | | | | |
| Consumer Discretionary - 12.55% | | | | |
| Auto Components - 0.76% | | | | |
| TRW Automotive Holdings Corp. (I) | | 12,408 | $ | 704,774 |
| Visteon Corp. (I) | | 10,481 | | 775,070 |
| | |
|
| | | | | 1,479,844 |
| Automobiles - 0.65% | | | | |
| Ford Motor Company (I) | | 84,527 | | 1,272,131 |
| Diversified Consumer Services - 1.37% | | | | |
| Apollo Group, Inc., Class A (I) | | 10,787 | | 488,220 |
| Capella Education Company (I) (L) | | 8,363 | | 482,294 |
| | | | |
| Mid Cap Value Equity Fund (continued) | | |
| | | Shares or | | |
| | | Principal | | |
| | | Amount | | Value |
| | |
|
| |
| COMMON STOCKS (continued) | | | | |
| Diversified Consumer Services (continued) | | | | |
| Career Education Corp. (I) | | 22,754 | $ | 548,599 |
| Corinthian Colleges, Inc. (I) (L) | | 47,244 | | 247,559 |
| DeVry, Inc. | | 8,990 | | 487,708 |
| ITT Educational Services, Inc. (I) (L) | | 5,295 | | 401,626 |
| | |
|
| | | | | 2,656,006 |
| Hotels, Restaurants & Leisure - 1.73% | | | | |
| Penn National Gaming, Inc. (I) (L) | | 61,287 | | 2,192,236 |
| Royal Caribbean Cruises, Ltd. (I) (L) | | 26,713 | | 1,169,762 |
| | |
|
| | | | | 3,361,998 |
| Household Durables - 0.88% | | | | |
| D.R. Horton, Inc. (L) | | 27,023 | | 319,952 |
| KB Home (L) | | 12,458 | | 165,069 |
| Lennar Corp., Class A (L) | | 19,594 | | 395,015 |
| Mohawk Industries, Inc. (I) | | 14,374 | | 835,273 |
| | |
|
| | | | | 1,715,309 |
| Leisure Equipment & Products - 1.53% | | | | |
| Hasbro, Inc. (L) | | 66,328 | | 2,978,127 |
| Media - 2.81% | | | | |
| DISH Network Corp. (I) | | 43,093 | | 1,001,912 |
| Liberty Media Corp. - Starz, Series A (I) | | 13,504 | | 947,981 |
| National CineMedia, Inc. | | 95,300 | | 1,800,217 |
| Regal Entertainment Group (L) | | 115,203 | | 1,721,133 |
| | |
|
| | | | | 5,471,243 |
| Multiline Retail - 2.07% | | | | |
| Macy’s, Inc. | | 82,991 | | 1,983,485 |
| Nordstrom, Inc. | | 45,077 | | 2,040,185 |
| | |
|
| | | | | 4,023,670 |
| Specialty Retail - 0.75% | | | | |
| Abercrombie & Fitch Company, Class A | | 25,563 | | 1,466,549 |
| | |
|
| | | | | 24,424,877 |
| Consumer Staples - 3.17% | | | | |
| Tobacco - 3.17% | | | | |
| Lorillard, Inc. | | 80,378 | | 6,170,619 |
| Energy - 10.68% | | | | |
| Energy Equipment & Services - 3.80% | | | | |
| Cameron International Corp. (I) | | 24,488 | | 1,447,975 |
| McDermott International, Inc. (I) | | 127,175 | | 2,918,666 |
| Nabors Industries, Ltd. (I) | | 74,464 | | 2,119,990 |
| Noble Corp. | | 20,202 | | 903,231 |
| | |
|
| | | | | 7,389,862 |
| Oil, Gas & Consumable Fuels - 6.88% | | | | |
| Alpha Natural Resources, Inc. (I) (L) | | 21,136 | | 1,145,994 |
| El Paso Corp. | | 107,022 | | 1,990,609 |
| Enbridge, Inc. | | 51,659 | | 3,094,374 |
| EQT Corp. | | 14,575 | | 718,547 |
| Newfield Exploration Company (I) | | 44,411 | | 3,232,677 |
| QEP Resources, Inc. | | 11,631 | | 460,006 |
| Ultra Petroleum Corp. (I) | | 8,518 | | 386,291 |
| Whiting Petroleum Corp. (I) | | 36,297 | | 2,371,646 |
| | |
|
| | | | | 13,400,144 |
| | | |
|
| | | | | 20,790,006 |
| Financials - 18.24% | | | | |
| Capital Markets - 1.39% | | | | |
| Artio Global Investors, Inc. (L) | | 22,777 | | 361,015 |
| Invesco, Ltd. | | 87,650 | | 2,352,526 |
| | |
|
| | | | | 2,713,541 |
| |
| The accompanying notes are an integral part of the financial statements. | 175 |
John Hancock Funds II
Portfolio of Investments — February 28, 2011 (Unaudited) (showing percentage of total net assets)
| | | | |
| Mid Cap Value Equity Fund (continued) | | |
| | | Shares or | | |
| | | Principal | | |
| | | Amount | | Value |
| | |
|
| |
| COMMON STOCKS (continued) | | | | |
| Commercial Banks - 6.88% | | | | |
| CIT Group, Inc. (I) | | 97,136 | $ | 4,207,932 |
| Comerica, Inc. (L) | | 44,767 | | 1,741,436 |
| Cullen/Frost Bankers, Inc. (L) | | 13,055 | | 764,501 |
| Fifth Third Bancorp | | 138,632 | | 2,024,027 |
| Huntington Bancshares, Inc. | | 150,570 | | 1,029,899 |
| KeyCorp | | 143,087 | | 1,307,815 |
| SunTrust Banks, Inc. | | 48,938 | | 1,476,459 |
| TCF Financial Corp. | | 51,911 | | 842,516 |
| | |
|
| | | | | 13,394,585 |
| Diversified Financial Services - 0.32% | | | | |
| PICO Holdings, Inc. (I) | | 20,894 | | 620,761 |
| Insurance - 6.83% | | | | |
| Assurant, Inc. | | 32,102 | | 1,304,304 |
| Axis Capital Holdings, Ltd. | | 34,603 | | 1,256,781 |
| Everest Re Group, Ltd. | | 14,859 | | 1,317,250 |
| Lincoln National Corp. (L) | | 84,631 | | 2,684,495 |
| PartnerRe, Ltd. | | 17,496 | | 1,387,433 |
| Transatlantic Holdings, Inc. | | 14,284 | | 727,484 |
| XL Group PLC | | 198,070 | | 4,624,935 |
| | |
|
| | | | | 13,302,682 |
| Real Estate Investment Trusts - 2.82% | | | | |
| AvalonBay Communities, Inc. (L) | | 4,122 | | 498,886 |
| Boston Properties, Inc. (L) | | 5,451 | | 522,860 |
| Equity Residential (L) | | 13,939 | | 768,178 |
| Pebblebrook Hotel Trust | | 17,649 | | 387,219 |
| ProLogis | | 95,153 | | 1,547,188 |
| Rayonier, Inc. | | 15,633 | | 958,772 |
| Ventas, Inc. (L) | | 14,377 | | 796,773 |
| | |
|
| | | | | 5,479,876 |
| | | |
|
| | | | | 35,511,445 |
| Health Care - 10.64% | | | | |
| Health Care Providers & Services - 2.39% | | | | |
| CIGNA Corp. | | 80,365 | | 3,380,956 |
| Universal Health Services, Inc., Class B | | 27,794 | | 1,270,464 |
| | |
|
| | | | | 4,651,420 |
| Life Sciences Tools & Services - 4.39% | | | | |
| Agilent Technologies, Inc. (I) | | 109,671 | | 4,614,956 |
| Life Technologies Corp. (I) | | 73,521 | | 3,923,816 |
| | |
|
| | | | | 8,538,772 |
| Pharmaceuticals - 3.86% | | | | |
| Forest Laboratories, Inc. (I) | | 27,747 | | 899,003 |
| Hospira, Inc. (I) | | 11,742 | | 620,565 |
| Mylan, Inc. (I) | | 163,181 | | 3,731,949 |
| Watson Pharmaceuticals, Inc. (I) | | 40,378 | | 2,260,764 |
| | |
|
| | | | | 7,512,281 |
| | | |
|
| | | | | 20,702,473 |
| Industrials - 16.69% | | | | |
| Aerospace & Defense - 0.92% | | | | |
| Goodrich Corp. | | 20,873 | | 1,799,879 |
| Airlines - 0.78% | | | | |
| Delta Air Lines, Inc. (I) | | 49,922 | | 561,123 |
| United Continental Holdings, Inc. (I) | | 28,771 | | 691,655 |
| US Airways Group, Inc. (I) (L) | | 30,677 | | 264,129 |
| | |
|
| | | | | 1,516,907 |
| Building Products - 0.74% | | | | |
| A.O. Smith Corp. (L) | | 35,472 | | 1,433,069 |
| Commercial Services & Supplies - 0.46% | | | | |
| Ritchie Brothers Auctioneers, Inc. (L) | | 35,259 | | 899,105 |
| | | | |
| Mid Cap Value Equity Fund (continued) | | |
| | | Shares or | | |
| | | Principal | | |
| | | Amount | | Value |
| | |
|
| |
| COMMON STOCKS (continued) | | | | |
| Construction & Engineering - 2.94% | | | | |
| Chicago Bridge & Iron Company NV | | 42,600 | $ | 1,513,152 |
| Fluor Corp. | | 14,162 | | 1,002,103 |
| Foster Wheeler AG (I) | | 30,400 | | 1,099,264 |
| Jacobs Engineering Group, Inc. (I) | | 23,001 | | 1,151,430 |
| KBR, Inc. | | 29,336 | | 962,221 |
| | |
|
| | | | | 5,728,170 |
| Electrical Equipment - 3.81% | | | | |
| Cooper Industries PLC (L) | | 71,374 | | 4,592,917 |
| Rockwell Automation, Inc. | | 17,203 | | 1,509,219 |
| The Babcock & Wilcox Company (I) | | 39,026 | | 1,317,908 |
| | |
|
| | | | | 7,420,044 |
| Machinery - 5.10% | | | | |
| AGCO Corp. (I) (L) | | 26,224 | | 1,436,551 |
| Eaton Corp. | | 24,891 | | 2,757,425 |
| Navistar International Corp. (I) | | 28,319 | | 1,755,212 |
| Oshkosh Corp. (I) | | 14,549 | | 518,963 |
| Parker Hannifin Corp. | | 14,093 | | 1,256,814 |
| Terex Corp. (I) | | 35,387 | | 1,194,311 |
| The Manitowoc Company, Inc. (L) | | 50,436 | | 999,137 |
| | |
|
| | | | | 9,918,413 |
| Road & Rail - 1.94% | | | | |
| Con-way, Inc. | | 11,294 | | 367,733 |
| J.B. Hunt Transport Services, Inc. (L) | | 14,759 | | 614,122 |
| Kansas City Southern (I) (L) | | 37,322 | | 2,009,416 |
| Landstar System, Inc. (L) | | 5,310 | | 236,136 |
| Old Dominion Freight Line, Inc. (I) | | 6,552 | | 201,671 |
| Werner Enterprises, Inc. (L) | | 14,402 | | 339,167 |
| | |
|
| | | | | 3,768,245 |
| | | |
|
| | | | | 32,483,832 |
| Information Technology - 7.45% | | | | |
| Computers & Peripherals - 0.53% | | | | |
| Western Digital Corp. (I) | | 33,444 | | 1,022,718 |
| Electronic Equipment, Instruments & Components - 1.16% | | |
| Avnet, Inc. (I) | | 65,774 | | 2,250,129 |
| IT Services - 0.69% | | | | |
| Computer Sciences Corp. (L) | | 27,702 | | 1,333,297 |
| Semiconductors & Semiconductor Equipment - 2.61% | | |
| LSI Corp. (I) | | 596,107 | | 3,749,513 |
| Microchip Technology, Inc. (L) | | 28,169 | | 1,039,718 |
| NXP Semiconductor NV (I) | | 9,357 | | 298,956 |
| | |
|
| | | | | 5,088,187 |
| Software - 2.46% | | | | |
| BMC Software, Inc. (I) | | 38,947 | | 1,927,876 |
| Check Point | | | | |
| Software Technologies, Ltd. (I) (L) | | 57,578 | | 2,869,688 |
| | |
|
| | | | | 4,797,564 |
| | | |
|
| | | | | 14,491,895 |
| Materials - 8.86% | | | | |
| Chemicals - 5.13% | | | | |
| Agrium, Inc. | | 12,333 | | 1,172,622 |
| Eastman Chemical Company | | 36,998 | | 3,455,983 |
| Huntsman Corp. | | 95,577 | | 1,686,934 |
| Lubrizol Corp. | | 14,481 | | 1,576,546 |
| PPG Industries, Inc. | | 23,682 | | 2,093,015 |
| | |
|
| | | | | 9,985,100 |
| Construction Materials - 0.39% | | | | |
| Cemex SAB de CV, SADR (I) (L) | | 84,372 | | 758,504 |
| |
| The accompanying notes are an integral part of the financial statements. | 176 |
John Hancock Funds II
Portfolio of Investments — February 28, 2011 (Unaudited) (showing percentage of total net assets)
| | | | |
| Mid Cap Value Equity Fund (continued) | | |
| | | Shares or | | |
| | | Principal | | |
| | | Amount | | Value |
| |
|
| |
| COMMON STOCKS (continued) | | | | |
| Containers & Packaging - 0.38% | | | | |
| Smurfit-Stone Container Corp. (I) | | 19,419 | $ | 746,466 |
| Metals & Mining - 1.83% | | | | |
| Cliffs Natural Resources, Inc. | | 8,490 | | 824,124 |
| Freeport-McMoRan Copper & Gold, Inc. | | 31,496 | | 1,667,713 |
| Steel Dynamics, Inc. | | 38,904 | | 718,168 |
| United States Steel Corp. (L) | | 6,065 | | 348,677 |
| | |
|
| | | | | 3,558,682 |
| Paper & Forest Products - 1.13% | | | | |
| Domtar Corp. | | 13,725 | | 1,199,565 |
| Louisiana-Pacific Corp. (I) (L) | | 95,927 | | 989,967 |
| | |
|
| | | | | 2,189,532 |
| | | |
|
| | | | | 17,238,284 |
| Telecommunication Services - 1.95% | | | | |
| Diversified Telecommunication Services - 1.71% | | | |
| CenturyLink, Inc. | | 20,667 | | 851,067 |
| Qwest Communications International, Inc. | | 159,405 | | 1,087,142 |
| Windstream Corp. (L) | | 111,069 | | 1,392,805 |
| | |
|
| | | | | 3,331,014 |
| Wireless Telecommunication Services - 0.24% | | | |
| Sprint Nextel Corp. (I) | | 107,738 | | 470,815 |
| | |
|
| | | | | 3,801,829 |
| Utilities - 6.84% | | | | |
| Electric Utilities - 2.85% | | | | |
| Entergy Corp. | | 16,134 | | 1,148,741 |
| FirstEnergy Corp. | | 45,085 | | 1,726,755 |
| Pepco Holdings, Inc. | | 84,636 | | 1,585,232 |
| Pinnacle West Capital Corp. | | 25,707 | | 1,085,607 |
| | |
|
| | | | | 5,546,335 |
| Gas Utilities - 0.21% | | | | |
| Questar Corp. | | 22,785 | | 407,168 |
| Multi-Utilities - 3.78% | | | | |
| CenterPoint Energy, Inc. | | 125,007 | | 1,982,611 |
| DTE Energy Company | | 44,420 | | 2,091,294 |
| Sempra Energy | | 26,357 | | 1,402,983 |
| Wisconsin Energy Corp. | | 31,956 | | 1,891,795 |
| | |
|
| | | | | 7,368,683 |
| | | |
|
| | | | | 13,322,186 |
|
| TOTAL COMMON STOCKS (Cost $129,889,230) | | $ | 188,937,446 |
|
| |
| SECURITIES LENDING COLLATERAL - 14.84% | | |
| John Hancock Collateral | | | | |
| Investment Trust, 0.2855% (W) (Y) | | 2,885,394 | | 28,875,295 |
|
| TOTAL SECURITIES LENDING | | | | |
| COLLATERAL (Cost $28,866,612) | | | $ | 28,875,295 |
|
| |
| SHORT-TERM INVESTMENTS - 2.84% | | | |
| Repurchase Agreement - 0.07% | | | | |
| Repurchase Agreement with State Street Corp. | | | |
| dated 02/28/2011 at 0.010% to be | | | | |
| repurchased at $135,000 on 03/01/2011, | | | | |
| collateralized by $130,000 Federal Home | | | |
| Loan Mortgage Corp., 4.375% due | | | | |
| 07/17/2015 (valued at $143,163, | | �� | | |
| including interest) | $ | 135,000 | $ | 135,000 |
| | | | |
| Mid Cap Value Equity Fund (continued) | | |
| | | Shares or | | |
| | | Principal | | |
| | | Amount | | Value |
| |
|
| |
| SHORT-TERM INVESTMENTS (continued) | | | |
| Short-Term Securities* - 2.77% | | | | |
| Federal Home Loan Bank Discount Notes, | | | | |
| 0.0702%, 03/01/2011 | $ | 5,400,000 | $ | 5,400,000 |
|
| TOTAL SHORT-TERM INVESTMENTS (Cost $5,535,000) | | $ | 5,535,000 |
|
| Total Investments (Mid Cap Value Equity Fund) | | | |
| (Cost $164,290,842) - 114.75% | | | $ | 223,347,741 |
| Other assets and liabilities, net - (14.75%) | | | (28,710,598) |
| | |
|
| TOTAL NET ASSETS - 100.00% | | | $ | 194,637,143 |
| | | |
|
| |
| |
| |
| Mid Cap Value Index Fund | | | |
| | | Shares or | | |
| | | Principal | | |
| | | Amount | | Value |
| |
|
| |
| COMMON STOCKS - 97.70% | | | | |
| Consumer Discretionary - 11.51% | | | | |
| Auto Components - 0.53% | | | | |
| Autoliv, Inc. | | 1,700 | $ | 127,313 |
| Lear Corp. | | 1,000 | | 105,800 |
| TRW Automotive Holdings Corp. (I) | | 2,000 | | 113,600 |
| | |
|
| | | | | 346,713 |
| Distributors - 0.70% | | | | |
| Genuine Parts Company | | 8,642 | | 455,347 |
| Diversified Consumer Services - 0.40% | | | | |
| H&R Block, Inc. (L) | | 17,302 | | 262,817 |
| Hotels, Restaurants & Leisure - 1.70% | | | | |
| Brinker International, Inc. | | 5,024 | | 118,767 |
| Darden Restaurants, Inc. | | 7,203 | | 339,477 |
| Hyatt Hotels Corp., Class A (I) | | 800 | | 36,600 |
| Penn National Gaming, Inc. (I) | | 1,800 | | 64,386 |
| Royal Caribbean Cruises, Ltd. (I) | | 4,885 | | 213,914 |
| Wendy’s/Arby’s Group, Inc., Class A | | 5,800 | | 27,608 |
| Wyndham Worldwide Corp. | | 9,644 | | 301,664 |
| | |
|
| | | | | 1,102,416 |
| Household Durables - 3.92% | | | | |
| D.R. Horton, Inc. | | 15,330 | | 181,507 |
| Fortune Brands, Inc. | | 8,374 | | 518,016 |
| Garmin, Ltd. | | 6,400 | | 217,280 |
| Harman International Industries, Inc. | | 1,900 | | 92,416 |
| Leggett & Platt, Inc. | | 8,249 | | 190,222 |
| Lennar Corp., Class A (L) | | 8,300 | | 167,328 |
| Mohawk Industries, Inc. (I) | | 3,283 | | 190,775 |
| Newell Rubbermaid, Inc. | | 15,893 | | 307,371 |
| NVR, Inc. (I) (L) | | 157 | | 114,274 |
| Pulte Group, Inc. (I) | | 18,400 | | 126,960 |
| Toll Brothers, Inc. (I) | | 4,900 | | 104,174 |
| Whirlpool Corp. | | 4,081 | | 336,683 |
| | |
|
| | | | | 2,547,006 |
| Internet & Catalog Retail - 0.77% | | | | |
| Liberty Media Corp. - Interactive, Series A (I) | 31,289 | | 502,501 |
| Leisure Equipment & Products - 1.24% | | | | |
| Hasbro, Inc. | | 6,972 | | 313,043 |
| Mattel, Inc. | | 19,535 | | 489,547 |
| | |
|
| | | | | 802,590 |
| Media - 0.65% | | | | |
| Clear Channel Outdoor | | | | |
| Holdings, Inc., Class A (I) | | 800 | | 11,792 |
| Gannett Company, Inc. | | 13,431 | | 221,746 |
| |
| The accompanying notes are an integral part of the financial statements. | 177 |
John Hancock Funds II
Portfolio of Investments — February 28, 2011 (Unaudited) (showing percentage of total net assets)
| | | | |
| Mid Cap Value Index Fund (continued) | | |
| | | Shares or | | |
| | | Principal | | |
| | | Amount | | Value |
| | |
|
| |
| COMMON STOCKS (continued) | | | | |
| Media (continued) | | | | |
| Lamar Advertising Company, Class A (I) | | 1,100 | $ | 42,647 |
| The Washington Post Company, Class B (L) | | 330 | | 142,920 |
| | |
|
| | | | | 419,105 |
| Specialty Retail - 1.49% | | | | |
| American Eagle Outfitters, Inc. | | 5,200 | | 79,820 |
| AutoNation, Inc. (I) (L) | | 2,365 | | 79,559 |
| Foot Locker, Inc. | | 8,400 | | 166,908 |
| GameStop Corp., Class A (I) | | 7,570 | | 151,022 |
| Limited Brands, Inc. | | 15,224 | | 487,472 |
| | |
|
| | | | | 964,781 |
| Textiles, Apparel & Luxury Goods - 0.11% | | | | |
| Phillips-Van Heusen Corp. | | 1,200 | | 72,012 |
| | |
|
| | | | | 7,475,288 |
| Consumer Staples - 5.29% | | | | |
| Beverages - 1.42% | | | | |
| Coca-Cola Enterprises, Inc. | | 18,600 | | 489,180 |
| Constellation Brands, Inc., Class A (I) | | 10,057 | | 204,358 |
| Dr. Pepper Snapple Group, Inc. | | 6,400 | | 230,784 |
| | |
|
| | | | | 924,322 |
| Food Products - 3.42% | | | | |
| Bunge, Ltd. | | 7,415 | | 535,141 |
| Dean Foods Company (I) | | 9,700 | | 102,432 |
| Hormel Foods Corp. | | 5,026 | | 137,712 |
| McCormick & Company, Inc., Class B | | 6,525 | | 310,916 |
| Ralcorp Holdings, Inc. (I) | | 2,986 | | 193,642 |
| Smithfield Foods, Inc. (I) | | 8,039 | | 186,103 |
| The J.M. Smucker Company | | 6,601 | | 454,413 |
| Tyson Foods, Inc., Class A | | 16,198 | | 301,769 |
| | |
|
| | | | | 2,222,128 |
| Household Products - 0.45% | | | | |
| Church & Dwight Company, Inc. | | 3,891 | | 293,537 |
| | |
|
| | | | | 3,439,987 |
| Energy - 5.59% | | | | |
| Energy Equipment & Services - 1.94% | | | | |
| Nabors Industries, Ltd. (I) | | 5,366 | | 152,770 |
| Patterson-UTI Energy, Inc. | | 8,670 | | 237,038 |
| Pride International, Inc. (I) | | 9,500 | | 394,345 |
| Rowan Companies, Inc. (I) | | 6,900 | | 294,423 |
| Tidewater, Inc. | | 2,911 | | 181,093 |
| | |
|
| | | | | 1,259,669 |
| Oil, Gas & Consumable Fuels - 3.65% | | | | |
| Cimarex Energy Company | | 4,617 | | 536,172 |
| Denbury Resources, Inc. (I) | | 13,385 | | 324,319 |
| El Paso Corp. | | 19,500 | | 362,700 |
| Forest Oil Corp. (I) | | 2,011 | | 71,370 |
| Kinder Morgan Management LLC (I) | | 2,217 | | 145,457 |
| Newfield Exploration Company (I) | | 3,627 | | 264,009 |
| Plains Exploration & Production Company (I) | | 7,571 | | 296,556 |
| Southern Union Company | | 6,300 | | 179,676 |
| Tesoro Corp. (I) | | 8,076 | | 192,047 |
| | |
|
| | | | | 2,372,306 |
| | | |
|
| | | | | 3,631,975 |
| Financials - 28.28% | | | | |
| Capital Markets - 1.28% | | | | |
| Federated Investors, Inc., Class B (L) | | 5,000 | | 137,800 |
| Jefferies Group, Inc. | | 6,100 | | 146,766 |
| Legg Mason, Inc. | | 8,400 | | 304,500 |
| LPL Investment Holdings, Inc. (I) | | 900 | | 30,249 |
| | | | |
| Mid Cap Value Index Fund (continued) | | |
| | | Shares or | | |
| | | Principal | | |
| | | Amount | | Value |
| | |
|
| |
| COMMON STOCKS (continued) | | | | |
| Capital Markets (continued) | | | | |
| Raymond James Financial, Inc. | | 5,600 | $ | 214,592 |
| | |
|
| | | | | 833,907 |
| Commercial Banks - 4.45% | | | | |
| Associated-Banc Corp. | | 8,988 | | 130,056 |
| BOK Financial Corp. | | 1,414 | | 72,609 |
| City National Corp. | | 2,500 | | 147,275 |
| Comerica, Inc. | | 9,792 | | 380,909 |
| Commerce Bancshares, Inc. | | 4,073 | | 163,572 |
| Cullen/Frost Bankers, Inc. | | 3,100 | | 181,536 |
| First Horizon National Corp. | | 9,085 | | 104,478 |
| Huntington Bancshares, Inc. | | 46,926 | | 320,974 |
| KeyCorp | | 47,473 | | 433,903 |
| Marshall & Ilsley Corp. | | 26,816 | | 208,360 |
| Regions Financial Corp. | | 67,767 | | 517,740 |
| Zions Bancorporation (L) | | 9,732 | | 227,340 |
| | |
|
| | | | | 2,888,752 |
| Consumer Finance - 0.61% | | | | |
| SLM Corp. (I) | | 26,946 | | 399,340 |
| Diversified Financial Services - 0.87% | | | | |
| Leucadia National Corp. | | 10,800 | | 357,804 |
| The NASDAQ OMX Group, Inc. (I) | | 7,200 | | 205,992 |
| | |
|
| | | | | 563,796 |
| Insurance - 9.52% | | | | |
| American Financial Group, Inc. | | 4,100 | | 141,983 |
| Arch Capital Group, Ltd. (I) | | 2,700 | | 244,350 |
| Assurant, Inc. | | 5,953 | | 241,870 |
| Assured Guaranty, Ltd. | | 8,495 | | 123,432 |
| Axis Capital Holdings, Ltd. | | 6,372 | | 231,431 |
| Cincinnati Financial Corp. | | 8,355 | | 284,488 |
| Everest Re Group, Ltd. | | 3,079 | | 272,953 |
| Fidelity National Financial, Inc., Class A | | 11,800 | | 163,430 |
| Genworth Financial, Inc., Class A (I) | | 26,461 | | 350,079 |
| HCC Insurance Holdings, Inc. | | 6,173 | | 192,227 |
| Lincoln National Corp. | | 17,106 | | 542,602 |
| Markel Corp. (I) | | 505 | | 209,903 |
| Mercury General Corp. | | 1,439 | | 59,200 |
| Old Republic International Corp. | | 13,199 | | 164,988 |
| PartnerRe, Ltd. | | 3,925 | | 311,253 |
| Reinsurance Group of America, Inc. | | 3,928 | | 237,212 |
| RenaissanceRe Holdings, Ltd. | | 2,960 | | 198,379 |
| Torchmark Corp. | | 4,532 | | 295,713 |
| Transatlantic Holdings, Inc. | | 3,400 | | 173,162 |
| Unum Group | | 17,754 | | 471,014 |
| Validus Holdings, Ltd. | | 3,654 | | 113,091 |
| W.R. Berkley Corp. | | 7,237 | | 216,748 |
| White Mountains Insurance Group, Ltd. | | 428 | | 162,533 |
| Willis Group Holdings PLC | | 9,450 | | 367,511 |
| XL Group PLC | | 17,739 | | 414,206 |
| | |
|
| | | | | 6,183,758 |
| Real Estate Investment Trusts - 9.85% | | | | |
| Alexandria Real Estate Equities, Inc. | | 1,900 | | 152,380 |
| AMB Property Corp. | | 9,082 | | 330,403 |
| AvalonBay Communities, Inc. | | 2,356 | | 285,147 |
| Chimera Investment Corp. | | 56,100 | | 241,791 |
| Digital Realty Trust, Inc. (L) | | 3,209 | | 188,753 |
| Duke Realty Corp. | | 8,700 | | 122,409 |
| Federal Realty Investment Trust | | 3,400 | | 286,212 |
| Health Care REIT, Inc. (L) | | 8,036 | | 419,640 |
| Hospitality Properties Trust | | 6,655 | | 153,065 |
| Kimco Realty Corp. | | 22,388 | | 433,879 |
| Liberty Property Trust | | 6,378 | | 215,385 |
| Nationwide Health Properties, Inc. | | 6,902 | | 294,991 |
| |
| The accompanying notes are an integral part of the financial statements. | 178 |
John Hancock Funds II
Portfolio of Investments — February 28, 2011 (Unaudited) (showing percentage of total net assets)
| | | | |
| Mid Cap Value Index Fund (continued) | | |
| | | Shares or | | |
| | | Principal | | |
| | | Amount | | Value |
| | |
|
| |
| COMMON STOCKS (continued) | | | | |
| Real Estate Investment Trusts (continued) | | | | |
| Piedmont Office Realty Trust, Inc., Class A | | 7,300 | $ | 146,000 |
| Plum Creek Timber Company, Inc. | | 8,776 | | 368,241 |
| ProLogis | | 30,662 | | 498,564 |
| Rayonier, Inc. | | 4,336 | | 265,927 |
| Realty Income Corp. | | 6,300 | | 226,611 |
| Regency Centers Corp. (L) | | 4,433 | | 200,593 |
| SL Green Realty Corp. | | 4,283 | | 324,352 |
| The Macerich Company | | 7,189 | | 364,051 |
| UDR, Inc. | | 10,065 | | 244,781 |
| Ventas, Inc. | | 8,648 | | 479,272 |
| Weingarten Realty Investors (L) | | 6,075 | | 157,160 |
| | |
|
| | | | | 6,399,607 |
| Thrifts & Mortgage Finance - 1.70% | | | | |
| Capitol Federal Financial, Inc. | | 8,915 | | 112,686 |
| Hudson City Bancorp, Inc. | | 25,900 | | 297,850 |
| New York Community Bancorp, Inc. (L) | | 22,511 | | 420,055 |
| People’s United Financial, Inc. | | 20,679 | | 272,549 |
| | |
|
| | | | | 1,103,140 |
| | | |
|
| | | | | 18,372,300 |
| Health Care - 4.80% | | | | |
| Biotechnology - 0.17% | | | | |
| Cephalon, Inc. (I) (L) | | 2,000 | | 112,620 |
| Health Care Equipment & Supplies - 1.70% | | | | |
| Alere, Inc. (I) | | 4,302 | | 166,229 |
| Beckman Coulter, Inc. | | 3,700 | | 307,581 |
| CareFusion Corp. (I) | | 6,300 | | 172,116 |
| Hologic, Inc. (I) | | 14,330 | | 289,179 |
| Kinetic Concepts, Inc. (I) | | 3,448 | | 168,849 |
| | |
|
| | | | | 1,103,954 |
| Health Care Providers & Services - 2.22% | | | | |
| Community Health Systems, Inc. (I) | | 2,500 | | 102,175 |
| Coventry Health Care, Inc. (I) | | 8,100 | | 244,620 |
| Humana, Inc. (I) | | 9,144 | | 594,451 |
| Lincare Holdings, Inc. | | 3,400 | | 99,756 |
| Omnicare, Inc. | | 6,294 | | 180,197 |
| Universal Health Services, Inc., Class B | | 4,862 | | 222,242 |
| | |
|
| | | | | 1,443,441 |
| Life Sciences Tools & Services - 0.41% | | | | |
| Charles River | | | | |
| Laboratories International, Inc. (I) | | 2,674 | | 97,441 |
| Pharmaceutical Product Development, Inc. | | 6,100 | | 167,567 |
| | |
|
| | | | | 265,008 |
| Pharmaceuticals - 0.30% | | | | |
| Endo Pharmaceuticals Holdings, Inc. (I) | | 4,000 | | 142,080 |
| Warner Chilcott PLC, Class A | | 2,100 | | 49,728 |
| | |
|
| | | | | 191,808 |
| | | |
|
| | | | | 3,116,831 |
| Industrials - 9.71% | | | | |
| Aerospace & Defense - 0.92% | | | | |
| Goodrich Corp. | | 6,920 | | 596,712 |
| Airlines - 0.64% | | | | |
| United Continental Holdings, Inc. (I) (L) | | 17,400 | | 418,296 |
| Building Products - 0.64% | | | | |
| Masco Corp. | | 20,065 | | 272,683 |
| Owens Corning, Inc. (I) | | 4,000 | | 142,920 |
| | |
|
| | | | | 415,603 |
| Commercial Services & Supplies - 1.41% | | | | |
| Avery Dennison Corp. | | 5,300 | | 211,576 |
| | | | |
| Mid Cap Value Index Fund (continued) | | |
| | | Shares or | | |
| | | Principal | | |
| | | Amount | | Value |
| | |
|
| |
| COMMON STOCKS (continued) | | | | |
| Commercial Services & Supplies (continued) | | | | |
| Cintas Corp. | | 7,447 | $ | 209,410 |
| Pitney Bowes, Inc. | | 11,195 | | 281,890 |
| R.R. Donnelley & Sons Company | | 11,593 | | 215,862 |
| | |
|
| | | | | 918,738 |
| Construction & Engineering - 0.97% | | | | |
| Aecom Technology Corp. (I) | | 4,981 | | 142,656 |
| KBR, Inc. | | 8,485 | | 278,308 |
| URS Corp. (I) | | 4,513 | | 209,990 |
| | |
|
| | | | | 630,954 |
| Electrical Equipment - 1.40% | | | | |
| Cooper Industries PLC | | 8,880 | | 571,428 |
| Rockwell Automation, Inc. | | 3,841 | | 336,971 |
| | |
|
| | | | | 908,399 |
| Machinery - 2.48% | | | | |
| Dover Corp. | | 10,220 | | 656,635 |
| Harsco Corp. | | 4,400 | | 150,348 |
| Pall Corp. | | 3,166 | | 172,104 |
| Pentair, Inc. | | 5,322 | | 197,340 |
| SPX Corp. | | 1,347 | | 107,437 |
| Terex Corp. (I) | | 3,000 | | 101,250 |
| Timken Company | | 4,600 | | 224,112 |
| | |
|
| | | | | 1,609,226 |
| Professional Services - 0.86% | | | | |
| Equifax, Inc. | | 6,949 | | 248,427 |
| Manpower, Inc. | | 2,236 | | 141,986 |
| Towers Watson & Company, Class A | | 2,800 | | 164,640 |
| | |
|
| | | | | 555,053 |
| Road & Rail - 0.39% | | | | |
| Hertz Global Holdings, Inc. (I) (L) | | 7,800 | | 118,638 |
| Ryder Systems, Inc. | | 2,801 | | 133,972 |
| | |
|
| | | | | 252,610 |
| | |
|
| | | | | 6,305,591 |
| Information Technology - 11.63% | | | | |
| Communications Equipment - 1.13% | | | | |
| Harris Corp. | | 7,100 | | 331,286 |
| Motorola Mobility Holdings, Inc. (I) | | 9,800 | | 295,960 |
| Tellabs, Inc. | | 19,713 | | 106,253 |
| | |
|
| | | | | 733,499 |
| Computers & Peripherals - 1.05% | | | | |
| Lexmark International, Inc., Class A (I) | | 4,192 | | 157,326 |
| Seagate Technology PLC (I) | | 25,662 | | 325,907 |
| Western Digital Corp. (I) | | 6,435 | | 196,782 |
| | |
|
| | | | | 680,015 |
| Electronic Equipment, Instruments & Components - 2.25% | | |
| Arrow Electronics, Inc. (I) | | 6,441 | | 252,487 |
| Avnet, Inc. (I) | | 8,206 | | 280,727 |
| Flextronics International, Ltd. (I) | | 42,700 | | 345,443 |
| Ingram Micro, Inc., Class A (I) | | 8,586 | | 171,119 |
| Jabil Circuit, Inc. | | 10,981 | | 235,323 |
| Molex, Inc. | | 3,242 | | 90,549 |
| Molex, Inc., Class A | | 3,879 | | 89,295 |
| | |
|
| | | | | 1,464,943 |
| Internet Software & Services - 0.42% | | | | |
| AOL, Inc. (I) | | 5,658 | | 118,082 |
| IAC/InterActiveCorp (I) | | 4,910 | | 152,554 |
| | |
|
| | | | | 270,636 |
| |
| The accompanying notes are an integral part of the financial statements. | 179 |
John Hancock Funds II
Portfolio of Investments — February 28, 2011 (Unaudited) (showing percentage of total net assets)
| | | | |
| Mid Cap Value Index Fund (continued) | | �� |
| | | Shares or | | |
| | | Principal | | |
| | | Amount | | Value |
| | |
|
| |
| COMMON STOCKS (continued) | | | | |
| IT Services - 1.50% | | | | |
| Computer Sciences Corp. | | 8,478 | $ | 408,046 |
| DST Systems, Inc. | | 1,000 | | 51,000 |
| Lender Processing Services, Inc. | | 2,500 | | 85,175 |
| SAIC, Inc. (I) (L) | | 16,298 | | 266,309 |
| Total Systems Services, Inc. | | 9,100 | | 161,525 |
| | |
|
| | | | | 972,055 |
| Semiconductors & Semiconductor Equipment - 4.76% | | |
| Advanced Micro Devices, Inc. (I) | | 19,894 | | 183,224 |
| KLA-Tencor Corp. | | 9,107 | | 444,604 |
| Lam Research Corp. (I) | | 4,333 | | 237,882 |
| LSI Corp. (I) | | 33,700 | | 211,973 |
| Maxim Integrated Products, Inc. | | 16,502 | | 455,125 |
| Microchip Technology, Inc. (L) | | 10,234 | | 377,737 |
| Micron Technology, Inc. (I) | | 48,211 | | 536,588 |
| National Semiconductor Corp. | | 12,795 | | 198,323 |
| Novellus Systems, Inc. (I) | | 5,200 | | 207,792 |
| Xilinx, Inc. | | 7,295 | | 242,559 |
| | |
|
| | | | | 3,095,807 |
| Software - 0.52% | | | | |
| Electronic Arts, Inc. (I) | | 6,300 | | 118,440 |
| Synopsys, Inc. (I) | | 8,000 | | 221,760 |
| | |
|
| | | | | 340,200 |
| | |
|
| | | | | 7,557,155 |
| Materials - 8.01% | | | | |
| Chemicals - 2.71% | | | | |
| Airgas, Inc. | | 4,123 | | 258,017 |
| Albemarle Corp. | | 4,449 | | 256,084 |
| Ashland, Inc. | | 4,083 | | 229,873 |
| Eastman Chemical Company | | 3,998 | | 373,453 |
| FMC Corp. | | 2,483 | | 192,284 |
| International Flavors & Fragrances, Inc. | | 4,302 | | 244,999 |
| Valspar Corp. | | 5,300 | | 201,506 |
| | |
|
| | | | | 1,756,216 |
| Construction Materials - 0.70% | | | | |
| Martin Marietta Materials, Inc. | | 1,592 | | 141,465 |
| Vulcan Materials Company | | 6,863 | | 314,669 |
| | |
|
| | | | | 456,134 |
| Containers & Packaging - 1.55% | | | | |
| Bemis Company, Inc. | | 6,124 | | 201,173 |
| Greif, Inc., Class A | | 1,330 | | 85,998 |
| Owens-Illinois, Inc. (I) | | 9,160 | | 279,288 |
| Sealed Air Corp. | | 8,704 | | 239,534 |
| Sonoco Products Company | | 5,505 | | 198,620 |
| | |
|
| | | | | 1,004,613 |
| Metals & Mining - 2.62% | | | | |
| Cliffs Natural Resources, Inc. | | 7,446 | | 722,783 |
| Reliance Steel & Aluminum Company | | 3,828 | | 211,803 |
| Steel Dynamics, Inc. | | 11,600 | | 214,136 |
| Titanium Metals Corp. (I) | | 1,700 | | 32,283 |
| United States Steel Corp. | | 2,863 | | 164,594 |
| Walter Energy, Inc. | | 2,950 | | 356,980 |
| | |
|
| | | | | 1,702,579 |
| Paper & Forest Products - 0.43% | | | | |
| MeadWestvaco Corp. | | 9,580 | | 281,173 |
| | |
|
| | | | | 5,200,715 |
| Telecommunication Services - 1.53% | | | | |
| Diversified Telecommunication Services - 1.22% | | | | |
| Frontier Communications Corp. | | 53,502 | | 454,232 |
| | | | |
| Mid Cap Value Index Fund (continued) | | |
| | | Shares or | | |
| | | Principal | | |
| | | Amount | | Value |
| | |
|
| |
| COMMON STOCKS (continued) | | | | |
| Diversified Telecommunication Services (continued) | | |
| Windstream Corp. | | 26,854 | $ | 336,749 |
| | |
|
| | | | | 790,981 |
| Wireless Telecommunication Services - 0.31% | | | | |
| Clearwire Corp. (I) (L) | | 3,000 | | 15,090 |
| Telephone & Data Systems, Inc. | | 2,700 | | 90,855 |
| Telephone & Data Systems, Inc. | | | | |
| Special Shares | | 1,479 | | 43,823 |
| United States Cellular Corp. (I) | | 1,033 | | 51,629 |
| | |
|
| | | | | 201,397 |
| | |
|
| | | | | 992,378 |
| Utilities - 11.35% | | | | |
| Electric Utilities - 2.16% | | | | |
| DPL, Inc. | | 6,357 | | 165,409 |
| FirstEnergy Corp. | | 6,172 | | 236,388 |
| Northeast Utilities | | 9,793 | | 333,354 |
| NV Energy, Inc. | | 12,800 | | 188,032 |
| Pepco Holdings, Inc. | | 12,560 | | 235,249 |
| Pinnacle West Capital Corp. | | 5,857 | | 247,341 |
| | |
|
| | | | | 1,405,773 |
| Gas Utilities - 1.88% | | | | |
| AGL Resources, Inc. | | 4,433 | | 168,498 |
| Energen Corp. | | 3,672 | | 224,359 |
| National Fuel Gas Company | | 3,910 | | 285,039 |
| ONEOK, Inc. | | 5,456 | | 352,294 |
| UGI Corp. | | 5,876 | | 187,386 |
| | |
|
| | | | | 1,217,576 |
| Independent Power Producers & Energy Traders - 0.94% | | |
| Constellation Energy Group, Inc. | | 10,582 | | 328,783 |
| NRG Energy, Inc. (I) | | 14,018 | | 280,220 |
| | |
|
| | | | | 609,003 |
| Multi-Utilities - 5.71% | | | | |
| Alliant Energy Corp. | | 5,950 | | 234,311 |
| Ameren Corp. | | 13,300 | | 371,868 |
| CenterPoint Energy, Inc. | | 22,119 | | 350,807 |
| CMS Energy Corp. | | 12,922 | | 248,878 |
| DTE Energy Company | | 9,204 | | 433,324 |
| Integrys Energy Group, Inc. | | 4,200 | | 205,674 |
| MDU Resources Group, Inc. | | 9,700 | | 208,259 |
| NiSource, Inc. (L) | | 15,052 | | 288,396 |
| NSTAR | | 5,755 | | 259,838 |
| OGE Energy Corp. | | 5,253 | | 252,669 |
| SCANA Corp. | | 6,759 | | 273,604 |
| TECO Energy, Inc. | | 10,952 | | 198,341 |
| Wisconsin Energy Corp. | | 6,495 | | 384,504 |
| | |
|
| | | | | 3,710,473 |
| Water Utilities - 0.66% | | | | |
| American Water Works Company, Inc. | | 9,511 | | 263,837 |
| Aqua America, Inc. (L) | | 7,300 | | 164,396 |
| | |
|
| | | | | 428,233 |
| | |
|
| | | | | 7,371,058 |
|
| TOTAL COMMON STOCKS (Cost $56,467,744) | | | $ | 63,463,278 |
|
| |
| SECURITIES LENDING COLLATERAL - 5.12% | | |
| John Hancock Collateral | | | | |
| Investment Trust, 0.2855% (W) (Y) | | 332,170 | | 3,324,154 |
|
| TOTAL SECURITIES LENDING | | | | |
| COLLATERAL (Cost $3,324,030) | | | $ | 3,324,154 |
|
| |
| The accompanying notes are an integral part of the financial statements. | 180 |
John Hancock Funds II
Portfolio of Investments — February 28, 2011 (Unaudited) (showing percentage of total net assets)
| | | | |
| Mid Cap Value Index Fund (continued) | | |
| | | Shares or | | |
| | | Principal | | |
| | | Amount | | Value |
| |
|
| |
| SHORT-TERM INVESTMENTS - 2.22% | | | |
| Short-Term Securities* - 2.22% | | | | |
| AIM Short-Term Investment Trust, STIC | | | | |
| Prime Portfolio, 0.130% | $ | 1,247,268 | $ | 1,247,268 |
| U.S. Treasury Bills, 0.090%, 04/07/2011 (F) | 50,000 | | 49,996 |
| U.S.Treasury Bills, 0.135%, 04/07/2011 (F) | 145,000 | | 144,980 |
| | |
|
| | | | | 1,442,244 |
|
| TOTAL SHORT-TERM INVESTMENTS (Cost $1,442,243) | | $ | 1,442,244 |
|
| Total Investments (Mid Cap Value Index Fund) | | | |
| (Cost $61,234,017) - 105.04% | | | $ | 68,229,676 |
| Other assets and liabilities, net - (5.04%) | | | | (3,272,090) |
| | | |
|
| TOTAL NET ASSETS - 100.00% | | | $ | 64,957,586 |
| | | |
|
| |
| |
| |
| Mid Value Fund | | | | |
| | | Shares or | | |
| | | Principal | | |
| | | Amount | | Value |
| |
|
| |
| COMMON STOCKS - 91.05% | | | | |
| Consumer Discretionary - 15.23% | | | | |
| Auto Components - 1.20% | | | | |
| BorgWarner, Inc. (I) (L) | | 61,300 | $ | 4,757,493 |
| Visteon Corp. (I) (S) | | 19,000 | | 1,405,050 |
| | |
|
| | | | | 6,162,543 |
| Diversified Consumer Services - 3.50% | | | | |
| Career Education Corp. (I) (L) | | 216,300 | | 5,214,993 |
| H&R Block, Inc. (L) | | 206,200 | | 3,132,178 |
| Strayer Education, Inc. (L) | | 13,200 | | 1,814,208 |
| Weight Watchers International, Inc. | | 127,400 | | 7,787,962 |
| | |
|
| | | | | 17,949,341 |
| Hotels, Restaurants & Leisure - 0.84% | | | | |
| International Game Technology (L) | | 260,800 | | 4,292,768 |
| Household Durables - 1.47% | | | | |
| Fortune Brands, Inc. | | 112,400 | | 6,953,064 |
| Pulte Group, Inc. (I) (L) | | 81,800 | | 564,420 |
| | |
|
| | | | | 7,517,484 |
| Internet & Catalog Retail - 0.73% | | | | |
| Liberty Media Corp. - Interactive, Series A (I) | 232,000 | | 3,725,920 |
| Leisure Equipment & Products - 1.40% | | | | |
| Mattel, Inc. | | 215,800 | | 5,407,948 |
| Sankyo Company, Ltd. | | 31,400 | | 1,781,010 |
| | |
|
| | | | | 7,188,958 |
| Media - 3.96% | | | | |
| DISH Network Corp. (I) | | 188,600 | | 4,384,950 |
| Liberty Media Corp. - Starz, Series A (I) | | 45,100 | | 3,166,020 |
| Meredith Corp. (L) | | 145,500 | | 5,130,330 |
| Scholastic Corp. (L) | | 124,200 | | 3,899,880 |
| Scripps Networks Interactive, Inc., Class A | | 43,700 | | 2,269,778 |
| The Washington Post Company, Class B (L) | 3,400 | | 1,472,506 |
| | |
|
| | | | | 20,323,464 |
| Multiline Retail - 0.27% | | | | |
| Dollar General Corp. (I) (L) | | 49,800 | | 1,406,850 |
| Specialty Retail - 1.86% | | | | |
| CarMax, Inc. (I) (L) | | 67,300 | | 2,380,401 |
| The Gap, Inc. (L) | | 256,300 | | 5,774,439 |
| | | | |
| Mid Value Fund (continued) | | | | |
| | | Shares or | | |
| | | Principal | | |
| | | Amount | | Value |
| | |
|
| |
| COMMON STOCKS (continued) | | | | |
| Specialty Retail (continued) | | | | |
| Tiffany & Company | | 22,600 | $ | 1,391,030 |
| | |
|
| | | | | 9,545,870 |
| | |
|
| | | | | 78,113,198 |
| Consumer Staples - 9.06% | | | | |
| Beverages - 0.39% | | | | |
| Brown Forman Corp., Class B (L) | | 28,700 | | 1,984,605 |
| Food & Staples Retailing - 2.01% | | | | |
| Sysco Corp. (L) | | 106,800 | | 2,967,972 |
| The Kroger Company | | 321,200 | | 7,355,480 |
| | |
|
| | | | | 10,323,452 |
| Food Products - 3.38% | | | | |
| Campbell Soup Company (L) | | 91,800 | | 3,089,988 |
| Flowers Foods, Inc. (L) | | 59,600 | | 1,585,360 |
| McCormick & Company, Inc., Class B (L) | | 74,100 | | 3,530,865 |
| Sara Lee Corp. | | 160,000 | | 2,739,200 |
| The Hershey Company | | 85,300 | | 4,462,896 |
| Tootsie Roll Industries, Inc. (L) | | 68,119 | | 1,948,203 |
| | |
|
| | | | | 17,356,512 |
| Household Products - 0.73% | | | | |
| Clorox Company (L) | | 54,900 | | 3,720,024 |
| Personal Products - 2.55% | | | | |
| Alberto-Culver Company | | 172,900 | | 6,438,796 |
| Avon Products, Inc. | | 141,200 | | 3,926,772 |
| The Estee Lauder Companies, Inc., Class A | | 28,700 | | 2,709,567 |
| | |
|
| | | | | 13,075,135 |
| | |
|
| | | | | 46,459,728 |
| Energy - 10.24% | | | | |
| Energy Equipment & Services - 1.32% | | | | |
| Exterran Holdings, Inc. (I) (L) | | 138,300 | | 3,139,410 |
| Weatherford International, Ltd. (I) | | 150,100 | | 3,629,418 |
| | |
|
| | | | | 6,768,828 |
| Oil, Gas & Consumable Fuels - 8.92% | | | | |
| Arch Coal, Inc. (L) | | 103,306 | | 3,463,850 |
| El Paso Corp. | | 397,900 | | 7,400,940 |
| EQT Corp. | | 135,600 | | 6,685,080 |
| Hess Corp. | | 53,800 | | 4,682,214 |
| Marathon Oil Corp. | | 171,900 | | 8,526,240 |
| Murphy Oil Corp. | | 48,200 | | 3,544,146 |
| Nexen, Inc. | | 372,700 | | 10,178,437 |
| Suncor Energy, Inc. | | 26,664 | | 1,253,741 |
| | |
|
| | | | | 45,734,648 |
| | |
|
| | | | | 52,503,476 |
| Financials - 21.66% | | | | |
| Capital Markets - 4.92% | | | | |
| E*TRADE Financial Corp. (I) | | 356,310 | | 5,693,834 |
| Federated Investors, Inc., Class B (L) | | 115,800 | | 3,191,448 |
| Greenhill & Company, Inc. (L) | | 68,200 | | 4,898,806 |
| Janus Capital Group, Inc. (L) | | 348,600 | | 4,681,698 |
| Northern Trust Corp. | | 131,100 | | 6,760,827 |
| | |
|
| | | | | 25,226,613 |
| Commercial Banks - 2.96% | | | | |
| CIT Group, Inc. (I) | | 140,200 | | 6,073,464 |
| Commerce Bancshares, Inc. (L) | | 37,475 | | 1,504,996 |
| First Horizon National Corp. (L) | | 293,058 | | 3,370,167 |
| First Republic Bank/San Francisco CA (I) | | 6,200 | | 181,350 |
| Marshall & Ilsley Corp. | | 98,600 | | 766,122 |
| |
| The accompanying notes are an integral part of the financial statements. | 181 |
John Hancock Funds II
Portfolio of Investments — February 28, 2011 (Unaudited) (showing percentage of total net assets)
| | | | |
| Mid Value Fund (continued) | | | | |
| | | Shares or | | |
| | | Principal | | |
| | | Amount | | Value |
| | |
|
| |
| COMMON STOCKS (continued) | | | | |
| Commercial Banks (continued) | | | | |
| Westamerica Bancorp. (L) | | 63,500 | $ | 3,275,330 |
| | | |
|
| | | | | 15,171,429 |
| Consumer Finance - 0.99% | | | | |
| Discover Financial Services | | 232,200 | | 5,050,350 |
| Insurance - 5.91% | | | | |
| Arthur J. Gallagher & Company (L) | | 44,000 | | 1,381,600 |
| Assured Guaranty, Ltd. | | 68,400 | | 993,852 |
| Axis Capital Holdings, Ltd. | | 52,800 | | 1,917,696 |
| Fidelity National Financial, Inc., Class A | | 307,300 | | 4,256,105 |
| First American Financial Corp. | | 321,200 | | 5,062,112 |
| Marsh & McLennan Companies, Inc. | | 273,700 | | 8,331,428 |
| OneBeacon Insurance Group, Ltd. | | 72,500 | | 993,250 |
| The Allstate Corp. | | 80,500 | | 2,558,290 |
| The Progressive Corp. | | 178,900 | | 3,726,487 |
| White Mountains Insurance Group, Ltd. | | 2,900 | | 1,101,275 |
| | |
|
| | | | | 30,322,095 |
| Real Estate Investment Trusts - 4.91% | | | | |
| Cousins Properties, Inc. (L) | | 190,748 | | 1,617,543 |
| Federal Realty Investment Trust | | 4,700 | | 395,646 |
| General Growth Properties, Inc. | | 140,647 | | 2,239,100 |
| Kimco Realty Corp. (L) | | 224,400 | | 4,348,872 |
| ProLogis | | 159,600 | | 2,595,096 |
| SL Green Realty Corp. (L) | | 31,900 | | 2,415,787 |
| Weingarten Realty Investors (L) | | 81,200 | | 2,100,644 |
| Weyerhaeuser Company (L) | | 388,797 | | 9,490,534 |
| | |
|
| | | | | 25,203,222 |
| Real Estate Management & Development - 1.07% | | | | |
| Forest City Enterprises, Inc., Class A (I) (L) | | 99,300 | | 1,876,770 |
| The St. Joe Company (I) (L) | | 135,400 | | 3,626,012 |
| | |
|
| | | | | 5,502,782 |
| Thrifts & Mortgage Finance - 0.90% | | | | |
| BankUnited, Inc. (I) | | 14,200 | | 402,570 |
| Capitol Federal Financial, Inc. | | 218,112 | | 2,756,936 |
| MGIC Investment Corp. (I) (L) | | 167,800 | | 1,441,402 |
| | |
|
| | | | | 4,600,908 |
| | | |
|
| | | | | 111,077,399 |
| Health Care - 5.97% | | | | |
| Biotechnology - 0.45% | | | | |
| Cephalon, Inc. (I) | | 40,700 | | 2,291,817 |
| Health Care Equipment & Supplies - 1.76% | | | | |
| Beckman Coulter, Inc. | | 42,400 | | 3,524,712 |
| Stryker Corp. (L) | | 28,500 | | 1,802,910 |
| Zimmer Holdings, Inc. (I) | | 59,300 | | 3,696,762 |
| | |
|
| | | | | 9,024,384 |
| Health Care Providers & Services - 3.20% | | | | |
| Cardinal Health, Inc. | | 55,400 | | 2,306,856 |
| Healthsouth Corp. (I) (L) | | 356,500 | | 8,630,865 |
| Quest Diagnostics, Inc. | | 23,700 | | 1,344,975 |
| Select Medical Holdings Corp. (I) | | 207,100 | | 1,615,380 |
| Tenet Healthcare Corp. (I) | | 352,600 | | 2,531,668 |
| | |
|
| | | | | 16,429,744 |
| Life Sciences Tools & Services - 0.32% | | | | |
| Charles River | | | | |
| Laboratories International, Inc. (I) | | 44,800 | | 1,632,512 |
| Pharmaceuticals - 0.24% | | | | |
| Forest Laboratories, Inc. (I) | | 38,500 | | 1,247,400 |
| | |
|
| | | | | 30,625,857 |
| | | | |
| Mid Value Fund (continued) | | | | |
| | | Shares or | | |
| | | Principal | | |
| | | Amount | | Value |
| | |
|
| |
| COMMON STOCKS (continued) | | | | |
| Industrials - 7.69% | | | | |
| Aerospace & Defense - 1.55% | | | | |
| Raytheon Company | | 59,500 | $ | 3,046,995 |
| Textron, Inc. (L) | | 180,500 | | 4,889,745 |
| | |
|
| | | | | 7,936,740 |
| Airlines - 1.94% | | | | |
| Delta Air Lines, Inc. (I) | | 184,700 | | 2,076,028 |
| Southwest Airlines Company | | 668,000 | | 7,902,440 |
| | |
|
| | | | | 9,978,468 |
| Commercial Services & Supplies - 0.67% | | | | |
| Cintas Corp. (L) | | 122,400 | | 3,441,888 |
| Machinery - 1.06% | | | | |
| Harsco Corp. (L) | | 33,400 | | 1,141,278 |
| WABCO Holdings, Inc. (I) | | 74,000 | | 4,323,820 |
| | |
|
| | | | | 5,465,098 |
| Professional Services - 1.77% | | | | |
| Equifax, Inc. | | 20,700 | | 740,025 |
| Manpower, Inc. | | 92,900 | | 5,899,150 |
| Verisk Analytics, Inc., Class A (I) | | 75,300 | | 2,435,955 |
| | |
|
| | | | | 9,075,130 |
| Road & Rail - 0.70% | | | | |
| Hertz Global Holdings, Inc. (I) (L) | | 234,800 | | 3,571,308 |
| | |
|
| | | | | 39,468,632 |
| Information Technology - 6.65% | | | | |
| Communications Equipment - 0.35% | | | | |
| Motorola Mobility Holdings, Inc. (I) | | 59,100 | | 1,784,820 |
| Electronic Equipment, Instruments & Components - 2.58% | | |
| AVX Corp. | | 131,000 | | 2,089,450 |
| Molex, Inc., Class A | | 209,200 | | 4,815,784 |
| Tyco Electronics, Ltd. | | 175,600 | | 6,328,624 |
| | |
|
| | | | | 13,233,858 |
| IT Services - 1.76% | | | | |
| Automatic Data Processing, Inc. | | 6,300 | | 315,000 |
| Computer Sciences Corp. (L) | | 58,100 | | 2,796,353 |
| CoreLogic, Inc. | | 73,600 | | 1,372,640 |
| Paychex, Inc. (L) | | 95,100 | | 3,198,213 |
| SAIC, Inc. (I) (L) | | 81,500 | | 1,331,710 |
| | |
|
| | | | | 9,013,916 |
| Semiconductors & Semiconductor Equipment - 1.65% | | |
| ASML Holding NV -New York | | | | |
| Registered Shares (L) | | 46,700 | | 2,036,120 |
| National Semiconductor Corp. (L) | | 40,200 | | 623,100 |
| Novellus Systems, Inc. (I) | | 145,600 | | 5,818,176 |
| | |
|
| | | | | 8,477,396 |
| Software - 0.31% | | | | |
| Electronic Arts, Inc. (I) (L) | | 86,300 | | 1,622,440 |
| | |
|
| | | | | 34,132,430 |
| Materials - 5.35% | | | | |
| Chemicals - 1.82% | | | | |
| International Flavors & Fragrances, Inc. (L) | | 66,300 | | 3,775,785 |
| Nalco Holding Company | | 217,000 | | 5,548,690 |
| | |
|
| | | | | 9,324,475 |
| Construction Materials - 0.46% | | | | |
| Vulcan Materials Company (L) | | 51,200 | | 2,347,520 |
| Containers & Packaging - 0.91% | | | | |
| Temple-Inland, Inc. | | 198,800 | | 4,649,932 |
| |
| The accompanying notes are an integral part of the financial statements. | 182 |
John Hancock Funds II
Portfolio of Investments — February 28, 2011 (Unaudited) (showing percentage of total net assets)
| | | | |
| Mid Value Fund (continued) | | | | |
| | | Shares or | | |
| | | Principal | | |
| | | Amount | | Value |
| | |
|
| |
| COMMON STOCKS (continued) | | | | |
| Metals & Mining - 1.97% | | | | |
| Agnico Eagle Mines, Ltd. (L) | | 37,400 | $ | 2,631,090 |
| Franco-Nevada Corp. | | 108,900 | | 3,705,660 |
| United States Steel Corp. (L) | | 65,700 | | 3,777,093 |
| | |
|
| | | | | 10,113,843 |
| Paper & Forest Products - 0.19% | | | | |
| Domtar Corp. | | 11,533 | | 1,007,984 |
| | |
|
| | | | | 27,443,754 |
| Telecommunication Services - 1.17% | | | | |
| Diversified Telecommunication Services - 0.25% | | | | |
| Hellenic Telecommunications | | | | |
| Organization SA, SADR | | 256,000 | | 1,272,320 |
| Wireless Telecommunication Services - 0.92% | | | | |
| Telephone & Data Systems, Inc. (L) | | 33,800 | | 1,137,370 |
| Telephone & Data Systems, Inc. | | | | |
| Special Shares | | 121,500 | | 3,600,045 |
| | |
|
| | | | | 4,737,415 |
| | | |
|
| | | | | 6,009,735 |
| Utilities - 8.03% | | | | |
| Electric Utilities - 3.57% | | | | |
| American Electric Power Company, Inc. (L) | | 49,900 | | 1,785,422 |
| Duke Energy Corp. (L) | | 110,500 | | 1,987,895 |
| FirstEnergy Corp. (L) | | 191,354 | | 7,328,858 |
| Pepco Holdings, Inc. | | 83,000 | | 1,554,590 |
| Pinnacle West Capital Corp. | | 15,100 | | 637,673 |
| PPL Corp. | | 197,100 | | 5,012,253 |
| | |
|
| | | | | 18,306,691 |
| Independent Power Producers & Energy Traders - 3.41% | | |
| Calpine Corp. (I) (L) | | 290,000 | | 4,387,700 |
| Constellation Energy Group, Inc. | | 121,600 | | 3,778,112 |
| GenOn Energy, Inc. (I) | | 1,600,184 | | 6,480,745 |
| NRG Energy, Inc. (I) | | 141,500 | | 2,828,585 |
| | |
|
| | | | | 17,475,142 |
| Multi-Utilities - 1.05% | | | | |
| NiSource, Inc. (L) | | 258,400 | | 4,950,944 |
| TECO Energy, Inc. | | 23,800 | | 431,018 |
| | |
|
| | | | | 5,381,962 |
| | | |
|
| | | | | 41,163,795 |
|
| TOTAL COMMON STOCKS (Cost $351,093,329) | | | $ | 466,998,004 |
|
| |
| PREFERRED SECURITIES - 0.21% | | | | |
| Financials - 0.12% | | | | |
| Insurance - 0.12% | | | | |
| Assured Guaranty, Ltd. 8.500% | | 10,250 | | 632,528 |
| Utilities - 0.09% | | | | |
| Electric Utilities - 0.09% | | | | |
| PPL Corp. 9.500% | | 8,300 | | 442,141 |
|
| TOTAL PREFERRED SECURITIES (Cost $978,205) | | | $ | 1,074,669 |
|
| |
| CONVERTIBLE BONDS - 1.52% | | | | |
| Financials - 0.14% | | | | |
| Janus Capital Group, Inc. | | | | |
| 3.250%, 07/15/2014 | $ | 402,000 | $ | 490,943 |
| MGIC Investment Corp. | | | | |
| 5.000%, 05/01/2017 | | 232,000 | | 252,880 |
| | |
|
| | | | | 743,823 |
| | | | |
| Mid Value Fund (continued) | | | |
| | | Shares or | | |
| | | Principal | | |
| | | Amount | | Value |
| |
|
| |
| CONVERTIBLE BONDS (continued) | | | | |
| Industrials - 0.42% | | | | |
| Hertz Global Holdings, Inc. | | | | |
| 5.250%, 06/01/2014 | $ | 194,000 | $ | 384,120 |
| Textron, Inc., Series TXT | | | | |
| 4.500%, 05/01/2013 | | 832,000 | | 1,777,360 |
| | |
|
| | | | | 2,161,480 |
| Materials - 0.34% | | | | |
| Alcoa, Inc. | | | | |
| 5.250%, 03/15/2014 | | 637,000 | | 1,725,474 |
| Telecommunication Services - 0.62% | | | | |
| Alcatel-Lucent USA, Inc. | | | | |
| 2.875%, 06/15/2025 | | 3,250,000 | | 3,160,625 |
|
| TOTAL CONVERTIBLE BONDS (Cost $5,869,822) | | $ | 7,791,402 |
|
| |
| SECURITIES LENDING COLLATERAL - 25.53% | | | |
| John Hancock Collateral | | | | |
| Investment Trust, 0.2855% (W) (Y) | | 13,081,976 | | 130,916,565 |
|
| TOTAL SECURITIES LENDING | | | | |
| COLLATERAL (Cost $130,913,320) | | | $ | 130,916,565 |
|
| |
| SHORT-TERM INVESTMENTS - 7.09% | | | | |
| Short-Term Securities* - 7.09% | | | | |
| State Street Institutional U.S. Government | | | | |
| Money Market Fund, 0.0647% | $ | 1,451,675 | $ | 1,451,617 |
| T. Rowe Price Reserve Fund, 0.2212% | | 34,905,945 | | 34,905,945 |
| | |
|
| | | | | 36,357,562 |
|
| TOTAL SHORT-TERM INVESTMENTS (Cost $36,357,562) | | $ | 36,357,562 |
|
| Total Investments (Mid Value Fund) | | | | |
| (Cost $525,212,238) - 125.40% | | | $ | 643,138,202 |
| Other assets and liabilities, net - (25.40%) | | | | (130,249,641) |
| | |
|
| TOTAL NET ASSETS - 100.00% | | | $ | 512,888,561 |
| | | |
|
| |
| |
| |
| Mutual Shares Fund | | | | |
| | | Shares or | | |
| | | Principal | | |
| | | Amount | | Value |
| |
|
| |
| COMMON STOCKS - 92.40% | | | | |
| Consumer Discretionary - 7.23% | | | | |
| Automobiles - 0.67% | | | | |
| Daimler AG (I) | | 34,736 | $ | 2,446,648 |
| Hotels, Restaurants & Leisure - 0.10% | | | | |
| Thomas Cook Group PLC | | 113,639 | | 349,214 |
| Household Durables - 0.64% | | | | |
| Stanley Black & Decker, Inc. | | 30,591 | | 2,319,716 |
| Leisure Equipment & Products - 0.60% | | | | |
| Mattel, Inc. | | 86,785 | | 2,174,832 |
| Media - 5.22% | | | | |
| British Sky Broadcasting Group PLC | | 250,184 | | 3,200,549 |
| Comcast Corp., Special Class A | | 71,586 | | 1,740,972 |
| News Corp., Class A | | 135,547 | | 2,354,451 |
| Time Warner Cable, Inc. | | 63,916 | | 4,613,457 |
| Time Warner, Inc. | | 130,198 | | 4,973,564 |
| Virgin Media, Inc. (L) | | 76,898 | | 2,094,702 |
| | |
|
| | | | | 18,977,695 |
| | |
|
| | | | | 26,268,105 |
| |
| The accompanying notes are an integral part of the financial statements. | 183 |
John Hancock Funds II
Portfolio of Investments — February 28, 2011 (Unaudited) (showing percentage of total net assets)
| | | | |
| Mutual Shares Fund (continued) | | |
| | | Shares or | | |
| | | Principal | | |
| | | Amount | | Value |
| | |
|
| |
| COMMON STOCKS (continued) | | | | |
| Consumer Staples - 23.05% | | | | |
| Beverages - 4.08% | | | | |
| Brown Forman Corp., Class B (L) | | 17,846 | $ | 1,234,051 |
| Carlsberg A/S | | 5,450 | | 579,472 |
| Coca-Cola Enterprises, Inc. | | 74,811 | | 1,967,529 |
| Dr. Pepper Snapple Group, Inc. | | 96,947 | | 3,495,909 |
| PepsiCo, Inc. | | 41,293 | | 2,618,802 |
| Pernod-Ricard SA | | 53,510 | | 4,932,225 |
| | |
|
| | | | | 14,827,988 |
| Food & Staples Retailing - 5.33% | | | | |
| Carrefour SA | | 38,209 | | 1,875,904 |
| CVS Caremark Corp. | | 323,893 | | 10,707,904 |
| The Kroger Company | | 204,869 | | 4,691,500 |
| Wal-Mart Stores, Inc. | | 40,309 | | 2,095,262 |
| | |
|
| | | | | 19,370,570 |
| Food Products - 4.89% | | | | |
| General Mills, Inc. | | 85,865 | | 3,189,026 |
| Kraft Foods, Inc., Class A (L) | | 262,313 | | 8,352,046 |
| Nestle SA | | 109,710 | | 6,210,145 |
| | |
|
| | | | | 17,751,217 |
| Tobacco - 8.75% | | | | |
| Altria Group, Inc. | | 268,059 | | 6,800,657 |
| British American Tobacco PLC | | 225,968 | | 9,042,966 |
| Imperial Tobacco Group PLC | | 199,311 | | 6,404,445 |
| Japan Tobacco, Inc. | | 651 | | 2,707,427 |
| Lorillard, Inc. | | 6,379 | | 489,716 |
| Philip Morris International, Inc. | | 45,528 | | 2,858,248 |
| Reynolds American, Inc. | | 102,122 | | 3,504,827 |
| | |
|
| | | | | 31,808,286 |
| | | |
|
| | | | | 83,758,061 |
| Energy - 7.75% | | | | |
| Energy Equipment & Services - 2.58% | | | | |
| Exterran Holdings, Inc. (I) | | 49,222 | | 1,117,339 |
| Pride International, Inc. (I) | | 58,012 | | 2,408,078 |
| Transocean, Ltd. (I)(L) | | 69,188 | | 5,855,380 |
| | |
|
| | | | | 9,380,797 |
| Oil, Gas & Consumable Fuels - 5.17% | | | | |
| Marathon Oil Corp. | | 158,633 | | 7,868,197 |
| Noble Energy, Inc. | | 15,851 | | 1,468,754 |
| Royal Dutch Shell PLC | | 155,158 | | 5,580,784 |
| The Williams Companies, Inc. | | 51,598 | | 1,566,515 |
| Total SA | | 37,295 | | 2,288,243 |
| | |
|
| | | | | 18,772,493 |
| | | |
|
| | | | | 28,153,290 |
| Financials - 12.92% | | | | |
| Capital Markets - 2.04% | | | | |
| Morgan Stanley | | 155,496 | | 4,615,121 |
| UBS AG Swiss Exchange (I) | | 141,451 | | 2,810,856 |
| | |
|
| | | | | 7,425,977 |
| Commercial Banks - 4.14% | | | | |
| Barclays PLC | | 716,630 | | 3,721,223 |
| Intesa Sanpaolo SpA | | 373,002 | | 1,259,164 |
| PNC Financial Services Group, Inc. | | 70,702 | | 4,362,313 |
| Wells Fargo & Company | | 176,101 | | 5,681,018 |
| | |
|
| | | | | 15,023,718 |
| Diversified Financial Services - 2.04% | | | | |
| Bank of America Corp. | | 308,400 | | 4,407,036 |
| Deutsche Boerse AG | | 29,779 | | 2,287,224 |
| | | | |
| Mutual Shares Fund (continued) | | |
| | | Shares or | | |
| | | Principal | | |
| | | Amount | | Value |
| | |
|
| |
| COMMON STOCKS (continued) | | | | |
| Diversified Financial Services (continued) | | | | |
| NYSE Euronext | | 19,058 | $ | 705,146 |
| | |
|
| | | | | 7,399,406 |
| Insurance - 3.02% | | | | |
| ACE, Ltd. | | 62,989 | | 3,984,054 |
| Old Republic International Corp. | | 61,129 | | 764,113 |
| White Mountains Insurance Group, Ltd. | | 9,814 | | 3,726,867 |
| Zurich Financial Services AG | | 8,588 | | 2,492,564 |
| | |
|
| | | | | 10,967,598 |
| Real Estate Investment Trusts - 1.48% | | | | |
| The Link | | 118,788 | | 367,920 |
| Weyerhaeuser Company | | 205,750 | | 5,022,358 |
| | |
|
| | | | | 5,390,278 |
| Real Estate Management & Development - 0.20% | | | | |
| Forestar Group, Inc. (I) | | 38,489 | | 741,298 |
| | |
|
| | | | | 46,948,275 |
| Health Care - 14.80% | | | | |
| Biotechnology - 2.18% | | | | |
| Amgen, Inc. (I) | | 63,805 | | 3,275,111 |
| Genzyme Corp. (I) | | 61,231 | | 4,619,879 |
| | |
|
| | | | | 7,894,990 |
| Health Care Equipment & Supplies - 3.04% | | | | |
| Alcon, Inc. | | 16,956 | | 2,805,031 |
| Boston Scientific Corp. (I)(L) | | 311,298 | | 2,228,894 |
| Medtronic, Inc. | | 111,710 | | 4,459,463 |
| Zimmer Holdings, Inc. (I) | | 24,955 | | 1,555,695 |
| | |
|
| | | | | 11,049,083 |
| Health Care Providers & Services - 4.82% | | | | |
| Community Health Systems, Inc. (I) | | 99,543 | | 4,068,322 |
| Coventry Health Care, Inc. (I) | | 35,700 | | 1,078,140 |
| Tenet Healthcare Corp. (I) | | 535,415 | | 3,844,280 |
| UnitedHealth Group, Inc. | | 200,271 | | 8,527,539 |
| | |
|
| | | | | 17,518,281 |
| Pharmaceuticals - 4.76% | | | | |
| Eli Lilly & Company | | 164,379 | | 5,680,938 |
| Merck & Company, Inc. | | 163,640 | | 5,329,755 |
| Pfizer, Inc. | | 326,253 | | 6,277,108 |
| | |
|
| | | | | 17,287,801 |
| | |
|
| | | | | 53,750,155 |
| Industrials - 4.71% | | | | |
| Air Freight & Logistics - 0.57% | | | | |
| TNT NV | | 78,214 | | 2,051,733 |
| Building Products - 0.93% | | | | |
| Owens Corning, Inc. (I) | | 94,610 | | 3,380,415 |
| Electrical Equipment - 0.63% | | | | |
| Alstom SA | | 38,643 | | 2,303,035 |
| Industrial Conglomerates - 1.20% | | | | |
| Koninklijke Philips Electronics NV | | 58,270 | | 1,901,804 |
| Orkla ASA | | 267,721 | | 2,441,692 |
| | |
|
| | | | | 4,343,496 |
| Marine - 1.38% | | | | |
| A P Moller Maersk A/S, Series A | | 506 | | 5,016,293 |
| | |
|
| | | | | 17,094,972 |
| Information Technology - 10.42% | | | | |
| Communications Equipment - 1.38% | | | | |
| Cisco Systems, Inc. (I) | | 149,520 | | 2,775,091 |
| |
| The accompanying notes are an integral part of the financial statements. | 184 |
John Hancock Funds II
Portfolio of Investments — February 28, 2011 (Unaudited) (showing percentage of total net assets)
| | | | |
| Mutual Shares Fund (continued) | | |
| | | Shares or | | |
| | | Principal | | |
| | | Amount | | Value |
| |
|
| | |
| COMMON STOCKS (continued) | | | | |
| Communications Equipment (continued) | | | | |
| Motorola Solutions, Inc. (I) | | 57,536 | $ | 2,223,191 |
| | | |
|
| | | | | 4,998,282 |
| Computers & Peripherals - 1.27% | | | | |
| Hewlett-Packard Company | | 106,026 | | 4,625,914 |
| Electronic Equipment, Instruments & Components - 0.80% | | |
| Tyco Electronics, Ltd. | | 80,933 | | 2,916,825 |
| Office Electronics - 1.85% | | | | |
| Xerox Corp. | | 625,993 | | 6,729,425 |
| Semiconductors & Semiconductor Equipment - 1.22% | | |
| LSI Corp. (I) | | 571,635 | | 3,595,584 |
| Maxim Integrated Products, Inc. | | 30,173 | | 832,171 |
| | |
|
| | | | | 4,427,755 |
| Software - 3.90% | | | | |
| McAfee, Inc. (I) | | 41,734 | | 2,001,145 |
| Microsoft Corp. | | 287,217 | | 7,634,228 |
| Nintendo Company, Ltd. | | 8,000 | | 2,349,099 |
| Symantec Corp. (I) | | 120,613 | | 2,174,652 |
| | |
|
| | | | | 14,159,124 |
| | | |
|
| | | | | 37,857,325 |
| Materials - 4.49% | | | | |
| Chemicals - 1.30% | | | | |
| Linde AG | | 30,850 | | 4,709,881 |
| Metals & Mining - 0.71% | | | | |
| ThyssenKrupp AG | | 62,501 | | 2,601,812 |
| Paper & Forest Products - 2.48% | | | | |
| Domtar Corp. | | 23,247 | | 2,031,788 |
| International Paper Company | | 167,609 | | 4,656,178 |
| MeadWestvaco Corp. | | 78,846 | | 2,314,130 |
| | |
|
| | | | | 9,002,096 |
| | | |
|
| | | | | 16,313,789 |
| Telecommunication Services - 3.09% | | | | |
| Diversified Telecommunication Services - 1.34% | | | |
| Telefonica SA | | 191,749 | | 4,876,888 |
| Wireless Telecommunication Services - 1.75% | | | |
| Vodafone Group PLC | | 2,235,634 | | 6,343,630 |
| | |
|
| | | | | 11,220,518 |
| Utilities - 3.94% | | | | |
| Electric Utilities - 2.51% | | | | |
| E.ON AG | | 127,968 | | 4,200,786 |
| Entergy Corp. | | 21,994 | | 1,565,973 |
| Exelon Corp. | | 79,969 | | 3,339,505 |
| | |
|
| | | | | 9,106,264 |
| Independent Power Producers & Energy Traders - 0.70% | | |
| NRG Energy, Inc. (I) | | 127,708 | | 2,552,883 |
| Multi-Utilities - 0.73% | | | | |
| GDF Suez | | 65,826 | | 2,667,671 |
| | |
|
| | | | | 14,326,818 |
|
| TOTAL COMMON STOCKS (Cost $301,391,561) | | $ | 335,691,308 |
|
| CORPORATE BONDS - 0.11% | | | | |
| Energy - 0.11% | | | | |
| OPTI Canada, Inc. | | | | |
| 9.000%, 12/15/2012 (S) | $ | 191,000 | $ | 190,523 |
| | | | |
| Mutual Shares Fund (continued) | | | |
| | | Shares or | | |
| | | Principal | | |
| | | Amount | | Value |
| |
|
| CORPORATE BONDS (continued) | | | | |
| Energy (continued) | | | | |
| OPTI Canada, Inc. (continued) | | | | |
| 9.750%, 08/15/2013 (S) | $ | 206,000 | $ | 202,910 |
| | |
|
| | | | | 393,433 |
|
| TOTAL CORPORATE BONDS (Cost $392,587) | | $ | 393,433 |
|
| TERM LOANS (M) - 0.07% | | | | |
| Consumer Discretionary - 0.07% | | | | |
| Clear Channel Communications, Inc. | | | | |
| 3.912%, 01/29/2016 | | 268,963 | | 242,963 |
|
| TOTAL TERM LOANS (Cost $223,016) | | | $ | 242,963 |
|
| SECURITIES LENDING COLLATERAL - 1.90% | | | |
| John Hancock Collateral | | | | |
| Investment Trust, 0.2855% (W)(Y) | | 690,668 | | 6,911,793 |
|
| TOTAL SECURITIES LENDING | | | | |
| COLLATERAL (Cost $6,911,327) | | | $ | 6,911,793 |
|
| SHORT-TERM INVESTMENTS - 7.68% | | | | |
| Short-Term Securities* - 7.68% | | | | |
| Federal Home Loan Bank Discount Notes, | | | | |
| 0.0702%, 03/01/2011 | $ | 22,900,000 | $ | 22,900,000 |
| U.S. Treasury Bills, 0.148%, 08/04/2011 | | 5,000,000 | | 4,996,640 |
| | |
|
| | | | | 27,896,640 |
|
| TOTAL SHORT-TERM INVESTMENTS (Cost $27,896,415) | | $ | 27,896,640 |
|
| Total Investments (Mutual Shares Fund) | | | | |
| (Cost $336,814,906) - 102.16% | | | $ | 371,136,137 |
| Other assets and liabilities, net - (2.16%) | | | | (7,829,344) |
| | |
|
| TOTAL NET ASSETS - 100.00% | | | $ | 363,306,793 |
| | | |
|
| |
| |
| Optimized Value Fund | | | | |
| | | Shares or | | |
| | | Principal | | |
| | | Amount | | Value |
| |
|
| COMMON STOCKS - 97.66% | | | | |
| Consumer Discretionary - 15.89% | | | | |
| Hotels, Restaurants & Leisure - 3.39% | | | | |
| Carnival Corp. | | 312,863 | $ | 13,349,864 |
| Media - 3.03% | | | | |
| Comcast Corp., Class A | | 225,068 | | 5,797,752 |
| Omnicom Group, Inc. | | 120,511 | | 6,134,010 |
| | |
|
| | | | | 11,931,762 |
| Multiline Retail - 0.79% | | | | |
| Target Corp. | | 59,050 | | 3,103,078 |
| Specialty Retail - 6.74% | | | | |
| Home Depot, Inc. | | 401,212 | | 15,033,414 |
| Lowe’s Companies, Inc. | | 305,653 | | 7,998,939 |
| Staples, Inc. | | 163,735 | | 3,487,556 |
| | |
|
| | | | | 26,519,909 |
| Textiles, Apparel & Luxury Goods - 1.94% | | | |
| The Timberland Company, Class A (I) | | 207,179 | | 7,653,192 |
| | |
|
| | | | | 62,557,805 |
| Consumer Staples - 11.55% | | | | |
| Beverages - 5.51% | | | | |
| Diageo PLC, SADR | | 183,508 | | 14,361,336 |
| |
| The accompanying notes are an integral part of the financial statements. | 185 |
John Hancock Funds II
Portfolio of Investments — February 28, 2011 (Unaudited) (showing percentage of total net assets)
| | | | |
| Optimized Value Fund (continued) | | |
| | | Shares or | | |
| | | Principal | | |
| | | Amount | | Value |
| | |
|
| COMMON STOCKS (continued) | | | | |
| Beverages (continued) | | | | |
| PepsiCo, Inc. | | 115,840 | $ | 7,346,573 |
| | | |
|
| | | | | 21,707,909 |
| Food & Staples Retailing - 2.77% | | | | |
| Safeway, Inc. | | 271,285 | | 5,919,439 |
| Walgreen Company | | 114,981 | | 4,983,277 |
| | |
|
| | | | | 10,902,716 |
| Household Products - 1.93% | | | | |
| Clorox Company | | 59,929 | | 4,060,789 |
| The Procter & Gamble Company | | 55,768 | | 3,516,172 |
| | |
|
| | | | | 7,576,961 |
| Tobacco - 1.34% | | | | |
| Philip Morris International, Inc. | | 84,133 | | 5,281,870 |
| | |
|
| | | | | 45,469,456 |
| Energy - 11.41% | | | | |
| Oil, Gas & Consumable Fuels - 11.41% | | | | |
| Chevron Corp. | | 122,845 | | 12,745,169 |
| ConocoPhillips | | 171,629 | | 13,364,750 |
| Exxon Mobil Corp. | | 100,013 | | 8,554,112 |
| Occidental Petroleum Corp. | | 100,641 | | 10,262,363 |
| | |
|
| | | | | 44,926,394 |
| | | |
|
| | | | | 44,926,394 |
| Financials - 23.75% | | | | |
| Capital Markets - 3.54% | | | | |
| Northern Trust Corp. | | 119,083 | | 6,141,110 |
| State Street Corp. | | 173,928 | | 7,778,060 |
| | |
|
| | | | | 13,919,170 |
| Commercial Banks - 3.54% | | | | |
| U.S. Bancorp | | 304,875 | | 8,454,184 |
| Wells Fargo & Company | | 170,332 | | 5,494,910 |
| | |
|
| | | | | 13,949,094 |
| Diversified Financial Services - 12.45% | | | | |
| Bank of America Corp. | | 1,079,768 | | 15,429,885 |
| JPMorgan Chase & Company | | 343,591 | | 16,042,264 |
| Moody’s Corp. | | 549,174 | | 17,518,648 |
| | |
|
| | | | | 48,990,797 |
| Insurance - 4.22% | | | | |
| Prudential Financial, Inc. | | 162,158 | | 10,674,861 |
| Stewart Information Services Corp. | | 532,894 | | 5,941,768 |
| | |
|
| | | | | 16,616,629 |
| | | |
|
| | | | | 93,475,690 |
| Health Care - 15.93% | | | | |
| Biotechnology - 2.99% | | | | |
| Amgen, Inc. (I) | | 229,179 | | 11,763,758 |
| Health Care Equipment & Supplies - 1.96% | | | | |
| Medtronic, Inc. | | 193,412 | | 7,721,007 |
| Health Care Providers & Services - 3.33% | | | | |
| AmSurg Corp. (I) | | 97,632 | | 2,307,044 |
| WellPoint, Inc. | | 162,655 | | 10,811,678 |
| | |
|
| | | | | 13,118,722 |
| Pharmaceuticals - 7.65% | | | | |
| Merck & Company, Inc. | | 200,012 | | 6,514,391 |
| Novartis AG, ADR | | 173,159 | | 9,743,657 |
| Pfizer, Inc. | | 718,921 | | 13,832,040 |
| | |
|
| | | | | 30,090,088 |
| | | |
|
| | | | | 62,693,575 |
| | | | |
| Optimized Value Fund (continued) | | | |
| | | Shares or | | |
| | | Principal | | |
| | | Amount | | Value |
| |
|
| COMMON STOCKS (continued) | | | | |
| Industrials - 9.51% | | | | |
| Aerospace & Defense - 1.12% | | | | |
| The Boeing Company | | 61,141 | $ | 4,402,763 |
| Air Freight & Logistics - 2.33% | | | | |
| FedEx Corp. | | 102,080 | | 9,189,242 |
| Commercial Services & Supplies - 4.16% | | | |
| Avery Dennison Corp. | | 292,668 | | 11,683,307 |
| Cintas Corp. | | 166,597 | | 4,684,708 |
| | |
|
| | | | | 16,368,015 |
| Industrial Conglomerates - 1.90% | | | | |
| General Electric Company | | 358,047 | | 7,490,343 |
| | |
|
| | | | | 37,450,363 |
| Information Technology - 8.54% | | | | |
| Communications Equipment - 3.44% | | | | |
| QUALCOMM, Inc. | | 227,471 | | 13,552,722 |
| Computers & Peripherals - 2.49% | | | | |
| Dell, Inc. (I) | | 618,465 | | 9,790,301 |
| IT Services - 1.04% | | | | |
| Automatic Data Processing, Inc. | | 81,843 | | 4,092,150 |
| Software - 1.57% | | | | |
| Oracle Corp. | | 188,017 | | 6,185,759 |
| | |
|
| | | | | 33,620,932 |
| Utilities - 1.08% | | | | |
| Electric Utilities - 1.08% | | | | |
| Entergy Corp. | | 59,758 | | 4,254,770 |
|
| TOTAL COMMON STOCKS (Cost $357,699,279) | | $ | 384,448,985 |
|
| SHORT-TERM INVESTMENTS - 2.34% | | | |
| Repurchase Agreement - 2.34% | | | | |
| Repurchase Agreement with State Street Corp. | | | |
| dated 02/28/2011 at 0.010% to be | | | | |
| repurchased at $9,200,003 on 03/01/2011, | | | |
| collateralized by $9,215,000 U.S. Treasury | | | |
| Notes, 2.125% due 05/31/2015 (valued at | | | |
| $9,387,781, including interest) | $ | 9,200,000 | $ | 9,200,000 |
|
| TOTAL SHORT-TERM INVESTMENTS (Cost $9,200,000) | | $ | 9,200,000 |
|
| Total Investments (Optimized Value Fund) | | | |
| (Cost $366,899,279) - 100.00% | | | $ | 393,648,985 |
| Other assets and liabilities, net - 0.00% | | | | 10,089 |
| | |
|
| TOTAL NET ASSETS - 100.00% | | | $ | 393,659,074 |
| | | |
|
| |
| |
| Real Estate Equity Fund | | | | |
| | | Shares or | | |
| | | Principal | | |
| | | Amount | | Value |
| |
|
| COMMON STOCKS - 95.14% | | | | |
| Consumer Discretionary - 3.78% | | | | |
| Hotels, Restaurants & Leisure - 3.78% | | | | |
| Marriott International, Inc., Class A (L) | | 215,373 | $ | 8,444,775 |
| Starwood Hotels & | | | | |
| Resorts Worldwide, Inc. (L) | | 91,500 | | 5,590,650 |
| | |
|
| | | | | 14,035,425 |
| | |
|
| | | | | 14,035,425 |
| |
| The accompanying notes are an integral part of the financial statements. | 186 |
John Hancock Funds II
Portfolio of Investments — February 28, 2011 (Unaudited) (showing percentage of total net assets)
| | | | |
| Real Estate Equity Fund (continued) | | | |
| | | Shares or | | |
| | | Principal | | |
| | | Amount | | Value |
| |
|
| |
| COMMON STOCKS (continued) | | | | |
| Financials - 91.36% | | | | |
| Real Estate Investment Trusts - 90.37% | | | | |
| Alexandria Real Estate Equities, Inc. | | 53,800 | $ | 4,314,760 |
| AMB Property Corp. | | 308,100 | | 11,208,678 |
| AvalonBay Communities, Inc. (L) | | 132,016 | | 15,977,896 |
| BioMed Realty Trust, Inc. | | 261,400 | | 4,744,410 |
| Boston Properties, Inc. | | 142,050 | | 13,625,436 |
| BRE Properties, Inc. | | 231,940 | | 11,019,469 |
| Camden Property Trust | | 192,100 | | 11,366,557 |
| CBL & Associates Properties, Inc. (L) | | 269,014 | | 4,801,900 |
| DCT Industrial Trust, Inc. (L) | | 325,300 | | 1,828,186 |
| Douglas Emmett, Inc. (L) | | 419,100 | | 7,858,125 |
| EastGroup Properties, Inc. | | 89,100 | | 4,056,723 |
| Equity One, Inc. (L) | | 258,500 | | 4,947,690 |
| Equity Residential | | 343,250 | | 18,916,508 |
| Essex Property Trust, Inc. (L) | | 77,500 | | 9,592,950 |
| Federal Realty Investment Trust | | 161,980 | | 13,635,476 |
| General Growth Properties, Inc. (I) | | 588,794 | | 9,373,600 |
| Healthcare Realty Trust, Inc. (L) | | 350,300 | | 8,161,990 |
| Highwoods Properties, Inc. | | 147,200 | | 4,994,496 |
| Host Hotels & Resorts, Inc. (L) | | 748,562 | | 13,773,541 |
| Kilroy Realty Corp. (L) | | 265,400 | | 10,284,250 |
| Kimco Realty Corp. | | 558,500 | | 10,823,730 |
| Plum Creek Timber Company, Inc. (L) | | 142,200 | | 5,966,712 |
| Post Properties, Inc. | | 56,800 | | 2,215,200 |
| ProLogis | | 439,100 | | 7,139,766 |
| Public Storage (L) | | 153,700 | | 17,252,825 |
| Regency Centers Corp. (L) | | 207,750 | | 9,400,688 |
| Simon Property Group, Inc. | | 330,451 | | 36,362,828 |
| SL Green Realty Corp. (L) | | 158,100 | | 11,972,913 |
| Starwood Property Trust, Inc. | | 98,600 | | 2,306,254 |
| Taubman Centers, Inc. (L) | | 129,600 | | 7,190,208 |
| Terreno Realty Corp. | | 55,800 | | 1,022,814 |
| The Macerich Company (L) | | 272,312 | | 13,789,880 |
| Vornado Realty Trust | | 183,874 | | 17,160,960 |
| Washington Real Estate Investment Trust | | 153,900 | | 4,807,836 |
| Weingarten Realty Investors (L) | | 131,600 | | 3,404,492 |
| | |
|
| | | | | 335,299,747 |
| Real Estate Management & Development - 0.99% | | | |
| Forest City Enterprises, Inc., Class A (L) | | 194,141 | | 3,669,265 |
| | |
|
| | | | | 338,969,012 |
|
| TOTAL COMMON STOCKS (Cost $206,296,379) | | $ | 353,004,437 |
|
| |
| SECURITIES LENDING COLLATERAL - 19.16% | | | |
| John Hancock Collateral | | | | |
| Investment Trust, 0.2855% (W)(Y) | | 7,105,842 | | 71,110,999 |
|
| TOTAL SECURITIES LENDING | | | | |
| COLLATERAL (Cost $71,093,364) | | | $ | 71,110,999 |
|
| |
| SHORT-TERM INVESTMENTS - 5.86% | | | |
| Short-Term Securities* - 5.86% | | | | |
| State Street Institutional US Government | | | | |
| Money Market Fund, 0.0647% | $ | 1,033,766 | $ | 1,033,766 |
| T. Rowe Price Prime Reserve Fund, 0.2212% | 20,703,031 | | 20,703,031 |
| | |
|
| | | | | 21,736,797 |
|
| TOTAL SHORT-TERM INVESTMENTS (Cost $21,736,798) | | $ | 21,736,797 |
|
| Total Investments (Real Estate Equity Fund) | | | |
| (Cost $299,126,541) - 120.16% | | | $ | 445,852,233 |
| Other assets and liabilities, net - (20.16%) | | | (74,802,591) |
| | |
|
| TOTAL NET ASSETS - 100.00% | | | $ | 371,049,642 |
| | | |
|
| | | | |
| Real Estate Securities Fund | | | | |
| | | Shares or | | |
| | | Principal | | |
| | | Amount | | Value |
| | |
|
| |
| COMMON STOCKS - 99.25% | | | | |
| Financials - 96.65% | | | | |
| Real Estate Investment Trusts - 96.65% | | | | |
| AMB Property Corp. (L) | | 143,850 | $ | 5,233,263 |
| American Assets Trust, Inc. | | 154,750 | | 3,336,410 |
| Apartment Investment & Management | | | | |
| Company, Class A | | 288,600 | | 7,402,590 |
| AvalonBay Communities, Inc. (L) | | 178,549 | | 21,609,785 |
| Boston Properties, Inc. (L) | | 294,764 | | 28,273,763 |
| Brandywine Realty Trust (L) | | 721,200 | | 8,870,760 |
| BRE Properties, Inc. (L) | | 251,670 | | 11,956,842 |
| Camden Property Trust (L) | | 163,200 | | 9,656,544 |
| Campus Crest Communities, Inc. | | 111,000 | | 1,589,520 |
| Cogdell Spencer, Inc. | | 451,600 | | 2,894,756 |
| Colonial Properties Trust (L) | | 449,250 | | 8,854,717 |
| CommonWealth | | 251,300 | | 7,214,823 |
| DCT Industrial Trust, Inc. (L) | | 262,050 | | 1,472,721 |
| Developers Diversified Realty Corp. (L) | | 725,050 | | 10,368,215 |
| Digital Realty Trust, Inc. (L) | | 236,850 | | 13,931,517 |
| Douglas Emmett, Inc. (L) | | 351,150 | | 6,584,062 |
| Entertainment Properties Trust (L) | | 99,211 | | 4,729,388 |
| Equity Lifestyle Properties, Inc. (L) | | 99,850 | | 5,795,294 |
| Equity Residential (L) | | 233,953 | | 12,893,150 |
| Extra Space Storage, Inc. (L) | | 446,250 | | 8,813,438 |
| Federal Realty Investment Trust | | 15,400 | | 1,296,372 |
| General Growth Properties, Inc. (I) | | 566,663 | | 9,021,275 |
| Glimcher Realty Trust (L) | | 244,350 | | 2,248,020 |
| HCP, Inc. (L) | | 472,137 | | 17,941,206 |
| Host Hotels & Resorts, Inc. (L) | | 1,320,606 | | 24,299,150 |
| Hudson Pacific Properties, Inc. | | 67,600 | | 1,017,380 |
| Kimco Realty Corp. (L) | | 885,850 | | 17,167,773 |
| LTC Properties, Inc. | | 175,850 | | 5,138,337 |
| Medical Properties Trust, Inc. (L) | | 78,500 | | 920,805 |
| Pebblebrook Hotel Trust | | 298,350 | | 6,545,799 |
| Post Properties, Inc. (L) | | 209,350 | | 8,164,650 |
| ProLogis | | 1,343,960 | | 21,852,790 |
| PS Business Parks, Inc. (L) | | 51,300 | | 3,233,952 |
| Public Storage (L) | | 147,826 | | 16,593,469 |
| Ramco-Gershenson Properties Trust (L) | | 242,126 | | 3,271,122 |
| Sabra Healthcare, Inc. (L) | | 91,733 | | 1,689,722 |
| Senior Housing Properties Trust | | 513,523 | | 12,601,854 |
| Simon Property Group, Inc. (L) | | 440,747 | | 48,499,800 |
| SL Green Realty Corp. (L) | | 265,500 | | 20,106,315 |
| Strategic Hotels & Resorts, Inc. (I) | | 887,500 | | 5,768,750 |
| Tanger Factory Outlet Centers, Inc. (L) | | 390,400 | | 10,404,160 |
| Taubman Centers, Inc. (L) | | 234,950 | | 13,035,026 |
| Vornado Realty Trust (L) | | 122,420 | | 11,425,459 |
| Washington Real Estate Investment Trust (L) | | 42 | | 1,312 |
| | |
|
| | | | | 443,726,056 |
| | |
|
| | | | | 443,726,056 |
| Health Care - 2.60% | | | | |
| Health Care Providers & Services - 2.60% | | | | |
| Brookdale Senior Living, Inc. (I)(L) | | 444,350 | | 11,948,572 |
|
| TOTAL COMMON STOCKS (Cost $342,205,715) | | | $ | 455,674,628 |
|
| |
| SECURITIES LENDING COLLATERAL - 26.38% | | |
| John Hancock Collateral | | | | |
| Investment Trust, 0.2855% (W)(Y) | | 12,103,740 | | 121,126,966 |
|
| TOTAL SECURITIES LENDING | | | | |
| COLLATERAL (Cost $121,119,224) | | | $ | 121,126,966 |
|
| |
| The accompanying notes are an integral part of the financial statements. | 187 |
John Hancock Funds II
Portfolio of Investments — February 28, 2011 (Unaudited) (showing percentage of total net assets)
| | | | |
| Real Estate Securities Fund (continued) | | |
| | | Shares or | | |
| | | Principal | | |
| | | Amount | | Value |
| |
|
| |
| SHORT-TERM INVESTMENTS - 1.22% | | | |
| Repurchase Agreement - 1.22% | | | | |
| Repurchase Agreement with State Street Corp. | | | |
| dated 02/28/2011 at 0.010% to be | | | | |
| repurchased at $5,605,002 on 03/01/2011, | | | |
| collateralized by $5,700,000 Federal Home | | | |
| Loan Mortgage Corp., 1.250% due | | | | |
| 09/30/2013 (valued at $5,721,375, | | | | |
| including interest) | $ | 5,605,000 | $ | 5,605,000 |
|
| TOTAL SHORT-TERM INVESTMENTS (Cost $5,605,000) | | $ | 5,605,000 |
|
| Total Investments (Real Estate Securities Fund) | | | |
| (Cost $468,929,939) - 126.85% | | | $ | 582,406,594 |
| Other assets and liabilities, net - (26.85%) | | | (123,293,329) |
| | |
|
| TOTAL NET ASSETS - 100.00% | | | $ | 459,113,265 |
| | | |
|
| |
| |
| |
| Real Return Bond Fund | | | | |
| | | Shares or | | |
| | | Principal | | |
| | | Amount | | Value |
| |
|
| |
| U.S. GOVERNMENT & AGENCY | | | | |
| OBLIGATIONS - 87.49% | | | | |
| U.S. Government - 86.96% | | | | |
| Treasury Inflation Protected Securities | | | | |
| 0.500%, 04/15/2015 | $ | 505,660 | $ | 524,425 |
| 0.625%, 04/15/2013 | | 29,033,200 | | 30,273,905 |
| 1.125%, 01/15/2021 | | 8,015,120 | | 8,089,011 |
| 1.375%, 07/15/2018 to 01/15/2020 (F) | | 49,007,910 | | 51,592,627 |
| 1.625%, 01/15/2015 to 01/15/2018 | | 23,342,529 | | 25,259,199 |
| 1.750%, 01/15/2028 | | 14,123,025 | | 14,255,428 |
| 1.875%, 07/15/2013 to 07/15/2019 | | 84,989,085 | | 92,179,168 |
| 2.000%, 01/15/2014 to 01/15/2016 | | 61,529,187 | | 67,190,121 |
| 2.000%, 01/15/2026 (F) | | 29,262,095 | | 30,930,942 |
| 2.375%, 04/15/2011 to 01/15/2027 | | 101,643,764 | | 111,609,662 |
| 2.500%, 07/15/2016 (F) | | 53,669,683 | | 60,902,532 |
| 2.500%, 01/15/2029 | | 20,926,400 | | 23,473,540 |
| 2.625%, 07/15/2017 | | 19,140,026 | | 21,964,673 |
| 3.000%, 07/15/2012 | | 59,181,839 | | 63,278,346 |
| 3.375%, 01/15/2012 to 04/15/2032 | | 34,687,059 | | 38,543,498 |
| 3.625%, 04/15/2028 | | 29,271,390 | | 37,414,779 |
| 3.875%, 04/15/2029 | | 50,204,863 | | 66,623,410 |
| | |
|
| | | | | 744,105,266 |
| U.S. Government Agency - 0.53% | | | | |
| FDIC Structured Sale Guaranteed Notes | | | | |
| Zero Coupon 10/25/2011 (S) | | 4,500,000 | | 4,483,530 |
| Federal National Mortgage Association | | | | |
| 1.525%, 10/01/2044 (P) | | 60,883 | | 60,837 |
| | |
|
| | | | | 4,544,367 |
|
| TOTAL U.S. GOVERNMENT & AGENCY | | | |
| OBLIGATIONS (Cost $749,184,884) | | | $ | 748,649,633 |
|
| |
| FOREIGN GOVERNMENT | | | | |
| OBLIGATIONS - 1.83% | | | | |
| Australia - 1.73% | | | | |
| Commonwealth of Australia | | | | |
| 3.000%, 09/20/2025 | AUD | 13,400,000 | | 14,823,477 |
| Italy - 0.10% | | | | |
| Republic of Italy | | | | |
| 2.100%, 09/15/2016 | EUR | 607,578 | | 838,930 |
|
| TOTAL FOREIGN GOVERNMENT | | | | |
| OBLIGATIONS (Cost $13,553,536) | | | $ | 15,662,407 |
|
| | | | |
| Real Return Bond Fund (continued) | | |
| | | Shares or | | |
| | | Principal | | |
| | | Amount | | Value |
| |
|
| |
| CORPORATE BONDS - 22.90% | | | | |
| Consumer Discretionary - 0.77% | | | | |
| EchoStar DBS Corp. | | | | |
| 6.375%, 10/01/2011 | $ | 1,708,000 | $ | 1,742,160 |
| Hyundai Capital Services, Inc. | | | | |
| 4.375%, 07/27/2016 (S) | | 1,000,000 | | 1,004,357 |
| Macy’s Retail Holdings, Inc. | | | | |
| 7.450%, 07/15/2017 | | 1,000,000 | | 1,112,500 |
| Pearson Dollar Finance PLC | | | | |
| 5.700%, 06/01/2014 (S) | | 2,500,000 | | 2,738,386 |
| | |
|
| | | | | 6,597,403 |
| Energy - 1.82% | | | | |
| BP Capital Markets PLC | | | | |
| 0.442%, 04/11/2011 (P) | | 200,000 | | 199,999 |
| Gaz Capital SA | | | | |
| 7.343%, 04/11/2013 (S) | | 300,000 | | 326,550 |
| 8.146%, 04/11/2018 (S) | | 400,000 | | 462,248 |
| Gazprom Via Gaz Capital SA | | | | |
| 5.092%, 11/29/2015 (S) | | 200,000 | | 204,500 |
| NGPL PipeCo LLC | | | | |
| 6.514%, 12/15/2012 (S) | | 9,300,000 | | 10,025,019 |
| Petrobras International Finance Company | | | | |
| 3.875%, 01/27/2016 | | 4,300,000 | | 4,342,355 |
| | |
|
| | | | | 15,560,671 |
| Financials - 18.83% | | | | |
| Ally Financial, Inc. | | | | |
| 5.375%, 06/06/2011 | | 4,200,000 | | 4,231,500 |
| 6.875%, 09/15/2011 | | 500,000 | | 511,250 |
| American Express Bank | | | | |
| 0.392%, 05/29/2012 (P) | | 5,900,000 | | 5,883,982 |
| American Express Bank FSB | | | | |
| 0.414%, 06/12/2012 (P) | | 700,000 | | 698,219 |
| American Express Centurion Bank | | | | |
| 0.414%, 06/12/2012 (P) | | 5,100,000 | | 5,083,792 |
| American International Group, Inc. | | | | |
| 0.413%, 10/18/2011 (P) | | 1,200,000 | | 1,194,767 |
| 5.850%, 01/16/2018 | | 2,800,000 | | 2,955,389 |
| American International Group, Inc. | | | | |
| (8.175% to 05/15/2038, then 3 month | | | | |
| LIBOR + 4.195%) | | | | |
| 05/15/2058 | | 1,500,000 | | 1,646,250 |
| Bank of America Corp. | | | | |
| 0.743%, 06/11/2012 (P) | GBP | 3,600,000 | | 5,778,684 |
| Barclays Bank PLC | | | | |
| 6.050%, 12/04/2017 (S) | $ | 5,200,000 | | 5,383,149 |
| Barclays Bank PLC (7.434% to | | | | |
| 12/15/2017, then 3 month | | | | |
| LIBOR + 3.170%) | | | | |
| 7.434%, (P)(Q)(S) | | 600,000 | | 586,500 |
| Countrywide Financial Corp, Series MTN | | | | |
| 0.751%, 05/07/2012 (P) | | 6,700,000 | | 6,671,806 |
| Countrywide Financial Corp. | | | | |
| 5.800%, 06/07/2012 | | 3,400,000 | | 3,584,997 |
| FCE Bank PLC | | | | |
| 7.125%, 01/16/2012 | EUR | 200,000 | | 284,960 |
| Ford Motor Credit Company LLC | | | | |
| 7.250%, 10/25/2011 | $ | 6,350,000 | | 6,555,511 |
| 7.800%, 06/01/2012 | | 450,000 | | 479,900 |
| GMAC Canada, Ltd. | | | | |
| 6.000%, 05/23/2012 | EUR | 2,000,000 | | 2,808,198 |
| HBOS PLC | | | | |
| 6.750%, 05/21/2018 (S) | $ | 1,000,000 | | 950,210 |
| ICICI Bank, Ltd. | | | | |
| 2.063%, 02/24/2014 (P)(S) | | 1,000,000 | | 998,150 |
| |
| The accompanying notes are an integral part of the financial statements. | 188 |
John Hancock Funds II
Portfolio of Investments — February 28, 2011 (Unaudited) (showing percentage of total net assets)
| | | | |
| Real Return Bond Fund (continued) | | |
| | | Shares or | | |
| | | Principal | | |
| | | Amount | | Value |
| |
|
| |
| CORPORATE BONDS (continued) | | | | |
| Financials (continued) | | | | |
| ING Bank NV | | | | |
| 0.933%, 01/13/2012 (S)(P) | $ | 10,800,000 | $ | 10,793,714 |
| 1.623%, 10/18/2013 (S)(P) | | 400,000 | | 399,476 |
| International Lease Finance Corp. | | | | |
| 5.350%, 03/01/2012 | | 4,300,000 | | 4,391,375 |
| 6.500%, 09/01/2014 (S) | | 700,000 | | 754,950 |
| 6.625%, 11/15/2013 | | 600,000 | | 627,000 |
| 6.750%, 09/01/2016 (S) | | 700,000 | | 757,750 |
| 7.125%, 09/01/2018 (S) | | 1,300,000 | | 1,418,625 |
| JPMorgan Chase & Company, Series 1 | | | | |
| 1.091%, 01/01/1900 (P) | EUR | 4,900,000 | | 6,331,261 |
| LeasePlan Corp. NV | | | | |
| 3.000%, 05/07/2012 (S) | $ | 1,800,000 | | 1,841,218 |
| Lehman Brothers Holdings, Inc. | | | | |
| 04/05/2011 (H) | EUR | 36,000 | | 11,674 |
| 5.125%, 06/27/2014 (H) | | 850,000 | | 278,577 |
| 6.200%, 09/26/2014 (H) | $ | 300,000 | | 77,250 |
| 6.875%, 05/02/2018 (H) | | 1,200,000 | | 313,500 |
| 7.000%, 09/27/2027 (H) | | 300,000 | | 76,125 |
| Merrill Lynch & Company, Inc. | | | | |
| 1.006%, 06/29/2012 (P) | EUR | 2,100,000 | | 2,832,765 |
| 1.457%, 09/27/2012 (P) | | 1,500,000 | | 2,016,225 |
| Morgan Stanley | | | | |
| 0.753%, 10/18/2016 (P) | $ | 400,000 | | 373,156 |
| 1.422%, 03/01/2013 (P) | EUR | 12,900,000 | | 17,431,851 |
| Mystic Re, Ltd. | | | | |
| 10.311%, 06/07/2011 (P)(S) | $ | 1,500,000 | | 1,526,250 |
| National Australia Bank, Ltd. | | | | |
| 5.350%, 06/12/2013 (S) | | 1,700,000 | | 1,841,902 |
| Pacific Life Global Funding | | | | |
| 5.150%, 04/15/2013 (S) | | 600,000 | | 638,275 |
| Pricoa Global Funding I | | | | |
| 0.433%, 06/26/2012 (P)(S) | | 7,600,000 | | 7,548,328 |
| Santander US Debt SA Unipersonal | | | | |
| 1.103%, 03/30/2012 (P)(S) | | 12,000,000 | | 11,878,824 |
| SLM Corp. | | | | |
| 3.646%, 02/01/2014 (P) | | 13,000 | | 12,933 |
| 5.050%, 11/14/2014 | | 1,000,000 | | 1,000,160 |
| 5.375%, 05/15/2014 | | 4,000,000 | | 4,124,232 |
| Swedbank AB | | | | |
| 2.800%, 02/10/2012 (S) | | 7,200,000 | | 7,358,278 |
| The Goldman Sachs Group, Inc. | | | | |
| 1.015%, 01/30/2017 (P) | EUR | 1,000,000 | | 1,282,238 |
| The Royal Bank of Scotland Group PLC | | | | |
| 2.733%, 08/23/2013 (P) | $ | 8,200,000 | | 8,328,740 |
| 4.875%, 03/16/2015 | | 4,200,000 | | 4,354,199 |
| TransCapitalInvest, Ltd. | | | | |
| 7.700%, 08/07/2013 (S) | | 1,300,000 | | 1,444,320 |
| UBS AG/Stamford CT | | | | |
| 1.413%, 02/23/2012 (P) | | 1,355,000 | | 1,366,345 |
| Vita Capital III, Ltd. | | | | |
| 1.423%, 01/01/2012 (P)(S) | | 500,000 | | 497,100 |
| Wells Fargo & Company, Series K | | | | |
| (7.980% to 03/15/2018, then 3 month | | | | |
| LIBOR + 3.770%) | | | | |
| (Q) | | 900,000 | | 963,000 |
| | |
|
| | | | | 161,178,830 |
| Health Care - 0.73% | | | | |
| Cardinal Health, Inc. | | | | |
| 6.000%, 06/15/2017 | | 595,000 | | 666,705 |
| HCA, Inc. | | | | |
| 7.250%, 09/15/2020 | | 5,200,000 | | 5,609,500 |
| | |
|
| | | | | 6,276,205 |
| | | | |
| Real Return Bond Fund (continued) | | |
| | | Shares or | | |
| | | Principal | | |
| | | Amount | | Value |
| |
|
| |
| CORPORATE BONDS (continued) | | | | |
| Industrials - 0.13% | | | | |
| GATX Financial Corp. | | | | |
| 5.800%, 03/01/2016 | $ | 1,000,000 | $ | 1,078,334 |
| Information Technology - 0.50% | | | | |
| NXP BV/NXP Funding LLC | | | | |
| 3.748%, 10/15/2013 (P) | EUR | 3,100,000 | | 4,245,761 |
| Materials - 0.12% | | | | |
| RPM International, Inc. | | | | |
| 6.500%, 02/15/2018 | $ | 1,000,000 | | 1,063,137 |
|
| TOTAL CORPORATE BONDS (Cost $190,625,147) | | $ | 196,000,341 |
|
| |
| MUNICIPAL BONDS - 0.20% | | | | |
| New Jersey - 0.06% | | | | |
| Tobacco Settlement Financing Corp. of | | | | |
| New Jersey | | | | |
| 5.000%, 06/01/2041 | | 900,000 | | 538,704 |
| Ohio - 0.06% | | | | |
| Buckeye Tobacco Settlement Financing | | | | |
| Authority | | | | |
| 6.000%, 06/01/2042 | | 800,000 | | 549,008 |
| West Virginia - 0.08% | | | | |
| Tobacco Settlement Finance Authority | | | | |
| 7.467%, 06/01/2047 | | 950,000 | | 658,635 |
|
| TOTAL MUNICIPAL BONDS (Cost $2,472,310) | | $ | 1,746,347 |
|
| |
| COLLATERALIZED MORTGAGE | | | | |
| OBLIGATIONS - 12.99% | | | | |
| Commercial & Residential - 9.99% | | | | |
| Arkle Master Issuer PLC, | | | | |
| Series 2010-1A, Class 2A | | | | |
| 1.463%, 05/17/2060 (P)(S) | | 4,000,000 | | 4,003,925 |
| Arran Residential Mortgages | | | | |
| Funding PLC, Series 2010-1A, | | | | |
| Class A1B | | | | |
| 2.291%, 05/16/2047 (P)(S) | EUR | 463,852 | | 640,140 |
| Banc of America | | | | |
| Commercial Mortgage, Inc. | | | | |
| Series 2007-3 A2FL, | | | | |
| 0.434%, 06/10/2049 (P)(S) | $ | 200,000 | | 192,603 |
| Series 2006-5, Class A4, | | | | |
| 5.414%, 09/10/2047 | | 500,000 | | 533,728 |
| Series 2007-3 A2, | | | | |
| 5.657%, 06/10/2049 (P) | | 200,000 | | 207,565 |
| Banc of America Funding Corp., | | | | |
| Series 2006-A, Class 1A1 | | | | |
| 2.793%, 02/20/2036 (P) | | 5,072,460 | | 4,879,996 |
| Banc of America Mortgage | | | | |
| Securities, Inc., Series 2005-A, | | | | |
| Class 2A2 | | | | |
| 3.030%, 02/25/2035 (P) | | 737,438 | | 653,287 |
| Bear Stearns Adjustable | | | | |
| Rate Mortgage Trust | | | | |
| Series 2005-5, Class A1, | | | | |
| 2.340%, 08/25/2035 (P) | | 321,711 | | 309,708 |
| Series 2005-5, Class A2, | | | | |
| 2.440%, 08/25/2035 (P) | | 565,978 | | 542,824 |
| Series 2003-3, Class 3A2, | | | | |
| 2.718%, 05/25/2033 (P) | | 125,482 | | 126,650 |
| Series 2005-2, Class A1, | | | | |
| 2.730%, 03/25/2035 (P) | | 1,020,873 | | 978,958 |
| Series 2005-2, Class A2, | | | | |
| 2.934%, 03/25/2035 (P) | | 322,356 | | 309,910 |
| |
| The accompanying notes are an integral part of the financial statements. | 189 |
John Hancock Funds II
Portfolio of Investments — February 28, 2011 (Unaudited) (showing percentage of total net assets)
| | | | |
| Real Return Bond Fund (continued) | | |
| | | Shares or | | |
| | | Principal | | |
| | | Amount | | Value |
| |
|
| |
| COLLATERALIZED MORTGAGE | | | | |
| OBLIGATIONS (continued) | | | | |
| Commercial & Residential (continued) | | | | |
| Bear Stearns Commercial Mortgage | | | | |
| Securities, Series 2006-BBA7, | | | | |
| Class A2 | | | | |
| 0.426%, 03/15/2019 (P)(S) | $ | 5,800,000 | $ | 5,641,701 |
| Citicorp Mortgage Securities, Inc., | | | | |
| Series 2007-3, Class 3A1 | | | | |
| 5.500%, 04/25/2037 | | 1,014,872 | | 910,626 |
| Citigroup Commercial Mortgage Trust, | | | | |
| Series 2007-C6, Class A4 | | | | |
| 5.698%, 12/10/2049 (P) | | 183,000 | | 198,334 |
| Citigroup Mortgage Loan Trust, Inc. | | | | |
| Series 2005-6, Class A3, | | | | |
| 2.210%, 08/25/2035 (P) | | 94,016 | | 89,693 |
| Series 2005-6, Class A1, | | | | |
| 2.510%, 08/25/2035 (P) | | 409,871 | | 388,355 |
| Series 2005-6, Class A2, | | | | |
| 2.560%, 08/25/2035 (P) | | 422,246 | | 382,116 |
| Series 2005-11, Class 1A1, | | | | |
| 2.820%, 12/25/2035 (P) | | 72,712 | | 66,921 |
| Citigroup/Deutsche Bank Commercial | | | | |
| Mortgage Trust, Series 2007-CD5, | | | | |
| Class A4 | | | | |
| 5.886%, 11/15/2044 (P) | | 500,000 | | 542,514 |
| Countrywide Home Loan Mortgage Pass | | | | |
| Through Trust, Series 2004-HYB5, | | | | |
| Class 2A1 | | | | |
| 3.049%, 04/20/2035 (P) | | 2,748,481 | | 2,645,652 |
| Credit Suisse Mortgage Capital | | | | |
| Certificates, Series 2007-C3, Class A4 | | | | |
| 5.716%, 06/15/2039 (P) | | 750,000 | | 798,464 |
| CS First Boston Mortgage | | | | |
| Securities Corp., Series 2004-AR3, | | | | |
| Class 2A | | | | |
| 2.722%, 04/25/2034 (P) | | 7,464,460 | | 7,519,324 |
| Granite Master Issuer PLC | | | | |
| Series 2006-3, Class A3, | | | | |
| 0.303%, 12/20/2054 (P) | | 1,089,322 | | 1,031,960 |
| Series 2006-4, Class A6, | | | | |
| 0.353%, 12/20/2054 (P) | | 212,778 | | 201,575 |
| GSR Mortgage Loan TrusT, | | | | |
| Series 2005-AR7, Class 2A1 | | | | |
| 2.872%, 11/25/2035 (P) | | 4,204,199 | | 3,781,097 |
| Harborview Mortgage Loan Trust, | | | | |
| Series 2004-1, Class 2A | | | | |
| 2.741%, 04/19/2034 (P) | | 8,828,312 | | 8,670,127 |
| Holmes Master Issuer PLC, | | | | |
| Series 2011-1A, Class A3 | | | | |
| 2.339%, 10/15/2054 (P)(S) | EUR | 4,700,000 | | 6,468,795 |
| JPMorgan Chase Commercial | | | | |
| Mortgage Securities Corp. | | | | |
| Series 2006-LDP9, Class A3, | | | | |
| 5.336%, 05/15/2047 | $ | 800,000 | | 850,217 |
| Series 2006-CB17, Class A4, | | | | |
| 5.429%, 12/12/2043 | | 620,000 | | 664,348 |
| JPMorgan Mortgage Trust, | | | | |
| Series 2007-A1, Class 4A2 | | | | |
| 2.977%, 07/25/2035 (P) | | 812,888 | | 802,499 |
| LB-UBS Commercial Mortgage Trust, | | | | |
| Series 2007-C7, Class A3 | | | | |
| 5.866%, 09/15/2045 (P) | | 200,000 | | 215,821 |
| MASTR Alternative Loans Trust, | | | | |
| Series 2006-2, Class 2A1 | | | | |
| 0.661%, 03/25/2036 (P) | | 782,735 | | 254,514 |
| | | | |
| Real Return Bond Fund (continued) | | |
| | | Shares or | | |
| | | Principal | | |
| | | Amount | | Value |
| |
|
| |
| COLLATERALIZED MORTGAGE | | | | |
| OBLIGATIONS (continued) | | | | |
| Commercial & Residential (continued) | | | | |
| Merrill Lynch Mortgage Investors, Inc., | | | | |
| Series 2005-A10, Class A | | | | |
| 0.471%, 02/25/2036 (P) | $ | 9,021,944 | $ | 7,056,135 |
| Merrill Lynch/Countrywide Commercial | | | | |
| Mortgage Trust, Series 2007-9, | | | | |
| Class A4 | | | | |
| 5.700%, 09/12/2049 | | 400,000 | | 425,748 |
| Morgan Stanley Capital I, | | | | |
| Series 2007-IQ15, Class A4 | | | | |
| 5.875%, 06/11/2049 (P) | | 1,160,000 | | 1,258,633 |
| Morgan Stanley Mortgage Loan Trust, | | | | |
| Series 2005-4, Class 5A3 | | | | |
| 5.500%, 08/25/2035 | | 3,486,544 | | 3,421,081 |
| New York Mortgage Trust, Inc., | | | | |
| Series 2006-1, Class 2A3 | | | | |
| 3.900%, 05/25/2036 (P) | | 1,700,000 | | 1,412,063 |
| RBSCF Trust, Series 2009-RR2, | | | | |
| Class WBA | | | | |
| 5.899%, 02/16/2051 (P)(S) | | 3,300,000 | | 3,571,958 |
| Residential Accredit Loans, Inc., | | | | |
| Series 2006-QO6, Class A1 | | | | |
| 0.441%, 06/25/2046 (P) | | 1,302,948 | | 526,787 |
| Structured Asset Mortgage | | | | |
| Investments, Inc., Series 2005-AR5, | | | | |
| Class A3 | | | | |
| 0.512%, 07/19/2035 (P) | | 6,600,566 | | 6,183,087 |
| Swan, Series 2010-1, Class A | | | | |
| 6.118%, 04/25/2041 (P) | AUD | 2,308,033 | | 2,313,240 |
| Thornburg Mortgage Securities Trust, | | | | |
| Series 2007-2 ,Class A2A | | | | |
| 0.390%, 06/25/2037 (P) | $ | 846,807 | | 828,250 |
| Wachovia Bank | | | | |
| Commercial Mortgage Trust | | | | |
| Series 2006-C23, Class A4, | | | | |
| 5.418%, 01/15/2045 (P) | | 870,000 | | 933,940 |
| Series 2006-C28, Class A4, | | | | |
| 5.572%, 10/15/2048 | | 500,000 | | 535,512 |
| WaMu Mortgage Pass-Through | | | | |
| Certificates, Series 2007-HY3, | | | | |
| Class 4A1 | | | | |
| 4.943%, 03/25/2037 (P) | | 1,105,491 | | 968,037 |
| Washington Mutual Alternative Mortgage | | | | |
| Pass-Through Certificates, | | | | |
| Series 2006-5, Class 3A6 | | | | |
| 6.268%, 07/25/2036 | | 827,897 | | 500,449 |
| U.S. Government Agency - 3.00% | | | | |
| Federal Home Loan Mortgage Corp. | | | | |
| Series 3397, Class FC, | | | | |
| 0.856%, 12/15/2037 (P) | | 7,818,394 | | 7,838,007 |
| Series 2979, Class MB, | | | | |
| 5.500%, 11/15/2018 | | 754,552 | | 778,112 |
| Federal National Mortgage Association | | | | |
| Series 2007-63, Class FC, | | | | |
| 0.611%, 07/25/2037 (P) | | 7,666,372 | | 7,617,409 |
| Series 2006-30, Class KF, | | | | |
| 0.700%, 05/25/2036 (P) | | 7,541,356 | | 7,516,820 |
| Series 2007-4, Class DF, | | | | |
| 0.706%, 02/25/2037 (P) | | 1,729,476 | | 1,710,010 |
| Series 2003-34, Class A1, | | | | |
| 6.000%, 04/25/2043 | | 17,123 | | 18,582 |
| Series 2004-T3, Class 1A1, | | | | |
| 6.000%, 02/25/2044 | | 25,929 | | 28,229 |
| |
| The accompanying notes are an integral part of the financial statements. | 190 |
John Hancock Funds II
Portfolio of Investments — February 28, 2011 (Unaudited) (showing percentage of total net assets)
| | | | |
| Real Return Bond Fund (continued) | | | | |
| | | Shares or | | |
| | | Principal | | |
| | | Amount | | Value |
| | |
|
| |
| COLLATERALIZED MORTGAGE | | | | |
| OBLIGATIONS (continued) | | | | |
| U.S. Government Agency (continued) | | | | |
| Federal National Mortgage | | | | |
| Association (continued) | | | | |
| Series 2004-W12, Class 1A1, | | | | |
| 6.000%, 07/25/2044 | $ | 156,802 | $ | 170,222 |
|
| TOTAL COLLATERALIZED MORTGAGE | | | | |
| OBLIGATIONS (Cost $105,832,944) | | | $ | 111,116,258 |
|
| |
| ASSET BACKED SECURITIES - 3.71% | | | | |
| AMMC CDO, Series 2005-5A, | | | | |
| Class A1A | | | | |
| 0.538%, 08/08/2017 (P)(S) | | 2,100,000 | | 2,008,003 |
| ARES CLO Funds, Series 2006-6RA, | | | | |
| Class A1B | | | | |
| 0.529%, 03/12/2018 (P)(S) | | 1,484,006 | | 1,439,709 |
| Argent Securities, Inc., Series 2005-W2, | | | | |
| Class A2B1 | | | | |
| 0.461%, 10/25/2035 (P) | | 266,217 | | 227,009 |
| Babson CLO Ltd./Cayman Islands, | | | | |
| Series 2004-2A, Class A2A | | | | |
| 0.633%, 11/15/2016 (P)(S) | | 792,381 | | 770,590 |
| Citibank Omni Master Trust, | | | | |
| Series 2009-A14A, Class A14 | | | | |
| 3.015%, 08/15/2018 (P)(S) | | 4,800,000 | | 5,119,032 |
| Citigroup Mortgage Loan Trust, Inc., | | | | |
| Series 2007-OPX1, Class A5A | | | | |
| 5.764%, 01/25/2037 | | 824,980 | | 456,656 |
| Duane Street CLC, Series 2005-1A, | | | | |
| Class A2 | | | | |
| 0.561%, 11/08/2017 (P)(S) | | 485,188 | | 464,170 |
| First Franklin Mortgage Loan Asset | | | | |
| Backed Certificates, Series 2006-FF15, | | | | |
| Class A3 | | | | |
| 0.311%, 11/25/2036 (P) | | 380,129 | | 376,891 |
| Harvest CLO SA, Series IX, Class A1 | | | | |
| 1.628%, 03/29/2017 (P) | EUR | 372,608 | | 467,904 |
| Magnolia Funding, Ltd., Series 2010-1A, | | | | |
| Class A1 | | | | |
| 3.000%, 04/20/2017 (P)(S) | | 710,436 | | 972,269 |
| MBNA Credit Card Master Note Trust, | | | | |
| Series 2002-A2, Class A | | | | |
| 5.600%, 07/17/2014 | | 1,900,000 | | 2,689,246 |
| Race Point CLO, Series 2A, Class A1 | | | | |
| 0.863%, 05/15/2015 (P)(S) | $ | 410,436 | | 403,209 |
| SLM Student Loan Trust, Series 2008-9, | | | | |
| Class A | | | | |
| 1.803%, 04/25/2023 (P) | | 15,308,565 | | 15,806,942 |
| Wood Street CLO BV, Series II-A, | | | | |
| Class A1 | | | | |
| 1.388%, 03/29/2021 (P)(S) | EUR | 397,091 | | 502,633 |
|
| TOTAL ASSET BACKED SECURITIES (Cost $31,283,115) | | | $ | 31,704,263 |
|
| |
| PREFERRED SECURITIES - 0.06% | | | | |
| Financials - 0.06% | | | | |
| Wells Fargo & Company, | | | | |
| Series L 7.500% | | 500 | $ | 515,000 |
|
| TOTAL PREFERRED SECURITIES (Cost $500,000) | | | $ | 515,000 |
|
| | | | |
| Real Return Bond Fund (continued) | | | | |
| | | Shares or | | |
| | | Principal | | |
| | | Amount | | Value |
| | |
|
| |
| OPTIONS PURCHASED - 0.01% | | | | |
| Puts - 0.01% | | | | |
| Over the Counter USD Purchased | | | | |
| Options (Expiration Date: 11/19/2012; | | | | |
| Strike Price : 2.00; Counterparty: | | | | |
| Goldman Sachs Capital | | | | |
| Markets LP) (I) | | 12,600,000 | $ | 83,571 |
|
| TOTAL OPTIONS PURCHASED (Cost $30,555) | | | $ | 83,571 |
|
| |
| SHORT-TERM INVESTMENTS - 0.31% | | | | |
| Repurchase Agreement - 0.20% | | | | |
| Morgan Stanley Tri-Party Repurchase | | | | |
| Agreement dated 02/28/2011 at | | | | |
| 0.180% to be repurchased at $100,001 | | | | |
| on 03/01/2011, collateralized by | | | | |
| $100,200 U.S. Treasury Notes, 1.375% | | | | |
| due 09/15/2012 (valued at $102,241, | | | | |
| including interest) | $ | 100,000 | $ | 100,000 |
| Repurchase Agreement with State | | | | |
| Street Corp. dated 02/28/2011 at | | | | |
| 0.010% to be repurchased at | | | | |
| $1,653,000 on 03/01/2011, | | | | |
| collateralized by $1,680,000 Federal | | | | |
| National Mortgage Association, | | | | |
| 0.625% due 09/24/2012 (valued at | | | | |
| $1,686,300, including interest) | | 1,653,000 | | 1,653,000 |
| | |
|
| | | | | 1,753,000 |
| Short-Term Securities* - 0.11% | | | | |
| U.S. Treasury Bill | | | | |
| 0.190%, 07/07/2011 | | 301,000 | | 300,800 |
| 0.253%, 08/25/2011 | | 600,000 | | 599,539 |
| | |
|
| | | | | 900,339 |
|
| TOTAL SHORT-TERM INVESTMENTS (Cost $2,653,339) | | | $ | 2,653,339 |
|
| Total Investments (Real Return Bond Fund) | | | | |
| (Cost $1,096,135,830) - 129.50% | | | $ | 1,108,131,159 |
| Other assets and liabilities, net - (29.50%) | | | | (252,406,205) |
| | |
|
| TOTAL NET ASSETS - 100.00% | | | $ | 855,724,954 |
| | | |
|
| |
| |
| |
| Retirement 2010 Portfolio | | | | |
| | | Shares or | | |
| | | Principal | | |
| | | Amount | | Value |
| | |
|
| |
| INVESTMENT COMPANIES - 100.01% | | | | |
| Affiliated Investment Companies - 100.01% | | | | |
| Equity - 8.00% | | | | |
| John Hancock Funds II (G) - 8.00% | | | | |
| Index 500, Class NAV (John Hancock) (2)(A) | | 61,997 | $ | 608,812 |
| International Equity Index, Class NAV (SSgA) | | 11,035 | | 202,937 |
| Fixed Income - 92.01% | | | | |
| John Hancock Funds II (G) - 92.01% | | | | |
| Total Bond Market, | | | | |
| Class NAV (Declaration) (A) | | 908,086 | | 9,335,121 |
| Total investments (Retirement 2010 Portfolio) | | | | |
| (Cost $10,071,518) - 100.01% | | | $ | 10,146,870 |
| Other assets and liabilities, net - (0.01%) | | | | (1,177) |
| | |
|
| TOTAL NET ASSETS - 100.00% | | | $ | 10,145,693 |
| | | |
|
| |
| The accompanying notes are an integral part of the financial statements. | 191 |
John Hancock Funds II
Portfolio of Investments — February 28, 2011 (Unaudited) (showing percentage of total net assets)
| | | | |
| Retirement 2015 Portfolio | | | | |
| | | Shares or | | |
| | | Principal | | |
| | | Amount | | Value |
| | |
|
| |
| INVESTMENT COMPANIES - 100.01% | | | | |
| Affiliated Investment Companies - 100.01% | | | | |
| Equity - 23.00% | | | | |
| John Hancock Funds II (G) - 23.00% | | | | |
| Index 500, Class NAV (John Hancock) (2)(A) | | 223,618 | $ | 2,195,928 |
| International Equity Index, Class NAV (SSgA) | | 40,162 | | 738,570 |
| Mid Cap Index, Class NAV | | | | |
| (John Hancock) (2)(A) | | 2,841 | | 59,349 |
| Small Cap Index, Class NAV | | | | |
| (John Hancock) (2)(A) | | 2,824 | | 39,755 |
| Fixed Income - 77.01% | | | | |
| John Hancock Funds II (G) - 77.01% | | | | |
| Total Bond Market, | | | | |
| Class NAV (Declaration) (A) | | 987,873 | | 10,155,343 |
| Total investments (Retirement 2015 Portfolio) | | | | |
| (Cost $13,041,778) - 100.01% | | | $ | 13,188,945 |
| Other assets and liabilities, net - (0.01%) | | | | (1,394) |
| | | |
|
| TOTAL NET ASSETS - 100.00% | | | $ | 13,187,551 |
| | | |
|
| |
| |
| |
| Retirement 2020 Portfolio | | | | |
| | | Shares or | | |
| | | Principal | | |
| | | Amount | | Value |
| | |
|
| |
| INVESTMENT COMPANIES - 100.01% | | | | |
| Affiliated Investment Companies - 100.01% | | | | |
| Equity - 44.00% | | | | |
| John Hancock Funds II (G) - 44.00% | | | | |
| Index 500, Class NAV (John Hancock) (2)(A) | | 551,637 | $ | 5,417,077 |
| International Equity Index, Class NAV (SSgA) | | 100,234 | | 1,843,311 |
| Mid Cap Index, Class NAV | | | | |
| (John Hancock) (2)(A) | | 30,614 | | 639,516 |
| Small Cap Index, Class NAV | | | | |
| (John Hancock) (2)(A) | | 26,718 | | 376,186 |
| Fixed Income - 56.01% | | | | |
| John Hancock Funds II (G) - 56.01% | | | | |
| Total Bond Market, | | | | |
| Class NAV (Declaration) (A) | | 1,024,631 | | 10,533,206 |
| Total investments (Retirement 2020 Portfolio) | | | | |
| (Cost $18,434,040) - 100.01% | | | $ | 18,809,296 |
| Other assets and liabilities, net - (0.01%) | | | | (1,761) |
| | | |
|
| TOTAL NET ASSETS - 100.00% | | | $ | 18,807,535 |
| | | |
|
| |
| |
| |
| Retirement 2025 Portfolio | | | | |
| | | Shares or | | |
| | | Principal | | |
| | | Amount | | Value |
| | |
|
| |
| INVESTMENT COMPANIES - 100.01% | | | | |
| Affiliated Investment Companies - 100.01% | | | | |
| Equity - 62.51% | | | | |
| John Hancock Funds II (G) - 62.51% | | | | |
| Index 500, Class NAV (John Hancock) (2)(A) | | 959,608 | $ | 9,423,346 |
| International Equity Index, Class NAV (SSgA) | | 168,210 | | 3,093,378 |
| Mid Cap Index, Class NAV | | | | |
| (John Hancock) (2)(A) | | 50,731 | | 1,059,768 |
| | | | |
| Retirement 2025 Portfolio (continued) | | |
| | | Shares or | | |
| | | Principal | | |
| | | Amount | | Value |
| | |
|
| |
| INVESTMENT COMPANIES (continued) | | | | |
| John Hancock Funds II (G) (continued) | | | | |
| Small Cap Index, Class NAV | | | | |
| (John Hancock) (2)(A) | | 52,891 | $ | 744,702 |
| Fixed Income - 37.50% | | | | |
| John Hancock Funds II (G) - 37.50% | | | | |
| Total Bond Market, | | | | |
| Class NAV (Declaration) (A) | | 835,866 | | 8,592,718 |
| Total investments (Retirement 2025 Portfolio) | | | | |
| (Cost $22,243,483) - 100.01% | | | $ | 22,913,912 |
| Other assets and liabilities, net - (0.01%) | | | | (2,315) |
| | |
|
| TOTAL NET ASSETS - 100.00% | | | $ | 22,911,597 |
| | | |
|
| |
| |
| |
| Retirement 2030 Portfolio | | | | |
| | | Shares or | | |
| | | Principal | | |
| | | Amount | | Value |
| | |
|
| |
| INVESTMENT COMPANIES - 100.01% | | | | |
| Affiliated Investment Companies - 100.01% | | | | |
| Equity - 73.01% | | | | |
| John Hancock Funds II (G) - 73.01% | | | | |
| Index 500, Class NAV (John Hancock) (2)(A) | | 812,113 | $ | 7,974,953 |
| International Equity Index, Class NAV (SSgA) | | 143,343 | | 2,636,072 |
| Mid Cap Index, Class NAV | | | | |
| (John Hancock) (2)(A) | | 41,530 | | 867,568 |
| Small Cap Index, Class NAV | | | | |
| (John Hancock) (2)(A) | | 49,768 | | 700,728 |
| |
| FIXED INCOME - 27.00% | | | | |
| John Hancock Funds II (G) - 27.00% | | | | |
| Total Bond Market, | | | | |
| Class NAV (Declaration) (A) | | 438,198 | | 4,504,681 |
| Total investments (Retirement 2030 Portfolio) | | | | |
| (Cost $16,181,752) - 100.01% | | | $ | 16,684,002 |
| Other assets and liabilities, net - (0.01%) | | | | (1,650) |
| | |
|
| TOTAL NET ASSETS - 100.00% | | | $ | 16,682,352 |
| | | |
|
| |
| |
| |
| Retirement 2035 Portfolio | | | | |
| | | Shares or | | |
| | | Principal | | |
| | | Amount | | Value |
| | |
|
| |
| INVESTMENT COMPANIES - 100.01% | | | | |
| Affiliated Investment Companies - 100.01% | | | | |
| Equity - 79.08% | | | | |
| John Hancock Funds II (G) - 79.08% | | | | |
| Index 500, Class NAV (John Hancock) (2)(A) | | 733,777 | $ | 7,205,689 |
| International Equity Index, Class NAV (SSgA) | | 132,915 | | 2,444,313 |
| Mid Cap Index, Class NAV | | | | |
| (John Hancock) (2)(A) | | 37,440 | | 782,131 |
| Small Cap Index, Class NAV | | | | |
| (John Hancock) (2)(A) | | 45,618 | | 642,295 |
| |
| The accompanying notes are an integral part of the financial statements. | 192 |
John Hancock Funds II
Portfolio of Investments — February 28, 2011 (Unaudited) (showing percentage of total net assets)
| | | | |
| Retirement 2035 Portfolio (continued) | | |
| | | Shares or | | |
| | | Principal | | |
| | | Amount | | Value |
| | |
|
| INVESTMENT COMPANIES (continued) | | | | |
| Fixed Income - 20.93% | | | | |
| John Hancock Funds II (G) - 20.93% | | | | |
| Total Bond Market, | | | | |
| Class NAV (Declaration) (A) | | 285,191 | $ | 2,931,759 |
| Total investments (Retirement 2035 Portfolio) | | | | |
| (Cost $13,515,356) - 100.01% | | | $ | 14,006,187 |
| Other assets and liabilities, net - (0.01%) | | | | (1,461) |
| | | |
|
| TOTAL NET ASSETS - 100.00% | | | $ | 14,004,726 |
| | | |
|
| |
| |
| |
| Retirement 2040 Portfolio | | | | |
| | | Shares or | | |
| | | Principal | | |
| | | Amount | | Value |
| | |
|
| INVESTMENT COMPANIES - 100.01% | | | | |
| Affiliated Investment Companies - 100.01% | | | | |
| Equity - 82.01% | | | | |
| John Hancock Funds II (G) - 82.01% | | | | |
| Index 500, Class NAV (John Hancock) (2)(A) | | 428,751 | $ | 4,210,332 |
| International Equity Index, Class NAV (SSgA) | | 78,324 | | 1,440,377 |
| Mid Cap Index, Class NAV | | | | |
| (John Hancock) (2)(A) | | 21,973 | | 459,021 |
| Small Cap Index, Class NAV | | | | |
| (John Hancock) (2)(A) | | 26,980 | | 379,880 |
| Fixed Income - 18.00% | | | | |
| John Hancock Funds II (G) - 18.00% | | | | |
| Total Bond Market, | | | | |
| Class NAV (Declaration) (A) | | 138,575 | | 1,424,548 |
| Total investments (Retirement 2040 Portfolio) | | | | |
| (Cost $7,656,877) - 100.01% | | | $ | 7,914,158 |
| Other assets and liabilities, net - (0.01%) | | | | (969) |
| | | |
|
| TOTAL NET ASSETS - 100.00% | | | $ | 7,913,189 |
| | | |
|
| |
| |
| |
| Retirement 2045 Portfolio | | | | |
| | | Shares or | | |
| | | Principal | | |
| | | Amount | | Value |
| | |
|
| INVESTMENT COMPANIES - 100.01% | | | | |
| Affiliated Investment Companies - 100.01% | | | | |
| Equity - 82.01% | | | | |
| John Hancock Funds II (G) - 82.01% | | | | |
| Index 500, Class NAV (John Hancock) (2)(A) | | 421,377 | $ | 4,137,922 |
| International Equity Index, Class NAV (SSgA) | | 76,977 | | 1,415,605 |
| Mid Cap Index, Class NAV | | | | |
| (John Hancock) (2)(A) | | 21,595 | | 451,127 |
| Small Cap Index, Class NAV | | | | |
| (John Hancock) (2)(A) | | 26,516 | | 373,346 |
| Fixed Income - 18.00% | | | | |
| John Hancock Funds II (G) - 18.00% | | | | |
| Total Bond Market, | | | | |
| Class NAV (Declaration) (A) | | 136,192 | | 1,400,050 |
| Total investments (Retirement 2045 Portfolio) | | | | |
| (Cost $7,538,557) - 100.01% | | | $ | 7,778,050 |
| Other assets and liabilities, net - (0.01%) | | | | (918) |
| | | |
|
| TOTAL NET ASSETS - 100.00% | | | $ | 7,777,132 |
| | | |
|
| | | | |
| Short Term Government Income Fund | | |
| | | Shares or | | |
| | | Principal | | |
| | | Amount | | Value |
| |
|
| |
| U.S. GOVERNMENT & AGENCY | | | | |
| OBLIGATIONS - 94.15% | | | | |
| U.S. Government - 22.20% | | | | |
| Treasury Inflation Protected Securities | | | | |
| 1.875%, 07/15/2013 | $ | 2,261,285 | $ | 2,437,595 |
| U.S. Treasury, Note | | | | |
| 1.250%, 09/30/2015 | | 1,700,000 | | 1,647,937 |
| U.S. Treasury Notes | | | | |
| 0.750%, 08/15/2013 | | 3,755,000 | | 3,742,090 |
| 1.125%, 12/15/2012 | | 4,470,000 | | 4,511,035 |
| 1.250%, 08/31/2015 | | 1,130,000 | | 1,097,777 |
| 1.500%, 12/31/2013 | | 790,000 | | 799,072 |
| 1.750%, 03/31/2014 | | 690,000 | | 701,428 |
| 1.875%, 06/15/2012 to 06/30/2015 | | 4,970,000 | | 5,047,302 |
| 2.000%, 01/31/2016 | | 1,275,000 | | 1,269,023 |
| 2.125%, 05/31/2015 | | 5,100,000 | | 5,172,930 |
| 2.500%, 04/30/2015 | | 2,395,000 | | 2,468,534 |
| | |
|
| | | | | 28,894,723 |
| U.S. Government Agency - 71.95% | | | | |
| Federal Agricultural Mortgage Corp. | | | | |
| 1.250%, 12/06/2013 | | 3,070,000 | | 3,041,599 |
| 2.125%, 09/15/2015 | | 3,580,000 | | 3,573,248 |
| 2.375%, 07/22/2015 | | 4,990,000 | | 4,970,539 |
| 3.250%, 08/11/2014 | | 805,000 | | 840,573 |
| 5.500%, 07/15/2011 (S) | | 3,505,000 | | 3,572,738 |
| Federal Farm Credit Bank | | | | |
| 1.840%, 03/01/2013 | | 5,500,000 | | 5,500,000 |
| 2.625%, 04/17/2014 | | 1,980,000 | | 2,054,072 |
| 3.875%, 10/07/2013 | | 1,430,000 | | 1,529,974 |
| Federal Home Loan Bank | | | | |
| 3.625%, 10/18/2013 | | 1,390,000 | | 1,478,161 |
| Federal Home Loan Mortgage Corp. | | | | |
| 1.125%, 10/25/2013 | | 2,520,000 | | 2,516,457 |
| 4.239%, 09/01/2039 (P) | | 819,383 | | 869,120 |
| 4.500%, 10/01/2024 to 11/01/2024 | | 4,087,076 | | 4,281,887 |
| 6.500%, 04/01/2038 | | 636,519 | | 709,278 |
| Federal National Mortgage Association | | | | |
| 0.750%, 12/18/2013 | | 1,630,000 | | 1,606,507 |
| 1.250%, 02/27/2014 | | 1,770,000 | | 1,766,957 |
| 1.500%, 09/08/2014 | | 3,320,000 | | 3,294,682 |
| 1.600%, 09/30/2014 | | 2,000,000 | | 1,981,096 |
| 1.850%, 03/25/2013 | | 2,470,000 | | 2,472,267 |
| 1.875%, 09/09/2015 | | 1,660,000 | | 1,629,353 |
| 2.000%, 04/15/2013 to 04/14/2014 | | 4,265,000 | | 4,272,955 |
| 2.375%, 07/28/2015 | | 1,835,000 | | 1,851,750 |
| 3.150%, 10/01/2040 (P) | | 6,013,757 | | 6,169,835 |
| 3.530%, 07/01/2039 (P) | | 291,631 | | 303,673 |
| 4.278%, 05/01/2034 (P) | | 279,083 | | 296,614 |
| 4.500%, 07/01/2025 | | 1,350,000 | | 1,415,192 |
| 4.948%, 04/01/2048 (P) | | 21,060 | | 22,503 |
| 5.500%, 05/01/2034 | | 3,547,852 | | 3,815,359 |
| 6.000%, 02/01/2037 | | 1,766,764 | | 1,922,303 |
| 6.500%, 09/01/2036 to 01/01/2039 | | 7,330,332 | | 8,171,686 |
| Government National Mortgage Association | | | | |
| 3.500%, 10/20/2039 (P) | | 252,423 | | 263,170 |
| 4.000%, 08/20/2039 (P) | | 850,169 | | 898,401 |
| Tennessee Valley Authority | | | | |
| 4.375%, 06/15/2015 | | 4,245,000 | | 4,637,960 |
| 4.750%, 08/01/2013 | | 1,460,000 | | 1,584,328 |
| 6.000%, 03/15/2013 | | 1,342,000 | | 1,478,783 |
| 6.790%, 05/23/2012 | | 7,525,000 | | 8,109,264 |
| |
| The accompanying notes are an integral part of the financial statements. | 193 |
John Hancock Funds II
Portfolio of Investments — February 28, 2011 (Unaudited) (showing percentage of total net assets)
| | | | |
| Short Term Government Income Fund (continued) |
| | | Shares or | | |
| | | Principal | | |
| | | Amount | | Value |
| |
|
| |
| U.S. GOVERNMENT & AGENCY | | | | |
| OBLIGATIONS (continued) | | | | |
| U.S. Government Agency (continued) | | | | |
| Tennessee Valley Authority (continued) | | | | |
| 7.140%, 05/23/2012 | $ | 700,000 | $ | 756,251 |
| | |
|
| | | | | 93,658,535 |
|
| TOTAL U.S. GOVERNMENT & AGENCY | | | | |
| OBLIGATIONS (Cost $122,024,057) | | | $ | 122,553,258 |
|
| |
| COLLATERALIZED MORTGAGE | | | | |
| OBLIGATIONS - 3.86% | | | | |
| U.S. Government Agency - 3.86% | | | | |
| Federal Home Loan Mortgage Corp., | | | | |
| Series 3499, Class PA | | | | |
| 4.500%, 08/15/2036 | | 1,411,076 | | 1,465,369 |
| Federal National Mortgage Association, | | | | |
| Series 2010-53, Class MA | | | | |
| 4.500%, 09/25/2037 | | 1,082,644 | | 1,136,088 |
| Government National Mortgage Association | | | | |
| Series 2010-88, Class BA, | | | | |
| 4.500%, 01/20/2036 | | 1,978,775 | | 2,071,910 |
| Series 2010-91, Class GA, | | | | |
| 4.500%, 09/20/2036 | | 335,658 | | 352,982 |
|
| TOTAL COLLATERALIZED MORTGAGE | | | | |
| OBLIGATIONS (Cost $5,059,047) | | | $ | 5,026,349 |
|
| |
| SHORT-TERM INVESTMENTS - 1.38% | | | | |
| Short-Term Securities* - 1.38% | | | | |
| Federal Home Loan Bank Discount Notes, | | | | |
| 0.0702%, 03/01/2011 | | 1,800,000 | | 1,800,000 |
|
| TOTAL SHORT-TERM INVESTMENTS (Cost $1,800,000) | | $ | 1,800,000 |
|
| Total Investments (Short Term Government Income Fund) | | | |
| (Cost $128,883,104) - 99.39% | | | $ | 129,379,607 |
| Other assets and liabilities, net - 0.61% | | | | 787,512 |
| | | |
|
| TOTAL NET ASSETS - 100.00% | | | $ | 130,167,119 |
| | | |
|
| |
| |
| |
| Small Cap Growth Fund | | | | |
| | | Shares or | | |
| | | Principal | | |
| | | Amount | | Value |
| |
|
| |
| COMMON STOCKS - 97.57% | | | | |
| Consumer Discretionary - 19.75% | | | | |
| Automobiles - 0.80% | | | | |
| Thor Industries, Inc. | | 47,140 | $ | 1,566,934 |
| Distributors - 0.72% | | | | |
| LKQ Corp. (I) | | 59,300 | | 1,408,968 |
| Hotels, Restaurants & Leisure - 2.96% | | | | |
| AFC Enterprises, Inc. (I) | | 66,813 | | 988,164 |
| Domino’s Pizza, Inc. (I) | | 98,730 | | 1,665,575 |
| Penn National Gaming, Inc. (I)(L) | | 40,260 | | 1,440,100 |
| The Cheesecake Factory, Inc. (I)(L) | | 59,327 | | 1,722,856 |
| | |
|
| | | | | 5,816,695 |
| Household Durables - 2.46% | | | | |
| Tempur-Pedic International, Inc. (I) | | 103,050 | | 4,837,166 |
| Leisure Equipment & Products - 1.59% | | | | |
| Brunswick Corp. (L) | | 100,550 | | 2,315,667 |
| RC2 Corp. (I) | | 37,460 | | 813,257 |
| | |
|
| | | | | 3,128,924 |
| | | | |
| Small Cap Growth Fund (continued) | | |
| | | Shares or | | |
| | | Principal | | |
| | | Amount | | Value |
| | |
|
| |
| COMMON STOCKS (continued) | | | | |
| Media - 1.12% | | | | |
| Cinemark Holdings, Inc. | | 109,410 | $ | 2,196,953 |
| Multiline Retail - 1.22% | | | | |
| Big Lots, Inc. (I) | | 58,290 | | 2,391,639 |
| Specialty Retail - 4.06% | | | | |
| Dick’s Sporting Goods, Inc. (I) | | 62,940 | | 2,337,592 |
| Lumber Liquidators Holdings, Inc. (I)(L) | | 57,760 | | 1,344,653 |
| The Children’s Place Retail Stores, Inc. (I) | | 17,950 | | 820,315 |
| Ulta Salon, Cosmetics & Fragrance, Inc. (I) | | 39,250 | | 1,637,903 |
| Williams-Sonoma, Inc. | | 51,200 | | 1,847,808 |
| | |
|
| | | | | 7,988,271 |
| Textiles, Apparel & Luxury Goods - 4.82% | | | | |
| Columbia Sportswear Company (L) | | 31,620 | | 1,985,420 |
| CROCS, Inc. (I) | | 98,570 | | 1,739,761 |
| Hanesbrands, Inc. (I) | | 128,138 | | 3,320,055 |
| Under Armour, Inc., Class A (I)(L) | | 36,700 | | 2,430,641 |
| | |
|
| | | | | 9,475,877 |
| | |
|
| | | | | 38,811,427 |
| Consumer Staples - 2.55% | | | | |
| Food & Staples Retailing - 0.67% | | | | |
| Fresh Market, Inc. (I) | | 32,080 | | 1,308,864 |
| Food Products - 1.88% | | | | |
| Green Mountain Coffee Roasters, Inc. (I)(L) | | 90,610 | | 3,695,075 |
| | |
|
| | | | | 5,003,939 |
| Energy - 6.08% | | | | |
| Energy Equipment & Services - 3.41% | | | | |
| Dril-Quip, Inc. (I) | | 16,170 | | 1,240,239 |
| Global Industries, Ltd. (I) | | 126,500 | | 1,135,970 |
| Gulfmark Offshore, Inc., Class A (I) | | 35,500 | | 1,575,490 |
| Hornbeck Offshore Services, Inc. (I) | | 33,990 | | 965,656 |
| Tidewater, Inc. | | 28,500 | | 1,772,985 |
| | |
|
| | | | | 6,690,340 |
| Oil, Gas & Consumable Fuels - 2.67% | | | | |
| Cabot Oil & Gas Corp. (L) | | 46,870 | | 2,140,084 |
| Overseas Shipholding Group, Inc. (L) | | 36,860 | | 1,244,394 |
| Rosetta Resources, Inc. (I) | | 41,100 | | 1,864,296 |
| | |
|
| | | | | 5,248,774 |
| | |
|
| | | | | 11,939,114 |
| Financials - 1.16% | | | | |
| Capital Markets - 1.16% | | | | |
| Evercore Partners, Inc., Class A | | 40,200 | | 1,386,096 |
| Stifel Financial Corp. (I) | | 12,340 | | 885,272 |
| | |
|
| | | | | 2,271,368 |
| | |
|
| | | | | 2,271,368 |
| Health Care - 15.02% | | | | |
| Biotechnology - 3.56% | | | | |
| Ardea Biosciences, Inc. (I)(L) | | 20,797 | | 551,328 |
| Exelixis, Inc. (I) | | 17,100 | | 212,895 |
| Incyte Corp. (I)(L) | | 76,050 | | 1,040,364 |
| Onyx Pharmaceuticals, Inc. (I) | | 29,300 | | 1,032,532 |
| Pharmasset, Inc. (I) | | 22,200 | | 1,110,000 |
| Regeneron Pharmaceuticals, Inc. (I)(L) | | 48,822 | | 1,770,774 |
| Seattle Genetics, Inc. (I)(L) | | 86,480 | | 1,284,228 |
| | |
|
| | | | | 7,002,121 |
| Health Care Equipment & Supplies - 4.96% | | | | |
| Gen-Probe, Inc. (I) | | 52,130 | | 3,277,933 |
| HeartWare International, Inc. (I)(L) | | 20,340 | | 1,710,187 |
| NuVasive, Inc. (I)(L) | | 42,340 | | 1,131,748 |
| |
| The accompanying notes are an integral part of the financial statements. | 194 |
John Hancock Funds II
Portfolio of Investments — February 28, 2011 (Unaudited) (showing percentage of total net assets)
| | | | |
| Small Cap Growth Fund (continued) | | |
| | | Shares or | | |
| | | Principal | | |
| | | Amount | | Value |
| | |
|
| |
| COMMON STOCKS (continued) | | | | |
| Health Care Equipment & Supplies (continued) | | | | |
| Volcano Corp. (I) | | 69,180 | $ | 1,815,283 |
| Zoll Medical Corp. (I) | | 38,900 | | 1,800,292 |
| | |
|
| | | | | 9,735,443 |
| Health Care Providers & Services - 1.27% | | | | |
| WellCare Health Plans, Inc. (I) | | 66,720 | | 2,505,336 |
| Health Care Technology - 1.88% | | | | |
| Allscripts-Misys Healthcare Solutions, Inc. (I) | | 70,090 | | 1,496,422 |
| SXC Health Solutions Corp. (I) | | 44,366 | | 2,189,462 |
| | |
|
| | | | | 3,685,884 |
| Life Sciences Tools & Services - 2.15% | | | | |
| Parexel International Corp. (I) | | 57,598 | | 1,351,825 |
| Pharmaceutical Product Development, Inc. | | 104,590 | | 2,873,087 |
| | |
|
| | | | | 4,224,912 |
| Pharmaceuticals - 1.20% | | | | |
| Auxilium Pharmaceuticals, Inc. (I)(L) | | 43,900 | | 986,433 |
| Salix Pharmaceuticals, Ltd. (I) | | 41,270 | | 1,375,942 |
| | |
|
| | | | | 2,362,375 |
| | | |
|
| | | | | 29,516,071 |
| Industrials - 19.41% | | | | |
| Aerospace & Defense - 0.84% | | | | |
| AerCap Holdings NV (I) | | 49,930 | | 677,550 |
| DigitalGlobe, Inc. (I) | | 30,100 | | 971,628 |
| | |
|
| | | | | 1,649,178 |
| Airlines - 1.49% | | | | |
| Allegiant Travel Company (L) | | 26,060 | | 1,075,496 |
| Copa Holdings SA, Class A | | 34,710 | | 1,851,084 |
| | |
|
| | | | | 2,926,580 |
| Building Products - 0.99% | | | | |
| Trex Company, Inc. (I)(L) | | 65,256 | | 1,954,417 |
| Commercial Services & Supplies - 3.31% | | | | |
| Corrections Corp. of America (I) | | 82,328 | | 2,045,028 |
| Knoll, Inc. (L) | | 18,660 | | 385,702 |
| Sykes Enterprises, Inc. (I) | | 116,364 | | 2,164,370 |
| The Geo Group, Inc. (I) | | 74,870 | | 1,903,944 |
| | |
|
| | | | | 6,499,044 |
| Construction & Engineering - 1.65% | | | | |
| Aecom Technology Corp. (I) | | 113,010 | | 3,236,606 |
| Machinery - 2.01% | | | | |
| ArvinMeritor, Inc. (I) | | 118,296 | | 2,119,864 |
| Commercial Vehicle Group, Inc. (I) | | 52,321 | | 824,579 |
| Lindsay Corp. (L) | | 14,370 | | 1,014,666 |
| | |
|
| | | | | 3,959,109 |
| Professional Services - 2.16% | | | | |
| The Advisory Board Company (I) | | 56,460 | | 2,888,494 |
| TrueBlue, Inc. (I) | | 83,690 | | 1,351,594 |
| | |
|
| | | | | 4,240,088 |
| Road & Rail - 3.82% | | | | |
| Con-way, Inc. | | 35,940 | | 1,170,206 |
| J.B. Hunt Transport Services, Inc. | | 80,060 | | 3,331,296 |
| Old Dominion Freight Line, Inc. (I) | | 64,920 | | 1,998,238 |
| Vitran Corp., Inc. (I) | | 79,550 | | 1,000,739 |
| | |
|
| | | | | 7,500,479 |
| Trading Companies & Distributors - 3.14% | | | | |
| RSC Holdings, Inc. (I)(L) | | 118,250 | | 1,611,748 |
| Rush Enterprises, Inc., Class A (I) | | 53,160 | | 997,813 |
| | | | |
| Small Cap Growth Fund (continued) | | |
| | | Shares or | | |
| | | Principal | | |
| | | Amount | | Value |
| | |
|
| |
| COMMON STOCKS (continued) | | | | |
| Trading Companies & Distributors (continued) | | | | |
| United Rentals, Inc. (I)(L) | | 115,170 | $ | 3,567,966 |
| | |
|
| | | | | 6,177,527 |
| | |
|
| | | | | 38,143,028 |
| Information Technology - 31.82% | | | | |
| Communications Equipment - 7.76% | | | | |
| Acme Packet, Inc. (I)(L) | | 30,000 | | 2,257,200 |
| ADTRAN, Inc. (L) | | 58,261 | | 2,649,710 |
| Aruba Networks, Inc. (I)(L) | | 57,730 | | 1,757,879 |
| Finisar Corp. (I) | | 71,430 | | 2,930,059 |
| Ixia (I) | | 56,290 | | 987,890 |
| JDS Uniphase Corp. (I) | | 56,340 | | 1,389,908 |
| Polycom, Inc. (I) | | 68,440 | | 3,271,432 |
| | |
|
| | | | | 15,244,078 |
| Electronic Equipment, Instruments & Components - 2.47% | | |
| Jabil Circuit, Inc. | | 226,610 | | 4,856,251 |
| Internet Software & Services - 3.08% | | | | |
| Ancestry.com, Inc. (I) | | 37,110 | | 1,219,435 |
| Demand Media, Inc. (I)(L) | | 41,680 | | 937,800 |
| Dice Holdings, Inc. (I)(L) | | 104,590 | | 1,436,021 |
| LivePerson, Inc. (I) | | 30,603 | | 306,948 |
| Quinstreet, Inc. (I)(L) | | 98,140 | | 2,138,471 |
| | |
|
| | | | | 6,038,675 |
| IT Services - 2.02% | | | | |
| Forrester Research, Inc. | | 3,600 | | 130,248 |
| Gartner, Inc. (I) | | 2,000 | | 75,440 |
| Hisoft Technology International, Ltd., ADR (I) | | 31,000 | | 767,870 |
| Syntel, Inc. | | 27,700 | | 1,458,405 |
| VeriFone Systems, Inc. (I) | | 33,820 | | 1,536,781 |
| | |
|
| | | | | 3,968,744 |
| Semiconductors & Semiconductor Equipment - 5.02% | | |
| Applied Micro Circuits Corp. (I)(L) | | 149,989 | | 1,574,885 |
| Cavium Networks, Inc. (I)(L) | | 51,060 | | 2,204,771 |
| Cypress Semiconductor Corp. (I) | | 70,400 | | 1,475,584 |
| OmniVision Technologies, Inc. (I) | | 50,060 | | 1,532,837 |
| Skyworks Solutions, Inc. (I)(L) | | 85,480 | | 3,072,151 |
| | |
|
| | | | | 9,860,228 |
| Software - 11.47% | | | | |
| Ariba, Inc. (I) | | 66,560 | | 2,060,032 |
| Cadence Design Systems, Inc. (I) | | 264,750 | | 2,634,263 |
| CommVault Systems, Inc. (I) | | 36,430 | | 1,330,788 |
| Concur Technologies, Inc. (I)(L) | | 36,160 | | 1,881,405 |
| Fortinet, Inc. (I) | | 29,300 | | 1,196,612 |
| Informatica Corp. (I)(L) | | 22,910 | | 1,076,999 |
| Parametric Technology Corp. (I) | | 76,380 | | 1,810,206 |
| Quest Software, Inc. (I) | | 38,880 | | 1,041,595 |
| RealD, Inc. (I)(L) | | 59,540 | | 1,336,674 |
| RealPage, Inc. (I) | | 48,594 | | 1,205,131 |
| SuccessFactors, Inc. (I)(L) | | 97,660 | | 3,506,970 |
| TIBCO Software, Inc. (I) | | 99,470 | | 2,448,951 |
| Velti PLC (I)(L) | | 74,401 | | 1,007,390 |
| | |
|
| | | | | 22,537,016 |
| | |
|
| | | | | 62,504,992 |
| Materials - 1.78% | | | | |
| Chemicals - 1.78% | | | | |
| LSB Industries, Inc. (I)(L) | | 47,110 | | 1,426,491 |
| |
| The accompanying notes are an integral part of the financial statements. | 195 |
John Hancock Funds II
Portfolio of Investments — February 28, 2011 (Unaudited) (showing percentage of total net assets)
| | | | |
| Small Cap Growth Fund (continued) | | |
| | | Shares or | | |
| | | Principal | | |
| | | Amount | | Value |
| |
|
| |
| COMMON STOCKS (continued) | | | | |
| Chemicals (continued) | | | | |
| Methanex Corp. (L) | | 71,060 | $ | 2,067,846 |
| | | |
|
| | | | | 3,494,337 |
| | | |
|
| | | | | 3,494,337 |
|
| TOTAL COMMON STOCKS (Cost $146,428,081) | | $ | 191,684,276 |
|
| |
| SECURITIES LENDING COLLATERAL - 19.44% | | | |
| John Hancock Collateral | | | | |
| Investment Trust, 0.2855% (W)(Y) | | 3,816,012 | | 38,188,360 |
|
| TOTAL SECURITIES LENDING | | | | |
| COLLATERAL (Cost $38,186,567) | | | $ | 38,188,360 |
|
| |
| SHORT-TERM INVESTMENTS - 4.48% | | | |
| Repurchase Agreement - 4.48% | | | | |
| Deutsche Bank Tri-Party Repurchase | | | | |
| Agreement dated 02-28-11 at 0.200% to be | | | |
| repurchased at $8,800,049 on 03-01-11, | | | | |
| collateralized by $8,937,013 U.S. Treasury | | | |
| Notes, 2.500% due 05-15-29 (valued at | | | | |
| $8,961,186, including interest) and $14,794 | | | |
| U.S. Treasury Notes, 0.500% due 10-15-13 | | | |
| (valued at $14,822, including interest) | $ | 8,800,000 | $ | 8,800,000 |
|
| TOTAL SHORT-TERM INVESTMENTS (Cost $8,800,000) | | $ | 8,800,000 |
|
| Total Investments (Small Cap Growth Fund) | | | |
| (Cost $193,414,648) - 121.49% | | | $ | 238,672,636 |
| Other assets and liabilities, net - (21.49%) | | | (42,212,708) |
| | |
|
| TOTAL NET ASSETS - 100.00% | | | $ | 196,459,928 |
| | | |
|
| |
| |
| |
| Small Cap Index Fund | | | | |
| | | Shares or | | |
| | | Principal | | |
| | | Amount | | Value |
| |
|
| |
| COMMON STOCKS - 95.03% | | | | |
| Consumer Discretionary - 12.61% | | | | |
| Auto Components - 0.90% | | | | |
| American Axle & | | | | |
| Manufacturing Holdings, Inc. (I) | | 4,379 | $ | 58,547 |
| Amerigon, Inc. (I) | | 1,664 | | 22,697 |
| Cooper Tire & Rubber Company | | 4,423 | | 103,764 |
| Dana Holding Corp. (I) | | 10,131 | | 191,273 |
| Dorman Products, Inc. (I) | | 829 | | 28,741 |
| Drew Industries, Inc. | | 1,432 | | 33,122 |
| Exide Technologies (I) | | 5,505 | | 65,510 |
| Fuel Systems Solutions, Inc. (I) | | 1,183 | | 34,449 |
| Modine Manufacturing Company (I) | | 3,404 | | 50,379 |
| Spartan Motors, Inc. | | 2,736 | | 17,374 |
| Standard Motor Products, Inc. | | 1,483 | | 17,247 |
| Stoneridge, Inc. (I) | | 1,160 | | 17,493 |
| Superior Industries International, Inc. | | 1,699 | | 33,776 |
| Tenneco, Inc. (I)(L) | | 4,319 | | 172,242 |
| | |
|
| | | | | 846,614 |
| Automobiles - 0.03% | | | | |
| Winnebago Industries, Inc. (I)(L) | | 2,175 | | 31,451 |
| Distributors - 0.15% | | | | |
| Audiovox Corp., Class A (I) | | 1,404 | | 11,625 |
| Core-Mark Holding Company, Inc. (I) | | 778 | | 26,413 |
| Pool Corp. (L) | | 3,634 | | 90,705 |
| | | | |
| Small Cap Index Fund (continued) | | |
| | | Shares or | | |
| | | Principal | | |
| | | Amount | | Value |
| | |
|
| |
| COMMON STOCKS (continued) | | | | |
| Distributors (continued) | | | | |
| Weyco Group, Inc. | | 630 | $ | 16,052 |
| | |
|
| | | | | 144,795 |
| Diversified Consumer Services - 1.06% | | | | |
| American Public Education, Inc. (I) | | 1,349 | | 57,225 |
| Archipelago Learning, Inc. (I) | | 997 | | 10,648 |
| Bridgepoint Education, Inc. (I)(L) | | 1,453 | | 27,200 |
| Capella Education Company (I)(L) | | 1,219 | | 70,300 |
| Coinstar, Inc. (I)(L) | | 2,296 | | 97,993 |
| Corinthian Colleges, Inc. (I)(L) | | 6,471 | | 33,908 |
| CPI Corp. | | 435 | | 10,035 |
| Grand Canyon Education, Inc. (I) | | 2,273 | | 36,550 |
| K12, Inc. (I) | | 1,834 | | 61,696 |
| Lincoln Educational Services Corp. | | 1,226 | | 19,015 |
| Mac-Gray Corp. | | 943 | | 15,050 |
| Matthews International Corp., Class A | | 2,171 | | 80,653 |
| Pre-Paid Legal Services, Inc. (I) | | 526 | | 34,684 |
| Regis Corp. | | 4,155 | | 72,837 |
| Sotheby’s | | 4,848 | | 238,619 |
| Steiner Leisure, Ltd. (I) | | 1,076 | | 50,744 |
| Stewart Enterprises, Inc., Class A (L) | | 5,830 | | 44,425 |
| Universal Technical Institute, Inc. | | 1,538 | | 28,299 |
| | |
|
| | | | | 989,881 |
| Hotels, Restaurants & Leisure - 2.22% | | | | |
| AFC Enterprises, Inc. (I) | | 1,943 | | 28,737 |
| Ambassadors Group, Inc. | | 1,531 | | 16,305 |
| Ameristar Casinos, Inc. | | 2,037 | | 34,120 |
| Biglari Holdings, Inc. (I) | | 102 | | 43,632 |
| BJ’s Restaurants, Inc. (I)(L) | | 1,644 | | 59,102 |
| Bob Evans Farms, Inc. | | 2,216 | | 69,449 |
| Boyd Gaming Corp. (I)(L) | | 3,991 | | 42,664 |
| Bravo Brio Restaurant Group, Inc. (I) | | 890 | | 15,335 |
| Buffalo Wild Wings, Inc. (I) | | 1,315 | | 69,682 |
| California Pizza Kitchen, Inc. (I) | | 1,446 | | 24,351 |
| CEC Entertainment, Inc. (I) | | 1,566 | | 60,589 |
| Churchill Downs, Inc. | | 864 | | 36,081 |
| Cracker Barrel Old Country Store, Inc. | | 1,719 | | 85,675 |
| Denny’s Corp. (I) | | 7,534 | | 29,307 |
| DineEquity, Inc. (I) | | 1,308 | | 74,831 |
| Domino’s Pizza, Inc. (I) | | 2,703 | | 45,600 |
| Gaylord Entertainment Company (I) | | 2,543 | | 91,624 |
| Interval Leisure Group, Inc. (I) | | 2,882 | | 48,735 |
| Isle of Capri Casinos, Inc. (I) | | 1,368 | | 12,654 |
| Jack in the Box, Inc. (I) | | 3,980 | | 87,560 |
| Jamba, Inc. (I) | | 5,027 | | 11,612 |
| Krispy Kreme Doughnuts, Inc. (I) | | 4,331 | | 27,155 |
| Life Time Fitness, Inc. (I) | | 3,026 | | 116,047 |
| Marcus Corp. | | 1,672 | | 21,769 |
| McCormick & Schmick’s | | | | |
| Seafood Restaurants, Inc. (I) | | 1,322 | | 13,577 |
| Morgans Hotel Group Company (I) | | 1,895 | | 16,847 |
| Multimedia Games, Inc. (I) | | 2,499 | | 13,745 |
| O’Charley’s, Inc. (I) | | 1,476 | | 9,373 |
| Orient-Express Hotels, Ltd., Class A (I) | | 7,470 | | 94,271 |
| P.F. Chang’s China Bistro, Inc. (L) | | 1,667 | | 77,415 |
| Papa John’s International, Inc. (I) | | 1,540 | | 44,937 |
| Peet’s Coffee & Tea, Inc. (I)(L) | | 842 | | 36,004 |
| Pinnacle Entertainment, Inc. (I) | | 4,508 | | 59,190 |
| Red Robin Gourmet Burgers, Inc. (I) | | 1,143 | | 27,272 |
| Ruby Tuesday, Inc. (I) | | 4,727 | | 63,153 |
| Ruth’s Hospitality Group, Inc. (I) | | 2,431 | | 12,179 |
| Scientific Games Corp., Class A (I) | | 4,811 | | 43,107 |
| Shuffle Master, Inc. (I) | | 4,026 | | 37,885 |
| Sonic Corp. (I) | | 4,577 | | 40,644 |
| |
| The accompanying notes are an integral part of the financial statements. | 196 |
John Hancock Funds II
Portfolio of Investments — February 28, 2011 (Unaudited) (showing percentage of total net assets)
| | | | |
| Small Cap Index Fund (continued) | | |
| | | Shares or | | |
| | | Principal | | |
| | | Amount | | Value |
| | |
|
| |
| COMMON STOCKS (continued) | | | | |
| Hotels, Restaurants & Leisure (continued) | | | | |
| Speedway Motorsports, Inc. | | 990 | $ | 14,474 |
| Texas Roadhouse, Inc., Class A (I) | | 4,165 | | 70,722 |
| The Cheesecake Factory, Inc. (I)(L) | | 4,361 | | 126,643 |
| Vail Resorts, Inc. (I) | | 2,626 | | 128,149 |
| | |
|
| | | | | 2,082,203 |
| Household Durables - 0.66% | | | | |
| American Greetings Corp., Class A | | 2,857 | | 61,854 |
| Beazer Homes USA, Inc. (I) | | 5,528 | | 25,705 |
| Blyth, Inc. | | 415 | | 14,264 |
| Cavco Industries, Inc. (I) | | 501 | | 20,451 |
| CSS Industries, Inc. | | 694 | | 12,145 |
| Ethan Allen Interiors, Inc. (L) | | 1,802 | | 39,734 |
| Furniture Brands International, Inc. (I) | | 3,563 | | 15,606 |
| Helen of Troy, Ltd. (I) | | 2,216 | | 61,893 |
| Hooker Furniture Corp. | | 916 | | 12,476 |
| Hovnanian Enterprises, Inc., Class A (I)(L) | | 4,040 | | 16,483 |
| iRobot Corp. (I)(L) | | 1,537 | | 44,143 |
| Kid Brands, Inc. (I) | | 1,070 | | 10,015 |
| La-Z-Boy, Inc. (I) | | 3,762 | | 37,770 |
| Libbey, Inc. (I) | | 1,514 | | 26,026 |
| Lifetime Brands, Inc. (I) | | 778 | | 9,344 |
| M/I Homes, Inc. (I) | | 1,411 | | 18,837 |
| Meritage Homes Corp. (I) | | 2,335 | | 60,266 |
| Ryland Group, Inc. | | 3,194 | | 55,448 |
| Sealy Corp. (I)(L) | | 3,821 | | 11,004 |
| Skyline Corp. | | 591 | | 11,873 |
| Standard Pacific Corp. (I) | | 7,809 | | 31,236 |
| Universal Electronics, Inc. (I) | | 991 | | 27,005 |
| | |
|
| | | | | 623,578 |
| Internet & Catalog Retail - 0.36% | | | | |
| Blue Nile, Inc. (I)(L) | | 912 | | 52,148 |
| drugstore.com, Inc. (I) | | 7,513 | | 14,951 |
| Gaiam, Inc., Class A | | 1,418 | | 10,848 |
| HSN, Inc. (I) | | 2,816 | | 91,464 |
| NutriSystem, Inc. (L) | | 2,000 | | 26,460 |
| Orbitz Worldwide, Inc. (I) | | 1,599 | | 5,644 |
| Overstock.com, Inc. (I) | | 1,130 | | 17,233 |
| PetMed Express, Inc. | | 1,710 | | 25,462 |
| Shutterfly, Inc. (I) | | 1,965 | | 83,906 |
| US Auto Parts Network, Inc. (I) | | 1,061 | | 8,615 |
| | |
|
| | | | | 336,731 |
| Leisure Equipment & Products - 0.60% | | | | |
| Arctic Cat, Inc. (I) | | 955 | | 12,138 |
| Brunswick Corp. | | 6,429 | | 148,060 |
| Callaway Golf Company | | 4,778 | | 36,982 |
| Eastman Kodak Company (I)(L) | | 19,536 | | 66,422 |
| Jakks Pacific, Inc. (I) | | 2,093 | | 39,014 |
| Leapfrog Enterprises, Inc. (I) | | 2,716 | | 11,787 |
| Polaris Industries, Inc. (L) | | 2,242 | | 169,159 |
| RC2 Corp. (I) | | 1,602 | | 34,779 |
| Smith & Wesson Holding Corp. (I) | | 4,331 | | 17,281 |
| Sturm Ruger & Company, Inc. | | 1,426 | | 25,754 |
| | |
|
| | | | | 561,376 |
| Media - 1.19% | | | | |
| AH Belo Corp. (I) | | 1,407 | | 10,116 |
| Arbitron, Inc. | | 1,934 | | 76,993 |
| Ascent Media Corp., Class A (I) | | 1,074 | | 44,807 |
| Ballantyne of Omaha, Inc. (I) | | 1,299 | | 9,431 |
| Belo Corp., Class A (I) | | 6,761 | | 53,885 |
| Cinemark Holdings, Inc. | | 4,090 | | 82,127 |
| CKX, Inc. (I) | | 4,275 | | 15,091 |
| Dex One Corp. (I) | | 3,739 | | 19,705 |
| | | | |
| Small Cap Index Fund (continued) | | |
| | | Shares or | | |
| | | Principal | | |
| | | Amount | | Value |
| | |
|
| |
| COMMON STOCKS (continued) | | | | |
| Media (continued) | | | | |
| Entercom Communications Corp., Class A (I) | | 1,812 | $ | 23,701 |
| Entravision | | | | |
| Communications Corp., Class A (I) | | 4,213 | | 9,901 |
| EW Scripps Company (I) | | 2,403 | | 22,997 |
| Fisher Communications, Inc. (I) | | 606 | | 16,217 |
| Global Sources, Ltd. (I) | | 1,736 | | 19,964 |
| Gray Television, Inc. (I) | | 4,203 | | 9,331 |
| Harte-Hanks, Inc. | | 2,859 | | 36,281 |
| Journal Communications, Inc., Class A (I) | | 3,333 | | 20,465 |
| Knology, Inc. (I) | | 2,256 | | 31,404 |
| Lee Enterprises, Inc. (I)(L) | | 3,737 | | 11,099 |
| LIN TV Corp., Class A (I) | | 2,525 | | 15,428 |
| Lions Gate Entertainment Corp. (I) | | 5,558 | | 34,015 |
| Live Nation Entertainment, Inc. (I) | | 10,194 | | 108,362 |
| Martha Stewart Living | | | | |
| Omnimedia, Inc., Class A (I)(L) | | 2,274 | | 9,323 |
| Media General, Inc., Class A (I)(L) | | 1,842 | | 12,599 |
| Mediacom Communications Corp., Class A (I) | | 3,031 | | 26,733 |
| National CineMedia, Inc. | | 3,910 | | 73,860 |
| Playboy Enterprises, Inc., Class B (I) | | 1,928 | | 11,838 |
| Rentrak Corp. (I) | | 749 | | 19,796 |
| Scholastic Corp. | | 2,210 | | 69,394 |
| Sinclair Broadcast Group, Inc., Class A | | 3,508 | | 45,394 |
| SuperMedia, Inc. (I) | | 1,007 | | 8,479 |
| The McClatchy Company, Class A (I)(L) | | 4,528 | | 18,157 |
| Valassis Communications, Inc. (I) | | 3,609 | | 101,846 |
| Warner Music Group Corp. (I) | | 3,495 | | 21,005 |
| World Wrestling Entertainment, Inc., Class A | | 1,809 | | 23,354 |
| | |
|
| | | | | 1,113,098 |
| Multiline Retail - 0.43% | | | | |
| 99 Cents Only Stores (I) | | 3,314 | | 55,145 |
| Dillard’s, Inc., Class A | | 3,024 | | 128,036 |
| Fred’s, Inc., Class A | | 2,880 | | 39,686 |
| Retail Ventures, Inc. (I) | | 1,689 | | 29,558 |
| Saks, Inc. (I)(L) | | 9,798 | | 120,026 |
| The Bon-Ton Stores, Inc. (I) | | 948 | | 14,846 |
| Tuesday Morning Corp. (I) | | 2,462 | | 11,498 |
| | |
|
| | | | | 398,795 |
| Specialty Retail - 3.03% | | | | |
| Americas Car-Mart, Inc. (I) | | 719 | | 17,817 |
| AnnTaylor Stores Corp. (I) | | 4,239 | | 98,387 |
| Asbury Automotive Group, Inc. (I) | | 2,155 | | 39,760 |
| Ascena Retail Group, Inc. (I) | | 4,274 | | 133,520 |
| Barnes & Noble, Inc. (L) | | 2,812 | | 37,653 |
| Bebe Stores, Inc. | | 2,482 | | 14,644 |
| Big 5 Sporting Goods Corp. | | 1,692 | | 23,586 |
| Brown Shoe Company, Inc. | | 3,154 | | 48,887 |
| Build-A-Bear Workshop, Inc. (I) | | 1,518 | | 10,049 |
| Cabela’s, Inc. (I) | | 2,915 | | 79,084 |
| Casual Male Retail Group, Inc. (I) | | 3,301 | | 14,095 |
| Charming Shoppes, Inc. (I) | | 8,626 | | 28,207 |
| Christopher & Banks Corp. | | 2,720 | | 16,619 |
| Citi Trends, Inc. (I) | | 1,081 | | 23,771 |
| Coldwater Creek, Inc. (I) | | 4,638 | | 13,728 |
| Collective Brands, Inc. (I) | | 4,697 | | 107,092 |
| Destination Maternity Corp. | | 377 | | 17,003 |
| DSW, Inc., Class A (I)(L) | | 988 | | 40,123 |
| Express, Inc. | | 1,151 | | 20,695 |
| Genesco, Inc. (I) | | 1,737 | | 68,646 |
| Group 1 Automotive, Inc. (L) | | 1,779 | | 75,163 |
| Haverty Furniture Companies, Inc. | | 1,424 | | 18,939 |
| hhgregg, Inc. (I) | | 975 | | 14,469 |
| Hibbett Sports, Inc. (I) | | 2,104 | | 66,087 |
| |
| The accompanying notes are an integral part of the financial statements. | 197 |
John Hancock Funds II
Portfolio of Investments — February 28, 2011 (Unaudited) (showing percentage of total net assets)
| | | | |
| Small Cap Index Fund (continued) | | |
| | | Shares or | | |
| | | Principal | | |
| | | Amount | | Value |
| | |
|
| |
| COMMON STOCKS (continued) | | | | |
| Specialty Retail (continued) | | | | |
| Hot Topic, Inc. | | 3,443 | $ | 18,420 |
| Jo-Ann Stores, Inc. (I) | | 1,980 | | 120,186 |
| Jos. A. Bank Clothiers, Inc. (I) | | 1,984 | | 91,482 |
| Kirkland’s, Inc. (I) | | 1,279 | | 19,543 |
| Lithia Motors, Inc., Class A | | 1,599 | | 24,209 |
| Lumber Liquidators Holdings, Inc. (I)(L) | | 1,633 | | 38,016 |
| MarineMax, Inc. (I) | | 1,747 | | 15,775 |
| Midas, Inc. (I) | | 1,297 | | 10,026 |
| Monro Muffler Brake, Inc. | | 2,156 | | 70,458 |
| New York & Company, Inc. (I) | | 2,016 | | 14,011 |
| OfficeMax, Inc. (I) | | 6,154 | | 84,556 |
| Pacific Sunwear of California, Inc. (I) | | 4,928 | | 22,225 |
| Penske Automotive Group, Inc. (I) | | 3,209 | | 65,367 |
| Pep Boys - Manny, Moe & Jack | | 3,805 | | 47,677 |
| Pier 1 Imports, Inc. (I) | | 7,608 | | 76,689 |
| Rent-A-Center, Inc. | | 4,752 | | 157,101 |
| Rue21, Inc. (I) | | 1,082 | | 37,892 |
| Sally Beauty Holdings, Inc. (I)(L) | | 6,863 | | 89,013 |
| Select Comfort Corp. (I) | | 4,004 | | 44,565 |
| Shoe Carnival, Inc. (I) | | 678 | | 17,587 |
| Sonic Automotive, Inc. | | 2,913 | | 41,889 |
| Stage Stores, Inc. | | 2,747 | | 47,908 |
| Stein Mart, Inc. | | 2,035 | | 16,667 |
| Systemax, Inc. (I) | | 852 | | 11,638 |
| Talbots, Inc. (I) | | 5,152 | | 32,200 |
| The Buckle, Inc. | | 1,875 | | 73,294 |
| The Cato Corp., Class A | | 2,017 | | 48,912 |
| The Children’s Place Retail Stores, Inc. (I) | | 1,956 | | 89,389 |
| The Finish Line, Inc., Class A | | 3,690 | | 64,427 |
| The Men’s Wearhouse, Inc. | | 3,793 | | 101,273 |
| The Wet Seal, Inc., Class A (I) | | 7,550 | | 29,974 |
| Ulta Salon, Cosmetics & Fragrance, Inc. (I) | | 2,281 | | 95,186 |
| Vitamin Shoppe, Inc. (I) | | 1,166 | | 40,565 |
| West Marine, Inc. (I) | | 1,205 | | 12,568 |
| Zumiez, Inc. (I) | | 1,505 | | 39,235 |
| | |
|
| | | | | 2,837,947 |
| Textiles, Apparel & Luxury Goods - 1.98% | | | | |
| Carter’s, Inc. (I) | | 4,277 | | 122,579 |
| Cherokee, Inc. | | 713 | | 12,107 |
| Columbia Sportswear Company (L) | | 812 | | 50,985 |
| CROCS, Inc. (I) | | 6,215 | | 109,695 |
| Deckers Outdoor Corp. (I) | | 2,793 | | 246,398 |
| G-III Apparel Group, Ltd. (I) | | 1,128 | | 44,353 |
| Iconix Brand Group, Inc. (I) | | 5,249 | | 116,003 |
| K-Swiss, Inc., Class A (I) | | 1,989 | | 19,910 |
| Kenneth Cole Productions, Inc., Class A (I) | | 662 | | 8,606 |
| Liz Claiborne, Inc. (I)(L) | | 6,978 | | 35,867 |
| Maidenform Brands, Inc. (I) | | 1,681 | | 45,622 |
| Movado Group, Inc. (I)(L) | | 1,246 | | 17,531 |
| Oxford Industries, Inc. | | 1,018 | | 24,554 |
| Perry Ellis International, Inc. (I) | | 762 | | 22,128 |
| Quiksilver, Inc. (I)(L) | | 9,466 | | 40,798 |
| RG Barry Corp. | | 866 | | 9,405 |
| Skechers U.S.A., Inc., Class A (I) | | 2,515 | | 52,262 |
| Steven Madden, Ltd. (I) | | 1,781 | | 76,832 |
| The Jones Group, Inc. | | 6,319 | | 84,043 |
| The Timberland Company, Class A (I) | | 2,952 | | 109,047 |
| The Warnaco Group, Inc. (I) | | 3,193 | | 187,461 |
| True Religion Apparel, Inc. (I) | | 1,889 | | 44,902 |
| Under Armour, Inc., Class A (I) | | 2,540 | | 168,224 |
| Unifi, Inc. (I) | | 1,033 | | 19,617 |
| Vera Bradley, Inc. (I) | | 931 | | 31,980 |
| Volcom, Inc. | | 1,449 | | 25,937 |
| | | | |
| Small Cap Index Fund (continued) | | |
| | | Shares or | | |
| | | Principal | | |
| | | Amount | | Value |
| | |
|
| |
| COMMON STOCKS (continued) | | | | |
| Textiles, Apparel & Luxury Goods (continued) | | | | |
| Wolverine World Wide, Inc. | | 3,568 | $ | 131,160 |
| | |
|
| | | | | 1,858,006 |
| | |
|
| | | | | 11,824,475 |
| Consumer Staples - 2.74% | | | | |
| Beverages - 0.14% | | | | |
| Boston Beer Company, Inc. (I) | | 621 | | 57,641 |
| Coca-Cola Bottling Company Consolidated | | 317 | | 18,291 |
| Heckmann Corp. (I) | | 6,608 | | 37,798 |
| National Beverage Corp. | | 872 | | 11,066 |
| Primo Water Corpprimo Water Corp. (I) | | 789 | | 10,083 |
| | |
|
| | | | | 134,879 |
| Food & Staples Retailing - 0.82% | | | | |
| Arden Group, Inc. | | 114 | | 8,869 |
| Casey’s General Stores, Inc. | | 2,720 | | 111,710 |
| Fresh Market, Inc. (I) | | 1,106 | | 45,125 |
| Ingles Markets, Inc. | | 1,063 | | 20,441 |
| Nash Finch Company | | 920 | | 37,140 |
| Pricesmart, Inc. | | 1,142 | | 40,644 |
| Rite Aid Corp. (I) | | 41,314 | | 54,121 |
| Ruddick Corp. | | 3,148 | | 115,532 |
| Spartan Stores, Inc. | | 1,701 | | 25,634 |
| The Andersons, Inc. | | 1,337 | | 64,229 |
| The Pantry, Inc. (I) | | 1,705 | | 26,871 |
| United Natural Foods, Inc. (I) | | 3,474 | | 147,471 |
| Village Super Market, Inc. | | 507 | | 15,230 |
| Weis Markets, Inc. | | 807 | | 32,014 |
| Winn-Dixie Stores, Inc. (I) | | 4,132 | | 28,841 |
| | |
|
| | | | | 773,872 |
| Food Products - 1.12% | | | | |
| B&G Foods, Inc. | | 3,482 | | 52,230 |
| Cal-Maine Foods, Inc. (L) | | 1,046 | | 30,198 |
| Calavo Growers, Inc. | | 854 | | 19,830 |
| Chiquita Brands International, Inc. (I) | | 3,282 | | 56,418 |
| Darling International, Inc. (I) | | 6,019 | | 83,604 |
| Diamond Foods, Inc. (L) | | 1,590 | | 81,011 |
| Dole Food Company, Inc. (I)(L) | | 2,648 | | 39,058 |
| Farmer Brothers Company | | 602 | | 7,904 |
| Fresh Del Monte Produce, Inc. | | 2,836 | | 81,053 |
| Imperial Sugar Company | | 967 | | 10,444 |
| J & J Snack Foods Corp. | | 1,048 | | 46,081 |
| John B. Sanfilippo & Son, Inc. (I) | | 748 | | 9,013 |
| Lancaster Colony Corp. | | 1,388 | | 80,115 |
| Limoneira Company | | 631 | | 14,519 |
| Pilgrim’s Pride Corp. (I) | | 3,648 | | 28,126 |
| Sanderson Farms, Inc. (L) | | 1,650 | | 68,228 |
| Seneca Foods Corp., Class A (I) | | 644 | | 18,116 |
| Smart Balance, Inc. (I) | | 4,932 | | 21,405 |
| Snyders-Lance, Inc. | | 1,914 | | 34,873 |
| The Hain Celestial Group, Inc. (I) | | 2,975 | | 88,715 |
| Tootsie Roll Industries, Inc. (L) | | 1,737 | | 49,678 |
| TreeHouse Foods, Inc. (I) | | 2,503 | | 130,582 |
| | |
|
| | | | | 1,051,201 |
| Household Products - 0.15% | | | | |
| Central Garden & Pet Company, Class A (I) | | 4,161 | | 38,323 |
| Oil-Dri Corp of America | | 506 | | 10,277 |
| Spectrum Brands Holdings, Inc. (I) | | 1,320 | | 37,884 |
| WD-40 Company | | 1,221 | | 49,646 |
| | |
|
| | | | | 136,130 |
| Personal Products - 0.33% | | | | |
| Elizabeth Arden, Inc. (I) | | 1,799 | | 52,333 |
| Inter Parfums, Inc. | | 1,092 | | 19,732 |
| |
| The accompanying notes are an integral part of the financial statements. | 198 |
John Hancock Funds II
Portfolio of Investments — February 28, 2011 (Unaudited) (showing percentage of total net assets)
| | | | |
| Small Cap Index Fund (continued) | | |
| | | Shares or | | |
| | | Principal | | |
| | | Amount | | Value |
| | |
|
| |
| COMMON STOCKS (continued) | | | | |
| Personal Products (continued) | | | | |
| Medifast, Inc. (I) | | 998 | $ | 23,094 |
| Nu Skin Enterprises, Inc., Class A | | 3,532 | | 112,741 |
| Nutraceutical International Corp. (I) | | 821 | | 12,151 |
| Prestige Brands Holdings, Inc. (I) | | 3,079 | | 33,931 |
| Revlon, Inc. (I) | | 931 | | 13,909 |
| Schiff Nutrition International, Inc. | | 1,117 | | 9,573 |
| Synutra International, Inc. (I)(L) | | 1,478 | | 18,120 |
| USANA Health Sciences, Inc. (I) | | 445 | | 15,495 |
| | |
|
| | | | | 311,079 |
| Tobacco - 0.18% | | | | |
| Alliance One International, Inc. (I)(L) | | 6,651 | | 24,143 |
| Star Scientific, Inc. (I)(L) | | 7,574 | | 13,633 |
| Universal Corp. | | 1,722 | | 72,014 |
| Vector Group, Ltd. | | 3,299 | | 55,720 |
| | |
|
| | | | | 165,510 |
| | | |
|
| | | | | 2,572,671 |
| Energy - 6.70% | | | | |
| Energy Equipment & Services - 2.21% | | | | |
| Allis-Chalmers Energy, Inc. (I) | | 2,695 | | 19,559 |
| Basic Energy Services, Inc. (I) | | 1,700 | | 32,606 |
| Bristow Group, Inc. (I) | | 2,603 | | 124,736 |
| Cal Dive International, Inc. (I) | | 7,063 | | 48,593 |
| CARBO Ceramics, Inc. | | 1,368 | | 169,591 |
| Complete Production Services, Inc. (I) | | 5,637 | | 162,402 |
| Dawson Geophysical Company (I) | | 618 | | 30,851 |
| Dril-Quip, Inc. (I) | | 2,453 | | 188,145 |
| Global Industries, Ltd. (I) | | 7,541 | | 67,718 |
| Gulf Islands Fabrication, Inc. | | 1,088 | | 33,695 |
| Gulfmark Offshore, Inc., Class A (I) | | 1,710 | | 75,890 |
| Helix Energy Solutions Group, Inc. (I) | | 7,595 | | 116,963 |
| Hercules Offshore, Inc. (I) | | 8,598 | | 42,474 |
| Hornbeck Offshore Services, Inc. (I) | | 1,720 | | 48,865 |
| ION Geophysical Corp. (I) | | 9,243 | | 118,495 |
| Key Energy Services, Inc. (I) | | 9,078 | | 140,709 |
| Lufkin Industries, Inc. | | 2,174 | | 169,898 |
| Matrix Service Company (I) | | 1,989 | | 27,766 |
| Natural Gas Services Group, Inc. (I) | | 1,018 | | 19,688 |
| Newpark Resources, Inc. (I) | | 6,581 | | 45,935 |
| OYO Geospace Corp. (I) | | 296 | | 30,097 |
| Parker Drilling Company (I) | | 8,639 | | 45,441 |
| PHI, Inc. (I) | | 1,069 | | 22,984 |
| Pioneer Drilling Company (I) | | 4,000 | | 45,280 |
| RPC, Inc. (L) | | 3,165 | | 61,971 |
| Tesco Corp. (I) | | 2,262 | | 41,598 |
| TetraTechnologies, Inc. (I) | | 5,562 | | 76,811 |
| Vantage Drilling Company (I) | | 11,443 | | 23,801 |
| Willbros Group, Inc. (I) | | 3,579 | | 40,657 |
| | |
|
| | | | | 2,073,219 |
| Oil, Gas & Consumable Fuels - 4.49% | | | | |
| Abraxas Petroleum Corp. (I) | | 5,137 | | 30,668 |
| Amyris, Inc. (I) | | 445 | | 14,458 |
| Apco Oil and Gas International, Inc. | | 629 | | 50,911 |
| Approach Resources, Inc. (I) | | 1,281 | | 41,697 |
| ATP Oil & Gas Corp. (I)(L) | | 3,268 | | 66,373 |
| Berry Petroleum Company, Class A | | 3,700 | | 192,363 |
| Bill Barrett Corp. (I) | | 3,296 | | 128,148 |
| BPZ Resources, Inc. (I)(L) | | 7,239 | | 47,054 |
| Brigham Exploration Company (I)(L) | | 8,423 | | 308,113 |
| Callon Petroleum Company (I) | | 2,242 | | 18,788 |
| Carrizo Oil & Gas, Inc. (I)(L) | | 2,273 | | 84,601 |
| Cheniere Energy, Inc. (I)(L) | | 4,419 | | 45,869 |
| Clayton Williams Energy, Inc. (I) | | 435 | | 46,145 |
| | | | |
| Small Cap Index Fund (continued) | | |
| | | Shares or | | |
| | | Principal | | |
| | | Amount | | Value |
| | |
|
| |
| COMMON STOCKS (continued) | | | | |
| Oil, Gas & Consumable Fuels (continued) | | | | |
| Clean Energy Fuels Corp. (I)(L) | | 3,352 | $ | 47,062 |
| Cloud Peak Energy, Inc. (I) | | 2,246 | | 46,043 |
| Contango Oil & Gas Company (I) | | 860 | | 52,701 |
| Crosstex Energy, Inc. (L) | | 3,015 | | 30,994 |
| CVR Energy, Inc. (I) | | 2,230 | | 42,147 |
| Delta Petroleum Corp. (I) | | 14,644 | | 17,133 |
| DHT Holdings, Inc. (L) | | 3,869 | | 17,991 |
| Endeavour International Corp. (I)(L) | | 1,657 | | 22,386 |
| Energy Partners, Ltd. (I) | | 2,132 | | 34,901 |
| Energy XXI Bermuda, Ltd. (I) | | 4,983 | | 171,814 |
| FX Energy, Inc. (I) | | 3,331 | | 38,173 |
| Gastar Exploration, Ltd. (I) | | 4,209 | | 20,835 |
| General Maritime Corp. | | 5,949 | | 16,657 |
| Georesources, Inc. (I) | | 986 | | 31,029 |
| GMX Resources, Inc. (I)(L) | | 2,464 | | 12,788 |
| Golar LNG Energy, Ltd. (I) | | 574 | | 1,824 |
| Golar LNG, Ltd. | | 2,635 | | 50,223 |
| Goodrich Petroleum Corp. (I)(L) | | 1,813 | | 36,876 |
| Green Plains Renewable Energy, Inc. (I)(L) | | 1,387 | | 16,963 |
| Gulfport Energy Corp. (I) | | 1,978 | | 58,529 |
| Harvest Natural Resources, Inc. (I)(L) | | 2,443 | | 36,401 |
| Hess Corp. | | 141 | | 12,271 |
| Houston American Energy Corp. (L) | | 1,342 | | 21,485 |
| International Coal Group, Inc. (I) | | 9,493 | | 93,696 |
| James River Coal Company (I) | | 2,015 | | 42,315 |
| Knightsbridge Tankers, Ltd. (L) | | 1,768 | | 43,122 |
| Kodiak Oil & Gas Corp. (I) | | 12,883 | | 97,524 |
| L&L Energy, Inc. (I)(L) | | 1,407 | | 10,567 |
| Magnum Hunter Resources Corp. (I) | | 3,901 | | 27,931 |
| McMoRan Exploration Company (I) | | 6,938 | | 121,415 |
| Nordic American Tanker Shipping, Ltd. (L) | | 3,290 | | 80,572 |
| Northern Oil and Gas, Inc. (I) | | 3,920 | | 124,538 |
| Oasis Petroleum, Inc. (I) | | 3,509 | | 121,131 |
| Overseas Shipholding Group, Inc. (L) | | 1,832 | | 61,848 |
| Panhandle Oil and Gas, Inc. | | 571 | | 16,508 |
| Patriot Coal Corp. (I) | | 5,657 | | 133,505 |
| Penn Virginia Corp. | | 3,315 | | 53,935 |
| Petroleum Development Corp. (I) | | 1,708 | | 80,156 |
| Petroquest Energy, Inc. (I) | | 4,055 | | 34,954 |
| RAM Energy Resources, Inc. (I) | | 5,182 | | 9,069 |
| Rentech, Inc. (I)(L) | | 16,297 | | 20,860 |
| Resolute Energy Corp. (I)(L) | | 2,740 | | 49,676 |
| REX American Resources Corp (I) | | 616 | | 9,037 |
| Rex Energy Corp. (I) | | 2,391 | | 30,127 |
| Rosetta Resources, Inc. (I) | | 3,823 | | 173,411 |
| Scorpio Tankers, Inc. (I) | | 1,349 | | 13,881 |
| Ship Finance International, Ltd. (L) | | 3,159 | | 65,676 |
| Stone Energy Corp. (I) | | 3,143 | | 95,170 |
| Swift Energy Company (I) | | 3,021 | | 129,752 |
| Syntroleum Corp. (I) | | 5,865 | | 9,443 |
| Teekay Tankers, Ltd., Class A | | 2,283 | | 24,405 |
| Transatlantic Petroleum, Ltd. (I)(L) | | 10,832 | | 35,312 |
| Uranium Energy Corp. (I)(L) | | 4,448 | | 25,354 |
| USEC, Inc. (I)(L) | | 8,215 | | 43,704 |
| Vaalco Energy, Inc. (I) | | 3,766 | | 30,203 |
| Venoco, Inc. (I) | | 1,475 | | 27,214 |
| W&T Offshore, Inc. | | 2,551 | | 65,127 |
| Warren Resources, Inc. (I) | | 5,380 | | 26,470 |
| Western Refining, Inc. (I)(L) | | 3,739 | | 60,834 |
| World Fuel Services Corp. | | 4,948 | | 205,045 |
| | |
|
| | | | | 4,205,901 |
| | |
|
| | | | | 6,279,120 |
| |
| The accompanying notes are an integral part of the financial statements. | 199 |
John Hancock Funds II
Portfolio of Investments — February 28, 2011 (Unaudited) (showing percentage of total net assets)
| | | | |
| Small Cap Index Fund (continued) | | |
| | | Shares or | | |
| | | Principal | | |
| | | Amount | | Value |
| | |
|
| |
| COMMON STOCKS (continued) | | | | |
| Financials - 19.31% | | | | |
| Capital Markets - 2.25% | | | | |
| American Capital, Ltd. (I) | | 24,517 | $ | 228,989 |
| Apollo Investment Corp. | | 13,847 | | 171,287 |
| Arlington Asset Investment Corp. | | 581 | | 16,303 |
| Artio Global Investors, Inc. | | 2,039 | | 32,318 |
| BGC Partners, Inc., Class A | | 4,143 | | 39,607 |
| BlackRock Kelso Capital Corp. | | 5,138 | | 63,865 |
| Calamos Asset Management, Inc. | | 1,458 | | 24,174 |
| Capital Southwest Corp. | | 197 | | 19,688 |
| Cohen & Steers, Inc. | | 1,266 | | 36,967 |
| Cowen Group, Inc., Class A (I) | | 2,905 | | 12,433 |
| Diamond Hill Investment Group, Inc. | | 181 | | 13,481 |
| Duff & Phelps Corp. | | 2,014 | | 31,721 |
| Epoch Holding Corp. | | 977 | | 15,368 |
| Evercore Partners, Inc., Class A | | 1,123 | | 38,721 |
| FBR Capital Markets Corp. (I) | | 4,032 | | 14,999 |
| Fifth Street Finance Corp. | | 3,894 | | 53,620 |
| Financial Engines, Inc. (I) | | 976 | | 23,824 |
| GAMCO Investors, Inc., Class A | | 493 | | 22,895 |
| GFI Group, Inc. | | 4,825 | | 24,125 |
| Gladstone Capital Corp. (L) | | 1,613 | | 18,372 |
| Gladstone Investment Corp. | | 1,733 | | 14,332 |
| Gleacher & Company, Inc. (I) | | 5,898 | | 11,324 |
| Golub Capital BDC Inc. | | 578 | | 9,988 |
| Harris & Harris Group, Inc. (I) | | 2,536 | | 14,836 |
| Hercules Technology Growth Capital, Inc. | | 2,639 | | 29,187 |
| HFF, Inc. (I) | | 1,383 | | 18,256 |
| Internet Capital Group, Inc. (I) | | 2,679 | | 36,676 |
| INTL FCStone, Inc. (I) | | 921 | | 22,297 |
| Investment Technology Group, Inc. (I) | | 3,132 | | 59,978 |
| JMP Group, Inc. | | 1,293 | | 11,042 |
| Kayne Anderson Energy | | | | |
| Development Company | | 774 | | 14,273 |
| KBW, Inc. | | 2,570 | | 65,766 |
| Knight Capital Group, Inc., Class A (I) | | 6,721 | | 94,161 |
| LaBranche & Company, Inc. (I) | | 2,951 | | 12,394 |
| Ladenburg Thalmann | | | | |
| Financial Services, Inc. (I) | | 7,076 | | 7,430 |
| Main Street Capital Corp. | | 1,084 | | 21,355 |
| MCG Capital Corp. | | 5,528 | | 40,354 |
| Medallion Financial Corp. | | 1,378 | | 11,162 |
| MF Global Holdings, Ltd. (I) | | 8,355 | | 72,438 |
| MVC Capital, Inc. | | 1,763 | | 24,876 |
| NGP Capital Resources Company | | 1,664 | | 16,740 |
| Oppenheimer Holdings, Inc., Class A | | 735 | | 24,123 |
| optionsXpress Holdings, Inc. | | 3,059 | | 49,586 |
| PennantPark Investment Corp. | | 2,553 | | 32,423 |
| Penson Worldwide, Inc. (I) | | 1,719 | | 11,311 |
| Piper Jaffray Companies (I) | | 1,128 | | 46,417 |
| Prospect Capital Corp. | | 5,878 | | 71,359 |
| Safeguard Scientifics, Inc. (I) | | 1,507 | | 31,617 |
| Sanders Morris Harris Group, Inc. | | 1,684 | | 11,839 |
| Solar Capital Ltd. | | 348 | | 8,526 |
| Stifel Financial Corp. (I) | | 2,451 | | 175,835 |
| SWS Group, Inc. | | 2,238 | | 12,063 |
| Teton Advisors, Inc., Class A | | 20 | | 300 |
| THL Credit, Inc. | | 721 | | 9,697 |
| TICC Capital Corp. | | 2,305 | | 29,089 |
| TradeStation Group, Inc. (I) | | 3,137 | | 21,112 |
| Triangle Capital Corp. | | 1,099 | | 21,112 |
| Virtus Investment Partners, Inc. (I) | | 376 | | 21,913 |
| Westwood Holdings Group, Inc. | | 434 | | 16,288 |
| | |
|
| | | | | 2,106,232 |
| | | | |
| Small Cap Index Fund (continued) | | |
| | | Shares or | | |
| | | Principal | | |
| | | Amount | | Value |
| | |
|
| |
| COMMON STOCKS (continued) | | | | |
| Commercial Banks - 5.25% | | | | |
| 1st Source Corp. | | 1,068 | $ | 20,901 |
| 1st United Bancorp, Inc. (I) | | 1,880 | | 12,070 |
| Alliance Financial Corp. | | 404 | | 12,819 |
| American National Bankshares, Inc. | | 528 | | 11,495 |
| Ameris Bancorp (I)(L) | | 1,775 | | 17,910 |
| Ames National Corp. | | 651 | | 12,252 |
| Arrow Financial Corp. | | 704 | | 17,628 |
| BancFirst Corp. | | 510 | | 21,440 |
| Banco Latinoamericano de | | | | |
| Comercio Exterior SA | | 1,981 | | 33,281 |
| Bancorp Rhode Island, Inc. | | 377 | | 11,879 |
| Bancorp, Inc. (I) | | 1,750 | | 14,840 |
| Bank of Marin Bancorp | | 428 | | 15,515 |
| Bank of the Ozarks, Inc. | | 906 | | 39,003 |
| Boston Private Financial Holdings, Inc. | | 5,526 | | 39,179 |
| Bridge Bancorp, Inc. | | 521 | | 11,530 |
| Bryn Mawr Bank Corp. | | 808 | | 16,928 |
| Camden National Corp. | | 555 | | 18,670 |
| Capital City Bank Group, Inc. | | 952 | | 11,967 |
| Cardinal Financial Corp. | | 2,163 | | 24,074 |
| Cathay General Bancorp | | 5,675 | | 100,561 |
| Center Financial Corp. (I) | | 2,746 | | 21,886 |
| Centerstate Banks, Inc. | | 2,024 | | 14,674 |
| Chemical Financial Corp. | | 1,729 | | 34,787 |
| Citizens & Northern Corp. | | 937 | | 14,720 |
| Citizens Republic Banking Corp., Inc. (I) | | 29,363 | | 24,691 |
| City Holding Company (L) | | 1,116 | | 38,223 |
| CNB Financial Corp. | | 964 | | 13,631 |
| CoBiz Financial, Inc. | | 2,591 | | 16,893 |
| Columbia Banking System, Inc. | | 2,865 | | 56,842 |
| Community Bank Systems, Inc. | | 2,361 | | 59,403 |
| Community Trust Bancorp, Inc. | | 922 | | 26,378 |
| CVB Financial Corp. | | 6,550 | | 54,758 |
| Danvers Bancorp, Inc. | | 1,487 | | 32,476 |
| Eagle Bancorp, Inc. (I) | | 1,237 | | 18,308 |
| Enterprise Financial Services Corp. (L) | | 1,204 | | 15,917 |
| Financial Institutions, Inc. | | 858 | | 16,551 |
| First Bancorp, Inc./ME | | 779 | | 11,381 |
| First BanCorp/Puerto Rico (I) | | 1,672 | | 7,758 |
| First Bancorp/Troy NC | | 1,141 | | 16,818 |
| First Busey Corp. | | 3,990 | | 20,229 |
| First Commonwealth Financial Corp. | | 7,591 | | 49,721 |
| First Community Bancshares, Inc. | | 1,220 | | 15,018 |
| First Financial Bancorp | | 4,182 | | 70,801 |
| First Financial Bankshares, Inc. (L) | | 1,475 | | 74,045 |
| First Financial Corp./Indiana | | 806 | | 26,122 |
| First Interstate Bancsystem, Inc. | | 930 | | 13,285 |
| First Merchants Corp. | | 1,988 | | 17,673 |
| First Midwest Bancorp, Inc. | | 5,389 | | 65,045 |
| First of Long Island Corp. | | 538 | | 14,526 |
| FirstMerit Corp. | | 7,716 | | 131,558 |
| FNB Corp. | | 8,264 | | 82,888 |
| German American Bancorp, Inc. (L) | | 859 | | 14,844 |
| Glacier Bancorp, Inc. (L) | | 5,205 | | 81,354 |
| Great Southern Bancorp, Inc. | | 769 | | 16,480 |
| Hancock Holding Company (L) | | 2,100 | | 72,807 |
| Hanmi Financial Corp. (I) | | 8,849 | | 11,061 |
| Heartland Financial USA, Inc. | | 977 | | 16,580 |
| Heritage Financial Corp. (I) | | 807 | | 12,073 |
| Home Bancorp, Inc. (I) | | 674 | | 9,786 |
| Home Bancshares, Inc. | | 1,546 | | 34,831 |
| Hudson Valley Holding Corp. | | 950 | | 20,254 |
| IBERIABANK Corp. | | 1,910 | | 109,424 |
| Independent Bank Corp. (L) | | 1,453 | | 39,507 |
| International Bancshares Corp. | | 3,842 | | 73,344 |
| |
| The accompanying notes are an integral part of the financial statements. | 200 |
John Hancock Funds II
Portfolio of Investments — February 28, 2011 (Unaudited) (showing percentage of total net assets)
| | | | |
| Small Cap Index Fund (continued) | | |
| | | Shares or | | |
| | | Principal | | |
| | | Amount | | Value |
| | |
|
| |
| COMMON STOCKS (continued) | | | | |
| Commercial Banks (continued) | | | | |
| Investors Bancorp, Inc. (I) | | 3,490 | $ | 47,255 |
| Lakeland Bancorp, Inc. | | 1,646 | | 15,851 |
| Lakeland Financial Corp. | | 1,178 | | 26,411 |
| MainSource Financial Group, Inc. | | 1,549 | | 15,397 |
| MB Financial, Inc. | | 3,866 | | 79,524 |
| Merchants Bancshares, Inc. | | 413 | | 10,532 |
| Metro Bancorp, Inc. (I) | | 1,155 | | 14,160 |
| Midsouth Bancorp, Inc. | | 659 | | 9,351 |
| Nara Bancorp, Inc. (I) | | 2,838 | | 29,742 |
| National Bankshares, Inc. | | 549 | | 15,921 |
| National Penn Bancshares, Inc. | | 9,161 | | 72,738 |
| NBT Bancorp, Inc. | | 2,395 | | 53,289 |
| Northfield Bancorp, Inc. (L) | | 1,402 | | 18,773 |
| Old National Bancorp | | 6,717 | | 75,230 |
| OmniAmerican Bancorp, Inc. (I) | | 1,007 | | 15,780 |
| Oriental Financial Group, Inc. | | 3,352 | | 40,123 |
| Orrstown Financial Services, Inc. | | 554 | | 15,235 |
| Pacific Continental Corp. | | 1,567 | | 15,780 |
| PacWest Bancorp (L) | | 2,215 | | 45,873 |
| Park National Corp. | | 857 | | 56,416 |
| Peapack Gladstone Financial Corp. | | 781 | | 10,426 |
| Penns Woods Bancorp, Inc. | | 343 | | 13,387 |
| Peoples Bancorp, Inc. | | 847 | | 11,443 |
| Pinnacle Financial Partners, Inc. (I)(L) | | 2,435 | | 38,838 |
| PrivateBancorp, Inc. | | 3,784 | | 54,187 |
| Prosperity Bancshares, Inc. (L) | | 3,340 | | 136,339 |
| Renasant Corp. (L) | | 1,818 | | 29,215 |
| Republic Bancorp, Inc., Class A | | 712 | | 12,204 |
| S&T Bancorp, Inc. | | 1,758 | | 39,203 |
| Sandy Spring Bancorp, Inc. | | 1,703 | | 32,510 |
| SCBT Financial Corp. | | 894 | | 28,957 |
| Sierra Bancorp | | 947 | | 10,265 |
| Signature Bank (I) | | 2,917 | | 151,363 |
| Simmons First National Corp., Class A | | 1,166 | | 33,557 |
| Southside Bancshares, Inc. | | 1,137 | | 25,935 |
| Southwest Bancorp, Inc. (I) | | 1,487 | | 21,160 |
| State Bancorp, Inc. | | 1,396 | | 14,686 |
| StellarOne Corp. | | 1,666 | | 24,540 |
| Sterling Bancorp | | 2,047 | | 20,552 |
| Sterling Bancshares, Inc. | | 6,682 | | 60,472 |
| Suffolk Bancorp | | 737 | | 15,175 |
| Susquehanna Bancshares, Inc. | | 9,366 | | 89,539 |
| SVB Financial Group (I)(L) | | 2,996 | | 162,323 |
| SY Bancorp, Inc. | | 823 | | 20,410 |
| Taylor Capital Group, Inc. (I) | | 785 | | 8,368 |
| Texas Capital Bancshares, Inc. (I) | | 2,597 | | 65,548 |
| Tompkins Financial Corp. | | 574 | | 23,534 |
| Tower Bancorp., Inc. | | 597 | | 13,689 |
| TowneBank (L) | | 1,673 | | 24,911 |
| TriCo Bancshares | | 1,036 | | 16,814 |
| Trustmark Corp. (L) | | 4,553 | | 106,768 |
| UMB Financial Corp. | | 2,250 | | 89,730 |
| Umpqua Holdings Corp. | | 8,280 | | 94,723 |
| Union First Market Bankshares Corp. | | 1,345 | | 15,481 |
| United Bankshares, Inc. (L) | | 2,792 | | 79,963 |
| United Community Banks, Inc. (I) | | 7,453 | | 10,211 |
| Univest Corp. of Pennsylvania | | 1,237 | | 22,315 |
| Virginia Commerce Bancorp, Inc. (I) | | 1,786 | | 10,537 |
| Washington Banking Company | | 1,270 | | 17,907 |
| Washington Trust Bancorp, Inc. | | 1,049 | | 24,106 |
| Webster Financial Corp. | | 4,710 | | 109,178 |
| WesBanco, Inc. | | 1,664 | | 34,678 |
| West Bancorp, Inc. | | 1,358 | | 10,334 |
| West Coast Bancorp (I) | | 7,117 | | 23,984 |
| Westamerica Bancorp. (L) | | 2,052 | | 105,842 |
| | | | |
| Small Cap Index Fund (continued) | | |
| | | Shares or | | |
| | | Principal | | |
| | | Amount | | Value |
| | |
|
| |
| COMMON STOCKS (continued) | | | | |
| Commercial Banks (continued) | | | | |
| Western Alliance Bancorp (I) | | 4,759 | $ | 38,595 |
| Whitney Holding Corp. | | 7,000 | | 99,260 |
| Wilshire Bancorp, Inc. | | 1,584 | | 10,470 |
| Wintrust Financial Corp. | | 2,470 | | 82,943 |
| | |
|
| | | | | 4,923,249 |
| Consumer Finance - 0.56% | | | | |
| Advance America Cash Advance Centers, Inc. | | 4,167 | | 22,418 |
| Cash America International, Inc. | | 2,138 | | 91,314 |
| Credit Acceptance Corp. (I) | | 392 | | 27,675 |
| Dollar Financial Corp. (I) | | 2,670 | | 57,111 |
| EZCORP, Inc., Class A (I) | | 3,354 | | 96,193 |
| First Cash Financial Services, Inc. (I) | | 2,207 | | 72,257 |
| Nelnet, Inc., Class A | | 1,936 | | 43,231 |
| Netspend Holdings, Inc. (I) | | 2,261 | | 29,642 |
| The First Marblehead Corp. (I)(L) | | 4,667 | | 10,874 |
| World Acceptance Corp. (I) | | 1,187 | | 70,994 |
| | |
|
| | | | | 521,709 |
| Diversified Financial Services - 0.42% | | | | |
| Compass Diversified Holdings | | 2,598 | | 42,114 |
| Encore Capital Group, Inc. (I) | | 1,029 | | 28,020 |
| Life Partners Holdings, Inc. (L) | | 718 | | 5,931 |
| MarketAxess Holdings, Inc. | | 1,984 | | 42,438 |
| NewStar Financial, Inc. (I) | | 2,120 | | 22,451 |
| PHH Corp. (I) | | 4,004 | | 98,819 |
| PICO Holdings, Inc. (I) | | 1,652 | | 49,081 |
| Portfolio Recovery Associates, Inc. (I) | | 1,237 | | 103,104 |
| | |
|
| | | | | 391,958 |
| Insurance - 2.42% | | | | |
| Alterra Capital Holdings, Ltd. | | 6,817 | | 147,452 |
| American Equity Investment Life | | | | |
| Holding Company | | 4,256 | | 56,179 |
| American Safety Insurance Holdings, Ltd. (I) | | 836 | | 17,849 |
| AMERISAFE, Inc. (I) | | 1,408 | | 28,104 |
| Amtrust Financial Services, Inc. | | 1,649 | | 31,710 |
| Argo Group International Holdings, Ltd. | | 2,210 | | 84,179 |
| Baldwin & Lyons, Inc., Class B | | 621 | | 15,146 |
| Citizens, Inc., Class A (I)(L) | | 2,841 | | 21,194 |
| CNA Surety Corp. (I) | | 1,294 | | 32,712 |
| CNO Financial Group, Inc. (I) | | 16,052 | | 116,216 |
| Delphi Financial Group, Inc., Class A | | 3,416 | | 105,759 |
| Donegal Group, Inc. | | 915 | | 11,675 |
| eHealth, Inc. (I) | | 1,761 | | 22,083 |
| EMC Insurance Group, Inc. | | 406 | | 9,910 |
| Employers Holdings, Inc. | | 3,054 | | 61,446 |
| Enstar Group, Ltd. (I) | | 482 | | 40,421 |
| FBL Financial Group, Inc., Class A | | 994 | | 31,053 |
| First American Financial Corp. | | 7,430 | | 117,097 |
| Flagstone Reinsurance Holdings SA | | 3,632 | | 41,405 |
| FPIC Insurance Group, Inc. (I) | | 705 | | 26,550 |
| Global Indemnity PLC (I) | | 1,032 | | 23,014 |
| Greenlight Capital Re, Ltd., Class A (I) | | 2,028 | | 58,690 |
| Hallmark Financial Services, Inc. (I) | | 1,048 | | 9,432 |
| Harleysville Group, Inc. | | 825 | | 30,154 |
| Hilltop Holdings, Inc. (I) | | 2,958 | | 28,633 |
| Horace Mann Educators Corp. | | 2,775 | | 47,036 |
| Infinity Property & Casualty Corp. | | 941 | | 57,128 |
| Kansas City Life Insurance Company | | 347 | | 11,847 |
| Maiden Holdings, Ltd. | | 3,605 | | 28,804 |
| Meadowbrook Insurance Group, Inc. | | 3,950 | | 40,132 |
| Montpelier Re Holdings, Ltd. | | 4,903 | | 98,894 |
| National Financial Partners Corp. (I) | | 3,079 | | 43,537 |
| National Interstate Corp. | | 508 | | 10,587 |
| |
| The accompanying notes are an integral part of the financial statements. | 201 |
John Hancock Funds II
Portfolio of Investments — February 28, 2011 (Unaudited) (showing percentage of total net assets)
| | | | |
| Small Cap Index Fund (continued) | | |
| | | Shares or | | |
| | | Principal | | |
| | | Amount | | Value |
| | |
|
| |
| COMMON STOCKS (continued) | | | | |
| Insurance (continued) | | | | |
| National Western Life Insurance | | | | |
| Company, Class A | | 161 | $ | 28,156 |
| Platinum Underwriters Holdings, Ltd. | | 2,858 | | 119,179 |
| Presidential Life Corp. | | 1,724 | | 17,274 |
| Primerica, Inc. | | 1,673 | | 43,096 |
| ProAssurance Corp. (I) | | 2,253 | | 142,682 |
| RLI Corp. | | 1,265 | | 72,624 |
| Safety Insurance Group, Inc. | | 893 | | 42,971 |
| SeaBright Holdings, Inc. | | 1,737 | | 18,291 |
| Selective Insurance Group, Inc. | | 3,790 | | 68,902 |
| State Auto Financial Corp. | | 1,098 | | 18,973 |
| Stewart Information Services Corp. | | 1,358 | | 15,142 |
| The Navigators Group, Inc. (I) | | 871 | | 45,693 |
| The Phoenix Companies, Inc. (I) | | 8,691 | | 23,118 |
| Tower Group, Inc. | | 2,874 | | 78,115 |
| United Fire & Casualty Company | | 1,669 | | 34,532 |
| | |
|
| | | | | 2,274,776 |
| Real Estate Investment Trusts - 7.01% | | | | |
| Acadia Realty Trust | | 2,950 | | 58,410 |
| Agree Realty Corp. | | 700 | | 17,871 |
| Alexander’s, Inc. | | 144 | | 56,985 |
| American Campus Communities, Inc. | | 4,690 | | 156,740 |
| American Capital Agency Corp. | | 3,555 | | 104,695 |
| Anworth Mortgage Asset Corp. | | 8,355 | | 59,655 |
| Apollo Commercial Real Estate Finance, Inc. | | 1,337 | | 22,756 |
| Ashford Hospitality Trust, Inc. (I) | | 2,972 | | 30,641 |
| Associated Estates Realty Corp. | | 2,987 | | 48,539 |
| BioMed Realty Trust, Inc. | | 9,403 | | 170,664 |
| Campus Crest Communities, Inc. | | 2,232 | | 31,962 |
| CapLease, Inc. | | 4,238 | | 22,758 |
| Capstead Mortage Corp. | | 5,021 | | 65,976 |
| CBL & Associates Properties, Inc. | | 10,000 | | 178,500 |
| Cedar Shopping Centers, Inc. | | 4,182 | | 25,343 |
| Chatham Lodging Trust | | 722 | | 12,613 |
| Chesapeake Lodging Trust | | 1,141 | | 21,223 |
| Cogdell Spencer, Inc. | | 3,408 | | 21,845 |
| Colonial Properties Trust | | 5,620 | | 110,770 |
| Colony Financial, Inc. | | 1,113 | | 23,651 |
| Coresite Realty Corp. | | 1,462 | | 22,719 |
| Cousins Properties, Inc. | | 6,739 | | 57,147 |
| CreXus Investment Corp. | | 1,160 | | 15,312 |
| Cypress Sharpridge Investments, Inc. | | 3,250 | | 40,495 |
| DCT Industrial Trust, Inc. (L) | | 15,274 | | 85,840 |
| DiamondRock Hospitality Company (I) | | 11,155 | | 131,183 |
| DuPont Fabros Technology, Inc. | | 2,971 | | 72,552 |
| Dynex Capital, Inc. | | 1,651 | | 17,451 |
| EastGroup Properties, Inc. | | 1,943 | | 88,465 |
| Education Realty Trust, Inc. | | 4,267 | | 35,203 |
| Entertainment Properties Trust | | 3,334 | | 158,932 |
| Equity Lifestyle Properties, Inc. | | 1,863 | | 108,129 |
| Equity One, Inc. (L) | | 2,844 | | 54,434 |
| Excel Trust, Inc. | | 1,300 | | 15,873 |
| Extra Space Storage, Inc. | | 6,298 | | 124,386 |
| FelCor Lodging Trust, Inc. (I) | | 7,110 | | 53,823 |
| First Industrial Realty Trust, Inc. (I) | | 4,600 | | 51,566 |
| First Potomac Realty Trust | | 3,540 | | 57,100 |
| Franklin Street Properties Corp. | | 5,044 | | 75,811 |
| Getty Realty Corp. | | 1,544 | | 45,424 |
| Gladstone Commercial Corp. | | 871 | | 15,992 |
| Glimcher Realty Trust | | 6,211 | | 57,141 |
| Government Properties Income Trust | | 1,939 | | 52,683 |
| Hatteras Financial Corp. | | 3,151 | | 93,207 |
| Healthcare Realty Trust, Inc. | | 4,462 | | 103,965 |
| Hersha Hospitality Trust | | 9,858 | | 64,767 |
| | | | |
| Small Cap Index Fund (continued) | | |
| | | Shares or | | |
| | | Principal | | |
| | | Amount | | Value |
| | |
|
| |
| COMMON STOCKS (continued) | | | | |
| Real Estate Investment Trusts (continued) | | | | |
| Highwoods Properties, Inc. | | 5,096 | $ | 172,907 |
| Home Properties, Inc. | | 2,651 | | 156,197 |
| Hudson Pacific Properties, Inc. | | 1,131 | | 17,022 |
| Inland Real Estate Corp. | | 5,569 | | 52,460 |
| Invesco Mortgage Capital, Inc. | | 2,757 | | 64,348 |
| Investors Real Estate Trust | | 5,449 | | 50,785 |
| iStar Financial, Inc. (I)(L) | | 6,790 | | 67,832 |
| Kilroy Realty Corp. | | 3,893 | | 150,854 |
| Kite Realty Group Trust | | 4,237 | | 23,897 |
| LaSalle Hotel Properties | | 5,038 | | 142,122 |
| Lexington Realty Trust | | 7,098 | | 67,218 |
| LTC Properties, Inc. | | 1,775 | | 51,866 |
| Medical Properties Trust, Inc. | | 8,110 | | 95,130 |
| MFA Financial, Inc. | | 19,750 | | 167,283 |
| Mid-America Apartment Communities, Inc. | | 2,315 | | 150,406 |
| Mission West Properties, Inc. | | 1,916 | | 13,125 |
| Monmouth Real Estate Investment Corp. | | 2,180 | | 18,007 |
| MPG Office Trust, Inc. (I) | | 4,092 | | 16,163 |
| National Health Investments, Inc. | | 1,753 | | 83,303 |
| National Retail Properties, Inc. (L) | | 5,897 | | 151,494 |
| Newcastle Investment Corp. (I) | | 4,629 | | 39,069 |
| NorthStar Realty Finance Corp. | | 5,564 | | 33,328 |
| Omega Healthcare Investors, Inc. | | 7,022 | | 168,317 |
| One Liberty Properties, Inc. | | 749 | | 11,145 |
| Parkway Properties, Inc. | | 1,640 | | 26,584 |
| Pebblebrook Hotel Trust | | 2,637 | | 57,856 |
| Pennsylvania Real Estate Investment Trust | | 4,017 | | 58,005 |
| Pennymac Mortgage Investment Trust | | 1,243 | | 23,431 |
| Post Properties, Inc. | | 3,476 | | 135,564 |
| Potlatch Corp. | | 2,852 | | 109,517 |
| PS Business Parks, Inc. | | 1,347 | | 84,915 |
| RAIT Financial Trust | | 7,366 | | 25,192 |
| Ramco-Gershenson Properties Trust | | 2,806 | | 37,909 |
| Redwood Trust, Inc. (L) | | 5,645 | | 92,465 |
| Resource Capital Corp. | | 3,620 | | 26,824 |
| Retail Opportunity Investments Corp. | | 2,995 | | 32,945 |
| Sabra Healthcare, Inc. | | 1,784 | | 32,861 |
| Saul Centers, Inc. | | 494 | | 22,724 |
| Sovran Self Storage, Inc. | | 2,011 | | 78,027 |
| Starwood Property Trust, Inc. | | 3,326 | | 77,795 |
| Strategic Hotels & Resorts, Inc. (I) | | 10,265 | | 66,723 |
| Sun Communities, Inc. | | 1,394 | | 48,205 |
| Sunstone Hotel Investors, Inc. (I) | | 8,580 | | 92,149 |
| Tanger Factory Outlet Centers, Inc. | | 5,704 | | 152,012 |
| Terreno Realty Corp. (I) | | 807 | | 14,792 |
| Two Harbors Investment Corp. | | 2,012 | | 22,233 |
| U-Store-It Trust | | 6,843 | | 70,141 |
| UMH Properties, Inc. | | 1,031 | | 10,681 |
| Universal Health Realty Income Trust | | 824 | | 32,770 |
| Urstadt Biddle Properties, Inc., Class A | | 1,632 | | 31,644 |
| Walter Investment Management Corp. | | 1,883 | | 36,888 |
| Washington Real Estate Investment Trust | | 4,579 | | 143,048 |
| Winthrop Realty Trust | | 1,733 | | 21,143 |
| | |
|
| | | | | 6,570,518 |
| Real Estate Management & Development - 0.14% | | | | |
| Avatar Holdings, Inc. (I) | | 713 | | 15,187 |
| Consolidated-Tomoka Land Company | | 485 | | 16,626 |
| Forestar Group, Inc. (I) | | 2,676 | | 51,540 |
| Kennedy-Wilson Holdings, Inc. (I) | | 1,546 | | 17,006 |
| Tejon Ranch Company (I) | | 948 | | 24,942 |
| Thomas Properties Group, Inc. (I) | | 2,869 | | 9,669 |
| | |
|
| | | | | 134,970 |
| |
| The accompanying notes are an integral part of the financial statements. | 202 |
John Hancock Funds II
Portfolio of Investments — February 28, 2011 (Unaudited) (showing percentage of total net assets)
| | | | |
| Small Cap Index Fund (continued) | | |
| | | Shares or | | |
| | | Principal | | |
| | | Amount | | Value |
| | |
|
| |
| COMMON STOCKS (continued) | | | | |
| Thrifts & Mortgage Finance - 1.26% | | | | |
| Abington Bancorp, Inc. | | 1,617 | $ | 20,213 |
| Astoria Financial Corp. | | 6,208 | | 87,036 |
| Bank Mutual Corp. | | 3,571 | | 16,498 |
| BankFinancial Corp. | | 1,555 | | 13,606 |
| Beneficial Mutual Bancorp, Inc. (I) | | 2,674 | | 24,066 |
| Berkshire Hill Bancorp, Inc. | | 1,051 | | 23,711 |
| Brookline Bancorp, Inc. | | 4,411 | | 45,830 |
| Dime Community Bancshares | | 2,061 | | 31,987 |
| ESB Financial Corp. | | 841 | | 11,656 |
| ESSA Bancorp, Inc. | | 1,216 | | 15,808 |
| Federal Agricultural Mortgage Corp., Class C | | 775 | | 15,446 |
| First Financial Holdings, Inc. | | 1,329 | | 14,167 |
| Flushing Financial Corp. | | 2,421 | | 34,669 |
| Home Federal Bancorp, Inc. | | 1,372 | | 15,257 |
| Kearny Financial Corp. | | 1,317 | | 12,933 |
| Meridian Interstate Bancorp, Inc. (I) | | 844 | | 10,972 |
| MGIC Investment Corp. (I) | | 14,549 | | 124,976 |
| NewAlliance Bancshares, Inc. | | 7,566 | | 118,332 |
| Northwest Bancshares, Inc. | | 7,964 | | 96,683 |
| OceanFirst Financial Corp. | | 1,180 | | 16,355 |
| Ocwen Financial Corp. (I) | | 5,433 | | 57,481 |
| Oritani Financial Corp. | | 4,139 | | 53,269 |
| Provident Financial Services, Inc. | | 4,318 | | 63,950 |
| Provident New York Bancorp | | 2,740 | | 25,975 |
| Radian Group, Inc. (L) | | 9,681 | | 68,348 |
| Territorial Bancorp, Inc. | | 971 | | 19,216 |
| The PMI Group, Inc. (I) | | 10,515 | | 31,124 |
| TrustCo Bank Corp. | | 5,586 | | 33,684 |
| United Financial Bancorp, Inc. | | 1,368 | | 21,354 |
| Viewpoint Financial Group | | 1,208 | | 16,042 |
| Westfield Financial, Inc. | | 2,585 | | 23,472 |
| WSFS Financial Corp. | | 468 | | 21,912 |
| | |
|
| | | | | 1,186,028 |
| | |
|
| | | | | 18,109,440 |
| Health Care - 11.55% | | | | |
| Biotechnology - 2.99% | | | | |
| Acorda Therapeutics, Inc. (I) | | 2,802 | | 58,758 |
| Affymax, Inc. (I) | | 1,725 | | 11,006 |
| Alkermes, Inc. (I) | | 6,853 | | 98,203 |
| Allos Therapeutics, Inc. (I)(L) | | 5,812 | | 19,412 |
| Alnylam Pharmaceuticals, Inc. (I)(L) | | 2,719 | | 29,855 |
| AMAG Pharmaceuticals, Inc. (I) | | 1,573 | | 28,959 |
| Ardea Biosciences, Inc. (I)(L) | | 1,008 | | 26,722 |
| Arena Pharmaceuticals, Inc. (I) | | 9,161 | | 14,841 |
| ARIAD Pharmaceuticals, Inc. (I) | | 9,229 | | 55,466 |
| Arqule, Inc. (I) | | 3,136 | | 19,976 |
| Array BioPharma, Inc. (I) | | 4,331 | | 12,127 |
| Aveo Pharmaceuticals, Inc. (I) | | 831 | | 11,451 |
| AVI BioPharma, Inc. (I) | | 8,291 | | 16,582 |
| BioCryst Pharmaceuticals, Inc. (I)(L) | | 2,310 | | 10,025 |
| BioMimetic Therapeutics, Inc. (I) | | 1,430 | | 19,276 |
| Biosante Pharmaceuticals, Inc. (I)(L) | | 5,991 | | 12,881 |
| BioSpecifics Technologies Corp. (I) | | 328 | | 8,817 |
| BioTime, Inc. (I) | | 1,886 | | 12,995 |
| Celera Corp. (I) | | 5,989 | | 38,090 |
| Celldex Therapeutics, Inc. (I)(L) | | 2,579 | | 10,135 |
| Cepheid, Inc. (I)(L) | | 4,305 | | 114,126 |
| Chelsea Therapeutics International, Inc. (I) | | 2,863 | | 11,824 |
| Clinical Data, Inc. (I) | | 891 | | 27,060 |
| Codexis, Inc. (I) | | 997 | | 10,628 |
| Cubist Pharmaceuticals, Inc. (I) | | 4,159 | | 91,207 |
| Curis, Inc. (I) | | 6,064 | | 18,859 |
| Cytori Therapeutics, Inc. (I)(L) | | 3,499 | | 20,364 |
| | | | |
| Small Cap Index Fund (continued) | | |
| | | Shares or | | |
| | | Principal | | |
| | | Amount | | Value |
| | |
|
| |
| COMMON STOCKS (continued) | | | | |
| Biotechnology (continued) | | | | |
| Dyax Corp. (I) | | 7,748 | $ | 13,327 |
| Dynavax Technologies Corp. (I)(L) | | 7,114 | | 21,271 |
| Emergent Biosolutions, Inc. (I) | | 1,437 | | 30,234 |
| Enzon Pharmaceuticals, Inc. (I) | | 3,513 | | 37,519 |
| Exact Sciences Corp. (I) | | 3,407 | | 18,500 |
| Exelixis, Inc. (I) | | 7,947 | | 98,940 |
| Genomic Health, Inc. (I) | | 1,054 | | 26,603 |
| Geron Corp. (I) | | 8,955 | | 44,327 |
| Halozyme Therapeutics, Inc. (I) | | 5,745 | | 39,698 |
| Idenix Pharmaceuticals, Inc. (I) | | 2,658 | | 8,984 |
| Immunogen, Inc. (I)(L) | | 4,924 | | 44,365 |
| Immunomedics, Inc. (I) | | 4,974 | | 18,205 |
| Incyte Corp. (I)(L) | | 6,354 | | 86,923 |
| Inhibitex, Inc. (I) | | 3,855 | | 9,059 |
| Inovio Biomedical Corp. (I) | | 6,489 | | 7,657 |
| InterMune, Inc. (I) | | 3,296 | | 120,667 |
| Ironwood Pharmaceuticals, Inc. (I) | | 1,610 | | 19,690 |
| Isis Pharmaceuticals, Inc. (I)(L) | | 6,831 | | 62,299 |
| Keryx Biopharmaceuticals Inc. (I) | | 3,815 | | 15,069 |
| Lexicon Pharmaceuticals, Inc. (I) | | 14,654 | | 28,429 |
| Ligand Pharmaceuticals, Inc., Class B (I) | | 1,571 | | 17,030 |
| Mannkind Corp. (I)(L) | | 4,893 | | 18,300 |
| Maxygen, Inc. | | 2,508 | | 10,458 |
| Medivation, Inc. (I) | | 2,514 | | 43,442 |
| Metabolix, Inc. (I) | | 2,038 | | 18,505 |
| Micromet, Inc. (I) | | 6,617 | | 41,224 |
| Momenta Pharmaceuticals, Inc. (I) | | 3,208 | | 44,527 |
| Nabi Biopharmaceuticals (I) | | 3,342 | | 18,916 |
| Neuralstem, Inc. (I) | | 3,863 | | 7,919 |
| Neurocrine Biosciences, Inc. (I) | | 3,564 | | 24,057 |
| Novavax, Inc. (I) | | 6,956 | | 18,086 |
| NPS Pharmaceuticals, Inc. (I) | | 4,932 | | 38,124 |
| Nymox Pharmaceutical Corp. (I)(L) | | 1,444 | | 9,372 |
| Omeros Corp. (I) | | 1,532 | | 9,943 |
| Onyx Pharmaceuticals, Inc. (I) | | 4,522 | | 159,355 |
| Opko Health, Inc. (I)(L) | | 6,578 | | 31,772 |
| Orexigen Therapeutics, Inc. (I)(L) | | 2,398 | | 7,817 |
| Osiris Therapeutics, Inc. (I) | | 1,318 | | 8,738 |
| PDL BioPharma, Inc. | | 10,068 | | 55,877 |
| Peregrine Pharmaceuticals, Inc. (I) | | 5,033 | | 11,224 |
| Pharmacyclics, Inc. (I)(L) | | 3,226 | | 16,646 |
| Pharmasset, Inc. (I) | | 2,141 | | 107,050 |
| Progenics Pharmaceuticals, Inc. (I)(L) | | 2,295 | | 12,967 |
| Rigel Pharmaceuticals, Inc. (I) | | 3,914 | | 27,359 |
| Sangamo Biosciences, Inc. (I)(L) | | 3,481 | | 28,788 |
| Savient Pharmaceuticals, Inc. (I) | | 4,907 | | 47,303 |
| SciClone Pharmaceuticals, Inc. (I) | | 2,903 | | 12,889 |
| Seattle Genetics, Inc. (I) | | 6,052 | | 89,872 |
| SIGA Technologies, Inc. (I) | | 2,552 | | 34,197 |
| Spectrum Pharmaceuticals, Inc. (I) | | 3,753 | | 25,483 |
| StemCells, Inc. (I) | | 10,380 | | 9,654 |
| SuperGen, Inc. (I) | | 4,416 | | 13,116 |
| Synta Pharmaceuticals Corp. (I) | | 1,759 | | 9,833 |
| Targacept, Inc. (I) | | 1,739 | | 49,857 |
| Theravance, Inc. (I)(L) | | 4,534 | | 103,285 |
| Vanda Pharmaceuticals, Inc. (I) | | 2,113 | | 15,552 |
| Vical, Inc. (I) | | 5,681 | | 11,987 |
| Zalicus Inc. (I) | | 5,580 | | 12,109 |
| Ziopharm Oncology, Inc. (I) | | 3,715 | | 22,624 |
| | |
|
| | | | | 2,806,668 |
| Health Care Equipment & Supplies - 3.04% | | | | |
| Abaxis, Inc. (I)(L) | | 1,595 | | 42,299 |
| ABIOMED, Inc. (I) | | 2,324 | | 28,980 |
| Accuray, Inc. (I) | | 3,776 | | 37,382 |
| |
| The accompanying notes are an integral part of the financial statements. | 203 |
John Hancock Funds II
Portfolio of Investments — February 28, 2011 (Unaudited) (showing percentage of total net assets)
| | | | |
| Small Cap Index Fund (continued) | | |
| | | Shares or | | |
| | | Principal | | |
| | | Amount | | Value |
| | |
|
| |
| COMMON STOCKS (continued) | | | | |
| Health Care Equipment & Supplies (continued) | | | | |
| Align Technology, Inc. (I) | | 4,295 | $ | 89,551 |
| Alphatec Holdings, Inc. (I)(L) | | 4,045 | | 10,760 |
| American Medical | | | | |
| Systems Holdings, Inc. (I)(L) | | 5,425 | | 118,862 |
| Analogic Corp. | | 883 | | 47,859 |
| AngioDynamics, Inc. (I) | | 1,802 | | 30,310 |
| Antares Pharma, Inc. (I) | | 6,121 | | 9,549 |
| ArthroCare Corp. (I) | | 1,955 | | 67,428 |
| Atrion Corp. | | 110 | | 19,397 |
| Cantel Medical Corp. | | 929 | | 20,299 |
| Cerus Corpcerus Corp. (I)(L) | | 3,754 | | 12,914 |
| Conceptus, Inc. (I) | | 2,283 | | 32,099 |
| CONMED Corp. (I) | | 2,084 | | 55,184 |
| CryoLife, Inc. (I) | | 2,285 | | 12,339 |
| Cutera, Inc. (I) | | 1,125 | | 10,868 |
| Cyberonics, Inc. (I) | | 2,005 | | 66,225 |
| Delcath Systems, Inc. (I)(L) | | 3,203 | | 20,980 |
| DexCom, Inc. (I) | | 4,479 | | 65,528 |
| Endologix, Inc. (I) | | 3,680 | | 21,859 |
| Exactech, Inc. (I) | | 697 | | 13,208 |
| Greatbatch, Inc. (I) | | 1,641 | | 40,828 |
| Haemonetics Corp. (I) | | 1,764 | | 108,751 |
| HeartWare International, Inc. (I) | | 656 | | 55,156 |
| ICU Medical, Inc. (I) | | 851 | | 35,733 |
| Immucor, Inc. (I) | | 5,048 | | 98,285 |
| Insulet Corp. (I)(L) | | 3,180 | | 56,286 |
| Integra LifeSciences Holdings Corp. (I) | | 1,505 | | 75,476 |
| Invacare Corp. (L) | | 2,073 | | 61,299 |
| IRIS International, Inc. (I) | | 1,343 | | 13,631 |
| Kensey Nash Corp. (I) | | 559 | | 14,679 |
| MAKO Surgical Corp. (I) | | 2,231 | | 45,959 |
| Masimo Corp. (L) | | 3,740 | | 112,724 |
| Medical Action Industries, Inc. (I) | | 1,187 | | 9,805 |
| Meridian Bioscience, Inc. (L) | | 2,931 | | 63,222 |
| Merit Medical Systems, Inc. (I) | | 2,042 | | 34,877 |
| Natus Medical, Inc. (I) | | 2,091 | | 33,163 |
| Neogen Corp. (I) | | 1,647 | | 61,581 |
| NuVasive, Inc. (I)(L) | | 2,844 | | 76,020 |
| NxStage Medical, Inc. (I) | | 1,981 | | 40,868 |
| OraSure Technologies, Inc. (I) | | 3,484 | | 24,144 |
| Orthofix International NV (I) | | 1,273 | | 40,227 |
| Orthovita, Inc. (I) | | 5,398 | | 12,847 |
| Palomar Medical Technologies, Inc. (I) | | 1,417 | | 22,644 |
| Quidel Corp. (I)(L) | | 1,565 | | 20,595 |
| Rochester Medical Corp. (I) | | 921 | | 9,735 |
| RTI Biologics, Inc. (I) | | 4,467 | | 12,016 |
| Sirona Dental Systems, Inc. (I) | | 2,405 | | 121,356 |
| Solta Medical, Inc. (I) | | 4,701 | | 14,714 |
| SonoSite, Inc. (I) | | 1,033 | | 37,136 |
| Spectranetics Corp. (I) | | 2,659 | | 12,816 |
| St. Jude Medical, Inc. (I) | | 244 | | 11,683 |
| STAAR Surgical Company (I) | | 2,728 | | 16,368 |
| Stereotaxis, Inc. (I) | | 2,590 | | 10,231 |
| STERIS Corp. | | 4,216 | | 142,712 |
| SurModics, Inc. (I) | | 1,368 | | 17,839 |
| Symmetry Medical, Inc. (I) | | 2,633 | | 23,802 |
| Syneron Medical, Ltd., ADR (I) | | 2,644 | | 38,867 |
| Synovis Life Technologies, Inc. (I) | | 909 | | 17,944 |
| TomoTherapy, Inc. (I) | | 3,864 | | 13,756 |
| Unilife Corp. (I) | | 3,657 | | 17,261 |
| Vascular Solutions, Inc. (I) | | 1,328 | | 14,595 |
| Volcano Corp. (I) | | 3,633 | | 95,330 |
| West Pharmaceutical Services, Inc. | | 2,371 | | 97,472 |
| Wright Medical Group, Inc. (I) | | 2,849 | | 45,100 |
| Young Innovations, Inc. | | 447 | | 14,156 |
| | | | |
| Small Cap Index Fund (continued) | | |
| | | Shares or | | |
| | | Principal | | |
| | | Amount | | Value |
| | |
|
| |
| COMMON STOCKS (continued) | | | | |
| Health Care Equipment & Supplies (continued) | | | | |
| Zoll Medical Corp. (I) | | 1,539 | $ | 71,225 |
| | |
|
| | | | | 2,848,794 |
| Health Care Providers & Services - 3.17% | | | | |
| Accretive Health, Inc. (I) | | 903 | | 18,358 |
| Air Methods Corp. (I) | | 784 | | 45,503 |
| Alliance HealthCare Services, Inc. (I) | | 2,292 | | 9,489 |
| Allied Healthcare International, Inc. (I) | | 3,662 | | 8,972 |
| Almost Family, Inc. (I) | | 588 | | 22,932 |
| Amedisys, Inc. (I)(L) | | 2,070 | | 74,354 |
| America Service Group, Inc. | | 727 | | 13,290 |
| American Dental Partners, Inc. (I) | | 1,239 | | 15,921 |
| AMERIGROUP Corp. (I) | | 3,692 | | 211,736 |
| AMN Healthcare Services, Inc. (I) | | 2,998 | | 22,395 |
| AmSurg Corp. (I) | | 2,240 | | 52,931 |
| Assisted Living Concepts, Inc. (I) | | 704 | | 25,309 |
| Bio-Reference Labs, Inc. (I) | | 1,689 | | 35,334 |
| BioScrip, Inc. (I) | | 2,960 | | 12,491 |
| Capital Senior Living Corp. (I) | | 2,136 | | 17,921 |
| CardioNet, Inc. (I) | | 2,024 | | 9,756 |
| Catalyst Health Solutions, Inc. (I) | | 2,730 | | 123,423 |
| Centene Corp. (I) | | 3,532 | | 107,620 |
| Chemed Corp. | | 1,607 | | 105,162 |
| Chindex International, Inc. (I) | | 1,052 | | 18,778 |
| Continucare Corp. (I) | | 2,307 | | 13,058 |
| Corvel Corp. (I) | | 505 | | 24,998 |
| Cross Country Healthcare, Inc. (I) | | 2,394 | | 19,918 |
| Emeritus Corp. (I) | | 1,656 | | 38,966 |
| Examworks Group, Inc. (I) | | 854 | | 17,994 |
| Five Star Quality Care, Inc. (I) | | 2,342 | | 16,441 |
| Genoptix, Inc. (I) | | 1,290 | | 32,237 |
| Gentiva Health Services, Inc. (I) | | 2,154 | | 60,807 |
| Hanger Orthopedic Group, Inc. (I) | | 1,837 | | 49,415 |
| Healthsouth Corp. (I)(L) | | 6,717 | | 162,619 |
| Healthspring, Inc. (I) | | 4,175 | | 157,147 |
| Healthways, Inc. (I) | | 2,512 | | 35,093 |
| HMS Holdings Corp. (I) | | 1,942 | | 146,738 |
| IPC The Hospitalist Company, Inc. (I) | | 1,166 | | 47,573 |
| Kindred Healthcare, Inc. (I) | | 2,790 | | 69,527 |
| Landauer, Inc. | | 673 | | 42,332 |
| LCA-Vision, Inc. (I) | | 1,488 | | 10,520 |
| LHC Group, Inc. (I) | | 1,127 | | 33,652 |
| Magellan Health Services, Inc. (I) | | 2,379 | | 114,144 |
| MedCath Corp. (I) | | 1,543 | | 21,941 |
| Metropolitan Health Networks, Inc. (I) | | 3,078 | | 15,298 |
| Molina Healthcare, Inc. (I) | | 1,100 | | 38,533 |
| MWI Veterinary Supply, Inc. (I) | | 899 | | 62,229 |
| National Healthcare Corp. | | 642 | | 30,559 |
| Owens & Minor, Inc. | | 4,473 | | 139,558 |
| PharMerica Corp. (I) | | 2,270 | | 26,673 |
| PSS World Medical, Inc. (I)(L) | | 4,101 | | 106,708 |
| RehabCare Group, Inc. (I) | | 1,807 | | 67,130 |
| Rural/Metro Corp. (I) | | 1,437 | | 21,541 |
| Select Medical Holdings Corp. (I) | | 3,673 | | 28,649 |
| Skilled Healthcare Group, Inc. (I) | | 1,472 | | 20,181 |
| Sun Healthcare Group, Inc. (I) | | 1,819 | | 26,739 |
| Sunrise Senior Living, Inc. (I) | | 4,120 | | 46,927 |
| Team Health Holdings, Inc. (I)(L) | | 1,159 | | 21,430 |
| The Ensign Group, Inc. | | 1,013 | | 30,805 |
| The Providence Service Corp. (I) | | 1,002 | | 16,443 |
| Triple-S Management Corp., Class B (I) | | 1,435 | | 28,356 |
| Universal American Financial Corp. | | 2,316 | | 47,663 |
| US Physical Therapy, Inc. (I) | | 766 | | 15,144 |
| WellCare Health Plans, Inc. (I) | | 3,055 | | 114,715 |
| | |
|
| | | | | 2,972,076 |
| |
| The accompanying notes are an integral part of the financial statements. | 204 |
John Hancock Funds II
Portfolio of Investments — February 28, 2011 (Unaudited) (showing percentage of total net assets)
| | | | |
| Small Cap Index Fund (continued) | | |
| | | Shares or | | |
| | | Principal | | |
| | | Amount | | Value |
| | |
|
| |
| COMMON STOCKS (continued) | | | | |
| Health Care Technology - 0.45% | | | | |
| athenahealth, Inc. (I) | | 2,404 | $ | 108,997 |
| Computer Programs & Systems, Inc. | | 714 | | 38,563 |
| MedAssets, Inc. (I) | | 3,132 | | 44,380 |
| Medidata Solutions, Inc. (I) | | 1,361 | | 35,264 |
| Merge Healthcare, Inc. (I) | | 3,991 | | 19,995 |
| Omnicell, Inc. (I) | | 2,421 | | 32,538 |
| Quality Systems, Inc. | | 1,360 | | 108,664 |
| Transcend Services, Inc. (I) | | 714 | | 15,201 |
| Vital Images, Inc. (I) | | 1,183 | | 17,733 |
| | |
|
| | | | | 421,335 |
| Life Sciences Tools & Services - 0.64% | | | | |
| Affymetrix, Inc. (I) | | 5,217 | | 25,615 |
| Albany Molecular Research, Inc. (I) | | 1,902 | | 8,597 |
| Bruker Corp. (I) | | 5,229 | | 100,345 |
| Caliper Life Sciences, Inc. (I) | | 3,327 | | 22,258 |
| Cambrex Corp. (I) | | 2,562 | | 14,040 |
| Dionex Corp. (I) | | 1,270 | | 149,631 |
| Enzo Biochem, Inc. (I) | | 2,628 | | 11,327 |
| eResearch Technology, Inc. (I) | | 3,629 | | 23,044 |
| Furiex Pharmaceuticals, Inc. (I) | | 755 | | 12,548 |
| Kendle International, Inc. (I) | | 1,240 | | 14,756 |
| Luminex Corp. (I) | | 2,729 | | 51,360 |
| Pacific Biosciences of California, Inc. (I) | | 1,118 | | 17,597 |
| Parexel International Corp. (I) | | 4,233 | | 99,349 |
| Sequenom, Inc. (I)(L) | | 7,987 | | 49,040 |
| | |
|
| | | | | 599,507 |
| Pharmaceuticals - 1.26% | | | | |
| Akorn, Inc. (I) | | 4,190 | | 23,422 |
| Auxilium Pharmaceuticals, Inc. (I)(L) | | 3,069 | | 68,960 |
| AVANIR Pharmaceuticals, Class A (I)(L) | | 6,777 | | 25,549 |
| Cadence Pharmaceuticals, Inc. (I)(L) | | 2,426 | | 18,219 |
| DepoMed, Inc. (I) | | 3,996 | | 33,526 |
| Durect Corp. (I) | | 6,895 | | 22,340 |
| Endo Pharmaceuticals, Inc. | | 156 | | 91 |
| Eurand NV (I) | | 1,411 | | 16,890 |
| Hi-Tech Pharmacal Company, Inc. (I) | | 765 | | 17,664 |
| Impax Laboratories, Inc. (I) | | 4,575 | | 94,199 |
| Inspire Pharmaceuticals, Inc. (I) | | 4,352 | | 17,495 |
| Jazz Pharmaceuticals, Inc. (I) | | 1,108 | | 27,290 |
| MAP Pharmaceuticals, Inc. (I) | | 1,198 | | 19,324 |
| Medicis Pharmaceutical Corp., Class A | | 4,363 | | 140,009 |
| Nektar Therapeutics (I) | | 6,912 | | 66,286 |
| Obagi Medical Products, Inc. (I) | | 1,426 | | 16,342 |
| Optimer Pharmaceuticals, Inc. (I)(L) | | 2,472 | | 29,516 |
| Pain Therapeutics, Inc. (I) | | 2,854 | | 19,521 |
| Par Pharmaceutical Companies, Inc. (I) | | 2,549 | | 78,713 |
| POZEN, Inc. (I)(L) | | 2,058 | | 10,578 |
| Questcor Pharmaceuticals, Inc. (I) | | 4,029 | | 52,216 |
| Salix Pharmaceuticals, Ltd. (I) | | 4,138 | | 137,961 |
| Santarus, Inc. (I) | | 4,137 | | 13,197 |
| The Medicines Company (I) | | 3,892 | | 67,682 |
| Viropharma, Inc. (I) | | 5,609 | | 100,569 |
| Vivus, Inc. (I)(L) | | 5,939 | | 45,196 |
| XenoPort, Inc. (I) | | 2,461 | | 17,891 |
| | |
|
| | | | | 1,180,646 |
| | | |
|
| | | | | 10,829,026 |
| Industrials - 14.73% | | | | |
| Aerospace & Defense - 1.77% | | | | |
| AAR Corp. (I)(L) | | 2,825 | | 77,094 |
| Aerovironment, Inc. (I) | | 1,240 | | 35,972 |
| American Science & Engineering, Inc. | | 634 | | 59,596 |
| Astronics Corp. (I) | | 706 | | 15,221 |
| | | | |
| Small Cap Index Fund (continued) | | |
| | | Shares or | | |
| | | Principal | | |
| | | Amount | | Value |
| | |
|
| |
| COMMON STOCKS (continued) | | | | |
| Aerospace & Defense (continued) | | | | |
| Ceradyne, Inc. (I) | | 1,855 | $ | 70,917 |
| Cubic Corp. | | 1,140 | | 57,353 |
| Curtiss-Wright Corp. | | 3,291 | | 121,438 |
| DigitalGlobe, Inc. (I) | | 1,968 | | 63,527 |
| Ducommun, Inc. | | 806 | | 18,030 |
| Esterline Technologies Corp. (I) | | 2,146 | | 153,589 |
| GenCorp, Inc. (I) | | 4,513 | | 23,422 |
| GeoEye, Inc. (I) | | 1,590 | | 70,835 |
| HEICO Corp. (L) | | 2,109 | | 116,670 |
| Herley Industries, Inc. (I) | | 1,012 | | 19,228 |
| Hexcel Corp. (I) | | 7,009 | | 130,017 |
| Kratos Defense & Security Solutions, Inc. (I) | | 1,462 | | 21,067 |
| Ladish Company, Inc. (I) | | 1,139 | | 61,779 |
| LMI Aerospace, Inc. (I) | | 745 | | 13,380 |
| Moog, Inc., Class A (I) | | 3,177 | | 144,268 |
| National Presto Industries, Inc. | | 329 | | 41,632 |
| Orbital Sciences Corp., Class A (I) | | 4,168 | | 74,149 |
| Taser International, Inc. (I)(L) | | 4,821 | | 18,223 |
| Teledyne Technologies, Inc. (I) | | 2,603 | | 136,319 |
| The Keyw Holding Corp. (I) | | 830 | | 11,828 |
| Triumph Group, Inc. | | 1,187 | | 102,782 |
| | |
|
| | | | | 1,658,336 |
| Air Freight & Logistics - 0.37% | | | | |
| Air Transport Services Group, Inc. (I) | | 4,052 | | 31,808 |
| Atlas Air Worldwide Holdings, Inc. (I) | | 1,870 | | 127,684 |
| Forward Air Corp. | | 2,130 | | 63,112 |
| HUB Group, Inc., Class A (I) | | 2,708 | | 94,672 |
| Pacer International, Inc. (I) | | 2,689 | | 14,601 |
| Park-Ohio Holdings Corp. (I) | | 614 | | 13,557 |
| | |
|
| | | | | 345,434 |
| Airlines - 0.63% | | | | |
| AirTran Holdings, Inc. (I) | | 9,745 | | 71,139 |
| Alaska Air Group, Inc. (I) | | 2,564 | | 152,430 |
| Allegiant Travel Company (L) | | 1,098 | | 45,314 |
| Hawaiian Holdings, Inc. (I) | | 3,885 | | 25,796 |
| JetBlue Airways Corp. (I)(L) | | 17,607 | | 100,360 |
| Pinnacle Airlines Corp. (I) | | 1,641 | | 9,928 |
| Republic Airways Holdings, Inc. (I)(L) | | 3,593 | | 22,780 |
| Skywest, Inc. | | 4,046 | | 66,759 |
| US Airways Group, Inc. (I)(L) | | 11,677 | | 100,539 |
| | |
|
| | | | | 595,045 |
| Building Products - 0.60% | | | | |
| A.O. Smith Corp. | | 2,609 | | 105,404 |
| AAON, Inc. (L) | | 914 | | 28,060 |
| Ameresco, Inc., Class A (I) | | 695 | | 10,022 |
| American Woodmark Corp. | | 714 | | 14,244 |
| Ameron International Corp. | | 654 | | 46,212 |
| Apogee Enterprises, Inc. | | 2,090 | | 28,570 |
| Builders FirstSource, Inc. (I) | | 3,898 | | 9,316 |
| Gibraltar Industries, Inc. (I) | | 2,248 | | 24,346 |
| Griffon Corp. (I) | | 3,285 | | 39,617 |
| Insteel Industries, Inc. | | 1,425 | | 17,627 |
| NCI Building Systems, Inc. (I) | | 1,497 | | 21,153 |
| Quanex Building Products Corp. | | 2,690 | | 50,814 |
| Simpson Manufacturing Company, Inc. | | 2,848 | | 82,393 |
| Trex Company, Inc. (I)(L) | | 1,130 | | 33,844 |
| Universal Forest Products, Inc. | | 1,393 | | 47,501 |
| | |
|
| | | | | 559,123 |
| Commercial Services & Supplies - 2.35% | | | | |
| ABM Industries, Inc. | | 3,752 | | 99,916 |
| ACCO Brands Corp. (I) | | 4,070 | | 34,799 |
| American Reprographics Company (I) | | 2,820 | | 25,098 |
| |
| The accompanying notes are an integral part of the financial statements. | 205 |
John Hancock Funds II
Portfolio of Investments — February 28, 2011 (Unaudited) (showing percentage of total net assets)
| | | | |
| Small Cap Index Fund (continued) | | |
| | | Shares or | | |
| | | Principal | | |
| | | Amount | | Value |
| | |
|
| |
| COMMON STOCKS (continued) | | | | |
| Commercial Services & Supplies (continued) | | | | |
| APAC Customer Services, Inc. (I) | | 2,442 | $ | 14,310 |
| Casella Waste Systems, Inc., Class A (I) | | 2,104 | | 15,422 |
| Cenveo, Inc. (I) | | 4,272 | | 23,880 |
| Clean Harbors, Inc. (I) | | 1,625 | | 149,305 |
| Consolidated Graphics, Inc. (I) | | 685 | | 37,360 |
| Courier Corp. | | 925 | | 13,200 |
| Deluxe Corp. | | 3,711 | | 94,816 |
| EnergySolutions, Inc. | | 6,458 | | 42,752 |
| EnerNOC, Inc. (I)(L) | | 1,454 | | 28,033 |
| Ennis, Inc. | | 1,908 | | 31,005 |
| Fuel Tech, Inc. (I) | | 1,558 | | 11,654 |
| G&K Services, Inc., Class A | | 1,350 | | 43,767 |
| Healthcare Services Group, Inc. | | 4,769 | | 84,745 |
| Herman Miller, Inc. | | 4,095 | | 110,319 |
| Higher One Holdings, Inc. (I) | | 767 | | 14,412 |
| HNI Corp. | | 3,262 | | 103,503 |
| Innerworkings, Inc. (I) | | 1,989 | | 16,250 |
| Interface, Inc., Class A | | 3,651 | | 60,862 |
| Kimball International, Inc., Class B | | 2,502 | | 17,914 |
| Knoll, Inc. (L) | | 3,368 | | 69,617 |
| M&F Worldwide Corp. (I) | | 816 | | 20,245 |
| McGrath Rentcorp | | 1,737 | | 47,785 |
| Metalico, Inc. (I) | | 2,802 | | 17,821 |
| Mine Safety Appliances Company (L) | | 1,890 | | 68,286 |
| Mobile Mini, Inc. (I)(L) | | 2,630 | | 59,806 |
| Multi-Color Corp. | | 883 | | 16,380 |
| Rollins, Inc. | | 4,605 | | 90,350 |
| Schawk, Inc., Class A | | 844 | | 15,251 |
| Standard Parking Corp. (I) | | 1,202 | | 21,828 |
| Steelcase, Inc., Class A | | 5,481 | | 53,221 |
| Sykes Enterprises, Inc. (I) | | 3,021 | | 56,191 |
| Team, Inc. (I) | | 1,400 | | 36,302 |
| Tetra Tech, Inc. (I) | | 4,423 | | 103,941 |
| The Brinks Company | | 3,442 | | 106,255 |
| The Geo Group, Inc. (I) | | 4,401 | | 111,917 |
| Unifirst Corp. | | 1,018 | | 57,415 |
| United Stationers, Inc. (I) | | 1,744 | | 117,580 |
| US Ecology, Inc. | | 1,397 | | 23,484 |
| Viad Corp. | | 1,484 | | 34,013 |
| | |
|
| | | | | 2,201,010 |
| Construction & Engineering - 0.78% | | | | |
| Comfort Systems USA, Inc. | | 2,697 | | 35,789 |
| Dycom Industries, Inc. (I) | | 2,765 | | 47,724 |
| EMCOR Group, Inc. (I) | | 4,762 | | 151,717 |
| Furmanite Corp. (I) | | 2,805 | | 20,392 |
| Granite Construction, Inc. (L) | | 2,510 | | 71,535 |
| Great Lakes Dredge & Dock Corp. | | 4,298 | | 33,825 |
| Insituform Technologies, Inc., Class A (I) | | 2,853 | | 73,722 |
| Layne Christensen Company (I) | | 1,414 | | 47,185 |
| MasTec, Inc. (I) | | 3,846 | | 71,613 |
| Michael Baker Corp. (I) | | 597 | | 18,788 |
| MYR Group, Inc. (I) | | 1,441 | | 32,509 |
| Northwest Pipe Company (I) | | 715 | | 16,974 |
| Orion Marine Group, Inc. (I) | | 2,004 | | 24,749 |
| Pike Electric Corp. (I) | | 1,307 | | 12,704 |
| Primoris Services Corp. | | 1,633 | | 13,962 |
| Sterling Construction Company, Inc. (I) | | 1,243 | | 16,283 |
| Tutor Perini Corp. | | 1,928 | | 45,925 |
| | |
|
| | | | | 735,396 |
| Electrical Equipment - 1.70% | | | | |
| A123 Systems, Inc. (I)(L) | | 5,334 | | 50,566 |
| Acuity Brands, Inc. (L) | | 3,114 | | 176,003 |
| Advanced Battery Technologies, Inc. (I)(L) | | 4,982 | | 19,330 |
| | | | |
| Small Cap Index Fund (continued) | | |
| | | Shares or | | |
| | | Principal | | |
| | | Amount | | Value |
| | |
|
| |
| COMMON STOCKS (continued) | | | | |
| Electrical Equipment (continued) | | | | |
| American Superconductor Corp. (I) | | 3,682 | $ | 97,647 |
| AZZ, Inc. | | 884 | | 37,711 |
| Belden, Inc. | | 3,382 | | 123,883 |
| Brady Corp., Class A | | 3,524 | | 125,948 |
| Broadwind Energy, Inc. (I) | | 7,209 | | 11,534 |
| Capstone Turbine Corp. (I)(L) | | 19,335 | | 29,389 |
| Encore Wire Corp. (L) | | 1,381 | | 32,398 |
| Ener1, Inc. (I) | | 4,596 | | 16,959 |
| EnerSys (I) | | 3,479 | | 123,505 |
| Franklin Electric Company, Inc. | | 1,697 | | 72,123 |
| Fuelcell Energy, Inc. (I)(L) | | 8,456 | | 14,798 |
| Generac Holdings, Inc. (I) | | 1,463 | | 26,817 |
| GrafTech International, Ltd. (I) | | 8,697 | | 174,027 |
| II-VI, Inc. (I) | | 1,812 | | 92,756 |
| LaBarge, Inc. (I) | | 1,074 | | 16,840 |
| LSI Industries, Inc. | | 1,530 | | 11,842 |
| Polypore International, Inc. (I) | | 1,576 | | 92,101 |
| Powell Industries, Inc. (I) | | 682 | | 25,500 |
| PowerSecure International, Inc. (I) | | 1,505 | | 11,137 |
| Preformed Line Products Company | | 178 | | 12,634 |
| Satcon Technology Corp. (I) | | 8,512 | | 30,984 |
| Vicor Corp. | | 1,415 | | 21,550 |
| Woodward, Inc. | | 4,411 | | 145,078 |
| | |
|
| | | | | 1,593,060 |
| Industrial Conglomerates - 0.19% | | | | |
| Raven Industries, Inc. | | 1,170 | | 63,484 |
| Seaboard Corp. | | 23 | | 53,365 |
| Standex International Corp. | | 917 | | 31,426 |
| Tredegar Industries, Inc. | | 1,772 | | 34,589 |
| | |
|
| | | | | 182,864 |
| Machinery - 3.17% | | | | |
| 3D Systems Corp. (I) | | 1,327 | | 64,957 |
| Actuant Corp., Class A | | 4,882 | | 138,161 |
| Alamo Group, Inc. | | 488 | | 14,220 |
| Albany International Corp., Class A | | 2,014 | | 49,061 |
| Altra Holdings, Inc. (I) | | 1,971 | | 42,633 |
| American Railcar Industries, Inc. (I) | | 732 | | 14,794 |
| Ampco-Pittsburgh Corp. | | 653 | | 17,318 |
| ArvinMeritor, Inc. (I) | | 6,819 | | 122,196 |
| Astec Industries, Inc. (I) | | 1,423 | | 48,852 |
| Badger Meter, Inc. (L) | | 1,099 | | 43,202 |
| Barnes Group, Inc. | | 3,540 | | 75,331 |
| Blount International, Inc. (I) | | 3,456 | | 52,531 |
| Briggs & Stratton Corp. | | 3,619 | | 72,850 |
| Cascade Corp. | | 651 | | 31,808 |
| Chart Industries, Inc. (I) | | 2,091 | | 94,910 |
| CIRCOR International, Inc. | | 1,229 | | 48,730 |
| CLARCOR, Inc. | | 3,610 | | 148,515 |
| Colfax Corp. (I) | | 1,737 | | 38,527 |
| Columbus McKinnon Corp. (I) | | 1,422 | | 24,558 |
| Commercial Vehicle Group, Inc. (I) | | 1,827 | | 28,794 |
| Douglas Dynamics, Inc. | | 836 | | 13,376 |
| Dynamic Materials Corp. | | 995 | | 26,298 |
| Energy Recovery, Inc. (I) | | 3,440 | | 11,662 |
| EnPro Industries, Inc. (I)(L) | | 1,456 | | 57,774 |
| ESCO Technologies, Inc. | | 1,912 | | 73,210 |
| Federal Signal Corp. | | 4,608 | | 29,814 |
| Flow International Corp. (I) | | 3,893 | | 15,533 |
| Force Protection, Inc. (I) | | 5,286 | | 26,641 |
| FreightCar America, Inc. (I) | | 877 | | 24,661 |
| Graham Corp. | | 788 | | 16,729 |
| Greenbrier Companies, Inc. (I) | | 1,392 | | 34,772 |
| John Bean Technologies Corp. | | 2,006 | | 38,054 |
| |
| The accompanying notes are an integral part of the financial statements. | 206 |
John Hancock Funds II
Portfolio of Investments — February 28, 2011 (Unaudited) (showing percentage of total net assets)
| | | | |
| Small Cap Index Fund (continued) | | |
| | | Shares or | | |
| | | Principal | | |
| | | Amount | | Value |
| | |
|
| |
| COMMON STOCKS (continued) | | | | |
| Machinery (continued) | | | | |
| Kadant, Inc. (I) | | 953 | $ | 24,797 |
| Kaydon Corp. | | 2,400 | | 94,176 |
| L.B. Foster Company (I) | | 736 | | 30,912 |
| Lindsay Corp. | | 899 | | 63,478 |
| Lydall, Inc. (I) | | 1,369 | | 12,239 |
| Met-Pro Corp. | | 1,225 | | 13,977 |
| Middleby Corp. (I) | | 1,202 | | 107,783 |
| Miller Industries, Inc. | | 836 | | 13,894 |
| Mueller Industries, Inc. | | 2,689 | | 91,372 |
| Mueller Water Products, Inc. | | 11,330 | | 46,000 |
| NACCO Industries, Inc., Class A | | 407 | | 50,692 |
| Nordson Corp. | | 2,462 | | 268,136 |
| PMFG, Inc. (I) | | 1,107 | | 20,546 |
| RBC Bearings, Inc. (I) | | 1,559 | | 56,420 |
| Robbins & Myers, Inc. | | 2,775 | | 118,298 |
| Sauer-Danfoss, Inc. (I) | | 851 | | 25,981 |
| Sun Hydraulics, Inc. | | 920 | | 33,212 |
| Tecumseh Products Company, Class A (I) | | 1,415 | | 17,022 |
| Tennant Company | | 1,360 | | 55,284 |
| The Gorman-Rupp Company | | 898 | | 33,522 |
| Titan International, Inc. | | 2,544 | | 61,107 |
| TriMas Corp. (I) | | 1,109 | | 22,812 |
| Twin Disc, Inc. | | 642 | | 20,775 |
| Wabash National Corp. (I) | | 4,953 | | 51,610 |
| Watts Water Technologies, Inc., Class A (L) | | 2,093 | | 81,857 |
| Xerium Technologies, Inc. (I) | | 613 | | 13,161 |
| | |
|
| | | | | 2,969,535 |
| Marine - 0.11% | | | | |
| Baltic Trading, Ltd. | | 1,281 | | 12,131 |
| Eagle Bulk Shipping, Inc. (I)(L) | | 4,618 | | 18,980 |
| Excel Maritime Carriers, Ltd. (I)(L) | | 2,959 | | 15,446 |
| Genco Shipping & Trading, Ltd. (I)(L) | | 2,060 | | 25,008 |
| Horizon Lines, Inc. | | 2,582 | | 11,800 |
| International Shipholding Corp. | | 453 | | 11,071 |
| Ultrapetrol Bahamas, Ltd. (I) | | 1,854 | | 10,327 |
| | |
|
| | | | | 104,763 |
| Professional Services - 1.17% | | | | |
| Acacia Research - Acacia Technologies (I) | | 2,458 | | 72,069 |
| Barrett Business Services, Inc. | | 676 | | 9,863 |
| CBIZ, Inc. (I) | | 3,202 | | 22,670 |
| CDI Corp. | | 944 | | 14,047 |
| CoStar Group, Inc. (I)(L) | | 1,491 | | 84,495 |
| CRA International, Inc. (I) | | 853 | | 22,127 |
| Exponent, Inc. (I) | | 1,003 | | 39,468 |
| GP Strategies Corp. (I) | | 1,200 | | 13,896 |
| Heidrick & Struggles International, Inc. | | 1,284 | | 34,963 |
| Hill International, Inc. (I) | | 2,048 | | 10,854 |
| Hudson Highland Group, Inc. (I) | | 2,775 | | 18,620 |
| Huron Consulting Group, Inc. (I) | | 1,628 | | 45,291 |
| ICF International, Inc. (I) | | 1,243 | | 28,179 |
| Insperity, Inc. (I) | | 1,591 | | 47,619 |
| Kelly Services, Inc., Class A (I) | | 1,917 | | 40,295 |
| Kforce, Inc. (I) | | 2,232 | | 39,864 |
| Korn/Ferry International (I) | | 3,343 | | 76,421 |
| Mistras Group, Inc. (I) | | 1,082 | | 16,327 |
| Navigant Consulting Company (I) | | 3,749 | | 35,203 |
| On Assignment, Inc. (I) | | 2,759 | | 28,970 |
| Resources Connection, Inc. | | 3,385 | | 65,297 |
| School Specialty, Inc. (I) | | 1,427 | | 21,904 |
| SFN Group, Inc. (I) | | 3,791 | | 52,430 |
| The Advisory Board Company (I) | | 1,105 | | 56,532 |
| The Corporate Executive Board Company | | 2,466 | | 98,813 |
| The Dolan Company (I) | | 2,240 | | 28,000 |
| | | | |
| Small Cap Index Fund (continued) | | |
| | | Shares or | | |
| | | Principal | | |
| | | Amount | | Value |
| | |
|
| |
| COMMON STOCKS (continued) | | | | |
| Professional Services (continued) | | | | |
| TrueBlue, Inc. (I) | | 3,200 | $ | 51,680 |
| Volt Information Sciences, Inc. (I) | | 1,254 | | 9,555 |
| VSE Corp. | | 331 | | 8,973 |
| | |
|
| | | | | 1,094,425 |
| Road & Rail - 0.95% | | | | |
| AMERCO, Inc. (I) | | 602 | | 58,147 |
| Arkansas Best Corp. | | 1,862 | | 44,167 |
| Avis Budget Group, Inc. (I) | | 7,456 | | 114,226 |
| Celadon Group, Inc. (I) | | 1,559 | | 22,777 |
| Dollar Thrifty Automotive Group, Inc. (I) | | 2,074 | | 110,150 |
| Genesee & Wyoming, Inc., Class A (I) | | 2,757 | | 143,612 |
| Heartland Express, Inc. (L) | | 3,612 | | 59,923 |
| Knight Transportation, Inc. | | 4,226 | | 78,646 |
| Marten Transport, Ltd. | | 1,177 | | 25,129 |
| Old Dominion Freight Line, Inc. (I) | | 3,012 | | 92,709 |
| Patriot Transportation Holding, Inc. (I) | | 378 | | 9,473 |
| RailAmerica, Inc. (I) | | 1,675 | | 25,125 |
| Roadrunner Transportation Systems, Inc. (I) | | 823 | | 11,596 |
| Saia, Inc. (I) | | 1,229 | | 18,533 |
| USA Truck, Inc. (I) | | 719 | | 9,196 |
| Werner Enterprises, Inc. (L) | | 3,041 | | 71,616 |
| | |
|
| | | | | 895,025 |
| Trading Companies & Distributors - 0.94% | | | | |
| Aceto Corp. | | 2,053 | | 16,280 |
| Aircastle, Ltd. | | 3,675 | | 44,394 |
| Applied Industrial Technologies, Inc. | | 3,037 | | 97,305 |
| Beacon Roofing Supply, Inc. (I) | | 3,313 | | 70,269 |
| CAI International, Inc. (I) | | 747 | | 15,821 |
| DXP Enterprises, Inc. (I) | | 625 | | 13,288 |
| H&E Equipment Services, Inc. (I) | | 2,087 | | 32,724 |
| Houston Wire & Cable Company (L) | | 1,417 | | 18,988 |
| Interline Brands, Inc. (I) | | 2,378 | | 52,102 |
| Kaman Corp., Class A | | 1,866 | | 59,469 |
| RSC Holdings, Inc. (I)(L) | | 3,634 | | 49,531 |
| Rush Enterprises, Inc., Class A (I) | | 2,341 | | 43,941 |
| Seacube Container Leasing, Ltd. | | 844 | | 12,677 |
| TAL International Group, Inc. | | 1,225 | | 42,728 |
| Textainer Group Holdings, Ltd. | | 672 | | 23,755 |
| Titan Machinery, Inc. (I) | | 961 | | 24,727 |
| United Rentals, Inc. (I)(L) | | 4,387 | | 135,909 |
| Watsco, Inc. (L) | | 1,976 | | 127,610 |
| | |
|
| | | | | 881,518 |
| | |
|
| | | | | 13,815,534 |
| Information Technology - 18.39% | | | | |
| Communications Equipment - 3.08% | | | | |
| Acme Packet, Inc. (I) | | 3,166 | | 238,210 |
| ADTRAN, Inc. (L) | | 4,466 | | 203,114 |
| Anaren, Inc. (I) | | 1,100 | | 23,342 |
| Arris Group, Inc. (I) | | 9,172 | | 121,070 |
| Aruba Networks, Inc. (I) | | 5,602 | | 170,581 |
| Aviat Networks, Inc. (I) | | 4,542 | | 27,752 |
| Bel Fuse, Inc., Class B | | 776 | | 16,994 |
| BigBand Networks, Inc. (I) | | 4,278 | | 11,123 |
| Black Box Corp. | | 1,299 | | 49,609 |
| Blue Coat Systems, Inc. (I) | | 3,030 | | 85,264 |
| Calix, Inc. (I) | | 564 | | 10,034 |
| Comtech Telecommunications Corp. | | 2,070 | | 55,994 |
| DG Fastchannel, Inc. (I) | | 1,835 | | 60,757 |
| Digi International, Inc. (I) | | 1,929 | | 21,354 |
| EMS Technologies, Inc. (I) | | 1,160 | | 22,550 |
| Emulex Corp. (I) | | 6,295 | | 69,245 |
| Extreme Networks, Inc. (I) | | 6,966 | | 27,307 |
| |
| The accompanying notes are an integral part of the financial statements. | 207 |
John Hancock Funds II
Portfolio of Investments — February 28, 2011 (Unaudited) (showing percentage of total net assets)
| | | | |
| Small Cap Index Fund (continued) | | |
| | | Shares or | | |
| | | Principal | | |
| | | Amount | | Value |
| | |
|
| |
| COMMON STOCKS (continued) | | | | |
| Communications Equipment (continued) | | | | |
| Finisar Corp. (I) | | 5,455 | $ | 223,764 |
| Globecomm Systems, Inc. (I) | | 1,670 | | 17,786 |
| Harmonic, Inc. (I) | | 8,162 | | 78,437 |
| Infinera Corp. (I) | | 6,415 | | 51,384 |
| InterDigital, Inc. | | 3,178 | | 151,527 |
| Ixia (I) | | 2,388 | | 41,909 |
| KVH Industries, Inc. (I) | | 1,225 | | 17,983 |
| Loral Space & Communications, Inc. (I) | | 781 | | 59,090 |
| NETGEAR, Inc. (I) | | 2,564 | | 84,099 |
| Network Equipment Technologies, Inc. (I) | | 2,462 | | 8,962 |
| Oclaro, Inc. (I) | | 3,620 | | 63,821 |
| Oplink Communications, Inc. (I) | | 1,427 | | 38,829 |
| PC-Tel, Inc. (I) | | 1,629 | | 12,201 |
| Plantronics, Inc. | | 3,462 | | 120,789 |
| Powerwave Technologies, Inc. (I) | | 9,826 | | 36,258 |
| Riverbed Technology, Inc. (I) | | 9,130 | | 376,978 |
| Seachange International, Inc. (I) | | 2,170 | | 20,485 |
| ShoreTel, Inc. (I) | | 3,374 | | 22,909 |
| Sonus Networks, Inc. (I) | | 15,096 | | 45,741 |
| Sycamore Networks, Inc. | | 1,412 | | 30,146 |
| Symmetricom, Inc. (I) | | 3,334 | | 18,870 |
| Tekelec, Inc. (I) | | 4,982 | | 38,212 |
| UTStarcom, Inc. (I)(L) | | 8,879 | | 18,202 |
| Viasat, Inc. (I) | | 2,388 | | 99,365 |
| | |
|
| | | | | 2,892,047 |
| Computers & Peripherals - 0.65% | | | | |
| Avid Technology, Inc. (I) | | 2,126 | | 46,900 |
| Cray, Inc. (I) | | 2,725 | | 20,111 |
| Electronics for Imaging, Inc. (I) | | 3,303 | | 50,965 |
| Hypercom Corp. (I) | | 3,381 | | 33,776 |
| Imation Corp. (I) | | 2,175 | | 24,969 |
| Immersion Corp. (I) | | 2,280 | | 16,188 |
| Intermec, Inc. (I) | | 3,617 | | 40,619 |
| Intevac, Inc. (I) | | 1,666 | | 21,275 |
| Novatel Wireless, Inc. (I) | | 2,314 | | 13,699 |
| Quantum Corp. (I) | | 15,646 | | 40,523 |
| Rimage Corp. (I) | | 834 | | 12,518 |
| Silicon Graphics International Corp. (I) | | 2,306 | | 35,766 |
| STEC, Inc. (I)(L) | | 2,966 | | 60,595 |
| Stratasys, Inc. (I) | | 1,491 | | 67,662 |
| Super Micro Computer, Inc. (I) | | 1,840 | | 27,508 |
| Synaptics, Inc. (I) | | 2,452 | | 72,334 |
| Xyratex, Ltd. (I) | | 2,221 | | 28,229 |
| | |
|
| | | | | 613,637 |
| Electronic Equipment, Instruments & Components - 2.48% | | |
| Agilysys, Inc. (I) | | 1,454 | | 7,299 |
| Anixter International, Inc. (L) | | 2,007 | | 143,741 |
| Benchmark Electronics, Inc. (I) | | 4,540 | | 85,624 |
| Brightpoint, Inc. (I) | | 5,173 | | 65,180 |
| Checkpoint Systems, Inc. (I) | | 2,890 | | 62,944 |
| Cognex Corp. | | 2,875 | | 80,241 |
| Coherent, Inc. (I) | | 1,821 | | 112,447 |
| Comverge, Inc. (I) | | 2,047 | | 10,419 |
| CTS Corp. | | 2,500 | | 29,650 |
| Daktronics, Inc. (L) | | 2,465 | | 28,224 |
| DDi Corp. | | 1,033 | | 10,712 |
| DTS, Inc. (I) | | 1,239 | | 56,189 |
| Echelon Corp. (I) | | 2,495 | | 21,856 |
| Electro Rent Corp. | | 1,217 | | 19,484 |
| Electro Scientific Industries, Inc. (I) | | 2,003 | | 30,526 |
| Fabrinet (I) | | 712 | | 20,812 |
| FARO Technologies, Inc. (I) | | 1,176 | | 41,924 |
| Gerber Scientific, Inc. (I) | | 2,002 | | 16,517 |
| | | | |
| Small Cap Index Fund (continued) | | |
| | | Shares or | | |
| | | Principal | | |
| | | Amount | | Value |
| | |
|
| |
| COMMON STOCKS (continued) | | | | |
| Electronic Equipment, Instruments & | | | | |
| Components (continued) | | | | |
| Insight Enterprises, Inc. (I) | | 3,392 | $ | 62,040 |
| IPG Photonics Corp. (I) | | 1,885 | | 107,294 |
| L-1 Identity Solutions, Inc. (I) | | 5,529 | | 65,850 |
| Littelfuse, Inc. | | 1,584 | | 83,683 |
| Maxwell Technologies, Inc. (I) | | 1,945 | | 35,224 |
| Measurement Specialties, Inc. (I) | | 1,082 | | 33,477 |
| Mercury Computer Systems, Inc. (I) | | 1,752 | | 33,253 |
| Methode Electronics, Inc. | | 2,713 | | 31,742 |
| Microvision, Inc. (I) | | 7,447 | | 12,436 |
| MTS Systems Corp. | | 1,152 | | 53,349 |
| Multi-Fineline Electronix, Inc. (I) | | 785 | | 22,467 |
| Newport Corp. (I) | | 2,662 | | 44,322 |
| OSI Systems, Inc. (I) | | 1,152 | | 43,338 |
| Park Electrochemical Corp. | | 1,465 | | 46,587 |
| Plexus Corp. (I) | | 2,923 | | 91,870 |
| Power-One, Inc. (I)(L) | | 5,079 | | 41,800 |
| Pulse Electronics Corp. | | 3,203 | | 19,346 |
| RadiSys Corp. (I) | | 1,964 | | 16,360 |
| Richardson Electronics, Ltd. | | 1,169 | | 15,197 |
| Rofin-Sinar Technologies, Inc. (I) | | 2,050 | | 79,499 |
| Rogers Corp. (I) | | 1,143 | | 53,904 |
| Sanmina-SCI Corp. (I) | | 5,778 | | 90,252 |
| Scansource, Inc. (I) | | 1,974 | | 72,110 |
| SMART Modular | | | | |
| Technologies (WWH), Inc. (I) | | 3,891 | | 26,965 |
| Spectrum Control, Inc. (I) | | 1,017 | | 14,248 |
| SYNNEX Corp. (I)(L) | | 1,606 | | 56,660 |
| TTM Technologies, Inc. (I) | | 5,817 | | 102,030 |
| Universal Display Corp. (I) | | 2,196 | | 92,430 |
| X-Rite, Inc. (I) | | 2,652 | | 12,332 |
| Zygo Corp. (I) | | 1,388 | | 20,098 |
| | |
|
| | | | | 2,323,952 |
| Internet Software & Services - 1.97% | | | | |
| Ancestry.com, Inc. (I) | | 1,375 | | 45,183 |
| comScore, Inc. (I) | | 1,660 | | 45,700 |
| Constant Contact, Inc. (I)(L) | | 2,092 | | 60,522 |
| DealerTrack Holdings, Inc. (I) | | 2,967 | | 59,874 |
| Dice Holdings, Inc. (I) | | 1,204 | | 16,531 |
| Digital River, Inc. (I) | | 2,863 | | 96,140 |
| Earthlink, Inc. | | 7,770 | | 63,947 |
| Envestnet, Inc. (I) | | 601 | | 7,543 |
| GSI Commerce, Inc. (I) | | 4,807 | | 99,927 |
| InfoSpace, Inc. (I) | | 2,689 | | 21,673 |
| Internap Network Services Corp. (I) | | 3,897 | | 26,500 |
| Intralinks Holdings, Inc. (I) | | 874 | | 24,638 |
| j2 Global Communications, Inc. (I) | | 3,270 | | 95,124 |
| Keynote Systems, Inc. | | 1,018 | | 17,907 |
| KIT Digital, Inc. (I) | | 2,109 | | 27,438 |
| Limelight Networks, Inc. (I) | | 3,402 | | 23,644 |
| Liquidity Services, Inc. (I) | | 1,101 | | 17,693 |
| LivePerson, Inc. (I) | | 3,301 | | 33,109 |
| LogMeIn, Inc. (I)(L) | | 1,070 | | 38,402 |
| LoopNet, Inc. (I) | | 1,423 | | 16,934 |
| Marchex, Inc., Class B | | 1,537 | | 13,818 |
| ModusLink Global Solutions, Inc. (I) | | 3,390 | | 23,391 |
| Move, Inc. (I) | | 11,823 | | 25,065 |
| NIC, Inc. | | 4,086 | | 41,432 |
| OpenTable, Inc. (I) | | 1,143 | | 101,578 |
| Openwave Systems, Inc. (I) | | 6,661 | | 14,787 |
| Perficient, Inc. (I) | | 1,722 | | 21,404 |
| Quinstreet, Inc. (I) | | 753 | | 16,408 |
| Rackspace Hosting, Inc. (I) | | 7,005 | | 258,555 |
| RealNetworks, Inc. (I) | | 6,149 | | 23,674 |
| |
| The accompanying notes are an integral part of the financial statements. | 208 |
John Hancock Funds II
Portfolio of Investments — February 28, 2011 (Unaudited) (showing percentage of total net assets)
| | | | |
| Small Cap Index Fund (continued) | | |
| | | Shares or | | |
| | | Principal | | |
| | | Amount | | Value |
| | |
|
| |
| COMMON STOCKS (continued) | | | | |
| Internet Software & Services (continued) | | | | |
| RightNow Technologies, Inc. (I) | | 1,595 | $ | 42,571 |
| Saba Software, Inc. (I) | | 2,348 | | 16,600 |
| SAVVIS, Inc. (I) | | 2,731 | | 88,730 |
| Stamps.com, Inc. | | 929 | | 12,486 |
| Support.com, Inc. (I) | | 3,532 | | 19,709 |
| Terremark Worldwide, Inc. (I) | | 4,242 | | 80,513 |
| The Knot, Inc. (I) | | 2,280 | | 22,868 |
| Travelzoo, Inc. (I) | | 399 | | 15,741 |
| United Online, Inc. | | 6,504 | | 39,089 |
| ValueClick, Inc. (I) | | 5,892 | | 87,968 |
| Vocus, Inc. (I) | | 1,234 | | 29,986 |
| Zix Corp. (I) | | 4,260 | | 15,719 |
| | |
|
| | | | | 1,850,521 |
| IT Services - 2.03% | | | | |
| Acxiom Corp. (I) | | 4,963 | | 85,066 |
| CACI International, Inc., Class A (I) | | 2,149 | | 127,479 |
| Cardtronics, Inc. (I) | | 1,967 | | 37,275 |
| Cass Information Systems, Inc. | | 611 | | 23,860 |
| CIBER, Inc. (I) | | 4,612 | | 21,538 |
| Computer Task Group, Inc. (I) | | 1,204 | | 14,123 |
| CSG Systems International, Inc. (I) | | 2,488 | | 48,640 |
| Echo Global Logistics, Inc. (I) | | 854 | | 10,094 |
| Euronet Worldwide, Inc. (I) | | 3,580 | | 64,691 |
| ExlService Holdings, Inc. (I) | | 1,107 | | 24,598 |
| Forrester Research, Inc. | | 1,034 | | 37,410 |
| Global Cash Access Holdings, Inc. (I) | | 3,966 | | 13,643 |
| Heartland Payment Systems, Inc. | | 2,741 | | 53,669 |
| iGate Corp. | | 1,735 | | 31,404 |
| Integral Systems, Inc. (I) | | 1,503 | | 18,397 |
| Jack Henry & Associates, Inc. | | 6,103 | | 194,747 |
| Lionbridge Technologies, Inc. (I) | | 4,585 | | 16,873 |
| ManTech International Corp., Class A (I) | | 1,583 | | 68,386 |
| MAXIMUS, Inc. | | 1,248 | | 92,352 |
| MoneyGram International, Inc. (I) | | 6,647 | | 18,346 |
| NCI, Inc. (I) | | 528 | | 12,091 |
| Online Resources Corp. (I) | | 2,336 | | 15,301 |
| Sapient Corp. (I) | | 7,484 | | 88,685 |
| SRA International, Inc., Class A (I) | | 3,105 | | 84,549 |
| Syntel, Inc. | | 943 | | 49,649 |
| TeleTech Holdings, Inc. (I) | | 2,201 | | 50,139 |
| The Hackett Group, Inc. (I) | | 2,365 | | 8,538 |
| TNS, Inc. (I) | | 1,938 | | 36,531 |
| Unisys Corp. (I) | | 3,110 | | 115,568 |
| VeriFone Systems, Inc. (I) | | 6,181 | | 280,865 |
| Virtusa Corp. (I) | | 1,004 | | 16,958 |
| Wright Express Corp. (I) | | 2,791 | | 142,341 |
| | |
|
| | | | | 1,903,806 |
| Semiconductors & Semiconductor Equipment - 3.85% | | |
| Advanced Analogic Technologies, Inc. (I) | | 3,506 | | 14,830 |
| Advanced Energy Industries, Inc. (I) | | 2,631 | | 42,412 |
| Amkor Technology, Inc. (I)(L) | | 7,611 | | 56,093 |
| Anadigics, Inc. (I) | | 4,777 | | 25,939 |
| Applied Micro Circuits Corp. (I) | | 4,755 | | 49,928 |
| ATMI, Inc. (I) | | 2,250 | | 41,040 |
| Axcelis Technologies, Inc. (I) | | 7,743 | | 21,293 |
| AXT, Inc. (I) | | 2,289 | | 16,984 |
| Brooks Automation, Inc. (I) | | 4,713 | | 59,148 |
| Cabot Microelectronics Corp. (I) | | 1,690 | | 82,506 |
| Cavium Networks, Inc. (I) | | 3,196 | | 138,003 |
| CEVA, Inc. (I) | | 1,528 | | 34,838 |
| Cirrus Logic, Inc. (I)(L) | | 4,975 | | 116,166 |
| Cohu, Inc. | | 1,725 | | 25,392 |
| Conexant Systems, Inc. (I) | | 6,606 | | 15,590 |
| | | | |
| Small Cap Index Fund (continued) | | |
| | | Shares or | | |
| | | Principal | | |
| | | Amount | | Value |
| | |
|
| |
| COMMON STOCKS (continued) | | | | |
| Semiconductors & Semiconductor Equipment (continued) | | |
| Cymer, Inc. (I) | | 2,159 | $ | 109,245 |
| Diodes, Inc. (I) | | 2,464 | | 71,357 |
| DSP Group, Inc. (I) | | 1,868 | | 14,739 |
| Energy Conversion Devices, Inc. (I)(L) | | 3,674 | | 14,402 |
| Entegris, Inc. (I) | | 9,584 | | 83,572 |
| Entropic Communications, Inc. (I)(L) | | 4,730 | | 43,800 |
| Evergreen Solar, Inc. (I)(L) | | 2,622 | | 5,821 |
| Exar Corp. (I) | | 2,724 | | 17,624 |
| FEI Company (I) | | 2,760 | | 92,543 |
| FormFactor, Inc. (I) | | 3,699 | | 36,361 |
| FSI International, Inc. (I) | | 3,086 | | 11,943 |
| GSI Technology, Inc. (I) | | 1,518 | | 14,284 |
| GT Solar International, Inc. (I) | | 4,529 | | 48,415 |
| Hittite Microwave Corp. (I) | | 1,947 | | 119,507 |
| Inphi Corpinphi Corp. (I) | | 505 | | 12,115 |
| Integrated Device Technology, Inc. (I) | | 11,403 | | 88,373 |
| Integrated Silicon Solution, Inc. (I) | | 1,932 | | 18,895 |
| IXYS Corp. (I) | | 1,775 | | 22,046 |
| Kopin Corp. (I) | | 5,093 | | 22,358 |
| Kulicke & Soffa Industries, Inc. (I) | | 5,084 | | 48,756 |
| Lattice Semiconductor Corp. (I) | | 8,387 | | 55,690 |
| LTX-Credence Corp. (I) | | 3,600 | | 32,184 |
| Mattson Technology, Inc. (I) | | 4,070 | | 10,663 |
| Micrel, Inc. | | 3,596 | | 48,330 |
| Microsemi Corp. (I) | | 5,974 | | 131,607 |
| Mindspeed Technologies, Inc. (I) | | 2,437 | | 18,862 |
| MIPS Technologies, Inc. (I) | | 3,641 | | 44,311 |
| MKS Instruments, Inc. | | 3,622 | | 108,732 |
| Monolithic Power Systems, Inc. (I) | | 2,383 | | 36,817 |
| MoSys, Inc. (I) | | 2,490 | | 14,044 |
| Nanometrics, Inc. (I) | | 1,322 | | 23,822 |
| Netlogic Microsystems, Inc. (I) | | 4,511 | | 186,710 |
| NVE Corp. (I) | | 358 | | 21,212 |
| OmniVision Technologies, Inc. (I) | | 3,999 | | 122,449 |
| Pericom Semiconductor Corp. (I) | | 1,914 | | 19,255 |
| Photronics, Inc. (I) | | 3,949 | | 35,304 |
| PLX Technology, Inc. (I) | | 3,118 | | 11,724 |
| Power Integrations, Inc. (L) | | 1,772 | | 70,596 |
| RF Micro Devices, Inc. (I) | | 19,404 | | 145,530 |
| Rubicon Technology, Inc. (I)(L) | | 1,157 | | 26,403 |
| Rudolph Technologies, Inc. (I) | | 2,362 | | 26,171 |
| Semtech Corp. (I) | | 4,443 | | 105,210 |
| Sigma Designs, Inc. (I) | | 2,244 | | 30,698 |
| Silicon Image, Inc. (I) | | 5,581 | | 44,871 |
| Spansion, Inc., Class A (I) | | 1,042 | | 21,955 |
| Standard Microsystems Corp. (I) | | 1,586 | | 42,077 |
| Supertex, Inc. (I) | | 722 | | 16,505 |
| Tessera Technologies, Inc. (I) | | 3,627 | | 63,146 |
| Trident Microsystems, Inc. (I) | | 5,809 | | 7,842 |
| TriQuint Semiconductor, Inc. (I) | | 11,189 | | 159,443 |
| Ultra Clean Holdings, Inc. (I) | | 1,685 | | 17,810 |
| Ultratech, Inc. (I) | | 1,740 | | 43,013 |
| Veeco Instruments, Inc. (I) | | 2,929 | | 139,362 |
| Volterra Semiconductor Corp. (I) | | 1,763 | | 44,480 |
| Zoran Corp. (I) | | 3,793 | | 42,520 |
| | |
|
| | | | | 3,605,666 |
| Software - 4.33% | | | | |
| Accelrys, Inc. (I) | | 4,083 | | 35,359 |
| ACI Worldwide, Inc. (I) | | 2,440 | | 76,396 |
| Actuate Corp. (I) | | 3,500 | | 16,695 |
| Advent Software, Inc. (I) | | 2,283 | | 66,207 |
| American Software, Inc., Class A | | 1,923 | | 12,923 |
| Ariba, Inc. (I) | | 6,508 | | 201,423 |
| Aspen Technology, Inc. (I) | | 4,555 | | 69,373 |
| |
| The accompanying notes are an integral part of the financial statements. | 209 |
John Hancock Funds II
Portfolio of Investments — February 28, 2011 (Unaudited) (showing percentage of total net assets)
| | | | |
| Small Cap Index Fund (continued) | | |
| | | Shares or | | |
| | | Principal | | |
| | | Amount | | Value |
| | |
|
| |
| COMMON STOCKS (continued) | | | | |
| Software (continued) | | | | |
| Blackbaud, Inc. | | 3,271 | $ | 87,041 |
| Blackboard, Inc. (I)(L) | | 2,471 | | 86,510 |
| Bottomline Technologies, Inc. (I) | | 2,301 | | 50,875 |
| BroadSoft, Inc. (I) | | 573 | | 20,227 |
| CDC Corp., Class A (I) | | 2,484 | | 7,328 |
| CommVault Systems, Inc. (I) | | 3,136 | | 114,558 |
| Concur Technologies, Inc. (I) | | 2,905 | | 151,147 |
| Deltek, Inc. (I) | | 1,580 | | 11,518 |
| DemandTec, Inc. (I) | | 1,476 | | 19,203 |
| Digimarc Corp. (I) | | 536 | | 16,010 |
| Ebix, Inc. (I) | | 1,969 | | 51,863 |
| Epicor Software Corp. (I) | | 3,609 | | 37,173 |
| EPIQ Systems, Inc. | | 2,391 | | 33,020 |
| Fair Isaac Corp. | | 3,009 | | 84,102 |
| FalconStor Software, Inc. (I) | | 2,680 | | 13,052 |
| Fortinet, Inc. (I) | | 3,028 | | 123,664 |
| Interactive Intelligence, Inc. (I) | | 965 | | 33,206 |
| JDA Software Group, Inc. (I) | | 3,186 | | 93,987 |
| Kenexa Corp. (I) | | 1,667 | | 38,658 |
| Lawson Software, Inc. (I) | | 10,085 | | 102,262 |
| Magma Design Automation, Inc. (I) | | 4,994 | | 33,210 |
| Manhattan Associates, Inc. (I) | | 1,633 | | 52,583 |
| Mentor Graphics Corp. (I) | | 7,749 | | 123,209 |
| MicroStrategy, Inc., Class A (I) | | 634 | | 75,351 |
| Monotype Imaging Holdings, Inc. (I) | | 1,682 | | 22,505 |
| Netscout Systems, Inc. (I) | | 2,240 | | 55,978 |
| NetSuite, Inc. (I) | | 1,341 | | 40,243 |
| Opnet Technologies, Inc. | | 967 | | 32,955 |
| Parametric Technology Corp. (I) | | 8,358 | | 198,085 |
| Pegasystems, Inc. | | 1,182 | | 47,611 |
| Progress Software Corp. (I) | | 4,567 | | 134,087 |
| PROS Holdings, Inc. (I) | | 1,521 | | 17,415 |
| QLIK Technologies, Inc. (I) | | 984 | | 25,741 |
| Quest Software, Inc. (I) | | 4,299 | | 115,170 |
| Radiant Systems, Inc. (I) | | 2,396 | | 41,091 |
| RealD, Inc. (I) | | 1,061 | | 23,819 |
| RealPage, Inc. (I) | | 1,125 | | 27,900 |
| Renaissance Learning, Inc. | | 1,041 | | 11,180 |
| Rosetta Stone, Inc. (I) | | 782 | | 11,699 |
| Rovi Corp. (I) | | 347 | | 19,236 |
| S1 Corp. (I) | | 3,881 | | 25,343 |
| Smith Micro Software, Inc. (I) | | 2,240 | | 20,989 |
| SolarWinds, Inc. (I) | | 2,555 | | 57,360 |
| Sourcefire, Inc. (I) | | 2,016 | | 54,634 |
| SRS Labs, Inc. (I) | | 1,015 | | 9,176 |
| SS&C Technologies Holdings, Inc. (I) | | 921 | | 18,042 |
| SuccessFactors, Inc. (I) | | 4,565 | | 163,929 |
| Synchronoss Technologies, Inc. (I) | | 1,709 | | 58,550 |
| Take-Two Interactive Software, Inc. (I) | | 5,120 | | 82,278 |
| Taleo Corp. (I) | | 2,900 | | 93,641 |
| TeleCommunication Systems, Inc. (I) | | 3,507 | | 14,975 |
| THQ, Inc. (I) | | 4,990 | | 28,742 |
| TIBCO Software, Inc. (I) | | 11,973 | | 294,775 |
| TiVo, Inc. (I) | | 8,423 | | 86,588 |
| Tyler Technologies, Inc. (I) | | 2,210 | | 48,885 |
| Ultimate Software Group, Inc. (I)(L) | | 1,817 | | 97,100 |
| VASCO Data Security International, Inc. (I) | | 2,103 | | 18,864 |
| Virnetx Holding Corp. | | 2,581 | | 30,972 |
| Wave Systems Corp. Class A (I)(L) | | 6,021 | | 23,723 |
| Websense, Inc. (I) | | 3,154 | | 67,559 |
| | |
|
| | | | | 4,058,973 |
| | | |
|
| | | | | 17,248,602 |
| | | | |
| Small Cap Index Fund (continued) | | |
| | | Shares or | | |
| | | Principal | | |
| | | Amount | | Value |
| | |
|
| |
| COMMON STOCKS (continued) | | | | |
| Materials - 5.36% | | | | |
| Chemicals - 2.35% | | | | |
| A. Schulman, Inc. | | 2,276 | $ | 50,664 |
| American Vanguard Corp. | | 1,709 | | 14,065 |
| Arch Chemicals, Inc. | | 1,651 | | 59,353 |
| Balchem Corp. | | 2,067 | | 74,412 |
| Calgon Carbon Corp. (I)(L) | | 4,090 | | 57,424 |
| Ferro Corp. (I) | | 6,260 | | 99,659 |
| Georgia Gulf Corp. (I) | | 2,470 | | 78,842 |
| H.B. Fuller Company | | 3,552 | | 76,546 |
| Hawkins, Inc. | | 633 | | 24,225 |
| Innophos Holdings, Inc. | | 1,551 | | 66,429 |
| Koppers Holdings, Inc. | | 1,493 | | 60,332 |
| Kraton Performance Polymers, Inc. (I) | | 807 | | 27,680 |
| Landec Corp. (I) | | 2,273 | | 13,979 |
| LSB Industries, Inc. (I) | | 1,251 | | 37,880 |
| Minerals Technologies, Inc. | | 1,355 | | 87,912 |
| NewMarket Corp. | | 726 | | 93,008 |
| Olin Corp. (L) | | 5,667 | | 105,463 |
| OM Group, Inc. (I) | | 2,235 | | 78,650 |
| Omnova Solutions, Inc. (I) | | 3,333 | | 23,464 |
| PolyOne Corp. | | 6,741 | | 93,565 |
| Quaker Chemical Corp. | | 801 | | 31,023 |
| Rockwood Holdings, Inc. (I) | | 3,763 | | 175,168 |
| Senomyx, Inc. (I) | | 2,943 | | 21,337 |
| Sensient Technologies Corp. | | 3,564 | | 118,966 |
| Solutia, Inc. (I) | | 8,774 | | 203,645 |
| Spartech Corp. (I) | | 2,327 | | 19,733 |
| Stepan Company | | 551 | | 38,675 |
| STR Holdings, Inc. (I)(L) | | 2,082 | | 37,705 |
| TPC Group, Inc. (I) | | 571 | | 16,588 |
| W.R. Grace & Company (I) | | 5,260 | | 200,090 |
| Westlake Chemical Corp. | | 1,426 | | 68,177 |
| Zep, Inc. | | 1,615 | | 25,339 |
| Zoltek Companies, Inc. (I) | | 2,060 | | 30,117 |
| | |
|
| | | | | 2,210,115 |
| Construction Materials - 0.10% | | | | |
| Headwaters, Inc. (I) | | 4,562 | | 23,129 |
| Texas Industries, Inc. | | 1,503 | | 61,292 |
| United States Lime & Minerals, Inc. (I) | | 202 | | 8,149 |
| | |
|
| | | | | 92,570 |
| Containers & Packaging - 0.51% | | | | |
| AEP Industries, Inc. (I) | | 390 | | 10,951 |
| Boise, Inc. | | 5,085 | | 45,663 |
| Graham Packaging Company, Inc. (I) | | 1,323 | | 22,478 |
| Graphic Packaging Holding Company (I) | | 8,271 | | 43,009 |
| Myers Industries, Inc. | | 2,648 | | 26,798 |
| Rock-Tenn Company, Class A (L) | | 2,781 | | 190,916 |
| Silgan Holdings, Inc. | | 3,847 | | 140,339 |
| | |
|
| | | | | 480,154 |
| Metals & Mining - 1.87% | | | | |
| A. M. Castle & Company (I) | | 1,228 | | 21,171 |
| Allied Nevada Gold Corp. (I) | | 5,417 | | 164,352 |
| AMCOL International Corp. (L) | | 1,738 | | 54,243 |
| Capital Gold Corp. (I) | | 4,646 | | 25,274 |
| Century Aluminum Company (I) | | 4,625 | | 78,394 |
| Coeur d’Alene Mines Corp. (I)(L) | | 6,346 | | 199,962 |
| Contango ORE, Inc. (I) | | 88 | | 1,716 |
| General Moly, Inc. (I)(L) | | 4,730 | | 24,785 |
| Globe Specialty Metals, Inc. | | 4,411 | | 102,732 |
| Golden Star Resources, Ltd. (I) | | 18,496 | | 58,447 |
| Haynes International, Inc. | | 879 | | 45,567 |
| Hecla Mining Company (I)(L) | | 18,519 | | 187,968 |
| |
| The accompanying notes are an integral part of the financial statements. | 210 |
John Hancock Funds II
Portfolio of Investments — February 28, 2011 (Unaudited) (showing percentage of total net assets)
| | | | |
| Small Cap Index Fund (continued) | | |
| | | Shares or | | |
| | | Principal | | |
| | | Amount | | Value |
| | |
|
| |
| COMMON STOCKS (continued) | | | | |
| Metals & Mining (continued) | | | | |
| Horsehead Holding Corp. (I) | | 3,157 | $ | 52,217 |
| Jaguar Mining, Inc. (I) | | 6,159 | | 32,643 |
| Kaiser Aluminum Corp. (L) | | 1,089 | | 55,027 |
| Materion Corp. (I) | | 1,451 | | 63,510 |
| Metals USA Holdings Corp. (I) | | 838 | | 12,528 |
| Molycorp, Inc. (I)(L) | | 1,855 | | 89,021 |
| Noranda Aluminum Holding Corp. (I) | | 1,001 | | 15,786 |
| Olympic Steel, Inc. | | 665 | | 17,882 |
| RTI International Metals, Inc. (I) | | 2,168 | | 61,788 |
| Stillwater Mining Company (I) | | 3,201 | | 76,408 |
| Thompson Creek Metals Company, Inc. (I) | | 11,838 | | 156,025 |
| Universal Stainless & Alloy Products, Inc. (I) | | 521 | | 18,001 |
| US Energy Corp. (I) | | 2,137 | | 13,655 |
| US Gold Corp. (I) | | 6,402 | | 46,479 |
| Worthington Industries, Inc. | | 4,036 | | 78,137 |
| | |
|
| | | | | 1,753,718 |
| Paper & Forest Products - 0.53% | | | | |
| Buckeye Technologies, Inc. | | 2,848 | | 74,618 |
| Clearwater Paper Corp. (I) | | 825 | | 65,423 |
| Deltic Timber Corp. | | 782 | | 47,522 |
| KapStone Paper and Packaging Corp. (I) | | 2,785 | | 47,763 |
| Louisiana-Pacific Corp. (I)(L) | | 9,151 | | 94,438 |
| Neenah Paper, Inc. | | 1,118 | | 21,767 |
| P.H. Glatfelter Company | | 3,345 | | 41,177 |
| Schweitzer-Mauduit International, Inc. | | 1,319 | | 72,321 |
| Wausau Paper Corp. | | 3,669 | | 29,462 |
| | |
|
| | | | | 494,491 |
| | |
|
| | | | | 5,031,048 |
| Telecommunication Services - 0.80% | | | | |
| Diversified Telecommunication Services - 0.67% | | | | |
| AboveNet, Inc. | | 1,565 | | 101,553 |
| Alaska Communications Systems Group, Inc. | | 3,309 | | 33,719 |
| Atlantic Tele-Network, Inc. | | 676 | | 26,357 |
| Cbeyond, Inc. (I) | | 1,957 | | 27,359 |
| Cincinnati Bell, Inc. (I) | | 14,703 | | 38,816 |
| Cogent Communications Group, Inc. (I) | | 3,292 | | 48,524 |
| Consolidated Communications Holdings, Inc. | | 1,806 | | 33,032 |
| General Communication, Inc., Class A (I) | | 3,431 | | 41,481 |
| Global Crossing, Ltd. (I) | | 2,167 | | 34,130 |
| Globalstar, Inc. (I) | | 5,806 | | 7,664 |
| Hughes Communications, Inc. (I) | | 675 | | 40,433 |
| IDT Corp., Class B | | 1,074 | | 27,956 |
| Iridium Communications, Inc. (I) | | 2,475 | | 23,265 |
| Neutral Tandem, Inc. (I)(L) | | 2,433 | | 41,848 |
| PAETEC Holding Corp. (I) | | 9,229 | | 35,070 |
| Premiere Global Services, Inc. (I) | | 4,485 | | 30,094 |
| Vonage Holdings Corp. (I) | | 7,613 | | 33,649 |
| | |
|
| | | | | 624,950 |
| Wireless Telecommunication Services - 0.13% | | | | |
| FiberTower Corp. (I) | | 3,653 | | 12,128 |
| ICO Global | | | | |
| Communications Holdings, Ltd. (I) | | 7,013 | | 16,060 |
| NTELOS Holdings Corp. | | 2,120 | | 41,170 |
| Shenandoah Telecommunications Company | | 1,723 | | 30,153 |
| USA Mobility, Inc. | | 1,638 | | 24,439 |
| | |
|
| | | | | 123,950 |
| | |
|
| | | | | 748,900 |
| Utilities - 2.84% | | | | |
| Electric Utilities - 1.16% | | | | |
| Allete, Inc. | | 2,243 | | 84,785 |
| Central Vermont Public Service Corp. | | 1,055 | | 22,429 |
| | | | |
| Small Cap Index Fund (continued) | | |
| | | Shares or | | |
| | | Principal | | |
| | | Amount | | Value |
| |
|
| |
| COMMON STOCKS (continued) | | | | |
| Electric Utilities (continued) | | | | |
| Cleco Corp. | | 4,301 | $ | 139,137 |
| El Paso Electric Company (I) | | 3,176 | | 89,246 |
| IDACORP, Inc. | | 3,411 | | 128,731 |
| MGE Energy, Inc. | | 1,649 | | 67,560 |
| Otter Tail Corp. | | 2,663 | | 59,971 |
| PNM Resources, Inc. | | 6,292 | | 83,747 |
| Portland General Electric Company | | 5,343 | | 125,133 |
| The Empire District Electric Company | | 2,949 | | 63,787 |
| UIL Holding Corp. | | 3,588 | | 110,295 |
| Unisource Energy Corp. | | 2,619 | | 95,489 |
| Unitil Corp. | | 926 | | 21,122 |
| | |
|
| | | | | 1,091,432 |
| Gas Utilities - 1.05% | | | | |
| Chesapeake Utilities Corp. | | 707 | | 28,874 |
| New Jersey Resources Corp. | | 2,893 | | 121,014 |
| Nicor, Inc. | | 3,188 | | 168,135 |
| Northwest Natural Gas Company | | 1,856 | | 87,232 |
| Piedmont Natural Gas Company, Inc. (L) | | 5,061 | | 148,287 |
| South Jersey Industries, Inc. | | 2,102 | | 115,316 |
| Southwest Gas Corp. | | 3,208 | | 124,695 |
| The Laclede Group, Inc. | | 1,589 | | 61,796 |
| WGL Holdings, Inc. | | 3,522 | | 133,836 |
| | |
|
| | | | | 989,185 |
| Independent Power Producers & Energy Traders - 0.05% | | |
| Dynegy, Inc. (I) | | 7,546 | | 43,691 |
| Multi-Utilities - 0.33% | | | | |
| Avista Corp. | | 3,916 | | 87,405 |
| Black Hills Corp. (L) | | 2,829 | | 87,190 |
| CH Energy Group, Inc. | | 1,187 | | 58,234 |
| NorthWestern Corp. | | 2,611 | | 77,573 |
| | |
|
| | | | | 310,402 |
| Water Utilities - 0.25% | | | | |
| American States Water Company | | 1,367 | | 45,849 |
| Artesian Resources Corp. | | 782 | | 15,280 |
| Cadiz, Inc. (I) | | 1,130 | | 14,464 |
| California Water Service Group | | 1,426 | | 50,309 |
| Connecticut Water Service, Inc. (L) | | 767 | | 19,551 |
| Consolidated Water Company, Ltd. | | 1,314 | | 14,349 |
| Middlesex Water Company | | 1,336 | | 25,077 |
| SJW Corp. | | 1,031 | | 25,589 |
| York Water Company | | 1,181 | | 20,042 |
| | |
|
| | | | | 230,510 |
| | |
|
| | | | | 2,665,220 |
|
| TOTAL COMMON STOCKS (Cost $53,889,239) | | $ | 89,124,036 |
|
| |
| CORPORATE BONDS - 0.00% | | | | |
| Financials - 0.00% | | | | |
| GAMCO Investors, Inc. | | | | |
| Zero Coupon 12/31/2015 | $ | 1,500 | $ | 964 |
|
| TOTAL CORPORATE BONDS (Cost $1,160) | | $ | 964 |
|
| |
| SECURITIES LENDING COLLATERAL - 9.34% | | |
| John Hancock Collateral | | | | |
| Investment Trust, 0.2855% (W)(Y) | | 875,413 | | 8,760,605 |
|
| TOTAL SECURITIES LENDING | | | | |
| COLLATERAL (Cost $8,760,429) | | | $ | 8,760,605 |
|
| |
| The accompanying notes are an integral part of the financial statements. | 211 |
John Hancock Funds II
Portfolio of Investments — February 28, 2011 (Unaudited) (showing percentage of total net assets)
| | | | |
| Small Cap Index Fund (continued) | | | |
| | | Shares or | | |
| | | Principal | | |
| | | Amount | | Value |
| |
|
| |
| SHORT-TERM INVESTMENTS - 4.58% | | | |
| Short-Term Securities* - 4.58% | | | | |
| Federal Home Loan Bank Discount Notes, | | | | |
| 0.0702%, 03/01/2011 | $ | 4,300,000 | $ | 4,300,000 |
|
| TOTAL SHORT-TERM INVESTMENTS (Cost $4,300,000) | | $ | 4,300,000 |
|
| Total Investments (Small Cap Index Fund) | | | |
| (Cost $66,950,828) - 108.95% | | | $ | 102,185,605 |
| Other assets and liabilities, net - (8.95%) | | | | (8,398,293) |
| | | |
|
| TOTAL NET ASSETS - 100.00% | | | $ | 93,787,312 |
| | | |
|
| |
| |
| |
| Small Cap Opportunities Fund | | | |
| | | Shares or | | |
| | | Principal | | |
| | | Amount | | Value |
| |
|
| |
| COMMON STOCKS - 98.48% | | | | |
| Consumer Discretionary - 15.31% | | | | |
| Auto Components - 1.75% | | | | |
| Dana Holding Corp. (I) | | 65,610 | $ | 1,238,717 |
| Dorman Products, Inc. (I) | | 142 | | 4,923 |
| Drew Industries, Inc. | | 2,900 | | 67,077 |
| Exide Technologies (I) | | 14,279 | | 169,920 |
| Federal Mogul Corp. (I) | | 1,584 | | 33,280 |
| Modine Manufacturing Company (I) | | 4,700 | | 69,560 |
| Motorcar Parts of America, Inc. (I) | | 2,990 | | 42,608 |
| Shiloh Industries, Inc. | | 1,546 | | 18,444 |
| Spartan Motors, Inc. | | 7,122 | | 45,225 |
| Standard Motor Products, Inc. | | 5,700 | | 66,291 |
| Superior Industries International, Inc. | | 6,650 | | 132,202 |
| TRW Automotive Holdings Corp. (I) | | 31,906 | | 1,812,261 |
| | |
|
| | | | | 3,700,508 |
| Distributors - 0.05% | | | | |
| Audiovox Corp., Class A (I) | | 2,806 | | 23,234 |
| Core-Mark Holding Company, Inc. (I) | | 2,690 | | 91,326 |
| | |
|
| | | | | 114,560 |
| Diversified Consumer Services - 0.25% | | | | |
| Cambium Learning Group, Inc. (I) | | 1,473 | | 5,273 |
| Carriage Services, Inc. (I) | | 403 | | 2,297 |
| Jackson Hewitt Tax Service, Inc. (I)(L) | | 2,200 | | 2,728 |
| Mac-Gray Corp. | | 693 | | 11,060 |
| Regis Corp. | | 11,767 | | 206,276 |
| Service Corp. International | | 27,375 | | 298,388 |
| Stewart Enterprises, Inc., Class A (L) | | 1,666 | | 12,695 |
| | |
|
| | | | | 538,717 |
| Hotels, Restaurants & Leisure - 4.09% | | | | |
| Bally Technologies, Inc. (I) | | 18,968 | | 732,734 |
| Benihana, Inc. (I) | | 700 | | 6,328 |
| Benihana, Inc., Class A (I) | | 1,322 | | 12,162 |
| Biglari Holdings, Inc. (I) | | 222 | | 94,963 |
| Bluegreen Corp. (I) | | 8,443 | | 36,220 |
| Bob Evans Farms, Inc. | | 6,300 | | 197,442 |
| Boyd Gaming Corp. (I)(L) | | 13,073 | | 139,750 |
| Brinker International, Inc. | | 43,439 | | 1,026,898 |
| Canterbury Park Holding Corp. (I) | | 100 | | 1,275 |
| Churchill Downs, Inc. | | 1,771 | | 73,957 |
| DineEquity, Inc. (I) | | 22,983 | | 1,314,857 |
| Dover Downs Gaming & Entertainment, Inc. | 2,392 | | 8,492 |
| Full House Resorts, Inc. (I) | | 482 | | 1,904 |
| Gaming Partners International Corp. | | 400 | | 2,956 |
| Gaylord Entertainment Company (I)(L) | | 9,200 | | 331,476 |
| Great Wolf Resorts, Inc. (I) | | 6,052 | | 16,643 |
| | | | |
| Small Cap Opportunities Fund (continued) | | |
| | | Shares or | | |
| | | Principal | | |
| | | Amount | | Value |
| | |
|
| |
| COMMON STOCKS (continued) | | | | |
| Hotels, Restaurants & Leisure (continued) | | | | |
| International Speedway Corp., Class A | | 5,732 | $ | 158,891 |
| Isle of Capri Casinos, Inc. (I) | | 7,512 | | 69,486 |
| Lakes Gaming, Inc. (I) | | 4,339 | | 11,629 |
| Life Time Fitness, Inc. (I) | | 6,300 | | 241,605 |
| Luby’s, Inc. (I) | | 7,323 | | 39,178 |
| Marcus Corp. | | 4,570 | | 59,501 |
| McCormick & Schmick’s | | | | |
| Seafood Restaurants, Inc. (I) | | 2,184 | | 22,430 |
| Monarch Casino & Resort, Inc. (I) | | 2,300 | | 24,035 |
| MTR Gaming Group, Inc. (I) | | 3,801 | | 10,225 |
| Multimedia Games, Inc. (I) | | 1,794 | | 9,867 |
| O’Charley’s, Inc. (I) | | 5,687 | | 36,112 |
| Orient-Express Hotels, Ltd., Class A (I) | | 11,800 | | 148,916 |
| P.F. Chang’s China Bistro, Inc. (L) | | 17,311 | | 803,923 |
| Papa John’s International, Inc. (I) | | 21,508 | | 627,603 |
| Penn National Gaming, Inc. (I) | | 8,043 | | 287,698 |
| Pinnacle Entertainment, Inc. (I) | | 8,929 | | 117,238 |
| Red Robin Gourmet Burgers, Inc. (I) | | 3,900 | | 93,054 |
| Rick’s Cabaret International, Inc. (I) | | 2,792 | | 30,377 |
| Ruby Tuesday, Inc. (I) | | 13,125 | | 175,350 |
| Ruth’s Hospitality Group, Inc. (I)(L) | | 2,390 | | 11,974 |
| Speedway Motorsports, Inc. (L) | | 7,516 | | 109,884 |
| Texas Roadhouse, Inc., Class A | | 61,695 | | 1,047,581 |
| Vail Resorts, Inc. (I) | | 5,349 | | 261,031 |
| Wendy’s/Arby’s Group, Inc., Class A | | 35,500 | | 168,980 |
| Wyndham Worldwide Corp. | | 2,892 | | 90,462 |
| | |
|
| | | | | 8,655,087 |
| Household Durables - 1.40% | | | | |
| Acme United Corp. | | 300 | | 3,015 |
| Bassett Furniture Industries, Inc. (I) | | 1,320 | | 8,910 |
| Beazer Homes USA, Inc. (I)(L) | | 18,820 | | 87,513 |
| Blyth, Inc. | | 1,011 | | 34,748 |
| Brookfield Homes Corp. (I) | | 6,073 | | 88,484 |
| Cavco Industries, Inc. (I) | | 648 | | 26,451 |
| CSS Industries, Inc. | | 649 | | 11,358 |
| Emerson Radio Corp. | | 6,514 | | 17,132 |
| Ethan Allen Interiors, Inc. (L) | | 51,914 | | 1,144,704 |
| Furniture Brands International, Inc. (I) | | 11,907 | | 52,153 |
| Helen of Troy, Ltd. (I) | | 6,300 | | 175,959 |
| Hooker Furniture Corp. | | 2,945 | | 40,111 |
| Jarden Corp. | | 2,206 | | 72,511 |
| Kid Brands, Inc. (I) | | 2,309 | | 21,612 |
| La-Z-Boy, Inc. (I) | | 7,801 | | 78,322 |
| Lennar Corp., Class A (L) | | 13,300 | | 268,128 |
| Lennar Corp., Class B | | 1,665 | | 27,323 |
| Lifetime Brands, Inc. | | 120 | | 1,441 |
| M/I Homes, Inc. (I) | | 4,200 | | 56,070 |
| Meritage Homes Corp. (I) | | 2,200 | | 56,782 |
| Mohawk Industries, Inc. (I) | | 8,400 | | 488,124 |
| Palm Harbor Homes, Inc. (I) | | 130 | | 7 |
| Ryland Group, Inc. | | 4,400 | | 76,384 |
| Skyline Corp. | | 705 | | 14,163 |
| Standard Pacific Corp. (I) | | 12,794 | | 51,176 |
| Stanley Furniture Company, Inc. (I)(L) | | 2,115 | | 11,633 |
| Toll Brothers, Inc. (I) | | 2,320 | | 49,323 |
| | |
|
| | | | | 2,963,537 |
| Internet & Catalog Retail - 0.03% | | | | |
| 1-800-Flowers.com, Inc., Class A (I) | | 5,890 | | 16,139 |
| dELiA*s, Inc. (I) | | 3,000 | | 5,910 |
| Gaiam, Inc., Class A | | 3,680 | | 28,152 |
| ValueVision Media, Inc. (I) | | 1,164 | | 7,787 |
| | |
|
| | | | | 57,988 |
| |
| The accompanying notes are an integral part of the financial statements. | 212 |
John Hancock Funds II
Portfolio of Investments — February 28, 2011 (Unaudited) (showing percentage of total net assets)
| | | | |
| Small Cap Opportunities Fund (continued) | | |
| | | Shares or | | |
| | | Principal | | |
| | | Amount | | Value |
| | |
|
| |
| COMMON STOCKS (continued) | | | | |
| Leisure Equipment & Products - 0.20% | | | | |
| Arctic Cat, Inc. (I) | | 2,970 | $ | 37,749 |
| Callaway Golf Company | | 12,707 | | 98,352 |
| Jakks Pacific, Inc. (I) | | 5,577 | | 103,955 |
| Leapfrog Enterprises, Inc. (I) | | 3,876 | | 16,822 |
| RC2 Corp. (I) | | 2,943 | | 63,893 |
| Smith & Wesson Holding Corp. (I) | | 7,968 | | 31,792 |
| Steinway Musical Instruments, Inc. (I) | | 2,960 | | 63,581 |
| The Nautilus Group, Inc. (I) | | 2,700 | | 7,182 |
| | |
|
| | | | | 423,326 |
| Media - 1.82% | | | | |
| AH Belo Corp. (I) | | 4,621 | | 33,225 |
| Ascent Media Corp., Class A (I) | | 3,374 | | 140,763 |
| Beasley Broadcasting Group, Inc. (I) | | 447 | | 2,740 |
| Cinemark Holdings, Inc. | | 9,951 | | 199,816 |
| CKX, Inc. (I) | | 3,100 | | 10,943 |
| Clear Channel Outdoor | | | | |
| Holdings, Inc., Class A (I) | | 2,442 | | 35,995 |
| EW Scripps Company (I) | | 10,882 | | 104,141 |
| Fisher Communications, Inc. (I) | | 2,124 | | 56,838 |
| Gannett Company, Inc. | | 12,178 | | 201,059 |
| Gray Television, Inc. (I) | | 5,000 | | 11,100 |
| Harte-Hanks, Inc. | | 9,457 | | 120,009 |
| Journal Communications, Inc., Class A (I) | | 8,668 | | 53,222 |
| Lee Enterprises, Inc. (I)(L) | | 6,700 | | 19,899 |
| Liberty Media Corp. - Capital, Series A (I) | | 8,389 | | 608,706 |
| Live Nation Entertainment, Inc. (I) | | 11,624 | | 123,563 |
| Madison Square Garden, Inc., Class A (I) | | 2,055 | | 58,691 |
| Martha Stewart Living | | | | |
| Omnimedia, Inc., Class A (I) | | 3,000 | | 12,300 |
| Media General, Inc., Class A (I)(L) | | 5,000 | | 34,200 |
| New Frontier Media, Inc. (I) | | 1,891 | | 3,990 |
| Outdoor Channel Holdings, Inc. | | 1,315 | | 10,296 |
| Radio One, Inc., Class D (I) | | 1,892 | | 4,200 |
| Salem Communications Corp., Class A | | 1,200 | | 5,064 |
| The Interpublic Group of Companies, Inc. | | 108,085 | | 1,426,722 |
| The McClatchy Company, Class A (I)(L) | | 14,872 | | 59,637 |
| The Washington Post Company, Class B (L) | | 1,176 | | 509,314 |
| | |
|
| | | | | 3,846,433 |
| Multiline Retail - 1.13% | | | | |
| Dillard’s, Inc., Class A (L) | | 43,289 | | 1,832,856 |
| Fred’s, Inc., Class A | | 10,002 | | 137,828 |
| Retail Ventures, Inc. (I) | | 6,471 | | 113,243 |
| Saks, Inc. (I)(L) | | 22,686 | | 277,904 |
| Tuesday Morning Corp. (I) | | 4,400 | | 20,548 |
| | |
|
| | | | | 2,382,379 |
| Specialty Retail - 3.53% | | | | |
| A.C. Moore Arts & Crafts, Inc. (I) | | 3,277 | | 10,536 |
| Americas Car-Mart, Inc. (I) | | 1,101 | | 27,283 |
| Asbury Automotive Group, Inc. (I) | | 3,500 | | 64,575 |
| AutoNation, Inc. (I)(L) | | 11,100 | | 373,404 |
| Barnes & Noble, Inc. (I)(L) | | 9,129 | | 122,237 |
| Bebe Stores, Inc. | | 16,985 | | 100,212 |
| Books-A-Million, Inc. | | 2,241 | | 13,267 |
| Borders Group, Inc. (I) | | 1,861 | | 471 |
| Brown Shoe Company, Inc. | | 6,762 | | 104,811 |
| Build-A-Bear Workshop, Inc. (I) | | 5,089 | | 33,689 |
| Cabela’s, Inc. (I) | | 8,792 | | 238,527 |
| Cache, Inc. (I) | | 2,290 | | 9,068 |
| Casual Male Retail Group, Inc. (I) | | 5,983 | | 25,547 |
| Charming Shoppes, Inc. (I) | | 17,375 | | 56,816 |
| Christopher & Banks Corp. | | 8,227 | | 50,267 |
| Collective Brands, Inc. (I) | | 4,984 | | 113,635 |
| Conn’s, Inc. (I)(L) | | 7,677 | | 34,163 |
| | | | |
| Small Cap Opportunities Fund (continued) | | |
| | | Shares or | | |
| | | Principal | | |
| | | Amount | | Value |
| | |
|
| |
| COMMON STOCKS (continued) | | | | |
| Specialty Retail (continued) | | | | |
| Cost Plus, Inc. (I) | | 2,370 | $ | 22,349 |
| Destination Maternity Corp. | | 200 | | 9,020 |
| Foot Locker, Inc. | | 16,400 | | 325,868 |
| GameStop Corp., Class A (I) | | 4,200 | | 83,790 |
| Genesco, Inc. (I) | | 30,880 | | 1,220,378 |
| Golfsmith International Holdings, Inc. (I) | | 700 | | 3,010 |
| Group 1 Automotive, Inc. (L) | | 3,100 | | 130,975 |
| Haverty Furniture Companies, Inc. | | 4,600 | | 61,180 |
| Hot Topic, Inc. | | 9,900 | | 52,965 |
| Jo-Ann Stores, Inc. (I) | | 2,944 | | 178,701 |
| Lithia Motors, Inc., Class A | | 5,348 | | 80,969 |
| MarineMax, Inc. (I) | | 5,338 | | 48,202 |
| New York & Company, Inc. (I) | | 3,700 | | 25,715 |
| Pacific Sunwear of California, Inc. (I) | | 15,200 | | 68,552 |
| Penske Automotive Group, Inc. (I)(L) | | 62,505 | | 1,273,227 |
| Pep Boys - Manny, Moe & Jack | | 9,800 | | 122,794 |
| Rent-A-Center, Inc. | | 13,500 | | 446,310 |
| Shoe Carnival, Inc. (I) | | 3,144 | | 81,555 |
| Sonic Automotive, Inc. | | 6,465 | | 92,967 |
| Stage Stores, Inc. | | 9,100 | | 158,704 |
| Stein Mart, Inc. | | 5,906 | | 48,370 |
| Systemax, Inc. (I) | | 4,045 | | 55,255 |
| The Finish Line, Inc., Class A | | 59,724 | | 1,042,781 |
| The Men’s Wearhouse, Inc. | | 10,200 | | 272,340 |
| The Wet Seal, Inc., Class A (I) | | 23,505 | | 93,315 |
| West Marine, Inc. (I) | | 5,185 | | 54,080 |
| Zale Corp. (I)(L) | | 8,357 | | 34,431 |
| | |
|
| | | | | 7,466,311 |
| Textiles, Apparel & Luxury Goods - 1.06% | | | | |
| Delta Apparel, Inc. (I) | | 330 | | 4,333 |
| Heelys, Inc. (I) | | 1,265 | | 3,491 |
| Iconix Brand Group, Inc. (I) | | 14,828 | | 327,699 |
| K-Swiss, Inc., Class A (I) | | 2,617 | | 26,196 |
| Kenneth Cole Productions, Inc., Class A (I) | | 2,300 | | 29,900 |
| Lacrosse Footwear, Inc. (L) | | 1,274 | | 22,091 |
| Lakeland Industries, Inc. (I) | | 700 | | 5,670 |
| Lazare Kaplan International, Inc. (I) | | 200 | | 300 |
| Movado Group, Inc. (I)(L) | | 4,100 | | 57,687 |
| Perry Ellis International, Inc. (I) | | 2,600 | | 75,504 |
| Phillips-Van Heusen Corp. (L) | | 19,553 | | 1,173,376 |
| Quiksilver, Inc. (I)(L) | | 20,460 | | 88,183 |
| RG Barry Corp. | | 1,273 | | 13,825 |
| Rocky Brands, Inc. (I) | | 545 | | 7,952 |
| Skechers U.S.A., Inc., Class A (I) | | 1,756 | | 36,490 |
| Tandy Brands Accessories, Inc. (I) | | 100 | | 301 |
| The Jones Group, Inc. | | 4,200 | | 55,860 |
| The Timberland Company, Class A (I) | | 6,496 | | 239,962 |
| Unifi, Inc. (I) | | 4,466 | | 84,809 |
| | |
|
| | | | | 2,253,629 |
| | | |
|
| | | | | 32,402,475 |
| Consumer Staples - 3.56% | | | | |
| Beverages - 0.23% | | | | |
| Central European Distribution Corp. (I) | | 5,941 | | 135,752 |
| Coca-Cola Bottling Company Consolidated | | 570 | | 32,889 |
| Constellation Brands, Inc., Class A (I) | | 13,013 | | 264,424 |
| Craft Brewers Alliance, Inc. (I) | | 2,766 | | 22,266 |
| Heckmann Corp. (I) | | 550 | | 3,146 |
| MGP Ingredients, Inc. | | 3,926 | | 35,687 |
| | |
|
| | | | | 494,164 |
| Food & Staples Retailing - 0.32% | | | | |
| Ingles Markets, Inc. | | 3,101 | | 59,632 |
| Nash Finch Company | | 2,459 | | 99,270 |
| |
| The accompanying notes are an integral part of the financial statements. | 213 |
John Hancock Funds II
Portfolio of Investments — February 28, 2011 (Unaudited) (showing percentage of total net assets)
| | | | |
| Small Cap Opportunities Fund (continued) | | |
| | | Shares or | | |
| | | Principal | | |
| | | Amount | | Value |
| | |
|
| |
| COMMON STOCKS (continued) | | | | |
| Food & Staples Retailing (continued) | | | | |
| Spartan Stores, Inc. | | 5,492 | $ | 82,764 |
| SUPERVALU, Inc. | | 1,500 | | 12,945 |
| Susser Holdings Corp. (I) | | 3,944 | | 54,624 |
| The Andersons, Inc. | | 2,861 | | 137,442 |
| The Pantry, Inc. (I) | | 5,183 | | 81,684 |
| Weis Markets, Inc. | | 1,721 | | 68,272 |
| Winn-Dixie Stores, Inc. (I)(L) | | 11,287 | | 78,783 |
| | |
|
| | | | | 675,416 |
| Food Products - 2.65% | | | | |
| Alico, Inc. | | 490 | | 12,990 |
| B&G Foods, Inc. (L) | | 6,392 | | 95,880 |
| Chiquita Brands International, Inc. (I) | | 5,723 | | 98,378 |
| Corn Products International, Inc. | | 23,753 | | 1,159,621 |
| Darling International, Inc. (I) | | 74,606 | | 1,036,277 |
| Del Monte Foods Company | | 15,777 | | 298,659 |
| Dole Food Company, Inc. (I)(L) | | 9,737 | | 143,621 |
| Farmer Brothers Company | | 100 | | 1,313 |
| Fresh Del Monte Produce, Inc. | | 12,485 | | 356,821 |
| HQ Sustainable Maritime Industries, Inc. (I) | | 3,233 | | 13,223 |
| Imperial Sugar Company | | 3,070 | | 33,156 |
| Omega Protein Corp. (I) | | 4,810 | | 55,267 |
| Ralcorp Holdings, Inc. (I)(L) | | 5,500 | | 356,675 |
| Seneca Foods Corp., Class A (I) | | 2,016 | | 56,710 |
| Smart Balance, Inc. (I) | | 911 | | 3,954 |
| Smithfield Foods, Inc. (I) | | 19,535 | | 452,235 |
| Tasty Baking Company | | 900 | | 2,646 |
| The Hain Celestial Group, Inc. (I) | | 9,339 | | 278,489 |
| TreeHouse Foods, Inc. (I)(L) | | 22,142 | | 1,155,148 |
| | |
|
| | | | | 5,611,063 |
| Household Products - 0.09% | | | | |
| Central Garden & Pet Company (I) | | 3,500 | | 31,955 |
| Central Garden & Pet Company, Class A (I) | | 9,400 | | 86,574 |
| Oil-Dri Corp of America | | 1,255 | | 25,489 |
| Orchids Paper Products Company | | 100 | | 1,241 |
| Spectrum Brands Holdings, Inc. (I) | | 1,699 | | 48,761 |
| | |
|
| | | | | 194,020 |
| Personal Products - 0.16% | | | | |
| CCA Industries, Inc. | | 400 | | 2,236 |
| Elizabeth Arden, Inc. (I) | | 5,100 | | 148,359 |
| Inter Parfums, Inc. | | 78 | | 1,409 |
| Mannatech, Inc. (I) | | 838 | | 1,617 |
| Nutraceutical International Corp. (I) | | 2,456 | | 36,349 |
| Parlux Fragrances, Inc. (I) | | 5,083 | | 16,215 |
| Physicians Formula Holdings, Inc. (I) | | 100 | | 380 |
| Prestige Brands Holdings, Inc. (I) | | 11,737 | | 129,342 |
| | |
|
| | | | | 335,907 |
| Tobacco - 0.11% | | | | |
| Alliance One International, Inc. (I)(L) | | 21,651 | | 78,593 |
| Universal Corp. | | 3,700 | | 154,734 |
| | |
|
| | | | | 233,327 |
| | | |
|
| | | | | 7,543,897 |
| Energy - 10.37% | | | | |
| Energy Equipment & Services - 5.87% | | | | |
| Basic Energy Services, Inc. (I) | | 9,920 | | 190,266 |
| Bolt Technology Corp. (I) | | 959 | | 13,858 |
| Bristow Group, Inc. (I) | | 7,457 | | 357,339 |
| Bronco Drilling Company, Inc. (I) | | 7,054 | | 63,133 |
| Cal Dive International, Inc. (I) | | 6,744 | | 46,399 |
| Complete Production Services, Inc. (I) | | 10,837 | | 312,214 |
| Dawson Geophysical Company (I) | | 1,849 | | 92,302 |
| Dresser-Rand Group, Inc. (I) | | 23,157 | | 1,141,177 |
| | | | |
| Small Cap Opportunities Fund (continued) | | |
| | | Shares or | | |
| | | Principal | | |
| | | Amount | | Value |
| | |
|
| |
| COMMON STOCKS (continued) | | | | |
| Energy Equipment & Services (continued) | | | | |
| ENGlobal Corp. (I) | | 267 | $ | 1,279 |
| Exterran Holdings, Inc. (I) | | 9,219 | | 209,271 |
| Geokinetics, Inc. (I) | | 1,068 | | 11,032 |
| Global Industries, Ltd. (I) | | 19,600 | | 176,008 |
| Gulf Islands Fabrication, Inc. | | 3,360 | | 104,059 |
| Gulfmark Offshore, Inc., Class A (I) | | 5,420 | | 240,540 |
| Helix Energy Solutions Group, Inc. (I)(L) | | 22,253 | | 342,696 |
| Helmerich & Payne, Inc. | | 1,700 | | 110,483 |
| Hercules Offshore, Inc. (I) | | 20,463 | | 101,087 |
| Hornbeck Offshore Services, Inc. (I)(L) | | 5,800 | | 164,778 |
| Key Energy Services, Inc. (I) | | 18,999 | | 294,485 |
| Lufkin Industries, Inc. | | 16,839 | | 1,315,968 |
| Matrix Service Company (I) | | 5,600 | | 78,176 |
| Mitcham Industries, Inc. (I) | | 2,445 | | 27,091 |
| Natural Gas Services Group, Inc. (I) | | 3,136 | | 60,650 |
| Newpark Resources, Inc. (I) | | 14,056 | | 98,111 |
| Oceaneering International, Inc. (I)(L) | | 13,625 | | 1,139,459 |
| Oil States International, Inc. (I) | | 8,316 | | 605,322 |
| Parker Drilling Company (I) | | 16,600 | | 87,316 |
| Patterson-UTI Energy, Inc. | | 56,144 | | 1,534,977 |
| PHI, Inc. (I) | | 2,500 | | 53,750 |
| Pioneer Drilling Company (I) | | 13,710 | | 155,197 |
| Rowan Companies, Inc. (I) | | 11,000 | | 469,370 |
| SEACOR Holdings, Inc. | | 5,000 | | 473,850 |
| Superior Energy Services, Inc. (I) | | 29,401 | | 1,126,352 |
| TetraTechnologies, Inc. (I) | | 7,049 | | 97,347 |
| TGC Industries, Inc. (I) | | 2,854 | | 19,122 |
| Tidewater, Inc. | | 6,200 | | 385,702 |
| Trico Marine Services, Inc. (I) | | 3,000 | | 360 |
| Union Drilling, Inc. (I) | | 5,316 | | 41,146 |
| Unit Corp. (I) | | 10,500 | | 624,750 |
| Willbros Group, Inc. (I) | | 3,944 | | 44,804 |
| | |
|
| | | | | 12,411,226 |
| Oil, Gas & Consumable Fuels - 4.50% | | | | |
| Alon USA Energy, Inc. (L) | | 8,155 | | 90,357 |
| Approach Resources, Inc. (I) | | 4,993 | | 162,522 |
| Atlas Energy LP | | 2,064 | | 34,027 |
| ATP Oil & Gas Corp. (I) | | 885 | | 17,974 |
| Berry Petroleum Company, Class A | | 7,500 | | 389,925 |
| Bill Barrett Corp. (I) | | 5,456 | | 212,129 |
| BioFuel Energy Corp. (I) | | 4,818 | | 4,167 |
| Clayton Williams Energy, Inc. (I) | | 1,200 | | 127,296 |
| Crimson Exploration, Inc. (I) | | 5,173 | | 22,399 |
| Crosstex Energy, Inc. (L) | | 10,600 | | 108,968 |
| CVR Energy, Inc. (I) | | 13,091 | | 247,420 |
| Delek US Holdings, Inc. | | 9,762 | | 109,823 |
| DHT Holdings, Inc. (L) | | 11,039 | | 51,331 |
| Double Eagle Petroleum & | | | | |
| Mining Company (I) | | 900 | | 9,819 |
| Energy Partners, Ltd. (I) | | 8,764 | | 143,467 |
| Forest Oil Corp. (I) | | 28,091 | | 996,950 |
| Frontier Oil Corp. | | 74,679 | | 2,083,544 |
| General Maritime Corp. (L) | | 8,231 | | 23,047 |
| Georesources, Inc. (I) | | 2,359 | | 74,238 |
| Green Plains Renewable Energy, Inc. (I)(L) | | 1,673 | | 20,461 |
| Harvest Natural Resources, Inc. (I)(L) | | 7,631 | | 113,702 |
| HKN, Inc. (I) | | 200 | | 680 |
| International Coal Group, Inc. (I)(L) | | 31,300 | | 308,931 |
| James River Coal Company (I)(L) | | 40,070 | | 841,470 |
| Overseas Shipholding Group, Inc. (L) | | 4,418 | | 149,152 |
| Patriot Coal Corp. (I) | | 3,300 | | 77,880 |
| Penn Virginia Corp. | | 3,100 | | 50,437 |
| Petroleum Development Corp. (I) | | 4,460 | | 209,308 |
| Petroquest Energy, Inc. (I) | | 6,000 | | 51,720 |
| |
| The accompanying notes are an integral part of the financial statements. | 214 |
John Hancock Funds II
Portfolio of Investments — February 28, 2011 (Unaudited) (showing percentage of total net assets)
| | | | |
| Small Cap Opportunities Fund (continued) | | |
| | | Shares or | | |
| | | Principal | | |
| | | Amount | | Value |
| | |
|
| |
| COMMON STOCKS (continued) | | | | |
| Oil, Gas & Consumable Fuels (continued) | | | | |
| Plains Exploration & Production Company (I) | | 5,221 | $ | 204,507 |
| Rex Energy Corp. (I) | | 4,079 | | 51,395 |
| SandRidge Energy, Inc. (I)(L) | | 85,305 | | 922,147 |
| Sunoco, Inc. | | 2,500 | | 104,650 |
| Swift Energy Company (I) | | 4,796 | | 205,988 |
| Teekay Corp. (L) | | 8,700 | | 299,367 |
| Tesoro Corp. (I) | | 21,000 | | 499,380 |
| USEC, Inc. (I)(L) | | 23,391 | | 124,440 |
| Warren Resources, Inc. (I) | | 7,110 | | 34,981 |
| Western Refining, Inc. (I)(L) | | 21,251 | | 345,754 |
| | |
|
| | | | | 9,525,753 |
| | | |
|
| | | | | 21,936,979 |
| Financials - 19.33% | | | | |
| Capital Markets - 2.00% | | | | |
| Affiliated Managers Group, Inc. (I) | | 8,522 | | 909,724 |
| American Capital, Ltd. (I) | | 26,254 | | 245,212 |
| Calamos Asset Management, Inc. | | 700 | | 11,606 |
| Capital Southwest Corp. | | 697 | | 69,658 |
| Cowen Group, Inc., Class A (I) | | 19,163 | | 82,018 |
| E*TRADE Financial Corp. (I) | | 13,535 | | 216,289 |
| FirstCity Financial Corp. (I) | | 400 | | 2,824 |
| GFI Group, Inc. | | 7,507 | | 37,535 |
| Gleacher & Company, Inc. (I) | | 4,718 | | 9,059 |
| Harris & Harris Group, Inc. (I) | | 7,423 | | 43,425 |
| Internet Capital Group, Inc. (I) | | 4,360 | | 59,688 |
| INTL FCStone, Inc. (I) | | 1,633 | | 39,535 |
| Investment Technology Group, Inc. (I) | | 7,631 | | 146,134 |
| JMP Group, Inc. | | 3,000 | | 25,620 |
| KBW, Inc. (L) | | 30,909 | | 790,961 |
| Knight Capital Group, Inc., Class A (I) | | 1,243 | | 17,414 |
| LaBranche & Company, Inc. (I) | | 9,046 | | 37,993 |
| MCG Capital Corp. | | 19,353 | | 141,277 |
| Medallion Financial Corp. | | 3,955 | | 32,036 |
| MF Global Holdings, Ltd. (I) | | 26,200 | | 227,154 |
| Oppenheimer Holdings, Inc., Class A | | 1,138 | | 37,349 |
| Penson Worldwide, Inc. (I)(L) | | 4,893 | | 32,196 |
| Piper Jaffray Companies (I) | | 300 | | 12,345 |
| Safeguard Scientifics, Inc. (I) | | 4,031 | | 84,570 |
| Sanders Morris Harris Group, Inc. | | 4,208 | | 29,582 |
| SEI Investments Company | | 37,206 | | 856,110 |
| SWS Group, Inc. | | 4,200 | | 22,638 |
| TradeStation Group, Inc. (I) | | 823 | | 5,539 |
| | |
|
| | | | | 4,225,491 |
| Commercial Banks - 6.72% | | | | |
| 1st Source Corp. | | 3,784 | | 74,053 |
| 1st United Bancorp, Inc. (I) | | 1,200 | | 7,704 |
| American National Bankshares, Inc. | | 48 | | 1,045 |
| Ameris Bancorp (I)(L) | | 2,190 | | 22,097 |
| Associated-Banc Corp. | | 72,807 | | 1,053,517 |
| BancFirst Corp. | | 14,850 | | 624,294 |
| Bancorp Rhode Island, Inc. | | 221 | | 6,964 |
| Bancorp, Inc. (I) | | 5,697 | | 48,311 |
| BancTrust Financial Group, Inc. (I)(L) | | 2,912 | | 7,688 |
| Bank of Florida Corp. (I) | | 2,087 | | 49 |
| Banner Corp. | | 2,606 | | 6,411 |
| Boston Private Financial Holdings, Inc. | | 13,212 | | 93,673 |
| Cadence Financial Corp. (I) | | 768 | | 1,920 |
| Cape Bancorp, Inc. (I) | | 443 | | 4,386 |
| Capital City Bank Group, Inc. | | 3,058 | | 38,439 |
| CapitalSource, Inc. | | 13,100 | | 99,298 |
| Capitol Bancorp, Ltd. (I)(L) | | 1,108 | | 166 |
| Cardinal Financial Corp. | | 4,974 | | 55,361 |
| Cascade Financial Corp. (I)(L) | | 800 | | 456 |
| | | | |
| Small Cap Opportunities Fund (continued) | | |
| | | Shares or | | |
| | | Principal | | |
| | | Amount | | Value |
| | |
|
| |
| COMMON STOCKS (continued) | | | | |
| Commercial Banks (continued) | | | | |
| Cathay General Bancorp | | 16,481 | $ | 292,043 |
| Center Bancorp, Inc. | | 785 | | 7,206 |
| Center Financial Corp. (I) | | 6,298 | | 50,195 |
| Centerstate Banks, Inc. | | 2,800 | | 20,300 |
| Central Pacific Financial Corp. (I) | | 92 | | 2,199 |
| Central Pacific Financial Corp. (I) | | 92 | | 1,673 |
| Chemical Financial Corp. | | 2,400 | | 48,288 |
| City Holding Company (L) | | 1,045 | | 35,791 |
| City National Corp. | | 400 | | 23,564 |
| CoBiz Financial, Inc. | | 8,144 | | 53,099 |
| Columbia Banking System, Inc. (L) | | 45,422 | | 901,172 |
| Commerce Bancshares, Inc. | | 19,927 | | 800,268 |
| Community Bank Systems, Inc. (L) | | 5,200 | | 130,832 |
| Community Trust Bancorp, Inc. | | 22,015 | | 629,849 |
| Crescent Financial Corp. (I) | | 510 | | 2,081 |
| CVB Financial Corp. | | 3,200 | | 26,752 |
| Danvers Bancorp, Inc. | | 1,684 | | 36,779 |
| East West Bancorp, Inc. | | 57,075 | | 1,325,282 |
| Encore Bancshares, Inc. (I) | | 1,486 | | 18,204 |
| Enterprise Financial Services Corp. (L) | | 3,305 | | 43,692 |
| Fidelity Southern Corp. (I) | | 753 | | 6,386 |
| Financial Institutions, Inc. | | 1,180 | | 22,762 |
| First BanCorp/Puerto Rico (I) | | 378 | | 1,754 |
| First Bancorp/Troy NC | | 3,981 | | 58,680 |
| First Busey Corp. | | 5,925 | | 30,040 |
| First California Financial Group, Inc. (I) | | 2,100 | | 7,791 |
| First Commonwealth Financial Corp. | | 18,527 | | 121,352 |
| First Community Bancshares, Inc. | | 2,035 | | 25,051 |
| First Financial Bancorp | | 2,000 | | 33,860 |
| First Financial Corp./Indiana | | 1,041 | | 33,739 |
| First Horizon National Corp. | | 19,542 | | 224,733 |
| First Merchants Corp. (L) | | 5,559 | | 49,420 |
| First Midwest Bancorp, Inc. | | 11,464 | | 138,370 |
| First Security Group, Inc. (I) | | 1,566 | | 1,284 |
| First South Bancorp, Inc. (I) | | 777 | | 4,196 |
| FNB Corp. | | 21,938 | | 220,038 |
| FNB United Corp. (I) | | 1,184 | | 414 |
| Fulton Financial Corp. | | 14,960 | | 162,914 |
| Glacier Bancorp, Inc. | | 2,400 | | 37,512 |
| Great Southern Bancorp, Inc. (L) | | 1,385 | | 29,681 |
| Greene County Bancshares, Inc. (I)(L) | | 3,216 | | 11,031 |
| Hampden Bancorp, Inc. | | 942 | | 11,690 |
| Hanmi Financial Corp. (I) | | 6,186 | | 7,733 |
| Heartland Financial USA, Inc. | | 1,787 | | 30,325 |
| Heritage Commerce Corp. (I) | | 1,454 | | 6,572 |
| Home Bancorp, Inc. (I) | | 1,531 | | 22,230 |
| Home Bancshares, Inc. | | 820 | | 18,475 |
| IBERIABANK Corp. | | 1,900 | | 108,851 |
| Independent Bank Corp. (L) | | 3,998 | | 108,706 |
| Independent Bank Corp. - Michigan (I) | | 2,100 | | 8,190 |
| International Bancshares Corp. (L) | | 12,800 | | 244,352 |
| Intervest Bancshares Corp. (I) | | 337 | | 920 |
| Investors Bancorp, Inc. (I) | | 238 | | 3,223 |
| Lakeland Bancorp, Inc. | | 4,194 | | 40,388 |
| Lakeland Financial Corp. | | 1,505 | | 33,742 |
| Macatawa Bank Corp. (I)(L) | | 400 | | 1,504 |
| MainSource Financial Group, Inc. (L) | | 4,787 | | 47,583 |
| Marshall & Ilsley Corp. | | 33,400 | | 259,518 |
| MB Financial, Inc. | | 9,169 | | 188,606 |
| MBT Financial Corp. (I) | | 1,037 | | 1,794 |
| Mercantile Bank Corp. (I) | | 938 | | 7,795 |
| Metro Bancorp, Inc. (I) | | 1,942 | | 23,809 |
| Midsouth Bancorp, Inc. | | 91 | | 1,291 |
| MidWestOne Financial Group, Inc. | | 305 | | 4,423 |
| Nara Bancorp, Inc. (I) | | 5,517 | | 57,818 |
| |
| The accompanying notes are an integral part of the financial statements. | 215 |
John Hancock Funds II
Portfolio of Investments — February 28, 2011 (Unaudited) (showing percentage of total net assets)
| | | | |
| Small Cap Opportunities Fund (continued) | | |
| | | Shares or | | |
| | | Principal | | |
| | | Amount | | Value |
| | |
|
| |
| COMMON STOCKS (continued) | | | | |
| Commercial Banks (continued) | | | | |
| National Penn Bancshares, Inc. | | 22,952 | $ | 182,239 |
| NBT Bancorp, Inc. | | 1,063 | | 23,652 |
| NewBridge Bancorp. (I) | | 300 | | 1,539 |
| North Valley Bancorp (I) | | 43 | | 452 |
| Northrim BanCorp, Inc. | | 492 | | 9,136 |
| Old National Bancorp | | 5,001 | | 56,011 |
| Old Second Bancorp, Inc. (L) | | 2,154 | | 2,219 |
| OmniAmerican Bancorp, Inc. (I) | | 1,002 | | 15,701 |
| Oriental Financial Group, Inc. | | 3,385 | | 40,518 |
| Pacific Capital Bancorp (I)(L) | | 777 | | 22,479 |
| Pacific Continental Corp. | | 1,881 | | 18,942 |
| Pacific Mercantile Bancorp (I)(L) | | 1,399 | | 6,477 |
| PacWest Bancorp (L) | | 1,100 | | 22,781 |
| Park National Corp. | | 500 | | 32,915 |
| Peoples Bancorp, Inc. | | 2,917 | | 39,409 |
| Pinnacle Financial Partners, Inc. (I)(L) | | 7,190 | | 114,681 |
| Popular, Inc. (I) | | 64,101 | | 208,328 |
| Porter Bancorp, Inc. | | 735 | | 6,189 |
| Preferred Bank/Los Angeles CA (I) | | 866 | | 1,308 |
| PrivateBancorp, Inc. | | 200 | | 2,864 |
| Renasant Corp. (L) | | 5,927 | | 95,247 |
| Republic Bancorp, Inc., Class A | | 34 | | 583 |
| Republic First Bancorp, Inc. (I) | | 431 | | 1,263 |
| S&T Bancorp, Inc. | | 3,300 | | 73,590 |
| Sandy Spring Bancorp, Inc. | | 2,720 | | 51,925 |
| SCBT Financial Corp. | | 1,000 | | 32,390 |
| Seacoast Banking Corp. of Florida (I) | | 3,000 | | 4,920 |
| Shore Bancshares, Inc. | | 600 | | 5,988 |
| Sierra Bancorp | | 1,510 | | 16,368 |
| Simmons First National Corp., Class A | | 1,300 | | 37,414 |
| Southern Community Financial Corp. (I) | | 1,600 | | 2,224 |
| Southside Bancshares, Inc. | | 1,518 | | 34,626 |
| Southwest Bancorp, Inc. | | 4,870 | | 69,300 |
| State Bancorp, Inc. | | 2,399 | | 25,237 |
| StellarOne Corp. | | 5,769 | | 84,977 |
| Sterling Bancorp | | 2,100 | | 21,084 |
| Sterling Bancshares, Inc. | | 18,924 | | 171,262 |
| Sun Bancorp, Inc. (I) | | 1,280 | | 5,606 |
| Superior Bancorp (I)(L) | | 817 | | 425 |
| Susquehanna Bancshares, Inc. | | 23,025 | | 220,119 |
| SVB Financial Group (I)(L) | | 4,080 | | 221,054 |
| Synovus Financial Corp. | | 51,541 | | 131,430 |
| Taylor Capital Group, Inc. (I)(L) | | 2,668 | | 28,441 |
| Texas Capital Bancshares, Inc. (I) | | 6,887 | | 173,828 |
| TIB Financial Corp. (I) | | 275 | | 5,363 |
| Tower Bancorp., Inc. | | 1,034 | | 23,710 |
| TowneBank (L) | | 2,574 | | 38,327 |
| TriCo Bancshares | | 1,200 | | 19,476 |
| Trustmark Corp. | | 1,900 | | 44,555 |
| UMB Financial Corp. | | 1,200 | | 47,856 |
| Umpqua Holdings Corp. | | 13,990 | | 160,046 |
| Union First Market Bankshares Corp. | | 2,929 | | 33,713 |
| United Bankshares, Inc. (L) | | 4,500 | | 128,880 |
| United Community Banks, Inc. (I) | | 13,213 | | 18,102 |
| Univest Corp. of Pennsylvania | | 1,457 | | 26,284 |
| Virginia Commerce Bancorp, Inc. (I) | | 5,971 | | 35,229 |
| Washington Banking Company | | 1,415 | | 19,952 |
| Washington Trust Bancorp, Inc. | | 2,492 | | 57,266 |
| Webster Financial Corp. | | 9,859 | | 228,532 |
| WesBanco, Inc. | | 6,655 | | 138,690 |
| West Bancorp, Inc. | | 1,300 | | 9,893 |
| West Coast Bancorp (I) | | 4,740 | | 15,974 |
| Western Alliance Bancorp (I) | | 13,721 | | 111,277 |
| Whitney Holding Corp. | | 12,607 | | 178,767 |
| Wilmington Trust Corp. | | 1,980 | | 8,890 |
| | | | |
| Small Cap Opportunities Fund (continued) | | |
| | | Shares or | | |
| | | Principal | | |
| | | Amount | | Value |
| | |
|
| |
| COMMON STOCKS (continued) | | | | |
| Commercial Banks (continued) | | | | |
| Wilshire Bancorp, Inc. (I) | | 4,239 | $ | 28,020 |
| Wintrust Financial Corp. | | 5,869 | | 197,081 |
| Yadkin Valley Financial Corp. (I) | | 1,614 | | 3,664 |
| Zions Bancorporation (L) | | 54,693 | | 1,277,628 |
| | |
|
| | | | | 14,229,963 |
| Consumer Finance - 0.20% | | | | |
| Cash America International, Inc. | | 5,000 | | 213,550 |
| CompuCredit Holdings Corp. (I) | | 2,395 | | 15,951 |
| Nelnet, Inc., Class A | | 7,214 | | 161,089 |
| The First Marblehead Corp. (I)(L) | | 17,177 | | 40,022 |
| United PanAm Financial Corp. (I) | | 100 | | 703 |
| | |
|
| | | | | 431,315 |
| Diversified Financial Services - 0.48% | | | | |
| Asset Acceptance Capital Corp. (I) | | 2,909 | | 17,105 |
| Asta Funding, Inc. | | 2,466 | | 21,331 |
| Encore Capital Group, Inc. (I) | | 2,498 | | 68,021 |
| Interactive Brokers Group, Inc., Class A | | 7,700 | | 118,965 |
| Marlin Business Services Corp. (I) | | 2,737 | | 30,381 |
| MicroFinancial, Inc. | | 400 | | 1,912 |
| NewStar Financial, Inc. (I) | | 8,564 | | 90,693 |
| PHH Corp. (I)(L) | | 9,859 | | 243,320 |
| PICO Holdings, Inc. (I) | | 1,400 | | 41,594 |
| Primus Guaranty, Ltd. (I) | | 379 | | 1,914 |
| Resource America, Inc. | | 2,296 | | 14,534 |
| The NASDAQ OMX Group, Inc. (I) | | 12,468 | | 356,709 |
| | |
|
| | | | | 1,006,479 |
| Insurance - 6.20% | | | | |
| 21st Century Holding Company (I) | | 1,233 | | 4,106 |
| Affirmative Insurance Holdings, Inc. (I) | | 1,153 | | 2,859 |
| Alleghany Corp. (I) | | 506 | | 172,420 |
| Allied World Assurance | | | | |
| Company Holdings, Ltd. | | 7,100 | | 438,141 |
| Alterra Capital Holdings, Ltd. | | 6,153 | | 133,089 |
| American Equity Investment Life | | | | |
| Holding Company (L) | | 13,300 | | 175,560 |
| American Financial Group, Inc. | | 15,574 | | 539,328 |
| American National Insurance Company | | 298 | | 24,218 |
| American Safety Insurance Holdings, Ltd. (I) | | 2,500 | | 53,375 |
| AMERISAFE, Inc. (I) | | 2,500 | | 49,900 |
| Amtrust Financial Services, Inc. | | 1,800 | | 34,614 |
| Arch Capital Group, Ltd. (I) | | 581 | | 52,581 |
| Argo Group International Holdings, Ltd. | | 7,062 | | 268,992 |
| Arthur J. Gallagher & Company | | 27,138 | | 852,133 |
| Aspen Insurance Holdings, Ltd. | | 7,600 | | 224,580 |
| Assurant, Inc. | | 6,139 | | 249,428 |
| Assured Guaranty, Ltd. | | 9,166 | | 133,182 |
| Axis Capital Holdings, Ltd. | | 10,224 | | 371,336 |
| Baldwin & Lyons, Inc., Class B | | 49 | | 1,195 |
| Citizens, Inc., Class A (I)(L) | | 3,000 | | 22,380 |
| CNA Surety Corp. (I) | | 7,732 | | 195,465 |
| CNO Financial Group, Inc. (I) | | 43,615 | | 315,773 |
| Delphi Financial Group, Inc., Class A | | 8,413 | | 260,466 |
| Donegal Group, Inc. | | 2,470 | | 31,517 |
| Eastern Insurance Holdings, Inc. | | 2,200 | | 28,556 |
| EMC Insurance Group, Inc. | | 570 | | 13,914 |
| Employers Holdings, Inc. | | 1,300 | | 26,156 |
| Endurance Specialty Holdings, Ltd. | | 7,600 | | 376,884 |
| Enstar Group, Ltd. (I) | | 371 | | 31,112 |
| Everest Re Group, Ltd. | | 1,077 | | 95,476 |
| FBL Financial Group, Inc., Class A | | 6,307 | | 197,031 |
| First Acceptance Corp. (I) | | 4,470 | | 8,091 |
| First American Financial Corp. | | 3,500 | | 55,160 |
| Flagstone Reinsurance Holdings SA | | 13,753 | | 156,784 |
| |
| The accompanying notes are an integral part of the financial statements. | 216 |
John Hancock Funds II
Portfolio of Investments — February 28, 2011 (Unaudited) (showing percentage of total net assets)
| | | | |
| Small Cap Opportunities Fund (continued) | | |
| | | Shares or | | |
| | | Principal | | |
| | | Amount | | Value |
| | |
|
| |
| COMMON STOCKS (continued) | | | | |
| Insurance (continued) | | | | |
| FPIC Insurance Group, Inc. (I) | | 18,482 | $ | 696,032 |
| Global Indemnity PLC (I) | | 2,203 | | 49,127 |
| Greenlight Capital Re, Ltd., Class A (I) | | 2,200 | | 63,668 |
| Hallmark Financial Services, Inc. (I) | | 5,371 | | 48,339 |
| Harleysville Group, Inc. | | 2,099 | | 76,718 |
| HCC Insurance Holdings, Inc. | | 14,800 | | 460,872 |
| Hilltop Holdings, Inc. (I) | | 10,029 | | 97,081 |
| Horace Mann Educators Corp. | | 8,400 | | 142,380 |
| Independence Holding Company | | 2,560 | | 21,683 |
| Maiden Holdings, Ltd. | | 10,359 | | 82,768 |
| MBIA, Inc. (I) | | 32,626 | | 365,737 |
| Meadowbrook Insurance Group, Inc. | | 6,998 | | 71,100 |
| Mercer Insurance Group, Inc. | | 100 | | 2,810 |
| Montpelier Re Holdings, Ltd. | | 12,327 | | 248,636 |
| National Financial Partners Corp. (I) | | 6,530 | | 92,334 |
| National Interstate Corp. | | 809 | | 16,860 |
| Old Republic International Corp. | | 24,854 | | 310,675 |
| OneBeacon Insurance Group, Ltd. | | 3,729 | | 51,087 |
| Platinum Underwriters Holdings, Ltd. | | 2,500 | | 104,250 |
| Presidential Life Corp. | | 5,383 | | 53,938 |
| ProAssurance Corp. (I) | | 800 | | 50,664 |
| Protective Life Corp. | | 11,042 | | 313,924 |
| Reinsurance Group of America, Inc. | | 9,191 | | 555,044 |
| RenaissanceRe Holdings, Ltd. | | 1,400 | | 93,828 |
| RLI Corp. | | 700 | | 40,187 |
| Safety Insurance Group, Inc. | | 7,526 | | 362,151 |
| SeaBright Holdings, Inc. | | 3,788 | | 39,888 |
| StanCorp Financial Group, Inc. | | 4,763 | | 219,098 |
| State Auto Financial Corp. | | 4,942 | | 85,398 |
| Stewart Information Services Corp. | | 3,944 | | 43,976 |
| The Hanover Insurance Group, Inc. | | 16,689 | | 775,538 |
| The Navigators Group, Inc. (I) | | 3,069 | | 161,000 |
| The Phoenix Companies, Inc. (I) | | 29,430 | | 78,284 |
| Tower Group, Inc. | | 8,683 | | 236,004 |
| Transatlantic Holdings, Inc. | | 6,644 | | 338,379 |
| United Fire & Casualty Company | | 847 | | 17,524 |
| Unitrin, Inc. | | 11,870 | | 347,672 |
| Universal Insurance Holdings, Inc. | | 1,687 | | 9,734 |
| Validus Holdings, Ltd. | | 4,687 | | 145,063 |
| White Mountains Insurance Group, Ltd. | | 1,470 | | 558,233 |
| | |
|
| | | | | 13,123,486 |
| Real Estate Investment Trusts - 2.11% | | | | |
| Alexandria Real Estate Equities, Inc. | | 9,838 | | 789,008 |
| Digital Realty Trust, Inc. (L) | | 14,600 | | 858,772 |
| LaSalle Hotel Properties | | 41,420 | | 1,168,458 |
| Senior Housing Properties Trust | | 25,131 | | 616,715 |
| Tanger Factory Outlet Centers, Inc. | | 38,600 | | 1,028,690 |
| | |
|
| | | | | 4,461,643 |
| Real Estate Management & Development - 0.58% | | | | |
| Avatar Holdings, Inc. (I) | | 3,110 | | 66,243 |
| Forest City Enterprises, Inc., Class A (I)(L) | | 6,938 | | 131,128 |
| Jones Lang LaSalle, Inc. | | 10,348 | | 1,018,450 |
| Thomas Properties Group, Inc. (I) | | 4,895 | | 16,496 |
| ZipRealty, Inc. (I) | | 1,500 | | 4,365 |
| | |
|
| | | | | 1,236,682 |
| Thrifts & Mortgage Finance - 1.04% | | | | |
| Abington Bancorp, Inc. | | 5,011 | | 62,638 |
| Astoria Financial Corp. | | 8,163 | | 114,445 |
| Atlantic Coast Financial Corp. (I) | | 176 | | 1,848 |
| Bank Mutual Corp. | | 7,714 | | 35,639 |
| BankAtlantic Bancorp, Inc. (I)(L) | | 11,198 | | 11,646 |
| BankFinancial Corp. | | 5,021 | | 43,934 |
| Beneficial Mutual Bancorp, Inc. (I) | | 2,325 | | 20,925 |
| | | | |
| Small Cap Opportunities Fund (continued) | | |
| | | Shares or | | |
| | | Principal | | |
| | | Amount | | Value |
| | |
|
| |
| COMMON STOCKS (continued) | | | | |
| Thrifts & Mortgage Finance (continued) | | | | |
| Berkshire Hill Bancorp, Inc. | | 3,391 | $ | 76,501 |
| BofI Holding, Inc. (I)(L) | | 1,889 | | 28,562 |
| Brookline Bancorp, Inc. | | 2,000 | | 20,780 |
| Clifton Savings Bancorp, Inc. | | 702 | | 8,003 |
| Dime Community Bancshares | | 2,740 | | 42,525 |
| Doral Financial Corp. (I) | | 7,640 | | 10,085 |
| ESSA Bancorp, Inc. | | 2,503 | | 32,539 |
| Federal Agricultural | | | | |
| Mortgage Corp., Class C (L) | | 1,987 | | 39,601 |
| First Defiance Financial Corp. | | 560 | | 7,840 |
| First Financial Holdings, Inc. | | 4,291 | | 45,742 |
| First Financial Northwest, Inc. | | 2,932 | | 17,504 |
| First Niagara Financial Group, Inc. | | 5,200 | | 75,296 |
| First PacTrust Bancorp, Inc. | | 935 | | 14,474 |
| Flushing Financial Corp. | | 6,985 | | 100,025 |
| Home Federal Bancorp, Inc. | | 3,822 | | 42,501 |
| Kaiser Federal Financial Group, Inc. | | 56 | | 755 |
| Kearny Financial Corp. | | 378 | | 3,712 |
| Legacy Bancorp, Inc. | | 689 | | 9,267 |
| Louisiana Bancorp, Inc. (I) | | 100 | | 1,479 |
| Meridian Interstate Bancorp, Inc. (I) | | 1,683 | | 21,879 |
| MGIC Investment Corp. (I)(L) | | 6,497 | | 55,809 |
| New England Bancshares, Inc. | | 100 | | 955 |
| NewAlliance Bancshares, Inc. | | 15,498 | | 242,389 |
| Northwest Bancshares, Inc. | | 10,407 | | 126,341 |
| OceanFirst Financial Corp. | | 1,700 | | 23,562 |
| Ocwen Financial Corp. (I) | | 6,390 | | 67,606 |
| Provident Financial Holdings, Inc. | | 505 | | 4,227 |
| Provident Financial Services, Inc. | | 11,062 | | 163,828 |
| Provident New York Bancorp | | 2,310 | | 21,899 |
| Radian Group, Inc. (L) | | 23,661 | | 167,047 |
| Roma Financial Corp. | | 100 | | 1,050 |
| Rome Bancorp, Inc. | | 600 | | 7,344 |
| Territorial Bancorp, Inc. | | 952 | | 18,840 |
| The PMI Group, Inc. (I) | | 40,858 | | 120,940 |
| TierOne Corp. (I) | | 1,301 | | 5 |
| Tree.com, Inc. (I) | | 2,817 | | 19,184 |
| United Financial Bancorp, Inc. | | 3,837 | | 59,896 |
| United Western Bancorp, Inc. (I) | | 928 | | 51 |
| Washington Federal, Inc. | | 8,700 | | 154,599 |
| Waterstone Financial, Inc. (I) | | 718 | | 2,104 |
| Westfield Financial, Inc. | | 6,234 | | 56,605 |
| | |
|
| | | | | 2,204,426 |
| | | |
|
| | | | | 40,919,485 |
| Health Care - 8.48% | | | | |
| Biotechnology - 0.14% | | | | |
| ADVENTRX Pharmaceuticals, Inc. (I) | | 3,772 | | 7,959 |
| Celera Corp. (I) | | 16,788 | | 106,772 |
| Codexis, Inc. (I) | | 1,215 | | 12,952 |
| Enzon Pharmaceuticals, Inc. (I)(L) | | 8,100 | | 86,508 |
| Infinity Pharmaceuticals, Inc. (I) | | 2,861 | | 16,565 |
| Maxygen, Inc. | | 6,500 | | 27,105 |
| Repligen Corp. (I) | | 1,800 | | 8,676 |
| SuperGen, Inc. (I) | | 2,200 | | 6,534 |
| Transcept Pharmaceuticals, Inc. (I) | | 736 | | 6,572 |
| Trimeris, Inc. (I) | | 4,175 | | 10,688 |
| | |
|
| | | | | 290,331 |
| Health Care Equipment & Supplies - 2.19% | | | | |
| Alere, Inc. (I) | | 7,254 | | 280,295 |
| Alphatec Holdings, Inc. (I)(L) | | 8,987 | | 23,905 |
| Analogic Corp. | | 1,500 | | 81,300 |
| AngioDynamics, Inc. (I) | | 5,487 | | 92,291 |
| Anika Therapeutics, Inc. (I) | | 2,936 | | 26,571 |
| |
| The accompanying notes are an integral part of the financial statements. | 217 |
John Hancock Funds II
Portfolio of Investments — February 28, 2011 (Unaudited) (showing percentage of total net assets)
| | | | |
| Small Cap Opportunities Fund (continued) | | |
| | | Shares or | | |
| | | Principal | | |
| | | Amount | | Value |
| | |
|
| |
| COMMON STOCKS (continued) | | | | |
| Health Care Equipment & Supplies (continued) | | | | |
| CONMED Corp. (I) | | 1,195 | $ | 31,644 |
| CryoLife, Inc. (I) | | 1,033 | | 5,578 |
| Cutera, Inc. (I) | | 3,818 | | 36,882 |
| Cynosure, Inc. (I) | | 2,183 | | 29,776 |
| Digirad Corp. (I) | | 3,687 | | 8,923 |
| Exactech, Inc. (I) | | 1,000 | | 18,950 |
| Greatbatch, Inc. (I) | | 5,280 | | 131,366 |
| Hologic, Inc. (I) | | 28,700 | | 579,166 |
| Invacare Corp. (L) | | 5,104 | | 150,925 |
| LeMaitre Vascular, Inc. | | 300 | | 2,022 |
| Medical Action Industries, Inc. (I) | | 1,100 | | 9,086 |
| Merit Medical Systems, Inc. (I) | | 2,000 | | 34,160 |
| Natus Medical, Inc. (I) | | 2,800 | | 44,408 |
| Palomar Medical Technologies, Inc. (I) | | 1,400 | | 22,372 |
| RTI Biologics, Inc. (I) | | 10,804 | | 29,063 |
| Solta Medical, Inc. (I) | | 2,011 | | 6,294 |
| Symmetry Medical, Inc. (I) | | 8,226 | | 74,363 |
| Teleflex, Inc. | | 20,647 | | 1,205,578 |
| The Cooper Companies, Inc. | | 25,422 | | 1,571,588 |
| TomoTherapy, Inc. (I) | | 10,316 | | 36,725 |
| TranS1, Inc. (I) | | 316 | | 1,049 |
| Wright Medical Group, Inc. (I) | | 5,200 | | 82,316 |
| Young Innovations, Inc. | | 600 | | 19,002 |
| | |
|
| | | | | 4,635,598 |
| Health Care Providers & Services - 4.00% | | | | |
| Air Methods Corp. (I) | | 2,857 | | 165,820 |
| Allied Healthcare International, Inc. (I) | | 10,597 | | 25,963 |
| American Dental Partners, Inc. (I) | | 3,740 | | 48,059 |
| AMN Healthcare Services, Inc. (I) | | 2,215 | | 16,546 |
| AmSurg Corp. (I) | | 4,638 | | 109,596 |
| Animal Health International, Inc. (I) | | 470 | | 1,833 |
| Assisted Living Concepts, Inc. (I) | | 2,580 | | 92,751 |
| Brookdale Senior Living, Inc. (I) | | 7,591 | | 204,122 |
| Capital Senior Living Corp. (I) | | 6,728 | | 56,448 |
| CardioNet, Inc. (I) | | 4,900 | | 23,618 |
| Centene Corp. (I) | | 2,721 | | 82,909 |
| Community Health Systems, Inc. (I) | | 6,700 | | 273,829 |
| Coventry Health Care, Inc. (I) | | 9,547 | | 288,319 |
| Cross Country Healthcare, Inc. (I) | | 3,485 | | 28,995 |
| Dynacq Healthcare, Inc. (I)(L) | | 941 | | 1,957 |
| Five Star Quality Care, Inc. (I) | | 7,281 | | 51,113 |
| Gentiva Health Services, Inc. (I) | | 30,855 | | 871,037 |
| Hanger Orthopedic Group, Inc. (I) | | 44,702 | | 1,202,484 |
| Health Net, Inc. (I) | | 13,712 | | 403,407 |
| Healthspring, Inc. (I) | | 29,038 | | 1,092,990 |
| Healthways, Inc. (I) | | 5,068 | | 70,800 |
| Integramed America, Inc. (I) | | 590 | | 5,994 |
| LCA-Vision, Inc. (I) | | 95 | | 672 |
| LifePoint Hospitals, Inc. (I) | | 4,432 | | 172,759 |
| Magellan Health Services, Inc. (I) | | 4,500 | | 215,910 |
| MedCath Corp. (I) | | 4,600 | | 65,412 |
| Molina Healthcare, Inc. (I) | | 3,816 | | 133,674 |
| National Healthcare Corp. | | 917 | | 43,649 |
| NovaMed, Inc. (I) | | 978 | | 12,851 |
| Omnicare, Inc. | | 9,500 | | 271,985 |
| Owens & Minor, Inc. | | 20,677 | | 645,122 |
| PharMerica Corp. (I) | | 2,629 | | 30,891 |
| RehabCare Group, Inc. (I) | | 1,651 | | 61,335 |
| Skilled Healthcare Group, Inc. (I) | | 2,200 | | 30,162 |
| Sun Healthcare Group, Inc. (I) | | 2,289 | | 33,648 |
| Triple-S Management Corp., Class B (I) | | 4,238 | | 83,743 |
| Universal American Financial Corp. | | 16,337 | | 336,215 |
| Universal Health Services, Inc., Class B | | 25,988 | | 1,187,911 |
| | | | |
| Small Cap Opportunities Fund (continued) | | |
| | | Shares or | | |
| | | Principal | | |
| | | Amount | | Value |
| | |
|
| |
| COMMON STOCKS (continued) | | | | |
| Health Care Providers & Services (continued) | | | | |
| WellCare Health Plans, Inc. (I) | | 600 | $ | 22,530 |
| | |
|
| | | | | 8,467,059 |
| Health Care Technology - 0.33% | | | | |
| Omnicell, Inc. (I) | | 48,949 | | 657,875 |
| Vital Images, Inc. (I) | | 3,100 | | 46,469 |
| | |
|
| | | | | 704,344 |
| Life Sciences Tools & Services - 0.66% | | | | |
| Affymetrix, Inc. (I) | | 17,285 | | 84,869 |
| Albany Molecular Research, Inc. (I) | | 1,696 | | 7,666 |
| BioClinica, Inc. (I) | | 1,600 | | 7,648 |
| Cambrex Corp. (I) | | 6,793 | | 37,226 |
| Dionex Corp. (I) | | 9,915 | | 1,168,185 |
| Enzo Biochem, Inc. (I) | | 2,322 | | 10,008 |
| Harvard Bioscience, Inc. (I) | | 6,820 | | 29,633 |
| Kendle International, Inc. (I) | | 2,783 | | 33,118 |
| Medtox Scientific, Inc. | | 1,823 | | 27,600 |
| | |
|
| | | | | 1,405,953 |
| Pharmaceuticals - 1.16% | | | | |
| Caraco Pharmaceutical Laboratories, Ltd. (I) | | 2,200 | | 11,462 |
| K-V Pharmaceutical Company, Class A (I)(L) | | 9,379 | | 76,064 |
| Lannett Company, Inc. (I) | | 1,100 | | 6,237 |
| Par Pharmaceutical Companies, Inc. (I) | | 2,620 | | 80,906 |
| Sucampo Pharmaceuticals, Inc. (I) | | 2,120 | | 9,095 |
| Valeant Pharmaceuticals International, Inc. (L) | | 6,166 | | 247,133 |
| Viropharma, Inc. (I) | | 82,440 | | 1,478,149 |
| Vivus, Inc. (I)(L) | | 70,366 | | 535,485 |
| | |
|
| | | | | 2,444,531 |
| | | |
|
| | | | | 17,947,816 |
| Industrials - 16.30% | | | | |
| Aerospace & Defense - 1.81% | | | | |
| AAR Corp. (I)(L) | | 40,001 | | 1,091,627 |
| Aerovironment, Inc. (I) | | 16,594 | | 481,392 |
| Ascent Solar Technologies, Inc. (I) | | 8,631 | | 28,914 |
| Ceradyne, Inc. (I) | | 5,778 | | 220,893 |
| CPI Aerostructures, Inc. (I) | | 1,142 | | 16,982 |
| Curtiss-Wright Corp. | | 23,021 | | 849,475 |
| Ducommun, Inc. | | 2,656 | | 59,415 |
| Esterline Technologies Corp. (I) | | 6,602 | | 472,505 |
| Innovative Solutions & Support, Inc. (I) | | 975 | | 5,792 |
| Kratos Defense & Security Solutions, Inc. (I) | | 2,100 | | 30,261 |
| Ladish Company, Inc. (I) | | 2,600 | | 141,024 |
| LMI Aerospace, Inc. (I) | | 2,716 | | 48,779 |
| Moog, Inc., Class A (I) | | 2,075 | | 94,226 |
| SIFCO Industries, Inc. | | 400 | | 6,500 |
| Sparton Corp. (I) | | 2,225 | | 17,355 |
| Sypris Solutions, Inc. (I) | | 500 | | 2,100 |
| Triumph Group, Inc. | | 3,146 | | 272,412 |
| | |
|
| | | | | 3,839,652 |
| Air Freight & Logistics - 0.71% | | | | |
| Air Transport Services Group, Inc. (I) | | 15,688 | | 123,151 |
| Atlas Air Worldwide Holdings, Inc. (I) | | 4,477 | | 305,690 |
| Pacer International, Inc. (I) | | 2,183 | | 11,854 |
| Park-Ohio Holdings Corp. (I) | | 394 | | 8,700 |
| UTi Worldwide, Inc. | | 52,753 | | 1,049,785 |
| | |
|
| | | | | 1,499,180 |
| Airlines - 0.19% | | | | |
| AirTran Holdings, Inc. (I) | | 500 | | 3,650 |
| Alaska Air Group, Inc. (I) | | 1,100 | | 65,395 |
| Hawaiian Holdings, Inc. (I) | | 2,300 | | 15,272 |
| JetBlue Airways Corp. (I)(L) | | 14,897 | | 84,913 |
| |
| The accompanying notes are an integral part of the financial statements. | 218 |
John Hancock Funds II
Portfolio of Investments — February 28, 2011 (Unaudited) (showing percentage of total net assets)
| | | | |
| Small Cap Opportunities Fund (continued) | | |
| | | Shares or | | |
| | | Principal | | |
| | | Amount | | Value |
| | |
|
| |
| COMMON STOCKS (continued) | | | | |
| Airlines (continued) | | | | |
| Pinnacle Airlines Corp. (I) | | 4,937 | $ | 29,869 |
| Republic Airways Holdings, Inc. (I)(L) | | 6,019 | | 38,160 |
| Skywest, Inc. | | 10,160 | | 167,640 |
| | |
|
| | | | | 404,899 |
| Building Products - 0.74% | | | | |
| American Woodmark Corp. | | 1,000 | | 19,950 |
| Ameron International Corp. | | 2,100 | | 148,386 |
| Apogee Enterprises, Inc. | | 5,813 | | 79,464 |
| Armstrong World Industries, Inc. | | 1,500 | | 62,460 |
| Gibraltar Industries, Inc. (I) | | 4,938 | | 53,479 |
| Griffon Corp. (I) | | 12,823 | | 154,645 |
| Insteel Industries, Inc. | | 3,980 | | 49,233 |
| Owens Corning, Inc. (I) | | 9,932 | | 354,870 |
| PGT, Inc. (I) | | 6,113 | | 14,610 |
| Quanex Building Products Corp. | | 700 | | 13,223 |
| Simpson Manufacturing Company, Inc. | | 7,000 | | 202,510 |
| Universal Forest Products, Inc. | | 4,434 | | 151,199 |
| US Home Systems, Inc. (I) | | 400 | | 1,888 |
| USG Corp. (I)(L) | | 15,000 | | 257,100 |
| | |
|
| | | | | 1,563,017 |
| Commercial Services & Supplies - 2.25% | | | | |
| ABM Industries, Inc. (L) | | 47,823 | | 1,273,502 |
| American Reprographics Company (I) | | 6,377 | | 56,755 |
| AMREP Corp. (I) | | 100 | | 1,026 |
| Casella Waste Systems, Inc., Class A (I) | | 3,091 | | 22,657 |
| CECO Environmental Corp. (I) | | 1,341 | | 7,966 |
| Consolidated Graphics, Inc. (I) | | 2,600 | | 141,804 |
| Courier Corp. | | 1,247 | | 17,795 |
| Covanta Holding Corp. | | 7,852 | | 132,856 |
| EnergySolutions, Inc. | | 4,781 | | 31,650 |
| Ennis, Inc. | | 6,869 | | 111,621 |
| Fuel Tech, Inc. (I) | | 2,200 | | 16,456 |
| G&K Services, Inc., Class A | | 2,091 | | 67,790 |
| Innerworkings, Inc. (I) | | 3,233 | | 26,414 |
| Intersections, Inc. | | 2,600 | | 25,974 |
| KAR Auction Services, Inc. (I) | | 20 | | 281 |
| Kimball International, Inc., Class B | | 5,161 | | 36,953 |
| M&F Worldwide Corp. (I) | | 302 | | 7,493 |
| McGrath Rentcorp | | 2,176 | | 59,862 |
| Mobile Mini, Inc. (I)(L) | | 8,178 | | 185,968 |
| Multi-Color Corp. | | 863 | | 16,009 |
| Schawk, Inc., Class A | | 3,135 | | 56,649 |
| Steelcase, Inc., Class A | | 10,496 | | 101,916 |
| Sykes Enterprises, Inc. (I) | | 375 | | 6,975 |
| Team, Inc. (I) | | 43,753 | | 1,134,515 |
| Unifirst Corp. | | 1,724 | | 97,234 |
| United Stationers, Inc. | | 2,142 | | 144,414 |
| Versar, Inc. (I) | | 2,653 | | 9,551 |
| Viad Corp. | | 4,781 | | 109,581 |
| Virco Manufacturing Corp. | | 700 | | 2,240 |
| Waste Connections, Inc. | | 29,878 | | 866,163 |
| | |
|
| | | | | 4,770,070 |
| Construction & Engineering - 0.45% | | | | |
| Argan, Inc. (I) | | 107 | | 963 |
| Dycom Industries, Inc. (I) | | 9,199 | | 158,775 |
| EMCOR Group, Inc. (I) | | 6,300 | | 200,718 |
| Great Lakes Dredge & Dock Corp. | | 14,865 | | 116,988 |
| Integrated Electrical Services, Inc. (I) | | 427 | | 1,635 |
| Layne Christensen Company (I) | | 3,684 | | 122,935 |
| Michael Baker Corp. (I) | | 600 | | 18,882 |
| MYR Group, Inc. (I) | | 1,600 | | 36,096 |
| Northwest Pipe Company (I) | | 1,838 | | 43,634 |
| Pike Electric Corp. (I) | | 6,752 | | 65,629 |
| | | | |
| Small Cap Opportunities Fund (continued) | | |
| | | Shares or | | |
| | | Principal | | |
| | | Amount | | Value |
| | |
|
| |
| COMMON STOCKS (continued) | | | | |
| Construction & Engineering (continued) | | | | |
| Sterling Construction Company, Inc. (I) | | 1,497 | $ | 19,611 |
| Tutor Perini Corp. | | 7,045 | | 167,812 |
| | |
|
| | | | | 953,678 |
| Electrical Equipment - 1.56% | | | | |
| Belden, Inc. | | 31,377 | | 1,149,340 |
| Brady Corp., Class A | | 1,812 | | 64,761 |
| Encore Wire Corp. (L) | | 5,577 | | 130,836 |
| EnerSys (I) | | 7,300 | | 259,150 |
| Franklin Electric Company, Inc. | | 711 | | 30,218 |
| General Cable Corp. (I) | | 6,249 | | 271,332 |
| GrafTech International, Ltd. (I) | | 56,789 | | 1,136,348 |
| Hoku Corp. (I) | | 435 | | 848 |
| LaBarge, Inc. (I) | | 1,000 | | 15,680 |
| LSI Industries, Inc. | | 2,497 | | 19,327 |
| Ocean Power Technologies, Inc. (I) | | 1,713 | | 8,908 |
| Orion Energy Systems, Inc. (I) | | 1,643 | | 6,473 |
| Polypore International, Inc. (I) | | 2,088 | | 122,023 |
| Powell Industries, Inc. (I) | | 1,101 | | 41,166 |
| PowerSecure International, Inc. (I) | | 1,924 | | 14,238 |
| SL Industries, Inc. (I) | | 300 | | 5,739 |
| Ultralife Corp. (I) | | 4,827 | | 24,907 |
| | |
|
| | | | | 3,301,294 |
| Industrial Conglomerates - 0.05% | | | | |
| Standex International Corp. | | 2,850 | | 97,670 |
| Machinery - 5.07% | | | | |
| Actuant Corp., Class A | | 1,600 | | 45,280 |
| Alamo Group, Inc. | | 2,992 | | 87,187 |
| Albany International Corp., Class A | | 3,813 | | 92,885 |
| American Railcar Industries, Inc. (I) | | 4,946 | | 99,959 |
| Ampco-Pittsburgh Corp. | | 1,873 | | 49,672 |
| Astec Industries, Inc. (I) | | 500 | | 17,165 |
| Barnes Group, Inc. | | 8,981 | | 191,116 |
| Briggs & Stratton Corp. | | 8,705 | | 175,232 |
| Cascade Corp. | | 2,291 | | 111,938 |
| Chart Industries, Inc. (I) | | 6,240 | | 283,234 |
| CIRCOR International, Inc. | | 432 | | 17,129 |
| Columbus McKinnon Corp. (I) | | 4,431 | | 76,523 |
| EnPro Industries, Inc. (I) | | 2,900 | | 115,072 |
| Federal Signal Corp. (I) | | 15,780 | | 102,097 |
| FreightCar America, Inc. (I) | | 2,800 | | 78,736 |
| Gardner Denver, Inc. | | 17,272 | | 1,263,274 |
| Gencor Industries, Inc. (I) | | 604 | | 4,790 |
| Greenbrier Companies, Inc. (I) | | 4,947 | | 123,576 |
| Hardinge, Inc. | | 3,300 | | 44,055 |
| Hurco Companies, Inc. (I) | | 1,523 | | 45,736 |
| IDEX Corp. | | 24,465 | | 1,008,937 |
| Kaydon Corp. | | 3,024 | | 118,662 |
| Key Technology, Inc. (I) | | 105 | | 2,125 |
| L.B. Foster Company | | 153 | | 6,426 |
| Lydall, Inc. (I) | | 2,491 | | 22,270 |
| Met-Pro Corp. | | 3,315 | | 37,824 |
| MFRI, Inc. (I) | | 180 | | 2,088 |
| Miller Industries, Inc. | | 3,291 | | 54,696 |
| Mueller Industries, Inc. | | 6,181 | | 210,030 |
| Mueller Water Products, Inc. | | 20,625 | | 83,738 |
| NACCO Industries, Inc., Class A | | 1,100 | | 137,005 |
| NN, Inc. (I) | | 3,985 | | 48,816 |
| Robbins & Myers, Inc. | | 7,576 | | 322,965 |
| Sauer-Danfoss, Inc. (I) | | 3,707 | | 113,175 |
| Tecumseh Products Company, Class A (I) | | 100 | | 1,203 |
| Terex Corp. (I) | | 4,900 | | 165,375 |
| The Eastern Company | | 100 | | 1,900 |
| Timken Company | | 13,200 | | 643,104 |
| |
| The accompanying notes are an integral part of the financial statements. | 219 |
John Hancock Funds II
Portfolio of Investments — February 28, 2011 (Unaudited) (showing percentage of total net assets)
| | | | |
| Small Cap Opportunities Fund (continued) | | |
| | | Shares or | | |
| | | Principal | | |
| | | Amount | | Value |
| | |
|
| |
| COMMON STOCKS (continued) | | | | |
| Machinery (continued) | | | | |
| Titan International, Inc. (L) | | 93,768 | $ | 2,252,307 |
| Trinity Industries, Inc. (L) | | 40,984 | | 1,276,652 |
| Twin Disc, Inc. | | 2,123 | | 68,700 |
| Valmont Industries, Inc. | | 9,221 | | 941,280 |
| Watts Water Technologies, Inc., Class A (L) | | 4,496 | | 175,839 |
| | |
|
| | | | | 10,719,773 |
| Marine - 0.25% | | | | |
| Alexander & Baldwin, Inc. | | 7,217 | | 302,681 |
| Eagle Bulk Shipping, Inc. (I)(L) | | 14,465 | | 59,451 |
| Excel Maritime Carriers, Ltd. (I)(L) | | 16,644 | | 86,882 |
| Genco Shipping & Trading, Ltd. (I)(L) | | 2,300 | | 27,922 |
| Horizon Lines, Inc. (L) | | 7,765 | | 35,486 |
| International Shipholding Corp. | | 569 | | 13,906 |
| | |
|
| | | | | 526,328 |
| Professional Services - 0.40% | | | | |
| Barrett Business Services, Inc. | | 1,353 | | 19,740 |
| CBIZ, Inc. (I)(L) | | 2,820 | | 19,966 |
| CDI Corp. | | 4,798 | | 71,394 |
| CRA International, Inc. (I) | | 1,920 | | 49,805 |
| Franklin Covey Company (I) | | 3,206 | | 26,065 |
| GP Strategies Corp. (I) | | 2,590 | | 29,992 |
| Heidrick & Struggles International, Inc. | | 1,007 | | 27,421 |
| Hill International, Inc. (I) | | 107 | | 567 |
| Hudson Highland Group, Inc. (I) | | 3,400 | | 22,814 |
| Huron Consulting Group, Inc. (I) | | 878 | | 24,426 |
| ICF International, Inc. (I) | | 1,637 | | 37,111 |
| Kelly Services, Inc., Class A (I) | | 6,524 | | 137,134 |
| Korn/Ferry International (I) | | 3,249 | | 74,272 |
| LECG Corp. (I) | | 3,950 | | 514 |
| National Technical Systems, Inc. | | 1,900 | | 14,516 |
| On Assignment, Inc. (I) | | 6,697 | | 70,319 |
| RCM Technologies, Inc. (I) | | 100 | | 508 |
| School Specialty, Inc. (I) | | 2,200 | | 33,770 |
| SFN Group, Inc. (I) | | 2,923 | | 40,425 |
| The Dolan Company (I) | | 7,694 | | 96,175 |
| Volt Information Sciences, Inc. (I) | | 4,968 | | 37,856 |
| | |
|
| | | | | 834,790 |
| Road & Rail - 1.46% | | | | |
| AMERCO, Inc. (I) | | 3,260 | | 314,883 |
| Arkansas Best Corp. | | 2,608 | | 61,862 |
| Avis Budget Group, Inc. (I) | | 9,889 | | 151,499 |
| Celadon Group, Inc. (I) | | 1,601 | | 23,391 |
| Covenant Transport, Inc. (I) | | 842 | | 7,325 |
| Dollar Thrifty Automotive Group, Inc. (I) | | 300 | | 15,933 |
| Landstar System, Inc. | | 18,116 | | 805,619 |
| Marten Transport, Ltd. | | 4,720 | | 100,772 |
| Old Dominion Freight Line, Inc. (I) | | 34,534 | | 1,062,957 |
| P.A.M. Transportation Services, Inc. (I) | | 2,122 | | 25,124 |
| RailAmerica, Inc. (I) | | 1,032 | | 15,480 |
| Ryder Systems, Inc. | | 8,700 | | 416,121 |
| Saia, Inc. (I) | | 3,700 | | 55,796 |
| Universal Truckload Services, Inc. (I) | | 533 | | 8,576 |
| USA Truck, Inc. (I) | | 2,424 | | 31,003 |
| | |
|
| | | | | 3,096,341 |
| Trading Companies & Distributors - 1.36% | | | | |
| Aceto Corp. | | 4,911 | | 38,944 |
| Aircastle, Ltd. | | 11,800 | | 142,544 |
| Applied Industrial Technologies, Inc. | | 5,900 | | 189,036 |
| Beacon Roofing Supply, Inc. (I) | | 50,795 | | 1,077,362 |
| CAI International, Inc. (I) | | 4,100 | | 86,838 |
| GATX Corp. | | 10,584 | | 367,159 |
| H&E Equipment Services, Inc. (I) | | 7,028 | | 110,199 |
| | | | |
| Small Cap Opportunities Fund (continued) | | |
| | | Shares or | | |
| | | Principal | | |
| | | Amount | | Value |
| | |
|
| |
| COMMON STOCKS (continued) | | | | |
| Trading Companies & Distributors (continued) | | | | |
| Interline Brands, Inc. (I) | | 6,430 | $ | 140,881 |
| Kaman Corp., Class A | | 437 | | 13,927 |
| Lawson Products, Inc. | | 2,029 | | 48,838 |
| Rush Enterprises, Inc., Class B (I) | | 7,405 | | 119,961 |
| TAL International Group, Inc. | | 4,902 | | 170,982 |
| Titan Machinery, Inc. (I) | | 3,197 | | 82,259 |
| United Rentals, Inc. (I) | | 80 | | 2,478 |
| WESCO International, Inc. (I) | | 4,994 | | 290,751 |
| Willis Lease Finance Corp. (I) | | 281 | | 3,704 |
| | |
|
| | | | | 2,885,863 |
| | | |
|
| | | | | 34,492,555 |
| Information Technology - 15.79% | | | | |
| Communications Equipment - 2.10% | | | | |
| Anaren, Inc. (I) | | 1,390 | | 29,496 |
| Arris Group, Inc. (I) | | 11,525 | | 152,130 |
| Aviat Networks, Inc. (I) | | 8,658 | | 52,900 |
| Aware, Inc. (I) | | 3,300 | | 11,748 |
| Bel Fuse, Inc., Class B | | 2,340 | | 51,246 |
| BigBand Networks, Inc. (I) | | 4,600 | | 11,960 |
| Black Box Corp. | | 3,723 | | 142,181 |
| Brocade Communications Systems, Inc. (I) | | 1,606 | | 10,230 |
| Calix, Inc. (I) | | 393 | | 6,994 |
| Cogo Group, Inc. (I) | | 8,803 | | 71,128 |
| Communications Systems, Inc. | | 901 | | 14,542 |
| Comtech Telecommunications Corp. | | 2,342 | | 63,351 |
| Digi International, Inc. (I) | | 5,526 | | 61,173 |
| EchoStar Corp., Class A (I) | | 3,771 | | 130,854 |
| EMS Technologies, Inc. (I) | | 3,696 | | 71,850 |
| Emulex Corp. (I) | | 12,377 | | 136,147 |
| Extreme Networks, Inc. (I) | | 3,605 | | 14,132 |
| Globecomm Systems, Inc. (I) | | 5,154 | | 54,890 |
| Harmonic, Inc. (I) | | 665 | | 6,391 |
| JDS Uniphase Corp. (I) | | 90,029 | | 2,221,015 |
| KVH Industries, Inc. (I) | | 2,148 | | 31,533 |
| Loral Space & Communications, Inc. (I) | | 456 | | 34,501 |
| NETGEAR, Inc. (I) | | 754 | | 24,731 |
| Network Engines, Inc. (I) | | 185 | | 383 |
| Oplink Communications, Inc. (I) | | 1,660 | | 45,169 |
| OpNext, Inc. (I) | | 6,648 | | 27,855 |
| ORBCOMM, Inc. (I) | | 8,038 | | 28,535 |
| Performance Technologies, Inc. (I) | | 1,302 | | 2,604 |
| Relm Wireless Corp. (I) | | 877 | | 1,701 |
| Seachange International, Inc. (I) | | 4,594 | | 43,367 |
| Sycamore Networks, Inc. | | 6,541 | | 139,650 |
| Symmetricom, Inc. (I) | | 2,967 | | 16,793 |
| Tellabs, Inc. | | 107,413 | | 578,956 |
| Tollgrade Communications, Inc. (I) | | 1,621 | | 16,194 |
| UTStarcom, Inc. (I)(L) | | 37,558 | | 76,994 |
| Viasat, Inc. (I) | | 1,415 | | 58,878 |
| Westell Technologies, Inc., Class A (I) | | 2,150 | | 7,031 |
| | |
|
| | | | | 4,449,233 |
| Computers & Peripherals - 0.32% | | | | |
| Avid Technology, Inc. (I) | | 8,929 | | 196,974 |
| Concurrent Computer Corp. (I) | | 526 | | 3,224 |
| Datalink Corp. (I) | | 1,469 | | 9,916 |
| Electronics for Imaging, Inc. (I) | | 5,909 | | 91,176 |
| Hutchinson Technology, Inc. (I) | | 3,000 | | 9,420 |
| Hypercom Corp. (I) | | 2,100 | | 20,979 |
| Imation Corp. (I) | | 8,805 | | 101,081 |
| Interphase Corp. (I) | | 400 | | 2,100 |
| Intevac, Inc. (I) | | 5,406 | | 69,035 |
| KEY Tronic Corp. (I) | | 900 | | 4,266 |
| Novatel Wireless, Inc. (I) | | 7,924 | | 46,910 |
| |
| The accompanying notes are an integral part of the financial statements. | 220 |
John Hancock Funds II
Portfolio of Investments — February 28, 2011 (Unaudited) (showing percentage of total net assets)
| | | | |
| Small Cap Opportunities Fund (continued) | | |
| | | Shares or | | |
| | | Principal | | |
| | | Amount | | Value |
| | |
|
| |
| COMMON STOCKS (continued) | | | | |
| Computers & Peripherals (continued) | | | | |
| Rimage Corp. | | 2,000 | $ | 30,020 |
| Silicon Graphics International Corp. (I) | | 6,217 | | 96,426 |
| | |
|
| | | | | 681,527 |
| Electronic Equipment, Instruments & Components - 3.32% | | |
| ADDvantage Technologies Group, Inc. (I) | | 471 | | 1,488 |
| Arrow Electronics, Inc. (I) | | 13,183 | | 516,774 |
| Avnet, Inc. (I) | | 3,200 | | 109,472 |
| AVX Corp. | | 7,446 | | 118,764 |
| Benchmark Electronics, Inc. (I) | | 4,167 | | 78,590 |
| Checkpoint Systems, Inc. (I) | | 6,338 | | 138,042 |
| Cognex Corp. | | 58 | | 1,619 |
| Coherent, Inc. (I) | | 3,429 | | 211,741 |
| Daktronics, Inc. | | 3,800 | | 43,510 |
| Electro Rent Corp. | | 5,714 | | 91,481 |
| FARO Technologies, Inc. (I) | | 2,008 | | 71,585 |
| Gerber Scientific, Inc. (I) | | 5,939 | | 48,997 |
| ID Systems, Inc. (I) | | 861 | | 4,193 |
| Ingram Micro, Inc., Class A (I) | | 64,589 | | 1,287,259 |
| Insight Enterprises, Inc. (I) | | 4,514 | | 82,561 |
| IntriCon Corp. (I) | | 80 | | 309 |
| L-1 Identity Solutions, Inc. (I) | | 20,315 | | 241,952 |
| Measurement Specialties, Inc. (I) | | 2,180 | | 67,449 |
| Mercury Computer Systems, Inc. (I) | | 2,190 | | 41,566 |
| Methode Electronics, Inc. | | 4,959 | | 58,020 |
| Multi-Fineline Electronix, Inc. (I) | | 3,411 | | 97,623 |
| Newport Corp. (I) | | 1,100 | | 18,315 |
| OSI Systems, Inc. (I) | | 34,538 | | 1,299,320 |
| PAR Technology Corp. (I) | | 1,700 | | 9,112 |
| PC Connection, Inc. (I) | | 4,289 | | 36,457 |
| PC Mall, Inc. (I) | | 2,932 | | 31,079 |
| Perceptron, Inc. (I) | | 846 | | 5,804 |
| Planar Systems, Inc. (I) | | 1,500 | | 3,900 |
| RadiSys Corp. (I) | | 2,116 | | 17,626 |
| Richardson Electronics, Ltd. | | 1,662 | | 21,606 |
| Rofin-Sinar Technologies, Inc. (I) | | 16,547 | | 641,693 |
| Rogers Corp. (I) | | 3,200 | | 150,912 |
| Sanmina-SCI Corp. (I) | | 2,300 | | 35,926 |
| Scansource, Inc. (I) | | 1,144 | | 41,790 |
| SMART Modular | | | | |
| Technologies (WWH), Inc. (I) | | 15,830 | | 109,702 |
| Spectrum Control, Inc. (I) | | 2,917 | | 40,867 |
| SYNNEX Corp. (I) | | 7,365 | | 259,837 |
| Tech Data Corp. (I) | | 6,299 | | 312,304 |
| Tessco Technologies, Inc. | | 1,768 | | 21,464 |
| TTM Technologies, Inc. (I) | | 8,002 | | 140,355 |
| Viasystems Group, Inc. (I) | | 260 | | 6,172 |
| Vicon Industries, Inc. (I) | | 102 | | 502 |
| Vishay Intertechnology, Inc. (I) | | 23,932 | | 417,613 |
| Vishay Precision Group, Inc. (I) | | 1,709 | | 28,284 |
| X-Rite, Inc. (I) | | 6,319 | | 29,383 |
| Zygo Corp. (I) | | 1,490 | | 21,575 |
| | |
|
| | | | | 7,014,593 |
| Internet Software & Services - 1.64% | | | | |
| AOL, Inc. (I) | | 2,699 | | 56,328 |
| DealerTrack Holdings, Inc. (I) | | 2,284 | | 46,091 |
| Digital River, Inc. (I) | | 1,500 | | 50,370 |
| Earthlink, Inc. | | 15,205 | | 125,137 |
| IAC/InterActiveCorp (I) | | 11,000 | | 341,770 |
| InfoSpace, Inc. (I) | | 8,265 | | 66,616 |
| Internap Network Services Corp. (I) | | 9,947 | | 67,640 |
| Keynote Systems, Inc. | | 600 | | 10,554 |
| Limelight Networks, Inc. (I) | | 6,400 | | 44,480 |
| Marchex, Inc., Class B | | 3,900 | | 35,061 |
| | | | |
| Small Cap Opportunities Fund (continued) | | |
| | | Shares or | | |
| | | Principal | | |
| | | Amount | | Value |
| | |
|
| |
| COMMON STOCKS (continued) | | | | |
| Internet Software & Services (continued) | | | | |
| Market Leader, Inc. (I) | | 500 | $ | 1,315 |
| ModusLink Global Solutions, Inc. | | 9,124 | | 62,956 |
| Open Text Corp. (I)(L) | | 18,994 | | 1,119,126 |
| Perficient, Inc. (I) | | 1,626 | | 20,211 |
| RealNetworks, Inc. (I) | | 22,892 | | 88,134 |
| Soundbite Communications, Inc. (I) | | 200 | | 540 |
| Support.com, Inc. (I) | | 6,257 | | 34,914 |
| TechTarget, Inc. (I) | | 5,473 | | 47,560 |
| The Knot, Inc. (I) | | 200 | | 2,006 |
| TheStreet.com, Inc. | | 6,959 | | 23,104 |
| United Online, Inc. | | 19,113 | | 114,869 |
| ValueClick, Inc. (I) | | 71,030 | | 1,060,478 |
| Web.com Group, Inc. (I) | | 4,251 | | 54,073 |
| | |
|
| | | | | 3,473,333 |
| IT Services - 1.65% | | | | |
| Acorn Energy, Inc. (I) | | 767 | | 3,137 |
| Acxiom Corp. (I) | | 7,534 | | 129,133 |
| CACI International, Inc., Class A (I) | | 4,865 | | 288,592 |
| China Information Technology, Inc. (I)(L) | | 4,800 | | 23,280 |
| CIBER, Inc. (I) | | 17,378 | | 81,155 |
| Computer Task Group, Inc. (I) | | 1,544 | | 18,111 |
| Convergys Corp. (I) | | 15,251 | | 214,582 |
| CoreLogic, Inc. (I) | | 6,410 | | 119,547 |
| Dynamics Research Corp. (I) | | 2,094 | | 32,164 |
| Integral Systems, Inc. (I) | | 2,513 | | 30,759 |
| INX, Inc. (I) | | 814 | | 6,268 |
| Jack Henry & Associates, Inc. | | 32,885 | | 1,049,360 |
| Online Resources Corp. (I) | | 6,713 | | 43,970 |
| SRA International, Inc., Class A (I) | | 6,412 | | 174,599 |
| StarTek, Inc. (I) | | 2,139 | | 11,893 |
| The Hackett Group, Inc. (I) | | 9,407 | | 33,959 |
| Tier Technologies, Inc., Class B (I) | | 1,809 | | 11,342 |
| Virtusa Corp. (I) | | 1,500 | | 25,335 |
| Wright Express Corp. (I) | | 23,303 | | 1,188,453 |
| | |
|
| | | | | 3,485,639 |
| Semiconductors & Semiconductor Equipment - 3.54% | | |
| Advanced Analogic Technologies, Inc. (I) | | 5,632 | | 23,823 |
| Advanced Energy Industries, Inc. (I) | | 50,526 | | 814,479 |
| Amtech Systems, Inc. (I) | | 2,327 | | 53,451 |
| Anadigics, Inc. (I) | | 8,400 | | 45,612 |
| ATMI, Inc. (I) | | 6,540 | | 119,290 |
| AuthenTec, Inc. (I) | | 5,081 | | 17,428 |
| Axcelis Technologies, Inc. (I) | | 1,200 | | 3,300 |
| AXT, Inc. (I) | | 7,100 | | 52,682 |
| BTU International, Inc. (I) | | 682 | | 7,400 |
| Cabot Microelectronics Corp. (I) | | 3,400 | | 165,988 |
| Cascade Microtech, Inc. (I) | | 1,613 | | 9,436 |
| CEVA, Inc. (I) | | 2,219 | | 50,593 |
| Cohu, Inc. | | 5,943 | | 87,481 |
| Cymer, Inc. (I) | | 22,644 | | 1,145,786 |
| DSP Group, Inc. (I) | | 6,013 | | 47,443 |
| Evergreen Solar, Inc. (I)(L) | | 3,516 | | 7,806 |
| Exar Corp. (I) | | 10,153 | | 65,690 |
| Fairchild Semiconductor International, Inc. (I) | | 16,880 | | 297,257 |
| FEI Company (I) | | 5,400 | | 181,062 |
| FormFactor, Inc. (I) | | 2,814 | | 27,662 |
| GSI Technology, Inc. (I) | | 4,700 | | 44,227 |
| Ikanos Communications, Inc. (I) | | 1,900 | | 2,394 |
| Integrated Device Technology, Inc. (I) | | 24,164 | | 187,271 |
| Integrated Silicon Solution, Inc. (I) | | 3,800 | | 37,164 |
| International Rectifier Corp. (I) | | 10,474 | | 336,634 |
| IXYS Corp. (I) | | 2,893 | | 35,931 |
| Lattice Semiconductor Corp. (I) | | 7,713 | | 51,214 |
| |
| The accompanying notes are an integral part of the financial statements. | 221 |
John Hancock Funds II
Portfolio of Investments — February 28, 2011 (Unaudited) (showing percentage of total net assets)
| | | | |
| Small Cap Opportunities Fund (continued) | | |
| | | Shares or | | |
| | | Principal | | |
| | | Amount | | Value |
| | |
|
| |
| COMMON STOCKS (continued) | | | | |
| Semiconductors & Semiconductor Equipment (continued) | | |
| Mattson Technology, Inc. (I) | | 6,000 | $ | 15,720 |
| MEMC Electronic Materials, Inc. (I) | | 9,085 | | 123,283 |
| MEMSIC, Inc. (I) | | 1,071 | | 3,609 |
| Microsemi Corp. (I) | | 400 | | 8,812 |
| MKS Instruments, Inc. | | 43,219 | | 1,297,434 |
| MoSys, Inc. (I) | | 1,015 | | 5,725 |
| Nanometrics, Inc. (I) | | 72 | | 1,297 |
| OmniVision Technologies, Inc. (I) | | 6,727 | | 205,981 |
| Pericom Semiconductor Corp. (I) | | 5,664 | | 56,980 |
| Photronics, Inc. (I) | | 13,324 | | 119,117 |
| Rudolph Technologies, Inc. (I) | | 4,000 | | 44,320 |
| Semtech Corp. (I) | | 44,894 | | 1,063,090 |
| Sigma Designs, Inc. (I) | | 7,872 | | 107,689 |
| Silicon Image, Inc. (I) | | 9,862 | | 79,290 |
| Standard Microsystems Corp. (I) | | 5,599 | | 148,541 |
| SunPower Corp., Class A (I) | | 4,209 | | 71,848 |
| SunPower Corp., Class B (I) | | 5,759 | | 97,212 |
| Supertex, Inc. (I) | | 1,700 | | 38,862 |
| Trident Microsystems, Inc. (I) | | 5,100 | | 6,885 |
| TriQuint Semiconductor, Inc. (I) | | 493 | | 7,025 |
| Zoran Corp. (I) | | 6,685 | | 74,939 |
| | |
|
| | | | | 7,496,163 |
| Software - 3.22% | | | | |
| American Software, Inc., Class A | | 3,149 | | 21,161 |
| Ariba, Inc. (I)(L) | | 76,678 | | 2,373,184 |
| Bsquare Corp. (I) | | 100 | | 1,200 |
| Epicor Software Corp. (I) | | 7,000 | | 72,100 |
| EPIQ Systems, Inc. | | 3,500 | | 48,335 |
| ePlus, Inc. (I) | | 1,986 | | 56,442 |
| Fair Isaac Corp. | | 300 | | 8,385 |
| JDA Software Group, Inc. (I) | | 1,800 | | 53,100 |
| Mentor Graphics Corp. (I) | | 600 | | 9,540 |
| Parametric Technology Corp. (I) | | 42,695 | | 1,011,872 |
| Quest Software, Inc. (I) | | 41,281 | | 1,105,918 |
| Rovi Corp. (I) | | 57 | | 3,159 |
| S1 Corp. (I) | | 4,353 | | 28,425 |
| Smith Micro Software, Inc. (I) | | 3,270 | | 30,640 |
| TeleCommunication Systems, Inc. (I) | | 6,815 | | 29,100 |
| THQ, Inc. (I) | | 11,400 | | 65,664 |
| TIBCO Software, Inc. (I) | | 77,295 | | 1,903,003 |
| | |
|
| | | | | 6,821,228 |
| | | |
|
| | | | | 33,421,716 |
| Materials - 7.54% | | | | |
| Chemicals - 3.52% | | | | |
| A. Schulman, Inc. | | 3,820 | | 85,033 |
| American Pacific Corp. (I) | | 1,717 | | 10,336 |
| American Vanguard Corp. | | 4,863 | | 40,022 |
| Arabian American Development Company (I) | | 2,312 | | 10,797 |
| Ashland, Inc. (I) | | 7,504 | | 422,475 |
| Cabot Corp. | | 7,889 | | 341,278 |
| Chase Corp. | | 1,432 | | 23,256 |
| Cytec Industries, Inc. | | 7,000 | | 397,810 |
| Ferro Corp. (I) | | 7,021 | | 111,774 |
| FMC Corp. | | 11,644 | | 901,711 |
| Georgia Gulf Corp. (I) | | 7,700 | | 245,784 |
| H.B. Fuller Company | | 300 | | 6,465 |
| Huntsman Corp. | | 4,200 | | 74,130 |
| Innophos Holdings, Inc. | | 30,001 | | 1,284,943 |
| Innospec, Inc. (I) | | 1,700 | | 45,577 |
| KMG Chemicals, Inc. | | 652 | | 12,238 |
| Kraton Performance Polymers, Inc. (I) | | 31,258 | | 1,072,149 |
| Landec Corp. (I) | | 6,581 | | 40,473 |
| Minerals Technologies, Inc. | | 2,700 | | 175,176 |
| | | | |
| Small Cap Opportunities Fund (continued) | | |
| | | Shares or | | |
| | | Principal | | |
| | | Amount | | Value |
| | |
|
| |
| COMMON STOCKS (continued) | | | | |
| Chemicals (continued) | | | | |
| NL Industries, Inc. | | 3,600 | $ | 49,212 |
| OM Group, Inc. (I) | | 5,098 | | 179,399 |
| Penford Corp. (I) | | 2,346 | | 13,959 |
| PolyOne Corp. | | 86,240 | | 1,197,011 |
| Quaker Chemical Corp. | | 975 | | 37,762 |
| Rockwood Holdings, Inc. (I) | | 3,661 | | 170,420 |
| Spartech Corp. (I) | | 6,400 | | 54,272 |
| Westlake Chemical Corp. | | 6,868 | | 328,359 |
| Zoltek Companies, Inc. (I)(L) | | 8,005 | | 117,033 |
| | |
|
| | | | | 7,448,854 |
| Construction Materials - 0.13% | | | | |
| Headwaters, Inc. (I) | | 15,327 | | 77,708 |
| Texas Industries, Inc. (L) | | 4,800 | | 195,744 |
| | |
|
| | | | | 273,452 |
| Containers & Packaging - 0.73% | | | | |
| AptarGroup, Inc. | | 18,098 | | 871,781 |
| Boise, Inc. | | 17,400 | | 156,252 |
| Graphic Packaging Holding Company (I) | | 24,214 | | 125,913 |
| Myers Industries, Inc. | | 8,603 | | 87,062 |
| Temple-Inland, Inc. | | 13,500 | | 315,765 |
| | |
|
| | | | | 1,556,773 |
| Metals & Mining - 1.86% | | | | |
| A. M. Castle & Company (I) | | 5,452 | | 93,992 |
| Allied Nevada Gold Corp. (I) | | 6,984 | | 211,895 |
| Century Aluminum Company (I) | | 11,480 | | 194,586 |
| Coeur d’Alene Mines Corp. (I) | | 1,550 | | 48,841 |
| Commercial Metals Company | | 19,700 | | 328,399 |
| Compass Minerals International, Inc. | | 10,924 | | 1,021,066 |
| Detour Gold Corp. (I) | | 9,897 | | 322,107 |
| Friedman Industries, Inc. | | 1,405 | | 14,331 |
| Haynes International, Inc. | | 2,800 | | 145,152 |
| Hecla Mining Company (I)(L) | | 8,800 | | 89,320 |
| Horsehead Holding Corp. (I) | | 10,408 | | 172,148 |
| Kaiser Aluminum Corp. (L) | | 4,400 | | 222,332 |
| Materion Corp. (I) | | 3,000 | | 131,310 |
| Olympic Steel, Inc. | | 2,278 | | 61,255 |
| Reliance Steel & Aluminum Company | | 8,700 | | 481,371 |
| RTI International Metals, Inc. (I) | | 5,200 | | 148,200 |
| Steel Dynamics, Inc. | | 400 | | 7,384 |
| Synalloy Corp. | | 380 | | 5,415 |
| Universal Stainless & Alloy Products, Inc. (I) | | 1,778 | | 61,430 |
| US Gold Corp. (I) | | 13,153 | | 95,491 |
| Worthington Industries, Inc. | | 3,800 | | 73,568 |
| | |
|
| | | | | 3,929,593 |
| Paper & Forest Products - 1.30% | | | | |
| Buckeye Technologies, Inc. | | 8,200 | | 214,840 |
| Clearwater Paper Corp. (I) | | 1,399 | | 110,941 |
| Domtar Corp. | | 5,000 | | 437,000 |
| KapStone Paper and Packaging Corp. (I) | | 6,511 | | 111,664 |
| Louisiana-Pacific Corp. (I)(L) | | 23,781 | | 245,420 |
| MeadWestvaco Corp. | | 14,845 | | 435,701 |
| Mercer International, Inc. (I)(L) | | 8,709 | | 120,794 |
| Neenah Paper, Inc. | | 3,386 | | 65,925 |
| P.H. Glatfelter Company | | 8,879 | | 109,300 |
| Schweitzer-Mauduit International, Inc. | | 16,028 | | 878,815 |
| Wausau Paper Corp. | | 2,400 | | 19,272 |
| | |
|
| | | | | 2,749,672 |
| | | |
|
| | | | | 15,958,344 |
| |
| The accompanying notes are an integral part of the financial statements. | 222 |
John Hancock Funds II
Portfolio of Investments — February 28, 2011 (Unaudited) (showing percentage of total net assets)
| | | | |
| Small Cap Opportunities Fund (continued) | | |
| | | Shares or | | |
| | | Principal | | |
| | | Amount | | Value |
| |
|
| |
| COMMON STOCKS (continued) | | | | |
| Telecommunication Services - 0.89% | | | | |
| Diversified Telecommunication Services - 0.53% | | | |
| Alaska Communications | | | | |
| Systems Group, Inc. (L) | | 73,681 | $ | 750,809 |
| General Communication, Inc., Class A (I) | | 9,787 | | 118,325 |
| Hughes Communications, Inc. (I) | | 1,496 | | 89,610 |
| Iridium Communications, Inc. (I) | | 10,611 | | 99,743 |
| Premiere Global Services, Inc. (I) | | 4,256 | | 28,558 |
| SureWest Communications (I) | | 2,863 | | 37,276 |
| | |
|
| | | | | 1,124,321 |
| Wireless Telecommunication Services - 0.36% | | | |
| FiberTower Corp. (I) | | 8,641 | | 28,688 |
| Leap Wireless International, Inc. (I) | | 3,505 | | 42,831 |
| MetroPCS Communications, Inc. (I) | | 1,700 | | 24,480 |
| Shenandoah Telecommunications Company | | 198 | | 3,465 |
| Telephone & Data Systems, Inc. | | 7,100 | | 238,915 |
| Telephone & Data Systems, Inc. | | | | |
| Special Shares | | 6,500 | | 192,595 |
| United States Cellular Corp. (I) | | 4,446 | | 222,211 |
| USA Mobility, Inc. | | 700 | | 10,444 |
| | |
|
| | | | | 763,629 |
| | | |
|
| | | | | 1,887,950 |
| Utilities - 0.91% | | | | |
| Gas Utilities - 0.69% | | | | |
| Energen Corp. | | 11,964 | | 731,000 |
| UGI Corp. | | 22,876 | | 729,516 |
| | |
|
| | | | | 1,460,516 |
| Independent Power Producers & Energy Traders - 0.18% | | | |
| GenOn Energy, Inc. (I) | | 90,120 | | 364,986 |
| Ormat Technologies, Inc. | | 531 | | 13,302 |
| | |
|
| | | | | 378,288 |
| Water Utilities - 0.04% | | | | |
| Pennichuck Corp. | | 233 | | 6,552 |
| SJW Corp. | | 2,989 | | 74,187 |
| | |
|
| | | | | 80,739 |
| | | |
|
| | | | | 1,919,543 |
|
| TOTAL COMMON STOCKS (Cost $142,942,618) | | $ | 208,430,760 |
|
| |
| SECURITIES LENDING COLLATERAL - 10.44% | | | |
| John Hancock Collateral | | | | |
| Investment Trust, 0.2855% (W)(Y) | | 2,207,313 | | 22,089,462 |
|
| TOTAL SECURITIES LENDING | | | | |
| COLLATERAL (Cost $22,087,058) | | | $ | 22,089,462 |
|
| |
| SHORT-TERM INVESTMENTS - 0.98% | | | |
| Short-Term Securities* - 0.98% | | | | |
| State Street Institutional Liquid Reserves | | | | |
| Fund, 0.2053% | $ | 2,070,502 | $ | 2,070,502 |
|
| TOTAL SHORT-TERM INVESTMENTS (Cost $2,070,502) | | $ | 2,070,502 |
|
| Total Investments (Small Cap Opportunities Fund) | | | |
| (Cost $167,100,178) - 109.90% | | | $ | 232,590,724 |
| Other assets and liabilities, net - (9.90%) | | | | (20,948,796) |
| | | |
|
| TOTAL NET ASSETS - 100.00% | | | $ | 211,641,928 |
| | | |
|
| | | | |
| Small Cap Value Fund | | | | |
| | | Shares or | | |
| | | Principal | | |
| | | Amount | | Value |
| | |
|
| |
| COMMON STOCKS - 96.55% | | | | |
| Consumer Discretionary - 17.18% | | | | |
| Diversified Consumer Services - 1.17% | | | | |
| Matthews International Corp., Class A | | 52,800 | $ | 1,961,520 |
| Hotels, Restaurants & Leisure - 4.11% | | | | |
| Bally Technologies, Inc. (I) | | 35,300 | | 1,363,639 |
| CEC Entertainment, Inc. | | 52,600 | | 2,035,094 |
| Choice Hotels International, Inc. (L) | | 49,000 | | 1,892,380 |
| Sonic Corp. (I) | | 176,400 | | 1,566,432 |
| | |
|
| | | | | 6,857,545 |
| Household Durables - 2.21% | | | | |
| Helen of Troy, Ltd. (I) | | 94,700 | | 2,644,971 |
| Tempur-Pedic International, Inc. (I) | | 22,300 | | 1,046,762 |
| | |
|
| | | | | 3,691,733 |
| Media - 2.23% | | | | |
| Arbitron, Inc. | | 93,600 | | 3,726,216 |
| Multiline Retail - 0.80% | | | | |
| Fred’s, Inc., Class A | | 97,200 | | 1,339,416 |
| Specialty Retail - 6.16% | | | | |
| Ascena Retail Group, Inc. (I) | | 78,800 | | 2,461,712 |
| Hibbett Sports, Inc. (I)(L) | | 23,600 | | 741,276 |
| Stage Stores, Inc. | | 221,500 | | 3,862,960 |
| The Cato Corp., Class A | | 132,600 | | 3,215,550 |
| | |
|
| | | | | 10,281,498 |
| Textiles, Apparel & Luxury Goods - 0.50% | | | | |
| Skechers U.S.A., Inc., Class A (I) | | 40,400 | | 839,512 |
| | |
|
| | | | | 28,697,440 |
| Consumer Staples - 2.49% | | | | |
| Food & Staples Retailing - 0.89% | | | | |
| Casey’s General Stores, Inc. | | 36,300 | | 1,490,841 |
| Food Products - 0.81% | | | | |
| Snyders-Lance, Inc. | | 74,200 | | 1,351,924 |
| Personal Products - 0.79% | | | | |
| Herbalife, Ltd. | | 16,700 | | 1,309,447 |
| | |
|
| | | | | 4,152,212 |
| Energy - 4.18% | | | | |
| Energy Equipment & Services - 2.23% | | | | |
| Bristow Group, Inc. (I) | | 35,500 | | 1,701,160 |
| SEACOR Holdings, Inc. | | 21,400 | | 2,028,078 |
| | |
|
| | | | | 3,729,238 |
| Oil, Gas & Consumable Fuels - 1.95% | | | | |
| Penn Virginia Corp. (L) | | 96,500 | | 1,570,055 |
| SM Energy Company | | 23,300 | | 1,688,551 |
| | |
|
| | | | | 3,258,606 |
| | |
|
| | | | | 6,987,844 |
| Financials - 23.52% | | | | |
| Capital Markets - 1.84% | | | | |
| Ares Capital Corp. | | 172,000 | | 3,066,760 |
| Commercial Banks - 7.47% | | | | |
| First Busey Corp. (L) | | 256,902 | | 1,302,493 |
| First Midwest Bancorp, Inc. | | 194,700 | | 2,350,029 |
| Hancock Holding Company (L) | | 23,700 | | 821,679 |
| International Bancshares Corp. (L) | | 102,600 | | 1,958,634 |
| MB Financial, Inc. | | 87,000 | | 1,789,590 |
| Webster Financial Corp. | | 136,200 | | 3,157,116 |
| Westamerica Bancorp. (L) | | 21,100 | | 1,088,338 |
| | |
|
| | | | | 12,467,879 |
| |
| The accompanying notes are an integral part of the financial statements. | 223 |
John Hancock Funds II
Portfolio of Investments — February 28, 2011 (Unaudited) (showing percentage of total net assets)
| | | | |
| Small Cap Value Fund (continued) | | |
| | | Shares or | | |
| | | Principal | | |
| | | Amount | | Value |
| | |
|
| |
| COMMON STOCKS (continued) | | | | |
| Insurance - 8.48% | | | | |
| Alleghany Corp. (I) | | 4,505 | $ | 1,535,079 |
| AMERISAFE, Inc. (I) | | 73,300 | | 1,463,068 |
| Assured Guaranty, Ltd. | | 86,500 | | 1,256,845 |
| Delphi Financial Group, Inc., Class A | | 119,800 | | 3,709,008 |
| Platinum Underwriters Holdings, Ltd. | | 59,900 | | 2,497,830 |
| Reinsurance Group of America, Inc. | | 48,100 | | 2,904,759 |
| Validus Holdings, Ltd. | | 25,769 | | 797,551 |
| | |
|
| | | | | 14,164,140 |
| Real Estate Investment Trusts - 3.21% | | | | |
| American Campus Communities, Inc. | | 40,100 | | 1,340,142 |
| DiamondRock Hospitality Company | | 127,812 | | 1,503,069 |
| Education Realty Trust, Inc. | | 177,200 | | 1,461,900 |
| Mack-Cali Realty Corp. | | 31,100 | | 1,055,534 |
| | |
|
| | | | | 5,360,645 |
| Thrifts & Mortgage Finance - 2.52% | | | | |
| NewAlliance Bancshares, Inc. | | 100,800 | | 1,576,512 |
| Northwest Bancshares, Inc. | | 217,400 | | 2,639,236 |
| | |
|
| | | | | 4,215,748 |
| | | |
|
| | | | | 39,275,172 |
| Health Care - 7.88% | | | | |
| Health Care Equipment & Supplies - 1.95% | | | | |
| Haemonetics Corp. (I) | | 12,600 | | 776,790 |
| ICU Medical, Inc. (I) | | 59,100 | | 2,481,609 |
| | |
|
| | | | | 3,258,399 |
| Health Care Providers & Services - 2.62% | | | | |
| AmSurg Corp. (I) | | 99,600 | | 2,353,548 |
| Corvel Corp. (I) | | 40,700 | | 2,014,650 |
| | |
|
| | | | | 4,368,198 |
| Life Sciences Tools & Services - 3.31% | | | | |
| Charles River | | | | |
| Laboratories International, Inc. (I) | | 73,300 | | 2,671,052 |
| ICON PLC, SADR (I) | | 143,500 | | 2,854,215 |
| | |
|
| | | | | 5,525,267 |
| | | |
|
| | | | | 13,151,864 |
| Industrials - 22.21% | | | | |
| Commercial Services & Supplies - 5.47% | | | | |
| ACCO Brands Corp. (I) | | 221,450 | | 1,893,398 |
| G&K Services, Inc., Class A | | 32,400 | | 1,050,408 |
| Standard Parking Corp. (I) | | 76,498 | | 1,389,204 |
| Unifirst Corp. | | 16,500 | | 930,600 |
| United Stationers, Inc. | | 57,400 | | 3,869,908 |
| | |
|
| | | | | 9,133,518 |
| Construction & Engineering - 0.36% | | | | |
| Sterling Construction Company, Inc. (I) | | 46,200 | | 605,220 |
| Electrical Equipment - 3.61% | | | | |
| Acuity Brands, Inc. (I)(L) | | 25,300 | | 1,429,956 |
| Belden, Inc. | | 125,300 | | 4,589,739 |
| | |
|
| | | | | 6,019,695 |
| Industrial Conglomerates - 3.35% | | | | |
| Carlisle Companies, Inc. | | 130,000 | | 5,591,300 |
| Machinery - 4.28% | | | | |
| Albany International Corp., Class A | | 98,600 | | 2,401,896 |
| ESCO Technologies, Inc. | | 49,600 | | 1,899,184 |
| Mueller Industries, Inc. | | 83,700 | | 2,844,126 |
| | |
|
| | | | | 7,145,206 |
| Marine - 1.81% | | | | |
| Kirby Corp. (I) | | 54,700 | | 3,027,098 |
| | | | |
| Small Cap Value Fund (continued) | | |
| | | Shares or | | |
| | | Principal | | |
| | | Amount | | Value |
| | |
|
| COMMON STOCKS (continued) | | | | |
| Road & Rail - 1.84% | | | | |
| Genesee & Wyoming, Inc., Class A (I) | | 59,000 | $ | 3,073,310 |
| Trading Companies & Distributors - 1.49% | | | | |
| GATX Corp. | | 71,900 | | 2,494,211 |
| | |
|
| | | | | 37,089,558 |
| Information Technology - 8.77% | | | | |
| Computers & Peripherals - 2.09% | | | | |
| Diebold, Inc. | | 72,400 | | 2,545,584 |
| Electronics for Imaging, Inc. (I) | | 61,648 | | 951,229 |
| | |
|
| | | | | 3,496,813 |
| Electronic Equipment, Instruments & Components - 2.45% | | |
| Coherent, Inc. (I) | | 21,900 | | 1,352,325 |
| MTS Systems Corp. | | 44,900 | | 2,079,319 |
| NAM TAI Electronics, Inc. | | 83,100 | | 651,504 |
| | |
|
| | | | | 4,083,148 |
| IT Services - 1.85% | | | | |
| MAXIMUS, Inc. | | 41,800 | | 3,093,200 |
| Office Electronics - 1.15% | | | | |
| Zebra Technologies Corp., Class A (I) | | 51,500 | | 1,921,980 |
| Software - 1.23% | | | | |
| Websense, Inc. (I)(L) | | 96,000 | | 2,056,320 |
| | |
|
| | | | | 14,651,461 |
| Materials - 5.11% | | | | |
| Chemicals - 2.39% | | | | |
| Kraton Performance Polymers, Inc. (I) | | 44,300 | | 1,519,488 |
| Zep, Inc. | | 156,900 | | 2,461,761 |
| | |
|
| | | | | 3,981,249 |
| Containers & Packaging - 1.38% | | | | |
| AptarGroup, Inc. | | 47,800 | | 2,302,526 |
| Paper & Forest Products - 1.34% | | | | |
| Deltic Timber Corp. (L) | | 36,900 | | 2,242,413 |
| | |
|
| | | | | 8,526,188 |
| Utilities - 5.21% | | | | |
| Electric Utilities - 2.54% | | | | |
| Unisource Energy Corp. | | 68,800 | | 2,508,448 |
| Westar Energy, Inc. (L) | | 66,800 | | 1,736,800 |
| | |
|
| | | | | 4,245,248 |
| Gas Utilities - 2.67% | | | | |
| Atmos Energy Corp. | | 51,200 | | 1,731,584 |
| New Jersey Resources Corp. | | 30,600 | | 1,279,998 |
| WGL Holdings, Inc. | | 38,100 | | 1,447,800 |
| | |
|
| | | | | 4,459,382 |
| | |
|
| | | | | 8,704,630 |
|
| TOTAL COMMON STOCKS (Cost $114,845,385) | | | $ | 161,236,369 |
|
| SECURITIES LENDING COLLATERAL - 4.79% | | |
| John Hancock Collateral | | | | |
| Investment Trust, 0.2855% (W)(Y) | | 0 | | 8,005,522 |
|
| TOTAL SECURITIES LENDING | | | | |
| COLLATERAL (Cost $8,004,966) | | | $ | 8,005,522 |
|
| |
| The accompanying notes are an integral part of the financial statements. | 224 |
John Hancock Funds II
Portfolio of Investments — February 28, 2011 (Unaudited) (showing percentage of total net assets)
| | | | |
| Small Cap Value Fund (continued) | | | |
| | | Shares or | | |
| | | Principal | | |
| | | Amount | | Value |
| |
|
| |
| SHORT-TERM INVESTMENTS - 3.29% | | | |
| Repurchase Agreement - 3.29% | | | | |
| Deutsche Tri-Party Repurchase Agreement | | | | |
| dated 02/28/2011 at 0.200% to be | | | | |
| repurchased at $5,500,031 on 03/01/2011, | | | |
| collateralized by $5,585,633 U.S. Treasury | | | |
| Notes, 2.500% due 05/15/2029 (valued at | | | |
| $5,600,741 including interest) and $9,270 | | | |
| U.S. Treasury Notes, 0.500% due | | | | |
| 10/15/2013 (valued at $9,288, | | | | |
| including interest) | $ | 5,500,000 | $ | 5,500,000 |
|
| TOTAL SHORT-TERM INVESTMENTS (Cost $5,500,000) | | $ | 5,500,000 |
|
| Total Investments (Small Cap Value Fund) | | | |
| (Cost $128,350,351) - 104.63% | | | $ | 174,741,891 |
| Other assets and liabilities, net - (4.63%) | | | | (7,738,060) |
| | | |
|
| TOTAL NET ASSETS - 100.00% | | | $ | 167,003,831 |
| | | |
|
| |
| |
| |
| Small Company Growth Fund | | | |
| | | Shares or | | |
| | | Principal | | |
| | | Amount | | Value |
| |
|
| |
| COMMON STOCKS - 98.56% | | | | |
| Consumer Discretionary - 15.86% | | | | |
| Auto Components - 1.85% | | | | |
| Tenneco, Inc. (I)(L) | | 27,603 | $ | 1,100,808 |
| TRW Automotive Holdings Corp. (I) | | 30,264 | | 1,718,995 |
| | |
|
| | | | | 2,819,803 |
| Distributors - 0.58% | | | | |
| Pool Corp. (L) | | 35,526 | | 886,729 |
| Diversified Consumer Services - 1.12% | | | | |
| Weight Watchers International, Inc. (I) | | 27,931 | | 1,707,422 |
| Hotels, Restaurants & Leisure - 4.93% | | | | |
| Buffalo Wild Wings, Inc. (I) | | 18,721 | | 992,026 |
| Choice Hotels International, Inc. (L) | | 24,829 | | 958,896 |
| Darden Restaurants, Inc. | | 20,415 | | 962,159 |
| Jack in the Box, Inc. (I) | | 43,315 | | 952,930 |
| P.F. Chang’s China Bistro, Inc. (L) | | 32,240 | | 1,497,226 |
| Penn National Gaming, Inc. (I)(L) | | 36,143 | | 1,292,835 |
| WMS Industries, Inc. (I) | | 21,638 | | 860,976 |
| | |
|
| | | | | 7,517,048 |
| Media - 1.02% | | | | |
| DreamWorks Animation SKG, Inc. (I) | | 22,909 | | 632,747 |
| National CineMedia, Inc. | | 48,899 | | 923,702 |
| | |
|
| | | | | 1,556,449 |
| Specialty Retail - 4.92% | | | | |
| Dick’s Sporting Goods, Inc. (I) | | 30,809 | | 1,144,246 |
| DSW, Inc., Class A (I)(L) | | 27,660 | | 1,123,273 |
| Foot Locker, Inc. | | 56,722 | | 1,127,066 |
| Group 1 Automotive, Inc. (L) | | 29,402 | | 1,242,234 |
| Tractor Supply Company | | 27,030 | | 1,407,452 |
| Williams-Sonoma, Inc. | | 40,377 | | 1,457,206 |
| | |
|
| | | | | 7,501,477 |
| Textiles, Apparel & Luxury Goods - 1.44% | | | |
| Maidenform Brands, Inc. (I) | | 37,970 | | 1,030,506 |
| Steven Madden, Ltd. (I) | | 26,891 | | 1,160,078 |
| | |
|
| | | | | 2,190,584 |
| | | |
|
| | | | | 24,179,512 |
| | | | |
| Small Company Growth Fund (continued) | | |
| | | Shares or | | |
| | | Principal | | |
| | | Amount | | Value |
| | |
|
| |
| COMMON STOCKS (continued) | | | | |
| Consumer Staples - 1.77% | | | | |
| Food Products - 1.08% | | | | |
| Diamond Foods, Inc. (L) | | 18,656 | $ | 950,523 |
| Ralcorp Holdings, Inc. (I)(L) | | 10,752 | | 697,267 |
| | |
|
| | | | | 1,647,790 |
| Personal Products - 0.69% | | | | |
| Nu Skin Enterprises, Inc., Class A | | 32,715 | | 1,044,263 |
| | |
|
| | | | | 2,692,053 |
| Energy - 8.53% | | | | |
| Energy Equipment & Services - 3.82% | | | | |
| Dresser-Rand Group, Inc. (I) | | 24,237 | | 1,194,399 |
| Dril-Quip, Inc. (I) | | 14,564 | | 1,117,059 |
| FMC Technologies, Inc. (I) | | 12,490 | | 1,174,685 |
| Lufkin Industries, Inc. | | 15,077 | | 1,178,268 |
| Patterson-UTI Energy, Inc. | | 42,166 | | 1,152,818 |
| | |
|
| | | | | 5,817,229 |
| Oil, Gas & Consumable Fuels - 4.71% | | | | |
| Bill Barrett Corp. (I) | | 23,497 | | 913,563 |
| Carrizo Oil & Gas, Inc. (I)(L) | | 31,152 | | 1,159,477 |
| Frontier Oil Corp. | | 61,728 | | 1,722,211 |
| Goodrich Petroleum Corp. (I)(L) | | 29,039 | | 590,653 |
| James River Coal Company (I)(L) | | 42,201 | | 886,221 |
| SandRidge Energy, Inc. (I) | | 177,200 | | 1,915,532 |
| | |
|
| | | | | 7,187,657 |
| | | |
|
| | | | | 13,004,886 |
| Financials - 5.46% | | | | |
| Capital Markets - 2.09% | | | | |
| Affiliated Managers Group, Inc. (I) | | 12,377 | | 1,321,245 |
| Greenhill & Company, Inc. (L) | | 12,606 | | 905,489 |
| Stifel Financial Corp. (I) | | 13,331 | | 956,366 |
| | |
|
| | | | | 3,183,100 |
| Commercial Banks - 2.16% | | | | |
| City National Corp. (L) | | 16,381 | | 965,005 |
| Huntington Bancshares, Inc. | | 145,458 | | 994,933 |
| SVB Financial Group (I)(L) | | 24,738 | | 1,340,305 |
| | |
|
| | | | | 3,300,243 |
| Insurance - 1.21% | | | | |
| Brown & Brown, Inc. | | 28,025 | | 732,573 |
| ProAssurance Corp. (I) | | 17,470 | | 1,106,375 |
| | |
|
| | | | | 1,838,948 |
| | | |
|
| | | | | 8,322,291 |
| Health Care - 14.98% | | | | |
| Biotechnology - 1.76% | | | | |
| Acorda Therapeutics, Inc. (I) | | 28,233 | | 592,046 |
| BioMarin Pharmaceutical, Inc. (I) | | 42,938 | | 1,050,263 |
| United Therapeutics Corp. (I) | | 15,545 | | 1,048,199 |
| | |
|
| | | | | 2,690,508 |
| Health Care Equipment & Supplies - 3.28% | | | | |
| Insulet Corp. (I) | | 39,717 | | 702,991 |
| Masimo Corp. | | 31,801 | | 958,482 |
| Meridian Bioscience, Inc. (L) | | 36,336 | | 783,768 |
| Sirona Dental Systems, Inc. (I) | | 24,719 | | 1,247,321 |
| Zoll Medical Corp. (I) | | 28,124 | | 1,301,579 |
| | |
|
| | | | | 4,994,141 |
| Health Care Providers & Services - 3.39% | | | | |
| Chemed Corp. | | 20,267 | | 1,326,272 |
| Health Management | | | | |
| Associates, Inc., Class A (I) | | 100,373 | | 1,003,730 |
| |
| The accompanying notes are an integral part of the financial statements. | 225 |
John Hancock Funds II
Portfolio of Investments — February 28, 2011 (Unaudited) (showing percentage of total net assets)
| | | | |
| Small Company Growth Fund (continued) | | |
| | | Shares or | | |
| | | Principal | | |
| | | Amount | | Value |
| | |
|
| |
| COMMON STOCKS (continued) | | | | |
| Health Care Providers & Services (continued) | | | | |
| MEDNAX, Inc. (I) | | 15,179 | $ | 985,572 |
| PSS World Medical, Inc. (I)(L) | | 38,839 | | 1,010,591 |
| VCA Antech, Inc. (I) | | 33,646 | | 842,496 |
| | |
|
| | | | | 5,168,661 |
| Health Care Technology - 1.58% | | | | |
| Allscripts-Misys Healthcare Solutions, Inc. (I) | | 59,615 | | 1,272,780 |
| Quality Systems, Inc. | | 14,158 | | 1,131,224 |
| | |
|
| | | | | 2,404,004 |
| Life Sciences Tools & Services - 2.58% | | | | |
| Bruker Corp. (I) | | 55,552 | | 1,066,043 |
| Parexel International Corp. (I) | | 38,230 | | 897,258 |
| PerkinElmer, Inc. | | 39,129 | | 1,036,919 |
| Techne Corp. | | 12,913 | | 925,733 |
| | |
|
| | | | | 3,925,953 |
| Pharmaceuticals - 2.39% | | | | |
| Medicis Pharmaceutical Corp., Class A | | 35,208 | | 1,129,825 |
| Perrigo Company | | 15,369 | | 1,174,653 |
| Valeant Pharmaceuticals International, Inc. (L) | | 33,511 | | 1,343,121 |
| | |
|
| | | | | 3,647,599 |
| | | |
|
| | | | | 22,830,866 |
| Industrials - 15.08% | | | | |
| Aerospace & Defense - 2.29% | | | | |
| Hexcel Corp. (I) | | 52,410 | | 972,206 |
| TransDigm Group, Inc. (I) | | 31,357 | | 2,520,476 |
| | |
|
| | | | | 3,492,682 |
| Air Freight & Logistics - 1.50% | | | | |
| Forward Air Corp. | | 36,412 | | 1,078,888 |
| HUB Group, Inc., Class A (I) | | 34,587 | | 1,209,162 |
| | |
|
| | | | | 2,288,050 |
| Commercial Services & Supplies - 1.58% | | | | |
| Corrections Corp. of America (I) | | 44,887 | | 1,114,993 |
| Fuel Tech, Inc. (I)(L) | | 46,282 | | 346,189 |
| Tetra Tech, Inc. (I) | | 40,172 | | 944,042 |
| | |
|
| | | | | 2,405,224 |
| Electrical Equipment - 1.78% | | | | |
| Regal-Beloit Corp. (L) | | 21,827 | | 1,592,280 |
| Thomas & Betts Corp. (I) | | 20,369 | | 1,128,239 |
| | |
|
| | | | | 2,720,519 |
| Machinery - 4.86% | | | | |
| ArvinMeritor, Inc. (I) | | 53,730 | | 962,842 |
| Kaydon Corp. | | 22,879 | | 897,772 |
| Kennametal, Inc. | | 27,056 | | 1,040,574 |
| Lincoln Electric Holdings, Inc. | | 15,640 | | 1,116,383 |
| Lindsay Corp. (L) | | 13,278 | | 937,560 |
| Terex Corp. (I) | | 33,255 | | 1,122,356 |
| Wabtec Corp. | | 23,350 | | 1,325,346 |
| | |
|
| | | | | 7,402,833 |
| Professional Services - 0.92% | | | | |
| CoStar Group, Inc. (I)(L) | | 24,651 | | 1,396,972 |
| Road & Rail - 0.79% | | | | |
| Knight Transportation, Inc. | | 64,488 | | 1,200,122 |
| Trading Companies & Distributors - 1.36% | | | | |
| Watsco, Inc. (I)(L) | | 13,401 | | 865,437 |
| WESCO International, Inc. (I) | | 20,847 | | 1,213,712 |
| | |
|
| | | | | 2,079,149 |
| | | |
|
| | | | | 22,985,551 |
| | | | |
| Small Company Growth Fund (continued) | | |
| | | Shares or | | |
| | | Principal | | |
| | | Amount | | Value |
| | |
|
| |
| COMMON STOCKS (continued) | | | | |
| Information Technology - 30.68% | | | | |
| Communications Equipment - 5.43% | | | | |
| Ciena Corp. (I) | | 75,481 | $ | 2,081,011 |
| Finisar Corp. (I) | | 49,310 | | 2,022,696 |
| Harmonic, Inc. (I) | | 102,005 | | 980,268 |
| NETGEAR, Inc. (I)(L) | | 32,294 | | 1,059,243 |
| Polycom, Inc. (I) | | 44,588 | | 2,131,306 |
| | |
|
| | | | | 8,274,524 |
| Electronic Equipment, Instruments & Components - 2.19% | | |
| Coherent, Inc. (I) | | 19,979 | | 1,233,703 |
| Littelfuse, Inc. | | 21,541 | | 1,138,011 |
| Tech Data Corp. (I) | | 19,467 | | 965,174 |
| | |
|
| | | | | 3,336,888 |
| Internet Software & Services - 2.81% | | | | |
| Open Text Corp. (I) | | 20,165 | | 1,188,122 |
| ValueClick, Inc. (I) | | 75,185 | | 1,122,512 |
| VistaPrint NV (I)(L) | | 17,859 | | 914,559 |
| WebMD Health Corp. (I) | | 18,158 | | 1,053,164 |
| | |
|
| | | | | 4,278,357 |
| IT Services - 1.23% | | | | |
| Alliance Data Systems Corp. (I)(L) | | 12,926 | | 1,017,793 |
| Global Payments, Inc. | | 17,980 | | 862,860 |
| | |
|
| | | | | 1,880,653 |
| Semiconductors & Semiconductor Equipment - 7.67% | | |
| Advanced Energy Industries, Inc. (I) | | 66,283 | | 1,068,482 |
| Cymer, Inc. (I) | | 22,884 | | 1,157,930 |
| Hittite Microwave Corp. (I) | | 21,233 | | 1,303,282 |
| Microsemi Corp. (I) | | 62,078 | | 1,367,578 |
| ON Semiconductor Corp. (I) | | 103,535 | | 1,154,415 |
| Power Integrations, Inc. (L) | | 22,984 | | 915,683 |
| RF Micro Devices, Inc. (I) | | 143,382 | | 1,075,365 |
| Semtech Corp. (I) | | 45,956 | | 1,088,238 |
| Teradyne, Inc. (I)(L) | | 80,714 | | 1,503,702 |
| Volterra Semiconductor Corp. (I) | | 41,597 | | 1,049,492 |
| | |
|
| | | | | 11,684,167 |
| Software - 11.35% | | | | |
| ANSYS, Inc. (I) | | 20,439 | | 1,151,124 |
| Aspen Technology, Inc. (I) | | 79,767 | | 1,214,851 |
| BroadSoft, Inc. (I) | | 19,121 | | 674,971 |
| CommVault Systems, Inc. (I) | | 36,545 | | 1,334,989 |
| Fair Isaac Corp. (L) | | 34,461 | | 963,185 |
| Informatica Corp. (I)(L) | | 45,084 | | 2,119,399 |
| Lawson Software, Inc. (I) | | 139,892 | | 1,418,505 |
| MICROS Systems, Inc. (I) | | 31,130 | | 1,483,033 |
| NICE Systems, Ltd., SADR (I) | | 33,718 | | 1,168,160 |
| Parametric Technology Corp. (I) | | 43,478 | | 1,030,429 |
| Quest Software, Inc. (I) | | 49,541 | | 1,327,203 |
| SolarWinds, Inc. (I) | | 32,947 | | 739,660 |
| SuccessFactors, Inc. (I)(L) | | 48,084 | | 1,726,696 |
| Websense, Inc. (I) | | 44,499 | | 953,169 |
| | |
|
| | | | | 17,305,374 |
| | | |
|
| | | | | 46,759,963 |
| Materials - 4.50% | | | | |
| Chemicals - 2.63% | | | | |
| Calgon Carbon Corp. (I)(L) | | 38,781 | | 544,485 |
| Intrepid Potash, Inc. (I)(L) | | 30,884 | | 1,192,122 |
| Olin Corp. | | 53,305 | | 992,006 |
| Rockwood Holdings, Inc. (I) | | 27,516 | | 1,280,870 |
| | |
|
| | | | | 4,009,483 |
| |
| The accompanying notes are an integral part of the financial statements. | 226 |
John Hancock Funds II
Portfolio of Investments — February 28, 2011 (Unaudited) (showing percentage of total net assets)
| | | | |
| Small Company Growth Fund (continued) | | |
| | | Shares or | | |
| | | Principal | | |
| | | Amount | | Value |
| |
|
| COMMON STOCKS (continued) | | | | |
| Containers & Packaging - 0.82% | | | | |
| Greif, Inc., Class A | | 19,368 | $ | 1,252,335 |
| Metals & Mining - 1.05% | | | | |
| Allied Nevada Gold Corp. (I) | | 10,040 | | 304,614 |
| Carpenter Technology Corp. | | 20,201 | | 839,958 |
| Detour Gold Corp. (I) | | 13,902 | | 452,454 |
| | |
|
| | | | | 1,597,026 |
| | | |
|
| | | | | 6,858,844 |
| Telecommunication Services - 0.96% | | | | |
| Wireless Telecommunication Services - 0.96% | | | |
| SBA Communications Corp., Class A (I) | | 34,867 | | 1,467,551 |
| Utilities - 0.74% | | | | |
| Electric Utilities - 0.74% | | | | |
| ITC Holdings Corp. | | 16,533 | | 1,133,337 |
|
| TOTAL COMMON STOCKS (Cost $103,570,128) | | $ | 150,234,854 |
|
| SECURITIES LENDING COLLATERAL - 17.32% | | |
| John Hancock Collateral | | | | |
| Investment Trust, 0.2855% (W)(Y) | | 2,638,828 | | 26,407,807 |
|
| TOTAL SECURITIES LENDING | | | | |
| COLLATERAL (Cost $26,394,555) | | | $ | 26,407,807 |
|
| SHORT-TERM INVESTMENTS - 0.66% | | | |
| Short-Term Securities* - 0.66% | | | | |
| State Street Institutional Liquid Reserves | | | | |
| Fund, 0.2053% | $ | 1,000,383 | $ | 1,000,383 |
|
| TOTAL SHORT-TERM INVESTMENTS (Cost $1,000,383) | $ | 1,000,383 |
|
| Total Investments (Small Company Growth Fund) | | | |
| (Cost $130,965,066) - 116.54% | | | $ | 177,643,044 |
| Other assets and liabilities, net - (16.54%) | | | (25,210,948) |
| | |
|
| TOTAL NET ASSETS - 100.00% | | | $ | 152,432,096 |
| | | |
|
| |
| |
| Small Company Value Fund | | | |
| | | Shares or | | |
| | | Principal | | |
| | | Amount | | Value |
| |
|
| COMMON STOCKS - 95.82% | | | | |
| Consumer Discretionary - 10.87% | | | | |
| Auto Components - 0.73% | | | | |
| Drew Industries, Inc. | | 143,800 | $ | 3,326,094 |
| Automobiles - 0.57% | | | | |
| Winnebago Industries, Inc. (I)(L) | | 178,800 | | 2,585,448 |
| Distributors - 0.64% | | | | |
| Pool Corp. (L) | | 117,000 | | 2,920,320 |
| Diversified Consumer Services - 0.97% | | | | |
| Matthews International Corp., Class A | | 119,200 | | 4,428,280 |
| Hotels, Restaurants & Leisure - 0.77% | | | | |
| Orient-Express Hotels, Ltd., Class A (I)(L) | | 277,000 | | 3,495,740 |
| Household Durables - 1.71% | | | | |
| CSS Industries, Inc. | | 84,200 | | 1,473,500 |
| Ethan Allen Interiors, Inc. (L) | | 56,000 | | 1,234,800 |
| M/I Homes, Inc. (I) | | 79,000 | | 1,054,650 |
| Meritage Homes Corp. (I)(L) | | 131,000 | | 3,381,110 |
| Stanley Furniture Company, Inc. (I) | | 111,600 | | 613,800 |
| | |
|
| | | | | 7,757,860 |
| | | | |
| Small Company Value Fund (continued) | | |
| | | Shares or | | |
| | | Principal | | |
| | | Amount | | Value |
| | |
|
| |
| COMMON STOCKS (continued) | | | | |
| Leisure Equipment & Products - 0.29% | | | | |
| Brunswick Corp. (L) | | 58,000 | $ | 1,335,740 |
| Media - 0.75% | | | | |
| Ascent Media Corp., Class A (I) | | 50,300 | | 2,098,516 |
| Saga Communications, Inc., Class A (I) | | 44,600 | | 1,293,400 |
| | |
|
| | | | | 3,391,916 |
| Multiline Retail - 0.42% | | | | |
| Fred’s, Inc., Class A | | 138,000 | | 1,901,640 |
| Specialty Retail - 3.82% | | | | |
| Aaron’s, Inc. (L) | | 368,150 | | 8,666,251 |
| Haverty Furniture Companies, Inc. (L) | | 164,700 | | 2,190,510 |
| MarineMax, Inc. (I)(L) | | 146,600 | | 1,323,798 |
| Stein Mart, Inc. | | 262,000 | | 2,145,780 |
| The Men’s Wearhouse, Inc. (L) | | 115,000 | | 3,070,500 |
| | |
|
| | | | | 17,396,839 |
| Textiles, Apparel & Luxury Goods - 0.20% | | | | |
| Culp, Inc. (I) | | 91,000 | | 914,550 |
| | |
|
| | | | | 49,454,427 |
| Consumer Staples - 0.90% | | | | |
| Food & Staples Retailing - 0.64% | | | | |
| Nash Finch Company (L) | | 72,100 | | 2,910,677 |
| Tobacco - 0.26% | | | | |
| Alliance One International, Inc. (I)(L) | | 324,300 | | 1,177,209 |
| | |
|
| | | | | 4,087,886 |
| Energy - 7.15% | | | | |
| Energy Equipment & Services - 2.68% | | | | |
| Atwood Oceanics, Inc. (I)(L) | | 50,400 | | 2,294,208 |
| CARBO Ceramics, Inc. (L) | | 42,400 | | 5,256,328 |
| Hercules Offshore, Inc. (I)(L) | | 167,400 | | 826,956 |
| TetraTechnologies, Inc. (I) | | 233,100 | | 3,219,111 |
| Union Drilling, Inc. (I) | | 80,000 | | 619,200 |
| | |
|
| | | | | 12,215,803 |
| Oil, Gas & Consumable Fuels - 4.47% | | | | |
| Cloud Peak Energy, Inc. (I) | | 108,500 | | 2,224,250 |
| Forest Oil Corp. (I)(L) | | 80,500 | | 2,856,945 |
| Northern Oil and Gas, Inc. (I) | | 158,000 | | 5,019,660 |
| Oasis Petroleum, Inc. (I) | | 166,000 | | 5,730,320 |
| Overseas Shipholding Group, Inc. (L) | | 32,600 | | 1,100,576 |
| Penn Virginia Corp. | | 208,000 | | 3,384,160 |
| | |
|
| | | | | 20,315,911 |
| | |
|
| | | | | 32,531,714 |
| Financials - 20.81% | | | | |
| Capital Markets - 3.63% | | | | |
| Ares Capital Corp. | | 316,400 | | 5,641,412 |
| Hercules Technology Growth Capital, Inc. | | 209,500 | | 2,317,070 |
| JMP Group, Inc. | | 104,000 | | 888,160 |
| Kohlberg Capital Corp. | | 188,267 | | 1,572,029 |
| Piper Jaffray Companies (I)(L) | | 40,700 | | 1,674,805 |
| Stifel Financial Corp. (I) | | 61,500 | | 4,412,010 |
| | |
|
| | | | | 16,505,486 |
| Commercial Banks - 5.41% | | | | |
| Columbia Banking System, Inc. (L) | | 75,000 | | 1,488,000 |
| East West Bancorp, Inc. (L) | | 176,700 | | 4,102,974 |
| Glacier Bancorp, Inc. (L) | | 206,000 | | 3,219,780 |
| Home Bancshares, Inc. | | 135,000 | | 3,041,550 |
| Signature Bank (I)(L) | | 57,000 | | 2,957,730 |
| SVB Financial Group (I)(L) | | 110,800 | | 6,003,144 |
| |
| The accompanying notes are an integral part of the financial statements. | 227 |
John Hancock Funds II
Portfolio of Investments — February 28, 2011 (Unaudited) (showing percentage of total net assets)
| | | | |
| Small Company Value Fund (continued) | | |
| | | Shares or | | |
| | | Principal | | |
| | | Amount | | Value |
| | |
|
| |
| COMMON STOCKS (continued) | | | | |
| Commercial Banks (continued) | | | | |
| Wintrust Financial Corp. (L) | | 113,100 | $ | 3,797,898 |
| | |
|
| | | | | 24,611,076 |
| Diversified Financial Services - 0.56% | | | | |
| Compass Diversified Holdings (L) | | 156,000 | | 2,528,760 |
| Insurance - 3.91% | | | | |
| Alterra Capital Holdings, Ltd. | | 136,300 | | 2,948,169 |
| Employers Holdings, Inc. | | 74,900 | | 1,506,988 |
| Fortegra Financial Corp. (I) | | 40,300 | | 459,420 |
| Markel Corp. (I)(L) | | 6,700 | | 2,784,855 |
| National Interstate Corp. | | 118,100 | | 2,461,204 |
| ProAssurance Corp. (I)(L) | | 120,200 | | 7,612,266 |
| | |
|
| | | | | 17,772,902 |
| Real Estate Investment Trusts - 7.30% | | | | |
| Acadia Realty Trust (L) | | 86,500 | | 1,712,700 |
| CBL & Associates Properties, Inc. (L) | | 364,500 | | 6,506,325 |
| Cedar Shopping Centers, Inc. | | 166,000 | | 1,005,960 |
| First Potomac Realty Trust | | 187,000 | | 3,016,310 |
| Hatteras Financial Corp. | | 83,200 | | 2,461,056 |
| Kilroy Realty Corp. (L) | | 127,000 | | 4,921,250 |
| LaSalle Hotel Properties (L) | | 153,500 | | 4,330,235 |
| Parkway Properties, Inc. | | 50,200 | | 813,742 |
| Potlatch Corp. (L) | | 91,000 | | 3,494,400 |
| Redwood Trust, Inc. | | 146,000 | | 2,391,480 |
| Washington Real Estate Investment Trust (L) | | 82,000 | | 2,561,680 |
| | |
|
| | | | | 33,215,138 |
| | |
|
| | | | | 94,633,362 |
| Health Care - 5.84% | | | | |
| Biotechnology - 0.68% | | | | |
| Exelixis, Inc. (I)(L) | | 249,000 | | 3,100,050 |
| Health Care Equipment & Supplies - 1.98% | | | | |
| Analogic Corp. (L) | | 37,900 | | 2,054,180 |
| AngioDynamics, Inc. (I) | | 106,800 | | 1,796,376 |
| Quidel Corp. (I)(L) | | 110,000 | | 1,447,600 |
| West Pharmaceutical Services, Inc. (L) | | 90,000 | | 3,699,900 |
| | |
|
| | | | | 8,998,056 |
| Health Care Providers & Services - 3.18% | | | | |
| Landauer, Inc. | | 37,300 | | 2,346,170 |
| National Healthcare Corp. | | 67,000 | | 3,189,200 |
| Owens & Minor, Inc. (L) | | 223,000 | | 6,957,600 |
| Triple-S Management Corp., Class B (I) | | 100,500 | | 1,985,880 |
| | |
|
| | | | | 14,478,850 |
| | |
|
| | | | | 26,576,956 |
| Industrials - 25.07% | | | | |
| Aerospace & Defense - 0.27% | | | | |
| Kratos Defense & Security Solutions, Inc. (I) | | 84,000 | | 1,210,440 |
| Air Freight & Logistics - 0.79% | | | | |
| UTi Worldwide, Inc. | | 181,000 | | 3,601,900 |
| Airlines - 1.18% | | | | |
| Alaska Air Group, Inc. (I) | | 90,000 | | 5,350,500 |
| Building Products - 1.69% | | | | |
| Ameron International Corp. | | 45,400 | | 3,207,964 |
| Gibraltar Industries, Inc. (I)(L) | | 166,600 | | 1,804,278 |
| Universal Forest Products, Inc. (L) | | 78,000 | | 2,659,800 |
| | |
|
| | | | | 7,672,042 |
| Commercial Services & Supplies - 3.28% | | | | |
| G&K Services, Inc., Class A | | 91,000 | | 2,950,220 |
| McGrath Rentcorp | | 184,000 | | 5,061,840 |
| Mine Safety Appliances Company | | 64,800 | | 2,341,224 |
| | | | |
| Small Company Value Fund (continued) | | |
| | | Shares or | | |
| | | Principal | | |
| | | Amount | | Value |
| | |
|
| |
| COMMON STOCKS (continued) | | | | |
| Commercial Services & Supplies (continued) | | | | |
| Waste Connections, Inc. (L) | | 157,000 | $ | 4,551,430 |
| | |
|
| | | | | 14,904,714 |
| Construction & Engineering - 1.48% | | | | |
| Comfort Systems USA, Inc. (L) | | 140,000 | | 1,857,800 |
| Insituform Technologies, Inc., Class A (I)(L) | | 166,000 | | 4,289,440 |
| Sterling Construction Company, Inc. (I) | | 46,200 | | 605,220 |
| | |
|
| | | | | 6,752,460 |
| Electrical Equipment - 2.03% | | | | |
| Belden, Inc. | | 107,500 | | 3,937,725 |
| Franklin Electric Company, Inc. | | 29,000 | | 1,232,500 |
| Woodward, Inc. | | 123,100 | | 4,048,759 |
| | |
|
| | | | | 9,218,984 |
| Machinery - 5.69% | | | | |
| Astec Industries, Inc. (I)(L) | | 51,000 | | 1,750,830 |
| Cascade Corp. | | 51,200 | | 2,501,632 |
| CIRCOR International, Inc. | | 69,000 | | 2,735,850 |
| IDEX Corp. | | 111,825 | | 4,611,663 |
| Nordson Corp. (L) | | 86,900 | | 9,464,278 |
| Robbins & Myers, Inc. | | 113,000 | | 4,817,190 |
| | |
|
| | | | | 25,881,443 |
| Marine - 1.63% | | | | |
| Kirby Corp. (I)(L) | | 133,800 | | 7,404,492 |
| Professional Services - 1.74% | | | | |
| FTI Consulting, Inc. (I)(L) | | 63,400 | | 2,091,566 |
| Navigant Consulting Company (I)(L) | | 193,000 | | 1,812,270 |
| On Assignment, Inc. (I)(L) | | 261,000 | | 2,740,500 |
| The Dolan Company (I) | | 102,100 | | 1,276,250 |
| | |
|
| | | | | 7,920,586 |
| Road & Rail - 3.34% | | | | |
| Genesee & Wyoming, Inc., Class A (I) | | 135,200 | | 7,042,568 |
| Landstar System, Inc. (L) | | 183,000 | | 8,138,010 |
| | |
|
| | | | | 15,180,578 |
| Trading Companies & Distributors - 1.95% | | | | |
| Beacon Roofing Supply, Inc. (I)(L) | | 308,000 | | 6,532,680 |
| Kaman Corp., Class A (L) | | 74,000 | | 2,358,380 |
| | |
|
| | | | | 8,891,060 |
| | |
|
| | | | | 113,989,199 |
| Information Technology - 10.87% | | | | |
| Communications Equipment - 1.23% | | | | |
| Ixia (I)(L) | | 225,000 | | 3,948,750 |
| Sonus Networks, Inc. (I)(L) | | 535,900 | | 1,623,777 |
| | |
|
| | | | | 5,572,527 |
| Computers & Peripherals - 0.29% | | | | |
| Xyratex, Ltd. (I) | | 104,500 | | 1,328,195 |
| Electronic Equipment, Instruments & Components - 3.57% | | |
| Cognex Corp. | | 38,000 | | 1,060,580 |
| Electro Rent Corp. | | 198,000 | | 3,169,980 |
| Electro Scientific Industries, Inc. (I) | | 85,000 | | 1,295,400 |
| Littelfuse, Inc. | | 77,200 | | 4,078,476 |
| Methode Electronics, Inc. | | 80,000 | | 936,000 |
| Newport Corp. (I) | | 128,000 | | 2,131,200 |
| SYNNEX Corp. (I)(L) | | 101,000 | | 3,563,280 |
| | |
|
| | | | | 16,234,916 |
| IT Services - 0.17% | | | | |
| StarTek, Inc. (I) | | 142,812 | | 794,035 |
| Semiconductors & Semiconductor Equipment - 3.47% | | |
| Advanced Energy Industries, Inc. (I)(L) | | 167,500 | | 2,700,100 |
| |
| The accompanying notes are an integral part of the financial statements. | 228 |
John Hancock Funds II
Portfolio of Investments — February 28, 2011 (Unaudited) (showing percentage of total net assets)
| | | | |
| Small Company Value Fund (continued) | | |
| | | Shares or | | |
| | | Principal | | |
| | | Amount | | Value |
| | |
|
| |
| COMMON STOCKS (continued) | | | | |
| Semiconductors & Semiconductor Equipment (continued) | | |
| ATMI, Inc. (I) | | 79,000 | $ | 1,440,960 |
| Brooks Automation, Inc. (I) | | 160,900 | | 2,019,295 |
| Cabot Microelectronics Corp. (I) | | 45,700 | | 2,231,074 |
| Cymer, Inc. (I) | | 70,200 | | 3,552,120 |
| Teradyne, Inc. (I)(L) | | 205,400 | | 3,826,602 |
| | |
|
| | | | | 15,770,151 |
| Software - 2.14% | | | | |
| Accelrys, Inc. (I) | | 112,000 | | 969,920 |
| Progress Software Corp. (I)(L) | | 207,450 | | 6,090,732 |
| Websense, Inc. (I) | | 124,000 | | 2,656,080 |
| | |
|
| | | | | 9,716,732 |
| | | |
|
| | | | | 49,416,556 |
| Materials - 9.98% | | | | |
| Chemicals - 2.54% | | | | |
| American Vanguard Corp. (L) | | 139,800 | | 1,150,554 |
| Arch Chemicals, Inc. | | 101,000 | | 3,630,950 |
| Innospec, Inc. (I) | | 165,600 | | 4,439,736 |
| Minerals Technologies, Inc. | | 36,000 | | 2,335,680 |
| | |
|
| | | | | 11,556,920 |
| Containers & Packaging - 1.84% | | | | |
| AptarGroup, Inc. | | 130,100 | | 6,266,917 |
| Myers Industries, Inc. | | 208,000 | | 2,104,960 |
| | |
|
| | | | | 8,371,877 |
| Metals & Mining - 3.58% | | | | |
| AMCOL International Corp. (L) | | 78,500 | | 2,449,985 |
| Carpenter Technology Corp. (L) | | 91,500 | | 3,804,570 |
| Franco-Nevada Corp. | | 88,000 | | 2,994,473 |
| North American Palladium, Ltd. (I)(L) | | 167,000 | | 1,165,660 |
| Royal Gold, Inc. (L) | | 57,000 | | 2,828,340 |
| Sims Metal Management, Ltd. (L) | | 157,800 | | 3,015,558 |
| | |
|
| | | | | 16,258,586 |
| Paper & Forest Products - 2.02% | | | | |
| Clearwater Paper Corp. (I) | | 48,000 | | 3,806,400 |
| Deltic Timber Corp. | | 63,000 | | 3,828,510 |
| Wausau Paper Corp. (L) | | 193,700 | | 1,555,411 |
| | |
|
| | | | | 9,190,321 |
| | | |
|
| | | | | 45,377,704 |
| Telecommunication Services - 0.35% | | | | |
| Diversified Telecommunication Services - 0.35% | | | | |
| Premiere Global Services, Inc. (I) | | 240,000 | | 1,610,400 |
| Utilities - 3.98% | | | | |
| Electric Utilities - 2.01% | | | | |
| Cleco Corp. (L) | | 126,000 | | 4,076,100 |
| El Paso Electric Company (I)(L) | | 151,900 | | 4,268,390 |
| The Empire District Electric Company (L) | | 36,500 | | 789,495 |
| | |
|
| | | | | 9,133,985 |
| Gas Utilities - 0.73% | | | | |
| Southwest Gas Corp. (L) | | 85,500 | | 3,323,385 |
| Multi-Utilities - 1.24% | | | | |
| Black Hills Corp. (L) | | 59,500 | | 1,833,790 |
| NorthWestern Corp. | | 76,000 | | 2,257,960 |
| Vectren Corp. (L) | | 59,600 | | 1,568,672 |
| | |
|
| | | | | 5,660,422 |
| | | |
|
| | | | | 18,117,792 |
|
| TOTAL COMMON STOCKS (Cost $317,068,973) | | | $ | 435,795,996 |
|
| | | | |
| Small Company Value Fund (continued) | |
| | | Shares or | | |
| | | Principal | | |
| | | Amount | | Value |
| |
|
| |
| PREFERRED SECURITIES - 1.19% | | | | |
| Financials - 1.19% | | | | |
| Commercial Banks - 0.78% | | | | |
| East West Bancorp., Inc., Series A 8.000% | | 2,114 | | 3,535,348 |
| Insurance - 0.41% | | | | |
| Assured Guaranty, Ltd. 8.500% | | 30,200 | | 1,863,642 |
| |
|
| | | | | 5,398,990 |
|
| TOTAL PREFERRED SECURITIES (Cost $3,602,606) | $ | 5,398,990 |
|
| |
| INVESTMENT COMPANIES - 0.89% | | | | |
| First Opportunity Fund, Inc. (I) | | 147,700 | | 1,075,256 |
| iShares Russell 2000 Value Index Fund (L) | | 39,800 | | 2,969,876 |
|
| TOTAL INVESTMENT COMPANIES (Cost $3,995,735) | $ | 4,045,132 |
|
| |
| SECURITIES LENDING COLLATERAL - 27.12% | | |
| John Hancock Collateral | | | | |
| Investment Trust, 0.2855% (W)(Y) | | 12,325,423 | | 123,345,442 |
|
| TOTAL SECURITIES LENDING | | | | |
| COLLATERAL (Cost $123,321,610) | | | $ | 123,345,442 |
|
| |
| SHORT-TERM INVESTMENTS - 2.22% | | | |
| Short-Term Securities* - 2.22% | | | | |
| State Street Institutional U.S. Government | | | | |
| Money Market Fund, 0.0647% | $ | 604,153 | $ | 604,153 |
| T. Rowe Price Prime Reserve Fund, 0.2212% | 9,481,825 | | 9,481,825 |
| |
|
| | | | | 10,085,978 |
|
| TOTAL SHORT-TERM INVESTMENTS (Cost $10,085,978) | $ | 10,085,978 |
|
| Total Investments (Small Company Value Fund) | | | |
| (Cost $458,074,902) - 127.24% | | | $ | 578,671,538 |
| Other assets and liabilities, net - (27.24%) | | | (123,888,570) |
| |
|
| TOTAL NET ASSETS - 100.00% | | | $ | 454,782,968 |
| | | |
|
| |
| |
| |
| Smaller Company Growth Fund | | |
| | | Shares or | | |
| | | Principal | | |
| | | Amount | | Value |
| |
|
| |
| COMMON STOCKS - 96.77% | | | | |
| Consumer Discretionary - 12.36% | | | | |
| Auto Components - 0.45% | | | | |
| American Axle & | | | | |
| Manufacturing Holdings, Inc. (I) | | 1,471 | $ | 19,667 |
| China Automotive Systems, Inc. (I) | | 239 | | 2,775 |
| Dana Holding Corp. (I) | | 4,973 | | 93,890 |
| Drew Industries, Inc. | | 10,786 | | 249,480 |
| Exide Technologies (I) | | 2,703 | | 32,166 |
| Federal Mogul Corp. (I) | | 366 | | 7,690 |
| Fuel Systems Solutions, Inc. (I) | | 587 | | 17,093 |
| Gentex Corp. | | 4,943 | | 149,674 |
| Modine Manufacturing Company (I) | | 1,010 | | 14,948 |
| Tenneco, Inc. (I)(L) | | 2,113 | | 84,266 |
| Wonder Auto Technology, Inc. (I) | | 426 | | 2,922 |
| |
|
| | | | | 674,571 |
| Automobiles - 0.05% | | | | |
| Tesla Motors, Inc. (I) | | 1,150 | | 27,474 |
| Thor Industries, Inc. | | 1,376 | | 45,738 |
| |
|
| | | | | 73,212 |
| Distributors - 0.03% | | | | |
| Pool Corp. | | 1,751 | | 43,705 |
| |
| The accompanying notes are an integral part of the financial statements. | 229 |
John Hancock Funds II
Portfolio of Investments — February 28, 2011 (Unaudited) (showing percentage of total net assets)
| | | | |
| Smaller Company Growth Fund (continued) |
| | | Shares or | | |
| | | Principal | | |
| | | Amount | | Value |
| | |
|
| |
| COMMON STOCKS (continued) | | | | |
| Diversified Consumer Services - 0.66% | | | | |
| American Public Education, Inc. (I) | | 633 | $ | 26,852 |
| Archipelago Learning, Inc. (I) | | 231 | | 2,467 |
| Bridgepoint Education, Inc. (I) | | 644 | | 12,056 |
| Capella Education Company (I)(L) | | 522 | | 30,104 |
| Coinstar, Inc. (I)(L) | | 1,060 | | 45,241 |
| Education Management Corp. (I)(L) | | 519 | | 10,053 |
| Grand Canyon Education, Inc. (I) | | 725 | | 11,658 |
| Hillenbrand, Inc. | | 19,800 | | 430,650 |
| K12, Inc. (I) | | 819 | | 27,551 |
| Matthews International Corp., Class A | | 1,038 | | 38,562 |
| Pre-Paid Legal Services, Inc. (I)(L) | | 240 | | 15,826 |
| Princeton Review, Inc. (I) | | 53,396 | | 49,124 |
| Sotheby’s | | 2,362 | | 116,258 |
| Steiner Leisure, Ltd. (I) | | 495 | | 23,344 |
| Strayer Education, Inc. | | 477 | | 65,559 |
| Universal Technical Institute, Inc. | | 727 | | 13,377 |
| Weight Watchers International, Inc. | | 1,167 | | 71,339 |
| | |
|
| | | | | 990,021 |
| Hotels, Restaurants & Leisure - 1.41% | | | | |
| AFC Enterprises, Inc. (I) | | 902 | | 13,341 |
| Ambassadors Group, Inc. | | 317 | | 3,376 |
| Bally Technologies, Inc. (I) | | 1,888 | | 72,933 |
| Biglari Holdings, Inc. (I) | | 15 | | 6,416 |
| BJ’s Restaurants, Inc. (I)(L) | | 2,368 | | 85,130 |
| Buffalo Wild Wings, Inc. (I) | | 609 | | 32,271 |
| California Pizza Kitchen, Inc. (I) | | 822 | | 13,842 |
| Caribou Coffee Company, Inc. (I) | | 21,632 | | 212,859 |
| CEC Entertainment, Inc. | | 723 | | 27,973 |
| Choice Hotels International, Inc. | | 682 | | 26,339 |
| Denny’s Corp. (I) | | 3,511 | | 13,658 |
| DineEquity, Inc. (I) | | 540 | | 30,893 |
| Domino’s Pizza, Inc. (I) | | 23,252 | | 392,261 |
| Gaylord Entertainment Company (I) | | 1,173 | | 42,263 |
| International Speedway Corp., Class A | | 488 | | 13,527 |
| Interval Leisure Group, Inc. (I) | | 1,407 | | 23,792 |
| Isle of Capri Casinos, Inc. (I) | | 740 | | 6,845 |
| Krispy Kreme Doughnuts, Inc. (I) | | 2,138 | | 13,405 |
| Life Time Fitness, Inc. (I) | | 1,328 | | 50,929 |
| Orient-Express Hotels, Ltd., Class A (I) | | 3,553 | | 44,839 |
| P.F. Chang’s China Bistro, Inc. | | 809 | | 37,570 |
| Panera Bread Company, Class A (I) | | 1,020 | | 119,085 |
| Papa John’s International, Inc. (I) | | 727 | | 21,214 |
| Peet’s Coffee & Tea, Inc. (I) | | 451 | | 19,285 |
| Ruby Tuesday, Inc. (I) | | 24,256 | | 324,060 |
| Scientific Games Corp., Class A (I) | | 2,420 | | 21,683 |
| Shuffle Master, Inc. (I) | | 1,889 | | 17,775 |
| Sonic Corp. (I) | | 2,062 | | 18,311 |
| Texas Roadhouse, Inc., Class A | | 14,485 | | 245,955 |
| The Cheesecake Factory, Inc. (I) | | 1,983 | | 57,586 |
| Vail Resorts, Inc. (I) | | 507 | | 24,742 |
| WMS Industries, Inc. (I) | | 2,035 | | 80,973 |
| | |
|
| | | | | 2,115,131 |
| Household Durables - 1.54% | | | | |
| Blyth, Inc. | | 188 | | 6,462 |
| Deer Consumer Products, Inc. (L) | | 710 | | 7,824 |
| Ethan Allen Interiors, Inc. | | 911 | | 20,088 |
| Harman International Industries, Inc. | | 43,400 | | 2,110,976 |
| Hovnanian Enterprises, Inc., Class A (I)(L) | | 2,252 | | 9,188 |
| iRobot Corp. (I) | | 762 | | 21,885 |
| Libbey, Inc. (I) | | 693 | | 11,913 |
| Sealy Corp. (I) | | 1,116 | | 3,214 |
| Tempur-Pedic International, Inc. (I) | | 2,281 | | 107,070 |
| | | | |
| Smaller Company Growth Fund (continued) |
| | | Shares or | | |
| | | Principal | | |
| | | Amount | | Value |
| | |
|
| |
| COMMON STOCKS (continued) | | | | |
| Household Durables (continued) | | | | |
| Universal Electronics, Inc. (I) | | 471 | $ | 12,835 |
| | |
|
| | | | | 2,311,455 |
| Internet & Catalog Retail - 0.41% | | | | |
| Blue Nile, Inc. (I)(L) | | 507 | | 28,990 |
| HSN, Inc. (I) | | 1,424 | | 46,252 |
| NutriSystem, Inc. | | 424 | | 5,610 |
| Orbitz Worldwide, Inc. (I) | | 721 | | 2,545 |
| Overstock.com, Inc. (I) | | 568 | | 8,662 |
| PetMed Express, Inc. | | 401 | | 5,971 |
| Shutterfly, Inc. (I) | | 7,194 | | 307,184 |
| US Auto Parts Network, Inc. (I) | | 24,950 | | 202,594 |
| Vitacost.com, Inc. (I) | | 560 | | 3,192 |
| | |
|
| | | | | 611,000 |
| Leisure Equipment & Products - 0.12% | | | | |
| Brunswick Corp. | | 1,561 | | 35,950 |
| Callaway Golf Company | | 794 | | 6,146 |
| Eastman Kodak Company (I)(L) | | 9,469 | | 32,195 |
| Leapfrog Enterprises, Inc. (I) | | 631 | | 2,739 |
| Marine Products Corp. (I) | | 392 | | 2,862 |
| Polaris Industries, Inc. (L) | | 1,134 | | 85,560 |
| Smith & Wesson Holding Corp. (I)(L) | | 1,373 | | 5,478 |
| Sturm Ruger & Company, Inc. | | 431 | | 7,784 |
| | |
|
| | | | | 178,714 |
| Media - 0.51% | | | | |
| Arbitron, Inc. | | 949 | | 37,780 |
| China MediaExpress Holdings, Inc. (I)(L) | | 362 | | 5,108 |
| CKX, Inc. (I) | | 1,640 | | 5,789 |
| Dex One Corp. (I) | | 1,322 | | 6,967 |
| DreamWorks Animation SKG, Inc. (I) | | 2,456 | | 67,835 |
| John Wiley & Sons, Inc. | | 1,606 | | 76,783 |
| Knology, Inc. (I) | | 1,111 | | 15,465 |
| Lions Gate Entertainment Corp. (I) | | 2,166 | | 13,256 |
| Live Nation Entertainment, Inc. (I) | | 4,890 | | 51,981 |
| Madison Square Garden, Inc., Class A (I) | | 2,193 | | 62,632 |
| Martha Stewart Living | | | | |
| Omnimedia, Inc., Class A (I) | | 958 | | 3,928 |
| Mediacom Communications Corp., Class A (I) | | 1,453 | | 12,815 |
| Morningstar, Inc. | | 787 | | 46,181 |
| National CineMedia, Inc. | | 1,909 | | 36,061 |
| Outdoor Channel Holdings, Inc. | | 447 | | 3,500 |
| ReachLocal, Inc. (I) | | 197 | | 3,751 |
| Sinclair Broadcast Group, Inc., Class A | | 1,075 | | 13,911 |
| The New York Times Company, Class A (I)(L) | | 1,610 | | 16,744 |
| Valassis Communications, Inc. (I) | | 9,734 | | 274,693 |
| Warner Music Group Corp. (I) | | 1,910 | | 11,479 |
| | |
|
| | | | | 766,659 |
| Multiline Retail - 1.05% | | | | |
| 99 Cents Only Stores (I) | | 23,200 | | 386,048 |
| Big Lots, Inc. | | 2,661 | | 109,181 |
| Kohl’s Corp. | | 19,400 | | 1,045,466 |
| Retail Ventures, Inc. (I) | | 561 | | 9,818 |
| Saks, Inc. (I) | | 2,408 | | 29,498 |
| | |
|
| | | | | 1,580,011 |
| Specialty Retail - 4.50% | | | | |
| Aaron’s, Inc. | | 2,712 | | 63,840 |
| Aeropostale, Inc. (I) | | 3,256 | | 84,461 |
| Americas Car-Mart, Inc. (I) | | 172 | | 4,262 |
| AnnTaylor Stores Corp. (I) | | 1,021 | | 23,697 |
| Asbury Automotive Group, Inc. (I) | | 674 | | 12,435 |
| Ascena Retail Group, Inc. (I) | | 10,910 | | 340,828 |
| Bebe Stores, Inc. | | 1,036 | | 6,112 |
| |
| The accompanying notes are an integral part of the financial statements. | 230 |
John Hancock Funds II
Portfolio of Investments — February 28, 2011 (Unaudited) (showing percentage of total net assets)
| | | | |
| Smaller Company Growth Fund (continued) |
| | | Shares or | | |
| | | Principal | | |
| | | Amount | | Value |
| | |
|
| |
| COMMON STOCKS (continued) | | | | |
| Specialty Retail (continued) | | | | |
| Casual Male Retail Group, Inc. (I) | | 60,399 | $ | 257,904 |
| Chico’s FAS, Inc. | | 150,195 | | 2,063,679 |
| Citi Trends, Inc. (I) | | 522 | | 11,479 |
| Coldwater Creek, Inc. (I) | | 2,276 | | 6,737 |
| DSW, Inc., Class A (I) | | 185 | | 7,513 |
| Express, Inc. | | 1,094 | | 19,670 |
| Genesco, Inc. (I) | | 11,104 | | 438,830 |
| Group 1 Automotive, Inc. (L) | | 7,020 | | 296,595 |
| hhgregg, Inc. (I) | | 696 | | 10,329 |
| Hibbett Sports, Inc. (I) | | 5,693 | | 178,817 |
| J. Crew Group, Inc. (I) | | 2,139 | | 92,234 |
| Jos. A. Bank Clothiers, Inc. (I) | | 8,836 | | 407,428 |
| Kirkland’s, Inc. (I) | | 560 | | 8,557 |
| Lithia Motors, Inc., Class A | | 7,663 | | 116,018 |
| Lumber Liquidators Holdings, Inc. (I) | | 773 | | 17,995 |
| Monro Muffler Brake, Inc. | | 1,010 | | 33,007 |
| New York & Company, Inc. (I) | | 618 | | 4,295 |
| Office Depot, Inc. (I) | | 4,879 | | 25,907 |
| OfficeMax, Inc. (I) | | 1,497 | | 20,569 |
| Pacific Sunwear of California, Inc. (I) | | 1,163 | | 5,245 |
| Penske Automotive Group, Inc. (I) | | 568 | | 11,570 |
| Pep Boys - Manny, Moe & Jack | | 30,969 | | 388,042 |
| Pier 1 Imports, Inc. (I) | | 4,128 | | 41,610 |
| Rue21, Inc. (I) | | 471 | | 16,494 |
| Sally Beauty Holdings, Inc. (I)(L) | | 3,543 | | 45,953 |
| Select Comfort Corp. (I) | | 1,952 | | 21,726 |
| Signet Jewelers, Ltd. (I) | | 3,020 | | 132,487 |
| The Buckle, Inc. | | 8,866 | | 346,572 |
| The Children’s Place Retail Stores, Inc. (I) | | 864 | | 39,485 |
| The Finish Line, Inc., Class A | | 19,940 | | 348,152 |
| The Wet Seal, Inc., Class A (I) | | 3,583 | | 14,225 |
| Tractor Supply Company | | 2,568 | | 133,716 |
| Ulta Salon, Cosmetics & Fragrance, Inc. (I) | | 6,634 | | 276,837 |
| Vitamin Shoppe, Inc. (I) | | 842 | | 29,293 |
| Williams-Sonoma, Inc. | | 8,670 | | 312,900 |
| Zumiez, Inc. (I) | | 754 | | 19,657 |
| | |
|
| | | | | 6,737,162 |
| Textiles, Apparel & Luxury Goods - 1.63% | | | | |
| Carter’s, Inc. (I) | | 1,012 | | 29,004 |
| CROCS, Inc. (I) | | 3,073 | | 54,238 |
| Deckers Outdoor Corp. (I) | | 7,157 | | 631,391 |
| Fuqi International, Inc. (I) | | 204 | | 910 |
| G-III Apparel Group, Ltd. (I) | | 574 | | 22,570 |
| Hanesbrands, Inc. (I) | | 2,193 | | 56,821 |
| Iconix Brand Group, Inc. (I) | | 17,094 | | 377,777 |
| K-Swiss, Inc., Class A (I) | | 623 | | 6,236 |
| Kenneth Cole Productions, Inc., Class A (I) | | 120 | | 1,560 |
| Liz Claiborne, Inc. (I)(L) | | 1,664 | | 8,553 |
| Maidenform Brands, Inc. (I) | | 823 | | 22,336 |
| Perry Ellis International, Inc. (I) | | 6,909 | | 200,637 |
| Steven Madden, Ltd. (I) | | 9,559 | | 412,375 |
| The Warnaco Group, Inc. (I) | | 8,494 | | 498,683 |
| True Religion Apparel, Inc. (I) | | 852 | | 20,252 |
| Under Armour, Inc., Class A (I) | | 1,288 | | 85,304 |
| Volcom, Inc. | | 602 | | 10,776 |
| | |
|
| | | | | 2,439,423 |
| | | |
|
| | | | | 18,521,064 |
| Consumer Staples - 1.14% | | | | |
| Beverages - 0.04% | | | | |
| Boston Beer Company, Inc. (I) | | 327 | | 30,352 |
| Coca-Cola Bottling Company Consolidated | | 98 | | 5,655 |
| Heckmann Corp. (I) | | 3,644 | | 20,844 |
| | | | |
| Smaller Company Growth Fund (continued) |
| | | Shares or | | |
| | | Principal | | |
| | | Amount | | Value |
| | |
|
| |
| COMMON STOCKS (continued) | | | | |
| Beverages (continued) | | | | |
| National Beverage Corp. | | 406 | $ | 5,152 |
| | |
|
| | | | | 62,003 |
| Food & Staples Retailing - 0.18% | | | | |
| BJ’s Wholesale Club, Inc. (I) | | 1,250 | | 60,525 |
| Casey’s General Stores, Inc. | | 1,333 | | 54,746 |
| Pricesmart, Inc. | | 632 | | 22,493 |
| QKL Stores, Inc. (I) | | 12,236 | | 37,075 |
| Rite Aid Corp. (I) | | 23,543 | | 30,841 |
| Susser Holdings Corp. (I) | | 153 | | 2,119 |
| United Natural Foods, Inc. (I) | | 1,612 | | 68,429 |
| | |
|
| | | | | 276,228 |
| Food Products - 0.79% | | | | |
| AgFeed Industries, Inc. (I) | | 1,266 | | 2,975 |
| Alico, Inc. | | 130 | | 3,446 |
| Calavo Growers, Inc. | | 136 | | 3,158 |
| Darling International, Inc. (I) | | 4,112 | | 57,116 |
| Diamond Foods, Inc. (L) | | 774 | | 39,435 |
| Farmer Brothers Company | | 90 | | 1,182 |
| Feihe International, Inc. (I)(L) | | 393 | | 3,301 |
| J & J Snack Foods Corp. | | 521 | | 22,908 |
| Pilgrim’s Pride Corp. (I) | | 660 | | 5,089 |
| Smart Balance, Inc. (I) | | 2,142 | | 9,296 |
| SunOpta, Inc. (I) | | 33,820 | | 232,343 |
| The Hain Celestial Group, Inc. (I) | | 11,965 | | 356,796 |
| Tootsie Roll Industries, Inc. | | 247 | | 7,064 |
| TreeHouse Foods, Inc. (I) | | 7,943 | | 414,386 |
| Zhongpin, Inc. (I) | | 992 | | 18,441 |
| | |
|
| | | | | 1,176,936 |
| Personal Products - 0.12% | | | | |
| China-Biotics, Inc. (I) | | 195 | | 2,278 |
| Inter Parfums, Inc. | | 9,619 | | 173,815 |
| USANA Health Sciences, Inc. (I) | | 281 | | 9,784 |
| | |
|
| | | | | 185,877 |
| Tobacco - 0.01% | | | | |
| Alliance One International, Inc. (I)(L) | | 1,894 | | 6,875 |
| | |
|
| | | | | 1,707,919 |
| Energy - 10.22% | | | | |
| Energy Equipment & Services - 2.87% | | | | |
| Allis-Chalmers Energy, Inc. (I) | | 1,379 | | 10,008 |
| Atwood Oceanics, Inc. (I) | | 1,328 | | 60,451 |
| Basic Energy Services, Inc. (I) | | 400 | | 7,672 |
| CARBO Ceramics, Inc. | | 692 | | 85,787 |
| Complete Production Services, Inc. (I) | | 2,195 | | 63,238 |
| Dawson Geophysical Company (I) | | 6,902 | | 344,548 |
| Dril-Quip, Inc. (I) | | 18,123 | | 1,390,034 |
| Exterran Holdings, Inc. (I) | | 2,115 | | 48,011 |
| Global Geophysical Services, Inc. (I) | | 635 | | 8,934 |
| Global Industries, Ltd. (I) | | 2,374 | | 21,319 |
| Hercules Offshore, Inc. (I) | | 2,021 | | 9,984 |
| ION Geophysical Corp. (I) | | 2,013 | | 25,807 |
| Key Energy Services, Inc. (I) | | 24,167 | | 374,589 |
| Lufkin Industries, Inc. | | 371 | | 28,994 |
| Matrix Service Company (I) | | 930 | | 12,983 |
| Newpark Resources, Inc. (I) | | 40,520 | | 282,830 |
| North American Energy Partners, Inc. (I) | | 32,230 | | 425,114 |
| Oil States International, Inc. (I) | | 623 | | 45,348 |
| OYO Geospace Corp. (I) | | 3,937 | | 400,314 |
| Patterson-UTI Energy, Inc. | | 16,110 | | 440,447 |
| Pioneer Drilling Company (I) | | 1,240 | | 14,037 |
| RPC, Inc. (L) | | 1,565 | | 30,643 |
| Superior Energy Services, Inc. (I) | | 2,776 | | 106,349 |
| |
| The accompanying notes are an integral part of the financial statements. | 231 |
John Hancock Funds II
Portfolio of Investments — February 28, 2011 (Unaudited) (showing percentage of total net assets)
| | | | |
| Smaller Company Growth Fund (continued) |
| | | Shares or | | |
| | | Principal | | |
| | | Amount | | Value |
| | |
|
| |
| COMMON STOCKS (continued) | | | | |
| Energy Equipment & Services (continued) | | | | |
| Tesco Corp. (I) | | 1,066 | $ | 19,604 |
| TetraTechnologies, Inc. (I) | | 2,683 | | 37,052 |
| Willbros Group, Inc. (I) | | 502 | | 5,703 |
| | |
|
| | | | | 4,299,800 |
| Oil, Gas & Consumable Fuels - 7.35% | | | | |
| Approach Resources, Inc. (I) | | 286 | | 9,309 |
| Atlas Energy LP | | 1 | | 9 |
| ATP Oil & Gas Corp. (I)(L) | | 1,535 | | 31,176 |
| BPZ Resources, Inc. (I)(L) | | 2,848 | | 18,512 |
| Brigham Exploration Company (I)(L) | | 14,256 | | 521,484 |
| Cabot Oil & Gas Corp. (L) | | 33,700 | | 1,538,742 |
| Carrizo Oil & Gas, Inc. (I)(L) | | 52,886 | | 1,968,417 |
| Cheniere Energy, Inc. (I)(L) | | 1,929 | | 20,023 |
| China Integrated Energy, Inc. (I)(L) | | 271 | | 1,707 |
| Clayton Williams Energy, Inc. (I) | | 278 | | 29,490 |
| Clean Energy Fuels Corp. (I)(L) | | 1,675 | | 23,517 |
| Comstock Resources, Inc. (I) | | 1,666 | | 44,232 |
| Contango Oil & Gas Company (I) | | 445 | | 27,270 |
| CVR Energy, Inc. (I) | | 974 | | 18,409 |
| Enbridge Energy Management LLC (I) | | 188 | | 12,570 |
| Endeavour International Corp. (I) | | 700 | | 9,457 |
| Energy XXI Bermuda, Ltd. (I) | | 2,351 | | 81,062 |
| Gastar Exploration, Ltd. (I) | | 1,977 | | 9,786 |
| Georesources, Inc. (I) | | 5,030 | | 158,294 |
| Goodrich Petroleum Corp. (I) | | 860 | | 17,492 |
| Gran Tierra Energy, Inc. (I) | | 9,053 | | 84,012 |
| Gulfport Energy Corp. (I) | | 1,179 | | 34,887 |
| Harvest Natural Resources, Inc. (I) | | 566 | | 8,433 |
| Holly Corp. | | 1,874 | | 107,080 |
| International Coal Group, Inc. (I)(L) | | 37,725 | | 372,346 |
| InterOil Corp. (I)(L) | | 11,900 | | 884,051 |
| Kodiak Oil & Gas Corp. (I) | | 50,892 | | 385,252 |
| L&L Energy, Inc. (I)(L) | | 790 | | 5,933 |
| Magnum Hunter Resources Corp. (I)(L) | | 51,108 | | 365,933 |
| McMoRan Exploration Company (I) | | 3,178 | | 55,615 |
| Northern Oil and Gas, Inc. (I) | | 1,919 | | 60,967 |
| Oasis Petroleum, Inc. (I) | | 1,786 | | 61,653 |
| Patriot Coal Corp. (I)(L) | | 3,205 | | 75,638 |
| Penn Virginia Corp. | | 8,320 | | 135,366 |
| Petroleum Development Corp. (I) | | 403 | | 18,913 |
| Resolute Energy Corp. (I)(L) | | 1,449 | | 26,270 |
| Rex Energy Corp. (I)(L) | | 142,450 | | 1,794,870 |
| Rosetta Resources, Inc. (I) | | 1,856 | | 84,188 |
| SandRidge Energy, Inc. (I)(L) | | 8,356 | | 90,328 |
| SM Energy Company | | 1,443 | | 104,574 |
| Swift Energy Company (I) | | 7,660 | | 328,997 |
| Uranium Energy Corp. (I)(L) | | 2,036 | | 11,605 |
| Venoco, Inc. (I) | | 1,063 | | 19,612 |
| Warren Resources, Inc. (I) | | 2,382 | | 11,719 |
| Western Refining, Inc. (I) | | 1,213 | | 19,736 |
| World Fuel Services Corp. | | 32,026 | | 1,327,157 |
| | |
|
| | | | | 11,016,093 |
| | | |
|
| | | | | 15,315,893 |
| Financials - 4.66% | | | | |
| Capital Markets - 0.68% | | | | |
| Cohen & Steers, Inc. | | 236 | | 6,891 |
| Duff & Phelps Corp. | | 743 | | 11,702 |
| E*TRADE Financial Corp. (I) | | 7,777 | | 124,276 |
| Epoch Holding Corp. | | 482 | | 7,582 |
| Evercore Partners, Inc., Class A | | 429 | | 14,792 |
| Financial Engines, Inc. (I) | | 960 | | 23,434 |
| GAMCO Investors, Inc., Class A | | 77 | | 3,576 |
| Gleacher & Company, Inc. (I) | | 970 | | 1,862 |
| | | | |
| Smaller Company Growth Fund (continued) |
| | | Shares or | | |
| | | Principal | | |
| | | Amount | | Value |
| | |
|
| |
| COMMON STOCKS (continued) | | | | |
| Capital Markets (continued) | | | | |
| Internet Capital Group, Inc. (I) | | 1,291 | $ | 17,674 |
| INTL FCStone, Inc. (I) | | 465 | | 11,258 |
| KBW, Inc. | | 770 | | 19,704 |
| Knight Capital Group, Inc., Class A (I) | | 23,170 | | 324,612 |
| optionsXpress Holdings, Inc. | | 1,517 | | 24,591 |
| Pzena Investment Management, Inc., Class A | | 313 | | 2,363 |
| Stifel Financial Corp. (I) | | 5,605 | | 402,103 |
| SWS Group, Inc. | | 361 | | 1,946 |
| THL Credit, Inc. | | 349 | | 4,694 |
| TradeStation Group, Inc. (I) | | 444 | | 2,988 |
| Westwood Holdings Group, Inc. | | 210 | | 7,881 |
| | |
|
| | | | | 1,013,929 |
| Commercial Banks - 1.07% | | | | |
| Boston Private Financial Holdings, Inc. (L) | | 25,420 | | 180,228 |
| Cardinal Financial Corp. | | 481 | | 5,354 |
| Columbia Banking System, Inc. | | 14,180 | | 281,331 |
| Danvers Bancorp, Inc. | | 700 | | 15,288 |
| East West Bancorp, Inc. | | 4,952 | | 114,985 |
| First Citizens BancShares, Inc. | | 1,091 | | 220,382 |
| IBERIABANK Corp. | | 4,750 | | 272,128 |
| Investors Bancorp, Inc. (I) | | 1,797 | | 24,331 |
| Nara Bancorp, Inc. (I) | | 445 | | 4,664 |
| Pinnacle Financial Partners, Inc. (I)(L) | | 563 | | 8,980 |
| Signature Bank (I) | | 1,430 | | 74,203 |
| SVB Financial Group (I)(L) | | 1,479 | | 80,132 |
| Texas Capital Bancshares, Inc. (I) | | 1,231 | | 31,070 |
| Umpqua Holdings Corp. | | 25,187 | | 288,139 |
| | |
|
| | | | | 1,601,215 |
| Consumer Finance - 0.61% | | | | |
| Cash America International, Inc. | | 8,848 | | 377,898 |
| Credit Acceptance Corp. (I) | | 335 | | 23,651 |
| Dollar Financial Corp. (I) | | 9,551 | | 204,296 |
| EZCORP, Inc., Class A (I) | | 1,567 | | 44,942 |
| First Cash Financial Services, Inc. (I) | | 7,535 | | 246,696 |
| The First Marblehead Corp. (I) | | 808 | | 1,883 |
| World Acceptance Corp. (I) | | 190 | | 11,364 |
| | |
|
| | | | | 910,730 |
| Diversified Financial Services - 1.36% | | | | |
| Asset Acceptance Capital Corp. (I) | | 350 | | 2,058 |
| Encore Capital Group, Inc. (I) | | 15,127 | | 411,908 |
| Interactive Brokers Group, Inc., Class A | | 1,338 | | 20,672 |
| Moody’s Corp. (L) | | 48,150 | | 1,535,985 |
| NewStar Financial, Inc. (I) | | 698 | | 7,392 |
| PICO Holdings, Inc. (I) | | 360 | | 10,696 |
| Portfolio Recovery Associates, Inc. (I) | | 601 | | 50,093 |
| | |
|
| | | | | 2,038,804 |
| Insurance - 0.20% | | | | |
| Citizens, Inc., Class A (I) | | 1,003 | | 7,482 |
| eHealth, Inc. (I) | | 260 | | 3,260 |
| Greenlight Capital Re, Ltd., Class A (I) | | 1,064 | | 30,792 |
| Hilltop Holdings, Inc. (I) | | 522 | | 5,053 |
| MBIA, Inc. (I) | | 1,971 | | 22,095 |
| Montpelier Re Holdings, Ltd. | | 11,530 | | 232,560 |
| | |
|
| | | | | 301,242 |
| Real Estate Investment Trusts - 0.36% | | | | |
| Alexander’s, Inc. | | 79 | | 31,263 |
| Apartment Investment & Management | | | | |
| Company, Class A | | 1,443 | | 37,013 |
| DCT Industrial Trust, Inc. | | 4,263 | | 23,958 |
| DuPont Fabros Technology, Inc. (L) | | 2,100 | | 51,282 |
| Equity Lifestyle Properties, Inc. | | 1,032 | | 59,897 |
| |
| The accompanying notes are an integral part of the financial statements. | 232 |
John Hancock Funds II
Portfolio of Investments — February 28, 2011 (Unaudited) (showing percentage of total net assets)
| | | | |
| Smaller Company Growth Fund (continued) |
| | | Shares or | | |
| | | Principal | | |
| | | Amount | | Value |
| | |
|
| |
| COMMON STOCKS (continued) | | | | |
| Real Estate Investment Trusts (continued) | | | | |
| Extra Space Storage, Inc. | | 2,929 | $ | 57,848 |
| Pebblebrook Hotel Trust | | 1,335 | | 29,290 |
| PS Business Parks, Inc. | | 694 | | 43,750 |
| Retail Opportunity Investments Corp. | | 957 | | 10,527 |
| Saul Centers, Inc. | | 171 | | 7,866 |
| Strategic Hotels & Resorts, Inc. (I) | | 1,865 | | 12,123 |
| Sun Communities, Inc. | | 404 | | 13,970 |
| Sunstone Hotel Investors, Inc. (I) | | 2,078 | | 22,318 |
| Taubman Centers, Inc. | | 1,926 | | 106,854 |
| U-Store-It Trust | | 3,039 | | 31,150 |
| | |
|
| | | | | 539,109 |
| Real Estate Management & Development - 0.25% | | | | |
| Altisource Portfolio Solutions SA (I) | | 9,507 | | 287,016 |
| Consolidated-Tomoka Land Company | | 124 | | 4,251 |
| Forest City Enterprises, Inc., Class A (I)(L) | | 2,796 | | 52,844 |
| Forestar Group, Inc. (I) | | 593 | | 11,421 |
| Kennedy-Wilson Holdings, Inc. (I) | | 781 | | 8,591 |
| Tejon Ranch Company (I) | | 487 | | 12,813 |
| | |
|
| | | | | 376,936 |
| Thrifts & Mortgage Finance - 0.13% | | | | |
| Beneficial Mutual Bancorp, Inc. (I) | | 1,141 | | 10,269 |
| Doral Financial Corp. (I) | | 4,483 | | 5,918 |
| MGIC Investment Corp. (I)(L) | | 2,224 | | 19,104 |
| Provident Financial Services, Inc. | | 10,510 | | 155,653 |
| | |
|
| | | | | 190,944 |
| | | |
|
| | | | | 6,972,909 |
| Health Care - 14.38% | | | | |
| Biotechnology - 2.56% | | | | |
| Acorda Therapeutics, Inc. (I) | | 1,376 | | 28,855 |
| Alkermes, Inc. (I) | | 2,180 | | 31,239 |
| Allos Therapeutics, Inc. (I) | | 2,783 | | 9,295 |
| Alnylam Pharmaceuticals, Inc. (I)(L) | | 1,263 | | 13,868 |
| AMAG Pharmaceuticals, Inc. (I) | | 744 | | 13,697 |
| Ardea Biosciences, Inc. (I) | | 828 | | 21,950 |
| Arena Pharmaceuticals, Inc. (I) | | 2,779 | | 4,502 |
| ARIAD Pharmaceuticals, Inc. (I) | | 4,469 | | 26,859 |
| Arqule, Inc. (I) | | 1,736 | | 11,058 |
| BioMarin Pharmaceutical, Inc. (I) | | 3,610 | | 88,301 |
| BioMimetic Therapeutics, Inc. (I) | | 735 | | 9,908 |
| BioSpecifics Technologies Corp. (I) | | 155 | | 4,166 |
| BioTime, Inc. (I) | | 545 | | 3,755 |
| Celera Corp. (I) | | 2,891 | | 18,387 |
| Cell Therapeutics, Inc. (I) | | 27,251 | | 7,630 |
| Cepheid, Inc. (I)(L) | | 2,123 | | 56,281 |
| China Biologic Products, Inc. (I)(L) | | 331 | | 5,574 |
| Clinical Data, Inc. (I) | | 446 | | 13,545 |
| Codexis, Inc. (I) | | 663 | | 7,068 |
| Cubist Pharmaceuticals, Inc. (I) | | 2,088 | | 45,790 |
| Dyax Corp. (I) | | 3,296 | | 5,669 |
| Emergent Biosolutions, Inc. (I) | | 367 | | 7,722 |
| Enzon Pharmaceuticals, Inc. (I) | | 1,683 | | 17,974 |
| Exelixis, Inc. (I) | | 3,838 | | 47,783 |
| Genomic Health, Inc. (I) | | 508 | | 12,822 |
| Geron Corp. (I) | | 2,747 | | 13,598 |
| Halozyme Therapeutics, Inc. (I) | | 2,830 | | 19,555 |
| Idenix Pharmaceuticals, Inc. (I) | | 1,285 | | 4,343 |
| Immunogen, Inc. (I) | | 1,556 | | 14,020 |
| Incyte Corp. (I) | | 4,336 | | 59,316 |
| InterMune, Inc. (I) | | 1,776 | | 65,019 |
| Ironwood Pharmaceuticals, Inc. (I) | | 1,640 | | 20,057 |
| Isis Pharmaceuticals, Inc. (I)(L) | | 3,320 | | 30,278 |
| Lexicon Pharmaceuticals, Inc. (I) | | 3,864 | | 7,496 |
| | | | |
| Smaller Company Growth Fund (continued) |
| | | Shares or | | |
| | | Principal | | |
| | | Amount | | Value |
| | |
|
| |
| COMMON STOCKS (continued) | | | | |
| Biotechnology (continued) | | | | |
| Ligand Pharmaceuticals, Inc., Class B (I) | | 622 | $ | 6,742 |
| Mannkind Corp. (I)(L) | | 2,856 | | 10,681 |
| Medivation, Inc. (I) | | 1,157 | | 19,993 |
| Metabolix, Inc. (I) | | 585 | | 5,312 |
| Micromet, Inc. (I) | | 2,561 | | 15,955 |
| Momenta Pharmaceuticals, Inc. (I) | | 1,479 | | 20,529 |
| Nabi Biopharmaceuticals (I) | | 1,121 | | 6,345 |
| NPS Pharmaceuticals, Inc. (I) | | 2,357 | | 18,220 |
| Onyx Pharmaceuticals, Inc. (I) | | 13,850 | | 488,074 |
| Opko Health, Inc. (I) | | 3,597 | | 17,374 |
| Orexigen Therapeutics, Inc. (I)(L) | | 817 | | 2,663 |
| Osiris Therapeutics, Inc. (I) | | 577 | | 3,826 |
| PDL BioPharma, Inc. | | 2,460 | | 13,653 |
| Pharmasset, Inc. (I) | | 836 | | 41,800 |
| Progenics Pharmaceuticals, Inc. (I)(L) | | 1,164 | | 6,577 |
| PROLOR Biotech, Inc. (I) | | 1,224 | | 6,977 |
| Protalix BioTherapeutics, Inc. (I) | | 1,573 | | 11,090 |
| Regeneron Pharmaceuticals, Inc. (I) | | 2,257 | | 81,861 |
| Rigel Pharmaceuticals, Inc. (I) | | 1,194 | | 8,346 |
| Sangamo Biosciences, Inc. (I)(L) | | 1,433 | | 11,851 |
| Savient Pharmaceuticals, Inc. (I) | | 1,237 | | 11,925 |
| Seattle Genetics, Inc. (I) | | 3,333 | | 49,495 |
| SIGA Technologies, Inc. (I) | | 1,350 | | 18,090 |
| SuperGen, Inc. (I) | | 59,700 | | 177,309 |
| Talecris Biotherapeutics Holdings Corp. (I) | | 2,207 | | 55,043 |
| Targacept, Inc. (I) | | 807 | | 23,137 |
| Theravance, Inc. (I)(L) | | 2,161 | | 49,228 |
| United Therapeutics Corp. (I) | | 28,204 | | 1,901,796 |
| | |
|
| | | | | 3,831,272 |
| Health Care Equipment & Supplies - 6.03% | | | | |
| Abaxis, Inc. (I)(L) | | 7,529 | | 199,669 |
| ABIOMED, Inc. (I) | | 1,133 | | 14,129 |
| Accuray, Inc. (I) | | 1,765 | | 17,474 |
| Align Technology, Inc. (I) | | 2,016 | | 42,034 |
| Alimera Sciences, Inc. (I) | | 275 | | 2,195 |
| American Medical | | | | |
| Systems Holdings, Inc. (I)(L) | | 2,693 | | 59,004 |
| AngioDynamics, Inc. (I) | | 16,009 | | 269,271 |
| ArthroCare Corp. (I) | | 13,152 | | 453,612 |
| Atrion Corp. | | 1,016 | | 179,161 |
| Cantel Medical Corp. | | 510 | | 11,144 |
| Conceptus, Inc. (I) | | 1,040 | | 14,622 |
| CONMED Corp. (I) | | 52,720 | | 1,396,026 |
| CryoLife, Inc. (I) | | 941 | | 5,081 |
| Cyberonics, Inc. (I) | | 987 | | 32,601 |
| DexCom, Inc. (I) | | 2,168 | | 31,718 |
| Exactech, Inc. (I) | | 296 | | 5,609 |
| Greatbatch, Inc. (I) | | 287 | | 7,141 |
| Haemonetics Corp. (I) | | 872 | | 53,759 |
| HeartWare International, Inc. (I) | | 342 | | 28,755 |
| Hill-Rom Holdings, Inc. | | 777 | | 29,580 |
| ICU Medical, Inc. (I) | | 8,296 | | 348,349 |
| Immucor, Inc. (I) | | 2,466 | | 48,013 |
| Insulet Corp. (I) | | 1,500 | | 26,550 |
| Integra LifeSciences Holdings Corp. (I) | | 5,428 | | 272,214 |
| Invacare Corp. (L) | | 12,850 | | 379,975 |
| IRIS International, Inc. (I) | | 639 | | 6,486 |
| Kensey Nash Corp. (I) | | 94 | | 2,468 |
| MAKO Surgical Corp. (I) | | 905 | | 18,643 |
| Masimo Corp. (L) | | 1,867 | | 56,271 |
| MELA Sciences, Inc. (I) | | 845 | | 2,222 |
| Meridian Bioscience, Inc. | | 501 | | 10,807 |
| Merit Medical Systems, Inc. (I) | | 947 | | 16,175 |
| Natus Medical, Inc. (I) | | 17,472 | | 277,106 |
| |
| The accompanying notes are an integral part of the financial statements. | 233 |
John Hancock Funds II
Portfolio of Investments — February 28, 2011 (Unaudited) (showing percentage of total net assets)
| | | | |
| Smaller Company Growth Fund (continued) |
| | | Shares or | | |
| | | Principal | | |
| | | Amount | | Value |
| | |
|
| |
| COMMON STOCKS (continued) | | | | |
| Health Care Equipment & Supplies (continued) | | | | |
| Neogen Corp. (I) | | 759 | $ | 28,379 |
| NuVasive, Inc. (I)(L) | | 1,389 | | 37,128 |
| NxStage Medical, Inc. (I) | | 1,013 | | 20,898 |
| OraSure Technologies, Inc. (I) | | 1,005 | | 6,965 |
| Orthofix International NV (I) | | 624 | | 19,718 |
| Orthovita, Inc. (I) | | 2,437 | | 5,800 |
| Palomar Medical Technologies, Inc. (I) | | 311 | | 4,970 |
| Quidel Corp. (I) | | 1,031 | | 13,568 |
| RTI Biologics, Inc. (I) | | 676 | | 1,818 |
| Sirona Dental Systems, Inc. (I) | | 10,851 | | 547,541 |
| SonoSite, Inc. (I) | | 475 | | 17,076 |
| St. Jude Medical, Inc. | | 27,530 | | 1,318,136 |
| Stereotaxis, Inc. (I) | | 1,629 | | 6,435 |
| SurModics, Inc. (I) | | 552 | | 7,198 |
| Symmetry Medical, Inc. (I) | | 1,266 | | 11,445 |
| Synovis Life Technologies, Inc. (I) | | 18,512 | | 365,427 |
| The Cooper Companies, Inc. | | 33,770 | | 2,087,661 |
| Thoratec Corp. (I) | | 1,956 | | 54,533 |
| TomoTherapy, Inc. (I) | | 1,575 | | 5,607 |
| Unilife Corp. (I) | | 1,857 | | 8,765 |
| Volcano Corp. (I) | | 1,620 | | 42,509 |
| West Pharmaceutical Services, Inc. | | 1,173 | | 48,222 |
| Wright Medical Group, Inc. (I) | | 1,380 | | 21,845 |
| Zoll Medical Corp. (I) | | 757 | | 35,034 |
| | |
|
| | | | | 9,034,542 |
| Health Care Providers & Services - 1.38% | | | | |
| Accretive Health, Inc. (I) | | 802 | | 16,305 |
| Air Methods Corp. (I) | | 397 | | 23,042 |
| Alliance HealthCare Services, Inc. (I) | | 1,023 | | 4,235 |
| Almost Family, Inc. (I) | | 293 | | 11,427 |
| Amedisys, Inc. (I) | | 358 | | 12,859 |
| AMERIGROUP Corp. (I) | | 873 | | 50,067 |
| AMN Healthcare Services, Inc. (I) | | 387 | | 2,891 |
| Bio-Reference Labs, Inc. (I) | | 11,776 | | 246,354 |
| Brookdale Senior Living, Inc. (I) | | 3,609 | | 97,046 |
| Catalyst Health Solutions, Inc. (I) | | 1,344 | | 60,762 |
| Centene Corp. (I) | | 638 | | 19,440 |
| Chemed Corp. | | 803 | | 52,548 |
| Corvel Corp. (I) | | 246 | | 12,177 |
| Emergency Medical | | | | |
| Services Corp., Class A (I) | | 534 | | 33,722 |
| Emeritus Corp. (I) | | 648 | | 15,247 |
| Genoptix, Inc. (I) | | 620 | | 15,494 |
| Hanger Orthopedic Group, Inc. (I) | | 1,030 | | 27,707 |
| Healthsouth Corp. (I) | | 3,291 | | 79,675 |
| Healthspring, Inc. (I) | | 5,884 | | 221,474 |
| HMS Holdings Corp. (I) | | 971 | | 73,369 |
| IPC The Hospitalist Company, Inc. (I) | | 573 | | 23,378 |
| Landauer, Inc. | | 114 | | 7,171 |
| LHC Group, Inc. (I) | | 3,439 | | 102,689 |
| Molina Healthcare, Inc. (I) | | 532 | | 18,636 |
| MWI Veterinary Supply, Inc. (I) | | 417 | | 28,865 |
| PSS World Medical, Inc. (I)(L) | | 1,946 | | 50,635 |
| RehabCare Group, Inc. (I) | | 307 | | 11,405 |
| Sunrise Senior Living, Inc. (I) | | 624 | | 7,107 |
| Team Health Holdings, Inc. (I) | | 568 | | 10,502 |
| Tenet Healthcare Corp. (I) | | 17,100 | | 122,778 |
| The Ensign Group, Inc. | | 8,775 | | 266,848 |
| US Physical Therapy, Inc. | | 11,821 | | 233,701 |
| VCA Antech, Inc. (I) | | 2,883 | | 72,190 |
| WellCare Health Plans, Inc. (I) | | 974 | | 36,574 |
| | |
|
| | | | | 2,068,320 |
| | | | |
| Smaller Company Growth Fund (continued) |
| | | Shares or | | |
| | | Principal | | |
| | | Amount | | Value |
| | |
|
| |
| COMMON STOCKS (continued) | | | | |
| Health Care Technology - 0.37% | | | | |
| Allscripts-Misys Healthcare Solutions, Inc. (I) | | 6,260 | $ | 133,651 |
| athenahealth, Inc. (I) | | 1,146 | | 51,960 |
| Emdeon, Inc., Class A (I) | | 1,120 | | 17,584 |
| HealthStream, Inc. (I) | | 1,925 | | 14,996 |
| MedAssets, Inc. (I) | | 1,533 | | 21,723 |
| Medidata Solutions, Inc. (I) | | 629 | | 16,297 |
| Merge Healthcare, Inc. (I) | | 44,643 | | 223,661 |
| Omnicell, Inc. (I) | | 1,161 | | 15,604 |
| Quality Systems, Inc. | | 714 | | 57,049 |
| Vital Images, Inc. (I) | | 469 | | 7,030 |
| | |
|
| | | | | 559,555 |
| Life Sciences Tools & Services - 1.69% | | | | |
| Albany Molecular Research, Inc. (I) | | 485 | | 2,192 |
| Bruker Corp. (I) | | 23,879 | | 458,238 |
| Dionex Corp. (I) | | 614 | | 72,341 |
| Enzo Biochem, Inc. (I) | | 1,234 | | 5,319 |
| eResearch Technology, Inc. (I) | | 40,198 | | 255,257 |
| ICON PLC, SADR (I) | | 16,358 | | 325,361 |
| Illumina, Inc. (I)(L) | | 14,280 | | 991,032 |
| Luminex Corp. (I) | | 1,341 | | 25,238 |
| Parexel International Corp. (I) | | 16,415 | | 385,260 |
| Sequenom, Inc. (I) | | 3,181 | | 19,531 |
| | |
|
| | | | | 2,539,769 |
| Pharmaceuticals - 2.35% | | | | |
| Akorn, Inc. (I) | | 50,589 | | 282,793 |
| Auxilium Pharmaceuticals, Inc. (I)(L) | | 1,680 | | 37,750 |
| Cadence Pharmaceuticals, Inc. (I)(L) | | 1,312 | | 9,853 |
| Caraco Pharmaceutical Laboratories, Ltd. (I) | | 349 | | 1,818 |
| Cardiome Pharma Corp. (I) | | 31,590 | | 182,274 |
| Durect Corp. (I) | | 2,754 | | 8,923 |
| Impax Laboratories, Inc. (I) | | 20,363 | | 419,274 |
| Inspire Pharmaceuticals, Inc. (I) | | 2,188 | | 8,796 |
| Jazz Pharmaceuticals, Inc. (I) | | 14,570 | | 358,859 |
| MAP Pharmaceuticals, Inc. (I) | | 690 | | 11,130 |
| Medicis Pharmaceutical Corp., Class A | | 2,135 | | 68,512 |
| Nektar Therapeutics (I) | | 34,617 | | 331,977 |
| Obagi Medical Products, Inc. (I) | | 651 | | 7,460 |
| Pain Therapeutics, Inc. | | 1,279 | | 8,748 |
| Par Pharmaceutical Companies, Inc. (I) | | 1,254 | | 38,724 |
| POZEN, Inc. (I) | | 843 | | 4,333 |
| Questcor Pharmaceuticals, Inc. (I) | | 2,080 | | 26,957 |
| Salix Pharmaceuticals, Ltd. (I) | | 11,400 | | 380,076 |
| Sucampo Pharmaceuticals, Inc. (I) | | 276 | | 1,184 |
| The Medicines Company (I) | | 1,880 | | 32,693 |
| Viropharma, Inc. (I) | | 2,746 | | 49,236 |
| Vivus, Inc. (I)(L) | | 2,860 | | 21,765 |
| Watson Pharmaceuticals, Inc. (I) | | 21,700 | | 1,214,969 |
| XenoPort, Inc. (I) | | 1,096 | | 7,968 |
| | |
|
| | | | | 3,516,072 |
| | |
|
| | | | | 21,549,530 |
| Industrials - 21.15% | | | | |
| Aerospace & Defense - 3.12% | | | | |
| AAR Corp. (I)(L) | | 899 | | 24,534 |
| Aerovironment, Inc. (I) | | 537 | | 15,578 |
| American Science & Engineering, Inc. | | 316 | | 29,704 |
| BE Aerospace, Inc. (I) | | 53,000 | | 1,787,160 |
| Cubic Corp. | | 565 | | 28,425 |
| DigitalGlobe, Inc. (I) | | 13,185 | | 425,612 |
| Esterline Technologies Corp. (I) | | 5,119 | | 366,367 |
| GenCorp, Inc. (I) | | 1,766 | | 9,166 |
| GeoEye, Inc. (I) | | 779 | | 34,704 |
| HEICO Corp. (L) | | 300 | | 16,596 |
| |
| The accompanying notes are an integral part of the financial statements. | 234 |
John Hancock Funds II
Portfolio of Investments — February 28, 2011 (Unaudited) (showing percentage of total net assets)
| | | | |
| Smaller Company Growth Fund (continued) |
| | | Shares or | | |
| | | Principal | | |
| | | Amount | | Value |
| | |
|
| |
| COMMON STOCKS (continued) | | | | |
| Aerospace & Defense (continued) | | | | |
| HEICO Corp., Class A | | 628 | $ | 24,567 |
| Hexcel Corp. (I) | | 15,994 | | 296,689 |
| Ladish Company, Inc. (I) | | 263 | | 14,265 |
| Moog, Inc., Class A (I) | | 1,380 | | 62,666 |
| National Presto Industries, Inc. | | 166 | | 21,006 |
| Orbital Sciences Corp., Class A (I) | | 75,183 | | 1,337,506 |
| Taser International, Inc. (I)(L) | | 2,095 | | 7,919 |
| Teledyne Technologies, Inc. (I) | | 639 | | 33,464 |
| TransDigm Group, Inc. (I) | | 1,654 | | 132,949 |
| | |
|
| | | | | 4,668,877 |
| Air Freight & Logistics - 1.71% | | | | |
| Atlas Air Worldwide Holdings, Inc. (I) | | 6,500 | | 443,820 |
| Forward Air Corp. | | 1,022 | | 30,282 |
| HUB Group, Inc., Class A (I) | | 57,453 | | 2,008,557 |
| Pacer International, Inc. (I) | | 1,230 | | 6,679 |
| UTi Worldwide, Inc. | | 3,585 | | 71,342 |
| | |
|
| | | | | 2,560,680 |
| Airlines - 0.08% | | | | |
| Allegiant Travel Company | | 469 | | 19,356 |
| AMR Corp. (I)(L) | | 5,869 | | 39,557 |
| Hawaiian Holdings, Inc. (I) | | 1,142 | | 7,583 |
| US Airways Group, Inc. (I)(L) | | 5,689 | | 48,982 |
| | |
|
| | | | | 115,478 |
| Building Products - 0.27% | | | | |
| A.O. Smith Corp. | | 8,515 | | 344,006 |
| AAON, Inc. | | 437 | | 13,416 |
| Simpson Manufacturing Company, Inc. | | 487 | | 14,089 |
| Trex Company, Inc. (I)(L) | | 463 | | 13,867 |
| USG Corp. (I) | | 1,268 | | 21,734 |
| | |
|
| | | | | 407,112 |
| Commercial Services & Supplies - 1.65% | | | | |
| APAC Customer Services, Inc. (I) | | 36,846 | | 215,918 |
| Cenveo, Inc. (I) | | 1,988 | | 11,113 |
| Clean Harbors, Inc. (I) | | 835 | | 76,720 |
| Consolidated Graphics, Inc. (I) | | 7,150 | | 389,961 |
| Corrections Corp. of America (I) | | 3,883 | | 96,454 |
| EnerNOC, Inc. (I)(L) | | 615 | | 11,857 |
| Fuel Tech, Inc. (I) | | 597 | | 4,466 |
| Healthcare Services Group, Inc. | | 2,199 | | 39,076 |
| Herman Miller, Inc. | | 1,910 | | 51,455 |
| Higher One Holdings, Inc. (I) | | 984 | | 18,489 |
| IESI-BFC, Ltd. | | 15,117 | | 376,111 |
| Innerworkings, Inc. (I) | | 965 | | 7,884 |
| Interface, Inc., Class A | | 1,707 | | 28,456 |
| KAR Auction Services, Inc. (I) | | 953 | | 13,380 |
| Knoll, Inc. (L) | | 1,654 | | 34,188 |
| M&F Worldwide Corp. (I) | | 143 | | 3,548 |
| Mobile Mini, Inc. (I)(L) | | 1,283 | | 29,175 |
| Rollins, Inc. | | 2,332 | | 45,754 |
| Schawk, Inc., Class A | | 5,758 | | 104,047 |
| Standard Parking Corp. (I) | | 498 | | 9,044 |
| Steelcase, Inc., Class A | | 28,303 | | 274,822 |
| Sykes Enterprises, Inc. (I) | | 18,290 | | 340,194 |
| Team, Inc. (I) | | 318 | | 8,246 |
| Tetra Tech, Inc. (I) | | 2,175 | | 51,113 |
| The Geo Group, Inc. (I) | | 2,270 | | 57,726 |
| United Stationers, Inc. | | 815 | | 54,947 |
| Viad Corp. | | 355 | | 8,137 |
| Waste Connections, Inc. | | 3,879 | | 112,452 |
| | |
|
| | | | | 2,474,733 |
| | | | |
| Smaller Company Growth Fund (continued) |
| | | Shares or | | |
| | | Principal | | |
| | | Amount | | Value |
| | |
|
| |
| COMMON STOCKS (continued) | | | | |
| Construction & Engineering - 2.79% | | | | |
| Chicago Bridge & Iron Company NV | | 63,500 | $ | 2,255,520 |
| EMCOR Group, Inc. (I) | | 2,340 | | 74,552 |
| Furmanite Corp. (I) | | 1,229 | | 8,935 |
| Great Lakes Dredge & Dock Corp. | | 1,965 | | 15,465 |
| Insituform Technologies, Inc., Class A (I) | | 1,381 | | 35,685 |
| MasTec, Inc. (I) | | 94,500 | | 1,759,590 |
| Michael Baker Corp. (I) | | 292 | | 9,189 |
| Orion Marine Group, Inc. (I) | | 947 | | 11,695 |
| Pike Electric Corp. (I) | | 650 | | 6,318 |
| | |
|
| | | | | 4,176,949 |
| Electrical Equipment - 3.34% | | | | |
| A123 Systems, Inc. (I) | | 2,403 | | 22,780 |
| Acuity Brands, Inc. (L) | | 1,516 | | 85,684 |
| Advanced Battery Technologies, Inc. (I)(L) | | 2,184 | | 8,474 |
| American Superconductor Corp. (I) | | 1,695 | | 44,951 |
| AZZ, Inc. | | 220 | | 9,385 |
| Belden, Inc. | | 48,400 | | 1,772,892 |
| Broadwind Energy, Inc. (I) | | 1,884 | | 3,014 |
| Capstone Turbine Corp. (I)(L) | | 8,687 | | 13,204 |
| Cooper Industries PLC | | 14,800 | | 952,380 |
| Ener1, Inc. (I) | | 2,865 | | 10,572 |
| EnerSys (I) | | 10,867 | | 385,779 |
| Franklin Electric Company, Inc. | | 695 | | 29,538 |
| Fushi Copperweld, Inc. (I) | | 16,796 | | 163,425 |
| General Cable Corp. (I) | | 5,170 | | 224,481 |
| GrafTech International, Ltd. (I) | | 17,882 | | 357,819 |
| Harbin Electric, Inc. (I)(L) | | 16,266 | | 308,729 |
| II-VI, Inc. (I) | | 7,069 | | 361,862 |
| Lihua International, Inc. (I)(L) | | 198 | | 2,142 |
| Polypore International, Inc. (I) | | 1,020 | | 59,609 |
| Powell Industries, Inc. (I) | | 288 | | 10,768 |
| Thomas & Betts Corp. (I) | | 1,825 | | 101,087 |
| Valence Technology, Inc. (I)(L) | | 2,547 | | 3,846 |
| Vicor Corp. | | 739 | | 11,255 |
| Woodward, Inc. | | 2,063 | | 67,852 |
| | |
|
| | | | | 5,011,528 |
| Industrial Conglomerates - 1.07% | | | | |
| Carlisle Companies, Inc. | | 35,450 | | 1,524,705 |
| Raven Industries, Inc. | | 572 | | 31,037 |
| Seaboard Corp. | | 13 | | 30,163 |
| Standex International Corp. | | 443 | | 15,182 |
| Tredegar Industries, Inc. | | 294 | | 5,739 |
| | |
|
| | | | | 1,606,826 |
| Machinery - 3.66% | | | | |
| 3D Systems Corp. (I) | | 656 | | 32,111 |
| Actuant Corp., Class A | | 14,591 | | 412,925 |
| American Railcar Industries, Inc. (I) | | 219 | | 4,426 |
| ArvinMeritor, Inc. (I) | | 3,150 | | 56,448 |
| Astec Industries, Inc. (I) | | 677 | | 23,241 |
| Badger Meter, Inc. (L) | | 503 | | 19,773 |
| Barnes Group, Inc. | | 1,065 | | 22,663 |
| Blount International, Inc. (I) | | 1,441 | | 21,903 |
| Briggs & Stratton Corp. | | 13,180 | | 265,313 |
| China Fire & Security Group, Inc. (I) | | 292 | | 1,679 |
| China Valves Technology, Inc. (I) | | 259 | | 1,580 |
| CLARCOR, Inc. | | 1,154 | | 47,476 |
| Colfax Corp. (I) | | 840 | | 18,631 |
| Columbus McKinnon Corp. (I) | | 13,824 | | 238,740 |
| Dynamic Materials Corp. | | 465 | | 12,290 |
| Energy Recovery, Inc. (I) | | 1,109 | | 3,760 |
| EnPro Industries, Inc. (I)(L) | | 9,906 | | 393,070 |
| ESCO Technologies, Inc. | | 935 | | 35,801 |
| Force Protection, Inc. (I) | | 2,474 | | 12,469 |
| |
| The accompanying notes are an integral part of the financial statements. | 235 |
John Hancock Funds II
Portfolio of Investments — February 28, 2011 (Unaudited) (showing percentage of total net assets)
| | | | |
| Smaller Company Growth Fund (continued) |
| | | Shares or | | |
| | | Principal | | |
| | | Amount | | Value |
| | |
|
| |
| COMMON STOCKS (continued) | | | | |
| Machinery (continued) | | | | |
| Gardner Denver, Inc. | | 1,848 | $ | 135,163 |
| Graco, Inc. | | 1,054 | | 42,908 |
| Greenbrier Companies, Inc. (I) | | 416 | | 10,392 |
| IDEX Corp. | | 2,884 | | 118,936 |
| John Bean Technologies Corp. | | 994 | | 18,856 |
| Kadant, Inc. (I) | | 429 | | 11,163 |
| Kennametal, Inc. | | 6,343 | | 243,952 |
| L.B. Foster Company | | 3,152 | | 132,384 |
| Lindsay Corp. (L) | | 441 | | 31,139 |
| Middleby Corp. (I) | | 4,547 | | 407,729 |
| Mueller Industries, Inc. | | 666 | | 22,631 |
| NACCO Industries, Inc., Class A | | 113 | | 14,074 |
| Navistar International Corp. (I) | | 17,630 | | 1,092,707 |
| Nordson Corp. | | 1,076 | | 117,187 |
| Oshkosh Corp. (I) | | 3,195 | | 113,966 |
| RBC Bearings, Inc. (I) | | 773 | | 27,975 |
| Robbins & Myers, Inc. | | 1,425 | | 60,748 |
| Sauer-Danfoss, Inc. (I) | | 213 | | 6,503 |
| SmartHeat, Inc. (I) | | 433 | | 1,979 |
| Sun Hydraulics, Inc. | | 449 | | 16,209 |
| Tennant Company | | 602 | | 24,471 |
| The Gorman-Rupp Company | | 532 | | 19,860 |
| The Manitowoc Company, Inc. | | 2,313 | | 45,821 |
| The Toro Company | | 1,103 | | 68,827 |
| Titan International, Inc. | | 1,183 | | 28,416 |
| TriMas Corp. (I) | | 6,220 | | 127,945 |
| Valmont Industries, Inc. | | 742 | | 75,743 |
| Wabash National Corp. (I) | | 28,587 | | 297,877 |
| WABCO Holdings, Inc. (I) | | 1,138 | | 66,493 |
| Wabtec Corp. | | 1,688 | | 95,811 |
| Westport Innovations, Inc. (I) | | 20,561 | | 377,706 |
| | |
|
| | | | | 5,479,870 |
| Marine - 0.07% | | | | |
| Kirby Corp. (I) | | 1,791 | | 99,114 |
| TBS International PLC, Class A (I) | | 303 | | 1,145 |
| | |
|
| | | | | 100,259 |
| Professional Services - 1.50% | | | | |
| Acacia Research - Acacia Technologies (I) | | 1,166 | | 34,187 |
| CBIZ, Inc. (I) | | 396 | | 2,804 |
| CoStar Group, Inc. (I) | | 694 | | 39,329 |
| Exponent, Inc. (I) | | 489 | | 19,242 |
| FTI Consulting, Inc. (I)(L) | | 4,647 | | 153,305 |
| Hill International, Inc. (I) | | 569 | | 3,016 |
| Huron Consulting Group, Inc. (I) | | 9,629 | | 267,879 |
| ICF International, Inc. (I) | | 616 | | 13,965 |
| Insperity, Inc. (I) | | 824 | | 24,662 |
| Kforce, Inc. (I) | | 17,548 | | 313,407 |
| Korn/Ferry International (I) | | 13,155 | | 300,723 |
| Mistras Group, Inc. (I) | | 423 | | 6,383 |
| Navigant Consulting Company (I) | | 1,761 | | 16,536 |
| Resources Connection, Inc. | | 1,622 | | 31,288 |
| SFN Group, Inc. (I) | | 1,863 | | 25,765 |
| The Advisory Board Company (I) | | 5,415 | | 277,031 |
| The Corporate Executive Board Company | | 1,208 | | 48,405 |
| The Dolan Company (I) | | 20,130 | | 251,625 |
| TrueBlue, Inc. (I) | | 18,457 | | 298,081 |
| VSE Corp. | | 4,675 | | 126,739 |
| | |
|
| | | | | 2,254,372 |
| Road & Rail - 1.06% | | | | |
| Avis Budget Group, Inc. (I) | | 3,623 | | 55,504 |
| Celadon Group, Inc. (I) | | 21,988 | | 321,245 |
| Dollar Thrifty Automotive Group, Inc. (I) | | 592 | | 31,441 |
| Genesee & Wyoming, Inc., Class A (I) | | 1,374 | | 71,572 |
| | | | |
| Smaller Company Growth Fund (continued) |
| | | Shares or | | |
| | | Principal | | |
| | | Amount | | Value |
| | |
|
| |
| COMMON STOCKS (continued) | | | | |
| Road & Rail (continued) | | | | |
| Heartland Express, Inc. (L) | | 1,916 | $ | 31,786 |
| Knight Transportation, Inc. | | 2,210 | | 41,128 |
| Landstar System, Inc. | | 1,730 | | 76,933 |
| Marten Transport, Ltd. | | 10,185 | | 217,450 |
| Old Dominion Freight Line, Inc. (I) | | 13,927 | | 428,673 |
| Patriot Transportation Holding, Inc. (I) | | 66 | | 1,654 |
| RailAmerica, Inc. (I) | | 565 | | 8,475 |
| Saia, Inc. (I) | | 560 | | 8,445 |
| Universal Truckload Services, Inc. (I) | | 75 | | 1,207 |
| Werner Enterprises, Inc. (L) | | 12,110 | | 285,191 |
| YRC Worldwide, Inc. (I)(L) | | 1,675 | | 4,523 |
| | |
|
| | | | | 1,585,227 |
| Trading Companies & Distributors - 0.83% | | | | |
| Applied Industrial Technologies, Inc. (L) | | 13,149 | | 421,294 |
| Beacon Roofing Supply, Inc. (I) | | 1,609 | | 34,127 |
| DXP Enterprises, Inc. (I) | | 6,656 | | 141,507 |
| H&E Equipment Services, Inc. (I) | | 987 | | 15,476 |
| Houston Wire & Cable Company (L) | | 386 | | 5,172 |
| Kaman Corp., Class A | | 320 | | 10,198 |
| RSC Holdings, Inc. (I)(L) | | 1,823 | | 24,847 |
| Rush Enterprises, Inc., Class A (I) | | 11,540 | | 216,606 |
| TAL International Group, Inc. | | 8,700 | | 303,456 |
| Titan Machinery, Inc. (I) | | 307 | | 7,899 |
| United Rentals, Inc. (I)(L) | | 2,132 | | 66,049 |
| | |
|
| | | | | 1,246,631 |
| | |
|
| | | | | 31,688,542 |
| Information Technology - 26.72% | | | | |
| Communications Equipment - 2.58% | | | | |
| Acme Packet, Inc. (I) | | 1,118 | | 84,118 |
| ADTRAN, Inc. (L) | | 2,000 | | 90,960 |
| Anaren, Inc. (I) | | 250 | | 5,305 |
| Aruba Networks, Inc. (I) | | 15,680 | | 477,456 |
| BigBand Networks, Inc. (I) | | 1,582 | | 4,113 |
| Blue Coat Systems, Inc. (I) | | 15,899 | | 447,398 |
| Calix, Inc. (I) | | 592 | | 10,532 |
| Ciena Corp. (I) | | 3,295 | | 90,843 |
| Comtech Telecommunications Corp. | | 974 | | 26,347 |
| DG Fastchannel, Inc. (I) | | 895 | | 29,633 |
| Digi International, Inc. (I) | | 840 | | 9,299 |
| EMS Technologies, Inc. (I) | | 270 | | 5,249 |
| Emulex Corp. (I) | | 30,870 | | 339,570 |
| Extreme Networks, Inc. (I) | | 1,066 | | 4,179 |
| Finisar Corp. (I) | | 2,442 | | 100,171 |
| Harmonic, Inc. (I) | | 3,942 | | 37,883 |
| Infinera Corp. (I) | | 3,209 | | 25,704 |
| InterDigital, Inc. | | 1,561 | | 74,428 |
| Ixia (I) | | 1,289 | | 22,622 |
| JDS Uniphase Corp. (I) | | 7,842 | | 193,462 |
| Meru Networks, Inc. (I) | | 283 | | 6,045 |
| NETGEAR, Inc. (I) | | 820 | | 26,896 |
| Oclaro, Inc. (I) | | 1,755 | | 30,941 |
| Oplink Communications, Inc. (I) | | 681 | | 18,530 |
| Plantronics, Inc. | | 10,008 | | 349,179 |
| Polycom, Inc. (I) | | 3,008 | | 143,782 |
| Powerwave Technologies, Inc. (I) | | 4,689 | | 17,302 |
| RADWARE, Ltd., ADR (I) | | 6,120 | | 230,540 |
| Riverbed Technology, Inc. (I) | | 7,710 | | 318,346 |
| Seachange International, Inc. (I) | | 996 | | 9,402 |
| ShoreTel, Inc. (I) | | 808 | | 5,486 |
| Sonus Networks, Inc. (I) | | 7,303 | | 22,128 |
| Sycamore Networks, Inc. | | 703 | | 15,009 |
| |
| The accompanying notes are an integral part of the financial statements. | 236 |
John Hancock Funds II
Portfolio of Investments — February 28, 2011 (Unaudited) (showing percentage of total net assets)
| | | | |
| Smaller Company Growth Fund (continued) |
| | | Shares or | | |
| | | Principal | | |
| | | Amount | | Value |
| | |
|
| |
| COMMON STOCKS (continued) | | | | |
| Communications Equipment (continued) | | | | |
| Viasat, Inc. (I)(L) | | 14,196 | $ | 590,696 |
| | | |
|
| | | | | 3,863,554 |
| Computers & Peripherals - 0.50% | | | | |
| Avid Technology, Inc. (I) | | 470 | | 10,368 |
| Cray, Inc. (I) | | 1,141 | | 8,421 |
| Electronics for Imaging, Inc. (I) | | 18,430 | | 284,375 |
| Intermec, Inc. (I) | | 1,694 | | 19,024 |
| Novatel Wireless, Inc. (I)(L) | | 41,210 | | 243,963 |
| QLogic Corp. (I) | | 3,720 | | 67,183 |
| Quantum Corp. (I) | | 7,394 | | 19,150 |
| STEC, Inc. (I)(L) | | 1,165 | | 23,801 |
| Stratasys, Inc. (I) | | 691 | | 31,358 |
| Super Micro Computer, Inc. (I) | | 923 | | 13,799 |
| Synaptics, Inc. (I) | | 1,201 | | 35,430 |
| | |
|
| | | | | 756,872 |
| Electronic Equipment, Instruments & Components - 2.62% | | |
| Anixter International, Inc. | | 1,016 | | 72,766 |
| Checkpoint Systems, Inc. (I) | | 1,396 | | 30,405 |
| China Security & | | | | |
| Surveillance Technology, Inc. (I) | | 881 | | 4,097 |
| Cognex Corp. | | 670 | | 18,700 |
| Comverge, Inc. (I) | | 847 | | 4,311 |
| Daktronics, Inc. | | 1,235 | | 14,141 |
| DTS, Inc. (I) | | 604 | | 27,391 |
| Echelon Corp. (I) | | 1,105 | | 9,680 |
| Electro Scientific Industries, Inc. (I) | | 346 | | 5,273 |
| Fabrinet (I) | | 357 | | 10,435 |
| FARO Technologies, Inc. (I) | | 541 | | 19,287 |
| Insight Enterprises, Inc. (I) | | 77,599 | | 1,419,286 |
| IPG Photonics Corp. (I) | | 906 | | 51,570 |
| Itron, Inc. (I) | | 1,423 | | 80,698 |
| KEMET Corp. (I) | | 20,075 | | 279,043 |
| L-1 Identity Solutions, Inc. (I) | | 2,966 | | 35,325 |
| Littelfuse, Inc. | | 2,240 | | 118,339 |
| Maxwell Technologies, Inc. (I)(L) | | 9,323 | | 168,840 |
| Mercury Computer Systems, Inc. (I) | | 989 | | 18,771 |
| Multi-Fineline Electronix, Inc. (I) | | 336 | | 9,616 |
| National Instruments Corp. | | 2,066 | | 64,315 |
| Newport Corp. (I) | | 18,540 | | 308,691 |
| OSI Systems, Inc. (I) | | 6,708 | | 252,355 |
| Plexus Corp. (I) | | 1,426 | | 44,819 |
| Power-One, Inc. (I)(L) | | 42,771 | | 352,005 |
| Pulse Electronics Corp. | | 1,388 | | 8,384 |
| Rofin-Sinar Technologies, Inc. (I) | | 10,479 | | 406,376 |
| Rogers Corp. (I) | | 195 | | 9,196 |
| Scansource, Inc. (I) | | 941 | | 34,375 |
| Universal Display Corp. (I) | | 1,153 | | 48,530 |
| | |
|
| | | | | 3,927,020 |
| Internet Software & Services - 6.64% | | | | |
| Ancestry.com, Inc. (I) | | 887 | | 29,147 |
| comScore, Inc. (I) | | 775 | | 21,336 |
| Constant Contact, Inc. (I)(L) | | 46,582 | | 1,347,617 |
| DealerTrack Holdings, Inc. (I) | | 1,359 | | 27,425 |
| Dice Holdings, Inc. (I) | | 1,278 | | 17,547 |
| Digital River, Inc. (I) | | 1,398 | | 46,945 |
| Equinix, Inc. (I) | | 22,400 | | 1,936,256 |
| GSI Commerce, Inc. (I) | | 2,108 | | 43,825 |
| InfoSpace, Inc. (I) | | 23,745 | | 191,385 |
| Internap Network Services Corp. (I) | | 1,645 | | 11,186 |
| j2 Global Communications, Inc. (I) | | 1,606 | | 46,719 |
| Keynote Systems, Inc. | | 11,420 | | 200,878 |
| Limelight Networks, Inc. (I) | | 1,745 | | 12,128 |
| Liquidity Services, Inc. (I) | | 520 | | 8,356 |
| | | | |
| Smaller Company Growth Fund (continued) |
| | | Shares or | | |
| | | Principal | | |
| | | Amount | | Value |
| | |
|
| |
| COMMON STOCKS (continued) | | | | |
| Internet Software & Services (continued) | | | | |
| LivePerson, Inc. (I) | | 22,361 | $ | 224,281 |
| LogMeIn, Inc. (I) | | 500 | | 17,945 |
| LoopNet, Inc. (I) | | 963 | | 11,460 |
| MercadoLibre, Inc. | | 933 | | 61,373 |
| Monster Worldwide, Inc. (I)(L) | | 89,451 | | 1,534,085 |
| Move, Inc. (I) | | 2,789 | | 5,913 |
| NIC, Inc. | | 24,916 | | 252,648 |
| Open Text Corp. (I) | | 6,130 | | 361,180 |
| OpenTable, Inc. (I) | | 486 | | 43,191 |
| Perficient, Inc. (I) | | 497 | | 6,178 |
| Quinstreet, Inc. (I) | | 879 | | 19,153 |
| Rackspace Hosting, Inc. (I) | | 3,331 | | 122,947 |
| RealNetworks, Inc. (I) | | 2,019 | | 7,773 |
| RightNow Technologies, Inc. (I) | | 854 | | 22,793 |
| SAVVIS, Inc. (I) | | 10,915 | | 354,628 |
| Sohu.com, Inc. (I) | | 1,069 | | 87,188 |
| Stamps.com, Inc. | | 377 | | 5,067 |
| Terremark Worldwide, Inc. (I) | | 1,517 | | 28,793 |
| The Knot, Inc. (I) | | 1,029 | | 10,321 |
| Travelzoo, Inc. (I)(L) | | 9,599 | | 378,681 |
| ValueClick, Inc. (I) | | 28,670 | | 428,043 |
| VistaPrint NV (I)(L) | | 31,629 | | 1,619,721 |
| Vocus, Inc. (I) | | 653 | | 15,868 |
| WebMD Health Corp. (I) | | 1,954 | | 113,332 |
| Zix Corp. (I) | | 75,645 | | 279,130 |
| | |
|
| | | | | 9,952,442 |
| IT Services - 3.50% | | | | |
| Acxiom Corp. (I) | | 2,684 | | 46,004 |
| Alliance Data Systems Corp. (I)(L) | | 23,610 | | 1,859,051 |
| Cardtronics, Inc. (I) | | 1,190 | | 22,551 |
| Cass Information Systems, Inc. | | 265 | | 10,348 |
| China Information Technology, Inc. (I) | | 1,100 | | 5,335 |
| CSG Systems International, Inc. (I) | | 17,506 | | 342,242 |
| Echo Global Logistics, Inc. (I) | | 387 | | 4,574 |
| Euronet Worldwide, Inc. (I) | | 1,611 | | 29,111 |
| ExlService Holdings, Inc. (I) | | 516 | | 11,466 |
| Forrester Research, Inc. | | 556 | | 20,116 |
| Gartner, Inc. (I) | | 3,043 | | 114,782 |
| Global Cash Access Holdings, Inc. (I) | | 1,828 | | 6,288 |
| Heartland Payment Systems, Inc. | | 1,346 | | 26,355 |
| iGate Corp. (I) | | 1,082 | | 19,584 |
| Integral Systems, Inc. (I) | | 619 | | 7,577 |
| Jack Henry & Associates, Inc. | | 2,865 | | 91,422 |
| ManTech International Corp., Class A (I) | | 814 | | 35,165 |
| MAXIMUS, Inc. | | 606 | | 44,844 |
| NCI, Inc. (I) | | 265 | | 6,069 |
| NeuStar, Inc., Class A (I) | | 2,597 | | 65,574 |
| Sapient Corp. | | 3,845 | | 45,563 |
| SRA International, Inc., Class A (I) | | 1,559 | | 42,452 |
| Syntel, Inc. | | 588 | | 30,958 |
| TeleTech Holdings, Inc. (I) | | 14,201 | | 323,499 |
| TNS, Inc. (I) | | 600 | | 11,310 |
| Unisys Corp. (I) | | 1,501 | | 55,777 |
| VeriFone Systems, Inc. (I) | | 34,101 | | 1,549,549 |
| Virtusa Corp. (I) | | 512 | | 8,648 |
| Wright Express Corp. (I) | | 7,881 | | 401,931 |
| | |
|
| | | | | 5,238,145 |
| Office Electronics - 0.05% | | | | |
| Zebra Technologies Corp., Class A (I) | | 1,991 | | 74,304 |
| Semiconductors & Semiconductor Equipment - 5.43% | | |
| Advanced Analogic Technologies, Inc. (I) | | 1,412 | | 5,973 |
| Amkor Technology, Inc. (I)(L) | | 3,884 | | 28,625 |
| Anadigics, Inc. (I) | | 2,331 | | 12,657 |
| |
| The accompanying notes are an integral part of the financial statements. | 237 |
John Hancock Funds II
Portfolio of Investments — February 28, 2011 (Unaudited) (showing percentage of total net assets)
| | | | |
| Smaller Company Growth Fund (continued) |
| | | Shares or | | |
| | | Principal | | |
| | | Amount | | Value |
| | |
|
| |
| COMMON STOCKS (continued) | | | | |
| Semiconductors & Semiconductor Equipment (continued) | | |
| Applied Micro Circuits Corp. (I) | | 2,272 | $ | 23,856 |
| Atheros Communications, Inc. (I) | | 2,521 | | 112,966 |
| ATMI, Inc. (I) | | 718 | | 13,096 |
| Cabot Microelectronics Corp. (I) | | 806 | | 39,349 |
| Cavium Networks, Inc. (I) | | 1,271 | | 54,882 |
| CEVA, Inc. (I) | | 775 | | 17,670 |
| Cirrus Logic, Inc. (I)(L) | | 2,313 | | 54,009 |
| Conexant Systems, Inc. (I) | | 2,890 | | 6,820 |
| Cymer, Inc. (I) | | 21,560 | | 1,090,936 |
| Cypress Semiconductor Corp. (I) | | 2,775 | | 58,164 |
| Diodes, Inc. (I) | | 1,250 | | 36,200 |
| Energy Conversion Devices, Inc. (I)(L) | | 878 | | 3,442 |
| Entegris, Inc. (I) | | 48,350 | | 421,612 |
| Entropic Communications, Inc. (I) | | 2,664 | | 24,669 |
| Exar Corp. (I) | | 464 | | 3,002 |
| EZchip Semiconductor, Ltd. (I) | | 7,610 | | 228,909 |
| FEI Company (I) | | 1,346 | | 45,131 |
| FormFactor, Inc. (I) | | 592 | | 5,819 |
| GT Solar International, Inc. (I) | | 3,190 | | 34,101 |
| Hittite Microwave Corp. (I) | | 868 | | 53,278 |
| Integrated Device Technology, Inc. (I) | | 2,703 | | 20,948 |
| IXYS Corp. (I) | | 820 | | 10,184 |
| Kopin Corp. (I) | | 2,285 | | 10,031 |
| Lattice Semiconductor Corp. (I) | | 46,031 | | 305,646 |
| LTX-Credence Corp. (I) | | 26,160 | | 233,870 |
| Maxlinear, Inc., Class A (I) | | 379 | | 3,987 |
| Micrel, Inc. | | 1,509 | | 20,281 |
| Microsemi Corp. (I) | | 16,142 | | 355,608 |
| MIPS Technologies, Inc. (I) | | 26,200 | | 318,854 |
| Monolithic Power Systems, Inc. (I) | | 101,964 | | 1,575,344 |
| Netlogic Microsystems, Inc. (I) | | 1,316 | | 54,469 |
| NVE Corp. (I) | | 3,814 | | 225,980 |
| O2Micro International, Ltd., ADR (I) | | 20,903 | | 170,987 |
| OmniVision Technologies, Inc. (I) | | 674 | | 20,638 |
| Pericom Semiconductor Corp. (I) | | 877 | | 8,823 |
| PMC-Sierra, Inc. (I) | | 43,250 | | 341,675 |
| Power Integrations, Inc. (L) | | 984 | | 39,203 |
| Rambus, Inc. (I) | | 1,967 | | 40,422 |
| RF Micro Devices, Inc. (I) | | 105,700 | | 792,750 |
| Rubicon Technology, Inc. (I) | | 646 | | 14,742 |
| Semtech Corp. (I) | | 1,428 | | 33,815 |
| Sigma Designs, Inc. (I) | | 328 | | 4,487 |
| Silicon Image, Inc. (I) | | 34,733 | | 279,253 |
| Silicon Laboratories, Inc. (I) | | 1,463 | | 66,420 |
| Standard Microsystems Corp. (I) | | 797 | | 21,144 |
| SunPower Corp., Class A (I) | | 1,279 | | 21,833 |
| SunPower Corp., Class B (I) | | 962 | | 16,239 |
| Teradyne, Inc. (I)(L) | | 4,153 | | 77,370 |
| Tessera Technologies, Inc. (I) | | 1,777 | | 30,938 |
| TriQuint Semiconductor, Inc. (I) | | 5,602 | | 79,829 |
| Ultratech, Inc. (I) | | 817 | | 20,196 |
| Varian Semiconductor | | | | |
| Equipment Associates, Inc. (I) | | 2,606 | | 124,332 |
| Veeco Instruments, Inc. (I) | | 1,405 | | 66,850 |
| Verigy, Ltd. (I) | | 2,116 | | 27,445 |
| Volterra Semiconductor Corp. (I) | | 12,706 | | 320,572 |
| Zoran Corp. (I) | | 619 | | 6,939 |
| | |
|
| | | | | 8,137,270 |
| Software - 5.40% | | | | |
| Accelrys, Inc. (I) | | 1,961 | | 16,982 |
| ACI Worldwide, Inc. (I) | | 1,169 | | 36,601 |
| Actuate Corp. (I) | | 1,503 | | 7,169 |
| Advent Software, Inc. (I)(L) | | 1,180 | | 34,220 |
| Ariba, Inc. (I) | | 3,308 | | 102,383 |
| | | | |
| Smaller Company Growth Fund (continued) |
| | | Shares or | | |
| | | Principal | | |
| | | Amount | | Value |
| | |
|
| |
| COMMON STOCKS (continued) | | | | |
| Software (continued) | | | | |
| AsiaInfo Holdings, Inc. (I) | | 1,846 | $ | 37,566 |
| Aspen Technology, Inc. (I) | | 2,024 | | 30,826 |
| Blackbaud, Inc. | | 1,546 | | 41,139 |
| Blackboard, Inc. (I)(L) | | 32,021 | | 1,121,055 |
| Bottomline Technologies, Inc. (I) | | 378 | | 8,358 |
| BroadSoft, Inc. (I) | | 759 | | 26,793 |
| Cadence Design Systems, Inc. (I) | | 9,411 | | 93,639 |
| China TransInfo Technology Corp. (I) | | 178 | | 828 |
| Clicksoftware Technologies, Ltd. (I) | | 41,020 | | 333,082 |
| CommVault Systems, Inc. (I) | | 1,441 | | 52,640 |
| Compuware Corp. (I) | | 40,940 | | 460,984 |
| Concur Technologies, Inc. (I) | | 1,569 | | 81,635 |
| Deltek, Inc. (I) | | 605 | | 4,410 |
| DemandTec, Inc. (I) | | 1,073 | | 13,960 |
| Ebix, Inc. (I) | | 1,363 | | 35,901 |
| EPIQ Systems, Inc. | | 1,099 | | 15,177 |
| Fortinet, Inc. (I) | | 9,103 | | 371,767 |
| Informatica Corp. (I) | | 3,305 | | 155,368 |
| Interactive Intelligence, Inc. (I) | | 10,083 | | 346,956 |
| Kenexa Corp. (I) | | 682 | | 15,816 |
| Manhattan Associates, Inc. (I) | | 772 | | 24,858 |
| MICROS Systems, Inc. (I) | | 2,838 | | 135,202 |
| MicroStrategy, Inc., Class A (I) | | 289 | | 34,348 |
| Monotype Imaging Holdings, Inc. (I) | | 801 | | 10,717 |
| Net 1 UEPS Technologies, Inc. (I) | | 679 | | 6,926 |
| Netscout Systems, Inc. (I) | | 10,998 | | 274,840 |
| NetSuite, Inc. (I) | | 680 | | 20,407 |
| NICE Systems, Ltd., SADR (I) | | 11,667 | | 404,203 |
| Novell, Inc. (I) | | 4,334 | | 25,484 |
| Opnet Technologies, Inc. | | 494 | | 16,836 |
| Parametric Technology Corp. (I) | | 4,151 | | 98,379 |
| Pegasystems, Inc. | | 587 | | 23,644 |
| Progress Software Corp. (I) | | 9,918 | | 291,192 |
| PROS Holdings, Inc. (I) | | 692 | | 7,923 |
| Quest Software, Inc. (I) | | 2,180 | | 58,402 |
| Radiant Systems, Inc. (I) | | 15,976 | | 273,988 |
| Renaissance Learning, Inc. | | 181 | | 1,944 |
| Rosetta Stone, Inc. (I) | | 404 | | 6,044 |
| Rovi Corp. (I) | | 26,076 | | 1,445,142 |
| S1 Corp. (I) | | 1,873 | | 12,231 |
| Smith Micro Software, Inc. (I) | | 19,834 | | 185,845 |
| SolarWinds, Inc. (I) | | 1,107 | | 24,852 |
| Solera Holdings, Inc. | | 2,474 | | 126,372 |
| Sourcefire, Inc. (I) | | 937 | | 25,393 |
| SS&C Technologies Holdings, Inc. (I) | | 928 | | 18,180 |
| SuccessFactors, Inc. (I) | | 1,739 | | 62,447 |
| Synchronoss Technologies, Inc. (I) | | 882 | | 30,217 |
| Taleo Corp. (I) | | 1,283 | | 41,428 |
| TeleCommunication Systems, Inc. (I) | | 1,662 | | 7,097 |
| TIBCO Software, Inc. (I) | | 19,961 | | 491,440 |
| TiVo, Inc. (I) | | 4,088 | | 42,025 |
| Tyler Technologies, Inc. (I) | | 966 | | 21,368 |
| Ultimate Software Group, Inc. (I) | | 6,186 | | 330,580 |
| VASCO Data Security International, Inc. (I) | | 1,060 | | 9,508 |
| Verint Systems, Inc. (I) | | 648 | | 22,278 |
| Virnetx Holding Corp. | | 1,290 | | 15,480 |
| Websense, Inc. (I) | | 734 | | 15,722 |
| | |
|
| | | | | 8,088,197 |
| | |
|
| | | | | 40,037,804 |
| Materials - 3.30% | | | | |
| Chemicals - 1.40% | | | | |
| Balchem Corp. | | 1,004 | | 36,144 |
| Calgon Carbon Corp. (I) | | 1,983 | | 27,841 |
| |
| The accompanying notes are an integral part of the financial statements. | 238 |
John Hancock Funds II
Portfolio of Investments — February 28, 2011 (Unaudited) (showing percentage of total net assets)
| | | | |
| Smaller Company Growth Fund (continued) |
| | | Shares or | | |
| | | Principal | | |
| | | Amount | | Value |
| | |
|
| |
| COMMON STOCKS (continued) | | | | |
| Chemicals (continued) | | | | |
| China Agritech, Inc. (I)(L) | | 329 | $ | 2,770 |
| Ferro Corp. (I) | | 3,035 | | 48,317 |
| Georgia Gulf Corp. (I) | | 419 | | 13,374 |
| Hawkins, Inc. | | 108 | | 4,133 |
| Innospec, Inc. (I) | | 839 | | 22,494 |
| Intrepid Potash, Inc. (I) | | 1,587 | | 61,258 |
| Kraton Performance Polymers, Inc. (I) | | 8,920 | | 305,956 |
| Kronos Worldwide, Inc. | | 9,920 | | 491,040 |
| Landec Corp. (I) | | 885 | | 5,443 |
| LSB Industries, Inc. (I) | | 595 | | 18,017 |
| NewMarket Corp. | | 428 | | 54,831 |
| PolyOne Corp. | | 2,141 | | 29,717 |
| Rockwood Holdings, Inc. (I) | | 1,474 | | 68,615 |
| Solutia, Inc. (I) | | 19,261 | | 447,048 |
| Spartech Corp. (I) | | 706 | | 5,987 |
| Stepan Company | | 139 | | 9,756 |
| STR Holdings, Inc. (I)(L) | | 16,868 | | 305,479 |
| TPC Group, Inc. (I) | | 213 | | 6,188 |
| W.R. Grace & Company (I) | | 2,574 | | 97,915 |
| Yongye International, Inc. (I)(L) | | 904 | | 6,843 |
| Zep, Inc. | | 766 | | 12,019 |
| Zoltek Companies, Inc. (I) | | 1,029 | | 15,044 |
| | |
|
| | | | | 2,096,229 |
| Construction Materials - 0.00% | | | | |
| United States Lime & Minerals, Inc. (I) | | 79 | | 3,187 |
| Containers & Packaging - 0.48% | | | | |
| Boise, Inc. | | 1,358 | | 12,195 |
| Graham Packaging Company, Inc. (I) | | 665 | | 11,298 |
| Graphic Packaging Holding Company (I) | | 1,513 | | 7,868 |
| Rock-Tenn Company, Class A (L) | | 5,161 | | 354,303 |
| Silgan Holdings, Inc. | | 8,304 | | 302,930 |
| Temple-Inland, Inc. | | 1,263 | | 29,542 |
| | |
|
| | | | | 718,136 |
| Metals & Mining - 1.14% | | | | |
| AK Steel Holding Corp. | | 1,356 | | 21,669 |
| Allied Nevada Gold Corp. (I) | | 2,819 | | 85,528 |
| Capital Gold Corp. (I) | | 2,160 | | 11,750 |
| General Moly, Inc. (I) | | 2,173 | | 11,387 |
| Globe Specialty Metals, Inc. | | 2,249 | | 52,379 |
| Golden Minerals Company (I) | | 426 | | 8,967 |
| Gulf Resources, Inc. (I) | | 732 | | 6,559 |
| Haynes International, Inc. | | 214 | | 11,094 |
| Hecla Mining Company (I)(L) | | 9,029 | | 91,644 |
| Horsehead Holding Corp. (I) | | 1,527 | | 25,257 |
| Materion Corp. (I) | | 712 | | 31,164 |
| Metals USA Holdings Corp. (I) | | 456 | | 6,817 |
| Royal Gold, Inc. | | 898 | | 44,559 |
| RTI International Metals, Inc. (I) | | 11,925 | | 339,863 |
| Schnitzer Steel Industries, Inc. | | 797 | | 51,167 |
| Stillwater Mining Company (I) | | 22,469 | | 536,335 |
| Thompson Creek Metals Company, Inc. (I) | | 24,604 | | 324,281 |
| US Gold Corp. (I) | | 3,974 | | 28,851 |
| Worthington Industries, Inc. | | 730 | | 14,133 |
| | |
|
| | | | | 1,703,404 |
| Paper & Forest Products - 0.28% | | | | |
| Buckeye Technologies, Inc. | | 11,908 | | 311,990 |
| Clearwater Paper Corp. (I) | | 404 | | 32,037 |
| Deltic Timber Corp. | | 198 | | 12,032 |
| KapStone Paper and Packaging Corp. (I) | | 1,215 | | 20,837 |
| P.H. Glatfelter Company | | 565 | | 6,955 |
| | | | |
| Smaller Company Growth Fund (continued) |
| | | Shares or | | |
| | | Principal | | |
| | | Amount | | Value |
| |
|
| |
| COMMON STOCKS (continued) | | | | |
| Paper & Forest Products (continued) | | | | |
| Schweitzer-Mauduit International, Inc. | | 636 | $ | 34,872 |
| | |
|
| | | | | 418,723 |
| | |
|
| | | | | 4,939,679 |
| Telecommunication Services - 2.58% | | | | |
| Diversified Telecommunication Services - 1.61% | | | |
| AboveNet, Inc. | | 532 | | 34,521 |
| Alaska Communications Systems Group, Inc. | 1,573 | | 16,029 |
| Atlantic Tele-Network, Inc. | | 4,866 | | 189,725 |
| Cbeyond, Inc. (I) | | 869 | | 12,149 |
| Cogent Communications Group, Inc. (I) | | 97,589 | | 1,438,462 |
| General Communication, Inc., Class A (I) | | 937 | | 11,328 |
| Global Crossing, Ltd. (I) | | 1,172 | | 18,459 |
| Hughes Communications, Inc. (I) | | 346 | | 20,725 |
| Iridium Communications, Inc. (I) | | 476 | | 4,474 |
| Level 3 Communications, Inc. (I) | | 38,212 | | 53,497 |
| Neutral Tandem, Inc. (I)(L) | | 28,018 | | 481,910 |
| PAETEC Holding Corp. (I) | | 4,586 | | 17,427 |
| Premiere Global Services, Inc. (I) | | 1,136 | | 7,623 |
| TW Telecom, Inc. (I) | | 5,062 | | 94,153 |
| Vonage Holdings Corp. (I) | | 4,120 | | 18,210 |
| | |
|
| | | | | 2,418,692 |
| Wireless Telecommunication Services - 0.97% | | | |
| ICO Global | | | | |
| Communications Holdings, Ltd. (I) | | 5,634 | | 12,902 |
| Leap Wireless International, Inc. (I) | | 2,206 | | 26,957 |
| NII Holdings, Inc. (I) | | 33,770 | | 1,383,219 |
| Shenandoah Telecommunications Company | | 794 | | 13,895 |
| USA Mobility, Inc. | | 780 | | 11,638 |
| | |
|
| | | | | 1,448,611 |
| | |
|
| | | | | 3,867,303 |
| Utilities - 0.26% | | | | |
| Electric Utilities - 0.08% | | | | |
| ITC Holdings Corp. | | 1,784 | | 122,293 |
| Independent Power Producers & Energy Traders - 0.04% | | |
| Dynegy, Inc. (I) | | 1,267 | | 7,336 |
| GenOn Energy, Inc. (I) | | 9,443 | | 38,244 |
| Ormat Technologies, Inc. | | 720 | | 18,036 |
| | |
|
| | | | | 63,616 |
| Multi-Utilities - 0.14% | | | | |
| Avista Corp. | | 9,230 | | 206,014 |
| | |
|
| | | | | 391,923 |
|
| TOTAL COMMON STOCKS (Cost $111,757,899) | | $ | 144,992,566 |
|
| |
| CORPORATE BONDS - 0.00% | | | | |
| Financials - 0.00% | | | | |
| GAMCO Investors, Inc. | | | | |
| Zero Coupon 12/31/2015 | $ | 200 | $ | 129 |
|
| TOTAL CORPORATE BONDS (Cost $155) | | $ | 129 |
|
| |
| INVESTMENT COMPANIES - 0.47% | | | | |
| iShares Russell 2000 Growth Index Fund | | 7,740 | | 711,693 |
|
| TOTAL INVESTMENT COMPANIES (Cost $686,406) | | $ | 711,693 |
|
| |
| SECURITIES LENDING COLLATERAL - 11.37% | | | |
| John Hancock Collateral | | | | |
| Investment Trust, 0.2855% (W)(Y) | | 1,702,406 | | 17,036,662 |
|
| TOTAL SECURITIES LENDING | | | | |
| COLLATERAL (Cost $17,036,688) | | | $ | 17,036,662 |
|
| |
| The accompanying notes are an integral part of the financial statements. | 239 |
John Hancock Funds II
Portfolio of Investments — February 28, 2011 (Unaudited) (showing percentage of total net assets)
| | | | |
| Smaller Company Growth Fund (continued) |
| | | Shares or | | |
| | | Principal | | |
| | | Amount | | Value |
| |
|
| |
| SHORT-TERM INVESTMENTS - 2.64% | | | |
| Repurchase Agreement - 1.85% | | | | |
| Repurchase Agreement with State Street Corp. | | | |
| dated 02/28/2011 at 0.010% to be | | | | |
| repurchased at $2,766,001 on 03/01/2011, | | | |
| collateralized by $2,825,000 U.S. Treasury | | | |
| Bills, 0.010% due 05/26/2011 (valued at | | | |
| $2,823,588, including interest) | $ | 2,766,000 | $ | 2,766,000 |
| Short-Term Securities* - 0.79% | | | | |
| Federal Home Loan Bank Discount Notes, | | | |
| 0.0702%, 03/01/2011 | | 860,000 | | 860,000 |
| State Street Institutional Liquid Reserves | | | | |
| Fund, 0.2053% | | 326,482 | | 326,482 |
| | |
|
| | | | | 1,186,482 |
|
| TOTAL SHORT-TERM INVESTMENTS (Cost $3,952,482) | $ | 3,952,482 |
|
| Total Investments (Smaller Company Growth Fund) | | |
| (Cost $133,433,630) - 111.25% | | | $ | 166,693,532 |
| Other assets and liabilities, net - (11.25%) | | | (16,861,203) |
| | |
|
| TOTAL NET ASSETS - 100.00% | | | $ | 149,832,329 |
| | | |
|
| |
| |
| |
| Spectrum Income Fund | | | | |
| | | Shares or | | |
| | | Principal | | |
| | | Amount | | Value |
| |
|
| |
| U.S. GOVERNMENT & AGENCY | | | | |
| OBLIGATIONS - 22.66% | | | | |
| U.S. Government - 3.63% | | | | |
| Treasury Inflation Protected Securities | | | | |
| 0.500%, 04/15/2015 | $ | 434,868 | $ | 451,005 |
| 1.750%, 01/15/2028 | | 83,692 | | 84,477 |
| 2.125%, 02/15/2040 | | 100,392 | | 104,329 |
| 2.500%, 01/15/2029 | | 96,979 | | 108,783 |
| U.S. Treasury Bonds | | | | |
| 3.500%, 02/15/2039 | | 1,115,000 | | 937,471 |
| 3.875%, 08/15/2040 | | 4,300,000 | | 3,860,592 |
| 4.500%, 08/15/2039 | | 620,000 | | 621,743 |
| 4.625%, 02/15/2040 | | 4,190,000 | | 4,284,275 |
| 6.000%, 02/15/2026 | | 400,000 | | 489,688 |
| 6.125%, 08/15/2029 | | 935,000 | | 1,166,704 |
| 6.750%, 08/15/2026 | | 1,325,000 | | 1,741,962 |
| 7.125%, 02/15/2023 | | 365,000 | | 486,419 |
| 7.250%, 08/15/2022 | | 140,000 | | 187,928 |
| 7.625%, 02/15/2025 | | 515,000 | | 722,931 |
| U.S. Treasury Notes | | | | |
| 1.000%, 08/31/2011 to 07/15/2013 | | 3,055,000 | | 3,066,558 |
| 1.125%, 01/15/2012 | | 680,000 | | 685,020 |
| 2.250%, 05/31/2014 | | 4,600,000 | | 4,740,875 |
| 2.625%, 07/31/2014 to 08/15/2020 | | 12,780,000 | | 13,085,551 |
| U.S. Treasury Strips, IO | | | | |
| Zero Coupon 05/15/2021 | | 540,000 | | 369,224 |
| | |
|
| | | | | 37,195,535 |
| U.S. Government Agency - 19.03% | | | | |
| Federal Home Loan Bank | | | | |
| 1.625%, 11/21/2012 | | 865,000 | | 879,213 |
| Federal Home Loan Mortgage Corp. | | | | |
| 0.875%, 10/28/2013 | | 890,000 | | 883,101 |
| 2.498%, 01/01/2036 (P) | | 93,602 | | 98,266 |
| 2.565%, 02/01/2035 (P) | | 101,315 | | 106,134 |
| 2.702%, 07/01/2035 (P) | | 30,578 | | 32,033 |
| 2.710%, 07/01/2035 (P) | | 57,272 | | 60,000 |
| 2.940%, 09/01/2032 (P) | | 4,307 | | 4,525 |
| | | | |
| Spectrum Income Fund (continued) | | |
| | | Shares or | | |
| | | Principal | | |
| | | Amount | | Value |
| |
|
| |
| U.S. GOVERNMENT & AGENCY | | | | |
| OBLIGATIONS (continued) | | | | |
| U.S. Government Agency (continued) | | | | |
| Federal Home Loan Mortgage Corp. (continued) | | | |
| 4.000%, 09/01/2040 to 12/01/2040 | $ | 2,046,345 | $ | 2,017,413 |
| 4.500%, 11/01/2018 to 09/01/2040 | | 4,392,087 | | 4,495,471 |
| 4.622%, 06/01/2038 (P) | | 98,649 | | 104,037 |
| 4.705%, 07/01/2038 (P) | | 184,841 | | 195,535 |
| 4.985%, 11/01/2035 (P) | | 17,946 | | 19,015 |
| 5.000%, 10/01/2018 to 04/01/2040 | | 2,722,903 | | 2,878,744 |
| 5.053%, 03/01/2036 (P) | | 39,299 | | 41,667 |
| 5.079%, 09/01/2035 (P) | | 79,437 | | 83,337 |
| 5.179%, 02/01/2037 (P) | | 38,146 | | 40,411 |
| 5.294%, 02/01/2037 (P) | | 97,649 | | 103,447 |
| 5.342%, 04/01/2037 (P) | | 244,535 | | 259,054 |
| 5.373%, 05/01/2037 (P) | | 77,158 | | 81,401 |
| 5.388%, 02/01/2038 (P) | | 233,791 | | 248,107 |
| 5.391%, 01/01/2036 (P) | | 6,250 | | 6,647 |
| 5.500%, 03/01/2018 to 10/01/2038 | | 3,576,457 | | 3,822,982 |
| 5.506%, 10/01/2036 (P) | | 275,101 | | 286,988 |
| 5.769%, 02/01/2037 (P) | | 61,631 | | 65,291 |
| 5.931%, 12/01/2036 (P) | | 265,187 | | 283,501 |
| 5.932%, 01/01/2037 (P) | | 19,221 | | 20,363 |
| 5.986%, 10/01/2036 (P) | | 276,815 | | 295,933 |
| 6.000%, 11/01/2011 to 12/01/2033 | | 481,289 | | 524,128 |
| 6.002%, 11/01/2036 (P) | | 187,357 | | 200,188 |
| 6.090%, 10/01/2036 (P) | | 234,935 | | 251,160 |
| 6.238%, 08/01/2036 (P) | | 246,846 | | 263,894 |
| 6.500%, 05/01/2017 to 11/01/2033 | | 101,327 | | 112,721 |
| 7.000%, 02/01/2024 to 06/01/2032 | | 24,880 | | 28,284 |
| 7.500%, 05/01/2024 to 06/01/2024 | | 2,784 | | 3,136 |
| 10.500%, 05/01/2019 | | 137 | | 158 |
| Federal National Mortgage Association | | | | |
| 1.000%, 09/23/2013 | | 325,000 | | 323,940 |
| 1.250%, 06/22/2012 | | 1,680,000 | | 1,696,120 |
| 1.985%, 10/01/2033 (P) | | 67,390 | | 69,059 |
| 2.565%, 11/01/2035 (P) | | 95,011 | | 99,216 |
| 2.610%, 07/01/2035 (P) | | 48,134 | | 50,213 |
| 2.962%, 07/01/2027 (P) | | 1,057 | | 1,089 |
| 3.500%, 01/01/2026 | | 749,587 | | 752,367 |
| 4.000%, 03/01/2025 to 01/01/2041 | | 17,464,580 | | 17,540,549 |
| 4.500%, 05/01/2019 to 02/01/2041 | | 25,208,387 | | 25,912,931 |
| 4.735%, 09/01/2035 (P) | | 279,109 | | 292,439 |
| 4.814%, 05/01/2038 (P) | | 70,389 | | 74,821 |
| 4.821%, 05/01/2038 (P) | | 259,544 | | 275,506 |
| 4.836%, 04/01/2038 (P) | | 120,756 | | 127,970 |
| 4.892%, 05/01/2038 (P) | | 241,838 | | 257,188 |
| 4.910%, 07/01/2036 (P) | | 90,337 | | 94,192 |
| 4.931%, 08/01/2038 (P) | | 151,302 | | 160,693 |
| 5.000%, 03/01/2018 to 10/01/2040 | | 10,777,971 | | 11,350,243 |
| 5.291%, 12/01/2035 (P) | | 15,726 | | 16,754 |
| 5.292%, 12/01/2035 (P) | | 19,577 | | 20,900 |
| 5.402%, 09/01/2037 (P) | | 75,966 | | 79,854 |
| 5.430%, 06/01/2037 (P) | | 90,344 | | 95,709 |
| 5.435%, 12/01/2035 (P) | | 20,485 | | 21,853 |
| 5.469%, 01/01/2019 (P) | | 764 | | 805 |
| 5.495%, 01/01/2037 (P) | | 101,100 | | 107,103 |
| 5.498%, 12/01/2035 (P) | | 27,221 | | 28,922 |
| 5.500%, 07/01/2013 to 09/01/2040 | | 16,122,254 | | 17,309,602 |
| 5.733%, 08/01/2037 (P) | | 105,179 | | 111,424 |
| 5.877%, 12/01/2036 (P) | | 146,051 | | 154,723 |
| 6.000%, 03/01/2021 to 11/01/2038 | | 11,365,239 | | 12,406,726 |
| 6.002%, 09/01/2036 (P) | | 143,976 | | 153,919 |
| 6.035%, 08/01/2036 (P) | | 189,903 | | 198,548 |
| 6.500%, 06/01/2013 to 04/01/2038 | | 2,125,544 | | 2,383,362 |
| 7.000%, 12/01/2029 to 04/01/2037 | | 40,022 | | 45,323 |
| 7.125%, 01/15/2030 | | 365,000 | | 478,814 |
| |
| The accompanying notes are an integral part of the financial statements. | 240 |
John Hancock Funds II
Portfolio of Investments — February 28, 2011 (Unaudited) (showing percentage of total net assets)
| | | | |
| Spectrum Income Fund (continued) | | |
| | | Shares or | | |
| | | Principal | | |
| | | Amount | | Value |
| |
|
| |
| U.S. GOVERNMENT & AGENCY | | | | |
| OBLIGATIONS (continued) | | | | |
| U.S. Government Agency (continued) | | | | |
| Government National | | | | |
| Mortgage Association | | | | |
| 4.000%, 08/15/2040 to 11/20/2040 | $ | 3,834,650 | $ | 3,843,759 |
| 4.500%, 03/20/2036 to 12/20/2040 | | 33,448,586 | | 30,342,712 |
| 5.000%, 02/15/2018 to 11/20/2040 | | 22,113,481 | | 23,559,489 |
| 5.500%, 02/15/2029 to 12/20/2040 | | 12,742,302 | | 13,850,967 |
| 6.000%, 11/15/2012 to 06/20/2040 | | 6,455,497 | | 7,101,496 |
| 6.500%, 12/15/2014 to 12/20/2033 | | 3,176,017 | | 3,584,730 |
| 7.000%, 04/15/2017 to 10/20/2036 | | 1,267,776 | | 1,444,299 |
| 9.250%, 10/15/2016 to 12/15/2019 | | 2,655 | | 3,015 |
| 9.750%, 07/15/2017 to 02/15/2021 | | 2,484 | | 2,887 |
| 10.250%, 11/15/2020 | | 2,061 | | 2,443 |
| 11.750%, 08/15/2013 | | 731 | | 804 |
| 12.000%, 12/15/2012 | | 50 | | 53 |
| 12.250%, 03/15/2014 to 07/20/2015 | | 529 | | 607 |
| 12.750%, 12/20/2013 to 11/20/2014 | | 595 | | 683 |
| | |
|
| | | | | 195,227,106 |
|
| TOTAL U.S. GOVERNMENT & AGENCY | | | |
| OBLIGATIONS (Cost $229,475,615) | | | $ | 232,422,641 |
|
| |
| FOREIGN GOVERNMENT | | | | |
| OBLIGATIONS - 13.99% | | | | |
| Argentina - 0.40% | | | | |
| City of Buenos Aires | | | | |
| 12.500%, 04/06/2015 (S) | | 350,000 | | 383,250 |
| Republic of Argentina | | | | |
| 2.500%, 12/31/2038 | | 900,000 | | 378,000 |
| 5.830%, 12/31/2033 (P) | ARS | 1,640,000 | | 670,011 |
| 7.000%, 10/03/2015 to 04/17/2017 | $ | 1,600,000 | | 1,501,375 |
| 7.875%, 04/11/2011 | | 100,200 | | 100,200 |
| 8.280%, 12/31/2033 | | 975,713 | | 839,114 |
| 8.750%, 06/02/2017 | | 270,000 | | 272,025 |
| | |
|
| | | | | 4,143,975 |
| Austria - 0.02% | | | | |
| Republic of Austria | | | | |
| 6.250%, 07/15/2027 | EUR | 98,000 | | 172,782 |
| Belgium - 0.12% | | | | |
| Kingdom of Belgium | | | | |
| 4.000%, 03/28/2018 | | 314,000 | | 436,034 |
| 4.250%, 09/28/2013 | | 197,000 | | 282,724 |
| 5.000%, 09/28/2012 to 03/28/2035 | | 373,000 | | 543,510 |
| | |
|
| | | | | 1,262,268 |
| Bermuda - 0.02% | | | | |
| Government of Bermuda | | | | |
| 5.603%, 07/20/2020 (S) | $ | 200,000 | | 206,962 |
| Brazil - 1.34% | | | | |
| Federative Republic of Brazil | | | | |
| 4.875%, 01/22/2021 | | 150,000 | | 152,250 |
| 5.625%, 01/07/2041 | | 1,410,000 | | 1,381,800 |
| 5.875%, 01/15/2019 | | 565,000 | | 625,766 |
| 6.000%, 05/15/2015 to 08/15/2020 | BRL | 3,756,000 | | 4,496,784 |
| 7.125%, 01/20/2037 | $ | 1,660,000 | | 1,958,800 |
| 8.750%, 02/04/2025 | | 475,000 | | 638,875 |
| 8.875%, 10/14/2019 | | 250,000 | | 330,625 |
| 10.000%, 01/01/2012 to 01/01/2021 | BRL | 7,284,000 | | 4,174,297 |
| | |
|
| | | | | 13,759,197 |
| Canada - 0.63% | | | | |
| Canada Housing Trust | | | | |
| 4.000%, 06/15/2012 | CAD | 870,000 | | 922,502 |
| | | | |
| Spectrum Income Fund (continued) | | |
| | | Shares or | | |
| | | Principal | | |
| | | Amount | | Value |
| |
|
| |
| FOREIGN GOVERNMENT | | | | |
| OBLIGATIONS (continued) | | | | |
| Canada (continued) | | | | |
| Government of Canada | | | | |
| 3.500%, 06/01/2013 to 06/01/2020 | $ | 1,967,000 | $ | 2,068,227 |
| 3.750%, 06/01/2019 | | 123,000 | | 131,727 |
| 4.000%, 06/01/2017 | | 85,000 | | 93,009 |
| 4.500%, 06/01/2015 | | 775,000 | | 862,371 |
| 5.000%, 06/01/2037 | | 326,000 | | 405,370 |
| 5.250%, 06/01/2012 | | 832,000 | | 895,885 |
| Province of Ontario | | | | |
| 4.200%, 06/02/2020 | | 600,000 | | 629,347 |
| Province of Quebec | | | | |
| 5.000%, 12/01/2038 | | 410,000 | | 449,922 |
| | |
|
| | | | | 6,458,360 |
| Chile - 0.01% | | | | |
| Republic of Chile | | | | |
| 3.875%, 08/05/2020 | $ | 130,000 | | 126,295 |
| Congo - 0.01% | | | | |
| Republic of Congo (Brazzaville) | | | | |
| 3.000%, 06/30/2029 | | 109,250 | | 63,365 |
| Denmark - 0.07% | | | | |
| Kingdom of Denmark | | | | |
| 5.000%, 11/15/2013 | DKK | 3,277,000 | | 656,022 |
| 7.000%, 11/10/2024 | | 364,000 | | 92,889 |
| | |
|
| | | | | 748,911 |
| Dominican Republic - 0.02% | | | | |
| Government of Dominican Republic | | | | |
| 7.500%, 05/06/2021 | $ | 200,000 | | 206,000 |
| Egypt - 0.05% | | | | |
| Arab Republic of Egypt | | | | |
| 5.750%, 04/29/2020 | | 400,000 | | 369,000 |
| 6.875%, 04/30/2040 | | 200,000 | | 178,800 |
| | |
|
| | | | | 547,800 |
| France - 0.56% | | | | |
| Government of France | | | | |
| 3.750%, 01/12/2012 | EUR | 1,700,000 | | 2,399,026 |
| 4.000%, 10/25/2014 | | 887,000 | | 1,300,002 |
| 5.500%, 04/25/2029 | | 386,000 | | 635,448 |
| 5.750%, 10/25/2032 | | 813,000 | | 1,399,356 |
| | |
|
| | | | | 5,733,832 |
| Gabon - 0.04% | | | | |
| Republic of Gabon | | | | |
| 8.200%, 12/12/2017 | $ | 385,000 | | 424,001 |
| Germany - 2.05% | | | | |
| Federal Republic of Germany | | | | |
| zero coupon 05/11/2011 | EUR | 4,800,000 | | 6,616,606 |
| 2.500%, 01/04/2021 | | 1,034,000 | | 1,346,350 |
| 3.000%, 07/04/2020 | | 478,000 | | 652,327 |
| 3.250%, 07/04/2015 | | 1,787,000 | | 2,572,624 |
| 4.000%, 01/04/2037 | | 1,244,000 | | 1,806,422 |
| 4.500%, 01/04/2013 | | 3,677,000 | | 5,354,418 |
| 4.750%, 07/04/2034 | | 203,000 | | 325,362 |
| 5.000%, 01/04/2012 | | 911,000 | | 1,299,286 |
| Government of Mexico | | | | |
| 5.950%, 03/19/2019 | $ | 974,000 | | 1,079,679 |
| | |
|
| | | | | 21,053,074 |
| Greece - 0.02% | | | | |
| Republic of Greece | | | | |
| 4.625%, 06/25/2013 | | 185,000 | | 158,452 |
| |
| The accompanying notes are an integral part of the financial statements. | 241 |
John Hancock Funds II
Portfolio of Investments — February 28, 2011 (Unaudited) (showing percentage of total net assets)
| | | | |
| Spectrum Income Fund (continued) | | |
| | | Shares or | | |
| | | Principal | | |
| | | Amount | | Value |
| |
|
| |
| FOREIGN GOVERNMENT | | | | |
| OBLIGATIONS (continued) | | | | |
| Grenada - 0.03% | | | | |
| Government of Grenada | | | | |
| 2.500%, 09/15/2025 | $ | 430,000 | $ | 258,000 |
| Hungary - 0.05% | | | | |
| Republic of Hungary | | | | |
| 6.250%, 01/29/2020 | | 204,000 | | 208,590 |
| 6.500%, 06/24/2019 | HUF | 46,990,000 | | 227,025 |
| 6.750%, 02/24/2017 | | 22,240,000 | | 110,845 |
| | |
|
| | | | | 546,460 |
| Indonesia - 0.25% | | | | |
| Republic of Indonesia | | | | |
| 5.875%, 03/13/2020 | $ | 179,000 | | 191,754 |
| 6.625%, 02/17/2037 | | 100,000 | | 105,587 |
| 6.875%, 01/17/2018 | | 300,000 | | 340,500 |
| 7.750%, 01/17/2038 | | 450,000 | | 538,125 |
| 8.250%, 07/15/2021 | IDR | 3,614,000,000 | | 394,832 |
| 11.000%, 12/15/2012 | | 1,800,000,000 | | 218,183 |
| 11.625%, 03/04/2019 | $ | 271,000 | | 391,256 |
| 11.625%, 03/04/2019 (S) | | 300,000 | | 433,125 |
| | |
|
| | | | | 2,613,362 |
| Iraq - 0.19% | | | | |
| Republic of Iraq | | | | |
| 5.800%, 01/15/2028 | | 2,257,000 | | 1,980,518 |
| Italy - 0.52% | | | | |
| Republic of Italy | | | | |
| 3.750%, 03/01/2021 | EUR | 698,000 | | 884,704 |
| 4.250%, 08/01/2014 | | 613,000 | | 866,736 |
| 4.500%, 02/01/2018 | | 127,000 | | 177,304 |
| 5.000%, 02/01/2012 to 09/01/2040 | | 1,570,000 | | 2,051,839 |
| 5.250%, 08/01/2017 | | 682,000 | | 996,144 |
| 7.250%, 11/01/2026 | | 198,000 | | 327,406 |
| | |
|
| | | | | 5,304,133 |
| Jamaica - 0.11% | | | | |
| Government of Jamaica | | | | |
| 8.000%, 06/24/2019 | $ | 450,000 | | 452,700 |
| 9.000%, 06/02/2015 | | 215,000 | | 230,050 |
| 10.625%, 06/20/2017 | | 350,000 | | 402,500 |
| | |
|
| | | | | 1,085,250 |
| Japan - 2.44% | | | | |
| Government of Japan | | | | |
| 0.500%, 12/20/2015 | JPY | 144,800,000 | | 1,765,017 |
| 0.600%, 09/20/2014 | | 154,350,000 | | 1,898,932 |
| 1.300%, 03/20/2015 to 06/20/2020 | | 293,700,000 | | 3,686,883 |
| 1.400%, 09/20/2015 to 03/20/2018 | | 154,500,000 | | 1,959,195 |
| 1.500%, 06/20/2019 | | 54,050,000 | | 684,145 |
| 1.700%, 09/20/2016 to 03/20/2017 | | 364,850,000 | | 4,716,271 |
| 1.900%, 03/20/2025 | | 116,000,000 | | 1,463,893 |
| 2.000%, 06/20/2022 to 12/20/2033 | | 104,000,000 | | 1,291,968 |
| 2.200%, 06/22/2020 | | 178,250,000 | | 2,375,219 |
| 2.300%, 06/20/2028 to 03/20/2040 | | 398,600,000 | | 5,161,185 |
| | |
|
| | | | | 25,002,708 |
| Jordan - 0.02% | | | | |
| Government of Jordan | | | | |
| 3.875%, 11/12/2015 | $ | 200,000 | | 183,000 |
| Lebanon - 0.07% | | | | |
| Republic of Lebanon | | | | |
| 4.000%, 12/31/2017 | | 175,000 | | 168,000 |
| 7.000%, 12/03/2024 | | 250,000 | | 252,300 |
| 8.250%, 04/12/2021 | | 100,000 | | 114,500 |
| | | | |
| Spectrum Income Fund (continued) | | |
| | | Shares or | | |
| | | Principal | | |
| | | Amount | | Value |
| |
|
| |
| FOREIGN GOVERNMENT | | | | |
| OBLIGATIONS (continued) | | | | |
| Lebanon (continued) | | | | |
| Republic of Lebanon (continued) | | | | |
| 9.000%, 03/20/2017 | $ | 175,000 | $ | 201,250 |
| | |
|
| | | | | 736,050 |
| Lithuania - 0.16% | | | | |
| Republic of Lithuania | | | | |
| 5.125%, 09/14/2017 (S) | | 200,000 | | 195,971 |
| 6.750%, 01/15/2015 | | 120,000 | | 129,000 |
| 6.750%, 01/15/2015 (S) | | 320,000 | | 344,294 |
| 7.375%, 02/11/2020 | | 915,000 | | 1,001,925 |
| | |
|
| | | | | 1,671,190 |
| Malaysia - 0.14% | | | | |
| Government of Malaysia | | | | |
| 3.700%, 05/15/2013 | MYR | 866,000 | | 286,772 |
| 3.702%, 02/25/2013 | | 805,000 | | 266,527 |
| 4.012%, 09/15/2017 | | 617,000 | | 205,338 |
| 4.378%, 11/29/2019 | | 1,820,000 | | 613,662 |
| 4.498%, 04/15/2030 | | 350,000 | | 111,859 |
| | |
|
| | | | | 1,484,158 |
| Mexico - 0.84% | | | | |
| Government of Mexico | | | | |
| 5.125%, 01/15/2020 | $ | 300,000 | | 314,250 |
| 5.625%, 01/15/2017 | | 90,000 | | 99,225 |
| 5.950%, 03/19/2019 | | 500,000 | | 554,250 |
| 8.000%, 06/11/2020 to 12/07/2023 | MXN | 2,808,300 | | 239,366 |
| 8.500%, 12/13/2018 to 11/18/2038 | | 55,451,000 | | 4,835,853 |
| 9.000%, 12/22/2011 | | 5,000,000 | | 427,639 |
| 10.000%, 12/05/2024 to 11/20/2036 | | 21,706,000 | | 2,110,345 |
| | |
|
| | | | | 8,580,928 |
| Netherlands - 0.05% | | | | |
| Kingdom of Netherlands | | | | |
| 5.500%, 01/15/2028 | EUR | 277,000 | | 466,642 |
| Nigeria - 0.02% | | | | |
| Federal Republic of Nigeria | | | | |
| 6.750%, 01/28/2021 (S) | $ | 200,000 | | 196,500 |
| Pakistan - 0.01% | | | | |
| Islamic Republic of Pakistan | | | | |
| 7.125%, 03/31/2016 | | 180,000 | | 155,256 |
| Peru - 0.08% | | | | |
| Republic of Peru | | | | |
| 5.625%, 11/18/2050 | | 750,000 | | 697,500 |
| 7.840%, 08/12/2020 (S) | PEN | 304,000 | | 123,228 |
| | |
|
| | | | | 820,728 |
| Philippines - 0.16% | | | | |
| Republic of Philippines | | | | |
| 6.375%, 01/15/2032 to 10/23/2034 | $ | 1,550,000 | | 1,642,125 |
| Poland - 0.14% | | | | |
| Republic of Poland | | | | |
| 3.875%, 07/16/2015 | | 170,000 | | 172,330 |
| 5.000%, 10/24/2013 | PLN | 1,441,000 | | 499,591 |
| 5.500%, 04/25/2015 to 10/25/2019 | | 1,809,000 | | 616,721 |
| 5.750%, 09/23/2022 | | 587,000 | | 194,856 |
| | |
|
| | | | | 1,483,498 |
| Russia - 0.75% | | | | |
| Government of Russia | | | | |
| 7.500%, 03/31/2030 | $ | 6,461,005 | | 7,472,152 |
| 7.850%, 03/10/2018 (S) | RUB | 5,000,000 | | 172,686 |
| | |
|
| | | | | 7,644,838 |
| |
| The accompanying notes are an integral part of the financial statements. | 242 |
John Hancock Funds II
Portfolio of Investments — February 28, 2011 (Unaudited) (showing percentage of total net assets)
| | | | |
| Spectrum Income Fund (continued) | | |
| | | Shares or | | |
| | | Principal | | |
| | | Amount | | Value |
| |
|
| |
| FOREIGN GOVERNMENT | | | | |
| OBLIGATIONS (continued) | | | | |
| Serbia - 0.07% | | | | |
| Republic of Serbia | | | | |
| 6.750%, 11/01/2024 | $ | 728,000 | $ | 728,000 |
| South Africa - 0.38% | | | | |
| Eskom Holdings, Ltd. | | | | |
| 5.750%, 01/26/2021 (S) | | 768,000 | | 766,080 |
| Republic of South Africa | | | | |
| 5.500%, 03/09/2020 | | 245,000 | | 257,863 |
| 6.500%, 06/02/2014 | | 135,000 | | 149,850 |
| 6.750%, 03/31/2021 | ZAR | 14,999,000 | | 1,871,244 |
| 8.000%, 12/21/2018 | | 2,960,000 | | 412,651 |
| 13.500%, 09/15/2015 | | 2,467,000 | | 431,013 |
| | |
|
| | | | | 3,888,701 |
| South Korea - 0.15% | | | | |
| Republic of Korea | | | | |
| 4.500%, 03/10/2015 | KRW | 1,116,900,000 | | 1,003,526 |
| 5.000%, 06/10/2020 | | 627,330,000 | | 569,716 |
| | |
|
| | | | | 1,573,242 |
| Spain - 0.12% | | | | |
| Kingdom of Spain | | | | |
| 4.100%, 07/30/2018 | EUR | 630,000 | | 823,640 |
| 5.750%, 07/30/2032 | | 301,000 | | 404,482 |
| | |
|
| | | | | 1,228,122 |
| Sweden - 0.16% | | | | |
| Kingdom of Sweden | | | | |
| 3.750%, 08/12/2017 | SEK | 3,590,000 | | 584,616 |
| Svensk Exportkredit AB | | | | |
| 3.625%, 05/27/2014 | EUR | 404,000 | | 574,658 |
| 5.125%, 03/01/2017 | $ | 425,000 | | 470,452 |
| | |
|
| | | | | 1,629,726 |
| Turkey - 0.61% | | | | |
| Republic of Turkey | | | | |
| 5.625%, 03/30/2021 | | 1,000,000 | | 998,920 |
| 6.750%, 05/30/2040 | | 550,000 | | 550,000 |
| 6.875%, 03/17/2036 | | 185,000 | | 189,163 |
| 7.000%, 03/11/2019 to 06/05/2020 | | 2,438,000 | | 2,707,519 |
| 7.500%, 11/07/2019 | | 180,000 | | 205,650 |
| 8.000%, 02/14/2034 | | 437,000 | | 506,920 |
| 10.000%, 06/17/2015 | TRY | 333,000 | | 213,391 |
| 10.500%, 01/15/2020 | | 1,000,000 | | 667,709 |
| 14.000%, 09/26/2012 | | 300,000 | | 201,157 |
| | |
|
| | | | | 6,240,429 |
| Ukraine - 0.11% | | | | |
| Republic of Ukraine | | | | |
| 6.580%, 11/21/2016 | $ | 325,000 | | 318,906 |
| 7.650%, 06/11/2013 | | 250,000 | | 261,625 |
| 7.750%, 09/23/2020 | | 210,000 | | 210,263 |
| 7.750%, 09/23/2020 (S) | | 300,000 | | 300,750 |
| | |
|
| | | | | 1,091,544 |
| United Arab Emirates - 0.03% | | | | |
| Mubadala Development Company | | | | |
| 5.750%, 05/06/2014 (S) | | 250,000 | | 269,371 |
| United Kingdom - 0.61% | | | | |
| Government of United Kingdom | | | | |
| 2.750%, 01/22/2015 | GBP | 209,000 | | 345,740 |
| 4.250%, 06/07/2032 to 09/07/2039 | | 2,666,000 | | 4,269,480 |
| 4.500%, 03/07/2013 to 03/07/2019 | | 662,000 | | 1,144,712 |
| 8.750%, 08/25/2017 | | 205,000 | | 447,992 |
| | |
|
| | | | | 6,207,924 |
| | | | |
| Spectrum Income Fund (continued) | | |
| | | Shares or | | |
| | | Principal | | |
| | | Amount | | Value |
| |
|
| |
| FOREIGN GOVERNMENT | | | | |
| OBLIGATIONS (continued) | | | | |
| Venezuela - 0.29% | | | | |
| Republic of Venezuela | | | | |
| 5.750%, 02/26/2016 | $ | 1,000,000 | $ | 717,500 |
| 6.000%, 12/09/2020 | | 145,000 | | 83,520 |
| 7.000%, 12/01/2018 | | 84,000 | | 56,280 |
| 7.650%, 04/21/2025 | | 500,000 | | 298,250 |
| 7.750%, 10/13/2019 | | 52,500 | | 34,834 |
| 8.500%, 10/08/2014 | | 587,000 | | 515,680 |
| 12.750%, 08/23/2022 | | 1,500,000 | | 1,263,000 |
| | |
|
| | | | | 2,969,064 |
| Vietnam - 0.07% | | | | |
| Socialist Republic of Vietnam | | | | |
| 6.750%, 01/29/2020 | | 775,000 | | 767,250 |
|
| TOTAL FOREIGN GOVERNMENT | | | | |
| OBLIGATIONS (Cost $138,869,568) | | | $ | 143,513,991 |
|
| |
| CORPORATE BONDS - 38.47% | | | | |
| Consumer Discretionary - 5.17% | | | | |
| ACE Hardware Corp. | | | | |
| 9.125%, 06/01/2016 (S) | | 475,000 | | 510,625 |
| Advance Auto Parts, Inc. | | | | |
| 5.750%, 05/01/2020 | | 360,000 | | 379,083 |
| Affinia Group, Inc. | | | | |
| 10.750%, 08/15/2016 (S) | | 90,000 | | 102,600 |
| Allison Transmission, Inc., PIK | | | | |
| 11.250%, 11/01/2015 (S) | | 638,000 | | 695,420 |
| AMC Entertainment Holdings, Inc. | | | | |
| 9.750%, 12/01/2020 (S) | | 325,000 | | 348,563 |
| American Honda Finance Corp. | | | | |
| 0.531%, 08/28/2012 (P) (S) | | 235,000 | | 234,896 |
| 6.250%, 07/16/2013 | EUR | 50,000 | | 74,502 |
| Ameristar Casinos, Inc. | | | | |
| 9.250%, 06/01/2014 | $ | 350,000 | | 376,250 |
| AMO Escrow Corp. | | | | |
| 11.500%, 12/15/2017 (S) | | 225,000 | | 240,750 |
| Arcos Dorados BV | | | | |
| 7.500%, 10/01/2019 (S) | | 500,000 | | 541,250 |
| Bankrate, Inc. | | | | |
| 11.750%, 07/15/2015 (S) | | 225,000 | | 256,781 |
| Banque PSA Finance | | | | |
| 3.625%, 04/29/2014 | EUR | 50,000 | | 68,965 |
| Beazer Homes USA, Inc. | | | | |
| 9.125%, 06/15/2018 | $ | 575,000 | | 593,688 |
| 9.125%, 05/15/2019 (S) | | 175,000 | | 180,469 |
| BMW Finance NV | | | | |
| 8.875%, 09/19/2013 | EUR | 90,000 | | 143,064 |
| Bresnan Broadband Holdings LLC | | | | |
| 8.000%, 12/15/2018 (S) | $ | 225,000 | | 236,250 |
| British Sky Broadcasting Group PLC | | | | |
| 6.100%, 02/15/2018 (S) | | 155,000 | | 174,396 |
| 9.500%, 11/15/2018 (S) | | 180,000 | | 239,833 |
| BSKYB Finance UK PLC | | | | |
| 5.750%, 10/20/2017 | GBP | 65,000 | | 113,405 |
| Cablevision Systems Corp. | | | | |
| 8.000%, 04/15/2020 | $ | 225,000 | | 245,250 |
| 8.625%, 09/15/2017 | | 50,000 | | 56,000 |
| Caesars Entertainment Operating | | | | |
| Company, Inc. | | | | |
| 11.250%, 06/01/2017 | | 500,000 | | 567,500 |
| CCH II LLC/CCH II Capital Corp. | | | | |
| 13.500%, 11/30/2016 | | 150,000 | | 181,688 |
| CCO Holdings LLC/CCO | | | | |
| Holdings Capital Corp. | | | | |
| 7.000%, 01/15/2019 | | 300,000 | | 305,250 |
| |
| The accompanying notes are an integral part of the financial statements. | 243 |
John Hancock Funds II
Portfolio of Investments — February 28, 2011 (Unaudited) (showing percentage of total net assets)
| | | | |
| Spectrum Income Fund (continued) | | |
| | | Shares or | | |
| | | Principal | | |
| | | Amount | | Value |
| |
|
| |
| CORPORATE BONDS (continued) | | | | |
| Consumer Discretionary (continued) | | | | |
| CCO Holdings LLC/CCO Holdings | | | | |
| Capital Corp. (continued) | | | | |
| 7.250%, 10/30/2017 | $ | 500,000 | $ | 525,000 |
| 7.875%, 04/30/2018 | | 500,000 | | 533,750 |
| Cedar Fair LP/Canada’s Wonderland | | | | |
| Company/Magnum Management Corp. | | | | |
| 9.125%, 08/01/2018 (S) | | 300,000 | | 327,000 |
| Cequel Communications | | | | |
| Holdings I LLC/Cequel Capital Corp. | | | | |
| 8.625%, 11/15/2017 (S) | | 750,000 | | 793,125 |
| Cinemark USA, Inc. | | | | |
| 8.625%, 06/15/2019 | | 250,000 | | 272,500 |
| Cirsa Finance Luxembourg SA | | | | |
| 8.750%, 05/15/2018 (S) | EUR | 300,000 | | 430,544 |
| Cirsa Funding Luxembourg SA | | | | |
| 8.750%, 05/15/2018 | | 90,000 | | 129,163 |
| Claire’s Stores, Inc. | | | | |
| 8.875%, 03/15/2019 (S) | $ | 250,000 | | 250,938 |
| Claire’s Stores, Inc., PIK | | | | |
| 9.625%, 06/01/2015 | | 100,000 | | 101,500 |
| Clear Channel Communications, Inc. | | | | |
| 7.250%, 10/15/2027 | | 125,000 | | 80,000 |
| Clear Channel Communications, Inc., | | | | |
| PIK | | | | |
| 11.000%, 08/01/2016 | | 625,000 | | 598,438 |
| Codere Finance Luxembourg SA | | | | |
| 8.250%, 06/15/2015 | EUR | 80,000 | | 113,708 |
| 8.250%, 06/15/2015 (S) | | 650,000 | | 923,876 |
| Comcast Cable Communications | | | | |
| Holdings, Inc. | | | | |
| 8.375%, 03/15/2013 | $ | 149,000 | | 168,993 |
| Comcast Corp. | | | | |
| 6.400%, 03/01/2040 | | 30,000 | | 31,213 |
| 6.950%, 08/15/2037 | | 145,000 | | 161,260 |
| Compass Group PLC | | | | |
| 7.000%, 12/08/2014 | GBP | 45,000 | | 82,296 |
| Conti-Gummi Finance BV | | | | |
| 6.500%, 01/15/2016 (S) | EUR | 75,000 | | 106,724 |
| 7.500%, 09/15/2017 (S) | | 225,000 | | 327,954 |
| 8.500%, 07/15/2015 (S) | | 50,000 | | 76,139 |
| Corp GEO SAB de CV | | | | |
| 8.875%, 09/25/2014 (S) | $ | 100,000 | | 112,000 |
| COX Communications, Inc. | | | | |
| 5.450%, 12/15/2014 | | 215,000 | | 237,441 |
| 6.250%, 06/01/2018 (S) | | 255,000 | | 284,846 |
| 8.375%, 03/01/2039 (S) | | 115,000 | | 147,118 |
| Daimler Finance North America LLC | | | | |
| 6.500%, 11/15/2013 | | 460,000 | | 518,486 |
| DineEquity, Inc. | | | | |
| 9.500%, 10/30/2018 (S) | | 350,000 | | 378,875 |
| DirectTV Holdings LLC/DirectTV | | | | |
| Financing Company, Inc. | | | | |
| 4.750%, 10/01/2014 | | 420,000 | | 451,784 |
| DIRECTV Holdings LLC | | | | |
| 3.550%, 03/15/2015 | | 325,000 | | 331,579 |
| DIRECTV Holdings LLC/DIRECTV | | | | |
| Financing Company, Inc. | | | | |
| 5.875%, 10/01/2019 | | 475,000 | | 514,775 |
| Discovery Communications LLC | | | | |
| 5.625%, 08/15/2019 | | 235,000 | | 255,818 |
| Easton-Bell Sports, Inc. | | | | |
| 9.750%, 12/01/2016 | | 100,000 | | 112,500 |
| Education Management LLC/Education | | | | |
| Management Finance Corp. | | | | |
| 8.750%, 06/01/2014 | | 200,000 | | 205,500 |
| | | | |
| Spectrum Income Fund (continued) | | |
| | | Shares or | | |
| | | Principal | | |
| | | Amount | | Value |
| |
|
| |
| CORPORATE BONDS (continued) | | | | |
| Consumer Discretionary (continued) | | | | |
| Education Management LLC/Education | | | | |
| Management Finance Corp. (continued) | | | | |
| 10.250%, 06/01/2016 | $ | 48,000 | $ | 50,160 |
| Fiat Finance & Trade, Ltd. | | | | |
| 6.625%, 02/15/2013 | EUR | 55,000 | | 79,123 |
| Ford Motor Company | | | | |
| 7.450%, 07/16/2031 | $ | 450,000 | | 489,749 |
| Ford Motor Credit Company LLC | | | | |
| 5.750%, 02/01/2021 | | 1,550,000 | | 1,529,061 |
| 12.000%, 05/15/2015 | | 550,000 | | 694,818 |
| Gaylord Entertainment Company | | | | |
| 6.750%, 11/15/2014 | | 325,000 | | 329,875 |
| Giraffe Acquisition Corp. | | | | |
| 9.125%, 12/01/2018 (S) | | 450,000 | | 459,000 |
| Grupo Posadas SAB de CV | | | | |
| 9.250%, 01/15/2015 (S) | | 300,000 | | 288,000 |
| Grupo Televisa SA | | | | |
| 6.625%, 01/15/2040 | | 285,000 | | 303,154 |
| Hanesbrands, Inc. | | | | |
| 6.375%, 12/15/2020 | | 400,000 | | 385,800 |
| 8.000%, 12/15/2016 | | 150,000 | | 162,375 |
| Hella KGaA Hueck & Company | | | | |
| 7.250%, 10/20/2014 | EUR | 70,000 | | 106,498 |
| Historic TW, Inc. | | | | |
| 6.875%, 06/15/2018 | $ | 570,000 | | 661,363 |
| Home Depot, Inc. | | | | |
| 5.200%, 03/01/2011 | | 200,000 | | 200,000 |
| 5.400%, 03/01/2016 | | 345,000 | | 384,127 |
| Hyatt Hotels Corp. | | | | |
| 5.750%, 08/15/2015 (S) | | 510,000 | | 529,605 |
| Intercontinental Hotels Group PLC | | | | |
| 6.000%, 12/09/2016 | GBP | 50,000 | | 83,935 |
| Interpublic Group of Companies, Inc. | | | | |
| 10.000%, 07/15/2017 | $ | 400,000 | | 473,000 |
| ITT Corp. | | | | |
| 7.375%, 11/15/2015 | | 125,000 | | 140,000 |
| ITV PLC | | | | |
| 10.000%, 06/30/2014 | EUR | 50,000 | | 79,520 |
| JC Penney Company, Inc. | | | | |
| 5.650%, 06/01/2020 | $ | 90,000 | | 86,850 |
| 7.125%, 11/15/2023 | | 50,000 | | 51,500 |
| JC Penney Corp., Inc. | | | | |
| 7.400%, 04/01/2037 | | 200,000 | | 192,000 |
| Johnson Controls, Inc. | | | | |
| 0.721%, 02/04/2014 (P) | | 320,000 | | 320,185 |
| KAR Holdings, Inc. | | | | |
| 10.000%, 05/01/2015 | | 1,225,000 | | 1,298,500 |
| Kingfisher PLC | | | | |
| 5.625%, 12/15/2014 | GBP | 30,000 | | 51,931 |
| Lamar Media Corp. | | | | |
| 7.875%, 04/15/2018 | $ | 300,000 | | 322,500 |
| Lennar Corp. | | | | |
| 5.600%, 05/31/2015 | | 45,000 | | 44,213 |
| Levi Strauss & Company | | | | |
| 7.625%, 05/15/2020 | | 325,000 | | 336,375 |
| 8.875%, 04/01/2016 | | 100,000 | | 104,625 |
| Limited Brands, Inc. | | | | |
| 8.500%, 06/15/2019 | | 200,000 | | 229,000 |
| Lions Gate Entertainment, Inc. | | | | |
| 10.250%, 11/01/2016 (S) | | 350,000 | | 370,125 |
| Lottomatica SpA | | | | |
| 5.375%, 12/05/2016 | EUR | 150,000 | | 209,178 |
| Lowe’s Companies, Inc. | | | | |
| 2.125%, 04/15/2016 | $ | 320,000 | | 311,111 |
| |
| The accompanying notes are an integral part of the financial statements. | 244 |
John Hancock Funds II
Portfolio of Investments — February 28, 2011 (Unaudited) (showing percentage of total net assets)
| | | | |
| Spectrum Income Fund (continued) | | |
| | | Shares or | | |
| | | Principal | | |
| | | Amount | | Value |
| |
|
| |
| CORPORATE BONDS (continued) | | | | |
| Consumer Discretionary (continued) | | | | |
| Mac-Gray Corp. | | | | |
| 7.625%, 08/15/2015 | $ | 525,000 | $ | 531,563 |
| Macy’s Retail Holdings, Inc. | | | | |
| 5.350%, 03/15/2012 | | 35,000 | | 36,225 |
| 5.900%, 12/01/2016 | | 25,000 | | 26,688 |
| Marks & Spencer PLC | | | | |
| 5.625%, 03/24/2014 | GBP | 30,000 | | 51,046 |
| Mattel, Inc. | | | | |
| 4.350%, 10/01/2020 | $ | 50,000 | | 48,887 |
| MCE Finance, Ltd. | | | | |
| 10.250%, 05/15/2018 | | 315,000 | | 362,250 |
| MDC Holdings, Inc. | | | | |
| 5.375%, 12/15/2014 | | 60,000 | | 63,194 |
| 5.625%, 02/01/2020 | | 260,000 | | 261,523 |
| MGM Resorts International | | | | |
| 9.000%, 03/15/2020 | | 125,000 | | 136,563 |
| 10.375%, 05/15/2014 | | 150,000 | | 168,000 |
| 11.125%, 11/15/2017 | | 725,000 | | 835,563 |
| 13.000%, 11/15/2013 | | 250,000 | | 299,375 |
| Michaels Stores, Inc. | | | | |
| 7.750%, 11/01/2018 (S) | | 725,000 | | 748,563 |
| Michaels Stores, Inc. (Zero Coupon | | | | |
| Steps up to 13.000% on 11/01/2011) | | | | |
| 11/01/2016 | | 625,000 | | 635,938 |
| Michelin Luxembourg SCS | | | | |
| 8.625%, 04/24/2014 | EUR | 50,000 | | 79,595 |
| Mohawk Industries, Inc. | | | | |
| 6.875%, 01/15/2016 | $ | 125,000 | | 134,063 |
| NCL Corp. Ltd. | | | | |
| 9.500%, 11/15/2018 (S) | | 125,000 | | 135,313 |
| 11.750%, 11/15/2016 | | 400,000 | | 472,500 |
| Net Servicos De Comunicacao SA | | | | |
| 7.500%, 01/27/2020 | | 400,000 | | 464,000 |
| NetFlix, Inc. | | | | |
| 8.500%, 11/15/2017 | | 325,000 | | 368,063 |
| News America, Inc. | | | | |
| 6.150%, 03/01/2037 | | 170,000 | | 172,212 |
| 7.850%, 03/01/2039 | | 85,000 | | 102,874 |
| Nexstar Broadcasting, Inc. | | | | |
| 7.000%, 01/15/2014 | | 105,000 | | 102,375 |
| Nexstar Broadcasting, Inc., PIK | | | | |
| 7.000%, 01/15/2014 | | 319,999 | | 310,399 |
| Nielsen Finance LLC/Nielsen Finance | | | | |
| Company | | | | |
| 11.500%, 05/01/2016 | | 65,000 | | 76,538 |
| Nordstrom, Inc. | | | | |
| 4.750%, 05/01/2020 | | 85,000 | | 87,736 |
| 6.750%, 06/01/2014 | | 50,000 | | 57,130 |
| O’Charleys, Inc. | | | | |
| 9.000%, 11/01/2013 | | 250,000 | | 254,063 |
| O’Reilly Automotive, Inc. | | | | |
| 4.875%, 01/14/2021 | | 430,000 | | 425,690 |
| Omnicom Group, Inc. | | | | |
| 4.450%, 08/15/2020 | | 100,000 | | 98,332 |
| 6.250%, 07/15/2019 | | 155,000 | | 172,585 |
| OSI Restaurant Partners, Inc. | | | | |
| 10.000%, 06/15/2015 | | 450,000 | | 473,625 |
| Palace Entertainment | | | | |
| Holdings LLC/Palace Entertainment | | | | |
| Holdings Corp. | | | | |
| 8.875%, 04/15/2017 (S) | | 100,000 | | 102,000 |
| Pinnacle Entertainment, Inc. | | | | |
| 8.625%, 08/01/2017 | | 275,000 | | 301,813 |
| 8.750%, 05/15/2020 | | 200,000 | | 213,250 |
| | | | |
| Spectrum Income Fund (continued) | | |
| | | Shares or | | |
| | | Principal | | |
| | | Amount | | Value |
| |
|
| |
| CORPORATE BONDS (continued) | | | | |
| Consumer Discretionary (continued) | | | | |
| PPR | | | | |
| 8.625%, 04/03/2014 | EUR | 100,000 | $ | 158,668 |
| Pulte Homes, Inc. | | | | |
| 5.200%, 02/15/2015 | $ | 75,000 | | 73,500 |
| QVC, Inc. | | | | |
| 7.125%, 04/15/2017 (S) | | 350,000 | | 373,625 |
| 7.500%, 10/01/2019 (S) | | 325,000 | | 346,938 |
| Regal Cinemas Corp. | | | | |
| 8.625%, 07/15/2019 | | 300,000 | | 321,750 |
| Regal Entertainment Group | | | | |
| 9.125%, 08/15/2018 | | 425,000 | | 454,750 |
| Reynolds Group Issuer, Inc. | | | | |
| 7.750%, 10/15/2016 (S) | | 275,000 | | 292,875 |
| Sealy Mattress Company | | | | |
| 8.250%, 06/15/2014 | | 125,000 | | 127,969 |
| 10.875%, 04/15/2016 (S) | | 200,000 | | 227,000 |
| Seminole Indian Tribe of Florida | | | | |
| 7.750%, 10/01/2017 (S) | | 200,000 | | 212,250 |
| Seneca Gaming Corp. | | | | |
| 8.250%, 12/01/2018 (S) | | 275,000 | | 284,625 |
| Sinclair Television Group, Inc. | | | | |
| 9.250%, 11/01/2017 (S) | | 400,000 | | 452,000 |
| Sirius XM Radio, Inc. | | | | |
| 8.750%, 04/01/2015 (S) | | 800,000 | | 887,000 |
| 9.750%, 09/01/2015 (S) | | 275,000 | | 311,094 |
| Speedway Motorsports, Inc. | | | | |
| 8.750%, 06/01/2016 | | 275,000 | | 302,156 |
| Standard Pacific Corp. | | | | |
| 8.375%, 05/15/2018 | | 100,000 | | 106,000 |
| 10.750%, 09/15/2016 | | 250,000 | | 293,750 |
| Stanley Black & Decker, Inc. | | | | |
| 5.200%, 09/01/2040 | | 155,000 | | 147,817 |
| Staples, Inc. | | | | |
| 7.750%, 04/01/2011 | | 190,000 | | 191,006 |
| 9.750%, 01/15/2014 | | 100,000 | | 120,795 |
| Tam Capital 2, Inc. | | | | |
| 9.500%, 01/29/2020 | | 100,000 | | 110,000 |
| TCM Sub LLC | | | | |
| 3.550%, 01/15/2015 (S) | | 810,000 | | 821,598 |
| The Goodyear Tire & Rubber Company | | | | |
| 10.500%, 05/15/2016 | | 425,000 | | 484,500 |
| The Hertz Corp. | | | | |
| 7.875%, 01/01/2014 | EUR | 78,000 | | 109,520 |
| The Interpublic Group of | | | | |
| Companies, Inc. | | | | |
| 6.250%, 11/15/2014 | $ | 110,000 | | 119,488 |
| The McClatchy Company | | | | |
| 11.500%, 02/15/2017 | | 450,000 | | 510,750 |
| Thomson Reuters Corp. | | | | |
| 5.950%, 07/15/2013 | | 145,000 | | 160,346 |
| Ticketmaster Entertainment, Inc. | | | | |
| 10.750%, 08/01/2016 | | 250,000 | | 274,375 |
| Time Warner Cable, Inc. | | | | |
| 5.400%, 07/02/2012 | | 325,000 | | 342,879 |
| 7.500%, 04/01/2014 | | 120,000 | | 138,575 |
| 8.250%, 02/14/2014 | | 215,000 | | 251,489 |
| Time Warner, Inc. | | | | |
| 7.700%, 05/01/2032 | | 95,000 | | 113,289 |
| Toys R Us - Delaware, Inc. | | | | |
| 7.375%, 09/01/2016 (S) | | 300,000 | | 316,125 |
| Toys R Us Property Company LLC | | | | |
| 8.500%, 12/01/2017 | | 300,000 | | 326,250 |
| Unitymedia Gmbh | | | | |
| 9.625%, 12/01/2019 | EUR | 50,000 | | 78,398 |
| |
| The accompanying notes are an integral part of the financial statements. | 245 |
John Hancock Funds II
Portfolio of Investments — February 28, 2011 (Unaudited) (showing percentage of total net assets)
| | | | |
| Spectrum Income Fund (continued) | | |
| | | Shares or | | |
| | | Principal | | |
| | | Amount | | Value |
| |
|
| |
| CORPORATE BONDS (continued) | | | | |
| Consumer Discretionary (continued) | | | | |
| Unitymedia Hessen GmbH & Company | | | | |
| KG/Unitymedia NRW GmbH | | | | |
| 8.125%, 12/01/2017 (S) | $ | 325,000 | $ | 348,563 |
| Universal City Development | | | | |
| Partners, Ltd./UCDP Finance, Inc. | | | | |
| 8.875%, 11/15/2015 | | 350,000 | | 382,375 |
| 10.875%, 11/15/2016 | | 150,000 | | 168,375 |
| Univision Communications, Inc. | | | | |
| 7.875%, 11/01/2020 (S) | | 550,000 | | 589,875 |
| 8.500%, 05/15/2021 (S) | | 875,000 | | 912,188 |
| UPC Germany GmbH | | | | |
| 9.625%, 12/01/2019 (S) | EUR | 57,000 | | 89,374 |
| Urbi Desarrollos Urbanos SAB de CV | | | | |
| 8.500%, 04/19/2016 | $ | 125,000 | | 129,989 |
| 9.500%, 01/21/2020 (S) | | 100,000 | | 114,500 |
| Videotron Ltee | | | | |
| 6.375%, 12/15/2015 | | 50,000 | | 51,125 |
| 9.125%, 04/15/2018 | | 100,000 | | 112,250 |
| Virgin Media Finance PLC | | | | |
| 8.875%, 10/15/2019 | GBP | 50,000 | | 92,256 |
| Wendy’s/Arby’s Restaurants LLC | | | | |
| 10.000%, 07/15/2016 | $ | 575,000 | | 639,688 |
| Whirlpool Corp. | | | | |
| 6.125%, 06/15/2011 | | 80,000 | | 81,192 |
| WPP PLC | | | | |
| 6.625%, 05/12/2016 | EUR | 100,000 | | 154,717 |
| Wyndham Worldwide Corp. | | | | |
| 5.625%, 03/01/2021 | $ | 95,000 | | 94,763 |
| 7.375%, 03/01/2020 | | 115,000 | | 127,215 |
| Wynn Las Vegas LLC/Wynn Las Vegas | | | | |
| Capital Corp. | | | | |
| 7.875%, 11/01/2017 | | 850,000 | | 907,375 |
| XM Satellite Radio, Inc. | | | | |
| 7.625%, 11/01/2018 (S) | | 175,000 | | 185,500 |
| 13.000%, 08/01/2013 (S) | | 1,125,000 | | 1,341,563 |
| Ziggo Bond Company BV | | | | |
| 8.000%, 05/15/2018 | EUR | 50,000 | | 74,000 |
| | |
|
| | | | | 53,058,144 |
| Consumer Staples - 1.98% | | | | |
| Altria Group, Inc. | | | | |
| 4.125%, 09/11/2015 | $ | 475,000 | | 493,762 |
| 8.500%, 11/10/2013 | | 745,000 | | 877,746 |
| 9.250%, 08/06/2019 | | 295,000 | | 382,928 |
| Anheuser-Busch InBev NV | | | | |
| 6.500%, 06/23/2017 | GBP | 20,000 | | 36,273 |
| 8.625%, 01/30/2017 | EUR | 100,000 | | 173,191 |
| Anheuser-Busch InBev Worldwide, Inc. | | | | |
| 3.000%, 10/15/2012 | $ | 390,000 | | 402,270 |
| 7.200%, 01/15/2014 (S) | | 200,000 | | 228,945 |
| Arcor | | | | |
| 7.250%, 11/09/2017 (S) | | 220,000 | | 230,230 |
| Avangardco Investments Public, Ltd. | | | | |
| 10.000%, 10/29/2015 | | 200,000 | | 195,750 |
| Bacardi, Ltd. | | | | |
| 7.750%, 04/09/2014 | EUR | 100,000 | | 155,912 |
| BAT International Finance PLC | | | | |
| 5.375%, 06/29/2017 | | 100,000 | | 149,420 |
| 6.375%, 12/12/2019 | GBP | 25,000 | | 44,970 |
| 8.125%, 11/15/2013 (S) | $ | 355,000 | | 413,001 |
| BFF International, Ltd. | | | | |
| 7.250%, 01/28/2020 (S) | | 100,000 | | 106,000 |
| Blue Merger Sub, Inc. | | | | |
| 7.625%, 02/15/2019 (S) | | 425,000 | | 429,250 |
| | | | |
| Spectrum Income Fund (continued) | | |
| | | Shares or | | |
| | | Principal | | |
| | | Amount | | Value |
| |
|
| |
| CORPORATE BONDS (continued) | | | | |
| Consumer Staples (continued) | | | | |
| Bumble Bee Acquisition Corp. | | | | |
| 9.000%, 12/15/2017 (S) | $ | 225,000 | $ | 243,000 |
| Bunge NA Finance LP | | | | |
| 5.900%, 04/01/2017 | | 295,000 | | 304,203 |
| Campofrio Food Group SA | | | | |
| 8.250%, 10/31/2016 | EUR | 50,000 | | 71,585 |
| 8.250%, 10/31/2016 (S) | | 62,000 | | 88,765 |
| Carlsberg Breweries A/S | | | | |
| 6.000%, 05/28/2014 | | 100,000 | | 149,423 |
| Casino Guichard Perrachon SA | | | | |
| 4.875%, 04/10/2014 | | 50,000 | | 72,096 |
| 6.375%, 04/04/2013 | | 50,000 | | 73,727 |
| CEDC Finance Corp. International, Inc. | | | | |
| 8.875%, 12/01/2016 | | 110,000 | | 163,559 |
| 9.125%, 12/01/2016 (S) | $ | 275,000 | | 297,688 |
| Central Garden and Pet Company | | | | |
| 8.250%, 03/01/2018 | | 225,000 | | 236,531 |
| Church & Dwight Company, Inc. | | | | |
| 3.350%, 12/15/2015 | | 80,000 | | 80,420 |
| Coca-Cola Enterprises, Inc. | | | | |
| 1.125%, 11/12/2013 | | 220,000 | | 217,203 |
| Coca-Cola Femsa SAB de CV | | | | |
| 4.625%, 02/15/2020 | | 245,000 | | 247,626 |
| Constellation Brands, Inc. | | | | |
| 8.375%, 12/15/2014 | | 25,000 | | 28,125 |
| Controladora Mabe SA CV | | | | |
| 7.875%, 10/28/2019 (S) | | 450,000 | | 493,875 |
| Cott Beverages, Inc. | | | | |
| 8.125%, 09/01/2018 | | 475,000 | | 511,219 |
| 8.375%, 11/15/2017 | | 125,000 | | 134,688 |
| Darling International, Inc. | | | | |
| 8.500%, 12/15/2018 (S) | | 100,000 | | 107,875 |
| Del Monte Corp. | | | | |
| 7.500%, 10/15/2019 | | 25,000 | | 30,375 |
| Delhaize Group SA | | | | |
| 5.625%, 06/27/2014 | EUR | 50,000 | | 73,712 |
| 6.500%, 06/15/2017 | $ | 250,000 | | 282,433 |
| Dole Food Company, Inc. | | | | |
| 13.875%, 03/15/2014 | | 130,000 | | 159,088 |
| DP World, Ltd. | | | | |
| 6.850%, 07/02/2037 (S) | | 490,000 | | 431,200 |
| Grupo Bimbo SAB de CV | | | | |
| 4.875%, 06/30/2020 (S) | | 710,000 | | 700,386 |
| Heineken NV | | | | |
| 7.125%, 04/07/2014 | EUR | 75,000 | | 113,759 |
| 7.250%, 03/10/2015 | GBP | 25,000 | | 45,731 |
| Imperial Tobacco Finance PLC | | | | |
| 4.375%, 11/22/2013 | EUR | 100,000 | | 143,300 |
| 6.875%, 06/13/2012 | GBP | 49,000 | | 84,199 |
| iPayment, Inc. | | | | |
| 9.750%, 05/15/2014 | $ | 425,000 | | 421,281 |
| JBS Finance II, Ltd. | | | | |
| 8.250%, 01/29/2018 (S) | | 550,000 | | 555,500 |
| JBS USA LLC/JBS USA Finance, Inc. | | | | |
| 11.625%, 05/01/2014 | | 275,000 | | 321,750 |
| Kraft Foods, Inc. | | | | |
| 6.500%, 02/09/2040 | | 200,000 | | 215,378 |
| Loblaw Companies, Ltd. | | | | |
| 5.220%, 06/18/2020 | CAD | 25,000 | | 26,748 |
| MHP SA | | | | |
| 10.250%, 04/29/2015 | $ | 635,000 | | 677,863 |
| Michael Foods, Inc. | | | | |
| 9.750%, 07/15/2018 (S) | | 525,000 | | 574,875 |
| Minerva Overseas, Ltd. | | | | |
| 10.875%, 11/15/2019 (S) | | 275,000 | | 299,063 |
| |
| The accompanying notes are an integral part of the financial statements. | 246 |
John Hancock Funds II
Portfolio of Investments — February 28, 2011 (Unaudited) (showing percentage of total net assets)
| | | | |
| Spectrum Income Fund (continued) | | |
| | | Shares or | | |
| | | Principal | | |
| | | Amount | | Value |
| |
|
| |
| CORPORATE BONDS (continued) | | | | |
| Consumer Staples (continued) | | | | |
| Pernod-Ricard SA | | | | |
| 7.000%, 01/15/2015 | EUR | 100,000 | $ | 151,462 |
| Philip Morris International, Inc. | | | | |
| 5.875%, 09/04/2015 | | 50,000 | | 76,667 |
| R&R Ice Cream, Ltd. | | | | |
| 8.375%, 11/15/2017 (S) | | 200,000 | | 287,720 |
| Ralcorp Holdings Corp. | | | | |
| 4.950%, 08/15/2020 | $ | 160,000 | | 158,924 |
| Reynolds American, Inc. | | | | |
| 7.250%, 06/01/2013 | | 485,000 | | 539,158 |
| Reynolds Group Issuer, Inc./Reynolds | | | | |
| Group Issuer LLC | | | | |
| 7.125%, 04/15/2019 (S) | | 600,000 | | 615,000 |
| 7.750%, 10/15/2016 | EUR | 90,000 | | 131,647 |
| Rite Aid Corp. | | | | |
| 8.000%, 08/15/2020 | $ | 300,000 | | 324,375 |
| 8.625%, 03/01/2015 | | 400,000 | | 371,000 |
| 9.750%, 06/12/2016 | | 125,000 | | 140,781 |
| 10.250%, 10/15/2019 | | 375,000 | | 412,969 |
| 10.375%, 07/15/2016 | | 75,000 | | 80,625 |
| SABMiller PLC | | | | |
| 6.200%, 07/01/2011 (S) | | 355,000 | | 361,338 |
| Safeway, Inc. | | | | |
| 5.800%, 08/15/2012 | | 150,000 | | 160,207 |
| Smithfield Foods, Inc. | | | | |
| 7.750%, 07/01/2017 | | 125,000 | | 135,313 |
| 10.000%, 07/15/2014 | | 75,000 | | 88,500 |
| Susser Holdings LLC/Susser | | | | |
| Finance Corp. | | | | |
| 8.500%, 05/15/2016 | | 300,000 | | 325,875 |
| Tesco PLC | | | | |
| 5.875%, 09/12/2016 | EUR | 50,000 | | 77,378 |
| 6.125%, 02/24/2022 | GBP | 50,000 | | 87,374 |
| The Coca-Cola Company | | | | |
| 0.750%, 11/15/2013 | $ | 425,000 | | 419,445 |
| 1.500%, 11/15/2015 | | 365,000 | | 349,219 |
| The Hertz Corp. | | | | |
| 7.500%, 10/15/2018 (S) | | 325,000 | | 344,094 |
| The Kroger Company | | | | |
| 5.400%, 07/15/2040 | | 175,000 | | 165,640 |
| 6.800%, 04/01/2011 | | 290,000 | | 291,399 |
| US Foodservice Corp. | | | | |
| 10.250%, 06/30/2015 (S) | | 775,000 | | 806,000 |
| Viterra, Inc. | | | | |
| 5.950%, 08/01/2020 (S) | | 150,000 | | 148,735 |
| Wesfarmers, Ltd. | | | | |
| 3.875%, 07/10/2015 | EUR | 50,000 | | 70,027 |
| Yasar Holdings SA Via Willow No 2 | | | | |
| 9.625%, 10/07/2015 | $ | 200,000 | | 210,000 |
| | |
|
| | | | | 20,328,769 |
| Energy - 5.14% | | | | |
| Adaro Indonesia PT | | | | |
| 7.625%, 10/22/2019 (S) | | 300,000 | | 329,250 |
| Alta Mesa Holdings/Alta Mesa Finance | | | | |
| Services Corp. | | | | |
| 9.625%, 10/15/2018 (S) | | 350,000 | | 354,375 |
| Anadarko Petroleum Corp. | | | | |
| 6.200%, 03/15/2040 | | 60,000 | | 58,734 |
| 6.375%, 09/15/2017 | | 205,000 | | 228,492 |
| 8.700%, 03/15/2019 | | 595,000 | | 734,285 |
| Antero Resources Finance Corp. | | | | |
| 9.375%, 12/01/2017 | | 650,000 | | 702,000 |
| Apache Corp. | | | | |
| 5.100%, 09/01/2040 | | 650,000 | | 603,344 |
| | | | |
| Spectrum Income Fund (continued) | | |
| | | Shares or | | |
| | | Principal | | |
| | | Amount | | Value |
| |
|
| |
| CORPORATE BONDS (continued) | | | | |
| Energy (continued) | | | | |
| Berry Petroleum Company | | | | |
| 6.750%, 11/01/2020 | $ | 225,000 | $ | 231,750 |
| 10.250%, 06/01/2014 | | 150,000 | | 174,000 |
| BG Energy Capital PLC | | | | |
| 5.125%, 12/07/2017 | GBP | 50,000 | | 86,138 |
| Bill Barrett Corp. | | | | |
| 9.875%, 07/15/2016 | $ | 300,000 | | 336,000 |
| Boardwalk Pipelines LP | | | | |
| 5.750%, 09/15/2019 | | 205,000 | | 220,283 |
| BP Capital Markets PLC | | | | |
| 3.125%, 10/01/2015 | | 395,000 | | 400,793 |
| Buckeye Partners LP | | | | |
| 5.500%, 08/15/2019 | | 505,000 | | 524,329 |
| 6.050%, 01/15/2018 | | 140,000 | | 153,570 |
| Canadian Natural Resources, Ltd. | | | | |
| 4.500%, 01/23/2013 | CAD | 25,000 | | 26,758 |
| 5.150%, 02/01/2013 | $ | 180,000 | | 192,231 |
| 5.450%, 10/01/2012 | | 65,000 | | 69,211 |
| 6.250%, 03/15/2038 | | 305,000 | | 329,709 |
| 6.450%, 06/30/2033 | | 75,000 | | 82,541 |
| Chesapeake Energy Corp. | | | | |
| 6.625%, 08/15/2020 | | 650,000 | | 682,500 |
| 9.500%, 02/15/2015 | | 100,000 | | 124,000 |
| Cie Generale de Geophysique-Veritas | | | | |
| 7.500%, 05/15/2015 | | 150,000 | | 155,250 |
| CNOOC Finance 2011, Ltd. | | | | |
| 5.750%, 01/26/2041 (S) | | 200,000 | | 202,539 |
| Colorado Interstate Gas Company | | | | |
| 5.950%, 03/15/2015 | | 150,000 | | 163,810 |
| Complete Production Services, Inc. | | | | |
| 8.000%, 12/15/2016 | | 725,000 | | 766,688 |
| Concho Resources, Inc. | | | | |
| 7.000%, 01/15/2021 | | 425,000 | | 445,188 |
| 8.625%, 10/01/2017 | | 675,000 | | 744,188 |
| Connacher Oil and Gas, Ltd. | | | | |
| 10.250%, 12/15/2015 (S) | | 800,000 | | 846,000 |
| Consol Energy, Inc. | | | | |
| 8.000%, 04/01/2017 (S) | | 550,000 | | 596,750 |
| 8.250%, 04/01/2020 (S) | | 350,000 | | 385,875 |
| Continental Resources, Inc. | | | | |
| 7.125%, 04/01/2021 | | 225,000 | | 239,625 |
| DCP Midstream LLC | | | | |
| 9.700%, 12/01/2013 (S) | | 140,000 | | 165,999 |
| DCP Midstream Operating LP | | | | |
| 3.250%, 10/01/2015 | | 150,000 | | 147,924 |
| Denbury Resources, Inc. | | | | |
| 8.250%, 02/15/2020 | | 374,000 | | 416,075 |
| 9.750%, 03/01/2016 | | 325,000 | | 368,875 |
| Devon Financing Corp. | | | | |
| 6.875%, 09/30/2011 | | 335,000 | | 347,043 |
| Diamond Offshore Drilling, Inc. | | | | |
| 4.875%, 07/01/2015 | | 240,000 | | 259,139 |
| 5.150%, 09/01/2014 | | 330,000 | | 359,655 |
| 5.700%, 10/15/2039 | | 75,000 | | 74,160 |
| 5.875%, 05/01/2019 | | 80,000 | | 88,243 |
| Drummond Company, Inc. | | | | |
| 7.375%, 02/15/2016 | | 186,000 | | 192,510 |
| El Paso Corp. | | | | |
| 8.250%, 02/15/2016 | | 225,000 | | 254,258 |
| 12.000%, 12/12/2013 | | 500,000 | | 617,500 |
| El Paso Natural Gas Company | | | | |
| 5.950%, 04/15/2017 | | 27,000 | | 29,421 |
| Enbridge Energy Partners LP | | | | |
| 5.200%, 03/15/2020 | | 70,000 | | 72,561 |
| 5.500%, 09/15/2040 | | 220,000 | | 204,831 |
| |
| The accompanying notes are an integral part of the financial statements. | 247 |
John Hancock Funds II
Portfolio of Investments — February 28, 2011 (Unaudited) (showing percentage of total net assets)
| | | | |
| Spectrum Income Fund (continued) | | |
| | | Shares or | | |
| | | Principal | | |
| | | Amount | | Value |
| |
|
| |
| CORPORATE BONDS (continued) | | | | |
| Energy (continued) | | | | |
| Enbridge, Inc. | | | | |
| 4.260%, 02/01/2021 | CAD | 55,000 | $ | 55,978 |
| EnCana Corp. | | | | |
| 5.800%, 01/18/2018 (S) | | 30,000 | | 34,410 |
| Encore Acquisition Company | | | | |
| 9.500%, 05/01/2016 | $ | 150,000 | | 169,500 |
| Energy Future Intermediate Holding | | | | |
| Company LLC | | | | |
| 10.000%, 12/01/2020 | | 1,275,000 | | 1,330,840 |
| Energy Transfer Equity LP | | | | |
| 7.500%, 10/15/2020 | | 975,000 | | 1,056,656 |
| Enterprise Products Operating LLC | | | | |
| 3.200%, 02/01/2016 | | 255,000 | | 254,645 |
| 5.900%, 04/15/2013 | | 300,000 | | 324,558 |
| 5.950%, 02/01/2041 | | 190,000 | | 184,804 |
| 7.550%, 04/15/2038 | | 300,000 | | 355,497 |
| EOG Resources, Inc. | | | | |
| 2.500%, 02/01/2016 | | 360,000 | | 351,301 |
| 5.625%, 06/01/2019 | | 50,000 | | 55,035 |
| 5.875%, 09/15/2017 | | 185,000 | | 207,784 |
| 6.125%, 10/01/2013 | | 215,000 | | 239,539 |
| Exterran Holdings, Inc. | | | | |
| 7.250%, 12/01/2018 (S) | | 400,000 | | 410,000 |
| Forest Oil Corp. | | | | |
| 7.250%, 06/15/2019 | | 93,000 | | 96,255 |
| Gazprom Via Gaz Capital SA | | | | |
| 4.560%, 12/09/2012 | EUR | 150,000 | | 214,258 |
| 7.288%, 08/16/2037 | $ | 490,000 | | 516,117 |
| 8.625%, 04/28/2034 | | 175,000 | | 212,940 |
| Goodrich Petroleum Corp. | | | | |
| 8.875%, 03/15/2019 (S) | | 325,000 | | 324,188 |
| Gulfstream Natural Gas System LLC | | | | |
| 6.950%, 06/01/2016 (S) | | 40,000 | | 46,178 |
| Helix Energy Solutions Group, Inc. | | | | |
| 9.500%, 01/15/2016 (S) | | 200,000 | | 208,000 |
| Hess Corp. | | | | |
| 6.000%, 01/15/2040 | | 280,000 | | 286,191 |
| 7.875%, 10/01/2029 | | 238,000 | | 293,072 |
| 8.125%, 02/15/2019 | | 55,000 | | 69,034 |
| Hilcorp Energy I LP / Hilcorp | | | | |
| Finance Company | | | | |
| 7.625%, 04/15/2021 (S) | | 450,000 | | 474,750 |
| 8.000%, 02/15/2020 (S) | | 375,000 | | 402,188 |
| Inergy LP/inergy Finance Corp. | | | | |
| 6.875%, 08/01/2021 (S) | | 75,000 | | 76,688 |
| Inergy LP/Inergy Finance Corp. | | | | |
| 7.000%, 10/01/2018 (S) | | 475,000 | | 492,219 |
| 8.750%, 03/01/2015 | | 162,000 | | 174,960 |
| International Coal Group, Inc. | | | | |
| 9.125%, 04/01/2018 | | 100,000 | | 110,500 |
| KazMunayGas National Company | | | | |
| 6.375%, 04/09/2021 (S) | | 200,000 | | 204,760 |
| 9.125%, 07/02/2018 | | 1,400,000 | | 1,694,000 |
| 11.750%, 01/23/2015 (S) | | 250,000 | | 312,500 |
| Kinder Morgan Finance Company | | | | |
| 5.700%, 01/05/2016 | | 480,000 | | 500,400 |
| Kinder Morgan, Inc. | | | | |
| 6.500%, 09/01/2012 | | 139,000 | | 147,166 |
| Linn Energy LLC/Linn Energy | | | | |
| Finance Corp. | | | | |
| 8.625%, 04/15/2020 (S) | | 600,000 | | 669,000 |
| Lukoil International Finance BV | | | | |
| 7.250%, 11/05/2019 | | 100,000 | | 109,015 |
| Magellan Midstream Partners LP | | | | |
| 6.550%, 07/15/2019 | | 145,000 | | 165,524 |
| | | | |
| Spectrum Income Fund (continued) | | |
| | | Shares or | | |
| | | Principal | | |
| | | Amount | | Value |
| |
|
| |
| CORPORATE BONDS (continued) | | | | |
| Energy (continued) | | | | |
| Marathon Oil Corp. | | | | |
| 5.900%, 03/15/2018 | $ | 100,000 | $ | 113,345 |
| 6.000%, 10/01/2017 | | 220,000 | | 251,118 |
| 6.600%, 10/01/2037 | | 50,000 | | 54,664 |
| Motiva Enterprises LLC | | | | |
| 6.850%, 01/15/2040 (S) | | 155,000 | | 179,594 |
| Nabors Industries, Inc. | | | | |
| 5.375%, 08/15/2012 | | 130,000 | | 136,566 |
| 9.250%, 01/15/2019 | | 415,000 | | 520,357 |
| Nak Naftogaz Ukraine | | | | |
| 9.500%, 09/30/2014 | | 300,000 | | 325,560 |
| Newfield Exploration Company | | | | |
| 6.875%, 02/01/2020 | | 580,000 | | 616,250 |
| Niska Gas Storage US LLC/Niska Gas | | | | |
| Storage Canada ULC | | | | |
| 8.875%, 03/15/2018 (S) | | 150,000 | | 163,500 |
| Noble Energy, Inc. | | | | |
| 6.000%, 03/01/2041 | | 365,000 | | 373,167 |
| Noble Holding International, Ltd. | | | | |
| 3.450%, 08/01/2015 | | 40,000 | | 40,849 |
| 6.050%, 03/01/2041 | | 210,000 | | 212,596 |
| Novatek Finance, Ltd. | | | | |
| 5.326%, 02/03/2016 (S) | | 200,000 | | 204,173 |
| 6.604%, 02/03/2021 (S) | | 300,000 | | 309,575 |
| NuStar Logistics LP | | | | |
| 4.800%, 09/01/2020 | | 205,000 | | 200,115 |
| 7.650%, 04/15/2018 | | 180,000 | | 209,915 |
| Oasis Petroleum, Inc. | | | | |
| 7.250%, 02/01/2019 (S) | | 175,000 | | 177,625 |
| Occidental Petroleum Corp. | | | | |
| 1.450%, 12/13/2013 | | 325,000 | | 325,810 |
| Oneok Partners LP | | | | |
| 3.250%, 02/01/2016 | | 300,000 | | 298,202 |
| Peabody Energy Corp. | | | | |
| 7.375%, 11/01/2016 | | 375,000 | | 423,750 |
| Pemex Project Funding Master Trust | | | | |
| 5.750%, 03/01/2018 | | 965,000 | | 1,016,111 |
| 6.250%, 08/05/2013 | EUR | 120,000 | | 176,937 |
| 6.625%, 06/15/2035 | $ | 85,000 | | 84,724 |
| 7.500%, 12/18/2013 | GBP | 50,000 | | 89,248 |
| Penn Virginia Corp. | | | | |
| 10.375%, 06/15/2016 | $ | 175,000 | | 196,438 |
| Penn Virginia Resource Partners LP/Penn | | | | |
| Virginia Resource Finance Corp. | | | | |
| 8.250%, 04/15/2018 | | 200,000 | | 213,000 |
| Petrobras International Finance Company | | | | |
| 5.750%, 01/20/2020 | | 360,000 | | 373,450 |
| 5.875%, 03/01/2018 | | 260,000 | | 276,630 |
| 7.875%, 03/15/2019 | | 115,000 | | 135,501 |
| Petrohawk Energy Corp. | | | | |
| 7.250%, 08/15/2018 (S) | | 275,000 | | 284,625 |
| 7.875%, 06/01/2015 | | 175,000 | | 185,500 |
| 10.500%, 08/01/2014 | | 500,000 | | 575,000 |
| Petroleos de Venezuela SA | | | | |
| 4.900%, 10/28/2014 | | 2,037,000 | | 1,374,975 |
| 5.000%, 10/28/2015 | | 211,538 | | 129,884 |
| 5.250%, 04/12/2017 | | 862,300 | | 500,134 |
| Petroleos Mexicanos | | | | |
| 5.500%, 01/21/2021 | | 320,000 | | 320,000 |
| 8.000%, 05/03/2019 | | 150,000 | | 178,125 |
| Petroleum Company of Trinidad & | | | | |
| Tobago, Ltd. | | | | |
| 9.750%, 08/14/2019 (S) | | 200,000 | | 244,000 |
| Petroplus Finance, Ltd. | | | | |
| 9.375%, 09/15/2019 (S) | | 475,000 | | 494,000 |
| |
| The accompanying notes are an integral part of the financial statements. | 248 |
John Hancock Funds II
Portfolio of Investments — February 28, 2011 (Unaudited) (showing percentage of total net assets)
| | | | |
| Spectrum Income Fund (continued) | | |
| | | Shares or | | |
| | | Principal | | |
| | | Amount | | Value |
| |
|
| |
| CORPORATE BONDS (continued) | | | | |
| Energy (continued) | | | | |
| Plains All American Pipeline LP | | | | |
| 4.250%, 09/01/2012 | $ | 345,000 | $ | 358,527 |
| 5.750%, 01/15/2020 | | 385,000 | | 413,148 |
| 6.500%, 05/01/2018 | | 200,000 | | 224,475 |
| Plains Exploration & Production | | | | |
| Company | | | | |
| 10.000%, 03/01/2016 | | 300,000 | | 340,500 |
| Power Sector Assets & Liabilities | | | | |
| Management Corp. | | | | |
| 7.390%, 12/02/2024 | | 100,000 | | 114,796 |
| Precision Drilling Corp. | | | | |
| 6.625%, 11/15/2020 (S) | | 300,000 | | 309,750 |
| QEP Resources, Inc. | | | | |
| 6.875%, 03/01/2021 | | 175,000 | | 183,313 |
| Quicksilver Resources, Inc. | | | | |
| 9.125%, 08/15/2019 | | 150,000 | | 159,000 |
| 11.750%, 01/01/2016 | | 400,000 | | 467,000 |
| Range Resources Corp. | | | | |
| 6.750%, 08/01/2020 | | 500,000 | | 528,125 |
| RDS Ultra-Deepwater, Ltd. | | | | |
| 11.875%, 03/15/2017 (S) | | 525,000 | | 581,438 |
| Regency Energy Partners LP/Regency | | | | |
| Energy Finance Corp. | | | | |
| 6.875%, 12/01/2018 | | 350,000 | | 367,500 |
| Reliance Holdings USA, Inc. | | | | |
| 4.500%, 10/19/2020 (S) | | 500,000 | | 472,999 |
| Repsol International Finance BV | | | | |
| 4.625%, 10/08/2014 | EUR | 37,000 | | 52,730 |
| 4.750%, 02/16/2017 | | 55,000 | | 77,607 |
| Rowan Companies, Inc. | | | | |
| 5.000%, 09/01/2017 | $ | 210,000 | | 216,838 |
| 7.875%, 08/01/2019 | | 230,000 | | 272,851 |
| SeaRiver Maritime, Inc. | | | | |
| zero coupon, 09/01/2012 | | 315,000 | | 303,976 |
| Shell International Finance BV | | | | |
| 1.875%, 03/25/2013 | | 360,000 | | 367,240 |
| SM Energy Co. | | | | |
| 6.625%, 02/15/2019 (S) | | 475,000 | | 480,344 |
| Smith International, Inc. | | | | |
| 8.625%, 03/15/2014 | | 325,000 | | 391,647 |
| Southeast Supply Header LLC | | | | |
| 4.850%, 08/15/2014 (S) | | 100,000 | | 104,869 |
| Southern Natural Gas Company | | | | |
| 5.900%, 04/01/2017 (S) | | 99,000 | | 107,016 |
| Southwestern Energy Company | | | | |
| 7.500%, 02/01/2018 | | 525,000 | | 597,188 |
| Swift Energy Company | | | | |
| 8.875%, 01/15/2020 | | 500,000 | | 547,500 |
| Talisman Energy, Inc. | | | | |
| 3.750%, 02/01/2021 | | 570,000 | | 530,989 |
| Tesoro Corp. | | | | |
| 6.500%, 06/01/2017 | | 525,000 | | 540,750 |
| 9.750%, 06/01/2019 | | 25,000 | | 28,188 |
| Texas Gas Transmission LLC | | | | |
| 5.500%, 04/01/2013 (S) | | 446,000 | | 477,011 |
| Total Capital Canada, Ltd. | | | | |
| 0.684%, 01/17/2014 (P) | | 185,000 | | 185,736 |
| 1.625%, 01/28/2014 | | 240,000 | | 240,549 |
| Transocean, Inc. | | | | |
| 5.250%, 03/15/2013 | | 305,000 | | 323,785 |
| Valero Energy Corp. | | | | |
| 6.125%, 06/15/2017 | | 510,000 | | 565,781 |
| 9.375%, 03/15/2019 | | 140,000 | | 178,272 |
| Weatherford International, Inc. | | | | |
| 5.950%, 06/15/2012 | | 380,000 | | 399,677 |
| | | | |
| Spectrum Income Fund (continued) | | |
| | | Shares or | | |
| | | Principal | | |
| | | Amount | | Value |
| |
|
| |
| CORPORATE BONDS (continued) | | | | |
| Energy (continued) | | | | |
| Weatherford International, Ltd. | | | | |
| 6.750%, 09/15/2040 | $ | 270,000 | $ | 289,230 |
| 9.625%, 03/01/2019 | | 200,000 | | 261,889 |
| Whiting Petroleum Corp. | | | | |
| 6.500%, 10/01/2018 | | 175,000 | | 181,563 |
| Williams Partners LP | | | | |
| 3.800%, 02/15/2015 | | 145,000 | | 150,478 |
| 4.125%, 11/15/2020 | | 295,000 | | 279,289 |
| 6.300%, 04/15/2040 | | 400,000 | | 413,525 |
| | |
|
| | | | | 52,690,952 |
| Financials - 11.98% | | | | |
| ACE INA Holdings, Inc. | | | | |
| 5.700%, 02/15/2017 | | 240,000 | | 263,058 |
| Aflac, Inc. | | | | |
| 8.500%, 05/15/2019 | | 420,000 | | 519,472 |
| Agile Property Holdings, Ltd. | | | | |
| 10.000%, 11/14/2016 (S) | | 500,000 | | 525,000 |
| Ahold Finance USA, Inc. | | | | |
| 5.875%, 03/14/2012 | EUR | 50,000 | | 71,447 |
| 6.500%, 03/14/2017 | GBP | 45,000 | | 80,740 |
| Akbank TAS | | | | |
| 5.125%, 07/22/2015 (S) | $ | 440,000 | | 439,560 |
| Alamsouth Bank NA | | | | |
| 5.200%, 04/01/2015 | | 450,000 | | 439,875 |
| Alfa Bank OJSC Via Alfa Bond | | | | |
| Issuance PLC | | | | |
| 7.875%, 09/25/2017 (S) | | 220,000 | | 227,150 |
| Alfa MTN Issuance, Ltd. | | | | |
| 8.000%, 03/18/2015 | | 300,000 | | 319,890 |
| Allianz Finance II BV (6.500% to | | | | |
| 01/13/2015, then 3 month | | | | |
| EURIBOR + 2.770%) | | | | |
| 01/13/2025 | EUR | 135,000 | | 201,836 |
| Ally Financial, Inc. | | | | |
| 6.250%, 12/01/2017 (S) | $ | 650,000 | | 678,438 |
| 7.500%, 09/15/2020 (S) | | 600,000 | | 656,250 |
| 8.300%, 02/12/2015 | | 450,000 | | 507,938 |
| AMB Property LP | | | | |
| 4.500%, 08/15/2017 | | 330,000 | | 335,941 |
| 6.625%, 12/01/2019 | | 185,000 | | 207,558 |
| American Express Centurion Bank | | | | |
| 5.550%, 10/17/2012 | | 100,000 | | 106,505 |
| American Express Credit Corp. | | | | |
| 5.125%, 08/25/2014 | | 215,000 | | 232,377 |
| American Honda Finance Corp. | | | | |
| 2.375%, 03/18/2013 (S) | | 175,000 | | 177,409 |
| American International Group, Inc. | | | | |
| 6.250%, 03/15/2037 | | 425,000 | | 388,875 |
| 8.250%, 08/15/2018 | | 425,000 | | 507,450 |
| Ameriprise Financial, Inc. | | | | |
| 7.300%, 06/28/2019 | | 365,000 | | 436,832 |
| ANZ National International, Ltd. | | | | |
| 2.375%, 12/21/2012 (S) | | 265,000 | | 268,982 |
| AON Financial Services Luxembourg SA | | | | |
| 6.250%, 07/01/2014 | EUR | 50,000 | | 73,089 |
| Assured Guaranty Municipal | | | | |
| Holdings, Inc. (6.400% to 12/15/2036, | | | | |
| then 1 month LIBOR + 2.215%) | | | | |
| 12/15/2066 (S) | $ | 275,000 | | 173,250 |
| AvalonBay Communities, Inc. | | | | |
| 6.100%, 03/15/2020 | | 210,000 | | 235,497 |
| 6.125%, 11/01/2012 | | 97,000 | | 104,145 |
| Aviv Healthcare Properties LP | | | | |
| 7.750%, 02/15/2019 (S) | | 150,000 | | 156,375 |
| |
| The accompanying notes are an integral part of the financial statements. | 249 |
John Hancock Funds II
Portfolio of Investments — February 28, 2011 (Unaudited) (showing percentage of total net assets)
| | | | |
| Spectrum Income Fund (continued) | | |
| | | Shares or | | |
| | | Principal | | |
| | | Amount | | Value |
| |
|
| |
| CORPORATE BONDS (continued) | | | | |
| Financials (continued) | | | | |
| Aviva PLC (6.875% to 05/22/2018, then | | | | |
| 3 month EURIBOR + 3.350%) | | | | |
| 05/22/2038 | EUR | 50,000 | $ | 70,205 |
| AXA SA (5.250% to 04/16/2020, then | | | | |
| 3 month EURIBOR + 3.050%) | | | | |
| 04/16/2040 | | 100,000 | | 127,389 |
| Banca Monte Dei Paschi Di Siena SpA | | | | |
| 4.750%, 04/30/2014 | | 150,000 | | 210,035 |
| Banco de Credito del Peru | | | | |
| 5.375%, 09/16/2020 (S) | $ | 300,000 | | 288,000 |
| Banco Votorantim SA | | | | |
| 7.375%, 01/21/2020 (S) | | 250,000 | | 260,544 |
| BanColombia SA | | | | |
| 4.250%, 01/12/2016 (S) | | 300,000 | | 294,000 |
| Bank Nederlandse Gemeenten | | | | |
| 4.125%, 06/28/2016 | EUR | 570,000 | | 829,023 |
| 4.625%, 09/13/2012 | | 445,000 | | 639,625 |
| Bank of America Corp. | | | | |
| 1.723%, 01/30/2014 (P) | $ | 330,000 | | 334,134 |
| 5.250%, 11/09/2016 | GBP | 50,000 | | 79,954 |
| 5.650%, 05/01/2018 | $ | 1,540,000 | | 1,627,245 |
| 5.750%, 08/15/2016 | | 210,000 | | 223,156 |
| 6.500%, 08/01/2016 | | 550,000 | | 617,282 |
| 7.375%, 05/15/2014 | | 340,000 | | 387,104 |
| Bank of America Corp. (4.000% to | | | | |
| 03/28/2013, then 3 month | | | | |
| EURIBOR + 0.840%) | | | | |
| 03/28/2018 | EUR | 100,000 | | 127,337 |
| Bank of America Corp. (4.750% to | | | | |
| 05/23/2012, then 1 month | | | | |
| EURIBOR + 0.770%) | | | | |
| 05/23/2017 | | 50,000 | | 65,564 |
| Bank of China Hong Kong, Ltd. | | | | |
| 5.550%, 02/11/2020 (S) | $ | 100,000 | | 102,848 |
| Bank of Montreal (5.200% to | | | | |
| 06/21/2012, then 3 month | | | | |
| CDOR + 1.000%) | | | | |
| 06/21/2017 | CAD | 30,000 | | 32,096 |
| Bank of New York Mellon Corp. | | | | |
| 0.584%, 01/31/2014 (P) | $ | 420,000 | | 420,601 |
| Bank of Nova Scotia | | | | |
| 2.250%, 01/22/2013 | | 160,000 | | 163,824 |
| 2.375%, 12/17/2013 | | 270,000 | | 275,771 |
| 3.340%, 03/25/2015 | CAD | 70,000 | | 72,648 |
| Bank One Corp. | | | | |
| 5.250%, 01/30/2013 | $ | 200,000 | | 213,111 |
| Banque du Liban | | | | |
| 10.000%, 04/25/2015 | | 100,000 | | 117,000 |
| Barclays Bank PLC | | | | |
| 4.000%, 10/07/2019 | EUR | 400,000 | | 545,105 |
| 4.875%, 03/31/2013 to 08/13/2019 | | 130,000 | | 181,918 |
| 5.200%, 07/10/2014 | $ | 905,000 | | 978,226 |
| 5.250%, 05/27/2014 | EUR | 50,000 | | 72,369 |
| 5.750%, 08/17/2021 | GBP | 50,000 | | 82,816 |
| 6.000%, 01/14/2021 | EUR | 75,000 | | 101,535 |
| 6.750%, 05/22/2019 | $ | 280,000 | | 314,647 |
| BB&T Corp. | | | | |
| 3.375%, 09/25/2013 | | 45,000 | | 47,028 |
| 5.700%, 04/30/2014 | | 375,000 | | 414,094 |
| BBVA Senior Finance SAU | | | | |
| 4.875%, 01/23/2014 | EUR | 50,000 | | 69,730 |
| Berkshire Hathaway Finance Corp. | | | | |
| 2.450%, 12/15/2015 | $ | 285,000 | | 283,884 |
| 4.250%, 01/15/2021 | | 455,000 | | 454,380 |
| | | | |
| Spectrum Income Fund (continued) | | |
| | | Shares or | | |
| | | Principal | | |
| | | Amount | | Value |
| |
|
| |
| CORPORATE BONDS (continued) | | | | |
| Financials (continued) | | | | |
| BNP Paribas | | | | |
| 5.000%, 01/15/2021 | $ | 440,000 | $ | 443,632 |
| 5.250%, 12/17/2012 | EUR | 50,000 | | 71,676 |
| BNP Paribas, Series E | | | | |
| 5.431%, 09/07/2017 | | 50,000 | | 73,459 |
| Boardwalk Pipelines LP | | | | |
| 5.500%, 02/01/2017 | $ | 155,000 | | 163,993 |
| Boston Properties LP | | | | |
| 4.125%, 05/15/2021 | | 145,000 | | 138,812 |
| BPCE SA | | | | |
| 2.375%, 10/04/2013 (S) | | 860,000 | | 860,464 |
| BR Properties SA | | | | |
| 9.000%, 10/07/2015 (S) | | 200,000 | | 196,000 |
| BTA Bank JSC | | | | |
| 10.750%, 07/01/2018 | | 150,000 | | 160,125 |
| Burlington Northern Santa Fe LLC | | | | |
| 5.050%, 03/01/2041 | | 275,000 | | 258,453 |
| Capital One Financial Corp. | | | | |
| 7.375%, 05/23/2014 | | 225,000 | | 259,301 |
| CB Richard Ellis Services, Inc. | | | | |
| 6.625%, 10/15/2020 | | 275,000 | | 283,594 |
| 11.625%, 06/15/2017 | | 200,000 | | 235,750 |
| CIT Group, Inc. | | | | |
| 7.000%, 05/01/2017 | | 2,500,000 | | 2,518,750 |
| Citigroup Finance Canada, Inc. | | | | |
| 6.750%, 09/22/2014 | CAD | 45,000 | | 50,812 |
| Citigroup Funding, Inc. | | | | |
| 7.375%, 06/16/2014 | EUR | 50,000 | | 76,098 |
| Citigroup, Inc. | | | | |
| 3.500%, 08/05/2015 | | 110,000 | | 147,781 |
| 4.587%, 12/15/2015 | $ | 440,000 | | 459,132 |
| 5.375%, 08/09/2020 | | 465,000 | | 481,701 |
| 5.500%, 04/11/2013 to 10/15/2014 | | 895,000 | | 964,983 |
| 5.850%, 07/02/2013 | | 225,000 | | 243,397 |
| 6.125%, 05/15/2018 | | 915,000 | | 1,003,236 |
| 6.250%, 09/02/2019 | GBP | 70,000 | | 120,348 |
| 6.400%, 03/27/2013 | EUR | 110,000 | | 160,313 |
| 6.500%, 08/19/2013 | $ | 590,000 | | 650,257 |
| Citigroup, Inc. (4.750% to 02/10/2014, | | | | |
| then 3 month EURIBOR + 1.400%) | | | | |
| 999.900%, 02/10/2019 | EUR | 40,000 | | 52,009 |
| Cloverie PLC for Zurich Insurance | | | | |
| Company (7.500% until 07/24/2019, | | | | |
| then 3 month EURIBOR + 5.850%) | | | | |
| 07/24/2039 | | 100,000 | | 151,622 |
| CNA Financial Corp. | | | | |
| 5.875%, 08/15/2020 | $ | 330,000 | | 343,148 |
| 6.500%, 08/15/2016 | | 140,000 | | 154,208 |
| Commonwealth Bank of Australia | | | | |
| 2.750%, 10/15/2012 (S) | | 210,000 | | 214,997 |
| 3.625%, 10/14/2014 | CAD | 50,000 | | 51,557 |
| Country Garden Holdings Company | | | | |
| 11.125%, 02/23/2018 (S) | $ | 250,000 | | 249,500 |
| Credit Agricole SA | | | | |
| 5.971%, 02/01/2018 | EUR | 100,000 | | 148,805 |
| Credit Agricole SA (5.000% to | | | | |
| 06/01/2018, then 3 month | | | | |
| LIBOR + 1.970%) | | | | |
| (Q) | GBP | 65,000 | | 89,575 |
| Credit Suisse Group Finance | | | | |
| Guernsey, Ltd. | | | | |
| 6.375%, 06/07/2013 | EUR | 116,000 | | 169,456 |
| Credit Suisse/London | | | | |
| 5.125%, 09/18/2017 | | 125,000 | | 182,783 |
| 6.125%, 08/05/2013 | | 50,000 | | 74,166 |
| |
| The accompanying notes are an integral part of the financial statements. | 250 |
John Hancock Funds II
Portfolio of Investments — February 28, 2011 (Unaudited) (showing percentage of total net assets)
| | | | |
| Spectrum Income Fund (continued) | | |
| | | Shares or | | |
| | | Principal | | |
| | | Amount | | Value |
| |
|
| |
| CORPORATE BONDS (continued) | | | | |
| Financials (continued) | | | | |
| Crown Castle Towers LLC | | | | |
| 4.523%, 01/15/2015 (S) | $ | 258,000 | $ | 268,169 |
| Daimler Finance North America LLC | | | | |
| 4.375%, 03/21/2013 | EUR | 100,000 | | 142,743 |
| Danske Bank A/S, Series E | | | | |
| 6.000%, 03/20/2016 (P) | | 75,000 | | 104,385 |
| Dar Al-Arkan International Sukuk | | | | |
| Company | | | | |
| 10.750%, 02/18/2015 (S) | $ | 300,000 | | 285,540 |
| Deutsche Bank AG | | | | |
| 4.875%, 09/24/2012 | EUR | 50,000 | | 71,753 |
| 5.000%, 06/24/2020 | | 100,000 | | 138,670 |
| 5.125%, 01/31/2013 | | 35,000 | | 50,140 |
| 5.375%, 10/12/2012 | $ | 380,000 | | 404,889 |
| Discover Financial Services | | | | |
| 10.250%, 07/15/2019 | | 245,000 | | 317,215 |
| DnB NOR Bank ASA | | | | |
| 3.875%, 06/29/2020 | EUR | 75,000 | | 100,387 |
| 4.750%, 03/28/2011 | | 75,000 | | 103,740 |
| DTEK Finance BV | | | | |
| 9.500%, 04/28/2015 | $ | 100,000 | | 105,250 |
| 9.500%, 04/28/2015 (S) | | 100,000 | | 105,250 |
| Duke Realty LP | | | | |
| 6.250%, 05/15/2013 | | 230,000 | | 246,103 |
| Dunkin Finance Corp. | | | | |
| 9.625%, 12/01/2018 (S) | | 375,000 | | 379,688 |
| E*Trade Financial Corp. | | | | |
| 7.875%, 12/01/2015 | | 450,000 | | 452,250 |
| E*Trade Financial Corp., PIK | | | | |
| 12.500%, 11/30/2017 | | 1,316,000 | | 1,559,460 |
| EC Finance PLC | | | | |
| 9.750%, 08/01/2017 (S) | EUR | 275,000 | | 428,029 |
| ERAC USA Finance LLC | | | | |
| 2.250%, 01/10/2014 (S) | $ | 110,000 | | 109,862 |
| 2.750%, 07/01/2013 (S) | | 95,000 | | 96,422 |
| 5.250%, 10/01/2020 (S) | | 350,000 | | 360,870 |
| 5.800%, 10/15/2012 (S) | | 387,000 | | 412,845 |
| ERP Operating LP | | | | |
| 5.250%, 09/15/2014 | | 145,000 | | 158,861 |
| Eurohypo AG | | | | |
| 4.500%, 01/21/2013 (S) | EUR | 342,000 | | 491,272 |
| Europcar Groupe SA | | | | |
| 4.593%, 05/15/2013 (P) (S) | | 250,000 | | 342,400 |
| European Investment Bank | | | | |
| 4.750%, 10/15/2017 | | 535,000 | | 805,759 |
| 6.500%, 08/07/2019 | AUD | 1,121,000 | | 1,148,812 |
| 8.750%, 08/25/2017 | GBP | 320,000 | | 673,361 |
| FCE Bank PLC | | | | |
| 9.375%, 01/17/2014 | EUR | 50,000 | | 77,536 |
| Federal Realty Investment Trust | | | | |
| 5.900%, 04/01/2020 | $ | 55,000 | | 60,411 |
| 6.000%, 07/15/2012 | | 135,000 | | 142,957 |
| Fifth Third Bancorp | | | | |
| 3.625%, 01/25/2016 | | 395,000 | | 396,641 |
| 6.250%, 05/01/2013 | | 380,000 | | 414,144 |
| 8.250%, 03/01/2038 | | 270,000 | | 325,410 |
| Fortis Bank SA/NV | | | | |
| 5.757%, 10/04/2017 | EUR | 75,000 | | 108,782 |
| GE Capital Canada Funding Company | | | | |
| 5.730%, 10/22/2037 | CAD | 35,000 | | 36,731 |
| GE Capital European Funding Company | | | | |
| 3.500%, 02/14/2013 | EUR | 110,000 | | 154,232 |
| 4.625%, 02/22/2027 | | 100,000 | | 129,807 |
| 5.250%, 05/18/2015 | | 145,000 | | 213,762 |
| | | | |
| Spectrum Income Fund (continued) | | |
| | | Shares or | | |
| | | Principal | | |
| | | Amount | | Value |
| |
|
| |
| CORPORATE BONDS (continued) | | | | |
| Financials (continued) | | | | |
| GE Capital Trust IV (4.625% to | | | | |
| 09/15/2016 then 3 month EURIBOR | | | | |
| +1.600%) | | | | |
| 09/15/2066 | $ | 135,000 | $ | 166,267 |
| GE Capital UK Funding Company | | | | |
| 5.625%, 12/12/2014 | GBP | 80,000 | | 139,758 |
| General Electric Capital Corp. | | | | |
| 2.100%, 01/07/2014 | $ | 1,520,000 | | 1,524,663 |
| 2.250%, 11/09/2015 | | 390,000 | | 378,018 |
| 3.500%, 08/13/2012 | | 395,000 | | 408,549 |
| 4.625%, 01/07/2021 | | 355,000 | | 352,780 |
| 5.300%, 02/11/2021 | | 250,000 | | 256,634 |
| 5.875%, 01/14/2038 | | 450,000 | | 451,477 |
| 6.875%, 01/10/2039 | | 815,000 | | 922,932 |
| General Shopping Finance, Ltd. | | | | |
| 10.000%, (S) | | 200,000 | | 201,000 |
| GMAC International Finance BV | | | | |
| 7.500%, 04/21/2015 | EUR | 100,000 | | 147,137 |
| Hannover Finance Luxembourg SA | | | | |
| 5.750%, 09/14/2040 (P) | | 50,000 | | 66,192 |
| HBOS PLC | | | | |
| 4.375%, 10/30/2019 (P) | | 59,000 | | 72,413 |
| 6.000%, 11/01/2033 (S) | $ | 420,000 | | 310,450 |
| Health Care REIT, Inc. | | | | |
| 4.700%, 09/15/2017 | | 180,000 | | 182,529 |
| Healthcare Realty Trust, Inc. | | | | |
| 5.750%, 01/15/2021 | | 150,000 | | 155,426 |
| Hospitality Properties Trust | | | | |
| 5.625%, 03/15/2017 | | 225,000 | | 234,890 |
| 7.875%, 08/15/2014 | | 145,000 | | 163,025 |
| Host Hotels & Resorts LP | | | | |
| 6.750%, 06/01/2016 | | 300,000 | | 311,250 |
| HSBC Bank Canada/Toronto | | | | |
| 3.558%, 10/04/2017 | CAD | 60,000 | | 60,783 |
| HSBC Bank PLC | | | | |
| 1.625%, 08/12/2013 (S) | $ | 160,000 | | 159,956 |
| 4.750%, 01/19/2021 (S) | | 555,000 | | 555,206 |
| HSBC Bank USA, Inc. | | | | |
| 4.625%, 04/01/2014 | | 100,000 | | 106,187 |
| HSBC Covered Bonds France | | | | |
| 3.375%, 01/20/2017 | EUR | 250,000 | | 341,688 |
| HSBC Holdings PLC | | | | |
| 4.875%, 01/15/2014 | | 50,000 | | 72,471 |
| 5.250%, 12/12/2012 | $ | 235,000 | | 249,111 |
| 6.000%, 06/10/2019 | EUR | 50,000 | | 73,857 |
| 6.250%, 03/19/2018 | | 200,000 | | 301,338 |
| 6.500%, 05/02/2036 | $ | 175,000 | | 181,132 |
| 9.875%, 04/08/2018 (P) | GBP | 60,000 | | 108,495 |
| HSBC Holdings PLC (3.625% to | | | | |
| 06/29/2015, then 3 month | | | | |
| EURIBOR + 0.930%) | | | | |
| 06/29/2020 | EUR | 125,000 | | 165,682 |
| HSBK Europe BV | | | | |
| 7.250%, 05/03/2017 | $ | 100,000 | | 103,000 |
| 7.750%, 05/13/2013 | | 100,000 | | 105,875 |
| 9.250%, 10/16/2013 | | 200,000 | | 219,540 |
| HUB International Holdings, Inc. | | | | |
| 9.000%, 12/15/2014 (S) | | 550,000 | | 576,125 |
| 10.250%, 06/15/2015 (S) | | 975,000 | | 1,014,000 |
| Hypothekenbank in Essen AG | | | | |
| 3.875%, 11/21/2013 | EUR | 421,000 | | 601,186 |
| ICICI Bank, Ltd. | | | | |
| 6.375%, 04/30/2022 (P) | $ | 425,000 | | 422,165 |
| ING Bank NV | | | | |
| 5.500%, 01/04/2012 | EUR | 71,000 | | 100,024 |
| |
| The accompanying notes are an integral part of the financial statements. | 251 |
John Hancock Funds II
Portfolio of Investments — February 28, 2011 (Unaudited) (showing percentage of total net assets)
| | | | |
| Spectrum Income Fund (continued) | | |
| | | Shares or | | |
| | | Principal | | |
| | | Amount | | Value |
| |
|
| |
| CORPORATE BONDS (continued) | | | | |
| Financials (continued) | | | | |
| Inter-American Development Bank | | | | |
| 4.400%, 01/26/2026 | CAD | 410,000 | $ | 418,297 |
| Intergas Finance BV | | | | |
| 6.375%, 05/14/2017 | $ | 200,000 | | 209,446 |
| International Lease Finance Corp. | | | | |
| 6.500%, 09/01/2014 (S) | | 200,000 | | 215,700 |
| 6.625%, 11/15/2013 | | 490,000 | | 512,050 |
| 8.250%, 12/15/2020 | | 750,000 | | 834,375 |
| 8.625%, 09/15/2015 (S) | | 1,025,000 | | 1,155,688 |
| 8.875%, 09/01/2017 | | 475,000 | | 541,500 |
| Intesa Sanpaolo SpA | | | | |
| 3.625%, 08/12/2015 (S) | | 420,000 | | 405,295 |
| 3.875%, 04/01/2015 | EUR | 50,000 | | 68,681 |
| 5.000%, 09/23/2019 | | 50,000 | | 67,484 |
| 6.625%, 05/08/2018 | | 50,000 | | 69,177 |
| Intesa Sanpaolo SpA (4.375% to | | | | |
| 06/26/2013, then 3 month | | | | |
| EURIBOR + 1.000%) | | | | |
| 06/26/2018 | | 50,000 | | 66,858 |
| iPayment Investors LP, PIK | | | | |
| 11.625%, 07/15/2014 (S) | $ | 567,579 | | 527,848 |
| IRSA Inversiones y Representaciones SA | | | | |
| 11.500%, 07/20/2020 (S) | | 302,000 | | 345,714 |
| Jefferies Group, Inc. | | | | |
| 6.250%, 01/15/2036 | | 260,000 | | 240,014 |
| 8.500%, 07/15/2019 | | 80,000 | | 94,616 |
| John Deere Capital Corp. | | | | |
| 4.950%, 12/17/2012 | | 475,000 | | 509,045 |
| JPMorgan Chase & Company | | | | |
| 0.961%, 02/26/2013 (P) | | 415,000 | | 417,803 |
| 3.400%, 06/24/2015 | | 1,470,000 | | 1,490,392 |
| 3.700%, 01/20/2015 | | 245,000 | | 253,566 |
| 4.650%, 06/01/2014 | | 905,000 | | 967,081 |
| 5.250%, 01/14/2015 | EUR | 50,000 | | 73,828 |
| 6.000%, 01/15/2018 | $ | 155,000 | | 172,402 |
| 6.300%, 04/23/2019 | | 95,000 | | 106,746 |
| JPMorgan Chase & Company (4.375% to | | | | |
| 11/12/2014, then 3 month | | | | |
| EURIBOR + 1.500%) | | | | |
| 11/12/2019 | EUR | 150,000 | | 202,751 |
| Kazakhstan Temir Zholy Finance BV | | | | |
| 7.000%, 05/11/2016 | $ | 150,000 | | 165,840 |
| KBC Internationale | | | | |
| Financieringsmaatschappij NV | | | | |
| 3.875%, 03/31/2015 | EUR | 70,000 | | 93,191 |
| KeyCorp | | | | |
| 3.750%, 08/13/2015 | $ | 935,000 | | 946,732 |
| Kilroy Realty LP | | | | |
| 5.000%, 11/03/2015 | | 225,000 | | 225,077 |
| 6.625%, 06/01/2020 | | 295,000 | | 303,267 |
| Kreditanstalt fuer Wiederaufbau | | | | |
| 4.375%, 07/04/2018 | EUR | 365,000 | | 539,005 |
| 4.700%, 06/02/2037 | CAD | 245,000 | | 250,029 |
| 5.500%, 12/07/2015 | GBP | 345,000 | | 621,615 |
| 6.000%, 08/20/2020 | AUD | 277,000 | | 272,761 |
| Legal & General Group PLC (4.000% to | | | | |
| 06/08/2015 then 3 month EURIBOR | | | | |
| +1.700%) | | | | |
| 06/08/2025 | EUR | 60,000 | | 76,587 |
| Lloyds TSB Bank PLC | | | | |
| 4.375%, 01/12/2015 (S) | $ | 250,000 | | 252,037 |
| 6.375%, 06/17/2016 | EUR | 110,000 | | 162,006 |
| 6.500%, 03/24/2020 | | 100,000 | | 131,315 |
| 6.500%, 09/14/2020 (S) | $ | 480,000 | | 462,915 |
| | | | |
| Spectrum Income Fund (continued) | | |
| | | Shares or | | |
| | | Principal | | |
| | | Amount | | Value |
| |
|
| |
| CORPORATE BONDS (continued) | | | | |
| Financials (continued) | | | | |
| Mack-Cali Realty LP | | | | |
| 5.800%, 01/15/2016 | $ | 75,000 | $ | 78,592 |
| 7.750%, 08/15/2019 | | 150,000 | | 180,205 |
| MassMutual Global Funding II | | | | |
| 3.625%, 07/16/2012 (S) | | 254,000 | | 262,674 |
| Mellon Funding Corp. | | | | |
| 6.375%, 11/08/2011 | GBP | 60,000 | | 100,423 |
| Merrill Lynch & Company, Inc. | | | | |
| 4.450%, 01/31/2014 | EUR | 40,000 | | 56,266 |
| 4.625%, 10/02/2013 | | 80,000 | | 112,926 |
| 5.450%, 02/05/2013 | $ | 350,000 | | 372,915 |
| 7.750%, 05/14/2038 | | 410,000 | | 464,498 |
| MetLife, Inc. | | | | |
| 1.561%, 08/06/2013 (P) | | 350,000 | | 356,006 |
| Metropolitan Life Global Funding I | | | | |
| 2.875%, 09/17/2012 (S) | | 80,000 | | 81,808 |
| 4.625%, 05/16/2017 | EUR | 100,000 | | 140,314 |
| 5.125%, 06/10/2014 (S) | $ | 165,000 | | 179,156 |
| Morgan Stanley | | | | |
| 1.903%, 01/24/2014 (P) | | 650,000 | | 659,556 |
| 3.450%, 11/02/2015 | | 245,000 | | 242,065 |
| 4.000%, 07/24/2015 | | 1,200,000 | | 1,229,111 |
| 4.100%, 01/26/2015 | | 885,000 | | 911,334 |
| 4.200%, 11/20/2014 | | 75,000 | | 77,880 |
| 4.500%, 10/29/2014 | EUR | 150,000 | | 209,712 |
| 4.900%, 02/23/2017 | CAD | 65,000 | | 65,854 |
| 5.000%, 05/02/2019 | EUR | 150,000 | | 202,874 |
| 5.125%, 11/30/2015 | GBP | 100,000 | | 167,179 |
| 6.000%, 04/28/2015 | $ | 1,150,000 | | 1,259,502 |
| 6.625%, 04/01/2018 | | 100,000 | | 110,539 |
| 7.300%, 05/13/2019 | | 880,000 | | 1,002,177 |
| MU Finance PLC | | | | |
| 8.375%, 02/01/2017 (S) | | 625,000 | | 675,000 |
| 8.750%, 02/01/2017 (S) | GBP | 50,000 | | 88,598 |
| Muenchener Rueckversicherungs AG | | | | |
| (5.767% to 06/12/2017, then 3 month | | | | |
| EURIBOR + 2.040%) | | | | |
| (Q) | EUR | 100,000 | | 129,715 |
| National Australia Bank, Ltd. | | | | |
| 2.350%, 11/16/2012 (S) | $ | 315,000 | | 320,186 |
| 4.500%, 06/23/2016 (P) | EUR | 100,000 | | 138,686 |
| 4.750%, 07/15/2016 | | 75,000 | | 108,097 |
| 5.375%, 12/08/2014 | GBP | 50,000 | | 86,821 |
| National Gas Company of Trinidad & | | | | |
| Tobago, Ltd. | | | | |
| 6.050%, 01/15/2036 (S) | $ | 105,000 | | 97,969 |
| National Rural Utilities | | | | |
| Cooperative Finance Corp. | | | | |
| 1.125%, 11/01/2013 | | 140,000 | | 138,859 |
| 2.625%, 09/16/2012 | | 185,000 | | 189,748 |
| Nationwide Building Society | | | | |
| 3.750%, 01/20/2015 | EUR | 100,000 | | 135,247 |
| 4.375%, 02/28/2022 | | 250,000 | | 335,813 |
| 5.625%, 09/09/2019 | GBP | 50,000 | | 81,255 |
| New York Life Funding | | | | |
| 5.125%, 02/03/2015 | | 50,000 | | 85,788 |
| New York Life Global Funding | | | | |
| 2.250%, 12/14/2012 (S) | $ | 420,000 | | 429,495 |
| 4.375%, 01/19/2017 | EUR | 100,000 | | 140,853 |
| Nissan Motor Acceptance Corp. | | | | |
| 3.250%, 01/30/2013 (S) | $ | 130,000 | | 133,401 |
| Nordea Bank AB | | | | |
| 1.750%, 10/04/2013 (S) | | 195,000 | | 193,883 |
| 2.125%, 01/14/2014 (S) | | 200,000 | | 199,782 |
| 2.500%, 11/13/2012 (S) | | 165,000 | | 168,200 |
| |
| The accompanying notes are an integral part of the financial statements. | 252 |
John Hancock Funds II
Portfolio of Investments — February 28, 2011 (Unaudited) (showing percentage of total net assets)
| | | | |
| Spectrum Income Fund (continued) | | |
| | | Shares or | | |
| | | Principal | | |
| | | Amount | | Value |
| |
|
| |
| CORPORATE BONDS (continued) | | | | |
| Financials (continued) | | | | |
| Nordea Bank AB (continued) | | | | |
| 4.500%, 03/26/2020 | EUR | 100,000 | $ | 133,280 |
| Nordea Hypotek AB | | | | |
| 3.500%, 01/18/2017 | | 294,000 | | 407,832 |
| Nuveen Investments, Inc. | | | | |
| 5.500%, 09/15/2015 | $ | 1,025,000 | | 896,875 |
| 10.500%, 11/15/2015 (S) | | 350,000 | | 357,875 |
| 10.500%, 11/15/2015 | | 650,000 | | 664,625 |
| Offshore Group Investments, Ltd. | | | | |
| 11.500%, 08/01/2015 (S) | | 250,000 | | 280,000 |
| Ohio National Financial Services, Inc. | | | | |
| 6.350%, 04/01/2013 (S) | | 15,000 | | 15,969 |
| Omega Healthcare Investors, Inc. | | | | |
| 6.750%, 10/15/2022 (S) | | 475,000 | | 479,750 |
| Ono Finance II PLC | | | | |
| 10.875%, 07/15/2019 (S) | | 150,000 | | 161,250 |
| 11.125%, 07/15/2019 (S) | EUR | 285,000 | | 423,765 |
| Paccar Financial Corp. | | | | |
| 1.950%, 12/17/2012 | $ | 135,000 | | 137,463 |
| Pacific Life Funding LLC | | | | |
| 5.125%, 01/20/2015 | GBP | 89,000 | | 149,460 |
| Pacific LifeCorp. | | | | |
| 6.000%, 02/10/2020 (S) | $ | 500,000 | | 527,823 |
| PartnerRe Finance B LLC | | | | |
| 5.500%, 06/01/2020 | | 290,000 | | 297,409 |
| PHH Corp. | | | | |
| 9.250%, 03/01/2016 (S) | | 275,000 | | 298,375 |
| Pinafore LLC/Pinafore, Inc. | | | | |
| 9.000%, 10/01/2018 (S) | | 425,000 | | 472,813 |
| Pinnacle Foods Finance LLC/Pinnacle | | | | |
| Foods Finance Corp. | | | | |
| 9.250%, 04/01/2015 | | 200,000 | | 208,500 |
| 10.625%, 04/01/2017 | | 150,000 | | 160,875 |
| PNC Funding Corp. | | | | |
| 4.375%, 08/11/2020 | | 350,000 | | 350,004 |
| 5.625%, 02/01/2017 | | 115,000 | | 123,871 |
| 6.700%, 06/10/2019 | | 345,000 | | 401,559 |
| Principal Financial Global | | | | |
| Funding II LLC | | | | |
| 4.500%, 01/26/2017 | EUR | 50,000 | | 65,480 |
| Principal Financial Group, Inc. | | | | |
| 6.050%, 10/15/2036 | $ | 180,000 | | 189,169 |
| 7.875%, 05/15/2014 | | 385,000 | | 445,640 |
| 8.875%, 05/15/2019 | | 135,000 | | 171,703 |
| Principal Life Global Funding I | | | | |
| 5.250%, 01/15/2013 (S) | | 190,000 | | 200,839 |
| Provident Companies, Inc. | | | | |
| 7.000%, 07/15/2018 | | 435,000 | | 483,275 |
| Provident Funding | | | | |
| Associates LP/PFG Finance Corp. | | | | |
| 10.125%, 02/15/2019 (S) | | 125,000 | | 128,750 |
| 10.250%, 04/15/2017 (S) | | 350,000 | | 386,750 |
| Prudential Financial, Inc. | | | | |
| 2.750%, 01/14/2013 | | 95,000 | | 96,287 |
| 3.625%, 09/17/2012 | | 325,000 | | 335,441 |
| 4.750%, 09/17/2015 | | 465,000 | | 498,000 |
| 5.375%, 06/21/2020 | | 140,000 | | 147,705 |
| Rabobank Nederland NV | | | | |
| 4.125%, 01/14/2020 | EUR | 200,000 | | 271,891 |
| RCI Banque SA | | | | |
| 4.375%, 01/27/2015 | | 28,000 | | 39,414 |
| 8.125%, 05/15/2012 | | 40,000 | | 58,625 |
| Realogy Corp. | | | | |
| 11.500%, 04/15/2017 (S) | $ | 425,000 | | 452,625 |
| | | | |
| Spectrum Income Fund (continued) | | |
| | | Shares or | | |
| | | Principal | | |
| | | Amount | | Value |
| |
|
| |
| CORPORATE BONDS (continued) | | | | |
| Financials (continued) | | | | |
| Reckson Operating Partnership LP | | | | |
| 6.000%, 03/31/2016 | $ | 335,000 | $ | 352,241 |
| Regency Centers LP | | | | |
| 5.875%, 06/15/2017 | | 120,000 | | 130,175 |
| 6.000%, 06/15/2020 | | 165,000 | | 167,813 |
| Regions Bank | | | | |
| 7.500%, 05/15/2018 | | 250,000 | | 265,000 |
| Regions Financial Corp. | | | | |
| 5.750%, 06/15/2015 | | 310,000 | | 310,000 |
| Reinsurance Group of America, Inc. | | | | |
| 5.625%, 03/15/2017 | | 35,000 | | 36,868 |
| 6.450%, 11/15/2019 | | 250,000 | | 270,016 |
| Reliance Intermediate Holdings LP | | | | |
| 9.500%, 12/15/2019 (S) | | 425,000 | | 461,125 |
| Rouse Company LP | | | | |
| 6.750%, 11/09/2015 | | 625,000 | | 654,688 |
| Rouse Company LP/TRC Co-Issuer, Inc. | | | | |
| 6.750%, 05/01/2013 (H) (S) | | 100,000 | | 103,625 |
| Royal Bank of Canada | | | | |
| 4.625%, 01/22/2018 | EUR | 390,000 | | 571,046 |
| Royal Bank of Canada (4.350% to | | | | |
| 06/15/2015, then 3 month | | | | |
| CDOR + 1.410%) | | | | |
| 06/15/2020 | CAD | 60,000 | | 63,545 |
| Royal Bank of Scotland Group PLC | | | | |
| 5.250%, 05/15/2013 | EUR | 60,000 | | 85,345 |
| RSHB Capital SA for OJSC Russian | | | | |
| Agricultural Bank | | | | |
| 6.299%, 05/15/2017 | $ | 500,000 | | 514,400 |
| 9.000%, 06/11/2014 | | 100,000 | | 114,000 |
| Santander Issuances S.A. Unipersonal | | | | |
| (4.500% to 09/30/2014, then 3 month | | | | |
| EURIBOR + 0.860%) | | | | |
| 09/30/2019 | EUR | 100,000 | | 123,346 |
| Santander Issuances S.A. Unipersonal | | | | |
| (4.750% to 05/29/2014, then 3 month | | | | |
| EURIBOR + 0.800%) | | | | |
| 05/29/2019 | | 100,000 | | 125,813 |
| Santander US Debt SA Unipersonal | | | | |
| 2.991%, 10/07/2013 (S) | | 400,000 | | 390,254 |
| 3.724%, 01/20/2015 (S) | | 400,000 | | 385,142 |
| Simon Property Group LP | | | | |
| 4.200%, 02/01/2015 | | 140,000 | | 147,488 |
| 6.750%, 05/15/2014 | | 155,000 | | 174,370 |
| Skandinaviska Enskilda Banken AB | | | | |
| 6.625%, 07/09/2014 | GBP | 50,000 | | 89,199 |
| SLM Corp. | | | | |
| 4.750%, 03/17/2014 | EUR | 100,000 | | 132,920 |
| 5.050%, 11/14/2014 | $ | 75,000 | | 75,012 |
| 5.125%, 08/27/2012 | | 510,000 | | 529,237 |
| 5.375%, 05/15/2014 | | 500,000 | | 515,529 |
| 6.250%, 01/25/2016 | | 735,000 | | 753,375 |
| 8.450%, 06/15/2018 | | 965,000 | | 1,061,500 |
| Societe Financement de l’Economie | | | | |
| Francaise | | | | |
| 3.250%, 01/16/2014 | EUR | 278,000 | | 393,974 |
| Societe Generale | | | | |
| 2.500%, 01/15/2014 (S) | $ | 305,000 | | 303,207 |
| 3.500%, 01/15/2016 (S) | | 420,000 | | 413,647 |
| 5.250%, 03/28/2013 | EUR | 100,000 | | 145,026 |
| 6.125%, 08/20/2018 | | 50,000 | | 74,211 |
| Springleaf Finance Corp. | | | | |
| 6.900%, 12/15/2017 | $ | 350,000 | | 314,125 |
| Standard Bank PLC | | | | |
| 8.125%, 12/02/2019 | | 500,000 | | 532,500 |
| |
| The accompanying notes are an integral part of the financial statements. | 253 |
John Hancock Funds II
Portfolio of Investments — February 28, 2011 (Unaudited) (showing percentage of total net assets)
| | | | |
| Spectrum Income Fund (continued) | | |
| | | Shares or | | |
| | | Principal | | |
| | | Amount | | Value |
| |
|
| |
| CORPORATE BONDS (continued) | | | | |
| Financials (continued) | | | | |
| Standard Chartered Bank | | | | |
| 5.875%, 09/26/2017 | EUR | 200,000 | $ | 288,608 |
| Standard Chartered PLC | | | | |
| 3.850%, 04/27/2015 (S) | $ | 755,000 | | 777,374 |
| Sun Life Financial, Inc. | | | | |
| 5.700%, 07/02/2019 | CAD | 60,000 | | 66,407 |
| Svenska Handelsbanken AB | | | | |
| 4.875%, 03/25/2014 | EUR | 75,000 | | 109,658 |
| 5.500%, 05/26/2016 | GBP | 50,000 | | 86,767 |
| Synovus Financial Corp. | | | | |
| 5.125%, 06/15/2017 | $ | 275,000 | | 259,876 |
| TAM Capital, Inc. | | | | |
| 7.375%, 04/25/2017 | | 200,000 | | 203,000 |
| The Allstate Corp. | | | | |
| 7.450%, 05/16/2019 | | 270,000 | | 324,514 |
| The Goldman Sachs Group, Inc. | | | | |
| 1.311%, 02/07/2014 (P) | | 720,000 | | 725,184 |
| 3.700%, 08/01/2015 | | 1,465,000 | | 1,485,860 |
| 3.750%, 02/04/2013 | EUR | 75,000 | | 104,828 |
| 4.500%, 01/30/2017 | | 150,000 | | 205,027 |
| 5.125%, 10/16/2014 | | 100,000 | | 143,554 |
| 5.250%, 12/15/2015 | GBP | 10,000 | | 16,841 |
| 6.000%, 06/15/2020 | $ | 215,000 | | 230,355 |
| 6.150%, 04/01/2018 | | 640,000 | | 701,106 |
| 6.250%, 02/01/2041 | | 350,000 | | 356,181 |
| 6.750%, 10/01/2037 | | 190,000 | | 194,742 |
| 7.500%, 02/15/2019 | | 545,000 | | 642,014 |
| The Royal Bank of Scotland PLC | | | | |
| 3.400%, 08/23/2013 | | 860,000 | | 876,614 |
| 5.375%, 09/30/2019 | EUR | 100,000 | | 134,095 |
| 5.750%, 05/21/2014 | | 50,000 | | 72,347 |
| 6.000%, 05/10/2013 | | 40,000 | | 56,366 |
| The Toronto-Dominion Bank | | | | |
| 5.690%, 06/03/2018 (P) | CAD | 75,000 | | 82,542 |
| The Travelers Companies, Inc. | | | | |
| 5.900%, 06/02/2019 | $ | 175,000 | | 194,737 |
| TNK-BP Finance SA | | | | |
| 6.625%, 03/20/2017 | | 150,000 | | 160,125 |
| 7.250%, 02/02/2020 (S) | | 100,000 | | 108,880 |
| Toyota Motor Credit Corp. | | | | |
| 3.200%, 06/17/2015 | | 195,000 | | 200,991 |
| TransCapitalInvest, Ltd. | | | | |
| 8.700%, 08/07/2018 | | 290,000 | | 353,800 |
| Travelers Insurance Company | | | | |
| Institutional Funding, Ltd. | | | | |
| 5.750%, 12/06/2011 | GBP | 54,000 | | 89,832 |
| Tube City IMS Corp. | | | | |
| 9.750%, 02/01/2015 | $ | 575,000 | | 602,313 |
| U.S. Bank NA (3.778% to 04/29/2015 | | | | |
| then 3 month LIBOR + 2.003%) | | | | |
| 04/29/2020 | | 250,000 | | 255,642 |
| UBS AG (4.250% to 09/16/2014, then | | | | |
| 3 month EURIBOR + 1.260%) | | | | |
| 09/16/2019 | EUR | 100,000 | | 139,067 |
| UBS AG/London | | | | |
| 6.000%, 04/18/2018 | | 50,000 | | 76,749 |
| 6.375%, 07/20/2016 | GBP | 25,000 | | 44,291 |
| UBS AG/Stamford CT | | | | |
| 1.304%, 01/28/2014 (P) | $ | 250,000 | | 252,571 |
| 1.413%, 02/23/2012 (P) | | 250,000 | | 252,093 |
| 4.875%, 08/04/2020 | | 250,000 | | 252,127 |
| UniCredit SpA | | | | |
| 4.250%, 07/29/2016 | EUR | 232,000 | | 318,431 |
| 4.375%, 02/10/2014 | | 50,000 | | 69,916 |
| 5.750%, 09/26/2017 | | 145,000 | | 198,895 |
| | | | |
| Spectrum Income Fund (continued) | | |
| | | Shares or | | |
| | | Principal | | |
| | | Amount | | Value |
| |
|
| |
| CORPORATE BONDS (continued) | | | | |
| Financials (continued) | | | | |
| UniCredit SpA (continued) | | | | |
| 6.100%, 02/28/2012 | $ | 24,000 | $ | 34,012 |
| Unum Group | | | | |
| 5.625%, 09/15/2020 | $ | 115,000 | | 116,837 |
| UnumProvident Finance Company PLC | | | | |
| 6.850%, 11/15/2015 (S) | | 105,000 | | 117,303 |
| US Bancorp | | | | |
| 1.375%, 09/13/2013 | | 160,000 | | 160,068 |
| 3.442%, 02/01/2016 | | 515,000 | | 514,804 |
| US Bank NA | | | | |
| 6.375%, 08/01/2011 | | 305,000 | | 312,447 |
| USI Holdings Corp. | | | | |
| 9.750%, 05/15/2015 (S) | | 225,000 | | 231,750 |
| VEB Finance, Ltd. | | | | |
| 6.902%, 07/09/2020 (S) | | 585,000 | | 612,086 |
| Ventas Realty LP/Ventas Capital Corp. | | | | |
| 3.125%, 11/30/2015 | | 255,000 | | 247,769 |
| 6.500%, 06/01/2016 | | 45,000 | | 47,182 |
| VTB Capital SA | | | | |
| 6.875%, 05/29/2018 | | 350,000 | | 374,500 |
| Wachovia Corp. | | | | |
| 5.750%, 02/01/2018 | | 630,000 | | 700,481 |
| WEA Finance LLC/WT | | | | |
| Finance Australia Pty, Ltd. | | | | |
| 6.750%, 09/02/2019 (S) | | 220,000 | | 251,495 |
| 7.500%, 06/02/2014 (S) | | 175,000 | | 199,975 |
| Wells Fargo & Company | | | | |
| 5.250%, 10/23/2012 | | 235,000 | | 250,510 |
| Wells Fargo Bank NA | | | | |
| 4.750%, 02/09/2015 | | 520,000 | | 550,422 |
| Wells Fargo Financial Canada Corp. | | | | |
| 4.330%, 12/06/2013 | CAD | 30,000 | | 32,028 |
| Westpac Banking Corp. | | | | |
| 2.100%, 08/02/2013 | $ | 250,000 | | 252,721 |
| 4.875%, 09/28/2012 | EUR | 75,000 | | 107,600 |
| 5.000%, 10/21/2019 | GBP | 50,000 | | 80,857 |
| Wind Acquisition Holdings Finance SA, | | | | |
| PIK | | | | |
| 12.250%, 07/15/2017 (S) | $ | 354,385 | | 414,630 |
| Woodside Finance, Ltd. | | | | |
| 4.500%, 11/10/2014 (S) | | 320,000 | | 338,179 |
| WPP Finance UK | | | | |
| 8.000%, 09/15/2014 | | 65,000 | | 75,666 |
| WT Finance Australia Property, Ltd. | | | | |
| 3.625%, 06/27/2012 | EUR | 50,000 | | 69,524 |
| Xstrata Finance Canada, Ltd. | | | | |
| 5.500%, 11/16/2011 (S) | $ | 290,000 | | 299,489 |
| Ziggo Bond Company BV | | | | |
| 8.000%, 05/15/2018 (S) | EUR | 450,000 | | 665,998 |
| Zions Bancorporation | | | | |
| 7.750%, 09/23/2014 | $ | 215,000 | | 233,756 |
| | |
|
| | | | | 122,827,643 |
| Health Care - 1.72% | | | | |
| Accellent, Inc. | | | | |
| 8.375%, 02/01/2017 | | 75,000 | | 79,500 |
| 10.000%, 11/01/2017 (S) | | 600,000 | | 594,000 |
| AmerisourceBergen Corp. | | | | |
| 5.625%, 09/15/2012 | | 385,000 | | 409,065 |
| Bausch & Lomb, Inc. | | | | |
| 9.875%, 11/01/2015 | | 275,000 | | 297,688 |
| Bayer AG | | | | |
| 5.625%, 05/23/2018 | GBP | 50,000 | | 87,214 |
| Biomet, Inc. | | | | |
| 11.625%, 10/15/2017 | $ | 625,000 | | 704,688 |
| |
| The accompanying notes are an integral part of the financial statements. | 254 |
John Hancock Funds II
Portfolio of Investments — February 28, 2011 (Unaudited) (showing percentage of total net assets)
| | | | |
| Spectrum Income Fund (continued) | | |
| | | Shares or | | |
| | | Principal | | |
| | | Amount | | Value |
| |
|
| |
| CORPORATE BONDS (continued) | | | | |
| Health Care (continued) | | | | |
| Boston Scientific Corp. | | | | |
| 4.500%, 01/15/2015 | $ | 320,000 | $ | 329,750 |
| 7.375%, 01/15/2040 | | 400,000 | | 443,616 |
| Capella Healthcare, Inc. | | | | |
| 9.250%, 07/01/2017 (S) | | 625,000 | | 671,875 |
| Cardinal Health, Inc. | | | | |
| 4.625%, 12/15/2020 | | 435,000 | | 432,167 |
| 5.500%, 06/15/2013 | | 250,000 | | 270,080 |
| Celgene Corp. | | | | |
| 2.450%, 10/15/2015 | | 175,000 | | 169,698 |
| Centene Corp. | | | | |
| 7.250%, 04/01/2014 | | 450,000 | | 464,063 |
| Community Health Systems, Inc. | | | | |
| 8.875%, 07/15/2015 | | 250,000 | | 265,000 |
| Crown NewCo 3 PLC | | | | |
| 7.000%, 02/15/2018 (S) | GBP | 100,000 | | 166,629 |
| Davita, Inc. | | | | |
| 6.375%, 11/01/2018 | $ | 300,000 | | 304,125 |
| DaVita, Inc. | | | | |
| 6.625%, 11/01/2020 | | 325,000 | | 329,469 |
| Endo Pharmaceuticals Holdings, Inc. | | | | |
| 7.000%, 12/15/2020 (S) | | 150,000 | | 156,563 |
| Express Scripts, Inc. | | | | |
| 5.250%, 06/15/2012 | | 400,000 | | 419,427 |
| 6.250%, 06/15/2014 | | 335,000 | | 373,974 |
| Fresenius US Finance II, Inc. | | | | |
| 9.000%, 07/15/2015 (S) | | 100,000 | | 114,625 |
| Giant Funding Corp. | | | | |
| 8.250%, 02/01/2018 (S) | | 225,000 | | 231,188 |
| HCA, Inc. | | | | |
| 8.500%, 04/15/2019 | | 100,000 | | 112,000 |
| 9.250%, 11/15/2016 | | 300,000 | | 324,000 |
| HCA, Inc., PIK | | | | |
| 9.625%, 11/15/2016 | | 250,000 | | 271,250 |
| Labco SAS | | | | |
| 8.500%, 01/15/2018 (S) | EUR | 100,000 | | 140,755 |
| Life Technologies Corp. | | | | |
| 3.375%, 03/01/2013 | $ | 175,000 | | 180,164 |
| 3.500%, 01/15/2016 | | 480,000 | | 479,328 |
| 4.400%, 03/01/2015 | | 460,000 | | 480,017 |
| LifePoint Hospitals, Inc. | | | | |
| 6.625%, 10/01/2020 (S) | | 150,000 | | 153,563 |
| McKesson Corp. | | | | |
| 3.250%, 03/01/2016 | | 75,000 | | 75,372 |
| Medassets, Inc. | | | | |
| 8.000%, 11/15/2018 (S) | | 300,000 | | 308,250 |
| Medco Health Solutions, Inc. | | | | |
| 2.750%, 09/15/2015 | | 360,000 | | 357,114 |
| Merck Financial Services GmbH | | | | |
| 3.375%, 03/24/2015 | EUR | 100,000 | | 139,192 |
| MultiPlan, Inc. | | | | |
| 9.875%, 09/01/2018 (S) | $ | 500,000 | | 538,125 |
| Mylan, Inc. | | | | |
| 7.625%, 07/15/2017 (S) | | 200,000 | | 219,750 |
| Oncure Medical Corp. | | | | |
| 11.750%, 05/15/2017 (S) | | 250,000 | | 247,500 |
| Radiation Therapy Services, Inc. | | | | |
| 9.875%, 04/15/2017 | | 300,000 | | 309,000 |
| Tenet Healthcare Corp. | | | | |
| 6.500%, 06/01/2012 | | 225,000 | | 230,625 |
| 8.000%, 08/01/2020 | | 525,000 | | 540,750 |
| 8.875%, 07/01/2019 | | 300,000 | | 341,250 |
| UHS Escrow Corp. | | | | |
| 7.000%, 10/01/2018 (S) | | 100,000 | | 102,500 |
| | | | |
| Spectrum Income Fund (continued) | | |
| | | Shares or | | |
| | | Principal | | |
| | | Amount | | Value |
| |
|
| |
| CORPORATE BONDS (continued) | | | | |
| Health Care (continued) | | | | |
| United Surgical Partners | | | | |
| International, Inc. | | | | |
| 8.875%, 05/01/2017 | $ | 450,000 | $ | 474,750 |
| UnitedHealth Group, Inc. | | | | |
| 3.875%, 10/15/2020 | | 190,000 | | 182,674 |
| 4.700%, 02/15/2021 | | 200,000 | | 203,820 |
| Universal Hospital Services, Inc. | | | | |
| 3.834%, 06/01/2015 (P) | | 200,000 | | 192,000 |
| Universal Hospital Services, Inc., PIK | | | | |
| 8.500%, 06/01/2015 | | 100,000 | | 104,500 |
| Valeant | | | | |
| Pharmaceuticals International, Inc. | | | | |
| 6.750%, 10/01/2017 (S) | | 250,000 | | 258,750 |
| 7.000%, 10/01/2020 (S) | | 350,000 | | 361,813 |
| Vanguard Health Holding | | | | |
| Company II LLC/Vanguard | | | | |
| Holding Company II, Inc. | | | | |
| 7.750%, 02/01/2019 (S) | | 225,000 | | 228,938 |
| 8.000%, 02/01/2018 (S) | | 225,000 | | 230,625 |
| Vanguard Health Systems, Inc. | | | | |
| zero coupon, 02/01/2016 (S) | | 300,000 | | 193,500 |
| Warner Chilcott Company LLC | | | | |
| 7.750%, 09/15/2018 (S) | | 1,100,000 | | 1,157,750 |
| Watson Pharmaceuticals, Inc. | | | | |
| 5.000%, 08/15/2014 | | 260,000 | | 280,786 |
| WellPoint, Inc. | | | | |
| 4.350%, 08/15/2020 | | 270,000 | | 269,373 |
| 6.000%, 02/15/2014 | | 285,000 | | 317,585 |
| 6.800%, 08/01/2012 | | 250,000 | | 269,647 |
| | |
|
| | | | | 17,591,420 |
| Industrials - 2.86% | | | | |
| ACCO Brands Corp. | | | | |
| 10.625%, 03/15/2015 | | 125,000 | | 141,250 |
| Aeropuertos Argentina 2000 SA | | | | |
| 10.750%, 12/01/2020 (S) | | 330,000 | | 354,750 |
| Aguila 3 SA | | | | |
| 7.875%, 01/31/2018 (S) | | 300,000 | | 311,250 |
| AGY Holding Corp. | | | | |
| 11.000%, 11/15/2014 | | 250,000 | | 222,500 |
| Air Jamaica, Ltd., Series REGS | | | | |
| 9.375%, 07/08/2015 | | 73,929 | | 76,886 |
| Amsted Industries, Inc. | | | | |
| 8.125%, 03/15/2018 (S) | | 200,000 | | 215,000 |
| Ardagh Glass Finance PLC | | | | |
| 7.125%, 06/15/2017 | EUR | 100,000 | | 134,200 |
| Associated Materials, Inc. | | | | |
| 9.125%, 11/01/2017 (S) | $ | 725,000 | | 783,906 |
| Atlantia SpA | | | | |
| 5.625%, 05/06/2016 | EUR | 100,000 | | 149,195 |
| Autoroutes du Sud de la France | | | | |
| 7.375%, 03/20/2019 | | 100,000 | | 167,859 |
| Avis Budget Car Rental LLC | | | | |
| 7.625%, 05/15/2014 | $ | 360,000 | | 370,350 |
| 9.625%, 03/15/2018 | | 75,000 | | 83,813 |
| BE Aerospace, Inc. | | | | |
| 8.500%, 07/01/2018 | | 450,000 | | 497,250 |
| Bombardier, Inc. | | | | |
| 6.125%, 05/15/2021 (S) | EUR | 100,000 | | 134,200 |
| 7.250%, 11/15/2016 | | 50,000 | | 72,102 |
| 7.450%, 05/01/2034 (S) | $ | 300,000 | | 288,000 |
| Canadian Pacific Railway Company | | | | |
| 7.250%, 05/15/2019 | | 260,000 | | 309,182 |
| Case New Holland, Inc. | | | | |
| 7.875%, 12/01/2017 (S) | | 950,000 | | 1,061,625 |
| |
| The accompanying notes are an integral part of the financial statements. | 255 |
John Hancock Funds II
Portfolio of Investments — February 28, 2011 (Unaudited) (showing percentage of total net assets)
| | | | |
| Spectrum Income Fund (continued) | | |
| | | Shares or | | |
| | | Principal | | |
| | | Amount | | Value |
| |
|
| |
| CORPORATE BONDS (continued) | | | | |
| Industrials (continued) | | | | |
| Cemex Espana Luxembourg | | | | |
| 9.250%, 05/12/2020 | $ | 75,000 | $ | 77,250 |
| Cie de St-Gobain | | | | |
| 4.000%, 10/08/2018 | EUR | 100,000 | | 136,177 |
| Clondalkin Acquisition BV | | | | |
| 2.302%, 12/15/2013 (P) (S) | $ | 175,000 | | 169,313 |
| 3.026%, 12/15/2013 (P) (S) | EUR | 90,000 | | 119,849 |
| Coleman Cable, Inc. | | | | |
| 9.000%, 02/15/2018 | $ | 325,000 | | 338,813 |
| Columbus McKinnon Corp. | | | | |
| 7.875%, 02/01/2019 (S) | | 150,000 | | 155,250 |
| Commercial Vehicle Group, Inc., PIK | | | | |
| 11.000%, 02/15/2013 | | 344,951 | | 369,098 |
| Continental Airlines 2009-1 Pass | | | | |
| Through Trust | | | | |
| 9.000%, 07/08/2016 | | 178,480 | | 205,252 |
| Continental Airlines 2009-2 Class A Pass | | | | |
| Through Trust | | | | |
| 7.250%, 11/10/2019 | | 243,094 | | 268,618 |
| Continental Airlines 2010 Class A Pass | | | | |
| Through Trust | | | | |
| 4.750%, 01/12/2021 | | 135,000 | | 133,988 |
| Continental Airlines, Inc. | | | | |
| 6.750%, 09/15/2015 (S) | | 825,000 | | 847,688 |
| Continental Airlines, Inc., Series B | | | | |
| 9.250%, 05/10/2017 | | 94,986 | | 100,685 |
| Cooper US, Inc. | | | | |
| 2.375%, 01/15/2016 | | 150,000 | | 147,448 |
| CSX Corp. | | | | |
| 5.750%, 03/15/2013 | | 200,000 | | 216,492 |
| Danaher European Finance Company | | | | |
| 4.500%, 07/22/2013 | EUR | 50,000 | | 71,239 |
| Delta Air Lines 2009-1 Class A Pass | | | | |
| Through Trust | | | | |
| 7.750%, 12/17/2019 | $ | 73,215 | | 82,367 |
| Delta Air Lines 2010-2 Class A Pass | | | | |
| Through Trust | | | | |
| 4.950%, 05/23/2019 | | 120,000 | | 122,100 |
| Delta Air Lines, Inc. | | | | |
| 6.821%, 08/10/2022 | | 109,886 | | 115,929 |
| 9.500%, 09/15/2014 (S) | | 359,000 | | 391,310 |
| 12.250%, 03/15/2015 (S) | | 800,000 | | 916,000 |
| Deluxe Corp. | | | | |
| 7.375%, 06/01/2015 | | 600,000 | | 625,500 |
| DP World Sukuk, Ltd. | | | | |
| 6.250%, 07/02/2017 | | 300,000 | | 291,000 |
| 6.250%, 07/02/2017 (S) | | 920,000 | | 887,800 |
| DP World, Ltd. | | | | |
| 6.850%, 07/02/2037 | | 200,000 | | 176,000 |
| Dycom Investments, Inc. | | | | |
| 7.125%, 01/15/2021 (S) | | 375,000 | | 382,969 |
| Embraer Overseas, Ltd. | | | | |
| 6.375%, 01/15/2020 | | 175,000 | | 184,625 |
| Experian Finance PLC | | | | |
| 4.750%, 02/04/2020 | EUR | 100,000 | | 140,134 |
| Finmeccanica Finance SA | | | | |
| 5.750%, 12/12/2018 | | 135,000 | | 200,795 |
| Florida East Coast Holdings Corp., PIK | | | | |
| 10.500%, 08/01/2017 (S) | $ | 175,000 | | 175,000 |
| Florida East Coast Railway Corp. | | | | |
| 8.125%, 02/01/2017 (S) | | 225,000 | | 235,125 |
| FTI Consulting, Inc. | | | | |
| 7.750%, 10/01/2016 | | 550,000 | | 576,813 |
| G4S PLC | | | | |
| 7.750%, 05/13/2019 | GBP | 50,000 | | 91,902 |
| | | | |
| Spectrum Income Fund (continued) | | |
| | | Shares or | | |
| | | Principal | | |
| | | Amount | | Value |
| |
|
| |
| CORPORATE BONDS (continued) | | | | |
| Industrials (continued) | | | | |
| Garda World Security Corp. | | | | |
| 9.750%, 03/15/2017 (S) | $ | 250,000 | $ | 268,750 |
| GATX Corp. | | | | |
| 3.500%, 07/15/2016 | | 205,000 | | 202,882 |
| GATX Financial Corp. | | | | |
| 5.500%, 02/15/2012 | | 275,000 | | 283,386 |
| General Dynamics Corp. | | | | |
| 1.800%, 07/15/2011 | | 150,000 | | 150,973 |
| GeoEye, Inc. | | | | |
| 9.625%, 10/01/2015 | | 150,000 | | 169,125 |
| Gibraltar Industries, Inc. | | | | |
| 8.000%, 12/01/2015 | | 575,000 | | 588,656 |
| Greater Toronto Airports Authority | | | | |
| 6.470%, 02/02/2034 (S) | CAD | 25,000 | | 30,088 |
| Grohe Holding GmbH | | | | |
| 3.873%, 01/15/2014 (P) | EUR | 150,000 | | 206,992 |
| 8.625%, 10/01/2014 (S) | | 50,000 | | 71,154 |
| Grupo Petrotemex SA de CV | | | | |
| 9.500%, 08/19/2014 (S) | $ | 325,000 | | 360,750 |
| Hertz Holdings Netherlands BV | | | | |
| 8.500%, 07/31/2015 (S) | EUR | 250,000 | | 375,174 |
| Interline Brands, Inc. | | | | |
| 7.000%, 11/15/2018 | $ | 375,000 | | 389,063 |
| Kansas City Southern de Mexico SA | | | | |
| de CV | | | | |
| 8.000%, 02/01/2018 | | 400,000 | | 437,000 |
| Kratos Defense & Security | | | | |
| Solutions, Inc. | | | | |
| 10.000%, 06/01/2017 | | 200,000 | | 225,500 |
| L-3 Communications Corp. | | | | |
| 4.750%, 07/15/2020 | | 475,000 | | 476,114 |
| L-3 Communications Corp., Series B | | | | |
| 6.375%, 10/15/2015 | | 200,000 | | 206,500 |
| Legrand SA | | | | |
| 4.250%, 02/24/2017 | EUR | 100,000 | | 137,433 |
| MAN SE | | | | |
| 7.250%, 05/20/2016 | | 25,000 | | 40,349 |
| Manpower, Inc. | | | | |
| 4.750%, 06/14/2013 | | 50,000 | | 68,914 |
| Masco Corp. | | | | |
| 6.125%, 10/03/2016 | $ | 125,000 | | 127,934 |
| 7.125%, 03/15/2020 | | 150,000 | | 156,117 |
| Maxim Crane Works LP | | | | |
| 12.250%, 04/15/2015 (S) | | 200,000 | | 210,500 |
| National Express Group PLC | | | | |
| 6.250%, 01/13/2017 | GBP | 50,000 | | 85,085 |
| Nortek, Inc. | | | | |
| 10.000%, 12/01/2018 (S) | $ | 200,000 | | 213,500 |
| Obrascon Huarte Lain SA | | | | |
| 7.375%, 04/28/2015 | EUR | 50,000 | | 68,739 |
| Odebrecht Drilling Norbe VIII/IX, Ltd. | | | | |
| 6.350%, 06/30/2021 (S) | $ | 100,000 | | 104,625 |
| OI European Group BV | | | | |
| 6.750%, 09/15/2020 (S) | EUR | 100,000 | | 142,135 |
| Oshkosh Corp. | | | | |
| 8.250%, 03/01/2017 | $ | 275,000 | | 305,250 |
| Plastipak Holdings, Inc. | | | | |
| 10.625%, 08/15/2019 (S) | | 225,000 | | 256,500 |
| Ply Gem Industries, Inc. | | | | |
| 8.250%, 02/15/2018 (S) | | 400,000 | | 409,500 |
| RBS Global, Inc./Rexnord LLC | | | | |
| 8.500%, 05/01/2018 | | 500,000 | | 544,375 |
| Rearden G Holdings EINS GmbH | | | | |
| 7.875%, 03/30/2020 (S) | | 350,000 | | 369,250 |
| |
| The accompanying notes are an integral part of the financial statements. | 256 |
John Hancock Funds II
Portfolio of Investments — February 28, 2011 (Unaudited) (showing percentage of total net assets)
| | | | |
| Spectrum Income Fund (continued) | | |
| | | Shares or | | |
| | | Principal | | |
| | | Amount | | Value |
| |
|
| |
| CORPORATE BONDS (continued) | | | | |
| Industrials (continued) | | | | |
| Rentokil Initial PLC | | | | |
| 4.625%, 03/27/2014 | EUR | 50,000 | $ | 70,063 |
| 5.750%, 03/31/2016 | GBP | 50,000 | | 83,021 |
| Republic Services, Inc. | | | | |
| 6.750%, 08/15/2011 | $ | 125,000 | | 127,909 |
| Rolls-Royce PLC | | | | |
| 7.375%, 06/14/2016 | GBP | 25,000 | | 47,368 |
| Roper Industries, Inc. | | | | |
| 6.250%, 09/01/2019 | $ | 335,000 | | 371,517 |
| RSC Equipment Rental, Inc. | | | | |
| 10.000%, 07/15/2017 (S) | | 250,000 | | 287,500 |
| RSC Equipment Rental, Inc./RSC | | | | |
| Holdings III LLC | | | | |
| 8.250%, 02/01/2021 (S) | | 50,000 | | 52,875 |
| SCF Capital LTD | | | | |
| 5.375%, 10/27/2017 | | 200,000 | | 194,500 |
| Securitas AB | | | | |
| 6.500%, 04/02/2013 | EUR | 50,000 | | 73,889 |
| Sequa Corp. | | | | |
| 11.750%, 12/01/2015 (S) | $ | 325,000 | | 352,625 |
| Sequa Corp., PIK | | | | |
| 13.500%, 12/01/2015 (S) | | 125,000 | | 138,438 |
| Southwest Airlines Company | | | | |
| 5.125%, 03/01/2017 | | 385,000 | | 400,761 |
| 6.500%, 03/01/2012 | | 410,000 | | 430,375 |
| Spirit Aerosystems, Inc. | | | | |
| 7.500%, 10/01/2017 | | 125,000 | | 132,813 |
| SPX Corp. | | | | |
| 6.875%, 09/01/2017 (S) | | 250,000 | | 268,750 |
| Stena AB | | | | |
| 6.125%, 02/01/2017 | EUR | 85,000 | | 113,190 |
| Terex Corp. | | | | |
| 8.000%, 11/15/2017 | $ | 350,000 | | 366,625 |
| 10.875%, 06/01/2016 | | 25,000 | | 29,250 |
| The Manitowoc Company, Inc. | | | | |
| 8.500%, 11/01/2020 | | 175,000 | | 190,313 |
| TransDigm, Inc. | | | | |
| 7.750%, 12/15/2018 (S) | | 475,000 | | 511,813 |
| Travelport LLC | | | | |
| 11.875%, 09/01/2016 | | 125,000 | | 117,656 |
| United Air Lines, Inc. | | | | |
| 12.000%, 11/01/2013 (S) | | 100,000 | | 110,250 |
| United Rentals North America, Inc. | | | | |
| 8.375%, 09/15/2020 | | 450,000 | | 476,438 |
| 10.875%, 06/15/2016 | | 500,000 | | 581,250 |
| US Airways 2010-1 Class A Pass | | | | |
| Through Trust | | | | |
| 6.250%, 04/22/2023 | | 105,000 | | 105,263 |
| USG Corp. | | | | |
| 8.375%, 10/15/2018 (S) | | 125,000 | | 131,172 |
| Valmont Industries, Inc. | | | | |
| 6.625%, 04/20/2020 | | 200,000 | | 209,817 |
| Volvo Treasury AB | | | | |
| 9.875%, 02/27/2014 | EUR | 50,000 | | 82,061 |
| Voto-Votorantim, Ltd. | | | | |
| 5.250%, 04/28/2017 (S) | | 50,000 | | 68,639 |
| Waste Management, Inc. | | | | |
| 4.750%, 06/30/2020 | $ | 385,000 | | 394,601 |
| 6.100%, 03/15/2018 | | 335,000 | | 376,388 |
| 7.375%, 05/15/2029 | | 15,000 | | 17,878 |
| WCA Waste Corp. | | | | |
| 9.250%, 06/15/2014 | | 400,000 | | 413,000 |
| | |
|
| | | | | 29,336,168 |
| | | | |
| Spectrum Income Fund (continued) | | |
| | | Shares or | | |
| | | Principal | | |
| | | Amount | | Value |
| |
|
| |
| CORPORATE BONDS (continued) | | | | |
| Information Technology - 0.87% | | | | |
| Advanced Micro Devices, Inc. | | | | |
| 7.750%, 08/01/2020 | $ | 275,000 | $ | 287,375 |
| 8.125%, 12/15/2017 | | 100,000 | | 106,500 |
| Affiliated Computer Services, Inc. | | | | |
| 5.200%, 06/01/2015 | | 130,000 | | 139,472 |
| Agilent Technologies, Inc. | | | | |
| 2.500%, 07/15/2013 | | 70,000 | | 70,873 |
| 5.000%, 07/15/2020 | | 145,000 | | 147,159 |
| Alcatel-Lucent | | | | |
| 6.375%, 04/07/2014 | EUR | 80,000 | | 115,088 |
| Anixter, Inc. | | | | |
| 10.000%, 03/15/2014 | $ | 300,000 | | 346,875 |
| Aspect Software, Inc. | | | | |
| 10.625%, 05/15/2017 (S) | | 150,000 | | 159,750 |
| Avaya, Inc. | | | | |
| 7.000%, 04/01/2019 (S) | | 200,000 | | 198,000 |
| 9.750%, 11/01/2015 | | 50,000 | | 51,750 |
| Avaya, Inc., PIK | | | | |
| 10.125%, 11/01/2015 | | 725,000 | | 750,375 |
| Broadcom Corp. | | | | |
| 1.500%, 11/01/2013 (S) | | 100,000 | | 99,278 |
| 2.375%, 11/01/2015 (S) | | 135,000 | | 130,666 |
| Brocade Communications Systems, Inc. | | | | |
| 6.875%, 01/15/2020 | | 25,000 | | 26,813 |
| CDW LLC/CDW Finance Corp. | | | | |
| 11.000%, 10/12/2015 | | 575,000 | | 625,313 |
| CDW LLC/CDW Finance Corp., PIK | | | | |
| 11.500%, 10/12/2015 | | 325,000 | | 352,625 |
| CommScope, Inc. | | | | |
| 8.250%, 01/15/2019 (S) | | 425,000 | | 440,938 |
| Equinix, Inc. | | | | |
| 8.125%, 03/01/2018 | | 275,000 | | 298,375 |
| Fidelity National | | | | |
| Information Services, Inc. | | | | |
| 7.625%, 07/15/2017 | | 325,000 | | 358,313 |
| 7.875%, 07/15/2020 | | 200,000 | | 222,000 |
| First Data Corp. | | | | |
| 9.875%, 09/24/2015 | | 225,000 | | 226,938 |
| 12.625%, 01/15/2021 (S) | | 1,350,000 | | 1,414,125 |
| First Data Corp., PIK | | | | |
| 10.550%, 09/24/2015 | | 250,000 | | 265,625 |
| Jabil Circuit, Inc. | | | | |
| 5.625%, 12/15/2020 | | 145,000 | | 141,738 |
| NXP BV/NXP Funding LLC | | | | |
| 9.500%, 10/15/2015 | | 150,000 | | 160,125 |
| 9.750%, 08/01/2018 (S) | | 225,000 | | 257,063 |
| Open Solutions, Inc. | | | | |
| 9.750%, 02/01/2015 (S) | | 150,000 | | 99,375 |
| SunGard Data Systems, Inc. | | | | |
| 10.250%, 08/15/2015 | | 75,000 | | 79,031 |
| 10.625%, 05/15/2015 | | 175,000 | | 193,813 |
| Telefonaktiebolaget LM Ericsson | | | | |
| 5.000%, 06/24/2013 | EUR | 50,000 | | 72,363 |
| 5.375%, 06/27/2017 | | 50,000 | | 74,210 |
| Viasat, Inc. | | | | |
| 8.875%, 09/15/2016 | $ | 150,000 | | 160,125 |
| Xerox Corp. | | | | |
| 5.500%, 05/15/2012 | | 35,000 | | 36,771 |
| 5.650%, 05/15/2013 | | 270,000 | | 292,084 |
| 6.350%, 05/15/2018 | | 350,000 | | 397,289 |
| 8.250%, 05/15/2014 | | 130,000 | | 152,125 |
| | |
|
| | | | | 8,950,338 |
| |
| The accompanying notes are an integral part of the financial statements. | 257 |
John Hancock Funds II
Portfolio of Investments — February 28, 2011 (Unaudited) (showing percentage of total net assets)
| | | | |
| Spectrum Income Fund (continued) | | |
| | | Shares or | | |
| | | Principal | | |
| | | Amount | | Value |
| |
|
| |
| CORPORATE BONDS (continued) | | | | |
| Materials - 2.89% | | | | |
| AK Steel Corp. | | | | |
| 7.625%, 05/15/2020 | $ | 300,000 | $ | 306,000 |
| Akzo Nobel NV | | | | |
| 7.250%, 03/27/2015 | EUR | 100,000 | | 157,019 |
| Allegheny Technologies, Inc. | | | | |
| 5.950%, 01/15/2021 | $ | 135,000 | | 142,725 |
| 9.375%, 06/01/2019 | | 165,000 | | 205,905 |
| ALROSA Finance SA | | | | |
| 7.750%, 11/03/2020 (S) | | 325,000 | | 344,500 |
| Anglo American Capital PLC | | | | |
| 2.150%, 09/27/2013 (S) | | 210,000 | | 211,950 |
| 4.450%, 09/27/2020 (S) | | 200,000 | | 201,110 |
| AngloGold Holdings PLC | | | | |
| 5.375%, 04/15/2020 | | 520,000 | | 529,229 |
| ArcelorMittal | | | | |
| 3.750%, 08/05/2015 | | 150,000 | | 151,503 |
| 5.375%, 06/01/2013 | | 800,000 | | 858,251 |
| 9.375%, 06/03/2016 | EUR | 100,000 | | 168,669 |
| Ardagh Packaging Finance PLC | | | | |
| 7.375%, 10/15/2017 (S) | $ | 225,000 | | 239,625 |
| Ball Corp. | | | | |
| 7.375%, 09/01/2019 | | 250,000 | | 271,875 |
| Barrick Gold Finance Company LLC | | | | |
| 6.125%, 09/15/2013 | | 305,000 | | 339,007 |
| Berry Plastics Corp. | | | | |
| 9.750%, 01/15/2021 (S) | | 475,000 | | 476,188 |
| BHP Billiton Finance, Ltd. | | | | |
| 4.750%, 04/04/2012 | EUR | 50,000 | | 71,123 |
| Boise Paper Holdings LLC/Boise Co- | | | | |
| Issuer Company | | | | |
| 8.000%, 04/01/2020 | $ | 150,000 | | 165,375 |
| Boise Paper Holdings LLC/Boise | | | | |
| Finance Company | | | | |
| 9.000%, 11/01/2017 | | 200,000 | | 223,000 |
| BWAY Holding Company | | | | |
| 10.000%, 06/15/2018 (S) | | 250,000 | | 277,500 |
| Cascades, Inc. | | | | |
| 7.750%, 12/15/2017 | | 225,000 | | 235,406 |
| 7.875%, 01/15/2020 | | 150,000 | | 156,563 |
| Celulosa Arauco y Constitucion SA | | | | |
| 5.000%, 01/21/2021 (S) | | 85,000 | | 81,675 |
| 5.125%, 07/09/2013 | | 80,000 | | 83,756 |
| Cemex Finance LLC | | | | |
| 9.500%, 12/14/2016 (S) | | 905,000 | | 971,065 |
| Cemex SAB de CV | | | | |
| 9.000%, 01/11/2018 (S) | | 200,000 | | 207,000 |
| CF Industries, Inc. | | | | |
| 6.875%, 05/01/2018 | | 425,000 | | 469,359 |
| China Oriental Group Company, Ltd. | | | | |
| 8.000%, 08/18/2015 (S) | | 200,000 | | 208,000 |
| Clarendon Alumina Production, Ltd. | | | | |
| 8.500%, 11/16/2021 | | 100,000 | | 101,300 |
| Clearwater Paper Corp. | | | | |
| 7.125%, 11/01/2018 (S) | | 150,000 | | 155,625 |
| 10.625%, 06/15/2016 | | 200,000 | | 228,500 |
| Corp. Nacional del Cobre de Chile | | | | |
| 3.750%, 11/04/2020 (S) | | 145,000 | | 136,891 |
| 7.500%, 01/15/2019 (S) | | 230,000 | | 279,215 |
| CRH America, Inc. | | | | |
| 5.300%, 10/15/2013 | | 140,000 | | 149,702 |
| CRH Finance BV | | | | |
| 7.375%, 05/28/2014 | EUR | 100,000 | | 152,355 |
| Crown European Holdings SA | | | | |
| 7.125%, 08/15/2018 | | 50,000 | | 73,482 |
| 7.125%, 08/15/2018 (S) | | 225,000 | | 330,670 |
| | | | |
| Spectrum Income Fund (continued) | | |
| | | Shares or | | |
| | | Principal | | |
| | | Amount | | Value |
| |
|
| |
| CORPORATE BONDS (continued) | | | | |
| Materials (continued) | | | | |
| Domtar Corp. | | | | |
| 9.500%, 08/01/2016 | $ | 50,000 | $ | 60,000 |
| Evraz Group SA | | | | |
| 8.875%, 04/24/2013 | | 200,000 | | 218,000 |
| Fibria Overseas Finance, Ltd. | | | | |
| 7.500%, 05/04/2020 (S) | | 287,000 | | 305,655 |
| FMG Resources August 2006 Pty, Ltd. | | | | |
| 7.000%, 11/01/2015 (S) | | 475,000 | | 492,813 |
| Freeport-McMoRan Copper & Gold, Inc. | | | | |
| 8.375%, 04/01/2017 | | 370,000 | | 410,700 |
| Georgia-Pacific LLC | | | | |
| 7.000%, 01/15/2015 (S) | | 50,000 | | 51,750 |
| 8.250%, 05/01/2016 (S) | | 75,000 | | 84,563 |
| Graphic Packaging International, Inc. | | | | |
| 7.875%, 10/01/2018 | | 300,000 | | 322,500 |
| 9.500%, 06/15/2017 | | 350,000 | | 388,500 |
| Heidelbergcement AG | | | | |
| 8.000%, 01/31/2017 | EUR | 175,000 | | 265,882 |
| Hexion US Finance Corp./Hexion Nova | | | | |
| Scotia Finance ULC | | | | |
| 8.875%, 02/01/2018 | $ | 250,000 | | 268,438 |
| 9.000%, 11/15/2020 (S) | | 175,000 | | 186,156 |
| Holcim US Finance | | | | |
| 6.000%, 12/30/2019 (S) | | 555,000 | | 577,372 |
| Huntsman International LLC | | | | |
| 8.625%, 03/15/2020 | | 100,000 | | 111,000 |
| 8.625%, 03/15/2021 (S) | | 700,000 | | 777,000 |
| Inversiones Cmpc SA | | | | |
| 4.750%, 01/19/2018 (S) | | 235,000 | | 226,137 |
| Kerling PLC | | | | |
| 10.625%, 02/01/2017 (S) | EUR | 450,000 | | 704,809 |
| Koppers, Inc. | | | | |
| 7.875%, 12/01/2019 | $ | 150,000 | | 162,750 |
| Lafarge SA | | | | |
| 5.000%, 04/13/2018 | EUR | 100,000 | | 133,579 |
| 6.150%, 07/15/2011 | $ | 340,000 | | 345,997 |
| LBI Escrow Corp. | | | | |
| 8.000%, 11/01/2017 | EUR | 89,850 | | 138,247 |
| Linde Finance BV | | | | |
| 6.500%, 01/29/2016 | GBP | 65,000 | | 118,223 |
| Lyondell Chemical Company | | | | |
| 8.000%, 11/01/2017 (S) | $ | 250,000 | | 281,406 |
| 11.000%, 05/01/2018 | | 800,000 | | 918,000 |
| Mercer International, Inc. | | | | |
| 9.500%, 12/01/2017 (S) | | 300,000 | | 324,000 |
| Metals USA, Inc. | | | | |
| 11.125%, 12/01/2015 | | 175,000 | | 185,938 |
| Momentive Performance Materials, Inc. | | | | |
| 9.000%, 01/15/2021 (S) | | 175,000 | | 186,156 |
| 11.500%, 12/01/2016 | | 425,000 | | 461,125 |
| New World Resources BV | | | | |
| 7.875%, 05/01/2018 (S) | EUR | 425,000 | | 630,465 |
| Novelis, Inc. | | | | |
| 8.750%, 12/15/2020 (S) | $ | 475,000 | | 523,688 |
| PolyOne Corp. | | | | |
| 7.375%, 09/15/2020 | | 200,000 | | 212,000 |
| POSCO | | | | |
| 4.250%, 10/28/2020 (S) | | 175,000 | | 161,894 |
| Praxair, Inc. | | | | |
| 2.125%, 06/14/2013 | | 340,000 | | 346,878 |
| Rexam PLC (6.750% to 06/292017, then | | | | |
| 3 month EURIBOR + 2.900%) | | | | |
| 06/29/2067 | EUR | 150,000 | | 202,335 |
| Rhodia SA | | | | |
| 6.875%, 09/15/2020 (S) | $ | 200,000 | | 204,750 |
| |
| The accompanying notes are an integral part of the financial statements. | 258 |
John Hancock Funds II
Portfolio of Investments — February 28, 2011 (Unaudited) (showing percentage of total net assets)
| | | | |
| Spectrum Income Fund (continued) | | |
| | | Shares or | | |
| | | Principal | | |
| | | Amount | | Value |
| |
|
| |
| CORPORATE BONDS (continued) | | | | |
| Materials (continued) | | | | |
| Rio Tinto Finance USA, Ltd. | | | | |
| 8.950%, 05/01/2014 | $ | 670,000 | $ | 811,140 |
| Ryerson Holding Corp. | | | | |
| zero coupon, 02/01/2015 | | 1,775,000 | | 940,750 |
| Ryerson, Inc. | | | | |
| 12.000%, 11/01/2015 | | 600,000 | | 645,000 |
| Sappi Papier Holding AG | | | | |
| 6.750%, 06/15/2012 (S) | | 100,000 | | 104,250 |
| Severstal Columbus LLC | | | | |
| 10.250%, 02/15/2018 | | 375,000 | | 408,750 |
| Severstal OAO Via Steel Capital SA | | | | |
| 6.700%, 10/25/2017 (S) | | 175,000 | | 166,487 |
| Smurfit Kappa Acquisitions Company | | | | |
| 7.250%, 11/15/2017 (S) | EUR | 125,000 | | 182,843 |
| 7.750%, 11/15/2019 (S) | | 254,000 | | 375,043 |
| Solo Cup Company | | | | |
| 8.500%, 02/15/2014 | $ | 225,000 | | 191,813 |
| 10.500%, 11/01/2013 | | 350,000 | | 357,000 |
| Solutia, Inc. | | | | |
| 7.875%, 03/15/2020 | | 325,000 | | 357,500 |
| 8.750%, 11/01/2017 | | 325,000 | | 359,531 |
| Southern Copper Corp. | | | | |
| 5.375%, 04/16/2020 | | 80,000 | | 82,124 |
| 7.500%, 07/27/2035 | | 200,000 | | 222,680 |
| Steel Capital SA | | | | |
| 9.750%, 07/29/2013 (S) | | 250,000 | | 281,250 |
| Steel Dynamics, Inc. | | | | |
| 6.750%, 04/01/2015 | | 25,000 | | 25,563 |
| 7.625%, 03/15/2020 | | 100,000 | | 107,500 |
| 7.750%, 04/15/2016 | | 50,000 | | 53,125 |
| Teck Resources, Ltd. | | | | |
| 3.850%, 08/15/2017 | | 35,000 | | 35,332 |
| 4.500%, 01/15/2021 | | 110,000 | | 110,973 |
| 9.750%, 05/15/2014 | | 25,000 | | 30,579 |
| 10.250%, 05/15/2016 | | 80,000 | | 97,400 |
| Texas Industries, Inc. | | | | |
| 9.250%, 08/15/2020 | | 300,000 | | 326,625 |
| The Dow Chemical Company | | | | |
| 2.500%, 02/15/2016 | | 470,000 | | 453,371 |
| 8.550%, 05/15/2019 | | 775,000 | | 982,066 |
| Vale Overseas, Ltd. | | | | |
| 6.250%, 01/23/2017 | | 405,000 | | 456,487 |
| 6.875%, 11/10/2039 | | 100,000 | | 107,854 |
| Vedanta Resources PLC | | | | |
| 9.500%, 07/18/2018 (S) | | 600,000 | | 661,500 |
| Verso Paper Holdings LLC | | | | |
| 11.500%, 07/01/2014 | | 125,000 | | 137,813 |
| West China Cement, Ltd. | | | | |
| 7.500%, 01/25/2016 (S) | | 200,000 | | 200,000 |
| | |
|
| | | | | 29,622,173 |
| Telecommunication Services - 3.56% | | | | |
| America Movil SAB de CV | | | | |
| 3.625%, 03/30/2015 | | 150,000 | | 154,248 |
| 5.625%, 11/15/2017 | | 110,000 | | 120,016 |
| 5.750%, 01/15/2015 | | 190,000 | | 209,789 |
| 6.375%, 03/01/2035 | | 600,000 | | 644,312 |
| 8.460%, 12/18/2036 | MXN | 1,000,000 | | 72,475 |
| American Tower Corp. | | | | |
| 4.500%, 01/15/2018 | $ | 155,000 | | 153,644 |
| 4.625%, 04/01/2015 | | 200,000 | | 208,631 |
| 5.050%, 09/01/2020 | | 135,000 | | 132,606 |
| 7.250%, 05/15/2019 | | 610,000 | | 693,516 |
| Ameritech Capital Funding, Inc. | | | | |
| 6.550%, 01/15/2028 | | 130,000 | | 133,826 |
| | | | |
| Spectrum Income Fund (continued) | | |
| | | Shares or | | |
| | | Principal | | |
| | | Amount | | Value |
| |
|
| |
| CORPORATE BONDS (continued) | | | | |
| Telecommunication Services (continued) | | | | |
| AT&T, Inc. | | | | |
| 5.875%, 04/28/2017 | GBP | 50,000 | $ | 87,953 |
| 6.300%, 01/15/2038 | $ | 690,000 | | 716,354 |
| 6.550%, 02/15/2039 | | 85,000 | | 90,562 |
| 6.700%, 11/15/2013 | | 115,000 | | 130,147 |
| Bertelsmann AG | | | | |
| 4.750%, 09/26/2016 | EUR | 75,000 | | 108,785 |
| British Telecommunications PLC | | | | |
| 5.150%, 01/15/2013 | $ | 175,000 | | 186,752 |
| 6.500%, 07/07/2015 | EUR | 50,000 | | 77,003 |
| 8.625%, 03/26/2020 | GBP | 20,000 | | 39,554 |
| Broadview Networks Holdings, Inc. | | | | |
| 11.375%, 09/01/2012 | $ | 425,000 | | 423,406 |
| Buccaneer Merger Sub, Inc. | | | | |
| 9.125%, 01/15/2019 (S) | | 250,000 | | 270,000 |
| CC Holdings GS V LLC/Crown Castle | | | | |
| GS III Corp. | | | | |
| 7.750%, 05/01/2017 (S) | | 380,000 | | 419,425 |
| Cincinnati Bell, Inc. | | | | |
| 7.000%, 02/15/2015 | | 450,000 | | 459,000 |
| Clearwire Communications LLC | | | | |
| 12.000%, 12/01/2015 (S) | | 1,400,000 | | 1,526,000 |
| Clearwire | | | | |
| Communications LLC/Clearwire | | | | |
| Finance, Inc. | | | | |
| 12.000%, 12/01/2017 (S) | | 325,000 | | 351,000 |
| COX Communications, Inc. | | | | |
| 7.125%, 10/01/2012 | | 171,000 | | 186,135 |
| Cricket Communications, Inc. | | | | |
| 7.750%, 05/15/2016 to 10/15/2020 | | 800,000 | | 816,000 |
| 10.000%, 07/15/2015 | | 425,000 | | 468,563 |
| Deutsche Telekom | | | | |
| International Finance BV | | | | |
| 6.000%, 01/20/2017 | EUR | 30,000 | | 46,239 |
| 7.125%, 09/26/2012 | GBP | 30,000 | | 52,371 |
| 8.125%, 05/29/2012 | EUR | 35,000 | | 52,000 |
| Digicel Group, Ltd. | | | | |
| 8.875%, 01/15/2015 (S) | $ | 280,000 | | 291,200 |
| 8.875%, 01/15/2015 | | 100,000 | | 104,000 |
| 10.500%, 04/15/2018 (S) | | 1,000,000 | | 1,140,000 |
| Digicel, Ltd. | | | | |
| 8.250%, 09/01/2017 (S) | | 375,000 | | 391,875 |
| Discovery Communications LLC | | | | |
| 3.700%, 06/01/2015 | | 350,000 | | 362,797 |
| Intelsat Bermuda, Ltd. | | | | |
| 11.250%, 02/04/2017 | | 1,000,000 | | 1,106,250 |
| Intelsat Jackson Holdings SA | | | | |
| 7.250%, 10/15/2020 (S) | | 450,000 | | 462,375 |
| 11.250%, 06/15/2016 | | 325,000 | | 347,750 |
| Intelsat Jackson Holdings, Ltd. | | | | |
| 8.500%, 11/01/2019 (S) | | 225,000 | | 246,938 |
| inVentiv Health, Inc. | | | | |
| 10.000%, 08/15/2018 (S) | | 325,000 | | 333,938 |
| Koninklijke KPN NV | | | | |
| 5.750%, 03/18/2016 | GBP | 50,000 | | 86,813 |
| 7.500%, 02/04/2019 | EUR | 50,000 | | 83,962 |
| Level 3 Financing, Inc. | | | | |
| 8.750%, 02/15/2017 | $ | 200,000 | | 196,500 |
| 9.250%, 11/01/2014 | | 300,000 | | 309,750 |
| MetroPCS Wireless, Inc. | | | | |
| 7.875%, 09/01/2018 | | 575,000 | | 607,344 |
| Nara Cable Funding, Ltd. | | | | |
| 8.875%, 12/01/2018 (S) | EUR | 100,000 | | 143,515 |
| NBCUniversal Media LLC | | | | |
| 2.100%, 04/01/2014 (S) | $ | 305,000 | | 301,342 |
| |
| The accompanying notes are an integral part of the financial statements. | 259 |
John Hancock Funds II
Portfolio of Investments — February 28, 2011 (Unaudited) (showing percentage of total net assets)
| | | | |
| Spectrum Income Fund (continued) | | |
| | | Shares or | | |
| | | Principal | | |
| | | Amount | | Value |
| |
|
| |
| CORPORATE BONDS (continued) | | | | |
| Telecommunication Services (continued) | | | | |
| NBCUniversal Media LLC (continued) | | | | |
| 5.150%, 04/30/2020 (S) | $ | 920,000 | $ | 947,702 |
| 5.950%, 04/01/2041 (S) | | 290,000 | | 285,594 |
| Nexstar Finance Holdings LLC | | | | |
| 11.375%, 04/01/2013 | | 162,798 | | 163,612 |
| Nextel Communications, Inc. | | | | |
| 5.950%, 03/15/2014 | | 325,000 | | 326,625 |
| Nextel Communications, Inc., Series D | | | | |
| 7.375%, 08/01/2015 | | 625,000 | | 626,563 |
| Nielsen Finance LLC | | | | |
| 11.625%, 02/01/2014 | | 163,000 | | 191,525 |
| NII Capital Corp. | | | | |
| 8.875%, 12/15/2019 | | 224,000 | | 247,520 |
| 10.000%, 08/15/2016 | | 1,131,000 | | 1,280,858 |
| OTE PLC | | | | |
| 4.625%, 05/20/2016 | EUR | 500,000 | | 604,273 |
| Paetec Holding Corp. | | | | |
| 8.875%, 06/30/2017 | $ | 375,000 | | 406,875 |
| Qwest Communications | | | | |
| International, Inc., Series B | | | | |
| 7.500%, 02/15/2014 | | 450,000 | | 456,750 |
| Qwest Corp. | | | | |
| 7.500%, 10/01/2014 | | 175,000 | | 200,375 |
| Rogers Communications, Inc. | | | | |
| 5.380%, 11/04/2019 | CAD | 25,000 | | 26,746 |
| 6.250%, 06/15/2013 | $ | 145,000 | | 160,614 |
| Royal KPN NV | | | | |
| 4.500%, 03/18/2013 | EUR | 80,000 | | 114,539 |
| Sable International Finance, Ltd. | | | | |
| 7.750%, 02/15/2017 (S) | $ | 250,000 | | 266,250 |
| SBA Telecommunications, Inc. | | | | |
| 8.000%, 08/15/2016 | | 25,000 | | 27,250 |
| 8.250%, 08/15/2019 | | 150,000 | | 165,375 |
| SBA Tower Trust | | | | |
| 4.254%, 04/15/2015 (S) | | 280,000 | | 292,671 |
| Sprint Capital Corp. | | | | |
| 6.875%, 11/15/2028 | | 175,000 | | 157,719 |
| 8.750%, 03/15/2032 | | 800,000 | | 832,000 |
| Sprint Nextel Corp. | | | | |
| 8.375%, 08/15/2017 | | 1,225,000 | | 1,358,219 |
| Sunrise Communications | | | | |
| International SA | | | | |
| 7.000%, 12/31/2017 (S) | EUR | 100,000 | | 146,620 |
| Telecom Italia Capital SA | | | | |
| 5.250%, 11/15/2013 | $ | 785,000 | | 820,305 |
| 6.175%, 06/18/2014 | | 195,000 | | 207,549 |
| 6.200%, 07/18/2011 | | 90,000 | | 91,718 |
| Telecom Italia Finance SA | | | | |
| 6.875%, 01/24/2013 | EUR | 130,000 | | 191,808 |
| Telecom Italia SpA | | | | |
| 5.250%, 02/10/2022 | | 50,000 | | 65,518 |
| 8.250%, 03/21/2016 | | 110,000 | | 174,644 |
| Telefonica Emisiones SAU | | | | |
| 2.582%, 04/26/2013 | $ | 125,000 | | 125,895 |
| 3.661%, 09/18/2017 | EUR | 100,000 | | 130,398 |
| 3.992%, 02/16/2016 | $ | 515,000 | | 517,038 |
| 4.674%, 02/07/2014 | EUR | 50,000 | | 70,958 |
| 4.693%, 11/11/2019 | | 50,000 | | 67,927 |
| 5.375%, 02/02/2018 | GBP | 50,000 | | 81,882 |
| 5.431%, 02/03/2014 | EUR | 100,000 | | 144,975 |
| 5.855%, 02/04/2013 | $ | 170,000 | | 181,486 |
| 5.877%, 07/15/2019 | | 370,000 | | 388,893 |
| 5.984%, 06/20/2011 | | 20,000 | | 20,312 |
| 6.221%, 07/03/2017 | | 440,000 | | 479,198 |
| | | | |
| Spectrum Income Fund (continued) | | |
| | | Shares or | | |
| | | Principal | | |
| | | Amount | | Value |
| |
|
| |
| CORPORATE BONDS (continued) | | | | |
| Telecommunication Services (continued) | | | | |
| Telekom Finanzmanagement GmbH | | | | |
| 6.375%, 01/29/2016 | EUR | 68,000 | $ | 103,829 |
| Telesat Canada | | | | |
| 11.000%, 11/01/2015 | $ | 500,000 | | 561,250 |
| 12.500%, 11/01/2017 | | 350,000 | | 421,313 |
| Telus Corp. | | | | |
| 4.950%, 03/15/2017 | CAD | 25,000 | | 26,879 |
| Thomson Reuters Corp. | | | | |
| 5.200%, 12/01/2014 | | 40,000 | | 44,226 |
| TPSA Eurofinance France SA | | | | |
| 6.000%, 05/22/2014 | EUR | 100,000 | | 149,315 |
| Trilogy International Partners LLC | | | | |
| 10.250%, 08/15/2016 (S) | $ | 425,000 | | 432,438 |
| Univision Communications, Inc. | | | | |
| 12.000%, 07/01/2014 (S) | | 350,000 | | 381,500 |
| UPC Holding BV | | | | |
| 8.375%, 08/15/2020 (S) | EUR | 275,000 | | 400,358 |
| 9.875%, 04/15/2018 (S) | $ | 275,000 | | 305,250 |
| Verizon Global Funding Corp. | | | | |
| 7.750%, 12/01/2030 | | 135,000 | | 165,673 |
| Verizon Virginia, Inc. | | | | |
| 4.625%, 03/15/2013 | | 865,000 | | 915,566 |
| Verizon Wireless Capital LLC | | | | |
| 3.750%, 05/20/2011 | | 200,000 | | 201,421 |
| Virgin Media Finance PLC | | | | |
| 9.500%, 08/15/2016 | | 725,000 | | 836,469 |
| Virgin Media Secured Finance PLC | | | | |
| 5.250%, 01/15/2021 (S) | | 200,000 | | 202,321 |
| Vodafone Group PLC | | | | |
| 5.625%, 02/27/2017 | | 205,000 | | 227,946 |
| West Corp. | | | | |
| 7.875%, 01/15/2019 (S) | | 300,000 | | 307,875 |
| 8.625%, 10/01/2018 (S) | | 650,000 | | 689,000 |
| Wind Acquisition Finance SA | | | | |
| 7.250%, 02/15/2018 (S) | | 425,000 | | 438,813 |
| 11.750%, 07/15/2017 | EUR | 50,000 | | 79,347 |
| 11.750%, 07/15/2017 (S) | | 65,000 | | 103,151 |
| 11.750%, 07/15/2017 (S) | $ | 500,000 | | 573,750 |
| Windstream Corp. | | | | |
| 8.625%, 08/01/2016 | | 325,000 | | 343,688 |
| | |
|
| | | | | 36,504,818 |
| Utilities - 2.30% | | | | |
| Abu Dhabi National Energy Company | | | | |
| 5.620%, 10/25/2012 (S) | | 720,000 | | 745,109 |
| AES Andres Dominicana/Itabo | | | | |
| Dominicana | | | | |
| 9.500%, 11/12/2020 | | 200,000 | | 214,500 |
| AGL Capital Corp. | | | | |
| 5.250%, 08/15/2019 | | 300,000 | | 316,444 |
| Alabama Power Company | | | | |
| 4.850%, 12/15/2012 | | 100,000 | | 106,901 |
| Allegheny Energy Supply Company LLC | | | | |
| 6.750%, 10/15/2039 (S) | | 400,000 | | 390,029 |
| 8.250%, 04/15/2012 (S) | | 95,000 | | 101,468 |
| Appalachian Power Company | | | | |
| 5.650%, 08/15/2012 | | 170,000 | | 179,858 |
| 6.375%, 04/01/2036 | | 245,000 | | 258,430 |
| Black Hills Corp. | | | | |
| 6.500%, 05/15/2013 | | 235,000 | | 253,739 |
| 9.000%, 05/15/2014 | | 115,000 | | 131,489 |
| Calpine Corp. | | | | |
| 7.500%, 02/15/2021 (S) | | 300,000 | | 306,750 |
| 7.875%, 07/31/2020 (S) | | 475,000 | | 502,313 |
| |
| The accompanying notes are an integral part of the financial statements. | 260 |
John Hancock Funds II
Portfolio of Investments — February 28, 2011 (Unaudited) (showing percentage of total net assets)
| | | | |
| Spectrum Income Fund (continued) | | |
| | | Shares or | | |
| | | Principal | | |
| | | Amount | | Value |
| |
|
| |
| CORPORATE BONDS (continued) | | | | |
| Utilities (continued) | | | | |
| Centerpoint Energy Resources Corp. | | | | |
| 5.850%, 01/15/2041 (S) | $ | 140,000 | $ | 139,969 |
| Centrica PLC | | | | |
| 5.125%, 12/10/2014 | GBP | 50,000 | | 86,736 |
| 7.125%, 12/09/2013 | EUR | 50,000 | | 76,916 |
| CEZ AS | | | | |
| 5.750%, 05/26/2015 | | 50,000 | | 75,432 |
| Cia de Saneamento Basico do Estado de | | | | |
| Sao Paulo | | | | |
| 6.250%, 12/16/2020 (S) | $ | 200,000 | | 200,500 |
| CMS Energy Corp. | | | | |
| 4.250%, 09/30/2015 | | 110,000 | | 110,528 |
| 6.250%, 02/01/2020 | | 105,000 | | 110,347 |
| Constellation Energy Group, Inc. | | | | |
| 5.150%, 12/01/2020 | | 560,000 | | 561,316 |
| Consumers Energy Company | | | | |
| 6.000%, 02/15/2014 | | 160,000 | | 175,521 |
| Dominion Resources, Inc. | | | | |
| 2.250%, 09/01/2015 | | 160,000 | | 156,089 |
| Dubai Electricity & Water Authority | | | | |
| 7.375%, 10/21/2020 (S) | | 425,000 | | 398,469 |
| E.CL SA | | | | |
| 5.625%, 01/15/2021 (S) | | 100,000 | | 98,118 |
| E.ON International Finance BV | | | | |
| 5.500%, 01/19/2016 | EUR | 80,000 | | 121,289 |
| 5.750%, 05/07/2020 | | 60,000 | | 93,700 |
| 6.000%, 10/30/2019 | GBP | 50,000 | | 89,076 |
| EDF SA | | | | |
| 6.250%, 01/25/2021 | EUR | 50,000 | | 80,482 |
| 6.875%, 12/12/2022 | GBP | 50,000 | | 94,603 |
| EDP Finance BV | | | | |
| 4.900%, 10/01/2019 (S) | $ | 355,000 | | 323,135 |
| Electricite de France | | | | |
| 4.600%, 01/27/2020 (S) | | 300,000 | | 309,093 |
| Enel Finance International NV | | | | |
| 3.875%, 10/07/2014 (S) | | 250,000 | | 257,792 |
| 6.000%, 10/07/2039 (S) | | 750,000 | | 685,170 |
| Enel SpA | | | | |
| 5.250%, 01/14/2015 | EUR | 105,000 | | 153,812 |
| 6.250%, 06/20/2019 | GBP | 50,000 | | 86,274 |
| Enogex LLC | | | | |
| 6.250%, 03/15/2020 (S) | $ | 175,000 | | 187,873 |
| Exelon Generation Company LLC | | | | |
| 6.250%, 10/01/2039 | | 335,000 | | 334,934 |
| Ferrellgas LP/Ferrellgas Finance Corp. | | | | |
| 6.500%, 05/01/2021 (S) | | 550,000 | | 536,250 |
| FirstEnergy Solutions Corp. | | | | |
| 4.800%, 02/15/2015 | | 560,000 | | 589,100 |
| Florida Gas Transmission Company LLC | | | | |
| 4.000%, 07/15/2015 (S) | | 75,000 | | 76,871 |
| Foresight Energy LLC/Foresight | | | | |
| Energy Corp. | | | | |
| 9.625%, 08/15/2017 (S) | | 425,000 | | 456,875 |
| Gas Natural Capital Markets SA | | | | |
| 4.125%, 01/26/2018 | EUR | 50,000 | | 63,514 |
| 5.250%, 07/09/2014 | | 100,000 | | 142,259 |
| GDF Suez | | | | |
| 5.625%, 01/18/2016 | | 75,000 | | 114,624 |
| Georgia Power Company | | | | |
| 4.750%, 09/01/2040 | $ | 480,000 | | 436,784 |
| Hydro One, Inc. | | | | |
| 5.180%, 10/18/2017 | CAD | 45,000 | | 50,345 |
| Israel Electric Corp., Ltd. | | | | |
| 9.375%, 01/28/2020 | $ | 250,000 | | 302,550 |
| | | | |
| Spectrum Income Fund (continued) | | |
| | | Shares or | | |
| | | Principal | | |
| | | Amount | | Value |
| |
|
| |
| CORPORATE BONDS (continued) | | | | |
| Utilities (continued) | | | | |
| Kentucky Utilities Company | | | | |
| 1.625%, 11/01/2015 (S) | $ | 95,000 | $ | 90,824 |
| Korea Hydro & Nuclear Power | | | | |
| Company, Ltd. | | | | |
| 3.125%, 09/16/2015 (S) | | 200,000 | | 196,194 |
| LG&E and KU Energy LLC | | | | |
| 2.125%, 11/15/2015 (S) | | 350,000 | | 335,427 |
| Majapahit Holding BV | | | | |
| 7.750%, 01/20/2020 | | 550,000 | | 620,125 |
| 8.000%, 08/07/2019 (S) | | 100,000 | | 113,750 |
| Massachusetts Electric Company | | | | |
| 5.900%, 11/15/2039 (S) | | 290,000 | | 306,575 |
| Monongahela Power Company | | | | |
| 5.700%, 03/15/2017 (S) | | 45,000 | | 48,731 |
| National Grid Gas PLC | | | | |
| 6.000%, 06/07/2017 | GBP | 10,000 | | 17,917 |
| National Grid PLC | | | | |
| 5.000%, 07/02/2018 | EUR | 62,000 | | 90,104 |
| 6.500%, 04/22/2014 | | 50,000 | | 75,964 |
| National Power Corp. | | | | |
| 4.563%, 08/23/2011 (P) (S) | $ | 200,000 | | 201,000 |
| 6.875%, 11/02/2016 | | 100,000 | | 114,809 |
| 9.625%, 05/15/2028 | | 135,000 | | 178,200 |
| Nevada Power Company | | | | |
| 6.650%, 04/01/2036 | | 410,000 | | 465,738 |
| 6.750%, 07/01/2037 | | 245,000 | | 278,695 |
| 8.250%, 06/01/2011 | | 250,000 | | 254,616 |
| NiSource Finance Corp. | | | | |
| 6.150%, 03/01/2013 | | 145,000 | | 157,213 |
| 6.250%, 12/15/2040 | | 185,000 | | 190,840 |
| 10.750%, 03/15/2016 | | 185,000 | | 242,212 |
| Northeast Utilities Corp. | | | | |
| 5.650%, 06/01/2013 | | 370,000 | | 400,011 |
| Northern States Power Company | | | | |
| 5.350%, 11/01/2039 | | 60,000 | | 60,871 |
| NRG Energy, Inc. | | | | |
| 7.625%, 01/15/2018 (S) | | 750,000 | | 780,938 |
| 8.250%, 09/01/2020 (S) | | 450,000 | | 473,625 |
| NV Energy, Inc. | | | | |
| 6.250%, 11/15/2020 | | 85,000 | | 86,774 |
| Ohio Power Company | | | | |
| 5.750%, 09/01/2013 | | 195,000 | | 213,016 |
| PacifiCorp | | | | |
| 6.250%, 10/15/2037 | | 100,000 | | 111,148 |
| Pennsylvania Electric Company | | | | |
| 6.150%, 10/01/2038 | | 240,000 | | 238,378 |
| Piedmont Natural Gas Company, Inc. | | | | |
| 6.000%, 12/19/2033 | | 15,000 | | 14,911 |
| PNM Resources, Inc. | | | | |
| 9.250%, 05/15/2015 | | 550,000 | | 617,375 |
| Progress Energy, Inc. | | | | |
| 4.400%, 01/15/2021 | | 460,000 | | 457,504 |
| Public Service Company of Oklahoma | | | | |
| 5.150%, 12/01/2019 | | 205,000 | | 217,299 |
| Public Service Electric & Gas Company | | | | |
| 5.500%, 03/01/2040 | | 155,000 | | 158,382 |
| 5.700%, 12/01/2036 | | 285,000 | | 296,749 |
| RRI Energy, Inc. | | | | |
| 7.875%, 06/15/2017 | | 125,000 | | 125,313 |
| RusHydro Finance, Ltd. | | | | |
| 7.875%, 10/28/2015 | RUB | 7,300,000 | | 248,128 |
| RWE Finance BV | | | | |
| 6.375%, 06/03/2013 | GBP | 30,000 | | 53,183 |
| 6.625%, 01/31/2019 | EUR | 50,000 | | 81,381 |
| |
| The accompanying notes are an integral part of the financial statements. | 261 |
John Hancock Funds II
Portfolio of Investments — February 28, 2011 (Unaudited) (showing percentage of total net assets)
| | | | |
| Spectrum Income Fund (continued) | | |
| | | Shares or | | |
| | | Principal | | |
| | | Amount | | Value |
| |
|
| |
| CORPORATE BONDS (continued) | | | | |
| Utilities (continued) | | | | |
| San Diego Gas & Electric Company | | | | |
| 6.000%, 06/01/2039 | $ | 175,000 | $ | 194,171 |
| Scottish Power UK PLC | | | | |
| 8.375%, 02/20/2017 | GBP | 20,000 | | 39,174 |
| Sempra Energy | | | | |
| 6.000%, 10/15/2039 | $ | 280,000 | | 290,110 |
| Severn Trent Utilities Finance PLC | | | | |
| 5.250%, 03/11/2016 | EUR | 65,000 | | 96,143 |
| Sierra Pacific Power Compnay | | | | |
| 5.450%, 09/01/2013 | $ | 190,000 | | 206,901 |
| Suez Environnement SA | | | | |
| 6.250%, 04/08/2019 | EUR | 100,000 | | 159,519 |
| Tampa Electric Company | | | | |
| 6.150%, 05/15/2037 | $ | 230,000 | | 248,883 |
| Teco Finance, Inc. | | | | |
| 5.150%, 03/15/2020 | | 345,000 | | 357,136 |
| 6.572%, 11/01/2017 | | 37,000 | | 41,975 |
| The AES Corp. | | | | |
| 7.750%, 03/01/2014 | | 50,000 | | 54,375 |
| 9.750%, 04/15/2016 | | 500,000 | | 581,250 |
| United Maritime Group LLC | | | | |
| 11.750%, 06/15/2015 | | 250,000 | | 257,500 |
| Veolia Environnement | | | | |
| 4.875%, 05/28/2013 | EUR | 85,000 | | 123,058 |
| 5.250%, 06/03/2013 | $ | 360,000 | | 386,364 |
| 5.875%, 02/01/2012 | EUR | 30,000 | | 42,870 |
| Virginia Electric and Power Company | | | | |
| 5.100%, 11/30/2012 | $ | 210,000 | | 224,493 |
| West Penn Power Company | | | | |
| 5.950%, 12/15/2017 (S) | | 220,000 | | 244,796 |
| Westar Energy, Inc. | | | | |
| 5.100%, 07/15/2020 | | 185,000 | | 195,309 |
| | |
|
| | | | | 23,641,323 |
|
| TOTAL CORPORATE BONDS (Cost $371,721,225) | | $ | 394,551,748 |
|
| |
| CAPITAL PREFERRED SECURITIES - 0.30% | | | |
| Consumer Staples - 0.04% | | | | |
| Land O’Lakes Capital Trust I | | | | |
| 7.450%, 03/15/2028 (S) | | 450,000 | | 405,563 |
| Financials - 0.26% | | | | |
| BAC Capital Trust VI | | | | |
| 5.625%, 03/08/2035 | | 445,000 | | 385,889 |
| BB&T Capital Trust II | | | | |
| 6.750%, 06/07/2036 | | 180,000 | | 184,168 |
| Capital One Capital IV (6.745% to | | | | |
| 02/17/2032, then 1 month | | | | |
| LIBOR + 1.170%) | | | | |
| 02/17/2037 | | 425,000 | | 425,000 |
| JPMorgan Chase Capital XXVII | | | | |
| 7.000%, 11/01/2039 | | 900,000 | | 942,250 |
| JPMorgan Chase Capital XVIII | | | | |
| 6.950%, 08/17/2036 | | 115,000 | | 120,638 |
| JPMorgan Chase Capital XXII | | | | |
| 6.450%, 02/02/2037 | | 245,000 | | 251,189 |
| The Goldman Sachs Capital I | | | | |
| 6.345%, 02/15/2034 | | 324,000 | | 317,283 |
| USB Capital XIII Trust | | | | |
| 6.625%, 12/15/2039 | | 75,000 | | 78,932 |
| | |
|
| | | | | 2,705,349 |
|
| TOTAL CAPITAL PREFERRED | | | | |
| SECURITIES (Cost $2,970,781) | | | $ | 3,110,912 |
|
| | | | |
| Spectrum Income Fund (continued) | | |
| | | Shares or | | |
| | | Principal | | |
| | | Amount | | Value |
| |
|
| |
| CONVERTIBLE BONDS - 0.02% | | | | |
| Telecommunication Services - 0.02% | | | | |
| Alcatel-Lucent USA, Inc. | | | | |
| 2.875%, 06/15/2025 | $ | 225,000 | $ | 218,813 |
|
| TOTAL CONVERTIBLE BONDS (Cost $146,926) | | $ | 218,813 |
|
| |
| MUNICIPAL BONDS - 0.38% | | | | |
| Arizona - 0.01% | | | | |
| Salt River Project Agricultural | | | | |
| Improvement & Power District | | | | |
| 4.839%, 01/01/2041 | | 155,000 | | 140,050 |
| California - 0.06% | | | | |
| Bay Area Toll Authority | | | | |
| 6.263%, 04/01/2049 | | 200,000 | | 202,348 |
| East Bay Municipal Utility District | | | | |
| 5.874%, 06/01/2040 | | 60,000 | | 60,194 |
| Los Angeles Department of Airports | | | | |
| 7.053%, 05/15/2040 | | 185,000 | | 193,055 |
| San Diego County Water Authority | | | | |
| 6.138%, 05/01/2049 | | 100,000 | | 99,968 |
| | |
|
| | | | | 555,565 |
| Colorado - 0.02% | | | | |
| Regional Transportation District | | | | |
| 5.000%, 11/01/2038 | | 195,000 | | 194,117 |
| District of Columbia - 0.02% | | | | |
| District of Columbia | | | | |
| 5.250%, 12/01/2034 | | 200,000 | | 206,936 |
| 5.591%, 12/01/2034 | | 40,000 | | 39,719 |
| | |
|
| | | | | 246,655 |
| Guam - 0.01% | | | | |
| Guam Power Authority | | | | |
| 7.500%, 10/01/2015 | | 110,000 | | 112,526 |
| Illinois - 0.08% | | | | |
| Chicago Illinois O’Hare International | | | | |
| Airport | | | | |
| 6.395%, 01/01/2040 | | 150,000 | | 144,176 |
| Chicago Illinois Transit Authority, | | | | |
| Series A | | | | |
| 6.899%, 12/01/2040 | | 245,000 | | 236,246 |
| Chicago Metropolitan Water Reclamation | | | | |
| District | | | | |
| 5.720%, 12/01/2038 | | 165,000 | | 164,327 |
| State of Illinois | | | | |
| 4.961%, 03/01/2016 | | 315,000 | | 315,387 |
| | |
|
| | | | | 860,136 |
| Kansas - 0.01% | | | | |
| Kansas Development Finance Authority | | | | |
| 5.501%, 05/01/2034 | | 120,000 | | 113,617 |
| Maryland - 0.01% | | | | |
| Maryland State Transportation Authority | | | | |
| 5.888%, 07/01/2043 | | 125,000 | | 127,695 |
| New York - 0.06% | | | | |
| City of New York | | | | |
| 5.846%, 06/01/2040 | | 95,000 | | 93,370 |
| Metropolitan Transportation Authority | | | | |
| 7.336%, 11/15/2039 | | 55,000 | | 62,755 |
| New York City Housing | | | | |
| Development Corp. | | | | |
| 6.420%, 11/01/2027 | | 100,000 | | 104,593 |
| New York City Municipal Water Finance | | | | |
| Authority | | | | |
| 5.952%, 06/15/2042 | | 95,000 | | 97,064 |
| |
| The accompanying notes are an integral part of the financial statements. | 262 |
John Hancock Funds II
Portfolio of Investments — February 28, 2011 (Unaudited) (showing percentage of total net assets)
| | | | |
| Spectrum Income Fund (continued) | | |
| | | Shares or | | |
| | | Principal | | |
| | | Amount | | Value |
| |
|
| |
| MUNICIPAL BONDS (continued) | | | | |
| New York (continued) | | | | |
| Tompkins County Industrial | | | | |
| Development Agency | | | | |
| 5.000%, 07/01/2037 | $ | 195,000 | $ | 195,854 |
| | | |
|
| | | | | 553,636 |
| Oregon - 0.01% | | | | |
| State of Oregon | | | | |
| 5.892%, 06/01/2027 | | 60,000 | | 63,622 |
| Pennsylvania - 0.03% | | | | |
| Commonwealth of Pennsylvania | | | | |
| 5.000%, 01/01/2018 | | 240,000 | | 258,986 |
| Texas - 0.02% | | | | |
| Texas State Transportation Commission, | | | | |
| Series B | | | | |
| 5.178%, 04/01/2030 | | 190,000 | | 189,945 |
| Utah - 0.01% | | | | |
| Utah Transit Authority | | | | |
| 5.937%, 06/15/2039 | | 135,000 | | 140,037 |
| Virginia - 0.02% | | | | |
| Virginia Commonwealth Transportation | | | | |
| Board | | | | |
| 5.350%, 05/15/2035 | | 35,000 | | 33,443 |
| Virginia Public Building Authority | | | | |
| 5.900%, 08/01/2030 | | 205,000 | | 209,381 |
| | |
|
| | | | | 242,824 |
| West Virginia - 0.01% | | | | |
| Tobacco Settlement Finance Authority | | | | |
| 7.467%, 06/01/2047 | | 67,500 | | 46,798 |
|
| TOTAL MUNICIPAL BONDS (Cost $3,878,437) | | $ | 3,846,209 |
|
| |
| TERM LOANS (M) - 1.82% | | | | |
| Consumer Discretionary - 0.61% | | | | |
| Adesa, Inc. | | | | |
| 3.020%, 10/18/2013 | | 281,551 | | 280,998 |
| Anchor Glass Container Corp. | | | | |
| 6.000%, 03/02/2016 | | 225,562 | | 226,266 |
| CCM Merger, Inc. | | | | |
| - 02/11/2017 (T) | | 350,000 | | 354,266 |
| 8.500%, 07/13/2012 | | 259,486 | | 261,107 |
| Charter Communications Operating LLC | | | | |
| 3.560%, 09/06/2016 | | 150,000 | | 150,352 |
| 7.250%, 03/06/2014 | | 181,976 | | 183,477 |
| Claire’s Stores, Inc. | | | | |
| - 05/29/2014 (T) | | 300,000 | | 292,232 |
| Clear Channel Communications, Inc. | | | | |
| 3.912%, 01/28/2016 | | 530,214 | | 485,411 |
| CSC Holdings, Inc. | | | | |
| 1.010%, 02/24/2012 | | 328,108 | | 326,468 |
| Federal Mogul Corp. | | | | |
| 2.198%, 12/28/2015 | | 83,811 | | 81,389 |
| 2.198%, 12/29/2014 | | 164,270 | | 159,522 |
| Ford Motor Company | | | | |
| 3.020%, 12/16/2013 | | 116,352 | | 116,302 |
| Getty Images, Inc. | | | | |
| 5.250%, 11/07/2016 | | 149,625 | | 151,449 |
| Las Vegas Sands LLC | | | | |
| - 11/23/2016 (T) | | 350,000 | | 348,313 |
| New Customer Service | | | | |
| 9.500%, 03/22/2017 | | 475,000 | | 486,875 |
| OSI Restaurant Partners, Inc. | | | | |
| 2.494%, 06/14/2013 | | 34,060 | | 33,464 |
| 2.625%, 06/14/2014 | | 408,649 | | 401,498 |
| | | | |
| Spectrum Income Fund (continued) | | |
| | | Shares or | | |
| | | Principal | | |
| | | Amount | | Value |
| |
|
| |
| TERM LOANS (M) (continued) | | | | |
| Consumer Discretionary (continued) | | | | |
| Six Flags Theme Parks, Inc. | | | | |
| 5.500%, 06/30/2016 | $ | 341,883 | $ | 344,661 |
| The ServiceMaster Company | | | | |
| 2.760%, 07/24/2014 | | 22,467 | | 22,116 |
| 2.775%, 07/24/2014 | | 225,605 | | 222,080 |
| Univision Communications, Inc. | | | | |
| 4.512%, 03/31/2017 | | 1,075,000 | | 1,048,573 |
| Weather Channel Company | | | | |
| 4.250%, 02/13/2017 | | 225,000 | | 227,081 |
| | |
|
| | | | | 6,203,900 |
| Consumer Staples - 0.02% | | | | |
| Del Monte Corp. | | | | |
| - 02/26/2018 (T) | | 250,000 | | 251,563 |
| Financials - 0.28% | | | | |
| Asurion Corp. | | | | |
| 6.764%, 07/03/2015 | | 308,190 | | 304,723 |
| HUB International Holdings, Inc. | | | | |
| 2.803%, 06/13/2014 | | 198,486 | | 197,692 |
| 2.803%, 06/13/2014 | | 44,616 | | 44,438 |
| International Lease Finance Corp. | | | | |
| 6.750%, 03/17/2015 | | 250,000 | | 251,563 |
| Nuveen Investments, Inc. | | | | |
| 3.304%, 11/13/2014 | | 747,867 | | 725,120 |
| 5.802%, 05/12/2017 | | 810,942 | | 807,901 |
| Pinafore LLC | | | | |
| - 09/29/2016 (T) | | 295,986 | | 297,096 |
| Pinnacle Foods Finance LLC | | | | |
| 2.760%, 04/02/2014 | | 241,549 | | 240,643 |
| | |
|
| | | | | 2,869,176 |
| Health Care - 0.23% | | | | |
| Bausch & Lomb, Inc. | | | | |
| 3.512%, 04/24/2015 | | 47,389 | | 47,448 |
| 3.543%, 04/24/2015 | | 195,171 | | 193,829 |
| Biomet, Inc. | | | | |
| 3.293%, 03/25/2015 | | 200,000 | | 199,781 |
| Community Health Systems, Inc. | | | | |
| - 01/25/2017 (T) | | 250,000 | | 250,545 |
| HCA, Inc. | | | | |
| 1.553%, 11/19/2012 | | 329,981 | | 328,180 |
| 2.553%, 11/18/2013 | | 250,000 | | 249,167 |
| Health Management Associates, Inc. | | | | |
| 2.053%, 02/28/2014 | | 232,127 | | 230,322 |
| IASIS Healthcare LLC | | | | |
| 5.554%, 06/13/2014 | | 662,048 | | 651,841 |
| Warner Chilcott Company LLC | | | | |
| 6.250%, 04/30/2015 | | 248,120 | | 249,826 |
| | |
|
| | | | | 2,400,939 |
| Industrials - 0.08% | | | | |
| AWAS | | | | |
| 7.750%, 06/10/2016 | | 539,000 | | 553,486 |
| DAE Aviation Holdings, Inc. | | | | |
| 5.310%, 07/31/2014 | | 122,052 | | 122,968 |
| 5.310%, 07/31/2014 | | 126,370 | | 127,318 |
| | |
|
| | | | | 803,772 |
| Information Technology - 0.28% | | | | |
| Attachmate Corp. | | | | |
| - 02/25/2017 (T) | | 175,000 | | 173,250 |
| CommScope, Inc. | | | | |
| 5.000%, 01/14/2018 | | 475,000 | | 481,927 |
| Fidelity National Information | | | | |
| Services, Inc. | | | | |
| 5.250%, 07/18/2016 | | 299,250 | | 301,804 |
| |
| The accompanying notes are an integral part of the financial statements. | 263 |
John Hancock Funds II
Portfolio of Investments — February 28, 2011 (Unaudited) (showing percentage of total net assets)
| | | | |
| Spectrum Income Fund (continued) | | |
| | | Shares or | | |
| | | Principal | | |
| | | Amount | | Value |
| |
|
| |
| TERM LOANS (M) (continued) | | | | |
| Information Technology (continued) | | | | |
| First Data Corp. | | | | |
| 3.012%, 09/24/2014 | $ | 355,302 | $ | 336,366 |
| 3.012%, 09/24/2014 | | 1,051,255 | | 995,347 |
| Skype Technologies SA | | | | |
| 7.000%, 02/23/2015 | | 168,438 | | 168,647 |
| Softlayer Technologies, Inc. | | | | |
| 7.250%, 10/15/2016 | | 375,000 | | 378,438 |
| | |
|
| | | | | 2,835,779 |
| Materials - 0.12% | | | | |
| Arizona Chemical, Inc. | | | | |
| 6.750%, 11/21/2016 | | 247,340 | | 249,865 |
| Global Brass and Copper, Inc. | | | | |
| 10.251%, 07/29/2015 | | 349,083 | | 363,047 |
| Novelis, Inc. | | | | |
| 5.250%, 12/19/2016 | | 650,000 | | 657,661 |
| | |
|
| | | | | 1,270,573 |
| Telecommunication Services - 0.16% | | | | |
| Intelsat Jackson Holdings SA | | | | |
| 3.303%, 02/02/2014 | | 250,000 | | 241,875 |
| 5.250%, 04/02/2018 | | 925,000 | | 931,215 |
| Syniverse Technologies, Inc. | | | | |
| 5.250%, 12/21/2017 | | 475,000 | | 479,948 |
| | |
|
| | | | | 1,653,038 |
| Utilities - 0.04% | | | | |
| New Development Holdings, Inc. | | | | |
| 7.000%, 07/03/2017 | | 370,234 | | 373,704 |
|
| TOTAL TERM LOANS (Cost $17,702,923) | | $ | 18,662,444 |
|
| |
| COLLATERALIZED MORTGAGE | | | | |
| OBLIGATIONS - 1.78% | | | | |
| Commercial & Residential - 1.53% | | | | |
| American Tower Trust, | | | | |
| Series 2007-1A, Class D | | | | |
| 5.957%, 04/15/2037 (S) | | 350,000 | | 370,681 |
| Banc of America | | | | |
| Commercial Mortgage, Inc. | | | | |
| Series 2003-1, Class A1, | | | | |
| 3.878%, 09/11/2036 | | 78,117 | | 78,496 |
| Series 2005-3, Class A2, | | | | |
| 4.501%, 07/10/2043 | | 268,030 | | 268,173 |
| Series 2003-1, Class A2, | | | | |
| 4.648%, 09/11/2036 | | 796,000 | | 831,502 |
| Series 2007-1, Class AAB, | | | | |
| 5.422%, 01/15/2049 | | 300,000 | | 315,917 |
| Banc of America Mortgage Securities | | | | |
| Series 2004-A, Class 2A2, | | | | |
| 2.788%, 02/25/2034 (P) | | 87,697 | | 80,817 |
| Series 2004-D, Class 2A2, | | | | |
| 2.956%, 05/25/2034 (P) | | 48,522 | | 45,629 |
| Series 2005-J, Class 2A1, | | | | |
| 3.123%, 11/25/2035 (P) | | 273,089 | | 227,877 |
| Series 2004-H, Class 2A2, | | | | |
| 3.170%, 09/25/2034 (P) | | 116,388 | | 111,728 |
| Series 2004-I, Class 3A2, | | | | |
| 4.807%, 10/25/2034 (P) | | 28,372 | | 27,981 |
| Series 2005-J, Class 3A1, | | | | |
| 5.249%, 11/25/2035 (P) | | 127,077 | | 117,386 |
| Bear Stearns Commercial | | | | |
| Mortgage Securities | | | | |
| Series 2005-PWR9, Class AAB, | | | | |
| 4.804%, 09/11/2042 | | 375,875 | | 391,313 |
| | | | |
| Spectrum Income Fund (continued) | | |
| | | Shares or | | |
| | | Principal | | |
| | | Amount | | Value |
| |
|
| |
| COLLATERALIZED MORTGAGE | | | | |
| OBLIGATIONS (continued) | | | | |
| Commercial & Residential (continued) | | | | |
| Bear Stearns Commercial Mortgage | | | | |
| Securities (continued) | | | | |
| Series 2002-TOP8, Class A2, | | | | |
| 4.830%, 08/15/2038 | $ | 320,000 | $ | 332,243 |
| Series 2005-PWR9, Class A4A, | | | | |
| 4.871%, 09/11/2042 | | 1,170,000 | | 1,243,541 |
| Series 2007-PW15, Class AAB, | | | | |
| 5.315%, 02/11/2044 | | 500,000 | | 525,936 |
| Series 2006-PW3, Class A4, | | | | |
| 5.540%, 09/11/2041 | | 628,000 | | 680,497 |
| Citigroup/Deutsche Bank | | | | |
| Commercial Mortgage Trust | | | | |
| Series 2007-CD4, Class ASB, | | | | |
| 5.278%, 12/11/2049 | | 45,000 | | 46,495 |
| Series 2006-CD3, Class AAB, | | | | |
| 5.608%, 10/15/2048 | | 250,000 | | 265,212 |
| Series 2006-CD3, Class A5, | | | | |
| 5.617%, 10/15/2048 | | 170,000 | | 183,774 |
| Series 2008-LS1, Class A3 | | | | |
| 6.013%, 12/10/2049 (P) | | 1,225,000 | | 1,292,220 |
| Series 2007-C9, Class A4 | | | | |
| 5.815%, 12/10/2049 (P) | | 580,000 | | 633,644 |
| Series 2005-C2, Class A4 | | | | |
| 4.832%, 04/15/2037 | | 575,000 | | 606,278 |
| Series 2001-1, Class A2 | | | | |
| 6.531%, 05/15/2033 | | 68,494 | | 68,442 |
| Series 2001-C2, Class A2 | | | | |
| 6.700%, 04/15/2034 | | 22,624 | | 22,667 |
| Greenwich Capital | | | | |
| Commercial Funding Corp. | | | | |
| Series 2005-GG3, Class A2, | | | | |
| 4.305%, 08/10/2042 | | 143,740 | | 144,576 |
| Series 2005-GG3, Class A3, | | | | |
| 4.569%, 08/10/2042 | | 250,000 | | 256,488 |
| Series 2005-GG3, Class AAB, | | | | |
| 4.619%, 08/10/2042 | | 112,646 | | 116,688 |
| Series 2010, Class C2 | | | | |
| 5.162%, 12/10/2043 (P) (S) | | 665,000 | | 697,961 |
| JPMorgan Chase Commercial | | | | |
| Mortgage Securities Corp. | | | | |
| Series 2010-CNTR, Class A2, | | | | |
| 4.311%, 08/05/2032 (S) | | 165,000 | | 159,380 |
| Series 2005-LDP4, Class ASB, | | | | |
| 4.824%, 10/15/2042 (P) | | 476,336 | | 499,072 |
| Series 2006-LDP9, Class A1, | | | | |
| 5.170%, 05/15/2047 | | 46,938 | | 47,211 |
| Series 2006-CB17, Class A1, | | | | |
| 5.279%, 12/12/2043 | | 85,123 | | 86,094 |
| Series 2006-LDP9, Class A3, | | | | |
| 5.336%, 05/15/2047 | | 290,000 | | 308,204 |
| Series 2007-C1, Class A4, | | | | |
| 5.716%, 02/15/2051 | | 270,000 | | 285,449 |
| LB-UBS Commercial Mortgage Trust | | | | |
| Series 2003-C7, Class A3, | | | | |
| 4.559%, 09/15/2027 (P) | | 475,000 | | 486,177 |
| Series 2005-C1, Class A4, | | | | |
| 4.742%, 02/15/2030 | | 133,000 | | 140,391 |
| Series 2003-C8, Class A3, | | | | |
| 4.830%, 11/15/2027 | | 347,026 | | 358,173 |
| Series 2006-C7, Class A3, | | | | |
| 5.347%, 11/15/2038 | | 311,000 | | 333,158 |
| |
| The accompanying notes are an integral part of the financial statements. | 264 |
John Hancock Funds II
Portfolio of Investments — February 28, 2011 (Unaudited) (showing percentage of total net assets)
| | | | |
| Spectrum Income Fund (continued) | | |
| | | Shares or | | |
| | | Principal | | |
| | | Amount | | Value |
| |
|
| |
| COLLATERALIZED MORTGAGE | | | | |
| OBLIGATIONS (continued) | | | | |
| Commercial & Residential (continued) | | | | |
| LB-UBS Commercial | | | | |
| Mortgage Trust (continued) | | | | |
| Series 2007-C2, Class A3, | | | | |
| 5.430%, 02/15/2040 | $ | 50,000 | $ | 53,360 |
| Series 2007-C1, Class A4 | | | | |
| 5.827%, 06/12/2050 (P) | | 815,000 | | 884,823 |
| Morgan Stanley Capital I | | | | |
| Series 2003-IQ4, Class A2, | | | | |
| 4.070%, 05/15/2040 | | 412,041 | | 425,275 |
| Series 2007-HQ11, Class A4, | | | | |
| 5.447%, 02/12/2044 (P) | | 245,000 | | 260,424 |
| Series 2007-T27, Class A1, | | | | |
| 5.606%, 06/11/2042 | | 296,213 | | 302,875 |
| Series 2006-T23, Class A1, | | | | |
| 5.682%, 08/12/2041 | | 20,055 | | 20,099 |
| Series 2010-H1, Class A1 | | | | |
| 3.750%, 02/25/2040 (P) | | 68,539 | | 70,092 |
| Series 1996-3, Class 4 | | | | |
| 9.600%, 03/15/2025 (P) | | 6,840 | | 7,375 |
| Series 2005-AR12, Class 2A1 | | | | |
| 5.009%, 09/25/2035 (P) | | 65,436 | | 60,754 |
| Series 2005-AR2, Class 2A2 | | | | |
| 2.744%, 03/25/2035 (P) | | 215,243 | | 198,514 |
| Wells Fargo Mortgage | | | | |
| Backed Securities Trust | | | | |
| Series 2003-O, Class 5A1, | | | | |
| 4.855%, 01/25/2034 (P) | | 170,832 | | 173,781 |
| Series 2005-AR2, Class 3A1, | | | | |
| 4.871%, 03/25/2035 (P) | | 113,443 | | 108,833 |
| Series 2006-AR16, Class A1, | | | | |
| 5.468%, 10/25/2036 (P) | | 584,881 | | 477,635 |
| | |
|
| | | | | 15,731,311 |
| U.S. Government Agency - 0.25% | | | | |
| Federal Home Loan Mortgage Corp. | | | | |
| Series 199, Class PO, | | | | |
| 08/01/2028 | | 4,946 | | 4,378 |
| Series 2568, Class KA, | | | | |
| 4.250%, 12/15/2021 | | 53,454 | | 54,163 |
| Series 2003-2614, Class IH IO, | | | | |
| 4.500%, 05/15/2016 | | 25,898 | | 240 |
| Series 2003-2586, Class NJ, | | | | |
| 4.500%, 08/15/2016 | | 32,953 | | 33,362 |
| Series 2003-2627, Class IE IO, | | | | |
| 4.500%, 04/15/2018 | | 14,309 | | 788 |
| Series 2688, Class DE, | | | | |
| 4.500%, 02/15/2020 | | 27,122 | | 27,098 |
| Series 2003-41, Class YV, | | | | |
| 5.500%, 04/25/2014 | | 136,123 | | 143,969 |
| Series 2005-R003, Class VA, | | | | |
| 5.500%, 08/15/2016 | | 332,044 | | 351,401 |
| Series R005, Class AB, | | | | |
| 5.500%, 12/15/2018 | | 156,128 | | 160,104 |
| Series 3354, Class PA, | | | | |
| 5.500%, 07/15/2028 | | 149,421 | | 149,556 |
| Series R006, Class AK, | | | | |
| 5.750%, 12/15/2018 | | 154,194 | | 157,630 |
| Series 2006-3123, Class VB, | | | | |
| 6.000%, 09/15/2013 | | 112,821 | | 114,462 |
| Series 2006-R007, Class VA, | | | | |
| 6.000%, 09/15/2016 | | 122,377 | | 126,537 |
| Series R013, Class AB, | | | | |
| 6.000%, 12/15/2021 | | 49,541 | | 50,816 |
| | | | |
| Spectrum Income Fund (continued) | | |
| | | Shares or | | |
| | | Principal | | |
| | | Amount | | Value |
| |
|
| |
| COLLATERALIZED MORTGAGE | | | | |
| OBLIGATIONS (continued) | | | | |
| U.S. Government Agency (continued) | | | | |
| Federal Home Loan Mortgage Corp. (continued) | | | |
| Series 2006-3195, Class PN, | | | | |
| 6.500%, 08/15/2030 | $ | 147,233 | $ | 148,993 |
| Federal National Mortgage Association | | | | |
| Series 400, Class 2, IO, | | | | |
| 4.500%, 11/25/2039 | | 25,328 | | 6,221 |
| Series 2005-46, Class CN, | | | | |
| 5.000%, 01/25/2020 | | 93,354 | | 95,722 |
| Series 2002-84, Class VA, | | | | |
| 5.500%, 11/25/2013 | | 90,346 | | 94,257 |
| Series 2006-B2, Class AB, | | | | |
| 5.500%, 05/25/2014 | | 50,532 | | 51,028 |
| Series 2006-3136, Class PB, | | | | |
| 6.000%, 01/15/2030 | | 411,000 | | 417,396 |
| Series 319, Class 2 IO, | | | | |
| 6.500%, 02/01/2032 | | 18,449 | | 4,329 |
| Government National | | | | |
| Mortgage Association | | | | |
| Series 1998-6, Class EA PO, | | | | |
| 03/16/2028 | | 20,578 | | 17,492 |
| Series 2004-43, Class A, | | | | |
| 2.822%, 12/16/2019 | | 280,057 | | 281,679 |
| Series 2004-43, Class D, | | | | |
| 4.994%, 03/16/2030 (P) | | 56,000 | | 59,025 |
| | |
|
| | | | | 2,550,646 |
|
| TOTAL COLLATERALIZED MORTGAGE | | | |
| OBLIGATIONS (Cost $17,453,674) | | | $ | 18,281,957 |
|
| |
| ASSET BACKED SECURITIES - 1.48% | | | | |
| Ally Auto Receivables Trust | | | | |
| Series 2010-4, Class A4, | | | | |
| 1.350%, 12/15/2015 | | 445,000 | | 435,856 |
| Series 2010-2, Class A3, | | | | |
| 1.380%, 07/15/2014 | | 240,000 | | 241,363 |
| Ally Master Owner Trust, Series 2011-1 | | | | |
| A2 | | | | |
| 2.150%, 01/15/2016 | | 330,000 | | 329,418 |
| American Express Credit | | | | |
| Account Master Trust | | | | |
| Series 2010-1, Class B, | | | | |
| 0.866%, 11/16/2015 (P) | | 390,000 | | 390,001 |
| Series 2006-2 Class B, | | | | |
| 5.550%, 01/15/2014 | | 175,000 | | 177,546 |
| AmeriCredit Automobile | | | | |
| Receivables Trust, Series 2011-1, | | | | |
| Class C | | | | |
| 2.850%, 08/08/2016 | | 75,000 | | 75,219 |
| AmeriCredit | | | | |
| Automobile Receivables Trust | | | | |
| Series 2010-1, Class C, | | | | |
| 5.190%, 08/17/2015 | | 135,000 | | 144,932 |
| Series 2006-RM, Class A3, | | | | |
| 5.530%, 01/06/2014 | | 514,454 | | 518,513 |
| Bank of America Auto Trust, | | | | |
| Series 2010-1A, Class A2 | | | | |
| 0.750%, 06/15/2012 (S) | | 47,590 | | 47,604 |
| Bank of America Credit Card Trust, | | | | |
| Series 2007-A8, Class A8 | | | | |
| 5.590%, 11/17/2014 | | 290,000 | | 308,420 |
| BankBoston Home Equity Loan Trust, | | | | |
| Series 1998-2, Class A6 | | | | |
| 6.640%, 12/25/2028 (P) | | 30,676 | | 30,003 |
| |
| The accompanying notes are an integral part of the financial statements. | 265 |
John Hancock Funds II
Portfolio of Investments — February 28, 2011 (Unaudited) (showing percentage of total net assets)
| | | | |
| Spectrum Income Fund (continued) | | |
| | | Shares or | | |
| | | Principal | | |
| | | Amount | | Value |
| |
|
| |
| ASSET BACKED SECURITIES (continued) | | | |
| BMW Vehicle Lease Trust, | | | | |
| Series 2009-1, Class A3 | | | | |
| 2.910%, 03/15/2012 | $ | 122,482 | $ | 123,288 |
| Cabela’s Master Credit Card Trust, | | | | |
| Series 2006-3A, Class A2 | | | | |
| 0.316%, 10/15/2014 (P) (S) | | 500,000 | | 498,559 |
| CarMax Auto Owner Trust | | | | |
| Series 2010-2, Class A3, | | | | |
| 1.410%, 02/16/2015 | | 180,000 | | 181,214 |
| Series 2010-3, Class A4, | | | | |
| 1.410%, 02/16/2016 | | 665,000 | | 656,347 |
| Series 2010-2, Class A4, | | | | |
| 2.040%, 10/15/2015 | | 175,000 | | 176,719 |
| CenterPoint Energy Transition Bond | | | | |
| Company LLC, Series 2005-A, | | | | |
| Class A2 | | | | |
| 4.970%, 08/01/2014 | | 66,364 | | 68,556 |
| Chase Funding Mortgage Loan Asset- | | | | |
| Backed Certificates | | | | |
| Series 2002-4, Class 2A1, | | | | |
| 1.002%, 10/25/2032 (P) | | 7,725 | | 6,664 |
| Series 2003-3, Class 1A6, | | | | |
| 3.717%, 10/25/2014 | | 114,377 | | 114,234 |
| Series 2002-2, Class 1M1, | | | | |
| 5.599%, 09/25/2031 | | 19,877 | | 14,258 |
| Chesapeake Funding LLC, | | | | |
| Series 2009-4A, Class C | | | | |
| 2.263%, 09/07/2020 (P) (S) | | 325,000 | | 325,711 |
| Chrysler Financial Lease Trust, | | | | |
| Series 2010-A, Class A2 | | | | |
| 1.780%, 06/15/2011 (S) | | 32,754 | | 32,774 |
| CitiFinancial Auto Issuance Trust, | | | | |
| Series 2009-1, Class A3 | | | | |
| 2.590%, 10/15/2013 (S) | | 326,000 | | 331,016 |
| CNH Equipment Trust | | | | |
| Series 2010-A, Class A4, | | | | |
| 2.490%, 01/15/2016 | | 355,000 | | 362,461 |
| Series 2009-B, Class A3, | | | | |
| 2.970%, 03/15/2013 | | 22,105 | | 22,158 |
| Series 2009-C, Class A4, | | | | |
| 3.000%, 08/17/2015 | | 625,000 | | 644,143 |
| Countrywide Asset-Backed Certificates, | | | | |
| Series 2004-BC1, Class M2 | | | | |
| 1.867%, 01/25/2034 (P) | | 156,562 | | 111,325 |
| Daimler Chrysler Auto Trust, | | | | |
| Series 2008-A, Class A3A | | | | |
| 3.700%, 06/08/2012 | | 20,842 | | 20,878 |
| Discover Card Master Trust | | | | |
| Series 2011-A1, Class A1, | | | | |
| 0.612%, 08/15/2016 (P) | | 345,000 | | 345,000 |
| Series 2009-A2, Class A, | | | | |
| 1.566%, 02/17/2015 (P) | | 545,000 | | 553,667 |
| Ford Credit Auto Owner Trust | | | | |
| Series 2011-A, Class A3, | | | | |
| 0.970%, 01/15/2015 | | 205,000 | | 205,006 |
| Series 2009-E, Class A3, | | | | |
| 1.510%, 01/15/2014 | | 115,000 | | 115,929 |
| Series 2009-E, Class A4, | | | | |
| 2.420%, 11/15/2014 | | 101,000 | | 103,503 |
| Series 2009-D, Class A4, | | | | |
| 2.980%, 08/15/2014 | | 250,000 | | 258,456 |
| Ford Credit Floorplan | | | | |
| Master Owner Trust | | | | |
| Series 2010-5, Class A1, | | | | |
| 1.500%, 09/15/2015 | | 190,000 | | 188,375 |
| | | | |
| Spectrum Income Fund (continued) | | |
| | | Shares or | | |
| | | Principal | | |
| | | Amount | | Value |
| |
|
| |
| ASSET BACKED SECURITIES (continued) | | | |
| Ford Credit Floorplan Master | | | | |
| Owner Trust (continued) | | | | |
| Series 2011-1, Class A1, | | | | |
| 2.120%, 02/15/2016 | $ | 840,000 | $ | 839,966 |
| Series 2010-3, Class A1, | | | | |
| 4.200%, 02/15/2017 (S) | | 225,000 | | 239,357 |
| Series 2010-3, Class C, | | | | |
| 4.990%, 02/15/2017 (S) | | 485,000 | | 509,662 |
| GE Equipment Midticket LLC | | | | |
| Series 2010-1, Class A3, | | | | |
| 0.940%, 07/14/2014 (S) | | 185,000 | | 184,832 |
| Series 2009-1, Class A3, | | | | |
| 2.340%, 06/17/2013 | | 234,218 | | 236,353 |
| GE Equipment Small Ticket LLC, | | | | |
| Series 2011-1, Class A3 | | | | |
| 1.450%, 01/21/2018 (S) | | 260,000 | | 259,827 |
| GS Auto Loan Trust, Series 2007-1, | | | | |
| Class A4 | | | | |
| 5.480%, 12/15/2014 | | 257,659 | | 262,195 |
| Honda Auto Receivables Owner Trust, | | | | |
| Series 2009-2, Class A4 | | | | |
| 4.430%, 07/15/2015 | | 190,000 | | 199,289 |
| Hyundai Auto Receivables Trust | | | | |
| Seriew 2011-A, Class A4, | | | | |
| 1.780%, 12/15/2015 | | 590,000 | | 588,972 |
| Series 2009-A, Class A4, | | | | |
| 3.150%, 03/15/2016 | | 295,000 | | 306,674 |
| John Deere Owner Trust, Series 2009-B, | | | | |
| Class A3 | | | | |
| 1.570%, 10/15/2013 | | 144,297 | | 145,088 |
| John Deere Owner Trust, Series 2009-A, | | | | |
| Class A3 | | | | |
| 2.590%, 10/15/2013 | | 52,416 | | 52,861 |
| JPMorgan Auto Receivables Trust, | | | | |
| Series 2007-A, Class A4 | | | | |
| 5.190%, 02/15/2014 (S) | | 48,718 | | 48,808 |
| JPMorgan Mortgage Acquisition Corp., | | | | |
| Series 2007-CH1, Class AV2 | | | | |
| 0.322%, 11/25/2036 (P) | | 22,899 | | 22,546 |
| Marriott Vacation Club Owner Trust | | | | |
| Series 2006-2A, Class A, | | | | |
| 5.362%, 10/20/2028 (S) | | 78,392 | | 81,344 |
| Series 2006-1A, Class A, | | | | |
| 5.737%, 04/20/2028 (S) | | 249,852 | | 261,101 |
| Series 2006-1A, Class B, | | | | |
| 5.827%, 04/20/2028 (S) | | 11,708 | | 12,119 |
| MBNA Credit Card Master Note Trust, | | | | |
| Series 2006-C3, Class C3 | | | | |
| 0.556%, 10/15/2013 (P) | | 415,000 | | 414,637 |
| Merrill Lynch Mortgage Investors, Inc., | | | | |
| Series 2005-WMC1, Class M1 | | | | |
| 0.762%, 09/25/2035 (P) | | 149,365 | | 138,911 |
| MMAF Equipment Finance LLC, | | | | |
| Series 2009-AA, Class A3 | | | | |
| 2.370%, 11/15/2013 (S) | | 110,000 | | 111,131 |
| Navistar Financial Corp Owner Trust, | | | | |
| Series 2010-B, Class A3 | | | | |
| 1.080%, 03/18/2014 (S) | | 315,000 | | 314,714 |
| Nissan Auto Lease Trust, Series 2009-A, | | | | |
| Class A3 | | | | |
| 2.920%, 12/15/2011 | | 85,510 | | 85,790 |
| PSE&G Transition Funding LLC, | | | | |
| Series 2001-1, Class A6 | | | | |
| 6.610%, 06/15/2015 | | 281,000 | | 302,540 |
| |
| The accompanying notes are an integral part of the financial statements. | 266 |
John Hancock Funds II
Portfolio of Investments — February 28, 2011 (Unaudited) (showing percentage of total net assets)
| | | | |
| Spectrum Income Fund (continued) | | |
| | | Shares or | | |
| | | Principal | | |
| | | Amount | | Value |
| |
|
| |
| ASSET BACKED SECURITIES (continued) | | | |
| Residential Asset Mortgage | | | | |
| Products, Inc., Series 2003-RZ2 | | | | |
| 3.600%, 04/25/2033 | $ | 17,962 | $ | 17,173 |
| SLM Student Loan Trust, Series 2008-4, | | | | |
| Class A2 | | | | |
| 1.353%, 07/25/2016 (P) | | 275,000 | | 278,863 |
| Toyota Auto Receivables Owner Trust, | | | | |
| Series 2010-B, ClassA4 | | | | |
| 1.470%, 01/17/2017 | | 65,000 | | 65,294 |
| Volkswagen Auto Lease Trust, | | | | |
| Series 2009-A, Class A3 | | | | |
| 3.410%, 04/16/2012 | | 274,993 | | 277,091 |
| Volkswagen Auto Loan Enhanced Trust, | | | | |
| Series 2010-1, Class A2 | | | | |
| 0.660%, 05/21/2012 | | 51,186 | | 51,206 |
| World Financial Network Credit | | | | |
| Card Master Trust | | | | |
| Series 2009-B, Class A, | | | | |
| 3.790%, 05/15/2016 | | 85,000 | | 87,957 |
| Series 2010-A, Class A, | | | | |
| 3.960%, 04/15/2019 | | 155,000 | | 160,255 |
| Series 2009-D, Class A, | | | | |
| 4.660%, 05/15/2017 | | 430,000 | | 458,714 |
|
| TOTAL ASSET BACKED SECURITIES (Cost $15,042,408) | $ | 15,174,386 |
|
| |
| COMMON STOCKS - 14.28% | | | | |
| Consumer Discretionary - 2.18% | | | | |
| Bed Bath & Beyond, Inc. (I) (L) | | 21,500 | $ | 1,035,225 |
| Cablevision Systems Corp., Class A | | 31,600 | | 1,164,460 |
| Comcast Corp., Class A | | 32,700 | | 842,352 |
| D.R. Horton, Inc. (L) | | 18,700 | | 221,408 |
| DISH Network Corp. (I) | | 5,100 | | 118,575 |
| Dollar General Corp. (I) | | 8,975 | | 253,544 |
| Ford Motor Company (I) | | 12,050 | | 181,353 |
| Fortune Brands, Inc. | | 32,400 | | 2,004,264 |
| General Motors Company (I) | | 23,000 | | 771,190 |
| Genuine Parts Company | | 13,400 | | 706,046 |
| H&R Block, Inc. (L) | | 22,900 | | 347,851 |
| Harley-Davidson, Inc. (L) | | 19,600 | | 800,072 |
| Home Depot, Inc. | | 59,100 | | 2,214,477 |
| Lakes Gaming, Inc. (I) | | 22,900 | | 61,372 |
| Lear Corp. | | 2,775 | | 293,595 |
| Macy’s, Inc. | | 25,000 | | 597,500 |
| Madison Square Garden, Inc., Class A (I) | | 9,925 | | 283,458 |
| Marriott International, Inc., Class A (L) | | 20,499 | | 803,766 |
| Mattel, Inc. | | 48,300 | | 1,210,398 |
| MGM Resorts International (I) | | 20,100 | | 280,194 |
| The McGraw-Hill Companies, Inc. (L) | | 37,800 | | 1,462,104 |
| The New York Times | | | | |
| Company, Class A (I) (L) | | 47,000 | | 488,800 |
| The Walt Disney Company | | 42,000 | | 1,837,080 |
| Tiffany & Company | | 4,300 | | 264,665 |
| Time Warner, Inc. | | 58,533 | | 2,235,961 |
| Whirlpool Corp. (L) | | 17,700 | | 1,460,250 |
| WPP PLC | | 34,500 | | 474,617 |
| | |
|
| | | | | 22,414,577 |
| Consumer Staples - 0.90% | | | | |
| Archer-Daniels-Midland Company | | 12,800 | | 475,904 |
| Avon Products, Inc. | | 39,400 | | 1,095,714 |
| Campbell Soup Company (L) | | 21,500 | | 723,690 |
| Clorox Company (L) | | 23,500 | | 1,592,360 |
| ConAgra Foods, Inc. (L) | | 35,700 | | 826,812 |
| Kimberly-Clark Corp. | | 22,600 | | 1,489,340 |
| McCormick & | | | | |
| Company, Inc., Class B (L) | | 12,700 | | 605,155 |
| | | | |
| Spectrum Income Fund (continued) | | |
| | | Shares or | | |
| | | Principal | | |
| | | Amount | | Value |
| | |
|
| |
| COMMON STOCKS (continued) | | | | |
| Consumer Staples (continued) | | | | |
| PepsiCo, Inc. | | 7,800 | $ | 494,676 |
| The Hershey Company | | 36,800 | | 1,925,376 |
| | |
|
| | | | | 9,229,027 |
| Energy - 2.07% | | | | |
| Anadarko Petroleum Corp. | | 25,550 | | 2,090,757 |
| Baker Hughes, Inc. (L) | | 9,700 | | 689,185 |
| BP PLC, SADR | | 23,800 | | 1,153,586 |
| Chevron Corp. | | 40,200 | | 4,170,750 |
| Complete | | | | |
| Production Services, Inc. (I) (L) | | 7,950 | | 229,040 |
| ConocoPhillips | | 13,000 | | 1,012,310 |
| Exxon Mobil Corp. | | 41,500 | | 3,549,495 |
| Murphy Oil Corp. | | 28,500 | | 2,095,605 |
| Royal Dutch Shell PLC, ADR | | 39,800 | | 2,875,550 |
| Schlumberger, Ltd. | | 20,300 | | 1,896,426 |
| Spectra Energy Corp. | | 25,100 | | 671,425 |
| Sunoco, Inc. (L) | | 19,700 | | 824,642 |
| | |
|
| | | | | 21,258,771 |
| Financials - 3.04% | | | | |
| American Express Company | | 62,200 | | 2,710,054 |
| Bank of America Corp. | | 169,085 | | 2,416,225 |
| Capital One Financial Corp. | | 19,400 | | 965,538 |
| Chubb Corp. (L) | | 10,600 | | 643,208 |
| CIT Group, Inc. (I) | | 11,400 | | 493,848 |
| General Growth Properties, Inc. (I) | | 23,875 | | 380,090 |
| JPMorgan Chase & Company | | 93,000 | | 4,342,170 |
| KeyCorp | | 61,600 | | 563,024 |
| Legg Mason, Inc. (L) | | 37,500 | | 1,359,375 |
| Lincoln National Corp. (L) | | 34,100 | | 1,081,652 |
| Marsh & McLennan Companies, Inc. | | 52,200 | | 1,588,968 |
| Morgan Stanley | | 17,600 | | 522,368 |
| NYSE Euronext | | 23,900 | | 884,300 |
| PNC Financial Services Group, Inc. | | 9,300 | | 573,810 |
| Regions Financial Corp. | | 76,300 | | 582,932 |
| SLM Corp. (I) | | 64,200 | | 951,444 |
| Sun Life Financial, Inc. (L) | | 27,100 | | 900,804 |
| SunTrust Banks, Inc. | | 35,100 | | 1,058,967 |
| The Allstate Corp. | | 38,300 | | 1,217,174 |
| The Bank of New York Mellon Corp. (L) | | 39,900 | | 1,212,561 |
| TLF Fund Term Asset Backed | | | | |
| Management Fees Company (I) | | 153,095 | | 1,259,974 |
| U.S. Bancorp | | 79,000 | | 2,190,670 |
| Wells Fargo & Company | | 83,000 | | 2,677,580 |
| Weyerhaeuser Company | | 23,589 | | 575,807 |
| | |
|
| | | | | 31,152,543 |
| Health Care - 0.70% | | | | |
| Amgen, Inc. (I) | | 12,000 | | 615,960 |
| Bristol-Myers Squibb Company (L) | | 40,100 | | 1,034,981 |
| Eli Lilly & Company | | 23,800 | | 822,528 |
| Johnson & Johnson | | 30,900 | | 1,898,496 |
| Merck & Company, Inc. | | 37,500 | | 1,221,375 |
| Pfizer, Inc. | | 81,706 | | 1,572,023 |
| | |
|
| | | | | 7,165,363 |
| Industrials - 1.84% | | | | |
| 3M Company (L) | | 25,100 | | 2,314,973 |
| Avery Dennison Corp. | | 21,100 | | 842,312 |
| Cooper Industries PLC | | 17,400 | | 1,119,690 |
| Eaton Corp. | | 3,600 | | 398,808 |
| Emerson Electric Company | | 10,200 | | 608,532 |
| General Electric Company | | 194,300 | | 4,064,756 |
| Honeywell International, Inc. | | 29,300 | | 1,696,763 |
| Illinois Tool Works, Inc. | | 34,100 | | 1,844,810 |
| |
| The accompanying notes are an integral part of the financial statements. | 267 |
John Hancock Funds II
Portfolio of Investments — February 28, 2011 (Unaudited) (showing percentage of total net assets)
| | | | |
| Spectrum Income Fund (continued) | | |
| | | Shares or | | |
| | | Principal | | |
| | | Amount | | Value |
| | |
|
| |
| COMMON STOCKS (continued) | | | | |
| Industrials (continued) | | | | |
| ITT Corp. | | 17,600 | $ | 1,019,568 |
| Lockheed Martin Corp. | | 10,500 | | 831,180 |
| Masco Corp. | | 55,600 | | 755,604 |
| The Boeing Company | | 18,300 | | 1,317,783 |
| United Continental Holdings, Inc. (I) | | 7,325 | | 176,093 |
| United Parcel Service, Inc., Class B (L) | | 20,800 | | 1,535,040 |
| USG Corp. (I) (L) | | 21,700 | | 371,938 |
| | |
|
| | | | | 18,897,850 |
| Information Technology - 0.96% | | | | |
| Analog Devices, Inc. | | 28,900 | | 1,152,532 |
| Applied Materials, Inc. | | 71,500 | | 1,174,745 |
| Cisco Systems, Inc. | | 39,100 | | 725,696 |
| Computer Sciences Corp. (L) | | 28,400 | | 1,366,892 |
| Dell, Inc. (I) | | 43,800 | | 693,354 |
| eBay, Inc. (I) | | 2,300 | | 77,062 |
| Electronic Arts, Inc. (I) (L) | | 27,400 | | 515,120 |
| Harris Corp. | | 23,000 | | 1,073,180 |
| Hewlett-Packard Company (I) | | 27,200 | | 1,186,736 |
| Microsoft Corp. | | 58,800 | | 1,562,904 |
| Texas Instruments, Inc. (L) | | 10,200 | | 363,222 |
| | |
|
| | | | | 9,891,443 |
| Materials - 0.90% | | | | |
| E.I. du Pont de Nemours & Company | | 16,300 | | 894,381 |
| International Flavors | | | | |
| & Fragrances, Inc. (L) | | 17,600 | | 1,002,320 |
| International Paper Company | | 59,500 | | 1,652,910 |
| MeadWestvaco Corp. (L) | | 26,200 | | 768,970 |
| Monsanto Company | | 22,800 | | 1,639,092 |
| Nucor Corp. (L) | | 33,900 | | 1,625,844 |
| Rock-Tenn Company, Class A (L) | | 6,025 | | 413,616 |
| Vulcan Materials Company (L) | | 25,900 | | 1,187,515 |
| | |
|
| | | | | 9,184,648 |
| Telecommunication Services - 0.61% | | | | |
| American Tower Corp., Class A (I) | | 3,850 | | 207,746 |
| AT&T, Inc. | | 89,435 | | 2,538,165 |
| Crown Castle International Corp. (I) | | 4,575 | | 192,836 |
| Qwest | | | | |
| Communications International, Inc. | | 153,700 | | 1,048,234 |
| Sprint Nextel Corp. (I) | | 89,875 | | 392,754 |
| Verizon Communications, Inc. | | 34,300 | | 1,266,356 |
| Vodafone Group PLC | | 202,500 | | 574,595 |
| | |
|
| | | | | 6,220,686 |
| Utilities - 1.08% | | | | |
| CenterPoint Energy, Inc. | | 23,600 | | 374,296 |
| Constellation Energy Group, Inc. | | 29,200 | | 907,244 |
| Duke Energy Corp. (L) | | 40,100 | | 721,399 |
| Entergy Corp. | | 20,900 | | 1,488,080 |
| Exelon Corp. (L) | | 35,600 | | 1,486,656 |
| FirstEnergy Corp. (L) | | 15,500 | | 593,650 |
| NiSource, Inc. (L) | | 69,900 | | 1,339,284 |
| NRG Energy, Inc. (I) | | 13,800 | | 275,862 |
| Pinnacle West Capital Corp. | | 16,700 | | 705,241 |
| PPL Corp. | | 25,400 | | 645,922 |
| Progress Energy, Inc. | | 21,800 | | 996,478 |
| TECO Energy, Inc. (L) | | 16,800 | | 304,248 |
| The AES Corp. (I) | | 21,875 | | 270,594 |
| Xcel Energy, Inc. | | 40,200 | | 962,388 |
| | |
|
| | | | | 11,071,342 |
|
| TOTAL COMMON STOCKS (Cost $124,493,053) | | | $ | 146,486,250 |
|
| | | | |
| Spectrum Income Fund (continued) | | |
| | | Shares or | | |
| | | Principal | | |
| | | Amount | | Value |
| |
|
| |
| PREFERRED SECURITIES - 0.55% | | | | |
| Consumer Discretionary - 0.17% | | | | |
| General Motors Company, Series B, | | | | |
| 4.750% 4.750% | | 24,525 | | 1,247,832 |
| Las Vegas Sands Corp. 10.000% | | 2,500 | | 282,000 |
| Spanish Broadcasting System, Series B, | | | | |
| PIK 10.750% | | | | 240,240 |
| | |
|
| | | | | 1,770,072 |
| Financials - 0.16% | | | | |
| Ally Financial, Inc. 7.000% (S) | | 1,700 | | 1,620,153 |
| Telecommunication Services - 0.22% | | | | |
| Lucent Technologies | | | | |
| Capital Trust I 7.750% | | 2,300 | | 2,246,824 |
|
| TOTAL PREFERRED SECURITIES (Cost $4,928,923) | $ | 5,637,049 |
|
| |
| SECURITIES LENDING COLLATERAL - 2.67% | | |
| John Hancock Collateral | | | | |
| Investment Trust, 0.2855% (W) (Y) | | 2,730,918 | | 27,329,390 |
|
| TOTAL SECURITIES LENDING | | | | |
| COLLATERAL (Cost $27,329,264) | | | $ | 27,329,390 |
|
| |
| SHORT-TERM INVESTMENTS - 4.49% | | | |
| Repurchase Agreement - 0.20% | | | | |
| Repurchase Agreement with State | | | | |
| Street Corp. dated 02/28/2011 at | | | | |
| 0.010% to be repurchased at | | | | |
| $2,036,757 on 03/01/2011, | | | | |
| collateralized by $1,945,000 Federal | | | | |
| Home Loan Mortgage Corp., 5.125% | | | | |
| due 07/15/2012 (valued at $2,076,288, | | | | |
| including interest) and $5,000 | | | | |
| U.S. Treasury Notes, 1.375% due | | | | |
| 05/15/2013 (valued at $5,065, | | | | |
| including interest) | $ | 2,036,757 | $ | 2,036,757 |
| Short-Term Securities* - 4.29% | | | | |
| T. Rowe Price Reserve Fund, 0.2212% | | 44,050,900 | | 44,050,900 |
|
| TOTAL SHORT-TERM INVESTMENTS (Cost $46,087,657) | $ | 46,087,657 |
|
| Total Investments (Spectrum Income Fund) | | | |
| (Cost $1,000,100,454) - 102.89% | | | $ | 1,055,323,447 |
| Other assets and liabilities, net - (2.89%) | | | | (29,623,859) |
| | |
|
| TOTAL NET ASSETS - 100.00% | | | $ | 1,025,699,588 |
| | | |
|
| |
| |
| |
| Total Bond Market Fund | | | | |
| | | Shares or | | |
| | | Principal | | |
| | | Amount | | Value |
| |
|
| |
| U.S. GOVERNMENT & AGENCY | | | | |
| OBLIGATIONS - 59.57% | | | | |
| U.S. Government - 23.29% | | | | |
| U.S. Treasury Bonds | | | | |
| 4.250%, 11/15/2040 | $ | 3,500,000 | $ | 3,356,717 |
| 4.375%, 02/15/2038 | | 2,000 | | 1,974 |
| 5.250%, 02/15/2029 | | 1,875,000 | | 2,122,266 |
| 6.750%, 08/15/2026 | | 700,000 | | 920,282 |
| 7.125%, 02/15/2023 | | 3,100,000 | | 4,131,234 |
| 7.500%, 11/15/2024 | | 400,000 | | 554,938 |
| 8.125%, 08/15/2021 | | 1,300,000 | | 1,835,844 |
| U.S. Treasury Notes | | | | |
| 0.500%, 11/30/2012 to 10/15/2013 | | 11,700,000 | | 11,598,426 |
| 0.625%, 01/31/2013 | | 5,000,000 | | 4,997,460 |
| |
| The accompanying notes are an integral part of the financial statements. | 268 |
John Hancock Funds II
Portfolio of Investments — February 28, 2011 (Unaudited) (showing percentage of total net assets)
| | | | |
| Total Bond Market Fund (continued) | | |
| | | Shares or | | |
| | | Principal | | |
| | | Amount | | Value |
| |
|
| |
| U.S. GOVERNMENT & AGENCY | | | | |
| OBLIGATIONS (continued) | | | | |
| U.S. Government (continued) | | | | |
| U.S. Treasury Notes (continued) | | | | |
| 1.250%, 10/31/2015 (L) | $ | 4,700,000 | $ | 4,545,046 |
| 1.375%, 01/15/2013 | | 8,000,000 | | 8,110,000 |
| 1.875%, 02/28/2014 to 10/31/2017 | | 13,900,000 | | 13,987,288 |
| 2.375%, 02/28/2015 | | 2,200,000 | | 2,260,676 |
| 2.625%, 08/15/2020 | | 1,300,000 | | 1,221,594 |
| 3.375%, 11/15/2019 | | 3,000,000 | | 3,041,016 |
| 3.500%, 05/15/2020 | | 1,500,000 | | 1,524,135 |
| 3.625%, 02/15/2020 | | 800,000 | | 823,625 |
| 3.750%, 11/15/2018 | | 4,968,000 | | 5,242,790 |
| | |
|
| | | | | 70,275,311 |
| U.S. Government Agency - 36.28% | | | | |
| Federal Farm Credit Bank | | | | |
| 3.875%, 10/07/2013 | | 775,000 | | 829,182 |
| 4.875%, 12/16/2015 | | 780,000 | | 873,910 |
| Federal Home Loan Bank | | | | |
| 5.000%, 11/17/2017 | | 1,020,000 | | 1,150,191 |
| 5.500%, 07/15/2036 | | 410,000 | | 449,664 |
| Federal Home Loan Mortgage Corp. | | | | |
| 4.000%, 08/01/2024 to 04/01/2039 | | 2,136,156 | | 2,132,087 |
| 4.500%, 07/01/2023 to 11/01/2039 | | 9,257,217 | | 9,543,841 |
| 5.000%, 07/01/2035 to 07/01/2039 | | 2,258,284 | | 2,372,047 |
| 5.500%, 08/23/2017 to 11/01/2038 | | 8,771,299 | | 9,442,717 |
| 6.000%, 11/01/2036 to 10/01/2038 | | 2,789,045 | | 3,029,564 |
| 6.250%, 07/15/2032 | | 150,000 | | 181,961 |
| 6.500%, 08/01/2038 | | 1,156,995 | | 1,289,249 |
| 6.750%, 09/15/2029 | | 2,100,000 | | 2,646,609 |
| 7.000%, 11/01/2037 | | 499,157 | | 565,005 |
| Federal National Mortgage Association | | | | |
| 2.111%, 01/01/2035 (P) | | 516,401 | | 534,168 |
| 3.752%, 04/01/2036 (P) | | 822,605 | | 854,342 |
| 4.000%, 07/01/2018 to 08/01/2039 | | 7,246,043 | | 7,247,929 |
| 4.500%, 04/01/2018 to 01/01/2040 | | 5,283,701 | | 5,455,534 |
| 4.945%, 07/01/2034 (P) | | 1,330,000 | | 1,409,384 |
| 5.000%, 05/01/2019 to 07/01/2038 | | 6,100,755 | | 6,439,596 |
| 5.286%, 05/01/2036 (P) | | 323,908 | | 342,526 |
| 5.500%, 09/01/2017 to 07/01/2038 | | 12,851,998 | | 13,813,281 |
| 5.566%, 04/01/2037 (P) | | 873,988 | | 925,881 |
| 5.693%, 04/01/2037 (P) | | 561,961 | | 595,328 |
| 6.000%, 07/01/2027 to 08/01/2036 | | 5,201,353 | | 5,678,252 |
| 6.125%, 03/15/2012 | | 500,000 | | 529,346 |
| 6.235%, 10/01/2037 (P) | | 772,969 | | 826,352 |
| 6.500%, 07/01/2031 to 11/01/2037 | | 1,292,349 | | 1,442,847 |
| 6.625%, 11/15/2030 | | 2,000,000 | | 2,509,732 |
| 7.000%, 10/01/2038 | | 885,842 | | 1,006,751 |
| 7.250%, 05/15/2030 | | 150,000 | | 199,224 |
| Government National Mortgage Association | | | | |
| 4.000%, 07/15/2039 | | 453,602 | | 454,955 |
| 4.500%, 06/15/2023 to 11/20/2039 | | 6,161,227 | | 6,384,257 |
| 5.000%, 11/20/2038 to 11/20/2039 | | 5,867,111 | | 6,244,444 |
| 5.500%, 08/15/2023 to 09/20/2039 | | 5,877,326 | | 6,376,238 |
| 6.000%, 07/20/2037 to 10/15/2038 | | 3,370,500 | | 3,707,420 |
| 6.500%, 10/20/2038 | | 822,207 | | 919,371 |
| Tennessee Valley Authority | | | | |
| 6.750%, 11/01/2025 | | 580,000 | | 724,781 |
| The Financing Corp. | | | | |
| 8.600%, 09/26/2019 | | 265,000 | | 364,372 |
| | |
|
| | | | | 109,492,338 |
|
| TOTAL U.S. GOVERNMENT & AGENCY | | | | |
| OBLIGATIONS (Cost $175,039,041) | | | $ | 179,767,649 |
|
| | | | |
| Total Bond Market Fund (continued) | | |
| | | Shares or | | |
| | | Principal | | |
| | | Amount | | Value |
| |
|
| |
| FOREIGN GOVERNMENT | | | | |
| OBLIGATIONS - 2.33% | | | | |
| Austria - 0.13% | | | | |
| Government of Austria | | | | |
| 5.000%, 05/19/2014 (S) | $ | 364,000 | $ | 401,278 |
| Brazil - 0.34% | | | | |
| Federative Republic of Brazil | | | | |
| 6.000%, 01/17/2017 | | 400,000 | | 447,400 |
| 7.125%, 01/20/2037 | | 500,000 | | 590,000 |
| | |
|
| | | | | 1,037,400 |
| Canada - 0.78% | | | | |
| Export Development Canada | | | | |
| 3.500%, 05/16/2013 | | 240,000 | | 253,588 |
| Government of Canada | | | | |
| 2.375%, 09/10/2014 | | 110,000 | | 113,119 |
| 5.000%, 02/15/2012 | | 160,000 | | 167,022 |
| 5.125%, 01/26/2017 | | 245,000 | | 273,320 |
| 5.200%, 02/21/2017 | | 200,000 | | 223,606 |
| 6.500%, 01/15/2026 | | 260,000 | | 316,924 |
| 7.500%, 07/15/2023 | | 200,000 | | 261,237 |
| Hydro-Quebec | | | | |
| 8.400%, 01/15/2022 | | 50,000 | | 68,094 |
| Province of Ontario | | | | |
| 4.500%, 02/03/2015 | | 500,000 | | 545,614 |
| Province of Saskatchewan | | | | |
| 8.000%, 02/01/2013 | | 115,000 | | 129,289 |
| | |
|
| | | | | 2,351,813 |
| Israel - 0.15% | | | | |
| Government of Israel | | | | |
| 5.125%, 03/26/2019 | | 210,000 | | 218,672 |
| 5.500%, 09/18/2023 | | 195,000 | | 218,544 |
| | |
|
| | | | | 437,216 |
| Italy - 0.15% | | | | |
| Republic of Italy | | | | |
| 6.875%, 09/27/2023 | | 415,000 | | 460,140 |
| Japan - 0.07% | | | | |
| Development Bank of Japan | | | | |
| 5.125%, 02/01/2017 | | 100,000 | | 111,584 |
| Japan Finance Corp. Municipal Enterprises | | | | |
| 4.625%, 04/21/2015 | | 100,000 | | 109,429 |
| | |
|
| | | | | 221,013 |
| Mexico - 0.09% | | | | |
| Government of Mexico | | | | |
| 5.950%, 03/19/2019 | | 11,000 | | 12,194 |
| 6.050%, 01/11/2040 | | 240,000 | | 244,800 |
| | |
|
| | | | | 256,994 |
| Norway - 0.07% | | | | |
| Eksportfinans AS | | | | |
| 5.500%, 06/26/2017 | | 200,000 | | 224,000 |
| Panama - 0.04% | | | | |
| Republic of Panama | | | | |
| 6.700%, 01/26/2036 | | 100,000 | | 110,000 |
| Peru - 0.19% | | | | |
| Republic of Peru | | | | |
| 7.125%, 03/30/2019 | | 490,000 | | 581,875 |
| South Africa - 0.12% | | | | |
| Republic of South Africa | | | | |
| 5.500%, 03/09/2020 | | 330,000 | | 347,325 |
| Sweden - 0.20% | | | | |
| Svensk Exportkredit AB | | | | |
| 3.250%, 09/16/2014 | | 400,000 | | 418,465 |
| |
| The accompanying notes are an integral part of the financial statements. | 269 |
John Hancock Funds II
Portfolio of Investments — February 28, 2011 (Unaudited) (showing percentage of total net assets)
| | | | |
| Total Bond Market Fund (continued) | | |
| | | Shares or | | |
| | | Principal | | |
| | | Amount | | Value |
| |
|
| |
| FOREIGN GOVERNMENT | | | | |
| OBLIGATIONS (continued) | | | | |
| Sweden (continued) | | | | |
| Svensk Exportkredit AB (continued) | | | | |
| 4.875%, 09/29/2011 | $ | 165,000 | $ | 169,321 |
| | |
|
| | | | | 587,786 |
|
| TOTAL FOREIGN GOVERNMENT | | | | |
| OBLIGATIONS (Cost $6,790,815) | | | $ | 7,016,840 |
|
| |
| CORPORATE BONDS - 31.47% | | | | |
| Consumer Discretionary - 1.64% | | | | |
| British Sky Broadcasting Group PLC | | | | |
| 9.500%, 11/15/2018 (S) | | 280,000 | | 373,074 |
| CBS Corp. | | | | |
| 8.875%, 05/15/2019 | | 200,000 | | 252,050 |
| Comcast Corp. | | | | |
| 5.700%, 07/01/2019 | | 190,000 | | 206,805 |
| DIRECTV Holdings LLC | | | | |
| 5.200%, 03/15/2020 | | 240,000 | | 247,711 |
| Discovery Communications LLC | | | | |
| 5.625%, 08/15/2019 | | 160,000 | | 174,174 |
| Family Dollar Stores, Inc. | | | | |
| 5.000%, 02/01/2021 | | 165,000 | | 163,088 |
| Grupo Televisa SA | | | | |
| 6.625%, 01/15/2040 | | 160,000 | | 170,192 |
| Hasbro, Inc. | | | | |
| 6.350%, 03/15/2040 | | 120,000 | | 120,313 |
| Home Depot, Inc. | | | | |
| 5.875%, 12/16/2036 | | 190,000 | | 192,641 |
| McDonald’s Corp. | | | | |
| 5.000%, 02/01/2019 | | 145,000 | | 159,281 |
| News America, Inc. | | | | |
| 6.650%, 11/15/2037 | | 335,000 | | 359,093 |
| O’Reilly Automotive, Inc. | | | | |
| 4.875%, 01/14/2021 | | 160,000 | | 158,396 |
| Stanley Black & Decker, Inc. | | | | |
| 6.150%, 10/01/2013 | | 170,000 | | 189,125 |
| Target Corp. | | | | |
| 6.500%, 10/15/2037 | | 220,000 | | 253,046 |
| TCI Communications, Inc. | | | | |
| 7.125%, 02/15/2028 | | 308,000 | | 345,589 |
| The Walt Disney Company | | | | |
| 5.625%, 09/15/2016 | | 250,000 | | 286,086 |
| Time Warner Cable, Inc. | | | | |
| 4.125%, 02/15/2021 | | 100,000 | | 93,742 |
| Time Warner Entertainment Company LP | | | | |
| 8.375%, 07/15/2033 | | 200,000 | | 248,249 |
| Time Warner, Inc. | | | | |
| 7.625%, 04/15/2031 | | 120,000 | | 141,793 |
| Toll Brothers Finance Corp. | | | | |
| 6.750%, 11/01/2019 | | 100,000 | | 104,998 |
| Viacom, Inc. | | | | |
| 4.250%, 09/15/2015 | | 100,000 | | 104,686 |
| 6.250%, 04/30/2016 | | 345,000 | | 395,836 |
| Vivendi SA | | | | |
| 5.750%, 04/04/2013 (S) | | 102,000 | | 110,019 |
| Yum! Brands, Inc. | | | | |
| 6.250%, 03/15/2018 | | 95,000 | | 107,291 |
| | |
|
| | | | | 4,957,278 |
| Consumer Staples - 2.85% | | | | |
| Altria Group, Inc. | | | | |
| 8.500%, 11/10/2013 | | 255,000 | | 300,437 |
| 9.250%, 08/06/2019 | | 425,000 | | 551,676 |
| Anheuser-Busch InBev Worldwide, Inc. | | | | |
| 6.875%, 11/15/2019 (S) | | 300,000 | | 356,510 |
| | | | |
| Total Bond Market Fund (continued) | | |
| | | Shares or | | |
| | | Principal | | |
| | | Amount | | Value |
| |
|
| |
| CORPORATE BONDS (continued) | | | | |
| Consumer Staples (continued) | | | | |
| Anheuser-Busch InBev | | | | |
| Worldwide, Inc. (continued) | | | | |
| 7.750%, 01/15/2019 (S) | $ | 290,000 | $ | 359,330 |
| Bottling Group LLC | | | | |
| 5.125%, 01/15/2019 | | 290,000 | | 317,660 |
| Brown-Forman Corp. | | | | |
| 2.500%, 01/15/2016 | | 150,000 | | 148,095 |
| 5.000%, 02/01/2014 | | 290,000 | | 316,308 |
| Cargill, Inc. | | | | |
| 7.350%, 03/06/2019 (S) | | 250,000 | | 301,763 |
| Clorox Company | | | | |
| 5.950%, 10/15/2017 | | 260,000 | | 290,488 |
| ConAgra Foods, Inc. | | | | |
| 5.819%, 06/15/2017 | | 25,000 | | 26,994 |
| 9.750%, 03/01/2021 | | 140,000 | | 186,564 |
| CVS Caremark Corp. | | | | |
| 6.125%, 08/15/2016 | | 305,000 | | 345,996 |
| 6.600%, 03/15/2019 | | 300,000 | | 347,550 |
| CVS Pass-Through Trust | | | | |
| 8.353%, 07/10/2031 (S) | | 165,386 | | 200,036 |
| Diageo Capital PLC | | | | |
| 4.828%, 07/15/2020 | | 240,000 | | 250,519 |
| General Mills, Inc. | | | | |
| 5.650%, 02/15/2019 | | 215,000 | | 238,783 |
| Kellogg Company | | | | |
| 4.150%, 11/15/2019 | | 100,000 | | 101,015 |
| Kimberly-Clark Corp. | | | | |
| 7.500%, 11/01/2018 | | 240,000 | | 299,903 |
| Kraft Foods, Inc. | | | | |
| 6.125%, 02/01/2018 | | 330,000 | | 370,813 |
| 6.875%, 02/01/2038 | | 120,000 | | 134,621 |
| Mead Johnson Nutrition Company | | | | |
| 4.900%, 11/01/2019 | | 100,000 | | 104,148 |
| PepsiCo, Inc. | | | | |
| 5.500%, 01/15/2040 | | 230,000 | | 240,238 |
| 7.900%, 11/01/2018 | | 42,000 | | 53,245 |
| Philip Morris International, Inc. | | | | |
| 6.875%, 03/17/2014 | | 270,000 | | 310,864 |
| SABMiller PLC | | | | |
| 6.500%, 07/15/2018 (S) | | 200,000 | | 232,132 |
| Safeway, Inc. | | | | |
| 6.350%, 08/15/2017 | | 155,000 | | 172,659 |
| Sysco Corp. | | | | |
| 5.375%, 03/17/2019 | | 150,000 | | 164,918 |
| Tate & Lyle International Finance PLC | | | | |
| 5.000%, 11/15/2014 (S) | | 260,000 | | 269,896 |
| Tesco PLC | | | | |
| 6.150%, 11/15/2037 (S) | | 82,000 | | 90,252 |
| The Coca-Cola Company | | | | |
| 3.150%, 11/15/2020 | | 150,000 | | 139,827 |
| The Kroger Company | | | | |
| 3.900%, 10/01/2015 | | 100,000 | | 103,908 |
| 6.400%, 08/15/2017 | | 210,000 | | 240,950 |
| Wal-Mart Stores, Inc. | | | | |
| 4.125%, 02/01/2019 | | 265,000 | | 272,566 |
| 6.200%, 04/15/2038 | | 386,000 | | 429,674 |
| Walgreen Company | | | | |
| 5.250%, 01/15/2019 | | 290,000 | | 319,489 |
| | |
|
| | | | | 8,589,827 |
| Energy - 4.41% | | | | |
| Apache Corp. | | | | |
| 6.000%, 09/15/2013 | | 200,000 | | 222,094 |
| Boardwalk Pipelines LP | | | | |
| 5.750%, 09/15/2019 | | 160,000 | | 171,928 |
| |
| The accompanying notes are an integral part of the financial statements. | 270 |
John Hancock Funds II
Portfolio of Investments — February 28, 2011 (Unaudited) (showing percentage of total net assets)
| | | | |
| Total Bond Market Fund (continued) | | |
| | | Shares or | | |
| | | Principal | | |
| | | Amount | | Value |
| |
|
| |
| CORPORATE BONDS (continued) | | | | |
| Energy (continued) | | | | |
| BP Capital Markets PLC | | | | |
| 5.250%, 11/07/2013 | $ | 220,000 | $ | 238,851 |
| Cameron International Corp. | | | | |
| 7.000%, 07/15/2038 | | 100,000 | | 115,591 |
| Canadian Natural Resources, Ltd. | | | | |
| 6.250%, 03/15/2038 | | 200,000 | | 216,203 |
| Cenovus Energy, Inc. | | | | |
| 5.700%, 10/15/2019 | | 100,000 | | 111,527 |
| Chevron Corp. | | | | |
| 4.950%, 03/03/2019 | | 215,000 | | 239,765 |
| CNOOC Finance 2011, Ltd. | | | | |
| 4.250%, 01/26/2021 (S) | | 200,000 | | 195,285 |
| ConocoPhillips | | | | |
| 5.750%, 02/01/2019 | | 270,000 | | 305,869 |
| DCP Midstream LLC | | | | |
| 9.700%, 12/01/2013 (S) | | 270,000 | | 320,140 |
| Devon Financing Corp. | | | | |
| 6.875%, 09/30/2011 | | 240,000 | | 248,628 |
| 7.875%, 09/30/2031 | | 120,000 | | 154,489 |
| Enbridge Energy Partners LP | | | | |
| 9.875%, 03/01/2019 | | 345,000 | | 458,271 |
| Energy Transfer Partners LP | | | | |
| 6.700%, 07/01/2018 | | 250,000 | | 284,956 |
| Enterprise Products Operating LLC | | | | |
| 6.650%, 04/15/2018 | | 110,000 | | 126,217 |
| 6.875%, 03/01/2033 | | 163,000 | | 179,235 |
| 9.750%, 01/31/2014 | | 175,000 | | 210,885 |
| EOG Resources, Inc. | | | | |
| 4.100%, 02/01/2021 | | 150,000 | | 145,030 |
| GlobalSantaFe Corp. | | | | |
| 5.000%, 02/15/2013 | | 275,000 | | 289,680 |
| Hess Corp. | | | | |
| 8.125%, 02/15/2019 | | 210,000 | | 263,585 |
| Kerr-McGee Corp. | | | | |
| 6.950%, 07/01/2024 | | 300,000 | | 336,145 |
| Kinder Morgan Energy Partners LP | | | | |
| 5.625%, 02/15/2015 | | 110,000 | | 121,516 |
| 5.850%, 09/15/2012 | | 225,000 | | 240,576 |
| 6.500%, 09/01/2039 | | 130,000 | | 132,899 |
| 7.300%, 08/15/2033 | | 30,000 | | 33,268 |
| 9.000%, 02/01/2019 | | 175,000 | | 222,137 |
| Magellan Midstream Partners LP | | | | |
| 6.550%, 07/15/2019 | | 150,000 | | 171,232 |
| Marathon Oil Corp. | | | | |
| 6.000%, 10/01/2017 | | 93,000 | | 106,155 |
| MidAmerican Energy Holdings Company | | | | |
| 8.480%, 09/15/2028 | | 365,000 | | 471,702 |
| Nabors Industries, Inc. | | | | |
| 9.250%, 01/15/2019 | | 290,000 | | 363,623 |
| Nexen, Inc. | | | | |
| 6.200%, 07/30/2019 | | 380,000 | | 406,450 |
| Noble Holding International, Ltd. | | | | |
| 6.050%, 03/01/2041 | | 170,000 | | 172,102 |
| 7.375%, 03/15/2014 | | 240,000 | | 275,000 |
| Occidental Petroleum Corp. | | | | |
| 4.100%, 02/01/2021 | | 150,000 | | 148,306 |
| Pemex Project Funding Master Trust | | | | |
| 6.625%, 06/15/2035 | | 120,000 | | 119,611 |
| 7.375%, 12/15/2014 | | 180,000 | | 206,510 |
| Petro-Canada | | | | |
| 5.950%, 05/15/2035 | | 190,000 | | 191,907 |
| 6.050%, 05/15/2018 | | 325,000 | | 368,737 |
| Petrobras International Finance Company | | | | |
| 8.375%, 12/10/2018 | | 415,000 | | 503,079 |
| | | | |
| Total Bond Market Fund (continued) | | |
| | | Shares or | | |
| | | Principal | | |
| | | Amount | | Value |
| |
|
| |
| CORPORATE BONDS (continued) | | | | |
| Energy (continued) | | | | |
| Petroleos Mexicanos | | | | |
| 4.875%, 03/15/2015 | $ | 300,000 | $ | 316,650 |
| Plains All American Pipeline LP | | | | |
| 8.750%, 05/01/2019 | | 190,000 | | 238,409 |
| Rockies Express Pipeline LLC | | | | |
| 3.900%, 04/15/2015 (S) | | 220,000 | | 218,917 |
| San Diego Gas & Electric Company, | | | | |
| Series FFF | | | | |
| 6.125%, 09/15/2037 | | 160,000 | | 179,896 |
| Shell International Finance BV | | | | |
| 6.375%, 12/15/2038 | | 265,000 | | 302,309 |
| Talisman Energy, Inc. | | | | |
| 3.750%, 02/01/2021 | | 160,000 | | 149,049 |
| 6.250%, 02/01/2038 | | 155,000 | | 163,538 |
| Texas Eastern Transmission LP | | | | |
| 6.000%, 09/15/2017 (S) | | 70,000 | | 78,016 |
| The Williams Companies, Inc. | | | | |
| 7.875%, 09/01/2021 | | 330,000 | | 412,337 |
| Tosco Corp. | | | | |
| 8.125%, 02/15/2030 | | 285,000 | | 366,397 |
| Total Capital SA | | | | |
| 3.125%, 10/02/2015 | | 100,000 | | 102,326 |
| 4.125%, 01/28/2021 | | 130,000 | | 128,921 |
| 4.250%, 12/15/2021 | | 230,000 | | 231,612 |
| TransCanada PipeLines, Ltd. | | | | |
| 5.850%, 03/15/2036 | | 200,000 | | 205,292 |
| Valero Energy Corp. | | | | |
| 6.125%, 06/15/2017 | | 275,000 | | 305,078 |
| 7.500%, 04/15/2032 | | 71,000 | | 79,086 |
| Weatherford International, Ltd. | | | | |
| 5.500%, 02/15/2016 | | 215,000 | | 233,874 |
| 6.000%, 03/15/2018 | | 178,000 | | 195,036 |
| Williams Partners LP | | | | |
| 5.250%, 03/15/2020 | | 310,000 | | 322,705 |
| | |
|
| | | | | 13,318,632 |
| Financials - 11.85% | | | | |
| AEGON Funding Company LLC | | | | |
| 5.750%, 12/15/2020 | | 145,000 | | 149,478 |
| African Development Bank | | | | |
| 6.875%, 10/15/2015 | | 105,000 | | 123,092 |
| Allied World Assurance Holdings, Ltd. | | | | |
| 7.500%, 08/01/2016 | | 320,000 | | 358,726 |
| American Express Bank FSB | | | | |
| 3.150%, 12/09/2011 | | 205,000 | | 209,492 |
| 6.000%, 09/13/2017 | | 405,000 | | 450,235 |
| American Express Company | | | | |
| 8.125%, 05/20/2019 | | 250,000 | | 312,391 |
| American Express Credit Corp., Series C | | | | |
| 7.300%, 08/20/2013 | | 240,000 | | 270,269 |
| American International Group, Inc. | | | | |
| 5.450%, 05/18/2017 | | 480,000 | | 499,862 |
| Asian Development Bank | | | | |
| 5.593%, 07/16/2018 | | 405,000 | | 461,544 |
| AXA SA | | | | |
| 8.600%, 12/15/2030 | | 140,000 | | 165,268 |
| Bank of America Corp. | | | | |
| 3.125%, 06/15/2012 | | 350,000 | | 361,664 |
| 4.500%, 04/01/2015 | | 120,000 | | 125,390 |
| 5.420%, 03/15/2017 | | 300,000 | | 307,359 |
| 6.500%, 08/01/2016 | | 200,000 | | 224,466 |
| Barclays Bank PLC | | | | |
| 5.125%, 01/08/2020 | | 340,000 | | 347,057 |
| 5.450%, 09/12/2012 | | 290,000 | | 308,312 |
| |
| The accompanying notes are an integral part of the financial statements. | 271 |
John Hancock Funds II
Portfolio of Investments — February 28, 2011 (Unaudited) (showing percentage of total net assets)
| | | | |
| Total Bond Market Fund (continued) | | |
| | | Shares or | | |
| | | Principal | | |
| | | Amount | | Value |
| |
|
| |
| CORPORATE BONDS (continued) | | | | |
| Financials (continued) | | | | |
| BB&T Corp. | | | | |
| 5.200%, 12/23/2015 | $ | 290,000 | $ | 312,099 |
| Berkshire Hathaway Finance Corp. | | | | |
| 5.400%, 05/15/2018 | | 290,000 | | 321,059 |
| BNP Paribas | | | | |
| 3.250%, 03/11/2015 | | 320,000 | | 322,903 |
| Boston Properties LP | | | | |
| 4.125%, 05/15/2021 | | 160,000 | | 153,172 |
| Capital One Bank USA NA | | | | |
| 8.800%, 07/15/2019 | | 350,000 | | 441,775 |
| Capital One Financial Corp. | | | | |
| 5.700%, 09/15/2011 | | 250,000 | | 256,600 |
| 7.375%, 05/23/2014 | | 290,000 | | 334,210 |
| Chubb Corp. | | | | |
| 5.750%, 05/15/2018 | | 100,000 | | 112,078 |
| Citigroup Funding, Inc. | | | | |
| 1.875%, 11/15/2012 | | 205,000 | | 209,099 |
| Citigroup, Inc. | | | | |
| 2.875%, 12/09/2011 | | 210,000 | | 214,143 |
| 5.500%, 04/11/2013 | | 345,000 | | 369,840 |
| 5.875%, 05/29/2037 | | 250,000 | | 245,221 |
| 6.125%, 11/21/2017 | | 433,000 | | 477,675 |
| 8.500%, 05/22/2019 | | 190,000 | | 235,608 |
| CNA Financial Corp. | | | | |
| 7.350%, 11/15/2019 | | 210,000 | | 239,295 |
| Credit Suisse AG | | | | |
| 5.400%, 01/14/2020 | | 230,000 | | 232,871 |
| Credit Suisse Guernsey, Ltd. (5.860% to | | | | |
| 05/01/2017, then 3 month LIBOR + 1.690%) | | | |
| (Q) | | 290,000 | | 280,213 |
| Deutsche Bank AG | | | | |
| 3.450%, 03/30/2015 | | 440,000 | | 450,202 |
| 3.875%, 08/18/2014 | | 380,000 | | 397,767 |
| Discover Financial Services | | | | |
| 10.250%, 07/15/2019 | | 100,000 | | 129,475 |
| Dresdner Bank AG | | | | |
| 7.250%, 09/15/2015 | | 220,000 | | 241,457 |
| Duke Realty LP | | | | |
| 5.950%, 02/15/2017 | | 72,000 | | 77,135 |
| ERAC USA Finance LLC | | | | |
| 5.250%, 10/01/2020 (S) | | 210,000 | | 216,522 |
| European Investment Bank | | | | |
| 2.375%, 03/14/2014 | | 570,000 | | 586,021 |
| 4.625%, 05/15/2014 to 10/20/2015 | | 824,000 | | 905,667 |
| Fifth Third Bancorp | | | | |
| 5.450%, 01/15/2017 | | 295,000 | | 308,917 |
| FIH Erhvervsbank A/S | | | | |
| 2.450%, 08/17/2012 (S) | | 210,000 | | 214,241 |
| First Horizon National Corp. | | | | |
| 5.375%, 12/15/2015 | | 150,000 | | 156,394 |
| FleetBoston Financial Corp. | | | | |
| 6.700%, 07/15/2028 | | 317,000 | | 324,753 |
| General Electric Capital Corp. | | | | |
| 2.200%, 06/08/2012 | | 290,000 | | 296,312 |
| 3.000%, 12/09/2011 | | 350,000 | | 357,267 |
| 6.000%, 08/07/2019 | | 150,000 | | 165,747 |
| 6.875%, 01/10/2039 | | 290,000 | | 328,405 |
| Harley-Davidson Funding Corp. | | | | |
| 5.750%, 12/15/2014 (S) | | 200,000 | | 212,783 |
| Hartford Financial Services Group, Inc. | | | | |
| 4.000%, 03/30/2015 | | 220,000 | | 222,556 |
| 5.950%, 10/15/2036 | | 135,000 | | 128,527 |
| Health Care REIT, Inc. | | | | |
| 4.950%, 01/15/2021 | | 160,000 | | 156,257 |
| | | | |
| Total Bond Market Fund (continued) | | |
| | | Shares or | | |
| | | Principal | | |
| | | Amount | | Value |
| |
|
| |
| CORPORATE BONDS (continued) | | | | |
| Financials (continued) | | | | |
| Hospitality Properties Trust | | | | |
| 7.875%, 08/15/2014 | $ | 180,000 | $ | 202,376 |
| Inter-American Development Bank | | | | |
| 7.000%, 06/15/2025 | | 175,000 | | 214,682 |
| International Bank for Reconstruction | | | | |
| & Development | | | | |
| 3.625%, 05/21/2013 | | 200,000 | | 211,394 |
| 8.625%, 10/15/2016 | | 285,000 | | 369,926 |
| International Finance Corp. | | | | |
| 3.500%, 05/15/2013 | | 155,000 | | 163,635 |
| John Deere Capital Corp. | | | | |
| 5.250%, 10/01/2012 | | 280,000 | | 299,254 |
| JPMorgan Chase & Company | | | | |
| 3.125%, 12/01/2011 | | 350,000 | | 357,363 |
| 4.750%, 05/01/2013 | | 350,000 | | 374,009 |
| 6.400%, 05/15/2038 | | 500,000 | | 555,474 |
| KeyCorp | | | | |
| 6.500%, 05/14/2013 | | 305,000 | | 334,056 |
| Kimco Realty Corp. | | | | |
| 6.875%, 10/01/2019 | | 190,000 | | 221,611 |
| Kreditanstalt fuer Wiederaufbau | | | | |
| 3.250%, 03/15/2013 | | 780,000 | | 817,364 |
| 5.125%, 03/14/2016 | | 450,000 | | 506,575 |
| Landwirtschaftliche Rentenbank | | | | |
| 5.125%, 02/01/2017 | | 210,000 | | 235,670 |
| Lincoln National Corp. | | | | |
| 5.650%, 08/27/2012 | | 145,000 | | 153,521 |
| Lincoln National Corp. (7.000% to 5/17/2016, | | | |
| then 3 month LIBOR + 2.358%) | | | | |
| 05/17/2066 | | 30,000 | | 29,850 |
| Marsh & McLennan Companies, Inc. | | | | |
| 5.750%, 09/15/2015 | | 290,000 | | 313,718 |
| MBNA Corp. | | | | |
| 5.000%, 06/15/2015 | | 400,000 | | 416,464 |
| Merrill Lynch & Company, Inc. | | | | |
| 6.875%, 04/25/2018 to 11/15/2018 | | 585,000 | | 658,293 |
| 7.750%, 05/14/2038 | | 345,000 | | 390,858 |
| Morgan Stanley | | | | |
| 2.250%, 03/13/2012 | | 200,000 | | 203,767 |
| 3.250%, 12/01/2011 | | 350,000 | | 357,768 |
| 7.300%, 05/13/2019 | | 490,000 | | 558,030 |
| National Rural Utilities Cooperative | | | | |
| Finance Corp. | | | | |
| 10.375%, 11/01/2018 | | 200,000 | | 274,343 |
| Nomura Holdings, Inc. | | | | |
| 4.125%, 01/19/2016 | | 320,000 | | 318,618 |
| Nordic Investment Bank | | | | |
| 2.375%, 12/15/2011 | | 355,000 | | 360,339 |
| Oesterreichische Kontrollbank AG | | | | |
| 4.875%, 02/16/2016 | | 329,000 | | 362,555 |
| PartnerRe Finance B LLC | | | | |
| 5.500%, 06/01/2020 | | 220,000 | | 225,621 |
| PNC Funding Corp. | | | | |
| 2.300%, 06/22/2012 | | 345,000 | | 353,457 |
| 4.250%, 09/21/2015 | | 130,000 | | 136,717 |
| 5.625%, 02/01/2017 | | 200,000 | | 215,427 |
| 6.700%, 06/10/2019 | | 190,000 | | 221,148 |
| ProLogis | | | | |
| 5.625%, 11/15/2016 | | 60,000 | | 64,380 |
| 7.625%, 08/15/2014 | | 410,000 | | 471,959 |
| Prudential Financial, Inc. | | | | |
| 3.875%, 01/14/2015 | | 110,000 | | 114,361 |
| 4.750%, 04/01/2014 to 09/17/2015 | | 490,000 | | 520,159 |
| 5.375%, 06/21/2020 | | 210,000 | | 221,558 |
| |
| The accompanying notes are an integral part of the financial statements. | 272 |
John Hancock Funds II
Portfolio of Investments — February 28, 2011 (Unaudited) (showing percentage of total net assets)
| | | | |
| Total Bond Market Fund (continued) | | |
| | | Shares or | | |
| | | Principal | | |
| | | Amount | | Value |
| |
|
| |
| CORPORATE BONDS (continued) | | | | |
| Financials (continued) | | | | |
| Realty Income Corp. | | | | |
| 5.950%, 09/15/2016 | $ | 135,000 | $ | 147,487 |
| Senior Housing Properties Trust | | | | |
| 4.300%, 01/15/2016 | | 320,000 | | 317,174 |
| Simon Property Group LP | | | | |
| 5.650%, 02/01/2020 | | 350,000 | | 381,142 |
| 5.875%, 03/01/2017 | | 86,000 | | 96,163 |
| SLM Corp. | | | | |
| 8.000%, 03/25/2020 | | 310,000 | | 328,988 |
| State Street Corp. | | | | |
| 2.150%, 04/30/2012 | | 215,000 | | 219,289 |
| SunTrust Banks, Inc. | | | | |
| 6.000%, 09/11/2017 | | 290,000 | | 311,839 |
| The Allstate Corp. | | | | |
| 5.950%, 04/01/2036 | | 270,000 | | 285,169 |
| The Bank of New York Mellon Corp. | | | | |
| 4.500%, 04/01/2013 | | 435,000 | | 464,686 |
| The Goldman Sachs Group, Inc. | | | | |
| 3.250%, 06/15/2012 | | 315,000 | | 326,042 |
| 6.125%, 02/15/2033 | | 345,000 | | 357,064 |
| 7.500%, 02/15/2019 | | 360,000 | | 424,083 |
| The Royal Bank of Scotland Group PLC | | | | |
| 4.875%, 03/16/2015 | | 120,000 | | 124,406 |
| 5.000%, 11/12/2013 | | 300,000 | | 299,247 |
| The Travelers Companies, Inc. | | | | |
| 5.500%, 12/01/2015 | | 190,000 | | 211,422 |
| 5.900%, 06/02/2019 | | 190,000 | | 211,428 |
| 6.250%, 06/20/2016 | | 190,000 | | 217,264 |
| U.S. Bank NA | | | | |
| 6.375%, 08/01/2011 | | 200,000 | | 204,883 |
| U.S. Bank NA (3.778% to 04/29/2015 then | | | | |
| 3 month LIBOR + 2.003%) | | | | |
| 04/29/2020 | | 250,000 | | 255,642 |
| Union Bank NA | | | | |
| 5.950%, 05/11/2016 | | 250,000 | | 271,431 |
| Unitrin, Inc. | | | | |
| 6.000%, 11/30/2015 | | 200,000 | | 206,305 |
| US Central Federal Credit Union | | | | |
| 1.900%, 10/19/2012 | | 200,000 | | 204,046 |
| Vornado Realty LP | | | | |
| 4.250%, 04/01/2015 | | 220,000 | | 225,870 |
| WEA Finance LLC/WT Finance | | | | |
| Australia Pty, Ltd. | | | | |
| 7.500%, 06/02/2014 (S) | | 390,000 | | 445,658 |
| Wells Fargo & Company | | | | |
| 3.000%, 12/09/2011 | | 350,000 | | 357,240 |
| 3.625%, 04/15/2015 | | 220,000 | | 227,904 |
| 5.000%, 11/15/2014 | | 290,000 | | 313,625 |
| Wells Fargo Bank NA | | | | |
| 5.950%, 08/26/2036 | | 485,000 | | 507,895 |
| Westpac Banking Corp. | | | | |
| 3.000%, 12/09/2015 | | 230,000 | | 229,052 |
| Willis North America, Inc. | | | | |
| 7.000%, 09/29/2019 | | 150,000 | | 164,463 |
| Xstrata Finance Canada, Ltd. | | | | |
| 5.800%, 11/15/2016 (S) | | 290,000 | | 322,075 |
| | |
|
| | | | | 35,774,153 |
| Health Care - 1.96% | | | | |
| Abbott Laboratories | | | | |
| 4.125%, 05/27/2020 | | 210,000 | | 212,161 |
| 4.350%, 03/15/2014 | | 350,000 | | 375,782 |
| Aetna, Inc. | | | | |
| 6.000%, 06/15/2016 | | 290,000 | | 328,744 |
| | | | |
| Total Bond Market Fund (continued) | | |
| | | Shares or | | |
| | | Principal | | |
| | | Amount | | Value |
| |
|
| |
| CORPORATE BONDS (continued) | | | | |
| Health Care (continued) | | | | |
| Amgen, Inc. | | | | |
| 5.700%, 02/01/2019 | $ | 145,000 | $ | 162,614 |
| 5.750%, 03/15/2040 | | 160,000 | | 166,239 |
| AstraZeneca PLC | | | | |
| 5.900%, 09/15/2017 | | 300,000 | | 343,359 |
| Baxter International, Inc. | | | | |
| 5.900%, 09/01/2016 | | 145,000 | | 167,760 |
| Becton Dickinson and Company | | | | |
| 3.250%, 11/12/2020 | | 160,000 | | 149,328 |
| Bristol-Myers Squibb Company | | | | |
| 6.800%, 11/15/2026 | | 140,000 | | 168,895 |
| Covidien International Finance SA | | | | |
| 6.000%, 10/15/2017 | | 287,000 | | 325,720 |
| Eli Lilly & Company | | | | |
| 7.125%, 06/01/2025 | | 220,000 | | 275,386 |
| GlaxoSmithKline Capital, Inc. | | | | |
| 4.375%, 04/15/2014 | | 370,000 | | 397,743 |
| 6.375%, 05/15/2038 | | 140,000 | | 159,549 |
| Howard Hughes Medical Institute | | | | |
| 3.450%, 09/01/2014 | | 210,000 | | 222,117 |
| Johnson & Johnson | | | | |
| 5.850%, 07/15/2038 | | 245,000 | | 276,248 |
| Life Technologies Corp. | | | | |
| 5.000%, 01/15/2021 | | 150,000 | | 151,728 |
| Novartis Securities Investment, Ltd. | | | | |
| 5.125%, 02/10/2019 | | 210,000 | | 228,934 |
| Pharmacia Corp. | | | | |
| 6.500%, 12/01/2018 | | 290,000 | | 336,838 |
| Quest Diagnostics, Inc. | | | | |
| 5.450%, 11/01/2015 | | 90,000 | | 97,443 |
| Roche Holdings, Inc. | | | | |
| 6.000%, 03/01/2019 (S) | | 200,000 | | 228,314 |
| St. Jude Medical, Inc. | | | | |
| 4.875%, 07/15/2019 | | 100,000 | | 105,438 |
| UnitedHealth Group, Inc. | | | | |
| 4.875%, 03/15/2015 | | 31,000 | | 33,523 |
| 5.800%, 03/15/2036 | | 210,000 | | 209,995 |
| WellPoint, Inc. | | | | |
| 6.375%, 06/15/2037 | | 120,000 | | 129,236 |
| Wyeth | | | | |
| 5.500%, 03/15/2013 | | 385,000 | | 419,286 |
| 6.000%, 02/15/2036 | | 230,000 | | 251,795 |
| | |
|
| | | | | 5,924,175 |
| Industrials - 1.97% | | | | |
| Allied Waste North America, Inc. | | | | |
| 6.875%, 06/01/2017 | | 200,000 | | 217,500 |
| Boeing Company | | | | |
| 8.750%, 09/15/2031 | | 275,000 | | 371,622 |
| Burlington Northern Santa Fe LLC | | | | |
| 4.700%, 10/01/2019 | | 160,000 | | 167,823 |
| Canadian National Railway Company | | | | |
| 6.375%, 10/15/2011 | | 135,000 | | 140,065 |
| Caterpillar Financial Services Corp. | | | | |
| 6.125%, 02/17/2014 | | 260,000 | | 293,237 |
| CSX Corp. | | | | |
| 6.250%, 04/01/2015 | | 205,000 | | 233,087 |
| 7.375%, 02/01/2019 | | 290,000 | | 351,416 |
| Emerson Electric Company | | | | |
| 4.875%, 10/15/2019 | | 215,000 | | 230,696 |
| FedEx Corp. | | | | |
| 8.000%, 01/15/2019 | | 145,000 | | 180,312 |
| GATX Corp. | | | | |
| 4.750%, 05/15/2015 | | 170,000 | | 178,022 |
| |
| The accompanying notes are an integral part of the financial statements. | 273 |
John Hancock Funds II
Portfolio of Investments — February 28, 2011 (Unaudited) (showing percentage of total net assets)
| | | | |
| Total Bond Market Fund (continued) | | |
| | | Shares or | | |
| | | Principal | | |
| | | Amount | | Value |
| |
|
| |
| CORPORATE BONDS (continued) | | | | |
| Industrials (continued) | | | | |
| General Dynamics Corp. | | | | |
| 5.250%, 02/01/2014 | $ | 265,000 | $ | 291,466 |
| General Electric Company | | | | |
| 5.000%, 02/01/2013 | | 525,000 | | 562,377 |
| Honeywell International, Inc. | | | | |
| 3.875%, 02/15/2014 | | 220,000 | | 234,826 |
| Ingersoll-Rand Global Holding Company, Ltd. | | | |
| 6.875%, 08/15/2018 | | 270,000 | | 312,444 |
| Lockheed Martin Corp., Series B | | | | |
| 6.150%, 09/01/2036 | | 250,000 | | 273,226 |
| Norfolk Southern Corp. | | | | |
| 7.050%, 05/01/2037 | | 200,000 | | 243,318 |
| Pitney Bowes, Inc. | | | | |
| 6.250%, 03/15/2019 | | 120,000 | | 129,822 |
| Roper Industries, Inc. | | | | |
| 6.250%, 09/01/2019 | | 100,000 | | 110,901 |
| Snap-On, Inc. | | | | |
| 6.125%, 09/01/2021 | | 210,000 | | 219,168 |
| Union Pacific Corp. | | | | |
| 6.625%, 02/01/2029 | | 260,000 | | 302,752 |
| United Technologies Corp. | | | | |
| 5.375%, 12/15/2017 | | 285,000 | | 321,328 |
| 6.125%, 02/01/2019 | | 350,000 | | 407,772 |
| Waste Management, Inc. | | | | |
| 6.125%, 11/30/2039 | | 160,000 | | 168,838 |
| | |
|
| | | | | 5,942,018 |
| Information Technology - 0.94% | | | | |
| Cisco Systems, Inc. | | | | |
| 5.900%, 02/15/2039 | | 250,000 | | 263,077 |
| Dell, Inc. | | | | |
| 4.700%, 04/15/2013 | | 225,000 | | 240,903 |
| Hewlett-Packard Company | | | | |
| 3.750%, 12/01/2020 | | 150,000 | | 144,524 |
| 4.750%, 06/02/2014 | | 240,000 | | 261,085 |
| International Business Machines Corp. | | | | |
| 5.600%, 11/30/2039 | | 300,000 | | 317,309 |
| Microsoft Corp. | | | | |
| 2.950%, 06/01/2014 | | 200,000 | | 208,971 |
| Motorola, Inc. | | | | |
| 6.000%, 11/15/2017 | | 180,000 | | 196,400 |
| Oracle Corp. | | | | |
| 5.750%, 04/15/2018 | | 380,000 | | 427,362 |
| SAIC, Inc. | | | | |
| 4.450%, 12/01/2020 (S) | | 150,000 | | 151,295 |
| Tyco Electronics Group SA | | | | |
| 6.550%, 10/01/2017 | | 305,000 | | 351,427 |
| Xerox Corp. | | | | |
| 6.750%, 12/15/2039 | | 230,000 | | 262,505 |
| | |
|
| | | | | 2,824,858 |
| Materials - 0.95% | | | | |
| Agrium, Inc. | | | | |
| 6.750%, 01/15/2019 | | 250,000 | | 290,897 |
| Alcoa, Inc. | | | | |
| 6.750%, 07/15/2018 | | 325,000 | | 369,025 |
| ArcelorMittal | | | | |
| 5.375%, 06/01/2013 | | 440,000 | | 472,038 |
| Commercial Metals Company | | | | |
| 7.350%, 08/15/2018 | | 140,000 | | 144,776 |
| CRH America, Inc. | | | | |
| 8.125%, 07/15/2018 | | 100,000 | | 118,018 |
| E.I. Du Pont de Nemours & Company | | | | |
| 5.875%, 01/15/2014 | | 45,000 | | 50,006 |
| | | | |
| Total Bond Market Fund (continued) | | |
| | | Shares or | | |
| | | Principal | | |
| | | Amount | | Value |
| |
|
| |
| CORPORATE BONDS (continued) | | | | |
| Materials (continued) | | | | |
| International Paper Company | | | | |
| 8.700%, 06/15/2038 | $ | 100,000 | $ | 132,358 |
| Potash Corp. of Saskatchewan, Inc. | | | | |
| 4.875%, 03/30/2020 | | 60,000 | | 62,715 |
| PPG Industries, Inc. | | | | |
| 3.600%, 11/15/2020 | | 100,000 | | 94,111 |
| Rio Tinto Alcan, Inc. | | | | |
| 6.125%, 12/15/2033 | | 240,000 | | 252,266 |
| Rio Tinto Finance USA, Ltd. | | | | |
| 6.500%, 07/15/2018 | | 110,000 | | 127,330 |
| The Dow Chemical Company | | | | |
| 5.700%, 05/15/2018 | | 140,000 | | 152,172 |
| 5.900%, 02/15/2015 | | 150,000 | | 167,296 |
| 9.400%, 05/15/2039 | | 130,000 | | 193,594 |
| The Sherwin-Williams Company | | | | |
| 3.125%, 12/15/2014 | | 110,000 | | 114,002 |
| Vale Overseas, Ltd. | | | | |
| 6.875%, 11/10/2039 | | 110,000 | | 118,640 |
| | |
|
| | | | | 2,859,244 |
| Telecommunication Services - 2.20% | | | | |
| America Movil SAB de CV | | | | |
| 5.000%, 03/30/2020 | | 480,000 | | 494,888 |
| American Tower Corp. | | | | |
| 4.500%, 01/15/2018 | | 150,000 | | 148,688 |
| Ameritech Capital Funding Corp. | | | | |
| 6.875%, 10/15/2027 | | 138,000 | | 147,247 |
| AT&T Corp. | | | | |
| 8.000%, 11/15/2031 | | 11,000 | | 13,970 |
| AT&T, Inc. | | | | |
| 5.350%, 09/01/2040 (S) | | 366,000 | | 335,591 |
| 5.625%, 06/15/2016 | | 200,000 | | 224,084 |
| 6.700%, 11/15/2013 | | 270,000 | | 305,562 |
| British Telecommunications PLC | | | | |
| 5.950%, 01/15/2018 | | 160,000 | | 177,570 |
| 9.875%, 12/15/2030 | | 160,000 | | 221,839 |
| CenturyTel, Inc. | | | | |
| 7.600%, 09/15/2039 | | 140,000 | | 147,778 |
| COX Communications, Inc. | | | | |
| 9.375%, 01/15/2019 (S) | | 95,000 | | 124,320 |
| Deutsche Telekom International Finance BV | | | | |
| 8.750%, 06/15/2030 | | 165,000 | | 216,389 |
| NBCUniversal Media LLC | | | | |
| 5.150%, 04/30/2020 (S) | | 240,000 | | 247,227 |
| Qwest Corp. | | | | |
| 8.375%, 05/01/2016 | | 270,000 | | 322,313 |
| Rogers Cable, Inc. | | | | |
| 7.875%, 05/01/2012 | | 265,000 | | 285,528 |
| Telecom Italia Capital SA | | | | |
| 7.721%, 06/04/2038 | | 200,000 | | 206,701 |
| Telefonica Europe BV | | | | |
| 8.250%, 09/15/2030 | | 125,000 | | 149,768 |
| Telefonos de Mexico SAB de CV | | | | |
| 5.500%, 11/15/2019 | | 210,000 | | 220,979 |
| Verizon Communications, Inc. | | | | |
| 5.250%, 04/15/2013 | | 275,000 | | 297,675 |
| 6.900%, 04/15/2038 | | 550,000 | | 623,826 |
| Verizon Global Funding Corp. | | | | |
| 7.375%, 09/01/2012 | | 250,000 | | 273,433 |
| Verizon Wireless Capital LLC | | | | |
| 7.375%, 11/15/2013 | | 330,000 | | 380,266 |
| 8.500%, 11/15/2018 | | 210,000 | | 272,109 |
| Vodafone Group PLC | | | | |
| 5.375%, 01/30/2015 | | 515,000 | | 566,102 |
| |
| The accompanying notes are an integral part of the financial statements. | 274 |
John Hancock Funds II
Portfolio of Investments — February 28, 2011 (Unaudited) (showing percentage of total net assets)
| | | | |
| Total Bond Market Fund (continued) | | |
| | | Shares or | | |
| | | Principal | | |
| | | Amount | | Value |
| |
|
| |
| CORPORATE BONDS (continued) | | | | |
| Telecommunication Services (continued) | | | | |
| Vodafone Group PLC (continued) | | | | |
| 5.450%, 06/10/2019 | $ | 205,000 | $ | 224,712 |
| | |
|
| | | | | 6,628,565 |
| Utilities - 2.70% | | | | |
| CenterPoint Energy Resources Corp. | | | | |
| 4.500%, 01/15/2021 (S) | | 207,000 | | 204,748 |
| Consolidated Edison Company of New | | | | |
| York, Inc. | | | | |
| 7.125%, 12/01/2018 | | 265,000 | | 322,264 |
| Constellation Energy Group, Inc. | | | | |
| 5.150%, 12/01/2020 | | 150,000 | | 150,353 |
| 7.600%, 04/01/2032 | | 58,000 | | 66,719 |
| Dominion Resources, Inc. | | | | |
| 5.000%, 03/15/2013 | | 262,000 | | 279,815 |
| DTE Energy Company | | | | |
| 6.350%, 06/01/2016 | | 215,000 | | 239,394 |
| Duke Energy Carolinas LLC | | | | |
| 5.625%, 11/30/2012 | | 300,000 | | 323,143 |
| 6.000%, 01/15/2038 | | 140,000 | | 151,807 |
| 7.000%, 11/15/2018 | | 270,000 | | 326,830 |
| E.ON International Finance BV | | | | |
| 5.800%, 04/30/2018 (S) | | 385,000 | | 433,663 |
| Enel Finance International NV | | | | |
| 6.000%, 10/07/2039 (S) | | 100,000 | | 91,356 |
| Enel Finance International SA | | | | |
| 5.125%, 10/07/2019 (S) | | 300,000 | | 301,165 |
| 6.250%, 09/15/2017 (S) | | 144,000 | | 157,164 |
| Entergy Texas, Inc. | | | | |
| 7.125%, 02/01/2019 | | 135,000 | | 158,185 |
| Exelon Generation Company LLC | | | | |
| 6.250%, 10/01/2039 | | 100,000 | | 99,980 |
| FirstEnergy Corp. | | | | |
| 6.450%, 11/15/2011 | | 6,000 | | 6,204 |
| FirstEnergy Solutions Corp. | | | | |
| 6.050%, 08/15/2021 | | 150,000 | | 156,874 |
| Florida Power & Light Company | | | | |
| 5.650%, 02/01/2037 | | 200,000 | | 211,219 |
| Florida Power Corp. | | | | |
| 5.650%, 04/01/2040 | | 220,000 | | 226,339 |
| FPL Group Capital, Inc. | | | | |
| 7.875%, 12/15/2015 | | 265,000 | | 316,499 |
| Georgia Power Company | | | | |
| 4.250%, 12/01/2019 | | 130,000 | | 133,163 |
| 5.950%, 02/01/2039 | | 265,000 | | 283,836 |
| Indiana Michigan Power Company | | | | |
| 6.050%, 03/15/2037 | | 295,000 | | 308,871 |
| Israel Electric Corp., Ltd. | | | | |
| 7.250%, 01/15/2019 (S) | | 170,000 | | 180,550 |
| NiSource Finance Corp. | | | | |
| 6.800%, 01/15/2019 | | 250,000 | | 287,964 |
| Oglethorpe Power Corp. | | | | |
| 5.375%, 11/01/2040 | | 150,000 | | 143,649 |
| Oncor Electric Delivery Company | | | | |
| 7.500%, 09/01/2038 | | 140,000 | | 172,941 |
| Pacific Gas & Electric Company | | | | |
| 6.050%, 03/01/2034 | | 170,000 | | 181,172 |
| 6.250%, 12/01/2013 | | 355,000 | | 395,708 |
| Pennsylvania Electric Company | | | | |
| 5.200%, 04/01/2020 | | 200,000 | | 204,817 |
| Progress Energy, Inc. | | | | |
| 4.400%, 01/15/2021 | | 165,000 | | 164,105 |
| Public Service Electric & Gas Company | | | | |
| 6.330%, 11/01/2013 | | 355,000 | | 399,180 |
| | | | |
| Total Bond Market Fund (continued) | | |
| | | Shares or | | |
| | | Principal | | |
| | | Amount | | Value |
| |
|
| |
| CORPORATE BONDS (continued) | | | | |
| Utilities (continued) | | | | |
| Southern California Edison Company, | | | | |
| Series 05-E | | | | |
| 5.350%, 07/15/2035 | $ | 345,000 | $ | 347,274 |
| Southwestern Public Service Company, | | | | |
| Series G | | | | |
| 8.750%, 12/01/2018 | | 155,000 | | 194,559 |
| Virginia Electric and Power Company | | | | |
| 8.875%, 11/15/2038 | | 190,000 | | 275,216 |
| Wisconsin Electric Power Company | | | | |
| 6.000%, 04/01/2014 | | 230,000 | | 258,322 |
| | |
|
| | | | | 8,155,048 |
|
| TOTAL CORPORATE BONDS (Cost $86,225,420) | | $ | 94,973,798 |
|
| |
| MUNICIPAL BONDS - 0.84% | | | | |
| California - 0.14% | | | | |
| State of California | | | | |
| 7.500%, 04/01/2034 | | 200,000 | | 216,174 |
| University of California | | | | |
| 5.770%, 05/15/2043 | | 220,000 | | 212,192 |
| | |
|
| | | | | 428,366 |
| District of Columbia - 0.03% | | | | |
| Metropolitan Washington Airports Authority | | | |
| 7.462%, 10/01/2046 | | 100,000 | | 96,791 |
| Georgia - 0.08% | | | | |
| Municipal Electric Authority of Georgia | | | | |
| 6.637%, 04/01/2057 | | 230,000 | | 230,828 |
| Illinois - 0.11% | | | | |
| State of Illinois | | | | |
| 5.100%, 06/01/2033 | | 285,000 | | 228,695 |
| 7.350%, 07/01/2035 | | 100,000 | | 103,572 |
| | |
|
| | | | | 332,267 |
| Maryland - 0.08% | | | | |
| Maryland State Transportation Authority | | | | |
| 5.888%, 07/01/2043 | | 230,000 | | 234,959 |
| New Jersey - 0.09% | | | | |
| New Jersey State Turnpike Authority | | | | |
| 7.102%, 01/01/2041 | | 250,000 | | 270,388 |
| New York - 0.14% | | | | |
| New York State Dormitory Authority | | | | |
| 5.628%, 03/15/2039 | | 210,000 | | 206,352 |
| New York State Urban Development Corp. | | | | |
| 5.770%, 03/15/2039 | | 200,000 | | 202,222 |
| | |
|
| | | | | 408,574 |
| North Carolina - 0.06% | | | | |
| North Carolina Turnpike Authority | | | | |
| 6.700%, 01/01/2039 | | 170,000 | | 175,731 |
| Texas - 0.05% | | | | |
| State of Texas | | | | |
| 5.517%, 04/01/2039 | | 160,000 | | 163,618 |
| Utah - 0.03% | | | | |
| State of Utah | | | | |
| 4.554%, 07/01/2024 | | 100,000 | | 100,532 |
| Washington - 0.03% | | | | |
| State of Washington | | | | |
| 5.481%, 08/01/2039 | | 100,000 | | 100,730 |
|
| TOTAL MUNICIPAL BONDS (Cost $2,541,797) | | $ | 2,542,784 |
|
| |
| The accompanying notes are an integral part of the financial statements. | 275 |
John Hancock Funds II
Portfolio of Investments — February 28, 2011 (Unaudited) (showing percentage of total net assets)
| | | | |
| Total Bond Market Fund (continued) | | |
| | | Shares or | | |
| | | Principal | | |
| | | Amount | | Value |
| |
|
| |
| COLLATERALIZED MORTGAGE | | | | |
| OBLIGATIONS - 7.62% | | | | |
| Commercial & Residential - 7.62% | | | | |
| Banc of America Commercial Mortgage, Inc. | | | |
| Series 2006-5, Class A3, | | | | |
| 5.390%, 09/10/2047 | $ | 320,000 | $ | 330,651 |
| Series 2006-4, Class A4, | | | | |
| 5.634%, 07/10/2046 | | 410,000 | | 445,164 |
| Series 2006-3, Class A4, | | | | |
| 5.889%, 07/10/2044 (P) | | 700,000 | | 765,060 |
| Bear Stearns Commercial Mortgage Securities | | | |
| Series 2005-T20, Class A3, | | | | |
| 5.149%, 10/12/2042 (P) | | 610,000 | | 633,578 |
| Series 2006-PW12, Class A4, | | | | |
| 5.722%, 09/11/2038 (P) | | 260,000 | | 286,188 |
| Citigroup/Deutsche Bank | | | | |
| Commercial Mortgage Trust | | | | |
| Series 2006-CD2, Class A4, | | | | |
| 5.344%, 01/15/2046 (P) | | 680,000 | | 734,181 |
| Series 2006-CD3, Class A5, | | | | |
| 5.617%, 10/15/2048 | | 760,000 | | 821,580 |
| CS First Boston Mortgage Securities Corp., | | | | |
| Series 2005-C3, Class A3 | | | | |
| 4.645%, 07/15/2037 | | 340,000 | | 353,648 |
| GE Capital Commercial Mortgage Corp. | | | | |
| Series 2005-C1, Class A2, | | | | |
| 4.353%, 06/10/2048 | | 460,021 | | 463,130 |
| Series 2005-C1, Class A3, | | | | |
| 4.578%, 06/10/2048 | | 540,000 | | 555,348 |
| GMAC Commercial Mortgage Securities, Inc., | | | |
| Series 2003-C3, Class A4 | | | | |
| 5.023%, 04/10/2040 | | 1,020,000 | | 1,086,413 |
| GS Mortgage Securities Corp. II, | | | | |
| Series 2007-GG10, Class A4 | | | | |
| 5.804%, 08/10/2045 (P) | | 1,105,000 | | 1,180,394 |
| JPMorgan Chase Commercial | | | | |
| Mortgage Securities Corp. | | | | |
| Series 2005-LDP2, Class A4, | | | | |
| 4.738%, 07/15/2042 | | 940,000 | | 990,776 |
| Series 2004-CBX, Class A6, | | | | |
| 4.899%, 01/12/2037 | | 540,000 | | 574,274 |
| Series 2005-LDP4, Class A4, | | | | |
| 4.918%, 10/15/2042 (P) | | 420,000 | | 446,164 |
| Series 2005-CB11, Class A3, | | | | |
| 5.197%, 08/12/2037 | | 380,000 | | 390,054 |
| Series 2005-LDP5, Class A4, | | | | |
| 5.229%, 12/15/2044 (P) | | 275,000 | | 296,357 |
| Series 2005-CB13, Class A3A1, | | | | |
| 5.280%, 01/12/2043 (P) | | 880,000 | | 914,584 |
| Series 2006-LDP8, Class AM, | | | | |
| 5.440%, 05/15/2045 | | 210,000 | | 220,982 |
| Series 2006-CB14, Class A3A, | | | | |
| 5.491%, 12/12/2044 (P)(S) | | 920,000 | | 947,640 |
| LB Commercial Conduit Mortgage Trust, | | | | |
| Series 2007-C3, Class A4 | | | | |
| 5.950%, 07/15/2044 (P) | | 660,000 | | 712,137 |
| LB-UBS Commercial Mortgage Trust | | | | |
| Series 2005-C1, Class A2, | | | | |
| 4.310%, 02/15/2030 | | 112,281 | | 112,404 |
| Series 2006-C7, Class A3, | | | | |
| 5.347%, 11/15/2038 | | 968,000 | | 1,036,968 |
| Series 2007-C2, Class A3, | | | | |
| 5.430%, 02/15/2040 | | 710,000 | | 757,711 |
| Series 2006-C3, Class A4, | | | | |
| 5.661%, 03/15/2039 (P) | | 380,000 | | 413,413 |
| | | | |
| Total Bond Market Fund (continued) | | |
| | | Shares or | | |
| | | Principal | | |
| | | Amount | | Value |
| |
|
| |
| COLLATERALIZED MORTGAGE | | | | |
| OBLIGATIONS (continued) | | | | |
| Commercial & Residential (continued) | | | | |
| Merrill Lynch Mortgage Trust, | | | | |
| Series 2008-C1, Class A4 | | | | |
| 5.690%, 02/12/2051 | $ | 145,000 | $ | 155,282 |
| Merrill Lynch/Countrywide Commercial | | | | |
| Mortgage Trust, Series 2007-8, Class A2 | | | | |
| 5.928%, 08/12/2049 (P) | | 1,080,000 | | 1,128,636 |
| Morgan Stanley Capital I | | | | |
| Series 2004-HQ3, Class A4, | | | | |
| 4.800%, 01/13/2041 | | 870,000 | | 917,226 |
| Series 2005-HQ6, Class A2A, | | | | |
| 4.882%, 08/13/2042 | | 904,545 | | 915,793 |
| Series 2006-T21, Class A2, | | | | |
| 5.090%, 10/12/2052 | | 169,209 | | 169,117 |
| Series 2007-T25, Class A3, | | | | |
| 5.514%, 11/12/2049 (P) | | 1,295,000 | | 1,398,724 |
| Series 2007-T27, Class A4, | | | | |
| 5.650%, 06/11/2042 (P) | | 1,630,000 | | 1,775,731 |
| Series 2006-T23, Class A2, | | | | |
| 5.737%, 08/12/2041 (P) | | 380,000 | | 404,796 |
| Wachovia Bank Commercial Mortgage Trust | | | |
| Series 2004-C12, Class A2, | | | | |
| 5.001%, 07/15/2041 | | 222,427 | | 223,460 |
| Series 2005-C17, Class A4, | | | | |
| 5.083%, 03/15/2042 (P) | | 410,000 | | 438,454 |
|
| TOTAL COLLATERALIZED MORTGAGE | | | |
| OBLIGATIONS (Cost $19,748,591) | | | $ | 22,996,018 |
|
| |
| ASSET BACKED SECURITIES - 0.29% | | | | |
| American Express Credit Account | | | | |
| Master Trust, Series 2006-2, Class A | | | | |
| 5.350%, 01/15/2014 | | 440,000 | | 446,502 |
| Mercedes-Benz Auto Receivables Trust, | | | | |
| Series 2009-1, Class A3 | | | | |
| 1.670%, 01/15/2014 | | 410,000 | | 413,882 |
|
| TOTAL ASSET BACKED SECURITIES (Cost $857,762) | $ | 860,384 |
|
| |
| SECURITIES LENDING COLLATERAL - 1.07% | | |
| John Hancock Collateral | | | | |
| Investment Trust, 0.2855% (W)(Y) | | 321,117 | | 3,213,547 |
|
| TOTAL SECURITIES LENDING | | | | |
| COLLATERAL (Cost $3,213,445) | | | $ | 3,213,547 |
|
| |
| SHORT-TERM INVESTMENTS - 0.42% | | | |
| Short-Term Securities* - 0.42% | | | | |
| State Street Institutional U.S. Government | | | | |
| Money Market Fund, 0.0647% | | 1,259,423 | | 1,259,423 |
|
| TOTAL SHORT-TERM INVESTMENTS (Cost $1,259,423) | $ | 1,259,423 |
|
| Total Investments (Total Bond Market Fund) | | | |
| (Cost $295,676,294) - 103.61% | | | $ | 312,630,443 |
| Other assets and liabilities, net - (3.61%) | | | | (10,879,969) |
| |
|
| TOTAL NET ASSETS - 100.00% | | | $ | 301,750,474 |
| | | |
|
| |
| The accompanying notes are an integral part of the financial statements. | 276 |
John Hancock Funds II
Portfolio of Investments — February 28, 2011 (Unaudited) (showing percentage of total net assets)
| | | | |
| Total Return Fund | | | | |
| | | Shares or | | |
| | | Principal | | |
| | | Amount | | Value |
| |
|
| |
| U.S. GOVERNMENT & AGENCY | | | | |
| OBLIGATIONS - 37.12% | | | | |
| U.S. Government - 1.25% | | | | |
| Treasury Inflation Protected Securities | | | | |
| 1.750%, 01/15/2028 | $ | 732,305 | $ | 739,170 |
| 2.000%, 01/15/2026 | | 4,858,612 | | 5,135,704 |
| 2.375%, 01/15/2025 to 01/15/2027 | | 2,560,330 | | 2,834,648 |
| 2.500%, 01/15/2029 (F) | | 14,699,520 | | 16,488,731 |
| 3.875%, 04/15/2029 | | 3,332,950 | | 4,422,928 |
| | |
|
| | | | | 29,621,181 |
| U.S. Government Agency - 35.87% | | | | |
| FDIC Structured Sale Guaranteed Notes | | | | |
| Zero Coupon 10/25/2011 (S) | | 300,000 | | 298,902 |
| Federal Home Loan Mortgage Corp. | | | | |
| 0.515%, 11/26/2012 | | 1,300,000 | | 1,296,569 |
| 0.875%, 10/28/2013 | | 9,100,000 | | 9,029,457 |
| 4.125%, 09/27/2013 | | 800,000 | | 861,114 |
| 4.500%, TBA | | 27,000,000 | | 27,489,472 |
| 4.760%, 11/01/2035 (P) | | 415,495 | | 441,431 |
| 4.875%, 11/15/2013 | | 900,000 | | 989,309 |
| 5.500%, 12/01/2036 to 02/01/2039 | | 9,433,909 | | 10,076,768 |
| 6.000%, 08/01/2026 to 05/01/2040 | | 86,642,098 | | 94,187,371 |
| Federal National Mortgage Association | | | | |
| 0.750%, 02/26/2013 | | 2,400,000 | | 2,400,065 |
| 1.125%, 09/30/2013 | | 16,900,000 | | 16,901,842 |
| 1.250%, 08/20/2013 | | 800,000 | | 803,811 |
| 2.185%, 11/01/2034 (P) | | 369,861 | | 382,769 |
| 2.295%, 11/01/2035 (P) | | 269,076 | | 273,505 |
| 2.329%, 01/01/2035 (P) | | 199,840 | | 208,277 |
| 2.339%, 05/01/2035 (P) | | 514,585 | | 534,288 |
| 2.495%, 03/01/2035 (P) | | 127,591 | | 133,734 |
| 2.684%, 06/01/2035 (P) | | 807,750 | | 846,278 |
| 2.769%, 07/01/2034 (P) | | 212,544 | | 223,178 |
| 4.000%, 06/01/2025 to 11/01/2025 | | 3,160,749 | | 3,252,178 |
| 4.500%, TBA | | 436,200,000 | | 442,987,273 |
| 4.500%, 03/01/2023 to 11/01/2040 | | 29,290,058 | | 30,112,052 |
| 4.770%, 09/01/2035 (P) | | 413,730 | | 440,797 |
| 5.000%, TBA | | 56,000,000 | | 58,425,612 |
| 5.000%, 03/01/2035 to 04/01/2037 | | 3,319,493 | | 3,496,320 |
| 5.500%, TBA | | 8,000,000 | | 8,551,322 |
| 5.500%, 05/01/2013 to 04/01/2040 | | 74,360,573 | | 79,681,559 |
| 6.000%, 10/01/2026 to 06/01/2040 | | 45,676,319 | | 49,760,885 |
| 6.500%, 10/01/2036 to 10/01/2038 | | 6,660,743 | | 7,427,216 |
| Government National Mortgage | | | | |
| Association | | | | |
| 6.000%, 05/15/2037 to 11/15/2039 | | 1,634,062 | | 1,804,448 |
| | |
|
| | | | | 853,317,802 |
|
| TOTAL U.S. GOVERNMENT & AGENCY | | | |
| OBLIGATIONS (Cost $879,569,362) | | | $ | 882,938,983 |
|
| |
| FOREIGN GOVERNMENT | | | | |
| OBLIGATIONS - 8.71% | | | | |
| Brazil - 0.27% | | | | |
| Federative Republic of Brazil | | | | |
| 10.250%, 01/10/2028 | BRL | 6,400,000 | | 3,946,628 |
| 12.500%, 01/05/2022 | | 3,600,000 | | 2,544,537 |
| | |
|
| | | | | 6,491,165 |
| Canada - 2.55% | | | | |
| Canada Housing Trust | | | | |
| 1.375%, 01/27/2014 | $ | 3,200,000 | | 3,187,414 |
| 2.750%, 12/15/2015 (S) | CAD | 4,500,000 | | 4,610,838 |
| 3.350%, 12/15/2020 | | 4,100,000 | | 4,120,805 |
| 4.000%, 06/15/2012 | | 2,900,000 | | 3,075,006 |
| 4.550%, 12/15/2012 | | 3,600,000 | | 3,880,537 |
| 4.800%, 06/15/2012 | | 2,700,000 | | 2,891,172 |
| | | | |
| Total Return Fund (continued) | | | |
| | | Shares or | | |
| | | Principal | | |
| | | Amount | | Value |
| |
|
| |
| FOREIGN GOVERNMENT | | | | |
| OBLIGATIONS (continued) | | | | |
| Canada (continued) | | | | |
| Government of Canada | | | | |
| 1.500%, 12/01/2012 | $ | 2,200,000 | $ | 2,254,980 |
| 1.750%, 03/01/2013 | | 6,500,000 | | 6,680,213 |
| 2.000%, 12/01/2014 | | 4,200,000 | | 4,265,839 |
| 2.500%, 09/01/2013 | | 5,200,000 | | 5,415,375 |
| 3.000%, 12/01/2015 | | 800,000 | | 837,425 |
| 4.500%, 06/01/2015 | | 600,000 | | 667,642 |
| Province of Ontario | | | | |
| 4.200%, 03/08/2018 | | 400,000 | | 428,762 |
| 4.300%, 03/08/2017 | | 1,300,000 | | 1,411,086 |
| 4.400%, 06/02/2019 | | 2,700,000 | | 2,901,593 |
| 4.600%, 06/02/2039 | | 1,100,000 | | 1,149,376 |
| 4.700%, 06/02/2037 | | 11,100,000 | | 11,738,203 |
| 5.500%, 06/02/2018 | | 700,000 | | 806,396 |
| Province of Quebec | | | | |
| 4.500%, 12/01/2016 to 12/01/2020 | | 300,000 | | 323,084 |
| | |
|
| | | | | 60,645,746 |
| France - 0.36% | | | | |
| Societe Financement de | | | | |
| l’Economie Francaise | | | | |
| 0.503%, 07/16/2012 (P)(S) | $ | 2,000,000 | | 2,005,460 |
| 2.125%, 05/20/2012 | EUR | 800,000 | | 1,113,119 |
| 3.375%, 05/05/2014 (S) | $ | 5,100,000 | | 5,361,997 |
| | |
|
| | | | | 8,480,576 |
| Japan - 4.69% | | | | |
| Government of Japan | | | | |
| 0.119%, 04/25/2011 | JPY | 9,130,000,000 | | 111,587,897 |
| Mexico - 0.79% | | | | |
| Government of Mexico | | | | |
| 6.000%, 06/18/2015 | MXN | 163,900,000 | | 13,286,903 |
| 6.050%, 01/11/2040 | $ | 1,400,000 | | 1,428,000 |
| 9.500%, 12/18/2014 | MXN | 45,000,000 | | 4,094,898 |
| | |
|
| | | | | 18,809,801 |
| Russia - 0.02% | | | | |
| Government of Russia | | | | |
| 3.625%, 04/29/2015 | $ | 400,000 | | 401,000 |
| South Korea - 0.03% | | | | |
| Korea Housing Finance Corp. | | | | |
| 4.125%, 12/15/2015 (S) | | 700,000 | | 710,352 |
|
| TOTAL FOREIGN GOVERNMENT | | | | |
| OBLIGATIONS (Cost $203,185,725) | | | $ | 207,126,537 |
|
| |
| CORPORATE BONDS - 28.51% | | | | |
| Consumer Discretionary - 0.06% | | | | |
| Comcast Corp. | | | | |
| 5.875%, 02/15/2018 | | 700,000 | | 772,773 |
| 6.450%, 03/15/2037 | | 700,000 | | 732,584 |
| | |
|
| | | | | 1,505,357 |
| Consumer Staples - 0.26% | | | | |
| CVS Pass-Through Trust | | | | |
| 6.943%, 01/10/2030 | | 280,188 | | 310,297 |
| Kraft Foods, Inc. | | | | |
| 6.125%, 02/01/2018 | | 2,500,000 | | 2,809,188 |
| 6.875%, 02/01/2038 | | 1,100,000 | | 1,234,027 |
| Philip Morris International, Inc. | | | | |
| 5.650%, 05/16/2018 | | 1,600,000 | | 1,798,373 |
| | |
|
| | | | | 6,151,885 |
| |
| The accompanying notes are an integral part of the financial statements. | 277 |
John Hancock Funds II
Portfolio of Investments — February 28, 2011 (Unaudited) (showing percentage of total net assets)
| | | | |
| Total Return Fund (continued) | | | |
| | | Shares or | | |
| | | Principal | | |
| | | Amount | | Value |
| |
|
| |
| CORPORATE BONDS (continued) | | | | |
| Energy - 1.57% | | | | |
| Gazprom via Gaz Capital SA | | | | |
| 6.212%, 11/22/2016 (S) | $ | 500,000 | $ | 531,250 |
| Gazprom via Gazprom International SA | | | | |
| 7.201%, 02/01/2020 | | 155,255 | | 167,365 |
| Gazprom via Morgan Stanley Bank AG | | | | |
| 9.625%, 03/01/2013 | | 300,000 | | 339,375 |
| Gazprom via White Nights Finance BV | | | | |
| 10.500%, 03/08/2014 to 03/25/2014 | | 6,800,000 | | 8,126,021 |
| Indian Oil Corp. Ltd. | | | | |
| 4.750%, 01/22/2015 | | 4,600,000 | | 4,749,610 |
| NGPL PipeCo LLC | | | | |
| 6.514%, 12/15/2012 (S) | | 4,600,000 | | 4,958,611 |
| Novatek Finance, Ltd. | | | | |
| 5.326%, 02/03/2016 (S) | | 700,000 | | 714,605 |
| Odebrecht Drilling Norbe VIII/IX, Ltd. | | | | |
| 6.350%, 06/30/2021 | | 2,000,000 | | 2,092,500 |
| Petrobras International Finance Company | | | | |
| 3.875%, 01/27/2016 | | 5,900,000 | | 5,958,115 |
| Petroleos Mexicanos | | | | |
| 8.000%, 05/03/2019 | | 6,500,000 | | 7,718,750 |
| Shell International Finance BV | | | | |
| 5.500%, 03/25/2040 | | 1,100,000 | | 1,132,225 |
| Total Capital SA | | | | |
| 4.450%, 06/24/2020 | | 800,000 | | 823,442 |
| | |
|
| | | | | 37,311,869 |
| Financials - 22.23% | | | | |
| AK Transneft OJSC via | | | | |
| TransCapitalInvest, Ltd. | | | | |
| 8.700%, 08/07/2018 (S) | | 1,000,000 | | 1,223,129 |
| Allstate Life Global Funding Trusts | | | | |
| 5.375%, 04/30/2013 | | 2,500,000 | | 2,706,743 |
| Ally Financial, Inc. | | | | |
| 3.512%, 02/11/2014 (P) | | 1,000,000 | | 1,011,190 |
| 6.250%, 12/01/2017 (S) | | 5,500,000 | | 5,740,625 |
| 6.875%, 08/28/2012 | | 5,810,000 | | 6,158,600 |
| 7.000%, 02/01/2012 | | 3,800,000 | | 3,942,500 |
| 7.500%, 09/15/2020 (S) | | 1,500,000 | | 1,640,625 |
| 8.300%, 02/12/2015 | | 3,900,000 | | 4,402,125 |
| American Express Bank FSB | | | | |
| 5.500%, 04/16/2013 | | 3,500,000 | | 3,761,905 |
| 6.000%, 09/13/2017 | | 200,000 | | 222,338 |
| American Express Centurion Bank | | | | |
| 6.000%, 09/13/2017 | | 200,000 | | 222,702 |
| American Express Company | | | | |
| 7.000%, 03/19/2018 | | 2,700,000 | | 3,170,435 |
| American Express Credit Corp | | | | |
| 5.375%, 10/01/2014 | GBP | 8,100,000 | | 13,804,995 |
| American Express Credit Corp. | | | | |
| 5.875%, 05/02/2013 | $ | 2,300,000 | | 2,493,989 |
| American Express Travel Related | | | | |
| Services Company, Inc. | | | | |
| 5.250%, 11/21/2011 (S) | | 1,366,000 | | 1,404,021 |
| American General Finance Corp. | | | | |
| 3.250%, 01/16/2013 | EUR | 2,193,000 | | 2,755,743 |
| 4.000%, 03/15/2011 | $ | 4,900,000 | | 4,900,000 |
| 4.875%, 07/15/2012 | | 600,000 | | 590,250 |
| American International Group, Inc. | | | | |
| 0.404%, 03/20/2012 (P) | | 4,200,000 | | 4,159,407 |
| 4.950%, 03/20/2012 | | 22,268,000 | | 22,936,263 |
| 5.850%, 01/16/2018 | | 5,400,000 | | 5,699,678 |
| 6.250%, 03/15/2037 | | 1,100,000 | | 1,006,500 |
| ANZ National International, Ltd. | | | | |
| 6.200%, 07/19/2013 (S) | | 3,100,000 | | 3,395,929 |
| | | | |
| Total Return Fund (continued) | | | |
| | | Shares or | | |
| | | Principal | | |
| | | Amount | | Value |
| |
|
| |
| CORPORATE BONDS (continued) | | | | |
| Financials (continued) | | | | |
| Australia & New Zealand Banking | | | | |
| Group, Ltd. | | | | |
| 2.125%, 01/10/2014 (S) | $ | 3,000,000 | $ | 3,017,460 |
| BAC Capital Trust VII | | | | |
| 5.250%, 08/10/2035 | GBP | 1,000,000 | | 1,235,461 |
| Banco Nacional De Desenvolvimento | | | | |
| Economico E Social | | | | |
| 4.125%, 09/15/2017 (S) | EUR | 600,000 | | 795,348 |
| Banco Santander Brasil SA | | | | |
| 4.250%, 01/14/2016 (S) | $ | 2,500,000 | | 2,486,392 |
| 4.500%, 04/06/2015 (S) | | 400,000 | | 408,330 |
| Banco Santander Chile | | | | |
| 1.553%, 04/20/2012 (P)(S) | | 3,800,000 | | 3,798,814 |
| Bank of America Corp. | | | | |
| 0.643%, 08/15/2016 (P) | | 1,100,000 | | 1,031,425 |
| 6.500%, 08/01/2016 | | 7,900,000 | | 8,866,407 |
| Bank of America NA | | | | |
| 6.000%, 10/15/2036 | | 900,000 | | 878,097 |
| Bank of China Hong Kong, Ltd. | | | | |
| 5.550%, 02/11/2020 (S) | | 700,000 | | 719,933 |
| Bank of Montreal | | | | |
| 2.850%, 06/09/2015 (S) | | 1,400,000 | | 1,420,080 |
| Bank of Nova Scotia | | | | |
| 1.650%, 10/29/2015 (S) | | 1,400,000 | | 1,338,273 |
| Barclays Bank Plc | | | | |
| 2.375%, 01/13/2014 | | 1,100,000 | | 1,105,530 |
| Barclays Bank PLC | | | | |
| 5.000%, 09/22/2016 | | 9,700,000 | | 10,297,336 |
| 5.450%, 09/12/2012 | | 23,000,000 | | 24,452,335 |
| 6.050%, 12/04/2017 (S) | | 2,900,000 | | 3,002,141 |
| BNP Paribas (5.186% to 06/29/2015, | | | | |
| then 3 month LIBOR + 1.680%) | | | | |
| (Q)(S) | | 7,600,000 | | 7,068,000 |
| BPCE SA | | | | |
| 2.375%, 10/04/2013 (S) | | 600,000 | | 600,324 |
| C10 Capital SPV, Ltd. (6.722% to | | | | |
| 12/31/2016, then 3 month | | | | |
| LIBOR + 4.710%) | | | | |
| (Q)(S) | | 1,700,000 | | 1,272,006 |
| Caelus Re, Ltd. | | | | |
| 6.561%, 06/07/2011 (P)(S) | | 1,200,000 | | 1,204,200 |
| CIT Group, Inc. | | | | |
| 7.000%, 05/01/2013 to 05/01/2017 | | 3,337,249 | | 3,383,269 |
| Citigroup, Inc. | | | | |
| 1.164%, 02/15/2013 (P) | | 2,100,000 | | 2,105,271 |
| 2.312%, 08/13/2013 (P) | | 400,000 | | 410,654 |
| 5.300%, 10/17/2012 | | 800,000 | | 847,266 |
| 5.500%, 08/27/2012 to 10/15/2014 | | 20,800,000 | | 22,414,818 |
| 5.625%, 08/27/2012 | | 1,700,000 | | 1,788,308 |
| 5.850%, 07/02/2013 | | 600,000 | | 649,058 |
| 6.000%, 08/15/2017 | | 900,000 | | 986,224 |
| 6.125%, 08/25/2036 | | 3,500,000 | | 3,362,786 |
| 8.500%, 05/22/2019 | | 2,200,000 | | 2,728,092 |
| Citigroup, Inc. (4.750% to 02/10/2014, | | | | |
| then 3 month EURIBOR + 1.400%) | | | | |
| 02/10/2019 | EUR | 1,500,000 | | 1,950,343 |
| Countrywide Financial Corp. | | | | |
| 5.800%, 06/07/2012 | $ | 3,300,000 | | 3,479,556 |
| Credit Suisse/New York NY | | | | |
| 2.200%, 01/14/2014 | | 1,300,000 | | 1,305,318 |
| Danske Bank A/S | | | | |
| 2.500%, 05/10/2012 (S) | | 2,500,000 | | 2,550,035 |
| Deutsche Bank AG/London | | | | |
| 6.000%, 09/01/2017 | | 4,600,000 | | 5,130,417 |
| |
| The accompanying notes are an integral part of the financial statements. | 278 |
John Hancock Funds II
Portfolio of Investments — February 28, 2011 (Unaudited) (showing percentage of total net assets)
| | | | |
| Total Return Fund (continued) | | | |
| | | Shares or | | |
| | | Principal | | |
| | | Amount | | Value |
| |
|
| |
| CORPORATE BONDS (continued) | | | | |
| Financials (continued) | | | | |
| Dexia Credit Local | | | | |
| 0.784%, 04/29/2014 (P)(S) | $ | 7,100,000 | $ | 7,058,238 |
| 0.953%, 09/23/2011 (P)(S) | | 5,200,000 | | 5,210,592 |
| Export-Import Bank of Korea | | | | |
| 1.050%, 03/03/2012 (S) | SGD | 4,400,000 | | 3,459,663 |
| Export-import Bank of Korea | | | | |
| 4.000%, 01/29/2021 | $ | 600,000 | | 542,705 |
| 5.125%, 06/29/2020 | | 1,100,000 | | 1,104,532 |
| Ford Motor Credit Company LLC | | | | |
| 3.053%, 01/13/2012 (P) | | 1,300,000 | | 1,313,247 |
| 7.250%, 10/25/2011 | | 100,000 | | 103,236 |
| 7.500%, 08/01/2012 | | 3,500,000 | | 3,733,814 |
| 7.800%, 06/01/2012 | | 7,800,000 | | 8,318,263 |
| 8.000%, 12/15/2016 | | 1,000,000 | | 1,132,772 |
| Fortis Bank Nederland Holding NV | | | | |
| 3.000%, 04/17/2012 | EUR | 500,000 | | 700,869 |
| General Electric Capital Corp. | | | | |
| 2.000%, 09/28/2012 | $ | 700,000 | | 715,548 |
| General Electric Capital Corp. (5.500% | | | | |
| to 09/15/2017, then 3 month | | | | |
| EURIBOR + 2.000%) | | | | |
| 09/15/2067 | EUR | 9,900,000 | | 12,636,891 |
| General Electric Capital Corp. (6.375% | | | | |
| to 11/15/17, then 3 month | | | | |
| LIBOR + 2.289%) | | | | |
| 11/15/2067 | $ | 4,100,000 | | 4,197,375 |
| GMAC, Inc. | | | | |
| 2.200%, 12/19/2012 | | 1,100,000 | | 1,128,411 |
| HSBC Bank PLC | | | | |
| 2.000%, 01/19/2014 (S) | | 1,400,000 | | 1,402,045 |
| HSBC Holdings PLC | | | | |
| 6.500%, 05/02/2036 to 09/15/2037 | | 2,100,000 | | 2,175,608 |
| ING Bank NV | | | | |
| 1.103%, 03/30/2012 (P)(S) | | 18,700,000 | | 18,644,480 |
| International Lease Finance Corp. | | | | |
| 1.058%, 08/15/2011 (P) | EUR | 7,600,000 | | 10,243,771 |
| 6.750%, 09/01/2016 (S) | $ | 1,300,000 | | 1,407,250 |
| Intesa Sanpaolo SpA | | | | |
| 2.713%, 02/24/2014 (P)(S) | | 3,300,000 | | 3,295,317 |
| Intesa Sanpaolo SpA/New York | | | | |
| 2.375%, 12/21/2012 | | 12,700,000 | | 12,775,209 |
| IPIC, Ltd. | | | | |
| 5.000%, 11/15/2020 (S) | | 800,000 | | 766,230 |
| JPMorgan Chase & Company | | | | |
| 6.000%, 01/15/2018 | | 2,300,000 | | 2,558,216 |
| JPMorgan Chase Bank NA | | | | |
| 6.000%, 10/01/2017 | | 3,900,000 | | 4,298,377 |
| LeasePlan Corp. NV | | | | |
| 3.125%, 02/10/2012 | EUR | 1,900,000 | | 2,658,415 |
| Lehman Brothers Holdings, Inc. | | | | |
| 11/24/2008 to 12/23/2010 (H) | $ | 20,100,000 | | 5,050,125 |
| 6.875%, 05/02/2018 (H) | | 1,100,000 | | 287,375 |
| Lloyds TSB Bank PLC | | | | |
| 4.875%, 01/21/2016 | | 1,700,000 | | 1,730,348 |
| Merrill Lynch & Company, Inc. | | | | |
| 5.450%, 02/05/2013 | | 1,400,000 | | 1,491,658 |
| 6.050%, 08/15/2012 | | 900,000 | | 956,514 |
| 6.400%, 08/28/2017 | | 3,100,000 | | 3,406,305 |
| 6.875%, 04/25/2018 | | 7,600,000 | | 8,549,293 |
| MetLife, Inc. | | | | |
| 6.400%, 12/15/2036 | | 900,000 | | 860,310 |
| Metropolitan Life Global Funding I | | | | |
| 0.703%, 07/13/2011 (P)(S) | | 12,100,000 | | 12,115,343 |
| Monumental Global Funding, Ltd. | | | | |
| 5.500%, 04/22/2013 (S) | | 1,900,000 | | 2,022,364 |
| | | | |
| Total Return Fund (continued) | | | |
| | | Shares or | | |
| | | Principal | | |
| | | Amount | | Value |
| |
|
| |
| CORPORATE BONDS (continued) | | | | |
| Financials (continued) | | | | |
| Morgan Stanley | | | | |
| 2.812%, 05/14/2013 (P) | $ | 4,100,000 | $ | 4,242,553 |
| 6.250%, 08/28/2017 | | 800,000 | | 873,806 |
| 7.300%, 05/13/2019 | | 300,000 | | 341,651 |
| Mystic Re, Ltd. | | | | |
| 10.311%, 06/07/2011 (P)(S) | | 700,000 | | 712,250 |
| National Australia Bank, Ltd. | | | | |
| 5.350%, 06/12/2013 (S) | | 2,600,000 | | 2,817,027 |
| Nationwide Building Society | | | | |
| 6.250%, 02/25/2020 (S) | | 3,000,000 | | 3,079,044 |
| Nordea Bank AB | | | | |
| 2.125%, 01/14/2014 (S) | | 600,000 | | 599,347 |
| Northern Rock Asset Management PLC | | | | |
| 5.625%, 06/22/2017 (S) | | 15,300,000 | | 15,344,064 |
| Pacific LifeCorp. | | | | |
| 6.000%, 02/10/2020 (S) | | 700,000 | | 738,952 |
| Pricoa Global Funding I | | | | |
| 0.404%, 01/30/2012 (P)(S) | | 3,200,000 | | 3,184,995 |
| 0.503%, 09/27/2013 (P)(S) | | 2,700,000 | | 2,661,730 |
| Principal Life Income Funding Trusts | | | | |
| 5.300%, 04/24/2013 | | 2,200,000 | | 2,365,370 |
| 5.550%, 04/27/2015 | | 3,500,000 | | 3,821,517 |
| Qatari Diar Finance QSC | | | | |
| 5.000%, 07/21/2020 (S) | | 1,200,000 | | 1,175,491 |
| Royal Bank of Scotland Group PLC | | | | |
| (6.990% to 10/05/2017, then 3 month | | | | |
| LIBOR + 2.670%) | | | | |
| (Q)(S) | | 6,800,000 | | 5,848,000 |
| Royal Bank of Scotland Group PLC | | | | |
| (7.648% to 09/30/2031, then 3 month | | | | |
| LIBOR + 2.500%) | | | | |
| (Q) | | 5,000,000 | | 4,575,000 |
| Royal Bank of Scotland PLC | | | | |
| 0.707%, 04/08/2011 (P)(S) | | 4,000,000 | | 4,001,704 |
| 3.000%, 12/09/2011 (S) | | 5,900,000 | | 6,009,534 |
| 3.950%, 09/21/2015 | | 1,600,000 | | 1,595,158 |
| RZD Capital, Ltd. | | | | |
| 5.739%, 04/03/2017 | | 1,100,000 | | 1,135,750 |
| Santander US Debt SA Unipersonal | | | | |
| 1.103%, 03/30/2012 (P)(S) | | 13,900,000 | | 13,759,638 |
| 2.991%, 10/07/2013 (S) | | 5,700,000 | | 5,561,114 |
| SLM Corp. | | | | |
| 0.533%, 10/25/2011 (P) | | 200,000 | | 198,367 |
| 0.964%, 11/15/2011 | EUR | 5,400,000 | | 7,254,251 |
| 1.044%, 06/17/2013 (P) | | 2,100,000 | | 2,644,581 |
| 5.375%, 05/15/2014 | $ | 500,000 | | 515,529 |
| 6.250%, 01/25/2016 | | 600,000 | | 615,000 |
| Springleaf Finance Corp. | | | | |
| 6.900%, 12/15/2017 | | 2,700,000 | | 2,423,250 |
| State Bank of India/London | | | | |
| 4.500%, 07/27/2015 (S) | | 1,700,000 | | 1,723,438 |
| SteelRiver Transmission Company LLC | | | | |
| 4.710%, 06/30/2017 (S) | | 2,500,000 | | 2,464,700 |
| Sumitomo Mitsui Banking Corp. | | | | |
| 1.950%, 01/14/2014 (S) | | 1,300,000 | | 1,301,286 |
| Swedbank AB | | | | |
| 3.625%, 12/02/2011 | EUR | 100,000 | | 139,883 |
| Sydney Airport Finance | | | | |
| Company Pty, Ltd. | | | | |
| 5.125%, 02/22/2021 (S) | $ | 400,000 | | 393,774 |
| Temasek Financial I, Ltd. | | | | |
| 4.300%, 10/25/2019 (S) | | 1,600,000 | | 1,626,755 |
| The Bear Stearns Companies LLC | | | | |
| 0.992%, 09/26/2013 (P) | EUR | 3,800,000 | | 5,184,397 |
| 6.950%, 08/10/2012 | $ | 4,100,000 | | 4,440,817 |
| |
| The accompanying notes are an integral part of the financial statements. | 279 |
John Hancock Funds II
Portfolio of Investments — February 28, 2011 (Unaudited) (showing percentage of total net assets)
| | | | |
| Total Return Fund (continued) | | | |
| | | Shares or | | |
| | | Principal | | |
| | | Amount | | Value |
| |
|
| |
| CORPORATE BONDS (continued) | | | | |
| Financials (continued) | | | | |
| The Goldman Sachs Group, Inc. | | | | |
| 1.042%, 05/23/2016 (P) | EUR | 600,000 | $ | 779,581 |
| 5.625%, 01/15/2017 | $ | 1,300,000 | | 1,377,561 |
| 6.150%, 04/01/2018 | | 7,500,000 | | 8,216,085 |
| 6.250%, 09/01/2017 | | 5,400,000 | | 5,996,657 |
| 6.375%, 05/02/2018 | EUR | 700,000 | | 1,043,969 |
| The Royal Bank of Scotland PLC | | | | |
| 2.625%, 05/11/2012 (S) | $ | 3,100,000 | | 3,172,825 |
| TNK-BP Finance SA | | | | |
| 6.125%, 03/20/2012 (S) | | 500,000 | | 521,250 |
| UBS AG/Stamford CT | | | | |
| 1.304%, 01/28/2014 (P) | | 1,000,000 | | 1,010,285 |
| 1.413%, 02/23/2012 (P) | | 2,100,000 | | 2,117,583 |
| 5.750%, 04/25/2018 | | 1,900,000 | | 2,064,893 |
| 5.875%, 12/20/2017 | | 2,100,000 | | 2,299,082 |
| Vnesheconombank Via VEB | | | | |
| Finance, Ltd. | | | | |
| 5.450%, 11/22/2017 (S) | | 700,000 | | 695,660 |
| Wachovia Corp. | | | | |
| 0.433%, 10/15/2011 (P) | | 1,100,000 | | 1,100,937 |
| 5.750%, 02/01/2018 | | 6,200,000 | | 6,893,625 |
| Westpac Banking Corp. | | | | |
| 0.783%, 07/16/2014 (P)(S) | | 1,000,000 | | 1,004,555 |
| 3.585%, 08/14/2014 (S) | | 1,600,000 | | 1,686,027 |
| | |
|
| | | | | 528,840,006 |
| Health Care - 0.54% | | | | |
| Amgen, Inc. | | | | |
| 6.150%, 06/01/2018 | | 9,100,000 | | 10,493,692 |
| AstraZeneca PLC | | | | |
| 5.900%, 09/15/2017 | | 1,000,000 | | 1,144,530 |
| 6.450%, 09/15/2037 | | 1,000,000 | | 1,148,523 |
| | |
|
| | | | | 12,786,745 |
| Industrials - 1.26% | | | | |
| Noble Group, Ltd. | | | | |
| 4.875%, 08/05/2015 (S) | | 1,000,000 | | 1,020,000 |
| Odebrecht Drilling Norbe VIII/IX, Ltd. | | | | |
| 6.350%, 06/30/2021 (S) | | 12,800,000 | | 13,392,000 |
| President and Fellows of Harvard | | | | |
| College | | | | |
| 6.500%, 01/15/2039 (S) | | 12,900,000 | | 15,526,053 |
| | |
|
| | | | | 29,938,053 |
| Materials - 1.72% | | | | |
| AngloGold Holdings PLC | | | | |
| 5.375%, 04/15/2020 | | 300,000 | | 305,324 |
| C8 Capital SPV, Ltd. (6.640% to | | | | |
| 12/31/2014, then 3 month | | | | |
| LIBOR + 4.400%) | | | | |
| (Q)(S) | | 4,500,000 | | 3,303,927 |
| CSN Resources SA | | | | |
| 6.500%, 07/21/2020 (S) | | 8,000,000 | | 8,460,000 |
| 6.500%, 07/21/2020 | | 2,600,000 | | 2,749,500 |
| Gerdau Trade, Inc. | | | | |
| 5.750%, 01/30/2021 (S) | | 600,000 | | 600,000 |
| GTL Trade Finance, Inc. | | | | |
| 7.250%, 10/20/2017 (S) | | 10,400,000 | | 11,557,000 |
| 7.250%, 10/20/2017 | | 2,900,000 | | 3,222,625 |
| Rohm & Haas Company | | | | |
| 6.000%, 09/15/2017 | | 1,500,000 | | 1,666,305 |
| The Dow Chemical Company | | | | |
| 4.850%, 08/15/2012 | | 7,000,000 | | 7,370,412 |
| 6.000%, 10/01/2012 | | 800,000 | | 860,081 |
| | | | |
| Total Return Fund (continued) | | | |
| | | Shares or | | |
| | | Principal | | |
| | | Amount | | Value |
| |
|
| |
| CORPORATE BONDS (continued) | | | | |
| Materials (continued) | | | | |
| Vale Overseas, Ltd. | | | | |
| 4.625%, 09/15/2020 | $ | 900,000 | $ | 883,462 |
| | |
|
| | | | | 40,978,636 |
| Telecommunication Services - 0.87% | | | | |
| Cellco Partnership/Verizon Wireless | | | | |
| Capital LLC | | | | |
| 2.914%, 05/20/2011 (P) | | 14,700,000 | | 14,783,717 |
| Qtel International Finance, Ltd. | | | | |
| 4.750%, 02/16/2021 (S) | | 3,000,000 | | 2,803,443 |
| Telecom Italia Capital SA | | | | |
| 0.913%, 07/18/2011 (P) | | 3,200,000 | | 3,198,973 |
| | |
|
| | | | | 20,786,133 |
|
| TOTAL CORPORATE BONDS (Cost $665,076,165) | | $ | 678,298,684 |
|
| |
| CONVERTIBLE BONDS - 0.51% | | | | |
| Energy - 0.51% | | | | |
| Chesapeake Energy Corp. | | | | |
| 2.250%, 12/15/2038 | | 600,000 | | 549,000 |
| Transocean, Inc. | | | | |
| 1.500%, 12/15/2037 | | 11,500,000 | | 11,500,000 |
| | |
|
| | | | | 12,049,000 |
|
| TOTAL CONVERTIBLE BONDS (Cost $11,152,999) | | $ | 12,049,000 |
|
| |
| TERM LOANS (M) - 0.42% | | | | |
| Consumer Discretionary - 0.07% | | | | |
| Ford Motor Company | | | | |
| 3.020%, 12/15/2013 | | 1,662,164 | | 1,661,463 |
| Financials - 0.27% | | | | |
| American General Finance Corp. | | | | |
| 7.250%, 04/08/2015 | | 2,500,000 | | 2,522,250 |
| CIT Group, Inc. | | | | |
| 6.250%, 08/11/2015 | | 621,689 | | 629,590 |
| Petroleum Export, Ltd. | | | | |
| 3.319%, 12/20/2012 | | 3,300,000 | | 3,283,500 |
| | |
|
| | | | | 6,435,340 |
| Utilities - 0.08% | | | | |
| Sensata Technologies, Inc. | | | | |
| 2.038%, 04/27/2013 | | 1,924,433 | | 1,919,022 |
|
| TOTAL TERM LOANS (Cost $9,980,876) | | | $ | 10,015,825 |
|
| |
| MUNICIPAL BONDS - 2.71% | | | | |
| California - 1.39% | | | | |
| California Infrastructure & Economic | | | | |
| Development Bank | | | | |
| 6.486%, 05/15/2049 | | 1,000,000 | | 996,790 |
| California State University | | | | |
| 6.434%, 11/01/2030 | | 1,200,000 | | 1,214,520 |
| City of Los Angeles CA | | | | |
| 5.713%, 06/01/2039 | | 1,000,000 | | 930,310 |
| Los Angeles Unified School District | | | | |
| 4.500%, 07/01/2023 | | 5,000,000 | | 4,916,050 |
| 6.758%, 07/01/2034 | | 2,700,000 | | 2,849,850 |
| San Diego Tobacco Settlement Revenue | | | | |
| Funding Corp. | | | | |
| 7.125%, 06/01/2032 | | 1,450,000 | | 1,095,968 |
| State of California | | | | |
| 5.650%, 04/01/2039 | | 800,000 | | 824,904 |
| 7.500%, 04/01/2034 | | 2,600,000 | | 2,810,262 |
| 7.550%, 04/01/2039 | | 900,000 | | 974,457 |
| 7.600%, 11/01/2040 | | 1,600,000 | | 1,738,256 |
| 7.950%, 03/01/2036 | | 7,900,000 | | 8,368,154 |
| |
| The accompanying notes are an integral part of the financial statements. | 280 |
John Hancock Funds II
Portfolio of Investments — February 28, 2011 (Unaudited) (showing percentage of total net assets)
| | | | |
| Total Return Fund (continued) | | | |
| | | Shares or | | |
| | | Principal | | |
| | | Amount | | Value |
| |
|
| |
| MUNICIPAL BONDS (continued) | | | | |
| California (continued) | | | | |
| Tobacco Securitization Authority of | | | | |
| Southern California | | | | |
| 5.125%, 06/01/2046 | $ | 1,500,000 | $ | 914,025 |
| University of California | | | | |
| 6.270%, 05/15/2031 | | 5,300,000 | | 5,339,909 |
| | |
|
| | | | | 32,973,455 |
| Illinois - 0.40% | | | | |
| Chicago Illinois Transit Authority | | | | |
| 6.200%, 12/01/2040 | | 1,000,000 | | 936,220 |
| Chicago Illinois Transit | | | | |
| Authority, Series A | | | | |
| 6.300%, 12/01/2021 | | 100,000 | | 105,569 |
| 6.899%, 12/01/2040 | | 2,700,000 | | 2,603,529 |
| Chicago Illinois Transit | | | | |
| Authority, Series B | | | | |
| 6.300%, 12/01/2021 | | 300,000 | | 316,707 |
| 6.899%, 12/01/2040 | | 2,600,000 | | 2,507,102 |
| Illinois Municipal Electric Agency | | | | |
| 6.832%, 02/01/2035 | | 200,000 | | 200,452 |
| State of Illinois | | | | |
| 4.071%, 01/01/2014 | | 2,100,000 | | 2,108,925 |
| 6.725%, 04/01/2035 | | 800,000 | | 779,024 |
| | |
|
| | | | | 9,557,528 |
| Iowa - 0.03% | | | | |
| Tobacco Settlement Authority of Iowa, | | | | |
| Series A | | | | |
| 6.500%, 06/01/2023 | | 895,000 | | 815,846 |
| Louisiana - 0.11% | | | | |
| State of Louisiana | | | | |
| 3.000%, 05/01/2043 (P) | | 2,600,000 | | 2,588,248 |
| Nevada - 0.07% | | | | |
| County of Clark | | | | |
| 6.820%, 07/01/2045 | | 1,400,000 | | 1,388,814 |
| Truckee Meadows Nevada Water | | | | |
| Authority, Series A | | | | |
| 5.000%, 07/01/2036 | | 200,000 | | 181,334 |
| | |
|
| | | | | 1,570,148 |
| New Jersey - 0.35% | | | | |
| New Jersey State Turnpike Authority | | | | |
| 7.414%, 01/01/2040 | | 7,400,000 | | 8,296,140 |
| North Carolina - 0.01% | | | | |
| North Carolina Turnpike Authority | | | | |
| 6.700%, 01/01/2039 | | 300,000 | | 310,113 |
| Ohio - 0.08% | | | | |
| American Municipal Power-Ohio, Inc. | | | | |
| 8.084%, 02/15/2050 | | 1,600,000 | | 1,811,728 |
| Texas - 0.11% | | | | |
| City of San Antonio TX | | | | |
| 6.308%, 02/01/2037 | | 2,600,000 | | 2,694,536 |
| West Virginia - 0.09% | | | | |
| Tobacco Settlement Finance Authority | | | | |
| 7.467%, 06/01/2047 | | 3,120,000 | | 2,163,096 |
| Wisconsin - 0.07% | | | | |
| Badger Tobacco Asset | | | | |
| Securitization Corp. | | | | |
| 6.125%, 06/01/2027 | | 1,520,000 | | 1,587,853 |
|
| TOTAL MUNICIPAL BONDS (Cost $63,567,143) | | $ | 64,368,691 |
|
| | | | |
| Total Return Fund (continued) | | | |
| | | Shares or | | |
| | | Principal | | |
| | | Amount | | Value |
| |
|
| |
| CAPITAL PREFERRED SECURITIES - 1.16% | | | |
| Financials - 1.16% | | | | |
| Citigroup Capital XXI (8.300% to | | | | |
| 12/21/2037, then 3 month | | | | |
| LIBOR + 4.170%) | | | | |
| 12/21/2057 | | 20,525,000 | | 21,140,750 |
| JPMorgan Chase Capital XX | | | | |
| 6.550%, 09/29/2036 | | 400,000 | | 411,016 |
| MUFG Capital Finance 5, Ltd. (6.299% | | | | |
| to 01/25/2017, then 6 month GBP | | | | |
| LIBOR + 2.060%) | | | | |
| (Q) | GBP | 1,500,000 | | 2,371,415 |
| State Street Capital Trust III (8.250% to | | | | |
| 03/15/2011, then 3 month | | | | |
| LIBOR + 4.990%) | | | | |
| (Q) | $ | 2,900,000 | | 2,906,177 |
| State Street Capital Trust IV | | | | |
| 1.302%, 06/15/2037 (P) | | 400,000 | | 324,474 |
| USB Capital IX (6.189% to 04/15/2011, | | | | |
| then 3 month LIBOR + 1.020%) | | | | |
| (Q) | | 300,000 | | 244,890 |
| ZFS Finance USA Trust IV (5.875% to | | | | |
| 05/09/2012, then 3 month | | | | |
| LIBOR + 1.815%) | | | | |
| 05/09/2032 (S) | | 321,000 | | 319,722 |
| | |
|
| | | | | 27,718,444 |
|
| TOTAL CAPITAL PREFERRED | | | | |
| SECURITIES (Cost $18,643,134) | | | $ | 27,718,444 |
|
| |
| COLLATERALIZED MORTGAGE | | | | |
| OBLIGATIONS - 4.93% | | | | |
| Commercial & Residential - 4.03% | | | | |
| American Home Mortgage | | | | |
| Investment Trust, Series 2004-4, | | | | |
| Class 4A | | | | |
| 2.262%, 02/25/2045 (P) | $ | 165,409 | $ | 152,545 |
| Arran Residential | | | | |
| Mortgages Funding PLC | | | | |
| Series 2010-1A, Class A1B, | | | | |
| 2.291%, 05/16/2047 (P)(S) | EUR | 1,020,474 | | 1,408,308 |
| Series 2010-1A, Class A2B, | | | | |
| 2.491%, 05/16/2047 (P)(S) | | 3,100,000 | | 4,272,301 |
| Bear Stearns Adjustable | | | | |
| Rate Mortgage Trust | | | | |
| Series 2004-8, Class 2A1, | | | | |
| 3.091%, 11/25/2034 (P) | $ | 2,517,039 | | 2,180,436 |
| Series 2004-9, Class 22A1, | | | | |
| 3.607%, 11/25/2034 (P) | | 666,686 | | 665,968 |
| Bear Stearns Alt-A Trust, Series 2005-7, | | | | |
| Class 22A1 | | | | |
| 2.961%, 09/25/2035 (P) | | 900,012 | | 710,386 |
| Bear Stearns Commercial | | | | |
| Mortgage Securities, Inc. | | | | |
| Series 2007-PW15, Class A4, | | | | |
| 5.331%, 02/11/2044 | | 400,000 | | 421,843 |
| Series 2007-T26, Class A4, | | | | |
| 5.471%, 01/12/2045 (P) | | 1,000,000 | | 1,076,515 |
| Series 2007-PW18, Class A4, | | | | |
| 5.700%, 06/13/2050 | | 4,300,000 | | 4,645,714 |
| Citigroup Mortgage Loan Trust, Inc. | | | | |
| Series 2005-11, Class 1A1, | | | | |
| 2.640%, 12/25/2035 (P) | | 763,472 | | 702,673 |
| Series 2005-11, Class A2A, | | | | |
| 2.690%, 12/25/2035 (P) | | 339,693 | | 327,304 |
| |
| The accompanying notes are an integral part of the financial statements. | 281 |
John Hancock Funds II
Portfolio of Investments — February 28, 2011 (Unaudited) (showing percentage of total net assets)
| | | | |
| Total Return Fund (continued) | | | |
| | | Shares or | | |
| | | Principal | | |
| | | Amount | | Value |
| |
|
| |
| COLLATERALIZED MORTGAGE | | | | |
| OBLIGATIONS (continued) | | | | |
| Commercial & Residential (continued) | | | | |
| Commercial Mortgage Pass-Through | | | | |
| Certificates, Series 2006-C8, Class A4 | | | | |
| 5.306%, 12/10/2046 | $ | 2,900,000 | $ | 3,066,526 |
| Countrywide Alternative Loan Trust | | | | |
| Series 2005-81, Class A1, | | | | |
| 0.542%, 02/25/2037 (P) | | 6,033,443 | | 3,700,727 |
| Series 2005-62, Class 2A1, | | | | |
| 1.292%, 12/25/2035 (P) | | 8,099,334 | | 5,207,839 |
| Countrywide Home Loan Mortgage | | | | |
| Pass Through Trust | | | | |
| Series 2004-HYB9, Class 1A1, | | | | |
| 2.812%, 02/20/2035 (P) | | 2,966,158 | | 2,591,479 |
| Series 2005-HYB9, Class 3A2A, | | | | |
| 3.017%, 02/20/2036 (P) | | 427,234 | | 359,340 |
| Series 2004-22, Class A3, | | | | |
| 3.121%, 11/25/2034 (P) | | 1,700,304 | | 1,507,666 |
| Credit Suisse Mortgage Capital | | | | |
| Certificates, Series 2006-C2, Class A3 | | | | |
| 5.659%, 03/15/2039 (P) | | 300,000 | | 325,086 |
| European Loan Condui, Series 25X, | | | | |
| Class A | | | | |
| 1.243%, 05/15/2019 (P) | EUR | 343,133 | | 418,223 |
| GE Capital Commercial Mortgage Corp., | | | | |
| Series 2002-3A, Class A1 | | | | |
| 4.229%, 12/10/2037 | $ | 502,953 | | 505,915 |
| Granite Master Issuer PLC, | | | | |
| Series 2005-1, Class A5 | | | | |
| 1.063%, 12/20/2054 (P) | EUR | 3,735,298 | | 4,878,757 |
| Greenpoint Mortgage Funding Trust | | | | |
| Series 2006-AR6, Class A1A, | | | | |
| 0.342%, 10/25/2046 (P) | $ | 438,688 | | 405,615 |
| Series 2006-AR8, Class 1A1A, | | | | |
| 0.342%, 01/25/2047 (P) | | 474,291 | | 441,351 |
| Greenwich Capital | | | | |
| Commercial Funding Corp. | | | | |
| Series 2005-GG3, Class A4, | | | | |
| 4.799%, 08/10/2042 (P) | | 100,000 | | 105,665 |
| Series 2007-GG9, Class A4, | | | | |
| 5.444%, 03/10/2039 | | 1,400,000 | | 1,495,632 |
| GS Mortgage Securities Corp. II, | | | | |
| Series 2007-EOP, Class A1 | | | | |
| 1.143%, 03/06/2020 (P)(S) | | 2,763,177 | | 2,734,775 |
| GSR Mortgage Loan Trust, | | | | |
| Series 2005-AR7, Class 6A1 | | | | |
| 5.177%, 11/25/2035 (P) | | 1,794,024 | | 1,758,047 |
| Holmes Master Issuer PLC, | | | | |
| Series 2011-1A, Class A3 | | | | |
| 2.339%, 10/15/2054 (P)(S) | EUR | 1,700,000 | | 2,339,777 |
| JPMorgan Chase Commercial | | | | |
| Mortgage Securities Corp. | | | | |
| Series 2010-C2, Class A3, | | | | |
| 4.070%, 11/15/2043 (S) | $ | 3,000,000 | | 2,909,319 |
| Series 2006-LDP9, Class A3, | | | | |
| 5.336%, 05/15/2047 | | 3,000,000 | | 3,188,315 |
| Series 2007-LDPX, Class A3, | | | | |
| 5.420%, 01/15/2049 | | 400,000 | | 425,136 |
| Series 2007-LD12, Class A4, | | | | |
| 5.882%, 02/15/2051 (P) | | 1,000,000 | | 1,085,029 |
| JPMorgan Mortgage Trust | | | | |
| Series 2005-A1, Class 6T1, | | | | |
| 5.035%, 02/25/2035 (P) | | 852,458 | | 867,207 |
| Series 2005-S3, Class 1A2, | | | | |
| 5.750%, 01/25/2036 | | 318,794 | | 298,902 |
| | | | |
| Total Return Fund (continued) | | | |
| | | Shares or | | |
| | | Principal | | |
| | | Amount | | Value |
| |
|
| |
| COLLATERALIZED MORTGAGE | | | | |
| OBLIGATIONS (continued) | | | | |
| Commercial & Residential (continued) | | | | |
| Mellon Residential Funding Corp., | | | | |
| Series 2000-TBC3, Class A1 | | | | |
| 0.706%, 12/15/2030 (P) | $ | 2,981,350 | $ | 2,841,495 |
| Merrill Lynch Commercial Trust, | | | | |
| Series 2008-LAQA, Class A1 | | | | |
| 0.802%, 07/09/2021 (P)(S) | | 4,998,969 | | 4,779,686 |
| Merrill Lynch Mortgage Investors, Inc. | | | | |
| Series 2005-A10, Class A, | | | | |
| 0.472%, 02/25/2036 (P) | | 978,283 | | 765,123 |
| Series 2005-2, Class 3A, | | | | |
| 1.260%, 10/25/2035 (P) | | 452,004 | | 391,698 |
| Merrill Lynch/Countrywide Commercial | | | | |
| Mortgage Trust, Series 2007-6, | | | | |
| Class A4 | | | | |
| 5.485%, 03/12/2051 (P) | | 2,000,000 | | 2,100,190 |
| MLCC Mortgage Investors, Inc., | | | | |
| Series 2005-3, Class 4A | | | | |
| 0.512%, 11/25/2035 (P) | | 224,953 | | 194,276 |
| Morgan Stanley Capital I | | | | |
| Series 2007-XLFA, Class A1, | | | | |
| 0.326%, 10/15/2020 (P)(S) | | 455,769 | | 443,113 |
| Series 2007-IQ14, Class A2FX, | | | | |
| 5.610%, 04/15/2049 | | 3,500,000 | | 3,573,180 |
| Series 2007-IQ16, Class A4, | | | | |
| 5.809%, 12/12/2049 | | 200,000 | | 217,912 |
| Morgan Stanley Reremic Trust, | | | | |
| Series 2009-GG10, Class A4A | | | | |
| 5.804%, 08/12/2045 (P)(S) | | 1,000,000 | | 1,088,182 |
| Structured Asset | | | | |
| Mortgage Investments, Inc. | | | | |
| Series 2007-AR2, Class 2A1, | | | | |
| 0.392%, 03/25/2037 (P) | | 2,693,541 | | 1,687,520 |
| Series 2005-AR5, Class A3, | | | | |
| 0.512%, 07/19/2035 (P) | | 1,971,003 | | 1,846,339 |
| Series 2005-AR8, Class A1A, | | | | |
| 0.542%, 02/25/2036 (P) | | 537,458 | | 330,415 |
| Structured Asset Securities Corp., | | | | |
| Series 2006-11, Class A1 | | | | |
| 2.784%, 10/25/2035 (P)(S) | | 827,462 | | 678,143 |
| Thornburg Mortgage Securities Trust | | | | |
| Series 2006-6, Class A1, | | | | |
| 0.372%, 11/25/2046 (P) | | 951,210 | | 944,165 |
| Series 2006-5, Class A1, | | | | |
| 0.382%, 10/25/2046 (P) | | 2,362,712 | | 2,337,228 |
| Wachovia Bank | | | | |
| Commercial Mortgage Trust | | | | |
| Series 2007-WHL8, Class A1, | | | | |
| 0.346%, 06/15/2020 (P)(S) | | 3,150,243 | | 2,994,136 |
| Series 2006-WL7A, Class A1, | | | | |
| 0.356%, 09/15/2021 (P)(S) | | 6,066,946 | | 6,009,168 |
| WaMu Mortgage Pass Through | | | | |
| Certificates, Series 2005-AR19, | | | | |
| Class A1A1 | | | | |
| 0.532%, 12/25/2045 (P) | | 2,562,731 | | 2,148,409 |
| WaMu Mortgage Pass-Through | | | | |
| Certificates, Series 2002-AR17, | | | | |
| Class 1A | | | | |
| 1.492%, 11/25/2042 (P) | | 160,794 | | 144,119 |
| Washington Mutual, Inc., Series 2001-7, | | | | |
| Class A | | | | |
| 1.521%, 05/25/2041 (P) | | 101,448 | | 99,173 |
| |
| The accompanying notes are an integral part of the financial statements. | 282 |
John Hancock Funds II
Portfolio of Investments — February 28, 2011 (Unaudited) (showing percentage of total net assets)
| | | | |
| Total Return Fund (continued) | | | |
| | | Shares or | | |
| | | Principal | | |
| | | Amount | | Value |
| |
|
| |
| COLLATERALIZED MORTGAGE | | | | |
| OBLIGATIONS (continued) | | | | |
| Commercial & Residential (continued) | | | | |
| Wells Fargo Mortgage | | | | |
| Backed Securities Trust | | | | |
| Series 2006-AR2, Class 2A1, | | | | |
| 2.802%, 03/25/2036 (P) | $ | 1,695,098 | $ | 1,494,956 |
| Series 2004-CC, Class A1, | | | | |
| 4.913%, 01/25/2035 (P) | | 1,638,521 | | 1,652,886 |
| | |
|
| | | | | 95,941,833 |
| U.S. Government Agency - 0.90% | | | | |
| Federal Home Loan Mortgage Corp. | | | | |
| Series 2007-3335, Class BF, | | | | |
| 0.416%, 07/15/2019 (P) | | 1,594,165 | | 1,594,147 |
| Series 3335, Class FT, | | | | |
| 0.416%, 08/15/2019 (P) | | 3,809,916 | | 3,809,973 |
| Series 3149, Class LF, | | | | |
| 0.566%, 05/15/2036 (P) | | 1,239,363 | | 1,235,330 |
| Series 2637, Class F, | | | | |
| 0.666%, 06/15/2018 (P) | | 166,531 | | 167,098 |
| Series T-63, Class 1A1, | | | | |
| 1.525%, 02/25/2045 (P) | | 156,110 | | 150,889 |
| Federal National Mortgage Association | | | | |
| Series 2007-73, Class A1, | | | | |
| 0.322%, 07/25/2037 (P) | | 1,691,812 | | 1,668,943 |
| Series 2005-120, Class NF, | | | | |
| 0.362%, 01/25/2021 (P) | | 5,197,511 | | 5,194,294 |
| Series 2007-30, Class AF, | | | | |
| 0.572%, 04/25/2037 (P) | | 1,727,339 | | 1,704,719 |
| Series 2003-W6, Class F, | | | | |
| 0.612%, 09/25/2042 (P) | | 1,478,795 | | 1,454,564 |
| Series 2005-75, Class FL, | | | | |
| 0.712%, 09/25/2035 (P) | | 3,154,026 | | 3,116,379 |
| Series 2006-5, Class 3A2, | | | | |
| 2.624%, 05/25/2035 (P) | | 207,177 | | 214,863 |
| Series 2003-37, Class HY, | | | | |
| 5.000%, 12/25/2016 | | 958,617 | | 957,829 |
| Series 2003-21, Class M, | | | | |
| 5.000%, 02/25/2017 | | 102,415 | | 104,361 |
| | |
|
| | | | | 21,373,389 |
|
| TOTAL COLLATERALIZED MORTGAGE | | | |
| OBLIGATIONS (Cost $121,211,735) | | | $ | 117,315,222 |
|
| |
| ASSET BACKED SECURITIES - 1.67% | | | | |
| Access Group, Series 2008-1, Class A | | | | |
| 1.603%, 10/27/2025 (P) | | 9,005,367 | | 9,096,229 |
| Bank of America Credit Card Trust, | | | | |
| Series 2008-A5, Class A5 | | | | |
| 1.466%, 12/16/2013 (P) | | 5,100,000 | | 5,119,980 |
| Bear Stearns Asset | | | | |
| Backed Securities Trust | | | | |
| Series 2007-HE1, Class 21A1, | | | | |
| 0.322%, 01/25/2037 (P) | | 1,312,490 | | 1,238,206 |
| Series 2007-HE5, Class 1A1, | | | | |
| 0.352%, 06/25/2047 (P) | | 468,082 | | 451,862 |
| BNC Mortgage Loan Trust, | | | | |
| Series 2007-2, Class A2 | | | | |
| 0.362%, 05/25/2037 (P) | | 1,168,409 | | 1,091,314 |
| Carrington Mortgage Loan Trust, | | | | |
| Series 2005-NC5, Class A2 | | | | |
| 0.582%, 10/25/2035 (P) | | 859,817 | | 817,581 |
| Citibank Omni Master Trust, | | | | |
| Series 2009-A8, Class A8 | | | | |
| 2.366%, 05/16/2016 (P)(S) | | 9,305,000 | | 9,452,494 |
| | | | |
| Total Return Fund (continued) | | | |
| | | Shares or | | |
| | | Principal | | |
| | | Amount | | Value |
| |
|
| |
| ASSET BACKED SECURITIES (continued) | | | |
| Countrywide Asset-Backed Certificates | | | | |
| Series 2007-1, Class 2A1, | | | | |
| 0.312%, 07/25/2037 (P) | $ | 2,696,950 | $ | 2,626,406 |
| Series 2006-15, Class A1, | | | | |
| 0.372%, 10/25/2046 (P) | | 6,522 | | 6,471 |
| First Franklin Mortgage Loan Asset | | | | |
| Backed Certificates, Series 2006-FF15, | | | | |
| Class A3 | | | | |
| 0.312%, 11/25/2036 (P) | | 204,096 | | 202,358 |
| GSAMP Trust, Series 2007-FM1, | | | | |
| Class A2A | | | | |
| 0.332%, 12/25/2036 (P) | | 504,599 | | 347,856 |
| HFC Home Equity Loan Asset Backed | | | | |
| Certificates, Series 2005-1, Class A | | | | |
| 0.552%, 01/20/2034 (P) | | 2,036,340 | | 1,858,519 |
| HSBC Asset Loan Obligation, | | | | |
| Series 2007-WF1, Class A1 | | | | |
| 0.322%, 12/25/2036 (P) | | 1,732,580 | | 1,663,024 |
| HSI Asset Securitization Corp. Trust, | | | | |
| Series 2006-HE2, Class 2A1 | | | | |
| 0.312%, 12/25/2036 (P) | | 48,247 | | 47,757 |
| JPMorgan Mortgage Acquisition Corp., | | | | |
| Series 2007-HE1, Class AV1 | | | | |
| 0.322%, 03/25/2047 (P) | | 993,791 | | 844,191 |
| Long Beach Mortgage Loan Trust, | | | | |
| Series 2004-4, Class 1A1 | | | | |
| 0.542%, 10/25/2034 (P) | | 58,753 | | 48,747 |
| Master Asset Backed Securities Trust, | | | | |
| Series 2007-HE1, Class A1 | | | | |
| 0.342%, 05/25/2037 (P) | | 441,662 | | 426,537 |
| Morgan Stanley Asset Backed Securities | | | | |
| Capital I, Series 2006-NC5, | | | | |
| Class A2A | | | | |
| 0.302%, 10/25/2036 (P) | | 7,486 | | 7,478 |
| Park Place Securities, Inc., | | | | |
| Series 2004-MCW1, Class A1 | | | | |
| 0.574%, 10/25/2034 (P) | | 236,346 | | 234,445 |
| Penta CLO SA, Series 2007-1X, | | | | |
| Class A1 | | | | |
| 1.478%, 06/04/2024 (P) | EUR | 968,307 | | 1,215,806 |
| Securitized Asset Backed | | | | |
| Receivables LLC Trust, | | | | |
| Series 2007-HE1, Class A2A | | | | |
| 0.322%, 12/25/2036 (P) | $ | 537,495 | | 200,457 |
| Small Business Administration | | | | |
| Participation Certificates, | | | | |
| Series 2007-2OL, Class 1 | | | | |
| 5.290%, 12/01/2027 | | 1,584,093 | | 1,704,706 |
| Specialty Underwriting & Residential | | | | |
| Finance, Series 2007-BC1, Class A2A | | | | |
| 0.322%, 01/25/2038 (P) | | 1,034,094 | | 960,643 |
| Structured Asset Securities Corp., | | | | |
| Series 2006-BC3, Class A2 | | | | |
| 0.312%, 10/25/2036 (P) | | 101,271 | | 100,816 |
|
| TOTAL ASSET BACKED SECURITIES (Cost $40,613,660) | $ | 39,763,883 |
|
| |
| COMMON STOCKS - 0.00% | | | | |
| Financials - 0.00% | | | | |
| |
| Insurance | | | | |
| American International Group, Inc. (I) | | 258 | | 9,574 |
|
| TOTAL COMMON STOCKS (Cost $10,728) | | $ | 9,574 |
|
| |
| The accompanying notes are an integral part of the financial statements. | 283 |
John Hancock Funds II
Portfolio of Investments — February 28, 2011 (Unaudited) (showing percentage of total net assets)
| | | | |
| Total Return Fund (continued) | | | |
| | | Shares or | | |
| | | Principal | | |
| | | Amount | | Value |
| |
|
| |
| PREFERRED SECURITIES - 0.73% | | | | |
| Consumer Discretionary - 0.01% | | | | |
| |
| Automobiles | | | | |
| General Motors Corp., | | | | |
| Series B, 5.250% (I) | | 20,000 | | 150,994 |
| Financials - 0.72% | | | | |
| |
| Commercial Banks | | | | |
| Wells Fargo & Company, Series L | | 11,000 | | 11,330,000 |
| |
| Diversified Financial Services | | | | |
| Citigroup, Inc., Series 1, 6.150% | | 445,000 | | 5,782,864 |
| |
| Insurance | | | | |
| American International | | | | |
| Group, Inc., 8.500% | | 6,200 | | 28,892 |
| | |
|
| | | | | 17,141,756 |
|
| TOTAL PREFERRED SECURITIES (Cost $16,095,096) | | $ | 17,292,750 |
|
| |
| SHORT-TERM INVESTMENTS - 35.45% | | | |
| Repurchase Agreement - 16.59% | | | | |
| Morgan Stanley Tri-Party Repurchase | | | | |
| Agreement dated 02/28/2011 at | | | | |
| 0.180% to be repurchased at | | | | |
| $137,100,686 on 03/01/2011, | | | | |
| collateralized by $139,293,600 | | | | |
| U.S. Treasury Notes, 1.125% due | | | | |
| 06/30/2011 (valued at $140,027,825, | | | | |
| including interest) | $ | 137,100,000 | $ | 137,100,000 |
| Barclays Bank Tri-Party Repurchase | | | | |
| Agreement dated 02/28/2011 at | | | | |
| 0.180% to be repurchased at | | | | |
| $18,000,090 on 03/01/2011, | | | | |
| collateralized by $17,865,000 | | | | |
| U.S. Treasury Notes, 2.625% due | | | | |
| 04/30/2016 (valued at $18,405,669, | | | | |
| including interest) | | 18,000,000 | | 18,000,000 |
| Repurchase Agreement with State | | | | |
| Street Corp. dated 02/28/2011 at | | | | |
| 0.010% to be repurchased at | | | | |
| $3,246,001on 03/01/2011, | | | | |
| collateralized by $3,295,000 | | | | |
| U.S. Treasury Notes., 0.875% due | | | | |
| 05/31/2011 (valued at $3,311,475, | | | | |
| including interest) | | 3,246,000 | | 3,246,000 |
| BNP Tri-Party Repurchase Agreement | | | | |
| dated 02/28/2011 at 0.180% to be | | | | |
| repurchased at $236,201,181 on | | | | |
| 03/01/2011, collateralized by | | | | |
| $186,944,000 U.S. Treasury Notes, | | | | |
| 1.875% due 07/15/2013 (valued at | | | | |
| $241,433,075, including interest) | | 236,200,000 | | 236,200,000 |
| | |
|
| | | | | 394,546,000 |
| Short-Term Securities* - 18.86% | | | | |
| Bank of Nova Scotia, | | | | |
| 0.562%, 08/09/2012 | | 3,700,000 | | 3,698,890 |
| Kells Funding LLC | | | | |
| 0.330%, 05/11/2011 | | 10,800,000 | | 10,792,971 |
| 0.310%, 05/12/2011 | | 11,800,000 | | 11,792,684 |
| 0.330%, 05/05/2011 | | 19,400,000 | | 19,383,639 |
| 0.270%, 03/22/2011 | | 2,300,000 | | 2,299,638 |
| 0.260%, 03/23/2011 | | 1,000,000 | | 999,841 |
| Straight A Funding LLC | | | | |
| 0.230%, 04/11/2011 | | 7,500,000 | | 7,498,035 |
| 0.250%, 05/05/2011 | | 3,100,000 | | 3,098,601 |
| | | | |
| Total Return Fund (continued) | | | |
| | | Shares or | | |
| | | Principal | | |
| | | Amount | | Value |
| |
|
| |
| SHORT-TERM INVESTMENTS (continued) | | | |
| Short-Term Securities* (continued) | | | | |
| Straight A Funding LLC (continued) | | | | |
| 0.250%, 05/09/2011 | $ | 27,600,000 | $ | 27,586,775 |
| 0.250%, 05/11/2011 | | 2,900,000 | | 2,898,570 |
| 0.250%, 05/11/2011 | | 1,100,000 | | 1,099,458 |
| 0.250%, 05/09/2011 | | 7,300,000 | | 7,296,502 |
| U.S. Treasury Bill | | | | |
| 0.158%, 08/25/2011 | | 17,100,000 | | 17,086,600 |
| 0.302%, 06/16/2011 (F) | | 90,000 | | 89,919 |
| 0.200%, 07/14/2011 | | 55,600,000 | | 55,558,654 |
| 0.223%, 07/21/2011 (F) | | 380,000 | | 379,664 |
| 0.200%, 08/04/2011 | | 24,800,000 | | 24,778,529 |
| 0.212%, 08/11/2011 (F) | | 92,600,000 | | 92,526,867 |
| 0.176%, 08/18/2011 (F) | | 98,700,000 | | 98,620,363 |
| 0.212%, 07/28/2011 (F) | | 61,210,000 | | 61,160,559 |
| | |
|
| | | | | 448,646,759 |
|
| TOTAL SHORT-TERM INVESTMENTS (Cost $843,192,759) | $ | 843,192,759 |
|
| Total Investments (Total Return Fund) | | | | |
| (Cost $2,872,299,382) - 121.92% | | | $ | 2,900,090,352 |
| Other assets and liabilities, net - (21.92%) | | | (521,343,120) |
| | |
|
| TOTAL NET ASSETS - 100.00% | | | $ | 2,378,747,232 |
| | | |
|
| |
| TBA SALE COMMITMENTS OUTSTANDING - (9.43)% | | |
| Federal National Mortgage Association - (9.43)% | | | |
| 4.500%, TBA | | (212,300,000) | | (214,559,996) |
| 6.000%, TBA | | (9,000,000) | | (9,782,132) |
|
| TOTAL TBA SALE COMMITMENTS | | | | |
| OUTSTANDING (Cost $(223,865,402)) | | | $ | (224,342,128) |
|
| |
| |
| |
| U.S. High Yield Bond Fund | | | |
| | | Shares or | | |
| | | Principal | | |
| | | Amount | | Value |
| |
|
| |
| CORPORATE BONDS - 74.95% | | | | |
| Consumer Discretionary - 21.72% | | | | |
| Allbritton Communications Company | | | | |
| 8.000%, 05/15/2018 | $ | 1,925,000 | $ | 2,016,412 |
| American Tire Distributors, Inc. | | | | |
| 9.750%, 06/01/2017 (S) | | 3,350,000 | | 3,701,750 |
| Ameristar Casinos, Inc. | | | | |
| 9.250%, 06/01/2014 | | 5,525,000 | | 5,939,375 |
| Barrington Broadcasting Group LLC | | | | |
| 10.500%, 08/15/2014 | | 4,925,000 | | 4,900,375 |
| CCO Holdings LLC/CCO | | | | |
| Holdings Capital Corp. | | | | |
| 7.875%, 04/30/2018 | | 825,000 | | 880,688 |
| 8.125%, 04/30/2020 | | 450,000 | | 485,438 |
| Charter Communications Operating LLC | | | | |
| 8.000%, 04/30/2012 (S) | | 10,216,000 | | 10,752,340 |
| Charter Communications, Inc. | | | | |
| 10.875%, 09/15/2014 (S) | | 1,400,000 | | 1,573,250 |
| Chukchansi Economic Development Authority | | | |
| 3.943%, 11/15/2012 (P)(S) | | 875,000 | | 658,438 |
| 8.000%, 11/15/2013 (S) | | 2,817,000 | | 2,112,750 |
| Cinemark USA, Inc. | | | | |
| 8.625%, 06/15/2019 | | 4,500,000 | | 4,905,000 |
| CityCenter Holdings LLC/CityCenter | | | | |
| Finance Corp. | | | | |
| 7.625%, 01/15/2016 (S) | | 225,000 | | 234,563 |
| |
| The accompanying notes are an integral part of the financial statements. | 284 |
John Hancock Funds II
Portfolio of Investments — February 28, 2011 (Unaudited) (showing percentage of total net assets)
| | | | |
| U.S. High Yield Bond Fund (continued) | | |
| | | Shares or | | |
| | | Principal | | |
| | | Amount | | Value |
| |
|
| |
| CORPORATE BONDS (continued) | | | | |
| Consumer Discretionary (continued) | | | | |
| CityCenter Holdings LLC/CityCenter | | | | |
| Finance Corp. PIK | | | | |
| 10.750%, 01/15/2017 (S) | $ | 1,000,000 | $ | 1,045,000 |
| Cooper Tire & Rubber Company | | | | |
| 7.625%, 03/15/2027 | | 3,225,000 | | 3,112,125 |
| CSC Holdings LLC | | | | |
| 6.750%, 04/15/2012 | | 990,000 | | 1,030,838 |
| 8.500%, 04/15/2014 | | 2,175,000 | | 2,436,000 |
| DineEquity, Inc. | | | | |
| 9.500%, 10/30/2018 (S) | | 625,000 | | 676,563 |
| Dish DBS Corp. | | | | |
| 6.625%, 10/01/2014 | | 2,250,000 | | 2,385,000 |
| DISH DBS Corp. | | | | |
| 7.000%, 10/01/2013 | | 200,000 | | 215,000 |
| 7.750%, 05/31/2015 | | 2,500,000 | | 2,731,250 |
| EchoStar DBS Corp. | | | | |
| 6.375%, 10/01/2011 | | 1,791,000 | | 1,826,820 |
| Fisher Communications, Inc. | | | | |
| 8.625%, 09/15/2014 | | 2,025,000 | | 2,080,688 |
| Gray Television, Inc. | | | | |
| 10.500%, 06/29/2015 | | 2,305,000 | | 2,449,063 |
| Greektown Superholdings, Inc. | | | | |
| 13.000%, 07/01/2015 | | 5,250,000 | | 5,958,750 |
| KAR Holdings, Inc. | | | | |
| 10.000%, 05/01/2015 | | 13,610,000 | | 14,426,600 |
| Lamar Media Corp. | | | | |
| 7.875%, 04/15/2018 | | 425,000 | | 456,875 |
| 9.750%, 04/01/2014 | | 2,520,000 | | 2,929,500 |
| Lin Television Corp. | | | | |
| 8.375%, 04/15/2018 | | 650,000 | | 706,875 |
| Mac-Gray Corp. | | | | |
| 7.625%, 08/15/2015 | | 3,470,000 | | 3,513,375 |
| Macy’s Retail Holdings, Inc. | | | | |
| 5.350%, 03/15/2012 | | 250,000 | | 258,750 |
| 7.450%, 09/15/2011 to 10/15/2016 | | 4,416,000 | | 4,779,061 |
| 7.875%, 08/15/2036 | | 3,450,000 | | 3,588,000 |
| NAI Entertainment Holdings LLC | | | | |
| 8.250%, 12/15/2017 (S) | | 2,100,000 | | 2,257,500 |
| Nexstar Broadcasting, Inc./Mission | | | | |
| Broadcasting, Inc. | | | | |
| 8.875%, 04/15/2017 | | 850,000 | | 922,250 |
| Nielsen Finance LLC/Nielsen | | | | |
| Finance Company | | | | |
| 7.750%, 10/15/2018 (S) | | 1,450,000 | | 1,567,813 |
| 11.500%, 05/01/2016 | | 260,000 | | 306,150 |
| O’Charleys, Inc. | | | | |
| 9.000%, 11/01/2013 | | 6,825,000 | | 6,935,906 |
| Regal Cinemas Corp. | | | | |
| 8.625%, 07/15/2019 | | 5,375,000 | | 5,764,688 |
| Rent-A-Center, Inc. | | | | |
| 6.625%, 11/15/2020 (S) | | 450,000 | | 444,375 |
| Salem Communications Corp. | | | | |
| 9.625%, 12/15/2016 | | 830,000 | | 910,925 |
| Service Corp. International | | | | |
| 6.750%, 04/01/2015 to 04/01/2016 | | 2,696,000 | | 2,859,166 |
| 7.000%, 06/15/2017 to 05/15/2019 | | 4,000,000 | | 4,234,813 |
| 7.500%, 04/01/2027 | | 1,798,000 | | 1,757,545 |
| 7.625%, 10/01/2018 | | 80,000 | | 87,000 |
| 7.875%, 02/01/2013 | | 850,000 | | 916,938 |
| 8.000%, 11/15/2021 | | 1,000,000 | | 1,095,000 |
| Sonic Automotive, Inc., Series B | | | | |
| 8.625%, 08/15/2013 | | 1,252,000 | | 1,270,780 |
| Speedway Motorsports Incspeedway | | | | |
| Motorsports Inc | | | | |
| 6.750%, 02/01/2019 (S) | | 300,000 | | 304,500 |
| | | | |
| U.S. High Yield Bond Fund (continued) | | |
| | | Shares or | | |
| | | Principal | | |
| | | Amount | | Value |
| |
|
| |
| CORPORATE BONDS (continued) | | | | |
| Consumer Discretionary (continued) | | | | |
| The Goodyear Tire & Rubber Company | | | | |
| 8.750%, 08/15/2020 | $ | 1,377,000 | $ | 1,518,143 |
| Toys R Us Property Company LLC | | | | |
| 8.500%, 12/01/2017 | | 800,000 | | 870,000 |
| 10.750%, 07/15/2017 | | 2,400,000 | | 2,742,000 |
| Videotron Ltee | | | | |
| 6.375%, 12/15/2015 | | 1,195,000 | | 1,221,888 |
| 6.875%, 01/15/2014 | | 2,260,000 | | 2,291,075 |
| 9.125%, 04/15/2018 | | 1,660,000 | | 1,863,350 |
| Yonkers Racing Corp. | | | | |
| 11.375%, 07/15/2016 (S) | | 1,470,000 | | 1,650,075 |
| | |
|
| | | | | 138,558,392 |
| Consumer Staples - 1.97% | | | | |
| B&G Foods, Inc. | | | | |
| 7.625%, 01/15/2018 | | 811,000 | | 865,743 |
| Blue Merger Sub, Inc. | | | | |
| 7.625%, 02/15/2019 (S) | | 775,000 | | 782,750 |
| Brickman Group Holdings, Inc. | | | | |
| 9.125%, 11/01/2018 (S) | | 475,000 | | 510,625 |
| Carriage Services, Inc. | | | | |
| 7.875%, 01/15/2015 | | 2,915,000 | | 2,958,725 |
| Darling International, Inc. | | | | |
| 8.500%, 12/15/2018 (S) | | 150,000 | | 161,813 |
| Del Monte Corp. | | | | |
| 7.500%, 10/15/2019 | | 250,000 | | 303,750 |
| KAR Holdings, Inc. | | | | |
| 8.750%, 05/01/2014 | | 1,200,000 | | 1,246,500 |
| NCO Group, Inc. | | | | |
| 11.875%, 11/15/2014 | | 4,975,000 | | 4,440,188 |
| Susser Holdings LLC/Susser Finance Corp. | | | | |
| 8.500%, 05/15/2016 | | 1,225,000 | | 1,330,656 |
| | |
|
| | | | | 12,600,750 |
| Energy - 11.76% | | | | |
| Arch Coal, Inc. | | | | |
| 8.750%, 08/01/2016 | | 2,775,000 | | 3,097,594 |
| Bristow Group, Inc. | | | | |
| 7.500%, 09/15/2017 | | 825,000 | | 868,313 |
| Cloud Peak Energy Resources LLC/Cloud | | | | |
| Peak Energy Finance Corp. | | | | |
| 8.250%, 12/15/2017 | | 450,000 | | 489,375 |
| 8.500%, 12/15/2019 | | 650,000 | | 716,625 |
| Coffeyville Resources LLC | | | | |
| 9.000%, 04/01/2015 (S) | | 5,647,000 | | 6,155,230 |
| Consol Energy, Inc. | | | | |
| 8.000%, 04/01/2017 (S) | | 300,000 | | 325,500 |
| 8.250%, 04/01/2020 (S) | | 260,000 | | 286,650 |
| Denbury Resources, Inc. | | | | |
| 6.375%, 08/15/2021 | | 475,000 | | 479,750 |
| 8.250%, 02/15/2020 | | 3,014,000 | | 3,353,075 |
| El Paso Corp. | | | | |
| 6.875%, 06/15/2014 | | 500,000 | | 546,387 |
| 6.950%, 06/01/2028 | | 1,325,000 | | 1,279,591 |
| 7.000%, 06/15/2017 | | 2,800,000 | | 3,127,569 |
| 7.250%, 06/01/2018 | | 4,650,000 | | 5,258,327 |
| 7.800%, 08/01/2031 | | 1,425,000 | | 1,507,536 |
| 8.050%, 10/15/2030 | | 700,000 | | 750,320 |
| 8.250%, 02/15/2016 | | 525,000 | | 593,268 |
| El Paso Pipeline Partners Operating | | | | |
| Company LLC | | | | |
| 6.500%, 04/01/2020 | | 175,000 | | 193,045 |
| Encore Acquisition Company | | | | |
| 9.500%, 05/01/2016 | | 1,525,000 | | 1,723,250 |
| |
| The accompanying notes are an integral part of the financial statements. | 285 |
John Hancock Funds II
Portfolio of Investments — February 28, 2011 (Unaudited) (showing percentage of total net assets)
| | | | |
| U.S. High Yield Bond Fund (continued) | | |
| | | Shares or | | |
| | | Principal | | |
| | | Amount | | Value |
| |
|
| |
| CORPORATE BONDS (continued) | | | | |
| Energy (continued) | | | | |
| Energy Transfer Equity LP | | | | |
| 7.500%, 10/15/2020 | $ | 4,390,000 | $ | 4,757,663 |
| Forest Oil Corp. | | | | |
| 7.250%, 06/15/2019 | | 1,875,000 | | 1,940,625 |
| 8.500%, 02/15/2014 | | 250,000 | | 278,125 |
| General Maritime Corp. | | | | |
| 12.000%, 11/15/2017 | | 1,800,000 | | 1,651,500 |
| Gulfmark Offshore, Inc. | | | | |
| 7.750%, 07/15/2014 | | 3,325,000 | | 3,374,875 |
| Hilcorp Energy I LP | | | | |
| 7.750%, 11/01/2015 (S) | | 2,315,000 | | 2,407,600 |
| 9.000%, 06/01/2016 (S) | | 1,295,000 | | 1,359,750 |
| Hornbeck Offshore Services, Inc. | | | | |
| 8.000%, 09/01/2017 | | 1,550,000 | | 1,590,688 |
| Inergy LP/inergy Finance Corp. | | | | |
| 6.875%, 08/01/2021 (S) | | 775,000 | | 792,438 |
| OPTI Canada, Inc. | | | | |
| 8.250%, 12/15/2014 | | 1,500,000 | | 817,500 |
| Overseas Shipholding Group, Inc. | | | | |
| 7.500%, 02/15/2024 | | 5,545,000 | | 4,851,875 |
| PHI, Inc. | | | | |
| 8.625%, 10/15/2018 | | 5,850,000 | | 6,127,875 |
| Regency Energy Partners LP/Regency Energy | | | |
| Finance Corp. | | | | |
| 6.875%, 12/01/2018 | | 300,000 | | 315,000 |
| Sabine Pass LNG LP | | | | |
| 7.500%, 11/30/2016 | | 10,845,000 | | 10,980,563 |
| 7.500%, 11/30/2016 (S) | | 1,563,000 | | 1,582,538 |
| Teekay Corp. | | | | |
| 8.500%, 01/15/2020 | | 475,000 | | 511,219 |
| Thermon Industries, Inc. | | | | |
| 9.500%, 05/01/2017 | | 875,000 | | 947,188 |
| | |
|
| | | | | 75,038,427 |
| Financials - 10.33% | | | | |
| American General Finance Corp. | | | | |
| 5.400%, 12/01/2015 | | 425,000 | | 384,625 |
| 5.750%, 09/15/2016 | | 1,650,000 | | 1,462,313 |
| 6.500%, 09/15/2017 | | 900,000 | | 796,500 |
| Aviv Healthcare Properties LP | | | | |
| 7.750%, 02/15/2019 (S) | | 1,275,000 | | 1,329,188 |
| CIT Group, Inc. | | | | |
| 7.000%, 05/01/2014 to 05/01/2017 | | 14,646,483 | | 14,809,585 |
| Dunkin Finance Corp. | | | | |
| 9.625%, 12/01/2018 (S) | | 900,000 | | 911,250 |
| Dupont Fabros Technology LP | | | | |
| 8.500%, 12/15/2017 | | 5,550,000 | | 6,118,875 |
| Emigrant Bancorp, Inc. | | | | |
| 6.250%, 06/15/2014 (S) | | 3,000,000 | | 2,501,277 |
| Ford Motor Credit Company LLC | | | | |
| 7.000%, 10/01/2013 | | 1,580,000 | | 1,715,836 |
| 7.250%, 10/25/2011 | | 340,000 | | 351,004 |
| 8.000%, 12/15/2016 | | 5,975,000 | | 6,768,313 |
| HUB International Holdings, Inc. | | | | |
| 10.250%, 06/15/2015 (S) | | 3,700,000 | | 3,848,000 |
| International Lease Finance Corp. | | | | |
| 6.500%, 09/01/2014 (S) | | 675,000 | | 727,988 |
| 6.750%, 09/01/2016 (S) | | 675,000 | | 730,688 |
| 7.125%, 09/01/2018 (S) | | 1,725,000 | | 1,882,406 |
| National Retail Properties, Inc. | | | | |
| 6.875%, 10/15/2017 | | 275,000 | | 297,016 |
| NSG Holdings, Inc. | | | | |
| 7.750%, 12/15/2025 (S) | | 2,125,000 | | 2,085,156 |
| Nuveen Investments, Inc. | | | | |
| 5.500%, 09/15/2015 | | 7,989,000 | | 6,990,375 |
| | | | |
| U.S. High Yield Bond Fund (continued) | | |
| | | Shares or | | |
| | | Principal | | |
| | | Amount | | Value |
| |
|
| |
| CORPORATE BONDS (continued) | | | | |
| Financials (continued) | | | | |
| Nuveen Investments, Inc. (continued) | | | | |
| 10.500%, 11/15/2015 (S) | $ | 325,000 | $ | 332,313 |
| 10.500%, 11/15/2015 | | 1,470,000 | | 1,503,075 |
| Omega Healthcare Investors, Inc. | | | | |
| 6.750%, 10/15/2022 (S) | | 2,375,000 | | 2,398,750 |
| Sabra Health Care LP/Sabra Capital Corp. | | | | |
| 8.125%, 11/01/2018 (S) | | 1,365,000 | | 1,440,075 |
| Springleaf Finance Corp. | | | | |
| 6.900%, 12/15/2017 | | 3,125,000 | | 2,804,688 |
| USI Holdings Corp. | | | | |
| 9.750%, 05/15/2015 (S) | | 3,000,000 | | 3,090,000 |
| Ventas Realty LP/Ventas Capital Corp. | | | | |
| 6.500%, 06/01/2016 | | 500,000 | | 524,243 |
| Vertellus Specialties, Inc. | | | | |
| 9.375%, 10/01/2015 (S) | | 125,000 | | 134,453 |
| | |
|
| | | | | 65,937,992 |
| Health Care - 5.23% | | | | |
| Biomet, Inc. | | | | |
| 11.625%, 10/15/2017 | | 3,765,000 | | 4,245,038 |
| Centene Corp. | | | | |
| 7.250%, 04/01/2014 | | 2,050,000 | | 2,114,063 |
| Community Health Systems, Inc. | | | | |
| 8.875%, 07/15/2015 | | 3,360,000 | | 3,561,600 |
| FMC Finance III SA | | | | |
| 6.875%, 07/15/2017 | | 700,000 | | 737,625 |
| Fresenius Medical Care Us Finance, Inc. | | | | |
| 5.750%, 02/15/2021 (S) | | 800,000 | | 774,000 |
| HCA, Inc. | | | | |
| 8.500%, 04/15/2019 | | 3,375,000 | | 3,780,000 |
| 9.125%, 11/15/2014 | | 600,000 | | 629,250 |
| 9.250%, 11/15/2016 | | 2,900,000 | | 3,132,000 |
| HCA, Inc., PIK | | | | |
| 9.625%, 11/15/2016 | | 1,709,000 | | 1,854,265 |
| Health Management Associates, Inc. | | | | |
| 6.125%, 04/15/2016 | | 1,925,000 | | 1,953,875 |
| Healthsouth Corp. | | | | |
| 7.250%, 10/01/2018 | | 500,000 | | 518,750 |
| 7.750%, 09/15/2022 | | 500,000 | | 520,625 |
| 10.750%, 06/15/2016 | | 2,100,000 | | 2,247,000 |
| Mylan, Inc. | | | | |
| 6.000%, 11/15/2018 (S) | | 375,000 | | 383,906 |
| 7.625%, 07/15/2017 (S) | | 850,000 | | 933,938 |
| 7.875%, 07/15/2020 (S) | | 175,000 | | 195,563 |
| Tenet Healthcare Corp. | | | | |
| 9.000%, 05/01/2015 | | 2,640,000 | | 2,904,000 |
| United Surgical Partners International, Inc. | | | | |
| 8.875%, 05/01/2017 | | 2,725,000 | | 2,874,875 |
| | |
|
| | | | | 33,360,373 |
| Industrials - 2.50% | | | | |
| Casella Waste Systems, Inc. | | | | |
| 7.750%, 02/15/2019 (S) | | 175,000 | | 179,375 |
| Columbus McKinnon Corp. | | | | |
| 7.875%, 02/01/2019 (S) | | 700,000 | | 724,500 |
| Corrections Corp. of America | | | | |
| 6.250%, 03/15/2013 | | 1,790,000 | | 1,792,238 |
| 7.750%, 06/01/2017 | | 1,000,000 | | 1,095,000 |
| Crown Americas LLC / Crown Americas | | | | |
| Capital Corp. II | | | | |
| 7.625%, 05/15/2017 | | 500,000 | | 545,000 |
| GEO Group, Inc. | | | | |
| 7.750%, 10/15/2017 | | 775,000 | | 826,344 |
| Interactive Data Corp. | | | | |
| 10.250%, 08/01/2018 (S) | | 800,000 | | 896,000 |
| |
| The accompanying notes are an integral part of the financial statements. | 286 |
John Hancock Funds II
Portfolio of Investments — February 28, 2011 (Unaudited) (showing percentage of total net assets)
| | | | |
| U.S. High Yield Bond Fund (continued) | | |
| | | Shares or | | |
| | | Principal | | |
| | | Amount | | Value |
| |
|
| |
| CORPORATE BONDS (continued) | | | | |
| Industrials (continued) | | | | |
| Interface, Inc. | | | | |
| 7.625%, 12/01/2018 (S) | $ | 200,000 | $ | 212,500 |
| Iron Mountain, Inc. | | | | |
| 8.000%, 06/15/2020 | | 3,650,000 | | 3,923,750 |
| 8.375%, 08/15/2021 | | 25,000 | | 27,656 |
| L-3 Communications Corp. | | | | |
| 5.875%, 01/15/2015 | | 700,000 | | 713,650 |
| L-3 Communications Corp., Series B | | | | |
| 6.375%, 10/15/2015 | | 500,000 | | 516,250 |
| RailAmerica, Inc. | | | | |
| 9.250%, 07/01/2017 | | 3,605,000 | | 3,992,538 |
| Titan International, Inc. | | | | |
| 7.875%, 10/01/2017 (S) | | 450,000 | | 481,500 |
| | |
|
| | | | | 15,926,301 |
| Information Technology - 4.01% | | | | |
| Aspect Software, Inc. | | | | |
| 10.625%, 05/15/2017 (S) | | 400,000 | | 426,000 |
| Equinix, Inc. | | | | |
| 8.125%, 03/01/2018 | | 1,350,000 | | 1,464,750 |
| Fidelity National Information Services, Inc. | | | | |
| 7.625%, 07/15/2017 | | 75,000 | | 82,688 |
| 7.875%, 07/15/2020 | | 300,000 | | 333,000 |
| First Data Corp. | | | | |
| 11.250%, 03/31/2016 | | 2,725,000 | | 2,629,625 |
| Lender Processing Services, Inc. | | | | |
| 8.125%, 07/01/2016 | | 4,095,000 | | 4,258,800 |
| Seagate HDD Cayman | | | | |
| 6.875%, 05/01/2020 (S) | | 425,000 | | 416,500 |
| 7.750%, 12/15/2018 (S) | | 1,575,000 | | 1,614,375 |
| Seagate Technology HDD Holdings | | | | |
| 6.800%, 10/01/2016 | | 875,000 | | 913,281 |
| SunGard Data Systems, Inc. | | | | |
| 4.875%, 01/15/2014 | | 1,600,000 | | 1,624,000 |
| 7.375%, 11/15/2018 (S) | | 650,000 | | 671,125 |
| 7.625%, 11/15/2020 (S) | | 325,000 | | 335,563 |
| 10.250%, 08/15/2015 | | 10,264,000 | | 10,815,690 |
| | |
|
| | | | | 25,585,397 |
| Materials - 2.59% | | | | |
| Ball Corp. | | | | |
| 5.750%, 05/15/2021 | | 900,000 | | 882,000 |
| Celanese US Holdings LLC | | | | |
| 6.625%, 10/15/2018 (S) | | 1,550,000 | | 1,619,750 |
| Chemtura Corp. | | | | |
| 7.875%, 09/01/2018 (S) | | 250,000 | | 266,875 |
| Georgia-Pacific LLC | | | | |
| 7.125%, 01/15/2017 (S) | | 2,230,000 | | 2,369,375 |
| 8.250%, 05/01/2016 (S) | | 1,000,000 | | 1,127,500 |
| Graham Packaging Company LP/GPC | | | | |
| Capital Corp. I | | | | |
| 9.875%, 10/15/2014 | | 5,270,000 | | 5,454,450 |
| Koppers, Inc. | | | | |
| 7.875%, 12/01/2019 | | 100,000 | | 108,500 |
| Novelis, Inc. | | | | |
| 8.375%, 12/15/2017 (S) | | 700,000 | | 771,750 |
| 8.750%, 12/15/2020 (S) | | 1,050,000 | | 1,157,625 |
| Owens-Brockway Glass Container, Inc. | | | | |
| 7.375%, 05/15/2016 | | 1,000,000 | | 1,090,000 |
| Owens-Illinois, Inc. | | | | |
| 7.800%, 05/15/2018 | | 1,550,000 | | 1,689,500 |
| | |
|
| | | | | 16,537,325 |
| Telecommunication Services - 8.47% | | | | |
| Buccaneer Merger Sub, Inc. | | | | |
| 9.125%, 01/15/2019 (S) | | 1,850,000 | | 1,998,000 |
| | | | |
| U.S. High Yield Bond Fund (continued) | | |
| | | Shares or | | |
| | | Principal | | |
| | | Amount | | Value |
| |
|
| |
| CORPORATE BONDS (continued) | | | | |
| Telecommunication Services (continued) | | | | |
| CC Holdings GS V LLC/Crown Castle | | | | |
| GS III Corp. | | | | |
| 7.750%, 05/01/2017 (S) | $ | 5,175,000 | $ | 5,711,906 |
| Cricket Communications, Inc. | | | | |
| 7.750%, 05/15/2016 | | 6,850,000 | | 7,243,875 |
| Crown Castle International Corp. | | | | |
| 7.125%, 11/01/2019 | | 1,725,000 | | 1,834,969 |
| 9.000%, 01/15/2015 | | 625,000 | | 703,125 |
| GCI, Inc. | | | | |
| 7.250%, 02/15/2014 | | 2,440,000 | | 2,464,400 |
| 8.625%, 11/15/2019 | | 4,825,000 | | 5,307,500 |
| Intelsat Jackson Holdings SA | | | | |
| 7.250%, 10/15/2020 (S) | | 175,000 | | 179,813 |
| Intelsat Subsidiary Holding Company SA | | | | |
| 8.875%, 01/15/2015 | | 1,600,000 | | 1,648,000 |
| MetroPCS Wireless, Inc. | | | | |
| 6.625%, 11/15/2020 | | 2,375,000 | | 2,312,656 |
| 7.875%, 09/01/2018 | | 1,150,000 | | 1,214,688 |
| Qwest Corp. | | | | |
| 6.500%, 06/01/2017 | | 750,000 | | 825,000 |
| 7.625%, 06/15/2015 | | 300,000 | | 344,250 |
| SBA Telecommunications, Inc. | | | | |
| 8.000%, 08/15/2016 | | 650,000 | | 708,500 |
| 8.250%, 08/15/2019 | | 825,000 | | 909,563 |
| Sprint Capital Corp. | | | | |
| 6.875%, 11/15/2028 | | 1,050,000 | | 946,313 |
| 8.750%, 03/15/2032 | | 4,540,000 | | 4,721,600 |
| Sprint Nextel Corp. | | | | |
| 6.000%, 12/01/2016 | | 13,350,000 | | 13,316,625 |
| TW Telecom Holdings, Inc. | | | | |
| 8.000%, 03/01/2018 | | 1,525,000 | | 1,635,563 |
| | |
|
| | | | | 54,026,346 |
| Utilities - 6.37% | | | | |
| AmeriGas Partners LP/AmericGas Eagle | | | | |
| Finance Corp. | | | | |
| 7.125%, 05/20/2016 | | 3,750,000 | | 3,900,000 |
| AmeriGas Partners LP/AmeriGas | | | | |
| Finance Corp. | | | | |
| 6.500%, 05/20/2021 | | 800,000 | | 824,000 |
| Calpine Construction Finance Company LP | | | | |
| 8.000%, 06/01/2016 (S) | | 600,000 | | 651,000 |
| Calpine Corp. | | | | |
| 7.250%, 10/15/2017 (S) | | 9,151,000 | | 9,585,673 |
| Ferrellgas LP/Ferrellgas Finance Corp. | | | | |
| 6.500%, 05/01/2021 (S) | | 775,000 | | 755,625 |
| 9.125%, 10/01/2017 | | 1,600,000 | | 1,768,000 |
| Ferrellgas Partners LP/Ferrellgas Partners | | | | |
| Finance Corp. | | | | |
| 8.625%, 06/15/2020 | | 2,075,000 | | 2,256,563 |
| Ipalco Enterprises, Inc. | | | | |
| 7.250%, 04/01/2016 (S) | | 6,185,000 | | 6,710,725 |
| 8.625%, 11/14/2011 | | 1,050,000 | | 1,094,625 |
| NRG Energy, Inc. | | | | |
| 7.375%, 02/01/2016 to 01/15/2017 | | 9,748,000 | | 10,186,680 |
| Suburban Propane Partners LP | | | | |
| 7.375%, 03/15/2020 | | 2,700,000 | | 2,889,000 |
| | |
|
| | | | | 40,621,891 |
|
| TOTAL CORPORATE BONDS (Cost $442,019,997) | | $ | 478,193,194 |
|
| |
| The accompanying notes are an integral part of the financial statements. | 287 |
John Hancock Funds II
Portfolio of Investments — February 28, 2011 (Unaudited) (showing percentage of total net assets)
| | | | |
| U.S. High Yield Bond Fund (continued) | | |
| | | Shares or | | |
| | | Principal | | |
| | | Amount | | Value |
| | |
|
| |
| CAPITAL PREFERRED SECURITIES - 0.18% | | | | |
| Financials - 0.18% | | | | |
| Emigrant Capital Trust I | | | | |
| 2.785%, 12/10/2033 (P)(S) | | 2,450,000 | | 1,153,289 |
|
| TOTAL CAPITAL PREFERRED SECURITIES (Cost $945,549) | $ | 1,153,289 |
|
| |
| CONVERTIBLE BONDS - 0.44% | | | | |
| Energy - 0.44% | | | | |
| Hornbeck Offshore Services, Inc. | | | | |
| 1.625%, 11/15/2026 (P) | | 2,975,000 | | 2,833,688 |
|
| TOTAL CONVERTIBLE BONDS (Cost $2,307,015) | | | $ | 2,833,688 |
|
| |
| TERM LOANS (M) - 19.67% | | | | |
| Consumer Discretionary - 8.28% | | | | |
| Acosta, Inc. | | | | |
| 4.500%, 07/28/2013 | | 1,249,601 | | 1,255,849 |
| Adesa, Inc. | | | | |
| 3.020%, 10/18/2013 | | 573,106 | | 571,980 |
| Advantage Sales & Marketing LLC | | | | |
| 9.250%, 06/18/2018 | | 600,000 | | 611,500 |
| Allison Transmission, Inc. | | | | |
| 3.020%, 08/07/2014 | | 2,808,329 | | 2,797,798 |
| Barrington Broadcasting Company LLC | | | | |
| 4.552%, 08/12/2013 | | 1,140,083 | | 1,097,330 |
| CCM Merger, Inc. | | | | |
| - 02/11/2017 (T) | | 1,975,000 | | 1,999,071 |
| CCO Holdings LLC | | | | |
| 2.762%, 09/06/2014 | | 4,900,000 | | 4,838,750 |
| Coinmach Corp. | | | | |
| 3.296%, 11/20/2014 | | 3,712,571 | | 3,480,535 |
| CSC Holdings, Inc. | | | | |
| 2.012%, 03/29/2013 | | 520,471 | | 522,062 |
| Federal Mogul Corp. | | | | |
| 2.198%, 12/28/2015 | | 2,856,103 | | 2,773,544 |
| 2.198%, 12/29/2014 | | 3,076,518 | | 2,987,589 |
| Ford Motor Company | | | | |
| 3.020%, 12/16/2013 | | 6,935,542 | | 6,932,615 |
| 3.020%, 12/16/2013 | | 2,599,414 | | 2,594,135 |
| Gray Television, Inc. | | | | |
| 3.770%, 12/31/2014 | | 2,585,075 | | 2,564,459 |
| Greenwood Racing, Inc. | | | | |
| 2.520%, 11/28/2011 | | 954,987 | | 940,662 |
| HMSC Corp. | | | | |
| 2.512%, 04/03/2014 | | 386,456 | | 332,352 |
| 5.762%, 10/03/2014 | | 2,650,000 | | 2,199,500 |
| Iconix Brand Group, Inc. | | | | |
| 2.560%, 01/02/2012 | | 529,988 | | 528,663 |
| J Crew Group, Inc. | | | | |
| - 01/26/2018 (T) | | 725,000 | | 725,000 |
| Nexstar Broadcasting, Inc. | | | | |
| 5.000%, 10/01/2012 | | 465,660 | | 464,496 |
| 5.000%, 09/30/2016 | | 728,340 | | 728,340 |
| Nielsen Finance LLC/Nielsen Finance Corp. | | | | |
| 2.263%, 08/09/2013 | | 1,193,936 | | 1,192,009 |
| Penn National Gaming, Inc. | | | | |
| 2.031%, 10/03/2012 | | 5,003,978 | | 4,990,077 |
| PEP Boys-Manny Moe & Jack | | | | |
| 2.300%, 10/28/2013 | | 233,411 | | 232,827 |
| Regal Cinemas Corp. | | | | |
| - 08/23/2017 (T) | | 200,000 | | 201,000 |
| The Goodyear Tire & Rubber Company | | | | |
| 1.960%, 04/30/2014 | | 2,850,000 | | 2,819,126 |
| Tire Rack Holdings, Inc. | | | | |
| 2.010%, 06/24/2012 | | 710,433 | | 699,184 |
| | | | |
| U.S. High Yield Bond Fund (continued) | | |
| | | Shares or | | |
| | | Principal | | |
| | | Amount | | Value |
| | |
|
| |
| TERM LOANS (M) (continued) | | | | |
| Consumer Discretionary (continued) | | | | |
| Web Services Company LLC | | | | |
| 7.000%, 08/28/2014 | | 1,706,913 | $ | 1,706,913 |
| | |
|
| | | | | 52,787,366 |
| Financials - 3.59% | | | | |
| American General Finance Corp. | | | | |
| 7.250%, 04/21/2015 | | 1,975,000 | | 1,992,578 |
| Amwins Group, Inc. | | | | |
| 2.816%, 06/08/2013 | | 2,166,790 | | 2,153,247 |
| 5.810%, 06/08/2014 | | 1,950,000 | | 1,755,000 |
| Capital Automotive Real Estate | | | | |
| Investment Trust | | | | |
| 4.750%, 12/14/2012 | | 6,492,013 | | 6,747,636 |
| Local TV Finance LLC | | | | |
| 2.310%, 05/07/2013 | | 3,933,650 | | 3,835,308 |
| LPL Holdings, Inc. | | | | |
| 2.040%, 06/28/2013 | | 4,165,134 | | 4,165,134 |
| Medical Properties Trust, Inc. | | | | |
| 5.000%, 05/17/2016 | | 475,833 | | 475,833 |
| NSG Holdings LLC | | | | |
| 1.802%, 06/15/2014 | | 65,511 | | 64,529 |
| 1.802%, 06/15/2014 | | 24,169 | | 23,806 |
| Nuveen Investments, Inc. | | | | |
| 3.035%, 11/13/2014 | | 503,976 | | 488,647 |
| 5.804%, 05/12/2017 | | 588,869 | | 586,660 |
| TPF Generation Holdings | | | | |
| 2.303%, 12/15/2011 | | 54,791 | | 54,688 |
| 2.303%, 12/13/2013 | | 174,783 | | 174,456 |
| 2.303%, 12/15/2013 | | 398,903 | | 398,155 |
| | |
|
| | | | | 22,915,677 |
| Health Care - 1.62% | | | | |
| Community Health Systems, Inc. | | | | |
| 2.560%, 07/25/2014 | | 2,326,597 | | 2,307,694 |
| Emdeon Business Services LLC | | | | |
| 2.270%, 11/18/2013 | | 449,537 | | 446,165 |
| 5.270%, 05/16/2014 | | 2,700,000 | | 2,675,249 |
| HCA, Inc. | | | | |
| 1.553%, 11/19/2012 | | 2,913,590 | | 2,897,685 |
| Health Management Associates, Inc. | | | | |
| 2.053%, 02/28/2014 | | 1,095,484 | | 1,086,964 |
| Skilled Healthcare Group, Inc. | | | | |
| 5.250%, 04/08/2016 | | 945,238 | | 944,057 |
| | |
|
| | | | | 10,357,814 |
| Industrials - 0.47% | | | | |
| Covanta Energy Corp. | | | | |
| 1.803%, 02/10/2014 | | 609,148 | | 605,037 |
| 1.813%, 02/10/2014 | | 1,190,933 | | 1,182,894 |
| Rexnord Holdings, Inc. | | | | |
| 7.296%, 02/20/2013 | | 1,420,041 | | 1,178,634 |
| | |
|
| | | | | 2,966,565 |
| Information Technology - 0.89% | | | | |
| First Data Corp. | | | | |
| 3.012%, 09/24/2014 | | 2,004,683 | | 1,897,683 |
| 3.012%, 09/24/2014 | | 2,873,134 | | 2,720,335 |
| SunGard Data Systems, Inc. | | | | |
| 2.014%, 02/28/2014 | | 1,052,018 | | 1,044,879 |
| | |
|
| | | | | 5,662,897 |
| Materials - 0.62% | | | | |
| Celanese Holdings LLC | | | | |
| 1.760%, 04/02/2014 | | 166,667 | | 166,852 |
| 3.303%, 10/31/2016 | | 735,941 | | 741,048 |
| |
| The accompanying notes are an integral part of the financial statements. | 288 |
John Hancock Funds II
Portfolio of Investments — February 28, 2011 (Unaudited) (showing percentage of total net assets)
| | | | |
| U.S. High Yield Bond Fund (continued) | | |
| | | Shares or | | |
| | | Principal | | |
| | | Amount | | Value |
| |
|
| |
| TERM LOANS (M) (continued) | | | | |
| Materials (continued) | | | | |
| Chemtura Corp. | | | | |
| 5.500%, 08/27/2016 | | 750,000 | $ | 748,125 |
| Georgia-Pacific Corp. | | | | |
| 2.302%, 12/21/2012 | | 2,158,062 | | 2,158,552 |
| Graham Packaging Company LP | | | | |
| 6.000%, 09/23/2016 | | 149,625 | | 150,774 |
| | |
|
| | | | | 3,965,351 |
| Telecommunication Services - 1.36% | | | | |
| Crown Castle Operating Company | | | | |
| 1.761%, 03/06/2014 | | 1,568,292 | | 1,560,232 |
| Fairpoint Communications, Inc. | | | | |
| 6.500%, 01/25/2016 | | 4,800,000 | | 4,736,669 |
| Level 3 Financing, Inc. | | | | |
| 2.553%, 03/13/2014 | | 2,450,000 | | 2,388,750 |
| | |
|
| | | | | 8,685,651 |
| Utilities - 2.84% | | | | |
| NRG Energy, Inc. | | | | |
| 2.039%, 02/01/2013 | | 1,045,328 | | 1,040,848 |
| 2.053%, 08/31/2015 | | 881,125 | | 886,632 |
| Texas Competitive Electric | | | | |
| Holdings Company LLC | | | | |
| 3.766%, 10/10/2014 | | 18,309,766 | | 15,393,936 |
| 3.766%, 10/10/2014 | | 987,500 | | 817,156 |
| | |
|
| | | | | 18,138,572 |
|
| TOTAL TERM LOANS (Cost $116,516,771) | | $ | 125,479,893 |
|
| |
| COMMON STOCKS - 0.01% | | | | |
| Consumer Discretionary - 0.01% | | | | |
| Tropicana Entertainment LLC (I) | | 7,500 | $ | 90,000 |
|
| TOTAL COMMON STOCKS (Cost $750,000) | | $ | 90,000 |
|
| |
| PREFERRED SECURITIES - 0.02% | | | | |
| Consumer Discretionary - 0.02% | | | | |
| Tropicana Las Vegas Resort & Casino LLC (I) | 2,110 | $ | 101,280 |
|
| TOTAL PREFERRED SECURITIES (Cost $211,000) | | $ | 101,280 |
|
| |
| WARRANTS - 0.00% | | | | |
| Muzak Holdings LLC (Strike | | | | |
| Price: $25.00) (I) | | 8,366 | | 0 |
|
| TOTAL WARRANTS (Cost $680,016) | | | $ | 0 |
|
| |
| SHORT-TERM INVESTMENTS - 3.65% | | | |
| Repurchase Agreement - 0.00% | | | | |
| Repurchase Agreement with State Street Corp. | | | |
| dated 02/28/2011 at 0.010% to be | | | | |
| repurchased at $27,203 on 03/01/2011, | | | | |
| collateralized by $30,000 U.S. Treasury | | | | |
| Notes, 1.375% due 05/15/2013 (valued at | | | |
| $30,392, including interest) | $ | 27,203 | $ | 27,203 |
| Short-Term Securities* - 3.65% | | | | |
| State Street Institutional Liquid Reserves | | | | |
| Fund, 0.2053% | | 23,253,044 | | 23,253,044 |
|
| TOTAL SHORT-TERM INVESTMENTS (Cost $23,280,247) | $ | 23,280,247 |
|
| Total Investments (U.S. High Yield Bond Fund) | | | |
| (Cost $586,710,595) - 98.92% | | | $ | 631,131,591 |
| Other assets and liabilities, net - 1.08% | | | | 6,897,479 |
| | | |
|
| TOTAL NET ASSETS - 100.00% | | | $ | 638,029,070 |
| | | |
|
| | | | |
| U.S. Multi-Sector Fund | | | | |
| | | Shares or | | |
| | | Principal | | |
| | | Amount | | Value |
| | |
|
| |
| COMMON STOCKS - 97.08% | | | | |
| Consumer Discretionary - 7.30% | | | | |
| Auto Components - 0.12% | | | | |
| Autoliv, Inc. (L) | | 5,100 | $ | 381,939 |
| BorgWarner, Inc. (I)(L) | | 4,600 | | 357,006 |
| Lear Corp. | | 970 | | 102,626 |
| Tenneco, Inc. (I) | | 3,200 | | 127,616 |
| TRW Automotive Holdings Corp. (I) | | 6,600 | | 374,880 |
| | |
|
| | | | | 1,344,067 |
| Distributors - 0.16% | | | | |
| Audiovox Corp., Class A (I) | | 25,800 | | 213,624 |
| Genuine Parts Company | | 29,600 | | 1,559,624 |
| | |
|
| | | | | 1,773,248 |
| Diversified Consumer Services - 0.34% | | | | |
| Apollo Group, Inc., Class A (I) | | 43,700 | | 1,977,862 |
| ITT Educational Services, Inc. (I)(L) | | 7,720 | | 585,562 |
| Weight Watchers International, Inc. | | 5,700 | | 348,441 |
| Sotheby’s | | 2,600 | | 127,972 |
| Strayer Education, Inc. (L) | | 2,280 | | 313,363 |
| Pre-Paid Legal Services, Inc. (I) | | 1,600 | | 105,504 |
| DeVry, Inc. | | 2,000 | | 108,500 |
| Career Education Corp. (I) | | 5,500 | | 132,605 |
| | |
|
| | | | | 3,699,809 |
| Hotels, Restaurants & Leisure - 2.26% | | | | |
| Brinker International, Inc. | | 5,500 | | 130,020 |
| Chipotle Mexican Grill, Inc. (I)(L) | | 1,650 | | 404,250 |
| Choice Hotels International, Inc. | | 12,000 | | 463,440 |
| Cracker Barrel Old Country Store, Inc. (L) | | 3,800 | | 189,392 |
| Darden Restaurants, Inc. | | 7,100 | | 334,623 |
| Domino’s Pizza, Inc. (I) | | 7,100 | | 119,777 |
| Einstein Noah Restaurant Group, Inc. | | 8,800 | | 141,592 |
| Las Vegas Sands Corp. (I) | | 28,000 | | 1,305,920 |
| McDonald’s Corp. | | 251,300 | | 19,018,384 |
| O’Charley’s, Inc. (I)(L) | | 28,700 | | 182,245 |
| Penn National Gaming, Inc. (I) | | 2,800 | | 100,156 |
| Ruby Tuesday, Inc. (I) | | 7,800 | | 104,208 |
| Ruth’s Hospitality Group, Inc. (I)(L) | | 19,200 | | 96,192 |
| Starwood Hotels & | | | | |
| Resorts Worldwide, Inc. (L) | | 1,700 | | 103,870 |
| Wyndham Worldwide Corp. | | 3,800 | | 118,864 |
| Wynn Resorts, Ltd. | | 2,720 | | 334,370 |
| Yum! Brands, Inc. | | 26,600 | | 1,338,778 |
| | |
|
| | | | | 24,486,081 |
| Household Durables - 0.10% | | | | |
| Fortune Brands, Inc. | | 6,900 | | 426,834 |
| Garmin, Ltd. (L) | | 6,300 | | 213,885 |
| MDC Holdings, Inc. (L) | | 3,500 | | 91,875 |
| Mohawk Industries, Inc. (I) | | 1,800 | | 104,598 |
| Newell Rubbermaid, Inc. | | 5,300 | | 102,502 |
| NVR, Inc. (I) | | 150 | | 109,179 |
| | |
|
| | | | | 1,048,873 |
| Internet & Catalog Retail - 0.18% | | | | |
| Amazon.com, Inc. (I) | | 2,670 | | 462,684 |
| Liberty Media Corp. - | | | | |
| Interactive, Series A (I) | | 32,600 | | 523,556 |
| Netflix, Inc. (I)(L) | | 2,870 | | 593,143 |
| priceline.com, Inc. (I) | | 810 | | 367,643 |
| | |
|
| | | | | 1,947,026 |
| Leisure Equipment & Products - 0.04% | | | | |
| Hasbro, Inc. | | 7,000 | | 314,300 |
| Polaris Industries, Inc. (L) | | 1,400 | | 105,630 |
| | |
|
| | | | | 419,930 |
| |
| The accompanying notes are an integral part of the financial statements. | 289 |
John Hancock Funds II
Portfolio of Investments — February 28, 2011 (Unaudited) (showing percentage of total net assets)
| | | | |
| U.S. Multi-Sector Fund (continued) | | |
| | | Shares or | | |
| | | Principal | | |
| | | Amount | | Value |
| | |
|
| |
| COMMON STOCKS (continued) | | | | |
| Media - 0.97% | | | | |
| Arbitron, Inc. | | 7,600 | $ | 302,556 |
| Charter Communications, Inc., Class A (I) | | 6,400 | | 292,928 |
| Clear Channel Outdoor | | | | |
| Holdings, Inc., Class A (I) | | 7,100 | | 104,654 |
| Comcast Corp., Class A | | 92,600 | | 2,385,376 |
| DIRECTV, Class A (I) | | 13,600 | | 625,192 |
| Discovery | | | | |
| Communications, Inc., Series A (I)(L) | | 4,900 | | 211,239 |
| Gannett Company, Inc. (L) | | 20,700 | | 341,757 |
| Liberty Global, Inc., Series A (I)(L) | | 9,700 | | 408,370 |
| Liberty Media Corp. - Capital, Series A (I) | | 5,100 | | 370,056 |
| Liberty Media Corp. - Starz, Series A (I) | | 1,500 | | 105,300 |
| Live Nation Entertainment, Inc. (I) | | 10,200 | | 108,426 |
| Mediacom | | | | |
| Communications Corp., Class A (I) | | 14,000 | | 123,480 |
| The McClatchy Company, Class A (I)(L) | | 20,400 | | 81,804 |
| The McGraw-Hill Companies, Inc. (L) | | 29,800 | | 1,152,664 |
| The Washington Post Company, Class B (L) | | 761 | | 329,581 |
| Time Warner Cable, Inc. | | 15,412 | | 1,112,438 |
| Time Warner, Inc. | | 48,000 | | 1,833,600 |
| Viacom, Inc., Class B | | 15,100 | | 674,366 |
| | |
|
| | | | | 10,563,787 |
| Multiline Retail - 0.47% | | | | |
| Dillard’s, Inc., Class A (L) | | 4,800 | | 203,232 |
| Dollar Tree, Inc. (I) | | 32,650 | | 1,642,948 |
| Family Dollar Stores, Inc. (L) | | 9,400 | | 470,752 |
| J.C. Penney Company, Inc. | | 9,200 | | 321,632 |
| Macy’s, Inc. | | 20,900 | | 499,510 |
| Sears Holdings Corp. (I)(L) | | 14,800 | | 1,232,988 |
| Target Corp. | | 13,900 | | 730,445 |
| | |
|
| | | | | 5,101,507 |
| Specialty Retail - 1.23% | | | | |
| Advance Auto Parts, Inc. | | 18,300 | | 1,147,044 |
| Aeropostale, Inc. (I)(L) | | 38,815 | | 1,006,861 |
| AutoNation, Inc. (I)(L) | | 14,900 | | 501,236 |
| AutoZone, Inc. (I)(L) | | 6,650 | | 1,715,368 |
| Best Buy Company, Inc. | | 36,500 | | 1,176,760 |
| Cabela’s, Inc. (I) | | 4,800 | | 130,224 |
| Destination Maternity Corp. | | 3,200 | | 144,320 |
| Foot Locker, Inc. | | 7,400 | | 147,038 |
| GameStop Corp., Class A (I) | | 5,000 | | 99,750 |
| Group 1 Automotive, Inc. | | 5,000 | | 211,250 |
| Guess?, Inc. (L) | | 2,400 | | 108,696 |
| Home Depot, Inc. | | 35,100 | | 1,315,197 |
| Jos. A. Bank Clothiers, Inc. (I) | | 7,837 | | 361,364 |
| Limited Brands, Inc. | | 12,300 | | 393,846 |
| O’Reilly Automotive, Inc. (I) | | 8,400 | | 466,872 |
| Penske Automotive Group, Inc. (I)(L) | | 7,100 | | 144,627 |
| PetSmart, Inc. | | 6,400 | | 261,568 |
| RadioShack Corp. (L) | | 10,000 | | 148,000 |
| Rent-A-Center, Inc. | | 4,200 | | 138,852 |
| Ross Stores, Inc. | | 12,300 | | 886,092 |
| Sally Beauty Holdings, Inc. (I) | | 14,700 | | 190,659 |
| TJX Companies, Inc. | | 46,500 | | 2,318,955 |
| Tractor Supply Company | | 5,100 | | 265,557 |
| Williams-Sonoma, Inc. | | 3,100 | | 111,879 |
| | |
|
| | | | | 13,392,015 |
| Textiles, Apparel & Luxury Goods - 1.43% | | | | |
| Carter’s, Inc. (I) | | 3,900 | | 111,774 |
| Coach, Inc. | | 44,700 | | 2,454,924 |
| Columbia Sportswear Company | | 1,800 | | 113,022 |
| Deckers Outdoor Corp. (I) | | 3,970 | | 350,233 |
| Fossil, Inc. (I) | | 4,000 | | 306,960 |
| | | | |
| U.S. Multi-Sector Fund (continued) | | |
| | | Shares or | | |
| | | Principal | | |
| | | Amount | | Value |
| | |
|
| |
| COMMON STOCKS (continued) | | | | |
| Textiles, Apparel & Luxury Goods (continued) | | | | |
| Iconix Brand Group, Inc. (I)(L) | | 5,200 | $ | 114,920 |
| NIKE, Inc., Class B | | 118,100 | | 10,514,443 |
| Steven Madden, Ltd. (I)(L) | | 4,700 | | 202,758 |
| The Timberland Company, Class A (I) | | 1,000 | | 36,940 |
| Under Armour, Inc., Class A (I) | | 1,800 | | 119,214 |
| VF Corp. (L) | | 11,800 | | 1,128,906 |
| | |
|
| | | | | 15,454,094 |
| | |
|
| | | | | 79,230,437 |
| Consumer Staples - 22.83% | | | | |
| Beverages - 6.01% | | | | |
| Brown Forman Corp., Class B | | 38,800 | | 2,683,020 |
| Coca-Cola Enterprises, Inc. | | 29,000 | | 762,700 |
| Constellation Brands, Inc., Class A (I)(L) | | 5,300 | | 107,696 |
| Hansen Natural Corp. (I) | | 24,700 | | 1,421,485 |
| Heckmann Corp. (I) | | 40,600 | | 232,232 |
| PepsiCo, Inc. | | 392,888 | | 24,916,957 |
| The Coca-Cola Company | | 549,000 | | 35,092,080 |
| | |
|
| | | | | 65,216,170 |
| Food & Staples Retailing - 5.82% | | | | |
| BJ’s Wholesale Club, Inc. (I) | | 2,400 | | 116,208 |
| Costco Wholesale Corp. | | 46,400 | | 3,470,256 |
| CVS Caremark Corp. | | 36,200 | | 1,196,772 |
| Nash Finch Company | | 4,500 | | 181,665 |
| Ruddick Corp. | | 5,700 | | 209,190 |
| Safeway, Inc. | | 17,800 | | 388,396 |
| SUPERVALU, Inc. (L) | | 26,390 | | 227,746 |
| Sysco Corp. (L) | | 139,800 | | 3,885,042 |
| The Kroger Company | | 57,500 | | 1,316,750 |
| United Natural Foods, Inc. (I)(L) | | 2,700 | | 114,615 |
| Wal-Mart Stores, Inc. | | 793,889 | | 41,266,350 |
| Walgreen Company | | 243,800 | | 10,566,292 |
| Weis Markets, Inc. | | 4,900 | | 194,383 |
| | |
|
| | | | | 63,133,665 |
| Food Products - 2.32% | | | | |
| Campbell Soup Company (L) | | 70,600 | | 2,376,396 |
| Corn Products International, Inc. | | 2,300 | | 112,286 |
| Dean Foods Company (I)(L) | | 12,400 | | 130,944 |
| Del Monte Foods Company | | 7,100 | | 134,403 |
| Farmer Brothers Company | | 14,000 | | 183,820 |
| Flowers Foods, Inc. (L) | | 23,500 | | 625,100 |
| Fresh Del Monte Produce, Inc. | | 3,800 | | 108,604 |
| General Mills, Inc. | | 147,000 | | 5,459,580 |
| Green Mountain Coffee Roasters, Inc. (I) | | 5,600 | | 228,368 |
| H.J. Heinz Company | | 40,100 | | 2,013,822 |
| Hormel Foods Corp. (L) | | 67,600 | | 1,852,240 |
| Kellogg Company | | 87,300 | | 4,675,788 |
| Kraft Foods, Inc., Class A | | 37,400 | | 1,190,816 |
| McCormick & Company, Inc., Class B | | 35,000 | | 1,667,750 |
| Ralcorp Holdings, Inc. (I) | | 3,300 | | 214,005 |
| Sara Lee Corp. | | 19,600 | | 335,552 |
| The Hershey Company | | 60,500 | | 3,165,360 |
| The J.M. Smucker Company | | 10,300 | | 709,052 |
| | |
|
| | | | | 25,183,886 |
| Household Products - 5.50% | | | | |
| Church & Dwight Company, Inc. | | 16,600 | | 1,252,304 |
| Clorox Company (L) | | 35,400 | | 2,398,704 |
| Colgate-Palmolive Company | | 112,000 | | 8,794,240 |
| Energizer Holdings, Inc. (I) | | 1,400 | | 93,562 |
| Kimberly-Clark Corp. | | 95,200 | | 6,273,680 |
| Spectrum Brands Holdings, Inc. (I) | | 3,600 | | 103,320 |
| |
| The accompanying notes are an integral part of the financial statements. | 290 |
John Hancock Funds II
Portfolio of Investments — February 28, 2011 (Unaudited) (showing percentage of total net assets)
| | | | |
| U.S. Multi-Sector Fund (continued) | | |
| | | Shares or | | |
| | | Principal | | |
| | | Amount | | Value |
| | |
|
| |
| COMMON STOCKS (continued) | | | | |
| Household Products (continued) | | | | |
| The Procter & Gamble Company | | 647,000 | $ | 40,793,350 |
| | | |
|
| | | | | 59,709,160 |
| Personal Products - 0.50% | | | | |
| Avon Products, Inc. | | 44,900 | | 1,248,669 |
| Herbalife, Ltd. | | 7,100 | | 556,711 |
| The Estee Lauder Companies, Inc., Class A | | 36,600 | | 3,455,406 |
| USANA Health Sciences, Inc. (I)(L) | | 4,900 | | 170,618 |
| | |
|
| | | | | 5,431,404 |
| Tobacco - 2.68% | | | | |
| Altria Group, Inc. | | 370,800 | | 9,407,196 |
| Lorillard, Inc. | | 40,800 | | 3,132,216 |
| Philip Morris International, Inc. | | 232,231 | | 14,579,462 |
| Reynolds American, Inc. | | 58,900 | | 2,021,448 |
| | |
|
| | | | | 29,140,322 |
| | | |
|
| | | | | 247,814,607 |
| Energy - 2.26% | | | | |
| Energy Equipment & Services - 0.46% | | | | |
| Atwood Oceanics, Inc. (I)(L) | | 3,100 | | 141,112 |
| Baker Hughes, Inc. | | 3,700 | | 262,885 |
| Complete Production Services, Inc. (I) | | 4,900 | | 141,169 |
| Core Laboratories NV | | 1,200 | | 124,020 |
| Diamond Offshore Drilling, Inc. (L) | | 3,700 | | 289,451 |
| Dril-Quip, Inc. (I) | | 1,500 | | 115,050 |
| Global Industries, Ltd. (I) | | 17,000 | | 152,660 |
| Gulfmark Offshore, Inc., Class A (I) | | 3,600 | | 159,768 |
| Halliburton Company | | 3,100 | | 145,514 |
| McDermott International, Inc. (I) | | 4,900 | | 112,455 |
| National Oilwell Varco, Inc. | | 15,800 | | 1,257,206 |
| Oil States International, Inc. (I) | | 1,500 | | 109,185 |
| Rowan Companies, Inc. (I) | | 7,100 | | 302,957 |
| RPC, Inc. (L) | | 5,800 | | 113,564 |
| Schlumberger, Ltd. | | 14,017 | | 1,309,468 |
| SEACOR Holdings, Inc. | | 960 | | 90,979 |
| Tidewater, Inc. | | 2,100 | | 130,641 |
| | |
|
| | | | | 4,958,084 |
| Oil, Gas & Consumable Fuels - 1.80% | | | | |
| Anadarko Petroleum Corp. | | 1,782 | | 145,821 |
| Apache Corp. | | 1,040 | | 129,605 |
| Approach Resources, Inc. (I) | | 5,200 | | 169,260 |
| Chevron Corp. | | 43,896 | | 4,554,210 |
| Cimarex Energy Company | | 1,200 | | 139,356 |
| Cloud Peak Energy, Inc. (I) | | 4,700 | | 96,350 |
| Concho Resources, Inc. (I) | | 2,800 | | 298,256 |
| ConocoPhillips | | 102,509 | | 7,982,376 |
| El Paso Corp. | | 6,400 | | 119,040 |
| Energy Partners, Ltd. (I) | | 8,800 | | 144,056 |
| Energy XXI Bermuda, Ltd. (I) | | 4,600 | | 158,608 |
| Exxon Mobil Corp. | | 11,698 | | 1,000,530 |
| Marathon Oil Corp. | | 29,000 | | 1,438,400 |
| Murphy Oil Corp. | | 4,800 | | 352,944 |
| Occidental Petroleum Corp. | | 5,749 | | 586,226 |
| Pioneer Natural Resources Company (L) | | 4,600 | | 470,764 |
| Ship Finance International, Ltd. (L) | | 7,200 | | 149,688 |
| Sunoco, Inc. (L) | | 7,400 | | 309,764 |
| Teekay Corp. (L) | | 3,500 | | 120,435 |
| Tesoro Corp. (I)(L) | | 5,300 | | 126,034 |
| Valero Energy Corp. | | 26,700 | | 752,406 |
| Western Refining, Inc. (I) | | 10,200 | | 165,954 |
| World Fuel Services Corp. | | 2,700 | | 111,888 |
| | |
|
| | | | | 19,521,971 |
| | | |
|
| | | | | 24,480,055 |
| | | | |
| U.S. Multi-Sector Fund (continued) | | |
| | | Shares or | | |
| | | Principal | | |
| | | Amount | | Value |
| | |
|
| |
| COMMON STOCKS (continued) | | | | |
| Financials - 2.33% | | | | |
| Capital Markets - 0.07% | | | | |
| American Capital, Ltd. (I)(L) | | 12,400 | $ | 115,816 |
| BlackRock Kelso Capital Corp. | | 16,500 | | 205,095 |
| GAMCO Investors, Inc., Class A | | 2,400 | | 111,456 |
| Safeguard Scientifics, Inc. (I) | | 7,500 | | 157,350 |
| Solar Capital Ltd. | | 8,300 | | 203,350 |
| | |
|
| | | | | 793,067 |
| Commercial Banks - 0.12% | | | | |
| CapitalSource, Inc. | | 36,100 | | 273,638 |
| Cathay General Bancorp (L) | | 5,800 | | 102,776 |
| CIT Group, Inc. (I) | | 10,300 | | 446,196 |
| OmniAmerican Bancorp, Inc. (I) | | 8,300 | | 130,061 |
| PNC Financial Services Group, Inc. | | 3,600 | | 222,120 |
| Regions Financial Corp. | | 14,200 | | 108,488 |
| | |
|
| | | | | 1,283,279 |
| Consumer Finance - 0.14% | | | | |
| Capital One Financial Corp. | | 5,000 | | 248,850 |
| Credit Acceptance Corp. (I)(L) | | 3,400 | | 240,040 |
| EZCORP, Inc., Class A (I) | | 4,700 | | 134,796 |
| First Cash Financial Services, Inc. (I)(L) | | 3,400 | | 111,316 |
| Nelnet, Inc., Class A | | 8,800 | | 196,504 |
| SLM Corp. (I) | | 32,300 | | 478,686 |
| World Acceptance Corp. (I) | | 2,300 | | 137,563 |
| | |
|
| | | | | 1,547,755 |
| Diversified Financial Services - 0.11% | | | | |
| Bank of America Corp. | | 61,979 | | 885,680 |
| Encore Capital Group, Inc. (I) | | 5,300 | | 144,319 |
| Marlin Business Services Corp. (I) | | 7,900 | | 87,690 |
| PHH Corp. (I)(L) | | 4,700 | | 115,996 |
| | |
|
| | | | | 1,233,685 |
| Insurance - 1.36% | | | | |
| ACE, Ltd. | | 7,400 | | 468,050 |
| Allied World Assurance | | | | |
| Company Holdings, Ltd. | | 5,400 | | 333,234 |
| American Financial Group, Inc. | | 10,500 | | 363,615 |
| American International Group, Inc. (I)(L) | | 64,100 | | 2,375,546 |
| AON Corp. | | 5,100 | | 268,464 |
| Arch Capital Group, Ltd. (I)(L) | | 4,000 | | 362,000 |
| Aspen Insurance Holdings, Ltd. | | 4,200 | | 124,110 |
| Assurant, Inc. | | 8,500 | | 345,355 |
| Axis Capital Holdings, Ltd. | | 9,300 | | 337,776 |
| Brown & Brown, Inc. | | 4,200 | | 109,788 |
| Chubb Corp. | | 7,800 | | 473,304 |
| CNA Surety Corp. (I) | | 5,000 | | 126,400 |
| CNO Financial Group, Inc. (I) | | 16,200 | | 117,288 |
| Employers Holdings, Inc. | | 5,900 | | 118,708 |
| Endurance Specialty Holdings, Ltd. (L) | | 6,000 | | 297,540 |
| Enstar Group, Ltd. (I) | | 1,300 | | 109,018 |
| Erie Indemnity Company | | 1,700 | | 118,728 |
| Everest Re Group, Ltd. | | 2,200 | | 195,030 |
| Flagstone Reinsurance Holdings SA | | 9,200 | | 104,880 |
| Genworth Financial, Inc., Class A (I) | | 8,200 | | 108,486 |
| Greenlight Capital Re, Ltd., Class A (I) | | 3,700 | | 107,078 |
| Hartford Financial Services Group, Inc. | | 17,900 | | 529,840 |
| Hilltop Holdings, Inc. (I) | | 19,800 | | 191,664 |
| MBIA, Inc. (I) | | 14,100 | | 158,061 |
| Mercury General Corp. | | 4,700 | | 193,358 |
| Montpelier Re Holdings, Ltd. (L) | | 5,400 | | 108,918 |
| Old Republic International Corp. (L) | | 14,200 | | 177,500 |
| PartnerRe, Ltd. | | 4,500 | | 356,850 |
| Platinum Underwriters Holdings, Ltd. | | 4,500 | | 187,650 |
| Presidential Life Corp. | | 10,400 | | 104,208 |
| |
| The accompanying notes are an integral part of the financial statements. | 291 |
John Hancock Funds II
Portfolio of Investments — February 28, 2011 (Unaudited) (showing percentage of total net assets)
| | | | |
| U.S. Multi-Sector Fund (continued) | | |
| | | Shares or | | |
| | | Principal | | |
| | | Amount | | Value |
| | |
|
| |
| COMMON STOCKS (continued) | | | | |
| Insurance (continued) | | | | |
| Protective Life Corp. | | 4,300 | $ | 122,249 |
| Prudential Financial, Inc. | | 11,100 | | 730,713 |
| RenaissanceRe Holdings, Ltd. | | 5,300 | | 355,206 |
| Safety Insurance Group, Inc. | | 2,200 | | 105,864 |
| StanCorp Financial Group, Inc. (L) | | 2,500 | | 115,000 |
| Symetra Financial Corp. | | 15,000 | | 214,500 |
| The Allstate Corp. | | 10,200 | | 324,156 |
| The Progressive Corp. | | 17,100 | | 356,193 |
| The Travelers Companies, Inc. | | 34,800 | | 2,085,564 |
| Torchmark Corp. | | 4,700 | | 306,675 |
| Transatlantic Holdings, Inc. | | 3,900 | | 198,627 |
| Unitrin, Inc. | | 3,800 | | 111,302 |
| Unum Group | | 4,100 | | 108,773 |
| Validus Holdings, Ltd. | | 10,700 | | 331,165 |
| W.R. Berkley Corp. (L) | | 10,100 | | 302,495 |
| | |
|
| | | | | 14,740,929 |
| Real Estate Investment Trusts - 0.42% | | | | |
| American Capital Agency Corp. | | 3,500 | | 103,075 |
| Annaly Capital Management, Inc. | | 32,700 | | 586,311 |
| AvalonBay Communities, Inc. (L) | | 2,040 | | 246,901 |
| CBL & Associates Properties, Inc. (L) | | 7,600 | | 135,660 |
| CommonWealth | | 7,300 | | 209,583 |
| Digital Realty Trust, Inc. (L) | | 3,100 | | 182,342 |
| Equity Residential (L) | | 7,200 | | 396,792 |
| Essex Property Trust, Inc. | | 860 | | 106,451 |
| Federal Realty Investment Trust | | 2,400 | | 202,032 |
| General Growth Properties, Inc. (I) | | 6,866 | | 109,307 |
| Getty Realty Corp. (L) | | 3,500 | | 102,970 |
| Glimcher Realty Trust | | 3,600 | | 33,120 |
| Hatteras Financial Corp. | | 6,400 | | 189,312 |
| iStar Financial, Inc. (I)(L) | | 17,500 | | 174,825 |
| One Liberty Properties, Inc. (L) | | 6,400 | | 95,232 |
| Pennymac Mortgage Investment Trust | | 9,500 | | 179,075 |
| Post Properties, Inc. (L) | | 3,300 | | 128,700 |
| Public Storage (L) | | 3,930 | | 441,143 |
| Realty Income Corp. | | 2,900 | | 104,313 |
| Simon Property Group, Inc. | | 4,110 | | 452,264 |
| Starwood Property Trust, Inc. | | 4,700 | | 109,933 |
| UDR, Inc. (L) | | 4,600 | | 111,872 |
| Winthrop Realty Trust | | 16,200 | | 197,640 |
| | |
|
| | | | | 4,598,853 |
| Real Estate Management & Development - 0.05% | | | | |
| Forest City Enterprises, Inc., Class A (I) | | 6,200 | | 117,180 |
| Jones Lang LaSalle, Inc. | | 1,200 | | 118,104 |
| Tejon Ranch Company (I) | | 4,300 | | 113,133 |
| The St. Joe Company (I)(L) | | 4,900 | | 131,222 |
| | |
|
| | | | | 479,639 |
| Thrifts & Mortgage Finance - 0.06% | | | | |
| Abington Bancorp, Inc. (L) | | 8,800 | | 110,000 |
| Fox Chase Bancorp, Inc. | | 10,000 | | 128,400 |
| New York Community Bancorp, Inc. (L) | | 6,200 | | 115,692 |
| Oritani Financial Corp. | | 9,300 | | 119,691 |
| TFS Financial Corp. | | 10,900 | | 113,142 |
| | |
|
| | | | | 586,925 |
| | | |
|
| | | | | 25,264,132 |
| Health Care - 27.65% | | | | |
| Biotechnology - 2.16% | | | | |
| Alexion Pharmaceuticals, Inc. (I) | | 1,200 | | 115,536 |
| Amgen, Inc. (I) | | 249,300 | | 12,796,569 |
| Biogen Idec, Inc. (I)(L) | | 19,400 | | 1,326,960 |
| Cephalon, Inc. (I)(L) | | 5,200 | | 292,812 |
| | | | |
| U.S. Multi-Sector Fund (continued) | | |
| | | Shares or | | |
| | | Principal | | |
| | | Amount | | Value |
| | |
|
| |
| COMMON STOCKS (continued) | | | | |
| Biotechnology (continued) | | | | |
| Enzon Pharmaceuticals, Inc. (I)(L) | | 19,700 | $ | 210,396 |
| Genzyme Corp. (I) | | 5,400 | | 407,430 |
| Gilead Sciences, Inc. (I) | | 193,800 | | 7,554,324 |
| Regeneron Pharmaceuticals, Inc. (I)(L) | | 3,300 | | 119,691 |
| Synta Pharmaceuticals Corp. (I) | | 16,400 | | 91,676 |
| Theravance, Inc. (I)(L) | | 17,900 | | 407,762 |
| United Therapeutics Corp. (I)(L) | | 1,660 | | 111,934 |
| | |
|
| | | | | 23,435,090 |
| Health Care Equipment & Supplies - 4.83% | | | | |
| Alere, Inc. (I) | | 30,900 | | 1,193,976 |
| Baxter International, Inc. | | 160,618 | | 8,536,847 |
| Becton, Dickinson & Company | | 56,800 | | 4,544,000 |
| C.R. Bard, Inc. (L) | | 22,400 | | 2,189,824 |
| CareFusion Corp. (I) | | 3,900 | | 106,548 |
| DENTSPLY International, Inc. | | 33,400 | | 1,248,158 |
| Edwards Lifesciences Corp. (I) | | 29,600 | | 2,517,184 |
| Gen-Probe, Inc. (I) | | 12,200 | | 767,136 |
| Hill-Rom Holdings, Inc. | | 2,500 | | 95,175 |
| IDEXX Laboratories, Inc. (I)(L) | | 16,500 | | 1,282,050 |
| Intuitive Surgical, Inc. (I) | | 3,690 | | 1,210,136 |
| Kinetic Concepts, Inc. (I)(L) | | 6,900 | | 337,893 |
| Medtronic, Inc. | | 290,100 | | 11,580,792 |
| Palomar Medical Technologies, Inc. (I) | | 7,600 | | 121,448 |
| ResMed, Inc. (I)(L) | | 40,600 | | 1,282,960 |
| St. Jude Medical, Inc. (I) | | 77,100 | | 3,691,548 |
| Stryker Corp. (L) | | 91,200 | | 5,769,312 |
| Syneron Medical, Ltd., ADR (I) | | 10,700 | | 157,290 |
| Teleflex, Inc. | | 3,300 | | 192,687 |
| The Cooper Companies, Inc. | | 2,000 | | 123,640 |
| Varian Medical Systems, Inc. (I)(L) | | 28,800 | | 1,995,264 |
| Zimmer Holdings, Inc. (I) | | 55,800 | | 3,478,572 |
| | |
|
| | | | | 52,422,440 |
| Health Care Providers & Services - 3.84% | | | | |
| Aetna, Inc. | | 37,400 | | 1,397,264 |
| Amedisys, Inc. (I)(L) | | 4,000 | | 143,680 |
| AMERIGROUP Corp. (I)(L) | | 5,000 | | 286,750 |
| AmerisourceBergen Corp. | | 35,200 | | 1,334,432 |
| Cardinal Health, Inc. | | 35,900 | | 1,494,876 |
| Centene Corp. (I)(L) | | 4,200 | | 127,974 |
| Chemed Corp. | | 1,700 | | 111,248 |
| CIGNA Corp. | | 3,500 | | 147,245 |
| Coventry Health Care, Inc. (I) | | 15,500 | | 468,100 |
| Express Scripts, Inc. (I) | | 111,310 | | 6,257,848 |
| Health Management | | | | |
| Associates, Inc., Class A (I) | | 12,500 | | 125,000 |
| Health Net, Inc. (I)(L) | | 11,800 | | 347,156 |
| Healthspring, Inc. (I) | | 3,800 | | 143,032 |
| Henry Schein, Inc. (I)(L) | | 22,500 | | 1,552,050 |
| Humana, Inc. (I) | | 21,900 | | 1,423,719 |
| Laboratory Corp. of America Holdings (I) | | 28,600 | | 2,577,718 |
| Lincare Holdings, Inc. (L) | | 25,287 | | 741,921 |
| McKesson Corp. | | 15,700 | | 1,244,696 |
| MEDNAX, Inc. (I) | | 12,000 | | 779,160 |
| Molina Healthcare, Inc. (I)(L) | | 3,700 | | 129,611 |
| Omnicare, Inc. (L) | | 10,500 | | 300,615 |
| Owens & Minor, Inc. | | 3,400 | | 106,080 |
| Patterson Companies, Inc. (L) | | 31,100 | | 1,038,118 |
| Quest Diagnostics, Inc. | | 41,100 | | 2,332,425 |
| Triple-S Management Corp., Class B (I) | | 34,276 | | 677,294 |
| UnitedHealth Group, Inc. | | 293,890 | | 12,513,836 |
| Universal American Financial Corp. | | 4,900 | | 100,842 |
| VCA Antech, Inc. (I)(L) | | 12,800 | | 320,512 |
| WellCare Health Plans, Inc. (I) | | 3,500 | | 131,425 |
| |
| The accompanying notes are an integral part of the financial statements. | 292 |
John Hancock Funds II
Portfolio of Investments — February 28, 2011 (Unaudited) (showing percentage of total net assets)
| | | | |
| U.S. Multi-Sector Fund (continued) | | |
| | | Shares or | | |
| | | Principal | | |
| | | Amount | | Value |
| | |
|
| |
| COMMON STOCKS (continued) | | | | |
| Health Care Providers & Services (continued) | | | | |
| WellPoint, Inc. | | 50,767 | $ | 3,374,482 |
| | | |
|
| | | | | 41,729,109 |
| Health Care Technology - 0.16% | | | | |
| Cerner Corp. (I)(L) | | 17,050 | | 1,712,673 |
| Life Sciences Tools & Services - 0.59% | | | | |
| Covance, Inc. (I)(L) | | 12,500 | | 705,375 |
| Furiex Pharmaceuticals, Inc. (I) | | 6,100 | | 101,382 |
| Illumina, Inc. (I)(L) | | 5,000 | | 347,000 |
| Mettler-Toledo International, Inc. (I)(L) | | 9,350 | | 1,602,310 |
| Pharmaceutical Product Development, Inc. | | 31,200 | | 857,064 |
| Techne Corp. (L) | | 9,500 | | 681,055 |
| Thermo Fisher Scientific, Inc. (I) | | 5,100 | | 284,682 |
| Waters Corp. (I)(L) | | 21,600 | | 1,793,880 |
| | |
|
| | | | | 6,372,748 |
| Pharmaceuticals - 16.07% | | | | |
| Abbott Laboratories | | 386,400 | | 18,585,840 |
| Allergan, Inc. | | 83,900 | | 6,222,863 |
| Bristol-Myers Squibb Company (L) | | 429,700 | | 11,090,557 |
| Eli Lilly & Company | | 392,700 | | 13,571,712 |
| Endo Pharmaceuticals Holdings, Inc. (I)(L) | | 44,600 | | 1,584,192 |
| Forest Laboratories, Inc. (I) | | 95,500 | | 3,094,200 |
| Hospira, Inc. (I) | | 5,100 | | 269,535 |
| Johnson & Johnson | | 645,900 | | 39,684,096 |
| Merck & Company, Inc. | | 914,010 | | 29,769,306 |
| Mylan, Inc. (I) | | 9,700 | | 221,839 |
| Perrigo Company | | 1,400 | | 107,002 |
| Pfizer, Inc. | | 2,545,279 | | 48,971,168 |
| Viropharma, Inc. (I)(L) | | 6,500 | | 116,545 |
| Warner Chilcott PLC, Class A | | 46,100 | | 1,091,648 |
| | |
|
| | | | | 174,380,503 |
| | | |
|
| | | | | 300,052,563 |
| Industrials - 5.03% | | | | |
| Aerospace & Defense - 1.14% | | | | |
| Alliant Techsystems, Inc. | | 1,400 | | 101,038 |
| Esterline Technologies Corp. (I) | | 1,600 | | 114,512 |
| GenCorp, Inc. (I)(L) | | 38,800 | | 201,372 |
| General Dynamics Corp. | | 52,600 | | 4,003,912 |
| Goodrich Corp. | | 1,500 | | 129,345 |
| Herley Industries, Inc. (I)(L) | | 12,000 | | 228,000 |
| ITT Corp. | | 4,400 | | 254,892 |
| L-3 Communications Holdings, Inc. | | 6,500 | | 515,385 |
| Lockheed Martin Corp. | | 4,000 | | 316,640 |
| Moog, Inc., Class A (I) | | 2,600 | | 118,066 |
| Northrop Grumman Corp. | | 11,300 | | 753,484 |
| Precision Castparts Corp. | | 6,410 | | 908,618 |
| Raytheon Company | | 2,000 | | 102,420 |
| Rockwell Collins, Inc. | | 20,800 | | 1,340,352 |
| Spirit Aerosystems | | | | |
| Holdings, Inc., Class A (I)(L) | | 4,700 | | 122,153 |
| Triumph Group, Inc. (L) | | 1,200 | | 103,908 |
| United Technologies Corp. | | 36,900 | | 3,082,626 |
| | |
|
| | | | | 12,396,723 |
| Air Freight & Logistics - 0.32% | | | | |
| C.H. Robinson Worldwide, Inc. (L) | | 42,400 | | 3,069,336 |
| Expeditors International of Washington, Inc. | | 8,400 | | 401,520 |
| | |
|
| | | | | 3,470,856 |
| Airlines - 0.07% | | | | |
| Alaska Air Group, Inc. (I) | | 1,900 | | 112,955 |
| Republic Airways Holdings, Inc. (I) | | 23,900 | | 151,526 |
| United Continental Holdings, Inc. (I) | | 16,300 | | 391,852 |
| | | | |
| U.S. Multi-Sector Fund (continued) | | |
| | | Shares or | | |
| | | Principal | | |
| | | Amount | | Value |
| | |
|
| |
| COMMON STOCKS (continued) | | | | |
| Airlines (continued) | | | | |
| US Airways Group, Inc. (I) | | 12,200 | $ | 105,042 |
| | |
|
| | | | | 761,375 |
| Commercial Services & Supplies - 0.45% | | | | |
| Avery Dennison Corp. | | 2,700 | | 107,784 |
| Copart, Inc. (I)(L) | | 21,000 | | 882,210 |
| Corrections Corp. of America (I) | | 7,700 | | 191,268 |
| Covanta Holding Corp. | | 6,000 | | 101,520 |
| Deluxe Corp. | | 4,900 | | 125,195 |
| M&F Worldwide Corp. (I)(L) | | 8,000 | | 198,480 |
| Pitney Bowes, Inc. (L) | | 23,200 | | 584,176 |
| R.R. Donnelley & Sons Company (L) | | 9,100 | | 169,442 |
| Rollins, Inc. | | 36,000 | | 706,320 |
| Stericycle, Inc. (I)(L) | | 21,100 | | 1,823,462 |
| | |
|
| | | | | 4,889,857 |
| Construction & Engineering - 0.04% | | | | |
| Granite Construction, Inc. (L) | | 4,100 | | 116,850 |
| KBR, Inc. | | 3,300 | | 108,240 |
| Primoris Services Corp. | | 14,200 | | 121,410 |
| Tutor Perini Corp. | | 5,000 | | 119,100 |
| | |
|
| | | | | 465,600 |
| Electrical Equipment - 0.07% | | | | |
| Acuity Brands, Inc. (L) | | 2,100 | | 118,692 |
| AMETEK, Inc. | | 7,500 | | 314,625 |
| Polypore International, Inc. (I)(L) | | 3,100 | | 181,164 |
| Roper Industries, Inc. (L) | | 1,300 | | 109,369 |
| | |
|
| | | | | 723,850 |
| Industrial Conglomerates - 1.42% | | | | |
| 3M Company | | 166,000 | | 15,310,180 |
| Seaboard Corp. | | 51 | | 118,330 |
| | |
|
| | | | | 15,428,510 |
| Machinery - 1.07% | | | | |
| ArvinMeritor, Inc. (I) | | 6,600 | | 118,272 |
| Caterpillar, Inc. | | 12,000 | | 1,235,160 |
| Cummins, Inc. | | 7,710 | | 779,635 |
| Danaher Corp. | | 112,900 | | 5,712,740 |
| Deere & Company | | 9,600 | | 865,440 |
| Eaton Corp. | | 4,080 | | 451,982 |
| Ingersoll-Rand PLC | | 4,300 | | 194,790 |
| John Bean Technologies Corp. | | 5,800 | | 110,026 |
| Joy Global, Inc. | | 4,900 | | 477,162 |
| Middleby Corp. (I)(L) | | 1,500 | | 134,505 |
| Miller Industries, Inc. | | 7,000 | | 116,340 |
| NACCO Industries, Inc., Class A | | 1,070 | | 133,269 |
| Navistar International Corp. (I) | | 2,200 | | 136,356 |
| Oshkosh Corp. (I) | | 3,400 | | 121,278 |
| PACCAR, Inc. (L) | | 7,300 | | 365,949 |
| Parker Hannifin Corp. | | 3,300 | | 294,294 |
| RBC Bearings, Inc. (I) | | 3,100 | | 112,189 |
| Timken Company | | 2,200 | | 107,184 |
| WABCO Holdings, Inc. (I) | | 2,200 | | 128,546 |
| | |
|
| | | | | 11,595,117 |
| Professional Services - 0.19% | | | | |
| Dun & Bradstreet Corp. | | 8,900 | | 719,120 |
| Huron Consulting Group, Inc. (I) | | 4,700 | | 130,754 |
| IHS, Inc., Class A (I)(L) | | 12,700 | | 1,062,990 |
| Kelly Services, Inc., Class A (I) | | 1,500 | | 31,530 |
| Verisk Analytics, Inc., Class A (I) | | 3,900 | | 126,165 |
| | |
|
| | | | | 2,070,559 |
| Road & Rail - 0.12% | | | | |
| Arkansas Best Corp. | | 4,200 | | 99,624 |
| |
| The accompanying notes are an integral part of the financial statements. | 293 |
John Hancock Funds II
Portfolio of Investments — February 28, 2011 (Unaudited) (showing percentage of total net assets)
| | | | |
| U.S. Multi-Sector Fund (continued) | | |
| | | Shares or | | |
| | | Principal | | |
| | | Amount | | Value |
| | |
|
| |
| COMMON STOCKS (continued) | | | | |
| Road & Rail (continued) | | | | |
| Genesee & Wyoming, Inc., Class A (I) | | 1,900 | $ | 98,971 |
| Old Dominion Freight Line, Inc. (I) | | 3,100 | | 95,418 |
| Ryder Systems, Inc. | | 2,200 | | 105,226 |
| Union Pacific Corp. | | 8,700 | | 830,067 |
| | |
|
| | | | | 1,229,306 |
| Trading Companies & Distributors - 0.14% | | | | |
| Applied Industrial Technologies, Inc. (L) | | 3,200 | | 102,528 |
| Fastenal Company (L) | | 13,200 | | 820,116 |
| RSC Holdings, Inc. (I)(L) | | 12,500 | | 170,375 |
| TAL International Group, Inc. | | 4,800 | | 167,424 |
| WESCO International, Inc. (I)(L) | | 2,400 | | 139,728 |
| WW Grainger, Inc. (L) | | 760 | | 101,240 |
| | |
|
| | | | | 1,501,411 |
| | | |
|
| | | | | 54,533,164 |
| Information Technology - 26.84% | | | | |
| Communications Equipment - 3.84% | | | | |
| Acme Packet, Inc. (I) | | 2,500 | | 188,100 |
| ADTRAN, Inc. | | 3,100 | | 140,988 |
| Aruba Networks, Inc. (I) | | 4,800 | | 146,160 |
| Cisco Systems, Inc. (I) | | 781,100 | | 14,497,216 |
| F5 Networks, Inc. (I)(L) | | 4,160 | | 490,922 |
| Harris Corp. | | 6,700 | | 312,622 |
| Loral Space & Communications, Inc. (I) | | 2,600 | | 196,716 |
| Motorola Solutions, Inc. (I) | | 2,600 | | 100,464 |
| QUALCOMM, Inc. | | 413,698 | | 24,648,127 |
| Riverbed Technology, Inc. (I) | | 2,800 | | 115,612 |
| Seachange International, Inc. (I)(L) | | 23,700 | | 223,728 |
| Symmetricom, Inc. (I) | | 16,500 | | 93,390 |
| Tellabs, Inc. (L) | | 29,000 | | 156,310 |
| Viasat, Inc. (I)(L) | | 9,500 | | 395,295 |
| | |
|
| | | | | 41,705,650 |
| Computers & Peripherals - 1.86% | | | | |
| Apple, Inc. (I) | | 29,350 | | 10,366,714 |
| Dell, Inc. (I) | | 90,000 | | 1,424,700 |
| Hewlett-Packard Company | | 133,800 | | 5,837,694 |
| Lexmark International, Inc., Class A (I)(L) | | 9,100 | | 341,523 |
| NCR Corp. (I) | | 7,500 | | 143,250 |
| NetApp, Inc. (I) | | 12,400 | | 640,584 |
| SanDisk Corp. (I) | | 2,200 | | 109,120 |
| Seagate Technology PLC (I) | | 27,500 | | 349,250 |
| Western Digital Corp. (I) | | 33,426 | | 1,022,167 |
| | |
|
| | | | | 20,235,002 |
| Electronic Equipment, Instruments & Components - 0.25% | | |
| Anixter International, Inc. (L) | | 1,800 | | 128,916 |
| Arrow Electronics, Inc. (I) | | 2,700 | | 105,840 |
| Dolby Laboratories, Inc., Class A (I)(L) | | 21,800 | | 1,102,426 |
| FLIR Systems, Inc. | | 18,500 | | 597,550 |
| Ingram Micro, Inc., Class A (I) | | 17,200 | | 342,796 |
| SYNNEX Corp. (I)(L) | | 3,300 | | 116,424 |
| Tech Data Corp. (I) | | 3,100 | | 153,698 |
| Trimble Navigation, Ltd. (I) | | 2,700 | | 132,705 |
| | |
|
| | | | | 2,680,355 |
| Internet Software & Services - 5.37% | | | | |
| Akamai Technologies, Inc. (I) | | 6,800 | | 255,204 |
| AOL, Inc. (I) | | 7,800 | | 162,786 |
| Earthlink, Inc. | | 22,200 | | 182,706 |
| eBay, Inc. (I) | | 296,500 | | 9,934,233 |
| Google, Inc., Class A (I) | | 76,952 | | 47,202,357 |
| IAC/InterActiveCorp (I) | | 3,600 | | 111,852 |
| j2 Global Communications, Inc. (I)(L) | | 3,700 | | 107,633 |
| OpenTable, Inc. (I) | | 1,400 | | 124,418 |
| | | | |
| U.S. Multi-Sector Fund (continued) | | |
| | | Shares or | | |
| | | Principal | | |
| | | Amount | | Value |
| | |
|
| |
| COMMON STOCKS (continued) | | | | |
| Internet Software & Services (continued) | | | | |
| United Online, Inc. (L) | | 16,300 | $ | 97,963 |
| VeriSign, Inc. | | 3,100 | | 109,399 |
| | |
|
| | | | | 58,288,551 |
| IT Services - 4.82% | | | | |
| Accenture PLC, Class A | | 104,100 | | 5,359,068 |
| Amdocs, Ltd. (I) | | 45,800 | | 1,366,672 |
| Automatic Data Processing, Inc. | | 76,800 | | 3,840,000 |
| Broadridge Financial Solutions, Inc. | | 13,200 | | 302,544 |
| CACI International, Inc., Class A (I) | | 2,100 | | 124,572 |
| Cognizant Technology | | | | |
| Solutions Corp., Class A (I) | | 53,700 | | 4,127,919 |
| Computer Sciences Corp. | | 6,100 | | 293,593 |
| Convergys Corp. (I) | | 8,900 | | 125,223 |
| CoreLogic, Inc. | | 5,600 | | 104,440 |
| DST Systems, Inc. | | 2,100 | | 107,100 |
| Fidelity National Information Services, Inc. | | 3,800 | | 123,082 |
| Fiserv, Inc. (I) | | 7,100 | | 449,217 |
| Global Payments, Inc. | | 20,100 | | 964,599 |
| International Business Machines Corp. | | 176,773 | | 28,616,013 |
| Jack Henry & Associates, Inc. | | 22,000 | | 702,020 |
| MasterCard, Inc., Class A | | 6,689 | | 1,609,106 |
| NeuStar, Inc., Class A (I) | | 3,800 | | 95,950 |
| Paychex, Inc. | | 85,000 | | 2,858,550 |
| SAIC, Inc. (I)(L) | | 6,100 | | 99,674 |
| Syntel, Inc. (L) | | 2,100 | | 110,565 |
| Total Systems Services, Inc. (L) | | 44,900 | | 796,975 |
| VeriFone Systems, Inc. (I)(L) | | 2,700 | | 122,688 |
| | |
|
| | | | | 52,299,570 |
| Office Electronics - 0.06% | | | | |
| Xerox Corp. | | 62,201 | | 668,661 |
| Semiconductors & Semiconductor Equipment - 0.16% | | |
| Atmel Corp. (I) | | 18,100 | | 265,708 |
| Avago Technologies, Ltd. | | 3,600 | | 122,364 |
| Broadcom Corp., Class A | | 8,300 | | 342,126 |
| First Solar, Inc. (I)(L) | | 2,260 | | 333,101 |
| Skyworks Solutions, Inc. (I) | | 3,500 | | 125,790 |
| Texas Instruments, Inc. | | 14,700 | | 523,467 |
| | |
|
| | | | | 1,712,556 |
| Software - 10.48% | | | | |
| ACI Worldwide, Inc. (I) | | 4,000 | | 125,240 |
| Adobe Systems, Inc. (I) | | 42,400 | | 1,462,800 |
| Advent Software, Inc. (I) | | 3,800 | | 110,200 |
| ANSYS, Inc. (I)(L) | | 13,500 | | 760,320 |
| Ariba, Inc. (I) | | 4,300 | | 133,085 |
| BMC Software, Inc. (I) | | 33,000 | | 1,633,500 |
| Citrix Systems, Inc. (I) | | 25,600 | | 1,796,096 |
| Compuware Corp. (I) | | 9,200 | | 103,592 |
| FactSet Research Systems, Inc. (L) | | 13,510 | | 1,416,929 |
| Informatica Corp. (I)(L) | | 23,300 | | 1,095,333 |
| Intuit, Inc. (I) | | 93,500 | | 4,916,230 |
| MICROS Systems, Inc. (I) | | 25,100 | | 1,195,764 |
| Microsoft Corp. | | 1,858,944 | | 49,410,727 |
| Oracle Corp. | | 1,352,200 | | 44,487,380 |
| Progress Software Corp. (I)(L) | | 4,200 | | 123,312 |
| Quest Software, Inc. (I) | | 20,000 | | 535,800 |
| Red Hat, Inc. (I) | | 4,600 | | 189,888 |
| Rovi Corp. (I) | | 3,500 | | 193,970 |
| Salesforce.com, Inc. (I)(L) | | 4,490 | | 593,892 |
| Symantec Corp. (I) | | 115,800 | | 2,087,874 |
| TIBCO Software, Inc. (I) | | 9,600 | | 236,352 |
| |
| The accompanying notes are an integral part of the financial statements. | 294 |
John Hancock Funds II
Portfolio of Investments — February 28, 2011 (Unaudited) (showing percentage of total net assets)
| | | | |
| U.S. Multi-Sector Fund (continued) | | |
| | | Shares or | | |
| | | Principal | | |
| | | Amount | | Value |
| | |
|
| |
| COMMON STOCKS (continued) | | | | |
| Software (continued) | | | | |
| VMware, Inc., Class A (I) | | 13,500 | $ | 1,129,275 |
| | | |
|
| | | | | 113,737,559 |
| | | |
|
| | | | | 291,327,904 |
| Materials - 0.87% | | | | |
| Chemicals - 0.61% | | | | |
| CF Industries Holdings, Inc. | | 950 | | 134,216 |
| E.I. du Pont de Nemours & Company | | 29,800 | | 1,635,126 |
| Ecolab, Inc. | | 47,600 | | 2,315,264 |
| FMC Corp. | | 1,300 | | 100,672 |
| Huntsman Corp. | | 7,000 | | 123,550 |
| Kronos Worldwide, Inc. (L) | | 2,400 | | 118,800 |
| LSB Industries, Inc. (I) | | 5,000 | | 151,400 |
| PPG Industries, Inc. | | 4,100 | | 362,358 |
| Sigma-Aldrich Corp. (L) | | 18,800 | | 1,201,132 |
| The Sherwin-Williams Company | | 3,300 | | 270,996 |
| Valhi, Inc. | | 5,200 | | 124,228 |
| Valspar Corp. | | 2,900 | | 110,258 |
| | |
|
| | | | | 6,648,000 |
| Construction Materials - 0.01% | | | | |
| Vulcan Materials Company (L) | | 2,400 | | 110,040 |
| Metals & Mining - 0.14% | | | | |
| Compass Minerals International, Inc. | | 1,200 | | 112,164 |
| Freeport-McMoRan Copper & Gold, Inc. | | 13,100 | | 693,645 |
| Kaiser Aluminum Corp. (L) | | 2,300 | | 116,219 |
| Schnitzer Steel Industries, Inc. | | 1,600 | | 102,720 |
| Southern Copper Corp. | | 9,600 | | 406,272 |
| Stillwater Mining Company (I)(L) | | 5,500 | | 131,285 |
| | |
|
| | | | | 1,562,305 |
| Paper & Forest Products - 0.11% | | | | |
| Domtar Corp. | | 1,300 | | 113,620 |
| Louisiana-Pacific Corp. (I)(L) | | 2,400 | | 24,768 |
| Schweitzer-Mauduit International, Inc. | | 18,465 | | 1,012,436 |
| | |
|
| | | | | 1,150,824 |
| | | |
|
| | | | | 9,471,169 |
| Telecommunication Services - 1.79% | | | | |
| Diversified Telecommunication Services - 1.70% | | | | |
| AT&T, Inc. | | 283,305 | | 8,040,196 |
| CenturyLink, Inc. (L) | | 16,100 | | 662,998 |
| Frontier Communications Corp. (L) | | 23,000 | | 195,270 |
| Verizon Communications, Inc. | | 248,600 | | 9,178,312 |
| Windstream Corp. (L) | | 24,100 | | 302,214 |
| | |
|
| | | | | 18,378,990 |
| Wireless Telecommunication Services - 0.09% | | | | |
| Crown Castle International Corp. (I) | | 7,300 | | 307,695 |
| MetroPCS Communications, Inc. (I)(L) | | 18,000 | | 259,200 |
| Telephone & Data Systems, Inc. | | 10,100 | | 339,865 |
| United States Cellular Corp. (I) | | 2,100 | | 104,958 |
| | |
|
| | | | | 1,011,718 |
| | | |
|
| | | | | 19,390,708 |
| Utilities - 0.18% | | | | |
| Electric Utilities - 0.07% | | | | |
| Edison International | | 2,800 | | 103,936 |
| Nextera Energy, Inc. | | 6,000 | | 332,820 |
| Southern Company | | 8,900 | | 339,179 |
| | |
|
| | | | | 775,935 |
| Gas Utilities - 0.01% | | | | |
| UGI Corp. | | 3,300 | | 105,237 |
| | | | |
| U.S. Multi-Sector Fund (continued) | | |
| | | Shares or | | |
| | | Principal | | |
| | | Amount | | Value |
| |
|
| COMMON STOCKS (continued) | | | | |
| Independent Power Producers & Energy Traders - 0.01% | | |
| NRG Energy, Inc. (I) | | 5,100 | $ | 101,949 |
| Multi-Utilities - 0.08% | | | | |
| Alliant Energy Corp. | | 5,300 | | 208,714 |
| Ameren Corp. | | 3,600 | | 100,656 |
| Dominion Resources, Inc. | | 5,600 | | 255,528 |
| DTE Energy Company | | 2,200 | | 103,576 |
| Integrys Energy Group, Inc. | | 2,100 | | 102,837 |
| NiSource, Inc. (L) | | 6,600 | | 126,456 |
| | |
|
| | | | | 897,767 |
| Water Utilities - 0.01% | | | | |
| Aqua America, Inc. (L) | | 4,500 | | 101,340 |
| | |
|
| | | | | 1,982,228 |
|
| TOTAL COMMON STOCKS (Cost $875,999,012) | | $ | 1,053,546,967 |
|
| Investment Companies - 0.61% | | | | |
| SPDR S&P 500 ETF Trust (L) | | 49,586 | | 6,602,376 |
|
| TOTAL INVESTMENT COMPANIES (Cost $6,052,847) | $ | 6,602,376 |
|
| SECURITIES LENDING COLLATERAL - 7.07% | | |
| John Hancock Collateral | | | | |
| Investment Trust, 0.2855% (W)(Y) | | 7,672,495 | | 76,781,724 |
|
| TOTAL SECURITIES LENDING | | | | |
| COLLATERAL (Cost $76,775,320) | | | $ | 76,781,724 |
|
| SHORT-TERM INVESTMENTS - 2.12% | | | |
| Short-Term Securities* - 2.12% | | | | |
| State Street Institutional Treasury Money | | | | |
| Market Fund, 0.0453% | $ | 18,970,110 | $ | 18,970,110 |
| U.S. Treasury Bills, 0.180%, 03/10/2011 | | 4,000,000 | | 3,999,904 |
| | |
|
| | | | | 22,970,014 |
|
| TOTAL SHORT-TERM INVESTMENTS (Cost $22,969,930) | $ | 22,970,014 |
|
| Total Investments (U.S. Multi-Sector Fund) | | | |
| (Cost $981,797,109) - 106.88% | | | $ | 1,159,901,081 |
| Other assets and liabilities, net - (6.88%) | | | (74,646,638) |
| | |
|
| TOTAL NET ASSETS - 100.00% | | | $ | 1,085,254,443 |
| | | |
|
| |
| SCHEDULE OF SECURITIES SOLD SHORT - (0.04)% | | |
| Financials - (0.04)% | | | | |
| GAMCO Investors, Inc., zero | | | | |
| coupon 12/31/2015 | $ | (752,400) | | (474,012) |
|
| TOTAL SCHEDULE OF SECURITIES SOLD | | | |
| SHORT (Cost $(474,012)) | | | $ | (474,012) |
|
| |
| |
| Value Fund | | | | |
| | | Shares or | | |
| | | Principal | | |
| | | Amount | | Value |
| |
|
| COMMON STOCKS - 92.32% | | | | |
| Consumer Discretionary - 12.67% | | | | |
| Auto Components - 1.15% | | | | |
| Lear Corp. (I) | | 21,249 | $ | 2,248,144 |
| Automobiles - 3.02% | | | | |
| Harley-Davidson, Inc. | | 145,198 | | 5,926,982 |
| Hotels, Restaurants & Leisure - 2.31% | | | | |
| Darden Restaurants, Inc. | | 96,217 | | 4,534,707 |
| |
| The accompanying notes are an integral part of the financial statements. | 295 |
John Hancock Funds II
Portfolio of Investments — February 28, 2011 (Unaudited) (showing percentage of total net assets)
| | | | |
| Value Fund (continued) | | | | |
| | | Shares or | | |
| | | Principal | | |
| | | Amount | | Value |
| | |
|
| COMMON STOCKS (continued) | | | | |
| Household Durables - 6.19% | | | | |
| Mohawk Industries, Inc. (I) | | 59,415 | $ | 3,452,606 |
| Newell Rubbermaid, Inc. | | 311,703 | | 6,028,336 |
| Whirlpool Corp. | | 32,174 | | 2,654,355 |
| | |
|
| | | | | 12,135,297 |
| | | |
|
| | | | | 24,845,130 |
| Consumer Staples - 6.61% | | | | |
| Beverages - 1.22% | | | | |
| Coca-Cola Enterprises, Inc. | | 90,997 | | 2,393,221 |
| Food & Staples Retailing - 1.72% | | | | |
| Sysco Corp. | | 120,904 | | 3,359,922 |
| Food Products - 2.10% | | | | |
| ConAgra Foods, Inc. | | 178,016 | | 4,122,851 |
| Personal Products - 1.57% | | | | |
| Avon Products, Inc. | | 110,818 | | 3,081,849 |
| | |
|
| | | | | 12,957,843 |
| Energy - 9.70% | | | | |
| Oil, Gas & Consumable Fuels - 9.70% | | | | |
| El Paso Corp. | | 383,144 | | 7,126,478 |
| Murphy Oil Corp. | | 28,500 | | 2,095,605 |
| Pioneer Natural Resources Company | | 41,368 | | 4,233,601 |
| The Williams Companies, Inc. | | 182,936 | | 5,553,937 |
| | |
|
| | | | | 19,009,621 |
| | | |
|
| | | | | 19,009,621 |
| Financials - 18.59% | | | | |
| Capital Markets - 4.24% | | | | |
| Northern Trust Corp. | | 74,109 | | 3,821,801 |
| The Charles Schwab Corp. | | 236,951 | | 4,494,961 |
| | |
|
| | | | | 8,316,762 |
| Commercial Banks - 6.65% | | | | |
| BB&T Corp. | | 117,530 | | 3,243,828 |
| Comerica, Inc. | | 83,627 | | 3,253,090 |
| First Horizon National Corp. | | 158,561 | | 1,823,452 |
| Wintrust Financial Corp. | | 88,009 | | 2,955,342 |
| Zions Bancorporation | | 75,722 | | 1,768,866 |
| | |
|
| | | | | 13,044,578 |
| Insurance - 6.14% | | | | |
| ACE, Ltd. | | 63,041 | | 3,987,343 |
| Marsh & McLennan Companies, Inc. | | 135,763 | | 4,132,626 |
| Willis Group Holdings PLC | | 100,778 | | 3,919,256 |
| | |
|
| | | | | 12,039,225 |
| Real Estate Investment Trusts - 1.56% | | | | |
| Weingarten Realty Investors | | 118,000 | | 3,052,660 |
| | |
|
| | | | | 36,453,225 |
| Health Care - 7.76% | | | | |
| Health Care Equipment & Supplies - 0.60% | | | | |
| Teleflex, Inc. | | 20,250 | | 1,182,398 |
| Health Care Providers & Services - 7.16% | | | | |
| Brookdale Senior Living, Inc. (I) | | 234,884 | | 6,316,031 |
| Healthsouth Corp. (I) | | 216,002 | | 5,229,409 |
| Henry Schein, Inc. (I) | | 36,084 | | 2,489,074 |
| | |
|
| | | | | 14,034,514 |
| | | |
|
| | | | | 15,216,912 |
| Industrials - 11.46% | | | | |
| Aerospace & Defense - 2.49% | | | | |
| Goodrich Corp. | | 56,644 | | 4,884,412 |
| | | | |
| Value Fund (continued) | | | | |
| | | Shares or | | |
| | | Principal | | |
| | | Amount | | Value |
| |
|
| COMMON STOCKS (continued) | | | | |
| Commercial Services & Supplies - 3.13% | | | |
| Avery Dennison Corp. | | 154,002 | $ | 6,147,760 |
| Electrical Equipment - 1.68% | | | | |
| The Babcock & Wilcox Company (I) | | 97,351 | | 3,287,543 |
| Machinery - 3.52% | | | | |
| Snap-On, Inc. | | 120,193 | | 6,902,684 |
| Road & Rail - 0.64% | | | | |
| Swift Transporation Company (I) | | 86,970 | | 1,254,107 |
| |
|
| | | | | 22,476,506 |
| Information Technology - 8.34% | | | | |
| Computers & Peripherals - 2.13% | | | | |
| Diebold, Inc. | | 118,856 | | 4,178,977 |
| Electronic Equipment, Instruments & Components - 0.92% | | |
| Flextronics International, Ltd. (I) | | 222,323 | | 1,798,593 |
| IT Services - 2.49% | | | | |
| Fidelity National Information Services, Inc. | 150,819 | | 4,885,027 |
| Office Electronics - 2.80% | | | | |
| Zebra Technologies Corp., Class A (I) | | 146,954 | | 5,484,323 |
| |
|
| | | | | 16,346,920 |
| Materials - 7.75% | | | | |
| Chemicals - 5.76% | | | | |
| PPG Industries, Inc. | | 22,351 | | 1,975,381 |
| Valspar Corp. | | 108,599 | | 4,128,934 |
| W.R. Grace & Company (I) | | 136,250 | | 5,182,950 |
| |
|
| | | | | 11,287,265 |
| Containers & Packaging - 1.99% | | | | |
| Sonoco Products Company | | 108,080 | | 3,899,526 |
| |
|
| | | | | 15,186,791 |
| Telecommunication Services - 2.02% | | | | |
| Diversified Telecommunication Services - 2.02% | | | |
| TW Telecom, Inc. (I) | | 213,113 | | 3,963,902 |
| Utilities - 7.42% | | | | |
| Electric Utilities - 4.68% | | | | |
| Edison International | | 144,712 | | 5,371,710 |
| Great Plains Energy, Inc. | | 198,171 | | 3,804,883 |
| |
|
| | | | | 9,176,593 |
| Multi-Utilities - 2.74% | | | | |
| CenterPoint Energy, Inc. | | 109,115 | | 1,730,564 |
| Wisconsin Energy Corp. | | 61,349 | | 3,631,861 |
| |
|
| | | | | 5,362,425 |
| |
|
| | | | | 14,539,018 |
|
| TOTAL COMMON STOCKS (Cost $129,886,097) | | $ | 180,995,868 |
|
| SHORT-TERM INVESTMENTS - 6.98% | | | |
| Short-Term Securities* - 6.98% | | | | |
| State Street Institutional Liquid Reserves | | | | |
| Fund, 0.2053% | $ | 13,678,370 | $ | 13,678,370 |
|
| TOTAL SHORT-TERM INVESTMENTS (Cost $13,678,370) | $ | 13,678,370 |
|
| Total Investments (Value Fund) (Cost $143,564,467) - 99.30% | $ | 194,674,238 |
| Other assets and liabilities, net - 0.70% | | | | 1,366,912 |
| |
|
| TOTAL NET ASSETS - 100.00% | | | $ | 196,041,150 |
| | | |
|
| |
| The accompanying notes are an integral part of the financial statements. | 296 |
John Hancock Funds II
Portfolio of Investments — February 28, 2011 (Unaudited) (showing percentage of total net assets)
| | | | |
| Value & Restructuring Fund | | | | |
| | | Shares or | | |
| | | Principal | | |
| | | Amount | | Value |
| | |
|
| |
| COMMON STOCKS - 97.36% | | | | |
| Consumer Discretionary - 5.72% | | | | |
| Automobiles - 1.00% | | | | |
| Ford Motor Company (I) | | 425,000 | $ | 6,396,250 |
| Household Durables - 2.48% | | | | |
| Newell Rubbermaid, Inc. | | 338,500 | | 6,546,590 |
| Stanley Black & Decker, Inc. | | 122,000 | | 9,251,260 |
| | |
|
| | | | | 15,797,850 |
| Specialty Retail - 2.24% | | | | |
| TJX Companies, Inc. | | 285,700 | | 14,247,859 |
| | |
|
| | | | | 36,441,959 |
| Consumer Staples - 4.86% | | | | |
| Food Products - 0.16% | | | | |
| Dole Food Company, Inc. (I)(L) | | 69,000 | | 1,017,750 |
| Personal Products - 1.07% | | | | |
| Avon Products, Inc. | | 245,000 | | 6,813,450 |
| Tobacco - 3.63% | | | | |
| Lorillard, Inc. | | 301,000 | | 23,107,770 |
| | |
|
| | | | | 30,938,970 |
| Energy - 23.34% | | | | |
| Oil, Gas & Consumable Fuels - 23.34% | | | | |
| Alpha Natural Resources, Inc. (I)(L) | | 425,700 | | 23,081,454 |
| Anadarko Petroleum Corp. (E) | | 168,200 | | 13,763,806 |
| Apache Corp. | | 18,550 | | 2,311,701 |
| ConocoPhillips | | 247,900 | | 19,303,973 |
| CONSOL Energy, Inc. | | 384,600 | | 19,503,066 |
| Devon Energy Corp. | | 234,300 | | 21,424,392 |
| Kinder Morgan, Inc. (I) | | 95,100 | | 2,900,550 |
| Murphy Oil Corp. | | 79,600 | | 5,852,988 |
| Noble Energy, Inc. | | 168,500 | | 15,613,210 |
| Petrohawk Energy Corp. (I) | | 147,000 | | 3,175,200 |
| Petroleo Brasileiro SA, ADR | | 544,600 | | 21,691,418 |
| | |
|
| | | | | 148,621,758 |
| | | |
|
| | | | | 148,621,758 |
| Financials - 14.39% | | | | |
| Capital Markets - 4.13% | | | | |
| Apollo Investment Corp. | | 404,000 | | 4,997,480 |
| Invesco, Ltd. | | 450,000 | | 12,078,000 |
| The Goldman Sachs Group, Inc. | | 56,500 | | 9,253,570 |
| | |
|
| | | | | 26,329,050 |
| Commercial Banks - 1.28% | | | | |
| PNC Financial Services Group, Inc. | | 132,200 | | 8,156,740 |
| Diversified Financial Services - 1.86% | | | | |
| JPMorgan Chase & Company | | 253,900 | | 11,854,591 |
| Insurance - 6.51% | | | | |
| ACE, Ltd. | | 291,300 | | 18,424,725 |
| AIA Group, Ltd. (I) | | 1,401,180 | | 4,115,113 |
| Loews Corp. | | 178,700 | | 7,728,775 |
| MetLife, Inc. | | 235,500 | | 11,153,280 |
| | |
|
| | | | | 41,421,893 |
| Real Estate Investment Trusts - 0.61% | | | | |
| Weyerhaeuser Company (L) | | 158,615 | | 3,871,792 |
| | |
|
| | | | | 91,634,066 |
| Health Care - 5.42% | | | | |
| Health Care Equipment & Supplies - 0.93% | | | | |
| Baxter International, Inc. | | 111,300 | | 5,915,595 |
| Health Care Providers & Services - 2.63% | | | | |
| AmerisourceBergen Corp. | | 440,500 | | 16,699,355 |
| | | | |
| Value & Restructuring Fund (continued) | | |
| | | Shares or | | |
| | | Principal | | |
| | | Amount | | Value |
| | |
|
| COMMON STOCKS (continued) | | | | |
| Pharmaceuticals - 1.86% | | | | |
| Bristol-Myers Squibb Company (L) | | 330,000 | $ | 8,517,300 |
| Warner Chilcott PLC, Class A | | 141,000 | | 3,338,880 |
| | |
|
| | | | | 11,856,180 |
| | | |
|
| | | | | 34,471,130 |
| Industrials - 17.07% | | | | |
| Aerospace & Defense - 3.46% | | | | |
| AerCap Holdings NV (I) | | 469,000 | | 6,364,330 |
| Bombardier, Inc. | | 428,200 | | 2,742,621 |
| United Technologies Corp. | | 155,000 | | 12,948,700 |
| | |
|
| | | | | 22,055,651 |
| Airlines - 1.51% | | | | |
| Copa Holdings SA, Class A | | 179,584 | | 9,577,215 |
| Construction & Engineering - 0.70% | | | | |
| Aecom Technology Corp. (I) | | 155,800 | | 4,462,112 |
| Electrical Equipment - 0.17% | | | | |
| Sensata Technologies Holding NV (I) | | 33,450 | | 1,107,195 |
| Industrial Conglomerates - 1.60% | | | | |
| Tyco International, Ltd. (E) | | 225,060 | | 10,204,220 |
| Machinery - 4.48% | | | | |
| AGCO Corp. (I)(L) | | 197,500 | | 10,819,050 |
| Eaton Corp. (E) | | 159,600 | | 17,680,488 |
| | |
|
| | | | | 28,499,538 |
| Professional Services - 0.35% | | | | |
| Nielsen Holdings NV (I) | | 84,000 | | 2,233,560 |
| Road & Rail - 4.80% | | | | |
| Union Pacific Corp. | | 320,000 | | 30,531,200 |
| | |
|
| | | | | 108,670,691 |
| Information Technology - 7.61% | | | | |
| Communications Equipment - 2.75% | | | | |
| Harris Corp. (L) | | 376,000 | | 17,544,160 |
| Electronic Equipment, Instruments & Components - 0.62% | | |
| Corning, Inc. | | 170,000 | | 3,920,200 |
| IT Services - 3.71% | | | | |
| International Business Machines Corp. | | 131,200 | | 21,238,656 |
| Visa, Inc., Class A | | 33,000 | | 2,410,650 |
| | |
|
| | | | | 23,649,306 |
| Office Electronics - 0.53% | | | | |
| Xerox Corp. | | 312,600 | | 3,360,450 |
| | |
|
| | | | | 48,474,116 |
| Materials - 14.67% | | | | |
| Chemicals - 5.87% | | | | |
| Celanese Corp., Series A | | 441,400 | | 18,296,030 |
| Lanxess AG | | 160,500 | | 11,944,789 |
| Methanex Corp. | | 114,000 | | 3,317,400 |
| PPG Industries, Inc. | | 42,633 | | 3,767,905 |
| | |
|
| | | | | 37,326,124 |
| Metals & Mining - 8.80% | | | | |
| Freeport-McMoRan Copper & Gold, Inc. | | 282,800 | | 14,974,260 |
| Grupo Mexico SAB de CV, Series B | | 2,365,000 | | 9,012,502 |
| Schnitzer Steel Industries, Inc. (L) | | 112,500 | | 7,222,500 |
| Southern Copper Corp. (L) | | 408,600 | | 17,291,952 |
| Vale SA, SADR (L) | | 220,200 | | 7,537,446 |
| | |
|
| | | | | 56,038,660 |
| | | |
|
| | | | | 93,364,784 |
| |
| The accompanying notes are an integral part of the financial statements. | 297 |
John Hancock Funds II
Portfolio of Investments — February 28, 2011 (Unaudited) (showing percentage of total net assets)
| | | | |
| Value & Restructuring Fund (continued) | | |
| | | Shares or | | |
| | | Principal | | |
| | | Amount | | Value |
| |
|
| COMMON STOCKS (continued) | | | | |
| Telecommunication Services - 4.28% | | | | |
| Diversified Telecommunication Services - 0.48% | | | |
| Windstream Corp. (L) | | 242,000 | $ | 3,034,680 |
| Wireless Telecommunication Services - 3.80% | | | |
| America Movil SAB de CV, | | | | |
| Series L, ADR (L) | | 421,500 | | 24,202,530 |
| | |
|
| | | | | 27,237,210 |
|
| TOTAL COMMON STOCKS (Cost $378,336,406) | | $ | 619,854,684 |
|
| |
| PREFERRED SECURITIES - 1.82% | | | | |
| Energy - 0.33% | | | | |
| Oil, Gas & Consumable Fuels - 0.33% | | | | |
| Apache Corp., Series D 6.000% (L) | | 30,700 | | 2,091,284 |
| Financials - 1.49% | | | | |
| Diversified Financial Services - 1.00% | | | | |
| 2009 Dole Food Automatic Common | | | | |
| Exchange Security Trust 7.000% (S) | | 235,223 | | 3,244,760 |
| Citigroup, Inc. 7.500% | | 23,547 | | 3,167,072 |
| | |
|
| | | | | 6,411,832 |
| Insurance - 0.49% | | | | |
| Hartford Financial Services Group, Inc., | | | | |
| Series F 7.250% (L) | | 112,500 | | 3,112,875 |
| | |
|
| | | | | 9,524,707 |
|
| TOTAL PREFERRED SECURITIES (Cost $9,472,734) | | $ | 11,615,991 |
|
| |
| CONVERTIBLE BONDS - 0.26% | | | | |
| Financials - 0.26% | | | | |
| Apollo Investment Corp. | | | | |
| 5.750%, 01/15/2016 (S) | $ | 1,557,000 | $ | 1,636,796 |
|
| TOTAL CONVERTIBLE BONDS (Cost $1,534,040) | | $ | 1,636,796 |
|
| |
| WARRANTS - 0.31% | | | | |
| Hartford Financial Services Group, Inc. | | | | |
| (Expiration Date: 06/26/2019, Strike Price: | | | |
| USD $9.79) (I) | | 95,000 | | 1,972,200 |
|
| TOTAL WARRANTS (Cost $1,301,500) | | | $ | 1,972,200 |
|
| |
| SECURITIES LENDING COLLATERAL - 9.72% | | | |
| John Hancock Collateral | | | | |
| Investment Trust, 0.2855% (W)(Y) | | 6,182,478 | | 61,870,529 |
|
| TOTAL SECURITIES LENDING | | | | |
| COLLATERAL (Cost $61,860,528) | | | $ | 61,870,529 |
|
| |
| SHORT-TERM INVESTMENTS - 0.34% | | | |
| Repurchase Agreement - 0.34% | | | | |
| Repurchase Agreement with State Street Corp. | | | |
| dated 02/28/2011 at 0.010% to be | | | | |
| repurchased at $2,205,001 on 03/01/2011, | | | |
| collateralized by $2,045,000 Federal Home | | | |
| Loan Mortgage Corp., 4.375% due | | | | |
| 07/17/2015 (valued at $2,252,056, | | | | |
| including interest) | $ | 2,205,000 | $ | 2,205,000 |
|
| TOTAL SHORT-TERM INVESTMENTS (Cost $2,205,000) | $ | 2,205,000 |
|
| Total Investments (Value & Restructuring Fund) | | | |
| (Cost $454,710,208) - 109.81% | | | $ | 699,155,200 |
| Other assets and liabilities, net - (9.81%) | | | | (62,488,491) |
| | | |
|
| TOTAL NET ASSETS - 100.00% | | | $ | 636,666,709 |
| | | |
|
Footnotes
Percentages are stated as a percent of net assets.
| |
| Key to Currency Abbreviations |
| |
| ARS | - Argentine Peso |
| AUD | - Australian Dollar |
| BRL | - Brazilian Real |
| CAD | - Canadian Dollar |
| DKK | - Danish Krone |
| EUR | - Euro |
| GBP | - British Pound |
| HKD | - Hong Kong Dollar |
| HUF | - Hungarian Forint |
| INR | - Indian Rupee |
| IDR | - Indonesian Rupiah |
| JPY | - Japanese Yen |
| KRW | - Korean Won |
| MXN | - Mexican Peso |
| MYR | - Malaysian Ringgit |
| PEN | - Peruvian Nuevo Sol |
| PHP | - Philippine Peso |
| PLN | - Polish Zloty |
| RUB | - Russian Ruble |
| SGD | - Singapore Dollar |
| SEK | - Swedish Krona |
| TRY | - Turkish Lira |
| ZAR | - South African Rand |
| |
| Key to Security Abbreviations and Legend |
| |
| ADR | - American Depositary Receipts |
| CDOR | - Canadian Dealer Offered Rate |
| CMT | - Constant Maturity Treasury |
| EURIBOR | - Euro Interbank Offered Rate |
| GBPLIBOR | - Pound Sterling LIBOR |
| GDR | - Global Depositary Receipts |
| IO | - Interest Only (Interest Tranche of Stripped Mortgage Pool) |
| LIBOR | - London Interbank Offered Rate |
| PIK | - Paid In Kind |
| PO | - Principal-Only Security |
| SADR | - Sponsored American Depositary Receipts |
| SPDR | - Standard & Poor’s Depositary Receipts |
| TBA | - To Be Announced |
| (A) | The subadviser is an affiliate of the adviser. |
| (B) | Security is linked to Republic of Argentina Gross Domestic |
| | Product (GDP). |
| (C) | The investment is an affiliate of the fund, the adviser and/or |
| | the subadviser. |
| (D) | Principal amount of security is adjusted for inflation. |
| (E) | All or portion of this security is segregated to meet the margin |
| | requirements on written options. |
| (F) | All or portion of this security is held at a broker to meet the |
| | margin requirements on futures contracts. |
| (G) | The Fund’s sub-adviser is shown parenthetically. |
| (H) | Non-income producing - Issuer is in default. |
| (I) | Non-income producing security. |
| (L) | All or a portion of the security is on loan as of February 28, 2011. |
| (M) | Term loans are variable rate obligations. The coupon rate shown |
| | represents the rate at period end unless the investment is unsettled. |
| (P) | Variable rate obligation. Securities reset coupon rates periodically. |
| | The coupon rate shown represents the rate at period end. |
| (Q) | Perpetual bonds have no stated maturity date. |
| (R) | Direct placement securities are restricted to resale and the Fund has |
| | limited rights to registration under the Securities Act of 1933. |
| (S) | The securities are exempt from registration under Rule 144A of the |
| | Securities Act of 1933. Such securities may be resold to qualified |
| | institutional buyers, in transactions exempt from registration. |
| |
| The accompanying notes are an integral part of the financial statements. | 298 |
John Hancock Funds II
Portfolio of Investments — February 28, 2011 (Unaudited) (showing percentage of total net assets)
| |
| (T) | All or a portion of this security represents an unsettled term loan |
| | commitment. Rate will be determined at time of settlement. |
| (V) | The Fund owns 5% or more of the outstanding voting shares of the |
| | issuer and the security is considered an affiliate of the Fund (See |
| | notes for further details). |
| (W) | Investment is an affiliate of the Fund, the adviser and/or subadviser. |
| | Also, it represents the investment of securities lending |
| | collateral received. |
| (Y) | The rate shown is the annualized seven-day yield as of |
| | February 28, 2011. |
| (2) | Manulife Asset Management (North America) Limited is doing |
| business as John Hancock Asset Management. |
| * | Yield represents either the annualized yield at the date of purchase, |
| | the stated coupon rate or, for floating rate securities, the rate at |
| | period end. |
| |
| The accompanying notes are an integral part of the financial statements. | 299 |
John Hancock Funds II
Portfolio of Investments — February 28, 2011 (Unaudited) (showing percentage of total net assets)
Certain Funds had the following country concentration as a percentage of total net assets on 2-28-11:
| | | |
| Alpha Opportunities Fund | | | |
| United States | 79.76% | | |
| Canada | 3.21% | | |
| United Kingdom | 2.95% | | |
| Switzerland | 1.75% | | |
| Brazil | 1.17% | | |
| Australia | 1.10% | | |
| Other Countries | 7.94% | | |
| Short-Term Investments & Other | 2.12% | | |
| | | |
| Capital Appreciation Fund | | | |
| United States | 88.82% | | |
| China | 2.78% | | |
| United Kingdom | 2.15% | | |
| Ireland | 1.40% | | |
| Germany | 1.07% | | |
| Israel | 1.05% | | |
| Other Countries | 2.39% | | |
| Short-Term Investments & Other | 0.34% | | |
| | | |
| Fundamental Value Fund | | | |
| United States | 75.77% | | |
| Switzerland | 5.48% | | |
| Canada | 4.77% | | |
| Hong Kong | 3.40% | | |
| United Kingdom | 2.55% | | |
| Netherlands | 1.74% | | |
| Other Countries | 2.43% | | |
| Short-Term Investments & Other | 3.86% | | |
| | | |
| High Yield Fund | | | |
| United States | 72.26% | | |
| Bermuda | 2.64% | | |
| Luxembourg | 2.47% | | |
| Netherlands | 2.29% | | |
| Cayman Islands | 1.60% | | |
| Mexico | 1.49% | | |
| United Kingdom | 1.44% | | |
| Marshall Islands | 1.24% | | |
| Argentina | 1.12% | | |
| Australia | 1.00% | | |
| Other Countries | 8.93% | | |
| Short-Term Investments & Other | 3.52% | | |
| | | |
| Mid Cap Stock Fund | | | |
| United States | 82.79% | | |
| United Kingdom | 4.27% | | |
| Brazil | 2.82% | | |
| Denmark | 2.03% | | |
| Bermuda | 1.63% | | |
| China | 1.01% | | |
| Other Countries | 3.04% | | |
| Short-Term Investments & Other | 2.41% | | |
| | | |
| Mid Cap Value Equity Fund | | | |
| United States | 85.51% | | |
| Bermuda | 5.50% | | |
| Canada | 3.27% | | |
| Israel | 1.47% | | |
| Other Countries | 1.32% | | |
| Short-Term Investments & Other | 2.93% | | |
| | | |
| Mutual Shares Fund | | | |
| United States | 61.19% | | |
| United Kingdom | 9.54% | | |
| Switzerland | 6.36% | | |
| Germany | 4.47% | | |
| France | 3.87% | | |
| Denmark | 1.54% | | |
| Japan | 1.39% | | |
| Spain | 1.34% | | |
| Netherlands | 1.09% | | |
| Other Countries | 1.79% | | |
| Short-Term Investments & Other | 7.42% | | |
| | | |
| Real Return Bond Fund | | | |
| United States | 115.91% | | |
| United Kingdom | 4.11% | | |
| Australia | 2.22% | | |
| Netherlands | 2.08% | | |
| Spain | 1.39% | | |
| Cayman Islands | 1.34% | | |
| Other Countries | 2.14% | | |
| Short-Term Investments & Other | (29.19%) | | |
| | | |
| Spectrum Income Fund | | | |
| United States | 69.01% | | |
| United Kingdom | 2.66% | | |
| Germany | 2.45% | | |
| Japan | 2.44% | | |
| Canada | 1.74% | | |
| Netherlands | 1.59% | | |
| Other Countries | 15.84% | | |
| Short-Term Investments & Other | 4.27% | | |
| | | |
| Total Return Fund | | | |
| United States | 63.43% | | |
| Japan | 4.75% | | |
| United Kingdom | 4.33% | | |
| Canada | 2.67% | | |
| Cayman Islands | 1.72% | | |
| Netherlands | 1.31% | | |
| France | 1.23% | | |
| Mexico | 1.12% | | |
| Other Countries | 5.91% | | |
| Short-Term Investments & Other | 13.53% | | |
| | | |
| Value & Restructuring Fund | | | |
| United States | 81.32% | | |
| Mexico | 5.22% | | |
| Brazil | 4.59% | | |
| Germany | 1.88% | | |
| Switzerland | 1.60% | | |
| Netherlands | 1.52% | | |
| Panama | 1.50% | | |
| Other Countries | 2.12% | | |
| Short-Term Investments & Other | 0.25% | | |
| |
| The accompanying notes are an integral part of the financial statements. | 300 |
John Hancock Funds II
Portfolio of Investments — February 28, 2011 (Unaudited) (showing percentage of total net assets)
Certain Funds had the following sector distribution as a percentage of total net assets on 2-28-11:
| | | |
| Emerging Markets Fund (formerly, Emerging Markets Value Fund) | | |
| Financials | 30.86% | | |
| Materials | 16.06% | | |
| Energy | 15.08% | | |
| Industrials | 11.04% | | |
| Consumer Discretionary | 8.47% | | |
| Information Technology | 7.24% | | |
| Consumer Staples | 5.93% | | |
| Telecommunication Services | 1.79% | | |
| Utilities | 1.35% | | |
| Health Care | 0.54% | | |
| Short-Term Investments & Other | 1.64% | | |
| | | |
| Emerging Markets Debt Fund | | | |
| Government** | 26.60% | | |
| Energy | 14.02% | | |
| Industrials | 11.71% | | |
| Consumer Staples | 9.83% | | |
| Materials | 9.69% | | |
| Financials | 7.61% | | |
| Telecommunication Services | 7.37% | | |
| Utilities | 4.95% | | |
| Consumer Discretionary | 2.97% | | |
| Health Care | 1.31% | | |
| Information Technology | 0.68% | | |
| Short-Term Investments & Other | 3.26% | | |
| | | |
| Global Agribusiness Fund | | | |
| Materials | 54.43% | | |
| Consumer Staples | 29.47% | | |
| Industrials | 16.59% | | |
| Net Other Assets and Liabilities | (0.49%) | | |
| | | |
| Global Bond Fund | | | |
| Financials | 35.71% | | |
| Mortgage Securities | 29.47% | | |
| Government** | 26.10% | | |
| Asset Backed Securities | 3.40% | | |
| Consumer Discretionary | 2.62% | | |
| Energy | 1.57% | | |
| Materials | 0.75% | | |
| Industrials | 0.71% | | |
| Health Care | 0.49% | | |
| Consumer Staples | 0.48% | | |
| Telecommunication Services | 0.41% | | |
| Information Technology | 0.24% | | |
| Short-Term Investments & Other | (1.95)% | | |
| | | |
| Global Infrastructure Fund | | | |
| Industrials | 36.07% | | |
| Utilities | 32.20% | | |
| Energy | 30.01% | | |
| Materials | 1.39% | | |
| Net Other Assets and Liabilities | 0.33% | | |
| | | |
| Global Real Estate Fund | | | |
| Financials | 97.39% | | |
| Health Care | 1.02% | | |
| Industrials | 0.07% | | |
| Short-Term Investments & Other | 1.52% | | |
| | | |
| Global Timber Fund | | | |
| Materials | 78.22% | | |
| Financials | 21.20% | | |
| Net Other Assets and Liabilities | 0.58% | | |
| | | |
| International Equity Index Fund | | | |
| Financials | 23.72% | | |
| Materials | 12.18% | | |
| Energy | 11.26% | | |
| Industrials | 10.32% | | |
| Consumer Discretionary | 8.46% | | |
| Consumer Staples | 7.78% | | |
| Information Technology | 6.45% | | |
| Health Care | 5.59% | | |
| Telecommunication Services | 5.47% | | |
| Utilities | 4.16% | | |
| Short-Term Investments & Other | 4.61% | | |
| | | |
| International Growth Stock Fund | | | |
| Consumer Discretionary | 17.22% | | |
| Health Care | 12.54% | | |
| Consumer Staples | 11.99% | | |
| Energy | 11.61% | | |
| Information Technology | 10.79% | | |
| Financials | 9.32% | | |
| Industrials | 7.90% | | |
| Telecommunication Services | 5.53% | | |
| Materials | 3.63% | | |
| Utilities | 2.69% | | |
| Short-Term Investments & Other | 6.78% | | |
| | | |
| International Opportunities Fund | | | |
| Consumer Discretionary | 21.28% | | |
| Financials | 17.98% | | |
| Industrials | 17.52% | | |
| Consumer Staples | 10.44% | | |
| Materials | 10.33% | | |
| Information Technology | 7.73% | | |
| Energy | 6.92% | | |
| Health Care | 2.59% | | |
| Telecommunication Services | 1.52% | | |
| Short-Term Investments & Other | 3.69% | | |
| | | |
| International Small Cap Fund | | | |
| Consumer Discretionary | 29.23% | | |
| Industrials | 19.91% | | |
| Financials | 19.14% | | |
| Information Technology | 7.95% | | |
| Consumer Staples | 5.42% | | |
| Energy | 4.45% | | |
| Materials | 2.57% | | |
| Health Care | 1.89% | | |
| Utilities | 1.02% | | |
| Telecommunication Services | 0.56% | | |
| Short-Term Investments & Other | 7.86% | | |
| |
| The accompanying notes are an integral part of the financial statements. | 301 |
John Hancock Funds II
Portfolio of Investments — February 28, 2011 (Unaudited) (showing percentage of total net assets)
| | | |
| International Small Company Fund | | | |
| Industrials | 24.28% | | |
| Consumer Discretionary | 18.75% | | |
| Materials | 14.35% | | |
| Financials | 12.64% | | |
| Information Technology | 8.85% | | |
| Energy | 6.76% | | |
| Consumer Staples | 5.72% | | |
| Health Care | 5.42% | | |
| Utilities | 1.87% | | |
| Telecommunication Services | 0.80% | | |
| Short-Term Investments & Other | 0.56% | | |
| | | |
| International Value Fund | | | |
| Financials | 21.55% | | |
| Information Technology | 14.28% | | |
| Telecommunication Services | 14.18% | | |
| Industrials | 10.53% | | |
| Health Care | 10.40% | | |
| Energy | 9.84% | | |
| Consumer Discretionary | 9.64% | | |
| Utilities | 2.92% | | |
| Consumer Staples | 2.59% | | |
| Materials | 1.59% | | |
| Short-Term Investments & Other | 2.48% | | |
** Includes foreign government obligations.
| |
| The accompanying notes are an integral part of the financial statements. | 302 |
John Hancock Funds II
Statements of Assets and Liabilities — February 28, 2011 (Unaudited)
| | | | |
| | | | | Alpha |
| | Active | All Cap | All Cap | Opportunities |
| Assets | Bond Fund | Core Fund | Value Fund | Fund |
|
| Investments in unaffiliated issuers, at value | $1,197,484,117 | $570,791,416 | $499,583,077 | $1,266,741,586 |
| Investments in affiliated issuers, at value (Note 2) | 6,574,232 | 90,153,900 | 65,659,104 | 190,861,182 |
| Securities loaned, at value (Note 2) | 6,456,888 | 88,295,782 | 64,195,407 | 184,822,798 |
| Repurchase agreements, at value (Note 2) | — | — | 10,772,000 | 43,500,000 |
| Total investments, at value | 1,210,515,237 | 749,241,098 | 640,209,588 | 1,685,925,566 |
| Cash | 53,696 | — | 506 | 39,700 |
| Foreign currency, at value | 81,040 | — | — | 13,831 |
| Cash held at broker for futures contracts | 78,113 | 1,532,443 | — | — |
| Receivable for investments sold | 3,970,878 | 13,500 | 2,775,994 | 15,099,115 |
| Receivable for fund shares sold | 13,282,199 | — | 172,915 | — |
| Dividends and interest receivable | 12,278,180 | 1,333,446 | 793,270 | 1,254,497 |
| Receivable for securities lending income | 1,557 | 12,693 | 9,374 | 75,478 |
| Swap contracts, at value (Note 3) | 344,398 | — | — | — |
| Receivable for futures variation margin | — | 516,398 | — | — |
| Other assets | 784 | 899 | 184 | 331 |
| Total assets | 1,240,606,082 | 752,650,477 | 643,961,831 | 1,702,408,518 |
| |
| Liabilities | | | | |
|
| Payable for investments purchased | 18,435,044 | — | 6,764,597 | 27,502,974 |
| Payable for delayed delivery securities purchased | 4,267,291 | — | — | — |
| Payable for forward foreign currency exchange contracts (Note 3) | 72,698 | — | — | — |
| Payable for fund shares repurchased | — | 46,058 | 295,113 | 781,774 |
| Payable upon return of securities loaned (Note 2) | 6,575,800 | 90,159,548 | 65,669,927 | 190,884,858 |
| Payable for futures variation margin | 9,984 | — | — | — |
| Payable to affiliates (Note 5) | | | | |
| Accounting and legal services fees | 25,585 | 14,650 | 12,508 | 32,567 |
| Trustees’ fees | 986 | 552 | 465 | 891 |
| Other liabilities and accrued expenses | 116,125 | 49,387 | 57,558 | 187,283 |
| Total liabilities | 29,503,513 | 90,270,195 | 72,800,168 | 219,390,347 |
| |
| Net assets | | | | |
|
| Capital paid-in | $1,161,466,480 | $765,031,682 | $421,415,223 | $1,190,435,548 |
| Undistributed net investment income (loss) | 9,131,157 | 1,028,624 | 270,611 | (1,771,148) |
| Accumulated undistributed net realized gain (loss) on investments | (4,449,338) | (186,568,957) | 20,858,568 | 98,911,845 |
| Net unrealized appreciation (depreciation) on investments | 44,954,270 | 82,888,933 | 128,617,261 | 195,441,926 |
| Net assets | $1,211,102,569 | $662,380,282 | $571,161,663 | $1,483,018,171 |
| Investments in unaffiliated issuers, including repurchase agreements, | | |
| at cost | $1,158,560,787 | $576,725,271 | $445,941,218 | $1,299,627,023 |
| Investments in affiliated issuers, at cost | $6,574,193 | $90,143,292 | $65,651,109 | $190,856,681 |
| Foreign currency, at cost | $81,918 | — | — | $13,833 |
| Net unamortized upfront payment on swaps | $689,317 | — | — | — |
| |
| Net asset value per share | | | | |
|
| The Funds have an unlimited number of shares authorized with no par value. Net asset value | | | |
| is calculated by dividing the net assets of each class of shares by the number of outstanding | | | |
| shares in the class. | | | | |
| |
| Class 1 | | | | |
| Net assets | $41,798,228 | — | $113,731,465 | — |
| Shares outstanding | 4,070,337 | — | 9,236,573 | — |
| Net asset value, offering price and redemption price per share | $10.27 | — | $12.31 | — |
| |
| Class NAV | | | | |
| Net assets | $1,169,304,341 | $662,380,282 | $457,430,198 | $1,483,018,171 |
| Shares outstanding | 113,945,367 | 71,948,738 | 37,338,088 | 119,510,734 |
| Net asset value, offering price and redemption price per share | $10.26 | $9.21 | $12.25 | $12.41 |
| |
| The accompanying notes are an integral part of the financial statements. | 303 |
John Hancock Funds II
Statements of Assets and Liabilities — February 28, 2011 (Unaudited)
| | | | |
| | | Capital | Capital | |
| | Blue Chip | Appreciation | Appreciation | Core |
| Assets | Growth Fund | Fund | Value Fund | Bond Fund |
|
| Investments in unaffiliated issuers, at value | $2,258,562,522 | $1,796,848,378 | $321,824,862 | $660,314,567 |
| Investments in affiliated issuers, at value (Note 2) | 147,839,143 | 107,256,885 | 767,943 | — |
| Securities loaned, at value (Note 2) | 144,886,042 | 104,983,002 | 765,600 | — |
| Total investments, at value | 2,551,287,707 | 2,009,088,265 | 323,358,405 | 660,314,567 |
| Receivable for investments sold | 15,262,232 | 24,421,961 | 6,674,554 | 24,608,764 |
| Receivable for delayed delivery securities sold | — | — | — | 192,830,089 |
| Receivable for fund shares sold | — | 260,402 | — | — |
| Dividends and interest receivable | 2,222,285 | 1,776,082 | 994,377 | 3,694,832 |
| Receivable for securities lending income | 18,202 | 16,110 | 39 | — |
| Other assets | 2,900 | 2,364 | — | 469 |
| Total assets | 2,568,793,326 | 2,035,565,184 | 331,027,375 | 881,448,721 |
| |
| Liabilities | | | | |
|
| Due to custodian | — | — | 36,000 | — |
| Payable for investments purchased | 14,336,501 | 24,741,132 | 12,509,985 | 18,757,544 |
| Payable for delayed delivery securities purchased | — | — | — | 244,493,966 |
| Payable for fund shares repurchased | 511,871 | 1,709,448 | — | 630,506 |
| Payable upon return of securities loaned (Note 2) | 147,876,045 | 107,279,653 | 768,000 | — |
| TBA sale commitments, at value (Note 2) | — | — | — | 24,464,166 |
| Payable to affiliates (Note 5) | | | | |
| Accounting and legal services fees | 53,611 | 42,705 | 6,564 | 13,882 |
| Trustees’ fees | 2,373 | 1,942 | 516 | 653 |
| Other liabilities and accrued expenses | 125,085 | 127,613 | 21,638 | 76,202 |
| Total liabilities | 162,905,486 | 133,902,493 | 13,342,703 | 288,436,919 |
| |
| Net assets | | | | |
|
| Capital paid-in | $2,012,353,029 | $1,591,328,157 | $306,326,078 | $593,418,467 |
| Undistributed net investment income (loss) | 89,562 | (32,910) | 467,752 | 550,948 |
| Accumulated undistributed net realized gain (loss) on investments | (429,738,058) | (218,644,096) | 1,329,510 | (4,683,527) |
| Net unrealized appreciation (depreciation) on investments | 823,183,307 | 529,011,540 | 9,561,332 | 3,725,914 |
| Net assets | $2,405,887,840 | $1,901,662,691 | $317,684,672 | $593,011,802 |
| Investments in unaffiliated issuers, including repurchase agreements, | | | | |
| at cost | $1,580,294,147 | $1,372,846,039 | $313,029,148 | $656,310,159 |
| Investments in affiliated issuers, at cost | $147,810,606 | $107,232,101 | $767,925 | — |
| Proceeds received on TBA sale commitments | — | — | — | $24,185,672 |
| |
| Net asset value per share | | | | |
|
| The Funds have an unlimited number of shares authorized with no par value. Net asset value | | | |
| is calculated by dividing the net assets of each class of shares by the number of outstanding | | | |
| shares in the class. | | | | |
| |
| Class 1 | | | | |
| Net assets | $530,564,832 | $391,314,621 | — | $12,197,723 |
| Shares outstanding | 24,392,329 | 33,252,158 | — | 947,009 |
| Net asset value, offering price and redemption price per share | $21.75 | $11.77 | — | $12.88 |
| |
| Class NAV | | | | |
| Net assets | $1,875,323,008 | $1,510,348,070 | $317,684,672 | $580,814,079 |
| Shares outstanding | 86,294,394 | 128,255,011 | 30,630,918 | 45,128,385 |
| Net asset value, offering price and redemption price per share | $21.73 | $11.78 | $10.37 | $12.87 |
| |
| The accompanying notes are an integral part of the financial statements. | 304 |
John Hancock Funds II
Statements of Assets and Liabilities — February 28, 2011 (Unaudited)
| | | | |
| | Core | | | |
| | Diversified | Core | | Emerging Markets |
| | Growth & | Fundamental | Core Global | Fund (formerly, |
| | Income | Holdings | Diversification | Emerging Markets |
| Assets | Portfolio | Portfolio | Portfolio | Value Fund) |
|
| Investments in unaffiliated issuers, at value | $16,987,803 | $7,853,969 | $18,140,745 | $2,010,659,945 |
| Investments in affiliated funds, at value (Note 9) | 11,319,959 | 5,236,067 | 12,097,298 | — |
| Investments in affiliated issuers, at value (Note 2) | — | — | — | 149,118,509 |
| Securities loaned, at value (Note 2) | — | — | — | 144,956,016 |
| Total investments, at value | 28,307,762 | 13,090,036 | 30,238,043 | 2,304,734,470 |
| Cash | — | — | — | — |
| Foreign currency, at value | — | — | — | 4,089,520 |
| Receivable for investments sold | — | 887 | — | — |
| Receivable for fund shares sold | 9,444 | — | 7,611 | 483,746 |
| Dividends and interest receivable | 15,374 | 8,957 | 17,775 | 3,289,537 |
| Receivable for securities lending income | — | — | — | 39,268 |
| Receivable due from adviser | 141 | 275 | 185 | — |
| Other assets | 27 | 10 | 35 | 1,062 |
| Total assets | 28,332,748 | 13,100,165 | 30,263,649 | 2,312,637,603 |
| |
| Liabilities | | | | |
|
| Payable for investments purchased | 21,169 | 7,174 | 22,239 | 6,373,023 |
| Payable for fund shares repurchased | — | 1,129 | — | 1,011 |
| Payable upon return of securities loaned (Note 2) | — | — | — | 149,109,134 |
| Payable to affiliates (Note 5) | | | | |
| Accounting and legal services fees | 618 | 289 | 674 | 48,103 |
| Trustees’ fees | 26 | 13 | 27 | 1,411 |
| Other liabilities and accrued expenses | 22,567 | 22,605 | 23,210 | 891,370 |
| Total liabilities | 44,380 | 31,210 | 46,150 | 156,424,052 |
| |
| Net assets | | | | |
|
| Capital paid-in | $24,410,543 | $11,227,263 | $27,346,932 | $1,712,500,880 |
| Undistributed net investment income (loss) | 64,374 | 44,076 | 58,106 | (8,491,465) |
| Accumulated undistributed net realized gain (loss) on investments | (48,197) | 9,748 | 34,667 | 1,300,860 |
| Net unrealized appreciation (depreciation) on investments | 3,861,648 | 1,787,868 | 2,777,794 | 450,903,276 |
| Net assets | $28,288,368 | $13,068,955 | $30,217,499 | $2,156,213,551 |
| Investments in unaffiliated issuers, including repurchase agreements, | | | | |
| at cost | $14,424,576 | $6,580,013 | $16,408,849 | $1,704,752,393 |
| Investments in affiliated issuers, at cost | $10,021,538 | $4,722,155 | $11,051,400 | $149,080,011 |
| Foreign currency, at cost | — | — | — | $4,107,719 |
| |
| Net asset value per share | | | | |
|
| The Funds have an unlimited number of shares authorized with no par value. Net asset value | | | |
| is calculated by dividing the net assets of each class of shares by the number of outstanding | | | |
| shares in the class. | | | | |
| |
| Class 1 | | | | |
| Net assets | $28,288,368 | $13,068,955 | $30,217,499 | — |
| Shares outstanding | 2,892,067 | 1,348,175 | 3,135,887 | — |
| Net asset value, offering price and redemption price per share | $9.78 | $9.69 | $9.64 | — |
| |
| Class NAV | | | | |
| Net assets | — | — | — | $2,156,213,551 |
| Shares outstanding | — | — | — | 185,175,446 |
| Net asset value, offering price and redemption price per share | — | — | — | $11.64 |
| |
| The accompanying notes are an integral part of the financial statements. | 305 |
John Hancock Funds II
Statements of Assets and Liabilities — February 28, 2011 (Unaudited)
| | | | |
| | Emerging | | | Global |
| | Markets | Equity-Income | Fundamental | Agribusiness |
| Assets | Debt Fund | Fund | Value Fund | Fund |
|
| Investments in unaffiliated issuers, at value | $15,630,166 | $1,280,970,656 | $1,615,082,872 | $3,194,360 |
| Investments in affiliated issuers, at value (Note 2) | — | 155,556,967 | 51,665,488 | — |
| Securities loaned, at value (Note 2) | — | 153,016,008 | 50,910,129 | — |
| Total investments, at value | 15,630,166 | 1,589,543,631 | 1,717,658,489 | 3,194,360 |
| Cash | 42,207 | — | 1,222 | 22,591 |
| Foreign currency, at value | — | — | — | 389 |
| Receivable for investments sold | — | 3,667,099 | 1,077,352 | 10,676 |
| Receivable for forward foreign currency exchange contracts (Note 3) | 25,791 | — | — | — |
| Receivable for fund shares sold | — | — | 26,409 | — |
| Dividends and interest receivable | 281,244 | 4,674,487 | 1,550,861 | 3,695 |
| Receivable for securities lending income | — | 46,826 | 10,892 | — |
| Receivable due from adviser | — | — | — | 832 |
| Other assets | 27 | 736 | — | — |
| Total assets | 15,979,435 | 1,597,932,779 | 1,720,325,225 | 3,232,543 |
| |
| Liabilities | | | | |
|
| Payable for investments purchased | — | 8,983,693 | 430,308 | 11,029 |
| Payable for fund shares repurchased | — | 330,974 | 132,027 | — |
| Payable upon return of securities loaned (Note 2) | — | 155,584,642 | 51,674,357 | — |
| Payable for futures variation margin | 950 | — | — | — |
| Distributions payable | 84,782 | — | — | — |
| Payable to affiliates (Note 5) | | | | |
| Accounting and legal services fees | 365 | 31,581 | 37,265 | 70 |
| Transfer agent fees | 4,183 | — | — | 614 |
| Trustees’ fees | 26 | 1,140 | 1,834 | 7 |
| Investment management fees | 112 | — | — | — |
| Other liabilities and accrued expenses | 42,049 | 111,952 | 177,132 | 41,995 |
| Total liabilities | 132,467 | 165,043,982 | 52,452,923 | 53,715 |
| |
| Net assets | | | | |
|
| Capital paid-in | $14,991,290 | $1,384,194,832 | $1,622,424,500 | $2,143,535 |
| Undistributed net investment income (loss) | (42,061) | 4,418,332 | (3,420,248) | (9,151) |
| Accumulated undistributed net realized gain (loss) on investments | 122,258 | (189,347,922) | (354,954,000) | 21,273 |
| Net unrealized appreciation (depreciation) on investments | 775,481 | 233,623,555 | 403,822,050 | 1,023,171 |
| Net assets | $15,846,968 | $1,432,888,797 | $1,667,872,302 | $3,178,828 |
| Investments in unaffiliated issuers, including repurchase agreements, | | | | |
| at cost | $14,879,593 | $1,200,371,087 | $1,262,193,237 | $2,171,186 |
| Investments in affiliated issuers, at cost | — | $155,549,243 | $51,662,616 | — |
| Foreign currency, at cost | — | — | — | $388 |
| |
| Net asset value per share | | | | |
|
| The Funds have an unlimited number of shares authorized with no par value. Net asset value | | | |
| is calculated by dividing the net assets of each class of shares by the number of outstanding | | | |
| shares in the class. | | | | |
| |
| Class A | | | | |
| Net assets | $12,677,569 | — | — | $1,581,712 |
| Shares outstanding | 1,200,000 | — | — | 105,189 |
| Net asset value and redemption price per share | $10.56 | — | — | $15.04 |
| |
| Class I | | | | |
| Net assets | $3,169,399 | — | — | $1,597,116 |
| Shares outstanding | 300,000 | — | — | 105,773 |
| Net asset value, offering price and redemption price per share | $10.56 | — | — | $15.10 |
| |
| Class 1 | | | | |
| Net assets | — | $195,195,368 | — | — |
| Shares outstanding | — | 12,978,091 | — | — |
| Net asset value, offering price and redemption price per share | — | $15.04 | — | — |
| |
| Class NAV | | | | |
| Net assets | — | $1,237,693,429 | $1,667,872,302 | — |
| Shares outstanding | — | 82,379,439 | 106,445,107 | — |
| Net asset value, offering price and redemption price per share | — | $15.02 | $15.67 | — |
| |
| Maximum Public Offering Price Per Share: | | | | |
| Class A (net asset value per share ÷ 95%) | $11.061 | — | — | $15.831 |
1 On single retail sales of less than $50,000. On sales of $50,000 or more and on group sales the offering price is reduced.
| |
| The accompanying notes are an integral part of the financial statements. | 306 |
John Hancock Funds II
Statements of Assets and Liabilities — February 28, 2011 (Unaudited)
| | | | |
| | | Global | | |
| | Global | Infrastructure | Global Real | Global |
| Assets | Bond Fund | Fund | Estate Fund | Timber Fund |
|
| Investments in unaffiliated issuers, at value | $933,683,904 | $2,682,880 | $492,347,666 | $3,078,473 |
| Investments in affiliated issuers, at value (Note 2) | — | — | 30,288,864 | — |
| Securities loaned, at value (Note 2) | — | — | 29,902,200 | — |
| Repurchase agreements, at value (Note 2) | 55,024,000 | — | 4,681,000 | — |
| Total investments, at value | 988,707,904 | 2,682,880 | 557,219,730 | 3,078,473 |
| Cash | 632 | 54,165 | 469 | 53,243 |
| Foreign currency, at value | 18,712,479 | 63 | 9,004,526 | — |
| Receivable for investments sold | 9,685,495 | 7,424 | 3,434,966 | — |
| Receivable for forward foreign currency exchange contracts (Note 3) | 8,590,484 | — | — | — |
| Dividends and interest receivable | 7,838,897 | 8,023 | 596,814 | 9,832 |
| Receivable for securities lending income | — | — | 8,255 | — |
| Swap contracts, at value (Note 3) | 3,313,258 | — | — | — |
| Receivable for futures variation margin | 148,022 | — | — | — |
| Receivable due from adviser | — | 707 | — | 414 |
| Other assets | 164,814 | — | 534 | 32 |
| Total assets | 1,037,161,985 | 2,753,262 | 570,265,294 | 3,141,994 |
| |
| Liabilities | | | | |
|
| Payable for collateral held by Fund | 7,459,000 | — | — | — |
| Payable for investments purchased | 112,527,436 | 19,164 | 4,950,880 | 2,916 |
| Payable for forward foreign currency exchange contracts (Note 3) | 5,878,755 | — | — | — |
| Payable for fund shares repurchased | 710,824 | — | 4,488,522 | — |
| Payable upon return of securities loaned (Note 2) | — | — | 30,290,179 | — |
| Written options, at value (Note 3) | 2,594,562 | — | — | — |
| Swap contracts, at value (Note 3) | 1,668,235 | — | — | — |
| Payable to affiliates (Note 5) | | | | |
| Accounting and legal services fees | 20,319 | 59 | 11,700 | 68 |
| Transfer agent fees | — | 508 | — | 593 |
| Trustees’ fees | 1,015 | 7 | 383 | 7 |
| Other liabilities and accrued expenses | 317,264 | 41,856 | 191,889 | 41,911 |
| Total liabilities | 131,177,410 | 61,594 | 39,933,553 | 45,495 |
| |
| Net assets | | | | |
|
| Capital paid-in | $942,224,595 | $2,209,898 | $719,561,941 | $2,320,385 |
| Undistributed net investment income (loss) | (17,817,513) | 19,296 | (14,527,129) | 4,585 |
| Accumulated undistributed net realized gain (loss) on investments | (24,227,275) | (11,563) | (292,374,530) | (35,668) |
| Net unrealized appreciation (depreciation) on investments | 5,804,768 | 474,037 | 117,671,459 | 807,197 |
| Net assets | $905,984,575 | $2,691,668 | $530,331,741 | $3,096,499 |
| Investments in unaffiliated issuers, including repurchase agreements, | | | | |
| at cost | $982,824,133 | $2,208,836 | $409,316,164 | $2,271,305 |
| Investments in affiliated issuers, at cost | — | — | $30,282,863 | — |
| Foreign currency, at cost | $18,466,415 | $63 | $8,949,014 | — |
| Premiums received on written options | $2,601,535 | — | — | — |
| Net unamortized upfront payment on swaps | $1,961,320 | — | — | — |
| |
| Net asset value per share | | | | |
|
| The Funds have an unlimited number of shares authorized with no par value. Net asset value | | | |
| is calculated by dividing the net assets of each class of shares by the number of outstanding | | | |
| shares in the class. | | | | |
| |
| Class A | | | | |
| Net assets | — | $1,339,309 | — | $1,540,743 |
| Shares outstanding | — | 109,240 | — | 112,543 |
| Net asset value and redemption price per share | — | $12.26 | — | $13.69 |
| |
| Class I | | | | |
| Net assets | — | $1,352,359 | — | $1,555,756 |
| Shares outstanding | — | 109,856 | — | 113,225 |
| Net asset value, offering price and redemption price per share | — | $12.31 | — | $13.74 |
| |
| Class 1 | | | | |
| Net assets | $73,840,686 | — | — | — |
| Shares outstanding | 6,006,509 | — | — | — |
| Net asset value, offering price and redemption price per share | $12.29 | — | — | — |
| |
| Class NAV | | | | |
| Net assets | $832,143,889 | — | $530,331,741 | — |
| Shares outstanding | 67,825,119 | — | 68,123,267 | — |
| Net asset value, offering price and redemption price per share | $12.27 | — | $7.78 | — |
| |
| Maximum Public Offering Price Per Share: | | | | |
| Class A (net asset value per share ÷ 95%) | — | $12.911 | — | $14.411 |
1 On single retail sales of less than $50,000. On sales of $50,000 or more and on group sales the offering price is reduced.
| |
| The accompanying notes are an integral part of the financial statements. | 307 |
John Hancock Funds II
Statements of Assets and Liabilities — February 28, 2011 (Unaudited)
| | | | |
| | Heritage | High Income | High Yield | Index 500 |
| Assets | Fund | Fund | Fund | Fund |
|
| Investments in unaffiliated issuers, at value | $227,053,451 | $460,345,976 | $817,390,080 | $2,202,088,512 |
| Investments in affiliated issuers, at value (Note 2) | 24,062,154 | — | 6,333,316 | 64,324,186 |
| Securities loaned, at value (Note 2) | 23,565,416 | — | 6,233,874 | 62,807,274 |
| Repurchase agreements, at value (Note 2) | — | 35,120 | 17,100,000 | — |
| Total investments, at value | 274,681,021 | 460,381,096 | 847,057,270 | 2,329,219,972 |
| Cash | — | 6,523 | 365,181 | 6,169 |
| Foreign currency, at value | 234 | 127,009 | 383,305 | — |
| Cash held at broker for futures contracts | — | — | — | 5,658,000 |
| Receivable for investments sold | 4,708,576 | — | 2,956,030 | — |
| Receivable for fund shares sold | 22,971 | — | — | 286,997 |
| Dividends and interest receivable | 47,205 | 5,022,588 | 16,612,463 | 4,534,278 |
| Receivable for securities lending income | 7,212 | — | 341 | 18,821 |
| Receivable for futures variation margin | — | — | — | 452,879 |
| Other assets | 181 | 505 | 771 | 1,453 |
| Total assets | 279,467,400 | 465,537,721 | 867,375,361 | 2,340,178,569 |
| |
| Liabilities | | | | |
|
| Payable for investments purchased | 7,428,206 | 1,509,226 | 6,290,133 | 6,210,662 |
| Payable for forward foreign currency exchange contracts (Note 3) | 9,222 | 102,782 | 144,017 | — |
| Payable for fund shares repurchased | — | 27,896 | 915,378 | — |
| Payable upon return of securities loaned (Note 2) | 24,058,518 | — | 6,333,300 | 64,316,983 |
| Payable for futures variation margin | — | — | 15,031 | — |
| Payable to affiliates (Note 5) | | | | |
| Accounting and legal services fees | 5,480 | 12,016 | 19,160 | 49,864 |
| Trustees’ fees | 268 | 523 | 1,340 | 2,307 |
| Other liabilities and accrued expenses | 40,612 | 59,981 | 99,441 | 35,899 |
| Total liabilities | 31,542,306 | 1,712,424 | 13,817,800 | 70,615,715 |
| |
| Net assets | | | | |
|
| Capital paid-in | $174,929,406 | $488,944,049 | $1,108,835,125 | $1,888,841,698 |
| Undistributed net investment income (loss) | (256,906) | 288,398 | 10,587,602 | 5,583,199 |
| Accumulated undistributed net realized gain (loss) on investments | 10,090,334 | (24,848,919) | (295,498,128) | (296,426,777) |
| Net unrealized appreciation (depreciation) on investments | 63,162,260 | (558,231) | 29,632,962 | 671,564,734 |
| Net assets | $247,925,094 | $463,825,297 | $853,557,561 | $2,269,562,854 |
| Investments in unaffiliated issuers, including repurchase agreements, | | | | |
| at cost | $187,455,102 | $460,840,225 | $811,025,884 | $1,598,112,778 |
| Investments in affiliated issuers, at cost | $24,054,446 | — | $6,333,295 | $64,322,017 |
| Foreign currency, at cost | $225 | $123,767 | $375,539 | — |
| |
| Net asset value per share | | | | |
|
| The Funds have an unlimited number of shares authorized with no par value. Net asset value | | | |
| is calculated by dividing the net assets of each class of shares by the number of outstanding | | | |
| shares in the class. | | | | |
| |
| Class 1 | | | | |
| Net assets | — | — | $102,563,982 | — |
| Shares outstanding | — | — | 10,883,968 | — |
| Net asset value, offering price and redemption price per share | — | — | $9.42 | — |
| |
| Class NAV | | | | |
| Net assets | $247,925,094 | $463,825,297 | $750,993,579 | $2,269,562,854 |
| Shares outstanding | 25,749,395 | 53,212,531 | 80,253,860 | 231,203,969 |
| Net asset value, offering price and redemption price per share | $9.63 | $8.72 | $9.36 | $9.82 |
| |
| The accompanying notes are an integral part of the financial statements. | 308 |
John Hancock Funds II
Statements of Assets and Liabilities — February 28, 2011 (Unaudited)
| | | | |
| | International | International | International | International |
| | Equity Index | Growth Stock | Opportunities | Small Cap |
| Assets | Fund | Fund | Fund | Fund |
|
| Investments in unaffiliated issuers, at value | $462,955,940 | $183,272,663 | $768,295,380 | $330,774,414 |
| Investments in affiliated issuers, at value (Note 2) | 9,849,059 | — | — | 23,945,841 |
| Securities loaned, at value (Note 2) | 9,417,197 | — | — | 22,901,883 |
| Total investments, at value | 482,222,196 | 183,272,663 | 768,295,380 | 377,622,138 |
| Cash | — | — | — | 71,957 |
| Foreign currency, at value | 9,239,559 | 722,014 | 282,016 | 644,794 |
| Cash held at broker for futures contracts | 162,178 | — | — | — |
| Foreign cash held at broker for futures contracts | 569,348 | — | — | — |
| Receivable for investments sold | 97,373 | 690,356 | 8,102,387 | — |
| Receivable for forward foreign currency exchange contracts (Note 3) | 556,107 | — | — | — |
| Receivable for fund shares sold | 5,230 | — | 5,518 | 47,591 |
| Dividends and interest receivable | 1,082,902 | 323,489 | 1,415,670 | 1,029,635 |
| Receivable for securities lending income | 7,812 | — | — | 12,648 |
| Receivable for futures variation margin | 834,782 | — | — | — |
| Other assets | 523 | — | 1,211 | 237 |
| Total assets | 494,778,010 | 185,008,522 | 778,102,182 | 379,429,000 |
| |
| Liabilities | | | | |
|
| Payable for investments purchased | 27,604 | 1,639,508 | 5,565,931 | — |
| Payable for forward foreign currency exchange contracts (Note 3) | 1,153 | — | — | — |
| Payable for fund shares repurchased | — | 48,716 | 85,232 | 512,129 |
| Payable upon return of securities loaned (Note 2) | 9,839,416 | — | — | 23,950,686 |
| Payable to affiliates (Note 5) | | | | |
| Accounting and legal services fees | 10,513 | 4,056 | 17,331 | 8,030 |
| Trustees’ fees | 484 | 66 | 1,191 | 318 |
| Other liabilities and accrued expenses | 32,645 | 97,597 | 234,734 | 175,454 |
| Total liabilities | 9,911,815 | 1,789,943 | 5,904,419 | 24,646,617 |
| |
| Net assets | | | | |
|
| Capital paid-in | $493,837,649 | $168,560,877 | $811,713,892 | $353,153,923 |
| Undistributed net investment income (loss) | (2,208,291) | 710,376 | (12,030,874) | 56,601 |
| Accumulated undistributed net realized gain (loss) on investments | (104,689,963) | 124,875 | (193,694,108) | (70,855,590) |
| Net unrealized appreciation (depreciation) on investments | 97,926,800 | 13,822,451 | 166,208,853 | 72,427,449 |
| Net assets | $484,866,195 | $183,218,579 | $772,197,763 | $354,782,383 |
| Investments in unaffiliated issuers, including repurchase agreements, | | | | |
| at cost | $375,966,327 | $169,454,675 | $602,175,846 | $281,273,202 |
| Investments in affiliated issuers, at cost | $9,848,432 | — | — | $23,944,351 |
| Foreign currency, at cost | $9,136,924 | $716,653 | $282,072 | $632,985 |
| |
| Net asset value per share | | | | |
|
| The Funds have an unlimited number of shares authorized with no par value. Net asset value | | | |
| is calculated by dividing the net assets of each class of shares by the number of outstanding | | | |
| shares in the class. | | | | |
| |
| Class 1 | | | | |
| Net assets | — | — | $92,875,491 | $148,843,611 |
| Shares outstanding | — | — | 6,488,738 | 8,998,626 |
| Net asset value, offering price and redemption price per share | — | — | $14.31 | $16.54 |
| |
| Class NAV | | | | |
| Net assets | $484,866,195 | $183,218,579 | $679,322,272 | $205,938,772 |
| Shares outstanding | 26,361,337 | 16,316,936 | 47,361,546 | 12,453,753 |
| Net asset value, offering price and redemption price per share | $18.39 | $11.23 | $14.34 | $16.54 |
| |
| The accompanying notes are an integral part of the financial statements. | 309 |
John Hancock Funds II
Statements of Assets and Liabilities — February 28, 2011 (Unaudited)
| | | | |
| | International | | Investment | |
| | Small Company | International | Quality | Large Cap |
| Assets | Fund | Value Fund | Bond Fund | Fund |
|
| Investments in unaffiliated issuers, at value | $206,370,359 | $1,325,272,962 | $426,788,462 | $295,914,578 |
| Investments in affiliated issuers, at value (Note 2) | 6,844,084 | 19,142,667 | 2,823,028 | 33,933,294 |
| Securities loaned, at value (Note 2) | 6,506,957 | 18,495,864 | 2,770,776 | 33,285,812 |
| Repurchase agreements, at value (Note 2) | — | 175,000 | 43,229,000 | 2,879,000 |
| Total investments, at value | 219,721,400 | 1,363,086,493 | 475,611,266 | 366,012,684 |
| Cash | — | 311 | 216 | 622 |
| Foreign currency, at value | 522,182 | 1,600,485 | — | — |
| Receivable for investments sold | 185,751 | — | 4,230,940 | 1,315,649 |
| Receivable for forward foreign currency exchange contracts (Note 3) | — | — | 1,344,538 | — |
| Receivable for fund shares sold | 10,145 | 122,676 | — | 83,339 |
| Dividends and interest receivable | 253,549 | 1,736,471 | 4,107,026 | 605,147 |
| Receivable for securities lending income | 9,788 | 11,794 | 303 | 4,867 |
| Swap contracts, at value (Note 3) | — | — | 123,876 | — |
| Receivable for futures variation margin | — | — | 52,688 | — |
| Other assets | 264 | 1,225 | 230 | 543 |
| Total assets | 220,703,079 | 1,366,559,455 | 485,471,083 | 368,022,851 |
| |
| Liabilities | | | | |
|
| Payable for investments purchased | 92,056 | 2,341,134 | 995,650 | 1,565,205 |
| Payable for delayed delivery securities purchased | — | — | 44,003,638 | — |
| Payable for forward foreign currency exchange contracts (Note 3) | — | — | 1,860,151 | — |
| Payable for fund shares repurchased | — | 1,037,584 | 157,459 | — |
| Payable upon return of securities loaned (Note 2) | 6,838,600 | 19,124,242 | 2,823,000 | 33,939,213 |
| Swap contracts, at value (Note 3) | — | — | 139,721 | — |
| Payable to affiliates (Note 5) | | | | |
| Accounting and legal services fees | 4,731 | 29,613 | 9,906 | 7,416 |
| Trustees’ fees | 161 | 1,565 | 338 | 334 |
| Other liabilities and accrued expenses | 106,308 | 523,396 | 76,785 | 35,438 |
| Total liabilities | 7,041,856 | 23,057,534 | 50,066,648 | 35,547,606 |
| |
| Net assets | | | | |
|
| Capital paid-in | $331,525,434 | $1,438,541,568 | $436,573,778 | $389,161,075 |
| Undistributed net investment income (loss) | (2,316,531) | 4,500,196 | 2,210,335 | 544,933 |
| Accumulated undistributed net realized gain (loss) on investments | (128,458,910) | (188,306,908) | (10,116,192) | (113,188,901) |
| Net unrealized appreciation (depreciation) on investments | 12,911,230 | 88,767,065 | 6,736,514 | 55,958,138 |
| Net assets | $213,661,223 | $1,343,501,921 | $435,404,435 | $332,475,245 |
| Investments in unaffiliated issuers, including repurchase agreements, | | | | |
| at cost | $199,982,819 | $1,255,281,162 | $465,902,670 | $276,124,830 |
| Investments in affiliated issuers, at cost | $6,842,460 | $19,136,978 | $2,822,999 | $33,929,716 |
| Foreign currency, at cost | $513,089 | $1,572,992 | — | — |
| |
| Net asset value per share | | | | |
|
| The Funds have an unlimited number of shares authorized with no par value. Net asset value | | | |
| is calculated by dividing the net assets of each class of shares by the number of outstanding | | | |
| shares in the class. | | | | |
| |
| Class 1 | | | | |
| Net assets | — | $307,392,105 | $67,121,970 | $47,484,846 |
| Shares outstanding | — | 19,738,751 | 5,494,728 | 3,484,696 |
| Net asset value, offering price and redemption price per share | — | $15.57 | $12.22 | $13.63 |
| |
| Class NAV | | | | |
| Net assets | $213,661,223 | $1,036,109,816 | $368,282,465 | $284,990,399 |
| Shares outstanding | 23,762,277 | 66,707,408 | 30,180,470 | 20,916,902 |
| Net asset value, offering price and redemption price per share | $8.99 | $15.53 | $12.20 | $13.62 |
| |
| The accompanying notes are an integral part of the financial statements. | 310 |
John Hancock Funds II
Statements of Assets and Liabilities — February 28, 2011 (Unaudited)
| | | | |
| | Large Cap | Mid Cap Growth | Mid Cap | Mid Cap |
| Assets | Value Fund | Index Fund | Index Fund | Stock Fund |
|
| Investments in unaffiliated issuers, at value | $192,692,918 | $58,918,019 | $249,061,088 | $758,558,344 |
| Investments in affiliated issuers, at value (Note 2) | — | 5,591,557 | 92,174,090 | 291,642,810 |
| Securities loaned, at value (Note 2) | — | 5,487,820 | 90,237,420 | 283,475,101 |
| Repurchase agreements, at value (Note 2) | — | — | — | 27,600,000 |
| Total investments, at value | 192,692,918 | 69,997,396 | 431,472,598 | 1,361,276,255 |
| Cash | — | — | 2,269 | 81,497 |
| Cash held at broker for futures contracts | — | — | 1,432,000 | — |
| Receivable for investments sold | 2,030,398 | — | 2,884,288 | 12,482,869 |
| Receivable for fund shares sold | — | 25,027 | — | 610,341 |
| Dividends and interest receivable | 638,241 | 28,970 | 304,567 | 409,671 |
| Receivable for securities lending income | — | 2,193 | 15,240 | 57,731 |
| Receivable for futures variation margin | — | 2,960 | 24,640 | — |
| Other assets | 1,090 | 118 | 333 | 1,146 |
| Total assets | 195,362,647 | 70,056,664 | 436,135,935 | 1,374,919,510 |
| |
| Liabilities | | | | |
|
| Payable for investments purchased | 1,131,183 | 109,759 | 1,491,657 | 15,056,117 |
| Payable for fund shares repurchased | 66,110 | 5,969 | 334,711 | 260,347 |
| Payable upon return of securities loaned (Note 2) | — | 5,593,723 | 92,150,631 | 291,652,868 |
| Payable to affiliates (Note 5) | | | | |
| Accounting and legal services fees | 7,863 | 1,416 | 7,536 | 23,575 |
| Trustees’ fees | 687 | 216 | 465 | 957 |
| Investment management fees | — | 1,685 | — | — |
| Other liabilities and accrued expenses | 28,880 | 29,139 | 27,060 | 127,934 |
| Total liabilities | 1,234,723 | 5,741,907 | 94,012,060 | 307,121,798 |
| |
| Net assets | | | | |
|
| Capital paid-in | $340,633,644 | $53,633,810 | $225,736,981 | $871,826,145 |
| Undistributed net investment income (loss) | 595,977 | (15,392) | 844,967 | (1,393,899) |
| Accumulated undistributed net realized gain (loss) on investments | (163,093,517) | (1,218,858) | (13,036,273) | (38,088,261) |
| Net unrealized appreciation (depreciation) on investments | 15,991,820 | 11,915,197 | 128,578,200 | 235,453,727 |
| Net assets | $194,127,924 | $64,314,757 | $342,123,875 | $1,067,797,712 |
| Investments in unaffiliated issuers, including repurchase agreements, | | | | |
| at cost | $176,701,133 | $52,524,844 | $211,111,304 | $834,214,397 |
| Investments in affiliated issuers, at cost | — | $5,591,455 | $92,171,956 | $291,610,123 |
| |
| Net asset value per share | | | | |
|
| The Funds have an unlimited number of shares authorized with no par value. Net asset value | | | |
| is calculated by dividing the net assets of each class of shares by the number of outstanding | | | |
| shares in the class. | | | | |
| |
| Class 1 | | | | |
| Net assets | $88,206,314 | $2,044,487 | — | $390,270,913 |
| Shares outstanding | 4,517,015 | 168,658 | — | 20,871,123 |
| Net asset value, offering price and redemption price per share | $19.53 | $12.12 | — | $18.70 |
| |
| Class NAV | | | | |
| Net assets | $105,921,610 | $62,270,270 | $342,123,875 | $677,526,799 |
| Shares outstanding | 5,414,599 | 5,136,275 | 16,376,732 | 36,141,491 |
| Net asset value, offering price and redemption price per share | $19.56 | $12.12 | $20.89 | $18.75 |
| |
| The accompanying notes are an integral part of the financial statements. | 311 |
John Hancock Funds II
Statements of Assets and Liabilities — February 28, 2011 (Unaudited)
| | | | |
| | Mid Cap Value | Mid Cap Value | Mid Value | Mutual |
| Assets | Equity Fund | Index Fund | Fund | Shares Fund |
|
| Investments in unaffiliated issuers, at value | $166,103,013 | $61,649,286 | $384,122,577 | $357,483,237 |
| Investments in affiliated issuers, at value (Note 2) | 28,875,295 | 3,324,154 | 130,916,565 | 6,911,793 |
| Securities loaned, at value (Note 2) | 28,234,433 | 3,256,236 | 128,099,060 | 6,741,107 |
| Repurchase agreements, at value (Note 2) | 135,000 | — | — | — |
| Total investments, at value | 223,347,741 | 68,229,676 | 643,138,202 | 371,136,137 |
| Cash | 723 | — | — | 42,893 |
| Foreign currency, at value | — | — | — | 412,857 |
| Receivable for investments sold | 1,074,656 | 587,687 | 2,514,023 | 210,159 |
| Receivable for forward foreign currency exchange contracts (Note 3) | — | — | — | 62,040 |
| Receivable for fund shares sold | 2,709 | 1,438 | — | 68,805 |
| Dividends and interest receivable | 305,235 | 104,908 | 654,624 | 629,922 |
| Receivable for securities lending income | 6,952 | 1,318 | 57,052 | 1,368 |
| Receivable for futures variation margin | — | 4,200 | — | — |
| Other assets | 71 | 118 | 396 | — |
| Total assets | 224,738,087 | 68,929,345 | 646,364,297 | 372,564,181 |
| |
| Liabilities | | | | |
|
| Payable for investments purchased | 1,191,163 | 614,493 | 2,355,520 | 430,375 |
| Payable for forward foreign currency exchange contracts (Note 3) | — | — | — | 1,807,729 |
| Payable for fund shares repurchased | — | — | 98,072 | — |
| Payable upon return of securities loaned (Note 2) | 28,871,415 | 3,325,268 | 130,944,560 | 6,913,267 |
| Payable to affiliates (Note 5) | | | | |
| Accounting and legal services fees | 4,343 | 1,415 | 11,333 | 8,065 |
| Trustees’ fees | 190 | 216 | 383 | 85 |
| Investment management fees | — | 1,120 | — | — |
| Other liabilities and accrued expenses | 33,833 | 29,247 | 65,868 | 97,867 |
| Total liabilities | 30,100,944 | 3,971,759 | 133,475,736 | 9,257,388 |
| |
| Net assets | | | | |
|
| Capital paid-in | $145,901,678 | $59,670,614 | $383,273,882 | $326,670,943 |
| Undistributed net investment income (loss) | 304,973 | 177,493 | (352,036) | 1,240,172 |
| Accumulated undistributed net realized gain (loss) on investments | (10,626,800) | (2,000,475) | 12,040,751 | 2,817,859 |
| Net unrealized appreciation (depreciation) on investments | 59,057,292 | 7,109,954 | 117,925,964 | 32,577,819 |
| Net assets | $194,637,143 | $64,957,586 | $512,888,561 | $363,306,793 |
| Investments in unaffiliated issuers, including repurchase agreements, | | | | |
| at cost | $135,424,230 | $57,909,987 | $394,298,918 | $329,903,579 |
| Investments in affiliated issuers, at cost | $28,866,612 | $3,324,030 | $130,913,320 | $6,911,327 |
| Foreign currency, at cost | — | — | — | $410,909 |
| |
| Net asset value per share | | | | |
|
| The Funds have an unlimited number of shares authorized with no par value. Net asset value | | | |
| is calculated by dividing the net assets of each class of shares by the number of outstanding | | | |
| shares in the class. | | | | |
| |
| Class 1 | | | | |
| Net assets | — | $2,782,269 | — | — |
| Shares outstanding | — | 252,677 | — | — |
| Net asset value, offering price and redemption price per share | — | $11.01 | — | — |
| |
| Class NAV | | | | |
| Net assets | $194,637,143 | $62,175,317 | $512,888,561 | $363,306,793 |
| Shares outstanding | 18,787,798 | 5,647,444 | 33,281,297 | 32,009,447 |
| Net asset value, offering price and redemption price per share | $10.36 | $11.01 | $15.41 | $11.35 |
| |
| The accompanying notes are an integral part of the financial statements. | 312 |
John Hancock Funds II
Statements of Assets and Liabilities — February 28, 2011 (Unaudited)
| | | | |
| | Optimized | Real Estate | Real Estate | Real Return |
| Assets | Value Fund | Equity Fund | Securities Fund | Bond Fund |
|
| Investments in unaffiliated issuers, at value | $384,448,985 | $303,738,945 | $334,893,563 | $1,106,378,159 |
| Investments in affiliated issuers, at value (Note 2) | — | 71,110,999 | 121,126,966 | — |
| Securities loaned, at value (Note 2) | — | 71,002,289 | 120,781,065 | — |
| Repurchase agreements, at value (Note 2) | 9,200,000 | — | 5,605,000 | 1,753,000 |
| Total investments, at value | 393,648,985 | 445,852,233 | 582,406,594 | 1,108,131,159 |
| Cash | 546 | — | 149 | 699 |
| Foreign currency, at value | — | — | — | 355,365 |
| Receivable for investments sold | 1,490,985 | 1,897,850 | 9,051,054 | 63,057 |
| Receivable for delay delivery securities sold | — | — | — | 38,538,162 |
| Receivable for forward foreign currency exchange contracts (Note 3) | — | — | — | 569,537 |
| Receivable for fund shares sold | — | — | — | 111,230 |
| Dividends and interest receivable | 1,157,696 | 486,920 | 22,538 | 4,983,254 |
| Receivable for securities lending income | — | 10,878 | 19,060 | — |
| Swap contracts, at value (Note 3) | — | — | — | 3,080,369 |
| Receivable for futures variation margin | — | — | — | 30,850 |
| Other assets | 646 | 144 | — | 24,713 |
| Total assets | 396,298,858 | 448,248,025 | 591,499,395 | 1,155,888,395 |
| |
| Liabilities | | | | |
|
| Payable for collateral held by Fund | — | — | — | 4,700,000 |
| Payable for investments purchased | 2,368,338 | — | 10,945,148 | 1,690,794 |
| Payable for delay delivery securities purchased | — | — | — | 288,500,736 |
| Payable for forward foreign currency exchange contracts (Note 3) | — | — | — | 1,711,963 |
| Payable for fund shares repurchased | 217,664 | 6,027,048 | 218,155 | — |
| Payable upon return of securities loaned (Note 2) | — | 71,121,262 | 121,153,406 | — |
| Written options, at value (Note 3) | — | — | — | 2,565,880 |
| Swap contracts, at value (Note 3) | — | — | — | 862,601 |
| Payable to affiliates (Note 5) | | | | |
| Accounting and legal services fees | 8,629 | 8,159 | 9,624 | 19,208 |
| Trustees’ fees | 398 | 269 | 373 | 1,580 |
| Other liabilities and accrued expenses | 44,755 | 41,645 | 59,424 | 110,679 |
| Total liabilities | 2,639,784 | 77,198,383 | 132,386,130 | 300,163,441 |
| |
| Net assets | | | | |
|
| Capital paid-in | $674,144,541 | $344,584,165 | $347,751,755 | $845,074,803 |
| Undistributed net investment income (loss) | 3,525,580 | 1,252,478 | 2,126,551 | 4,273,627 |
| Accumulated undistributed net realized gain (loss) on investments | (310,760,753) | (121,512,693) | (4,241,696) | (4,500,742) |
| Net unrealized appreciation (depreciation) on investments | 26,749,706 | 146,725,692 | 113,476,655 | 10,877,266 |
| Net assets | $393,659,074 | $371,049,642 | $459,113,265 | $855,724,954 |
| Investments in unaffiliated issuers, including repurchase agreements, | | | | |
| at cost | $366,899,279 | $228,033,177 | $347,810,715 | $1,096,135,830 |
| Investments in affiliated issuers, at cost | — | $71,093,364 | $121,119,224 | — |
| Foreign currency, at cost | — | — | — | $348,843 |
| Premiums received on written options | — | — | — | $2,055,722 |
| Net unamortized upfront payment on swaps | — | — | — | $1,804,310 |
| |
| Net asset value per share | | | | |
|
| The Funds have an unlimited number of shares authorized with no par value. Net asset value | | | |
| is calculated by dividing the net assets of each class of shares by the number of outstanding | | | |
| shares in the class. | | | | |
| |
| Class 1 | | | | |
| Net assets | $50,884,259 | — | $459,113,265 | $94,721,915 |
| Shares outstanding | 4,047,352 | — | 32,868,189 | 7,579,449 |
| Net asset value, offering price and redemption price per share | $12.57 | — | $13.97 | $12.50 |
| |
| Class NAV | | | | |
| Net assets | $342,774,815 | $371,049,642 | — | $761,003,039 |
| Shares outstanding | 27,260,313 | 44,299,633 | — | 61,520,320 |
| Net asset value, offering price and redemption price per share | $12.57 | $8.38 | — | $12.37 |
| |
| The accompanying notes are an integral part of the financial statements. | 313 |
John Hancock Funds II
Statements of Assets and Liabilities — February 28, 2011 (Unaudited)
| | | | |
| | Retirement | Retirement | Retirement | Retirement |
| | 2010 | 2015 | 2020 | 2025 |
| Assets | Portfolio | Portfolio | Portfolio | Portfolio |
|
| Investments in affiliated funds, at value (Note 9) | $10,146,870 | $13,188,945 | $18,809,296 | $22,913,912 |
| Total investments, at value | 10,146,870 | 13,188,945 | 18,809,296 | 22,913,912 |
| Cash | 20,853 | 20,748 | 20,534 | 20,114 |
| Receivable for investments sold | 230,325 | — | — | 290,608 |
| Receivable for fund shares sold | — | 128,222 | 143,033 | — |
| Receivable due from adviser | 261 | 255 | 234 | 232 |
| Total assets | 10,398,309 | 13,338,170 | 18,973,097 | 23,224,866 |
| |
| Liabilities | | | | |
|
| Payable for investments purchased | — | 128,183 | 142,977 | — |
| Payable for fund shares repurchased | 230,294 | — | — | 290,538 |
| Payable to affiliates (Note 5) | | | | |
| Accounting and legal services fees | 124 | 177 | 239 | 307 |
| Trustees’ fees | 118 | 119 | 118 | 117 |
| Other liabilities and accrued expenses | 22,080 | 22,140 | 22,228 | 22,307 |
| Total liabilities | 252,616 | 150,619 | 165,562 | 313,269 |
| |
| Net assets | | | | |
|
| Capital paid-in | $10,107,156 | $13,045,722 | $18,434,285 | $22,250,117 |
| Undistributed net investment income (loss) | (2,114) | (2,818) | (3,773) | (4,743) |
| Accumulated undistributed net realized gain (loss) on investments | (34,701) | (2,520) | 1,767 | (4,206) |
| Net unrealized appreciation (depreciation) on investments | 75,352 | 147,167 | 375,256 | 670,429 |
| Net assets | $10,145,693 | $13,187,551 | $18,807,535 | $22,911,597 |
| Investments in affiliated issuers, at cost | $10,071,518 | $13,041,778 | $18,434,040 | $22,243,483 |
| |
| Net asset value per share | | | | |
|
| The Funds have an unlimited number of shares authorized with no par value. Net asset value | | | |
| is calculated by dividing the net assets of each class of shares by the number of outstanding | | | |
| shares in the class. | | | | |
| |
| Class 1 | | | | |
| Net assets | $10,145,693 | $13,187,551 | $18,807,535 | $22,911,597 |
| Shares outstanding | 982,718 | 1,261,117 | 1,770,887 | 2,129,188 |
| Net asset value, offering price and redemption price per share | $10.32 | $10.46 | $10.62 | $10.76 |
| |
| The accompanying notes are an integral part of the financial statements. | 314 |
John Hancock Funds II
Statements of Assets and Liabilities — February 28, 2011 (Unaudited)
| | | | |
| | Retirement | Retirement | Retirement | Retirement |
| | 2030 | 2035 | 2040 | 2045 |
| Assets | Portfolio | Portfolio | Portfolio | Portfolio |
|
| Investments in affiliated funds, at value (Note 9) | $16,684,002 | $14,006,187 | $7,914,158 | $7,778,050 |
| Total investments, at value | 16,684,002 | 14,006,187 | 7,914,158 | 7,778,050 |
| Cash | 20,516 | 20,637 | 20,896 | 20,917 |
| Receivable for fund shares sold | 375,699 | 2,981 | 45,853 | 60,738 |
| Receivable due from adviser | 244 | 292 | 291 | 293 |
| Total assets | 17,080,461 | 14,030,097 | 7,981,198 | 7,859,998 |
| |
| Liabilities | | | | |
|
| Payable for investments purchased | 375,650 | 2,939 | 45,830 | 60,715 |
| Payable to affiliates (Note 5) | | | | |
| Accounting and legal services fees | 208 | 178 | 96 | 91 |
| Trustees’ fees | 117 | 118 | 119 | 119 |
| Other liabilities and accrued expenses | 22,134 | 22,136 | 21,964 | 21,941 |
| Total liabilities | 398,109 | 25,371 | 68,009 | 82,866 |
| |
| Net assets | | | | |
|
| Capital paid-in | $16,170,963 | $13,511,292 | $7,654,446 | $7,535,227 |
| Undistributed net investment income (loss) | (3,206) | (2,707) | (1,484) | (1,393) |
| Accumulated undistributed net realized gain (loss) on investments | 12,345 | 5,310 | 2,946 | 3,805 |
| Net unrealized appreciation (depreciation) on investments | 502,250 | 490,831 | 257,281 | 239,493 |
| Net assets | $16,682,352 | $14,004,726 | $7,913,189 | $7,777,132 |
| Investments in affiliated issuers, at cost | $16,181,752 | $13,515,356 | $7,656,877 | $7,538,557 |
| |
| Net asset value per share | | | | |
|
| The Funds have an unlimited number of shares authorized with no par value. Net asset value | | | |
| is calculated by dividing the net assets of each class of shares by the number of outstanding | | | |
| shares in the class. | | | | |
| |
| Class 1 | | | | |
| Net assets | $16,682,352 | $14,004,726 | $7,913,189 | $7,777,132 |
| Shares outstanding | 1,537,884 | 1,284,250 | 724,390 | 711,498 |
| Net asset value, offering price and redemption price per share | $10.85 | $10.90 | $10.92 | $10.93 |
| |
| The accompanying notes are an integral part of the financial statements. | 315 |
John Hancock Funds II
Statements of Assets and Liabilities — February 28, 2011 (Unaudited)
| | | | |
| | Short Term | | | Small Cap |
| | Government | Small Cap | Small Cap | Opportunities |
| Assets | Income Fund | Growth Fund | Index Fund | Fund |
|
| Investments in unaffiliated issuers, at value | $129,379,607 | $154,522,295 | $84,914,602 | $188,847,063 |
| Investments in affiliated issuers, at value (Note 2) | — | 38,188,360 | 8,760,605 | 22,089,462 |
| Securities loaned, at value (Note 2) | — | 37,161,981 | 8,510,398 | 21,654,199 |
| Repurchase agreements, at value (Note 2) | — | 8,800,000 | — | — |
| Total investments, at value | 129,379,607 | 238,672,636 | 102,185,605 | 232,590,724 |
| Cash | 56,650 | 91,561 | 32,302 | — |
| Cash held at broker for futures contracts | — | — | 350,000 | — |
| Receivable for investments sold | 93 | 882,403 | 76,349 | 1,781,083 |
| Receivable for fund shares sold | — | — | — | 29,564 |
| Dividends and interest receivable | 783,765 | 52,020 | 48,667 | 87,430 |
| Receivable for securities lending income | — | 10,760 | 5,901 | 6,203 |
| Receivable for futures variation margin | — | — | 6,380 | — |
| Receivable due from adviser | 5 | — | — | — |
| Other assets | 31 | — | 49 | 119 |
| Total assets | 130,220,151 | 239,709,380 | 102,705,253 | 234,495,123 |
| |
| Liabilities | | | | |
|
| Payable for investments purchased | — | 4,933,705 | — | 371,322 |
| Payable for fund shares repurchased | — | 82,876 | 133,639 | 344,458 |
| Payable upon return of securities loaned (Note 2) | — | 38,188,561 | 8,756,174 | 22,093,124 |
| Payable to affiliates (Note 5) | | | | |
| Accounting and legal services fees | 2,953 | 4,311 | 2,060 | 4,601 |
| Trustees’ fees | 159 | 137 | 130 | 91 |
| Other liabilities and accrued expenses | 49,920 | 39,862 | 25,938 | 39,599 |
| Total liabilities | 53,032 | 43,249,452 | 8,917,941 | 22,853,195 |
| |
| Net assets | | | | |
|
| Capital paid-in | $130,242,905 | $137,131,292 | $84,744,563 | $178,053,303 |
| Undistributed net investment income (loss) | (259,149) | (617,383) | 42,826 | 292,863 |
| Accumulated undistributed net realized gain (loss) on investments | (313,140) | 14,688,031 | (26,469,545) | (32,194,784) |
| Net unrealized appreciation (depreciation) on investments | 496,503 | 45,257,988 | 35,469,468 | 65,490,546 |
| Net assets | $130,167,119 | $196,459,928 | $93,787,312 | $211,641,928 |
| Investments in unaffiliated issuers, including repurchase agreements, | | | | |
| at cost | $128,883,104 | $155,228,081 | $58,190,399 | $145,013,120 |
| Investments in affiliated issuers, at cost | — | $38,186,567 | $8,760,429 | $22,087,058 |
| |
| Net asset value per share | | | | |
|
| The Funds have an unlimited number of shares authorized with no par value. Net asset value | | | |
| is calculated by dividing the net assets of each class of shares by the number of outstanding | | | |
| shares in the class. | | | | |
| |
| Class 1 | | | | |
| Net assets | — | — | — | $73,473,959 |
| Shares outstanding | — | — | — | 3,203,139 |
| Net asset value, offering price and redemption price per share | — | — | — | $22.94 |
| |
| Class NAV | | | | |
| Net assets | $130,167,119 | $196,459,928 | $93,787,312 | $138,167,969 |
| Shares outstanding | 12,992,554 | 17,359,067 | 6,662,249 | 6,049,530 |
| Net asset value, offering price and redemption price per share | $10.02 | $11.32 | $14.08 | $22.84 |
| |
| The accompanying notes are an integral part of the financial statements. | 316 |
John Hancock Funds II
Statements of Assets and Liabilities — February 28, 2011 (Unaudited)
| | | | |
| | Small Cap | Small Company | Small Company | Smaller Company |
| Assets | Value Fund | Growth Fund | Value Fund | Growth Fund |
|
| Investments in unaffiliated issuers, at value | $153,427,635 | $125,518,217 | $334,672,902 | $130,330,275 |
| Investments in affiliated issuers, at value (Note 2) | 8,005,522 | 26,407,807 | 123,345,442 | 17,036,662 |
| Securities loaned, at value (Note 2) | 7,808,734 | 25,717,020 | 120,653,194 | 16,560,595 |
| Repurchase agreements, at value (Note 2) | 5,500,000 | — | — | 2,766,000 |
| Total investments, at value | 174,741,891 | 177,643,044 | 578,671,538 | 166,693,532 |
| Cash | 8,467 | — | — | 9,456 |
| Cash held at broker for futures contracts | — | — | — | 216,000 |
| Receivable for investments sold | 174,899 | 2,015,772 | 160,953 | 1,206,111 |
| Receivable for fund shares sold | 19,616 | — | 91,645 | — |
| Dividends and interest receivable | 113,662 | 56,213 | 280,662 | 52,779 |
| Receivable for securities lending income | 1,265 | 4,123 | 18,363 | 8,646 |
| Receivable for futures variation margin | — | — | — | 982 |
| Other assets | 24 | 291 | 506 | 43 |
| Total assets | 175,059,824 | 179,719,443 | 579,223,667 | 168,187,549 |
| |
| Liabilities | | | | |
|
| Payable for investments purchased | 3,858 | 557,863 | 559,199 | 1,270,856 |
| Payable for fund shares repurchased | — | 294,402 | 481,930 | 2,708 |
| Payable upon return of securities loaned (Note 2) | 8,009,960 | 26,400,588 | 123,339,718 | 17,039,153 |
| Payable to affiliates (Note 5) | | | | |
| Accounting and legal services fees | 3,739 | 3,359 | 10,041 | 3,309 |
| Trustees’ fees | 101 | 151 | 483 | 192 |
| Other liabilities and accrued expenses | 38,335 | 30,984 | 49,328 | 39,002 |
| Total liabilities | 8,055,993 | 27,287,347 | 124,440,699 | 18,355,220 |
| |
| Net assets | | | | |
|
| Capital paid-in | $117,683,616 | $129,987,467 | $387,961,335 | $108,662,162 |
| Undistributed net investment income (loss) | (52,321) | (285,830) | 82,738 | (316,260) |
| Accumulated undistributed net realized gain (loss) on investments | 2,980,996 | (23,947,519) | (53,857,741) | 8,209,385 |
| Net unrealized appreciation (depreciation) on investments | 46,391,540 | 46,677,978 | 120,596,636 | 33,277,042 |
| Net assets | $167,003,831 | $152,432,096 | $454,782,968 | $149,832,329 |
| Investments in unaffiliated issuers, including repurchase agreements, | | | | |
| at cost | $120,345,385 | $104,570,511 | $334,753,292 | $116,396,942 |
| Investments in affiliated issuers, at cost | $8,004,966 | $26,394,555 | $123,321,610 | $17,036,688 |
| |
| Net asset value per share | | | | |
|
| The Funds have an unlimited number of shares authorized with no par value. Net asset value | | | |
| is calculated by dividing the net assets of each class of shares by the number of outstanding | | | |
| shares in the class. | | | | |
| |
| Class 1 | | | | |
| Net assets | — | — | $132,448,147 | — |
| Shares outstanding | — | — | 4,900,649 | — |
| Net asset value, offering price and redemption price per share | — | — | $27.03 | — |
| |
| Class NAV | | | | |
| Net assets | $167,003,831 | $152,432,096 | $322,334,821 | $149,832,329 |
| Shares outstanding | 9,862,629 | 10,574,285 | 11,938,781 | 12,614,228 |
| Net asset value, offering price and redemption price per share | $16.93 | $14.42 | $27.00 | $11.88 |
| |
| The accompanying notes are an integral part of the financial statements. | 317 |
John Hancock Funds II
Statements of Assets and Liabilities — February 28, 2011 (Unaudited)
| | | | |
| | Spectrum | Total Bond | Total | U.S. High Yield |
| Assets | Income Fund | Market Fund | Return Fund | Bond Fund |
|
| Investments in unaffiliated issuers, at value | $999,081,058 | $306,261,084 | $2,505,544,352 | $631,104,388 |
| Investments in affiliated issuers, at value (Note 2) | 27,329,390 | 3,213,547 | — | — |
| Securities loaned, at value (Note 2) | 26,876,242 | 3,155,812 | — | — |
| Repurchase agreements, at value (Note 2) | 2,036,757 | — | 394,546,000 | 27,203 |
| Total investments, at value | 1,055,323,447 | 312,630,443 | 2,900,090,352 | 631,131,591 |
| Cash | 143 | — | 908 | — |
| Foreign currency, at value | 525,450 | — | 235,746 | — |
| Receivable for investments sold | 5,312,054 | 20,026,225 | 18,096 | — |
| Receivable for delayed delivery securities sold | 800,049 | — | 246,512,485 | — |
| Receivable for forward foreign currency exchange contracts (Note 3) | 929,806 | — | 2,829,112 | — |
| Receivable for fund shares sold | — | — | 16,628,065 | 13,756 |
| Dividends and interest receivable | 10,745,270 | 2,537,273 | 12,417,218 | 10,149,445 |
| Receivable for securities lending income | 6,281 | 431 | — | — |
| Swap contracts, at value (Note 3) | 148,375 | — | 18,836,935 | — |
| Receivable for futures variation margin | — | — | 678,961 | — |
| Other assets | 898 | 172 | 2,628 | 693 |
| Total assets | 1,073,791,773 | 335,194,544 | 3,198,250,506 | 641,295,485 |
| |
| Liabilities | | | | |
|
| Payable for collateral held by Fund | — | — | 14,100,000 | — |
| Payable for investments purchased | 15,738,040 | — | 23,079,394 | 3,181,553 |
| Payable for delayed delivery securities purchased | 3,427,484 | — | 544,490,164 | — |
| Payable for forward foreign currency exchange contracts (Note 3) | 1,077,876 | — | 3,773,916 | — |
| Payable for fund shares repurchased | — | 30,186,603 | 473,219 | — |
| Payable upon return of securities loaned (Note 2) | 27,329,932 | 3,214,250 | — | — |
| Written options, at value (Note 3) | — | — | 8,079,056 | — |
| TBA sale commitments, at value (Note 2) | — | — | 224,342,128 | — |
| Swap contracts, at value (Note 3) | 71,512 | — | 724,167 | — |
| Payable for futures variation margin | 238,399 | — | — | — |
| Payable to affiliates (Note 5) | | | | |
| Accounting and legal services fees | 22,335 | 10,290 | 52,185 | 14,418 |
| Trustees’ fees | 887 | 525 | 2,607 | 984 |
| Other liabilities and accrued expenses | 185,720 | 32,402 | 386,438 | 69,460 |
| Total liabilities | 48,092,185 | 33,444,070 | 819,503,274 | 3,266,415 |
| |
| Net assets | | | | |
|
| Capital paid-in | $994,162,158 | $279,086,049 | $2,361,005,133 | $590,792,408 |
| Undistributed net investment income (loss) | 5,757,497 | 1,920,333 | 6,891,014 | 6,373,215 |
| Accumulated undistributed net realized gain (loss) on investments | (29,411,634) | 3,789,943 | (21,016,801) | (3,557,549) |
| Net unrealized appreciation (depreciation) on investments | 55,191,567 | 16,954,149 | 31,867,886 | 44,420,996 |
| Net assets | $1,025,699,588 | $301,750,474 | $2,378,747,232 | $638,029,070 |
| Investments in unaffiliated issuers, including repurchase agreements, | | | | |
| at cost | $972,771,190 | $292,462,849 | $2,872,299,382 | $586,710,595 |
| Investments in affiliated issuers, at cost | $27,329,264 | $3,213,445 | — | — |
| Foreign currency, at cost | $523,629 | — | $234,658 | — |
| Proceeds received on TBA sale commitments | — | — | $223,865,402 | — |
| Premiums received on written options | — | — | $6,339,595 | — |
| Net unamortized upfront payment on swaps | ($12,553) | — | $12,054,232 | — |
| |
| Net asset value per share | | | | |
|
| The Funds have an unlimited number of shares authorized with no par value. Net asset value | | | |
| is calculated by dividing the net assets of each class of shares by the number of outstanding | | | |
| shares in the class. | | | | |
| |
| Class 1 | | | | |
| Net assets | — | — | $339,779,046 | $63,166,886 |
| Shares outstanding | — | — | 24,410,689 | 4,832,323 |
| Net asset value, offering price and redemption price per share | — | — | $13.92 | $13.07 |
| |
| Class NAV | | | | |
| Net assets | $1,025,699,588 | $301,750,474 | $2,038,968,186 | $574,862,184 |
| Shares outstanding | 94,741,429 | 29,356,006 | 146,933,216 | 44,000,704 |
| Net asset value, offering price and redemption price per share | $10.83 | $10.28 | $13.88 | $13.06 |
| |
| The accompanying notes are an integral part of the financial statements. | 318 |
John Hancock Funds II
Statements of Assets and Liabilities — February 28, 2011 (Unaudited)
| | | |
| | | | Value & |
| | U.S. Multi- | | Restructuring |
| Assets | Sector Fund | Value Fund | Fund |
|
| Investments in unaffiliated issuers, at value | $1,007,875,273 | $194,674,238 | $574,309,840 |
| Investments in affiliated issuers, at value (Note 2) | 76,781,724 | — | 61,870,529 |
| Securities loaned, at value (Note 2) | 75,244,084 | — | 60,769,831 |
| Repurchase agreements, at value (Note 2) | — | — | 2,205,000 |
| Total investments, at value | 1,159,901,081 | 194,674,238 | 699,155,200 |
| Cash | — | — | 792 |
| Receivable for investments sold | 474,012 | 1,360,371 | — |
| Receivable for fund shares sold | — | — | 22,453 |
| Dividends and interest receivable | 2,282,357 | 382,118 | 1,450,119 |
| Receivable for securities lending income | 23,597 | — | 11,797 |
| Other assets | 10,995 | 21 | 824 |
| Total assets | 1,162,692,042 | 196,416,748 | 700,641,185 |
| |
| Liabilities | | | |
|
| Payable for investments purchased | 42,810 | 250,127 | 1,856,124 |
| Payable for fund shares repurchased | 8,634 | 86,036 | — |
| Payable upon return of securities loaned (Note 2) | 76,802,437 | — | 61,872,291 |
| Written options, at value (Note 3) | — | — | 173,625 |
| Investments sold short, at value (Note 2) | 474,012 | — | — |
| Payable to affiliates (Note 5) | | | |
| Accounting and legal services fees | 24,365 | 4,316 | 14,182 |
| Trustees’ fees | 1,062 | 150 | 627 |
| Other liabilities and accrued expenses | 84,279 | 34,969 | 57,627 |
| Total liabilities | 77,437,599 | 375,598 | 63,974,476 |
| |
| Net assets | | | |
|
| Capital paid-in | $1,092,053,194 | $141,354,467 | $557,727,213 |
| Undistributed net investment income (loss) | 2,762,601 | 279,694 | 1,312,349 |
| Accumulated undistributed net realized gain (loss) on investments | (187,663,507) | 3,297,218 | (166,752,822) |
| Net unrealized appreciation (depreciation) on investments | 178,102,155 | 51,109,771 | 244,379,969 |
| Net assets | $1,085,254,443 | $196,041,150 | $636,666,709 |
| Investments in unaffiliated issuers, including repurchase agreements, at cost | $905,021,789 | $143,564,467 | $392,849,680 |
| Investments in affiliated issuers, at cost | $76,775,320 | — | $61,860,528 |
| Proceeds received on short sales | $474,012 | — | — |
| Premiums received on written options | — | — | $107,922 |
| |
| Net asset value per share | | | |
|
| The Funds have an unlimited number of shares authorized with no par value. Net asset value is calculated | | |
| by dividing the net assets of each class of shares by the number of outstanding shares in the class. | | | |
| |
| Class NAV | | | |
| Net assets | $1,085,254,443 | $196,041,150 | $636,666,709 |
| Shares outstanding | 109,008,571 | 18,624,412 | 53,261,471 |
| Net asset value, offering price and redemption price per share | $9.96 | $10.53 | $11.95 |
| |
| The accompanying notes are an integral part of the financial statements. | 319 |
John Hancock Funds II
Statements of Operations — February 28, 2011 (Unaudited)
| | | | |
| | | | | Alpha |
| | Active Bond | All Cap | All Cap | Opportunities |
| Investment income | Fund | Core Fund | Value Fund | Fund |
|
| Interest | $28,353,912 | $8,567 | $548 | $38,258 |
| Dividends | 96,443 | 5,567,042 | 4,173,877 | 7,539,303 |
| Securities lending | 9,989 | 85,818 | 50,076 | 403,567 |
| Less foreign taxes withheld | (14,425) | — | (18,491) | (60,119) |
| Total investment income | 28,445,919 | 5,661,427 | 4,206,010 | 7,921,009 |
| |
| Expenses | | | | |
|
| Investment management fees (Note 5) | 3,174,317 | 2,325,528 | 1,981,285 | 6,424,948 |
| Class 1 distribution and service fees (Note 5) | 10,475 | — | 24,441 | — |
| Accounting and legal services fees (Note 5) | 76,174 | 43,098 | 36,415 | 94,944 |
| Professional fees | 29,352 | 18,158 | 17,039 | 26,872 |
| Custodian fees | 77,920 | 24,410 | 38,219 | 160,347 |
| Trustees’ fees (Note 5) | 4,561 | 2,806 | 2,223 | 5,721 |
| Registration and filing fees | 13,573 | 774 | 3,077 | 8,151 |
| Other | 5,249 | 3,331 | 3,233 | 6,429 |
| Total expenses before reductions and amounts recaptured | 3,391,621 | 2,418,105 | 2,105,932 | 6,727,412 |
| Net expense reductions and amounts recaptured (Note 5) | (11,115) | (6,296) | (5,340) | (13,941) |
| Total expenses | 3,380,506 | 2,411,809 | 2,100,592 | 6,713,471 |
| Net investment income (loss) | 25,065,413 | 3,249,618 | 2,105,418 | 1,207,538 |
| |
| Realized and unrealized gain (loss) | | | | |
|
| Net realized gain (loss) on | | | | |
| Investments in unaffiliated issuers | (1,547,234) | 60,799,796 | 23,745,838 | 142,476,583 |
| Investments in affiliated issuers | (4,165) | (6,369) | (3,321) | (43,137) |
| Futures contracts | (45,775) | (2,395) | — | — |
| Written options | — | — | — | 119,731 |
| Swap contracts | 5,000 | — | — | — |
| Foreign currency transactions | (13,106) | — | — | (632,893) |
| | (1,605,280) | 60,791,032 | 23,742,517 | 141,920,284 |
| |
| Change in net unrealized appreciation (depreciation) of | | | | |
| Investments in unaffiliated issuers | 11,440,029 | 85,884,189 | 113,201,785 | 224,979,929 |
| Investments in affiliated issuers | 39 | (3,758) | (12,120) | (2,099) |
| Futures contracts | (2,393) | 864,878 | — | — |
| Written options | — | — | — | (23,222) |
| Swap contracts | (344,919) | — | — | — |
| Translation of assets and liabilities in foreign currencies | (69,363) | — | — | (11,990) |
| | 11,023,393 | 86,745,309 | 113,189,665 | 224,942,618 |
| Net realized and unrealized gain (loss) | 9,418,113 | 147,536,341 | 136,932,182 | 366,862,902 |
| |
| Increase (decrease) in net assets from operations | $34,483,526 | $150,785,959 | $139,037,600 | $368,070,440 |
| |
| The accompanying notes are an integral part of the financial statements. | 320 |
John Hancock Funds II
Statements of Operations — February 28, 2011 (Unaudited)
| | | | |
| | | Capital | Capital | |
| | Blue Chip | Appreciation | Appreciation | Core Bond |
| Investment income | Growth Fund | Fund | Value Fund1 | Fund |
|
| Interest | $14,572 | $1,519 | $254,254 | $9,869,850 |
| Dividends | 9,735,030 | 7,224,248 | 609,520 | — |
| Securities lending | 131,100 | 133,300 | 39 | 258 |
| Less foreign taxes withheld | — | (9,130) | — | — |
| Total investment income | 9,880,702 | 7,349,937 | 863,813 | 9,870,108 |
| |
| Expenses | | | | |
|
| Investment management fees (Note 5) | 8,597,996 | 6,179,879 | 384,771 | 1,766,334 |
| Class 1 distribution and service fees (Note 5) | 120,785 | 92,592 | — | 3,394 |
| Accounting and legal services fees (Note 5) | 158,339 | 126,556 | 6,564 | 43,680 |
| Professional fees | 31,272 | 26,743 | 8,118 | 24,260 |
| Custodian fees | 94,059 | 100,742 | 9,054 | 44,939 |
| Trustees’ fees (Note 5) | 10,114 | 8,251 | 516 | 2,922 |
| Registration and filing fees | 3,496 | 2,640 | 2,445 | 5,250 |
| Other | 10,153 | 9,246 | 2,022 | 3,615 |
| Total expenses before reductions and amounts recaptured | 9,026,214 | 6,546,649 | 413,490 | 1,894,394 |
| Net expense reductions and amounts recaptured (Note 5) | (349,560) | (18,446) | (17,429) | (6,281) |
| Total expenses | 8,676,654 | 6,528,203 | 396,061 | 1,888,113 |
| Net investment income (loss) | 1,204,048 | 821,734 | 467,752 | 7,981,995 |
| |
| Realized and unrealized gain (loss) | | | | |
|
| Net realized gain (loss) on | | | | |
| Investments in unaffiliated issuers | 52,643,456 | 36,653,297 | 1,315,776 | 938,513 |
| Investments in affiliated issuers | (23,870) | (3,049) | (75) | (232) |
| Capital gain distributions received from unaffiliated underlying funds | — | — | — | 164 |
| Foreign currency transactions | (3,960) | (94,956) | 13,809 | — |
| | 52,615,626 | 36,555,292 | 1,329,510 | 938,445 |
| |
| Change in net unrealized appreciation (depreciation) of | | | | |
| Investments in unaffiliated issuers | 559,117,270 | 398,634,865 | 9,561,315 | (11,743,425) |
| Investments in affiliated issuers | (40,437) | (49,782) | 17 | — |
| Translation of assets and liabilities in foreign currencies | 64 | 5,983 | — | — |
| | 559,076,897 | 398,591,066 | 9,561,332 | (11,743,425) |
| Net realized and unrealized gain (loss) | 611,692,523 | 435,146,358 | 10,890,842 | (10,804,980) |
| |
| Increase (decrease) in net assets from operations | $612,896,571 | $435,968,092 | $11,358,594 | ($2,822,985) |
1 Period from 1-6-11 (inception date) to 2-28-11.
| |
| The accompanying notes are an integral part of the financial statements. | 321 |
John Hancock Funds II
Statements of Operations — February 28, 2011 (Unaudited)
| | | | |
| Core | | | |
| | Diversified | Core | Core | Emerging Markets |
| | Growth & | Fundamental | Global | Fund (formerly, |
| | Income | Holdings | Diversification | Emerging Markets |
| Investment income | Portfolio | Portfolio | Portfolio | Value Fund) |
|
| Interest | — | — | — | $21,287 |
| Dividends | $192,344 | $95,724 | $226,215 | 11,028,277 |
| Income distributions received from affiliated underlying funds | 179,745 | 89,928 | 228,220 | — |
| Securities lending | — | — | — | 274,085 |
| Less foreign taxes withheld | — | — | — | (1,272,793) |
| Total investment income | 372,089 | 185,652 | 454,435 | 10,050,856 |
| |
| Expenses | | | | |
|
| Investment management fees (Note 5) | 5,410 | 2,702 | 5,911 | 9,407,183 |
| Class A distribution and service fees (Note 5) | — | — | — | — |
| Class 1 distribution and service fees (Note 5) | 6,387 | 3,190 | 6,979 | — |
| Accounting and legal services fees (Note 5) | 1,830 | 916 | 2,006 | 141,702 |
| Professional fees | 9,177 | 9,180 | 9,211 | 34,278 |
| Printing and postage | — | — | — | — |
| Custodian fees | 5,970 | 5,970 | 5,970 | 1,004,640 |
| Trustees’ fees (Note 5) | 122 | 64 | 131 | 8,548 |
| Registration and filing fees | 1,511 | 1,397 | 1,575 | 14,972 |
| Other | 1,025 | 1,027 | 974 | 10,683 |
| Total expenses before reductions and amounts recaptured | 31,432 | 24,446 | 32,757 | 10,622,006 |
| Net expense reductions and amounts recaptured (Note 5) | (15,802) | (16,640) | (15,681) | (20,793) |
| Total expenses | 15,630 | 7,806 | 17,076 | 10,601,213 |
| Net investment income (loss) | 356,459 | 177,846 | 437,359 | (550,357) |
| |
| Realized and unrealized gain (loss) | | | | |
|
| Net realized gain (loss) on | | | | |
| Investments in unaffiliated issuers | 15,401 | 35,099 | 35,925 | 24,947,0661 |
| Investments in affiliated issuers | 4,595 | 36,905 | 10,851 | (26,723) |
| Capital gain distributions received from unaffiliated underlying funds | 159,908 | 100,082 | 207,231 | — |
| Capital gain distributions received from affiliated underlying funds | 40,339 | 25,265 | 52,350 | — |
| Foreign currency transactions | — | — | — | (550,354) |
| | 220,243 | 197,351 | 306,357 | 24,369,989 |
| |
| Change in net unrealized appreciation (depreciation) of | | | | |
| Investments in unaffiliated issuers | 1,814,022 | 684,064 | 1,485,524 | 227,504,6582 |
| Investments in affiliated issuers | 1,423,104 | 544,351 | 1,218,547 | (17,996) |
| Translation of assets and liabilities in foreign currencies | — | — | — | 16,299 |
| | 3,237,126 | 1,228,415 | 2,704,071 | 227,502,961 |
| Net realized and unrealized gain (loss) | 3,457,369 | 1,425,766 | 3,010,428 | 251,872,950 |
| |
| Increase (decrease) in net assets from operations | $3,813,828 | $1,603,612 | $3,447,787 | $251,322,593 |
1 Net of India foreign taxes of $33,374.
2 Net of $440,927 decrease in deferred India foreign withholding taxes.
| |
| The accompanying notes are an integral part of the financial statements. | 322 |
John Hancock Funds II
Statements of Operations — February 28, 2011 (Unaudited)
| | | | |
| | Emerging | | | Global |
| | Markets | Equity-Income | Fundamental | Agribusiness |
| Investment income | Debt Fund | Fund | Value Fund | Fund |
|
| Interest | $551,793 | $67,525 | $553,111 | — |
| Dividends | 1,340 | 16,299,005 | 13,312,665 | $11,497 |
| Securities lending | — | 180,431 | 47,903 | — |
| Less foreign taxes withheld | (2,845) | (127,394) | (78,235) | (477) |
| Total investment income | 550,288 | 16,419,567 | 13,835,444 | 11,020 |
| |
| Expenses | | | | |
|
| Investment management fees (Note 5) | 57,465 | 5,050,666 | 5,835,068 | 12,198 |
| Class A distribution and service fees (Note 5) | 19,023 | — | — | 2,143 |
| Class 1 distribution and service fees (Note 5) | — | 41,720 | — | — |
| Transfer agent fees (Note 5) | 12,116 | — | — | 1,653 |
| Accounting and legal services fees (Note 5) | 1,145 | 92,614 | 110,634 | 205 |
| State registration fees (Note 5) | — | — | — | 451 |
| Professional fees | 26,783 | 24,332 | 24,699 | 20,065 |
| Printing and postage | 201 | — | — | 34 |
| Custodian fees | 6,719 | 91,736 | 176,748 | 6,440 |
| Trustees’ fees (Note 5) | 76 | 5,646 | 7,356 | 11 |
| Registration and filing fees | 885 | 3,706 | 1,780 | 3,272 |
| Other | 852 | 6,197 | 11,013 | 1,278 |
| Total expenses before reductions and amounts recaptured | 125,265 | 5,316,617 | 6,167,298 | 47,750 |
| Net expense reductions and amounts recaptured (Note 5) | (25,713) | (205,837) | (16,138) | (30,185) |
| Total expenses | 99,552 | 5,110,780 | 6,151,160 | 17,565 |
| Net investment income (loss) | 450,736 | 11,308,787 | 7,684,284 | (6,545) |
| |
| Realized and unrealized gain (loss) | | | | |
|
| Net realized gain (loss) on | | | | |
| Investments in unaffiliated issuers | 274,560 | 13,950,642 | 20,465,728 | 42,779 |
| Investments in affiliated issuers | — | (46,395) | — | — |
| Futures contracts | (7,108) | — | — | — |
| Foreign currency transactions | 13,477 | 3,799 | (19,347) | (372) |
| | 280,929 | 13,908,046 | 20,446,381 | 42,407 |
| |
| Change in net unrealized appreciation (depreciation) of | | | | |
| Investments in unaffiliated issuers | (75,352) | 274,601,776 | 308,607,609 | 702,251 |
| Investments in affiliated issuers | — | 4,728 | 3,006 | — |
| Futures contracts | (951) | — | — | — |
| Translation of assets and liabilities in foreign currencies | 23,341 | 1,367 | 4,192 | 8 |
| | (52,962) | 274,607,871 | 308,614,807 | 702,259 |
| Net realized and unrealized gain (loss) | 227,967 | 288,515,917 | 329,061,188 | 744,666 |
| |
| Increase (decrease) in net assets from operations | $678,703 | $299,824,704 | $336,745,472 | $738,121 |
| |
| The accompanying notes are an integral part of the financial statements. | 323 |
John Hancock Funds II
Statements of Operations — February 28, 2011 (Unaudited)
| | | | |
| | | Global | Global | Global |
| | Global | Infrastructure | Real Estate | Timber |
| Investment income | Bond Fund | Fund | Fund | Fund |
|
| Interest | $12,437,308 | — | $146 | — |
| Dividends | 2,616 | $38,879 | 7,808,918 | $31,337 |
| Securities lending | — | — | 58,100 | — |
| Less foreign taxes withheld | — | (2,784) | (482,200) | (1,220) |
| Total investment income | 12,439,924 | 36,095 | 7,384,964 | 30,117 |
| |
| Expenses | | | | |
|
| Investment management fees (Note 5) | 3,026,738 | 10,399 | 2,240,584 | 11,941 |
| Class A distribution and service fees (Note 5) | — | 1,827 | — | 2,098 |
| Class 1 distribution and service fees (Note 5) | 19,139 | — | — | — |
| Transfer agent fees (Note 5) | — | 1,408 | — | 1,616 |
| Accounting and legal services fees (Note 5) | 62,122 | 176 | 35,511 | 201 |
| State registration fees (Note 5) | — | 451 | — | 451 |
| Professional fees | 38,607 | 20,064 | 29,351 | 19,932 |
| Printing and postage | — | 29 | — | 34 |
| Custodian fees | 330,548 | 5,267 | 203,191 | 5,613 |
| Trustees’ fees (Note 5) | 4,169 | 9 | 2,217 | 11 |
| Registration and filing fees | 6,447 | 3,281 | 4,666 | 3,323 |
| Other | 5,472 | 1,258 | 3,560 | 1,270 |
| Total expenses before reductions and amounts recaptured | 3,493,242 | 44,169 | 2,519,080 | 46,490 |
| Net expense reductions and amounts recaptured (Note 5) | (9,042) | (29,194) | (5,176) | (29,295) |
| Total expenses | 3,484,200 | 14,975 | 2,513,904 | 17,195 |
| Net investment income (loss) | 8,955,724 | 21,120 | 4,871,060 | 12,922 |
| |
| Realized and unrealized gain (loss) | | | | |
|
| Net realized gain (loss) on | | | | |
| Investments in unaffiliated issuers | (9,726,136) | (12,818) | 31,583,447 | 37,958 |
| Investments in affiliated issuers | — | — | (4,318) | — |
| Futures contracts | (3,898,904) | — | — | — |
| Written options | 2,439,487 | — | — | — |
| Swap contracts | (395,522) | — | — | — |
| Foreign currency transactions | 20,889,265 | (168) | 208,074 | (1,336) |
| | 9,308,190 | (12,986) | 31,787,203 | 36,622 |
| |
| Change in net unrealized appreciation (depreciation) of | | | | |
| Investments in unaffiliated issuers | 16,713,328 | 518,927 | 51,463,953 | 563,359 |
| Investments in affiliated issuers | — | — | (5,735) | — |
| Futures contracts | (3,688,198) | — | — | — |
| Written options | 1,799,733 | — | — | — |
| Swap contracts | (4,951,446) | — | — | — |
| Translation of assets and liabilities in foreign currencies | (11,888,923) | 50 | 62,047 | 20 |
| | (2,015,506) | 518,977 | 51,520,265 | 563,379 |
| Net realized and unrealized gain (loss) | 7,292,684 | 505,991 | 83,307,468 | 600,001 |
| |
| Increase (decrease) in net assets from operations | $16,248,408 | $527,111 | $88,178,528 | $612,923 |
| |
| The accompanying notes are an integral part of the financial statements. | 324 |
John Hancock Funds II
Statements of Operations — February 28, 2011 (Unaudited)
| | | | |
| | Heritage | High | High | Index |
| Investment income | Fund | Income Fund | Yield Fund | 500 Fund |
|
| Interest | $911 | $19,846,125 | $36,411,294 | $26,651 |
| Dividends | 720,507 | 1,854,814 | 765,247 | 20,688,573 |
| Securities lending | 103,211 | — | 3,074 | 103,586 |
| Less foreign taxes withheld | (586) | — | — | — |
| Total investment income | 824,043 | 21,700,939 | 37,179,615 | 20,818,810 |
| |
| Expenses | | | | |
|
| Investment management fees (Note 5) | 974,357 | 1,821,592 | 2,854,909 | 4,717,782 |
| Class 1 distribution and service fees (Note 5) | — | — | 22,849 | — |
| Accounting and legal services fees (Note 5) | 16,473 | 38,834 | 61,438 | 146,918 |
| Professional fees | 14,883 | 26,677 | 27,881 | 29,248 |
| Custodian fees | 23,685 | 32,946 | 80,705 | 5,970 |
| Trustees’ fees (Note 5) | 1,192 | 2,697 | 4,745 | 10,254 |
| Registration and filing fees | 1,482 | 2,549 | 1,661 | 1,772 |
| Other | 2,963 | 3,544 | 10,610 | 11,657 |
| Total expenses before reductions and amounts recaptured | 1,035,035 | 1,928,839 | 3,064,798 | 4,923,601 |
| Net expense reductions and amounts recaptured (Note 5) | (2,397) | (5,569) | (8,822) | (21,501) |
| Total expenses | 1,032,638 | 1,923,270 | 3,055,976 | 4,902,100 |
| Net investment income (loss) | (208,595) | 19,777,669 | 34,123,639 | 15,916,710 |
| |
| Realized and unrealized gain (loss) | | | | |
|
| Net realized gain (loss) on | | | | |
| Investments in unaffiliated issuers | 16,658,569 | 18,219,350 | 22,486,677 | 10,379,060 |
| Investments in affiliated issuers | (691) | — | (728) | (7,723) |
| Futures contracts | 162,049 | — | (1,214,881) | 6,094,915 |
| Foreign currency transactions | (123,478) | (212,828) | (18,296) | — |
| | 16,696,449 | 18,006,522 | 21,252,772 | 16,466,252 |
| |
| Change in net unrealized appreciation (depreciation) of | | | | |
| Investments in unaffiliated issuers | 52,822,047 | 42,587,291 | 43,074,761 | 449,791,151 |
| Investments in affiliated issuers | (13,309) | — | 85 | (14,212) |
| Futures contracts | 16,507 | — | 100,125 | 5,249,645 |
| Translation of assets and liabilities in foreign currencies | (25,419) | (106,491) | (334,246) | — |
| | 52,799,826 | 42,480,800 | 42,840,725 | 455,026,584 |
| Net realized and unrealized gain (loss) | 69,496,275 | 60,487,322 | 64,093,497 | 471,492,836 |
| |
| Increase (decrease) in net assets from operations | $69,287,680 | $80,264,991 | $98,217,136 | $487,409,546 |
| |
| The accompanying notes are an integral part of the financial statements. | 325 |
John Hancock Funds II
Statements of Operations — February 28, 2011 (Unaudited)
| | | | |
| | International | International | International | International |
| | Equity | Growth | Opportunities | Small Cap |
| Investment income | Index Fund | Stock Fund1 | Fund | Fund |
|
| Interest | $15,983 | $13,363 | $2,674 | $25,748 |
| Dividends | 4,190,498 | 1,580,535 | 3,805,775 | 2,637,814 |
| Securities lending | 86,829 | — | — | 39,012 |
| Less foreign taxes withheld | (311,168) | (60,766) | (330,977) | (136,378) |
| Total investment income | 3,982,142 | 1,533,132 | 3,477,472 | 2,566,196 |
| |
| Expenses | | | | |
|
| Investment management fees (Note 5) | 1,151,399 | 580,418 | 3,355,991 | 1,683,182 |
| Class 1 distribution and service fees (Note 5) | — | — | 22,962 | 36,075 |
| Accounting and legal services fees (Note 5) | 30,940 | 10,103 | 55,038 | 23,945 |
| Professional fees | 18,831 | 16,795 | 22,612 | 17,957 |
| Custodian fees | 8,174 | 80,380 | 266,854 | 178,940 |
| Trustees’ fees (Note 5) | 2,129 | 388 | 4,131 | 1,502 |
| Registration and filing fees | 2,270 | 8,449 | 1,188 | 2,165 |
| Other | 2,881 | 1,152 | 4,934 | 2,468 |
| Total expenses before reductions and amounts recaptured | 1,216,624 | 697,685 | 3,733,710 | 1,946,234 |
| Net expense reductions and amounts recaptured (Note 5) | (4,540) | (1,515) | (7,917) | (3,499) |
| Total expenses | 1,212,084 | 696,170 | 3,725,793 | 1,942,735 |
| Net investment income (loss) | 2,770,058 | 836,962 | (248,321) | 623,461 |
| |
| Realized and unrealized gain (loss) | | | | |
|
| Net realized gain (loss) on | | | | |
| Investments in unaffiliated issuers | (699,739) | 148,643 | 87,157,476 | 9,423,547 |
| Investments in affiliated issuers | (2,319) | — | — | (558) |
| Capital gain distributions received from unaffiliated underlying funds | — | 111 | — | — |
| Futures contracts | 1,591,025 | — | — | — |
| Foreign currency transactions | 1,267,318 | 23,268 | (570,892) | 69,616 |
| | 2,156,285 | 172,022 | 86,586,584 | 9,492,605 |
| |
| Change in net unrealized appreciation (depreciation) of | | | | |
| Investments in unaffiliated issuers | 79,725,995 | 13,817,988 | 79,021,278 | 52,748,117 |
| Investments in affiliated issuers | (1,547) | — | — | (1,631) |
| Futures contracts | 1,196,618 | — | — | — |
| Translation of assets and liabilities in foreign currencies | 239,222 | 4,463 | 90,179 | 22,822 |
| | 81,160,288 | 13,822,451 | 79,111,457 | 52,769,308 |
| Net realized and unrealized gain (loss) | 83,316,573 | 13,994,473 | 165,698,041 | 62,261,913 |
| |
| Increase (decrease) in net assets from operations | $86,086,631 | $14,831,435 | $165,449,720 | $62,885,374 |
1 Period from 9-16-10 (inception date) to 2-28-11.
| |
| The accompanying notes are an integral part of the financial statements. | 326 |
John Hancock Funds II
Statements of Operations — February 28, 2011 (Unaudited)
| | | | |
| | International | | Investment | |
| | Small Company | International | Quality | Large Cap |
| Investment income | Fund | Value Fund | Bond Fund | Fund |
|
| Interest | $1,301 | $17,974 | $8,009,947 | $27,397 |
| Dividends | 1,645,831 | 10,667,597 | — | 2,611,015 |
| Securities lending | 68,056 | 308,248 | 364 | 26,697 |
| Less foreign taxes withheld | (106,696) | (675,142) | — | — |
| Total investment income | 1,608,492 | 10,318,677 | 8,010,311 | 2,665,109 |
| |
| Expenses | | | | |
|
| Investment management fees (Note 5) | 916,328 | 5,006,115 | 1,221,522 | 1,153,955 |
| Class 1 distribution and service fees (Note 5) | — | 72,114 | 18,289 | 10,850 |
| Accounting and legal services fees (Note 5) | 13,840 | 89,829 | 30,311 | 21,929 |
| Professional fees | 16,541 | 25,257 | 28,758 | 15,432 |
| Custodian fees | 95,082 | 594,968 | 36,477 | 15,504 |
| Trustees’ fees (Note 5) | 842 | 6,190 | 1,712 | 1,414 |
| Registration and filing fees | 754 | 31 | 6,766 | 1,565 |
| Other | 2,139 | 8,831 | 2,209 | 2,172 |
| Total expenses before reductions and amounts recaptured | 1,045,526 | 5,803,335 | 1,346,044 | 1,222,821 |
| Net expense reductions and amounts recaptured (Note 5) | (2,030) | (13,085) | (4,402) | (3,205) |
| Total expenses | 1,043,496 | 5,790,250 | 1,341,642 | 1,219,616 |
| Net investment income (loss) | 564,996 | 4,528,427 | 6,668,669 | 1,445,493 |
| |
| Realized and unrealized gain (loss) | | | | |
|
| Net realized gain (loss) on | | | | |
| Investments in unaffiliated issuers | 3,183,730 | 24,586,441 | 448,387 | 14,299,104 |
| Investments in affiliated issuers | (648) | (8,289) | — | (5,830) |
| Futures contracts | — | — | 515,116 | — |
| Swap contracts | — | — | (48,245) | — |
| Foreign currency transactions | 56,597 | 98,697 | (626,456) | — |
| | 3,239,679 | 24,676,849 | 288,802 | 14,293,274 |
| |
| Change in net unrealized appreciation (depreciation) of | | | | |
| Investments in unaffiliated issuers | 43,551,689 | 254,110,007 | (13,951,887) | 54,685,205 |
| Investments in affiliated issuers | (936) | (5,424) | 29 | (4,194) |
| Futures contracts | — | — | 348,422 | — |
| Swap contracts | — | — | 573,041 | — |
| Translation of assets and liabilities in foreign currencies | 13,152 | 108,601 | (97,320) | — |
| | 43,563,905 | 254,213,184 | (13,127,715) | 54,681,011 |
| Net realized and unrealized gain (loss) | 46,803,584 | 278,890,033 | (12,838,913) | 68,974,285 |
| |
| Increase (decrease) in net assets from operations | $47,368,580 | $283,418,460 | ($6,170,244) | $70,419,778 |
| |
| The accompanying notes are an integral part of the financial statements. | 327 |
John Hancock Funds II
Statements of Operations — February 28, 2011 (Unaudited)
| | | | |
| | | Mid Cap | | |
| | Large Cap | Growth | Mid Cap | Mid Cap |
| Investment income | Value Fund | Index Fund | Index Fund | Stock Fund |
|
| Interest | $1,896 | $645 | $50,354 | $22,338 |
| Dividends | 4,288,296 | 256,794 | 2,535,735 | 2,577,610 |
| Securities lending | 24,745 | 9,997 | 99,097 | 291,633 |
| Less foreign taxes withheld | (2,006) | (87) | — | (38,871) |
| Total investment income | 4,312,931 | 267,349 | 2,685,186 | 2,852,710 |
| |
| Expenses | | | | |
|
| Investment management fees (Note 5) | 1,588,563 | 151,417 | 729,130 | 3,963,145 |
| Class 1 distribution and service fees (Note 5) | 20,583 | 179 | — | 85,010 |
| Accounting and legal services fees (Note 5) | 30,927 | 4,126 | 22,383 | 68,186 |
| Professional fees | 19,061 | 14,162 | 15,530 | 20,671 |
| Custodian fees | 5,676 | 5,970 | 6,591 | 118,958 |
| Trustees’ fees (Note 5) | 2,528 | 249 | 1,745 | 4,299 |
| Registration and filing fees | 46 | 1,097 | 1,524 | 1,623 |
| Other | 3,450 | 1,060 | 3,000 | 5,013 |
| Total expenses before reductions and amounts recaptured | 1,670,834 | 178,260 | 779,903 | 4,266,905 |
| Net expense reductions and amounts recaptured (Note 5) | (19,261) | (5,512) | (3,260) | (9,990) |
| Total expenses | 1,651,573 | 172,748 | 776,643 | 4,256,915 |
| Net investment income (loss) | 2,661,358 | 94,601 | 1,908,543 | (1,404,205) |
| |
| Realized and unrealized gain (loss) | | | | |
|
| Net realized gain (loss) on | | | | |
| Investments in unaffiliated issuers | 62,923,398 | 1,331,826 | 18,623,324 | 112,497,564 |
| Investments in affiliated issuers | 1,018 | (2,231) | (2,221) | (22,395) |
| Futures contracts | — | (140) | 1,238,919 | — |
| Foreign currency transactions | 6,999 | — | — | (1,454,119) |
| | 62,931,415 | 1,329,455 | 19,860,022 | 111,021,050 |
| |
| Change in net unrealized appreciation (depreciation) of | | | | |
| Investments in unaffiliated issuers | 42,436,690 | 16,431,324 | 69,423,700 | 183,290,582 |
| Investments in affiliated issuers | (17,431) | 47 | (20,765) | (39,879) |
| Futures contracts | — | 62,980 | 694,283 | — |
| Translation of assets and liabilities in foreign currencies | 35 | — | — | 32,505 |
| | 42,419,294 | 16,494,351 | 70,097,218 | 183,283,208 |
| Net realized and unrealized gain (loss) | 105,350,709 | 17,823,806 | 89,957,240 | 294,304,258 |
| |
| Increase (decrease) in net assets from operations | $108,012,067 | $17,918,407 | $91,865,783 | $292,900,053 |
| |
| The accompanying notes are an integral part of the financial statements. | 328 |
John Hancock Funds II
Statements of Operations — February 28, 2011 (Unaudited)
| | | | |
| | Mid Cap Value | Mid Cap Value | Mid Value | Mutual |
| Investment income | Equity Fund | Index Fund | Fund | Shares Fund1 |
|
| Interest | $6,904 | $933 | $192,883 | $60,496 |
| Dividends | 1,443,606 | 708,844 | 3,831,302 | 2,629,638 |
| Securities lending | 41,726 | 6,191 | 196,958 | 21,963 |
| Less foreign taxes withheld | (8,159) | — | (11,476) | (70,386) |
| Total investment income | 1,484,077 | 715,968 | 4,209,667 | 2,641,711 |
| |
| Expenses | | | | |
|
| Investment management fees (Note 5) | 769,568 | 151,210 | 2,335,120 | 1,279,486 |
| Class 1 distribution and service fees (Note 5) | — | 278 | — | — |
| Accounting and legal services fees (Note 5) | 12,731 | 4,109 | 33,450 | 19,487 |
| Professional fees | 14,416 | 14,173 | 19,967 | 20,091 |
| Custodian fees | 14,999 | 5,970 | 38,988 | 68,238 |
| Trustees’ fees (Note 5) | 864 | 249 | 2,091 | 719 |
| Registration and filing fees | 1,436 | 1,184 | 3,409 | 15,212 |
| Other | 1,927 | 903 | 2,830 | 1,235 |
| Total expenses before reductions and amounts recaptured | 815,941 | 178,076 | 2,435,855 | 1,404,468 |
| Net expense reductions and amounts recaptured (Note 5) | (1,859) | (5,623) | (120,101) | (2,929) |
| Total expenses | 814,082 | 172,453 | 2,315,754 | 1,401,539 |
| Net investment income (loss) | 669,995 | 543,515 | 1,893,913 | 1,240,172 |
| |
| Realized and unrealized gain (loss) | | | | |
|
| Net realized gain (loss) on | | | | |
| Investments in unaffiliated issuers | 11,119,750 | 494,286 | 14,527,610 | 2,895,411 |
| Investments in affiliated issuers | (1,971) | (1,238) | (13,654) | (1,940) |
| Futures contracts | — | 114,312 | — | — |
| Foreign currency transactions | (428) | — | (137) | 215,921 |
| | 11,117,351 | 607,360 | 14,513,819 | 3,109,392 |
| |
| Change in net unrealized appreciation (depreciation) of | | | | |
| Investments in unaffiliated issuers | 35,896,462 | 12,934,849 | 94,078,236 | 34,320,765 |
| Investments in affiliated issuers | (6,921) | (9) | (20,520) | 466 |
| Futures contracts | — | 158,735 | — | — |
| Translation of assets and liabilities in foreign currencies | 875 | — | — | (1,743,412) |
| | 35,890,416 | 13,093,575 | 94,057,716 | 32,577,819 |
| Net realized and unrealized gain (loss) | 47,007,767 | 13,700,935 | 108,571,535 | 35,687,211 |
| |
| Increase (decrease) in net assets from operations | $47,677,762 | $14,244,450 | $110,465,448 | $36,927,383 |
1 Period from 9-16-10 (inception date) to 2-28-11.
| |
| The accompanying notes are an integral part of the financial statements. | 329 |
John Hancock Funds II
Statements of Operations — February 28, 2011 (Unaudited)
| | | | |
| | Optimized | Real Estate | Real Estate | Real Return |
| Investment income | Value Fund | Equity Fund | Securities Fund | Bond Fund |
|
| Interest | $271 | $141,042 | $598,897 | $11,562,568 |
| Dividends | 4,927,590 | 5,534,793 | 6,473,856 | 18,750 |
| Securities lending | — | 55,941 | 86,775 | — |
| Less foreign taxes withheld | (108,462) | — | (8,441) | — |
| Total investment income | 4,819,399 | 5,731,776 | 7,151,087 | 11,581,318 |
| |
| Expenses | | | | |
|
| Investment management fees (Note 5) | 1,232,548 | 1,476,962 | 1,389,334 | 3,005,743 |
| Class 1 distribution and service fees (Note 5) | 11,594 | — | 99,238 | 23,900 |
| Accounting and legal services fees (Note 5) | 25,440 | 24,432 | 28,519 | 61,942 |
| Professional fees | 14,609 | 16,978 | 16,435 | 32,315 |
| Custodian fees | 5,648 | 20,175 | 31,789 | 86,843 |
| Trustees’ fees (Note 5) | 1,651 | 1,541 | 1,851 | 5,255 |
| Registration and filing fees | 3,177 | 1,763 | 2,405 | 1,713 |
| Other | 2,724 | 2,314 | 2,334 | 8,566 |
| Total expenses before reductions and amounts recaptured | 1,297,391 | 1,544,165 | 1,571,905 | 3,226,277 |
| Net expense reductions and amounts recaptured (Note 5) | (3,726) | (67,274) | (4,163) | (8,899) |
| Total expenses | 1,293,665 | 1,476,891 | 1,567,742 | 3,217,378 |
| Net investment income (loss) | 3,525,734 | 4,254,885 | 5,583,345 | 8,363,940 |
| |
| Realized and unrealized gain (loss) | | | | |
|
| Net realized gain (loss) on | | | | |
| Investments in unaffiliated issuers | 63,179,647 | 8,711,693 | 20,320,569 | 43,365,568 |
| Investments in affiliated issuers | — | (8,919) | (9,322) | — |
| Futures contracts | — | — | — | 450,699 |
| Written options | — | — | — | 1,808,887 |
| Swap contracts | — | — | — | (3,026,022) |
| Foreign currency transactions | 1,141 | — | — | (2,106,339) |
| | 63,180,788 | 8,702,774 | 20,311,247 | 40,492,793 |
| |
| Change in net unrealized appreciation (depreciation) of | | | | |
| Investments in unaffiliated issuers | 21,091,833 | 54,803,532 | 57,899,909 | (31,553,935) |
| Investments in affiliated issuers | — | (15,245) | (15,863) | — |
| Futures contracts | — | — | — | (536,113) |
| Written options | — | — | — | 1,707,648 |
| Swap contracts | — | — | — | 450,231 |
| Translation of assets and liabilities in foreign currencies | — | — | — | (1,785,046) |
| | 21,091,833 | 54,788,287 | 57,884,046 | (31,717,215) |
| Net realized and unrealized gain (loss) | 84,272,621 | 63,491,061 | 78,195,293 | 8,775,578 |
| |
| Increase (decrease) in net assets from operations | $87,798,355 | $67,745,946 | $83,778,638 | $17,139,518 |
| |
| The accompanying notes are an integral part of the financial statements. | 330 |
John Hancock Funds II
Statements of Operations — February 28, 2011 (Unaudited)
| | | | |
| | Retirement | Retirement | Retirement | Retirement |
| | 2010 | 2015 | 2020 | 2025 |
| Investment income | Portfolio | Portfolio | Portfolio | Portfolio |
|
| Income distributions received from affiliated underlying funds | $33,459 | $52,483 | $65,888 | $115,454 |
| Total investment income | 33,459 | 52,483 | 65,888 | 115,454 |
| |
| Expenses | | | | |
|
| Investment management fees (Note 5) | 953 | 1,244 | 1,652 | 2,241 |
| Class 1 distribution and service fees (Note 5) | 795 | 1,037 | 1,377 | 1,867 |
| Accounting and legal services fees (Note 5) | 171 | 237 | 311 | 434 |
| Professional fees | 14,320 | 14,320 | 14,333 | 14,356 |
| Custodian fees | 5,970 | 5,970 | 5,970 | 5,970 |
| Trustees’ fees (Note 5) | 2 | 2 | 2 | 4 |
| Registration and filing fees | 910 | 972 | 1,045 | 1,104 |
| Other | 481 | 481 | 481 | 482 |
| Total expenses before reductions and amounts recaptured | 23,602 | 24,263 | 25,171 | 26,458 |
| Net expense reductions and amounts recaptured (Note 5) | (21,060) | (20,946) | (20,766) | (20,482) |
| Total expenses | 2,542 | 3,317 | 4,405 | 5,976 |
| Net investment income (loss) | 30,917 | 49,166 | 61,483 | 109,478 |
| |
| Realized and unrealized gain (loss) | | | | |
|
| Net realized gain (loss) on | | | | |
| Investments in affiliated issuers | (56,857) | (29,169) | (23,128) | (35,221) |
| Capital gain distributions received from unaffiliated underlying funds | 39,001 | 47,012 | 41,842 | 48,821 |
| | (17,856) | 17,843 | 18,714 | 13,600 |
| |
| Change in net unrealized appreciation (depreciation) of | | | | |
| Investments in affiliated issuers | 74,606 | 147,256 | 376,168 | 672,078 |
| | 74,606 | 147,256 | 376,168 | 672,078 |
| Net realized and unrealized gain (loss) | 56,750 | 165,099 | 394,882 | 685,678 |
| |
| Increase (decrease) in net assets from operations | $87,667 | $214,265 | $456,365 | $795,156 |
| |
| The accompanying notes are an integral part of the financial statements. | 331 |
John Hancock Funds II
Statements of Operations — February 28, 2011 (Unaudited)
| | | | |
| | Retirement | Retirement | Retirement | Retirement |
| | 2030 | 2035 | 2040 | 2045 |
| Investment income | Portfolio | Portfolio | Portfolio | Portfolio |
|
| Income distributions received from affiliated underlying funds | $77,809 | $65,131 | $30,554 | $24,660 |
| Total investment income | 77,809 | 65,131 | 30,554 | 24,660 |
| |
| Expenses | | | | |
|
| Investment management fees (Note 5) | 1,446 | 1,255 | 643 | 597 |
| Class 1 distribution and service fees (Note 5) | 1,205 | 1,046 | 536 | 498 |
| Accounting and legal services fees (Note 5) | 279 | 244 | 122 | 113 |
| Professional fees | 14,429 | 14,260 | 14,265 | 14,265 |
| Custodian fees | 5,970 | 5,970 | 5,970 | 5,970 |
| Trustees’ fees (Note 5) | 2 | 2 | 2 | 2 |
| Registration and filing fees | 964 | 918 | 796 | 782 |
| Other | 480 | 483 | 482 | 481 |
| Total expenses before reductions and amounts recaptured | 24,775 | 24,178 | 22,816 | 22,708 |
| Net expense reductions and amounts recaptured (Note 5) | (20,921) | (20,831) | (21,099) | (21,115) |
| Total expenses | 3,854 | 3,347 | 1,717 | 1,593 |
| Net investment income (loss) | 73,955 | 61,784 | 28,837 | 23,067 |
| |
| Realized and unrealized gain (loss) | | | | |
|
| Net realized gain (loss) on | | | | |
| Investments in affiliated issuers | (3,973) | (6,355) | (2,074) | (245) |
| Capital gain distributions received from unaffiliated underlying funds | 24,553 | 16,879 | 7,086 | 5,716 |
| | 20,580 | 10,524 | 5,012 | 5,471 |
| |
| Change in net unrealized appreciation (depreciation) of | | | | |
| Investments in affiliated issuers | 504,269 | 493,091 | 259,621 | 241,833 |
| | 504,269 | 493,091 | 259,621 | 241,833 |
| Net realized and unrealized gain (loss) | 524,849 | 503,615 | 264,633 | 247,304 |
| |
| Increase (decrease) in net assets from operations | $598,804 | $565,399 | $293,470 | $270,371 |
| |
| The accompanying notes are an integral part of the financial statements. | 332 |
John Hancock Funds II
Statements of Operations — February 28, 2011 (Unaudited)
| | | | |
| | Short Term | | | Small Cap |
| | Government | Small Cap | Small Cap | Opportunities |
| Investment income | Income Fund | Growth Fund | Index Fund | Fund |
|
| Interest | $1,195,690 | $3,404 | $12,878 | $110,660 |
| Dividends | — | 307,262 | 590,161 | 1,080,164 |
| Securities lending | — | 48,213 | 46,832 | 43,831 |
| Less foreign taxes withheld | — | (1,400) | (48) | (4,071) |
| Total investment income | 1,195,690 | 357,479 | 649,823 | 1,230,584 |
| |
| Expenses | | | | |
|
| Investment management fees (Note 5) | 355,624 | 926,549 | 197,587 | 916,930 |
| Class 1 distribution and service fees (Note 5) | — | — | — | 14,935 |
| Accounting and legal services fees (Note 5) | 9,210 | 12,556 | 5,981 | 13,162 |
| Professional fees | 24,992 | 17,655 | 13,668 | 14,477 |
| Custodian fees | 11,959 | 15,698 | 5,970 | 19,782 |
| Trustees’ fees (Note 5) | 697 | 773 | 460 | 720 |
| Registration and filing fees | 1,314 | 1,820 | 1,421 | 1,745 |
| Other | 1,638 | 1,651 | 1,363 | 1,902 |
| Total expenses before reductions and amounts recaptured | 405,434 | 976,702 | 226,450 | 983,653 |
| Net expense reductions and amounts recaptured (Note 5) | 332 | (1,840) | (875) | (80,489) |
| Total expenses | 405,766 | 974,862 | 225,575 | 903,164 |
| Net investment income (loss) | 789,924 | (617,383) | 424,248 | 327,420 |
| |
| Realized and unrealized gain (loss) | | | | |
|
| Net realized gain (loss) on | | | | |
| Investments in unaffiliated issuers | 529,719 | 17,574,582 | 2,469,582 | 5,655,438 |
| Investments in affiliated issuers | — | (1,994) | (824) | (2,765) |
| Futures contracts | — | — | 556,752 | — |
| Foreign currency transactions | — | — | 1,602 | (86) |
| | 529,719 | 17,572,588 | 3,027,112 | 5,652,587 |
| |
| Change in net unrealized appreciation (depreciation) of | | | | |
| Investments in unaffiliated issuers | (1,701,942) | 41,130,785 | 21,889,275 | 56,417,632 |
| Investments in affiliated issuers | — | 1,793 | (2,114) | (3,490) |
| Futures contracts | — | — | 291,171 | — |
| Translation of assets and liabilities in foreign currencies | — | — | 165 | — |
| | (1,701,942) | 41,132,578 | 22,178,497 | 56,414,142 |
| Net realized and unrealized gain (loss) | (1,172,223) | 58,705,166 | 25,205,609 | 62,066,729 |
| |
| Increase (decrease) in net assets from operations | ($382,299) | $58,087,783 | $25,629,857 | $62,394,149 |
| |
| The accompanying notes are an integral part of the financial statements. | 333 |
John Hancock Funds II
Statements of Operations — February 28, 2011 (Unaudited)
| | | | |
| | Small Cap | Small Company | Small Company | Smaller Company |
| Investment income | Value Fund | Growth Fund | Value Fund | Growth Fund |
|
| Interest | $4,452 | $2,266 | $10,806 | $999 |
| Dividends | 1,616,788 | 408,738 | 3,395,053 | 313,222 |
| Securities lending | 16,130 | 31,313 | 83,061 | 57,104 |
| Less foreign taxes withheld | — | (4,521) | (1,972) | (238) |
| Total investment income | 1,637,370 | 437,796 | 3,486,948 | 371,087 |
| |
| Expenses | | | | |
|
| Investment management fees (Note 5) | 801,335 | 685,261 | 2,101,755 | 725,402 |
| Class 1 distribution and service fees (Note 5) | — | — | 29,162 | — |
| Accounting and legal services fees (Note 5) | 11,002 | 9,779 | 29,357 | 9,771 |
| Professional fees | 17,493 | 14,089 | 16,212 | 17,356 |
| Custodian fees | 14,061 | 11,810 | 32,141 | 13,970 |
| Trustees’ fees (Note 5) | 647 | 666 | 1,928 | 727 |
| Registration and filing fees | 1,797 | 1,455 | 1,909 | 2,255 |
| Other | 1,468 | 1,993 | 3,109 | 1,834 |
| Total expenses before reductions and amounts recaptured | 847,803 | 725,053 | 2,215,573 | 771,315 |
| Net expense reductions and amounts recaptured (Note 5) | 2,342 | (1,427) | (110,329) | (83,968) |
| Total expenses | 850,145 | 723,626 | 2,105,244 | 687,347 |
| Net investment income (loss) | 787,225 | (285,830) | 1,381,704 | (316,260) |
| |
| Realized and unrealized gain (loss) | | | | |
|
| Net realized gain (loss) on | | | | |
| Investments in unaffiliated issuers | 4,729,696 | 8,908,771 | 9,672,631 | 12,565,086 |
| Investments in affiliated issuers | (2,337) | (1,009) | (5,146) | (3,858) |
| Futures contracts | — | — | — | 168,504 |
| Foreign currency transactions | — | (279) | 57 | 4 |
| | 4,727,359 | 8,907,483 | 9,667,542 | 12,729,736 |
| |
| Change in net unrealized appreciation (depreciation) of | | | | |
| Investments in unaffiliated issuers | 32,536,900 | 34,167,381 | 107,437,314 | 29,913,243 |
| Investments in affiliated issuers | (974) | (7,646) | (18,507) | (1,667) |
| Futures contracts | — | — | — | 33,822 |
| | 32,535,926 | 34,159,735 | 107,418,807 | 29,945,398 |
| Net realized and unrealized gain (loss) | 37,263,285 | 43,067,218 | 117,086,349 | 42,675,134 |
| |
| Increase (decrease) in net assets from operations | $38,050,510 | $42,781,388 | $118,468,053 | $42,358,874 |
| |
| The accompanying notes are an integral part of the financial statements. | 334 |
John Hancock Funds II
Statements of Operations — February 28, 2011 (Unaudited)
| | | | |
| | Spectrum | Total Bond | Total Return | U.S. High Yield |
| Investment income | Income Fund | Market Fund | Fund | Bond Fund |
|
| Interest | $20,733,350 | $9,117,704 | $30,484,789 | $25,505,443 |
| Dividends | 1,788,809 | — | 2,101,356 | — |
| Securities lending | 25,388 | 1,389 | — | 166 |
| Less foreign taxes withheld | (25,986) | (157) | — | — |
| Total investment income | 22,521,561 | 9,118,936 | 32,586,145 | 25,505,609 |
| |
| Expenses | | | | |
|
| Investment management fees (Note 5) | 3,381,440 | 1,128,631 | 7,561,913 | 2,337,929 |
| Class 1 distribution and service fees (Note 5) | — | — | 87,829 | 14,600 |
| Accounting and legal services fees (Note 5) | 66,232 | 32,903 | 160,864 | 46,289 |
| Professional fees | 35,165 | 19,134 | 45,966 | 25,947 |
| Custodian fees | 164,669 | 5,970 | 286,895 | 45,113 |
| Trustees’ fees (Note 5) | 4,463 | 2,515 | 10,954 | 3,560 |
| Registration and filing fees | 7,138 | 1,494 | 12,335 | 1,604 |
| Other | 5,611 | 3,640 | 11,432 | 4,854 |
| Total expenses before reductions and amounts recaptured | 3,664,718 | 1,194,287 | 8,178,188 | 2,479,896 |
| Net expense reductions and amounts recaptured (Note 5) | (125,850) | (4,786) | (23,240) | (6,639) |
| Total expenses | 3,538,868 | 1,189,501 | 8,154,948 | 2,473,257 |
| Net investment income (loss) | 18,982,693 | 7,929,435 | 24,431,197 | 23,032,352 |
| |
| Realized and unrealized gain (loss) | | | | |
|
| Net realized gain (loss) on | | | | |
| Investments in unaffiliated issuers | 11,343,597 | 7,723,643 | (2,951,129) | 17,183,962 |
| Investments in affiliated issuers | (7,404) | (805) | — | (22) |
| Capital gain distributions received from unaffiliated underlying funds | — | — | — | 137 |
| Futures contracts | (127,128) | — | 1,651,977 | — |
| Written options | — | — | 2,227,441 | — |
| Swap contracts | (73,546) | — | (5,297,133) | — |
| Foreign currency transactions | 402,510 | — | 1,061,403 | — |
| | 11,538,029 | 7,722,838 | (3,307,441) | 17,184,077 |
| |
| Change in net unrealized appreciation (depreciation) of | | | | |
| Investments in unaffiliated issuers | 21,282,508 | (21,163,579) | (24,355,930) | 10,680,555 |
| Investments in affiliated issuers | 507 | 146 | — | (103) |
| Futures contracts | 216,257 | — | (2,935,775) | — |
| Written options | — | — | 241,202 | — |
| Swap contracts | 89,416 | — | 1,264,341 | — |
| Translation of assets and liabilities in foreign currencies | (57,936) | — | 4,602,198 | — |
| | 21,530,752 | (21,163,433) | (21,183,964) | 10,680,452 |
| Net realized and unrealized gain (loss) | 33,068,781 | (13,440,595) | (24,491,405) | 27,864,529 |
| |
| Increase (decrease) in net assets from operations | $52,051,474 | ($5,511,160) | ($60,208) | $50,896,881 |
| |
| The accompanying notes are an integral part of the financial statements. | 335 |
John Hancock Funds II
Statements of Operations — February 28, 2011 (Unaudited)
| | | |
| | | | Value & |
| | U.S. Multi- | | Restructuring |
| Investment income | Sector Fund | Value Fund | Fund |
|
| Interest | $52,852 | $10,407 | $76,433 |
| Dividends | 11,132,537 | 1,475,272 | 6,323,267 |
| Securities lending | 137,762 | — | 56,114 |
| Less foreign taxes withheld | (109) | — | (59,032) |
| Total investment income | 11,323,042 | 1,485,679 | 6,396,782 |
| |
| Expenses | | | |
|
| Investment management fees (Note 5) | 3,872,362 | 646,726 | 2,376,295 |
| Accounting and legal services fees (Note 5) | 73,185 | 12,604 | 41,995 |
| Professional fees | 21,146 | 14,407 | 19,236 |
| Custodian fees | 67,781 | 15,686 | 33,759 |
| Trustees’ fees (Note 5) | 4,985 | 791 | 2,884 |
| Registration and filing fees | 1,680 | 2,528 | 349 |
| Other | 6,363 | 2,064 | 4,429 |
| Total expenses before reductions and amounts recaptured | 4,047,502 | 694,806 | 2,478,947 |
| Net expense reductions and amounts recaptured (Note 5) | (10,659) | (1,847) | (6,132) |
| Total expenses | 4,036,843 | 692,959 | 2,472,815 |
| Net investment income (loss) | 7,286,199 | 792,720 | 3,923,967 |
| |
| Realized and unrealized gain (loss) | | | |
|
| Net realized gain (loss) on | | | |
| Investments in unaffiliated issuers | 40,599,632 | 6,675,456 | 12,139,748 |
| Investments in affiliated issuers | (9,038) | — | (748) |
| Capital gain distributions received from unaffiliated underlying funds | — | 92 | — |
| Futures contracts | 401,709 | — | — |
| Written options | — | — | (142,562) |
| Foreign currency transactions | — | — | (1,307) |
| | 40,992,303 | 6,675,548 | 11,995,131 |
| |
| Change in net unrealized appreciation (depreciation) of | | | |
| Investments in unaffiliated issuers | 143,329,520 | 38,693,187 | 145,186,541 |
| Investments in affiliated issuers | (745) | — | (12,703) |
| Futures contracts | 102,373 | — | — |
| Written options | — | — | (1,099,154) |
| Translation of assets and liabilities in foreign currencies | (4) | — | 328 |
| | 143,431,144 | 38,693,187 | 144,075,012 |
| Net realized and unrealized gain (loss) | 184,423,447 | 45,368,735 | 156,070,143 |
| |
| Increase (decrease) in net assets from operations | $191,709,646 | $46,161,455 | $159,994,110 |
| |
| The accompanying notes are an integral part of the financial statements. | 336 |
John Hancock Funds II
Statements of Changes in Net Assets
| | | | | | |
| | Active Bond Fund | All Cap Core Fund | All Cap Value Fund |
| | Six months | | Six months | | Six months | |
| | ended | | ended | | ended | |
| | 2/28/11 | Year ended | 2/28/11 | Year ended | 2/28/11 | Year ended |
| Increase (decrease) in net assets | (Unaudited) | 8/31/10 | (Unaudited) | 8/31/10 | (Unaudited) | 8/31/10 |
|
| From operations | | | | | | |
| Net investment income (loss) | $25,065,413 | $35,563,291 | $3,249,618 | $5,239,542 | $2,105,418 | $1,169,196 |
| Net realized gain (loss) | (1,605,280) | 7,149,820 | 60,791,032 | 47,636,602 | 23,742,517 | 38,118,902 |
| Change in net unrealized appreciation (depreciation) | 11,023,393 | 55,585,688 | 86,745,309 | (51,204,340) | 113,189,665 | (21,331,544) |
| Increase (decrease) in net assets resulting from | | | | | | |
| operations | 34,483,526 | 98,298,799 | 150,785,959 | 1,671,804 | 139,037,600 | 17,956,554 |
| Distributions to shareholders | | | | | | |
| From net investment income | | | | | | |
| Class 1 | (950,369) | (1,973,081) | — | — | (406,148) | (261,582) |
| Class NAV | (22,483,790) | (33,421,644) | (5,534,351) | (5,839,540) | (1,926,881) | (991,293) |
| From net realized gain | | | | | | |
| Class 1 | (118,801) | — | — | — | (4,560,545) | — |
| Class NAV | (3,002,949) | — | — | — | (19,502,202) | — |
| Total distributions | (26,555,909) | (35,394,725) | (5,534,351) | (5,839,540) | (26,395,776) | (1,252,875) |
| From Portfolio share transactions (Note 6) | 371,866,945 | 195,524,971 | 993,791 | 48,511,723 | 37,001,626 | 56,898,600 |
| Total increase (decrease) | 379,794,562 | 258,429,045 | 146,245,399 | 44,343,987 | 149,643,450 | 73,602,279 |
| |
| Net assets | | | | | | |
|
| Beginning of period | 831,308,007 | 572,878,962 | 516,134,883 | 471,790,896 | 421,518,213 | 347,915,934 |
| End of period | $1,211,102,569 | $831,308,007 | $662,380,282 | $516,134,883 | $571,161,663 | $421,518,213 |
| |
| Undistributed net investment income (loss) | $9,131,157 | $7,499,903 | $1,028,624 | $3,313,357 | $270,611 | $498,222 |
| |
| | Alpha Opportunities Fund | Blue Chip Growth Fund | Capital Appreciation Fund |
| | Six months | | Six months | | Six months | |
| | ended | | ended | | ended | |
| | 2/28/11 | Year ended | 2/28/11 | Year ended | 2/28/11 | Year ended |
| Increase (decrease) in net assets | (Unaudited) | 8/31/10 | (Unaudited) | 8/31/10 | (Unaudited) | 8/31/10 |
|
| From operations | | | | | | |
| Net investment income (loss) | $1,207,538 | $2,264,817 | $1,204,048 | $814,753 | $821,734 | $2,848,219 |
| Net realized gain (loss) | 141,920,284 | 137,162,936 | 52,615,626 | 23,181,731 | 36,555,292 | 49,264,607 |
| Change in net unrealized appreciation (depreciation) | 224,942,618 | (118,495,509) | 559,076,897 | 30,265,504 | 398,591,066 | (57,157,640) |
| Increase (decrease) in net assets resulting from | | | | | | |
| operations | 368,070,440 | 20,932,244 | 612,896,571 | 54,261,988 | 435,968,092 | (5,044,814) |
| Distributions to shareholders | | | | | | |
| From net investment income | | | | | | |
| Class 1 | — | — | (75,198) | (432,630) | (348,747) | (288,944) |
| Class NAV | (3,769,419) | (3,676,398) | (1,039,288) | (1,942,437) | (1,928,816) | (3,136,340) |
| From net realized gain | | | | | | |
| Class NAV | (134,059,130) | (66,318,614) | — | — | — | — |
| Total distributions | (137,828,549) | (69,995,012) | (1,114,486) | (2,375,067) | (2,277,563) | (3,425,284) |
| From Portfolio share transactions (Note 6) | 139,931,772 | 491,310,825 | (70,352,362) | 397,647,286 | (47,311,584) | 379,395,267 |
| Total increase (decrease) | 370,173,663 | 442,248,057 | 541,429,723 | 449,534,207 | 386,378,945 | 370,925,169 |
| |
| Net assets | | | | | | |
|
| Beginning of period | 1,112,844,508 | 670,596,451 | 1,864,458,117 | 1,414,923,910 | 1,515,283,746 | 1,144,358,577 |
| End of period | $1,483,018,171 | $1,112,844,508 | $2,405,887,840 | $1,864,458,117 | $1,901,662,691 | $1,515,283,746 |
| |
| Undistributed net investment income (loss) | ($1,771,148) | $790,733 | $89,562 | — | ($32,910) | $1,422,919 |
| |
| The accompanying notes are an integral part of the financial statements. | 337 |
John Hancock Funds II
Statements of Changes in Net Assets
| | | | | |
| | Capital | | | | |
| | Appreciation | | | Core Diversified Growth & |
| | Value Fund | Core Bond Fund | Income Portfolio |
| | Period | Six months | | Six months | |
| | ended | ended | | ended | |
| | 2/28/111 | 2/28/11 | Year ended | 2/28/11 | Year ended |
| Increase (decrease) in net assets | (Unaudited) | (Unaudited) | 8/31/10 | (Unaudited) | 8/31/10 |
|
| From operations | | | | | |
| Net investment income (loss) | $467,752 | $7,981,995 | $15,126,662 | $356,459 | $416,408 |
| Net realized gain (loss) | 1,329,510 | 938,445 | 29,631,961 | 220,243 | 715,208 |
| Change in net unrealized appreciation | | | | | |
| (depreciation) | 9,561,332 | (11,743,425) | 3,463,907 | 3,237,126 | (449,523) |
| Increase (decrease) in net assets resulting | | | | | |
| from operations | 11,358,594 | (2,822,985) | 48,222,530 | 3,813,828 | 682,093 |
| Distributions to shareholders | | | | | |
| From net investment income | | | | | |
| Class 1 | — | (226,837) | (443,812) | (462,491) | (340,744) |
| Class NAV | — | (10,099,350) | (17,692,398) | — | — |
| From net realized gain | | | | | |
| Class 1 | — | (577,656) | (83,670) | (857,384) | (62,472) |
| Class NAV | — | (26,451,013) | (3,027,045) | — | — |
| Total distributions | — | (37,354,856) | (21,246,925) | (1,319,875) | (403,216) |
| From Portfolio share transactions (Note 6) | 306,326,078 | 54,808,954 | 130,158,472 | 3,007,036 | 10,982,497 |
| Total increase (decrease) | 317,684,672 | 14,631,113 | 157,134,077 | 5,500,989 | 11,261,374 |
| |
| Net assets | | | | | |
|
| Beginning of period | — | 578,380,689 | 421,246,612 | 22,787,379 | 11,526,005 |
| End of period | $317,684,672 | $593,011,802 | $578,380,689 | $28,288,368 | $22,787,379 |
| |
| Undistributed net investment income (loss) | $467,752 | $550,948 | $2,895,140 | $64,374 | $170,406 |
| | | | | | |
| | | | | | Emerging Markets |
| | Core Fundamental | Core Global | Fund (formerly, Emerging |
| | Holdings Portfolio | Diversification Portfolio | Markets Value Fund) |
| | Six months | | Six months | | Six months | |
| | ended | | ended | | ended | |
| | 2/28/11 | Year ended | 2/28/11 | Year ended | 2/28/11 | Year ended |
| Increase (decrease) in net assets | (Unaudited) | 8/31/10 | (Unaudited) | 8/31/10 | (Unaudited) | 8/31/10 |
|
| From operations | | | | | | |
| Net investment income (loss) | $177,846 | $249,872 | $437,359 | $385,675 | ($550,357) | $9,956,636 |
| Net realized gain (loss) | 197,351 | 532,844 | 306,357 | 695,937 | 24,369,989 | 131,456,971 |
| Change in net unrealized appreciation (depreciation) | 1,228,415 | (250,022) | 2,704,071 | (679,126) | 227,502,961 | 72,761,876 |
| Increase (decrease) in net assets resulting from | | | | | | |
| operations | 1,603,612 | 532,694 | 3,447,787 | 402,486 | 251,322,593 | 214,175,483 |
| Distributions to shareholders | | | | | | |
| From net investment income | | | | | | |
| Class A | — | — | — | — | — | — |
| Class I | — | — | — | — | — | — |
| Class 1 | (233,043) | (222,294) | (538,849) | (287,130) | — | — |
| Class NAV | — | — | — | — | (14,994,978) | (9,182,920) |
| From net realized gain | | | | | | |
| Class A | — | — | — | — | — | — |
| Class I | — | — | — | — | — | — |
| Class 1 | (536,065) | (58,243) | (841,224) | (56,528) | — | — |
| Class NAV | — | — | — | — | (130,193,801) | (4,392,025) |
| Total distributions | (769,108) | (280,537) | (1,380,073) | (343,658) | (145,188,779) | (13,574,945) |
| From Portfolio share transactions (Note 6) | 207,386 | 3,848,167 | 3,839,973 | 16,519,823 | 460,183,788 | 352,276,490 |
| Total increase (decrease) | 1,041,890 | 4,100,324 | 5,907,687 | 16,578,651 | 566,317,602 | 552,877,028 |
| |
| Net assets | | | | | | |
|
| Beginning of period | 12,027,065 | 7,926,741 | 24,309,812 | 7,731,161 | 1,589,895,949 | 1,037,018,921 |
| End of period | $13,068,955 | $12,027,065 | $30,217,499 | $24,309,812 | $2,156,213,551 | $1,589,895,949 |
| |
| Undistributed net investment income (loss) | $44,076 | $99,273 | $58,106 | $159,596 | ($8,491,465) | $7,053,870 |
1 Period from 1-6-11 (inception date) to 2-28-11.
2 Period from 1-4-10 (inception date) to 8-31-10.
| |
| The accompanying notes are an integral part of the financial statements. | 338 |
John Hancock Funds II
Statements of Changes in Net Assets
| | | | | | |
| | Emerging Markets | | | | |
| | Debt Fund | Equity-Income Fund | Fundamental Value Fund |
| | Six months | | Six months | | Six months | |
| | ended | | ended | | ended | |
| | 2/28/11 | Period ended | 2/28/11 | Year ended | 2/28/11 | Year ended |
| Increase (decrease) in net assets | (Unaudited) | 8/31/102 | (Unaudited) | 8/31/10 | (Unaudited) | 8/31/101 |
|
| From operations | | | | | | |
| Net investment income (loss) | $450,736 | $510,253 | $11,308,787 | $17,176,429 | $7,684,284 | $10,620,739 |
| Net realized gain (loss) | 280,929 | 47,960 | 13,908,046 | 14,987,370 | 20,446,381 | (51,329,684) |
| Change in net unrealized appreciation (depreciation) | (52,962) | 828,443 | 274,607,871 | (11,228,176) | 308,614,807 | 109,541,395 |
| Increase (decrease) in net assets resulting from | | | | | | |
| operations | 678,703 | 1,386,656 | 299,824,704 | 20,935,623 | 336,745,472 | 68,832,450 |
| Distributions to shareholders | | | | | | |
| From net investment income | | | | | | |
| Class A | (427,026) | (452,224) | — | — | — | — |
| Class I | (114,241) | (120,500) | — | — | — | — |
| Class 1 | — | — | (2,465,568) | (2,722,683) | — | (800,100) |
| Class NAV | — | — | (16,945,130) | (13,892,855) | (17,266,770) | (11,591,001) |
| From net realized gain | | | | | | |
| Class A | (83,520) | — | — | — | — | — |
| Class I | (20,880) | — | — | — | — | — |
| Total distributions | (645,667) | (572,724) | (19,410,698) | (16,615,538) | (17,266,770) | (12,391,101) |
| From Portfolio share transactions (Note 6) | — | 15,000,000 | 31,185,459 | 344,899,695 | 553,603 | (108,338,440) |
| Total increase (decrease) | 33,036 | 15,813,932 | 311,599,465 | 349,219,780 | 320,032,305 | (51,897,091) |
| |
| Net assets | | | | | | |
|
| Beginning of period | 15,813,932 | — | 1,121,289,332 | 772,069,552 | 1,347,839,997 | 1,399,737,088 |
| End of period | $15,846,968 | $15,813,932 | $1,432,888,797 | $1,121,289,332 | $1,667,872,302 | $1,347,839,997 |
| |
| Undistributed net investment income (loss) | ($42,061) | $48,470 | $4,418,332 | $12,520,243 | ($3,420,248) | $6,162,238 |
| |
| | Global Agribusiness Fund | Global Bond Fund | Global Infrastructure Fund |
| | Six months | | Six months | | Six months | |
| | ended | | ended | | ended | |
| | 2/28/11 | Year ended | 2/28/11 | Year ended | 2/28/11 | Year ended |
| Increase (decrease) in net assets | (Unaudited) | 8/31/10 | (Unaudited) | 8/31/10 | (Unaudited) | 8/31/10 |
|
| From operations | | | | | | |
| Net investment income (loss) | ($6,545) | $21,886 | $8,955,724 | $17,445,851 | $21,120 | $58,916 |
| Net realized gain (loss) | 42,407 | 95,764 | 9,308,190 | 44,876,254 | (12,986) | 177,148 |
| Change in net unrealized appreciation (depreciation) | 702,259 | 29,646 | (2,015,506) | 26,000,650 | 518,977 | (152,049) |
| Increase (decrease) in net assets resulting from | | | | | | |
| operations | 738,121 | 147,296 | 16,248,408 | 88,322,755 | 527,111 | 84,015 |
| Distributions to shareholders | | | | | | |
| From net investment income | | | | | | |
| Class A | (2,924) | (11,987) | — | — | (19,514) | (12,312) |
| Class I | (6,460) | (14,626) | — | — | (22,911) | (14,707) |
| Class 1 | — | — | (4,180,633) | (5,497,480) | — | — |
| Class NAV | — | — | (45,203,206) | (54,530,728) | — | — |
| From net realized gain | | | | | | |
| Class A | (44,913) | (4,610) | — | — | (59,055) | — |
| Class I | (45,061) | (4,620) | — | — | (59,240) | — |
| Total distributions | (99,358) | (35,843) | (49,383,839) | (60,028,208) | (160,720) | (27,019) |
| From Portfolio share transactions (Note 6) | 99,358 | 35,843 | 133,528,429 | 131,751,056 | 160,720 | 27,019 |
| Total increase (decrease) | 738,121 | 147,296 | 100,392,998 | 160,045,603 | 527,111 | 84,015 |
| |
| Net assets | | | | | | |
|
| Beginning of period | 2,440,707 | 2,293,411 | 805,591,577 | 645,545,974 | 2,164,557 | 2,080,542 |
| End of period | $3,178,828 | $2,440,707 | $905,984,575 | $805,591,577 | $2,691,668 | $2,164,557 |
| |
| Undistributed net investment income (loss) | ($9,151) | $6,778 | ($17,817,513) | $22,610,602 | $19,296 | $40,601 |
1 Class 1 shares were terminated on 5-7-10.
| |
| The accompanying notes are an integral part of the financial statements. | 339 |
John Hancock Funds II
Statements of Changes in Net Assets
| | | | | | |
| | Global Real Estate Fund | Global Timber Fund | Heritage Fund |
| | Six months | | Six months | | Six months | |
| | ended | | ended | | ended | |
| | 2/28/11 | Year ended | 2/28/11 | Year ended | 2/28/11 | Year ended |
| Increase (decrease) in net assets | (Unaudited) | 8/31/10 | (Unaudited) | 8/31/10 | (Unaudited) | 8/31/10 |
|
| From operations | | | | | | |
| Net investment income (loss) | $4,871,060 | $6,423,167 | $12,922 | $65,263 | ($208,595) | ($939,848) |
| Net realized gain (loss) | 31,787,203 | 37,770,959 | 36,622 | 365,621 | 16,696,449 | 36,807,820 |
| Change in net unrealized appreciation (depreciation) | 51,520,265 | (6,366,200) | 563,379 | (230,492) | 52,799,826 | (15,338,642) |
| Increase (decrease) in net assets resulting from | | | | | | |
| operations | 88,178,528 | 37,827,926 | 612,923 | 200,392 | 69,287,680 | 20,529,330 |
| Distributions to shareholders | | | | | | |
| From net investment income | | | | | | |
| Class A | — | — | (20,068) | (1,900) | — | — |
| Class I | — | — | (26,090) | (3,083) | — | — |
| Class NAV | (18,000,655) | (12,096,501) | — | — | — | — |
| From net realized gain | | | | | | |
| Class A | — | — | (130,333) | — | — | — |
| Class I | — | — | (130,608) | — | — | — |
| Class NAV | — | — | — | — | (7,044,879) | — |
| Total distributions | (18,000,655) | (12,096,501) | (307,099) | (4,983) | (7,044,879) | — |
| From Portfolio share transactions (Note 6) | 10,494,109 | 152,546,046 | 307,099 | 4,984 | (29,794,789) | (28,364,311) |
| Total increase (decrease) | 80,671,982 | 178,277,471 | 612,923 | 200,393 | 32,448,012 | (7,834,981) |
| |
| Net assets | | | | | | |
|
| Beginning of period | 449,659,759 | 271,382,288 | 2,483,576 | 2,283,183 | 215,477,082 | 223,312,063 |
| End of period | $530,331,741 | $449,659,759 | $3,096,499 | $2,483,576 | $247,925,094 | $215,477,082 |
| |
| Undistributed net investment income (loss) | ($14,527,129) | ($1,397,534) | $4,585 | $37,821 | ($256,906) | ($48,311) |
| |
| | High Income Fund | High Yield Fund | Index 500 Fund |
| | Six months | | Six months | | Six months | |
| | ended | | ended | | ended | |
| | 2/28/11 | Year ended | 2/28/11 | Year ended | 2/28/11 | Year ended |
| Increase (decrease) in net assets | (Unaudited) | 8/31/10 | (Unaudited) | 8/31/10 | (Unaudited) | 8/31/10 |
|
| From operations | | | | | | |
| Net investment income (loss) | $19,777,669 | $49,095,101 | $34,123,639 | $94,557,591 | $15,916,710 | $31,638,132 |
| Net realized gain (loss) | 18,006,522 | (13,908,229) | 21,252,772 | (21,152,393) | 16,466,252 | (19,499,677) |
| Change in net unrealized appreciation (depreciation) | 42,480,800 | 113,429,765 | 42,840,725 | 130,083,060 | 455,026,584 | 67,894,441 |
| Increase (decrease) in net assets resulting from | | | | | | |
| operations | 80,264,991 | 148,616,637 | 98,217,136 | 203,488,258 | 487,409,546 | 80,032,896 |
| Distributions to shareholders | | | | | | |
| From net investment income | | | | | | |
| Class 1 | — | — | (3,748,971) | (7,242,355) | — | — |
| Class NAV | (20,755,934) | (58,474,637) | (34,416,973) | (99,722,018) | (31,475,841) | (37,125,883) |
| Total distributions | (20,755,934) | (58,474,637) | (38,165,944) | (106,964,373) | (31,475,841) | (37,125,883) |
| From Portfolio share transactions (Note 6) | (104,945,189) | 4,786,678 | (198,012,842) | (70,360,937) | (4,733,386) | (81,641,227) |
| Total increase (decrease) | (45,436,132) | 94,928,678 | (137,961,650) | 26,162,948 | 451,200,319 | (38,734,214) |
| |
| Net assets | | | | | | |
|
| Beginning of period | 509,261,429 | 414,332,751 | 991,519,211 | 965,356,263 | 1,818,362,535 | 1,857,096,749 |
| End of period | $463,825,297 | $509,261,429 | $853,557,561 | $991,519,211 | $2,269,562,854 | $1,818,362,535 |
| |
| Undistributed net investment income (loss) | $288,398 | $1,266,663 | $10,587,602 | $14,629,907 | $5,583,199 | $21,142,330 |
| |
| The accompanying notes are an integral part of the financial statements. | 340 |
John Hancock Funds II
Statements of Changes in Net Assets
| | | | | |
| | | | International | | |
| | International Equity | Growth Stock | International |
| | Index Fund | Fund | Opportunities Fund |
| | Six months | | Period | Six months | |
| | ended | | ended | ended | |
| | 2/28/11 | Year ended | 2/28/111 | 2/28/11 | Year ended |
| Increase (decrease) in net assets | (Unaudited) | 8/31/10 | (Unaudited) | (Unaudited) | 8/31/10 |
|
| From operations | | | | | |
| Net investment income (loss) | $2,770,058 | $8,333,152 | $836,962 | ($248,321) | $7,769,055 |
| Net realized gain (loss) | 2,156,285 | (12,469,222) | 172,022 | 86,586,584 | 33,926,537 |
| Change in net unrealized appreciation | | | | | |
| (depreciation) | 81,160,288 | 8,689,813 | 13,822,451 | 79,111,457 | (40,646,019) |
| Increase (decrease) in net assets resulting | | | | | |
| from operations | 86,086,631 | 4,553,743 | 14,831,435 | 165,449,720 | 1,049,573 |
| Distributions to shareholders | | | | | |
| From net investment income | | | | | |
| Class 1 | — | — | — | (2,151,913) | (872,208) |
| Class NAV | (9,972,458) | (12,540,484) | (126,586) | (14,979,019) | (7,340,000) |
| From net realized gain | | | | | |
| Class NAV | — | — | (47,147) | — | — |
| Total distributions | (9,972,458) | (12,540,484) | (173,733) | (17,130,932) | (8,212,208) |
| From Portfolio share transactions (Note 6) | 32,034,345 | 62,774,402 | 168,560,877 | (178,852,499) | 73,360,944 |
| Total increase (decrease) | 108,148,518 | 54,787,661 | 183,218,579 | (30,533,711) | 66,198,309 |
| |
| Net assets | | | | | |
|
| Beginning of period | 376,717,677 | 321,930,016 | — | 802,731,474 | 736,533,165 |
| End of period | $484,866,195 | $376,717,677 | $183,218,579 | $772,197,763 | $802,731,474 |
| |
| Undistributed net investment income (loss) | ($2,208,291) | $4,994,109 | $710,376 | ($12,030,874) | $5,348,379 |
| | | | | | |
| | International Small | International Small | | |
| | Cap Fund | Company Fund | International Value Fund |
| | Six months | | Six months | | Six months | |
| | ended | | ended | | ended | |
| | 2/28/11 | Year ended | 2/28/11 | Year ended | 2/28/11 | Year ended |
| Increase (decrease) in net assets | (Unaudited) | 8/31/10 | (Unaudited) | 8/31/10 | (Unaudited) | 8/31/10 |
|
| From operations | | | | | | |
| Net investment income (loss) | $623,461 | $2,723,815 | $564,996 | $1,451,998 | $4,528,427 | $26,027,337 |
| Net realized gain (loss) | 9,492,605 | 1,102,647 | 3,239,679 | 2,924,629 | 24,676,849 | 3,155,738 |
| Change in net unrealized appreciation (depreciation) | 52,769,308 | 29,654,692 | 43,563,905 | 185,079 | 254,213,184 | (38,119,695) |
| Increase (decrease) in net assets resulting from | | | | | | |
| operations | 62,885,374 | 33,481,154 | 47,368,580 | 4,561,706 | 283,418,460 | (8,936,620) |
| Distributions to shareholders | | | | | | |
| From net investment income | | | | | | |
| Class 1 | (1,254,483) | (2,141,419) | — | — | (4,779,922) | (5,831,083) |
| Class NAV | (1,739,444) | (1,933,946) | (3,439,425) | (5,041,096) | (16,267,321) | (17,411,266) |
| Total distributions | (2,993,927) | (4,075,365) | (3,439,425) | (5,041,096) | (21,047,243) | (23,242,349) |
| From Portfolio share transactions (Note 6) | 15,140,345 | 14,947,655 | 19,056,823 | 26,327,650 | (78,052,494) | 43,378,739 |
| Total increase (decrease) | 75,031,792 | 44,353,444 | 62,985,978 | 25,848,260 | 184,318,723 | 11,199,770 |
| |
| Net assets | | | | | | |
|
| Beginning of period | 279,750,591 | 235,397,147 | 150,675,245 | 124,826,985 | 1,159,183,198 | 1,147,983,428 |
| End of period | $354,782,383 | $279,750,591 | $213,661,223 | $150,675,245 | $1,343,501,921 | $1,159,183,198 |
| |
| Undistributed net investment income (loss) | $56,601 | $2,427,067 | ($2,316,531) | $557,898 | $4,500,196 | $21,019,012 |
1 Period from 9-16-10 (inception date) to 2-28-11.
| |
| The accompanying notes are an integral part of the financial statements. | 341 |
John Hancock Funds II
Statements of Changes in Net Assets
| | | | | | |
| | Investment Quality | | | | |
| | Bond Fund | Large Cap Fund | Large Cap Value Fund |
| | Six months | | Six months | | Six months | |
| | ended | | ended | | ended | |
| | 2/28/11 | Year ended | 2/28/11 | Year ended | 2/28/11 | Year ended |
| Increase (decrease) in net assets | (Unaudited) | 8/31/10 | (Unaudited) | 8/31/10 | (Unaudited) | 8/31/10 |
|
| From operations | | | | | | |
| Net investment income (loss) | $6,668,669 | $8,258,875 | $1,445,493 | $2,540,273 | $2,661,358 | $5,761,559 |
| Net realized gain (loss) | 288,802 | (1,072,736) | 14,293,274 | 16,145,485 | 62,931,415 | 27,913,447 |
| Change in net unrealized appreciation (depreciation) | (13,127,715) | 16,103,747 | 54,681,011 | (9,117,660) | 42,419,294 | (47,063,137) |
| Increase (decrease) in net assets resulting from | | | | | | |
| operations | (6,170,244) | 23,289,886 | 70,419,778 | 9,568,098 | 108,012,067 | (13,388,131) |
| Distributions to shareholders | | | | | | |
| From net investment income | | | | | | |
| Class 1 | (1,143,831) | (3,317,158) | (354,970) | (310,523) | (982,056) | (1,120,244) |
| Class NAV | (5,307,058) | (6,436,446) | (2,294,785) | (1,826,185) | (4,778,782) | (6,764,574) |
| Total distributions | (6,450,889) | (9,753,604) | (2,649,755) | (2,136,708) | (5,760,838) | (7,884,818) |
| From Portfolio share transactions (Note 6) | 107,640,377 | 140,889,090 | (206,056) | 30,168,627 | (375,106,343) | (28,477,984) |
| Total increase (decrease) | 95,019,244 | 154,425,372 | 67,563,967 | 37,600,017 | (272,855,114) | (49,750,933) |
| |
| Net assets | | | | | | |
|
| Beginning of period | 340,385,191 | 185,959,819 | 264,911,278 | 227,311,261 | 466,983,038 | 516,733,971 |
| End of period | $435,404,435 | $340,385,191 | $332,475,245 | $264,911,278 | $194,127,924 | $466,983,038 |
| |
| Undistributed net investment income (loss) | $2,210,335 | $1,992,555 | $544,933 | $1,749,195 | $595,977 | $3,695,457 |
| |
| | Mid Cap Growth | | | | |
| | Index Fund | Mid Cap Index Fund | Mid Cap Stock Fund |
| | Six months | | Six months | | Six months | |
| | ended | | ended | | ended | |
| | 2/28/11 | Period ended | 2/28/11 | Year ended | 2/28/11 | Year ended |
| Increase (decrease) in net assets | (Unaudited) | 8/31/101 | (Unaudited) | 8/31/10 | (Unaudited) | 8/31/10 |
|
| From operations | | | | | | |
| Net investment income (loss) | $94,601 | $12,068 | $1,908,543 | $5,080,497 | ($1,404,205) | ($1,630,513) |
| Net realized gain (loss) | 1,329,455 | (2,548,313) | 19,860,022 | 9,003,107 | 111,021,050 | 107,744,480 |
| Change in net unrealized appreciation (depreciation) | 16,494,351 | (4,579,154) | 70,097,218 | 66,781,100 | 183,283,208 | (39,775,453) |
| Increase (decrease) in net assets resulting from | | | | | | |
| operations | 17,918,407 | (7,115,399) | 91,865,783 | 80,864,704 | 292,900,053 | 66,338,514 |
| Distributions to shareholders | | | | | | |
| From net investment income | | | | | | |
| Class 1 | (1,545) | — | — | — | — | — |
| Class NAV | (120,519) | — | (3,498,092) | (5,711,496) | — | (86,849) |
| From net realized gain | | | | | | |
| Class NAV | — | — | (6,185,882) | — | — | — |
| Total distributions | (122,064) | — | (9,683,974) | (5,711,496) | — | (86,849) |
| From Portfolio share transactions (Note 6) | (1,766,969) | 55,400,782 | (27,981,741) | (293,365,124) | (12,076,624) | 7,101,748 |
| Total increase (decrease) | 16,029,374 | 48,285,383 | 54,200,068 | (218,211,916) | 280,823,429 | 73,353,413 |
| |
| Net assets | | | | | | |
|
| Beginning of period | 48,285,383 | — | 287,923,807 | 506,135,723 | 786,974,283 | 713,620,870 |
| End of period | $64,314,757 | $48,285,383 | $342,123,875 | $287,923,807 | $1,067,797,712 | $786,974,283 |
| |
| Undistributed net investment income (loss) | ($15,392) | $12,071 | $844,967 | $2,434,516 | ($1,393,899) | $10,306 |
1 Period from 4-30-10 (inception date) to 8-31-10.
| |
| The accompanying notes are an integral part of the financial statements. | 342 |
John Hancock Funds II
Statements of Changes in Net Assets
| | | | | | |
| | Mid Cap Value | Mid Cap Value | | |
| | Equity Fund | Index Fund | Mid Value Fund |
| | Six months | | Six months | | Six months | |
| | ended | | ended | | ended | |
| | 2/28/11 | Year ended | 2/28/11 | Period ended | 2/28/11 | Year ended |
| Increase (decrease) in net assets | (Unaudited) | 8/31/10 | (Unaudited) | 8/31/101 | (Unaudited) | 8/31/10 |
|
| From operations | | | | | | |
| Net investment income (loss) | $669,995 | $1,552,283 | $543,515 | $277,641 | $1,893,913 | $6,581,213 |
| Net realized gain (loss) | 11,117,351 | 3,816,847 | 607,360 | (2,607,835) | 14,513,819 | 35,036,960 |
| Change in net unrealized appreciation (depreciation) | 35,890,416 | 8,499,975 | 13,093,575 | (5,983,621) | 94,057,716 | (22,088,585) |
| Increase (decrease) in net assets resulting from | | | | | | |
| operations | 47,677,762 | 13,869,105 | 14,244,450 | (8,313,815) | 110,465,448 | 19,529,588 |
| Distributions to shareholders | | | | | | |
| From net investment income | | | | | | |
| Class 1 | — | — | (12,014) | — | — | — |
| Class NAV | (1,067,672) | (1,771,675) | (631,652) | — | (7,615,885) | (1,845,863) |
| From net realized gain | | | | | | |
| Class NAV | — | — | — | — | (30,135,070) | (8,405,286) |
| Total distributions | (1,067,672) | (1,771,675) | (643,666) | — | (37,750,955) | (10,251,149) |
| From Portfolio share transactions (Note 6) | (780,586) | (25,284,314) | 3,283,609 | 56,387,008 | 48,801,724 | 81,564,974 |
| Total increase (decrease) | 45,829,504 | (13,186,884) | 16,884,393 | 48,073,193 | 121,516,217 | 90,843,413 |
| |
| Net assets | | | | | | |
|
| Beginning of period | 148,807,639 | 161,994,523 | 48,073,193 | — | 391,372,344 | 300,528,931 |
| End of period | $194,637,143 | $148,807,639 | $64,957,586 | $48,073,193 | $512,888,561 | $391,372,344 |
| |
| Undistributed net investment income (loss) | $304,973 | $702,650 | $177,493 | $277,644 | ($352,036) | $5,369,936 |
| | | | | |
| | Mutual | | | | |
| | Shares Fund | Optimized Value Fund | Real Estate Equity Fund |
| | Period | Six months | | Six months | |
| | ended | ended | | ended | |
| | 2/28/112 | 2/28/11 | Year ended | 2/28/11 | Year ended |
| Increase (decrease) in net assets | (Unaudited) | (Unaudited) | 8/31/10 | (Unaudited) | 8/31/10 |
|
| From operations | | | | | |
| Net investment income (loss) | $1,240,172 | $3,525,734 | $4,532,264 | $4,254,885 | $3,708,903 |
| Net realized gain (loss) | 3,109,392 | 63,180,788 | 34,809,113 | 8,702,774 | 3,642,288 |
| Change in net unrealized appreciation | | | | | |
| (depreciation) | 32,577,819 | 21,091,833 | (30,743,394) | 54,788,287 | 61,875,003 |
| Increase (decrease) in net assets resulting | | | | | |
| from operations | 36,927,383 | 87,798,355 | 8,597,983 | 67,745,946 | 69,226,194 |
| Distributions to shareholders | | | | | |
| From net investment income | | | | | |
| Class 1 | — | (326,810) | (939,448) | — | — |
| Class NAV | — | (2,371,312) | (5,250,993) | (3,995,406) | (5,771,107) |
| From net realized gain | | | | | |
| Class NAV | (291,533) | — | — | — | — |
| Total distributions | (291,533) | (2,698,122) | (6,190,441) | (3,995,406) | (5,771,107) |
| From Portfolio share transactions (Note 6) | 326,670,943 | (1,659,970) | 10,919,735 | 1,934,094 | 33,199,850 |
| Total increase (decrease) | 363,306,793 | 83,440,263 | 13,327,277 | 65,684,634 | 96,654,937 |
| |
| Net assets | | | | | |
|
| Beginning of period | — | 310,218,811 | 296,891,534 | 305,365,008 | 208,710,071 |
| End of period | $363,306,793 | $393,659,074 | $310,218,811 | $371,049,642 | $305,365,008 |
| |
| Undistributed net investment income (loss) | $1,240,172 | $3,525,580 | $2,697,968 | $1,252,478 | $992,999 |
1 Period from 4-30-10 (inception date) to 8-31-10.
2 Period from 9-16-10 (inception date) to 2-28-11.
| |
| The accompanying notes are an integral part of the financial statements. | 343 |
John Hancock Funds II
Statements of Changes in Net Assets
| | | | | | |
| | Real Estate Securities Fund | Real Return Bond Fund | Retirement 2010 Portfolio |
| | Six months | | Six months | | Six months | |
| | ended | | ended | | ended | |
| | 2/28/11 | Year ended | 2/28/11 | Year ended | 2/28/11 | Period ended |
| Increase (decrease) in net assets | (Unaudited) | 8/31/10 | (Unaudited) | 8/31/10 | (Unaudited) | 8/31/101 |
|
| From operations | | | | | | |
| Net investment income (loss) | $5,583,345 | $5,906,873 | $8,363,940 | $27,276,535 | $30,917 | $234 |
| Net realized gain (loss) | 20,311,247 | 24,983,995 | 40,492,793 | 85,605,502 | (17,856) | — |
| Change in net unrealized appreciation (depreciation) | 57,884,046 | 42,563,646 | (31,717,215) | 28,161,532 | 74,606 | 746 |
| Increase (decrease) in net assets resulting from | | | | | | |
| operations | 83,778,638 | 73,454,514 | 17,139,518 | 141,043,569 | 87,667 | 980 |
| Distributions to shareholders | | | | | | |
| From net investment income | | | | | | |
| Class 1 | (6,909,456) | (3,702,351) | (2,159,134) | (2,516,836) | (33,268) | — |
| Class NAV | — | — | (19,347,886) | (41,589,642) | — | — |
| From net realized gain | | | | | | |
| Class 1 | — | — | (3,697,499) | — | (16,845) | — |
| Class NAV | — | — | (29,098,290) | — | — | — |
| Total distributions | (6,909,456) | (3,702,351) | (54,302,809) | (44,106,478) | (50,113) | — |
| From Portfolio share transactions (Note 6) | 30,449,755 | 206,891,051 | (192,796,699) | (129,359,907) | 10,080,359 | 26,800 |
| Total increase (decrease) | 107,318,937 | 276,643,214 | (229,959,990) | (32,422,816) | 10,117,913 | 27,780 |
| |
| Net assets | | | | | | |
|
| Beginning of period | 351,794,328 | 75,151,114 | 1,085,684,944 | 1,118,107,760 | 27,780 | — |
| End of period | $459,113,265 | $351,794,328 | $855,724,954 | $1,085,684,944 | $10,145,693 | $27,780 |
| |
| Undistributed net investment income (loss) | $2,126,551 | $3,452,662 | $4,273,627 | $17,416,707 | ($2,114) | $237 |
| |
| | Retirement 2015 Portfolio | Retirement 2020 Portfolio | Retirement 2025 Portfolio |
| | Six months | | Six months | | Six months | |
| | ended | | ended | | ended | |
| | 2/28/11 | Period ended | 2/28/11 | Period ended | 2/28/11 | Period ended |
| Increase (decrease) in net assets | (Unaudited) | 8/31/101 | (Unaudited) | 8/31/101 | (Unaudited) | 8/31/101 |
|
| From operations | | | | | | |
| Net investment income (loss) | $49,166 | $177 | $61,483 | $124 | $109,478 | $77 |
| Net realized gain (loss) | 17,843 | — | 18,714 | — | 13,600 | — |
| Change in net unrealized appreciation (depreciation) | 147,256 | (89) | 376,168 | (912) | 672,078 | (1,649) |
| Increase (decrease) in net assets resulting from | | | | | | |
| operations | 214,265 | 88 | 456,365 | (788) | 795,156 | (1,572) |
| Distributions to shareholders | | | | | | |
| From net investment income | | | | | | |
| Class 1 | (52,164) | — | (65,383) | — | (114,301) | — |
| From net realized gain | | | | | | |
| Class 1 | (20,363) | — | (16,947) | — | (17,806) | — |
| Total distributions | (72,527) | — | (82,330) | — | (132,107) | — |
| From Portfolio share transactions (Note 6) | 13,018,925 | 26,800 | 18,407,488 | 26,800 | 22,223,320 | 26,800 |
| Total increase (decrease) | 13,160,663 | 26,888 | 18,781,523 | 26,012 | 22,886,369 | 25,228 |
| |
| Net assets | | | | | | |
|
| Beginning of period | 26,888 | — | 26,012 | — | 25,228 | — |
| End of period | $13,187,551 | $26,888 | $18,807,535 | $26,012 | $22,911,597 | $25,228 |
| |
| Undistributed net investment income (loss) | ($2,818) | $180 | ($3,773) | $127 | ($4,743) | $80 |
1 Period from 4-30-10 (inception date) to 8-31-10.
| |
| The accompanying notes are an integral part of the financial statements. | 344 |
John Hancock Funds II
Statements of Changes in Net Assets
| | | | | | |
| | Retirement 2030 Portfolio | Retirement 2035 Portfolio | Retirement 2040 Portfolio |
| | Six months | | Six months | | Six months | |
| | ended | | ended | | ended | |
| | 2/28/11 | Period ended | 2/28/11 | Period ended | 2/28/11 | Period ended |
| Increase (decrease) in net assets | (Unaudited) | 8/31/101 | (Unaudited) | 8/31/101 | (Unaudited) | 8/31/101 |
|
| From operations | | | | | | |
| Net investment income (loss) | $73,955 | $54 | $61,784 | $39 | $28,837 | $33 |
| Net realized gain (loss) | 20,580 | — | 10,524 | — | 5,012 | — |
| Change in net unrealized appreciation (depreciation) | 504,269 | (2,019) | 493,091 | (2,260) | 259,621 | (2,340) |
| Increase (decrease) in net assets resulting from | | | | | | |
| operations | 598,804 | (1,965) | 565,399 | (2,221) | 293,470 | (2,307) |
| Distributions to shareholders | | | | | | |
| From net investment income | | | | | | |
| Class 1 | (77,218) | — | (64,533) | — | (30,357) | — |
| From net realized gain | | | | | | |
| Class 1 | (8,235) | — | (5,214) | — | (2,066) | — |
| Total distributions | (85,453) | — | (69,747) | — | (32,423) | — |
| From Portfolio share transactions (Note 6) | 16,144,166 | 26,800 | 13,484,495 | 26,800 | 7,627,649 | 26,800 |
| Total increase (decrease) | 16,657,517 | 24,835 | 13,980,147 | 24,579 | 7,888,696 | 24,493 |
| |
| Net assets | | | | | | |
|
| Beginning of period | 24,835 | — | 24,579 | — | 24,493 | — |
| End of period | $16,682,352 | $24,835 | $14,004,726 | $24,579 | $7,913,189 | $24,493 |
| |
| Undistributed net investment income (loss) | ($3,206) | $57 | ($2,707) | $42 | ($1,484) | $36 |
| |
| | | | Short Term Government | | |
| | Retirement 2045 Portfolio | Income Fund | Small Cap Growth Fund |
| | Six months | | Six months | | Six months | |
| | ended | | ended | | ended | |
| | 2/28/11 | Period ended | 2/28/11 | Period ended | 2/28/11 | Year ended |
| Increase (decrease) in net assets | (Unaudited) | 8/31/101 | (Unaudited) | 8/31/10 | (Unaudited) | 8/31/10 |
|
| From operations | | | | | | |
| Net investment income (loss) | $23,067 | $33 | $789,924 | $988,290 | ($617,383) | ($947,835) |
| Net realized gain (loss) | 5,471 | — | 529,719 | 977,944 | 17,572,588 | 26,287,621 |
| Change in net unrealized appreciation (depreciation) | 241,833 | (2,340) | (1,701,942) | 2,159,935 | 41,132,578 | (18,885,643) |
| Increase (decrease) in net assets resulting from | | | | | | |
| operations | 270,371 | (2,307) | (382,299) | 4,126,169 | 58,087,783 | 6,454,143 |
| Distributions to shareholders | | | | | | |
| From net investment income | | | | | | |
| Class 1 | (24,496) | — | — | — | — | — |
| Class NAV | — | — | (1,647,663) | (1,433,787) | — | — |
| From net realized gain | | | | | | |
| Class 1 | (1,666) | — | — | — | — | — |
| Class NAV | — | — | (938,847) | (48,663) | (16,923,419) | — |
| Total distributions | (26,162) | — | (2,586,510) | (1,482,450) | (16,923,419) | — |
| From Portfolio share transactions (Note 6) | 7,508,430 | 26,800 | (2,976,315) | 108,667,206 | 6,448,216 | 20,552,374 |
| Total increase (decrease) | 7,752,639 | 24,493 | (5,945,124) | 111,310,925 | 47,612,580 | 27,006,517 |
| |
| Net assets | | | | | | |
|
| Beginning of period | 24,493 | — | 136,112,243 | 24,801,318 | 148,847,348 | 121,840,831 |
| End of period | $7,777,132 | $24,493 | $130,167,119 | $136,112,243 | $196,459,928 | $148,847,348 |
| |
| Undistributed net investment income (loss) | ($1,393) | $36 | ($259,149) | $598,590 | ($617,383) | — |
1 Period from 4-30-10 (inception date) to 8-31-10.
| |
| The accompanying notes are an integral part of the financial statements. | 345 |
John Hancock Funds II
Statements of Changes in Net Assets
| | | | | | |
| | | | Small Cap | | |
| | Small Cap Index Fund | Opportunities Fund | Small Cap Value Fund |
| | Six months | | Six months | | Six months | |
| | ended | | ended | | ended | |
| | 2/28/11 | Year ended | 2/28/11 | Year ended | 2/28/11 | Year ended |
| Increase (decrease) in net assets | (Unaudited) | 8/31/10 | (Unaudited) | 8/31/10 | (Unaudited) | 8/31/10 |
|
| From operations | | | | | | |
| Net investment income (loss) | $424,248 | $940,552 | $327,420 | ($32,886) | $787,225 | $418,612 |
| Net realized gain (loss) | 3,027,112 | 16,217,737 | 5,652,587 | 8,249,056 | 4,727,359 | 5,284,084 |
| Change in net unrealized appreciation (depreciation) | 22,178,497 | (7,996,722) | 56,414,142 | (3,820,809) | 32,535,926 | 2,594,197 |
| Increase (decrease) in net assets resulting from | | | | | | |
| operations | 25,629,857 | 9,161,567 | 62,394,149 | 4,395,361 | 38,050,510 | 8,296,893 |
| Distributions to shareholders | | | | | | |
| From net investment income | | | | | | |
| Class 1 | — | — | — | (70,639) | — | — |
| Class NAV | (850,661) | (1,405,466) | — | (115,688) | (972,144) | (361,933) |
| From net realized gain | | | | | | |
| Class NAV | — | — | — | — | (6,119,890) | (1,190,204) |
| Total distributions | (850,661) | (1,405,466) | — | (186,327) | (7,092,034) | (1,552,137) |
| From Portfolio share transactions (Note 6) | (1,266,505) | (37,786,621) | (3,505,233) | 50,257,008 | 5,082,722 | 44,826,898 |
| Total increase (decrease) | 23,512,691 | (30,030,520) | 58,888,916 | 54,466,042 | 36,041,198 | 51,571,654 |
| |
| Net assets | | | | | | |
|
| Beginning of period | 70,274,621 | 100,305,141 | 152,753,012 | 98,286,970 | 130,962,633 | 79,390,979 |
| End of period | $93,787,312 | $70,274,621 | $211,641,928 | $152,753,012 | $167,003,831 | $130,962,633 |
| |
| Undistributed net investment income (loss) | $42,826 | $469,239 | $292,863 | ($34,557) | ($52,321) | $132,598 |
| |
| | Small Company | Small Company | Smaller Company |
| | Growth Fund | Value Fund | Growth Fund |
| | Six months | | Six months | | Six months | |
| | ended | | ended | | ended | |
| | 2/28/11 | Year ended | 2/28/11 | Year ended | 2/28/11 | Year ended |
| Increase (decrease) in net assets | (Unaudited) | 8/31/10 | (Unaudited) | 8/31/10 | (Unaudited) | 8/31/10 |
|
| From operations | | | | | | |
| Net investment income (loss) | ($285,830) | ($427,968) | $1,381,704 | $1,823,427 | ($316,260) | ($747,516) |
| Net realized gain (loss) | 8,907,483 | 9,026,125 | 9,667,542 | 4,315,162 | 12,729,736 | 32,930,098 |
| Change in net unrealized appreciation (depreciation) | 34,159,735 | 5,081,306 | 107,418,807 | 9,986,122 | 29,945,398 | (21,915,822) |
| Increase (decrease) in net assets resulting from | | | | | | |
| operations | 42,781,388 | 13,679,463 | 118,468,053 | 16,124,711 | 42,358,874 | 10,266,760 |
| Distributions to shareholders | | | | | | |
| From net investment income | | | | | | |
| Class 1 | — | — | (620,915) | (926,808) | — | — |
| Class NAV | — | — | (1,616,452) | (2,675,344) | — | — |
| From net realized gain | | | | | | |
| Class NAV | — | — | — | — | (29,330,242) | — |
| From capital paid-in | | | | | | |
| Return of capital | — | (132,484) | — | — | — | — |
| Total distributions | — | (132,484) | (2,237,367) | (3,602,152) | (29,330,242) | — |
| From Portfolio share transactions (Note 6) | (5,992,463) | (19,835,840) | (9,540,988) | (27,580,288) | 21,216,285 | (53,153,249) |
| Total increase (decrease) | 36,788,925 | (6,288,861) | 106,689,698 | (15,057,729) | 34,244,917 | (42,886,489) |
| |
| Net assets | | | | | | |
|
| Beginning of period | 115,643,171 | 121,932,032 | 348,093,270 | 363,150,999 | 115,587,412 | 158,473,901 |
| End of period | $152,432,096 | $115,643,171 | $454,782,968 | $348,093,270 | $149,832,329 | $115,587,412 |
| |
| Undistributed net investment income (loss) | ($285,830) | — | $82,738 | $938,401 | ($316,260) | — |
| |
| The accompanying notes are an integral part of the financial statements. | 346 |
John Hancock Funds II
Statements of Changes in Net Assets
| | | | | | |
| | Spectrum Income Fund | Total Bond Market Fund | Total Return Fund |
| | Six months | | Six months | | Six months | |
| | ended | | ended | | ended | |
| | 2/28/11 | Year ended | 2/28/11 | Year ended | 2/28/11 | Year ended |
| Increase (decrease) in net assets | (Unaudited) | 8/31/10 | (Unaudited) | 8/31/10 | (Unaudited) | 8/31/10 |
|
| From operations | | | | | | |
| Net investment income (loss) | $18,982,693 | $39,773,049 | $7,929,435 | $18,924,802 | $24,431,197 | $41,207,013 |
| Net realized gain (loss) | 11,538,029 | 22,271,277 | 7,722,838 | 4,288,965 | (3,307,441) | 164,252,596 |
| Change in net unrealized appreciation (depreciation) | 21,530,752 | 25,261,578 | (21,163,433) | 21,565,645 | (21,183,964) | 31,062,618 |
| Increase (decrease) in net assets resulting from | | | | | | |
| operations | 52,051,474 | 87,305,904 | (5,511,160) | 44,779,412 | (60,208) | 236,522,227 |
| Distributions to shareholders | | | | | | |
| From net investment income | | | | | | |
| Class 1 | — | — | — | — | (9,827,866) | (8,375,955) |
| Class NAV | (26,083,429) | (42,165,410) | (9,670,438) | (19,836,600) | (52,073,795) | (55,235,186) |
| From net realized gain | | | | | | |
| Class 1 | — | — | — | — | (16,745,861) | (3,091,691) |
| Class NAV | — | — | (6,037,071) | (8,065,365) | (92,324,636) | (20,383,404) |
| Total distributions | (26,083,429) | (42,165,410) | (15,707,509) | (27,901,965) | (170,972,158) | (87,086,236) |
| From Portfolio share transactions (Note 6) | 163,001,857 | (109,222,241) | (200,872,809) | 60,432,361 | 369,325,115 | 250,317,435 |
| Total increase (decrease) | 188,969,902 | (64,081,747) | (222,091,478) | 77,309,808 | 198,292,749 | 399,753,426 |
| |
| Net assets | | | | | | |
|
| Beginning of period | 836,729,686 | 900,811,433 | 523,841,952 | 446,532,144 | 2,180,454,483 | 1,780,701,057 |
| End of period | $1,025,699,588 | $836,729,686 | $301,750,474 | $523,841,952 | $2,378,747,232 | $2,180,454,483 |
| |
| Undistributed net investment income (loss) | $5,757,497 | $12,858,233 | $1,920,333 | $3,661,336 | $6,891,014 | $44,361,478 |
| |
| | U.S. High Yield Bond Fund | U.S. Multi-Sector Fund | Value Fund |
| | Six months | | Six months | | Six months | |
| | ended | | ended | | ended | |
| | 2/28/11 | Year ended | 2/28/11 | Year ended | 2/28/11 | Year ended |
| Increase (decrease) in net assets | (Unaudited) | 8/31/10 | (Unaudited) | 8/31/10 | (Unaudited) | 8/31/10 |
|
| From operations | | | | | | |
| Net investment income (loss) | $23,032,352 | $61,529,361 | $7,286,199 | $12,910,597 | $792,720 | $1,359,337 |
| Net realized gain (loss) | 17,184,077 | 19,865,815 | 40,992,303 | (3,588,351) | 6,675,548 | 15,998,222 |
| Change in net unrealized appreciation (depreciation) | 10,680,452 | 38,112,880 | 143,431,144 | 6,798,483 | 38,693,187 | (4,231,351) |
| Increase (decrease) in net assets resulting from | | | | | | |
| operations | 50,896,881 | 119,508,056 | 191,709,646 | 16,120,729 | 46,161,455 | 13,126,208 |
| Distributions to shareholders | | | | | | |
| From net investment income | | | | | | |
| Class 1 | (2,341,891) | (3,412,154) | — | — | — | — |
| Class NAV | (25,120,616) | (59,831,871) | (12,874,368) | (12,428,759) | (1,309,113) | (976,292) |
| From net realized gain | | | | | | |
| Class NAV | — | — | — | — | (10,344,558) | — |
| Total distributions | (27,462,507) | (63,244,025) | (12,874,368) | (12,428,759) | (11,653,671) | (976,292) |
| From Portfolio share transactions (Note 6) | (134,285,564) | (84,569,257) | 4,695,113 | 28,126,520 | 16,326,434 | 10,978,308 |
| Total increase (decrease) | (110,851,190) | (28,305,226) | 183,530,391 | 31,818,490 | 50,834,218 | 23,128,224 |
| |
| Net assets | | | | | | |
|
| Beginning of period | 748,880,260 | 777,185,486 | 901,724,052 | 869,905,562 | 145,206,932 | 122,078,708 |
| End of period | $638,029,070 | $748,880,260 | $1,085,254,443 | $901,724,052 | $196,041,150 | $145,206,932 |
| |
| Undistributed net investment income (loss) | $6,373,215 | $10,803,370 | $2,762,601 | $8,350,770 | $279,694 | $796,087 |
| |
| The accompanying notes are an integral part of the financial statements. | 347 |
John Hancock Funds II
Statements of Changes in Net Assets
| | | | | | |
| | Value & | | | | |
| | Restructuring Fund | | | | |
| | Six months | | | | | |
| | ended | | | | | |
| | 2/28/11 | Year ended | | | | |
| Increase (decrease) in net assets | (Unaudited) | 8/31/10 | | | | |
| | | | |
| From operations | | | | | | |
| Net investment income (loss) | $3,923,967 | $8,657,686 | | | | |
| Net realized gain (loss) | 11,995,131 | (16,841,332) | | | | |
| Change in net unrealized appreciation (depreciation) | 144,075,012 | 44,773,630 | | | | |
| Increase (decrease) in net assets resulting from | | | | | | |
| operations | 159,994,110 | 36,589,984 | | | | |
| Distributions to shareholders | | | | | | |
| From net investment income | | | | | | |
| Class NAV | (8,175,799) | (7,347,600) | | | | |
| Total distributions | (8,175,799) | (7,347,600) | | | | |
| From Portfolio share transactions (Note 6) | (18,332,651) | (40,182,103) | | | | |
| Total increase (decrease) | 133,485,660 | (10,939,719) | | | | |
| | | | | |
| Net assets | | | | | | |
| | | | |
| Beginning of period | 503,181,049 | 514,120,768 | | | | |
| End of period | $636,666,709 | $503,181,049 | | | | |
| | | | | |
| Undistributed net investment income (loss) | $1,312,349 | $5,564,181 | | | | |
| |
| The accompanying notes are an integral part of the financial statements. | 348 |
John Hancock Funds II
Financial Highlights
| | | | | | | | | | | | | | | | | | | | | | | | | | | | | | |
| Per share operating performance for a share outstanding throughout the period | | Ratios and supplemental data | | | | |
|
| | | | | Income (loss) from | | | | | | | | | | | | | | | | | | | | | | | |
| | | | | investment operations | | | Less distributions | | | | | | | Ratios to average net assets | | | | |
| | | |
| | |
| | | | | |
| | | | |
| |
| | | | | | | Net real- | | | | | | | | | | | | | | | | | | | | | | | | |
| | | | | | | ized and | | | | | | | | | | | | | | | | | | Expenses | | Expenses | | | | |
| | | Net asset | | Net | | unrealized | | | | | | | | | | | | Net asset | | | | Net | | before | | including | | Net | | |
| | | value, | | investment | | gain (loss) | | Total from | | From net | | From net | | From | | Total | | value, | | | | assets, | | reductions | | reductions | | investment | | |
| | | beginning | | income | | on invest- | | investment | | investment | | realized | | capital | | distri- | | end of | | Total | | end of | | and amounts | | and amounts | | income | | Portfolio |
| | | of period | | (loss) | | ments | | operations | | income | | gain | | paid-in | | butions | | period | | return | | period | | recaptured | | recaptured | | (loss) | | turnover |
| Period ended | ($) | | ($)1 | | ($) | | ($) | | ($) | | ($) | | ($) | | ($) | | ($) | | (%) | | (in millions) | | (%) | | (%) | | (%) | | (%) |
|
| |
| Active Bond Fund | | | | | | | | | | | | | | | | | | | | | | | | | | | |
| CLASS 1 | | | | | | | | | | | | | | | | | | | | | | | | | | | | |
|
| 02-28-20112 | 10.21 | | 0.24 | | 0.08 | | 0.32 | | (0.23) | | (0.03) | | — | | (0.26) | | 10.27 | | 3.183,4 | | 42 | | 0.695 | | 0.695 | | 4.665 | | 366 |
| 08-31-2010 | 9.30 | | 0.51 | | 0.92 | | 1.43 | | (0.52) | | — | | — | | (0.52) | | 10.21 | | 15.883 | | 43 | | 0.69 | | 0.69 | | 5.26 | | 75 |
| 08-31-2009 | 9.12 | | 0.52 | | 0.20 | | 0.72 | | (0.51) | | (0.03) | | — | | (0.54) | | 9.30 | | 8.68 | | 33 | | 0.71 | | 0.71 | | 6.10 | | 906 |
| 08-31-2008 | 9.54 | | 0.47 | | (0.40) | | 0.07 | | (0.49) | | — | | — | | (0.49) | | 9.12 | | 0.72 | | 33 | | 0.72 | | 0.72 | | 4.97 | | 1336 |
| 08-31-2007 | 9.60 | | 0.47 | | (0.06) | | 0.41 | | (0.47) | | —7 | | — | | (0.47) | | 9.54 | | 4.38 | | 36 | | 0.73 | | 0.73 | | 4.92 | | 1656 |
| 08-31-20068 | 9.61 | | 0.36 | | (0.11) | | 0.25 | | (0.26) | | — | | — | | (0.26) | | 9.60 | | 2.684 | | 37 | | 0.795 | | 0.795 | | 4.275 | | 406 |
|
| |
| CLASS NAV | | | | | | | | | | | | | | | | | | | | | | | | | | | | |
|
| 02-28-20112 | 10.20 | | 0.24 | | 0.08 | | 0.32 | | (0.23) | | (0.03) | | — | | (0.26) | | 10.26 | | 3.213,4 | | 1,169 | | 0.645 | | 0.645 | | 4.745 | | 366 |
| 08-31-2010 | 9.30 | | 0.52 | | 0.91 | | 1.43 | | (0.53) | | — | | — | | (0.53) | | 10.20 | | 15.833 | | 788 | | 0.64 | | 0.64 | | 5.30 | | 75 |
| 08-31-2009 | 9.12 | | 0.52 | | 0.20 | | 0.72 | | (0.51) | | (0.03) | | — | | (0.54) | | 9.30 | | 8.73 | | 540 | | 0.66 | | 0.66 | | 6.15 | | 906 |
| 08-31-2008 | 9.53 | | 0.47 | | (0.38) | | 0.09 | | (0.50) | | — | | — | | (0.50) | | 9.12 | | 0.88 | | 554 | | 0.67 | | 0.67 | | 5.02 | | 1336 |
| 08-31-2007 | 9.60 | | 0.48 | | (0.07) | | 0.41 | | (0.48) | | —7 | | — | | (0.48) | | 9.53 | | 4.34 | | 523 | | 0.68 | | 0.68 | | 4.99 | | 1656 |
| 08-31-20068 | 9.58 | | 0.35 | | (0.06) | | 0.29 | | (0.27) | | — | | — | | (0.27) | | 9.60 | | 3.094 | | 399 | | 0.705 | | 0.705 | | 4.305 | | 406 |
|
| 1. Based on the average daily shares outstanding. 2. Unaudited. 3. Total returns would have been lower had certain expenses not been reduced during the periods shown. 4. Not | | |
| annualized. 5. Annualized. 6. The Portfolio turnover rates, including the effect of “TBA” (to be announced) securities for the periods ended, were as follows: 43% for 2-28-11, 154% for |
| 8-31-09, 255% for 8-31-08 and 299% for 8-31-07. The year ended 8-31-06 includes the effect of TBA transactions. 7. Less than ($0.005) per share. 8. The inception dates for Class 1 and |
| Class NAV shares are 10-15-05 and 10-27-05, respectively. | | | | | | | | | | | | | | | | | | | | | | |
| |
| All Cap Core Fund | | | | | | | | | | | | | | | | | | | | | | | | | | |
| CLASS NAV | | | | | | | | | | | | | | | | | | | | | | | | | | | | |
|
| 02-28-20112 | 7.18 | | 0.05 | | 2.06 | | 2.11 | | (0.08) | | — | | — | | (0.08) | | 9.21 | | 29.423,4 | | 662 | | 0.805 | | 0.805 | | 1.085 | | 110 |
| 08-31-2010 | 7.21 | | 0.08 | | (0.02) | | 0.06 | | (0.09) | | — | | — | | (0.09) | | 7.18 | | 0.733 | | 516 | | 0.81 | | 0.81 | | 1.01 | | 196 |
| 08-31-2009 | 9.22 | | 0.10 | | (1.98) | | (1.88) | | (0.13) | | —6 | | — | | (0.13) | | 7.21 | | (20.07) | | 472 | | 0.83 | | 0.83 | | 1.52 | | 186 |
| 08-31-2008 | 11.06 | | 0.11 | | (1.31) | | (1.20) | | (0.13) | | (0.51) | | — | | (0.64) | | 9.22 | | (11.50) | | 711 | | 0.80 | | 0.80 | | 1.14 | | 239 |
| 08-31-2007 | 9.92 | | 0.12 | | 1.06 | | 1.18 | | (0.03) | | (0.01) | | — | | (0.04) | | 11.06 | | 11.93 | | 477 | | 0.83 | | 0.83 | | 1.12 | | 244 |
| 08-31-20067 | 10.00 | | 0.05 | | (0.13) | | (0.08) | | — | | — | | — | | — | | 9.92 | | (0.80)4 | | 284 | | 0.845 | | 0.845 | | 1.425 | | 86 |
|
| 1. Based on the average daily shares outstanding. 2. Unaudited. 3. Total returns would have been lower had certain expenses not been reduced during the periods shown. 4. Not | | |
| annualized. 5. Annualized. 6. Less than ($0.005) per share. 7. The inception date for Class NAV shares is 4-28-06. | | | | | | | | | | | | |
| |
| All Cap Value Fund | | | | | | | | | | | | | | | | | | | | | | | | | | |
| CLASS 1 | | | | | | | | | | | | | | | | | | | | | | | | | | | | |
|
| 02-28-20112 | 9.78 | | 0.05 | | 3.07 | | 3.12 | | (0.05) | | (0.54) | | — | | (0.59) | | 12.31 | | 32.373,4 | | 114 | | 0.875 | | 0.875 | | 0.795 | | 32 |
| 08-31-2010 | 9.28 | | 0.03 | | 0.50 | | 0.53 | | (0.03) | | — | | — | | (0.03) | | 9.78 | | 5.703 | | 83 | | 0.92 | | 0.92 | | 0.25 | | 86 |
| 08-31-2009 | 11.19 | | 0.06 | | (1.72) | | (1.66) | | (0.06) | | (0.19) | | — | | (0.25) | | 9.28 | | (14.42) | | 84 | | 0.96 | | 0.96 | | 0.67 | | 75 |
| 08-31-2008 | 17.26 | | 0.09 | | (0.50) | | (0.41) | | (0.21) | | (5.45) | | — | | (5.66) | | 11.19 | | (4.62) | | 25 | | 0.97 | | 0.97 | | 0.73 | | 76 |
| 08-31-2007 | 15.84 | | 0.14 | | 1.82 | | 1.96 | | (0.12) | | (0.42) | | — | | (0.54) | | 17.26 | | 12.64 | | 26 | | 0.97 | | 0.97 | | 0.82 | | 82 |
| 08-31-20066 | 13.84 | | 0.11 | | 1.91 | | 2.02 | | (0.02) | | — | | — | | (0.02) | | 15.84 | | 14.644,7 | | 21 | | 0.945 | | 0.945 | | 0.805 | | 48 |
|
| |
| CLASS NAV | | | | | | | | | | | | | | | | | | | | | | | | | | | | |
|
| 02-28-20112 | 9.74 | | 0.05 | | 3.05 | | 3.10 | | (0.05) | | (0.54) | | — | | (0.59) | | 12.25 | | 32.363,4 | | 457 | | 0.825 | | 0.825 | | 0.845 | | 32 |
| 08-31-2010 | 9.24 | | 0.03 | | 0.50 | | 0.53 | | (0.03) | | — | | — | | (0.03) | | 9.74 | | 5.773 | | 339 | | 0.87 | | 0.87 | | 0.32 | | 86 |
| 08-31-2009 | 11.14 | | 0.04 | | (1.68) | | (1.64) | | (0.07) | | (0.19) | | — | | (0.26) | | 9.24 | | (14.34) | | 264 | | 0.91 | | 0.91 | | 0.48 | | 75 |
| 08-31-2008 | 17.21 | | 0.10 | | (0.50) | | (0.40) | | (0.22) | | (5.45) | | — | | (5.67) | | 11.14 | | (4.57) | | 69 | | 0.92 | | 0.92 | | 0.78 | | 76 |
| 08-31-2007 | 15.80 | | 0.15 | | 1.81 | | 1.96 | | (0.13) | | (0.42) | | — | | (0.55) | | 17.21 | | 12.62 | | 70 | | 0.88 | | 0.88 | | 0.93 | | 82 |
| 08-31-20066 | 13.80 | | 0.12 | | 1.91 | | 2.03 | | (0.03) | | — | | — | | (0.03) | | 15.80 | | 14.694,7 | | 195 | | 0.895 | | 0.895 | | 0.885 | | 48 |
|
| 1. Based on the average daily shares outstanding. 2. Unaudited. 3. Total returns would have been lower had certain expenses not been reduced during the periods shown. 4. Not | | |
| annualized. 5. Annualized. 6. The inception date for Class 1 and Class NAV shares is 10-15-05. 7. The Adviser/Subadviser voluntarily paid Class 1 and Class NAV $46,991 and $410,290 , |
| respectively, for a potential lost investment opportunity. Excluding these payments, the total return would have been 14.38% for Class 1 and 14.45% for Class NAV. | | | | |
| |
| Alpha Opportunities Fund | | | | | | | | | | | | | | | | | | | | | | | | | | |
| CLASS NAV | | | | | | | | | | | | | | | | | | | | | | | | | | | | |
|
| 02-28-20112 | 10.35 | | 0.01 | | 3.32 | | 3.33 | | (0.03) | | (1.24) | | — | | (1.27) | | 12.41 | | 33.083,4 | | 1,483 | | 1.015 | | 1.015 | | 0.185 | | 91 |
| 08-31-2010 | 10.87 | | 0.03 | | 0.58 | | 0.61 | | (0.06) | | (1.07) | | — | | (1.13) | | 10.35 | | 5.013 | | 1,113 | | 1.04 | | 1.04 | | 0.28 | | 171 |
| 08-31-20096 | 10.00 | | 0.03 | | 0.85 | | 0.88 | | (0.01) | | — | | — | | (0.01) | | 10.87 | | 8.804 | | 671 | | 1.085 | | 1.085 | | 0.425 | | 202 |
|
| 1. Based on the average daily shares outstanding. 2. Unaudited. 3. Total returns would have been lower had certain expenses not been reduced during the periods shown. 4. Not | | |
| annualized. 5. Annualized. 6. The inception date for Class NAV shares is 10-7-08. | | | | | | | | | | | | | | | | | | | | |
| |
| The accompanying notes are an integral part of the financial statements. | 349 |
John Hancock Funds II
Financial Highlights
| | | | | | | | | | | | | | | | | | | | | | | | | | | | | | |
| Per share operating performance for a share outstanding throughout the period | Ratios and supplemental data | | | | |
|
| | | | | Income (loss) from | | | | | | | | | | | | | | | | | | | | | | | |
| | | | | investment operations | | | Less distributions | | | | | | | | Ratios to average net assets | | | | |
| | | |
| | |
| | | | | | |
| | | | |
| |
| | | | | | | Net real- | | | | | | | | | | | | | | | | | | | | | | | | |
| | | | | | | ized and | | | | | | | | | | | | | | | | | | Expenses | | Expenses | | | | |
| | | Net asset | | Net | | unrealized | | | | | | | | | | | | Net asset | | | | Net | | before | | including | | Net | | |
| | | value, | | investment | | gain (loss) | | Total from | | From net | | From net | | From | | Total | | value, | | | | assets, | | reductions | | reductions | | investment | | |
| | | beginning | | income | | on invest- | | investment | | investment | | realized | | capital | | distri- | | end of | | Total | | end of | | and amounts | | and amounts | | income | | Portfolio |
| | | of period | | (loss) | | ments | | operations | | income | | gain | | paid-in | | butions | | period | | return | | period | | recaptured | | recaptured | | (loss) | | turnover |
| Period ended | ($) | | ($)1 | | ($) | | ($) | | ($) | | ($) | | ($) | | ($) | | ($) | | (%) | | (in millions) | | (%) | | (%) | | (%) | | (%) |
|
| |
| Blue Chip Growth Fund | | | | | | | | | | | | | | | | | | | | | | | | | | |
| CLASS 1 | | | | | | | | | | | | | | | | | | | | | | | | | | | | |
|
| 02-28-20112 | 16.31 | | 0.01 | | 5.43 | | 5.44 | | —3 | | — | | — | | —3 | | 21.75 | | 33.374,5 | | 531 | | 0.866 | | 0.836 | | 0.076 | | 20 |
| 08-31-2010 | 15.60 | | —7 | | 0.73 | | 0.73 | | (0.02) | | — | | — | | (0.02) | | 16.31 | | 4.654 | | 405 | | 0.88 | | 0.84 | | 0.03 | | 49 |
| 08-31-2009 | 19.07 | | 0.03 | | (3.46) | | (3.43) | | (0.04) | | — | | — | | (0.04) | | 15.60 | | (17.95)4 | | 153 | | 0.90 | | 0.87 | | 0.19 | | 59 |
| 08-31-2008 | 20.98 | | 0.05 | | (1.78) | | (1.73) | | (0.08) | | (0.10) | | — | | (0.18) | | 19.07 | | (8.35)4 | | 192 | | 0.89 | | 0.86 | | 0.26 | | 44 |
| 08-31-2007 | 17.82 | | 0.088 | | 3.17 | | 3.25 | | (0.09) | | — | | — | | (0.09) | | 20.98 | | 18.284 | | 204 | | 0.89 | | 0.86 | | 0.398 | | 33 |
| 08-31-20069 | 16.53 | | 0.08 | | 1.22 | | 1.30 | | (0.01) | | — | | — | | (0.01) | | 17.82 | | 7.884,5 | | 185 | | 0.906 | | 0.886 | | 0.516 | | 28 |
|
| |
| CLASS NAV | | | | | | | | | | | | | | | | | | | | | | | | | | | | |
|
| 02-28-20112 | 16.30 | | 0.01 | | 5.43 | | 5.44 | | (0.01) | | — | | — | | (0.01) | | 21.73 | | 33.394,5 | | 1,875 | | 0.816 | | 0.786 | | 0.126 | | 20 |
| 08-31-2010 | 15.59 | | 0.01 | | 0.72 | | 0.73 | | (0.02) | | — | | — | | (0.02) | | 16.30 | | 4.704 | | 1,460 | | 0.83 | | 0.79 | | 0.05 | | 49 |
| 08-31-2009 | 19.06 | | 0.03 | | (3.45) | | (3.42) | | (0.05) | | — | | — | | (0.05) | | 15.59 | | (17.90)4 | | 1,262 | | 0.85 | | 0.82 | | 0.25 | | 59 |
| 08-31-2008 | 20.97 | | 0.06 | | (1.78) | | (1.72) | | (0.09) | | (0.10) | | — | | (0.19) | | 19.06 | | (8.31)4 | | 1,850 | | 0.84 | | 0.81 | | 0.29 | | 44 |
| 08-31-2007 | 17.80 | | 0.098 | | 3.17 | | 3.26 | | (0.09) | | — | | — | | (0.09) | | 20.97 | | 18.374 | | 1,483 | | 0.84 | | 0.81 | | 0.448 | | 33 |
| 08-31-20069 | 16.51 | | 0.09 | | 1.22 | | 1.31 | | (0.02) | | — | | — | | (0.02) | | 17.80 | | 7.904,5 | | 1,088 | | 0.856 | | 0.836 | | 0.586 | | 28 |
|
| 1. Based on the average daily shares outstanding. 2. Unaudited. 3. Less than ($0.005) per share. 4. Total returns would have been lower had certain expenses not been reduced during the |
| periods shown. 5. Not annualized. 6. Annualized. 7. Less than $0.005 per share. 8. Net investment income (loss) per share and ratio of net investment income (loss) to average net assets |
| reflects special dividends received by the Fund which amounted to the following amounts: $0.04 for Class 1 and Class NAV. Percentage of average net assets was 0.18% for Class 1 and |
| Class NAV. 9. The inception date for Class 1 and Class NAV shares is 10-15-05. | | | | | | | | | | | | | | | | | | | | |
| |
| Capital Appreciation Fund | | | | | | | | | | | | | | | | | | | | | | | | | | |
| CLASS 1 | | | | | | | | | | | | | | | | | | | | | | | | | | | | |
|
| 02-28-20112 | 9.11 | | —3 | | 2.67 | | 2.67 | | (0.01) | | — | | — | | (0.01) | | 11.77 | | 29.324,5 | | 391 | | 0.786 | | 0.786 | | 0.056 | | 43 |
| 08-31-2010 | 8.84 | | 0.02 | | 0.27 | | 0.29 | | (0.02) | | — | | — | | (0.02) | | 9.11 | | 3.274 | | 321 | | 0.79 | | 0.79 | | 0.19 | | 73 |
| 08-31-2009 | 10.14 | | 0.02 | | (1.28) | | (1.26) | | (0.04) | | — | | — | | (0.04) | | 8.84 | | (12.37) | | 53 | | 0.81 | | 0.81 | | 0.32 | | 78 |
| 08-31-2008 | 10.79 | | 0.04 | | (0.66) | | (0.62) | | (0.03) | | — | | — | | (0.03) | | 10.14 | | (5.80) | | 61 | | 0.80 | | 0.80 | | 0.34 | | 85 |
| 08-31-2007 | 9.44 | | 0.03 | | 1.33 | | 1.36 | | (0.01) | | — | | — | | (0.01) | | 10.79 | | 14.43 | | 66 | | 0.81 | | 0.81 | | 0.27 | | 63 |
| 08-31-20067 | 9.20 | | 0.01 | | 0.23 | | 0.24 | | — | | — | | — | | — | | 9.44 | | 2.615 | | 68 | | 0.886 | | 0.886 | | 0.106 | | 57 |
|
| |
| CLASS NAV | | | | | | | | | | | | | | | | | | | | | | | | | | | | |
|
| 02-28-20112 | 9.12 | | 0.01 | | 2.67 | | 2.68 | | (0.02) | | — | | — | | (0.02) | | 11.78 | | 29.344,5 | | 1,510 | | 0.736 | | 0.736 | | 0.106 | | 43 |
| 08-31-2010 | 8.85 | | 0.02 | | 0.28 | | 0.30 | | (0.03) | | — | | — | | (0.03) | | 9.12 | | 3.314 | | 1,194 | | 0.74 | | 0.74 | | 0.20 | | 73 |
| 08-31-2009 | 10.16 | | 0.03 | | (1.30) | | (1.27) | | (0.04) | | — | | — | | (0.04) | | 8.85 | | (12.39) | | 1,091 | | 0.76 | | 0.76 | | 0.36 | | 78 |
| 08-31-2008 | 10.80 | | 0.04 | | (0.65) | | (0.61) | | (0.03) | | — | | — | | (0.03) | | 10.16 | | (5.65) | | 973 | | 0.75 | | 0.75 | | 0.41 | | 85 |
| 08-31-2007 | 9.45 | | 0.04 | | 1.32 | | 1.36 | | (0.01) | | — | | — | | (0.01) | | 10.80 | | 14.42 | | 586 | | 0.76 | | 0.76 | | 0.34 | | 63 |
| 08-31-20067 | 9.20 | | 0.01 | | 0.24 | | 0.25 | | — | | — | | — | | — | | 9.45 | | 2.725 | | 393 | | 0.836 | | 0.836 | | 0.156 | | 57 |
|
| 1. Based on the average daily shares outstanding. 2. Unaudited. 3. Less than $0.005 per share. 4. Total returns would have been lower had certain expenses not been reduced during the |
| periods shown. 5. Not annualized. 6. Annualized. 7. The inception date for Class 1 and Class NAV shares is 10-15-05. | | | | | | | | | | | | |
| |
| Capital Appreciation Value Fund | | | | | | | | | | | | | | | | | | | | | | | | |
| CLASS NAV | | | | | | | | | | | | | | | | | | | | | | | | | | | | |
|
| 02-28-20112,3 | 10.00 | | 0.02 | | 0.35 | | 0.37 | | — | | — | | — | | — | | 10.37 | | 3.704,5 | | 318 | | 0.916 | | 0.876 | | 1.056 | | 11 |
|
| 1. Based on the average daily shares outstanding. 2. Unaudited. 3. The inception date for Class NAV shares is 1-6-11. 4. Total returns would have been lower had certain expenses not |
| been reduced during the period shown. 5. Not annualized. 6. Annualized. | | | | | | | | | | | | | | | | | | | | |
| |
| The accompanying notes are an integral part of the financial statements. | 350 |
John Hancock Funds II
Financial Highlights
| | | | | | | | | | | | | | | | | | | | | | | | | | | | | | |
| Per share operating performance for a share outstanding throughout the period | | | | | | Ratios and supplemental data | | | | |
|
| | | | | Income (loss) from | | | | | | | | | | | | | | | | | | | | | | | |
| | | | | investment operations | | | Less distributions | | | | | | | | Ratios to average net assets | | | | |
| | | |
| | |
| | | | | | |
| | | | |
| |
| | | | | | | Net real- | | | | | | | | | | | | | | | | | | | | | | | | |
| | | | | | | ized and | | | | | | | | | | | | | | | | | | Expenses | | Expenses | | | | |
| | | Net asset | | Net | | unrealized | | | | | | | | | | | | Net asset | | | | Net | | before | | including | | Net | | |
| | | value, | | investment | | gain (loss) | | Total from | | From net | | From net | | From | | Total | | value, | | | | assets, | | reductions | | reductions | | investment | | |
| | | beginning | | income | | on invest- | | investment | | investment | | realized | | capital | | distri- | | end of | | Total | | end of | | and amounts | | and amounts | | income | | Portfolio |
| | | of period | | (loss) | | ments | | operations | | income | | gain | | paid-in | | butions | | period | | return | | period | | recaptured | | recaptured | | (loss) | | turnover |
| Period ended | ($) | | ($)1 | | ($) | | ($) | | ($) | | ($) | | ($) | | ($) | | ($) | | (%) | | (in millions) | | (%) | | (%) | | (%) | | (%) |
|
| |
| Core Bond Fund | | | | | | | | | | | | | | | | | | | | | | | | | | |
| CLASS 1 | | | | | | | | | | | | | | | | | | | | | | | | | | | | | |
|
| 02-28-20112 | 13.76 | | 0.19 | | (0.26) | | (0.07) | | (0.23) | | (0.58) | | — | | (0.81) | | 12.88 | | (0.46)3,4 | | 12 | | 0.685 | | 0.685 | | 2.895 | | 3046 |
| 08-31-2010 | 13.09 | | 0.41 | | 0.86 | | 1.27 | | (0.51) | | (0.09) | | — | | (0.60) | | 13.76 | | 9.993 | | 14 | | 0.69 | | 0.69 | | 3.09 | | 4966 |
| 08-31-2009 | 12.59 | | 0.52 | | 0.65 | | 1.17 | | (0.57) | | (0.10) | | — | | (0.67) | | 13.09 | | 9.71 | | 10 | | 0.76 | | 0.76 | | 4.20 | | 5716 |
| 08-31-2008 | 12.51 | | 0.56 | | 0.11 | | 0.67 | | (0.59) | | — | | — | | (0.59) | | 12.59 | | 5.43 | | 4 | | 0.80 | | 0.80 | | 4.46 | | 3956 |
| 08-31-2007 | 12.52 | | 0.58 | | (0.02) | | 0.56 | | (0.57) | | —7 | | — | | (0.57) | | 12.51 | | 4.60 | | 2 | | 0.82 | | 0.82 | | 4.67 | | 3136 |
| 08-31-20068 | 12.51 | | 0.47 | | (0.12) | | 0.35 | | (0.34) | | — | | — | | (0.34) | | 12.52 | | 2.864 | | 1 | | 0.885 | | 0.885 | | 4.395 | | 436 |
|
| |
| CLASS NAV | | | | | | | | | | | | | | | | | | | | | | | | | | | | |
|
| 02-28-20112 | 13.75 | | 0.19 | | (0.26) | | (0.07) | | (0.23) | | (0.58) | | — | | (0.81) | | 12.87 | | (0.43)3,4 | | 581 | | 0.635 | | 0.635 | | 2.945 | | 3046 |
| 08-31-2010 | 13.07 | | 0.41 | | 0.87 | | 1.28 | | (0.51) | | (0.09) | | — | | (0.60) | | 13.75 | | 10.133 | | 564 | | 0.64 | | 0.64 | | 3.11 | | 4966 |
| 08-31-2009 | 12.58 | | 0.53 | | 0.63 | | 1.16 | | (0.57) | | (0.10) | | — | | (0.67) | | 13.07 | | 9.69 | | 411 | | 0.71 | | 0.71 | | 4.29 | | 5716 |
| 08-31-2008 | 12.50 | | 0.57 | | 0.10 | | 0.67 | | (0.59) | | — | | — | | (0.59) | | 12.58 | | 5.49 | | 267 | | 0.75 | | 0.75 | | 4.51 | | 3956 |
| 08-31-2007 | 12.51 | | 0.59 | | (0.02) | | 0.57 | | (0.58) | | —7 | | — | | (0.58) | | 12.50 | | 4.67 | | 267 | | 0.77 | | 0.77 | | 4.71 | | 3136 |
| 08-31-20068 | 12.50 | | 0.46 | | (0.11) | | 0.35 | | (0.34) | | — | | — | | (0.34) | | 12.51 | | 2.904 | | 197 | | 0.835 | | 0.835 | | 4.245 | | 436 |
|
| 1. Based on the average daily shares outstanding. 2. Unaudited. 3. Total returns would have been lower had certain expenses not been reduced during the periods shown. 4. Not | | |
| annualized. 5. Annualized. 6. The Portfolio turnover rates, including the effect of “TBA” (to be announced) securities for the periods ended, were as follows: 550% for 2-28-11, 850% for |
| 8-31-10, 1,220% for 8-31-09, 807% for 8-31-08 and 623% for 8-31-07. The year ended 8-31-06 includes the effect of TBA transactions. 7. Less than ($0.005) per share. 8. The inception |
| date for Class 1 and Class NAV shares is 10-15-05. | | | | | | | | | | | | | | | | | | | | | | | | |
| |
| Core Diversified Growth & Income Portfolio | | | | | | | | | | | | | | | | | | | | | | |
| CLASS 1 | | | | | | | | | | | | | | | | | | | | | | | | | | | | |
|
| 02-28-20112 | 8.84 | | 0.133 | | 1.31 | | 1.44 | | (0.18) | | (0.32) | | — | | (0.50) | | 9.78 | | 16.454,5 | | 28 | | 0.256 | | 0.126,7 | | 2.793,6 | | 7 |
| 08-31-2010 | 8.50 | | 0.203 | | 0.37 | | 0.57 | | (0.19) | | (0.04) | | — | | (0.23) | | 8.84 | | 6.625 | | 23 | | 0.30 | | 0.117 | | 2.243 | | 58 |
| 08-31-2009 | 9.75 | | 0.253 | | (1.39)8 | | (1.14) | | (0.11) | | — | | — | | (0.11) | | 8.50 | | (11.47)5 | | 12 | | 1.04 | | 0.067 | | 3.083 | | 6 |
| 08-31-20089 | 10.00 | | 0.023 | | (0.27) | | (0.25) | | — | | — | | — | | — | | 9.75 | | (2.50)4 | | 1 | | 15.516 | | 0.086,7 | | 1.433,6 | | —10 |
|
| 1. Based on the average daily shares outstanding. 2. Unaudited. 3. Recognition of net investment income by the Portfolio is affected by the timing of the declaration of dividends by the |
| underlying funds in which the Portfolio invests. 4. Not annualized. 5. Total returns would have been lower had certain expenses not been reduced during the periods shown. 6. Annualized. |
| 7. Ratios do not include expenses indirectly incurred from underlying funds whose expense ratios can vary based on the mix of underlying funds held by the Portfolio. The range of expense |
| ratios of the underlying funds held by the Portfolio was as follows: 0.36% – 0.56% for the period ended 2-28-11, 0.35% – 0.56%, 0.37% – 0.79% and 0.32% – 0.71% for the years | | |
| ended 8-31-10, 8-31-09 and 8-31-08, respectively. 8. The amount shown for a share outstanding does not correspond with the aggregate net gain (loss) on investments for the period due |
| to the timing of sales and repurchases of shares in relation to fluctuating market values of the investments of the fund. 9. The inception date for Class 1 shares is 7-1-08. 10. Less than 1%. |
| |
| Core Fundamental Holdings Portfolio | | | | | | | | | | | | | | | | | | | | | | | | |
| CLASS 1 | | | | | | | | | | | | | | | | | | | | | | | | | | | | |
|
| 02-28-20112 | 9.09 | | 0.133 | | 1.09 | | 1.22 | | (0.19) | | (0.43) | | — | | (0.62) | | 9.69 | | 13.664,5 | | 13 | | 0.386 | | 0.126,7 | | 2.793,6 | | 18 |
| 08-31-2010 | 8.77 | | 0.223 | | 0.38 | | 0.60 | | (0.22) | | (0.06) | | — | | (0.28) | | 9.09 | | 6.834 | | 12 | | 0.47 | | 0.117 | | 2.443 | | 69 |
| 08-31-2009 | 9.78 | | 0.263 | | (1.13)8 | | (0.87) | | (0.14) | | — | | — | | (0.14) | | 8.77 | | (8.64)4 | | 8 | | 1.42 | | 0.067 | | 3.123 | | 17 |
| 08-31-20089 | 10.00 | | 0.043 | | (0.26) | | (0.22) | | — | | — | | — | | — | | 9.78 | | (2.20)5 | | 1 | | 15.486 | | 0.086,7 | | 2.213,6 | | —10 |
|
| 1. Based on the average daily shares outstanding. 2. Unaudited. 3. Recognition of net investment income by the Portfolio is affected by the timing of the declaration of dividends by the |
| underlying funds in which the Portfolio invests. 4. Total returns would have been lower had certain expenses not been reduced during the periods shown. 5. Not annualized. 6. Annualized. |
| 7. Ratios do not include expenses indirectly incurred from underlying funds whose expense ratios can vary based on the mix of underlying funds held by the Portfolio. The range of expense |
| ratios of the underlying funds held by the Portfolios was as follows: 0.35% – 0.56% for the period ended 2-28-11, 0.35% – 0.56%, 0.37% – 0.51% and 0.32% – 0.50% for the year | | |
| ended 8-31-10, 8-31-09 and 8-31-08, respectively. 8. The amount shown for a share outstanding does not correspond with the aggregate net gain (loss) on investments for the period due |
| to the timing of sales and repurchases of shares in relation to fluctuating market values of the investments of the fund. 9. The inception date for Class 1 shares is 7-1-08. 10. Less than 1%. |
| |
| Core Global Diversification Portfolio | | | | | | | | | | | | | | | | | | | | | | | | |
| CLASS 1 | | | | | | | | | | | | | | | | | | | | | | | | | | | | |
|
| 02-28-20112 | 8.90 | | 0.153 | | 1.05 | | 1.20 | | (0.18) | | (0.28) | | — | | (0.46) | | 9.64 | | 13.684,5 | | 30 | | 0.236 | | 0.126,7 | | 3.133,6 | | 11 |
| 08-31-2010 | 8.54 | | 0.203 | | 0.39 | | 0.59 | | (0.19) | | (0.04) | | — | | (0.23) | | 8.90 | | 6.915 | | 24 | | 0.33 | | 0.117 | | 2.263 | | 60 |
| 08-31-2009 | 9.51 | | 0.263 | | (1.07)8 | | (0.81) | | (0.16) | | — | | — | | (0.16) | | 8.54 | | (8.11) | | 8 | | 1.55 | | 0.067 | | 3.333 | | 11 |
| 08-31-20089 | 10.00 | | 0.033 | | (0.52) | | (0.49) | | — | | — | | — | | — | | 9.51 | | (4.90)4 | | 1 | | 15.706 | | 0.086,7 | | 1.923,6 | | —10 |
|
| 1. Based on the average daily shares outstanding. 2. Unaudited. 3. Recognition of net investment income by the Portfolio is affected by the timing of the declaration of dividends by the |
| underlying funds in which the Portfolio invests. 4. Not annualized. 5. Total returns would have been lower had certain expenses not been reduced during the periods shown. 6. Annualized. |
| 7. Ratios do not include expenses indirectly incurred from underlying funds whose expense ratios can vary based on the mix of underlying funds held by the Portfolio. The range of expense |
| ratios of the underlying funds held by the Portfolio was as follows: 0.36% – 0.56% for the period ended 2-28-11, 0.35% – 0.56%, 0.37% – 0.79% and 0.33% – 0.71% for the years | | |
| ended 8-31-10, 8-31-09 and 8-31-08, respectively. 8. The amount shown for a share outstanding does not correspond with the aggregate net gain (loss) on investments for the period due |
| to the timing of sales and repurchases of shares in relation to fluctuating market values of the investments of the fund. 9. The inception date for Class 1 shares is 7-1-08. 10. Less than 1%. |
| |
| The accompanying notes are an integral part of the financial statements. | 351 |
John Hancock Funds II
Financial Highlights
| | | | | | | | | | | | | | | | | | | | | | | | | | | | | | |
| Per share operating performance for a share outstanding throughout the period | | | | | | Ratios and supplemental data | | | | |
|
| | | | | Income (loss) from | | | | | | | | | | | | | | | | | | | | | | | |
| | | | | investment operations | | | Less distributions | | | | | | | | Ratios to average net assets | | | | |
| | | |
| | |
| | | | | | |
| | | | |
| |
| | | | | | | Net real- | | | | | | | | | | | | | | | | | | | | | | | | |
| | | | | | | ized and | | | | | | | | | | | | | | | | | | Expenses | | Expenses | | | | |
| | | Net asset | | Net | | unrealized | | | | | | | | | | | | Net asset | | | | Net | | before | | including | | Net | | |
| | | value, | | investment | | gain (loss) | | Total from | | From net | | From net | | From | | Total | | value, | | | | assets, | | reductions | | reductions | | investment | | |
| | | beginning | | income | | on invest- | | investment | | investment | | realized | | capital | | distri- | | end of | | Total | | end of | | and amounts | | and amounts | | income | | Portfolio |
| | | of period | | (loss) | | ments | | operations | | income | | gain | | paid-in | | butions | | period | | return | | period | | recaptured | | recaptured | | (loss) | | turnover |
| Period ended | ($) | | ($)1 | | ($) | | ($) | | ($) | | ($) | | ($) | | ($) | | ($) | | (%) | | (in millions) | | (%) | | (%) | | (%) | | (%) |
|
| |
| Emerging Markets Fund (formerly, Emerging Markets Value Fund) | | | | | | | | | | | | | | | | |
| CLASS NAV | | | | | | | | | | | | | | | | | | | | | | | | | | | | |
|
| 02-28-20112 | 10.82 | | —3 | | 1.72 | | 1.72 | | (0.09) | | (0.81) | | — | | (0.90) | | 11.64 | | 15.674,5 | | 2,156 | | 1.076 | | 1.076 | | (0.06)6 | | 7 |
| 08-31-2010 | 9.09 | | 0.08 | | 1.77 | | 1.85 | | (0.08) | | (0.04) | | — | | (0.12) | | 10.82 | | 20.434 | | 1,590 | | 1.08 | | 1.08 | | 0.81 | | 29 |
| 08-31-2009 | 9.47 | | 0.10 | | (0.19) | | (0.09) | | (0.16) | | (0.13) | | — | | (0.29) | | 9.09 | | 1.07 | | 1,037 | | 1.07 | | 1.07 | | 1.39 | | 32 |
| 08-31-2008 | 11.02 | | 0.24 | | (1.59) | | (1.35) | | (0.10) | | (0.10) | | — | | (0.20) | | 9.47 | | (12.61) | | 577 | | 1.08 | | 1.08 | | 2.11 | | 13 |
| 08-31-20077 | 10.00 | | 0.08 | | 0.94 | | 1.02 | | — | | — | | — | | — | | 11.02 | | 10.205 | | 482 | | 1.106 | | 1.106 | | 2.146 | | 2 |
|
| 1. Based on the average daily shares outstanding. 2. Unaudited. 3. Less than ($0.005) per share. 4. Total returns would have been lower had certain expenses not been reduced during the |
| periods shown. 5. Not annualized. 6. Annualized. 7. The inception date for Class NAV shares is 5-1-07. | | | | | | | | | | | | | | |
| |
| Emerging Markets Debt Fund | | | | | | | | | | | | | | | | | | | | | | | | |
| CLASS A | | | | | | | | | | | | | | | | | | | | | | | | | | | | |
|
| 02-28-20112 | 10.54 | | 0.30 | | 0.17 | | 0.47 | | (0.38) | | (0.07) | | — | | (0.45) | | 10.56 | | 4.273,4,7 | | 13 | | 1.675 | | 1.355 | | 5.595 | | 57 |
| 08-31-20106 | 10.00 | | 0.34 | | 0.58 | | 0.92 | | (0.38) | | — | | — | | (0.38) | | 10.54 | | 9.363,4,7 | | 13 | | 1.855 | | 1.255 | | 5.095 | | 112 |
|
| |
| CLASS I | | | | | | | | | | | | | | | | | | | | | | | | | | | | |
|
| 02-28-20112 | 10.54 | | 0.32 | | 0.18 | | 0.50 | | (0.41) | | (0.07) | | — | | (0.48) | | 10.56 | | 4.523,4 | | 3 | | 1.235 | | 0.885 | | 6.065 | | 57 |
| 08-31-20106 | 10.00 | | 0.36 | | 0.58 | | 0.94 | | (0.40) | | — | | — | | (0.40) | | 10.54 | | 9.623,4 | | 3 | | 1.515 | | 0.885 | | 5.475 | | 112 |
|
| 1. Based on the average daily shares outstanding. 2. Unaudited. 3. Not annualized. 4. Total returns would have been lower had certain expenses not been reduced during the periods |
| shown. 5. Annualized. 6. The inception date for Class A and Class I shares is 1-4-10. 7. Does not reflect the effect of sales charges, if any. | | | | | | | | |
| |
| Equity-Income Fund | | | | | | | | | | | | | | | | | | | | | | | | | | |
| CLASS 1 | | | | | | | | | | | | | | | | | | | | | | | | | | | | |
|
| 02-28-20112 | 12.05 | | 0.12 | | 3.07 | | 3.19 | | (0.20) | | — | | — | | (0.20) | | 15.04 | | 26.593,4 | | 195 | | 0.875 | | 0.845 | | 1.725 | | 11 |
| 08-31-2010 | 11.85 | | 0.23 | | 0.21 | | 0.44 | | (0.24) | | — | | — | | (0.24) | | 12.05 | | 3.663 | | 140 | | 0.89 | | 0.86 | | 1.84 | | 13 |
| 08-31-2009 | 16.11 | | 0.29 | | (3.04) | | (2.75) | | (0.38) | | (1.13) | | — | | (1.51) | | 11.85 | | (15.65)3 | | 139 | | 0.91 | | 0.88 | | 2.73 | | 46 |
| 08-31-2008 | 19.52 | | 0.36 | | (2.52) | | (2.16) | | (0.32) | | (0.93) | | — | | (1.25) | | 16.11 | | (11.83)3 | | 163 | | 0.89 | | 0.86 | | 2.06 | | 30 |
| 08-31-2007 | 18.13 | | 0.33 | | 2.22 | | 2.55 | | (0.30) | | (0.86) | | — | | (1.16) | | 19.52 | | 14.373 | | 212 | | 0.89 | | 0.86 | | 1.70 | | 20 |
| 08-31-20066 | 16.03 | | 0.26 | | 1.90 | | 2.16 | | (0.06) | | — | | — | | (0.06) | | 18.13 | | 13.523,4 | | 183 | | 0.905 | | 0.895 | | 1.685 | | 39 |
|
| |
| CLASS NAV | | | | | | | | | | | | | | | | | | | | | | | | | | | | |
|
| 02-28-20112 | 12.04 | | 0.12 | | 3.07 | | 3.19 | | (0.21) | | — | | — | | (0.21) | | 15.02 | | 26.583,4 | | 1,238 | | 0.825 | | 0.795 | | 1.765 | | 11 |
| 08-31-2010 | 11.83 | | 0.24 | | 0.22 | | 0.46 | | (0.25) | | — | | — | | (0.25) | | 12.04 | | 3.803 | | 981 | | 0.84 | | 0.81 | | 1.94 | | 13 |
| 08-31-2009 | 16.10 | | 0.29 | | (3.04) | | (2.75) | | (0.39) | | (1.13) | | — | | (1.52) | | 11.83 | | (15.68)3 | | 633 | | 0.86 | | 0.83 | | 2.77 | | 46 |
| 08-31-2008 | 19.51 | | 0.37 | | (2.52) | | (2.15) | | (0.33) | | (0.93) | | — | | (1.26) | | 16.10 | | (11.79)3 | | 774 | | 0.84 | | 0.81 | | 2.14 | | 30 |
| 08-31-2007 | 18.11 | | 0.34 | | 2.22 | | 2.56 | | (0.30) | | (0.86) | | — | | (1.16) | | 19.51 | | 14.463 | | 711 | | 0.84 | | 0.81 | | 1.75 | | 20 |
| 08-31-20066 | 16.01 | | 0.27 | | 1.89 | | 2.16 | | (0.06) | | — | | — | | (0.06) | | 18.11 | | 13.543,4 | | 535 | | 0.855 | | 0.845 | | 1.755 | | 39 |
|
| 1. Based on the average daily shares outstanding. 2. Unaudited. 3. Total returns would have been lower had certain expenses not been reduced during the periods shown. 4. Not | | |
| annualized. 5. Annualized. 6. The inception date for Class 1 and Class NAV shares is 10-15-05. | | | | | | | | | | | | | | | | |
| |
| Fundamental Value Fund | | | | | | | | | | | | | | | | | | | | | | | | | | |
| CLASS NAV | | | | | | | | | | | | | | | | | | | | | | | | | | | | |
|
| 02-28-20112 | 12.66 | | 0.07 | | 3.10 | | 3.17 | | (0.16) | | — | | — | | (0.16) | | 15.67 | | 25.124,5 | | 1,668 | | 0.806 | | 0.806 | | 1.006 | | 7 |
| 08-31-2010 | 12.29 | | 0.09 | | 0.39 | | 0.48 | | (0.11) | | — | | — | | (0.11) | | 12.66 | | 3.865 | | 1,348 | | 0.80 | | 0.80 | | 0.71 | | 26 |
| 08-31-2009 | 15.35 | | 0.13 | | (3.03) | | (2.90) | | (0.16) | | — | | — | | (0.16) | | 12.29 | | (18.75) | | 1,299 | | 0.81 | | 0.81 | | 1.19 | | 36 |
| 08-31-2008 | 17.56 | | 0.15 | | (2.03) | | (1.88) | | (0.18) | | (0.15) | | — | | (0.33) | | 15.35 | | (10.93) | | 1,533 | | 0.80 | | 0.80 | | 0.93 | | 14 |
| 08-31-2007 | 15.83 | | 0.21 | | 1.86 | | 2.07 | | (0.13) | | (0.21) | | — | | (0.34) | | 17.56 | | 13.12 | | 946 | | 0.80 | | 0.80 | | 1.21 | | 6 |
| 08-31-20063 | 14.31 | | 0.13 | | 1.42 | | 1.55 | | (0.03) | | — | | — | | (0.03) | | 15.83 | | 10.874 | | 695 | | 0.816 | | 0.816 | | 1.006 | | 8 |
|
| 1. Based on the average daily shares outstanding. 2. Unaudited. 3. The inception date for Class NAV shares is 10-15-05. 4. Not annualized. 5. Total returns would have been lower had |
| certain expenses not been reduced during the periods shown. 6. Annualized. | | | | | | | | | | | | | | | | | | | | |
| |
| The accompanying notes are an integral part of the financial statements. | 352 |
John Hancock Funds II
Financial Highlights
| | | | | | | | | | | | | | | | | | | | | | | | | | | | | | |
| Per share operating performance for a share outstanding throughout the period | | | | | | Ratios and supplemental data | | | | |
|
| | | | | Income (loss) from | | | | | | | | | | | | | | | | | | | | | | | | |
| | | | | investment operations | | | | Less distributions | | | | | | | | Ratios to average net assets | | | | |
| | | |
| | |
| | | | | | |
| | | | |
| |
| | | | | | | Net real- | | | | | | | | | | | | | | | | | | | | | | | | |
| | | | | | | ized and | | | | | | | | | | | | | | | | | | Expenses | | Expenses | | | | |
| | | Net asset | | Net | | unrealized | | | | | | | | | | | | Net asset | | | | Net | | before | | including | | Net | | |
| | | value, | | investment | | gain (loss) | | Total from | | From net | | From net | | From | | Total | | value, | | | | assets, | | reductions | | reductions | | investment | | |
| | | beginning | | income | | on invest- | | investment | | investment | | realized | | capital | | distri- | | end of | | Total | | end of | | and amounts | | and amounts | | income | | Portfolio |
| | | of period | | (loss) | | ments | | operations | | income | | gain | | paid-in | | butions | | period | | return | | period | | recaptured | | recaptured | | (loss) | | turnover |
| Period ended | ($) | | ($)1 | | ($) | | ($) | | ($) | | ($) | | ($) | | ($) | | ($) | | (%) | | (in millions) | | (%) | | (%) | | (%) | | (%) |
|
| |
| Global Agribusiness Fund | | | | | | | | | | | | | | | | | | | | | | | | | |
| CLASS A | | | | | | | | | | | | | | | | | | | | | | | | | | | | |
|
| 02-28-20112 | 11.95 | | (0.05) | | 3.61 | | 3.56 | | (0.03) | | (0.44) | | — | | (0.47) | | 15.04 | | 30.103,4,5 | | 2 | | 3.546 | | 1.446 | | (0.68)6 | | 30 |
| 08-31-2010 | 11.41 | | 0.08 | | 0.62 | | 0.70 | | (0.11) | | (0.05) | | — | | (0.16) | | 11.95 | | 6.193,4 | | 1 | | 4.27 | | 1.45 | | 0.70 | | 91 |
| 08-31-20098 | 10.00 | | 0.04 | | 1.41 | | 1.45 | | (0.04) | | — | | — | | (0.04) | | 11.41 | | 14.523,4,5 | | 1 | | 4.726 | | 1.456 | | 0.586 | | 84 |
|
| |
| CLASS I | | | | | | | | | | | | | | | | | | | | | | | | | | | | |
|
| 02-28-20112 | 12.00 | | (0.02) | | 3.62 | | 3.60 | | (0.06) | | (0.44) | | — | | (0.50) | | 15.10 | | 30.374,5 | | 2 | | 3.116 | | 1.016,7 | | (0.23)6 | | 30 |
| 08-31-2010 | 11.43 | | 0.13 | | 0.63 | | 0.76 | | (0.14) | | (0.05) | | — | | (0.19) | | 12.00 | | 6.674 | | 1 | | 3.94 | | 1.00 | | 1.15 | | 91 |
| 08-31-20098 | 10.00 | | 0.07 | | 1.41 | | 1.48 | | (0.05) | | — | | — | | (0.05) | | 11.43 | | 14.844,5 | | 1 | | 4.426 | | 1.006 | | 1.036 | | 84 |
|
| 1. Based on the average daily shares outstanding. 2. Unaudited. 3. Does not reflect the effect of sales charges, if any. 4. Total returns would have been lower had certain expenses not |
| been reduced during the periods shown. 5. Not annualized. 6. Annualized. 7. Includes the impact of expense recapture for the period ended 2-28-11: less than 0.01% of average net |
| assets for Class I shares. See Note 5. 8. The inception date for Class A and Class I shares is 1-2-09. | | | | | | | | | | | | | | | | |
| |
| Global Bond Fund | | | | | | | | | | | | | | | | | | | | | | | | | | |
| CLASS 1 | | | | | | | | | | | | | | | | | | | | | | | | | | | | |
|
| 02-28-20112 | 12.78 | | 0.13 | | 0.08 | | 0.21 | | (0.70) | | — | | — | | (0.70) | | 12.29 | | 1.835,9 | | 74 | | 0.853 | | 0.853 | | 2.033 | | 964 |
| 08-31-2010 | 12.41 | | 0.28 | | 1.18 | | 1.46 | | (1.09) | | — | | — | | (1.09) | | 12.78 | | 12.425 | | 76 | | 0.86 | | 0.86 | | 2.31 | | 511 |
| 08-31-2009 | 15.05 | | 0.47 | | 0.02 | | 0.49 | | (1.90) | | (1.23) | | — | | (3.13) | | 12.41 | | 6.02 | | 59 | | 0.87 | | 0.87 | | 3.98 | | 4484 |
| 08-31-2008 | 14.81 | | 0.67 | | 0.47 | | 1.14 | | (0.78) | | (0.12) | | — | | (0.90) | | 15.05 | | 7.73 | | 74 | | 0.88 | | 0.88 | | 4.28 | | 9754 |
| 08-31-2007 | 14.83 | | 0.53 | | (0.04)6 | | 0.49 | | (0.35) | | (0.16) | | — | | (0.51) | | 14.81 | | 3.40 | | 42 | | 0.867 | | 0.867 | | 3.64 | | 2724 |
| 08-31-20068 | 14.56 | | 0.44 | | (0.08)6 | | 0.36 | | (0.09) | | — | | — | | (0.09) | | 14.83 | | 2.469 | | 41 | | 0.843 | | 0.843 | | 3.423 | | 248 |
|
| |
| CLASS NAV | | | | | | | | | | | | | | | | | | | | | | | | | | | |
|
| 02-28-20112 | 12.76 | | 0.13 | | 0.09 | | 0.22 | | (0.71) | | — | | — | | (0.71) | | 12.27 | | 1.885,9 | | 832 | | 0.803 | | 0.803 | | 2.083 | | 964 |
| 08-31-2010 | 12.39 | | 0.29 | | 1.17 | | 1.46 | | (1.09) | | — | | — | | (1.09) | | 12.76 | | 12.455 | | 730 | | 0.81 | | 0.81 | | 2.35 | | 511 |
| 08-31-2009 | 15.02 | | 0.47 | | 0.03 | | 0.50 | | (1.90) | | (1.23) | | — | | (3.13) | | 12.39 | | 6.14 | | 586 | | 0.82 | | 0.82 | | 4.00 | | 4484 |
| 08-31-2008 | 14.78 | | 0.68 | | 0.47 | | 1.15 | | (0.79) | | (0.12) | | — | | (0.91) | | 15.02 | | 7.81 | | 509 | | 0.83 | | 0.83 | | 4.37 | | 9754 |
| 08-31-2007 | 14.79 | | 0.54 | | (0.03)6 | | 0.51 | | (0.36) | | (0.16) | | — | | (0.52) | | 14.78 | | 3.51 | | 754 | | 0.817 | | 0.817 | | 3.68 | | 2724 |
| 08-31-20068 | 14.52 | | 0.45 | | (0.09)6 | | 0.36 | | (0.09) | | — | | — | | (0.09) | | 14.79 | | 2.489 | | 554 | | 0.793 | | 0.793 | | 3.563 | | 248 |
|
| 1. Based on the average daily shares outstanding. 2. Unaudited. 3. Annualized. 4. The Portfolio turnover rates including the effect of 3TBA3 (to be announced) for the periods ended were |
| as follows: 124% for the period ended 2-28-11, 735% for the year ended 8-31-09, 1,190% for the year ended 8-31-08 and 914% for the year ended 8-31-07. 5. Total returns would have |
| been lower had certain expenses not been reduced during the periods shown. 6. The amount shown for a share outstanding does not correspond with the aggregate net gain (loss) on |
| investments for the period due to the timing of sales and repurchases of shares in relation to fluctuating market values of the investments of the fund. 7. Includes interest and fees on |
| inverse floaters. Excluding this expense the ratio for Class 1 and Class NAV would have been 0.86% and 0.81%, respectively. 8. The inception date for Class 1 and Class NAV shares is |
| 10-15-05. 9. Not annualized. | | | | | | | | | | | | | | | | | | | | | | | | | | |
| |
| Global Infrastructure Fund | | | | | | | | | | | | | | | | | | | | | | | | | | |
| CLASS A | | | | | | | | | | | | | | | | | | | | | | | | | | | | |
|
| 02-28-20112 | 10.54 | | 0.09 | | 2.40 | | 2.49 | | (0.19) | | (0.58) | | — | | (0.77) | | 12.26 | | 24.173,4,5 | | 1 | | 3.836 | | 1.446 | | 1.506 | | 47 |
| 08-31-2010 | 10.26 | | 0.26 | | 0.14 | | 0.40 | | (0.12) | | — | | — | | (0.12) | | 10.54 | | 3.873,4 | | 1 | | 4.47 | | 1.45 | | 2.41 | | 162 |
| 08-31-20098 | 10.00 | | 0.19 | | 0.18 | | 0.37 | | (0.11) | | — | | — | | (0.11) | | 10.26 | | 3.853,4,5 | | 1 | | 5.696 | | 1.456 | | 3.176 | | 39 |
|
| |
| CLASS I | | | | | | | | | | | | | | | | | | | | | | | | | | | | |
|
| 02-28-20112 | 10.58 | | 0.11 | | 2.42 | | 2.53 | | (0.22) | | (0.58) | | — | | (0.80) | | 12.31 | | 24.514,5 | | 1 | | 3.396 | | 1.016,7 | | 1.956 | | 47 |
| 08-31-2010 | 10.28 | | 0.31 | | 0.13 | | 0.44 | | (0.14) | | — | | — | | (0.14) | | 10.58 | | 4.284 | | 1 | | 4.13 | | 1.00 | | 2.87 | | 162 |
| 08-31-20098 | 10.00 | | 0.22 | | 0.18 | | 0.40 | | (0.12) | | — | | — | | (0.12) | | 10.28 | | 4.164,5 | | 1 | | 5.396 | | 1.006 | | 3.626 | | 39 |
|
| 1. Based on the average daily shares outstanding. 2. Unaudited. 3. Does not reflect the effect of sales charges, if any. 4. Total returns would have been lower had certain expenses not |
| been reduced during the periods shown. 5. Not annualized. 6. Annualized. 7. Includes the impact of expense recapture for the period ended 2-28-11: less than 0.01% of average net |
| assets for Class I shares. See Note 5. 8. The inception date for Class A and Class I shares is 1-2-09. | | | | | | | | | | | | | | | | |
| |
| Global Real Estate Fund | | | | | | | | | | | | | | | | | | | | | | | | |
| CLASS NAV | | | | | | | | | | | | | | | | | | | | | | | | | | | | |
|
| 02-28-20112 | 6.75 | | 0.07 | | 1.23 | | 1.30 | | (0.27) | | — | | — | | (0.27) | | 7.78 | | 19.523 | | 530 | | 1.024 | | 1.024 | | 1.974 | | 56 |
| 08-31-2010 | 6.24 | | 0.14 | | 0.65 | | 0.79 | | (0.28) | | — | | — | | (0.28) | | 6.75 | | 12.84 | | 450 | | 1.06 | | 1.06 | | 2.06 | | 105 |
| 08-31-2009 | 8.15 | | 0.17 | | (1.87) | | (1.70) | | (0.21) | | — | | — | | (0.21) | | 6.24 | | (20.28) | | 271 | | 1.09 | | 1.09 | | 3.30 | | 118 |
| 08-31-2008 | 11.37 | | 0.18 | | (2.60) | | (2.42) | | (0.35) | | (0.45) | | — | | (0.80) | | 8.15 | | (22.75) | | 608 | | 1.07 | | 1.07 | | 1.95 | | 68 |
| 08-31-2007 | 10.30 | | 0.18 | | 1.34 | | 1.52 | | (0.45) | | — | | — | | (0.45) | | 11.37 | | 14.70 | | 465 | | 1.08 | | 1.08 | | 1.54 | | 97 |
| 08-31-20065 | 10.00 | | 0.06 | | 0.24 | | 0.30 | | — | | — | | — | | — | | 10.30 | | 3.003 | | 355 | | 1.094 | | 1.094 | | 1.654 | | 87 |
|
| 1. Based on the average daily shares outstanding. 2. Unaudited. 3. Not annualized. 4. Annualized. 5. The inception date for Class NAV shares is 4-28-06. | | | | | | |
| |
| The accompanying notes are an integral part of the financial statements. | 353 |
John Hancock Funds II
Financial Highlights
| | | | | | | | | | | | | | | | | | | | | | | | | | | | | | |
| Per share operating performance for a share outstanding throughout the period | | | | | | Ratios and supplemental data | | | | |
|
| | | | | Income (loss) from | | | | | | | | | | | | | | | | | | | | | | | |
| | | | | investment operations | | | Less distributions | | | | | | | | Ratios to average net assets | | | | |
| | | |
| | |
| | | | | | |
| | | | |
| |
| | | | | | | Net real- | | | | | | | | | | | | | | | | | | | | | | | | |
| | | | | | | ized and | | | | | | | | | | | | | | | | | | Expenses | | Expenses | | | | |
| | | Net asset | | Net | | unrealized | | | | | | | | | | | | Net asset | | | | Net | | before | | including | | Net | | |
| | | value, | | investment | | gain (loss) | | Total from | | From net | | From net | | From | | Total | | value, | | | | assets, | | reductions | | reductions | | investment | | |
| | | beginning | | income | | on invest- | | investment | | investment | | realized | | capital | | distri- | | end of | | Total | | end of | | and amounts | | and amounts | | income | | Portfolio |
| | | of period | | (loss) | | ments | | operations | | income | | gain | | paid-in | | butions | | period | | return | | period | | recaptured | | recaptured | | (loss) | | turnover |
| Period ended | ($) | | ($)1 | | ($) | | ($) | | ($) | | ($) | | ($) | | ($) | | ($) | | (%) | | (in millions) | | (%) | | (%) | | (%) | | (%) |
|
| |
| Global Timber Fund | | | | | | | | | | | | | | | | | | | | | | | | | | |
| CLASS A | | | | | | | | | | | | | | | | | | | | | | | | | | | | |
|
| 02-28-20112 | 12.30 | | 0.05 | | 2.84 | | 2.89 | | (0.20) | | (1.30) | | — | | (1.50) | | 13.69 | | 24.533,4,5 | | 2 | | 3.526 | | 1.446 | | 0.696 | | 40 |
| 08-31-2010 | 11.35 | | 0.297 | | 0.68 | | 0.97 | | (0.02) | | — | | — | | (0.02) | | 12.30 | | 8.543,5 | | 1 | | 4.10 | | 1.45 | | 2.327 | | 113 |
| 08-31-20098 | 10.00 | | 0.03 | | 1.36 | | 1.39 | | (0.04) | | — | | — | | (0.04) | | 11.35 | | 13.983,4,5 | | 1 | | 5.306 | | 1.456 | | 0.486 | | 67 |
|
| |
| CLASS I | | | | | | | | | | | | | | | | | | | | | | | | | | | | |
|
| 02-28-20112 | 12.37 | | 0.08 | | 2.85 | | 2.93 | | (0.26) | | (1.30) | | — | | (1.56) | | 13.74 | | 24.773,4 | | 2 | | 3.106 | | 1.016 | | 1.146 | | 40 |
| 08-31-2010 | 11.37 | | 0.357 | | 0.68 | | 1.03 | | (0.03) | | — | | — | | (0.03) | | 12.37 | | 9.083 | | 1 | | 3.77 | | 1.00 | | 2.777 | | 113 |
| 08-31-20098 | 10.00 | | 0.06 | | 1.36 | | 1.42 | | (0.05) | | — | | — | | (0.05) | | 11.37 | | 14.314,3 | | 1 | | 5.006 | | 1.006 | | 0.936 | | 67 |
|
| 1. Based on the average daily shares outstanding. 2. Unaudited. 3. Total returns would have been lower had certain expenses not been reduced during the periods shown. 4. Not | | |
| annualized. 5. Does not reflect the effect of sales charges, if any. 6. Annualized. 7. Net investment income (loss) per share and ratio of net investment income (loss) to average net assets |
| reflects special dividends received by the Fund which amounted to $0.30 and $0.36 per share and 2.40% and 2.87% for Class A and Class I, respectively. 8. The inception date for Class A |
| and Class I shares is 1-2-09. | | | | | | | | | | | | | | | | | | | | | | | | | | |
| |
| Heritage Fund | | | | | | | | | | | | | | | | | | | | | | | | | | |
| CLASS NAV | | | | | | | | | | | | | | | | | | | | | | | | | | | | |
|
| 02-28-20112 | 7.31 | | (0.01) | | 2.62 | | 2.61 | | — | | (0.29) | | — | | (0.29) | | 9.63 | | 35.883,4 | | 248 | | 0.905 | | 0.905 | | (0.18)5 | | 48 |
| 08-31-2010 | 6.74 | | (0.03) | | 0.60 | | 0.57 | | — | | — | | — | | — | | 7.31 | | 8.463 | | 215 | | 0.92 | | 0.92 | | (0.37) | | 201 |
| 08-31-2009 | 12.55 | | (0.02) | | (4.32) | | (4.34) | | (0.02) | | (1.45) | | — | | (1.47) | | 6.74 | | (33.26) | | 223 | | 0.98 | | 0.98 | | (0.31) | | 189 |
| 08-31-2008 | 14.37 | | (0.07) | | (0.64) | | (0.71) | | — | | (1.11) | | — | | (1.11) | | 12.55 | | (6.15) | | 114 | | 0.98 | | 0.98 | | (0.52) | | 154 |
| 08-31-2007 | 10.70 | | (0.06)6 | | 3.73 | | 3.67 | | — | | — | | — | | — | | 14.37 | | 34.30 | | 170 | | 0.97 | | 0.97 | | (0.48)6 | | 152 |
| 08-31-20067 | 10.00 | | (0.01) | | 0.71 | | 0.70 | | — | | — | | — | | — | | 10.70 | | 7.004 | | 123 | | 1.045 | | 1.045 | | (0.15)5 | | 205 |
|
| 1. Based on the average daily shares outstanding. 2. Unaudited. 3. Total returns would have been lower had certain expenses not been reduced during the periods shown. 4. Not | | |
| annualized. 5. Annualized. 6. Net investment income (loss) per share and ratio of net investment income (loss) to average net assets reflects special dividends received by the Fund which |
| amounted to the following amounts: $0.02 and 0.14%, respectively. 7. The inception date for Class NAV shares is 10-29-05. | | | | | | | | | | |
| |
| High Income Fund | | | | | | | | | | | | | | | | | | | | | | | | | | |
| CLASS NAV | | | | | | | | | | | | | | | | | | | | | | | | | | | | |
|
| 02-28-20112 | 7.82 | | 0.31 | | 0.91 | | 1.22 | | (0.32) | | — | | — | | (0.32) | | 8.72 | | 15.853,4 | | 464 | | 0.725 | | 0.725 | | 7.395 | | 31 |
| 08-31-2010 | 6.38 | | 0.77 | | 1.61 | | 2.38 | | (0.94) | | — | | — | | (0.94) | | 7.82 | | 38.614 | | 509 | | 0.71 | | 0.71 | | 10.11 | | 44 |
| 08-31-2009 | 7.98 | | 0.65 | | (1.34) | | (0.69) | | (0.91) | | — | | — | | (0.91) | | 6.38 | | (5.78) | | 414 | | 0.73 | | 0.73 | | 12.15 | | 68 |
| 08-31-2008 | 10.61 | | 0.79 | | (2.24) | | (1.45) | | (0.74) | | (0.44) | | — | | (1.18) | | 7.98 | | (14.76) | | 447 | | 0.72 | | 0.72 | | 8.80 | | 53 |
| 08-31-2007 | 9.87 | | 0.69 | | 0.76 | | 1.45 | | (0.69) | | (0.02) | | — | | (0.71) | | 10.61 | | 14.81 | | 383 | | 0.73 | | 0.73 | | 6.38 | | 67 |
| 08-31-20066 | 10.00 | | 0.23 | | (0.25) | | (0.02) | | (0.11) | | — | | — | | (0.11) | | 9.87 | | (0.14)3 | | 289 | | 0.775 | | 0.775 | | 6.735 | | 76 |
|
| 1. Based on the average daily shares outstanding. 2. Unaudited. 3. Not annualized. 4. Total returns would have been lower had certain expenses not been reduced during the periods |
| shown. 5. Annualized. 6. The inception date for Class NAV shares is 4-28-06. | | | | | | | | | | | | | | | | | | | | |
| |
| High Yield Fund | | | | | | | | | | | | | | | | | | | | | | | | | | |
| CLASS 1 | | | | | | | | | | | | | | | | | | | | | | | | | | | | |
|
| 02-28-20112 | 8.80 | | 0.36 | | 0.65 | | 1.01 | | (0.39) | | — | | — | | (0.39) | | 9.42 | | 11.743,4 | | 103 | | 0.765 | | 0.765 | | 7.975 | | 42 |
| 08-31-2010 | 8.00 | | 0.78 | | 0.90 | | 1.68 | | (0.88) | | — | | — | | (0.88) | | 8.80 | | 21.923 | | 82 | | 0.75 | | 0.75 | | 9.09 | | 81 |
| 08-31-2009 | 8.81 | | 0.81 | | (0.73) | | 0.08 | | (0.89) | | — | | — | | (0.89) | | 8.00 | | 3.66 | | 60 | | 0.76 | | 0.76 | | 11.73 | | 73 |
| 08-31-2008 | 9.92 | | 0.84 | | (1.04) | | (0.20) | | (0.83) | | (0.08) | | — | | (0.91) | | 8.81 | | (2.33) | | 43 | | 0.75 | | 0.75 | | 8.98 | | 59 |
| 08-31-2007 | 10.12 | | 0.77 | | (0.17) | | 0.60 | | (0.74) | | (0.06) | | — | | (0.80) | | 9.92 | | 6.02 | | 48 | | 0.75 | | 0.75 | | 7.48 | | 776 |
| 08-31-20068 | 10.10 | | 0.65 | | (0.03) | | 0.62 | | (0.60) | | — | | — | | (0.60) | | 10.12 | | 6.414 | | 44 | | 0.765 | | 0.765 | | 7.225 | | 83 |
|
| |
| CLASS NAV | | | | | | | | | | | | | | | | | | | | | | | | | | | | |
|
| 02-28-20112 | 8.74 | | 0.36 | | 0.65 | | 1.01 | | (0.39) | | — | | — | | (0.39) | | 9.36 | | 11.853,4 | | 751 | | 0.715 | | 0.715 | | 8.015 | | 42 |
| 08-31-2010 | 7.95 | | 0.78 | | 0.90 | | 1.68 | | (0.89) | | — | | — | | (0.89) | | 8.74 | | 21.993 | | 910 | | 0.70 | | 0.70 | | 9.15 | | 81 |
| 08-31-2009 | 8.77 | | 0.83 | | (0.75) | | 0.08 | | (0.90) | | — | | — | | (0.90) | | 7.95 | | 3.62 | | 906 | | 0.71 | | 0.71 | | 12.18 | | 73 |
| 08-31-2008 | 9.87 | | 0.84 | | (1.03) | | (0.19) | | (0.83) | | (0.08) | | — | | (0.91) | | 8.77 | | (2.18) | | 1,511 | | 0.70 | | 0.70 | | 9.04 | | 59 |
| 08-31-2007 | 10.08 | | 0.77 | | (0.17) | | 0.60 | | (0.75) | | (0.06) | | — | | (0.81) | | 9.87 | | 6.00 | | 1,547 | | 0.70 | | 0.70 | | 7.55 | | 776 |
| 08-31-20067 | 10.06 | | 0.66 | | (0.03) | | 0.63 | | (0.61) | | — | | — | | (0.61) | | 10.08 | | 6.494 | | 1,144 | | 0.715 | | 0.715 | | 7.365 | | 83 |
|
| 1. Based on the average daily shares outstanding. 2. Unaudited. 3. Total returns would have been lower had certain expenses not been reduced during the periods shown. 4. Not | | |
| annualized. 5. Annualized. 6. The Portfolio turnover rates including the effect of “TBA” (to be announced) for the period ended was as follows: 80% for the year ended 8-31-07. 7. The |
| inception date for Class 1 and Class NAV shares is 10-15-05. | | | | | | | | | | | | | | | | | | | | | | |
| |
| The accompanying notes are an integral part of the financial statements. | 354 |
John Hancock Funds II
Financial Highlights
| | | | | | | | | | | | | | | | | | | | | | | | | | | | | | |
| Per share operating performance for a share outstanding throughout the period | | | | | | Ratios and supplemental data | | | | |
|
| | | | | Income (loss) from | | | | | | | | | | | | | | | | | | | | | | | |
| | | | | investment operations | | | Less distributions | | | | | | | | Ratios to average net assets | | | | |
| | | |
| | |
| | | | | | |
| | | | |
| |
| | | | | | | Net real- | | | | | | | | | | | | | | | | | | | | | | | | |
| | | | | | | ized and | | | | | | | | | | | | | | | | | | Expenses | | Expenses | | | | |
| | | Net asset | | Net | | unrealized | | | | | | | | | | | | Net asset | | | | Net | | before | | including | | Net | | |
| | | value, | | investment | | gain (loss) | | Total from | | From net | | From net | | From | | Total | | value, | | | | assets, | | reductions | | reductions | | investment | | |
| | | beginning | | income | | on invest- | | investment | | investment | | realized | | capital | | distri- | | end of | | Total | | end of | | and amounts | | and amounts | | income | | Portfolio |
| | | of period | | (loss) | | ments | | operations | | income | | gain | | paid-in | | butions | | period | | return | | period | | recaptured | | recaptured | | (loss) | | turnover |
| Period ended | ($) | | ($)1 | | ($) | | ($) | | ($) | | ($) | | ($) | | ($) | | ($) | | (%) | | (in millions) | | (%) | | (%) | | (%) | | (%) |
|
| |
| Index 500 Fund | | | | | | | | | | | | | | | | | | | | | | | | | | |
| CLASS NAV | | | | | | | | | | | | | | | | | | | | | | | | | | | | |
|
| 02-28-20112 | 7.82 | | 0.07 | | 2.07 | | 2.14 | | (0.14) | | — | | — | | (0.14) | | 9.82 | | 27.473,4 | | 2,270 | | 0.485 | | 0.485 | | 1.555 | | 2 |
| 08-31-2010 | 7.63 | | 0.13 | | 0.22 | | 0.35 | | (0.16) | | — | | — | | (0.16) | | 7.82 | | 4.463 | | 1,818 | | 0.48 | | 0.48 | | 1.55 | | 17 |
| 08-31-2009 | 9.47 | | 0.15 | | (1.93) | | (1.78) | | (0.06) | | — | | — | | (0.06) | | 7.63 | | (18.66) | | 1,857 | | 0.49 | | 0.49 | | 2.26 | | 33 |
| 08-31-2008 | 10.80 | | 0.17 | | (1.42) | | (1.25) | | (0.05) | | (0.03) | | — | | (0.08) | | 9.47 | | (11.69) | | 961 | | 0.49 | | 0.49 | | 1.71 | | 2 |
| 08-31-20076 | 10.00 | | 0.17 | | 0.67 | | 0.84 | | (0.04) | | — | | — | | (0.04) | | 10.80 | | 8.413,4 | | 83 | | 0.585 | | 0.515 | | 1.935 | | 3 |
|
| 1. Based on the average daily shares outstanding. 2. Unaudited. 3. Total returns would have been lower had certain expenses not been reduced during the periods shown. 4. Not | | |
| annualized. 5. Annualized. 6. The inception date for Class NAV shares is 10-27-06. | | | | | | | | | | | | | | | | | | |
| |
| International Equity Index Fund | | | | | | | | | | | | | | | | | | | | | | | | |
| CLASS NAV | | | | | | | | | | | | | | | | | | | | | | | | | | | | |
|
| 02-28-20112 | 15.34 | | 0.11 | | 3.34 | | 3.45 | | (0.40) | | — | | — | | (0.40) | | 18.39 | | 22.633,4 | | 485 | | 0.565 | | 0.565 | | 1.285 | | 3 |
| 08-31-2010 | 15.51 | | 0.33 | | 0.06 | | 0.39 | | (0.56) | | — | | — | | (0.56) | | 15.34 | | 2.314 | | 377 | | 0.56 | | 0.56 | | 2.10 | | 21 |
| 08-31-2009 | 18.53 | | 0.37 | | (3.08) | | (2.71) | | (0.28) | | (0.03) | | — | | (0.31) | | 15.51 | | (14.15) | | 322 | | 0.58 | | 0.58 | | 2.91 | | 27 |
| 08-31-2008 | 22.51 | | 0.57 | | (3.39) | | (2.82) | | (0.58) | | (0.58) | | — | | (1.16) | | 18.53 | | (13.58) | | 494 | | 0.56 | | 0.56 | | 2.68 | | 10 |
| 08-31-2007 | 18.97 | | 0.47 | | 3.64 | | 4.11 | | (0.35) | | (0.22) | | — | | (0.57) | | 22.51 | | 21.97 | | 421 | | 0.56 | | 0.56 | | 2.23 | | 15 |
| 08-31-20066 | 15.59 | | 0.41 | | 3.17 | | 3.58 | | (0.20) | | — | | — | | (0.20) | | 18.97 | | 23.163 | | 308 | | 0.585 | | 0.585 | | 2.785 | | 11 |
|
| 1. Based on the average daily shares outstanding. 2. Unaudited. 3. Not annualized. 4. Total returns would have been lower had certain expenses not been reduced during the periods |
| shown. 5. Annualized. 6. The inception date for Class NAV shares is 10-29-05. | | | | | | | | | | | | | | | | | | | | |
| |
| International Growth Stock Fund | | | | | | | | | | | | | | | | | | | | | | | | |
| CLASS NAV | | | | | | | | | | | | | | | | | | | | | | | | | | | | |
|
| 02-28-20112,3 | 10.00 | | 0.06 | | 1.18 | | 1.24 | | (0.01) | | —4 | | — | | (0.01) | | 11.23 | | 12.415,6 | | 183 | | 1.017 | | 1.017 | | 1.217 | | 13 |
|
| 1. Based on the average daily shares outstanding. 2. Unaudited. 3. The inception date for Class NAV shares is 9-16-10. 4. Less than ($0.005) per share. 5. Not annualized. 6. Total returns |
| would have been lower had certain expenses not been reduced during the period shown. 7. Annualized. | | | | | | | | | | | | | | |
| |
| International Opportunities Fund | | | | | | | | | | | | | | | | | | | | | | | | |
| CLASS 1 | | | | | | | | | | | | | | | | | | | | | | | | | | | | |
|
| 02-28-20112 | 11.93 | | (0.01) | | 2.71 | | 2.70 | | (0.32) | | — | | — | | (0.32) | | 14.31 | | 22.733,4 | | 93 | | 1.025 | | 1.025 | | (0.14)5 | | 49 |
| 08-31-2010 | 11.95 | | 0.11 | | (0.01) | | 0.10 | | (0.12) | | — | | — | | (0.12) | | 11.93 | | 0.763 | | 82 | | 1.01 | | 1.01 | | 0.87 | | 142 |
| 08-31-2009 | 15.16 | | 0.12 | | (3.20) | | (3.08) | | (0.13) | | — | | — | | (0.13) | | 11.95 | | (20.11) | | 29 | | 1.03 | | 1.03 | | 1.20 | | 121 |
| 08-31-2008 | 19.32 | | 0.24 | | (1.67) | | (1.43) | | (0.25) | | (2.48) | | — | | (2.73) | | 15.16 | | (10.51) | | 32 | | 1.04 | | 1.04 | | 1.36 | | 111 |
| 08-31-2007 | 16.13 | | 0.25 | | 3.19 | | 3.44 | | (0.05) | | (0.20) | | — | | (0.25) | | 19.32 | | 21.48 | | 23 | | 1.04 | | 1.04 | | 1.40 | | 127 |
| 08-31-20066 | 13.71 | | 0.11 | | 3.01 | | 3.12 | | (0.70) | | — | | — | | (0.70) | | 16.13 | | 23.364,7 | | 9 | | 1.075 | | 1.075 | | 0.785 | | 99 |
|
| |
| CLASS NAV | | | | | | | | | | | | | | | | | | | | | | | | | | | |
|
| 02-28-20112 | 11.96 | | —8 | | 2.71 | | 2.71 | | (0.33) | | — | | — | | (0.33) | | 14.34 | | 22.723,4 | | 679 | | 0.975 | | 0.975 | | (0.06)5 | | 49 |
| 08-31-2010 | 11.97 | | 0.11 | | —9 | | 0.11 | | (0.12) | | — | | — | | (0.12) | | 11.96 | | 0.893 | | 721 | | 0.96 | | 0.96 | | 0.90 | | 142 |
| 08-31-2009 | 15.19 | | 0.13 | | (3.21) | | (3.08) | | (0.14) | | — | | — | | (0.14) | | 11.97 | | (20.06) | | 708 | | 0.98 | | 0.98 | | 1.26 | | 121 |
| 08-31-2008 | 19.36 | | 0.25 | | (1.68) | | (1.43) | | (0.26) | | (2.48) | | — | | (2.74) | | 15.19 | | (10.50) | | 844 | | 0.99 | | 0.99 | | 1.38 | | 111 |
| 08-31-2007 | 16.16 | | 0.24 | | 3.21 | | 3.45 | | (0.05) | | (0.20) | | — | | (0.25) | | 19.36 | | 21.51 | | 764 | | 0.99 | | 0.99 | | 1.34 | | 127 |
| 08-31-20066 | 13.72 | | 0.10 | | 3.04 | | 3.14 | | (0.70) | | — | | — | | (0.70) | | 16.16 | | 23.514,7 | | 552 | | 1.025 | | 1.025 | | 0.735 | | 99 |
|
| 1. Based on the average daily shares outstanding. 2. Unaudited. 3. Total returns would have been lower had certain expenses not been reduced during the periods shown. 4. Not | | |
| annualized. 5. Annualized. 6. The inception date for Class 1 and Class NAV shares is 10-15-05. 7. The Adviser/Subadviser voluntarily reimbursed Class 1 and Class NAV $11,316 and |
| $3,937,220, respectively, for a potential lost investment opportunity. Excluding these reimbursements, the total return would have been 23.19% for Class 1 and 22.62% for Class NAV. |
| 8. Less than ($0.005) per share. 9. Less than $0.005 per share. | | | | | | | | | | | | | | | | | | | | | | |
| |
| The accompanying notes are an integral part of the financial statements. | 355 |
John Hancock Funds II
Financial Highlights
| | | | | | | | | | | | | | | | | | | | | | | | | | | | | | |
| Per share operating performance for a share outstanding throughout the period | | Ratios and supplemental data | | | | |
|
| | | | | Income (loss) from | | | | | | | | | | | | | | | | | | | | | | | |
| | | | | investment operations | | | Less distributions | | | | | | | | Ratios to average net assets | | | | |
| | | |
| | |
| | | | | |
| | | | |
| |
| | | | | | | Net real- | | | | | | | | | | | | | | | | | | | | | | | | |
| | | | | | | ized and | | | | | | | | | | | | | | | | | | Expenses | | Expenses | | | | |
| | | Net asset | | Net | | unrealized | | | | | | | | | | | | Net asset | | | | Net | | before | | including | | Net | | |
| | | value, | | investment | | gain (loss) | | Total from | | From net | | From net | | From | | Total | | value, | | | | assets, | | reductions | | reductions | | investment | | |
| | | beginning | | income | | on invest- | | investment | | investment | | realized | | capital | | distri- | | end of | | Total | | end of | | and amounts | | and amounts | | income | | Portfolio |
| | | of period | | (loss) | | ments | | operations | | income | | gain | | paid-in | | butions | | period | | return | | period | | recaptured | | recaptured | | (loss) | | turnover |
| Period ended | ($) | | ($)1 | | ($) | | ($) | | ($) | | ($) | | ($) | | ($) | | ($) | | (%) | | (in millions) | | (%) | | (%) | | (%) | | (%) |
|
| |
| International Small Cap Fund | | | | | | | | | | | | | | | | | | | |
| CLASS 1 | | | | | | | | | | | | | | | | | | | | | | | | | | |
|
| 02-28-20112 | | 13.72 | | 0.03 | | 2.93 | | 2.96 | | (0.14) | | — | | — | | (0.14) | | 16.54 | | 21.583,4 | | 149 | | 1.195 | | 1.195 | | 0.345 | | 10 |
| 08-31-2010 | | 12.15 | | 0.13 | | 1.65 | | 1.78 | | (0.21) | | — | | — | | (0.21) | | 13.72 | | 14.733 | | 125 | | 1.22 | | 1.22 | | 1.00 | | 21 |
| 08-31-2009 | | 15.71 | | 0.20 | | (2.43) | | (2.23) | | (0.16) | | (1.17) | | — | | (1.33) | | 12.15 | | (9.88) | | 116 | | 1.23 | | 1.23 | | 2.16 | | 49 |
| 08-31-2008 | | 24.53 | | 0.31 | | (5.42) | | (5.11) | | (0.63) | | (3.08) | | — | | (3.71) | | 15.71 | | (23.67) | | 47 | | 1.18 | | 1.18 | | 1.61 | | 29 |
| 08-31-2007 | | 20.95 | | 0.28 | | 6.44 | | 6.72 | | (0.28) | | (2.86) | | — | | (3.14) | | 24.53 | | 34.99 | | 81 | | 1.16 | | 1.16 | | 1.24 | | 26 |
| 08-31-20066 | | 18.48 | | 0.27 | | 2.24 | | 2.51 | | (0.04) | | — | | — | | (0.04) | | 20.95 | | 13.584 | | 37 | | 1.185 | | 1.185 | | 1.555 | | 89 |
|
| |
| CLASS NAV | | | | | | | | | | | | | | | | | | | | | | | | | | |
|
| 02-28-20112 | | 13.71 | | 0.03 | | 2.94 | | 2.97 | | (0.14) | | — | | — | | (0.14) | | 16.54 | | 21.723,4 | | 206 | | 1.145 | | 1.145 | | 0.405 | | 10 |
| 08-31-2010 | | 12.14 | | 0.15 | | 1.63 | | 1.78 | | (0.21) | | — | | — | | (0.21) | | 13.71 | | 14.783 | | 154 | | 1.17 | | 1.17 | | 1.11 | | 21 |
| 08-31-2009 | | 15.72 | | 0.23 | | (2.48) | | (2.25) | | (0.16) | | (1.17) | | — | | (1.33) | | 12.14 | | (9.94) | | 120 | | 1.18 | | 1.18 | | 2.43 | | 49 |
| 08-31-2008 | | 24.53 | | 0.34 | | (5.42) | | (5.08) | | (0.65) | | (3.08) | | — | | (3.73) | | 15.72 | | (23.58) | | 295 | | 1.13 | | 1.13 | | 1.79 | | 29 |
| 08-31-2007 | | 20.95 | | 0.26 | | 6.46 | | 6.72 | | (0.28) | | (2.86) | | — | | (3.14) | | 24.53 | | 35.01 | | 376 | | 1.11 | | 1.11 | | 1.16 | | 26 |
| 08-31-20066 | | 18.45 | | 0.25 | | 2.29 | | 2.54 | | (0.04) | | — | | — | | (0.04) | | 20.95 | | 13.804 | | 359 | | 1.135 | | 1.135 | | 1.435 | | 89 |
|
| 1. Based on the average daily shares outstanding. 2. Unaudited. 3. Total returns would have been lower had certain expenses not been reduced during the periods shown. 4. Not | | |
| annualized. 5. Annualized. 6. The inception date for Class 1 and Class NAV shares is 10-15-05. | | | | | | | | |
| |
| International Small Company Fund | | | | | | | | | | | | | | | | | | | | |
| CLASS NAV | | | | | | | | | | | | | | | | | | | | | | | | | | |
|
| 02-28-20112 | | 7.08 | | 0.02 | | 2.04 | | 2.06 | | (0.15) | | — | | — | | (0.15) | | 8.99 | | 29.183,4 | | 214 | | 1.085 | | 1.085 | | 0.595 | | 5 |
| 08-31-2010 | | 7.11 | | 0.08 | | 0.20 | | 0.28 | | (0.31) | | — | | — | | (0.31) | | 7.08 | | 3.873 | | 151 | | 1.12 | | 1.12 | | 1.11 | | 28 |
| 08-31-2009 | | 8.49 | | 0.11 | | (1.24) | | (1.13) | | (0.10) | | (0.15) | | — | | (0.25) | | 7.11 | | (12.23) | | 125 | | 1.09 | | 1.09 | | 2.03 | | 21 |
| 08-31-2008 | | 11.53 | | 0.16 | | (2.19) | | (2.03) | | (0.15) | | (0.86) | | — | | (1.01) | | 8.49 | | (19.32) | | 404 | | 1.10 | | 1.10 | | 1.66 | | 11 |
| 08-31-2007 | | 9.33 | | 0.12 | | 2.14 | | 2.26 | | (0.06) | | — | | — | | (0.06) | | 11.53 | | 24.30 | | 250 | | 1.11 | | 1.11 | | 1.06 | | 32 |
| 08-31-20066 | | 10.00 | | 0.04 | | (0.71) | | (0.67) | | — | | — | | — | | — | | 9.33 | | (6.70)4 | | 221 | | 1.145 | | 1.145 | | 1.375 | | 57 |
|
| 1. Based on the average daily shares outstanding. 2. Unaudited. 3. Total returns would have been lower had certain expenses not been reduced during the periods shown. 4. Not | | |
| annualized. 5. Annualized. 6. The inception date for Class NAV shares is 4-28-06. | | | | | | | | | | |
| |
| International Value Fund | | | | | | | | | | | | | | | | | | | | | | |
| CLASS 1 | | | | | | | | | | | | | | | | | | | | | | | | | | |
|
| 02-28-20112 | | 12.62 | | 0.05 | | 3.14 | | 3.19 | | (0.24) | | — | | — | | (0.24) | | 15.57 | | 25.443,4 | | 307 | | 0.965 | | 0.965 | | 0.695 | | 10 |
| 08-31-2010 | | 12.99 | | 0.27 | | (0.38) | | (0.11) | | (0.26) | | — | | — | | (0.26) | | 12.62 | | (0.97)3 | | 259 | | 0.98 | | 0.96 | | 2.04 | | 19 |
| 08-31-2009 | | 15.68 | | 0.29 | | (2.09) | | (1.80) | | (0.51) | | (0.38) | | — | | (0.89) | | 12.99 | | (9.96)3 | | 294 | | 0.98 | | 0.96 | | 2.69 | | 26 |
| 08-31-2008 | | 19.73 | | 0.55 | | (3.25) | | (2.70) | | (0.36) | | (0.99) | | — | | (1.35) | | 15.68 | | (15.08)3 | | 372 | | 0.99 | | 0.98 | | 3.07 | | 21 |
| 08-31-2007 | | 17.91 | | 0.45 | | 2.93 | | 3.38 | | (0.46) | | (1.10) | | — | | (1.56) | | 19.73 | | 19.453 | | 162 | | 1.00 | | 0.98 | | 2.32 | | 24 |
| 08-31-20066 | | 15.20 | | 0.46 | | 2.30 | | 2.76 | | (0.05) | | — | | — | | (0.05) | | 17.91 | | 18.223,4 | | 134 | | 1.015 | | 0.995 | | 3.175 | | 59 |
|
| |
| CLASS NAV | | | | | | | | | | | | | | | | | | | | | | | | | | |
|
| 02-28-20112 | | 12.59 | | 0.05 | | 3.14 | | 3.19 | | (0.25) | | — | | — | | (0.25) | | 15.53 | | 25.463,4 | | 1,036 | | 0.915 | | 0.915 | | 0.735 | | 10 |
| 08-31-2010 | | 12.96 | | 0.29 | | (0.39) | | (0.10) | | (0.27) | | — | | — | | (0.27) | | 12.59 | | (0.93)3 | | 900 | | 0.93 | | 0.91 | | 2.19 | | 19 |
| 08-31-2009 | | 15.64 | | 0.30 | | (2.08) | | (1.78) | | (0.52) | | (0.38) | | — | | (0.90) | | 12.96 | | (9.85)3 | | 854 | | 0.93 | | 0.91 | | 2.78 | | 26 |
| 08-31-2008 | | 19.70 | | 0.53 | | (3.23) | | (2.70) | | (0.37) | | (0.99) | | — | | (1.36) | | 15.64 | | (15.09)3 | | 1,053 | | 0.94 | | 0.92 | | 2.94 | | 21 |
| 08-31-2007 | | 17.88 | | 0.47 | | 2.91 | | 3.38 | | (0.46) | | (1.10) | | — | | (1.56) | | 19.70 | | 19.503 | | 1,081 | | 0.95 | | 0.93 | | 2.42 | | 24 |
| 08-31-20066 | | 15.16 | | 0.47 | | 2.30 | | 2.77 | | (0.05) | | — | | — | | (0.05) | | 17.88 | | 18.353,4 | | 836 | | 0.965 | | 0.945 | | 3.215 | | 59 |
|
| 1. Based on the average daily shares outstanding. 2. Unaudited. 3. Total returns would have been lower had certain expenses not been reduced during the periods shown. 4. Not | | |
| annualized. 5. Annualized. 6. The inception date for Class 1 and Class NAV shares is 10-15-05. | | | | | | | | | | |
| |
| The accompanying notes are an integral part of the financial statements. | 356 |
John Hancock Funds II
Financial Highlights
| | | | | | | | | | | | | | | | | | | | | | | | | | | | | | |
| Per share operating performance for a share outstanding throughout the period | | | | | | Ratios and supplemental data | | | | |
|
| | | | | Income (loss) from | | | | | | | | | | | | | | | | | | | | | | | |
| | | | | investment operations | | | Less distributions | | | | | | | Ratios to average net assets | | | | |
| | | |
| | |
| | | | | | |
| | | | |
| |
| | | | | | | Net real- | | | | | | | | | | | | | | | | | | | | | | | | |
| | | | | | | ized and | | | | | | | | | | | | | | | | | | Expenses | | Expenses | | | | |
| | | Net asset | | Net | | unrealized | | | | | | | | | | | | Net asset | | | | Net | | before | | including | | Net | | |
| | | value, | | investment | | gain (loss) | | Total from | | From net | | From net | | From | | Total | | value, | | | | assets, | | reductions | | reductions | | investment | | |
| | | beginning | | income | | on invest- | | investment | | investment | | realized | | capital | | distri- | | end of | | Total | | end of | | and amounts | | and amounts | | income | | Portfolio |
| | | of period | | (loss) | | ments | | operations | | income | | gain | | paid-in | | butions | | period | | return | | period | | recaptured | | recaptured | | (loss) | | turnover |
| Period ended | ($) | | ($)1 | | ($) | | ($) | | ($) | | ($) | | ($) | | ($) | | ($) | | (%) | | (in millions) | | (%) | | (%) | | (%) | | (%) |
|
| |
| Investment Quality Bond Fund | | | | | | | | | | | | | | | | | | | | | | | | |
| CLASS 1 | | | | | | | | | | | | | | | | | | | | | | | | | | | | | |
|
| 02-28-20112 | 12.59 | | 0.19 | | (0.37) | | (0.18) | | (0.19) | | — | | — | | (0.19) | | 12.22 | | (1.43)3,4 | | 67 | | 0.685 | | 0.685 | | 3.115 | | 226 |
| 08-31-2010 | 11.87 | | 0.48 | | 0.83 | | 1.31 | | (0.59) | | — | | — | | (0.59) | | 12.59 | | 11.383 | | 79 | | 0.71 | | 0.71 | | 3.98 | | 17 |
| 08-31-2009 | 11.62 | | 0.49 | | 0.40 | | 0.89 | | (0.60) | | (0.04) | | — | | (0.64) | | 11.87 | | 8.16 | | 64 | | 0.75 | | 0.75 | | 4.45 | | 35 |
| 08-31-2008 | 11.70 | | 0.54 | | (0.02) | | 0.52 | | (0.60) | | — | | — | | (0.60) | | 11.62 | | 4.52 | | 54 | | 0.76 | | 0.76 | | 4.61 | | 81 |
| 08-31-2007 | 11.76 | | 0.56 | | (0.04) | | 0.52 | | (0.58) | | —7 | | — | | (0.58) | | 11.70 | | 4.49 | | 43 | | 0.78 | | 0.78 | | 4.77 | | 37 |
| 08-31-20068 | 11.84 | | 0.46 | | (0.16) | | 0.30 | | (0.38) | | — | | — | | (0.38) | | 11.76 | | 2.644 | | 35 | | 0.845 | | 0.845 | | 4.425 | | 35 |
|
| |
| CLASS NAV | | | | | | | | | | | | | | | | | | | | | | | | | | | | |
|
| 02-28-20112 | 12.58 | | 0.19 | | (0.38) | | (0.19) | | (0.19) | | — | | — | | (0.19) | | 12.20 | | (1.49)3,4 | | 368 | | 0.635 | | 0.635 | | 3.195 | | 226 |
| 08-31-2010 | 11.86 | | 0.48 | | 0.83 | | 1.31 | | (0.59) | | — | | — | | (0.59) | | 12.58 | | 11.443 | | 261 | | 0.66 | | 0.66 | | 4.00 | | 17 |
| 08-31-2009 | 11.61 | | 0.50 | | 0.39 | | 0.89 | | (0.60) | | (0.04) | | — | | (0.64) | | 11.86 | | 8.23 | | 122 | | 0.70 | | 0.70 | | 4.47 | | 35 |
| 08-31-2008 | 11.69 | | 0.55 | | (0.02) | | 0.53 | | (0.61) | | — | | — | | (0.61) | | 11.61 | | 4.57 | | 149 | | 0.71 | | 0.71 | | 4.66 | | 81 |
| 08-31-2007 | 11.75 | | 0.56 | | (0.04) | | 0.52 | | (0.58) | | —7 | | — | | (0.58) | | 11.69 | | 4.56 | | 123 | | 0.73 | | 0.73 | | 4.83 | | 37 |
| 08-31-20068 | 11.83 | | 0.46 | | (0.16) | | 0.30 | | (0.38) | | — | | — | | (0.38) | | 11.75 | | 2.684 | | 93 | | 0.795 | | 0.795 | | 4.515 | | 35 |
|
| 1. Based on the average daily shares outstanding. 2. Unaudited. 3. Total returns would have been lower had certain expenses not been reduced during the periods shown. 4. Not | | |
| annualized. 5. Annualized. 6. The Portfolio turnover rate including the effect of “TBA” (to be announced) for the period ended 2-28-11 was 67%. 7. Less than ($0.005) per share. 8. The |
| inception date for Class 1 and Class NAV shares is 10-15-05. | | | | | | | | | | | | | | | | | | | | | | |
| |
| Large Cap Fund | | | | | | | | | | | | | | | | | | | | | | | | | | |
| CLASS 1 | | | | | | | | | | | | | | | | | | | | | | | | | | | | |
|
| 02-28-20112 | 10.84 | | 0.06 | | 2.83 | | 2.89 | | (0.10) | | — | | — | | (0.10) | | 13.63 | | 26.753,4 | | 47 | | 0.845 | | 0.845 | | 0.915 | | 32 |
| 08-31-2010 | 10.44 | | 0.11 | | 0.38 | | 0.49 | | (0.09) | | — | | — | | (0.09) | | 10.84 | | 4.633 | | 38 | | 0.85 | | 0.85 | | 0.94 | | 50 |
| 08-31-2009 | 13.69 | | 0.12 | | (3.13) | | (3.01) | | (0.24) | | — | | — | | (0.24) | | 10.44 | | (21.66) | | 21 | | 0.86 | | 0.86 | | 1.33 | | 99 |
| 08-31-2008 | 16.12 | | 0.18 | | (2.06) | | (1.88) | | (0.14) | | (0.41) | | — | | (0.55) | | 13.69 | | (12.04) | | 26 | | 0.80 | | 0.80 | | 1.20 | | 55 |
| 08-31-2007 | 14.67 | | 0.19 | | 1.78 | | 1.97 | | (0.13) | | (0.39) | | — | | (0.52) | | 16.12 | | 13.59 | | 31 | | 0.81 | | 0.81 | | 1.15 | | 29 |
| 08-31-20066 | 13.26 | | 0.11 | | 1.31 | | 1.42 | | (0.01) | | — | | — | | (0.01) | | 14.67 | | 10.734 | | 2 | | 0.935 | | 0.935 | | 0.865 | | 24 |
|
| |
| CLASS NAV | | | | | | | | | | | | | | | | | | | | | | | | | | | | |
|
| 02-28-20112 | 10.84 | | 0.06 | | 2.83 | | 2.89 | | (0.11) | | — | | — | | (0.11) | | 13.62 | | 26.713,4 | | 285 | | 0.795 | | 0.795 | | 0.955 | | 32 |
| 08-31-2010 | 10.44 | | 0.11 | | 0.38 | | 0.49 | | (0.09) | | — | | — | | (0.09) | | 10.84 | | 4.673 | | 227 | | 0.80 | | 0.80 | | 0.96 | | 50 |
| 08-31-2009 | 13.70 | | 0.13 | | (3.14) | | (3.01) | | (0.25) | | — | | — | | (0.25) | | 10.44 | | (21.65) | | 206 | | 0.81 | | 0.81 | | 1.36 | | 99 |
| 08-31-2008 | 16.13 | | 0.18 | | (2.05) | | (1.87) | | (0.15) | | (0.41) | | — | | (0.56) | | 13.70 | | (11.99) | | 363 | | 0.75 | | 0.75 | | 1.26 | | 55 |
| 08-31-2007 | 14.67 | | 0.18 | | 1.80 | | 1.98 | | (0.13) | | (0.39) | | — | | (0.52) | | 16.13 | | 13.67 | | 348 | | 0.76 | | 0.76 | | 1.11 | | 29 |
| 08-31-20066 | 13.26 | | 0.12 | | 1.31 | | 1.43 | | (0.02) | | — | | — | | (0.02) | | 14.67 | | 10.794 | | 192 | | 0.885 | | 0.885 | | 0.955 | | 24 |
|
| 1. Based on the average daily shares outstanding. 2. Unaudited. 3. Total returns would have been lower had certain expenses not been reduced during the periods shown. 4. Not | | |
| annualized. 5. Annualized. 6. The inception date for Class 1 and Class NAV shares is 10-15-05. | | | | | | | | | | | | | | | | |
| |
| Large Cap Value Fund | | | | | | | | | | | | | | | | | | | | | | | | | | |
| CLASS 1 | | | | | | | | | | | | | | | | | | | | | | | | | | | | | |
|
| 02-28-20112 | 15.36 | | 0.13 | | 4.25 | | 4.38 | | (0.21) | | — | | — | | (0.21) | | 19.53 | | 28.623,4 | | 88 | | 0.905 | | 0.895 | | 1.495 | | 94 |
| 08-31-2010 | 16.00 | | 0.16 | | (0.56) | | (0.40) | | (0.24) | | — | | — | | (0.24) | | 15.36 | | (2.67)3 | | 73 | | 0.89 | | 0.89 | | 0.97 | | 165 |
| 08-31-2009 | 21.99 | | 0.28 | | (6.00) | | (5.72) | | (0.27) | | — | | — | | (0.27) | | 16.00 | | (25.96) | | 84 | | 0.91 | | 0.91 | | 1.82 | | 168 |
| 08-31-2008 | 25.90 | | 0.26 | | (3.30) | | (3.04) | | (0.22) | | (0.65) | | — | | (0.87) | | 21.99 | | (12.16) | | 109 | | 0.88 | | 0.88 | | 1.08 | | 62 |
| 08-31-2007 | 22.97 | | 0.24 | | 2.83 | | 3.07 | | (0.14) | | — | | — | | (0.14) | | 25.90 | | 13.39 | | 130 | | 0.91 | | 0.91 | | 0.96 | | 63 |
| 08-31-20066 | 20.31 | | 0.23 | | 2.48 | | 2.71 | | (0.05) | | — | | — | | (0.05) | | 22.97 | | 13.334 | | 105 | | 0.985 | | 0.985 | | 1.245 | | 54 |
|
| |
| CLASS NAV | | | | | | | | | | | | | | | | | | | | | | | | | | | | | |
|
| 02-28-20112 | 15.39 | | 0.12 | | 4.27 | | 4.39 | | (0.22) | | — | | — | | (0.22) | | 19.56 | | 28.633,4 | | 106 | | 0.855 | | 0.845 | | 1.345 | | 94 |
| 08-31-2010 | 16.03 | | 0.17 | | (0.57) | | (0.40) | | (0.24) | | — | | — | | (0.24) | | 15.39 | | (2.62)3 | | 394 | | 0.84 | | 0.84 | | 1.03 | | 165 |
| 08-31-2009 | 22.03 | | 0.28 | | (5.99) | | (5.71) | | (0.29) | | — | | — | | (0.29) | | 16.03 | | (25.90) | | 433 | | 0.86 | | 0.86 | | 1.80 | | 168 |
| 08-31-2008 | 25.95 | | 0.28 | | (3.31) | | (3.03) | | (0.24) | | (0.65) | | — | | (0.89) | | 22.03 | | (12.13) | | 621 | | 0.83 | | 0.83 | | 1.18 | | 62 |
| 08-31-2007 | 23.01 | | 0.26 | | 2.82 | | 3.08 | | (0.14) | | — | | — | | (0.14) | | 25.95 | | 13.42 | | 412 | | 0.86 | | 0.86 | | 1.00 | | 63 |
| 08-31-20066 | 20.33 | | 0.17 | | 2.56 | | 2.73 | | (0.05) | | — | | — | | (0.05) | | 23.01 | | 13.434 | | 234 | | 0.895 | | 0.895 | | 0.895 | | 54 |
|
| 1. Based on the average daily shares outstanding. 2. Unaudited. 3. Total returns would have been lower had certain expenses not been reduced during the periods shown. 4. Not | | |
| annualized. 5. Annualized. 6. The inception date for Class 1 and Class NAV shares is 10-15-05. | | | | | | | | | | | | | | | | |
| |
| The accompanying notes are an integral part of the financial statements. | 357 |
John Hancock Funds II
Financial Highlights
| | | | | | | | | | | | | | | | | | | | | | | | | | | | | | |
| Per share operating performance for a share outstanding throughout the period | | | | | | Ratios and supplemental data | | | | |
|
| | | | | Income (loss) from | | | | | | | | | | | | | | | | | | | | | | | |
| | | | | investment operations | | | Less distributions | | | | | | | Ratios to average net assets | | | | |
| | | |
| | |
| | | | | | |
| | | | |
| |
| | | | | | | Net real- | | | | | | | | | | | | | | | | | | | | | | | | |
| | | | | | | ized and | | | | | | | | | | | | | | | | | | Expenses | | Expenses | | | | |
| | | Net asset | | Net | | unrealized | | | | | | | | | | | | Net asset | | | | Net | | before | | including | | Net | | |
| | | value, | | investment | | gain (loss) | | Total from | | From net | | From net | | From | | Total | | value, | | | | assets, | | reductions | | reductions | | investment | | |
| | | beginning | | income | | on invest- | | investment | | investment | | realized | | capital | | distri- | | end of | | Total | | end of | | and amounts | | and amounts | | income | | Portfolio |
| | | of period | | (loss) | | ments | | operations | | income | | gain | | paid-in | | butions | | period | | return | | period | | recaptured | | recaptured | | (loss) | | turnover |
| Period ended | ($) | | ($)1 | | ($) | | ($) | | ($) | | ($) | | ($) | | ($) | | ($) | | (%) | | (in millions) | | (%) | | (%) | | (%) | | (%) |
|
| |
| Mid Cap Growth Index Fund | | | | | | | | | | | | | | | | | | | | | | |
| CLASS 1 | | | | | | | | | | | | | | | | | | | | | | | | | | |
|
| 02-28-20112 | 8.82 | | —3 | | 3.32 | | 3.32 | | (0.02) | | — | | — | | (0.02) | | 12.12 | | 37.664,5 | | 2 | | 0.676 | | 0.656 | | 0.066 | | 22 |
| 08-31-20107 | 10.00 | | —3 | | (1.18) | | (1.18) | | — | | — | | — | | — | | 8.82 | | (11.80)4,5 | | —8 | | 0.846 | | 0.656 | | 0.046 | | 42 |
|
| |
| CLASS NAV | | | | | | | | | | | | | | | | | | | | | | | | | | | | |
|
| 02-28-20112 | 8.82 | | 0.02 | | 3.30 | | 3.32 | | (0.02) | | — | | — | | (0.02) | | 12.12 | | 37.704,5 | | 62 | | 0.626 | | 0.606 | | 0.336 | | 22 |
| 08-31-20107 | 10.00 | | —3 | | (1.18) | | (1.18) | | — | | — | | — | | — | | 8.82 | | (11.80)4,5 | | 48 | | 0.796 | | 0.606 | | 0.066 | | 42 |
|
| 1. Based on the average daily shares outstanding. 2. Unaudited. 3. Less than $0.005 per share. 4. Total returns would have been lower had certain expenses not been reduced during the |
| periods shown. 5. Not annualized. 6. Annualized. 7. The inception date for Class 1 and Class NAV shares is 4-30-10. 8. Less than $500,000. | | | | | | |
| |
| Mid Cap Index Fund | | | | | | | | | | | | | | | | | | | | | | | | |
| CLASS NAV | | | | | | | | | | | | | | | | | | | | | | | | | | | | |
|
| 02-28-20112 | 16.01 | | 0.12 | | 5.37 | | 5.49 | | (0.22) | | (0.39) | | — | | (0.61) | | 20.89 | | 34.543,4 | | 342 | | 0.505 | | 0.505 | | 1.235 | | 7 |
| 08-31-2010 | 14.53 | | 0.16 | | 1.48 | | 1.64 | | (0.16) | | — | | — | | (0.16) | | 16.01 | | 11.333 | | 288 | | 0.49 | | 0.49 | | 0.99 | | 17 |
| 08-31-2009 | 18.37 | | 0.17 | | (3.69) | | (3.52) | | (0.13) | | (0.19) | | — | | (0.32) | | 14.53 | | (18.69) | | 506 | | 0.50 | | 0.50 | | 1.36 | | 28 |
| 08-31-2008 | 21.18 | | 0.18 | | (1.05) | | (0.87) | | (0.26) | | (1.68) | | — | | (1.94) | | 18.37 | | (4.61) | | 332 | | 0.49 | | 0.49 | | 0.93 | | 48 |
| 08-31-2007 | 18.37 | | 0.276 | | 2.65 | | 2.92 | | (0.08) | | (0.03) | | — | | (0.11) | | 21.18 | | 15.93 | | 428 | | 0.51 | | 0.51 | | 1.326 | | 64 |
| 08-31-20067 | 16.85 | | 0.17 | | 1.38 | | 1.55 | | (0.03) | | — | | — | | (0.03) | | 18.37 | | 9.203,4 | | 172 | | 0.565 | | 0.565 | | 1.145 | | 10 |
|
| 1. Based on the average daily shares outstanding. 2. Unaudited. 3. Total returns would have been lower had certain expenses not been reduced during the periods shown. 4. Not | | |
| annualized. 5. Annualized. 6. Net investment income (loss) per share and ratio of net investment income (loss) to average net assets reflects special dividends received by the Fund which |
| amounted to the following amounts: $0.06 and 0.28%, respectively. 7. The inception date for Class NAV shares is 10-29-05. | | | | | | | | | | |
| |
| Mid Cap Stock Fund | | | | | | | | | | | | | | | | | | | | | | | | | | |
| CLASS 1 | | | | | | | | | | | | | | | | | | | | | | | | | | | | |
|
| 02-28-20112 | 13.61 | | (0.03) | | 5.12 | | 5.09 | | — | | — | | — | | — | | 18.70 | | 37.403,4 | | 390 | | 0.935 | | 0.935 | | (0.33)5 | | 63 |
| 08-31-2010 | 12.45 | | (0.03) | | 1.19 | | 1.16 | | — | | — | | — | | — | | 13.61 | | 9.324 | | 279 | | 0.93 | | 0.93 | | (0.23) | | 123 |
| 08-31-2009 | 16.90 | | —6 | | (4.45) | | (4.45) | | — | | — | | — | | — | | 12.45 | | (26.33)4 | | 266 | | 0.94 | | 0.94 | | 0.01 | | 159 |
| 08-31-2008 | 19.00 | | (0.03) | | (0.74) | | (0.77) | | — | | (1.33) | | — | | (1.33) | | 16.90 | | (4.91)4 | | 379 | | 0.93 | | 0.93 | | (0.16) | | 125 |
| 08-31-2007 | 15.81 | | 0.037 | | 3.96 | | 3.99 | | (0.06) | | (0.74) | | — | | (0.80) | | 19.00 | | 25.914 | | 136 | | 0.93 | | 0.93 | | 0.187 | | 114 |
| 08-31-20068 | 13.86 | | (0.04) | | 2.01 | | 1.97 | | — | | (0.02) | | — | | (0.02) | | 15.81 | | 14.203,4,9 | | 107 | | 0.965 | | 0.965 | | (0.30)5 | | 104 |
|
| |
| CLASS NAV | | | | | | | | | | | | | | | | | | | | | | | | | | | | |
|
| 02-28-20112 | 13.64 | | (0.02) | | 5.13 | | 5.11 | | — | | — | | — | | — | | 18.75 | | 37.463,4 | | 678 | | 0.885 | | 0.885 | | (0.28)5 | | 63 |
| 08-31-2010 | 12.47 | | (0.03) | | 1.20 | | 1.17 | | —10 | | — | | — | | —10 | | 13.64 | | 9.404 | | 508 | | 0.88 | | 0.88 | | (0.18) | | 123 |
| 08-31-2009 | 16.93 | | —6 | | (4.46) | | (4.46) | | —10 | | — | | — | | —10 | | 12.47 | | (26.30)4 | | 447 | | 0.89 | | 0.89 | | 0.04 | | 159 |
| 08-31-2008 | 19.03 | | (0.01) | | (0.76) | | (0.77) | | —10 | | (1.33) | | — | | (1.33) | | 16.93 | | (4.90)4 | | 348 | | 0.88 | | 0.88 | | (0.08) | | 125 |
| 08-31-2007 | 15.83 | | 0.037 | | 3.97 | | 4.00 | | (0.06) | | (0.74) | | — | | (0.80) | | 19.03 | | 25.954 | | 366 | | 0.88 | | 0.88 | | 0.197 | | 114 |
| 08-31-20068 | 13.87 | | (0.04) | | 2.02 | | 1.98 | | — | | (0.02) | | — | | (0.02) | | 15.83 | | 14.273,4,9 | | 194 | | 0.915 | | 0.915 | | (0.26)5 | | 104 |
|
| 1. Based on the average daily shares outstanding. 2. Unaudited. 3. Not annualized. 4. Total returns would have been lower had certain expenses not been reduced during the periods |
| shown. 5. Annualized. 6. Less than $0.005 per share. 7. Net investment income (loss) per share and ratio of net investment income (loss) to average net assets reflects special dividends |
| received by the Fund which amounted to the following: $0.07 and $0.06 per share and 0.42% and 0.35% for Class 1 and Class NAV, respectively. 8. The inception date for Class 1 and |
| Class NAV shares is 10-15-05. 9. The Adviser/Subadviser voluntarily paid Class 1 and Class NAV $510,149 and $847,342, respectively, for a potential lost investment opportunity. Excluding |
| these payments, the total return would have been 13.67% for Class 1 and 13.77% for Class NAV. 10. Less than ($0.005) per share. | | | | | | | | | | |
| |
| Mid Cap Value Equity Fund | | | | | | | | | | | | | | | | | | | | | | | | | | |
| CLASS NAV | | | | | | | | | | | | | | | | | | | | | | | | | | | | |
|
| 02-28-20112 | 7.88 | | 0.04 | | 2.50 | | 2.54 | | (0.06) | | — | | — | | (0.06) | | 10.36 | | 32.233,4 | | 195 | | 0.925 | | 0.925 | | 0.765 | | 35 |
| 08-31-2010 | 7.38 | | 0.07 | | 0.51 | | 0.58 | | (0.08) | | — | | — | | (0.08) | | 7.88 | | 7.853 | | 149 | | 0.92 | | 0.92 | | 0.87 | | 60 |
| 08-31-2009 | 9.86 | | 0.10 | | (2.30) | | (2.20) | | (0.08) | | (0.20) | | — | | (0.28) | | 7.38 | | (21.56) | | 162 | | 0.95 | | 0.95 | | 1.61 | | 37 |
| 08-31-2008 | 11.42 | | 0.07 | | (1.31) | | (1.24) | | (0.11) | | (0.21) | | — | | (0.32) | | 9.86 | | (11.17) | | 91 | | 0.97 | | 0.97 | | 0.69 | | 53 |
| 08-31-2007 | 9.65 | | 0.13 | | 1.70 | | 1.83 | | (0.06) | | — | | — | | (0.06) | | 11.42 | | 18.99 | | 129 | | 0.94 | | 0.94 | | 1.22 | | 26 |
| 08-31-20066 | 10.00 | | 0.03 | | (0.38) | | (0.35) | | — | | — | | — | | — | | 9.65 | | (3.50)4 | | 98 | | 1.025 | | 1.025 | | 0.795 | | 24 |
|
| 1. Based on the average daily shares outstanding. 2. Unaudited. 3. Total returns would have been lower had certain expenses not been reduced during the periods shown. 4. Not | | |
| annualized. 5. Annualized. 6. The inception date for Class NAV shares is 4-28-06. | | | | | | | | | | | | | | | | | | |
| |
| The accompanying notes are an integral part of the financial statements. | 358 |
John Hancock Funds II
Financial Highlights
| | | | | | | | | | | | | | | | | | | | | | | | | | | | | | |
| Per share operating performance for a share outstanding throughout the period | | | | | | Ratios and supplemental data | | | | |
|
| | | | | Income (loss) from | | | | | | | | | | | | | | | | | | | | | | | |
| | | | | investment operations | | | Less distributions | | | | | | | | Ratios to average net assets | | | | |
| | | |
| | |
| | | | | | |
|
| | | |
| |
| | | | | | | Net real- | | | | | | | | | | | | | | | | | | | | | | | | |
| | | | | | | ized and | | | | | | | | | | | | | | | | | | Expenses | | Expenses | | | | |
| | | Net asset | | Net | | unrealized | | | | | | | | | | | | Net asset | | �� | | Net | | before | | including | | Net | | |
| | | value, | | investment | | gain (loss) | | Total from | | From net | | From net | | From | | Total | | value, | | | | assets, | | reductions | | reductions | | investment | | |
| | | beginning | | income | | on invest- | | investment | | investment | | realized | | capital | | distri- | | end of | | Total | | end of | | and amounts | | and amounts | | income | | Portfolio |
| | | of period | | (loss) | | ments | | operations | | income | | gain | | paid-in | | butions | | period | | return | | period | | recaptured | | recaptured | | (loss) | | turnover |
| Period ended | ($) | | ($)1 | | ($) | | ($) | | ($) | | ($) | | ($) | | ($) | | ($) | | (%) | | (in millions) | | (%) | | (%) | | (%) | | (%) |
|
| |
| Mid Cap Value Index Fund | | | | | | | | | | | | | | | | | | | | | | | | |
| CLASS 1 | | | | | | | | | | | | | | | | | | | | | | | | | | | |
|
| 02-28-20112 | 8.63 | | 0.10 | | 2.39 | | 2.49 | | (0.11) | | — | | — | | (0.11) | | 11.01 | | 28.933,4 | | 3 | | 0.675 | | 0.655,6 | | 1.995 | | 17 |
| 08-31-20107 | 10.00 | | 0.05 | | (1.42) | | (1.37) | | — | | — | | — | | — | | 8.63 | | (13.70)3,4 | | —8 | | 0.835 | | 0.655 | | 1.515 | | 39 |
|
| |
| CLASS NAV | | | | | | | | | | | | | | | | | | | | | | | | | | | |
|
| 02-28-20112 | 8.63 | | 0.09 | | 2.40 | | 2.49 | | (0.11) | | — | | — | | (0.11) | | 11.01 | | 28.973,4 | | 62 | | 0.625 | | 0.605,6 | | 1.895 | | 17 |
| 08-31-20107 | 10.00 | | 0.04 | | (1.41) | | (1.37) | | — | | — | | — | | — | | 8.63 | | (13.70)3,4 | | 48 | | 0.785 | | 0.605 | | 1.445 | | 39 |
|
| 1. Based on the average daily shares outstanding. 2. Unaudited. 3. Total returns would have been lower had certain expenses not been reduced during the periods shown. 4. Not | | |
| annualized. 5. Annualized. 6. Includes the impact of expense recapture for the period ended 2-28-11: less than 0.01% of average net assets for Class 1 and Class NAV shares. See Note 5. |
| 7. The inception date for Class 1 and Class NAV shares is 4-30-10. 8. Less than $500,000. | | | | | | | | | | | | | | | | | | |
| |
| Mid Value Fund | | | | | | | | | | | | | | | | | | | | | | | | | | |
| CLASS NAV | | | | | | | | | | | | | | | | | | | | | | | | | | | |
|
| 02-28-20112 | 13.11 | | 0.06 | | 3.46 | | 3.52 | | (0.25) | | (0.97) | | — | | (1.22) | | 15.41 | | 27.373,4 | | 513 | | 1.055 | | 0.995 | | 0.815 | | 21 |
| 08-31-2010 | 12.61 | | 0.266 | | 0.68 | | 0.94 | | (0.08) | | (0.36) | | — | | (0.44) | | 13.11 | | 7.284 | | 391 | | 1.05 | | 1.00 | | 1.936 | | 50 |
| 08-31-20097 | 10.00 | | 0.05 | | 2.56 | | 2.61 | | — | | — | | — | | — | | 12.61 | | 26.103,4 | | 301 | | 1.105 | | 1.055 | | 0.645 | | 30 |
|
| 1. Based on the average daily shares outstanding. 2. Unaudited. 3. Not annualized. 4. Total returns would have been lower had certain expenses not been reduced during the periods |
| shown. 5. Annualized. 6. Net investment income (loss) per share and ratio of net investment income (loss) to average net assets reflect a special dividend received by the Fund which |
| amounted to $0.18 and 1.35%, respectively. 7. The inception date for Class NAV shares is 1-2-09. | | | | | | | | | | | | | | | | |
| |
| Mutual Shares Fund | | | | | | | | | | | | | | | | | | | | | | | | |
| CLASS NAV | | | | | | | | | | | | | | | | | | | | | | | | | | | | |
|
| 02-28-20112,3 | 10.00 | | 0.05 | | 1.31 | | 1.36 | | — | | (0.01) | | — | | (0.01) | | 11.35 | | 13.604,5 | | 363 | | 1.056 | | 1.056 | | 0.936 | | 14 |
|
| 1. Based on the average daily shares outstanding. 2. Unaudited. 3. The inception date for Class NAV shares is 9-16-10. 4. Total returns would have been lower had certain expenses not |
| been reduced during the period shown. 5. Not annualized. 6. Annualized. | | | | | | | | | | | | | | | | | | | | |
| |
| Optimized Value Fund | | | | | | | | | | | | | | | | | | | | | | | | | | |
| CLASS 1 | | | | | | | | | | | | | | | | | | | | | | | | | | | |
|
| 02-28-20112 | 9.85 | | 0.11 | | 2.69 | | 2.80 | | (0.08) | | — | | — | | (0.08) | | 12.57 | | 28.503 | | 51 | | 0.774 | | 0.774 | | 1.954 | | 138 |
| 08-31-2010 | 9.76 | | 0.14 | | 0.15 | | 0.29 | | (0.20) | | — | | — | | (0.20) | | 9.85 | | 2.875 | | 41 | | 0.78 | | 0.78 | | 1.37 | | 148 |
| 08-31-2009 | 12.98 | | 0.18 | | (3.12) | | (2.94) | | (0.28) | | — | | — | | (0.28) | | 9.76 | | (22.32) | | 48 | | 0.79 | | 0.79 | | 2.05 | | 144 |
| 08-31-2008 | 17.55 | | 0.24 | | (3.32) | | (3.08) | | (0.27) | | (1.22) | | — | | (1.49) | | 12.98 | | (18.77) | | 69 | | 0.73 | | 0.73 | | 1.63 | | 159 |
| 08-31-2007 | 16.56 | | 0.31 | | 1.68 | | 1.99 | | (0.20) | | (0.80) | | — | | (1.00) | | 17.55 | | 12.12 | | 106 | | 0.74 | | 0.74 | | 1.75 | | 169 |
| 08-31-2006 | 14.09 | | 0.22 | | 2.31 | | 2.53 | | (0.06) | | —6 | | — | | (0.06) | | 16.56 | | 17.983 | | 96 | | 0.794 | | 0.794 | | 1.624 | | 127 |
|
| |
| CLASS NAV | | | | | | | | | | | | | | | | | | | | | | | | | | | |
|
| 02-28-20112 | 9.86 | | 0.11 | | 2.69 | | 2.80 | | (0.09) | | — | | — | | (0.09) | | 12.57 | | 28.443 | | 343 | | 0.724 | | 0.724 | | 1.994 | | 138 |
| 08-31-2010 | 9.77 | | 0.15 | | 0.15 | | 0.30 | | (0.21) | | — | | — | | (0.21) | | 9.86 | | 2.935 | | 269 | | 0.73 | | 0.73 | | 1.42 | | 148 |
| 08-31-2009 | 12.98 | | 0.19 | | (3.11) | | (2.92) | | (0.29) | | — | | — | | (0.29) | | 9.77 | | (22.19) | | 248 | | 0.73 | | 0.73 | | 2.18 | | 144 |
| 08-31-2008 | 17.57 | | 0.25 | | (3.34) | | (3.09) | | (0.28) | | (1.22) | | — | | (1.50) | | 12.98 | | (18.82) | | 694 | | 0.69 | | 0.69 | | 1.69 | | 159 |
| 08-31-2007 | 16.56 | | 0.32 | | 1.69 | | 2.01 | | (0.20) | | (0.80) | | — | | (1.00) | | 17.57 | | 12.26 | | 680 | | 0.69 | | 0.69 | | 1.81 | | 169 |
| 08-31-2006 | 14.09 | | 0.24 | | 2.29 | | 2.53 | | (0.06) | | —6 | | — | | (0.06) | | 16.56 | | 17.983 | | 362 | | 0.744 | | 0.744 | | 1.734 | | 127 |
|
| 1. Based on the average daily shares outstanding. 2. Unaudited. 3. Not annualized. 4. Annualized. 5. Total returns would have been lower had certain expenses not been reduced during |
| the periods shown. 6. Less than ($0.005) per share. | | | | | | | | | | | | | | | | | | | | | | | | |
| |
| Real Estate Equity Fund | | | | | | | | | | | | | | | | | | | | | | | | | | |
| CLASS NAV | | | | | | | | | | | | | | | | | | | | | | | | | | | |
|
| 02-28-20112 | 6.96 | | 0.10 | | 1.41 | | 1.51 | | (0.09) | | — | | — | | (0.09) | | 8.38 | | 21.813,4 | | 371 | | 0.915 | | 0.875 | | 2.505 | | 12 |
| 08-31-2010 | 5.35 | | 0.10 | | 1.67 | | 1.77 | | (0.16) | | — | | — | | (0.16) | | 6.96 | | 33.543 | | 305 | | 0.92 | | 0.88 | | 1.55 | | 40 |
| 08-31-2009 | 8.52 | | 0.18 | | (3.15) | | (2.97) | | (0.19) | | (0.01) | | — | | (0.20) | | 5.35 | | (34.63)3 | | 209 | | 0.93 | | 0.90 | | 3.81 | | 75 |
| 08-31-2008 | 10.82 | | 0.20 | | (1.24) | | (1.04) | | (0.12) | | (1.14) | | — | | (1.26) | | 8.52 | | (9.91)3 | | 264 | | 0.91 | | 0.87 | | 2.20 | | 27 |
| 08-31-2007 | 10.99 | | 0.28 | | (0.12)6 | | 0.16 | | (0.17) | | (0.16) | | — | | (0.33) | | 10.82 | | 1.283 | | 254 | | 0.90 | | 0.87 | | 2.41 | | 55 |
| 08-31-20067 | 10.00 | | 0.08 | | 0.91 | | 0.99 | | — | | — | | — | | — | | 10.99 | | 9.903,4 | | 275 | | 0.925 | | 0.905 | | 2.295 | | 50 |
|
| 1. Based on the average daily shares outstanding. 2. Unaudited. 3. Total returns would have been lower had certain expenses not been reduced during the periods shown. 4. Not | | |
| annualized. 5. Annualized. 6. The amount shown for a share outstanding does not correspond with the aggregate net gain (loss) on investments for the period due to the timing of sales |
| and repurchases of shares in relation to fluctuating market values of the investments of the fund. 7. The inception date for Class NAV shares is 4-28-06. | | | | | | |
| |
| The accompanying notes are an integral part of the financial statements. | 359 |
John Hancock Funds II
Financial Highlights
| | | | | | | | | | | | | | | | | | | | | | | | | | | | | | |
| Per share operating performance for a share outstanding throughout the period | | | | | | Ratios and supplemental data | | | | |
|
| | | | | Income (loss) from | | | | | | | | | | | | | | | | | | | | | | | |
| | | | | investment operations | | | Less distributions | | | | | | | | Ratios to average net assets | | | | |
| | | |
| | |
| | | | | | |
| | | | |
| |
| | | | | | | Net real- | | | | | | | | | | | | | | | | | | | | | | | | |
| | | | | | | ized and | | | | | | | | | | | | | | | | | | Expenses | | Expenses | | | | |
| | | Net asset | | Net | | unrealized | | | | | | | | | | | | Net asset | | | | Net | | before | | including | | Net | | |
| | | value, | | investment | | gain (loss) | | Total from | | From net | | From net | | From | | Total | | value, | | | | assets | | reductions | | reductions | | investment | | |
| | | beginning | | income | | on invest- | | investment | | investment | | realized | | capital | | distri- | | end of | | Total | | end of | | and amounts | | and amounts | | income | | Portfolio |
| | | of period | | (loss) | | ments | | operations | | income | | gain | | paid-in | | butions | | period | | return | | period | | recaptured | | recaptured | | (loss) | | turnover |
| Period ended | ($) | | ($)1 | | ($) | | ($) | | ($) | | ($) | | ($) | | ($) | | ($) | | (%) | | (in millions) | | (%) | | (%) | | (%) | | (%) |
|
| |
| Real Estate Securities Fund | | | | | | | | | | | | | | | | | | | | | | | | | | |
| CLASS 1 | | | | | | | | | | | | | | | | | | | | | | | | | | | | |
|
| 02-28-20112 | 11.53 | | 0.18 | | 2.48 | | 2.66 | | (0.22) | | — | | — | | (0.22) | | 13.97 | | 23.293,4 | | 459 | | 0.795 | | 0.795 | | 2.815 | | 48 |
| 08-31-2010 | 8.72 | | 0.22 | | 2.72 | | 2.94 | | (0.13) | | — | | — | | (0.13) | | 11.53 | | 33.944 | | 352 | | 0.80 | | 0.80 | | 2.13 | | 87 |
| 08-31-2009 | 13.60 | | 0.26 | | (4.79) | | (4.53) | | (0.26) | | (0.09) | | — | | (0.35) | | 8.72 | | (33.01) | | 75 | | 0.84 | | 0.84 | | 3.30 | | 119 |
| 08-31-2008 | 17.80 | | 0.32 | | (1.57) | | (1.25) | | (0.30) | | (2.65) | | — | | (2.95) | | 13.60 | | (7.58) | | 113 | | 0.82 | | 0.82 | | 2.18 | | 74 |
| 08-31-2007 | 29.94 | | 0.50 | | 1.52 | | 2.02 | | (0.93) | | (13.23) | | — | | (14.16) | | 17.80 | | 4.30 | | 145 | | 0.80 | | 0.80 | | 2.25 | | 87 |
| 08-31-20066 | 23.03 | | 0.64 | | 6.46 | | 7.10 | | (0.16) | | (0.03) | | — | | (0.19) | | 29.94 | | 30.963 | | 171 | | 0.825 | | 0.825 | | 2.765 | | 199 |
|
| 1. Based on the average daily shares outstanding. 2. Unaudited. 3. Not annualized. 4. Total returns would have been lower had certain expenses not been reduced during the periods | | |
| shown. 5. Annualized. 6. The inception date for Class 1 shares is 10-15-05. | | | | | | | | | | | | | | | | | | | | |
| |
| Real Return Bond Fund | | | | | | | | | | | | | | | | | | | | | | | | | | |
| CLASS 1 | | | | | | | | | | | | | | | | | | | | | | | | | | | | |
|
| 02-28-20112 | 13.08 | | 0.12 | | 0.09 | | 0.21 | | (0.29) | | (0.50) | | — | | (0.79) | | 12.50 | | 1.723,4 | | 95 | | 0.795 | | 0.795 | | 1.945 | | 180 |
| 08-31-2010 | 12.10 | | 0.26 | | 1.15 | | 1.41 | | (0.43) | | — | | — | | (0.43) | | 13.08 | | 11.903 | | 94 | | 0.77 | | 0.77 | | 2.09 | | 354 |
| 08-31-2009 | 14.15 | | 0.42 | | (0.55) | | (0.13) | | (0.42) | | (1.50) | | — | | (1.92) | | 12.10 | | 0.99 | | 60 | | 0.79 | | 0.79 | | 3.59 | | 6286 |
| 08-31-2008 | 13.17 | | 0.60 | | 1.03 | | 1.63 | | (0.65) | | — | | — | | (0.65) | | 14.15 | | 12.64 | | 46 | | 0.80 | | 0.80 | | 4.26 | | 9926 |
| 08-31-2007 | 13.41 | | 0.55 | | (0.29) | | 0.26 | | (0.46) | | (0.04) | | — | | (0.50) | | 13.17 | | 1.973 | | 19 | | 0.79 | | 0.79 | | 4.16 | | 1976 |
| 08-31-20067 | 13.52 | | 0.53 | | (0.24) | | 0.29 | | (0.40) | | —8 | | — | | (0.40) | | 13.41 | | 2.274 | | 17 | | 0.805 | | 0.805 | | 4.525 | | 216 |
|
| |
| CLASS NAV | | | | | | | | | | | | | | | | | | | | | | | | | | | | |
|
| 02-28-20112 | 12.96 | | 0.12 | | 0.09 | | 0.21 | | (0.30) | | (0.50) | | — | | (0.80) | | 12.37 | | 1.683,4 | | 761 | | 0.745 | | 0.745 | | 1.985 | | 180 |
| 08-31-2010 | 11.99 | | 0.27 | | 1.14 | | 1.41 | | (0.44) | | — | | — | | (0.44) | | 12.96 | | 11.993 | | 991 | | 0.72 | | 0.72 | | 2.15 | | 354 |
| 08-31-2009 | 14.03 | | 0.43 | | (0.55) | | (0.12) | | (0.42) | | (1.50) | | — | | (1.92) | | 11.99 | | 1.11 | | 1,058 | | 0.74 | | 0.74 | | 3.72 | | 6286 |
| 08-31-2008 | 13.07 | | 0.60 | | 1.02 | | 1.62 | | (0.66) | | — | | — | | (0.66) | | 14.03 | | 12.63 | | 819 | | 0.75 | | 0.75 | | 4.30 | | 9926 |
| 08-31-2007 | 13.32 | | 0.59 | | (0.34) | | 0.25 | | (0.46) | | (0.04) | | — | | (0.50) | | 13.07 | | 1.953 | | 951 | | 0.74 | | 0.74 | | 4.53 | | 1976 |
| 08-31-20067 | 13.43 | | 0.55 | | (0.26) | | 0.29 | | (0.40) | | —8 | | — | | (0.40) | | 13.32 | | 2.324 | | 684 | | 0.755 | | 0.755 | | 4.755 | | 216 |
|
| 1. Based on the average daily shares outstanding. 2. Unaudited. 3. Total returns would have been lower had certain expenses not been reduced during the periods shown. 4. Not | | |
| annualized. 5. Annualized. 6. The Portfolio turnover rates, including the effect of “TBA” (to be announced) securities for the periods ended, were as follows: 772% for the year ended | | |
| 8-31-09, 1,192% for the year ended 8-31-08 and 230% for the year ended 8-31-07. The year ended 8-31-06 includes the effect of TBA transactions. 7. The inception date for Class 1 and |
| Class NAV shares is 10-15-05. 8. Less than ($0.005) per share. | | | | | | | | | | | | | | | | | | | | | | |
| |
| Retirement 2010 Portfolio | | | | | | | | | | | | | | | | | | | | | | | | | | |
| CLASS 1 | | | | | | | | | | | | | | | | | | | | | | | | | | | | |
|
| 02-28-20112 | 10.37 | | 0.103 | | —4 | | 0.10 | | (0.10) | | (0.05) | | — | | (0.15) | | 10.32 | | 0.995,6 | | 10 | | 1.497,8 | | 0.167,8 | | 1.953,7 | | 89 |
| 08-31-20109 | 10.00 | | 0.093 | | 0.28 | | 0.37 | | — | | — | | — | | — | | 10.37 | | 3.705,6 | | —10 | | 308.907,8 | | 0.167,8 | | 2.553,7 | | — |
|
| 1. Based on the average daily shares outstanding. 2. Unaudited. 3. Recognition of net investment income by the Portfolios is affected by the timing of the declaration of dividends by the |
| underlying funds in which the Portfolios invests. 4. Less than ($0.005) per share. 5. Total returns would have been lower had certain expenses not been reduced during the periods shown. |
| 6. Not annualized. 7. Annualized. 8. Ratios do not include expenses indirectly incurred from underlying funds whose expense ratios can vary based on the mix of underlying funds held by |
| the Portfolio. The range of expense ratios of the underlying funds held by the Portfolio was 0.48% – 0.56% for the periods ended 2-28-11 and 8-31-10. 9. The inception date for Class 1 |
| shares is 4-30-10. 10. Less than $500,000. | | | | | | | | | | | | | | | | | | | | | | | | | | |
| |
| Retirement 2015 Portfolio | | | | | | | | | | | | | | | | | | | | | | | | | | |
| CLASS 1 | | | | | | | | | | | | | | | | | | | | | | | | | | | | |
|
| 02-28-20112 | 10.03 | | 0.123 | | 0.44 | | 0.56 | | (0.09) | | (0.04) | | — | | (0.13) | | 10.46 | | 5.634,5 | | 13 | | 1.176,7 | | 0.166,7 | | 2.373,6 | | 24 |
| 08-31-20108 | 10.00 | | 0.073 | | (0.04) | | 0.03 | | — | | — | | — | | — | | 10.03 | | 0.304,5 | | —9 | | 315.946,7 | | 0.166,7 | | 1.963,6 | | — |
|
| 1. Based on the average daily shares outstanding. 2. Unaudited. 3. Recognition of net investment income by the Portfolios is affected by the timing of the declaration of dividends by | | |
| the underlying funds in which the Portfolios invests. 4. Total returns would have been lower had certain expenses not been reduced during the periods shown. 5. Not annualized. | | |
| 6. Annualized. 7. Ratios do not include expenses indirectly incurred from underlying funds whose expense ratios can vary based on the mix of underlying funds held by the Portfolio. The | | |
| range of expense ratios of the underlying funds held by the Portfolio was 0.48% - 0.56% for the periods ended 2-28-11 and 8-31-10. 8. The inception date for Class 1 shares is 4-30-10. |
| 9. Less than $500,000. | | | | | | | | | | | | | | | | | | | | | | | | | | | | |
| |
| Retirement 2020 Portfolio | | | | | | | | | | | | | | | | | | | | | | | | | | |
| CLASS 1 | | | | | | | | | | | | | | | | | | | | | | | | | | | | |
|
| 02-28-20112 | 9.70 | | 0.123 | | 0.94 | | 1.06 | | (0.11) | | (0.03) | | — | | (0.14) | | 10.62 | | 10.964,5 | | 19 | | 0.916,7 | | 0.166,7 | | 2.233,6 | | 20 |
| 08-31-20108 | 10.00 | | 0.053 | | (0.35) | | (0.30) | | — | | — | | — | | — | | 9.70 | | (3.00)4,5 | | —9 | | 323.166,7 | | 0.166,7 | | 1.413,6 | | — |
|
| 1. Based on the average daily shares outstanding. 2. Unaudited. 3. Recognition of net investment income by the Portfolios is affected by the timing of the declaration of dividends by | | |
| the underlying funds in which the Portfolios invests. 4. Total returns would have been lower had certain expenses not been reduced during the periods shown. 5. Not annualized. | | |
| 6. Annualized. 7. Ratios do not include expenses indirectly incurred from underlying funds whose expense ratios can vary based on the mix of underlying funds held by the Portfolio. The | | |
| range of expense ratios of the underlying funds held by the Portfolio was 0.48% – 0.56% for the periods ended 2-28-11 and 8-31-10. 8. The inception date for Class 1 shares is 4-30-10. |
| 9. Less than $500,000. | | | | | | | | | | | | | | | | | | | | | | | | | | | |
| |
| The accompanying notes are an integral part of the financial statements. | 360 |
John Hancock Funds II
Financial Highlights
| | | | | | | | | | | | | | | | | | | | | | | | | | | | | | |
| Per share operating performance for a share outstanding throughout the period | | | | | | Ratios and supplemental data | | | | |
|
| | | | | Income (loss) from | | | | | | | | | | | | | | | | | | | | | | | |
| | | | | investment operations | | Less distributions | | | | | | | | Ratios to average net assets | | | | |
| | | |
| |
| | | | | | | |
| | | | |
| |
| | | | | | | Net real- | | | | | | | | | | | | | | | | | | | | | | | | |
| | | | | | | ized and | | | | | | | | | | | | | | | | | | Expenses | | Expenses | | | | |
| | | Net asset | | Net | | unrealized | | | | | | | | | | | | Net asset | | | | Net | | before | | including | | Net | | |
| | | value, | | investment | | gain (loss) | | Total from | | From net | | From net | | From | | Total | | value, | | | | assets, | | reductions | | reductions | | investment | | |
| | | beginning | | income | | on invest- | | investment | | investment | | realized | | capital | | distri- | | end of | | Total | | end of | | and amounts | | and amounts | | income | | Portfolio |
| | | of period | | (loss) | | ments | | operations | | income | | gain | | paid-in | | butions | | period | | return | | period | | recaptured | | recaptured | | (loss) | | turnover |
| Period ended | ($) | | ($)1 | | ($) | | ($) | | ($) | | ($) | | ($) | | ($) | | ($) | | (%) | | (in millions) | | (%) | | (%) | | (%) | | (%) |
|
| |
| Retirement 2025 Portfolio | | | | | | | | | | | | | | | | | | | | | | | | | | |
| CLASS 1 | | | | | | | | | | | | | | | | | | | | | | | | | | | |
|
| 02-28-20112 | 9.40 | | 0.153 | | 1.37 | | 1.52 | | (0.14) | | (0.02) | | — | | (0.16) | | 10.76 | | 16.244,5 | | 23 | | 0.716,7 | | 0.166,7 | | 2.933,6 | | 36 |
| 08-31-20108 | 10.00 | | 0.033 | | (0.63) | | (0.60) | | — | | — | | — | | — | | 9.40 | | (6.00)4,5 | | —9 | | 329.876,7 | | 0.166,7 | | 0.893,6 | | — |
|
| 1. Based on the average daily shares outstanding. 2. Unaudited. 3. Recognition of net investment income by the Portfolios is affected by the timing of the declaration of dividends by | | |
| the underlying funds in which the Portfolios invests. 4. Total returns would have been lower had certain expenses not been reduced during the periods shown. 5. Not annualized. | | |
| 6. Annualized. 7. Ratios do not include expenses indirectly incurred from underlying funds whose expense ratios can vary based on the mix of underlying funds held by the Portfolio. The | | |
| range of expense ratios of the underlying funds held by the Portfolio was 0.48% – 0.56% for the periods ended 2-28-11 and 8-31-10. 8. The inception date for Class 1 shares is 4-30-10. |
| 9. Less than $500,000. | | | | | | | | | | | | | | | | | | | | | | | | | | | | |
| |
| Retirement 2030 Portfolio | | | | | | | | | | | | | | | | | | | | | | | | | | |
| CLASS 1 | | | | | | | | | | | | | | | | | | | | | | | | | | | |
|
| 02-28-20112 | 9.25 | | 0.163 | | 1.60 | | 1.76 | | (0.15) | | (0.01) | | — | | (0.16) | | 10.85 | | 19.164,5 | | 17 | | 1.036,7 | | 0.166,7 | | 3.073,6 | | 7 |
| 08-31-20108 | 10.00 | | 0.023 | | (0.77) | | (0.75) | | — | | — | | — | | — | | 9.25 | | (7.50)4,5 | | —9 | | 333.406,7 | | 0.166,7 | | 0.633,6 | | — |
|
| 1. Based on the average daily shares outstanding. 2. Unaudited. 3. Recognition of net investment income by the Portfolios is affected by the timing of the declaration of dividends by | | |
| the underlying funds in which the Portfolios invests. 4. Total returns would have been lower had certain expenses not been reduced during the periods shown. 5. Not annualized. | | |
| 6. Annualized. 7. Ratios do not include expenses indirectly incurred from underlying funds whose expense ratios can vary based on the mix of underlying funds held by the Portfolio. The | | |
| range of expense ratios of the underlying funds held by the Portfolio was 0.48% – 0.56% for the periods ended 2-28-11 and 8-31-10. 8. The inception date for Class 1 shares is 4-30-10. |
| 9. Less than $500,000. | | | | | | | | | | | | | | | | | | | | | | | | | | | | |
| |
| Retirement 2035 Portfolio | | | | | | | | | | | | | | | | | | | | | | | | | | |
| CLASS 1 | | | | | | | | | | | | | | | | | | | | | | | | | | | |
|
| 02-28-20112 | 9.15 | | 0.163 | | 1.75 | | 1.91 | | (0.15) | | (0.01) | | — | | (0.16) | | 10.90 | | 20.914,5 | | 14 | | 1.166,7 | | 0.166,7 | | 2.953,6 | | 20 |
| 08-31-20108 | 10.00 | | 0.013 | | (0.86) | | (0.85) | | — | | — | | — | | — | | 9.15 | | (8.50)4,5 | | —9 | | 335.746,7 | | 0.166,7 | | 0.463,6 | | — |
|
| 1. Based on the average daily shares outstanding. 2. Unaudited. 3. Recognition of net investment income by the Portfolios is affected by the timing of the declaration of dividends by | | |
| the underlying funds in which the Portfolios invests. 4. Total returns would have been lower had certain expenses not been reduced during the periods shown. 5. Not annualized. | | |
| 6. Annualized. 7. Ratios do not include expenses indirectly incurred from underlying funds whose expense ratios can vary based on the mix of underlying funds held by the Portfolio. The | | |
| range of expense ratios of the underlying funds held by the Portfolio was 0.48% – 0.56% for the periods ended 2-28-11 and 8-31-10. 8. The inception date for Class 1 shares is 4-30-10. |
| 9. Less than $500,000. | | | | | | | | | | | | | | | | | | | | | | | | | | | | |
| |
| Retirement 2040 Portfolio | | | | | | | | | | | | | | | | | | | | | | | | | | |
| CLASS 1 | | | | | | | | | | | | | | | | | | | | | | | | | | | | |
|
| 02-28-20112 | 9.12 | | 0.143 | | 1.82 | | 1.96 | | (0.15) | | (0.01) | | — | | (0.16) | | 10.92 | | 21.624,5 | | 8 | | 2.136,7 | | 0.166,7 | | 2.693,6 | | 9 |
| 08-31-20108 | 10.00 | | 0.013 | | (0.89) | | (0.88) | | — | | — | | — | | — | | 9.12 | | (8.80)4,5 | | —9 | | 336.546,7 | | 0.166,7 | | 0.393,6 | | — |
|
| 1. Based on the average daily shares outstanding. 2. Unaudited. 3. Recognition of net investment income by the Portfolios is affected by the timing of the declaration of dividends by | | |
| the underlying funds in which the Portfolios invests. 4. Total returns would have been lower had certain expenses not been reduced during the periods shown. 5. Not annualized. | | |
| 6. Annualized. 7. Ratios do not include expenses indirectly incurred from underlying funds whose expense ratios can vary based on the mix of underlying funds held by the Portfolio. The | | |
| range of expense ratios of the underlying funds held by the Portfolio was 0.48% – 0.56% for the periods ended 2-28-11 and 8-31-10. 8. The inception date for Class 1 shares is 4-30-10. |
| 9. Less than $500,000. | | | | | | | | | | | | | | | | | | | | | | | | | | | | |
| |
| Retirement 2045 Portfolio | | | | | | | | | | | | | | | | | | | | | | | | | | |
| CLASS 1 | | | | | | | | | | | | | | | | | | | | | | | | | | | |
|
| 02-28-20112 | 9.12 | | 0.123 | | 1.85 | | 1.97 | | (0.15) | | (0.01) | | — | | (0.16) | | 10.93 | | 21.684,5 | | 8 | | 2.286,7 | | 0.166,7 | | 2.323,6 | | 1 |
| 08-31-20108 | 10.00 | | 0.013 | | (0.89) | | (0.88) | | — | | — | | — | | — | | 9.12 | | (8.80)4,5 | | —9 | | 336.546,7 | | 0.166,7 | | 0.393,6 | | — |
|
| 1. Based on the average daily shares outstanding. 2. Unaudited. 3. Recognition of net investment income by the Portfolios is affected by the timing of the declaration of dividends by | | |
| the underlying funds in which the Portfolios invests. 4. Total returns would have been lower had certain expenses not been reduced during the periods shown. 5. Not annualized. | | |
| 6. Annualized. 7. Ratios do not include expenses indirectly incurred from underlying funds whose expense ratios can vary based on the mix of underlying funds held by the Portfolio. The | | |
| range of expense ratios of the underlying funds held by the Portfolio was 0.48% – 0.56% for the periods ended 2-28-11 and 8-31-10. 8. The inception date for Class 1 shares is 4-30-10. |
| 9. Less than $500,000. | | | | | | | | | | | | | | | | | | | | | | | | | | | | |
| |
| Short Term Government Income Fund | | | | | | | | | | | | | | | | | | | | | | | | |
| CLASS NAV | | | | | | | | | | | | | | | | | | | | | | | | | | | | |
|
| 02-28-20112 | 10.25 | | 0.06 | | (0.08) | | (0.02) | | (0.14) | | (0.07) | | — | | (0.21) | | 10.02 | | (0.22)3,4 | | 130 | | 0.645 | | 0.645,6 | | 1.245 | | 39 |
| 08-31-2010 | 10.14 | | 0.12 | | 0.26 | | 0.38 | | (0.25) | | (0.02) | | — | | (0.27) | | 10.25 | | 3.783 | | 136 | | 0.68 | | 0.64 | | 1.22 | | 137 |
| 08-31-20097 | 10.00 | | 0.13 | | 0.01 | | 0.14 | | — | | — | | — | | — | | 10.14 | | 1.403,4 | | 25 | | 1.215 | | 0.655 | | 2.025 | | 177 |
|
| 1. Based on the average daily shares outstanding. 2. Unaudited. 3. Total returns would have been lower had certain expenses not been reduced during the periods shown. 4. Not | | |
| annualized. 5. Annualized. 6. Includes the impact of expense recapture for the period ended 2-28-11: less than 0.01% of average net assets for Class NAV shares. See Note 5. 7. The | | |
| inception date for Class NAV shares is 1-2-09. | | | | | | | | | | | | | | | | | | | | | | | | | | |
| |
| The accompanying notes are an integral part of the financial statements. | 361 |
John Hancock Funds II
Financial Highlights
| | | | | | | | | | | | | | | | | | | | | | | | | | | | | |
| Per share operating performance for a share outstanding throughout the period | | | | | | Ratios and supplemental data | | | | |
|
| | | | Income (loss) from | | | | | | | | | | | | | | | | | | | | | | | |
| | | | investment operations | | | Less distributions | | | | | | | Ratios to average net assets | | | | |
| | |
| | |
| | | | | | |
| | | | |
| |
| | | | | | Net real- | | | | | | | | | | | | | | | | | | | | | | | | |
| | | | | | ized and | | | | | | | | | | | | | | | | | | Expenses | | Expenses | | | | |
| | Net asset | | Net | | unrealized | | | | | | | | | | | | Net asset | | | | Net | | before | | including | | Net | | |
| | value, | | investment | | gain (loss) | | Total from | | From net | | From net | | From | | Total | | value, | | | | assets, | | reductions | | reductions | | investment | | |
| | beginning | | income | | on invest- | | investment | | investment | | realized | | capital | | distri- | | end of | | Total | | end of | | and amounts | | and amounts | | income | | Portfolio |
| | of period | | (loss) | | ments | | operations | | income | | gain | | paid-in | | butions | | period | | return | | period | | recaptured | | recaptured | | (loss) | | turnover |
| Period ended | ($) | | ($)1 | | ($) | | ($) | | ($) | | ($) | | ($) | | ($) | | ($) | | (%) | | (in millions) | | (%) | | (%) | | (%) | | (%) |
|
| |
| Small Cap Growth Fund | | | | | | | | | | | | | | | | | | | | | | | | | | |
| CLASS NAV | | | | | | | | | | | | | | | | | | | | | | | | | | |
|
| 02-28-20112 | 8.91 | | (0.04) | | 3.52 | | 3.48 | | — | | (1.07) | | — | | (1.07) | | 11.32 | | 40.093,4 | | 196 | | 1.115 | | 1.115 | | (0.71)5 | | 74 |
| 08-31-2010 | 8.38 | | (0.07) | | 0.60 | | 0.53 | | — | | — | | — | | — | | 8.91 | | 6.324 | | 149 | | 1.13 | | 1.13 | | (0.75) | | 143 |
| 08-31-20096 | 10.00 | | (0.04) | | (1.58) | | (1.62) | | — | | — | | — | | — | | 8.38 | | (16.20)3 | | 122 | | 1.185 | | 1.185 | | (0.59)5 | | 214 |
|
| 1. Based on the average daily shares outstanding. 2. Unaudited. 3. Not annualized. 4. Total returns would have been lower had certain expenses not been reduced during the periods |
| shown. 5. Annualized. 6. The inception date for Class NAV shares is 9-10-08. | | | | | | | | | | | | | | | | | | | | |
| |
| Small Cap Index Fund | | | | | | | | | | | | | | | | | | | | | | | | | | |
| CLASS NAV | | | | | | | | | | | | | | | | | | | | | | | | | | |
|
| 02-28-20112 | 10.37 | | 0.06 | | 3.78 | | 3.84 | | (0.13) | | — | | — | | (0.13) | | 14.08 | | 37.113 | | 94 | | 0.544 | | 0.544 | | 1.024 | | 4 |
| 08-31-2010 | 9.88 | | 0.09 | | 0.53 | | 0.62 | | (0.13) | | — | | — | | (0.13) | | 10.37 | | 6.245 | | 70 | | 0.53 | | 0.53 | | 0.82 | | 34 |
| 08-31-2009 | 12.96 | | 0.11 | | (2.95) | | (2.84) | | (0.09) | | (0.15) | | — | | (0.24) | | 9.88 | | (21.60) | | 100 | | 0.55 | | 0.55 | | 1.33 | | 96 |
| 08-31-2008 | 17.03 | | 0.19 | | (1.04) | | (0.85) | | (0.30) | | (2.92) | | — | | (3.22) | | 12.96 | | (5.60)5 | | 125 | | 0.56 | | 0.56 | | 1.39 | | 86 |
| 08-31-2007 | 15.95 | | 0.20 | | 1.50 | | 1.70 | | (0.13) | | (0.49) | | — | | (0.62) | | 17.03 | | 10.705 | | 89 | | 0.54 | | 0.54 | | 1.19 | | 40 |
| 08-31-20066 | 14.05 | | 0.12 | | 1.80 | | 1.92 | | (0.02) | | — | | — | | (0.02) | | 15.95 | | 13.693,5 | | 125 | | 0.584 | | 0.564 | | 0.924 | | 40 |
|
| 1. Based on the average daily shares outstanding. 2. Unaudited. 3. Not annualized. 4. Annualized. 5. Total returns would have been lower had certain expenses not been reduced during |
| the periods shown. 6. The inception date for Class NAV shares is 10-29-05. | | | | | | | | | | | | | | | | | | | | |
| |
| Small Cap Opportunities Fund | | | | | | | | | | | | | | | | | | | | | | | | | | |
| CLASS 1 | | | | | | | | | | | | | | | | | | | | | | | | | | |
|
| 02-28-20112 | 16.16 | | 0.03 | | 6.75 | | 6.78 | | — | | — | | — | | — | | 22.94 | | 41.963,4 | | 73 | | 1.115 | | 1.025 | | 0.325 | | 15 |
| 08-31-2010 | 15.14 | | (0.01) | | 1.06 | | 1.05 | | (0.03) | | — | | — | | (0.03) | | 16.16 | | 6.903 | | 48 | | 1.12 | | 1.04 | | (0.06) | | 33 |
| 08-31-2009 | 18.87 | | 0.06 | | (3.57) | | (3.51) | | (0.22) | | — | | — | | (0.22) | | 15.14 | | (18.28)3 | | 45 | | 1.21 | | 1.16 | | 0.49 | | 98 |
| 08-31-2008 | 23.45 | | 0.35 | | (4.53) | | (4.18) | | (0.33) | | (0.07) | | — | | (0.40) | | 18.87 | | (18.09)3 | | 25 | | 1.11 | | 1.11 | | 1.62 | | 81 |
| 08-31-2007 | 23.24 | | 0.32 | | 0.83 | | 1.15 | | (0.31) | | (0.63) | | — | | (0.94) | | 23.45 | | 4.853 | | 35 | | 1.09 | | 1.09 | | 1.32 | | 48 |
| 08-31-20066 | 21.36 | | 0.21 | | 1.72 | | 1.93 | | (0.05) | | —7 | | — | | (0.05) | | 23.24 | | 9.043,4 | | 30 | | 1.105 | | 1.105 | | 1.015 | | 59 |
|
| |
| CLASS NAV | | | | | | | | | | | | | | | | | | | | | | | | | |
|
| 02-28-20112 | 16.09 | | 0.04 | | 6.71 | | 6.75 | | — | | — | | — | | — | | 22.84 | | 41.953,4 | | 138 | | 1.065 | | 0.975 | | 0.385 | | 15 |
| 08-31-2010 | 15.07 | | —8 | | 1.05 | | 1.05 | | (0.03) | | — | | — | | (0.03) | | 16.09 | | 6.983 | | 105 | | 1.07 | | 0.99 | | (0.01) | | 33 |
| 08-31-2009 | 18.79 | | 0.09 | | (3.58) | | (3.49) | | (0.23) | | — | | — | | (0.23) | | 15.07 | | (18.24)3 | | 54 | | 1.16 | | 1.11 | | 0.68 | | 98 |
| 08-31-2008 | 23.35 | | 0.47 | | (4.62) | | (4.15) | | (0.34) | | (0.07) | | — | | (0.41) | | 18.79 | | (18.04)3 | | 97 | | 1.06 | | 1.06 | | 1.68 | | 81 |
| 08-31-2007 | 23.14 | | 0.34 | | 0.81 | | 1.15 | | (0.31) | | (0.63) | | — | | (0.94) | | 23.35 | | 4.883 | | 194 | | 1.04 | | 1.04 | | 1.37 | | 48 |
| 08-31-20066 | 21.26 | | 0.22 | | 1.71 | | 1.93 | | (0.05) | | —7 | | — | | (0.05) | | 23.14 | | 9.093,4 | | 217 | | 1.055 | | 1.055 | | 1.055 | | 59 |
|
| 1. Based on the average daily shares outstanding. 2. Unaudited. 3. Total returns would have been lower had certain expenses not been reduced during the periods shown. 4. Not | | |
| annualized. 5. Annualized. 6. The inception date for Class 1 and Class NAV shares is 10-15-05. 7. Less than ($0.005) per share. 8. Less than $0.005 per share. | | | | |
| |
| Small Cap Value Fund | | | | | | | | | | | | | | | | | | | | | | | | | | |
| CLASS NAV | | | | | | | | | | | | | | | | | | | | | | | | | | |
|
| 02-28-20112 | 13.72 | | 0.08 | | 3.89 | | 3.97 | | (0.10) | | (0.66) | | — | | (0.76) | | 16.93 | | 29.083,4 | | 167 | | 1.115 | | 1.115 | | 1.045 | | 6 |
| 08-31-2010 | 12.50 | | 0.07 | | 1.39 | | 1.46 | | (0.06) | | (0.18) | | — | | (0.24) | | 13.72 | | 11.723 | | 131 | | 1.14 | | 1.14 | | 0.51 | | 22 |
| 08-31-20096 | 10.00 | | 0.03 | | 2.47 | | 2.50 | | — | | — | | — | | — | | 12.50 | | 25.003,4 | | 79 | | 1.325 | | 1.325 | | 0.335 | | 9 |
|
| 1. Based on the average daily shares outstanding. 2. Unaudited. 3. Total returns would have been lower had certain expenses not been reduced during the periods shown. 4. Not | | |
| annualized. 5. Annualized. 6. The inception date for Class NAV shares is 12-16-08. | | | | | | | | | | | | | | | | | | |
| |
| Small Company Growth Fund | | | | | | | | | | | | | | | | | | | | | | | | | | |
| CLASS NAV | | | | | | | | | | | | | | | | | | | | | | | | | |
|
| 02-28-20112 | 10.46 | | (0.03) | | 3.99 | | 3.96 | | — | | — | | — | | — | | 14.42 | | 37.863,4 | | 152 | | 1.075 | | 1.075 | | (0.42)5 | | 27 |
| 08-31-2010 | 9.51 | | (0.03)6 | | 0.99 | | 0.96 | | — | | — | | (0.01) | | (0.01) | | 10.46 | | 10.094 | | 116 | | 1.11 | | 1.11 | | (0.31)6 | | 35 |
| 08-31-2009 | 11.95 | | (0.02) | | (2.42) | | (2.44) | | — | | — | | — | | — | | 9.51 | | (20.42) | | 122 | | 1.13 | | 1.13 | | (0.24) | | 58 |
| 08-31-2008 | 13.09 | | (0.07) | | (0.77) | | (0.84) | | — | | (0.30) | | — | | (0.30) | | 11.95 | | (6.57) | | 169 | | 1.10 | | 1.10 | | (0.54) | | 38 |
| 08-31-2007 | 11.09 | | (0.09) | | 2.29 | | 2.20 | | — | | (0.20) | | — | | (0.20) | | 13.09 | | 20.04 | | 208 | | 1.11 | | 1.11 | | (0.68) | | 39 |
| 08-31-20067 | 10.00 | | (0.08) | | 1.17 | | 1.09 | | — | | — | | — | | — | | 11.09 | | 10.903 | | 74 | | 1.165 | | 1.165 | | (0.83)5 | | 49 |
|
| 1. Based on the average daily shares outstanding. 2. Unaudited. 3. Not annualized. 4. Total returns would have been lower had certain expenses not been reduced during the periods |
| shown. 5. Annualized. 6. Net investment income (loss) per share and ratio of net investment income (loss) to average net assets reflect a special dividend received by the Fund which |
| amounted to $0.02 and 0.22%, respectively. 7. The inception date for Class NAV shares is 10-29-05. | | | | | | | | | | | | | | |
| |
| The accompanying notes are an integral part of the financial statements. | 362 |
John Hancock Funds II
Financial Highlights
| | | | | | | | | | | | | | | | | | | | | | | | | | | | | |
| Per share operating performance for a share outstanding throughout the period | | | | | | Ratios and supplemental data | | | | |
|
| | | | Income (loss) from | | | | | | | | | | | | | | | | | | | | | | | |
| | | | investment operations | | | Less distributions | | | | | | | Ratios to average net assets | | | | |
| | |
| | |
| | | | | | |
| | | | |
| |
| | | | | | Net real- | | | | | | | | | | | | | | | | | | | | | | | | |
| | | | | | ized and | | | | | | | | | | | | | | | | | | Expenses | | Expenses | | | | |
| | Net asset | | Net | | unrealized | | | | | | | | | | | | Net asset | | | | Net | | before | | including | | Net | | |
| | value, | | investment | | gain (loss) | | Total from | | From net | | From net | | From | | Total | | value, | | | | assets, | | reductions | | reductions | | investment | | |
| | beginning | | income | | on invest- | | investment | | investment | | realized | | capital | | distri- | | end of | | Total | | end of | | and amounts | | and amounts | | income | | Portfolio |
| | of period | | (loss) | | ments | | operations | | income | | gain | | paid-in | | butions | | period | | return | | period | | recaptured | | recaptured | | (loss) | | turnover |
| Period ended | ($) | | ($)1 | | ($) | | ($) | | ($) | | ($) | | ($) | | ($) | | ($) | | (%) | | (in millions) | | (%) | | (%) | | (%) | | (%) |
|
| |
| Small Company Value Fund | | | | | | | | | | | | | | | | | | | | | | | | | | |
| CLASS 1 | | | | | | | | | | | | | | | | | | | | | | | | | | |
|
| 02-28-20112 | 20.19 | | 0.08 | | 6.89 | | 6.97 | | (0.13) | | — | | — | | (0.13) | | 27.03 | | 34.553,5 | | 132 | | 1.126 | | 1.076 | | 0.646 | | 6 |
| 08-31-2010 | 19.71 | | 0.09 | | 0.58 | | 0.67 | | (0.19) | | — | | — | | (0.19) | | 20.19 | | 3.343 | | 98 | | 1.12 | | 1.07 | | 0.42 | | 26 |
| 08-31-2009 | 24.91 | | 0.13 | | (4.83) | | (4.70) | | (0.13) | | (0.37) | | — | | (0.50) | | 19.71 | | (18.47)3 | | 101 | | 1.13 | | 1.08 | | 0.77 | | 23 |
| 08-31-2008 | 25.81 | | 0.13 | | 0.12 | | 0.25 | | (0.04) | | (1.11) | | — | | (1.15) | | 24.91 | | 1.153 | | 134 | | 1.12 | | 1.07 | | 0.52 | | 22 |
| 08-31-2007 | 23.66 | | 0.05 | | 2.54 | | 2.59 | | (0.07) | | (0.37) | | — | | (0.44) | | 25.81 | | 10.983 | | 144 | | 1.11 | | 1.06 | | 0.20 | | 18 |
| 08-31-20064 | 21.09 | | 0.10 | | 2.52 | | 2.62 | | (0.05) | | — | | — | | (0.05) | | 23.66 | | 12.413,5 | | 149 | | 1.126 | | 1.106 | | 0.466 | | 12 |
|
| |
| CLASS NAV | | | | | | | | | | | | | | | | | | | | | | | | | |
|
| 02-28-20112 | 20.17 | | 0.08 | | 6.89 | | 6.97 | | (0.14) | | — | | — | | (0.14) | | 27.00 | | 34.573,5 | | 322 | | 1.076 | | 1.026 | | 0.696 | | 6 |
| 08-31-2010 | 19.69 | | 0.10 | | 0.57 | | 0.67 | | (0.19) | | — | | — | | (0.19) | | 20.17 | | 3.393 | | 251 | | 1.07 | | 1.02 | | 0.47 | | 26 |
| 08-31-2009 | 24.89 | | 0.14 | | (4.83) | | (4.69) | | (0.14) | | (0.37) | | — | | (0.51) | | 19.69 | | (18.43)3 | | 262 | | 1.08 | | 1.03 | | 0.84 | | 23 |
| 08-31-2008 | 25.79 | | 0.14 | | 0.12 | | 0.26 | | (0.05) | | (1.11) | | — | | (1.16) | | 24.89 | | 1.203 | | 418 | | 1.07 | | 1.02 | | 0.58 | | 22 |
| 08-31-2007 | 23.63 | | 0.06 | | 2.54 | | 2.60 | | (0.07) | | (0.37) | | — | | (0.44) | | 25.79 | | 11.043 | | 319 | | 1.06 | | 1.01 | | 0.25 | | 18 |
| 08-31-20064 | 21.06 | | 0.11 | | 2.51 | | 2.62 | | (0.05) | | — | | — | | (0.05) | | 23.63 | | 12.443,5 | | 239 | | 1.076 | | 1.056 | | 0.536 | | 12 |
|
| 1. Based on the average daily shares outstanding. 2. Unaudited. 3. Total returns would have been lower had certain expenses not been reduced during the periods shown. 4. The inception |
| date for Class 1 and Class NAV shares is 10-15-05. 5. Not annualized. 6. Annualized. | | | | | | | | | | | | | | | | | | |
| |
| Smaller Company Growth Fund | | | | | | | | | | | | | | | | | | | | | | | | |
| CLASS NAV | | | | | | | | | | | | | | | | | | | | | | | | |
|
| 02-28-20112 | 10.84 | | (0.03) | | 4.00 | | 3.97 | | — | | (2.93) | | — | | (2.93) | | 11.88 | | 37.673,4 | | 150 | | 1.135 | | 1.015 | | (0.46)5 | | 43 |
| 08-31-2010 | 10.38 | | (0.05) | | 0.51 | | 0.46 | | — | | — | | — | | — | | 10.84 | | 4.433 | | 116 | | 1.13 | | 1.00 | | (0.43) | | 86 |
| 08-31-20096 | 10.00 | | (0.04) | | 0.42 | | 0.38 | | — | | — | | — | | — | | 10.38 | | 3.803,4 | | 158 | | 1.295 | | 1.175 | | (0.47)5 | | 70 |
|
| 1. Based on the average daily shares outstanding. 2. Unaudited. 3. Total returns would have been lower had certain expenses not been reduced during the periods shown. 4. Not | | |
| annualized. 5. Annualized. 6. The inception date for Class NAV shares is 10-7-08. | | | | | | | | | | | | | | | | | | | | |
| |
| Spectrum Income Fund | | | | | | | | | | | | | | | | | | | | | | | | | | |
| CLASS NAV | | | | | | | | | | | | | | | | | | | | | | | | | |
|
| 02-28-20112 | 10.53 | | 0.22 | | 0.39 | | 0.61 | | (0.31) | | — | | — | | (0.31) | | 10.83 | | 5.913,4 | | 1,026 | | 0.795 | | 0.765 | | 4.105 | | 366 |
| 08-31-2010 | 10.00 | | 0.47 | | 0.56 | | 1.03 | | (0.50) | | — | | — | | (0.50) | | 10.53 | | 10.583 | | 837 | | 0.79 | | 0.76 | | 4.55 | | 796 |
| 08-31-2009 | 10.09 | | 0.48 | | 0.03 | | 0.51 | | (0.53) | | (0.07) | | — | | (0.60) | | 10.00 | | 5.853 | | 901 | | 0.83 | | 0.81 | | 5.27 | | 736 |
| 08-31-2008 | 10.51 | | 0.48 | | (0.26) | | 0.22 | | (0.50) | | (0.14) | | — | | (0.64) | | 10.09 | | 2.063 | | 1,065 | | 0.86 | | 0.83 | | 4.62 | | 676 |
| 08-31-2007 | 10.27 | | 0.47 | | 0.24 | | 0.71 | | (0.45) | | (0.02) | | — | | (0.47) | | 10.51 | | 7.003 | | 979 | | 0.88 | | 0.86 | | 4.46 | | 736 |
| 08-31-20067 | 10.00 | | 0.35 | | 0.19 | | 0.54 | | (0.27) | | — | | — | | (0.27) | | 10.27 | | 5.473,4 | | 764 | | 0.945 | | 0.935 | | 4.155 | | 123 |
|
| 1. Based on the average daily shares outstanding. 2. Unaudited. 3. Total returns would have been lower had certain expenses not been reduced during the periods shown. 4. Not | | |
| annualized. 5. Annualized. 6. The Portfolio turnover rates including the effect of “TBA” (to be announced) for the periods ended were as follows: 50% for the period ended 2-28-11, 113% |
| for the year ended 8-31-10, 111% for the year ended 8-31-09, 114% for the year ended 8-31-08 and 110% for the year ended 8-31-07. 7. The inception date for Class NAV shares is |
| 10-29-05. | | | | | | | | | | | | | | | | | | | | | | | | | | | | | |
| |
| Total Bond Market Fund | | | | | | | | | | | | | | | | | | | | | | | | | | |
| CLASS NAV | | | | | | | | | | | | | | | | | | | | | | | | | | |
|
| 02-28-20112 | 10.72 | | 0.18 | | (0.27) | | (0.09) | | (0.22) | | (0.13) | | — | | (0.35) | | 10.28 | | (0.82)3,4 | | 302 | | 0.525 | | 0.525 | | 3.445 | | 21 |
| 08-31-2010 | 10.42 | | 0.36 | | 0.49 | | 0.85 | | (0.39) | | (0.16) | | — | | (0.55) | | 10.72 | | 8.434 | | 524 | | 0.52 | | 0.52 | | 3.47 | | 47 |
| 08-31-2009 | 10.07 | | 0.39 | | 0.34 | | 0.73 | | (0.37) | | (0.01) | | — | | (0.38) | | 10.42 | | 7.43 | | 447 | | 0.53 | | 0.53 | | 3.82 | | 91 |
| 08-31-2008 | 10.02 | | 0.46 | | 0.08 | | 0.54 | | (0.49) | | — | | — | | (0.49) | | 10.07 | | 5.544 | | 60 | | 0.61 | | 0.57 | | 4.56 | | 97 |
| 08-31-20076 | 10.00 | | 0.40 | | (0.05) | | 0.35 | | (0.33) | | — | | — | | (0.33) | | 10.02 | | 3.543,4 | | 54 | | 0.625 | | 0.565 | | 4.665 | | 101 |
|
| 1. Based on the average daily shares outstanding. 2. Unaudited. 3. Not annualized. 4. Total returns would have been lower had certain expenses not been reduced during the periods |
| shown. 5. Annualized. 6. The inception date for Class NAV shares is 10-27-06. | | | | | | | | | | | | | | | | | | | | |
| |
| The accompanying notes are an integral part of the financial statements. | 363 |
John Hancock Funds II
Financial Highlights
| | | | | | | | | | | | | | | | | | | | | | | | | | | | | |
| Per share operating performance for a share outstanding throughout the period | | | | | | Ratios and supplemental data | | | | |
|
| | | | Income (loss) from | | | | | | | | | | | | | | | | | | | | | | | |
| | | | investment operations | | | Less distributions | | | | | | | | Ratios to average net assets | | | | |
| | |
| | |
| | | | | | |
| | | | |
| |
| | | | | | Net real- | | | | | | | | | | | | | | | | | | | | | | | | |
| | | | | | ized and | | | | | | | | | | | | | | | | | | Expenses | | Expenses | | | | |
| | Net asset | | Net | | unrealized | | | | | | | | | | | | Net asset | | | | Net | | before | | including | | Net | | |
| | value, | | investment | | gain (loss) | | Total from | | From net | | From net | | From | | Total | | value, | | | | assets, | | reductions | | reductions | | investment | | |
| | beginning | | income | | on invest- | | investment | | investment | | realized | | capital | | distri- | | end of | | Total | | end of | | and amounts | | and amounts | | income | | Portfolio |
| | of period | | (loss) | | ments | | operations | | income | | gain | | paid-in | | butions | | period | | return | | period | | recaptured | | recaptured | | (loss) | | turnover |
| Period ended | ($) | | ($)1 | | ($) | | ($) | | ($) | | ($) | | ($) | | ($) | | ($) | | (%) | | (in millions) | | (%) | | (%) | | (%) | | (%) |
|
| |
| Total Return Fund | | | | | | | | | | | | | | | | | | | | | | | | | | | | |
| CLASS 1 | | | | | | | | | | | | | | | | | | | | | | | | | |
|
| 02-28-20112 | 15.04 | | 0.15 | | (0.15) | | — | | (0.42) | | (0.70) | | — | | (1.12) | | 13.92 | | 0.013,4 | | 340 | | 0.775 | | 0.775 | | 2.155 | | 2616 |
| 08-31-2010 | 14.02 | | 0.28 | | 1.38 | | 1.66 | | (0.47) | | (0.17) | | — | | (0.64) | | 15.04 | | 12.223 | | 349 | | 0.77 | | 0.77 | | 1.99 | | 3796 |
| 08-31-2009 | 14.11 | | 0.50 | | 1.05 | | 1.55 | | (0.67) | | (0.97) | | — | | (1.64) | | 14.02 | | 12.65 | | 234 | | 0.78 | | 0.78 | | 3.81 | | 2896 |
| 08-31-2008 | 13.79 | | 0.61 | | 0.44 | | 1.05 | | (0.68) | | (0.05) | | — | | (0.73) | | 14.11 | | 7.783 | | 160 | | 0.79 | | 0.79 | | 4.32 | | 1216 |
| 08-31-2007 | 13.78 | | 0.64 | | (0.06) | | 0.58 | | (0.54) | | (0.03) | | — | | (0.57) | | 13.79 | | 4.26 | | 126 | | 0.837,8 | | 0.837,8 | | 4.67 | | 3496 |
| 08-31-20069 | 13.70 | | 0.46 | | (0.04) | | 0.42 | | (0.34) | | — | | — | | (0.34) | | 13.78 | | 3.144 | | 118 | | 0.825 | | 0.825 | | 3.855 | | 398 |
|
| |
| CLASS NAV | | | | | | | | | | | | | | | | | | | | | | | | | |
|
| 02-28-20112 | 15.00 | | 0.16 | | (0.16) | | — | | (0.42) | | (0.70) | | — | | (1.12) | | 13.88 | | 0.043,4 | | 2,039 | | 0.725 | | 0.725 | | 2.205 | | 2616 |
| 08-31-2010 | 13.99 | | 0.29 | | 1.36 | | 1.65 | | (0.47) | | (0.17) | | — | | (0.64) | | 15.00 | | 12.223 | | 1,832 | | 0.72 | | 0.72 | | 2.02 | | 3796 |
| 08-31-2009 | 14.08 | | 0.52 | | 1.04 | | 1.56 | | (0.68) | | (0.97) | | — | | (1.65) | | 13.99 | | 12.75 | | 1,547 | | 0.73 | | 0.73 | | 3.91 | | 2896 |
| 08-31-2008 | 13.75 | | 0.62 | | 0.45 | | 1.07 | | (0.69) | | (0.05) | | — | | (0.74) | | 14.08 | | 7.933 | | 1,680 | | 0.74 | | 0.74 | | 4.37 | | 1216 |
| 08-31-2007 | 13.75 | | 0.65 | | (0.08) | | 0.57 | | (0.54) | | (0.03) | | — | | (0.57) | | 13.75 | | 4.26 | | 1,400 | | 0.787,8 | | 0.787,8 | | 4.77 | | 3496 |
| 08-31-20069 | 13.67 | | 0.47 | | (0.05) | | 0.42 | | (0.34) | | — | | — | | (0.34) | | 13.75 | | 3.184 | | 1,041 | | 0.775 | | 0.775 | | 3.955 | | 398 |
|
| 1. Based on the average daily shares outstanding. 2. Unaudited. 3. Total returns would have been lower had certain expenses not been reduced during the periods shown. 4. Not | | |
| annualized. 5. Annualized. 6. The Portfolio turnover rates including the effect of “TBA” (to be announced) for the periods ended were as follows: 386% for the period ended 2-28-11, |
| 615% for the year ended 8-31-10, 832% for the year ended 8-31-09, 440% for the year ended 8-31-08 and 443% for the year ended 8-31-07. 7. Includes interest expense on securities |
| sold short. Excluding interest expense the ratio for Class 1 and Class NAV would have been 0.81% and 0.76%, respectively. 8. Includes interest and fees on inverse floaters. Excluding this |
| expense the ratio for Class 1 and Class NAV would have been 0.82% and 0.77%, respectively. 9. The inception date for Class 1 and Class NAV shares is 10-15-05. | | | | |
| |
| U.S. High Yield Bond Fund | | | | | | | | | | | | | | | | | | | | | | | | | | |
| CLASS 1 | | | | | | | | | | | | | | | | | | | | | | | | | | |
|
| 02-28-20112 | 12.62 | | 0.45 | | 0.53 | | 0.98 | | (0.53) | | — | | — | | (0.53) | | 13.07 | | 7.933,4 | | 63 | | 0.825 | | 0.825 | | 7.165 | | 25 |
| 08-31-2010 | 11.74 | | 0.97 | | 0.91 | | 1.88 | | (1.00) | | — | | — | | (1.00) | | 12.62 | | 16.573 | | 52 | | 0.81 | | 0.81 | | 7.84 | | 34 |
| 08-31-2009 | 12.09 | | 1.01 | | (0.44) | | 0.57 | | (0.92) | | — | | — | | (0.92) | | 11.74 | | 6.40 | | 34 | | 0.82 | | 0.82 | | 9.59 | | 48 |
| 08-31-2008 | 12.87 | | 0.92 | | (0.76) | | 0.16 | | (0.94) | | —6 | | — | | (0.94) | | 12.09 | | 1.25 | | 6 | | 0.82 | | 0.82 | | 7.43 | | 59 |
| 08-31-2007 | 13.05 | | 0.95 | | (0.18) | | 0.77 | | (0.95) | | —6 | | — | | (0.95) | | 12.87 | | 5.94 | | 4 | | 0.84 | | 0.84 | | 7.25 | | 86 |
| 08-31-20067 | 12.74 | | 0.80 | | 0.02 | | 0.82 | | (0.51) | | — | | — | | (0.51) | | 13.05 | | 6.554 | | 2 | | 0.875 | | 0.875 | | 7.125 | | 108 |
|
| |
| CLASS NAV | | | | | | | | | | | | | | | | | | | | | | | | | |
|
| 02-28-20112 | 12.62 | | 0.46 | | 0.51 | | 0.97 | | (0.53) | | — | | — | | (0.53) | | 13.06 | | 7.883,4 | | 575 | | 0.775 | | 0.775 | | 7.185 | | 25 |
| 08-31-2010 | 11.74 | | 0.97 | | 0.92 | | 1.89 | | (1.01) | | — | | — | | (1.01) | | 12.62 | | 16.633 | | 697 | | 0.76 | | 0.76 | | 7.89 | | 34 |
| 08-31-2009 | 12.09 | | 0.99 | | (0.41) | | 0.58 | | (0.93) | | — | | — | | (0.93) | | 11.74 | | 6.46 | | 743 | | 0.77 | | 0.77 | | 9.56 | | 48 |
| 08-31-2008 | 12.87 | | 0.93 | | (0.77) | | 0.16 | | (0.94) | | —6 | | — | | (0.94) | | 12.09 | | 1.31 | | 523 | | 0.77 | | 0.77 | | 7.48 | | 59 |
| 08-31-2007 | 13.05 | | 0.96 | | (0.18) | | 0.78 | | (0.96) | | —6 | | — | | (0.96) | | 12.87 | | 6.02 | | 392 | | 0.79 | | 0.79 | | 7.31 | | 86 |
| 08-31-20067 | 12.74 | | 0.80 | | 0.02 | | 0.82 | | (0.51) | | — | | — | | (0.51) | | 13.05 | | 6.584 | | 288 | | 0.825 | | 0.825 | | 7.065 | | 108 |
|
| 1. Based on the average daily shares outstanding. 2. Unaudited. 3. Total returns would have been lower had certain expenses not been reduced during the periods shown. 4. Not | | |
| annualized. 5. Annualized. 6. Less than ($0.005) per share. 7. The inception date for Class 1 and Class NAV shares is 10-15-05. | | | | | | | | | | |
| |
| U.S. Multi-Sector Fund | | | | | | | | | | | | | | | | | | | | | | | | | | |
| CLASS NAV | | | | | | | | | | | | | | | | | | | | | | | | | | |
|
| 02-28-20112 | 8.30 | | 0.07 | | 1.71 | | 1.78 | | (0.12) | | — | | — | | (0.12) | | 9.96 | | 21.493,4 | | 1,085 | | 0.795 | | 0.795 | | 1.435 | | 55 |
| 08-31-2010 | 8.25 | | 0.12 | | 0.05 | | 0.17 | | (0.12) | | — | | — | | (0.12) | | 8.30 | | 1.923 | | 902 | | 0.79 | | 0.79 | | 1.33 | | 34 |
| 08-31-2009 | 9.65 | | 0.13 | | (1.33) | | (1.20) | | (0.20) | | — | | — | | (0.20) | | 8.25 | | (12.22) | | 870 | | 0.81 | | 0.81 | | 1.72 | | 67 |
| 08-31-2008 | 11.29 | | 0.13 | | (1.28) | | (1.15) | | (0.14) | | (0.35) | | — | | (0.49) | | 9.65 | | (10.64) | | 904 | | 0.79 | | 0.79 | | 1.25 | | 84 |
| 08-31-2007 | 10.41 | | 0.13 | | 0.90 | | 1.03 | | (0.10) | | (0.05) | | — | | (0.15) | | 11.29 | | 9.93 | | 1,524 | | 0.80 | | 0.80 | | 1.19 | | 72 |
| 08-31-20066 | 10.00 | | 0.09 | | 0.33 | | 0.42 | | (0.01) | | — | | — | | (0.01) | | 10.41 | | 4.254 | | 1,227 | | 0.825 | | 0.825 | | 1.015 | | 116 |
|
| 1. Based on the average daily shares outstanding. 2. Unaudited. 3. Total returns would have been lower had certain expenses not been reduced during the periods shown. 4. Not | | |
| annualized. 5. Annualized. 6. The inception date for Class NAV shares is 10-29-05. | | | | | | | | | | | | | | | | | | |
| |
| The accompanying notes are an integral part of the financial statements. | 364 |
John Hancock Funds II
Financial Highlights
| | | | | | | | | | | | | | | | | | | | | | | | | | | | | |
| Per share operating performance for a share outstanding throughout the period | | | | | | Ratios and supplemental data | | | | |
|
| | | | Income (loss) from | | | | | | | | | | | | | | | | | | | | | | | |
| | | | investment operations | | | Less distributions | | | | | | | | Ratios to average net assets | | | |
| | |
| | |
| | | | | | |
| | | | |
| |
| | | | | | Net real- | | | | | | | | | | | | | | | | | | | | | | | | |
| | | | | | ized and | | | | | | | | | | | | | | | | | | Expenses | | Expenses | | | | |
| | Net asset | | Net | | unrealized | | | | | | | | | | | | Net asset | | | | Net | | before | | including | | Net | | |
| | value, | | investment | | gain (loss) | | Total from | | From net | | From net | | From | | Total | | value, | | | | assets, | | reductions | | reductions | | investment | | |
| | beginning | | income | | on invest- | | investment | | investment | | realized | | capital | | distri- | | end of | | Total | | end of | | and amounts | | and amounts | | income | | Portfolio |
| | of period | | (loss) | | ments | | operations | | income | | gain | | paid-in | | butions | | period | | return | | period | | recaptured | | recaptured | | (loss) | | turnover |
| Period ended | ($) | | ($)1 | | ($) | | ($) | | ($) | | ($) | | ($) | | ($) | | ($) | | (%) | | (in millions) | | (%) | | (%) | | (%) | | (%) |
|
| |
| Value Fund | | | | | | | | | | | | | | | | | | | | | | | | | | | | | |
| |
| CLASS NAV | | | | | | | | | | | | | | | | | | | | | | | | | | | | | |
|
| 02-28-20112 | 8.59 | | 0.04 | | 2.56 | | 2.60 | | (0.07) | | (0.59) | | — | | (0.66) | | 10.53 | | 30.843,4 | | 196 | | 0.795 | | 0.795 | | 0.905 | | 23 |
| 08-31-2010 | 7.77 | | 0.09 | | 0.80 | | 0.89 | | (0.07) | | — | | — | | (0.07) | | 8.59 | | 11.403 | | 145 | | 0.80 | | 0.80 | | 1.02 | | 60 |
| 08-31-2009 | 9.53 | | 0.08 | | (1.77) | | (1.69) | | (0.07) | | — | | — | | (0.07) | | 7.77 | | (17.56) | | 122 | | 0.87 | | 0.87 | | 1.24 | | 59 |
| 08-31-2008 | 11.43 | | 0.08 | | (1.20) | | (1.12) | | (0.06) | | (0.72) | | — | | (0.78) | | 9.53 | | (10.48)3 | | 26 | | 1.08 | | 0.99 | | 0.79 | | 76 |
| 08-31-20076 | 10.00 | | 0.08 | | 1.36 | | 1.44 | | (0.01) | | — | | — | | (0.01) | | 11.43 | | 14.453,4 | | 14 | | 1.405 | | 0.995 | | 0.885 | | 70 |
|
| 1. Based on the average daily shares outstanding. 2. Unaudited. 3. Total returns would have been lower had certain expenses not been reduced during the periods shown. 4. Not | | |
| annualized. 5. Annualized. 6. The inception date for Class NAV shares is 10-27-06. | | | | | | | | | | | | | | | | | | |
| |
| Value & Restructuring Fund | | | | | | | | | | | | | | | | | | | | | | | | | | |
| |
| CLASS NAV | | | | | | | | | | | | | | | | | | | | | | | | | | | | | |
|
| 02-28-20112 | 9.14 | | 0.07 | | 2.90 | | 2.97 | | (0.16) | | — | | — | | (0.16) | | 11.95 | | 32.513,4 | | 637 | | 0.855 | | 0.855 | | 1.345 | | 11 |
| 08-31-2010 | 8.69 | | 0.156 | | 0.43 | | 0.58 | | (0.13) | | — | | — | | (0.13) | | 9.14 | | 6.563 | | 503 | | 0.85 | | 0.85 | | 1.506 | | 25 |
| 08-31-2009 | 11.98 | | 0.14 | | (3.31) | | (3.17) | | (0.12) | | — | | — | | (0.12) | | 8.69 | | (26.21) | | 514 | | 0.87 | | 0.87 | | 1.82 | | 29 |
| 08-31-2008 | 12.92 | | 0.14 | | (0.85) | | (0.71) | | (0.19) | | (0.04) | | — | | (0.23) | | 11.98 | | (5.68) | | 568 | | 0.86 | | 0.86 | | 1.10 | | 14 |
| 08-31-2007 | 11.08 | | 0.187 | | 1.82 | | 2.00 | | (0.12) | | (0.04) | | — | | (0.16) | | 12.92 | | 18.12 | | 395 | | 0.86 | | 0.86 | | 1.407 | | 19 |
| 08-31-20068 | 10.00 | | 0.12 | | 0.99 | | 1.11 | | (0.03) | | — | | — | | (0.03) | | 11.08 | | 11.074 | | 296 | | 0.925 | | 0.925 | | 1.335 | | 17 |
|
| 1. Based on the average daily shares outstanding. 2. Unaudited. 3. Total returns would have been lower had certain expenses not been reduced during the periods shown. 4. Not | | |
| annualized. 5. Annualized. 6. Net investment income (loss) per share and ratio of net investment income (loss) to average net assets reflects special dividends received by the Fund which |
| amounted to $0.03 and 0.30%, respectively. 7. Net investment income (loss) per share and ratio of net investment income (loss) to average net assets reflects special dividends received by |
| the Fund which amounted to $0.04 and 0.31%, respectively. 8. The inception date for Class NAV shares is 10-29-05. | | | | | | | | | | | | |
| |
| The accompanying notes are an integral part of the financial statements. | 365 |
John Hancock Funds II
Notes to Financial Statements (Unaudited)
1. ORGANIZATION John Hancock Funds II (the Trust) is an open-end management investment company organized as a Massachusetts business trust. It is a series company with multiple investment series (the Funds), sixty-seven of which are presented in this report. Each Fund, with the exception of Global Agribusiness Fund, Global Bond Fund, Global Infrastructure Fund, Global Real Estate Fund, Global Timber Fund, Real Estate Equity Fund, Real Estate Securities Fund, Real Return Bond Fund and U.S. Multi-Sector Fund, is diversified for purposes of the Investment Company Act of 1940, as amended (the 1940 Act).
The Funds may offer multiple classes of shares. The shares currently offered by the Trust are detailed in the Statements of Assets and Liabilities. Class A shares are open to all investors. Class I shares are offered to institutions and certain investors. Class 1 shares are offered only to certain affiliates of Manulife Financial Corporation (MFC). Class NAV shares are offered to the John Hancock Lifestyle and Lifecycle Funds, and other affiliated John Hancock funds. Core Diversified Growth & Income Portfolio, Core Fundamental Holdings Portfolio, Core Global Diversification Portfolio and Retirement 2010 Portfolio, Retirement 2015 Portfolio, Retirement 2020 Portfolio, Retirement 2025 Portfolio, Retirement 2030 Portfolio, Retirement 2035 Portfolio, Retirement 2040 Portfolio and Retirement 2045 Portfolio (Retirement Portfolios) are series of the Trust and operate as “funds of funds” that invest in other series of the Trust and certain other investments. Shareholders of each class have exclusive voting rights to matters that affect that class. The distribution and service fees, transfer agent fees, state registration fees, and printing and postage for each class may differ.
Effective December 31, 2010, Emerging Markets Fund changed its name from Emerging Markets Value Fund.
On March 25, 2011, the Board of Trustees of the Global Timber Fund voted to terminate and liquidate the Fund as of March 31, 2011.
2. SIGNIFICANT ACCOUNTING POLICIES The financial statements have been prepared in conformity with accounting principles generally accepted in the United States of America, which require management to make certain estimates and assumptions at the date of the financial statements. Actual results could differ from those estimates. Events or transactions occurring after the end of the fiscal period through the date that the financial statements were issued have been evaluated in the preparation of the financial statements. The following summarizes the significant accounting policies of the Funds:
Security Valuation Investments are stated at value as of the close of regular trading on the New York Stock Exchange (NYSE), normally at 4:00 p.m., Eastern Time. The Fund uses a three-tier hierarchy to prioritize the pricing assumptions, referred to as inputs, used in valuation techniques to measure fair value. Level 1 includes securities valued using quoted prices in active markets for identical securities. Level 2 includes securities valued using significant observable inputs. Observable inputs may include quoted prices for similar securities, interest rates, prepayment speeds and credit risk. Prices for securities valued using these inputs are received from independent pricing vendors and brokers and are based on an evaluation of the inputs described. Level 3 includes securities valued using significant unobservable inputs when market prices are not readily available or reliable, including the Fund’s own assumptions in determining the fair value of investments. Factors used in determining value may include market or issuer specific events, changes in interest rates and credit quality. The inputs or methodology used for valuing securities are not necessarily an indication of the risk associated with investing in those securities.
As of February 28, 2011, all investments for All Cap Core Fund, Core Diversified Growth & Income Portfolio, Core Fundamental Holdings Portfolio, Core Global Diversification Portfolio, Retirement 2010 Portfolio, Retirement 2015 Portfolio, Retirement 2020 Portfolio, Retirement 2025 Portfolio, Retirement 2030 Portfolio, Retirement 2035 Portfolio, Retirement 2040 Portfolio, Retirement 2045 Portfolio, Real Estate Equity Fund, Small Company Growth Fund and Value Fund are categorized as Level 1 under the hierarchy described above. Also, all investment of All Cap Value Fund, Index 500 Fund, Large Cap Fund, Mid Cap Growth Index Fund, Mid Cap Index Fund, Mid Cap Value Equity Fund, Mid Cap Value Index Fund, Optimized Value Fund, Real Estate Securities Fund, Small Cap Growth Fund and Small Cap Value Fund are categorized as Level 1 under the hierarchy described above except for repurchase agreements and/or short term discount notes which are categorized as Level 2. In addition, all investments for Short Term Government Income Fund are categorized as Level 2 under the hierarchy described above.
The following is a summary of the values by input classification of the Fund’s investments as of February 28, 2011, by major security category or type:
| | | | |
| | | | Level 2 | Level 3 |
| | Total Market | Level 1 | Significant | Significant |
| | Value at | Quoted | Observable | Unobservable |
| | 2-28-11 | Price | Inputs | Inputs |
|
| Active Bond Fund | | | | |
| U.S. Government & Agency Obligations | $315,981,467 | — | $315,981,467 | — |
| Foreign Government Obligations | 3,165,635 | — | 3,165,635 | — |
| Corporate Bonds | 523,290,174 | — | 522,964,504 | $325,670 |
| Capital Preferred Securities | 26,179,249 | — | 26,179,249 | — |
| Convertible Bonds | 1,361,763 | — | 1,361,763 | — |
| Term Loans | 1,723,219 | — | 1,723,219 | — |
| Municipal Bonds | 2,372,536 | — | 2,372,536 | — |
| Collateralized Mortgage Obligations | 233,934,391 | — | 225,790,767 | 8,143,624 |
| Asset Backed Securities | 28,627,000 | — | 27,385,526 | 1,241,474 |
| Common Stocks | 16,748 | — | 344 | 16,404 |
| Preferred Securities | 3,522,193 | $2,796,205 | 404,922 | 321,066 |
| Securities Lending Collateral | 6,574,232 | 6,574,232 | — | — |
| Short-Term Investments | 63,766,630 | 37,166,630 | 26,600,000 | — |
| |
|
| Total Investments in Securities | $1,210,515,237 | $46,537,067 | $1,153,929,932 | $10,048,238 |
| Other Financial Instruments: | | | | |
| Futures | ($10,755) | ($10,755) | — | — |
| Forward Foreign Currency Contracts | ($72,698) | — | ($72,698) | — |
| Credit Default Swaps | $344,398 | — | $344,398 | — |
SIGNIFICANT ACCOUNTING POLICIES, CONTINUED
| | | | |
| | | | Level 2 | Level 3 |
| | Total Market | Level 1 | Significant | Significant |
| | Value at | Quoted | Observable | Unobservable |
| | 2-28-11 | Price | Inputs | Inputs |
|
| Alpha Opportunities Fund | | | | |
| Common Stocks | | | | |
| Consumer Discretionary | $255,072,573 | $244,190,539 | $10,882,034 | — |
| Consumer Staples | 100,482,684 | 86,269,644 | 14,213,040 | — |
| Energy | 164,360,070 | 140,241,429 | 24,118,641 | — |
| Financials | 189,969,944 | 167,367,031 | 22,602,913 | |
| Health Care | 148,154,945 | 144,682,209 | 3,472,736 | |
| Industrials | 165,511,641 | 144,465,383 | 21,046,258 | — |
| Information Technology | 281,578,889 | 272,820,615 | 8,758,274 | — |
| Materials | 129,848,187 | 102,183,532 | 27,664,655 | — |
| Telecommunication Services | 7,449,098 | 7,449,098 | — | — |
| Utilities | 4,864,820 | 4,864,820 | — | — |
| Preferred Securities | | | | |
| Financials | 25,159 | 25,159 | — | — |
| Investment Companies | 4,246,374 | 4,246,374 | — | — |
| Securities Lending Collateral | 190,861,182 | 190,861,182 | — | — |
| Short-Term Investments | 43,500,000 | — | 43,500,000 | — |
| |
|
| Total Investments in Securities | $1,685,925,566 | $1,509,667,015 | $176,258,551 | — |
|
| |
| Blue Chip Growth Fund | | | | |
| Common Stocks | | | | |
| Consumer Discretionary | $496,773,597 | $496,773,597 | — | — |
| Consumer Staples | 17,585,848 | 16,289,343 | $1,296,505 | — |
| Energy | 219,025,221 | 219,025,221 | — | — |
| Financials | 267,900,770 | 266,888,276 | 1,012,494 | — |
| Health Care | 172,871,798 | 172,871,798 | — | — |
| Industrials | 355,580,513 | 355,580,513 | — | — |
| Information Technology | 725,560,450 | 696,673,975 | 28,886,475 | — |
| Materials | 96,600,927 | 96,600,927 | — | — |
| Telecommunication Services | 39,237,662 | 39,237,662 | — | — |
| Securities Lending Collateral | 147,839,143 | 147,839,143 | — | — |
| Short-Term Investments | 12,311,778 | 12,311,778 | — | — |
| |
|
| Total Investments in Securities | $2,551,287,707 | $2,520,092,233 | $31,195,474 | — |
|
| |
| Capital Appreciation Fund | | | | |
| Common Stocks | | | | |
| Consumer Discretionary | $426,328,365 | $385,712,964 | $40,615,401 | — |
| Consumer Staples | 100,966,305 | 100,966,305 | — | — |
| Energy | 118,100,372 | 118,100,372 | — | — |
| Financials | 75,133,279 | 75,133,279 | — | — |
| Health Care | 237,769,264 | 237,769,264 | — | — |
| Industrials | 189,513,662 | 189,513,662 | — | — |
| Information Technology | 654,763,260 | 627,013,404 | 27,749,856 | — |
| Materials | 70,438,806 | 70,438,806 | — | — |
| Telecommunication Services | 22,162,339 | 22,162,339 | — | — |
| Securities Lending Collateral | 107,256,885 | 107,256,885 | — | — |
| Short-Term Investments | 6,655,728 | 6,655,728 | — | — |
| |
|
| Total Investments in Securities | $2,009,088,265 | $1,940,723,008 | $68,365,257 | — |
|
| |
| Capital Appreciation Value Fund | | | | |
| Common Stocks | | | | |
| Consumer Discretionary | $20,209,543 | $20,209,543 | — | — |
| Consumer Staples | 34,684,042 | 34,684,042 | — | — |
| Energy | 15,495,815 | 12,769,251 | $2,726,564 | — |
| Financials | 35,108,681 | 35,108,681 | — | — |
| Health Care | 24,334,435 | 24,334,435 | — | — |
| Industrials | 28,108,418 | 24,222,705 | 3,885,713 | — |
| Information Technology | 30,812,438 | 30,812,438 | — | — |
| Materials | 4,533,179 | 4,533,179 | — | — |
| Telecommunication Services | 5,335,440 | 5,335,440 | — | — |
| Utilities | 3,916,928 | 3,916,928 | — | — |
| Preferred Securities | | | | |
| Consumer Discretionary | 3,251,265 | 3,251,265 | — | — |
| Financials | 3,096,106 | 3,096,106 | — | — |
SIGNIFICANT ACCOUNTING POLICIES, CONTINUED
| | | | |
| | | | Level 2 | Level 3 |
| | Total Market | Level 1 | Significant | Significant |
| | Value at | Quoted | Observable | Unobservable |
| | 2-28-11 | Price | Inputs | Inputs |
|
| Capital Appreciation Value Fund (continued) | | | | |
| Corporate Bonds | | | | |
| Consumer Discretionary | $5,883,209 | — | $5,883,209 | — |
| Consumer Staples | 439,142 | — | 439,142 | — |
| Energy | 1,263,400 | — | 1,263,400 | — |
| Financials | 5,093,013 | — | 5,093,013 | — |
| Health Care | 711,350 | — | 711,350 | — |
| Industrials | 3,374,434 | — | 3,374,434 | — |
| Information Technology | 617,101 | — | 617,101 | — |
| Telecommunication Services | 1,992,954 | — | 1,992,954 | — |
| Utilities | 1,337,888 | — | 1,337,888 | — |
| Convertible Bonds | | | | |
| Consumer Discretionary | 2,008,490 | — | 2,008,490 | — |
| Energy | 3,312,195 | — | 3,312,195 | — |
| Financials | 1,158,550 | — | 1,158,550 | — |
| Health Care | 725,415 | — | 725,415 | — |
| Industrials | 829,438 | — | 829,438 | — |
| Information Technology | 2,491,490 | — | 2,491,490 | — |
| Materials | 2,093,235 | — | 2,093,235 | — |
| Telecommunication Services | 921,009 | — | 921,009 | — |
| Term Loans | | | | |
| Consumer Discretionary | 19,075,667 | — | 19,075,667 | — |
| Consumer Staples | 1,003,611 | — | 1,003,611 | — |
| Financials | 1,507,500 | — | 1,507,500 | — |
| Health Care | 3,107,941 | — | 3,107,941 | — |
| Information Technology | 1,646,496 | — | 1,646,496 | — |
| Materials | 748,594 | — | 748,594 | — |
| Utilities | 1,059,844 | | 1,059,844 | — |
| Securities Lending Collateral | 767,943 | $767,943 | — | — |
| Short-Term Investments | 51,302,206 | 51,302,206 | — | — |
| |
|
| Total Investments in Securities | $323,358,405 | $254,344,162 | $69,014,243 | — |
|
| |
| Core Bond Fund | | | | |
| U.S. Government & Agency Obligations | $322,077,774 | — | $306,115,913 | $15,961,861 |
| Foreign Government Obligations | 12,645,972 | — | 12,645,972 | — |
| Corporate Bonds | 127,250,306 | — | 127,250,306 | — |
| Municipal Bonds | 6,677,324 | — | 6,677,324 | — |
| Capital Preferred Securities | 1,135,602 | — | 1,135,602 | — |
| Collateralized Mortgage Obligations | 137,238,671 | — | 135,668,247 | 1,570,424 |
| Asset Backed Securities | 41,200,303 | — | 41,200,303 | — |
| Short-Term Investments | 12,088,615 | $12,088,615 | — | — |
| |
|
| Total Investments in Securities | $660,314,567 | $12,088,615 | $630,693,667 | $17,532,285 |
| TBA Sale Commitments | ($24,464,166) | — | ($24,464,166) | — |
|
| |
| Emerging Markets Fund | | | | |
| Common Stocks | | | | |
| Bermuda | $1,497,902 | — | $1,497,902 | — |
| Brazil | 261,164,686 | $261,164,686 | — | — |
| Chile | 40,794,563 | 40,794,563 | — | — |
| China | 193,959,640 | 30,628,013 | 163,276,856 | $54,771 |
| Czech Republic | 5,623,622 | — | 5,623,622 | — |
| Hong Kong | 114,116,990 | 12,117,107 | 101,999,883 | — |
| Hungary | 8,486,803 | — | 8,486,803 | — |
| India | 185,120,796 | 39,971,553 | 145,131,381 | 17,862 |
| Indonesia | 61,174,314 | — | 60,973,102 | 201,212 |
| Israel | 203,980 | — | — | 203,980 |
| Korea | 116,663 | — | 116,663 | — |
| Luxembourg | 238,605 | — | 238,605 | — |
| Malaysia | 68,471,296 | — | 68,471,296 | — |
| Mexico | 115,509,924 | 115,509,924 | — | — |
| Philippines | 12,104,195 | — | 12,104,195 | — |
| Poland | 36,388,758 | — | 36,388,758 | — |
| Russia | 128,950,801 | 60,355,836 | 68,594,965 | — |
| South Africa | 176,533,446 | 43,829,971 | 132,703,475 | — |
SIGNIFICANT ACCOUNTING POLICIES, CONTINUED
| | | | |
| | | | Level 2 | Level 3 |
| | Total Market | Level 1 | Significant | Significant |
| | Value at | Quoted | Observable | Unobservable |
| | 2-28-11 | Price | Inputs | Inputs |
|
| Emerging Markets Fund (continued) | | | | |
| South Korea | $291,836,467 | $67,736,800 | $224,099,667 | — |
| Taiwan | 277,748,896 | 14,151,896 | 263,590,832 | $6,168 |
| Thailand | 42,530,421 | — | 42,530,421 | — |
| Turkey | 43,599,005 | — | 43,599,005 | — |
| Preferred Securities | | | | |
| Brazil | 54,300,144 | 54,300,144 | — | — |
| Malaysia | 158,595 | — | 158,595 | — |
| Rights | 167,247 | 5,931 | 161,316 | — |
| Warrants | 33,683 | 69 | 33,614 | — |
| Securities Lending Collateral | 149,118,509 | 149,118,509 | — | — |
| Short-Term Investments | 34,784,519 | 34,784,519 | — | — |
| |
|
| Total Investments in Securities | $2,304,734,470 | $924,469,521 | $1,379,780,956 | $483,993 |
|
| |
| Emerging Markets Debt Fund | | | | |
| Foreign Government Obligations | $3,825,550 | — | $3,825,550 | — |
| U.S. Government & Agency Obligations | 389,801 | — | 389,801 | — |
| Corporate Bonds | 10,952,346 | — | 10,748,301 | $204,045 |
| Convertible Bonds | 53,000 | — | 53,000 | — |
| Preferred Securities | 109,469 | $81,875 | 27,594 | — |
| Short-Term Investments | 300,000 | — | 300,000 | — |
| |
|
| Total Investments in Securities | $15,630,166 | $81,875 | $15,344,246 | $204,045 |
| Other Financial Instruments: | | | | |
| Futures | ($951) | ($951) | — | — |
| Forward Foreign Currency Contracts | $25,791 | — | $25,791 | — |
|
| |
| Equity Income Fund | | | | |
| Common Stocks | | | | |
| Consumer Discretionary | $205,200,163 | $200,314,730 | $4,885,433 | — |
| Consumer Staples | 88,568,127 | 88,568,127 | — | — |
| Energy | 202,525,115 | 202,525,115 | — | — |
| Financials | 281,576,369 | 281,576,369 | — | — |
| Health Care | 69,105,006 | 69,105,006 | — | — |
| Industrials | 181,391,350 | 181,391,350 | — | — |
| Information Technology | 97,317,522 | 97,317,522 | — | — |
| Materials | 83,863,524 | 83,863,524 | — | — |
| Telecommunication Services | 52,755,672 | 46,893,996 | 5,861,676 | — |
| Utilities | 103,997,318 | 103,997,318 | — | — |
| Preferred Securities | | | | |
| Consumer Discretionary | 7,464,096 | 7,464,096 | — | — |
| Securities Lending Collateral | 155,556,967 | 155,556,967 | — | — |
| Short-Term Investments | 60,222,402 | 60,222,402 | — | — |
| |
|
| Total Investments in Securities | $1,589,543,631 | $1,578,796,522 | $10,747,109 | — |
|
| |
| Fundamental Value Fund | | | | |
| Common Stocks | | | | |
| Consumer Discretionary | $85,568,139 | $82,754,419 | $2,813,720 | — |
| Consumer Staples | 265,122,874 | 242,109,822 | 23,013,052 | — |
| Energy | 286,280,883 | 275,494,970 | 10,785,913 | — |
| Financials | 445,890,079 | 393,029,364 | 52,860,715 | — |
| Health Care | 204,896,366 | 191,688,295 | 13,208,071 | — |
| Industrials | 88,738,837 | 49,264,309 | 39,474,528 | — |
| Information Technology | 90,004,596 | 90,004,596 | — | — |
| Materials | 128,893,458 | 107,536,229 | 21,357,229 | — |
| Telecommunication Services | 5,441,291 | 5,441,291 | — | — |
| Convertible Bonds | | | | |
| Materials | 2,658,589 | — | 2,658,589 | — |
| Securities Lending Collateral | 51,665,488 | 51,665,488 | — | — |
| Short-Term Investments | 62,497,889 | — | 62,497,889 | — |
| |
|
| Total Investments in Securities | $1,717,658,489 | $1,488,988,783 | $228,669,706 | — |
SIGNIFICANT ACCOUNTING POLICIES, CONTINUED
| | | | |
| | | | Level 2 | Level 3 |
| | Total Market | Level 1 | Significant | Significant |
| | Value at | Quoted | Observable | Unobservable |
| | 2-28-11 | Price | Inputs | Inputs |
|
| Global Agribusiness Fund | | | | |
| Common Stocks | | | | |
| Australia | $7,523 | — | $7,523 | — |
| Brazil | 54,718 | $54,718 | — | — |
| Canada | 752,994 | 752,994 | — | — |
| Chile | 37,093 | 37,093 | — | — |
| Germany | 23,157 | — | 23,157 | — |
| Indonesia | 80,820 | — | 80,820 | — |
| Ireland | 43,820 | — | 43,820 | — |
| Japan | 27,570 | — | 27,570 | — |
| Malaysia | 68,050 | — | 68,050 | — |
| Netherlands | 96,900 | 96,900 | — | — |
| Norway | 143,694 | 143,694 | — | — |
| Singapore | 327,514 | — | 327,514 | — |
| Switzerland | 249,084 | 249,084 | — | — |
| United Kingdom | 26,422 | — | 26,422 | — |
| United States | 1,253,965 | 1,253,965 | — | — |
| Warrants | 1,036 | 1,036 | — | — |
| |
|
| Total Investments in Securities | $3,194,360 | $2,589,484 | $604,876 | — |
|
| |
| Global Bond Fund | | | | |
| Foreign Government Obligations | $208,951,662 | — | $208,951,662 | — |
| Corporate Bonds | 375,036,643 | — | 373,838,863 | $1,197,780 |
| U.S. Government & Agency Obligations | 129,117,685 | — | 129,117,685 | — |
| Municipal Bonds | 27,206,617 | — | 27,206,617 | — |
| Term Loans | 3,375,389 | — | 3,375,389 | — |
| Capital Preferred Securities | 2,554,205 | — | 2,554,205 | — |
| Collateralized Mortgage Obligations | 138,163,523 | — | 134,447,407 | 3,716,116 |
| Asset Backed Securities | 30,807,064 | — | 16,535,653 | 14,271,411 |
| Preferred Securities | 129,332 | $129,332 | — | — |
| Certificate of Deposit | 8,302,380 | — | 8,302,380 | — |
| Short-Term Investments | 65,063,404 | — | 65,063,404 | — |
| |
|
| Total Investments in Securities | $988,707,904 | $129,332 | $969,393,265 | $19,185,307 |
| Other Financial Instruments: | | | | |
| Futures | ($2,516,151) | ($2,516,151) | — | — |
| Forward Foreign Currency Contracts | $2,711,729 | — | $2,711,729 | — |
| Written Options | ($2,594,562) | ($482,009) | ($2,098,059) | ($14,494) |
| Interest Rate Swaps | $1,318,549 | — | $1,318,549 | — |
| Credit Default Swaps | $326,474 | — | $326,474 | — |
|
| |
| Global Infrastructure Fund | | | | |
| Common Stocks | | | | |
| Australia | $32,657 | — | $32,657 | — |
| Belgium | 25,401 | — | 25,401 | — |
| Bermuda | 12,195 | $12,195 | — | — |
| Brazil | 82,810 | 82,810 | — | — |
| Canada | 470,395 | 470,395 | — | — |
| China | 26,556 | — | 26,556 | — |
| France | 124,386 | 56,761 | 67,625 | — |
| Germany | 207,143 | 108,997 | 98,146 | — |
| Hong Kong | 115,428 | — | 115,428 | — |
| Indonesia | 5,406 | — | 5,406 | — |
| Italy | 238,289 | — | 238,289 | — |
| Japan | 22,105 | — | 22,105 | — |
| Netherlands | 126,934 | — | 126,934 | — |
| Portugal | 23,092 | 23,092 | — | — |
| Singapore | 25,927 | — | 25,927 | — |
| Spain | 54,245 | — | 54,245 | — |
| Sweden | 15,681 | — | 15,681 | — |
| Thailand | 89,652 | — | 89,652 | — |
| United Kingdom | 205,553 | 56,534 | 149,019 | — |
| United States | 779,025 | 779,025 | — | — |
| |
|
| Total Investments in Securities | $2,682,880 | $1,589,809 | $1,093,071 | — |
SIGNIFICANT ACCOUNTING POLICIES, CONTINUED
| | | | |
| | | | Level 2 | Level 3 |
| | Total Market | Level 1 | Significant | Significant |
| | Value at | Quoted | Observable | Unobservable |
| | 2-28-11 | Price | Inputs | Inputs |
|
| Global Real Estate Fund | | | | |
| Common Stocks | | | | |
| Australia | $40,783,939 | — | $40,783,939 | — |
| Canada | 21,366,812 | $21,366,812 | — | — |
| Cayman Islands | 1,980,516 | — | 1,980,516 | — |
| China | 3,418,629 | — | 3,418,629 | — |
| Finland | 1,036,889 | — | 1,036,889 | — |
| France | 22,710,634 | — | 22,710,634 | — |
| Germany | 1,057,023 | — | 1,057,023 | — |
| Guernsey, C.I. | 390,156 | — | 390,156 | — |
| Hong Kong | 81,635,308 | — | 81,635,308 | — |
| Italy | 1,902,557 | — | 1,902,557 | — |
| Japan | 57,793,662 | — | 57,793,662 | — |
| Jersey, C.I. | 3,350,596 | — | 3,350,596 | — |
| Netherlands | 7,271,783 | — | 7,271,783 | — |
| Norway | 1,828,874 | — | 1,828,874 | — |
| Philippines | 2,440,775 | — | 2,440,775 | — |
| Singapore | 13,619,108 | — | 13,619,108 | — |
| South Africa | 1,029,849 | — | 1,029,849 | — |
| Sweden | 2,520,064 | — | 2,520,064 | — |
| United Kingdom | 27,563,462 | — | 27,563,462 | — |
| United States | 228,299,051 | 228,299,051 | — | — |
| Rights | 250,179 | 74,749 | 175,430 | — |
| Securities Lending Collateral | 30,288,864 | 30,288,864 | — | — |
| Short-Term Investments | 4,681,000 | — | 4,681,000 | — |
| |
|
| Total Investments in Securities | $557,219,730 | $280,029,476 | $277,190,254 | — |
|
| |
| Global Timber Fund | | | | |
| Common Stocks | | | | |
| Brazil | $95,708 | $95,708 | — | — |
| Canada | 586,928 | 586,928 | — | — |
| China | 40,097 | — | $40,097 | — |
| Finland | 345,600 | — | 345,600 | — |
| Hong Kong | 262,549 | 245,803 | 16,746 | — |
| Japan | 163,116 | — | 163,116 | — |
| South Africa | 43,265 | 43,265 | — | — |
| South Korea | 34,096 | — | 34,096 | — |
| Sweden | 72,833 | — | 72,833 | — |
| United States | 1,304,556 | 1,304,556 | — | — |
| Preferred Securities | | | | |
| Brazil | 129,725 | 129,725 | — | — |
| |
|
| Total Investments in Securities | $3,078,473 | $2,405,985 | $672,488 | — |
|
| |
| Heritage Fund | | | | |
| Common Stocks | | | | |
| Consumer Discretionary | $48,891,036 | $48,891,036 | — | — |
| Consumer Staples | 11,494,804 | 11,494,804 | — | — |
| Energy | 18,202,877 | 18,202,877 | — | — |
| Financials | 14,451,036 | 14,451,036 | — | — |
| Health Care | 32,083,782 | 32,083,782 | — | — |
| Industrials | 42,642,916 | 42,642,916 | — | — |
| Information Technology | 58,671,472 | 57,038,752 | $1,632,720 | — |
| Materials | 11,359,442 | 11,359,442 | — | — |
| Telecommunication Services | 7,818,513 | 7,818,513 | — | — |
| Utilities | 1,735,020 | 1,735,020 | — | — |
| Securities Lending Collateral | 24,062,154 | 24,062,154 | — | — |
| Short-Term Investments | 3,267,969 | 3,267,969 | — | — |
| |
|
| Total Investments in Securities | $274,681,021 | $273,048,301 | $1,632,720 | — |
| Other Financial Instruments: | | | | |
| Forward Foreign Currency Contracts | ($9,222) | — | ($9,222) | — |
SIGNIFICANT ACCOUNTING POLICIES, CONTINUED
| | | | |
| | | | Level 2 | Level 3 |
| | Total Market | Level 1 | Significant | Significant |
| | Value at | Quoted | Observable | Unobservable |
| | 2-28-11 | Price | Inputs | Inputs |
|
| High Income Fund | | | | |
| Corporate Bonds | $155,690,750 | — | $143,164,681 | $12,526,069 |
| Convertible Bonds | 119,660,486 | — | 119,660,486 | — |
| Term Loans | 25,613,161 | — | 25,613,161 | — |
| Collateralized Mortgage Obligations | 773,929 | — | 496,405 | 277,524 |
| Common Stocks | 93,949,948 | $83,406,528 | 3,195,001 | 7,348,419 |
| Preferred Securities | 52,509,416 | 17,192,059 | 20,075,360 | 15,241,997 |
| Warrants | 2,748,286 | 2,748,286 | — | — |
| Short-Term Investments | 9,435,120 | — | 9,435,120 | — |
| |
|
| Total Investments in Securities | $460,381,096 | $103,346,873 | $321,640,214 | $35,394,009 |
| Other Financial Instruments: | | | | |
| Forward Foreign Currency Contracts | ($102,782) | — | ($102,782) | — |
|
| |
| High Yield Fund | | | | |
| Foreign Government Obligations | $30,035,662 | — | $29,952,549 | $83,113 |
| Corporate Bonds | 706,689,558 | — | 706,689,558 | — |
| Capital Preferred Securities | 9,639,739 | — | 9,639,739 | — |
| Convertible Bonds | 10,835,269 | — | 10,835,269 | — |
| Term Loans | 28,448,776 | — | 25,905,178 | 2,543,598 |
| Common Stocks | 16,910,572 | $16,860,497 | 50,075 | — |
| Preferred Securities | 20,571,741 | 18,347,263 | 2,224,478 | — |
| Warrants | 369,693 | 51,462 | 90,203 | 228,028 |
| Securities Lending Collateral | 6,333,316 | 6,333,316 | — | — |
| Short-Term Investments | 17,222,944 | — | 17,222,944 | — |
| |
|
| Total Investments in Securities | $847,057,270 | $41,592,538 | $802,609,993 | $2,854,739 |
| Other Financial Instruments: | | | | |
| Futures | $60,601 | $60,601 | — | — |
| Forward Foreign Currency Contracts | ($144,017) | — | ($144,017) | — |
|
| |
| International Equity Index Fund | | | | |
| Common Stocks | | | | |
| Australia | $26,144,611 | — | $26,144,611 | — |
| Austria | 1,373,256 | — | 1,373,256 | — |
| Belgium | 3,021,544 | — | 3,021,544 | — |
| Bermuda | 298,195 | — | 298,195 | — |
| Brazil | 7,880,918 | $7,880,918 | — | — |
| Canada | 37,255,531 | 37,255,531 | — | — |
| Cayman Islands | 443,888 | — | 443,888 | — |
| Chile | 1,508,753 | 1,508,753 | — | — |
| China | 12,847,522 | — | 12,847,522 | — |
| Colombia | 735,785 | 735,785 | — | — |
| Czech Republic | 425,758 | — | 425,758 | — |
| Denmark | 3,377,477 | — | 3,377,477 | — |
| Egypt | 387,046 | — | 387,046 | — |
| Finland | 3,434,166 | — | 3,434,166 | — |
| France | 30,031,004 | — | 30,031,004 | — |
| Germany | 25,745,194 | — | 25,745,194 | — |
| Greece | 949,336 | — | 949,336 | — |
| Hong Kong | 14,334,815 | 147,482 | 14,187,333 | — |
| Hungary | 459,897 | — | 459,897 | — |
| India | 7,246,354 | 6,928,724 | 317,630 | — |
| Indonesia | 2,511,451 | 65,269 | 2,446,182 | — |
| Ireland | 1,581,692 | 42,666 | 1,539,026 | — |
| Israel | 2,373,933 | 1,272 | 2,372,661 | — |
| Italy | 9,101,019 | — | 9,101,019 | — |
| Japan | 69,166,893 | — | 69,166,893 | — |
| Korea | 46,995 | — | 46,995 | — |
| Luxembourg | 1,561,877 | — | 1,561,877 | — |
| Malaysia | 3,162,226 | — | 3,162,226 | — |
| Mauritius | 85,587 | — | 85,587 | — |
| Mexico | 5,085,790 | 5,085,790 | — | — |
| Netherlands | 8,538,126 | — | 8,538,126 | — |
| New Zealand | 339,414 | — | 339,414 | — |
| Norway | 2,519,466 | — | 2,519,466 | — |
SIGNIFICANT ACCOUNTING POLICIES, CONTINUED
| | | | |
| | | | Level 2 | Level 3 |
| | Total Market | Level 1 | Significant | Significant |
| | Value at | Quoted | Observable | Unobservable |
| | 2-28-11 | Price | Inputs | Inputs |
|
| International Equity Index Fund (continued) | | | | |
| Peru | $501,622 | $501,622 | — | — |
| Philippines | 633,671 | — | $633,671 | — |
| Poland | 1,877,594 | — | 1,877,594 | — |
| Portugal | 879,148 | — | 879,148 | — |
| Russia | 7,794,697 | 6,460,951 | 1,333,746 | — |
| Singapore | 4,989,649 | — | 4,989,649 | — |
| South Africa | 7,340,356 | — | 7,340,356 | — |
| South Korea | 14,500,589 | 191,232 | 14,309,357 | — |
| Spain | 11,303,966 | — | 11,303,966 | — |
| Sweden | 9,507,304 | — | 9,507,304 | — |
| Switzerland | 26,059,908 | — | 26,059,908 | — |
| Taiwan | 9,665,711 | — | 9,665,711 | — |
| Thailand | 1,751,536 | — | 1,751,536 | — |
| Turkey | 1,468,862 | — | 1,468,862 | — |
| Ukraine | 32,247 | — | 32,247 | — |
| United Kingdom | 68,486,432 | 51,521 | 68,408,566 | $26,345 |
| United States | 231,617 | 231,617 | — | — |
| Preferred Securities | | | | |
| Brazil | 9,529,146 | 9,529,146 | — | — |
| Germany | 1,522,123 | — | 1,522,123 | — |
| Korea | 36,386 | — | 36,386 | — |
| South Korea | 435,070 | — | 435,070 | — |
| Rights | 10,088 | 165 | 9,923 | — |
| Warrants | 1,908 | 1,908 | — | — |
| Securities Lending Collateral | 9,849,059 | 9,849,059 | — | — |
| Short-Term Investments | 9,837,988 | 9,837,988 | — | — |
| |
|
| Total Investments in Securities | $482,222,196 | $96,307,399 | $385,888,452 | $26,345 |
| Other Financial Instruments: | | | | |
| Futures | $834,782 | $834,782 | — | — |
| Forward Foreign Currency Contracts | $554,954 | — | $554,954 | — |
|
| |
| International Growth Stock Fund | | | | |
| Common Stocks | | | | |
| Australia | $11,210,339 | — | $11,210,339 | — |
| Belgium | 2,811,907 | — | 2,811,907 | — |
| Brazil | 4,597,033 | $4,597,033 | — | — |
| Canada | 10,324,944 | 10,324,944 | — | — |
| China | 2,625,311 | — | 2,625,311 | — |
| Denmark | 3,171,601 | — | 3,171,601 | — |
| France | 11,961,360 | — | 11,961,360 | — |
| Germany | 11,061,141 | — | 11,061,141 | — |
| Hong Kong | 3,427,573 | — | 3,427,573 | — |
| India | 3,135,923 | 2,367,917 | 768,006 | — |
| Ireland | 3,836,636 | — | 3,836,636 | — |
| Israel | 3,218,174 | 3,218,174 | — | — |
| Japan | 16,302,527 | — | 16,302,527 | — |
| Mexico | 6,471,603 | 6,471,603 | — | — |
| Netherlands | 7,660,904 | 778,464 | 6,882,440 | — |
| Philippines | 1,488,133 | — | 1,488,133 | — |
| Russia | 2,225,417 | — | 2,225,417 | — |
| Singapore | 5,061,362 | — | 5,061,362 | — |
| South Korea | 3,871,741 | — | 3,871,741 | — |
| Sweden | 4,541,775 | — | 4,541,775 | — |
| Switzerland | 12,404,708 | — | 12,404,708 | — |
| Taiwan | 3,860,173 | — | 3,860,173 | — |
| Turkey | 1,252,784 | — | 1,252,784 | — |
| United Kingdom | 34,275,200 | — | 34,275,200 | — |
| Short-Term Investments | 12,474,394 | 12,474,394 | — | — |
| |
|
| Total Investments in Securities | $183,272,663 | $40,232,529 | $143,040,134 | — |
SIGNIFICANT ACCOUNTING POLICIES, CONTINUED
| | | | |
| | | | Level 2 | Level 3 |
| | Total Market | Level 1 | Significant | Significant |
| | Value at | Quoted | Observable | Unobservable |
| | 2-28-11 | Price | Inputs | Inputs |
|
| International Opportunities Fund | | | | |
| Common Stocks | | | | |
| Argentina | $8,260,324 | $8,260,324 | — | — |
| Belgium | 20,278,399 | — | $20,278,399 | — |
| Brazil | 54,200,077 | 54,200,077 | — | — |
| Canada | 28,995,051 | 28,995,051 | — | — |
| China | 17,700,937 | 17,700,937 | — | — |
| Denmark | 34,981,413 | — | 34,981,413 | — |
| France | 62,922,789 | — | 62,922,789 | — |
| Germany | 62,338,462 | — | 62,338,462 | — |
| Hong Kong | 43,351,737 | — | 43,351,737 | — |
| India | 15,473,103 | 15,473,103 | — | — |
| Japan | 114,845,273 | — | 114,845,273 | — |
| Luxembourg | 11,753,204 | 11,753,204 | — | — |
| Netherlands | 40,349,784 | 26,980,599 | 13,369,185 | — |
| South Africa | 14,690,069 | — | 14,690,069 | — |
| Spain | 32,284,702 | — | 32,284,702 | — |
| Sweden | 7,930,359 | — | 7,930,359 | — |
| Switzerland | 55,053,280 | — | 55,053,280 | — |
| United Kingdom | 99,235,086 | — | 99,235,086 | — |
| United States | 19,060,194 | 19,060,194 | — | — |
| Short-Term Investments | 24,591,137 | 24,591,137 | — | — |
| |
|
| Total Investments in Securities | $768,295,380 | $207,014,626 | $561,280,754 | — |
|
| |
| International Small Cap Fund | | | | |
| Common Stocks | | | | |
| Australia | $24,887,511 | — | $24,887,511 | — |
| Austria | 7,506,162 | — | 7,506,162 | — |
| Bahamas | 6,553,825 | $6,553,825 | — | — |
| Belgium | 6,512,830 | — | 6,512,830 | — |
| Canada | 37,259,806 | 37,259,806 | — | — |
| China | 10,918,854 | — | 10,918,854 | — |
| Finland | 10,203,718 | — | 10,203,718 | — |
| Germany | 4,402,571 | — | 4,402,571 | — |
| Greece | 6,466,530 | — | 6,466,530 | — |
| Hong Kong | 27,421,803 | — | 27,421,803 | — |
| Japan | 25,685,679 | — | 25,685,679 | — |
| Liechtenstein | 4,065,709 | — | 4,065,709 | — |
| Netherlands | 26,868,194 | — | 26,868,194 | — |
| Norway | 5,351,500 | — | 5,351,500 | — |
| Singapore | 403,343 | — | 403,343 | — |
| South Korea | 17,558,315 | — | 17,558,315 | — |
| Spain | 9,300,902 | — | 9,300,902 | — |
| Sweden | 3,679,338 | — | 3,679,338 | — |
| Switzerland | 11,826,854 | — | 11,826,854 | — |
| Taiwan | 19,325,589 | — | 19,325,589 | — |
| Thailand | 12,272,013 | — | 12,272,013 | — |
| United Kingdom | 41,610,572 | — | 41,610,572 | — |
| United States | 6,794,679 | 6,794,679 | — | — |
| Securities Lending Collateral | 23,945,841 | 23,945,841 | — | — |
| Short-Term Investments | 26,800,000 | — | 26,800,000 | — |
| |
|
| Total Investments in Securities | $377,622,138 | $74,554,151 | $303,067,987 | — |
|
| |
| International Small Company Fund | | | | |
| Common Stocks | | | | |
| Australia | $17,821,061 | $297,056 | $17,487,060 | $36,945 |
| Austria | 1,533,223 | — | 1,533,223 | — |
| Belgium | 2,194,747 | — | 2,194,747 | — |
| Bermuda | 1,077,534 | 161,580 | 915,954 | — |
| Canada | 28,093,962 | 28,084,430 | 9,532 | — |
| Cayman Islands | 38,555 | — | 38,555 | — |
| China | 227,667 | — | 227,667 | — |
SIGNIFICANT ACCOUNTING POLICIES, CONTINUED
| | | | |
| | | | Level 2 | Level 3 |
| | Total Market | Level 1 | Significant | Significant |
| | Value at | Quoted | Observable | Unobservable |
| | 2-28-11 | Price | Inputs | Inputs |
|
| International Small Company Fund (continued) | | | | |
| Cyprus | $289,699 | — | $289,699 | — |
| Denmark | 2,065,134 | — | 2,065,134 | — |
| Finland | 4,778,347 | — | 4,778,347 | — |
| France | 7,788,189 | — | 7,788,189 | — |
| Germany | 10,187,944 | $140,750 | 10,047,194 | — |
| Gibraltar | 63,250 | — | 63,250 | — |
| Greece | 2,257,210 | — | 2,257,210 | — |
| Hong Kong | 5,803,860 | 25,051 | 5,726,731 | $52,078 |
| Ireland | 2,142,538 | — | 2,141,403 | 1,135 |
| Israel | 2,402,875 | 365,798 | 2,037,077 | — |
| Italy | 6,398,400 | 2,648 | 6,390,437 | 5,315 |
| Japan | 46,814,934 | — | 46,814,934 | — |
| Liechtenstein | 63,539 | — | 63,539 | — |
| Luxembourg | 121,975 | — | 121,975 | — |
| Malaysia | 30,458 | — | 30,458 | — |
| Monaco | 57,729 | — | 57,729 | — |
| Netherlands | 4,096,020 | — | 4,096,020 | — |
| New Zealand | 1,592,230 | — | 1,554,841 | 37,389 |
| Norway | 2,160,448 | — | 2,160,448 | — |
| Peru | 257,380 | — | 257,380 | — |
| Portugal | 701,965 | — | 701,965 | — |
| Singapore | 2,796,539 | — | 2,796,539 | — |
| South Africa | 136,844 | 136,844 | — | — |
| Spain | 4,609,649 | — | 4,609,649 | — |
| Sweden | 5,799,744 | — | 5,799,744 | — |
| Switzerland | 12,302,275 | — | 12,302,275 | — |
| United Arab Emirates | 13,878 | — | 13,878 | — |
| United Kingdom | 35,272,379 | 12,237 | 35,242,690 | 17,452 |
| United States | 402,973 | 394,415 | 8,558 | — |
| Convertible Bonds | 7,294 | — | 7,294 | — |
| Warrants | 25,943 | 25,318 | 625 | — |
| Rights | 32,439 | 31,892 | 547 | — |
| Securities Lending Collateral | 6,844,084 | 6,844,084 | — | — |
| Short-Term Investments | 416,486 | 416,486 | — | — |
| |
|
| Total Investments in Securities | $219,721,400 | $36,938,589 | $182,632,497 | $150,314 |
|
| |
| International Value Fund | | | | |
| Common Stocks | | | | |
| Australia | $24,585,806 | — | $24,585,806 | — |
| Austria | 12,477,755 | — | 12,477,755 | — |
| Bermuda | 7,593,768 | $7,593,768 | — | — |
| Canada | 17,292,792 | 17,292,792 | — | — |
| China | 10,862,058 | — | 10,862,058 | — |
| France | 147,700,036 | — | 147,700,036 | — |
| Germany | 123,441,693 | — | 123,441,693 | — |
| Hong Kong | 21,972,469 | — | 21,972,469 | — |
| Ireland | 15,688,880 | 5,125,276 | 10,563,604 | — |
| Italy | 28,864,165 | — | 28,864,165 | — |
| Japan | 94,179,173 | — | 94,179,173 | — |
| Netherlands | 84,833,010 | — | 84,833,010 | — |
| Norway | 54,717,536 | — | 54,717,536 | — |
| Russia | 20,075,404 | 20,075,404 | — | — |
| Singapore | 46,323,425 | 20,400,068 | 25,923,357 | — |
| South Korea | 60,525,347 | 60,525,347 | — | — |
| Spain | 44,885,336 | — | 44,885,336 | — |
| Sweden | 20,870,738 | — | 20,870,738 | — |
| Switzerland | 101,772,415 | — | 101,772,415 | — |
| Taiwan | 68,933,835 | — | 68,933,835 | — |
| United Kingdom | 284,119,618 | — | 284,119,618 | — |
| United States | 18,453,567 | 18,453,567 | — | — |
| Securities Lending Collateral | 19,142,667 | 19,142,667 | — | — |
| Short-Term Investments | 33,775,000 | — | 33,775,000 | — |
| |
|
| Total Investments in Securities | $1,363,086,493 | $168,608,889 | $1,194,477,604 | — |
SIGNIFICANT ACCOUNTING POLICIES, CONTINUED
| | | | |
| | | | Level 2 | Level 3 |
| | Total Market | Level 1 | Significant | Significant |
| | Value at | Quoted | Observable | Unobservable |
| | 2-28-11 | Price | Inputs | Inputs |
| Investment Quality Bond Fund | | | | |
|
| U.S. Government & Agency Obligations | $134,743,974 | — | $134,743,974 | — |
| Foreign Government Obligations | 3,659,784 | — | 3,659,784 | — |
| Corporate Bonds | 236,528,693 | — | 236,528,693 | — |
| Capital Preferred Securities | 718,570 | — | 718,570 | — |
| Convertible Bonds | 30,407 | — | 30,407 | — |
| Municipal Bonds | 12,374,582 | — | 12,374,582 | — |
| Collateralized Mortgage Obligations | 35,903,527 | — | 35,903,527 | — |
| Asset Backed Securities | 5,599,701 | — | 4,299,701 | $1,300,000 |
| Securities Lending Collateral | 2,823,028 | $2,823,028 | — | — |
| Short-Term Investments | 43,229,000 | — | 43,229,000 | — |
| |
|
| Total Investments in Securities | $475,611,266 | $2,823,028 | $471,488,238 | $1,300,000 |
| Other Financial Instruments: | | | | |
| Futures | $398,951 | $398,951 | — | — |
| Forward Foreign Currency Contracts | ($515,613) | — | ($515,613) | — |
| Interest Rate Swaps | $29,060 | — | $29,060 | — |
| Credit Default Swaps | ($44,905) | — | ($44,905) | — |
| |
| Large Cap Value Fund | | | | |
|
| Common Stocks | | | | |
| Consumer Discretionary | $28,051,648 | $27,374,803 | $676,845 | — |
| Consumer Staples | 11,516,153 | 11,516,153 | — | — |
| Energy | 27,584,983 | 27,584,983 | — | — |
| Financials | 38,020,417 | 38,020,417 | — | — |
| Health Care | 9,284,233 | 9,284,233 | — | — |
| Industrials | 24,576,891 | 24,576,891 | — | — |
| Information Technology | 12,656,325 | 12,656,325 | — | — |
| Materials | 11,405,303 | 11,405,303 | — | — |
| Telecommunication Services | 7,161,940 | 7,161,940 | — | — |
| Utilities | 14,213,413 | 14,213,413 | — | — |
| Preferred Securities | | | | — |
| Consumer Discretionary | 1,134,624 | 1,134,624 | — | — |
| Short-Term Investments | 7,086,988 | 7,086,988 | — | — |
| |
|
| Total Investments in Securities | $192,692,918 | $192,016,073 | $676,845 | — |
| |
| Mid Cap Stock Fund | | | | |
|
| Common Stocks | | | | |
| Consumer Discretionary | $293,067,218 | $264,709,943 | $28,357,275 | — |
| Consumer Staples | 39,354,248 | 39,354,248 | — | — |
| Energy | 27,871,453 | 25,659,606 | 2,211,847 | — |
| Financials | 27,335,954 | 19,688,317 | 7,647,637 | — |
| Health Care | 146,481,416 | 146,481,416 | — | — |
| Industrials | 148,536,772 | 136,293,894 | 12,242,878 | — |
| Information Technology | 319,447,671 | 314,094,679 | 5,352,992 | — |
| Materials | 39,938,713 | 21,573,988 | 18,364,725 | — |
| Securities Lending Collateral | 291,642,810 | 291,642,810 | — | — |
| Short-Term Investments | 27,600,000 | — | 27,600,000 | — |
| |
|
| Total Investments in Securities | $1,361,276,255 | $1,259,498,901 | $101,777,354 | — |
| |
| Mid Value Fund | | | | |
|
| Common Stocks | | | | |
| Consumer Discretionary | $78,113,198 | $76,332,188 | $1,781,010 | — |
| Consumer Staples | 46,459,728 | 46,459,728 | — | — |
| Energy | 52,503,476 | 52,503,476 | — | — |
| Financials | 111,077,399 | 111,077,399 | — | — |
| Health Care | 30,625,857 | 30,625,857 | — | — |
| Industrials | 39,468,632 | 39,468,632 | — | — |
| Information Technology | 34,132,430 | 34,132,430 | — | — |
| Materials | 27,443,754 | 27,443,754 | — | — |
| Telecommunication Services | 6,009,735 | 6,009,735 | — | — |
| Utilities | 41,163,795 | 41,163,795 | — | — |
| Preferred Securities | | | | |
| Financials | 632,528 | — | 632,528 | — |
| Utilities | 442,141 | 442,141 | — | — |
SIGNIFICANT ACCOUNTING POLICIES, CONTINUED
| | | | |
| | | | Level 2 | Level 3 |
| | Total Market | Level 1 | Significant | Significant |
| | Value at | Quoted | Observable | Unobservable |
| | 2-28-11 | Price | Inputs | Inputs |
| Mid Value Fund (continued) | | | | |
|
| Convertible Bonds | | | | |
| Financials | $743,823 | — | $743,823 | — |
| Industrials | 2,161,480 | — | 2,161,480 | — |
| Materials | 1,725,474 | — | 1,725,474 | — |
| Telecommunication Services | 3,160,625 | — | 3,160,625 | — |
| Securities Lending Collateral | 130,916,565 | $130,916,565 | — | — |
| Short-Term Investments | 36,357,562 | 36,357,562 | — | — |
| |
|
| Total Investments in Securities | $643,138,202 | $632,933,262 | $10,204,940 | — |
| |
| Mutual Shares Fund | | | | |
|
| Common Stocks | | | | |
| Consumer Discretionary | $26,268,105 | $20,271,694 | $5,996,411 | — |
| Consumer Staples | 83,758,061 | 52,005,477 | 31,752,584 | — |
| Energy | 28,153,290 | 20,284,263 | 7,869,027 | — |
| Financials | 46,948,275 | 34,009,324 | 12,938,951 | — |
| Health Care | 53,750,155 | 53,750,155 | — | — |
| Industrials | 17,094,972 | 3,380,415 | 13,714,557 | — |
| Information Technology | 37,857,325 | 35,508,226 | 2,349,099 | — |
| Materials | 16,313,789 | 9,002,096 | 7,311,693 | — |
| Telecommunication Services | 11,220,518 | — | 11,220,518 | — |
| Utilities | 14,326,818 | 7,458,361 | 6,868,457 | — |
| Corporate Bonds | | | | |
| Energy | 393,433 | — | 393,433 | — |
| Term Loans | 242,963 | — | 242,963 | — |
| Securities Lending Collateral | 6,911,793 | 6,911,793 | — | — |
| Short-Term Investments | 27,896,640 | — | 27,896,640 | — |
| |
|
| Total Investments in Securities | $371,136,137 | $242,581,804 | $128,554,333 | — |
| Other Financial Instruments: | | | | |
| Forward Foreign Currency Contracts | ($1,745,689) | — | ($1,745,689) | — |
| |
| Real Return Bond Fund | | | | |
|
| U.S. Government & Agency Obligations | $748,649,633 | — | $748,649,633 | — |
| Foreign Government Obligations | 15,662,407 | — | 15,662,407 | — |
| Corporate Bonds | 196,000,341 | — | 195,002,191 | $998,150 |
| Municipal Bonds | 1,746,347 | — | 1,746,347 | — |
| Collateralized Mortgage Obligations | 111,116,258 | — | 104,647,463 | 6,468,795 |
| Asset Backed Securities | 31,704,263 | — | 28,526,697 | 3,177,566 |
| Preferred Securities | 515,000 | $515,000 | — | — |
| Options Purchased | 83,571 | — | 83,571 | — |
| Short-Term Investments | 2,653,339 | — | 2,653,339 | — |
| |
|
| Total Investments in Securities | $1,108,131,159 | $515,000 | $1,096,971,648 | $10,644,511 |
| Other Financial Instruments: | | | | |
| Futures | $115,362 | $115,362 | — | — |
| Forward Foreign Currency Contracts | ($1,142,426) | — | ($1,142,426) | — |
| Written Options | ($2,565,880) | ($86,495) | ($2,460,049) | ($19,336) |
| Interest Rate Swaps | $379,920 | — | $379,920 | — |
| Credit Default Swaps | $1,837,848 | — | $1,837,848 | — |
| |
| Small Cap Index Fund | | | | |
|
| Common Stocks | | | | |
| Consumer Discretionary | $11,824,475 | $11,824,475 | — | — |
| Consumer Staples | 2,572,671 | 2,572,671 | — | — |
| Energy | 6,279,120 | 6,257,737 | $21,383 | — |
| Financials | 18,109,440 | 18,109,440 | — | — |
| Health Care | 10,829,026 | 10,828,935 | — | $91 |
| Industrials | 13,815,534 | 13,815,534 | — | — |
| Information Technology | 17,248,602 | 17,248,602 | — | — |
| Materials | 5,031,048 | 5,031,048 | — | — |
| Telecommunication Services | 748,900 | 748,900 | — | — |
| Utilities | 2,665,220 | 2,665,220 | — | — |
SIGNIFICANT ACCOUNTING POLICIES, CONTINUED
| | | | |
| | | | Level 2 | Level 3 |
| | Total Market | Level 1 | Significant | Significant |
| | Value at | Quoted | Observable | Unobservable |
| | 2-28-11 | Price | Inputs | Inputs |
| Small Cap Index Fund (continued) | | | | |
|
| Corporate Bonds | | | | |
| Financials | $964 | — | $964 | — |
| Securities Lending Collateral | 8,760,605 | $8,760,605 | — | — |
| Short-Term Investments | 4,300,000 | — | 4,300,000 | — |
| |
|
| Total Investments in Securities | $102,185,605 | $97,863,167 | $4,322,347 | $91 |
| Other Financial Instruments: | | | | |
| Futures | $234,706 | $234,706 | — | — |
| |
| Small Cap Opportunities Fund | | | | |
|
| Common Stocks | | | | |
| Consumer Discretionary | $32,402,475 | $32,402,475 | — | — |
| Consumer Staples | 7,543,897 | 7,543,897 | — | — |
| Energy | 21,936,979 | 21,936,979 | — | — |
| Financials | 40,919,485 | 40,917,812 | $1,673 | — |
| Health Care | 17,947,816 | 17,947,816 | — | — |
| Industrials | 34,492,555 | 34,492,555 | — | — |
| Information Technology | 33,421,716 | 33,421,716 | — | — |
| Materials | 15,958,344 | 15,958,344 | — | — |
| Telecommunication Services | 1,887,950 | 1,887,950 | — | — |
| Utilities | 1,919,543 | 1,919,543 | — | — |
| Securities Lending Collateral | 22,089,462 | 22,089,462 | — | — |
| Short-Term Investments | 2,070,502 | 2,070,502 | — | — |
| |
|
| Total Investments in Securities | $232,590,724 | $232,589,051 | $1,673 | — |
| |
| Small Company Value Fund | | | | |
|
| Common Stocks | | | | |
| Consumer Discretionary | $49,454,427 | $49,454,427 | — | — |
| Consumer Staples | 4,087,886 | 4,087,886 | — | — |
| Energy | 32,531,714 | 32,531,714 | — | — |
| Financials | 94,633,362 | 94,633,362 | — | — |
| Health Care | 26,576,956 | 26,576,956 | — | — |
| Industrials | 113,989,199 | 113,989,199 | — | — |
| Information Technology | 49,416,556 | 49,416,556 | — | — |
| Materials | 45,377,704 | 45,377,704 | — | — |
| Telecommunication Services | 1,610,400 | 1,610,400 | — | — |
| Utilities | 18,117,792 | 18,117,792 | — | — |
| Preferred Securities | | | | |
| Financials | 5,398,990 | — | $5,398,990 | — |
| Investment Companies | 4,045,132 | 4,045,132 | — | — |
| Securities Lending Collateral | 123,345,442 | 123,345,442 | — | — |
| Short-Term Investments | 10,085,978 | 10,085,978 | — | — |
| |
|
| Total Investments in Securities | $578,671,538 | $573,272,548 | $5,398,990 | — |
| |
| Smaller Company Growth Fund | | | | |
|
| Common Stocks | | | | |
| Consumer Discretionary | $18,521,064 | $18,517,872 | — | $3,192 |
| Consumer Staples | 1,707,919 | 1,707,919 | — | — |
| Energy | 15,315,893 | 15,305,885 | $10,008 | — |
| Financials | 6,972,909 | 6,972,909 | — | — |
| Health Care | 21,549,530 | 21,549,530 | — | — |
| Industrials | 31,688,542 | 31,688,542 | — | — |
| Information Technology | 40,037,804 | 40,037,804 | — | — |
| Materials | 4,939,679 | 4,939,679 | — | — |
| Telecommunication Services | 3,867,303 | 3,867,303 | — | — |
| Utilities | 391,923 | 391,923 | — | — |
| Corporate Bonds | 129 | — | 129 | — |
| Investment Companies | 711,693 | 711,693 | — | — |
| Securities Lending Collateral | 17,036,662 | 17,036,662 | — | — |
| Short-Term Investments | 3,952,482 | 326,482 | 3,626,000 | — |
| |
|
| Total Investments in Securities | $166,693,532 | $163,054,203 | $3,636,137 | $3,192 |
| Other Financial Instruments: | | | | |
| Futures | $17,140 | $17,140 | — | — |
SIGNIFICANT ACCOUNTING POLICIES, CONTINUED
| | | | |
| | | | Level 2 | Level 3 |
| | Total Market | Level 1 | Significant | Significant |
| | Value at | Quoted | Observable | Unobservable |
| | 2-28-11 | Price | Inputs | Inputs |
| Spectrum Income Fund | | | | |
|
| U.S. Government & Agency Obligations | $232,422,641 | — | $232,422,641 | — |
| Foreign Government Obligations | 143,513,991 | — | 143,255,991 | $258,000 |
| Corporate Bonds | 394,551,748 | — | 394,350,748 | 201,000 |
| Capital Preferred Securities | 3,110,912 | — | 3,110,912 | — |
| Convertible Bonds | 218,813 | — | 218,813 | — |
| Municipal Bonds | 3,846,209 | — | 3,846,209 | — |
| Term Loans | 18,662,444 | — | 18,662,444 | — |
| Collateralized Mortgage Obligations | 18,281,957 | — | 18,281,957 | — |
| Asset Backed Securities | 15,174,386 | — | 14,848,675 | 325,711 |
| Common Stocks | 146,486,250 | $145,437,038 | 1,049,212 | — |
| Preferred Securities | 5,637,049 | 3,494,656 | 2,142,393 | — |
| Securities Lending Collateral | 27,329,390 | 27,329,390 | — | — |
| Short-Term Investments | 46,087,657 | 44,050,900 | 2,036,757 | — |
| |
|
| Total Investments in Securities | $1,055,323,447 | $220,311,984 | $834,226,752 | $784,711 |
| Other Financial Instruments: | | | | |
| Futures | ($7,388) | ($7,388) | — | — |
| Forward Foreign Currency Contracts | ($148,070) | — | ($148,070) | — |
| Interest Rate Swaps | $88,253 | — | $88,253 | — |
| Credit Default Swaps | ($11,390) | — | ($11,390) | — |
| |
| Total Bond Market Fund | | | | |
|
| U.S. Government & Agency Obligations | $179,767,649 | — | $179,767,649 | — |
| Foreign Government Obligations | 7,016,840 | — | 7,016,840 | — |
| Corporate Bonds | 94,973,798 | — | 94,973,798 | — |
| Municipal Bonds | 2,542,784 | — | 2,542,784 | — |
| Collateralized Mortgage Obligations | 22,996,018 | — | 22,996,018 | — |
| Asset Backed Securities | 860,384 | — | 860,384 | — |
| Securities Lending Collateral | 3,213,547 | $3,213,547 | — | — |
| Short-Term Investments | 1,259,423 | 1,259,423 | — | — |
| |
|
| Total Investments in Securities | $312,630,443 | $4,472,970 | $308,157,473 | — |
| |
| Total Return Fund | | | | |
|
| U.S. Government & Agency Obligations | $882,938,983 | — | $882,938,983 | — |
| Foreign Government Obligations | 207,126,537 | — | 207,126,537 | — |
| Corporate Bonds | 678,298,684 | — | 678,298,684 | — |
| Convertible Bonds | 12,049,000 | — | 12,049,000 | — |
| Term Loans | 10,015,825 | — | 10,015,825 | — |
| Municipal Bonds | 64,368,691 | — | 64,368,691 | — |
| Capital Preferred Securities | 27,718,444 | — | 27,718,444 | — |
| Collateralized Mortgage Obligations | 117,315,222 | — | 114,975,445 | $2,339,777 |
| Asset Backed Securities | 39,763,883 | — | 38,548,077 | 1,215,806 |
| Common Stocks | 9,574 | $9,574 | — | — |
| Preferred Securities | 17,292,750 | 11,358,892 | 5,933,858 | — |
| Short-Term Investments | 843,192,759 | — | 843,192,759 | — |
| |
|
| Total Investments in Securities | $2,900,090,352 | $11,368,466 | $2,885,166,303 | $3,555,583 |
| TBA Sale Commitments | ($224,342,129) | — | ($224,342,129) | — |
| Other Financial Instruments: | | | | |
| Futures | $1,143,041 | $1,143,041 | — | — |
| Forward Foreign Currency Contracts | ($944,804) | — | ($944,804) | — |
| Written Options | ($8,079,056) | ($593,474) | ($7,474,914) | ($10,668) |
| Interest Rate Swaps | $3,350,210 | — | $3,350,210 | — |
| Credit Default Swaps | $14,762,558 | — | $14,762,558 | — |
| |
| U.S. High Yield Bond Fund | | | | |
|
| Corporate Bonds | $478,193,194 | — | $478,193,194 | — |
| Capital Preferred Securities | 1,153,289 | — | 1,153,289 | — |
| Convertible Bonds | 2,833,688 | — | 2,833,688 | — |
| Term Loans | 125,479,893 | — | 125,479,893 | — |
| Common Stocks | 90,000 | — | 90,000 | — |
| Preferred Securities | 101,280 | — | — | $101,280 |
| Short-Term Investments | 23,280,247 | $23,253,044 | 27,203 | — |
| |
|
| Total Investments in Securities | $631,131,591 | $23,253,044 | $607,777,267 | $101,280 |
SIGNIFICANT ACCOUNTING POLICIES, CONTINUED
| | | | |
| | | | Level 2 | Level 3 |
| | Total Market | Level 1 | Significant | Significant |
| | Value at | Quoted | Observable | Unobservable |
| | 2-28-11 | Price | Inputs | Inputs |
| U.S. Multi-Sector Fund | | | | |
|
| Common Stocks | | | | |
| Consumer Discretionary | $79,230,437 | $79,230,437 | — | — |
| Consumer Staples | 247,814,607 | 247,814,607 | — | — |
| Energy | 24,480,055 | 24,480,055 | — | — |
| Financials | 25,264,132 | 25,264,132 | — | — |
| Health Care | 300,052,563 | 300,052,563 | — | — |
| Industrials | 54,533,164 | 54,533,164 | — | — |
| Information Technology | 291,327,904 | 291,327,904 | — | — |
| Materials | 9,471,169 | 9,471,169 | — | — |
| Telecommunication Services | 19,390,708 | 19,390,708 | — | — |
| Utilities | 1,982,228 | 1,982,228 | — | — |
| Investment Companies | 6,602,376 | 6,602,376 | — | — |
| Securities Lending Collateral | 76,781,724 | 76,781,724 | — | — |
| Short-Term Investments | 22,970,014 | 18,970,110 | $3,999,904 | — |
| |
|
| Total Investments in Securities | $1,159,901,081 | $1,155,901,177 | $3,999,904 | — |
| Securities Sold Short | ($474,012) | — | ($474,012) | — |
| |
| Value & Restructuring Fund | | | | |
|
| Common Stocks | | | | |
| Consumer Discretionary | $36,441,959 | $36,441,959 | — | — |
| Consumer Staples | 30,938,970 | 30,938,970 | — | — |
| Energy | 148,621,758 | 148,621,758 | — | — |
| Financials | 91,634,066 | 87,518,953 | $4,115,113 | — |
| Health Care | 34,471,130 | 34,471,130 | — | — |
| Industrials | 108,670,691 | 108,670,691 | — | — |
| Information Technology | 48,474,116 | 48,474,116 | — | — |
| Materials | 93,364,784 | 81,419,995 | 11,944,789 | — |
| Telecommunication Services | 27,237,210 | 27,237,210 | — | — |
| Preferred Securities | | | | |
| Energy | 2,091,284 | 2,091,284 | — | — |
| Financials | 9,524,707 | 6,279,947 | 3,244,760 | — |
| Convertible Bonds | | | | |
| Financials | 1,636,796 | — | 1,636,796 | — |
| Warrants | 1,972,200 | 1,972,200 | — | — |
| Securities Lending Collateral | 61,870,529 | 61,870,529 | — | — |
| Short-Term Investments | 2,205,000 | — | 2,205,000 | — |
| |
|
| Total Investments in Securities | $699,155,200 | $676,008,742 | $23,146,458 | — |
| Other Financial Instruments: | | | | |
| Written Options | ($173,625) | ($173,625) | — | — |
Changes in valuation techniques may result in transfers in or out of an assigned level within the disclosure hierarchy. During the six-month period ended February 28, 2011, there were no significant transfers in or out of Level 1 or Level 2 assets.
The following is a reconciliation of Level 3 assets for which significant unobservable inputs were used to determine fair value. Transfers in or out of Level 3 represent the beginning value of any security or instrument where a change in the level has occurred from the beginning to the end of the period.
| | | | | | |
Active Bond Fund | | | | | | |
|
| | | Collateralized | Asset | | | |
| | Corporate | Mortgage | Backed | Common | Preferred | |
| | Bonds | Obligations | Securities | Stocks | Securities | Totals |
| Balance as of 8-31-10 | $201,858 | $1,457,503 | $1,864,506 | $18,356 | $359,270 | $3,901,493 |
| Accrued discounts/premiums | 318 | — | 586 | — | — | 904 |
| Realized gain (loss) | 279 | — | (370,066) | — | — | (369,787) |
| Change in unrealized appreciation (depreciation) | (2,037) | 286,688 | 542,523 | (1,952) | (38,204) | 787,018 |
| Net purchases (sales) | 125,252 | 7,033,231 | (341,149) | — | — | 6,817,334 |
| Net transfers in and/out of Level 3 | — | (633,798) | (454,926) | — | — | (1,088,724) |
| Balance as of 2-28-11 | $325,670 | $8,143,624 | $1,241,474 | $16,404 | $321,066 | $10,048,238 |
| Change in unrealized at period end* | ($2,037) | $286,688 | $183,898 | ($1,952) | ($38,204) | $428,393 |
SIGNIFICANT ACCOUNTING POLICIES, CONTINUED
| | | | | | |
| Core Bond Fund | | | | | | |
|
| | U.S. | | | | | |
| | Government | Collateralized | | | | |
| | & Agency | Mortgage | | | | |
| | Obligations | Obligations | Totals | | | |
| Balance as of 8-31-10 | — | $1,631,384 | $1,631,384 | | | |
| Accrued discounts/premiums | — | 46 | 46 | | | |
| Realized gain (loss) | — | 41 | 41 | | | |
| Change in unrealized appreciation (depreciation) | $3,049 | (43,805) | (40,756) | | | |
| Net purchases (sales) | 15,958,812 | (17,242) | 15,941,570 | | | |
| Net transfers in and/out of Level 3 | — | — | — | | | |
| Balance as of 2-28-11 | $15,961,861 | $1,570,424 | $17,532,285 | | | |
| Change in unrealized at period end* | $3,049 | ($43,805) | ($40,756) | | | |
| |
| Emerging Markets Fund | | | | | | |
|
| | China | India | Indonesia | Israel | Taiwan | Totals |
| Balance as of 8-31-10 | — | $17,188 | — | — | — | $17,188 |
| Accrued discounts/premiums | — | — | — | — | — | — |
| Realized gain (loss) | — | — | — | — | — | — |
| Change in unrealized appreciation (depreciation) | ($66) | 674 | $4,754 | $10,149 | $1,174 | 16,685 |
| Net purchases (sales) | — | — | — | — | — | — |
| Net transfers in and/out of Level 3 | 54,837 | — | 196,458 | 193,831 | 4,994 | 450,120 |
| Balance as of 2-28-11 | $54,771 | $17,862 | $201,212 | $203,980 | $6,168 | $483,993 |
| Change in unrealized at period end* | ($66) | $674 | $4,754 | $10,149 | $1,174 | $16,685 |
| |
| Emerging Markets Debt Fund | | | | | | |
|
| | Corporate | | | | | |
| | Bonds | | | | | |
| Balance as of 8-31-10 | — | | | | | |
| Accrued discounts/premiums | — | | | | | |
| Realized gain (loss) | — | | | | | |
| Change in unrealized appreciation (depreciation) | $3,407 | | | | | |
| Net purchases (sales) | 200,638 | | | | | |
| Net transfers in and/out of Level 3 | — | | | | | |
| Balance as of 2-28-11 | $204,045 | | | | | |
| Change in unrealized at period end* | $3,407 | | | | | |
| | |
| | | | | | |
| Global Bond Fund | | | | | | |
|
| | | Collateralized | Asset | | | |
| | Corporate | Mortgage | Backed | | Written | |
| | Bonds | Obligations | Securities | Totals | Options | |
| Balance as of 8-31-10 | — | — | $741,201 | $741,201 | — | |
| Accrued discounts/premiums | — | — | 22,856 | 22,856 | — | |
| Realized gain (loss) | — | — | 1,552 | 1,552 | — | |
| Change in unrealized appreciation (depreciation) | ($2,220) | ($12,718) | 259,793 | 244,855 | $5,106 | |
| Net purchases (sales) | 1,200,000 | 3,728,834 | 12,159,191 | 17,088,025 | — | |
| Net transfers in and/out of Level 3 | — | — | 1,086,818 | 1,086,818 | (19,600) | |
| Balance as of 2-28-11 | $1,197,780 | $3,716,116 | $14,271,411 | $19,185,307 | ($14,494) | |
| Change in unrealized at period end* | ($2,220) | ($12,718) | $259,793 | $244,855 | $5,106 | |
| | |
| High Income Fund | | | | | | |
|
| | | Collateralized | | | | |
| | Corporate | Mortgage | Common | Preferred | | |
| | Bonds | Obligations | Stocks | Securities | Totals | |
| Balance as of 8-31-10 | $3,331,456 | $306,024 | $6,701,677 | $20,222,011 | $30,561,168 | |
| Accrued discounts/premiums | 16,211 | 468 | — | — | 16,679 | |
| Realized gain (loss) | — | (7,608,339) | — | — | (7,608,339) | |
| Change in unrealized appreciation (depreciation) | 609,168 | 7,606,991 | (1,770,748) | (2,250,506) | 4,194,905 | |
| Net purchases (sales) | 8,537,901 | (27,620) | 2,417,490 | (2,729,611) | 8,198,160 | |
| Net transfers in and/out of Level 3 | 31,333 | — | — | 103 | 31,436 | |
| Balance as of 2-28-11 | $12,526,069 | $277,524 | $7,348,419 | $15,241,997 | $35,394,009 | |
| Change in unrealized at period end* | $609,168 | ($878) | ($2,070,924) | ($1,813,768) | ($3,276,402) | |
SIGNIFICANT ACCOUNTING POLICIES, CONTINUED
| | | | | | |
| High Yield Fund | | | | | | |
|
| | Foreign | | | | | |
| | Government | Corporate | | Preferred | | |
| | Obligations | Bonds | Term Loans | Securities | Warrants | Totals |
| Balance as of 8-31-10 | $4,261,167 | $72,000 | $7,069 | $16,826 | $102,981 | $4,460,043 |
| Accrued discounts/premiums | — | — | 7,525 | — | — | 7,525 |
| Realized gain (loss) | 41,133 | (2,429,501) | 15 | — | — | (2,388,353) |
| Change in unrealized appreciation (depreciation) | (18,437) | 2,443,956 | (3,944,990) | (16,826) | 125,047 | (1,411,250) |
| Net purchases (sales) | (100,585) | (14,455) | — | — | — | (115,040) |
| Net transfers in and/out of Level 3 | (4,100,165) | (72,000) | 6,473,979 | — | — | 2,301,814 |
| Balance as of 2-28-11 | $83,113 | — | $2,543,598 | — | $228,028 | $2,854,739 |
| Change in unrealized at period end* | $2,288 | — | ($3,944,990) | ($16,826) | $125,047 | ($3,834,481) |
| | | | | | |
| International Equity Index Fund | | | | | | |
|
| | | United | | | | |
| | China | Kingdom | Totals | | | |
| Balance as of 8-31-10 | $459,163 | — | $459,163 | | | |
| Accrued discounts/premiums | — | — | — | | | |
| Realized gain (loss) | — | — | — | | | |
| Change in unrealized appreciation (depreciation) | — | $5,967 | 5,967 | | | |
| Net purchases (sales) | — | — | — | | | |
| Net transfers in and/out of Level 3 | (459,163) | 20,378 | (438,785) | | | |
| Balance as of 2-28-11 | — | $26,345 | $26,345 | | | |
| Change in unrealized at period end* | — | $5,967 | $5,967 | | | |
| | | | | | |
| International Opportunities Fund | | | | | | |
|
| | China | | | | | |
| Balance as of 8-31-10 | $8,797,367 | | | | | |
| Accrued discounts/premiums | — | | | | | |
| Realized gain (loss) | 1,745,572 | | | | | |
| Change in unrealized appreciation (depreciation) | (460,095) | | | | | |
| Net purchases (sales) | (10,082,844) | | | | | |
| Net transfers in and/out of Level 3 | — | | | | | |
| Balance as of 2-28-11 | — | | | | | |
| Change in unrealized at period end* | — | | | | | |
| | | | | | | | | |
| International Small Company Fund | | | | | | | | | |
|
| | | | Hong | | | | | United | |
| | Australia | Canada | Kong | Ireland | Italy | New Zealand | Singapore | Kingdom | Totals |
| Balance as of 8-31-10 | — | — | — | — | — | — | — | $7,602 | $7,602 |
| Accrued discounts/premiums | — | — | — | — | — | — | — | — | — |
| Realized gain (loss) | — | — | — | — | — | — | — | — | — |
| Change in unrealized appreciation | | | | | | | | | |
| (depreciation) | ($15,274) | ($8,607) | ($56) | $91 | $434 | ($6,214) | ($1,534) | (2,254) | (33,414) |
| Net purchases (sales) | — | 8,607 | — | — | — | 43,603 | — | — | 52,210 |
| Net transfers in and/out of Level 3 | 52,219 | — | 52,134 | 1,044 | 4,881 | — | 1,534 | 12,104 | 123,916 |
| Balance as of 2-28-11 | $36,945 | — | $52,078 | $1,135 | $5,315 | $37,389 | — | $17,452 | $150,314 |
| Change in unrealized at | | | | | | | | | |
| period end* | ($15,274) | ($8,607) | ($56) | $91 | $434 | ($6,214) | ($1,534) | ($2,254) | ($33,414) |
| | | | | |
| Investment Quality Bond Fund | | | | | |
|
| | Asset Backed | | | | |
| | Securities | | | | |
| Balance as of 8-31-10 | $1,063,900 | | | | |
| Accrued discounts/premiums | 165 | | | | |
| Realized gain (loss) | — | | | | |
| Change in unrealized appreciation (depreciation) | 6,075 | | | | |
| Net purchases (sales) | 1,293,760 | | | | |
| Net transfers in and/out of Level 3 | (1,063,900) | | | | |
| Balance as of 2-28-11 | $1,300,000 | | | | |
| Change in unrealized at period end* | $6,075 | | | | |
| | | | | |
| SIGNIFICANT ACCOUNTING POLICIES, CONTINUED | | | | |
| |
| Mid Cap Value Equity Fund | | | | | |
|
| | Financials | | | | |
| Balance as of 8-31-10 | $3,396,484 | | | | |
| Accrued discounts/premiums | — | | | | |
| Realized gain (loss) | (1,461,586) | | | | |
| Change in unrealized appreciation (depreciation) | 1,617,516 | | | | |
| Net purchases (sales) | (3,552,414) | | | | |
| Net transfers in and/out of Level 3 | — | | | | |
| Balance as of 2-28-11 | — | | | | |
| Change in unrealized at period end* | — | | | | |
| |
| Real Return Bond Fund | | | | | |
|
| | | Collateralized | Asset | | |
| | Corporate | Mortgage | Backed | | Written |
| | Bonds | Obligations | Securities | Totals | Options |
| Balance as of 8-31-10 | — | $3,592,242 | $2,447,518 | $6,039,760 | — |
| Accrued discounts/premiums | — | — | 3,124 | 3,124 | — |
| Realized gain (loss) | — | — | 4,286 | 4,286 | — |
| Change in unrealized appreciation (depreciation) | ($1,850) | (22,138) | 123,817 | 99,829 | $22,466 |
| Net purchases (sales) | 1,000,000 | 6,490,933 | 1,504,742 | 8,995,675 | — |
| Net transfers in and/out of Level 3 | — | (3,592,242) | (905,921) | (4,498,163) | (41,802) |
| Balance as of 2-28-11 | $998,150 | $6,468,795 | $3,177,566 | $10,644,511 | ($19,336) |
| Change in unrealized at period end* | ($1,850) | ($22,138) | $123,817 | $99,829 | $22,466 |
|
| |
| Small Cap Index Fund | | | | | |
| | Health | | | | |
| | Care | | | | |
| Balance as of 8-31-10 | $89 | | | | |
| Accrued discounts/premiums | — | | | | |
| Realized gain (loss) | — | | | | |
| Change in unrealized appreciation (depreciation) | 2 | | | | |
| Net purchases (sales) | — | | | | |
| Net transfers in and/out of Level 3 | — | | | | |
| Balance as of 2-28-11 | $91 | | | | |
| Change in unrealized at period end* | $2 | | | | |
| |
| Smaller Company Growth Fund | | | | | |
|
| | Consumer | | | | |
| | Discretionary | | | | |
| Balance as of 8-31-10 | — | | | | |
| Accrued discounts/premiums | — | | | | |
| Realized gain (loss) | ($227) | | | | |
| Change in unrealized appreciation (depreciation) | 320 | | | | |
| Net purchases (sales) | (367) | | | | |
| Net transfers in and/out of Level 3 | 3,466 | | | | |
| Balance as of 2-28-11 | $3,192 | | | | |
| Change in unrealized at period end* | $320 | | | | |
| | |
| | | | |
| Spectrum Income Fund | | | | |
|
| | Foreign | | Asset | |
| | Government | Corporate | Backed | |
| | Obligations | Bonds | Securities | Totals |
| Balance as of 8-31-10 | $342,940 | $570,688 | $320,239 | $1,233,867 |
| Accrued discounts/premiums | 3,548 | 284 | 251 | 4,083 |
| Realized gain (loss) | 3,955 | — | — | 3,955 |
| Change in unrealized appreciation (depreciation) | 25,817 | (3,195) | 5,221 | 27,843 |
| Net purchases (sales) | (118,260) | (366,777) | — | (485,037) |
| Net transfers in and/out of Level 3 | — | — | — | — |
| Balance as of 2-28-11 | $258,000 | $201,000 | $325,711 | $784,711 |
| Change in unrealized at period end* | $30,886 | $1,000 | $5,221 | $37,107 |
SIGNIFICANT ACCOUNTING POLICIES, CONTINUED
| | | | |
| Total Return Fund | | | | |
|
| | Collateralized | Asset | | |
| | Mortgage | Backed | | Written |
| | Obligations | Securities | Totals | Options |
| Balance as of 8-31-10 | — | — | — | — |
| Accrued discounts/premiums | — | $100 | $100 | — |
| Realized gain (loss) | — | — | — | — |
| Change in unrealized appreciation (depreciation) | ($8,007) | 12,659 | 4,652 | $12,395 |
| Net purchases (sales) | 2,347,784 | 1,203,047 | 3,550,831 | — |
| Net transfers in and/out of Level 3 | — | — | — | (23,063) |
| Balance as of 2-28-11 | $2,339,777 | $1,215,806 | $3,555,583 | ($10,668) |
| Change in unrealized at period end* | ($8,007) | $12,659 | $4,652 | $12,395 |
| |
| U.S. High Yield Bond Fund | | | | |
|
| | Preferred | | | |
| | Securities | | | |
| Balance as of 8-31-10 | $84,000 | | | |
| Accrued discounts/premiums | — | | | |
| Realized gain (loss) | — | | | |
| Change in unrealized appreciation (depreciation) | (53,840) | | | |
| Net purchases (sales) | — | | | |
| Net transfers in and/out of Level 3 | 71,120 | | | |
| Balance as of 2-28-11 | $101,280 | | | |
| Change in unrealized at period end* | ($53,840) | | | |
* Change in unrealized appreciation (depreciation) attributable to level 3 securities held at the period end.
In order to value the securities, the Funds use the following valuation techniques. Equity securities held by the Funds are valued at the last sale price or official closing price on the principal securities exchange on which they trade. In the event there were no sales during the day or closing prices are not available, then securities are valued using the last quoted bid or evaluated price. Investments by the Funds in underlying affiliated funds and/or other open-end management investment companies are valued at their respective net asset values each business day. Debt obligations are valued based on the evaluated prices provided by an independent pricing service, which utilizes both dealer-supplied and electronic data processing techniques, taking into account factors such as institutional-size trading in similar groups of securities, yield, quality, coupon rate, maturity, type of issue, trading characteristics and other market data. Foreign securities and currencies, including forward foreign currency contracts, are valued in U.S. dollars, based on foreign currency exchange rates supplied by an independent pricing service. Certain securities and forward foreign currency contracts traded only in the over-the-counter market are valued at the last bid price quoted by brokers making markets in the securities at the close of trading. Certain short-term securities are valued at amortized cost.
Other portfolio securities and assets, where market quotations are not readily available, are valued at fair value, as determined in good faith by the Fund’s Pricing Committee, following procedures established by the Board of Trustees. Generally, trading in non-U.S. securities is substantially completed each day at various times prior to the close of trading on the NYSE. Significant market events that affect the values of non-U.S. securities may occur between the time when the valuation of the securities is generally determined and the close of the NYSE. During significant market events, these securities will be valued at fair value, as determined in good faith, following procedures established by the Board of Trustees. The Fund may use a fair valuation model to value non-U.S. securities in order to adjust for events which may occur between the close of foreign exchanges and the close of the NYSE.
Repurchase Agreements The Funds may enter into repurchase agreements. When a Fund enters into a repurchase agreement, it receives collateral which is held in a segregated account by the Funds’ custodian. The collateral amount is marked-to-market and monitored on a daily basis to ensure that the collateral held is in an amount not less than the principal amount of the repurchase agreement plus any accrued interest. In the event of a default by the counterparty, realization of the collateral proceeds could be delayed, during which time the collateral value may decline. Collateral for certain tri-party repurchase agreements is held at a third-party custodian bank in a segregated account for the benefit of the Funds.
When-Issued/Delayed Delivery Securities The Funds may purchase or sell debt securities on a when-issued or delayed-delivery basis, or in a “To Be Announced” (TBA) or “forward commitment” transaction, with delivery or payment to occur at a later date beyond the normal settlement period. TBA securities resulting from these transactions are included in the Portfolio of Investments or in a schedule to the Portfolio of Investments (TBA Sale Commitments Outstanding). At the time that the Fund enters into a commitment to purchase or sell a security, the transaction is recorded and the value of the security is reflected in the Fund’s net asset value. The price of such security and the date that the security will be delivered and paid for are fixed at the time the transaction is negotiated. The value of the security may vary with market fluctuations. No interest accrues to the Fund until payment takes place. At the time that the Fund enters into this type of transaction, the Fund is required to have sufficient cash and/or liquid securities to cover its commitments.
Certain risks may arise upon entering into when-issued or delayed-delivery securities transactions, including the potential inability of counterparties to meet the terms of their contracts, and the issuer’s failure to issue the securities due to political, economic, or other factors. Additionally, losses may arise due to declines in the value of the securities prior to settlement date.
Short Sales Certain Funds may make short sales of securities or maintain a short position, provided that at all times when a short position is open a Fund owns an equal amount of such securities or securities convertible into or exchangeable, without payment of any further consideration, for an equal amount of the securities of the same issuer as the securities sold short (a short sale “against-the-box”).
In addition, certain Funds may also sell a security it does not own in anticipation of a decline in the market value of that security (a “short sale”). To complete such a transaction, a Fund must borrow the security to make delivery to the buyer. A Fund is then obligated to replace the security borrowed by purchasing it at market price at the time of replacement. The price at such time may be more or less than the price at which the security was sold by a Fund. Until the security is replaced, a Fund is
SIGNIFICANT ACCOUNTING POLICIES, CONTINUED
required to pay the lender any dividends or interest that accrues during the period of the loan. To borrow the security, a Fund also may be required to pay a premium, which would increase the cost of the security sold. The proceeds of the short sale will be retained by the broker, to the extent necessary to meet margin requirements, until the short position is closed out.
Until a Fund replaces a borrowed security, it will maintain cash or other liquid assets at such a level that will equal the current value of the security sold short; and will not be less than the market value of the security at the time it was sold short. A Fund will incur a loss as a result of the short sale if the price of the security increases between the date of the short sale and the date on which a Fund replaced the borrowed security. A Fund will realize a gain if the security declines in price between those dates. The amount of any gain will be decreased, and the amount of any loss increased, by the amount of any premium, dividends or interest the Fund may be required to pay in connection with a short sale.
Term Loans (Floating Rate Loans) Certain Funds may invest in term loans, which often include debt securities that are rated below investment grade at the time of purchase. Term loans are generally subject to legal or contractual restrictions on resale. The liquidity of term loans, including the volume and frequency of secondary market trading in such loans, varies significantly over time and among individual loans. During periods of infrequent trading, valuing a term loan can be more difficult and buying and selling a term loan at an acceptable price can be more difficult and delayed, which could result in a loss.
A Fund’s ability to receive payments of principal, interest and other amounts in connection with term loans will depend primarily on the financial condition of the borrower. A Fund’s failure to receive scheduled payments on a term loan due to a default, bankruptcy or other reason, would adversely affect the Fund’s income and would likely reduce the value of its assets. Because many term loans are not rated by independent credit rating agencies, a decision to invest in a particular loan could depend exclusively on the subadviser’s credit analysis of the borrower and/or term loan agents. A Fund may have limited rights to enforce the terms of an underlying loan.
Security Transactions and Related Investment Income Investment security transactions are accounted for on a trade date plus one basis for daily net asset value calculations. However, for financial reporting purposes, investment transactions are reported on trade date. Interest income is accrued as earned. Gains and losses on securities sold are determined on the basis of identified cost and may include proceeds from litigation. Dividend income is recorded on the ex-date, except for dividends of foreign securities where the dividend may not be known until after the ex-date. In those cases, dividend income is recorded when the Fund becomes aware of the dividends. Interest income includes coupon interest and amortization/accretion of premiums/discounts on debt securities. Debt obligations may be placed in a non-accrual status and related interest income may be reduced by stopping current accruals and writing off interest receivable when the collection of all or a portion of interest has become doubtful.
Inflation Indexed Bonds Inflation-indexed bonds, including Treasury Inflation Protected Securities (TIPs), are securities that generally have a lower coupon interest rate fixed at issuance but whose principal value is periodically adjusted to a rate of inflation, such as the Consumer Price Index. Over the life of an inflation-indexed bond, interest is paid on the inflation adjusted principal value as described above. Increases in the principal amount of these securities are recorded as interest income. Decreases in the principal amount of these securities reduce interest income to the extent of income recorded in the current fiscal period. Excess amounts are recorded as an adjustment to cost.
Payment-In-Kind Bonds The Funds may invest in payment-in-kind bonds (PIK Bonds). PIK Bonds allow the issuer, at its option, to make current interest payments on the bonds either in cash or in additional bonds. The market prices of PIK Bonds are affected to a greater extent by interest rate changes and thereby tend to be more volatile than securities which pay cash interest periodically. The Funds accrue income on these securities and this income is required to be distributed to shareholders. Because no cash is received at the time income accrues on these securities, the Funds may need to sell other investments to make distributions.
Real Estate Investment Trusts From time to time, the Funds may invest in real estate investment trusts (REITs) and, as a result, will estimate the components of distributions from these securities. Distributions from REITs received in excess of income are recorded as a reduction of cost of investments and/or as a realized gain.
Securities Lending Certain Funds may lend securities to earn additional income. Each Fund receives and maintains cash collateral received from the borrower in an amount not less than the market value of the loaned securities. The Funds will invest collateral in John Hancock Collateral Investment Trust (JHCIT), an affiliate of the Fund, and as a result, the Funds will receive the benefit of any gains and bear any losses generated by JHCIT. Although risk of the loss of the securities lent is mitigated by holding the collateral, the Funds could experience a delay in recovering securities and a possible loss of income or value if the borrower fails to return the securities or if collateral investments decline in value. The Funds may receive compensation for lending securities by retaining a portion of the return on the investment of the collateral and compensation from fees earned from borrowers of the securities. Income received from JHCIT is a component of securities lending income as recorded on the Statement of Operations.
Foreign Currency Translation Assets, including investments and liabilities denominated in foreign currencies, are translated into U.S. dollar values each day at the prevailing exchange rate. Purchases and sales of securities, income and expenses are translated into U.S. dollars at the prevailing exchange rate on the date of the transaction. The effect of changes in foreign currency exchange rates on securities is reflected as a component of the realized and unrealized gains (losses) on investments.
Funds that invest internationally generally carry more risk than funds that invest strictly in U.S. securities. Risks can result from differences in economic and political conditions, regulations, market practices (including higher transaction costs) and accounting standards. Foreign investments are also subject to a decline in the value of a foreign currency versus the U.S. dollar, which reduces the dollar value of securities denominated in that currency.
The Funds may be subject to capital gains and repatriation taxes as imposed by certain countries in which they invests. Such taxes are generally based upon income and/or capital gains earned or repatriated. Taxes are accrued based upon net investment income, net realized gains and net unrealized appreciation.
Stripped Securities Stripped mortgage backed securities are financial instruments structured to separate principal and interest cash flows so that one class receives the entire principal from the underlying mortgage assets (PO or principal only), while the other class receives the interest cash flows (IO or interest only). Both PO and IO investments represent an interest in the cash flows of an underlying stripped mortgage backed security. If the underlying mortgage assets experience greater than anticipated prepayments of principal, the Funds may fail to fully receive their initial investment in an IO security. The market value of these securities can be extremely volatile in response to changes in interest rates. In addition, these securities present additional credit risk such that the Funds may not receive all or part of their principal or interest payments because the borrower or issuer has defaulted on its obligation.
SIGNIFICANT ACCOUNTING POLICIES, CONTINUED
Line of Credit The Funds may borrow from banks for temporary or emergency purposes, including meeting redemption requests that otherwise might require the untimely sale of securities. Pursuant to the custodian agreement, the custodian may loan money to a Fund to make properly authorized payments. The Funds are obligated to repay the custodian for any overdraft, including any related costs or expenses. The custodian has a lien, security interest or security entitlement in any Fund property that is not segregated, to the maximum extent permitted by law for any overdraft.
In addition, the Funds and other affiliated funds have entered into an agreement with State Street Bank and Trust Company (SSBT) which enables them to participate in a $200 million unsecured committed line of credit. A commitment fee, payable at the end of each calendar quarter, based on the average daily unused portion of the line of credit, is charged to each participating fund on a pro rata basis and is reflected in other expenses on the Statement of Operations. For the period ended February 28, 2011, the Funds had no borrowings under the line of credit.
Effective March 30, 2011, the line of credit with SSBT expired and a similar arrangement was established with Citibank N.A.
Expenses The majority of expenses are directly attributable to an individual fund. Expenses that are not readily attributable to a specific fund are allocated among all funds in an equitable manner, taking into consideration, among other things, the nature and type of expense and the fund’s relative assets. Expense estimates are accrued in the period to which they relate and adjustments are made when actual amounts are known.
Class Allocations Income, common expenses, and realized and unrealized gains (losses) are determined at the fund level and allocated daily to each class of shares based on the net asset value of the class. Class-specific expenses, such as distribution and service fees, if any, transfer agent fees, state registration fees and printing and postage, for all classes, are calculated daily at the class level based on the appropriate net asset value of each class and the specific expense rates applicable to each class.
Federal Income Taxes The Funds intend to continue to qualify as regulated investment companies by complying with the applicable provisions of the Internal Revenue Code and will not be subject to federal income tax on taxable income that is distributed to shareholders. Therefore, no federal income tax provision is required.
For federal income tax purposes, certain Funds have capital loss carryforwards available to offset future net realized capital gains. The following table details the capital loss carryforward available as of August 31, 2010.
| | | | | |
| | | CAPITAL LOSS CARRYFORWARDS | |
| | | EXPIRING AT AUGUST 31 | |
| FUND | 2014 | 2015 | 2016 | 2017 | 2018 |
|
| All Cap Core Fund | — | — | — | $161,190,786 | $83,604,897 |
| Blue Chip Growth Fund | — | — | $30,360 | 201,660,850 | 243,929,588 |
| Capital Appreciation Fund | $21,055 | $15,745,631 | 7,209,640 | 159,559,023 | 33,983,723 |
| Equity-Income Fund | — | — | | 77,245,378 | 91,896,968 |
| Fundamental Value Fund | — | — | — | 67,420,909 | 241,358,537 |
| Global Bond Fund | — | — | — | 26,092,479 | — |
| Global Real Estate Fund | — | — | 9,668,659 | 49,590,388 | 207,343,435 |
| High Income Fund | — | — | — | 6,152,875 | 2,712,429 |
| High Yield Fund | — | — | 991,060 | 66,823,008 | 229,714,878 |
| Index 500 Fund | — | — | — | 15,771,272 | 200,933,455 |
| International Equity Index Fund | — | — | — | 3,637,697 | 77,060,203 |
| International Opportunities Fund | — | — | — | 124,967,978 | 120,549,657 |
| International Small Cap Fund | — | — | — | — | 76,750,929 |
| International Small Company Fund | — | — | — | — | 130,964,900 |
| International Value Fund | — | — | — | 15,012,374 | 197,105,545 |
| Investment Quality Bond Fund | — | — | — | 3,399,479 | 2,500,698 |
| Large Cap Fund | — | — | — | 40,155,382 | 79,956,914 |
| Large Cap Value Fund | — | — | 2,565,968 | 78,527,943 | 130,485,979 |
| Mid Cap Index Fund | — | — | — | 2,614,050 | 1,625,550 |
| Mid Cap Stock Fund | — | — | — | 84,455,365 | 59,353,578 |
| Mid Cap Value Equity Fund | — | — | — | 1,586,750 | 13,512,695 |
| Optimized Value | — | — | 6,372,104 | 216,637,523 | 139,759,660 |
| Real Estate Equity Fund | — | — | — | 9,589,346 | 46,833,838 |
| Real Estate Securities Fund | — | — | — | 6,783,480 | 6,943,457 |
| Small Cap Index Fund | — | — | — | 868,942 | 21,671,436 |
| Small Cap Opportunities Fund | — | — | 869,705 | 13,904,174 | 20,931,052 |
| Small Company Growth Fund | — | — | — | 14,620,860 | 15,881,406 |
| Small Company Value Fund | — | — | — | 7,019,758 | 42,434,468 |
| Spectrum Income Fund | — | — | — | 16,131,303 | 18,496,559 |
| U.S. High Yield Bond Fund | — | — | 469,396 | 13,647,086 | 4,845,131 |
| U.S. Multi-Sector Fund | — | — | 3,502,461 | 108,759,462 | 66,810,220 |
| Value & Restructuring Fund | — | — | 1,288,503 | 52,994,469 | 75,764,790 |
Under the recently enacted Regulated Investment Company Modernization Act of 2010, the Funds will be permitted to carry forward capital losses incurred in taxable years beginning after December 22, 2010 for an unlimited period. However, any losses incurred during those future taxable years will be required to be utilized prior to the losses incurred in pre-enactment taxable years. As a result of this ordering rule, pre-enactment capital loss carryforwards may be more likely to expire unused. Additionally, post-enactment capital losses that are carried forward will retain their character as either short-term or long-term capital losses rather than being considered all short-term as under previous law.
As of August 31, 2010, the Funds have no uncertain tax positions that would require financial statement recognition, de-recognition or disclosure. The Funds’ federal tax return are subject to examination by the Internal Revenue Service for a period of three years.
SIGNIFICANT ACCOUNTING POLICIES, CONTINUED
The costs of investments owned on February 28, 2011, including short-term investments, for federal income tax purposes, were as follows:
| | | | |
| | | | | Net Unrealized |
| | Aggregate | Unrealized | Unrealized | Appreciation |
| Fund | Cost | Appreciation | Depreciation | (Depreciation) |
|
| Active Bond Fund | $1,166,251,003 | $67,214,659 | ($22,950,425) | $44,264,234 |
| All Cap Core Fund | 669,781,349 | 83,368,592 | (3,908,843) | 79,459,749 |
| All Cap Value Fund | 513,213,016 | 128,970,816 | (1,974,244) | 126,996,572 |
| Alpha Opportunities Fund | 1,508,338,035 | 193,033,313 | (15,445,782) | 177,587,531 |
| Blue Chip Growth Fund | 1,764,837,639 | 786,587,221 | (137,153) | 786,450,068 |
| Capital Appreciation Fund | 1,518,758,456 | 491,712,177 | (1,382,368) | 490,329,809 |
| Capital Appreciation Value Fund | 313,797,073 | 11,519,133 | (1,957,801) | 9,561,332 |
| Core Bond Fund | 657,485,647 | 6,070,570 | (3,241,650) | 2,828,920 |
| Core Diversified Growth & Income Portfolio | 24,563,358 | 3,873,917 | (129,513) | 3,744,404 |
| Core Fundamental Holdings Portfolio | 11,396,299 | 1,755,442 | (61,705) | 1,693,737 |
| Core Global Diversification Portfolio | 27,572,507 | 2,837,520 | (171,984) | 2,665,536 |
| Emerging Markets Fund | 1,858,283,997 | 509,650,717 | (63,200,244) | 446,450,473 |
| Emerging Markets Debt Fund | 14,927,951 | 755,168 | (52,953) | 702,215 |
| Equity-Income Fund | 1,390,033,952 | 217,472,762 | (17,963,083) | 199,509,679 |
| Fundamental Value Fund | 1,338,731,039 | 384,871,953 | (5,944,503) | 378,927,450 |
| Global Agribusiness Fund | 2,186,592 | 1,010,844 | (3,076) | 1,007,768 |
| Global Bond Fund | 989,601,902 | 23,240,750 | (24,134,748) | (893,998) |
| Global Infrastructure Fund | 2,207,411 | 487,295 | (11,826) | 475,469 |
| Global Real Estate Fund | 495,673,167 | 66,493,197 | (4,946,634) | 61,546,563 |
| Global Timber Fund | 2,271,305 | 828,107 | (20,939) | 807,168 |
| Heritage Fund | 212,921,807 | 63,183,481 | (1,424,267) | 61,759,214 |
| High Income Fund | 467,173,286 | 80,287,965 | (87,080,155) | (6,792,190) |
| High Yield Fund | 821,489,273 | 66,309,557 | (40,741,560) | 25,567,997 |
| Index 500 Fund | 1,757,135,016 | 583,404,864 | (11,319,908) | 572,084,956 |
| International Equity Index Fund | 398,140,324 | 98,333,091 | (14,251,219) | 84,081,872 |
| International Growth Stock Fund | 169,454,675 | 16,520,270 | (2,702,282) | 13,817,988 |
| International Opportunities Fund | 638,787,629 | 130,290,254 | (782,503) | 129,507,751 |
| International Small Cap Fund | 307,317,671 | 95,983,927 | (25,679,460) | 70,304,467 |
| International Small Company Fund | 208,617,650 | 42,766,879 | (31,663,129) | 11,103,750 |
| International Value Fund | 1,275,283,977 | 196,814,337 | (109,011,821) | 87,802,516 |
| Investment Quality Bond Fund | 471,516,652 | 9,884,669 | (5,790,055) | 4,094,614 |
| Large Cap Fund | 317,424,425 | 52,668,824 | (4,080,565) | 48,588,259 |
| Large Cap Value Fund | 189,103,847 | 5,230,157 | (1,641,086) | 3,589,071 |
| Mid Cap Growth Index Fund | 58,604,465 | 12,331,397 | (938,466) | 11,392,931 |
| Mid Cap Index Fund | 326,059,493 | 106,952,544 | (1,539,439) | 105,413,105 |
| Mid Cap Stock Fund | 1,131,146,537 | 250,979,247 | (20,849,529) | 230,129,718 |
| Mid Cap Value Equity Fund | 170,935,548 | 52,696,280 | (284,087) | 52,412,193 |
| Mid Cap Value Index Fund | 61,585,631 | 7,827,473 | (1,183,428) | 6,644,045 |
| Mid Value Fund | 526,788,061 | 119,291,092 | (2,940,951) | 116,350,141 |
| Mutual Shares Fund | 336,814,906 | 36,120,661 | (1,799,430) | 34,321,231 |
| Optimized Value Fund | 378,071,533 | 22,497,535 | (6,920,083) | 15,577,452 |
| Real Estate Equity Fund | 372,918,824 | 72,994,452 | (61,043) | 72,933,409 |
| Real Estate Securities Fund | 479,760,945 | 102,947,153 | (301,504) | 102,645,649 |
| Real Return Bond Fund | 1,108,002,548 | 14,337,871 | (14,209,260) | 128,611 |
| Retirement 2010 Portfolio | 10,071,518 | 75,352 | — | 75,352 |
| Retirement 2015 Portfolio | 13,041,778 | 147,167 | — | 147,167 |
| Retirement 2020 Portfolio | 18,434,040 | 375,256 | — | 375,256 |
| Retirement 2025 Portfolio | 22,243,483 | 676,904 | (6,475) | 670,429 |
| Retirement 2030 Portfolio | 16,181,752 | 511,419 | (9,169) | 502,250 |
| Retirement 2035 Portfolio | 13,515,356 | 491,018 | (187) | 490,831 |
| Retirement 2040 Portfolio | 7,656,877 | 257,281 | — | 257,281 |
| Retirement 2045 Portfolio | 7,538,557 | 239,493 | — | 239,493 |
| Short Term Government Income Fund | 129,753,129 | 537,993 | (911,515) | (373,522) |
| Small Cap Growth Fund | 195,192,123 | 44,394,733 | (914,220) | 43,480,513 |
| Small Cap Index Fund | 73,987,106 | 29,311,466 | (1,112,967) | 28,198,499 |
| Small Cap Opportunities Fund | 169,277,175 | 65,675,790 | (2,362,241) | 63,313,549 |
| Small Cap Value Fund | 128,435,621 | 47,026,109 | (719,839) | 46,306,270 |
| Small Company Growth Fund | 133,317,803 | 45,556,983 | (1,231,742) | 44,325,241 |
| Small Company Value Fund | 473,444,864 | 118,287,479 | (13,060,805) | 105,226,674 |
| Smaller Company Growth Fund | 134,592,146 | 34,255,876 | (2,154,490) | 32,101,386 |
| Spectrum Income Fund | 1,006,802,722 | 58,847,769 | (10,327,044) | 48,520,725 |
| Total Bond Market Fund | 296,600,970 | 17,200,845 | (1,171,372) | 16,029,473 |
| Total Return Fund | 2,874,023,251 | 65,606,164 | (39,539,063) | 26,067,101 |
| U.S. High Yield Bond Fund | 588,321,448 | 45,802,757 | (2,992,614) | 42,810,143 |
SIGNIFICANT ACCOUNTING POLICIES, CONTINUED
| | | | |
| | | | | Net Unrealized |
| | Aggregate | Unrealized | Unrealized | Appreciation |
| Fund | Cost | Appreciation | Depreciation | (Depreciation) |
|
| U.S. Multi-Sector Fund | $1,023,376,756 | $140,556,861 | ($4,032,536) | $136,524,325 |
| Value Fund | 145,402,744 | 49,675,616 | (404,122) | 49,271,494 |
| Value & Restructuring Fund | 484,836,897 | 214,666,312 | (348,009) | 214,318,303 |
Distribution of Income and Gains Distributions to shareholders from net investment income and net realized gains, if any, are recorded on the ex-date. Emerging Markets Debt Fund generally declares dividends daily and pays them monthly. Active Bond Fund, Core Bond Fund, High Income Fund, High Yield Fund, Investment Quality Bond Fund, Real Return Bond Fund, Short Term Government Income Fund, Spectrum Income Fund, Total Bond Market Fund, Total Return Fund and U.S. High Yield Bond Fund generally declare and pay dividends quarterly. All other funds generally declare and pay dividends annually. All Funds generally declare and pay capital gain distributions, if any, annually.
Distributions paid by the Funds with respect to each class of shares are calculated in the same manner, at the same time and in the same amount, except for the effect of expenses that may be applied differently to each class.
Such distributions, on a tax basis, are determined in conformity with income tax regulations, which may differ from accounting principles generally accepted in the United States of America. Short term gains from underlying funds are treated as ordinary income for tax purposes.
Capital accounts within financial statements are adjusted for permanent book-tax differences. These adjustments have no impact on net assets or the results of operations. Temporary book-tax differences, if any, will reverse in a subsequent period. Permanent book-tax differences are primarily attributable to foreign currency transactions, net operating losses, pay-downs, real estate investment trusts, defaulted bonds, derivative transactions, partnerships, amortization and accretion on debt securities, Treasury Inflation-Protected securities, tender fees and investments in passive foreign investment companies.
3. DERIVATIVE INSTRUMENTS The Funds may invest in derivatives in order to meet their investment objectives. The use of derivatives may involve risks different from, or potentially greater than, the risks associated with investing directly in securities. Specifically, derivatives expose the Funds to the risk that the counterparty to an over-the-counter (OTC) derivatives contract will be unable or unwilling to make timely settlement payments or otherwise honor its obligations. OTC derivatives transactions typically can only be closed out with the other party to the transaction. If the counterparty defaults, the Funds will have contractual remedies, but there is no assurance that the counterparty will meet its contractual obligations or that the Funds will succeed in enforcing them.
Futures A futures contract is a contractual agreement to buy or sell a particular commodity, currency, or financial instrument at a pre-determined price in the future. Risks related to the use of futures contracts include possible illiquidity of the futures markets, contract prices that can be highly volatile and imperfectly correlated to movements in hedged security values and/or interest rates and potential losses in excess of the amounts recognized on the Statements of Assets and Liabilities.
Futures contracts are valued at the quoted daily settlement prices established by the exchange on which they trade. Upon entering into a futures contract, the Funds are required to deposit initial margin with the broker in the form of cash or securities. The amount of required margin is generally based on a percentage of the contract value; this amount is the initial margin for the trade. The margin deposit must then be maintained at the established level over the life of the contract. Futures contracts are marked-to-market daily and an appropriate payable or receivable for the change in value (variation margin) is recorded by the Funds.
The following table summarizes the contracts held at February 28, 2011 and the range of futures contracts notional amounts held by the Funds during the six months ended February 28, 2011. In addition, the table details how the Funds used futures contracts during the six months ended February 28, 2011.
Active Bond Fund
The Fund used futures contracts to manage duration of the Fund. During the period ended February 28, 2011, the Fund held futures contracts with total absolute values ranging from approximately $12.3 million to $12.9 million, as measured at each quarter end.
| | | | | | |
| | | | | | | UNREALIZED |
| | | NUMBER | | EXPIRATION | | APPRECIATION |
| FUND | OPEN CONTRACTS | OF CONTRACTS | POSITION | DATE | VALUE | (DEPRECIATION) |
|
| Active Bond Fund | U.S. Treasury 30-Year Bond Futures | 21 | Long | Jun 2011 | $2,527,219 | $22,909 |
| | U.S. Treasury 5-Year Note Futures | 62 | Short | Jun 2011 | (7,250,125) | (22,941) |
| | U.S. Treasury 10-Year Note Futures | 21 | Short | Jun 2011 | (2,499,984) | (10,723) |
|
| | | | | | | ($10,755) |
All Cap Core Fund
The Fund used futures contracts as a substitute for securities purchased. During the period ended February 28, 2011, the Fund held futures contracts with total absolute values ranging from approximately $8.1 million to $9.4 million, as measured at each quarter end.
| | | | | | |
| | | | | | | UNREALIZED |
| | | NUMBER | | EXPIRATION | | APPRECIATION |
| FUND | OPEN CONTRACTS | OF CONTRACTS | POSITION | DATE | VALUE | (DEPRECIATION) |
|
| All Cap Core Fund | Russell 2000 Mini Index Futures | 14 | Long | Mar 2011 | $1,152,060 | $68,880 |
| | S&P Emini Index Futures | 125 | Long | Mar 2011 | 8,288,125 | 447,518 |
|
| | | | | | | $516,398 |
DERIVATIVE INSTRUMENTS, CONTINUED
Emerging Markets Debt Fund
The Fund used futures contracts to manage duration of the fund. During the period ended February 28, 2011, the Fund held futures contracts with total absolute values ranging from $0 to approximately $595.2 thousand, as measured at each quarter end.
| | | | | | |
| | | | | | | UNREALIZED |
| | | NUMBER | | EXPIRATION | | APPRECIATION |
| FUND | OPEN CONTRACTS | OF CONTRACTS | POSITION | DATE | VALUE | (DEPRECIATION) |
|
| Emerging Markets Debt Fund | U.S. Treasury 10-Year Note Futures | 5 | Short | June 2011 | ($595,234) | ($951) |
|
| | | | | | | ($951) |
Global Bond Fund
The Fund used futures contracts to enhance potential gain, manage duration of the Fund, manage against anticipated interest rate changes, maintain diversity and liquidity of the Fund and as a substitute for securities purchased. During the period ended February 28, 2011, the Fund held futures contracts with total absolute values ranging from approximately $179.2 million to $1.9 billion, as measured at each quarter end.
| | | | | | |
| | | | | | | UNREALIZED |
| | | NUMBER | | EXPIRATION | | APPRECIATION |
| FUND | OPEN CONTRACTS | OF CONTRACTS | POSITION | DATE | VALUE | (DEPRECIATION) |
|
| Global Bond Fund | 3-Month EURIBOR Futures | 493 | Long | Jun 2011 | $167,595,672 | ($107,222) |
| | 3-Month EURIBOR Futures | 1,561 | Long | Sep 2011 | 529,262,803 | (1,013,004) |
| | 3-Month EURIBOR Futures | 1,462 | Long | Dec 2011 | 494,612,089 | (1,465,490) |
| | 3-Month EuroYen TIBOR Futures | 1,488 | Long | Jun 2011 | 453,171,078 | 17,542 |
| | 10-Year Japan Government Bond Futures | 9 | Long | Mar 2011 | 15,351,873 | (40,340) |
| | Eurodollar Futures | 180 | Long | Jun 2011 | 44,835,750 | 15,750 |
| | Eurodollar Futures | 522 | Long | Sep 2011 | 129,912,750 | 45,675 |
| | Eurodollar Futures | 275 | Long | Dec 2011 | 68,330,625 | 30,938 |
|
| | | | | | | ($2,516,151) |
Heritage Fund
The Fund used futures contracts as a substitute for securities purchased. During the period ended February 28, 2011, the Fund held futures contracts with total absolute values ranging from $0 to approximately $3.1 million, as measured at each quarter end. At February 28, 2011, the Fund held no futures contracts.
High Yield Fund
The Fund used futures contracts to manage against anticipated interest rate changes. During the period ended February 28, 2011, the Fund held futures contracts with total absolute values ranging from approximately $56.3 million to $60.0 million, as measured at each quarter end.
| | | | | | |
| | | | | | | UNREALIZED |
| | | NUMBER | | EXPIRATION | | APPRECIATION |
| FUND | OPEN CONTRACTS | OF CONTRACTS | POSITION | DATE | VALUE | (DEPRECIATION) |
|
| High Yield Fund | U.S. Treasury Long-Term Bond Futures | 95 | Long | Jun 2011 | $11,741,406 | $355,558 |
| | U.S. Treasury 5-Year Note Futures | 381 | Short | Jun 2011 | (44,553,187) | (294,957) |
|
| | | | | | | $60,601 |
Index 500 Fund
The Fund used futures contracts as a substitute for securities purchased. During the period ended February 28, 2011, the Fund held futures contracts with total absolute values ranging from approximately $35.1 million to $81.2 million, as measured at each quarter end.
| | | | | | |
| | | | | | | UNREALIZED |
| | | NUMBER | | EXPIRATION | | APPRECIATION |
| FUND | OPEN CONTRACTS | OF CONTRACTS | POSITION | DATE | VALUE | (DEPRECIATION) |
|
| Index 500 Fund | S&P 500 Index Futures | 245 | Long | Mar 2011 | $81,223,625 | $4,779,557 |
|
| | | | | | | $4,779,557 |
International Equity Index Fund
The Fund used futures contracts as a substitute for securities purchased. During the period ended February 28, 2011, the Fund held futures contracts with total absolute values ranging from approximately $16.4 million to $21.5 million, as measured at each quarter end.
DERIVATIVE INSTRUMENTS, CONTINUED
| | | | | | |
| | | | | | | UNREALIZED |
| | | NUMBER | | EXPIRATION | | APPRECIATION |
| FUND | OPEN CONTRACTS | OF CONTRACTS | POSITION | DATE | VALUE | (DEPRECIATION) |
|
| International Equity Index Fund | ASX SPI 200 Index Futures | 16 | Long | Mar 2011 | $1,965,436 | $23,741 |
| | CAC 40 Index Futures | 37 | Long | Mar 2011 | 2,098,490 | 102,927 |
| | DAX Index Futures | 4 | Long | Mar 2011 | 1,003,983 | 32,646 |
| | FTSE 100 Index Futures | 27 | Long | Mar 2011 | 2,621,920 | 61,998 |
| | FTSE JSE Top 40 Index Futures | 20 | Long | Mar 2011 | 834,930 | 21,018 |
| | Hang Seng Index Futures | 5 | Long | Mar 2011 | 747,881 | 12,068 |
| | IBEX 35 Index Futures | 4 | Long | Mar 2011 | 598,871 | (1,684) |
| | MSCI Taiwan Index Futures | 91 | Long | Mar 2011 | 2,800,980 | (614) |
| | OMX 30 Index Futures | 55 | Long | Mar 2011 | 981,492 | (5,753) |
| | S&P TSE 60 Index Futures | 18 | Long | Mar 2011 | 3,011,024 | 227,365 |
| | Topix Index Futures | 42 | Long | Mar 2011 | 4,882,587 | 361,070 |
|
| | | | | | | $834,782 |
Investment Quality Bond Fund
The Fund used futures contracts to manage duration of the Fund, manage against anticipated interest rate changes and as a substitute for securities purchased. During the period ended February 28, 2011, the Fund held futures contracts with total absolute values ranging from approximately $65.4 million to $155.3 million, as measured at each quarter end.
| | | | | | |
| | | | | | | UNREALIZED |
| | | NUMBER | | EXPIRATION | | APPRECIATION |
| FUND | OPEN CONTRACTS | OF CONTRACTS | POSITION | DATE | VALUE | (DEPRECIATION) |
|
| Investment Quality Bond Fund | Australian 10-Year Treasury Bond Futures | 42 | Long | Mar 2011 | $4,439,016 | $34,267 |
| | U.K. Long Gilt Bond Futures | 62 | Long | Jun 2011 | 11,760,204 | 71,324 |
| | U.S. Treasury 2-Year Note Futures | 12 | Long | Jun 2011 | 2,619,563 | 535 |
| | U.S. Treasury 5-Year Note Futures | 272 | Long | Jun 2011 | 31,807,000 | 99,121 |
| | U.S. Treasury Long-Term Bond Futures | 31 | Long | Jun 2011 | 3,831,406 | 70,167 |
| | 10-Year German Euro-BUND Futures | 68 | Short | Mar 2011 | (11,646,998) | 120,952 |
| | 30-Year German Euro-BUXL Futures | 31 | Short | Mar 2011 | (4,500,293) | 151,525 |
| | U.S. Treasury 10-Year Note Futures | 679 | Short | Jun 2011 | (80,832,828) | (113,885) |
| | U.S. Treasury 30-Year Bond Futures | 32 | Short | Jun 2011 | (3,851,000) | (35,055) |
|
| | | | | | | $398,951 |
Mid Cap Growth Index Fund
The Fund used futures contracts as a substitute for securities purchased. During the period ended February 28, 2011, the Fund held futures contracts with total absolute values ranging from approximately $605.8 thousand to $851.9 thousand, as measured at each quarter end.
| | | | | | |
| | | | | | | UNREALIZED |
| | | NUMBER | | EXPIRATION | | APPRECIATION |
| FUND | OPEN CONTRACTS | OF CONTRACTS | POSITION | DATE | VALUE | (DEPRECIATION) |
|
| Mid Cap Growth Index Fund | S&P MidCap 400 E-Mini Index Futures | 8 | Long | Mar 2011 | $772,720 | $34,100 |
|
| | | | | | | $34,100 |
Mid Cap Index Fund
The Fund used futures contracts as a substitute for securities purchased. During the period ended February 28, 2011, the Fund held futures contracts with total absolute values ranging from approximately $6.6 million to $8.6 million, as measured at each quarter end.
| | | | | | |
| | | | | | | UNREALIZED |
| | | NUMBER | | EXPIRATION | | APPRECIATION |
| FUND | OPEN CONTRACTS | OF CONTRACTS | POSITION | DATE | VALUE | (DEPRECIATION) |
|
| Mid Cap Index Fund | S&P MidCap 400 E-Mini Index Futures | 88 | Long | Mar 2011 | $8,499,920 | $388,862 |
|
| | | | | | | $388,862 |
Mid Cap Value Index Fund
The Fund used futures contracts as a substitute for securities purchased. During the period ended February 28, 2011, the Fund held futures contracts with total absolute values ranging from approximately $1.3 million to $1.9 million, as measured at each quarter end.
| | | | | | |
| | | | | | | UNREALIZED |
| | | NUMBER | | EXPIRATION | | APPRECIATION |
| FUND | OPEN CONTRACTS | OF CONTRACTS | POSITION | DATE | VALUE | (DEPRECIATION) |
|
| Mid Cap Value Index Fund | S&P MidCap 400 E-Mini Index Futures | 15 | Long | Mar 2011 | $1,448,850 | $114,295 |
|
| | | | | | | $114,295 |
DERIVATIVE INSTRUMENTS, CONTINUED
Real Return Bond Fund
The Fund used futures contracts to enhance potential gain/income, manage duration of the Fund and manage against anticipated interest rate changes. During the period ended February 28, 2011, the Fund held futures contracts and total notional value ranging from approximately $82.8 million to $182.5 million, as measured at each quarter end.
| | | | | | |
| | | | | | | UNREALIZED |
| | | NUMBER | | EXPIRATION | | APPRECIATION |
| FUND | OPEN CONTRACTS | OF CONTRACTS | POSITION | DATE | VALUE | (DEPRECIATION) |
|
| Real Return Bond Fund | Eurodollar Futures | 145 | Long | Jun 2011 | $36,117,688 | $35,163 |
| | Eurodollar Futures | 389 | Long | Sep 2011 | 96,812,375 | 119,987 |
| | Eurodollar Futures | 200 | Long | Mar 2012 | 49,565,000 | (39,788) |
|
| | | | | | | $115,362 |
Small Cap Index Fund
The Fund used futures contracts as a substitute for securities purchased. During the period ended February 28, 2011, the Fund held futures contracts with total absolute values ranging from approximately $1.7 million to $4.8 million, as measured at each quarter end.
| | | | | | |
| | | | | | | UNREALIZED |
| | | NUMBER | | EXPIRATION | | APPRECIATION |
| FUND | OPEN CONTRACTS | OF CONTRACTS | POSITION | DATE | VALUE | (DEPRECIATION) |
|
| Small Cap Index Fund | Russell 2000 Mini Index Futures | 58 | Long | Mar 2011 | $4,772,820 | $234,706 |
|
| | | | | | | $234,706 |
Smaller Company Growth Fund
The Fund used futures contracts as a substitute for securities purchased. During the period ended February 28, 2011, the Fund held futures contracts with total absolute values ranging from approximately $363.3 thousand to $493.7 thousand, as measured at each quarter end.
| | | | | | |
| | | | | | | UNREALIZED |
| | | NUMBER | | EXPIRATION | | APPRECIATION |
| FUND | OPEN CONTRACTS | OF CONTRACTS | POSITION | DATE | VALUE | (DEPRECIATION) |
|
| Smaller Company Growth Fund | Russell 2000 Mini Index Futures | 6 | Long | Mar 2011 | $493,740 | $17,140 |
|
| | | | | | | $17,140 |
Spectrum Income Fund
The Fund used futures contracts to manage duration of the Fund, manage against anticipated interest rate changes and gain exposure to foreign currency. During the period ended February 28, 2011 the Fund held futures contracts with total absolute values ranging from approximately $3.5 million to $12.7 million, as measured at each quarter end.
| | | | | | |
| | | | | | | UNREALIZED |
| | | NUMBER | | EXPIRATION | | APPRECIATION |
| FUND | OPEN CONTRACTS | OF CONTRACTS | POSITION | DATE | VALUE | (DEPRECIATION) |
|
| Spectrum Income Fund | U.S. Treasury 5-Year Note Futures | 13 | Long | Jun 2011 | $1,520,188 | $3,096 |
| | U.S. Treasury 10-Year Note Futures | 8 | Long | Jun 2011 | 952,375 | 2,093 |
| | U.S. Treasury Long-Term Bond Futures | 1 | Long | Jun 2011 | 123,594 | 2,355 |
| | U.K. Long Gilt Bond Futures | 2 | Short | Jun 2011 | (379,361) | (849) |
| | U.S. Treasury 5-Year Note Futures | 28 | Short | Jun 2011 | (3,274,250) | (5,447) |
| | U.S. Treasury 10-Year Note Futures | 35 | Short | Jun 2011 | (4,166,641) | (6,488) |
| | U.S. Treasury 30-Year Bond Futures | 2 | Short | Jun 2011 | (240,688) | (2,148) |
|
| | | | | | | ($7,388) |
Total Return Fund
The Fund used futures contracts to enhance potential gain/income, manage duration of the Fund, manage against anticipated interest rate changes, maintain diversity and liquidity of the Fund and as a substitute for securities purchased. During the period ended February 28, 2011, the Fund held futures contracts with total absolute values ranging from approximately $921.0 million to $2.8 billion, as measured at each quarter end.
| | | | | | |
| | | | | | | UNREALIZED |
| | | NUMBER | | EXPIRATION | | APPRECIATION |
| FUND | OPEN CONTRACTS | OF CONTRACTS | POSITION | DATE | VALUE | (DEPRECIATION) |
|
| Total Return Fund | Eurodollar Futures | 924 | Long | Mar 2011 | $230,272,350 | $258,025 |
| | Eurodollar Futures | 1,277 | Long | Jun 2011 | 318,084,738 | 544,287 |
| | Eurodollar Futures | 2,196 | Long | Sep 2011 | 546,529,500 | 688,813 |
| | Eurodollar Futures | 3,350 | Long | Dec 2011 | 832,391,250 | 1,377,700 |
| | Eurodollar Futures | 1,555 | Long | Mar 2012 | 385,367,875 | 36,463 |
| | Eurodollar Futures | 841 | Long | Jun 2012 | 207,684,950 | (357,050) |
| | Eurodollar Futures | 525 | Long | Sep 2012 | 129,169,688 | (904,063) |
DERIVATIVE INSTRUMENTS, CONTINUED
| | | | | | |
| | | | | | | UNREALIZED |
| | | NUMBER | | EXPIRATION | | APPRECIATION |
| FUND | OPEN CONTRACTS | OF CONTRACTS | POSITION | DATE | VALUE | (DEPRECIATION) |
|
| Total Return Fund, continued | Eurodollar Futures | 292 | Long | Dec 2012 | $71,598,400 | ($587,150) |
| | U.S. Treasury 2-Year Note Futures | 327 | Long | Jun 2011 | 71,383,078 | 86,016 |
|
| | | | | | | $1,143,041 |
U.S. Multi-Sector Fund
The Fund used futures contracts to gain exposure to certain securities markets. During the period ended February 28, 2011, the Fund held futures contracts with total absolute values ranging from $0 to approximately $6.1 million, as measured at each quarter end. At February 28, 2011, the Fund held no futures contracts.
Forward Foreign Currency Contracts A forward foreign currency contract is an agreement between two parties to buy and sell a specific currency at a price that is set on the date of the contract. The forward contract calls for delivery of the currency on a future date that is specified in the contract. Risks related to the use of forwards include the possible failure of counterparties to meet the terms of the forward agreement, the failure of the counterparties to timely post collateral, the risk that currency movements will not occur thereby reducing the Fund’s total return, and the potential for losses in excess of the amounts recognized on the Statements of Assets and Liabilities.
The market value of a forward foreign currency contract fluctuates with changes in foreign currency exchange rates. Forward foreign currency contracts are marked-to-market daily and the change in value is recorded by a Fund as an unrealized gain or loss. Realized gains or losses, equal to the difference between the value of the contract at the time it was opened and the value at the time it was closed, are recorded upon delivery or receipt of the currency.
The following table summarizes the contracts held at February 28, 2011 and the range of notional contract amounts held by the Funds during the six-month ended February 28, 2011. In addition, the table details how the Funds used forward foreign currency contracts during the six-month ended February 28, 2011.
Active Bond Fund
The Fund used forward foreign currency contracts to manage against anticipated currency exchange rate changes. During the period ended February 28, 2011, the Fund held forward foreign currency contracts with USD notional absolute values ranging from $0 to approximately $3.1 million, as measured at each quarter end.
| | | | | | | |
| | | PRINCIPAL | PRINCIPAL | | | | |
| | | AMOUNT | AMOUNT | | | | UNREALIZED |
| | | COVERED BY | COVERED BY | | | SETTLEMENT | APPRECIATION |
| FUND | CURRENCY | CONTRACT | CONTRACT (USD) | | COUNTERPARTY | DATE | (DEPRECIATION) |
|
| Active Bond | SELLS | | | | | | |
|
| | Pound Sterling | 1,950,984 | $3,098,162 | | Royal Bank of Scotland PLC | 3/31/2011 | ($72,698) |
| | | | $3,098,162 | | | | ($72,698) |
Alpha Opportunities Fund
The Fund used forward foreign currency contracts to manage against anticipated currency exchange rate changes. During the period ended February 28, 2011, the Fund held forward foreign currency contracts with USD notional absolute values ranging from $0 to approximately $5.3 million, as measured at each quarter end. At February 28, 2011, the Fund held no forward foreign currency contracts.
Emerging Markets Debts Fund
The Fund used forward foreign currency contracts to manage against anticipated currency exchange rate changes. During the period ended February 28, 2011, the Fund held forward foreign currency contracts with USD notional absolute values ranging from $0 to approximately $2.8 million, as measured at each quarter end.
| | | | | | | |
| | | PRINCIPAL | PRINCIPAL | | | | |
| | | AMOUNT | AMOUNT | | | | UNREALIZED |
| | | COVERED BY | COVERED BY | | | SETTLEMENT | APPRECIATION |
| FUND | CURRENCY | CONTRACT | CONTRACT (USD) | | COUNTERPARTY | DATE | (DEPRECIATION) |
|
| Emerging Markets Debt Fund | BUYS | | | | | | |
|
| | Australian Dollar | 500,000 | $491,050 | | Bank of Montreal | 3/31/2011 | $16,209 |
| | Canadian Dollar | 496,715 | 501,383 | | Toronto Dominion Bank | 3/31/2011 | 9,582 |
| | | | $992,433 | | | | $25,791 |
Global Bond Fund
The Fund used forward foreign currency contracts to enhance potential gain, manage against anticipated currency exchange rate changes, gain exposure to foreign currencies and to maintain diversity and liquidity of the Fund. During the period ended February 28, 2011, the Fund held forward foreign currency contracts with USD notional absolute values ranging from approximately $879.8 million to $1.2 billion, as measured at each quarter end.
| | | | | | | |
| | | PRINCIPAL | PRINCIPAL | | | | |
| | | AMOUNT | AMOUNT | | | | UNREALIZED |
| | | COVERED BY | COVERED BY | | | SETTLEMENT | APPRECIATION |
| FUND | CURRENCY | CONTRACT | CONTRACT (USD) | | COUNTERPARTY | DATE | (DEPRECIATION) |
|
| Global Bond Fund | BUYS | | | | | | |
|
| | Australian Dollar | 300,000 | $300,155 | | Barclays Bank PLC | 3/3/2011 | $5,253 |
| | Australian Dollar | 300,000 | 302,832 | | Bank of America N.A. | 4/29/2011 | 423 |
| | Australian Dollar | 9,594,000 | 9,415,931 | | Barclays Bank PLC | 4/29/2011 | 282,143 |
| | Australian Dollar | 200,000 | 196,210 | | Royal Bank of Scotland PLC | 4/29/2011 | 5,960 |
DERIVATIVE INSTRUMENTS, CONTINUED
| | | | | | | |
| | | PRINCIPAL | PRINCIPAL | | | | |
| | | AMOUNT | AMOUNT | | | | UNREALIZED |
| | | COVERED BY | COVERED BY | | | SETTLEMENT | APPRECIATION |
| FUND | CURRENCY | CONTRACT | CONTRACT (USD) | | COUNTERPARTY | DATE | (DEPRECIATION) |
|
| Global Bond Fund, continued | BUYS | | | | | | |
|
| | Brazilian Real | 604,905 | $354,700 | | Citibank N.A. | 3/2/2011 | $8,869 |
| | Brazilian Real | 604,905 | 356,540 | | Barclays Capital | 4/4/2011 | 5,116 |
| | Brazilian Real | 604,905 | 357,087 | | Citibank N.A. | 6/2/2011 | (337) |
| | Canadian Dollar | 200,000 | 201,515 | | Barclays Bank PLC | 3/3/2011 | 4,334 |
| | Canadian Dollar | 200,000 | 205,380 | | Bank of America N.A. | 3/17/2011 | 413 |
| | Canadian Dollar | 1,029,000 | 1,037,475 | | Citibank N.A. | 3/17/2011 | 21,331 |
| | | | | | Morgan Stanley & | | |
| | Canadian Dollar | 23,616,000 | 23,888,158 | | Company, Inc. | 3/17/2011 | 411,905 |
| | Chilean Peso | 11,892,800 | 24,197 | | Deutsche Bank AG London | 6/3/2011 | 626 |
| | Chinese Yuan | | | | | | |
| | Renminbi | 5,243,872 | 792,000 | | Barclays Capital | 4/7/2011 | 6,558 |
| | Chinese Yuan | | | | Credit Suisse First Boston | | |
| | Renminbi | 2,713,852 | 410,000 | | London | 4/7/2011 | 3,277 |
| | Chinese Yuan | | | | | | |
| | Renminbi | 1,693,755 | 256,000 | | HSBC Bank USA | 4/7/2011 | 1,932 |
| | Chinese Yuan | | | | | | |
| | Renminbi | 2,063,880 | 312,000 | | JPMorgan Chase Bank | 4/7/2011 | 2,296 |
| | Chinese Yuan | | | | Morgan Stanley & | | |
| | Renminbi | 14,456,988 | 2,184,000 | | Company, Inc. | 4/7/2011 | 17,570 |
| | Chinese Yuan | | | | | | |
| | Renminbi | 15,361,766 | 2,299,598 | | Barclays Capital | 6/15/2011 | 44,055 |
| | Chinese Yuan | | | | | | |
| | Renminbi | 11,611,655 | 1,770,831 | | Deutsche Bank AG London | 6/15/2011 | 690 |
| | Chinese Yuan | | | | | | |
| | Renminbi | 7,705,376 | 1,148,000 | | HSBC Bank USA | 6/15/2011 | 27,564 |
| | Chinese Yuan | | | | | | |
| | Renminbi | 15,517,000 | 2,360,000 | | JPMorgan Chase Bank | 6/15/2011 | 7,337 |
| | Chinese Yuan | | | | | | |
| | Renminbi | 30,243,209 | 4,515,373 | | Royal Bank of Scotland PLC | 6/15/2011 | 98,655 |
| | Chinese Yuan | | | | | | |
| | Renminbi | 7,508,850 | 1,130,000 | | Bank of America N.A. | 9/14/2011 | 18,126 |
| | Chinese Yuan | | | | | | |
| | Renminbi | 7,390,320 | 1,113,000 | | Citibank N.A. | 9/14/2011 | 17,002 |
| | Chinese Yuan | | | | | | |
| | Renminbi | 18,401,664 | 2,768,000 | | HSBC Bank USA | 9/14/2011 | 45,669 |
| | Chinese Yuan | | | | | | |
| | Renminbi | 36,862,580 | 5,537,000 | | JPMorgan Chase Bank | 9/14/2011 | 99,399 |
| | Chinese Yuan | | | | | | |
| | Renminbi | 1,046,000 | 162,802 | | Barclays Capital | 11/15/2011 | (2,548) |
| | Chinese Yuan | | | | | | |
| | Renminbi | 6,292,666 | 968,624 | | Citibank N.A. | 11/15/2011 | (4,548) |
| | Chinese Yuan | | | | | | |
| | Renminbi | 2,570,000 | 400,125 | | JPMorgan Chase Bank | 11/15/2011 | (6,385) |
| | Chinese Yuan | | | | | | |
| | Renminbi | 3,868,200 | 630,000 | | Bank of America N.A. | 9/8/2015 | (2,231) |
| | Chinese Yuan | | | | | | |
| | Renminbi | 6,668,200 | 1,092,925 | | Barclays Capital | 9/8/2015 | (10,744) |
| | Chinese Yuan | | | | | | |
| | Renminbi | 30,936,600 | 5,114,017 | | Citibank N.A. | 9/8/2015 | (93,325) |
| | Chinese Yuan | | | | | | |
| | Renminbi | 3,950,000 | 653,595 | | JPMorgan Chase Bank | 9/8/2015 | (12,550) |
| | Chinese Yuan | | | | Morgan Stanley & | | |
| | Renminbi | 3,753,050 | 610,000 | | Company, Inc. | 9/8/2015 | (918) |
| | Danish Krone | 30,214,000 | 5,590,071 | | BNP Paribas SA | 5/5/2011 | (788) |
| | Euro | 409,000 | 555,936 | | Bank of America N.A. | 3/3/2011 | 8,457 |
| | Euro | 763,000 | 1,033,945 | | BNP Paribas SA | 3/3/2011 | 18,943 |
| | Euro | 4,357,000 | 5,944,970 | | Citibank N.A. | 3/3/2011 | 67,395 |
| | Euro | 5,672,000 | 7,648,749 | | Credit Suisse London Branch | 3/3/2011 | 178,228 |
| | Euro | 16,734,000 | 23,040,809 | | Royal Bank of Scotland PLC | 3/3/2011 | 50,977 |
| | Euro | 775,000 | 1,048,203 | | Citibank N.A. | 4/19/2011 | 20,618 |
| | Euro | 20,979,000 | 28,531,167 | | Royal Bank of Scotland PLC | 4/19/2011 | 401,463 |
| | Indian Rupee | 123,633,000 | 2,700,000 | | Bank of America N.A. | 3/9/2011 | 27,832 |
| | Indian Rupee | 40,900,000 | 903,867 | | Citibank N.A. | 3/9/2011 | (1,452) |
| | Indian Rupee | 88,958,880 | 1,956,000 | | JPMorgan Chase Bank | 3/9/2011 | 6,784 |
DERIVATIVE INSTRUMENTS, CONTINUED
| | | | | | | |
| | | PRINCIPAL | PRINCIPAL | | | | |
| | | AMOUNT | AMOUNT | | | | UNREALIZED |
| | | COVERED BY | COVERED BY | | | SETTLEMENT | APPRECIATION |
| FUND | CURRENCY | CONTRACT | CONTRACT (USD) | | COUNTERPARTY | DATE | (DEPRECIATION) |
|
| Global Bond Fund, continued | BUYS | | | | | | |
|
| | Indian Rupee | 68,948,000 | $1,529,581 | | Royal Bank of Scotland PLC | 3/9/2011 | ($8,315) |
| | Indian Rupee | 422,835,535 | 9,021,795 | | Citibank N.A. | 8/12/2011 | 55,629 |
| | Indian Rupee | 38,400,000 | 821,390 | | Deutsche Bank AG London | 8/12/2011 | 2,980 |
| | Indonesian | | | | | | |
| | Rupiah | 22,954,000,000 | 2,495,000 | | JPMorgan Chase Bank | 4/15/2011 | 89,089 |
| | Indonesian | | | | | | |
| | Rupiah | 9,207,850,000 | 999,531 | | Citibank N.A. | 7/27/2011 | 18,128 |
| | Indonesian | | | | | | |
| | Rupiah | 8,377,950,000 | 893,267 | | HSBC Bank USA | 7/27/2011 | 32,671 |
| | Indonesian | | | | | | |
| | Rupiah | 2,702,000,000 | 294,368 | | JPMorgan Chase Bank | 7/27/2011 | 4,260 |
| | Indonesian | | | | | | |
| | Rupiah | 5,241,000,000 | 565,067 | | Deutsche Bank AG London | 10/31/2011 | 6,412 |
| | Indonesian | | | | | | |
| | Rupiah | 11,063,500,000 | 1,198,442 | | Royal Bank of Scotland PLC | 10/31/2011 | 7,924 |
| | Japanese Yen | 202,141,000 | 2,437,005 | | Citibank N.A. | 3/1/2011 | 34,006 |
| | Japanese Yen | 21,546,292,000 | 259,215,986 | | UBS AG | 3/28/2011 | 4,214,417 |
| | Malaysian | | | | | | |
| | Ringgit | 600,000 | 194,963 | | Barclays Capital | 8/11/2011 | (356) |
| | Malaysian | | | | | | |
| | Ringgit | 2,531,275 | 821,542 | | Citibank N.A. | 8/11/2011 | (531) |
| | Malaysian | | | | | | |
| | Ringgit | 1,019,852 | 331,390 | | HSBC Bank USA | 8/11/2011 | (604) |
| | Malaysian | | | | | | |
| | Ringgit | 600,000 | 194,710 | | JPMorgan Chase Bank | 8/11/2011 | (103) |
| | Mexican Peso | 1,897,727 | 155,000 | | Deutsche Bank AG London | 7/7/2011 | 111 |
| | Mexican Peso | 124,517,781 | 10,033,709 | | HSBC Bank USA | 7/7/2011 | 143,772 |
| | Mexican Peso | 24,367,776 | 1,968,000 | | UBS AG | 7/7/2011 | 23,704 |
| | Norwegian Krone | 37,155,000 | 6,450,129 | | Barclays Bank PLC | 5/5/2011 | 162,180 |
| | Philippine Peso | 11,000,000 | 255,102 | | Bank of America N.A. | 6/15/2011 | (3,385) |
| | Philippine Peso | 20,000,000 | 468,823 | | Citibank N.A. | 6/15/2011 | (11,156) |
| | Philippine Peso | 38,330,000 | 871,731 | | Citibank N.A. | 6/15/2011 | 5,388 |
| | Philippine Peso | 40,700,000 | 926,685 | | Citibank N.A. | 6/15/2011 | 4,668 |
| | Philippine Peso | 19,000,000 | 437,184 | | Citibank N.A. | 6/15/2011 | (2,400) |
| | Philippine Peso | 50,000,000 | 1,147,315 | | Citibank N.A. | 6/15/2011 | (3,148) |
| | Philippine Peso | 38,474,000 | 877,200 | | Deutsche Bank AG London | 6/15/2011 | 3,214 |
| | Philippine Peso | 28,905,000 | 660,384 | | HSBC Bank USA | 6/15/2011 | 1,059 |
| | Philippine Peso | 39,525,000 | 901,368 | | JPMorgan Chase Bank | 6/15/2011 | 3,096 |
| | | | | | Morgan Stanley & | | |
| | Philippine Peso | 87,995,980 | 1,999,000 | | Company, Inc. | 6/15/2011 | 14,643 |
| | Philippine Peso | 25,432,500 | 591,660 | | Royal Bank of Scotland PLC | 6/15/2011 | (9,679) |
| | Pound Sterling | 6,515,000 | 10,415,335 | | Bank of America N.A. | 3/21/2011 | 174,117 |
| | Pound Sterling | 5,729,000 | 9,048,270 | | Barclays Bank PLC | 3/21/2011 | 263,622 |
| | Pound Sterling | 21,689,000 | 34,921,583 | | Citibank N.A. | 3/21/2011 | 331,619 |
| | | | | | Credit Suisse London | | |
| | Pound Sterling | 253,000 | 405,691 | | Branch | 3/21/2011 | 5,534 |
| | Pound Sterling | 100,000 | 154,796 | | HSBC Bank USA | 3/21/2011 | 7,744 |
| | Pound Sterling | 6,336,000 | 9,850,836 | | Royal Bank of Canada | 3/21/2011 | 447,670 |
| | Pound Sterling | 8,701,000 | 13,983,636 | | Royal Bank of Scotland PLC | 3/21/2011 | 158,931 |
| | | | | | Goldman Sachs | | |
| | Singapore Dollar | 355,183 | 268,000 | | International | 3/9/2011 | 11,288 |
| | Singapore Dollar | 1,373,442 | 1,050,000 | | HSBC Bank USA | 3/9/2011 | 29,965 |
| | Singapore Dollar | 703,714 | 550,390 | | Barclays Bank PLC | 9/9/2011 | 3,570 |
| | Singapore Dollar | 200,000 | 156,548 | | Citibank N.A. | 9/9/2011 | 891 |
| | Singapore Dollar | 200,000 | 156,262 | | Citibank N.A. | 9/9/2011 | 1,177 |
| | Singapore Dollar | 200,000 | 156,357 | | JPMorgan Chase Bank | 9/9/2011 | 1,082 |
| | Singapore Dollar | 200,000 | 155,554 | | Royal Bank of Scotland PLC | 9/9/2011 | 1,885 |
| | South Korean | | | | | | |
| | Won | 2,802,824,000 | 2,516,000 | | Barclays Capital | 3/9/2011 | (32,493) |
| | South Korean | | | | Morgan Stanley & | | |
| | Won | 3,591,200,000 | 3,200,000 | | Company, Inc. | 3/9/2011 | (17,934) |
| | South Korean | | | | | | |
| | Won | 1,904,790,000 | 1,692,626 | | Barclays Capital | 5/9/2011 | (1,547) |
| | South Korean | | | | | | |
| | Won | 3,747,222,500 | 3,321,499 | | Citibank N.A. | 5/9/2011 | 5,297 |
DERIVATIVE INSTRUMENTS, CONTINUED
| | | | | | | |
| | | PRINCIPAL | PRINCIPAL | | | | |
| | | AMOUNT | AMOUNT | | | | UNREALIZED |
| | | COVERED BY | COVERED BY | | | SETTLEMENT | APPRECIATION |
| FUND | CURRENCY | CONTRACT | CONTRACT (USD) | | COUNTERPARTY | DATE | (DEPRECIATION) |
|
| Global Bond Fund, continued | BUYS | | | | | | |
|
| | South Korean | | | | Goldman Sachs | | |
| | Won | 107,234,785 | $94,497 | | International | 5/9/2011 | $707 |
| | South Korean | | | | | | |
| | Won | 251,000,000 | 223,588 | | HSBC Bank USA | 5/9/2011 | (750) |
| | South Korean | | | | | | |
| | Won | 8,868,672,600 | 7,667,474 | | JPMorgan Chase Bank | 5/9/2011 | 206,162 |
| | South Korean | | | | | | |
| | Won | 502,000,000 | 443,718 | | Royal Bank of Scotland PLC | 5/9/2011 | 1,960 |
| | South Korean | | | | | | |
| | Won | 2,612,770,000 | 2,302,000 | | Barclays Capital | 8/12/2011 | 21,250 |
| | South Korean | | | | Morgan Stanley & | | |
| | Won | 2,836,024,000 | 2,522,592 | | Company, Inc. | 8/12/2011 | (826) |
| | South Korean | | | | | | |
| | Won | 3,558,000,000 | 3,186,744 | | Royal Bank of Scotland PLC | 8/12/2011 | (23,005) |
| | Swedish Krona | 26,618,000 | 4,128,406 | | BNP Paribas SA | 5/5/2011 | 61,141 |
| | Taiwan Dollar | 683,025 | 22,884 | | Deutsche Bank AG London | 4/6/2011 | 98 |
| | Taiwan Dollar | 82,556,160 | 2,872,000 | | HSBC Bank USA | 4/6/2011 | (94,228) |
|
| | | | $576,046,400 | | | | $8,133,975 |
| |
| | SELLS | | | | | | |
|
| | Australian Dollar | 300,000 | $304,973 | | Bank of America N.A. | 3/3/2011 | ($435) |
| | Australian Dollar | 6,709,000 | 6,558,819 | | Deutsche Bank AG London | 4/29/2011 | (222,965) |
| | Brazilian Real | 604,905 | 359,207 | | Barclays Capital | 3/2/2011 | (4,361) |
| | Brazilian Real | 604,905 | 362,002 | | Citibank N.A. | 4/4/2011 | 346 |
| | Canadian Dollar | 200,000 | 205,436 | | Bank of America N.A. | 3/3/2011 | (413) |
| | Chinese Yuan | | | | | | |
| | Renminbi | 26,172,346 | 3,989,047 | | Citibank N.A. | 4/7/2011 | 3,413 |
| | Chinese Yuan | | | | | | |
| | Renminbi | 10,921,239 | 1,668,000 | | Barclays Capital | 6/15/2011 | 1,811 |
| | Euro | 11,662,000 | 15,833,556 | | BNP Paribas SA | 3/3/2011 | (259,215) |
| | | | | | Credit Suisse London | | |
| | Euro | 6,059,000 | 8,241,088 | | Branch | 3/3/2011 | (119,922) |
| | Euro | 3,604,000 | 4,979,034 | | Royal Bank of Canada | 3/3/2011 | 5,758 |
| | Euro | 36,287,000 | 49,679,083 | | Royal Bank of Scotland PLC | 3/3/2011 | (394,521) |
| | Euro | 14,839,000 | 20,441,568 | | Royal Bank of Scotland PLC | 4/4/2011 | (26,901) |
| | Indian Rupee | 283,735,015 | 6,214,355 | | Citibank N.A. | 3/9/2011 | (45,960) |
| | Indian Rupee | 38,400,000 | 842,660 | | Deutsche Bank AG London | 3/9/2011 | (4,596) |
| | Indian Rupee | 94,820 | 2,043 | | HSBC Bank USA | 3/9/2011 | (49) |
| | Indian Rupee | 98,203 | 2,121 | | JPMorgan Chase Bank | 3/9/2011 | (45) |
| | Indian Rupee | 111,842 | 2,413 | | UBS AG | 3/9/2011 | (55) |
| | Japanese Yen | 660,000,000 | 7,964,329 | | Citibank N.A. | 3/25/2011 | (104,840) |
| | Japanese Yen | 2,930,000,000 | 35,311,500 | | Royal Bank of Scotland PLC | 4/11/2011 | (514,961) |
| | Japanese Yen | 283,324,000 | 3,443,392 | | Citibank N.A. | 4/14/2011 | (21,021) |
| | Japanese Yen | 373,496,000 | 4,516,003 | | Royal Bank of Canada | 4/14/2011 | (51,010) |
| | Japanese Yen | 2,010,000,000 | 24,512,195 | | Citibank N.A. | 4/27/2011 | (68,008) |
| | | | | | Morgan Stanley & | | |
| | Pound Sterling | 2,091,000 | 3,398,178 | | Company, Inc. | 3/7/2011 | (914) |
| | Pound Sterling | 2,363,000 | 3,799,749 | | Bank of America N.A. | 3/21/2011 | (41,061) |
| | Pound Sterling | 16,810,000 | 26,213,833 | | Barclays Bank PLC | 3/21/2011 | (1,109,063) |
| | Pound Sterling | 8,807,000 | 13,769,980 | | BNP Paribas SA | 3/21/2011 | (544,878) |
| | Pound Sterling | 4,110,000 | 6,557,180 | | Citibank N.A. | 3/21/2011 | (123,195) |
| | Pound Sterling | 16,809,000 | 26,217,216 | | Deutsche Bank AG London | 3/21/2011 | (1,104,057) |
| | Pound Sterling | 13,537,000 | 21,250,230 | | Royal Bank of Scotland PLC | 3/21/2011 | (752,749) |
| | Singapore Dollar | 703,714 | 549,906 | | Barclays Bank PLC | 3/9/2011 | (3,439) |
| | Singapore Dollar | 624,911 | 480,314 | | Citibank N.A. | 3/9/2011 | (11,066) |
| | Singapore Dollar | 200,000 | 156,250 | | JPMorgan Chase Bank | 3/9/2011 | (1,014) |
| | Singapore Dollar | 200,000 | 155,509 | | Royal Bank of Scotland PLC | 3/9/2011 | (1,755) |
| | South African | | | | | | |
| | Rand | 92,876 | 13,576 | | JPMorgan Chase Bank | 7/28/2011 | 524 |
| | South Korean | | | | Morgan Stanley & | | |
| | Won | 2,836,024,000 | 2,546,946 | | Company, Inc. | 3/9/2011 | 34,021 |
| | South Korean | | | | | | |
| | Won | 3,558,000,000 | 3,216,998 | | Royal Bank of Scotland PLC | 3/9/2011 | 64,350 |
| | | | $303,758,689 | | | | ($5,422,246) |
DERIVATIVE INSTRUMENTS, CONTINUED
Heritage Fund
The Fund used forward foreign currency contracts to manage against anticipated currency exchange rate changes. During the period ended February 28, 2011, the Fund held foreign forward currency contracts with USD notional absolute values ranging from approximately $1.0 million to $1.7 million, as measured at each quarter end.
| | | | | | | |
| | | PRINCIPAL | PRINCIPAL | | | | |
| | | AMOUNT | AMOUNT | | | | UNREALIZED |
| | | COVERED BY | COVERED BY | | | SETTLEMENT | APPRECIATION |
| FUND | CURRENCY | CONTRACT | CONTRACT (USD) | | COUNTERPARTY | DATE | (DEPRECIATION) |
|
| Heritage Fund | SELLS | | | | | | |
|
| | Pound Sterling | 739,632 | $1,192,874 | | Bank of America N.A. | 3/31/2011 | ($9,222) |
|
| | | | $1,192,874 | | | | ($9,222) |
High Income Fund
The Fund used forward foreign currency contracts to manage against anticipated currency exchange rate changes. During the period ended February 28, 2011, the Fund held forward foreign currency contracts with USD notional absolute values ranging from approximately $1.2 million to $5.2 million, as measured at each quarter end.
| | | | | | | |
| | | PRINCIPAL | PRINCIPAL | | | | |
| | | AMOUNT | AMOUNT | | | | UNREALIZED |
| | | COVERED BY | COVERED BY | | | SETTLEMENT | APPRECIATION |
| FUND | CURRENCY | CONTRACT | CONTRACT (USD) | | COUNTERPARTY | DATE | (DEPRECIATION) |
|
| High Income Fund | SELLS | | | | | | |
|
| | Canadian Dollar | 4,140,000 | $4,178,906 | | Toronto Dominion Bank | 3/31/2011 | ($79,866) |
| | Pound Sterling | 615,000 | 976,620 | | Royal Bank of Scotland PLC | 3/31/2011 | (22,916) |
|
| | | | $5,155,526 | | | | ($102,782) |
High Yield Fund
The Fund used forward foreign currency contracts to manage against anticipated currency exchange rate changes. During the period ended February 28, 2011, the Fund held forward foreign currency contracts with USD notional absolute values ranging from approximately $14.2 million to $15.1 million, as measured at each quarter end.
| | | | | | | |
| | | PRINCIPAL | PRINCIPAL | | | | |
| | | AMOUNT | AMOUNT | | | | UNREALIZED |
| | | COVERED BY | COVERED BY | | | SETTLEMENT | APPRECIATION |
| FUND | CURRENCY | CONTRACT | CONTRACT (USD) | | COUNTERPARTY | DATE | (DEPRECIATION) |
|
| High Yield Fund | SELLS | | | | | | |
|
| | Euro | 4,305,000 | $5,862,764 | | JPMorgan Chase Bank | 3/15/2011 | ($76,936) |
| | Euro | 2,008,733 | 2,737,597 | | Citibank N.A. | 5/18/2011 | (31,528) |
| | Euro | 4,080,340 | 5,589,373 | | UBS AG London | 5/18/2011 | (35,553) |
|
| | | | $14,189,734 | | | | ($144,017) |
International Equity Index Fund
The Fund used forward foreign currency contracts to gain exposure to foreign currencies. During the period ended February 28, 2011, the Fund held forward foreign currency contracts with USD notional absolute values ranging from approximately $13.7 million to $15.8 million, as measured at each quarter end.
| | | | | | | |
| | | PRINCIPAL | PRINCIPAL | | | | |
| | | AMOUNT | AMOUNT | | | | UNREALIZED |
| | | COVERED BY | COVERED BY | | | SETTLEMENT | APPRECIATION |
| FUND | CURRENCY | CONTRACT | CONTRACT (USD) | | COUNTERPARTY | DATE | (DEPRECIATION) |
|
| International Equity Index Fund | BUYS | | | | | | |
|
| | Australian Dollar | 1,800,000 | $1,756,980 | | Standard Chartered Bank | 4/20/2011 | $64,597 |
| | Canadian Dollar | 2,500,000 | 2,517,167 | | Standard Chartered Bank | 4/20/2011 | 53,355 |
| | Euro | 2,400,000 | 3,110,184 | | Standard Chartered Bank | 4/20/2011 | 199,673 |
| | Hong Kong Dollar | 5,000,000 | 643,476 | | Standard Chartered Bank | 4/20/2011 | (1,153) |
| | Japanese Yen | 375,000,000 | 4,521,068 | | Standard Chartered Bank | 4/20/2011 | 64,545 |
| | Pound Sterling | 1,500,000 | 2,335,350 | | Standard Chartered Bank | 4/20/2011 | 102,058 |
| | Swedish Krona | 6,000,000 | 873,210 | | Standard Chartered Bank | 4/20/2011 | 71,879 |
|
| | | | $15,757,435 | | | | $554,954 |
DERIVATIVE INSTRUMENTS, CONTINUED
Investment Quality Bond Fund
The Fund used forward foreign currency contracts to manage against anticipated currency exchange rate changes and gain exposure to foreign currencies. During the period ended February 28, 2011, the Fund held forward foreign currency contracts with USD notional absolute values ranging from approximately $40.2 million to $100.4 million, as measured at each quarter end.
| | | | | | | |
| | | PRINCIPAL | PRINCIPAL | | | | |
| | | AMOUNT | AMOUNT | | | | UNREALIZED |
| | | COVERED BY | COVERED BY | | | SETTLEMENT | APPRECIATION |
| FUND | CURRENCY | CONTRACT | CONTRACT (USD) | | COUNTERPARTY | DATE | (DEPRECIATION) |
|
| Investment Quality Bond Fund | BUYS | | | | | | |
|
| | Australian Dollar | 5,150,000 | $5,085,115 | | Deutsche Bank AG London | 3/16/2011 | $149,310 |
| | Canadian Dollar | 1,700,000 | 1,710,468 | | Bank of America N.A. | 3/16/2011 | 38,808 |
| | Canadian Dollar | 1,437,000 | 1,441,975 | | Barclays Bank PLC | 3/16/2011 | 36,678 |
| | Canadian Dollar | 1,438,000 | 1,443,282 | | BNP Paribas SA | 3/16/2011 | 36,399 |
| | Euro | 4,015,000 | 5,388,893 | | Barclays Bank PLC | 3/16/2011 | 150,618 |
| | Euro | 3,071,000 | 4,202,234 | | JPMorgan Chase Bank | 3/16/2011 | 34,837 |
| | Euro | 3,655,000 | 4,741,047 | | UBS AG | 3/16/2011 | 301,771 |
| | Japanese Yen | 511,071,000 | 6,133,385 | | Bank of America N.A. | 3/16/2011 | 114,612 |
| | Norwegian Krone | 4,778,000 | 791,060 | | Deutsche Bank AG London | 3/16/2011 | 61,506 |
| | Norwegian Krone | 4,777,000 | 797,296 | | JPMorgan Chase Bank | 3/16/2011 | 55,091 |
| | Pound Sterling | 2,755,000 | 4,295,307 | | Barclays Bank PLC | 3/16/2011 | 182,841 |
| | South Korean Won | 1,936,050,000 | 1,711,425 | | UBS AG | 3/16/2011 | 4,189 |
| | Swedish Krona | 5,555,000 | 864,369 | | Citibank N.A. | 3/16/2011 | 12,114 |
| | Swedish Krona | 16,415,000 | 2,428,027 | | JPMorgan Chase Bank | 3/16/2011 | 161,974 |
|
| | | | $41,033,883 | | | | $1,340,748 |
| |
| | SELLS | | | | | | |
|
| | Australian Dollar | 2,100,000 | $2,069,490 | | Bank of America N.A. | 3/16/2011 | ($64,936) |
| | Australian Dollar | 565,000 | 567,543 | | Barclays Bank PLC | 3/16/2011 | (6,720) |
| | Australian Dollar | 3,135,000 | 3,046,907 | | Deutsche Bank AG London | 3/16/2011 | (139,487) |
| | Australian Dollar | 3,896,000 | 3,850,366 | | JPMorgan Chase Bank | 3/16/2011 | (109,502) |
| | Brazilian Real | 2,729,000 | 1,577,639 | | Citibank N.A. | 3/16/2011 | (58,910) |
| | Canadian Dollar | 850,000 | 863,602 | | BNP Paribas SA | 3/16/2011 | (11,036) |
| | Canadian Dollar | 2,875,000 | 2,900,185 | | Royal Bank of Canada | 3/16/2011 | (58,149) |
| | Canadian Dollar | 850,000 | 862,819 | | UBS AG | 3/16/2011 | (11,819) |
| | Chilean Peso | 611,250,000 | 1,280,507 | | Citibank N.A. | 3/31/2011 | (1,361) |
| | Euro | 4,867,000 | 6,450,757 | | Bank of America N.A. | 3/16/2011 | (264,261) |
| | Euro | 958,000 | 1,302,962 | | Barclays Bank PLC | 3/16/2011 | (18,795) |
| | Euro | 976,000 | 1,301,340 | | BNP Paribas SA | 3/16/2011 | (45,251) |
| | Euro | 327,000 | 438,621 | | Citibank N.A. | 3/16/2011 | (12,542) |
| | Euro | 1,395,000 | 1,816,246 | | Goldman Sachs International | 3/16/2011 | (108,441) |
| | Euro | 416,000 | 550,118 | | HSBC Bank USA | 3/16/2011 | (23,838) |
| | Euro | 313,000 | 413,999 | | Morgan Stanley & Company, Inc. | 3/16/2011 | (17,848) |
| | Euro | 327,000 | 434,925 | | UBS AG | 3/16/2011 | (16,238) |
| | Euro | 1,162,000 | 1,539,442 | | Westpac Banking Corp. | 3/16/2011 | (63,773) |
| | Japanese Yen | 71,550,000 | 874,037 | | Bank of America N.A. | 3/16/2011 | (683) |
| | Japanese Yen | 219,029,000 | 2,618,277 | | Barclays Bank PLC | 3/16/2011 | (59,419) |
| | Japanese Yen | 146,022,000 | 1,755,718 | | BNP Paribas SA | 3/16/2011 | (29,445) |
| | Japanese Yen | 146,020,000 | 1,744,835 | | Goldman Sachs International | 3/16/2011 | (40,304) |
| | Japanese Yen | 71,550,000 | 873,477 | | Westpac Banking Corp. | 3/16/2011 | (1,243) |
| | Mexican Peso | 49,870,000 | 4,015,945 | | Royal Bank of Canada | 3/16/2011 | (99,498) |
| | Norwegian Krone | 4,875,000 | 861,696 | | Citibank N.A. | 3/16/2011 | (8,178) |
| | Norwegian Krone | 9,555,000 | 2,438,129 | | JPMorgan Chase Bank | 3/16/2011 | (136,698) |
| | Pound Sterling | 2,145,000 | 3,382,933 | | Bank of America N.A. | 3/16/2011 | (103,683) |
| | Pound Sterling | 3,107,000 | 4,891,757 | | Goldman Sachs International | 3/16/2011 | (158,554) |
| | Pound Sterling | 833,000 | 1,296,156 | | HSBC Bank USA | 3/16/2011 | (57,854) |
| | South Korean Won | 1,936,050,000 | 1,719,405 | | JPMorgan Chase Bank | 3/16/2011 | 3,790 |
| | Swedish Krona | 10,860,000 | 1,581,834 | | UBS AG | 3/16/2011 | (131,685) |
|
| | | | $59,321,667 | | | | ($1,856,361) |
DERIVATIVE INSTRUMENTS, CONTINUED
Mid Cap Stock Fund
The Fund used forward foreign currency contracts to manage against anticipated currency exchange rate changes. During the period ended February 28, 2011, the Fund held forward foreign currency contracts with USD notional absolute values ranging from $0 to approximately $16.3 million, as measured at each quarter end. At February 28, 2011, the Fund held no forward foreign currency contracts.
Mutual Shares Fund
The Fund used forward foreign currency contracts to manage against anticipated currency exchange rates changes. During the period ended February 28, 2011, the Fund held forward foreign currency contracts with USD notional absolute values from approximately $72.3 million to $84.5million, as measured at each quarter end.
| | | | | | | |
| | | PRINCIPAL | PRINCIPAL | | | | |
| | | AMOUNT | AMOUNT | | | | UNREALIZED |
| | | COVERED BY | COVERED BY | | | SETTLEMENT | APPRECIATION |
| FUND | CURRENCY | CONTRACT | CONTRACT (USD) | | COUNTERPARTY | DATE | (DEPRECIATION) |
|
| Mutual Shares Fund | BUYS | | | | | | |
|
| |
| | Danish Krone | 121,040 | $22,381 | | Deutsche Bank AG London | 4/26/2011 | $12 |
| | Danish Krone | 545,200 | 100,430 | | State Street Bank & Trust Company | 4/26/2011 | 434 |
| | Swiss Franc | 452,410 | 473,382 | | Bank of America N.A. | 5/10/2011 | 13,861 |
| | Swiss Franc | 641,299 | 650,211 | | Deutsche Bank AG London | 5/10/2011 | 40,465 |
|
| | | | $1,246,404 | | | | $54,772 |
| |
| | SELLS | | | | | | |
|
| | Danish Krone | 3,582,870 | $645,981 | | State Street Bank & Trust Company | 4/26/2011 | ($16,865) |
| | Euro | 121,642 | 163,813 | | Bank of America N.A. | 4/15/2011 | (3,954) |
| | Euro | 116,735 | 158,701 | | Barclays Bank PLC | 4/15/2011 | (2,298) |
| | Euro | 2,197,154 | 2,988,803 | | Deutsche Bank AG London | 4/15/2011 | (41,488) |
| | Euro | 810,000 | 1,100,725 | | HSBC Bank PLC | 4/15/2011 | (16,418) |
| | Euro | 21,225,224 | 28,261,386 | | State Street Bank & Trust Company | 4/15/2011 | (1,012,213) |
| | Japanese Yen | 2,226,555 | 27,000 | | Bank of America N.A. | 4/20/2011 | (227) |
| | Japanese Yen | 66,769,670 | 823,747 | | Barclays Bank PLC | 4/20/2011 | 7,268 |
| | Japanese Yen | 60,406,658 | 732,598 | | Deutsche Bank AG London | 4/20/2011 | (6,073) |
| | Japanese Yen | 64,606,015 | 787,999 | | State Street Bank & Trust Company | 4/20/2011 | (2,023) |
| | Norwegian Krone | 12,529,343 | 2,133,017 | | Bank of America N.A. | 5/18/2011 | (95,115) |
| | Pound Sterling | 15,609,529 | 25,037,684 | | Deutsche Bank AG London | 5/12/2011 | (320,086) |
| | Pound Sterling | 320,000 | 516,194 | | HSBC Bank PLC | 5/12/2011 | (3,648) |
| | Swiss Franc | 140,000 | 146,905 | | Bank of America N.A. | 5/10/2011 | (3,875) |
| | Swiss Franc | 4,556,919 | 4,731,084 | | Deutsche Bank AG London | 5/10/2011 | (176,693) |
| | Swiss Franc | 2,663,492 | 2,761,812 | | State Street Bank & Trust Company | 5/10/2011 | (106,753) |
|
| | | | $71,017,449 | | | | ($1,800,461) |
Real Return Bond Fund
The Fund used forward foreign currency contracts to enhance potential gain, manage against anticipated currency exchange rate changes, gain exposure to foreign currencies and to maintain diversity and liquidity of the Fund. During the period ended February 28, 2011, the Fund held forward foreign currency contracts with USD notional absolute values ranging from approximately $132.7 million to $153.0 million, as measured at each quarter end.
| | | | | | | |
| | | PRINCIPAL | PRINCIPAL | | | | |
| | | AMOUNT | AMOUNT | | | | UNREALIZED |
| | | COVERED BY | COVERED BY | | | SETTLEMENT | APPRECIATION |
| FUND | CURRENCY | CONTRACT | CONTRACT (USD) | | COUNTERPARTY | DATE | (DEPRECIATION) |
|
| Real Return Bond | BUYS | | | | | | |
|
| | Brazilian Real | 10,846,224 | $6,359,930 | | Citibank N.A. | 3/2/2011 | $159,017 |
| | Brazilian Real | 10,846,224 | 6,392,918 | | Barclays Bank PLC | 4/4/2011 | 91,732 |
| | Brazilian Real | 10,846,224 | 6,402,730 | | Citibank N.A. | 6/2/2011 | (6,042) |
| | Canadian Dollar | 8,291,000 | 8,386,548 | | Morgan Stanley & Company, Inc. | 3/17/2011 | 144,610 |
| | Chinese Yuan Renminbi | 1,335,000 | 207,782 | | Barclays Bank PLC | 11/15/2011 | (3,252) |
| | Chinese Yuan Renminbi | 8,032,795 | 1,236,480 | | Citibank N.A. | 11/15/2011 | (5,806) |
| | Chinese Yuan Renminbi | 4,979,149 | 774,754 | | JPMorgan Chase Bank | 11/15/2011 | (11,917) |
| | Chinese Yuan Renminbi | 10,000,000 | 1,543,448 | | Deutsche Bank AG London | 2/13/2012 | (7,341) |
| | Chinese Yuan Renminbi | 29,032,780 | 4,457,787 | | JPMorgan Chase Bank | 2/13/2012 | 1,959 |
| | Indian Rupee | 5,937,120 | 126,000 | | Bank of America N.A. | 3/9/2011 | 4,996 |
| | Indian Rupee | 16,672,300 | 370,000 | | Barclays Bank PLC | 3/9/2011 | (2,143) |
| | Indian Rupee | 138,677,100 | 3,042,265 | | Citibank N.A. | 3/9/2011 | 17,499 |
| | Indian Rupee | 111,386,900 | 2,440,000 | | Deutsche Bank AG London | 3/9/2011 | 17,635 |
| | Indian Rupee | 76,371,500 | 1,654,000 | | JPMorgan Chase Bank | 3/9/2011 | 31,057 |
| | Indian Rupee | 14,560,000 | 322,991 | | Royal Bank of Scotland PLC | 3/9/2011 | (1,739) |
| | Indian Rupee | 18,128,000 | 400,000 | | UBS AG | 3/9/2011 | (25) |
| | Indian Rupee | 45,500,000 | 973,262 | | Deutsche Bank AG London | 8/12/2011 | 3,531 |
| | Indian Rupee | 253,887,603 | 5,461,710 | | HSBC Bank USA, N.A. | 8/12/2011 | (11,257) |
| | Indian Rupee | 82,345,317 | 1,772,296 | | Royal Bank of Scotland PLC | 8/12/2011 | (4,509) |
DERIVATIVE INSTRUMENTS, CONTINUED
| | | | | | | |
| | | PRINCIPAL | PRINCIPAL | | | | |
| | | AMOUNT | AMOUNT | | | | UNREALIZED |
| | | COVERED BY | COVERED BY | | | SETTLEMENT | APPRECIATION |
| FUND | CURRENCY | CONTRACT | CONTRACT (USD) | | COUNTERPARTY | DATE | (DEPRECIATION) |
|
| Real Return Bond, continued | BUYS | | | | | | |
|
| | Malaysian Ringgit | 963,101 | $313,000 | | Citibank N.A. | 5/11/2011 | $1,269 |
| | Malaysian Ringgit | 3,810,970 | 1,232,575 | | Barclays Bank PLC | 8/11/2011 | 3,499 |
| | Malaysian Ringgit | 3,610,000 | 1,170,181 | | Citibank N.A. | 8/11/2011 | 710 |
| | Malaysian Ringgit | 1,050,760 | 341,433 | | HSBC Bank USA, N.A. | 8/11/2011 | (623) |
| | Malaysian Ringgit | 600,000 | 194,710 | | JPMorgan Chase Bank | 8/11/2011 | (103) |
| | Singapore Dollar | 2,014,421 | 1,530,000 | | Deutsche Bank AG London | 3/9/2011 | 53,979 |
| | Singapore Dollar | 2,887,280 | 2,255,925 | | Bank of America N.A. | 6/9/2011 | 15,669 |
| | Singapore Dollar | 1,014,421 | 793,400 | | Barclays Bank Plc | 9/9/2011 | 5,146 |
| | Singapore Dollar | 500,000 | 390,941 | | Citibank N.A. | 9/9/2011 | 2,656 |
| | Singapore Dollar | 300,000 | 234,535 | | JPMorgan Chase Bank | 9/9/2011 | 1,623 |
| | Singapore Dollar | 200,000 | 155,554 | | Royal Bank of Scotland PLC | 9/9/2011 | 1,885 |
|
| | | | $60,937,155 | | | | $503,715 |
| |
| | SELLS | | | | | | |
|
| | Australian Dollar | 2,994,000 | $2,926,979 | | Deutsche Bank AG London | 4/29/2011 | ($99,502) |
| | Brazilian Real | 10,846,224 | 6,440,751 | | Barclays Bank PLC | 3/2/2011 | (78,196) |
| | Brazilian Real | 10,846,224 | 6,490,858 | | Citibank N.A. | 4/4/2011 | 6,209 |
| | Euro | 2,037,000 | 2,765,798 | | Bank of America N.A. | 4/19/2011 | (43,477) |
| | Euro | 1,150,000 | 1,586,009 | | BNP Paribas | 4/19/2011 | 17 |
| | Euro | 4,700,000 | 6,367,010 | | JPMorgan Chase Bank | 4/19/2011 | (114,870) |
| | Euro | 3,504,000 | 4,795,855 | | Royal Bank of Scotland PLC | 4/19/2011 | (36,594) |
| | Euro | 33,538,000 | 45,211,773 | | UBS AG | 4/19/2011 | (1,041,268) |
| | Indian Rupee | 45,500,000 | 998,464 | | Deutsche Bank AG London | 3/9/2011 | (5,446) |
| | Indian Rupee | 253,887,603 | 5,604,583 | | HSBC Bank USA, N.A. | 3/9/2011 | 2,820 |
| | Indian Rupee | 82,345,317 | 1,818,882 | | Royal Bank of Scotland PLC | 3/9/2011 | 2,019 |
| | Pound Sterling | 1,312,000 | 2,045,958 | | Barclays Bank PLC | 3/21/2011 | (86,561) |
| | Pound Sterling | 3,000 | 4,821 | | Citibank N.A. | 3/21/2011 | (55) |
| | Pound Sterling | 1,312,000 | 2,046,343 | | Deutsche Bank AG London | 3/21/2011 | (86,176) |
| | Pound Sterling | 875,000 | 1,367,848 | | Royal Bank of Scotland PLC | 3/21/2011 | (54,373) |
| | Singapore Dollar | 1,014,421 | 792,702 | | Barclays Bank PLC | 3/9/2011 | (4,957) |
| | Singapore Dollar | 500,000 | 390,705 | | Citibank N.A. | 3/9/2011 | (2,455) |
| | Singapore Dollar | 300,000 | 234,375 | | JPMorgan Chase Bank | 3/9/2011 | (1,521) |
| | Singapore Dollar | 200,000 | 155,509 | | Royal Bank of Scotland PLC | 3/9/2011 | (1,755) |
|
| | | | $92,045,223 | | | | ($1,646,141) |
Spectrum Income Fund
The Fund used forward foreign currency contracts to manage against anticipated currency exchange rate changes, gain exposure to foreign currencies, to maintain diversity and liquidity of the Fund and for risk management. During the period ended February 28, 2011, the Fund held forward foreign currency contracts with USD notional absolute values ranging from approximately $93.7 million to $105.6 million, as measured at each quarter end.
| | | | | | | |
| | | PRINCIPAL | PRINCIPAL | | | | |
| | | AMOUNT | AMOUNT | | | | UNREALIZED |
| | | COVERED BY | COVERED BY | | | SETTLEMENT | APPRECIATION |
| FUND | CURRENCY | CONTRACT | CONTRACT (USD) | | COUNTERPARTY | DATE | (DEPRECIATION) |
|
| Spectrum Income Fund | BUYS | | | | | | |
|
| | Australian Dollar | 1,061,980 | $1,051,308 | | JPMorgan Chase Bank | 5/18/2011 | $19,617 |
| | Brazilian Real | 605,000 | 355,318 | | Credit Suisse London | 5/18/2011 | 2,940 |
| | Canadian Dollar | 113,236 | 114,582 | | Royal Bank of Canada | 5/18/2011 | 1,770 |
| | Chilean Peso | 263,220,000 | 545,930 | | Credit Suisse London | 5/9/2011 | 4,444 |
| | Chilean Peso | 462,286,200 | 964,000 | | Credit Suisse London | 5/18/2011 | 1,990 |
| | Chinese Yuan Renminbi | 4,855,000 | 736,611 | | Credit Suisse Securities Ltd. | 7/7/2011 | 4,467 |
| | Chinese Yuan Renminbi | 4,748,455 | 719,341 | | State Street Bank London | 7/7/2011 | 5,473 |
| | Chinese Yuan Renminbi | 5,460,000 | 838,002 | | State Street Bank London | 12/16/2011 | (705) |
| | Chinese Yuan Renminbi | 3,245,000 | 497,661 | | Morgan Stanley & Company, Inc. | 12/19/2011 | 6 |
| | Chinese Yuan Renminbi | 9,740,000 | 1,493,292 | | State Street Bank London | 12/19/2011 | 475 |
| | Czech Koruna | 4,623,996 | 256,974 | | Bank of America Merrill Lynch | 5/18/2011 | 4,998 |
| | Danish Krone | 1,086,651 | 196,857 | | Goldman Sachs International | 5/18/2011 | 4,136 |
| | Euro | 2,665,000 | 3,666,507 | | Morgan Stanley & Company, Inc. | 3/1/2011 | 11,059 |
| | Euro | 63,000 | 83,558 | | State Street Bank London | 3/9/2011 | 3,372 |
| | Hungarian Forint | 47,638,665 | 235,195 | | Deutsche Bank AG | 5/18/2011 | 4,801 |
| | Indian Rupee | 16,920,000 | 369,836 | | State Street Bank London | 3/7/2011 | 3,622 |
| | Japanese Yen | 5,568,092 | 68,000 | | JPMorgan Chase Bank | 5/18/2011 | 104 |
| | Japanese Yen | 797,419,292 | 9,530,528 | | UBS AG | 5/18/2011 | 222,836 |
| | Malaysian Ringgit | 208,556 | 68,000 | | Standard Chartered Bank | 3/22/2011 | 277 |
| | Mexican Peso | 11,140,000 | 918,611 | | Goldman Sachs International | 3/1/2011 | 1,860 |
DERIVATIVE INSTRUMENTS, CONTINUED
| | | | | | | |
| | | PRINCIPAL | PRINCIPAL | | | | |
| | | AMOUNT | AMOUNT | | | | UNREALIZED |
| | | COVERED BY | COVERED BY | | | SETTLEMENT | APPRECIATION |
| FUND | CURRENCY | CONTRACT | CONTRACT (USD) | | COUNTERPARTY | DATE | (DEPRECIATION) |
|
| Spectrum Income Fund, continued BUYS | | | | | | |
|
| | Mexican Peso | 6,460,000 | $516,986 | | Royal Bank of Scotland PLC | 3/1/2011 | $16,788 |
| | Norwegian Krone | 6,360,000 | 1,089,652 | | Morgan Stanley & Company, Inc. | 4/26/2011 | 42,763 |
| | Norwegian Krone | 8,901,489 | 1,528,126 | | State Street Bank London | 5/18/2011 | 54,853 |
| | Philippine Peso | 56,878,360 | 1,298,000 | | Standard Chartered Bank | 5/18/2011 | 4,295 |
| | Polish Zloty | 1,540,000 | 502,262 | | State Street Bank London | 3/7/2011 | 34,447 |
| | Polish Zloty | 1,545,000 | 539,145 | | Credit Suisse Securities Ltd. | 5/10/2011 | (3,392) |
| | Polish Zloty | 1,616,424 | 564,000 | | Bank of America Merrill Lynch | 5/18/2011 | (3,832) |
| | Polish Zloty | 1,396,334 | 478,754 | | Goldman Sachs International | 5/18/2011 | 5,143 |
| | Pound Sterling | 335,000 | 517,957 | | Credit Suisse Securities Ltd. | 4/11/2011 | 26,448 |
| | Russian Ruble | 30,775,000 | 996,132 | | JPMorgan Chase Bank | 3/17/2011 | 68,782 |
| | Russian Ruble | 18,567,395 | 638,000 | | Bank of America Merrill Lynch | 3/23/2011 | 4,234 |
| | Russian Ruble | 25,743,549 | 831,000 | | JPMorgan Chase Bank | 3/23/2011 | 59,453 |
| | Russian Ruble | 2,142,700 | 70,000 | | Standard Chartered Bank | 3/23/2011 | 4,115 |
| | Russian Ruble | 11,335,000 | 362,256 | | State Street Bank London | 3/23/2011 | 29,814 |
| | Russian Ruble | 16,490,000 | 565,113 | | Goldman Sachs and Company | 5/25/2011 | 2,234 |
| | Singapore Dollar | 1,385,000 | 1,083,487 | | Morgan Stanley & Company, Inc. | 4/21/2011 | 5,850 |
| | Singapore Dollar | 1,435,000 | 1,119,921 | | Standard Chartered Bank | 4/21/2011 | 8,742 |
| | Singapore Dollar | 1,655,457 | 1,295,000 | | Citibank N.A. | 5/18/2011 | 7,274 |
| | Singapore Dollar | 2,708,363 | 2,116,967 | | Standard Chartered Bank | 5/18/2011 | 13,581 |
| | Singapore Dollar | 635,000 | 497,805 | | Standard Chartered Bank | 5/23/2011 | 1,736 |
| | South African Rand | 168,341 | 23,000 | | JPMorgan Chase Bank | 5/18/2011 | 906 |
| | South Korean Won | 509,495,000 | 439,921 | | Citibank N.A. | 3/21/2011 | 11,588 |
| | South Korean Won | 2,610,899,000 | 2,320,000 | | Bank of America Merrill Lynch | 4/14/2011 | (4,683) |
| | South Korean Won | 34,735,500 | 31,000 | | JPMorgan Chase Bank | 4/14/2011 | (197) |
| | South Korean Won | 680,870,000 | 602,860 | | Standard Chartered Bank | 5/17/2011 | 1,743 |
| | South Korean Won | 643,735,000 | 565,424 | | Morgan Stanley & Company, Inc. | 5/31/2011 | 6,410 |
| | Swedish Krona | 3,595,000 | 508,487 | | State Street Bank London | 3/2/2011 | 59,121 |
| | Swedish Krona | 3,210,000 | 472,834 | | Morgan Stanley & Company, Inc. | 3/21/2011 | 33,528 |
| | Swedish Krona | 13,753,900 | 2,114,846 | | State Street Bank London | 5/18/2011 | 48,401 |
| | Swedish Krona | 3,475,000 | 537,243 | | Morgan Stanley & Company, Inc. | 6/1/2011 | 8,893 |
| | Swiss Franc | 1,629,155 | 1,689,995 | | Credit Suisse Securities Ltd. | 5/18/2011 | 64,728 |
| | Taiwan Dollar | 22,950,850 | 806,000 | | JPMorgan Chase Bank | 5/18/2011 | (32,828) |
| | Thailand Baht | 12,161,000 | 396,188 | | Citibank N.A. | 5/18/2011 | 226 |
| | Turkish Lira | 31,916 | 20,000 | | JPMorgan Chase Bank | 5/18/2011 | (257) |
| | Turkish Lira | 390,323 | 242,527 | | Morgan Stanley & Company, Inc. | 5/18/2011 | (1,072) |
|
| | | | $50,090,999 | | | | $877,377 |
| |
| | SELLS | | | | | | |
|
| | Brazilian Real | 3,025,000 | $1,783,608 | | Morgan Stanley & Company, Inc. | 4/4/2011 | ($24,953) |
| | Brazilian Real | 6,690,720 | 3,945,000 | | Goldman Sachs and Company | 5/18/2011 | (16,986) |
| | Canadian Dollar | 1,415,000 | 1,436,709 | | Royal Bank of Canada | 5/24/2011 | (17,018) |
| | Chilean Peso | 263,220,000 | 547,315 | | Credit Suisse London | 5/9/2011 | (3,059) |
| | Chilean Peso | 295,981,050 | 615,000 | | Credit Suisse London | 5/18/2011 | (3,480) |
| | Euro | 525,000 | 683,366 | | Credit Suisse Securities Ltd. | 3/1/2011 | (41,107) |
| | Euro | 2,140,000 | 2,797,205 | | State Street Bank London | 3/1/2011 | (155,888) |
| | Euro | 4,669,000 | 6,239,512 | | State Street Bank London | 3/9/2011 | (202,900) |
| | Euro | 500,000 | 681,545 | | Morgan Stanley & Company, Inc. | 4/21/2011 | (8,000) |
| | Euro | 395,000 | 537,666 | | Credit Suisse Securities Ltd. | 5/10/2011 | (6,931) |
| | Euro | 205,000 | 282,335 | | Deutsche Bank AG | 5/10/2011 | (304) |
| | Euro | 11,702,766 | 15,838,473 | | Bank of America Merrill Lynch | 5/18/2011 | (294,297) |
| | Euro | 1,236,143 | 1,701,241 | | JPMorgan Chase Bank | 5/18/2011 | (2,837) |
| | Euro | 1,010,027 | 1,365,475 | | Royal Bank of Scotland PLC | 5/18/2011 | (26,890) |
| | Euro | 103,205 | 140,588 | | UBS AG | 5/18/2011 | (1,686) |
| | Euro | 2,655,000 | 3,648,275 | | Morgan Stanley & Company, Inc. | 6/1/2011 | (10,906) |
| | Indian Rupee | 16,920,000 | 368,949 | | Credit Suisse London | 3/7/2011 | (4,509) |
| | Japanese Yen | 42,300,000 | 503,242 | | State Street Bank London | 3/8/2011 | (13,861) |
| | Japanese Yen | 40,435,000 | 480,437 | | Citibank N.A. | 3/22/2011 | (13,913) |
| | Japanese Yen | 54,010,000 | 658,964 | | UBS AG | 4/21/2011 | (1,492) |
| | Japanese Yen | 44,275,000 | 531,755 | | Citibank N.A. | 5/23/2011 | (9,804) |
| | Malaysian Ringgit | 2,202,200 | 700,000 | | JPMorgan Chase Bank | 3/22/2011 | (20,955) |
| | Mexican Peso | 17,600,000 | 1,406,040 | | State Street Bank London | 3/1/2011 | (48,205) |
| | Mexican Peso | 11,572,563 | 951,480 | | JPMorgan Chase Bank | 5/18/2011 | 1,463 |
| | Mexican Peso | 1,914,638 | 156,831 | | Morgan Stanley & Company, Inc. | 5/18/2011 | (346) |
| | Mexican Peso | 11,665,000 | 954,544 | | Goldman Sachs International | 6/1/2011 | (2,103) |
| | Philippine Peso | 56,878,360 | 1,289,513 | | Standard Chartered Bank | 5/18/2011 | (12,782) |
| | Pound Sterling | 28,304 | 46,000 | | JPMorgan Chase Bank | 5/18/2011 | 24 |
DERIVATIVE INSTRUMENTS, CONTINUED
| | | | | | | |
| | | PRINCIPAL | PRINCIPAL | | | | |
| | | AMOUNT | AMOUNT | | | | UNREALIZED |
| | | COVERED BY | COVERED BY | | | SETTLEMENT | APPRECIATION |
| FUND | CURRENCY | CONTRACT | CONTRACT (USD) | | COUNTERPARTY | DATE | (DEPRECIATION) |
|
| Spectrum Income Fund, continued SELLS | | | | | | |
|
| | Pound Sterling | 151,931 | $244,133 | | Royal Bank of Scotland PLC | 5/18/2011 | ($2,657) |
| | Singapore Dollar | 695,000 | 544,756 | | Citibank N.A. | 4/21/2011 | (1,879) |
| | South African Rand | 5,412,520 | 761,137 | | Goldman Sachs International | 5/18/2011 | (11,111) |
| | South African Rand | 7,499,411 | 1,015,823 | | State Street Bank London | 5/18/2011 | (49,177) |
| | Swedish Krona | 3,595,000 | 558,291 | | Morgan Stanley & Company, Inc. | 3/2/2011 | (9,317) |
| | Swedish Krona | 3,210,000 | 501,180 | | Deutsche Bank AG | 3/21/2011 | (5,182) |
| | Swedish Krona | 4,389,399 | 684,000 | | Goldman Sachs International | 5/18/2011 | (6,375) |
| | Turkish Lira | 1,447,954 | 899,686 | | Morgan Stanley & Company, Inc. | 5/18/2011 | 3,976 |
|
| | | | $55,500,074 | | | | ($1,025,447) |
Total Return Fund
The Fund used forward foreign currency contracts to enhance potential gain, manage against anticipated currency exchange rate changes, gain exposure to foreign currencies and to maintain diversity and liquidity of the Fund. During the period ended February 28, 2011, the Fund held forward foreign currency contracts with USD notional absolute values ranging from approximately $324.3 million to $535.5 million, as measured at each quarter end.
| | | | | | | |
| | | PRINCIPAL | PRINCIPAL | | | | |
| | | AMOUNT | AMOUNT | | | | UNREALIZED |
| | | COVERED BY | COVERED BY | | | SETTLEMENT | APPRECIATION |
| FUND | CURRENCY | CONTRACT | CONTRACT (USD) | | COUNTERPARTY | DATE | (DEPRECIATION) |
|
| Total Return Fund | BUYS | | | | | | |
|
| | Australian Dollar | 6,906,000 | $6,750,739 | | Westpac Banking Corp. | 4/29/2011 | $230,182 |
| | Brazilian Real | 52,064,531 | 30,529,220 | | Citibank N.A. | 3/2/2011 | 763,322 |
| | Brazilian Real | 52,064,531 | 30,687,570 | | Barclays Capital | 4/4/2011 | 440,333 |
| | Brazilian Real | 52,064,531 | 30,734,670 | | Citibank N.A. | 6/2/2011 | (29,001) |
| | Brazilian Real | 372,200 | 200,000 | | Bank of America N.A. | 9/2/2011 | 14,438 |
| | Brazilian Real | 185,950 | 100,000 | | Morgan Stanley & Company, Inc. | 9/2/2011 | 7,133 |
| | Canadian Dollar | 3,699,000 | 3,757,858 | | Deutsche Bank AG London | 3/17/2011 | 48,287 |
| | Canadian Dollar | 18,947,000 | 19,165,351 | | Morgan Stanley & Company, Inc. | 3/17/2011 | 330,469 |
| | Canadian Dollar | 1,040,000 | 1,060,862 | | Royal Bank of Scotland PLC | 3/17/2011 | 9,263 |
| | Chinese Yuan Renminbi | 1,549,000 | 241,089 | | Barclays Capital | 11/15/2011 | (3,773) |
| | Chinese Yuan Renminbi | 9,317,509 | 1,434,235 | | Citibank N.A. | 11/15/2011 | (6,735) |
| | Chinese Yuan Renminbi | 22,915,219 | 3,569,071 | | HSBC Bank USA | 11/15/2011 | (58,316) |
| | Chinese Yuan Renminbi | 26,307,000 | 4,089,760 | | JPMorgan Chase Bank | 11/15/2011 | (59,364) |
| | Chinese Yuan Renminbi | 27,280,000 | 4,266,767 | | Barclays Capital | 2/13/2012 | (76,267) |
| | Indian Rupee | 66,376,000 | 1,455,986 | | Barclays Capital | 3/9/2011 | 8,531 |
| | Indian Rupee | 101,028,000 | 2,200,000 | | JPMorgan Chase Bank | 3/9/2011 | 29,077 |
| | Indian Rupee | 36,688,000 | 806,413 | | Royal Bank of Scotland PLC | 3/9/2011 | 3,069 |
| | Indian Rupee | 27,870,000 | 600,000 | | Bank of America N.A. | 5/9/2011 | 7,811 |
| | Indian Rupee | 65,684,000 | 1,425,944 | | Barclays Capital | 5/9/2011 | 6,544 |
| | Indian Rupee | 65,270,000 | 1,401,675 | | JPMorgan Chase Bank | 5/9/2011 | 21,785 |
| | Indian Rupee | 46,160,000 | 1,000,000 | | Morgan Stanley & Company, Inc. | 5/9/2011 | 6,694 |
| | Indian Rupee | 204,092,000 | 4,357,402 | | Citibank N.A. | 8/12/2011 | 24,040 |
| | Indonesian Rupiah | 2,941,760,000 | 320,000 | | Citibank N.A. | 4/15/2011 | 11,174 |
| | Indonesian Rupiah | 10,684,000,000 | 1,200,000 | | JPMorgan Chase Bank | 4/15/2011 | 2,771 |
| | Indonesian Rupiah | 6,375,000,000 | 700,000 | | Morgan Stanley & Company, Inc. | 4/15/2011 | 17,677 |
| | Indonesian Rupiah | 9,463,559,500 | 1,021,452 | | Barclays Capital | 7/27/2011 | 24,468 |
| | Indonesian Rupiah | 661,500,000 | 70,000 | | BNP Paribas SA | 7/27/2011 | 3,110 |
| | Indonesian Rupiah | 16,454,000,000 | 1,773,822 | | Citibank N.A. | 7/27/2011 | 44,687 |
| | Indonesian Rupiah | 16,247,100,000 | 1,738,865 | | HSBC Bank USA | 7/27/2011 | 56,778 |
| | Indonesian Rupiah | 3,329,000,000 | 362,676 | | JPMorgan Chase Bank | 7/27/2011 | 5,248 |
| | Indonesian Rupiah | 661,500,000 | 70,000 | | Royal Bank of Scotland PLC | 7/27/2011 | 3,110 |
| | Indonesian Rupiah | 6,456,000,000 | 696,065 | | Deutsche Bank AG London | 10/31/2011 | 7,899 |
| | Indonesian Rupiah | 13,629,200,000 | 1,476,368 | | Royal Bank of Scotland PLC | 10/31/2011 | 9,762 |
| | Malaysian Ringgit | 3,400,000 | 1,100,435 | | Barclays Capital | 8/11/2011 | 2,343 |
| | Malaysian Ringgit | 6,660,000 | 2,158,714 | | Citibank N.A. | 8/11/2011 | 1,433 |
| | Malaysian Ringgit | 1,888,696 | 613,711 | | HSBC Bank USA | 8/11/2011 | (1,119) |
| | Malaysian Ringgit | 1,100,000 | 356,969 | | JPMorgan Chase Bank | 8/11/2011 | (188) |
| | Mexican Peso | 1,570,000 | 127,249 | | Citibank N.A. | 7/7/2011 | 1,075 |
| | Mexican Peso | 6,614,285 | 536,678 | | Deutsche Bank AG London | 7/7/2011 | 3,942 |
| | Mexican Peso | 223,927,157 | 18,270,074 | | HSBC Bank USA | 7/7/2011 | 32,650 |
| | Norwegian Krone | 3,356,185 | 600,000 | | Deutsche Bank AG London | 3/3/2011 | (734) |
| | Norwegian Krone | 1,677,712 | 300,000 | | UBS AG | 3/3/2011 | (435) |
| | Philippine Peso | 13,200,000 | 300,000 | | Bank of America N.A. | 4/15/2011 | 2,483 |
| | Philippine Peso | 8,496,000 | 200,000 | | Barclays Capital | 4/15/2011 | (5,311) |
| | Philippine Peso | 19,495,500 | 450,000 | | Citibank N.A. | 4/15/2011 | (3,253) |
| | Philippine Peso | 19,527,000 | 450,000 | | JPMorgan Chase Bank | 4/15/2011 | (2,531) |
DERIVATIVE INSTRUMENTS, CONTINUED
| | | | | | | |
| | | PRINCIPAL | PRINCIPAL | | | | |
| | | AMOUNT | AMOUNT | | | | UNREALIZED |
| | | COVERED BY | COVERED BY | | | SETTLEMENT | APPRECIATION |
| FUND | CURRENCY | CONTRACT | CONTRACT (USD) | | COUNTERPARTY | DATE | (DEPRECIATION) |
|
| Total Return Fund, continued | BUYS | | | | | | |
|
| | Philippine Peso | 6,000,000 | $139,147 | | Bank of America N.A. | 6/15/2011 | ($1,846) |
| | Philippine Peso | 115,790,000 | 2,600,000 | | Barclays Capital | 6/15/2011 | 49,663 |
| | Philippine Peso | 67,928,000 | 1,570,504 | | Citibank N.A. | 6/15/2011 | (16,084) |
| | Philippine Peso | 20,951,000 | 480,643 | | Deutsche Bank AG London | 6/15/2011 | (1,214) |
| | Philippine Peso | 9,247,000 | 211,263 | | HSBC Bank USA | 6/15/2011 | 339 |
| | Philippine Peso | 91,745,000 | 2,088,369 | | JPMorgan Chase Bank | 6/15/2011 | 11,064 |
| | Philippine Peso | 30,087,000 | 678,048 | | Barclays Capital | 11/15/2011 | 7,206 |
| | Philippine Peso | 97,237,500 | 2,216,558 | | Citibank N.A. | 11/15/2011 | (1,902) |
| | Philippine Peso | 13,215,000 | 300,000 | | Deutsche Bank AG London | 11/15/2011 | 981 |
| | Philippine Peso | 13,176,000 | 300,000 | | Goldman Sachs International | 11/15/2011 | 93 |
| | Philippine Peso | 39,498,000 | 900,000 | | JPMorgan Chase Bank | 11/15/2011 | (404) |
| | Singapore Dollar | 2,312,410 | 1,800,000 | | Citibank N.A. | 3/9/2011 | 18,294 |
| | Singapore Dollar | 385,590 | 300,000 | | Goldman Sachs International | 3/9/2011 | 3,197 |
| | Singapore Dollar | 3,247,359 | 2,500,000 | | HSBC Bank USA | 3/9/2011 | 53,463 |
| | Singapore Dollar | 775,050 | 600,000 | | JPMorgan Chase Bank | 3/9/2011 | 9,437 |
| | Singapore Dollar | 132,170 | 100,000 | | Morgan Stanley & Company, Inc. | 3/9/2011 | 3,928 |
| | Singapore Dollar | 4,278,304 | 3,345,012 | | Bank of America N.A. | 6/9/2011 | 20,983 |
| | Singapore Dollar | 257,280 | 200,000 | | Citibank N.A. | 6/9/2011 | 2,417 |
| | Singapore Dollar | 1,857,876 | 1,425,439 | | Deutsche Bank AG London | 6/9/2011 | 36,263 |
| | Singapore Dollar | 2,270,030 | 1,750,000 | | Goldman Sachs International | 6/9/2011 | 35,967 |
| | Singapore Dollar | 1,491,875 | 1,150,000 | | JPMorgan Chase Bank | 6/9/2011 | 23,747 |
| | Singapore Dollar | 1,182,399 | 898,295 | | Royal Bank of Scotland PLC | 6/9/2011 | 31,968 |
| | Singapore Dollar | 700,000 | 547,485 | | Barclays Bank PLC | 9/9/2011 | 3,551 |
| | Singapore Dollar | 1,300,000 | 1,016,276 | | Citibank N.A. | 9/9/2011 | 7,076 |
| | Singapore Dollar | 1,200,000 | 940,918 | | Deutsche Bank AG London | 9/9/2011 | 3,714 |
| | Singapore Dollar | 2,152,579 | 1,687,300 | | JPMorgan Chase Bank | 9/9/2011 | 7,196 |
| | Singapore Dollar | 1,500,000 | 1,174,307 | | Royal Bank of Scotland PLC | 9/9/2011 | 6,484 |
| | South African Rand | 3,484,750 | 500,000 | | JPMorgan Chase Bank | 4/28/2011 | (3,659) |
| | South African Rand | 2,790,600 | 400,000 | | Morgan Stanley & Company, Inc. | 4/28/2011 | (2,528) |
| | South African Rand | 46,215,307 | 6,755,636 | | JPMorgan Chase Bank | 7/28/2011 | (260,776) |
| | South African Rand | 2,280,450 | 300,000 | | Barclays Bank PLC | 9/13/2011 | 18,272 |
| | South African Rand | 759,900 | 100,000 | | Morgan Stanley & Company, Inc. | 9/13/2011 | 6,056 |
| | South African Rand | 760,000 | 100,000 | | UBS AG | 9/13/2011 | 6,070 |
| | South Korean Won | 338,220,000 | 300,000 | | Morgan Stanley & Company, Inc. | 3/9/2011 | (312) |
| | South Korean Won | 341,490,000 | 300,000 | | Bank of America N.A. | 5/9/2011 | 3,176 |
| | South Korean Won | 477,700,000 | 426,413 | | Barclays Capital | 5/9/2011 | (2,310) |
| | South Korean Won | 2,621,860,000 | 2,330,698 | | Citibank N.A. | 5/9/2011 | (3,002) |
| | South Korean Won | 450,115,350 | 400,824 | | Goldman Sachs International | 5/9/2011 | (1,210) |
| | South Korean Won | 612,250,000 | 538,732 | | HSBC Bank USA | 5/9/2011 | 4,826 |
| | South Korean Won | 12,944,170,250 | 11,291,519 | | JPMorgan Chase Bank | 5/9/2011 | 200,356 |
| | South Korean Won | 6,074,136,000 | 5,400,000 | | Morgan Stanley & Company, Inc. | 5/9/2011 | (7,363) |
| | South Korean Won | 537,000,000 | 474,654 | | Royal Bank of Scotland PLC | 5/9/2011 | 2,096 |
| | South Korean Won | 464,600,000 | 400,000 | | UBS AG | 5/9/2011 | 12,473 |
| | South Korean Won | 383,180,000 | 340,000 | | Citibank N.A. | 8/12/2011 | 720 |
| | South Korean Won | 349,463,000 | 310,000 | | Goldman Sachs International | 8/12/2011 | 739 |
| | South Korean Won | 150,220,000 | 133,618 | | Morgan Stanley & Company, Inc. | 8/12/2011 | (44) |
| | South Korean Won | 188,000,000 | 168,383 | | Royal Bank of Scotland PLC | 8/12/2011 | (1,216) |
| | Taiwan Dollar | 9,911,000 | 325,805 | | Bank of America N.A. | 4/6/2011 | 7,671 |
| | Taiwan Dollar | 25,995,374 | 867,740 | | Deutsche Bank AG London | 4/6/2011 | 6,928 |
| | Taiwan Dollar | 10,169,926 | 336,085 | | JPMorgan Chase Bank | 4/6/2011 | 6,103 |
|
| | | | $248,147,361 | | | | $2,243,208 |
| |
| | SELLS | | | | | | |
|
| | Brazilian Real | 52,064,531 | $30,917,180 | | Barclays Capital | 3/2/2011 | ($375,362) |
| | Brazilian Real | 52,064,531 | 31,157,709 | | Citibank N.A. | 4/4/2011 | 29,805 |
| | Canadian Dollar | 3,222,000 | 3,265,910 | | Citibank N.A. | 3/17/2011 | (49,418) |
| | Canadian Dollar | 1,997,000 | 2,017,549 | | Credit Suisse London Branch | 3/17/2011 | (37,296) |
| | Euro | 3,587,000 | 4,893,906 | | Barclays Bank PLC | 4/19/2011 | (53,010) |
| | Euro | 26,811,000 | 36,198,320 | | Citibank N.A. | 4/19/2011 | (777,357) |
| | Euro | 310,000 | 427,383 | | Deutsche Bank AG London | 4/19/2011 | (145) |
| | Euro | 1,700,000 | 2,302,961 | | JPMorgan Chase Bank | 4/19/2011 | (41,549) |
| | Euro | 26,296,000 | 35,449,007 | | UBS AG | 4/19/2011 | (816,423) |
| | Indian Rupee | 204,092,000 | 4,470,016 | | Citibank N.A. | 3/9/2011 | (33,059) |
| | Japanese Yen | 9,130,000,000 | 111,169,963 | | Citibank N.A. | 4/25/2011 | (478,704) |
| | Pound Sterling | 1,431,000 | 2,231,529 | | Barclays Bank PLC | 3/21/2011 | (94,412) |
| | Pound Sterling | 1,430,000 | 2,230,390 | | Deutsche Bank AG London | 3/21/2011 | (93,926) |
DERIVATIVE INSTRUMENTS, CONTINUED
| | | | | | | |
| | | PRINCIPAL | PRINCIPAL | | | | |
| | | AMOUNT | AMOUNT | | | | UNREALIZED |
| | | COVERED BY | COVERED BY | | | SETTLEMENT | APPRECIATION |
| FUND | CURRENCY | CONTRACT | CONTRACT (USD) | | COUNTERPARTY | DATE | (DEPRECIATION) |
|
| Total Return Fund, continued | SELLS | | | | | | |
|
| | Pound Sterling | 9,433,000 | $14,986,606 | | Royal Bank of Scotland PLC | 3/21/2011 | ($345,749) |
| | Singapore Dollar | 700,000 | 547,003 | | Barclays Bank PLC | 3/9/2011 | (3,421) |
| | Singapore Dollar | 1,300,000 | 1,015,620 | | Citibank N.A. | 3/9/2011 | (6,596) |
| | Singapore Dollar | 1,200,000 | 939,997 | | Deutsche Bank AG London | 3/9/2011 | (3,587) |
| | Singapore Dollar | 2,152,579 | 1,685,758 | | JPMorgan Chase Bank | 3/9/2011 | (6,857) |
| | Singapore Dollar | 1,500,000 | 1,173,332 | | Royal Bank of Scotland PLC | 3/9/2011 | (6,148) |
| | South Korean Won | 150,220,000 | 134,908 | | Morgan Stanley & Company, Inc. | 3/9/2011 | 1,802 |
| | South Korean Won | 188,000,000 | 169,982 | | Royal Bank of Scotland PLC | 3/9/2011 | 3,400 |
|
| | | | $287,385,029 | | | | ($3,188,012) |
Options There are two types of options, a put option and a call option. Options are traded either over-the-counter or on an exchange. A call option gives the purchaser of the option the right to buy (and the seller the obligation to sell) the underlying instrument at the exercise price. A put option gives the purchaser of the option the right to sell (and the writer the obligation to buy) the underlying instrument at the exercise price. Writing puts and buying calls may increase the Funds’ exposure to changes in the value of the underlying instrument. Buying puts and writing calls may decrease the Funds’ exposure to such changes. Risks related to the use of options include the loss of the premium, possible illiquidity of the options markets, trading restrictions imposed by an exchange, movements in underlying security values, and for written options, potential losses in excess of the amounts recognized on the Statements of Assets and Liabilities.
Options listed on an exchange are valued at their closing price. If no closing price is available, then they are valued at the mean between the last bid and ask prices from the exchange on which they are principally traded. For options not listed on an exchange, an independent pricing source is used to value the options at the mean between the last bid and ask prices. When the Fund purchases an option, the premium paid by the Fund is included in the Portfolio of Investments and subsequently “marked-to-market” to reflect current market value. If the purchased option expires, the Fund realizes a loss equal to the cost of the option. If the Fund exercises a call option, the cost of the securities acquired by exercising the call is increased by the premium paid to buy the call. If the Fund exercises a put option, it realizes a gain or loss from the sale of the underlying security and the proceeds from such sale are decreased by the premium paid. If the Fund enters into a closing sale transaction, the Fund realizes a gain or loss, depending on whether proceeds from the closing sale are greater or less than the original cost. When the Fund writes an option, the premium received is included as a liability and subsequently “marked-to-market” to reflect current market value of the option written. Premiums received from writing options that expire unexercised are recorded as realized gains. Premiums received from writing options which are exercised or are closed are added to or offset against the proceeds or amount paid on the transaction to determine the realized gain or loss. If a put option on a security is exercised, the premium received reduces the cost basis of the securities purchased by the Fund.
During the six-month ended February 28, 2011, the Funds used purchased options for the following reasons: Global Bond Fund used purchased options to enhance potential gain/income, and Real Return Bond Fund used purchased options to enhance potential gain/income, manage against anticipated interest rate changes and maintain diversity and liquidity of the Fund. During the period ended February 28, 2011, Global Bond Fund and Real Return Bond Fund held purchased options with market values up to approximately $17,000 and $84,000 respectively.
The following tables summarize the Funds’ written options activities during the six months ended February 28, 2011. In addition, the tables detail how the Funds used written option contracts during the six-month period ended December 31, 2010.
| | | | |
| | NUMBER OF CONTRACTS | PREMIUMS RECEIVED | | |
| Alpha Opportunities Fund | | | | |
| | |
| Outstanding, beginning of period | 370 | $59,318 | | |
| Options written | 432 | 137,190 | | |
| Option closed | (674) | (155,343) | | |
| Options expired | (128) | (41,165) | | |
| Outstanding, end of period | — | — | | |
| | | |
| Global Bond Fund | | | | |
| | |
| Outstanding, beginning of period | 217,300,000 | $1,683,382 | | |
| Options written | 436,841,560 | 3,463,876 | | |
| Options closed | (98,600,000) | (262,465) | | |
| Options expired | (267,740,718) | (2,283,258) | | |
| Outstanding, end of period | 287,800,842 | $2,601,535 | | |
| | | |
| Real Return Bond Fund | | | | |
| | |
| Outstanding, beginning of period | 240,900,000 | $1,953,290 | | |
| Options written | 269,401,586 | 2,151,964 | | |
| Options closed | (10,500,455) | (302,418) | | |
| Options expired | (241,000,929) | (1,747,114) | | |
| Outstanding, end of period | 258,800,202 | $2,055,722 | | |
| | | |
| Total Return Fund | | | | |
| | |
| Outstanding, beginning of period | 653,000,118 | $4,990,767 | | |
| Options written | 577,702,328 | 4,594,624 | | |
| Options closed | (141,900,000) | (543,247) | | |
| Options expired | (476,101,144) | (2,702,549) | | |
| Outstanding, end of period | 612,701,302 | $6,339,595 | | |
DERIVATIVE INSTRUMENTS, CONTINUED
| | | | |
| | NUMBER OF CONTRACTS | PREMIUMS RECEIVED | | |
| Value & Restructuring Fund | | | | |
| | |
| Outstanding, beginning of period | 8,498 | $1,738,841 | | |
| Options written | 6,720 | 825,579 | | |
| Options closed | (9,362) | (1,863,546) | | |
| Options expired | (5,571) | (592,952) | | |
| Outstanding, end of period | 285 | $107,922 | | |
Options on Securities
Alpha Opportunities Fund
The Fund used written options to enhance potential gain/income. At February 28, 2011, the Fund held no options on securities.
Value & Restructuring Fund
The Fund used written options to enhance potential gain/income.
| | | | | | |
| | | EXERCISE | EXPIRATION | NUMBER OF | | |
| FUND | NAME OF ISSUER | PRICE | DATE | CONTRACTS | PREMIUM | VALUE |
|
| Value & Restructuring Fund | CALLS | | | | | |
|
| | Anadarko Petroleum Corp. | $85.00 | May 2011 | 100 | $30,954 | ($43,500) |
| | Eaton Corp. | 100.00 | Apr 2011 | 90 | 55,969 | (94,500) |
| | Tyco International Ltd. | 42.00 | Apr 2011 | 95 | 20,999 | (35,625) |
|
| | | | | 285 | $107,922 | ($173,625) |
Options on Exchange-Traded Futures Contracts
Global Bond Fund
The Fund used written options to enhance potential gain/income, manage against anticipated interest rate changes and maintain diversity and liquidity of the Fund.
| | | | | | |
| | | EXERCISE | EXPIRATION | NUMBER OF | | |
| FUND | NAME OF ISSUER | PRICE | DATE | CONTRACTS | PREMIUM | VALUE |
|
| Global Bond Fund | CALLS | | | | | |
|
| | Eurodollar Futures | $99.375 | Sep 2011 | 258 | $111,713 | ($158,025) |
| | U.S. Treasury 10-Year Note Futures | 118.500 | Mar 2011 | 115 | 51,822 | (141,953) |
| | U.S. Treasury 10-Year Note Futures | 119.500 | Mar 2011 | 115 | 29,124 | (82,656) |
| | U.S. Treasury 10-Year Note Futures | 122.000 | May 2011 | 96 | 54,900 | (51,000) |
|
| | | | | 584 | $247,559 | ($433,634) |
| |
| | PUTS | | | | | |
|
| | Eurodollar Futures | $99.375 | Sep 2011 | 258 | $158,589 | ($48,375) |
|
| | | | | 258 | $158,589 | ($48,375) |
Real Return Bond Fund
The Fund used written options to enhance potential gain/income, manage against anticipated interest rate changes and maintain diversity and liquidity of the Fund.
| | | | | | |
| | | EXERCISE | EXPIRATION | NUMBER OF | | |
| FUND | NAME OF ISSUER | PRICE | DATE | CONTRACTS | PREMIUM | VALUE |
|
| Real Return Bond Fund | CALLS | | | | | |
|
| | Eurodollar Futures | $99.375 | Sep 2011 | 37 | $17,319 | ($22,663) |
| | U.S. Treasury 10-Year Note Futures | 122.000 | Mar 2011 | 11 | 3,925 | (1,202) |
| | U.S. Treasury 10-Year Note Futures | 121.000 | Mar 2011 | 24 | 8,690 | (6,000) |
| | U.S. Treasury 10-Year Note Futures | 120.000 | Mar 2011 | 41 | 18,382 | (21,141) |
| | U.S. Treasury 10-Year Note Futures | 122.000 | May 2011 | 52 | 28,551 | (28,551) |
|
| | | | | 165 | $76,867 | ($79,557) |
| |
| | PUTS | | | | | |
|
| | Eurodollar Futures | $99.375 | Sep 2011 | 37 | $23,677 | ($6,938) |
|
| | | | | 37 | $23,677 | ($6,938) |
Total Return Fund
The Fund used written options to enhance potential gain/income, manage against anticipated interest rate changes and maintain diversity and liquidity of the Fund.
| | | | | | |
| | | EXERCISE | EXPIRATION | NUMBER OF | | |
| FUND | NAME OF ISSUER | PRICE | DATE | CONTRACTS | PREMIUM | VALUE |
|
| Total Return Fund | CALLS | | | | | |
|
| | Eurodollar Futures | $99.375 | Sep 2011 | 447 | $191,524 | ($273,787) |
| | U.S. Treasury 10-Year Note Futures | 122.000 | May 2011 | 68 | 37,018 | (36,125) |
|
| | | | | 515 | $228,542 | ($309,912) |
DERIVATIVE INSTRUMENTS, CONTINUED
| | | | | | |
| | | EXERCISE | EXPIRATION | NUMBER OF | | |
| FUND | NAME OF ISSUER | PRICE | DATE | CONTRACTS | PREMIUM | VALUE |
|
| Total Return Fund, | | | | | | |
| continued | PUTS | | | | | |
|
| | Eurodollar Futures | $99.375 | Sep 2011 | 447 | $278,486 | ($83,812) |
| | Eurodollar Futures | 99.000 | Mar 2012 | 340 | 268,511 | (199,750) |
|
| | | | | 787 | $546,997 | ($283,562) |
Foreign Currency Options
Global Bond Fund
The Fund used written options to enhance potential gain/income.
| | | | | | | | | |
| | | | | | | | USD | | |
| | | | EXERCISE | EXPIRATION | | NOTIONAL | NOTIONAL | | |
| FUND | DESCRIPTION | COUNTERPARTY | PRICE | DATE | | AMOUNT | AMOUNT | PREMIUM | VALUE |
|
| Global Bond Fund | CALLS | | | | | | | | |
|
| | U.S. Dollar versus Korean Won | Bank of America N.A. | $1,227.00 | Mar 2011 | USD | 7,700,000 | $7,700,000 | $101,640 | ($216) |
| | U.S. Dollar versus Korean Won | Citibank N.A. | 1,180.00 | Apr 2011 | USD | 3,900,000 | 3,900,000 | 27,768 | (23,408) |
| | U.S. Dollar versus Korean Won | The Royal Bank of Scotland PLC | 1,180.00 | Apr 2011 | USD | 3,900,000 | 3,900,000 | 27,885 | (23,407) |
| | U.S. Dollar versus Mexican Peso | JPMorgan Chase Bank | 12.80 | Apr 2011 | USD | 5,400,000 | 5,400,000 | 51,300 | (12,382) |
|
| | | | | | | 20,900,000 | $20,900,000 | $208,593 | ($59,413) |
| |
| | PUTS | | | | | | | | |
|
| | Australian Dollar versus U.S. Dollar | JPMorgan Chase Bank | $0.97 | Mar 2011 | AUD | 4,600,000 | $4,518,000 | $41,998 | ($5) |
|
| | | | | | | 4,600,000 | $4,518,000 | $41,998 | ($5) |
Interest Rate Swaptions
Global Bond Fund
The Fund used written interest rate swaptions to enhance potential gain/income, manage against anticipated interest rate changes and maintain diversity and liquidity of the Fund.
| | | | | | | | | | | |
| | | | | | PAY/ | | | | | | |
| | | | | | RECEIVE | | | | | | |
| | | | | FLOATING | FLOATING | EXERCISE | EXPIRATION | | NOTIONAL | | |
| FUND | NAME OF ISSUER | | COUNTERPARTY | RATE INDEX | RATE | RATE | DATE | | AMOUNT | PREMIUM | VALUE |
|
| Global Bond Fund | CALLS | | | | | | | | | | |
|
| | 2-Year Interest Rate Swap | | Bank of America N.A. | 3-Month USD LIBOR | Receive | 2.25% | Sep 2012 | USD | 25,900,000 | $228,133 | ($350,904) |
| | 2-Year Interest Rate Swap | | The Royal Bank of Scotland PLC | 3-Month USD LIBOR | Receive | 2.20% | Sep 2012 | USD | 50,800,000 | 390,799 | (688,259) |
| | 3-Year Interest Rate Swap | | Bank of America N.A. | 3-Month USD LIBOR | Receive | 3.00% | Jun 2012 | USD | 10,800,000 | 109,872 | (129,489) |
| | 3-Year Interest Rate Swap | | Barclay’s Bank PLC | 3-Month USD LIBOR | Receive | 3.00% | Jun 2012 | USD | 5,000,000 | 44,795 | (59,949) |
| | 3-Year Interest Rate Swap | | Citibank N.A. | 3-Month USD LIBOR | Receive | 3.00% | Jun 2012 | USD | 8,100,000 | 87,856 | (97,117) |
| | 3-Year Interest Rate Swap | | Deutsche Bank AG | 3-Month USD LIBOR | Receive | 3.00% | Jun 2012 | USD | 6,400,000 | 69,580 | (76,734) |
| | 3-Year Interest Rate Swap | | Deutsche Bank AG | 3-Month USD LIBOR | Receive | 2.70% | Jun 2012 | USD | 6,900,000 | 71,626 | (101,625) |
| | 3-Year Interest Rate Swap | | JPMorgan Chase Bank | 3-Month USD LIBOR | Receive | 3.00% | Jun 2012 | USD | 7,500,000 | 71,054 | (89,923) |
| | 3-Year Interest Rate Swap | | The Royal Bank of Scotland PLC | 3-Month USD LIBOR | Receive | 3.00% | Jun 2012 | USD | 7,700,000 | 85,321 | (92,321) |
| | 3-Year Interest Rate Swap | | The Royal Bank of Scotland PLC | 3-Month USD LIBOR | Receive | 2.75% | Jun 2012 | USD | 6,600,000 | 64,680 | (97,207) |
| | 10-Year Interest Rate Swap | | Morgan Stanley Capital Services, Inc. | 3-Month USD LIBOR | Receive | 10.00% | Jul 2012 | USD | 6,600,000 | 39,600 | (1,152) |
|
| | | | | | | | | | 142,300,000 | $1,263,316 | ($1,784,680) |
Real Return Bond Fund
The Fund used written interest rate swaptions to enhance potential gain/income, manage against anticipated interest rate changes and maintain diversity and liquidity of the Fund.
| | | | | | | | | | | |
| | | | | | PAY/ | | | | | | |
| | | | | FLOATING | RECEIVE | | | | | | |
| | | | | RATE | FLOATING | EXERCISE | EXPIRATION | | NOTIONAL | | |
| FUND | NAME OF ISSUER | | COUNTERPARTY | INDEX | RATE | RATE | DATE | | AMOUNT | PREMIUM | VALUE |
|
| Real Return | | | | | | | | | | | |
| Bond Fund | CALLS | | | | | | | | | | |
|
| | 2-Year Interest Rate Swap | | Bank of America N.A. | 3-Month USD LIBOR | Receive | 2.25% | Sep 2012 | USD | 3,400,000 | $23,237 | ($46,065) |
| | 2-Year Interest Rate Swap | | Merrill Lynch Capital Services | 3-Month USD LIBOR | Receive | 2.25% | Sep 2012 | USD | 1,500,000 | 9,600 | (20,323) |
| | 2-Year Interest Rate Swap | | The Royal Bank of Scotland PLC | 3-Month USD LIBOR | Receive | 2.25% | Sep 2012 | USD | 67,900,000 | 547,222 | (919,936) |
| | 3-Year Interest Rate Swap | | Bank of America N.A. | 3-Month USD LIBOR | Receive | 3.00% | Jun 2012 | USD | 35,000,000 | 328,913 | (419,640) |
| | 3-Year Interest Rate Swap | | Citibank N.A. | 3-Month USD LIBOR | Receive | 3.00% | Jun 2012 | USD | 7,500,000 | 86,014 | (89,923) |
| | 5-Year Interest Rate Swap | | Goldman Sachs Capital Markets, L.P. | 3-Month USD LIBOR | Receive | 1.00% | Nov 2012 | USD | 12,600,000 | 71,887 | (161,277) |
| | 5-Year Interest Rate Swap | | Goldman Sachs Capital Markets, L.P. | 3-Month USD LIBOR | Receive | 2.70% | Mar 2011 | USD | 5,500,000 | 20,350 | (9,031) |
| | 5-Year Interest Rate Swap | | Merrill Lynch Capital Services | 3-Month USD LIBOR | Receive | 2.70% | Mar 2011 | USD | 5,100,000 | 22,313 | (8,374) |
| | 5-Year Interest Rate Swap | | UBS AG | 3-Month USD LIBOR | Receive | 2.70% | Mar 2011 | USD | 4,500,000 | 13,556 | (7,389) |
| | 10-Year Interest Rate Swap | | Merrill Lynch Capital Services | 3-Month USD LIBOR | Receive | 10.00% | Jul 2012 | USD | 2,400,000 | 15,840 | (419) |
| | 10-Year Interest Rate Swap | | The Royal Bank of Scotland PLC | 3-Month USD LIBOR | Receive | 10.00% | Jul 2012 | USD | 4,200,000 | 28,560 | (733) |
|
| | | | | | | | | | 149,600,000 | $1,167,492 | ($1,683,110) |
DERIVATIVE INSTRUMENTS, CONTINUED
| | | | | | | | | | | |
| | | | | | PAY/ | | | | | | |
| | | | | FLOATING | RECEIVE | | | | | | |
| | | | | RATE | FLOATING | EXERCISE | EXPIRATION | | NOTIONAL | | |
| FUND | NAME OF ISSUER | | COUNTERPARTY | INDEX | RATE | RATE | DATE | | AMOUNT | PREMIUM | VALUE |
|
| Real Return | | | | | | | | | | | |
| Bond Fund, | | | | | | | | | | | |
| continued | PUTS | | | | | | | | | | |
|
| | 5-Year Interest Rate Swap | | Goldman Sachs Capital Markets, L.P. | 3-Month USD LIBOR | Receive | 1.90% | Mar 2011 | USD | 5,500,000 | $7,150 | ($645) |
| | 5-Year Interest Rate Swap | | Merrill Lynch Capital Services | 3-Month USD LIBOR | Receive | 2.10% | Mar 2011 | USD | 5,100,000 | 10,200 | (3,928) |
| | 5-Year Interest Rate Swap | | UBS AG | 3-Month USD LIBOR | Receive | 2.10% | Mar 2011 | USD | 4,500,000 | 13,556 | (3,465) |
|
| | | | | | | | | | 15,100,000 | $30,906 | ($8,038) |
Total Return Fund
The Fund used written interest rate swaptions to enhance potential gain/income, manage against anticipated interest rate changes and maintain diversity and liquidity of the Fund.
| | | | | | | | | | | |
| | | | | | PAY/ | | | | | | |
| | | | | FLOATING | RECEIVE | | | | | | |
| | | | | RATE | FLOATING | EXERCISE | EXPIRATION | | NOTIONAL | | |
| FUND | NAME OF ISSUER | | COUNTERPARTY | INDEX | RATE | RATE | DATE | | AMOUNT | PREMIUM | VALUE |
|
| Total Return Fund | CALLS | | | | | | | | | | |
|
| | 5-Year Interest Rate Swap | | Citibank N.A. | 3 Month USD-LIBOR | Receive | 1.90% | Mar 2011 | USD | 18,000,000 | $40,810 | ($2,110) |
|
| | | | | | | | | | 18,000,000 | $40,810 | ($2,110) |
| |
| | PUTS | | | | | | | | | | |
|
| | 1-Year Interest Rate Swap | | The Royal Bank of Scotland PLC | 3 Month USD-LIBOR | Receive | 1.75% | Nov 2012 | USD | 37,900,000 | $143,072 | ($299,626) |
| | 2-Year Interest Rate Swap | | Bank of America N.A. | 3 Month USD-LIBOR | Receive | 2.25% | Sep 2012 | USD | 22,500,000 | 189,369 | (304,839) |
| | 2-Year Interest Rate Swap | | Citibank N.A. | 3 Month USD-LIBOR | Receive | 2.25% | Sep 2012 | USD | 2,700,000 | 18,394 | (36,581) |
| | 2-Year Interest Rate Swap | | Morgan Stanley Capital Services, Inc. | 3 Month USD-LIBOR | Receive | 2.25% | Sep 2012 | USD | 32,000,000 | 195,800 | (433,549) |
| | 2-Year Interest Rate Swap | | The Royal Bank of Scotland PLC | 3 Month USD-LIBOR | Receive | 2.25% | Sep 2012 | USD | 97,800,000 | 769,975 | (1,325,034) |
| | 3-Year Interest Rate Swap | | Bank of America N.A. | 3 Month USD-LIBOR | Receive | 3.00% | Jun 2012 | USD | 29,700,000 | 307,948 | (356,094) |
| | 3-Year Interest Rate Swap | | Barclays Bank PLC | 3 Month USD-LIBOR | Receive | 3.00% | Jun 2012 | USD | 13,000,000 | 116,262 | (155,866) |
| | 3-Year Interest Rate Swap | | Citibank N.A. | 3 Month USD-LIBOR | Receive | 3.00% | Jun 2012 | USD | 28,300,000 | 308,165 | (339,309) |
| | 3-Year Interest Rate Swap | | Deutsche Bank AG | 3 Month USD-LIBOR | Receive | 3.00% | Jun 2012 | USD | 19,800,000 | 215,447 | (237,396) |
| | 3-Year Interest Rate Swap | | Deutsche Bank AG | 3 Month USD-LIBOR | Receive | 2.75% | Jun 2012 | USD | 12,500,000 | 129,757 | (184,104) |
| | 3-Year Interest Rate Swap | | JPMorgan Chase Bank | 3 Month USD-LIBOR | Receive | 3.00% | Jun 2012 | USD | 35,200,000 | 359,696 | (422,037) |
| | 3-Year Interest Rate Swap | | The Royal Bank of Scotland PLC | 3 Month USD-LIBOR | Receive | 3.00% | Jun 2012 | USD | 52,400,000 | 448,986 | (628,260) |
| | 3-Year Interest Rate Swap | | The Royal Bank of Scotland PLC | 3 Month USD-LIBOR | Receive | 2.75% | Jun 2012 | USD | 15,700,000 | 153,860 | (231,234) |
| | 5-Year Interest Rate Swap | | Citibank N.A. | 3 Month USD-LIBOR | Receive | 3.25% | Jul 2012 | USD | 17,900,000 | 442,548 | (536,506) |
| | 5-Year Interest Rate Swap | | Citibank N.A. | 3 Month USD-LIBOR | Receive | 2.70% | Mar 2011 | USD | 18,000,000 | 77,400 | (29,556) |
| | 5-Year Interest Rate Swap | | The Royal Bank of Scotland PLC | 3 Month USD-LIBOR | Receive | 3.25% | Jul 2012 | USD | 5,900,000 | 148,149 | (176,837) |
| | 10-Year Interest Rate Swap | | Bank of America N.A. | 3 Month USD-LIBOR | Receive | 4.00% | Jun 2011 | USD | 5,900,000 | 82,010 | (58,478) |
| | 10-Year Interest Rate Swap | | Barclays Bank PLC | 3 Month USD-LIBOR | Receive | 4.00% | Jun 2011 | USD | 3,200,000 | 44,960 | (31,717) |
| | 10-Year Interest Rate Swap | | Deutsche Bank AG | 3 Month USD-LIBOR | Receive | 4.00% | Jun 2011 | USD | 2,900,000 | 39,585 | (28,744) |
| | 10-Year Interest Rate Swap | | Morgan Stanley Capital Services, Inc. | 3 Month USD-LIBOR | Receive | 10.00% | Jul 2012 | USD | 11,300,000 | 68,083 | (1,973) |
| | 10-Year Interest Rate Swap | | The Royal Bank of Scotland PLC | 3 Month USD-LIBOR | Receive | 4.00% | Jun 2011 | USD | 6,700,000 | 94,701 | (66,408) |
|
| | | | | | | | | | 471,300,000 | $4,354,167 | ($5,884,148) |
Credit Default Swaptions
Global Bond Fund
The Fund used written credit default swaptions to enhance potential gain/income.
| | | | | | | | | | | | |
| | | | | | BUY/SELL | EXERCISE | EXPIRATION | | NOTIONAL | USD NOTIONAL | | |
| FUND | DESCRIPTION | | COUNTERPARTY | INDEX | PROTECTION | RATE | DATE | | AMOUNT | AMOUNT | PREMIUM | VALUE |
|
| Global Bond Fund | PUTS | | | | | | | | | | | |
|
| | 5-Year Credit Default Swap | | BNP Paribas | DJ ITRAXX | Sell | 1.60% | Mar 2011 | EUR | 2,300,000 | $3,173,885 | $11,389 | ($15) |
| | 5-Year Credit Default Swap | | BNP Paribas | DJ ITRAXX | Sell | 1.20% | Mar 2011 | EUR | 5,000,000 | 6,899,749 | 30,171 | (1,398) |
| | 5-Year Credit Default Swap | | Credit Suisse International | CDX.IG15 | Sell | 1.50% | Mar 2011 | USD | 13,600,000 | 13,600,000 | 40,120 | (56) |
| | 5-Year Credit Default Swap | | Morgan Stanley Capital Services, Inc. | DJ ITRAXX | Sell | 1.50% | Mar 2011 | EUR | 13,600,000 | 18,737,318 | 71,987 | (310) |
| | 5-Year Credit Default Swap | | Morgan Stanley Capital Services, Inc. | DJ ITRAXX | Sell | 1.60% | Mar 2011 | EUR | 34,300,000 | 47,332,281 | 187,108 | (227) |
| | 5-Year Credit Default Swap | | Morgan Stanley Capital Services, Inc. | CDX.IG15 | Sell | 1.50% | Mar 2011 | USD | 18,500,000 | 18,500,000 | 68,240 | (76) |
| | 5-Year Credit Default Swap | | Morgan Stanley Capital Services, Inc. | DJ ITRAXX | Sell | 1.30% | Mar 2011 | EUR | 5,600,000 | 7,727,719 | 30,242 | (1,407) |
| | 5-Year Credit Default Swap | | UBS AG | DJ ITRAXX | Sell | 1.20% | Mar 2011 | EUR | 8,000,000 | 11,039,599 | 48,294 | (2,237) |
|
| | | | | | | | | | 100,900,000 | $127,010,551 | $487,551 | ($5,726) |
DERIVATIVE INSTRUMENTS, CONTINUED
Real Return Bond Fund
The Fund used written credit default swaptions to enhance potential gain/income and manage duration of the Fund.
| | | | | | | | | | | | |
| | | | | | | | | | USD | |
| | | | | BUY/SELL | EXERCISE | EXPIRATION | | NOTIONAL | NOTIONAL | |
| FUND | DESCRIPTION | | COUNTERPARTY | INDEX | PROTECTION | RATE | DATE | | AMOUNT | AMOUNT | PREMIUM | VALUE |
|
| REAL RETURN | | | | | | | | | | | | |
| BOND FUND | CALLS | | | | | | | | | | | |
|
| | 5-Year Credit Default Swap | | BNP Paribas | CDX.IG15 | Sell | 0.80% | Mar 2011 | USD | 1,000,000 | $1,000,000 | $2,200 | ($1,168) |
| | 5-Year Credit Default Swap | | Morgan Stanley Capital Services, Inc. | DJ ITRAXX | Sell | 0.90% | Mar 2011 | EUR | 3,800,000 | 5,243,810 | 11,263 | (3,681) |
| | 5-Year Credit Default Swap | | Barclay’s Bank PLC | CDX.IG15 | Sell | 0.80% | Jun 2011 | USD | 1,200,000 | 1,200,000 | 3,780 | (3,044) |
| | 5-Year Credit Default Swap | | Credit Suisse International | CDX.IG15 | Sell | 0.80% | Jun 2011 | USD | 600,000 | 600,000 | 1,800 | (1,522) |
| | 5-Year Credit Default Swap | | JPMorgan Chase Bank | CDX.IG15 | Sell | 0.80% | Jun 2011 | USD | 500,000 | 500,000 | 1,650 | (1,268) |
| | 5-Year Credit Default Swap | | UBS AG | CDX.IG15 | Sell | 0.80% | Jun 2011 | USD | 600,000 | 600,000 | 1,680 | (1,522) |
| | 5-Year Credit Default Swap | | Credit Suisse International | CDX.IG15 | Sell | 0.80% | Sep 2011 | USD | 300,000 | 300,000 | 1,170 | (880) |
|
| | | | | | | | | | 8,000,000 | $9,443,810 | $23,543 | ($13,085) |
| |
| | PUTS | | | | | | | | | | | |
|
| | 5-Year Credit Default Swap | | BNP Paribas | CDX.IG15 | Sell | 1.30% | Mar 2011 | USD | 1,000,000 | 1,000,000 | $2,700 | ($39) |
| | 5-Year Credit Default Swap | | Morgan Stanley Capital Services, Inc. | CDX.IG15 | Sell | 1.70% | Mar 2011 | USD | 800,000 | 800,000 | 3,760 | — |
| | 5-Year Credit Default Swap | | Morgan Stanley Capital Services, Inc. | DJ ITRAXX | Sell | 1.60% | Mar 2011 | EUR | 3,800,000 | 5,243,810 | 28,924 | (25) |
| | 5-Year Credit Default Swap | | Morgan Stanley Capital Services, Inc. | DJ ITRAXX | Sell | 1.80% | Mar 2011 | EUR | 800,000 | 1,103,960 | 5,753 | — |
| | 5-Year Credit Default Swap | | Barclay’s Bank PLC | CDX.IG15 | Sell | 1.20% | Jun 2011 | USD | 1,800,000 | 1,800,000 | 5,700 | (3,188) |
| | 5-Year Credit Default Swap | | BNP Paribas | CDX.IG15 | Sell | 1.20% | Jun 2011 | USD | 200,000 | 200,000 | 880 | (354) |
| | 5-Year Credit Default Swap | | Credit Suisse International | CDX.IG15 | Sell | 1.20% | Jun 2011 | USD | 600,000 | 600,000 | 2,220 | (1,063) |
| | 5-Year Credit Default Swap | | JPMorgan Chase Bank | CDX.IG15 | Sell | 1.20% | Jun 2011 | USD | 500,000 | 500,000 | 2,175 | (886) |
| | 5-Year Credit Default Swap | | Morgan Stanley Capital Services, Inc. | CDX.IG15 | Sell | 1.20% | Jun 2011 | USD | 800,000 | 800,000 | 4,000 | (1,417) |
| | 5-Year Credit Default Swap | | Credit Suisse International | CDX.IG15 | Sell | 1.20% | Sep 2011 | USD | 300,000 | 300,000 | 1,380 | (1,068) |
|
| | | | | | | | | | 10,600,000 | $12,347,770 | $57,492 | ($8,040) |
Total Return Fund
The Fund used written credit default swaptions to enhance potential gain/income.
| | | | | | | | | | | | |
| | | | | | | | | | | USD | | |
| | | | | | BUY/SELL | EXERCISE | EXPIRATION | | NOTIONAL | NOTIONAL | | |
| FUND | DESCRIPTION | | COUNTERPARTY | INDEX | PROTECTION | RATE | DATE | | AMOUNT | AMOUNT | PREMIUM | VALUE |
|
| Total Return Fund | CALLS | | | | | | | | | | | |
|
| | 5-Year Credit Default Swap | | Bank of America N.A. | CDX.IG15 | Sell | 0.80% | Jun 2011 | USD | 5,000,000 | $5,000,000 | $16,500 | ($12,684) |
|
| | | | | | | | | | 5,000,000 | $5,000,000 | $16,500 | ($12,684) |
| |
| | PUTS | | | | | | | | | | | |
| | 5-Year Credit Default Swap | | Bank of America N.A. | CDX.IG15 | Sell | 1.20% | Jun 2011 | USD | 5,000,000 | $5,000,000 | $15,500 | ($8,856) |
|
| | | | | | | | | | 5,000,000 | $5,000,000 | $15,500 | ($8,856) |
Inflation Floors
Global Bond Fund
The Fund used written inflation floor options to enhance potential gain/income.
| | | | | | | | | | |
| | | | | STRIKE | EXERCISE | EXPIRATION | | NOTIONAL | | |
| FUND | DESCRIPTION | | COUNTERPARTY | INDEX | INDEX | DATE | | AMOUNT | PREMIUM | VALUE |
|
| Global Bond Fund | Floor- OTC CPURNSA Index | | Citibank N.A. | 217.965 | Maximum of ((1+0.0%)10 – | Sep 2020 | USD | 1,700,000 | $21,930 | ($11,414) |
| | | | | | (Index Final/Index Initial)) or $0 | | | | | |
| | Floor- OTC CPURNSA Index | | Deutsche Bank AG | 218.011 | Maximum of ((1+0.0%)10 – | Oct 2020 | USD | 2,000,000 | 19,600 | (14,494) |
| | | | | | (Index Final/Index Initial)) or $0 | | | | | |
|
| | | | | | | | | 3,700,000 | $41,530 | ($25,908) |
Real Return Bond Fund
The Fund used written inflation floor options to enhance potential gain/income.
| | | | | | | | | | |
| | | | | STRIKE | EXERCISE | EXPIRATION | | NOTIONAL | | |
| FUND | DESCRIPTION | | COUNTERPARTY | INDEX | INDEX | DATE | | AMOUNT | PREMIUM | VALUE |
|
| Real Return Bond Fund | Floor- OTC CPURNSA Index | | Deutsche Bank AG | 215.949 | Maximum of ((1+0.0%)10 – | Mar 2020 | USD | 2,900,000 | $21,750 | ($19,336) |
| | | | | | (Index Final/Index Initial)) or $0 | | | | | |
| | Floor- OTC CPURNSA Index | | Citibank N.A. | 215.949 | Maximum of ((1+0.0%)10 – | Mar 2020 | USD | 12,300,000 | 103,980 | (76,950) |
| | | | | | (Index Final/Index Initial)) or $0 | | | | | |
| | Floor- OTC CPURNSA Index | | Citibank N.A. | 216.687 | Maximum of ((1+0.0%)10 – | Apr 2020 | USD | 23,900,000 | 213,520 | (152,885) |
| | | | | | (Index Final/Index Initial)) or $0 | | | | | |
|
| | | | | | | | | 39,100,000 | $339,250 | ($249,171) |
DERIVATIVE INSTRUMENTS, CONTINUED
Total Return Fund
The Fund used written inflation floor options to enhance potential gain/income.
| | | | | | | | | | |
| | | | | STRIKE | EXERCISE | | | NOTIONAL | | |
| FUND | DESCRIPTION | | COUNTERPARTY | INDEX | INDEX | EXPIRATION DATE | | AMOUNT | PREMIUM | VALUE |
|
| Total Return Fund | Floor- OTC CPURNSA Index | | Deutsche Bank AG | 215.949 | Maximum of ((1+0.0%)10 – | Mar 2020 | USD | 1,600,000 | $12,000 | ($10,668) |
| | | | | | (Index Final/Index Initial)) or $0 | | | | | |
| | Floor- OTC CPURNSA Index | | Citibank N.A. | 215.949 | Maximum of ((1+0.0%)10 – | Mar 2020 | USD | 4,500,000 | 38,060 | (28,152) |
| | | | | | (Index Final/Index Initial)) or $0 | | | | | |
| | Floor- OTC CPURNSA Index | | Citibank N.A. | 216.687 | Maximum of ((1+0.0%)10 – | Apr 2020 | USD | 11,000,000 | 98,100 | (70,365) |
| | | | | | (Index Final/Index Initial)) or $0 | | | | | |
| | Floor- OTC CPURNSA Index | | Citibank N.A. | 217.965 | Maximum of ((1+0.0%)10 – | Sep 2020 | USD | 4,100,000 | 52,890 | (27,528) |
| | | | | | (Index Final/Index Initial)) or $0 | | | | | |
|
| | | | | | | | | 21,200,000 | $201,050 | ($136,713) |
Forward Volatility Options
Global Bond Fund
The Fund used written forward volatility options to hedge against future expectations of volatility.
| | | | | | | | |
| | | | | EXERCISE | EXPIRATION | NOTIONAL | | |
| FUND | DESCRIPTION | | COUNTERPARTY | PRICE* | DATE | AMOUNT | PREMIUM | VALUE |
|
| Global Bond Fund | Call & Put – OTC 1-Year | | Morgan Stanley Capital Services, Inc. | — | Nov 2011 | 12,800,000 | $139,191 | ($216,207) |
| | Forward Volatility Agreement | | | | | | | |
| | Call & Put – OTC 2-Year | | JPMorgan Chase Bank | — | Oct 2011 | 2,600,000 | 13,208 | (20,614) |
| | Forward Volatility Agreement | | | | | | | |
|
| | | | | | | 15,400,000 | $152,399 | ($236,821) |
Real Return Bond Fund
The Fund used written forward volatility options to hedge against future expectations of volatility.
| | | | | | | | |
| | | | | EXERCISE | EXPIRATION | NOTIONAL | | |
| FUND | DESCRIPTION | | COUNTERPARTY | PRICE* | DATE | AMOUNT | PREMIUM | VALUE |
|
| Real Return Bond Fund | Call & Put – OTC 1-Year | | JPMorgan Chase Bank | — | Oct 2011 | 5,500,000 | $27,940 | ($43,607) |
| | Forward Volatility Agreement | | | | | | | |
| | Call & Put – OTC 1-Year | | JPMorgan Chase Bank | — | Oct 2011 | 5,400,000 | 28,513 | (42,815) |
| | Forward Volatility Agreement | | | | | | | |
| | Call & Put – OTC 2-Year | | Morgan Stanley Capital Services, Inc. | — | Oct 2011 | 11,900,000 | 132,156 | (201,800) |
| | Forward Volatility Agreement | | | | | | | |
| | Call & Put – OTC 2-Year | | Morgan Stanley Capital Services, Inc. | — | Nov 2011 | 13,600,000 | 147,886 | (229,719) |
| | Forward Volatility Agreement | | | | | | | |
|
| | | | | | | 36,400,000 | $336,495 | ($517,941) |
Total Return Fund
The Fund used written forward volatility options to hedge against future expectations of volatility.
| | | | | | | | |
| | | | | EXERCISE | EXPIRATION | NOTIONAL | | |
| FUND | DESCRIPTION | | COUNTERPARTY | PRICE* | DATE | AMOUNT | PREMIUM | VALUE |
|
| Total Return Fund | Call & Put – | | JPMorgan Chase Bank | — | Oct 2011 | 13,300,000 | $67,564 | ($105,451) |
| | OTC 1-Year Forward Volatility Agreement | | | | | | | |
| | Call & Put – | | Morgan Stanley Capital Services, Inc. | — | Oct 2011 | 43,500,000 | 483,455 | (737,674) |
| | OTC 2-Year Forward Volatility Agreement | | | | | | | |
| | Call & Put – | | Morgan Stanley Capital Services, Inc. | — | Nov 2011 | 35,400,000 | 385,010 | (597,946) |
| | OTC 2-Year Forward Volatility Agreement | | | | | | | |
|
| | | | | | | 92,200,000 | $936,029 | ($1,441,071) |
* Exercise price determined on a future date, based upon implied volatility parameters.
Swaps The Funds may enter into interest rate, credit default, and other forms of swap agreements. Swap agreements are privately negotiated agreements between a Fund and counterparty to exchange cash flows, assets, foreign currencies or market-linked returns at specified intervals. Swaps are marked-to-market daily based upon values from third party vendors or broker quotations, and the change in value is recorded as unrealized appreciation/depreciation of swap contracts. The value of the swap may typically implicate collateral posting obligations by the party that is considered out-of-the-money on the swap.
Upfront payments made/received by the Funds are amortized/accreted for financial reporting purposes, with the unamortized/unaccreted portion included in the Statements of Assets and Liabilities. A termination payment by the counterparty or the Funds is recorded as realized gain or loss, as well as the net periodic payments received or paid by a Fund.
Entering into swap agreements involves, to varying degrees, elements of credit, market and documentation risk that may amount to values that are in excess of the amounts recognized on the Statements of Assets and Liabilities. Such risks involve the possibility that there will be no liquid market for the swap, that a counterparty
DERIVATIVE INSTRUMENTS, CONTINUED
may default on its obligation or delay payment under the swap terms. The counterparty may disagree or contest the terms of the swap. Market risks may also accompany the swap, including interest rate risk. The Funds may also suffer losses if they are unable to terminate or assign outstanding swaps or reduce their exposure through offsetting transactions.
Interest Rate Swaps Interest rate swaps represent an agreement between a Fund and counterparty to exchange cash flows based on the difference between two interest rates applied to a notional amount. The payment flows are usually netted against each other, with the difference being paid by one party to the other. The Fund settles accrued net interest receivable or payable under the swap contracts on a periodic basis.
The following table summarizes the contracts held at February 28, 2011 and the range of notional contracts amounts held by the Funds during the six-month period ended February 28, 2011. In addition, the table details how the Funds used interest rate swap contracts during the six-month period ended February 28, 2011.
The fund had the following interest rate swap contracts open at February 28, 2011
Global Bond Fund
The Fund used interest rate swaps to enhance potential gain/income, manage against anticipated interest rate changes, manage duration of the Fund and substitute for securities purchase. During the period ended February 28, 2011, the Fund held interest rate swaps with total USD notional amounts ranging approximately from $125.6 million to $181.1 million, as measured at each quarter end.
| | | | | | | | | | |
| | | | | | | | | UNAMORTIZED | | |
| | | | | | | | | UPFRONT | | |
| | | | | USD | PAYMENTS | PAYMENTS | | PAYMENT | UNREALIZED | |
| | | NOTIONAL | | NOTIONAL | MADE | RECEIVED | MATURITY | PAID | APPRECIATION | MARKET |
| FUND | COUNTERPARTY | AMOUNT | CURRENCY | AMOUNT | BY FUND | BY FUND | DATE | (RECEIVED) | (DEPRECIATION) | VALUE |
|
| Global Bond Fund | | | | | | | | | |
| | Bank of America N.A. | 2,200,000 | USD | $2,200,000 | Fixed 4.250% | 3 Month LIBOR | Jun 2041 | $22,880 | $10,094 | $32,974 |
| | Barclays Bank PLC | 37,193,487 | BRL | 24,142,349 | CDI | Fixed 11.315% | Jan 2012 | — | (152,908) | (152,908) |
| | Barclays Bank PLC | 6,400,000 | USD | 6,400,000 | Fixed 3.500% | 3 Month LIBOR | Jun 2021 | 237,440 | (141,284) | 96,156 |
| | BNP Paribas | 5,100,000 | USD | 5,100,000 | Fixed 3.500% | 3 Month LIBOR | Jun 2021 | 51,918 | 24,706 | 76,624 |
| | Citibank N.A | 7,500,000 | USD | 7,500,000 | Fixed 4.250% | 3 Month LIBOR | Jun 2041 | 156,974 | (44,561) | 112,413 |
| | Citibank N.A | 9,200,000 | USD | 9,200,000 | Fixed 3.500% | 3 Month LIBOR | Jun 2021 | 236,900 | (98,676) | 138,224 |
| | Credit Suisse International | 1,610,000,000 | JPY | 19,397,383 | 6 Month LIBOR | Fixed 1.500% | Jun 2021 | 292,950 | (54,041) | 238,909 |
| | Deutsche Bank AG | 2,900,000 | USD | 2,900,000 | Fixed 4.250% | 3 Month LIBOR | Jun 2041 | 50,460 | (6,994) | 43,466 |
| | Goldman Sachs | 4,200,000 | USD | 4,200,000 | Fixed 3.500% | 3 Month LIBOR | Jun 2021 | 122,892 | (59,790) | 63,102 |
| | HSBC Bank USA | 14,817,441 | BRL | 9,705,393 | CDI | Fixed 11.360% | Jan 2012 | 167,895 | (48,601) | 119,294 |
| | HSBC Bank USA | 37,018,360 | BRL | 24,971,958 | CDI | Fixed 11.530 % | Jan 2012 | 30,954 | (138,696) | (107,742) |
| | HSBC Bank USA | 10,000,000 | USD | 10,000,000 | Fixed 3.500% | 3 Month LIBOR | Jun 2021 | 192,898 | (42,655) | 150,243 |
| | JPMorgan Chase Bank | 2,500,000 | CAD | 2,387,661 | 3 Month BA-CDOR | Fixed 5.800% | Dec 2023 | 13,576 | 45,226 | 58,802 |
| | JPMorgan Chase Bank | 8,076,048 | BRL | 5,346,351 | CDI | Fixed 11.250% | Jan 2012 | — | (37,906) | (37,906) |
| | Morgan Stanley Capital Services, Inc. | 8,500,000 | USD | 8,500,000 | Fixed 4.250% | 3 Month LIBOR | Jun 2041 | 22,100 | 105,301 | 127,401 |
| | Morgan Stanley Capital Services, Inc. | 13,800,000 | USD | 13,800,000 | Fixed 3.500% | 3 Month LIBOR | Jun 2021 | 313,738 | (106,403) | 207,335 |
| | The Royal Bank of Scotland PLC | 4,828,338 | BRL | 3,196,188 | CDI | Fixed 11.245% | Jan 2012 | — | (22,663) | (22,663) |
| | The Royal Bank of Scotland PLC | 450,000,000 | JPY | 5,439,381 | 6 Month LIBOR | Fixed 1.500% | Jun 2021 | 78,371 | (11,595) | 66,776 |
| | The Royal Bank of Scotland PLC | 3,700,000 | USD | 3,700,000 | Fixed 3.500% | 3 Month LIBOR | Jun 2021 | 35,150 | 20,440 | 55,590 |
| | The Royal Bank of Scotland PLC | 2,400,000 | USD | 2,400,000 | Fixed 4.250% | 3 Month LIBOR | Jun 2041 | 130,800 | (94,828) | 35,972 |
| | UBS AG | 1,100,000 | USD | 1,100,000 | Fixed 4.250% | 3 Month LIBOR | Jun 2041 | 33,330 | (16,843) | 16,487 |
|
| | | | | $171,586,664 | | | | $2,191,226 | ($872,677) | $1,318,549 |
Investment Quality Bond Fund
The Fund used interest rate swaps to manage duration of the Fund, manage against anticipated interest rate changes and as a substitute for securities purchased. During the period ended February 28, 2011, the Fund held interest rate swaps with total USD notional amounts as represented below.
| | | | | | | | | | |
| | | | | | | | | UNAMORTIZED | | |
| | | | | | | | | UPFRONT | | |
| | | | | USD | PAYMENTS | PAYMENTS | | PAYMENT | UNREALIZED | |
| | | NOTIONAL | | NOTIONAL | MADE | RECEIVED | MATURITY | PAID | APPRECIATION | MARKET |
| FUND | COUNTERPARTY | AMOUNT | CURRENCY | AMOUNT | BY FUND | BY FUND | DATE | (RECEIVED) | (DEPRECIATION) | VALUE |
|
| Investment Quality Bond Fund | | | | | | | | | |
| | JPMorgan Chase Bank | 2,480,000 | USD | $2,480,000 | Fixed 4.3175% | 3 Month LIBOR | Dec 2028 | — | ($94,816) | ($94,816) |
| | JPMorgan Chase Bank | 925,000 | USD | 925,000 | Fixed 3.425% | 3 Month LIBOR | Jul 2039 | — | 123,876 | 123,876 |
|
| | | | | $3,405,000 | | | | — | $29,060 | $29,060 |
DERIVATIVE INSTRUMENTS, CONTINUED
Real Return Bond Fund
The Fund used interest rate swaps to enhance potential gain/income, manage against anticipated interest rate changes, manage duration of the Fund and substitute for securities purchase. During the period ended February 28, 2011, the Fund held interest rate swaps with total USD notional amounts ranging from approximately $90.2 million to $198.4 million as measured at each quarter end.
| | | | | | | | | | |
| | | | | | | | | UNAMORTIZED | | |
| | | | | | | | | UPFRONT | | |
| | | | | USD | PAYMENTS | PAYMENTS | | PAYMENT | UNREALIZED | |
| | | NOTIONAL | | NOTIONAL | MADE | RECEIVED | MATURITY | PAID | APPRECIATION | MARKET |
| PORTFOLIO | COUNTERPARTY | AMOUNT | CURRENCY | AMOUNT | BY FUND | BY FUND | DATE | (RECEIVED) | (DEPRECIATION) | VALUE |
|
| Real Return Bond Trust | | | | | | | | | |
| | Barclays Bank PLC | 18,815,567 | BRL | $11,120,393 | CDI | Fixed 10.680% | Jan 2012 | ($34,925) | ($159,318) | ($194,243) |
| | Barclays Bank PLC | 4,841,202 | BRL | 3,603,604 | CDI | Fixed 12.285% | Jan 2013 | 20,715 | 26,874 | 47,589 |
| | Barclays Bank PLC | 300,000 | USD | 300,000 | Fixed 4.25% | 3 Month LIBOR | Jun 2041 | 1,800 | 2,697 | 4,497 |
| | BNP Paribas | 5,036,345 | BRL | 3,894,170 | CDI | Fixed 11.880% | Jan 2013 | (32,069) | 40,854 | 8,785 |
| | Goldman Sachs | 24,879,519 | BRL | 18,417,873 | CDI | Fixed 11.890% | Jan 2013 | 19,124 | 41,572 | 60,696 |
| | HSBC Bank USA | 5,767,065 | BRL | 3,819,549 | CDI | Fixed 11.670% | Jan 2012 | 53,400 | 48,029 | 101,429 |
| | HSBC Bank USA | 5,449,139 | BRL | 3,531,959 | CDI | Fixed 11.1400% | Jan 2012 | 23,786 | 27,811 | 51,597 |
| | HSBC Bank USA | 24,374,252 | BRL | 15,638,672 | CDI | Fixed 11.360% | Jan 2012 | 11,777 | 184,458 | 196,235 |
| | HSBC Bank USA | 5,553,464 | BRL | 4,226,631 | CDI | Fixed 11.890% | Jan 2013 | 10,384 | 3,163 | 13,547 |
| | JPMorgan Chase Bank | 5,266,988 | BRL | 3,507,746 | CDI | Fixed 11.250% | Jan 2012 | (153) | (24,568) | (24,721) |
| | JPMorgan Chase Bank | 2,700,000 | EUR | 3,428,053 | FRCPXTOB | Fixed 2.028% | Oct 2011 | — | 100,071 | 100,071 |
| | JPMorgan Chase Bank | 1,618,163 | BRL | 1,189,189 | CDI | Fixed 12.170% | Jan 2013 | 9,342 | 3,002 | 12,344 |
| | Morgan Stanley Capital Services, Inc. | 7,733,455 | BRL | 4,763,208 | CDI | Fixed 10.115% | Jan 2012 | (36,074) | (166,835) | (202,909) |
| | Morgan Stanley Capital Services, Inc. | 5,159,359 | BRL | 3,444,250 | CDI | Fixed 11.600% | Jan 2012 | 13,362 | 71,722 | 85,084 |
| | Morgan Stanley Capital Services, Inc. | 874,180 | BRL | 547,345 | CDI | Fixed 11.630% | Jan 2012 | (12) | 2,286 | 2,274 |
| | Morgan Stanley Capital Services, Inc. | 4,433,227 | BRL | 3,222,342 | CDI | Fixed 11.980% | Jan 2013 | — | 16,839 | 16,839 |
| | UBS AG | 1,800,000 | EUR | 2,276,369 | FRCPXTOB | Fixed 2.095% | Oct 2011 | — | 75,752 | 75,752 |
| | UBS AG | 4,349,983 | BRL | 3,263,274 | CDI | Fixed 12.070% | Jan 2013 | (20,768) | 45,822 | 25,054 |
|
| | | | | $90,194,627 | | | | $39,689 | $340,231 | $379,920 |
Spectrum Income Fund
The Fund used interest rate swaps to enhance potential gain/income. During the period ended February 28, 2011, the Fund held interest rate swaps with total USD notional amounts ranging from $0 to approximately $9.8 million as measured at each quarter end.
| | | | | | | | | | |
| | | | | | | | | UNAMORTIZED | | |
| | | | | | | | | UPFRONT | | |
| | | | | USD | PAYMENTS | PAYMENTS | | PAYMENT | UNREALIZED | |
| | | NOTIONAL | | NOTIONAL | MADE | RECEIVED | MATURITY | PAID | APPRECIATION | MARKET |
| FUND | COUNTERPARTY | AMOUNT | CURRENCY | AMOUNT | BY FUND | BY FUND | DATE | (RECEIVED) | (DEPRECIATION) | VALUE |
|
| Spectrum Income Fund | | | | | | | | | |
| | JPMorgan Chase Bank | 2,400,000 | USD | $2,400,000 | Fixed 1.39250% | 3 Month LIBOR | Nov 2015 | — | $78,532 | $78,532 |
| | JPMorgan Chase Bank | 4,600,000 | USD | 4,600,000 | Fixed 2.58000% | 3 Month LIBOR | Feb 2016 | — | (60,122) | (60,122) |
| | JPMorgan Chase Bank | 2,800,000 | USD | 2,800,000 | 3 Month LIBOR | Fixed 3.79000% | Feb 2021 | — | 69,843 | 69,843 |
|
| | | | | $9,800,000 | | | | — | $88,253 | $88,253 |
Total Return Fund
The Fund used interest rate swaps to enhance potential gain/income, manage against anticipated interest rate changes, manage duration of the Fund and substitute for securities purchase. During the period ended November 30, 2010, the Fund held interest rate swaps with total USD notional amounts ranging from $228.2 million to $411.5 million, as measured at each quarter end.
| | | | | | | | | | |
| | | | | | | | | UNAMORTIZED | | |
| | | | | | | | | UPFRONT | | |
| | | | | USD | PAYMENTS | PAYMENTS | | PAYMENT | UNREALIZED | |
| | | NOTIONAL | | NOTIONAL | MADE | RECEIVED | MATURITY | PAID | APPRECIATION | MARKET |
| FUND | COUNTERPARTY | AMOUNT | CURRENCY | AMOUNT | BY FUND | BY FUND | DATE | (RECEIVED) | (DEPRECIATION) | VALUE |
|
| Total Return Fund | | | | | | | | | |
| | Bank of America N.A. | 14,000,000 | USD | $14,000,000 | Fixed 2.500% | 3 Month LIBOR | Jun 2016 | $240,800 | ($184,209) | $56,591 |
| | Bank of America N.A. | 26,200,000 | USD | 26,200,000 | Fixed 3.000% | 3 Month LIBOR | Jun 2018 | 762,420 | (473,730) | 288,690 |
| | Bank of America N.A. | 3,600,000 | USD | 3,600,000 | Fixed 3.500% | 3 Month LIBOR | Jun 2021 | 118,764 | (64,677) | 54,087 |
| | Bank of America N.A. | 800,000 | USD | 800,000 | Fixed 4.250% | 3 Month LIBOR | Jun 2041 | 34,768 | (22,777) | 11,991 |
| | Barclays Bank PLC | 795,727 | BRL | 383,992 | CDI | Fixed 10.600% | Jan 2012 | — | 913 | 913 |
| | Barclays Bank PLC | 881,850 | BRL | 568,828 | CDI | Fixed 10.835% | Jan 2012 | 1,683 | 2,715 | 4,398 |
| | Barclays Bank PLC | 2,800,000 | USD | 2,800,000 | Fixed 2.500% | 3 Month LIBOR | Jun 2016 | 51,660 | (40,342) | 11,318 |
| | BNP Paribas | 4,559,663 | BRL | 2,874,313 | CDI | Fixed 11.390% | Jan 2012 | — | 9,347 | 9,347 |
| | BNP Paribas | 3,630,748 | BRL | 2,721,289 | CDI | Fixed 11.880% | Jan 2013 | 375 | 5,955 | 6,330 |
| | BNP Paribas | 26,447,631 | BRL | 20,255,272 | CDI | Fixed 12.800% | Jan 2013 | 55,042 | 268,285 | 323,327 |
| | BNP Paribas | 1,248,943 | BRL | 1,094,901 | CDI | Fixed 12.110% | Jan 2014 | — | 3,984 | 3,984 |
| | BNP Paribas | 800,000 | USD | 800,000 | Fixed 4.250% | 3 Month LIBOR | Jun 2041 | 35,200 | (23,209) | 11,991 |
| | Citibank N.A | 3,300,000 | USD | 3,300,000 | Fixed 3.500% | 3 Month LIBOR | Jun 2021 | 99,660 | (50,080) | 49,580 |
| | Citibank N.A | 15,400,000 | USD | 15,400,000 | Fixed 4.250% | 3 Month LIBOR | Jun 2041 | 436,521 | (205,700) | 230,821 |
| | Credit Suisse International | 20,516,352 | BRL | 15,228,639 | CDI | Fixed 12.480% | Jan 2013 | 46,762 | 93,919 | 140,681 |
| | Credit Suisse International | 600,000 | USD | 600,000 | Fixed 4.250% | 3 Month LIBOR | Jun 2041 | 18,990 | (9,997) | 8,993 |
DERIVATIVE INSTRUMENTS, CONTINUED
| | | | | | | | | | |
| | | | | | | | | UNAMORTIZED | | |
| | | | | | | | | UPFRONT | | |
| | | | | USD | PAYMENTS | PAYMENTS | | PAYMENT | UNREALIZED | |
| | | NOTIONAL | | NOTIONAL | MADE | RECEIVED | MATURITY | PAID | APPRECIATION | MARKET |
| FUND | COUNTERPARTY | AMOUNT | CURRENCY | AMOUNT | BY FUND | BY FUND | DATE | (RECEIVED) | (DEPRECIATION) | VALUE |
|
| Total Return Fund (continued) | | | | | | | | | |
| | Deutsche Bank AG | 2,500,000 | AUD | $1,774,875 | 3 Month BBR-BBSW | Fixed 4.500% | Jun 2011 | $327 | ($7,015) | ($6,688) |
| | Deutsche Bank AG | 5,800,000 | USD | 5,800,000 | Fixed 2.500% | 3 Month LIBOR | Jun 2016 | 92,510 | (69,065) | 23,445 |
| | Deutsche Bank AG | 6,300,000 | USD | 6,300,000 | Fixed 3.500% | 3 Month LIBOR | Jun 2021 | 197,697 | (103,044) | 94,653 |
| | Goldman Sachs | 264,555 | BRL | 157,522 | CDI | Fixed 10.835% | Jan 2012 | 88 | 1,231 | 1,319 |
| | Goldman Sachs | 4,577,796 | BRL | 2,858,905 | CDI | Fixed 10.990% | Jan 2012 | 8,777 | 12,614 | 21,391 |
| | Goldman Sachs | 19,482,831 | BRL | 14,275,191 | CDI | Fixed 11.890% | Jan 2013 | 6,547 | 40,962 | 47,509 |
| | Goldman Sachs | 4,438,526 | BRL | 3,183,732 | CDI | Fixed 11.930% | Jan 2013 | (8,611) | 20,297 | 11,686 |
| | Goldman Sachs | 8,383,628 | BRL | 7,723,783 | CDI | Fixed 12.650% | Jan 2014 | 94,095 | 56,546 | 150,641 |
| | Goldman Sachs | 2,000,000 | USD | 2,000,000 | Fixed 4.250% | 3 Month LIBOR | Jun 2041 | 68,200 | (38,223) | 29,977 |
| | HSBC Bank | 422,542 | BRL | 318,167 | CDI | Fixed 14.765% | Jan 2012 | 1,327 | 28,280 | 29,607 |
| | HSBC Bank | 1,237,661 | BRL | 597,321 | CDI | Fixed 10.610% | Jan 2012 | — | 1,614 | 1,614 |
| | HSBC Bank | 2,548,791 | BRL | 1,660,703 | CDI | Fixed 11.140% | Jan 2012 | 13,188 | 10,946 | 24,134 |
| | HSBC Bank | 3,156,378 | BRL | 1,976,393 | CDI | Fixed 11.360% | Jan 2012 | 16,337 | 9,075 | 25,412 |
| | HSBC Bank | 1,319,856 | BRL | 958,977 | CDI | Fixed 12.300% | Jan 2013 | 6,033 | 7,433 | 13,466 |
| | HSBC Bank | 2,740,364 | BRL | 1,970,010 | CDI | Fixed 11.880% | Jan 2013 | (2,570) | 3,453 | 883 |
| | HSBC Bank | 20,362,702 | BRL | 14,957,584 | CDI | Fixed 11.890% | Jan 2013 | 13,388 | 36,285 | 49,673 |
| | HSBC Bank | 15,121,661 | BRL | 13,625,209 | CDI | Fixed 12.540% | Jan 2014 | 31,811 | 198,149 | 229,960 |
| | HSBC Bank | 28,900,000 | MXN | 2,214,984 | TIIE-Banxico | Fixed 7.330% | Jan 2015 | 10,066 | 54,450 | 64,516 |
| | HSBC Bank | 300,000 | USD | 300,000 | Fixed 4.250% | 3 Month LIBOR | Jun 2041 | 5,586 | (1,089) | 4,497 |
| | JPMorgan Chase Bank | 530,485 | BRL | 255,995 | CDI | Fixed 10.600% | Jan 2012 | — | 609 | 609 |
| | JPMorgan Chase Bank | 7,211,466 | BRL | 5,491,349 | CDI | Fixed 12.170% | Jan 2013 | 15,267 | 39,720 | 54,987 |
| | JPMorgan Chase Bank | 2,737,356 | BRL | 2,370,490 | CDI | Fixed 12.200% | Jan 2014 | (859) | 17,429 | 16,570 |
| | JPMorgan Chase Bank | 3,000,000 | USD | 3,000,000 | Fixed 2.500% | 3 Month LIBOR | Jun 2016 | 54,300 | (42,173) | 12,127 |
| | JPMorgan Chase Bank | 3,500,000 | USD | 3,500,000 | Fixed 3.000% | 3 Month LIBOR | Jun 2018 | 92,750 | (54,185) | 38,565 |
| | JPMorgan Chase Bank | 700,000 | USD | 700,000 | Fixed 4.250% | 3 Month LIBOR | Jun 2041 | 31,920 | (21,428) | 10,492 |
| | Merrill Lynch Capital Services, Inc. | 5,020,045 | BRL | 3,204,292 | CDI | Fixed 10.990% | Jan 2012 | 8,545 | 14,903 | 23,448 |
| | Merrill Lynch Capital Services, Inc. | 1,352,133 | BRL | 1,012,701 | CDI | Fixed 14.765% | Jan 2012 | 2,666 | 92,078 | 94,744 |
| | Merrill Lynch Capital Services, Inc. | 6,705,484 | BRL | 3,936,605 | CDI | Fixed 11.980% | Jan 2012 | — | 146,346 | 146,346 |
| | Merrill Lynch Capital Services, Inc. | 16,811,967 | BRL | 12,314,109 | CDI | Fixed 11.900% | Jan 2013 | 29,016 | (4,746) | 24,270 |
| | Morgan Stanley Capital Services, Inc. | 2,586,049 | BRL | 1,854,796 | CDI | Fixed 11.980% | Jan 2013 | 5,453 | 4,369 | 9,822 |
| | Morgan Stanley Capital Services, Inc. | 8,665,735 | BRL | 6,360,809 | CDI | Fixed 12.590% | Jan 2013 | 39,735 | 34,949 | 74,684 |
| | Morgan Stanley Capital Services, Inc. | 16,668,920 | BRL | 15,128,282 | CDI | Fixed 12.510% | Jan 2014 | 64,102 | 177,312 | 241,414 |
| | Morgan Stanley Capital Services, Inc. | 6,500,000 | USD | 6,500,000 | Fixed 3.000% | 3 Month LIBOR | Jun 2018 | 197,340 | (125,718) | 71,622 |
| | Morgan Stanley Capital Services, Inc. | 3,300,000 | USD | 3,300,000 | Fixed 3.500% | 3 Month LIBOR | Jun 2021 | 92,400 | (42,820) | 49,580 |
| | Morgan Stanley Capital Services, Inc. | 6,400,000 | USD | 6,400,000 | Fixed 4.250% | 3 Month LIBOR | Jun 2041 | 69,500 | 26,426 | 95,926 |
| | The Royal Bank of Scotland PLC | 28,500,000 | USD | 28,500,000 | Fixed 4.250% | 3 Month LIBOR | Jun 2041 | 709,530 | (282,361) | 427,169 |
| | UBS AG | 33,700,000 | AUD | 23,967,444 | 3 Month BBR-BBSW | Fixed 4.500% | Jun 2011 | 318 | (90,473) | (90,155) |
| | UBS AG | 3,506,283 | BRL | 2,182,691 | CDI | Fixed 11.420% | Jan 2012 | — | 8,433 | 8,433 |
| | UBS AG | 7,871,029 | BRL | 4,551,967 | CDI | Fixed 10.575% | Jan 2012 | (28,532) | (73,133) | (101,665) |
| | UBS AG | 1,400,842 | BRL | 1,042,238 | CDI | Fixed 12.070% | Jan 2013 | 4,734 | 3,334 | 8,068 |
| | UBS AG | 1,117,772 | BRL | 986,842 | CDI | Fixed 12.250% | Jan 2014 | 4,991 | 3,593 | 8,584 |
| | UBS AG | 3,200,000 | USD | 3,200,000 | Fixed 3.000% | 3 Month LIBOR | Jun 2018 | 86,400 | (51,140) | 35,260 |
| | UBS AG | 3,300,000 | USD | 3,300,000 | Fixed 3.500% | 3 Month LIBOR | Jun 2021 | 94,050 | (44,470) | 49,580 |
| | UBS AG | 600,000 | USD | 600,000 | Fixed 4.250% | 3 Month LIBOR | Jun 2041 | 22,650 | (13,657) | 8,993 |
|
| | | | | $336,941,200 | | | | $4,053,717 | ($703,507) | $3,350,210 |
Credit Default Swaps Credit default swaps (CDS) involve the exchange of a fixed rate premium (paid by the Buyer), for protection against the loss in value of an underlying debt instrument, referenced entity or index, in the event of a defined credit event (such as payment default or bankruptcy). Under the terms of the swap, one party acts as a “guarantor” (the Seller), receiving the premium and agreeing to remedies that are specified within the credit default agreement. The Funds may enter into CDS in which they may act as either Buyer or Seller. By acting as the Seller, the Funds may incur economic leverage since they would be obligated to pay the Buyer the notional amount of the contract in the event of a default. The amount of loss in such case would be reduced by any recovery value on the underlying credit.
The following table summarizes the contracts held at February 28, 2011 and the range of notional contract amounts held by the Funds during the six-month period ended February 28, 2011. In addition, the table details how the Funds used credit default swap contracts as a buyer of protection during the six-month period ended February 28, 2011.
Active Bond Fund
The Fund used credit default swaps to manage against potential credit events. During the period ended February 28, 2011, the Fund held credit default swaps with total USD notional amounts as represented below.
| | | | | | | | | | | |
| | | | | | | | | | UNAMORTIZED | | |
| | | | | | | | | | UPFRONT | | |
| | | | | | | USD | (PAY)/ | | PAYMENT | UNREALIZED | |
| | | | | NOTIONAL | | NOTIONAL | RECEIVED | MATURITY | PAID | APPRECIATION | MARKET |
| FUND | COUNTERPARTY | REFERENCE OBLIGATION | | AMOUNT | CURRENCY | AMOUNT | FIXED RATE | DATE | (RECEIVED) | (DEPRECIATION) | VALUE |
|
| Active Bond Fund | | | | | | | | | | |
| | Bank of America N.A. | Republic of Italy | | 10,000,000 | USD | $10,000,000 | (1.000)% | Mar 2016 | $689,317 | ($344,919) | $344,398 |
|
| | | | | | | $10,000,000 | | | $689,317 | ($344,919) | $344,398 |
DERIVATIVE INSTRUMENTS, CONTINUED
Global Bond Fund
The Fund used credit default swaps to enhance potential gain/income and manage against potential credit events. During the period ended February 28, 2011, the Fund held credit default swaps with total USD notional amounts ranging from approximately $25.9 million to $98.9 million as measured at each quarter end.
| | | | | | | | | | | |
| | | | | | | | | | UNAMORTIZED | | |
| | | | | | | | | | UPFRONT | | |
| | | | | | | USD | (PAY)/ | | PAYMENT | UNREALIZED | |
| | | | | NOTIONAL | | NOTIONAL | RECEIVED | MATURITY | PAID | APPRECIATION | MARKET |
| FUND | COUNTERPARTY | | REFERENCE OBLIGATION | AMOUNT | CURRENCY | AMOUNT | FIXED RATE | DATE | (RECEIVED) | (DEPRECIATION) | VALUE |
|
| Global Bond Fund | | | | | | | | | | |
| | Bank of America N.A. | | Intuit, Inc. | 2,000,000 | USD | $2,000,000 | (1.380)% | Mar 2017 | — | ($104,180) | ($104,180) |
| | Bank of America N.A. | | Xstrata Canada Corp. | 3,000,000 | USD | 3,000,000 | (0.910)% | Jun 2012 | — | (32,983) | (32,983) |
| | Bank of America N.A. | | Lafarge | 2,000,000 | USD | 2,000,000 | (1.690)% | Sep 2016 | — | 77,999 | 77,999 |
| | Bank of America N.A. | | Rio Tinto Alcan, Inc. | 700,000 | USD | 700,000 | (0.290)% | Mar 2011 | — | (504) | (504) |
| | Bank of America N.A. | | CBS Corp. | 1,800,000 | USD | 1,800,000 | (1.000)% | Jun 2019 | $194,496 | (157,702) | 36,794 |
| | Barclays Bank PLC | | XL Capital Ltd. | 300,000 | USD | 300,000 | (0.310)% | Mar 2012 | — | 261 | 261 |
| | Barclays Bank PLC | | Southwest Airlines Co. | 500,000 | USD | 500,000 | (0.640)% | Mar 2017 | — | 20,840 | 20,840 |
| | Barclays Bank PLC | | Norfolk Southern | 2,000,000 | USD | 2,000,000 | (0.450)% | Sep 2014 | — | (13,857) | (13,857) |
| | Bear Stearns | | Loews Corp. | 200,000 | USD | 200,000 | (0.330)% | Mar 2016 | — | 6,293 | 6,293 |
| | Bear Stearns | | CNA Financial Corp. | 500,000 | USD | 500,000 | (0.440)% | Sep 2011 | — | (102) | (102) |
| | BNP Paribas | | D.R. Horton, Inc. | 800,000 | USD | 800,000 | (4.030)% | Jun 2011 | — | (13,037) | (13,037) |
| | BNP Paribas | | Vivendi | 800,000 | USD | 800,000 | (1.743)% | Jun 2013 | — | (25,458) | (25,458) |
| | BNP Paribas | | Vivendi | 800,000 | USD | 800,000 | (1.780)% | Jun 2013 | — | (26,218) | (26,218) |
| | BNP Paribas | | Vivendi | 700,000 | USD | 700,000 | (1.820)% | Jun 2013 | — | (23,642) | (23,642) |
| | Citibank N.A | | Autozone, Inc. | 500,000 | USD | 500,000 | (0.680)% | Dec 2012 | — | (3,401) | (3,401) |
| | Citibank N.A | | Pearson PLC | 1,000,000 | USD | 1,000,000 | (0.690)% | Jun 2018 | — | 6,842 | 6,842 |
| | Credit Suisse International | | Sealed Air Corp. | 700,000 | USD | 700,000 | (0.500)% | Sep 2013 | — | 10,064 | 10,064 |
| | Credit Suisse International | | Masco Corp. | 700,000 | USD | 700,000 | (0.907)% | Dec 2016 | — | 56,691 | 56,691 |
| | Credit Suisse International | | Valeo | 1,200,000 | EUR | 1,792,500 | (1.000)% | Jun 2013 | 47,267 | (62,522) | (15,255) |
| | Deutsche Bank AG | | Tate & Lyle Public Limited Company | 300,000 | USD | 300,000 | (0.510)% | Dec 2014 | — | 2,098 | 2,098 |
| | Deutsche Bank AG | | Nationwide Health Properties, Inc. | 600,000 | USD | 600,000 | (0.620)% | Sep 2011 | — | (1,573) | (1,573) |
| | Deutsche Bank AG | | Jones Apparel Group | 600,000 | USD | 600,000 | (1.000)% | Dec 2014 | 14,461 | 9,925 | 24,386 |
| | JPMorgan Chase Bank | | CNA Financial Corp. | 500,000 | USD | 500,000 | (0.440)% | Sep 2011 | — | (102) | (102) |
| | JPMorgan Chase Bank | | Sabre Holdings Corp. | 700,000 | USD | 700,000 | (0.930)% | Sep 2011 | — | (229) | (229) |
| | JPMorgan Chase Bank | | D.R. Horton Inc. | 1,800,000 | USD | 1,800,000 | (1.000)% | Mar 2015 | 73,321 | (7,802) | 65,519 |
| | UBS AG | | Capital One Financial Corp. | 600,000 | USD | 600,000 | (0.350)% | Sep 2011 | — | (966) | (966) |
|
| | | | | | | $25,892,500 | | | $329,545 | ($283,265) | $46,280 |
Investment Quality Bond Fund
The Fund used credit default swaps to manage against potential credit events. During the period ended February 28, 2011, the Fund held credit default swaps with total USD notional amounts as represented below.
| | | | | | | | | | | |
| | | | | | | | | | UNAMORTIZED | | |
| | | | | | | | | | UPFRONT | | |
| | | | | | | USD | (PAY)/ | | PAYMENT | UNREALIZED | |
| | | | | NOTIONAL | | NOTIONAL | RECEIVED | MATURITY | PAID | APPRECIATION | MARKET |
| FUND | COUNTERPARTY | | REFERENCE OBLIGATION | AMOUNT | CURRENCY | AMOUNT | FIXED RATE | DATE | (RECEIVED) | (DEPRECIATION) | VALUE |
|
| Investment Quality Bond Fund | | | | | | | | | | |
| | Goldman Sachs | | Macy’s, Inc. | 500,000 | USD | $500,000 | (2.700)% | Sep 2013 | — | ($24,961) | ($24,961) |
| | UBS AG | | Everest Reinsurance Holdings, Inc. | 600,000 | USD | 600,000 | (1.800)% | Dec 2013 | — | (19,944) | (19,944) |
|
| | | | | | | $1,100,000 | | | — | ($44,905) | ($44,905) |
Real Return Bond Fund
The Fund used credit default swaps to enhance potential gain/income and manage against potential credit events. During the period ended February 28, 2011, the Fund held credit default swaps with total USD notional amounts ranging from approximately $6.7 million to $7.6 million as measured at each quarter end.
| | | | | | | | | | | |
| | | | | | | | | UNAMORTIZED | | |
| | | | | | | | | UPFRONT | | |
| | | | | | USD | (PAY)/ | | PAYMENT | UNREALIZED | |
| | | | NOTIONAL | | NOTIONAL | RECEIVED | MATURITY | PAID | APPRECIATION | MARKET |
| PORTFOLIO COUNTERPARTY | | REFERENCE OBLIGATION | AMOUNT | CURRENCY | AMOUNT | FIXED RATE | DATE | (RECEIVED) | (DEPRECIATION) | VALUE |
|
| Real Return Bond Trust | | | | | | | | | | |
| Barclays Bank PLC | | Cardinal Health, Inc. | 595,000 | USD | $595,000 | (1.000)% | Jun 2017 | ($11,689) | $2,878 | ($8,811) |
| BNP Paribas | | International Lease Finance Corp. | 600,000 | USD | 600,000 | (1.600)% | Dec 2013 | — | 9,219 | 9,219 |
| Citibank N.A. | | GATX Corp. | 1,000,000 | USD | 1,000,000 | (1.070)% | Mar 2016 | — | 18,596 | 18,596 |
| Deutsche Bank AG | | Macy’s, Inc | 1,000,000 | USD | 1,000,000 | (2.100)% | Sep 2017 | — | (36,521) | (36,521) |
| Goldman Sachs | | RPM International, Inc. | 1,000,000 | USD | 1,000,000 | (1.500)% | Mar 2018 | — | (287) | (287) |
| Morgan Stanley Capital Services, Inc. | | Pearson PLC | 2,500,000 | USD | 2,500,000 | (0.750)% | Jun 2014 | — | (27,111) | (27,111) |
|
| | | | | | $6,695,000 | | | ($11,689) | ($33,226) | ($44,915) |
DERIVATIVE INSTRUMENTS, CONTINUED
Implied credit spreads are utilized in determining the market value of CDS agreements in which the Fund is the Seller at period end. The implied credit spread generally represents the yield of the instrument above a credit-risk free rate, such as the U.S. Treasury Bond Yield, and may include upfront payments required to be made to enter into the agreement. It also serves as an indicator of the current status of the payment/performance risk and represents the likelihood or risk of default for the credit derivative. Wider credit spreads represent a deterioration of the referenced entity’s credit rating and an increased risk of default or other credit event occurring as defined under the terms of the agreement. The maximum potential amount of future payments (undiscounted) that the Fund as the Seller could be required to make under a CDS agreement would be an amount equal to the notional amount of the agreement.
The following table summarizes the contracts held at February 28, 2011 and the range of notional contracts amounts held by the Funds during the six-month period ended February 28, 2011. In addition, the table details how the Funds used credit default swap contracts as a seller of protection during the six-month period ended February 28, 2011.
The fund had the following credit default swap contracts open at February 28, 2011
Global Bond Fund
The Fund used credit default swaps to enhance potential gain/income and gain exposure to a security or credit index. During the period ended February 28, 2011, the Fund held credit default swaps with total USD notional amounts ranging from approximately $23.7 million to $119.9 million as measured at each quarter end.
| | | | | | | | | | | | |
| | | | | IMPLIED | | | | | | UNAMORTIZED | | |
| | | | | CREDIT | | | | (PAY)/ | | UPFRONT | | |
| | | | | SPREAD | | | USD | RECEIVED | | PAYMENT | UNREALIZED | |
| | | | REFERENCE | AT | NOTIONAL | | NOTIONAL | FIXED MATURITY | | PAID | APPRECIATION | MARKET |
| FUND | COUNTERPARTY | | OBLIGATION | 2-28-2011 | AMOUNT | CURRENCY | AMOUNT | RATE | DATE | (RECEIVED) | (DEPRECIATION) | VALUE |
|
| Global Bond Fund | | | | | | | | | | | |
| | Bank of America N.A. | | Federative Republic of Brazil | 0.46% | 1,300,000 | USD | $1,300,000 | 1.000% | Dec 2011 | $3,667 | $4,684 | $8,351 |
| | Bank of America N.A. | | Ally Financial Inc | 1.42% | 1,500,000 | USD | 1,500,000 | 5.000% | Dec 2012 | 22,951 | 87,556 | 110,507 |
| | Bank of America N.A. | | French Republic | 0.90% | 1,500,000 | USD | 1,500,000 | 0.250% | Mar 2016 | (59,793) | 13,777 | (46,016) |
| | Bank of America N.A. | | French Republic | 0.90% | 2,800,000 | USD | 2,800,000 | 0.250% | Mar 2016 | (113,009) | 27,112 | (85,897) |
| | Barclays Bank PLC | | Federative Republic of Brazil | 0.46% | 700,000 | USD | 700,000 | 1.000% | Dec 2011 | 2,061 | 2,436 | 4,497 |
| | Barclays Bank PLC | | United Mexican States | 0.51% | 6,300,000 | USD | 6,300,000 | 1.000% | Dec 2011 | 15,854 | 21,672 | 37,526 |
| | BNP Paribas | | Commonwealth of Australia | 0.45% | 2,800,000 | USD | 2,800,000 | 1.000% | Jun 2015 | 40,907 | 29,399 | 70,306 |
| | Citibank N.A | | United Kingdom of Great | 0.56% | 6,500,000 | USD | 6,500,000 | 1.000% | Jun 2015 | 36,449 | 95,710 | 132,159 |
| | | | Britain and Northern Ireland | | | | | | | | | |
| | Citibank N.A | | United Kingdom of Great | 0.56% | 2,000,000 | USD | 2,000,000 | 1.000% | Jun 2015 | 16,146 | 24,518 | 40,664 |
| | | | Britain and Northern Ireland | | | | | | | | | |
| | Citibank N.A | | United Kingdom of Great | 0.56% | 2,100,000 | USD | 2,100,000 | 1.000% | Jun 2015 | 13,514 | 29,183 | 42,697 |
| | | | Britain and Northern Ireland | | | | | | | | | |
| | Citibank N.A. | | Russian Federation | 0.50% | 2,100,000 | USD | 2,100,000 | 1.000% | Dec 2011 | 4,805 | 7,961 | 12,766 |
| | Citibank N.A. | | MCDX.NA.15 | n/a | 2,800,000 | USD | 2,800,000 | 1.000% | Dec 2015 | (76,365) | 19,645 | (56,720) |
| | Citibank N.A. | | Republic of Korea | 1.01% | 2,400,000 | USD | 2,400,000 | 1.000% | Dec 2015 | 24,332 | (20,392) | 3,940 |
| | Citibank N.A. | | People’s Republic of China | 0.76% | 3,000,000 | USD | 3,000,000 | 1.000% | Mar 2016 | 31,489 | 9,034 | 40,523 |
| | Credit Suisse International | | People’s Republic of China | 0.76% | 2,700,000 | USD | 2,700,000 | 1.000% | Mar 2016 | 28,268 | 8,202 | 36,470 |
| | Deutsche Bank AG | | Federative Republic of Brazil | 0.46% | 1,800,000 | USD | 1,800,000 | 1.000% | Dec 2011 | 5,422 | 6,141 | 11,563 |
| | Deutsche Bank AG | | Commonwealth of Australia | 0.45% | 2,300,000 | USD | 2,300,000 | 1.000% | Jun 2015 | 37,398 | 20,353 | 57,751 |
| | Deutsche Bank AG | | United Kingdom of Great | 0.56% | 1,600,000 | USD | 1,600,000 | 1.000% | Jun 2015 | 10,320 | 22,211 | 32,531 |
| | | | Britain and Northern Ireland | | | | | | | | | |
| | Deutsche Bank AG | | French Republic | 0.88% | 7,400,000 | USD | 7,400,000 | 0.250% | Dec 2015 | (180,949) | (27,611) | (208,560) |
| | Deutsche Bank AG | | French Republic | 0.88% | 3,800,000 | USD | 3,800,000 | 0.250% | Dec 2015 | (75,923) | (31,175) | (107,098) |
| | Deutsche Bank AG | | United Kingdom of Great | 0.61% | 5,200,000 | USD | 5,200,000 | 1.000% | Dec 2015 | 105,637 | (970) | 104,667 |
| | | | Britain And Northern Ireland | | | | | | | | | |
| | Deutsche Bank AG | | United States of America | 0.46% | 6,700,000 | USD | 6,700,000 | 0.250% | Dec 2015 | (87,840) | 47,081 | (40,759) |
| | Deutsche Bank AG | | Commonwealth of Australia | 0.52% | 2,700,000 | USD | 2,700,000 | 1.000% | Mar 2016 | 56,544 | 10,898 | 67,442 |
| | Deutsche Bank AG | | Republic of Korea | 1.02% | 600,000 | USD | 600,000 | 1.000% | Mar 2016 | (1,556) | 2,117 | 561 |
| | Goldman Sachs | | MCDX.NA.15 | n/a | 6,000,000 | USD | 6,000,000 | 1.000% | Dec 2015 | (216,631) | 95,089 | (121,542) |
| | Goldman Sachs | | People’s Republic of China | 0.74% | 5,000,000 | USD | 5,000,000 | 1.000% | Dec 2015 | 102,340 | (32,068) | 70,272 |
| | JPMorgan Chase Bank | | United Kingdom of Great | 0.56% | 6,400,000 | USD | 6,400,000 | 1.000% | Jun 2015 | 28,215 | 101,911 | 130,126 |
| | | | Britain and Northern Ireland | | | | | | | | | |
| | JPMorgan Chase Bank | | Republic of Korea | 1.02% | 1,500,000 | USD | 1,500,000 | 1.000% | Mar 2016 | (4,244) | 5,646 | 1,402 |
| | Merrill Lynch International | | Russian Federation | 0.50% | 3,300,000 | USD | 3,300,000 | 1.000% | Dec 2011 | 8,056 | 12,005 | 20,061 |
| | Morgan Stanley Capital Services, Inc. | | Russian Federation | 0.50% | 300,000 | USD | 300,000 | 1.000% | Dec 2011 | 736 | 1,088 | 1,824 |
| | Morgan Stanley Capital Services, Inc. | | French Republic | 0.88% | 5,100,000 | USD | 5,100,000 | 0.250% | Dec 2015 | (115,170) | (28,567) | (143,737) |
| | Morgan Stanley Capital Services, Inc. | | French Republic | 0.88% | 2,300,000 | USD | 2,300,000 | 0.250% | Dec 2015 | (44,820) | (20,003) | (64,823) |
| | Morgan Stanley Capital Services, Inc. | | MCDX.NA.15 | n/a | 1,900,000 | USD | 1,900,000 | 1.000% | Dec 2015 | (51,968) | 13,480 | (38,488) |
| | Morgan Stanley Capital Services, Inc. | | State of California | 2.19% | 4,300,000 | USD | 4,300,000 | 2.950% | Dec 2020 | — | 213,988 | 213,988 |
| | Morgan Stanley Capital Services, Inc. | | State of Connecticut | 1.44% | 2,300,000 | USD | 2,300,000 | 1.630% | Mar 2021 | — | 33,178 | 33,178 |
| | The Royal Bank of Scotland PLC | | Commonwealth of Australia | 0.52% | 1,200,000 | USD | 1,200,000 | 1.000% | Mar 2016 | 26,540 | 3,434 | 29,974 |
| | The Royal Bank of Scotland PLC | | Commonwealth of Australia | 0.52% | 2,000,000 | USD | 2,000,000 | 1.000% | Mar 2016 | 43,327 | 6,630 | 49,957 |
| | UBS AG | | French Republic | 0.88% | 1,200,000 | USD | 1,200,000 | 0.250% | Dec 2015 | (22,765) | (11,055) | (33,820) |
| | UBS AG | | French Republic | 0.90% | 4,500,000 | USD | 4,500,000 | 0.250% | Mar 2016 | (173,396) | 35,347 | (138,049) |
|
| | | | | | | | $119,900,000 | | | ($559,451) | $839,645 | $280,194 |
DERIVATIVE INSTRUMENTS, CONTINUED
Real Return Bond Fund
The Fund used credit default swaps to enhance potential gain/income and gain exposure to a security or credit index. During the period ended February 28, 2011, the Fund held credit default swaps with total USD notional amounts ranging from approximately $50.3 million to $51.4 million as measured at each quarter end.
| | | | | | | | | | | | |
| | | | | IMPLIED | | | | | | UNAMORTIZED | | |
| | | | | CREDIT | | | | (PAY)/ | | UPFRONT | | |
| | | | | SPREAD | | | USD | RECEIVED | | PAYMENT | UNREALIZED | |
| | | | REFERENCE | AT | NOTIONAL | | NOTIONAL | FIXED | MATURITY | PAID | APPRECIATION | MARKET |
| FUND | COUNTERPARTY | | OBLIGATION | 2-28-2011 | AMOUNT | CURRENCY | AMOUNT | RATE | DATE | (RECEIVED) | (DEPRECIATION) | VALUE |
|
| |
| Real Return Bond Fund | | | | | | | | | | | |
| | Bank of America N.A. | | Republic of Italy | 0.67% | 200,000 | USD | $200,000 | 1.000% | Jun 2011 | ($761) | $1,361 | $600 |
| | Bank of America N.A. | | Government of Japan | 0.79% | 4,100,000 | USD | 4,100,000 | 1.000% | Dec 2015 | 86,779 | (38,811) | 47,968 |
| | Barclays Bank PLC | | Federative Republic of Brazil | 1.08% | 1,300,000 | USD | 1,300,000 | 1.000% | Jun 2015 | (9,337) | 7,343 | (1,994) |
| | Barclays Bank PLC | | Federative Republic of Brazil | 1.08% | 1,000,000 | USD | 1,000,000 | 1.000% | Jun 2015 | (16,045) | 14,511 | (1,534) |
| | Barclays Bank PLC | | CDX.EM.14 | n/a | 900,000 | USD | 900,000 | 5.000% | Dec 2015 | 118,838 | 421 | 119,259 |
| | Barclays Bank PLC | | French Republic | 0.88% | 2,300,000 | USD | 2,300,000 | 0.250% | Dec 2015 | (42,529) | (22,294) | (64,823) |
| | BNP Paribas | | CDX.NA.IG.15 | n/a | 7,200,000 | USD | 7,200,000 | 1.000% | Dec 2015 | 44,822 | 28,506 | 73,328 |
| | Citibank N.A. | | French Republic | 0.82% | 2,000,000 | USD | 2,000,000 | 0.250% | Jun 2015 | (40,235) | (5,849) | (46,084) |
| | Citibank N.A. | | United Kingdom of Great | 0.56% | 2,500,000 | USD | 2,500,000 | 1.000% | Jun 2015 | 17,050 | 33,780 | 50,830 |
| | | | Britain and Northern Ireland | | | | | | | | | |
| | Citibank N.A. | | CDX.NA.IG.15 | n/a | 11,700,000 | USD | 11,700,000 | 5.000% | Dec 2015 | 1,522,550 | 27,821 | 1,550,371 |
| | Deutsche Bank AG | | French Republic | 0.82% | 1,600,000 | USD | 1,600,000 | 0.250% | Jun 2015 | (44,857) | 7,989 | (36,868) |
| | Deutsche Bank AG | | Republic of Italy | 1.70% | 1,100,000 | USD | 1,100,000 | 1.000% | Jun 2015 | (22,414) | (6,530) | (28,944) |
| | Deutsche Bank AG | | United Kingdom of Great | 0.56% | 1,000,000 | USD | 1,000,000 | 1.000% | Jun 2015 | 4,006 | 16,326 | 20,332 |
| | | | Britain and Northern Ireland | | | | | | | | | |
| | Deutsche Bank AG | | United Kingdom of Great | 0.56% | 3,100,000 | USD | 3,100,000 | 1.000% | Jun 2015 | 22,340 | 40,688 | 63,028 |
| | | | Britain and Northern Ireland | | | | | | | | | |
| | Deutsche Bank AG | | CDX.EM.14 | n/a | 300,000 | USD | 300,000 | 5.000% | Dec 2015 | 39,752 | 1 | 39,753 |
| | Deutsche Bank AG | | Federative Republic of Brazil | 1.48% | 4,100,000 | USD | 4,100,000 | 1.000% | Jun 2020 | (124,411) | (21,167) | (145,578) |
| | HSBC Bank USA | | Federative Republic of Brazil | 1.08% | 1,000,000 | USD | 1,000,000 | 1.000% | Jun 2015 | (11,901) | 10,367 | (1,534) |
| | JPMorgan Chase Bank | | Federative Republic of Brazil | 1.08% | 400,000 | USD | 400,000 | 1.000% | Jun 2015 | (3,825) | 3,211 | (614) |
| | JPMorgan Chase Bank | | French Republic | 0.82% | 1,400,000 | USD | 1,400,000 | 0.250% | Jun 2015 | (42,334) | 10,075 | (32,259) |
| | JPMorgan Chase Bank | | Petroleo Brasileiro S/A | 1.50% | 400,000 | USD | 400,000 | 1.000% | Sep 2015 | (10,176) | 2,410 | (7,766) |
| | | | Petrobras | | | | | | | | | |
| | The Royal Bank of Scotland PLC | | CDX.EM.14 | n/a | 700,000 | USD | 700,000 | 5.000% | Dec 2015 | 93,636 | (879) | 92,757 |
| | The Royal Bank of Scotland PLC | | Government of Japan | 0.79% | 600,000 | USD | 600,000 | 1.000% | Dec 2015 | 12,547 | (5,527) | 7,020 |
| | UBS AG | | CDX.EM.14 | n/a | 1,400,000 | USD | 1,400,000 | 5.000% | Dec 2015 | 182,815 | 2,700 | 185,515 |
|
| | | | | | | | $50,300,000 | | | $1,776,310 | $106,453 | $1,882,763 |
Spectrum Income Fund
The Fund used credit default swaps to gain exposure to a security. During the period ended February 28, 2011, the Fund held credit default swaps with total USD notional amounts ranging from $0 to approximately $100 thousand as measured at each quarter end.
| | | | | | | | | | | | |
| | | | | IMPLIED | | | | | | UNAMORTIZED | | |
| | | | | CREDIT | | | | (PAY)/ | | UPFRONT | | |
| | | | | SPREAD | | | USD | RECEIVED | | PAYMENT | UNREALIZED | |
| | | | REFERENCE | AT | NOTIONAL | | NOTIONAL | FIXED | MATURITY | PAID | APPRECIATION | MARKET |
| FUND | COUNTERPARTY | | OBLIGATION | 2-28-2011 | AMOUNT | CURRENCY | AMOUNT | RATE | DATE | (RECEIVED) | (DEPRECIATION) | VALUE |
|
| |
| Spectrum Income Fund | | | | | | | | | | | |
| | JPMorgan Chase Bank | | Arab Republic of Egypt | 3.59% | 100,000 | USD | $100,000 | 0.250% | Mar 2016 | ($12,553) | $1,163 | ($11,390) |
|
| | | | | | | | $100,000 | | | ($12,553) | $1,163 | ($11,390) |
Total Return Fund
The Fund used credit default swaps to enhance potential gain/income and gain exposure to a security or credit index. During the period ended February 28, 2011, the Fund held credit default swaps with total USD notional amounts ranging from approximately $189.6 million to $424.2 million as measured at each quarter end.
| | | | | | | | | | | | |
| | | | | IMPLIED | | | | | | UNAMORTIZED | | |
| | | | | CREDIT | | | | (PAY)/ | | UPFRONT | | |
| | | | | SPREAD | | | USD | RECEIVED | | PAYMENT | UNREALIZED | |
| | | | REFERENCE | AT | NOTIONAL | | NOTIONAL | FIXED | MATURITY | PAID | APPRECIATION | MARKET |
| FUND | COUNTERPARTY | | OBLIGATION | 2-28-2011 | AMOUNT | CURRENCY | AMOUNT | RATE | DATE | (RECEIVED) | (DEPRECIATION) | VALUE |
|
| |
| Total Return Fund | | | | | | | | | | | |
| | Bank of America N.A. | | Sallie Mae | 0.52% | 2,600,000 | USD | $2,600,000 | 5.000% | Sep 2011 | ($94,457) | $186,121 | $91,664 |
| | Bank of America N.A. | | Berkshire Hathaway, Inc. | 0.70% | 1,800,000 | USD | 1,800,000 | 1.000% | Mar 2015 | (25,281) | 49,752 | 24,471 |
| | Bank of America N.A. | | People’s Republic of China | 0.68% | 500,000 | USD | 500,000 | 1.000% | Jun 2015 | 7,264 | 326 | 7,590 |
| | Bank of America N.A. | | People’s Republic of China | 0.68% | 1,500,000 | USD | 1,500,000 | 1.000% | Jun 2015 | 20,765 | 2,004 | 22,769 |
| | Bank of America N.A. | | United Mexican States | 1.11% | 300,000 | USD | 300,000 | 1.000% | Sep 2015 | (3,859) | 3,079 | (780) |
| | Bank of America N.A. | | CDX.EM.14 | n/a | 6,100,000 | USD | 6,100,000 | 5.000% | Dec 2015 | 786,888 | 21,425 | 808,313 |
| | Bank of America N.A. | | CDX.NA.IG.15 | n/a | 49,100,000 | USD | 49,100,000 | 1.000% | Dec 2015 | (50,360) | 550,415 | 500,055 |
| | Bank of America N.A. | | Metlife, Inc. | 1.34% | 1,700,000 | USD | 1,700,000 | 1.000% | Dec 2015 | (59,268) | 36,531 | (22,737) |
| | Bank of America N.A. | | Prudential Financial, Inc. | 1.25% | 2,400,000 | USD | 2,400,000 | 1.000% | Dec 2015 | (67,167) | 45,186 | (21,981) |
DERIVATIVE INSTRUMENTS, CONTINUED
| | | | | | | | | | | | |
| | | | | IMPLIED | | | | | | UNAMORTIZED | | |
| | | | | CREDIT | | | | (PAY)/ | | UPFRONT | | |
| | | | | SPREAD | | | USD | RECEIVED | | PAYMENT | UNREALIZED | |
| | | | REFERENCE | AT | NOTIONAL | | NOTIONAL | FIXED | MATURITY | PAID | APPRECIATION | MARKET |
| FUND | COUNTERPARTY | | OBLIGATION | 2-28-2011 | AMOUNT | CURRENCY | AMOUNT | RATE | DATE | (RECEIVED) | (DEPRECIATION) | VALUE |
|
| |
| Total Return Fund, continued | | | | | | | | | | | |
| | Bank of America N.A. | | French Republic | 0.90% | 1,200,000 | USD | $1,200,000 | 0.250% | Mar 2016 | ($47,346) | $10,533 | ($36,813) |
| | Bank of America N.A. | | Government of Japan | 0.81% | 200,000 | USD | 200,000 | 1.000% | Mar 2016 | 2,772 | (597) | 2,175 |
| | Bank of America N.A. | | Government of Japan | 0.81% | 200,000 | USD | 200,000 | 1.000% | Mar 2016 | 2,582 | (407) | 2,175 |
| | Barclays Bank PLC | | Citigroup, Inc. | 0.35% | 300,000 | USD | 300,000 | 1.000% | Mar 2011 | (83) | 789 | 706 |
| | Barclays Bank PLC | | General Electric Capital Corp. | 0.36% | 3,900,000 | USD | 3,900,000 | 0.620% | Mar 2011 | — | 5,362 | 5,362 |
| | Barclays Bank PLC | | Bank of America Corp. | 0.50% | 500,000 | USD | 500,000 | 1.000% | Dec 2011 | (813) | 3,830 | 3,017 |
| | Barclays Bank PLC | | CDX.NA.IG.9 | n/a | 14,949,732 | USD | 14,949,732 | 0.758% | Dec 2012 | — | 208,908 | 208,908 |
| | Barclays Bank PLC | | General Electric Capital Corp. | 0.47% | 3,900,000 | USD | 3,900,000 | 0.640% | Dec 2012 | — | 16,754 | 16,754 |
| | Barclays Bank PLC | | United Mexican States | 1.05% | 1,200,000 | USD | 1,200,000 | 1.000% | Mar 2015 | (21,425) | 21,482 | 57 |
| | Barclays Bank PLC | | CDX.EM.13 | n/a | 1,000,000 | USD | 1,000,000 | 5.000% | Jun 2015 | 102,271 | 20,365 | 122,636 |
| | Barclays Bank PLC | | CDX.EM.13 | n/a | 7,900,000 | USD | 7,900,000 | 5.000% | Jun 2015 | 841,908 | 126,915 | 968,823 |
| | Barclays Bank PLC | | Federative Republic of Brazil | 1.08% | 500,000 | USD | 500,000 | 1.000% | Jun 2015 | (5,946) | 5,179 | (767) |
| | Barclays Bank PLC | | CDX.EM.14 | n/a | 4,600,000 | USD | 4,600,000 | 5.000% | Dec 2015 | 553,780 | 55,768 | 609,548 |
| | Barclays Bank PLC | | CDX.NA.HY.15 | n/a | 1,900,000 | USD | 1,900,000 | 5.000% | Dec 2015 | 56,603 | 42,998 | 99,601 |
| | Barclays Bank PLC | | French Republic | 0.90% | 800,000 | USD | 800,000 | 0.250% | Mar 2016 | (28,623) | 4,081 | (24,542) |
| | Barclays Bank PLC | | People’s Republic of China | 0.76% | 700,000 | USD | 700,000 | 1.000% | Mar 2016 | 8,253 | 1,202 | 9,455 |
| | Barclays Bank PLC | | Republic of Italy | 1.79% | 900,000 | USD | 900,000 | 1.000% | Mar 2016 | (34,431) | 3,435 | (30,996) |
| | BNP Paribas | | Citigroup, Inc. | 0.35% | 200,000 | USD | 200,000 | 1.000% | Mar 2011 | (49) | 519 | 470 |
| | BNP Paribas | | General Electric Capital Corp. | 0.38% | 2,000,000 | USD | 2,000,000 | 5.000% | Sep 2011 | 24,453 | 47,774 | 72,227 |
| | BNP Paribas | | CDX.NA.IG.15 | n/a | 4,200,000 | USD | 4,200,000 | 1.000% | Dec 2015 | 2,084 | 40,691 | 42,775 |
| | BNP Paribas | | People’s Republic of China | 0.76% | 300,000 | USD | 300,000 | 1.000% | Mar 2016 | 3,580 | 472 | 4,052 |
| | Citibank N.A | | General Electric Capital Corp. | 0.37% | 1,000,000 | USD | 1,000,000 | 5.000% | Jun 2011 | (7,106) | 31,461 | 24,355 |
| | Citibank N.A | | General Electric Capital Corp. | 0.37% | 1,000,000 | USD | 1,000,000 | 5.000% | Jun 2011 | (6,740) | 31,095 | 24,355 |
| | Citibank N.A | | CDX.NA.HY.8 | n/a | 5,777,640 | USD | 5,777,640 | 0.355% | Jun 2012 | — | 20,058 | 20,058 |
| | Citibank N.A | | CDX.NA.HY.8 | n/a | 4,814,700 | USD | 4,814,700 | 0.360% | Jun 2012 | — | 17,081 | 17,081 |
| | Citibank N.A | | CDX.NA.HY.8 | n/a | 1,348,116 | USD | 1,348,116 | 0.401% | Jun 2012 | — | 5,621 | 5,621 |
| | Citibank N.A | | Dell, Inc. | 0.43% | 4,800,000 | USD | 4,800,000 | 1.000% | Sep 2013 | 26,449 | 52,422 | 78,871 |
| | Citibank N.A | | General Electric Capital Corp. | 0.58% | 600,000 | USD | 600,000 | 4.325% | Dec 2013 | — | 67,562 | 67,562 |
| | Citibank N.A | | United Mexican States | 1.05% | 1,200,000 | USD | 1,200,000 | 1.000% | Mar 2015 | (21,864) | 21,921 | 57 |
| | Citibank N.A | | People’s Republic of China | 0.68% | 400,000 | USD | 400,000 | 1.000% | Jun 2015 | 5,483 | 589 | 6,072 |
| | Citibank N.A | | Republic of Kazakhstan | 1.55% | 300,000 | USD | 300,000 | 1.000% | Mar 2016 | (8,542) | 1,275 | (7,267) |
| | Citibank N.A. | | Federative Republic of Brazil | 1.12% | 1,000,000 | USD | 1,000,000 | 1.000% | Sep 2015 | (14,169) | 11,081 | (3,088) |
| | Citibank N.A. | | United Mexican States | 1.11% | 700,000 | USD | 700,000 | 1.000% | Sep 2015 | (9,598) | 7,778 | (1,820) |
| | Citibank N.A. | | CDX.EM.14 | n/a | 14,800,000 | USD | 14,800,000 | 5.000% | Dec 2015 | 1,827,212 | 1,802 | 1,829,014 |
| | Citibank N.A. | | CDX.NA.HY.15 | n/a | 7,200,000 | USD | 7,200,000 | 5.000% | Dec 2015 | 52,292 | 325,144 | 377,436 |
| | Citibank N.A. | | CDX.NA.IG.15 | n/a | 9,000,000 | USD | 9,000,000 | 1.000% | Dec 2015 | (18,598) | 110,258 | 91,660 |
| | Citibank N.A. | | Metlife, Inc. | 1.34% | 2,500,000 | USD | 2,500,000 | 1.000% | Dec 2015 | (87,158) | 53,721 | (33,437) |
| | Credit Suisse International | | CDX.EM.13 | n/a | 600,000 | USD | 600,000 | 5.000% | Jun 2015 | 66,475 | 7,106 | 73,581 |
| | Credit Suisse International | | Federative Republic of Brazil | 1.08% | 4,300,000 | USD | 4,300,000 | 1.000% | Jun 2015 | (49,505) | 42,909 | (6,596) |
| | Credit Suisse International | | Federative Republic of Brazil | 1.12% | 1,900,000 | USD | 1,900,000 | 1.000% | Sep 2015 | (20,982) | 15,115 | (5,867) |
| | Credit Suisse International | | CDX.NA.HY.15 | n/a | 600,000 | USD | 600,000 | 5.000% | Dec 2015 | (2,781) | 34,234 | 31,453 |
| | Deutsche Bank AG | | General Electric Capital Corp. | 0.38% | 500,000 | USD | 500,000 | 1.500% | Sep 2011 | — | 4,672 | 4,672 |
| | Deutsche Bank AG | | General Electric Capital Corp. | 0.38% | 2,400,000 | USD | 2,400,000 | 1.000% | Sep 2011 | (17,912) | 31,159 | 13,247 |
| | Deutsche Bank AG | | CDX.NA.IG.9 | n/a | 9,837,888 | USD | 9,837,888 | 0.708% | Dec 2012 | — | 127,559 | 127,559 |
| | Deutsche Bank AG | | Berkshire Hathaway, Inc. | 0.40% | 1,600,000 | USD | 1,600,000 | 0.850% | Mar 2013 | — | 17,383 | 17,383 |
| | Deutsche Bank AG | | CDX.NA.IG.10 | n/a | 1,928,998 | USD | 1,928,998 | 0.530% | Jun 2013 | — | 21,932 | 21,932 |
| | Deutsche Bank AG | | United Kingdom of Great | 0.51% | 1,600,000 | USD | 1,600,000 | 1.000% | Dec 2014 | 8,542 | 23,584 | 32,126 |
| | | | Britain and Northern Ireland | | | | | | | | | |
| | Deutsche Bank AG | | United Mexican States | 1.05% | 700,000 | USD | 700,000 | 1.000% | Mar 2015 | (12,754) | 12,787 | 33 |
| | Deutsche Bank AG | | CDX.EM.13 | n/a | 5,400,000 | USD | 5,400,000 | 5.000% | Jun 2015 | 568,498 | 93,735 | 662,233 |
| | Deutsche Bank AG | | Federative Republic of Brazil | 1.08% | 1,700,000 | USD | 1,700,000 | 1.000% | Jun 2015 | (15,502) | 12,894 | (2,608) |
| | Deutsche Bank AG | | Federative Republic of Brazil | 1.08% | 500,000 | USD | 500,000 | 1.000% | Jun 2015 | (3,974) | 3,207 | (767) |
| | Deutsche Bank AG | | CDX.EM.14 | n/a | 3,500,000 | USD | 3,500,000 | 5.000% | Dec 2015 | 405,370 | 58,416 | 463,786 |
| | Deutsche Bank AG | | CDX.NA.HY.15 | n/a | 19,600,000 | USD | 19,600,000 | 5.000% | Dec 2015 | 179,224 | 848,240 | 1,027,464 |
| | Deutsche Bank AG | | CDX.NA.IG.15 | n/a | 13,900,000 | USD | 13,900,000 | 1.000% | Dec 2015 | (36,675) | 178,238 | 141,563 |
| | Deutsche Bank AG | | French Republic | 0.90% | 400,000 | USD | 400,000 | 0.250% | Mar 2016 | (15,797) | 3,526 | (12,271) |
| | Deutsche Bank AG | | Metlife, Inc. | 1.40% | 1,500,000 | USD | 1,500,000 | 1.000% | Mar 2016 | (30,512) | 5,185 | (25,327) |
| | Deutsche Bank AG | | Republic of Kazakhstan | 1.55% | 300,000 | USD | 300,000 | 1.000% | Mar 2016 | (8,953) | 1,686 | (7,267) |
| | Deutsche Bank AG | | United Kingdom of Great | 0.63% | 700,000 | USD | 700,000 | 1.000% | Mar 2016 | 13,371 | 649 | 14,020 |
| | | | Britain and Northern Ireland | | | | | | | | | |
| | Goldman Sachs | | Citigroup, Inc. | 0.35% | 300,000 | USD | 300,000 | 1.000% | Mar 2011 | (79) | 785 | 706 |
| | Goldman Sachs | | CDX.NA.IG.10 | n/a | 2,411,247 | USD | 2,411,247 | 0.463% | Jun 2013 | — | 23,309 | 23,309 |
| | Goldman Sachs | | Berkshire Hathaway, Inc. | 0.70% | 1,000,000 | USD | 1,000,000 | 1.000% | Mar 2015 | (14,045) | 27,640 | 13,595 |
| | Goldman Sachs | | Federative Republic of Brazil | 1.08% | 500,000 | USD | 500,000 | 1.000% | Jun 2015 | (5,553) | 4,786 | (767) |
| | Goldman Sachs | | CDX.NA.IG.15 | n/a | 7,600,000 | USD | 7,600,000 | 1.000% | Dec 2015 | (13,084) | 90,486 | 77,402 |
DERIVATIVE INSTRUMENTS, CONTINUED
| | | | | | | | | | | | |
| | | | | IMPLIED | | | | | | UNAMORTIZED | | |
| | | | | CREDIT | | | | (PAY)/ | | UPFRONT | | |
| | | | | SPREAD | | | USD | RECEIVED | | PAYMENT | UNREALIZED | |
| | | | REFERENCE | AT | NOTIONAL | | NOTIONAL | FIXED | MATURITY | PAID | APPRECIATION | MARKET |
| FUND | COUNTERPARTY | | OBLIGATION | 2-28-2011 | AMOUNT | CURRENCY | AMOUNT | RATE | DATE | (RECEIVED) | (DEPRECIATION) | VALUE |
|
| Total Return Fund, continued | | | | | | | | | | | |
| | Goldman Sachs | | French Republic | 0.88% | 300,000 | USD | $300,000 | 0.250% | Dec 2015 | ($5,474) | ($2,981) | ($8,455) |
| | Goldman Sachs | | United Kingdom Of Great | 0.61% | 1,000,000 | USD | 1,000,000 | 1.000% | Dec 2015 | 21,583 | (1,455) | 20,128 |
| | | | Britain And Northern Ireland | | | | | | | | | |
| | Goldman Sachs | | Republic of Italy | 1.79% | 300,000 | USD | 300,000 | 1.000% | Mar 2016 | (11,345) | 1,013 | (10,332) |
| | Goldman Sachs | | CDX.NA.IG.9 | n/a | 868,049 | USD | 868,049 | 0.553% | Dec 2017 | — | 11,254 | 11,254 |
| | HSBC Bank | | CDX.EM.13 | n/a | 8,400,000 | USD | 8,400,000 | 5.000% | Jun 2015 | 862,945 | 167,196 | 1,030,141 |
| | HSBC Bank | | Federative Republic of Brazil | 1.08% | 1,300,000 | USD | 1,300,000 | 1.000% | Jun 2015 | (29,858) | 27,864 | (1,994) |
| | HSBC Bank | | Federative Republic of Brazil | 1.12% | 700,000 | USD | 700,000 | 1.000% | Sep 2015 | (6,350) | 4,188 | (2,162) |
| | HSBC Bank | | CDX.EM.14 | n/a | 1,000,000 | USD | 1,000,000 | 5.000% | Dec 2015 | 120,098 | 12,412 | 132,510 |
| | HSBC Bank | | Republic of Kazakhstan | 1.55% | 400,000 | USD | 400,000 | 1.000% | Mar 2016 | (11,573) | 1,883 | (9,690) |
| | JPMorgan Chase Bank | | General Electric Capital Corp. | 0.38% | 2,400,000 | USD | 2,400,000 | 5.000% | Sep 2011 | 29,344 | 57,328 | 86,672 |
| | JPMorgan Chase Bank | | United Kingdom of Great | 0.53% | 900,000 | USD | 900,000 | 1.000% | Mar 2015 | 3,396 | 14,998 | 18,394 |
| | | | Britain and Northern Ireland | | | | | | | | | |
| | JPMorgan Chase Bank | | United Kingdom of Great | 0.53% | 1,800,000 | USD | 1,800,000 | 1.000% | Mar 2015 | 6,111 | 30,677 | 36,788 |
| | | | Britain and Northern Ireland | | | | | | | | | |
| | JPMorgan Chase Bank | | CDX.EM.13 | n/a | 1,200,000 | USD | 1,200,000 | 5.000% | Jun 2015 | 126,611 | 20,552 | 147,163 |
| | JPMorgan Chase Bank | | Federative Republic of Brazil | 1.12% | 8,800,000 | USD | 8,800,000 | 1.000% | Sep 2015 | (106,754) | 79,578 | (27,176) |
| | JPMorgan Chase Bank | | CDX.EM.14 | n/a | 300,000 | USD | 300,000 | 5.000% | Dec 2015 | 36,559 | 3,194 | 39,753 |
| | JPMorgan Chase Bank | | CDX.NA.HY.15 | n/a | 5,200,000 | USD | 5,200,000 | 5.000% | Dec 2015 | (46,870) | 319,462 | 272,592 |
| | JPMorgan Chase Bank | | CDX.NA.IG.15 | n/a | 13,100,000 | USD | 13,100,000 | 1.000% | Dec 2015 | 22,770 | 110,646 | 133,416 |
| | JPMorgan Chase Bank | | Government of Japan | 0.81% | 800,000 | USD | 800,000 | 1.000% | Mar 2016 | 6,883 | 1,818 | 8,701 |
| | JPMorgan Chase Bank | | State of Qatar | 1.17% | 2,900,000 | USD | 2,900,000 | 1.000% | Mar 2016 | (6,870) | (11,521) | (18,391) |
| | JPMorgan Chase Bank | | CDX.NA.IG.9 | n/a | 1,928,998 | USD | 1,928,998 | 0.553% | Dec 2017 | — | 25,623 | 25,623 |
| | Morgan Stanley Capital Services, Inc. | | General Electric Capital Corp. | 0.38% | 2,300,000 | USD | 2,300,000 | 1.000% | Sep 2011 | (10,675) | 23,370 | 12,695 |
| | Morgan Stanley Capital Services, Inc. | | CDX.NA.IG.9 | n/a | 3,900,000 | USD | 3,900,000 | 0.963% | Dec 2012 | — | 69,203 | 69,203 |
| | Morgan Stanley Capital Services, Inc. | | Federative Republic of Brazil | 0.75% | 900,000 | USD | 900,000 | 1.660% | Mar 2013 | — | 23,543 | 23,543 |
| | Morgan Stanley Capital Services, Inc. | | United Kingdom of Great | 0.51% | 300,000 | USD | 300,000 | 1.000% | Dec 2014 | 1,706 | 4,318 | 6,024 |
| | | | Britain and Northern Ireland | | | | | | | | | |
| | Morgan Stanley Capital Services, Inc. | | CDX.EM.13 | n/a | 9,800,000 | USD | 9,800,000 | 5.000% | Jun 2015 | 1,074,422 | 127,409 | 1,201,831 |
| | Morgan Stanley Capital Services, Inc. | | Federative Republic of Brazil | 1.08% | 500,000 | USD | 500,000 | 1.000% | Jun 2015 | (4,023) | 3,256 | (767) |
| | Morgan Stanley Capital Services, Inc. | | Federative Republic of Brazil | 1.12% | 9,900,000 | USD | 9,900,000 | 1.000% | Sep 2015 | (121,819) | 91,246 | (30,573) |
| | Morgan Stanley Capital Services, Inc. | | CDX.EM.14 | n/a | 4,400,000 | USD | 4,400,000 | 5.000% | Dec 2015 | 526,408 | 56,637 | 583,045 |
| | Morgan Stanley Capital Services, Inc. | | CDX.NA.HY.15 | n/a | 33,400,000 | USD | 33,400,000 | 5.000% | Dec 2015 | 819,053 | 931,829 | 1,750,882 |
| | Morgan Stanley Capital Services, Inc. | | CDX.NA.IG.15 | n/a | 6,600,000 | USD | 6,600,000 | 1.000% | Dec 2015 | (11,971) | 79,188 | 67,217 |
| | Morgan Stanley Capital Services, Inc. | | Abu Dhabi | 1.16% | 4,800,000 | USD | 4,800,000 | 1.000% | Mar 2016 | (13,641) | (13,392) | (27,033) |
| | Morgan Stanley Capital Services, Inc. | | French Republic | 0.90% | 500,000 | EUR | 500,000 | 0.250% | Mar 2016 | (16,799) | 1,460 | (15,339) |
| | Societe Generale Paris | | United Kingdom of Great | 0.53% | 5,000,000 | USD | 5,000,000 | 1.000% | Mar 2015 | 7,524 | 94,664 | 102,188 |
| | | | Britain and Northern Ireland | | | | | | | | | |
| | Societe Generale Paris | | United Kingdom of Great | 0.53% | 8,600,000 | USD | 8,600,000 | 1.000% | Mar 2015 | 29,149 | 146,615 | 175,764 |
| | | | Britain and Northern Ireland | | | | | | | | | |
| | The Royal Bank of Scotland PLC | | People’s Republic of China | 0.68% | 900,000 | USD | 900,000 | 1.000% | Jun 2015 | 12,706 | 956 | 13,662 |
| | The Royal Bank of Scotland PLC | | United Mexican States | 1.11% | 1,900,000 | USD | 1,900,000 | 1.000% | Sep 2015 | (19,381) | 14,442 | (4,939) |
| | The Royal Bank of Scotland PLC | | CDX.NA.HY.15 | n/a | 4,700,000 | USD | 4,700,000 | 5.000% | Dec 2015 | 47,439 | 198,943 | 246,382 |
| | The Royal Bank of Scotland PLC | | French Republic | 0.88% | 700,000 | USD | 700,000 | 0.250% | Dec 2015 | (12,933) | (6,796) | (19,729) |
| | The Royal Bank of Scotland PLC | | French Republic | 0.90% | 500,000 | USD | 500,000 | 0.250% | Mar 2016 | (16,569) | 1,230 | (15,339) |
| | UBS AG | | Citigroup, Inc. | 0.35% | 900,000 | USD | 900,000 | 1.000% | Mar 2011 | (236) | 2,353 | 2,117 |
| | UBS AG | | Berkshire Hathaway, Inc. | 0.70% | 1,000,000 | USD | 1,000,000 | 1.000% | Mar 2015 | (14,408) | 28,003 | 13,595 |
| | UBS AG | | CDX.EM.14 | n/a | 500,000 | USD | 500,000 | 5.000% | Dec 2015 | 63,999 | 2,256 | $66,255 |
| | UBS AG | | CDX.NA.HY.15 | n/a | 300,000 | USD | 300,000 | 5.000% | Dec 2015 | (2,780) | 18,506 | 15,726 |
| | UBS AG | | CDX.NA.IG.15 | n/a | 6,200,000 | USD | 6,200,000 | 1.000% | Dec 2015 | 32,600 | 30,544 | 63,144 |
| | UBS AG | | French Republic | 0.88% | 1,600,000 | USD | 1,600,000 | 0.250% | Dec 2015 | (30,353) | (14,741) | (45,094) |
| | UBS AG | | French Republic | 0.90% | 1,400,000 | USD | 1,400,000 | 0.250% | Mar 2016 | (55,237) | 12,289 | (42,948) |
|
| | | | | | | $424,165,368 | | | $8,000,515 | $6,762,043 | $14,762,558 |
| |
| BA-CDOR | Bankers’ Acceptance- Canadian Deposit Offering Rate |
| BBR | Bank Bill Rate |
| BBSW | Bank Bill Swap Rate |
| CDI | Brazil Interbank Deposit Rate |
| LIBOR | London Interbank Offered Rate |
| FRCPXTOB | French CPI Ex Tobacco Daily Reference Index |
| TIIE | Tasa de Intere’s Interbancaria de Equilibrio (Interbank Equilibrium Interest Rate) |
DERIVATIVE INSTRUMENTS, CONTINUED
Currency symbols are defined as follows:
| |
| AUD | Australian Dollar |
| BRL | Brazilian Real |
| CAD | Canadian Dollar |
| EUR | Euro |
| JPY | Japanese Yen |
| MXN | Mexican Peso |
| USD | U.S. Dollar |
Cash Collateral Received by Portfolios For certain transactions, the Funds may receive cash collateral from counterparties. Payable for collateral held is presented in each respective Funds’ Statement of Assets and Liabilities. At February 28, 2011, the following Funds held cash collateral with respect to the financial instruments noted below:
| | | | |
| | | Cash Collateral Held | | |
| |
| |
| | | | Forward | |
| | | | Foreign | |
| | | | Currency | |
| Fund | Swaps | TBAs | Contracts | Total |
|
| Global Bond Fund | $6,640,000 | $640,000 | $280,000 | $7,560,000 |
| Real Return Bond Fund | 1,670,000 | — | 3,030,000 | 4,700,000 |
| Total Return Fund | 10,700,000 | 3,140,000 | 260,000 | 14,100,000 |
Fair Value of Derivative Instruments by Risk Category The table below summarizes the fair value of derivatives held by the Funds at February 28, 2011 by risk category:
| | | | | |
| | | Statement of | | | |
| | | Assets and | Financial | Asset | Liability |
| | | Liabilities | Instruments | Derivatives | Derivatives |
| Fund | Risk | Location | Location | Fair Value | Fair Value |
|
| Active Bond Fund | Interest rate contracts | Receivable/payable for | Futures† | $22,909 | ($33,664) |
| | | futures | | | |
| | Foreign currency contracts | Receivable/payable for | Forward foreign currency | — | (72,698) |
| | | forward foreign currency | contracts | | |
| | | exchange contracts | | | |
| | Credit contracts | Swap contracts, at value | Credit default swaps | 344,398 | — |
| | Total | | | $367,307 | ($106,362) |
|
| All Cap Core Fund | Equity contracts | Receivable/payable for | Futures† | $516,398 | — |
| | | futures | | | |
| | Total | | | $516,398 | — |
|
| Emerging Markets Debt Fund | Interest rate contracts | Receivable/payable for | Futures† | — | ($951) |
| | | futures | | | |
| | Foreign currency contracts | Receivable/payable for | Forward foreign currency | $25,791 | — |
| | | forward foreign currency | contracts | | |
| | | exchange contracts | | | |
| | Total | | | $25,791 | ($951) |
|
| Global Bond Fund | Interest rate contracts | Receivable/payable for | Futures†/Written options/ | $1,749,673 | ($5,476,693) |
| | | futures; Written options, at | Interest rate swaps | | |
| | | value; Swap contracts, at | | | |
| | | value | | | |
| | Credit contracts | Swap contracts, at value; | Credit default swaps/Written | 1,673,490 | (1,352,742) |
| | | Written options, at value | options | | |
| | Foreign currency contracts | Receivable/payable for | Forward foreign currency | 8,590,484 | (5,938,173) |
| | | forward foreign currency | contracts/Written options | | |
| | | exchange contracts; Written | | | |
| | | options, at value | | | |
| | Total | | | $12,013,647 | ($12,767,608) |
|
| Heritage Fund | Foreign currency contracts | Receivable/payable for | Forward foreign currency | — | ($9,222) |
| | | forward foreign currency | contracts | | |
| | | exchange contracts | | | |
| | Total | | | — | ($9,222) |
|
| High Income Fund | Foreign currency contracts | Receivable/payable for | Forward foreign currency | — | ($102,782) |
| | | forward foreign currency | contracts | | |
| | | exchange contracts | | | |
| | Total | | | — | ($102,782) |
|
| High Yield Fund | Interest rate contracts | Receivable/payable for | Futures† | $355,558 | ($294,957) |
| | | futures | | | |
| | Foreign currency contracts | Receivable/payable for | Forward foreign currency | — | (144,017) |
| | | forward foreign currency | contracts | | |
| | | exchange contracts | | | |
| | Total | | | $355,558 | ($438,974) |
|
| Index 500 Fund | Equity contracts | Receivable/payable for | Futures† | $4,779,557 | — |
| | | futures | | | |
| | Total | | | $4,779,557 | — |
|
DERIVATIVE INSTRUMENTS, CONTINUED
| | | | | |
| | | Statement of | | | |
| | | Assets and | Financial | Asset | Liability |
| | | Liabilities | Instruments | Derivatives | Derivatives |
| Fund | Risk | Location | Location | Fair Value | Fair Value |
|
| International Equity Index | Equity contracts | Receivable/payable for | Futures† | $842,833 | ($8,051) |
| Fund | | futures | | | |
| | Foreign currency contracts | Receivable/payable for | Forward foreign currency | 556,107 | (1,153) |
| | | forward foreign currency | contracts | | |
| | | exchange contracts | | | |
| | Total | | | $1,398,940 | ($9,204) |
|
| Investment Quality Bond Fund | Interest rate contracts | Receivable/payable for | Futures†/Interest rate swaps | $671,767 | ($243,756) |
| | | futures; Swap contracts, | | | |
| | | at value | | | |
| | Credit contracts | Swap contracts, at value | Credit default swaps | — | (44,905) |
| | Foreign currency contracts | Receivable/payable for | Forward foreign currency | 1,344,538 | (1,860,151) |
| | | forward foreign currency | contracts | | |
| | | exchange contracts | | | |
| | Total | | | $2,016,305 | ($2,148,812) |
|
| Mid Cap Growth Index Fund | Equity contracts | Receivable/payable for | Futures† | $34,100 | — |
| | | futures | | | |
| | Total | | | $34,100 | — |
|
| Mid Cap Index Fund | Equity contracts | Receivable/payable for | Futures† | $388,862 | — |
| | | futures | | | |
| | Total | | | $388,862 | — |
|
| Mid Cap Value Index Fund | Equity contracts | Receivable/payable for | Futures† | $114,295 | — |
| | | futures | | | |
|
| | Total | | | $114,295 | — |
| Mutual Shares Fund | Foreign currency contracts | Receivable/payable for | Forward foreign currency | $62,040 | ($1,807,729) |
| | | forward foreign currency | contracts | | |
| | | exchange contracts | | | |
| | Total | | | $62,040 | ($1,807,729) |
|
| Real Return Bond Fund | Interest rate contracts | Receivable/payable for | Futures†/Written options/ | $1,040,514 | ($3,009,416) |
| | | futures; Written options, at | Purchased options/Interest | | |
| | | value; Investments in | rate swaps | | |
| | | unaffiliated issuers, at | | | |
| | | value*; Swap contracts, at | | | |
| | | value | | | |
| | Credit contracts | Swap contracts, at value; | Credit default swaps/Written | 2,278,576 | (461,853) |
| | | Written options, at value | options | | |
| | Foreign currency contracts | Receivable/payable for | Forward foreign currency | 569,537 | (1,711,963) |
| | | forward foreign currency | contracts | | |
| | | exchange contracts | | | |
| | Total | | | $3,888,627 | ($5,183,232) |
|
| Small Cap Index Fund | Equity contracts | Receivable/payable for | Futures† | $234,706 | — |
| | | futures | | | |
| | Total | | | $234,706 | — |
|
| Smaller Company Growth | Equity contracts | Receivable/payable for | Futures† | $17,140 | — |
| Fund | | futures | | | |
| | Total | | | $17,140 | — |
|
| Spectrum Income Fund | Interest rate contracts | Receivable/payable for | Futures†/Interest rate swaps | $155,919 | ($75,054) |
| | | futures; Swap contracts, at | | | |
| | | value | | | |
| | Credit contracts | Swap contracts, at value | Credit default swaps | — | (11,390) |
| | Foreign currency contracts | Receivable/payable for | Forward foreign currency | 929,806 | (1,077,876) |
| | | forward foreign currency | contracts | | |
| | | exchange contracts | | | |
| | Total | | | $1,085,725 | ($1,164,320) |
|
| Total Return Fund | Interest rate contracts | Receivable/payable for | Futures†/Written options/ | $6,540,022 | ($10,104,287) |
| | | futures; Written options, at | Interest rate swaps | | |
| | | value; Swap contracts, at | | | |
| | | value | | | |
| | Credit contracts | Swap contracts, at value; | Credit default swaps/Written | 15,288,217 | (547,199) |
| | | Written options, at value | options | | |
| | Foreign currency contracts | Receivable/payable for | Forward foreign currency | 2,829,112 | (3,773,916) |
| | | forward foreign currency | contracts | | |
| | | exchange contracts | | | |
| | Total | | | $24,657,351 | ($14,425,402) |
|
| Value & Restructuring Fund | Equity contracts | Written options, at value | Written options | — | ($173,625) |
| | Total | | | — | ($173,625) |
|
† Reflects cumulative appreciation/depreciation on futures as disclosed in Note 3. Only the year end variation margin is separately disclosed in the Statements of Assets and Liabilities.
* Purchased options are included in the Fund’s Investments.
DERIVATIVE INSTRUMENTS, CONTINUED
Effect of Derivative Instruments on the Statements of Operations The table below summarizes the net realized gain (loss) included in the net increase (decrease) in net assets from operations, classified by derivative instrument and risk category, for the six-month period ended February 28, 2011:
| | | | | | | |
| | Statement of Operations Location—Net Realized Gain (Loss) on: | |
| |
| |
| | | Investments | Written | Futures | Swap | Foreign Currency | |
| Fund | Risk | (Purchased Options) | Options | Contracts | Contracts | Transactions* | Total |
|
| Active Bond Fund | Interest rate contracts | — | — | ($45,775) | — | — | ($45,775) |
| | Credit contracts | — | — | — | $5,000 | — | 5,000 |
| | Foreign currency contracts | — | — | — | — | ($7,726) | (7,726) |
| | Total | — | — | ($45,775) | $5,000 | ($7,726) | ($48,501) |
|
| All Cap Core Fund | Equity contracts | — | — | ($2,395) | — | — | ($2,395) |
| | Total | — | — | ($2,395) | — | — | ($2,395) |
|
| Alpha Opportunities Fund | Equity contracts | — | $119,731 | — | — | — | $119,731 |
| | Foreign currency contracts | — | — | — | — | ($355,926) | (355,926) |
| | Total | — | $119,731 | — | — | ($355,926) | ($236,195) |
|
| Emerging Markets Debt Fund | Interest rate contracts | — | — | ($7,108) | — | — | ($7,108) |
| | Foreign currency contracts | — | — | — | — | ($402) | (402) |
| | Total | — | — | ($7,108) | — | ($402) | ($7,510) |
|
| Global Bond Fund | Interest rate contracts | — | $755,874 | ($3,898,904) | ($1,494,665) | — | ($4,637,695) |
| | Credit contracts | — | 239,742 | — | 1,099,143 | — | 1,338,885 |
| | Foreign currency contracts | ($60,480) | 1,443,871 | — | — | $8,387,348 | 9,770,739 |
| | Total | ($60,480) | $2,439,487 | ($3,898,904) | ($395,522) | $8,387,348 | $6,471,929 |
|
| Heritage Fund | Equity contracts | — | — | $162,049 | — | — | $162,049 |
| | Foreign currency contracts | — | — | — | — | ($122,476) | (122,476) |
| | Total | — | — | $162,049 | — | ($122,476) | $39,573 |
|
| High Income Fund | Foreign currency contracts | — | — | — | — | ($215,807) | ($215,807) |
| | Total | — | — | — | — | ($215,807) | ($215,807) |
|
| High Yield Fund | Interest rate contracts | — | — | ($1,214,881) | — | — | ($1,214,881) |
| | Foreign currency contracts | — | — | — | — | ($743,935) | (743,935) |
| | Total | — | — | ($1,214,881) | — | ($743,935) | ($1,958,816) |
|
| Index 500 Fund | Equity contracts | — | — | $6,094,915 | — | — | $6,094,915 |
| | Total | — | — | $6,094,915 | — | — | $6,094,915 |
|
| International Equity Index Fund | Equity contracts | — | — | $1,591,025 | — | $997,095 | $2,588,120 |
| | Total | — | — | $1,591,025 | — | $997,095 | $2,588,120 |
|
| Investment Quality Bond Fund | Interest rate contracts | — | — | $515,116 | ($35,963) | — | $479,153 |
| | Credit contracts | — | — | — | (12,282) | — | (12,282) |
| | Foreign currency contracts | — | — | — | — | ($624,554) | (624,554) |
| | Total | — | — | $515,116 | ($48,245) | ($624,554) | ($157,683) |
|
| Mid Cap Growth Index Fund | Equity contracts | — | — | ($140) | — | — | ($140) |
| | Total | — | — | ($140) | — | — | ($140) |
|
| Mid Cap Index Fund | Equity contracts | — | — | $1,238,919 | — | — | $1,238,919 |
| | Total | — | — | $1,238,919 | — | — | $1,238,919 |
|
| Mid Cap Stock Fund | Foreign currency contracts | — | — | — | — | ($678,168) | ($678,168) |
| | Total | — | — | — | — | ($678,168) | ($678,168) |
|
| Mid Cap Value Index Fund | Equity contracts | — | — | $114,312 | — | — | $114,312 |
| | Total | — | — | $114,312 | — | — | $114,312 |
|
| Mutual Shares Fund | Foreign currency contracts | — | — | — | — | $55,091 | $55,091 |
| | Total | — | — | — | — | $55,091 | $55,091 |
|
| Real Return Bond Fund | Interest rate contracts | — | $1,745,488 | $450,699 | ($3,252,024) | — | ($1,055,837) |
| | Credit contracts | — | 63,399 | — | 226,002 | — | 289,401 |
| | Foreign currency contracts | — | — | — | — | ($2,584,105) | (2,584,105) |
| | Total | — | $1,808,887 | $450,699 | ($3,026,022) | ($2,584,105) | ($3,350,541) |
|
| Small Cap Index Fund | Equity contracts | — | — | $556,752 | — | — | $556,752 |
| | Total | — | — | $556,752 | — | — | $556,752 |
|
| Smaller Company Growth Fund | Equity contracts | — | — | $168,504 | — | — | $168,504 |
| | Total | — | — | $168,504 | — | — | $168,504 |
|
| Spectrum Income Fund | Interest rate contracts | — | — | ($127,128) | ($59,174) | — | ($186,302) |
| | Credit contracts | — | — | — | (14,372) | — | (14,372) |
| | Foreign currency contracts | — | — | — | — | ($785,631) | (785,631) |
| | Total | — | — | ($127,128) | (73,546) | ($785,631) | ($986,305) |
|
| Total Return Fund | Interest rate contracts | — | $2,180,863 | $1,651,977 | ($7,164,437) | — | ($3,331,597) |
| | Credit contracts | — | 46,578 | — | 1,867,304 | — | 1,913,882 |
| | Foreign currency contracts | — | — | — | — | ($6,988,556) | (6,988,556) |
| | Total | — | $2,227,441 | $1,651,977 | ($5,297,133) | ($6,988,556) | ($8,406,271) |
|
| U.S. Multi-Sector Fund | Equity contracts | — | — | $401,709 | — | — | $401,709 |
| | Total | — | — | $401,709 | — | — | $401,709 |
|
| Value & Restructuring Fund | Equity contracts | — | ($142,562) | — | — | — | ($142,562) |
| | Total | — | ($142,562) | — | — | — | ($142,562) |
|
* Realized gain/loss associated with forward foreign currency contracts is included in the caption on the Statements of Operations.
DERIVATIVE INSTRUMENTS, CONTINUED
The table below summarizes the net change in unrealized appreciation (depreciation) included in the net increase (decrease) in net assets from operations, classified by derivative instrument and risk category, for the six-month period ended February 28, 2011:
| | | | | | | |
| | Statement of Operations Location—Change in Unrealized Appreciation (Depreciation) of: | |
| |
| |
| | | | | | | Translation of Assets | |
| | | Investments | Written | Futures | Swap | and Liabilities in | |
| Fund | Risk | (Purchased Options) | Options | Contracts | Contracts | Foreign Currencies* | Total |
|
| Active Bond Fund | Interest rate contracts | — | — | ($2,393) | — | — | ($2,393) |
| | Credit contracts | — | — | — | ($344,919) | — | (344,919) |
| | Foreign currency contracts | — | — | — | | ($72,698) | (72,698) |
| | Total | — | — | ($2,393) | ($344,919) | ($72,698) | ($420,010) |
|
| All Cap Core Fund | Equity contracts | — | — | $864,878 | — | — | $864,878 |
| | Total | — | — | $864,878 | — | — | $864,878 |
|
| Alpha Opportunities Fund | Equity contracts | — | ($23,222) | — | — | — | ($23,222) |
| | Foreign currency contracts | — | — | — | — | ($13,122) | (13,122) |
| | Total | — | ($23,222) | — | — | ($13,122) | ($36,344) |
|
| Emerging Markets Debt Fund | Interest rate contracts | — | — | ($951) | — | — | ($951) |
| | Foreign currency contracts | — | — | — | — | $22,954 | 22,954 |
| | Total | — | — | ($951) | — | $22,954 | $22,003 |
|
| Global Bond Fund | Interest rate contracts | — | $1,282,519 | ($3,688,198) | ($3,003,742) | — | ($5,409,421) |
| | Credit contracts | — | 472,819 | — | (1,947,704) | — | (1,474,885) |
| | Foreign currency contracts | — | 44,395 | — | — | ($12,946,818) | (12,902,423) |
| | Total | — | $1,799,733 | ($3,688,198) | ($4,951,446) | ($12,946,818) | ($19,786,729) |
|
| Heritage Fund | Foreign currency contracts | — | — | — | — | ($25,560) | ($25,560) |
| | Equity contracts | — | — | $16,507 | — | — | 16,507 |
|
| | Total | — | — | $16,507 | — | ($25,560) | ($9,053) |
|
| High Income Fund | Foreign currency contracts | — | — | — | — | $110,715 | $110,715 |
| | Total | — | — | — | — | $110,715 | $110,715 |
|
| High Yield Fund | Interest rate contracts | — | — | $100,125 | — | — | $100,125 |
| | Foreign currency contracts | — | — | — | — | ($321,831) | (321,831) |
| | Total | — | — | $100,125 | — | ($321,831) | ($221,706) |
|
| Index 500 Fund | Equity contracts | — | — | $5,249,645 | — | — | $5,249,645 |
| | Total | — | — | $5,249,645 | — | — | $5,249,645 |
|
| International Equity Index Fund | Equity contracts | — | — | $1,196,618 | — | — | $1,196,618 |
| | Foreign currency contracts | — | — | — | — | $122,497 | 122,497 |
| | Total | — | — | $1,196,618 | — | $122,497 | $1,319,115 |
|
| Investment Quality Bond Fund | Interest rate contracts | — | — | $348,422 | $583,389 | — | $931,811 |
| | Credit contracts | — | — | — | (10,348) | — | (10,348) |
| | Foreign currency contracts | — | — | — | — | ($116,623) | (116,623) |
| | Total | — | — | $348,422 | $573,041 | ($116,623) | $804,840 |
|
| Mid Cap Growth Index Fund | Equity contracts | — | — | $62,980 | — | — | $62,980 |
| | Total | — | — | $62,980 | — | — | $62,980 |
|
| Mid Cap Index Fund | Equity contracts | — | — | $694,283 | — | — | $694,283 |
| | Total | — | — | $694,283 | — | — | $694,283 |
|
| Mid Cap Stock Fund | Equity contracts | — | — | — | — | $28,846 | $28,846 |
| | Total | — | — | — | — | $28,846 | $28,846 |
|
| Mid Cap Value Index Fund | Equity contracts | — | — | $158,735 | — | — | $158,735 |
| | Total | — | — | $158,735 | — | — | $158,735 |
|
| Mutual Shares Fund | Foreign currency contracts | — | — | — | — | ($1,745,689) | ($1,745,689) |
| | Total | — | — | — | — | ($1,745,689) | ($1,745,689) |
|
| Real Return Bond Fund | Interest rate contracts | $53,016 | $1,646,977 | ($536,123) | $569,277 | — | $1,733,147 |
| | Credit contracts | — | 60,671 | — | (119,046) | — | (58,375) |
| | Foreign currency contracts | — | — | — | — | ($1,815,278) | (1,815,278) |
| | Total | $53,016 | $1,707,648 | ($536,123) | $450,231 | ($1,815,278) | ($140,506) |
|
| Small Cap Index Fund | Equity contracts | — | — | $291,171 | — | — | $291,171 |
| | Total | — | — | $291,171 | — | — | $291,171 |
|
| Smaller Company Growth Fund | Equity contracts | — | — | $33,822 | — | — | $33,822 |
| | Total | — | — | $33,822 | — | — | $33,822 |
|
| Spectrum Income Fund | Interest rate contracts | — | — | $216,257 | $88,253 | — | $304,510 |
| | Credit contracts | — | — | — | 1,163 | — | 1,163 |
| | Foreign currency contracts | — | — | — | — | ($154,747) | (154,747) |
| | Total | — | — | $216,257 | $89,416 | ($154,747) | $150,926 |
|
| Total Return Fund | Interest rate contracts | — | $242,736 | ($2,935,775) | ($4,712,253) | — | ($7,405,292) |
| | Credit contracts | — | (1,534) | — | 5,976,594 | — | 5,975,060 |
| | Foreign currency contracts | — | — | — | — | $4,505,642 | 4,505,642 |
| | Total | — | $241,202 | ($2,935,775) | $1,264,341 | $4,505,642 | $3,075,410 |
|
| U.S. Multi-Sector Fund | Equity contracts | — | — | $102,373 | — | — | $102,373 |
| | Total | — | — | $102,373 | — | — | $102,373 |
|
| Value & Restructuring Fund | Equity contracts | — | ($1,099,154) | — | — | — | ($1,099,154) |
| | Total | — | ($1,099,154) | — | — | — | ($1,099,154) |
|
* Change in unrealized appreciation/depreciation associated with forward foreign currency contracts is included in the caption on the Statements of Operations.
4. GUARANTEES AND INDEMNIFICATIONS Under the Fund’s organizational documents, its Officers and Trustees are indemnified against certain liabilities arising out of the performance of their duties to the Funds. Additionally, in the normal course of business, the Funds enter into contracts with service providers that contain general indemnification clauses. The Funds’ maximum exposure under these arrangements is unknown, as this would involve future claims that may be made against the Funds that have not yet occurred. The risk of material loss from such claims is considered remote.
5. FEES AND TRANSACTIONS WITH AFFILIATES John Hancock Investment Management Services, LLC (the Adviser), serves as investment adviser for the Funds. John Hancock Funds, LLC (the Distributor), an affiliate of the Adviser, serves as principal underwriter of the Funds. The Adviser and the Distributor are indirect wholly owned subsidiaries of MFC.
Management Fee The Funds have an investment management contract with the Adviser under which the Funds pay a monthly management fee to the Adviser equivalent, on an annual basis, as detailed below. Aggregate net assets generally include the net assets of the Funds and the net assets of a similar fund of John Hancock Trust (JHT), unless otherwise noted below. JHT Funds are advised by the Adviser and are distributed by an affiliate of the Adviser, John Hancock Distributors, LLC.
• Active Bond Fund — 0.60% of the aggregate net assets
• All Cap Core Fund — a) 0.80% of the first $500 million of aggregate net assets and b) 0.75% of the excess over $500 million of aggregate net assets.
• All Cap Value Fund — a) 0.80% of the first $500 million of aggregate net assets and b) 0.75% of the excess over $500 million of aggregate net assets. Prior to September 24, 2010, the advisory fees paid were as follows: a) 0.85% of the first $250 million of aggregate net assets; b) 0.80% of aggregate net assets between $250 million and $500 million; and c) 0.75% of the excess over $500 million of aggregate net assets.
• Alpha Opportunities Fund — a) 1.025% of the first $250 million of aggregate net assets; b) 1.00% of aggregate net assets between $250 million and $500 million; c) 0.975% of aggregate net assets between $500 million and $1 billion; and d) 0.950% of the excess over $1 billion of aggregate net assets.
• Core Bond Fund — a) 0.69% of the first $200 million of aggregate net assets; b) 0.64% of aggregate net assets between $200 million and $400 million; and c) 0.57% of the excess over $400 million of aggregate net assets.
• Core Fundamental Holdings Portfolio, Core Global Diversification Portfolio and Core Diversified Growth and Income Portfolio — Aggregate net assets include the net assets of the Portfolios and the net assets of similar funds of JHT for all the funds listed. The monthly management fee paid on these assets is a) 0.05% on the first $500 million of aggregate net assets and b) 0.04% on the excess over $500 million of aggregate net assets.
• Blue Chip Growth Fund and Equity-Income Fund — a) 0.825% of the first $1 billion of aggregate net assets and b) 0.775% of the excess over $1 billion of aggregate net assets. However, when aggregate net assets exceed $1 billion on any day, the annual rate of advisory fee for that day is 0.800% on the first $1 billion of aggregate net assets of the fund.
• Capital Appreciation Fund — a) 0.85% of the first $300 million of aggregate net assets; b) 0.80% of aggregate net assets between $300 million and $500 million; c) 0.70% of the aggregate net assets between $500 million and $1 billion; and d) 0.67% of the excess over $1 billion of aggregate net assets.
�� Capital Appreciation Value Fund — If net assets are less than $500 million, then the following fee schedule applies: a) 0.95% of the first $250 million of aggregate net assets and b) 0.85% of the excess over $250 million of aggregate net assets. If net assets equal or exceed $500 million but are less than $2 billion, then the following fee schedule shall apply: a) 0.85% of the first $1 billion of aggregate net assets and b) 0.80% of the excess over $1 billion of aggregate net assets. If net assets equal or exceed $2 billion but are less than $3 billion, then the following fee schedule shall apply: a) 0.85% of the first $500 million of aggregate net assets and b) 0.80% of the excess over $500 million of aggregate net assets. If net assets equal or exceed $3 billion, then the advisory fee to be paid is 0.80% of aggregate net assets.
• Emerging Markets Fund — a) 1.00% of the first $100 million of aggregate net assets and b) 0.95% excess over $100 million of aggregate net assets.
• Emerging Markets Debt Fund — a) 0.725% of the first $250 million of average net assets; b) 0.700% of average nets assets between $250 million and $750 million; and c) 0.675% of the excess over $750 million of average net assets.
• Fundamental Value Fund — a) 0.85% of the first $50 million of aggregate net assets; b) 0.80% of aggregate net assets between $50 million and $500 million; and c) 0.75% of the excess over $500 million of aggregate net assets.
• Global Bond Fund and Real Estate Securities Fund — 0.70% of aggregate net assets.
• Global Agribusiness Fund, Global Infrastructure Fund and Global Timber Fund — a) 0.85% of the first $250 million of average net assets and b) 0.80% excess over $250 million of average net assets.
• Global Real Estate Fund — a) 0.90% of the first $500 million of average net assets; b) 0.875% of average net assets between $500 million and $750 million; and c) 0.850% of the excess over $750 million of average net assets. Prior to September 24, 2010, the advisory fees paid were as follows: a) 0.95% of the first $500 million of average net assets; b) 0.925% of average net assets between $500 million and $750 million; and c) 0.90% of the excess over $750 million of average net assets.
• Heritage Fund — a) 0.85% of the first $400 million of aggregate net assets; b) 0.825% of aggregate net assets between $400 million and $1 billion; and c) 0.80% of the excess over $1 billion of aggregate net assets.
• High Income Fund — a) 0.725% of the first $150 million of aggregate net assets; b) 0.675% of aggregate net assets between $150 million and $500 million; c) 0.65% of the aggregate net assets between $500 million and $2.5 billion; and d) 0.60% of the excess over $2.5 billion of aggregate net assets.
• High Yield Fund — a) 0.70% of the first $500 million of aggregate net assets and b) 0.65% of the excess over $500 million of aggregate net assets.
• Index 500 Fund — a) 0.47% of the first $500 million of aggregate net assets and b) 0.46% of the excess over $500 million of aggregate net assets.
• International Growth Stock Fund — a) 0.85% of the first $250 million of aggregate net assets; b) 0.80% of aggregate net assets between $250 million and $750 million; and c) 0.75% of the excess over $750 million of aggregate net assets.
• International Equity Index Fund — a) 0.55% of the first $100 million of aggregate net assets, and b) 0.53% of the excess over $100 million of aggregate net assets.
• International Small Cap Fund — a) 1.05% of the first $200 million of average net assets; b) 0.95% of average net assets between $200 million and $500 million; and c) 0.85% of the excess over $500 million of average net assets.
FEES AND TRANSACTIONS WITH AFFILIATES, CONTINUED
• International Small Company Fund — 0.95% of aggregate net assets.
• International Opportunities Fund — a) 0.90% of the first $750 million of aggregate net assets; b) 0.85% of aggregate net assets between $750 million and $1.5 billion; and c) 0.80% of the excess over $1.5 billion of aggregate net assets.
• International Value Fund — Aggregate net assets are the aggregate net assets of the Fund, Mutual Shares Fund and International Small Cap Fund and the following funds of JHT: International Value Trust, Global Trust, Income Trust and Mutual Shares Trust. The advisory fee paid is as follows: a) 0.95% of the first $150 million of aggregate net assets; b) 0.85% of aggregate net assets between $150 million and $300 million and c) 0.80% excess over $300 million of aggregate net assets. However, when aggregate net assets exceed $300 million, then the advisory fee rate is 0.80% of aggregate net assets of the Fund.
• Investment Quality Bond Fund — a) 0.60% of the first $500 million of aggregate net assets and b) 0.55% of the excess over $500 million of aggregate net assets.
• Large Cap Fund — a) 0.78% of the first $250 million of aggregate net assets; b) 0.73% of aggregate net assets between $250 million and $500 million; c) 0.68% of aggregate net assets between $500 million and $750 million; and d) 0.65% of the excess over $750 million of aggregate net assets.
• Large Cap Value Fund — a) 0.825% of the first $500 million of aggregate net assets; b) 0.80% of aggregate net assets between $500 million and $1 billion; c) 0.775% of aggregate net assets between $1 billion and $1.5 billion; d) 0.72% of aggregate net assets between $1.5 billion and $2 billion; and e) 0.70% of the excess over $2 billion of aggregate net assets.
• Mid Cap Index Fund and Small Cap Index Fund — a) 0.49% of the first $250 million of aggregate net assets; b) 0.48% of aggregate net assets between $250 million and $500 million; and c) 0.46% of the excess over $500 million of aggregate net assets.
• Mid Cap Stock Fund — a) 0.875% of the first $200 million of aggregate net assets; b) 0.85% of aggregate net assets between $200 million and $500 million; and c) 0.825% of the excess over $500 million of aggregate net assets.
• Mid Cap Growth Index Fund and Mid Cap Value Index Fund — a) 0.53% of the first $50 million of aggregate net assets; b) 0.51% of aggregate net assets between $50 million and $100 million; and c) 0.49% of the excess over $100 million of aggregate net assets.
• Mid Cap Value Equity Fund — a) 0.875% of the first $250 million of aggregate net assets; b) 0.85% of aggregate net assets between $250 million and $500 million; c) 0.825% of aggregate net assets between $500 million and $1 billion; and d) 0.80% of the excess over $1 billion of aggregate net assets.
• Mid Value Fund — a) 1.05% of the first $50 million of aggregate net assets and b) 1.00% excess over $50 million of aggregate net assets.
• Mutual Shares Fund — 0.96% of the aggregate net assets.
• Optimized Value Fund — a) 0.70% of the first $500 million of aggregate net assets; b) 0.65% of aggregate net assets between $500 million and $1 billion; and c) 0.60% of the excess over $1 billion of aggregate net assets.
• Real Estate Equity Fund — a) 0.875% of the first $250 million of average net assets; b) 0.85% of average net assets between $250 million and $500 million; and c) 0.825% of the excess over $500 million of average net assets.
• Real Return Bond Fund — a) 0.70% of the first $1 billion of aggregate net assets and b) 0.65% excess over $1 billion of aggregate net assets.
• Short-Term Government Income Fund — a) 0.57% of the first $250 million of aggregate net assets and b) 0.55% excess over $250 million of aggregate net assets.
• Small Cap Growth Fund — a) 1.10% of the first $100 million of aggregate net assets and b) 1.05% excess over $100 million of aggregate net assets.
• Small Cap Opportunities Fund — a) 1.00% of the first $500 million of aggregate net assets; b) 0.95% of aggregate net assets between $500 million and $1 billion; c) 0.90% of aggregate net assets between $1 billion and $2 billion; and d) 0.85% of the excess over $2 billion of aggregate net assets.
• Small Cap Value Fund — a) 1.10% of the first $100 million of aggregate net assets; b) 1.05% of aggregate net assets between $100 million and $600 million; and c) 1.00% of the excess over $600 million of aggregate net assets.
• Small Company Growth Fund — a) 1.05% of the first $250 million of aggregate net assets and b) 1.00% excess over $250 million of aggregate net assets. However, when the aggregate net assets of Small Company Growth Fund, JHT Small Company Growth Trust, Small Cap Opportunities Fund, JHT Small Cap Opportunities Trust, Value Fund, International Growth Stock Fund, JHT International Growth Stock Trust and JHT Value Trust exceed $1 billion, then the advisory rate for Small Company Growth Fund will be 1.00% of aggregate net assets.
• Smaller Company Growth Fund — a) 1.10% of the first $125 million of aggregate net assets; b) 1.05% of aggregate net assets between $125 million and $375 million; c) 1.00% of aggregate net assets between $375 million and $1 billion and d) 0.95% of the excess over $1 billion of aggregate net assets.
• Small Company Value Fund — a) 1.05% of the first $500 million of aggregate net assets and b) 1.00% excess over $500 million of aggregate net assets.
• Spectrum Income Fund — a) 0.80% of the first $250 million of aggregate net assets and b) 0.725% excess over $250 million of aggregate net assets.
• Total Bond Market Fund — a) 0.49% of the first $500 million of average net assets and b) 0.47% excess over $500 million of average net assets.
• Total Return Fund — If Relationship Net Assets are equal to or exceed $3 billion, then the following fee schedule applies: a) 0.70% of the first $1 billion of aggregate net assets and b) 0.675% excess over $1 billion of aggregate net assets. If Relationship Net Assets are less than $3 billion, then the advisory fee to be paid is 0.70% of aggregate net assets. Relationship Net Assets are aggregate net assets of all Portfolios of the Trust and John Hancock Trust that are subadvised by PIMCO.
• U.S. High Yield Bond Fund — a) 0.75% of the first $200 million of aggregate net assets and b) 0.72% excess over $200 million of aggregate net assets.
• U.S. Multi-Sector Fund — a) 0.78% of the first $500 million of aggregate net assets; b) 0.76% of aggregate net assets between $500 million and $1 billion; c) 0.75% of aggregate net assets between $1 billion and $2.5 billion and d) 0.74% of the excess over $2.5 billion of aggregate net assets.
• Value Fund — a) 0.75% of the first $200 million of aggregate net assets; b) 0.725% of aggregate net assets between $200 million and $500 million; and c) 0.65% of the excess over $500 million of aggregate net assets.
FEES AND TRANSACTIONS WITH AFFILIATES, CONTINUED
• Value & Restructuring Fund — a) 0.825% of the first $500 million of aggregate net assets; b) 0.80% of aggregate net assets between $500 million and $1 billion; and c) 0.775% of the excess over $1 billion of aggregate net assets.
• The Retirement Portfolios pay the Adviser a management fee for its services to the Portfolios. The management fee has two components: (a) a fee on net assets invested in affiliated funds (Affiliated Fund Assets) and (b) a fee on net assets not invested in affiliated funds (Other Assets). Affiliated funds are any funds of The Trust, John Hancock Trust (JHT) and John Hancock Funds III (JHF III) excluding John Hancock Money Market Trust B, John Hancock 500 Index Trust B, John Hancock International Equity Index Trust B and John Hancock Total Bond Market Trust B. The fee on assets invested in Affiliated Fund Assets is stated as an annual percentage of the current value of the aggregate net assets of all the Portfolios and is equivalent to the sum of: (a) 0.06% of the first $7.5 billion of aggregate net assets and (b) 0.05% of the excess over $7.5 billion of aggregate net assets. The fee on Other Assets is stated as an annual percentage of the current value of the aggregate net assets of all the Portfolios and is equivalent to the sum of: (a) 0.51% of the first $7.5 billion of aggregate net assets and (b) 0.50% of the excess over $7.5 billion of aggregate net assets and is applied to the Other Assets of the Portfolios.
The organizations described below as the subadvisers to the Trust and its Funds pursuant to Subadvisory Agreements with the Adviser. Fund management is allocated among the following managers:
| |
| Fund | Subadviser |
|
| Active Bond Fund | Declaration Management and Research LLC and John Hancock Asset Management a division of Manulife Asset Management |
| (US) LLC (formerly, MFC Global Investment Management (U.S.), LLC)1,3 |
|
|
| All Cap Core Fund | QS Investors, LLC |
|
| All Cap Value Fund | Lord, Abbett & Company, LLC |
|
| Alpha Opportunities Fund | Wellington Management Company, LLP |
| Investment Quality Bond Fund | |
| Mid Cap Stock Fund | |
| Small Cap Growth Fund | |
| Small Cap Value Fund | |
|
| Core Diversified Growth & Income Portfolio | John Hancock Asset Management a division of Manulife Asset Management (North America) Limited (formerly, MFC Global |
| Core Fundamental Holdings Portfolio | Investment Management (U.S.A.) Limited)1,2 and John Hancock Asset Management a division of Manulife Asset Management |
| Core Global Diversification Portfolio | (US) LLC (formerly, MFC Global Investment Management (U.S.) LLC)1,3 |
| Retirement Portfolios | |
|
| Global Agribusiness Fund | John Hancock Asset Management a division of Manulife Asset Management (North America) Limited (formerly, MFC Global |
| Global Infrastructure Fund | Investment Management (U.S.A.) Limited)1,2 |
| Global Timber Fund | |
| Index 500 Fund | |
| Mid Cap Index Fund | |
| Optimized Value Fund | |
| Small Cap Index Fund | |
|
| Emerging Markets Debt Fund | John Hancock Asset Management a division of Manulife Asset Management (US) LLC (formerly, MFC Global Investment |
| High Income Fund | Management (U.S.) LLC)1,3 |
| Short Term Government Income Fund | |
|
| Blue Chip Growth Fund | T. Rowe Price Associates, Inc. |
| Capital Appreciation Value Fund | |
| Equity-Income Fund | |
| Large Cap Value Fund4 | |
| Mid Value Fund | |
| Real Estate Equity Fund | |
| Small Company Value Fund | |
| Spectrum Income Fund | |
|
| Capital Appreciation Fund | Jennison Associates, LLC |
|
| Core Bond Fund | Wells Capital Management, Inc. |
| U.S. High Yield Bond Fund | |
|
| Emerging Markets Fund | Dimensional Fund Advisors LP |
| International Small Company Fund | |
|
| Fundamental Value Fund | Davis Selected Advisors, L.P. |
|
| Global Bond Fund | Pacific Investment Management Company LLC |
| Real Return Bond Fund | |
| Total Return Fund | |
|
| Global Real Estate Fund | Deutsche Investment Management Americas, Inc. |
| Real Estate Securities Fund | |
|
| Heritage Fund | American Century Investment Management, Inc. |
|
| High Yield Fund | Western Asset Management Company |
|
FEES AND TRANSACTIONS WITH AFFILIATES, CONTINUED
| |
| Fund | Subadviser |
|
| International Equity Index Fund | SSgA Funds Management, Inc. |
| Mid Cap Growth Index Fund | |
| Mid Cap Value Index Fund | |
|
| International Opportunities Fund | Marsico Capital Management, LLC |
|
| International Small Cap Fund | Franklin Templeton Investment Corp. |
|
| International Value Fund | Templeton Investment Counsel, LLC |
|
| Large Cap Fund | UBS Global Asset Management (Americas) Inc. |
|
| Mutual Shares Fund | Franklin Mutual Advisers, LLC |
|
| Small Cap Opportunities Fund | Invesco Advisers, Inc. and Dimensional Fund Advisors LP |
|
| International Growth Stock Fund | Invesco Advisers, Inc. |
| Small Company Growth Fund | |
| Value Fund | |
|
| Smaller Company Growth Fund | John Hancock Asset Management a division of Manulife Asset Management (North America) Limited (formerly, MFC Global |
| | Investment Management (U.S.A.) Limited)1,2, Frontier Capital Management Company, LLC and Perimeter Capital Management |
|
| Total Bond Market Fund | Declaration Management & Research, LLC1 |
|
| U.S. Multi-Sector Fund | Grantham, Mayo, Van Otterloo & Company, LLC |
|
| Mid Cap Value Equity Fund | Columbia Management Investment Advisors, LLC |
| Value & Restructuring Fund | |
|
1 An affiliate of the Adviser.
2 Manulife Asset Management (North America) Limited is doing business as John Hancock Asset Management.
3 Manulife Asset Management (U.S.) LLC is doing business as John Hancock Asset Management.
4 Prior to January 1, 2011, the Subadviser was BlackRock Investment Management, LLC.
The Funds are not responsible for payment of the subadvisory fees. The investment management fees incurred for the six-month ended February 28, 2011 were equivalent to an annual effective rate of the Funds’ average daily net assets as follows:
| | | | |
| Fund | Annual Effective Rate | | Fund | Annual Effective Rate |
| |
|
|
| Active Bond Fund | 0.60% | | Mid Cap Index Fund | 0.47% |
| All Cap Core Fund | 0.78% | | Mid Cap Stock Fund | 0.83% |
| All Cap Value Fund | 0.78% | | Mid Cap Value Equity Fund | 0.87% |
| Alpha Opportunities Fund | 0.97% | | Mid Cap Value Index Fund | 0.53% |
| Blue Chip Growth Fund | 0.78% | | Mid Value Fund | 1.00% |
| Capital Appreciation Fund | 0.70% | | Mutual Shares Fund | 0.96% |
| Capital Appreciation Value Fund | 0.85% | | Optimized Value Fund | 0.69% |
| Core Bond Fund | 0.59% | | Real Estate Equity Fund | 0.87% |
| Core Diversified Growth & Income Portfolio | 0.04% | | Real Estate Securities Fund | 0.70% |
| Core Fundamental Holdings Portfolio | 0.04% | | Real Return Bond Fund | 0.70% |
| Core Global Diversification Portfolio | 0.04% | | Retirement 2010 Portfolio | 0.06% |
| Emerging Markets Fund | 0.95% | | Retirement 2015 Portfolio | 0.06% |
| Emerging Markets Debt Fund | 0.73% | | Retirement 2020 Portfolio | 0.06% |
| Equity-Income Fund | 0.78% | | Retirement 2025 Portfolio | 0.06% |
| Fundamental Value Fund | 0.76% | | Retirement 2030 Portfolio | 0.06% |
| Global Agribusiness Fund | 0.85% | | Retirement 2035 Portfolio | 0.06% |
| Global Bond Fund | 0.70% | | Retirement 2040 Portfolio | 0.06% |
| Global Infrastructure Fund | 0.85% | | Retirement 2045 Portfolio | 0.06% |
| Global Real Estate Fund | 0.91% | | Short Term Government Income Fund | 0.56% |
| Global Timber Fund | 0.85% | | Small Cap Growth Fund | 1.06% |
| Heritage Fund | 0.85% | | Small Cap Index Fund | 0.47% |
| High Income Fund | 0.68% | | Small Cap Opportunities Fund | 1.00% |
| High Yield Fund | 0.67% | | Small Cap Value Fund | 1.05% |
| Index 500 Fund | 0.46% | | Small Company Value Fund | 1.03% |
| International Equity Index Fund | 0.53% | | Small Company Growth Fund | 1.01% |
| International Growth Stock Fund | 0.84% | | Smaller Company Growth Fund | 1.07% |
| International Opportunities Fund | 0.88% | | Spectrum Income Fund | 0.73% |
| International Small Cap Fund | 1.01% | | Total Bond Market Fund | 0.49% |
| International Small Company Fund | 0.95% | | Total Return Fund | 0.68% |
| International Value Fund | 0.80% | | U.S. High Yield Bond Fund | 0.73% |
| Investment Quality Bond Fund | 0.58% | | U.S. Multi-Sector Fund | 0.76% |
| Large Cap Fund | 0.76% | | Value Fund | 0.74% |
| Large Cap Value Fund | 0.82% | | Value & Restructuring Fund | 0.81% |
| Mid Cap Growth Index Fund | 0.53% | | | |
FEES AND TRANSACTIONS WITH AFFILIATES, CONTINUED
Expense Reimbursements The Adviser voluntarily agrees to waive a portion of its management fee if certain expenses of the respective Funds exceed the percentage of average net assets as detailed below. Expenses excluded from this waiver are taxes, portfolio brokerage commissions, interest, litigation and indemnification expenses, and extraordinary expenses not incurred in the ordinary course of the Funds’ business, advisory fees, class specific expenses, and fees under any agreements or plans of the Funds dealing with services for shareholders and others with beneficial interests in shares of the Funds. This expense reduction will continue in effect until terminated by the Adviser.
| | | | |
| | Voluntary Cap | | | Voluntary Cap |
| Fund | Expense | | Fund | Expense |
| |
|
|
| Active Bond Fund | 0.150% | | Mid Cap Growth Index Fund | 0.075% |
| All Cap Core Fund | 0.200% | | Mid Cap Index Fund | 0.075% |
| All Cap Value Fund | 0.200% | | Mid Cap Stock Fund | 0.200% |
| Alpha Opportunities Fund | 0.200% | | Mid Cap Value Equity Fund | 0.200% |
| Blue Chip Growth Fund | 0.200% | | Mid Cap Value Index Fund | 0.075% |
| Capital Appreciation Fund | 0.200% | | Mid Value Fund | 0.200% |
| Capital Appreciation Value Fund | 0.200% | | Mutual Shares Fund | 0.200% |
| Core Bond Fund | 0.150% | | Optimized Value Fund | 0.200% |
| Emerging Markets Fund | 0.250% | | Real Estate Equity Fund | 0.200% |
| Emerging Markets Debt Fund | 0.150% | | Real Estate Securities Fund | 0.200% |
| Equity-Income Fund | 0.200% | | Real Return Bond Fund | 0.150% |
| Fundamental Value Fund | 0.200% | | Small Cap Growth Fund | 0.200% |
| Global Bond Fund | 0.150% | | Small Cap Index Fund | 0.075% |
| Global Real Estate Fund | 0.250% | | Small Cap Opportunities Fund | 0.200% |
| Heritage Fund | 0.200% | | Small Cap Value Fund | 0.200% |
| High Income Fund | 0.150% | | Small Company Growth Fund | 0.200% |
| High Yield Fund | 0.150% | | Small Company Value Fund | 0.200% |
| Index 500 Fund | 0.075% | | Smaller Company Growth Fund | 0.200% |
| International Equity Index Fund | 0.075% | | Spectrum Income Fund | 0.150% |
| International Growth Stock Fund | 0.250% | | Total Bond Market Fund | 0.075% |
| International Opportunities Fund | 0.250% | | Total Return Fund | 0.150% |
| International Small Cap Fund | 0.250% | | U.S. High Yield Bond Fund | 0.150% |
| International Small Company Fund | 0.250% | | U.S. Multi-Sector Fund | 0.200% |
| International Value Fund | 0.250% | | Value Fund | 0.200% |
| Investment Quality Bond Fund | 0.150% | | Value & Restructuring Fund | 0.200% |
| Large Cap Fund | 0.200% | | | |
| Large Cap Value Fund | 0.200% | | | |
The Adviser has voluntarily agreed to waive a portion of its management fee for certain Funds (the Participating Funds) of the Trust and JHT. The waiver equals, on an annualized basis, 0.01% of that portion of the aggregate net assets of all the Participating Funds that exceeds $85 billion. The amount of the Reimbursement is calculated daily and allocated among all the Participating Funds in proportion to the daily net assets of each Fund.
The Adviser has contractually agreed to waive its advisory fee on International Value Fund, Small Cap Opportunities Fund and Smaller Company Growth Fund so that the amount retained by the Adviser after payment of the subadvisory fees for each Fund does not exceed 0.45% of the Fund’s average net assets. The expense reimbursement shall continue in effect until December 31, 2011, and may terminate anytime thereafter.
The Adviser has contractually agreed to limit Fund expenses for Global Agribusiness Fund, Global Infrastructure Fund and Global Timber Fund (excluding taxes, portfolio brokerage commissions, interest, acquired fees, litigation and indemnification expenses and extraordinary expenses not incurred in the ordinary course of the Fund’s business, and fees under any agreements or plans of the Fund dealing with services for shareholders and others with beneficial interests in shares of the Fund) and short dividends so that the total Fund operating expenses do not exceed 1.45% and 1.00% of average net assets for Class A and Class I, respectively. This expense reimbursement shall continue in effect until December 31, 2011, and may terminate anytime thereafter.
In addition, for Global Agribusiness Fund, Global Infrastructure Fund and Global Timber Fund the Adviser has voluntarily agreed to reduce its advisory fee or make a payment to reimburse each Fund, in an amount equal to the amount by which all Fund level expenses of the Fund exceed 0.97% of average net assets. This voluntary expense reimbursement may terminate at anytime.
The Adviser has contractually agreed to limit Fund expenses for Emerging Markets Debt Fund (excluding taxes, portfolio brokerage commissions, interest, underlying fund expenses, litigation and indemnification expenses and extraordinary expenses not incurred in the ordinary course of the Fund’s business, and fees under any agreements or plans of the Fund dealing with services for shareholders and others with beneficial interests in shares of the Fund) so that the total Fund operating expenses do not exceed 1.35% for Emerging Markets Debt Fund Class A and 0.88% for Emerging Markets Debt Fund Class I of the average net assets of those classes. This expense reimbursement shall continue in effect until December 31, 2011, and may terminate anytime thereafter.
Prior to January 1, 2011, the Adviser has contractually agreed to limit Fund expenses so that the total Fund operating expenses do not exceed 1.14% for Small Cap Value Fund Class NAV.
The Adviser has contractually agreed to reimburse Core Diversified Growth & Income Portfolio, Core Fundamental Holdings Portfolio and Core Global Diversification Portfolio for “other” fund expenses exceeding 0.06% of the Funds’ average net assets. This expense reimbursement shall continue in effect until December 31, 2011, and may terminate anytime thereafter.
In addition, the Core Diversified Growth & Income Portfolio, Core Fundamental Holdings Portfolio and Core Global Diversification Portfolio receive a fee equal to 0.05% of the average net asset value of their investment in the underlying American Funds for providing various account maintenance services.
FEES AND TRANSACTIONS WITH AFFILIATES, CONTINUED
The Adviser has contractually agreed to reimburse Short Term Government Income Fund for “other” fund expenses exceeding 0.08% of the Funds average net assets. This expense reimbursement shall continue in effect until December 31, 2011, and may terminate at any time thereafter.
The Adviser also voluntarily agreed to waive a portion of its advisory fees for the Funds sub-advised by T. Rowe Price Associates, Inc. which include Blue Chip Growth Fund, Capital Appreciation Value Fund, Equity-Income Fund, Mid Value Fund, Real Estate Equity Fund, Small Company Value Fund and Spectrum Income Fund. This voluntary waiver is the amount that the subadvisory fee is reduced by T. Rowe Price Associates, Inc. This voluntary expense reimbursement may terminate at anytime.
The Adviser voluntarily agrees to waive its advisory fee for the Large Cap Value Fund so that the effective advisory fee rate does not exceed 0.78% of the Fund’s average annual net assets. The Adviser may terminate this voluntary waiver at any time upon notice to the Trust.
For the Retirement Portfolios, the Adviser has contractually agreed to waive other fund level expenses excluding advisory fees, 12b-1 fees, service fees, transfer agent fees, blue sky fees, printing, taxes, brokerage commissions, interest expenses, acquired fund fees, litigation and indemnification expenses and other extraordinary expenses not incurred in the ordinary course of business. The waivers are such that these expenses will not exceed 0.05% of average net assets. This expense limitation shall continue in effect until December 31, 2011 and thereafter until terminated by the Adviser.
In addition, the Adviser voluntarily agrees to waive its advisory fee for each Retirement Portfolio (each a “Portfolio”) so that the aggregate advisory fee retained by the Adviser with respect to both the Portfolio and its underlying investments (after payment of subadvisory fees) does not exceed 0.51% of the Portfolio’s first $7.5 billion of average annual net assets and 0.50% of the Portfolio’s average annual net assets in excess of $7.5 billion. The Adviser may terminate this voluntary waiver at any time upon notice to the Trust.
For the six-month period ended February 28, 2011, the waivers under these agreements amounted to:
| | | | |
| Fund | Expense Reductions | | Fund | Expense Reductions |
| |
|
| Active Bond Fund | $11,115 | | Mid Cap Index Fund | $3,260 |
| All Cap Core Fund | 6,296 | | Mid Cap Stock Fund | 9,990 |
| All Cap Value Fund | 5,340 | | Mid Cap Value Equity Fund | 1,859 |
| Alpha Opportunities Fund | 13,941 | | Mid Cap Value Index Fund | 6,512 |
| Blue Chip Growth Fund | 349,560 | | Mid Value Fund | 120,101 |
| Capital Appreciation Fund | 18,446 | | Mutual Shares Fund | 2,929 |
| Capital Appreciation Value Fund | 17,429 | | Optimized Value Fund | 3,726 |
| Core Bond Fund | 6,281 | | Real Estate Equity Fund | 67,274 |
| Core Diversified Growth & Income Portfolio | 15,802 | | Real Estate Securities Fund | 4,163 |
| Core Fundamental Holdings Portfolio | 16,640 | | Real Return Bond Fund | 8,899 |
| Core Global Diversification Portfolio | 15,681 | | Retirement 2010 Portfolio | 21,060 |
| Emerging Markets Fund | 20,793 | | Retirement 2015 Portfolio | 20,946 |
| Emerging Markets Debt Fund | 25,780 | | Retirement 2020 Portfolio | 20,766 |
| Equity-Income Fund | 205,837 | | Retirement 2025 Portfolio | 20,482 |
| Fundamental Value Fund | 16,138 | | Retirement 2030 Portfolio | 20,921 |
| Global Agribusiness Fund | 30,204 | | Retirement 2035 Portfolio | 20,831 |
| Global Bond Fund | 9,042 | | Retirement 2040 Portfolio | 21,099 |
| Global Infrastructure Fund | 29,212 | | Retirement 2045 Portfolio | 21,115 |
| Global Real Estate Fund | 5,176 | | Short Term Government Income Fund | 2,642 |
| Global Timber Fund | 29,314 | | Small Cap Growth Fund | 1,840 |
| Heritage Fund | 2,397 | | Small Cap Index Fund | 875 |
| High Income Fund | 5,569 | | Small Cap Opportunities Fund | 80,489 |
| High Yield Fund | 8,822 | | Small Cap Value Fund | 1,603 |
| Index 500 Fund | 21,501 | | Small Company Growth Fund | 1,427 |
| International Equity Index Fund | 4,540 | | Small Company Value Fund | 110,329 |
| International Growth Stock Fund | 1,515 | | Smaller Company Growth Fund | 83,968 |
| International Opportunities Fund | 7,917 | | Spectrum Income Fund | 125,850 |
| International Small Cap Fund | 3,499 | | Total Bond Market Fund | 4,786 |
| International Small Company Fund | 2,030 | | Total Return Fund | 23,240 |
| International Value Fund | 13,085 | | U.S. High Yield Bond Fund | 6,639 |
| Investment Quality Bond Fund | 4,402 | | U.S. Multi-Sector Fund | 10,659 |
| Large Cap Fund | 3,205 | | Value Fund | 1,847 |
| Large Cap Value Fund | 19,261 | | Value & Restructuring Fund | 6,132 |
| Mid Cap Growth Index Fund | 6,826 | | | |
Expense Recapture The Adviser may recapture operating expenses reimbursed or fees waived under previous expense limitation or waiver arrangements made subsequent to January 1, 2009, for a period of three years following the beginning of the month in which such reimbursements or waivers originally occurred. The table below outlines the amounts recovered during the six months ended February 28, 2011, and the amount of waived or reimbursed expenses subject to potential recovery and the respective expiration dates. Certain reimbursements or waivers are not subject to recapture.
| | | | |
| | Amounts eligible | Amounts eligible | Amounts eligible | Amount recovered |
| | for recovery through | for recovery through | for recovery through | during the period |
| Fund Name | August 1, 2012 | August 1, 2013 | February 1, 2014 | ended February 28, 2011 |
|
| Core Diversified Growth & Income Portfolio | $31,371 | $28,024 | $11,970 | — |
| Core Fundamental Holdings Portfolio | 31,982 | 32,089 | 14,726 | — |
FEES AND TRANSACTIONS WITH AFFILIATES, CONTINUED
| | | | |
| | Amounts eligible | Amounts eligible | Amounts eligible | Amount recovered |
| | for recovery through | for recovery through | for recovery through | during the period |
| Fund Name | August 1, 2012 | August 1, 2013 | February 1, 2014 | ended February 28, 2011 |
|
| Core Global Diversification Portfolio | $32,906 | $31,047 | $11,494 | — |
| Emerging Markets Debt Fund | — | 59,439 | 25,615 | $67 |
| Global Agribusiness Fund | 46,153 | 67,527 | 30,174 | 19 |
| Global Infrastructure Fund | 52,109 | 67,965 | 29,186 | 18 |
| Global Timber Fund | 47,036 | 68,666 | 29,285 | 19 |
| Mid Cap Growth Index Fund | — | 34,976 | 6,222 | 1,314 |
| Mid Cap Value Index Fund | — | 33,799 | 5,908 | 889 |
| Retirement 2010 Portfolio | — | 28,378 | 21,060 | — |
| Retirement 2015 Portfolio | — | 28,377 | 20,946 | — |
| Retirement 2020 Portfolio | — | 28,376 | 20,766 | — |
| Retirement 2025 Portfolio | — | 28,376 | 20,482 | — |
| Retirement 2030 Portfolio | — | 28,375 | 20,921 | — |
| Retirement 2035 Portfolio | — | 28,375 | 20,831 | — |
| Retirement 2040 Portfolio | — | 28,375 | 21,099 | — |
| Retirement 2045 Portfolio | — | 28,375 | 21,115 | — |
| Short Term Government Income Fund | 42,536 | 41,396 | 1,312 | 2,974 |
| Small Cap Value Fund | — | — | — | 3,945 |
| | $284,093 | $691,935 | $333,112 | $9,245 |
Accounting and Legal Services Pursuant to the service agreement, the Funds reimburses the Adviser for all expenses associated with providing the administrative, financial, legal, accounting and recordkeeping services of the Funds, including the preparation of all tax returns, periodic reports to shareholders and regulatory reports, among other services. These expenses are allocated to each share class based on its relative net assets at the time the expense was incurred. The accounting and legal services fees incurred for the six months ended February 28, 2011, amounted to an annual rate of 0.01% of the Funds’ average daily net assets, except for Large Cap Value Fund which amounted to an approximate annual rate of 0.02% of the Fund’s average daily net assets.
Distribution and Service Plans The Funds have a distribution agreement with the Distributor. The Funds have adopted distribution and service plans with respect to Class A and Class I shares pursuant to Rule 12b-1 under the 1940 Act, to pay the Distributor for services provided as the distributor of shares of the Funds. The Funds may pay up to the following contractual rates of distribution and service fees under these arrangements, expressed as an annual percentage of average daily net assets for each class of the Fund’s shares.
| |
| Class | 12b-1 Fee |
|
| Class A | 0.30% |
| Class 1 | 0.05% |
Sales Charges Class A shares of Emerging Markets Debt Fund, Global Agribusiness Fund, Global Infrastructure Fund and Global Timber Fund are assessed up-front sales charges, which result in payments to the Distributor. For the six-month period ended February 28, 2011, no sales charges were assessed.
Transfer Agent Fees Emerging Markets Debt Fund, Global Agribusiness Fund, Global Infrastructure Fund and Global Timber Fund have a transfer agent agreement with John Hancock Signature Services, Inc. (Signature Services or Transfer Agent), an affiliate of the Adviser. The transfer agent fees paid to Signature Services are determined based on the cost to Signature Services (Signature Services Cost) of providing recordkeeping services. The Signature Services Cost includes a component of allocated John Hancock corporate overhead for providing transfer agent services to the Fund and to all other John Hancock affiliated funds. It also includes out-of-pocket expenses that are comprised of payments made to third-parties for recordkeeping services provided to their clients who invest in one or more John Hancock funds. In addition, Signature Services Cost may be reduced by certain revenues that Signature Services receive in connection with the service they provide to the funds. Signature Services Cost is calculated monthly and allocated, as applicable, to four categories of share classes: Institutional Share Classes, Retirement Share Classes, Municipal Bond Classes and all other Retail Share Classes. Within each of these categories, the applicable costs are allocated to the affected John Hancock affiliated funds and/or classes, based on the relative average daily net assets.
Class Level Expenses Class level expenses for the six months ended February 28, 2011 were:
| | | | | |
| | | | | State | |
| | | Distribution and | Transfer | registration | Printing |
| Fund | Class | service fees | agent fees | fees | and postage |
|
| Emerging Markets Debt Fund | | | | | |
| | A | $19,023 | $11,295 | — | $161 |
| | I | — | 821 | — | 40 |
| | Total | $19,023 | $12,116 | — | $201 |
|
| Global Agribusiness Fund | | | | | |
| | A | $2,143 | $1,282 | $225 | $17 |
| | I | — | 371 | 226 | 17 |
| | Total | $2,143 | $1,653 | $451 | $34 |
|
| Global Infrastructure Fund | | | | | |
| | A | $1,827 | $1,091 | $225 | $14 |
| | I | — | 317 | 226 | 15 |
| | Total | $1,827 | $1,408 | $451 | $29 |
|
FEES AND TRANSACTIONS WITH AFFILIATES, CONTINUED
| | | | | |
| | | | | State | |
| | | Distribution and | Transfer | registration | Printing |
| Fund | Class | service fees | agent fees | fees | and postage |
|
| Global Timber Fund | | | | | |
| | A | $2,098 | $1,252 | $225 | $17 |
| | I | — | 364 | 226 | 17 |
| | Total | $2,098 | $1,616 | $451 | $34 |
|
Trustee Expenses The Trust compensates each Trustee who is not an employee of the Adviser or its affiliates. The costs of paying Trustee compensation and expenses are allocated to each Fund based on its average daily net assets.
6. FUND SHARE TRANSACTIONS Transactions in Funds shares for the six months ended February 28, 2011 and for the year ended August 31, 2010 were as follows:
| | | | |
| Active Bond Fund | Six months ended 2/28/11 | Year ended 8/31/10 |
| | Shares | Amount | Shares | Amount |
| Class 1 shares | | | | |
|
| Sold | 358,316 | $3,646,136 | 1,120,472 | $10,992,910 |
| Distributions reinvested | 106,050 | 1,069,170 | 204,554 | 1,973,081 |
| Repurchased | (592,752) | (6,031,684) | (658,873) | (6,427,610) |
| | | | | |
| Net increase (decrease) | (128,386) | ($1,316,378) | 666,153 | $6,538,381 |
| |
| Class NAV shares | | | | |
|
| Sold | 35,083,165 | $357,509,704 | 19,572,824 | $192,986,233 |
| Distributions reinvested | 2,530,374 | 25,486,739 | 3,467,282 | 33,421,644 |
| Repurchased | (969,394) | (9,813,120) | (3,828,214) | (37,421,287) |
| | | | | |
| Net increase | 36,644,145 | $373,183,323 | 19,211,892 | $188,986,590 |
| |
| Net increase | 36,515,759 | $371,866,945 | 19,878,045 | $195,524,971 |
|
| |
| All Cap Core Fund | Six months ended 2/28/11 | Year ended 8/31/10 |
| | Shares | Amount | Shares | Amount |
| Class NAV shares | | | | |
|
| Sold | 89,849 | $733,958 | 5,989,779 | $44,989,632 |
| Distributions reinvested | 639,809 | 5,534,351 | 759,368 | 5,839,540 |
| Repurchased | (630,643) | (5,274,518) | (303,937) | (2,317,449) |
| |
| Net increase | 99,015 | $993,791 | 6,445,210 | $48,511,723 |
|
| |
| All Cap Value Fund | Six months ended 2/28/11 | Year ended 8/31/10 |
| | Shares | Amount | Shares | Amount |
| Class 1 shares | | | | |
|
| Sold | 750,890 | $8,829,036 | 766,557 | $7,886,839 |
| Distributions reinvested | 432,262 | 4,966,693 | 25,848 | 261,582 |
| Repurchased | (405,443) | (4,586,344) | (1,335,725) | (13,525,526) |
| | | | | |
| Net increase (decrease) | 777,709 | $9,209,385 | (543,320) | ($5,377,105) |
| |
| Class NAV shares | | | | |
|
| Sold | 1,348,589 | $14,199,885 | 6,334,705 | $63,845,521 |
| Distributions reinvested | 1,874,811 | 21,429,083 | 98,440 | 991,293 |
| Repurchased | (680,837) | (7,836,727) | (253,055) | (2,561,109) |
| | | | | |
| Net increase | 2,542,563 | $27,792,241 | 6,180,090 | $62,275,705 |
| |
| Net increase | 3,320,272 | $37,001,626 | 5,636,770 | $56,898,600 |
|
| |
| Alpha Opportunities Fund | Six months ended 2/28/11 | Year ended 8/31/10 |
| | Shares | Amount | Shares | Amount |
| Class NAV shares | | | | |
|
| Sold | 2,115,375 | $25,031,968 | 40,681,168 | $435,987,888 |
| Distributions reinvested | 11,851,122 | 137,828,549 | 6,357,403 | 69,995,012 |
| Repurchased | (1,926,078) | (22,928,745) | (1,283,093) | (14,672,075) |
| |
| Net increase | 12,040,419 | $139,931,772 | 45,755,478 | $491,310,825 |
|
| |
| Blue Chip Growth Fund | Six months ended 2/28/11 | Year ended 8/31/10 |
| | Shares | Amount | Shares | Amount |
| Class 1 shares | | | | |
|
| Sold | 855,904 | $17,498,618 | 17,853,592 | $302,868,266 |
| Distributions reinvested | 3,666 | 75,198 | 24,858 | 432,630 |
| Repurchased | (1,268,355) | (25,006,860) | (2,874,015) | (49,260,408) |
| | | | | |
| Net increase (decrease) | (408,785) | ($7,433,044) | 15,004,435 | $254,040,488 |
| |
| Class NAV shares | | | | |
|
| Sold | 1,305,618 | $26,544,997 | 10,631,908 | $178,441,816 |
| Distributions reinvested | 50,722 | 1,039,288 | 111,988 | 1,942,437 |
| Repurchased | (4,621,631) | (90,503,603) | (2,112,185) | (36,777,455) |
| | | | | |
| Net increase (decrease) | (3,265,291) | ($62,919,318) | 8,631,711 | $143,606,798 |
| |
| Net increase (decrease) | (3,674,076) | ($70,352,362) | 23,636,146 | $397,647,286 |
|
FUND SHARE TRANSACTIONS, CONTINUED
| | | | |
| Capital Appreciation Fund | Six months ended 2/28/11 | Year ended 8/31/10 |
| | Shares | Amount | Shares | Amount |
| Class 1 shares | | | | |
|
| Sold | 741,580 | $8,156,197 | 31,721,669 | $331,170,669 |
| Distributions reinvested | 30,863 | 348,747 | 29,216 | 288,944 |
| Repurchased | (2,784,235) | (30,202,881) | (2,510,518) | (24,298,783) |
| | | | | |
| Net increase (decrease) | (2,011,792) | ($21,697,937) | 29,240,367 | $307,160,830 |
| |
| Class NAV shares | | | | |
|
| Sold | 4,309,083 | $48,488,044 | 14,501,926 | $140,533,351 |
| Distributions reinvested | 170,541 | 1,928,816 | 317,122 | 3,136,340 |
| Repurchased | (7,102,643) | (76,030,507) | (7,294,827) | (71,435,254) |
| | | | | |
| Net increase (decrease) | (2,623,019) | ($25,613,647) | 7,524,221 | $72,234,437 |
|
| Net increase (decrease) | (4,634,811) | ($47,311,584) | 36,764,588 | $379,395,267 |
|
| |
| Capital Appreciation Value Fund | Period ended 2/28/111 | | |
| | Shares | Amount | | |
| Class NAV shares | | | | |
| |
| Sold | 30,702,528 | $307,050,282 | | |
| Repurchased | (71,610) | (724,204) | | |
| | |
| Net increase | 30,630,918 | $306,326,078 | | |
| |
1 Period from 1-6-11 (inception date) to 2-28-11.
| | | | |
| Core Bond Fund | Six months ended 2/28/11 | Year ended 8/31/10 |
| | Shares | Amount | Shares | Amount |
| Class 1 shares | | | | |
|
| Sold | 141,875 | $1,909,972 | 568,528 | $7,556,401 |
| Distributions reinvested | 62,590 | 804,493 | 40,221 | 527,482 |
| Repurchased | (269,998) | (3,573,718) | (358,087) | (4,717,286) |
| | | | | |
| Net increase (decrease) | (65,533) | ($859,253) | 250,662 | $3,366,597 |
| |
| Class NAV shares | | | | |
|
| Sold | 5,163,659 | $69,536,202 | 9,744,066 | $129,314,066 |
| Distributions reinvested | 2,847,843 | 36,550,363 | 1,580,704 | 20,719,443 |
| Repurchased | (3,937,945) | (50,418,358) | (1,728,307) | (23,241,634) |
| | | | | |
| Net increase | 4,073,557 | $55,668,207 | 9,596,463 | $126,791,875 |
| |
| Net increase | 4,008,024 | $54,808,954 | 9,847,125 | $130,158,472 |
|
| |
| Core Diversified Growth & Income Portfolio | Six months ended 2/28/11 | Year ended 8/31/10 |
| | Shares | Amount | Shares | Amount |
| Class 1 shares | | | | |
|
| Sold | 329,691 | $3,165,246 | 1,448,369 | $12,999,035 |
| Distributions reinvested | 139,817 | 1,319,875 | 44,653 | 403,216 |
| Repurchased | (154,096) | (1,478,085) | (272,037) | (2,419,754) |
| |
| Net increase | 315,412 | $3,007,036 | 1,220,985 | $10,982,497 |
|
| |
| Core Fundamental Holdings Portfolio | Six months ended 2/28/11 | Year ended 8/31/10 |
| | Shares | Amount | Shares | Amount |
| Class 1 shares | | | | |
|
| Sold | 211,475 | $2,048,499 | 616,096 | $5,647,762 |
| Distributions reinvested | 81,820 | 769,108 | 30,626 | 280,537 |
| Repurchased | (267,544) | (2,610,221) | (227,789) | (2,080,132) |
| |
| Net increase | 25,751 | $207,386 | 418,933 | $3,848,167 |
|
| |
| Core Global Diversification Portfolio | Six months ended 2/28/11 | Year ended 8/31/10 |
| | Shares | Amount | Shares | Amount |
| Class 1 shares | | | | |
| Sold | 454,543 | $4,361,905 | 2,072,255 | $18,692,064 |
| Distributions reinvested | 147,286 | 1,380,073 | 38,057 | 343,658 |
| | | | | |
| Repurchased | (198,726) | (1,902,005) | (282,641) | (2,515,899) |
| |
| Net increase | 403,103 | $3,839,973 | 1,827,671 | $16,519,823 |
|
| |
| Emerging Markets Fund | Six months ended 2/28/11 | Year ended 8/31/10 |
| | Shares | Amount | Shares | Amount |
| Class NAV shares | | | | |
|
| Sold | 30,011,816 | $362,816,150 | 41,146,809 | $439,069,351 |
| Distributions reinvested | 12,149,689 | 145,188,779 | 1,301,529 | 13,574,945 |
| Repurchased | (3,879,872) | (47,821,141) | (9,594,804) | (100,367,806) |
| |
| Net increase | 38,281,633 | $460,183,788 | 32,853,534 | $352,276,490 |
|
| |
| Emerging Markets Debt Fund | Six months ended 2/28/11 | Period ended 8/31/101 |
| | Shares | Amount | Shares | Amount |
| Class A shares | | | | |
|
| Net increase | — | — | 1,200,000 | $12,000,000 |
| |
| Class I shares | | | | |
|
| Sold | — | — | 300,000 | $3,000,000 |
| | | | | |
| Net increase | — | — | 300,000 | $3,000,000 |
| |
| Net increase | — | — | 1,500,000 | $15,000,000 |
|
1 Period from 1-4-10 (inception date) to 8-31-10.
FUND SHARE TRANSACTIONS, CONTINUED
| | | | |
| Equity-Income Fund | Six months ended 2/28/11 | Year ended 8/31/10 |
| | Shares | Amount | Shares | Amount |
| Class 1 shares | | | | |
|
| Sold | 1,571,426 | $22,085,727 | 1,136,097 | $14,550,393 |
| Distributions reinvested | 173,999 | 2,465,568 | 218,164 | 2,722,683 |
| Repurchased | (426,075) | (5,808,730) | (1,434,780) | (17,907,268) |
| | | | |
| Net increase (decrease) | 1,319,350 | $18,742,565 | (80,519) | ($634,192) |
| |
| Class NAV shares | | | | |
|
| Sold | 1,507,422 | $20,891,593 | 28,181,582 | $349,012,943 |
| Distributions reinvested | 1,197,536 | 16,945,130 | 1,114,103 | 13,892,855 |
| Repurchased | (1,790,214) | (25,393,829) | (1,322,542) | (17,371,911) |
| | | | | |
| Net increase | 914,744 | $12,442,894 | 27,973,143 | $345,533,887 |
| |
| Net increase | 2,234,094 | $31,185,459 | 27,892,624 | $344,899,695 |
|
| |
| Fundamental Value Fund | Six months ended 2/28/11 | Year ended 8/31/101 |
| | Shares | Amount | Shares | Amount |
| Class 1 shares | | | | |
|
| Sold | — | — | 230,017 | $3,118,764 |
| Distributions reinvested | — | — | 60,158 | 800,100 |
| Repurchased | — | — | (8,477,940) | (122,517,412) |
| | | | | |
| Net increase (decrease) | — | — | (8,187,765) | ($118,598,548) |
| |
| Class NAV shares | | | | |
|
| Sold | 1,682,204 | $24,338,200 | 9,887,742 | $130,483,262 |
| Distributions reinvested | 1,148,820 | 17,266,770 | 873,474 | 11,591,001 |
| Repurchased | (2,819,735) | (41,051,367) | (9,980,281) | (131,814,155) |
| | | | | |
| Net increase | 11,289 | $553,603 | 780,935 | $10,260,108 |
| |
| Net increase (decrease) | 11,289 | $553,603 | (7,406,830) | ($108,338,440) |
|
1 Class 1 shares were terminated on 5-7-10.
| | | | |
| Global Agribusiness Fund | Six months ended 2/28/11 | Year ended 8/31/10 |
| | Shares | Amount | Shares | Amount |
| Class A shares | | | | |
| Distributions reinvested | 3,432 | $47,837 | 1,393 | $16,597 |
| | | | | |
| Net increase | 3,432 | $47,837 | 1,393 | $16,597 |
| |
| Class I shares | | | | |
|
| Distributions reinvested | 3,683 | $51,521 | 1,614 | $19,246 |
| | | | |
| Net increase | 3,683 | $51,521 | 1,614 | $19,246 |
| |
| Net increase | 7,115 | $99,358 | 3,007 | $35,843 |
|
| |
| Global Bond Fund | Six months ended 2/28/11 | Year ended 8/31/10 |
| | Shares | Amount | Shares | Amount |
| Class 1 shares | | | | |
|
| Sold | 618,774 | $7,927,135 | 1,390,237 | $17,234,567 |
| Distributions reinvested | 349,844 | 4,180,633 | 462,751 | 5,497,480 |
| Repurchased | (900,387) | (11,329,403) | (693,458) | (8,369,535) |
| | | | | |
| Net increase | 68,231 | $778,365 | 1,159,530 | $14,362,512 |
| |
| Class NAV shares | | | | |
|
| Sold | 9,241,813 | $117,262,829 | 12,383,690 | $150,328,655 |
| Distributions reinvested | 3,792,215 | 45,203,206 | 4,597,869 | 54,530,728 |
| Repurchased | (2,381,533) | (29,715,971) | (7,121,619) | (87,470,839) |
| | | | | |
| Net increase | 10,652,495 | $132,750,064 | 9,859,940 | $117,388,544 |
|
| Net increase | 10,720,726 | $133,528,429 | 11,019,470 | $131,751,056 |
|
| |
| Global Infrastructure Fund | Six months ended 2/28/11 | Year ended 8/31/10 |
| | Shares | Amount | Shares | Amount |
| Class A shares | | | | |
|
| Distributions reinvested | 6,905 | $78,569 | 1,121 | $12,312 |
| | | | | |
| Net increase | 6,905 | $78,569 | 1,121 | $12,312 |
| |
| Class I shares | | | | |
|
| Distributions reinvested | 7,200 | $82,151 | 1,337 | $14,707 |
| | | | | |
| Net increase | 7,200 | $82,151 | 1,337 | $14,707 |
| |
| Net increase | 14,105 | $160,720 | 2,458 | $27,019 |
|
| |
| Global Real Estate Fund | Six months ended 2/28/11 | Year ended 8/31/10 |
| | Shares | Amount | Shares | Amount |
| Class NAV shares | | | | |
|
| Sold | 3,191,269 | $23,865,147 | 24,738,839 | $163,536,934 |
| Distributions reinvested | 2,459,106 | 18,000,655 | 1,855,292 | 12,096,502 |
| Repurchased | (4,144,322) | (31,371,693) | (3,479,782) | (23,087,390) |
| |
| Net increase | 1,506,053 | $10,494,109 | 23,114,349 | $152,546,046 |
|
FUND SHARE TRANSACTIONS, CONTINUED
| | | | |
| Global Timber Fund | Six months ended 2/28/11 | Year ended 8/31/10 |
| | Shares | Amount | Shares | Amount |
| Class A shares | | | | |
|
| Distributions reinvested | 11,956 | $150,401 | 161 | $1,901 |
| | | | | |
| Net increase | 11,956 | $150,401 | 161 | $1,901 |
| |
| Class I shares | | | | |
|
| Distributions reinvested | 12,426 | $156,698 | 262 | $3,083 |
| | | | | |
| Net increase | 12,426 | $156,698 | 262 | $3,083 |
| |
| Net increase | 24,382 | $307,099 | 423 | $4,984 |
|
| |
| Heritage Fund | Six months ended 2/28/11 | Year ended 8/31/10 |
| | Shares | Amount | Shares | Amount |
| Class NAV shares | | | | |
|
| Sold | 1,060,990 | $9,887,394 | 3,419,285 | $24,322,436 |
| Distributions reinvested | 759,965 | 7,044,879 | — | — |
| Repurchased | (5,538,570) | (46,727,062) | (7,068,836) | (52,686,747) |
| |
| Net decrease | (3,717,615) | ($29,794,789) | (3,649,551) | ($28,364,311) |
|
| |
| High Income Fund | Six months ended 2/28/11 | Year ended 8/31/10 |
| | Shares | Amount | Shares | Amount |
| Class NAV shares | | | | |
|
| Sold | 495,679 | $4,234,130 | 1,112,260 | $8,563,942 |
| Distributions reinvested | 2,538,692 | 20,755,934 | 7,798,025 | 58,474,637 |
| Repurchased | (14,967,496) | (129,935,253) | (8,690,057) | (62,251,901) |
| |
| Net increase (decrease) | (11,933,125) | ($104,945,189) | 220,228 | $4,786,678 |
|
| |
| High Yield Fund | Six months ended 2/28/11 | Year ended 8/31/10 |
| | Shares | Amount | Shares | Amount |
| Class 1 shares | | | | |
|
| Sold | 1,890,956 | $17,316,221 | 3,270,706 | $28,220,902 |
| Distributions reinvested | 421,220 | 3,748,971 | 852,521 | 7,242,355 |
| Repurchased | (734,107) | (6,751,566) | (2,265,092) | (19,547,007) |
| | | | | |
| Net increase | 1,578,069 | $14,313,626 | 1,858,135 | $15,916,250 |
| |
| Class NAV shares | | | | |
|
| Sold | 409,839 | $3,748,937 | 5,542,770 | $47,184,167 |
| Distributions reinvested | 3,901,397 | 34,416,973 | 11,829,059 | 99,722,018 |
| Repurchased | (28,092,492) | (250,492,378) | (27,279,969) | (233,183,372) |
| | | | | |
| Net decrease | (23,781,256) | ($212,326,468) | (9,908,140) | ($86,277,187) |
| |
| Net decrease | (22,203,187) | ($198,012,842) | (8,050,005) | ($70,360,937) |
|
| |
| Index 500 Fund | Six months ended 2/28/11 | Year ended 8/31/10 |
| | Shares | Amount | Shares | Amount |
| Class NAV shares | | | | |
|
| Sold | 9,112,270 | $82,681,949 | 47,283,287 | $385,075,004 |
| Distributions reinvested | 3,395,452 | 31,475,841 | 4,538,617 | 37,125,883 |
| Repurchased | (13,836,054) | (118,891,176) | (62,524,928) | (503,842,114) |
| |
| Net decrease | (1,328,332) | ($4,733,386) | (10,703,024) | ($81,641,227) |
|
| |
| International Equity Index Fund | Six months ended 2/28/11 | Year ended 8/31/10 |
| | Shares | Amount | Shares | Amount |
| Class NAV shares | | | | |
|
| Sold | 2,447,373 | $43,282,000 | 8,001,037 | $128,103,035 |
| Distributions reinvested | 569,529 | 9,972,458 | 771,722 | 12,540,484 |
| Repurchased | (1,213,131) | (21,220,113) | (4,968,341) | (77,869,117) |
| |
| Net increase | 1,803,771 | $32,034,345 | 3,804,418 | $62,774,402 |
|
| |
| International Growth Stock Fund | Period ended 2/28/111 | | |
| | Shares | Amount | | |
| Class NAV shares | | | | |
| |
| Sold | 16,412,052 | $169,585,864 | | |
| Distributions reinvested | 16,071 | 173,733 | | |
| Repurchased | (111,187) | (1,198,720) | | |
| | |
| Net increase | 16,316,936 | $168,560,877 | | |
| |
1 Period from 9-16-10 (inception date) to 2-28-11.
FUND SHARE TRANSACTIONS, CONTINUED
| | | | |
| International Opportunities Fund | Six months ended 2/28/11 | Year ended 8/31/10 |
| | Shares | Amount | Shares | Amount |
| Class 1 shares | | | | |
|
| Sold | 232,864 | $3,219,827 | 5,615,330 | $72,477,245 |
| Distributions reinvested | 153,928 | 2,151,913 | 68,840 | 872,208 |
| Repurchased | (729,233) | (10,169,618) | (1,243,711) | (15,159,564) |
| | | | | |
| Net increase (decrease) | (342,441) | ($4,797,878) | 4,440,459 | $58,189,889 |
| |
| Class NAV shares | | | | |
|
| Sold | 1,416,914 | $19,931,167 | 10,655,584 | $129,348,432 |
| Distributions reinvested | 1,069,166 | 14,979,019 | 578,408 | 7,340,000 |
| Repurchased | (15,431,799) | (208,964,807) | (10,052,901) | (121,517,377) |
| | | | | |
| Net increase (decrease) | (12,945,719) | ($174,054,621) | 1,181,091 | $15,171,055 |
| |
| Net increase (decrease) | (13,288,160) | ($178,852,499) | 5,621,550 | $73,360,944 |
|
| |
| International Small Cap Fund | Six months ended 2/28/11 | Year ended 8/31/10 |
| | Shares | Amount | Shares | Amount |
| Class 1 shares | | | | |
|
| Sold | 644,569 | $9,915,416 | 1,822,643 | $24,671,513 |
| Distributions reinvested | 78,552 | 1,254,483 | 163,218 | 2,141,419 |
| Repurchased | (869,104) | (13,855,018) | (2,360,372) | (30,897,122) |
| | | | | |
| Net decrease | (145,983) | ($2,685,119) | (374,511) | ($4,084,190) |
| |
| Class NAV shares | | | | |
|
| Sold | 1,392,177 | $20,894,939 | 2,515,791 | $33,526,767 |
| Distributions reinvested | 108,988 | 1,739,444 | 147,404 | 1,933,946 |
| Repurchased | (300,956) | (4,808,919) | (1,270,399) | (16,428,868) |
| | | | |
| Net increase | 1,200,209 | $17,825,464 | 1,392,796 | $19,031,845 |
| |
| Net increase | 1,054,226 | $15,140,345 | 1,018,285 | $14,947,655 |
|
| |
| International Small Company Fund | Six months ended 2/28/11 | Year ended 8/31/10 |
| | Shares | Amount | Shares | Amount |
| Class NAV shares | | | | |
|
| Sold | 2,711,948 | $21,048,240 | 5,259,819 | $37,819,013 |
| Distributions reinvested | 406,071 | 3,439,425 | 700,152 | 5,041,096 |
| Repurchased | (633,283) | (5,430,842) | (2,249,718) | (16,532,459) |
| |
| Net increase | 2,484,736 | $19,056,823 | 3,710,253 | $26,327,650 |
|
| |
| International Value Fund | Six months ended 2/28/11 | Year ended 8/31/10 |
| | Shares | Amount | Shares | Amount |
| Class 1 shares | | | | |
|
| Sold | 277,616 | $4,142,126 | 575,671 | $7,863,287 |
| Distributions reinvested | 330,562 | 4,779,922 | 426,249 | 5,831,083 |
| Repurchased | (1,427,602) | (20,645,198) | (3,049,137) | (40,496,384) |
| | | | | |
| Net decrease | (819,424) | ($11,723,150) | (2,047,217) | ($26,802,014) |
| |
| Class NAV shares | | | | |
|
| Sold | 2,133,547 | $30,981,897 | 12,251,180 | $158,468,437 |
| Distributions reinvested | 1,128,108 | 16,267,321 | 1,276,486 | 17,411,266 |
| Repurchased | (8,012,617) | (113,578,562) | (8,009,072) | (105,698,950) |
| | | | | |
| Net increase (decrease) | (4,750,962) | ($66,329,344) | 5,518,594 | $70,180,753 |
| |
| Net increase (decrease) | (5,570,386) | ($78,052,494) | 3,471,377 | $43,378,739 |
|
| |
| Investment Quality Bond Fund | Six months ended 2/28/11 | Year ended 8/31/10 |
| | Shares | Amount | Shares | Amount |
| Class 1 shares | | | | |
|
| Sold | 162,483 | $2,009,183 | 1,677,052 | $20,307,983 |
| Distributions reinvested | 93,234 | 1,143,831 | 277,878 | 3,317,158 |
| Repurchased | (1,040,943) | (12,782,316) | (1,046,024) | (12,567,761) |
| | | | | |
| Net increase (decrease) | (785,226) | ($9,629,302) | 908,906 | $11,057,380 |
| |
| Class NAV shares | | | | |
|
| Sold | 9,175,521 | $114,414,200 | 11,251,067 | $139,201,920 |
| Distributions reinvested | 433,949 | 5,307,058 | 539,830 | 6,436,446 |
| Repurchased | (201,292) | (2,451,579) | (1,321,650) | (15,806,656) |
| | | | | |
| Net increase | 9,408,178 | $117,269,679 | 10,469,247 | $129,831,710 |
| |
| Net increase | 8,622,952 | $107,640,377 | 11,378,153 | $140,889,090 |
|
| |
| Large Cap Fund | Six months ended 2/28/11 | Year ended 8/31/10 |
| | Shares | Amount | Shares | Amount |
| Class 1 shares | | | | |
|
| Sold | 296,750 | $3,815,299 | 2,069,496 | $23,508,535 |
| Distributions reinvested | 27,348 | 354,970 | 26,932 | 310,523 |
| Repurchased | (359,743) | (4,515,942) | (591,928) | (6,752,814) |
| | | | | |
| Net increase (decrease) | (35,645) | ($345,673) | 1,504,500 | $17,066,244 |
| |
| Class NAV shares | | | | |
|
| Sold | 44,379 | $565,944 | 1,403,395 | $15,904,559 |
| Distributions reinvested | 176,794 | 2,294,785 | 158,386 | 1,826,185 |
| Repurchased | (217,126) | (2,721,112) | (401,888) | (4,628,361) |
| | | | | |
| Net increase | 4,047 | $139,617 | 1,159,893 | $13,102,383 |
| |
| Net increase (decrease) | (31,598) | ($206,056) | 2,664,393 | $30,168,627 |
|
FUND SHARE TRANSACTIONS, CONTINUED
| | | | |
| Large Cap Value Fund | Six months ended 2/28/11 | Year ended 8/31/10 |
| | Shares | Amount | Shares | Amount |
| Class 1 shares | | | | |
|
| Sold | 122,172 | $2,226,989 | 335,306 | $5,542,360 |
| Distributions reinvested | 53,460 | 982,056 | 65,819 | 1,120,244 |
| Repurchased | (395,425) | (7,192,008) | (907,768) | (15,073,671) |
| | | | | |
| Net decrease | (219,793) | ($3,982,963) | (506,643) | ($8,411,067) |
| |
| Class NAV shares | | | | |
|
| Sold | 88,154 | $1,588,651 | 3,971,541 | $66,694,596 |
| Distributions reinvested | 259,717 | 4,778,782 | 396,749 | 6,764,574 |
| Repurchased | (20,549,735) | (377,490,813) | (5,748,892) | (93,526,087) |
| | | | | |
| Net decrease | (20,201,864) | ($371,123,380) | (1,380,602) | ($20,066,917) |
| |
| Net decrease | (20,421,657) | ($375,106,343) | (1,887,245) | ($28,477,984) |
|
| |
| Mid Cap Growth Index Fund | Six months ended 2/28/11 | Period ended 8/31/101 |
| | Shares | Amount | Shares | Amount |
| Class 1 shares | | | | |
|
| Sold | 173,193 | $1,948,265 | 4,507 | $42,994 |
| Distributions reinvested | 135 | 1,545 | — | — |
| Repurchased | (9,177) | (104,987) | — | — |
| | | | | |
| Net increase | 164,151 | $1,844,823 | 4,507 | $42,994 |
|
| Class NAV shares | | | | |
|
| Sold | 227,459 | $2,362,826 | 6,881,168 | $68,207,432 |
| Distributions reinvested | 10,553 | 120,519 | — | — |
| Repurchased | (571,484) | (6,095,137) | (1,411,421) | (12,849,644) |
| | | | | |
| Net increase (decrease) | (333,472) | ($3,611,792) | 5,469,747 | $55,357,788 |
| |
| Net increase (decrease) | (169,321) | ($1,766,969) | 5,474,254 | $55,400,782 |
|
| |
| 1 Period from 4-30-10 (inception date) to 8-31-10. | | | |
| |
| Mid Cap Index Fund | Six months ended 2/28/11 | Year ended 8/31/10 |
| | Shares | Amount | Shares | Amount |
| Class NAV shares | | | | |
|
| Sold | 233,557 | $4,629,497 | 1,249,747 | $19,546,521 |
| Distributions reinvested | 492,572 | 9,683,974 | 360,120 | 5,711,496 |
| Repurchased | (2,335,077) | (42,295,212) | (18,452,349) | (318,623,141) |
| |
| Net decrease | (1,608,948) | ($27,981,741) | (16,842,482) | ($293,365,124) |
|
| |
| Mid Cap Stock Fund | Six months ended 2/28/11 | Year ended 8/31/10 |
| | Shares | Amount | Shares | Amount |
| Class 1 shares | | | | |
|
| Sold | 1,510,772 | $25,884,730 | 1,337,709 | $19,294,821 |
| Repurchased | (1,110,031) | (18,420,478) | (2,263,458) | (31,435,588) |
| | | | | |
| Net increase (decrease) | 400,741 | $7,464,252 | (925,749) | ($12,140,767) |
| |
| Class NAV shares | | | | |
|
| Sold | 1,127,625 | $18,562,771 | 3,398,093 | $47,091,040 |
| Distributions reinvested | — | — | 6,194 | 86,849 |
| Repurchased | (2,273,451) | (38,103,647) | (1,981,156) | (27,935,374) |
| | | | | |
| Net increase (decrease) | (1,145,826) | ($19,540,876) | 1,423,131 | $19,242,515 |
| |
| Net increase (decrease) | (745,085) | ($12,076,624) | 497,382 | $7,101,748 |
|
| |
| Mid Cap Value Equity Fund | Six months ended 2/28/11 | Year ended 8/31/10 |
| | Shares | Amount | Shares | Amount |
| Class NAV shares | | | | |
|
| Sold | 644,076 | $5,950,603 | 1,148,371 | $9,223,549 |
| Distributions reinvested | 107,520 | 1,067,672 | 220,083 | 1,771,675 |
| Repurchased | (838,581) | (7,798,861) | (4,455,506) | (36,279,538) |
| |
| Net decrease | (86,985) | ($780,586) | (3,087,052) | ($25,284,314) |
|
| |
| Mid Cap Value Index Fund | Six months ended 2/28/11 | Period ended 8/31/101 |
| | Shares | Amount | Shares | Amount |
| Class 1 shares | | | | |
|
| Sold | 262,325 | $2,691,544 | 6,874 | $63,799 |
| Distributions reinvested | 1,159 | 12,014 | — | — |
| Repurchased | (17,681) | (178,017) | — | — |
| | | | | |
| Net increase | 245,803 | $2,525,541 | 6,874 | $63,799 |
| |
| Class NAV shares | | | | |
|
| Sold | 385,650 | $3,760,118 | 6,942,610 | $68,748,698 |
| Distributions reinvested | 60,911 | 631,652 | — | — |
| Repurchased | (359,777) | (3,633,702) | (1,381,950) | (12,425,489) |
| | | | | |
| Net increase | 86,784 | $758,068 | 5,560,660 | $56,323,209 |
| |
| Net increase | 332,587 | $3,283,609 | 5,567,534 | $56,387,008 |
|
| |
| 1 Period from 4-30-10 (inception date) to 8-31-10. | | | |
FUND SHARE TRANSACTIONS, CONTINUED
| | | | |
| Mid Value Fund | Six months ended 2/28/11 | Year ended 8/31/10 |
| | Shares | Amount | Shares | Amount |
| Class NAV shares | | | | |
|
| Sold | 1,746,087 | $24,370,961 | 6,440,166 | $87,615,419 |
| Distributions reinvested | 2,591,006 | 37,750,955 | 752,102 | 10,251,149 |
| Repurchased | (902,164) | (13,320,192) | (1,187,573) | (16,301,594) |
|
| Net increase | 3,434,929 | $48,801,724 | 6,004,695 | $81,564,974 |
|
| |
| Mutual Shares Fund | Period ended 2/28/111 | | |
| | Shares | Amount | | |
| |
| Class NAV shares | | | | |
| Sold | 32,124,509 | $327,920,279 | | |
| Distributions reinvested | 26,894 | 291,533 | | |
| Repurchased | (141,956) | (1,540,869) | | |
| | |
| Net increase | 32,009,447 | $326,670,943 | | |
| | |
| |
| 1 Period from 9-16-10 (inception date) to 2-28-11. | | | |
| |
| Optimized Value Fund | Six months ended 2/28/11 | Year ended 8/31/101 |
| | Shares | Amount | Shares | Amount |
| Class A shares | | | | |
|
| Sold | — | — | 3,228 | $32,482 |
| Repurchased | — | — | (34,101) | (349,927) |
| | | | | |
| Net decrease | — | — | (30,873) | ($317,445) |
| |
| Class B shares | | | | |
|
| Repurchased | — | — | (10,009) | ($103,713) |
| | | | | |
| Net decrease | — | — | (10,009) | ($103,713) |
| |
| Class C shares | | | | |
|
| Sold | — | — | 150 | $1,521 |
| Repurchased | — | — | (1,813) | (18,777) |
| |
| Net decrease | — | — | (1,663) | ($17,256) |
| |
| Class I shares | | | | |
|
| Sold | — | — | 696 | $7,000 |
| Repurchased | — | — | (1,385) | (14,488) |
| | | | | |
| Net decrease | — | — | (689) | ($7,488) |
| |
| Class 1 shares | | | | |
|
| Sold | 274,865 | $3,251,569 | 248,562 | $2,636,307 |
| Distributions reinvested | 27,980 | 326,810 | 90,944 | 939,448 |
| Repurchased | (464,389) | (5,324,050) | (1,060,196) | (10,767,479) |
| | | | | |
| Net decrease | (161,544) | ($1,745,671) | (720,690) | ($7,191,724) |
| |
| Class NAV shares | | | | |
|
| Sold | 127,557 | $1,490,826 | 1,660,726 | $16,804,164 |
| Distributions reinvested | 203,023 | 2,371,312 | 508,325 | 5,250,993 |
| Repurchased | (329,351) | (3,776,437) | (342,158) | (3,497,796) |
| | | | | |
| Net increase | 1,229 | $85,701 | 1,826,893 | $18,557,361 |
|
| Net increase (decrease) | (160,315) | ($1,659,970) | 1,062,969 | $10,919,735 |
|
| |
| 1 Class A, B, C and I shares were terminated on 12-11-09. | | | |
| |
| Real Estate Equity Fund | Six months ended 2/28/11 | Year ended 8/31/10 |
| | Shares | Amount | Shares | Amount |
| Class NAV shares | | | | |
|
| Sold | 3,016,002 | $22,915,905 | 13,443,299 | $86,939,103 |
| Distributions reinvested | 522,275 | 3,995,406 | 973,205 | 5,771,107 |
| Repurchased | (3,141,199) | (24,977,217) | (9,504,703) | (59,510,360) |
| |
| Net increase | 397,078 | $1,934,094 | 4,911,801 | $33,199,850 |
|
| |
| Real Estate Securities Fund | Six months ended 2/28/11 | Year ended 8/31/10 |
| | Shares | Amount | Shares | Amount |
| Class 1 shares | | | | |
|
| Sold | 3,130,170 | $40,360,399 | 24,309,563 | $231,798,363 |
| Distributions reinvested | 550,116 | 6,909,456 | 372,470 | 3,702,351 |
| Repurchased | (1,322,825) | (16,820,100) | (2,793,338) | (28,609,663) |
| |
| Net increase | 2,357,461 | $30,449,755 | 21,888,695 | $206,891,051 |
| |
| Real Return Bond Fund | Six months ended 2/28/11 | Year ended 8/31/10 |
| | Shares | Amount | Shares | Amount |
| Class 1 shares | | | | |
|
| Sold | 744,825 | $9,611,157 | 2,760,560 | $34,758,569 |
| Distributions reinvested | 468,370 | 5,856,633 | 201,709 | 2,516,836 |
| Repurchased | (844,112) | (10,741,421) | (686,591) | (8,622,587) |
| | | | |
| Net increase | 369,083 | $4,726,369 | 2,275,678 | $28,652,818 |
| |
| Class NAV shares | | | | |
|
| Sold | 4,844,727 | $60,732,834 | 18,053,013 | $222,172,446 |
| Distributions reinvested | 3,906,422 | 48,446,176 | 3,371,162 | 41,589,642 |
| Repurchased | (23,713,201) | (306,702,078) | (33,232,176) | (421,774,813) |
| | | | | |
| Net decrease | (14,962,052) | ($197,523,068) | (11,808,001) | ($158,012,725) |
| |
| Net decrease | (14,592,969) | ($192,796,699) | (9,532,323) | ($129,359,907) |
|
FUND SHARE TRANSACTIONS, CONTINUED
| | | | |
| Retirement 2010 Portfolio | Six months ended 2/28/11 | Period ended 8/31/101 |
| | Shares | Amount | Shares | Amount |
| Class 1 shares | | | | |
|
| Sold | 1,291,604 | $13,297,697 | 2,680 | $26,800 |
| Distributions reinvested | 4,895 | 49,738 | — | — |
| Repurchased | (316,461) | (3,267,076) | — | — |
| |
| Net increase | 980,038 | $10,080,359 | 2,680 | $26,800 |
|
| |
| 1 Period from 4-30-10 (inception date) to 8-31-10. | | | |
| |
| Retirement 2015 Portfolio | Six months ended 2/28/11 | Period ended 8/31/101 |
| | Shares | Amount | Shares | Amount |
| Class 1 shares | | | | |
|
| Sold | 1,358,704 | $14,058,541 | 2,681 | $26,800 |
| Distributions reinvested | 7,057 | 72,197 | — | — |
| Repurchased | (107,325) | (1,111,813) | — | — |
| |
| Net increase | 1,258,436 | $13,018,925 | 2,681 | $26,800 |
|
| |
| 1 Period from 4-30-10 (inception date) to 8-31-10. | | | | |
| |
| Retirement 2020 Portfolio | Six months ended 2/28/11 | Period ended 8/31/101 |
| | Shares | Amount | Shares | Amount |
| Class 1 shares | | | | |
|
| Sold | 1,872,489 | $19,503,039 | 2,683 | $26,800 |
| Distributions reinvested | 7,967 | 81,983 | — | — |
| Repurchased | (112,252) | (1,177,534) | — | — |
| |
| Net increase | 1,768,204 | $18,407,488 | 2,683 | $26,800 |
|
| |
| 1 Period from 4-30-10 (inception date) to 8-31-10. | | | |
| |
| Retirement 2025 Portfolio | Six months ended 2/28/11 | Period ended 8/31/101 |
| | Shares | Amount | Shares | Amount |
| Class 1 shares | | | | |
|
| Sold | 2,384,040 | $24,922,598 | 2,685 | $26,800 |
| Distributions reinvested | 12,725 | 131,706 | — | — |
| Repurchased | (270,262) | (2,830,984) | — | — |
| |
| Net increase | 2,126,503 | $22,223,320 | 2,685 | $26,800 |
|
| |
| 1 Period from 4-30-10 (inception date) to 8-31-10. | | | |
| |
| Retirement 2030 Portfolio | Six months ended 2/28/11 | Period ended 8/31/101 |
| | Shares | Amount | Shares | Amount |
| Class 1 shares | | | | |
|
| Sold | 1,559,641 | $16,403,467 | 2,686 | $26,800 |
| Distributions reinvested | 8,185 | 85,040 | — | — |
| Repurchased | (32,628) | (344,341) | — | — |
| |
| Net increase | 1,535,198 | $16,144,166 | 2,686 | $26,800 |
|
| |
| 1 Period from 4-30-10 (inception date) to 8-31-10. | | | |
| |
| Retirement 2035 Portfolio | Six months ended 2/28/11 | Period ended 8/31/101 |
| | Shares | Amount | Shares | Amount |
| Class 1 shares | | | | |
|
| Sold | 1,365,444 | $14,362,668 | 2,686 | $26,800 |
| Distributions reinvested | 6,663 | 69,359 | — | — |
| Repurchased | (90,543) | (947,532) | — | — |
| |
| Net increase | 1,281,564 | $13,484,495 | 2,686 | $26,800 |
|
| |
| 1 Period from 4-30-10 (inception date) to 8-31-10. | | | |
| |
| Retirement 2040 Portfolio | Six months ended 2/28/11 | Period ended 8/31/101 |
| | Shares | Amount | Shares | Amount |
| Class 1 shares | | | | |
|
| Sold | 739,513 | $7,818,630 | 2,687 | $26,800 |
| Distributions reinvested | 3,072 | 32,013 | — | — |
| Repurchased | (20,882) | (222,994) | — | — |
| |
| Net increase | 721,703 | $7,627,649 | 2,687 | $26,800 |
|
| |
| 1 Period from 4-30-10 (inception date) to 8-31-10. | | | |
| |
| Retirement 2045 Portfolio | Six months ended 2/28/11 | Period ended 8/31/101 |
| | Shares | Amount | Shares | Amount |
|
| Class 1 shares | | | | |
| Sold | 709,600 | $7,516,700 | 2,687 | $26,800 |
| Distributions reinvested | 2,470 | 25,762 | — | — |
| Repurchased | (3,259) | (34,032) | — | — |
| |
| Net increase | 708,811 | $7,508,430 | 2,687 | $26,800 |
|
| |
| 1 Period from 4-30-10 (inception date) to 8-30-10. | | | |
FUND SHARE TRANSACTIONS, CONTINUED
| | | | |
| Short Term Government Income Fund | Six months ended 2/28/11 | Year ended 8/31/10 |
| | Shares | Amount | Shares | Amount |
| Class NAV shares | | | | |
|
| Sold | 703,983 | $7,143,863 | 12,207,638 | $122,786,545 |
| Distributions reinvested | 257,410 | 2,586,510 | 146,434 | 1,482,450 |
| Repurchased | (1,242,123) | (12,706,688) | (1,525,666) | (15,601,789) |
| |
| Net increase (decrease) | (280,730) | ($2,976,315) | 10,828,406 | $108,667,206 |
|
| |
| Small Cap Growth Fund | Six months ended 2/28/11 | Year ended 8/31/10 |
| | Shares | Amount | Shares | Amount |
| Class NAV shares | | | | |
|
| Sold | 540,259 | $5,695,434 | 4,259,213 | $39,480,154 |
| Distributions reinvested | 1,622,571 | 16,923,419 | — | — |
| Repurchased | (1,509,913) | (16,170,637) | (2,088,002) | (18,927,780) |
| |
| Net increase | 652,917 | $6,448,216 | 2,171,211 | $20,552,374 |
|
| |
| Small Cap Index Fund | Six months ended 2/28/11 | Year ended 8/31/10 |
| | Shares | Amount | Shares | Amount |
| Class NAV shares | | | | |
|
| Sold | 534,300 | $6,818,642 | 2,380,696 | $24,939,436 |
| Distributions reinvested | 63,105 | 850,661 | 134,366 | 1,405,466 |
| Repurchased | (713,221) | (8,935,808) | (5,892,615) | (64,131,523) |
| |
| Net decrease | (115,816) | ($1,266,505) | (3,377,553) | ($37,786,621) |
|
| |
| Small Cap Opportunities Fund | Six months ended 2/28/11 | Year ended 8/31/10 |
| | Shares | Amount | Shares | Amount |
| Class 1 shares | | | | |
|
| Sold | 489,593 | $10,335,775 | 671,775 | $12,169,760 |
| Distributions reinvested | — | — | 4,374 | 70,639 |
| Repurchased | (226,662) | (4,358,698) | (692,030) | (11,543,177) |
| | | | | |
| Net increase (decrease) | 262,931 | $5,977,077 | (15,881) | $697,222 |
| |
| Class NAV shares | | | | |
|
| Sold | 79,510 | $1,716,936 | 3,459,335 | $57,765,699 |
| Distributions reinvested | — | — | 7,199 | 115,688 |
| Repurchased | (571,129) | (11,199,246) | (478,479) | (8,321,601) |
| | | | | |
| Net increase (decrease) | (491,619) | ($9,482,310) | 2,988,055 | $49,559,786 |
| |
| Net increase (decrease) | (228,688) | ($3,505,233) | 2,972,174 | $50,257,008 |
|
| |
| Small Cap Value Fund | Six months ended 2/28/11 | Year ended 8/31/10 |
| | Shares | Amount | Shares | Amount |
| Class NAV shares | | | | |
|
| Sold | 377,495 | $6,028,229 | 3,713,348 | $52,320,763 |
| Distributions reinvested | 427,231 | 7,092,034 | 115,572 | 1,552,137 |
| Repurchased | (490,364) | (8,037,541) | (631,669) | (9,046,002) |
| |
| Net increase | 314,362 | $5,082,722 | 3,197,251 | $44,826,898 |
|
| |
| Small Company Growth Fund | Six months ended 2/28/11 | Year ended 8/31/10 |
| | Shares | Amount | Shares | Amount |
| Class NAV shares | | | | |
|
| Sold | 278,564 | $3,627,121 | 1,324,622 | $13,572,170 |
| Distributions reinvested | — | — | 12,825 | 132,484 |
| Repurchased | (757,576) | (9,619,584) | (3,110,507) | (33,540,494) |
| |
| Net decrease | (479,012) | ($5,992,463) | (1,773,060) | ($19,835,840) |
|
| |
| Small Company Value Fund | Six months ended 2/28/11 | Year ended 8/31/10 |
| | Shares | Amount | Shares | Amount |
| Class 1 shares | | | | |
|
| Sold | 293,975 | $7,306,225 | 459,760 | $9,838,663 |
| Distributions reinvested | 23,983 | 620,915 | 44,345 | 926,808 |
| Repurchased | (250,685) | (6,001,623) | (809,881) | (17,174,743) |
| | | | | |
| Net increase (decrease) | 67,273 | $1,925,517 | (305,776) | ($6,409,272) |
| |
| Class NAV shares | | | | |
|
| Sold | 406,211 | $10,013,506 | 1,691,923 | $34,629,477 |
| Distributions reinvested | 62,508 | 1,616,452 | 128,190 | 2,675,344 |
| Repurchased | (953,328) | (23,096,463) | (2,698,885) | (58,475,837) |
| | | | | |
| Net decrease | (484,609) | ($11,466,505) | (878,772) | ($21,171,016) |
| |
| Net decrease | (417,336) | ($9,540,988) | (1,184,548) | ($27,580,288) |
|
| |
| Smaller Company Growth Fund | Six months ended 2/28/11 | Year ended 8/31/10 |
| | Shares | Amount | Shares | Amount |
| Class NAV shares | | | | |
|
| Sold | 178,801 | $2,105,337 | 1,251,549 | $13,866,706 |
| Distributions reinvested | 2,563,832 | 29,330,242 | — | — |
| Repurchased | (791,706) | (10,219,294) | (5,861,028) | (67,019,955) |
| |
| Net increase (decrease) | 1,950,927 | $21,216,285 | (4,609,479) | ($53,153,249) |
|
FUND SHARE TRANSACTIONS, CONTINUED
| | | | |
| Spectrum Income Fund | Six months ended 2/28/11 | Year ended 8/31/10 |
| | Shares | Amount | Shares | Amount |
| Class NAV shares | | | | |
|
| Sold | 13,358,193 | $142,668,434 | 14,692,075 | $151,650,440 |
| Distributions reinvested | 2,477,181 | 26,083,429 | 4,120,205 | 42,165,410 |
| Repurchased | (543,514) | (5,750,006) | (29,450,678) | (303,038,091) |
| |
| Net increase (decrease) | 15,291,860 | $163,001,857 | (10,638,398) | ($109,222,241) |
|
| |
| Total Bond Market Fund | Six months ended 2/28/11 | Year ended 8/31/10 |
| | Shares | Amount | Shares | Amount |
| Class NAV shares | | | | |
|
| Sold | 10,910,888 | $114,058,799 | 17,993,502 | $186,885,462 |
| Distributions reinvested | 1,523,133 | 15,707,509 | 2,711,879 | 27,901,965 |
| Repurchased | (31,931,731) | (330,639,117) | (14,722,834) | (154,355,066) |
| |
| Net increase (decrease) | (19,497,710) | ($200,872,809) | 5,982,547 | $60,432,361 |
|
| |
| Total Return Fund | Six months ended 2/28/11 | Year ended 8/31/10 |
| | Shares | Amount | Shares | Amount |
| Class 1 shares | | | | |
|
| Sold | 1,832,311 | $27,075,652 | 8,022,224 | $114,999,649 |
| Distributions reinvested | 1,897,666 | 26,573,727 | 819,087 | 11,467,647 |
| Repurchased | (2,514,035) | (35,907,971) | (2,303,923) | (32,568,600) |
| | | | | |
| Net increase | 1,215,942 | $17,741,408 | 6,537,388 | $93,898,696 |
| |
| Class NAV shares | | | | |
|
| Sold | 20,863,217 | $297,075,685 | 23,055,618 | $325,594,051 |
| Distributions reinvested | 10,356,344 | 144,398,431 | 5,420,130 | 75,618,590 |
| Repurchased | (6,392,872) | (89,890,409) | (16,991,998) | (244,793,902) |
| | | | | |
| Net increase | 24,826,689 | $351,583,707 | 11,483,750 | $156,418,739 |
| |
| Net increase | 26,042,631 | $369,325,115 | 18,021,138 | $250,317,435 |
|
| |
| U.S. High Yield Bond Fund | Six months ended 2/28/11 | Year ended 8/31/10 |
| | Shares | Amount | Shares | Amount |
| Class 1 shares | | | | |
|
| Sold | 906,979 | $11,622,921 | 1,718,779 | $21,262,692 |
| Distributions reinvested | 186,008 | 2,341,891 | 279,102 | 3,412,154 |
| Repurchased | (406,487) | (5,207,066) | (784,931) | (9,691,933) |
| | | | | |
| Net increase | 686,500 | $8,757,746 | 1,212,950 | $14,982,913 |
| |
| Class NAV shares | | | | |
|
| Sold | 569,686 | $7,351,931 | 6,519,258 | $80,022,145 |
| Distributions reinvested | 1,996,334 | 25,120,616 | 4,901,882 | 59,831,871 |
| Repurchased | (13,774,054) | (175,515,857) | (19,491,464) | (239,406,186) |
| | | | | |
| Net decrease | (11,208,034) | ($143,043,310) | (8,070,324) | ($99,552,170) |
| |
| Net decrease | (10,521,534) | ($134,285,564) | (6,857,374) | ($84,569,257) |
|
| |
| U.S. Multi-Sector Fund | Six months ended 2/28/11 | Year ended 8/31/10 |
| | Shares | Amount | Shares | Amount |
| Class NAV shares | | | | |
|
| Sold | 1,520,638 | $14,586,033 | 12,751,552 | $110,244,293 |
| Distributions reinvested | 1,329,997 | 12,874,368 | 1,385,592 | 12,428,759 |
| Repurchased | (2,439,423) | (22,765,288) | (10,922,924) | (94,546,532) |
| |
| Net increase | 411,212 | $4,695,113 | 3,214,220 | $28,126,520 |
|
| |
| Value Fund | Six months ended 2/28/11 | Year ended 8/31/10 |
| | Shares | Amount | Shares | Amount |
| Class NAV shares | | | | |
|
| Sold | 952,163 | $8,852,429 | 2,819,953 | $25,142,502 |
| Distributions reinvested | 1,181,914 | 11,653,671 | 114,186 | 976,292 |
| Repurchased | (420,062) | (4,179,666) | (1,740,900) | (15,140,486) |
| |
| Net increase | 1,714,015 | $16,326,434 | 1,193,239 | $10,978,308 |
|
| |
| Value & Restructuring Fund | Six months ended 2/28/11 | Year ended 8/31/10 |
| | Shares | Amount | Shares | Amount |
| Class NAV shares | | | | |
|
| Sold | 1,000,012 | $11,484,089 | 7,975,317 | $75,279,121 |
| Distributions reinvested | 714,044 | 8,175,799 | 752,057 | 7,347,600 |
| Repurchased | (3,499,428) | (37,992,539) | (12,811,196) | (122,808,824) |
| |
| Net decrease | (1,785,372) | ($18,332,651) | (4,083,822) | ($40,182,103) |
|
FUND SHARE TRANSACTIONS, CONTINUED
Affiliates of the Trust owned shares of beneficial interest of the following Funds on February 28, 2011:
| | | | |
| Fund | Class | % by Class | | |
| | |
| Emerging Markets Debt Fund | A | 100% | | |
| Emerging Markets Debt Fund | I | 100% | | |
| Global Agribusiness Fund | A | 99% | | |
| Global Agribusiness Fund | I | 99% | | |
| Global Infrastructure Fund | A | 100% | | |
| Global Infrastructure Fund | I | 100% | | |
| Global Timber Fund | A | 100% | | |
| Global Timber Fund | I | 100% | | |
Affiliates of the Trust owned 100% of the shares of beneficial interest of Class 1 shares and Class NAV shares.
7. PURCHASE AND SALE OF SECURITIES Purchases and sales of securities, other than short-term securities and U.S. Treasury obligations, are aggregated below for the six months ended February 28, 2011. In addition, the purchases and sales of U.S. Treasury obligations are aggregated below for six months ended February 28, 2011.
| | | | |
| | PURCHASES | SALES AND MATURITIES |
| FUND | U.S. GOVERNMENT | OTHER ISSUERS | U.S. GOVERNMENT | OTHER ISSUERS |
|
| Active Bond Fund | $288,625,701 | $469,828,458 | $217,818,407 | $152,104,377 |
| All Cap Core Fund | — | 646,507,840 | — | 645,570,278 |
| All Cap Value Fund | — | 173,426,999 | — | 160,623,895 |
| Alpha Opportunities Fund | — | 1,193,813,499 | — | 1,162,153,096 |
| Blue Chip Growth Fund | — | 423,578,668 | — | 490,360,978 |
| Capital Appreciation Fund | — | 742,858,761 | — | 771,109,935 |
| Capital Appreciation Value Fund | — | 289,973,518 | — | 29,430,828 |
| Core Bond Fund | 771,073,060 | 1,236,489,617 | 794,556,860 | 1,205,285,363 |
| Core Diversified Growth & Income Portfolio | — | 4,104,919 | — | 1,863,423 |
| Core Fundamental Holdings Portfolio | — | 2,377,188 | — | 2,637,754 |
| Core Global Diversification Portfolio | — | 6,117,347 | — | 2,962,604 |
| Emerging Markets Fund | — | 421,617,095 | — | 130,952,645 |
| Emerging Markets Debt Fund | 488,411 | 8,899,076 | 503,613 | 7,731,675 |
| Equity-Income Fund | — | 148,578,252 | — | 133,150,304 |
| Fundamental Value Fund | — | 99,244,498 | — | 121,211,561 |
| Global Agribusiness Fund | — | 867,460 | — | 859,143 |
| Global Bond Fund | 207,227,402 | 657,002,374 | 269,802,951 | 594,311,529 |
| Global Infrastructure Fund | — | 1,145,968 | — | 1,152,898 |
| Global Real Estate Fund | — | 274,146,735 | — | 279,670,294 |
| Global Timber Fund | — | 1,151,244 | — | 1,105,680 |
| Heritage Fund | — | 108,952,506 | — | 140,242,368 |
| High Income Fund | — | 159,341,626 | — | 263,461,761 |
| High Yield Fund | 4,280,955 | 346,132,157 | 4,306,823 | 531,369,728 |
| Index 500 Fund | — | 43,165,030 | — | 96,726,031 |
| International Equity Index Fund | — | 35,242,883 | — | 10,972,690 |
| International Growth Stock Fund | — | 176,105,078 | — | 19,261,995 |
| International Opportunities Fund | — | 360,425,286 | — | 559,728,747 |
| International Small Cap Fund | — | 41,591,157 | — | 29,677,523 |
| International Small Company Fund | — | 26,085,771 | — | 10,020,439 |
| International Value Fund | — | 125,375,498 | — | 207,532,360 |
| Investment Quality Bond Fund | 59,999,490 | 126,731,232 | 47,084,184 | 40,090,163 |
| Large Cap Fund | — | 97,929,656 | — | 97,180,207 |
| Large Cap Value Fund | — | 361,290,719 | — | 734,217,746 |
| Mid Cap Growth Index Fund | — | 12,167,893 | — | 14,029,924 |
| Mid Cap Index Fund | — | 21,899,782 | — | 56,191,057 |
| Mid Cap Stock Fund | — | 585,922,541 | — | 581,707,040 |
| Mid Cap Value Equity Fund | — | 60,333,787 | — | 64,228,101 |
| Mid Cap Value Index Fund | — | 13,740,782 | — | 9,665,294 |
| Mid Value Fund | — | 101,472,140 | — | 89,248,266 |
| Mutual Shares Fund | — | 338,300,287 | — | 39,192,077 |
| Optimized Value Fund | — | 479,361,734 | — | 486,485,255 |
| Real Estate Equity Fund | — | 38,406,043 | — | 44,335,832 |
| Real Estate Securities Fund | — | 218,360,862 | — | 188,805,441 |
| Real Return Bond Fund | 2,028,652,688 | 50,456,510 | 2,329,895,144 | 60,558,473 |
| Retirement 2010 Portfolio | — | 13,332,433 | — | 3,266,882 |
| Retirement 2015 Portfolio | — | 14,127,859 | — | 1,119,646 |
| Retirement 2020 Portfolio | — | 19,623,712 | — | 1,229,193 |
PURCHASE AND SALE OF SECURITIES, CONTINUED
| | | | |
| | PURCHASES | SALES AND MATURITIES |
| FUND | U.S. GOVERNMENT | OTHER ISSUERS | U.S. GOVERNMENT | OTHER ISSUERS |
|
| Retirement 2025 Portfolio | — | $25,113,375 | — | $2,897,244 |
| Retirement 2030 Portfolio | — | 16,476,571 | — | 353,381 |
| Retirement 2035 Portfolio | — | 14,406,128 | — | 946,927 |
| Retirement 2040 Portfolio | — | 7,818,849 | — | 222,399 |
| Retirement 2045 Portfolio | — | 7,509,594 | — | 33,294 |
| Short Term Government Income Fund | $6,401,409 | 42,760,221 | $7,029,164 | 46,041,605 |
| Small Cap Growth Fund | — | 126,828,458 | — | 134,482,626 |
| Small Cap Index Fund | — | 3,527,678 | — | 7,271,540 |
| Small Cap Opportunities Fund | — | 27,704,395 | — | 31,872,260 |
| Small Cap Value Fund | — | 8,828,384 | — | 13,363,629 |
| Small Company Growth Fund | — | 36,500,340 | — | 41,107,082 |
| Small Company Value Fund | — | 23,216,557 | — | 36,303,585 |
| Smaller Company Growth Fund | — | 57,510,658 | — | 66,159,946 |
| Spectrum Income Fund | 52,652,848 | 411,585,874 | 45,580,028 | 274,785,512 |
| Total Bond Market Fund | 87,337,705 | 5,764,019 | 140,775,877 | 137,688,273 |
| Total Return Fund | 4,799,224,916 | 1,530,452,728 | 5,362,261,792 | 1,219,832,250 |
| U.S. High Yield Bond Fund | — | 151,943,312 | — | 259,723,266 |
| U.S. Multi-Sector Fund | — | 549,077,460 | — | 546,955,524 |
| Value Fund | — | 38,667,837 | — | 40,359,445 |
| Value & Restructuring Fund | — | 65,326,670 | — | 84,034,645 |
8. INVESTMENT BY AFFILIATED FUNDS Certain investors in the Funds are affiliated funds and are managed by the Adviser and its affiliates. The affiliated funds do not invest in the Funds for the purpose of exercising management or control; however, this investment may represent a significant portion of the Funds’ net assets. For the six months ended February 28, 2011, the following funds had an affiliate ownership concentration of 5% or more of the their net assets:
| | | | |
| FUND | | | FUND | |
| |
|
| Active Bond Fund | 96.5% | | Mid Cap Growth Index Fund | 96.8% |
| All Cap Core Fund | 100.0% | | Mid Cap Index Fund | 100.0% |
| All Cap Value Fund | 80.1% | | Mid Cap Stock Fund | 63.5% |
| Alpha Opportunities Fund | 100.0% | | Mid Cap Value Equity Fund | 100.0% |
| Blue Chip Growth Fund | 77.9% | | Mid Cap Value Index Fund | 95.7% |
| Capital Appreciation Fund | 69.4% | | Mid Value Fund | 100.0% |
| Capital Appreciation Value Fund | 100.0% | | Mutual Shares Fund | 100.0% |
| Core Bond Fund | 97.9% | | Optimized Value Fund | 87.0% |
| Emerging Markets Fund | 98.3% | | Real Estate Equity Fund | 100.0% |
| Equity-Income Fund | 86.4% | | Real Return Bond Fund | 88.9% |
| Fundamental Value Fund | 95.0% | | Short Term Government Income Fund | 100.0% |
| Global Bond Fund | 91.9% | | Small Cap Growth Fund | 100.0% |
| Global Real Estate Fund | 99.8% | | Small Cap Index Fund | 100.0% |
| Heritage Fund | 100.0% | | Small Cap Opportunities Fund | 65.3% |
| High Income Fund | 98.4% | | Small Cap Value Fund | 100.0% |
| High Yield Fund | 88.0% | | Small Company Growth Fund | 100.0% |
| Index 500 Fund | 100.0% | | Small Company Value Fund | 70.9% |
| International Equity Index Fund | 100.0% | | Smaller Company Growth Fund | 100.0% |
| International Growth Stock Fund | 100.0% | | Spectrum Income Fund | 100.0% |
| International Opportunities Fund | 88.0% | | Total Bond Market Fund | 100.0% |
| International Small Cap Fund | 58.1% | | Total Return Fund | 69.6% |
| International Small Company Fund | 100.0% | | U.S. High Yield Bond Fund | 90.1% |
| International Value Fund | 68.7% | | U.S. Multi-Sector Fund | 100.0% |
| Investment Quality Bond Fund | 84.6% | | Value Fund | 100.0% |
| Large Cap Fund | 85.7% | | Value & Restructuring Fund | 100.0% |
| Large Cap Value Fund | 54.6% | | | |
9. INVESTMENT IN AFFILIATED UNDERLYING FUNDS Core Diversified Growth & Income Portfolio, Core Fundamental Holdings Portfolio, Core Global Diver-sification Portfolio and the Retirement Portfolios invest primarily in affiliated underlying funds that are managed by the Adviser and affiliates. The Funds do not invest in the affiliated underlying funds for the purpose of exercising management or control; however, the Funds’ investment may represent a significant portion of each underlying Fund’s net assets. For the six months ended February 28, 2011, none of these Funds held 5% or more of an underlying Fund’s net assets.
10. DIRECT PLACEMENT SECURITIES The Funds may hold direct placement securities which are restricted as to resale and the Funds have limited rights to registration under the Securities Act of 1933. The following table summarizes the direct placement securities held at February 28, 2011.
| | | | | | | |
| | | | | | | Value as a | |
| | | | | Beginning | Ending | percentage | |
| | | Acquisition | Acquisition | share | share | of Fund’s | Value as |
| Fund | Issuer, Description | date | cost | amount | amount | net assets | of 2-28-11 |
|
| High Income Fund | Dominion Petroleum Acquisitions | 9/19/07 | $838,461 | 948,612 | 996,635 | 0.22% | $1,035,850 |
| | Bought : 48,023 | | $48,023 | | | | |
| | First Michigan Bank | 4/30/10 | $1,675,002 | 279,167 | 279,167 | 0.33% | $1,538,194 |
11. TRANSACTIONS IN SECURITIES OF AFFILIATED ISSUERS Affiliated issuers, as defined by the 1940 Act, are those in which Fund’s holdings of an issuer represent 5% or more of the outstanding voting securities of the issuer. A summary of the Fund’s transactions in the securities of these issuers during the period ended February 28, 2011, is set forth below:
| | | | | | |
| | | Beginning | Ending | Realized | Dividend | Ending |
| Fund | Affiliate | share amount | share amount | gain (loss) | income | value |
|
| High Income Fund | Greektown Superholdings, Inc. | 7,894 | 7,894 | — | — | $872,908 |
| | Bought: none Sold: none | | | | | |
| | Greektown Superholdings, Inc., Series A | 154,240 | 154,240 | — | — | $17,055,662 |
| | Bought: none Sold: none | | | | | |
John Hancock Funds II
Evaluation of Advisory and Subadvisory Agreements by the Board of Trustees
At its meeting on December 17, 2010, the Board, including all of the Independent Trustees, approved the Capital Appreciation Value Fund (the “New Fund”), a new series of John Hancock Funds II (the “Trust”):
This section describes the evaluation by the Board of Trustees of:
(a) an amendment (the “Advisory Agreement Amendment”) to the advisory agreement between John Hancock Funds II (the “Trust”) and John Hancock Investment Management Services, LLC (the “Adviser” or “JHIMS”) to add the New Fund;
(b) the subadvisory agreement amendment between the Adviser and T. Rowe Price Associates, Inc. (“T. Rowe Price” or the “Subadviser”) to add the New Fund (the “Subadvisory Agreement Amendment”); and
Evaluation by the Board of Trustees
The Board, including the Independent Trustees, is responsible for selecting the Trust’s Adviser, approving the Adviser’s selection of subadvisers for each of the portfolios of the Trust (the “Funds”) and approving the Trust’s advisory and sub-advisory agreements (and any sub-subadvisory agreements), their periodic continuation and any amendments. Consistent with SEC rules, the Board regularly evaluates the Trust’s advisory and subadvisory arrangements, including consideration of the factors listed below. The Board may also consider other factors (including conditions and trends prevailing generally in the economy, the securities markets and the industry) and does not treat any single factor as determinative, and each Trustee may attribute different weights to different factors. The Board is furnished with an analysis of its fiduciary obligations in connection with its evaluation and, throughout the evaluation process, the Board is assisted by counsel for the Trust and the Independent Trustees are also separately assisted by independent legal counsel. The factors considered by the Board include:
1. the nature, extent and quality of the services to be provided by the Adviser to the Trust and by the subadvisers to the Funds;
2. the investment performance of the Funds and their subadvisers;
3. the extent to which economies of scale would be realized as a Fund grows and whether fee levels reflect these economies of scale for the benefit of Fund shareholders;
4. the costs of the services to be provided and the profits to be realized by the Adviser and its affiliates (including any subadvisers that are affiliated with the Adviser) and the subadvisers from the their relationships with the Trust; and
5. comparative services rendered and comparative advisory and subadvisory fee rates.
The Board believes that information relating to all of these factors is relevant to its evaluation of the Trust’s advisory agreement. The Board also took into account any indirect benefits expected to be derived by the Adviser and its affiliates from their relationship with the Funds. With respect to its evaluation of subadvisory agreements (including any sub-subadvisory agreements) with entities that are not affiliated with the Adviser, the Board believes that, in view of the Trust’s “manager-of-managers” advisory structure, the costs of the services to be provided and the profits to be realized by those subadvisers that are not affiliated with the Adviser from their relationship with the Trust generally are not a material factor in the Board’s consideration of these subadvisory agreements because such fees are paid by the Adviser and not by the Funds and the Board relies on the ability of the Adviser to negotiate the subadvisory fees at arms-length.
In evaluating subadvisory arrangements, the Board also considers any other material business relationships that unaffiliated subadvisers and their affiliates have with the Adviser or its affiliates, including the involvement by certain affiliates of certain subadvisers in the distribution of financial products, including shares of the Trust, offered by the Adviser and other affiliates of the Adviser (“Material Relationships”).
Approval of Advisory Agreement
At its meeting on December 17, 2010, the Board, including all the Independent Trustees, approved the Advisory Agreement Amendment.
In approving the Advisory Agreement Amendment, and with reference to the factors that it regularly considers, the Board:
(1)–(a) considered the high value to the Trust of continuing its relationship with JHIMS as the Trust’s adviser, the skills and competency with which JHIMS has in the past managed the Trust’s affairs and its subadvisory relationships, JHIMS’s oversight and monitoring of the subadvisers’ investment performance and compliance programs including its timeliness in responding to performance issues and the qualifications of JHIMS’ personnel,
(b) considered JHIMS’s compliance policies and procedures and its responsiveness to regulatory changes and mutual fund industry developments, and
(c) considered JHIMS’s administrative capabilities, including its ability to supervise the other service providers for the Funds and concluded that JHIMS may reasonably be expected to perform its services under the Advisory Agreement with respect to the New Fund;
(2)–(a) reviewed the advisory fee structure for the New Fund and the incorporation of the subadvisory fee breakpoints (as described below under “Approval of Subadvisory Agreements” below) and concluded that, although economies of scale cannot be measured with precision, these arrangements permit shareholders of the New Fund to benefit from economies of scale if the assets of such funds grow;
(b) considered that the Adviser has agreed to waive its management fee for the New Fund, and each of the funds of the Trust and John Hancock Trust (except those listed below) (the “Participating Portfolios”) or otherwise reimburse the expenses of the Participating Portfolios as follows (the “Reimbursement”): The Reimbursement shall equal, on an annualized basis, 0.01% of that portion of the aggregate net assets of all the Participating Portfolios that exceed $85 billion. The amount of the Reimbursement shall be calculated daily and allocated among all the Participating Portfolios in proportion to the daily net assets of each Participating Portfolio, and that Reimbursement may be terminated or modified by the Adviser only upon notice to the Trust and approval of the Board of Trustees of the Trust. (The Funds that are not Participating Portfolios as of the date of this semi-annual report are each of the funds of funds of the Trust and John Hancock Trust.)
(3)–(a) reviewed and considered an analysis presented by JHIMS regarding the anticipated profitability of JHIMS’s and its affiliates’ relationship with the New Fund and whether JHIMS has the financial ability to provide a high level of services to the New Fund,
(b) considered that JHIMS will derive reputational and other indirect benefits from providing advisory services to the New Fund, and
(c) noted that for the New Fund, JHIMS will pay the subadvisory fee out of the advisory fees JHIMS will receive from the New Fund and concluded that the advisory fees to be paid by the Trust with respect to the New Fund are reasonable in light of such information; and
(d) considered that the Adviser should be entitled to earn a reasonable level of profits in exchange for the level of services it will provide to the New Fund and the entrepreneurial risk that it assumes as Adviser. Based upon its review, the Board concluded that the Adviser and its affiliates’ anticipated level of profitability, if any, from their relationship with the New Fund was reasonable and not excessive.
(4) reviewed comparative information with respect to the advisory fee rates and concluded that the anticipated advisory fees for the New Fund are generally within a competitive range of those incurred by other comparable funds. In this regard, the Board took into account management’s discussion with respect to the
John Hancock Funds II
Evaluation of Advisory and Subadvisory Agreements by the Board of Trustees
advisory fee structure. The Board also noted that the Adviser pays the subadvisory fees of the New Fund. The Board also took into account the level and quality of services expected to be provided by JHIMS with respect to the New Fund, as well as the other factors considered.
Additional information that the Board considered in approving the Advisory Agreement Amendment is set forth in Appendix A.
Approval of Subadvisory Agreements
At its meeting on December 17, 2010, the Board, including all the Independent Trustees, approved the Subadvisory Agreement Amendment.
In making its determination with respect to the Subadvisory Agreement Amendment and with reference to the factors that it considers, the Board reviewed or considered:
(1) information relating to the Subadviser’s business, including current subadvisory services to the Trust (and other funds in the John Hancock family of funds);
(2) the performance of other John Hancock funds managed by the subadviser, including a comparable fund in the John Hancock Trust as set forth in Appendix A;
(3) information relating to the nature and scope of Material Relationships and their significance to the Trust’s adviser and unaffiliated Subadvisers; and
(4) the proposed subadvisory fee for the New Fund and comparative fee information as set forth in Appendix A.
The Board’s decision to approve the Subadvisory Agreement was based on a number of determinations, including the following:
(1) The Subadviser has extensive experience and demonstrated skills as a manager, including the Subadviser’s experience in managing other funds within the John Hancock fund complex;
(2) The subadvisory fees for the New Fund are: (i) within industry norms and (ii) paid by the Adviser and not by the New Fund and are reasonable; and
(3) Subadvisory breakpoints are reflected as breakpoints in the advisory fees for the New Fund.
John Hancock Funds II
| | |
| Appendix A |
|
| |
| Trust/Fund | Comparable Performance | |
| (Subadviser) | as of September 30, 2010 | Estimated Fees and Expenses |
|
| |
| JHF II | JHT Capital Appreciation Value Trust has slightly | Estimated advisory fees for this Fund are higher than |
| Capital Appreciation Value | outperformed its peer group and slightly | its peer group median. |
| | underperformed its benchmark for the 1-year time | |
| (T. Rowe Price) | period | Estimated subadvisory fees for this Fund are higher |
| | | than its peer group median. |
| | | |
John Hancock Funds II
Evaluation of Subadvisory Agreement by the Board of Trustees
At its meeting on December 17, 2010, the Board of Trustees (the “Board”) of John Hancock Funds II (the “Trust”), including all of the Independent Trustees, approved the appointment of John Hancock Asset Management a division of Manulife Asset Management (US) LLC (“John Hancock Asset Management” or the “Subadviser”) as an additional subadviser to the following funds (the “Portfolios”), each a series of the Trust.
| |
| Portfolios |
| |
| a. | Core Diversified Growth & Income Portfolio |
| b. | Core Fundamental Holdings Portfolio |
| c. | Core Global Diversification Portfolio |
| d. | Retirement 2045 Portfolio |
| e. | Retirement 2040 Portfolio |
| f. | Retirement 2035 Portfolio |
| g. | Retirement 2030 Portfolio |
| h. | Retirement 2025 Portfolio |
| i. | Retirement 2020 Portfolio |
| j. | Retirement 2015 Portfolio |
| k. | Retirement 2010 Portfolio |
This section describes the evaluation by the Board of Trustees of the amendment to the subadvisory agreement between John Hancock Investment Management Services, LLC (the “Adviser”), the adviser to the Portfolios, and the Subadviser relating to each of the Portfolios (the “Subadvisory Agreement Amendment”).
Evaluation of Subadvisory Agreement by the Board of Trustees
The Board, including the Independent Trustees, is responsible for approving the Adviser’s selection of fund subadvisers and approving the funds’ subadvisory agreements, their periodic continuation and any amendments. Consistent with SEC rules, the Board regularly evaluates the Trust’s subadvisory arrangements, including consideration of the factors listed below. The Board may also consider other factors (including conditions and trends prevailing generally in the economy, the securities markets and the industry) and does not treat any single factor as determinative, and each Trustee may attribute different weights to different factors. The Board is furnished with an analysis of its fiduciary obligations in connection with its evaluation and, throughout the evaluation process, the Board is assisted by counsel for the Trust and the Independent Trustees are also separately assisted by independent legal counsel. The factors considered by the Board with respect to each fund are:
1. the nature, extent and quality of the services to be provided by the subadviser to the fund;
2. the investment performance of the fund and its subadviser;
3. the extent to which economies of scale would be realized as a fund grows and whether fee levels reflect these economies of scale for the benefit of fund shareholders;
4. the costs of the services to be provided and the profits to be realized by the subadviser and its affiliates (including the Adviser with respect to affiliated subadvisers) from the relationship with the Trust; and
5. comparative services rendered and comparative subadvisory fee rates.
In making its determination and with reference to the factors that it considers, the Board reviews:
1. information relating to the subadviser’s business, including current subadvisory services to the Trust (and other funds in the John Hancock family of funds);
2. the performance of the fund and the performance of other John Hancock funds managed by the subadviser; and
3. the subadvisory fee for the fund, including any breakpoints.
The Board approved the Subadvisory Agreement Amendment with the Subadviser for each of the Portfolios at its meeting on December 17, 2010. Particular considerations of the Board in approving the Subadvisory Agreement Amendment included the following:
1. The subadvisory fees for the Portfolios are paid by the Adviser, not the Portfolios, and are reasonable, and approval of the Subadvisory Agreement Amendment will not result in any change in the advisory fees for any of the Portfolios.
2. Approval of the Subadvisory Agreement Amendment reflects the re-allocation of subadvisory services between the Subadviser and John Hancock Asset Management a division of Manulife Asset Management (North America) Limited (“John Hancock Asset Management (North America)”), the current subadviser to the Portfolios, each of which is affiliated with the Adviser.
3. The personnel of John Hancock Asset Management (North America) and the Adviser who have currently and previously managed the assets of the Portfolios, with John Hancock Asset Management (North America) and the Subadviser, are expected to continue to manage the Portfolios and the Board is generally satisfied with their skill and experience and with the performance of the Portfolios.
4. The performance of each Portfolio as noted below and management’s discussion of the same:
(a) The Core Diversified Growth & Income Portfolio has outperformed its peer group and underperformed its benchmark index for the one year period and underperformed its peer group and benchmark index for the since inception period ended September 30, 2010;
(b) The Core Fundamental Holdings Portfolio has underperformed its peer group and benchmark index for the one year period and outperformed its peer group and underperformed its benchmark index for the since inception period ended September 30, 2010;
(c) The Core Global Diversification Portfolio has underperformed its peer group and outperformed its benchmark index for the one year period and outperformed its peer group and benchmark index for the since inception period ended September 30, 2010;
(d) The Retirement 2045 Portfolio has outperformed its peer group and benchmark index for the since inception period ended September 30, 2010;
(e) The Retirement 2040 Portfolio has underperformed its peer group and outperformed its benchmark index for the since inception period ended September 30, 2010;
(f) The Retirement 2035 Portfolio has outperformed its peer group and benchmark index for since inception period ended September 30, 2010;
(g) The Retirement 2030 Portfolio has underperformed its peer group and outperformed its benchmark index for the one year and since inception periods ended September 30, 2010;
(h) The Retirement 2025 Portfolio has outperformed its peer group and benchmark index for the since inception period ended September 30, 2010;
(i) The Retirement 2020 Portfolio has outperformed its peer group and benchmark index for the since inception period ended September 30, 2010;
(j) The Retirement 2015 Portfolio has outperformed its peer group and benchmark index for the since inception period ended September 30, 2010; and
(k) The Retirement 2010 Portfolio has underperformed its peer group and outperformed its benchmark index for the one year and since inception periods ended September 30, 2010.
John Hancock Funds II
Evaluation of Subadvisory Agreement by the Board of Trustees
5. John Hancock Asset Management has demonstrated skill as a manager, is currently the subadviser to multiple funds of the Trust and John Hancock Trust and may be expected to provide a high quality of investment management services and personnel to each of the Portfolios.
In addition, the Board reviewed the subadvisory fees to be paid to the Subadviser with respect to the Portfolios, each of which operates as a fund of funds and invests in underlying funds. The Board concluded, with respect to each such fund of funds, that the subadvisory fee is based on services provided that are in addition to, rather than duplicative of, the services provided pursuant to the advisory agreements for the underlying funds. The Board also concluded that the additional services are necessary because of the differences between the investment policies, strategies and techniques of the fund of funds and those of its underlying funds.
John Hancock Funds II
Evaluation of Subadvisory Agreement by the Board of Trustees
At its meeting on December 17, 2010, the Board of Trustees (the “Board”) of John Hancock Funds II (the “Trust”), including all of the Independent Trustees, approved the subadvisory agreement appointing T. Rowe Price Associates, Inc. (“T. Rowe Price” or the “Subadviser”) as the new subadviser to the Large Cap Value Fund (the “Fund”).
This section describes the evaluation by the Board of the amendment to the sub-advisory agreement between John Hancock Investment Management Services, LLC (the “Adviser”), the adviser to the Portfolio, and the Subadviser relating to the Portfolio (the “Subadvisory Agreement Amendment”).
Evaluation of Subadvisory Agreement by the Board of Trustees
The Board, including the Independent Trustees, is responsible for approving the Adviser’s selection of fund subadvisers and approving the funds’ subadvisory agreements, their periodic continuation and any amendments. Consistent with SEC rules, the Board regularly evaluates the Trust’s subadvisory arrangements, including consideration of the factors listed below. The Board may also consider other factors (including conditions and trends prevailing generally in the economy, the securities markets and the industry) and does not treat any single factor as determinative, and each Trustee may attribute different weights to different factors. The Board is furnished with an analysis of its fiduciary obligations in connection with its evaluation and, throughout the evaluation process, the Board is assisted by counsel for the Trust and the Independent Trustees are also separately assisted by independent legal counsel. The factors considered by the Board with respect to each fund are:
1. the nature, extent and quality of the services to be provided by the subadviser to the fund;
2. the investment performance of the fund and its subadviser;
3. the extent to which economies of scale would be realized as a fund grows and whether fee levels reflect these economies of scale for the benefit of fund shareholders;
4. the costs of the services to be provided and the profits to be realized by the subadviser and its affiliates from its relationship with the Trust; and
5. comparative services rendered and comparative subadvisory fee rates.
With respect to its evaluation of subadvisory agreements with entities that are not affiliated with the Adviser, the Board believes that, in view of JHF II’s “manager-of-managers” advisory structure, the costs of the services to be provided and the profits to be realized by those subadvisers that are not affiliated with the Adviser from their relationship with JHF II, generally, are not a material factor in the Board’s consideration of these subadvisory agreements because such fees are paid to subadvisers by the Adviser and not by the funds and because the Board relies on the ability of the Adviser to negotiate such subadvisory fees at arm’s-length. In evaluating subadvisory arrangements, the Board also considers other material business relationships that unaffiliated subadvisers and their affiliates have with the Adviser or its affiliates, including the involvement by certain affiliates of certain subadvisers in the distribution of financial products, including shares of JHF II, offered by the Adviser and other affiliates of the Adviser (“Material Relationships”).
In making its determination with respect to the Subadvisory Agreement Amendment and with reference to the factors that it considers, the Board reviewed or considered:
1. information relating to the subadviser’s business, including current subadvisory services to JHF II (and other funds in the John Hancock family of funds);
2. the performance of the fund and the performance of other JHF II and JHT funds, as well as other comparable funds, managed by the subadviser;
3. the subadvisory fee for the fund, including any breakpoints; and
4. information relating to the nature and scope of Material Relationships and their significance to the Adviser and the subadviser.
The Board approved the Subadvisory Agreement Amendment with the Subadviser for the Fund at its meeting on December 17, 2010. Particular considerations of the Board in approving the Subadvisory Agreement Amendment included the following:
1. T. Rowe Price has demonstrated skills as a manager, is currently the subadviser to multiple funds of JHF II and JHT and may be expected to provide a high quality of investment management services and personnel to the Fund.
2. The Equity Income Fund, which is managed by T. Rowe Price in a style similar to that of the Fund, has outperformed the Fund, and has outperformed its benchmark index, since the inception of the funds in 2005.
3. Although the subadvisory fee rates under the new subadvisory agreement will be the same as under the prior subadvisory agreement, T. Rowe Price has voluntarily agreed to waive a portion of its subadvisory fee. In addition, the subadvisory fee rates with respect to the Fund under the new subadvisory agreement are within industry norms and are reasonable, and the subadvisory fee is paid by the Adviser and not by the Fund. In addition, approval of the Subadvisory Agreement Amendment will not result in any change in the advisory fees of the fund.
4. Subadvisory breakpoints are reflected as breakpoints in the advisory fees of the Fund.
John Hancock Funds II
For More Information
PROXY VOTING POLICY A description of the Trust’s proxy voting policies and procedures and information regarding how the Trust voted proxies relating to fund securities during the most recent twelve-month period ended June 30 is available without charge, upon request, by calling 1-800-344-1029 or on the Trust’s Web site at www.jhfunds.com or on the SEC Web site at www.sec.gov.
QUARTERLY PORTFOLIO DISCLOSURE The Trust files a complete schedule of portfolio holdings with the SEC for the first and third quarters of each fiscal year on Form N-Q. The fund’s Form N-Q is available electronically on the SEC Web site (www.sec.gov); hard copies may be reviewed and copied at the SEC’s Public Reference Room, 450 Fifth St., N.W., Washington, DC 20549. For more information on the Public Reference Room, call 1-800-SEC-0330.

ITEM 2. CODE OF ETHICS.
(a) Not Applicable
(b) Not Applicable
(c) Not Applicable
(d) Not Applicable
(e) Not Applicable
(f) Not Applicable
ITEM 3. AUDIT COMMITTEE FINANCIAL EXPERT.
Not Applicable
ITEM 4. PRINCIPAL ACCOUNTANT FEES AND SERVICES.
(a) Not Applicable
(b) Not Applicable
(c) Not Applicable
(d) Not Applicable
(e) Not Applicable
(f) Not Applicable.
(g) Not Applicable
(h) Not Applicable
ITEM 5. AUDIT COMMITTEE OF LISTED REGISTRANTS
Not Applicable.
ITEM 6. SCHEDULE OF INVESTMENTS.
(a) Included with Item 1.
(b) Not Applicable.
ITEM 7. DISCLOSURE OF PROXY VOTING POLICIES AND PROCEDURES FOR CLOSED-END MANAGEMENT INVESTMENT COMPANIES.
Not Applicable.
ITEM 8. PORTFOLIO MANAGERS OF CLOSED-END MANAGEMENT INVESTMENT COMPANIES.
Not Applicable.
ITEM 9. PURCHASE OF EQUITY SECURITIES BY CLOSED-END MANAGEMENT INVESTMENT COMPANIES AND AFFILIATED PURCHASERS.
Not Applicable.
ITEM 10. SUBMISSION OF MATTERS TO VOTE OF SECURITY HOLDERS.
Not Applicable.
ITEM 11. CONTROLS AND PROCEDURES.
(a) EVALUATION OF DISCLOSURE CONTROLS AND PROCEDURES. The Registrant maintains disclosure controls and procedures that are designed to ensure that information required to be disclosed in this Form N-CSR is recorded, processed, summarized and reported within the
periods specified in the rules and forms of the Securities and Exchange Commission. Such disclosure controls and procedures include controls and procedures designed to ensure that such information is accumulated and communicated to the Registrant's management, including its principal executive officer and principal financial officer, as appropriate, to allow timely decisions regarding required disclosure.
Within 90 days prior to the filing date of this Form N-CSR, the Registrant had carried out an evaluation, under the supervision and with the participation of the Registrant's management, including the Registrant's principal executive officer and the Registrant's principal financial officer, of the effectiveness of the design and operation of the Registrant's disclosure controls and procedures relating to information required to be disclosed on Form N-CSR. Based on such evaluation, the Registrant's principal executive officer and principal financial officer concluded that the Registrant's disclosure controls and procedures are operating effectively to ensure that:
(i) information required to be disclosed in this Form N-CSR is recorded, processed, summarized and reported within the periods specified in the rules and forms of the Securities and Exchange Commission, and
(ii) information is accumulated and communicated to the Registrant’s management, including its principal executive officer and principal financial officer, as appropriate, to allow timely decisions regarding required disclosure.
(b) CHANGE IN REGISTRANT’S INTERNAL CONTROL: Not Applicable.
ITEM 12. EXHIBITS.
(a)(1) Not applicable
(a)(2)(i) CERTIFICATION OF PRINCIPAL EXECUTIVE OFFICER.
(a)(2)(ii) CERTIFICATION OF PRINCIPAL FINANCIAL OFFICER.
(b) CERTIFICATION PURSUANT TO Rule 30a-2(b) OF THE INVESTMENT COMPANY ACT OF 1940
Pursuant to the requirements of the Securities Exchange Act of 1934 and the Investment Company Act of 1940, the registrant has duly caused this report to be signed on its behalf by the undersigned, thereunto duly authorized.
JOHN HANCOCK FUNDS II
/s/ Hugh McHaffie
_______________________________
Hugh McHaffie
President
Date: April 25, 2011
Pursuant to the requirements of the Securities Exchange Act of 1934 and the Investment Company Act of 1940, this report has been signed below by the following persons on behalf of the registrant and in the capacities and on the dates indicated.
/s/ Hugh McHaffie
________________________________
Hugh McHaffie
President
Date: April 25, 2011
/s/ Charles A. Rizzo
_________________________________
Charles A. Rizzo
Chief Financial Officer
Date: April 25, 2011