| |
| UNITED STATES |
| SECURITIES AND EXCHANGE COMMISSION |
| Washington, D.C. 20549 |
| |
| FORM N-CSR |
| |
| CERTIFIED SHAREHOLDER REPORT OF REGISTERED MANAGEMENT INVESTMENT |
| COMPANIES |
| Investment Company Act file number 811-21779 |
| |
| JOHN HANCOCK FUNDS II |
| --------------------------------------------------------- |
| (Exact name of registrant as specified in charter) |
| |
| 601 CONGRESS STREET, BOSTON, MA 02210-2805 |
| ------------------------------------------------------------- |
| (Address of principal executive offices) (Zip code) |
| |
| MICHAEL J. LEARY, 601 CONGRESS STREET, BOSTON, MA 02210-2805 |
| ------------------------------------------------------------------------------------------ |
| (Name and address of agent for service) |
| |
| Registrant's telephone number, including area code: (617) 663-4490 |
| -------------- |
| Date of fiscal year end: 12/31 | |
| ------ | | |
| ------- |
| Date of reporting period: 6/30/11 | |
ITEM 1. REPORTS TO STOCKHOLDERS.
The Registrant prepared three semiannual reports to shareholders for the period ended June 30, 2011. The first report applies to the 5 Lifestyle Portfolios, the second report applies to the Retirement Distribution Portfolio and the third report applies to the Retirement Rising Distribution Portfolio.

John Hancock
Lifestyle Aggressive Portfolio
Goal and strategy
The Portfolio seeks long-term growth of capital. Current income is not a consideration. The Portfolio operates as a fund of funds and normally invests 100% of its assets in underlying funds that invest primarily in equity securities.
| | |
| Asset Allocation | |
| | |
| Equity | 98% of Total |
|
| U.S. Large Cap | | 47% |
|
| International Large Cap | 11% |
|
| Emerging Markets | | 10% |
|
| U.S. Mid Cap | | 9% |
|
| U.S. Small Cap | | 6% |
|
| Large Blend | | 5% |
|
| International Small Cap | 5% |
|
| Natural Resources | | 3% |
|
| Real Estate | | 1% |
|
| Small Growth | | 1% |
|
| |
| Other | | 2% of Total |
|
| Currency | | 2% |
|
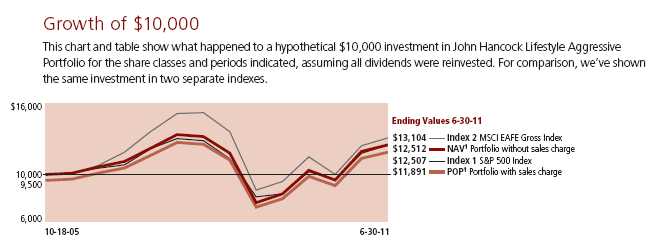
As a percentage of net assets on 6-30-11.
Portfolio results
During the six months ended June 30, 2011, John Hancock Lifestyle Aggressive Portfolio’s Class A, Class B, Class C, Class R1, Class R3, Class R4, Class R5 and Class 1 returned 4.62%, 4.20%, 4.20%, 4.44%, 4.46%, 4.55%, 4.79% and 4.80%, respectively, at net asset value. In comparison, the S&P 500 Index returned 6.02%, over the same period. The Portfolio also underperformed the 5.45% return of the Morningstar, Inc.’s average large blend fund.1
Performance review
Although the Portfolio generated solid absolute returns, on a relative basis compared to the S&P 500 Index, there were several exposures that detracted from results. For example, underperformance from allocations to emerging markets and global natural resource equities was in contrast to their positive contributions last year. There were, however, a number of bright spots, including the value added by allocations to U.S. real estate, mid caps and small caps.
The shifting market currents in the first half of the year proved to be a dif-ficult environment for active management in general, including managers in our Portfolio. For example, Emerging Markets Fund (DFA), which had been a strong contributor last year, detracted from relative performance due to its overweight in smaller-cap issues. Results for International Opportunities Fund (Marsico), another strong performer in 2010, were hurt by selection in financial and energy stocks. Fundamental Value Fund’s (Davis) relative performance was hindered by selection in materials and energy stocks.
However, there were a number of bright spots. Capital Appreciation Fund’s (Jennison), relative performance, which trailed last year, benefited from an overweight in consumer discretionary and an underweight in the energy sectors, good stock selection and large-cap focus. International Core Fund (GMO) had success as the market began to reward the kind of mega-cap quality stocks that the fund emphasizes. Relative performance of International Value Fund (Franklin) gained in the health care sector through both selection and an overweight position, and in financials through strong selection.
The Portfolio’s manager lineup has remained largely the same, with the exception of a newly established position in Capital Appreciation Value Fund (T. Rowe Price), which replaced T. Rowe’s Large Cap Value Fund, which liquidated. This fund has a flexible, yet conservative mandate that seeks to outperform the broad equity market with less risk than its benchmark over a full market cycle. We believe it is a welcome addition for what may be an increasingly volatile market environment going forward.
1 Figures from Morningstar, Inc. include reinvested dividends and do not take into account sales charges. Actual load-adjusted performance is lower.
This commentary reflects the views of the portfolio managers through the end of the Portfolio’s period discussed in this report. The managers’ statements reflect their own opinions. As such, they are in no way guarantees of future events and are not intended to be used as investment advice or a recommendation regarding any specific security. They are also subject to change at any time as market and other conditions warrant.
Past performance is no guarantee of future results.
| |
| 4 | Lifestyle Portfolios | Semiannual report |
| | | | | | | |
| | Class B | Class C | Class R12 | Class R32 | Class R42 | Class R52 | Class 12 |
|
| Start date | 10-18-05 | 10-18-05 | 9-18-06 | 10-18-05 | 10-18-05 | 10-18-05 | 10-15-05 |
|
| Without sales charge | $12,003 | $12,020 | $11,033 | $12,364 | $12,551 | $12,765 | $12,856 |
|
| With maximum sales charge | 11,903 | 12,020 | 11,033 | 12,364 | 12,551 | 12,765 | 12,856 |
|
| Index 1 | 12,507 | 12,507 | 11,079 | 12,507 | 12,507 | 12,507 | 12,544 |
|
| Index 2 | 13,104 | 13,104 | 10,767 | 13,104 | 13,104 | 13,104 | 13,041 |
|
S&P 500 Index — is an unmanaged index that includes 500 widely traded common stocks.
MSCI EAFE Index (gross of foreign withholding taxes on dividends) (Europe, Australasia, Far East) — is a free float adjusted market capitalization index that is designed to measure developed market equity performance, excluding the U.S. and Canada.
It is not possible to invest directly in an index. Index figures do not reflect sales charges, which would have resulted in lower values if they did.
Performance chart
Total returns with maximum sales charge (POP) for the period ended 6-30-11
| | | | | | | | |
| | Class A | Class B | Class C | Class R12 | Class R32 | Class R2 | Class R52 | Class 12 |
| Start date | 10-18-05 | 10-18-05 | 10-18-05 | 9-18-06 | 10-18-05 | 10-18-05 | 10-18-05 | 10-15-05 |
|
| Average annual returns — 1 year | 24.75% | 25.21% | 29.22% | 30.81% | 30.87% | 31.12% | 31.62% | 31.73% |
|
| Average annual returns — 5 years | 1.37% | 1.30% | 1.67% | — | 2.18% | 2.46% | 2.78% | 2.91% |
|
| Average annual returns — Since inception | 3.08% | 3.10% | 3.28% | 2.07% | 3.79% | 4.07% | 4.37% | 4.50% |
|
| Cumulative returns — 6 months | –0.62% | –0.80% | 3.20% | 4.44% | 4.46% | 4.55% | 4.79% | 4.80% |
|
| Cumulative returns — 1 year | 24.75% | 25.21% | 29.22% | 30.81% | 30.87% | 31.12% | 31.62% | 31.73% |
|
| Cumulative returns — 5 years | 7.06% | 6.69% | 8.62% | — | 11.38% | 12.92% | 14.71% | 15.40% |
|
| Cumulative returns — Since inception | 18.91% | 19.03% | 20.20% | 10.33% | 23.64% | 25.51% | 27.65% | 28.56% |
|
Performance figures assume all distributions are reinvested. Returns with maximum sales charge reflect a sales charge on Class A shares of 5%, and the applicable contingent deferred sales charge (CDSC) on Class B shares and Class C shares. The Class B shares’ CDSC declines annually between years 1–6 according to the following schedule: 5, 4, 3, 3, 2, 1%. No sales charges will be assessed after the sixth year. Class C shares held for less than one year are subject to a 1% CDSC. Sales charges are not applicable for Class R1, Class R3, Class R4, Class R5 and Class 1 shares.
The expense ratios of the Portfolio, both net (including any fee waivers or expense limitations) and gross (excluding any fee waivers or expense limitations), are set forth according to the most recent publicly available prospectuses for the Portfolio and may differ from the expense ratios disclosed in the Financial Highlights tables in this report. The waivers and expense limitations are contractual at least until 4-30-12 for Class A, Class B, Class C, Class R1, Class R3, Class R4 and Class R5 shares. The following expense ratios include expenses of the underlying affiliated funds in which the Portfolio invests. The expenses are as follows:
| | | | | | | | |
| | Class A | Class B | Class C | Class R1 | Class R3 | Class R4 | Class R5 | Class 1 |
| Net (%) | 1.47 | 2.24 | 2.17 | 1.75 | 1.70 | 1.41 | 1.12 | 0.98 |
| Gross (%) | 1.47 | 2.24 | 2.17 | 1.75 | 1.70 | 1.41 | 1.12 | 1.00 |
The returns reflect past results and should not be considered indicative of future performance. The return and principal value of an investment will fluctuate so that shares, when redeemed, may be worth more or less than their original cost. Due to market volatility, the Portfolio’s current performance may be higher or lower than the performance shown. For performance data current to the most recent month end, please call 1-800-225-5291 or visit the Portfolio’s Web site at www.jhfunds.com.
This performance information does not reflect the deduction of taxes that a shareholder may pay on Portfolio distributions or the redemption of Portfolio shares. The Portfolio’s performance results reflect any applicable expense reductions, without which the expenses would increase and results would have been less favorable.
1 NAV represents net asset value and POP represents public offering price. Performance of the classes will vary based on the difference in sales charges paid by shareholders investing in the different classes and the fee structure of those classes.
2 For certain types of investors, as described in the Portfolio’s Class R1, Class R3, Class R4, Class R5 and Class 1 shares prospectuses.
| |
| Semiannual report | Lifestyle Portfolios | 5 |
John Hancock
Lifestyle Growth Portfolio
Goal and strategy
The Portfolio seeks long-term growth of capital. Current income is also a consideration. The Portfolio operates as a fund of funds and normally invests approximately 20% of its assets in underlying funds that invest primarily in fixed-income securities and approximately 80% of its assets in underlying funds that invest primarily in equity securities.
| | |
| Asset Allocation | | |
| | | |
| Equity | 81% of Total |
|
| U.S. Large Cap | | 42% |
|
| International Large Cap | 9% |
|
| Emerging Markets | | 7% |
|
| U.S. Mid Cap | | 7% |
|
| Large Blend | | 6% |
|
| International Small Cap | 3% |
|
| U.S. Small Cap | | 3% |
|
| Real Estate | | 2% |
|
| Natural Resources | | 2% |
|
| |
| Fixed Income | 17% of Total |
|
| Multi-Sector Bond | | 5% |
|
| Intermediate Bond | | 4% |
|
| High-Yield Bond | | 4% |
|
| Bank Loan | | 2% |
|
| Global Bond | | 1% |
|
| Treasury Inflation- | | |
| Protected Securities | | 1% |
|
| Other | | 2% of Total |
|
| Currency | | 2% |
|
As a percentage of net assets on 6-30-11.
Portfolio results
During the six months ended June 30, 2011, John Hancock Lifestyle Growth Portfolio’s Class A, Class B, Class C, Class R1, Class R3, Class R4, Class R5, Class 1 and Class 5 returned 4.42%, 4.02%, 4.03%, 4.25%, 4.27%, 4.43%, 4.58%, 4.60% and 4.68%, respectively, at net asset value. In comparison, the S&P 500 Index returned 6.02%, the Barclays Capital U.S. Aggregate Bond Index returned 2.72% and a blended index — 80% S&P 500 Index/20% Barclays Capital U.S. Aggregate Bond Index — returned 5.38% over the same period. The Portfolio’s results underperformed the 4.61% return of the Morningstar, Inc. average aggressive allocation fund.1
Performance review
Although the Portfolio generated solid absolute returns, on a relative basis compared to the blended index there were several exposures that detracted from results. For example, underperformance from allocations to emerging markets and global natural resource equities was in contrast to their positive contributions last year. There were, however, a number of positive contributors, including the value added by allocations to U.S. real estate, mid-cap stocks, high-yield and multi-sector bonds and TIPS (Treasury Inflation-Protected Securities).
The shifting market currents this quarter proved to be a difficult environment for active management in general, including managers in our Portfolio. For example, Emerging Markets Fund (DFA), which had been a strong contributor last year, detracted from relative performance due to its overweight in smaller-cap issues. Results for International Opportunities Fund (Marsico), another strong performer in 2010, were hurt by selection in financial and energy stocks. Fundamental Value Fund’s (Davis) relative performance was hindered by selection in materials and energy stocks.
However, there were a number of bright spots. Capital Appreciation Fund’s (Jennison) relative performance, which trailed last year, benefited from an overweight in consumer discretionary stocks and an underweight in the energy sector, good stock selection and large-cap focus. International Core Fund (GMO) had success as the market began to reward the kind of mega-cap quality stocks that the fund emphasizes. Relative performance of International Value Fund (Franklin) gained in the health care sector through both selection and an overweight position, and in financials through strong selection.
The Portfolio’s manager lineup has remained largely the same, with the exception of a newly established position in Capital Appreciation Value Fund (T. Rowe Price), which replaced T. Rowe’s Large Cap Value Fund, which liquidated. This fund has a flexible, yet conservative mandate that seeks to outperform the broad equity market with less risk than the benchmark over a full market cycle. We believe it is a welcome addition for what may be an increasingly volatile market environment going forward.
1 Figures from Morningstar, Inc. include reinvested dividends and do not take into account sales charges. Actual load-adjusted performance is lower.
This commentary reflects the views of the portfolio managers through the end of the Portfolio’s period discussed in this report. The managers’ statements reflect their own opinions. As such, they are in no way guarantees of future events and are not intended to be used as investment advice or a recommendation regarding any specific security. They are also subject to change at any time as market and other conditions warrant.
Past performance is no guarantee of future results.
| |
| 6 | Lifestyle Portfolios | Semiannual report |

| | | | | | | | |
| | Class B | Class C | Class R12 | Class R32 | Class R42 | Class R52 | Class 12 | Class 52 |
|
| Start date | 10-18-05 | 10-18-05 | 9-18-06 | 10-18-05 | 10-18-05 | 10-18-05 | 10-15-05 | 7-3-06 |
|
| Without sales charge | $12,412 | $12,442 | $11,572 | $12,781 | $12,991 | $13,205 | $13,286 | $12,232 |
|
| With maximum sales charge | 12,312 | 12,442 | 11,572 | 12,781 | 12,991 | 13,205 | 13,286 | 12,232 |
|
| Index 1 | 12,507 | 12,507 | 11,079 | 12,507 | 12,507 | 12,507 | 12,544 | 11,561 |
|
| Index 2 | 13,772 | 13,772 | 13,332 | 13,772 | 13,772 | 13,772 | 13,778 | 13,715 |
|
| Index 3 | 12,919 | 12,919 | 11,645 | 12,919 | 12,919 | 12,919 | 12,951 | 12,118 |
|
S&P 500 Index — is an unmanaged index that includes 500 widely traded common stocks.
Barclays Capital U.S. Aggregate Bond Index — an unmanaged index of dollar-denominated and non-convertible investment grade debt issues.
80% S&P 500/20% Barclays Capital U.S. Aggregate Bond Index Blend — is comprised of 80% S&P 500 Index and 20% Barclays Capital U.S. Aggregate Bond Index. It is not possible to invest directly in an index. Index figures do not reflect sales charges, which would have resulted in lower values if they did.
Performance chart
Total returns with maximum sales charge (POP) for the period ended 6-30-11
| | | | | | | | | |
| | Class A | Class B | Class C | Class R12 | Class R32 | Class R42 | Class R52 | Class 12 | Class 52 |
|
| Start date | 10-18-05 | 10-18-05 | 10-18-05 | 9-18-06 | 10-18-05 | 10-18-05 | 10-18-05 | 10-15-05 | 7-3-06 |
|
| Average annual returns — 1 year | 20.06% | 20.23% | 24.37% | 25.88% | 25.91% | 26.25% | 26.72% | 26.80% | 26.89% |
|
| Average annual returns — 5 years | 2.53% | 2.46% | 2.84% | — | 3.35% | 3.65% | 3.95% | 4.07% | 4.11% |
|
| Average annual returns — Since inception | 3.71% | 3.72% | 3.91% | 3.10% | 4.40% | 4.70% | 5.00% | 5.10% | 4.11% |
|
| Cumulative returns — 6 months | –0.81% | –0.98% | 3.03% | 4.25% | 4.27% | 4.43% | 4.58% | 4.60% | 4.68% |
|
| Cumulative returns — 1 year | 20.06% | 20.23% | 24.37% | 25.88% | 25.91% | 26.25% | 26.72% | 26.80% | 26.89% |
|
| Cumulative returns — 5 years | 13.29% | 12.91% | 15.05% | — | 17.91% | 19.62% | 21.36% | 22.07% | 22.32% |
|
| Cumulative returns — Since inception | 23.06% | 23.12% | 24.42% | 15.72% | 27.81% | 29.91% | 32.05% | 32.86% | 22.32% |
|
Performance figures assume all distributions are reinvested. Returns with maximum sales charge reflect a sales charge on Class A shares of 5%, and the applicable contingent deferred sales charge (CDSC) on Class B shares and Class C shares. The Class B shares’ CDSC declines annually between years 1–6 according to the following schedule: 5, 4, 3, 3, 2, 1%. No sales charges will be assessed after the sixth year. Class C shares held for less than one year are subject to a 1% CDSC. Sales charges are not applicable for Class R1, Class R3, Class R4, Class R5, Class 1 and Class 5 shares.
The expense ratios of the Portfolio, both net (including any fee waivers or expense limitations) and gross (excluding any fee waivers or expense limitations), are set forth according to the most recent publicly available prospectuses for the Portfolio and may differ from the expense ratios disclosed in the Financial Highlights tables in this report. The waivers and expense limitations are contractual at least until 4-30-12 for Class A, Class B, Class C, Class R1, Class R3, Class R4 and Class R5 shares. The following expense ratios include expenses of the underlying affiliated funds in which the Portfolio invests. The expenses are as follows:
| | | | | | | | | |
| | Class A | Class B | Class C | Class R1 | Class R3 | Class R4 | Class R5 | Class 1 | Class 5 |
| Net (%) | 1.43 | 2.14 | 2.12 | 1.67 | 1.63 | 1.31 | 1.04 | 0.94 | 0.90 |
| Gross (%) | 1.43 | 2.14 | 2.12 | 1.67 | 1.63 | 1.31 | 1.04 | 0.95 | 0.90 |
The returns reflect past results and should not be considered indicative of future performance. The return and principal value of an investment will fluctuate so that shares, when redeemed, may be worth more or less than their original cost. Due to market volatility, the Portfolio’s current performance may be higher or lower than the performance shown. For performance data current to the most recent month end, please call 1-800-225-5291 or visit the Portfolio’s Web site at www.jhfunds.com.
This performance information does not reflect the deduction of taxes that a shareholder may pay on Portfolio distributions or the redemption of Portfolio shares. The Portfolio’s performance results reflect any applicable expense reductions, without which the expenses would increase and results would have been less favorable.
1 NAV represents net asset value and POP represents public offering price. Performance of the classes will vary based on the difference in sales charges paid by shareholders investing in the different classes and the fee structure of those classes.
2 For certain types of investors, as described in the Portfolio’s Class R1, Class R3, Class R4, Class R5, Class 1 and Class 5 shares prospectuses.
| |
| Semiannual report | Lifestyle Portfolios | 7 |
John Hancock
Lifestyle Balanced Portfolio
Goal and strategy
The Portfolio seeks a balance between a high level of current income and growth of capital, with a greater emphasis on growth of capital. The Portfolio operates as a fund of funds and normally invests approximately 40% of its assets in underlying funds that invest primarily in fixed-income securities and approximately 60% of its assets in underlying funds that invest primarily in equity securities.
| | |
| Asset Allocation | | |
| | | |
| Equity | 60% of Total |
|
| U.S. Large Cap | | 32% |
|
| International Large Cap | 6% |
|
| Emerging Markets | | 5% |
|
| U.S. Mid Cap | | 4% |
|
| Large Blend | | 4% |
|
| U.S. Small Cap | | 3% |
|
| International Small Cap | 2% |
|
| Real Estate | | 2% |
|
| Natural Resources | | 2% |
|
| |
| Fixed Income | 38% of Total |
|
| Intermediate Bond | | 11% |
|
| Multi-Sector Bond | | 11% |
|
| High-Yield Bond | | 7% |
|
| Bank Loan | | 4% |
|
| Global Bond | | 3% |
|
| Treasury Inflation- | | |
| Protected Securities | | 2% |
|
| |
| Other | | 2% of Total |
|
| Currency | | 2% |
|
As a percentage of net assets on 6-30-11.
Portfolio results
During the six months ended June 30, 2011, John Hancock Lifestyle Balanced Portfolio’s Class A, Class B, Class C, Class R1, Class R3, Class R4, Class R5, Class 1 and Class 5 returned 4.27%, 3.90%, 3.90%, 4.10%, 4.09%, 4.24%, 4.39%, 4.45% and 4.47%, respectively, at net asset value. In comparison, the S&P 500 Index returned 6.02%, the Barclays Capital U.S. Aggregate Bond Index returned 2.72% and a blended index — 60% S&P 500 Index/40% Barclays Capital U.S. Aggregate Bond Index — returned 4.72% over the same period. Morningstar, Inc.’s moderate allocation fund category returned an average 4.27%.1
Performance review
Diversification across a wide range of sectors benefited Portfolio performance, with weightings to high-yield bonds, TIPS (Treasury Inflation-Protected Securities), multi-sector bonds, global bonds and U.S. mid-caps contributing positively. Allocations to emerging markets and global natural resources were drags on performance in sharp contrast to last year.
The shifting market currents this quarter proved to be a difficult environment for active management in general, including managers in our Portfolio. For example, Emerging Markets Fund (DFA), which had been a strong contributor last year, detracted from relative performance due to its overweight and selection in smaller-cap issues. Results for International Opportunities Fund (Marsico), another strong performer in 2010, were hurt by selection in financial and energy stocks. Fundamental Value Fund’s (Davis) relative performance was hindered by selection in materials and energy stocks.
However, there were a number of bright spots. For example, Strategic Income Opportunities Fund (John Hancock) continued its strong performance, aided by good selection in high-yield and non-U.S. bonds, and currencies. Capital Appreciation Fund’s (Jennison), relative performance, which trailed last year, benefited from an overweight in the consumer discretionary sector and an underweight in the energy sector, good stock selection and large-cap focus. International Core Fund (GMO) had success as the market began to reward the kind of mega-cap quality stocks that the Fund emphasizes.
The Portfolio’s manager lineup has remained largely the same, with the exception of a newly established position in Capital Appreciation Value Fund (T. Rowe Price), which replaced T. Rowe’s Large Cap Value Fund, which liquidated. This fund has a flexible, yet conservative mandate that seeks to outperform the broad equity market with less risk than the benchmark over a full market cycle. We believe it is a welcome addition for what may be an increasingly volatile market environment going forward.
1 Figures from Morningstar, Inc. include reinvested dividends and do not take into account sales charges. Actual load-adjusted performance is lower.
This commentary reflects the views of the portfolio managers through the end of the Portfolio’s period discussed in this report. The managers’ statements reflect their own opinions. As such, they are in no way guarantees of future events and are not intended to be used as investment advice or a recommendation regarding any specific security. They are also subject to change at any time as market and other conditions warrant.
Past performance is no guarantee of future results.
| |
| 8 | Lifestyle Portfolios | Semiannual report |

| | | | | | | | |
| | Class B | Class C | Class R12 | Class R32 | Class R42 | Class R52 | Class 12 | Class 52 |
|
| Start date | 10-18-05 | 10-18-05 | 9-18-06 | 10-18-05 | 10-18-05 | 10-18-05 | 10-15-05 | 7-3-06 |
|
| Without sales charge | $12,710 | $12,766 | $11,902 | $13,097 | $13,309 | $13,534 | $13,594 | $12,724 |
|
| With maximum sales charge | 12,610 | 12,766 | 11,902 | 13,097 | 13,309 | 13,534 | 13,594 | 12,724 |
|
| Index 1 | 12,507 | 12,507 | 11,079 | 12,507 | 12,507 | 12,507 | 12,544 | 11,561 |
|
| Index 2 | 13,772 | 13,772 | 13,332 | 13,772 | 13,772 | 13,772 | 13,778 | 13,715 |
|
| Index 3 | 13,256 | 13,256 | 12,161 | 13,256 | 13,256 | 13,256 | 13,282 | 12,618 |
|
S&P 500 Index — is an unmanaged index that includes 500 widely traded common stocks.
Barclays Capital U.S. Aggregate Bond Index — is an unmanaged index of dollar-denominated and non-convertible investment grade debt issues.
60% S&P 500/40% Barclays Capital U.S. Aggregate Bond Index Blend — is comprised of 60% S&P 500 Index and 40% Barclays Capital U.S. Aggregate Bond Index. It is not possible to invest directly in an index. Index figures do not reflect sales charges, which would have resulted in lower values if they did.
Performance chart
Total returns with maximum sales charge (POP) for the period ended 6-30-11
| | | | | | | | | |
| | Class A | Class B | Class C | Class R12 | Class R32 | Class R42 | Class R52 | Class 12 | Class 52 |
|
| Start date | 10-18-05 | 10-18-05 | 10-18-05 | 9-18-06 | 10-18-05 | 10-18-05 | 10-18-05 | 10-15-05 | 7-3-06 |
|
| Average annual returns — 1 year | 15.44% | 15.62% | 19.67% | 21.06% | 21.08% | 21.47% | 21.87% | 21.96% | 22.10% |
|
| Average annual returns — 5 years | 3.36% | 3.30% | 3.71% | — | 4.17% | 4.47% | 4.79% | 4.87% | 4.94% |
|
| Average annual returns — Since inception | 4.16% | 4.15% | 4.38% | 3.70% | 4.85% | 5.14% | 5.45% | 5.52% | 4.94% |
|
| Cumulative returns — 6 months | –0.93% | –1.10% | 2.90% | 4.10% | 4.09% | 4.24% | 4.39% | 4.45% | 4.47% |
|
| Cumulative returns — 1 year | 15.44% | 15.62% | 19.67% | 21.06% | 21.08% | 21.47% | 21.87% | 21.96% | 22.10% |
|
| Cumulative returns — 5 years | 17.98% | 17.61% | 19.95% | — | 22.69% | 24.44% | 26.39% | 26.82% | 27.24% |
|
| Cumulative returns — Since inception | 26.14% | 26.10% | 27.66% | 19.02% | 30.97% | 33.09% | 35.34% | 35.94% | 27.24% |
|
Performance figures assume all distributions are reinvested. Returns with maximum sales charge reflect a sales charge on Class A shares of 5% and the applicable contingent deferred sales charge (CDSC) on Class B shares and Class C shares. The Class B shares’ CDSC declines annually between years 1–6 according to the following schedule: 5, 4, 3, 3, 2, 1%. No sales charges will be assessed after the sixth year. Class C shares held for less than one year are subject to a 1% CDSC. Sales charges are not applicable for Class R1, Class R3, Class R4, Class R5, Class 1 and Class 5 shares.
The expense ratios of the Portfolio, both net (including any fee waivers or expense limitations) and gross (excluding any fee waivers or expense limitations), are set forth according to the most recent publicly available prospectuses for the Portfolio and may differ from the expense ratios disclosed in the Financial Highlights tables in this report. The waivers and expense limitations are contractual at least until 4-30-12 for Class A, Class B, Class C, Class R1, Class R3, Class R4 and Class R5 shares. The following expense ratios include expenses of the underlying affiliated funds in which the Portfolio invests. The expenses are as follows:
| | | | | | | | | |
| | Class A | Class B | Class C | Class R1 | Class R3 | Class R4 | Class R5 | Class 1 | Class 5 |
| Net (%) | 1.40 | 2.11 | 2.10 | 1.67 | 1.60 | 1.26 | 0.99 | 0.92 | 0.88 |
| Gross (%) | 1.40 | 2.11 | 2.10 | 1.67 | 1.60 | 1.26 | 0.99 | 0.93 | 0.88 |
The returns reflect past results and should not be considered indicative of future performance. The return and principal value of an investment will fluctuate so that shares, when redeemed, may be worth more or less than their original cost. Due to market volatility, the Portfolio’s current performance may be higher or lower than the performance shown. For performance data current to the most recent month end, please call 1-800-225-5291 or visit the Portfolio’s Web site at www.jhfunds.com.
This performance information does not reflect the deduction of taxes that a shareholder may pay on Portfolio distributions or the redemption of Portfolio shares. The Portfolio’s performance results reflect any applicable expense reductions, without which the expenses would increase and results would have been less favorable.
1 NAV represents net asset value and POP represents public offering price. Performance of the classes will vary based on the difference in sales charges paid by shareholders investing in the different classes and the fee structure of those classes.
2 For certain types of investors, as described in the Portfolio’s Class R1, Class R3, Class R4, Class R5, Class 1 and Class 5 shares prospectuses.
| |
| Semiannual report | Lifestyle Portfolios | 9 |
John Hancock
Lifestyle Moderate Portfolio
Goal and strategy
The Portfolio seeks a balance between a high level of current income and growth of capital, with a greater emphasis on income. The Portfolio operates as a fund of funds and normally invests approximately 60% of its assets in underlying funds that invest primarily in fixed-income securities and approximately 40% of its assets in underlying funds that invest primarily in equity securities.
| | |
| Asset Allocation | | |
| | | |
| Equity | 38% of Total |
|
| U.S. Large Cap | | 20% |
|
| International Large Cap | 6% |
|
| U.S. Mid Cap | | 3% |
|
| Emerging Markets | | 2% |
|
| Large Blend | | 2% |
|
| Real Estate | | 2% |
|
| International Small Cap | 1% |
|
| U.S. Small Cap | | 1% |
|
| Natural Resources | | 1% |
|
| |
| Fixed Income | 60% of Total |
|
| Intermediate Bond | | 25% |
|
| Multi-Sector Bond | | 15% |
|
| High-Yield Bond | | 7% |
|
| Bank Loan | | 6% |
|
| Global Bond | | 4% |
|
| Treasury Inflation- | | |
| Protected Securities | | 3% |
|
| |
| Other | | 2% of Total |
|
| Currency | | 2% |
|
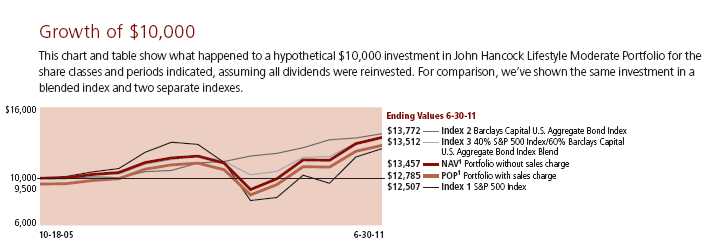
As a percentage of net assets on 6-30-11.
Portfolio results
During the six months ended June 30, 2011, John Hancock Lifestyle Moderate Portfolio’s Class A, Class B, Class C, Class R1, Class R3, Class R4, Class R5, Class 1 and Class 5 returned 4.13%, 3.67%, 3.68%, 3.89%, 3.90%, 4.05%, 4.22%, 4.29% and 4.32%, respectively, at net asset value. In comparison, the S&P 500 Index returned 6.02%, the Barclays Capital U.S. Aggregate Bond Index returned 2.72% and a blended index — 40% S&P 500 Index/60% Barclays Capital U.S. Aggregate Bond Index — returned 4.06% over the same period. Morningstar, Inc.’s conservative allocation fund group returned an average 3.83%.1
Performance review
Diversification across a wide range of asset classes helped the Portfolio outpace the blended index and Morningstar peer group. Allocations to high-yield bonds, TIPS (Treasury Inflation-Protected Securities), multi-sector bonds, global bonds and U.S. mid-cap stocks contributed positively. Allocations to emerging markets and international large cap were drags on performance.
The Portfolio had positive contributions from a number of managers. On the fixed-income side, both Active Bond Fund (Declaration/John Hancock) and Strategic Income Opportunities Fund (John Hancock) continued the strong performance of last year. Active Bond Fund’s performance was helped by its overweight to the credit sector, which performed well. Performance of Strategic Income Opportunities Fund was aided by strong selection in high-yield and non-U.S. bonds and currencies.
Among equity managers, Global Shareholder Yield Fund (Epoch) benefited from overweighting staples and underweighting financials. Relative performance of International Value Fund (Franklin) gained in the health care sector through both stock selection and an overweight position, and in financials through strong stock selection. Underweighting the materials sector also added to relative performance. U.S. Equity Fund (GMO) (formerly U.S. Multi Sector Fund), which had under-performed during prior periods, contributed positively, as the market began to reward the kind of mega-cap quality stocks that the fund emphasizes.
On the downside, Fundamental Value Fund’s (Davis) relative performance was hindered by selection in materials and energy stocks. Emerging Markets Fund (DFA), which had been a strong contributor last year, detracted from relative performance due to its overweight and selection in smaller-cap issues. Relative performance of International Opportunities Fund (Marsico), another strong performer in 2010, was hurt by selection in financial and energy stocks.
The Portfolio’s manager lineup remained the same during the period.
1 Figures from Morningstar, Inc. include reinvested dividends and do not take into account sales charges. Actual load-adjusted performance is lower.
This commentary reflects the views of the portfolio managers through the end of the Portfolio’s period discussed in this report. The managers’ statements reflect their own opinions. As such, they are in no way guarantees of future events and are not intended to be used as investment advice or a recommendation regarding any specific security. They are also subject to change at any time as market and other conditions warrant.
Past performance is no guarantee of future results.
| |
| 10 | Lifestyle Portfolios | Semiannual report |
| | | | | | | | |
| | Class B | Class C | Class R12 | Class R32 | Class R42 | Class R52 | Class 12 | Class 52 |
|
| Start date | 10-18-05 | 10-18-05 | 9-18-06 | 10-18-05 | 10-18-05 | 10-18-05 | 10-15-05 | 7-3-06 |
|
| Without sales charge | $12,864 | $12,927 | $12,329 | $13,251 | $13,436 | $13,696 | $13,783 | $13,152 |
|
| With maximum sales charge | 12,764 | 12,927 | 12,329 | 13,251 | 13,436 | 13,696 | 13,783 | 13,152 |
|
| Index 1 | 12,507 | 12,507 | 11,079 | 12,507 | 12,507 | 12,507 | 12,544 | 11,561 |
|
| Index 2 | 13,772 | 13,772 | 13,332 | 13,772 | 13,772 | 13,772 | 13,778 | 13,715 |
|
| Index 3 | 13,512 | 13,512 | 12,618 | 13,512 | 13,512 | 13,512 | 13,532 | 13,056 |
|
S&P 500 Index — is an unmanaged index that includes 500 widely traded common stocks.
Barclays Capital U.S. Aggregate Bond Index — is an unmanaged index of dollar-denominated and non-convertible investment grade debt issues.
40% S&P 500/60% Barclays Capital U.S. Aggregate Bond Index Blend — is comprised of 40% S&P 500 Index and 60% Barclays Capital U.S. Aggregate Bond Index It is not possible to invest directly in an index. Index figures do not reflect sales charges, which would have resulted in lower values if they did.
Performance chart
Total returns with maximum sales charge (POP) for the period ended 6-30-11
| | | | | | | | | |
| | Class A | Class B | Class C | Class R12 | Class R32 | Class R42 | Class R52 | Class 12 | Class 52 |
|
| Start date | 10-18-05 | 10-18-05 | 10-18-05 | 9-18-06 | 10-18-05 | 10-18-05 | 10-18-05 | 10-15-05 | 7-3-06 |
|
| Average annual returns — 1 year | 11.02% | 10.99% | 15.05% | 16.46% | 16.55% | 16.80% | 17.28% | 17.41% | 17.49% |
|
| Average annual returns — 5 years | 4.05% | 3.95% | 4.38% | — | 4.81% | 5.09% | 5.45% | 5.59% | 5.63% |
|
| Average annual returns — Since inception | 4.40% | 4.37% | 4.61% | 4.47% | 5.06% | 5.32% | 5.67% | 5.78% | 5.63% |
|
| Cumulative returns — 6 months | –1.05% | –1.33% | 2.68% | 3.89% | 3.90% | 4.05% | 4.22% | 4.29% | 4.32% |
|
| Cumulative returns — 1 year | 11.02% | 10.99% | 15.05% | 16.46% | 16.55% | 16.80% | 17.28% | 17.41% | 17.49% |
|
| Cumulative returns — 5 years | 21.97% | 21.35% | 23.89% | — | 26.49% | 28.19% | 30.41% | 31.23% | 31.52% |
|
| Cumulative returns — Since inception | 27.85% | 27.64% | 29.27% | 23.29% | 32.51% | 34.36% | 36.96% | 37.83% | 31.52% |
|
Performance figures assume all distributions are reinvested. Returns with maximum sales charge reflect a sales charge on Class A shares of 5%, and the applicable contingent deferred sales charge (CDSC) on Class B shares and Class C shares. The Class B shares’ CDSC declines annually between years 1–6 according to the following schedule: 5, 4, 3, 3, 2, 1%. No sales charges will be assessed after the sixth year. Class C shares held for less than one year are subject to a 1% CDSC. Sales charges are not applicable for Class R1, Class R3, Class R4, Class R5, Class 1 and Class 5 shares.
The expense ratios of the Portfolio, both net (including any fee waivers or expense limitations) and gross (excluding any fee waivers or expense limitations), are set forth according to the most recent publicly available prospectuses for the Portfolio and may differ from the expense ratios disclosed in the Financial Highlights tables in this report. The waivers and expense limitations are contractual at least until 4-30-12 for Class A, Class B, Class C, Class R1, Class R3, Class R4 and Class R5 shares. The following expense ratios include expenses of the underlying affiliated funds in which the Portfolio invests. The expenses are as follows:
| | | | | | | | | |
| | Class A | Class B | Class C | Class R1 | Class R3 | Class R4 | Class R5 | Class 1 | Class 5 |
| Net (%) | 1.36 | 2.08 | 2.06 | 1.67 | 1.61 | 1.33 | 0.99 | 0.87 | 0.83 |
| Gross (%) | 1.36 | 2.08 | 2.06 | 1.67 | 1.61 | 1.33 | 0.99 | 0.88 | 0.83 |
The returns reflect past results and should not be considered indicative of future performance. The return and principal value of an investment will fluctuate so that shares, when redeemed, may be worth more or less than their original cost. Due to market volatility, the Portfolio’s current performance may be higher or lower than the performance shown. For performance data current to the most recent month end, please call 1-800-225-5291 or visit the Portfolio’s Web site at www.jhfunds.com.
This performance information does not reflect the deduction of taxes that a shareholder may pay on Portfolio distributions or the redemption of Portfolio shares. The Portfolio’s performance results reflect any applicable expense reductions, without which the expenses would increase and results would have been less favorable.
1 NAV represents net asset value and POP represents public offering price. Performance of the classes will vary based on the difference in sales charges paid by shareholders investing in the different classes and the fee structure of those classes.
2 For certain types of investors, as described in the Portfolio’s Class R1, Class R3, Class R4, Class R5, Class 1 and Class 5 shares prospectuses.
| | |
| | Semiannual report | Lifestyle Portfolios | 11 |
John Hancock
Lifestyle Conservative Portfolio
Goal and strategy
The Portfolio seeks a high level of current income with some consideration given to growth of capital. The Portfolio operates as a fund of funds and normally invests approximately 80% of its assets in underlying funds that invest primarily in fixed-income securities and approximately 20% of its assets in underlying funds that invest primarily in equity securities.
| | |
| Asset Allocation | | |
| | | |
| Equity | 20% of Total |
|
| U.S. Large Cap | | 12% |
|
| International Large Cap | 4% |
|
| Real Estate | | 2% |
|
| U.S. Mid Cap | | 1% |
|
| Natural Resources | | 1% |
|
| |
| Fixed Income | 78% of Total |
|
| Intermediate Bond | | 34% |
|
| Multi-Sector Bond | | 17% |
|
| High-Yield Bond | | 8% |
|
| Bank Loan | | 7% |
|
| Global Bond | | 4% |
|
| Short-Term Bond | | 4% |
|
| Treasury Inflation- | | |
| Protected Securities | | 4% |
|
| |
| Other | | 2% of Total |
|
| Currency | | 2% |
|
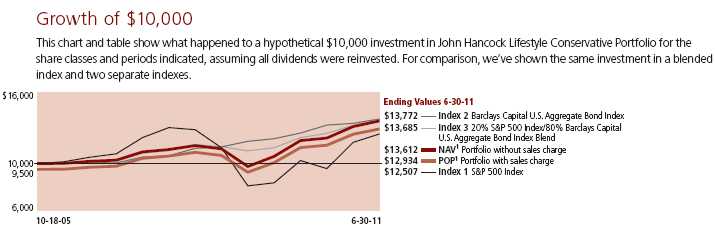
As a percentage of net assets on 6-30-11.
Portfolio results
During the six months ended June 30, 2011, John Hancock Lifestyle Conservative Portfolio’s Class A, Class B, Class C, Class R1, Class R3, Class R4, Class R5 and Class 1 returned 3.64%, 3.26%, 3.28%, 3.42%, 3.40%, 3.62%, 3.79% and 3.80%, respectively, at net asset value. In comparison, the S&P 500 Index returned 6.02%, the Barclays Capital U.S. Aggregate Bond Index returned 2.72% and a blended index — 20% S&P 500 Index/80% Barclays Capital U.S. Aggregate Bond Index — returned 3.40% over the same period. Morningstar, Inc.’s average conservative allocation fund returned 3.83%.1
Performance review
Diversification across a wide range of asset classes helped the Portfolio outpace the blended index’s performance. Positive contributions from weightings to high-yield bonds, TIPS (Treasury Inflation-Protected Securities), multi-sector bonds, global bonds, U.S. mid-cap stocks and U.S. real estate were partially offset by small negative contributions from international large-cap stocks and emerging markets.
The Portfolio had positive contributions from a number of managers. On the fixed-income side, both Active Bond Fund (Declaration/John Hancock) and Strategic Income Opportunities Fund (John Hancock) continued the strong relative performance of last year. Active Bond Fund’s relative performance was helped by its overweight to the credit sector, which performed well. Performance of Strategic Income Opportunities Fund was aided by strong selection in high-yield and non-U.S. bonds and currencies.
Among equity managers, Global Shareholder Yield Fund (Epoch) benefited from overweighting staples and underweighting financials. International Value Fund (Franklin) gained in the health care sector through both stock selection and an overweight position, and in financials through strong stock selection. Underweighting the materials sector also added to performance.
On the downside, Fundamental Value Fund’s (Davis) relative performance was hindered by selection in materials and energy stocks. Relative results for High Income Fund (John Hancock), one of last year’s big performers, were hurt by selection in the gaming and auto sectors. Multi-Sector Bond Fund (Stone Harbor) had an emphasis on shorter-duration bonds, which trailed long-duration bonds as interest rates fell during the period.
The Portfolio’s manager lineup remained the same during the period.
1 Figures from Morningstar, Inc. include reinvested dividends and do not take into account sales charges. Actual load-adjusted performance is lower.
This commentary reflects the views of the portfolio managers through the end of the Portfolio’s period discussed in this report. The managers’ statements reflect their own opinions. As such, they are in no way guarantees of future events and are not intended to be used as investment advice or a recommendation regarding any specific security. They are also subject to change at any time as market and other conditions warrant.
Past performance is no guarantee of future results.
| |
| 12 | Lifestyle Portfolios | Semiannual report |
| | | | | | | |
| | Class B | Class C | Class R12 | Class R32 | Class R42 | Class R52 | Class 12 |
|
| Start date | 10-18-05 | 10-18-05 | 9-18-06 | 10-18-05 | 10-18-05 | 10-18-05 | 10-15-05 |
|
| Without sales charge | $13,036 | $13,073 | $12,673 | $13,417 | $13,593 | $13,859 | $13,946 |
|
| With maximum sales charge | 12,936 | 13,073 | 12,673 | 13,417 | 13,593 | 13,859 | 13,946 |
|
| Index 1 | 12,507 | 12,507 | 11,079 | 12,507 | 12,507 | 12,507 | 12,544 |
|
| Index 2 | 13,772 | 13,772 | 13,332 | 13,772 | 13,772 | 13,772 | 13,778 |
|
| Index 3 | 13,685 | 13,685 | 13,011 | 13,685 | 13,685 | 13,685 | 13,698 |
|
S&P 500 Index — is an unmanaged index that includes 500 widely traded common stocks.
Barclays Capital U.S. Aggregate Bond Index — is an unmanaged index of dollar-denominated and non-convertible investment grade debt issues.
20% S&P 500/80% Barclays Capital U.S. Aggregate Bond Index Blend — is comprised of 20% S&P 500 Index and 80% Barclays Capital U.S. Aggregate Bond Index. It is not possible to invest directly in an index. Index figures do not reflect sales charges, which would have resulted in lower values if they did.
Performance chart
Total returns with maximum sales charge (POP) for the period ended 6-30-11
| | | | | | | | |
| | Class A | Class B | Class C | Class R12 | Class R32 | Class R42 | Class R52 | Class 12 |
|
| Start date | 10-18-05 | 10-18-05 | 10-18-05 | 9-18-06 | 10-18-05 | 10-18-05 | 10-18-05 | 10-15-05 |
|
| Average annual returns — 1 year | 6.37% | 6.14% | 10.27% | 11.50% | 11.56% | 11.97% | 12.40% | 12.46% |
|
| Average annual returns — 5 years | 4.69% | 4.63% | 5.03% | — | 5.48% | 5.73% | 6.09% | 6.22% |
|
| Average annual returns — Since inception | 4.62% | 4.62% | 4.81% | 5.07% | 5.29% | 5.53% | 5.89% | 6.00% |
|
| Cumulative returns — 6 months | –1.53% | –1.74% | 2.28% | 3.42% | 3.40% | 3.62% | 3.79% | 3.80% |
|
| Cumulative returns — 1 year | 6.37% | 6.14% | 10.27% | 11.50% | 11.56% | 11.97% | 12.40% | 12.46% |
|
| Cumulative returns — 5 years | 25.74% | 25.39% | 27.80% | — | 30.55% | 32.10% | 34.42% | 35.23% |
|
| Cumulative returns — Since inception | 29.34% | 29.36% | 30.73% | 26.73% | 34.17% | 35.93% | 38.59% | 39.46% |
|
Performance figures assume all distributions are reinvested. Returns with maximum sales charge reflect a sales charge on Class A shares of 5%, and the applicable contingent deferred sales charge (CDSC) on Class B shares and Class C shares. The Class B shares’ CDSC declines annually between years 1–6 according to the following schedule: 5, 4, 3, 3, 2, 1%. No sales charges will be assessed after the sixth year. Class C shares held for less than one year are subject to a 1% CDSC. Sales charges are not applicable for Class R1, Class R3, Class R4, Class R5 and Class 1 shares.
The expense ratios of the Portfolio, both net (including any fee waivers or expense limitations) and gross (excluding any fee waivers or expense limitations), are set forth according to the most recent publicly available prospectuses for the Portfolio and may differ from the expense ratios disclosed in the Financial Highlights tables in this report. The waivers and expense limitations are contractual at least until 4-30-12 for Class A, Class B, Class C, Class R1, Class R3, Class R4 and Class R5 shares. The following expense ratios include expenses of the underlying affiliated funds in which the Portfolio invests. The expenses are as follows:
| | | | | | | | |
| | Class A | Class B | Class C | Class R1 | Class R3 | Class R4 | Class R5 | Class 1 |
| Net (%) | 1.33 | 2.05 | 2.03 | 1.59 | 1.57 | 1.32 | 0.95 | 0.84 |
| Gross (%) | 1.33 | 2.05 | 2.03 | 1.59 | 1.57 | 1.32 | 0.95 | 0.85 |
The returns reflect past results and should not be considered indicative of future performance. The return and principal value of an investment will fluctuate so that shares, when redeemed, may be worth more or less than their original cost. Due to market volatility, the Portfolio’s current performance may be higher or lower than the performance shown. For performance data current to the most recent month end, please call 1-800-225-5291 or visit the Portfolio’s Web site at www.jhfunds.com.
This performance information does not reflect the deduction of taxes that a shareholder may pay on Portfolio distributions or the redemption of Portfolio shares. The Portfolio’s performance results reflect any applicable expense reductions, without which the expenses would increase and results would have been less favorable.
1 NAV represents net asset value and POP represents public offering price. Performance of the classes will vary based on the difference in sales charges paid by shareholders investing in the different classes and the fee structure of those classes.
2 For certain types of investors, as described in the Portfolio’s Class R1, Class R3, Class R4, Class R5 and Class 1 shares prospectuses.
| |
| Semiannual report | Lifestyle Portfolios | 13 |
Your expenses
As a shareholder of a John Hancock Funds II Lifestyle Portfolio, you incur two types of costs: (1) transaction costs, including sales charges (loads) on certain purchase and redemption fees on certain exchanges and redemptions, and (2) ongoing costs, including management fees, distribution and service (12b-1) fees and other Portfolio expenses. In addition to the operating expenses which the Portfolio bears directly, the Portfolio indirectly bears a pro rata share of the operating expenses of the affiliated underlying funds in which the Portfolio invests. Because the affiliated underlying funds have varied operating expenses and transaction costs and the Portfolio may own different proportions of the underlying funds at different times, the amount of expenses incurred indirectly by the Portfolio will vary. Had these indirect expenses been reflected in the following analysis, total expenses would have been higher than the amounts shown.
This example is intended to help you understand your ongoing costs (in dollars) of investing in the Portfolio so you can compare these costs with the ongoing costs of investing in other mutual funds. The example is based on an investment of $1,000 at the beginning of the period and held for the entire period (January 1, 2011 through June 30, 2011).
Actual expenses:
The first line of each share class in the table below and on the following pages provides information about actual account values and actual expenses. You may use the information in this line, together with the amount you invested, to estimate the expenses that you paid over the period. Simply divide your account value by $1,000 (for example, an $8,600 account value divided by $1,000 = 8.6), then multiply the result by the number in the first line under the heading entitled “Expenses paid during period” to estimate the expenses you paid on your account during this period.
Hypothetical example for comparison purposes:
The second line of each share class in the table below and on the following pages provides information about hypothetical account values and hypothetical expenses based on the actual expense ratio for the share class and an assumed annualized rate of return of 5% per year before expenses, which is not the actual return of the share class. The hypothetical account values and expenses may not be used to estimate the actual ending account balance or expenses you paid for the period. You may use this information to compare the ongoing costs of investing in the Portfolio and other funds. To do so, compare this 5% hypothetical example with the 5% hypothetical examples that appear in the shareholder reports of the other funds.
Please note that the expenses shown in the table are meant to highlight your ongoing costs only and do not reflect any transactional costs and insurance-related charges. Therefore, the second line of each share class in the table is useful in comparing ongoing costs only, and will not help you determine the relative total costs of owning different funds. In addition, if these transactional costs were included, your costs would have been higher.
| |
| 14 | Lifestyle Portfolios | Semiannual report |
Shareholder expense example chart
| | | | | |
| | | Beginning | Ending | Expenses Paid | |
| | | Account Value | Account Value | During Period1 | Annualized |
| | | 1-1-11 | 6-30-11 | 1-1-11–6-30-11 | Expense Ratio2 |
| Lifestyle Aggressive Portfolio | | | | |
|
| Class A | Actual | $1,000.00 | $1,046.20 | $2.79 | 0.55% |
| | Hypothetical (5% annualized return before expenses) | 1,000.00 | 1,022.10 | 2.76 | 0.55% |
|
| Class B | Actual | 1,000.00 | 1,042.00 | 6.84 | 1.35% |
| | Hypothetical (5% annualized return before expenses) | 1,000.00 | 1,018.10 | 6.76 | 1.35% |
|
| Class C | Actual | 1,000.00 | 1,042.00 | 6.33 | 1.25% |
| | Hypothetical (5% annualized return before expenses) | 1,000.00 | 1,018.60 | 6.26 | 1.25% |
|
| Class R1 | Actual | 1,000.00 | 1,044.40 | 4.56 | 0.90% |
| | Hypothetical (5% annualized return before expenses) | 1,000.00 | 1,020.30 | 4.51 | 0.90% |
|
| Class R3 | Actual | 1,000.00 | 1,044.60 | 4.16 | 0.82% |
| | Hypothetical (5% annualized return before expenses) | 1,000.00 | 1,020.70 | 4.11 | 0.82% |
|
| Class R4 | Actual | 1,000.00 | 1,045.50 | 2.79 | 0.55% |
| | Hypothetical (5% annualized return before expenses) | 1,000.00 | 1,022.10 | 2.76 | 0.55% |
|
| Class R5 | Actual | 1,000.00 | 1,047.90 | 1.12 | 0.22% |
| | Hypothetical (5% annualized return before expenses) | 1,000.00 | 1,023.70 | 1.10 | 0.22% |
|
| Class 1 | Actual | 1,000.00 | 1,048.00 | 0.56 | 0.11% |
| | Hypothetical (5% annualized return before expenses) | 1,000.00 | 1,024.20 | 0.55 | 0.11% |
| |
| Lifestyle Growth Portfolio | | | | |
|
| Class A | Actual | $1,000.00 | $1,044.20 | $2.79 | 0.55% |
| | Hypothetical (5% annualized return before expenses) | 1,000.00 | 1,022.10 | 2.76 | 0.55% |
|
| Class B | Actual | 1,000.00 | 1,040.20 | 6.53 | 1.29% |
| | Hypothetical (5% annualized return before expenses) | 1,000.00 | 1,018.40 | 6.46 | 1.29% |
|
| Class C | Actual | 1,000.00 | 1,040.30 | 6.32 | 1.25% |
| | Hypothetical (5% annualized return before expenses) | 1,000.00 | 1,018.60 | 6.26 | 1.25% |
|
| Class R1 | Actual | 1,000.00 | 1,042.50 | 4.30 | 0.85% |
| | Hypothetical (5% annualized return before expenses) | 1,000.00 | 1,020.60 | 4.26 | 0.85% |
|
| Class R3 | Actual | 1,000.00 | 1,042.70 | 3.95 | 0.78% |
| | Hypothetical (5% annualized return before expenses) | 1,000.00 | 1,020.90 | 3.91 | 0.78% |
|
| Class R4 | Actual | 1,000.00 | 1,044.30 | 2.48 | 0.49% |
| | Hypothetical (5% annualized return before expenses) | 1,000.00 | 1,022.40 | 2.46 | 0.49% |
|
| Class R5 | Actual | 1,000.00 | 1,045.80 | 0.91 | 0.18% |
| | Hypothetical (5% annualized return before expenses) | 1,000.00 | 1,023.90 | 0.90 | 0.18% |
|
| Class 1 | Actual | 1,000.00 | 1,046.00 | 0.56 | 0.11% |
| | Hypothetical (5% annualized return before expenses) | 1,000.00 | 1,024.20 | 0.55 | 0.11% |
|
| Class 5 | Actual | 1,000.00 | 1,046.80 | 0.30 | 0.06% |
| | Hypothetical (5% annualized return before expenses) | 1,000.00 | 1,024.50 | 0.30 | 0.06% |
| |
| Semiannual report | Lifestyle Portfolios | 15 |
Shareholder expense example chart, continued
| | | | | |
| | | Beginning | Ending | Expenses Paid | |
| | | Account Value | Account Value | During Period1 | Annualized |
| | | 1-1-11 | 6-30-11 | 1-1-11–6-30-11 | Expense Ratio2 |
| Lifestyle Balanced Portfolio | | | | |
|
| Class A | Actual | $1,000.00 | $1,042.70 | $2.79 | 0.55% |
| | Hypothetical (5% annualized return before expenses) | 1,000.00 | 1,022.10 | 2.76 | 0.55% |
|
| Class B | Actual | 1,000.00 | 1,039.00 | 6.37 | 1.26% |
| | Hypothetical (5% annualized return before expenses) | 1,000.00 | 1,018.50 | 6.31 | 1.26% |
|
| Class C | Actual | 1,000.00 | 1,039.00 | 6.32 | 1.25% |
| | Hypothetical (5% annualized return before expenses) | 1,000.00 | 1,018.60 | 6.26 | 1.25% |
|
| Class R1 | Actual | 1,000.00 | 1,041.00 | 4.55 | 0.90% |
| | Hypothetical (5% annualized return before expenses) | 1,000.00 | 1,020.30 | 4.51 | 0.90% |
|
| Class R3 | Actual | 1,000.00 | 1,040.90 | 3.85 | 0.76% |
| | Hypothetical (5% annualized return before expenses) | 1,000.00 | 1,021.00 | 3.81 | 0.76% |
|
| Class R4 | Actual | 1,000.00 | 1,042.40 | 2.43 | 0.48% |
| | Hypothetical (5% annualized return before expenses) | 1,000.00 | 1,022.40 | 2.41 | 0.48% |
|
| Class R5 | Actual | 1,000.00 | 1,043.90 | 0.86 | 0.17% |
| | Hypothetical (5% annualized return before expenses) | 1,000.00 | 1,024.00 | 0.85 | 0.17% |
|
| Class 1 | Actual | 1,000.00 | 1,044.50 | 0.56 | 0.11% |
| | Hypothetical (5% annualized return before expenses) | 1,000.00 | 1,024.20 | 0.55 | 0.11% |
|
| Class 5 | Actual | 1,000.00 | 1,044.70 | 0.30 | 0.06% |
| | Hypothetical (5% annualized return before expenses) | 1,000.00 | 1,024.50 | 0.30 | 0.06% |
| |
| Lifestyle Moderate Portfolio | | | | |
|
| Class A | Actual | $1,000.00 | $1,041.30 | $2.78 | 0.55% |
| | Hypothetical (5% annualized return before expenses) | 1,000.00 | 1,022.10 | 2.76 | 0.55% |
|
| Class B | Actual | 1,000.00 | 1,036.70 | 6.46 | 1.28% |
| | Hypothetical (5% annualized return before expenses) | 1,000.00 | 1,018.40 | 6.41 | 1.28% |
|
| Class C | Actual | 1,000.00 | 1,036.80 | 6.31 | 1.25% |
| | Hypothetical (5% annualized return before expenses) | 1,000.00 | 1,018.60 | 6.26 | 1.25% |
|
| Class R1 | Actual | 1,000.00 | 1,038.90 | 4.95 | 0.98% |
| | Hypothetical (5% annualized return before expenses) | 1,000.00 | 1,019.90 | 4.91 | 0.98% |
|
| Class R3 | Actual | 1,000.00 | 1,039.00 | 4.25 | 0.84% |
| | Hypothetical (5% annualized return before expenses) | 1,000.00 | 1,020.60 | 4.21 | 0.84% |
|
| Class R4 | Actual | 1,000.00 | 1,040.50 | 2.93 | 0.58% |
| | Hypothetical (5% annualized return before expenses) | 1,000.00 | 1,021.90 | 2.91 | 0.58% |
|
| Class R5 | Actual | 1,000.00 | 1,042.20 | 1.11 | 0.22% |
| | Hypothetical (5% annualized return before expenses) | 1,000.00 | 1,023.70 | 1.10 | 0.22% |
|
| Class 1 | Actual | 1,000.00 | 1,042.90 | 0.56 | 0.11% |
| | Hypothetical (5% annualized return before expenses) | 1,000.00 | 1,024.20 | 0.55 | 0.11% |
|
| Class 5 | Actual | 1,000.00 | 1,043.20 | 0.30 | 0.06% |
| | Hypothetical (5% annualized return before expenses) | 1,000.00 | 1,024.50 | 0.30 | 0.06% |
|
| |
| 16 | Lifestyle Portfolios | Semiannual report |
Shareholder expense example chart, continued
| | | | | |
| | | Beginning | Ending | Expenses Paid | |
| | | Account Value | Account Value | During Period1 | Annualized |
| | | 1-1-11 | 6-30-11 | 1-1-11–6-30-11 | Expense Ratio2 |
| Lifestyle Conservative Portfolio | | | | |
|
| Class A | Actual | $1,000.00 | $1,036.40 | $2.78 | 0.55% |
| | Hypothetical (5% annualized return before expenses) | 1,000.00 | 1,022.10 | 2.76 | 0.55% |
|
| Class B | Actual | 1,000.00 | 1,032.60 | 6.45 | 1.28% |
| | Hypothetical (5% annualized return before expenses) | 1,000.00 | 1,018.40 | 6.41 | 1.28% |
|
| Class C | Actual | 1,000.00 | 1,032.80 | 6.30 | 1.25% |
| | Hypothetical (5% annualized return before expenses) | 1,000.00 | 1,018.60 | 6.26 | 1.25% |
|
| Class R1 | Actual | 1,000.00 | 1,034.20 | 4.94 | 0.98% |
| | Hypothetical (5% annualized return before expenses) | 1,000.00 | 1,019.90 | 4.91 | 0.98% |
|
| Class R3 | Actual | 1,000.00 | 1,034.00 | 4.44 | 0.88% |
| | Hypothetical (5% annualized return before expenses) | 1,000.00 | 1,020.40 | 4.41 | 0.88% |
|
| Class R4 | Actual | 1,000.00 | 1,036.20 | 2.98 | 0.59% |
| | Hypothetical (5% annualized return before expenses) | 1,000.00 | 1,021.90 | 2.96 | 0.59% |
|
| Class R5 | Actual | 1,000.00 | 1,037.90 | 1.41 | 0.28% |
| | Hypothetical (5% annualized return before expenses) | 1,000.00 | 1,023.40 | 1.40 | 0.28% |
|
| Class 1 | Actual | 1,000.00 | 1,038.00 | 0.61 | 0.12% |
| | Hypothetical (5% annualized return before expenses) | 1,000.00 | 1,024.20 | 0.60 | 0.12% |
|
1 Expenses are equal to the annualized expense ratio, multiplied by the average account value over the period, multiplied by the number of days in the period (181) and divided by 365 (to reflect the one-half year period).
2 The Portfolios’ expense ratios do not include fees and expenses indirectly incurred by the underlying funds who expense ratios can vary based on the mix of underlying funds held by the Portfolios. The range of expense ratios of the underlying funds held by the Portfolios was as follows:
| | | | | |
| | Lifestyle | Lifestyle | Lifestyle | Lifestyle | Lifestyle |
| Period ended | Aggressive | Growth | Balanced | Moderate | Conservative |
| 6-30-11 | 0.48%–1.38% | 0.48%–1.38% | 0.48%–1.38% | 0.48%–1.14% | 0.48%–1.11% |
| |
| Semiannual report | Lifestyle Portfolios | 17 |
Portfolio’s investments
| |
| Investment companies | |
| | |
| Underlying Funds’ Subadvisers | |
| American Century Management, Inc. | (American Century) |
| Columbia Management Investment | |
| Advisors, LLC | (Columbia) |
| Davis Selected Advisors, L.P. | (Davis) |
| Declaration Management & | (Declaration) |
| Research LLC | |
| Deutsche Asset Management | (Deutsche) |
| Dimensional Fund Advisors LP | (DFA) |
| Epoch Investment Partners, Inc. | (Epoch) |
| First Quadrant L.P. | (First Quadrant) |
| Franklin Mutual Advisers | |
| Franklin Templeton Investment Corp. | (Franklin) |
| Templeton Investment Counsel, LLC | |
| Frontier Capital Management Company | (Frontier) |
| Grantham, Mayo, Van Otterloo & Co. LLC | (GMO) |
| Invesco Advisers, Inc. | (Invesco) |
| Jennison Associates LLC | (Jennison) |
| John Hancock Asset Management* | (John Hancock) |
| Lord Abbett | (Lord Abbett) |
| Marsico Capital Management, LLC | (Marsico) |
| Pacific Investment Management Company | (PIMCO) |
| Perimeter Capital Management, LLC | (Perimeter) |
| QS Investors, LLC | (QS Investors) |
| Rainier Investment Management, Inc. | (Rainier) |
| Robeco Investment Management, Inc. | (Robeco) |
| SSgA Funds Management, Inc. | (SSgA) |
| Stone Harbor Investment Partners, LP | (Stone Harbor) |
| T. Rowe Price Associates, Inc. | (T. Rowe Price) |
| UBS Global Asset Management | |
| (Americas) Inc. | (UBS) |
| Wellington Management Company, LLP | (Wellington) |
| Wells Capital Management, Inc. | (Wells Capital) |
| Western Asset Management Company | (WAMCO) |
* Manulife Asset Management (US) LLC and Manulife Asset Management (North America) Limited are doing business as John Hancock Asset Management.
Lifestyle Aggressive Portfolio
Securities owned by the Portfolio on 6-30-11 (Unaudited)
| | |
| | Shares | Value |
| Affiliated Investment Companies — 100.00% | |
|
| EQUITY 98.00% | | |
| | | |
| John Hancock Funds II (G) 87.97% | | |
|
| All Cap Core, Class NAV (QS Investors) | 11,035,776 | $103,736,293 |
|
| All Cap Value, Class NAV (Lord Abbett) | 6,739,279 | 81,882,236 |
|
| Alpha Opportunities, Class NAV (Wellington) | 17,827,929 | 218,926,973 |
|
| Blue Chip Growth, Class NAV (T. Rowe Price) | 11,758,246 | 256,212,184 |
|
| Capital Appreciation, Class NAV (Jennison) | 17,533,144 | 214,255,020 |
|
| Capital Appreciation Value, Class NAV | | |
| (T.Rowe Price) (I) | 4,446,538 | 46,510,784 |
|
| Emerging Markets, Class NAV (DFA) | 32,259,241 | 386,143,120 |
|
| Equity-Income, Class NAV (T. Rowe Price) | 13,576,115 | 201,605,302 |
|
| Fundamental Value, Class NAV (Davis) | 13,270,490 | 205,825,298 |
|
| Global Real Estate, Class NAV (Deutsche) | 4,331,167 | 34,129,598 |
|
| Heritage, Class NAV (American Century) | 4,636,546 | 46,411,826 |
|
| Index 500, Class NAV (John Hancock2)(A) | 18,414,486 | 180,830,253 |
|
| International Equity Index, Class NAV (SSgA) | 1,451,546 | 26,737,468 |
|
| International Growth Stock , Class NAV (Invesco) | 3,215,898 | 37,336,574 |
|
| International Opportunities, Class NAV (Marsico) | 8,073,282 | 113,671,809 |
|
| International Small Cap, Class NAV (Franklin) | 2,774,177 | 46,744,876 |
|
| International Small Company, Class NAV (DFA) | 5,180,010 | 46,257,485 |
|
| International Value, Class NAV (Franklin) | 9,796,488 | 151,649,629 |
|
| Large Cap, Class NAV (UBS) | 3,010,160 | 41,088,685 |
|
| Mid Cap Index, Class NAV (John Hancock2) (A) | 3,845,971 | 81,573,038 |
|
| Mid Cap Stock, Class NAV (Wellington) (I) | 5,469,499 | 104,959,692 |
|
| Mid Cap Value Equity, Class NAV (Columbia) | 3,344,684 | 35,453,647 |
|
| Mid Value, Class NAV (T. Rowe Price) | 4,935,125 | 76,297,029 |
|
| Mutual Shares, Class NAV (Franklin) | 4,378,818 | 50,049,891 |
|
| Natural Resources, Class NAV (Wellington) | 5,299,026 | 125,109,999 |
|
| Optimized Value, Class NAV (John Hancock2) (A) | 5,457,523 | 68,328,187 |
|
| Real Estate Equity, Class NAV (T. Rowe Price) | 2,333,647 | 20,092,702 |
|
| Small Cap Growth, Class NAV (Wellington) | 2,824,607 | 33,471,590 |
|
| Small Cap Index, Class NAV (John Hancock2) (A) | 1,338,206 | 18,975,763 |
|
| Small Cap Opportunities, Class NAV | | |
| (Invesco/DFA) (I) | 1,655,351 | 38,089,621 |
|
| Small Cap Value, Class NAV (Wellington) | 2,172,312 | 37,906,849 |
|
| Small Company Growth, Class NAV (Invesco) (I) | 2,000,389 | 29,925,819 |
|
| Small Company Value, Class NAV (T. Rowe Price) | 2,003,779 | 54,522,827 |
|
| Smaller Company Growth, Class NAV | | |
| (Frontier/John Hancock2(A)/Perimeter) | 2,461,766 | 30,107,395 |
|
| Technical Opportunities, Class NAV (Wellington) (I) | 5,910,046 | 69,088,439 |
|
| U.S. Equity, Class NAV (GMO) | 15,571,606 | 160,543,257 |
|
| Value, Class NAV (Invesco) | 3,600,101 | 38,053,067 |
|
| Value & Restructuring, Class NAV (Columbia) | 6,373,866 | 75,785,268 |
| | | |
| John Hancock Funds III (G) 8.93% | | |
|
| Disciplined Value, Class NAV (Robeco) | 5,513,497 | 74,432,208 |
|
| International Core, Class NAV (GMO) | 4,704,883 | 147,874,486 |
|
| Rainier Growth, Class NAV (Rainier) | 6,555,310 | 141,725,796 |
| | | |
| John Hancock Investment Trust (G) 1.10% | |
|
| Small Cap Intrinsic Value, Class NAV | | |
| (John Hancock1) (A) | 3,265,811 | 45,068,194 |
| | | |
| OTHER 2.00% | | |
| | | |
| John Hancock Funds II (G) 2.00% | | |
|
| Currency Strategies, Class NAV (First Quadrant) (I) | 8,992,040 | 81,557,802 |
| | | |
| Total Investments (Lifestyle Aggressive Portfolio) |
| (Cost $3,278,359,184) 100.00% | | $4,078,947,979 |
| | | |
| Other assets and liabilities, net (0.00%) | (87,813) |
|
| TOTAL NET ASSETS 100.00% | | $4,078,860,166 |
| | | |
| Percentages are based upon net assets. | | |
See notes to financial statements
| |
| 18 | Lifestyle Portfolios | Semiannual report |
Lifestyle Growth Portfolio
Securities owned by the Portfolio on 6-30-11 (Unaudited)
| | |
| | Shares | Value |
| Affiliated Investment Companies — 99.99% | |
|
| EQUITY 81.00% | | |
| | | |
| John Hancock Funds II (G) 72.91% | | |
|
| All Cap Core, Class NAV (QS Investors) | 33,722,004 | $316,986,837 |
|
| All Cap Value, Class NAV (Lord Abbett) | 16,657,336 | 202,386,636 |
|
| Alpha Opportunities, Class NAV (Wellington) | 52,703,312 | 647,196,666 |
|
| Blue Chip Growth, Class NAV (T. Rowe Price) | 31,063,524 | 676,874,181 |
|
| Capital Appreciation, Class NAV (Jennison) | 44,010,135 | 537,803,850 |
|
| Capital Appreciation Value, Class NAV | | |
| (T.Rowe Price) (I) | 12,351,834 | 129,200,180 |
|
| Emerging Markets, Class NAV (DFA) | 70,252,502 | 840,922,452 |
|
| Equity-Income, Class NAV (T. Rowe Price) | 33,077,514 | 491,201,082 |
|
| Fundamental Value, Class NAV (Davis) | 38,408,918 | 595,722,318 |
|
| Global Real Estate, Class NAV (Deutsche) | 22,846,342 | 180,029,175 |
|
| Heritage, Class NAV (American Century) | 9,044,590 | 90,536,344 |
|
| Index 500, Class NAV (John Hancock2)(A) | 36,695,990 | 360,354,626 |
|
| International Equity Index, Class NAV (SSgA) | 5,093,013 | 93,813,291 |
|
| International Growth Stock , Class NAV (Invesco) | 7,015,207 | 81,446,548 |
|
| International Opportunities, Class NAV (Marsico) | 19,768,002 | 278,333,474 |
|
| International Small Cap, Class NAV (Franklin) | 4,988,459 | 84,055,540 |
|
| International Small Company, Class NAV (DFA) | 9,532,761 | 85,127,552 |
|
| International Value, Class NAV (Franklin) | 23,652,160 | 366,135,430 |
|
| Large Cap, Class NAV (UBS) | 9,087,833 | 124,048,922 |
|
| Mid Cap Index, Class NAV (John Hancock2) (A) | 11,779,917 | 249,852,046 |
|
| Mid Cap Stock, Class NAV (Wellington) (I) | 11,243,716 | 215,766,916 |
|
| Mid Cap Value Equity, Class NAV (Columbia) | 5,530,151 | 58,619,602 |
|
| Mid Value, Class NAV (T. Rowe Price) | 11,182,033 | 172,874,226 |
|
| Mutual Shares, Class NAV (Franklin) | 12,144,536 | 138,812,044 |
|
| Natural Resources, Class NAV (Wellington) | 11,556,026 | 272,837,785 |
|
| Optimized Value, Class NAV (John Hancock2) (A) | 13,103,896 | 164,060,782 |
|
| Real Estate Equity, Class NAV (T. Rowe Price) | 12,343,257 | 106,275,439 |
|
| Small Cap Growth, Class NAV (Wellington) | 5,009,511 | 59,362,702 |
|
| Small Cap Opportunities, Class NAV | | |
| (Invesco/DFA) (I) | 2,712,220 | 62,408,193 |
|
| Small Cap Value, Class NAV (Wellington) | 3,653,192 | 63,748,209 |
|
| Small Company Growth, Class NAV (Invesco) (I) | 3,475,442 | 51,992,615 |
|
| Small Company Value, Class NAV (T. Rowe Price) | 3,453,123 | 93,959,475 |
|
| Smaller Company Growth, Class NAV | | |
| (Frontier/John Hancock2 (A)/Perimeter) | 4,114,561 | 50,321,077 |
|
| Technical Opportunities, Class NAV (Wellington) (I) | 18,064,674 | 211,176,038 |
|
| U.S. Equity, Class NAV (GMO) | 47,312,331 | 487,790,133 |
|
| Value, Class NAV (Invesco) | 5,996,900 | 63,387,231 |
|
| Value & Restructuring, Class NAV (Columbia) | 16,795,535 | 199,698,907 |
| | | |
| John Hancock Funds III (G) 7.47% | | |
|
| Disciplined Value, Class NAV (Robeco) | 13,858,561 | 187,090,576 |
|
| International Core, Class NAV (GMO) | 11,389,728 | 357,979,143 |
|
| Rainier Growth, Class NAV (Rainier) | 16,996,711 | 367,468,892 |
| | | |
| John Hancock Investment Trust (G) 0.62% | |
|
| Small Cap Intrinsic Value, Class NAV | | |
| (John Hancock1) (A) | 5,452,196 | 75,240,306 |
| | | |
| FIXED INCOME 16.97% | | |
| John Hancock Funds II (G) 16.97% | | |
|
| Active Bond, Class NAV | | |
| (John Hancock1/Declaration) (A) | 10,260,121 | 104,345,433 |
|
| Floating Rate Income, Class NAV (WAMCO) | 33,633,659 | 319,856,092 |
|
| Global Bond, Class NAV (PIMCO) | 9,048,960 | 115,102,769 |
|
| Global High Yield, Class NAV (Stone Harbor) | 7,168,232 | 75,911,578 |
|
| High Income, Class NAV (John Hancock1) (A) | 15,320,433 | 127,312,795 |
|
| High Yield, Class NAV (WAMCO) | 17,175,778 | 156,814,853 |
|
| Multi-Sector Bond, Class NAV (Stone Harbor) | 17,913,255 | 186,118,724 |
|
| Real Return Bond, Class NAV (PIMCO) | 7,980,952 | 100,639,805 |
|
| Spectrum Income, Class NAV (T. Rowe Price) | 18,065,162 | 194,923,098 |
|
| Strategic Income Opportunities, Class NAV | | |
| (John Hancock1) (A) | 19,661,894 | 220,016,589 |
|
| Total Return, Class NAV (PIMCO) | 24,996,351 | 350,448,842 |
|
| U.S. High Yield Bond, Class NAV (Wells Capital) | 9,553,989 | 122,004,439 |
| | | |
| OTHER 2.02% | | |
| John Hancock Funds II (G) 2.02% | | |
|
| Currency Strategies, Class NAV (First Quadrant) (I) | 27,170,878 | 246,439,859 |
| | | |
| Total Investments (Lifestyle Growth Portfolio) | |
| (Cost $10,170,977,394) 99.99% | | $12,212,832,317 |
| | | |
| Other assets and liabilities, net 0.01% | | 1,117,518 |
|
| TOTAL NET ASSETS 100.00% | | $12,213,949,835 |
| | | |
| Percentages are based upon net assets. | | |
Lifestyle Balanced Portfolio
Securities owned by the Portfolio on 6-30-11 (Unaudited)
| | |
| | Shares | Value |
| Affiliated Investment Companies — 99.99% | |
|
| EQUITY 59.80% | | |
| | | |
| John Hancock Funds II (G) 53.85% | | |
|
| All Cap Core, Class NAV (QS Investors) | 26,917,431 | $253,023,856 |
|
| All Cap Value, Class NAV (Lord Abbett) | 13,110,149 | 159,288,309 |
|
| Alpha Opportunities, Class NAV (Wellington) | 37,785,972 | 464,011,738 |
|
| Blue Chip Growth, Class NAV (T. Rowe Price) | 24,051,768 | 524,088,019 |
|
| Capital Appreciation, Class NAV (Jennison) | 31,924,147 | 390,113,073 |
|
| Capital Appreciation Value, Class NAV | | |
(T.Rowe Price) (I) | 11,134,226 | 116,464,004 |
|
| Emerging Markets, Class NAV (DFA) | 45,815,623 | 548,413,002 |
|
| Equity-Income, Class NAV (T. Rowe Price) | 20,526,242 | 304,814,698 |
|
| Fundamental Value, Class NAV (Davis) | 29,085,661 | 451,118,595 |
|
| Global Real Estate, Class NAV (Deutsche) | 21,385,447 | 168,517,320 |
|
| Heritage, Class NAV (American Century) | 6,573,546 | 65,801,195 |
|
| Index 500, Class NAV (John Hancock2)(A) | 34,203,042 | 335,873,870 |
|
| International Equity Index, Class NAV (SSgA) | 635,587 | 11,707,511 |
|
| International Growth Stock , Class NAV (Invesco) | 6,016,572 | 69,852,401 |
|
| International Opportunities, Class NAV (Marsico) | 13,078,938 | 184,151,452 |
|
| International Small Cap, Class NAV (Franklin) | 2,149,288 | 36,215,509 |
|
| International Small Company, Class NAV (DFA) | 4,084,749 | 36,476,805 |
|
| International Value, Class NAV (Franklin) | 16,779,499 | 259,746,651 |
|
| Large Cap, Class NAV (UBS) | 8,530,390 | 116,439,822 |
|
| Mid Cap Stock, Class NAV (Wellington) (I) | 10,247,729 | 196,653,921 |
|
| Mid Cap Value Equity, Class NAV (Columbia) | 6,086,746 | 64,519,511 |
|
| Mid Value, Class NAV (T. Rowe Price) | 8,069,772 | 124,758,679 |
|
| Mutual Shares, Class NAV (Franklin) | 10,893,904 | 124,517,324 |
|
| Natural Resources, Class NAV (Wellington) | 8,712,985 | 205,713,572 |
|
| Optimized Value, Class NAV (John Hancock2) (A) | 10,278,882 | 128,691,599 |
|
| Real Estate Equity, Class NAV (T. Rowe Price) | 12,445,256 | 107,153,655 |
|
| Small Cap Growth, Class NAV (Wellington) | 4,546,760 | 53,879,112 |
|
| Small Cap Opportunities, Class NAV | | |
| (Invesco/DFA) (I) | 1,412,498 | 32,501,583 |
|
| Small Cap Value, Class NAV (Wellington) | 2,140,013 | 37,343,230 |
|
| Small Company Growth, Class NAV (Invesco) (I) | 2,671,254 | 39,961,953 |
|
| Small Company Value, Class NAV (T. Rowe Price) | 3,365,674 | 91,579,980 |
|
| Smaller Company Growth, Class NAV | | |
| (Frontier/John Hancock2(A)/Perimeter) | 3,177,426 | 38,859,916 |
|
| Technical Opportunities, Class NAV (Wellington) (I) | 17,236,679 | 201,496,772 |
|
| U.S. Equity, Class NAV (GMO) | 34,616,680 | 356,897,973 |
|
| Value, Class NAV (Invesco) | 6,099,446 | 64,471,145 |
|
| Value & Restructuring, Class NAV (Columbia) | 13,374,735 | 159,025,601 |
| | | |
| John Hancock Funds III (G) 5.60% | | |
|
| Disciplined Value, Class NAV (Robeco) | 11,092,706 | 149,751,525 |
|
| International Core, Class NAV (GMO) | 8,261,213 | 259,649,920 |
|
| Rainier Growth, Class NAV (Rainier) | 12,426,923 | 268,670,076 |
| | | |
| John Hancock Investment Trust (G) 0.35% | |
|
| Small Cap Intrinsic Value, Class NAV | | |
| (John Hancock1) (A) | 3,086,593 | 42,594,982 |
| | | |
| FIXED INCOME 38.17% | | |
| John Hancock Funds II (G) 38.17% | | |
|
| Active Bond, Class NAV | | |
| (John Hancock1/Declaration) (A) | 44,885,685 | 456,487,420 |
|
| Core Bond, Class NAV (Wells Capital) | 16,942,906 | 220,088,343 |
|
| Floating Rate Income, Class NAV (WAMCO) | 52,401,141 | 498,334,848 |
|
| Global Bond, Class NAV (PIMCO) | 29,966,187 | 381,169,895 |
|
| Global High Yield, Class NAV (Stone Harbor) | 12,392,532 | 131,236,914 |
|
| High Income, Class NAV (John Hancock1) (A) | 24,215,270 | 201,228,897 |
|
| High Yield, Class NAV (WAMCO) | 31,401,185 | 286,692,821 |
|
| Investment Quality Bond, Class NAV (Wellington) | 7,164,563 | 87,407,671 |
|
| Multi-Sector Bond, Class NAV (Stone Harbor) | 41,573,817 | 431,951,956 |
|
| Real Return Bond, Class NAV (PIMCO) | 22,575,749 | 284,680,195 |
|
| Spectrum Income, Class NAV (T. Rowe Price) | 39,989,959 | 431,491,654 |
|
| Strategic Income Opportunities, Class NAV | | |
| (John Hancock1) (A) | 39,789,508 | 445,244,589 |
|
| Total Return, Class NAV (PIMCO) | 38,174,761 | 535,210,150 |
|
| U.S. High Yield Bond, Class NAV (Wells Capital) | 18,255,071 | 233,117,251 |
| | | |
| OTHER 2.02% | | |
| John Hancock Funds II (G) 2.02% | | |
|
| Currency Strategies, Class NAV (First Quadrant) (I) | 27,024,653 | 245,113,604 |
| | | |
| Total Investments (Lifestyle Balanced Portfolio) | |
| (Cost $10,232,083,790) 99.99% | | $12,114,266,067 |
| | | |
| Other assets and liabilities, net 0.01% | | 836,686 |
|
| TOTAL NET ASSETS 100.00% | | $12,115,102,753 |
| | | |
| Percentages are based upon net assets. | | |
See notes to financial statements
| |
| Semiannual report | Lifestyle Portfolios | 19 |
Lifestyle Moderate Portfolio
Securities owned by the Portfolio on 6-30-11 (Unaudited)
| | |
| | Shares | Value |
| Affiliated Investment Companies — 99.97% | |
|
| EQUITY 38.32% | | |
| | | |
| John Hancock Funds II (G) 33.83% | | |
|
| All Cap Value, Class NAV (Lord Abbett) | 906,161 | $11,009,858 |
|
| Alpha Opportunities, Class NAV (Wellington) | 6,804,583 | 83,560,282 |
|
| Blue Chip Growth, Class NAV (T. Rowe Price) | 8,437,472 | 183,852,506 |
|
| Capital Appreciation, Class NAV (Jennison) | 4,537,890 | 55,453,013 |
|
| Capital Appreciation Value, Class NAV | | |
| (T.Rowe Price) (I) | 1,113,719 | 11,649,505 |
|
| Emerging Markets, Class NAV (DFA) | 6,590,054 | 78,882,942 |
|
| Equity-Income, Class NAV (T. Rowe Price) | 7,991,876 | 118,679,365 |
|
| Fundamental Value, Class NAV (Davis) | 7,690,187 | 119,274,806 |
|
| Global Real Estate, Class NAV (Deutsche) | 6,288,414 | 49,552,699 |
|
| Index 500, Class NAV (John Hancock2)(A) | 10,008,670 | 98,285,137 |
|
| International Growth Stock , Class NAV (Invesco) | 1,680,917 | 19,515,451 |
|
| International Opportunities, Class NAV (Marsico) | 2,249,948 | 31,679,269 |
|
| International Small Cap, Class NAV (Franklin) | 195,401 | 3,292,504 |
|
| International Small Company, Class NAV (DFA) | 368,203 | 3,288,051 |
|
| International Value, Class NAV (Franklin) | 3,387,627 | 52,440,464 |
|
| Mid Cap Stock, Class NAV (Wellington) (I) | 2,868,151 | 55,039,827 |
|
| Mid Value, Class NAV (T. Rowe Price) | 3,475,108 | 53,725,163 |
|
| Natural Resources, Class NAV (Wellington) | 1,106,838 | 26,132,453 |
|
| Real Estate Equity, Class NAV (T. Rowe Price) | 3,782,456 | 32,566,947 |
|
| Small Cap Growth, Class NAV (Wellington) | 831,771 | 9,856,487 |
|
| Small Cap Value, Class NAV (Wellington) | 540,251 | 9,427,373 |
|
| Small Company Growth, Class NAV (Invesco) (I) | 574,591 | 8,595,876 |
|
| Small Company Value, Class NAV (T. Rowe Price) | 646,684 | 17,596,264 |
|
| Smaller Company Growth, Class NAV | | |
| (Frontier/John Hancock2 (A) /Perimeter) | 756,836 | 9,256,101 |
|
| U.S. Equity, Class NAV (GMO) | 9,014,125 | 92,935,634 |
|
| Value & Restructuring, Class NAV (Columbia) | 3,688,463 | 43,855,824 |
| | | |
| John Hancock Funds III (G) 4.49% | | |
|
| Global Shareholder Yield, Class NAV (Epoch) | 9,503,844 | 92,852,561 |
|
| International Core, Class NAV (GMO) | 1,542,761 | 48,488,982 |
|
| Rainier Growth, Class NAV (Rainier) | 1,325,907 | 28,666,112 |
| | | |
| FIXED INCOME 59.62% | | |
| | | |
| John Hancock Funds II (G) 59.62% | | |
|
| Active Bond, Class NAV | | |
| (John Hancock1/Declaration) (A) | 25,949,628 | 263,907,720 |
|
| Core Bond, Class NAV (Wells Capital) | 14,384,354 | 186,852,754 |
|
| Floating Rate Income, Class NAV (WAMCO) | 24,591,880 | 233,868,778 |
|
| Global Bond, Class NAV (PIMCO) | 10,723,763 | 136,406,259 |
|
| Global High Yield, Class NAV (Stone Harbor) | 5,263,514 | 55,740,614 |
|
| High Income, Class NAV (John Hancock1) (A) | 6,557,830 | 54,495,564 |
|
| High Yield, Class NAV (WAMCO) | 9,963,618 | 90,967,830 |
|
| Investment Quality Bond, Class NAV (Wellington) | 10,148,571 | 123,812,566 |
|
| Multi-Sector Bond, Class NAV (Stone Harbor) | 17,300,017 | 179,747,176 |
|
| Real Return Bond, Class NAV (PIMCO) | 9,468,477 | 119,397,490 |
|
| Spectrum Income, Class NAV (T. Rowe Price) | 16,901,018 | 182,361,979 |
|
| Strategic Income Opportunities, Class NAV | | |
| (John Hancock1) (A) | 17,057,142 | 190,869,417 |
|
| Total Bond Market, Class NAV (Declaration) (A) | 6,229,055 | 64,034,685 |
|
| Total Return, Class NAV (PIMCO) | 21,419,517 | 300,301,625 |
|
| U.S. High Yield Bond, Class NAV (Wells Capital) | 5,644,620 | 72,081,794 |
| | | |
| OTHER 2.03% | | |
| | | |
| John Hancock Funds II (G) 2.03% | | |
|
| Currency Strategies, Class NAV (First Quadrant) (I) | 8,479,603 | 76,909,996 |
| | | |
| Total Investments (Lifestyle Moderate Portfolio) | |
| (Cost $3,355,003,060) 99.97% | | $3,781,167,703 |
| | | |
| Other assets and liabilities, net 0.03% | | 1,182,924 |
|
| TOTAL NET ASSETS 100.00% | | $3,782,350,627 |
| | | |
| Percentages are based upon net assets. | | |
Lifestyle Conservative Portfolio
Securities owned by the Portfolio on 6-30-11 (Unaudited)
| | |
| | Shares | Value |
| Affiliated Investment Companies — 99.95% | |
|
| EQUITY 20.45% | | |
| | | |
| John Hancock Funds II (G) 16.98% | | |
|
| All Cap Value, Class NAV (Lord Abbett) | 429,509 | $5,218,537 |
|
| Blue Chip Growth, Class NAV (T. Rowe Price) | 4,394,687 | 95,760,228 |
|
| Capital Appreciation Value, Class NAV | | |
| (T.Rowe Price) (I) | 543,410 | 5,684,064 |
|
| Emerging Markets, Class NAV (DFA) | 1,317,609 | 15,771,775 |
|
| Equity-Income, Class NAV (T. Rowe Price) | 6,054,439 | 89,908,425 |
|
| Fundamental Value, Class NAV (Davis) | 4,969,682 | 77,079,760 |
|
| Global Real Estate, Class NAV (Deutsche) | 4,899,588 | 38,608,753 |
|
| Index 500, Class NAV (John Hancock2) (A) | 5,360,852 | 52,643,569 |
|
| International Value, Class NAV (Franklin) | 1,900,685 | 29,422,607 |
|
| Mid Cap Stock, Class NAV (Wellington) (I) | 529,069 | 10,152,827 |
|
| Mid Value, Class NAV (T. Rowe Price) | 645,122 | 9,973,582 |
|
| Natural Resources, Class NAV (Wellington) | 816,083 | 19,267,723 |
|
| Real Estate Equity, Class NAV (T. Rowe Price) | 3,186,172 | 27,432,938 |
|
| Small Cap Growth, Class NAV (Wellington) | 664,127 | 7,869,904 |
|
| Small Company Value, Class NAV (T. Rowe Price) | 289,903 | 7,888,271 |
|
| U.S. Equity, Class NAV (GMO) | 2,982,350 | 30,748,032 |
| | | |
| John Hancock Funds III (G) 3.47% | | |
|
| Global Shareholder Yield, Class NAV (Epoch) | 7,923,897 | 77,416,473 |
|
| International Core, Class NAV (GMO) | 939,540 | 29,529,743 |
| | | |
| FIXED INCOME 77.43% | | |
| | | |
| John Hancock Funds II (G) 77.43% | | |
|
| Active Bond, Class NAV | | |
| (John Hancock1/Declaration)(A) | 26,775,980 | 272,311,721 |
|
| Core Bond, Class NAV (Wells Capital) | 13,379,589 | 173,800,861 |
|
| Floating Rate Income, Class NAV (WAMCO) | 22,574,521 | 214,683,698 |
|
| Global Bond, Class NAV (PIMCO) | 10,438,694 | 132,780,186 |
|
| Global High Yield, Class NAV (Stone Harbor) | 4,663,444 | 49,385,873 |
|
| High Income, Class NAV (John Hancock1) (A) | 5,611,484 | 46,631,430 |
|
| High Yield, Class NAV (WAMCO) | 8,434,875 | 77,010,413 |
|
| Investment Quality Bond, Class NAV (Wellington) | 13,995,204 | 170,741,486 |
|
| Multi-Sector Bond, Class NAV (Stone Harbor) | 15,750,927 | 163,652,134 |
|
| Real Return Bond, Class NAV (PIMCO) | 9,421,505 | 118,805,181 |
|
| Short Term Government Income, Class NAV | | |
| (John Hancock1) (A) | 13,766,690 | 138,079,903 |
|
| Spectrum Income, Class NAV (T. Rowe Price) | 15,359,762 | 165,731,831 |
|
| Strategic Income Opportunities, Class NAV | | |
| (John Hancock1) (A) | 16,058,513 | 179,694,756 |
|
| Total Bond Market, Class NAV (Declaration) (A) | 11,700,648 | 120,282,666 |
|
| Total Return, Class NAV (PIMCO) | 21,337,140 | 299,146,709 |
|
| U.S. High Yield Bond, Class NAV (Wells Capital) | 4,949,678 | 63,207,387 |
| | | |
| OTHER 2.07% | | |
| | | |
| John Hancock Funds II (G) 2.07% | | |
|
| Currency Strategies, Class NAV (First Quadrant) (I) | 7,043,290 | 63,882,640 |
| | | |
| Total Investments (Lifestyle Conservative Portfolio) |
| (Cost $2,825,973,952) 99.95% | | $3,080,206,086 |
| | | |
| Other assets and liabilities, net 0.05% | | 1,665,474 |
|
| TOTAL NET ASSETS 100.00% | | $3,081,871,560 |
Percentages are based upon net assets.
Footnote Legend:
(A) The subadviser is an affiliate of the adviser.
(G) The underlying fund’s subadviser is shown parenthetically.
(I) Non-income producing.
1 Manulife Asset Management (US) LLC is doing business as John Hancock Asset Management.
2 Manulife Asset Management (North America) Limited is doing business as John Hancock Asset Management.
See notes to financial statements
| |
| 20 | Lifestyle Portfolios | Semiannual report |
Financial statements
Statements of assets and liabilities 6-30-11 (Unaudited)
These Statements of Assets and Liabilities are the Portfolios’ balance sheets. They show the value of what each Portfolio owns, is due and owes. You’ll also find the net asset value and the maximum offering price per share for each Portfolio. Net asset value is calculated by dividing the net assets of each class of shares by the number of outstanding shares in the class.
| | | |
| | Lifestyle | Lifestyle | Lifestyle |
| | Aggressive | Growth | Balanced |
| Assets | | | |
|
| Investments in affiliated funds, at value (Note 7) | $4,078,947,979 | $12,212,832,317 | $12,114,266,067 |
| Receivable for investments sold | 12,129,931 | 34,883,627 | 26,121,053 |
| Receivable for fund shares sold | 1,123,835 | 3,913,139 | 5,209,607 |
| Dividends and interest receivable | — | 3,116,473 | 5,438,259 |
| Other assets | 57,624 | 101,012 | 101,100 |
| Total assets | 4,092,259,369 | 12,254,846,568 | 12,151,136,086 |
| | | | |
| Liabilities | | | |
|
| Payable for investments purchased | — | 3,224,969 | 5,641,836 |
| Payable for fund shares repurchased | 13,144,001 | 36,905,958 | 29,475,930 |
| Distributions payable | — | — | 139,101 |
| Payable to affiliates (Note 4): Accounting and legal services fees | 128,905 | 387,529 | 380,925 |
| Transfer agent fees | 49,630 | 174,496 | 179,917 |
| Trustees’ fees | 909 | 2,886 | 3,037 |
| Distribution and service fees | 6,440 | 12,397 | 17,290 |
| Investment management fees | 51 | — | — |
| Other liabilities and accrued expenses | 69,267 | 188,498 | 195,297 |
| Total liabilities | 13,399,203 | 40,896,733 | 36,033,333 |
| | | | |
| Net assets | | | |
|
| Capital paid-in | $3,976,050,751 | $11,828,668,215 | $11,881,806,786 |
| Undistributed net investment income (Accumulated net investment loss) | (3,619,487) | 34,454,713 | 6,182 |
| Accumulated net realized loss on investments | (694,159,893) | (1,691,028,016) | (1,648,892,492) |
| Net unrealized appreciation (depreciation) on investments | 800,588,795 | 2,041,854,923 | 1,882,182,277 |
| Net assets | $4,078,860,166 | $12,213,949,835 | $12,115,102,753 |
| Investments in affiliated funds, at cost | $3,278,359,184 | $10,170,977,394 | $10,232,083,790 |
| | | | |
| Net asset value per share | | | |
|
| The Portfolios have an unlimited number of shares authorized with par value of $0.01 | | | |
| per share. Net asset value is calculated by dividing the net assets of each class of | | | |
| shares by the number of outstanding shares in the class. | | | |
| Class A: Net assets | $211,586,066 | $721,141,528 | $722,366,346 |
| Shares outstanding | 16,395,128 | 53,586,909 | 53,759,615 |
| Net asset value and redemption price per share | $12.91 | $13.46 | $13.44 |
| Class B:1 Net assets | $25,867,346 | $100,102,985 | $82,733,500 |
| Shares outstanding | 2,007,461 | 7,446,068 | 6,156,765 |
| Net asset value, offering price and redemption price per share | $12.89 | $13.44 | $13.44 |
| Class C:1 Net assets | $126,643,110 | $466,644,452 | $512,124,634 |
| Shares outstanding | 9,823,857 | 34,740,558 | 38,083,765 |
| Net asset value, offering price and redemption price per share | $12.89 | $13.43 | $13.45 |
| Class R1: Net assets | $10,734,077 | $15,949,900 | $17,510,268 |
| Shares outstanding | 830,200 | 1,181,062 | 1,306,977 |
| Net asset value, offering price and redemption price per share | $12.93 | $13.50 | $13.40 |
| Class R3: Net assets | $12,608,128 | $24,703,775 | $38,560,115 |
| Shares outstanding | 979,066 | 1,839,221 | 2,874,809 |
| Net asset value, offering price and redemption price per share | $12.88 | $13.43 | $13.41 |
| Class R4: Net assets | $9,693,432 | $21,116,491 | $31,988,659 |
| Shares outstanding | 752,438 | 1,569,554 | 2,384,783 |
| Net asset value, offering price and redemption price per share | $12.88 | $13.45 | $13.41 |
| Class R5: Net assets | $13,215,955 | $27,128,535 | $44,672,788 |
| Shares outstanding | 1,024,388 | 2,013,631 | 3,326,502 |
| Net asset value, offering price and redemption price per share | $12.90 | $13.47 | $13.43 |
| Class 1: Net assets | $3,668,512,052 | $10,720,575,833 | $10,604,989,118 |
| Shares outstanding | 284,945,549 | 798,203,738 | 792,978,670 |
| Net asset value, offering price and redemption price per share | $12.87 | $13.43 | $13.37 |
| Class 5: Net assets | — | $116,586,336 | $60,157,325 |
| Shares outstanding | — | 8,687,854 | 4,496,694 |
| Net asset value, offering price and redemption price per share | — | $13.42 | $13.38 |
| Maximum public offering price per share | | | |
| Class A (net asset value per share ÷ 95%)2 | $13.59 | $14.17 | $14.15 |
1 Redemption price per share is equal to net asset value less any applicable contingent deferred sales charge.
2 On single retail sales of less than $50,000. On sales of $50,000 or more and on group sales the offering price is reduced.
| | |
| See notes to financial statements | Semiannual report | Lifestyle Portfolios | 21 |
| | |
F I N A N C I A L S T A T E M E N T SStatements of assets and liabilities 6-30-11 (Unaudited)
Continued
| | |
| | Lifestyle | Lifestyle |
| | Moderate | Conservative |
| Assets | | |
|
| Investments in affiliated funds, at value (Note 7) | $3,781,167,703 | $3,080,206,086 |
| Receivable for investments sold | 11,190,362 | 7,258,987 |
| Receivable for fund shares sold | 2,653,318 | 3,719,204 |
| Dividends and interest receivable | 2,504,325 | 2,234,415 |
| Other assets | 68,422 | 69,891 |
| Total assets | 3,797,584,130 | 3,093,488,583 |
| |
| Liabilities | | |
|
| Payable for investments purchased | 2,593,377 | 2,316,408 |
| Payable for fund shares repurchased | 12,173,436 | 8,599,931 |
| Distributions payable | 170,643 | 424,682 |
| Payable to affiliates (Note 4): Accounting and legal services fees | 122,326 | 109,479 |
| Transfer agent fees | 71,227 | 71,127 |
| Trustees’ fees | 1,017 | 1,212 |
| Distribution and service fees | 5,272 | 5,115 |
| Other liabilities and accrued expenses | 96,205 | 89,069 |
| Total liabilities | 15,233,503 | 11,617,023 |
| | | |
| Net assets | | |
|
| Capital paid-in | $3,654,858,030 | $2,978,402,439 |
| Undistributed net investment income | 2,772 | 1,905 |
| Accumulated net realized loss on investments | (298,674,818) | (150,764,918) |
| Net unrealized appreciation (depreciation) on investments | 426,164,643 | 254,232,134 |
| Net assets | $3,782,350,627 | $3,081,871,560 |
| Investments in affiliated funds, at cost | $3,355,003,060 | $2,825,973,952 |
| | | |
| Net asset value per share | | |
|
| The Portfolios have an unlimited number of shares authorized with par value of $0.01 | | |
| per share. Net asset value is calculated by dividing the net assets of each class of | | |
| shares by the number of outstanding shares in the class. | | |
| Class A: Net assets | $273,864,525 | $264,355,596 |
| Shares outstanding | 21,036,840 | 20,242,160 |
| Net asset value and redemption price per share | $13.02 | $13.06 |
| Class B:1 Net assets | $31,437,568 | $33,042,849 |
| Shares outstanding | 2,416,287 | 2,529,458 |
| Net asset value, offering price and redemption price per share | $13.01 | $13.06 |
| Class C:1 Net assets | $216,504,696 | $222,787,025 |
| Shares outstanding | 16,628,472 | 17,061,866 |
| Net asset value, offering price and redemption price per share | $13.02 | $13.06 |
| Class R1: Net assets | $7,159,664 | $5,949,640 |
| Shares outstanding | 549,972 | 455,153 |
| Net asset value, offering price and redemption price per share | $13.02 | $13.07 |
| Class R3: Net assets | $11,402,066 | $12,321,088 |
| Shares outstanding | 876,832 | 944,551 |
| Net asset value, offering price and redemption price per share | $13.00 | $13.04 |
| Class R4: Net assets | $7,927,873 | $8,442,254 |
| Shares outstanding | 610,554 | 647,070 |
| Net asset value, offering price and redemption price per share | $12.98 | $13.05 |
| Class R5: Net assets | $14,549,514 | $12,116,999 |
| Shares outstanding | 1,119,356 | 928,120 |
| Net asset value, offering price and redemption price per share | $13.00 | $13.06 |
| Class 1: Net assets | $3,193,254,068 | $2,522,856,109 |
| Shares outstanding | 245,813,679 | 193,439,437 |
| Net asset value, offering price and redemption price per share | $12.99 | $13.04 |
| Class 5: Net assets | $26,250,653 | — |
| Shares outstanding | 2,022,539 | — |
| Net asset value, offering price and redemption price per share | $12.98 | — |
| | | |
| Maximum public offering price per share | | |
|
| Class A (net asset value per share ÷ 95%)2 | $13.71 | $13.75 |
1 Redemption price per share is equal to net asset value less any applicable contingent deferred sales charge.
2 On single retail sales of less than $50,000. On sales of $50,000 or more and on group sales the offering price is reduced.
| | |
| 22 | Lifestyle Portfolios | Semiannual report | See notes to financial statements |
| | | |
F I N A N C I A L S T A T E M E N T S
Statements of operations For the six months ended 6-30-11 (Unaudited)
These Statements of Operations summarize the Portfolios’ investment income earned and expenses directly incurred in operating each Portfolio. They also show net gains (losses) for the period stated.
| | | | | |
| | Lifestyle | Lifestyle | Lifestyle | Lifestyle | Lifestyle |
| | Aggressive | Growth | Balanced | Moderate | Conservative |
| Investment income | | | | | |
|
| Income distributions received from affiliated | | | | | |
| underlying funds | — | $45,336,014 | $98,173,391 | $47,714,881 | $48,108,641 |
| Expenses | | | | | |
| Investment management fees (Note 4) | $915,514 | 2,607,341 | 2,484,323 | 751,565 | 603,741 |
| Distribution and service fees (Note 4) | 2,024,045 | 6,486,270 | 6,619,594 | 2,355,996 | 2,201,280 |
| Transfer agent fees (Note 4) | 298,573 | 1,025,517 | 1,048,350 | 407,017 | 404,216 |
| Accounting and legal services fees (Note 4) | 306,596 | 914,600 | 890,568 | 280,208 | 230,886 |
| State registration fees (Note 4) | 41,682 | 61,215 | 64,920 | 48,477 | 51,650 |
| Professional fees | 39,957 | 88,022 | 86,676 | 37,790 | 33,692 |
| Printing and postage (Note 4) | 16,120 | 73,615 | 58,163 | 18,400 | 18,384 |
| Custodian fees | 5,951 | 5,951 | 5,951 | 5,951 | 5,951 |
| Trustees’ fees (Note 4) | 15,468 | 46,520 | 45,679 | 14,367 | 11,864 |
| Registration and filing fees | 20,041 | 98,127 | 121,897 | 69,206 | 54,946 |
| Other | 17,920 | 41,721 | 41,152 | 17,320 | 14,854 |
| Total expenses before reductions and | | | | | |
| amounts recaptured | 3,701,867 | 11,448,899 | 11,467,273 | 4,006,297 | 3,631,464 |
| | | | | | |
| Net expense reductions and amounts recaptured | | | | | |
| (Note 4) | (82,380) | (128,220) | (70,477) | — | — |
| Total expenses | 3,619,487 | 11,320,679 | 11,396,796 | 4,006,297 | 3,631,464 |
| | | | | | |
| Net investment income (loss) | (3,619,487) | 34,015,335 | 86,776,595 | 43,708,584 | 44,477,177 |
| |
| Realized and unrealized gain (loss) | | | | | |
|
| Net realized gain (loss) on | | | | | |
| Investments in affiliated underlying funds | 9,299,724 | 5,917,802 | (3,776,026) | 904,975 | 3,624,589 |
| Change in net unrealized appreciation | | | | | |
| (depreciation) of | | | | | |
| Investments in affiliated underlying funds | 179,708,938 | 492,675,891 | 417,741,754 | 106,757,585 | 61,085,194 |
| Net realized and unrealized gain | 189,008,662 | 498,593,693 | 413,965,728 | 107,662,560 | 64,709,783 |
| | | | | |
| Increase in net assets from operations | $185,389,175 | $532,609,028 | $500,742,323 | $151,371,144 | $109,186,960 |
| | |
| See notes to financial statements | Semiannual report | Lifestyle Portfolios | 23 |
| | |
F I N A N C I A L S T A T E M E N T SStatements of changes in net assets
These Statements of Changes in Net Assets show how the value of the Portfolios’ net assets have changed during the period. They reflect earnings less expenses, any investment gains and losses, distributions, if any, paid to shareholders and the net of Portfolio share transactions.
| | | | |
| | Lifestyle Aggressive | | Lifestyle Growth | |
| | Six Months Ended 6-30-11 | Year Ended 12-31-10 | Six Months Ended 6-30-11 | Year Ended 12-31-10 |
| | (Unaudited) | | (Unaudited) | |
| Increase (decrease) in net assets | | | | |
|
| From operations | | | | |
| Net investment income (loss) | ($3,619,487) | $25,200,893 | $34,015,335 | $193,093,652 |
| Net realized gain (loss) | 9,299,724 | (34,630,916) | 5,917,802 | 155,625,530 |
| Change in net unrealized appreciation (depreciation) | 179,708,938 | 539,816,745 | 492,675,891 | 1,163,853,629 |
| Increase in net assets resulting from | 185,389,175 | 530,386,722 | 532,609,028 | 1,512,572,811 |
| operations | | | | |
| |
| Distributions to shareholders | | | | |
| | | | | |
| From net investment income | | | | |
| Class A | — | (475,639) | — | (7,830,429) |
| Class B | — | — | — | (552,736) |
| Class C | — | — | — | (2,857,718) |
| Class R1 | — | — | — | (159,043) |
| Class R3 | — | (11,124) | — | (263,910) |
| Class R4 | — | (31,239) | — | (277,122) |
| Class R5 | — | (69,856) | — | (354,466) |
| Class 1 | — | — | — | (179,130,375) |
| Class 5 | — | (25,224,475) | — | (1,723,497) |
| From net realized gain | | | | |
| Class A | — | (1,806,250) | — | (5,892,066) |
| Class B | — | (146,492) | — | (896,445) |
| Class C | — | (673,946) | — | (4,050,175) |
| Class R1 | — | (79,528) | — | (150,736) |
| Class R3 | — | (122,075) | — | (233,328) |
| Class R4 | — | (81,627) | — | (193,531) |
| Class R5 | — | (113,836) | — | (214,353) |
| Class 1 | — | (34,861,743) | — | (103,498,945) |
| Class 5 | — | — | — | (970,645) |
| | | | | |
| Total distributions | — | (63,697,830) | — | (309,249,520) |
| | | | | |
| From Portfolio share transactions (Note 5) | 34,859,024 | 55,504,569 | 112,535,395 | 533,198,162 |
| |
| Total increase | 220,248,199 | 522,193,461 | 645,144,423 | 1,736,521,453 |
| | | | | |
| Net assets | | | | |
|
| Beginning of period | 3,858,611,967 | 3,336,418,506 | 11,568,805,412 | 9,832,283,959 |
| | | | | |
| End of period | $4,078,860,166 | $3,858,611,967 | $12,213,949,835 | $11,568,805,412 |
| |
| Undistributed net investment income | ($3,619,487) | — | $34,454,713 | $439,378 |
| (Accumulated net investment loss) | | | | |
| | |
| 24 | Lifestyle Portfolios | Semiannual report | See notes to financial statements |
| | | |
F I N A N C I A L S T A T E M E N T SStatements of changes in net assets
Continued
| | | | |
| | Lifestyle Balanced | | Lifestyle Moderate | |
| | Six Months Ended 6-30-11 | Year Ended 12-31-10 | Six Months Ended 6-30-11 | Year Ended 12-31-10 |
| | (Unaudited) | | (Unaudited) | |
| Increase (decrease) in net assets | | | | |
|
| From operations | | | | |
| Net investment income | $86,776,595 | $285,812,365 | $43,708,584 | $113,177,254 |
| Net realized gain (loss) | (3,776,026) | 100,111,494 | 904,975 | 16,967,318 |
| Change in net unrealized appreciation | 417,741,754 | 939,029,364 | 106,757,585 | 243,513,038 |
| (depreciation) | | | | |
| Increase in net assets resulting from | 500,742,323 | 1,324,953,223 | 151,371,144 | 373,657,610 |
| operations | | | | |
| |
| Distributions to shareholders | | | | |
| | | | | |
| From net investment income | | | | |
| Class A | (3,735,584) | (12,316,849) | (2,607,093) | (6,004,885) |
| Class B | (153,858) | (1,103,762) | (191,073) | (551,703) |
| Class C | (980,524) | (6,932,674) | (1,352,410) | (3,984,622) |
| Class R1 | (62,600) | (276,506) | (55,186) | (180,227) |
| Class R3 | (171,325) | (775,357) | (91,195) | (263,761) |
| Class R4 | (184,571) | (662,605) | (77,867) | (196,346) |
| Class R5 | (322,678) | (952,191) | (167,775) | (359,442) |
| Class 1 | (81,561,056) | (261,408,646) | (39,240,525) | (100,806,164) |
| Class 5 | (460,026) | (1,197,779) | (314,469) | (692,426) |
| From net realized gain | | | | |
| Class A | — | (5,827,726) | — | (2,171,717) |
| Class B | — | (744,111) | — | (255,928) |
| Class C | — | (4,473,888) | — | (1,809,705) |
| Class R1 | — | (144,968) | — | (66,482) |
| Class R3 | — | (390,408) | — | (93,970) |
| Class R4 | — | (288,408) | — | (72,832) |
| Class R5 | — | (393,208) | — | (111,349) |
| Class 1 | — | (100,572,024) | — | (30,164,371) |
| Class 5 | — | (482,593) | — | (218,560) |
| | | | | |
| Total distributions | (87,632,222) | (398,943,703) | (44,097,593) | (148,004,490) |
| | | | | |
| From Portfolio share transactions (Note 5) | 419,135,934 | 875,814,605 | 163,432,887 | 460,538,401 |
| |
| Total increase | 832,246,035 | 1,801,824,125 | 270,706,438 | 686,191,521 |
| |
| Net assets | | | | |
|
| Beginning of period | 11,282,856,718 | 9,481,032,593 | 3,511,644,189 | 2,825,452,668 |
| | | | | |
| End of period | $12,115,102,753 | $11,282,856,718 | $3,782,350,627 | $3,511,644,189 |
| | | | | |
| Undistributed net investment income | $6,182 | $861,809 | $2,772 | $391,781 |
| | |
| See notes to financial statements | Semiannual report | Lifestyle Portfolios | 25 |
| | |
F I N A N C I A L S T A T E M E N T SStatements of changes in net assets
Continued
| | | | |
| Lifestyle Conservative | | | |
| | Six Months Ended 6-30-11 | Year Ended 12-31-10 | | |
| | (Unaudited) | | | |
| Increase (decrease) in net assets | | | | |
|
| From operations | | | | |
| Net investment income | $44,477,177 | $102,572,314 | | |
| Net realized gain | 3,624,589 | 37,379,341 | | |
| Change in net unrealized appreciation | 61,085,194 | 115,923,453 | | |
| (depreciation) | | | | |
| Increase in net assets resulting from | 109,186,960 | 255,875,108 | | |
| operations | | | | |
| | | |
| Distributions to shareholders | | | | |
| From net investment income | | | | |
| Class A | (3,352,038) | (6,707,189) | | |
| Class B | (305,583) | (717,507) | | |
| Class C | (2,064,865) | (4,766,114) | | |
| Class R1 | (72,677) | (256,696) | | |
| Class R3 | (131,989) | (331,001) | | |
| Class R4 | (109,682) | (191,961) | | |
| Class R5 | (176,037) | (394,781) | | |
| Class 1 | (38,629,455) | (89,108,986) | | |
| From net realized gain | | | | |
| Class A | — | (2,079,581) | | |
| Class B | — | (269,077) | | |
| Class C | — | (1,811,410) | | |
| Class R1 | — | (81,023) | | |
| Class R3 | — | (101,731) | | |
| Class R4 | — | (61,882) | | |
| Class R5 | — | (101,354) | | |
| Class 1 | — | (22,926,013) | | |
| | | | | |
| Total distributions | (44,842,326) | (129,906,306) | | |
| | | | | |
| From Portfolio share transactions (Note 5) | 156,198,301 | 496,509,122 | | |
| | | |
| Total increase | 220,542,935 | 622,477,924 | | |
| | | | | |
| Net assets | | | | |
|
| Beginning of year | 2,861,328,625 | 2,238,850,701 | | |
| | | | | |
| End of year | $3,081,871,560 | $2,861,328,625 | | |
| | | | | |
| Undistributed net investment income | $1,905 | $367,054 | | |
| | |
| 26 | Lifestyle Portfolios | Semiannual report | See notes to financial statements |
| | | |
Financial highlights
These Financial Highlights show how each Portfolio’s net asset value for a share has changed since the beginning of the period.
| | | | | | | | | | | | | | | |
| Lifestyle Aggressive | |
| |
| Per share operating performance for a share outstanding throughout the period | | | Ratios and supplemental data | |
|
| | Income (loss) from | | | | | | | | | | | | |
| | investment operations | | Less distributions | | | Ratios to average net assets | |
| |
| |
| |
| |
| | | | Net | | | | | | | | | Expenses | | | |
| | | | realized | Total | | | | | | | Expenses | including | | Net | |
| | Net asset | Net | and | from | From net | | | | | | before re- | reduc- | | assets, | |
| | value, | invest- | unrealized | invest- | invest- | | | | Net asset | | ductions and | tions and | Net | end of | |
| | beginning | ment in- | gain (loss) | ment | ment | From net | From | Total value, | end | Total | amounts | amounts | investment | period (in | Portfolio |
| | of period | come (loss) on | invest- | operations | income | realized | capital | distribu- | of period | return | recaptured | recaptured | income | millions) | turnover |
| Period ended | ($) | ($)1,2 | ments ($) | ($) | ($) | gain ($) | paid-in ($) | tions ($) | ($) | (%)3 | (%) | (%) | (loss) (%)1 | ($) | (%) |
|
| CLASS A | | | | | | | | | | | | | | | |
|
| 6-30-20114 | 12.34 | (0.03) | 0.60 | 0.57 | — | — | — | — | 12.91 | 4.625,6 | 0.557,8 | 0.557, 8 | (0.55)8 | 212 | 6 |
| 12-31-2010 | 10.82 | 0.04 | 1.64 | 1.68 | (0.04) | (0.12) | — | (0.16) | 12.34 | 15.505 | 0.597 | 0.617,9 | 0.34 | 185 | 19 |
| 12-31-2009 | 8.02 | 0.06 | 2.83 | 2.89 | (0.05) | (0.04) | — | (0.09) | 10.82 | 36.045 | 0.727 | 0.657 | 0.70 | 138 | 23 |
| 12-31-2008 | 15.22 | 0.10 | (6.58) | (6.48) | (0.09) | (0.63) | — | (0.72) | 8.02 | (42.40)5 | 0.667 | 0.617 | 0.77 | 78 | 36 |
| 12-31-2007 | 14.72 | 0.11 | 1.05 | 1.16 | (0.12) | (0.54) | — | (0.66) | 15.22 | 8.005 | 0.597 | 0.597 | 0.69 | 116 | 21 |
| 12-31-200610 | 14.06 | 0.08 | 1.24 | 1.32 | (0.37) | (0.29) | — | (0.66) | 14.72 | 9.405,6 | 0.658,11 | 0.648,11 | 1.698 | 56 | 5 |
| 8-31-200612 | 12.63 | (0.07) | 1.56 | 1.49 | (0.06) | — | — | (0.06) | 14.06 | 11.855,6 | 0.848,11 | 0.658,11 | (0.59)8 | 35 | 23 |
|
| CLASS B | | | | | | | | | | | | | | | |
|
| 6-30-20114 | 12.37 | (0.09) | 0.61 | 0.52 | — | — | — | — | 12.89 | 4.205,6 | 1.297,8 | 1.357,8,9 | (1.35)8 | 26 | 6 |
| 12-31-2010 | 10.86 | (0.05) | 1.64 | 1.59 | — | (0.08) | — | (0.08) | 12.37 | 14.615 | 1.377 | 1.357,9 | (0.46) | 24 | 19 |
| 12-31-2009 | 8.06 | (0.01) | 2.84 | 2.83 | — | (0.03) | — | (0.03) | 10.86 | 35.095 | 1.607 | 1.357 | (0.15) | 22 | 23 |
| 12-31-2008 | 15.23 | —13 | (6.54) | (6.54) | — | (0.63) | — | (0.63) | 8.06 | (42.84)5 | 1.517 | 1.357 | 0.01 | 16 | 36 |
| 12-31-2007 | 14.72 | (0.02) | 1.07 | 1.05 | — | (0.54) | — | (0.54) | 15.23 | 7.235 | 1.377 | 1.357 | (0.13) | 24 | 21 |
| 12-31-200610 | 14.00 | 0.05 | 1.23 | 1.28 | (0.27) | (0.29) | — | (0.56) | 14.72 | 9.155,6 | 1.548,11 | 1.358,11 | 1.078 | 13 | 5 |
| 8-31-200612 | 12.63 | (0.15) | 1.56 | 1.41 | (0.04) | — | — | (0.04) | 14.00 | 11.225,6 | 2.008,11 | 1.348,11 | (1.23)8 | 8 | 23 |
|
| CLASS C | | | | | | | | | | | | | | | |
|
| 6-30-20114 | 12.37 | (0.08) | 0.60 | 0.52 | — | — | — | — | 12.89 | 4.205,6 | 1.267,8 | 1.257, 8 | (1.25)8 | 127 | 6 |
| 12-31-2010 | 10.86 | (0.04) | 1.63 | 1.59 | — | (0.08) | — | (0.08) | 12.37 | 14.615 | 1.297 | 1.337,9 | (0.39) | 111 | 19 |
| 12-31-2009 | 8.06 | (0.01) | 2.84 | 2.83 | — | (0.03) | — | (0.03) | 10.86 | 35.095 | 1.437 | 1.357 | (0.14) | 89 | 23 |
| 12-31-2008 | 15.23 | 0.01 | (6.55) | (6.54) | — | (0.63) | — | (0.63) | 8.06 | (42.79)5 | 1.367 | 1.317 | 0.05 | 62 | 36 |
| 12-31-2007 | 14.73 | —13 | 1.05 | 1.05 | (0.01) | (0.54) | — | (0.55) | 15.23 | 7.215 | 1.327 | 1.317 | 0.03 | 95 | 21 |
| 12-31-200610 | 14.00 | 0.05 | 1.24 | 1.29 | (0.27) | (0.29) | — | (0.56) | 14.73 | 9.225,6 | 1.368,11 | 1.358,11 | 1.108 | 39 | 5 |
| 8-31-200612 | 12.63 | (0.15) | 1.57 | 1.42 | (0.05) | — | — | (0.05) | 14.00 | 11.225,6 | 1.608,11 | 1.348,11 | (1.27)8 | 25 | 23 |
|
| CLASS R1 | | | | | | | | | | | | | | | |
|
| 6-30-20114 | 12.38 | (0.06) | 0.61 | 0.55 | — | — | — | — | 12.93 | 4.445,6 | 0.907,8 | 0.907, 8 | (0.90)8 | 11 | 6 |
| 12-31-2010 | 10.87 | —14 | 1.63 | 1.63 | — | (0.12) | — | (0.12) | 12.38 | 14.995 | 0.917 | 0.967,9 | (0.03) | 8 | 19 |
| 12-31-2009 | 8.05 | 0.08 | 2.79 | 2.87 | (0.01) | (0.04) | — | (0.05) | 10.87 | 35.665 | 1.167 | 1.057 | 0.81 | 6 | 23 |
| 12-31-2008 | 15.27 | 0.10 | (6.63) | (6.53) | (0.06) | (0.63) | — | (0.69) | 8.05 | (42.56)5 | 1.497 | 0.857 | 0.83 | 2 | 36 |
| 12-31-2007 | 14.76 | 0.15 | 1.00 | 1.15 | (0.10) | (0.54) | — | (0.64) | 15.27 | 7.925 | 3.547 | 0.727,16 | 0.92 | 1 | 21 |
| 12-31-200610,12 | 14.11 | 0.08 | 1.23 | 1.31 | (0.37) | (0.29) | — | (0.66) | 14.76 | 9.255,6 | 12.898,11 | 0.708,11 | 1.798 | —15 | 5 |
|
| CLASS R3 | | | | | | | | | | | | | | | |
|
| 6-30-20114 | 12.33 | (0.05) | 0.60 | 0.55 | — | — | — | — | 12.88 | 4.465,6 | 0.827,8 | 0.827,8 | (0.82)8 | 13 | 6 |
| 12-31-2010 | 10.82 | 0.01 | 1.63 | 1.64 | (0.01) | (0.12) | — | (0.13) | 12.33 | 15.215 | 0.857 | 0.847 | 0.06 | 12 | 19 |
| 12-31-2009 | 8.03 | 0.03 | 2.83 | 2.86 | (0.03) | (0.04) | — | (0.07) | 10.82 | 35.595 | 0.957 | 0.957 | 0.31 | 10 | 23 |
| 12-31-2008 | 15.22 | 0.07 | (6.57) | (6.50) | (0.06) | (0.63) | — | (0.69) | 8.03 | (42.54)5 | 0.917 | 0.867 | 0.59 | 6 | 36 |
| 12-31-2007 | 14.72 | 0.11 | 1.03 | 1.14 | (0.10) | (0.54) | — | (0.64) | 15.22 | 7.855 | 1.217 | 0.817,16 | 0.68 | 7 | 21 |
| 12-31-200610 | 14.06 | 0.08 | 1.24 | 1.32 | (0.37) | (0.29) | — | (0.66) | 14.72 | 9.365,6 | 2.218,11 | 0.728,11 | 1.708 | 2 | 5 |
| 8-31-200612 | 12.63 | (0.05) | 1.54 | 1.49 | (0.06) | — | — | (0.06) | 14.06 | 11.815,6 | 8.078,11 | 0.698,11 | (0.47)8 | 1 | 23 |
|
| CLASS R4 | | | | | | | | | | | | | | | |
|
| 6-30-20114 | 12.32 | (0.03) | 0.59 | 0.56 | — | — | — | — | 12.88 | 4.555,6 | 0.567,8 | 0.557,8 | (0.55)8 | 10 | 6 |
| 12-31-2010 | 10.81 | 0.04 | 1.64 | 1.68 | (0.05) | (0.12) | — | (0.17) | 12.32 | 15.565 | 0.557 | 0.557 | 0.34 | 8 | 19 |
| 12-31-2009 | 8.01 | 0.06 | 2.83 | 2.89 | (0.05) | (0.04) | — | (0.09) | 10.81 | 36.095 | 0.627 | 0.627 | 0.68 | 9 | 23 |
| 12-31-2008 | 15.21 | 0.18 | (6.66) | (6.48) | (0.09) | (0.63) | — | (0.72) | 8.01 | (42.38)5 | 0.667 | 0.567 | 1.56 | 6 | 36 |
| 12-31-2007 | 14.71 | 0.11 | 1.07 | 1.18 | (0.14) | (0.54) | — | (0.68) | 15.21 | 8.135 | 0.967 | 0.547,16 | 0.70 | 5 | 21 |
| 12-31-200610 | 14.07 | 0.08 | 1.25 | 1.33 | (0.40) | (0.29) | — | (0.69) | 14.71 | 9.465,6 | 1.388,11 | 0.538,11 | 1.718 | 2 | 5 |
| 8-31-200612 | 12.63 | (0.05) | 1.55 | 1.50 | (0.06) | — | — | (0.06) | 14.07 | 11.945,6 | 4.088,11 | 0.498,11 | (0.38)8 | 2 | 23 |
| | |
| See notes to financial statements | Semiannual report | Lifestyle Portfolios | 27 |
| | |
Financial highlights
Continued
| | | | | | | | | | | | | | | |
| Lifestyle Aggressive continued | | | | | | | | | | |
| |
| Per share operating performance for a share outstanding throughout the period | | | Ratios and supplemental data | |
|
| | Income (loss) from | | | | | | | | | | | | |
| | investment operations | | Less distributions | | | Ratios to average net assets | |
| |
| |
| |
| |
| | | | Net | | | | | | | | | | | | |
| | | | realized | Total | | | | | | | Expenses | Expenses | | Net | |
| | Net asset | Net | and | from | From net | | | | | | before re- | including | | assets, | |
| | value, | invest- | unrealized | invest- | invest- | | | | Net asset | | ductions and | reductions | Net | end of | |
| | beginning | ment in- | gain (loss) | ment | ment | From net | From | Total value, | end | Total | amounts | and amounts | investment | period (in | Portfolio |
| | of period | come (loss) | on invest- | operations | income | realized | capital | distribu- | of period | return | recaptured | recaptured | income | millions) | turnover |
| Period ended | ($) | ($)1,2 | ments ($) | ($) | ($) | gain ($) | paid-in ($) | tions ($) | ($) | (%)3 | (%) | (%) (loss) | (%)1 | ($) | (%) |
|
| CLASS R5 | | | | | | | | | | | | | | | |
|
| 6-30-20114 | 12.31 | (0.01) | 0.60 | 0.59 | — | — | — | — | 12.90 | 4.795,6 | 0.237,8 | 0.227,8 | (0.22)8 | 13 | 6 |
| 12-31-2010 | 10.80 | 0.08 | 1.63 | 1.71 | (0.08) | (0.12) | — | (0.20) | 12.31 | 15.845 | 0.267 | 0.257 | 0.68 | 11 | 19 |
| 12-31-2009 | 8.00 | 0.09 | 2.83 | 2.92 | (0.08) | (0.04) | — | (0.12) | 10.80 | 36.515 | 0.327 | 0.327 | 0.97 | 10 | 23 |
| 12-31-2008 | 15.21 | 0.17 | (6.62) | (6.45) | (0.13) | (0.63) | — | (0.76) | 8.00 | (42.18)5 | 0.327 | 0.247 | 1.42 | 6 | 36 |
| 12-31-2007 | 14.71 | 0.22 | 1.00 | 1.22 | (0.18) | (0.54) | — | (0.72) | 15.21 | 8.425 | 1.117 | 0.237,16 | 1.40 | 3 | 21 |
| 12-31-200610 | 14.09 | 0.09 | 1.26 | 1.35 | (0.44) | (0.29) | — | (0.73) | 14.71 | 9.575,6 | 4.078,11 | 0.238,11 | 1.908 | 1 | 5 |
| 8-31-200612 | 12.63 | 0.01 | 1.52 | 1.53 | (0.07) | — | — | (0.07) | 14.09 | 12.165,6 | 8.268,11 | 0.208,11 | 0.058 | —15 | 23 |
|
| CLASS 1 | | | | | | | | | | | | | | | |
|
| 6-30-20114 | 12.28 | (0.01) | 0.60 | 0.59 | — | — | — | — | 12.87 | 4.805,6 | 0.127,8 | 0.117,8 | (0.11)8 | 3,669 | 6 |
| 12-31-2010 | 10.77 | 0.09 | 1.63 | 1.72 | (0.09) | (0.12) | — | (0.21) | 12.28 | 16.015 | 0.127 | 0.117 | 0.79 | 3,499 | 19 |
| 12-31-2009 | 7.98 | 0.10 | 2.83 | 2.93 | (0.10) | (0.04) | — | (0.14) | 10.77 | 36.705 | 0.117 | 0.117 | 1.11 | 3,052 | 23 |
| 12-31-2008 | 15.18 | 0.15 | (6.57) | (6.42) | (0.15) | (0.63) | — | (0.78) | 7.98 | (42.08)5 | 0.127 | 0.127 | 1.24 | 2,120 | 36 |
| 12-31-2007 | 14.68 | 0.15 | 1.09 | 1.24 | (0.20) | (0.54) | — | (0.74) | 15.18 | 8.54 | 0.117 | 0.117 | 0.94 | 3,416 | 21 |
| 12-31-200610 | 14.07 | 0.10 | 1.25 | 1.35 | (0.45) | (0.29) | — | (0.74) | 14.68 | 9.596 | 0.118,11 | 0.118,11 | 2.098 | 2,782 | 5 |
| 8-31-200612 | 12.60 | 0.06 | 1.48 | 1.54 | (0.07) | — | — | (0.07) | 14.07 | 12.276 | 0.118,11 | 0.118,11 | 0.488 | 2,422 | 23 |
|
1 Recognition of net investment income by the Portfolio is affected by the timing of the declaration of dividends by the underlying funds in which the Portfolio invests.
2 Based on the average daily shares outstanding.
3 Does not reflect the effect of sales charges, if any.
4 Unaudited.
5 Total returns would have been lower had certain expenses not been reduced during the periods shown.
6 Not annualized.
7 Ratios do not include expenses indirectly incurred from underlying funds whose expense ratios can vary based on the mix of underlying funds held by the Portfolio. The range
of expense ratios of the underlying funds held by the Portfolios was as follows: 0.48%–1.38%, 0.48%–1.39%, 0.49%–1.40%, 0.49%–2.84% and 0.79%–0.91%, for the
periods ended 6-30-11, 12-31-10, 12-31-09, 12-31-08 and 12-31-07, respectively.
8 Annualized.
9 Includes the impact of expense recapture for the following periods ended: 6-30-11: 0.08% of average net assets for Class B shares. 12-31-10: 0.03%, 0.03%, 0.05% and
0.05% of average net assets for Class A, Class B, Class C and Class R1 shares, respectively. See Note 4.
10 The fiscal year-end changed from August 31 to December 31.
11 Does not include expenses of the underlying affiliated funds in which the Portfolio invests.
12 The inception date for Class A, Class B, Class C, Class R3, Class R4 and Class R5 shares is 10-18-05 and the inception dates for Class R1 and Class 1 shares are 9-18-06 and
10-15-05, respectively.
13 Less than $0.005 per share.
14 Less than ($0.005) per share.
15 Less than $500,000.
16 Includes transfer agent fee earned credits of less that 0.01% of average net assets.
| | | | | | | | | | | | | | | |
| Lifestyle Growth | | | | | | | | | | | |
| |
| Per share operating performance for a share outstanding throughout the period | | | Ratios and supplemental data | |
|
| | Income (loss) from | | | | | | | | | | | | |
| | investment operations | | Less distributions | | Ratios to average net assets | |
| |
| |
| |
| |
| | | | Net | | | | | | | | | | | | |
| | | | realized | Total | | | | | | | Expenses | Expenses | | Net | |
| | Net asset | Net | and | from | From net | | | | | | before re- | including | | assets, | |
| | value, | invest- | unrealized | invest- | invest- | | | | Net asset | | ductions and | reductions | Net | end of | |
| | beginning | ment in- | gain (loss) | ment | ment | From net | From | Total value, | end | Total | amounts | and amounts | investment | period (in | Portfolio |
| | of period | come (loss) | on invest- | operations | income | realized | capital | distribu- | of period | return | recaptured | recaptured | income | millions) | turnover |
| Period ended | ($) | ($)1,2 | ments ($) | ($) | ($) | gain ($) | paid-in ($) | tions ($) | ($) | (%)3 | (%) | (%) (loss) | (%)1 | ($) | (%) |
|
| CLASS A | | | | | | | | | | | | | | | |
|
| 6-30-20114 | 12.89 | 0.01 | 0.56 | 0.57 | — | — | — | — | 13.46 | 4.425,6 | 0.557,8 | 0.557,8 | 0.228 | 721 | 5 |
| 12-31-2010 | 11.50 | 0.19 | 1.51 | 1.70 | (0.18) | (0.13) | — | (0.31) | 12.89 | 14.775 | 0.567 | 0.557 | 1.58 | 593 | 19 |
| 12-31-2009 | 8.73 | 0.21 | 2.81 | 3.02 | (0.21) | (0.04) | — | (0.25) | 11.50 | 34.545 | 0.647 | 0.627 | 2.17 | 417 | 26 |
| 12-31-2008 | 15.05 | 0.27 | (5.85) | (5.58) | (0.26) | (0.48) | — | (0.74) | 8.73 | (36.89)5 | 0.597 | 0.577 | 2.14 | 251 | 37 |
| 12-31-2007 | 14.72 | 0.28 | 0.73 | 1.01 | (0.23) | (0.45) | — | (0.68) | 15.05 | 6.965 | 0.547 | 0.537 | 1.79 | 332 | 18 |
| 12-31-20069 | 14.63 | 0.16 | 1.01 | 1.17 | (0.43) | (0.36) | (0.29) | (1.08) | 14.72 | 8.005,6 | 0.588,10 | 0.588,10 | 3.188 | 165 | 4 |
| 8-31-200611 | 13.35 | 0.07 | 1.28 | 1.35 | (0.07) | — | — | (0.07) | 14.63 | 10.185,6 | 0.728,10 | 0.618,10 | 0.558 | 103 | 26 |
| | | | | | | | | | | | | | | | |
| | | | | | | | | | | | | | | | |
| 28 | Lifestyle Portfolios | Semiannual report | See notes to financial statements |
Financial highlights
Continued
| | | | | | | | | | | | | | | |
| Lifestyle Growth continued | | | | | | | | | | | | |
| | | | | | | | | | | | | |
| Per share operating performance for a share outstanding throughout the period | | | Ratios and supplemental data | |
|
| | Income (loss) from | | | | | | | | | | | | |
| | investment operations | | Less distributions | | | Ratios to average net assets | |
| |
| |
| |
| |
| | | | Net | | | | | | | | | | | | |
| | | | realized | Total | | | | | | | Expenses | Expenses | | Net | |
| | Net asset | Net | and | from | From net | | | | | | before re- | including | | assets, | |
| | value, | invest- | unrealized | invest- | invest- | | | | Net asset | | ductions and | reductions | Net | end of | |
| | beginning | ment in- | gain (loss) | ment | ment | From net | From | Total value, | end | Total | amounts | and amounts | investment | period (in | Portfolio |
| | of period | come | (loss) on invest- | operations | income | realized | capital | distribu- | of period | return | recaptured | recaptured | income | millions) | turnover |
| Period ended | ($) | ($)1,2 | ments ($) | ($) | ($) | gain ($) | paid-in ($) | tions ($) | ($) | (%)3 | (%) | (%) (loss) | (%)1 | ($) | (%) |
|
| CLASS B | | | | | | | | | | | | | | | |
|
| 6-30-20114 | 12.92 | (0.04) | 0.56 | 0.52 | — | — | — | — | 13.44 | 4.025,6 | 1.267,8 | 1.297,8,12 | (0.53)8 | 100 | 5 |
| 12-31-2010 | 11.54 | 0.08 | 1.51 | 1.59 | (0.08) | (0.13) | — | (0.21) | 12.92 | 13.815 | 1.297 | 1.357,12 | 0.69 | 89 | 19 |
| 12-31-2009 | 8.77 | 0.13 | 2.81 | 2.94 | (0.13) | (0.04) | — | (0.17) | 11.54 | 33.535 | 1.487 | 1.357 | 1.32 | 75 | 26 |
| 12-31-2008 | 15.06 | 0.16 | (5.81) | (5.65) | (0.16) | (0.48) | — | (0.64) | 8.77 | (37.35)5 | 1.417 | 1.327 | 1.30 | 54 | 37 |
| 12-31-2007 | 14.73 | 0.16 | 0.73 | 0.89 | (0.11) | (0.45) | — | (0.56) | 15.06 | 6.145 | 1.307 | 1.297 | 1.02 | 78 | 18 |
| 12-31-20069 | 14.57 | 0.12 | 1.01 | 1.13 | (0.36) | (0.36) | (0.25) | (0.97) | 14.73 | 7.775,6 | 1.408,10 | 1.358,10 | 2.458 | 39 | 4 |
| 8-31-200611 | 13.35 | (0.02) | 1.30 | 1.28 | (0.06) | — | — | (0.06) | 14.57 | 9.575,6 | 1.698,10 | 1.348,10 | (0.19)8 | 24 | 26 |
|
| CLASS C | | | | | | | | | | | | | | | |
|
| 6-30-20114 | 12.91 | (0.03) | 0.55 | 0.52 | — | — | — | — | 13.43 | 4.035,6 | 1.257,8 | 1.257,8,12 | (0.49)8 | 467 | 5 |
| 12-31-2010 | 11.53 | 0.10 | 1.51 | 1.61 | (0.10) | (0.13) | — | (0.23) | 12.91 | 13.935 | 1.257 | 1.257 | 0.84 | 404 | 19 |
| 12-31-2009 | 8.76 | 0.14 | 2.81 | 2.95 | (0.14) | (0.04) | — | (0.18) | 11.53 | 33.635 | 1.357 | 1.347 | 1.37 | 305 | 26 |
| 12-31-2008 | 15.05 | 0.17 | (5.81) | (5.64) | (0.17) | (0.48) | — | (0.65) | 8.76 | (37.33)5 | 1.307 | 1.297 | 1.36 | 206 | 37 |
| 12-31-2007 | 14.72 | 0.16 | 0.74 | 0.90 | (0.12) | (0.45) | — | (0.57) | 15.05 | 6.195 | 1.257 | 1.257 | 1.05 | 294 | 18 |
| 12-31-20069 | 14.57 | 0.13 | 0.99 | 1.12 | (0.36) | (0.36) | (0.25) | (0.97) | 14.72 | 7.735,6 | 1.298,10 | 1.298,10 | 2.538 | 152 | 4 |
| 8-31-200611 | 13.35 | (0.02) | 1.30 | 1.28 | (0.06) | — | — | (0.06) | 14.57 | 9.575,6 | 1.448,10 | 1.338,10 | (0.14)8 | 93 | 26 |
|
| CLASS R1 | | | | | | | | | | | | | | | |
|
| 6-30-20114 | 12.95 | (0.01) | 0.56 | 0.55 | — | — | — | — | 13.50 | 4.255,6 | 0.857,8 | 0.857,8 | (0.11)8 | 16 | 5 |
| 12-31-2010 | 11.57 | 0.15 | 1.50 | 1.65 | (0.14) | (0.13) | — | (0.27) | 12.95 | 14.285 | 0.877 | 0.867 | 1.24 | 15 | 19 |
| 12-31-2009 | 8.77 | 0.25 | 2.75 | 3.00 | (0.16) | (0.04) | — | (0.20) | 11.57 | 34.155 | 1.027 | 1.027 | 2.45 | 11 | 26 |
| 12-31-2008 | 15.10 | 0.34 | (5.96) | (5.62) | (0.23) | (0.48) | — | (0.71) | 8.77 | (37.05)5 | 1.347 | 0.837 | 2.81 | 3 | 37 |
| 12-31-2007 | 14.77 | 0.32 | 0.66 | 0.98 | (0.20) | (0.45) | — | (0.65) | 15.10 | 6.755 | 2.427 | 0.737 | 2.02 | 2 | 18 |
| 12-31-20069,11 | 14.70 | 0.14 | 1.00 | 1.14 | (0.42) | (0.36) | (0.29) | (1.07) | 14.77 | 7.755,6 | 12.958,10 | 0.698,10 | 3.238 | —13 | 4 |
|
| CLASS R3 | | | | | | | | | | | | | | | |
|
| 6-30-20114 | 12.88 | — | 0.55 | 0.55 | — | — | — | — | 13.43 | 4.275,6 | 0.797,8 | 0.787,8 | (0.02)8 | 25 | 5 |
| 12-31-2010 | 11.50 | 0.15 | 1.51 | 1.66 | (0.15) | (0.13) | — | (0.28) | 12.88 | 14.465 | 0.817 | 0.817 | 1.24 | 23 | 19 |
| 12-31-2009 | 8.73 | 0.18 | 2.81 | 2.99 | (0.18) | (0.04) | — | (0.22) | 11.50 | 34.265 | 0.887 | 0.887 | 1.77 | 19 | 26 |
| 12-31-2008 | 15.03 | 0.24 | (5.84) | (5.60) | (0.22) | (0.48) | — | (0.70) | 8.73 | (37.06)5 | 0.847 | 0.837 | 1.93 | 12 | 37 |
| 12-31-2007 | 14.71 | 0.28 | 0.69 | 0.97 | (0.20) | (0.45) | — | (0.65) | 15.03 | 6.695 | 0.987 | 0.807 | 1.83 | 14 | 18 |
| 12-31-20069 | 14.61 | 0.16 | 1.01 | 1.17 | (0.42) | (0.36) | (0.29) | (1.07) | 14.71 | 8.005,6 | 1.358,10 | 0.718,10 | 3.138 | 4 | 4 |
| 8-31-200611 | 13.35 | 0.07 | 1.26 | 1.33 | (0.07) | — | — | (0.07) | 14.61 | 9.985,6 | 5.078,10 | 0.688,10 | 0.628 | 2 | 26 |
|
| CLASS R4 | | | | | | | | | | | | | | | |
|
| 6-30-20114 | 12.88 | 0.02 | 0.55 | 0.57 | — | — | — | — | 13.45 | 4.435,6 | 0.497,8 | 0.497,8 | 0.278 | 21 | 5 |
| 12-31-2010 | 11.50 | 0.19 | 1.51 | 1.70 | (0.19) | (0.13) | — | (0.32) | 12.88 | 14.805 | 0.487 | 0.487 | 1.57 | 19 | 19 |
| 12-31-2009 | 8.72 | 0.21 | 2.82 | 3.03 | (0.21) | (0.04) | — | (0.25) | 11.50 | 34.735 | 0.547 | 0.547 | 2.11 | 16 | 26 |
| 12-31-2008 | 15.03 | 0.29 | (5.86) | (5.57) | (0.26) | (0.48) | — | (0.74) | 8.72 | (36.87)5 | 0.567 | 0.567 | 2.34 | 13 | 37 |
| 12-31-2007 | 14.71 | 0.27 | 0.74 | 1.01 | (0.24) | (0.45) | — | (0.69) | 15.03 | 6.955 | 0.647 | 0.537 | 1.76 | 15 | 18 |
| 12-31-20069 | 14.64 | 0.16 | 1.01 | 1.17 | (0.44) | (0.36) | (0.30) | (1.10) | 14.71 | 8.045,6 | 0.808,10 | 0.538,10 | 3.128 | 7 | 4 |
| 8-31-200611 | 13.35 | 0.08 | 1.29 | 1.37 | (0.08) | — | — | (0.08) | 14.64 | 10.265,6 | 1.788,10 | 0.498,10 | 0.698 | 5 | 26 |
|
| CLASS R5 | | | | | | | | | | | | | | | |
|
| 6-30-20114 | 12.88 | 0.04 | 0.55 | 0.59 | — | — | — | — | 13.47 | 4.585,6 | 0.197,8 | 0.187,8 | 0.588 | 27 | 5 |
| 12-31-2010 | 11.50 | 0.21 | 1.52 | 1.73 | (0.22) | (0.13) | — | (0.35) | 12.88 | 15.065 | 0.217 | 0.217 | 1.80 | 22 | 19 |
| 12-31-2009 | 8.72 | 0.25 | 2.81 | 3.06 | (0.24) | (0.04) | — | (0.28) | 11.50 | 35.095 | 0.267 | 0.267 | 2.48 | 18 | 26 |
| 12-31-2008 | 15.04 | 0.33 | (5.87) | (5.54) | (0.30) | (0.48) | — | (0.78) | 8.72 | (36.64)5 | 0.247 | 0.247 | 2.67 | 10 | 37 |
| 12-31-2007 | 14.71 | 0.39 | 0.67 | 1.06 | (0.28) | (0.45) | — | (0.73) | 15.046 | 7.315 | 0.547 | 0.217 | 2.53 | 8 | 18 |
| 12-31-20069 | 14.66 | 0.18 | 1.02 | 1.20 | (0.47) | (0.36) | (0.32) | (1.15) | 14.71 | 8.155,6 | 1.408,10 | 0.208,10 | 3.548 | 2 | 4 |
| 8-31-200611 | 13.35 | 0.09 | 1.30 | 1.39 | (0.08) | — | — | (0.08) | 14.66 | 10.475,6 | 2.528,10 | 0.198,10 | 0.708 | 2 | 26 |
|
| | |
| See notes to financial statements | Semiannual report | Lifestyle Portfolios | 29 |
| | |
Financial highlights
Continued
| | | | | | | | | | | | | | | |
| Lifestyle Growth continued | | | | | | | | | | | | |
| | | | | | | | | | | | | |
| Per share operating performance for a share outstanding throughout the period | | | Ratios and supplemental data | |
|
| | Income (loss) from | | | | | | | | | | | | |
| | investment operations | | Less distributions | | | Ratios to average net assets | |
| |
| |
| |
| |
| | | | Net | | | | | | | | | | | | |
| | | | realized | Total | | | | | | | Expenses | Expenses | | Net | |
| | Net asset | Net | and | from | From net | | | | | | before re- | including | | assets, | |
| | value, | invest- | unrealized | invest- | invest- | | | | Net asset | | ductions and | reductions | Net | end of | |
| | beginning | ment in- | gain (loss) | ment | ment | From net | From | Total | value, end | Total | amounts | and amounts | investment | period (in | Portfolio |
| | of period | come (loss) | on invest- | operations | income | realized | capital | distribu- | of period | return | recaptured | recaptured | income | millions) | turnover |
| Period ended | ($) | ($)1,2 | ments ($) | ($) | ($) | gain ($) | paid-in ($) | tions ($) | ($) | (%)3 | (%) | (%) (loss) | (%)1 | ($) | (%) |
|
| CLASS 1 | | | | | | | | | | | | | | | |
|
| 6-30-20114 | 12.84 | 0.04 | 0.55 | 0.59 | — | — | — | — | 13.43 | 4.605,6 | 0.117,8 | 0.117,8 | 0.648 | 10,721 | 5 |
| 12-31-2010 | 11.45 | 0.23 | 1.52 | 1.75 | (0.23) | (0.13) | — | (0.36) | 12.84 | 15.305 | 0.117 | 0.117 | 1.92 | 10,305 | 19 |
| 12-31-2009 | 8.68 | 0.25 | 2.81 | 3.06 | (0.25) | (0.04) | — | (0.29) | 11.45 | 35.275 | 0.117 | 0.117 | 2.55 | 8,903 | 26 |
| 12-31-2008 | 15.00 | 0.32 | (5.85) | (5.53) | (0.31) | (0.48) | — | (0.79) | 8.68 | (36.63)5 | 0.127 | 0.127 | 2.49 | 6,345 | 37 |
| 12-31-2007 | 14.67 | 0.30 | 0.77 | 1.07 | (0.29) | (0.45) | — | (0.74) | 15.006 | 7.445 | 0.117 | 0.117 | 1.94 | 9,574 | 18 |
| 12-31-20069 | 14.63 | 0.17 | 1.03 | 1.20 | (0.48) | (0.36) | (0.32) | (1.16) | 14.67 | 8.186 | 0.118,10 | 0.118,10 | 3.348 | 8,059 | 4 |
| 8-31-200611 | 13.31 | 0.15 | 1.25 | 1.40 | (0.08) | — | — | (0.08) | 14.63 | 10.586 | 0.118,10 | 0.118,10 | 1.178 | 7,081 | 26 |
|
| CLASS 5 | | | | | | | | | | | | | | | |
|
| 6-30-20114 | 12.82 | 0.05 | 0.55 | 0.60 | — | — | — | — | 13.42 | 4.685,6 | 0.067,8 | 0.067,8 | 0.718 | 117 | 5 |
| 12-31-2010 | 11.44 | 0.25 | 1.50 | 1.75 | (0.24) | (0.13) | — | (0.37) | 12.82 | 15.285 | 0.067 | 0.067 | 2.07 | 98 | 19 |
| 12-31-2009 | 8.67 | 0.27 | 2.80 | 3.07 | (0.26) | (0.04) | — | (0.30) | 11.44 | 35.375 | 0.077 | 0.077 | 2.70 | 68 | 26 |
| 12-31-2008 | 14.98 | 0.35 | (5.86) | (5.51) | (0.32) | (0.48) | — | (0.80) | 8.67 | (36.57)5 | 0.077 | 0.077 | 2.78 | 41 | 37 |
| 12-31-2007 | 14.66 | 0.37 | 0.70 | 1.07 | (0.30) | (0.45) | — | (0.75) | 14.98 | 7.425 | 0.067 | 0.067 | 2.39 | 46 | 18 |
| 12-31-20069 | 14.62 | 0.24 | 0.97 | 1.21 | (0.48) | (0.36) | (0.33) | (1.17) | 14.66 | 8.246 | 0.068,10 | 0.068,10 | 4.688 | 15 | 4 |
| 8-31-200611 | 14.40 | —14 | 0.22 | 0.22 | — | — | — | — | 14.62 | 1.536 | 0.068,10 | 0.068,10 | (0.02)8 | 3 | 26 |
|
1 Recognition of net investment income by the Portfolio is affected by the timing of the declaration of dividends by the underlying funds in which the Portfolio invests.
2 Based on the average daily shares outstanding.
3 Does not reflect the effect of sales charges, if any.
4 Unaudited.
5 Total returns would have been lower had certain expenses not been reduced during the periods shown.
6 Not annualized.
7 Ratios do not include expenses indirectly incurred from underlying funds whose expense ratios can vary based on the mix of underlying funds held by the Portfolio. The range
of expense ratios of the underlying funds held by the Portfolios was as follows: 0.48%–1.38%, 0.48%–1.39%, 0.49%–1.40%, 0.49–2.84% and 0.79%–0.91% for the
periods ended 6-30-11, 12-31-10, 12-31-09, 12-31-08 and 12-31-07, respectively.
8 Annualized.
9 The fiscal year-end changed from August 31 to December 31.
10 Does not include expenses of the underlying affiliated funds in which the Portfolio invests.
11 The inception date for Class A, Class B, Class C, Class R3, Class R4 and Class R5 shares is 10-18-05 and the inception dates for Class R1, Class 1 and Class 5 shares are
9-18-06, 10-15-05 and 7-3-06, respectively.
12 Includes the impact of expense recapture for the following periods ended: 6-30-11: 0.01% of average net assets for Class C shares. 12-31-10: 0.07% of average net assets
for Class B shares. See Note 4.
13 Less than $500,000.
14 Less than $0.005 per share.
| | | | | | | | | | | | | | | |
| Lifestyle Balanced | | | | | | | | | | | | | |
| | | | | | | | | | | | | | | |
| Per share operating performance for a share outstanding throughout the period | | | Ratios and supplemental data | |
|
| | Income (loss) from | | | | | | | | | | | | |
| | investment operations | | Less distributions | | | Ratios to average net assets | |
| |
| |
| |
| |
| | | | Net | | | | | | | | | | | | |
| | | | realized | Total | | | | | | | Expenses | Expenses | | Net | |
| | Net asset | Net | and | from | From net | | | | | | before re- | including | | assets, | |
| | value, | invest- | unrealized | invest- | invest- | | | | Net asset | | ductions and | reductions | Net | end of | |
| | beginning | ment in- | gain (loss) | ment | ment | From net | From | Total value, | end | Total | amounts | and amounts | investment | period (in | Portfolio |
| | of period | come (loss) | on invest- | operations | income | realized | capital | distribu- | of period | return | recaptured | recaptured | income | millions) | turnover |
| Period ended | ($) | ($)1,2 | ments ($) | ($) | ($) | gain ($) | paid-in ($) | tions ($) | ($) | (%)3 | (%) | (%) (loss) | (%)1 | ($) | (%) |
|
| CLASS A | | | | | | | | | | | | | | | |
|
| 6-30-20114 | 12.96 | 0.08 | 0.47 | 0.55 | (0.07) | — | — | (0.07) | 13.44 | 4.275,6 | 0.557,8 | 0.557,8 | 1.168 | 722 | 5 |
| 12-31-2010 | 11.85 | 0.31 | 1.23 | 1.54 | (0.30) | (0.13) | — | (0.43) | 12.96 | 13.135 | 0.547 | 0.547 | 2.55 | 588 | 19 |
| 12-31-2009 | 9.22 | 0.35 | 2.65 | 3.00 | (0.33) | (0.04) | — | (0.37) | 11.85 | 32.875 | 0.577 | 0.567 | 3.35 | 408 | 319 |
| 12-31-2008 | 14.54 | 0.45 | (4.96) | (4.51) | (0.42) | (0.39) | — | (0.81) | 9.22 | (31.63)5 | 0.547 | 0.547 | 3.60 | 249 | 36 |
| 12-31-2007 | 14.37 | 0.42 | 0.42 | 0.84 | (0.35) | (0.32) | — | (0.67) | 14.54 | 5.905 | 0.517 | 0.507 | 2.84 | 284 | 14 |
| 12-31-200610 | 14.38 | 0.24 | 0.81 | 1.05 | (0.43) | (0.27) | (0.36) | (1.06) | 14.37 | 7.256 | 0.558,11 | 0.558,11 | 4.778 | 125 | 3 |
| 8-31-200612 | 13.35 | 0.19 | 1.01 | 1.20 | (0.17) | —13 | — | (0.17) | 14.38 | 9.085,6 | 0.708,11 | 0.588,11 | 1.608 | 81 | 23 |
|
| | |
| 30 | Lifestyle Portfolios | Semiannual report | See notes to financial statements |
| | | |
Financial highlights
Continued
| | | | | | | | | | | | | | | |
| Lifestyle Balanced continued | | | | | | | | | | | | |
| | | | | | | | | | | | | |
| Per share operating performance for a share outstanding throughout the period | | | Ratios and supplemental data | |
|
| | Income (loss) from | | | | | | | | | | | | |
| | investment operations | | Less distributions | | | | Ratios to average net assets | |
| |
| |
| |
| |
| | | | Net | | | | | | | | | | | | |
| | | | realized | Total | | | | | | | Expenses | Expenses | | Net | |
| | Net asset | Net | and | from | From net | | | | | | before re- | including | | assets, | |
| | value, | invest- | unrealized | invest- | invest- | | | | Net asset | | ductions and | reductions | Net | end of | |
| | beginning | ment in- | gain (loss) | ment | ment | From net | From | Total value, | end | Total | amounts | and amounts | investment | period (in | Portfolio |
| | of period | come (loss) | on invest- | operations | income | realized | capital | distribu- | of period | return | recaptured | recaptured | income | millions) | turnover |
| Period ended | ($) | ($)1,2 | ments ($) | ($) | ($) | gain ($) | paid-in ($) | tions ($) | ($) | (%)3 | (%) | (%) | (loss) (%)1 | ($) | (%) |
|
| CLASS B | | | | | | | | | | | | | | | |
|
| 6-30-20114 | 12.96 | 0.03 | 0.48 | 0.51 | (0.03) | — | — | (0.03) | 13.44 | 3.905,6 | 1.267,8 | 1.267,8 | 0.428 | 83 | 5 |
| 12-31-2010 | 11.85 | 0.20 | 1.24 | 1.44 | (0.20) | (0.13) | — | (0.33) | 12.96 | 12.235 | 1.287 | 1.317,14 | 1.67 | 74 | 19 |
| 12-31-2009 | 9.21 | 0.25 | 2.68 | 2.93 | (0.25) | (0.04) | — | (0.29) | 11.85 | 31.995 | 1.407 | 1.357 | 2.44 | 64 | 319 |
| 12-31-2008 | 14.53 | 0.33 | (4.94) | (4.61) | (0.32) | (0.39) | — | (0.71) | 9.21 | (32.22)5 | 1.367 | 1.327 | 2.66 | 46 | 36 |
| 12-31-2007 | 14.37 | 0.29 | 0.42 | 0.71 | (0.23) | (0.32) | — | (0.55) | 14.53 | 5.025 | 1.307 | 1.307 | 1.95 | 60 | 14 |
| 12-31-200610 | 14.37 | 0.20 | 0.81 | 1.01 | (0.40) | (0.27) | (0.34) | (1.01) | 14.37 | 6.966 | 1.418,11 | 1.348,11 | 4.008 | 32 | 3 |
| 8-31-200612 | 13.35 | 0.10 | 1.02 | 1.12 | (0.10) | —13 | — | (0.10) | 14.37 | 8.475,6 | 1.738,11 | 1.348,11 | 0.848 | 20 | 23 |
|
| CLASS C | | | | | | | | | | | | | | | |
|
| 6-30-20114 | 12.97 | 0.03 | 0.48 | 0.51 | (0.03) | — | — | (0.03) | 13.45 | 3.905,6 | 1.257,8 | 1.257,8 | 0.448 | 512 | 5 |
| 12-31-2010 | 11.86 | 0.22 | 1.23 | 1.45 | (0.21) | (0.13) | — | (0.34) | 12.97 | 12.345 | 1.247 | 1.247 | 1.82 | 448 | 19 |
| 12-31-2009 | 9.22 | 0.27 | 2.67 | 2.94 | (0.26) | (0.04) | — | (0.30) | 11.86 | 32.085 | 1.277 | 1.267 | 2.63 | 327 | 319 |
| 12-31-2008 | 14.55 | 0.34 | (4.95) | (4.61) | (0.33) | (0.39) | — | (0.72) | 9.22 | (32.19)5 | 1.247 | 1.247 | 2.76 | 209 | 36 |
| 12-31-2007 | 14.39 | 0.31 | 0.42 | 0.73 | (0.25) | (0.32) | — | (0.57) | 14.55 | 5.105 | 1.227 | 1.217 | 2.09 | 268 | 14 |
| 12-31-200610 | 14.38 | 0.20 | 0.82 | 1.02 | (0.40) | (0.27) | (0.34) | (1.01) | 14.39 | 7.036 | 1.258,11 | 1.258,11 | 4.108 | 128 | 3 |
| 8-31-200612 | 13.35 | 0.12 | 1.01 | 1.13 | (0.10) | —13 | — | (0.10) | 14.38 | 8.555,6 | 1.418,11 | 1.298,11 | 0.978 | 79 | 23 |
|
| CLASS R1 | | | | | | | | | | | | | | | |
|
| 6-30-20114 | 12.92 | 0.05 | 0.48 | 0.53 | (0.05) | — | — | (0.05) | 13.40 | 4.105,6 | 0.907,8 | 0.907,8 | 0.788 | 18 | 5 |
| 12-31-2010 | 11.82 | 0.26 | 1.23 | 1.49 | (0.26) | (0.13) | — | (0.39) | 12.92 | 12.755 | 0.887 | 0.887 | 2.17 | 15 | 19 |
| 12-31-2009 | 9.20 | 0.43 | 2.51 | 2.94 | (0.28) | (0.04) | — | (0.32) | 11.82 | 32.215 | 1.077 | 1.077 | 3.96 | 10 | 319 |
| 12-31-2008 | 14.53 | 0.44 | (5.01) | (4.57) | (0.37) | (0.39) | — | (0.76) | 9.20 | (32.01)5 | 2.587 | 1.067 | 3.69 | 1 | 36 |
| 12-31-2007 | 14.38 | 0.49 | 0.31 | 0.80 | (0.33) | (0.32) | — | (0.65) | 14.53 | 5.585 | 7.357 | 0.787,15 | 3.25 | 1 | 14 |
| 12-31-200610,12 | 14.44 | 0.21 | 0.78 | 0.99 | (0.42) | (0.27) | (0.36) | (1.05) | 14.38 | 6.845,6 | 13.068,11 | 0.708,11 | 4.968 | —16 | 3 |
|
| CLASS R3 | | | | | | | | | | | | | | | |
|
| 6-30-20114 | 12.94 | 0.06 | 0.47 | 0.53 | (0.06) | — | — | (0.06) | 13.41 | 4.095,6 | 0.777,8 | 0.767,8 | 0.898 | 39 | 5 |
| 12-31-2010 | 11.83 | 0.28 | 1.23 | 1.51 | (0.27) | (0.13) | — | (0.40) | 12.94 | 12.895 | 0.797 | 0.797 | 2.28 | 39 | 19 |
| 12-31-2009 | 9.20 | 0.30 | 2.67 | 2.97 | (0.30) | (0.04) | — | (0.34) | 11.83 | 32.625 | 0.847 | 0.847 | 2.94 | 30 | 319 |
| 12-31-2008 | 14.52 | 0.40 | (4.95) | (4.55) | (0.38) | (0.39) | — | (0.77) | 9.20 | (31.89)5 | 0.817 | 0.807 | 3.21 | 20 | 36 |
| 12-31-2007 | 14.36 | 0.43 | 0.37 | 0.80 | (0.32) | (0.32) | — | (0.64) | 14.52 | 5.655 | 0.857 | 0.767,15 | 2.90 | 23 | 14 |
| 12-31-200610 | 14.37 | 0.22 | 0.82 | 1.04 | (0.42) | (0.27) | (0.36) | (1.05) | 14.36 | 7.225,6 | 1.248,11 | 0.728,11 | 4.558 | 5 | 3 |
| 8-31-200612 | 13.35 | 0.36 | 0.82 | 1.18 | (0.16) | —13 | — | (0.16) | 14.37 | 8.925,6 | 3.708 | 0.698,11 | 3.108 | 3 | 23 |
|
| CLASS R4 | | | | | | | | | | | | | | | |
|
| 6-30-20114 | 12.94 | 0.08 | 0.47 | 0.55 | (0.08) | — | — | (0.08) | 13.41 | 4.245,6 | 0.487,8 | 0.487,8 | 1.208 | 32 | 5 |
| 12-31-2010 | 11.84 | 0.31 | 1.23 | 1.54 | (0.31) | (0.13) | — | (0.44) | 12.94 | 13.195 | 0.457 | 0.457 | 2.53 | 29 | 19 |
| 12-31-2009 | 9.20 | 0.35 | 2.66 | 3.01 | (0.33) | (0.04) | — | (0.37) | 11.84 | 33.105 | 0.537 | 0.537 | 3.37 | 24 | 319 |
| 12-31-2008 | 14.52 | 0.43 | (4.94) | (4.51) | (0.42) | (0.39) | — | (0.81) | 9.20 | (31.68)5 | 0.527 | 0.527 | 3.51 | 14 | 36 |
| 12-31-2007 | 14.36 | 0.39 | 0.45 | 0.84 | (0.36) | (0.32) | — | (0.68) | 14.52 | 5.915 | 0.587 | 0.517,15 | 2.63 | 18 | 14 |
| 12-31-200610 | 14.38 | 0.23 | 0.81 | 1.04 | (0.43) | (0.27) | (0.36) | (1.06) | 14.36 | 7.275,6 | 0.708,11 | 0.528,11 | 4.558 | 10 | 3 |
| 8-31-200612 | 13.35 | 0.16 | 1.06 | 1.22 | (0.19) | —13 | — | (0.19) | 14.38 | 9.195,6 | 1.468,11 | 0.488,11 | 1.378 | 7 | 23 |
|
| CLASS R5 | | | | | | | | | | | | | | | |
|
| 6-30-20114 | 12.96 | 0.10 | 0.47 | 0.57 | (0.10) | — | — | (0.10) | 13.43 | 4.395,6 | 0.177,8 | 0.177,8 | 1.508 | 45 | 5 |
| 12-31-2010 | 11.85 | 0.35 | 1.23 | 1.58 | (0.34) | (0.13) | — | (0.47) | 12.96 | 13.525 | 0.187 | 0.187 | 2.89 | 38 | 19 |
| 12-31-2009 | 9.21 | 0.39 | 2.65 | 3.04 | (0.36) | (0.04) | — | (0.40) | 11.85 | 33.455 | 0.227 | 0.227 | 3.74 | 27 | 319 |
| 12-31-2008 | 14.52 | 0.54 | (5.01) | (4.47) | (0.45) | (0.39) | — | (0.84) | 9.21 | (31.40)5 | 0.217 | 0.217 | 4.46 | 15 | 36 |
| 12-31-2007 | 14.36 | 0.50 | 0.38 | 0.88 | (0.40) | (0.32) | — | (0.72) | 14.52 | 6.185 | 0.437 | 0.217,15 | 3.35 | 10 | 14 |
| 12-31-200610 | 14.38 | 0.24 | 0.82 | 1.06 | (0.44) | (0.27) | (0.37) | (1.08) | 14.36 | 7.415,6 | 1.698,11 | 0.208,11 | 4.858 | 2 | 3 |
| 8-31-200612 | 13.35 | 0.18 | 1.06 | 1.24 | (0.21) | —13 | — | (0.21) | 14.38 | 9.395,6 | 2.588,11 | 0.198,11 | 1.488 | 1 | 23 |
|
| | |
| See notes to financial statements | Semiannual report | Lifestyle Portfolios | 31 |
| | |
Financial highlights
Continued
| | | | | | | | | | | | | | | |
| Lifestyle Balanced continued | | | | | | | | | | | | |
| | | | | | | | | | | | | |
| Per share operating performance for a share outstanding throughout the period | | | Ratios and supplemental data | |
|
| | Income (loss) from | | | | | | | | | | | | |
| | investment operations | | Less distributions | | | | Ratios to average net assets | | |
| |
| |
| |
| |
| | | | Net | | | | | | | | | | | | |
| | | | realized | Total | | | | | | | Expenses | Expenses | | Net | |
| | Net asset | Net | and | from | From net | | | | | | before re- | including | | assets, | |
| | value, | invest- | unrealized | invest- | invest- | | | | Net asset | | ductions and | reductions | Net | end of | |
| | beginning | ment in- | gain (loss) | ment | ment | From net | From | Total value, | end | Total | amounts | and amounts | investment | period (in | Portfolio |
| | of period | come (loss) | on invest- | operations | income | realized | capital | distribu- | of period | return | recaptured | recaptured | income | millions) | turnover |
| Period ended | ($) | ($)1,2 | ments ($) | ($) | ($) | gain ($) | paid-in ($) | tions ($) | ($) | (%)3 | (%) | (%) (loss) | (%)1 | ($) | (%) |
|
| CLASS 1 | | | | | | | | | | | | | | | |
|
| 6-30-20114 | 12.90 | 0.10 | 0.47 | 0.57 | (0.10) | — | — | (0.10) | 13.37 | 4.455,6 | 0.117,8 | 0.117,8 | 1.568 | 10,605 | 5 |
| 12-31-2010 | 11.80 | 0.35 | 1.23 | 1.58 | (0.35) | (0.13) | — | (0.48) | 12.90 | 13.575 | 0.117 | 0.117 | 2.88 | 10,003 | 19 |
| 12-31-2009 | 9.17 | 0.38 | 2.66 | 3.04 | (0.37) | (0.04) | — | (0.41) | 11.80 | 33.59 | 0.117 | 0.117 | 3.65 | 8,557 | 319 |
| 12-31-2008 | 14.47 | 0.47 | (4.91) | (4.44) | (0.47) | (0.39) | — | (0.86) | 9.17 | (31.37) | 0.127 | 0.127 | 3.79 | 6,241 | 36 |
| 12-31-2007 | 14.31 | 0.42 | 0.47 | 0.89 | (0.41) | (0.32) | — | (0.73) | 14.47 | 6.30 | 0.117 | 0.117 | 2.84 | 8,928 | 14 |
| 12-31-200610 | 14.34 | 0.24 | 0.82 | 1.06 | (0.45) | (0.27) | (0.37) | (1.09) | 14.31 | 7.406 | 0.118,11 | 0.118,11 | 4.848 | 7,609 | 3 |
| 8-31-200612 | 13.31 | 0.22 | 1.03 | 1.25 | (0.22) | —13 | — | (0.22) | 14.34 | 9.476 | 0.118,11 | 0.118,11 | 1.818 | 6,736 | 23 |
|
| CLASS 5 | | | | | | | | | | | | | | | |
|
| 6-30-20114 | 12.91 | 0.11 | 0.47 | 0.58 | (0.11) | — | — | (0.11) | 13.38 | 4.475,6 | 0.067,8 | 0.067,8 | 1.648 | 60 | 5 |
| 12-31-2010 | 11.80 | 0.37 | 1.23 | 1.60 | (0.36) | (0.13) | — | (0.49) | 12.91 | 13.715 | 0.067 | 0.067 | 3.07 | 49 | 19 |
| 12-31-2009 | 9.17 | 0.40 | 2.65 | 3.05 | (0.38) | (0.04) | — | (0.42) | 11.80 | 33.66 | 0.077 | 0.077 | 3.89 | 32 | 319 |
| 12-31-2008 | 14.48 | 0.50 | (4.95) | (4.45) | (0.47) | (0.39) | — | (0.86) | 9.17 | (31.38) | 0.077 | 0.077 | 4.07 | 18 | 36 |
| 12-31-2007 | 14.32 | 0.50 | 0.40 | 0.90 | (0.42) | (0.32) | — | (0.74) | 14.48 | 6.35 | 0.067 | 0.067 | 3.39 | 19 | 14 |
| 12-31-200610 | 14.35 | 0.33 | 0.74 | 1.07 | (0.45) | (0.27) | (0.38) | (1.10) | 14.32 | 7.426 | 0.068,11 | 0.068,11 | 6.638 | 7 | 3 |
| 8-31-200612 | 14.17 | —17 | 0.31 | 0.31 | (0.13) | — | — | (0.13) | 14.35 | 2.236 | 0.018,11 | 0.018,11 | (0.01)8 | 1 | 23 |
|
1 Recognition of net investment income by the Portfolio is affected by the timing of the declaration of dividends by the underlying funds in which the Portfolio invests.
2 Based on the average daily shares outstanding.
3 Does not reflect the effect of sales charges, if any.
4 Unaudited.
5 Total returns would have been lower had certain expenses not been reduced during the periods shown.
6 Not annualized.
7 Ratios do not include expenses indirectly incurred from underlying funds whose expense ratios can vary based on the mix of underlying funds held by the Portfolio. The range
of expense ratios of the underlying funds held by the Portfolios was as follows: 0.48%–1.38%, 0.48%–1.39%, 0.49%–1.40%, .049%–2.84% and 0.79%–0.91% for the
periods ended 6-30-11, 12-31-10, 12-31-09, 12-31-08 and 12-31-07, respectively.
8 Annualized.
9 Excludes merger activity.
10 The fiscal year-end changed from August 31 to December 31.
11 Does not include expenses of the underlying affiliated funds in which the Portfolio invests.
12 The inception date for Class A, Class B, Class C, Class R3, Class R4 and Class R5 shares is 10-18-05 and the inception dates for Class R1, Class 1 and Class 5 shares are
9-18-06, 10-15-05 and 7-3-06, respectively.
13 Less than ($0.005) per share.
14 Includes the impact of expense recapture which amounted to 0.03% of average net assets.
15 Includes transfer agent fee earned credits of less than 0.01% of average net assets.
16 Less than $500,000.
17 Less than $0.005 per share.
| | | | | | | | | | | | | | | |
| Lifestyle Moderate | | | | | | | | | | | | |
| |
| Per share operating performance for a share outstanding throughout the period | | | Ratios and supplemental data | |
|
| | Income (loss) from | | | | | | | | | | | | |
| | investment operations | | Less distributions | | | | Ratios to average net assets | | |
| |
| |
| |
| |
| | | | Net | | | | | | | | | | | | |
| | | | realized | Total | | | | | | | Expenses | Expenses | | Net | |
| | Net asset | Net | and | from | From net | | | | | | before re- | including | | assets, | |
| | value, | invest- | unrealized | invest- | invest- | | | | Net asset | | ductions and | reductions | Net | end of | |
| | beginning | ment in- | gain (loss) | ment | ment | From net | From | Total value, | end | Total | amounts | and amounts | investment | period (in | Portfolio |
| | of period | come (loss) | on invest- | operations | income | realized | capital | distribu- | of period | return | recaptured | recaptured | income | millions) | turnover |
| Period ended | ($) | ($)1,2 | ments ($) | ($) | ($) | gain ($) | paid-in ($) | tions ($) | ($) | (%)3 | (%) | (%) (loss) | (%)1 | ($) | (%) |
|
| CLASS A | | | | | | | | | | | | | | | |
|
| 6-30-20114 | 12.63 | 0.14 | 0.38 | 0.52 | (0.13) | — | — | (0.13) | 13.02 | 4.135 | 0.556,7 | 0.556,7 | 2.116 | 274 | 6 |
| 12-31-2010 | 11.77 | 0.41 | 0.97 | 1.38 | (0.39) | (0.13) | — | (0.52) | 12.63 | 11.858 | 0.557 | 0.557 | 3.37 | 220 | 20 |
| 12-31-2009 | 9.59 | 0.45 | 2.19 | 2.64 | (0.42) | (0.04) | — | (0.46) | 11.77 | 27.888 | 0.547 | 0.547 | 4.27 | 146 | 29 |
| 12-31-2008 | 13.57 | 0.58 | (3.76) | (3.18) | (0.54) | (0.26) | — | (0.80) | 9.59 | (23.88)8 | 0.537 | 0.537 | 4.81 | 86 | 32 |
| 12-31-2007 | 13.53 | 0.50 | 0.14 | 0.64 | (0.41) | (0.19) | — | (0.60) | 13.57 | 4.788 | 0.537 | 0.537 | 3.57 | 76 | 13 |
| 12-31-20069 | 13.64 | 0.27 | 0.52 | 0.79 | (0.36) | (0.21) | (0.33) | (0.90) | 13.53 | 5.778,5 | 0.576,10 | 0.566,10 | 5.866 | 37 | 1 |
| 8-31-200611 | 12.94 | 0.25 | 0.66 | 0.91 | (0.21) | — | — | (0.21) | 13.64 | 7.108,5 | 0.836,10 | 0.576,10 | 2.216 | 25 | 24 |
|
| | |
| 32 | Lifestyle Portfolios | Semiannual report | See notes to financial statements |
| | | |
Financial highlights
Continued
| | | | | | | | | | | | | | | |
| Lifestyle Moderate continued | | | | | | | | | | | | |
| |
| Per share operating performance for a share outstanding throughout the period | | | Ratios and supplemental data | |
|
| | Income (loss) from | | | | | | | | | | | | |
| | investment operations | | Less distributions | | | Ratios to average net assets | |
| |
| |
| |
| |
| | | | Net | | | | | | | | | | | | |
| | | | realized | Total | | | | | | | Expenses | Expenses | | Net | |
| | Net asset | Net | and | from | From net | | | | | | before re- | including | | assets, | |
| | value, | invest- | unrealized | invest- | invest- | | | | Net asset | | ductions | and reductions | Net | end of | |
| | beginning | ment in- | gain (loss) | ment | ment | From net | From | Total value, | end | Total | amounts | and amounts | investment | period (in | Portfolio |
| | of period | come (loss) | on invest- | operations | income | realized | capital | distribu- | of period | return | recaptured | recaptured | income | millions) | turnover |
| Period ended | ($) | ($)1,2 | ments ($) | ($) | ($) | gain ($) | paid-in ($) | tions ($) | ($) | (%)3 | (%) | (%) (loss) | (%)1 | ($) | (%) |
|
| CLASS B | | | | | | | | | | | | | | | |
|
| 6-30-20114 | 12.63 | 0.09 | 0.37 | 0.46 | (0.08) | — | — | (0.08) | 13.01 | 3.675 | 1.286,7 | 1.286,7 | 1.376 | 31 | 6 |
| 12-31-2010 | 11.76 | 0.30 | 0.99 | 1.29 | (0.29) | (0.13) | — | (0.42) | 12.63 | 11.058 | 1.307 | 1.347,12 | 2.50 | 26 | 20 |
| 12-31-2009 | 9.58 | 0.35 | 2.20 | 2.55 | (0.33) | (0.04) | — | (0.37) | 11.76 | 26.918 | 1.417 | 1.357 | 3.33 | 20 | 29 |
| 12-31-2008 | 13.56 | 0.45 | (3.74) | (3.29) | (0.43) | (0.26) | — | (0.69) | 9.58 | (24.56)8 | 1.397 | 1.367 | 3.70 | 14 | 32 |
| 12-31-2007 | 13.52 | 0.38 | 0.15 | 0.53 | (0.30) | (0.19) | — | (0.49) | 13.56 | 3.978 | 1.437 | 1.357 | 2.73 | 15 | 13 |
| 12-31-20069 | 13.62 | 0.23 | 0.52 | 0.75 | (0.33) | (0.21) | (0.31) | (0.85) | 13.52 | 5.495,8 | 1.666,10 | 1.356,10 | 4.876 | 7 | 1 |
| 8-31-200611 | 12.94 | 0.15 | 0.68 | 0.83 | (0.15) | — | — | (0.15) | 13.62 | 6.425,8 | 2.436,10 | 1.346,10 | 1.286 | 5 | 24 |
|
| CLASS C | | | | | | | | | | | | | | | |
|
| 6-30-20114 | 12.64 | 0.09 | 0.37 | 0.46 | (0.08) | — | — | (0.08) | 13.02 | 3.685 | 1.256,7 | 1.256,7 | 1.396 | 217 | 6 |
| 12-31-2010 | 11.77 | 0.32 | 0.98 | 1.30 | (0.30) | (0.13) | — | (0.43) | 12.64 | 11.158 | 1.257 | 1.257 | 2.67 | 183 | 20 |
| 12-31-2009 | 9.59 | 0.38 | 2.18 | 2.56 | (0.34) | (0.04) | — | (0.38) | 11.77 | 27.008 | 1.257 | 1.257 | 3.58 | 116 | 29 |
| 12-31-2008 | 13.57 | 0.48 | (3.75) | (3.27) | (0.45) | (0.26) | — | (0.71) | 9.59 | (24.44)8 | 1.257 | 1.257 | 4.02 | 69 | 32 |
| 12-31-2007 | 13.53 | 0.41 | 0.13 | 0.54 | (0.31) | (0.19) | — | (0.50) | 13.57 | 4.058 | 1.247 | 1.247 | 2.94 | 69 | 13 |
| 12-31-20069 | 13.63 | 0.24 | 0.51 | 0.75 | (0.33) | (0.21) | (0.31) | (0.85) | 13.53 | 5.495,8 | 1.326,10 | 1.286,10 | 5.136 | 29 | 1 |
| 8-31-200611 | 12.94 | 0.17 | 0.67 | 0.84 | (0.15) | — | — | (0.15) | 13.63 | 6.495,8 | 1.676 | 1.296,10 | 1.516 | 18 | 24 |
|
| CLASS R1 | | | | | | | | | | | | | | | |
|
| 6-30-20114 | 12.63 | 0.10 | 0.39 | 0.49 | (0.10) | — | — | (0.10) | 13.02 | 3.895 | 0.986,7 | 0.986,7 | 1.576 | 7 | 6 |
| 12-31-2010 | 11.76 | 0.33 | 1.00 | 1.33 | (0.33) | (0.13) | — | (0.46) | 12.63 | 11.458 | 0.937 | 0.987,12 | 2.72 | 7 | 20 |
| 12-31-2009 | 9.58 | 0.50 | 2.09 | 2.59 | (0.37) | (0.04) | — | (0.41) | 11.76 | 27.358 | 1.147 | 1.067 | 4.57 | 6 | 29 |
| 12-31-2008 | 13.58 | 0.64 | (3.87) | (3.23) | (0.51) | (0.26) | — | (0.77) | 9.58 | (24.21)8 | 1.977 | 0.857 | 5.39 | 2 | 32 |
| 12-31-2007 | 13.54 | 0.52 | 0.10 | 0.62 | (0.39) | (0.19) | — | (0.58) | 13.58 | 4.638 | 4.107 | 0.717,13 | 3.73 | 1 | 13 |
| 12-31-20069,11 | 13.69 | 0.25 | 0.50 | 0.75 | (0.36) | (0.21) | (0.33) | (0.90) | 13.54 | 5.435,8 | 13.146,10 | 0.706,10 | 6.076 | —14 | 1 |
|
| CLASS R3 | | | | | | | | | | | | | | | |
|
| 6-30-20114 | 12.62 | 0.12 | 0.37 | 0.49 | (0.11) | — | — | (0.11) | 13.00 | 3.905 | 0.846,7 | 0.846,7 | 1.896 | 11 | 6 |
| 12-31-2010 | 11.76 | 0.35 | 0.99 | 1.34 | (0.35) | (0.13) | — | (0.48) | 12.62 | 11.568 | 0.877 | 0.877 | 2.87 | 10 | 20 |
| 12-31-2009 | 9.58 | 0.39 | 2.21 | 2.60 | (0.38) | (0.04) | — | (0.42) | 11.76 | 27.438 | 0.957 | 0.957 | 3.72 | 8 | 29 |
| 12-31-2008 | 13.57 | 0.55 | (3.78) | (3.23) | (0.50) | (0.26) | — | (0.76) | 9.58 | (24.22)8 | 1.007 | 0.867 | 4.55 | 5 | 32 |
| 12-31-2007 | 13.53 | 0.47 | 0.15 | 0.62 | (0.39) | (0.19) | — | (0.58) | 13.57 | 4.618 | 1.517 | 0.837,13 | 3.40 | 4 | 13 |
| 12-31-20069 | 13.65 | 0.23 | 0.55 | 0.78 | (0.36) | (0.21) | (0.33) | (0.90) | 13.53 | 5.665,8 | 3.136,10 | 0.786,10 | 4.896 | 1 | 1 |
| 8-31-200611 | 12.94 | 0.33 | 0.58 | 0.91 | (0.20) | — | — | (0.20) | 13.65 | 7.105,8 | 8.446,10 | 0.696,10 | 2.936 | 1 | 24 |
|
| CLASS R4 | | | | | | | | | | | | | | | |
|
| 6-30-20114 | 12.60 | 0.13 | 0.38 | 0.51 | (0.13) | — | — | (0.13) | 12.98 | 4.055 | 0.586,7 | 0.586,7 | 2.046 | 8 | 6 |
| 12-31-2010 | 11.74 | 0.40 | 0.97 | 1.37 | (0.38) | (0.13) | — | (0.51) | 12.60 | 11.848 | 0.587 | 0.607,12 | 3.30 | 7 | 20 |
| 12-31-2009 | 9.57 | 0.40 | 2.22 | 2.62 | (0.41) | (0.04) | — | (0.45) | 11.74 | 27.718 | 0.707 | 0.667 | 3.83 | 5 | 29 |
| 12-31-2008 | 13.55 | 0.56 | (3.75) | (3.19) | (0.53) | (0.26) | — | (0.79) | 9.57 | (23.94)8 | 0.797 | 0.577 | 4.66 | 4 | 32 |
| 12-31-2007 | 13.51 | 0.47 | 0.18 | 0.65 | (0.42) | (0.19) | — | (0.61) | 13.55 | 4.878 | 1.137 | 0.547,13 | 3.38 | 4 | 13 |
| 12-31-20069 | 13.63 | 0.25 | 0.53 | 0.78 | (0.36) | (0.21) | (0.33) | (0.90) | 13.51 | 5.805,8 | 1.536,10 | 0.526,10 | 5.446 | 2 | 1 |
| 8-31-200611 | 12.94 | 0.30 | 0.62 | 0.92 | (0.23) | — | — | (0.23) | 13.63 | 7.145,8 | 4.656,10 | 0.496,10 | 2.596 | 1 | 24 |
|
| CLASS R5 | | | | | | | | | | | | | | | |
|
| 6-30-20114 | 12.62 | 0.15 | 0.38 | 0.53 | (0.15) | — | — | (0.15) | 13.00 | 4.225 | 0.226,7 | 0.226,7 | 2.416 | 15 | 6 |
| 12-31-2010 | 11.75 | 0.46 | 0.97 | 1.43 | (0.43) | (0.13) | — | (0.56) | 12.62 | 12.358 | 0.247 | 0.247 | 3.75 | 11 | 20 |
| 12-31-2009 | 9.58 | 0.46 | 2.19 | 2.65 | (0.44) | (0.04) | — | (0.48) | 11.75 | 28.108 | 0.327 | 0.327 | 4.39 | 8 | 29 |
| 12-31-2008 | 13.56 | 0.63 | (3.78) | (3.15) | (0.57) | (0.26) | — | (0.83) | 9.58 | (23.67)8 | 0.367 | 0.237 | 5.27 | 5 | 32 |
| 12-31-2007 | 13.52 | 0.58 | 0.11 | 0.69 | (0.46) | (0.19) | — | (0.65) | 13.56 | 5.158 | 0.977 | 0.217,13 | 4.21 | 4 | 13 |
| 12-31-20069 | 13.64 | 0.32 | 0.48 | 0.80 | (0.37) | (0.21) | (0.34) | (0.92) | 13.52 | 5.935,8 | 2.836,10 | 0.206,10 | 6.836 | 1 | 1 |
| 8-31-200611 | 12.94 | 0.22 | 0.73 | 0.95 | (0.25) | — | — | (0.25) | 13.64 | 7.405,8 | 4.866,10 | 0.196,10 | 1.926 | 1 | 24 |
|
| | |
| See notes to financial statements | Semiannual report | Lifestyle Portfolios | 33 |
| | |
Financial highlights
Continued
| | | | | | | | | | | | | | | |
| Lifestyle Moderate continued | | | | | | | | | | | | |
| | | | | | | | | | | | | |
| Per share operating performance for a share outstanding throughout the period | | | Ratios and supplemental data | |
|
| | Income (loss) from | | | | | | | | | | | | |
| | investment operations | | Less distributions | | | Ratios to average net assets | |
| |
| |
| |
| |
| | | | Net | | | | | | | | | | | | |
| | | | realized | Total | | | | | | | Expenses | Expenses | | Net | |
| | Net asset | Net | and | from | From net | | | | | | before re- | including | | assets, | |
| | value, | invest- | unrealized | invest- | invest- | | | | Net asset | | ductions and | reductions | Net | end of | |
| | beginning | ment in- | gain (loss) | ment | ment | From net | From | Total value, | end | Total | amounts | and amounts | investment | period (in | Portfolio |
| | of period | come (loss) | on invest- | operations | income | realized | capital | distribu- | of period | return | recaptured | recaptured | income | millions) | turnover |
| Period ended | ($) | ($)1,2 | ments ($) | ($) | ($) | gain ($) | paid-in ($) | tions ($) | ($) | (%)3 | (%) | (%) (loss) | (%)1 | ($) | (%) |
|
| CLASS 1 | | | | | | | | | | | | | | | |
|
| 6-30-20114 | 12.61 | 0.16 | 0.38 | 0.54 | (0.16) | — | — | (0.16) | 12.99 | 4.295 | 0.116,7 | 0.116,7 | 2.496 | 3,193 | 6 |
| 12-31-2010 | 11.74 | 0.44 | 1.00 | 1.44 | (0.44) | (0.13) | — | (0.57) | 12.61 | 12.438 | 0.117 | 0.117 | 3.66 | 3,026 | 20 |
| 12-31-2009 | 9.56 | 0.47 | 2.21 | 2.68 | (0.46) | (0.04) | — | (0.50) | 11.74 | 28.498 | 0.117 | 0.117 | 4.49 | 2,503 | 29 |
| 12-31-2008 | 13.54 | 0.59 | (3.73) | (3.14) | (0.58) | (0.26) | — | (0.84) | 9.56 | (23.63)8 | 0.127 | 0.127 | 4.90 | 1,857 | 32 |
| 12-31-2007 | 13.50 | 0.49 | 0.21 | 0.70 | (0.47) | (0.19) | — | (0.66) | 13.54 | 5.25 | 0.117 | 0.117,13 | 3.53 | 2,339 | 13 |
| 12-31-20069 | 13.63 | 0.27 | 0.54 | 0.81 | (0.38) | (0.21) | (0.35) | (0.94) | 13.50 | 5.905 | 0.116,10 | 0.116,10 | 5.806 | 2,008 | 1 |
| 8-31-200611 | 12.93 | 0.26 | 0.70 | 0.96 | (0.26) | — | — | (0.26) | 13.63 | 7.475 | 0.116,10 | 0.116,10 | 2.236 | 1,820 | 24 |
|
| CLASS 5 | | | | | | | | | | | | | | | |
|
| 6-30-20114 | 12.60 | 0.17 | 0.37 | 0.54 | (0.16) | — | — | (0.16) | 12.98 | 4.325 | 0.066,7 | 0.066,7 | 2.586 | 26 | 6 |
| 12-31-2010 | 11.73 | 0.47 | 0.97 | 1.44 | (0.44) | (0.13) | — | (0.57) | 12.60 | 12.508 | 0.067 | 0.067 | 3.87 | 22 | 20 |
| 12-31-2009 | 9.56 | 0.51 | 2.17 | 2.68 | (0.47) | (0.04) | — | (0.51) | 11.73 | 28.458 | 0.077 | 0.077 | 4.78 | 14 | 29 |
| 12-31-2008 | 13.54 | 0.67 | (3.80) | (3.13) | (0.59) | (0.26) | — | (0.85) | 9.56 | (23.59)8 | 0.077 | 0.077 | 5.70 | 8 | 32 |
| 12-31-2007 | 13.49 | 0.53 | 0.19 | 0.72 | (0.48) | (0.19) | — | (0.67) | 13.54 | 5.39 | 0.067 | 0.067 | 3.80 | 5 | 13 |
| 12-31-20069 | 13.62 | 0.34 | 0.47 | 0.81 | (0.38) | (0.21) | (0.35) | (0.94) | 13.49 | 5.935 | 0.066,10 | 0.066,10 | 7.216 | 3 | 1 |
| 8-31-200611 | 13.48 | —15 | 0.30 | 0.30 | (0.16) | — | — | (0.16) | 13.62 | 2.275 | 0.016,10 | 0.016,10 | (0.01)6 | 1 | 24 |
|
1 Recognition of net investment income by the Portfolio is affected by the timing of the declaration of dividends by the underlying funds in which the Portfolio invests.
2 Based on the average daily shares outstanding.
3 Does not reflect the effect of sales charges, if any.
4 Unaudited.
5 Not annualized.
6 Annualized.
7 Ratios do not include expenses indirectly incurred from underlying funds whose expense ratios can vary based on the mix of underlying funds held by the Portfolio. The range
of expense ratios of the underlying funds held by the Portfolio was as follows: 0.48%–1.14%, 0.48%–1.14%, 0.49%–1.17%, 0.49%–2.40% and 0.79%–0.91% for the
periods ended 6-30-11, 12-31-10, 12-31-09, 12-31-08 and 12-31-07, respectively.
8 Total returns would have been lower had certain expenses not been reduced during the periods shown.
9 The fiscal year-end changed from August 31 to December 31.
10 Does not include expenses of the underlying affiliated funds in which the Portfolio invests.
11 The inception date for Class A, Class B, Class C, Class R3, Class R4 and Class R5 shares is 10-18-05 and the inception dates for Class R1, Class 1 and Class 5 shares are
9-18-06, 10-15-05 and 7-3-06, respectively.
12 Includes the impact of expense recapture for the following period ended: 12-31-10: 0.04%, 0.05% and 0.02% of average net assets Class B, Class R1 and Class R4 shares,
respectively. See Note 4.
13 Includes transfer agent fee earned credits of less than 0.01% of average net assets.
14 Less than $500,000.
15 Less than $0.005 per share.
| | | | | | | | | | | | | | | |
| Lifestyle Conservative | | | | | | | | | | | | | |
| |
| Per share operating performance for a share outstanding throughout the period | | | Ratios and supplemental data | |
|
| | Income (loss) from | | | | | | | | | | | | |
| | investment operations | | Less distributions | | Ratios to average net assets | | |
| |
| |
| |
| |
| | | | Net | | | | | | | | Expenses | | | | |
| | | | realized | Total | | | | | | | before | Expenses | | Net | |
| | Net asset | Net | and | from | From net | | | | | | reduc- | including | | assets, | |
| | value, | invest- | unrealized | invest- | invest- | | | | Net asset | | tions and | reductions | Net | end of | |
| | beginning | ment in- | gain (loss) | ment | ment | From net | From | Total value, | end | Total | amounts | and amounts | investment | period (in | Portfolio |
| | of period | come (loss) | on invest- | operations | income | realized | capital | distribu- | of period | return | recaptured | recaptured | income | millions) | turnover |
| Period ended | ($) | ($)1,2 | ments ($) | ($) | ($) | gain ($) | paid-in ($) | tions ($) | ($) | (%)3 | (%) | (%) (loss) | (%)1 | ($) | (%) |
|
| CLASS A | | | | | | | | | | | | | | | |
|
| 6-30-20114 | 12.77 | 0.18 | 0.28 | 0.46 | (0.17) | — | — | (0.17) | 13.06 | 3.645 | 0.556,7 | 0.556,7 | 2.816 | 264 | 6 |
| 12-31-2010 | 12.15 | 0.48 | 0.71 | 1.19 | (0.45) | (0.12) | — | (0.57) | 12.77 | 9.96 | 0.557 | 0.557 | 3.78 | 218 | 24 |
| 12-31-2009 | 10.39 | 0.54 | 1.77 | 2.31 | (0.50) | (0.05) | — | (0.55) | 12.15 | 22.538 | 0.527 | 0.527 | 4.80 | 141 | 24 |
| 12-31-2008 | 13.32 | 0.73 | (2.75) | (2.02) | (0.63) | (0.28) | — | (0.91) | 10.39 | (15.41)8 | 0.537 | 0.537 | 6.01 | 87 | 33 |
| 12-31-2007 | 13.29 | 0.59 | 0.05 | 0.64 | (0.49) | (0.12) | — | (0.61) | 13.32 | 4.898 | 0.557 | 0.547 | 4.38 | 44 | 13 |
| 12-31-20069 | 13.63 | 0.33 | 0.23 | 0.56 | (0.38) | (0.16) | (0.36) | (0.90) | 13.29 | 4.115,8 | 0.646,13 | 0.566,13 | 7.206 | 20 | 2 |
| 8-31-200610 | 13.16 | 0.31 | 0.41 | 0.72 | (0.25) | — | — | (0.25) | 13.63 | 5.535,8 | 1.026,13 | 0.576,13 | 2.756 | 12 | 20 |
|
| | |
| 34 | Lifestyle Portfolios | Semiannual report | See notes to financial statements |
| | | |
Financial highlights
Continued
| | | | | | | | | | | | | | | |
| Lifestyle Conservative continued | | | | | | | | | | | |
| |
| Per share operating performance for a share outstanding throughout the period | | | Ratios and supplemental data | |
|
| | Income (loss) from | | | | | | | | | | | | |
| | investment operations | | Less distributions | | Ratios to average net assets | |
| |
| |
| |
| |
| | | | Net | | | | | | | | | | | | |
| | | | realized | Total | | | | | | | Expenses | Expenses | | Net | |
| | Net asset | Net | and | from | From net | | | | | | before re- | including | | assets, | |
| | value, | invest- | unrealized | invest- | invest- | | | | Net asset | | ductions and | reductions | Net | end of | |
| | beginning | ment in- | gain (loss) | ment | ment | From net | From | Total value, | end | Total | amounts | and amounts | investment | period (in | Portfolio |
| | of period | come (loss) | on invest- | operations | income | realized | capital | distribu- | of period | return | recaptured | recaptured | income | millions) | turnover |
| Period ended | ($) | ($)1,2 | ments ($) | ($) | ($) | gain ($) | paid-in ($) | tions ($) | ($) | (%)3 | (%) | (%) | (loss) (%)1 | ($) | (%) |
|
| CLASS B | | | | | | | | | | | | | | | |
|
| 6-30-20114 | 12.77 | 0.13 | 0.29 | 0.42 | (0.13) | — | — | (0.13) | 13.06 | 3.265 | 1.286,7 | 1.286,7 | 2.036 | 33 | 6 |
| 12-31-2010 | 12.15 | 0.37 | 0.73 | 1.10 | (0.36) | (0.12) | — | (0.48) | 12.77 | 9.16 | 1.297 | 1.297,14 | 2.96 | 28 | 24 |
| 12-31-2009 | 10.40 | 0.44 | 1.77 | 2.21 | (0.41) | (0.05) | — | (0.46) | 12.15 | 21.468 | 1.357 | 1.357 | 3.88 | 21 | 24 |
| 12-31-2008 | 13.32 | 0.59 | (2.70) | (2.11) | (0.53) | (0.28) | — | (0.81) | 10.40 | (16.04)8 | 1.367 | 1.347 | 4.81 | 13 | 33 |
| 12-31-2007 | 13.29 | 0.50 | 0.04 | 0.54 | (0.39) | (0.12) | — | (0.51) | 13.32 | 4.118 | 1.547 | 1.327 | 3.71 | 10 | 13 |
| 12-31-20069 | 13.63 | 0.29 | 0.22 | 0.51 | (0.35) | (0.16) | (0.34) | (0.85) | 13.29 | 3.755,8 | 1.886,13 | 1.336,13 | 6.206 | 4 | 2 |
| 8-31-200610 | 13.16 | 0.24 | 0.41 | 0.65 | (0.18) | — | — | (0.18) | 13.63 | 4.995,8 | 3.126,13 | 1.336,13 | 2.086 | 3 | 20 |
|
| CLASS C | | | | | | | | | | | | | | | |
|
| 6-30-20114 | 12.77 | 0.13 | 0.29 | 0.42 | (0.13) | — | — | (0.13) | 13.06 | 3.285 | 1.256,7 | 1.256,7 | 2.066 | 223 | 6 |
| 12-31-2010 | 12.14 | 0.39 | 0.72 | 1.11 | (0.36) | (0.12) | — | (0.48) | 12.77 | 9.28 | 1.247 | 1.247 | 3.10 | 189 | 24 |
| 12-31-2009 | 10.39 | 0.46 | 1.76 | 2.22 | (0.42) | (0.05) | — | (0.47) | 12.14 | 21.58 | 1.247 | 1.247 | 4.08 | 119 | 24 |
| 12-31-2008 | 13.32 | 0.62 | (2.73) | (2.11) | (0.54) | (0.28) | — | (0.82) | 10.39 | (16.03)8 | 1.247 | 1.247 | 5.05 | 73 | 33 |
| 12-31-2007 | 13.28 | 0.52 | 0.04 | 0.56 | (0.40) | (0.12) | — | (0.52) | 13.32 | 4.228 | 1.287 | 1.287,11 | 3.88 | 44 | 13 |
| 12-31-20069 | 13.62 | 0.30 | 0.21 | 0.51 | (0.35) | (0.16) | (0.34) | (0.85) | 13.28 | 3.765,8 | 1.416,13 | 1.296,13 | 6.556 | 14 | 2 |
| 8-31-200610 | 13.16 | 0.29 | 0.35 | 0.64 | (0.18) | — | — | (0.18) | 13.62 | 4.915,8 | 2.056,13 | 1.316,13 | 2.546 | 8 | 20 |
|
| CLASS R1 | | | | | | | | | | | | | | | |
|
| 6-30-20114 | 12.78 | 0.12 | 0.32 | 0.44 | (0.15) | — | — | (0.15) | 13.07 | 3.425 | 0.986,7 | 0.986,7 | 1.826 | 6 | 6 |
| 12-31-2010 | 12.15 | 0.41 | 0.74 | 1.15 | (0.40) | (0.12) | — | (0.52) | 12.78 | 9.56 | 0.887 | 0.937,14 | 3.24 | 8 | 24 |
| 12-31-2009 | 10.41 | 0.57 | 1.66 | 2.23 | (0.44) | (0.05) | — | (0.49) | 12.15 | 21.748 | 1.167 | 1.067 | 5.00 | 7 | 24 |
| 12-31-2008 | 13.34 | 1.02 | (3.07) | (2.05) | (0.60) | (0.28) | — | (0.88) | 10.41 | (15.62)8 | 2.317 | 0.887 | 8.75 | 2 | 33 |
| 12-31-2007 | 13.30 | 0.57 | 0.07 | 0.64 | (0.48) | (0.12) | — | (0.60) | 13.34 | 4.838 | 9.697 | 0.717,11 | 4.21 | —12 | 13 |
| 12-31-20069,10 | 13.67 | 0.30 | 0.23 | 0.53 | (0.38) | (0.16) | (0.36) | (0.90) | 13.30 | 3.855,8 | 13.246,13 | 0.706,13 | 7.386 | —12 | 2 |
|
| CLASS R3 | | | | | | | | | | | | | | | |
|
| 6-30-20114 | 12.76 | 0.17 | 0.26 | 0.43 | (0.15) | — | — | (0.15) | 13.04 | 3.405 | 0.886,7 | 0.886,7 | 2.576 | 12 | 6 |
| 12-31-2010 | 12.14 | 0.42 | 0.74 | 1.16 | (0.42) | (0.12) | — | (0.54) | 12.76 | 9.68 | 0.867 | 0.867 | 3.36 | 11 | 24 |
| 12-31-2009 | 10.40 | 0.46 | 1.79 | 2.25 | (0.46) | (0.05) | — | (0.51) | 12.14 | 21.94 | 0.927 | 0.927 | 4.14 | 8 | 24 |
| 12-31-2008 | 13.33 | 0.54 | (2.59) | (2.05) | (0.60) | (0.28) | — | (0.88) | 10.40 | (15.62)8 | 0.907 | 0.837 | 4.27 | 6 | 33 |
| 12-31-2007 | 13.29 | 0.70 | (0.07) | 0.63 | (0.47) | (0.12) | — | (0.59) | 13.33 | 4.818 | 1.897 | 0.817,11 | 5.17 | 4 | 13 |
| 12-31-20069 | 13.65 | 0.29 | 0.25 | 0.54 | (0.38) | (0.16) | (0.36) | (0.90) | 13.29 | 3.935,8 | 6.236,13 | 0.776,13 | 6.236 | —12 | 2 |
| 8-31-200610 | 13.16 | 0.28 | 0.44 | 0.72 | (0.23) | — | — | (0.23) | 13.65 | 5.555,8 | 14.726,13 | 0.686,13 | 2.466 | —12 | 20 |
|
| CLASS R4 | | | | | | | | | | | | | | | |
|
| 6-30-20114 | 12.76 | 0.19 | 0.27 | 0.46 | (0.17) | — | — | (0.17) | 13.05 | 3.625 | 0.596,7 | 0.596,7 | 2.946 | 8 | 6 |
| 12-31-2010 | 12.13 | 0.47 | 0.72 | 1.19 | (0.44) | (0.12) | — | (0.56) | 12.76 | 9.90 | 0.617 | 0.677,14 | 3.77 | 7 | 24 |
| 12-31-2009 | 10.39 | 0.52 | 1.75 | 2.27 | (0.48) | (0.05) | — | (0.53) | 12.13 | 22.228 | 0.777 | 0.667 | 4.60 | 4 | 24 |
| 12-31-2008 | 13.31 | 0.64 | (2.65) | (2.01) | (0.63) | (0.28) | — | (0.91) | 10.39 | (15.38)8 | 0.877 | 0.577 | 5.21 | 3 | 33 |
| 12-31-2007 | 13.28 | 0.53 | 0.12 | 0.65 | (0.50) | (0.12) | — | (0.62) | 13.31 | 4.978 | 1.467 | 0.537,11 | 3.96 | 3 | 13 |
| 12-31-20069 | 13.64 | 0.28 | 0.27 | 0.55 | (0.38) | (0.16) | (0.37) | (0.91) | 13.28 | 4.065,8 | 2.876 | 0.516,13 | 6.176,13 | 1 | 2 |
| 8-31-200610 | 13.16 | 0.44 | 0.30 | 0.74 | (0.26) | — | — | (0.26) | 13.64 | 5.665,8 | 10.016 | 0.456,13 | 3.896,13 | 1 | 20 |
|
| CLASS R5 | | | | | | | | | | | | | | | |
|
| 6-30-20114 | 12.77 | 0.19 | 0.29 | 0.48 | (0.19) | — | — | (0.19) | 13.06 | 3.795 | 0.286,7 | 0.286,7 | 3.016 | 12 | 6 |
| 12-31-2010 | 12.15 | 0.50 | 0.74 | 1.24 | (0.50) | (0.12) | — | (0.62) | 12.77 | 10.34 | 0.237 | 0.237 | 3.96 | 9 | 24 |
| 12-31-2009 | 10.40 | 0.57 | 1.75 | 2.32 | (0.52) | (0.05) | — | (0.57) | 12.15 | 22.67 | 0.337 | 0.337 | 5.08 | 9 | 24 |
| 12-31-2008 | 13.32 | 0.86 | (2.83) | (1.97) | (0.67) | (0.28) | — | (0.95) | 10.40 | (15.10)8 | 0.527 | 0.257 | 7.19 | 4 | 33 |
| 12-31-2007 | 13.29 | 0.57 | 0.12 | 0.69 | (0.54) | (0.12) | — | (0.66) | 13.32 | 5.278 | 3.427 | 0.227,11 | 4.23 | 1 | 13 |
| 12-31-20069 | 13.65 | 0.28 | 0.29 | 0.57 | (0.40) | (0.16) | (0.37) | (0.93) | 13.29 | 4.195,8 | 6.376,13 | 0.206,13 | 6.016 | —12 | 2 |
| 8-31-200610 | 13.16 | 0.28 | 0.49 | 0.77 | (0.28) | — | — | (0.28) | 13.65 | 5.945,8 | 9.186,13 | 0.196,13 | 2.446 | —12 | 20 |
|
| | |
| See notes to financial statements | Semiannual report | Lifestyle Portfolios | 35 |
| | |
Financial highlights
Continued
| | | | | | | | | | | | | | | |
| Lifestyle Conservative continued | | | | | | | | | | | |
| |
| Per share operating performance for a share outstanding throughout the period | | | Ratios and supplemental data | |
|
| | Income (loss) from | | | | | | | | | | | | |
| | investment operations | | Less distributions | | Ratios to average net assets | |
| |
| |
| |
| |
| | | | Net | | | | | | | | | | | | |
| | | | realized | Total | | | | | | | Expenses | Expenses | | Net | |
| | Net asset | Net | and | from | From net | | | | | | before re- | including | | assets, | |
| | value, | invest- | unrealized | invest- | invest- | | | | Net asset | | ductions and | reductions | Net | end of | |
| | beginning | ment in- | gain (loss) | ment | ment | From net | From | Total value, | end | Total | amounts | and amounts | investment | period (in | Portfolio |
| | of period | come (loss) | on invest- | operations | income | realized | capital | distribu- | of period | return | recaptured | recaptured | income | millions) | turnover |
| Period ended | ($) | ($)1,2 | ments ($) | ($) | ($) | gain ($) | paid-in ($) | tions ($) | ($) | (%)3 | (%) | (%) (loss) | (%)1 | ($) | (%) |
|
| CLASS 1 | | | | | | | | | | | | | | | |
|
| 6-30-20114 | 12.76 | 0.20 | 0.28 | 0.48 | (0.20) | — | — | (0.20) | 13.04 | 3.805 | 0.126,7 | 0.126,7 | 3.156 | 2,523 | 6 |
| 12-31-2010 | 12.13 | 0.51 | 0.75 | 1.26 | (0.51) | (0.12) | — | (0.63) | 12.76 | 10.51 | 0.117 | 0.117 | 4.08 | 2,391 | 24 |
| 12-31-2009 | 10.38 | 0.56 | 1.78 | 2.34 | (0.54) | (0.05) | — | (0.59) | 12.13 | 22.96 | 0.127 | 0.127 | 4.99 | 1,931 | 24 |
| 12-31-2008 | 13.30 | 0.71 | (2.67) | (1.96) | (0.68) | (0.28) | — | (0.96) | 10.38 | (15.02)8 | 0.127 | 0.127 | 5.71 | 1,393 | 33 |
| 12-31-2007 | 13.27 | 0.57 | 0.14 | 0.71 | (0.56) | (0.12) | — | (0.68) | 13.30 | 5.388 | 0.117 | 0.117 | 4.24 | 1,401 | 13 |
| 12-31-20069 | 13.64 | 0.32 | 0.25 | 0.57 | (0.40) | (0.16) | (0.38) | (0.94) | 13.27 | 4.165 | 0.116,13 | 0.116,13 | 6.966 | 1,184 | 2 |
| 8-31-200610 | 13.15 | 0.30 | 0.48 | 0.78 | (0.29) | — | — | (0.29) | 13.64 | 6.015 | 0.126,13 | 0.126,13 | 2.546 | 1,097 | 20 |
|
1 Recognition of net investment income by the Portfolio is affected by the timing of the declaration of dividends by the underlying funds in which the Portfolio invests.
2 Based on the average daily shares outstanding.
3 Does not reflect the effect of sales charges, if any.
4 Unaudited.
5 Not annualized.
6 Annualized.
7 Ratios do not include expenses indirectly incurred from underlying funds whose expense ratios can vary based on the mix of underlying funds held by the Portfolio. The range
of expense ratios of the underlying funds held by the Portfolio was as follows: 0.48%–1.11%, 0.48%–1.13%, 0.49%–1.09%, 0.49%–2.40%, and 0.79%–0.91% for the
periods ended 6-30-11, 12-31-10, 12-31-09, 12-31-08 and 12-31-07, respectively.
8 Total returns would have been lower had certain expenses not been reduced during the periods shown.
9 The fiscal year-end changed from August 31 to December 31.
10 The inception date for Class A, Class B, Class C, Class R3, Class R4 and Class R5 shares is 10-18-05 and the inception dates for Class R1 and Class 1 shares are 9-18-06 and
10-15-05, respectively.
11 Includes transfer agent fee earned credits of less than 0.01% of average net assets.
12 Less than $500,000.
13 Does not include expenses of the underlying affiliated funds in which the Portfolio invests.
14 Includes the impact of expense recapture for the following period ended: 12-31-10: less than 0.005%, 0.05% and 0.06% of average net assets for Class B, Class R1 and
Class R4 shares, respectively. See Note 4.
| | |
| 36 | Lifestyle Portfolios | Semiannual report | See notes to financial statements |
| | | |
Notes to financial statements
(Unaudited)
Note 1 — Organization
John Hancock Funds II (the Trust) is an open-end management investment company organized as a Massachusetts business trust. The Trust is a series company which means it has several funds, each with a stated investment objective that it pursues through separate investment policies. The Trust currently offers multiple investment funds, five of which (collectively, Lifestyle Portfolios or the Portfolios, and individually the Portfolio) are presented in this report. The Lifestyle Portfolios are series of the Trust and operate as “funds of funds” that invest in shares of underlying funds of the Trust, John Hancock Funds III (JHF III) and also in other affiliated funds of the John Hancock funds complex. Each Portfolio is diversified for purposes of the Investment Company Act of 1940, as amended (1940 Act).
The Portfolios may offer multiple classes of shares. The shares currently offered by the Trust are detailed in the Statements of Assets and Liabilities. Class A, Class B and Class C shares are open to all investors. Class R1, Class R3, Class R4 and Class R5 shares are available only to certain retirement plans. Class 1 shares are offered only to certain affiliates of Manulife Financial Corporation (MFC). Class 5 shares are available only to the John Hancock Freedom 529 Plan. Shareholders of each class have exclusive voting rights to matters that affect that class. The distribution of service fees, if any, and transfer agent fees for each class may differ. Class B shares convert to Class A shares eight years after purchase.
The accounting policies of the underlying funds of the Portfolios are outlined in the underlying funds’ shareholder reports, available without charge by calling 1-800-344-1029, at jhfunds.com and on the Securities and Exchange Commission (SEC) Web site at www.sec.gov or at the SEC’s public reference room in Washington, D.C. The underlying funds are not covered by this report.
Note 2 — Significant accounting policies
The financial statements have been prepared in conformity with accounting principles generally accepted in the United States of America, which require management to make certain estimates and assumptions at the date of the financial statements. Actual results could differ from those estimates. Events or transactions occurring after the end of the fiscal period through the date that the financial statements were issued have been evaluated in the preparation of the financial statements. The following summarizes the significant accounting policies of the Portfolios:
Security valuation. Investments are stated at value as of the close of regular trading on the New York Stock Exchange (NYSE), normally at 4:00 p.m., Eastern Time. The Portfolios use a three-tier hierarchy to prioritize the pricing assumptions, referred to as inputs, used in valuation techniques to measure fair value. Level 1 includes securities valued using quoted prices in active markets for identical securities, including registered investment companies. Level 2 includes securities valued using significant observable inputs. Observable inputs may include quoted prices for similar securities, interest rates, prepayment speeds and credit risk. Prices for securities valued using these inputs are received from independent pricing vendors and brokers and are based on an evaluation of the inputs described. Level 3 includes securities valued using significant unobservable inputs when market prices are not readily available or reliable, including the Portfolios’ own assumptions in determining the fair value of investments. Factors used in determining value may include market or issuer specific events, changes in interest rates and credit quality. The inputs or methodology used for valuing securities are not necessarily an indication of the risk associated with investing in those securities.
As of June 30, 2011, all investments for the Portfolios are categorized as Level 1 under the hierarchy described above. Changes in valuation techniques may result in transfers in or out of an assigned level within the disclosure hierarchy. During the six months ended June 30, 2011, there were no significant transfers in or out of Level 1 assets.
Investments by the Portfolios in underlying affiliated funds and/or other investment companies are valued at their respective net asset values each business day.
New accounting pronouncement. In May 2011, Accounting Standards Update 2011-04 (ASU 2011-04), Amendments to Achieve Common Fair Value Measurement and Disclosure Requirements in U.S. GAAP and IFRSs, was issued and is effective during interim and annual periods beginning after December 15, 2011. ASU 2011-04 amends Financial Accounting Standards Board (FASB) Topic 820, Fair Value Measurement. The amendments are the result of the work by the FASB and the International Accounting Standards Board to develop common requirements for measuring fair value and for disclosing information about fair value measurements in accordance with GAAP. Management is currently evaluating the application of ASU 2011-04 and its impact, if any, on the Portfolios’ financial statements.
Security transactions and related investment income. Investment security transactions are accounted for on a trade date plus one basis for daily net asset value calculations. However, for financial reporting purposes, investment transactions are reported on trade date. Income and capital gain distributions from underlying funds are recorded on ex-date. Interest income is accrued as earned. Gains and losses on securities sold are determined on the basis of identified cost and may include proceeds from litigation.
| |
| Semiannual report | Lifestyle Portfolios | 37 |
Line of credit. The Portfolios may borrow from banks for temporary or emergency purposes, including meeting redemption requests that otherwise might require the untimely sale of securities. Pursuant to the custodian agreement, the custodian may loan money to a Portfolio to make properly authorized payments. The Portfolios are obligated to repay the custodian for any overdraft, including any related costs or expenses. The custodian has a lien, security interest or security entitlement in any Portfolio property that is not segregated, to the maximum extent permitted by law for any overdraft.
In addition, effective March 30, 2011, the Portfolios and other affiliated funds have entered into an agreement with Citibank N.A. which enables them to participate in a $200 million unsecured committed line of credit. Prior to March 30, 2011, the Portfolios had a similar agreement with State Street Bank and Trust Company. A commitment fee, payable at the end of each calendar quarter, based on the average daily unused portion of the line of credit, is charged to each participating fund on a pro rata basis and is reflected in other expenses on the Statements of Operations. For the six months ended June 30, 2011, the Portfolios had no borrowings under the lines of credit.
Expenses. The majority of expenses are directly attributable to an individual portfolio. Expenses that are not readily attributable to a specific portfolio are allocated among all portfolios in an equitable manner, taking into consideration, among other things, the nature and type of expense and the portfolio’s relative assets. Expense estimates are accrued in the period to which they relate and adjustments are made when actual amounts are known.
Class allocations. Income, common expenses and realized and unrealized gains (losses) are determined at the portfolio level and allocated daily to each class of shares based on the net asset value of the class. Class-specific expenses, such as distribution and service fees, if any, and transfer agent fees, are calculated daily for each class, based on the net asset value of the class and the applicable specific expense rates applicable to each class.
Federal income taxes. The Portfolios intend to continue to qualify as regulated investment companies by complying with the applicable provisions of the Internal Revenue Code and will not be subject to federal income tax on taxable income that is distributed to shareholders. Therefore, no federal income tax provisions are required.
For federal income tax purposes, the Portfolios have capital loss carryforwards available to offset future net realized capital gains. The following table details the capital loss carryforwards available as of December 31, 2010:
| | | | |
| | Capital Loss Carryforward | | |
| | Expiring at December 31, | | |
| |
| Portfolio | 2016 | 2017 | 2018 | |
| |
| Lifestyle Aggressive | $129,404,422 | $364,659,388 | $69,543,765 | |
| Lifestyle Growth | 331,154,610 | 966,013,756 | — | |
| Lifestyle Balanced | 164,498,926 | 987,127,767 | 57,259,117 | |
| Lifestyle Moderate | 39,351,498 | 168,786,302 | 17,270,240 | |
| Lifestyle Conservative | — | 89,776,301 | 4,984,075 | |
Under the recently enacted Regulated Investment Company Modernization Act of 2010, the Portfolios will be permitted to carry forward capital losses incurred in taxable years beginning after December 22, 2010 for an unlimited period. However, any losses incurred during those future taxable years will be required to be utilized prior to the losses incurred in pre-enactment taxable years. As a result of this ordering rule, pre-enactment capital loss carryforwards may be more likely to expire unused. Additionally, post-enactment capital losses that are carried forward will retain their character as either short-term or long-term capital losses rather than being considered all short-term as under previous law.
As of December 31, 2010, the Portfolios had no uncertain tax positions that would require financial statement recognition, derecognition or disclosure. The Portfolios’ federal tax returns are subject to examination by the Internal Revenue Service for a period of three years.
The cost of investments owned on June 30, 2011, including short-term investments, for federal income tax purposes, was as follows.
| | | | |
| | | | | Net Unrealized |
| | | Unrealized | Unrealized | Appreciation/ |
| Portfolio | Aggregate Cost | Appreciation | Depreciation | (Depreciation) |
|
| Lifestyle Aggressive | $3,418,211,226 | $666,226,257 | ($5,489,504) | $660,736,753 |
| Lifestyle Growth | 10,570,754,846 | 1,672,125,301 | (30,047,830) | 1,642,077,471 |
| Lifestyle Balanced | 10,668,314,446 | 1,474,874,137 | (28,922,516) | 1,445,951,621 |
| Lifestyle Moderate | 3,429,174,813 | 357,234,946 | (5,242,056) | 351,992,890 |
| Lifestyle Conservative | 2,885,603,083 | 199,289,009 | (4,686,006) | 194,603,003 |
Distribution of income and gains. Distributions to shareholders from net investment income and net realized gains, if any, are recorded on the ex-date. The Lifestyle Aggressive and Lifestyle Growth Portfolios generally declare and pay dividends and capital gain distributions, if any, at least annually. The Lifestyle Balanced, Lifestyle Moderate and Lifestyle Conservative Portfolios generally declare and pay dividends quarterly and capital gain distributions, if any, at least annually.
| |
| 38 | Lifestyle Portfolios | Semiannual report |
Distributions paid by the Portfolios with respect to each class of shares are calculated in the same manner, at the same time and in the same amount, except for the effect of expenses that may be applied differently to each class.
Such distributions, on a tax basis, are determined in conformity with income tax regulations, which may differ from accounting principles generally accepted in the United States of America. Short term gains from underlying funds are treated as ordinary income for tax purposes. The final determination of tax characteristics of the Portfolio’s distribution will occur at the end of the year and will subsequently be reported to shareholders.
Capital accounts within financial statements are adjusted for permanent book-tax differences. These adjustments have no impact on net assets or the results of operations. Temporary book-tax differences, if any, will reverse in a subsequent period. Book-tax differences are primarily attributable to wash sale loss deferrals for all Portfolios.
Note 3 — Guarantees and indemnifications
Under the Portfolios’ organizational documents, its Officers and Trustees are indemnified against certain liabilities arising out of the performance of their duties to the Portfolios. Additionally, in the normal course of business, the Portfolios enter into contracts with service providers that contain general indemnification clauses. The Portfolios’ maximum exposure under these arrangements is unknown, as this would involve future claims that may be made against the Portfolios that have not yet occurred. The risk of material loss from such claims is considered remote.
Note 4 — Fees and transactions with affiliates
John Hancock Investment Management Services, LLC (the Adviser) serves as investment adviser for the Portfolios. John Hancock Funds, LLC (the Distributor), an affiliate of the Adviser, serves as principal underwriter of the Portfolios. The Adviser and the Distributor are indirect wholly owned subsidiaries of MFC.
Management fee. The Portfolios pay the Adviser a management fee for its services to the Portfolios. The management fee has two components: (a) a fee on net assets invested in affiliated funds (Affiliated Fund Assets) and (b) a fee on net assets not invested in affiliated funds (Other Assets). Affiliated funds are any funds of the Trust, John Hancock Variable Insurance Trust (JHVIT) (formerly known as John Hancock Trust) and JHF III, excluding John Hancock Money Market Trust B, John Hancock 500 Index Trust B, John Hancock International Equity Index Trust B and John Hancock Total Bond Market Trust B. The fee on assets invested in Affiliated Fund Assets is stated as an annual percentage of the current value of the aggregate net assets of all the Portfolios and is equivalent to the sum of: (a) 0.05% of the first $7.5 billion of aggregate net assets and (b) 0.04% of the excess over $7.5 billion of aggregate net asset. The fee on Other Assets is stated as an annual percentage of the current value of the aggregate net assets of all the Portfolios and is equivalent to the sum of: (a) 0.50% of the first $7.5 billion aggregate net assets and (b) 0.49% of the excess over $7.5 billion of aggregate net assets and is applied to the other assets of the Portfolios.
John Hancock Asset Management a division of Manulife Asset Management (North America) Limited and John Hancock Asset Management a division of Manulife Asset Management (US) LLC, both indirectly owned subsidiaries of MFC and affiliates of the Adviser, act as subadvisers to the Portfolios. QS Investors, LLC also acts as subadviser. The Portfolios are not responsible for payment of the subadvisory fees. The investment management fees incurred for the six months ended June 30, 2011 were equivalent to an annual effective rate of each Portfolio’s average daily net assets as follows:
| | | |
| Portfolio | Annual Effective Rate | | |
| | |
| Lifestyle Aggressive | 0.05% | | |
| Lifestyle Growth | 0.04% | | |
| Lifestyle Balanced | 0.04% | | |
| Lifestyle Moderate | 0.04% | | |
| Lifestyle Conservative | 0.04% | | |
Expense reimbursements. The Adviser voluntarily agreed to waive a portion of its management fee if certain expenses of the Lifestyle Portfolios exceed 0.10% of average net assets. Expenses excluded from this waiver are taxes, brokerage commissions, interest, litigation and indemnification expenses, advisory fees, Rule 12b-1 fees, printing and postage, transfer agent fees, state registration fees, service fees, underlying fund expenses and other extraordinary expenses not incurred in the ordinary course of the Portfolios’ business. This expense reduction will continue in effect until terminated by the Adviser.
The Adviser has voluntarily agreed to waive its advisory fee or reimburse the Portfolios so that the aggregate advisory fee retained by the Adviser with respect to both the Portfolios and the underlying investments does not exceed 0.51% of the Lifestyle Portfolios’ first $7.5 billion of average daily net assets and 0.50% of the Portfolios’ average daily net assets in excess of $7.5 billion. This voluntary waiver may terminate at any time.
The Adviser has contractually agreed to waive fees and/or reimburse certain class specific expenses, including 12b-1 fees, transfer agent fees, service fees, state registration fees, and printing and postage for Class A, Class B, Class C, Class R1, Class R3, Class R4, and Class R5 shares, to the extent that the above expenses for each class exceed 0.59%, 1.29%, 1.29%, 1.04%, 0.94%, 0.64% and 0.34%, respectively, of the average daily net assets attributable to the classes. This expense fee waiver and/or reimbursement will continue in effect until at least April 30, 2012.
| |
| Semiannual report | Lifestyle Portfolios | 39 |
For the six months ended June 30, 2011, the expense reductions related to these plans amounted to the following and are reflected as a reduction of total expenses in the Statements of Operations:
| | | | | | | | | |
| | | | Expense Reimbursement by Class | | | | |
|
| Portfolio | Class A | Class B | Class C | Class R1 | Class R3 | Class R4 | Class R5 | Class 1 | Class 5 |
|
| Lifestyle Aggressive | $4,496 | $2,329 | $2,720 | $235 | $285 | $214 | $292 | $81,913 | — |
| Lifestyle Growth | 7,877 | 1,131 | 5,248 | 212 | 291 | 246 | 304 | 126,635 | $1,298 |
| Lifestyle Balanced | 3,909 | 471 | 2,897 | 99 | 232 | 184 | 257 | 62,098 | 330 |
Expense recapture. The Adviser may recapture operating expenses reimbursed or fees waived under previous expense limitation or waiver arrangements made subsequent to January 1, 2009, for a period of three years following the beginning of the month in which such reimbursements or waivers originally occurred. The table below outlines the amount recovered during the six months ended June 30, 2011 and the amount of waived or reimbursed expenses subject to potential recovery and the respective expiration dates. Certain reimbursements or waivers are not subject to recapture.
| | | | |
| Portfolio | Amounts eligible for recovery | Amounts eligible for recovery | Amounts eligible for recovery | Amount recovered during the |
| | through December 1, 2012 | through December 1, 2013 | through June 1, 2014 | six months ended June 30, 2011 |
|
| Lifestyle Aggressive | $21,047 | $7,850 | $1,760 | $10,104 |
| Lifestyle Growth | — | — | — | 15,022 |
Accounting and legal services. Pursuant to a service agreement, the Portfolios reimburse the Adviser for all expenses associated with providing the administrative, financial, legal, accounting and recordkeeping services of the Portfolios, including the preparation of all tax returns, periodic reports to shareholders and regulatory reports, among other services. These expenses are allocated to each share class based on its relative net assets at the time the expense was incurred. These accounting and legal services fees incurred for the six months ended June 30, 2011 amounted to an annual rate of 0.02% of each Portfolio’s average daily net assets.
Distribution and service plans. The Portfolios have a distribution agreement with the Distributor. The Portfolios have adopted distribution and service plans with respect to Class A, Class B, Class C, Class R1, Class R3, Class R4 and Class 1 shares pursuant to Rule 12b-1 under the 1940 Act, to pay the Distributor for services provided as the distributor of shares of the Portfolios. In addition, under the service plan for Class R1, Class R3, Class R4 and Class R5 shares, the Portfolios pay for certain other services. The Portfolios may pay up to the following contractual rates of distribution and service fees under these arrangements, expressed as an annual percentage of average daily net assets for each class of the Portfolios’ shares:
| | | | |
| Class | 12b-1 Fee | Service Fee | | |
| | |
| A | 0.30% | — | | |
| B | 1.00% | — | | |
| C | 1.00% | — | | |
| R1 | 0.50% | 0.25% | | |
| R3 | 0.50% | 0.15% | | |
| R4 | 0.25% | 0.10% | | |
| R5 | — | 0.05% | | |
| 1 | 0.05% | — | | |
Sales charges. Class A shares are assessed up-front sales charges of up to 5% of the net asset value of such shares. The following summarizes the net up-front sales charges received by the Distributor during the six months ended June 30, 2011:
| | | | | |
| Lifestyle Aggressive | Lifestyle Growth | Lifestyle Balanced | Lifestyle Moderate | Lifestyle Conservative |
|
| |
| Net sales charges | $491,335 | $3,539,357 | $3,291,934 | $1,045,418 | $819,045 |
| Retained for printing prospectuses, | | | | | |
| advertising and sales literature | 77,216 | 566,362 | 533,512 | 170,574 | 134,085 |
| Sales commission to unrelated broker-dealers | 405,636 | 2,921,524 | 2,702,725 | 862,473 | 669,251 |
| Sales commission to affiliated sales personnel | 8,483 | 51,471 | 55,697 | 12,371 | 15,709 |
Class B and Class C shares are subject to contingent deferred sales charges (CDSCs). Class B shares that are redeemed within six years of purchase are subject to CDSCs, at declining rates, beginning at 5.00% of the lesser of the current market value at the time of redemption or the original purchase cost of the shares being redeemed. Class C shares that are redeemed within one year of purchase are subject to a 1.00% CDSC of the lesser of the current market value at the time of redemption or the original purchase cost of the shares being redeemed. Proceeds from CDSCs are paid to the Distributor and are used, in whole or in part, to defray its expenses for providing distribution-related services to the Portfolios in connection with the sale of Class B and Class C shares. During the six months ended June 30, 2011, CDSCs received by the Distributor for Class B and Class C were as follows:
| |
| 40 Lifestyle Portfolios | Semiannual report |
| | | | |
| Portfolio | Class B | Class C | | |
| | |
| Lifestyle Aggressive | $29,587 | $9,173 | | |
| Lifestyle Growth | 93,215 | 28,249 | | |
| Lifestyle Balanced | 86,851 | 33,077 | | |
| Lifestyle Moderate | 27,999 | 19,260 | | |
| Lifestyle Conservative | 36,185 | 24,334 | | |
Transfer agent fees. The Portfolios have a transfer agent agreement with John Hancock Signature Services, Inc. (Signature Services or Transfer Agent), an affiliate of the Adviser. The transfer agent fees paid to Signature Services are determined based on the cost to Signature Services (Signature Services Cost) of providing recordkeeping services. The Signature Services Cost includes a component of allocated John Hancock corporate overhead for providing transfer agent services to the Portfolios and to all other John Hancock affiliated funds. It also includes out-of-pocket expenses that are comprised of payments made to third-parties for recordkeeping services provided to their clients who invest in one or more John Hancock funds. In addition, Signature Services Cost may be reduced by certain revenues that Signature Services receives in connection with the fees associated with retirement and small accounts. Signature Services Cost is calculated monthly and allocated, as applicable, to four categories of share classes: Institutional Share Classes, Retirement Share Classes, Municipal Bond Classes and all other Retail Share Classes. Within each of these categories, the applicable costs are allocated to the affected John Hancock affiliated funds and/or classes, based on the relative average daily net assets.
| | | | | |
| Class level expenses. Class level expenses for the six months ended June 30, 2011 were: | | |
| | | |
| | | Distribution and | Transfer | State | Printing and |
| Portfolio | Share class | service fees | agent fees | registration fees | postage |
|
| Lifestyle Aggressive | Class A | $297,614 | $168,778 | $9,429 | $8,026 |
| | Class B | 125,495 | 21,350 | 5,298 | 1,401 |
| | Class C | 600,051 | 102,068 | 6,408 | 5,849 |
| | Class R1 | 36,592 | 1,463 | 4,746 | 376 |
| | Class R3 | 40,608 | 1,767 | 5,186 | 149 |
| | Class R4 | 16,374 | 1,335 | 5,330 | 186 |
| | Class R5 | 3,070 | 1,812 | 5,285 | 133 |
| | Class 1 | 904,241 | — | — | — |
| | Total | $2,024,045 | $298,573 | $41,682 | $16,120 |
|
| Lifestyle Growth | Class A | $987,278 | $559,525 | $20,588 | $34,742 |
| | Class B | 473,107 | 80,475 | 6,528 | 7,964 |
| | Class C | 2,194,043 | 373,123 | 12,127 | 29,449 |
| | Class R1 | 61,794 | 2,504 | 4,986 | 671 |
| | Class R3 | 78,434 | 3,418 | 5,678 | 290 |
| | Class R4 | 35,689 | 2,895 | 5,513 | 266 |
| | Class R5 | 6,018 | 3,577 | 5,795 | 233 |
| | Class 1 | 2,649,907 | — | — | — |
| | Total | $6,486,270 | $1,025,517 | $61,215 | $73,615 |
|
| Lifestyle Balanced | Class A | $976,154 | $553,108 | $20,052 | $24,693 |
| | Class B | 392,774 | 66,799 | 5,850 | 5,596 |
| | Class C | 2,413,135 | 410,360 | 16,042 | 26,122 |
| | Class R1 | 61,087 | 2,319 | 5,114 | 672 |
| | Class R3 | 125,165 | 5,440 | 5,550 | 336 |
| | Class R4 | 53,265 | 4,315 | 6,811 | 309 |
| | Class R5 | 10,341 | 6,009 | 5,501 | 435 |
| | Class 1 | 2,587,673 | — | — | — |
| | Total | $6,619,594 | $1,048,350 | $64,920 | $58,163 |
|
| Lifestyle Moderate | Class A | $369,341 | $209,260 | $11,265 | $7,017 |
| | Class B | 141,475 | 24,043 | 5,324 | 1,641 |
| | Class C | 990,279 | 168,328 | 11,113 | 8,877 |
| | Class R1 | 26,727 | 1,012 | 5,102 | 304 |
| | Class R3 | 30,786 | 1,361 | 5,193 | 138 |
| | Class R4 | 13,037 | 1,057 | 5,231 | 187 |
| | Class R5 | 3,344 | 1,956 | 5,249 | 236 |
| | Class 1 | 781,007 | — | — | — |
| | Total | $2,355,996 | $407,017 | $48,477 | $18,400 |
|
| Lifestyle Conservative | Class A | $356,683 | $202,020 | $12,213 | $7,252 |
| | Class B | 151,357 | 25,720 | 5,567 | 1,520 |
| | Class C | 1,008,041 | 171,332 | 8,601 | 8,795 |
| | Class R1 | 28,852 | 1,072 | 4,932 | 331 |
| | Class R3 | 32,757 | 1,421 | 7,391 | 116 |
| | Class R4 | 12,660 | 1,036 | 5,276 | 191 |
| | Class R5 | 2,762 | 1,615 | 7,670 | 179 |
| | Class 1 | 608,168 | — | — | — |
| | Total | $2,201,280 | $404,216 | $51,650 | $18,384 |
|
|
Semiannual report | Lifestyle Portfolios 41 |
Trustee expenses. The Portfolios compensate each Trustee who is not an employee of the Adviser or its affiliates. The costs of paying Trustee compensation and expenses are allocated to each Portfolio based on its average daily net assets.
Note 5 — Portfolio share transactions
Transactions in Portfolio shares for the six months ended June 30, 2011 and for the year ended December 31, 2010 were as follows.
| | | | |
| Lifestyle Aggressive | | | | |
| | Six months ended 6-30-11 | | Year ended 12-31-10 |
| | Shares | Amount | Shares | Amount |
| Class A shares | | | | |
|
| Sold | 3,969,131 | $50,744,200 | 6,305,037 | $70,594,208 |
| Distributions reinvested | — | — | 179,719 | 2,208,744 |
| | | | | |
| Repurchased | (2,542,696) | (32,475,075) | (4,272,684) | (47,184,373) |
| Net increase | 1,426,435 | $18,269,125 | 2,212,072 | $25,618,579 |
| |
| Class B shares | | | | |
|
| Sold | 222,386 | $2,855,561 | 304,055 | $3,382,176 |
| Distributions reinvested | — | — | 11,119 | 136,983 |
| | | | | |
| Repurchased | (161,280) | (2,055,986) | (381,053) | (4,236,010) |
| Net increase (decrease) | 61,106 | $799,575 | (65,879) | ($716,851) |
| |
| Class C shares | | | | |
|
| Sold | 1,619,659 | $20,729,101 | 2,508,754 | $27,954,313 |
| Distributions reinvested | — | — | 51,465 | 634,050 |
| | | | | |
| Repurchased | (760,589) | (9,732,583) | (1,821,170) | (20,136,171) |
| Net increase | 859,070 | $10,996,518 | 739,049 | $8,452,192 |
| |
| Class R1 shares | | | | |
|
| Sold | 339,497 | $4,364,709 | 331,421 | $3,708,886 |
| Distributions reinvested | — | — | 5,029 | 62,001 |
| | | | | |
| Repurchased | (185,088) | (2,378,296) | (223,167) | (2,514,129) |
| Net increase | 154,409 | $1,986,413 | 113,283 | $1,256,758 |
| |
| Class R3 shares | | | | |
|
| Sold | 178,919 | $2,260,878 | 407,234 | $4,509,668 |
| Distributions reinvested | — | — | 10,847 | 133,199 |
| | | | | |
| Repurchased | (184,365) | (2,376,241) | (380,475) | (4,275,316) |
| Net increase (decrease) | (5,446) | ($115,363) | 37,606 | $367,551 |
| |
| Class R4 shares | | | | |
|
| Sold | 336,611 | $4,344,809 | 228,047 | $2,518,760 |
| Distributions reinvested | — | — | 9,198 | 112,863 |
| | | | | |
| Repurchased | (249,817) | (3,213,939) | (359,415) | (3,862,856) |
| Net increase (decrease) | 86,794 | $1,130,870 | (122,170) | ($1,231,233) |
| |
| Class R5 shares | | | | |
|
| Sold | 272,121 | $3,457,912 | 357,321 | $3,960,507 |
| Distributions reinvested | — | — | 14,983 | 183,692 |
| | | | | |
| Repurchased | (175,137) | (2,223,825) | (359,621) | (4,022,202) |
| Net increase | 96,984 | $1,234,087 | 12,683 | $121,997 |
| |
| Class 1 shares | | | | |
|
| Sold | 6,739,225 | $85,621,672 | 14,472,185 | $161,177,263 |
| Distributions reinvested | — | — | 4,913,019 | 60,086,218 |
| | | | | |
| Repurchased | (6,657,599) | (85,063,873) | (17,954,899) | (199,627,905) |
| Net increase | 81,626 | $557,799 | 1,430,305 | $21,635,576 |
| |
| Net increase | 2,760,978 | $34,859,024 | 4,356,949 | $55,504,569 |
|
| 42 Lifestyle Portfolios | Semiannual report |
| | | | |
| Lifestyle Growth | | | | |
| | | | | |
| | Six months ended 6-30-11 | | Year ended 12-31-10 |
| | Shares | Amount | Shares | Amount |
| Class A shares | | | | |
|
| Sold | 14,348,664 | $191,515,372 | 18,814,650 | $225,001,303 |
| Distributions reinvested | — | — | 1,030,999 | 13,227,661 |
| | | | | |
| Repurchased | (6,791,778) | (90,487,515) | (10,099,050) | (119,743,641) |
| Net increase | 7,556,886 | $101,027,857 | 9,746,599 | $118,485,323 |
| | | | | |
| Class B shares | | | | |
|
| Sold | 1,110,117 | $14,822,299 | 1,265,708 | $15,127,498 |
| Distributions reinvested | — | — | 102,276 | 1,316,279 |
| | | | | |
| Repurchased | (577,380) | (7,691,929) | (978,368) | (11,624,127) |
| Net increase | 532,737 | $7,130,370 | 389,616 | $4,819,650 |
| |
| Class C shares | | | | |
|
| Sold | 6,451,844 | $86,094,305 | 9,702,393 | $115,563,855 |
| Distributions reinvested | — | — | 492,454 | 6,327,921 |
| | | | | |
| Repurchased | (3,001,910) | (39,970,450) | (5,375,747) | (63,668,960) |
| Net increase | 3,449,934 | $46,123,855 | 4,819,100 | $58,222,816 |
| |
| Class R1 shares | | | | |
|
| Sold | 416,437 | $5,542,631 | 502,427 | $5,987,652 |
| Distributions reinvested | — | — | 18,671 | 240,862 |
| | | | | |
| Repurchased | (409,960) | (5,514,484) | (289,081) | (3,493,178) |
| Net increase | 6,477 | $28,147 | 232,017 | $2,735,336 |
| |
| Class R3 shares | | | | |
|
| Sold | 475,511 | $6,295,126 | 661,010 | $7,911,722 |
| Distributions reinvested | — | — | 38,602 | 494,881 |
| | | | | |
| Repurchased | (447,595) | (6,005,828) | (507,021) | (6,122,404) |
| Net increase | 27,916 | $289,298 | 192,591 | $2,284,199 |
| |
| Class R4 shares | | | | |
|
| Sold | 252,411 | $3,364,153 | 730,506 | $8,662,769 |
| Distributions reinvested | — | — | 36,712 | 470,653 |
| | | | | |
| Repurchased | (189,850) | (2,535,199) | (671,736) | (7,797,633) |
| Net increase | 62,561 | $828,954 | 95,482 | $1,335,789 |
| |
| Class R5 shares | | | | |
|
| Sold | 581,814 | $7,738,582 | 734,800 | $8,763,730 |
| Distributions reinvested | — | — | 44,173 | 566,295 |
| | | | | |
| Repurchased | (262,173) | (3,482,061) | (624,225) | (7,547,846) |
| Net increase | 319,641 | $4,256,521 | 154,748 | $1,782,179 |
| |
| Class 1 shares | | | | |
|
| Sold | 12,584,131 | $167,027,721 | 37,252,046 | $443,658,442 |
| Distributions reinvested | — | — | 22,114,970 | 282,629,320 |
| | | | | |
| Repurchased | (17,113,726) | (228,202,794) | (33,910,544) | (402,925,018) |
| Net increase (decrease) | (4,529,595) | ($61,175,073) | 25,456,472 | $323,362,744 |
| |
| Class 5 shares | | | | |
|
| Sold | 1,127,400 | $14,949,424 | 1,615,561 | $19,248,023 |
| Distributions reinvested | — | — | 211,140 | 2,694,142 |
| | | | | |
| Repurchased | (69,082) | (923,958) | (149,920) | (1,772,039) |
| Net increase | 1,058,318 | $14,025,466 | 1,676,781 | $20,170,126 |
| |
| Net increase | 8,484,875 | $112,535,395 | 42,763,406 | $533,198,162 |
|
| | |
| | Semiannual report | Lifestyle Portfolios | 43 |
| | | | |
| Lifestyle Balanced | | | | |
| | | | | |
| | Six months ended 6-30-11 | | Year ended 12-31-10 |
| | Shares | Amount | Shares | Amount |
| |
| Class A shares | | | | |
|
| Sold | 14,215,373 | $189,869,237 | 19,580,426 | $240,102,252 |
| Distributions reinvested | 265,057 | 3,561,018 | 1,373,063 | 17,275,109 |
| | | | | |
| Repurchased | (6,065,496) | (80,911,398) | (10,042,103) | (122,781,303) |
| Net increase | 8,414,934 | $112,518,857 | 10,911,386 | $134,596,058 |
| |
| Class B shares | | | | |
|
| Sold | 892,305 | $11,904,212 | 1,180,688 | $14,435,721 |
| Distributions reinvested | 10,223 | 137,384 | 130,755 | 1,655,395 |
| | | | | |
| Repurchased | (485,522) | (6,468,620) | (993,298) | (12,095,506) |
| Net increase | 417,006 | $5,572,976 | 318,145 | $3,995,610 |
| |
| Class C shares | | | | |
|
| Sold | 6,551,893 | $87,446,554 | 12,290,967 | $150,133,097 |
| Distributions reinvested | 66,363 | 892,150 | 810,001 | 10,258,850 |
| | | | | |
| Repurchased | (3,084,410) | (41,163,540) | (6,152,559) | (75,155,891) |
| Net increase | 3,533,846 | $47,175,164 | 6,948,409 | $85,236,056 |
| |
| Class R1 shares | | | | |
|
| Sold | 342,213 | $4,555,802 | 618,303 | $7,531,435 |
| Distributions reinvested | 3,408 | 45,654 | 25,021 | 314,158 |
| | | | | |
| Repurchased | (162,876) | (2,169,765) | (391,958) | (4,806,555) |
| Net increase | 182,745 | $2,431,691 | 251,366 | $3,039,038 |
| |
| Class R3 shares | | | | |
|
| Sold | 451,658 | $5,994,304 | 1,574,471 | $18,999,404 |
| Distributions reinvested | 12,724 | 170,623 | 92,237 | 1,161,080 |
| | | | | |
| Repurchased | (620,078) | (8,289,081) | (1,175,431) | (14,485,233) |
| Net increase (decrease) | (155,696) | ($2,124,154) | 491,277 | $5,675,251 |
| |
| Class R4 shares | | | | |
|
| Sold | 592,977 | $7,973,131 | 1,183,979 | $14,474,628 |
| Distributions reinvested | 13,764 | 184,571 | 75,526 | 947,259 |
| | | | | |
| Repurchased | (456,690) | (6,142,763) | (1,087,613) | (13,126,262) |
| Net increase | 150,051 | $2,014,939 | 171,892 | $2,295,625 |
| |
| Class R5 shares | | | | |
|
| Sold | 1,049,257 | $13,916,839 | 1,413,916 | $17,398,471 |
| Distributions reinvested | 24,027 | 322,678 | 107,201 | 1,345,399 |
| | | | | |
| Repurchased | (700,826) | (9,339,884) | (884,630) | (10,964,930) |
| Net increase | 372,458 | $4,899,633 | 636,487 | $7,778,940 |
| |
| Class 1 shares | | | | |
|
| Sold | 22,856,447 | $303,681,541 | 48,988,036 | $599,105,962 |
| Distributions reinvested | 6,100,303 | 81,561,056 | 29,027,359 | 361,980,670 |
| | | | | |
| Repurchased | (11,152,536) | (148,356,087) | (28,069,764) | (341,123,667) |
| Net increase | 17,804,214 | $236,886,510 | 49,945,631 | $619,962,965 |
| |
| Class 5 shares | | | | |
|
| Sold | 767,873 | $10,221,386 | 1,182,532 | $14,454,724 |
| Distributions reinvested | 34,382 | 460,026 | 134,459 | 1,680,372 |
| | | | | |
| Repurchased | (69,451) | (921,094) | (243,328) | (2,900,034) |
| Net increase | 732,804 | $9,760,318 | 1,073,663 | $13,235,062 |
| |
| Net increase | 31,452,362 | $419,135,934 | 70,748,256 | $875,814,605 |
|
| |
| 44 | Lifestyle Portfolios | Semiannual report |
| | | | |
| Lifestyle Moderate | | | | |
| | Six months ended 6-30-11 | | Year ended 12-31-10 |
| | Shares | Amount | Shares | Amount |
| |
| Class A shares | | | | |
|
| Sold | 5,735,229 | $74,315,727 | 7,839,288 | $95,797,648 |
| Distributions reinvested | 187,951 | 2,441,718 | 619,398 | 7,647,128 |
| | | | | |
| Repurchased | (2,308,725) | (29,898,167) | (3,445,806) | (41,973,126) |
| Net increase | 3,614,455 | $46,859,278 | 5,012,880 | $61,471,650 |
| |
| Class B shares | | | | |
|
| Sold | 534,941 | $6,933,113 | 638,918 | $7,781,974 |
| Distributions reinvested | 12,405 | 161,031 | 57,501 | 710,843 |
| | | | | |
| Repurchased | (181,619) | (2,351,027) | (306,127) | (3,734,736) |
| Net increase | 365,727 | $4,743,117 | 390,292 | $4,758,081 |
| |
| Class C shares | | | | |
|
| Sold | 3,389,340 | $43,897,503 | 6,582,442 | $79,898,068 |
| Distributions reinvested | 94,044 | 1,221,710 | 417,998 | 5,173,078 |
| | | | | |
| Repurchased | (1,324,043) | (17,114,920) | (2,412,411) | (29,434,773) |
| Net increase | 2,159,341 | $28,004,293 | 4,588,029 | $55,636,373 |
| |
| Class R1 shares | | | | |
|
| Sold | 182,632 | $2,367,212 | 307,418 | $3,717,017 |
| Distributions reinvested | 3,318 | 43,109 | 17,242 | 212,703 |
| | | | | |
| Repurchased | (169,752) | (2,194,276) | (280,296) | (3,438,717) |
| Net increase | 16,198 | $216,045 | 44,364 | $491,003 |
| |
| Class R3 shares | | | | |
|
| Sold | 251,336 | $3,244,734 | 283,692 | $3,466,476 |
| Distributions reinvested | 7,025 | 91,127 | 29,029 | 357,731 |
| | | | | |
| Repurchased | (137,493) | (1,778,954) | (264,667) | (3,255,213) |
| Net increase | 120,868 | $1,556,907 | 48,054 | $568,994 |
| |
| Class R4 shares | | | | |
|
| Sold | 119,630 | $1,545,377 | 326,284 | $3,934,571 |
| Distributions reinvested | 6,010 | 77,867 | 21,817 | 268,881 |
| | | | | |
| Repurchased | (99,109) | (1,275,993) | (150,156) | (1,811,443) |
| Net increase | 26,531 | $347,251 | 197,945 | $2,392,009 |
| |
| Class R5 shares | | | | |
|
| Sold | 382,559 | $4,920,119 | 524,830 | $6,382,507 |
| Distributions reinvested | 12,903 | 167,362 | 38,129 | 469,165 |
| | | | | |
| Repurchased | (169,869) | (2,192,378) | (330,550) | (4,064,450) |
| Net increase | 225,593 | $2,895,103 | 232,409 | $2,787,222 |
| |
| Class 1 shares | | | | |
|
| Sold | 8,147,928 | $105,004,153 | 25,257,401 | $306,609,811 |
| Distributions reinvested | 3,027,797 | 39,240,525 | 10,659,990 | 130,970,535 |
| | | | | |
| Repurchased | (5,316,139) | (68,951,847) | (9,137,901) | (111,993,007) |
| Net increase | 5,859,586 | $75,292,831 | 26,779,490 | $325,587,339 |
| |
| Class 5 shares | | | | |
|
| Sold | 336,258 | $4,354,611 | 599,558 | $7,284,955 |
| Distributions reinvested | 24,281 | 314,469 | 74,120 | 910,986 |
| | | | | |
| Repurchased | (89,325) | (1,151,018) | (111,299) | (1,350,211) |
| Net increase | 271,214 | $3,518,062 | 562,379 | $6,845,730 |
| |
| Net increase | 12,659,513 | $163,432,887 | 37,855,842 | $460,538,401 |
|
| |
| Semiannual report | Lifestyle Portfolios | 45 |
| | | | |
| Lifestyle Conservative | | | | |
| | Six months ended 6-30-11 | | Year ended 12-31-10 |
| | Shares | Amount | Shares | Amount |
| |
| Class A shares | | | | |
|
| Sold | 6,821,902 | $88,875,050 | 10,041,016 | $126,533,979 |
| Distributions reinvested | 230,167 | 2,995,714 | 622,255 | 7,844,596 |
| | | | | |
| Repurchased | (3,877,810) | (50,450,529) | (5,202,312) | (65,496,196) |
| Net increase | 3,174,259 | $41,420,235 | 5,460,959 | $68,882,379 |
| |
| Class B shares | | | | |
|
| Sold | 554,310 | $7,221,152 | 838,104 | $10,539,336 |
| Distributions reinvested | 18,165 | 236,413 | 64,666 | 815,716 |
| | | | | |
| Repurchased | (245,787) | (3,200,929) | (401,195) | (5,021,870) |
| Net increase | 326,688 | $4,256,636 | 501,575 | $6,333,182 |
| |
| Class C shares | | | | |
|
| Sold | 4,141,007 | $53,946,145 | 7,384,187 | $92,601,801 |
| Distributions reinvested | 128,647 | 1,674,347 | 427,536 | 5,392,803 |
| | | | | |
| Repurchased | (2,040,945) | (26,523,813) | (2,745,826) | (34,549,114) |
| Net increase | 2,228,709 | $29,096,679 | 5,065,897 | $63,445,490 |
| |
| Class R1 shares | | | | |
|
| Sold | 132,944 | $1,736,156 | 337,200 | $4,245,154 |
| Distributions reinvested | 4,670 | 60,802 | 23,156 | 292,218 |
| | | | | |
| Repurchased | (341,120) | (4,445,643) | (246,997) | (3,145,624) |
| Net increase (decrease) | (203,506) | ($2,648,685) | 113,359 | $1,391,748 |
| |
| Class R3 shares | | | | |
|
| Sold | 322,963 | $4,205,768 | 438,423 | $5,515,699 |
| Distributions reinvested | 10,151 | 131,989 | 34,350 | 432,732 |
| | | | | |
| Repurchased | (224,776) | (2,913,911) | (309,773) | (3,930,221) |
| Net increase | 108,338 | $1,423,846 | 163,000 | $2,018,210 |
| |
| Class R4 shares | | | | |
|
| Sold | 274,830 | $3,573,746 | 315,088 | $3,965,586 |
| Distributions reinvested | 8,434 | 109,682 | 20,102 | 253,285 |
| | | | | |
| Repurchased | (147,207) | (1,914,282) | (137,036) | (1,733,405) |
| Net increase | 136,057 | $1,769,146 | 198,154 | $2,485,466 |
| |
| Class R5 shares | | | | |
|
| Sold | 350,952 | $4,551,255 | 430,442 | $5,380,666 |
| Distributions reinvested | 13,418 | 174,628 | 39,422 | 496,135 |
| | | | | |
| Repurchased | (171,496) | (2,229,306) | (438,988) | (5,550,349) |
| Net increase | 192,874 | $2,496,577 | 30,876 | $326,452 |
| |
| Class 1 shares | | | | |
|
| Sold | 10,570,903 | $137,711,351 | 28,313,977 | $353,882,230 |
| Distributions reinvested | 2,972,690 | 38,629,455 | 8,906,887 | 112,034,998 |
| | | | | |
| Repurchased | (7,544,979) | (97,956,939) | (8,990,485) | (114,291,033) |
| Net increase | 5,998,614 | $78,383,867 | 28,230,379 | $351,626,195 |
|
| Net increase | 11,962,033 | $156,198,301 | 39,764,199 | $496,509,122 |
| |
| 46 | Lifestyle Portfolios | Semiannual report |
Note 6 — Purchase and sale of securities
The following summarizes the purchases and sales of the affiliated underlying funds for the six months ended June 30, 2011:
| | | |
| Portfolio | Purchases | Sales | |
| |
| Lifestyle Aggressive | $266,532,258 | $234,798,118 | |
| Lifestyle Growth | 741,331,570 | 594,835,330 | |
| Lifestyle Balanced | 1,060,063,519 | 642,492,264 | |
| Lifestyle Moderate | 393,074,848 | 230,798,685 | |
| Lifestyle Conservative | 336,329,464 | 181,815,693 | |
Note 7 — Investment in affiliated underlying funds
The Portfolios invest primarily in affiliated underlying funds that are managed by the Adviser and affiliates. The Portfolios do not invest in the affiliated underlying funds for the purpose of exercising management or control; however, the Portfolios’ investment may represent a significant portion of each underlying fund’s net assets. For the six months ended June 30, 2011, the following Portfolios held 5% or more of an affiliated underlying fund’s net assets:
| |
| | Percent of Underlying |
| Portfolio Affiliate Class NAV | Funds’ Net Assets |
|
| Lifestyle Aggressive | |
John Hancock Funds II | |
| All Cap Core | 15.39% |
| All Cap Value | 12.73% |
| Alpha Opportunities | 14.12% |
| Blue Chip Growth | 10.30% |
| Capital Appreciation | 10.57% |
| Capital Appreciation Value | 11.58% |
| Currency Strategies | 9.46% |
| Emerging Markets Value | 16.73% |
| Equity-Income | 12.74% |
| Fundamental Value | 12.35% |
| Global Real Estate | 6.37% |
| Heritage | 19.23% |
| Index 500 | 7.60% |
| International Equity Index | 5.21% |
| International Growth Stock | 16.46% |
| International Opportunities | 15.56% |
| International Small Cap | 13.35% |
| International Small Company | 21.88% |
| International Value | 11.46% |
| Large Cap | 12.53% |
| Mid Cap Index | 23.59% |
| Mid Cap Stock | 9.89% |
| Mid Cap Value Equity | 18.95% |
| Mid Value | 15.35% |
| Mutual Shares | 12.40% |
| Natural Resources | 12.30% |
| Optimized Value | 16.61% |
| Real Estate Equity | 6.06% |
| Small Cap Growth | 17.22% |
| Small Cap Index | 18.89% |
| Small Cap Opportunities | 18.63% |
| Small Cap Value | 22.06% |
| Small Company Growth | 20.10% |
| Small Company Value | 12.43% |
| Smaller Company Growth | 20.49% |
| Technical Opportunities | 10.03% |
| U.S. Equity | 14.22% |
| Value | 19.56% |
| Value & Restructuring | 12.81% |
| John Hancock Funds III | |
| International Core | 8.27% |
| Rainier Growth | 8.77% |
| John Hancock Investment Trust | |
| Small Cap Intrinsic Value | 10.10% |
| |
| | Percent of Underlying |
| Portfolio Affiliate Class NAV | Funds’ Net Assets |
|
| Lifestyle Growth | |
| John Hancock Funds II | |
| Active Bond | 8.27% |
| All Cap Core | 47.03% |
| All Cap Value | 31.46% |
| Alpha Opportunities | 41.73% |
| Blue Chip Growth | 27.21% |
| Capital Appreciation | 26.53% |
| Capital Appreciation Value | 32.16% |
| Currency Strategies | 28.59% |
| Emerging Markets | 36.44% |
| Equity-Income | 31.05% |
| Floating Rate Income | 13.08% |
| Fundamental Value | 35.73% |
| Global Bond | 12.52% |
| Global High Yield | 20.68% |
| Global Real Estate | 33.58% |
| Heritage | 37.52% |
| High Income | 29.32% |
| High Yield | 14.98% |
| Index 500 | 15.15% |
| International Equity Index | 18.27% |
| International Growth Stock | 35.91% |
| International Opportunities | 38.10% |
| International Small Cap | 24.00% |
| International Small Company | 40.27% |
| International Value | 27.67% |
| Large Cap | 37.83% |
| Mid Cap Index | 72.24% |
| Mid Cap Stock | 20.33% |
| Mid Cap Value Equity | 31.33% |
| Mid Value | 34.78% |
| Multi-Sector Bond | 17.59% |
| Mutual Shares | 34.40% |
| Natural Resources | 26.83% |
| Optimized Value | 39.88% |
| Real Estate Equity | 32.07% |
| Real Return Bond | 12.69% |
| Small Cap Growth | 30.53% |
| Small Cap Opportunities | 30.52% |
| Small Cap Value | 37.10% |
| Small Company Growth | 34.93% |
| Small Company Value | 21.42% |
| Smaller Company Growth | 34.25% |
| Spectrum Income | 18.25% |
| Strategic Income Opportunities | 9.99% |
| Technical Opportunities | 30.67% |
| Total Return | 14.47% |
| U.S. Equity | 43.22% |
| U.S. High Yield Bond | 20.01% |
| Value | 32.58% |
| Value & Restructuring | 33.74% |
| John Hancock Funds III | |
| Disciplined Value | 11.93% |
| International Core | 20.02% |
| Rainier Growth | 22.73% |
| John Hancock Investment Trust | |
| Small Cap Intrinsic Value | 16.85% |
| |
| Semiannual report | Lifestyle Portfolios | 47 |
| |
| | Percent of Underlying |
| Portfolio Affiliate Class NAV | Funds’ Net Assets |
|
| Lifestyle Balanced | |
| John Hancock Funds II | |
| Active Bond | 36.18% |
| All Cap Core | 37.54% |
| All Cap Value | 24.76% |
| Alpha Opportunities | 29.92% |
| Blue Chip Growth | 21.07% |
| Capital Appreciation | 19.24% |
| Capital Appreciation Value | 28.99% |
| Core Bond | 37.05% |
| Currency Strategies | 28.44% |
| Emerging Markets | 23.77% |
| Equity Income | 19.27% |
| Floating Rate Income | 20.39% |
| Fundamental Value | 27.06% |
| Global Bond | 41.47% |
| Global High Yield | 35.75% |
| Global Real Estate | 31.44% |
| Heritage | 27.27% |
| High Income | 46.35% |
| High Yield | 27.39% |
| Index 500 | 14.12% |
| International Growth Stock | 30.80% |
| International Opportunities | 25.20% |
| International Small Cap | 10.34% |
| International Small Company | 17.26% |
| International Value | 19.63% |
| Investment Quality Bond | 19.45% |
| Large Cap | 35.51% |
| Mid Cap Stock | 18.53% |
| Mid Cap Value Equity | 34.49% |
| Mid Value | 25.10% |
| Multi-Sector Bond | 40.82% |
| Mutual Shares | 30.86% |
| Natural Resources | 20.23% |
| Optimized Value | 31.28% |
| Real Estate Equity | 32.34% |
| Real Return Bond | 35.89% |
| Small Cap Growth | 27.71% |
| Small Cap Opportunities | 15.89% |
| Small Cap Value | 21.73% |
| Small Company Growth | 26.85% |
| Small Company Value | 20.88% |
| Smaller Company Growth | 26.45% |
| Spectrum Income | 40.41% |
| Strategic Income Opportunities | 20.22% |
| Technical Opportunities | 29.26% |
| Total Return | 22.10% |
| U.S. Equity | 31.62% |
| U.S. High Yield Bond | 38.23% |
| Value | 33.14% |
| Value & Restructuring | 26.87% |
| John Hancock Funds II | |
| Disciplined Value | 9.55% |
| International Core | 14.52% |
| Rainier Growth | 16.62% |
| John Hancock Investment Trust | |
| Small Cap Intrinsic Value | 9.54% |
| |
| | Percent of Underlying |
| Portfolio Affiliate Class NAV | Funds’ Net Assets |
|
| Lifestyle Moderate | |
| John Hancock Funds II | |
| Active Bond | 20.91% |
| Alpha Opportunities | 5.39% |
| Blue Chip Growth | 7.39% |
| Core Bond | 31.46% |
| Currency Strategies | 8.92% |
| Equity-Income | 7.50% |
| Floating Rate Income | 9.57% |
| Fundamental Value | 7.15% |
| Global Bond | 14.84% |
| Global High Yield | 15.18% |
| Global Real Estate | 9.24% |
| High Income | 12.55% |
| High Yield | 8.69% |
| International Growth Stock | 8.60% |
| Investment Quality Bond | 27.56% |
| Mid Cap Stock | 5.18% |
| Mid Value | 10.81% |
| Multi-Sector Bond | 16.98% |
| Real Estate Equity | 9.83% |
| Real Return Bond | 15.05% |
| Small Cap Growth | 5.07% |
| Small Cap Value | 5.49% |
| Small Company Growth | 5.77% |
| Smaller Company Growth | 6.30% |
| Spectrum Income | 17.08% |
| Strategic Income Opportunities | 8.67% |
| Total Bond Market | 17.96% |
| Total Return | 12.40% |
| U.S. Equity | 8.23% |
| U.S. High Yield Bond | 11.82% |
| Value & Restructuring | 7.41% |
| John Hancock Funds III | |
| Global Shareholder Yield | 21.33% |
| |
| | Percent of Underlying |
| Portfolio Affiliate Class NAV | Funds’ Net Assets |
|
| Lifestyle Conservative | |
| John Hancock Funds II | |
| Active Bond | 21.58% |
| Core Bond | 29.26% |
| Currency Strategies | 7.41% |
| Equity Income | 5.68% |
| Floating Rate Income | 8.78% |
| Global Bond | 14.45% |
| Global High Yield | 13.45% |
| Global Real Estate | 7.20% |
| High Income | 10.74% |
| High Yield | 7.36% |
| Investment Quality Bond | 38.00% |
| Multi-Sector Bond | 15.46% |
| Real Estate Equity | 8.28% |
| Real Return Bond | 14.98% |
| Short Term Government Income | 100.00% |
| Spectrum Income | 15.52% |
| Strategic Income Opportunities | 8.16% |
| Total Bond Market | 33.73% |
| Total Return | 12.35% |
| U.S. High Yield Bond | 10.36% |
| John Hancock Funds III | |
| Global Shareholder Yield | 17.78% |
| |
| 48 | Lifestyle Portfolios | Semiannual report |
EVALUATION OF ADVISORY AND SUBADVISORY AGREEMENTS BY THE BOARD OF TRUSTEES
This section describes the evaluation by the Board of Trustees of the Advisory Agreement (the “Advisory Agreement”) and the Subadvisory Agreements (the “Subadvisory Agreements”) for each of the portfolios (the “Funds”) of John Hancock Funds II (the “Trust”) discussed in this semi-annual report.
At in-person meetings on May 25–27, 2011 the Board, including all the Independent Trustees, approved for an annual period the continuation of the Advisory and Subadvisory Agreements with respect to each of the Funds.
Evaluation by the Board of Trustees
The Board, including the Trustees who are not considered to be “interested persons” of the Trust under the Investment Company Act of 1940, as amended (the “1940 Act”) (the “Independent Trustees”), is responsible for selecting the Trust’s adviser, John Hancock Investment Management Services, LLC (the “Adviser” or “JHIMS”), approving the Adviser’s selection of subadvisers for each of the portfolios of the Trust (each a “Subadviser, and collectively, the “Subadvisers”) and approving the Trust’s advisory and subadvisory (and any sub-subadvisory) agreements, their periodic continuation and any amendments. Consistent with Securities and Exchange Commission rules, the Board regularly evaluates the Trust’s advisory and subadvisory arrangements, including consideration of the factors listed below. The Board may also consider other factors (including conditions and trends prevailing generally in the economy, the securities markets and the industry) and does not treat any single factor as determinative, and each Trustee may attribute different weights to different factors. The Board is furnished with an analysis of its fiduciary obligations in connection with its evaluation and, throughout the evaluation process, the Board is assisted by counsel for the Trust and the Independent Trustees are also separately assisted by independent legal counsel. The factors considered by the Board are:
(1) the nature, extent and quality of the services to be provided by the Adviser to the Trust and by the Subadvisers to the Funds;
(2) the investment performance of the Funds and their Subadvisers;
(3) the extent to which economies of scale would be realized as a Fund grows and whether fee levels reflect these economies of scale for the benefit of Trust shareholders;
(4) the costs of the services to be provided and the profits to be realized by the Adviser and its affiliates (including any subadvisers that are affiliated with the Adviser) from the Adviser’s relationship with the Trust; and
(5) comparative services rendered and comparative advisory and subadvisory fee rates.
The Board believes that information relating to all of these factors is relevant to its evaluation of the Trust’s advisory agreement. With respect to its evaluation of subadvisory agreements with subadvisers not affiliated with the Adviser, the Board believes that, in view of the Trust’s “manager-of-managers” advisory structure, the costs of the services to be provided and the profits to be realized by those subadvisers that are not affiliated with the Adviser from their relationship with the Trust generally are not a material factor in the Board’s consideration of these subadvisory agreements because such fees are paid by the Adviser and not by the Funds and the Board relies on the ability of the Adviser to negotiate the subadvisory fees at arms-length.
In evaluating subadvisory arrangements, the Board also considers other material business relationships that unaffiliated Subadvisers and their affiliates have with the Adviser or its affiliates, including the involvement by certain affiliates of certain sub-advisers in the distribution of financial products, including shares of the Trust, offered by the Adviser and other affiliates of the Adviser (“Material Relationships”).
Approval of Advisory and Subadvisory Agreements
At in-person meetings on May 25–27, 2011, the Board, including all the Independent Trustees, re-approved the Advisory Agreement and the applicable Subadvisory Agreements with respect to each of the Funds.
In considering the Advisory Agreement and the Subadvisory Agreements, the Board received in advance of the meeting a variety of materials relating to each Fund, the Adviser and each Subadviser, including comparative performance, fee and expense information for a peer group of similar mutual funds prepared by an independent third-party provider of mutual fund data, including performance information for relevant benchmark indices and other information provided by the Adviser and the Subadvisers regarding the nature, extent and quality of services provided by the Adviser and the Subadvisers under their respective Agreements. The Board also took into account discussions with management and information provided to the Board in its meetings throughout the year with respect to the services provided by the Adviser and the Subadvisers to the Funds, including quarterly performance reports prepared by management containing reviews of investment results, and periodic presentations from the Subadvisers with respect to the Funds they manage. The Board noted the affiliation of certain of the Subadvisers with JHIMS, noting any potential conflicts of interest.
Throughout the process, the Trustees were afforded the opportunity to ask questions of and request additional information from management. The Independent Trustees also received a memorandum from their independent counsel discussing the legal standards for their consideration of the proposed continuation of the Agreements and discussed the proposed continuation of the Agreements in private sessions with their independent legal counsel at which no representatives of management were present.
| |
| Semiannual report | Lifestyle Portfolios | 49 |
Approval of Advisory Agreement
Among the information received by the Board from the Adviser relating to the nature, extent and quality of services provided to the Funds, the Board reviewed information provided by JHIMS relating to its operations and personnel and information regarding JHIMS’ compliance and regulatory history. The Board also noted that on a regular basis it receives and reviews information from the Trust’s Chief Compliance Officer (“CCO”) regarding the Funds’ compliance policies and procedures established pursuant to Rule 38a-1 under the 1940 Act. The Board also considers the Adviser’s risk management processes.
The Trustees also took into account their knowledge of JHIMS’s management and the quality of the performance of its duties, through Board meetings, discussions and reports during the preceding year and through each Trustee’s experience as a Trustee of the Trust and of another trust in the complex.
In approving the renewal of the Advisory Agreement, and with reference to the factors that it regularly considers when considering approval of advisory and subadvisory agreements as listed above, the Board:
(1) — (a) considered the high value to the Trust of continuing its relationship with JHIMS as the Trust’s adviser, the skills and competency with which JHIMS has in the past managed the Trust’s affairs and its subadvisory relationships, JHIMS’ oversight and monitoring of the subadvisers’ investment performance and compliance programs including its timeliness in responding to performance issues and the qualifications of JHIMS’ personnel;
(b) considered JHIMS’ compliance policies and procedures and noted its responsiveness to regulatory changes and mutual fund industry developments;
(c) considered JHIMS’ administrative capabilities, including its ability to supervise the other service providers for the Funds;
(d) reviewed the financial condition of the Adviser and whether it had the financial wherewithal to provide a high level and quality of services to the Funds; and
(e) recognized the Adviser’s reputation and experience in serving as an investment adviser to the Trust, and considered the benefit to shareholders of investing in funds that are part of a family of funds offering a variety of investments.
The Board concluded that JHIMS may reasonably be expected to continue to provide a high quality of services under the Advisory Agreement with respect to the Funds;
(2) — (a) reviewed the investment performance of each of the Funds;
(b) reviewed the comparative performance of their respective benchmarks;
(c) considered the performance of comparable funds as included in a report prepared by an independent third party provider of mutual fund data (i.e., funds underlying variable insurance products having approximately the same investment clas-sification/objective), if any. Such report included each Fund’s ranking within a smaller group of peer funds and the Fund’s ranking within broader groups of funds, as well as a description of the methodology used to determine the similarity of each Fund with the funds included in each group; and
(d) took into account JHIMS’ analysis of each Fund’s performance and its plans and recommendations regarding the Trust’s subadvisory arrangements generally and with respect to particular Funds.
The Board concluded that the performance of each of the Funds has generally been in line with or generally outperformed the historical performance of comparable funds and the Funds’ respective benchmarks with the exceptions noted in Appendix A and in such cases, that appropriate action is being taken to address performance, if necessary, or that such performance is reasonable in light of all factors considered, and that JHIMS may reasonably be expected to continue ably to monitor the performance of the Funds and each of their subadvisers.
(3) — (a) with respect to each Fund (except those listed below), considered that the Adviser has agreed to waive its management fee for each of these Funds and each of the funds of John Hancock Variable Insurance Trust (except those listed below) (the “Participating Portfolios”) or otherwise reimburse the expenses of the Participating Portfolios as follows (the “Reimbursement”) and that, at the request of the Board, the Reimbursement rate was increased effective May 31, 2011. The current Reimbursement rate is as follows: The Reimbursement shall equal, on an annualized basis, 0.01% of that portion of the aggregate net assets of all the Participating Portfolios that exceed $75 billion but is less than $100 billion and 0.015% of that portion of the aggregate net assets of all the Participating Portfolios that equals or exceeds $100 billion. The amount of the Reimbursement shall be calculated daily and allocated among all the Participating Portfolios in proportion to the daily net assets of each Participating Portfolio, and that Reimbursement may be terminated or modified by the Adviser only upon notice to the Trust and approval of the Board of Trustees of the Trust. (The Funds that are not Participating Portfolios as of the date of this report are each of the funds of funds of the Trust and John Hancock Variable Insurance Trust.)
| |
| 50 | Lifestyle Portfolios | Semiannual report |
(b) reviewed the Trust’s advisory fee structure and the incorporation therein of any subadvisory fee breakpoints in the advisory fees charged and concluded that (i) most of the Funds contain breakpoints at the subadvisory fee level and that such breakpoints are reflected as breakpoints in the advisory fees for Funds and (ii) although economies of scale cannot be measured with precision, these arrangements permit shareholders of Funds with advisory fee breakpoints to benefit from economies of scale if those Funds grow. The Board also took into account management’s discussion of the Funds’ advisory fee structure, including with respect to those Funds that did not currently have breakpoints, and also noted that management had agreed to add breakpoints or implement additional breakpoints to the advisory fee structure of certain of the Funds; and
(c) The Board also considered the effect of the Funds’ growth in size on their performances and fees. The Board also noted that if the Funds’ assets increase over time, the Portfolios may realize other economies of scale if assets increase proportionally more than certain other fixed expenses.
(4) — (a) reviewed the financial statements of JHIMS and considered (i) an analysis presented by JHIMS regarding the net profitability to JHIMS and Manulife Financial Corporation, the Adviser’s parent, of each Fund;
(b) reviewed and considered an analysis presented by JHIMS regarding the profitability of JHIMS’ relationship with each Fund and whether JHIMS has the financial ability to continue to provide a high level of services to the Fund;
(c) considered that JHIMS also provides administrative services to the Funds on a cost basis pursuant to an administrative services agreement and took into account information prepared by JHIMS indicating the allocation of such costs;
(d) noted that certain of the Funds’ Subadvisers are affiliates of the Adviser;
(e) John Hancock Signature Services, LLC and John Hancock Funds, LLC, affiliates of the Adviser, provide transfer agency services and distribution services to the Funds, respectively, and that JHIMS also derives reputational and other indirect benefits from providing advisory services to the Funds;
(f) noted that the subadvisory fees for the Funds are paid by JHIMS; and
(g) considered that the Adviser should be entitled to earn a reasonable level of profits in exchange for the level of services it provides to each Fund and the entrepreneurial risk that it assumes as Adviser.
Based upon its review, the Board concluded that the Adviser and its affiliates’ level of profitability, if any, from their relationship with each Fund was reasonable and not excessive.
(5) — reviewed comparative information prepared by an independent third-party provider of mutual fund data including, among other data, each Fund’s contractual and actual advisory and subadvisory fees and total expenses as compared to similarly situated investment companies underlying variable insurance products deemed to be comparable to the Funds. The Board considered each Fund’s ranking within a smaller group of peer funds chosen by the independent third-party provider, as well as the Fund’s ranking within broader groups of funds. In comparing each Funds actual and contractual management fee to that of comparable funds, the Board noted that such fee includes both advisory and administrative costs.
The Board determined that the Trust’s advisory fees are generally within a competitive range of those incurred by other comparable funds. In this regard, the Board took into account management’s discussion with respect to the advisory/subadvisory fee structure, including the amount of the advisory fee retained by the Adviser after payment of the subadvisory fee. The Board also noted that JHIMS is currently waiving fees and/or reimbursing expenses with respect to certain of the Funds. The Board also noted that the Adviser pays the subadvisory fees of the Funds, and that such fees are negotiated at arm’s length with respect to unaffiliated Subadvisers. In addition, the Board noted that the Adviser effected advisory and subadvisory fee reductions in the past year with respect to several Funds. The Board also noted management’s discussion of the Funds’ expenses, as well as certain actions taken over the past several years to reduce the Funds’ operating expenses. The Board also took into account the level and quality of services provided by JHIMS with respect to the Funds, as well as the other factors considered. The Board concluded that the advisory fees paid by the Trust with respect to the Funds are reasonable.
In addition, the Trustees reviewed the advisory fee to be paid to the Adviser for each Fund and concluded that the advisory fee to be paid to the Adviser is based on services provided that are in addition to, rather than duplicative of, the services provided pursuant to the advisory agreements for the underlying portfolios of the Funds and that the additional services are necessary because of the differences between the investment policies, strategies and techniques of a fund of funds and those of its underlying portfolios.
Additional information relating to each Fund’s fees and expenses and performance that the Board considered in approving the Advisory Agreement is set forth in Appendix A.
| |
| Semiannual report | Lifestyle Portfolios | 51 |
Approval of Subadvisory Agreements
In making its determination with respect to the factors that its considers in considering approval of the Subadvisory Agreements, the Board reviewed:
(1) information relating to each subadviser’s business, including current subadvisory services to the Trust (and other funds in the John Hancock family of funds);
(2) the historical and current performance of each Fund and comparative performance information relating to the Fund’s benchmark and comparable funds;
(3) the subadvisory fee for each Fund and comparative fee information prepared by an independent third party of mutual fund data; and
(4) information relating to the nature and scope of Material Relationships and their significance to the Trust’s Adviser and unaffiliated Subadvisers.
With respect to the services provided by each of the Subadvisers, the Board received information provided to the Board by each Subadviser, including each Subadviser’s Form ADV, as well as considered information presented throughout the past year. The Board considered the Subadviser’s current level of staffing and its overall resources, as well as its compensation program. The Board reviewed each Subadviser’s history and investment experience, as well as information regarding the qualifications, background and responsibilities of the Subadviser’s investment and compliance personnel who provide services to the Portfolios. The Board also considered, among other things, the Subadviser’s compliance program and any disciplinary history. The Board also considered the Subadviser’s risk assessment and monitoring process. The Board noted each Subadviser’s regulatory history, including whether it was currently involved in any regulatory actions or investigations as well as material litigation, and any settlements and amelioratory actions undertaken, as appropriate. The Board also noted that the CCO and his staff conduct regular, periodic compliance reviews with each of the Subadvisers and present reports to the Independent Trustees regarding the same, which includes evaluating the regulatory compliance systems of the Subadvisers and procedures reasonably designed by them to assure compliance with the federal securities laws. The Board also took into account the financial condition of each Subadviser.
The Board considered each Subadviser’s investment process and philosophy. The Board took into account that each Subadviser’s responsibilities include the development and maintenance of an investment program for the applicable Fund which is consistent with the Fund’s investment objectives, the selection of investment securities and the placement of orders for the purchase and sale of such securities, as well as the implementation of compliance controls related to performance of these services. The Board also received information with respect to each Subadviser’s brokerage policies and practices, including with respect to best execution and soft dollars. The Board also reviewed information relating to the nature and scope of Material Relationships and their significance to the Adviser and its affiliates and to unaffiliated Subadvisers.
The Board also took into account the subadvisory fees paid by the Adviser to fees charged by each Fund’s Subadviser to manage other subadvised portfolios and portfolios not subject to regulation under the 1940 Act.
The Board also received information with respect to any Material Relationships with respect to the unaffiliated Subadvisers, which include arrangements in which unaffiliated subadvisers or their affiliates provide advisory, distribution or management services in connection with financial products sponsored by the Trust’s adviser or its affiliates, and may include other registered investment companies, a 529 education savings plan, managed separate accounts and exempt group annuity contracts sold to qualified plans. The Board also received information and took into account any other potential conflicts of interests the Adviser might have in connection with the Subadvisory Agreements.
The Board’s decision to approve each Subadvisory Agreement was based on a number of determinations, including the following:
(1) The Subadviser has extensive experience and demonstrated skills as a manager;
(2) Although not without variation, the performance of each Fund managed by a Subadviser has generally been in line with or generally outperformed the historical performance of comparable funds and the Fund’s respective benchmarks with the exceptions noted in Appendix A (with respect to such exceptions, the Board concluded that appropriate action was being taken to address such Funds’ performance, if necessary, or that performance was reasonable in light of all factors considered);
(3) The subadvisory fees generally are competitive and within the range of industry norms, are paid by JHIMS out of its advisory fees it receives from the Fund and would not be an expense of the Fund, and, with respect to each Subadviser that is not affiliated with the Adviser, are a product of arm’s length negotiation between the Adviser and the Subadviser; and the Board concluded that each Fund’s subadvisory fees are reasonable; and
(4) With respect to those Funds that have subadvisory fees that contain breakpoints, such breakpoints are reflected as breakpoints in the advisory fees for the Funds in order to permit shareholders to benefit from economies of scale if those Funds grow.
52 Lifestyle Portfolios | Semiannual report
In addition, the Trustees reviewed the subadvisory fee to be paid to the Subadviser for the Funds and concluded that the subad-visory fee to be paid to the Subadviser with respect to each Fund is based on services provided that are in addition to, rather than duplicative of, the services provided pursuant to the subadvisory agreements for the underlying portfolios of the Funds and that the additional services are necessary because of the differences between the investment policies, strategies and techniques of a fund of funds and those of its underlying portfolios.
Additional information relating to each Fund’s fees and expenses and performance that the Board considered for a particular Fund is set forth in Appendix A.
Based on their evaluation of all factors that they deemed to be material, including those factors described above, and assisted by the advice of independent counsel, the Board, including the Independent Trustees, concluded that renewal of the Advisory Agreement and each of the Subadvisory Agreements would be in the best interest of each of the Funds and its respective shareholders. Accordingly, the Board, and the Independent Trustees voting separately, approved the Advisory Agreement for an additional one-year period.
| |
| Semiannual report | Lifestyle Portfolios | 53 |
| | | |
| Appendix A |
|
| |
| |
| |
| Portfolio | Performance of Portfolios, | | |
| (Subadviser) | as of March 31, 2011 | Fees and Expenses | Comments |
|
| |
| |
| JHF II Lifestyle | Benchmark Index — The Fund | Subadvisory fees for this | |
| Aggressive | slightly outperformed for the | Fund are lower than the peer | |
| | one-year period and slightly | group median. | |
| (John Hancock Asset | outperformed for the three- | | |
| Management) | year period. | Net management fees for this | |
| | Fund are lower than the peer | |
| | Morningstar Category — The | group median. | |
| Fund modestly outperformed | | |
| | for the one-year period and | Total expenses for this Fund | |
| | outperformed for the three- | are slightly lower than the peer | |
| | year period. | group median. | |
| | | | |
|
| |
| JHF II Lifestyle | Benchmark Index — The Fund | Subadvisory fees for this | The Board took into account |
| Balanced | modestly outperformed for the | Fund are lower than the peer | management’s discussion of the |
| | one-year period and modestly | group median. | Fund’s expenses. |
| (John Hancock Asset | outperformed for the three- | | |
| Management) | year period. | Net management fees for this | The Board noted the Fund’s |
| | Fund are lower than the peer | favorable overall performance. |
| | Morningstar Category — The | group median. | |
| | Fund modestly outperformed | | |
| | for the one-year period and | Total expenses for this Fund | |
| | outperformed for the three- | are slightly higher than the | |
| | year period. | peer group median. | |
|
| JHF II Lifestyle | Benchmark Index — The | Subadvisory fees for this Fund are | The Board took into account |
| Conservative | Fund outperformed for the | lower than the peer group median. | management’s discussion of the |
| | one-year period and mod- | | Fund’s performance, including |
| (John Hancock Asset | estly outperformed for the | Net management fees for this | the Fund’s relative performance |
| Management) | three-year period. | Fund are lower than the peer | versus its peers over the more |
| | | group median. | recent period. |
| Morningstar Category — The | | |
| | Fund slightly underperformed | Total expenses for this Fund | The Board took into account |
| | for the one-year period | are slightly higher than the peer | management’s discussion of the |
| | and outperformed for the | group median. | Fund’s expenses. |
| | three-year period. | | |
|
| JHF II Lifestyle Growth | Benchmark Index — The | Subadvisory fees for this | |
| | Fund modestly outperformed | Fund are lower than the peer | |
| (John Hancock Asset | for the one-year period | group median. | |
| Management) | and outperformed for the | | |
| | three-year period. | Net management fees for this | |
| | | Fund is in line with the peer | |
| | Morningstar Category — The | group median. | |
| Fund slightly outperformed | | |
| | for the one-year period | Total expenses for this Fund | |
| | and outperformed for the | are slightly lower than the peer | |
| | three-year period. | group median. | |
| | | | |
|
| JHF II Lifestyle | Benchmark Index —The Fund | Subadvisory fees — Limited | The Board took into account |
| Moderate | outperformed for the one-year | peer group | management’s discussion of the |
| | period and outperformed for | | Fund’s expenses. |
| (John Hancock Asset | the three-year period. | Net management fees for this | |
| Management) | | Fund are lower than the peer | The Board noted the Fund’s |
| | Morningstar Category — | group median. | favorable overall performance. |
| | The Fund outperformed | | |
| | for the one-year period | Total expenses for this Fund are | |
| | and outperformed for the | slightly higher than the peer | |
| | three-year period. | group median. | |
| |
| 54 | Lifestyle Portfolios | Semiannual report |
More information
| | |
| Trustees | Investment adviser | |
| James M. Oates, Chairman | John Hancock Investment Management Services, LLC | |
| James R. Boyle† | | |
| Charles L. Bardelis* | Subadvisers | |
| Peter S. Burgess* | John Hancock Asset Management | |
| Grace K. Fey | | |
| Theron S. Hoffman | Principal distributor | |
| Hassell H. McClellan | John Hancock Funds, LLC | |
| Steven M. Roberts* | | |
| | Custodian | |
| Officers | State Street Bank and Trust Company | |
| Hugh McHaffie | | |
| President | Transfer agent | |
| | John Hancock Signature Services, Inc. | |
| Thomas M. Kinzler | | |
| Secretary and Chief Legal Officer | Legal counsel | |
| | K&L Gates LLP | |
| Francis V. Knox, Jr. | | |
| Chief Compliance Officer |
| |
| | The report is certified under the Sarbanes-Oxley Act, which | |
| Michael J. Leary | requires mutual funds and other public companies to affirm | |
| Treasurer | that, to the best of their knowledge, the information in | |
| | their financial reports is fairly and accurately stated in all | |
| Charles A. Rizzo | material respects. | |
| Chief Financial Officer |
| |
| | | |
| John G. Vrysen | | |
| Chief Operating Officer | | |
| | | |
| *Member of the Audit Committee | | |
| †Non-Independent Trustee | | |
The Fund’s proxy voting policies and procedures, as well as the Fund’s proxy voting record for the most recent twelvemonth period ended June 30, are available free of charge on the Securities and Exchange Commission (SEC) Web site at www.sec.gov or on our Web site.
The Fund’s complete list of portfolio holdings, for the first and third fiscal quarters, is filed with the SEC on Form N-Q. The Fund’s Form N-Q is available on our Web site and the SEC’s Web site, www.sec.gov, and can be reviewed and copied (for a fee) at the SEC’s Public Reference Room in Washington, DC. Call 1-800-SEC-0330 to receive information on the operation of the SEC’s Public Reference Room.
We make this information on your fund, as well as monthly portfolio holdings, and other fund details available on our Web site www.jhfunds.com or by calling 1-800-225-5291.
| | |
| You can also contact us: | | |
| 1-800-225-5291 | Regular mail: | Express mail: |
| jhfunds.com | John Hancock Signature Services, Inc. | John Hancock Signature Services, Inc. |
| | P.O. Box 55913 | Mutual Fund Image Operations |
| | Boston, MA 02205-5913 | 30 Dan Road |
| | | Canton, MA 02021 |
|
| |
| Semiannual report | Lifestyle Portfolios | 55 |

| |
| John Hancock Retirement Distribution Portfolio | |
| |
| Table of Contents | |
| |
| Your expenses | Page 3 |
| Portfolio summary | Page 4 |
| Portfolio of investments | Page 5 |
| Financial statements | Page 6 |
| Financial highlights | Page 9 |
| Notes to financial statements | Page 10 |
| Evaluation of Advisory and Subadvisory Agreements | |
| By the Board of Trustees | Page 15 |
| More information | Page 22 |
Your expenses
These examples are intended to help you understand your ongoing operating expenses.
Understanding your portfolio expenses
As a shareholder of the Portfolio, you incur two types of costs:
• Transaction costs which include sales charges (loads) on purchases or redemptions (varies by share class), minimum account fee charge, etc.
• Ongoing operating expenses including management fees, distribution and service fees (if applicable), and other portfolio expenses.
We are going to present only your ongoing operating expenses here.
Actual expenses/actual returns
This example is intended to provide information about your portfolio’s actual ongoing operating expenses, and is based on your portfolio’s actual return. It assumes an account value of $1,000.00 on January 1, 2011 with the same investment held until June 30, 2011.
| | | |
| | Account value | Ending value | Expenses paid during |
| | on 1-1-11 | on 6-30-11 | period ended 6-30-111,2 |
|
| Class A | $1,000.00 | $1,032.30 | $3.02 |
Together with the value of your account, you may use this information to estimate the operating expenses that you paid over the period. Simply divide your account value at June 30, 2011, by $1,000.00, then multiply it by the “expenses paid” for your share class from the table above. For example, for an account value of $8,600.00, the operating expenses should be calculated as follows:
Example
[ My account value $8,600.00 / $1,000.00 = 8.6 ] x $[ “expenses paid” from table ] = My actual expenses
Hypothetical example for comparison purposes
This table allows you to compare your portfolio’s ongoing operating expenses with those of any other fund. It provides an example of the Portfolio’s hypothetical account values and hypothetical expenses based on each class’s actual expense ratio and an assumed 5% annualized return before expenses (which is not your portfolio’s actual return). It assumes an account value of $1,000.00 on January 1, 2011, with the same investment held until June 30, 2011. Look in any other fund shareholder report to find its hypothetical example and you will be able to compare these expenses.
| | | |
| | Account value | Ending value | Expenses paid during |
| | on 1-1-11 | on 6-30-11 | period ended 6-30-111,2 |
|
| Class A | $1,000.00 | $1,021.80 | $3.01 |
Remember, these examples do not include any transaction costs, therefore, these examples will not help you to determine the relative total costs of owning different funds. If transaction costs were included, your expenses would have been higher. See the prospectus for details regarding transaction costs.
1 Expenses are equal to the Portfolio's annualized expense ratio of 0.60% for Class A shares, multiplied by the average account value over the period, multiplied by 181/365 (to reflect the one-half year period).
2 Ratios do not include expenses indirectly incurred from underlying funds whose expense ratios can vary based on the mix of underlying funds held by the Portfolio. The range of expense ratios of the underlying funds held by the Portfolio was 0.64% - 1.02%.
| | | | |
| Portfolio Summary | | | | |
| |
| Asset Allocation1 | | | | |
| Equity- Affiliated | 11% | | Fixed Income - Affiliated | 81% |
| International Large Cap | 5% | | Multi-Sector Bond | 38% |
| U.S. Large Cap | 4% | | Intermediate Bond | 16% |
| Real Estate | 2% | | High Yield Bond | 15% |
| Equity - Unaffiliated | 8% | | Bank Loan | 7% |
| Exchange-Traded Funds | 8% | | Global Bond | 5% |
| |
| |
| 1 As a percentage of net assets on 6-30-11. | | | |
Retirement Distribution Portfolio
As of 6-30-11 (Unaudited)
| | |
| | Shares | Value |
| Affiliated Investment Companies 91.92% | | $5,655,104 |
|
| Equity 10.93% | | |
|
| John Hancock Funds II (G) 5.94% | | 365,300 |
|
| Equity-Income, Class NAV (T. Rowe Price) | 16,297 | 242,007 |
| Global Real Estate, Class NAV (Deutsche) | 15,646 | 123,293 |
| | | |
| John Hancock Funds III (G) 4.99% | | 307,333 |
|
| Global Shareholder Yield, Class NAV (Epoch) | 31,457 | 307,333 |
| | | |
| Fixed Income 80.99% | | |
|
| John Hancock Funds II (G) 80.99% | | 4,982,471 |
|
| Active Bond, Class NAV (John Hancock1/Declaration) (A) | 60,129 | 611,517 |
| Floating Rate Income, Class NAV (WAMCO) | 45,018 | 428,124 |
| Global Bond, Class NAV (PIMCO) | 24,127 | 306,898 |
| Global High Yield, Class NAV (Stone Harbor) | 23,336 | 247,133 |
| High Yield, Class NAV (WAMCO) | 53,752 | 490,760 |
| Multi-Sector Bond, Class NAV (Stone Harbor) | 112,422 | 1,168,067 |
| Strategic Income Opportunities, Class NAV (John Hancock1)(A) | 105,052 | 1,175,537 |
| Total Return, Class NAV (PIMCO) | 26,388 | 369,963 |
| U.S. High Yield Bond, Class NAV (Wells Capital) | 14,446 | 184,472 |
| | | |
| Unaffiliated Investment Companies 8.07% | | 496,635 |
|
| Equity 8.07% | | |
| WisdomTree Equity Income Fund | 11,970 | 496,635 |
|
| Total investments (Cost $6,231,143)† 99.99% | | $6,151,739 |
|
| Other assets and liabilities, net 0.01% | | $743 |
|
| Total net assets 100.00% | | $6,152,482 |
|
| |
| Percentages are based upon net assets. |
| |
| (A) | The subadviser is an affiliate of the adviser. |
| | |
| (G) | The underlying fund's subadviser is shown parenthetically. |
| | |
| 1 | Manulife Asset Management (US) LLC is doing business as John Hancock Asset Management. |
| | |
| † | At 6-30-11, the aggregate cost of investment securities for federal income tax purposes was $6,234,379. Net |
| | unrealized depreciation aggregated $82,640, of which $63,726 related to appreciated investment securities |
| | and $146,366 related to depreciated investment securities. |
| |
| Underlying Funds’ Investment Managers | |
| Declaration Management & Research, LLC | (Declaration) |
| Deutsche Asset Management | (Deutsche) |
| Epoch Investment Partners, Inc. | (Epoch) |
| John Hancock Asset Management1 | (John Hancock) |
| Pacific Investment Management Company | (PIMCO) |
| Stone Harbor Investment Partners, LP | (Stone Harbor) |
| T. Rowe Price Associates, Inc. | (T. Rowe Price) |
| Wells Capital Management, Inc. | (Wells Capital) |
| Western Asset Management Company | (WAMCO) |
| |
| See notes to financial statements | |
| 5 |
Retirement Distribution Portfolio
Statement of Assets and Liabilities — June 30, 2011 (Unaudited)
| | |
| Assets | | |
|
| Investments in unaffiliated issuers, at value | | |
| (Cost $581,022) | $ | 496,635 |
| Investments in affiliated funds, at value (Cost | | |
| $5,650,121) (Note 7) | | 5,655,104 |
| Total investments, at value (Cost $6,231,143) | | 6,151,739 |
| Cash | | 23,597 |
| Receivable for investments sold | | 5,558 |
| Dividends receivable | | 12,294 |
| Receivable due from adviser | | 524 |
| Other assets | | 8,648 |
| Total assets | | 6,202,360 |
| |
| |
| Liabilities | | |
|
| Payable for investments purchased | | 12,706 |
| Distributions payable | | 5,492 |
| Payable to affiliates (Note 4) | | |
| Accounting and legal services fees | | 205 |
| Transfer agent fees | | 837 |
| Trustees' fees | | 103 |
| Other liabilities and accrued expenses | | 30,535 |
| Total liabilities | | 49,878 |
| |
| |
| Net assets | | |
|
| Capital paid-in | $ | 6,369,436 |
| Accumulated distributions in excess of net | | |
| investment income | | (59,981) |
| Accumulated net realized loss on investments | | (77,569) |
| Net unrealized appreciation (depreciation) on | | |
| investments | | (79,404) |
| Net assets | $ | 6,152,482 |
| |
| |
| Net asset value per share | | |
|
| Based on net asset values and shares | | |
| outstanding-the Portfolio has an unlimited | | |
| number of shares authorized with no par value | | |
| Class A ($6,152,482 ÷ 529,813 shares) | $ | 11.61 |
| |
| Maximum offering price per share | | |
| Class A (net asset value per share ÷ 95%)1 | $ | 12.22 |
1 On single retail sales of less than $50,000. On sales of $50,000 or more and on group sales the offering price is reduced.
| |
| See notes to financial statements | |
| 6 |
Retirement Distribution Portfolio
Statement of Operations — June 30, 2011 (Unaudited)
| | |
| Investment income | | |
|
| Income distributions received from affiliated | | |
| underlying funds | $ | 104,031 |
| Dividends | | 10,358 |
| Interest | | 199 |
| | | |
| Total investment income | | 114,588 |
| |
| Expenses | | |
|
| Investment management fees (Note 4) | | 4,726 |
| Distribution and service fees (Note 4) | | 9,002 |
| Accounting and legal services fees (Note 4) | | 456 |
| Transfer agent fees (Note 4) | | 5,101 |
| Trustees' fees (Note 4) | | 26 |
| State registration fees | | 6,648 |
| Printing and postage | | 723 |
| Professional fees | | 15,966 |
| Custodian fees | | 5,951 |
| Registration and filing fees | | 14,202 |
| Other | | 2,420 |
| Total expenses before reductions and | | |
| amounts recaptured | | 65,221 |
| Net expense reductions and amounts | | |
| recaptured (Note 4) | | (47,292) |
| | | |
| Total expenses | | 17,929 |
| |
| Net investment income | | 96,659 |
| |
| |
| Realized and unrealized gain (loss) | | |
|
| Net realized gain on | | |
| Investments in unaffiliated issuers | | 142,836 |
| Investments in affiliated issuers | | 53,476 |
| | | 196,312 |
| |
| Change in net unrealized appreciation | | |
| (depreciation) of | | |
| Investments in unaffiliated issuers | | (110,141) |
| Investments in affiliated issuers | | 9,636 |
| | | (100,505) |
| |
| Net realized and unrealized gain | | 95,807 |
| |
| Increase in net assets from operations | $ | 192,466 |
| |
| See notes to financial statements | |
| 7 |
Retirement Distribution Portfolio
Statements of Changes in Net Assets
| | | | |
| | | Six months | | |
| | | ended | | Year ended |
| | | 6/30/11 | | 12/31/10 |
| | | (Unaudited) | | |
| Increase (decrease) in net assets | | | | |
|
| From operations | | | | |
| Net investment income | $ | 96,659 | $ | 168,009 |
| Net realized gain (loss) | | 196,312 | | (32,534) |
| Change in net unrealized appreciation | | | | |
| (depreciation) | | (100,505) | | 351,414 |
| | | | | |
| Increase in net assets resulting from | | | | |
| operations | | 192,466 | | 486,889 |
| |
| Distributions to shareholders | | | | |
| From net investment income | | (156,640) | | (167,912) |
| From net realized gain | | — | | (54,983) |
| From tax return of capital | | — | | (74,325) |
| | | | | |
| Total distributions | | (156,640) | | (297,220) |
| | | | | |
| From Portfolio share transactions (Note 5) | | 133,541 | | 575,237 |
| |
| Total increase | | 169,367 | | 764,906 |
| | | | | |
| Net assets | | | | |
|
| Beginning of period | | 5,983,115 | | 5,218,209 |
| End of period | $ | 6,152,482 | $ | 5,983,115 |
| Accumulated distributions in excess of net | | | | |
| investment income | $ | (59,981) | $ | — |
| |
| See notes to financial statements | |
| 8 |
Retirement Distribution Portfolio
Financial Highlights (For a share outstanding throughout the period)
| | | | | | | | |
| Class A Shares | | | | | | | | |
| |
| Period ended | | | | | | | | |
| | | 6-30-111 | | 12-31-10 | | 12-31-09 | | 12-31-08 |
| Per share operating performance | | | | | | | | |
| |
| |
| |
| |
|
| Net asset value, beginning of period | $ | 11.54 | $ | 11.16 | $ | 9.44 | $ | 13.18 |
| Net investment income | 3 | 0.19 | | 0.34 | | 0.39 | | 0.46 |
| Net realized and unrealized gain (loss) on | | | | | | | | |
| investments | | 0.18 | | 0.64 | | 1.93 | | (3.45) |
| Total from investment operations | | 0.37 | | 0.98 | | 2.32 | | (2.99) |
| |
| Less distributions | | | | | | | | |
| From net investment income | | (0.30) | | (0.34) | | (0.40) | | (0.58) |
| From net realized gain | | — | | (0.11) | | (0.04) | | — |
| From tax return of capital | | — | | (0.15) | | (0.16) | | (0.17) |
| Total distributions | | (0.30) | | (0.60) | | (0.60) | | (0.75) |
| |
| Net asset value, end of period | $ | 11.61 | $ | 11.54 | $ | 11.16 | $ | 9.44 |
| |
| Total return (%) | 4,5 | 3.236 | | 8.99 | | 25.35 | | (23.47) |
| |
| Ratios and supplemental data | | | | | | | | |
| |
| |
| |
| |
|
| Net assets, end of period (in millions) | $ | 6 | $ | 6 | $ | 5 | $ | 4 |
| Ratios (as a percentage of average net | | | | | | | | |
| assets): | | | | | | | | |
| Expenses before reductions and amounts | | | | | | | | |
| recaptured | 7 | 2.178 | | 2.20 | | 2.38 | | 1.71 |
| Expenses including reductions and amounts | | | | | | | | |
| recaptured | 7 | 0.608 | | 0.68 | | 0.64 | | 0.60 |
| Net investment income | | 3.228 | | 3.00 | | 3.94 | | 3.97 |
| Portfolio turnover (%) | | 47 | | 29 | | 38 | | 16 |
1 Unaudited.
2 The inception date for Class A shares is 1-2-08.
3 Based on the average daily shares outstanding.
4 Total returns would have been lower had certain expenses not been reduced during the periods shown.
5 Does not reflect the effect of sales charges, if any.
6 Not annualized.
7 Ratios do not include expenses indirectly incurred from underlying funds whose expense ratios can vary based on the mix of underlying funds held by the Portfolio. The range of expense ratios of the underlying funds held by the Portfolio was 0.64%-1.02%, 0.52%-1.00%, 0.53%-1.09% and 0.61%-1.13%, for the period ended 6-30-11 and years ended 12-31-10, 12-31-09 and 12-31-08, respectively.
8 Annualized.
| |
| See notes to financial statements | |
| 9 |
Notes to financial statements (unaudited)
Note 1 — Organization
John Hancock Retirement Distribution Portfolio (the Portfolio) is a diversified series of John Hancock Funds II (the Trust), an open-end management investment company organized as a Massachusetts business trust and registered under the Investment Company Act of 1940, as amended (the 1940 Act). The Portfolio seeks to provide a stated, targeted (non-guaranteed) quarterly distribution. As a secondary objective, the Portfolio seeks capital appreciation.
The Portfolio operates as a “fund of funds” that invest in Class NAV shares of underlying funds of the Trust, John Hancock Funds III (JHF III) and also in other affiliated funds of the John Hancock funds complex. The Portfolio may also invest in unaffiliated underlying funds and other permitted security investments.
The accounting policies of the underlying funds of the Portfolio are outlined in the underlying funds’ shareholder reports, available without charge by calling 1-800-344-1029 or on the Securities and Exchange Commission (SEC) Web site at www.sec.gov or at the SEC’s public reference room in Washington, D.C. The underlying funds are not covered by this report. On June 24, 2011, the Board of Trustees approved a Plan of Liquidation and Termination of the Portfolio expected to be effective on or about August 19, 2011.
Note 2 — Significant accounting policies
The financial statements have been prepared in conformity with accounting principles generally accepted in the United States of America, which require management to make certain estimates and assumptions at the date of the financial statements. Actual results could differ from those estimates. Events or transactions occurring after the end of the fiscal period through the date that the financial statements were issued have been evaluated in the preparation of the financial statements. The following summarizes the significant accounting policies of the Portfolio:
Security valuation. Investments are stated at value as of the close of regular trading on the New York Stock Exchange (NYSE), normally at 4:00 P.M., Eastern Time. The Portfolio uses a three-tier hierarchy to prioritize the pricing assumptions, referred to as inputs, used in valuation techniques to measure fair value. Level 1 includes securities valued using quoted prices in active markets for identical securities, including registered investment companies. Level 2 includes securities valued using significant observable inputs. Observable inputs may include quoted prices for similar securities, interest rates, prepayment speeds and credit risk. Prices for securities valued using these inputs are received from independent pricing vendors and brokers and are based on an evaluation of the inputs described. Level 3 includes securities valued using significant unobservable inputs when market prices are not readily available or reliable, including the Portfolio’s own assumptions in determining the fair value of investments. Factors used in determining value may include market or issuer specific events, changes in interest rates and credit quality. The inputs or methodology used for valuing securities are not necessarily an indication of the risk associated with investing in those securities.
As of June 30, 2011, all investments are categorized as Level 1 under the hierarchy described above. Changes in valuation techniques may result in transfers in or out of an assigned level within the disclosure hierarchy. During the six month period ended June 30, 2011, there were no significant transfers in or out of Level 1 or Level 2 assets.
In order to value the securities, the Portfolio uses the following valuation techniques. Investments by the Portfolio in underlying affiliated funds and/or other open-end management investment companies are valued at their respective net asset values each business day.
Security transactions and related investment income. Investment security transactions are accounted for on a trade date plus one basis for daily net asset value calculations. However, for financial reporting purposes, investment transactions are reported on trade date. Interest income is
accrued as earned. Gains and losses on securities sold are determined on the basis of identified cost and may include proceeds from litigation. Dividend and capital gain distributions from underlying funds are recorded on ex-date.
Line of credit. The Portfolio may borrow from banks for temporary or emergency purposes, including meeting redemption requests that otherwise might require the untimely sale of securities. Pursuant to the custodian agreement, the custodian may loan money to the Portfolio to make properly authorized payments. The Portfolio is obligated to repay the custodian for any overdraft, including any related costs or expenses. The custodian has a lien, security interest or security entitlement in any Portfolio property that is not segregated, to the maximum extent permitted by law for any overdraft.
In addition, effective March 30, 2011, the Portfolio and other affiliated funds have entered into an agreement with Citibank N.A. which enables them to participate in a $200 million unsecured committed line of credit. Prior to March 30, 2011, the Portfolio had a similar agreement with State Street Bank and Trust Company. A commitment fee, payable at the end of each calendar quarter, based on the average daily unused portion of the line of credit, is charged to each participating fund or portfolio on a pro rata basis and is reflected in other expenses on the Statement of Operations. For the six months ended June 30, 2011, the Portfolio had no borrowings under the lines of credit.
Expenses. The majority of expenses are directly attributable to an individual portfolio. Expenses that are not readily attributable to a specific portfolio are allocated among all portfolios in an equitable manner, taking into consideration, among other things, the nature and type of expense and the portfolio’s relative assets. Expense estimates are accrued in the period to which they relate and adjustments are made when actual amounts are known.
Federal income taxes. The Portfolio intends to continue to qualify as a regulated investment company by complying with the applicable provisions of the Internal Revenue Code and will not be subject to federal income tax on taxable income that is distributed to shareholders. Therefore, no federal income tax provision is required.
For federal income tax purposes, the Portfolio has a capital loss carryforward of $270,645 available to offset future net realized capital gains as of December 31, 2010. The loss carryforward expires as follows: December 31, 2017 — $172,106 and December 31, 2018 —$98,539.
Under the recently enacted Regulated Investment Company Modernization Act of 2010, the Portfolio will be permitted to carry forward capital losses incurred in taxable years beginning after December 22, 2010 for an unlimited period. However, any losses incurred during those future taxable years will be required to be utilized prior to the losses incurred in pre-enactment taxable years. As a result of this ordering rule, pre-enactment capital loss carryforwards may be more likely to expire unused. Additionally, post-enactment capital losses that are carried forward will retain their character as either short-term or long-term capital losses rather than being considered all short-term as under previous law.
As of December 31, 2010, the Portfolio had no uncertain tax positions that would require financial statement recognition, derecognition or disclosure. The Portfolio’s federal tax returns are subject to examination by the Internal Revenue Service for a period of three years.
Distribution of income and gains. Distributions to shareholders from net investment income and net realized gains, if any, are recorded on the ex-date. The Portfolio uses a quarterly targeted distribution strategy and distributes substantially all of its net income quarterly and capital gains, if any, annually. If the Portfolio has not met its distribution goal from net income and capital gains, then the distributions may consist of a return of capital.
Such distributions, on a tax basis, are determined in conformity with income tax regulations, which may differ from accounting principles generally accepted in the United States of America. Short-term gains from underlying funds are treated as ordinary income for tax purposes. The final determination of tax characteristics of the Portfolio’s distribution will occur at the end of the year and will subsequently be reported to shareholders.
Capital accounts within financial statements are adjusted for permanent book-tax differences. These adjustments have no impact on net assets or the results of operations. Temporary book tax differences, if any, will reverse in a subsequent period. Book-tax differences are primarily attributable to wash sale loss deferrals.
Note 3 - Guarantees and indemnifications
Under the Portfolio’s organizational documents, its Officers and Trustees are indemnified against certain liabilities arising out of the performance of their duties to the Portfolio. Additionally, in the normal course of business, the Portfolio enters into contracts with service providers that contain general indemnification clauses. The Portfolio’s maximum exposure under these arrangements is unknown, as this would involve future claims that may be made against the Portfolio that have not yet occurred. The risk of material loss from such claims is considered remote.
Note 4 — Fees and transactions with affiliates
John Hancock Investment Management Services, LLC (the Adviser) serves as investment adviser for the Trust. John Hancock Funds, LLC (the Distributor), an affiliate of the Adviser, serves as principal underwriter of the Portfolio. The Adviser and the Distributor are indirect wholly owned subsidiaries of Manulife Financial Corporation (MFC).
Management fee. The Portfolio pays the Adviser a management fee for its services to the Portfolio. The management fee has two components: (a) a fee on net assets invested in a fund of the Trust or JHF III (Affiliated Fund Assets); and (b) a fee on net assets invested in investments other than a fund of the Trust or JHF III (Other Assets). The fee on assets invested in Affiliated Fund Assets is stated as an annual percentage of the current value of the aggregate net assets of the Portfolio and the Retirement Rising Distribution Portfolio and is equivalent to the sum of: (a) 0.06% of the first $500 million of aggregate net assets and (b) 0.05% of the excess over $500 million of aggregate net assets. The fee on Other Assets is stated as an annual percentage of the current value of the aggregate net assets of the Portfolio and the Retirement Rising Distribution Portfolio and is equivalent to the sum of: (a) 0.51% of the first $500 million of aggregate net assets and (b) 0.50% of the excess over $500 million of aggregate net assets and is applied to the Other Assets of the Portfolio. The investment management fees incurred for the six months ended June 30, 2011 were equivalent to an annual effective rate of 0.16% of the Portfolio’s average daily net assets.
John Hancock Asset Management a division of Manulife Asset Management (North America) LLC, and John Hancock Asset Management a division of Manulife Asset Management (US) LLC, both indirectly owned subsidiaries of MFC and affiliates of the Adviser, act as subadvisers to the Portfolio. The Portfolio is not responsible for the payment of subadvisory fees.
The Adviser has contractually agreed to waive fees and/or reimburse certain Portfolio level expenses to 0.09% of the Portfolio’s average annual net assets. This agreement excludes management fees, underlying fund expenses, taxes, portfolio brokerage commissions, interest, Rule 12b-1 fees, transfer agency fees, state registration fees, printing and postage, litigation and indemnification expenses, and other extraordinary expenses not incurred in the ordinary course of the Portfolio’s business. In addition, fees incurred under any agreement or plans of the Portfolio dealing with services for the shareholders and others with beneficial interest in shares of the Portfolio, are excluded. The Adviser has also agreed to a contractual expense limit on Class A specific expenses (which include 12b-1 fees, transfer agent fees, state registration fees, and printing and postage fees) of 0.35%. These expense waivers and/or reimbursements will continue in effect until at least April 30, 2012.
Accordingly, the expense reductions amounted to $47,292 for the six months ended June 30, 2011.
Expense recapture. The Adviser may recapture operating expenses reimbursed or fees waived under previous expense limitation or waiver arrangements made for a period of three years following the beginning of the month in which such reimbursements or waivers originally occurred. The table below outlines the amounts recovered during the six months ended June 30, 2011 and the amount of waived or reimbursed expenses subject to potential recovery and the respective expiration dates. Certain reimbursements or waivers are not subject to recapture.
| | | | |
| Amount eligible for | Amount eligible for | Amount eligible for | Amount recovered |
| recovery through | recovery through | recovery through June | during the six months |
| December 1, 2012 | December 1, 2013 | 1, 2014 | ended June 30, 2011 |
|
| $ | 76,944 | $ | 85,120 | $ | 47,292 | | - |
|
Accounting and legal services. Pursuant to a service agreement, the Portfolio reimburses the Adviser for all expenses associated with providing the administrative, financial, legal, accounting and recordkeeping services of the Portfolio, including the preparation of all tax returns, periodic reports to shareholders and regulatory reports, among other services. These accounting and legal services fees incurred for the six months ended June 30, 2011 amounted to an annual rate of 0.02% of the Portfolio’s average daily net assets.
Distribution and service plans. The Portfolio has a distribution agreement with the Distributor. The Portfolio has adopted distribution and service plans with respect to Class A shares pursuant to Rule 12b-1 under the 1940 Act, to pay the Distributor for services provided as the distributor of shares of the Portfolio. Accordingly, the Portfolio may pay up to an annual rate of 0.30% of average daily net assets for Class A shares for distribution and service fees.
Sales charges. Class A shares are assessed up-front sales charges, which resulted in payments to the Distributor amounting to $4,804 for the six months ended June 30, 2011. Of this amount, $852 was retained and used for printing prospectuses, advertising, sales literature and other purposes, and $3,952 was paid as sales commissions to broker-dealers.
Transfer agent fees. The Portfolio has a transfer agent agreement with John Hancock Signature Services, Inc. (Signature Services or Transfer Agent), an affiliate of the Adviser. The transfer agent fees paid to Signature Services are determined based on the cost to Signature Services (Signature Services Cost) of providing recordkeeping services. The Signature Services Cost includes a component of allocated John Hancock corporate overhead for providing transfer agent services to the Portfolio and to all other John Hancock affiliated funds. It also includes out-of-pocket expenses that are comprised of payments made to third-parties for recordkeeping services provided to their clients who invest in one or more John Hancock funds. In addition, Signature Services Cost may be reduced by certain fees that Signature Services receives with retirement and small accounts. Signature Services Cost is calculated monthly and allocated, as applicable, to four categories of share classes: Institutional Share Classes, Retirement Share Classes, Municipal Bond Classes and all other Retail Share Classes. Within each of these categories, the applicable costs are allocated to the affected John Hancock affiliated funds and/or classes, based on the relative average daily net assets.
Trustee expenses. The Portfolio compensates each Trustee who is not an employee of the Adviser or its affiliates. The costs of paying Trustee compensation and expenses are allocated to each Portfolio based on its average daily net assets.
Note 5 — Portfolio share transactions
Transactions in Portfolio shares for the six months ended June 30, 2011 and for the year ended December 31, 2010 were as follows:
| | | | |
| | Six months ended | Year ended |
| | 6/30/11 | 12/31/10 |
| |
|
| | Shares | Amount | Shares | Amount |
| Class A shares | | | | |
| Sold | 18,746 | $ | 216,944 | 49,254 $ | 563,290 |
| Distributions reinvested | 12,620 | 146,333 | 25,084 | 284,065 |
| Repurchased | (19,862) | (229,736) | (23,740) | (272,118) |
| |
|
| Net increase | 11,504 | $ | 133,541 | 50,598 | $ | 575,237 |
| |
|
Affiliates of the Portfolio owned 89% of the shares of beneficial interest of Class A shares on June 30, 2011.
Note 6 — Purchase and sale of securities
Purchases and sales of securities, other than short-term securities, aggregated to $4,501,950 and $2,606,687, respectively, for the six months ended June 30, 2011.
Note 7 — Investment in affiliated underlying funds
The Portfolio invests in affiliated underlying funds that are managed by the Adviser and affiliates. The Portfolio does not invest in the affiliated underlying funds for the purpose of exercising management or control; however, the Portfolio’s investment may represent a significant portion of each underlying fund’s net assets. For the six months ended June 30, 2011, the Portfolio held less than 5% of the total net assets in any of the underlying funds.
Note 8 — Subsequent event
On August 19, 2011, the Portfolio liquidated.
|
| EVALUATION OF ADVISORY AND SUBADVISORY |
| AGREEMENTS BY THE BOARD OF TRUSTEES |
This section describes the evaluation by the Board of Trustees of the Advisory Agreement (the “Advisory Agreement”) and the Subadvisory Agreements (the “Subadvisory Agreements”) for each of the portfolios (the “Funds”) of John Hancock Funds II (the “Trust”) discussed in this semi-annual report.
At in-person meetings on May 25-27, 2011 the Board, including all the Independent Trustees, approved for an annual period the continuation of the Advisory and Subadvisory Agreements with respect to each of the Funds.
Evaluation by the Board of Trustees
The Board, including the Trustees who are not considered to be “interested persons” of the Trust under the Investment Company Act of 1940, as amended (the “1940 Act”) (the “Independent Trustees”), is responsible for selecting the Trust’s adviser, John Hancock Investment Management Services, LLC (the “Adviser” or “JHIMS”), approving the Adviser’s selection of subadvisers for each of the portfolios of the Trust (each a “Sub-Adviser, and collectively, the “Sub-Advisers”) and approving the Trust’s advisory and subadvisory (and any sub-subadvisory) agreements, their periodic continuation and any amendments. Consistent with Securities and Exchange Commission rules, the Board regularly evaluates the Trust’s advisory and subadvisory arrangements, including consideration of the factors listed below. The Board may also consider other factors (including conditions and trends prevailing generally in the economy, the securities markets and the industry) and does not treat any single factor as determinative, and each Trustee may attribute different weights to different factors. The Board is furnished with an analysis of its fiduciary obligations in connection with its evaluation and, throughout the evaluation process, the Board is assisted by counsel for the Trust and the Independent Trustees are also separately assisted by independent legal counsel. The factors considered by the Board are:
(1) the nature, extent and quality of the services to be provided by the Adviser to the Trust and by the Sub-Advisers to the Funds;
(2) the investment performance of the Funds and their Sub-Advisers;
(3) the extent to which economies of scale would be realized as a Fund grows and whether fee levels reflect these economies of scale for the benefit of Trust shareholders;
(4) the costs of the services to be provided and the profits to be realized by the Adviser and its affiliates (including any subadvisers that are affiliated with the Adviser) from the Adviser’s relationship with the Trust; and
(5) comparative services rendered and comparative advisory and subadvisory fee rates.
The Board believes that information relating to all of these factors is relevant to its evaluation of the Trust’s advisory agreement. With respect to its evaluation of subadvisory agreements with subadvisers not affiliated with the Adviser, the Board believes that, in view of the Trust’s “manager-of-managers” advisory structure, the costs of the services to be provided and the profits to be realized by those subadvisers that are not affiliated with the Adviser from their relationship with the Trust generally are not a material factor in the Board’s consideration of these subadvisory agreements because such fees are paid by the Adviser and not by the Funds and the Board relies on the ability of the Adviser to negotiate the subadvisory fees at arms-length.
In evaluating subadvisory arrangements, the Board also considers other material business relationships that unaffiliated Sub-Advisers and their affiliates have with the Adviser or its affiliates, including the involvement by certain affiliates of certain subadvisers in the distribution of financial products, including shares of the Trust, offered by the Adviser and other affiliates of the Adviser (“Material Relationships”).
Approval of Advisory and Subadvisory Agreements
At an in-person meetings on May 25-27, 2011, the Board, including all the Independent Trustees, re-approved the Advisory Agreement and the applicable Subadvisory Agreements with respect to each of the Funds.
In considering the Advisory Agreement and the Subadvisory Agreements, the Board received in advance of the meeting a variety of materials relating to each Fund, the Adviser and each Sub-Adviser, including comparative performance, fee and expense information for a peer group of similar mutual funds prepared by an independent third-party provider of mutual fund data, including performance information for relevant benchmark indices and other information provided by the Adviser and the Sub-Advisers regarding the nature, extent and quality of services provided by the Adviser and the Sub-Advisers under their respective Agreements. The Board also took into account discussions with management and information provided to the Board in its meetings throughout the year with respect to the services provided by the Adviser and the Sub-Advisers to the Funds, including quarterly performance reports prepared by management containing reviews of investment results, and periodic presentations from the Sub-Advisers with respect to the Funds they manage. The Board noted the affiliation of certain of the Sub-Advisers with JHIMS, noting any potential conflicts of interest.
Throughout the process, the Trustees were afforded the opportunity to ask questions of and request additional information from management. The Independent Trustees also received a memorandum from their independent counsel discussing the legal standards for their consideration of the proposed continuation of the Agreements and discussed the proposed continuation of the Agreements in private sessions with their independent legal counsel at which no representatives of management were present.
Approval of Advisory Agreement
Among the information received by the Board from the Adviser relating to the nature, extent and quality of services provided to the Funds, the Board reviewed information provided by JHIMS relating to its operations and personnel and information regarding JHIMS' compliance and regulatory history. The Board also noted that on a regular basis it receives and reviews information from the Trust’s Chief Compliance Officer (“CCO”) regarding the Funds’ compliance policies and procedures established pursuant to Rule 38a-1 under the 1940 Act. The Board also considers the Adviser’s risk management processes.
The Trustees also took into account their knowledge of JHIMS's management and the quality of the performance of its duties, through Board meetings, discussions and reports during the preceding year and through each Trustee's experience as a Trustee of the Trust and of another trust in the complex.
In approving the renewal of the Advisory Agreement, and with reference to the factors that it regularly considers when considering approval of advisory and subadvisory agreements as listed above, the Board:
(1) - (a) considered the high value to the Trust of continuing its relationship with JHIMS as the Trust’s adviser, the skills and competency with which JHIMS has in the past managed the Trust’s affairs and its subadvisory relationships, JHIMS’ oversight and monitoring of the subadvisers’ investment performance and compliance programs including its timeliness in responding to performance issues and the qualifications of JHIMS’ personnel;
(b) considered JHIMS’ compliance policies and procedures and noted its responsiveness to regulatory changes and mutual fund industry developments;
(c) considered JHIMS’ administrative capabilities, including its ability to supervise the other service providers for the Funds;
(d) reviewed the financial condition of the Adviser and whether it had the financial wherewithal to provide a high level and quality of services to the Funds; and
(e) recognized the Adviser’s reputation and experience in serving as an investment adviser to the Trust, and considered the benefit to shareholders of investing in funds that are part of a family of funds offering a variety of investments.
The Board concluded that JHIMS may reasonably be expected to continue to provide a high quality of services under the Advisory Agreement with respect to the Funds;
(2) - (a) reviewed the investment performance of each of the Funds;
(b) reviewed the comparative performance of their respective benchmarks;
(c) considered the performance of comparable funds as included in a report prepared by an independent third party provider of mutual fund data (i.e., funds underlying variable insurance products having approximately the same investment classification/objective), if any. Such report included each Fund’s ranking within a smaller group of peer funds and the Fund’s ranking within broader groups of funds, as well as a description of the methodology used to determine the similarity of each Fund with the funds included in each group; and
(d) took into account JHIMS’ analysis of each Fund’s performance and its plans and recommendations regarding the Trust’s subadvisory arrangements generally and with respect to particular Funds.
The Board concluded that the performance of each of the Funds has generally been in line with or generally outperformed the historical performance of comparable funds and the Funds’ respective benchmarks with the exceptions noted in Appendix A and in such cases, that appropriate action is being taken to address performance, if necessary, or that such performance is reasonable in light of all factors considered, and that JHIMS may reasonably be expected to continue ably to monitor the performance of the Funds and each of their subadvisers.
3)– (a) with respect to each Fund (except those listed below), considered that the Adviser has agreed to waive its management fee for each of these Funds and each of the funds of John Hancock Variable Insurance Trust (except those listed below) (the “Participating Portfolios”) or otherwise reimburse the expenses of the Participating Portfolios as follows (the “Reimbursement”) and that, at the request of the Board, the Reimbursement rate was increased effective May 31, 2011. The current Reimbursement rate is as follows: The Reimbursement shall equal, on an annualized basis, 0.01% of that portion of the aggregate net assets of all the Participating Portfolios that exceed $75 billion but is less than $100 billion and 0.015% of that portion of the aggregate net assets of all the Participating Portfolios that equals or exceeds $100 billion. The amount of the Reimbursement shall be calculated daily and allocated among all the Participating Portfolios in proportion to the daily net assets of each Participating Portfolio, and that Reimbursement may be terminated or modified by the Adviser only upon notice to the Trust and approval of the Board of Trustees of the Trust. (The Funds that are not Participating Portfolios as of the date of this report are each of the funds of funds of the Trust and John Hancock Variable Insurance Trust.)
(b) reviewed the Trust’s advisory fee structure and the incorporation therein of any subadvisory fee breakpoints in the advisory fees charged and concluded that (i) most of the Funds contain breakpoints at the subadvisory fee level and that such breakpoints are reflected as breakpoints in the advisory fees for Funds and (ii) although economies of scale cannot be measured with precision, these arrangements permit shareholders of Funds with advisory fee breakpoints to benefit from economies of scale if those Funds grow. The Board also took into account management’s discussion of the Funds’ advisory fee structure, including with respect to those Funds that did not currently have breakpoints, and also noted that management had agreed to add breakpoints or implement additional breakpoints to the advisory fee structure of certain of the Funds; and
(c) The Board also considered the effect of the Funds’ growth in size on their performances and fees. The Board also noted that if the Funds’ assets increase over time, the Portfolios may realize other economies of scale if assets increase proportionally more than certain other fixed expenses.
(4) -(a) reviewed the financial statements of JHIMS and considered (i) an analysis presented by JHIMS regarding the net profitability to JHIMS and Manulife Financial Corporation, the Adviser’s parent, of each Fund;
(b) reviewed and considered an analysis presented by JHIMS regarding the profitability of JHIMS’ relationship with each Fund and whether JHIMS has the financial ability to continue to provide a high level of services to the Fund;
(c) considered that JHIMS also provides administrative services to the Funds on a cost basis pursuant to an administrative services agreement and took into account information prepared by JHIMS indicating the allocation of such costs;
(d) noted that certain of the Funds’ Sub-Advisers are affiliates of the Adviser;
(e) John Hancock Signature Services, LLC and John Hancock Funds, LLC, affiliates of the Adviser, provide transfer agency services and distribution services to the Funds, respectively, and that JHIMS also derives reputational and other indirect benefits from providing advisory services to the Funds;
(f) noted that the subadvisory fees for the Funds are paid by JHIMS; and
(g) considered that the Adviser should be entitled to earn a reasonable level of profits in exchange for the level of services it provides to each Fund and the entrepreneurial risk that it assumes as Adviser.
Based upon its review, the Board concluded that the Adviser and its affiliates’ level of profitability, if any, from their relationship with each Fund was reasonable and not excessive.
5 - reviewed comparative information prepared by an independent third-party provider of mutual fund data including, among other data, each Fund’s contractual and actual advisory and subadvisory fees and total expenses as compared to similarly situated investment companies underlying variable insurance products deemed to be comparable to the Funds. The Board considered each Fund’s ranking within a smaller group of peer funds chosen by the independent third-party provider, as well as the Fund’s ranking within broader groups of funds. In comparing each Funds actual and contractual management fee to that of comparable funds, the Board noted that such fee includes both advisory and administrative costs.
The Board determined that the Trust’s advisory fees are generally within a competitive range of those incurred by other comparable funds. In this regard, the Board took into account management’s discussion with respect to the advisory/subadvisory fee structure, including the amount of the advisory fee retained by the Adviser after payment of the subadvisory fee. The Board also noted that JHIMS is currently waiving fees and/or reimbursing expenses with respect to certain of the Funds. The Board also noted that the Adviser pays the subadvisory fees of the Funds, and that such fees are negotiated at arm’s length with respect to unaffiliated Sub-Advisers. In addition, the Board noted that the Adviser effected advisory and subadvisory fee reductions in the past year with respect to several Funds. The Board also noted management’s discussion of the Funds’ expenses, as well as certain actions taken over the past several years to reduce the Funds’ operating expenses. The Board also took into account the level and quality of services provided by JHIMS with respect to the Funds, as well as the other factors considered. The Board concluded that the advisory fees paid by the Trust with respect to the Funds are reasonable.
In addition, the Trustees reviewed the advisory fee to be paid to the Adviser for each Fund and concluded that the advisory fee to be paid to the Adviser is based on services provided that are in addition to, rather than duplicative of, the services provided pursuant to the advisory agreements for the underlying portfolios of the Funds and that the additional services are necessary because of the differences between the investment policies, strategies and techniques of a fund of funds and those of its underlying portfolios.
Additional information relating to each Fund’s fees and expenses and performance that the Board considered in approving the Advisory Agreement is set forth in Appendix A.
Approval of Subadvisory Agreements
In making its determination with respect to the factors that its considers in considering approval of the Sub-Advisory Agreements, the Board reviewed:
(1) information relating to each subadviser’s business, including current subadvisory services to the Trust (and other funds in the John Hancock family of funds);
(2) the historical and current performance of each Fund and comparative performance information relating to the Fund’s benchmark and comparable funds;
(3) the subadvisory fee for each Fund and comparative fee information prepared by an independent third party of mutual fund data; and
(4) information relating to the nature and scope of Material Relationships and their significance to the Trust’s Adviser and unaffiliated Sub-Advisers.
With respect to the services provided by each of the Sub-Advisers, the Board received information provided to the Board by each Sub-Adviser, including each Sub-Adviser’s Form ADV, as well as considered information presented throughout the past year. The Board considered the Sub-Adviser’s current level of staffing and its overall resources, as well as its compensation program. The Board reviewed each Sub-Adviser’s history and investment experience, as well as information regarding the qualifications, background and responsibilities of the Sub-Adviser’s investment and compliance personnel who provide services to the Portfolios. The Board also considered, among other things, the Sub-Adviser’s compliance program and any disciplinary history. The Board also considered the Sub-Adviser’s risk assessment and monitoring process. The Board noted each Sub-Adviser’s regulatory history, including whether it was currently involved in any regulatory actions or investigations as well as material litigation, and any settlements and amelioratory actions undertaken, as appropriate. The Board also noted that the CCO and his staff conduct regular, periodic compliance reviews with each of the Sub-Advisers and present reports to the Independent Trustees regarding the same, which includes evaluating the regulatory compliance systems of the Sub-Advisers and procedures reasonably designed by them to assure compliance with the federal securities laws. The Board also took into account the financial condition of each Sub-Adviser.
The Board considered each Sub-Adviser’s investment process and philosophy. The Board took into account that each Sub-Adviser’s responsibilities include the development and maintenance of an investment program for the applicable Fund which is consistent with the Fund’s investment objectives, the selection of investment securities and the placement of orders for the purchase and sale of such securities, as well as the implementation of compliance controls related to performance of these services. The Board also received information with respect to each Sub-Adviser’s brokerage policies and practices, including with respect to best execution and soft dollars. The Board also reviewed information relating to the nature and scope of Material Relationships and their significance to the Adviser and its affiliates and to unaffiliated Sub-Advisers.
The Board also took into account the sub-advisory fees paid by the Adviser to fees charged by each Fund’s Sub-Adviser to manage other sub-advised portfolios and portfolios not subject to regulation under the 1940 Act.
The Board also received information with respect to any Material Relationships with respect to the unaffiliated Sub-Advisers, which include arrangements in which unaffiliated subadvisers or their affiliates provide advisory, distribution or management services in connection with financial products sponsored by the Trust’s adviser or its affiliates, and may include other registered investment companies, a 529 education savings plan, managed separate accounts and exempt group annuity contracts sold to qualified plans. The Board also received information and took into account any other potential conflicts of interests the Adviser might have in connection with the Sub-Advisory Agreements.
The Board’s decision to approve each Subadvisory Agreement was based on a number of determinations, including the following:
(1) The Sub-Adviser has extensive experience and demonstrated skills as a manager;
(2) Although not without variation, the performance of each Fund managed by a Sub-Adviser has generally been in line with or generally outperformed the historical performance of comparable funds and the Fund’s respective benchmarks with the exceptions noted in Appendix A (with respect to such exceptions, the Board concluded that appropriate action was being taken to address such Funds’ performance, if necessary, or that performance was reasonable in light of all factors considered);
(3) The subadvisory fees generally are competitive and within the range of industry norms, are paid by JHIMS out of its advisory fees it receives from the Fund and would not be an expense of the Fund, and, with respect to each Sub-Adviser that is not affiliated with the Adviser, are a product of arm’s length negotiation between the Adviser and the Sub-Adviser; and the Board concluded that each Fund’s subadvisory fees are reasonable; and
(4) With respect to those Funds that have subadvisory fees that contain breakpoints, such breakpoints are reflected as breakpoints in the advisory fees for the Funds in order to permit shareholders to benefit from economies of scale if those Funds grow.
In addition, the Trustees reviewed the subadvisory fee to be paid to the Sub-Adviser for the Funds and concluded that the subadvisory fee to be paid to the Sub-Adviser with respect to each Fund is based on services provided that are in addition to, rather than duplicative of, the services provided pursuant to the subadvisory agreements for the underlying portfolios of the Funds and that the additional services are necessary because of the differences between the investment policies, strategies and techniques of a fund of funds and those of its underlying portfolios.
Additional information relating to each Fund’s fees and expenses and performance that the Board considered for a particular Fund is set forth in Appendix A.
Based on their evaluation of all factors that they deemed to be material, including those factors described above, and assisted by the advice of independent counsel, the Board, including the Independent Trustees, concluded that renewal of the Advisory Agreement and each of the Sub-Advisory Agreements would be in the best interest of each of the Funds and its respective shareholders. Accordingly, the Board, and the Independent Trustees voting separately, approved the Advisory Agreement for an additional one-year period.
| | | | | | |
| John Hancock Funds II |
| |
| Appendix A |
|
| PORTFOLIO | | PERFORMANCE OF TRUST, | | | | |
| (SUBADVISER) | | AS OF MARCH 31, 2011 | | FEES AND EXPENSES | | OTHER COMMENTS |
|
| |
| | | Benchmark Index - The | | Subadvisory fees: Limited | | |
| | | Fund underperformed for | | peer group. | | The Board took into account management’s discussion of performance |
| | | the one-year period and | | | | and its proposed plans with respect to the Fund. |
| | | underperformed for the | | Net management fees for this | | |
| | | three-year period. | | Fund are lower than the peer | | The Board took into account management’s discussion of the Fund’s |
| Retirement | | | | group median. | | expenses. |
| Distribution | | Morningstar Category - The | | | | |
| | Fund slightly | | Total expenses for this Fund | | The Board noted that the Fund is subject to a voluntary fee waiver that |
| (John Hancock | | underperformed for the one- | | are higher than the peer | | reduces certain expenses of the Fund. |
| Asset | | year period and modestly | | group median. | | |
| Management) | | underperformed for the | | | | |
| | | three-year period. | | | | |
|
|
| 21 |
More information
| |
| Trustees | Investment adviser |
| James M. Oates, Chairman | John Hancock Investment Management Services, LLC |
| James R. Boyle† | |
| Grace K. Fey | Investment subadviser |
| Charles L. Bardelis* | John Hancock Asset Management |
| Peter S. Burgess* | |
| Theron S. Hoffman | Principal distributor |
| Hassell H. McClellan | John Hancock Funds, LLC |
| Steven M. Roberts* | |
| | Custodian |
| *Member of the Audit Committee | State Street Bank and Trust Company |
| †Non-Independent Trustee | |
| | Transfer agent |
| Officers | John Hancock Signature Services, Inc. |
| Hugh McHaffie | |
| President | Legal counsel |
| Thomas M. Kinzler | K&L Gates LLP |
| Secretary and Chief Legal Officer | |
| Francis V. Knox, Jr. | |
| Chief Compliance Officer | |
| Michael J. Leary | |
| Treasurer | |
| Charles A. Rizzo | |
| Chief Financial Officer | |
| John G. Vrysen | |
| Chief Operating Officer | |
The Fund’s proxy voting policies and procedures, as well as the Fund’s proxy voting record, if any, for the most recent twelve-month period ended June 30, are available free of charge on the Securities and Exchange Commission (SEC) Web site at www.sec.gov or on our Web site.
The Fund’s complete list of portfolio holdings, for the first and third fiscal quarters, is filed with the SEC on Form N-Q. The Fund’s Form N-Q is available on our Web site and the SEC’s Web site, www.sec.gov, and can be reviewed and copied (for a fee) at the SEC’s Public Reference Room in Washington, DC. Call 1-800-SEC-0330 to receive information on the operation of the SEC's Public Reference Room.
We make this information on your fund, as well as monthly portfolio holdings, and other fund details available on our Web site www.jhfunds.com or by calling 1-800-225-5291.
| | |
| You can also contact us: | | |
| 1-800-225-5291 | Regular mail: | Express mail: |
| jhfunds.com | John Hancock Signature Services, Inc. | John Hancock Signature Services, Inc. |
| | P.O. Box 55913 | Mutual Fund Image Operations |
| | Boston, MA 02205-5913 | 30 Dan Road |
| | | Canton, MA 02021 |
| |
| John Hancock Retirement Rising Distribution Portfolio | |
| |
| Table of Contents | |
| |
| Your expenses | Page 3 |
| Portfolio summary | Page 4 |
| Portfolio of investments | Page 5 |
| Financial statements | Page 6 |
| Financial highlights | Page 9 |
| Notes to financial statements | Page 10 |
| Evaluation of Advisory and Subadvisory Agreements | |
| By the Board of Trustees | Page 15 |
| More information | Page 22 |
Your expenses
These examples are intended to help you understand your ongoing operating expenses.
Understanding your portfolio expenses
As a shareholder of the Portfolio, you incur two types of costs:
• Transaction costs which include sales charges (loads) on purchases or redemptions (varies by share class), minimum account fee charge, etc.
• Ongoing operating expenses including management fees, distribution and service fees (if applicable), and other portfolio expenses.
We are going to present only your ongoing operating expenses here.
Actual expenses/actual returns
This example is intended to provide information about your portfolio’s actual ongoing operating expenses, and is based on your portfolio’s actual return. It assumes an account value of $1,000.00 on January 1, 2011 with the same investment held until June 30, 2011.
| | | |
| | Account value | Ending value | Expenses paid during |
| | on 1-1-11 | on 6-30-11 | period ended 6-30-111,2 |
|
| Class A | $1,000.00 | $1,030.70 | $3.07 |
Together with the value of your account, you may use this information to estimate the operating expenses that you paid over the period. Simply divide your account value at June 30, 2011, by $1,000.00, then multiply it by the “expenses paid” for your share class from the table above. For example, for an account value of $8,600.00, the operating expenses should be calculated as follows:
Example
[ My account value $8,600.00 / $1,000.00 = 8.6 ] x $[ “expenses paid” from table ] = My actual expenses
Hypothetical example for comparison purposes
This table allows you to compare your portfolio’s ongoing operating expenses with those of any other fund. It provides an example of the Portfolio’s hypothetical account values and hypothetical expenses based on each class’s actual expense ratio and an assumed 5% annualized return before expenses (which is not your portfolio’s actual return). It assumes an account value of $1,000.00 on January 1, 2011, with the same investment held until June 30, 2011. Look in any other fund shareholder report to find its hypothetical example and you will be able to compare these expenses.
| | | |
| | Account value | Ending value | Expenses paid during |
| | on 1-1-11 | on 6-30-11 | period ended 6-30-111,2 |
|
| Class A | $1,000.00 | $1,021.80 | $3.06 |
Remember, these examples do not include any transaction costs, therefore, these examples will not help you to determine the relative total costs of owning different funds. If transaction costs were included, your expenses would have been higher. See the prospectus for details regarding transaction costs.
1 Expenses are equal to the Portfolio's annualized expense ratio of 0.61% for Class A shares, multiplied by the average account value over the period, multiplied by 181/365 (to reflect the one-half year period).
2 Ratios do not include expenses indirectly incurred from underlying funds whose expense ratios can vary based on the mix of underlying funds held by the Portfolio. The range of expense ratios of the underlying funds held by the Portfolio was 0.64% - 1.02%.
| | | | | |
| Portfolio Summary | | | | | |
| | | |
| Asset Allocation1 | | | | | |
| Equity - Affiliated | 17% | | Fixed Income - Affiliated | 70% | |
| U.S. Large Cap | 18% | | Multi-Sector Bond | 28% | |
| Real Estate | 5% | | Intermediate Bond | 14% | |
| International Large Cap | 4% | | High Yield Bond | 11% | |
| Equity - Unaffiliated | 13% | | Treasury Inflation - Protected Securities | 7% | |
| Exchange-Traded Funds | 13% | | Bank Loan | 5% | |
| | | | Global Bond | 5% | |
1 As a percentage of net assets on 6-30-11.
Retirement Rising Distribution Portfolio
As of 6-30-11 (Unaudited)
| | |
| | Shares | Value |
| | | |
| Affiliated Investment Companies 86.85% | | $4,736,185 |
|
| Equity 16.97% | | |
| | | |
| John Hancock Funds II (G) 12.95% | | 705,888 |
|
| Equity-Income, Class NAV (T. Rowe Price) | 29,071 | 431,709 |
| Global Real Estate, Class NAV (Deutsche) | 34,794 | 274,179 |
| | | |
| John Hancock Funds III (G) 4.02% | | 219,354 |
|
| Global Shareholder Yield, Class NAV (Epoch) | 22,452 | 219,354 |
| | | |
| Fixed Income 69.88% | | |
|
| John Hancock Funds II (G) 69.88% | | 3,810,943 |
|
| Active Bond, Class NAV (John Hancock1/Declaration) (A) | 42,710 | 434,363 |
| Floating Rate Income, Class NAV (WAMCO) | 28,583 | 271,822 |
| Global Bond, Class NAV (PIMCO) | 21,397 | 272,172 |
| Global High Yield, Class NAV (Stone Harbor) | 15,457 | 163,690 |
| High Yield, Class NAV (WAMCO) | 35,874 | 327,527 |
| Multi-Sector Bond, Class NAV (Stone Harbor) | 73,311 | 761,703 |
| Real Return Bond, Class NAV (PIMCO) | 30,170 | 380,441 |
| Strategic Income Opportunities, Class NAV (John Hancock1) (A) | 68,250 | 763,714 |
| Total Return, Class NAV (PIMCO) | 23,292 | 326,558 |
| U.S. High Yield Bond, Class NAV (Wells Capital) | 8,532 | 108,953 |
| | | |
| Unaffiliated Investment Companies 13.15% | | 717,269 |
|
| Equity 13.15% | | |
| PowerShares DB Commodity Index Tracking Fund (I) | 11,120 | 322,035 |
| WisdomTree Equity Income Fund | 9,526 | 395,234 |
| |
| Total investments (Cost $5,543,596)† 100.00% | | $5,453,454 |
|
| Other assets and liabilities, net 0.00% | | $89 |
|
| Total net assets 100.00% | | $5,453,543 |
|
Percentages are based upon net assets.
(A) The subadviser is an affiliate of the adviser.
(G) The underlying fund's subadviser is shown parenthetically.
(I) Non-income producing.
1 Manulife Asset Management (US) LLC is doing business as John Hancock Asset Management.
† At 6-30-11, the aggregate cost of investment securities for federal income tax purposes was $5,557,148. Net unrealized depreciation aggregated $103,694, of which $46,550 related to appreciated investment securities and $150,244 related to depreciated investment securities.
| |
| Underlying Funds’ Investment Managers | |
| Declaration Management & Research, LLC | (Declaration) |
| Deutsche Asset Management | (Deutsche) |
| Epoch Investment Partners, Inc. | (Epoch) |
| John Hancock Asset Management1 | (John Hancock) |
| Pacific Investment Management Company | (PIMCO) |
| Stone Harbor Investment Partners, LP | (Stone Harbor) |
| T. Rowe Price Associates, Inc. | (T. Rowe Price) |
| Wells Capital Management, Inc. | (Wells Capital) |
| Western Asset Management Company | (WAMCO) |
See notes to financial statements
Retirement Rising Distribution Portfolio
Statement of Assets and Liabilities — June 30, 2011 (Unaudited)
| | |
| Assets | | |
|
| Investments in unaffiliated issuers, at value | | |
| (Cost $784,713) | $ | 717,269 |
| Investments in affiliated funds, at value (Cost | | |
| $4,758,883) (Note 7) | | 4,736,185 |
| | | |
| Total investments, at value (Cost $5,543,596) | | 5,453,454 |
| | | |
| Cash | | 23,205 |
| Receivable for investments sold | | 62 |
| Dividends receivable | | 8,109 |
| Receivable due from adviser | | 250 |
| Other assets | | 8,324 |
| | | |
| Total assets | | 5,493,404 |
| |
| |
| Liabilities | | |
|
| Payable for investments purchased | | 8,377 |
| Payable to affiliates (Note 4) | | |
| Accounting and legal services fees | | 182 |
| Transfer agent fees | | 755 |
| Trustees' fees | | 102 |
| Other liabilities and accrued expenses | | 30,445 |
| | | |
| Total liabilities | | 39,861 |
| |
| |
| Net assets | | |
|
| Capital paid-in | $ | 5,810,740 |
| Accumulated distributions in excess of net | | |
| investment income | | (22,358) |
| Accumulated net realized loss on investments | | (244,697) |
| Net unrealized appreciation (depreciation) on | | |
| investments | | (90,142) |
| | | |
| Net assets | $ | 5,453,543 |
| |
| |
| Net asset value per share | | |
|
| Based on net asset values and shares | | |
| outstanding-the Portfolio has an unlimited | | |
| number of shares authorized with no par value | | |
| Class A ($5,453,543 ÷ 467,238 shares) | $ | 11.67 |
| |
| Maximum offering price per share | | |
| Class A (net asset value per share ÷ 95%)1 | $ | 12.28 |
1 On single retail sales of less than $50,000. On sales of $50,000 or more and on group sales the offering price is reduced.
See notes to financial statements
Retirement Rising Distribution Portfolio
Statement of Operations — June 30, 2011 (Unaudited)
| | |
| Investment income | | |
|
| Income distributions received from affiliated | | |
| underlying funds | $ | 79,005 |
| Dividends | | 8,589 |
| Interest | | 193 |
| | | |
| Total investment income | | 87,787 |
| |
| Expenses | | |
|
| Investment management fees (Note 4) | | 4,620 |
| Distribution and service fees (Note 4) | | 8,107 |
| Accounting and legal services fees (Note 4) | | 404 |
| Transfer agent fees (Note 4) | | 4,597 |
| Trustees' fees (Note 4) | | 24 |
| State registration fees | | 6,599 |
| Printing and postage | | 851 |
| Professional fees | | 15,955 |
| Custodian fees | | 5,951 |
| Registration and filing fees | | 10,582 |
| Other | | 2,417 |
| | | |
| Total expenses before reductions and | | |
| amounts recaptured | | 60,107 |
| | | |
| Net expense reductions and amounts | | |
| recaptured (Note 4) | | (43,597) |
| | | |
| Total expenses | | 16,510 |
| |
| Net investment income | | 71,277 |
| |
| |
| Realized and unrealized gain (loss) | | |
|
| Net realized gain on | | |
| Investments in unaffiliated issuers | | 40,161 |
| Investments in affiliated issuers | | 48,639 |
| | | |
| | | 88,800 |
| Change in net unrealized appreciation | | |
| (depreciation) of | | |
| Investments in unaffiliated issuers | | (22,091) |
| Investments in affiliated issuers | | 27,260 |
| | | |
| | | 5,169 |
| |
| Net realized and unrealized gain | | 93,969 |
| |
| Increase in net assets from operations | $ | 165,246 |
See notes to financial statements
Retirement Rising Distribution Portfolio
Statements of Changes in Net Assets
| | | | |
| | | Six months | | |
| | | ended | | Year ended |
| | | 6/30/11 | | 12/31/10 |
| | | (Unaudited) | | |
| Increase (decrease) in net assets | | | | |
|
| From operations | | | | |
| Net investment income | $ | 71,277 | $ | 142,823 |
| Net realized gain (loss) | | 88,800 | | (25,902) |
| Change in net unrealized appreciation | | | | |
| (depreciation) | | 5,169 | | 272,895 |
| Increase in net assets resulting from | | | | |
| operations | | 165,246 | | 389,816 |
| |
| Distributions to shareholders | | | | |
| From net investment income | | (94,919) | | (227,921) |
| From net realized gain | | — | | (83,344) |
| Total distributions | | (94,919) | | (311,265) |
| | | | | |
| From Portfolio share transactions (Note 5) | | 3,382 | | 395,890 |
| |
| Total increase | | 73,709 | | 474,441 |
| | | | | |
| Net assets | | | | |
|
| Beginning of period | | 5,379,834 | | 4,905,393 |
| End of period | $ | 5,453,543 | $ | 5,379,834 |
| | | | | |
| Undistributed (accumulated distributions in | | | | |
| excess of) net investment income | $ | (22,358) | $ | 1,284 |
See notes to financial statements
Retirement Rising Distribution Portfolio
Financial Highlights (For a share outstanding throughout the period)
| | | | | | | | |
| Class A Shares | | | | | | | | |
| |
| Period ended | | | | | | | | |
| | | 6-30-111 | | 12-31-10 | | 12-31-09 | | 12-31-082 |
| Per share operating performance | | | | | | | | |
| |
| |
| |
| |
|
| Net asset value, beginning of period | $ | 11.52 | $ | 11.34 | $ | 9.34 | $ | 12.70 |
| Net investment income | 3 | 0.15 | | 0.32 | | 0.36 | | 0.41 |
| Net realized and unrealized gain (loss) on | | | | | | | | |
| investments | | 0.20 | | 0.55 | | 2.05 | | (3.29) |
| Total from investment operations | | 0.35 | | 0.87 | | 2.41 | | (2.88) |
| |
| Less distributions | | | | | | | | |
| From net investment income | | (0.20) | | (0.51) | | (0.37) | | (0.48) |
| From net realized gain | | — | | (0.18) | | (0.04) | | — |
| Total distributions | | (0.20) | | (0.69) | | (0.41) | | (0.48) |
| |
| Net asset value, end of period | $ | 11.67 | $ | 11.52 | $ | 11.34 | $ | 9.34 |
| |
| Total return (%) | 4,5 | 3.076 | | 7.88 | | 26.35 | | (23.21) |
| |
| Ratios and supplemental data | | | | | | | | |
| |
| |
| |
| |
|
| Net assets, end of period (in millions) | $ | 5 | $ | 5 | $ | 5 | $ | 4 |
| Ratios (as a percentage of average net | | | | | | | | |
| assets): | | | | | | | | |
| Expenses before reductions and amounts | | | | | | | | |
| recaptured | 7 | 2.228 | | 2.339 | | 2.559 | | 1.71 |
| Expenses net of fee waivers including | | | | | | | | |
| reductions and amounts recaptured | 7 | 0.618 | | 0.739 | | 0.699 | | 0.62 |
| Net investment income | | 2.648 | | 2.81 | | 3.54 | | 3.59 |
| Portfolio turnover (%) | | 38 | | 29 | | 38 | | 17 |
1 Unaudited.
2 The inception date for Class A shares is 1-2-08.
3 Based on the average daily shares outstanding.
4 Total returns would have been lower had certain expenses not been reduced during the periods shown.
5 Does not reflect the effect of sales charges, if any.
6 Not annualized.
7 Ratios do not include expenses indirectly incurred from underlying funds whose expense ratios can vary based on the mix of underlying funds held by the Portfolio. The range of expense ratios of the underlying funds held by the Portfolio was 0.64%-1.02%, 0.52%-1.06%, 0.53%-1.18% and 0.61%-1.13%, for the period ended 6-30-11 and years ended 12-31-10, 12-31-09 and 12-31-08, respectively.
8 Annualized.
9 Includes tax expense, which was 0.05% of average net assets.
See notes to financial statements
Notes to financial statements (unaudited)
Note 1 — Organization
John Hancock Retirement Rising Distribution Portfolio (the Portfolio) is a diversified series of John Hancock Funds II (the Trust), an open-end management investment company organized as a Massachusetts business trust and registered under the Investment Company Act of 1940, as amended (the 1940 Act). The Portfolio seeks to provide a stated, targeted (non-guaranteed) quarterly distribution. As a secondary objective, the Portfolio seeks capital appreciation.
The Portfolio operates as a “fund of funds” that invests in Class NAV shares of underlying funds of the Trust, John Hancock Funds III (JHF III) and also in other affiliated funds of the John Hancock funds complex. The Portfolio may also invest in unaffiliated underlying funds and other permitted security investments.
The accounting policies of the underlying funds of the Portfolio are outlined in the underlying funds’ shareholder reports, available without charge by calling 1-800-344-1029 or on the Securities and Exchange Commission (SEC) Web site at www.sec.gov or at the SEC’s public reference room in Washington, D.C. The underlying funds are not covered by this report. On June 24, 2011, the Board of Trustees approved a Plan of Liquidation and Termination of the Portfolio expected to be effective on or about August 19, 2011.
Note 2 — Significant accounting policies
The financial statements have been prepared in conformity with accounting principles generally accepted in the United States of America, which require management to make certain estimates and assumptions at the date of the financial statements. Actual results could differ from those estimates. Events or transactions occurring after the end of the fiscal period through the date that the financial statements were issued have been evaluated in the preparation of the financial statements. The following summarizes the significant accounting policies of the Portfolio:
Security valuation. Investments are stated at value as of the close of regular trading on the New York Stock Exchange (NYSE), normally at 4:00 P.M., Eastern Time. The Portfolio uses a three-tier hierarchy to prioritize the pricing assumptions, referred to as inputs, used in valuation techniques to measure fair value. Level 1 includes securities valued using quoted prices in active markets for identical securities, including registered investment companies. Level 2 includes securities valued using significant observable inputs. Observable inputs may include quoted prices for similar securities, interest rates, prepayment speeds and credit risk. Prices for securities valued using these inputs are received from independent pricing vendors and brokers and are based on an evaluation of the inputs described. Level 3 includes securities valued using significant unobservable inputs when market prices are not readily available or reliable, including the Portfolio’s own assumptions in determining the fair value of investments. Factors used in determining value may include market or issuer specific events, changes in interest rates and credit quality. The inputs or methodology used for valuing securities are not necessarily an indication of the risk associated with investing in those securities.
As of June 30, 2011, all investments are categorized as Level 1 under the hierarchy described above. Changes in valuation techniques may result in transfers in or out of an assigned level within the disclosure hierarchy. During the six month period ended June 30, 2011, there were no significant transfers in or out of Level 1 or Level 2 assets.
In order to value the securities, the Portfolio uses the following valuation techniques. Investments by the Portfolio in underlying affiliated funds and/or other open-end management investment companies are valued at their respective net asset values each business day.
Security transactions and related investment income. Investment security transactions are accounted for on a trade date plus one basis for daily net asset value calculations. However, for financial reporting purposes, investment transactions are reported on trade date. Interest income is
accrued as earned. Gains and losses on securities sold are determined on the basis of identified cost and may include proceeds from litigation. Dividend and capital gain distributions from underlying funds are recorded on ex-date.
Line of credit. The Portfolio may borrow from banks for temporary or emergency purposes, including meeting redemption requests that otherwise might require the untimely sale of securities. Pursuant to the custodian agreement, the custodian may loan money to the Portfolio to make properly authorized payments. The Portfolio is obligated to repay the custodian for any overdraft, including any related costs or expenses. The custodian has a lien, security interest or security entitlement in any Portfolio property that is not segregated, to the maximum extent permitted by law for any overdraft.
In addition, effective March 30, 2011, the Portfolio and other affiliated funds have entered into an agreement with Citibank N.A. which enables them to participate in a $200 million unsecured committed line of credit. Prior to March 30, 2011, the Portfolio had a similar agreement with State Street Bank and Trust Company. A commitment fee, payable at the end of each calendar quarter, based on the average daily unused portion of the line of credit, is charged to each participating fund or portfolio on a pro rata basis and is reflected in other expenses on the Statement of Operations. For the six months ended June 30, 2011, the Portfolio had no borrowings under the lines of credit.
Expenses. The majority of expenses are directly attributable to an individual portfolio. Expenses that are not readily attributable to a specific portfolio are allocated among all portfolios in an equitable manner, taking into consideration, among other things, the nature and type of expense and the portfolio’s relative assets. Expense estimates are accrued in the period to which they relate and adjustments are made when actual amounts are known.
Federal income taxes. The Portfolio intends to continue to qualify as a regulated investment company by complying with the applicable provisions of the Internal Revenue Code and will not be subject to federal income tax on taxable income that is distributed to shareholders. Therefore, no federal income tax provision is required.
As of December 31, 2010, the Portfolio had no uncertain tax positions that would require financial statement recognition, derecognition or disclosure. The Portfolio’s federal tax returns are subject to examination by the Internal Revenue Service for a period of three years.
Distribution of income and gains. Distributions to shareholders from net investment income and net realized gains, if any, are recorded on the ex-date. The Portfolio uses a quarterly targeted distribution strategy and distributes substantially all of its net income quarterly and capital gains, if any, annually. If the Portfolio has not met its distribution goal from net income and capital gains, then the distributions may consist of a return of capital.
Such distributions, on a tax basis, are determined in conformity with income tax regulations, which may differ from accounting principles generally accepted in the United States of America. Short term gains from underlying funds are treated as ordinary income for tax purposes. The final determination of tax characteristics of the Portfolio’s distribution will occur at the end of the year and will subsequently be reported to shareholders.
Capital accounts within financial statements are adjusted for permanent book-tax differences. These adjustments have no impact on net assets or the results of operations. Temporary book-tax differences, if any, will reverse in a subsequent period. Book-tax differences are primarily attributable to short-term capital gain distributions received from underlying funds, wash sale loss deferrals, distribution reclassifications, non-deductible excise tax, and treatment of certain realized capital losses.
Note 3 — Guarantees and indemnifications
Under the Portfolio’s organizational documents, its Officers and Trustees are indemnified against certain liabilities arising out of the performance of their duties to the Portfolio. Additionally, in the normal course of business, the Portfolio enters into contracts with service providers that contain general indemnification clauses. The Portfolio’s maximum exposure under these arrangements is unknown, as this would involve future claims that may be made against the Portfolio that have not yet occurred. The risk of material loss from such claims is considered remote.
Note 4 — Fees and transactions with affiliates
John Hancock Investment Management Services, LLC (the Adviser) serves as investment adviser for the Trust. John Hancock Funds, LLC (the Distributor), an affiliate of the Adviser, serves as principal underwriter of the Portfolio. The Adviser and the Distributor are indirect wholly owned subsidiaries of Manulife Financial Corporation (MFC).
Management fee. The Portfolio pays the Adviser a management fee for its services to the Portfolio. The management fee has two components: (a) a fee on net assets invested in a fund of the Trust or JHF III (Affiliated Fund Assets); and (b) a fee on net assets invested in investments other than a fund of the Trust or JHF III (Other Assets). The fee on assets invested in Affiliated Fund Assets is stated as an annual percentage of the current value of the aggregate net assets of the Portfolio and the Retirement Distribution Portfolio and is equivalent to the sum of: (a) 0.06% of the first $500 million of aggregate net assets and (b) 0.05% of the excess over $500 million of aggregate net assets. The fee on Other Assets is stated as an annual percentage of the current value of the aggregate net assets of the Portfolio and the Retirement Distribution Portfolio and is equivalent to the sum of: (a) 0.51% of the first $500 million of aggregate net assets and (b) 0.50% of the excess over $500 million of aggregate net assets and is applied to the Other Assets of the Portfolio. The investment management fees incurred for the six months ended June 30, 2011 were equivalent to an annual effective rate of 0.17% of the Portfolio’s average daily net assets.
John Hancock Asset Management a division of Manulife Asset Management (North America) LLC, and John Hancock Asset Management a division of Manulife Asset Management (US) LLC, both indirectly owned subsidiaries of MFC and affiliates of the Adviser, act as subadvisers to the Portfolio. The Portfolio is not responsible for the payment of subadvisory fees.
The Adviser has contractually agreed to waive fees and/or reimburse certain Portfolio level expenses to 0.09% of the Portfolio’s average annual net assets. This agreement excludes management fees, underlying fund expenses, taxes, portfolio brokerage commissions, interest, Rule 12b-1 fees, transfer agency fees, state registration fees, printing and postage, litigation and indemnification expenses, and other extraordinary expenses not incurred in the ordinary course of the Portfolio’s business. In addition, fees incurred under any agreement or plans of the Portfolio dealing with services for the shareholders and others with beneficial interest in shares of the Portfolio, are excluded. The Adviser has also agreed to a contractual expense limit on Class A specific expenses (which include 12b-1 fees, transfer agent fees, state registration fees, and printing and postage fees) of 0.35%. These expense waivers and/or reimbursements will continue in effect until at least April 30, 2012.
Accordingly, the expense reductions amounted to $43,597 for the six months ended June 30, 2011.
Expense recapture. The Adviser may recapture operating expenses reimbursed or fees waived under previous expense limitation or waiver arrangements made subsequent to January 1, 2009, for a period of three years following the beginning of the month in which such reimbursements or waivers originally occurred. The table below outlines the amounts recovered during the six months ended June 30, 2011 and the amount of waived or reimbursed expenses subject to potential recovery and the respective expiration dates. Certain reimbursements or waivers are not subject to recapture.
| | | | | | | | | |
| Amount eligible for | | Amount eligible for | | Amount eligible for | | Amount recovered |
| recovery through | | recovery through | | recovery through June | | during the six months |
| December 1, 2012 | | December 1, 2013 | | 1, 2014 | | | ended June 30, 2011 |
|
| $ | 78,403 | | $ | 81,608 | | $ | 43,597 | | - |
|
Accounting and legal services. Pursuant to a service agreement, the Portfolio reimburses the Adviser for all expenses associated with providing the administrative, financial, legal, accounting and recordkeeping services of the Portfolio, including the preparation of all tax returns, periodic reports to shareholders and regulatory reports, among other services. The accounting and legal services fees incurred for the six months ended June 30, 2011, amounted to an annual rate of 0.01% of the Portfolio’s average daily net assets.
Distribution and service plans. The Portfolio has a distribution agreement with the Distributor. The Portfolio has adopted distribution and service plans with respect to Class A pursuant to Rule 12b-1 under the 1940 Act, to pay the Distributor for services provided as the distributor of shares of the Portfolio. The Portfolio may pay up to the annual rate of 0.30% of average daily net assets for Class A shares for distribution and service fees.
Sales charges. Class A shares may be assessed up-front sales charges. During the six months ended June 30, 2011, there were no upfront sales charges for Class A shares.
Transfer agent fees. The Portfolio has a transfer agent agreement with John Hancock Signature Services, Inc. (Signature Services or Transfer Agent), an affiliate of the Adviser. The transfer agent fees paid to Signature Services are determined based on the cost to Signature Services (Signature Services Cost) of providing recordkeeping services. The Signature Services Cost includes a component of allocated John Hancock corporate overhead for providing transfer agent services to the Portfolio and to all other John Hancock affiliated funds. It also includes out-of-pocket expenses that are comprised of payments made to third-parties for recordkeeping services provided to their clients who invest in one or more John Hancock funds. In addition, Signature Services Cost may be reduced by certain fees that Signature Services receives with retirement and small accounts. Signature Services Cost is calculated monthly and allocated, as applicable, to four categories of share classes: Institutional Share Classes, Retirement Share Classes, Municipal Bond Classes and all other Retail Share Classes. Within each of these categories, the applicable costs are allocated to the affected John Hancock affiliated funds and/or classes, based on the relative average daily net assets.
Trustee expenses. The Portfolio compensates each Trustee who is not an employee of the Adviser or its affiliates. The costs of paying Trustee compensation and expenses are allocated to each portfolio based on its average daily net assets.
Note 5 — Portfolio share transactions
Transactions in Portfolio shares for the six months ended June 30, 2011 and for the year ended December 31, 2010 were as follows:
| | | | | | | |
| | Six months ended | | Year ended |
| | 6/30/11 | | 12/31/10 |
| |
| |
|
| | Shares | | Amount | | Shares | | Amount |
| Class A shares | | | | | | | |
| Sold | — | $ | — | | 7,729 | $ | 88,185 |
| Distributions reinvested | 8,083 | | 94,169 | | 27,103 | | 311,265 |
| Repurchased | (7,799) | | (90,787) | | (303) | | (3,560) |
| |
| |
| |
| |
|
| Net increase | 284 | $ | 3,382 | | 34,529 | $ | 395,890 |
| |
| |
| |
| |
|
Affiliates of the Portfolio owned 100% of the shares of beneficial interest of Class A shares on June 30, 2011.
Note 6 — Purchase and sale of securities
Purchases and sales of securities, other than short-term securities, aggregated $3,617,536 and $1,918,412, respectively, for the six months ended June 30, 2011.
Note 7 — Investment in affiliated underlying funds
The Portfolio invests in affiliated underlying funds that are managed by the Adviser and affiliates. The Portfolio does not invest in the affiliated underlying funds for the purpose of exercising management or control; however, the Portfolio’s investment may represent a significant portion of each underlying Fund’s net assets. For the six months ended June 30, 2011, the Portfolio held less than 5% of the total net assets in any underlying funds.
Note 8 — Subsequent event
On August 19, 2011, the Portfolio liquidated.
|
| EVALUATION OF ADVISORY AND SUBADVISORY |
| AGREEMENTS BY THE BOARD OF TRUSTEES |
This section describes the evaluation by the Board of Trustees of the Advisory Agreement (the “Advisory Agreement”) and the Subadvisory Agreements (the “Subadvisory Agreements”) for each of the portfolios (the “Funds”) of John Hancock Funds II (the “Trust”) discussed in this semi-annual report.
At in-person meetings on May 25-27, 2011 the Board, including all the Independent Trustees, approved for an annual period the continuation of the Advisory and Subadvisory Agreements with respect to each of the Funds.
Evaluation by the Board of Trustees
The Board, including the Trustees who are not considered to be “interested persons” of the Trust under the Investment Company Act of 1940, as amended (the “1940 Act”) (the “Independent Trustees”), is responsible for selecting the Trust’s adviser, John Hancock Investment Management Services, LLC (the “Adviser” or “JHIMS”), approving the Adviser’s selection of subadvisers for each of the portfolios of the Trust (each a “Sub-Adviser, and collectively, the “Sub-Advisers”) and approving the Trust’s advisory and subadvisory (and any sub-subadvisory) agreements, their periodic continuation and any amendments. Consistent with Securities and Exchange Commission rules, the Board regularly evaluates the Trust’s advisory and subadvisory arrangements, including consideration of the factors listed below. The Board may also consider other factors (including conditions and trends prevailing generally in the economy, the securities markets and the industry) and does not treat any single factor as determinative, and each Trustee may attribute different weights to different factors. The Board is furnished with an analysis of its fiduciary obligations in connection with its evaluation and, throughout the evaluation process, the Board is assisted by counsel for the Trust and the Independent Trustees are also separately assisted by independent legal counsel. The factors considered by the Board are:
(1) the nature, extent and quality of the services to be provided by the Adviser to the Trust and by the Sub-Advisers to the Funds;
(2) the investment performance of the Funds and their Sub-Advisers;
(3) the extent to which economies of scale would be realized as a Fund grows and whether fee levels reflect these economies of scale for the benefit of Trust shareholders;
(4) the costs of the services to be provided and the profits to be realized by the Adviser and its affiliates (including any subadvisers that are affiliated with the Adviser) from the Adviser’s relationship with the Trust; and
(5) comparative services rendered and comparative advisory and subadvisory fee rates.
The Board believes that information relating to all of these factors is relevant to its evaluation of the Trust’s advisory agreement. With respect to its evaluation of subadvisory agreements with subadvisers not affiliated with the Adviser, the Board believes that, in view of the Trust’s “manager-of-managers” advisory structure, the costs of the services to be provided and the profits to be realized by those subadvisers that are not affiliated with the Adviser from their relationship with the Trust generally are not a material factor in the Board’s consideration of these subadvisory agreements because such fees are paid by the Adviser and not by the Funds and the Board relies on the ability of the Adviser to negotiate the subadvisory fees at arms-length.
In evaluating subadvisory arrangements, the Board also considers other material business relationships that unaffiliated Sub-Advisers and their affiliates have with the Adviser or its affiliates, including the involvement by certain affiliates of certain subadvisers in the distribution of financial products, including shares of the Trust, offered by the Adviser and other affiliates of the Adviser (“Material Relationships”).
Approval of Advisory and Subadvisory Agreements
At an in-person meetings on May 25-27, 2011, the Board, including all the Independent Trustees, re-approved the Advisory Agreement and the applicable Subadvisory Agreements with respect to each of the Funds.
In considering the Advisory Agreement and the Subadvisory Agreements, the Board received in advance of the meeting a variety of materials relating to each Fund, the Adviser and each Sub-Adviser, including comparative performance, fee and expense information for a peer group of similar mutual funds prepared by an independent third-party provider of mutual fund data, including performance information for relevant benchmark indices and other information provided by the Adviser and the Sub-Advisers regarding the nature, extent and quality of services provided by the Adviser and the Sub-Advisers under their respective Agreements. The Board also took into account discussions with management and information provided to the Board in its meetings throughout the year with respect to the services provided by the Adviser and the Sub-Advisers to the Funds, including quarterly performance reports prepared by management containing reviews of investment results, and periodic presentations from the Sub-Advisers with respect to the Funds they manage. The Board noted the affiliation of certain of the Sub-Advisers with JHIMS, noting any potential conflicts of interest.
Throughout the process, the Trustees were afforded the opportunity to ask questions of and request additional information from management. The Independent Trustees also received a memorandum from their independent counsel discussing the legal standards for their consideration of the proposed continuation of the Agreements and discussed the proposed continuation of the Agreements in private sessions with their independent legal counsel at which no representatives of management were present.
Approval of Advisory Agreement
Among the information received by the Board from the Adviser relating to the nature, extent and quality of services provided to the Funds, the Board reviewed information provided by JHIMS relating to its operations and personnel and information regarding JHIMS' compliance and regulatory history. The Board also noted that on a regular basis it receives and reviews information from the Trust’s Chief Compliance Officer (“CCO”) regarding the Funds’ compliance policies and procedures established pursuant to Rule 38a-1 under the 1940 Act. The Board also considers the Adviser’s risk management processes.
The Trustees also took into account their knowledge of JHIMS's management and the quality of the performance of its duties, through Board meetings, discussions and reports during the preceding year and through each Trustee's experience as a Trustee of the Trust and of another trust in the complex.
In approving the renewal of the Advisory Agreement, and with reference to the factors that it regularly considers when considering approval of advisory and subadvisory agreements as listed above, the Board:
(1) - (a) considered the high value to the Trust of continuing its relationship with JHIMS as the Trust’s adviser, the skills and competency with which JHIMS has in the past managed the Trust’s affairs and its subadvisory relationships, JHIMS’ oversight and monitoring of the subadvisers’ investment performance and compliance programs including its timeliness in responding to performance issues and the qualifications of JHIMS’ personnel;
(b) considered JHIMS’ compliance policies and procedures and noted its responsiveness to regulatory changes and mutual fund industry developments;
(c) considered JHIMS’ administrative capabilities, including its ability to supervise the other service providers for the Funds;
(d) reviewed the financial condition of the Adviser and whether it had the financial wherewithal to provide a high level and quality of services to the Funds; and
(e) recognized the Adviser’s reputation and experience in serving as an investment adviser to the Trust, and considered the benefit to shareholders of investing in funds that are part of a family of funds offering a variety of investments.
The Board concluded that JHIMS may reasonably be expected to continue to provide a high quality of services under the Advisory Agreement with respect to the Funds;
(2) - (a) reviewed the investment performance of each of the Funds;
(b) reviewed the comparative performance of their respective benchmarks;
(c) considered the performance of comparable funds as included in a report prepared by an independent third party provider of mutual fund data (i.e., funds underlying variable insurance products having approximately the same investment classification/objective), if any. Such report included each Fund’s ranking within a smaller group of peer funds and the Fund’s ranking within broader groups of funds, as well as a description of the methodology used to determine the similarity of each Fund with the funds included in each group; and
(d) took into account JHIMS’ analysis of each Fund’s performance and its plans and recommendations regarding the Trust’s subadvisory arrangements generally and with respect to particular Funds.
The Board concluded that the performance of each of the Funds has generally been in line with or generally outperformed the historical performance of comparable funds and the Funds’ respective benchmarks with the exceptions noted in Appendix A and in such cases, that appropriate action is being taken to address performance, if necessary, or that such performance is reasonable in light of all factors considered, and that JHIMS may reasonably be expected to continue ably to monitor the performance of the Funds and each of their subadvisers.
3)– (a) with respect to each Fund (except those listed below), considered that the Adviser has agreed to waive its management fee for each of these Funds and each of the funds of John Hancock Variable Insurance Trust (except those listed below) (the “Participating Portfolios”) or otherwise reimburse the expenses of the Participating Portfolios as follows (the “Reimbursement”) and that, at the request of the Board, the Reimbursement rate was increased effective May 31, 2011. The current Reimbursement rate is as follows: The Reimbursement shall equal, on an annualized basis, 0.01% of that portion of the aggregate net assets of all the Participating Portfolios that exceed $75 billion but is less than $100 billion and 0.015% of that portion of the aggregate net assets of all the Participating Portfolios that equals or exceeds $100 billion. The amount of the Reimbursement shall be calculated daily and allocated among all the Participating Portfolios in proportion to the daily net assets of each Participating Portfolio, and that Reimbursement may be terminated or modified by the Adviser only upon notice to the Trust and approval of the Board of Trustees of the Trust. (The Funds that are not Participating Portfolios as of the date of this report are each of the funds of funds of the Trust and John Hancock Variable Insurance Trust.)
(b) reviewed the Trust’s advisory fee structure and the incorporation therein of any subadvisory fee breakpoints in the advisory fees charged and concluded that (i) most of the Funds contain breakpoints at the subadvisory fee level and that such breakpoints are reflected as breakpoints in the advisory fees for Funds and (ii) although economies of scale cannot be measured with precision, these arrangements permit shareholders of Funds with advisory fee breakpoints to benefit from economies of scale if those Funds grow. The Board also took into account management’s discussion of the Funds’ advisory fee structure, including with respect to those Funds that did not currently have breakpoints, and also noted that management had agreed to add breakpoints or implement additional breakpoints to the advisory fee structure of certain of the Funds; and
(c) The Board also considered the effect of the Funds’ growth in size on their performances and fees. The Board also noted that if the Funds’ assets increase over time, the Portfolios may realize other economies of scale if assets increase proportionally more than certain other fixed expenses.
(4) -(a) reviewed the financial statements of JHIMS and considered (i) an analysis presented by JHIMS regarding the net profitability to JHIMS and Manulife Financial Corporation, the Adviser’s parent, of each Fund;
(b) reviewed and considered an analysis presented by JHIMS regarding the profitability of JHIMS’ relationship with each Fund and whether JHIMS has the financial ability to continue to provide a high level of services to the Fund;
(c) considered that JHIMS also provides administrative services to the Funds on a cost basis pursuant to an administrative services agreement and took into account information prepared by JHIMS indicating the allocation of such costs;
(d) noted that certain of the Funds’ Sub-Advisers are affiliates of the Adviser;
(e) John Hancock Signature Services, LLC and John Hancock Funds, LLC, affiliates of the Adviser, provide transfer agency services and distribution services to the Funds, respectively, and that JHIMS also derives reputational and other indirect benefits from providing advisory services to the Funds;
(f) noted that the subadvisory fees for the Funds are paid by JHIMS; and
(g) considered that the Adviser should be entitled to earn a reasonable level of profits in exchange for the level of services it provides to each Fund and the entrepreneurial risk that it assumes as Adviser.
Based upon its review, the Board concluded that the Adviser and its affiliates’ level of profitability, if any, from their relationship with each Fund was reasonable and not excessive.
5 - reviewed comparative information prepared by an independent third-party provider of mutual fund data including, among other data, each Fund’s contractual and actual advisory and subadvisory fees and total expenses as compared to similarly situated investment companies underlying variable insurance products deemed to be comparable to the Funds. The Board considered each Fund’s ranking within a smaller group of peer funds chosen by the independent third-party provider, as well as the Fund’s ranking within broader groups of funds. In comparing each Funds actual and contractual management fee to that of comparable funds, the Board noted that such fee includes both advisory and administrative costs.
The Board determined that the Trust’s advisory fees are generally within a competitive range of those incurred by other comparable funds. In this regard, the Board took into account management’s discussion with respect to the advisory/subadvisory fee structure, including the amount of the advisory fee retained by the Adviser after payment of the subadvisory fee. The Board also noted that JHIMS is currently waiving fees and/or reimbursing expenses with respect to certain of the Funds. The Board also noted that the Adviser pays the subadvisory fees of the Funds, and that such fees are negotiated at arm’s length with respect to unaffiliated Sub-Advisers. In addition, the Board noted that the Adviser effected advisory and subadvisory fee reductions in the past year with respect to several Funds. The Board also noted management’s discussion of the Funds’ expenses, as well as certain actions taken over the past several years to reduce the Funds’ operating expenses. The Board also took into account the level and quality of services provided by JHIMS with respect to the Funds, as well as the other factors considered. The Board concluded that the advisory fees paid by the Trust with respect to the Funds are reasonable.
In addition, the Trustees reviewed the advisory fee to be paid to the Adviser for each Fund and concluded that the advisory fee to be paid to the Adviser is based on services provided that are in addition to, rather than duplicative of, the services provided pursuant to the advisory agreements for the underlying portfolios of the Funds and that the additional services are necessary because of the differences between the investment policies, strategies and techniques of a fund of funds and those of its underlying portfolios.
Additional information relating to each Fund’s fees and expenses and performance that the Board considered in approving the Advisory Agreement is set forth in Appendix A.
Approval of Subadvisory Agreements
In making its determination with respect to the factors that its considers in considering approval of the Sub-Advisory Agreements, the Board reviewed:
(1) information relating to each subadviser’s business, including current subadvisory services to the Trust (and other funds in the John Hancock family of funds);
(2) the historical and current performance of each Fund and comparative performance information relating to the Fund’s benchmark and comparable funds;
(3) the subadvisory fee for each Fund and comparative fee information prepared by an independent third party of mutual fund data; and
(4) information relating to the nature and scope of Material Relationships and their significance to the Trust’s Adviser and unaffiliated Sub-Advisers.
With respect to the services provided by each of the Sub-Advisers, the Board received information provided to the Board by each Sub-Adviser, including each Sub-Adviser’s Form ADV, as well as considered information presented throughout the past year. The Board considered the Sub-Adviser’s current level of staffing and its overall resources, as well as its compensation program. The Board reviewed each Sub-Adviser’s history and investment experience, as well as information regarding the qualifications, background and responsibilities of the Sub-Adviser’s investment and compliance personnel who provide services to the Portfolios. The Board also considered, among other things, the Sub-Adviser’s compliance program and any disciplinary history. The Board also considered the Sub-Adviser’s risk assessment and monitoring process. The Board noted each Sub-Adviser’s regulatory history, including whether it was currently involved in any regulatory actions or investigations as well as material litigation, and any settlements and amelioratory actions undertaken, as appropriate. The Board also noted that the CCO and his staff conduct regular, periodic compliance reviews with each of the Sub-Advisers and present reports to the Independent Trustees regarding the same, which includes evaluating the regulatory compliance systems of the Sub-Advisers and procedures reasonably designed by them to assure compliance with the federal securities laws. The Board also took into account the financial condition of each Sub-Adviser.
The Board considered each Sub-Adviser’s investment process and philosophy. The Board took into account that each Sub-Adviser’s responsibilities include the development and maintenance of an investment program for the applicable Fund which is consistent with the Fund’s investment objectives, the selection of investment securities and the placement of orders for the purchase and sale of such securities, as well as the implementation of compliance controls related to performance of these services. The Board also received information with respect to each Sub-Adviser’s brokerage policies and practices, including with respect to best execution and soft dollars. The Board also reviewed information relating to the nature and scope of Material Relationships and their significance to the Adviser and its affiliates and to unaffiliated Sub-Advisers.
The Board also took into account the sub-advisory fees paid by the Adviser to fees charged by each Fund’s Sub-Adviser to manage other sub-advised portfolios and portfolios not subject to regulation under the 1940 Act.
The Board also received information with respect to any Material Relationships with respect to the unaffiliated Sub-Advisers, which include arrangements in which unaffiliated subadvisers or their affiliates provide advisory, distribution or management services in connection with financial products sponsored by the Trust’s adviser or its affiliates, and may include other registered investment companies, a 529 education savings plan, managed separate accounts and exempt group annuity contracts sold to qualified plans. The Board also received information and took into account any other potential conflicts of interests the Adviser might have in connection with the Sub-Advisory Agreements.
The Board’s decision to approve each Subadvisory Agreement was based on a number of determinations, including the following:
(1) The Sub-Adviser has extensive experience and demonstrated skills as a manager;
(2) Although not without variation, the performance of each Fund managed by a Sub-Adviser has generally been in line with or generally outperformed the historical performance of comparable funds and the Fund’s respective benchmarks with the exceptions noted in Appendix A (with respect to such exceptions, the Board concluded that appropriate action was being taken to address such Funds’ performance, if necessary, or that performance was reasonable in light of all factors considered);
(3) The subadvisory fees generally are competitive and within the range of industry norms, are paid by JHIMS out of its advisory fees it receives from the Fund and would not be an expense of the Fund, and, with respect to each Sub-Adviser that is not affiliated with the Adviser, are a product of arm’s length negotiation between the Adviser and the Sub-Adviser; and the Board concluded that each Fund’s subadvisory fees are reasonable; and
(4) With respect to those Funds that have subadvisory fees that contain breakpoints, such breakpoints are reflected as breakpoints in the advisory fees for the Funds in order to permit shareholders to benefit from economies of scale if those Funds grow.
In addition, the Trustees reviewed the subadvisory fee to be paid to the Sub-Adviser for the Funds and concluded that the subadvisory fee to be paid to the Sub-Adviser with respect to each Fund is based on services provided that are in addition to, rather than duplicative of, the services provided pursuant to the subadvisory agreements for the underlying portfolios of the Funds and that the additional services are necessary because of the differences between the investment policies, strategies and techniques of a fund of funds and those of its underlying portfolios.
Additional information relating to each Fund’s fees and expenses and performance that the Board considered for a particular Fund is set forth in Appendix A.
Based on their evaluation of all factors that they deemed to be material, including those factors described above, and assisted by the advice of independent counsel, the Board, including the Independent Trustees, concluded that renewal of the Advisory Agreement and each of the Sub-Advisory Agreements would be in the best interest of each of the Funds and its respective shareholders. Accordingly, the Board, and the Independent Trustees voting separately, approved the Advisory Agreement for an additional one-year period.
|
| John Hancock Funds II |
|
| Appendix A |
| | | | | |
| PORTFOLIO | PERFORMANCE OF TRUST, | | | | |
| (SUBADVISER) | AS OF MARCH 31, 2011 | | FEES AND EXPENSES | | OTHER COMMENTS |
| |
|
| | Benchmark Index - The | | Subadvisory fees: Limited | | The Board took into account management’s discussion of performance |
| | Fund underperformed for | | peer group. | | and its proposed plans with respect to the Fund. |
| | the one-year period and | | | | |
| Retirement | underperformed for the | | Net management fees for this | | The Board took into account management’s discussion of the Fund’s |
| Rising | three-year period. | | Fund are lower than the peer | | expenses. |
| Distribution | | | group median. | | |
| | Morningstar Category - The | | | | The Board noted that the Fund is subject to a voluntary fee waiver that |
| (John Hancock | Fund slightly | | Total expenses for this Fund | | reduces certain expenses of the Fund. |
| Asset | underperformed for the one- | | are higher than the peer | | |
| Management) | year period and | | group median. | | |
| | underperformed for the | | | | |
| | three-year period. | | | | |
| |
| More information | |
|
| |
| |
| |
| |
| Trustees | Investment adviser |
| James M. Oates, Chairman | John Hancock Investment Management Services, LLC |
| James R. Boyle† | |
| Grace K. Fey | Investment subadviser |
| Charles L. Bardelis* | John Hancock Asset Management |
| Peter S. Burgess* | |
| Theron S. Hoffman | Principal distributor |
| Hassell H. McClellan | John Hancock Funds, LLC |
| Steven M. Roberts* | |
| | Custodian |
| *Member of the Audit Committee | State Street Bank and Trust Company |
| †Non-Independent Trustee | |
| | Transfer agent |
| Officers | John Hancock Signature Services, Inc. |
| Hugh McHaffie | |
| President | Legal counsel |
| Thomas M. Kinzler | K&L Gates LLP |
| Secretary and Chief Legal Officer | |
| Francis V. Knox, Jr. | |
| Chief Compliance Officer | |
| Michael J. Leary | |
| Treasurer | |
| Charles A. Rizzo | |
| Chief Financial Officer | |
| John G. Vrysen | |
| Chief Operating Officer | |
The Fund’s proxy voting policies and procedures, as well as the Fund’s proxy voting record, if any, for the most recent twelve-month period ended June 30, are available free of charge on the Securities and Exchange Commission (SEC) Web site at www.sec.gov or on our Web site.
The Fund’s complete list of portfolio holdings, for the first and third fiscal quarters, is filed with the SEC on Form N-Q. The Fund’s Form N-Q is available on our Web site and the SEC’s Web site, www.sec.gov, and can be reviewed and copied (for a fee) at the SEC’s Public Reference Room in Washington, DC. Call 1-800-SEC-0330 to receive information on the operation of the SEC's Public Reference Room.
We make this information on your fund, as well as monthly portfolio holdings, and other fund details available on our Web site www.jhfunds.com or by calling 1-800-225-5291.
| | |
| You can also contact us: | | |
| 1-800-225-5291 | Regular mail: | Express mail: |
| jhfunds.com | John Hancock Signature Services, Inc. | John Hancock Signature Services, Inc. |
| | P.O. Box 55913 | Mutual Fund Image Operations |
| | Boston, MA 02205-5913 | 30 Dan Road |
| | | Canton, MA 02021 |
ITEM 2. CODE OF ETHICS.
(a)Not Applicable
(b)Not Applicable
(c)Not Applicable
(d)Not Applicable
(e)Not Applicable
(f)Not Applicable
ITEM 3. AUDIT COMMITTEE FINANCIAL EXPERT.
Not Applicable
ITEM 4. PRINCIPAL ACCOUNTANT FEES AND SERVICES.
(a) Not Applicable
(b) Not Applicable
(c) Not Applicable
(d) Not Applicable
(e) Not Applicable
(f) Not Applicable
(g) Not Applicable
(h) Not Applicable
ITEM 5. AUDIT COMMITTEE OF LISTED REGISTRANTS
Not Applicable.
ITEM 6. SCHEDULE OF INVESTMENTS.
(a) Included with Item 1.
(b) Not Applicable
ITEM 7. DISCLOSURE OF PROXY VOTING POLICIES AND PROCEDURES FOR CLOSED-END MANAGEMENT INVESTMENT COMPANIES.
Not Applicable.
ITEM 8. PORTFOLIO MANAGERS OF CLOSED-END MANAGEMENT INVESTMENT COMPANIES.
Not Applicable.
ITEM 9. PURCHASE OF EQUITY SECURITIES BY CLOSED-END MANAGEMENT INVESTMENT COMPANIES AND AFFILIATED PURCHASERS.
Not Applicable.
ITEM 10. SUBMISSION OF MATTERS TO VOTE OF SECURITY HOLDERS.
Not Applicable.
ITEM 11. CONTROLS AND PROCEDURES.
(a) EVALUATION OF DISCLOSURE CONTROLS AND PROCEDURES. The Registrant maintains disclosure controls and procedures that are designed to ensure that information required to be disclosed in this Form N-CSR is recorded, processed, summarized and reported within the
periods specified in the rules and forms of the Securities and Exchange Commission. Such disclosure controls and procedures include controls and procedures designed to ensure that such information is accumulated and communicated to the Registrant's management, including its principal executive officer and principal financial officer, as appropriate, to allow timely decisions regarding required disclosure.
Within 90 days prior to the filing date of this Form N-CSR, the Registrant had carried out an evaluation, under the supervision and with the participation of the Registrant's management, including the Registrant's principal executive officer and the Registrant's principal financial officer, of the effectiveness of the design and operation of the Registrant's disclosure controls and procedures relating to information required to be disclosed on Form N-CSR. Based on such evaluation, the Registrant's principal executive officer and principal financial officer concluded that the Registrant's disclosure controls and procedures are operating effectively to ensure that:
(i) information required to be disclosed in this Form N-CSR is recorded, processed, summarized and reported within the periods specified in the rules and forms of the Securities and Exchange Commission, and
(ii) information is accumulated and communicated to the Registrant’s management, including its principal executive officer and principal financial officer, as appropriate, to allow timely decisions regarding required disclosure.
(b) CHANGE IN REGISTRANT’S INTERNAL CONTROL: Not Applicable.
ITEM 12. EXHIBITS.
(a)(1) Not applicable
(a)(2)(i) CERTIFICATION OF PRINCIPAL EXECUTIVE OFFICER.
(a)(2)(ii) CERTIFICATION OF PRINCIPAL FINANCIAL OFFICER.
(b) CERTIFICATION PURSUANT TO Rule 30a-2(b) OF THE INVESTMENT COMPANY ACT OF 1940
Pursuant to the requirements of the Securities Exchange Act of 1934 and the Investment Company Act of 1940, the registrant has duly caused this report to be signed on its behalf by the undersigned, thereunto duly authorized.
JOHN HANCOCK FUNDS II
/s/ Hugh McHaffie
Hugh McHaffie
President
Date: August 22, 2011
Pursuant to the requirements of the Securities Exchange Act of 1934 and the Investment Company Act of 1940, this report has been signed below by the following persons on behalf of the registrant and in the capacities and on the dates indicated.
/s/ Hugh McHaffie
Hugh McHaffie
President
Date: August 22, 2011
/s/ Charles A. Rizzo
Charles A. Rizzo
Chief Financial Officer
Date: August 22, 2011