ITEM 1. REPORTS TO STOCKHOLDERS.
The Registrant prepared ten annual reports to shareholders for the year ended July 31, 2012 for series of John Hancock Funds II with July 31 fiscal year end. The first report applies to the Technical Opportunities Fund, the second report applies to the Global High Yield Fund, the third report applies to Multi Sector Bond Fund, the fourth report applies to Currency Strategies Fund, the fifth report applies Fundamental All Cap Core Fund, the sixth report applies to Fundamental Large Cap Core Fund, the seventh report applies to Fundamental Large Cap Value Fund, the eight report applies to the China Emerging Leaders Fund, the ninth report applies to the Diversified Strategies Fund and the tenth report applies to the global Absolute Return Strategy Fund. China Emerging Leaders Fund, Diversified Strategies Fund, and Global Absolute Return Strategy Fund began operations during the fiscal year ended July 31, 2012.
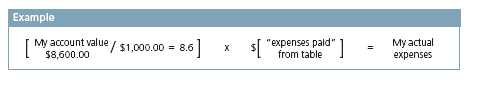
We are going to present only your ongoing operating expenses here.
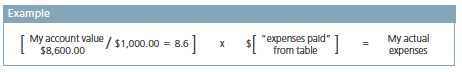
This example is intended to provide information about the Fund’s actual ongoing operating expenses, and is based on the Fund’s actual return. It assumes an account value of $1,000.00 on February 1, 2012 with the same investment held until July 31, 2012.
Together with the value of your account, you may use this information to estimate the operating expenses that you paid over the period. Simply divide your account value at July 31, 2012, by $1,000.00, then multiply it by the “expenses paid” for your share class from the table above. For example, for an account value of $8,600.00, the operating expenses should be calculated as follows:
IO Interest Only Security – Interest Tranche of Stripped Mortgage Pool. Rate shown is the annualized yield at the end of the period.
(C) Security purchased on a when-issued or delayed delivery.
(D) Par value of foreign bonds is expressed in local currency as shown parenthetically in security description.
(H) Non-income producing - Issuer is in default.
(I) Non-income producing security.
(K) Underlying issuer is shown parenthetically in security description.
(M) Term loans are variable rate obligations. The coupon rate shown represents the rate at period end.
(P) Variable rate obligation. The coupon rate shown represents the rate at period end.
(Q) Perpetual bonds have no stated maturity date. Date shown is next call date.
(S) These securities are exempt from registration under Rule 144A of the Securities Act of 1933. Such securities may be resold, normally to qualified institutional buyers, in transactions exempt from registration. Rule 144A securities amounted to $184,411,111 or 17.2% of the Fund's net assets as of 7-31-12.
(T) A portion of this position represents unsettled loan commitment at period end where the coupon rate will be determined at time of settlement.
(Y) The rate shown is the annualized seven-day yield as of 7-31-12.
(Z) Zero coupon bonds are issued at a discount from their principal amount in lieu of paying interest periodically.
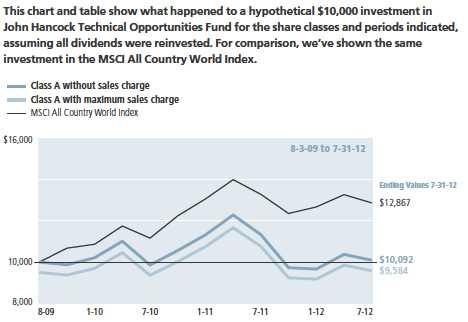
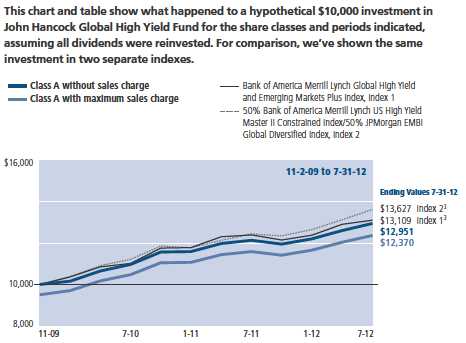
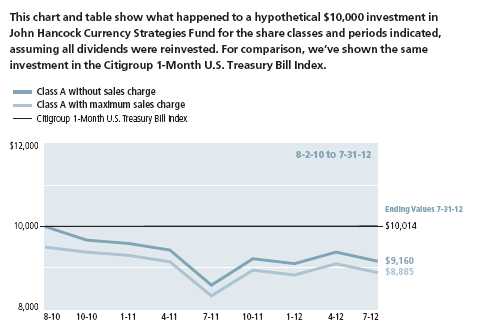
It is not possible to invest directly in an index. Index figures do not reflect expenses, which would have resulted in lower values if they did.
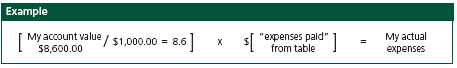
We are going to present only your ongoing operating expenses here.
This example is intended to provide information about the Fund’s actual ongoing operating expenses, and is based on the Fund’s actual return. It assumes an account value of $1,000.00 on February 1, 2012 with the same investment held until July 31, 2012.
Together with the value of your account, you may use this information to estimate the operating expenses that you paid over the period. Simply divide your account value at July 31, 2012, by $1,000.00, then multiply it by the “expenses paid” for your share class from the table above. For example, for an account value of $8,600.00, the operating expenses should be calculated as follows:
Financial statements
Statement of assets and liabilities 7-31-12
This Statement of assets and liabilities is the Fund’s balance sheet. It shows the value of what the Fund owns, is due and owes. You’ll also find the net asset value and the maximum offering price per share.
| |
| Assets | |
|
| Investments, at value (Cost $4,698,396) | $4,757,645 |
| Cash | 149,863 |
| Dividends receivable | 2,359 |
| Receivable due from adviser | 900 |
| Other receivables and prepaid expenses | 16,858 |
| | |
| Total assets | 4,927,625 |
| |
| Liabilities | |
|
| Payable to affiliates | |
| Accounting and legal services fees | 12 |
| Transfer agent fees | 1,281 |
| Trustees’ fees | 5 |
| Other liabilities and accrued expenses | 101,667 |
| | |
| Total liabilities | 102,965 |
| |
| Net assets | |
|
| Paid-in capital | $4,813,275 |
| Undistributed net investment income | 2,274 |
| Accumulated net realized gain (loss) on investments and foreign | |
| currency transactions | (50,138) |
| Net unrealized appreciation (depreciation) on investments | 59,249 |
| | |
| Net assets | $4,824,660 |
| |
| Net asset value per share | |
|
| Based on net asset values and shares outstanding — the Fund has an | |
| unlimited number of shares authorized with no par value | |
| Class A ($3,772,561 ÷ 378,925 shares) | $9.96 |
| Class I ($1,052,099 ÷ 105,363 shares) | $9.99 |
| |
| Maximum offering price per share | |
|
| Class A (net asset value per share ÷ 95%)1 | $10.48 |
1 On single retail sales of less than $50,000. On sales of $50,000 or more and on group sales the offering price is reduced.
| |
| See notes to financial statements | Annual report | Fundamental All Cap Core Fund 15 |
F I N A N C I A L S T A T E M E N T S
Statement of operations For the year ended 7-31-12
This Statement of operations summarizes the Fund’s investment income earned and expenses incurred in operating the Fund. It also shows net gains (losses) for the period stated.
| |
| Investment income | |
|
| Dividends | $56,870 |
| Less foreign taxes withheld | (47) |
| |
| Total investment income | 56,823 |
| |
| Expenses | |
|
| Investment management fees | 24,658 |
| Distribution and service fees | 7,953 |
| Accounting and legal services fees | 484 |
| Transfer agent fees | 6,571 |
| Trustees’ fees | 29 |
| State registration fees | 55,504 |
| Printing and postage | 3,514 |
| Professional fees | 43,019 |
| Custodian fees | 12,028 |
| Registration and filing fees | 57,651 |
| Other | 7,650 |
| | |
| Total expenses | 219,061 |
|
| Less expense reductions | (176,180) |
| | |
| Net expenses | 42,881 |
| | |
| Net investment income | 13,942 |
| |
| Realized and unrealized gain (loss) | |
|
| Net realized gain (loss) on | |
| Investments | (48,230) |
| Foreign currency transactions | 12 |
| | (48,218) |
| Change in net unrealized appreciation (depreciation) of | |
| Investments | 157,874 |
| | |
| Net realized and unrealized gain | 109,656 |
| | |
| Increase in net assets from operations | $123,598 |
| | |
| 16 Fundamental All Cap Core Fund | Annual report | See notes to financial statements |
F I N A N C I A L S T A T E M E N T S
Statements of changes in net assets
These Statements of changes in net assets show how the value of the Fund’s net assets has changed during the last two periods. The difference reflects earnings less expenses, any investment gains and losses, distributions, if any, paid to shareholders and the net of Fund share transactions.
| | |
| | Year | Period |
| | ended | ended |
| | 7-31-12 | 7-31-111 |
| |
| Increase (decrease) in net assets | | |
|
| From operations | | |
| Net investment income (loss) | $13,942 | ($821) |
| Net realized gain (loss) | (48,218) | 14,007 |
| Change in net unrealized appreciation (depreciation) | 157,874 | (98,625) |
| | | |
| Increase (decrease) in net assets resulting from operations | 123,598 | (85,439) |
| | | |
| Distributions to shareholders | | |
| From net investment income | | |
| Class A | (5,690) | — |
| Class I | (5,560) | — |
| From net realized gain | | |
| Class A | (11,479) | — |
| Class I | (5,456) | — |
| | | |
| Total distributions | (28,185) | — |
| | | |
| From Fund share transactions | 1,550,539 | 3,264,147 |
| | | |
| Total increase | 1,645,952 | 3,178,708 |
| |
| Net assets | | |
|
| Beginning of period | 3,178,708 | — |
| | | |
| End of period | $4,824,660 | $3,178,708 |
| | | |
| Undistributed net investment income | $2,274 | $124 |
1 Period from 6-1-11 (commencement of operations) to 7-31-11.
| | |
| See notes to financial statements | Annual report | Fundamental All Cap Core Fund 17 |
Financial highlights
The Financial highlights show how the Fund’s net asset value for a share has changed since the end of the previous period.
| | |
| CLASS A SHARES Period ended | 7-31-12 | 7-31-111 |
| | | |
| Per share operating performance | | |
|
| Net asset value, beginning of period | $9.73 | $10.00 |
| Net investment income (loss)2 | 0.02 | (0.01) |
| Net realized and unrealized gain (loss) on investments | 0.28 | (0.26) |
| Total from investment operations | 0.30 | (0.27) |
| Less distributions | | |
| From net investment income | (0.02) | — |
| From net realized gain | (0.05) | — |
| Total distributions | (0.07) | — |
| Net asset value, end of period | $9.96 | $9.73 |
| Total return (%)3,4 | 3.15 | (2.70)5 |
| |
| Ratios and supplemental data | | |
|
| Net assets, end of period (in millions) | $4 | $2 |
| Ratios (as a percentage of average net assets): | | |
| Expenses before reductions and amounts recaptured | 5.62 | 5.776 |
| Expenses including reductions and amounts recaptured | 1.30 | 1.306 |
| Net investment income (loss) | 0.24 | (0.33)6 |
| Portfolio turnover (%) | 47 | 8 |
| |
1 Period from 6-1-11 (commencement of operations) to 7-31-11.
2 Based on the average daily shares outstanding.
3 Does not reflect the effect of sales charges, if any.
4 Total returns would have been lower had certain expenses not been reduced during the periods shown.
5 Not annualized.
6 Annualized.
| | |
| 18 Fundamental All Cap Core Fund | Annual report | See notes to financial statements |
| | |
| CLASS I SHARES Period ended | 7-31-12 | 7-31-111 |
| |
| Per share operating performance | | |
|
| Net asset value, beginning of period | $9.74 | $10.00 |
| Net investment income2 | 0.07 | —3 |
| Net realized and unrealized gain (loss) on investments | 0.28 | (0.26) |
| Total from investment operations | 0.35 | (0.26) |
| Less distributions | | |
| From net investment income | (0.05) | — |
| From net realized gain | (0.05) | — |
| Total distributions | (0.10) | — |
| Net asset value, end of period | $9.99 | $9.74 |
| Total return (%)4 | 3.63 | (2.60)5 |
| |
| Ratios and supplemental data | | |
|
| Net assets, end of period (in millions) | $1 | $1 |
| Ratios (as a percentage of average net assets): | | |
| Expenses before reductions and amounts recaptured | 7.00 | 5.456 |
| Expenses including reductions and amounts recaptured | 0.84 | 0.846 |
| Net investment income | 0.75 | 0.146 |
| Portfolio turnover (%) | 47 | 8 |
| |
1 Period from 6-1-11 (commencement of operations) to 7-31-11.
2 Based on the average daily shares outstanding.
3 Less than $0.005 per share.
4 Total returns would have been lower had certain expenses not been reduced during the periods shown.
5 Not annualized.
6 Annualized.
| | |
| See notes to financial statements | Annual report | Fundamental All Cap Core Fund 19 |
Notes to financial statements
Note 1 — Organization
John Hancock Fundamental All Cap Core Fund (the Fund) is a series of John Hancock Funds II (the Trust), an open-end management investment company organized as a Massachusetts business trust and registered under the Investment Company Act of 1940, as amended (the 1940 Act). The investment objective of the Fund is to seek long-term capital appreciation.
The Fund may offer multiple classes of shares. The shares currently offered are detailed in the Statement of assets and liabilities. Class A shares are offered to all investors. Class I shares are offered to institutions and certain investors. Shareholders of each class have exclusive voting rights to matters that affect that class. The distribution and service fees, if any, transfer agent fees, printing and postage and state registration fees for each class may differ.
Note 2 — Significant accounting policies
The financial statements have been prepared in conformity with accounting principles generally accepted in the United States of America, which require management to make certain estimates and assumptions at the date of the financial statements. Actual results could differ from those estimates. Events or transactions occurring after the end of the fiscal period through the date that the financial statements were issued have been evaluated in the preparation of the financial statements. The following summarizes the significant accounting policies of the Fund:
Security valuation. Investments are stated at value as of the close of regular trading on the New York Stock Exchange (NYSE), normally at 4:00 P.M., Eastern Time. In order to value the securities, the Fund uses the following valuation techniques: Equity securities held by the Fund are valued at the last sale price or official closing price on the principal securities exchange on which they trade. In the event there were no sales during the day or closing prices are not available, then securities are valued using the last quoted bid or evaluated price. Certain securities traded only in the over-the-counter market are valued at the last bid price quoted by brokers making markets in the securities at the close of trading. Other portfolio securities and assets, where market quotations are not readily available, are valued at fair value, as determined in good faith by the Fund’s Pricing Committee, following procedures established by the Board of Trustees.
The Fund uses a three-tier hierarchy to prioritize the pricing assumptions, referred to as inputs, used in valuation techniques to measure fair value. Level 1 includes securities valued using quoted prices in active markets for identical securities. Level 2 includes securities valued using significant observable inputs. Observable inputs may include quoted prices for similar securities, interest rates, prepayment speeds and credit risk. Prices for securities valued using these inputs are received from independent pricing vendors and brokers and are based on an evaluation of the inputs described. Level 3 includes securities valued using significant unobservable inputs when market prices are not readily available or reliable, including the Fund’s own assumptions in determining the fair value of investments. Factors used in determining value may include market or issuer specific events, changes in interest rates and credit quality. The inputs or methodology used for valuing securities are not necessarily an indication of the risks associated with investing in those securities. Changes in valuation techniques may result in transfers into or out of an assigned level within the disclosure hierarchy.
| |
| 20 Fundamental All Cap Core Fund | Annual report |
The following is a summary of the values by input classification of the Fund’s investments as of July 31, 2012, by major security category or type:
| | | | |
| | | | | LEVEL 3 |
| | | | LEVEL 2 | SIGNIFICANT |
| | TOTAL MARKET | LEVEL 1 | SIGNIFICANT | UNOBSERVABLE |
| | VALUE AT 7-31-12 | QUOTED PRICE | OBSERVABLE INPUTS | INPUTS |
|
| Common Stocks | | | | |
| Consumer Discretionary | $887,868 | $887,868 | — | — |
| Consumer Staples | 241,358 | 114,870 | $126,488 | — |
| Energy | 422,417 | 422,417 | — | — |
| Financials | 935,492 | 935,492 | — | — |
| Health Care | 275,840 | 275,840 | — | — |
| Industrials | 498,636 | 498,636 | — | — |
| Information Technology | 1,414,800 | 1,414,800 | — | — |
| Materials | 81,234 | 81,234 | — | — |
| |
|
| Total Investments in | | | | |
| Securities | $4,757,645 | $4,631,157 | $126,488 | — |
Security transactions and related investment income. Investment security transactions are accounted for on a trade date plus one basis for daily net asset value calculations. However, for financial reporting purposes, investment transactions are reported on trade date. Dividend income is recorded on the ex-date. Gains and losses on securities sold are determined on the basis of identified cost and may include proceeds from litigation.
Line of credit. The Fund may borrow from banks for temporary or emergency purposes, including meeting redemption requests that otherwise might require the untimely sale of securities. Pursuant to the custodian agreement, the custodian may loan money to the Fund to make properly authorized payments. The Fund is obligated to repay the custodian for any overdraft, including any related costs or expenses. The custodian may have a lien, security interest or security entitlement in any Fund property that is not otherwise segregated or pledged, to the maximum extent permitted by law, to the extent of any overdraft.
In addition, the Fund and other affiliated funds have entered into an agreement with Citibank N.A. which enables them to participate in a $200 million unsecured committed line of credit. A commitment fee, payable at the end of each calendar quarter, based on the average daily unused portion of the line of credit, is charged to each participating fund on a pro rata basis and is reflected in other expenses on the Statement of operations. For the year ended July 31, 2012, the Fund had no borrowings under the line of credit.
Expenses. Within the John Hancock Funds complex, expenses that are directly attributable to an individual fund are allocated to such fund. Expenses that are not readily attributable to a specific fund are allocated among all funds in an equitable manner, taking into consideration, among other things, the nature and type of expense and the fund’s relative net assets. Expense estimates are accrued in the period to which they relate and adjustments are made when actual amounts are known.
Class allocations. Income, common expenses and realized and unrealized gains (losses) are determined at the fund level and allocated daily to each class of shares based on the net assets of the class. Class-specific expenses, such as distribution and service fees, if any, transfer agent fees, state registration fees and printing and postage, for all classes, are calculated daily at the class level based on the appropriate net assets of each class and the specific expense rates applicable to each class.
| |
| Annual report | Fundamental All Cap Core Fund 21 |
Federal income taxes. The Fund intends to continue to qualify as a regulated investment company by complying with the applicable provisions of the Internal Revenue Code and will not be subject to federal income tax on taxable income that is distributed to shareholders. Therefore, no federal income tax provision is required.
Under the Regulated Investment Company Modernization Act of 2010, the Fund is permitted to carry forward capital losses for an unlimited period. Capital losses that are carried forward will retain their character as either short-term or long-term capital losses rather than being considered all short-term as under previous law.
For federal income tax purposes, as of July 31, 2012, the Fund had $3,924 of long-term capital loss carryforward available to offset future net realized capital gains.
As of July 31, 2012, the Fund had no uncertain tax positions that would require financial statement recognition, derecognition or disclosure. The Fund’s federal tax returns are subject to examination by the Internal Revenue Service for a period of three years.
Distribution of income and gains. Distributions to shareholders from net investment income and net realized gains, if any, are recorded on the ex-date. The Fund generally declares and pays dividends and capital gain distributions, if any, annually.
The tax character of distributions for the year ended July 31, 2012 was $28,185 of ordinary income.
Distributions paid by the Fund with respect to each class of shares are calculated in the same manner, at the same time and in the same amount, except for the effect of class level expenses that may be applied differently to each class. As of July 31, 2012, the components of distributable earnings on a tax basis included $2,274 of undistributed ordinary income.
Such distributions and distributable earnings, on a tax basis, are determined in conformity with income tax regulations, which may differ from accounting principles generally accepted in the United States of America. Material distributions in excess of tax basis earnings and profits, if any, are reported in the Fund’s financial statements as a return of capital.
Capital accounts within the financial statements are adjusted for permanent book-tax differences. These adjustments have no impact on net assets or the results of operations. Temporary book-tax differences, if any, will reverse in a subsequent period. Book-tax differences are primarily attributable to wash sale loss deferrals.
Note 3 — Guarantees and indemnifications
Under the Fund’s organizational documents, its Officers and Trustees are indemnified against certain liabilities arising out of the performance of their duties to the Fund. Additionally, in the normal course of business, the Fund enters into contracts with service providers that contain general indemnification clauses. The Fund’s maximum exposure under these arrangements is unknown, as this would involve future claims that may be made against the Fund that have not yet occurred. The risk of material loss from such claims is considered remote.
Note 4 — Fees and transactions with affiliates
John Hancock Investment Management Services, LLC (the Adviser) serves as investment adviser for the Fund. John Hancock Funds, LLC (the Distributor), an affiliate of the Adviser, serves as principal underwriter of the Fund. The Adviser and the Distributor are indirect wholly owned subsidiaries of Manulife Financial Corporation (MFC).
| |
| 22 Fundamental All Cap Core Fund | Annual report |
Management fee. The Fund has an investment management agreement with the Adviser under which the Fund pays a daily management fee to the Adviser equivalent, on an annual basis, to the sum of: a) 0.675% of the first $2,500,000,000 of the Fund’s aggregate average daily net assets together with the assets of Fundamental All Cap Core Trust, a series of John Hancock Variable Insurance Trust (combined aggregate average daily net assets); and b) 0.650% of the combined aggregate average daily net assets in excess of $2,500,000,000. Prior to September 26, 2011, the Fund paid a daily management fee to the Adviser equivalent, on an annual basis, to the sum of a) 0.675% of the first $2,500,000,000 of the Fund’s average daily net assets; and b) 0.650% of the Fund’s average daily net assets in excess of $2,500,000,000. The Adviser has a subadvisory agreement with John Hancock Asset Management a division of Manulife Asset Management (US) LLC, an indirectly owned subsidiary of MFC and an affiliate of the Adviser. The Fund is not responsible for payment of the subadvisory fees.
The Adviser has contractually agreed to waive a portion of its management fee for certain funds (the Participating Portfolios) of the Trust and John Hancock Variable Insurance Trust. The waiver equals, on an annualized basis, 0.01% of that portion of the aggregate net assets of all the Participating Funds that exceeds $75 billion but is less than $100 billion; and 0.015% of that portion of the aggregate net assets of all the Participating Portfolios that equals or exceeds $100 billion. The amount of the reimbursement is calculated daily and allocated among all the Participating Portfolios in proportion to the daily net assets of each fund. This arrangement may be amended or terminated at any time by the Adviser upon notice to the funds and with the approval of the Board of Trustees.
The Adviser has contractually agreed to waive all or a portion of its management fee and reimburse or pay operating expenses of the Fund to the extent necessary to maintain the Fund’s total operating expenses at 1.30% and 0.84% for Class A and Class I shares, excluding certain expenses such as taxes, brokerage commissions, interest expense, litigation and indemnification expenses and other extraordinary expenses. The current expense limitation agreement expires on December 31, 2012, unless renewed by mutual agreement of the Fund and the Adviser based upon a determination that this is appropriate under the circumstances at the time.
Additionally, the Adviser has voluntarily agreed to waive other Fund level expenses excluding advisory fees, 12b-1 fees, service fees, transfer agent fees, blue sky fees, taxes, printing and postage, brokerage commissions, interest expenses, acquired fund fees, litigation and indemnification expenses and other extraordinary expenses not incurred in the ordinary course of business. The waivers are such that these expenses will not exceed 0.20% of average net assets. This voluntary expense reimbursement may be terminated at any time by the Adviser on notice to the Fund.
Accordingly, these expense reductions described above amounted to $114,490 and $61,690 for Class A and Class I shares, respectively, for the year ended July 31, 2012.
The investment management fees, including the input of the waivers and reimbursements described above, incurred for the year ended July 31, 2012 were equivalent to a net effective rate of 0.00% the Fund’s average daily net assets.
Expense recapture. The Adviser may recapture operating expenses reimbursed or fees waived under previous expense limitation or waiver arrangements for a period of three years following the beginning of the month in which such reimbursements or waivers originally occurred to the extent that the Fund is below its expense limitation during this period. The table below outlines the amounts recovered during the year ended July 31, 2012, and the amount of waived or reimbursed expenses subject to potential recovery and the respective expiration dates. Certain reimbursements or waivers are not subject to recapture.
| |
| Annual report | Fundamental All Cap Core Fund 23 |
| | | | |
| | AMOUNTS | AMOUNTS | AMOUNTS | AMOUNTS |
| | ELIGIBLE FOR | ELIGIBLE FOR | ELIGIBLE FOR | ELIGIBLE FOR |
| | RECOVERY | RECOVERY | RECOVERY | RECOVERY |
| | THROUGH | THROUGH | THROUGH | THROUGH |
| FUND | JULY 1, 2013 | JULY 1, 2014 | JULY 1, 2015 | JULY 31, 2012 |
|
| Fundamental All Cap Core | — | $22,975 | $176,057 | — |
Accounting and legal services. Pursuant to a service agreement, the Fund reimburses the Adviser for all expenses associated with providing the administrative, financial, legal, accounting and recordkeeping services to the Fund, including the preparation of all tax returns, periodic reports to shareholders and regulatory reports, among other services. These expenses are allocated to each share class based on its relative net assets at the time the expense was incurred. These accounting and legal services fees incurred for the year ended July 31, 2012 amounted to an annual rate of 0.01% of the Fund’s average daily net assets.
Distribution and service plans. The Fund has a distribution agreement with the Distributor. The Fund has adopted distribution and service plans with respect to Class A shares pursuant to Rule 12b-1 under the 1940 Act, to pay the Distributor for services provided as the distributor of shares of the Fund. The Fund pays 0.30% for Class A shares for distribution and service fees under these arrangements, expressed as an annual percentage of average daily net assets for each class of the Fund’s shares.
Sales charges. Class A shares are assessed up-front sales charges, which resulted in payments to the Distributor amounting to $5,431 for the year ended July 31, 2012. Of this amount, $855 was retained and used for printing prospectuses, advertising, sales literature and other purposes and $4,576 was paid as sales commissions to broker-dealers.
Transfer agent fees. The Fund has a transfer agent agreement with John Hancock Signature Services, Inc. (Signature Services), an affiliate of the Adviser. The transfer agent fees paid to Signature Services are determined based on the cost to Signature Services (Signature Services Cost) of providing recordkeeping services. The Signature Services Cost includes a component of allocated John Hancock corporate overhead for providing transfer agent services to the Fund and to all other John Hancock affiliated funds. It also includes out-of-pocket expenses that are comprised of payments made to third-parties for recordkeeping services provided to their clients who invest in one or more John Hancock funds. In addition, Signature Services Cost may be reduced by certain fees that Signature Services receives in connection with retirement and small accounts. Signature Services Cost is calculated monthly and allocated, as applicable, to four categories of share classes: Institutional Share Classes, Retirement Share Classes, Municipal Bond Classes and all other Retail Share Classes. Within each of these categories, the applicable costs are allocated to the affected John Hancock affiliated funds and/or classes, based on the relative average daily net assets.
Class level expenses. Class level expenses for the year ended July 31, 2012 were:
| | | | |
| | DISTRIBUTION | TRANSFER | STATE | PRINTING AND |
| CLASS | AND SERVICE FEES | AGENT FEES | REGISTRATION FEES | POSTAGE FEES |
|
| A | $7,953 | $5,411 | $27,752 | $2,231 |
| I | — | 1,160 | 27,752 | 1,283 |
| Total | $7,953 | $6,571 | $55,504 | $3,514 |
Trustee expenses. The Fund compensates each Trustee who is not an employee of the Adviser or its affiliates. The costs of paying Trustee compensation and expenses are allocated to the Fund based on its average daily net assets.
| |
| 24 Fundamental All Cap Core Fund | Annual report |
Note 5 — Fund share transactions
Transactions in Fund shares for the year ended July 31, 2012 and for the period ended July 31, 2011 were as follows:
| | | | |
| | Year ended 7-31-12 | Period ended 7-31-111 |
| | Shares | Amount | Shares | Amount |
| Class A shares | | | | |
|
| Sold | 199,274 | $1,931,654 | 210,437 | $2,101,647 |
| Distributions reinvested | 416 | 3,789 | — | — |
| Repurchased | (31,202) | (299,324) | — | — |
| | | | | |
| Net increase | 168,488 | $1,636,119 | 210,437 | $2,101,647 |
| |
| Class I shares | | | | |
|
| Sold | 25,743 | $266,173 | 116,250 | $1,162,500 |
| Distributions reinvested | 1,106 | 10,068 | — | — |
| Repurchased | (37,736) | (361,821) | — | — |
| | | | | |
| Net increase (decrease) | (10,887) | ($85,580) | 116,250 | $1,162,500 |
| |
| Net increase | 157,601 | $1,550,539 | 326,687 | $3,264,147 |
|
1 Period from 6-1-11 (commencement of operations) to 7-31-11.
Affiliates of the Fund owned 53% and 100% of shares of beneficial interest of Class A and Class I shares on July 31, 2012.
Note 6 — Purchase and sale of securities
Purchases and sales of securities, other than short-term securities, aggregated $3,325,113 and $1,723,293, respectively, for the year ended July 31, 2012.
| |
| Annual report | Fundamental All Cap Core Fund 25 |
Auditor’s report
Report of Independent Registered Public Accounting Firm
To the Board of Trustees of John Hancock Funds II and Shareholders of
John Hancock Fundamental All Cap Core Fund:
In our opinion, the accompanying statement of assets and liabilities, including the schedule of investments, and the related statements of operations and of changes in net assets and the financial highlights present fairly, in all material respects, the financial position of John Hancock Fundamental All Cap Core Fund (the “Fund”) at July 31, 2012, and the results of its operations, the changes in its net assets and the financial highlights for each of the periods indicated, in conformity with accounting principles generally accepted in the United States of America. These financial statements and financial highlights (hereafter referred to as “financial statements”) are the responsibility of the Fund’s management; our responsibility is to express an opinion on these financial statements based on our audits. We conducted our audits of these financial statements in accordance with the standards of the Public Company Accounting Oversight Board (United States). Those standards require that we plan and perform the audit to obtain reasonable assurance about whether the financial statements are free of material misstatement. An audit includes examining, on a test basis, evidence supporting the amounts and disclosures in the financial statements, assessing the accounting principles used and significant estimates made by management, and evaluating the overall financial statement presentation. We believe that our audits, which included confirmation of securities at July 31, 2012 by correspondence with the custodian, and the application of alternative auditing procedures where securities purchased confirmations had not been received, provide a reasonable basis for our opinion.
PricewaterhouseCoopers LLP
Boston, Massachusetts
September 24, 2012
| |
| 26 Fundamental All Cap Core Fund | Annual report |
Tax information
Unaudited
For federal income tax purposes, the following information is furnished with respect to the distributions of the Fund, if any, paid during its taxable year ended July 31, 2012.
The Fund reports the maximum amount allowable of its net taxable income as eligible for the corporate dividends-received deduction.
The Fund reports the maximum amount allowable of its net taxable income as qualified dividend income as provided in the Jobs and Growth Tax Relief Reconciliation Act of 2003.
Eligible shareholders will be mailed a 2012 Form 1099-DIV in early 2013. This will reflect the tax character of all distributions paid in calendar year 2012.
| |
| Annual report | Fundamental All Cap Core Fund 27 |
Evaluation of Advisory and Subadvisory Agreements by the Board of Trustees
This section describes the evaluation by the Board of Trustees (the Board) of the Advisory Agreement (the Advisory Agreement) and each of the Subadvisory Agreements and the Sub-Subadvisory Agreements (collectively, the Subadvisory Agreements) for each of the portfolios (the Funds) of John Hancock Funds II (the Trust) discussed in this report.
At in-person meetings held on May 24–25, 2012, the Board, including all of the Trustees who are not considered to be “interested persons” of the Trust under the Investment Company Act of 1940, as amended (the 1940 Act) (the Independent Trustees), approved for an annual period the continuation of the Advisory and Subadvisory Agreements with respect to each of the Funds.
Evaluation by the Board of Trustees
The Board, including the Independent Trustees, is responsible for selecting the Trust’s adviser, John Hancock Investment Management Services, LLC (the Adviser or JHIMS), approving the Adviser’s selection of subadvisers for each of the Funds (each a Subadviser, and collectively, the Subadvisers) and approving the Trust’s advisory and subadvisory (and any sub-subadvisory) agreements, their periodic continuation and any amendments. Consistent with Securities and Exchange Commission rules, the Board regularly evaluates the Trust’s advisory and subadvisory arrangements, including consideration of the factors listed below. The Board may also consider other factors (including conditions and trends prevailing generally in the economy, the securities markets and the industry) and does not treat any single factor as determinative, and each Trustee may attribute different weights to different factors. The Board is furnished with an analysis of its fiduciary obligations in connection with its evaluation and, throughout the evaluation process, the Board is assisted by counsel for the Trust and the Independent Trustees are also separately assisted by independent legal counsel. The factors considered by the Board are:
1. the nature, extent and quality of the services to be provided by the Adviser to the Trust and by the Subadvisers to the Funds;
2. the investment performance of the Funds and their Subadvisers;
3. the extent to which economies of scale would be realized as a Fund grows and whether fee levels reflect these economies of scale for the benefit of Fund shareholders;
4. the costs of the services to be provided and the profits to be realized by the Adviser and its affiliates (including any subadvisers that are affiliated with the Adviser) from the Adviser’s relationship with the Trust; and
5. comparative services rendered and comparative advisory and subadvisory fee rates.
The Board believes that information relating to all of these factors is relevant to its evaluation of the Trust’s advisory agreement. The Board also takes into account any indirect benefits expected to be derived by the Adviser and its affiliates and the Subadvisers and their affiliates from their relationships with the Funds. With respect to its evaluation of subadvisory agreements (including any sub-subadvisory agreements) with subadvisers not affiliated with the Adviser, the Board believes that, in view of the Trust’s “manager-of-managers” advisory structure, the costs of the services to be provided and the profits to be realized by those subadvisers that are not affiliated with the Adviser from their relationship with the Trust generally are not a material factor in the Board’s consideration of these subadvisory agreements because such fees are paid by the Adviser and not by the Funds and the Board relies on the ability of the Adviser to negotiate the subadvisory fees at arm’s length.
| |
| 28 Fundamental All Cap Core Fund | Annual report |
In evaluating subadvisory arrangements, the Board also considers other material business relationships that unaffiliated Subadvisers and their affiliates have with the Adviser or its affiliates, including the involvement by certain affiliates of certain Subadvisers in the distribution of financial products, including shares of the Trust, offered by the Adviser and other affiliates of the Adviser (Material Relationships).
Approval of Advisory and Subadvisory Agreements
At in-person meetings held on May 24–25, 2012, the Board, including all of the Independent Trustees, re-approved the Advisory Agreement and the applicable Subadvisory Agreements with respect to each of the Funds.
In considering the Advisory Agreement and the Subadvisory Agreements, the Board received in advance of the meeting a variety of materials relating to each Fund, the Adviser and each Subadviser, including comparative performance, fee and expense information for a peer group of similar mutual funds prepared by an independent third party provider of mutual fund data, including performance information for relevant benchmark indices and other information provided by the Adviser and the Subadvisers regarding the nature, extent and quality of services provided by the Adviser and the Subadvisers under their respective Agreements. The Board also took into account discussions with management and information provided to the Board in its meetings throughout the year with respect to the services provided by the Adviser and the Subadvisers to the Funds, including quarterly performance reports prepared by management containing reviews of investment results, and periodic presentations from the Subadvisers with respect to the Funds they manage. The Board noted the affiliation of certain of the Subadvisers with JHIMS, noting any potential conflicts of interest.
Throughout the process, the Trustees were afforded the opportunity to ask questions of and request additional information from management. The Independent Trustees also received a memorandum from their independent counsel discussing the legal standards for their consideration of the proposed continuation of the Agreements and discussed the proposed continuation of the Agreements in private sessions with their independent legal counsel at which no representatives of management were present.
Approval of Advisory Agreement
Among the information received by the Board from the Adviser relating to the nature, extent and quality of services provided to the Funds, the Board reviewed information provided by JHIMS relating to its operations and personnel and information regarding JHIMS’s compliance and regulatory history. The Board also noted that on a regular basis it receives and reviews information from the Trust’s Chief Compliance Officer (CCO) regarding the Funds’ compliance policies and procedures established pursuant to Rule 38a-1 under the 1940 Act. The Board also considers the Adviser’s risk management processes. The Board considered that JHIMS is responsible for the management of the day-to-day operations of the Funds, including but not limited to, general supervision of and coordination of the services provided by the Subadvisers, and is also responsible for monitoring and reviewing the activities of the Subadvisers and other third-party service providers.
In considering the nature, extent and quality of the services provided by the Adviser, the Trustees also took into account their knowledge of JHIMS’ management and the quality of the performance of its duties, through Board meetings, discussions and reports during the preceding year and through each Trustee’s experience as a Trustee of the Trust and of another trust in the complex.
| |
| Annual report | Fundamental All Cap Core Fund 29 |
In approving the renewal of the Advisory Agreement, and with reference to the factors that it regularly considers when considering approval of advisory and subadvisory agreements as listed above, the Board:
(1) — (a) considered the high value to the Trust of continuing its relationship with JHIMS as the Trust’s adviser, the skills and competency with which JHIMS has in the past managed the Trust’s affairs and its subadvisory relationships, JHIMS’s oversight and monitoring of the Subadvisers’ investment performance and compliance programs including its timeliness in responding to performance issues and the qualifications of JHIMS’s personnel;
(b) considered JHIMS’s compliance policies and procedures and noted its responsiveness to regulatory changes and mutual fund industry developments;
(c) considered JHIMS’s administrative capabilities, including its ability to supervise the other service providers for the Funds;
(d) considered the financial condition of JHIMS and whether it had the financial wherewithal to provide a high level and quality of services to the Funds; and
(e) recognized JHIMS’s reputation and experience in serving as an investment adviser to the Trust, and considered the benefit to shareholders of investing in funds that are part of a family of funds offering a variety of investments.
The Board concluded that JHIMS may reasonably be expected to continue to provide a high quality of services under the Advisory Agreement with respect to the Funds;
(2) — (a) reviewed the investment performance of each of the Funds;
(b) reviewed the comparative performance of their respective benchmarks;
(c) considered the performance of comparable funds as included in a report prepared by an independent third party provider of mutual fund data (i.e., funds underlying variable insurance products having approximately the same investment classification/objective), if any. Such report included each Fund’s ranking within a smaller group of peer funds and the Fund’s ranking within broader groups of funds, as well as a description of the methodology used to determine the similarity of each Fund with the funds included in each group; and
(d) took into account JHIMS’s analysis of each Fund’s performance and its plans and recommendations regarding the Trust’s subadvisory arrangements generally and with respect to particular Funds.
The Board concluded that the performance of each of the Funds has generally been in-line with or generally outperformed the historical performance of comparable funds and the Fund’s respective benchmarks with the exceptions noted in Appendix A and in such cases, that appropriate action is being taken to address performance, if necessary, or that such performance is reasonable in light of all factors considered, and that JHIMS may reasonably be expected to continue ably to monitor the performance of the Funds and each of their Subadvisers;
(3) — (a) with respect to each Fund (except those listed below), considered that the Adviser has agreed to waive its management fee for each of these Funds and each of the funds of John Hancock Variable Insurance Trust (except those listed below) (the Participating Portfolios) or otherwise reimburse the expenses of the Participating Portfolios as follows (the Reimbursement) and that, at the request of the Board, the Reimbursement rate was
| |
| 30 Fundamental All Cap Core Fund | Annual report |
increased effective May 31, 2011. The current Reimbursement rate is as follows: The Reimbursement shall equal, on an annualized basis, 0.01% of that portion of the aggregate net assets of all the Participating Portfolios that exceed $75 billion but is less than $100 billion and 0.015% of that portion of the aggregate net assets of all the Participating Portfolios that equals or exceeds $100 billion. The amount of the Reimbursement shall be calculated daily and allocated among all the Participating Portfolios in proportion to the daily net assets of each Participating Portfolio, and that Reimbursement may be terminated or modified by the Adviser only upon notice to the Trust and approval of the Board of Trustees of the Trust. (The Funds that are not Participating Portfolios as of the date of this annual report are each of the funds of funds, money market funds and index funds of the Trust and John Hancock Variable Insurance Trust.)
(b) reviewed the Trust’s advisory fee structure and the incorporation therein of any subadvisory fee breakpoints in the advisory fees charged and concluded that (i) most of the Funds contain breakpoints at the subadvisory fee level and that such breakpoints are reflected as breakpoints in the advisory fees for Funds and (ii) although economies of scale cannot be measured with precision, these arrangements permit shareholders of Funds with advisory fee breakpoints to benefit from economies of scale if those Funds grow. The Board also took into account management’s discussion of the Funds’ advisory fee structure, including with respect to those Funds that did not currently have breakpoints, and also noted that management had agreed to add breakpoints or implement additional breakpoints to the advisory fee structure of certain of the Funds; and
(c) The Board also considered the effect of the Funds’ growth in size on their performances and fees.
The Board also noted that if the Funds’ assets increase over time, the Funds may realize other economies of scale if assets increase proportionally more than certain other fixed expenses;
(4) — (a) reviewed the financial statements of JHIMS and considered an analysis presented by JHIMS regarding the net profitability to JHIMS and Manulife Financial Corporation, the Adviser’s parent, of each Fund;
(b) reviewed and considered an analysis presented by JHIMS regarding the profitability of JHIMS’s relationship with each Fund and whether JHIMS has the financial ability to continue to provide a high level of services to the Fund;
(c) considered that JHIMS also provides administrative services to the Funds on a cost basis pursuant to an administrative services agreement and took into account information prepared by JHIMS indicating the allocation of such costs;
(d) noted that certain of the Funds’ Subadvisers are affiliates of the Adviser;
(e) noted that John Hancock Signature Services, LLC and John Hancock Funds, LLC, affiliates of the Adviser, provide transfer agency services and distribution services to the Funds, respectively, and that JHIMS also derives reputational and other indirect benefits from providing advisory services to the Funds;
(f) noted that the subadvisory fees for the Funds are paid by JHIMS and are negotiated at arm’s length with respect to the unaffiliated Subadvisers; and
(g) considered that the Adviser should be entitled to earn a reasonable level of profits in exchange for the level of services it provides to each Fund and the entrepreneurial risk that it assumes as Adviser.
| |
| Annual report | Fundamental All Cap Core Fund 31 |
Based upon its review, the Board concluded that the Adviser and its affiliates’ level of profitability, if any, from their relationship with each Fund was reasonable and not excessive; and
(5) reviewed comparative information prepared by an independent third party provider of mutual fund data including, among other data, each Fund’s contractual and actual advisory and subadvisory fees and total expenses as compared to similarly situated investment companies underlying variable insurance products deemed to be comparable to the Funds. The Board considered each Fund’s ranking within a smaller group of peer funds chosen by the independent third party provider, as well as the Fund’s ranking within broader groups of funds. In comparing each Fund’s actual and contractual management fee to that of comparable funds, the Board noted that such fee includes both advisory and administrative costs.
The Board determined that the Trust’s advisory fees are generally within a competitive range of those incurred by other comparable funds. In this regard, the Board took into account management’s discussion with respect to the advisory/subadvisory fee structure, including the amount of the advisory fee retained by the Adviser after payment of the subadvisory fee. The Board also noted that JHIMS is currently waiving fees and/or reimbursing expenses with respect to certain of the Funds. The Board also noted that the Adviser pays the subadvisory fees of the Funds, and that such fees are negotiated at arm’s length with respect to unaffiliated Subadvisers. In addition, the Board noted that the Adviser effected advisory and subadvisory fee reductions in the past year with respect to several Funds. The Board also noted management’s discussion of the Funds’ expenses, as well as certain actions taken over the past several years to reduce the Funds’ operating expenses. The Board also took into account the level and quality of services provided by JHIMS with respect to the Funds, as well as the other factors considered. The Board concluded that the advisory fees paid by the Trust with respect to the Funds are reasonable.
Additional information relating to each Fund’s fees and expenses and performance that the Board considered in approving the Advisory Agreement is set forth in Appendix A.
Approval of Subadvisory Agreements
In making its determination with respect to the factors that it considers in considering approval of the Subadvisory Agreements, the Board reviewed:
(1) information relating to each Subadviser’s business, including current subadvisory services to the Trust (and other funds in the John Hancock family of funds);
(2) the historical and current performance of each Fund and comparative performance information relating to the Fund’s benchmark and comparable funds;
(3) the subadvisory fee for each Fund, including any breakpoints, and comparative fee information prepared by an independent third party of mutual fund data; and
(4) information relating to the nature and scope of Material Relationships and their significance to the Trust’s Adviser and unaffiliated Subadvisers.
With respect to the services provided by each of the Subadvisers, the Board received information provided to the Board by each Subadviser, including each Subadviser’s Form ADV, as well as considered information presented throughout the past year. The Board considered the Subadviser’s current level of staffing and its overall resources, as well as its compensation program. The Board reviewed each Subadviser’s history and investment experience, as well as information regarding the qualifications, background and responsibilities of the Subadviser’s investment and compliance personnel who provide services to the Funds. The Board also considered, among other things, the Subadviser’s compliance program and any disciplinary history. The Board also considered the Subadviser’s risk assessment and monitoring process. The Board noted each Subadviser’s regulatory
| |
| 32 Fundamental All Cap Core Fund | Annual report |
history, including whether it was currently involved in any regulatory actions or investigations as well as material litigation, and any settlements and amelioratory actions undertaken, as appropriate. The Board also noted that the CCO and his staff conduct regular, periodic compliance reviews with each of the Subadvisers and present reports to the Independent Trustees regarding the same, which includes evaluating the regulatory compliance systems of the Subadvisers and procedures reasonably designed by them to assure compliance with the federal securities laws. The Board also took into account the financial condition of each Subadviser.
The Board considered each Subadviser’s investment process and philosophy. The Board took into account that each Subadviser’s responsibilities include the development and maintenance of an investment program for the applicable Fund which is consistent with the Fund’s investment objectives, the selection of investment securities and the placement of orders for the purchase and sale of such securities, as well as the implementation of compliance controls related to performance of these services. The Board also received information with respect to each Subadviser’s brokerage policies and practices, including with respect to best execution and soft dollars. The Board also reviewed information relating to the nature and scope of Material Relationships and their significance to the Adviser and its affiliates and to unaffiliated Subadvisers.
The Board also took into account the sub-advisory fees paid by the Adviser to fees charged by each Fund’s Subadviser to manage other sub-advised portfolios and portfolios not subject to regulation under the 1940 Act, as applicable.
The Board also received information regarding any Material Relationships with respect to the unaffiliated Subadvisers, which include arrangements in which unaffiliated Subadvisers or their affiliates provide advisory, distribution or management services in connection with financial products sponsored by the Trust’s Adviser or its affiliates, and may include other registered investment companies, a 529 education savings plan, managed separate accounts and exempt group annuity contracts sold to qualified plans. The Board also received information and took into account any other potential conflicts of interests the Adviser might have in connection with the Subadvisory Agreements.
The Board’s decision to approve each Subadvisory Agreement was based on a number of determinations, including the following:
(1) The Subadviser has extensive experience and demonstrated skills as a manager;
(2) Although not without variation, the performance of each Fund managed by a Subadviser has generally been in-line with or generally outperformed the historical performance of comparable funds and the Fund’s respective benchmarks with the exceptions noted in Appendix A (with respect to such exceptions, the Board concluded that appropriate action was being taken to address such Fund’s performance, if necessary, or that performance was reasonable in light of all factors considered);
(3) The subadvisory fees generally are (i) competitive and within the range of industry norms and (ii) are paid by JHIMS out of its advisory fees it receives from the Fund (in the case of each sub-subadvisory agreement, that the sub-subadvisory fee would be paid by the Subadviser out of the subadvisory fee) and would not be an expense of the Fund, and, with respect to each Subadviser that is not affiliated with the Adviser, are a product of arm’s length negotiation between the Adviser and the Subadviser; and the Board concluded that each Fund’s subadvisory fees are reasonable; and
(4) With respect to those Funds that have subadvisory fees that contain breakpoints, such breakpoints are reflected as breakpoints in the advisory fees for the Funds in order to permit shareholders to benefit from economies of scale if those Funds grow.
| |
| Annual report | Fundamental All Cap Core Fund 33 |
Additional information relating to each Fund’s fees and expenses and performance that the Board considered for a particular Fund is set forth in Appendix A.
Based on their evaluation of all factors that they deemed to be material, including those factors described above, and assisted by the advice of independent counsel, the Board, including the Independent Trustees, concluded that renewal of the Advisory Agreement and each of the Subadvisory Agreements would be in the best interest of each of the Funds and its respective shareholders. Accordingly, the Board, and the Independent Trustees voting separately, approved the Advisory Agreement and each of the Subadvisory Agreements for an additional one-year period.
| | | |
| Appendix A |
|
| |
| Portfolio | Performance of Fund, | | |
| (Subadviser) | as of March 31, 2012 | Fees and Expenses | Other Comments |
|
| |
| Fundamental All | Benchmark Index — | The subadvised peer | The Board noted |
| Cap Core Fund | The Fund launched | group is too small for | that the inception |
| | June 1st of 2011. | comparative purposes. | date for this Fund |
| (John Hancock | | | was June 1, 2011. |
| Asset Management | Lipper Peer Group — | | |
| a division of | The Fund launched | Net management fees | |
| Manulife Asset | June 1st of 2011. | for this Fund are | |
| Management | | lower than the peer | |
| (US) LLC) | | group median. | |
| | | |
| | Total expenses for | |
| | this Fund are slightly | |
| | | lower than the peer | |
| | | group median. | |
|
| |
| 34 Fundamental All Cap Core Fund | Annual report |
Trustees and Officers
This chart provides information about the Trustees and Officers of John Hancock Funds II who oversee your John Hancock fund. Officers elected by the Trustees manage the day-to-day operations of the Portfolio and execute policies formulated by the Trustees.
Independent Trustees
| | |
| Name, Year of Birth | Trustee | Number of |
| Position(s) held with Fund | of the | John Hancock |
| Principal occupation(s) and other | Trust | funds overseen |
| directorships during past 5 years | since1 | by Trustee |
| |
| Charles L. Bardelis, Born: 1941 | 2005 | 198 |
|
| Director, Island Commuter Corp. (Marine Transport). Trustee of John Hancock Variable Insurance |
| Trust (since 1988), John Hancock Funds II (since 2005) and former Trustee of John Hancock | |
| Funds III (2005–2006). | | |
| |
| Peter S. Burgess, Born: 1942 | 2005 | 198 |
|
| Consultant (financial, accounting and auditing matters) (since 1999); Certified Public Accountant. |
| Partner, Arthur Andersen (independent public accounting firm) (prior to 1999). Director of the following |
| publicly traded companies: Lincoln Educational Services Corporation (since 2004), Symetra Financial |
| Corporation (since 2010) and PMA Capital Corporation (2004–2010). Trustee of John Hancock Variable |
| Insurance Trust (since 2005), John Hancock Funds II (since 2005), and former Trustee of John Hancock |
| Funds III (2005–2006). | | |
| |
| Grace K. Fey, Born: 1946 | 2008 | 198 |
|
| Chief Executive Officer, Grace Fey Advisors (since 2007); Director & Executive Vice President, Frontier |
| Capital Management Company (1988–2007); Director, Fiduciary Trust (since 2009). Trustee of |
| John Hancock Variable Insurance Trust (since 2008) and John Hancock Funds II (since 2008). |
| |
| Theron S. Hoffman, Born: 1947 | 2008 | 198 |
|
| Chief Executive Officer, T. Hoffman Associates, LLC (consulting firm) (since 2003); Director, The Todd |
| Organization (consulting firm) (2003–2010); President, Westport Resources Management (investment |
| management consulting firm) (2006–2008); Partner/Operating Head & Senior Managing Director, |
| Putnam Investments (2000–2003); Executive Vice President, Thomson Corp. (1997–2000) (financial |
| and legal information publishing). Trustee of John Hancock Variable Insurance Trust (since 2008) and |
| John Hancock Funds II (since 2008). | | |
| |
| Hassell H. McClellan, Born: 1945 | 2005 | 198 |
|
| Associate Professor, The Graduate School of The Wallace E. Carroll School of Management, Boston |
| College (since 1984). Trustee of John Hancock Variable Insurance Trust (since 2005), John Hancock |
| Funds II (since 2005), Trustee of Virtus Variable Insurance Trust (formerly, Phoenix Edge Series Funds) |
| (since 2008), and Director of the Barnes Group (since 2010). | | |
| |
| James M. Oates, Born: 1946 | 2005 | 198 |
|
| Managing Director, Wydown Group (financial consulting firm) (since 1994); Chairman, Emerson |
| Investment Management, Inc. (since 2000); Chairman, Hudson Castle Group, Inc. (formerly IBEX |
| Capital Markets, Inc.) (financial services company) (1997–2011). Director of the following publicly traded |
| companies: Stifel Financial (since 1996); Investor Financial Services Corporation (1995–2007); and |
| Connecticut River Bancorp (since 1998). Director of the following Mutual Funds: Virtus Funds (formerly, |
| Phoenix Mutual Funds) (since 1988). Chairman of the Boards of John Hancock Variable Insurance Trust |
| and John Hancock Funds II (since 2005) and former Trustee of John Hancock Funds III (2005–2006). |
| |
| Annual report | Fundamental All Cap Core Fund 35 |
Non-Independent Trustee2
| | |
| Name, Year of Birth | Trustee | Number of |
| Position(s) held with Fund | of the | John Hancock |
| Principal occupation(s) and other | Trust | funds overseen |
| directorships during past 5 years | since1 | by Trustee |
| |
| James R. Boyle,3 Born: 1959 | 2005 | 198 |
|
| Senior Executive Vice President, John Hancock Financial Services (since 1999, including prior positions); |
| Chairman and Director, John Hancock Advisers, LLC, John Hancock Funds, LLC, and John Hancock |
| Investment Management Services, LLC (2005–2010); Trustee, John Hancock Variable Insurance Trust |
| (since 2005), John Hancock Funds II (since 2005), and John Hancock retail funds (2005–2010). |
1 Because the Trust does not hold regular annual shareholders meetings, each Trustee holds office for an indefinite term until his/her successor is duly elected and qualified or until he/she dies, retires, resigns, is removed or becomes disqualified.
2 Non-Independent Trustees hold positions or are affiliated with the Fund’s investment adviser, subadviser, underwriter or their affiliates.
3 Mr. Boyle is an “interested person” (as defined in the 1940 Act) due to his position with Manulife Financial Corporation (or its affiliates), the ultimate parent of the Adviser.
Principal officers who are not Trustees
| |
| Name, Year of Birth | Officer |
| Position(s) held with Fund | of the |
| Principal occupation(s) and other | Trust |
| directorships during past 5 years | since |
| |
| Hugh McHaffie, Born: 1959 | 2009 |
|
| President | |
| Executive Vice President, John Hancock Financial Services (since 2006, including prior positions); | |
| President of John Hancock Variable Insurance Trust and John Hancock Funds II (since 2009); Trustee, |
| John Hancock retail funds (since 2010); Chairman and Director, John Hancock Advisers, LLC, | |
| John Hancock Investment Management Services, LLC and John Hancock Funds, LLC (since 2010). | |
| |
| Thomas M. Kinzler, Born: 1955 | 2008 |
|
| Secretary and Chief Legal Officer | |
| Vice President, John Hancock Financial Services (since 2006); Secretary and Chief Legal Counsel, | |
| John Hancock Funds, LLC (since 2007); Secretary and Chief Legal Officer, John Hancock retail funds, |
| John Hancock Variable Insurance Trust and John Hancock Funds II (since 2006). | |
| |
| Francis V. Knox, Jr., Born: 1947 | 2008 |
|
| Chief Compliance Officer | |
| Vice President, John Hancock Financial Services (since 2005); Chief Compliance Officer, John Hancock |
| retail funds, John Hancock Funds II, John Hancock Variable Insurance Trust, John Hancock Advisers, |
| LLC and John Hancock Investment Management Services, LLC (since 2005); Vice President and Chief |
| Compliance Officer, John Hancock Asset Management a division of Manulife Asset Management (US) |
| LLC (2005–2008). | |
| |
| Michael J. Leary, Born: 1965 | 2008 |
|
| Treasurer | |
| Assistant Vice President, John Hancock Financial Services (since 2007); Treasurer, John Hancock Funds II |
| and John Hancock Variable Insurance Trust (since 2009); Treasurer, John Hancock retail funds (2009– |
| 2010); Vice President, John Hancock Advisers, LLC and John Hancock Investment Management Services, |
| LLC (since 2007); Assistant Treasurer, John Hancock retail funds (2007–2009 & 2010), John Hancock |
| Funds II and John Hancock Variable Insurance Trust (2007–2009) and John Hancock Funds III (since |
| 2009); Vice President and Director of Fund Administration, JP Morgan (2004–2007). | |
| |
| 36 Fundamental All Cap Core Fund | Annual report |
Principal officers who are not Trustees (continued)
| |
| Name, Year of Birth | Officer |
| Position(s) held with Fund | of the |
| Principal occupation(s) and other | Trust |
| directorships during past 5 years | since |
|
| |
| Charles A. Rizzo, Born: 1957 | 2008 |
|
| Chief Financial Officer | |
| Vice President, John Hancock Financial Services (since 2008); Senior Vice President, John Hancock | |
| Advisers, LLC and John Hancock Investment Management Services, LLC (since 2008); Chief Financial |
| Officer, John Hancock retail funds, John Hancock Funds II and John Hancock Variable Insurance Trust |
| (since 2007); Assistant Treasurer, Goldman Sachs Mutual Fund Complex (2005–2007); Vice President, |
| Goldman Sachs (2005–2007). | |
| |
| John G. Vrysen, Born: 1955 | 2008 |
|
| Chief Operating Officer | |
| Senior Vice President, John Hancock Financial Services (since 2006); Director, Executive Vice President |
| and Chief Operating Officer, John Hancock Advisers, LLC, John Hancock Investment Management | |
| Services, LLC and John Hancock Funds, LLC (since 2005); Chief Operating Officer, John Hancock Funds |
| II and John Hancock Variable Insurance Trust (since 2007); Chief Operating Officer, John Hancock retail |
| funds (until 2009); Trustee, John Hancock retail funds (since 2009). | |
The business address for all Trustees and Officers is 601 Congress Street, Boston, Massachusetts 02210-2805.
The Statement of Additional Information of the Fund includes additional information about members of the Board of Trustees of the Fund and is available without charge, upon request, by calling 1-800-225-5291.
| |
| Annual report | Fundamental All Cap Core Fund 37 |
More information
| |
| Trustees | Investment adviser |
| James M. Oates, Chairman | John Hancock Investment Management |
| James R. Boyle† | Services, LLC |
| Charles L. Bardelis* | |
| Peter S. Burgess* | Subadviser |
| Grace K. Fey | John Hancock Asset Management a division of |
| Theron S. Hoffman | Manulife Asset Management (US) LLC |
| Hassell H. McClellan | |
| | Principal distributor |
| Officers | John Hancock Funds, LLC |
| Hugh McHaffie | |
| President | Custodian |
| | State Street Bank and Trust Company |
| Thomas M. Kinzler | |
| Secretary and Chief Legal Officer | Transfer agent |
| | John Hancock Signature Services, Inc. |
| Francis V. Knox, Jr. | |
| Chief Compliance Officer | Legal counsel |
| | K&L Gates LLP |
| Michael J. Leary | |
| Treasurer | Independent registered |
| | public accounting firm |
| Charles A. Rizzo | PricewaterhouseCoopers LLP |
| Chief Financial Officer | |
| | |
| John G. Vrysen | |
| Chief Operating Officer | |
| |
| *Member of the Audit Committee | |
| †Non-Independent Trustee | |
The Fund’s proxy voting policies and procedures, as well as the Fund’s proxy voting record for the most recent twelve-month period ended June 30, are available free of charge on the Securities and Exchange Commission (SEC) Web site at www.sec.gov or on our Web site.
The Fund’s complete list of portfolio holdings, for the first and third fiscal quarters, is filed with the SEC on Form N-Q. The Fund’s Form N-Q is available on our Web site and the SEC’s Web site, www.sec.gov, and can be reviewed and copied (for a fee) at the SEC’s Public Reference Room in Washington, DC. Call 1-202-551-8090 to receive information on the operation of the SEC’s Public Reference Room.
We make this information on your fund, as well as monthly portfolio holdings, and other fund details available on our Web site at www.jhfunds.com or by calling 1-800-225-5291.
| | |
| You can also contact us: | | |
| 1-800-225-5291 | Regular mail: | Express mail: |
| jhfunds.com | John Hancock Signature Services, Inc. | John Hancock Signature Services, Inc. |
| | P.O. Box 55913 | Mutual Fund Image Operations |
| | Boston, MA 02205-5913 | 30 Dan Road |
| | | Canton, MA 02021 |
| |
| 38 Fundamental All Cap Core Fund | Annual report |

1-800-225-5291
1-800-554-6713 TDD
1-800-338-8080 EASI-Line
www.jhfunds.com
Now available: electronic delivery
www.jhfunds.com/edelivery
| |
| This report is for the information of the shareholders of John Hancock Fundamental All Cap Core Fund. | 376A 7/12 |
| It is not authorized for distribution to prospective investors unless preceded or accompanied by a prospectus. | 9/12 |

A look at performance
Total returns for the period ended July 31, 2012
| | | | | | | | | |
| | Average annual total returns (%) | | Cumulative total returns (%) | |
| | with maximum sales charge | | | with maximum sales charge | |
|
| | | | Since | | | | | Since |
| | 1-year | 5-year | 10-year | inception 1 | | 1-year | 5-year | 10-year | inception 1 |
|
| Class A | 1.74 | — | — | –0.86 | | 1.74 | — | — | –1.01 |
|
| Class I2 | 7.58 | — | — | 4.08 | | 7.58 | — | — | 4.78 |
|
Performance figures assume all distributions are reinvested. Figures reflect maximum sales charges on Class A shares of 5.00%.
The expense ratios of the Fund, both net (including any fee waivers or expense limitations) and gross (excluding any fee waivers or expense limitations), are set forth according to the most recent publicly available prospectuses for the Fund and may differ from those disclosed in the Financial highlights tables in this report. The fee waivers and expense limitations are contractual at least until 12-31-12 for Class A and Class I shares. Had the fee waivers and expense limitations not been in place gross expenses would apply. The expense ratios are as follows:
| | | | | | | | |
| | Class A | Class I | | | | | | |
| Net (%) | 1.30 | 0.84 | | | | | | |
| Gross (%) | 3.82 | 3.99 | | | | | | |
Expenses have been estimated for the Fund’s first full year of operations.
The returns reflect past results and should not be considered indicative of future performance. The return and principal value of an investment will fluctuate so that shares, when redeemed, may be worth more or less than their original cost. Due to market volatility, the Fund’s current performance may be higher or lower than the performance shown. For current to the most recent month-end performance data, please call 1-800-225-5291 or visit the Fund’s Web site at www.jhfunds.com.
The performance table above and the chart on the next page do not reflect the deduction of taxes that a shareholder may pay on fund distributions or on the redemption of fund shares. The Fund’s performance results reflect any applicable fee waivers or expense reductions, without which the expenses would increase and results would have been less favorable.
| |
| 6 | Fundamental Large Cap Core Fund | Annual report |
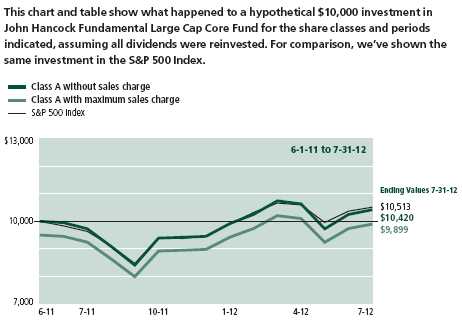
| | | | | | |
| | | Without | With maximum | | | |
| | Start date | sales charge | sales charge | Index | | |
| | |
| Class I 2 | 6-1-11 | $10,478 | $10,478 | $10,513 | | |
| | |
S&P 500 Index is an unmanaged index that includes 500 widely traded common stocks.
It is not possible to invest directly in an index. Index figures do not reflect expenses, which would have resulted in lower values if they did.
1 From 6-1-11.
2 For certain types of investors as described in the Fund’s Class I share prospectus.
| |
| Annual report | Fundamental Large Cap Core Fund | 7 |
Management’s discussion of
Fund performance
By John Hancock Asset Management a division of Manulife Asset Management (US) LLC
The stock market finished the year ended July 31, 2012 with a solid gain, despite a rough start last summer when double-dip recession fears, Europe’s sovereign debt crisis, the federal budget deficit debate and Standard & Poor’s historic U.S. credit rating downgrade pushed the market sharply lower. Subsequent signs of stabilization in Europe and encouraging economic data at home triggered a market rally from October into the early months of the new year. By spring, however, mounting concerns about Europe were pressuring markets worldwide. Stocks rebounded in late June as the European Central Bank took steps to avert a financial crisis, but then bounced around for much of July. Despite the year’s gyrations, the S&P 500 Index managed a 9.13% return for the 12-month period.
Over the same period, John Hancock Fundamental Large Cap Core Fund’s Class A shares returned 7.09%, excluding sales charges, trailing its benchmark, the S&P 500 Index, but beating the 2.56% average return of its peer group, the Morningstar, Inc. large growth category. Sector allocations — particularly not having exposure to the better performing telecommunications and utilities sectors — hampered results versus the benchmark index. Individual detractors included shale gas producer Ultra Petroleum Corp. and exploration and production company Apache Corp., whose stocks were hurt by the decline in energy commodity prices. The Fund also lost ground from not owning leading index component Apple, Inc. as the success of its strong product line drove steep stock price gains. We later added a position in the stock. Top contributors included biotechnology leader Amgen, Inc., whose dividend increase and share buyback program attracted investors and drove the stock sharply higher. Housing-related stocks, including home-builder Lennar Corp., also rallied nicely, benefiting from a pickup in housing orders and real estate prices in the second half of the period.
This commentary reflects the views of the portfolio managers through the end of the period discussed in this report. The managers’ statements reflect their own opinions. As such, they are in no way guarantees of future events and are not intended to be used as investment advice or a recommendation regarding any specific security. They are also subject to change at any time as market and other conditions warrant.
Past performance is no guarantee of future results.
Large company stocks as a group could fall out of favor with the market, causing the Fund to underperform. The prices of medium and small company stocks can change more frequently and dramatically than those of large company stocks. Foreign investing, especially in emerging markets, has additional risks such as currency and market volatility and political and social instability. Hedging and other strategic transactions may increase volatility of a fund and, if the transaction is not successful, could result in a significant loss. If the fund invests in illiquid securities, it may be difficult to sell them at a price approximating their value. For additional information on these and other risk considerations, please see the Fund’s prospectus.
Sector investing is subject to greater risks than the market as a whole. Because the Fund may focus on particular sectors of the economy, its performance may depend on the performance of those sectors.
| |
| 8 | Fundamental Large Cap Core Fund | Annual report |
Your expenses
These examples are intended to help you understand your ongoing operating expenses of investing in the Fund so you can compare these costs with the ongoing costs of investing in other mutual funds.
Understanding fund expenses
As a shareholder of the Fund, you incur two types of costs:
▪ Transaction costs which include sales charges (loads) on purchases or redemptions (varies by share class), minimum account fee charge, etc.
▪ Ongoing operating expenses including management fees, distribution and service fees (if applicable), and other fund expenses.
We are going to present only your ongoing operating expenses here.
Actual expenses/actual returns
This example is intended to provide information about the Fund’s actual ongoing operating expenses, and is based on the Fund’s actual return. It assumes an account value of $1,000.00 on February 1, 2012 with the same investment held until July 31, 2012.
| | | |
| | Account value | Ending value | Expenses paid during |
| | on 2-1-12 | on 7-31-12 | period ended 7-31-121 |
|
| Class A | $1,000.00 | $1,050.80 | $6.63 |
|
| Class I | 1,000.00 | 1,053.80 | 4.29 |
|
Together with the value of your account, you may use this information to estimate the operating expenses that you paid over the period. Simply divide your account value at July 31, 2012, by $1,000.00, then multiply it by the “expenses paid” for your share class from the table above. For example, for an account value of $8,600.00, the operating expenses should be calculated as follows:
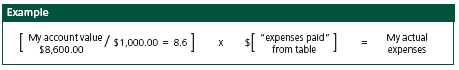
| |
| Annual report | Fundamental Large Cap Core Fund | 9 |
Your expenses
Hypothetical example for comparison purposes
This table allows you to compare the Fund’s ongoing operating expenses with those of any other fund. It provides an example of the Fund’s hypothetical account values and hypothetical expenses based on each class’s actual expense ratio and an assumed 5% annualized return before expenses (which is not the Fund’s actual return). It assumes an account value of $1,000.00 on February 1, 2012, with the same investment held until July 31, 2012. Look in any other fund shareholder report to find its hypothetical example and you will be able to compare these expenses.
| | | |
| | Account value | Ending value | Expenses paid during |
| | on 2-1-12 | on 7-31-12 | period ended 7-31-121 |
|
| Class A | $1,000.00 | $1,018.40 | $6.52 |
|
| Class I | 1,000.00 | 1,020.70 | 4.22 |
|
Remember, these examples do not include any transaction costs, therefore, these examples will not help you to determine the relative total costs of owning different funds. If transaction costs were included, your expenses would have been higher. See the prospectus for details regarding transaction costs.
1 Expenses are equal to the Fund’s annualized expense ratio of 1.30% and 0.84% for Class A and Class I shares, respectively, multiplied by the average account value over the period, multiplied by 182/366 (to reflect the one-half year period).
| |
| 10 | Fundamental Large Cap Core Fund | Annual report |
Portfolio summary
| | | | |
| Top 10 Holdings (38.7% of Net Assets on 7-31-12)1,2 | | | |
|
| Amazon.com, Inc. | 6.2% | | Google, Inc., Class A | 3.3% |
| |
|
| QUALCOMM, Inc. | 5.7% | | Ancestry.com, Inc. | 3.2% |
| |
|
| Apple, Inc. | 4.2% | | Lennar Corp., Class A | 2.9% |
| |
|
| JPMorgan Chase & Company | 4.1% | | Lowe’s Companies, Inc. | 2.8% |
| |
|
| Amgen, Inc. | 3.6% | | T. Rowe Price Group, Inc. | 2.7% |
| |
|
| |
| Sector Composition1,3 | | | | |
|
| Information Technology | 26.5% | | Consumer Staples | 6.6% |
| |
|
| Financials | 17.6% | | Industrials | 6.4% |
| |
|
| Consumer Discretionary | 16.9% | | Materials | 1.5% |
| |
|
| Energy | 11.8% | | Other | 1.7% |
| |
|
| Health Care | 11.0% | | | |
| | |
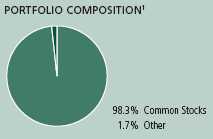
1 As a percentage of net assets on 7-31-12.
2 Cash and cash equivalents not included.
3 Sector investing is subject to greater risks than the market as a whole. Because the Fund may focus on particular sectors of the economy, its performance may depend on the performance of those sectors.
| |
| Annual report | Fundamental Large Cap Core Fund | 11 |
Fund’s investments
As of 7-31-12
| | |
| | Shares | Value |
| |
| Common Stocks 98.3% | | $3,982,680 |
|
| (Cost $3,812,397) | | |
| | | |
| Consumer Discretionary 16.9% | | 685,907 |
| | | |
| Household Durables 2.9% | | |
|
| Lennar Corp., Class A | 3,963 | 115,758 |
| | | |
| Internet & Catalog Retail 6.5% | | |
|
| Amazon.com, Inc. (I) | 1,069 | 249,397 |
|
| Blue Nile, Inc. (I) | 551 | 14,149 |
| | | |
| Media 3.0% | | |
|
| Omnicom Group, Inc. | 1,609 | 80,739 |
|
| The Walt Disney Company | 835 | 41,032 |
| | | |
| Multiline Retail 0.7% | | |
|
| Target Corp. | 490 | 29,719 |
| | | |
| Specialty Retail 3.8% | | |
|
| Lowe’s Companies, Inc. | 4,483 | 113,734 |
|
| The Home Depot, Inc. | 793 | 41,379 |
| | | |
| Consumer Staples 6.6% | | 266,032 |
| | | |
| Beverages 5.4% | | |
|
| Diageo PLC, ADR | 716 | 76,540 |
|
| PepsiCo, Inc. | 1,340 | 97,458 |
|
| SABMiller PLC | 1,061 | 45,674 |
| | | |
| Tobacco 1.2% | | |
|
| Philip Morris International, Inc. | 507 | 46,360 |
| | | |
| Energy 11.8% | | 477,138 |
| | | |
| Energy Equipment & Services 4.3% | | |
|
| National Oilwell Varco, Inc. | 885 | 63,986 |
|
| Schlumberger, Ltd. | 1,527 | 108,814 |
| | | |
| Oil, Gas & Consumable Fuels 7.5% | | |
|
| Apache Corp. | 1,071 | 92,235 |
|
| Chevron Corp. | 380 | 41,640 |
|
| Exxon Mobil Corp. | 495 | 42,991 |
|
| Occidental Petroleum Corp. | 887 | 77,196 |
|
| Ultra Petroleum Corp. (I) | 2,116 | 50,276 |
| | |
| 12 | Fundamental Large Cap Core Fund | Annual report | See notes to financial statements |
| | |
| | Shares | Value |
| | | |
| Financials 17.6% | | $713,233 |
| | | |
| Capital Markets 6.3% | | |
|
| State Street Corp. | 1,347 | 54,392 |
|
| T. Rowe Price Group, Inc. | 1,828 | 111,051 |
|
| The Goldman Sachs Group, Inc. | 886 | 89,397 |
| | | |
| Commercial Banks 1.9% | | |
|
| Wells Fargo & Company | 2,222 | 75,126 |
| | | |
| Consumer Finance 1.1% | | |
|
| American Express Company | 799 | 46,110 |
| | | |
| Diversified Financial Services 6.6% | | |
|
| Bank of America Corp. | 13,918 | 102,158 |
|
| JPMorgan Chase & Company | 4,559 | 164,124 |
| | | |
| Insurance 1.7% | | |
|
| Prudential Financial, Inc. | 1,468 | 70,875 |
| | | |
| Health Care 11.0% | | 445,405 |
| | | |
| Biotechnology 3.6% | | |
|
| Amgen, Inc. | 1,780 | 147,028 |
| | | |
| Health Care Equipment & Supplies 1.6% | | |
|
| Medtronic, Inc. | 1,635 | 64,452 |
| | | |
| Health Care Providers & Services 1.3% | | |
|
| Amsurg Corp. (I) | 1,783 | 52,670 |
| | | |
| Pharmaceuticals 4.5% | | |
|
| Merck & Company, Inc. | 2,177 | 96,158 |
|
| Novartis AG, ADR | 661 | 38,748 |
|
| Pfizer, Inc. | 1,928 | 46,349 |
| | | |
| Industrials 6.4% | | 258,317 |
| | | |
| Air Freight & Logistics 2.0% | | |
|
| United Parcel Service, Inc., Class B | 1,052 | 79,542 |
| | | |
| Industrial Conglomerates 2.0% | | |
|
| General Electric Company | 3,996 | 82,917 |
| | | |
| Professional Services 2.4% | | |
|
| Robert Half International, Inc. | 3,549 | 95,858 |
| | | |
| Information Technology 26.5% | | 1,075,360 |
| | | |
| Communications Equipment 8.2% | | |
|
| Cisco Systems, Inc. | 6,278 | 100,134 |
|
| QUALCOMM, Inc. | 3,890 | 232,155 |
| | | |
| Computers & Peripherals 4.2% | | |
|
| Apple, Inc. | 280 | 171,013 |
| | | |
| Internet Software & Services 6.5% | | |
|
| Ancestry.com, Inc. (I) | 3,865 | 129,362 |
|
| Google, Inc., Class A (I) | 209 | 132,291 |
| | | |
| IT Services 3.5% | | |
|
| Broadridge Financial Solutions, Inc. | 2,504 | 53,010 |
|
| Visa, Inc., Class A | 689 | 88,929 |
| | |
| See notes to financial statements | Annual report | Fundamental Large Cap Core Fund | 13 |
| | |
| | Shares | Value |
| | | |
| Software 4.1% | | |
|
| FactSet Research Systems, Inc. | 887 | $82,456 |
|
| Oracle Corp. | 2,848 | 86,010 |
| | | |
| Materials 1.5% | | 61,288 |
| | | |
| Chemicals 1.5% | | |
|
| Air Products & Chemicals, Inc. | 762 | 61,288 |
| |
| Total investments (Cost $3,812,397)† 98.3% | | $3,982,680 |
|
| |
| Other assets and liabilities, net 1.7% | | $68,280 |
|
| |
| Total net assets 100.0% | | $4,050,960 |
|
The percentage shown for each investment category is the total value of the category as a percentage of net assets of the Fund.
ADR American Depositary Receipts
(I) Non-income producing security.
† At 7-31-12, the aggregate cost of investment securities for federal income tax purposes was $3,842,182. Net unrealized appreciation aggregated $140,498 of which $331,397 related to appreciated investment securities and $190,899 related to depreciated investment securities.
| | |
| 14 | Fundamental Large Cap Core Fund | Annual report | See notes to financial statements |
F I N A N C I A L S T A T E M E N T S
Financial statements
Statement of assets and liabilities 7-31-12
This Statement of assets and liabilities is the Fund’s balance sheet. It shows the value of what the Fund owns, is due and owes. You’ll also find the net asset value and the maximum offering price per share.
| |
| Assets | |
|
| Investments, at value (Cost $3,812,397) | $3,982,680 |
| Cash | 152,204 |
| Receivable for investments sold | 11,507 |
| Receivable for fund shares sold | 2,623 |
| Dividends receivable | 1,973 |
| Receivable due from adviser | 803 |
| Other receivables and prepaid expenses | 16,859 |
| | |
| Total assets | 4,168,649 |
| |
| Liabilities | |
|
| Payable to affiliates | |
| Accounting and legal services fees | 37 |
| Transfer agent fees | 1,012 |
| Trustees’ fees | 4 |
| Other liabilities and accrued expenses | 116,636 |
| | |
| Total liabilities | 117,689 |
| |
| Net assets | |
|
| Paid-in capital | $3,887,443 |
| Undistributed net investment income | 8,194 |
| Accumulated net realized gain (loss) on investments and foreign | |
| currency transactions | (14,960) |
| Net unrealized appreciation (depreciation) on investments | 170,283 |
| | |
| Net assets | $4,050,960 |
| |
| Net asset value per share | |
|
| Based on net asset values and shares outstanding — the Fund has an | |
| unlimited number of shares authorized with no par value | |
| Class A ($2,918,992 ÷ 281,945 shares) | $10.35 |
| Class I ($1,131,968 ÷ 109,021 shares) | $10.38 |
| |
| Maximum offering price per share | |
|
| Class A (net asset value per share ÷ 95%)1 | $10.89 |
1 On single retail sales of less than $50,000. On sales of $50,000 or more and on group sales the offering price is reduced.
| | |
| See notes to financial statements | Annual report | Fundamental Large Cap Core Fund | 15 |
F I N A N C I A L S T A T E M E N T S
Statement of operations For the year ended 7-31-12
This Statement of operations summarizes the Fund’s investment income earned and expenses incurred in operating the Fund. It also shows net gains (losses) for the period stated.
| |
| Investment income | |
|
| Dividends | $61,718 |
| Less foreign taxes withheld | (206) |
| | |
| Total investment income | 61,512 |
| |
| Expenses | |
|
| Investment management fees | 25,288 |
| Distribution and service fees | 7,391 |
| Accounting and legal services fees | 492 |
| Transfer agent fees | 6,236 |
| Trustees’ fees | 28 |
| State registration fees | 55,504 |
| Printing and postage | 3,575 |
| Professional fees | 42,944 |
| Custodian fees | 12,028 |
| Registration and filing fees | 71,065 |
| Other | 7,649 |
| | |
| Total expenses | 232,200 |
| Less expense reductions | (191,568) |
| | |
| Net expenses | 40,632 |
| | |
| Net investment income | 20,880 |
| |
| Realized and unrealized gain (loss) | |
|
| Net realized gain (loss) on | |
| Investments | (14,069) |
| Foreign currency transactions | 26 |
| | |
| | (14,043) |
| Change in net unrealized appreciation (depreciation) of | |
| Investments | 263,704 |
| |
| Net realized and unrealized gain | 249,661 |
| | |
| Increase in net assets from operations | $270,541 |
| | |
| 16 | Fundamental Large Cap Core Fund | Annual report | See notes to financial statements |
F I N A N C I A L S T A T E M E N T S
Statements of changes in net assets
These Statements of changes in net assets show how the value of the Fund’s net assets has changed during the last two periods. The difference reflects earnings less expenses, any investment gains and losses, distributions, if any, paid to shareholders and the net of Fund share transactions.
| | |
| | Year | Period |
| | ended | ended |
| | 7-31-12 | 7-31-111 |
| |
| Increase (decrease) in net assets | | |
|
| From operations | | |
| Net investment income | $20,880 | $307 |
| Net realized gain (loss) | (14,043) | 10,880 |
| Change in net unrealized appreciation (depreciation) | 263,704 | (93,421) |
| | | |
| Increase (decrease) in net assets resulting from operations | 270,541 | (82,234) |
| | | |
| Distributions to shareholders | | |
| From net investment income | | |
| Class A | (7,730) | — |
| Class I | (6,671) | — |
| From net realized gain | | |
| Class A | (7,947) | — |
| Class I | (3,824) | — |
| | | |
| Total distributions | (26,172) | — |
| | | |
| From Fund share transactions | 710,675 | 3,178,150 |
| | | |
| Total increase | 955,044 | 3,095,916 |
| |
| Net assets | | |
|
| Beginning of year | 3,095,916 | — |
| | | |
| End of year | $4,050,960 | $3,095,916 |
| | | |
| Undistributed net investment income | $8,194 | $1,240 |
1 Period from 6-1-11 (commencement of operations) to 7-31-11.
| | |
| See notes to financial statements | Annual report | Fundamental Large Cap Core Fund | 17 |
Financial highlights
The Financial highlights show how the Fund’s net asset value for a share has changed during the period.
| | | | | | |
| CLASS A SHARES Period ended | | | | | 7-31-12 | 7-31-111 |
| |
| Per share operating performance | | | | | | |
|
| Net asset value, beginning of period | | | | | $9.73 | $10.00 |
| Net investment income2 | | | | | 0.04 | —3 |
| Net realized and unrealized gain (loss) on investments | | | | | 0.64 | (0.27) |
| Total from investment operations | | | | | 0.68 | (0.27) |
| Less distributions | | | | | | |
| From net investment income | | | | | (0.03) | — |
| From net realized gain | | | | | (0.03) | — |
| Total distributions | | | | | (0.06) | — |
| Net asset value, end of period | | | | | $10.35 | $9.73 |
| Total return (%)4,5 | | | | | 7.09 | (2.70)6 |
| |
| Ratios and supplemental data | | | | | | |
|
| Net assets, end of period (in millions) | | | | | $3 | $2 |
| Ratios (as a percentage of average net assets): | | | | | | |
| Expenses before reductions and amounts recaptured | | | | | 6.29 | 5.957 |
| Expenses including reductions and amounts recaptured | | | | | 1.30 | 1.307 |
| Net investment income (loss) | | | | | 0.46 | (0.12)7 |
| Portfolio turnover (%) | | | | | 40 | 4 |
1 Period from 6-1-11 (commencement of operations) to 7-31-11.
2 Based on the average daily shares outstanding.
3 Less than ($0.005) per share.
4 Does not reflect the effect of sales charges, if any.
5 Total returns would have been lower had certain expenses not been reduced during the period shown.
6 Not annualized.
7 Annualized.
| | |
| 18 | Fundamental Large Cap Core Fund | Annual report | See notes to financial statements |
| | | | | | |
| CLASS I SHARES Period ended | | | | | 7-31-12 | 7-31-111 |
| |
| Per share operating performance | | | | | | |
|
| Net asset value, beginning of period | | | | | $9.74 | $10.00 |
| Net investment income2 | | | | | 0.09 | 0.01 |
| Net realized and unrealized gain (loss) on investments | | | | | 0.64 | (0.27) |
| Total from investment operations | | | | | 0.73 | (0.26) |
| Less distributions | | | | | | |
| From net investment income | | | | | (0.06) | — |
| From net realized gain | | | | | (0.03) | — |
| Total distributions | | | | | (0.09) | — |
| Net asset value, end of period | | | | | $10.38 | $9.74 |
| Total return (%)3 | | | | | 7.58 | (2.60)4 |
| |
| Ratios and supplemental data | | | | | | |
|
| Net assets, end of period (in millions) | | | | | $1 | $1 |
| Ratios (as a percentage of average net assets): | | | | | | |
| Expenses before reductions and amounts recaptured | | | | | 7.53 | 5.615 |
| Expenses including reductions and amounts recaptured | | | | | 0.84 | 0.845 |
| Net investment income | | | | | 0.93 | 0.365 |
| Portfolio turnover (%) | | | | | 40 | 4 |
1 Period from 6-1-11 (commencement of operations) to 7-31-11.
2 Based on the average daily shares outstanding.
3 Total returns would have been lower had certain expenses not been reduced during the period shown.
4 Not annualized.
5 Annualized.
| | |
| See notes to financial statements | Annual report | Fundamental Large Cap Core Fund | 19 |
Notes to financial statements
Note 1 — Organization
John Hancock Fundamental Large Cap Core Fund (the Fund) is a series of John Hancock Funds II (the Trust), an open-end management investment company organized as a Massachusetts business trust and registered under the Investment Company Act of 1940, as amended (the 1940 Act). The investment objective of the Fund is to seek long-term capital appreciation.
The Fund may offer multiple classes of shares. The shares currently offered are detailed in the Statement of assets and liabilities. Class A shares are offered to all investors. Class I shares are offered to institutions and certain investors. Shareholders of each class have exclusive voting rights to matters that affect that class. The distribution and service fees, if any, transfer agent fees, printing and postage and state registration fees for each class may differ.
Note 2 — Significant accounting policies
The financial statements have been prepared in conformity with accounting principles generally accepted in the United States of America, which require management to make certain estimates and assumptions at the date of the financial statements. Actual results could differ from those estimates. Events or transactions occurring after the end of the fiscal period through the date that the financial statements were issued have been evaluated in the preparation of the financial statements. The following summarizes the significant accounting policies of the Fund:
Security valuation. Investments are stated at value as of the close of regular trading on the New York Stock Exchange (NYSE), normally at 4:00 P.M., Eastern Time. In order to value the securities, the Fund uses the following valuation techniques: Equity securities held by the Fund are valued at the last sale price or official closing price on the principal securities exchange on which they trade. In the event there were no sales during the day or closing prices are not available, then securities are valued using the last quoted bid or evaluated price. Certain securities traded only in the over-the-counter market are valued at the last bid price quoted by brokers making markets in the securities at the close of trading. Other portfolio securities and assets, where market quotations are not readily available, are valued at fair value, as determined in good faith by the Fund’s Pricing Committee, following procedures established by the Board of Trustees.
The Fund uses a three-tier hierarchy to prioritize the pricing assumptions, referred to as inputs, used in valuation techniques to measure fair value. Level 1 includes securities valued using quoted prices in active markets for identical securities. Level 2 includes securities valued using significant observable inputs. Observable inputs may include quoted prices for similar securities, interest rates, prepayment speeds and credit risk. Prices for securities valued using these inputs are received from independent pricing vendors and brokers and are based on an evaluation of the inputs described. Level 3 includes securities valued using significant unobservable inputs when market prices are not readily available or reliable, including the Fund’s own assumptions in determining the fair value of investments. Factors used in determining value may include market or issuer specific events, changes in interest rates and credit quality. The inputs or methodology used for valuing securities are not necessarily an indication of the risks associated with investing in those securities. Changes in valuation techniques may result in transfers into or out of an assigned level within the disclosure hierarchy.
| |
| 20 | Fundamental Large Cap Core Fund | Annual report |
The following is a summary of the values by input classification of the Fund’s investments as of July 31, 2012, by major security category or type:
| | | | |
| | | | | LEVEL 3 |
| | | | LEVEL 2 | SIGNIFICANT |
| | TOTAL MARKET | LEVEL 1 | SIGNIFICANT | UNOBSERVABLE |
| | VALUE AT 7-31-12 | QUOTED PRICE | OBSERVABLE INPUTS | INPUTS |
|
| Common Stocks | | | | |
| Consumer Discretionary | $685,907 | $685,907 | — | — |
| Consumer Staples | 266,032 | 220,358 | $45,674 | — |
| Energy | 477,138 | 477,138 | — | — |
| Financials | 713,233 | 713,233 | — | — |
| Health Care | 445,405 | 445,405 | — | — |
| Industrials | 258,317 | 258,317 | — | — |
| Information Technology | 1,075,360 | 1,075,360 | — | — |
| Materials | 61,288 | 61,288 | — | — |
| |
|
| Total Investments in | | | | |
| Securities | $3,982,680 | $3,937,006 | $45,674 | — |
Security transactions and related investment income. Investment security transactions are accounted for on a trade date plus one basis for daily net asset value calculations. However, for financial reporting purposes, investment transactions are reported on trade date. Dividend income is recorded on the ex-date. Gains and losses on securities sold are determined on the basis of identified cost and may include proceeds from litigation.
Line of credit. The Fund may borrow from banks for temporary or emergency purposes, including meeting redemption requests that otherwise might require the untimely sale of securities. Pursuant to the custodian agreement, the custodian may loan money to the Fund to make properly authorized payments. The Fund is obligated to repay the custodian for any overdraft, including any related costs or expenses. The custodian may have a lien, security interest or security entitlement in any Fund property that is not otherwise segregated or pledged, to the maximum extent permitted by law, to the extent of any overdraft.
In addition, the Fund and other affiliated funds have entered into an agreement with Citibank N.A. which enables them to participate in a $200 million unsecured committed line of credit. A commitment fee, payable at the end of each calendar quarter, based on the average daily unused portion of the line of credit, is charged to each participating fund on a pro rata basis and is reflected in other expenses on the Statement of operations. For the year ended July 31, 2012, the Fund had no borrowings under the line of credit.
Expenses. Within the John Hancock Funds complex, expenses that are directly attributable to an individual fund are allocated to such fund. Expenses that are not readily attributable to a specific fund are allocated among all funds in an equitable manner, taking into consideration, among other things, the nature and type of expense and the fund’s relative net assets. Expense estimates are accrued in the period to which they relate and adjustments are made when actual amounts are known.
Class allocations. Income, common expenses and realized and unrealized gains (losses) are determined at the fund level and allocated daily to each class of shares based on the net assets of the class. Class-specific expenses, such as distribution and service fees, if any, transfer agent fees, state registration fees and printing and postage, for all classes, are calculated daily at the class level based on the appropriate net assets of each class and the specific expense rates applicable to each class.
| |
| Annual report | Fundamental Large Cap Core Fund | 21 |
Federal income taxes. The Fund intends to continue to qualify as a regulated investment company by complying with the applicable provisions of the Internal Revenue Code and will not be subject to federal income tax on taxable income that is distributed to shareholders. Therefore, no federal income tax provision is required.
As of July 31, 2012, the Fund had no uncertain tax positions that would require financial statement recognition, derecognition or disclosure. The Fund’s federal tax returns are subject to examination by the Internal Revenue Service for a period of three years.
Distribution of income and gains. Distributions to shareholders from net investment income and net realized gains, if any, are recorded on the ex-date. The Fund generally declares and pays dividends and capital gain distributions, if any, annually.
The tax character of distributions for the year ended July 31, 2012 was ordinary income of $26,172.
Distributions paid by the Fund with respect to each class of shares are calculated in the same manner, at the same time and in the same amount, except for the effect of class level expenses that may be applied differently to each class. As of July 31, 2012, the components of distributable earnings on a tax basis consisted of $23,019 of undistributed ordinary income.
Such distributions and distributable earnings, on a tax basis, are determined in conformity with income tax regulations, which may differ from accounting principles generally accepted in the United States of America. Material distributions in excess of tax basis earnings and profits, if any, are reported in the Fund’s financial statements as a return of capital.
Capital accounts within the financial statements are adjusted for permanent book-tax differences. These adjustments have no impact on net assets or the results of operations. Temporary book-tax differences, if any, will reverse in a subsequent period. Book-tax differences are primarily attributable to wash sale deferrals.
Note 3 — Guarantees and indemnifications
Under the Fund’s organizational documents, its Officers and Trustees are indemnified against certain liabilities arising out of the performance of their duties to the Fund. Additionally, in the normal course of business, the Fund enters into contracts with service providers that contain general indemnification clauses. The Fund’s maximum exposure under these arrangements is unknown, as this would involve future claims that may be made against the Fund that have not yet occurred. The risk of material loss from such claims is considered remote.
Note 4 — Fees and transactions with affiliates
John Hancock Investment Management Services, LLC (the Adviser) serves as investment adviser for the Fund. John Hancock Funds, LLC (the Distributor), an affiliate of the Adviser, serves as principal underwriter of the Fund. The Adviser and the Distributor are indirect wholly owned subsidiaries of Manulife Financial Corporation (MFC).
Management fee. The Fund has an investment management agreement with the Adviser under which the Fund pays a daily management fee to the Adviser equivalent, on an annual basis, to the sum of: a) 0.725% of the first $500,000,000 of the Fund’s average daily net assets; b) 0.700% of the next $500,000,000; c) 0.675% of the next $500,000,000; and d) 0.650% of the Fund’s average daily net assets in excess of $1,500,000,000. The Adviser has a subadvisory agreement with John Hancock Asset Management a division of Manulife Asset Management (US) LLC, an indirectly owned subsidiary of MFC and an affiliate of the Adviser. The Fund is not responsible for payment of the subadvisory fees.
| |
| 22 | Fundamental Large Cap Core Fund | Annual report |
The Adviser has contractually agreed to waive a portion of its management fee for certain funds (the Participating Portfolios) of the Trust and John Hancock Variable Insurance Trust. The waiver equals, on an annualized basis, 0.01% of that portion of the aggregate net assets of all the Participating Portfolios that exceeds $75 billion but is less than $100 billion; and 0.015% of that portion of the aggregate net assets of all the Participating Portfolios that equals or exceeds $100 billion. The amount of the reimbursement is calculated daily and allocated among all the Participating Portfolios in proportion to the daily net assets of each fund. This arrangement may be amended or terminated at any time by the Adviser upon notice to the funds and with the approval of the Board of Trustees.
The Adviser has contractually agreed to waive fees and/or reimburse certain expenses for each share class of the Fund. This agreement excludes interest expense, brokerage commissions, litigation and indemnification expenses, taxes and other extraordinary expenses not incurred in the ordinary course of the Fund’s business. The fee waivers and/or reimbursements were such that these expenses would not exceed 1.30% and 0.84% of average net assets for Class A and Class I shares, respectively. The fee waivers and/or reimbursements will continue in effect until December 31, 2012, unless renewed by mutual agreement of the Fund and the Adviser based upon a determination that this is appropriate under the circumstances at the time.
Additionally, the Adviser has voluntarily agreed to waive other fund level expenses excluding advisory fees, 12b-1 fees, transfer agent and service fees, state registration fees, taxes, printing and postage, interest expense, broker commissions, litigation, acquired fund fees and indemnification expenses and other extraordinary expenses not incurred in the ordinary course of the Fund’s business. The waivers are such that these expenses will not exceed 0.20% of average net assets. This voluntary expense reimbursement will continue in effect until terminated at any time by the Adviser on notice to the Fund.
Accordingly, the fee waivers and/or expense reimbursements described above amounted to $123,026 and $68,542 for Class A and Class I shares, respectively, for the year ended July 31, 2012.
The investment management fees, including the impact of the waivers and reimbursements described above, incurred for the year ended July 31, 2012 were equivalent to a net effective rate of 0.00% of the Fund’s average daily net assets.
Expense recapture. The Adviser may recapture operating expenses reimbursed or fees waived under previous expense limitation or waiver arrangements for a period of three years following the beginning of the month in which such reimbursements or waivers originally occurred to the extent that the Fund is below its expense limitation during this period. For the year ended July 31, 2012, the Fund did not recapture any expenses. The table below outlines the amount of waived or reimbursed expenses subject to potential recovery and the respective expiration dates. Certain reimbursements or waivers are not subject to recapture.
| | | | |
| | AMOUNTS ELIGIBLE FOR | AMOUNTS ELIGIBLE FOR | AMOUNTS ELIGIBLE FOR | AMOUNT RECOVERED |
| | RECOVERY THROUGH | RECOVERY THROUGH | RECOVERY THROUGH | DURING THE PERIOD |
| FUND | JULY 1, 2013 | JULY 1, 2014 | JULY 1, 2015 | ENDED JULY 31, 2012 |
|
| Fundamental Large | — | $23,241 | $191,450 | — |
| Cap Core Fund | | | | |
Accounting and legal services. Pursuant to a service agreement, the Fund reimburses the Adviser for all expenses associated with providing the administrative, financial, legal, accounting and recordkeeping services to the Fund, including the preparation of all tax returns, periodic reports to shareholders and regulatory reports, among other services. These expenses are allocated to each share class based on its relative net assets at the time the expense was incurred. These accounting and legal services fees incurred for the year ended July 31, 2012 amounted to an annual rate of 0.01% of the Fund’s average daily net assets.
| |
| Annual report | Fundamental Large Cap Core Fund | 23 |
Distribution and service plans. The Fund has a distribution agreement with the Distributor. The Fund has adopted distribution and service plans with respect to Class A pursuant to Rule 12b-1 under the 1940 Act, to pay the Distributor for services provided as the distributor of shares of the Fund. The Fund pays 0.30% for Class A shares for distribution and service fees, expressed as an annual percentage of average daily net assets.
Sales charges. Class A shares are assessed up-front sales charges, which resulted in payments to the Distributor amounting to $754 for the year ended July 31, 2012. Of this amount, $136 was retained and used for printing prospectuses, advertising, sales literature and other purposes and $618 was paid as sales commissions to broker-dealers.
Transfer agent fees. The Fund has a transfer agent agreement with John Hancock Signature Services, Inc. (Signature Services), an affiliate of the Adviser. The transfer agent fees paid to Signature Services are determined based on the cost to Signature Services (Signature Services Cost) of providing recordkeeping services. The Signature Services Cost includes a component of allocated John Hancock corporate overhead for providing transfer agent services to the Fund and to all other John Hancock affiliated funds. It also includes out-of-pocket expenses that are comprised of payments made to third-parties for recordkeeping services provided to their clients who invest in one or more John Hancock funds. In addition, Signature Services Cost may be reduced by certain fees that Signature Services receives in connection with retirement and small accounts. Signature Services Cost is calculated monthly and allocated, as applicable, to four categories of share classes: Institutional Share Classes, Retirement Share Classes, Municipal Bond Classes and all other Retail Share Classes. Within each of these categories, the applicable costs are allocated to the affected John Hancock affiliated funds and/or classes, based on the relative average daily net assets.
Class level expenses. Class level expenses for the year ended July 31, 2012 were:
| | | | |
| | DISTRIBUTION | TRANSFER | STATE | PRINTING AND |
| CLASS | AND SERVICE FEES | AGENT FEES | REGISTRATION FEES | POSTAGE |
|
| A | $7,391 | $5,052 | $27,752 | $2,206 |
| I | — | $1,184 | $27,752 | $1,369 |
| | | | | |
| Total | $7,391 | $6,236 | $55,504 | $3,575 |
Trustee expenses. The Trust compensates each Trustee who is not an employee of the Adviser or its affiliates. The costs of paying Trustee compensation and expenses are allocated to each fund based on its average daily net assets.
| |
| 24 | Fundamental Large Cap Core Fund | Annual report |
Note 5 — Fund share transactions
Transactions in Fund shares for the year ended July 31, 2012 and period ended July 31, 2011 were as follows:
| | | | |
| | Year ended 7-31-12 | Period ended 7-31-111 |
| | Shares | Amount | Shares | Amount |
| Class A shares | | | | |
|
| Sold | 138,949 | $1,350,466 | 202,555 | $2,023,250 |
| Distributions reinvested | 383 | 3,593 | — | — |
| Repurchased | (59,942) | (593,022) | — | — |
| | | | | |
| Net increase | 79,390 | $761,037 | 202,555 | $2,023,250 |
| |
| Class I shares | | | | |
|
| Sold | 31,664 | $323,806 | 115,490 | $1,154,900 |
| Distributions reinvested | 1,018 | 9,546 | — | — |
| Repurchased | (39,151) | (383,714) | — | — |
| | | | | |
| Net increase (decrease) | (6,469) | ($50,362) | 115,490 | $1,154,900 |
| |
| Net increase | 72,921 | $710,675 | 318,045 | $3,178,150 |
|
1 Period from 6-1-11 (commencement of operations) to 7-31-11.
Affiliates of the Fund owned 67% and 88% of shares of beneficial interest of Class A and Class I on July 31, 2012.
Note 6 — Purchase and sale of securities
Purchases and sales of securities, other than short-term securities, aggregated $2,142,451 and $1,378,460, respectively, for the year ended July 31, 2012.
| |
| Annual report | Fundamental Large Cap Core Fund | 25 |
Auditor’s report
Report of Independent Registered Public Accounting Firm
To the Board of Trustees of John Hancock Funds II and Shareholders of
John Hancock Fundamental Large Cap Core Fund:
In our opinion, the accompanying statement of assets and liabilities, including the schedule of investments, and the related statements of operations and of changes in net assets and the financial highlights present fairly, in all material respects, the financial position of John Hancock Fundamental Large Cap Core Fund (the “Fund”) at July 31, 2012, and the results of its operations, the changes in its net assets and the financial highlights for each of the periods indicated, in conformity with accounting principles generally accepted in the United States of America. These financial statements and financial highlights (hereafter referred to as “financial statements”) are the responsibility of the Fund’s management; our responsibility is to express an opinion on these financial statements based on our audits. We conducted our audits of these financial statements in accordance with the standards of the Public Company Accounting Oversight Board (United States). Those standards require that we plan and perform the audit to obtain reasonable assurance about whether the financial statements are free of material misstatement. An audit includes examining, on a test basis, evidence supporting the amounts and disclosures in the financial statements, assessing the accounting principles used and significant estimates made by management, and evaluating the overall financial statement presentation. We believe that our audits, which included confirmation of securities at July 31, 2012 by correspondence with the custodian, and the application of alternative auditing procedures where securities purchased confirmations had not been received, provide a reasonable basis for our opinion.
PricewaterhouseCoopers LLP
Boston, Massachusetts
September 24, 2012
| |
| 26 | Fundamental Large Cap Core Fund | Annual report |
Tax information
Unaudited
For federal income tax purposes, the following information is furnished with respect to the distributions of the Fund, if any, paid during its taxable year ended July 31, 2012.
The Fund reports the maximum amount allowable of its net taxable income as eligible for the corporate dividends-received deduction.
The Fund reports the maximum amount allowable of its net taxable income as qualified dividend income as provided in the Jobs and Growth Tax Relief Reconciliation Act of 2003.
Eligible shareholders will be mailed a 2012 Form 1099-DIV in early 2013. This will reflect the tax character of all distributions paid in calendar year 2012.
| |
| Annual report | Fundamental Large Cap Core Fund | 27 |
Evaluation of Advisory and Subadvisory Agreements by the Board of Trustees
This section describes the evaluation by the Board of Trustees (the Board) of the Advisory Agreement (the Advisory Agreement) and each of the Subadvisory Agreements and the Sub-Subadvisory Agreements (collectively, the Subadvisory Agreements) for each of the portfolios (the Funds) of John Hancock Funds II (the Trust) discussed in this report.
At in-person meetings held on May 24–25, 2012, the Board, including all of the Trustees who are not considered to be “interested persons” of the Trust under the Investment Company Act of 1940, as amended (the 1940 Act) (the Independent Trustees), approved for an annual period the continuation of the Advisory and Subadvisory Agreements with respect to each of the Funds.
Evaluation by the Board of Trustees
The Board, including the Independent Trustees, is responsible for selecting the Trust’s adviser, John Hancock Investment Management Services, LLC (the Adviser or JHIMS), approving the Adviser’s selection of subadvisers for each of the Funds (each a Subadviser, and collectively, the Subadvisers) and approving the Trust’s advisory and subadvisory (and any sub-subadvisory) agreements, their periodic continuation and any amendments. Consistent with Securities and Exchange Commission rules, the Board regularly evaluates the Trust’s advisory and subadvisory arrangements, including consideration of the factors listed below. The Board may also consider other factors (including conditions and trends prevailing generally in the economy, the securities markets and the industry) and does not treat any single factor as determinative, and each Trustee may attribute different weights to different factors. The Board is furnished with an analysis of its fiduciary obligations in connection with its evaluation and, throughout the evaluation process, the Board is assisted by counsel for the Trust and the Independent Trustees are also separately assisted by independent legal counsel. The factors considered by the Board are:
1. the nature, extent and quality of the services to be provided by the Adviser to the Trust and by the Subadvisers to the Funds;
2. the investment performance of the Funds and their Subadvisers;
3. the extent to which economies of scale would be realized as a Fund grows and whether fee levels reflect these economies of scale for the benefit of Fund shareholders;
4. the costs of the services to be provided and the profits to be realized by the Adviser and its affiliates (including any subadvisers that are affiliated with the Adviser) from the Adviser’s relationship with the Trust; and
5. comparative services rendered and comparative advisory and subadvisory fee rates.
The Board believes that information relating to all of these factors is relevant to its evaluation of the Trust’s advisory agreement. The Board also takes into account any indirect benefits expected to be derived by the Adviser and its affiliates and the Subadvisers and their affiliates from their relationships with the Funds. With respect to its evaluation of subadvisory agreements (including any sub-subadvisory agreements) with subadvisers not affiliated with the Adviser, the Board believes that, in view of the Trust’s “manager-of-managers” advisory structure, the costs of the services to be provided and the profits to be realized by those subadvisers that are not affiliated with the Adviser from their relationship with the Trust generally are not a material factor in the Board’s consideration of these subadvisory agreements because such fees are paid by the Adviser and not by the Funds and the Board relies on the ability of the Adviser to negotiate the subadvisory fees at arm’s length.
| |
| 28 | Fundamental Large Cap Core Fund | Annual report |
In evaluating subadvisory arrangements, the Board also considers other material business relationships that unaffiliated Subadvisers and their affiliates have with the Adviser or its affiliates, including the involvement by certain affiliates of certain Subadvisers in the distribution of financial products, including shares of the Trust, offered by the Adviser and other affiliates of the Adviser (Material Relationships).
Approval of Advisory and Subadvisory Agreements
At in-person meetings held on May 24–25, 2012, the Board, including all of the Independent Trustees, re-approved the Advisory Agreement and the applicable Subadvisory Agreements with respect to each of the Funds.
In considering the Advisory Agreement and the Subadvisory Agreements, the Board received in advance of the meeting a variety of materials relating to each Fund, the Adviser and each Subadviser, including comparative performance, fee and expense information for a peer group of similar mutual funds prepared by an independent third party provider of mutual fund data, including performance information for relevant benchmark indices and other information provided by the Adviser and the Subadvisers regarding the nature, extent and quality of services provided by the Adviser and the Subadvisers under their respective Agreements. The Board also took into account discussions with management and information provided to the Board in its meetings throughout the year with respect to the services provided by the Adviser and the Subadvisers to the Funds, including quarterly performance reports prepared by management containing reviews of investment results, and periodic presentations from the Subadvisers with respect to the Funds they manage. The Board noted the affiliation of certain of the Subadvisers with JHIMS, noting any potential conflicts of interest.
Throughout the process, the Trustees were afforded the opportunity to ask questions of and request additional information from management. The Independent Trustees also received a memorandum from their independent counsel discussing the legal standards for their consideration of the proposed continuation of the Agreements and discussed the proposed continuation of the Agreements in private sessions with their independent legal counsel at which no representatives of management were present.
Approval of Advisory Agreement
Among the information received by the Board from the Adviser relating to the nature, extent and quality of services provided to the Funds, the Board reviewed information provided by JHIMS relating to its operations and personnel and information regarding JHIMS’s compliance and regulatory history. The Board also noted that on a regular basis it receives and reviews information from the Trust’s Chief Compliance Officer (CCO) regarding the Funds’ compliance policies and procedures established pursuant to Rule 38a-1 under the 1940 Act. The Board also considers the Adviser’s risk management processes. The Board considered that JHIMS is responsible for the management of the day-to-day operations of the Funds, including but not limited to, general supervision of and coordination of the services provided by the Subadvisers, and is also responsible for monitoring and reviewing the activities of the Subadvisers and other third-party service providers.
In considering the nature, extent and quality of the services provided by the Adviser, the Trustees also took into account their knowledge of JHIMS’ management and the quality of the performance of its duties, through Board meetings, discussions and reports during the preceding year and through each Trustee’s experience as a Trustee of the Trust and of another trust in the complex.
| |
| Annual report | Fundamental Large Cap Core Fund | 29 |
In approving the renewal of the Advisory Agreement, and with reference to the factors that it regularly considers when considering approval of advisory and subadvisory agreements as listed above, the Board:
(1) — (a) considered the high value to the Trust of continuing its relationship with JHIMS as the Trust’s adviser, the skills and competency with which JHIMS has in the past managed the Trust’s affairs and its subadvisory relationships, JHIMS’s oversight and monitoring of the Subadvisers’ investment performance and compliance programs including its timeliness in responding to performance issues and the qualifications of JHIMS’s personnel;
(b) considered JHIMS’s compliance policies and procedures and noted its responsiveness to regulatory changes and mutual fund industry developments;
(c) considered JHIMS’s administrative capabilities, including its ability to supervise the other service providers for the Funds;
(d) considered the financial condition of JHIMS and whether it had the financial wherewithal to provide a high level and quality of services to the Funds; and
(e) recognized JHIMS’s reputation and experience in serving as an investment adviser to the Trust, and considered the benefit to shareholders of investing in funds that are part of a family of funds offering a variety of investments.
The Board concluded that JHIMS may reasonably be expected to continue to provide a high quality of services under the Advisory Agreement with respect to the Funds;
(2) — (a) reviewed the investment performance of each of the Funds;
(b) reviewed the comparative performance of their respective benchmarks;
(c) considered the performance of comparable funds as included in a report prepared by an independent third party provider of mutual fund data (i.e., funds underlying variable insurance products having approximately the same investment classification/objective), if any. Such report included each Fund’s ranking within a smaller group of peer funds and the Fund’s ranking within broader groups of funds, as well as a description of the methodology used to determine the similarity of each Fund with the funds included in each group; and
(d) took into account JHIMS’s analysis of each Fund’s performance and its plans and recommendations regarding the Trust’s subadvisory arrangements generally and with respect to particular Funds.
The Board concluded that the performance of each of the Funds has generally been in-line with or generally outperformed the historical performance of comparable funds and the Fund’s respective benchmarks with the exceptions noted in Appendix A and in such cases, that appropriate action is being taken to address performance, if necessary, or that such performance is reasonable in light of all factors considered, and that JHIMS may reasonably be expected to continue ably to monitor the performance of the Funds and each of their Subadvisers;
(3) — (a) with respect to each Fund (except those listed below), considered that the Adviser has agreed to waive its management fee for each of these Funds and each of the funds of John Hancock Variable Insurance Trust (except those listed below) (the Participating Portfolios) or otherwise reimburse the expenses of the Participating Portfolios as follows (the Reimbursement) and that, at the request of the Board, the Reimbursement rate was
| |
| 30 | Fundamental Large Cap Core Fund | Annual report |
increased effective May 31, 2011. The current Reimbursement rate is as follows: The Reimbursement shall equal, on an annualized basis, 0.01% of that portion of the aggregate net assets of all the Participating Portfolios that exceed $75 billion but is less than $100 billion and 0.015% of that portion of the aggregate net assets of all the Participating Portfolios that equals or exceeds $100 billion. The amount of the Reimbursement shall be calculated daily and allocated among all the Participating Portfolios in proportion to the daily net assets of each Participating Portfolio, and that Reimbursement may be terminated or modified by the Adviser only upon notice to the Trust and approval of the Board of Trustees of the Trust. (The Funds that are not Participating Portfolios as of the date of this annual report are each of the funds of funds, money market funds and index funds of the Trust and John Hancock Variable Insurance Trust.)
(b) reviewed the Trust’s advisory fee structure and the incorporation therein of any subadvisory fee breakpoints in the advisory fees charged and concluded that (i) most of the Funds contain breakpoints at the subadvisory fee level and that such breakpoints are reflected as breakpoints in the advisory fees for Funds and (ii) although economies of scale cannot be measured with precision, these arrangements permit shareholders of Funds with advisory fee breakpoints to benefit from economies of scale if those Funds grow. The Board also took into account management’s discussion of the Funds’ advisory fee structure, including with respect to those Funds that did not currently have breakpoints, and also noted that management had agreed to add breakpoints or implement additional breakpoints to the advisory fee structure of certain of the Funds; and
(c) The Board also considered the effect of the Funds’ growth in size on their performances and fees.
The Board also noted that if the Funds’ assets increase over time, the Funds may realize other economies of scale if assets increase proportionally more than certain other fixed expenses;
(4) — (a) reviewed the financial statements of JHIMS and considered an analysis presented by JHIMS regarding the net profitability to JHIMS and Manulife Financial Corporation, the Adviser’s parent, of each Fund;
(b) reviewed and considered an analysis presented by JHIMS regarding the profitability of JHIMS’s relationship with each Fund and whether JHIMS has the financial ability to continue to provide a high level of services to the Fund;
(c) considered that JHIMS also provides administrative services to the Funds on a cost basis pursuant to an administrative services agreement and took into account information prepared by JHIMS indicating the allocation of such costs;
(d) noted that certain of the Funds’ Subadvisers are affiliates of the Adviser;
(e) noted that John Hancock Signature Services, LLC and John Hancock Funds, LLC, affiliates of the Adviser, provide transfer agency services and distribution services to the Funds, respectively, and that JHIMS also derives reputational and other indirect benefits from providing advisory services to the Funds;
(f) noted that the subadvisory fees for the Funds are paid by JHIMS and are negotiated at arm’s length with respect to the unaffiliated Subadvisers; and
(g) considered that the Adviser should be entitled to earn a reasonable level of profits in exchange for the level of services it provides to each Fund and the entrepreneurial risk that it assumes as Adviser.
| |
| Annual report | Fundamental Large Cap Core Fund | 31 |
Based upon its review, the Board concluded that the Adviser and its affiliates’ level of profitability, if any, from their relationship with each Fund was reasonable and not excessive; and
(5) reviewed comparative information prepared by an independent third party provider of mutual fund data including, among other data, each Fund’s contractual and actual advisory and subadvisory fees and total expenses as compared to similarly situated investment companies underlying variable insurance products deemed to be comparable to the Funds. The Board considered each Fund’s ranking within a smaller group of peer funds chosen by the independent third party provider, as well as the Fund’s ranking within broader groups of funds. In comparing each Fund’s actual and contractual management fee to that of comparable funds, the Board noted that such fee includes both advisory and administrative costs.
The Board determined that the Trust’s advisory fees are generally within a competitive range of those incurred by other comparable funds. In this regard, the Board took into account management’s discussion with respect to the advisory/subadvisory fee structure, including the amount of the advisory fee retained by the Adviser after payment of the subadvisory fee. The Board also noted that JHIMS is currently waiving fees and/or reimbursing expenses with respect to certain of the Funds. The Board also noted that the Adviser pays the subadvisory fees of the Funds, and that such fees are negotiated at arm’s length with respect to unaffiliated Subadvisers. In addition, the Board noted that the Adviser effected advisory and subadvisory fee reductions in the past year with respect to several Funds. The Board also noted management’s discussion of the Funds’ expenses, as well as certain actions taken over the past several years to reduce the Funds’ operating expenses. The Board also took into account the level and quality of services provided by JHIMS with respect to the Funds, as well as the other factors considered. The Board concluded that the advisory fees paid by the Trust with respect to the Funds are reasonable.
Additional information relating to each Fund’s fees and expenses and performance that the Board considered in approving the Advisory Agreement is set forth in Appendix A.
Approval of Subadvisory Agreements
In making its determination with respect to the factors that it considers in considering approval of the Subadvisory Agreements, the Board reviewed:
(1) information relating to each Subadviser’s business, including current subadvisory services to the Trust (and other funds in the John Hancock family of funds);
(2) the historical and current performance of each Fund and comparative performance information relating to the Fund’s benchmark and comparable funds;
(3) the subadvisory fee for each Fund, including any breakpoints, and comparative fee information prepared by an independent third party of mutual fund data; and
(4) information relating to the nature and scope of Material Relationships and their significance to the Trust’s Adviser and unaffiliated Subadvisers.
With respect to the services provided by each of the Subadvisers, the Board received information provided to the Board by each Subadviser, including each Subadviser’s Form ADV, as well as considered information presented throughout the past year. The Board considered the Subadviser’s current level of staffing and its overall resources, as well as its compensation program. The Board reviewed each Subadviser’s history and investment experience, as well as information regarding the qualifications, background and responsibilities of the Subadviser’s investment and compliance personnel who provide services to the Funds. The Board also considered, among other things, the Subadviser’s compliance program and any disciplinary history. The Board also considered the Subadviser’s risk assessment and monitoring process. The Board noted each Subadviser’s regulatory
| |
| 32 | Fundamental Large Cap Core Fund | Annual report |
history, including whether it was currently involved in any regulatory actions or investigations as well as material litigation, and any settlements and amelioratory actions undertaken, as appropriate. The Board also noted that the CCO and his staff conduct regular, periodic compliance reviews with each of the Subadvisers and present reports to the Independent Trustees regarding the same, which includes evaluating the regulatory compliance systems of the Subadvisers and procedures reasonably designed by them to assure compliance with the federal securities laws. The Board also took into account the financial condition of each Subadviser.
The Board considered each Subadviser’s investment process and philosophy. The Board took into account that each Subadviser’s responsibilities include the development and maintenance of an investment program for the applicable Fund which is consistent with the Fund’s investment objectives, the selection of investment securities and the placement of orders for the purchase and sale of such securities, as well as the implementation of compliance controls related to performance of these services. The Board also received information with respect to each Subadviser’s brokerage policies and practices, including with respect to best execution and soft dollars. The Board also reviewed information relating to the nature and scope of Material Relationships and their significance to the Adviser and its affiliates and to unaffiliated Subadvisers.
The Board also took into account the sub-advisory fees paid by the Adviser to fees charged by each Fund’s Subadviser to manage other sub-advised portfolios and portfolios not subject to regulation under the 1940 Act, as applicable.
The Board also received information regarding any Material Relationships with respect to the unaffiliated Subadvisers, which include arrangements in which unaffiliated Subadvisers or their affiliates provide advisory, distribution or management services in connection with financial products sponsored by the Trust’s Adviser or its affiliates, and may include other registered investment companies, a 529 education savings plan, managed separate accounts and exempt group annuity contracts sold to qualified plans. The Board also received information and took into account any other potential conflicts of interests the Adviser might have in connection with the Subadvisory Agreements.
The Board’s decision to approve each Subadvisory Agreement was based on a number of determinations, including the following:
(1) The Subadviser has extensive experience and demonstrated skills as a manager;
(2) Although not without variation, the performance of each Fund managed by a Subadviser has generally been in-line with or generally outperformed the historical performance of comparable funds and the Fund’s respective benchmarks with the exceptions noted in Appendix A (with respect to such exceptions, the Board concluded that appropriate action was being taken to address such Fund’s performance, if necessary, or that performance was reasonable in light of all factors considered);
(3) The subadvisory fees generally are (i) competitive and within the range of industry norms and (ii) are paid by JHIMS out of its advisory fees it receives from the Fund (in the case of each sub-subadvisory agreement, that the sub-subadvisory fee would be paid by the Subadviser out of the subadvisory fee) and would not be an expense of the Fund, and, with respect to each Subadviser that is not affiliated with the Adviser, are a product of arm’s length negotiation between the Adviser and the Subadviser; and the Board concluded that each Fund’s subadvisory fees are reasonable; and
(4) With respect to those Funds that have subadvisory fees that contain breakpoints, such breakpoints are reflected as breakpoints in the advisory fees for the Funds in order to permit shareholders to benefit from economies of scale if those Funds grow.
| |
| Annual report | Fundamental Large Cap Core Fund | 33 |
Additional information relating to each Fund’s fees and expenses and performance that the Board considered for a particular Fund is set forth in Appendix A.
Based on their evaluation of all factors that they deemed to be material, including those factors described above, and assisted by the advice of independent counsel, the Board, including the Independent Trustees, concluded that renewal of the Advisory Agreement and each of the Subadvisory Agreements would be in the best interest of each of the Funds and its respective shareholders. Accordingly, the Board, and the Independent Trustees voting separately, approved the Advisory Agreement and each of the Subadvisory Agreements for an additional one-year period.
| | | |
| Appendix A |
|
| Portfolio | Performance of Fund, | | | |
| (Subadviser) | as of March 31, 2012 | | Fees and Expenses | | Other Comments | |
|
| Fundamental Large | Benchmark Index — The | Subadvisory fees | The Board noted that |
| Cap Core Fund | Fund launched June 1st | for this Fund are | the inception date |
| | of 2011. | lower than the peer | for this Fund was |
| (John Hancock | | group median. | June 1, 2011. |
| Asset Management | Lipper Peer Group — The | | |
| a division of | Fund launched June 1st | Net management | |
| Manulife Asset | of 2011. | fees for this Fund | |
| Management | | are equal to the peer | |
| (US) LLC) | | group median. | |
| |
| | | Total expenses for | |
| | | this Fund are slightly | |
| | | higher than the peer | |
| | | group median. | |
|
| |
| 34 | Fundamental Large Cap Core Fund | Annual report |
Trustees and Officers
This chart provides information about the Trustees and Officers of John Hancock Funds II who oversee your John Hancock fund. Officers elected by the Trustees manage the day-to-day operations of the Portfolio and execute policies formulated by the Trustees.
| | |
| Independent Trustees | | |
| | | |
| Name, Year of Birth | Trustee | Number of |
| Position(s) held with Fund | of the | John Hancock |
| Principal occupation(s) and other | Trust | funds overseen |
| directorships during past 5 years | since1 | by Trustee |
| |
| Charles L. Bardelis, Born: 1941 | 2005 | 198 |
|
| Director, Island Commuter Corp. (Marine Transport). Trustee of John Hancock Variable Insurance |
| Trust (since 1988), John Hancock Funds II (since 2005) and former Trustee of John Hancock | |
| Funds III (2005–2006). | | |
|
| |
| Peter S. Burgess, Born: 1942 | 2005 | 198 |
|
| Consultant (financial, accounting and auditing matters) (since 1999); Certified Public Accountant. |
| Partner, Arthur Andersen (independent public accounting firm) (prior to 1999). Director of the following |
| publicly traded companies: Lincoln Educational Services Corporation (since 2004), Symetra Financial |
| Corporation (since 2010) and PMA Capital Corporation (2004–2010). Trustee of John Hancock Variable |
| Insurance Trust (since 2005), John Hancock Funds II (since 2005), and former Trustee of John Hancock |
| Funds III (2005–2006). | | |
|
| |
| Grace K. Fey, Born: 1946 | 2008 | 198 |
|
| Chief Executive Officer, Grace Fey Advisors (since 2007); Director & Executive Vice President, Frontier |
| Capital Management Company (1988–2007); Director, Fiduciary Trust (since 2009). Trustee of |
| John Hancock Variable Insurance Trust (since 2008) and John Hancock Funds II (since 2008). |
|
| |
| Theron S. Hoffman, Born: 1947 | 2008 | 198 |
|
| Chief Executive Officer, T. Hoffman Associates, LLC (consulting firm) (since 2003); Director, The Todd |
| Organization (consulting firm) (2003–2010); President, Westport Resources Management (investment |
| management consulting firm) (2006–2008); Partner/Operating Head & Senior Managing Director, |
| Putnam Investments (2000–2003); Executive Vice President, Thomson Corp. (1997–2000) (financial |
| and legal information publishing). Trustee of John Hancock Variable Insurance Trust (since 2008) and |
| John Hancock Funds II (since 2008). | | |
|
| |
| Hassell H. McClellan, Born: 1945 | 2005 | 198 |
|
| Associate Professor, The Graduate School of The Wallace E. Carroll School of Management, Boston |
| College (since 1984). Trustee of John Hancock Variable Insurance Trust (since 2005), John Hancock |
| Funds II (since 2005), Trustee of Virtus Variable Insurance Trust (formerly, Phoenix Edge Series Funds) |
| (since 2008), and Director of the Barnes Group (since 2010). | | |
|
| |
| James M. Oates, Born: 1946 | 2005 | 198 |
|
| Managing Director, Wydown Group (financial consulting firm) (since 1994); Chairman, Emerson |
| Investment Management, Inc. (since 2000); Chairman, Hudson Castle Group, Inc. (formerly IBEX |
| Capital Markets, Inc.) (financial services company) (1997–2011). Director of the following publicly traded |
| companies: Stifel Financial (since 1996); Investor Financial Services Corporation (1995–2007); and |
| Connecticut River Bancorp (since 1998). Director of the following Mutual Funds: Virtus Funds (formerly, |
| Phoenix Mutual Funds) (since 1988). Chairman of the Boards of John Hancock Variable Insurance Trust |
| and John Hancock Funds II (since 2005) and former Trustee of John Hancock Funds III (2005–2006). |
| |
| Annual report | Fundamental Large Cap Core Fund | 35 |
| | |
| Non-Independent Trustee2 | | |
| | | |
| Name, Year of Birth | Trustee | Number of |
| Position(s) held with Fund | of the | John Hancock |
| Principal occupation(s) and other | Trust | funds overseen |
| directorships during past 5 years | since1 | by Trustee |
| |
| James R. Boyle,3 Born: 1959 | 2005 | 198 |
|
| Senior Executive Vice President, John Hancock Financial Services (since 1999, including prior positions); |
| Chairman and Director, John Hancock Advisers, LLC, John Hancock Funds, LLC, and John Hancock |
| Investment Management Services, LLC (2005–2010); Trustee, John Hancock Variable Insurance Trust |
| (since 2005), John Hancock Funds II (since 2005), and John Hancock retail funds (2005–2010). |
1 Because the Trust does not hold regular annual shareholders meetings, each Trustee holds office for an indefinite term until his/her successor is duly elected and qualified or until he/she dies, retires, resigns, is removed or becomes disqualified.
2 Non-Independent Trustees hold positions or are affiliated with the Fund’s investment adviser, subadviser, underwriter or their affiliates.
3 Mr. Boyle is an “interested person” (as defined in the 1940 Act) due to his position with Manulife Financial Corporation (or its affiliates), the ultimate parent of the Adviser.
| |
| Principal officers who are not Trustees | |
| | |
| Name, Year of Birth | Officer |
| Position(s) held with Fund | of the |
| Principal occupation(s) and other | Trust |
| directorships during past 5 years | since |
| |
| Hugh McHaffie, Born: 1959 | 2009 |
|
| President | |
| Executive Vice President, John Hancock Financial Services (since 2006, including prior positions); | |
| President of John Hancock Variable Insurance Trust and John Hancock Funds II (since 2009); Trustee, |
| John Hancock retail funds (since 2010); Chairman and Director, John Hancock Advisers, LLC, | |
| John Hancock Investment Management Services, LLC and John Hancock Funds, LLC (since 2010). | |
|
| |
| Thomas M. Kinzler, Born: 1955 | 2008 |
|
| Secretary and Chief Legal Officer | |
| Vice President, John Hancock Financial Services (since 2006); Secretary and Chief Legal Counsel, | |
| John Hancock Funds, LLC (since 2007); Secretary and Chief Legal Officer, John Hancock retail funds, |
| John Hancock Variable Insurance Trust and John Hancock Funds II (since 2006). | |
|
| |
| Francis V. Knox, Jr., Born: 1947 | 2008 |
|
| Chief Compliance Officer | |
| Vice President, John Hancock Financial Services (since 2005); Chief Compliance Officer, John Hancock |
| retail funds, John Hancock Funds II, John Hancock Variable Insurance Trust, John Hancock Advisers, |
| LLC and John Hancock Investment Management Services, LLC (since 2005); Vice President and Chief |
| Compliance Officer, John Hancock Asset Management a division of Manulife Asset Management (US) |
| LLC (2005–2008). | |
|
| |
| Michael J. Leary, Born: 1965 | 2008 |
|
| Treasurer | |
| Assistant Vice President, John Hancock Financial Services (since 2007); Treasurer, John Hancock Funds II |
| and John Hancock Variable Insurance Trust (since 2009); Treasurer, John Hancock retail funds (2009– |
| 2010); Vice President, John Hancock Advisers, LLC and John Hancock Investment Management Services, |
| LLC (since 2007); Assistant Treasurer, John Hancock retail funds (2007–2009 & 2010), John Hancock |
| Funds II and John Hancock Variable Insurance Trust (2007–2009) and John Hancock Funds III (since |
| 2009); Vice President and Director of Fund Administration, JP Morgan (2004–2007). | |
| |
| 36 | Fundamental Large Cap Core Fund | Annual report |
| |
| Principal officers who are not Trustees (continued) | |
| | |
| Name, Year of Birth | Officer |
| Position(s) held with Fund | of the |
| Principal occupation(s) and other | Trust |
| directorships during past 5 years | since |
| |
| Charles A. Rizzo, Born: 1957 | 2008 |
|
| Chief Financial Officer | |
| Vice President, John Hancock Financial Services (since 2008); Senior Vice President, John Hancock | |
| Advisers, LLC and John Hancock Investment Management Services, LLC (since 2008); Chief Financial |
| Officer, John Hancock retail funds, John Hancock Funds II and John Hancock Variable Insurance Trust |
| (since 2007); Assistant Treasurer, Goldman Sachs Mutual Fund Complex (2005–2007); Vice President, |
| Goldman Sachs (2005–2007). | |
|
| |
| John G. Vrysen, Born: 1955 | 2008 |
|
| Chief Operating Officer | |
| Senior Vice President, John Hancock Financial Services (since 2006); Director, Executive Vice President |
| and Chief Operating Officer, John Hancock Advisers, LLC, John Hancock Investment Management | |
| Services, LLC and John Hancock Funds, LLC (since 2005); Chief Operating Officer, John Hancock Funds |
| II and John Hancock Variable Insurance Trust (since 2007); Chief Operating Officer, John Hancock retail |
| funds (until 2009); Trustee, John Hancock retail funds (since 2009). | |
The business address for all Trustees and Officers is 601 Congress Street, Boston, Massachusetts 02210-2805.
The Statement of Additional Information of the Fund includes additional information about members of the Board of Trustees of the Fund and is available without charge, upon request, by calling 1-800-225-5291.
| |
| Annual report | Fundamental Large Cap Core Fund | 37 |
More information
| |
| Trustees | Investment adviser |
| James M. Oates, Chairman | John Hancock Investment Management |
| James R. Boyle† | Services, LLC |
| Charles L. Bardelis* | |
| Peter S. Burgess* | Subadviser |
| Grace K. Fey | First Quadrant, L.P. |
| Theron S. Hoffman | |
| Hassell H. McClellan | Principal distributor |
| | John Hancock Funds, LLC |
| Officers | |
| Hugh McHaffie | Custodian |
| President | State Street Bank and Trust Company |
| | |
| Thomas M. Kinzler | Transfer agent |
| Secretary and Chief Legal Officer | John Hancock Signature Services, Inc. |
| | |
| Francis V. Knox, Jr. | Legal counsel |
| Chief Compliance Officer | K&L Gates LLP |
| | |
| Michael J. Leary | Independent registered |
| Treasurer | public accounting firm |
| | PricewaterhouseCoopers LLP |
| Charles A. Rizzo | |
| Chief Financial Officer | |
| | |
| John G. Vrysen | |
| Chief Operating Officer | |
| |
| *Member of the Audit Committee | |
| †Non-Independent Trustee | |
The Fund’s proxy voting policies and procedures, as well as the Fund’s proxy voting record for the most recent twelve-month period ended June 30, are available free of charge on the Securities and Exchange Commission (SEC) Web site at www.sec.gov or on our Web site.
The Fund’s complete list of portfolio holdings, for the first and third fiscal quarters, is filed with the SEC on Form N-Q. The Fund’s Form N-Q is available on our Web site and the SEC’s Web site, www.sec.gov, and can be reviewed and copied (for a fee) at the SEC’s Public Reference Room in Washington, DC. Call 1-202-551-8090 to receive information on the operation of the SEC’s Public Reference Room.
We make this information on your fund, as well as monthly portfolio holdings, and other fund details available on our Web site at www.jhfunds.com or by calling 1-800-225-5291.
| | |
| You can also contact us: | | |
| 1-800-225-5291 | Regular mail: | Express mail: |
| jhfunds.com | John Hancock Signature Services, Inc. | John Hancock Signature Services, Inc. |
| | P.O. Box 55913 | Mutual Fund Image Operations |
| | Boston, MA 02205-5913 | 30 Dan Road |
| | | Canton, MA 02021 |
| |
| 38 | Fundamental Large Cap Core Fund | Annual report |

1-800-225-5291
1-800-554-6713 TDD
1-800-338-8080 EASI-Line
www.jhfunds.com
Now available: electronic delivery
www.jhfunds.com/edelivery
| |
| This report is for the information of the shareholders of John Hancock Fundamental Large Cap Core Fund. | 372A 7/12 |
| It is not authorized for distribution to prospective investors unless preceded or accompanied by a prospectus. | 9/12 |

A look at performance
Total returns for the period ended July 31, 2012
| | | | | | | | | |
| | Average annual total returns (%) | | Cumulative total returns (%) | |
| | with maximum sales charge | | | with maximum sales charge | |
|
| | | | | Since | | | | | Since |
| | 1-year | 5-year | 10-year | inception | | 1-year | 5-year | 10-year | inception |
|
| Class A | 3.82 | — | — | –1.541 | | 3.82 | — | — | –1.791 |
|
| Class I2 | 9.87 | — | — | 3.371 | | 9.87 | — | — | 3.941 |
|
Performance figures assume all distributions are reinvested. Figures reflect maximum sales charges on Class A shares of 5.00%.
The expense ratios of the Fund, both net (including any fee waivers or expense limitations) and gross (excluding any fee waivers or expense limitations), are set forth according to the most recent publicly available prospectuses for the Fund and may differ from those disclosed in the Financial highlights tables in this report. The fee waivers and expense limitations are contractual at least until 12-31-12 for Class A and Class I shares. Had the fee waivers and expense limitations not been in place gross expenses would apply. The expense ratios are as follows:
| | | | | | | | | | |
| | Class A | Class I | | | | | | | | |
| Net (%) | 1.30 | 0.84 | | | | | | | | |
| Gross (%) | 3.79 | 3.97 | | | | | | | | |
The returns reflect past results and should not be considered indicative of future performance. The return and principal value of an investment will fluctuate so that shares, when redeemed, may be worth more or less than their original cost. Due to market volatility, the Fund’s current performance may be higher or lower than the performance shown. For current to the most recent month-end performance data, please call 1-800-225-5291 or visit the Fund’s Web site at www.jhfunds.com.
The performance table above and the chart on the next page do not reflect the deduction of taxes that a shareholder may pay on fund distributions or on the redemption of fund shares. The Fund’s performance results reflect any applicable fee waivers or expense reductions, without which the expenses would increase and results would have been less favorable.
| |
| 6 | Fundamental Large Cap Value Fund | Annual report |
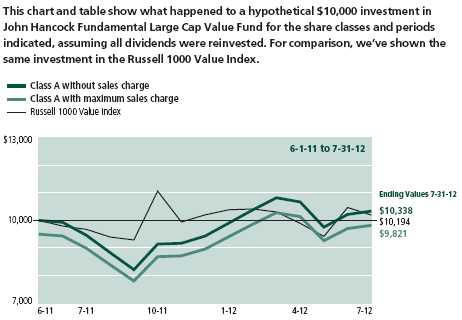
| | | | | | | |
| | | Without | With maximum | | | | |
| | Start date | sales charge | sales charge | Index | | | |
| | | |
| Class I2 | 6-1-11 | $10,394 | $10,394 | $10,194 | | | |
| | | |
Russell 1000 Value Index is an unmanaged index containing those securities in the Russell 1000 Index with a less-than-average growth orientation.
It is not possible to invest directly in an index. Index figures do not reflect expenses, which would have resulted in lower values if they did.
1 From 6-1-11.
2 For certain types of investors, as described in the Fund’s prospectus.
| |
| Annual report | Fundamental Large Cap Value Fund | 7 |
Management’s discussion of
Fund performance
By John Hancock Asset Management a division of Manulife Asset Management (US) LLC
Large-cap stocks across both the value and growth disciplines finished the 12 months ended July 31, 2012 with solid gains, despite a volatile year. The market got off to a rough start last summer, falling sharply due to double-dip recession fears, Europe’s sovereign debt crisis, the federal budget deficit debate and Standard & Poor’s historic U.S. credit rating downgrade. Subsequent signs of stabilization in Europe and encouraging economic news at home triggered a market rally from October into the early months of the new year. By spring, however, mounting concerns about Europe were again pressuring markets worldwide. Stocks rebounded late in June after the European Central Bank took steps to avert a financial crisis, but then bounced around for much of July. Large-cap stocks finished the year slightly ahead of small caps. Within large cap, growth stocks modestly outpaced value.
For the 12-month period, John Hancock Fundamental Large Cap Value Fund’s Class A shares returned 9.28%, excluding sales charges, beating the 7.64% return of its benchmark, the Russell 1000 Value Index, and the 4.96% average gain of its peer group, the Morningstar, Inc. large value fund category. Security selection was favorable, especially in the consumer discretionary sector where top contributors included building products retailer The Home Depot, Inc. and homebuilder Lennar Corp. Both stocks rallied sharply as the housing market began to improve. Health care stock picks also contributed, led by biotechnology leader Amgen, Inc., whose shares soared following news of a dividend increase and stock buyback program. Having no or little exposure to the strong performing telecommunications services and utilities sectors hampered relative performance. However, the biggest individual detractors were financials. They included The Goldman Sachs Group, Inc., whose shares were hurt by a slowdown in trading and merger-and-acquisition activity, and investment manager AllianceBernstein Holding LP, whose stock slid as the company struggled to reduce expenses in the wake of asset outflows.
This commentary reflects the views of the portfolio managers through the end of the period discussed in this report. The managers’ statements reflect their own opinions. As such, they are in no way guarantees of future events and are not intended to be used as investment advice or a recommendation regarding any specific security. They are also subject to change at any time as market and other conditions warrant.
Past performance is no guarantee of future results.
Large company stocks as a group could fall out of favor with the market, causing the Fund to underperform. The prices of medium and small company stocks can change more frequently and dramatically than those of large company stocks. Foreign investing, especially in emerging markets, has additional risks such as currency and market volatility and political and social instability. Hedging and other strategic transactions may increase volatility of a fund and, if the transaction is not successful, could result in a significant loss. If the Fund invests in illiquid securities, it may be difficult to sell them at a price approximating their value. For additional information on these and other risk considerations, please see the Fund’s prospectus.
Sector investing is subject to greater risks than the market as a whole. Because the Fund may focus on particular sectors of the economy, its performance may depend on the performance of those sectors.
| |
| 8 | Fundamental Large Cap Value Fund | Annual report |
Your expenses
These examples are intended to help you understand your ongoing operating expenses of investing in the Fund so you can compare these costs with the ongoing costs of investing in other mutual funds.
Understanding fund expenses
As a shareholder of the Fund, you incur two types of costs:
▪ Transaction costs which include sales charges (loads) on purchases or redemptions (varies by share class), minimum account fee charge, etc.
▪ Ongoing operating expenses including management fees, distribution and service fees (if applicable), and other fund expenses.
We are going to present only your ongoing operating expenses here.
Actual expenses/actual returns
This example is intended to provide information about the Fund’s actual ongoing operating expenses, and is based on the Fund’s actual return. It assumes an account value of $1,000.00 on February 1, 2012 with the same investment held until July 31, 2012.
| | | |
| | Account value | Ending value | Expenses paid during |
| | on 2-1-12 | on 7-31-12 | period ended 7-31-121 |
|
| Class A | $1,000.00 | $1,043.70 | $6.61 |
|
| Class I | 1,000.00 | 1,046.70 | 4.27 |
|
| Class NAV | 1,000.00 | 1,046.70 | 3.66 |
|
Together with the value of your account, you may use this information to estimate the operating expenses that you paid over the period. Simply divide your account value at July 31, 2012, by $1,000.00, then multiply it by the “expenses paid” for your share class from the table above. For example, for an account value of $8,600.00, the operating expenses should be calculated as follows:
| |
| Annual report | Fundamental Large Cap Value Fund | 9 |
Your expenses
Hypothetical example for comparison purposes
This table allows you to compare the Fund’s ongoing operating expenses with those of any other fund. It provides an example of the Fund’s hypothetical account values and hypothetical expenses based on each class’s actual expense ratio and an assumed 5% annualized return before expenses (which is not the Fund’s actual return). It assumes an account value of $1,000.00 on February 1, 2012, with the same investment held until July 31, 2012. Look in any other fund shareholder report to find its hypothetical example and you will be able to compare these expenses.
| | | |
| | Account value | Ending value | Expenses paid during |
| | on 2-1-12 | on 7-31-12 | period ended 7-31-121 |
|
| Class A | $1,000.00 | $1,018.40 | $6.52 |
|
| Class I | 1,000.00 | 1,020.70 | 4.22 |
|
| Class NAV | 1,000.00 | 1,021.30 | 3.62 |
|
Remember, these examples do not include any transaction costs, therefore, these examples will not help you to determine the relative total costs of owning different funds. If transaction costs were included, your expenses would have been higher. See the prospectus for details regarding transaction costs.
1 Expenses are equal to the Fund’s annualized expense ratio of 1.30%, 0.84% and 0.72% for Class A, Class I and Class NAV shares, respectively, multiplied by the average account value over the period, multiplied by 182/366 (to reflect the one-half year period).
| |
| 10 | Fundamental Large Cap Value Fund | Annual report |
Portfolio summary
| | | | |
| Top 10 Holdings (33.0% of Net Assets on 7-31-12)1,2 | | | |
|
| Amgen, Inc. | 4.1% | | Avery Dennison Corp. | 3.2% |
| |
|
| JPMorgan Chase & Company | 3.8% | | Merck & Company, Inc. | 3.0% |
| |
|
| Wells Fargo & Company | 3.6% | | QUALCOMM, Inc. | 3.0% |
| |
|
| Carnival Corp. | 3.3% | | Diageo PLC, ADR | 2.9% |
| |
|
| Lowe’s Companies, Inc. | 3.2% | | The Goldman Sachs Group, Inc. | 2.9% |
| |
|
| |
| Sector Composition1,3 | | | | |
|
| Financials | 25.6% | | Information Technology | 9.7% |
| |
|
| Consumer Discretionary | 17.6% | | Consumer Staples | 9.4% |
| |
|
| Health Care | 12.4% | | Utilities | 1.0% |
| |
|
| Industrials | 12.1% | | Short-Term Investments & Other | 1.7% |
| |
|
| Energy | 10.5% | | | |
| | |

1 As a percentage of net assets on 7-31-12.
2 Cash and cash equivalents not included.
3 Sector investing is subject to greater risks than the market as a whole. Because the Fund may focus on particular sectors of the economy, its performance may depend on the performance of those sectors.
| |
| Annual report | Fundamental Large Cap Value Fund | 11 |
Fund’s investments
As of 7-31-12
| | |
| | Shares | Value |
| |
| Common Stocks 98.3% | | $778,607,901 |
|
| (Cost $717,950,670) | | |
| | | |
| Consumer Discretionary 17.6% | | 139,491,252 |
| | | |
| Hotels, Restaurants & Leisure 3.3% | | |
|
| Carnival Corp. | 783,022 | 26,058,973 |
| | | |
| Household Durables 2.8% | | |
|
| Dorel Industries, Inc., Class B | 192,050 | 5,342,968 |
|
| Lennar Corp., Class A | 570,582 | 16,666,700 |
| | | |
| Media 4.6% | | |
|
| Comcast Corp., Class A | 356,565 | 11,606,191 |
|
| Lamar Advertising Company, Class A (I) | 425,835 | 12,924,092 |
|
| Omnicom Group, Inc. | 232,397 | 11,661,681 |
| | | |
| Multiline Retail 1.4% | | |
|
| Target Corp. | 188,033 | 11,404,201 |
| | | |
| Specialty Retail 4.3% | | |
|
| Lowe’s Companies, Inc. | 1,012,470 | 25,686,364 |
|
| The Home Depot, Inc. | 158,601 | 8,275,800 |
| | | |
| Textiles, Apparel & Luxury Goods 1.2% | | |
|
| Adidas AG | 131,553 | 9,864,282 |
| | | |
| Consumer Staples 9.4% | | 74,204,829 |
| | | |
| Beverages 6.8% | | |
|
| Diageo PLC, ADR | 217,800 | 23,282,820 |
|
| PepsiCo, Inc. | 253,204 | 18,415,527 |
|
| SABMiller PLC (I) | 284,109 | 12,230,317 |
| | | |
| Household Products 1.3% | | |
|
| The Procter & Gamble Company | 152,515 | 9,843,318 |
| | | |
| Tobacco 1.3% | | |
|
| Philip Morris International, Inc. | 114,095 | 10,432,847 |
| | | |
| Energy 10.5% | | 83,025,311 |
| | | |
| Energy Equipment & Services 1.3% | | |
|
| National Oilwell Varco, Inc. | 145,224 | 10,499,695 |
| | | |
| Oil, Gas & Consumable Fuels 9.2% | | |
|
| Apache Corp. | 239,587 | 20,633,232 |
|
| Chevron Corp. | 188,200 | 20,622,956 |
|
| Exxon Mobil Corp. | 109,357 | 9,497,655 |
|
| Occidental Petroleum Corp. | 250,164 | 21,771,773 |
| | |
| 12 | Fundamental Large Cap Value Fund | Annual report | See notes to financial statements |
| | |
| | Shares | Value |
| | | |
| Financials 25.6% | | $202,467,290 |
| | | |
| Capital Markets 7.9% | | |
|
| AllianceBernstein Holding LP | 809,367 | 9,809,528 |
|
| Northern Trust Corp. | 367,733 | 16,695,078 |
|
| State Street Corp. | 336,879 | 13,603,174 |
|
| The Goldman Sachs Group, Inc. | 224,963 | 22,698,767 |
| | | |
| Commercial Banks 6.0% | | |
|
| U.S. Bancorp | 554,782 | 18,585,197 |
|
| Wells Fargo & Company | 841,035 | 28,435,393 |
| | | |
| Diversified Financial Services 7.5% | | |
|
| Bank of America Corp. | 3,038,713 | 22,304,153 |
|
| JPMorgan Chase & Company | 845,155 | 30,425,580 |
|
| Moody’s Corp. | 171,484 | 6,950,247 |
| | | |
| Insurance 4.2% | | |
|
| Prudential Financial, Inc. | 338,551 | 16,345,242 |
|
| Stewart Information Services Corp. | 973,341 | 16,614,931 |
| | | |
| Health Care 12.4% | | 98,335,761 |
| | | |
| Biotechnology 4.1% | | |
|
| Amgen, Inc. | 395,151 | 32,639,473 |
| | | |
| Health Care Equipment & Supplies 1.9% | | |
|
| Medtronic, Inc. | 374,617 | 14,767,402 |
| | | |
| Health Care Providers & Services 2.1% | | |
|
| Amsurg Corp. (I) | 311,537 | 9,202,803 |
|
| VCA Antech, Inc. (I) | 421,585 | 7,672,847 |
| | | |
| Pharmaceuticals 4.3% | | |
|
| Merck & Company, Inc. | 538,083 | 23,767,126 |
|
| Novartis AG, ADR | 175,471 | 10,286,110 |
| | | |
| Industrials 12.1% | | 95,668,170 |
| | | |
| Aerospace & Defense 1.0% | | |
|
| The Boeing Company | 107,035 | 7,910,957 |
| | | |
| Air Freight & Logistics 2.0% | | |
|
| FedEx Corp. | 172,587 | 15,584,606 |
| | | |
| Commercial Services & Supplies 3.2% | | |
|
| Avery Dennison Corp. | 814,779 | 25,087,045 |
| | | |
| Electrical Equipment 1.8% | | |
|
| Sensata Technologies Holding NV (I) | 509,256 | 14,620,740 |
| | | |
| Industrial Conglomerates 2.7% | | |
|
| General Electric Company | 1,030,912 | 21,391,424 |
| | | |
| Professional Services 1.4% | | |
|
| Robert Half International, Inc. | 409,974 | 11,073,398 |
| | | |
| Information Technology 9.7% | | 77,294,924 |
| | | |
| Communications Equipment 5.8% | | |
|
| Cisco Systems, Inc. | 1,197,308 | 19,097,063 |
|
| QUALCOMM, Inc. | 392,266 | 23,410,435 |
|
| Tellabs, Inc. | 1,137,464 | 3,742,257 |
| | |
| See notes to financial statements | Annual report | Fundamental Large Cap Value Fund | 13 |
| | | | | |
| | | | | Shares | Value |
| | | | | | |
| IT Services 1.3% | | | | | |
|
| Broadridge Financial Solutions, Inc. | | | | 474,125 | $10,037,226 |
| | | | | | |
| Software 2.6% | | | | | |
|
| Microsoft Corp. | | | | 267,156 | 7,873,087 |
|
| Oracle Corp. | | | | 434,929 | 13,134,856 |
| | | | | | |
| Utilities 1.0% | | | | | 8,120,364 |
| | | | | | |
| Electric Utilities 1.0% | | | | | |
|
| Entergy Corp. | | | | 111,743 | 8,120,364 |
| | | | | | |
| | | | Maturity | | |
| | Yield (%) | | date | Par value | Value |
| |
| Short-Term Investments 1.3% | | | | | $10,000,000 |
|
| (Cost $10,000,000) | | | | | |
| | | | | | |
| Federal Home Loan Bank Discount Notes | 0.001 (Y) | | 08-02-12 | $10,000,000 | 10,000,000 |
| |
| Total investments (Cost $727,950,670)† 99.6% | | | | $788,607,901 |
|
| |
| Other assets and liabilities, net 0.4% | | | | $3,553,475 |
|
| |
| Total net assets 100.0% | | | | | $792,161,376 |
|
The percentage shown for each investment category is the total value of the category as a percentage of net assets of the Fund.
ADR American Depositary Receipts
(I) Non-income producing security.
(Y) The rate shown is the annualized seven-day yield as of 7-31-12.
† At 7-31-12, the aggregate cost of investment securities for federal income tax purposes was $728,014,515. Net unrealized appreciation aggregated $60,593,386, of which $77,782,061 related to appreciated investment securities and $17,188,675 related to depreciated investment securities.
| | |
| 14 | Fundamental Large Cap Value Fund | Annual report | See notes to financial statements |
F I N A N C I A L S T A T E M E N T S
Financial statements
Statement of assets and liabilities 7-31-12
This Statement of assets and liabilities is the Fund’s balance sheet. It shows the value of what the Fund owns, is due and owes. You’ll also find the net asset value and the maximum offering price per share.
| |
| Assets | |
|
| Investments, at value (Cost $727,950,670) | $788,607,901 |
| Cash | 8,762,574 |
| Receivable for fund shares sold | 12,104 |
| Dividends receivable | 339,303 |
| Other receivables and prepaid expenses | 17,562 |
| | |
| Total assets | 797,739,444 |
| |
| Liabilities | |
|
| Payable for fund shares repurchased | 5,404,861 |
| Payable to affiliates | |
| Transfer agent fees | 942 |
| Trustees’ fees | 462 |
| Other liabilities and accrued expenses | 171,803 |
| | |
| Total liabilities | 5,578,068 |
| |
| Net assets | |
|
| Paid-in capital | $717,725,076 |
| Undistributed net investment income | 3,878,701 |
| Accumulated net realized gain (loss) on investments and foreign | |
| currency transactions | 9,900,368 |
| Net unrealized appreciation (depreciation) on investments | 60,657,231 |
| | |
| Net assets | $792,161,376 |
| |
| Net asset value per share | |
|
| Based on net asset values and shares outstanding — the Fund has an | |
| unlimited number of shares authorized with no par value | |
| Class A ($2,637,460 ÷ 256,911 shares) | $10.27 |
| Class I ($1,010,995 ÷ 98,185 shares) | $10.30 |
| Class NAV ($788,512,921 ÷ 76,584,183 shares) | $10.30 |
| |
| Maximum offering price per share | |
|
| Class A (net asset value per share ÷ 95%)1 | $10.81 |
1 On single retail sales of less than $50,000. On sales of $50,000 or more and on group sales the offering price is reduced.
| | |
| See notes to financial statements | Annual report | Fundamental Large Cap Value Fund | 15 |
F I N A N C I A L S T A T E M E N T S
Statement of operations For the year ended 7-31-12
This Statement of operations summarizes the Fund’s investment income earned and expenses incurred in operating the Fund. It also shows net gains (losses) for the period stated.
| |
| Investment income | |
|
| Dividends | $9,657,535 |
| Interest | 563 |
| Less foreign taxes withheld | (44,003) |
| | |
| Total investment income | 9,614,095 |
| |
| Expenses | |
|
| Investment management fees | 3,025,143 |
| Distribution and service fees | 6,458 |
| Accounting and legal services fees | 51,167 |
| Transfer agent fees | 5,541 |
| Trustees’ fees | 3,585 |
| State registration fees | 55,504 |
| Printing and postage | 3,330 |
| Professional fees | 47,233 |
| Custodian fees | 64,925 |
| Registration and filing fees | 139,888 |
| Other | 10,940 |
| | |
| Total expenses | 3,413,714 |
| Less expense reductions and amounts recaptured | (53,793) |
| | |
| Net expenses | 3,359,921 |
| | |
| Net investment income | 6,254,174 |
| |
| Realized and unrealized gain (loss) | |
|
| Net realized gain (loss) on | |
| Investments | 10,990,727 |
| Foreign currency transactions | (20,658) |
| | |
| | 10,970,069 |
| Change in net unrealized appreciation (depreciation) of | |
| Investments | 60,832,734 |
| |
| |
| Net realized and unrealized gain | 71,802,803 |
| | |
| Increase in net assets from operations | $78,056,977 |
| | |
| 16 | Fundamental Large Cap Value Fund | Annual report | See notes to financial statements |
F I N A N C I A L S T A T E M E N T S
Statements of changes in net assets
These Statements of changes in net assets show how the value of the Fund’s net assets has changed during the last two periods. The difference reflects earnings less expenses, any investment gains and losses, distributions, if any, paid to shareholders and the net of Fund share transactions.
| | |
| | Year | Period |
| | ended | ended |
| | 7-31-12 | 7-31-111 |
| |
| Increase (decrease) in net assets | | |
|
| From operations | | |
| Net investment income | $6,254,174 | $2,156 |
| Net realized gain | 10,970,069 | 6,266 |
| Change in net unrealized appreciation (depreciation) | 60,832,734 | (175,503) |
| | | |
| Increase (decrease) in net assets resulting from operations | 78,056,977 | (167,081) |
| | | |
| Distributions to shareholders | | |
| From net investment income | | |
| Class A | (7,223) | — |
| Class I | (6,741) | — |
| Class NAV | (2,351,019) | — |
| From net realized gain | | |
| Class A | (5,698) | — |
| Class I | (3,154) | — |
| Class NAV | (1,081,097) | — |
| | | |
| Total distributions | (3,454,932) | — |
| | | |
| From Fund share transactions | 714,615,382 | 3,111,030 |
| | | |
| Total increase | 789,217,427 | 2,943,949 |
| |
| Net assets | | |
|
| Beginning of period | 2,943,949 | — |
| | | |
| End of period | $792,161,376 | $2,943,949 |
| | | |
| Undistributed net investment income | $3,878,701 | $3,043 |
1 Period from 6-1-11 (commencement of operations) to 7-31-11.
| | |
| See notes to financial statements | Annual report | Fundamental Large Cap Value Fund | 17 |
Financial highlights
The Financial highlights show how the Fund’s net asset value for a share has changed during the period.
| | | | | | |
| CLASS A SHARES Period ended | | | | | 7-31-12 | 7-31-111 |
| |
| Per share operating performance | | | | | | |
|
| Net asset value, beginning of period | | | | | $9.46 | $10.00 |
| Net investment income2 | | | | | 0.09 | —3 |
| Net realized and unrealized gain (loss) on investments | | | | | 0.78 | (0.54) |
| Total from investment operations | | | | | 0.87 | (0.54) |
| Less distributions | | | | | | |
| From net investment income | | | | | (0.03) | — |
| From net realized gain | | | | | (0.03) | — |
| Total distributions | | | | | (0.06) | — |
| Net asset value, end of period | | | | | $10.27 | $9.46 |
| Total return (%)4,5 | | | | | 9.28 | (5.40)6 |
| |
| Ratios and supplemental data | | | | | | |
|
| Net assets, end of period (in millions) | | | | | $3 | $2 |
| Ratios (as a percentage of average net assets): | | | | | | |
| Expenses before reductions and amounts recaptured | | | | | 2.79 | 5.957 |
| Expenses Including reductions and amounts recaptured | | | | | 1.30 | 1.307 |
| Net investment income | | | | | 0.94 | 0.267 |
| Portfolio turnover (%) | | | | | 26 | 5 |
1 Period from 6-1-11 (commencement of operations) to 7-31-11.
2 Based on the average daily shares outstanding.
3 Less than $0.005 per share.
4 Does not reflect the effect of sales charges, if any.
5 Total returns would have been lower had certain expenses not been reduced during the periods shown.
6 Not annualized.
7 Annualized.
| | |
| 18 | Fundamental Large Cap Value Fund | Annual report | See notes to financial statements |
| | | | | | |
| CLASS I SHARES Period ended | | | | | 7-31-12 | 7-31-111 |
| |
| Per share operating performance | | | | | | |
|
| Net asset value, beginning of period | | | | | $9.46 | $10.00 |
| Net investment income2 | | | | | 0.14 | 0.01 |
| Net realized and unrealized gain (loss) on investments | | | | | 0.79 | (0.55) |
| Total from investment operations | | | | | 0.93 | (0.54) |
| Less distributions | | | | | | |
| From net investment income | | | | | (0.06) | — |
| From net realized gain | | | | | (0.03) | — |
| Total distributions | | | | | (0.09) | — |
| Net asset value, end of period | | | | | $10.30 | $9.46 |
| Total return (%)4 | | | | | 9.87 | (5.40)3 |
| |
| Ratios and supplemental data | | | | | | |
|
| Net assets, end of period (in millions) | | | | | $1 | $1 |
| Ratios (as a percentage of average net assets): | | | | | | |
| Expenses before reductions and amounts recaptured | | | | | 4.02 | 5.615 |
| Expenses including reductions and amounts recaptured | | | | | 0.84 | 0.845 |
| Net investment income | | | | | 1.44 | 0.745 |
| Portfolio turnover (%) | | | | | 26 | 5 |
1 Period from 6-1-11 (commencement of operations) to 7-31-11.
2 Based on the average daily shares outstanding.
3 Not annualized.
4 Total returns would have been lower had certain expenses not been reduced during the periods shown.
5 Annualized.
| | | | | | |
| CLASS NAV SHARES Period ended | | | | | | 7-31-121 |
| |
| Per share operating performance | | | | | | |
|
| Net asset value, beginning of period | | | | | | $8.13 |
| Net investment income2 | | | | | | 0.13 |
| Net realized and unrealized gain on investments | | | | | | 2.13 |
| Total from investment operations | | | | | | 2.26 |
| Less distributions | | | | | | |
| From net investment income | | | | | | (0.06) |
| From net realized gain | | | | | | (0.03) |
| Total distributions | | | | | | (0.09) |
| Net asset value, end of period | | | | | | $10.30 |
| Total return (%)3 | | | | | | 27.864 |
| |
| Ratios and supplemental data | | | | | | |
|
| Net assets, end of period (in millions) | | | | | | $789 |
| Ratios (as a percentage of average net assets): | | | | | | |
| Expenses before reductions and amounts recaptured | | | | | | 0.745 |
| Expenses Including reductions and amounts recaptured | | | | | | 0.755 |
| Net investment income | | | | | | 1.405 |
| Portfolio turnover (%) | | | | | | 26 |
1 Period from 8-23-11 (commencement of operations) to 7-31-12.
2 Based on the average daily shares outstanding.
3 Total returns would have been lower had certain expenses not been reduced during the periods shown.
4 Not annualized.
5 Annualized.
| | |
| See notes to financial statements | Annual report | Fundamental Large Cap Value Fund | 19 |
Notes to financial statements
Note 1 — Organization
John Hancock Fundamental Large Cap Value Fund (the Fund) is a series of John Hancock Funds II (the Trust), an open-end management investment company organized as a Massachusetts business trust and registered under the Investment Company Act of 1940, as amended (the 1940 Act). The investment objective of the Fund is to seek long-term capital appreciation.
The Fund may offer multiple classes of shares. The shares currently offered are detailed in the Statement of assets and liabilities. Class A shares are offered to all investors. Class I shares are offered to institutions and certain investors. Class NAV shares are offered to John Hancock affiliated fund of funds. Shareholders of each class have exclusive voting rights to matters that affect that class. The distribution and service fees, if any, transfer agent fees, printing and postage and state registration fees for each class may differ.
Note 2 — Significant accounting policies
The financial statements have been prepared in conformity with accounting principles generally accepted in the United States of America, which require management to make certain estimates and assumptions at the date of the financial statements. Actual results could differ from those estimates. Events or transactions occurring after the end of the fiscal period through the date that the financial statements were issued have been evaluated in the preparation of the financial statements. The following summarizes the significant accounting policies of the Fund:
Security valuation. Investments are stated at value as of the close of regular trading on the New York Stock Exchange (NYSE), normally at 4:00 P.M., Eastern Time. In order to value the securities, the Fund uses the following valuation techniques: Equity securities held by the Fund are valued at the last sale price or official closing price on the principal securities exchange on which they trade. In the event there were no sales during the day or closing prices are not available, then securities are valued using the last quoted bid or evaluated price. Certain securities traded only in the over-the-counter market are valued at the last bid price quoted by brokers making markets in the securities at the close of trading. Other portfolio securities and assets, where market quotations are not readily available, are valued at fair value, as determined in good faith by the Fund’s Pricing Committee, following procedures established by the Board of Trustees.
The Fund uses a three-tier hierarchy to prioritize the pricing assumptions, referred to as inputs, used in valuation techniques to measure fair value. Level 1 includes securities valued using quoted prices in active markets for identical securities. Level 2 includes securities valued using significant observable inputs. Observable inputs may include quoted prices for similar securities, interest rates, prepayment speeds and credit risk. Prices for securities valued using these inputs are received from independent pricing vendors and brokers and are based on an evaluation of the inputs described. Level 3 includes securities valued using significant unobservable inputs when market prices are not readily available or reliable, including the Fund’s own assumptions in determining the fair value of investments. Factors used in determining value may include market or issuer specific events, changes in interest rates and credit quality. The inputs or methodology used for valuing securities are not necessarily an indication of the risks associated with investing in those securities. Changes in valuation techniques may result in transfers into or out of an assigned level within the disclosure hierarchy.
| |
| 20 | Fundamental Large Cap Value Fund | Annual report |
The following is a summary of the values by input classification of the Fund’s investments as of July 31, 2012, by major security category or type:
| | | | |
| | | | | LEVEL 3 |
| | | | LEVEL 2 | SIGNIFICANT |
| | TOTAL MARKET | LEVEL 1 | SIGNIFICANT | UNOBSERVABLE |
| | VALUE AT 7-31-12 | QUOTED PRICE | OBSERVABLE INPUTS | INPUTS |
|
| Common Stocks | | | | |
| Consumer Discretionary | $139,491,252 | $129,626,970 | $9,864,282 | — |
| Consumer Staples | 74,204,829 | 61,974,512 | 12,230,317 | — |
| Energy | 83,025,311 | 83,025,311 | — | — |
| Financials | 202,467,290 | 202,467,290 | — | — |
| Health Care | 98,335,761 | 98,335,761 | — | — |
| Industrials | 95,668,170 | 95,668,170 | — | — |
| Information Technology | 77,294,924 | 77,294,924 | — | — |
| Utilities | 8,120,364 | 8,120,364 | — | — |
| Short-Term Investments | 10,000,000 | — | 10,000,000 | — |
| |
|
| Total Investments | | | | |
| in Securities | $788,607,901 | $756,513,302 | $32,094,599 | — |
Security transactions and related investment income. Investment security transactions are accounted for on a trade date plus one basis for daily net asset value calculations. However, for financial reporting purposes, investment transactions are reported on trade date. Dividend income is recorded on the ex-date. Gains and losses on securities sold are determined on the basis of identified cost and may include proceeds from litigation.
Foreign taxes. The Fund may be subject to withholding tax on income or capital gains or repatriation taxes as imposed by certain countries in which it invests. Taxes are accrued based upon net investment income, net realized gains or net unrealized appreciation.
Line of credit. The Fund may borrow from banks for temporary or emergency purposes, including meeting redemption requests that otherwise might require the untimely sale of securities. Pursuant to the custodian agreement, the custodian may loan money to the Fund to make properly authorized payments. The Fund is obligated to repay the custodian for any overdraft, including any related costs or expenses. The custodian may have a lien, security interest or security entitlement in any Fund property that is not otherwise segregated or pledged, to the maximum extent permitted by law, to the extent of any overdraft.
In addition, the Fund and other affiliated funds have entered into an agreement with Citibank N.A. which enables them to participate in a $200 million unsecured committed line of credit. A commitment fee, payable at the end of each calendar quarter, based on the average daily unused portion of the line of credit, is charged to each participating fund on a pro rata basis and is reflected in other expenses on the Statement of operations. For the year ended July 31, 2012, the Fund had no borrowings under the line of credit.
Expenses. Within the John Hancock Funds complex, expenses that are directly attributable to an individual fund are allocated to such fund. Expenses that are not readily attributable to a specific fund are allocated among all funds in an equitable manner, taking into consideration, among other things, the nature and type of expense and the fund’s relative net assets. Expense estimates are accrued in the period to which they relate and adjustments are made when actual amounts are known.
Class allocations. Income, common expenses and realized and unrealized gains (losses) are determined at the fund level and allocated daily to each class of shares based on the net assets of the class. Class-specific expenses, such as distribution and service fees, if any, transfer agent
| |
| Annual report | Fundamental Large Cap Value Fund | 21 |
fees, printing and postage and state registration fees, for all classes, are calculated daily at the class level based on the appropriate net assets of each class and the specific expense rates applicable to each class.
Federal income taxes. The Fund intends to continue to qualify as a regulated investment company by complying with the applicable provisions of the Internal Revenue Code and will not be subject to federal income tax on taxable income that is distributed to shareholders. Therefore, no federal income tax provision is required.
As of July 31, 2012, the Fund had no uncertain tax positions that would require financial statement recognition, derecognition or disclosure. The Fund’s federal tax returns are subject to examination by the Internal Revenue Service for a period of three years.
Distribution of income and gains. Distributions to shareholders from net investment income and net realized gains, if any, are recorded on the ex-date. The Fund generally declares and pays dividends and capital gain distributions, if any, annually.
The tax character of distributions for the year ended July 31, 2012 was ordinary income of $3,446,874 and long-term capital gains of $8,058.
Distributions paid by the Fund with respect to each class of shares are calculated in the same manner, at the same time and in the same amount, except for the effect of class level expenses that may be applied differently to each class. As of July 31, 2012, the components of distributable earnings on a tax basis included $13,842,914 of undistributed ordinary income.
Such distributions and distributable earnings, on a tax basis, are determined in conformity with income tax regulations, which may differ from accounting principles generally accepted in the United States of America. Material distributions in excess of tax basis earnings and profits, if any, are reported in the Fund’s financial statements as a return of capital.
Capital accounts within the financial statements are adjusted for permanent book-tax differences. These adjustments have no impact on net assets or the results of operations. Temporary book-tax differences, if any, will reverse in a subsequent period. The Fund had no material book-tax differences at July 31, 2012.
Note 3 — Guarantees and indemnifications
Under the Fund’s organizational documents, its Officers and Trustees are indemnified against certain liabilities arising out of the performance of their duties to the Fund. Additionally, in the normal course of business, the Fund enters into contracts with service providers that contain general indemnification clauses. The Fund’s maximum exposure under these arrangements is unknown, as this would involve future claims that may be made against the Fund that have not yet occurred. The risk of material loss from such claims is considered remote.
Note 4 — Fees and transactions with affiliates
John Hancock Investment Management Services, LLC (the Adviser) serves as investment adviser for the Fund. John Hancock Funds, LLC (the Distributor), an affiliate of the Adviser, serves as principal underwriter of the Fund. The Adviser and the Distributor are indirect wholly owned subsidiaries of Manulife Financial Corporation (MFC).
| |
| 22 | Fundamental Large Cap Value Fund | Annual report |
Management fee. The Fund has an investment management agreement with the Adviser under which the Fund pays a daily management fee to the Adviser equivalent, on an annual basis, to the sum of: a) 0.70% of the first $500,000,000 of the Fund’s aggregate average daily net assets together with the assets of Fundamental Large Cap Value Trust, a series of John Hancock Variable Insurance Trust and Optimized Value Fund, a series of John Hancock Funds II (combined aggregate average daily net assets); b) 0.65% of the next $500,000,000 of the combined aggregate average daily net assets; and c) 0.60% of the combined aggregate average daily net assets in excess of $1,000,000,000. Prior to September 26, 2011 the Fund paid a daily management fee to the Adviser equivalent, on an annual basis, to the sum of a) 0.70% of the first $500,000,000 of the Fund’s average daily net assets; b) 0.65% of the next $500,000,000; and c) 0.60% of the Fund’s average daily net assets in excess of $1,000,000,000. The Adviser has a subadvisory agreement with John Hancock Asset Management a division of Manulife Asset Management (US) LLC, an indirectly owned subsidiary of MFC and an affiliate of the Adviser. The Fund is not responsible for payment of the subadvisory fees.
The Adviser has contractually agreed to waive a portion of its management fee for certain Funds (the Participating Portfolios) of the Trust and John Hancock Variable Insurance Trust. The waiver equals, on an annualized basis, 0.01% of that portion of the aggregate net assets of all the Participating Funds that exceeds $75 billion but is less than $100 billion; and 0.015% of that portion of the aggregate net assets of all the Participating Portfolios that equals or exceeds $100 billion. The amount of the reimbursement is calculated daily and allocated among all the Participating Portfolios in proportion to the daily net assets of each fund. This arrangement may be amended or terminated at any time by the Adviser upon notice to the Funds and with the approval of the Board of Trustees.
The Adviser has contractually agreed to waive all or a portion of its management fee and reimburse or pay operating expenses of the Fund to the extent necessary to maintain the total operating expenses at 1.30%, 0.84% and 0.82% for Class A, Class I and Class NAV shares, excluding certain expenses such as taxes, brokerage commissions, interest expense, litigation and indemnification expenses and other extraordinary expenses. Accordingly the current expense limitation agreement expires on December 31, 2012 for Class A and Class I shares and November 30, 2012 for Class NAV shares, unless renewed by mutual agreement of the Fund and the Adviser based upon a determination that this is appropriate under the circumstances at the time.
Additionally, the Adviser has voluntarily agreed to waive other Fund level expenses excluding advisory fees, 12b-1 fees, service fees, transfer agent fees, blue sky fees, taxes, printing and postage, brokerage commissions, interest expenses, acquired fund fees, litigation and indemnification expenses and other extraordinary expenses not incurred in the ordinary course of business. The waivers are such that these expenses will not exceed 0.20% of average net assets. This voluntary expense reimbursement may be terminated at any time by the Adviser on notice to the Fund.
Accordingly, these expense reductions described above amounted to $32,257, $31,288 and $12,663 for Class A, Class I and Class NAV shares, respectively, for the year ended July 31, 2012.
The investment management fees, including the impact of the waivers and reimbursements described above, incurred for the year ended July 31, 2012 were equivalent to a net effective rate of 0.66% the Fund’s average daily net assets.
| |
| Annual report | Fundamental Large Cap Value Fund | 23 |
Expense recapture. The Adviser may recapture operating expenses reimbursed or fees waived under previous expense limitation or waiver arrangements for a period of three years following the beginning of the month in which such reimbursements or waivers originally occurred to the extent that the Fund is below its expense limitation during this period. The table below outlines the amounts recovered during the year ended July 31, 2012, and the amount of waived or reimbursed expenses subject to potential recovery and the respective expiration dates. Certain reimbursements or waivers are not subject to recapture.
| | | | |
| | AMOUNTS ELIGIBLE FOR | AMOUNTS ELIGIBLE FOR | AMOUNTS ELIGIBLE FOR | AMOUNTS RECOVERED |
| | RECOVERY THROUGH | RECOVERY THROUGH | RECOVERY THROUGH | DURING THE PERIOD |
| FUND | JULY 1, 2013 | JULY 1, 2014 | JULY 1, 2015 | ENDED JULY 31, 2012 |
|
| Fundamental Large | — | $705 | $58,372 | $22,415 |
| Cap Value | | | | |
Accounting and legal services. Pursuant to a service agreement, the Fund reimburses the Adviser for all expenses associated with providing the administrative, financial, legal, accounting and recordkeeping services to the Fund, including the preparation of all tax returns, periodic reports to shareholders and regulatory reports, among other services. These expenses are allocated to each share class based on its relative net assets at the time the expense was incurred. These accounting and legal services fees incurred for the year ended July 31, 2012 amounted to an annual rate of 0.01% of the Fund’s average daily net assets.
Distribution and service plans. The Fund has a distribution agreement with the Distributor. The Fund has adopted distribution and service plans with respect to Class A shares pursuant to Rule 12b-1 under the 1940 Act, to pay the Distributor for services provided as the distributor of shares of the Fund. The Fund pays 0.30% for Class A shares for distribution and service fees under these arrangements, expressed as an annual percentage of average daily net assets for each class of the Fund’s shares.
Sales charges. Class A shares are assessed up-front sales charges, which resulted in payments to the Distributor amounting to $5,626 for the year ended July 31, 2012. Of this amount, $909 was retained and used for printing prospectuses, advertising, sales literature and other purposes and $4,717 was paid as sales commissions to broker-dealers.
Transfer agent fees. The Fund has a transfer agent agreement with John Hancock Signature Services, Inc. (Signature Services), an affiliate of the Adviser. The transfer agent fees paid to Signature Services are determined based on the cost to Signature Services (Signature Services Cost) of providing recordkeeping services. The Signature Services Cost includes a component of allocated John Hancock corporate overhead for providing transfer agent services to the Fund and to all other John Hancock affiliated funds. It also includes out-of-pocket expenses that are comprised of payments made to third-parties for recordkeeping services provided to their clients who invest in one or more John Hancock funds. In addition, Signature Services Cost may be reduced by certain fees that Signature Services receives in connection with retirement and small accounts. Signature Services Cost is calculated monthly and allocated, as applicable, to four categories of share classes: Institutional Share Classes, Retirement Share Classes, Municipal Bond Classes and all other Retail Share Classes. Within each of these categories, the applicable costs are allocated to the affected John Hancock affiliated funds and/or classes, based on the relative average daily net assets.
Class level expenses. Class level expenses for the year ended July 31, 2012 were:
| | | | |
| | DISTRIBUTION | TRANSFER | PRINTING AND | STATE |
| CLASS | AND SERVICE FEES | AGENT FEES | POSTAGE | REGISTRATION FEES |
|
| A | $6,458 | $4,407 | $2,068 | $27,752 |
| I | — | 1,134 | 1,262 | 27,752 |
| | | | | |
| Total | $6,458 | $5,541 | $3,330 | $55,504 |
| |
| 24 | Fundamental Large Cap Value Fund | Annual report |
Trustee expenses. The Fund compensates each Trustee who is not an employee of the Adviser or its affiliates. The costs of paying Trustee compensation and expenses are allocated to each Fund based on its average daily net assets.
Note 5 — Fund share transactions
Transactions in Fund shares for the year ended July 31, 2012 and for the period ended July 31, 2011 were as follows:
| | | | |
| | | Year ended 7-31-12 | Period ended 7-31-111 |
| | Shares | Amount | Shares | Amount |
| Class A shares | | | | |
|
| Sold | 85,071 | $846,464 | 195,710 | $1,956,030 |
| Distributions reinvested | 123 | 1,153 | — | — |
| Repurchased | (23,993) | (239,863) | — | — |
| | | | | |
| Net increase | 61,201 | $607,754 | 195,710 | $1,956,030 |
| |
| Class I shares | | | | |
|
| Sold | 19,226 | $204,790 | 115,500 | $1,155,000 |
| Distributions reinvested | 964 | 9,038 | — | — |
| Repurchased | (37,505) | (368,974) | — | — |
| | | | | |
| Net increase (decrease) | (17,315) | ($155,146) | 115,500 | $1,155,000 |
| |
| Class NAV shares2 | | | | |
|
| Sold | 77,067,336 | $719,456,567 | — | — |
| Distributions reinvested | 366,288 | 3,432,117 | — | — |
| Repurchased | (849,441) | (8,725,910) | — | — |
| | | | | |
| Net increase | 76,584,183 | $714,162,774 | — | — |
| |
| Net increase | 76,628,069 | $714,615,382 | 311,210 | $3,111,030 |
|
1 Period from 6-1-11 (commencement of operations) to 7-31-11.
2 Period from 8-23-11 (commencement of operations) to 7-31-12.
Affiliates of the Fund owned 74%, 96% and 100% of shares of beneficial interest of Class A, Class I and Class NAV shares on July 31, 2012.
Note 6 — Purchase and sale of securities
Purchases and sales of securities, other than short-term securities, aggregated $817,990,582 and $114,104,793, respectively, for the year ended July 31, 2012.
Note 7 — Investment by affiliated funds
Certain investors in the Fund are affiliated funds and are managed by the Adviser and its affiliates. The affiliated funds do not invest in the Fund for the purpose of exercising management or control; however, this investment may represent a significant portion of the Fund’s net assets. For the year ended July 31, 2012, the following funds had an affiliate ownership concentration of 5% or more of the Fund’s net assets:
| | |
| FUND | AFFILIATE CONCENTRATION | |
| |
| John Hancock Lifestyle Growth Portfolio | 37.4% | |
| John Hancock Lifestyle Balanced Portfolio | 29.4% | |
| John Hancock Lifestyle Aggressive Portfolio | 14.1% | |
| John Hancock Lifestyle Moderate Portfolio | 9.2% | |
| |
| Annual report | Fundamental Large Cap Value Fund | 25 |
Auditor’s report
Report of Independent Registered Public Accounting Firm
To the Board of Trustees of John Hancock Funds II and Shareholders of
John Hancock Fundamental Large Cap Value Fund:
In our opinion, the accompanying statement of assets and liabilities, including the schedule of investments, and the related statements of operations and of changes in net assets and the financial highlights present fairly, in all material respects, the financial position of John Hancock Fundamental Large Cap Value Fund (the “Fund”) at July 31, 2012, and the results of its operations, the changes in its net assets and the financial highlights for each of the periods indicated, in conformity with accounting principles generally accepted in the United States of America. These financial statements and financial highlights (hereafter referred to as “financial statements”) are the responsibility of the Fund’s management; our responsibility is to express an opinion on these financial statements based on our audits. We conducted our audits of these financial statements in accordance with the standards of the Public Company Accounting Oversight Board (United States). Those standards require that we plan and perform the audit to obtain reasonable assurance about whether the financial statements are free of material misstatement. An audit includes examining, on a test basis, evidence supporting the amounts and disclosures in the financial statements, assessing the accounting principles used and significant estimates made by management, and evaluating the overall financial statement presentation. We believe that our audits, which included confirmation of securities at July 31, 2012 by correspondence with the custodian, and the application of alternative auditing procedures where securities purchased confirmations had not been received, provide a reasonable basis for our opinion.
PricewaterhouseCoopers LLP
Boston, Massachusetts
September 24, 2012
| |
| 26 | Fundamental Large Cap Value Fund | Annual report |
Tax information
Unaudited
For federal income tax purposes, the following information is furnished with respect to the distributions of the Fund, if any, paid during its taxable year ended July 31, 2012.
The Fund reports the maximum amount allowable of its net taxable income as eligible for the corporate dividends-received deduction.
The Fund reports the maximum amount allowable of its net taxable income as qualified dividend income as provided in the Jobs and Growth Tax Relief Reconciliation Act of 2003.
The Fund paid $8,058 in capital gain dividends.
Eligible shareholders will be mailed a 2012 Form 1099-DIV in early 2013. This will reflect the tax character of all distributions paid in calendar year 2012.
| |
| Annual report | Fundamental Large Cap Value Fund | 27 |
Evaluation of Advisory and Subadvisory Agreements by the Board of Trustees
This section describes the evaluation by the Board of Trustees (the Board) of the Advisory Agreement (the Advisory Agreement) and each of the Subadvisory Agreements and the Sub-Subadvisory Agreements (collectively, the Subadvisory Agreements) for each of the portfolios (the Funds) of John Hancock Funds II (the Trust) discussed in this report.
At in-person meetings held on May 24–25, 2012, the Board, including all of the Trustees who are not considered to be “interested persons” of the Trust under the Investment Company Act of 1940, as amended (the 1940 Act) (the Independent Trustees), approved for an annual period the continuation of the Advisory and Subadvisory Agreements with respect to each of the Funds.
Evaluation by the Board of Trustees
The Board, including the Independent Trustees, is responsible for selecting the Trust’s adviser, John Hancock Investment Management Services, LLC (the Adviser or JHIMS), approving the Adviser’s selection of subadvisers for each of the Funds (each a Subadviser, and collectively, the Subadvisers) and approving the Trust’s advisory and subadvisory (and any sub-subadvisory) agreements, their periodic continuation and any amendments. Consistent with Securities and Exchange Commission rules, the Board regularly evaluates the Trust’s advisory and subadvisory arrangements, including consideration of the factors listed below. The Board may also consider other factors (including conditions and trends prevailing generally in the economy, the securities markets and the industry) and does not treat any single factor as determinative, and each Trustee may attribute different weights to different factors. The Board is furnished with an analysis of its fiduciary obligations in connection with its evaluation and, throughout the evaluation process, the Board is assisted by counsel for the Trust and the Independent Trustees are also separately assisted by independent legal counsel. The factors considered by the Board are:
1. the nature, extent and quality of the services to be provided by the Adviser to the Trust and by the Subadvisers to the Funds;
2. the investment performance of the Funds and their Subadvisers;
3. the extent to which economies of scale would be realized as a Fund grows and whether fee levels reflect these economies of scale for the benefit of Fund shareholders;
4. the costs of the services to be provided and the profits to be realized by the Adviser and its affiliates (including any subadvisers that are affiliated with the Adviser) from the Adviser’s relationship with the Trust; and
5. comparative services rendered and comparative advisory and subadvisory fee rates.
The Board believes that information relating to all of these factors is relevant to its evaluation of the Trust’s advisory agreement. The Board also takes into account any indirect benefits expected to be derived by the Adviser and its affiliates and the Subadvisers and their affiliates from their relationships with the Funds. With respect to its evaluation of subadvisory agreements (including any sub-subadvisory agreements) with subadvisers not affiliated with the Adviser, the Board believes that, in view of the Trust’s “manager-of-managers” advisory structure, the costs of the services to be provided and the profits to be realized by those subadvisers that are not affiliated with the Adviser from their relationship with the Trust generally are not a material factor in the Board’s consideration of these subadvisory agreements because such fees are paid by the Adviser and not by the Funds and the Board relies on the ability of the Adviser to negotiate the subadvisory fees at arm’s length.
| |
| 28 | Fundamental Large Cap Value Fund | Annual report |
In evaluating subadvisory arrangements, the Board also considers other material business relationships that unaffiliated Subadvisers and their affiliates have with the Adviser or its affiliates, including the involvement by certain affiliates of certain Subadvisers in the distribution of financial products, including shares of the Trust, offered by the Adviser and other affiliates of the Adviser (Material Relationships).
Approval of Advisory and Subadvisory Agreements
At in-person meetings held on May 24–25, 2012, the Board, including all of the Independent Trustees, re-approved the Advisory Agreement and the applicable Subadvisory Agreements with respect to each of the Funds.
In considering the Advisory Agreement and the Subadvisory Agreements, the Board received in advance of the meeting a variety of materials relating to each Fund, the Adviser and each Subadviser, including comparative performance, fee and expense information for a peer group of similar mutual funds prepared by an independent third party provider of mutual fund data, including performance information for relevant benchmark indices and other information provided by the Adviser and the Subadvisers regarding the nature, extent and quality of services provided by the Adviser and the Subadvisers under their respective Agreements. The Board also took into account discussions with management and information provided to the Board in its meetings throughout the year with respect to the services provided by the Adviser and the Subadvisers to the Funds, including quarterly performance reports prepared by management containing reviews of investment results, and periodic presentations from the Subadvisers with respect to the Funds they manage. The Board noted the affiliation of certain of the Subadvisers with JHIMS, noting any potential conflicts of interest.
Throughout the process, the Trustees were afforded the opportunity to ask questions of and request additional information from management. The Independent Trustees also received a memorandum from their independent counsel discussing the legal standards for their consideration of the proposed continuation of the Agreements and discussed the proposed continuation of the Agreements in private sessions with their independent legal counsel at which no representatives of management were present.
Approval of Advisory Agreement
Among the information received by the Board from the Adviser relating to the nature, extent and quality of services provided to the Funds, the Board reviewed information provided by JHIMS relating to its operations and personnel and information regarding JHIMS’s compliance and regulatory history. The Board also noted that on a regular basis it receives and reviews information from the Trust’s Chief Compliance Officer (CCO) regarding the Funds’ compliance policies and procedures established pursuant to Rule 38a-1 under the 1940 Act. The Board also considers the Adviser’s risk management processes. The Board considered that JHIMS is responsible for the management of the day-to-day operations of the Funds, including but not limited to, general supervision of and coordination of the services provided by the Subadvisers, and is also responsible for monitoring and reviewing the activities of the Subadvisers and other third-party service providers.
In considering the nature, extent and quality of the services provided by the Adviser, the Trustees also took into account their knowledge of JHIMS’ management and the quality of the performance of its duties, through Board meetings, discussions and reports during the preceding year and through each Trustee’s experience as a Trustee of the Trust and of another trust in the complex.
| |
| Annual report | Fundamental Large Cap Value Fund | 29 |
In approving the renewal of the Advisory Agreement, and with reference to the factors that it regularly considers when considering approval of advisory and subadvisory agreements as listed above, the Board:
(1) — (a) considered the high value to the Trust of continuing its relationship with JHIMS as the Trust’s adviser, the skills and competency with which JHIMS has in the past managed the Trust’s affairs and its subadvisory relationships, JHIMS’s oversight and monitoring of the Subadvisers’ investment performance and compliance programs including its timeliness in responding to performance issues and the qualifications of JHIMS’s personnel;
(b) considered JHIMS’s compliance policies and procedures and noted its responsiveness to regulatory changes and mutual fund industry developments;
(c) considered JHIMS’s administrative capabilities, including its ability to supervise the other service providers for the Funds;
(d) considered the financial condition of JHIMS and whether it had the financial wherewithal to provide a high level and quality of services to the Funds; and
(e) recognized JHIMS’s reputation and experience in serving as an investment adviser to the Trust, and considered the benefit to shareholders of investing in funds that are part of a family of funds offering a variety of investments.
The Board concluded that JHIMS may reasonably be expected to continue to provide a high quality of services under the Advisory Agreement with respect to the Funds;
(2) — (a) reviewed the investment performance of each of the Funds;
(b) reviewed the comparative performance of their respective benchmarks;
(c) considered the performance of comparable funds as included in a report prepared by an independent third party provider of mutual fund data (i.e., funds underlying variable insurance products having approximately the same investment classification/objective), if any. Such report included each Fund’s ranking within a smaller group of peer funds and the Fund’s ranking within broader groups of funds, as well as a description of the methodology used to determine the similarity of each Fund with the funds included in each group; and
(d) took into account JHIMS’s analysis of each Fund’s performance and its plans and recommendations regarding the Trust’s subadvisory arrangements generally and with respect to particular Funds.
The Board concluded that the performance of each of the Funds has generally been in-line with or generally outperformed the historical performance of comparable funds and the Fund’s respective benchmarks with the exceptions noted in Appendix A and in such cases, that appropriate action is being taken to address performance, if necessary, or that such performance is reasonable in light of all factors considered, and that JHIMS may reasonably be expected to continue ably to monitor the performance of the Funds and each of their Subadvisers;
(3) — (a) with respect to each Fund (except those listed below), considered that the Adviser has agreed to waive its management fee for each of these Funds and each of the funds of John Hancock Variable Insurance Trust (except those listed below) (the Participating Portfolios) or otherwise reimburse the expenses of the Participating Portfolios as follows (the Reimbursement) and that, at the request of the Board, the Reimbursement rate was
| |
| 30 | Fundamental Large Cap Value Fund | Annual report |
increased effective May 31, 2011. The current Reimbursement rate is as follows: The Reimbursement shall equal, on an annualized basis, 0.01% of that portion of the aggregate net assets of all the Participating Portfolios that exceed $75 billion but is less than $100 billion and 0.015% of that portion of the aggregate net assets of all the Participating Portfolios that equals or exceeds $100 billion. The amount of the Reimbursement shall be calculated daily and allocated among all the Participating Portfolios in proportion to the daily net assets of each Participating Portfolio, and that Reimbursement may be terminated or modified by the Adviser only upon notice to the Trust and approval of the Board of Trustees of the Trust. (The Funds that are not Participating Portfolios as of the date of this annual report are each of the funds of funds, money market funds and index funds of the Trust and John Hancock Variable Insurance Trust.)
(b) reviewed the Trust’s advisory fee structure and the incorporation therein of any subadvisory fee breakpoints in the advisory fees charged and concluded that (i) most of the Funds contain breakpoints at the subadvisory fee level and that such breakpoints are reflected as breakpoints in the advisory fees for Funds and (ii) although economies of scale cannot be measured with precision, these arrangements permit shareholders of Funds with advisory fee breakpoints to benefit from economies of scale if those Funds grow. The Board also took into account management’s discussion of the Funds’ advisory fee structure, including with respect to those Funds that did not currently have breakpoints, and also noted that management had agreed to add breakpoints or implement additional breakpoints to the advisory fee structure of certain of the Funds; and
(c) The Board also considered the effect of the Funds’ growth in size on their performances and fees.
The Board also noted that if the Funds’ assets increase over time, the Funds may realize other economies of scale if assets increase proportionally more than certain other fixed expenses;
(4) — (a) reviewed the financial statements of JHIMS and considered an analysis presented by JHIMS regarding the net profitability to JHIMS and Manulife Financial Corporation, the Adviser’s parent, of each Fund;
(b) reviewed and considered an analysis presented by JHIMS regarding the profitability of JHIMS’s relationship with each Fund and whether JHIMS has the financial ability to continue to provide a high level of services to the Fund;
(c) considered that JHIMS also provides administrative services to the Funds on a cost basis pursuant to an administrative services agreement and took into account information prepared by JHIMS indicating the allocation of such costs;
(d) noted that certain of the Funds’ Subadvisers are affiliates of the Adviser;
(e) noted that John Hancock Signature Services, LLC and John Hancock Funds, LLC, affiliates of the Adviser, provide transfer agency services and distribution services to the Funds, respectively, and that JHIMS also derives reputational and other indirect benefits from providing advisory services to the Funds;
(f) noted that the subadvisory fees for the Funds are paid by JHIMS and are negotiated at arm’s length with respect to the unaffiliated Subadvisers; and
(g) considered that the Adviser should be entitled to earn a reasonable level of profits in exchange for the level of services it provides to each Fund and the entrepreneurial risk that it assumes as Adviser.
| |
| Annual report | Fundamental Large Cap Value Fund | 31 |
Based upon its review, the Board concluded that the Adviser and its affiliates’ level of profitability, if any, from their relationship with each Fund was reasonable and not excessive; and
(5) reviewed comparative information prepared by an independent third party provider of mutual fund data including, among other data, each Fund’s contractual and actual advisory and subadvisory fees and total expenses as compared to similarly situated investment companies underlying variable insurance products deemed to be comparable to the Funds. The Board considered each Fund’s ranking within a smaller group of peer funds chosen by the independent third party provider, as well as the Fund’s ranking within broader groups of funds. In comparing each Fund’s actual and contractual management fee to that of comparable funds, the Board noted that such fee includes both advisory and administrative costs.
The Board determined that the Trust’s advisory fees are generally within a competitive range of those incurred by other comparable funds. In this regard, the Board took into account management’s discussion with respect to the advisory/subadvisory fee structure, including the amount of the advisory fee retained by the Adviser after payment of the subadvisory fee. The Board also noted that JHIMS is currently waiving fees and/or reimbursing expenses with respect to certain of the Funds. The Board also noted that the Adviser pays the subadvisory fees of the Funds, and that such fees are negotiated at arm’s length with respect to unaffiliated Subadvisers. In addition, the Board noted that the Adviser effected advisory and subadvisory fee reductions in the past year with respect to several Funds. The Board also noted management’s discussion of the Funds’ expenses, as well as certain actions taken over the past several years to reduce the Funds’ operating expenses. The Board also took into account the level and quality of services provided by JHIMS with respect to the Funds, as well as the other factors considered. The Board concluded that the advisory fees paid by the Trust with respect to the Funds are reasonable.
Additional information relating to each Fund’s fees and expenses and performance that the Board considered in approving the Advisory Agreement is set forth in Appendix A.
Approval of Subadvisory Agreements
In making its determination with respect to the factors that it considers in considering approval of the Subadvisory Agreements, the Board reviewed:
(1) information relating to each Subadviser’s business, including current subadvisory services to the Trust (and other funds in the John Hancock family of funds);
(2) the historical and current performance of each Fund and comparative performance information relating to the Fund’s benchmark and comparable funds;
(3) the subadvisory fee for each Fund, including any breakpoints, and comparative fee information prepared by an independent third party of mutual fund data; and
(4) information relating to the nature and scope of Material Relationships and their significance to the Trust’s Adviser and unaffiliated Subadvisers.
With respect to the services provided by each of the Subadvisers, the Board received information provided to the Board by each Subadviser, including each Subadviser’s Form ADV, as well as considered information presented throughout the past year. The Board considered the Subadviser’s current level of staffing and its overall resources, as well as its compensation program. The Board reviewed each Subadviser’s history and investment experience, as well as information regarding the qualifications, background and responsibilities of the Subadviser’s investment and compliance personnel who provide services to the Funds. The Board also considered, among other things, the Subadviser’s compliance program and any disciplinary history. The Board also considered the Subadviser’s risk assessment and monitoring process. The Board noted each Subadviser’s regulatory
| |
| 32 | Fundamental Large Cap Value Fund | Annual report |
history, including whether it was currently involved in any regulatory actions or investigations as well as material litigation, and any settlements and amelioratory actions undertaken, as appropriate. The Board also noted that the CCO and his staff conduct regular, periodic compliance reviews with each of the Subadvisers and present reports to the Independent Trustees regarding the same, which includes evaluating the regulatory compliance systems of the Subadvisers and procedures reasonably designed by them to assure compliance with the federal securities laws. The Board also took into account the financial condition of each Subadviser.
The Board considered each Subadviser’s investment process and philosophy. The Board took into account that each Subadviser’s responsibilities include the development and maintenance of an investment program for the applicable Fund which is consistent with the Fund’s investment objectives, the selection of investment securities and the placement of orders for the purchase and sale of such securities, as well as the implementation of compliance controls related to performance of these services. The Board also received information with respect to each Subadviser’s brokerage policies and practices, including with respect to best execution and soft dollars. The Board also reviewed information relating to the nature and scope of Material Relationships and their significance to the Adviser and its affiliates and to unaffiliated Subadvisers.
The Board also took into account the sub-advisory fees paid by the Adviser to fees charged by each Fund’s Subadviser to manage other sub-advised portfolios and portfolios not subject to regulation under the 1940 Act, as applicable.
The Board also received information regarding any Material Relationships with respect to the unaffiliated Subadvisers, which include arrangements in which unaffiliated Subadvisers or their affiliates provide advisory, distribution or management services in connection with financial products sponsored by the Trust’s Adviser or its affiliates, and may include other registered investment companies, a 529 education savings plan, managed separate accounts and exempt group annuity contracts sold to qualified plans. The Board also received information and took into account any other potential conflicts of interests the Adviser might have in connection with the Subadvisory Agreements.
The Board’s decision to approve each Subadvisory Agreement was based on a number of determinations, including the following:
(1) The Subadviser has extensive experience and demonstrated skills as a manager;
(2) Although not without variation, the performance of each Fund managed by a Subadviser has generally been in-line with or generally outperformed the historical performance of comparable funds and the Fund’s respective benchmarks with the exceptions noted in Appendix A (with respect to such exceptions, the Board concluded that appropriate action was being taken to address such Fund’s performance, if necessary, or that performance was reasonable in light of all factors considered);
(3) The subadvisory fees generally are (i) competitive and within the range of industry norms and (ii) are paid by JHIMS out of its advisory fees it receives from the Fund (in the case of each sub-subadvisory agreement, that the sub-subadvisory fee would be paid by the Subadviser out of the subadvisory fee) and would not be an expense of the Fund, and, with respect to each Subadviser that is not affiliated with the Adviser, are a product of arm’s length negotiation between the Adviser and the Subadviser; and the Board concluded that each Fund’s subadvisory fees are reasonable; and
(4) With respect to those Funds that have subadvisory fees that contain breakpoints, such breakpoints are reflected as breakpoints in the advisory fees for the Funds in order to permit shareholders to benefit from economies of scale if those Funds grow.
| |
| Annual report | Fundamental Large Cap Value Fund | 33 |
Additional information relating to each Fund’s fees and expenses and performance that the Board considered for a particular Fund is set forth in Appendix A.
Based on their evaluation of all factors that they deemed to be material, including those factors described above, and assisted by the advice of independent counsel, the Board, including the Independent Trustees, concluded that renewal of the Advisory Agreement and each of the Subadvisory Agreements would be in the best interest of each of the Funds and its respective shareholders. Accordingly, the Board, and the Independent Trustees voting separately, approved the Advisory Agreement and each of the Subadvisory Agreements for an additional one-year period.
| | | |
| Appendix A |
|
| Portfolio | Performance of Fund, | | | |
| (Subadviser) | as of March 31, 2012 | | Fees and Expenses | | Other Comments | |
|
| Fundamental | Benchmark Index — The | The subadvised peer | The Board noted that |
| Large Cap Value | Fund launched June 1st | group is too small for | the inception date |
| Fund | of 2011. | comparative purposes. | for this Fund was |
| | | | June 1, 2011. |
| | Lipper Peer Group — The | | |
| (John Hancock | Fund launched June 1st | Net management | |
| Asset | of 2011. | fees for this Fund are | |
| Management a | | lower than the peer | |
| division of | | group median. | |
| Manulife Asset | | | |
| Management | | Total expenses for | |
| (US) LLC) | | this Fund are slightly | |
| | | higher than the peer | |
| | | group median. | |
|
| |
| 34 | Fundamental Large Cap Value Fund | Annual report |
Trustees and Officers
This chart provides information about the Trustees and Officers of John Hancock Funds II who oversee your John Hancock fund. Officers elected by the Trustees manage the day-to-day operations of the Portfolio and execute policies formulated by the Trustees.
| | |
| Independent Trustees | | |
| | | |
| Name, Year of Birth | Trustee | Number of |
| Position(s) held with Fund | of the | John Hancock |
| Principal occupation(s) and other | Trust | funds overseen |
| directorships during past 5 years | since1 | by Trustee |
| |
| Charles L. Bardelis, Born: 1941 | 2005 | 198 |
|
| Director, Island Commuter Corp. (Marine Transport). Trustee of John Hancock Variable Insurance |
| Trust (since 1988), John Hancock Funds II (since 2005) and former Trustee of John Hancock | |
| Funds III (2005–2006). | | |
|
| |
| Peter S. Burgess, Born: 1942 | 2005 | 198 |
|
| Consultant (financial, accounting and auditing matters) (since 1999); Certified Public Accountant. |
| Partner, Arthur Andersen (independent public accounting firm) (prior to 1999). Director of the following |
| publicly traded companies: Lincoln Educational Services Corporation (since 2004), Symetra Financial |
| Corporation (since 2010) and PMA Capital Corporation (2004–2010). Trustee of John Hancock Variable |
| Insurance Trust (since 2005), John Hancock Funds II (since 2005), and former Trustee of John Hancock |
| Funds III (2005–2006). | | |
|
| |
| Grace K. Fey, Born: 1946 | 2008 | 198 |
|
| Chief Executive Officer, Grace Fey Advisors (since 2007); Director & Executive Vice President, Frontier |
| Capital Management Company (1988–2007); Director, Fiduciary Trust (since 2009). Trustee of |
| John Hancock Variable Insurance Trust (since 2008) and John Hancock Funds II (since 2008). |
|
| |
| Theron S. Hoffman, Born: 1947 | 2008 | 198 |
|
| Chief Executive Officer, T. Hoffman Associates, LLC (consulting firm) (since 2003); Director, The Todd |
| Organization (consulting firm) (2003–2010); President, Westport Resources Management (investment |
| management consulting firm) (2006–2008); Partner/Operating Head & Senior Managing Director, |
| Putnam Investments (2000–2003); Executive Vice President, Thomson Corp. (1997–2000) (financial |
| and legal information publishing). Trustee of John Hancock Variable Insurance Trust (since 2008) and |
| John Hancock Funds II (since 2008). | | |
|
| |
| Hassell H. McClellan, Born: 1945 | 2005 | 198 |
|
| Associate Professor, The Graduate School of The Wallace E. Carroll School of Management, Boston |
| College (since 1984). Trustee of John Hancock Variable Insurance Trust (since 2005), John Hancock |
| Funds II (since 2005), Trustee of Virtus Variable Insurance Trust (formerly, Phoenix Edge Series Funds) |
| (since 2008), and Director of the Barnes Group (since 2010). | | |
|
| |
| James M. Oates, Born: 1946 | 2005 | 198 |
|
| Managing Director, Wydown Group (financial consulting firm) (since 1994); Chairman, Emerson |
| Investment Management, Inc. (since 2000); Chairman, Hudson Castle Group, Inc. (formerly IBEX |
| Capital Markets, Inc.) (financial services company) (1997–2011). Director of the following publicly traded |
| companies: Stifel Financial (since 1996); Investor Financial Services Corporation (1995–2007); and |
| Connecticut River Bancorp (since 1998). Director of the following Mutual Funds: Virtus Funds (formerly, |
| Phoenix Mutual Funds) (since 1988). Chairman of the Boards of John Hancock Variable Insurance Trust |
| and John Hancock Funds II (since 2005) and former Trustee of John Hancock Funds III (2005–2006). |
| |
| Annual report | Fundamental Large Cap Value Fund | 35 |
| | |
| Non-Independent Trustee2 | | |
| | | |
| Name, Year of Birth | Trustee | Number of |
| Position(s) held with Fund | of the | John Hancock |
| Principal occupation(s) and other | Trust | funds overseen |
| directorships during past 5 years | since1 | by Trustee |
| |
| James R. Boyle,3 Born: 1959 | 2005 | 198 |
|
| Senior Executive Vice President, John Hancock Financial Services (since 1999, including prior positions); |
| Chairman and Director, John Hancock Advisers, LLC, John Hancock Funds, LLC, and John Hancock |
| Investment Management Services, LLC (2005–2010); Trustee, John Hancock Variable Insurance Trust |
| (since 2005), John Hancock Funds II (since 2005), and John Hancock retail funds (2005–2010). |
1 Because the Trust does not hold regular annual shareholders meetings, each Trustee holds office for an indefinite term until his/her successor is duly elected and qualified or until he/she dies, retires, resigns, is removed or becomes disqualified.
2 Non-Independent Trustees hold positions or are affiliated with the Fund’s investment adviser, subadviser, underwriter or their affiliates.
3 Mr. Boyle is an “interested person” (as defined in the 1940 Act) due to his position with Manulife Financial Corporation (or its affiliates), the ultimate parent of the Adviser.
| |
| Principal officers who are not Trustees | |
| | |
| Name, Year of Birth | Officer |
| Position(s) held with Fund | of the |
| Principal occupation(s) and other | Trust |
| directorships during past 5 years | since |
| |
| Hugh McHaffie, Born: 1959 | 2009 |
|
| President | |
| Executive Vice President, John Hancock Financial Services (since 2006, including prior positions); | |
| President of John Hancock Variable Insurance Trust and John Hancock Funds II (since 2009); Trustee, |
| John Hancock retail funds (since 2010); Chairman and Director, John Hancock Advisers, LLC, | |
| John Hancock Investment Management Services, LLC and John Hancock Funds, LLC (since 2010). | |
|
| |
| Thomas M. Kinzler, Born: 1955 | 2008 |
|
| Secretary and Chief Legal Officer | |
| Vice President, John Hancock Financial Services (since 2006); Secretary and Chief Legal Counsel, | |
| John Hancock Funds, LLC (since 2007); Secretary and Chief Legal Officer, John Hancock retail funds, |
| John Hancock Variable Insurance Trust and John Hancock Funds II (since 2006). | |
|
| |
| Francis V. Knox, Jr., Born: 1947 | 2008 |
|
| Chief Compliance Officer | |
| Vice President, John Hancock Financial Services (since 2005); Chief Compliance Officer, John Hancock |
| retail funds, John Hancock Funds II, John Hancock Variable Insurance Trust, John Hancock Advisers, |
| LLC and John Hancock Investment Management Services, LLC (since 2005); Vice President and Chief |
| Compliance Officer, John Hancock Asset Management a division of Manulife Asset Management (US) |
| LLC (2005–2008). | |
|
| |
| Michael J. Leary, Born: 1965 | 2008 |
|
| Treasurer | |
| Assistant Vice President, John Hancock Financial Services (since 2007); Treasurer, John Hancock Funds II |
| and John Hancock Variable Insurance Trust (since 2009); Treasurer, John Hancock retail funds (2009– |
| 2010); Vice President, John Hancock Advisers, LLC and John Hancock Investment Management Services, |
| LLC (since 2007); Assistant Treasurer, John Hancock retail funds (2007–2009 & 2010), John Hancock |
| Funds II and John Hancock Variable Insurance Trust (2007–2009) and John Hancock Funds III (since |
| 2009); Vice President and Director of Fund Administration, JP Morgan (2004–2007). | |
| |
| 36 | Fundamental Large Cap Value Fund | Annual report |
| |
| Principal officers who are not Trustees (continued) | |
| | |
| Name, Year of Birth | Officer |
| Position(s) held with Fund | of the |
| Principal occupation(s) and other | Trust |
| directorships during past 5 years | since |
| |
| Charles A. Rizzo, Born: 1957 | 2008 |
|
| Chief Financial Officer | |
| Vice President, John Hancock Financial Services (since 2008); Senior Vice President, John Hancock | |
| Advisers, LLC and John Hancock Investment Management Services, LLC (since 2008); Chief Financial |
| Officer, John Hancock retail funds, John Hancock Funds II and John Hancock Variable Insurance Trust |
| (since 2007); Assistant Treasurer, Goldman Sachs Mutual Fund Complex (2005–2007); Vice President, |
| Goldman Sachs (2005–2007). | |
|
| |
| John G. Vrysen, Born: 1955 | 2008 |
|
| Chief Operating Officer | |
| Senior Vice President, John Hancock Financial Services (since 2006); Director, Executive Vice President |
| and Chief Operating Officer, John Hancock Advisers, LLC, John Hancock Investment Management | |
| Services, LLC and John Hancock Funds, LLC (since 2005); Chief Operating Officer, John Hancock Funds |
| II and John Hancock Variable Insurance Trust (since 2007); Chief Operating Officer, John Hancock retail |
| funds (until 2009); Trustee, John Hancock retail funds (since 2009). | |
The business address for all Trustees and Officers is 601 Congress Street, Boston, Massachusetts 02210-2805.
The Statement of Additional Information of the Fund includes additional information about members of the Board of Trustees of the Fund and is available without charge, upon request, by calling 1-800-225-5291.
| |
| Annual report | Fundamental Large Cap Value Fund | 37 |
More information
| |
| Trustees | Investment adviser |
| James M. Oates, Chairman | John Hancock Investment Management |
| James R. Boyle† | Services, LLC |
| Charles L. Bardelis* | |
| Peter S. Burgess* | Subadviser |
| Grace K. Fey | John Hancock Asset Management a division of |
| Theron S. Hoffman | Manulife Asset Management (US) LLC |
| Hassell H. McClellan | |
| | Principal distributor |
| Officers | John Hancock Funds, LLC |
| Hugh McHaffie | |
| President | Custodian |
| | State Street Bank and Trust Company |
| Thomas M. Kinzler | |
| Secretary and Chief Legal Officer | Transfer agent |
| | John Hancock Signature Services, Inc. |
| Francis V. Knox, Jr. | |
| Chief Compliance Officer | Legal counsel |
| | K&L Gates LLP |
| Michael J. Leary | |
| Treasurer | Independent registered |
| | public accounting firm |
| Charles A. Rizzo | PricewaterhouseCoopers LLP |
| Chief Financial Officer | |
| | |
| John G. Vrysen | |
| Chief Operating Officer | |
| |
| *Member of the Audit Committee | |
| †Non-Independent Trustee | |
The Fund’s proxy voting policies and procedures, as well as the Fund’s proxy voting record for the most recent twelve-month period ended June 30, are available free of charge on the Securities and Exchange Commission (SEC) Web site at www.sec.gov or on our Web site.
The Fund’s complete list of portfolio holdings, for the first and third fiscal quarters, is filed with the SEC on Form N-Q. The Fund’s Form N-Q is available on our Web site and the SEC’s Web site, www.sec.gov, and can be reviewed and copied (for a fee) at the SEC’s Public Reference Room in Washington, DC. Call 1-202-551-8090 to receive information on the operation of the SEC’s Public Reference Room.
We make this information on your fund, as well as monthly portfolio holdings, and other fund details available on our Web site at www.jhfunds.com or by calling 1-800-225-5291.
| | |
| You can also contact us: | | |
| 1-800-225-5291 | Regular mail: | Express mail: |
| jhfunds.com | John Hancock Signature Services, Inc. | John Hancock Signature Services, Inc. |
| | P.O. Box 55913 | Mutual Fund Image Operations |
| | Boston, MA 02205-5913 | 30 Dan Road |
| | | Canton, MA 02021 |
| |
| 38 | Fundamental Large Cap Value Fund | Annual report |

1-800-225-5291
1-800-554-6713 TDD
1-800-338-8080 EASI-Line
www.jhfunds.com
Now available: electronic delivery
www.jhfunds.com/edelivery
| |
| This report is for the information of the shareholders of John Hancock Fundamental Large Cap Value Fund. | 374A 7/12 |
| It is not authorized for distribution to prospective investors unless preceded or accompanied by a prospectus. | 9/12 |
| |
| John Hancock China Emerging Leaders Fund | |
| |
| Table of Contents | |
| |
| Management's discussion of fund performance | Page 3 |
| A look at performance | Page 4 |
| Your expenses | Page 6 |
| Portfolio summary | Page 7 |
| Fund's investments | Page 8 |
| Financial statements | Page 10 |
| Financial highlights | Page 13 |
| Notes to financial statements | Page 16 |
| Federal tax information | Page 23 |
| Trustees and Officers | Page 24 |
| More information | Page 27 |
John Hancock China Emerging Leaders Fund
Management’s Discussion of Fund Performance
By Atlantis Investment Management (H.K.) Ltd.
Chinese markets rose during the period from the Fund’s inception, December 29, 2011, through July 31, 2012, with the MSCI China Index up 5.29% for the period. The year 2012 started on a positive note, on the back of fourth quarter regional economic data that indicated a soft landing in China. The market bounce continued into February when January data proved better than expected, but the rally came to an end in March, when the Chinese government revised the 2012 gross domestic product (GDP) growth target down from 8.0% to 7.5%, the first reduction in three years. Figures released in April showed that first quarter GDP growth (8.1% year over year) was the lowest in three years and that sparked a market decline. The sell-off accelerated in May on renewed fears around the eurozone debt crisis. The Chinese authorities took prompt action to respond, such as fast-tracking of approvals for infrastructure investment, additional aid for small and medium-sized businesses and initiatives to further develop and liberalize the financial system.
Portfolio Update
John Hancock China Emerging Leaders Fund was launched on December 29, 2011 and from inception through July 31, 2012, performance for the Fund’s Class A shares declined 6.80%, excluding sales charges. In the same period, the Fund’s benchmark index, the MSCI China Index, returned 5.29%. The Fund underperformed the benchmark in part because it held a relatively high cash position during the period. Other factors contributing to the Fund’s performance lag were an underweight in, and poor stock selection within, the strong performing financials and information technology sectors and an overweight and unrewarding stock selection in the poor performing materials sector. On the other hand, an overweight position in health care had a positive impact on Fund performance. By the end of the reporting period, the Fund was fully invested, with almost two thirds of its net assets allocated to Chinese large-cap stocks, primarily in H shares, which are Hong Kong-issued shares of companies incorporated in mainland China. The bulk of the remainder of Fund assets was allocated to Hong Kong-listed Chinese companies that had a majority of shares owned by Chinese individuals prior to their listing. The latter experienced a major sell-off in May when global markets suffered double-digit declines due to the European debt crisis and fears of an economic hard landing in China.
This commentary reflects the views of the portfolio manager through the end of the period discussed in this report. The manager’s statements reflect his own opinions. As such, they are in no way guarantees of future events, and are not intended to be used as investment advice or a recommendation regarding any specific security. They are also subject to change at any time as market and other conditions warrant. Past performance is no guarantee of future results.
International investing involves special risks such as political, economic and currency risks and differences in accounting standards and financial reporting. Although they are larger and/or more established than many emerging markets, the markets of China function in many ways as emerging markets, and carry the high levels of risk associated with emerging markets.
A look at performance
Total returns for the period ended July 31, 2012
| | | | | | | | | |
| | Average annual total returns (%) | | Cumulative total returns (%) | |
| | with maximum sales charge | | | with maximum sales charge | |
|
| | | | | Since | | | | | Since |
| | 1-year | 5-year | 10-year | inception | | 1-year | 5-year | 10-year | inception1 |
|
| Class A | — | — | — | — | | — | — | — | –11.49 |
|
| Class I2 | — | — | — | — | | — | — | — | –6.60 |
|
| Class NAV2 | — | — | — | — | | — | — | — | –6.60 |
|
Performance figures assume all distributions are reinvested. Figures reflect maximum sales charges on Class A shares of 5.00%.
The expense ratios of the Fund, both net (including any fee waivers or expense limitations) and gross (excluding any fee waivers or expense limitations), are set forth according to the most recent publicly available prospectuses for the Fund and may differ from those disclosed in the Financial highlights tables in this report. The fee waivers and expense limitations are contractual at least until 12-31-12 for Class A shares. Had the fee waivers and expense limitations not been in place gross expenses would apply. For all other classes the net expenses equal the gross expenses. The expense ratios are as follows:
| | | | | | | | | |
| | Class A | Class I | Class NAV | | | | | | |
| Net (%) | 1.80 | 1.40 | 1.32 | | | | | | |
| Gross (%) | 1.82 | 1.40 | 1.32 | | | | | | |
The returns reflect past results and should not be considered indicative of future performance. The return and principal value of an investment will fluctuate so that shares, when redeemed, may be worth more or less than their original cost. Due to market volatility, the Fund’s current performance may be higher or lower than the performance shown. For current to the most recent month-end performance data, please call 1-800-225-5291 or visit the Fund’s Web site at www.jhfunds.com.
The performance table above and the chart on the next page do not reflect the deduction of taxes that a shareholder may pay on fund distributions or on the redemption of fund shares. The Fund’s performance results reflect any applicable fee waivers or expense reductions, without which the expenses would increase and results would have been less favorable.
Footnotes on the following page.
|
| China Emerging Leaders Fund | Annual report |
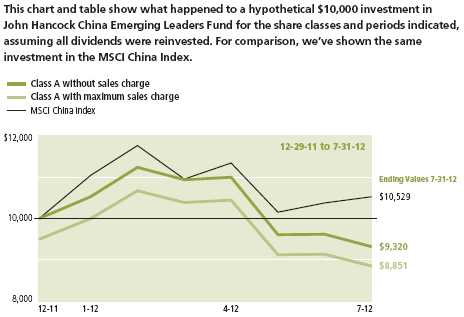
| | | | | |
| | | Without | With maximum | | |
| | Start date | sales charge | sales charge | Index | |
| |
| Class I2 | 12-29-11 | $9,340 | $9,340 | $10,529 | |
| |
| Class NAV2 | 12-29-11 | 9,340 | 9,340 | 10,529 | |
| |
MSCI China Index (gross of foreign withholding taxes on dividends) is an unmanaged free float-adjusted market capitalization weighted index that is designed to measure large and mid cap equity market performance in China.
It is not possible to invest directly in an index. Index figures do not reflect expenses, which would have resulted in lower values if they did.
1 From 12-29-11.
2 For certain types of investors, as described in the Fund’s prospectuses.
|
| Annual report | China Emerging Leaders Fund |
Your expenses
These examples are intended to help you understand your ongoing operating expenses of investing in the Fund so you can compare these costs with the ongoing costs of investing in other mutual funds.
Understanding your fund expenses
As a shareholder of the Fund, you incur two types of costs:
● Transaction costs which include sales charges (loads) on purchases or redemptions (varies by share class), minimum account fee charge, etc.
● Ongoing operating expenses including management fees, distribution and service fees (if applicable), and other fund expenses.
We are going to present only your ongoing operating expenses here.
Actual expenses/actual returns
This example is intended to provide information about your fund’s actual ongoing operating expenses, and is based on your fund’s actual return. It assumes an account value of $1,000.00 on February 1, 2012, with the same investment held until July 31, 2012.
| | | | |
| | Account value | Ending value | Expenses paid during | |
| | on 2-1-12 | on 7-31-12 | period ended 7-31-121 | |
| |
| Class A | $1,000.00 | $885.10 | $8.44 | |
| |
| Class I | 1,000.00 | 887.00 | 6.76 | |
| |
| Class NAV | 1,000.00 | 887.00 | 6.29 | |
| |
Together with the value of your account, you may use this information to estimate the operating expenses that you paid over the period. Simply divide your account value at July 31, 2012 by $1,000.00, then multiply it by the “expenses paid” for your share class from the table above. For example, for an account value of $8,600.00, the operating expenses should be calculated as follows:
Example
[ My account value $8,600.00 / $1,000.00 = 8.6 ] x $[ “expenses paid” from table ] = My actual expenses
Hypothetical example for comparison purposes
This table allows you to compare the Fund’s ongoing operating expenses with those of any other fund. It provides an example of the Fund’s hypothetical account values and hypothetical expenses based on each class’s actual expense ratio and an assumed 5% annualized return before expenses (which is not the Fund’s actual return). It assumes an account value of $1,000.00 on February 1, 2012, with the same investment held until July 31, 2012. Look in any other fund shareholder report to find its hypothetical example and you will be able to compare these expenses.
| | | | |
| | Account value | Ending value | Expenses paid during | |
| | on 2-1-12 | on 7-31-12 | period ended 7-31-121 | |
| |
| Class A | $1,000.00 | $1,015.90 | $9.02 | |
| |
| Class I | 1,000.00 | 1,017.70 | 7.22 | |
| |
| Class NAV | 1,000.00 | 1,018.20 | 6.72 | |
| |
Remember, these examples do not include any transaction costs; therefore, these examples will not help you to determine the relative total costs of owning different funds. If transaction costs were included, your expenses would have been higher. See the prospectuses for details regarding transaction costs.
1 Expenses are equal to the Fund's annualized expense ratio of 1.80%, 1.44% and 1.34% for Class A, Class I and Class NAV shares, respectively, multiplied by the average account value over the period, multiplied by 182/366 (to reflect the one-half year period).
China Emerging Leaders Fund
As of 7-31-12
Portfolio Summary
| |
| Top 10 Holdings (38.7% of Net Assets on 7-31-12)1,2 | |
| PICC Property & Casualty Company, Ltd., H Shares | 5.1% |
| China Resource Power Holdings, Ltd. | 4.4% |
| Biosensors International Group, Ltd. | 4.1% |
| China Mobile, Ltd. | 4.1% |
| Silver Base Group Holdings, Ltd. | 3.8% |
| China Metal Recycling Holdings, Ltd. | 3.7% |
| Sinopharm Group Company, Ltd., H Shares | 3.6% |
| Inner Mongolia Yitai Coal Company, H Shares | 3.4% |
| China Foods, Ltd. | 3.3% |
| China Minsheng Banking Corp., Ltd., H Shares | 3.2% |
| |
| |
| Country Concentration1,3 | |
| China | 56.4% |
| Hong Kong | 30.3% |
| United States | 8.3% |
| Singapore | 4.1% |
| Mongolia | 0.9% |
| |
| |
| Sector Composition1,3 | |
| Consumer Discretionary | 15.0% |
| Financials | 13.8% |
| Health Care | 12.6% |
| Consumer Staples | 11.2% |
| Industrials | 10.7% |
| Energy | 9.6% |
| Materials | 7.4% |
| Utilities | 5.7% |
| Telecommunication Services | 4.1% |
| Information Technology | 1.6% |
| Short-Term Investments & Other | 8.3% |
1 As a percentage of net assets on 7-31-12.
2 Cash and cash equivalents not included.
3 Sector investing is subject to greater risks than the market as a whole. Because the Fund may focus on particular sectors of the economy, its performance may depend on the performance of those sectors. International investing involves special risks such as political, economic and currency risks and differences in accounting standards and financial reporting. Although they are larger and/or more established than many emerging markets, the markets of China function in many ways as emerging markets and carry the high levels of risk associated with emerging markets.
China Emerging Leaders Fund
Fund’s investments
As of 7-31-12
| | |
| | Shares | Value |
| |
| Common Stocks 90.2% | | $256,945,063 |
|
| (Cost $278,804,356) | | |
| |
| China 54.9% | | 156,274,443 |
|
| Baoxin Auto Group, Ltd. (I) | 11,000,000 | 5,288,024 |
| Beijing Capital International Airport Company, Ltd., H Shares | 10,000,000 | 6,787,734 |
| China Communications Construction Company, Ltd., H Shares | 10,000,000 | 8,773,873 |
| China Minsheng Banking Corp., Ltd., H Shares | 10,000,000 | 9,223,022 |
| China Petroleum & Chemical Corp., H Shares | 10,000,000 | 9,041,522 |
| China Qinfa Group, Ltd. (I) | 10,000,000 | 1,022,915 |
| China Shipping Container Lines Company, Ltd., H Shares (I) | 12,000,000 | 2,885,170 |
| China Yurun Food Group, Ltd. | 10,000,000 | 5,977,469 |
| CNOOC, Ltd. | 3,000,000 | 6,023,087 |
| Dongwu Cement International, Ltd. (I) | 7,000,000 | 1,173,482 |
| Inner Mongolia Yitai Coal Company, H Shares (I) | 1,733,000 | 9,721,266 |
| Intime Department Store Group Company, Ltd. | 6,000,000 | 5,606,286 |
| Lenovo Group, Ltd. | 6,500,000 | 4,493,431 |
| PICC Property & Casualty Company, Ltd., H Shares | 13,000,000 | 14,435,998 |
| Ping An Insurance Group Company, H Shares | 1,000,000 | 7,810,390 |
| Renhe Commercial Holdings Company, Ltd. (I) | 160,000,000 | 6,545,955 |
| Sany Heavy Equipment International Holdings Company, Ltd. | 11,000,000 | 5,473,322 |
| Shandong Weigao Group Medical Polymer Company, Ltd., H Shares | 7,000,000 | 7,786,203 |
| Silver Base Group Holdings, Ltd. | 26,714,000 | 10,845,591 |
| Sinopharm Group Company, Ltd., H Shares | 3,500,000 | 10,231,661 |
| Tsingtao Brewery Company, Ltd., H Shares | 1,000,000 | 5,839,183 |
| Xiao Nan Guo Restaurants Holdings, Ltd. (I) | 24,200,000 | 3,619,998 |
| Yanzhou Coal Mining Company, Ltd., H Shares | 1,000,000 | 1,476,501 |
| Zhaojin Mining Industry Company, Ltd., H Shares | 5,000,000 | 6,192,360 |
| |
| Hong Kong 30.3% | | 86,370,838 |
|
| China Foods, Ltd. | 10,000,000 | 9,374,541 |
| China Mengniu Dairy Company, Ltd. | 2,200,000 | 6,513,474 |
| China Metal Recycling Holdings, Ltd. | 15,000,000 | 10,626,324 |
| China Mobile, Ltd. | 1,000,000 | 11,693,409 |
| China Resource Power Holdings, Ltd. | 6,000,000 | 12,622,522 |
| China State Construction International Holdings, Ltd. | 6,200,000 | 6,431,429 |
| China Water Affairs Group, Ltd. | 15,500,000 | 3,746,326 |
| Galaxy Entertainment Group, Ltd. (I) | 3,000,000 | 7,169,437 |
| Haier Electronics Group Company, Ltd. (I) | 8,000,000 | 9,186,431 |
| Hao Tian Resources Group, Ltd. (I) | 32,000,000 | 701,093 |
| Hua Han Bio-Pharmaceutical Holdings, Ltd., H Shares | 33,000,000 | 5,938,051 |
| Ming Fung Jewellery Group, Ltd. (I) | 20,000,000 | 924,258 |
| Silver Grant International, Ltd. | 9,000,000 | 1,443,543 |
| |
| Mongolia 0.9% | | 2,498,152 |
|
| Mongolian Mining Corp. (I) | 4,550,000 | 2,498,152 |
| |
| Singapore 4.1% | | 11,801,630 |
|
| Biosensors International Group, Ltd. (I) | 12,000,000 | 11,801,630 |
| |
| |
| Warrants 1.5% | | $4,210,470 |
|
| (Cost $6,683,204) | | |
| |
| China 1.5% | | 4,210,470 |
|
| Anhui Quanchai Engine Company (Expiration Date: 3-30-17; Strike Price: CNY 0.00) | | |
| (I) | 3,000,111 | 4,210,470 |
|
| See notes to financial statements |
China Emerging Leaders Fund
Fund’s investments
As of 7-31-12
| | |
| | Shares | Value |
| |
| Short-Term Investments 8.9% | | $25,387,991 |
|
| (Cost $25,387,991) | | |
| | | |
| Money Market Funds 8.9% | | 25,387,991 |
|
| State Street Institutional Liquid Reserves Fund, 0.1930% (Y) | 25,387,991 | 25,387,991 |
| |
| Total investments (Cost $310,875,551)† 100.6% | | $286,543,524 |
|
| Other assets and liabilities, net (0.6%) | | ($1,813,863) |
|
| Total net assets 100.0% | | $284,729,661 |
|
The percentage shown for each investment category is the total value of the category as a percentage of the net assets of the Fund.
CNY Chinese Yuan Renminbi
(I) Non-income producing security.
(Y) The rate shown is the annualized seven-day yield as of 7-31-12.
† At 7-31-12, the aggregate cost of investment securities for federal income tax purposes was $310,876,796. Net unrealized depreciation aggregated $24,333,272, of which $10,379,914 related to appreciated investment securities and $34,713,186 related to depreciated investment securities.
The Fund had the following sector composition as of 7-31-12 (as a percentage of total net assets):
| | | | | |
| Consumer Discretionary | 15.0% | | | | |
| Financials | 13.8% | | | | |
| Health Care | 12.6% | | | | |
| Consumer Staples | 11.2% | | | | |
| Industrials | 10.7% | | | | |
| Energy | 9.6% | | | | |
| Materials | 7.4% | | | | |
| Utilities | 5.7% | | | | |
| Telecommunication Services | 4.1% | | | | |
| Information Technology | 1.6% | | | | |
| Short-Term Investments & Other | 8.3% | | | | |
|
| See notes to financial statements |
China Emerging Leaders Fund
Statement of Assets and Liabilities — July 31, 2012
| | | |
| Assets | | | |
| | |
| Investments, at value (Cost $310,875,551) | $286,543,524 | | |
| Foreign currency, at value (Cost $35,681) | 35,676 | | |
| Receivable for fund shares sold | 8,776 | | |
| Dividends and interest receivable | 326,160 | | |
| Other receivables and prepaid expenses | 21,393 | | |
| | | | |
| Total assets | 286,935,529 | | |
| | | |
| | | |
| Liabilities | | | |
| | |
| Payable for investments purchased | 2,075,261 | | |
| Payable to affiliates | | | |
| Accounting and legal services fees | 2,449 | | |
| Transfer agent fees | 40 | | |
| Trustees' fees | 187 | | |
| Other liabilities and accrued expenses | 127,931 | | |
| | | | |
| Total liabilities | 2,205,868 | | |
| | | |
| | | |
| Net assets | | | |
| | |
| Paid-in capital | $301,869,194 | | |
| Undistributed net investment income | 798,129 | | |
| Accumulated net realized gain (loss) on | | | |
| investments and foreign currency transactions | 6,394,429 | | |
| Net unrealized appreciation (depreciation) on | | | |
| investments and translation of assets and | | | |
| liabilities in foreign currencies | (24,332,091) | | |
| | | | |
| Net assets | $284,729,661 | | |
| | | |
| | | |
| Net asset value per share | | | |
| | |
| Based on net asset values and shares | | | |
| outstanding-the Fund has an unlimited number | | | |
| of shares authorized with no par value | | | |
| Class A ($93,199 ÷ 10,000 shares) | $9.32 | | |
| Class I ($93,397 ÷ 10,000 shares) | $9.34 | | |
| Class NAV ($284,543,065 ÷ 30,452,750 shares) | $9.34 | | |
| | | |
| Maximum offering price per share | | | |
| Class A (net asset value per share ÷ 95%)1 | $9.81 | | |
1 On single retail sales of less than $50,000. On sales of $50,000 or more and on group sales the offering price is reduced.
|
| See notes to financial statements |
China Emerging Leaders Fund
Statement of Operations — For the Period Ended July 31, 20121
| | | |
| Investment income | | | |
| | |
| Dividends | $2,320,594 | | |
| Interest | 17,157 | | |
| Less foreign taxes withheld | (159,087) | | |
| | | | |
| Total investment income | 2,178,664 | | |
| | | |
| Expenses | | | |
| | |
| Investment management fees | 1,102,474 | | |
| Distribution and service fees | 183 | | |
| Accounting and legal services fees | 12,784 | | |
| Transfer agent fees | 188 | | |
| Trustees' fees | 778 | | |
| Professional fees | 54,842 | | |
| Custodian fees | 111,215 | | |
| Registration and filing fees | 54,664 | | |
| Other | 6,646 | | |
| | | | |
| Total expenses | 1,343,774 | | |
| | | | |
| Less expense reductions | (3,450) | | |
| | | | |
| Net expenses | 1,340,324 | | |
| | | |
| Net investment income | 838,340 | | |
| | | |
| | | |
| Realized and unrealized gain (loss) | | | |
| | |
| Net realized gain (loss) on | | | |
| Investments | 6,394,429 | | |
| Foreign currency transactions | (40,290) | | |
| | | | |
| | 6,354,139 | | |
| | | |
| Change in net unrealized appreciation | | | |
| (depreciation) of | | | |
| Investments | (24,332,027) | | |
| Translation of assets and liabilities in foreign | | | |
| currencies | (64) | | |
| | | | |
| | (24,332,091) | | |
| | | |
| Net realized and unrealized loss | (17,977,952) | | |
| | | |
| Decrease in net assets from operations | ($17,139,612) | | |
1 Period from 12-29-11 (commencement of operations) to 7-31-12.
|
| See notes to financial statements |
China Emerging Leaders Fund
Statement of Changes in Net Assets
| | | |
| | Period | | |
| | ended | | |
| | 7/31/121 | | |
| | | |
| Increase (decrease) in net assets | | | |
| | |
| From operations | | | |
| Net investment income | $838,340 | | |
| Net realized gain | 6,354,139 | | |
| Change in net unrealized appreciation | | | |
| (depreciation) | (24,332,091) | | |
| | | | |
| Decrease in net assets resulting from | | | |
| operations | (17,139,612) | | |
| | | |
| From Fund share transactions | 301,869,273 | | |
| | | |
| Total increase | 284,729,661 | | |
| | | | |
| Net assets | | | |
| | |
| Beginning of period | — | | |
| | | | |
| End of period | $284,729,661 | | |
| | | | |
| Undistributed net investment income | $798,129 | | |
1 Period from 12-29-11 (commencement of operations) to 7-31-12.
|
| See notes to financial statements |
China Emerging Leaders Fund
Financial Highlights
| | | | |
| Class A Shares | | | | |
| | | |
| Period ended | | | | |
| | | 7-31-121 | | |
| Per share operating performance | | | | |
| |
| | |
| Net asset value, beginning of period | | $10.00 | | |
| Net investment income2 | | 0.02 | | |
| Net realized and unrealized loss on | | | | |
| investments | | (0.70) | | |
| | | | | |
| Total from investment operations | | (0.68) | | |
| | | |
| Net asset value, end of period | | $9.32 | | |
| | | |
| Total return (%)3 | | (6.80)4,5 | | |
| | | |
| Ratios and supplemental data | | | | |
| |
| | |
| Net assets, end of period (in millions) | | — 6 | | |
| Ratios (as a percentage of average net | | | | |
| assets): | | | | |
| Expenses before reductions | | 1.837 | | |
| Expenses net of fee waivers and credits | | 1.807 | | |
| Net investment income | | 0.357 | | |
| Portfolio turnover (%) | | 35 | | |
1 Period from 12-29-11 (commencement of operations) to 7-31-12.
2 Based on the average daily shares outstanding.
3 Does not reflect the effect of sales charges, if any.
4 Not annualized.
5 Total returns would have been lower had certain expenses not been reduced during the period shown.
6 Less than $500,000.
7 Annualized.
|
| See notes to financial statements |
China Emerging Leaders Fund
Financial Highlights
| | | | |
| Class I Shares | | | | |
| | | |
| Period ended | | | | |
| | | 7-31-121 | | |
| Per share operating performance | | | | |
| |
| | |
| Net asset value, beginning of period | | $10.00 | | |
| Net investment income2 | | 0.04 | | |
| Net realized and unrealized loss on | | | | |
| investments | | (0.70) | | |
| | | | | |
| Total from investment operations | | (0.66) | | |
| | | |
| Net asset value, end of period | | $9.34 | | |
| | | |
| Total return (%) | | (6.60)3,4 | | |
| | | |
| Ratios and supplemental data | | | | |
| |
| | |
| Net assets, end of period (in millions) | | — 5 | | |
| Ratios (as a percentage of average net | | | | |
| assets): | | | | |
| Expenses before reductions | | 1.446 | | |
| Expenses net of fee waivers and credits | | 1.446 | | |
| Net investment income | | 0.726 | | |
| Portfolio turnover (%) | | 35 | | |
1 Period from 12-29-11 (commencement of operations) to 7-31-12.
2 Based on the average daily shares outstanding.
3 Total returns would have been lower had certain expenses not been reduced during the period shown.
4 Not annualized.
5 Less than $500,000.
6 Annualized.
|
| See notes to financial statements |
China Emerging Leaders Fund
Financial Highlights
| | | | |
| Class NAV Shares | | | | |
| | | |
| Period ended | | | | |
| | | 7-31-121 | | |
| Per share operating performance | | | | |
| |
| | |
| Net asset value, beginning of period | | $10.00 | | |
| Net investment income2 | | 0.05 | | |
| Net realized and unrealized loss on | | | | |
| investments | | (0.71) | | |
| | | | | |
| Total from investment operations | | (0.66) | | |
| | | |
| Net asset value, end of period | | $9.34 | | |
| | | |
| Total return (%) | | (6.60)3,4 | | |
| | | |
| Ratios and supplemental data | | | | |
| |
| | |
| Net assets, end of period (in millions) | | $285 | | |
| Ratios (as a percentage of average net | | | | |
| assets): | | | | |
| Expenses before reductions | | 1.345 | | |
| Expenses net of fee waivers and credits | | 1.345 | | |
| Net investment income | | 0.845 | | |
| Portfolio turnover (%) | | 35 | | |
1 Period from 12-29-11 (commencement of operations) to 7-31-12.
2 Based on the average daily shares outstanding.
3 Total returns would have been lower had certain expenses not been reduced during the period shown.
4 Not annualized.
5 Annualized.
|
| See notes to financial statements |
China Emerging Leaders Fund
Notes to Financial Statements
Note 1 — Organization
John Hancock China Emerging Leaders Fund (the Fund) is a series of John Hancock Funds II (the Trust), an open-end management investment company organized as a Massachusetts business trust and registered under the Investment Company Act of 1940, as amended (the 1940 Act). The investment objective of the Fund is to achieve long-term capital appreciation.
The Fund may offer multiple classes of shares. The shares currently offered are detailed in the Statement of Assets and Liabilities. Class A shares are offered to all investors. Class I shares are offered to institutions and certain investors. Class NAV shares are sold to John Hancock affiliated funds of funds. Shareholders of each class have exclusive voting rights to matters that affect that class. The distribution and service fees, if any, transfer agent fees, printing and postage and state registration fees for each class may differ.
Note 2 - Significant accounting policies
The financial statements have been prepared in conformity with accounting principles generally accepted in the United States of America, which require management to make certain estimates and assumptions at the date of the financial statements. Actual results could differ from those estimates. Events or transactions occurring after the end of the fiscal period through the date that the financial statements were issued have been evaluated in the preparation of the financial statements. The following summarizes the significant accounting policies of the Fund:
Security valuation. Investments are stated at value as of the close of regular trading on the New York Stock Exchange (NYSE), normally at 4:00 P.M., Eastern Time. In order to value the securities, the Fund uses the following valuation techniques: Equity securities, including exchange-traded and closed-end funds, held by the Fund are valued at the last sale price or official closing price on the principal securities exchange on which they trade. In the event there were no sales during the day or closing prices are not available, then securities are valued using the last quoted bid or evaluated price. Foreign securities and currencies are valued in U.S. dollars, based on foreign currency exchange rates supplied by an independent pricing service. Certain securities traded only in the over-the-counter market are valued at the last bid price quoted by brokers making markets in the securities at the close of trading. Certain short-term securities are valued at amortized cost.
Other portfolio securities and assets, where market quotations are not readily available, are valued at fair value, as determined in good faith by the Fund’s Pricing Committee, following procedures established by the Board of Trustees. Generally, trading in non-U.S. securities is substantially completed each day at various times prior to the close of trading on the NYSE. Significant market events that affect the values of non-U.S. securities may occur between the time when the valuation of the securities is generally determined and the close of the NYSE. During significant market events, these securities will be valued at fair value, as determined in good faith, following procedures established by the Board of Trustees. The Fund may use a fair valuation model to value non-U.S. securities in order to adjust for events which may occur between the close of foreign exchanges and the close of the NYSE.
The Fund uses a three-tier hierarchy to prioritize the pricing assumptions, referred to as inputs, used in valuation techniques to measure fair value. Level 1 includes securities valued using quoted prices in active markets for identical securities. Level 2 includes securities valued using significant observable inputs. Observable inputs may include quoted prices for similar securities, interest rates, prepayment speeds and credit risk. Prices for securities valued using these inputs are received from independent pricing vendors and brokers and are based on an evaluation of the inputs described. Level 3 includes securities valued using significant unobservable inputs when market prices are not readily available or reliable, including the Fund’s own assumptions in determining the fair value of investments. Factors used in determining value may include market or issuer specific events, changes in interest rates and credit quality. The inputs or methodology used for valuing securities are not necessarily an indication of
the risks associated with investing in those securities. Changes in valuation techniques may result in transfers into or out of an assigned level within the disclosure hierarchy.
As of July 31, 2012, all investments were categorized as Level 2 under the hierarchy described above, except for short-term investments which were categorized as Level 1.
Security transactions and related investment income. Investment security transactions are accounted for on a trade date plus one basis for daily net asset value calculations. However, for financial reporting purposes, investment transactions are reported on trade date. Interest income is accrued as earned. Dividend income is recorded on the ex-date, except for dividends of foreign securities where the dividend may not be known until after the ex-date. In those cases, dividend income, net of withholding taxes, is recorded when the Fund becomes aware of the dividends. Foreign taxes are provided for based on the Fund’s understanding of the tax rules and rates that exist in the foreign markets in which it invests. Gains and losses on securities sold are determined on the basis of identified cost and may include proceeds from litigation.
Foreign currency translation. Assets, including investments and liabilities denominated in foreign currencies, are translated into U.S. dollar values each day at the prevailing exchange rate. Purchases and sales of securities, income and expenses are translated into U.S. dollars at the prevailing exchange rate on the date of the transaction. The effect of changes in foreign currency exchange rates on the value of securities is reflected as a component of the realized and unrealized gains (losses) on investments.
Funds investing in a single country or in a limited geographic region tend to be riskier than funds that invest more broadly. Risks can result from differences in economic and political conditions, regulations, market practices (including higher transaction costs) and accounting standards. Foreign investments are also subject to a decline in the value of a foreign currency versus the U.S. dollar, which reduces the dollar value of securities denominated in that currency.
Foreign taxes. The Fund may be subject to withholding tax on income or capital gains or repatriation taxes as imposed by certain countries in which it invests. Taxes are accrued based upon net investment income, net realized gains or net unrealized appreciation.
Line of credit. The Fund may borrow from banks for temporary or emergency purposes, including meeting redemption requests that otherwise might require the untimely sale of securities. Pursuant to the custodian agreement, the custodian may loan money to the Fund to make properly authorized payments. The Fund is obligated to repay the custodian for any overdraft, including any related costs or expenses. The custodian may have a lien, security interest or security entitlement in any Fund property that is not otherwise segregated or pledged, to the maximum extent permitted by law, to the extent of any overdraft.
In addition, the Fund and other affiliated funds have entered into an agreement with Citibank N.A. which enables them to participate in a $200 million unsecured committed line of credit. A commitment fee, payable at the end of each calendar quarter, based on the average daily unused portion of the line of credit, is charged to each participating fund on a pro rata basis and is reflected in other expenses on the Statement of operations. For the period ended July 31, 2012, the Fund had no borrowings under the line of credit.
Expenses. Within the John Hancock Funds complex, expenses that are directly attributable to an individual fund are allocated to such fund. Expenses that are not readily attributable to a specific fund are allocated among all funds in an equitable manner, taking into consideration, among other things, the nature and type of expense and the fund’s relative net assets. Expense estimates are accrued in the period to which they relate and adjustments are made when actual amounts are known.
Class allocations. Income, common expenses and realized and unrealized gains (losses) are determined at the fund level and allocated daily to each class of shares based on the net assets of the class. Class-specific expenses, such as distribution and service fees, if any, transfer agent fees, state
registration fees and printing and postage, for all classes, are calculated daily at the class level based on the appropriate net assets of each class and the specific expense rates applicable to each class.
Federal income taxes. The Fund intends to qualify as a regulated investment company by complying with the applicable provisions of the Internal Revenue Code and will not be subject to federal income tax on taxable income that is distributed to shareholders. Therefore, no federal income tax provision is required.
As of July 31, 2012, the Fund had no uncertain tax positions that would require financial statement recognition, derecognition or disclosure. The Fund’s federal tax returns are subject to examination by the Internal Revenue Service for a period of three years.
Distribution of income and gains. Distributions to shareholders from net investment income and net realized gains, if any, are recorded on the ex-date. The Fund declares and pays dividends and capital gain distributions, if any, at least annually.
Distributions paid by the Fund with respect to each class of shares are calculated in the same manner, at the same time and in the same amount, except for the effect of class level expenses that may be applied differently to each class. As of July 31, 2012, the components of distributable earnings on a tax basis consisted of $7,193,803 of undistributed ordinary income.
Such distributions and distributable earnings, on a tax basis, are determined in conformity with income tax regulations, which may differ from accounting principles generally accepted in the United States of America. Material distributions in excess of tax basis earnings and profits, if any, are reported in the Fund’s financial statements as a return of capital.
Capital accounts within the financial statements are adjusted for permanent book-tax differences. These adjustments have no impact on net assets or the results of operations. Temporary book-tax differences, if any, will reverse in a subsequent period. The Fund had no material book-tax differences at July 31, 2012.
Note 3 - Guarantees and indemnifications
Under the Fund’s organizational documents, its Officers and Trustees are indemnified against certain liabilities arising out of the performance of their duties to the Fund. Additionally, in the normal course of business, the Fund enters into contracts with service providers that contain general indemnification clauses. The Fund’s maximum exposure under these arrangements is unknown, as this would involve future claims that may be made against the Fund that have not yet occurred. The risk of material loss from such claims is considered remote.
Note 4 – Fees and transactions with affiliates
John Hancock Investment Management Services, LLC (the Adviser), serves as investment adviser for the Fund. John Hancock Funds, LLC (the Distributor), an affiliate of the Adviser, serves as principal underwriter of the Fund. The Adviser and the Distributor are indirect wholly owned subsidiaries of Manulife Financial Corporation (MFC).
Management fee. The Fund has an investment management agreement with the Adviser under which the Fund pays a daily management fee to the Adviser equivalent, on an annual basis, to the sum of: a) 1.10% of the first $500,000,000 of the Fund’s average daily net assets, b) 1.05% of the next $500,000,000 of the Fund’s average daily net assets and c) 1.00% of the Fund’s average daily net assets in excess of $1,000,000,000. The Adviser has a subadvisory agreement with Atlantis Investment Management (H.K.) Ltd. The Fund is not responsible for payment of the subadvisory fees.
The Adviser has contractually agreed to waive a portion of its management fee for certain funds (the Participating Portfolios) of the Trust and John Hancock Variable Insurance Trust. The waiver equals, on an annualized basis, 0.01% of that portion of the aggregate net assets of all the Participating Portfolios that exceeds $75 billion but is less than $100 billion; and 0.015% of that portion of the aggregate net assets of all the Participating Portfolios that equals or exceeds $100 billion. The amount of the reimbursement is
calculated daily and allocated among all the Participating Portfolios in proportion to the daily net assets of each fund. This arrangement may be amended or terminated at any time by the Adviser upon notice to the funds and with the approval of the Board of Trustees.
The Adviser has contractually agreed to waive and/or reimburse operating expenses for Class A and Class I shares, excluding certain expenses such as taxes, brokerage commissions, interest expense, litigation and indemnification expenses and other extraordinary expenses not incurred in the ordinary course of the Fund’s business. The fee waivers and/or reimbursements are such that the expenses will not exceed 1.80% and 1.44% for Class A and Class I shares, respectively. The fee waivers and/or reimbursements will continue in effect until December 31, 2012, unless renewed by mutual agreement of the Fund and the Adviser based upon a determination that this is appropriate under the circumstances at the time.
Additionally, the Adviser has voluntarily agreed to waive and/or reimburse a portion of its management fee in order to limit the Fund’s expenses, excluding certain expenses such as taxes, brokerage commissions, interest expense, litigation and indemnification expenses and other extraordinary expenses not incurred in the ordinary course of the Fund’s business, advisory fees, 12b-1 fees, transfer agent fees and service fees, state registration fees and printing and postage, to 0.25% of the Fund’s average net assets. This voluntary expense reimbursement may be terminated at any time by the Adviser on notice to the Fund.
Accordingly, these expense reductions amounted to $17, $2 and $3,431 for Class A, Class I and Class NAV shares, respectively, for the period ended July 31, 2012.
The investment management fees, including the impact of waivers and reimbursements described above, incurred for the period ended July 31, 2012 were equivalent to a net effective rate of 1.10% of the Fund’s average daily net assets.
Expense recapture. The Adviser may recapture operating expenses reimbursed or fees waived under previous expense limitation or waiver arrangements for a period of three years following the beginning of the month in which such reimbursements or waivers originally occurred to the extent that the Fund is below its expense limitation during this period. Certain reimbursements or waivers are not subject to recapture. The expenses waived or reimbursed subject to potential recovery through July 1, 2015 are $15. For the period ended July 31, 2012, the Fund did not recapture any expenses.
Accounting and legal services. Pursuant to a service agreement, the Fund reimburses the Adviser for all expenses associated with providing the administrative, financial, legal, accounting and recordkeeping services to the Fund, including the preparation of all tax returns, periodic reports to shareholders and regulatory reports, among other services. These expenses are allocated to each share class based on its relative net assets at the time the expense was incurred. These accounting and legal services fees incurred for the period ended July 31, 2012 amounted to an annual rate of 0.01% of the Fund’s average daily net assets.
Distribution and service plans. The Fund has a distribution agreement with the Distributor. The Fund has adopted distribution and service plans with respect to Class A shares pursuant to Rule 12b-1 under the 1940 Act, to pays the Distributor for services provided as the distributor of shares of the Fund. The Fund pays 0.30% for Class A shares for distribution and service fees, expressed as an annual percentage of average daily net assets.
Transfer agent fees. The Fund has a transfer agent agreement with John Hancock Signature Services, Inc. (Signature Services), an affiliate of the Adviser. The transfer agent fees paid to Signature Services are determined based on the cost to Signature Services (Signature Services Cost) of providing recordkeeping services. The Signature Services Cost includes a component of allocated John Hancock corporate overhead for providing transfer agent services to the Fund and to all other John Hancock affiliated funds. It also includes out-of-pocket expenses that are comprised of payments made to third-parties for recordkeeping services provided to their clients who invest in one or more John Hancock funds. In addition, Signature Services Cost may be reduced by certain fees that Signature Services
receives in connection with retirement and small accounts. Signature Services Cost is calculated monthly and allocated, as applicable, to four categories of share classes: Institutional Share Classes, Retirement Share Classes, Municipal Bond Classes and all other Retail Share Classes. Within each of these categories, the applicable costs are allocated to the affected John Hancock affiliated funds and/or classes, based on the relative average daily net assets.
Class level expenses. Class level expenses for the period ended July 31, 2012 were:
| | | | |
| | Distribution and | Transfer agent | | |
| Class | service fees | fees | | |
| | |
| A | $183 | $121 | | |
| | |
| I | - | 67 | | |
| | |
| Total | $183 | $188 | | |
| | |
The Fund did not incur printing and postage and state registration fees for the period ended July 31, 2012.
Trustee expenses. The Trust compensates each Trustee who is not an employee of the Adviser or its affiliates. The costs of paying Trustee compensation and expenses are allocated to the Fund based on its average daily net assets.
Note 5 - Fund share transactions
Transactions in Fund shares for the period ended July 31, 2012 were as follows:
| | | | | | |
| | | | Period ended | | | |
| | | | 7/31/121 | | | |
| | |
| | |
| | | Shares | | Amount | | |
| Class A shares | | | | | | |
| Sold | | 10,000 | | $100,000 | | |
| | |
| |
| | |
| Net increase | | 10,000 | | $100,000 | | |
| | |
| |
| | |
| Class I shares | | | | | | |
| Sold | | 10,000 | | $100,000 | | |
| | |
| |
| | |
| Net increase | | 10,000 | | $100,000 | | |
| | |
| |
| | |
| Class NAV shares | | | | | | |
| Sold | | 30,477,216 | | $301,911,759 | | |
| Repurchased | | (24,466) | | (242,486) | | |
| | |
| |
| | |
| Net increase | | 30,452,750 | | $301,669,273 | | |
| | |
| |
| | |
| Net increase | | 30,472,750 | | $301,869,273 | | |
| | |
| |
| | |
1 Period from 12-29-11 (commencement of operations) to 7-31-12.
Affiliates of the Fund owned 100% of shares of beneficial interest of the Fund on July 31, 2012.
Note 6 - Purchase and sale of securities
Purchases and sales of securities, other than short-term securities, aggregated $338,003,290 and $58,910,159, respectively, for the period ended July 31, 2012.
Note 7 - Investment by affiliated funds
Certain investors in the Fund are affiliated funds and are managed by the Adviser and its affiliates. The affiliated funds do not invest in the Fund for the purpose of exercising management or control; however, this investment may represent a significant portion of the Fund’s net assets. For the period ended July 31, 2012, the following funds had an affiliate ownership concentration of 5% or more of the Fund’s net assets:
| | | |
| | Affiliated | | |
| Fund | Concentration | | |
| John Hancock Lifestyle Growth Portfolio | 39.1% | | |
| John Hancock Lifestyle Balanced Portfolio | 28.7% | | |
| John Hancock Lifestyle Aggressive Portfolio | 16.5% | | |
|
| Report of Independent Registered Public Accounting Firm |
To the Board of Trustees of John Hancock Funds II and Shareholders of John Hancock China Emerging Leaders Fund:
In our opinion, the accompanying statement of assets and liabilities, including the schedule of investments, and the related statements of operations and of changes in net assets and the financial highlights present fairly, in all material respects, the financial position of John Hancock China Emerging Leaders Fund (the “Fund”) at July 31, 2012, and the results of its operations, the changes in its net assets and the financial highlights for the period December 29, 2011 (commencement of operations) through July 31, 2012, in conformity with accounting principles generally accepted in the United States of America. These financial statements and financial highlights (hereafter referred to as “financial statements”) are the responsibility of the Fund’s management; our responsibility is to express an opinion on these financial statements based on our audit. We conducted our audit of these financial statements in accordance with the standards of the Public Company Accounting Oversight Board (United States). Those standards require that we plan and perform the audit to obtain reasonable assurance about whether the financial statements are free of material misstatement. An audit includes examining, on a test basis, evidence supporting the amounts and disclosures in the financial statements, assessing the accounting principles used and significant estimates made by management, and evaluating the overall financial statement presentation. We believe that our audit, which included confirmation of securities at July 31, 2012 by correspondence with the custodian, and the application of alternative auditing procedures where securities purchased confirmations had not been received, provides a reasonable basis for our opinion.
PricewaterhouseCoopers LLP
Boston, Massachusetts
September 24, 2012
Federal Tax Information (Unaudited)
For federal income tax purposes, the following information is furnished with respect to the distributions of the Fund, if any, paid during its taxable year ended July 31, 2012.
The Fund reports the maximum amount allowable of its net taxable income as eligible for the corporate dividends-received deduction.
The Fund reports the maximum amount allowable of its net taxable income as qualified dividend income as provided in the Jobs and Growth Tax Relief Reconciliation Act of 2003.
The fund intends to pass through foreign tax credits of $159,087.
Eligible shareholders will be mailed a 2012 Form 1099-DIV in early 2013. This will reflect the tax character of all distributions paid in calendar year 2012.
Trustees and Officers
This chart provides information about the Trustees and Officers of John Hancock Funds II who oversee your John Hancock fund. Officers elected by the Trustees manage the day-to-day operations of the Portfolio and execute policies formulated by the Trustees.
| | |
| Independent Trustees | | |
| | | |
| Name, Year of Birth | Trustee | Number of |
| Position(s) held with Fund | of the | John Hancock |
| Principal occupation(s) and other | Trust | funds overseen |
| directorships during past 5 years | since1 | by Trustee |
| |
| Charles L. Bardelis, Born: 1941 | 2005 | 198 |
|
| Director, Island Commuter Corp. (Marine Transport). Trustee of John Hancock Variable Insurance |
| Trust (since 1988), John Hancock Funds II (since 2005) and former Trustee of John Hancock | |
| Funds III (2005–2006). | | |
|
| |
| Peter S. Burgess, Born: 1942 | 2005 | 198 |
|
| Consultant (financial, accounting and auditing matters) (since 1999); Certified Public Accountant. |
| Partner, Arthur Andersen (independent public accounting firm) (prior to 1999). Director of the following |
| publicly traded companies: Lincoln Educational Services Corporation (since 2004), Symetra Financial |
| Corporation (since 2010) and PMA Capital Corporation (2004–2010). Trustee of John Hancock Variable |
| Insurance Trust (since 2005), John Hancock Funds II (since 2005), and former Trustee of John Hancock |
| Funds III (2005–2006). | | |
|
| |
| Grace K. Fey, Born: 1946 | 2008 | 198 |
|
| Chief Executive Officer, Grace Fey Advisors (since 2007); Director & Executive Vice President, Frontier |
| Capital Management Company (1988–2007); Director, Fiduciary Trust (since 2009). Trustee of |
| John Hancock Variable Insurance Trust (since 2008) and John Hancock Funds II (since 2008). |
|
| |
| Theron S. Hoffman, Born: 1947 | 2008 | 198 |
|
| Chief Executive Officer, T. Hoffman Associates, LLC (consulting firm) (since 2003); Director, The Todd |
| Organization (consulting firm) (2003–2010); President, Westport Resources Management (investment |
| management consulting firm) (2006–2008); Partner/Operating Head & Senior Managing Director, |
| Putnam Investments (2000–2003); Executive Vice President, Thomson Corp. (1997–2000) (financial |
| and legal information publishing). Trustee of John Hancock Variable Insurance Trust (since 2008) and |
| John Hancock Funds II (since 2008). | | |
|
| |
| Hassell H. McClellan, Born: 1945 | 2005 | 198 |
|
| Associate Professor, The Graduate School of The Wallace E. Carroll School of Management, Boston |
| College (since 1984). Trustee of John Hancock Variable Insurance Trust (since 2005), John Hancock |
| Funds II (since 2005), Trustee of Virtus Variable Insurance Trust (formerly, Phoenix Edge Series Funds) |
| (since 2008), and Director of the Barnes Group (since 2010). | | |
|
| |
| James M. Oates, Born: 1946 | 2005 | 198 |
|
| Managing Director, Wydown Group (financial consulting firm) (since 1994); Chairman, Emerson |
| Investment Management, Inc. (since 2000); Chairman, Hudson Castle Group, Inc. (formerly IBEX |
| Capital Markets, Inc.) (financial services company) (1997–2011). Director of the following publicly traded |
| companies: Stifel Financial (since 1996); Investor Financial Services Corporation (1995–2007); and |
| Connecticut River Bancorp (since 1998). Director of the following Mutual Funds: Virtus Funds (formerly, |
| Phoenix Mutual Funds) (since 1988). Chairman of the Boards of John Hancock Variable Insurance Trust |
| and John Hancock Funds II (since 2005) and former Trustee of John Hancock Funds III (2005–2006). |
|
| Annual report | China Emerging Leaders Fund |
| | |
| Non-Independent Trustee2 | | |
| | | |
| Name, Year of Birth | Trustee | Number of |
| Position(s) held with Fund | of the | John Hancock |
| Principal occupation(s) and other | Trust | funds overseen |
| directorships during past 5 years | since1 | by Trustee |
| |
| James R. Boyle,3 Born: 1959 | 2005 | 198 |
|
| Senior Executive Vice President, John Hancock Financial Services (since 1999, including prior positions); |
| Chairman and Director, John Hancock Advisers, LLC, John Hancock Funds, LLC, and John Hancock |
| Investment Management Services, LLC (2005–2010); Trustee, John Hancock Variable Insurance Trust |
| (since 2005), John Hancock Funds II (since 2005), and John Hancock retail funds (2005–2010). |
1 Because the Trust does not hold regular annual shareholders meetings, each Trustee holds office for an indefinite term until his/her successor is duly elected and qualified or until he/she dies, retires, resigns, is removed or becomes disqualified.
2 Non-Independent Trustees hold positions or are affiliated with the Fund’s investment adviser, subadviser, underwriter or their affiliates.
3 Mr. Boyle is an “interested person” (as defined in the 1940 Act) due to his position with Manulife Financial Corporation (or its affiliates), the ultimate parent of the Adviser.
| |
| Principal officers who are not Trustees | |
| | |
| Name, Year of Birth | Officer |
| Position(s) held with Fund | of the |
| Principal occupation(s) and other | Trust |
| directorships during past 5 years | since |
| |
| Hugh McHaffie, Born: 1959 | 2009 |
|
| President | |
| Executive Vice President, John Hancock Financial Services (since 2006, including prior positions); | |
| President of John Hancock Variable Insurance Trust and John Hancock Funds II (since 2009); Trustee, |
| John Hancock retail funds (since 2010); Chairman and Director, John Hancock Advisers, LLC, | |
| John Hancock Investment Management Services, LLC and John Hancock Funds, LLC (since 2010). | |
|
| |
| Thomas M. Kinzler, Born: 1955 | 2008 |
|
| Secretary and Chief Legal Officer | |
| Vice President, John Hancock Financial Services (since 2006); Secretary and Chief Legal Counsel, | |
| John Hancock Funds, LLC (since 2007); Secretary and Chief Legal Officer, John Hancock retail funds, |
| John Hancock Variable Insurance Trust and John Hancock Funds II (since 2006). | |
|
| |
| Francis V. Knox, Jr., Born: 1947 | 2008 |
|
| Chief Compliance Officer | |
| Vice President, John Hancock Financial Services (since 2005); Chief Compliance Officer, John Hancock |
| retail funds, John Hancock Funds II, John Hancock Variable Insurance Trust, John Hancock Advisers, |
| LLC and John Hancock Investment Management Services, LLC (since 2005); Vice President and Chief |
| Compliance Officer, John Hancock Asset Management a division of Manulife Asset Management (US) |
| LLC (2005–2008). | |
|
| |
| Michael J. Leary, Born: 1965 | 2008 |
|
| Treasurer | |
| Assistant Vice President, John Hancock Financial Services (since 2007); Treasurer, John Hancock Funds II |
| and John Hancock Variable Insurance Trust (since 2009); Treasurer, John Hancock retail funds (2009– |
| 2010); Vice President, John Hancock Advisers, LLC and John Hancock Investment Management Services, |
| LLC (since 2007); Assistant Treasurer, John Hancock retail funds (2007–2009 & 2010), John Hancock |
| Funds II and John Hancock Variable Insurance Trust (2007–2009) and John Hancock Funds III (since |
| 2009); Vice President and Director of Fund Administration, JP Morgan (2004–2007). | |
|
| China Emerging Leaders Fund | Annual report |
| |
| Principal officers who are not Trustees (continued) | |
| |
| Name, Year of Birth | Officer |
| Position(s) held with Fund | of the |
| Principal occupation(s) and other | Trust |
| directorships during past 5 years | since |
| |
| Charles A. Rizzo, Born: 1957 | 2008 |
|
| Chief Financial Officer | |
| Vice President, John Hancock Financial Services (since 2008); Senior Vice President, John Hancock | |
| Advisers, LLC and John Hancock Investment Management Services, LLC (since 2008); Chief Financial |
| Officer, John Hancock retail funds, John Hancock Funds II and John Hancock Variable Insurance Trust |
| (since 2007); Assistant Treasurer, Goldman Sachs Mutual Fund Complex (2005–2007); Vice President, |
| Goldman Sachs (2005–2007). | |
|
| |
| John G. Vrysen, Born: 1955 | 2008 |
|
| Chief Operating Officer | |
| Senior Vice President, John Hancock Financial Services (since 2006); Director, Executive Vice President |
| and Chief Operating Officer, John Hancock Advisers, LLC, John Hancock Investment Management | |
| Services, LLC and John Hancock Funds, LLC (since 2005); Chief Operating Officer, John Hancock Funds |
| II and John Hancock Variable Insurance Trust (since 2007); Chief Operating Officer, John Hancock retail |
| funds (until 2009); Trustee, John Hancock retail funds (since 2009). | |
The business address for all Trustees and Officers is 601 Congress Street, Boston, Massachusetts 02210-2805.
The Statement of Additional Information of the Fund includes additional information about members of the Board of Trustees of the Fund and is available without charge, upon request, by calling 1-800-225-5291.
|
| Annual report | China Emerging Leaders Fund |
| |
| Trustees | Investment adviser |
| Charles L. Bardelis* | John Hancock Investment Management Services, LLC |
| James M. Oates, Chairman | |
| James R. Boyle† | Investment subadviser |
| Peter S. Burgess* | Atlantis Investment Management (Hong Kong) Ltd. |
| Grace K Fey | |
| Theron S. Hoffman | Principal distributor |
| Hassell H. McClellan | John Hancock Funds, LLC |
| | |
| | Custodian |
| | State Street Bank and Trust Company |
| | |
| Officers | Transfer agent |
| Hugh McHaffie | John Hancock Signature Services, Inc. |
| President | |
| Thomas M. Kinzler | Legal counsel |
| Secretary and Chief Legal Officer | K&L Gates LLP |
| Francis V. Knox, Jr. | |
| Chief Compliance Officer | Independent registered |
| Michael J. Leary | public accounting firm |
| Treasurer | PricewaterhouseCoopers LLP |
| Charles A. Rizzo | |
| Chief Financial Officer | |
| John G. Vrysen | |
| Chief Operating Officer | |
| |
| *Member of the Audit Committee | |
| †Non-Independent Trustee | |
The Fund’s proxy voting policies and procedures, as well as the Fund’s proxy voting record, if any, for the most recent twelve-month period ended June 30, are available free of charge on the Securities and Exchange Commission (SEC) Web site at www.sec.gov or on our Web site.
The Fund’s complete list of portfolio holdings, for the first and third fiscal quarters, is filed with the SEC on Form N-Q. The Fund’s Form N-Q is available on our Web site and the SEC’s Web site, www.sec.gov, and can be reviewed and copied (for a fee) at the SEC’s Public Reference Room in Washington, DC. Call 1-202-551-8090 to receive information on the operation of the SEC's Public Reference Room.
We make this information on your fund, as well as monthly portfolio holdings, and other fund details available on our Web site www.jhfunds.com or by calling 1-800-225-5291.
| | |
| You can also contact us: | | |
| 1-800-225-5291 | Regular mail: | Express mail: |
| jhfunds.com | John Hancock Signature Services, Inc. | John Hancock Signature Services, Inc. |
| | P.O. Box 55913 | Mutual Fund Image Operations |
| | Boston, MA 02205-5913 | 30 Dan Road |
| | | Canton, MA 02021 |

| |
| John Hancock Diversified Strategies Fund | |
| |
| Table of Contents | |
| Management’s discussion of Fund performance | Page 3 |
| A look at performance | Page 4 |
| Your expenses | Page 6 |
| Portfolio summary | Page 7 |
| Fund's investments | Page 8 |
| Financial statements | Page 17 |
| Financial highlights | Page 20 |
| Notes to financial statements | Page 22 |
| Trustees and Officers | Page 30 |
| More information | Page 33 |
John Hancock Diversified Strategies Fund
Management’s Discussion of Fund Performance
By John Hancock Asset Management a division of Manulife Asset Management (US) LLC
John Hancock Diversified Strategies Fund posted positive performance in its first 10 months of operations. From inception September 30, 2011 through July 31, 2012, the Fund’s Class A shares returned 11.65%, excluding sales charges. That compared to the 21.03% return of the S&P 500 Index, the 9.89% return of the Fund’s benchmark, a blend of 70% Barclays Capital U.S. Aggregate Bond Index/30% S&P 500 Index, and the 9.58% median return on the U.S. conservative allocation funds category tracked by Morningstar, Inc. in the same period.
The Fund began operations in volatile times, epitomized by a downgrade in the U.S. credit rating, the macroeconomic turbulence of several European countries and their banks, and fears of a slowdown in emerging markets. The Fund’s positive performance resulted from asset allocation, diversification and a well-managed risk mitigation strategy using long-dated U.S. Treasury strips.
The Fund typically maintains a large allocation to fixed income, covering many global fixed-income sectors (some of these positions are held in investments in mutual funds). The fixed-income portion of the Fund outperformed its benchmark index by allocating away from core bonds, such as U.S. Treasuries and investment grade bonds, and diversifying in higher-yielding, non-core assets, such as emerging market debt and non-U.S. fixed income, among others. Additionally, the Fund’s use of Treasury strips as a risk hedging position produced strong returns due to a dramatic fall to record lows for Treasury yields. The equity portion of the Fund, made up of investments in several mutual funds, generated strong returns aided by an allocation to a global real estate investment trust, as well as high dividend and less economically sensitive equity portfolios. The portion of the Fund invested in alternatives posted positive results, driven by strong performance in commodities and long/short equities.
This commentary reflects the views of the portfolio managers through the end of the period discussed in this report. The managers’ statements reflect their own opinions. As such, they are in no way guarantees of future events, and are not intended to be used as investment advice or a recommendation regarding any specific security. They are also subject to change at any time as market and other conditions warrant.
Past performance is no guarantee of future results. The Fund’s performance depends on the Adviser's skill in determining the strategic asset class allocations, the mix of underlying strategies and funds and the performance of those underlying strategies and funds. The underlying strategies and funds' performance may be lower than the performance of the asset class which they were selected to represent. The Fund is subject to the same risks as the underlying strategies and funds in which it invests, which include the following: stocks and bonds can decline due to adverse issuer, market, regulatory or economic developments; foreign investing, especially in emerging markets, has additional risks, such as currency and market volatility and political and social instability; the securities of small-capitalization companies are subject to higher volatility than larger, more established companies; and high-yield bonds are subject to additional risks, such as increased risk of default. Absolute return funds are not designed to outperform stocks and bonds in strong markets and there is no guarantee of positive returns. They employ certain techniques which are intended to reduce risk and volatility in the portfolio and provide protection against a decline in the Fund’s assets. However, there is no guarantee that any investment strategy will be successful or that the Fund’s objectives will be achieved. Commodity investments involve the risk of volatile market price fluctuation of commodities resulting from fluctuating demand, supply disruption, speculation and other factors.
A look at performance
Total returns for the period ended July 31, 2012
| | | | | | | | |
| | Average annual total returns (%) | Cumulative total returns (%) | |
| | with maximum sales charge | | with maximum sales charge | |
|
| | | | | Since | | | | Since |
| | 1-year | 5-year | 10-year | inception | 1-year | 5-year | 10-year | inception1 |
|
| Class A | — | — | — | — | — | — | — | 6.03 |
|
| Class I2 | — | — | — | — | — | — | — | 11.96 |
|
Performance figures assume all distributions are reinvested. Figures reflect maximum sales charges on Class A shares of 5.00%.
The expense ratios of the Fund, both net (including any fee waivers or expense limitations) and gross (excluding any fee waivers or expense limitations), are set forth according to the most recent publicly available prospectuses for the Fund and may differ from those disclosed in the Financial highlights tables in this report. The fee waivers and expense limitations are contractual at least until 11-30-12 for Class A and Class I shares. Had the fee waivers and expense limitations not been in place gross expenses would apply. The expense ratios are as follows:
| | | | |
| | Class A | Class I | | |
| Net (%) | 1.55 | 1.13 | | |
| Gross (%) | 1.76 | 1.34 | | |
The returns reflect past results and should not be considered indicative of future performance. The return and principal value of an investment will fluctuate so that shares, when redeemed, may be worth more or less than their original cost. Due to market volatility, the Fund’s current performance may be higher or lower than the performance shown. For current to the most recent month-end performance data, please call 1-800-225-5291 or visit the Fund’s Web site at www.jhfunds.com.
The performance table above and the chart on the next page do not reflect the deduction of taxes that a shareholder may pay on fund distributions or on the redemption of fund shares. The Fund’s performance results reflect any applicable fee waivers or expense reductions, without which the expenses would increase and results would have been less favorable.
Footnotes on the following page.
| |
| Diversified Strategies Fund | Annual report | |
| | |
| 4 |
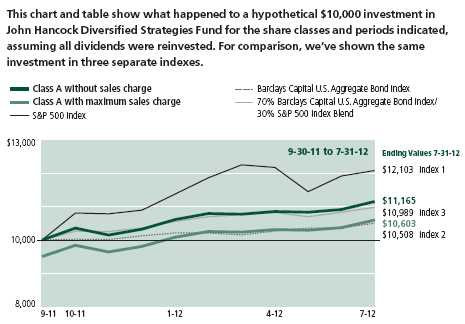
| | | | | | |
| | | | With | | | |
| | | Without | maximum | | | |
| | Start date | sales charge | sales charge | Index 1 | Index 2 | Index 3 |
|
| Class I2 | 9-30-11 | $11,196 | $11,196 | $12,103 | $10,508 | $10,989 |
|
S&P 500 Index — Index 1 — is an unmanaged index that includes 500 widely traded common stocks.
Barclays Capital U.S. Aggregate Bond Index — Index 2 — is an unmanaged index of dollar-denominated and nonconvertible investment-grade debt issues.
70% Barclays Capital U.S. Aggregate Bond Index/30% S&P 500 Index Blend — Index 3 — is comprised of 70% Barclays Capital U.S. Aggregate Bond Index and 30% S&P 500 Index.
It is not possible to invest directly in an index. Index figures do not reflect expenses, which would have resulted in lower values if they did.
1 From 9-30-11.
2 For certain types of investors as described in the Fund’s prospectus.
| |
| | Annual report | Diversified Strategies Fund |
| | |
| 5 |
Your expenses
These examples are intended to help you understand your ongoing operating expenses of investing in the Fund so you can compare these costs with the ongoing costs of investing in other mutual funds.
Understanding your fund expenses
As a shareholder of the Fund, you incur two types of costs:
• Transaction costs which include sales charges (loads) on purchases or redemptions (if applicable), minimum account fee charge, etc.
• Ongoing operating expenses including management fees, distribution and service fees (if applicable), and other fund expenses.
We are going to present only your ongoing operating expenses here.
Actual expenses/actual returns
This example is intended to provide information about your fund’s actual ongoing operating expenses, and is based on your fund’s actual return. It assumes an account value of $1,000.00 on February 1, 2012 with the same investment held until July 31, 2012.
| | | |
| | Account value | Ending value | Expenses paid during |
| | on 2-1-12 | on 7-31-12 | period ended 7-31-121,2 |
|
| Class A | $1,000.00 | $1,051.40 | $5.97 |
| Class I | 1,000.00 | 1,052.30 | 3.98 |
Together with the value of your account, you may use this information to estimate the operating expenses that you paid over the period. Simply divide your account value at July 31, 2012, by $1,000.00, then multiply it by the “expenses paid” for your share class from the table above. For example, for an account value of $8,600.00, the operating expenses should be calculated as follows:
Example
[ My account value $8,600.00 / $1,000.00 = 8.6 ] x $[ “expenses paid” from table ] = My actual expenses
Hypothetical example for comparison purposes
This table allows you to compare your fund’s ongoin g operating expenses with those of any other fund. It provides an example of the Fund’s hypothetical account values and hypothetical expenses based on each class’s actual expense ratio and an assumed 5% annualized return before expenses (which is not your fund’s actual return). It assumes an account value of $1,000.00 on February 1, 2012, with the same investment held until July 31, 2012. Look in any other fund shareholder report to find its hypothetical example and you will be able to compare these expenses. Please remember that these hypothetical account values and expenses may not be used to estimate the actual ending account balance or expenses you paid for the period.
| | | |
| | Account value | Ending value | Expenses paid during |
| | on 2-1-12 | on 7-31-12 | period ended 7-31-121,2 |
|
| Class A | $1,000.00 | $1,019.00 | $5.87 |
| Class I | 1,000.00 | 1,021.00 | 3.92 |
Remember, these examples do not include any transaction costs, therefore, these examples will not help you to determine the relative total costs of owning different funds. If transaction costs were included, your expenses would have been higher. See the prospectus for details regarding transaction costs.
1 Expenses are equal to the Fund's annualized expense ratio of 1.17% and 0.78% for Class A and Class I shares, respectively, multiplied by the average account value over the period, multiplied by 182/366 (to reflect the one-half year period).
2 The Fund's expense ratios do not included fees and expenses indirectly incurred by the underlying funds, whose expense ratios can vary based on the underling funds held by the Fund. The range of expense ratios of the underlying funds held by the Fund were 0.75% to 1.43% for the period ended July 31, 2012.
Diversified Strategies
Portfolio summary
As of 7-31-12
| |
| | Value as a |
| | percentage of |
| Portfolio Composition | Fund's net assets |
| Fixed Income (67.1%) | |
| Corporate Bonds | 49.4% |
| U.S. Government & Agency Obligations | 11.1% |
| Collateralized Mortgage Obligations | 2.8% |
| Capital Preferred Securities | 1.4% |
| Asset Backed Securities | 1.0% |
| Term Loans | 0.9% |
| Preferred Securities | 0.4% |
| Municipal Bonds | 0.1% |
| Affiliated Investment Companies (26.0%) | |
| Equity | |
| Capital Appreciation Value, Class NAV (T.Rowe Price) | 4.0% |
| Global Real Estate, Class NAV (Deutsche) | 1.0% |
| Redwood, Class NAV (RCM) | 4.7% |
| Global Shareholder Yield, Class NAV (Epoch) | 4.0% |
| Alternative | |
| Currency Strategies, Class NAV (First Quadrant) | 4.5% |
| Global Absolute Return Strategies, Class NAV (Standard Life) | 2.9% |
| Fixed Income | |
| Multi Sector Bond, Class NAV (Stone Harbor) | 4.9% |
| Unaffiliated Investment Companies (5.4%) | |
| Alternative | |
| AQR Managed Futures Strategy Fund, Class I | 2.7% |
| Equity | |
| Turner Spectrum Fund Institutional Class I | 2.7% |
| Other Assets and Liabilities | 1.5% |
| |
| | Value as a |
| | percentage of |
| Fixed Income Quality Composition1,2 | Fund's net assets |
| AAA | 1.1% |
| AA | 0.8% |
| A | 2.4% |
| BBB | 30.3% |
| BB | 18.3% |
| B | 22.4% |
| CCC | 7.8% |
| U.S. Government | 12.2% |
| U.S. Government Agency | 4.7% |
1 Ratings are from Moody's Investors Service, Inc. If not available, we have used S&P ratings. In the absence of ratings from these agencies, we have used Fitch, Inc. ratings. Not Rated securities are those with no ratings available. All are as of 7-31-12 and do not reflect subsequent downgrades or upgrades, if any.
2 Composition based on fixed income securities which represent $28,877,204 and 67.1% of the Fund's net assets at 7-31-12. Percentages shown are based on total fixed income securities.
Diversified Strategies Fund
Fund’s investments
As of 7-31-12
| | | | |
| | | Maturity | Par value^ | |
| | Rate (%) | date | | Value |
| |
| Corporate Bonds 49.4% | | | | $21,285,270 |
|
| (Cost $19,752,333) | | | | |
| |
| Consumer Discretionary 7.2% | | | | 3,115,017 |
|
| |
| Auto Components 0.7% | | | | |
| Allison Transmission, Inc. (S) | 7.125 | 05/15/19 | 125,000 | 131,407 |
| Exide Technologies | 8.625 | 02/01/18 | 45,000 | 35,775 |
| Visteon Corp. | 6.750 | 04/15/19 | 160,000 | 155,600 |
| | | | | |
| Diversified Financial Services 0.0% | | | | |
| Rivers Pittsburgh Borrower LP (S) | 9.500 | 06/15/19 | 15,000 | 15,656 |
| | | | | |
| Food Products 0.2% | | | | |
| Simmons Foods, Inc. (S) | 10.500 | 11/01/17 | 100,000 | 91,500 |
| | | | | |
| Hotels, Restaurants & Leisure 2.5% | | | | |
| Caesars Entertainment Operating Company, Inc. | 11.250 | 06/01/17 | 100,000 | 108,250 |
| CCM Merger, Inc. (S) | 9.125 | 05/01/19 | 150,000 | 152,250 |
| Downstream Development Authority of the Quapaw Tribe of | | | | |
| Oklahoma (S) | 10.500 | 07/01/19 | 100,000 | 104,250 |
| Greektown Superholdings, Inc. | 13.000 | 07/01/15 | 100,000 | 108,750 |
| Jacobs Entertainment, Inc. | 9.750 | 06/15/14 | 100,000 | 97,500 |
| Marina District Finance Company, Inc. | 9.500 | 10/15/15 | 75,000 | 72,844 |
| MGM Resorts International (S) | 8.625 | 02/01/19 | 100,000 | 105,875 |
| Seminole Indian Tribe of Florida (S) | 7.750 | 10/01/17 | 200,000 | 218,500 |
| Sugarhouse HSP Gaming Property Mezzanine LP (S) | 8.625 | 04/15/16 | 100,000 | 105,000 |
| | | | | |
| Household Durables 0.1% | | | | |
| American Standard Americas (S) | 10.750 | 01/15/16 | 30,000 | 26,738 |
| | | | | |
| Media 1.5% | | | | |
| DISH DBS Corp. | 6.750 | 06/01/21 | 125,000 | 136,719 |
| Grupo Televisa SAB | 6.625 | 01/15/40 | 100,000 | 128,516 |
| Regal Entertainment Group | 9.125 | 08/15/18 | 100,000 | 112,250 |
| WMG Acquisition Corp. | 9.500 | 06/15/16 | 100,000 | 109,875 |
| XM Satellite Radio, Inc. (S) | 7.625 | 11/01/18 | 150,000 | 162,750 |
| | | | | |
| Multiline Retail 0.4% | | | | |
| Macy's Retail Holdings, Inc. | 7.875 | 08/15/36 | 175,000 | 188,858 |
| | | | | |
| Oil, Gas & Consumable Fuels 0.1% | | | | |
| Landry's, Inc. (S) | 9.375 | 05/01/20 | 30,000 | 31,313 |
| | | | | |
| Specialty Retail 1.1% | | | | |
| Automotores Gildemeister SA (S) | 8.250 | 05/24/21 | 150,000 | 157,500 |
| AutoNation, Inc. | 5.500 | 02/01/20 | 65,000 | 68,250 |
| AutoNation, Inc. | 6.750 | 04/15/18 | 32,000 | 35,560 |
| Hillman Group, Inc. | 10.875 | 06/01/18 | 100,000 | 106,250 |
| Toys R Us Property Company II LLC | 8.500 | 12/01/17 | 100,000 | 108,000 |
| | | | | |
| Textiles, Apparel & Luxury Goods 0.6% | | | | |
| Burlington Coat Factory Warehouse Corp. | 10.000 | 02/15/19 | 125,000 | 132,656 |
| Levi Strauss & Company | 7.625 | 05/15/20 | 100,000 | 106,625 |
| |
| Consumer Staples 1.9% | | | | 795,631 |
|
| |
| Beverages 0.2% | | | | |
| Ajecorp BV (S) | 6.500 | 05/14/22 | 30,000 | 31,125 |
| Corp. Lindley SA (S) | 6.750 | 11/23/21 | 25,000 | 27,750 |
| |
| See notes to financial statements. | |
| | |
| 8 |
Diversified Strategies Fund
Fund’s investments
As of 7-31-12
| | | | |
| | | Maturity | Par value^ | |
| | Rate (%) | date | | Value |
| |
| Consumer Staples (continued) | | | | |
|
| |
| Food & Staples Retailing 0.4% | | | | |
| Rite Aid Corp. | 9.250 | 03/15/20 | 150,000 | $151,500 |
| Safeway, Inc. | 7.250 | 02/01/31 | 20,000 | 20,653 |
| | | | | |
| Food Products 0.4% | | | | |
| Corp. Pesquera Inca SAC (S) | 9.000 | 02/10/17 | 78,000 | 83,850 |
| Del Monte Corp. | 7.625 | 02/15/19 | 100,000 | 99,250 |
| | | | | |
| Household Products 0.4% | | | | |
| Reynolds Group Issuer, Inc. | 9.000 | 04/15/19 | 100,000 | 101,750 |
| Yankee Candle Company, Inc. | 8.500 | 02/15/15 | 4,000 | 4,065 |
| YCC Holdings LLC, PIK | 10.250 | 02/15/16 | 40,000 | 40,750 |
| | | | | |
| Personal Products 0.3% | | | | |
| Revlon Consumer Products Corp. | 9.750 | 11/15/15 | 125,000 | 133,438 |
| | | | | |
| Tobacco 0.2% | | | | |
| Alliance One International, Inc. | 10.000 | 07/15/16 | 100,000 | 101,500 |
| |
| Energy 4.2% | | | | 1,823,604 |
|
| |
| Energy Equipment & Services 0.9% | | | | |
| Offshore Group Investments, Ltd. (S) | 11.500 | 08/01/15 | 45,000 | 49,500 |
| Trinidad Drilling, Ltd. (S) | 7.875 | 01/15/19 | 100,000 | 106,750 |
| Weatherford International, Inc. | 6.800 | 06/15/37 | 200,000 | 231,569 |
| | | | | |
| Oil, Gas & Consumable Fuels 3.3% | | | | |
| Afren PLC (S) | 10.250 | 04/08/19 | 200,000 | 212,500 |
| Alpha Natural Resources, Inc. | 6.000 | 06/01/19 | 150,000 | 130,500 |
| Arch Coal, Inc. | 7.250 | 06/15/21 | 125,000 | 108,750 |
| EV Energy Partners LP | 8.000 | 04/15/19 | 100,000 | 101,000 |
| Kinder Morgan Energy Partners LP | 5.800 | 03/15/35 | 200,000 | 224,313 |
| Linn Energy LLC | 8.625 | 04/15/20 | 150,000 | 162,750 |
| Nexen, Inc. | 6.400 | 05/15/37 | 200,000 | 254,495 |
| Peabody Energy Corp. (S) | 6.250 | 11/15/21 | 35,000 | 34,563 |
| Targa Resources Partners LP (S) | 6.375 | 08/01/22 | 100,000 | 102,500 |
| TransCanada Pipelines, Ltd. (6.350% to 05/15/2017, then 3 | | | | |
| month LIBOR + 2.210%) | 6.350 | 05/15/67 | 100,000 | 104,414 |
| |
| Financials 15.2% | | | | 6,521,347 |
|
| |
| Capital Markets 1.8% | | | | |
| Affinion Group Holdings, Inc. | 11.625 | 11/15/15 | 100,000 | 74,000 |
| Jefferies Group, Inc. | 6.875 | 04/15/21 | 200,000 | 206,000 |
| Morgan Stanley | 5.750 | 01/25/21 | 300,000 | 305,511 |
| The Goldman Sachs Group, Inc. | 6.750 | 10/01/37 | 200,000 | 206,030 |
| | | | | |
| Commercial Banks 1.7% | | | | |
| Abbey National Treasury Services PLC | 4.000 | 04/27/16 | 200,000 | 201,225 |
| Banco de Credito del Peru (S) | 4.750 | 03/16/16 | 100,000 | 105,500 |
| Barclays Bank PLC | 5.140 | 10/14/20 | 200,000 | 198,183 |
| ICICI Bank, Ltd. (S) | 5.750 | 11/16/20 | 200,000 | 202,133 |
| Synovus Financial Corp. | 7.875 | 02/15/19 | 20,000 | 21,650 |
| | | | | |
| Consumer Finance 1.2% | | | | |
| Capital One Financial Corp. | 6.150 | 09/01/16 | 250,000 | 280,610 |
| Discover Bank | 7.000 | 04/15/20 | 200,000 | 233,691 |
| |
| See notes to financial statements. | |
| |
| 9 |
Diversified Strategies Fund
Fund’s investments
As of 7-31-12
| | | | |
| | | Maturity | Par value^ | |
| | Rate (%) | date | | Value |
| |
| Financials (continued) | | | | |
|
| |
| Diversified Financial Services 4.0% | | | | |
| Bank of America NA | 6.000 | 10/15/36 | 200,000 | $224,723 |
| Citigroup, Inc. | 5.850 | 12/11/34 | 200,000 | 227,868 |
| General Electric Capital Corp. | 5.300 | 02/11/21 | 250,000 | 286,759 |
| General Electric Capital Corp. (7.125% until 06/15/2022, then | | | | |
| 3 month LIBOR + 5.296%) (Q) | 7.125 | 06/15/22 | 100,000 | 108,199 |
| International Lease Finance Corp. (S) | 7.125 | 09/01/18 | 100,000 | 113,125 |
| JPMorgan Chase & Company (7.900% to 04/30/2018, then 3 | | | | |
| month LIBOR + 3.470%) (Q) | 7.900 | 04/30/18 | 200,000 | 220,712 |
| Merrill Lynch & Company, Inc. | 7.750 | 05/14/38 | 200,000 | 245,477 |
| Rabobank Nederland NV (11.000% to 06/30/2019, then 3 | | | | |
| month LIBOR + 10.868%) (Q)(S) | 11.000 | 06/30/19 | 200,000 | 255,500 |
| SPL Logistics Escrow LLC (S) | 8.875 | 08/01/20 | 24,000 | 24,480 |
| | | | | |
| Insurance 3.1% | | | | |
| AXA SA (6.379% to 12/14/2036, then 3 month LIBOR + | | | | |
| 2.256%) (Q)(S) | 6.379 | 12/14/36 | 200,000 | 162,500 |
| CNA Financial Corp. | 7.250 | 11/15/23 | 200,000 | 236,791 |
| CNO Financial Group, Inc. (S) | 9.000 | 01/15/18 | 100,000 | 107,500 |
| Glen Meadow Pass-Through Trust (6.505% to 02/15/2017, | | | | |
| then 3 month LIBOR + 2.125%) (S) | 6.505 | 02/12/67 | 200,000 | 147,000 |
| Liberty Mutual Group, Inc. (S) | 6.500 | 03/15/35 | 50,000 | 53,689 |
| Liberty Mutual Group, Inc. (S) | 7.800 | 03/15/37 | 200,000 | 208,500 |
| Lincoln National Corp. (6.050% to 04/20/2017, then 3 month | | | | |
| LIBOR + 2.040%) | 6.050 | 04/20/67 | 200,000 | 193,000 |
| Willis Group Holdings PLC | 5.750 | 03/15/21 | 200,000 | 224,112 |
| | | | | |
| Real Estate Investment Trusts 2.8% | | | | |
| DDR Corp. | 7.500 | 04/01/17 | 200,000 | 230,208 |
| Host Hotels & Resorts LP (S) | 5.250 | 03/15/22 | 200,000 | 211,750 |
| MPT Operating Partnership LP | 6.375 | 02/15/22 | 35,000 | 36,225 |
| MPT Operating Partnership LP | 6.875 | 05/01/21 | 100,000 | 106,250 |
| Prologis LP | 6.875 | 03/15/20 | 200,000 | 246,645 |
| Weyerhaeuser Company | 7.375 | 03/15/32 | 200,000 | 235,191 |
| SL Green Realty Corp. | 7.750 | 03/15/20 | 100,000 | 116,710 |
| | | | | |
| Real Estate Management & Development 0.3% | | | | |
| General Shopping Investments, Ltd. USGG (Q)(S) | 12.000 | 03/20/17 | 30,000 | 27,900 |
| Realogy Corp. (S) | 7.875 | 02/15/19 | 100,000 | 101,000 |
| | | | | |
| Thrifts & Mortgage Finance 0.3% | | | | |
| Nationstar Mortgage LLC | 10.875 | 04/01/15 | 125,000 | 135,000 |
| |
| Health Care 1.5% | | | | 640,225 |
|
| |
| Biotechnology 0.2% | | | | |
| Grifols, Inc. | 8.250 | 02/01/18 | 100,000 | 109,500 |
| | | | | |
| Health Care Equipment & Supplies 0.4% | | | | |
| Alere, Inc. | 8.625 | 10/01/18 | 150,000 | 153,750 |
| | | | | |
| Health Care Providers & Services 0.6% | | | | |
| BioScrip, Inc. | 10.250 | 10/01/15 | 100,000 | 108,750 |
| HCA, Inc. | 7.500 | 02/15/22 | 100,000 | 112,250 |
| National Mentor Holdings, Inc. (S) | 12.500 | 02/15/18 | 45,000 | 45,225 |
| |
| See notes to financial statements. | |
| | |
| 10 |
Diversified Strategies Fund
Fund’s investments
As of 7-31-12
| | | | |
| | | Maturity | Par value^ | |
| | Rate (%) | date | | Value |
| |
| Health Care (continued) | | | | |
|
| |
| Pharmaceuticals 0.3% | | | | |
| Endo Health Solutions, Inc. | 7.250 | 01/15/22 | 100,000 | $110,750 |
| |
| Industrials 6.2% | | | | 2,675,740 |
|
| |
| Aerospace & Defense 1.3% | | | | |
| Ducommun, Inc. | 9.750 | 07/15/18 | 100,000 | 103,500 |
| Huntington Ingalls Industries, Inc. | 7.125 | 03/15/21 | 150,000 | 161,063 |
| Kratos Defense & Security Solutions, Inc. | 10.000 | 06/01/17 | 120,000 | 129,000 |
| Textron Financial Corp. (6.000% to 02/15/2017, then 3 month | | | | |
| LIBOR + 1.735%) (S) | 6.000 | 02/15/67 | 150,000 | 118,500 |
| Textron, Inc. | 7.250 | 10/01/19 | 30,000 | 35,739 |
| | | | | |
| Airlines 2.2% | | | | |
| American Airlines 2011-1 Class B Pass Through Trust (S) | 7.000 | 01/31/18 | 97,685 | 97,929 |
| Continental Airlines 1997-4 Class A Pass Through Trust | 6.900 | 01/02/18 | 31,580 | 33,712 |
| Continental Airlines 2010-1 Class A Pass Through Trust | 4.750 | 01/12/21 | 190,869 | 200,412 |
| Delta Air Lines 2002-1 Class G-1 Pass Through Trust | 6.718 | 01/02/23 | 71,479 | 77,198 |
| Delta Air Lines 2007-1 Class A Pass Through Trust | 6.821 | 08/10/22 | 146,587 | 158,138 |
| Delta Air Lines 2010-1 Class A Pass Through Trust | 6.200 | 07/02/18 | 170,410 | 184,043 |
| United Air Lines 2007-1 Class C Pass Through Trust (P) | 2.984 | 07/02/14 | 172,391 | 166,357 |
| US Airways 2012-1 Class A Pass Through Trust | | | | |
| Series 2012-1A, Class PTT | 5.900 | 10/01/24 | 25,000 | 26,000 |
| | | | | |
| Building Products 0.5% | | | | |
| Voto-Votorantim, Ltd. (S) | 6.750 | 04/05/21 | 200,000 | 224,500 |
| | | | | |
| Commercial Services & Supplies 0.5% | | | | |
| Steelcase, Inc. | 6.375 | 02/15/21 | 200,000 | 215,161 |
| | | | | |
| Electrical Equipment 0.3% | | | | |
| Coleman Cable, Inc. | 9.000 | 02/15/18 | 130,000 | 137,313 |
| | | | | |
| Industrial Conglomerates 0.5% | | | | |
| Odebrecht Finance, Ltd. (Q)(S) | 7.500 | 09/14/15 | 200,000 | 212,000 |
| | | | | |
| Marine 0.1% | | | | |
| Navios South American Logistics, Inc. | 9.250 | 04/15/19 | 50,000 | 45,750 |
| | | | | |
| Road & Rail 0.7% | | | | |
| Avis Budget Car Rental LLC | 8.250 | 01/15/19 | 100,000 | 107,375 |
| Florida East Coast Railway Corp. | 8.125 | 02/01/17 | 100,000 | 105,250 |
| The Hertz Corp. | 6.750 | 04/15/19 | 100,000 | 105,000 |
| | | | | |
| Trading Companies & Distributors 0.1% | | | | |
| Aircastle, Ltd. | 6.750 | 04/15/17 | 15,000 | 15,750 |
| Aircastle, Ltd. | 7.625 | 04/15/20 | 15,000 | 16,050 |
| |
| Information Technology 0.2% | | | | 105,000 |
|
| |
| IT Services 0.2% | | | | |
| Brightstar Corp. (S) | 9.500 | 12/01/16 | 100,000 | 105,000 |
| |
| Materials 6.5% | | | | 2,797,686 |
|
| |
| Chemicals 0.9% | | | | |
| American Pacific Corp. | 9.000 | 02/01/15 | 150,000 | 151,313 |
| Braskem Finance, Ltd. (S) | 7.000 | 05/07/20 | 100,000 | 112,750 |
| Ineos Finance PLC (S) | 7.500 | 05/01/20 | 100,000 | 101,500 |
| |
| See notes to financial statements. | |
| | |
| 11 |
Diversified Strategies Fund
Fund’s investments
As of 7-31-12
| | | | |
| | | Maturity | Par value^ | |
| | Rate (%) | date | | Value |
| |
| Materials (continued) | | | | |
|
| LyondellBasell Industries NV | 5.000 | 04/15/19 | 25,000 | $27,125 |
| | | | | |
| Construction Materials 0.3% | | | | |
| Building Materials Corp. of America (S) | 6.750 | 05/01/21 | 100,000 | 109,250 |
| | | | | |
| Containers & Packaging 0.4% | | | | |
| Consolidated Container Company LLC (S) | 10.125 | 07/15/20 | 30,000 | 31,275 |
| Pretium Packaging LLC | 11.500 | 04/01/16 | 100,000 | 102,000 |
| Tekni-Plex, Inc. (S) | 9.750 | 06/01/19 | 43,000 | 44,720 |
| | | | | |
| Metals & Mining 3.8% | | | | |
| Alcoa, Inc. | 5.400 | 04/15/21 | 200,000 | 205,203 |
| Commercial Metals Company | 7.350 | 08/15/18 | 200,000 | 208,250 |
| FMG Resources August 2006 Pty, Ltd. (S) | 8.250 | 11/01/19 | 25,000 | 26,313 |
| FMG Resources August 2006 Pty, Ltd. (S) | 6.875 | 04/01/22 | 100,000 | 99,750 |
| FMG Resources August 2006 Pty, Ltd. (S) | 6.875 | 02/01/18 | 25,000 | 25,250 |
| JMC Steel Group (S) | 8.250 | 03/15/18 | 100,000 | 100,250 |
| Metinvest BV (S) | 8.750 | 02/14/18 | 200,000 | 185,500 |
| Mongolian Mining Corp. (S) | 8.875 | 03/29/17 | 200,000 | 201,500 |
| Rain CII Carbon LLC (S) | 8.000 | 12/01/18 | 100,000 | 102,250 |
| Steel Dynamics, Inc. | 7.750 | 04/15/16 | 125,000 | 129,844 |
| SunCoke Energy, Inc. | 7.625 | 08/01/19 | 100,000 | 99,375 |
| Taseko Mines, Ltd. | 7.750 | 04/15/19 | 100,000 | 96,000 |
| Vale Overseas, Ltd. | 6.875 | 11/10/39 | 125,000 | 152,090 |
| | | | | |
| Paper & Forest Products 1.1% | | | | |
| Georgia-Pacific LLC | 7.250 | 06/01/28 | 171,000 | 215,013 |
| International Paper Company | 9.375 | 05/15/19 | 200,000 | 271,165 |
| |
| Telecommunication Services 3.8% | | | | 1,650,642 |
|
| |
| Diversified Telecommunication Services 3.3% | | | | |
| American Tower Corp. | 4.700 | 03/15/22 | 40,000 | 41,806 |
| CenturyLink, Inc. | 7.600 | 09/15/39 | 200,000 | 205,722 |
| CenturyLink, Inc. | 5.800 | 03/15/22 | 50,000 | 53,115 |
| GTP Towers Issuer LLC (S) | 8.112 | 02/15/15 | 100,000 | 105,105 |
| Intelsat Jackson Holdings SA | 7.250 | 10/15/20 | 100,000 | 106,750 |
| Level 3 Communications Inc (S) | 8.875 | 06/01/19 | 200,000 | 203,500 |
| PAETEC Holding Corp. | 9.875 | 12/01/18 | 100,000 | 112,750 |
| Telecom Italia Capital SA | 7.200 | 07/18/36 | 200,000 | 172,000 |
| Telefonica Emisiones SAU | 5.134 | 04/27/20 | 200,000 | 178,394 |
| West Corp. | 11.000 | 10/15/16 | 100,000 | 105,500 |
| Windstream Corp. | 7.750 | 10/01/21 | 150,000 | 160,500 |
| | | | | |
| Wireless Telecommunication Services 0.5% | | | | |
| Digicel, Ltd. (S) | 8.250 | 09/01/17 | 100,000 | 104,750 |
| Nextel Communications, Inc. | 7.375 | 08/01/15 | 100,000 | 100,750 |
| |
| Utilities 2.7% | | | | 1,160,378 |
|
| |
| Electric Utilities 1.0% | | | | |
| Allegheny Energy Supply Company LLC (S) | 6.750 | 10/15/39 | 200,000 | 215,620 |
| PNM Resources, Inc. | 9.250 | 05/15/15 | 150,000 | 171,375 |
| Southern California Edison Company (6.250% to 02/01/2022, | | | | |
| then 3 month LIBOR + 4.199%) (Q) | 6.250 | 02/01/22 | 30,000 | 32,082 |
| | | | | |
| Independent Power Producers & Energy Traders 1.4% | | | | |
| DPL, Inc. (S) | 7.250 | 10/15/21 | 200,000 | 227,500 |
| |
| See notes to financial statements. | |
| | |
| 12 |
Diversified Strategies Fund
Fund’s investments
As of 7-31-12
| | | | |
| | | Maturity | Par value^ | |
| | Rate (%) | date | | Value |
| |
| Utilities (continued) | | | | |
|
| Ipalco Enterprises, Inc. | 5.000 | 05/01/18 | 200,000 | $206,000 |
| NRG Energy, Inc. | 8.250 | 09/01/20 | 150,000 | 161,625 |
| | | | | |
| Multi-Utilities 0.3% | | | | |
| CMS Energy Corp. | 5.050 | 03/15/22 | 40,000 | 42,687 |
| Integrys Energy Group, Inc. (6.110% to 12/01/2016, then 3 | | | | |
| month LIBOR + 2.120%) | 6.110 | 12/01/66 | 100,000 | 103,489 |
|
| |
| U.S. Government & Agency Obligations 11.1% | | | | $4,759,880 |
|
| (Cost $4,357,931) | | | | |
| |
| U.S. Government 8.2% | | | | 3,515,654 |
|
| U.S. Treasury Bonds | 1.750 | 05/15/22 | 75,000 | 76,863 |
| U.S. Treasury Bonds | 3.125 | 11/15/41 | 440,000 | 492,113 |
| United States Treasury Strip PO | 5.029 | 08/15/41 | 6,500,000 | 2,946,678 |
| |
| U.S. Government Agency 2.9% | | | | 1,244,226 |
|
| Federal National Mortgage Association | | | | |
| 30 Yr Pass Thru | 4.000 | 10/01/41 | 1,138,526 | 1,244,226 |
|
| |
| Capital Preferred Securities 1.4% | | | | $612,358 |
|
| (Cost $568,712) | | | | |
| |
| Financials 1.4% | | | | 612,358 |
|
| Fifth Third Capital Trust IV (6.500% to 04/15/2017 then 3 | | | | |
| month LIBOR + 1.368%) | 6.500 | 04/15/37 | 150,000 | 149,813 |
| MetLife Capital Trust X (9.250% to 04/08/2038, then 3 month | | | | |
| LIBOR + 5.540%) (S) | 9.250 | 04/08/38 | 30,000 | 37,350 |
| Regions Financing Trust II (6.625% to 05/15/2027, then 3 | | | | |
| month LIBOR + 1.290%) | 6.625 | 05/15/47 | 150,000 | 146,250 |
| State Street Capital Trust III (P)(Q) | 5.458 | 01/29/49 | 175,000 | 175,945 |
| ZFS Finance USA Trust II (6.450% to 06/15/2016, then 3 | | | | |
| month LIBOR + 2.000%) (S) | 6.450 | 12/15/65 | 100,000 | 103,000 |
|
| |
| Municipal Bonds 0.1% | | | | $33,758 |
|
| (Cost $32,234) | | | | |
| |
| State of Illinois | 5.100 | 06/01/33 | 35,000 | 33,758 |
|
| |
| Term Loans (M) 0.9% | | | | $396,783 |
|
| (Cost $378,165) | | | | |
| |
| Consumer Discretionary 0.9 % | | | | 396,783 |
|
| |
| Hotels, Restaurants & Leisure 0.3% | | | | |
| Kalispel Tribal Economic Authority | 7.500 | 02/25/17 | 142,614 | 139,048 |
| | | | | |
| Media 0.3% | | | | |
| Clear Channel Communications, Inc. | 3.889 | 01/29/16 | 147,640 | 111,099 |
| | | | | |
| Health Care Providers & Services 0.3% | | | | |
| National Mentor Holdings, Inc. | 7.000 | 02/09/17 | 148,869 | 146,636 |
| |
| See notes to financial statements. | |
| | |
| 13 |
Diversified Strategies Fund
Fund’s investments
As of 7-31-12
| | | | |
| | | Maturity | Par value^ | |
| | Rate (%) | date | | Value |
| |
| Collateralized Mortgage Obligations 2.8% | | | | $1,219,980 |
|
| (Cost $1,127,318) | | | | |
| |
| Commercial & Residential 2.5% | | | | 1,058,127 |
|
| American Home Mortgage Assets | | | | |
| Series 2006-6, Class XP IO | 2.261 | 12/25/46 | 1,645,020 | 113,153 |
| Americold LLC Trust (S) | | | | |
| Series 2010-ARTA, Class D | 7.443 | 01/14/29 | 100,000 | 113,893 |
| Countrywide Alternative Loan Trust | | | | |
| Series 2007-16CB, Class 4A7 | 6.000 | 08/25/37 | 136,774 | 107,449 |
| Fontainebleau Resorts LLC (S) | | | | |
| Series 2012-FBLU, Class D | 5.007 | 05/05/27 | 100,000 | 103,892 |
| Greenwich Capital Commercial Funding Corp. | | | | |
| Series 2006-GG7, Class AM (P) | 5.874 | 07/10/38 | 220,000 | 234,112 |
| JPMorgan Chase Commercial Mortgage Securities Corp. | | | | |
| Series 2006-LDP7, Class AM (P) | 5.871 | 04/15/45 | 250,000 | 273,439 |
| WaMu Mortgage Pass Through Certificates | | | | |
| Series 2005-AR6, Class X IO | 1.600 | 04/25/45 | 1,973,559 | 112,189 |
| |
| Thrifts & Mortgage Finance 0.1% | | | | 58,127 |
|
| UBS-Barclays Commercial Mortgage Trust (S) | 1.994 | 05/10/63 | 550,000 | 58,127 |
| |
| U.S. Government Agency 0.2% | | | | 103,726 |
|
| Federal Home Loan Mortgage Corp. | | | | |
| Series K018, Class X1 IO | 1.469 | 01/25/22 | 409,372 | 41,706 |
| Series K710, Class X1 IO | 1.916 | 05/25/19 | 280,000 | 27,818 |
| Federal National Mortgage Association | | | | |
| Series 407, Class C6 IO | 5.500 | 01/25/40 | 213,175 | 34,202 |
| |
| Asset Backed Securities 1.0% | | | | $405,944 |
|
| (Cost $394,007) | | | | |
| |
| Asset Backed Securities Corp. Home Equity | | | | |
| Series 2006-HE1, Class A3 | 0.446 | 01/25/36 | 69,294 | 56,896 |
| Citicorp Residential Mortgage Securities, Inc. | | | | |
| Series 2007-2, Class A6 | 6.265 | 06/25/37 | 38,825 | 37,759 |
| Dominos Pizza Master Issuer LLC | | | | |
| Series 2012-1A, Class A2 (S) | 5.216 | 01/25/42 | 119,100 | 126,620 |
| Home Equity Asset Trust | | | | |
| Series 2003-1, Class M1 | 1.746 | 06/25/33 | 121,187 | 97,841 |
| Master Asset Backed Securities Trust | | | | |
| Series 2007-HE2, Class A2 | 0.946 | 08/25/37 | 66,083 | 59,719 |
| Soundview Home Equity Loan Trust | | | | |
| Series 2006-OPT2, Class A3 | 0.426 | 05/25/36 | 33,688 | 27,109 |
| | | | | |
| | | | Shares | Value |
|
| |
| Preferred Securities 0.4% | | | | $163,231 |
|
| (Cost $154,190) | | | | |
| |
| Financials 0.3% | | | | 105,297 |
|
| PNC Financial Services Group, Inc., 6.125% | | | 2,150 | 58,717 |
| U.S. Bancorp, 6.000% | | | 1,700 | 46,580 |
| |
| See notes to financial statements. | |
| | |
| 14 |
Diversified Strategies Fund
Fund’s investments
As of 7-31-12
| | |
| | Shares | Value |
| Industrials 0.1% | | $57,934 |
|
| Continental Airlines Finance Trust II, 6.000% | 700 | 23,013 |
| United Technologies Corp., 7.500% | 662 | 34,921 |
| |
| Affiliated Investment Companies 26.0% | | $11,189,050 |
|
| (Cost $10,518,363) | | |
| | | |
| Alternative 7.4% | | 3,178,680 |
|
| John Hancock Funds II (G) 7.4% | | |
| Currency Strategies, Class NAV (First Quadrant) (I) | 208,398 | 1,933,936 |
| Global Absolute Return Strategies, Class NAV (Standard | | |
| Life) (I) | 117,318 | 1,244,744 |
| | | |
| Equity 13.7% | | 5,884,995 |
|
| John Hancock Funds II (G) 9.7% | | |
| Capital Appreciation Value, Class NAV (T.Rowe Price) | 154,910 | 1,700,913 |
| Global Real Estate, Class NAV (Deutsche) | 55,514 | 436,895 |
| Redwood, Class NAV (RCM) | 191,194 | 2,030,479 |
| | | |
| John Hancock Funds III (G) 4.0% | | |
| Global Shareholder Yield, Class NAV (Epoch) | 174,462 | 1,716,708 |
| | | |
| Fixed Income 4.9% | | 2,125,375 |
|
| John Hancock Funds II (G) 4.9% | | |
| Multi Sector Bond, Class NAV (Stone Harbor) | 206,347 | 2,125,375 |
| |
| Unaffiliated Investment Companies 5.4% | | $2,330,888 |
|
| (Cost $2,393,498) | | |
| | | |
| Alternative 2.7% | | 1,171,956 |
|
| AQR Managed Futures Strategy Fund, Class I | 119,954 | 1,171,956 |
| | | |
| Equity 2.7% | | 1,158,932 |
|
| Turner Spectrum Fund Institutional Class I | 106,519 | 1,158,932 |
| |
| Total investments (Cost $39,676,751)† 98.5% | | $42,397,142 |
|
| Other assets and liabilities, net 1.5% | | $664,756 |
|
| Total net assets 100.0% | | $43,061,898 |
|
^The percentage shown for each investment category is the total value of the category as a percentage of the net assets of the Fund. All par values are denominated in U.S. Dollars unless otherwise indicated.
Notes to Portfolio of Investments
IO Interest Only Security – (Interest Tranche of Stripped Mortgage Pool). Rate shown is the annualized yield at the end of the period.
LIBOR London Interbank Offered Rate.
PIK Paid In Kind.
PO Principal Only Security – (Principal Tranche of Stripped Security). Rate shown is the annualized yield on date of purchase.
USGG U.S. Generic Government Index.
(G) The Fund's sub-adviser is shown parenthetically.
| |
| See notes to financial statements. | |
| | |
| 15 |
Diversified Strategies Fund
Fund’s investments
As of 7-31-12
(I) Non-income producing security.
(M) Term loans are variable rate obligations. The coupon rate shown represents the rate at period end.
(P) Variable rate obligation. The coupon rate shown represents the rate at period end.
(Q) Perpetual bonds have no stated maturity date. Date shown is next call date.
(S) These securities are exempt from registration under Rule 144A of the Securities Act of 1933. Such securities may be resold, normally to qualified institutional buyers, in transactions exempt from registration. Rule 144A securities amounted to $7,014,672 or 16.3% of the Fund's net assets as of 7-31-12.
† At 7-31-12, the aggregate cost of investment securities for federal income tax purposes was $39,703,934. Net unrealized appreciation aggregated $2,693,208, of which $2,857,921 related to appreciated investment securities and $164,713 related to depreciated investment securities.
| | | |
| Investment Companies | | | |
| Underlying Funds’ Investment Managers | | |
| | | |
| Deutsche Asset Management, Inc. | (Deutsche) | | |
| Epoch Investment Partners, Inc. | (Epoch) | | |
| First Quadrant, L.P. | (First Quadrant) | | |
| RCM Capital Management LLC | (RCM) | | |
| Standard Life Investments | | | |
| (Corporate Funds) Limited | (Standard Life) | | |
| Stone Harbor Investment Partners LP | (Stone Harbor) | | |
| T. Rowe Price Associates, Inc. | (T. Rowe Price) | | |
| |
| See notes to financial statements. | |
| | |
| 16 |
Diversified Strategies Fund
Statement of Assets and Liabilities — July 31, 2012
| | | |
| Assets | | | |
| | |
| Investments, at value (Cost $29,158,388) | $31,208,092 | | |
| Investments in affiliated funds, at value (Cost | | | |
| $10,518,363) | 11,189,050 | | |
| | | | |
| Total investments, at value (Cost | | | |
| $39,676,751) | 42,397,142 | | |
| | | | |
| Cash | 470,451 | | |
| Dividends and interest receivable | 462,613 | | |
| Other receivables and prepaid expenses | 3,325 | | |
| | | | |
| Total assets | 43,333,531 | | |
| | | |
| | | |
| Liabilities | | | |
| | |
| Payable for investments purchased | 207,137 | | |
| Payable to affiliates | | | |
| Accounting and legal services fees | 374 | | |
| Trustees' fees | 102 | | |
| Investment management fees | 526 | | |
| Other liabilities and accrued expenses | 63,494 | | |
| | | | |
| Total liabilities | 271,633 | | |
| | | |
| | | |
| Net assets | | | |
| | |
| Paid-in capital | $38,977,459 | | |
| Undistributed net investment income | 926,966 | | |
| Accumulated net realized gain (loss) on | | | |
| investments | 437,082 | | |
| Net unrealized appreciation (depreciation) on | | | |
| investments | 2,720,391 | | |
| | | | |
| Net assets | $43,061,898 | | |
| | | |
| | | |
| Net asset value per share | | | |
| | |
| Based on net asset values and shares | | | |
| outstanding-the Fund has an unlimited number | | | |
| of shares authorized with no par value | | | |
| Class A ($33,107,213 ÷ 3,000,000 shares) | $11.04 | | |
| Class I ($9,954,685 ÷ 900,000 shares) | $11.06 | | |
| | | |
| Maximum offering price per share | | | |
| Class A (net asset value per share ÷ 95%)1 | $11.62 | | |
1 On single retail sales of less than $50,000. On sales of $50,000 or more and on group sales the offering price is reduced.
| |
| The accompanying notes are an integral part of the financial statements. | |
| | |
| 17 |
Diversified Strategies Fund
Statement of Operations — For the Period Ended July 31, 20121
| | | |
| Investment income | | | |
| | |
| Interest | $1,469,495 | | |
| Income distributions received from affiliated | | | |
| underlying funds | 161,271 | | |
| Dividends | 6,063 | | |
| Less foreign taxes withheld | (92) | | |
| | | | |
| Total investment income | 1,636,737 | | |
| | | |
| Expenses | | | |
| | |
| Investment management fees | 195,811 | | |
| Distribution and service fees | 78,895 | | |
| Accounting and legal services fees | 4,574 | | |
| Transfer agent fees | 61,814 | | |
| Trustees' fees | 352 | | |
| Professional fees | 48,481 | | |
| Custodian fees | 9,791 | | |
| Registration and filing fees | 22,723 | | |
| Other | 6,749 | | |
| | | | |
| Total expenses | 429,190 | | |
| | | | |
| Less expense reductions | (59,456) | | |
| | | | |
| Net expenses | 369,734 | | |
| | | |
| Net investment income | 1,267,003 | | |
| | | |
| | | |
| Realized and unrealized gain (loss) | | | |
| | |
| Net realized gain (loss) on | | | |
| Investments in unaffiliated issuers | 301,010 | | |
| Investments in affiliated issuers | 166,444 | | |
| Capital gain distributions received from | | | |
| unaffiliated underlying funds | 54,295 | | |
| Capital gain distributions received from affiliated | | | |
| underlying funds | 12,478 | | |
| | 534,227 | | |
| | | |
| Change in net unrealized appreciation | | | |
| (depreciation) of | | | |
| Investments in unaffiliated issuers | 2,049,704 | | |
| Investments in affiliated issuers | 670,687 | | |
| | 2,720,391 | | |
| | | |
| Net realized and unrealized gain | 3,254,618 | | |
| | | |
| Increase in net assets from operations | $4,521,621 | | |
1 Period from 9-30-11 (commencement of operations) to 7-31-12.
| |
| See notes to financial statements. | |
| | |
| 18 |
Diversified Strategies Fund
Statement of Changes in Net Assets
| | | |
| | Period ended | | |
| | 7/31/121 | | |
| | | |
| Increase (decrease) in net assets | | | |
| | |
| From operations | | | |
| Net investment income | $1,267,003 | | |
| Net realized gain | 534,227 | | |
| Change in net unrealized appreciation | | | |
| (depreciation) | 2,720,391 | | |
| | | | |
| Increase in net assets resulting from | | | |
| operations | 4,521,621 | | |
| | | |
| Distributions to shareholders | | | |
| From net investment income | | | |
| Class A | (298,380) | | |
| Class I | (98,865) | | |
| From net realized gain | | | |
| Class A | (48,060) | | |
| Class I | (14,418) | | |
| Total distributions | (459,723) | | |
| | | | |
| From Fund share transactions | 39,000,000 | | |
| | | |
| Total increase | 43,061,898 | | |
| | | | |
| Net assets | | | |
| | |
| Beginning of period | — | | |
| | | | |
| End of period | $43,061,898 | | |
| | | |
| Undistributed net investment income | $926,966 | | |
1 Period from 9-30-11 (commencement of operations) to 7-31-12.
| |
| The accompanying notes are an integral part of the financial statements. | |
| | |
| 19 |
Diversified Strategies Fund
Financial Highlights (For a share outstanding throughout the period)
| | | |
| Class A Shares | | | |
| | | |
| Period ended | | | |
| | 7-31-121 | | |
| Per share operating performance | | | |
| | |
| Net asset value, beginning of period | $10.00 | | |
| Net investment income2 | 0.32 | | |
| Net realized and unrealized gain on | | | |
| investments | 0.84 | | |
| | | | |
| Total from investment operations | 1.16 | | |
| | | |
| Less distributions | | | |
| From net investment income | (0.10) | | |
| From net realized gain | (0.02) | | |
| | | |
| Total distributions | (0.12) | | |
| | | |
| Net asset value, end of period | $11.04 | | |
| | | |
| Total return (%)3 | 11.654,5 | | |
| | | |
| Ratios and supplemental data | | | |
| | |
| Net assets, end of period (in millions) | $33 | | |
| Ratios (as a percentage of average net | | | |
| assets): | | | |
| Expenses before reductions and amounts | | | |
| recaptured6 | 1.357 | | |
| Expenses including reductions and amounts | | | |
| recaptured6 | 1.177 | | |
| Net investment income | 3.607 | | |
| Portfolio turnover (%) | 21 | | |
1 Period from 9-30-11 (commencement of operations) to 7-31-12.
2 Based on the average daily shares outstanding.
3 Does not reflect the effect of sales charges, if any.
4 Total returns would have been lower had certain expenses not been reduced during the period shown.
5 Not annualized.
6 Ratios do not include expenses indirectly incurred from underlying funds whose expense ratios can vary based on the of underlying
funds held by the Fund. The range of expense ratios of the underlying funds held by the Fund was as follows: 0.75% to 1.43% for the
period ended 7-31-12.
7 Annualized.
| |
| See notes to financial statements. | |
| | |
| 20 |
Diversified Strategies Fund
Financial Highlights (For a share outstanding throughout the period)
| | | |
| Class I Shares | | | |
| | | |
| Period ended | | | |
| | 7-31-121 | | |
| Per share operating performance | | | |
| | |
| Net asset value, beginning of period | $10.00 | | |
| Net investment income2 | 0.35 | | |
| Net realized and unrealized gain on | | | |
| investments | 0.84 | | |
| | | | |
| Total from investment operations | 1.19 | | |
| | | |
| Less distributions | | | |
| From net investment income | (0.11) | | |
| From net realized gain | (0.02) | | |
| | | | |
| Total distributions | (0.13) | | |
| | | |
| Net asset value, end of period | $11.06 | | |
| | | |
| Total return (%) | 11.963,4 | | |
| | | |
| Ratios and supplemental data | | | |
| | |
| Net assets, end of period (in millions) | $10 | | |
| Ratios (as a percentage of average net | | | |
| assets): | | | |
| Expenses before reductions and amounts | | | |
| recaptured5 | 0.956 | | |
| Expenses including reductions and amounts | | | |
| recaptured5 | 0.786 | | |
| Net investment income | 3.996 | | |
| Portfolio turnover (%) | 21 | | |
1 Period from 9-30-11 (commencement of operations) to 7-31-12.
2 Based on the average daily shares outstanding.
3 Total returns would have been lower had certain expenses not been reduced during the period shown.
4 Not annualized.
5 Ratios do not include expenses indirectly incurred from underlying funds whose expense ratios can vary based on the of underlying
funds held by the Fund. The range of expense ratios of the underlying funds held by the Fund was as follows: 0.75% to 1.43% for the
period ended 7-31-12.
6 Annualized.
| |
| See notes to financial statements. | |
| | |
| 21 |
Notes to Financial Statements
Note 1 — Organization
John Hancock Diversified Strategies Fund (the Fund) is a series of John Hancock Funds II (the Trust), an open-end management investment company organized as a Massachusetts business trust and registered under the Investment Company Act of 1940, as amended (the 1940 Act). The investment objective of the Fund is to seek to achieve consistent returns over the long term with a focus on capital preservation.
The Fund operates as a “fund of funds”, investing in Class NAV shares of affiliated underlying funds of the Trust and other funds in the John Hancock Funds complex and other permitted investments, including other unaffiliated funds.
The Fund may offer multiple classes of shares. The shares currently offered are detailed in the Statement of assets and liabilities. Class A shares are offered to all investors. Class I shares are offered to institutions and certain investors. Shareholders of each class have exclusive voting rights to matters that affect that class. The distribution and service fees, if any, transfer agent fees, printing and postage and state registration fees for each class may differ.
The accounting policies of the underlying funds of the Fund are outlined in the underlying funds’ shareholder reports, available without charge by calling 1-800-344-1029 and jhfunds.com, on the Securities and Exchange Commission (SEC) Web site at www.sec.gov or at the SEC’s public reference room in Washington, D.C. The underlying funds are not covered by this report.
Note 2 - Significant accounting policies
The financial statements have been prepared in conformity with accounting principles generally accepted in the United States of America, which require management to make certain estimates and assumptions at the date of the financial statements. Actual results could differ from those estimates. Events or transactions occurring after the end of the fiscal period through the date that the financial statements were issued have been evaluated in the preparation of the financial statements. The following summarizes the significant accounting policies of the Fund:
Security valuation. Investments are stated at value as of the close of regular trading on the New York Stock Exchange (NYSE), normally at 4:00 p.m., Eastern Time. In order to value the securities, the Fund uses the following valuation techniques. Equity securities held by the Fund are valued at the last sale price or official closing price on the principal securities exchange on which they trade. In the event there were no sales during the day or closing prices are not available, then securities are valued using the last quoted bid or evaluated price. Investments by the Fund in underlying affiliated funds and/or other open-end management investment companies are valued at their respective net asset values each business day. Debt obligations are valued based on the evaluated prices provided by an independent pricing service, which utilizes both dealer-supplied and electronic data processing techniques, taking into account factors such as institutional-size trading in similar groups of securities, yield, quality, coupon rate, maturity, type of issue, trading characteristics and other market data. Certain short-term securities are valued at amortized cost. Other portfolio securities and assets, where market quotations are not readily available, are valued at fair value, as determined in good faith by the Fund’s Pricing Committee, following procedures established by the Board of Trustees.
The Fund uses a three-tier hierarchy to prioritize the pricing assumptions, referred to as inputs, used in valuation techniques to measure fair value. Level 1 includes securities valued using quoted prices in active markets for identical securities, including registered investment companies. Level 2 includes securities valued using significant observable inputs. Observable inputs may include quoted prices for similar securities, interest rates, prepayment speeds and credit risk. Prices for securities valued using these inputs are received from independent pricing vendors and brokers and are based on an evaluation of the inputs described. Level 3 includes securities valued using significant unobservable inputs when market prices are not readily available or reliable, including the Fund’s own assumptions in determining the fair value of
investments. Factors used in determining value may include market or issuer specific events, changes in interest rates and credit quality. The inputs or methodology used for valuing securities are not necessarily an indication of the risks associated with investing in those securities. Changes in valuation techniques may result in transfers into or out of an assigned level within the disclosure hierarchy.
The following is a summary of the values by input classification of the Fund’s investments as of July 31, 2012, by major security category or type:
| | | | |
| | | | Level 2 | Level 3 |
| | Total Market | Level 1 | Significant | Significant |
| | Value at | Quoted | Observable | Unobservable |
| | 7/31/2012 | Price | Inputs | Inputs |
| |
|
| Corporate Bonds | $21,285,270 | - | $21,257,370 | $27,900 |
| | | | | |
| U.S. Government & Agency | | | | |
| Obligations | 4,759,880 | - | 4,759,880 | - |
| | | | | |
| Capital Preferred Securities | 612,358 | - | 612,358 | - |
| | | | | |
| Municipal Bonds | 33,758 | - | 33,758 | - |
| | | | | |
| Term Loans | 396,783 | - | 396,783 | - |
| Collateralized Mortgage | | | | |
| Obligations | 1,219,980 | - | 1,219,980 | - |
| | | | | |
| Asset Backed Securities | 405,944 | - | 405,944 | - |
| | | | | |
| Preferred Securities | 163,231 | $93,638 | 69,593 | - |
| Affiliated Investment | | | | |
| Companies | 11,189,050 | 11,189,050 | - | - |
| Unaffiliated Investment | | | | |
| Companies | 2,330,888 | 2,330,888 | - | - |
| |
|
| Total Investments in | | | | |
| Securities | $42,397,142 | $13,613,576 | $28,755,666 | $27,900 |
Security transactions and related investment income. Investment security transactions are accounted for on a trade date plus one basis for daily net asset value calculations. However, for financial reporting purposes, investment transactions are reported on trade date. Interest income is accrued as earned. Interest income includes coupon interest and amortization/accretion of premiums/discounts on debt securities. Debt obligations may be placed in a non-accrual status and related interest income may be reduced by stopping current accruals and writing off interest receivable when the collection of all or a portion of interest has become doubtful. Dividend income is recorded on the ex-date. Income and capital gain distributions from underlying funds are recorded on ex-date. Gains and losses on securities sold are determined on the basis of identified cost and may include proceeds from litigation.
Line of credit. The Fund may borrow from banks for temporary or emergency purposes, including meeting redemption requests that otherwise might require the untimely sale of securities. Pursuant to the custodian agreement, the custodian may loan money to the Fund to make properly authorized payments. The Fund is obligated to repay the custodian for any overdraft, including any related costs or expenses. The custodian may have a lien, security interest or security entitlement in any Fund property that is not otherwise segregated or pledged, to the maximum extent permitted by law, to the extent of any overdraft.
In addition, the Fund and other affiliated funds have entered into an agreement with Citibank N.A. which enables them to participate in a $200 million unsecured committed line of credit. A commitment fee, payable at the end of each calendar quarter, based on the average daily unused portion of the line of credit, is charged to each participating fund on a pro rata basis and is
reflected in other expenses on the Statement of operations. For the period ended July 31, 2012, the Fund had no borrowings under the line of credit.
Expenses. Within the John Hancock Funds complex, expenses that are directly attributable to an individual fund are allocated to such fund. Expenses that are not readily attributable to a specific fund are allocated among all funds in an equitable manner, taking into consideration, among other things, the nature and type of expense and the fund’s relative net assets. Expense estimates are accrued in the period to which they relate and adjustments are made when actual amounts are known.
Class allocations. Income, common expenses and realized and unrealized gains (losses) are determined at the fund level and allocated daily to each class of shares based on the net assets of the class. Class-specific expenses, such as distribution and service fees, if any, transfer agent fees, printing and postage and state registration fees are calculated daily for each class, based on the net asset value of the class and the applicable specific expense rates.
Federal income taxes. The Fund intends to qualify as a regulated investment company by complying with the applicable provisions of the Internal Revenue Code and will not be subject to federal income tax on taxable income that is distributed to shareholders. Therefore, no federal income tax provision is required.
As of July 31, 2012, the Fund had no uncertain tax positions that would require financial statement recognition, derecognition or disclosure. The Fund’s federal tax returns are subject to examination by the Internal Revenue Service for a period of three years.
Distribution of income and gains. Distributions to shareholders from net investment income and net realized gains, if any, are recorded on the ex-date. The Fund generally declares and pays dividends and capital gain distributions, if any, at least annually.
The tax character of distributions for the period ended July 31, 2012 was as follows:
| | |
| | July 31, 2012 | |
| |
| Ordinary Income | $459,473 | |
| |
| Long-Term Capital Gain | $250 | |
| |
Distributions paid by the Fund with respect to each class of shares are calculated in the same manner, at the same time and in the same amount, except for the effect of class level expenses that may be applied differently to each class. As of July 31, 2012, the components of distributable earnings on a tax basis included $1,391,231 of undistributed ordinary income.
Such distributions on a tax basis, are determined in conformity with income tax regulations, which may differ from accounting principles generally accepted in the United States of America. Material distributions in excess of tax basis earnings and profits, if any, are reported in the Fund’s financial statements as a return of capital. Short term gains from underlying funds are treated as ordinary income for tax purposes.
Capital accounts within the financial statements are adjusted for permanent book-tax differences. These adjustments have no impact on net assets or the results of operations. Temporary book-tax differences, if any, will reverse in a subsequent period. Book-tax differences are primarily attributable to amortization and accretion on debt securities and non-deductible 12b-1 fees.
Note 3 - Guarantees and indemnifications
Under the Fund’s organizational documents, its Officers and Trustees are indemnified against certain liabilities arising out of the performance of their duties to the Fund. Additionally, in the normal course of business, the Fund enters into contracts with service providers that contain general indemnification clauses. The Fund’s maximum exposure under these arrangements is
unknown, as this would involve future claims that may be made against the Fund that have not yet occurred. The risk of material loss from such claims is considered remote.
Note 4 – Fees and transactions with affiliates
John Hancock Investment Management Services, LLC (the Adviser), serves as investment adviser for the Fund. John Hancock Funds, LLC (the Distributor), an affiliate of the Adviser, serves as principal underwriter of the Fund. The Adviser and the Distributor are indirect wholly owned subsidiaries of Manulife Financial Corporation (MFC).
Management fee. The Fund has an investment management agreement with The Adviser under which the Fund pays a daily management fee to the Adviser equivalent, on an annual basis based on two components: (a) a fee on assets invested in a fund of John Hancock Funds III (JHF III) or John Hancock Funds II (JHF II) and (b) a fee on assets invested in investments other than a fund of JHF III and JHF II (Other Assets). The fee on assets invested in the fund of JHF III or JHF II is stated as an annual percentage of the current value of the aggregate net assets of the Fund and is equivalent to the sum of: (a) 0.250% of the first $1,000,000,000 of the Fund’s aggregate net assets and (b) 0.225% of the excess over $1,000,000,000 of the Fund’s aggregate net assets. The fee on Other Assets is stated as an annual percentage of the current value of the aggregate net assets of the Fund and is equivalent to the sum of: (a) 0.700% of the first $1,000,000,000 of the Fund’s aggregate net assets and (b) 0.675% of the excess over $1,000,000,000 of the Fund’s aggregate net assets. The Adviser has a subadvisory agreement with John Hancock Asset Management a division of Manulife Asset Management (US) LLC, an indirectly owned subsidiary of MFC and an affiliate of the Adviser. The Fund is not responsible for payment of the subadvisory fees.
The Adviser has contractually agreed to waive a portion of its management fee for certain Funds (the Participating Portfolios) of the Trust and John Hancock Variable Insurance Trust. The waiver equals, on an annualized basis, 0.01% of that portion of the aggregate net assets of all the Participating Portfolios that exceeds $75 billion but is less than $100 billion; and 0.015% of that portion of the aggregate net assets of all the Participating Portfolios that equals or exceeds $100 billion. The amount of the Reimbursement is calculated daily and allocated among all the Participating Portfolios in proportion to the daily net assets of each Fund. This arrangement may be amended or terminated at any time by the Adviser upon notice to the Funds and with the approval of the Board of Trustees.
The Adviser has contractually agreed to waive fees and/or reimburse certain expenses for each share class of the Fund excluding certain expenses such as taxes, brokerage commissions, interest expense, litigation and indemnification expenses and other extraordinary expenses not incurred in the ordinary course of the Fund’s business. The fee waivers and/or reimbursements are such that these expenses will not exceed 1.22% and 0.80% for Class A and Class I shares, respectively. The fee waivers and/or reimbursements will continue in effect until November 30, 2012, unless renewed by mutual agreement of the Fund and the Adviser based upon a determination that is appropriate under the circumstances at the time.
Additionally, the Adviser has voluntarily agreed to waive other fund level expenses excluding advisory fees, 12b-1 fees, transfer agent fees, service fees, blue sky fees, printing and postage, acquired fund fees, litigation and indemnification expenses and other extraordinary expenses not incurred in the ordinary course of business. This voluntary expense reimbursement may be terminated at any time by the Adviser on notice to the Fund. The waivers are such that these expenses will not exceed 0.10% of the Fund’s average daily net assets.
The investment management fees including the impact of waivers and reimbursements described above, incurred for the period ended July 31, 2012 were equivalent to a net effective rate of 0.40% of the Fund’s average daily net assets.
Accordingly, the fee waivers and/or expense reimbursements described above amounted to $45,729 and $13,727 for Class A and Class I shares, respectively, for the period ended July 31, 2012.
Expense recapture. The Adviser may recapture operating expenses reimbursed or fees waived under previous expense limitation or waiver arrangements for a period of three years following the beginning of the month in which such reimbursements or waivers originally occurred to the extent that the Fund is below its expense limitation during this period. For period ended July 31, 2012, the Fund did not recapture any expenses. In addition, there were $59,475 in waived or reimbursed expenses subject to potential recovery through July 1, 2015.
Accounting and legal services. Pursuant to a service agreement, the Fund reimburses the Adviser for all expenses associated with providing the administrative, financial, legal, accounting and recordkeeping services to the Fund, including the preparation of all tax returns, periodic reports to shareholders and regulatory reports, among other services. These expenses are allocated to each share class based on its relative net assets at the time the expense was incurred. These accounting and legal services fees incurred for the period ended July 31, 2012 amounted to an annual rate of 0.01% of the Fund’s average daily net assets.
Distribution and service plans. The Fund has a distribution agreement with the Distributor. The Fund has adopted distribution and service plans with respect to Class A shares pursuant to Rule 12b-1 under the 1940 Act, to pay the Distributor for services provided as the distributor of shares of the Fund. The Fund pays 0.30% for Class A shares of distribution and service fees under these arrangements, expressed as an annual percentage of average daily net assets.
Transfer agent fees. The Fund has a transfer agent agreement with John Hancock Signature Services, Inc. (Signature Services), an affiliate of the Adviser. The transfer agent fees paid to Signature Services are determined based on the cost to Signature Services (Signature Services Cost) of providing recordkeeping services. The Signature Services Cost includes a component of allocated John Hancock corporate overhead for providing transfer agent services to the Fund and to all other John Hancock affiliated funds. It also includes out-of-pocket expenses that are comprised of payments made to third-parties for recordkeeping services provided to their clients who invest in one or more John Hancock funds. In addition, Signature Services Cost may be reduced by certain fees that Signature Services receives in connection with retirement and small accounts. Signature Services Cost is calculated monthly and allocated, as applicable, to four categories of share classes: Institutional Share Classes, Retirement Share Classes, Municipal Bond Classes and all other Retail Share Classes. Within each of these categories, the applicable costs are allocated to the affected John Hancock affiliated funds and/or classes, based on the relative average daily net assets.
Class level expenses. Class level expenses for the period ended July 31, 2012 were:
| | |
| Class | Distribution and service fees | Transfer agent fees |
|
| A | $78,895 | $53,154 |
|
| I | - | 8,660 |
|
| Total | $78,895 | $61,814 |
|
The Fund did not incur printing and postage and state registration fees for the period ended July 31, 2012.
Trustee expenses. The Fund compensates each Trustee who is not an employee of the Adviser or its affiliates. The costs of paying Trustee compensation and expenses are allocated to each Fund based on its average daily net assets.
Note 5 - Fund share transactions
Transactions in Fund shares for the period ended July 31, 2012 were as follows:
| | | | |
| | Period ended | |
| | 7/31/121 | |
| |
| |
| | Shares | | Amount | |
| Class A shares | | | | |
| Sold | 3,000,000 | | $30,000,000 | |
|
| |
| |
| Net increase | 3,000,000 | | $30,000,000 | |
|
| |
| |
| Class I shares | | | | |
| Sold | 900,000 | | $9,000,000 | |
|
| |
| |
| Net increase | 900,000 | | $9,000,000 | |
|
| |
| |
| Net increase | 3,900,000 | | $39,000,000 | |
|
| |
| |
1 Period from 9-30-11 (commencement of operations) to 7-31-12.
Affiliates of the Fund owned 100% of shares of beneficial interest of Class A and Class I, respectively, on July 31, 2012.
Note 6 - Purchase and sale of securities
Purchases and sales of securities, other than short-term securities and U.S. Treasury obligations, aggregated $44,156,906 and $8,071,268, respectively, for the period ended July 31, 2012. Purchases and sales of U.S. Treasury obligations aggregated $3,153,945 and $31,127, respectively, for the period ended July 31, 2012.
Note 7 – Investment in affiliated underlying funds
The Fund invests in affiliated underlying funds that are managed by the Adviser and affiliates. The Fund does not invest in the affiliated underlying funds for the purpose of exercising management or control; however, the Fund’s investment may represent a significant portion of each underlying Fund’s net assets. For the period ended July 31, 2012, the Funds do not hold 5% or more of an underlying Funds’ net assets.
Auditors’ report
Report of Independent Registered Public Accounting Firm
To the Board of Trustees of John Hancock Funds II and Shareholders of John Hancock
Diversified Strategies Fund:
In our opinion, the accompanying statement of assets and liabilities, including the schedule of investments, and the related statements of operations and of changes in net assets and the financial highlights present fairly, in all material respects, the financial position of John Hancock Diversified Strategies Fund (the “Fund”) at July 31, 2012, and the results of its operations, the changes in its net assets and the financial highlights for the period September 30, 2011 (commencement of operations) through July 31, 2012, in conformity with accounting principles generally accepted in the United States of America. These financial statements and financial highlights (hereafter referred to as “financial statements”) are the responsibility of the Fund’s management; our responsibility is to express an opinion on these financial statements based on our audit. We conducted our audit of these financial statements in accordance with the standards of the Public Company Accounting Oversight Board (United States). Those standards require that we plan and perform the audit to obtain reasonable assurance about whether the financial statements are free of material misstatement. An audit includes examining, on a test basis, evidence supporting the amounts and disclosures in the financial statements, assessing the accounting principles used and significant estimates made by management, and evaluating the overall financial statement presentation. We believe that our audit, which included confirmation of securities at July 31, 2012 by correspondence with the custodian, agent banks and brokers, and the application of alternative auditing procedures where securities purchased confirmations had not been received, provides a reasonable basis for our opinion.
PricewaterhouseCoopers LLP
Boston, Massachusetts
September 24, 2012
Federal Tax Information (Unaudited)
Taxable Funds
For federal income tax purposes, the following information is furnished with respect to the distributions of the Fund, if any, paid during its taxable year ended July 31, 2012.
The Fund reports the maximum amount allowable of its net taxable income as eligible for the corporate dividends-received deduction.
The Fund reports the maximum amount allowable of its net taxable income as qualified dividend income as provided in the Jobs and Growth Tax Relief Reconciliation Act of 2003.
The Fund paid $250 in capital gain dividends.
Eligible shareholders will be mailed a 2012 Form 1099-DIV in early 2013. This will reflect the tax character of all distributions paid in calendar year 2012.
Trustees and Officers
This chart provides information about the Trustees and Officers of John Hancock Funds II who oversee your John Hancock fund. Officers elected by the Trustees manage the day-to-day operations of the Portfolio and execute policies formulated by the Trustees.
Independent Trustees
| | |
| Name, Year of Birth | Trustee | Number of |
| Position(s) held with Fund | of the | John Hancock |
| Principal occupation(s) and other | Trust | funds overseen |
| directorships during past 5 years | since1 | by Trustee |
| |
| Charles L. Bardelis, Born: 1941 | 2005 | 198 |
|
| Director, Island Commuter Corp. (Marine Transport). Trustee of John Hancock Variable Insurance |
| Trust (since 1988), John Hancock Funds II (since 2005) and former Trustee of John Hancock | |
| Funds III (2005–2006). | | |
|
| |
| Peter S. Burgess, Born: 1942 | 2005 | 198 |
|
| Consultant (financial, accounting and auditing matters) (since 1999); Certified Public Accountant. |
| Partner, Arthur Andersen (independent public accounting firm) (prior to 1999). Director of the following |
| publicly traded companies: Lincoln Educational Services Corporation (since 2004), Symetra Financial |
| Corporation (since 2010) and PMA Capital Corporation (2004–2010). Trustee of John Hancock Variable |
| Insurance Trust (since 2005), John Hancock Funds II (since 2005), and former Trustee of John Hancock |
| Funds III (2005–2006). | | |
|
| |
| Grace K. Fey, Born: 1946 | 2008 | 198 |
|
| Chief Executive Officer, Grace Fey Advisors (since 2007); Director & Executive Vice President, Frontier |
| Capital Management Company (1988–2007); Director, Fiduciary Trust (since 2009). Trustee of |
| John Hancock Variable Insurance Trust (since 2008) and John Hancock Funds II (since 2008). |
|
| |
| Theron S. Hoffman, Born: 1947 | 2008 | 198 |
|
| Chief Executive Officer, T. Hoffman Associates, LLC (consulting firm) (since 2003); Director, The Todd |
| Organization (consulting firm) (2003–2010); President, Westport Resources Management (investment |
| management consulting firm) (2006–2008); Partner/Operating Head & Senior Managing Director, |
| Putnam Investments (2000–2003); Executive Vice President, Thomson Corp. (1997–2000) (financial |
| and legal information publishing). Trustee of John Hancock Variable Insurance Trust (since 2008) and |
| John Hancock Funds II (since 2008). | | |
|
| |
| Hassell H. McClellan, Born: 1945 | 2005 | 198 |
|
| Associate Professor, The Graduate School of The Wallace E. Carroll School of Management, Boston |
| College (since 1984). Trustee of John Hancock Variable Insurance Trust (since 2005), John Hancock |
| Funds II (since 2005), Trustee of Virtus Variable Insurance Trust (formerly, Phoenix Edge Series Funds) |
| (since 2008), and Director of the Barnes Group (since 2010). | | |
|
| |
| James M. Oates, Born: 1946 | 2005 | 198 |
|
| Managing Director, Wydown Group (financial consulting firm) (since 1994); Chairman, Emerson |
| Investment Management, Inc. (since 2000); Chairman, Hudson Castle Group, Inc. (formerly IBEX |
| Capital Markets, Inc.) (financial services company) (1997–2011). Director of the following publicly traded |
| companies: Stifel Financial (since 1996); Investor Financial Services Corporation (1995–2007); and |
| Connecticut River Bancorp (since 1998). Director of the following Mutual Funds: Virtus Funds (formerly, |
| Phoenix Mutual Funds) (since 1988). Chairman of the Boards of John Hancock Variable Insurance Trust |
| and John Hancock Funds II (since 2005) and former Trustee of John Hancock Funds III (2005–2006). |
| |
| Annual report | Diversified Strategies Fund |
| |
| 30 |
| | |
| Non-Independent Trustee2 | | |
| | | |
| Name, Year of Birth | Trustee | Number of |
| Position(s) held with Fund | of the | John Hancock |
| Principal occupation(s) and other | Trust | funds overseen |
| directorships during past 5 years | since1 | by Trustee |
| |
| James R. Boyle,3 Born: 1959 | 2005 | 198 |
|
| Senior Executive Vice President, John Hancock Financial Services (since 1999, including prior positions); |
| Chairman and Director, John Hancock Advisers, LLC, John Hancock Funds, LLC, and John Hancock |
| Investment Management Services, LLC (2005–2010); Trustee, John Hancock Variable Insurance Trust |
| (since 2005), John Hancock Funds II (since 2005), and John Hancock retail funds (2005–2010). |
1 Because the Trust does not hold regular annual shareholders meetings, each Trustee holds office for an indefinite term until his/her successor is duly elected and qualified or until he/she dies, retires, resigns, is removed or becomes disqualified.
2 Non-Independent Trustees hold positions or are affiliated with the Fund’s investment adviser, subadviser, underwriter or their affiliates.
3 Mr. Boyle is an “interested person” (as defined in the 1940 Act) due to his position with Manulife Financial Corporation (or its affiliates), the ultimate parent of the Adviser.
Principal officers who are not Trustees
| |
| Name, Year of Birth | Officer |
| Position(s) held with Fund | of the |
| Principal occupation(s) and other | Trust |
| directorships during past 5 years | since |
| |
| Hugh McHaffie, Born: 1959 | 2009 |
|
| President | |
| Executive Vice President, John Hancock Financial Services (since 2006, including prior positions); | |
| President of John Hancock Variable Insurance Trust and John Hancock Funds II (since 2009); Trustee, |
| John Hancock retail funds (since 2010); Chairman and Director, John Hancock Advisers, LLC, | |
| John Hancock Investment Management Services, LLC and John Hancock Funds, LLC (since 2010). | |
|
| |
| Thomas M. Kinzler, Born: 1955 | 2008 |
|
| Secretary and Chief Legal Officer | |
| Vice President, John Hancock Financial Services (since 2006); Secretary and Chief Legal Counsel, | |
| John Hancock Funds, LLC (since 2007); Secretary and Chief Legal Officer, John Hancock retail funds, |
| John Hancock Variable Insurance Trust and John Hancock Funds II (since 2006). | |
|
| |
| Francis V. Knox, Jr., Born: 1947 | 2008 |
|
| Chief Compliance Officer | |
| Vice President, John Hancock Financial Services (since 2005); Chief Compliance Officer, John Hancock |
| retail funds, John Hancock Funds II, John Hancock Variable Insurance Trust, John Hancock Advisers, |
| LLC and John Hancock Investment Management Services, LLC (since 2005); Vice President and Chief |
| Compliance Officer, John Hancock Asset Management a division of Manulife Asset Management (US) |
| LLC (2005–2008). | |
|
| |
| Michael J. Leary, Born: 1965 | 2008 |
|
| Treasurer | |
| Assistant Vice President, John Hancock Financial Services (since 2007); Treasurer, John Hancock Funds II |
| and John Hancock Variable Insurance Trust (since 2009); Treasurer, John Hancock retail funds (2009– |
| 2010); Vice President, John Hancock Advisers, LLC and John Hancock Investment Management Services, |
| LLC (since 2007); Assistant Treasurer, John Hancock retail funds (2007–2009 & 2010), John Hancock |
| Funds II and John Hancock Variable Insurance Trust (2007–2009) and John Hancock Funds III (since |
| 2009); Vice President and Director of Fund Administration, JP Morgan (2004–2007). | |
| |
| Diversified Strategies Fund | Annual report | |
| | |
| 31 |
Principal officers who are not Trustees (continued)
| |
| Name, Year of Birth | Officer |
| Position(s) held with Fund | of the |
| Principal occupation(s) and other | Trust |
| directorships during past 5 years | since |
| |
| Charles A. Rizzo, Born: 1957 | 2008 |
|
| Chief Financial Officer | |
| Vice President, John Hancock Financial Services (since 2008); Senior Vice President, John Hancock | |
| Advisers, LLC and John Hancock Investment Management Services, LLC (since 2008); Chief Financial |
| Officer, John Hancock retail funds, John Hancock Funds II and John Hancock Variable Insurance Trust |
| (since 2007); Assistant Treasurer, Goldman Sachs Mutual Fund Complex (2005–2007); Vice President, |
| Goldman Sachs (2005–2007). | |
| |
| |
| John G. Vrysen, Born: 1955 | 2008 |
|
| Chief Operating Officer | |
| Senior Vice President, John Hancock Financial Services (since 2006); Director, Executive Vice President |
| and Chief Operating Officer, John Hancock Advisers, LLC, John Hancock Investment Management | |
| Services, LLC and John Hancock Funds, LLC (since 2005); Chief Operating Officer, John Hancock Funds |
| II and John Hancock Variable Insurance Trust (since 2007); Chief Operating Officer, John Hancock retail |
| funds (until 2009); Trustee, John Hancock retail funds (since 2009). | |
The business address for all Trustees and Officers is 601 Congress Street, Boston, Massachusetts 02210-2805.
The Statement of Additional Information of the Fund includes additional information about members of the Board of Trustees of the Fund and is available without charge, upon request, by calling 1-800-225-5291.
| |
| | Annual report | Diversified Strategies Fund |
| | |
| 32 |
More information
| |
| Trustees | Investment adviser |
| James M. Oates, Chairman | John Hancock Investment Management Services, LLC |
| James R. Boyle† | |
| Grace K. Fey† | Investment subadviser |
| Charles L. Bardelis* | John Hancock Asset Management a division of |
| Peter S. Burgess* | Manulife Asset Management (US) LLC |
| Theron S. Hoffman | |
| Hassell H. McClellan* | Principal distributor |
| *Member of the Audit Committee | John Hancock Funds, LLC |
| †Non-Independent Trustee | |
| | Custodian |
| | State Street Bank and Trust Company |
| | |
| Officers | Transfer agent |
| Hugh McHaffie | John Hancock Signature Services, Inc. |
| President | |
| Thomas M. Kinzler | Legal counsel |
| Secretary and Chief Legal Officer | K&L Gates LLP |
| Francis V. Knox, Jr. | |
| Chief Compliance Officer | Independent registered |
| Michael J. Leary | public accounting firm |
| Treasurer | PricewaterhouseCoopers LLP |
| Charles A. Rizzo | |
| Chief Financial Officer | |
| John G. Vrysen | |
| Chief Operating Officer | |
The Fund’s proxy voting policies and procedures, as well as the Fund’s proxy voting record, if any, for the most recent twelve-month period ended June 30, are available free of charge on the Securities and Exchange Commission (SEC) Web site at www.sec.gov or on our Web site.
The Fund’s complete list of portfolio holdings, for the first and third fiscal quarters, is filed with the SEC on Form N-Q. The Fund’s Form N-Q is available on our Web site and the SEC’s Web site, www.sec.gov, and can be reviewed and copied (for a fee) at the SEC’s Public Reference Room in Washington, DC. Call 1-202-551-8090 to receive information on the operation of the SEC's Public Reference Room.
We make this information on your fund, as well as monthly portfolio holdings, and other fund details available on our Web site at www.jhfunds.com or by calling 1-800-225-5291.
| | |
| You can also contact us: | | |
| 1-800-225-5291 | Regular mail: | Express mail: |
| jhfunds.com | John Hancock Signature Services, Inc. | John Hancock Signature Services, Inc. |
| | P.O. Box 55913 | Mutual Fund Image Operations |
| | Boston, MA 02205-5913 | 30 Dan Road |
| | | Canton, MA 02021 |

A look at performance
Total returns for the period ended July 31, 2012
| | | | | | | | | |
| | Average annual total returns (%) | | Cumulative total returns (%) | |
| | with maximum sales charge | | | with maximum sales charge | |
|
| | | | | Since | | | | | Since |
| | 1-year | 5-year | 10-year | Inception | | 1-year | 5-year | 10-year | Inception1 |
|
| Class A | — | — | — | — | | — | — | — | 0.60 |
|
| Class I2 | — | — | — | — | | — | — | — | 6.20 |
|
| Class NAV2 | — | — | — | — | | — | — | — | 6.10 |
|
Performance figures assume all distributions are reinvested. Figures reflect maximum sales charges on Class A shares of 5.00%.
The expense ratios of the Fund, both net (including any fee waivers or expense limitations) and gross (excluding any fee waivers or expense limitations), are set forth according to the most recent publicly available prospectus for the Fund and may differ from those disclosed in the Financial highlights tables in this report. The fee waivers and expense limitations are contractual at least until 12-31-12 for Class A and Class I shares. Had the fee waivers and expense limitations not been in place gross expenses would apply. For all other classes the net expenses equal the gross expenses. The expense ratios are as follows:
| | | | | | | | |
| | Class A | Class I | Class NAV | | | | | |
| Net (%) | 1.95 | 1.57 | 1.40 | | | | | |
| Gross (%) | 1.96 | 1.57 | 1.40 | | | | | |
Expenses have been estimated for the Fund’s first year of operations.
The returns reflect past results and should not be considered indicative of future performance. The return and principal value of an investment will fluctuate so that shares, when redeemed, may be worth more or less than their original cost. Due to market volatility, the Fund’s current performance may be higher or lower than the performance shown. For current to the most recent month-end performance data, please call 1-800-225-5291 or visit the Fund’s Web site at www.jhfunds.com.
The performance table above and the chart on the next page do not reflect the deduction of taxes that a shareholder may pay on fund distributions or on the redemption of fund shares. The Fund’s performance results reflect any applicable fee waivers or expense reductions, without which the expenses would increase and results would have been less favorable.
| |
| 6 | Global Absolute Return Strategies Fund | Annual report |
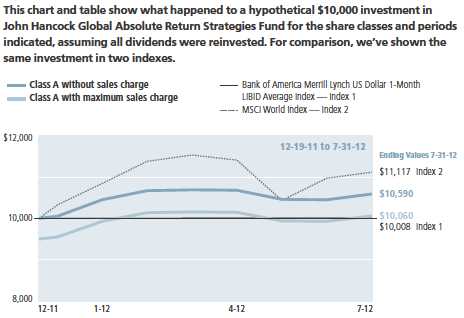
| | | | |
| | | Without | With maximum | |
| | Start date | sales charge | sales charge | Index |
|
| Class I2 | 12-19-11 | $10,620 | $10,620 | $10,008 |
|
| Class NAV2 | 12-19-11 | 10,610 | 10,610 | 10,008 |
|
Bank of America Merrill Lynch US Dollar 1-Month LIBID Average Index — Index 1 — tracks the performance of a synthetic asset paying LIBID (London Interbank Bid Rate) to a stated maturity.
MSCI World Index (gross of foreign withholding taxes on dividends) — Index 2 — is a free float-adjusted market capitalization weighted index that is designed to measure equity market performance of developed markets.
It is not possible to invest directly in an index. Index figures do not reflect expenses, which would have resulted in lower values if they did.
1 From 12-19-11. Class R2 and R6 shares were first offered on 3-1-12. Because the classes have limited operating history, performance is not included.
2 For certain types of investors as described in the Fund’s prospectuses.
| |
| Annual report | Global Absolute Return Strategies Fund | 7 |
Management’s discussion of
Fund performance
By Standard Life Investments (Corporate Funds) Limited
Shortly after the period ended, David Millar left Standard Life Investments and no longer serves as a portfolio manager on the Fund. Portfolio managers Euan Munro and Guy Stern continue to manage the Fund with the same objective and strategy.
Global financial markets generally performed well in the period from the Fund’s mid-December 2011 inception to July 31, 2012, though not without bouts of sharp volatility. In the U.S., good economic growth in late 2011 and early 2012 resulted in solid gains for stocks and credit-sensitive bonds. But worries about a slowdown resulted in volatility and buoyed demand for the dollar and safe-haven U.S. Treasury securities. Europe endured a cycle of fiscal crisis followed by policy response followed by a repeat of fiscal crisis. In that environment, European stock performance varied widely but was mostly positive, while European corporate and government bonds also generally managed gains.
The Fund enjoyed a positive return and outperformed its benchmark. For the period from inception December 19, 2011 to July 31, 2012, John Hancock Global Absolute Return Strategies Fund’s Class A shares returned 5.90%, excluding sales charges. At the same time, the MSCI World Index returned 11.17% and the Bank of America Merrill Lynch U.S. Dollar 1-Month LIBID Average Index, the Fund’s benchmark, returned 0.08%. In managing the Fund, we use a range of techniques across a wide spectrum of equity and fixed-income securities, as well as derivative instruments. We use a wide range of derivative contracts (including futures, swaps, options, swaptions and others), which may be either exchange traded or over-the-counter with one specific counterparty. The Fund uses these instruments to manage volatility and to efficiently implement investment ideas. They are frequently tied to long positions of the Portfolio. For example, in volatile market conditions these derivatives typically temper returns in order to reduce volatility associated with rapid gains or losses on equities. Several factors contributed to the Fund’s performance in the period since its inception. First, in fixed-income markets of developed economies, it was beneficial to hold corporate and other non-government bonds and this positioning helped performance. Second, bonds of select resource-based economies tended to enjoy healthier fiscal conditions and currencies than those of many developed nations. In particular, the Fund benefited from holding securities issued by Mexico, whose government bonds have done well so far in 2012. Third, despite sharp volatility in April and May, it was beneficial during the period overall to have exposure to a number of global equity markets. A leading detractor was the Fund’s exposure to Korean equities. The Fund has taken deliberate exposure to aspects of eurozone financials that we see as offering potential value. In addition, some of the better rated eurozone banks may be counterparties to a number of our over-the-counter derivatives contracts. Such exposure is closely monitored and would be removed should the credit-worthiness of any such institution materially decrease.
This commentary reflects the views of the portfolio managers through the end of the period discussed in this report. The managers’ statements reflect their own opinions. As such, they are in no way guarantees of future events and are not intended to be used as investment advice or a recommendation regarding any specific security. They are also subject to change at any time as market and other conditions warrant.
Past performance is no guarantee of future results.
Absolute return funds are not designed to outperform stocks and bonds in strong markets and there is no guarantee of positive returns. They employ certain techniques which are intended to reduce risk and volatility in the portfolio and provide protection against a decline in the Fund’s assets. However, there is no guarantee that any investment strategy will be successful or that the Fund’s objectives will be achieved. The use of hedging and derivatives transactions could produce disproportionate gains or losses and may increase volatility and costs. The issuer or grantor of a security, or counterparty to a transaction, may be unable or unwilling to make principal, interest or settlement payments. If the Fund invests in illiquid securities, it may be difficult to sell them at a price approximating their value. Currency transactions are impacted by fluctuations in exchange rates, which may adversely affect the U.S. dollar value of a fund’s investments. Foreign investing, especially in emerging markets, has additional risks such as currency and market volatility and political and social instability.
| |
| 8 | Global Absolute Return Strategies Fund | Annual report |
Your expenses
These examples are intended to help you understand your ongoing operating expenses of investing in the Fund so you can compare these costs with the ongoing costs of investing in other mutual funds.
Understanding fund expenses
As a shareholder of the Fund, you incur two types of costs:
▪ Transaction costs which include sales charges (loads) on purchases or redemptions (varies by share class), minimum account fee charge, etc.
▪ Ongoing operating expenses including management fees, distribution and service fees (if applicable), and other fund expenses.
We are going to present only your ongoing operating expenses here.
Actual expenses/actual returns
This example is intended to provide information about the Fund’s actual ongoing operating expenses, and is based on the Fund’s actual return. It assumes an account value of $1,000.00 on February 1, 2012 with the same investment held until July 31, 2012.
| | | |
| | Account value | Ending value | Expenses paid during |
| | on 2-1-12 | on 7-31-12 | period ended 7-31-121 |
|
| Class A | $1,000.00 | $1,013.40 | $9.76 |
|
| Class I | 1,000.00 | 1,016.30 | 7.97 |
|
| Class NAV | 1,000.00 | 1,015.30 | 7.17 |
|
For the classes noted below, the example assumes an account value of $1,000.00 on March 1, 2012, with the same investment held until July 31, 2012.
| | | |
| | Account value | Ending value | Expenses paid during |
| | on 3-1-12 | on 7-31-12 | period ended 7-31-112 |
|
| Class R2 | 1,000.00 | 991.60 | 8.35 |
|
| Class R6 | 1,000.00 | 993.40 | 6.27 |
|
Together with the value of your account, you may use this information to estimate the operating expenses that you paid over the period. Simply divide your account value at July 31, 2012, by $1,000.00, then multiply it by the “expenses paid” for your share class from the table above. For example, for an account value of $8,600.00, the operating expenses should be calculated as follows:
| |
| Annual report | Global Absolute Return Strategies Fund | 9 |
Your expenses
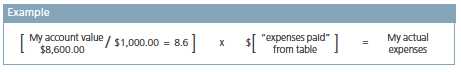
Hypothetical example for comparison purposes
This table allows you to compare the Fund’s ongoing operating expenses with those of any other fund. It provides an example of the Fund’s hypothetical account values and hypothetical expenses based on each class’s actual expense ratio and an assumed 5% annualized return before expenses (which is not the Fund’s actual return). It assumes an account value of $1,000.00 on February 1, 2012, with the same investment held until July 31, 2012. Look in any other fund shareholder report to find its hypothetical example and you will be able to compare these expenses.
| | | |
| | Account value | Ending value | Expenses paid during |
| | on 2-1-12 | on 7-31-12 | period ended 7-31-123 |
|
| Class A | $1,000.00 | $1,015.20 | $9.77 |
|
| Class I | 1,000.00 | 1,017.00 | 7.97 |
|
| Class R2 | 1,000.00 | 1,014.90 | 10.02 |
|
| Class R6 | 1,000.00 | 1,017.40 | 7.52 |
|
| Class NAV | 1,000.00 | 1,017.80 | 7.17 |
|
Remember, these examples do not include any transaction costs, therefore, these examples will not help you to determine the relative total costs of owning different funds. If transaction costs were included, your expenses would have been higher. See the prospectus for details regarding transaction costs.
1 Expenses are equal to the Fund’s annualized expense ratio of 1.95%, 1.59% and 1.43% for Class A, Class I and Class NAV shares, respectively, multiplied by the average account value over the period, multiplied by 182/366 (to reflect the one-half year period).
2 Expenses are equal to the Fund’s annualized expense ratio of 2.00% and 1.50% for Class R2 and Class R6 shares, respectively, multiplied by the average account value over the period, multiplied by 153/365 (to reflect the period).
3 Expenses are equal to the Fund’s annualized expense ratio multiplied by the average account value over the period, multiplied by 182/366 (to reflect the one-half year period).
| |
| 10 | Global Absolute Return Strategies Fund | Annual report |
Portfolio summary
| | | | |
| Corporate Bonds | 27.5% | | | |
| | | |
| United States | 10.5% | | | |
| | | |
| United Kingdom | 4.5% | | | |
| | | |
| Netherlands | 3.2% | | | |
| | | |
| France | 3.1% | | | |
| | | |
| Luxembourg | 0.8% | | | |
| | | |
| Ireland | 0.7% | | | |
| | | |
| Italy | 0.7% | | | |
| | | |
| Germany | 0.6% | | | |
| | | |
| Sweden | 0.6% | | | |
| | | |
| Spain | 0.5% | | | |
| | | |
| Other Countries | 2.3% | | | |
| | | |
| | | | |
| Equities | 18.8% | | | |
| | | |
| United States | 7.7% | | | |
| | | |
| Russia | 2.8% | | | |
| | | |
| United Kingdom | 1.5% | | | |
| | | |
| Germany | 0.7% | | | |
| | | |
| France | 0.6% | | | |
| | | |
| Japan | 0.6% | | | |
| | | |
| Australia | 0.5% | | | |
| | | |
| Sweden | 0.4% | | | |
| | | |
| Netherlands | 0.4% | | | |
| | | |
| China | 0.4% | | | |
| | | |
| Other Countries | 3.2% | | | |
| | | |
| | | | |
| | | | | |
| U.S. Government | 18.6% | | | |
| | | |
| Treasury Inflation | | | | |
| Protected Securities | 18.6% | | | |
| | | |
| | | | |
| Foreign Government Obligations | 7.4% | | | |
| | | |
| Mexico | 4.9% | | | |
| | | |
| Germany | 2.0% | | | |
| | | |
| Other Countries | 0.5% | | | |
| | | |
| | | | |
| Certificate of Deposit | 4.3% | | | |
| | | |
| | | | |
| Purchased Options | 3.6% | | | |
| | | |
| | | | |
| Short-Term Investments & Other | 19.8% | | | |
| | | |
| Time Deposits | 13.2% | | | |
| | | |
| U.S. Government | 3.6% | | | |
| | | |
| Repurchase Agreement | 0.8% | | | |
| | | |
| Derivatives* | –3.5% | | | |
| | | |
| Other Assets & Liabilities | 5.7% | | | |
| | | |
* See derivative instruments disclosure and tables in the notes to financial statements.
As a percentage of net assets on 7-31-12.
Absolute return funds are not designed to outperform stocks and bonds in strong markets and there is no guarantee of positive returns. They employ certain techniques which are intended to reduce risk and volatility in the portfolio and provide protection against a decline in the Fund’s assets. However, there is no guarantee that any investment strategy will be successful or that the Fund’s objectives will be achieved. The use of hedging and derivatives transactions could produce disproportionate gains or losses and may increase volatility and costs.
Currency transactions are impacted by fluctuations in exchange rates, which may adversely affect the U.S. dollar value of a fund’s investments. Foreign investing, especially in emerging markets, has additional risks such as currency and market volatility and political and social instability.
| |
| Annual report | Global Absolute Return Strategies Fund | 11 |
Fund’s investments
As of 7-31-12
| | | | | |
| | | | Maturity | | |
| | Rate (%) | | date | Par value^ | Value |
| Corporate Bonds 27.5% | | | | $230,780,450 |
|
| (Cost $229,357,267) | | | | | |
| | | | | | |
| Australia 0.3% | | | | | 2,770,178 |
|
| Australia & New Zealand Banking Group, Ltd. | | | | | |
| (EUR) (D) | 3.750 | | 03-10-17 | 200,000 | 269,633 |
|
| FMG Resources August 2006 Pty, Ltd. (S) | 6.875 | | 04-01-22 | 95,000 | 94,763 |
|
| FMG Resources August 2006 Pty, Ltd. (S) | 8.250 | | 11-01-19 | 1,100,000 | 1,157,750 |
|
| Origin Energy Finance, Ltd. (EUR) (P) | 7.875 | | 06-16-71 | 100,000 | 122,732 |
|
| Santos Finance, Ltd. (8.250% to 9-22-17, then | | | | | |
| 3 month EURIBOR + 6.851%) (EUR) (D) | 8.250 | | 09-22-70 | 400,000 | 484,787 |
|
| Westpac Banking Corp. (EUR) (D) | 4.250 | | 09-22-16 | 470,000 | 640,513 |
| | | | | | |
| Austria 0.1% | | | | | 417,445 |
|
| Sappi Papier Holding GmbH (S) | 6.625 | | 04-15-21 | 250,000 | 228,750 |
|
| VERBUND International Finance GmbH | | | | | |
| (EUR) (D) | 4.750 | | 07-16-19 | 130,000 | 188,695 |
| | | | | | |
| Belgium 0.0% | | | | | 171,274 |
|
| Anheuser-Busch InBev NV (EUR) (D) | 4.000 | | 06-02-21 | 120,000 | 171,274 |
| | | | | | |
| Brazil 0.1% | | | | | 826,711 |
|
| OGX Austria GmbH (S) | 8.500 | | 06-01-18 | 450,000 | 396,563 |
|
| Vale SA (EUR) (D) | 4.375 | | 03-24-18 | 320,000 | 430,148 |
| | | | | | |
| Canada 0.3% | | | | | 2,415,356 |
|
| Air Canada (S) | 9.250 | | 08-01-15 | 860,000 | 862,150 |
|
| Bombardier, Inc. (S) | 5.750 | | 03-15-22 | 130,000 | 130,650 |
|
| Bombardier, Inc. (S) | 7.750 | | 03-15-20 | 295,000 | 331,506 |
|
| Cascades, Inc. | 7.875 | | 01-15-20 | 80,000 | 82,400 |
|
| Inmet Mining Corp. (S) | 8.750 | | 06-01-20 | 475,000 | 467,875 |
|
| NOVA Chemicals Corp. | 8.375 | | 11-01-16 | 485,000 | 540,775 |
| | | | | | |
| Cayman Islands 0.3% | | | | | 2,067,971 |
|
| Hutchison Whampoa Finance 09, Ltd. (EUR) (D) | 4.750 | | 11-14-16 | 750,000 | 1,038,242 |
|
| IPIC GMTN, Ltd. (EUR) (D) | 4.875 | | 05-14-16 | 410,000 | 552,388 |
|
| Thames Water Utilities Cayman Finance, Ltd. | | | | | |
| (EUR) (D) | 3.250 | | 11-09-16 | 100,000 | 133,444 |
|
| UPCB Finance, Ltd. (EUR) (D) | 7.625 | | 01-15-20 | 260,000 | 343,897 |
| | | | | | |
| Czech Republic 0.1% | | | | | 829,014 |
|
| CEZ AS (EUR) (D) | 4.500 | | 06-29-20 | 460,000 | 653,638 |
|
| CEZ AS (EUR) (D) | 6.000 | | 07-18-14 | 130,000 | 175,376 |
| | |
| 12 | Global Absolute Return Strategies Fund | Annual report | See notes to financial statements |
| | | | | |
| | | | Maturity | | |
| | Rate (%) | | date | Par value^ | Value |
| Denmark 0.5% | | | | | $4,037,833 |
|
| AP Moeller—Maersk A/S (EUR) (D) | 4.875 | | 10-30-14 | 530,000 | 697,620 |
|
| Danske Bank A/S (EUR) (D) | 3.875 | | 05-18-16 | 200,000 | 256,835 |
|
| Danske Bank A/S (EUR) (D) | 4.750 | | 06-04-14 | 450,000 | 581,895 |
|
| Danske Bank A/S (4.100% to 3-16-18, then | | | | | |
| 3 month EURIBOR + 1.810%) (EUR) (D) | 4.100 | | 03-16-18 | 300,000 | 350,664 |
|
| DONG Energy A/S (EUR) (D) | 4.875 | | 12-16-21 | 300,000 | 446,924 |
|
| DONG Energy A/S (EUR) (D) | 6.500 | | 05-07-19 | 150,000 | 236,745 |
|
| DONG Energy A/S (EUR) (D)(P) | 7.750 | | 06-01-21 | 280,000 | 374,657 |
|
| ISS A/S (EUR) (D) | 8.875 | | 05-15-16 | 175,000 | 221,780 |
|
| TDC A/S (EUR) (D) | 4.375 | | 02-23-18 | 630,000 | 870,713 |
| | | | | | |
| Finland 0.1% | | | | | 1,192,768 |
|
| Fortum OYJ (EUR) (D) | 4.000 | | 05-24-21 | 200,000 | 281,897 |
|
| Nokia OYJ (EUR) (D) | 5.500 | | 02-04-14 | 50,000 | 60,910 |
|
| Pohjola Bank PLC (EUR) (D) | 5.750 | | 02-28-22 | 300,000 | 401,316 |
|
| Teollisuuden Voima OYJ (EUR) (D) | 4.625 | | 02-04-19 | 330,000 | 448,645 |
| | | | | | |
| France 3.1% | | | | | 26,181,622 |
|
| Alstom SA (EUR) (D) | 3.875 | | 03-02-16 | 500,000 | 654,030 |
|
| Alstom SA (EUR) (D) | 4.000 | | 09-23-14 | 100,000 | 129,762 |
|
| Areva SA (EUR) (D) | 4.625 | | 10-05-17 | 600,000 | 767,109 |
|
| Autoroutes du Sud de la France SA (EUR) (D) | 4.000 | | 09-24-18 | 300,000 | 407,237 |
|
| AXA SA (5.250% to 4-16-20, then 3 month | | | | | |
| EURIBOR + 3.050%) (EUR) (D) | 5.250 | | 04-16-40 | 400,000 | 412,410 |
|
| Banque PSA Finance SA (EUR) (D) | 4.250 | | 02-25-16 | 100,000 | 115,596 |
|
| Banque PSA Finance SA (EUR) (D) | 6.000 | | 07-16-14 | 200,000 | 248,594 |
|
| BNP Paribas SA (EUR) (D) | 3.000 | | 02-24-17 | 300,000 | 385,702 |
|
| BNP Paribas SA (EUR) (D) | 3.500 | | 03-07-16 | 500,000 | 653,939 |
|
| BNP Paribas SA (4.730% to 4-12-16, then | | | | | |
| 3 month EURIBOR + 1.690%) (EUR) (D)(Q) | 4.730 | | 04-12-16 | 150,000 | 140,266 |
|
| BNP Paribas SA (8.667% to 9-11-13, then | | | | | |
| 3 month EURIBOR + 4.050%) (EUR) (D)(Q) | 8.667 | | 09-11-13 | 150,000 | 184,560 |
|
| Bouygues SA (EUR) (D) | 4.375 | | 10-29-14 | 60,000 | 79,040 |
|
| Casino Guichard Perrachon SA (EUR) (D) | 4.379 | | 02-08-17 | 200,000 | 268,845 |
|
| Casino Guichard Perrachon SA (EUR) (D) | 4.472 | | 04-04-16 | 700,000 | 937,448 |
|
| Casino Guichard Perrachon SA (EUR) (D) | 6.375 | | 04-04-13 | 150,000 | 191,178 |
|
| Christian Dior SA (EUR) (D) | 3.750 | | 09-23-14 | 450,000 | 578,273 |
|
| Cie de Saint-Gobain (EUR) (D) | 4.500 | | 09-30-19 | 680,000 | 931,033 |
|
| Cie de Saint-Gobain (EUR) (D) | 8.250 | | 07-28-14 | 100,000 | 139,910 |
|
| Cie Financiere et Industrielle des Autoroutes SA | | | | | |
| (EUR) (D) | 5.000 | | 05-24-21 | 350,000 | 503,117 |
|
| Cie Generale de Geophysique-Veritas | 9.500 | | 05-15-16 | 100,000 | 109,125 |
|
| CNP Assurances (EUR) (D)(P) | 6.875 | | 09-30-41 | 100,000 | 92,920 |
|
| Credit Agricole SA (EUR) (D) | 3.875 | | 02-13-19 | 300,000 | 384,849 |
|
| Credit Agricole SA (EUR) (D) | 5.971 | | 02-01-18 | 500,000 | 620,118 |
|
| Credit Logement SA (EUR) (D) | 5.454 | | 02-16-21 | 200,000 | 238,730 |
|
| Electricite de France SA (EUR) (D) | 3.875 | | 01-18-22 | 700,000 | 950,500 |
|
| Electricite de France SA (EUR) (D) | 4.625 | | 09-11-24 | 250,000 | 358,821 |
|
| Eutelsat SA (EUR) (D) | 5.000 | | 01-14-19 | 400,000 | 564,198 |
|
| France Telecom SA (EUR) (D) | 3.875 | | 04-09-20 | 330,000 | 457,760 |
| | |
| See notes to financial statements | Annual report | Global Absolute Return Strategies Fund | 13 |
| | | | | |
| | | | Maturity | | |
| | Rate (%) | | date | Par value^ | Value |
| France (continued) | | | | | |
|
| France Telecom SA (EUR) (D) | 5.000 | | 01-22-14 | 100,000 | $130,830 |
|
| GDF Suez (EUR) (D) | 3.500 | | 10-18-22 | 875,000 | 1,175,826 |
|
| GDF Suez (EUR) (D) | 6.875 | | 01-24-19 | 300,000 | 477,750 |
|
| HSBC Holdings PLC (EUR) (D) | 4.875 | | 01-15-14 | 200,000 | 259,952 |
|
| Labco SAS (EUR) (D) | 8.500 | | 01-15-18 | 100,000 | 114,735 |
|
| Lafarge SA (EUR) (D) | 6.625 | | 11-29-18 | 875,000 | 1,121,494 |
|
| Lafarge SA (EUR) (D) | 8.875 | | 05-27-14 | 330,000 | 446,651 |
|
| Lagardere SCA (EUR) (D) | 4.875 | | 10-06-14 | 300,000 | 380,616 |
|
| Legrand SA (EUR) (D) | 4.375 | | 03-21-18 | 300,000 | 414,965 |
|
| Mercialys SA (EUR) (D) | 4.125 | | 03-26-19 | 300,000 | 394,530 |
|
| Pernod-Ricard SA (EUR) (D) | 4.875 | | 03-18-16 | 500,000 | 681,285 |
|
| Pernod-Ricard SA (EUR) (D) | 7.000 | | 01-15-15 | 150,000 | 208,590 |
|
| Peugeot SA (EUR) (D) | 5.000 | | 10-28-16 | 65,000 | 73,374 |
|
| PPR (EUR) (D) | 3.125 | | 04-23-19 | 592,000 | 775,568 |
|
| PPR (EUR) (D) | 3.750 | | 04-08-15 | 77,000 | 101,219 |
|
| PPR (EUR) (D) | 8.625 | | 04-03-14 | 120,000 | 166,110 |
|
| RCI Banque SA (EUR) (D) | 4.000 | | 12-02-13 | 110,000 | 138,108 |
|
| RCI Banque SA (EUR) (D) | 5.625 | | 03-13-15 | 776,000 | 1,008,933 |
|
| RCI Banque SA (EUR) (D) | 5.625 | | 10-05-15 | 80,000 | 104,464 |
|
| RTE EDF Transport SA (EUR) (D) | 4.125 | | 02-03-21 | 200,000 | 276,075 |
|
| Societe des Autoroutes Paris-Rhin-Rhone | | | | | |
| (EUR) (D) | 7.500 | | 01-12-15 | 300,000 | 419,763 |
|
| Societe Fonciere Lyonnaise SA (EUR) (D) | 4.625 | | 05-25-16 | 300,000 | 384,804 |
|
| Societe Generale SA | 2.500 | | 01-15-14 | 110,000 | 109,120 |
|
| Societe Generale SA (EUR) (D) | 4.000 | | 04-20-16 | 500,000 | 652,305 |
|
| Societe Generale SA (EUR) (D) | 4.750 | | 03-02-21 | 200,000 | 266,863 |
|
| Societe Generale SA (EUR) (D) | 6.125 | | 08-20-18 | 200,000 | 253,320 |
|
| Societe Generale SA (7.756% to 5-22-13, then | | | | | |
| 3 month EURIBOR + 3.350%) (EUR) (D)(Q) | 7.756 | | 05-22-13 | 150,000 | 153,185 |
|
| Societe Generale SA (9.375% to 9-4-19, then | | | | | |
| 3 month EURIBOR + 8.901%) (EUR) (D)(Q) | 9.375 | | 09-04-19 | 150,000 | 177,547 |
|
| SPCM SA (EUR) (D) | 8.250 | | 06-15-17 | 50,000 | 66,442 |
|
| Suez Environnement SA (EUR) (D) | 6.250 | | 04-08-19 | 100,000 | 156,658 |
|
| Unibail-Rodamco SE (EUR) (D) | 3.375 | | 03-11-15 | 100,000 | 129,487 |
|
| Unibail-Rodamco SE (EUR) (D) | 3.875 | | 12-13-17 | 390,000 | 525,966 |
|
| Unibail-Rodamco SE (EUR) (D) | 4.625 | | 09-23-16 | 75,000 | 103,078 |
|
| Valeo SA (EUR) (D) | 3.750 | | 06-24-13 | 90,000 | 113,321 |
|
| Valeo SA (EUR) (D) | 5.750 | | 01-19-17 | 200,000 | 270,949 |
|
| Veolia Environnement SA (EUR) (D) | 4.625 | | 03-30-27 | 200,000 | 272,007 |
|
| Veolia Environnement SA (EUR) (D) | 5.125 | | 05-24-22 | 100,000 | 143,662 |
|
| Veolia Environnement SA (EUR) (D) | 6.750 | | 04-24-19 | 640,000 | 988,580 |
|
| Vivendi SA (EUR) (D) | 3.875 | | 11-30-15 | 500,000 | 647,489 |
|
| Vivendi SA (EUR) (D) | 4.125 | | 07-18-17 | 300,000 | 390,931 |
| | | | | | |
| Germany 0.6% | | | | | 4,994,110 |
|
| Daimler AG (EUR) (D) | 1.750 | | 05-21-15 | 100,000 | 126,105 |
|
| Daimler AG (EUR) (D) | 2.000 | | 05-05-17 | 257,000 | 326,297 |
|
| Evonik Industries AG (EUR) (D) | 7.000 | | 10-14-14 | 390,000 | 536,083 |
|
| FMC Finance VIII SA (EUR) (D) | 6.500 | | 09-15-18 | 200,000 | 282,069 |
| | |
| 14 | Global Absolute Return Strategies Fund | Annual report | See notes to financial statements |
| | | | | |
| | | | Maturity | | |
| | Rate (%) | | date | Par value^ | Value |
| Germany (continued) | | | | | |
|
| Henkel AG & Company KGaA (5.375% to | | | | | |
| 11-25-15, then 3 month EURIBOR + 2.850%) | | | | | |
| (EUR) (D) | 5.375 | | 11-25-15 | 280,000 | $366,905 |
|
| IKB Deutsche Industriebank AG (EUR) (D) | 4.500 | | 07-09-13 | 150,000 | 166,565 |
|
| Metro AG (EUR) (D) | 7.625 | | 03-05-15 | 150,000 | 212,950 |
|
| Schaeffler Finance BV (EUR) (D) | 7.750 | | 02-15-17 | 200,000 | 258,384 |
|
| ThyssenKrupp AG (EUR) (D) | 8.000 | | 06-18-14 | 430,000 | 584,257 |
|
| UniCredit Bank AG (EUR) (D) | 6.000 | | 02-05-14 | 300,000 | 372,257 |
|
| Unitymedia GmbH (EUR) (D) | 9.625 | | 12-01-19 | 500,000 | 681,334 |
|
| Unitymedia Hessen GmbH & Company KG | | | | | |
| (EUR) (D) | 8.125 | | 12-01-17 | 280,000 | 371,212 |
|
| Volkswagen Leasing GmbH (EUR) (D) | 2.750 | | 07-13-15 | 550,000 | 709,692 |
| | | | | | |
| Greece 0.0% | | | | | 202,000 |
|
| Navios Maritime Holdings, Inc. | 8.875 | | 11-01-17 | 200,000 | 202,000 |
| | | | | | |
| Hong Kong 0.0% | | | | | 210,000 |
|
| Nord Anglia Education UK Holdings PLC (S) | 10.250 | | 04-01-17 | 200,000 | 210,000 |
| | | | | | |
| Ireland 0.7% | | | | | 5,872,386 |
|
| Ardagh Glass Finance PLC (EUR) (D) | 7.125 | | 06-15-17 | 125,000 | 148,417 |
|
| Ardagh Glass Finance PLC (EUR) (D) | 8.750 | | 02-01-20 | 100,000 | 120,579 |
|
| Ardagh Glass Finance PLC (EUR) (D) | 9.250 | | 07-01-16 | 100,000 | 134,729 |
|
| Ardagh Packaging Finance PLC (S) | 9.125 | | 10-15-20 | 400,000 | 419,000 |
|
| Bord Gais Eireann (EUR) (D) | 5.750 | | 06-16-14 | 150,000 | 190,754 |
|
| CRH Finance, Ltd. (EUR) (D) | 7.375 | | 05-28-14 | 210,000 | 285,610 |
|
| FGA Capital Ireland PLC (EUR) (D) | 5.250 | | 02-28-14 | 330,000 | 410,214 |
|
| GE Capital European Funding (EUR) (D) | 2.000 | | 02-27-15 | 46,000 | 57,838 |
|
| GE Capital European Funding (EUR) (D) | 3.625 | | 06-15-17 | 310,000 | 404,939 |
|
| GE Capital European Funding (EUR) (D) | 4.250 | | 02-06-14 | 130,000 | 167,623 |
|
| GE Capital European Funding (EUR) (D) | 4.250 | | 03-01-17 | 350,000 | 476,223 |
|
| GE Capital European Funding (EUR) (D) | 4.625 | | 02-22-27 | 300,000 | 424,894 |
|
| GE Capital European Funding (EUR) (D) | 4.750 | | 07-30-14 | 34,000 | 44,821 |
|
| GE Capital European Funding (EUR) (D) | 5.250 | | 05-18-15 | 930,000 | 1,262,818 |
|
| GE Capital European Funding (EUR) (D) | 5.375 | | 01-16-18 | 570,000 | 820,876 |
|
| Intesa Sanpaolo Bank Ireland PLC (EUR) (D) | 4.000 | | 08-08-13 | 100,000 | 122,868 |
|
| Smurfit Kappa Acquisitions (EUR) (D) | 7.750 | | 11-15-19 | 150,000 | 200,248 |
|
| The Governor & Company of the Bank of | | | | | |
| Ireland (EUR) (D) | 4.625 | | 04-08-13 | 150,000 | 179,935 |
| | | | | | |
| Italy 0.7% | | | | | 5,848,026 |
|
| Atlantia SpA (EUR) (D) | 4.375 | | 09-16-25 | 70,000 | 77,372 |
|
| Atlantia SpA (EUR) (D) | 5.000 | | 06-09-14 | 100,000 | 128,879 |
|
| Banco Popolare SC (EUR) (D) | 4.000 | | 04-06-13 | 300,000 | 364,888 |
|
| Edison SpA (EUR) (D) | 3.875 | | 11-10-17 | 400,000 | 503,878 |
|
| Eni SpA (EUR) (D) | 4.250 | | 02-03-20 | 163,000 | 209,619 |
|
| Eni SpA (EUR) (D) | 5.875 | | 01-20-14 | 300,000 | 392,784 |
|
| Intesa Sanpaolo SpA (EUR) (D) | 3.750 | | 11-23-16 | 750,000 | 861,024 |
|
| Intesa Sanpaolo SpA (EUR) (D) | 5.000 | | 02-28-17 | 400,000 | 478,760 |
|
| Intesa Sanpaolo SpA (EUR) (D) | 5.375 | | 12-19-13 | 300,000 | 375,687 |
|
| Intesa Sanpaolo SpA (3.750% to 3-2-15, then | | | | | |
| 3 month EURIBOR + 0.890%) (EUR) (D) | 3.750 | | 03-02-20 | 300,000 | 280,531 |
| | |
| See notes to financial statements | Annual report | Global Absolute Return Strategies Fund | 15 |
| | | | | |
| | | | Maturity | | |
| | Rate (%) | | date | Par value^ | Value |
| Italy (continued) | | | | | |
|
| Lottomatica Group SpA (EUR) (D) | 5.375 | | 12-05-16 | 300,000 | $381,670 |
|
| Lottomatica Group SpA (EUR) (D)(P) | 8.250 | | 03-31-66 | 50,000 | 55,368 |
|
| Telecom Italia SpA (EUR) (D) | 4.750 | | 05-19-14 | 350,000 | 443,869 |
|
| Telecom Italia SpA (EUR) (D) | 5.125 | | 01-25-16 | 300,000 | 377,531 |
|
| Telecom Italia SpA (EUR) (D) | 7.000 | | 01-20-17 | 300,000 | 396,422 |
|
| Unicredit SpA (EUR) (D) | 4.875 | | 03-07-17 | 220,000 | 259,370 |
|
| Unicredit SpA (EUR) (D) | 5.250 | | 01-14-14 | 210,000 | 260,374 |
| | | | | | |
| Jersey, C.I. 0.3% | | | | | 2,718,338 |
|
| ASIF III Jersey, Ltd. (EUR) (D) | 4.750 | | 09-11-13 | 270,000 | 341,661 |
|
| BAA Funding, Ltd. (EUR) (D) | 4.125 | | 10-12-16 | 960,000 | 1,285,029 |
|
| BAA Funding, Ltd. (EUR) (D) | 4.600 | | 09-30-14 | 180,000 | 236,324 |
|
| HSBC Capital Funding LP (5.369% to 3-24-14, | | | | | |
| then 3 month EURIBOR + 2.000%) (EUR) (D)(Q) | 5.369 | | 03-24-14 | 260,000 | 307,236 |
|
| UBS AG (4.500% to 9-16-14, then 3 month | | | | | |
| EURIBOR + 1.260%) (EUR) (D) | 4.500 | | 09-16-19 | 450,000 | 548,088 |
| | | | | | |
| Luxembourg 0.8% | | | | | 6,954,832 |
|
| ArcelorMittal (EUR) (D) | 8.250 | | 06-03-13 | 150,000 | 193,945 |
|
| Cemex Espana Luxembourg (S) | 9.250 | | 05-12-20 | 650,000 | 572,000 |
|
| Cirsa Funding Luxembourg SA (EUR) (D) | 8.750 | | 05-15-18 | 100,000 | 102,123 |
|
| ConvaTec Healthcare E SA (EUR) (D) | 7.375 | | 12-15-17 | 100,000 | 128,884 |
|
| Expro Finance Luxembourg SCA (S) | 8.500 | | 12-15-16 | 825,000 | 818,813 |
|
| Fiat Industrial Finance Europe SA (EUR) (D) | 5.250 | | 03-11-15 | 520,000 | 654,536 |
|
| Fiat Industrial Finance Europe SA (EUR) (D) | 6.250 | | 03-09-18 | 300,000 | 378,348 |
|
| Finmeccanica Finance SA (EUR) (D) | 8.125 | | 12-03-13 | 130,000 | 169,835 |
|
| GCL Holdings SCA (EUR) (D) | 9.375 | | 04-15-18 | 100,000 | 113,197 |
|
| Geo Travel Finance SCA (EUR) (D) | 10.375 | | 05-01-19 | 100,000 | 120,579 |
|
| Hannover Finance Luxembourg SA (EUR) (D)(P) | 5.750 | | 02-26-24 | 420,000 | 527,103 |
|
| INEOS Group Holdings SA (EUR) (D) | 7.875 | | 02-15-16 | 200,000 | 210,398 |
|
| Intelsat Jackson Holdings SA | 7.250 | | 10-15-20 | 250,000 | 266,875 |
|
| Intelsat Luxembourg SA | 11.250 | | 02-04-17 | 725,000 | 754,000 |
|
| Matterhorn Mobile Holdings SA (EUR) (D) | 8.250 | | 02-15-20 | 300,000 | 388,499 |
|
| Michelin Luxembourg SCS (EUR) (D) | 8.625 | | 04-24-14 | 100,000 | 139,490 |
|
| Sunrise Communications Holdings SA (EUR) (D) | 8.500 | | 12-31-18 | 200,000 | 265,766 |
|
| Talanx Finanz Luxembourg SA (EUR) (D)(P) | 8.367 | | 06-15-42 | 100,000 | 126,116 |
|
| Telecom Italia Finance SA (EUR) (D) | 7.750 | | 01-24-33 | 50,000 | 61,807 |
|
| Wind Acquisition Finance SA (EUR) (D) | 7.375 | | 02-15-18 | 430,000 | 464,261 |
|
| Wind Acquisition Finance SA (EUR) (D) | 11.750 | | 07-15-17 | 50,000 | 51,215 |
|
| Wind Acquisition Finance SA (S) | 11.750 | | 07-15-17 | 400,000 | 332,000 |
|
| Zinc Capital SA (EUR) (D) | 8.875 | | 05-15-18 | 100,000 | 115,042 |
| | | | | | |
| Mexico 0.1% | | | | | 899,575 |
|
| America Movil SAB de CV (EUR) (D) | 3.750 | | 06-28-17 | 450,000 | 610,432 |
|
| Kansas City Southern de Mexico SA de CV | 6.125 | | 06-15-21 | 100,000 | 111,500 |
|
| Petroleos Mexicanos (EUR) (D) | 5.500 | | 01-09-17 | 130,000 | 177,643 |
| | | | | | |
| Netherlands 3.2% | | | | | 26,402,226 |
|
| ABB Finance BV (EUR) (D) | 2.625 | | 03-26-19 | 390,000 | 503,231 |
|
| ABN Amro Bank NV (EUR) (D) | 3.625 | | 10-06-17 | 710,000 | 928,602 |
|
| ABN Amro Bank NV (EUR) (D) | 6.375 | | 04-27-21 | 440,000 | 544,729 |
|
| Aegon NV (EUR) (D) | 4.125 | | 12-08-14 | 300,000 | 392,056 |
| | |
| 16 | Global Absolute Return Strategies Fund | Annual report | See notes to financial statements |
| | | | | |
| | | | Maturity | | |
| | Rate (%) | | date | Par value^ | Value |
| Netherlands (continued) | | | | | |
|
| Allianz Finance II BV (EUR) (D) | 4.750 | | 07-22-19 | 300,000 | $425,674 |
|
| Allianz Finance II BV (5.750% to 7-8-21, then | | | | | |
| 3 month EURIBOR + 2.349%) (EUR) (D) | 5.750 | | 07-08-41 | 800,000 | 928,424 |
|
| BMW Finance NV (EUR) (D) | 3.625 | | 01-29-18 | 300,000 | 409,743 |
|
| BMW Finance NV (EUR) (D) | 3.875 | | 01-18-17 | 200,000 | 273,662 |
|
| BMW Finance NV (EUR) (D) | 4.000 | | 09-17-14 | 130,000 | 171,366 |
|
| Carlson Wagonlit BV (S) | 6.875 | | 06-15-19 | 200,000 | 206,500 |
|
| Coca-Cola HBC Finance BV (EUR) (D) | 4.250 | | 11-16-16 | 180,000 | 222,854 |
|
| Conti-Gummi Finance BV (EUR) (D) | 6.500 | | 01-15-16 | 340,000 | 446,574 |
|
| Conti-Gummi Finance BV (EUR) (D) | 7.500 | | 09-15-17 | 225,000 | 298,295 |
|
| CRH Finance BV (EUR) (D) | 5.000 | | 01-25-19 | 400,000 | 553,581 |
|
| Daimler International Finance BV (EUR) (D) | 6.125 | | 09-08-15 | 400,000 | 568,779 |
|
| Deutsche Bahn Finance BV (EUR) (D) | 4.750 | | 03-14-18 | 130,000 | 187,627 |
|
| Deutsche Telekom International Finance BV | | | | | |
| (EUR) (D) | 4.250 | | 07-13-22 | 280,000 | 397,698 |
|
| Deutsche Telekom International Finance BV | | | | | |
| (EUR) (D) | 5.750 | | 04-14-15 | 510,000 | 703,817 |
|
| Deutsche Telekom International Finance BV | | | | | |
| (EUR) (D) | 6.000 | | 01-20-17 | 325,000 | 477,303 |
|
| E.ON International Finance BV (EUR) (D) | 5.750 | | 05-07-20 | 430,000 | 678,323 |
|
| EADS Finance BV (EUR) (D) | 4.625 | | 08-12-16 | 150,000 | 207,494 |
|
| EN Germany Holdings BV (EUR) (D) | 10.750 | | 11-15-15 | 100,000 | 121,810 |
|
| Enel Finance International NV (EUR) (D) | 4.625 | | 06-24-15 | 1,125,000 | 1,425,709 |
|
| Enel Finance International NV (EUR) (D) | 5.750 | | 10-24-18 | 400,000 | 514,396 |
|
| Fortis Bank Nederland NV (EUR) (D) | 4.625 | | 07-09-14 | 460,000 | 600,270 |
|
| HeidelbergCement Finance BV (EUR) (D) | 6.750 | | 12-15-15 | 300,000 | 409,723 |
|
| HeidelbergCement Finance BV (EUR) (D) | 7.500 | | 04-03-20 | 100,000 | 136,882 |
|
| HeidelbergCement Finance BV (EUR) (D) | 8.000 | | 01-31-17 | 275,000 | 389,537 |
|
| Heineken NV (EUR) (D) | 2.500 | | 03-19-19 | 50,000 | 64,029 |
|
| ING Bank NV (EUR) (D) | 3.375 | | 03-03-15 | 510,000 | 653,746 |
|
| ING Bank NV (EUR) (D) | 4.250 | | 01-13-17 | 500,000 | 672,709 |
|
| ING Bank NV (EUR) (D) | 4.875 | | 01-18-21 | 330,000 | 458,393 |
|
| ING Bank NV (4.625% to 3-15-14, then | | | | | |
| 3 month EURIBOR + 1.440%) (EUR) (D) | 4.625 | | 03-15-19 | 520,000 | 599,659 |
|
| InterXion Holding NV (EUR) (D) | 9.500 | | 02-12-17 | 50,000 | 68,410 |
|
| KBC IFIMA NV (EUR) (D) | 3.625 | | 03-07-14 | 100,000 | 125,510 |
|
| KBC IFIMA NV (EUR) (D) | 3.875 | | 03-31-15 | 300,000 | 377,593 |
|
| KBC IFIMA NV (EUR) (D) | 4.500 | | 09-17-14 | 550,000 | 703,518 |
|
| KPN NV (EUR) (D) | 4.250 | | 03-01-22 | 300,000 | 396,754 |
|
| KPN NV (EUR) (D) | 4.750 | | 05-29-14 | 100,000 | 131,045 |
|
| KPN NV (EUR) (D) | 5.625 | | 09-30-24 | 210,000 | 308,862 |
|
| KPN NV (EUR) (D) | 6.500 | | 01-15-16 | 150,000 | 213,668 |
|
| LeasePlan Corp. NV (EUR) (D) | 4.125 | | 01-13-15 | 400,000 | 512,250 |
|
| Linde Finance BV (6.000% to 7-13-13, then | | | | | |
| 3 month EURIBOR + 3.375%) (EUR) (D)(Q) | 6.000 | | 07-13-13 | 300,000 | 381,891 |
|
| Linde Finance BV (7.375% to 7-14-16, then | | | | | |
| 3 month EURIBOR + 4.125%) (EUR) (D) | 7.375 | | 07-14-66 | 340,000 | 479,467 |
|
| LyondellBasell Industries NV | 5.000 | | 04-15-19 | 200,000 | 217,000 |
|
| LyondellBasell Industries NV | 5.750 | | 04-15-24 | 400,000 | 453,000 |
| | |
| See notes to financial statements | Annual report | Global Absolute Return Strategies Fund | 17 |
| | | | | |
| | | | Maturity | | |
| | Rate (%) | | date | Par value^ | Value |
| Netherlands (continued) | | | | | |
|
| NXP BV (S) | 9.750 | | 08-01-18 | 125,000 | $143,125 |
|
| Rabobank Nederland NV (EUR) (D) | 3.875 | | 04-20-16 | 200,000 | 265,782 |
|
| Rabobank Nederland NV (EUR) (D) | 4.375 | | 05-05-16 | 955,000 | 1,291,553 |
|
| Rabobank Nederland NV (8.375% to | | | | | |
| 7-26-16, then 5 Year U.S. Treasury Note Rate | | | | | |
| + 6.425%) (Q) | 8.375 | | 07-26-16 | 150,000 | 153,885 |
|
| Rabobank Netherlands (EUR) (D) | 3.500 | | 10-17-18 | 750,000 | 991,117 |
|
| Repsol International Finance BV (EUR) (D) | 4.250 | | 02-12-16 | 200,000 | 243,566 |
|
| RWE Finance BV (EUR) (D) | 6.500 | | 08-10-21 | 500,000 | 821,198 |
|
| RWE Finance BV (EUR) (D) | 6.625 | | 01-31-19 | 300,000 | 474,137 |
|
| Swiss Reinsurance Company (5.252% to | | | | | |
| 5-25-16, then 6 month EURIBOR + 2.090%) | | | | | |
| (EUR) (D)(Q) | 5.252 | | 05-25-16 | 150,000 | 162,413 |
|
| Telefonica Europe BV (EUR) (D) | 5.875 | | 02-14-33 | 120,000 | 132,529 |
|
| TenneT Holding BV (6.655% to 6-1-17, then | | | | | |
| 5 Year EUR Swap Rate + 3.600%) (EUR) (D)(Q) | 6.655 | | 06-01-17 | 300,000 | 388,017 |
|
| UPC Holding BV (EUR) (D) | 8.375 | | 08-15-20 | 300,000 | 394,036 |
|
| Volkswagen International Finance NV (EUR) (D) | 2.125 | | 01-19-15 | 471,000 | 596,364 |
|
| Ziggo Bond Company BV (EUR) (D) | 8.000 | | 05-15-18 | 300,000 | 402,341 |
| | | | | | |
| Norway 0.1% | | | | | 694,903 |
|
| DNB Bank ASA (EUR) (D) | 4.375 | | 02-24-21 | 410,000 | 567,878 |
|
| Statkraft AS (EUR) (D) | 6.625 | | 04-02-19 | 80,000 | 127,025 |
| | | | | | |
| South Africa 0.0% | | | | | 236,236 |
|
| Edcon Pty, Ltd. (EUR) (D)(P) | 3.912 | | 06-15-14 | 100,000 | 111,966 |
|
| Foodcorp Pty, Ltd. (EUR) (D) | 8.750 | | 03-01-18 | 100,000 | 124,270 |
| | | | | | |
| Spain 0.5% | | | | | 4,530,089 |
|
| Amadeus Capital Markets SA (EUR) (D) | 4.875 | | 07-15-16 | 430,000 | 555,063 |
|
| Banco Bilbao Vizcaya Argentaria SA (EUR) (D) | 4.250 | | 03-30-15 | 150,000 | 180,965 |
|
| Banco Santander SA (EUR) (D) | 4.375 | | 03-16-15 | 200,000 | 242,797 |
|
| BBVA Senior Finance SAU (EUR) (D) | 3.250 | | 04-23-15 | 550,000 | 638,389 |
|
| BBVA Senior Finance SAU (EUR) (D) | 4.875 | | 01-23-14 | 100,000 | 122,198 |
|
| Gas Natural Capital Markets SA (EUR) (D) | 5.000 | | 02-13-18 | 200,000 | 229,492 |
|
| Gas Natural Capital Markets SA (EUR) (D) | 5.250 | | 07-09-14 | 50,000 | 62,543 |
|
| Iberdrola Finanzas SAU (EUR) (D) | 4.750 | | 01-25-16 | 900,000 | 1,081,013 |
|
| Obrascon Huarte Lain SA (EUR) (D) | 7.375 | | 04-28-15 | 100,000 | 126,424 |
|
| Telefonica Emisiones SAU (EUR) (D) | 3.661 | | 09-18-17 | 550,000 | 610,266 |
|
| Telefonica Emisiones SAU (EUR) (D) | 4.674 | | 02-07-14 | 550,000 | 680,939 |
| | | | | | |
| Sweden 0.6% | | | | | 4,837,768 |
|
| Handelsbanken AB (EUR) (D) | 4.375 | | 10-20-21 | 250,000 | 356,724 |
|
| Handelsbanken AB (EUR) (D) | 4.875 | | 03-25-14 | 70,000 | 91,990 |
|
| Investor AB (EUR) (D) | 3.250 | | 09-17-18 | 500,000 | 655,625 |
|
| Norcell Sweden Holding 2 AB (EUR) (D) | 10.750 | | 09-29-19 | 100,000 | 128,577 |
|
| Nordea Bank AB (EUR) (D) | 4.000 | | 06-29-20 | 430,000 | 591,005 |
|
| Nordea Bank AB (EUR) (D) | 4.000 | | 03-29-21 | 210,000 | 248,007 |
|
| Nordea Bank AB (EUR) (D)(P) | 4.625 | | 02-15-22 | 200,000 | 250,952 |
|
| Nordea Bank AB (6.250% to 9-10-13, then | | | | | |
| 3 month EURIBOR + 3.200%) (EUR) (D) | 6.250 | | 09-10-18 | 140,000 | 178,299 |
| | |
| 18 | Global Absolute Return Strategies Fund | Annual report | See notes to financial statements |
| | | | | |
| | | | Maturity | | |
| | Rate (%) | | date | Par value^ | Value |
| Sweden (continued) | | | | | |
|
| Sandvik AB (EUR) (D) | 6.875 | | 02-25-14 | 90,000 | $120,547 |
|
| SEB AB (EUR) (D) | 3.750 | | 05-19-16 | 530,000 | 703,832 |
|
| SEB AB (9.250% to 3-31-15, then 5 Year EUR | | | | | |
| Swap Rate + 6.400%) (EUR) (D)(Q) | 9.250 | | 03-31-15 | 100,000 | 131,345 |
|
| Swedbank AB (EUR) (D) | 3.375 | | 02-09-17 | 430,000 | 564,143 |
|
| TeliaSonera AB (EUR) (D) | 3.625 | | 02-14-24 | 430,000 | 576,508 |
|
| Vattenfall AB (EUR) (D) | 6.750 | | 01-31-19 | 150,000 | 240,214 |
| | | | | | |
| United Kingdom 4.5% | | | | | 37,749,248 |
|
| Abbey National Treasury Services PLC (EUR) (D) | 3.375 | | 10-20-15 | 555,000 | 692,937 |
|
| Anglo American Capital PLC (EUR) (D) | 4.250 | | 09-30-13 | 120,000 | 153,667 |
|
| Aviva PLC (5.700% to 9-29-15, then 3 month | | | | | |
| EURIBOR + 2.350%) (EUR) (D)(Q) | 5.700 | | 09-29-15 | 220,000 | 215,197 |
|
| Barclays Bank PLC (EUR) (D) | 4.000 | | 01-20-17 | 470,000 | 627,202 |
|
| Barclays Bank PLC (EUR) (D) | 5.250 | | 05-27-14 | 100,000 | 131,485 |
|
| Barclays Bank PLC (EUR) (D) | 6.625 | | 03-30-22 | 150,000 | 182,035 |
|
| Barclays Bank PLC (4.500% to 3-4-14, then | | | | | |
| 3 month EURIBOR + 3.200%) (EUR) (D) | 4.500 | | 03-04-19 | 190,000 | 223,167 |
|
| BAT International Finance PLC (EUR) (D) | 5.375 | | 06-29-17 | 300,000 | 438,393 |
|
| BP Capital Markets PLC (EUR) (D) | 3.830 | | 10-06-17 | 260,000 | 356,981 |
|
| Brambles Finance PLC (EUR) (D) | 4.625 | | 04-20-18 | 230,000 | 320,217 |
|
| British Telecommunications PLC (EUR) (D) | 5.250 | | 06-23-14 | 90,000 | 119,384 |
|
| British Telecommunications PLC (EUR) (D) | 6.500 | | 07-07-15 | 555,000 | 784,948 |
|
| Credit Agricole SA London EUR) (D) | 3.000 | | 07-20-15 | 650,000 | 824,650 |
|
| Credit Suisse AG London (EUR) (D) | 4.750 | | 08-05-19 | 50,000 | 71,043 |
|
| Credit Suisse AG London (EUR) (D) | 6.125 | | 08-05-13 | 190,000 | 246,415 |
|
| EC Finance PLC (EUR) (D) | 9.750 | | 08-01-17 | 100,000 | 123,963 |
|
| Experian Finance PLC (EUR) (D) | 4.750 | | 02-04-20 | 300,000 | 439,127 |
|
| FCE Bank PLC (EUR) (D) | 4.750 | | 01-19-15 | 430,000 | 560,821 |
|
| FCE Bank PLC (EUR) (D) | 7.250 | | 07-15-13 | 150,000 | 194,713 |
|
| FCE Bank PLC (EUR) (D) | 9.375 | | 01-17-14 | 50,000 | 68,053 |
|
| G4S International Finance PLC (EUR) (D) | 2.875 | | 05-02-17 | 221,000 | 277,386 |
|
| Hammerson PLC (EUR) (D) | 4.875 | | 06-19-15 | 460,000 | 612,751 |
|
| HSBC Bank PLC (EUR) (D) | 3.875 | | 10-24-18 | 200,000 | 275,807 |
|
| Imperial Tobacco Finance PLC (EUR) (D) | 7.250 | | 09-15-14 | 300,000 | 415,777 |
|
| Imperial Tobacco Finance PLC (EUR) (D) | 8.375 | | 02-17-16 | 445,000 | 674,079 |
|
| Kerling PLC (EUR) (D) | 10.625 | | 02-01-17 | 50,000 | 52,600 |
|
| Legal & General Group PLC (4.000% to 6-8-15 | | | | | |
| then 3 month EURIBOR + 1.700%) (EUR) (D) | 4.000 | | 06-08-25 | 380,000 | 434,823 |
|
| Lloyds TSB Bank PLC (EUR) (D) | 3.750 | | 09-07-15 | 980,000 | 1,265,623 |
|
| Lloyds TSB Bank PLC (EUR) (D) | 6.250 | | 04-15-14 | 50,000 | 66,344 |
|
| Lloyds TSB Bank PLC (EUR) (D) | 6.375 | | 06-17-16 | 400,000 | 560,210 |
|
| Lloyds TSB Bank PLC (EUR) (D) | 6.500 | | 03-24-20 | 620,000 | 720,055 |
|
| Mondi Finance PLC (EUR) (D) | 5.750 | | 04-03-17 | 180,000 | 248,642 |
|
| Motability Operations Group PLC (EUR) (D) | 3.250 | | 11-30-18 | 390,000 | 513,144 |
|
| National Grid PLC (EUR) (D) | 4.375 | | 03-10-20 | 150,000 | 216,550 |
|
| National Grid PLC (EUR) (D) | 5.000 | | 07-02-18 | 305,000 | 443,734 |
|
| National Grid PLC (EUR) (D) | 6.500 | | 04-22-14 | 200,000 | 269,699 |
|
| Nationwide Building Society | 0.720 | | 01-24-13 | 18,000,000 | 18,000,000 |
| | |
| See notes to financial statements | Annual report | Global Absolute Return Strategies Fund | 19 |
| | | | | |
| | | | Maturity | | |
| | Rate (%) | | date | Par value^ | Value |
| United Kingdom (continued) | | | | | |
|
| Nationwide Building Society (EUR) (D) | 3.750 | | 01-20-15 | 860,000 | $1,107,572 |
|
| Nationwide Building Society (EUR) (D) | 6.750 | | 07-22-20 | 350,000 | 429,938 |
|
| Rexam PLC (EUR) (D) | 4.375 | | 03-15-13 | 120,000 | 150,115 |
|
| Rexam PLC (6.750% to 6-29-17, then 3 month | | | | | |
| EURIBOR + 2.900%) (EUR) (D) | 6.750 | | 06-29-67 | 100,000 | 117,764 |
|
| Royal Bank of Scotland Group PLC (EUR) (D) | 5.250 | | 05-15-13 | 160,000 | 202,430 |
|
| Royal Bank of Scotland PLC (EUR) (D) | 4.875 | | 07-15-15 | 965,000 | 1,267,063 |
|
| Royal Bank of Scotland PLC (EUR) (D) | 4.875 | | 01-20-17 | 300,000 | 399,620 |
|
| Royal Bank of Scotland PLC (EUR) (D) | 6.000 | | 05-10-13 | 520,000 | 648,284 |
|
| SABMiller PLC (EUR) (D) | 4.500 | | 01-20-15 | 210,000 | 280,088 |
|
| SSE PLC (5.025% to 10-1-15, then 5 Year EUR | | | | | |
| Swap Rate + 3.150%) (EUR) (D)(Q) | 5.025 | | 10-01-15 | 350,000 | 422,027 |
|
| UBS AG (EUR) (D) | 6.000 | | 04-18-18 | 280,000 | 416,884 |
|
| United Utilities Water PLC (EUR) (D) | 4.250 | | 01-24-20 | 220,000 | 311,418 |
|
| Virgin Media Finance PLC (GBP) (D) | 8.875 | | 10-15-19 | 100,000 | 174,423 |
| | | | | | |
| United States 10.5% | | | | | 87,720,541 |
|
| Accellent, Inc. | 8.375 | | 02-01-17 | 70,000 | 72,800 |
|
| Accuride Corp. | 9.500 | | 08-01-18 | 175,000 | 176,531 |
|
| Aleris International, Inc. | 7.625 | | 02-15-18 | 250,000 | 260,000 |
|
| Alliance Data Systems Corp. (S) | 6.375 | | 04-01-20 | 80,000 | 83,200 |
|
| Alliance One International, Inc. | 10.000 | | 07-15-16 | 480,000 | 487,200 |
|
| Allison Transmission, Inc. (S) | 7.125 | | 05-15-19 | 37,000 | 38,896 |
|
| Alta Mesa Holdings LP | 9.625 | | 10-15-18 | 75,000 | 75,188 |
|
| AMC Entertainment, Inc. | 8.750 | | 06-01-19 | 203,000 | 220,255 |
|
| AMC Entertainment, Inc. | 9.750 | | 12-01-20 | 1,060,000 | 1,150,100 |
|
| Amgen, Inc. (EUR) (D) | 4.375 | | 12-05-18 | 250,000 | 354,633 |
|
| Apria Healthcare Group, Inc. | 11.250 | | 11-01-14 | 375,000 | 391,875 |
|
| Atlas Pipeline Partners LP | 8.750 | | 06-15-18 | 100,000 | 107,250 |
|
| Atwood Oceanics, Inc. | 6.500 | | 02-01-20 | 373,000 | 397,245 |
|
| Avaya, Inc. (S) | 7.000 | | 04-01-19 | 200,000 | 180,250 |
|
| Avis Budget Car Rental LLC | 9.625 | | 03-15-18 | 625,000 | 691,406 |
|
| Bank of America Corp. (EUR) (D) | 4.000 | | 03-28-18 | 450,000 | 462,323 |
|
| Bank of America Corp. (EUR) (D) | 4.625 | | 02-18-14 | 100,000 | 127,598 |
|
| Bank of America Corp. (EUR) (D) | 4.750 | | 04-03-17 | 100,000 | 132,620 |
|
| Bank of America Corp. (EUR) (D) | 5.125 | | 09-26-14 | 550,000 | 716,646 |
|
| Bank of America Corp. (EUR) (D) | 7.000 | | 06-15-16 | 850,000 | 1,206,815 |
|
| BE Aerospace, Inc. | 5.250 | | 04-01-22 | 660,000 | 693,000 |
|
| Beazer Homes USA, Inc. (S) | 6.625 | | 04-15-18 | 160,000 | 162,600 |
|
| Beazer Homes USA, Inc. | 8.125 | | 06-15-16 | 195,000 | 197,681 |
|
| Beazer Homes USA, Inc. | 9.125 | | 06-15-18 | 470,000 | 458,250 |
|
| Berry Plastics Corp. | 8.250 | | 11-15-15 | 325,000 | 343,688 |
|
| BMW US Capital LLC (EUR) (D) | 5.000 | | 05-28-15 | 340,000 | 465,900 |
|
| Boise Paper Holdings LLC | 8.000 | | 04-01-20 | 475,000 | 535,563 |
|
| Boyd Gaming Corp. (S) | 9.000 | | 07-01-20 | 570,000 | 564,300 |
|
| Cablevision Systems Corp. | 8.625 | | 09-15-17 | 950,000 | 1,085,375 |
|
| Caesars Entertainment Operating | | | | | |
| Company, Inc. | 11.250 | | 06-01-17 | 370,000 | 400,525 |
|
| Caesars Operating Escrow LLC (S) | 8.500 | | 02-15-20 | 470,000 | 471,763 |
| | |
| 20 | Global Absolute Return Strategies Fund | Annual report | See notes to financial statements |
| | | | | |
| | | | Maturity | | |
| | Rate (%) | | date | Par value^ | Value |
| United States (continued) | | | | | |
|
| Calpine Corp. (S) | 7.875 | | 07-31-20 | 1,400,000 | $1,578,500 |
|
| Casella Waste Systems, Inc. | 7.750 | | 02-15-19 | 945,000 | 937,913 |
|
| CCO Holdings LLC | 7.375 | | 06-01-20 | 1,100,000 | 1,221,000 |
|
| CCO Holdings LLC | 7.875 | | 04-30-18 | 325,000 | 354,656 |
|
| CDW LLC | 8.500 | | 04-01-19 | 1,225,000 | 1,298,500 |
|
| CF Industries, Inc. | 7.125 | | 05-01-20 | 130,000 | 162,500 |
|
| Chaparral Energy, Inc. | 8.250 | | 09-01-21 | 725,000 | 786,625 |
|
| Chesapeake Energy Corp. | 6.875 | | 11-15-20 | 90,000 | 89,100 |
|
| Chesapeake Energy Corp. | 7.250 | | 12-15-18 | 340,000 | 350,200 |
|
| Chesapeake Oilfield Operating LLC (S) | 6.625 | | 11-15-19 | 125,000 | 113,750 |
|
| Chrysler Group LLC | 8.250 | | 06-15-21 | 650,000 | 676,813 |
|
| Citigroup, Inc. (EUR) (D) | 4.000 | | 11-26-15 | 730,000 | 946,471 |
|
| Citigroup, Inc. (EUR) (D) | 5.000 | | 08-02-19 | 120,000 | 160,609 |
|
| Citigroup, Inc. (EUR) (D) | 6.400 | | 03-27-13 | 120,000 | 152,486 |
|
| Citigroup, Inc. (EUR) (D) | 7.375 | | 09-04-19 | 600,000 | 906,666 |
|
| Citigroup, Inc. (4.750% to 2-10-14, then | | | | | |
| 3 month EURIBOR + 1.400%) (EUR) (D) | 4.750 | | 02-10-19 | 520,000 | 560,472 |
|
| CityCenter Holdings LLC, PIK | 10.750 | | 01-15-17 | 139,788 | 147,302 |
|
| Clear Channel Communications, Inc. | 9.000 | | 03-01-21 | 950,000 | 793,250 |
|
| Clear Channel Worldwide Holdings, Inc. (S) | 7.625 | | 03-15-20 | 10,000 | 9,375 |
|
| Clear Channel Worldwide Holdings, Inc. (S) | 7.625 | | 03-15-20 | 620,000 | 593,650 |
|
| Community Health Systems, Inc. | 8.000 | | 11-15-19 | 600,000 | 649,500 |
|
| Concho Resources, Inc. | 5.500 | | 10-01-22 | 40,000 | 40,500 |
|
| Concho Resources, Inc. | 6.500 | | 01-15-22 | 400,000 | 428,000 |
|
| Concho Resources, Inc. | 7.000 | | 01-15-21 | 250,000 | 274,375 |
|
| Continental Resources, Inc. (S) | 5.000 | | 09-15-22 | 522,000 | 542,880 |
|
| Cricket Communications, Inc. | 7.750 | | 10-15-20 | 650,000 | 620,750 |
|
| Crown Americas LLC | 6.250 | | 02-01-21 | 100,000 | 110,500 |
|
| D.R. Horton, Inc. | 6.500 | | 04-15-16 | 65,000 | 71,338 |
|
| Del Monte Corp. | 7.625 | | 02-15-19 | 970,000 | 962,725 |
|
| DineEquity, Inc. | 9.500 | | 10-30-18 | 210,000 | 232,050 |
|
| DISH DBS Corp. (S) | 5.875 | | 07-15-22 | 1,225,000 | 1,261,750 |
|
| DISH DBS Corp. | 6.750 | | 06-01-21 | 375,000 | 410,156 |
|
| DJO Finance LLC | 7.750 | | 04-15-18 | 850,000 | 720,375 |
|
| DJO Finance LLC | 10.875 | | 11-15-14 | 300,000 | 312,750 |
|
| El Paso Corp. | 7.000 | | 06-15-17 | 270,000 | 309,451 |
|
| El Paso Corp. | 7.750 | | 01-15-32 | 50,000 | 58,660 |
|
| El Paso Pipeline Partners Operating | | | | | |
| Company LLC | 6.500 | | 04-01-20 | 62,000 | 72,915 |
|
| Endo Health Solutions, Inc. | 7.250 | | 01-15-22 | 200,000 | 221,500 |
|
| Endo Pharmaceuticals Holdings, Inc. | 7.000 | | 12-15-20 | 225,000 | 248,906 |
|
| Energy Future Intermediate Holding | | | | | |
| Company LLC | 10.000 | | 12-01-20 | 550,000 | 605,688 |
|
| Energy XXI Gulf Coast, Inc. | 7.750 | | 06-15-19 | 1,050,000 | 1,102,500 |
|
| EP Energy LLC (S) | 9.375 | | 05-01-20 | 995,000 | 1,070,869 |
|
| First Data Corp. (S) | 8.250 | | 01-15-21 | 575,000 | 573,563 |
|
| First Data Corp., PIK (S) | 8.750 | | 01-15-22 | 70,000 | 70,263 |
|
| First Data Corp., PIK | 10.550 | | 09-24-15 | 100,000 | 102,500 |
|
| Ford Motor Company | 7.450 | | 07-16-31 | 540,000 | 670,275 |
| | |
| See notes to financial statements | Annual report | Global Absolute Return Strategies Fund | 21 |
| | | | | |
| | | | Maturity | | |
| | Rate (%) | | date | Par value^ | Value |
| United States (continued) | | | | | |
|
| Ford Motor Company | 8.900 | | 01-15-32 | 60,000 | $77,100 |
|
| Freescale Semiconductor, Inc. | 10.750 | | 08-01-20 | 680,000 | 724,200 |
|
| Frontier Communications Corp. | 8.125 | | 10-01-18 | 575,000 | 626,750 |
|
| Frontier Communications Corp. | 8.250 | | 04-15-17 | 775,000 | 848,625 |
|
| GE Capital Trust IV (4.625% to 9-15-16, then | | | | | |
| month EURIBOR + 1.600%) (EUR) (D) (S) | 4.625 | | 09-15-66 | 390,000 | 437,588 |
|
| GenOn Americas Generation LLC | 8.500 | | 10-01-21 | 125,000 | 130,000 |
|
| GenOn Energy, Inc. | 9.500 | | 10-15-18 | 620,000 | 683,550 |
|
| Goodrich Petroleum Corp. | 8.875 | | 03-15-19 | 475,000 | 451,250 |
|
| Griffon Corp. | 7.125 | | 04-01-18 | 220,000 | 229,900 |
|
| GWR Operating Partnership LLP | 10.875 | | 04-01-17 | 100,000 | 113,000 |
|
| Gymboree Corp. | 9.125 | | 12-01-18 | 70,000 | 65,363 |
|
| Halcon Resources Corp. (S) | 9.750 | | 07-15-20 | 155,000 | 157,713 |
|
| HCA, Inc. | 7.250 | | 09-15-20 | 750,000 | 838,125 |
|
| HCA, Inc. | 7.500 | | 11-15-95 | 625,000 | 509,375 |
|
| Health Management Associates, Inc. (S) | 7.375 | | 01-15-20 | 550,000 | 593,313 |
|
| HealthSouth Corp. | 8.125 | | 02-15-20 | 239,000 | 264,394 |
|
| Hexion US Finance Corp. | 6.625 | | 04-15-20 | 5,000 | 5,113 |
|
| Hexion US Finance Corp. | 8.875 | | 02-01-18 | 725,000 | 734,063 |
|
| IASIS Healthcare LLC | 8.375 | | 05-15-19 | 545,000 | 534,100 |
|
| Infor US, Inc. (S) | 9.375 | | 04-01-19 | 350,000 | 374,500 |
|
| Infor US, Inc. (S) | 11.500 | | 07-15-18 | 733,000 | 830,123 |
|
| Innovation Ventures LLC (S) | 9.500 | | 08-15-19 | 570,000 | 567,150 |
|
| Interactive Data Corp. | 10.250 | | 08-01-18 | 173,000 | 195,923 |
|
| Jarden Corp. | 6.125 | | 11-15-22 | 175,000 | 187,469 |
|
| Jarden Corp. | 7.500 | | 05-01-17 | 1,000,000 | 1,130,000 |
|
| JPMorgan Chase & Company (EUR) (D) | 3.750 | | 06-15-16 | 400,000 | 534,013 |
|
| JPMorgan Chase & Company (EUR) (D) | 3.875 | | 09-23-20 | 700,000 | 962,232 |
|
| JPMorgan Chase & Company (EUR) (D) | 6.125 | | 04-01-14 | 150,000 | 199,443 |
|
| JPMorgan Chase & Company (4.375% to | | | | | |
| 11-12-14, then 3 month EURIBOR + 1.500%) | | | | | |
| (EUR) (D) | 4.375 | | 11-12-19 | 200,000 | 232,619 |
|
| Kinetic Concepts, Inc. (S) | 10.500 | | 11-01-18 | 425,000 | 449,438 |
|
| Kinetic Concepts, Inc. (S) | 12.500 | | 11-01-19 | 50,000 | 46,000 |
|
| Laredo Petroleum, Inc. (S) | 7.375 | | 05-01-22 | 65,000 | 68,575 |
|
| Laredo Petroleum, Inc. | 9.500 | | 02-15-19 | 450,000 | 508,500 |
|
| Laureate Education, Inc. (S) | 9.250 | | 09-01-19 | 2,000,000 | 1,975,000 |
|
| Level 3 Financing, Inc. | 8.125 | | 07-01-19 | 250,000 | 263,125 |
|
| Level 3 Financing, Inc. | 8.625 | | 07-15-20 | 1,095,000 | 1,174,388 |
|
| Libbey Glass, Inc. (S) | 6.875 | | 05-15-20 | 445,000 | 469,475 |
|
| Limited Brands, Inc. | 5.625 | | 02-15-22 | 670,000 | 701,825 |
|
| Limited Brands, Inc. | 6.625 | | 04-01-21 | 100,000 | 111,125 |
|
| Linn Energy LLC (S) | 6.250 | | 11-01-19 | 30,000 | 29,700 |
|
| Linn Energy LLC (S) | 6.500 | | 05-15-19 | 493,000 | 491,768 |
|
| Linn Energy LLC | 8.625 | | 04-15-20 | 7,000 | 7,595 |
|
| Longview Fibre Paper & Packaging, Inc. (S) | 8.000 | | 06-01-16 | 575,000 | 593,688 |
|
| Marina District Finance Company, Inc. | 9.500 | | 10-15-15 | 1,060,000 | 1,029,525 |
|
| Merrill Lynch & Company, Inc. (EUR) (D) | 4.625 | | 10-02-13 | 80,000 | 101,377 |
|
| Merrill Lynch & Company, Inc. (EUR) (D) | 4.875 | | 05-30-14 | 150,000 | 192,463 |
| | |
| 22 | Global Absolute Return Strategies Fund | Annual report | See notes to financial statements |
| | | | | |
| | | | Maturity | | |
| | Rate (%) | | date | Par value^ | Value |
| United States (continued) | | | | | |
|
| MetroPCS Wireless, Inc. | 6.625 | | 11-15-20 | 700,000 | $707,000 |
|
| MGM Resorts International | 6.625 | | 07-15-15 | 750,000 | 775,313 |
|
| MGM Resorts International | 7.625 | | 01-15-17 | 625,000 | 639,844 |
|
| Michael Foods, Inc. | 9.750 | | 07-15-18 | 500,000 | 552,500 |
|
| Morgan Stanley (EUR) (D) | 4.500 | | 02-23-16 | 1,200,000 | 1,503,012 |
|
| Morgan Stanley (EUR) (D) | 5.375 | | 08-10-20 | 100,000 | 124,498 |
|
| Newfield Exploration Company | 5.625 | | 07-01-24 | 325,000 | 346,531 |
|
| Novelis, Inc. | 8.750 | | 12-15-20 | 480,000 | 532,800 |
|
| NPC International, Inc. | 10.500 | | 01-15-20 | 550,000 | 619,438 |
|
| NRG Energy, Inc. | 7.875 | | 05-15-21 | 510,000 | 541,875 |
|
| NRG Energy, Inc. | 8.250 | | 09-01-20 | 1,110,000 | 1,196,025 |
|
| Peabody Energy Corp. (S) | 6.250 | | 11-15-21 | 650,000 | 641,875 |
|
| Pemex Project Funding Master Trust (EUR) (D) | 6.375 | | 08-05-16 | 473,000 | 664,135 |
|
| Pfizer, Inc. (EUR) (D) | 5.750 | | 06-03-21 | 200,000 | 320,839 |
|
| Pinnacle Entertainment, Inc. | 8.750 | | 05-15-20 | 365,000 | 396,938 |
|
| Pioneer Natural Resources Company | 7.500 | | 01-15-20 | 175,000 | 217,616 |
|
| Plains Exploration & Production Company | 7.625 | | 04-01-20 | 875,000 | 951,563 |
|
| Production Resource Group, Inc. | 8.875 | | 05-01-19 | 195,000 | 147,225 |
|
| Quicksilver Resources, Inc. | 9.125 | | 08-15-19 | 25,000 | 22,250 |
|
| Regions Bank | 7.500 | | 05-15-18 | 750,000 | 862,500 |
|
| Reynolds Group Issuer, Inc. (EUR) (D) | 7.750 | | 10-15-16 | 100,000 | 128,269 |
|
| Reynolds Group Issuer, Inc. | 7.875 | | 08-15-19 | 500,000 | 551,250 |
|
| Reynolds Group Issuer, Inc. | 8.500 | | 05-15-18 | 600,000 | 604,500 |
|
| Rite Aid Corp. | 7.500 | | 03-01-17 | 410,000 | 420,763 |
|
| Rite Aid Corp. | 9.250 | | 03-15-20 | 1,065,000 | 1,075,650 |
|
| SandRidge Energy, Inc. | 8.750 | | 01-15-20 | 564,000 | 600,660 |
|
| Sealed Air Corp. (S) | 8.125 | | 09-15-19 | 300,000 | 336,750 |
|
| Sealed Air Corp. (S) | 8.375 | | 09-15-21 | 250,000 | 285,000 |
|
| Service Corp. International | 7.000 | | 05-15-19 | 600,000 | 652,500 |
|
| Service Corp. International | 8.000 | | 11-15-21 | 300,000 | 353,250 |
|
| Solutia, Inc. | 8.750 | | 11-01-17 | 34,000 | 38,505 |
|
| Sprint Capital Corp. | 6.875 | | 11-15-28 | 1,925,000 | 1,727,688 |
|
| Sprint Nextel Corp. (S) | 9.125 | | 03-01-17 | 45,000 | 50,063 |
|
| Summit Materials LLC (S) | 10.500 | | 01-31-20 | 70,000 | 76,650 |
|
| SunGard Data Systems, Inc. | 7.625 | | 11-15-20 | 200,000 | 214,750 |
|
| SUPERVALU, Inc. | 7.500 | | 11-15-14 | 200,000 | 190,500 |
|
| SUPERVALU, Inc. | 8.000 | | 05-01-16 | 420,000 | 361,725 |
|
| Tekni-Plex, Inc. (S) | 9.750 | | 06-01-19 | 550,000 | 572,000 |
|
| Tenet Healthcare Corp. | 10.000 | | 05-01-18 | 150,000 | 174,000 |
|
| The Hertz Corp. | 6.750 | | 04-15-19 | 250,000 | 262,500 |
|
| Toll Brothers Finance Corp. | 5.875 | | 02-15-22 | 582,000 | 621,434 |
|
| TransUnion Holding Company, Inc., PIK (S) | 9.625 | | 06-15-18 | 389,000 | 420,120 |
|
| Triumph Group, Inc. | 8.625 | | 07-15-18 | 105,000 | 117,075 |
|
| UAL 2007-1 Pass Through Trust | 6.636 | | 07-02-22 | 932,445 | 974,405 |
|
| United Rentals North America, Inc. | 8.375 | | 09-15-20 | 1,040,000 | 1,102,400 |
|
| United Surgical Partners International, Inc. (S) | 9.000 | | 04-01-20 | 50,000 | 53,875 |
|
| Univision Communications, Inc. (S) | 7.875 | | 11-01-20 | 750,000 | 808,125 |
|
| US Airways 2011-1 Class A Pass Through Trust | 7.125 | | 10-22-23 | 506,727 | 542,198 |
| | |
| See notes to financial statements | Annual report | Global Absolute Return Strategies Fund | 23 |
| | | | | |
| | | | Maturity | | |
| | Rate (%) | | date | Par value^ | Value |
| United States (continued) | | | | | |
|
| Valeant Pharmaceuticals International, Inc. (S) | 6.750 | | 10-01-17 | 350,000 | $372,750 |
|
| Valeant Pharmaceuticals International, Inc. (S) | 6.750 | | 08-15-21 | 200,000 | 202,500 |
|
| Vector Group Ltd. | 11.000 | | 08-15-15 | 100,000 | 103,750 |
|
| Visant Corp. | 10.000 | | 10-01-17 | 260,000 | 261,950 |
|
| Wachovia Corp. (EUR) (D) | 4.375 | | 11-27-18 | 500,000 | 655,634 |
|
| Wal-Mart Stores, Inc. (EUR) (D) | 4.875 | | 09-21-29 | 100,000 | 160,951 |
|
| Wells Fargo & Company (EUR) (D) | 4.125 | | 11-03-16 | 250,000 | 342,576 |
|
| Wells Fargo & Company (EUR) (D) | 4.125 | | 11-03-16 | 50,000 | 68,433 |
|
| West Corp. | 7.875 | | 01-15-19 | 375,000 | 399,844 |
|
| Westvaco Corp. | 8.200 | | 01-15-30 | 150,000 | 180,910 |
|
| Windstream Corp. | 7.750 | | 10-01-21 | 1,175,000 | 1,257,250 |
|
| Zurich Finance USA, Inc. (EUR) (D) | 4.500 | | 09-17-14 | 200,000 | 262,520 |
|
| Zurich Finance USA, Inc. (EUR) (D) | 4.500 | | 09-17-14 | 50,000 | 65,630 |
|
| Zurich Finance USA, Inc. (5.750% to 10-2-13, | | | | | |
| then 3 month EURIBOR + 2.670%) (EUR) (D) | 5.750 | | 10-02-23 | 445,000 | 558,847 |
| |
| U.S. Government & Agency Obligations 18.6% | | | $155,950,271 |
|
| (Cost $153,170,873) | | | | | |
| |
| United States 18.6% | | | | | 155,950,271 |
|
| Treasury Inflation Protected Securities | | | | | |
| Inflation Indexed Note | 0.125 | | 04-15-16 | 6,475,223 | 6,804,546 |
| Inflation Indexed Note | 0.500 | | 04-15-15 | 15,462,090 | 16,179,624 |
| Inflation Indexed Note | 0.625 | | 04-15-13 | 5,751,976 | 5,780,736 |
| Inflation Indexed Note | 0.625 | | 07-15-21 | 815,760 | 923,912 |
| Inflation Indexed Note | 1.125 | | 01-15-21 | 485,382 | 567,290 |
| Inflation Indexed Note | 1.250 | | 07-15-20 | 17,860,141 | 21,052,642 |
| Inflation Indexed Note | 1.375 | | 07-15-18 | 21,836,766 | 25,276,057 |
| Inflation Indexed Note | 1.625 | | 01-15-15 | 2,392,777 | 2,559,711 |
| Inflation Indexed Note | 1.750 | | 01-15-28 | 9,976,391 | 12,921,761 |
| Inflation Indexed Note | 1.875 | | 07-15-13 | 430,454 | 442,224 |
| Inflation Indexed Note | 1.875 | | 07-15-15 | 1,967,281 | 2,158,168 |
| Inflation Indexed Note | 2.000 | | 01-15-14 | 497,524 | 518,863 |
| Inflation Indexed Note | 2.000 | | 01-15-26 | 5,573,117 | 7,305,136 |
| Inflation Indexed Note | 2.125 | | 02-15-40 | 7,792,999 | 11,684,628 |
| Inflation Indexed Note | 2.125 | | 02-15-41 | 1,907,936 | 2,881,879 |
| Inflation Indexed Note | 2.375 | | 01-15-17 | 9,805,377 | 11,412,537 |
| Inflation Indexed Note | 2.375 | | 01-15-25 | 5,475,607 | 7,390,361 |
| Inflation Indexed Note | 2.375 | | 01-15-27 | 1,541,919 | 2,129,415 |
| Inflation Indexed Note | 3.375 | | 04-15-32 | 771,689 | 1,290,469 |
| Inflation Indexed Note | 3.875 | | 04-15-29 | 9,992,975 | 16,670,312 |
| |
| Foreign Government Obligations 7.4% | | | | $61,815,438 |
|
| (Cost $59,185,980) | | | | | |
| |
| Australia 0.0% | | | | | 150,130 |
|
| Commonwealth of Australia | | | | | |
| Bond (AUD) (D) | 3.000 | | 09-20-25 | 102,000 | 150,130 |
| |
| Germany 2.0% | | | | | 16,526,786 |
|
| Federal Republic of Germany�� | | | | | |
| Bond (EUR) (D) | 0.010 | | 06-13-14 | 1,600,000 | 1,971,435 |
| Bond (EUR) (D) | 0.500 | | 04-07-17 | 4,000,000 | 4,962,891 |
| Bond (EUR) (D) | 0.750 | | 02-24-17 | 650,000 | 816,795 |
| Bond (EUR) (D) | 1.750 | | 06-14-13 | 1,000,000 | 1,249,508 |
| | |
| 24 | Global Absolute Return Strategies Fund | Annual report | See notes to financial statements |
| | | | | |
| | | | Maturity | | |
| | Rate (%) | | date | Par value^ | Value |
| Germany (continued) | | | | |
|
| Bond (EUR) (D) | 1.750 | | 07-04-22 | 4,950,000 | $6,348,715 |
| Bond (EUR) (D) | 2.500 | | 01-04-21 | 855,000 | 1,177,442 |
| | | | | | |
| Mexico 4.9% | | | | | 40,854,560 |
|
| Government of Mexico | | | | | |
| Bond (MXN) (D) | 6.500 | | 06-10-21 | 123,300,000 | 10,186,220 |
| Bond (MXN) (D) | 7.500 | | 06-03-27 | 116,112,200 | 10,260,403 |
| Bond (MXN) (D) | 8.500 | | 05-31-29 | 106,960,000 | 10,213,347 |
| Bond (MXN) (D) | 10.000 | | 12-05-24 | 95,600,000 | 10,194,590 |
| | | | | | |
| Sweden 0.0% | | | | | 259,213 |
|
| Kingdom of Sweden | | | | | |
| Bond (SEK) (D) | 0.250 | | 06-01-22 | 1,681,115 | 259,213 |
| | | | | | |
| United Kingdom 0.5% | | | | 4,024,749 |
|
| Government of United Kingdom | | | | |
| Bond (GBP) (D) | 1.250 | | 11-22-32 | 59,169 | 116,878 |
| Bond (GBP) (D) | 1.875 | | 11-22-22 | 1,956,592 | 3,907,871 |
| |
| | | | | Shares | Value |
| Common Stocks 18.6% | | | $156,349,632 |
|
| (Cost $153,125,751) | | | | | |
| | | | | | |
| Australia 0.5% | | | | | 4,601,505 |
|
| Brambles, Ltd. | | | | 171,917 | 1,120,432 |
|
| Oil Search, Ltd. | | | | 252,176 | 1,831,483 |
|
| Santos, Ltd. | | | | 147,583 | 1,649,590 |
| | | | | | |
| Austria 0.2% | | | | | 1,342,892 |
|
| Oesterreichische Post AG | | | 42,213 | 1,342,892 |
| | | | | |
| Belgium 0.2% | | | | | 1,569,015 |
|
| Umicore SA | | | | 35,565 | 1,569,015 |
| | | | | | |
| Bermuda 0.2% | | | | | 1,529,525 |
|
| Arch Capital Group, Ltd. (I) | | | 35,050 | 1,359,940 |
|
| Lazard, Ltd., Class A | | | | 6,316 | 169,585 |
| | | | | | |
| Canada 0.3% | | | | | 2,208,819 |
|
| Cenovus Energy, Inc. | | | | 25,469 | 778,406 |
|
| Suncor Energy, Inc. | | | | 46,787 | 1,430,413 |
| | | | | | |
| China 0.4% | | | | | 3,096,066 |
|
| 51job, Inc., ADR (I) | | | | 24,455 | 847,366 |
|
| Baidu, Inc., ADR (I) | | | | 15,146 | 1,825,396 |
|
| China ZhengTong Auto Services Holdings, Ltd. (I) | | | 891,500 | 423,304 |
| | | | | |
| Denmark 0.3% | | | | | 2,615,984 |
|
| Novo Nordisk A/S | | | | 16,935 | 2,615,984 |
| | | | | | |
| Finland 0.1% | | | | | 1,021,484 |
|
| Wartsila OYJ | | | | 34,226 | 1,021,484 |
| | | | | | |
| France 0.6% | | | | | 5,287,735 |
|
| BNP Paribas SA | | | | 31,049 | 1,149,036 |
|
| Ingenico SA | | | | 21,015 | 1,124,610 |
|
| L’Oreal SA | | | | 7,358 | 880,293 |
|
| Sanofi | | | | 26,225 | 2,133,796 |
| | |
| See notes to financial statements | Annual report | Global Absolute Return Strategies Fund | 25 |
| | |
| | Shares | Value |
| Germany 0.5% | | $4,446,475 |
|
| BMW AG | 20,347 | 1,513,573 |
|
| Kabel Deutschland Holding AG | 29,500 | 1,848,067 |
|
| SAP AG | 17,043 | 1,084,835 |
| | | |
| Hong Kong 0.3% | | 2,991,168 |
|
| BOC Hong Kong Holdings, Ltd. | 639,000 | 1,951,973 |
|
| China Mengniu Dairy Company, Ltd. | 351,000 | 1,039,195 |
| | | |
| Indonesia 0.1% | | 860,538 |
|
| Lippo Karawaci Tbk PT | 9,173,000 | 860,538 |
| | | |
| Ireland 0.1% | | 1,113,098 |
|
| Shire PLC | 38,649 | 1,113,098 |
| | | |
| Italy 0.1% | | 712,856 |
|
| Snam SpA | 177,271 | 712,856 |
| | | |
| Japan 0.6% | | 4,821,047 |
|
| Japan Tobacco, Inc. | 32,200 | 1,013,671 |
|
| Mitsui Fudosan Company, Ltd. | 47,000 | 903,814 |
|
| Seven & I Holdings Company, Ltd. | 55,700 | 1,762,778 |
|
| Yokogawa Electric Corp. | 110,900 | 1,140,784 |
| | | |
| Malaysia 0.1% | | 878,357 |
|
| UEM Land Holdings BHD (I) | 1,386,200 | 878,357 |
| | | |
| Netherlands 0.4% | | 3,113,945 |
|
| European Aeronautic Defence & Space Company NV | 32,697 | 1,172,618 |
|
| Gemalto NV | 18,218 | 1,392,762 |
|
| LyondellBasell Industries NV, Class A | 12,319 | 548,565 |
| | | |
| Norway 0.2% | | 1,944,385 |
|
| DNB ASA | 184,946 | 1,944,385 |
| | | |
| Portugal 0.2% | | 1,527,302 |
|
| Galp Energia SGPS SA | 113,438 | 1,527,302 |
| | | |
| Russia 2.8% | | 23,848,743 |
|
| Gazprom OAO, ADR | 699,505 | 6,442,441 |
|
| LUKOIL OAO, ADR | 96,758 | 5,437,800 |
|
| Magnit OJSC, GDR | 50,576 | 1,638,157 |
|
| MMC Norilsk Nickel OJSC, ADR | 136,708 | 2,112,139 |
|
| NovaTek OAO, GDR | 6,417 | 692,005 |
|
| Rosneft Oil Company, GDR | 443,068 | 2,653,602 |
|
| Sberbank of Russia, ADR | 245,857 | 2,739,978 |
|
| Uralkali OSJC, GDR | 29,896 | 1,246,065 |
|
| VTB Bank OJSC, GDR | 271,118 | 886,556 |
| | | |
| South Korea 0.2% | | 1,701,512 |
|
| Hyundai Mobis | 3,485 | 917,209 |
|
| Samsung Electronics Company, Ltd. | 683 | 784,303 |
| | | |
| Spain 0.2% | | 1,473,610 |
|
| Grifols SA (I) | 47,385 | 1,473,610 |
| | |
| 26 | Global Absolute Return Strategies Fund | Annual report | See notes to financial statements |
| | |
| | Shares | Value |
| Sweden 0.4% | | $3,601,650 |
|
| Elekta AB, Series B | 21,732 | 1,008,332 |
|
| Lundin Petroleum AB (I) | 67,994 | 1,434,759 |
|
| Swedbank AB, Class A | 66,538 | 1,158,559 |
| | | |
| Switzerland 0.4% | | 3,088,998 |
|
| ACE, Ltd. | 20,461 | 1,503,884 |
|
| Syngenta AG | 4,655 | 1,585,114 |
| | | |
| United Kingdom 1.5% | | 12,371,910 |
|
| Aveva Group PLC | 27,738 | 773,665 |
|
| Burberry Group PLC | 69,077 | 1,349,071 |
|
| Croda International PLC | 19,723 | 723,872 |
|
| Imperial Tobacco Group PLC | 33,288 | 1,292,045 |
|
| Lloyds Banking Group PLC (I) | 2,942,426 | 1,385,452 |
|
| Petrofac, Ltd. | 58,107 | 1,349,470 |
|
| Rolls-Royce Holdings PLC | 75,746 | 1,004,893 |
|
| Telecity Group PLC | 135,993 | 1,822,420 |
|
| The Weir Group PLC | 42,209 | 1,088,271 |
|
| Tullow Oil PLC | 78,744 | 1,582,751 |
| | | |
| United States 7.7% | | 64,581,013 |
|
| Acuity Brands, Inc. | 30,768 | 1,782,698 |
|
| Altera Corp. | 28,996 | 1,027,908 |
|
| Altria Group, Inc. | 31,547 | 1,134,746 |
|
| Apple, Inc. (I) | 4,836 | 2,953,635 |
|
| Arthur J. Gallagher & Company | 19,291 | 684,445 |
|
| AT&T, Inc. | 97,692 | 3,704,481 |
|
| Baxter International, Inc. | 26,749 | 1,565,084 |
|
| Beam, Inc. | 22,626 | 1,422,723 |
|
| BorgWarner, Inc. (I) | 26,199 | 1,757,953 |
|
| Calpine Corp. (I) | 110,855 | 1,894,512 |
|
| Celgene Corp. (I) | 22,026 | 1,507,900 |
|
| Citigroup, Inc. | 83,045 | 2,253,011 |
|
| Dr. Pepper Snapple Group, Inc. | 31,764 | 1,447,803 |
|
| eBay, Inc. (I) | 38,598 | 1,709,891 |
|
| Equinix, Inc. (I) | 6,055 | 1,078,880 |
|
| Express Scripts Holding Company (I) | 38,735 | 2,244,306 |
|
| Facebook, Inc., Class A (I) | 5,396 | 117,147 |
|
| Hanesbrands, Inc. (I) | 17,190 | 516,044 |
|
| J.B. Hunt Transport Services, Inc. | 34,697 | 1,909,029 |
|
| JPMorgan Chase & Company | 73,637 | 2,650,932 |
|
| Kraft Foods, Inc., Class A | 54,212 | 2,152,759 |
|
| Lowe’s Companies, Inc. | 31,478 | 798,597 |
|
| Mastercard, Inc., Class A | 4,117 | 1,797,359 |
|
| Medicis Pharmaceutical Corp., Class A | 36,803 | 1,211,555 |
|
| Micron Technology, Inc. (I) | 131,557 | 816,969 |
|
| National Oilwell Varco, Inc. | 21,206 | 1,533,194 |
|
| Occidental Petroleum Corp. | 11,818 | 1,028,521 |
|
| ON Semiconductor Corp. (I) | 210,775 | 1,462,779 |
|
| Pall Corp. | 25,788 | 1,377,337 |
| | |
| See notes to financial statements | Annual report | Global Absolute Return Strategies Fund | 27 |
| | | | | |
| | | | | Shares | Value |
| United States (continued) | | | | | |
|
| Penn National Gaming, Inc. (I) | | | | 36,390 | $1,416,299 |
|
| Pfizer, Inc. | | | | 79,743 | 1,917,022 |
|
| Philip Morris International, Inc. | | | | 17,782 | 1,625,986 |
|
| Polycom, Inc. (I) | | | | 84,012 | 734,265 |
|
| priceline.com, Inc. (I) | | | | 1,324 | 876,144 |
|
| Sprint Nextel Corp. (I) | | | | 219,547 | 957,225 |
|
| Starbucks Corp. | | | | 23,650 | 1,070,872 |
|
| Stryker Corp. | | | | 37,044 | 1,927,399 |
|
| The Estee Lauder Companies, Inc., Class A | | | | 20,178 | 1,056,924 |
|
| The Home Depot, Inc. | | | | 37,929 | 1,979,135 |
|
| The Walt Disney Company | | | | 47,563 | 2,337,246 |
|
| Time Warner Cable, Inc. | | | | 15,911 | 1,351,321 |
|
| Virgin Media, Inc. | | | | 46,321 | 1,268,269 |
|
| Walter Energy, Inc. | | | | 15,181 | 520,708 |
| |
| | | | | Shares | Value |
| Preferred Securities 0.2% | | | | | $2,059,766 |
|
| (Cost $1,836,814) | | | | | |
| | | | | | |
| Germany 0.2% | | | | | 2,059,766 |
|
| Henkel AG & Company KgaA, 0.800% | | | | 28,683 | 2,059,766 |
| | | | Maturity | | |
| | Rate (%) | | date | Par value^ | Value |
| Certificate of Deposit 4.3% | | | | | $36,000,000 |
|
| (Cost $36,000,000) | | | | | |
| | | | | | |
| Bank of Tokyo-Mitsubishi UFJ, Ltd. | 0.250 | | 09-24-12 | 18,000,000 | 18,000,000 |
|
| Deutsche Bank AG | 0.380 | | 10-24-12 | 18,000,000 | 18,000,000 |
| |
| | | | | Number of | |
| | | | | contracts/ | |
| | | | | notional | Value |
| Purchased Options 3.6% | | | | | $30,223,169 |
|
| (Cost $32,924,438) | | | | | |
| | | | | | |
| Call Options 2.8% | | | | | 23,759,612 |
|
| Exchange Traded on CBOE SPX Volatility Index | | | | | |
| (Expiration Date: 10-17-12; Strike Price: $26; | | | | | |
| Counterparty: Royal Bank of Scotland) (I) | | | | 327,500 | 876,063 |
|
| Exchange Traded on CBOE SPX Volatility Index | | | | | |
| (Expiration Date: 9-29-12; Strike Price: $29; | | | | | |
| Counterparty: Royal Bank of Scotland) (I) | | | | 276,000 | 358,800 |
|
| Exchange Traded on S&P 500 Index | | | | | |
| (Expiration Date: 12-22-12; Strike Price: $1,450; | | | | | |
| Counterparty: Royal Bank of Scotland) (I) | | | | 183,500 | 4,523,275 |
|
| Exchange Traded on S&P 500 Index | | | | | |
| (Expiration Date: 3-16-13; Strike Price: $1,450; | | | | | |
| Counterparty: Royal Bank of Scotland) (I) | | | | 90,000 | 3,685,500 |
|
| Exchange Traded on S&P 500 Index | | | | | |
| (Expiration Date: 9-22-12; Strike Price: $1,425; | | | | | |
| Counterparty: Royal Bank of Scotland) (I) | | | | 21,900 | 249,660 |
|
| Over the Counter on 2 Year Interest Rate Swap | | | | | |
| (Expiration Date: 7-23-14; Strike Price: EUR 1.50; | | | | |
| Counterparty: UBS Securities LLC) (I) | | | | 30,000,000 | 586,351 |
| | |
| 28 | Global Absolute Return Strategies Fund | Annual report | See notes to financial statements |
| | |
| | Number of | |
| | contracts/ | |
| | notional | Value |
| Call Options (continued) | | |
|
| Over the Counter on 3 Year Interest Rate Swap | | |
| (Expiration Date: 1-19-15; Strike Price: EUR 2.60; | | |
| Counterparty: Royal Bank of Scotland) (I) | 2,800,000 | $165,276 |
|
| Over the Counter on 3 Year Interest Rate Swap | | |
| (Expiration Date: 12-19-14; Strike Price : EUR 2.60; | | |
| Counterparty: Morgan Stanley & Company) (I) | 33,100,000 | 1,985,485 |
|
| Over the Counter on 3 Year Interest Rate Swap | | |
| (Expiration Date: 6-22-15; Strike Price: EUR 2.60; | | |
| Counterparty: Royal Bank of Scotland) (I) | 50,000,000 | 2,720,795 |
|
| Over the Counter on 3 Year Interest Rate Swap | | |
| (Expiration Date: 6-29-15; Strike Price: EUR 2.60; | | |
| Counterparty: Royal Bank of Scotland) (I) | 37,500,000 | 2,034,220 |
|
| Over the Counter on KOSPI 200 Index | | |
| (Expiration Date: 12-12-13; Strike Price: KRW 249.32; | | |
| Counterparty: UBS Securities LLC) (I) | 92,748,752 | 2,126,764 |
|
| Over the Counter on KOSPI 200 Index | | |
| (Expiration Date: 3-14-13; Strike Price: KRW 239.94; | | |
| Counterparty: Banque Nationale de Paris) (I) | 7,256,703 | 141,378 |
|
| Over the Counter on KOSPI 200 Index | | |
| (Expiration Date: 3-14-13; Strike Price: KRW 265; | | |
| Counterparty: UBS Securities LLC) (I) | 49,562,380 | 407,038 |
|
| Over the Counter on KOSPI 200 Index | | |
| (Expiration Date: 3-14-13; Strike Price: KRW 266.30; | | |
| Counterparty: UBS Securities LLC) (I) | 67,890,000 | 529,839 |
|
| Over the Counter on KOSPI 200 Index | | |
| (Expiration Date: 3-14-13; Strike Price: KRW 269.82; | | |
| Counterparty: UBS Securities LLC) (I) | 23,623,077 | 160,202 |
|
| Over the Counter on KOSPI 200 Index | | |
| (Expiration Date: 6-12-14; Strike Price: KRW 242.36; | | |
| Counterparty: UBS Securities LLC) (I) | 39,820,635 | 1,183,437 |
|
| Over the Counter on KOSPI 200 Index | | |
| (Expiration Date: 6-12-14; Strike Price: KRW 252.24; | | |
| Counterparty: Banque Nationale de Paris) (I) | 50,361,542 | 1,261,373 |
|
| Over the Counter on the USD vs. JPY | | |
| (Expiration Date: 12-18-14; Strike Price: $83.00; | | |
| Counterparty: Goldman Sachs & Company) (I) | 18,750,000 | 764,156 |
| |
| Put Options 0.8% | | 6,463,557 |
|
| Exchange Traded on CBOE SPX Volatility Index | | |
| (Expiration Date: 8-22-12; Strike Price: $23; | | |
| Counterparty: Royal Bank of Scotland) (I) | 184,000 | 763,600 |
|
| Exchange Traded on CBOE SPX Volatility Index | | |
| (Expiration Date: 9-19-12; Strike Price: $20; | | |
| Counterparty: Royal Bank of Scotland) (I) | 327,500 | 614,063 |
|
| Over the Counter on Apple CBOE Flex Options | | |
| (Expiration Date: 1-19-13; Strike Price: $555; | | |
| Counterparty: Royal Bank of Scotland) (I) | 9,800 | 267,540 |
|
| Over the Counter on Apple CBOE Flex Options | | |
| (Expiration Date: 1-19-13; Strike Price: $560; | | |
| Counterparty: Royal Bank of Scotland) (I) | 2,000 | 58,000 |
|
| Over the Counter on Hang Seng Index | | |
| (Expiration Date: 12-30-13; Strike Price: HKD 15,982.72; | | |
| Counterparty: UBS Securities LLC) (I) | 2,400 | 262,013 |
|
| Over the Counter on Hang Seng Index | | |
| (Expiration Date: 12-30-13; Strike Price: HKD 15,995.83; | | |
| Counterparty: UBS Securities LLC) (I) | 2,000 | 219,112 |
| | |
| See notes to financial statements | Annual report | Global Absolute Return Strategies Fund | 29 |
| | | | | |
| | | | | Number of | |
| | | | | contracts/ | |
| | | | | notional | Value |
| Put Options (continued) | | | | | |
|
| Over the Counter on Hang Seng Index | | | | | |
| (Expiration Date: 12-30-13; Strike Price: HKD 16,003.08; | | | | |
| Counterparty: UBS Securities LLC) (I) | | | | 3,650 | $400,656 |
|
| Over the Counter on Hang Seng Index | | | | | |
| (Expiration Date: 12-30-13; Strike Price: HKD 16,140.43; | | | | |
| Counterparty: UBS Securities LLC) (I) | | | | 2,000 | 227,762 |
|
| Over the Counter on Hang Seng Index | | | | | |
| (Expiration Date: 12-30-13; Strike Price: HKD 16,199.60; | | | | |
| Counterparty: UBS Securities LLC) (I) | | | | 2,500 | 289,254 |
|
| Over the Counter on Hang Seng Index | | | | | |
| (Expiration Date: 12-30-13; Strike Price: HKD 16,304.39; | | | | |
| Counterparty: UBS Securities LLC) (I) | | | | 3,500 | 416,495 |
|
| Over the Counter on Hang Seng Index | | | | | |
| (Expiration Date: 12-30-13; Strike Price: HKD 16,531.99; | | | | |
| Counterparty: UBS Securities LLC) (I) | | | | 5,000 | 632,458 |
|
| Over the Counter on Hang Seng Index | | | | | |
| (Expiration Date: 12-30-13; Strike Price: HKD 16,858.17; | | | | |
| Counterparty: UBS Securities LLC) (I) | | | | 7,430 | 1,025,749 |
|
| Over the Counter on Hang Seng Index | | | | | |
| (Expiration Date: 12-30-13; Strike Price: HKD 16,907.08; | | | | |
| Counterparty: UBS Securities LLC) (I) | | | | 9,200 | 1,286,855 |
| | | | | | |
| | | | Maturity | | |
| | Yield* | | date | Par value^ | Value |
| Short-Term Investments 17.6% | | | | $148,023,081 |
|
| (Cost $148,022,546) | | | | | |
| | | | | | |
| Time Deposits 13.2% | | | | | 111,024,521 |
| | | | | | |
| Barclays Bank PLC | 0.100% | | 08-02-12 | 13,002,823 | 13,002,823 |
|
| BNP Paribas | 0.130% | | 08-02-12 | 18,003,552 | 18,003,552 |
|
| Commonwealth of Australia | 0.100% | | 08-02-12 | 13,000,667 | 13,000,667 |
|
| DZ Bank AG | 0.120% | | 08-02-12 | 18,003,424 | 18,003,424 |
|
| ING Bank | 0.100% | | 08-02-12 | 18,005,489 | 18,005,489 |
|
| Rabobank USA Financial Corp. | 0.100% | | 08-02-12 | 13,003,959 | 13,003,959 |
|
| Societe Generale SA | 0.150% | | 08-02-12 | 18,004,607 | 18,004,607 |
| | | | | | |
| U.S. Government 3.6% | | | | | 29,998,560 |
| | | | | | |
| U.S. Treasury Bill | 0.080% | | 08-23-12 | 10,000,000 | 9,999,690 |
|
| U.S. Treasury Bill | 0.080% | | 09-20-12 | 10,000,000 | 9,999,030 |
|
| U.S. Treasury Bill | 0.090% | | 08-16-12 | 10,000,000 | 9,999,840 |
| | | | | | |
| Repurchase Agreement 0.8% | | | | | 7,000,000 |
| | | | | | |
| Repurchase Agreement with State Street Corp. dated | | | | |
| 7-31-12 at 0.010% to be repurchased at $7,000,002 on | | | | |
| 8-1-12, collateralized by $7,145,000 Federal Home Loan | | | | |
| Bank Discount Notes 0.010% due 9-12-12 (valued at | | | | |
| $7,141,428, including interest) | | | | 7,000,000 | 7,000,000 |
| |
| Total investments (Cost $813,623,669)† 97.8% | | | $821,201,807 |
|
| |
| Other assets and liabilities, net 2.2% | | | | | $18,175,690 |
|
| |
| Total net assets 100.0% | | | | $839,377,497 |
|
^ The percentage shown for each investment category is the total value of that category as a percentage of the net assets of the Fund. All par values are denominated in U.S. Dollars unless otherwise indicated.
| | |
| 30 | Global Absolute Return Strategies Fund | Annual report | See notes to financial statements |
Notes to Portfolio of Investments
ADR American Depositary Receipts
EURIBOR Euro Interbank Offered Rate
GDR Global Depositary Receipt
PIK Payment-in-kind
(D) Par value of foreign bonds is expressed in local currency as shown parenthetically in security description.
(I) Non-income producing security.
(P) Variable rate obligation. The coupon rate shown represents the rate at period end.
(Q) Perpetual bonds have no stated maturity date. Date shown is next call date.
(S) These securities are exempt from registration under Rule 144A of the Securities Act of 1933. Such securities may be resold, normally to qualified institutional buyers, in transactions exempt from registration.
* Yield represents the annualized yield at the date of purchase.
† At 7-31-12, the aggregate cost of investment securities for federal income tax purposes was $814,885,960. Net unrealized appreciation aggregated $6,315,847, of which $18,578,895 related to appreciated investment securities and $12,263,048 related to depreciated investment securities.
| |
| Currency abbreviations |
| AUD | Australian Dollar |
| EUR | Euro |
| GBP | Pound Sterling |
| HKD | Hong Kong Dollar |
| JPY | Japanese Yen |
| KRW | Korean Won |
| MXN | Mexican Peso |
| SEK | Swedish Krona |
The Fund had the following portfolio composition as a percentage of net assets on 7-31-12:
| | | |
| U.S. Government | 18.6% | | |
| Financials | 16.5% | | |
| Foreign Government Obligations | 7.4% | | |
| Consumer Discretionary | 6.3% | | |
| Energy | 5.3% | | |
| Industrials | 3.9% | | |
| Consumer Staples | 3.7% | | |
| Purchased Options | 3.6% | | |
| Information Technology | 3.2% | | |
| Telecommunication Services | 3.1% | | |
| Materials | 3.0% | | |
| Health Care | 3.0% | | |
| Utilities | 2.6% | | |
| Short-Term Investments & Other | 19.8% | | |
| | |
| See notes to financial statements | Annual report | Global Absolute Return Strategies Fund | 31 |
F I N A N C I A L S T A T E M E N T S
Financial statements
Statement of assets and liabilities 7-31-12
This Statement of assets and liabilities is the Fund’s balance sheet. It shows the value of what the Fund owns, is due and owes. You’ll also find the net asset value and the maximum offering price per share.
| |
| Assets | |
|
| Investments, at value (Cost $813,623,669) | $821,201,807 |
| Cash | 1,656,276 |
| Foreign currency, at value (Cost $45,975) | 45,932 |
| Cash held at broker for futures contracts | 34,867,677 |
| Receivable for investments sold | 7,540,238 |
| Receivable for fund shares sold | 8,831,044 |
| Receivable for forward foreign currency exchange contracts | 6,406,028 |
| Dividends and interest receivable | 5,278,219 |
| Swap contracts, at value (includes net unamortized upfront payments | |
| of $9,167,681) | 14,387,173 |
| Receivable for futures variation margin | 1,125,605 |
| Receivable due from adviser | 2,734 |
| Other receivables and prepaid expenses | 82,583 |
| | |
| Total assets | 901,425,316 |
| |
| Liabilities | |
|
| Payable for investments purchased | 7,566,998 |
| Payable for forward foreign currency exchange contracts | 7,202,055 |
| Payable for fund shares repurchased | 224,813 |
| Written options, at value (premiums received $31,367,081) | 35,719,050 |
| Swap contracts, at value (includes net unamortized upfront payments | |
| of $29,327) | 11,051,464 |
| Payable to affiliates | |
| Accounting and legal services fees | 4,087 |
| Transfer agent fees | 55,648 |
| Trustees’ fees | 264 |
| Other liabilities and accrued expenses | 223,440 |
| | |
| Total liabilities | 62,047,819 |
| |
| Net assets | |
|
| Paid-in capital | $821,410,953 |
| Undistributed net investment income | 10,940,964 |
| Accumulated net realized gain (loss) on investments, futures contracts, | |
| written options, foreign currency transactions and swap agreements | 6,498,205 |
| Net unrealized appreciation (depreciation) on investments, futures | |
| contracts, written options, translation of assets and liabilities in foreign | |
| currencies and swap agreements | 527,375 |
| | |
| Net assets | $839,377,497 |
| | |
| 32 | Global Absolute Return Strategies Fund | Annual report | See notes to financial statements |
F I N A N C I A L S T A T E M E N T S
Statement of assets and liabilities (continued)
| |
| Net asset value per share | |
|
| Based on net asset values and shares outstanding — the Fund has an | |
| unlimited number of shares authorized with no par value | |
| Class A ($174,932,669 ÷ 16,520,076 shares) | $10.59 |
| Class I ($167,281,823 ÷ 15,755,475 shares) | $10.62 |
| Class R2 ($99,181 ÷ 9,372 shares) | $10.58 |
| Class R6 ($99,387 ÷ 9,372 shares) | $10.60 |
| Class NAV ($496,964,437 ÷ 46,827,238 shares) | $10.61 |
| |
| Maximum offering price per share1 | |
|
| Class A (net asset value per share ÷ 95%) | $11.15 |
1 On single retail sales of less than $50,000. On sales of $50,000 or more and on group sales the offering price is reduced.
| | |
| See notes to financial statements | Annual report | Global Absolute Return Strategies Fund | 33 |
F I N A N C I A L S T A T E M E N T S
Statement of operations For the period ended 7-31-12
This Statement of operations summarizes the Fund’s investment income earned and expenses incurred in operating the Fund. It also shows net gains (losses) for the period stated.
| |
| Investment income | |
|
| Interest | $3,683,987 |
| Dividends | 783,205 |
| Less foreign taxes withheld | (75,987) |
| | |
| Total investment income | 4,391,205 |
| |
| Expenses | |
|
| Investment management fees | 2,614,977 |
| Distribution and service fees | 74,086 |
| Accounting and legal services fees | 23,307 |
| Transfer agent fees | 83,736 |
| Trustees’ fees | 1,223 |
| State registration fees | 44,448 |
| Printing and postage | 3,274 |
| Professional fees | 101,604 |
| Custodian fees | 102,532 |
| Registration and filing fees | 108,726 |
| Other | 35,978 |
| | |
| Total expenses | 3,193,891 |
| Less expense reductions | (29,998) |
| | |
| Net expenses | 3,163,893 |
| | |
| Net investment income | 1,227,312 |
| |
| Realized and unrealized gain (loss) | |
|
| Net realized gain (loss) on | |
| Investments | 2,623,420 |
| Futures contracts | 8,161,936 |
| Written options | (2,645,838) |
| Swap contracts | 3,857,272 |
| Foreign currency transactions | 4,214,149 |
| | |
| | 16,210,939 |
| Change in net unrealized appreciation (depreciation) of | |
| Investments | 7,578,138 |
| Futures contracts | 3,966,548 |
| Written options | (4,351,969) |
| Swap contracts | (5,802,645) |
| Translation of assets and liabilities in foreign currencies | (862,697) |
| | |
| | 527,375 |
| | |
| Net realized and unrealized gain | 16,738,314 |
| | |
| Increase in net assets from operations | $17,965,626 |
| | |
| 34 | Global Absolute Return Strategies Fund | Annual report | See notes to financial statements |
F I N A N C I A L S T A T E M E N T S
Statements of changes in net assets
This Statement of changes in net assets show how the value of the Fund’s net assets has changed during the period. The difference reflects earnings less expenses, any investment gains and losses, distributions, if any, paid to shareholders and the net of Fund share transactions.
| |
| | Period |
| | ended |
| | 7-31-12 |
| Increase (decrease) in net assets | |
|
| From operations | |
| Net investment income | $1,227,312 |
| Net realized gain | 16,210,939 |
| Change in net unrealized appreciation (depreciation) | 527,375 |
| | |
| Increase in net assets resulting from operations | 17,965,626 |
| | |
| From Fund share transactions | 821,411,871 |
| | |
| Total increase | 839,377,497 |
| |
| Net assets | |
|
| Beginning of period | — |
| | |
| End of period | $839,377,497 |
| | |
| Undistributed net investment income | $10,940,964 |
| | |
| See notes to financial statements | Annual report | Global Absolute Return Strategies Fund | 35 |
Financial highlights
The Financial highlights show how the Fund’s net asset value for a share has changed during the period.
| |
| CLASS A SHARES Period ended | 7-31-121 |
| |
| Per share operating performance | |
|
| Net asset value, beginning of period | $10.00 |
| Net investment income2 | —3 |
| Net realized and unrealized gain on investments | 0.59 |
| Total from investment operations | 0.59 |
| Net asset value, end of period | $10.59 |
| Total return (%)4 | 5.905,6 |
| |
| Ratios and supplemental data | |
|
| Net assets, end of period (in millions) | $175 |
| Ratios (as a percentage of average net assets): | |
| Expenses before reductions and amounts recaptured | 1.977 |
| Expenses including reductions and amounts recaptured | 1.957 |
| Net investment loss | (0.01)7 |
| Portfolio turnover (%) | 33 |
1 Period from 12-19-11 (commencement of operations) to 7-31-12.
2 Based on the average daily shares outstanding.
3 Less than ($0.005) per share.
4 Does not reflect the effect of sales charges, if any.
5 Total returns would have been lower had certain expenses not been reduced during the period shown.
6 Not annualized.
7 Annualized.
| |
| CLASS I SHARES Period ended | 7-31-121 |
| |
| Per share operating performance | |
|
| Net asset value, beginning of period | $10.00 |
| Net investment income2 | 0.04 |
| Net realized and unrealized gain on investments | 0.58 |
| Total from investment operations | 0.62 |
| Net asset value, end of period | $10.62 |
| Total return (%) | 6.203,4 |
| |
| Ratios and supplemental data | |
|
| Net assets, end of period (in millions) | $167 |
| Ratios (as a percentage of average net assets): | |
| Expenses before reductions and amounts recaptured | 1.605 |
| Expenses including reductions and amounts recaptured | 1.595 |
| Net investment income | 0.585 |
| Portfolio turnover (%) | 33 |
1 Period from 12-19-11 (commencement of operations) to 7-31-12.
2 Based on the average daily shares outstanding.
3 Total returns would have been lower had certain expenses not been reduced during the period shown.
4 Not annualized.
5 Annualized.
| | |
| 36 | Global Absolute Return Strategies Fund | Annual report | See notes to financial statements |
| |
| CLASS R2 SHARES Period ended | 7-31-121 |
| |
| Per share operating performance | |
|
| Net asset value, beginning of period | $10.67 |
| Net investment income2 | 0.01 |
| Net realized and unrealized loss on investments | (0.10) |
| Total from investment operations | (0.09) |
| Net asset value, end of period | $10.58 |
| Total return (%) | (0.84)3,4 |
| |
| Ratios and supplemental data | |
|
| Net assets, end of period (in millions) | —5 |
| Ratios (as a percentage of average net assets): | |
| Expenses before reductions and amounts recaptured | 18.316 |
| Expenses including reductions and amounts recaptured | 2.006 |
| Net investment income | 0.196 |
| Portfolio turnover (%) | 33 |
1 Period from 3-1-12 (inception date) to 7-31-12.
2 Based on the average daily shares outstanding.
3 Total returns would have been lower had certain expenses not been reduced during the period shown.
4 Not annualized.
5 Less than $500,000.
6 Annualized.
| |
| CLASS R6 SHARES Period ended | 7-31-121 |
| |
| Per share operating performance | |
|
| Net asset value, beginning of period | $10.67 |
| Net investment income2 | 0.03 |
| Net realized and unrealized loss on investments | (0.10) |
| Total from investment operations | (0.07) |
| Net asset value, end of period | $10.60 |
| Total return (%) | (0.66)3,4 |
| |
| Ratios and supplemental data | |
|
| Net assets, end of period (in millions) | —5 |
| Ratios (as a percentage of average net assets): | |
| Expenses before reductions and amounts recaptured | 18.046 |
| Expenses including reductions and amounts recaptured | 1.506 |
| Net investment income | 0.696 |
| Portfolio turnover (%) | 33 |
1 Period from 3-1-12 (inception date) to 7-31-12.
2 Based on the average daily shares outstanding.
3 Total returns would have been lower had certain expenses not been reduced during the period shown.
4 Not annualized.
5 Less than $500,000.
6 Annualized.
| | |
| See notes to financial statements | Annual report | Global Absolute Return Strategies Fund | 37 |
| |
| CLASS NAV SHARES Period ended | 7-31-121 |
| |
| Per share operating performance | |
|
| Net asset value, beginning of period | $10.00 |
| Net investment income2 | 0.04 |
| Net realized and unrealized gain on investments | 0.57 |
| Total from investment operations | 0.61 |
| Net asset value, end of period | $10.61 |
| Total return (%) | 6.103,4 |
| |
| Ratios and supplemental data | |
|
| Net assets, end of period (in millions) | $497 |
| Ratios (as a percentage of average net assets): | |
| Expenses before reductions and amounts recaptured | 1.435 |
| Expenses including reductions and amounts recaptured | 1.435 |
| Net investment income | 0.695 |
| Portfolio turnover (%) | 33 |
1 Period from 12-19-11 (commencement of operations) to 7-31-12.
2 Based on the average daily shares outstanding.
3 Total returns would have been lower had certain expenses not been reduced during the period shown.
4 Not annualized.
5 Annualized.
| | |
| 38 | Global Absolute Return Strategies Fund | Annual report | See notes to financial statements |
Notes to financial statements
Note 1 — Organization
John Hancock Global Absolute Return Strategies Fund (the Fund) is a series of John Hancock Funds II (the Trust), an open-end management investment company organized as a Massachusetts business trust and registered under the Investment Company Act of 1940, as amended (the 1940 Act). The investment objective of the Fund is to seek long term total return.
The Fund may offer multiple classes of shares. The shares currently offered by the Trust are detailed in the Statements of assets and liabilities. Class A shares are open to all investors. Class I shares are offered to institutions and certain investors. Class R2 shares are available only to certain retirement plans. Class R6 shares are only available to certain retirement plans, institutions and other investors. Class NAV shares are offered to John Hancock affiliated funds of funds. Shareholders of each class have exclusive voting rights to matters that affect that class. The distribution and service fees, if any, transfer agent fees, printing and postage and state registration fees for each class may differ. Certain Class I shares may be exchanged for Class R6 shares within one year after the commencement of operations of Class R6 shares.
Note 2 — Significant accounting policies
The financial statements have been prepared in conformity with accounting principles generally accepted in the United States of America, which require management to make certain estimates and assumptions at the date of the financial statements. Actual results could differ from those estimates. Events or transactions occurring after the end of the fiscal period through the date that the financial statements were issued have been evaluated in the preparation of the financial statements. The following summarizes the significant accounting policies of the Fund:
Security valuation. Investments are stated at value as of the close of regular trading on the New York Stock Exchange (NYSE), normally at 4:00 P.M., Eastern Time. In order to value the securities, the Fund uses the following valuation techniques. Equity securities held by the Fund are valued at the last sale price or official closing price on the principal securities exchange on which they trade. In the event there were no sales during the day or closing prices are not available, then securities are valued using the last quoted bid or evaluated price. Debt obligations are valued based on the evaluated prices provided by an independent pricing service, which utilizes both dealer-supplied and electronic data processing techniques, taking into account factors such as institutional-size trading in similar groups of securities, yield, quality, coupon rate, maturity, type of issue, trading characteristics and other market data. Options listed on an exchange are valued at the mean between the last bid and ask prices from the exchange on which they are principally traded. For options not listed on an exchange, an independent pricing source is used to value the options at the mean between the last bid and ask prices. Futures contracts are valued at the quoted daily settlement prices established by the exchange on which they trade. Swaps are marked-to-market daily based upon values from third party vendors, which may include a registered commodities exchange, or broker quotations. Foreign securities and currencies, including forward foreign currency contracts, are valued in U.S. dollars, based on foreign currency exchange rates supplied by an independent pricing service. Certain securities and forward foreign currency contracts traded only in the over-the-counter market are valued at the last bid price quoted by brokers making markets in the securities at the close of trading. Certain short-term securities are valued at amortized cost.
Other portfolio securities and assets, where market quotations are not readily available, are valued at fair value, as determined in good faith by the Fund’s Pricing Committee, following procedures established by the Board of Trustees. Generally, trading in non-U.S. securities is substantially
| |
| Annual report | Global Absolute Return Strategies Fund | 39 |
completed each day at various times prior to the close of trading on the NYSE. Significant market events that affect the values of non-U.S. securities may occur between the time when the valuation of the securities is generally determined and the close of the NYSE. During significant market events, these securities will be valued at fair value, as determined in good faith, following procedures established by the Board of Trustees. The Fund may use a fair valuation model to value non-U.S. securities in order to adjust for events which may occur between the close of foreign exchanges and the close of the NYSE.
The Fund uses a three-tier hierarchy to prioritize the pricing assumptions, referred to as inputs, used in valuation techniques to measure fair value. Level 1 includes securities valued using quoted prices in active markets for identical securities. Level 2 includes securities valued using significant observable inputs. Observable inputs may include quoted prices for similar securities, interest rates, prepayment speeds and credit risk. Prices for securities valued using these inputs are received from independent pricing vendors and brokers and are based on an evaluation of the inputs described. Level 3 includes securities valued using significant unobservable inputs when market prices are not readily available or reliable, including the Fund’s own assumptions in determining the fair value of investments. Factors used in determining value may include market or issuer specific events, changes in interest rates and credit quality. The inputs or methodology used for valuing securities are not necessarily an indication of the risks associated with investing in those securities. Changes in valuation techniques may result in transfers into or out of an assigned level within the disclosure hierarchy.
The following is a summary of the values by input classification of the Fund’s investments as of July 31, 2012, by major security category or type:
| | | | |
| | | | | LEVEL 3 |
| | | | LEVEL 2 | SIGNIFICANT |
| | TOTAL MARKET | LEVEL 1 | SIGNIFICANT | UNOBSERVABLE |
| INVESTMENTS IN SECURITIES | VALUE AT 7-31-12 | QUOTED PRICE | OBSERVABLE INPUTS | INPUTS |
|
| Corporate Bonds | $230,780,450 | — | $230,780,450 | — |
| U.S. Government & | | | | |
| Agency Obligations | 155,950,271 | — | 155,950,271 | — |
| Foreign Government | | | | |
| Obligations | 61,815,438 | — | 61,815,438 | — |
| Common Stocks | 156,349,632 | $92,301,639 | 64,047,993 | — |
| Preferred Securities | 2,059,766 | — | 2,059,766 | — |
| Certificates of Deposit | 36,000,000 | — | 36,000,000 | — |
| Purchased Options | 30,223,169 | 11,070,961 | 19,152,208 | — |
| Short-Term Investments | 148,023,081 | — | 148,023,081 | — |
| |
|
| Total Investments in | | | | |
| Securities | $821,201,807 | $103,372,600 | $717,829,207 | — |
| Other Financial Instruments | | | | |
| Futures | $3,966,548 | $3,892,799 | $73,749 | — |
| Forward Foreign Currency | | | | |
| Contracts | ($796,027) | — | ($796,027) | — |
| Written Options | ($35,719,050) | ($7,400,600) | ($28,318,450) | — |
| Interest Rate Swap | ($2,395,474) | — | ($2,395,474) | — |
| Credit Default Swaps | $7,899,355 | — | $7,899,355 | — |
| Variance Swaps | ($2,221,452) | — | ($2,221,452) | — |
| Inflation Swaps | $53,280 | — | $53,280 | — |
| |
| 40 | Global Absolute Return Strategies Fund | Annual report |
Repurchase agreements. The Fund may enter into repurchase agreements. When the Fund enters into a repurchase agreement, it receives collateral which is held in a segregated account by the Fund’s custodian. The collateral amount is marked-to-market and monitored on a daily basis to ensure that the collateral held is in an amount not less than the principal amount of the repurchase agreement plus any accrued interest. In the event of a default by the counterparty, realization of the collateral proceeds could be delayed, during which time the collateral value may decline.
Security transactions and related investment income. Investment security transactions are accounted for on a trade date plus one basis for daily net asset value calculations. However, for financial reporting purposes, investment transactions are reported on trade date. Interest income is accrued as earned. Interest income includes coupon interest and amortization- accretion of premiums- discounts on debt securities. Debt obligations may be placed in a non-accrual status and related interest income may be reduced by stopping current accruals and writing off interest receivable when the collection of all or a portion of interest has become doubtful. Dividend income is recorded on the ex-date, except for dividends of foreign securities where the dividend may not be known until after the ex-date. In those cases, dividend income, net of withholding taxes, is recorded when the Fund becomes aware of the dividends. Foreign taxes are provided for based on the Fund’s understanding of the tax rules and rates that exist in the foreign markets in which it invests. Gains and losses on securities sold are determined on the basis of identified cost and may include proceeds from litigation.
Inflation indexed bonds. Inflation-indexed bonds are securities that generally have a lower coupon interest rate fixed at issuance but whose principal value is periodically adjusted to a rate of inflation, such as the Consumer Price Index. Over the life of an inflation-indexed bond, interest is paid on the inflation adjusted principal value as described above. Increases in the principal amount of these securities are recorded as interest income. Decreases in the principal amount of these securities may reduce interest income to the extent of income previously recorded. Excess amounts are recorded as an adjustment to cost.
Foreign currency translation. Assets, including investments and liabilities denominated in foreign currencies, are translated into U.S. dollar values each day at the prevailing exchange rate. Purchases and sales of securities, income and expenses are translated into U.S. dollars at the prevailing exchange rate on the date of the transaction. The effect of changes in foreign currency exchange rates on the value of securities is reflected as a component of the realized and unrealized gains (losses) on investments.
Funds that invest internationally generally carry more risk than funds that invest strictly in U.S. securities. Risks can result from differences in economic and political conditions, regulations, market practices (including higher transaction costs) and accounting standards. Foreign investments are also subject to a decline in the value of a foreign currency versus the U.S. dollar, which reduces the dollar value of securities denominated in that currency.
Foreign taxes. The Fund may be subject to withholding tax on income or capital gains or repatriation taxes as imposed by certain countries in which it invests. Taxes are accrued based upon net investment income, net realized gains or net unrealized appreciation.
Line of credit. The Fund may borrow from banks for temporary or emergency purposes, including meeting redemption requests that otherwise might require the untimely sale of securities. Pursuant to the custodian agreement, the custodian may loan money to the Fund to make properly authorized payments. The Fund is obligated to repay the custodian for any overdraft, including any related costs or expenses. The custodian may have a lien, security interest or security entitlement in any Fund property that is not otherwise segregated or pledged, to the maximum extent permitted by law, to the extent of any overdraft.
| |
| Annual report | Global Absolute Return Strategies Fund | 41 |
In addition, the Fund and other affiliated funds have entered into an agreement with Citibank N.A. which enables them to participate in a $200 million unsecured committed line of credit. A commitment fee, payable at the end of each calendar quarter, based on the average daily unused portion of the line of credit, is charged to each participating fund on a pro rata basis and is reflected in other expenses on the Statement of operations. For the period ended July 31, 2012, the Fund had no borrowings under the line of credit.
Expenses. Within the John Hancock Funds complex, expenses that are directly attributable to an individual fund are allocated to such fund. Expenses that are not readily attributable to a specific fund are allocated among all funds in an equitable manner, taking into consideration, among other things, the nature and type of expense and the fund’s relative net assets. Expense estimates are accrued in the period to which they relate and adjustments are made when actual amounts are known.
Class allocations. Income, common expenses and realized and unrealized gains (losses) are determined at the fund level and allocated daily to each class of shares based on the net assets of the class. Class-specific expenses, such as distribution and service fees, if any, transfer agent fees, state registration fees and printing and postage, for all classes, are calculated daily at the class level based on the appropriate net assets of each class and the specific expense rates applicable to each class.
Federal income taxes. The Fund intends to qualify as a regulated investment company by complying with the applicable provisions of the Internal Revenue Code and will not be subject to federal income tax on taxable income that is distributed to shareholders. Therefore, no federal income tax provision is required.
As of July 31, 2012, the Fund had no uncertain tax positions that would require financial statement recognition, derecognition or disclosure. The Fund’s federal tax returns are subject to examination by the Internal Revenue Service for a period of three years.
Distribution of income and gains. Distributions to shareholders from net investment income and net realized gains, if any, are recorded on the ex-date. The Fund declares and pays dividends and capital gain distributions, if any, annually.
Distributions paid by the Fund with respect to each class of shares are calculated in the same manner, at the same time and in the same amount, except for the effect of class level expenses that may be applied differently to each class. As of July 31, 2012, the components of distributable earnings on a tax basis consisted of $15,291,569 of undistributed ordinary income and $4,337,947 of long-term capital gains.
Such distributions and distributable earnings, on a tax basis, are determined in conformity with income tax regulations, which may differ from accounting principles generally accepted in the United States of America. Material distributions in excess of tax basis earnings and profits, if any, are reported in the Fund’s financial statements as a return of capital.
Capital accounts within the financial statements are adjusted for permanent book-tax differences. These adjustments have no impact on net assets or the results of operations. Temporary book-tax differences, if any, will reverse in a subsequent period. Book-tax differences are primarily attributable to foreign currency transactions, derivative transactions, and amortization and accretion on debt securities.
| |
| 42 | Global Absolute Return Strategies Fund | Annual report |
New accounting pronouncement. In December 2011, the Financial Accounting Standards Board issued Accounting Standards Update No. 2011-11 (ASU 2011-11), Disclosures about Offsetting Assets and Liabilities. The update creates new disclosure requirements requiring entities to disclose both gross and net information for derivatives and other financial instruments that are either offset in the Statement of assets and liabilities or subject to an enforceable master netting arrangement or similar agreement. The disclosure requirements are effective for annual reporting periods beginning on or after January 1, 2013 and interim periods within those annual periods. ASU 2011-11 may result in additional disclosure relating to the presentation of derivatives and certain other financial instruments.
Note 3 — Derivative instruments
The Fund may invest in derivatives in order to meet its investment objective. The use of derivatives may involve risks different from, or potentially greater than, the risks associated with investing directly in securities. Specifically, the Fund is exposed to the risk that the counterparty to an over-the-counter (OTC) derivatives contract will be unable or unwilling to make timely settlement payments or otherwise honor its obligations. OTC derivatives transactions typically can only be closed out with the other party to the transaction. If the counterparty defaults, the Fund will have contractual remedies, but there is no assurance that the counterparty will meet its contractual obligations or that the Fund will succeed in enforcing them.
Futures. A futures contract is a contractual agreement to buy or sell a particular currency or financial instrument at a pre-determined price in the future. Risks related to the use of futures contracts include possible illiquidity of the futures markets, contract prices that can be highly volatile and imperfectly correlated to movements in hedged security values and/or interest rates and potential losses in excess of the amounts recognized on the Statement of assets and liabilities.
Upon entering into a futures contract, the Fund is required to deposit initial margin with the broker in the form of cash or securities. The amount of required margin is generally based on a percentage of the contract value; this amount is the initial margin for the trade. The margin deposit must then be maintained at the established level over the life of the contract. Futures collateral receivable/payable is included on the Statement of assets of liabilities. Futures contracts are marked-to-market daily and an appropriate payable or receivable for the change in value (variation margin) and unrealized gain or loss is recorded by the Fund. When the contract is closed, the Fund records a realized gain or loss equal to the difference between the value of the contract at the time it was opened and the value at the time it was closed.
During the period ended July 31, 2012, the Fund used futures contracts to manage against anticipated changes in securities markets, gain exposure to certain securities markets and/or substitute for securities purchased (or to be purchased) and maintain diversity and liquidity of the portfolio. The following table summarizes the contracts held at July 31, 2012. During the period ended July 31, 2012, the Fund held futures contracts with USD notional values ranging up to $473.2 million, as measured at each quarter end.
| |
| Annual report | Global Absolute Return Strategies Fund | 43 |
| | | | | |
| | | | | | UNREALIZED |
| OPEN | NUMBER OF | | EXPIRATION | | APPRECIATION |
| CONTRACTS | CONTRACTS | POSITION | DATE | VALUE | (DEPRECIATION) |
|
| E-Mini NASDAQ | 1,706 | Long | Sep 2012 | $89,957,380 | $2,167,719 |
| 100 Index Futures | | | | | |
| E-Mini S&P 500 Index | 186 | Long | Sep 2012 | 12,783,780 | 272,397 |
| Futures | | | | | |
| Ultra Long U.S. | 664 | Long | Sep 2012 | 114,540,000 | 3,671,195 |
| Treasury Bond Futures | | | | | |
| 3-Year Australian | 488 | Short | Sep 2012 | (56,409,582) | 549,162 |
| Treasury Bond Futures | | | | | |
| ASX SPI 200 Index | 42 | Short | Sep 2012 | (4,664,264) | (151,787) |
| Futures | | | | | |
| Dow Jones Euro | 70 | Short | Sep 2012 | (2,005,059) | (133,014) |
| STOXX 50 Index | | | | | |
| Futures | | | | | |
| Dow Jones Euro | 3,604 | Short | Sep 2012 | (18,735,174) | (500,408) |
| STOXX Banks Futures | | | | | |
| FTSE 100 Index | 36 | Short | Sep 2012 | (3,164,173) | (40,992) |
| Futures | | | | | |
| Hang Seng Index | 16 | Short | Aug 2012 | (2,033,760) | (95,275) |
| Futures | | | | | |
| OMX 30 Index | 35 | Short | Aug 2012 | (550,940) | (20,938) |
| Futures | | | | | |
| Russell 2000 Mini | 2,024 | Short | Sep 2012 | (158,803,040) | (1,816,581) |
| Index Futures | | | | | |
| Swiss Market Index | 10 | Short | Sep 2012 | (655,536) | (49,672) |
| Futures | | | | | |
| TOPIX Index Futures | 95 | Short | Sep 2012 | (8,925,440) | 114,742 |
| | | | | | $3,966,548 |
Forward foreign currency contracts. A forward foreign currency contract is an agreement between two parties to buy and sell a specific currency at a price that is set on the date of the contract. The forward contract calls for delivery of the currency on a future date that is specified in the contract. Risks related to the use of forwards include the possible failure of counterparties to meet the terms of the forward agreement, the failure of the counterparties to timely post collateral, the risk that currency movements will not occur thereby reducing the Fund’s total return, and the potential for losses in excess of the amounts recognized on the Statement of assets and liabilities.
The market value of a forward foreign currency contract fluctuates with changes in foreign currency exchange rates. Forward foreign currency contracts are marked-to-market daily and the change in value is recorded by the Fund as an unrealized gain or loss. Realized gains or losses, equal to the difference between the value of the contract at the time it was opened and the value at the time it was closed, are recorded upon delivery or receipt of the currency or settlement with the counterparty.
During the period ended July 31, 2012, the Fund used forward foreign currency contracts to manage against anticipated currency exchange rates and gain exposure to foreign currency. The following table summarizes the contracts held at July 31, 2012. During the period ended July 31, 2012, the Fund held forward foreign currency contracts with USD notional values ranging from up to $558.5 million, as measured at each quarter end.
| |
| 44 | Global Absolute Return Strategies Fund | Annual report |
| | | | | | |
| | PRINCIPAL | PRINCIPAL | | | | |
| | AMOUNT | AMOUNT | | | | UNREALIZED |
| | COVERED BY | COVERED BY | | | SETTLEMENT | APPRECIATION |
| CURRENCY | CONTRACT | CONTRACT (USD) | | COUNTERPARTY | DATE | (DEPRECIATION) |
|
| Buys | | | | | | |
| AUD | 2,062 | $2,018 | | Barclays Bank PLC | 9-6-12 | $143 |
| AUD | 4,077 | 4,143 | | BNP Paribas SA | 9-6-12 | 128 |
| AUD | 3,853 | 4,044 | | Royal Bank of Scotland PLC | 9-6-12 | (9) |
| BRL | 18,000,000 | 10,445,379 | | Barclays Bank PLC | 9-19-12 | (1,735,331) |
| BRL | 62,300,000 | 30,547,045 | | Barclays Bank PLC | 9-21-12 | (411,639) |
| CHF | 1,558,983 | 1,593,417 | | BNP Paribas SA | 8-2 12 | 3,411 |
| CHF | 33,935 | 37,158 | | UBS AG | 8-10-12 | (2,393) |
| CZK | 193,410,000 | 10,322,081 | | Barclays Bank PLC | 9-19 12 | (925,671) |
| EUR | 5,601,215 | 6,890,755 | | BNP Paribas SA | 8-10-12 | 1,576 |
| EUR | 87,517 | 109,103 | | Royal Bank of Scotland PLC | 8-10-12 | (1,412) |
| EUR | 317,021 | 394,980 | | BNP Paribas SA | 9-6-12 | (4,767) |
| EUR | 49,597 | 62,379 | | Royal Bank of Scotland PLC | 9-6-12 | (1,331) |
| EUR | 37,814 | 46,526 | | UBS AG | 9-6-12 | 19 |
| EUR | 113,428 | 142,588 | | BNP Paribas SA | 9-7 12 | (2,970) |
| GBP | 2,238 | 3,478 | | BNP Paribas SA | 9-6-12 | 30 |
| GBP | 13,094 | 20,445 | | Royal Bank of Scotland PLC | 9-6-12 | 84 |
| SEK | 23,630 | 3,273 | | Barclays Bank PLC | 9-6-12 | 196 |
| | | $60,628,812 | | | | ($3,079,936) |
| Sells | | | | | | |
| AUD | 290,265 | $296,163 | | UBS AG | 8-10-12 | ($8,651) |
| AUD | 139,764 | 134,781 | | BNP Paribas SA | 9-6-12 | (11,623) |
| AUD | 10,434 | 10,352 | | Royal Bank of Scotland PLC | 9-6-12 | (578) |
| AUD | 2,234 | 2,277 | | UBS AG | 9-6-12 | (63) |
| AUD | 1,400,000 | 1,354,455 | | Barclays Bank PLC | 9-7-12 | (111,924) |
| AUD | 1,400,000 | 1,426,804 | | BNP Paribas SA | 9-7-12 | (39,575) |
| AUD | 1,600,000 | 1,592,704 | | Royal Bank of Scotland PLC | 9-7-12 | (83,158) |
| AUD | 11,000,000 | 11,091,520 | | Barclays Bank PLC | 9-19-12 | (417,431) |
| AUD | 26,000,000 | 26,354,165 | | Barclays Bank PLC | 9-21-12 | (843,854) |
| AUD | 1,400,000 | 1,416,758 | | UBS AG | 9-21-12 | (47,751) |
| CAD | 157,653 | 159,998 | | Royal Bank of Scotland PLC | 8-10-12 | 2,822 |
| CAD | 15,855,803 | 15,500,000 | | BNP Paribas SA | 8-21-12 | (304,345) |
| CAD | 1,950,000 | 1,895,200 | | BNP Paribas SA | 9-7-12 | (47,796) |
| CAD | 4,600,000 | 4,505,784 | | Royal Bank of Scotland PLC | 9-7-12 | (77,695) |
| CAD | 20,426,000 | 20,000,000 | | UBS AG | 9-21-12 | (346,543) |
| CAD | 6,029,940 | 5,853,509 | | Barclays Bank PLC | 9-21-12 | (152,974) |
| CAD | 13,205,283 | 13,000,000 | | BNP Paribas SA | 9-24-12 | (153,070) |
| CAD | 9,733,894 | 9,502,944 | | Royal Bank of Scotland PLC | 9-24-12 | (192,463) |
| CAD | 16,357,600 | 16,000,000 | | UBS AG | 9-24-12 | (292,923) |
| CHF | 1,270,000 | 1,315,541 | | Barclays Bank PLC | 9-7-12 | 13,617 |
| CHF | 1,800,000 | 1,903,002 | | BNP Paribas SA | 9-7-12 | 57,755 |
| CHF | 1,400,000 | 1,472,519 | | Royal Bank of Scotland PLC | 9-7-12 | 37,327 |
| CZK | 193,410,000 | 10,445,379 | | Barclays Bank PLC | 9-19-12 | 1,048,968 |
| DKK | 924,221 | 163,357 | | Royal Bank of Scotland PLC | 8-10-12 | 10,516 |
| DKK | 2,740,000 | 463,320 | | Royal Bank of Scotland PLC | 9-7-12 | 9,880 |
| EUR | 7,192,919 | 9,392,836 | | Barclays Bank PLC | 8-10-12 | 541,903 |
| EUR | 2,861,268 | 3,551,783 | | BNP Paribas SA | 8-10-12 | 30,974 |
| EUR | 16,647,373 | 20,320,588 | | Royal Bank of Scotland PLC | 8-10-12 | (164,111) |
| EUR | 801,377 | 1,002,061 | | UBS AG | 8-10-12 | 15,961 |
| EUR | 9,904,724 | 12,577,980 | | Barclays Bank PLC | 8-29-12 | 387,644 |
| EUR | 10,200,000 | 12,932,009 | | BNP Paribas SA | 8-29-12 | 378,260 |
| EUR | 13,400,000 | 16,641,084 | | Royal Bank of Scotland PLC | 8-29-12 | 148,904 |
| EUR | 27,612,884 | 34,268,859 | | Barclays Bank PLC | 9-6-12 | 280,918 |
| |
| Annual report | Global Absolute Return Strategies Fund | 45 |
| | | | | | |
| | PRINCIPAL | PRINCIPAL | | | | |
| | AMOUNT | AMOUNT | | | | UNREALIZED |
| | COVERED BY | COVERED BY | | | SETTLEMENT | APPRECIATION |
| CURRENCY | CONTRACT | CONTRACT (USD) | | COUNTERPARTY | DATE | (DEPRECIATION) |
|
| Sells | | | | | | |
| EUR | 1,522,799 | $1,926,869 | | BNP Paribas SA | 9-6-12 | $52,497 |
| EUR | 29,957,446 | 37,777,899 | | Royal Bank of Scotland PLC | 9-6-12 | 904,100 |
| EUR | 2,394,425 | 2,971,341 | | UBS AG | 9-6-12 | 24,109 |
| EUR | 5,403,683 | 6,718,912 | | Barclays Bank PLC | 9-7-12 | 67,578 |
| EUR | 5,095,359 | 6,439,240 | | BNP Paribas SA | 9-7-12 | 167,418 |
| EUR | 35,145,898 | 44,317,514 | | Royal Bank of Scotland PLC | 9-7-12 | 1,056,815 |
| EUR | 700,450 | 859,243 | | UBS AG | 9-7-12 | (2,933) |
| EUR | 13,888,083 | 17,000,000 | | BNP Paribas SA | 9-18-12 | (97,198) |
| EUR | 29,067,842 | 36,901,975 | | UBS AG | 9-18-12 | 1,117,436 |
| EUR | 5,063,752 | 6,196,022 | | Barclays Bank PLC | 10-18-12 | (40,359) |
| EUR | 14,400,988 | 17,730,482 | | Barclays Bank PLC | 10-23-12 | (6,620) |
| GBP | 752,217 | 1,216,777 | | UBS AG | 8-10-12 | 37,422 |
| GBP | 1,148,243 | 1,783,260 | | Barclays Bank PLC | 9-6-12 | (16,965) |
| GBP | 1,048,674 | 1,640,511 | | BNP Paribas SA | 9-6-12 | (3,608) |
| GBP | 494,841 | 768,255 | | Royal Bank of Scotland PLC | 9-6-12 | (7,561) |
| GBP | 4,990,000 | 7,786,927 | | BNP Paribas SA | 9-7-12 | (36,430) |
| GBP | 2,500,000 | 3,916,653 | | Royal Bank of Scotland PLC | 9-7-12 | (2,865) |
| HKD | 2,081,565 | 268,361 | | UBS AG | 8-10-12 | (73) |
| HKD | 10,900,000 | 1,405,179 | | Royal Bank of Scotland PLC | 9-7-12 | (605) |
| JPY | 15,308,455 | 190,648 | | UBS AG | 8-10-12 | (5,317) |
| JPY | 635,000,000 | 8,024,692 | | Royal Bank of Scotland PLC | 9-7-12 | (106,342) |
| JPY | 300,000,000 | 3,740,550 | | BNP Paribas SA | 9-7-12 | (100,883) |
| JPY | 2,228,465,550 | 28,243,568 | | Royal Bank of Scotland PLC | 10-22-12 | (307,574) |
| NOK | 662,413 | 114,933 | | UBS AG | 8-10-12 | 5,067 |
| NOK | 2,350,000 | 390,225 | | BNP Paribas SA | 9-7-12 | 861 |
| SEK | 2,460,917 | 363,439 | | Barclays Bank PLC | 8-10-12 | 1,689 |
| SEK | 24,849 | 3,462 | | Barclays Bank PLC | 9-6-12 | (187) |
| SEK | 1,720,343 | 237,907 | | BNP Paribas SA | 9-6-12 | (14,707) |
| SEK | 18,885 | 2,706 | | Royal Bank of Scotland PLC | 9-6-12 | (67) |
| SEK | 3,300,000 | 455,049 | | Barclays Bank PLC | 9-7-12 | (29,500) |
| SEK | 5,900,000 | 849,003 | | Royal Bank of Scotland PLC | 9-7-12 | (17,312) |
| SGD | 1,345,000 | 1,057,950 | | Royal Bank of Scotland PLC | 9-7-12 | (22,898) |
| | | $497,847,284 | | | | $2,283,909 |
| |
| Currency abbreviations |
| AUD | Australian Dollar |
| BRL | Brazilian Real |
| CAD | Canadian Dollar |
| CHF | Swiss Franc |
| CZK | Czech Koruna |
| DKK | Danish Krone |
| EUR | Euro |
| GBP | Pound Sterling |
| HKD | Hong Kong Dollar |
| JPY | Japanese Yen |
| NOK | Norwegian Krone |
| SEK | Swedish Krona |
| SGD | Singapore Dollar |
Options. There are two types of options, a put option and a call option. Options are traded either over-the-counter or on an exchange. A call option gives the purchaser of the option the right to buy (and the seller the obligation to sell) the underlying instrument at the exercise price. A put option gives the purchaser of the option the right to sell (and the writer the obligation to buy) the underlying instrument at the exercise price. Writing puts and buying calls may increase the Fund’s exposure to changes in the value of the underlying instrument. Buying puts and writing calls may
| |
| 46 | Global Absolute Return Strategies Fund | Annual report |
decrease the Fund’s exposure to such changes. Risks related to the use of options include the loss of the premium, possible illiquidity of the options markets, trading restrictions imposed by an exchange and movements in underlying security values, and for written options, potential losses in excess of the amounts recognized on the Statement of assets and liabilities.
When the Fund purchases an option, the premium paid by the Fund is included in the portfolio of investments and subsequently “marked-to-market” to reflect current market value. If the purchased option expires, the Fund realizes a loss equal to the cost of the option. If the Fund exercises a call option, the cost of the securities acquired by exercising the call is increased by the premium paid to buy the call. If the Fund exercises a put option, it realizes a gain or loss from the sale of the underlying security and the proceeds from such sale are decreased by the premium paid. If the Fund enters into a closing sale transaction, the Fund realizes a gain or loss, depending on whether proceeds from the closing sale are greater or less than the original cost. When the Fund writes an option, the premium received is included as a liability and subsequently “marked-to-market” to reflect current market value of the option written. Premiums received from writing options that expire unexercised are recorded as realized gains. Premiums received from writing options which are exercised or are closed are added to or offset against the proceeds or amount paid on the transaction to determine the realized gain or loss. If a put option on a security is exercised, the premium received reduces the cost basis of the securities purchased by the Fund.
During the period ended July 31, 2012, the Fund used purchased options to manage against anticipated currency exchange rates, changes in securities markets and to gain exposure to foreign currency, certain markets and/or substitute for securities purchased or to be purchased. During the period ended July 31, 2012, the Fund held purchased options with market values ranging up to $30.2 million, as measured at each quarter end.
During the period ended July 31, 2012, the Fund wrote option contracts to manage against anticipated currency exchange rates, changes in securities markets and anticipated interest rate changes and to gain exposure to foreign currency and certain markets and/or substitute for securities purchase or to be purchased. The following tables summarize the Fund’s written options activities during the period ended July 31, 2012 and the contracts held at July 31, 2012.
| | | |
| | NUMBER OF | NOTIONAL | |
| | CONTRACTS | (CURRENCY & | PREMIUMS |
| | (EQUITY) | INTEREST RATE) | RECEIVED |
|
| Outstanding, beginning of period | — | — | — |
| Options written | 72,258 | 315,500,000 | $37,235,248 |
| Options closed | (1,670) | (43,500,000) | (5,868,167) |
| Options exercised | — | — | — |
| Options expired | — | — | — |
| Outstanding, end of period | 70,588 | 272,000,000 | $31,367,081 |
Options on securities
| | | | | | |
| | | | EXPIRATION | NUMBER OF | | |
| NAME OF ISSUER | EXERCISE PRICE | | DATE | CONTRACTS | PREMIUM | VALUE |
|
| Calls | | | | | | |
| Apple, Inc. | $555.00 | | Jan 2013 | 98 | $679,581 | ($782,285) |
| Apple, Inc. | 560.00 | | Jan 2013 | 20 | 136,132 | (153,100) |
| | | | | 118 | $815,713 | ($935,385) |
| |
| Annual report | Global Absolute Return Strategies Fund | 47 |
Index options
| | | | | | |
| | | | EXPIRATION | NUMBER OF | | |
| NAME OF ISSUER | EXERCISE PRICE | | DATE | CONTRACTS | PREMIUM | VALUE |
|
| Calls | | | | | | |
| S&P 500 Index | 1,350 | | Dec 2012 | 560 | $4,044,537 | ($4,163,600) |
| S&P 500 Index | 1,325 | | Mar 2013 | 300 | 2,787,669 | (3,237,000) |
| | | | | 860 | $6,832,206 | ($7,400,600) |
|
| Puts | | | | | | |
| S&P 500 Index | 1,140 | | Dec 2013 | 4,000 | $416,908 | ($288,824) |
| S&P 500 Index | 1,137 | | Dec 2013 | 4,000 | 416,316 | (286,493) |
| S&P 500 Index | 1,151 | | Dec 2013 | 6,500 | 647,023 | (487,246) |
| S&P 500 Index | 1,144 | | Dec 2013 | 4,500 | 465,608 | (329,701) |
| S&P 500 Index | 1,161 | | Dec 2013 | 6,500 | 657,949 | (504,533) |
| S&P 500 Index | 1,159 | | Dec 2013 | 3,170 | 324,316 | (243,714) |
| S&P 500 Index | 1,183 | | Dec 2013 | 13,800 | 1,339,079 | (1,148,788) |
| S&P 500 Index | 1,178 | | Dec 2013 | 17,940 | 1,668,061 | (1,469,401) |
| S&P 500 Index | 1,168 | | Dec 2013 | 9,200 | 830,980 | (730,988) |
|
| | | | | 69,610 | $6,766,240 | ($5,489,688) |
Foreign currency options
| | | | | | | |
| | | EXERCISE | | EXPIRATION | NOTIONAL | | |
| DESCRIPTION | COUNTERPARTY | PRICE | | DATE | AMOUNT | PREMIUM | VALUE |
|
| Puts | | | | | | | |
| USD versus JPY | Goldman | $68.00 | | Dec 2014 | $18,750,000 | $1,066,375 | ($496,331) |
| | Sachs | | | | | | |
Interest rate swaptions
| | | | | | | | | |
| | | FLOATING | PAY/RECEIVE | | | | | | |
| | | RATE | FLOATING | EXERCISE | EXPIRATION | CUR- | NOTIONAL | | |
| DESCRIPTION | COUNTERPARTY | INDEX | RATE | RATE | DATE | RENCY | AMOUNT | PREMIUM | VALUE |
|
| Calls | | | | | | | | | |
| 10-Year Interest | UBS AG | EUR | Receive | 1.70% | Jul 2014 | EUR | 15,000,000 | $433,201 | ($434,770) |
| Rate Swap | | EURIBOR | | | | | | | |
| | | TELERATE | | | | | | | |
| 10-Year Interest | Morgan Stanley | EUR | Receive | 2.70% | Dec 2014 | EUR | 17,300,000 | 968,127 | (1,456,572) |
| Rate Swap | | EURIBOR | | | | | | | |
| | | TELERATE | | | | | | | |
| 10-Year Interest | Royal Bank of | EUR | Receive | 2.80% | Jan 2015 | EUR | 1,500,000 | 90,054 | (136,069) |
| Rate Swap | Scotland PLC | EURIBOR | | | | | | | |
| | | TELERATE | | | | | | | |
| 10-Year Interest | Royal Bank of | EUR | Receive | 2.80% | Jun 2015 | EUR | 26,000,000 | 2,201,020 | (2,282,185) |
| Rate Swap | Scotland PLC | EURIBOR | | | | | | | |
| | | TELERATE | | | | | | | |
| 10-Year Interest | Royal Bank of | EUR | Receive | 2.80% | Jun 2015 | EUR | 19,750,000 | 1,481,673 | (1,731,374) |
| Rate Swap | Scotland PLC | EURIBOR | | | | | | | |
| | | TELERATE | | | | | | | |
| 30-Year Interest | Royal Bank of | USD LIBOR | Receive | 2.80% | Apr 2013 | USD | 12,488,000 | 738,209 | (1,493,110) |
| Rate Swap | Scotland PLC | BBA | | | | | | | |
| 30-Year Interest | Barclays Bank | USD LIBOR | Receive | 2.80% | Apr 2013 | USD | 6,812,000 | 373,929 | (814,467) |
| Rate Swap | PLC | BBA | | | | | | | |
| 30-Year Interest | Royal Bank of | USD LIBOR | Receive | 2.80% | Apr 2013 | USD | 36,000,000 | 2,096,913 | (4,361,454) |
| Rate Swap | Scotland PLC | BBA | | | | | | | |
| 30-Year Interest | Royal Bank of | USD LIBOR | Receive | 2.80% | May 2013 | USD | 6,400,000 | 540,800 | (778,842) |
| Rate Swap | Scotland PLC | BBA | | | | | | | |
| 30-Year Interest | Barclays Bank | USD LIBOR | Receive | 2.40% | Jun 2013 | USD | 41,000,000 | 2,394,400 | (2,868,520) |
| Rate Swap | PLC | BBA | | | | | | | |
| 30-Year Interest | Royal Bank of | USD LIBOR | Receive | 2.40% | Jun 2013 | USD | 16,000,000 | 927,900 | (1,129,744) |
| Rate Swap | Scotland PLC | BBA | | | | | | | |
| |
| 48 | Global Absolute Return Strategies Fund | Annual report |
| | | | | | | | | |
| | | FLOATING | PAY/RECEIVE | | | | | | |
| | | RATE | FLOATING | EXERCISE | EXPIRATION | CUR- | NOTIONAL | | |
| DESCRIPTION | COUNTERPARTY | INDEX | RATE | RATE | DATE | RENCY | AMOUNT | PREMIUM | VALUE |
|
| 30-Year Interest | Royal Bank of | USD LIBOR | Receive | 2.40% | Jun 2013 | USD | 28,500,000 | $1,652,821 | ($2,012,356) |
| Rate Swap | Scotland PLC | BBA | | | | | | | |
| 30-Year Interest | Morgan Stanley | USD LIBOR | Receive | 2.40% | Jul 2013 | USD | 7,500,000 | 562,500 | (537,052) |
| Rate Swap | | BBA | | | | | | | |
| 30-Year Interest | Morgan Stanley | USD LIBOR | Receive | 2.40% | Jul 2013 | USD | 19,000,000 | 1,425,000 | (1,360,531) |
| Rate Swap | | BBA | | | | | | | |
| | | | | | | | 253,250,000 | $15,886,547 | ($21,397,046) |
Swaps. The Fund may enter into interest rate, credit default, and other forms of swap agreements. Swap agreements are agreements between a fund and counterparty to exchange cash flows, assets, foreign currencies or market-linked returns at specified intervals. Swap agreements are privately negotiated in the over-the-counter market (OTC swaps) or may be executed on a registered commodities exchange (exchange traded swaps). Swaps are marked-to-market daily and the change in value is recorded as a component of unrealized appreciation/depreciation of swap contracts. The value of the swap will typically implicate collateral posting obligations by the party that is considered out-of-the-money on the swap.
Upfront payments made/received by the Fund are amortized/accreted for financial reporting purposes, with the unamortized/unaccreted portion included in the Statement of assets and liabilities. A termination payment by the counterparty or the Fund is recorded as realized gain or loss, as well as the net periodic payments received or paid by the Fund.
Entering into swap agreements involves, to varying degrees, elements of credit, market and documentation risk that may amount to values that are in excess of the amounts recognized on the Statement of assets and liabilities. Such risks involve the possibility that there will be no liquid market for the swap, or that a counterparty may default on its obligation or delay payment under the swap terms. The counterparty may disagree or contest the terms of the swap. Market risks may also accompany the swap, including interest rate risk. The Fund may also suffer losses if it is unable to terminate or assign outstanding swaps or reduce its exposure through offsetting transactions.
Interest rate swaps. Interest rate swaps represent an agreement between a Fund and counterparty to exchange cash flows based on the difference between two interest rates applied to a notional amount. The payment flows are usually netted against each other, with the difference being paid by one party to the other. The Fund settles accrued net interest receivable or payable under the swap contracts at specified, future intervals.
During the period ended July 31, 2012, the Fund used interest rate swaps to manage against anticipated interest rate changes and maintain diversity and liquidity of the portfolio. The following table summarizes the interest rate swap contracts held as of July 31, 2012. During the period ended July 31, 2012, the Fund held interest rate swaps with total USD notional amounts ranging up to $298.0 million, as measured at each quarter end.
| | | | | | | | | |
| | | | | | | | | | UNREALIZED |
| | | | | | | | | | APPRECIATION |
| | NOTIONAL | | | USD NOTIONAL | | PAYMENTS MADE | PAYMENTS RECEIVED | MATURITY | (DEPRECIATION)/ |
| COUNTERPARTY | AMOUNT | | CURRENCY | AMOUNT | | BY FUND | BY FUND | DATE | MARKET VALUE |
|
| Barclays Bank | 12,000,000 | | USD | 12,000,000 | | Fixed 2.093% | 3 Month LIBOR | Apr 2022 | ($645,452) |
| PLC | | | | | | | | | |
| Barclays Bank | 18,446,000 | | EUR | 23,242,891 | | Fixed 1.794% | EUR-EURIBOR- | May 2042 | 681,761 |
| PLC | | | | | | | TELERATE | | |
| Barclays Bank | 4,054,000 | | EUR | 5,080,474 | | Fixed 1.695% | EUR-EURIBOR- | May 2042 | 179,592 |
| PLC | | | | | | | TELERATE | | |
| |
| Annual report | Global Absolute Return Strategies Fund | 49 |
| | | | | | | | | |
| | | | | | | | | | UNREALIZED |
| | | | | | | | | | APPRECIATION |
| | NOTIONAL | | | USD NOTIONAL | | PAYMENTS MADE | PAYMENTS RECEIVED | MATURITY | (DEPRECIATION)/ |
| COUNTERPARTY | AMOUNT | | CURRENCY | AMOUNT | | BY FUND | BY FUND | DATE | MARKET VALUE |
|
| Barclays Bank | 16,234,000 | | GBP | 25,500,379 | | GBP- LIBOR- BBA | Fixed 3.394% | May 2042 | ($138,548) |
| PLC | | | | | | | | | |
| Barclays Bank | 3,566,000 | | GBP | 5,585,962 | | GBP- LIBOR- BBA | Fixed 3.330% | May 2042 | (48,687) |
| PLC | | | | | | | | | |
| Barclays Bank | 27,500,000 | | USD | 27,500,000 | | Fixed 1.820% | 3 Month LIBOR | Jun 2022 | (619,839) |
| PLC | | | | | | | | | |
| Barclays Bank | 2,488,734 | | AUD | 2,551,077 | | AUD-BBR-BBSW | Fixed 3.980% | Jul 2022 | (15,391) |
| PLC | | | | | | | | | |
| Barclays Bank | 2,488,734 | | AUD | 2,551,077 | | AUD-BBR-BBSW | Fixed 3.970% | Jul 2022 | (16,871) |
| PLC | | | | | | | | | |
| Goldman Sachs | 26,000,000 | | USD | 26,000,000 | | Fixed 2.039% | 3 Month LIBOR | Dec 2021 | (1,227,755) |
| Morgan Stanley | 11,750,000 | | GBP | 18,453,952 | | GBP- LIBOR- BBA | Fixed 3.600% | Jun 2042 | 94,187 |
| Morgan Stanley | 15,100,000 | | EUR | 19,155,849 | | Fixed 2.270% | EUR-EURIBOR- | Jun 2042 | 27,610 |
| | | | | | | | TELERATE | | |
| Morgan Stanley | 17,000,000 | | USD | 17,000,000 | | Fixed 1.613% | 3 Month LIBOR | Jul 2022 | (17,817) |
| The Royal Bank | 28,000,000 | | USD | 28,000,000 | | Fixed 1.775% | 3 Month LIBOR | Jul 2022 | (488,992) |
| of Scotland PLC | | | | | | | | | |
| The Royal Bank | 11,040,234 | | AUD | 11,480,738 | | AUD-BBR-BBSW | Fixed 3.903% | Jul 2022 | (119,139) |
| of Scotland PLC | | | | | | | | | |
| The Royal Bank | 11,040,234 | | AUD | 11,386,345 | | AUD-BBR-BBSW | Fixed 3.913% | Jul 2022 | (112,576) |
| of Scotland PLC | | | | | | | | | |
| The Royal Bank | 10,500,000 | | GBP | 16,444,586 | | GBP- LIBOR- BBA | Fixed 3.550% | Jun 2042 | 42,768 |
| of Scotland PLC | | | | | | | | | |
| The Royal Bank | 9,000,000 | | EUR | 11,389,493 | | Fixed 2.245% | EUR-EURIBOR- | Jul 2042 | 33,685 |
| of Scotland PLC | | | | | | | TELERATE | | |
| UBS AG | 8,000,000 | | EUR | 9,792,797 | | Fixed 2.267% | EUR-EURIBOR- | Jul 2042 | 17,460 |
| | | | | | | | TELERATE | | |
| UBS AG | 8,000,000 | | EUR | 10,088,794 | | Fixed 2.394% | EUR-EURIBOR- | Jul 2042 | (58,295) |
| | | | | | | | TELERATE | | |
| UBS AG | 7,500,000 | | GBP | 11,679,751 | | GBP- LIBOR- BBA | Fixed 3.540% | Jul 2042 | 25,051 |
| UBS AG | 2,000,000 | | GBP | 3,138,998 | | GBP- LIBOR- BBA | Fixed 3.573% | Jul 2042 | 11,774 |
| | | | | 298,023,163 | | | | | ($2,395,474) |
Credit default swaps. Credit default swaps (CDS) involve the exchange of a fixed rate premium (paid by the Buyer), for protection against the loss in value of an underlying debt instrument, referenced entity or index, in the event of a defined credit event (such as payment default or bankruptcy). Under the terms of the swap, one party acts as a “guarantor” (the Seller), receiving the premium and agreeing to remedies that are specified within the credit default agreement. The Fund may enter into CDS in which it may act as either Buyer or Seller. By acting as the Seller, the Fund may incur economic leverage since it would be obligated to pay the Buyer the notional amount of the contract in the event of a default. The amount of loss in such case would be reduced by any recovery value on the underlying credit.
The resulting values for credit default swap agreements on credit indices serve as an indicator of the current status of the payment/performance risk and represent the likelihood of an expected liability (or profit) for the credit derivative should the swap agreement be closed/sold as of the period end. Increasing market values, in absolute terms when compared to the notional amount of the swap, represent a deterioration of the referenced entity’s credit soundness and a greater likelihood of a credit event occurring. The maximum potential amount of future payments (undiscounted) that the Fund as the Seller could be required to make under a CDS agreement would be an amount equal to the notional amount of the agreement.
During the period ended July 31, 2012, the Fund used CDS as a Buyer of protection to manage against potential credit events and gain exposure to security or credit index. The following table
| |
| 50 | Global Absolute Return Strategies Fund | Annual report |
summarizes the credit default swap contracts the Fund held as of July 31, 2012 as a Buyer of protection. During the period ended July 31, 2012, the Fund held credit default swap contracts with total USD notional amounts ranging up to $55.2 million, as measured at each quarter end.
| | | | | | | | | | | |
| | | | | | | | | | UNAMORTIZED | | |
| | | | | | USD | | (PAY)/ | | UPFRONT | UNREALIZED | |
| COUNTER- | REFERENCE | NOTIONAL | | | NOTIONAL | | RECEIVED | MATURITY | PAYMENT PAID | APPRECIATION | MARKET |
| PARTY | OBLIGATION | AMOUNT | | CURRENCY | AMOUNT | | FIXED RATE | DATE | (RECEIVED) | (DEPRECIATION) | VALUE |
|
| Buy | | | | | | | | | | | |
| Barclays Bank | iTraxx Europe Senior | 2,000,000 | | EUR | $2,506,401 | | (1.00%) | Jun 2017 | $211,720 | ($43,218) | $168,502 |
| PLC | Financials S17 5-year | | | | | | | | | | |
| | index | | | | | | | | | | |
| BNP Paribas | iTraxx Europe Senior | 4,200,000 | | EUR | 5,263,442 | | (1.00%) | Jun 2017 | 445,440 | (91,585) | 353,855 |
| | Financials S17 5-year | | | | | | | | | | |
| | index | | | | | | | | | | |
| BNP Paribas | iTraxx Europe Senior | 20,000,000 | | EUR | 25,309,984 | | (1.00%) | Jun 2017 | 1,772,021 | (86,998) | 1,685,023 |
| | Financials S17 5-year | | | | | | | | | | |
| | index | | | | | | | | | | |
| Credit Sussie | iTraxx Europe Senior | 5,200,000 | | EUR | 6,499,480 | | (1.00%) | Jun 2017 | 536,095 | (97,989) | 438,106 |
| International | Financials S17 5-year | | | | | | | | | | |
| | index | | | | | | | | | | |
| Morgan | iTraxx Europe Senior | 7,800,000 | | EUR | 9,774,571 | | (1.00%) | Jun 2017 | 817,731 | (160,572) | 657,159 |
| Stanley | Financials S17 5-year | | | | | | | | | | |
| | index | | | | | | | | | | |
| | | | | | $49,353,878 | | | | $3,783,007 | ($480,362) | $3,302,645 |
The Fund used CDS as a Seller of protection during the period ended July 31, 2012 to take a long position in the exposure of the benchmark credit and gain exposure to security or credit index. The following table summarizes the credit default swap contracts the Fund held as of July 31, 2012 where the Fund acted as a Seller of protection. During the period ended July 31, 2012, the Fund acted as Seller on credit default swap contracts with total USD notional amounts ranging up to $128.1 million, as measured at each quarter end.
| | | | | | | | | | | |
| | | | | | | | | | UNAMORTIZED | | |
| | | | | | | | (PAY)/ | | UPFRONT | | |
| | | | | | USD | | RECEIVED | | PAYMENT | UNREALIZED | |
| | REFERENCE | NOTIONAL | | CUR- | NOTIONAL | | FIXED | MATURITY | PAID | APPRECIATION | MARKET |
| COUNTERPARTY | OBLIGATION | AMOUNT | | RENCY | AMOUNT | | RATE | DATE | (RECEIVED) | (DEPRECIATION) | VALUE |
|
| Sell | | | | | | | | | | | |
| Barclays Bank PLC | iTraxx Europe | 5,000,000 | | EUR | $6,610,749 | | 5.000 % | Jun 2017 | $543,458 | ($307,451) | $236,007 |
| | Sub. Financials | | | | | | | | | | |
| | S17 5-year | | | | | | | | | | |
| | index | | | | | | | | | | |
| BNP Paribas | iTraxx Europe | 5,000,000 | | EUR | 6,633,253 | | 5.000 % | Jun 2017 | 483,704 | (247,697) | 236,007 |
| | Sub. Financials | | | | | | | | | | |
| | S17 5-year | | | | | | | | | | |
| | index | | | | | | | | | | |
| BNP Paribas | iTraxx Europe | 5,500,000 | | EUR | 7,270,997 | | 5.000 % | Jun 2017 | 276,669 | (17,061) | 259,608 |
| | Sub. Financials | | | | | | | | | | |
| | S17 5-year | | | | | | | | | | |
| | index | | | | | | | | | | |
| BNP Paribas | iTraxx Europe | 50,000,000 | | EUR | 63,274,960 | | 5.000 % | Jun 2017 | 1,769,979 | 590,090 | 2,360,069 |
| | Sub. Financials | | | | | | | | | | |
| | S17 5-year | | | | | | | | | | |
| | index | | | | | | | | | | |
| Credit Sussie | CDX North | 1,188,000 | | USD | 1,188,000 | | 5.000 % | Jun 2017 | (29,327) | 301 | (29,026) |
| International | American High | | | | | | | | | | |
| | Yield S18 5-year | | | | | | | | | | |
| | index | | | | | | | | | | |
| |
| Annual report | Global Absolute Return Strategies Fund | 51 |
| | | | | | | | | | | |
| | | | | | | | | | UNAMORTIZED | | |
| | | | | | | | (PAY)/ | | UPFRONT | | |
| | | | | | USD | | RECEIVED | | PAYMENT | UNREALIZED | |
| | REFERENCE | NOTIONAL | | CUR- | NOTIONAL | | FIXED | MATURITY | PAID | APPRECIATION | MARKET |
| COUNTERPARTY | OBLIGATION | AMOUNT | | RENCY | AMOUNT | | RATE | DATE | (RECEIVED) | (DEPRECIATION) | VALUE |
|
| Sell | | | | | | | | | | | |
| Morgan Stanley | iTraxx Europe | 26,000,000 | | EUR | $34,676,191 | | 5.000 % | Jun 2017 | $2,071,868 | ($844,632) | $1,227,236 |
| | Sub. Financials | | | | | | | | | | |
| | S17 5-year | | | | | | | | | | |
| | index | | | | | | | | | | |
| Morgan Stanley | iTraxx Europe | 6,500,000 | | EUR | 8,399,626 | | 5.000 % | Jun 2017 | 238,996 | 67,813 | 306,809 |
| | Sub. Financials | | | | | | | | | | |
| | S17 5-year | | | | | | | | | | |
| | index | | | | | | | | | | |
| | | | | | $128,053,776 | | | | $5,355,347 | ($758,637) | $4,596,710 |
Variance Swaps. Variance swap agreements involve two parties agreeing to exchange cash flows based on the measured variance (or square of volatility) of a specified underlying asset. One party agrees to exchange a “fixed rate” or strike price payment for the “floating rate” or realized price variance on the underlying asset with respect to the notional amount. At inception, the strike price is generally chosen such that the fair value of the swap is zero. At the maturity date, a net cash flow is exchanged, where the payoff amount is equivalent to the difference between the realized price variance of the underlying asset and the strike price multiplied by the notional amount. As a receiver of the realized price variance, the Fund would receive the payoff amount when the realized price variance of the underlying asset is greater than the strike price and would owe the payoff amount when the variance is less than the strike. As a payer of the realized price variance the Fund would owe the payoff amount when the realized price variance of the underlying asset is greater than the strike price and would receive the payoff amount when the variance is less than the strike.
The Fund used variance swaps during the period ended July 31, 2012 to manage against anticipated changes in securities markets. The following table summarizes the variance swap contracts the Fund held as of July 31, 2012. During the period ended July 31, 2012, the Fund held variance swap contracts with total USD notional amounts ranging up to $3.5 million, as measured at each quarter end.
| | | | | | | | | |
| | | | | | | | | | UNREALIZED |
| | | | | USD | | PAY/ | | | APPRECIATION |
| | REFERENCE | CUR- | NOTIONAL | NOTIONAL | | RECEIVE | MATURITY | VOLATILITY | (DEPRECIATION)/ |
| COUNTERPARTY | ENTITY | RENCY | AMOUNT | AMOUNT | | VARIANCE | DATE | STRIKE PRICE | MARKET VALUE |
|
| BNP Paribas SA | Nikkei 225 Index | JPY | 865,000 | $11,026 | | Receive | Dec 2013 | 29.70% | ($50,828) |
| BNP Paribas SA | Nikkei 225 Index | JPY | 1,000,000 | 12,342 | | Receive | Dec 2013 | 28.70% | (39,791) |
| BNP Paribas SA | Nikkei 225 Index | JPY | 6,350,000 | 79,464 | | Receive | Dec 2013 | 28.75% | (245,747) |
| BNP Paribas SA | Nikkei 225 Index | JPY | 2,000,000 | 25,042 | | Receive | Dec 2013 | 28.75% | (74,672) |
| BNP Paribas SA | Nikkei 225 Index | JPY | 4,500,000 | 56,745 | | Receive | Dec 2013 | 31.00% | (279,521) |
| BNP Paribas SA | Nikkei 225 Index | JPY | 19,059,026 | 237,361 | | Receive | Dec 2013 | 30.00% | (899,244) |
| BNP Paribas SA | Nikkei 225 Index | JPY | 21,500,000 | 271,287 | | Receive | Dec 2013 | 27.80% | (359,153) |
| BNP Paribas SA | FTSE 100 Index | GBP | 9,000 | 14,284 | | Pay | Dec 2013 | 27.50% | 28,583 |
| BNP Paribas SA | FTSE 100 Index | GBP | 11,000 | 17,706 | | Pay | Dec 2013 | 27.00% | 18,973 |
| BNP Paribas SA | FTSE 100 Index | GBP | 38,000 | 59,514 | | Pay | Dec 2013 | 27.00% | 33,580 |
| BNP Paribas SA | FTSE 100 Index | GBP | 46,000 | 71,705 | | Pay | Dec 2013 | 27.00% | 49,427 |
| BNP Paribas SA | FTSE 100 Index | GBP | 57,000 | 88,766 | | Pay | Dec 2013 | 26.50% | (19,153) |
| BNP Paribas SA | S&P 500 Index | USD | 5,000 | 5,000 | | Pay | Dec 2013 | 26.70% | 8,474 |
| BNP Paribas SA | S&P 500 Index | USD | 11,000 | 11,000 | | Pay | Dec 2013 | 27.80% | 37,884 |
| BNP Paribas SA | S&P 500 Index | USD | 10,000 | 10,000 | | Pay | Dec 2013 | 29.00% | 41,958 |
| BNP Paribas SA | S&P 500 Index | USD | 105,000 | 105,000 | | Pay | Dec 2013 | 26.80% | 152,333 |
| BNP Paribas SA | S&P 500 Index | USD | 10,000 | 10,000 | | Pay | Dec 2013 | 27.00% | 15,159 |
| BNP Paribas SA | S&P 500 Index | USD | 60,000 | 60,000 | | Pay | Dec 2013 | 29.50% | 221,640 |
| BNP Paribas SA | S&P 500 Index | USD | 221,958 | 221,958 | | Pay | Dec 2013 | 28.30% | 502,154 |
| BNP Paribas SA | S&P 500 Index | USD | 265,000 | 265,000 | | Pay | Dec 2013 | 26.50% | 73,164 |
| |
| 52 | Global Absolute Return Strategies Fund | Annual report |
| | | | | | | | | |
| | | | | | | | | | UNREALIZED |
| | | | | USD | | PAY/ | | | APPRECIATION |
| | REFERENCE | CUR- | NOTIONAL | NOTIONAL | | RECEIVE | MATURITY | VOLATILITY | (DEPRECIATION)/ |
| COUNTERPARTY | ENTITY | RENCY | AMOUNT | AMOUNT | | VARIANCE | DATE | STRIKE PRICE | MARKET VALUE |
|
| BNP Paribas SA | China Enterprises Index | HKD | 150,000 | $19,314 | | Receive | Dec 2013 | 37.20% | ($105,746) |
| | (Hang Seng) | | | | | | | | |
| BNP Paribas SA | China Enterprises Index | HKD | 410,000 | 52,832 | | Receive | Dec 2013 | 37.40% | (272,657) |
| | (Hang Seng) | | | | | | | | |
| BNP Paribas SA | China Enterprises Index | HKD | 500,000 | 64,451 | | Receive | Dec 2013 | 36.50% | (276,049) |
| | (Hang Seng) | | | | | | | | |
| BNP Paribas SA | China Enterprises Index | HKD | 565,000 | 72,839 | | Receive | Dec 2013 | 35.00% | (198,179) |
| | (Hang Seng) | | | | | | | | |
| Goldman Sachs | Nikkei 225 Index | JPY | 23,000,000 | 287,730 | | Receive | Dec 2013 | 29.40% | (897,379) |
| Goldman Sachs | S&P 500 Index | USD | 290,000 | 290,000 | | Pay | Dec 2013 | 27.80% | 510,428 |
| Morgan Stanley | Nikkei 225 Index | JPY | 29,000,000 | 371,664 | | Receive | Dec 2013 | 33.00% | (2,879,214) |
| Morgan Stanley | Nikkei 225 Index | JPY | 237,000 | 3,060 | | Receive | Dec 2013 | 29.00% | (12,874) |
| Morgan Stanley | Nikkei 225 Index | JPY | 353,000 | 4,603 | | Receive | Dec 2013 | 29.00% | (19,076) |
| Morgan Stanley | Nikkei 225 Index | JPY | 1,225,000 | 15,228 | | Receive | Dec 2013 | 28.50% | (46,038) |
| Morgan Stanley | Nikkei 225 Index | JPY | 3,750,000 | 46,354 | | Receive | Dec 2013 | 28.70% | (150,856) |
| Morgan Stanley | FTSE 100 Index | GBP | 62,000 | 98,059 | | Pay | Dec 2013 | 27.80% | 226,061 |
| Morgan Stanley | S&P 500 Index | USD | 370,000 | 370,000 | | Pay | Dec 2013 | 33.65% | 3,191,905 |
| Morgan Stanley | S&P 500 Index | USD | 3,000 | 3,000 | | Pay | Dec 2013 | 27.00% | 8,963 |
| Morgan Stanley | S&P 500 Index | USD | 5,000 | 5,000 | | Pay | Dec 2013 | 27.00% | 14,829 |
| Morgan Stanley | S&P 500 Index | USD | 46,440 | 46,440 | | Pay | Dec 2013 | 27.20% | 100,884 |
| Morgan Stanley | China Enterprises Index | HKD | 762,600 | 98,196 | | Receive | Dec 2013 | 37.70% | (631,674) |
| | (Hang Seng) | | | | | | | | |
| | | | | $3,481,970 | | | | | ($2,221,452) |
Inflation swaps. In an inflation swap, one party pays a fixed rate on a notional principal amount while the other party pays a floating rate linked to an inflation index on that same notional amount. The party paying the floating rate pays the inflation adjusted rate multiplied by the notional principal amount. If the average inflation rate over the term of the swap is the same as the fixed rate of the swap, the two legs will have the same value and the swap will break even.
The Fund used inflation swaps during the period ended July 31, 2012 to maintain diversity and liquidity of the portfolio and manage against anticipated changes in inflation. The following table summarizes the inflation swap contracts the Fund held as of July 31, 2012. During the period ended July 31, 2012, the Fund held inflation swap contracts with total USD notional amounts ranging up to $11.1 million, as measured at each quarter end.
| | | | | | | | | |
| | | | | | | | | | UNREALIZED |
| | | | | | | | | | APPRECIATION |
| | NOTIONAL | | CUR- | USD NOTIONAL | | PAYMENTS MADE | PAYMENTS RECEIVED | MATURITY | (DEPRECIATION)/ |
| COUNTERPARTY | AMOUNT | | RENCY | AMOUNT | | BY FUND | BY FUND | DATE | MARKET VALUE |
|
| Morgan Stanley | $2,060,000 | | GBP | $3,199,592 | | Fixed 2.83% | GBP-Non Revised RPI | Jul 2022 | ($31,982) |
| Morgan Stanley | 700,000 | | GBP | 1,087,240 | | GBP-Non Revised RPI | Fixed 3.3475% | Jul 2042 | 40,350 |
| The Royal Bank of Scotland PLC | 2,860,000 | | EUR | 3,522,233 | | Fixed 1.76% | EUR-EX Tobacco | Jul 2022 | 68,155 |
| | | | | | | | NR CPI | | |
| The Royal Bank of Scotland PLC | 3,270,000 | | USD | 3,270,000 | | USD-Non Revised CPI | Fixed 2.36% | Jul 2022 | (23,243) |
| | | | | $11,079,065 | | | | | $53,280 |
| |
| Annual report | Global Absolute Return Strategies Fund | 53 |
Fair value of derivative instruments by risk category
The table below summarizes the fair value of derivatives held by the Fund at July 31, 2012 by risk category:
| | | | |
| | | FINANCIAL | ASSET | LIABILITY |
| | STATEMENT OF ASSETS | INSTRUMENTS | DERIVATIVES | DERIVATIVES |
| RISK | AND LIABILITIES LOCATION | LOCATION | FAIR VALUE | FAIR VALUE |
|
| Interest rate contracts | Investments, at value* | Purchased options | $7,492,127 | — |
| Interest rate contracts | Written options, at value | Written options | — | ($21,397,046) |
| Interest rate contracts | Receivable/payable for futures | Futures† | 4,220,357 | — |
| Interest rate contracts | Swap contracts, at value | Interest rate swaps | 1,113,888 | (3,509,362) |
| Interest rate contracts | Swap contracts, at value | Inflation swaps | 108,505 | (55,225) |
| Foreign exchange contracts | Investments, at value* | Purchased options | 764,156 | — |
| Foreign exchange contracts | Written options, at value | Written options | — | (496,331) |
| Foreign exchange contracts | Receivable/payable for forward | Forward foreign | 6,406,028 | (7,202,055) |
| | foreign currency exchange contracts | currency contracts | | |
| Equity contracts | Investments, at value* | Purchased options | 21,966,886 | — |
| Equity contracts | Written options, at value | Written options | — | (13,825,673) |
| Equity contracts | Receivable/payable for futures | Futures† | 2,554,858 | (2,808,667) |
| Equity contracts | Swap contracts, at value | Variance swaps | 5,236,399 | (7,457,851) |
| Credit contracts | Swap contracts, at value | Credit default swaps | 7,928,381 | (29,026) |
* Purchased options are included in the Portfolio of investments.
† Reflects cumulative appreciation/depreciation on futures as disclosed in Note 3. Only the period end variation margin is separately disclosed on the Statement of assets and liabilities.
Effect of derivative instruments on the Statement of operations
The table below summarizes the net realized gain (loss) included in the net increase (decrease) in net assets from operations, classified by derivative instrument and risk category, for the period ended July 31, 2012:
| | | | | | | |
| | STATEMENT OF | INVESTMENTS | | | | FOREIGN | |
| | OPERATIONS | (PURCHASED | WRITTEN | FUTURES | SWAP | CURRENCY | |
| RISK | LOCATION | OPTIONS) | OPTIONS | CONTRACTS | CONTRACTS | TRANSACTIONS* | TOTAL |
|
| Interest rate | Net realized gain | — | $1,329,062 | $1,253,008 | $186,625 | — | $2,768,695 |
| contracts | (loss) | | | | | | |
| Foreign exchange | Net realized gain | — | — | — | — | $4,358,899 | $4,358,899 |
| contracts | (loss) | | | | | | |
| Equity contracts | Net realized gain | $930,448 | (3,974,900) | 6,908,928 | 2,237 | — | $3,866,713 |
| | (loss) | | | | | | |
| Credit contracts | Net realized gain | — | — | — | 3,668,410 | — | $3,668,410 |
| | (loss) | | | | | | |
| Total | | $930,448 | ($2,645,838) | $8,161,936 | $3,857,272 | $4,358,899 | $14,662,717 |
* Realized gain/loss associated with forward foreign currency contracts is included in the caption on the Statement of operations.
| |
| 54 | Global Absolute Return Strategies Fund | Annual report |
The table below summarizes the net change in unrealized appreciation (depreciation) included in the net increase (decrease) in net assets from operations, classified by derivative instrument and risk category, for the period ended July 31, 2012:
| | | | | | | |
| | | | | | | TRANSLATION | |
| | | | | | | OF ASSETS | |
| | STATEMENT OF | INVESTMENTS | | | | AND LIABILITIES | |
| | OPERATIONS | (PURCHASED | FUTURES | WRITTEN | SWAP | IN FOREIGN | |
| RISK | LOCATION | OPTIONS) | CONTRACTS | OPTIONS | CONTRACTS | CURRENCIES* | TOTAL |
|
| Interest rate | Change in | $1,610,018 | $4,220,357 | ($5,510,499) | ($2,342,194) | — | ($2,022,318) |
| contracts | unrealized | | | | | | |
| | appreciation | | | | | | |
| | (depreciation) | | | | | | |
| Foreign exchange | Change in | (220,654) | — | 570,044 | — | ($796,027) | ($446,637) |
| contracts | unrealized | | | | | | |
| | appreciation | | | | | | |
| | (depreciation) | | | | | | |
| Equity contracts | Change in | (4,090,633) | (253,809) | 588,486 | (2,221,452) | — | ($5,977,408) |
| | unrealized | | | | | | |
| | appreciation | | | | | | |
| | (depreciation) | | | | | | |
| Credit contracts | Change in | — | — | — | (1,238,999) | — | ($1,238,999) |
| | unrealized | | | | | | |
| | appreciation | | | | | | |
| | (depreciation) | | | | | | |
| Total | | ($2,701,269) | $3,966,548 | ($4,351,969) | ($5,802,645) | ($796,027) | ($9,685,362) |
* Change in unrealized appreciation/depreciation associated with forward foreign currency contracts is included in the caption on the Statement of operations.
Note 4 — Guarantees and indemnifications
Under the Fund’s organizational documents, its Officers and Trustees are indemnified against certain liabilities arising out of the performance of their duties to the Fund. Additionally, in the normal course of business, the Fund enters into contracts with service providers that contain general indemnification clauses. The Fund’s maximum exposure under these arrangements is unknown, as this would involve future claims that may be made against the Fund that have not yet occurred. The risk of material loss from such claims is considered remote.
Note 5 — Fees and transactions with affiliates
John Hancock Investment Management Services, LLC (the Adviser), serves as investment adviser for the Fund. John Hancock Funds, LLC (the Distributor), an affiliate of the Adviser, serves as principal underwriter of the Fund. The Adviser and the Distributor are indirect wholly owned subsidiaries of Manulife Financial Corporation (MFC).
Management fee. The Fund pays the Adviser a daily management fee for its services. If the net assets of the Fund were equal to or less than $500,000,000, the management fee paid to the Adviser is equivalent, on an annual basis, to the sum of: a) 1.30% of the first $200,000,000 of the Fund’s average daily net assets and b) 1.25% of the next $300,000,000 of average daily net assets. If the net assets of the Fund exceed $500,000,000, the management fee paid to the Adviser is equivalent, on an annual basis, to 1.20% of average daily net assets. The Adviser has a subadvisory agreement with Standard Life Investments (Corporate Funds) Limited. The Fund is not responsible for payment of the subadvisory fees.
| |
| Annual report | Global Absolute Return Strategies Fund | 55 |
The Adviser has contractually agreed to waive a portion of its management fee for certain funds (the Participating Funds) of the Trust and John Hancock Variable Insurance Trust. The waiver equals, on an annualized basis, 0.01% of that portion of the aggregate net assets of all the Participating Funds that exceeds $75 billion but is less than $100 billion; and 0.015% of that portion of the aggregate net assets of all the Participating Funds that equals or exceeds $100 billion. The amount of the reimbursement is calculated daily and allocated among all the Participating Funds in proportion to the daily net assets of each fund. This arrangement may be amended or terminated at any time by the Adviser upon notice to the funds and with approval of the Board of Trustees.
The Adviser has contractually agreed to waive all or a portion of its management fee and/or reimburse operating expenses of the Fund, excluding certain expenses such as taxes, brokerage commissions, interest expense, litigation and indemnification expenses and other extraordinary expenses, to the extent necessary to maintain the Fund’s total operating expenses at 1.95%, 1.59%, 2.00% and 1.50% for Class A, Class I, Class R2 and Class R6 shares, respectively. The fee waivers and/or reimbursements will continue in effect until December 31, 2012 for Class A, Class I and Class R6 shares and March 1, 2013 for Class R2 shares, unless renewed by mutual agreement of the Fund and the Adviser based upon a determination that this is appropriate under the circumstances at the time.
The Adviser has voluntarily agreed to waive a portion of its management fee and/or reimburse the Fund, in order to limit the Fund’s expenses, excluding taxes, brokerage commissions, interest expense, litigation and indemnifications expenses and other extraordinary expenses not incurred in the ordinary course of the Fund’s business, advisory fees, 12b-1 fees, transfer agent fees and service fees, state registration fees and printing and postage fees, to 0.20% of the Fund’s average daily net asset value, on an annual basis. This voluntary arrangement may be amended or terminated at any time by the Adviser upon notice to the Fund.
For the period ended July 31, 2012, the expense reductions amounted to the following:
| | | |
| | EXPENSE | | |
| CLASS | REDUCTIONS | | |
| | |
| Class A | $6,012 | | |
| Class I | 5,387 | | |
| Class R2 | 6,713 | | |
| Class R6 | 6,816 | | |
| Class NAV | 5,070 | | |
| Total | $29,998 | | |
The investment management fees, including the impact of waivers and reimbursements incurred for the period ended July 31, 2012 were equivalent to a net effective rate of 1.24% of the Fund’s average daily net assets.
Expense recapture. The Adviser may recapture operating expenses reimbursed or fees waived under previous expense limitation or waiver arrangements made subsequent to December 19, 2011, for a period of three years following the beginning of the month in which such reimbursements or waivers originally occurred to the extent that the Fund is below its expense limitation during this period. Certain reimbursements or waivers are not subject to recapture. The expenses waived or reimbursed subject to potential recovery through July 1, 2015 are $23,266. For the period ended July 31, 2012, the Fund did not recapture any expenses.
Accounting and legal services. Pursuant to a service agreement, the Fund reimburses the Adviser for all expenses associated with providing the administrative, financial, legal, accounting and recordkeeping services to the Fund, including the preparation of all tax returns, periodic reports to shareholders and regulatory reports, among other services. These expenses are allocated to each
| |
| 56 | Global Absolute Return Strategies Fund | Annual report |
share class based on its relative net assets at the time the expense was incurred. These accounting and legal services fees incurred for the period ended July 31, 2012 amounted to an annual rate of 0.01% of the Fund’s average daily net assets.
Distribution and service plans. The Fund has a distribution agreement with the Distributor. The Fund has adopted distribution and service plans with respect to Class A and Class R2 pursuant to Rule 12b-1 under the 1940 Act, to pay the Distributor for services provided as the distributor of shares of the Fund. The Fund pays up to 0.30% and 0.25% for Class A and Class R2, respectively for distribution and service fees, expressed as an annual percentage of average daily net assets.
Sales charges. Class A shares are assessed up-front sales charges, which resulted in payments to the Distributor amounting to $179,456 for the period ended July 31, 2012. Of this amount, $23,438 was retained and used for printing prospectuses, advertising, sales literature and other purposes, $151,333 was paid as sales commissions to broker-dealers and $4,685 was paid as sales commissions to sales personnel of Signator Investors, Inc., a broker-dealer affiliate of the Adviser.
Transfer agent fees. The Fund has a transfer agent agreement with John Hancock Signature Services, Inc. (Signature Services), an affiliate of the Adviser. The transfer agent fees paid to Signature Services are determined based on the cost to Signature Services (Signature Services Cost) of providing recordkeeping services. The Signature Services Cost includes a component of allocated John Hancock corporate overhead for providing transfer agent services to the Fund and to all other John Hancock affiliated funds. It also includes out-of-pocket expenses that are comprised of payments made to third-parties for recordkeeping services provided to their clients who invest in one or more John Hancock funds. In addition, Signature Services Cost may be reduced by certain fees that Signature Services receives in connection with retirement and small accounts. Signature Services Cost is calculated monthly and allocated, as applicable, to four categories of share classes: Institutional Share Classes, Retirement Share Classes, Municipal Bond Classes and all other Retail Share Classes. Within each of these categories, the applicable costs are allocated to the affected John Hancock affiliated funds and/or classes, based on the relative average daily net assets.
Class level expenses. Class level expenses for the period ended July 31, 2012 were:
| | | | |
| | DISTRIBUTION | TRANSFER | STATE | PRINTING AND |
| CLASS | AND SERVICE FEES | AGENT FEES | REGISTRATION FEES | POSTAGE |
|
| Class A | $73,983 | $47,767 | $13,351 | $726 |
| Class I | — | 35,943 | 17,441 | 2,524 |
| Class R2 | 103 | 13 | 6,828 | 12 |
| Class R6 | — | 13 | 6,828 | 12 |
| Total | $74,086 | $83,736 | $44,448 | $3,274 |
Trustee expenses. The Trust compensates each Trustee who is not an employee of the Adviser or its affiliates. The costs of paying Trustee compensation and expenses are allocated to each Fund based on its average daily net assets.
Note 6 — Fund share transactions
Transactions in Fund shares for the period ended July 31, 2012 were as follows:
| | | | |
| | | | Period ended 7-31-12 |
| | | | Shares | Amount |
| Class A shares1 | | | | |
|
| Sold | | | 17,012,010 | $178,509,182 |
| Repurchased | | | (491,934) | (5,169,958) |
| | | | | |
| Net increase | | | 16,520,076 | $173,339,224 |
| |
| Annual report | Global Absolute Return Strategies Fund | 57 |
| | | | |
| | | | Period ended 7-31-12 |
| | | | Shares | Amount |
| Class I shares1 | | | | |
|
| Sold | | | 16,693,504 | $176,277,719 |
| Repurchased | | | (938,029) | (9,894,949) |
| | | | | |
| Net increase | | | 15,755,475 | $166,382,770 |
| | | | | |
| Class R2 shares2 | | | | |
|
| Sold | | | 9,372 | $100,000 |
| | | | | |
| Net increase | | | 9,372 | $100,000 |
| | | | | |
| Class R6 shares2 | | | | |
|
| Sold | | | 9,372 | $100,000 |
| | | | | |
| Net increase | | | 9,372 | $100,000 |
| | | | | |
| Class NAV shares1 | | | | |
|
| Sold | | | 47,020,792 | $483,507,167 |
| Repurchased | | | (193,554) | (2,017,290) |
| | | | | |
| Net increase | | | 46,827,238 | $481,489,877 |
| | | | | |
| Net increase | | | 79,121,533 | $821,411,871 |
|
1 Period from 12-19-11 (commencement of operations) to 7-31-12.
2 Period from 3-1-12 (inception date) to 7-31-12.
Affiliates of the Fund owned 100% of shares of beneficial interest of Class R2, Class R6 and Class NAV on July 31, 2012.
Note 7 — Purchase and sale of securities
Purchases and sales of securities, other than short-term securities and U.S. Treasury obligations, aggregated $556,017,713 and $77,553,483, respectively, for the period ended July 31, 2012. Purchases and sales of U.S. Treasury obligations aggregated $165,087,994 and $12,409,983, respectively, for the period ended July 31, 2012.
Note 8 — Investment by affiliated funds
Certain investors in the Fund are affiliated funds and are managed by the Adviser and its affiliates. The affiliated funds do not invest in the Fund for the purpose of exercising management or control; however, this investment may represent a significant portion of the Fund’s net assets. For the period ended July 31, 2012, the following funds had an affiliate ownership concentration of 5% or more of the Fund’s net assets:
| | | |
| | AFFILIATED | | |
| FUND | CONCENTRATION | | |
| | |
| John Hancock Lifestyle Balanced Portfolio | 18.3% | | |
| John Hancock Lifestyle Growth Portfolio | 13.5% | | |
| John Hancock Lifestyle Moderate Portfolio | 6.4% | | |
| John Hancock Lifestyle Conservative Portfolio | 6.3% | | |
| |
| 58 | Global Absolute Return Strategies Fund | Annual report |
Auditor’s report
Report of Independent Registered Public Accounting Firm
To the Board of Trustees of John Hancock Funds II and Shareholders of
John Hancock Global Absolute Return Strategies Fund:
In our opinion, the accompanying statement of assets and liabilities, including the schedule of investments, and the related statements of operations and of changes in net assets and the financial highlights present fairly, in all material respects, the financial position of John Hancock Global Absolute Return Strategies Fund (the “Fund”) at July 31, 2012, and the results of its operations, the changes in its net assets and the financial highlights for the period December 19, 2011 (commencement of operations) through July 31, 2012, in conformity with accounting principles generally accepted in the United States of America. These financial statements and financial highlights (hereafter referred to as “financial statements”) are the responsibility of the Fund’s management; our responsibility is to express an opinion on these financial statements based on our audit. We conducted our audit of these financial statements in accordance with the standards of the Public Company Accounting Oversight Board (United States). Those standards require that we plan and perform the audit to obtain reasonable assurance about whether the financial statements are free of material misstatement. An audit includes examining, on a test basis, evidence supporting the amounts and disclosures in the financial statements, assessing the accounting principles used and significant estimates made by management, and evaluating the overall financial statement presentation. We believe that our audit, which included confirmation of securities at July 31, 2012 by correspondence with the custodian and brokers, and the application of alternative auditing procedures where securities purchased confirmations had not been received, provides a reasonable basis for our opinion.
PricewaterhouseCoopers LLP
Boston, Massachusetts
September 24, 2012
| |
| Annual report | Global Absolute Return Strategies Fund | 59 |
Tax information
Unaudited
For federal income tax purposes, the following information is furnished with respect to the distributions of the Fund, if any, paid during its taxable year ended July 31, 2012.
The Fund reports the maximum amount allowable of its net taxable income as eligible for the corporate dividends-received deduction.
The Fund reports the maximum amount allowable of its net taxable income as qualified dividend income as provided in the Jobs and Growth Tax Relief Reconciliation Act of 2003.
Eligible shareholders will be mailed a 2012 Form 1099-DIV in early 2013. This will reflect the tax character of all distributions paid in calendar year 2012.
| |
| 60 | Global Absolute Return Strategies Fund | Annual report |
Trustees and Officers
This chart provides information about the Trustees and Officers of John Hancock Funds II who oversee your John Hancock fund. Officers elected by the Trustees manage the day-to-day operations of the Portfolio and execute policies formulated by the Trustees.
| | |
| Independent Trustees | | |
| | | |
| Name, Year of Birth | Trustee | Number of |
| Position(s) held with Fund | of the | John Hancock |
| Principal occupation(s) and other | Trust | funds overseen |
| directorships during past 5 years | since1 | by Trustee |
| |
| Charles L. Bardelis, Born: 1941 | 2005 | 198 |
|
| Director, Island Commuter Corp. (Marine Transport). Trustee of John Hancock Variable Insurance |
| Trust (since 1988), John Hancock Funds II (since 2005) and former Trustee of John Hancock | |
| Funds III (2005–2006). | | |
| |
| Peter S. Burgess, Born: 1942 | 2005 | 198 |
|
| Consultant (financial, accounting and auditing matters) (since 1999); Certified Public Accountant. |
| Partner, Arthur Andersen (independent public accounting firm) (prior to 1999). Director of the following |
| publicly traded companies: Lincoln Educational Services Corporation (since 2004), Symetra Financial |
| Corporation (since 2010) and PMA Capital Corporation (2004–2010). Trustee of John Hancock Variable |
| Insurance Trust (since 2005), John Hancock Funds II (since 2005), and former Trustee of John Hancock |
| Funds III (2005–2006). | | |
| |
| Grace K. Fey, Born: 1946 | 2008 | 198 |
|
| Chief Executive Officer, Grace Fey Advisors (since 2007); Director & Executive Vice President, Frontier |
| Capital Management Company (1988–2007); Director, Fiduciary Trust (since 2009). Trustee of |
| John Hancock Variable Insurance Trust (since 2008) and John Hancock Funds II (since 2008). |
| |
| Theron S. Hoffman, Born: 1947 | 2008 | 198 |
|
| Chief Executive Officer, T. Hoffman Associates, LLC (consulting firm) (since 2003); Director, The Todd |
| Organization (consulting firm) (2003–2010); President, Westport Resources Management (investment |
| management consulting firm) (2006–2008); Partner/Operating Head & Senior Managing Director, |
| Putnam Investments (2000–2003); Executive Vice President, Thomson Corp. (1997–2000) (financial |
| and legal information publishing). Trustee of John Hancock Variable Insurance Trust (since 2008) and |
| John Hancock Funds II (since 2008). | | |
| |
| Hassell H. McClellan, Born: 1945 | 2005 | 198 |
|
| Associate Professor, The Graduate School of The Wallace E. Carroll School of Management, Boston |
| College (since 1984). Trustee of John Hancock Variable Insurance Trust (since 2005), John Hancock |
| Funds II (since 2005), Trustee of Virtus Variable Insurance Trust (formerly, Phoenix Edge Series Funds) |
| (since 2008), and Director of the Barnes Group (since 2010). | | |
| |
| James M. Oates, Born: 1946 | 2005 | 198 |
|
| Managing Director, Wydown Group (financial consulting firm) (since 1994); Chairman, Emerson |
| Investment Management, Inc. (since 2000); Chairman, Hudson Castle Group, Inc. (formerly IBEX |
| Capital Markets, Inc.) (financial services company) (1997–2011). Director of the following publicly traded |
| companies: Stifel Financial (since 1996); Investor Financial Services Corporation (1995–2007); and |
| Connecticut River Bancorp (since 1998). Director of the following Mutual Funds: Virtus Funds (formerly, |
| Phoenix Mutual Funds) (since 1988). Chairman of the Boards of John Hancock Variable Insurance Trust |
| and John Hancock Funds II (since 2005) and former Trustee of John Hancock Funds III (2005–2006). |
| |
| Annual report | Global Absolute Return Strategies Fund | 61 |
| | |
| Non-Independent Trustee2 | | |
| | | |
| Name, Year of Birth | Trustee | Number of |
| Position(s) held with Fund | of the | John Hancock |
| Principal occupation(s) and other | Trust | funds overseen |
| directorships during past 5 years | since1 | by Trustee |
| |
| James R. Boyle,3 Born: 1959 | 2005 | 198 |
|
| Senior Executive Vice President, John Hancock Financial Services (since 1999, including prior positions); |
| Chairman and Director, John Hancock Advisers, LLC, John Hancock Funds, LLC, and John Hancock |
| Investment Management Services, LLC (2005–2010); Trustee, John Hancock Variable Insurance Trust |
| (since 2005), John Hancock Funds II (since 2005), and John Hancock retail funds (2005–2010). |
1 Because the Trust does not hold regular annual shareholders meetings, each Trustee holds office for an indefinite term until his/her successor is duly elected and qualified or until he/she dies, retires, resigns, is removed or becomes disqualified.
2 Non-Independent Trustees hold positions or are affiliated with the Fund’s investment adviser, subadviser, underwriter or their affiliates.
3 Mr. Boyle is an “interested person” (as defined in the 1940 Act) due to his position with Manulife Financial Corporation (or its affiliates), the ultimate parent of the Adviser.
| |
| Principal officers who are not Trustees | |
| | |
| Name, Year of Birth | Officer |
| Position(s) held with Fund | of the |
| Principal occupation(s) and other | Trust |
| directorships during past 5 years | since |
| |
| Hugh McHaffie, Born: 1959 | 2009 |
|
| President | |
| Executive Vice President, John Hancock Financial Services (since 2006, including prior positions); | |
| President of John Hancock Variable Insurance Trust and John Hancock Funds II (since 2009); Trustee, |
| John Hancock retail funds (since 2010); Chairman and Director, John Hancock Advisers, LLC, | |
| John Hancock Investment Management Services, LLC and John Hancock Funds, LLC (since 2010). | |
| |
| Thomas M. Kinzler, Born: 1955 | 2008 |
|
| Secretary and Chief Legal Officer | |
| Vice President, John Hancock Financial Services (since 2006); Secretary and Chief Legal Counsel, | |
| John Hancock Funds, LLC (since 2007); Secretary and Chief Legal Officer, John Hancock retail funds, |
| John Hancock Variable Insurance Trust and John Hancock Funds II (since 2006). | |
| |
| Francis V. Knox, Jr., Born: 1947 | 2008 |
|
| Chief Compliance Officer | |
| Vice President, John Hancock Financial Services (since 2005); Chief Compliance Officer, John Hancock |
| retail funds, John Hancock Funds II, John Hancock Variable Insurance Trust, John Hancock Advisers, |
| LLC and John Hancock Investment Management Services, LLC (since 2005); Vice President and Chief |
| Compliance Officer, John Hancock Asset Management a division of Manulife Asset Management (US) |
| LLC (2005–2008). | |
| |
| Michael J. Leary, Born: 1965 | 2008 |
|
| Treasurer | |
| Assistant Vice President, John Hancock Financial Services (since 2007); Treasurer, John Hancock Funds II |
| and John Hancock Variable Insurance Trust (since 2009); Treasurer, John Hancock retail funds (2009– |
| 2010); Vice President, John Hancock Advisers, LLC and John Hancock Investment Management Services, |
| LLC (since 2007); Assistant Treasurer, John Hancock retail funds (2007–2009 & 2010), John Hancock |
| Funds II and John Hancock Variable Insurance Trust (2007–2009) and John Hancock Funds III (since |
| 2009); Vice President and Director of Fund Administration, JP Morgan (2004–2007). | |
| |
| 62 | Global Absolute Return Strategies Fund | Annual report |
| |
| Principal officers who are not Trustees (continued) | |
| |
| Name, Year of Birth | Officer |
| Position(s) held with Fund | of the |
| Principal occupation(s) and other | Trust |
| directorships during past 5 years | since |
| |
| Charles A. Rizzo, Born: 1957 | 2008 |
|
| Chief Financial Officer | |
| Vice President, John Hancock Financial Services (since 2008); Senior Vice President, John Hancock | |
| Advisers, LLC and John Hancock Investment Management Services, LLC (since 2008); Chief Financial |
| Officer, John Hancock retail funds, John Hancock Funds II and John Hancock Variable Insurance Trust |
| (since 2007); Assistant Treasurer, Goldman Sachs Mutual Fund Complex (2005–2007); Vice President, |
| Goldman Sachs (2005–2007). | |
| |
| John G. Vrysen, Born: 1955 | 2008 |
|
| Chief Operating Officer | |
| Senior Vice President, John Hancock Financial Services (since 2006); Director, Executive Vice President |
| and Chief Operating Officer, John Hancock Advisers, LLC, John Hancock Investment Management | |
| Services, LLC and John Hancock Funds, LLC (since 2005); Chief Operating Officer, John Hancock Funds |
| II and John Hancock Variable Insurance Trust (since 2007); Chief Operating Officer, John Hancock retail |
| funds (until 2009); Trustee, John Hancock retail funds (since 2009). | |
The business address for all Trustees and Officers is 601 Congress Street, Boston, Massachusetts 02210-2805.
The Statement of Additional Information of the Fund includes additional information about members of the Board of Trustees of the Fund and is available without charge, upon request, by calling 1-800-225-5291.
| |
| Annual report | Global Absolute Return Strategies Fund | 63 |
More information
| |
| Trustees | Investment adviser |
| James M. Oates, Chairman | John Hancock Investment Management |
| James R. Boyle† | Services, LLC |
| Charles L. Bardelis* | |
| Peter S. Burgess* | Subadviser |
| Grace K. Fey | Standard Life Investments (Corporate Funds) |
| Theron S. Hoffman | Limited |
| Hassell H. McClellan | |
| | Principal distributor |
| Officers | John Hancock Funds, LLC |
| Hugh McHaffie | |
| President | Custodian |
| | State Street Bank and Trust Company |
| Thomas M. Kinzler | |
| Secretary and Chief Legal Officer | Transfer agent |
| | John Hancock Signature Services, Inc. |
| Francis V. Knox, Jr. | |
| Chief Compliance Officer | Legal counsel |
| | K&L Gates LLP |
| Michael J. Leary | |
| Treasurer | Independent registered |
| | public accounting firm |
| Charles A. Rizzo | PricewaterhouseCoopers LLP |
| Chief Financial Officer | |
| | |
| John G. Vrysen | |
| Chief Operating Officer | |
| |
| *Member of the Audit Committee | |
| †Non-Independent Trustee | |
The Fund’s proxy voting policies and procedures, as well as the Fund’s proxy voting record for the most recent twelve-month period ended June 30, are available free of charge on the Securities and Exchange Commission (SEC) Web site at www.sec.gov or on our Web site.
The Fund’s complete list of portfolio holdings, for the first and third fiscal quarters, is filed with the SEC on Form N-Q. The Fund’s Form N-Q is available on our Web site and the SEC’s Web site, www.sec.gov, and can be reviewed and copied (for a fee) at the SEC’s Public Reference Room in Washington, DC. Call 1-202-551-8090 to receive information on the operation of the SEC’s Public Reference Room.
We make this information on your fund, as well as monthly portfolio holdings, and other fund details available on our Web site at www.jhfunds.com or by calling 1-800-225-5291.
| | |
| You can also contact us: | | |
| 1-800-225-5291 | Regular mail: | Express mail: |
| jhfunds.com | John Hancock Signature Services, Inc. | John Hancock Signature Services, Inc. |
| | P.O. Box 55913 | Mutual Fund Image Operations |
| | Boston, MA 02205-5913 | 30 Dan Road |
| | | Canton, MA 02021 |
| |
| 64 | Global Absolute Return Strategies Fund | Annual report |

1-800-225-5291
1-800-554-6713 TDD
1-800-338-8080 EASI-Line
www.jhfunds.com
Now available: electronic delivery
www.jhfunds.com/edelivery
| |
| This report is for the information of the shareholders of John Hancock Global Absolute Return Strategies Fund. | 395A 7/12 |
| It is not authorized for distribution to prospective investors unless preceded or accompanied by a prospectus. | 9/12 |
ITEM 2. CODE OF ETHICS.
(a) As of the end of the fiscal year July 31, 2012 the registrant has adopted a code of ethics, as defined in Item 2 of Form N-CSR, that applies to its Principal Executive Officer and Principal Chief Financial Officer. A copy of the code of ethics is filed as an exhibit to this Form N-CSR.
(b) Not applicable
(c) Not applicable
(d) Not applicable
(e) Not applicable
(f)(1) A copy of the Code of Ethics is attached hereto.
|
| JOHN HANCOCK VARIABLE INSURANCE TRUST |
| JOHN HANCOCK FUNDS |
| JOHN HANCOCK FUNDS II |
| JOHN HANCOCK FUNDS III |
| |
| SARBANES-OXLEY CODE OF ETHICS |
| FOR |
| PRINCIPAL EXECUTIVE, PRINCIPAL FINANCIAL OFFICERS & TREASURER |
I. Covered Officers/Purpose of the Code
This code of ethics (this “Code”) for John Hancock Variable Insurance Trust, John Hancock Funds1, John Hancock Funds II and John Hancock Funds III, each a registered management investment company under the Investment Company Act of 1940, as amended (“1940 Act”), which may issue shares in separate and distinct series (each investment company and series thereunder to be hereinafter referred to as a “Fund”), applies to each Fund’s Principal Executive Officer (“President”), Principal Financial Officer (“Chief Financial Officer”) and Treasurer (“Treasurer”) (the “Covered Officers” as set forth in Exhibit A) for the purpose of promoting:
► honest and ethical conduct, including the ethical handling of actual or apparent conflicts of interest between personal and professional relationships;
► full, fair, accurate, timely and understandable disclosure in reports and documents that the Fund files with, or submits to, the Securities and Exchange Commission (“SEC”) and in other public communications made by the Fund;
► compliance with applicable laws and governmental rules and regulations;
► the prompt internal reporting of violations of the Code to an appropriate person or persons identified in the Code; and
► accountability for adherence to the Code.
_____________________________
1 John Hancock Funds includes the following trusts: John Hancock Bank and Thrift Opportunity Fund; John Hancock Bond Trust; John Hancock California Tax-Free Income Fund; John Hancock Capital Series; John Hancock Current Interest; John Hancock Income Securities Trust; John Hancock Investment Trust; John Hancock Investment Trust II; John Hancock Investment Trust III; John Hancock Investors Trust; John Hancock Municipal Securities Trust; John Hancock Premium Dividend Fund ; Trust; John Hancock Preferred Income Fund; John Hancock Preferred Income Fund II; John Hancock Preferred Income Fund III; John Hancock Series Trust; John Hancock Sovereign Bond Fund; John Hancock Strategic Series; John Hancock Tax-Exempt Series Fund; John Hancock Tax-Advantaged Dividend Income Fund; John Hancock Tax-Advantaged Global Shareholder Yield Fund and John Hancock Hedged Equity and Income Fund.
Each of the Covered Officers should adhere to a high standard of business ethics and should be sensitive to situations that may give rise to actual as well as apparent conflicts of interest.
II. Covered Officers Should Handle Ethically Actual and Apparent Conflicts of Interest
Overview
A “conflict of interest” occurs when a Covered Officer’s private interest interferes with the interests of, or his service to, the Fund. For example, a conflict of interest would arise if a Covered Officer, or a member of his family, receives improper personal benefits as a result of his position with the Fund. Certain conflicts of interest arise out of the relationships between the Covered Officers and the Fund and already are subject to conflict of interest provisions in the Investment Company Act of 1940, as amended (the “Investment Company Act”) and the Investment Advisers Act of 1940, as amended (the “Investment Advisers Act”). For example, Covered Officers may not individually engage in certain transactions (such as the purchase or sale of securities or other property) with the Fund because of their status as “affiliated persons” of the Fund. Each of the Covered Officers is an officer or employee of the investment adviser or a service provider (“Service Provider”) to the Fund. The Fund’s, the investment adviser’s and the Service Provider’s compliance programs and procedures are designed to prevent, or identify and correct, violations of these provisions. This Code does not, and is not intended to, repeat or replace these programs and procedures, and such conflicts fall outside of the parameters of this Code.
Although typically not presenting an opportunity for improper personal benefit, conflicts arise from, or as a result of, the contractual relationship between the Fund and the investment adviser and the Service Provider of which the Covered Officers are also officers or employees. As a result, this Code recognizes that the Covered Officers will, in the normal course of their duties (whether formally for the Fund, for the investment adviser or for the Service Provider), be involved in establishing policies and implementing decisions which will have different effects on the investment adviser, the Service Provider and the Fund. The participation of the Covered Officers in such activities is inherent in the contractual relationship between the Fund and the investment adviser and the Service Provider and is consistent with the performance by the Covered Officers of their duties as officers of the Fund. Thus, if such participation is performed in conformity with the provisions of the Investment Company Act and the Investment Advisers Act, it will be deemed to have been handled ethically. In addition, it is recognized by the Fund’s Board of Trustees/Directors (the “Board”) that the Covered Officers may also be officers or employees of one or more other investment companies covered by other Codes.
Other conflicts of interest are covered by the Code, even if such conflicts of interest are not subject to provisions in the Investment Company Act and the Investment Advisers Act. The following list provides examples of conflicts of interest under the Code, but the Covered Officers should keep in mind that these examples are not exhaustive. The overarching principle is that the personal interest of a Covered Officer should not be placed improperly before the interest of the Fund.
Each Covered Officer must:
► not use his/her personal influence or personal relationships improperly to influence investment decisions or financial reporting by the Fund whereby the Covered Officer would benefit personally to the detriment of the Fund;
► not cause the Fund to take action, or fail to take action, for the individual personal benefit of the Covered Officer rather than for the benefit of the Fund; and
► not use material non-public knowledge of portfolio transactions made or contemplated for the Fund to trade personally or cause others to trade personally in contemplation of the market effect of such transactions.
Additionally, conflicts of interest may arise in other situations, the propriety of which may be discussed, if material, with the Fund’s Chief Compliance Officer (“CCO”). Examples of these include:
► service as a director/trustee on the board of any public or private company;
► the receipt of any non-nominal gifts;
► the receipt of any entertainment from any company with which the Fund has current or prospective business dealings unless such entertainment is business-related, reasonable in cost, appropriate as to time and place, and not so frequent as to raise any question of impropriety (or other formulation as the Fund already uses in another code of conduct);
► any ownership interest in, or any consulting or employment relationship with, any of the Fund’s service providers, other than its investment adviser, any sub-adviser, principal underwriter, administrator or any affiliated person thereof; and
► a direct or indirect financial interest in commissions, transaction charges or spreads paid by the Fund for effecting portfolio transactions or for selling or redeeming shares other than an interest arising from the Covered Officer’s employment, such as compensation or equity ownership.
III. Disclosure & Compliance
► Each Covered Officer should familiarize himself or herself with the disclosure requirements generally applicable to the Fund;
► Each Covered Officer should not knowingly misrepresent, or cause others to misrepresent, facts about the Fund to others, whether within or outside the Fund, including to the Fund’s directors and auditors, and to governmental regulators and self-regulatory organizations;
► Each Covered Officer should, to the extent appropriate within his/her area of responsibility, consult with other officers and employees of the Fund and the Fund’s adviser or any sub-adviser with the goal of promoting full, fair, accurate, timely and understandable disclosure in the reports and documents the Fund files with, or submits to, the SEC and in other public communications made by the Fund; and
► It is the responsibility of each Covered Officer to promote compliance with the standards and restrictions imposed by applicable laws, rules and regulations.
IV. Reporting & Accountability
Each Covered Officer must:
► upon adoption of the Code (or thereafter as applicable, upon becoming an Covered Officer), affirm in writing to the Fund’s CCO that he/she has received, read, and understands the Code;
► annually thereafter affirm to the Fund’s CCO that he/she has complied with the requirements of the Code;
► not retaliate against any employee or Covered Officer or their affiliated persons for reports of potential violations that are made in good faith;
► notify the Fund’s CCO promptly if he/she knows of any violation of this Code (Note: failure to do so is itself a violation of this Code); and
► report at least annually any change in his/her affiliations from the prior year.
The Fund’s CCO is responsible for applying this Code to specific situations in which questions are presented under it and has the authority to interpret this Code in any particular situation. However, any approvals or waivers sought by the Principal Executive Officer will be considered by the Fund’s Board or the Compliance Committee thereof (the “Committee”).
The Fund will follow these procedures in investigating and enforcing this Code:
► the Fund’s CCO will take all appropriate action to investigate any potential violations reported to him/her;
► if, after such investigation, the CCO believes that no violation has occurred, the CCO is not required to take any further action;
► any matter that the CCO believes is a violation will be reported to the Board or, if applicable, Compliance Committee;
► if the Board or, if applicable, Compliance Committee concurs that a violation has occurred, the Board, either upon its determination of a violation or upon recommendation of the Compliance Committee, if applicable, will consider appropriate action, which may include review of, and appropriate modifications to, applicable policies and procedures; notification to appropriate personnel of the Service Provider or the investment adviser or its board; or a recommendation to dismiss the Registrant’s Executive Officer;
► the Board, or if applicable the Compliance Committee, will be responsible for granting waivers, as appropriate; and
► any changes to or waivers of this Code will, to the extent required, be disclosed as provided by SEC rules.
V. Other Policies & Procedures
This Code shall be the sole code of ethics adopted by the Fund for purposes of Section 406 of the Sarbanes-Oxley Act of 2002 and the rules and forms applicable to registered investment companies thereunder. Insofar as other policies or procedures of the Fund, the Fund’s adviser, any sub-adviser, principal underwriter or other service providers govern or purport to govern the behavior or activities of the Covered Officers who are subject to this Code, they are superseded by this Code to the extent that they overlap or conflict with the provisions of this Code. The Fund’s and its investment adviser’s codes of ethics under Rule 204A-1 under the Investment Advisers Act and Rule 17j-1 under the Investment Company Act, respectively, are separate requirements applying to the Covered Officers and others, and are not part of this Code.
VI. Amendments
Any amendments to this Code, other than amendments to Exhibit A, must be approved or ratified by a majority vote of the Fund’s Board, including a majority of independent directors.
VII. Confidentiality
All reports and records prepared or maintained pursuant to this Code will be considered confidential and shall be maintained and protected accordingly. Except as otherwise required by law or this Code, such matters shall not be disclosed to anyone other than the Fund’s Board and its counsel, the investment adviser and the relevant Service Providers.
VIII. Internal Use
The Code is intended solely for the internal use by the Fund and does not constitute an admission, by or on behalf of the Fund, as to any fact, circumstance, or legal conclusion.
|
| Exhibit A |
| Persons Covered by this Code of Ethics |
| (As of October 2012) |
John Hancock Variable Insurance Trust
► Principal Executive Officer and President – Hugh McHaffie
► Principal Financial Officer and Chief Financial Officer – Charles Rizzo
► Treasurer – Michael J. Leary
John Hancock Funds
► Principal Executive Officer and President – Hugh McHaffie
► Principal Financial Officer and Chief Financial Officer – Charles Rizzo
► Treasurer – Salvatore Schiavone
John Hancock Funds II
► Principal Executive Officer and President – Hugh McHaffie
► Principal Financial Officer and Chief Financial Officer – Charles Rizzo
► Treasurer – Michael J. Leary
John Hancock Funds III
► Principal Executive Officer and President – Hugh McHaffie
► Principal Financial Officer and Chief Financial Officer – Charles Rizzo
► Treasurer – Salvatore Schiavone
(f)(3) The Registrant will provide a copy of the Code of Ethics to any person without charge, upon request by calling the following toll free number (800) 344-1029.
ITEM 3. AUDIT COMMITTEE FINANCIAL EXPERT.
The Board of Trustees has determined that at least one member of its audit committee is an “audit committee financial expert”. Peter S. Burgess is the audit committee financial expert and is “independent”, pursuant to general instructions on Form N-CSR Item 3.
ITEM 4. PRINCIPAL ACCOUNTANT FEES AND SERVICES.
| | | |
| (a) | AUDIT FEES: | |
| | 2012: | $418,589 | |
| | 2011: | $235,271 | |
These fees represent aggregate fees billed for the last two fiscal years (the “Reporting Periods”) for professional services rendered by the principal accountant for the audits of the Registrant’s annual financial statements or services that are normally provided by the accountant in connection with statutory and regulatory filing or engagements for such Reporting Periods.
| | | |
| (b) | AUDIT RELATED FEES: |
| | 2012: | $7,770 | |
| | 2011: | $9,647 | |
These fees represent the aggregate fees billed for the Reporting Periods for assurance and related services by the principal accountant that are reasonably related to the performance of the audit of the Registrant’s financial statements and are not reported under paragraph (a) of this Item. Such fees relate to professional services rendered by the principal accountant for separate reports in connection with service provider internal controls review.
| | | |
| (c) | TAX FEES: | |
| | 2012: | $34,485 | |
| | 2011: | $23,700 | |
These fees represent aggregate fees billed for the Reporting Periods for professional services rendered by the principal accountant for tax compliance, tax advice and tax planning. The tax services provided by the principal accountant related to the review of the Registrant’s federal and state tax returns and tax distribution requirements.
| | | |
| (d) | ALL OTHER FEES: | |
| | 2011: | $8,533 | |
| | 2011: | $1,176 | |
These fees represent all other fees billed to the Registrant for products and services provided by the principal accountant. These fees were billed to the Registrant and were approved by the Registrant’s audit committee.
(e) (1) Audit Committee Pre-Approval Policies and Procedures:
The Trust’s Audit Committee must pre-approve all audit and non-audit services provided by the independent registered public accounting firm (the “Auditor”) relating to the operations or financial reporting of the funds. Prior to the commencement of any audit or non-audit services to a fund, the Audit Committee reviews the services to determine whether they are appropriate and permissible under applicable law.
The Trust’s Audit Committee has adopted policies and procedures to, among other purposes, provide a framework for the Committee’s consideration of audit-related and non-audit services by the Auditor. The policies and procedures require that any audit-related and non-audit service provided by the Auditor and any non-audit service provided by the Auditor to a fund service provider that relates directly to the operations and financial reporting of a fund are subject to approval by the Audit Committee before such service is provided. Audit-related services provided by the Auditor that are expected to exceed $25,000 per instance/per fund are subject to specific pre-approval by the Audit Committee. Tax services provided by the Auditor that are expected to exceed $30,000 per instance/per fund are subject to specific pre-approval by the Audit Committee.
All audit services, as well as the audit-related and non-audit services that are expected to exceed the amounts stated above, must be approved in advance of provision of the service by formal resolution of the Audit Committee. At the regularly scheduled Audit Committee meetings, the Committee reviews a report summarizing the services, including fees, provided by the Auditor.
(2) Amount approved by the Audit Committee pursuant paragraph (c) (7) (i) (C) of Rule 2-01 of Regulation S-X: None.
(f) Not applicable.
(g) The aggregate non-audit fees billed by the registrant’s principal accountant for services rendered to the registrant and rendered to the registrant’s control affiliates for each of the last two fiscal years of the registrant were $4,022,758 for the fiscal year ended July 31, 2012 and $1,489,372 for the fiscal year ended July 31, 2011.
(h) The audit committee of the registrant has considered the non-audit services provided by the registrant’s principal accountant to the control affiliates and has determined that the services that were non pre-approved are compatible with maintaining the principal accountant’s independence.
ITEM 5. AUDIT COMMITTEE OF LISTED REGISTRANTS
Peter S. Burgess – Chairman
Charles L. Bardelis
Steven M. Roberts
ITEM 6. SCHEDULE OF INVESTMENTS.
(a) This schedule is included as part of the Report to shareholders filed under Item 1 of this form.
(b) Not applicable.
ITEM 7. DISCLOSURE OF PROXY VOTING POLICIES AND PROCEDURES FOR CLOSED-END MANAGEMENT INVESTMENT COMPANIES.
Not applicable.
ITEM 8. PORTFOLIO MANAGERS OF CLOSED-END MANAGEMENT INVESTMENT COMPANIES.
Not applicable.
ITEM 9. PURCHASE OF EQUITY SECURITIES BY CLOSED-END MANAGEMENT INVESTMENT COMPANIES AND AFFILIATED PURCHASERS.
Not applicable.
ITEM 10. SUBMISSION OF MATTERS TO VOTE OF SECURITY HOLDERS.
No material changes.
ITEM 11. CONTROLS AND PROCEDURES.
(a) EVALUATION OF DISCLOSURE CONTROLS AND PROCEDURES. The Registrant maintains disclosure controls and procedures that are designed to ensure that information required to be disclosed in this Form N-CSR is recorded, processed, summarized and reported within the periods specified in the rules and forms of the Securities and Exchange Commission. Such disclosure controls and procedures include controls and procedures designed to ensure that such information is accumulated and communicated to the Registrant's management, including its principal executive officer and principal financial officer, as appropriate, to allow timely decisions regarding required disclosure.
Within 90 days prior to the filing date of this Form N-CSR, the Registrant had carried out an evaluation, under the supervision and with the participation of the Registrant's management, including the Registrant's principal executive officer and the Registrant's principal financial officer, of the effectiveness of the design and operation of the Registrant's disclosure controls and procedures relating to information required to be disclosed on Form N-CSR. Based on such evaluation, the Registrant's principal executive officer and principal financial officer concluded that the Registrant's disclosure controls and procedures are operating effectively to ensure that:
(i) information required to be disclosed in this Form N-CSR is recorded, processed, summarized and reported within the periods specified in the rules and forms of the Securities and Exchange Commission, and
(ii) information is accumulated and communicated to the Registrant’s management, including its principal executive officer and principal financial officer, as appropriate, to allow timely decisions regarding required disclosure.
(b) CHANGE IN REGISTRANT’S INTERNAL CONTROL: Not applicable.
ITEM 12. EXHIBITS.
(a)(1) Code of Ethics for Principal Executive Officer and Principal Financial Officer.
(a)(2) The certifications required by Rule 30a-2(a) under the 1940 Act.
(b) The certifications required by Rule 30a-2(b) under the 1940 Act.
(c)(1) Contact person at the registrant.
Pursuant to the requirements of the Securities Exchange Act of 1934 and the Investment Company Act of 1940, the registrant has duly caused this report to be signed on its behalf by the undersigned, thereunto duly authorized.
JOHN HANCOCK FUNDS II
/s/Hugh McHaffie
Hugh McHaffie
President
Date: September 24, 2012
Pursuant to the requirements of the Securities Exchange Act of 1934 and the Investment Company Act of 1940, this report has been signed below by the following persons on behalf of the registrant and in the capacities and on the dates indicated.
/s/Hugh McHaffie
Hugh McHaffie
President
Date: September 24, 2012
/s/ Charles A. Rizzo
Charles A. Rizzo
Chief Financial Officer
Date: September 24, 2012