|
| UNITED STATES |
| SECURITIES AND EXCHANGE COMMISSION |
| Washington, D.C. 20549 |
| |
| FORM N-CSR |
| |
| CERTIFIED SHAREHOLDER REPORT OF REGISTERED MANAGEMENT INVESTMENT |
| COMPANIES |
| Investment Company Act file number 811-21779 |
| |
| JOHN HANCOCK FUNDS II |
| --------------------------------------------------------- |
| (Exact name of registrant as specified in charter) |
| |
| 601 CONGRESS STREET, BOSTON, MA 02210-2805 |
| ------------------------------------------------------------- |
| (Address of principal executive offices) (Zip code) |
| |
| SALVATORE SCHIAVONE, 601 CONGRESS STREET, BOSTON, MA 02210-2805 |
| ------------------------------------------------------------------------------------------ |
| (Name and address of agent for service) |
| |
| Registrant's telephone number, including area code: (617) 663-4497 |
| -------------- |
|
| Date of fiscal year end: 7/31 |
| ------ |
| |
| Date of reporting period: 7/31/13 |
| ------- |
ITEM 1. REPORTS TO STOCKHOLDERS.
The Registrant prepared eleven annual reports to shareholders for the year ended July 31, 2013 for series of John Hancock Funds II with July 31 fiscal year end. The first report applies to the Technical Opportunities Fund, the second report applies to the Global High Yield Fund, the third report applies to Short Duration Credit Opportunities Fund, the fourth report applies to Currency Strategies Fund, the fifth report applies Fundamental All Cap Core Fund, the sixth report applies to Fundamental Large Cap Core Fund, the seventh report applies to Fundamental Large Cap Value Fund, the eight report applies to the China Emerging Leaders Fund, the ninth report applies to the Diversified Strategies Fund, the tenth report applies to the Global Absolute Return Strategy Fund, and the eleventh report applies to the International Growth Equity Fund. International Growth Equity Fund is the successor of the Turner International Growth Fund which was acquired January 11, 2013.

A look at performance
Total returns for the period ended July 31, 2013
| | | | | | | | |
| | Average annual total returns (%) | Cumulative total returns (%) | |
| | with maximum sales charge | | with maximum sales charge | |
|
| | 1-year | 5-year | 10-year | Since
inception1 | 1-year | 5-year | 10-year | Since
inception1 |
|
| Class A | 29.43 | — | — | 6.90 | 29.43 | — | — | 30.60 |
|
| Class I2 | 36.64 | — | — | 8.69 | 36.64 | — | — | 39.55 |
|
| Class NAV2 | 37.00 | — | — | 8.87 | 37.00 | — | — | 40.47 |
|
| Index† | 21.16 | — | — | 11.76 | 21.16 | — | — | 55.91 |
|
Performance figures assume all distributions have been reinvested. Figures reflect maximum sales charges on Class A shares of 5.00%.
The expense ratios of the fund, both net (including any fee waivers or expense limitations) and gross (excluding any fee waivers or expense limitations), are set forth according to the most recent publicly available prospectuses for the fund and may differ from those disclosed in the Financial highlights tables in this report. For all classes, the net expenses equal the gross expenses. The expense ratios are as follows:
| | | |
| | Class A | Class I | Class NAV |
| Net/Gross (%) | 1.78 | 1.45 | 1.22 |
The returns reflect past results and should not be considered indicative of future performance. The return and principal value of an investment will fluctuate so that shares, when redeemed, may be worth more or less than their original cost. Due to market volatility, the fund’s current performance may be higher or lower than the performance shown. For current to the most recent month-end performance data, please call 800-225-5291 or visit the fund’s website at jhinvestments.com.
The performance table above and the chart on the next page do not reflect the deduction of taxes that a shareholder may pay on fund distributions or on the redemption of fund shares. The fund’s performance results reflect any applicable fee waivers or expense reductions, without which the expenses would increase and results would have been less favorable.
† Index is the MSCI All Country World Index
See the following page for footnotes.
| |
| 6 | Technical Opportunities Fund | Annual report |

| | | | |
| | | With maximum | Without | |
| | Start date | sales charge | sales charge | Index |
|
| Class I2 | 8-3-09 | $13,955 | $13,955 | $15,591 |
|
| Class NAV2 | 8-3-09 | 14,047 | 14,047 | 15,591 |
|
MSCI All Country World Index (gross of foreign withholding tax on dividends) is a free float-adjusted market capitalization weighted index that is designed to measure the equity market performance of developed and emerging markets.
It is not possible to invest directly in an index. Index figures do not reflect expenses or sales charges, which would have resulted in lower values if they did.
Footnotes related to performance pages
1 From 8-3-09.
2 For certain types of investors as described in the fund’s prospectuses.
| |
| Annual report | Technical Opportunities Fund | 7 |
Management’s discussion of
Fund performance
Wellington Management Company, LLP
Global equities climbed higher during the 12-month period ended July 31, 2013, as measured by the MSCI All Country World Index. Stocks rebounded strongly leading into the period after an equity sell-off in the second quarter of 2012. This trend continued into the first quarter of 2013 as solid corporate earnings results and favorable global liquidity dynamics lifted enthusiasm for stocks. Following a dramatic shift in monetary policy to a more aggressive management of a 2% inflation target by the Bank of Japan, Japanese equities rose sharply. U.S. equities also outperformed global indexes as the U.S. economy appeared relatively stable compared to other countries. Although investors initially reacted negatively to news in May that the U.S. Federal Reserve might slow its bond-buying program sooner than expected, U.S. equities recovered into the end of the period. Ongoing challenges in resolving European sovereign debt issues weighed on investors during the period as did political unrest in Turkey, Egypt, and Brazil.
For the 12-month period ended July 31, 2013, John Hancock Technical Opportunities Fund’s Class A shares posted a total return of 36.27%, excluding sales charges, outperforming both the 21.16% return of the fund’s benchmark, the MSCI All Country World Index, and the 22.79% average return of its Morningstar, Inc. world stock fund peer group.† The fund’s position in Regeneron Pharmaceuticals, Inc. was the largest contributor to relative results during the 12-month period. Regeneron Pharmaceuticals is a biopharmaceutical company that discovers, develops, and commercializes pharmaceutical products for the treatment of serious medical conditions, including cancer, eye diseases, and inflammatory diseases. The company continued to maintain a bullish trend throughout the period and remained a top position in the fund at period end. Onyx Pharmaceuticals, Inc., also contributed to relative performance. The company discovers and develops novel therapeutics based upon the genetics of human disease, with an emphasis on cancer. After a stock price breakout in June 2012, on positive news on its latest myeloma drug, there was a larger stock price jump in June 2013, which was driven by potential takeover interests by Amgen, Inc. and other drugmakers. The fund’s cash positioning, while averaging less than 4% over the period, detracted as the markets trended upward.
This commentary reflects the views of the portfolio manager through the end of the period discussed in this report. As such, they are in no way guarantees of future events and are not intended to be used as investment advice or a recommendation regarding any specific security. They are also subject to change at any time as market and other conditions warrant.
Wellington Management is an independent and unaffiliated investment subadvisor.
Past performance is no guarantee of future results.
† Figures from Morningstar, Inc. include distributions reinvested and do not take into account sales charges. Actual load-adjusted performance is lower.
| |
| 8 | Technical Opportunities Fund | Annual report |
Your expenses
These examples are intended to help you understand your ongoing operating expenses of investing in the fund so you can compare these costs with the ongoing costs of investing in other mutual funds.
Understanding fund expenses
As a shareholder of the fund, you incur two types of costs:
■ Transaction costs, which include sales charges (loads) on purchases or redemptions (varies by share class), minimum account fee charge, etc.
■ Ongoing operating expenses, including management fees, distribution and service fees (if applicable) and other fund expenses.
We are going to present only your ongoing operating expenses here.
Actual expenses/actual returns
This example is intended to provide information about the fund’s actual ongoing operating expenses and is based on the fund’s actual return. It assumes an account value of $1,000.00 on February 1, 2013, with the same investment held until July 31, 2013.
| | | |
| | Account value | Ending value | Expenses paid during |
| | on 2-1-13 | on 7-31-13 | period ended 7-31-131 |
|
| Class A | $1,000.00 | $1,192.20 | $9.46 |
|
| Class I | 1,000.00 | 1,194.10 | 7.78 |
|
| Class NAV | 1,000.00 | 1,194.70 | 6.69 |
|
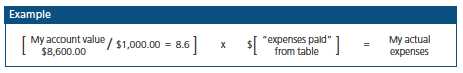
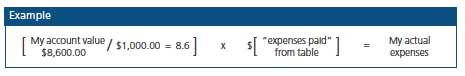
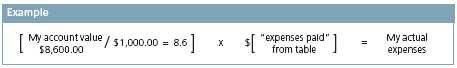
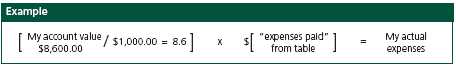
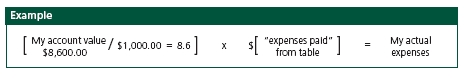
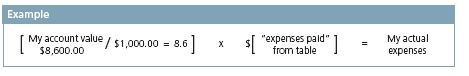
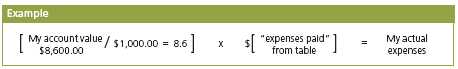
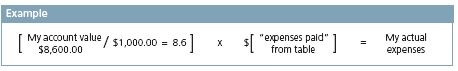
Together with the value of your account, you may use this information to estimate the operating expenses that you paid over the period. Simply divide your account value at July 31, 2013, by $1,000.00, then multiply it by the “expenses paid” for your share class from the table above. For example, for an account value of $8,600.00, the operating expenses should be calculated as follows:
| |
| Annual report | Technical Opportunities Fund | 9 |
Your expenses
Hypothetical example for comparison purposes
This table allows you to compare the fund’s ongoing operating expenses with those of any other fund. It provides an example of the fund’s hypothetical account values and hypothetical expenses based on each class’s actual expense ratio and an assumed 5% annualized return before expenses (which is not the fund’s actual return). It assumes an account value of $1,000.00 on February 1, 2013, with the same investment held until July 31, 2013. Look in any other fund shareholder report to find its hypothetical example and you will be able to compare these expenses. Please remember that these hypothetical account values and expenses may not be used to estimate the actual ending account balance or expenses you paid for the period.
| | | |
| | Account value | Ending value | Expenses paid during |
| | on 2-1-13 | on 7-31-13 | period ended 7-31-131 |
|
| Class A | $1,000.00 | $1,016.20 | $8.70 |
|
| Class I | 1,000.00 | 1,017.70 | 7.15 |
|
| Class NAV | 1,000.00 | 1,018.70 | 6.16 |
|
Remember, these examples do not include any transaction costs, therefore, these examples will not help you to determine the relative total costs of owning different funds. If transaction costs were included, your expenses would have been higher. See the prospectus for details regarding transaction costs.
1 Expenses are equal to the fund’s annualized expense ratio of 1.74%, 1.43%, and 1.23% for Class A, Class I, and Class NAV shares, respectively, multiplied by the average account value over the period, multiplied by 181/365 (to reflect the one-half year period).
| |
| 10 | Technical Opportunities Fund | Annual report |
Portfolio summary
| | | | |
| Top 10 Holdings (25.2% of Net Assets on 7-31-13)1,2 | | | |
|
| Regeneron Pharmaceuticals, Inc. | 4.8% | | Vertex Pharmaceuticals, Inc. | 1.9% |
| |
|
| Onyx Pharmaceuticals, Inc. | 4.2% | | Guidewire Software, Inc. | 1.8% |
| |
|
| Jazz Pharmaceuticals PLC | 3.1% | | LinkedIn Corp., Class A | 1.8% |
| |
|
| Cubist Pharmaceuticals, Inc. | 2.2% | | Gilead Sciences, Inc. | 1.8% |
| |
|
| Pharmacyclics, Inc. | 1.9% | | Biogen Idec, Inc. | 1.7% |
| |
|
| |
| |
| Sector Composition1,3 | | | | |
|
| Health Care | 41.2% | | Energy | 3.1% |
| |
|
| Consumer Discretionary | 16.2% | | Consumer Staples | 2.1% |
| |
|
| Financials | 13.1% | | Materials | 0.5% |
| |
|
| Information Technology | 12.5% | | Short-Term Investments & Other | 1.9% |
| |
|
| Industrials | 9.4% | | | |
| | |

1 As a percentage of net assets on 7-31-13.
2 Cash and cash equivalents not included.
3 Foreign investing, especially in emerging markets, has additional risks, such as currency and market volatility and political and social instability. Hedging and other strategic transactions may increase volatility of a fund and, if the transaction is not successful, could result in a significant loss. The fund may invest its assets in a small number of issuers. Performance could suffer significantly from adverse events affecting these issuers. Investments concentrated in one sector may fluctuate more widely than investments diversified across sectors. Frequently trading securities may increase transaction costs (thus lowering performance) and taxable distributions. Owning an ETF generally reflects the risks of owning the underlying securities it is designed to track, which may cause a lack of liquidity, more volatility and increased management fees. The fund may invest in IPOs, which are frequently volatile in price and may lead to increased portfolio turnover. The fund can invest up to 100% of its assets in cash, which may cause the fund to not meet its investment objective. For additional information on these and other risk considerations, please see the fund’s prospectuses.
| |
| Annual report | Technical Opportunities Fund | 11 |
Fund’s investments
As of 7-31-13
| | |
| | Shares | Value |
| Common Stocks 98.1% | | $657,244,197 |
|
| (Cost $548,448,032) | | |
| | | |
| Consumer Discretionary 16.2% | | 108,564,099 |
| | | |
| Diversified Consumer Services 0.5% | | |
|
| Service Corp. International | 183,700 | 3,484,790 |
| | | |
| Hotels, Restaurants & Leisure 5.0% | | |
|
| Bally Technologies, Inc. (I)(L) | 91,000 | 6,522,880 |
|
| Chuy’s Holdings, Inc. (I)(L) | 86,900 | 3,066,702 |
|
| Denny’s Corp. (I) | 692,600 | 3,940,894 |
|
| Galaxy Entertainment Group, Ltd. (I) | 713,000 | 3,738,130 |
|
| Sands China, Ltd. | 694,000 | 3,755,242 |
|
| Starbucks Corp. | 94,600 | 6,739,304 |
|
| The Wendy’s Company (L) | 831,000 | 5,908,410 |
| | | |
| Household Durables 1.2% | | |
|
| Harman International Industries, Inc. | 84,900 | 5,138,997 |
|
| Sony Corp. | 149,700 | 3,145,586 |
| | | |
| Internet & Catalog Retail 1.1% | | |
|
| HomeAway, Inc. (I) | 82,100 | 2,472,031 |
|
| Rakuten, Inc. | 358,200 | 4,827,440 |
| | | |
| Media 1.0% | | |
|
| DISH Network Corp., Class A | 156,900 | 7,005,585 |
| | | |
| Multiline Retail 1.9% | | |
|
| J Front Retailing Company, Ltd. | 319,000 | 2,534,925 |
|
| Marks & Spencer Group PLC | 489,456 | 3,576,805 |
|
| Nordstrom, Inc. | 105,300 | 6,448,572 |
| | | |
| Specialty Retail 2.8% | | |
|
| Cabela’s, Inc. (I)(L) | 53,500 | 3,672,240 |
|
| DSW, Inc., Class A | 106,200 | 8,048,898 |
|
| The Gap, Inc. | 147,800 | 6,784,020 |
| | | |
| Textiles, Apparel & Luxury Goods 2.7% | | |
|
| Fifth & Pacific Companies, Inc. (I) | 199,500 | 4,752,090 |
|
| Michael Kors Holdings, Ltd. (I) | 108,737 | 7,322,350 |
|
| Steven Madden, Ltd. (I) | 110,428 | 5,678,208 |
| | | |
| Consumer Staples 2.1% | | 13,747,574 |
| | | |
| Beverages 0.4% | | |
|
| Asahi Group Holdings, Ltd. | 101,800 | 2,595,010 |
| | |
| 12 | Technical Opportunities Fund | Annual report | See notes to financial statements |
| | |
| | Shares | Value |
| Food & Staples Retailing 0.9% | | |
|
| Seven & I Holdings Company, Ltd. | 160,700 | $6,052,660 |
| | | |
| Food Products 0.8% | | |
|
| The Hain Celestial Group, Inc. (I)(L) | 69,900 | 5,099,904 |
| | | |
| Energy 3.1% | | 20,678,936 |
| | | |
| Energy Equipment & Services 1.0% | | |
|
| Atwood Oceanics, Inc. (I) | 59,000 | 3,324,060 |
|
| Oceaneering International, Inc. | 38,700 | 3,138,183 |
| | | |
| Oil, Gas & Consumable Fuels 2.1% | | |
|
| Cobalt International Energy, Inc. (I) | 189,900 | 5,478,615 |
|
| Pioneer Natural Resources Company | 26,340 | 4,076,378 |
|
| Tesoro Corp. | 82,000 | 4,661,700 |
| | | |
| Financials 13.1% | | 87,478,145 |
| | | |
| Capital Markets 0.6% | | |
|
| TD Ameritrade Holding Corp. | 133,600 | 3,611,208 |
| | | |
| Commercial Banks 3.6% | | |
|
| Bank of the Ozarks, Inc. | 100,400 | 4,797,112 |
|
| Community Bank Systems, Inc. (L) | 61,400 | 2,059,356 |
|
| Mitsubishi UFJ Financial Group | 795,800 | 4,970,458 |
|
| Mizuho Financial Group, Inc. | 2,221,000 | 4,665,463 |
|
| Synovus Financial Corp. | 1,016,000 | 3,383,280 |
|
| Texas Capital Bancshares, Inc. (I) | 33,400 | 1,519,366 |
|
| The Bank of Yokohama, Ltd. | 426,000 | 2,335,819 |
| | | |
| Diversified Financial Services 0.6% | | |
|
| Osaka Securities Exchange Company, Ltd. | 44,400 | 4,158,682 |
| | | |
| Insurance 4.3% | | |
|
| American International Group, Inc. (I) | 141,600 | 6,444,216 |
|
| Marsh & McLennan Companies, Inc. | 97,700 | 4,090,699 |
|
| MS&AD Insurance Group Holdings | 149,800 | 3,877,890 |
|
| T&D Holdings, Inc. | 313,400 | 3,963,088 |
|
| Tokio Marine Holdings, Inc. | 166,100 | 5,304,237 |
|
| Unum Group | 160,000 | 5,062,400 |
| | | |
| Real Estate Investment Trusts 0.6% | | |
|
| Unibail-Rodamco SE | 17,359 | 4,225,759 |
| | | |
| Real Estate Management & Development 1.5% | | |
|
| Hulic Company, Ltd. (I) | 391,300 | 4,681,696 |
|
| Mitsui Fudosan Company, Ltd. | 179,000 | 5,396,400 |
| | | |
| Thrifts & Mortgage Finance 1.9% | | |
|
| MGIC Investment Corp. (I) | 645,400 | 4,930,856 |
|
| Ocwen Financial Corp. (I) | 168,000 | 8,000,160 |
| | | |
| Health Care 41.2% | | 275,979,002 |
| | | |
| Biotechnology 23.9% | | |
|
| Alkermes PLC (I) | 283,529 | 9,520,904 |
|
| Amgen, Inc. | 61,400 | 6,649,006 |
|
| Biogen Idec, Inc. (I) | 53,000 | 11,560,890 |
|
| Cubist Pharmaceuticals, Inc. (I) | 235,300 | 14,666,249 |
| | |
| See notes to financial statements | Annual report | Technical Opportunities Fund | 13 |
| | |
| | Shares | Value |
| Biotechnology (continued) | | |
|
| Gilead Sciences, Inc. (I) | 196,500 | $12,074,925 |
|
| Medivation, Inc. (I) | 101,500 | 5,873,805 |
|
| Onyx Pharmaceuticals, Inc. (I)(L) | 214,370 | 28,146,781 |
|
| Pharmacyclics, Inc. (I) | 115,700 | 12,568,491 |
|
| Regeneron Pharmaceuticals, Inc. (I) | 117,830 | 31,821,170 |
|
| Sarepta Therapeutics, Inc. (I)(L) | 76,200 | 2,820,924 |
|
| Seattle Genetics, Inc. (I)(L) | 207,930 | 8,425,324 |
|
| TESARO, Inc. (I) | 76,200 | 2,599,944 |
|
| United Therapeutics Corp. (I) | 17,600 | 1,317,184 |
|
| Vertex Pharmaceuticals, Inc. (I) | 155,300 | 12,392,940 |
| | | |
| Health Care Equipment & Supplies 2.8% | | |
|
| Boston Scientific Corp. (I) | 761,200 | 8,312,304 |
|
| HeartWare International, Inc. (I) | 52,200 | 4,824,324 |
|
| ICU Medical, Inc. (I) | 79,700 | 5,713,693 |
| | | |
| Health Care Providers & Services 3.7% | | |
|
| Brookdale Senior Living, Inc. (I) | 99,200 | 2,888,704 |
|
| HCA Holdings, Inc. | 181,900 | 7,094,100 |
|
| LifePoint Hospitals, Inc. (I) | 73,900 | 3,632,924 |
|
| Molina Healthcare, Inc. (I) | 164,800 | 6,117,376 |
|
| Universal Health Services, Inc., Class B | 67,700 | 4,735,615 |
| | | |
| Life Sciences Tools & Services 0.7% | | |
|
| Illumina, Inc. (I) | 59,600 | 4,757,272 |
| | | |
| Pharmaceuticals 10.1% | | |
|
| Actavis, Inc. (I) | 38,800 | 5,209,676 |
|
| Bristol-Myers Squibb Company | 204,400 | 8,838,256 |
|
| Eli Lilly & Company | 172,100 | 9,140,231 |
|
| Hisamitsu Pharmaceutical Company, Inc. | 47,100 | 2,594,052 |
|
| Jazz Pharmaceuticals PLC (I) | 275,500 | 20,803,005 |
|
| Merck & Company, Inc. | 185,800 | 8,949,986 |
|
| Mylan, Inc. (I) | 240,700 | 8,077,892 |
|
| Pacira Pharmaceuticals, Inc. (I)(L) | 113,500 | 3,851,055 |
| | | |
| Industrials 9.4% | | 63,277,696 |
| | | |
| Aerospace & Defense 5.4% | | |
|
| BAE Systems PLC | 852,061 | 5,796,762 |
|
| Cubic Corp. | 75,443 | 3,813,644 |
|
| DigitalGlobe, Inc. (I) | 150,400 | 4,872,960 |
|
| Rolls-Royce Holdings PLC | 485,693 | 8,660,169 |
|
| Safran SA | 165,479 | 9,749,887 |
|
| Thales SA | 66,977 | 3,447,608 |
| | | |
| Airlines 1.2% | | |
|
| United Continental Holdings, Inc. (I) | 234,000 | 8,154,900 |
| | | |
| Electrical Equipment 2.0% | | |
|
| Hubbell, Inc., Class B | 75,000 | 8,051,250 |
|
| Mitsubishi Electric Corp. | 574,000 | 5,568,059 |
| | | |
| Machinery 0.8% | | |
|
| Makita Corp. | 36,100 | 1,879,503 |
|
| SMC Corp. | 15,500 | 3,282,954 |
| | |
| 14 | Technical Opportunities Fund | Annual report | See notes to financial statements |
| | | |
| | | Shares | Value |
| Information Technology 12.5% | | | $83,966,185 |
| | | | |
| Computers & Peripherals 3.1% | | | |
|
| 3D Systems Corp. (I)(L) | | 123,100 | 5,814,013 |
|
| NetApp, Inc. (L) | | 132,400 | 5,444,288 |
|
| Seagate Technology PLC | | 93,100 | 3,808,721 |
|
| Stratasys, Ltd. (I)(L) | | 62,000 | 5,496,300 |
| | | | |
| Electronic Equipment, Instruments & Components 0.8% | | |
|
| FEI Company | | 70,240 | 5,440,088 |
| | | | |
| Internet Software & Services 2.9% | | | |
|
| Facebook, Inc., Class A (I) | | 97,500 | 3,590,925 |
|
| Internet Initiative Japan, Inc. (I) | | 61,000 | 2,100,209 |
|
| LinkedIn Corp., Class A (I) | | 59,470 | 12,119,391 |
|
| United Internet AG | | 57,743 | 1,884,730 |
| | | | |
| IT Services 1.2% | | | |
|
| Cap Gemini SA | | 80,510 | 4,421,812 |
|
| Nomura Research Institute, Ltd. | | 72,300 | 2,367,654 |
|
| Otsuka Corp. | | 13,700 | 1,546,223 |
| | | | |
| Software 4.5% | | | |
|
| Adobe Systems, Inc. (I) | | 81,100 | 3,834,408 |
|
| Guidewire Software, Inc. (I) | | 277,900 | 12,160,904 |
|
| Infoblox, Inc. (I) | | 120,100 | 3,927,270 |
|
| Informatica Corp. (I) | | 142,700 | 5,446,859 |
|
| ServiceNow, Inc. (I) | | 104,690 | 4,562,390 |
| | | | |
| Materials 0.5% | | | 3,552,560 |
| | | | |
| Metals & Mining 0.5% | | | |
|
| U.S. Silica Holdings, Inc. (L) | | 146,800 | 3,552,560 |
| |
| | Yield (%) | Shares | Value |
| Securities Lending Collateral 9.8% | | | $65,352,785 |
|
| (Cost $65,345,337) | | | |
| John Hancock Collateral Investment Trust (W) | 0.1995 (Y) | 6,530,511 | 65,352,785 |
| |
| | | Par Value | Value |
|
| Short-Term Investments 0.8% | | | $5,600,000 |
|
| (Cost $5,600,000) | | | |
| | | | |
| Repurchase Agreement 0.8% | | | 5,600,000 |
|
| Bank of America Tri-Party Repurchase Agreement dated 7-31-13 at 0.070% | | |
| to be repurchased at $5,600,011 on 8-1-13, collateralized by $5,592,232 | | |
| Government National Mortgage Association, 3.500% due 10-20-42 | | |
| (valued at $5,712,001, including interest) | | $5,600,000 | 5,600,000 |
| |
| Total investments (Cost $619,393,369)† 108.7% | | $728,196,982 |
|
| |
| Other assets and liabilities, net (8.7%) | | | ($58,378,974) |
|
| |
| Total net assets 100.0% | | | $669,818,008 |
|
The percentage shown for each investment category is the total value of the category as a percentage of the net assets of the fund.
| | |
| See notes to financial statements | Annual report | Technical Opportunities Fund | 15 |
Notes to Schedule of Investments
(I) Non-income producing security.
(L) A portion of this security is on loan as of 7-31-13.
(W) Investment is an affiliate of the fund, the advisor and/or subadvisor. This investment represents collateral received for securities lending.
(Y) The rate shown is the annualized seven-day yield as of 7-31-13.
† At 7-31-13, the aggregate cost of investment securities for federal income tax purposes was $620,750,864. Net unrealized appreciation aggregated $107,446,118, of which $110,350,011 related to appreciated investment securities and $2,903,893 related to depreciated investment securities.
The fund had the following country concentration as a percentage of net assets on 7-31-13:
| | |
| United States | 74.8% | |
| Japan | 11.6% | |
| Ireland | 5.1% | |
| France | 3.3% | |
| United Kingdom | 2.7% | |
| Hong Kong | 1.6% | |
| Macau | 0.6% | |
| Germany | 0.3% | |
| | |
| |
| Total | 100.0% | |
| | |
| 16 | Technical Opportunities Fund | Annual report | See notes to financial statements |
F I N A N C I A L S T A T E M E N T S
Financial statements
Statement of assets and liabilities 7-31-13
This Statement of assets and liabilities is the fund’s balance sheet. It shows the value of what the fund owns, is due and owes. You’ll also find the net asset value and the maximum offering price per share.
| |
| Assets | |
|
| Investments in unaffiliated issuers, at value (Cost $554,048,032) including | |
| $64,033,042 of securities loaned | $662,844,197 |
| Investments in affiliated issuers, at value (Cost $65,345,337) | 65,352,785 |
| | |
| Total investments, at value (Cost $619,393,369) | 728,196,982 |
| Cash | 80,358 |
| Receivable for investments sold | 23,477,997 |
| Receivable for fund shares sold | 165,995 |
| Dividends and interest receivable | 147,512 |
| Receivable for securities lending income | 32,127 |
| Other receivables and prepaid expenses | 25,131 |
| | |
| Total assets | 752,126,102 |
| |
| Liabilities | |
|
| Payable for investments purchased | 16,492,985 |
| Payable for fund shares repurchased | 307,480 |
| Payable upon return of securities loaned | 65,395,014 |
| Payable to affiliates | |
| Accounting and legal services fees | 13,473 |
| Transfer agent fees | 7,727 |
| Trustees’ fees | 508 |
| Other liabilities and accrued expenses | 90,907 |
| | |
| Total liabilities | 82,308,094 |
| | |
| Net assets | $669,818,008 |
| |
| Net assets consist of | |
|
| Paid-in capital | $524,411,075 |
| Accumulated net investment loss | (3,517) |
| Accumulated net realized gain (loss) on investments and foreign | |
| currency transactions | 36,610,101 |
| Net unrealized appreciation (depreciation) on investments and translation | |
| of assets and liabilities in foreign currencies | 108,800,349 |
| | |
| Net assets | $669,818,008 |
| | |
| See notes to financial statements | Annual report | Technical Opportunities Fund | 17 |
F I N A N C I A L S T A T E M E N T S
Statement of assets and liabilities (continued)
| |
| Net asset value per share | |
|
| Based on net asset values and shares outstanding — the fund has an | |
| unlimited number of shares authorized with no par value | |
| Class A ($45,494,030 ÷ 3,458,543 shares)1 | $13.15 |
| Class I ($18,285,863 ÷ 1,369,474 shares) | $13.35 |
| Class NAV ($606,038,115 ÷ 45,078,568 shares) | $13.44 |
| |
| Maximum offering price per share | |
|
| Class A (net asset value per share ÷ 95%)2 | $13.84 |
1 Redemption price is equal to net asset value less any applicable contingent deferred sales change.
2 On single retail sales of less than $50,000. On sales of $50,000 or more and on group sales the offering price is reduced.
| | |
| 18 | Technical Opportunities Fund | Annual report | See notes to financial statements |
F I N A N C I A L S T A T E M E N T S
Statement of operations For the year ended 7-31-13
This Statement of operations summarizes the fund’s investment income earned and expenses incurred in operating the fund. It also shows net gains (losses) for the period stated.
| |
| Investment income | |
|
| Dividends | $5,266,075 |
| Securities lending | 754,167 |
| Interest | 24,998 |
| Less foreign taxes withheld | (194,283) |
| | |
| Total investment income | 5,850,957 |
| |
| Expenses | |
|
| Investment management fees | 6,385,493 |
| Distribution and service fees | 132,767 |
| Accounting and legal services fees | 70,891 |
| Transfer agent fees | 94,736 |
| Trustees’ fees | 5,529 |
| State registration fees | 38,673 |
| Printing and postage | 16,286 |
| Professional fees | 55,724 |
| Custodian fees | 166,734 |
| Registration and filing fees | 33,316 |
| Other | 11,534 |
| | |
| Total expenses | 7,011,683 |
| Less expense reductions | (21,453) |
| | |
| Net expenses | 6,990,230 |
| | |
| Net investment loss | (1,139,273) |
| |
| Realized and unrealized gain (loss) | |
|
| |
| Net realized gain (loss) on | |
| Investments in unaffiliated issuers | 114,877,827 |
| Investments in affiliated issuers | 4,429 |
| Foreign currency transactions | 8,984 |
| | 114,891,240 |
| Change in net unrealized appreciation (depreciation) of | |
| Investments in unaffiliated issuers | 61,349,851 |
| Investments in affiliated issuers | (22,594) |
| Translation of assets and liabilities in foreign currencies | (2,830) |
| | 61,324,427 |
| Net realized and unrealized gain | 176,215,667 |
| | |
| Increase in net assets from operations | $175,076,394 |
| | |
| See notes to financial statements | Annual report | Technical Opportunities Fund | 19 |
F I N A N C I A L S T A T E M E N T S
Statements of changes in net assets
These Statements of changes in net assets show how the value of the fund’s net assets has changed during the last two periods. The difference reflects earnings less expenses, any investment gains and losses, distributions, if any, paid to shareholders and the net of fund share transactions.
| | |
| | Year | Year |
| | ended | ended |
| | 7-31-13 | 7-31-12 |
| Increase (decrease) in net assets | | |
|
| From operations | | |
| Net investment loss | ($1,139,273) | ($3,104,066) |
| Net realized gain (loss) | 114,891,240 | (71,816,856) |
| Change in net unrealized appreciation (depreciation) | 61,324,427 | (5,977,695) |
| | | |
| Increase (decrease) in net assets resulting from operations | 175,076,394 | (80,898,617) |
| | | |
| Distributions to shareholders | | |
| From net realized gain | | |
| Class A | — | (3,359,268) |
| Class I | — | (1,477,257) |
| Class NAV | — | (18,131,169) |
| | | |
| Total distributions | — | (22,967,694) |
| | | |
| From fund share transactions | (5,916,914) | (118,120,569) |
| | | |
| Total increase (decrease) | 169,159,480 | (221,986,880) |
| |
| Net assets | | |
|
| Beginning of year | 500,658,528 | 722,645,408 |
| | | |
| End of year | $669,818,008 | $500,658,528 |
| | | |
| Accumulated net investment loss | ($3,517) | ($1,414,427) |
| | |
| 20 | Technical Opportunities Fund | Annual report | See notes to financial statements |
Financial highlights
The Financial highlights show how the fund’s net asset value for a share has changed during the period.
| | | | |
| CLASS A SHARES Period ended | 7-31-13 | 7-31-12 | 7-31-11 | 7-31-101 |
| |
| Per share operating performance | | | | |
|
| Net asset value, beginning of period | $9.65 | $11.33 | $9.86 | $10.00 |
| Net investment loss2 | (0.08) | (0.10) | (0.09) | (0.13) |
| Net realized and unrealized gain (loss) on investments | 3.58 | (1.17) | 1.56 | (0.01) |
| Total from investment operations | 3.50 | (1.27) | 1.47 | (0.14) |
| Less distributions | | | | |
| From net realized gain | — | (0.41) | — | — |
| Net asset value, end of period | $13.15 | $9.65 | $11.33 | $9.86 |
| Total return (%)3 | 36.27 | (10.93) | 14.91 | (1.40)4 |
| |
| Ratios and supplemental data | | | | |
|
| Net assets, end of period (in millions) | $45 | $51 | $125 | $165 |
| Ratios (as a percentage of average net assets): | | | | |
| Expenses before reductions | 1.78 | 1.88 | 1.90 | 1.875 |
| Expenses including reductions and amounts recaptured | 1.78 | 1.88 | 1.90 | 1.875 |
| Net investment loss | (0.69) | (1.04) | (0.79) | (1.23)5 |
| Portfolio turnover (%) | 391 | 507 | 361 | 389 |
| |
1 Period from 8-3-09 (commencement of operations) to 7-31-10.
2 Based on the average daily shares outstanding.
3 Does not reflect the effect of sales charges, if any.
4 Not annualized.
5 Annualized.
| | | | |
| CLASS I SHARES Period ended | 7-31-13 | 7-31-12 | 7-31-11 | 7-31-101 |
| |
| Per share operating performance | | | | |
|
| Net asset value, beginning of period | $9.77 | $11.42 | $9.89 | $10.00 |
| Net investment loss2 | (0.04) | (0.07) | (0.04) | (0.09) |
| Net realized and unrealized gain (loss) on investments | 3.62 | (1.17) | 1.57 | (0.02) |
| Total from investment operations | 3.58 | (1.24) | 1.53 | (0.11) |
| Less distributions | | | | |
| From net realized gain | — | (0.41) | — | — |
| Net asset value, end of period | $13.35 | $9.77 | $11.42 | $9.89 |
| Total return (%)3 | 36.64 | (10.57) | 15.47 | (1.10)4 |
| |
| Ratios and supplemental data | | | | |
|
| Net assets, end of period (in millions) | $18 | $17 | $63 | $79 |
| Ratios (as a percentage of average net assets): | | | | |
| Expenses before reductions | 1.48 | 1.55 | 1.49 | 1.525 |
| Expenses including reductions and amounts recaptured | 1.47 | 1.51 | 1.49 | 1.525 |
| Net investment loss | (0.39) | (0.69) | (0.37) | (0.89)5 |
| Portfolio turnover (%) | 391 | 507 | 361 | 389 |
| |
1 Period from 8-3-09 (commencement of operations) to 7-31-10.
2 Based on the average daily shares outstanding.
3 Total returns would have been lower had certain expenses not been reduced during the applicable periods shown.
4 Not annualized.
5 Annualized.
| | |
| See notes to financial statements | Annual report | Technical Opportunities Fund | 21 |
| | | | |
| CLASS NAV SHARES Period ended | 7-31-13 | 7-31-12 | 7-31-11 | 7-31-101 |
| |
| Per share operating performance | | | | |
|
| Net asset value, beginning of period | $9.81 | $11.45 | $9.90 | $10.00 |
| Net investment loss2 | (0.02) | (0.04) | (0.03) | (0.07) |
| Net realized and unrealized gain (loss) on investments | 3.65 | (1.19) | 1.58 | (0.03) |
| Total from investment operations | 3.63 | (1.23) | 1.55 | (0.10) |
| Less distributions | | | | |
| From net realized gain | — | (0.41) | — | — |
| Net asset value, end of period | $13.44 | $9.81 | $11.45 | $9.90 |
| Total return (%)3 | 37.00 | (10.45) | 15.66 | (1.00)4 |
| |
| Ratios and supplemental data | | | | |
|
| Net assets, end of period (in millions) | $606 | $433 | $535 | $349 |
| Ratios (as a percentage of average net assets): | | | | |
| Expenses before reductions | 1.24 | 1.32 | 1.37 | 1.395 |
| Expenses including reductions and amounts recaptured | 1.23 | 1.32 | 1.37 | 1.395 |
| Net investment loss | (0.16) | (0.46) | (0.31) | (0.72)5 |
| Portfolio turnover (%) | 391 | 507 | 361 | 389 |
| |
1 Period from 8-3-09 (commencement of operations) to 7-31-10.
2 Based on the average daily shares outstanding.
3 Total returns would have been lower had certain expenses not been reduced during the applicable periods shown.
4 Not annualized.
5 Annualized.
| | |
| 22 | Technical Opportunities Fund | Annual report | See notes to financial statements |
Notes to financial statements
Note 1 — Organization
John Hancock Technical Opportunities Fund (the fund) is a series of John Hancock Funds II (the Trust), an open-end management investment company organized as a Massachusetts business trust and registered under the Investment Company Act of 1940, as amended (the 1940 Act). The investment objective of the fund is to seek long-term capital appreciation.
The fund may offer multiple classes of shares. The shares currently offered are detailed in the Statement of assets and liabilities. Class A shares are offered to all investors. Class I shares are offered to institutions and certain investors. Class NAV shares are offered to John Hancock affiliated funds of funds and certain 529 plans. Shareholders of each class have exclusive voting rights to matters that affect that class. The distribution and service fees, if any, and transfer agent fees, printing and postage and state registration fees for each class may differ.
Note 2 — Significant accounting policies
The financial statements have been prepared in conformity with accounting principles generally accepted in the United States of America, which require management to make certain estimates and assumptions as of the date of the financial statements. Actual results could differ from those estimates and those differences could be significant. Events or transactions occurring after the end of the fiscal period through the date that the financial statements were issued have been evaluated in the preparation of the financial statements. The following summarizes the significant accounting policies of the fund:
Security valuation. Investments are stated at value as of the close of regular trading on the New York Stock Exchange (NYSE), normally at 4:00 P.M., Eastern Time. In order to value the securities, the fund uses the following valuation techniques: Equity securities held by the fund are valued at the last sale price or official closing price on the principal securities exchange on which they trade. In the event there were no sales during the day or closing prices are not available, the securities are valued using the last quoted bid or evaluated price. Investments by the funds in open-end mutual funds, including John Hancock Collateral Investment Trust (JHCIT), are valued at their respective net asset values each business day. Foreign securities and currencies are valued in U.S. dollars, based on foreign currency exchange rates supplied by an independent pricing service. Certain securities traded only in the over-the-counter market are valued at the last bid price quoted by brokers making markets in the securities at the close of trading. Certain short-term securities are valued at amortized cost.
Other portfolio securities and assets, for which reliable market quotations are not readily available, are valued at fair value as determined in good faith by the fund’s Pricing Committee following procedures established by the Board of Trustees, which include price verification procedures. The frequency with which these fair valuation procedures are used cannot be predicted and fair value of securities may differ significantly from the value that would have been used had a ready market for such securities existed. Generally, trading in foreign securities is substantially completed each day at various times prior to the close of trading on the NYSE. Significant market events that affect the values of foreign securities may occur between the time when the valuation of the securities is generally determined and the close of the NYSE. During significant market events, these securities will be valued at fair value, as determined in good faith, following procedures established by the Board of Trustees. The fund may use a fair valuation model to value foreign securities in order to adjust for events that may occur between the close of foreign exchanges and the close of the NYSE.
| |
| Annual report | Technical Opportunities Fund | 23 |
The fund uses a three-tier hierarchy to prioritize the pricing assumptions, referred to as inputs, used in valuation techniques to measure fair value. Level 1 includes securities valued using quoted prices in active markets for identical securities. Level 2 includes securities valued using other significant observable inputs. Observable inputs may include quoted prices for similar securities, interest rates, prepayment speeds and credit risk. Prices for securities valued using these inputs are received from independent pricing vendors and brokers and are based on an evaluation of the inputs described. Level 3 includes securities valued using significant unobservable inputs when market prices are not readily available or reliable, including the fund’s own assumptions in determining the fair value of investments. Factors used in determining value may include market or issuer specific events or trends, changes in interest rates and credit quality. The inputs or methodology used for valuing securities are not necessarily an indication of the risks associated with investing in those securities. Changes in valuation techniques may result in transfers into or out of an assigned level within the disclosure hierarchy.
The following is a summary of the values by input classification of the fund’s investments as of July 31, 2013, by major security category or type:
| | | | |
| | | | | LEVEL 3 |
| | | | LEVEL 2 | SIGNIFICANT |
| | TOTAL MARKET | LEVEL 1 | SIGNIFICANT | UNOBSERVABLE |
| | VALUE AT 7-31-13 | QUOTED PRICE | OBSERVABLE INPUTS | INPUTS |
|
| Common Stocks | | | | |
| Consumer Discretionary | $108,564,099 | $86,985,971 | $21,578,128 | — |
| Consumer Staples | 13,747,574 | 5,099,904 | 8,647,670 | — |
| Energy | 20,678,936 | 20,678,936 | — | — |
| Financials | 87,478,145 | 43,898,653 | 43,579,492 | — |
| Health Care | 275,979,002 | 273,384,950 | 2,594,052 | — |
| Industrials | 63,277,696 | 24,892,754 | 38,384,942 | — |
| Information Technology | 83,966,185 | 71,645,557 | 12,320,628 | — |
| Materials | 3,552,560 | 3,552,560 | — | — |
| Securities Lending | | | | |
| Collateral | 65,352,785 | 65,352,785 | — | — |
| Short-Term Investments | 5,600,000 | — | 5,600,000 | — |
| |
|
| Total Investments in | | | | |
| Securities | $728,196,982 | $595,492,070 | $132,704,912 | — |
Repurchase agreements. The fund may enter into repurchase agreements. When the fund enters into a repurchase agreement, it receives collateral that is held in a segregated account by the fund’s custodian. The collateral amount is marked-to-market and monitored on a daily basis to ensure that the collateral held is in an amount not less than the principal amount of the repurchase agreement plus any accrued interest. Collateral for certain tri-party repurchase agreements is held at a third-party custodian bank in a segregated account for the benefit of the fund.
Repurchase agreements are typically governed by the terms and conditions of the Master Repurchase Agreement and/or Global Master Repurchase Agreement (collectively, MRA). Upon an event of default, the non-defaulting party may close out all transactions traded under the MRA and net amounts owed. Absent an event of default, the MRA does not result in an offset of the reported amounts of assets and liabilities in the Statement of assets and liabilities. In the event of a default by the counterparty, realization of the collateral proceeds could be delayed, during which time the collateral value may decline or the counterparty may have insufficient assets to pay back claims resulting from close-out of the transactions. Collateral received by the fund for repurchase agreements is disclosed in the fund’s investments as part of the caption related to the repurchase agreement.
| |
| 24 | Technical Opportunities Fund | Annual report |
Security transactions and related investment income. Investment security transactions are accounted for on a trade date plus one basis for daily net asset value calculations. However, for financial reporting purposes, investment transactions are reported on trade date. Interest income is accrued as earned. Dividend income is recorded on the ex-date, except for dividends of foreign securities where the dividend may not be known until after the ex-date. In those cases, dividend income, net of withholding taxes, is recorded when the fund becomes aware of the dividends. Foreign taxes are provided for based on the fund’s understanding of the tax rules and rates that exist in the foreign markets in which it invests. Gains and losses on securities sold are determined on the basis of identified cost and may include proceeds from litigation.
Securities lending. The fund may lend its securities to earn additional income. It receives cash collateral from the borrower in an amount not less than the market value of the loaned securities. The fund will invest its collateral in JHCIT, an affiliate of the fund, which has a floating net asset value (NAV) and is registered with the SEC as an investment company. JHCIT invests cash received as collateral as part of the securities lending program in short term money-market investments. The fund will receive the benefit of any gains and bear any losses generated by JHCIT with respect to the cash collateral.
If a borrower fails to return loaned securities when due, then the lending agent is responsible to and indemnifies the fund for the lent securities. The lending agent uses the collateral received from the borrower to purchase replacement securities of the same issue, type, class and series of the loaned securities. If the value of the collateral is less than the purchase cost of replacement securities, the lending agent is responsible for satisfying the shortfall but only to the extent that the shortfall is not due to any decrease in JHCIT.
Although the risk of the loss of the securities lent is mitigated by receiving collateral from the borrower and through lending agent indemnification, the fund could experience a delay in recovering its securities or could experience a lower than expected return, if the borrower fails to return the securities on a timely basis. The fund may receive compensation for lending its securities by retaining a portion of the return on the investment of the collateral and compensation from fees earned from borrowers of the securities. Net income received from JHCIT is a component of securities lending income as recorded on the Statement of operations.
Collateral received by the fund is shown on the Statement of assets and liabilities as Payable upon return of securities loaned.
Foreign currency translation. Assets, including investments and liabilities denominated in foreign currencies, are translated into U.S. dollar values each day at the prevailing exchange rate. Purchases and sales of securities, income and expenses are translated into U.S. dollars at the prevailing exchange rate on the date of the transaction. The effect of changes in foreign currency exchange rates on the value of securities is reflected as a component of the realized and unrealized gains (losses) on investments.
Funds that invest internationally generally carry more risk than funds that invest strictly in U.S. securities. Risks can result from differences in economic and political conditions, regulations, market practices (including higher transaction costs), accounting standards and other factors. Foreign investments are also subject to a decline in the value of a foreign currency versus the U.S. dollar, which reduces the dollar value of securities denominated in that currency.
Foreign taxes. The fund may be subject to withholding tax on income and/or capital gains or repatriation taxes imposed by certain countries in which the fund invests. Taxes are accrued based upon investment income, realized gains or unrealized appreciation.
| |
| Annual report | Technical Opportunities Fund | 25 |
Line of credit. The fund may borrow from banks for temporary or emergency purposes, including meeting redemption requests that otherwise might require the untimely sale of securities. Pursuant to the fund custodian agreement, the custodian may loan money to the fund to make properly authorized payments. The fund is obligated to repay the custodian for any overdraft, including any related costs or expenses. The custodian may have a lien, security interest or security entitlement in any fund property that is not otherwise segregated or pledged, to the maximum extent permitted by law, to the extent of any overdraft.
In addition, the fund and other affiliated funds have entered into an agreement with Citibank N.A. that enables them to participate in a $300 million unsecured committed line of credit. A commitment fee, payable at the end of each calendar quarter, based on the average daily unused portion of the line of credit, is charged to each participating fund on a pro rata basis and is reflected in other expenses on the Statement of operations. Prior to March 27, 2013, the fund participated in a $200 million unsecured line of credit, also with Citibank, with terms otherwise similar to the existing agreement. Commitment fees for the year ended July 31, 2013 were $485. For the year ended July 31, 2013, the fund had no borrowings under either line of credit.
Expenses. Within the John Hancock funds complex, expenses that are directly attributable to an individual fund are allocated to such fund. Expenses that are not readily attributable to a specific fund are allocated among all funds in an equitable manner, taking into consideration, among other things, the nature and type of expense and the fund’s relative net assets. Expense estimates are accrued in the period to which they relate and adjustments are made when actual amounts are known.
Class allocations. Income, common expenses and realized and unrealized gains (losses) are determined at the fund level and allocated daily to each class of shares based on the net assets of the class. Class-specific expenses, such as distribution and service fees, if any, transfer agent fees, state registration fees and printing and postage expenses, for all classes, are calculated daily at the class level based on the appropriate net assets of each class and the specific expense rates applicable to each class.
Federal income taxes. The fund intends to continue to qualify as a regulated investment company by complying with the applicable provisions of the Internal Revenue Code and will not be subject to federal income tax on taxable income that is distributed to shareholders. Therefore, no federal income tax provision is required.
As of July 31, 2013, the fund had no uncertain tax positions that would require financial statement recognition, derecognition or disclosure. The fund’s federal tax returns are subject to examination by the Internal Revenue Service for a period of three years.
Distribution of income and gains. Distributions to shareholders from net investment income and net realized gains, if any, are recorded on the ex-date. The fund generally declares and pays dividends and capital gain distributions, if any, annually.
The tax character of distributions for the years ended July 31, 2013 and 2012 was as follows:
| | | | |
| | JULY 31, 2013 | JULY 31, 2012 | | |
| | |
| Ordinary Income | — | $9,254,484 | | |
| Long-Term Capital Gain | — | $13,713,210 | | |
| Total | — | $22,967,694 | | |
Distributions paid by the fund with respect to each class of shares are calculated in the same manner, at the same time and in the same amount, except for the effect of class level expenses that may be applied differently to each class. As of July 31, 2013, the components of distributable
| |
| 26 | Technical Opportunities Fund | Annual report |
earnings on a tax basis consisted of $14,269,840 of undistributed ordinary income and $23,697,756 of long-term capital gains.
Such distributions and distributable earnings, on a tax basis, are determined in conformity with income tax regulations, which may differ from accounting principles generally accepted in the United States of America. Material distributions in excess of tax basis earnings and profits, if any, are reported in the fund’s financial statements as a return of capital.
Capital accounts within the financial statements are adjusted for permanent book-tax differences. These adjustments have no impact on net assets or the results of operations. Temporary book-tax differences, if any, will reverse in a subsequent period. Book-tax differences are primarily attributable to net operating losses and wash sale loss deferrals.
Note 3 — Guarantees and indemnifications
Under the Trust’s organizational documents, its Officers and Trustees are indemnified against certain liabilities arising out of the performance of their duties to the Trust, including the fund. Additionally, in the normal course of business, the fund enters into contracts with service providers that contain general indemnification clauses. The fund’s maximum exposure under these arrangements is unknown, as this would involve future claims that may be made against the fund that have not yet occurred. The risk of material loss from such claims is considered remote.
Note 4 — Fees and transactions with affiliates
John Hancock Advisers, LLC (the Advisor) serves as investment advisor for the fund. John Hancock Funds, LLC (the Distributor), an affiliate of the Advisor, serves as principal underwriter of the fund. The Advisor and the Distributor are indirect, wholly owned subsidiaries of Manulife Financial Corporation (MFC).
Management fee. The fund has an investment management agreement with the Advisor under which the fund pays a daily management fee to the Advisor equivalent, on an annual basis, to the sum of: a) 1.20% of the first $250,000,000 of the fund’s average daily net assets and b) 1.15% of the fund’s average daily net assets in excess of $250,000,000.
Effective June 1, 2013, the Advisor has contractually agreed to waive a portion of its management fee for certain funds (the Participating portfolios) of the Trust, John Hancock Funds, John Hancock Funds III and John Hancock Variable Insurance Trust. The waiver equals, on an annualized basis, 0.01% of that portion of the aggregate net assets of all the Participating portfolios that exceeds $75 billion but is less than or equal to $125 billion; 0.0125% of that portion of the aggregate net assets of all the Participating portfolios that exceeds $125 billion but is less than or equal to $150 billion; and 0.015% of that portion of the aggregate net assets of all the Participating portfolios that exceeds $150 billion. The amount of the reimbursement is calculated daily and allocated among all the Participating portfolios in proportion to the daily net assets of each fund. This arrangement may be amended or terminated at any time by the Advisor upon notice to the fund and with the approval of the Board of Trustees.
Prior to June 1, 2013, the advisor had contractually agreed to waive a portion of its management fee for certain funds (the Participating Portfolios) of the Trust and John Hancock Variable Insurance Trust. The waiver equaled, on an annualized basis, 0.01% of that portion of the aggregate net assets of all the Participating Portfolios that exceeded $75 billion but was less than $100 billion; and 0.015% of that portion of the aggregate net assets of all the Participating Portfolios that equaled or exceeded $100 billion. The amount of the reimbursement was calculated daily and allocated among all the Participating Portfolios in proportion to the daily net assets of each fund.
| |
| Annual report | Technical Opportunities Fund | 27 |
Prior to December 1, 2012, the Advisor contractually agreed to waive fees and/or reimburse certain expenses for each share class of the fund excluding certain expenses such as taxes, brokerage commissions, interest expense, acquired fund fees, litigation and indemnification expenses, and other extraordinary expenses not incurred in the ordinary course of the fund’s business. The fee waivers and/or reimbursements were such that these expenses would not exceed 1.95% and 1.59% for Class A and Class I shares, respectively. This contractual expense limitation is no longer in effect for the fund.
Additionally, the Advisor has voluntarily agreed to waive other fund level expenses excluding advisory fees, 12b-1 fees, service fees, transfer agent fees, printing and postage, blue sky fees, taxes, brokerage commissions, interest expense, acquired fund fees, litigation and indemnification expenses and other extraordinary expenses not incurred in the ordinary course of business. This voluntary expense reimbursement will continue in effect until terminated at any time by the Advisor on notice to the fund. The waivers are such that these expenses will not exceed 0.20% of average net assets.
Accordingly, these expense reductions amounted to $1,696, $712 and $19,045 for Class A, Class I and Class NAV shares, respectively, for the year ended July 31, 2013.
The investment management fees incurred for the year ended July 31, 2013 were equivalent to a net annual effective rate of 1.17% of the fund’s average daily net assets.
Expense recapture. The Advisor may recapture operating expenses reimbursed or fees waived under previous expense limitation or waiver arrangements for a period of three years following the beginning of the month in which such reimbursements or waivers originally occurred to the extent that the fund is below its expense limitation during this period. For the year ended July 31, 2013, the fund did not recapture any expenses. As of July 31, 2013, the fund has no amounts waived or reimbursed subject to recovery going forward.
Accounting and legal services. Pursuant to a service agreement, the fund reimburses the Advisor for all expenses associated with providing the administrative, financial, legal, accounting and recordkeeping services to the fund, including the preparation of all tax returns, periodic reports to shareholders and regulatory reports, among other services. These expenses are allocated to each share class based on its relative net assets at the time the expense was incurred. These accounting and legal services fees incurred for the year ended July 31, 2013 amounted to an annual rate of 0.01% of the fund’s average daily net assets.
Distribution and service plans. The fund has a distribution agreement with the Distributor. The fund has adopted distribution and service plans with respect to Class A pursuant to Rule 12b-1 under the 1940 Act, to pay the Distributor for services provided as the distributor of shares of the fund. The fund pays 0.30% for Class A shares distribution and service fees under these arrangements, expressed as an annual percentage of average daily net assets for the fund’s Class A shares.
Sales charges. Class A shares are assessed up-front sales charges, which resulted in payments to the Distributor amounting to $42,239 for the year ended July 31, 2013. Of this amount, $6,823 was retained and used for printing prospectuses, advertising, sales literature and other purposes, $35,026 was paid as sales commissions to broker-dealers and $390 was paid as sales commissions to sales personnel of Signator Investors, Inc., a broker-dealer affiliate of the Advisor.
Class A shares may be subject to contingent deferred sales charges (CDSCs). Certain Class A shares that are acquired through purchases of $1 million or more and are redeemed within one year of purchase are subject to a 1.00% CDSC. CDSCs are applied to the lesser of the current market value at the time of redemption or the original purchase cost of the shares being redeemed. Proceeds
| |
| 28 | Technical Opportunities Fund | Annual report |
from CDSCs are used to compensate the Distributor for providing distribution-related services in connection with the sale of these shares. During the year ended July 31, 2013, there were no CDSCs received by the Distributor for Class A shares.
Transfer agent fees. The fund has a transfer agent agreement with John Hancock Signature Services, Inc. (Signature Services), an affiliate of the Advisor. The transfer agent fees paid to Signature Services are determined based on the cost to Signature Services (Signature Services Cost) of providing recordkeeping services. The Signature Services Cost includes a component of allocated John Hancock corporate overhead for providing transfer agent services to the fund and to all other John Hancock affiliated funds. It also includes out-of-pocket expenses that are comprised of payments made to third-parties for recordkeeping services provided to their clients who invest in one or more John Hancock funds. In addition, Signature Services Cost may be reduced by certain fees that Signature Services receives in connection with retirement and small accounts. Signature Services Cost is calculated monthly and allocated, as applicable, to four categories of share classes: Institutional Share Classes, Retirement Share Classes, Municipal Bond Classes and all other Retail Share Classes. Within each of these categories, the applicable costs are allocated to the affected John Hancock affiliated funds and/or classes, based on the relative average daily net assets.
Class level expenses. Class level expenses for the year ended July 31, 2013 were:
| | | | |
| | DISTRIBUTION | TRANSFER | STATE | PRINTING AND |
| CLASS | AND SERVICE FEES | AGENT FEES | REGISTRATION FEES | POSTAGE |
|
| A | $132,767 | $78,121 | $19,510 | $13,305 |
| I | — | 16,615 | 19,163 | 2,981 |
| Total | $132,767 | $94,736 | $38,673 | $16,286 |
Trustee expenses. The fund compensates each Trustee who is not an employee of the Advisor or its affiliates. The costs of paying Trustee compensation and expenses are allocated to each fund based on its average daily net assets.
Note 5 — Fund share transactions
Transactions in fund shares for the years ended July 31, 2013 and 2012 were as follows:
| | | | |
| | Year ended 7-31-13 | | Year ended 7-31-12 |
| | Shares | Amount | Shares | Amount |
| Class A shares | | | | |
|
| Sold | 665,826 | $7,731,533 | 574,825 | $5,603,251 |
| Distributions reinvested | — | — | 360,725 | 3,253,738 |
| Repurchased | (2,509,969) | (26,860,100) | (6,664,412) | (64,322,341) |
| | | | | |
| Net decrease | (1,844,143) | ($19,128,567) | (5,728,862) | ($55,465,352) |
| |
| Class I shares | | | | |
|
| Sold | 625,607 | $7,282,687 | 546,121 | $5,379,169 |
| Distributions reinvested | — | — | 111,925 | 1,020,757 |
| Repurchased | (963,137) | (10,567,533) | (4,436,239) | (43,097,390) |
| | | | | |
| Net decrease | (337,530) | ($3,284,846) | (3,778,193) | ($36,697,464) |
| |
| Class NAV shares | | | | |
|
| Sold | 7,047,702 | $84,734,367 | 7,413,399 | $74,029,581 |
| Distributions reinvested | — | — | 1,983,717 | 18,131,169 |
| Repurchased | (6,069,547) | (68,237,868) | (12,036,455) | (118,118,503) |
| | | | | |
| Net increase (decrease) | 978,155 | $16,496,499 | (2,639,339) | ($25,957,753) |
| |
| Total net decrease | (1,203,518) | ($5,916,914) | (12,146,394) | ($118,120,569) |
|
| |
| Annual report | Technical Opportunities Fund | 29 |
Affiliates of the fund owned 100% of shares of beneficial interest of Class NAV on July 31, 2013.
Note 6 — Purchase and sale of securities
Purchases and sales of securities, other than short-term securities, amounted to $2,062,305,500 and $2,070,425,640, respectively, for the year ended July 31, 2013.
Note 7 — Investment by affiliated funds
Certain investors in the fund are affiliated funds that are managed by the Advisor and its affiliates. The affiliated funds do not invest in the fund for the purpose of exercising management or control; however, affiliated fund investments may represent a significant portion of the fund’s net assets. At July 31, 2013, the following funds had an affiliate ownership of 5% or more of the fund’s net assets:
| | |
| FUND | AFFILIATE CONCENTRATION | |
| |
| John Hancock Lifestyle Aggressive Portfolio | 15.9% | |
| John Hancock Lifestyle Growth Portfolio | 42.1% | |
| John Hancock Lifestyle Balanced Portfolio | 24.4% | |
| |
| 30 | Technical Opportunities Fund | Annual report |
Auditor’s report
Report of Independent Registered Public Accounting Firm
To the Board of Trustees of John Hancock Funds II and Shareholders of
John Hancock Technical Opportunities Fund:
In our opinion, the accompanying statement of assets and liabilities, including the schedule of investments, and the related statements of operations and of changes in net assets and the financial highlights present fairly, in all material respects, the financial position of John Hancock Technical Opportunities Fund (the “Fund”) at July 31, 2013, and the results of its operations for the year then ended, the changes in its net assets for each of the two years in the period then ended and the financial highlights for each of the periods indicated, in conformity with accounting principles generally accepted in the United States of America. These financial statements and financial highlights (hereafter referred to as “financial statements”) are the responsibility of the Fund’s management; our responsibility is to express an opinion on these financial statements based on our audits. We conducted our audits of these financial statements in accordance with the standards of the Public Company Accounting Oversight Board (United States). Those standards require that we plan and perform the audit to obtain reasonable assurance about whether the financial statements are free of material misstatement. An audit includes examining, on a test basis, evidence supporting the amounts and disclosures in the financial statements, assessing the accounting principles used and significant estimates made by management, and evaluating the overall financial statement presentation. We believe that our audits, which included confirmation of securities at July 31, 2013 by correspondence with the custodians and brokers and the application of alternative auditing procedures where securities purchased confirmations had not been received, provide a reasonable basis for our opinion.
PricewaterhouseCoopers LLP
Boston, Massachusetts
September 20, 2013
| |
| Annual report | Technical Opportunities Fund | 31 |
Evaluation of Advisory and Subadvisory Agreements by the Board of Trustees
This section describes the evaluation by the Board of Trustees (the Board) of John Hancock Funds II (the Trust) of the Advisory Agreement (the Advisory Agreement) with John Hancock Investment Management Services, LLC (the Advisor) and the Subadvisory Agreement (the Subadvisory Agreement) with Wellington Management Company, LLP (the Subadvisor) for Technical Opportunities Fund (the fund). The Advisory Agreement and Subadvisory Agreement are collectively referred to as the Agreements.
Approval of Advisory and Subadvisory Agreements
At in-person meetings held on May 16-17, 2013, the Board, including the Trustees who are not considered to be interested persons of the Trust under the Investment Company Act of 1940, as amended (the 1940 Act) (the Independent Trustees), reapproved for an annual period the continuation of the Advisory Agreement between the Trust and the Advisor and the Subadvisory Agreement between the Advisor and the Subadvisor with respect to the fund.
In considering the Advisory Agreement and the Subadvisory Agreement, the Board received in advance of the meeting a variety of materials relating to the fund, the Advisor, and the Subadvisor, including comparative performance, fee and expense information for peer groups of similar mutual funds prepared by an independent third-party provider of mutual fund data; performance information for the fund’s benchmark index; and, with respect to the Subadvisor, comparative performance information for comparably managed accounts; and other information provided by the Advisor and the Subadvisor regarding the nature, extent, and quality of services provided by the Advisor and the Subadvisor under their respective Agreements, as well as information regarding the Advisor’s revenues and costs of providing services to the fund and any compensation paid to affiliates of the Advisor. At the meeting at which the renewal of the Advisory Agreement and Subadvisory Agreement is considered, particular focus is given to information concerning fund performance, comparability of fees and total expenses and profitability. However, the Board notes that the evaluation process with respect to the Advisor and the Subadvisor is an ongoing one. In this regard, the Board also took into account discussions with management and information provided to the Board at prior meetings with respect to the services provided by the Advisor and the Subadvisor to the fund, including quarterly performance reports prepared by management containing reviews of investment results and prior presentations from the Subadvisor with respect to the fund. The Board also considered the nature, quality, and extent of non-advisory services, if any, to be provided to the fund by the Advisor’s affiliates, including distribution services.
Throughout the process, the Board asked questions of and requested additional information from management. The Board is assisted by counsel for the Trust and the Independent Trustees are also separately assisted by independent legal counsel throughout the process. The Independent Trustees also received a memorandum from their independent counsel discussing the legal standards for their consideration of the proposed continuation of the Agreements and discussed the proposed continuation of the Agreements in private sessions with their independent legal counsel at which no representatives of management were present.
Approval of Advisory Agreement
In approving the Advisory Agreement with respect to the fund, the Board, including the Independent Trustees, considered a variety of factors, including those discussed below. The Board also considered other factors (including conditions and trends prevailing generally in the economy, the securities markets, and the industry) and does not treat any single factor as determinative and each Trustee may attribute different weights to different factors. The Board’s conclusions may be based in part on its consideration of the Advisory and Subadvisory Agreements in prior years and on the Board’s ongoing regular review of fund performance and operations throughout the year.
| |
| 32 | Technical Opportunities Fund | Annual report |
Nature, extent, and quality of services. Among the information received by the Board from the Advisor relating to the nature, extent, and quality of services provided to the fund, the Board reviewed information provided by the Advisor relating to its operations and personnel, descriptions of its organizational and management structure, and information regarding the Advisor’s compliance and regulatory history, including its Form ADV. The Board also noted that on a regular basis it receives and reviews information from the Trust’s Chief Compliance Officer (CCO) regarding the fund’s compliance policies and procedures established pursuant to Rule 38a-1 under the 1940 Act. The Board also considered the Advisor’s risk management processes. The Board considered that the Advisor is responsible for the management of the day-to-day operations of the fund, including, but not limited to, general supervision of and coordination of the services provided by the Subadvisor, and is also responsible for monitoring and reviewing the activities of the Subadvisor and other third-party service providers.
In considering the nature, extent, and quality of the services provided by the Advisor, the Trustees also took into account their knowledge of the Advisor’s management and the quality of the performance of the Advisor’s duties through Board meetings, discussions, and reports during the preceding year and through each Trustee’s experience as a Trustee of the Trust and of the other trusts in the complex.
In the course of their deliberations regarding the Advisory Agreement, the Board considered, among other things:
(a) the skills and competency with which the Advisor has in the past managed the Trust’s affairs and its subadvisory relationship, the Advisor’s oversight and monitoring of the Subadvisor’s investment performance and compliance programs, such as the Subadvisor’s compliance with fund policies and objective; review of brokerage matters, including with respect to trade allocation and best execution; and the Advisor’s timeliness in responding to performance issues;
(b) the background, qualifications and skills of the Advisor’s personnel;
(c) the Advisor’s compliance policies and procedures and its responsiveness to regulatory changes and mutual fund industry developments;
(d) the Advisor’s administrative capabilities, including its ability to supervise the other service providers for the fund;
(e) the financial condition of the Advisor and whether it has the financial wherewithal to provide a high level and quality of services to the fund; and
(f) the Advisor’s reputation and experience in serving as an investment adviser to the Trust and the benefit to shareholders of investing in funds that are part of a family of funds offering a variety of investments.
The Board concluded that the Advisor may reasonably be expected to continue to provide a high quality of services under the Advisory Agreement with respect to the fund.
Investment performance. In considering the fund’s performance, the Board noted that it reviews at its regularly scheduled meetings information about the fund’s performance results. In connection with the consideration of the Advisory Agreement, the Board:
(a) reviewed information prepared by management regarding the fund’s performance;
(b) considered the comparative performance of the fund’s benchmark;
| |
| Annual report | Technical Opportunities Fund | 33 |
(c) considered the performance of comparable funds, if any, as included in the report prepared by an independent third-party provider of mutual fund data. Such report included the fund’s ranking within a smaller group of peer funds and the fund’s ranking within broader groups of funds; and
(d) took into account the Advisor’s analysis of the fund’s performance and its plans and recommendations regarding the Trust’s subadvisory arrangements generally.
The Board noted that the fund underperformed its benchmark index for the one- and three-year periods ended December 31, 2012. The Board also noted that the fund had outperformed its peer group average for the one-year period and underperformed the peer group average for the three-year period ended December 31, 2012.
The Board noted that the fund’s performance is being closely monitored. The Board took into account management’s discussion of the fund’s performance and noted the fund’s recent relative performance improvements.
The Board concluded that the fund’s performance is being reasonably addressed.
Fees and expenses. The Board reviewed comparative information prepared by an independent third-party provider of mutual fund data, including, among other data, the fund’s contractual and net management fees and total expenses as compared to similarly situated investment companies deemed to be comparable to the fund. The Board considered the fund’s ranking within a smaller group of peer funds chosen by the independent third-party provider, as well as the fund’s ranking within a broader group of funds. In comparing the fund’s contractual and net management fees to those of comparable funds, the Board noted that such fees include both advisory and administrative costs.
The Board noted that net management fees for this fund are higher than the peer group median and that total expenses for this fund are higher than the peer group median. The Board took into account management’s discussion of the fund’s expenses.
The Board also took into account management’s discussion with respect to the advisory/subadvisory fee structure, including the amount of the advisory fee retained by the Advisor after payment of the subadvisory fee. The Board also took into account that management had agreed to implement an overall fee waiver across a number of funds in the complex, including the fund, which is discussed further below. In addition, the Board noted that the Advisor effected advisory and subadvisory fee reductions in the past year with respect to the fund. The Board also noted that the Advisor pays the subadvisory fees of the fund, and that such fees are negotiated at arm’s length with respect to the Subadvisor. The Board also noted management’s discussion of the fund’s expenses, as well as certain actions taken over the past several years to reduce the fund’s operating expenses. The Board reviewed information provided by the Advisor concerning investment advisory fees charged to other clients (including other funds in the complex) having similar investment mandates, if any. The Board considered any differences between the Advisor’s and Subadvisor’s services to the fund and the services they provide to other comparable clients or funds. The Board concluded that the advisory fee paid with respect to the fund is reasonable.
Profitability/indirect benefits. In considering the costs of the services to be provided and the profits to be realized by the Advisor and its affiliates from the Advisor’s relationship with the Trust, the Board:
(a) reviewed financial information of the Advisor;
(b) reviewed and considered an analysis presented by the Advisor regarding the net profitability to the Advisor and its affiliates with respect to the fund;
| |
| 34 | Technical Opportunities Fund | Annual report |
(c) received and reviewed profitability information with respect to the John Hancock fund complex as a whole;
(d) received information with respect to the Advisor’s allocation methodologies used in preparing the profitability data;
(e) considered that the John Hancock insurance companies that are affiliates of the Advisor, as shareholders of the Trust directly or through their separate accounts, receive certain tax credits or deductions relating to foreign taxes paid and dividends received by certain funds of the Trust and noted that these tax benefits, which are not available to participants in qualified retirement plans under applicable income tax law, are reflected in the profitability analysis reviewed by the Board;
(f) considered that the Advisor also provides administrative services to the fund on a cost basis pursuant to an administrative services agreement;
(g) noted that affiliates of the Advisor provide transfer agency services and distribution services to the fund, and that the Trust’s distributor also receives Rule 12b-1 payments to support distribution of the fund;
(h) noted that the Advisor also derives reputational and other indirect benefits from providing advisory services to the fund;
(i) noted that the subadvisory fees for the fund are paid by the Advisor and are negotiated at arm’s length; and
(j) considered that the Advisor should be entitled to earn a reasonable level of profits in exchange for the level of services it provides to the fund and the entrepreneurial risk that it assumes as Advisor.
Based upon its review, the Board concluded that the level of profitability, if any, of the Advisor and its affiliates from their relationship with the fund was reasonable and not excessive.
Economies of scale. In considering the extent to which economies of scale would be realized as the fund grows and whether fee levels reflect these economies of scale for the benefit of fund shareholders, the Board:
(a) considered that the Advisor has agreed, effective June 1, 2013, to waive its management fee for the fund and each of the open-end funds of John Hancock Funds II, John Hancock Funds III, each other John Hancock fund (except those listed below) (the Participating Portfolios) or otherwise reimburse the expenses of the Participating Portfolios as follows (the Reimbursement):
The Reimbursement shall equal, on an annualized basis, 0.01% of that portion of the aggregate net assets of all the Participating Portfolios that exceeds $75 billion but is less than or equal to $125 billion, 0.0125% of that portion of the aggregate net assets of all the Participating Portfolios that exceeds $125 billion but is less than or equal to $150 billion and 0.015% of that portion of the aggregate net assets of all the Participating Portfolios that exceeds $150 billion. (The funds that are not Participating Portfolios as of the date of this annual report are each of the fund of funds, money market funds, index funds and closed-end funds);
(b) reviewed the Trust’s advisory fee structure and the incorporation therein of any subadvisory fee breakpoints in the advisory fees charged and concluded that (i) the fund’s fee structure contains breakpoints at the subadvisory fee level and that such breakpoints are reflected as breakpoints in the advisory fees for the fund and (ii) although economies of scale cannot be measured with precision, these arrangements permit shareholders of the fund to benefit
| |
| Annual report | Technical Opportunities Fund | 35 |
from economies of scale if the fund grows. The Board also took into account management’s discussion of the fund’s advisory fee structure; and
(c) the Board also considered the effect of the fund’s growth in size on its performance and fees. The Board also noted that if the fund’s assets increase over time, the fund may realize other economies of scale.
Approval of Subadvisory Agreement
In making its determination with respect to approval of the Subadvisory Agreement, the Board reviewed:
(1) information relating to the Subadvisor’s business, including current subadvisory services to the Trust (and other funds in the John Hancock family of funds);
(2) the historical and current performance of the fund, and comparative performance information relating to the fund’s benchmark and comparable funds;
(3) the subadvisory fee for the fund, including any breakpoints, and comparative fee information, where available, prepared by an independent third-party provider of mutual fund data; and
(4) information relating to the nature and scope of any material relationships and their significance to the Trust’s Advisor and Subadvisor.
Nature, extent, and quality of services. With respect to the services provided by the Subadvisor, the Board received information provided to the Board by the Subadvisor, including the Subadvisor’s Form ADV, as well as took into account information presented throughout the past year. The Board considered the Subadvisor’s current level of staffing and its overall resources, as well as received information relating to the Subadvisor’s compensation program. The Board reviewed the Subadvisor’s history and investment experience, as well as information regarding the qualifications, background, and responsibilities of the Subadvisor’s investment and compliance personnel who provide services to the fund. The Board also considered, among other things, the Subadvisor’s compliance program and any disciplinary history. The Board also considered the Subadvisor’s risk assessment and monitoring process. The Board reviewed the Subadvisor’s regulatory history, including whether it was currently involved in any regulatory actions or investigations as well as material litigation, and any settlements and amelioratory actions undertaken, as appropriate. The Board noted that the Advisor conducts regular, periodic reviews of the Subadvisor and its operations, including regarding investment processes and organizational and staffing matters. The Board also noted that the Trust’s CCO and his staff conduct regular, periodic compliance reviews with the Subadvisor and present reports to the Independent Trustees regarding the same, which includes evaluating the regulatory compliance systems of the Subadvisor and procedures reasonably designed by it to assure compliance with the federal securities laws. The Board also took into account the financial condition of the Subadvisor.
The Board considered the Subadvisor’s investment process and philosophy. The Board took into account that the Subadvisor’s responsibilities include the development and maintenance of an investment program for the fund, that is consistent with the fund’s investment objective, the selection of investment securities and the placement of orders for the purchase and sale of such securities, as well as the implementation of compliance controls related to performance of these services. The Board also received information with respect to the Subadvisor’s brokerage policies and practices, including with respect to best execution and soft dollars.
Subadvisor compensation. In considering the cost of services to be provided by the Subadvisor and the profitability to the Subadvisor of its relationship with the fund, the Board noted that the fees under the Subadvisory Agreement are paid by the Advisor and not the fund.
| |
| 36 | Technical Opportunities Fund | Annual report |
The Board also relied on the ability of the Advisor to negotiate the Subadvisory Agreement with the Subadvisor, which is not affiliated with the Advisor, and the fees thereunder at arm’s length. As a result, the costs of the services to be provided and the profits to be realized by the Subadvisor from its relationship with the Trust were not a material factor in the Board’s consideration of the Subadvisory Agreement.
The Board also received information regarding the nature and scope (including their significance to the Advisor and its affiliates and to the Subadvisor) of any material relationships with respect to the Subadvisor, which includes arrangements in which the Subadvisor or its affiliates provide advisory, distribution, or management services in connection with financial products sponsored by the Trust’s Advisor or its affiliates, and may include other registered investment companies, a 529 education savings plan, managed separate account, and exempt group annuity contracts sold to qualified plans. The Board also received information and took into account any other potential conflicts of interest the Advisor might have in connection with the Subadvisory Agreement.
In addition, the Board considered other potential indirect benefits that the Subadvisor and its affiliates may receive from the Subadvisor’s relationship with the fund, such as the opportunity to provide advisory services to additional funds in the John Hancock fund complex and reputational benefits.
Subadvisory fees. The Board considered that the fund pays an advisory fee to the Advisor and that, in turn, the Advisor pays a subadvisory fee to the Subadvisor. The Board also took into account the sub-advisory fees paid by the Advisor to the Subadvisor with respect to the fund to fees charged by the fund’s Subadvisor to manage other subadvised portfolios and portfolios not subject to regulation under the 1940 Act, as applicable.
Subadvisor performance. As noted above, the Board considered the fund’s performance as compared to the fund’s peer group and benchmark and noted that the Board reviews information about the fund’s performance results at its regularly scheduled meetings. The Board noted the Advisor’s expertise and resources in monitoring the performance, investment style, and risk-adjusted performance of the Subadvisor. The Board was mindful of the Advisor’s focus on the Subadvisor’s performance. The Board also noted the Subadvisor’s long-term performance record for similar accounts, as applicable.
The Board’s decision to approve the Subadvisory Agreement was based on a number of determinations, including the following:
(1) The Subadvisor has extensive experience and demonstrated skills as a manager;
(2) The performance of the fund is being monitored and reasonably addressed;
(3) The subadvisory fees are reasonable in relation to the level and quality of services being provided; and
(4) Subadvisory fee breakpoints are reflected as breakpoints in the advisory fees for the fund in order to permit shareholders to benefit from economies of scale if the fund grows.
Based on the Board’s evaluation of all factors that the Board deemed to be material, including those factors described above, the Board, including the Independent Trustees, concluded that renewal of the Advisory Agreement and the Subadvisory Agreement would be in the best interest of the fund and its shareholders. Accordingly, the Board, and the Independent Trustees voting separately, approved the Advisory Agreement and Subadvisory Agreement for an additional one-year period.
| |
| Annual report | Technical Opportunities Fund | 37 |
Trustees and Officers
This chart provides information about the Trustees and Officers who oversee your John Hancock fund. Officers elected by the Trustees manage the day-to-day operations of the fund and execute policies formulated by the Trustees.
Independent Trustees
| | |
| Name, year of birth | Trustee | Number of John |
| Position(s) held with fund | of the | Hancock funds |
| Principal occupation(s) and other | Trust | overseen by |
| directorships during past 5 years | since1 | Trustee |
| |
| James M. Oates, Born: 1946 | 2012 | 231 |
|
| Managing Director, Wydown Group (financial consulting firm) (since 1994); Chairman and Director, |
| Emerson Investment Management, Inc. (since 2000); Independent Chairman, Hudson Castle Group, Inc. |
| (formerly IBEX Capital Markets, Inc.) (financial services company) (1997–2011); Director, Stifel Financial |
| (since 1996); Director, Investor Financial Services Corporation (1995–2007); Director, Connecticut River |
| Bancorp (since 1998); Director, Virtus Funds (formerly Phoenix Mutual Funds) (since 1988). Trustee |
| and Chairperson of the Board, John Hancock retail funds (since 2012); Trustee (2005–2006 and since |
| 2012) and Chairperson of the Board (since 2012), John Hancock Funds III; Trustee (since 2004) and |
| Chairperson of the Board (since 2005), John Hancock Variable Insurance Trust; Trustee and Chairperson |
| of the Board (since 2005), John Hancock Funds II. | | |
|
| |
| Charles L. Bardelis,3 Born: 1941 | 2012 | 231 |
|
| Director, Island Commuter Corp. (marine transport). Trustee, John Hancock retail funds (since 2012); |
| Trustee, John Hancock Funds III (2005–2006 and since 2012); Trustee, John Hancock Variable Insurance |
| Trust (since 1988); Trustee, John Hancock Funds II (since 2005). | | |
|
| |
| Peter S. Burgess,3 Born: 1942 | 2012 | 231 |
|
| Consultant (financial, accounting, and auditing matters) (since 1999); Certified Public Accountant; |
| Partner, Arthur Andersen (independent public accounting firm) (prior to 1999); Director, Lincoln |
| Educational Services Corporation (since 2004); Director, Symetra Financial Corporation (since 2010); |
| former Director, PMA Capital Corporation (2004–2010). Trustee, John Hancock retail funds (since 2012); |
| Trustee, John Hancock Funds III (2005–2006 and since 2012); Trustee, John Hancock Variable Insurance |
| Trust and John Hancock Funds II (since 2005). | | |
|
| |
| William H. Cunningham,2 Born: 1944 | 1994 | 231 |
|
| Professor, University of Texas, Austin, Texas (since 1971); former Chancellor, University of Texas |
| System and former President of the University of Texas, Austin, Texas; Director, LIN Television (since |
| 2009); Chairman (since 2009) and Director (since 2006), Lincoln National Corporation (insurance); |
| Director, Resolute Energy Corporation (since 2009); Director, Southwest Airlines (since 2000); former |
| Director, Introgen (manufacturer of biopharmaceuticals) (until 2008); former Director, Hicks Acquisition |
| Company I, Inc. (until 2007); former Director, Texas Exchange Bank, SSB (formerly Bank of Crowley) |
| (until 2009); former Advisory Director, JPMorgan Chase Bank (formerly Texas Commerce Bank–Austin) |
| (until 2009). Trustee, John Hancock retail funds (since 1986); Trustee, John Hancock Variable Insurance |
| Trust (since 2012); Trustee, John Hancock Funds II (since 2012 and 2005–2006). | |
|
| |
| Grace K. Fey, Born: 1946 | 2012 | 231 |
|
| Chief Executive Officer, Grace Fey Advisors (since 2007); Director and Executive Vice President, |
| Frontier Capital Management Company (1988–2007); Director, Fiduciary Trust (since 2009). |
| Trustee, John Hancock retail funds (since 2012); Trustee, John Hancock Variable Insurance Trust and |
| John Hancock Funds II (since 2008). | | |
| |
| 38 | Technical Opportunities Fund | Annual report |
Independent Trustees (continued)
| | |
| Name, year of birth | Trustee | Number of John |
| Position(s) held with fund | of the | Hancock funds |
| Principal occupation(s) and other | Trust | overseen by |
| directorships during past 5 years | since1 | Trustee |
| |
| Theron S. Hoffman,3 Born: 1947 | 2012 | 231 |
|
| Chief Executive Officer, T. Hoffman Associates, LLC (consulting firm) (since 2003); Director, The Todd |
| Organization (consulting firm) (2003–2010); President, Westport Resources Management (investment |
| management consulting firm) (2006–2008); Senior Managing Director, Partner, and Operating Head, |
| Putnam Investments (2000–2003); Executive Vice President, The Thomson Corp. (financial and |
| legal information publishing) (1997–2000). Trustee, John Hancock retail funds (since 2012); Trustee, |
| John Hancock Variable Insurance Trust and John Hancock Funds II (since 2008). | |
|
| |
| Deborah C. Jackson,2 Born: 1952 | 2008 | 231 |
|
| President, Cambridge College, Cambridge, Massachusetts (since 2011); Chief Executive Officer, |
| American Red Cross of Massachusetts Bay (2002–2011); Board of Directors of Eastern Bank Corporation |
| (since 2001); Board of Directors of Eastern Bank Charitable Foundation (since 2001); Board of Directors |
| of American Student Assistance Corporation (1996–2009); Board of Directors of Boston Stock Exchange |
| (2002–2008); Board of Directors of Harvard Pilgrim Healthcare (health benefits company) (2007–2011). |
| Trustee, John Hancock retail funds (since 2008); Trustee of John Hancock Variable Insurance Trust and |
| John Hancock Funds II (since 2012). | | |
|
| |
| Hassell H. McClellan, Born: 1945 | 2012 | 231 |
|
| Associate Professor, The Wallace E. Carroll School of Management, Boston College (since 1984); |
| Trustee, Virtus Variable Insurance Trust (formerly Phoenix Edge Series Funds) (since 2008); Director, |
| The Barnes Group (since 2010). Trustee, John Hancock retail funds (since 2012); Trustee, John Hancock |
| Funds III (2005–2006 and since 2012); Trustee, John Hancock Variable Insurance Trust and | |
| John Hancock Funds II (since 2005). | | |
|
| |
| Steven R. Pruchansky,2 Born: 1944 | 1991 | 231 |
|
| Chairman and Chief Executive Officer, Greenscapes of Southwest Florida, Inc. (since 2000); Director |
| and President, Greenscapes of Southwest Florida, Inc. (until 2000); Member, Board of Advisors, First |
| American Bank (until 2010); Managing Director, Jon James, LLC (real estate) (since 2000); Director, |
| First Signature Bank & Trust Company (until 1991); Director, Mast Realty Trust (until 1994); President, |
| Maxwell Building Corp. (until 1991). Trustee (since 1992) and Chairperson of the Board (2011–2012), |
| John Hancock retail funds; Trustee and Vice Chairperson of the Board, John Hancock retail funds, |
| John Hancock Variable Insurance Trust and John Hancock Funds II (since 2012). | |
|
| |
| Gregory A. Russo,2 Born: 1949 | 2009 | 231 |
|
| Director and Audit Committee Chairman (since 2012) and Member, Audit Committee and Finance |
| Committee (since 2011), NCH Healthcare System, Inc. (holding company for multi-entity healthcare |
| system); Director and Member of Finance Committee, The Moorings, Inc. (nonprofit continuing care |
| community) (since 2012); Vice Chairman, Risk & Regulatory Matters, KPMG LLP (KPMG) (2002–2006); |
| Vice Chairman, Industrial Markets, KPMG (1998–2002); Chairman and Treasurer, Westchester |
| County, New York, Chamber of Commerce (1986–1992); Director, Treasurer and Chairman of |
| Audit and Finance Committees, Putnam Hospital Center (1989–1995); Director and Chairman of |
| Fundraising Campaign, United Way of Westchester and Putnam Counties, New York (1990–1995). |
| Trustee, John Hancock retail funds (since 2008); Trustee, John Hancock Variable Insurance Trust and |
| John Hancock Funds II (since 2012). | | |
| |
| Annual report | Technical Opportunities Fund | 39 |
Non-Independent Trustees4
| | |
| Name, year of birth | Trustee | Number of John |
| Position(s) held with fund | of the | Hancock funds |
| Principal occupation(s) and other | Trust | overseen by |
| directorships during past 5 years | since1 | Trustee |
| |
| James R. Boyle, Born: 1959 | 2012 | 231 |
|
| Senior Executive Vice President, John Hancock Financial Services (1999–2012, including prior positions); |
| Chairman and Director, John Hancock Advisers, LLC, John Hancock Funds, LLC, and John Hancock |
| Investment Management Services, LLC (2005–2010). Trustee, John Hancock retail funds (since 2012 and |
| 2005–2010), Trustee, John Hancock Variable Insurance Trust and John Hancock Funds II (since 2005). |
|
| |
| Craig Bromley,2 Born: 1966 | 2012 | 231 |
|
| President, John Hancock Financial Services (since 2012); Senior Executive Vice President and General |
| Manager, U.S. Division, John Hancock Financial Services (since 2012); President and Chief Executive |
| Officer, Manulife Insurance Company (Manulife (Japan) (2005–2012), including prior positions). |
| Trustee, John Hancock retail funds (since 2012); Trustee, John Hancock Variable Insurance Trust and |
| John Hancock Funds II (since 2012). | | |
|
| |
| Warren A. Thomson,2 Born: 1955 | 2012 | 231 |
|
| Senior Executive Vice President and Chief Investment Officer, Manulife Financial Corporation and The |
| Manufacturers Life Insurance Company (since 2009); Chairman and Chief Executive Officer, Manulife |
| Asset Management (since 2001, including prior positions); Director (since 2006), and President and |
| Chief Executive Officer of Manulife Asset Management Limited (since 2013); Director and Chairman, |
| Hancock Natural Resources Group, Inc. (since 2013). Trustee, John Hancock retail funds, John Hancock |
| Variable Insurance Trust and John Hancock Funds II (since 2012). | | |
Principal officers who are not Trustees
| |
| Name, year of birth | Officer |
| Position(s) held with fund | of the |
| Principal occupation(s) and other | Trust |
| directorships during past 5 years | since |
| |
| Hugh McHaffie, Born: 1959 | 2009 |
|
| President | |
| Executive Vice President, John Hancock Financial Services (since 2006, including prior positions); | |
| Chairman and Director, John Hancock Advisers, LLC, John Hancock Investment Management Services, |
| LLC and John Hancock Funds, LLC (since 2010); President, John Hancock Advisers, LLC (since 2012); |
| President, John Hancock Investment Management Services, LLC (since 2010). President (since 2012) and |
| former Trustee (2010–2012), John Hancock retail funds; President, John Hancock Variable Insurance |
| Trust and John Hancock Funds II (since 2009). | |
|
| |
| Andrew G. Arnott, Born: 1971 | 2009 |
|
| Executive Vice President | |
| Senior Vice President, John Hancock Financial Services (since 2009); Director and Executive Vice | |
| President, John Hancock Advisers, LLC (since 2005, including prior positions); Director and Executive |
| Vice President, John Hancock Investment Management Services, LLC (since 2006, including prior | |
| positions); President, John Hancock Funds, LLC (since 2004, including prior positions); Executive Vice |
| President, John Hancock retail funds, John Hancock Variable Insurance Trust and John Hancock Funds II |
| (since 2007, including prior positions). | |
|
| |
| Thomas M. Kinzler, Born: 1955 | 2006 |
|
| Secretary and Chief Legal Officer | |
| Vice President, John Hancock Financial Services (since 2006); Secretary and Chief Legal Counsel, | |
| John Hancock Funds, LLC (since 2007); Secretary and Chief Legal Officer, John Hancock retail funds, |
| John Hancock Variable Insurance Trust and John Hancock Funds II (since 2006). | |
| |
| 40 | Technical Opportunities Fund | Annual report |
Principal officers who are not Trustees (continued)
| |
| Name, year of birth | Officer |
| Position(s) held with fund | of the |
| Principal occupation(s) and other | Trust |
| directorships during past 5 years | since |
| |
| Francis V. Knox, Jr., Born: 1947 | 2005 |
|
| Chief Compliance Officer | |
| Vice President, John Hancock Financial Services (since 2005); Chief Compliance Officer, John Hancock |
| retail funds, John Hancock Variable Insurance Trust, John Hancock Funds II, John Hancock Advisers, |
| LLC and John Hancock Investment Management Services, LLC (since 2005); Vice President and Chief |
| Compliance Officer, John Hancock Asset Management a division of Manulife Asset Management (US) |
| LLC (2005–2008). | |
|
| |
| Charles A. Rizzo, Born: 1957 | 2007 |
|
| Chief Financial Officer | |
| Vice President, John Hancock Financial Services (since 2008); Senior Vice President, John Hancock | |
| Advisers, LLC and John Hancock Investment Management Services, LLC (since 2008); Chief Financial |
| Officer, John Hancock retail funds, John Hancock Variable Insurance Trust and John Hancock Funds II |
| (since 2007). | |
|
| |
| Salvatore Schiavone, Born: 1965 | 2009 |
|
| Treasurer | |
| Assistant Vice President, John Hancock Financial Services (since 2007); Vice President, John Hancock |
| Advisers, LLC and John Hancock Investment Management Services, LLC (since 2007); Treasurer, | |
| John Hancock retail funds (since 2007, including prior positions); Treasurer, John Hancock Variable | |
| Insurance Trust and John Hancock Funds II (since 2010 and 2007–2009, including prior positions). | |
John Hancock retail funds is comprised of John Hancock Funds III and 34 other John Hancock funds consisting of 24 series of other John Hancock trusts and 10 closed-end funds.
The business address for all Trustees and Officers is 601 Congress Street, Boston, Massachusetts 02210-2805.
The Statement of Additional Information of the fund includes additional information about members of the Board of Trustees of the Trust and is available without charge, upon request, by calling 800-225-5291.
1 Each Trustee holds office until his or her successor is elected and qualified, or until the Trustee’s death, retirement, resignation or removal.
2 Became a Trustee of the Trust effective December 1, 2012.
3 Member of Audit Committee.
4 Because Messrs. Bromley and Thomson are senior executives or directors and Mr. Boyle held prior positions as a senior executive and director of the Advisor and/or its affiliates, each of them is considered an “interested person,” as defined in the Investment Company Act of 1940, of the Trust.
| |
| Annual report | Technical Opportunities Fund | 41 |
More information
| |
| Trustees | Investment advisor |
| James M. Oates, Chairperson | John Hancock Investment Management |
| Steven R. Pruchansky, Vice Chairperson | Services, LLC |
| Charles L. Bardelis* | |
| James R. Boyle† | Subadvisor |
| Craig Bromley† | Wellington Management Company, LLP |
| Peter S. Burgess* | |
| William H. Cunningham | Principal distributor |
| Grace K. Fey | John Hancock Funds, LLC |
| Theron S. Hoffman* | |
| Deborah C. Jackson | Custodian |
| Hassell H. McClellan | State Street Bank and Trust Company |
| Gregory A. Russo | |
| Warren A. Thomson† | Transfer agent |
| | John Hancock Signature Services, Inc. |
| Officers | |
| Hugh McHaffie | Legal counsel |
| President | K&L Gates LLP |
| | |
| Andrew G. Arnott | Independent registered |
| Executive Vice President | public accounting firm |
| | PricewaterhouseCoopers LLP |
| Thomas M. Kinzler | |
| Secretary and Chief Legal Officer | |
| | |
| Francis V. Knox, Jr. | |
| Chief Compliance Officer | |
| | |
| Charles A. Rizzo | |
| Chief Financial Officer | |
| | |
| Salvatore Schiavone | |
| Treasurer | |
*Member of the Audit Committee
†Non-Independent Trustee
The fund’s proxy voting policies and procedures, as well as the fund’s proxy voting record for the most recent twelve-month period ended June 30, are available free of charge on the Securities and Exchange Commission (SEC) website at sec.gov or on our website.
The fund’s complete list of portfolio holdings, for the first and third fiscal quarters, is filed with the SEC on Form N-Q. The fund’s Form N-Q is available on our website and the SEC’s website, sec.gov, and can be reviewed and copied (for a fee) at the SEC’s Public Reference Room in Washington, DC. Call 800-SEC-0330 to receive information on the operation of the SEC’s Public Reference Room.
We make this information on your fund, as well as monthly portfolio holdings, and other fund details available on our website at jhinvestments.com or by calling 800-225-5291.
| | |
| You can also contact us: | | |
| 800-225-5291 | Regular mail: | Express mail: |
| jhinvestments.com | Investment Operations | Investment Operations |
| | John Hancock Signature Services, Inc. | John Hancock Signature Services, Inc. |
| | P.O. Box 55913 | 30 Dan Road |
| | Boston, MA 02205-5913 | Canton, MA 02021 |
| |
| 42 | Technical Opportunities Fund | Annual report |

800-225-5291
800-338-8080 EASI-Line
jhinvestments.com

| |
| This report is for the information of the shareholders of John Hancock Technical Opportunities Fund. | |
| It is not authorized for distribution to prospective investors unless preceded or accompanied by a prospectus. | 347A 7/13 |
| MF150768 | 9/13 |
A look at performance
Total returns for the period ended July 31, 2013
| | | | | | | | | | | | |
| | | | | | | | | | | | SEC 30-day | SEC 30-day |
| | Average annual total returns (%) | | Cumulative total returns (%) | | yield (%) | yield (%) |
| | with maximum sales charge | | | with maximum sales charge | | subsidized | unsubsidized1 |
|
| | 1-year | 5-year | 10-year | Since inception2 | | 1-year | 5-year | 10-year | Since inception2 | | as of 7-31-13 | as of 7-31-13 |
|
| Class A | –1.28 | — | — | 3.55 | | –1.28 | — | — | 13.99 | | 3.05 | 0.92 |
|
| Class I3 | 3.73 | — | — | 5.13 | | 3.73 | — | — | 20.65 | | 3.52 | 1.22 |
|
| Class NAV3 | 3.88 | — | — | 5.31 | | 3.88 | — | — | 21.41 | | 3.66 | 3.66 |
|
| Index† | 1.73 | — | — | 3.97 | | 1.73 | — | — | 15.71 | | — | — |
|
Performance figures assume all distributions are reinvested. Figures reflect maximum sales charges on Class A shares of 4.50%.
The expense ratios of the fund, both net (including any fee waivers or expense limitations) and gross (excluding any fee waivers or expense limitations), are set forth according to the most recent publicly available prospectuses for the fund and may differ from those disclosed in the Financial highlights tables in this report. The fee waivers and expense limitations are contractual at least until 11-30-14 for Class A and Class I shares. Had the fee waivers and expense limitations not been in place, gross expenses would apply. For all other classes, the net expenses equal the gross expenses. The expense ratios are as follows:
| | | | | | | | | |
| | Class A | Class I | Class NAV | | | | | | |
| Net (%) | 1.21 | 0.90 | 0.75 | | | | | | |
| Gross (%) | 1.39 | 0.99 | 0.75 | | | | | | |
The returns reflect past results and should not be considered indicative of future performance. The return and principal value of an investment will fluctuate so that shares, when redeemed, may be worth more or less than their original cost. Due to market volatility, the fund’s current performance may be higher or lower than the performance shown. For current to the most recent month-end performance data, please call 800-225-5291 or visit the fund’s website at jhinvestments.com.
The performance table above and the chart on the next page do not reflect the deduction of taxes that a shareholder may pay on fund distributions or on the redemption of fund shares. The fund’s performance results reflect any applicable fee waivers or expense reductions, without which the expenses would increase and results would have been less favorable.
† Index is the Barclays 1-5 Year U.S. Credit Index.
See the following page for footnotes.
| |
| 6 | Short Duration Credit Opportunities Fund | Annual report |

| | | | |
| | | With maximum | Without | |
| | Start date | sales charge | sales charge | Index |
|
| Class I3 | 11-2-09 | $12,065 | $12,065 | $11,571 |
|
| Class NAV3 | 11-2-09 | 12,141 | 12,141 | 11,571 |
|
Barclays 1-5 Year U.S. Credit Index includes investment-grade corporate and international dollar-denominated bonds with maturities of 1 to 5 years.
It is not possible to invest directly in an index. Index figures do not reflect expenses or sales charges, which would have resulted in lower values if they did.
Footnotes related to performance pages
1 Unsubsidized yields reflect what the yields would have been without the effects of waivers and reimbursements.
2 From 11-2-09.
3 For certain types of investors as described in the fund’s prospectuses.
| |
| Annual report | Short Duration Credit Opportunities Fund | 7 |
Management’s discussion of
Fund performance
Stone Harbor Investment Partners LP
For the 12 months ended July 31, 2013, Class A shares of John Hancock Short Duration Credit Opportunities Fund posted a total return of 3.41%, excluding sales charges. For the same 12-month period, the nontraditional bond fund category as tracked by Morningstar, Inc. returned an average 2.64%.† During the same one-year period, the Barclays 1–5 Year U.S. Credit Index, the fund’s benchmark, gained 1.73%.
Performance in fixed-income markets was mixed over the past year. In the United States, Treasuries and AAA-rated debt significantly underperformed more credit-sensitive sectors of the market as longer-term U.S. Treasury rates, which began the period near record lows, climbed steadily higher. Part of that movement was driven by macroeconomic concerns, as investors closely watched the actions of Congress and the U.S. Federal Reserve for any potential changes in fiscal and monetary policies.
Against this backdrop, the fund’s low duration benefited relative performance versus its benchmark index and broader peer group. Duration measures the fund’s interest-rate sensitivity and is generally expressed in years; the price of a shorter-duration bond typically declines less than a longer-duration bond as interest rates rise. Our focus on higher-yielding sectors also contributed to performance. High yield was one of the best-performing segments of the market over the fund’s fiscal year, and the fund’s significant overweight position boosted returns. Prices in the high-yield bond market tend to be driven more by macroeconomic and company-specific fundamentals than by interest-rate movements, and as the economy continued to improve over the year, high yield performed well. The fund’s exposure to leveraged loans also contributed to gains over the period. The fund’s modest allocation to emerging-market debt, a sector that posted a loss over the trailing 12 months, detracted slightly from relative performance, as did our use of investment-grade and high-yield credit default swap index positions to hedge against potential volatility in the credit markets that might have emerged in the wake of the Cyprus default in Europe and the sequester in the United States.
This commentary reflects the views of the portfolio managers through the end of the period discussed in this report. As such, they are in no way guarantees of future events and are not intended to be used as investment advice or a recommendation regarding any specific security. They are also subject to change at any time as market and other conditions warrant.
Past performance is no guarantee of future results.
† Figures from Morningstar, Inc. include reinvested distributions and do not take into account sales charges. Actual load-adjusted performance is lower.
| |
| 8 | Short Duration Credit Opportunities Fund | Annual report |
Your expenses
These examples are intended to help you understand your ongoing operating expenses of investing in the fund so you can compare these costs with the ongoing costs of investing in other mutual funds.
Understanding fund expenses
As a shareholder of the fund, you incur two types of costs:
▪ Transaction costs, which include sales charges (loads) on purchases or redemptions (varies by share class), minimum account fee charge, etc.
▪ Ongoing operating expenses, including management fees, distribution and service fees (if applicable) and other fund expenses.
We are going to present only your ongoing operating expenses here.
Actual expenses/actual returns
This example is intended to provide information about the fund’s actual ongoing operating expenses and is based on the fund’s actual return. It assumes an account value of $1,000.00 on February 1, 2013, with the same investment held until July 31, 2013.
| | | |
| | Account value | Ending value | Expenses paid during |
| | on 2-1-13 | on 7-31-13 | period ended 7-31-131 |
|
| Class A | $1,000.00 | $997.90 | $5.99 |
|
| Class I | 1,000.00 | 999.30 | 4.46 |
|
| Class NAV | 1,000.00 | 1,000.10 | 3.67 |
|
Together with the value of your account, you may use this information to estimate the operating expenses that you paid over the period. Simply divide your account value at July 31, 2013, by $1,000.00, then multiply it by the “expenses paid” for your share class from the table above. For example, for an account value of $8,600.00, the operating expenses should be calculated as follows:
| |
| Annual report | Short Duration Credit Opportunities Fund | 9 |
Your expenses
Hypothetical example for comparison purposes
This table allows you to compare the fund’s ongoing operating expenses with those of any other fund. It provides an example of the fund’s hypothetical account values and hypothetical expenses based on each class’s actual expense ratio and an assumed 5% annualized return before expenses (which is not the fund’s actual return). It assumes an account value of $1,000.00 on February 1, 2013, with the same investment held until July 31, 2013. Look in any other fund shareholder report to find its hypothetical example and you will be able to compare these expenses. Please remember that these hypothetical account values and expenses may not be used to estimate the actual ending account balance or expenses you paid for the period.
| | | |
| | Account value | Ending value | Expenses paid during |
| | on 2-1-13 | on 7-31-13 | period ended 7-31-131 |
|
| Class A | $1,000.00 | $1,018.80 | $6.06 |
|
| Class I | 1,000.00 | 1,020.30 | 4.51 |
|
| Class NAV | 1,000.00 | 1,021.10 | 3.71 |
|
Remember, these examples do not include any transaction costs, therefore, these examples will not help you to determine the relative total costs of owning different funds. If transaction costs were included, your expenses would have been higher. See the prospectuses for details regarding transaction costs.
1 Expenses are equal to the fund’s annualized expense ratio of 1.21%, 0.90% and 0.74% for Class A, Class I and Class NAV shares, respectively, multiplied by the average account value over the period, multiplied by 181/365 (to reflect the one-half year period).
| |
| 10 | Short Duration Credit Opportunities Fund | Annual report |
Portfolio summary
| | | | |
| Portfolio Composition1 | | | | |
|
| Corporate Bonds | 42.5% | | U.S. Government Agency | 2.2% |
| |
|
| Term Loans | 19.9% | | Convertible Bonds | 1.7% |
| |
|
| Collateralized Mortgage Obligations | 16.6% | | Structured Notes | 0.2% |
| |
|
| Foreign Government Obligations | 9.5% | | Preferred Securities | 0.2% |
| |
|
| Asset-Backed Securities | 3.3% | | Short-Term Investments & Other | 3.9% |
| |
|
| |
| Quality Composition1,2 | | | | |
|
| U.S. Government Agency | 2.2% | | B | 20.8% |
| |
|
| AAA | 4.3% | | CCC & Below | 4.7% |
| |
|
| AA | 1.2% | | Equity | 0.2% |
| |
|
| A | 12.4% | | Not Rated | 6.5% |
| |
|
| BBB | 31.7% | | Short-Term Investments & Other | 3.9% |
| |
|
| BB | 12.1% | | | |
| | |
Fixed-income investments are subject to interest-rate and credit risk; their value will normally decline as interest rates rise or if the creditor is unable or unwilling to make principal or interest payments. Investments in higher-yielding, lower-rated securities include a higher risk of default. Foreign investing, especially in emerging markets, has additional risks, such as currency and market volatility and political and social instability. Currency transactions are affected by fluctuations in exchange rates. The use of hedging and derivatives could produce disproportionate gains or losses and may increase costs. Mortgage- and asset-backed securities may be sensitive to changes in interest rates, and may be subject to early repayment and the market’s perception of issuer creditworthiness. Illiquid securities may be difficult to sell at a price approximating their value. Loan participations and assignments involve additional risks, including credit, interest-rate, counterparty, liquidity, and lending risks. A portfolio concentrated in one sector or that holds a limited number of securities may fluctuate more than a diversified portfolio. Please see the fund’s prospectus for additional risks.
1 As a percentage of net assets on 7-31-13.
2 Ratings are from Moody’s Investors Service, Inc. If not available, we have used Standard & Poor’s Ratings Services. In the absence of ratings from these agencies, we have used Fitch Ratings, Inc. “Not Rated” securities are those with no ratings available from these agencies. All ratings are as of 7-31-13 and do not reflect subsequent downgrades or upgrades, if any.
| |
| Annual report | Short Duration Credit Opportunities Fund | 11 |
Fund’s investments
As of 7-31-13
| | | | | |
| | | | Maturity | | |
| | Rate (%) | | date | Par value^ | Value |
| Corporate Bonds 42.5% | | | | $492,411,449 |
|
| (Cost $493,802,837) | | | | | |
| | | | | | |
| Consumer Discretionary 7.0% | | | | 81,195,795 |
| | | | | |
| Auto Components 0.1% | | | | | |
|
| The Goodyear Tire & Rubber Company | 6.500 | | 03-01-21 | 415,000 | 434,159 |
|
| The Goodyear Tire & Rubber Company | 7.000 | | 05-15-22 | 190,000 | 201,875 |
| | | | | | |
| Automobiles 0.7% | | | | | |
|
| Chrysler Group LLC | 8.000 | | 06-15-19 | 465,000 | 507,431 |
|
| Ford Motor Credit Company LLC | 8.125 | | 01-15-20 | 3,600,000 | 4,428,813 |
|
| Hyundai Capital Services, Inc. (S) | 6.000 | | 05-05-15 | 3,125,000 | 3,359,413 |
| | | | | | |
| Distributors 0.0% | | | | | |
|
| Burlington Holdings LLC, PIK (S) | 9.000 | | 02-15-18 | 290,000 | 299,425 |
| | | | | | |
| Diversified Consumer Services 0.2% | | | | | |
|
| Outerwall, Inc. (S) | 6.000 | | 03-15-19 | 595,000 | 603,925 |
|
| SSI Investments II, Ltd. | 11.125 | | 06-01-18 | 425,000 | 468,563 |
|
| The ServiceMaster Company | 7.000 | | 08-15-20 | 175,000 | 162,969 |
|
| The ServiceMaster Company | 7.450 | | 08-15-27 | 250,000 | 207,500 |
|
| The ServiceMaster Company | 8.000 | | 02-15-20 | 324,000 | 316,710 |
| | | | | | |
| Hotels, Restaurants & Leisure 0.7% | | | | | |
|
| Boyd Gaming Corp. | 9.125 | | 12-01-18 | 530,000 | 564,450 |
|
| Isle of Capri Casinos, Inc. | 5.875 | | 03-15-21 | 980,000 | 950,600 |
|
| Landry’s, Inc. (S) | 9.375 | | 05-01-20 | 585,000 | 633,263 |
|
| Marriott International, Inc. | 3.000 | | 03-01-19 | 3,250,000 | 3,292,985 |
|
| MGM Resorts International | 6.625 | | 12-15-21 | 905,000 | 954,775 |
|
| Pinnacle Entertainment, Inc. | 8.750 | | 05-15-20 | 395,000 | 427,588 |
|
| PNK Finance Corp. (C)(S) | 6.375 | | 08-01-21 | 210,000 | 211,313 |
|
| RHP Hotel Properties LP (S) | 5.000 | | 04-15-21 | 490,000 | 480,200 |
| | | | | | |
| Household Durables 0.1% | | | | | |
|
| American Standard Americas (S) | 10.750 | | 01-15-16 | 260,000 | 273,975 |
|
| Lennar Corp. (S) | 5.000 | | 11-15-22 | 455,000 | 436,800 |
|
| Norcraft Companies LP | 10.500 | | 12-15-15 | 565,000 | 587,600 |
| | | | | | |
| Household Products 0.0% | | | | | |
|
| Spectrum Brands Escrow Corp. (S) | 6.375 | | 11-15-20 | 520,000 | 552,500 |
| | | | | | |
| Media 3.9% | | | | | |
|
| Allbritton Communications Company | 8.000 | | 05-15-18 | 480,000 | 519,000 |
|
| AMC Networks, Inc. | 7.750 | | 07-15-21 | 375,000 | 420,000 |
|
| British Sky Broadcasting Group PLC (S) | 3.125 | | 11-26-22 | 3,275,000 | 3,077,874 |
| | |
| 12 | Short Duration Credit Opportunities Fund | Annual report | See notes to financial statements |
| | | | | |
| | | | Maturity | | |
| | Rate (%) | | date | Par value^ | Value |
| Media (continued) | | | | | |
|
| Cablevision Systems Corp. | 7.750 | | 04-15-18 | 615,000 | $684,188 |
|
| Cablevision Systems Corp. | 8.000 | | 04-15-20 | 305,000 | 344,650 |
|
| CBS Corp. | 4.850 | | 07-01-42 | 3,375,000 | 3,126,583 |
|
| CCO Holdings LLC | 5.125 | | 02-15-23 | 200,000 | 183,000 |
|
| CCO Holdings LLC | 6.625 | | 01-31-22 | 645,000 | 659,513 |
|
| Comcast Corp. | 4.250 | | 01-15-33 | 3,375,000 | 3,252,356 |
|
| DIRECTV Holdings LLC | 6.000 | | 08-15-40 | 3,100,000 | 3,061,957 |
|
| Discovery Communications LLC | 3.300 | | 05-15-22 | 3,250,000 | 3,124,391 |
|
| DISH DBS Corp. | 5.000 | | 03-15-23 | 1,820,000 | 1,706,250 |
|
| DISH DBS Corp. | 5.875 | | 07-15-22 | 340,000 | 339,150 |
|
| Globo Comunicacao e Participacoes SA | | | | | |
| (6.250% to 7-20-15, then 9.375% | | | | | |
| thereafter) (Q) | 6.250 | | 07-20-15 | 100,000 | 104,000 |
|
| Gray Television, Inc. | 7.500 | | 10-01-20 | 550,000 | 578,875 |
|
| Mediacom LLC | 7.250 | | 02-15-22 | 570,000 | 607,050 |
|
| Myriad International Holdings BV (S) | 6.000 | | 07-18-20 | 200,000 | 206,500 |
|
| Nara Cable Funding, Ltd. (S) | 8.875 | | 12-01-18 | 510,000 | 535,500 |
|
| NBCUniversal Media LLC | 4.375 | | 04-01-21 | 2,850,000 | 3,089,397 |
|
| News America, Inc. | 6.650 | | 11-15-37 | 2,725,000 | 3,185,356 |
|
| Nexstar Broadcasting, Inc. (S) | 6.875 | | 11-15-20 | 470,000 | 486,450 |
|
| Omnicom Group, Inc. | 4.450 | | 08-15-20 | 2,950,000 | 3,136,107 |
|
| Pearson Funding Five PLC (S) | 3.250 | | 05-08-23 | 1,525,000 | 1,408,545 |
|
| Pearson Funding Four PLC (S) | 3.750 | | 05-08-22 | 1,675,000 | 1,630,711 |
|
| Quebecor Media, Inc. | 5.750 | | 01-15-23 | 555,000 | 542,513 |
|
| Radio One, Inc., PIK | 12.500 | | 05-24-16 | 740,496 | 744,198 |
|
| Sinclair Television Group, Inc. | 6.125 | | 10-01-22 | 340,000 | 343,400 |
|
| The Interpublic Group of Companies, Inc. | 4.000 | | 03-15-22 | 3,250,000 | 3,161,639 |
|
| Time Warner, Inc. | 7.700 | | 05-01-32 | 2,425,000 | 3,150,926 |
|
| Unitymedia KabelBW GmbH | 9.500 | | 03-15-21 | EUR 400,000 | 602,648 |
|
| Univision Communications, Inc. (S) | 7.875 | | 11-01-20 | 445,000 | 488,388 |
|
| Univision Communications, Inc. (S) | 8.500 | | 05-15-21 | 575,000 | 632,500 |
| | | | | | |
| Multiline Retail 0.7% | | | | | |
|
| Macy’s Retail Holdings, Inc. | 3.875 | | 01-15-22 | 4,575,000 | 4,637,069 |
|
| Macy’s Retail Holdings, Inc. | 6.900 | | 04-01-29 | 175,000 | 202,627 |
|
| Nordstrom, Inc. | 7.000 | | 01-15-38 | 2,500,000 | 3,229,140 |
|
| The Bon-Ton Department Stores, Inc. (S) | 8.000 | | 06-15-21 | 490,000 | 503,475 |
| | | | | | |
| Specialty Retail 0.5% | | | | | |
|
| AutoZone, Inc. | 3.700 | | 04-15-22 | 3,125,000 | 3,071,931 |
|
| Express LLC | 8.750 | | 03-01-18 | 490,000 | 525,525 |
|
| GRD Holdings III Corp. (S) | 10.750 | | 06-01-19 | 280,000 | 300,300 |
|
| L Brands, Inc. | 6.950 | | 03-01-33 | 125,000 | 125,000 |
|
| Petco Holdings Inc., PIK (S) | 8.500 | | 10-15-17 | 350,000 | 358,750 |
|
| RadioShack Corp. | 6.750 | | 05-15-19 | 220,000 | 152,900 |
|
| The Home Depot, Inc. | 2.700 | | 04-01-23 | 1,525,000 | 1,450,818 |
| | | | | | |
| Textiles, Apparel & Luxury Goods 0.1% | | | | | |
|
| Levi Strauss & Company | 6.875 | | 05-01-22 | 500,000 | 550,000 |
|
| Quiksilver, Inc. (S) | 7.875 | | 08-01-18 | 330,000 | 344,850 |
|
| Quiksilver, Inc. (S) | 10.000 | | 08-01-20 | 245,000 | 252,963 |
| | |
| See notes to financial statements | Annual report | Short Duration Credit Opportunities Fund | 13 |
| | | | | |
| | | | Maturity | | |
| | Rate (%) | | date | Par value^ | Value |
| Consumer Staples 3.0% | | | | | $35,327,594 |
| | | | | | |
| Beverages 0.4% | | | | | |
|
| Diageo Investment Corp. | 2.875 | | 05-11-22 | 1,625,000 | 1,574,931 |
|
| SABMiller Holdings, Inc. (S) | 3.750 | | 01-15-22 | 3,100,000 | 3,160,301 |
| | | | | | |
| Food & Staples Retailing 0.5% | | | | | |
|
| Bakkavor Finance 2 PLC | 8.250 | | 02-15-18 | GBP 100,000 | 157,449 |
|
| Cencosud SA (S) | 5.500 | | 01-20-21 | 150,000 | 152,268 |
|
| CVS Caremark Corp. | 4.125 | | 05-15-21 | 750,000 | 796,771 |
|
| CVS Pass-Through Trust | 6.036 | | 12-10-28 | 1,768,274 | 1,971,119 |
|
| Hawk Acquisition Sub, Inc. (S) | 4.250 | | 10-15-20 | 510,000 | 489,600 |
|
| New Albertsons, Inc. | 8.000 | | 05-01-31 | 1,350,000 | 1,053,000 |
|
| R&R PLC, PIK | 9.250 | | 05-15-18 | EUR 525,000 | 719,387 |
|
| The Kroger Company | 5.150 | | 08-01-43 | 975,000 | 977,478 |
| | | | | | |
| Food Products 0.8% | | | | | |
|
| B&G Foods, Inc. | 4.625 | | 06-01-21 | 505,000 | 487,956 |
|
| Boparan Finance PLC | 9.750 | | 04-30-18 | EUR 225,000 | 330,085 |
|
| Brickman Group Holdings, Inc. (S) | 9.125 | | 11-01-18 | 440,000 | 473,000 |
|
| Chiquita Brands International, Inc. (S) | 7.875 | | 02-01-21 | 605,000 | 642,813 |
|
| ConAgra Foods, Inc. | 4.650 | | 01-25-43 | 3,225,000 | 3,083,945 |
|
| Corporacion Azucarera del Peru SA (S) | 6.375 | | 08-02-22 | 100,000 | 98,750 |
|
| Dean Foods Company | 9.750 | | 12-15-18 | 635,000 | 721,519 |
|
| Del Monte Corp. | 7.625 | | 02-15-19 | 745,000 | 778,525 |
|
| Grupo Bimbo SAB de CV (S) | 4.875 | | 06-30-20 | 200,000 | 212,916 |
|
| IOI Investment L BHD | 4.375 | | 06-27-22 | 200,000 | 190,018 |
|
| Mriya Agro Holding PLC (S) | 9.450 | | 04-19-18 | 200,000 | 186,000 |
|
| Pilgrim’s Pride Corp. | 7.875 | | 12-15-18 | 495,000 | 535,838 |
|
| Post Holdings, Inc. (S) | 7.375 | | 02-15-22 | 30,000 | 32,175 |
|
| Post Holdings, Inc. | 7.375 | | 02-15-22 | 700,000 | 750,750 |
|
| Shearer’s Foods LLC (S) | 9.000 | | 11-01-19 | 385,000 | 411,469 |
|
| Smithfield Foods, Inc. | 6.625 | | 08-15-22 | 610,000 | 645,075 |
| | | | | | |
| Household Products 0.1% | | | | | |
|
| NBTY, Inc. | 9.000 | | 10-01-18 | 205,000 | 227,038 |
|
| Reynolds Group Issuer, Inc. | 9.875 | | 08-15-19 | 635,000 | 685,800 |
|
| The Sun Products Corp. (S) | 7.750 | | 03-15-21 | 505,000 | 515,100 |
| | | | | | |
| Personal Products 0.1% | | | | | |
|
| Elizabeth Arden, Inc. | 7.375 | | 03-15-21 | 475,000 | 513,000 |
|
| First Quality Finance Company, Inc. (S) | 4.625 | | 05-15-21 | 260,000 | 247,650 |
|
| Hypermarcas SA (S) | 6.500 | | 04-20-21 | 179,000 | 179,224 |
| | | | | | |
| Tobacco 1.1% | | | | | |
|
| Altria Group, Inc. | 2.850 | | 08-09-22 | 3,375,000 | 3,117,157 |
|
| Lorillard Tobacco Company | 6.875 | | 05-01-20 | 2,650,000 | 3,056,719 |
|
| Philip Morris International, Inc. | 1.125 | | 08-21-17 | 3,175,000 | 3,106,188 |
|
| Reynolds American, Inc. | 6.750 | | 06-15-17 | 2,625,000 | 3,046,580 |
| | | | | | |
| Energy 7.0% | | | | 81,240,538 |
| | | | | |
| Energy Equipment & Services 1.1% | | | | | |
|
| Basic Energy Services, Inc. | 7.750 | | 02-15-19 | 475,000 | 479,750 |
|
| Basic Energy Services, Inc. | 7.750 | | 10-15-22 | 400,000 | 397,000 |
| | |
| 14 | Short Duration Credit Opportunities Fund | Annual report | See notes to financial statements |
| | | | | |
| | | | Maturity | | |
| | Rate (%) | | date | Par value^ | Value |
| Energy Equipment & Services (continued) | | | | | |
|
| GeoPark Latin America, Ltd. | | | | | |
| Agencia en Chile (S) | 7.500 | | 02-11-20 | 200,000 | $204,000 |
|
| Hornbeck Offshore Services, Inc. (S) | 5.000 | | 03-01-21 | 300,000 | 288,000 |
|
| National Oilwell Varco, Inc. | 2.600 | | 12-01-22 | 1,675,000 | 1,576,121 |
|
| Offshore Group Investment, Ltd. (S) | 7.125 | | 04-01-23 | 700,000 | 701,750 |
|
| Pacific Drilling SA (S) | 5.375 | | 06-01-20 | 560,000 | 548,800 |
|
| Parker Drilling Company (S) | 7.500 | | 08-01-20 | 200,000 | 200,500 |
|
| Parker Drilling Company | 9.125 | | 04-01-18 | 550,000 | 588,500 |
|
| SESI LLC | 6.375 | | 05-01-19 | 409,000 | 431,495 |
|
| SESI LLC | 7.125 | | 12-15-21 | 320,000 | 348,800 |
|
| Transocean, Inc. | 6.375 | | 12-15-21 | 3,000,000 | 3,387,735 |
|
| Trinidad Drilling, Ltd. (S) | 7.875 | | 01-15-19 | 475,000 | 503,500 |
|
| Weatherford International, Ltd. | 7.000 | | 03-15-38 | 2,955,000 | 3,187,231 |
| | | | | | |
| Oil, Gas & Consumable Fuels 5.9% | | | | | |
|
| Access Midstream Partners LP | 4.875 | | 05-15-23 | 440,000 | 418,000 |
|
| Anadarko Petroleum Corp. | 6.375 | | 09-15-17 | 2,725,000 | 3,177,772 |
|
| Apache Corp. | 4.750 | | 04-15-43 | 1,845,000 | 1,786,945 |
|
| Arch Coal, Inc. | 7.250 | | 06-15-21 | 595,000 | 480,463 |
|
| Atlas Pipeline Partners LP (S) | 4.750 | | 11-15-21 | 565,000 | 518,388 |
|
| Bonanza Creek Energy, Inc. | 6.750 | | 04-15-21 | 475,000 | 486,875 |
|
| BP Capital Markets PLC | 2.750 | | 05-10-23 | 3,475,000 | 3,233,011 |
|
| Calumet Specialty Products Partners LP | 9.375 | | 05-01-19 | 205,000 | 223,963 |
|
| Calumet Specialty Products Partners LP | 9.625 | | 08-01-20 | 280,000 | 309,400 |
|
| Chesapeake Energy Corp. | 3.250 | | 03-15-16 | 550,000 | 548,625 |
|
| Cloud Peak Energy Resources LLC | 8.500 | | 12-15-19 | 505,000 | 545,400 |
|
| CONSOL Energy, Inc. | 8.250 | | 04-01-20 | 695,000 | 748,863 |
|
| Cosan Luxembourg SA (S) | 5.000 | | 03-14-23 | 200,000 | 187,500 |
|
| Ecopetrol SA | 7.625 | | 07-23-19 | 25,000 | 29,750 |
|
| El Paso Pipeline Partners Operating | | | | | |
| Company LLC | 4.700 | | 11-01-42 | 2,725,000 | 2,470,768 |
|
| Encana Corp. | 6.625 | | 08-15-37 | 1,150,000 | 1,332,694 |
|
| Enterprise Products Operating LLC | 3.350 | | 03-15-23 | 3,200,000 | 3,089,405 |
|
| EP Energy LLC | 6.875 | | 05-01-19 | 385,000 | 411,950 |
|
| EP Energy LLC | 9.375 | | 05-01-20 | 415,000 | 471,025 |
|
| Forest Oil Corp. | 7.250 | | 06-15-19 | 490,000 | 483,875 |
|
| Forest Oil Corp. (S) | 7.500 | | 09-15-20 | 320,000 | 311,200 |
|
| Gazprom OAO (S) | 4.950 | | 02-06-28 | 214,000 | 187,250 |
|
| Gazprom OAO | 9.250 | | 04-23-19 | 504,000 | 617,400 |
|
| Indo Energy Finance II BV (S) | 6.375 | | 01-24-23 | 300,000 | 253,500 |
|
| Intergas Finance BV | 6.375 | | 05-14-17 | 269,000 | 289,565 |
|
| KazMunayGas National Company | 6.375 | | 04-09-21 | 350,000 | 379,750 |
|
| KazMunayGas National Company (S) | 6.375 | | 04-09-21 | 200,000 | 217,000 |
|
| KazMunayGas National Company (S) | 9.125 | | 07-02-18 | 1,213,000 | 1,476,828 |
|
| KazMunayGas National Company | 11.750 | | 01-23-15 | 215,000 | 241,875 |
|
| Kinder Morgan Energy Partners LP (C) | 2.650 | | 02-01-19 | 3,250,000 | 3,267,379 |
|
| Kodiak Oil & Gas Corp. (S) | 5.500 | | 01-15-21 | 325,000 | 327,438 |
|
| Laredo Petroleum, Inc. | 7.375 | | 05-01-22 | 295,000 | 311,225 |
|
| Linn Energy LLC | 7.750 | | 02-01-21 | 560,000 | 565,600 |
| | |
| See notes to financial statements | Annual report | Short Duration Credit Opportunities Fund | 15 |
| | | | | |
| | | | Maturity | | |
| | Rate (%) | | date | Par value^ | Value |
| Oil, Gas & Consumable Fuels (continued) | | | | | |
|
| MEG Energy Corp. (S) | 6.375 | | 01-30-23 | 535,000 | $535,000 |
|
| Midstates Petroleum Company, Inc. (S) | 10.750 | | 10-01-20 | 540,000 | 561,600 |
|
| Novatek Finance, Ltd. (S) | 6.604 | | 02-03-21 | 218,000 | 236,225 |
|
| Oasis Petroleum, Inc. | 7.250 | | 02-01-19 | 590,000 | 629,825 |
|
| Pacific Rubiales Energy Corp. (S) | 5.125 | | 03-28-23 | 123,000 | 115,989 |
|
| Peabody Energy Corp. | 6.250 | | 11-15-21 | 765,000 | 749,700 |
|
| Pemex Project Funding Master Trust | 6.625 | | 06-15-35 | 376,000 | 402,320 |
|
| Pertamina Persero PT | 6.000 | | 05-03-42 | 200,000 | 172,500 |
|
| Petrobras International Finance Company | 2.875 | | 02-06-15 | 42,000 | 42,658 |
|
| Petroleos de Venezuela SA | 4.900 | | 10-28-14 | 1,701,574 | 1,601,181 |
|
| Petroleos de Venezuela SA | 5.000 | | 10-28-15 | 75,515 | 66,642 |
|
| Petroleos de Venezuela SA | 5.000 | | 10-28-15 | 32,114 | 28,341 |
|
| Petroleos de Venezuela SA | 5.250 | | 04-12-17 | 182,800 | 149,896 |
|
| Petroleos de Venezuela SA | 8.500 | | 11-02-17 | 13,672,700 | 12,578,884 |
|
| Petroleos Mexicanos (S) | 7.650 | | 11-24-21 | MXN 5,250,000 | 433,473 |
|
| Petroliam Nasional BHD | 7.625 | | 10-15-26 | 100,000 | 128,258 |
|
| Petronas Capital, Ltd. | 7.875 | | 05-22-22 | 763,000 | 980,824 |
|
| Phillips 66 | 4.300 | | 04-01-22 | 3,175,000 | 3,271,657 |
|
| Pioneer Natural Resources Company | 3.950 | | 07-15-22 | 3,250,000 | 3,225,290 |
|
| QEP Resources, Inc. | 5.375 | | 10-01-22 | 485,000 | 481,363 |
|
| Rosneft Oil Company | 3.149 | | 03-06-17 | 200,000 | 197,750 |
|
| Sabine Pass Liquefaction LLC (S) | 5.625 | | 02-01-21 | 590,000 | 581,888 |
|
| Sabine Pass LNG LP | 7.500 | | 11-30-16 | 450,000 | 495,000 |
|
| Samson Investment Company (S) | 10.000 | | 02-15-20 | 625,000 | 662,500 |
|
| SandRidge Energy, Inc. | 8.750 | | 01-15-20 | 850,000 | 892,500 |
|
| Sibur Securities, Ltd. (S) | 3.914 | | 01-31-18 | 200,000 | 190,500 |
|
| Sinopec Capital 2013, Ltd. (S) | 3.125 | | 04-24-23 | 232,000 | 209,282 |
|
| Sinopec Group Overseas Development | | | | | |
| 2012, Ltd. | 3.900 | | 05-17-22 | 200,000 | 196,025 |
|
| Sinopec Group Overseas Development 2012, | | | | | |
| Ltd. (S) | 4.875 | | 05-17-42 | 200,000 | 187,421 |
|
| State Oil Company of the Azerbaijan Republic | 5.450 | | 02-09-17 | 200,000 | 209,500 |
|
| Tesoro Logistics LP (S) | 6.125 | | 10-15-21 | 450,000 | 454,500 |
|
| TransCanada Pipelines, Ltd. | 7.250 | | 08-15-38 | 3,471,000 | 4,517,524 |
|
| Valero Energy Corp. | 6.625 | | 06-15-37 | 2,750,000 | 3,078,127 |
|
| Venoco, Inc. | 8.875 | | 02-15-19 | 525,000 | 523,031 |
|
| Zhaikmunai LP (S) | 7.125 | | 11-13-19 | 200,000 | 209,500 |
| | | | | | |
| Financials 12.2% | | | | 141,170,990 |
| | | | | |
| Capital Markets 0.7% | | | | | |
|
| Alphabet Holding Company, Inc., PIK | 7.750 | | 11-01-17 | 255,000 | 263,925 |
|
| Morgan Stanley | 4.875 | | 11-01-22 | 4,575,000 | 4,589,215 |
|
| The Goldman Sachs Group, Inc. | 5.250 | | 07-27-21 | 3,100,000 | 3,346,611 |
| | | | | | |
| Commercial Banks 3.8% | | | | | |
|
| Abbey National Treasury Services PLC | 4.000 | | 04-27-16 | 3,125,000 | 3,315,541 |
|
| Banco de Credito del Peru (S) | 4.250 | | 04-01-23 | 43,000 | 39,345 |
|
| Banco de Credito del Peru | 5.375 | | 09-16-20 | 60,000 | 61,800 |
| | |
| 16 | Short Duration Credit Opportunities Fund | Annual report | See notes to financial statements |
| | | | | |
| | | | Maturity | | |
| | Rate (%) | | date | Par value^ | Value |
| Commercial Banks (continued) | | | | | |
|
| Banco do Brasil SA/Cayman Island (6.250% | | | | | |
| to 4-15-24, then 10 Year U.S. Treasury | | | | | |
| + 4.398%) (Q)(S) | 6.250 | | 04-15-24 | 200,000 | $166,000 |
|
| Bancolombia SA | 5.125 | | 09-11-22 | 104,000 | 96,720 |
|
| Bank of Nova Scotia | 1.450 | | 04-25-18 | 3,175,000 | 3,089,437 |
|
| BBVA Banco Continental SA (S) | 5.000 | | 08-26-22 | 50,000 | 49,000 |
|
| Brazil Loan Trust 1 (S) | 5.477 | | 07-24-23 | 1,093,953 | 1,133,795 |
|
| CIT Group, Inc. | 5.000 | | 08-15-22 | 310,000 | 307,288 |
|
| CIT Group, Inc. | 5.250 | | 03-15-18 | 520,000 | 552,500 |
|
| Fifth Third Bancorp | 3.625 | | 01-25-16 | 3,200,000 | 3,379,386 |
|
| HSBC Holdings PLC | 6.500 | | 09-15-37 | 2,850,000 | 3,247,447 |
|
| ICICI Bank, Ltd. | 4.700 | | 02-21-18 | 200,000 | 204,414 |
|
| Intesa Sanpaolo SpA | 3.125 | | 01-15-16 | 8,100,000 | 8,030,656 |
|
| LBG Capital No.1 PLC | 6.439 | | 05-23-20 | EUR 400,000 | 536,131 |
|
| Mizuho Corporate Bank, Ltd. (S) | 2.950 | | 10-17-22 | 3,500,000 | 3,198,542 |
|
| PNC Bank NA | 4.875 | | 09-21-17 | 2,700,000 | 2,999,057 |
|
| PNC Funding Corp. | 5.125 | | 02-08-20 | 1,625,000 | 1,817,398 |
|
| Russian Agricultural Bank OJSC | 7.750 | | 05-29-18 | 226,000 | 254,250 |
|
| Santander Holdings USA, Inc. | 3.000 | | 09-24-15 | 3,225,000 | 3,318,525 |
|
| Societe Generale SA (S) | 5.750 | | 04-20-16 | 3,325,000 | 3,570,594 |
|
| Standard Chartered PLC (6.409% to 1-30-17, | | | | | |
| then 3 month LIBOR + 1.510%) (Q)(S) | 6.409 | | 01-30-17 | 3,500,000 | 3,563,000 |
|
| Turkiye Garanti Bankasi AS (S) | 5.250 | | 09-13-22 | 200,000 | 181,000 |
|
| VTB Capital SA | 6.875 | | 05-29-18 | 234,000 | 250,965 |
|
| VTB Capital SA | 6.950 | | 10-17-22 | 200,000 | 201,500 |
| | | | | | |
| Consumer Finance 0.4% | | | | | |
|
| Ally Financial, Inc. | 8.000 | | 11-01-31 | 395,000 | 472,025 |
|
| Capital One Financial Corp. | 4.750 | | 07-15-21 | 500,000 | 532,938 |
|
| Capital One Financial Corp. | 6.150 | | 09-01-16 | 3,635,000 | 4,065,777 |
| | | | | | |
| Diversified Financial Services 3.3% | | | | | |
|
| Aviation Capital Group Corp. (S) | 6.750 | | 04-06-21 | 2,925,000 | 3,130,566 |
|
| Bank of America Corp. | 5.000 | | 05-13-21 | 5,225,000 | 5,620,684 |
|
| BM&FBovespa SA (S) | 5.500 | | 07-16-20 | 150,000 | 155,250 |
|
| Citigroup, Inc. | 5.000 | | 09-15-14 | 2,350,000 | 2,442,574 |
|
| Citigroup, Inc. | 5.500 | | 02-15-17 | 4,875,000 | 5,343,141 |
|
| Citigroup, Inc. | 8.500 | | 05-22-19 | 1,475,000 | 1,882,714 |
|
| Countrywide Financial Corp. | 6.250 | | 05-15-16 | 1,325,000 | 1,455,868 |
|
| Dubai Holding Commercial Operations | | | | | |
| MTN, Ltd. | 6.000 | | 02-01-17 | GBP 150,000 | 232,181 |
|
| European Bank for Reconstruction | | | | | |
| & Development | 7.200 | | 06-08-16 | IDR 780,000,000 | 72,641 |
|
| European Investment Bank (Z) | Zero | | 12-31-18 | ZAR 1,480,000 | 99,642 |
|
| General Electric Capital Corp. | 6.750 | | 03-15-32 | 1,225,000 | 1,477,123 |
|
| Gruposura Finance (S) | 5.700 | | 05-18-21 | 201,000 | 205,020 |
|
| Inter-American Development Bank (Z) | Zero | | 08-20-15 | IDR 8,050,000,000 | 671,201 |
|
| International Lease Finance Corp. (S) | 6.500 | | 09-01-14 | 2,925,000 | 3,060,281 |
|
| International Lease Finance Corp. | 8.250 | | 12-15-20 | 501,000 | 579,908 |
|
| JPMorgan Chase & Company | 6.000 | | 01-15-18 | 2,700,000 | 3,105,986 |
| | |
| See notes to financial statements | Annual report | Short Duration Credit Opportunities Fund | 17 |
| | | | | |
| | | | Maturity | | |
| | Rate (%) | | date | Par value^ | Value |
| Diversified Financial Services (continued) | | | | | |
|
| Merrill Lynch & Company, Inc. | 6.050 | | 05-16-16 | 3,530,000 | $3,870,126 |
|
| Nationstar Mortgage LLC | 6.500 | | 07-01-21 | 305,000 | 304,238 |
|
| Provident Funding Associates LP (S) | 6.750 | | 06-15-21 | 200,000 | 202,500 |
|
| Provident Funding Associates LP (S) | 10.125 | | 02-15-19 | 350,000 | 390,250 |
|
| Rabobank Nederland NV | 3.950 | | 11-09-22 | 3,325,000 | 3,196,841 |
|
| Sinochem Overseas Capital Company, Ltd. (S) | 4.500 | | 11-12-20 | 865,000 | 871,787 |
|
| Sinochem Overseas Capital Company, Ltd. | 4.500 | | 11-12-20 | 236,000 | 237,852 |
| | | | | | |
| Insurance 2.4% | | | | | |
|
| Aegon NV | 4.625 | | 12-01-15 | 3,025,000 | 3,253,369 |
|
| American Equity Investment Life | | | | | |
| Holding Company | 6.625 | | 07-15-21 | 305,000 | 315,675 |
|
| AXA SA | 8.600 | | 12-15-30 | 2,195,000 | 2,658,534 |
|
| Boardwalk Pipelines LP | 3.375 | | 02-01-23 | 3,425,000 | 3,169,663 |
|
| Burlington Northern Santa Fe LLC | 4.400 | | 03-15-42 | 3,315,000 | 3,118,059 |
|
| Fairfax Financial Holdings, Ltd. (S) | 5.800 | | 05-15-21 | 2,925,000 | 3,010,969 |
|
| Fidelity National Financial, Inc. | 6.600 | | 05-15-17 | 1,475,000 | 1,632,008 |
|
| Genworth Financial, Inc. | 7.625 | | 09-24-21 | 3,270,000 | 3,926,936 |
|
| Hartford Financial Services Group, Inc. | 6.000 | | 01-15-19 | 2,950,000 | 3,381,626 |
|
| ING US, Inc. (S) | 2.900 | | 02-15-18 | 3,250,000 | 3,242,938 |
| | | | | | |
| Real Estate Investment Trusts 1.5% | | | | | |
|
| Boston Properties LP | 3.850 | | 02-01-23 | 3,150,000 | 3,117,416 |
|
| Corporate Office Properties LP (S) | 3.600 | | 05-15-23 | 1,525,000 | 1,413,649 |
|
| DDR Corp. | 7.875 | | 09-01-20 | 2,600,000 | 3,209,419 |
|
| Kimco Realty Corp. | 4.300 | | 02-01-18 | 2,975,000 | 3,223,216 |
|
| Simon Property Group LP | 3.375 | | 03-15-22 | 1,450,000 | 1,443,856 |
|
| WEA Finance LLC (S) | 6.750 | | 09-02-19 | 3,950,000 | 4,701,318 |
| | | | | | |
| Real Estate Management & Development 0.1% | | | | |
|
| BR Malls International Finance, Ltd. (Q) | 8.500 | | 01-21-16 | 60,000 | 59,552 |
|
| BR Malls International Finance, Ltd. (Q)(S) | 8.500 | | 01-21-16 | 50,000 | 49,631 |
|
| Country Garden Holdings Company, Ltd. (S) | 7.500 | | 01-10-23 | 200,000 | 185,500 |
|
| Emaar Sukuk, Ltd. | 6.400 | | 07-18-19 | 200,000 | 213,500 |
|
| Kaisa Group Holdings, Ltd. (S) | 8.875 | | 03-19-18 | 200,000 | 191,500 |
| | | | | | |
| Thrifts & Mortgage Finance 0.0% | | | | | |
|
| Alfa Bank OJSC (S) | 7.500 | | 09-26-19 | 200,000 | 209,500 |
| | | | | | |
| Health Care 2.4% | | | | 27,490,183 |
| | | | | |
| Health Care Equipment & Supplies 0.2% | | | | | |
|
| Biomet, Inc. | 6.500 | | 08-01-20 | 765,000 | 803,250 |
|
| Hologic, Inc. | 6.250 | | 08-01-20 | 450,000 | 476,438 |
|
| Kinetic Concepts, Inc. | 10.500 | | 11-01-18 | 530,000 | 583,000 |
|
| Kinetic Concepts, Inc. | 12.500 | | 11-01-19 | 370,000 | 390,813 |
|
| Universal Hospital Services, Inc. | 7.625 | | 08-15-20 | 280,000 | 296,100 |
| | | | | | |
| Health Care Providers & Services 1.4% | | | | | |
|
| Emergency Medical Services Corp. | 8.125 | | 06-01-19 | 575,000 | 623,875 |
|
| Express Scripts Holding Company | 4.750 | | 11-15-21 | 2,975,000 | 3,195,406 |
|
| Fresenius Medical Care US Finance II, Inc. (S) | 5.875 | | 01-31-22 | 550,000 | 580,250 |
|
| HCA Holdings, Inc. | 7.750 | | 05-15-21 | 250,000 | 271,875 |
| | |
| 18 | Short Duration Credit Opportunities Fund | Annual report | See notes to financial statements |
| | | | | |
| | | | Maturity | | |
| | Rate (%) | | date | Par value^ | Value |
| Health Care Providers & Services (continued) | | | | |
|
| HCA, Inc. | 7.500 | | 02-15-22 | 650,000 | $732,875 |
|
| Health Management Associates, Inc. | 7.375 | | 01-15-20 | 455,000 | 515,288 |
|
| HealthSouth Corp. | 8.125 | | 02-15-20 | 375,000 | 410,625 |
|
| Humana, Inc. | 8.150 | | 06-15-38 | 2,500,000 | 3,303,275 |
|
| IASIS Healthcare LLC | 8.375 | | 05-15-19 | 530,000 | 556,500 |
|
| Prospect Medical Holdings, Inc. (S) | 8.375 | | 05-01-19 | 615,000 | 645,750 |
|
| Radiation Therapy Services, Inc. | 9.875 | | 04-15-17 | 475,000 | 330,125 |
|
| United Surgical Partners International, Inc. | 9.000 | | 04-01-20 | 555,000 | 614,663 |
|
| UnitedHealth Group, Inc. | 5.800 | | 03-15-36 | 4,030,000 | 4,532,335 |
| | | | | | |
| Pharmaceuticals 0.8% | | | | | |
|
| AbbVie, Inc. (S) | 1.750 | | 11-06-17 | 3,200,000 | 3,163,443 |
|
| Actavis, Inc. | 3.250 | | 10-01-22 | 1,650,000 | 1,576,389 |
|
| Allergan, Inc. | 3.375 | | 09-15-20 | 3,050,000 | 3,120,345 |
|
| VPII Escrow Corp. (S) | 6.750 | | 08-15-18 | 265,000 | 279,575 |
|
| VPII Escrow Corp. (S) | 7.500 | | 07-15-21 | 455,000 | 487,988 |
| | | | | | |
| Industrials 2.3% | | | | 26,373,007 |
| | | | | |
| Aerospace & Defense 0.6% | | | | | |
|
| Erickson Air-Crane, Inc. (S) | 8.250 | | 05-01-20 | 495,000 | 499,950 |
|
| L-3 Communications Corp. | 4.750 | | 07-15-20 | 2,925,000 | 3,072,751 |
|
| Northrop Grumman Corp. | 1.750 | | 06-01-18 | 3,100,000 | 3,039,054 |
|
| TransDigm, Inc. (S) | 5.500 | | 10-15-20 | 375,000 | 366,563 |
| | | | | | |
| Air Freight & Logistics 0.0% | | | | | |
|
| Park-Ohio Industries, Inc. | 8.125 | | 04-01-21 | 275,000 | 298,375 |
| | | | | | |
| Building Products 0.3% | | | | | |
|
| Cleaver-Brooks, Inc. (S) | 8.750 | | 12-15-19 | 460,000 | 494,500 |
|
| Griffon Corp. | 7.125 | | 04-01-18 | 700,000 | 736,750 |
|
| Owens Corning | 7.000 | | 12-01-36 | 2,225,000 | 2,362,087 |
| | | | | | |
| Commercial Services & Supplies 0.4% | | | | | |
|
| ACCO Brands Corp. | 6.750 | | 04-30-20 | 615,000 | 631,144 |
|
| Clean Harbors, Inc. | 5.250 | | 08-01-20 | 160,000 | 164,000 |
|
| TransUnion Holding Company, Inc. | 9.625 | | 06-15-18 | 170,000 | 184,450 |
|
| Waste Management, Inc. | 4.600 | | 03-01-21 | 2,878,000 | 3,074,691 |
| | | | | | |
| Construction & Engineering 0.1% | | | | | |
|
| Aguila 3 SA (C)(S) | 7.875 | | 01-31-18 | 265,000 | 273,068 |
|
| China Overseas Finance Cayman II, Ltd. | 5.500 | | 11-10-20 | 200,000 | 207,703 |
|
| MasTec, Inc. | 4.875 | | 03-15-23 | 650,000 | 611,000 |
| | | | | | |
| Containers & Packaging 0.1% | | | | | |
|
| Ardagh Packaging Finance PLC | 9.250 | | 10-15-20 | EUR 550,000 | 782,911 |
| | | | | | |
| Electrical Equipment 0.3% | | | | | |
|
| ABB Finance USA, Inc. | 2.875 | | 05-08-22 | 3,375,000 | 3,251,114 |
|
| Faenza GmbH (C)(S) | 8.250 | | 08-15-21 | EUR 425,000 | 571,731 |
| | | | | | |
| Household Durables 0.0% | | | | | |
|
| RSI Home Products, Inc. (S) | 6.875 | | 03-01-18 | 385,000 | 396,550 |
| | | | | | |
| Industrial Conglomerates 0.0% | | | | | |
|
| Odebrecht Finance, Ltd. (S) | 5.125 | | 06-26-22 | 200,000 | 195,000 |
| | |
| See notes to financial statements | Annual report | Short Duration Credit Opportunities Fund | 19 |
| | | | | |
| | | | Maturity | | |
| | Rate (%) | | date | Par value^ | Value |
| Machinery 0.1% | | | | | |
|
| The Manitowoc Company, Inc. | 8.500 | | 11-01-20 | 175,000 | $196,875 |
|
| Xerium Technologies, Inc. | 8.875 | | 06-15-18 | 350,000 | 351,750 |
| | | | | | |
| Road & Rail 0.3% | | | | | |
|
| Canadian National Railway Company | 2.850 | | 12-15-21 | 3,150,000 | 3,089,602 |
| | | | | | |
| Trading Companies & Distributors 0.1% | | | | | |
|
| Aircastle, Ltd. | 6.750 | | 04-15-17 | 500,000 | 541,250 |
|
| American Builders & Contractors Supply | | | | | |
| Company, Inc. (S) | 5.625 | | 04-15-21 | 345,000 | 344,138 |
|
| HD Supply, Inc. (S) | 7.500 | | 07-15-20 | 600,000 | 636,000 |
| | | | | | |
| Information Technology 2.0% | | | | 22,698,400 |
| | | | | |
| Communications Equipment 0.1% | | | | | |
|
| CommScope, Inc. (S) | 8.250 | | 01-15-19 | 535,000 | 587,163 |
| | | | | | |
| Computers & Peripherals 0.3% | | | | | |
|
| Apple, Inc. | 2.400 | | 05-03-23 | 3,475,000 | 3,190,922 |
|
| NCR Corp. | 5.000 | | 07-15-22 | 575,000 | 556,313 |
| | | | | | |
| Electronic Equipment, Instruments & Components 0.1% | | | | |
|
| CPI International, Inc. | 8.000 | | 02-15-18 | 490,000 | 503,475 |
| | | | | | |
| Internet Software & Services 0.3% | | | | | |
|
| Baidu, Inc. (C) | 3.250 | | 08-06-18 | 3,625,000 | 3,636,411 |
|
| Tencent Holdings, Ltd. (S) | 3.375 | | 03-05-18 | 200,000 | 202,061 |
| | | | | | |
| IT Services 0.3% | | | | | |
|
| Cielo SA | 3.750 | | 11-16-22 | 200,000 | 175,000 |
|
| iGATE Corp. | 9.000 | | 05-01-16 | 355,000 | 382,956 |
|
| The Western Union Company | 2.875 | | 12-10-17 | 3,175,000 | 3,197,387 |
| | | | | | |
| Semiconductors & Semiconductor Equipment 0.5% | | | | |
|
| Altera Corp. | 1.750 | | 05-15-17 | 4,825,000 | 4,781,010 |
|
| Amkor Technology, Inc. (S) | 6.375 | | 10-01-22 | 85,000 | 84,363 |
|
| Amkor Technology, Inc. | 6.375 | | 10-01-22 | 605,000 | 601,975 |
|
| Magnachip Semiconductor Corp. (S) | 6.625 | | 07-15-21 | 505,000 | 506,263 |
|
| STATS ChipPAC, Ltd. (S) | 4.500 | | 03-20-18 | 200,000 | 196,500 |
| | | | | | |
| Software 0.4% | | | | | |
|
| First Data Corp. (S) | 6.750 | | 11-01-20 | 265,000 | 276,594 |
|
| First Data Corp. (S) | 7.375 | | 06-15-19 | 225,000 | 236,250 |
|
| First Data Corp. | 12.625 | | 01-15-21 | 600,000 | 657,750 |
|
| Infor US, Inc. | 11.500 | | 07-15-18 | 630,000 | 726,075 |
|
| Nuance Communications, Inc. (S) | 5.375 | | 08-15-20 | 500,000 | 487,500 |
|
| Oracle Corp. | 2.375 | | 01-15-19 | 1,700,000 | 1,712,432 |
| | | | | | |
| Materials 2.3% | | | | 26,670,280 |
| | | | | |
| Chemicals 0.9% | | | | | |
|
| Braskem Finance, Ltd. (Q)(S) | 7.375 | | 10-04-15 | 100,000 | 94,750 |
|
| Cabot Corp. | 3.700 | | 07-15-22 | 3,425,000 | 3,312,759 |
|
| Chemtura Corp. | 5.750 | | 07-15-21 | 315,000 | 313,425 |
|
| Hexion US Finance Corp. (S) | 6.625 | | 04-15-20 | 355,000 | 362,988 |
|
| Hexion US Finance Corp. | 6.625 | | 04-15-20 | 505,000 | 516,363 |
|
| Ineos Finance PLC (S) | 8.375 | | 02-15-19 | 410,000 | 449,975 |
|
| LyondellBasell Industries NV | 6.000 | | 11-15-21 | 3,300,000 | 3,780,513 |
| | |
| 20 | Short Duration Credit Opportunities Fund | Annual report | See notes to financial statements |
| | | | | |
| | | | Maturity | | |
| | Rate (%) | | date | Par value^ | Value |
| Chemicals (continued) | | | | | |
|
| Mexichem SAB de CV (S) | 4.875 | | 09-19-22 | 200,000 | $197,000 |
|
| Momentive Performance Materials, Inc. | 8.875 | | 10-15-20 | 475,000 | 505,875 |
|
| Trinseo Materials Operating SCA (S) | 8.750 | | 02-01-19 | 910,000 | 903,175 |
| | | | | | |
| Construction Materials 0.0% | | | | | |
|
| Cementos Pacasmayo SAA (S) | 4.500 | | 02-08-23 | 100,000 | 93,000 |
|
| Cemex Finance LLC (S) | 9.375 | | 10-12-22 | 200,000 | 224,000 |
| | | | | | |
| Containers & Packaging 0.1% | | | | | |
|
| ARD Finance SA, PIK (S) | 11.125 | | 06-01-18 | 413,068 | 446,113 |
|
| Cascades, Inc. | 7.750 | | 12-15-17 | 450,000 | 472,500 |
|
| Sealed Air Corp. (S) | 8.375 | | 09-15-21 | 645,000 | 732,075 |
| | | | | | |
| Metals & Mining 1.1% | | | | | |
|
| APERAM (S) | 7.375 | | 04-01-16 | 275,000 | 264,688 |
|
| APERAM (S) | 7.750 | | 04-01-18 | 250,000 | 236,250 |
|
| Cia Minera Milpo SAA (S) | 4.625 | | 03-28-23 | 200,000 | 184,500 |
|
| Corporacion Nacional del Cobre de Chile (S) | 3.000 | | 07-17-22 | 469,000 | 432,267 |
|
| Corporacion Nacional del Cobre de Chile (S) | 4.250 | | 07-17-42 | 200,000 | 166,179 |
|
| Corporacion Nacional del Cobre de Chile | 6.150 | | 10-24-36 | 803,000 | 878,369 |
|
| Ferrexpo Finance PLC (S) | 7.875 | | 04-07-16 | 200,000 | 187,330 |
|
| Freeport-McMoRan Copper & Gold, Inc. (S) | 3.875 | | 03-15-23 | 3,050,000 | 2,761,851 |
|
| Gold Fields Orogen Holding BVI, Ltd. | 4.875 | | 10-07-20 | 200,000 | 164,869 |
|
| Metalloinvest Finance, Ltd. (S) | 6.500 | | 07-21-16 | 203,000 | 212,643 |
|
| Newmont Mining Corp. | 6.250 | | 10-01-39 | 2,850,000 | 2,714,990 |
|
| Samarco Mineracao SA (S) | 4.125 | | 11-01-22 | 200,000 | 176,000 |
|
| Severstal OAO (S) | 5.900 | | 10-17-22 | 200,000 | 184,500 |
|
| Southern Copper Corp. | 5.250 | | 11-08-42 | 100,000 | 79,540 |
|
| Taseko Mines, Ltd. | 7.750 | | 04-15-19 | 280,000 | 282,800 |
|
| Vale Overseas, Ltd. | 5.625 | | 09-15-19 | 2,950,000 | 3,202,243 |
|
| Vedanta Resources PLC (S) | 6.000 | | 01-31-19 | 205,000 | 199,875 |
|
| Vedanta Resources PLC (S) | 8.250 | | 06-07-21 | 204,000 | 213,180 |
|
| Volcan Cia Minera SAA (S) | 5.375 | | 02-02-22 | 58,000 | 56,695 |
| | | | | | |
| Paper & Forest Products 0.2% | | | | | |
|
| Ainsworth Lumber Company, Ltd. (S) | 7.500 | | 12-15-17 | 450,000 | 477,000 |
|
| Louisiana-Pacific Corp. | 7.500 | | 06-01-20 | 600,000 | 660,000 |
|
| Mercer International, Inc. | 9.500 | | 12-01-17 | 500,000 | 530,000 |
| | | | | | |
| Telecommunication Services 1.9% | | | | 21,900,883 |
| | | | | |
| Diversified Telecommunication Services 1.3% | | | | |
|
| CenturyLink, Inc. | 5.800 | | 03-15-22 | 590,000 | 587,050 |
|
| CenturyLink, Inc. | 7.650 | | 03-15-42 | 295,000 | 278,775 |
|
| Cincinnati Bell, Inc. | 8.375 | | 10-15-20 | 610,000 | 643,550 |
|
| Cincinnati Bell, Inc. | 8.750 | | 03-15-18 | 470,000 | 488,800 |
|
| Crown Castle International Corp. | 5.250 | | 01-15-23 | 455,000 | 437,938 |
|
| CyrusOne LP | 6.375 | | 11-15-22 | 600,000 | 630,000 |
|
| Frontier Communications Corp. | 9.000 | | 08-15-31 | 1,259,000 | 1,227,525 |
|
| Intelsat Jackson Holdings SA | 7.250 | | 04-01-19 | 545,000 | 589,281 |
|
| Level 3 Financing, Inc. | 7.000 | | 06-01-20 | 725,000 | 752,188 |
|
| Level 3 Financing, Inc. | 10.000 | | 02-01-18 | 375,000 | 405,000 |
|
| Mobile Challenger Intermediate Group SA, PIK | 8.750 | | 03-15-19 | EUR 400,000 | 526,819 |
| | |
| See notes to financial statements | Annual report | Short Duration Credit Opportunities Fund | 21 |
| | | | | |
| | | | Maturity | | |
| | Rate (%) | | date | Par value^ | Value |
| Diversified Telecommunication Services (continued) | | | | |
|
| Telefonica Emisiones SAU | 3.192 | | 04-27-18 | 2,725,000 | $2,693,137 |
|
| Telefonica Emisiones SAU | 6.421 | | 06-20-16 | 1,900,000 | 2,090,198 |
|
| UPC Holding BV | 6.375 | | 09-15-22 | EUR 850,000 | 1,130,571 |
|
| Wind Acquisition Finance SA (S) | 6.500 | | 04-30-20 | 410,000 | 418,200 |
|
| Wind Acquisition Finance SA (S) | 11.750 | | 07-15-17 | 100,000 | 105,500 |
|
| Wind Acquisition Holdings Finance SA, PIK (S) | 12.250 | | 07-15-17 | 795,866 | 819,742 |
|
| Windstream Corp. | 7.500 | | 04-01-23 | 835,000 | 853,788 |
| | | | | | |
| Wireless Telecommunication Services 0.6% | | | | | |
|
| America Movil SAB de CV | 3.125 | | 07-16-22 | 3,100,000 | 2,890,530 |
|
| Cricket Communications, Inc. | 7.750 | | 10-15-20 | 500,000 | 568,750 |
|
| Digicel Group, Ltd. | 10.500 | | 04-15-18 | 234,000 | 253,890 |
|
| Matterhorn Mobile Holdings SA | 8.250 | | 02-15-20 | EUR 450,000 | 633,128 |
|
| MTS International Funding, Ltd. (S) | 5.000 | | 05-30-23 | 350,000 | 327,320 |
|
| NII International Telecom SCA (S) | 11.375 | | 08-15-19 | 320,000 | 351,200 |
|
| Softbank Corp. (S) | 4.500 | | 04-15-20 | 365,000 | 353,138 |
|
| Sprint Capital Corp. | 8.750 | | 03-15-32 | 1,375,000 | 1,450,625 |
|
| TBG Global Pte, Ltd. (S) | 4.625 | | 04-03-18 | 200,000 | 197,000 |
|
| VimpelCom Holdings BV (S) | 5.200 | | 02-13-19 | 200,000 | 197,240 |
| | | | | | |
| Utilities 2.4% | | | | 28,343,779 |
| | | | | |
| Electric Utilities 1.6% | | | | | |
|
| Centrais Eletricas Brasileiras SA | 5.750 | | 10-27-21 | 200,000 | 194,500 |
|
| Edison Mission Energy (H) | 7.000 | | 05-15-17 | 1,275,000 | 784,125 |
|
| Emgesa SA ESP (S) | 8.750 | | 01-25-21 | COP 176,000,000 | 99,390 |
|
| Emgesa SA ESP | 8.750 | | 01-25-21 | COP 129,000,000 | 72,849 |
|
| Exelon Generation Company LLC | 4.000 | | 10-01-20 | 3,065,000 | 3,129,592 |
|
| Georgia Power Company | 4.300 | | 03-15-42 | 4,725,000 | 4,405,902 |
|
| Oncor Electric Delivery Company LLC | 4.100 | | 06-01-22 | 3,000,000 | 3,142,014 |
|
| PacifiCorp | 4.100 | | 02-01-42 | 3,525,000 | 3,282,177 |
|
| PPL Energy Supply LLC | 4.600 | | 12-15-21 | 3,200,000 | 3,270,752 |
| | | | | | |
| Gas Utilities 0.3% | | | | | |
|
| Empresa de Energia de Bogota SA (S) | 6.125 | | 11-10-21 | 200,000 | 212,500 |
|
| EQT Corp. | 8.125 | | 06-01-19 | 2,725,000 | 3,314,284 |
| | | | | | |
| Independent Power Producers & Energy Traders 0.2% | | | | |
|
| AES Corp. | 7.375 | | 07-01-21 | 375,000 | 423,750 |
|
| Calpine Corp. (S) | 7.500 | | 02-15-21 | 202,000 | 216,140 |
|
| Calpine Corp. (S) | 7.875 | | 01-15-23 | 212,000 | 230,020 |
|
| Empresas Publicas de Medellin ESP | 8.375 | | 02-01-21 | COP 48,000,000 | 26,600 |
|
| Empresas Publicas de Medellin ESP (S) | 8.375 | | 02-01-21 | COP 220,000,000 | 121,916 |
|
| GenOn Energy, Inc. | 9.500 | | 10-15-18 | 1,120,000 | 1,282,400 |
|
| NRG Energy, Inc. | 8.500 | | 06-15-19 | 400,000 | 432,000 |
|
| The AES Corp. | 8.000 | | 06-01-20 | 300,000 | 347,250 |
| | | | | | |
| Multi-Utilities 0.3% | | | | | |
|
| MidAmerican Energy Holdings Company | 5.750 | | 04-01-18 | 2,870,000 | 3,355,618 |
| | |
| 22 | Short Duration Credit Opportunities Fund | Annual report | See notes to financial statements |
| | | | | |
| | | | Maturity | | |
| | Rate (%) | | date | Par value^ | Value |
| U.S. Government & Agency Obligations 2.2% | | | $25,801,965 |
|
| (Cost $25,748,577) | | | | | |
| |
| U.S. Government Agency 2.2% | | | | 25,801,965 |
|
| Federal Home Loan Mortgage Corp. | | | | | |
| Freddie Mac Pool (P) | 2.726 | | 07-01-38 | 2,087,194 | 2,196,114 |
| Freddie Mac Pool (P) | 2.752 | | 11-01-36 | 437,616 | 458,568 |
| Freddie Mac Pool (P) | 5.502 | | 01-01-37 | 415,773 | 439,115 |
|
| Federal National Mortgage Association | | | | | |
| Fannie Mae Pool (P) | 2.371 | | 04-01-37 | 1,770,570 | 1,891,678 |
| Fannie Mae Pool (P) | 2.799 | | 11-01-35 | 411,528 | 432,942 |
| Fannie Mae Pool (P) | 2.856 | | 12-01-42 | 429,460 | 432,208 |
| Fannie Mae Pool (C) | 3.000 | | TBA | 3,150,000 | 3,048,117 |
| Fannie Mae Pool (C) | 3.500 | | TBA | 900,000 | 940,957 |
| Fannie Mae Pool (P) | 3.908 | | 10-01-38 | 707,744 | 753,021 |
| Fannie Mae Pool (C) | 4.000 | | TBA | 3,300,000 | 3,429,680 |
| Fannie Mae Pool | 4.000 | | 08-01-25 | 484,041 | 512,365 |
| Fannie Mae Pool (C) | 4.500 | | TBA | 4,700,000 | 4,981,266 |
| Fannie Mae Pool (C) | 5.000 | | TBA | 1,750,000 | 1,887,402 |
| Fannie Mae Pool | 5.000 | | 01-01-16 | 611,035 | 651,074 |
| Fannie Mae Pool | 5.000 | | 01-01-19 | 4,304 | 4,586 |
| Fannie Mae Pool (C) | 5.500 | | TBA | 1,800,000 | 1,960,453 |
| Fannie Mae Pool (P) | 5.791 | | 01-01-37 | 350,837 | 369,715 |
| Fannie Mae Pool | 6.500 | | 01-01-37 | 825,955 | 929,853 |
|
| Government National Mortgage Association | | | | | |
| Ginnie Mae Pool | 6.000 | | 08-15-35 | 435,855 | 482,851 |
| |
| Foreign Government Obligations 9.5% | | | $109,557,059 |
|
| (Cost $115,984,775) | | | | | |
| |
| Brazil 1.2% | | | | | 13,807,778 |
|
| Federative Republic of Brazil | | | | | |
| Bond (Z) | Zero | | 01-01-17 | BRL 2,314,000 | 712,722 |
| Bond | 2.625 | | 01-05-23 | 1,791,000 | 1,544,738 |
| Bond | 7.125 | | 01-20-37 | 1,192,000 | 1,398,812 |
| Bond | 8.250 | | 01-20-34 | 644,000 | 837,200 |
| Note | 5.875 | | 01-15-19 | 439,000 | 495,412 |
| Note | 10.000 | | 01-01-17 | BRL 2,369,000 | 1,028,007 |
| Note | 10.000 | | 01-01-21 | BRL 6,857,000 | 2,907,111 |
| Note | 10.000 | | 01-01-23 | BRL 11,616,000 | 4,883,776 |
| |
| Colombia 0.5% | | | | | 5,391,675 |
|
| Bogota Distrito Capital | | | | | |
| Note | 9.750 | | 07-26-28 | COP 2,065,000,000 | 1,389,563 |
| Note | 9.750 | | 07-26-28 | COP 400,000,000 | 269,165 |
|
| Republic of Colombia | | | | | |
| Bond | 7.375 | | 09-18-37 | 1,478,000 | 1,869,670 |
| Bond | 7.750 | | 04-14-21 | COP 151,000,000 | 92,939 |
| Bond | 8.125 | | 05-21-24 | 476,000 | 627,130 |
| Bond | 9.850 | | 06-28-27 | COP 200,000,000 | 139,902 |
| Bond | 12.000 | | 10-22-15 | COP 1,661,000,000 | 1,003,306 |
| |
| Croatia 0.1% | | | | | 562,546 |
|
| Republic of Croatia | | | | | |
| Bond | 6.375 | | 03-24-21 | 230,000 | 243,271 |
| Bond | 6.625 | | 07-14-20 | 297,000 | 319,275 |
| | |
| See notes to financial statements | Annual report | Short Duration Credit Opportunities Fund | 23 |
| | | | | |
| | | | Maturity | | |
| | Rate (%) | | date | Par value^ | Value |
| Dominican Republic 0.1% | | | | | $1,581,018 |
|
| Government of Dominican Republic | | | | | |
| Bond (S) | 5.875 | | 04-18-24 | 278,000 | 268,965 |
| Bond | 7.500 | | 05-06-21 | 1,181,000 | 1,278,433 |
| Bond | 9.040 | | 01-23-18 | 30,494 | 33,620 |
| |
| El Salvador 0.0% | | | | | 399,578 |
|
| Republic of El Salvador | | | | | |
| Bond (S) | 7.375 | | 12-01-19 | 180,000 | 201,600 |
| Bond | 8.250 | | 04-10-32 | 189,000 | 197,978 |
| |
| Ghana 0.0% | | | | | 175,000 |
|
| Republic of Ghana | | | | | |
| Bond | 8.500 | | 10-04-17 | 160,000 | 175,000 |
| |
| Hungary 0.4% | | | | | 3,987,151 |
|
| Republic of Hungary | | | | | |
| Bond | 3.500 | | 07-18-16 | EUR 272,000 | 361,747 |
| Bond | 4.125 | | 02-19-18 | 154,000 | 150,535 |
| Bond | 4.375 | | 07-04-17 | EUR 158,000 | 211,068 |
| Bond | 5.000 | | 03-30-16 | GBP 37,000 | 56,534 |
| Bond | 5.500 | | 05-06-14 | GBP 11,000 | 16,958 |
| Bond | 5.500 | | 12-22-16 | HUF 20,480,000 | 92,358 |
| Bond | 5.500 | | 12-20-18 | HUF 22,000,000 | 97,873 |
| Bond | 6.000 | | 11-24-23 | HUF 18,370,000 | 79,287 |
| Bond | 6.375 | | 03-29-21 | 720,000 | 751,680 |
| Bond | 6.500 | | 06-24-19 | HUF 9,200,000 | 42,800 |
| Bond | 6.750 | | 02-24-17 | HUF 26,160,000 | 122,040 |
| Bond | 6.750 | | 11-24-17 | HUF 54,420,000 | 254,651 |
| Bond | 7.000 | | 06-24-22 | HUF 104,060,000 | 481,871 |
| Bond | 7.625 | | 03-29-41 | 158,000 | 165,900 |
| Bond | 7.750 | | 08-24-15 | HUF 65,450,000 | 309,421 |
| Bond | 8.000 | | 02-12-15 | HUF 169,300,000 | 792,428 |
| |
| Indonesia 0.7% | | | | | 7,853,956 |
|
| Republic of Indonesia | | | | | |
| Bond (S) | 3.375 | | 04-15-23 | 841,000 | 737,978 |
| Bond | 4.875 | | 05-05-21 | 1,083,000 | 1,099,245 |
| Bond | 5.625 | | 05-15-23 | IDR 2,974,000,000 | 246,931 |
| Bond | 5.875 | | 03-13-20 | 104,000 | 113,100 |
| Bond | 6.125 | | 05-15-28 | IDR 1,000,000,000 | 80,869 |
| Bond | 6.625 | | 05-15-33 | IDR 2,700,000,000 | 221,203 |
| Bond | 7.000 | | 05-15-22 | IDR 15,200,000,000 | 1,404,002 |
| Bond | 7.000 | | 05-15-27 | IDR 300,000,000 | 26,612 |
| Bond | 7.750 | | 01-17-38 | 123,000 | 148,215 |
| Bond | 8.250 | | 06-15-32 | IDR 1,500,000,000 | 145,978 |
| Bond | 8.500 | | 10-12-35 | 1,575,000 | 2,023,875 |
| Bond | 11.000 | | 09-15-25 | IDR 210,000,000 | 24,968 |
| Bond (S) | 11.625 | | 03-04-19 | 575,000 | 787,750 |
| Bond | 11.625 | | 03-04-19 | 579,000 | 793,230 |
| |
| Iraq 0.1% | | | | | 955,080 |
|
| Republic of Iraq | | | | | |
| Bond | 5.800 | | 01-15-28 | 1,137,000 | 955,080 |
| |
| Ivory Coast 0.0% | | | | | 167,200 |
|
| Republic of Ivory Coast | | | | | |
| Bond | 5.750 | | 12-31-32 | 190,000 | 167,200 |
| | |
| 24 | Short Duration Credit Opportunities Fund | Annual report | See notes to financial statements |
| | | | | |
| | | | Maturity | | |
| | Rate (%) | | date | Par value^ | Value |
| Lithuania 0.1% | | | | $649,565 |
|
| Republic of Lithuania | | | | |
| Bond (S) | 6.625 | | 02-01-22 | 554,000 | 649,565 |
| |
| Malaysia 0.3% | | | | 3,560,831 |
|
| Government of Malaysia | | | | |
| Bond | 3.314 | | 10-31-17 | MYR 220,000 | 66,626 |
| Bond | 3.418 | | 08-15-22 | MYR 1,180,000 | 345,706 |
| Bond | 3.480 | | 03-15-23 | MYR 1,240,000 | 363,355 |
| Bond | 3.492 | | 03-31-20 | MYR 470,000 | 140,386 |
| Bond | 3.580 | | 09-28-18 | MYR 920,000 | 279,259 |
| Bond | 3.844 | | 04-15-33 | MYR 300,000 | 88,749 |
| Bond | 4.012 | | 09-15-17 | MYR 3,330,000 | 1,034,852 |
| Bond | 4.160 | | 07-15-21 | MYR 3,510,000 | 1,083,996 |
| Bond | 4.392 | | 04-15-26 | MYR 500,000 | 157,902 |
| |
| Mexico 1.1% | | | | 12,990,395 |
|
| Government of Mexico | | | | |
| Bond | 2.000 | | 06-09-22 | MXN 306,769 | 23,805 |
| Bond | 2.500 | | 12-10-20 | MXN 3,023,156 | 243,754 |
| Bond | 3.500 | | 12-14-17 | MXN 1,682,280 | 143,369 |
| Bond | 4.000 | | 06-13-19 | MXN 1,632,801 | 144,237 |
| Bond | 5.125 | | 01-15-20 | 14,000 | 15,582 |
| Bond | 5.750 | | 10-12-10 | 982,000 | 918,170 |
| Bond | 6.050 | | 01-11-40 | 1,924,000 | 2,135,640 |
| Bond | 6.250 | | 06-16-16 | MXN 1,180,000 | 96,909 |
| Bond | 6.500 | | 06-10-21 | MXN 6,737,000 | 548,735 |
| Bond | 6.500 | | 06-09-22 | MXN 13,926,000 | 1,131,729 |
| Bond | 6.750 | | 09-27-34 | 2,138,000 | 2,586,980 |
| Bond | 7.500 | | 06-03-27 | MXN 3,877,000 | 333,544 |
| Bond | 7.750 | | 05-29-31 | MXN 28,649,000 | 2,436,437 |
| Bond | 8.000 | | 12-07-23 | MXN 13,538,000 | 1,218,726 |
| Bond | 8.500 | | 05-31-29 | MXN 1,083,000 | 99,343 |
| Bond | 10.000 | | 12-05-24 | MXN 8,770,000 | 913,435 |
| |
| Morocco 0.0% | | | | 181,750 |
|
| Kingdom of Morocco | | | | |
| Bond (S) | 4.250 | | 12-11-22 | 200,000 | 181,750 |
| |
| Nigeria 0.0% | | | | 236,060 |
|
| Federal Republic of Nigeria | | | | |
| Bond (S) | 6.375 | | 07-12-23 | 232,000 | 236,060 |
| |
| Panama 0.2% | | | | 2,305,638 |
|
| Republic of Panama | | | | |
| Bond | 5.200 | | 01-30-20 | 464,000 | 513,880 |
| Bond | 6.700 | | 01-26-36 | 393,000 | 465,705 |
| Bond | 7.125 | | 01-29-26 | 134,000 | 165,825 |
| Bond | 8.875 | | 09-30-27 | 99,000 | 138,848 |
| Bond | 9.375 | | 04-01-29 | 696,000 | 1,021,380 |
| |
| Peru 0.1% | | | | 1,600,263 |
|
| Republic of Peru | | | | |
| Bond | 5.200 | | 09-12-23 | PEN 240,000 | 85,700 |
| Bond | 5.625 | | 11-18-50 | 271,000 | 276,420 |
| Bond | 6.850 | | 02-12-42 | PEN 180,000 | 66,856 |
| Bond | 6.900 | | 08-12-37 | PEN 140,000 | 53,822 |
| Bond | 6.950 | | 08-12-31 | PEN 310,000 | 119,321 |
| Bond | 7.350 | | 07-21-25 | 275,000 | 350,625 |
| Bond | 8.200 | | 08-12-26 | PEN 30,000 | 13,506 |
| Bond | 8.750 | | 11-21-33 | 435,000 | 634,013 |
| | |
| See notes to financial statements | Annual report | Short Duration Credit Opportunities Fund | 25 |
| | | | | |
| | | | Maturity | | |
| | Rate (%) | | date | Par value^ | Value |
| Philippines 0.1% | | | | | $1,340,130 |
|
| Republic of Philippines | | | | | |
| Bond | 7.750 | | 01-14-31 | 1,023,000 | 1,340,130 |
| |
| Poland 0.6% | | | | | 7,090,229 |
|
| Republic of Poland | | | | | |
| Bond | 3.000 | | 08-24-16 | PLN 3,419,522 | 1,108,922 |
| Bond | 3.750 | | 04-25-18 | PLN 6,520,000 | 2,068,685 |
| Bond | 4.000 | | 10-25-23 | PLN 3,790,000 | 1,177,483 |
| Bond | 5.000 | | 04-25-16 | PLN 310,000 | 102,034 |
| Bond | 5.000 | | 03-23-22 | 307,000 | 329,258 |
| Bond | 5.125 | | 04-21-21 | 569,000 | 618,788 |
| Bond | 5.750 | | 10-25-21 | PLN 400,000 | 140,348 |
| Bond | 5.750 | | 09-23-22 | PLN 520,000 | 182,924 |
| Bond | 6.375 | | 07-15-19 | 1,164,000 | 1,361,787 |
| |
| Romania 0.0% | | | | | 143,184 |
|
| Government of Romania | | | | | |
| Bond | 5.850 | | 07-28-14 | RON 320,000 | 97,635 |
| Bond | 6.000 | | 10-19-13 | RON 100,000 | 30,193 |
| Bond | 6.250 | | 10-25-14 | RON 50,000 | 15,356 |
| |
| Russia 0.8% | | | | | 8,817,886 |
|
| Government of Russia | | | | | |
| Bond | 7.000 | | 11-24-21 | RUB 4,780,000 | 139,652 |
| Bond | 7.000 | | 01-25-23 | RUB 19,150,000 | 566,166 |
| Bond | 7.350 | | 01-20-16 | RUB 34,130,000 | 1,061,854 |
| Bond | 7.500 | | 03-15-18 | RUB 4,100,000 | 129,726 |
| Bond | 7.500 | | 02-27-19 | RUB 7,060,000 | 222,436 |
| Bond | 7.600 | | 04-14-21 | RUB 56,000,000 | 1,760,114 |
| Bond | 7.600 | | 07-20-22 | RUB 23,040,000 | 716,472 |
| Eurobond | 7.500 | | 03-31-30 | 2,501,989 | 2,933,582 |
| Eurobond | 7.850 | | 03-10-18 | RUB 10,000,000 | 319,084 |
| Eurobond | 12.750 | | 06-24-28 | 560,000 | 968,800 |
| |
| South Africa 0.8% | | | | | 9,093,284 |
|
| Republic of South Africa | | | | | |
| Bond | 5.500 | | 03-09-20 | 1,232,000 | 1,319,780 |
| Bond | 6.250 | | 03-31-36 | ZAR 5,090,000 | 382,198 |
| Bond | 6.750 | | 03-31-21 | ZAR 8,300,000 | 802,329 |
| Bond | 7.000 | | 02-28-31 | ZAR 8,820,000 | 755,683 |
| Bond | 7.250 | | 01-15-20 | ZAR 8,810,000 | 885,929 |
| Bond | 8.000 | | 12-21-18 | ZAR 32,470,000 | 3,427,954 |
| Bond | 8.250 | | 09-15-17 | ZAR 390,000 | 41,449 |
| Bond | 10.500 | | 12-21-26 | ZAR 6,080,000 | 731,412 |
| Bond | 13.500 | | 09-15-15 | ZAR 6,445,000 | 746,550 |
| |
| Thailand 0.2% | | | | | 2,701,456 |
|
| Kingdom of Thailand | | | | | |
| Bond | 1.200 | | 07-14-21 | THB 18,719,019 | 585,941 |
| Bond | 2.800 | | 10-10-17 | THB 10,320,000 | 322,950 |
| Bond | 3.250 | | 06-16-17 | THB 13,230,000 | 422,439 |
| Bond | 3.580 | | 12-17-27 | THB 3,260,000 | 97,058 |
| Bond | 3.625 | | 06-16-23 | THB 16,230,000 | 503,971 |
| Bond | 3.650 | | 12-17-21 | THB 24,460,000 | 769,097 |
| |
| Turkey 1.3% | | | | | 15,027,925 |
|
| Republic of Turkey | | | | | |
| Bond | 3.250 | | 03-23-23 | 818,000 | 707,570 |
| Bond | 4.000 | | 04-29-15 | TRY 846,752 | 444,819 |
| Bond | 4.500 | | 02-11-15 | TRY 542,005 | 286,828 |
| | |
| 26 | Short Duration Credit Opportunities Fund | Annual report | See notes to financial statements |
| | | | | |
| | | | Maturity | | |
| | Rate (%) | | date | Par value^ | Value |
| Turkey (continued) | | | | | |
|
| Bond | 4.875 | | 04-16-43 | 200,000 | $166,500 |
| Bond | 5.125 | | 03-25-22 | 226,000 | 228,825 |
| Bond | 5.625 | | 03-30-21 | 175,000 | 184,625 |
| Bond | 6.000 | | 01-14-41 | 1,938,000 | 1,870,170 |
| Bond | 6.250 | | 09-26-22 | 485,000 | 528,650 |
| Bond | 6.300 | | 02-14-18 | TRY 4,650,000 | 2,168,935 |
| Bond | 6.500 | | 01-07-15 | TRY 2,510,000 | 1,252,439 |
| Bond | 6.750 | | 04-03-18 | 317,000 | 355,833 |
| Bond | 7.000 | | 09-26-16 | 108,000 | 120,420 |
| Bond | 7.000 | | 03-11-19 | 300,000 | 342,000 |
| Bond | 7.000 | | 06-05-20 | 83,000 | 95,035 |
| Bond | 7.100 | | 03-08-23 | TRY 1,490,000 | 669,594 |
| Bond | 7.250 | | 03-05-38 | 493,000 | 557,090 |
| Bond | 7.375 | | 02-05-25 | 601,000 | 691,150 |
| Bond | 7.500 | | 09-24-14 | TRY 610,000 | 310,049 |
| Bond | 7.500 | | 07-14-17 | 103,000 | 118,193 |
| Bond | 8.000 | | 02-14-34 | 1,449,000 | 1,756,913 |
| Bond | 8.300 | | 06-20-18 | TRY 1,060,000 | 533,025 |
| Bond | 8.500 | | 09-14-22 | TRY 440,000 | 214,778 |
| Bond | 9.000 | | 01-27-16 | TRY 670,000 | 348,160 |
| Bond | 9.000 | | 03-08-17 | TRY 1,000,000 | 516,542 |
| Bond | 9.500 | | 01-12-22 | TRY 830,000 | 433,017 |
| Bond | 10.500 | | 01-15-20 | TRY 230,000 | 126,765 |
| |
| Ukraine 0.3% | | | | | 3,057,862 |
|
| Republic of Ukraine | | | | | |
| Bond | 4.950 | | 10-13-15 | EUR 507,000 | 649,032 |
| Bond | 6.580 | | 11-21-16 | 544,000 | 510,000 |
| Bond (S) | 6.875 | | 09-23-15 | 100,000 | 97,250 |
| Bond (S) | 7.500 | | 04-17-23 | 400,000 | 349,500 |
| Bond (S) | 7.800 | | 11-28-22 | 859,000 | 770,953 |
| Bond | 9.250 | | 07-24-17 | 682,000 | 681,127 |
| |
| Uruguay 0.0% | | | | | 392,000 |
|
| Republic of Uruguay | | | | | |
| Bond | 7.875 | | 01-15-33 | 299,580 | 392,000 |
| |
| Venezuela 0.5% | | | | | 5,487,619 |
|
| Republic of Venezuela | | | | | |
| Bond | 5.750 | | 02-26-16 | 95,000 | 85,975 |
| Bond | 6.000 | | 12-09-20 | 161,000 | 118,738 |
| Bond | 8.250 | | 10-13-24 | 1,683,200 | 1,296,064 |
| Bond | 8.500 | | 10-08-14 | 509,000 | 511,545 |
| Bond | 9.250 | | 09-15-27 | 81,000 | 67,230 |
| Bond | 11.950 | | 08-05-31 | 575,000 | 543,375 |
| Bond | 12.750 | | 08-23-22 | 2,484,600 | 2,534,292 |
| Bond | 13.625 | | 08-15-18 | 320,000 | 330,400 |
| |
| Capital Preferred Securities 0.0% | | | | | $156,823 |
|
| (Cost $147,519) | | | | | |
| |
| Industrials 0.0% | | | | | 156,823 |
| Hutchison Whampoa International 10, Ltd. | | | | | |
| (6.000% to 10-28-15, then reset of 5 Year U.S. | | | | | |
| Treasury Note Rate + 4.885% until 10-28-20, | | | | | |
| then 3 month LIBOR + 5.638%) (Q) | 6.000 | | 10-28-15 | 149,000 | 156,823 |
| | |
| See notes to financial statements | Annual report | Short Duration Credit Opportunities Fund | 27 |
| | | | | |
| | | | Maturity | | |
| | Rate (%) | | date | Par value^ | Value |
| Convertible Bonds 1.7% | | | | $18,954,385 |
|
| (Cost $18,006,623) | | | | | |
| | | | | | |
| Consumer Discretionary 0.2% | | | | 2,801,578 |
| | | | | |
| Auto Components 0.1% | | | | | |
|
| TRW Automotive, Inc. | 3.500 | | 12-01-15 | 423,000 | 1,061,730 |
| | | | | | |
| Hotels, Restaurants & Leisure 0.0% | | | | | |
|
| Home Inns & Hotels Management, Inc. | 2.000 | | 12-15-15 | 98,000 | 86,608 |
| | | | | | |
| Household Durables 0.1% | | | | | |
|
| The Ryland Group, Inc. | 0.250 | | 06-01-19 | 1,797,000 | 1,653,240 |
| | | | | | |
| Energy 0.2% | | | | 1,654,563 |
| | | | | |
| Energy Equipment & Services 0.1% | | | | | |
|
| Hornbeck Offshore Services, Inc. (S) | 1.500 | | 09-01-19 | 431,000 | 519,894 |
|
| Subsea 7 SA | 2.250 | | 10-11-13 | 600,000 | 606,600 |
| | | | | | |
| Oil, Gas & Consumable Fuels 0.1% | | | | | |
|
| Stone Energy Corp. | 1.750 | | 03-01-17 | 549,000 | 528,069 |
| | | | | | |
| Health Care 0.0% | | | | | 371,114 |
| | | | | | |
| Biotechnology 0.0% | | | | | |
|
| Dendreon Corp. | 2.875 | | 01-15-16 | 511,000 | 371,114 |
| | | | | | |
| Industrials 0.4% | | | | 4,251,453 |
| | | | | |
| Aerospace & Defense 0.2% | | | | | |
|
| Triumph Group, Inc. | 2.625 | | 10-01-26 | 679,000 | 1,957,218 |
| | | | | | |
| Airlines 0.0% | | | | | |
|
| AirTran Holdings, Inc. | 5.250 | | 11-01-16 | 322,000 | 472,736 |
| | | | | | |
| Machinery 0.2% | | | | | |
|
| Altra Holdings, Inc. | 2.750 | | 03-01-31 | 806,000 | 912,795 |
|
| Greenbrier Companies, Inc. | 3.500 | | 04-01-18 | 886,000 | 908,704 |
| | | | | | |
| Information Technology 0.7% | | | | 7,768,506 |
| | | | | |
| Communications Equipment 0.4% | | | | | |
|
| Alcatel-Lucent USA, Inc., Series A | 2.875 | | 06-15-23 | 880,000 | 853,600 |
|
| Ciena Corp. (S) | 4.000 | | 03-15-15 | 925,000 | 1,166,656 |
|
| Comtech Telecommunications Corp. | 3.000 | | 05-01-29 | 2,453,000 | 2,534,256 |
| | | | | | |
| Semiconductors & Semiconductor Equipment 0.1% | | | | |
|
| Intel Corp. | 2.950 | | 12-15-35 | 1,071,000 | 1,150,656 |
| | | | | | |
| Software 0.2% | | | | | |
|
| Callidus Software, Inc. | 4.750 | | 06-01-16 | 461,000 | 490,677 |
|
| NetSuite, Inc. (S) | 0.250 | | 06-01-18 | 717,000 | 747,473 |
|
| Nuance Communications, Inc. | 2.750 | | 11-01-31 | 810,000 | 825,188 |
| | | | | | |
| Materials 0.2% | | | | 2,107,171 |
| | | | | |
| Metals & Mining 0.2% | | | | | |
|
| RTI International Metals, Inc. | 1.625 | | 10-15-19 | 544,000 | 552,160 |
|
| RTI International Metals, Inc. | 3.000 | | 12-01-15 | 1,383,000 | 1,555,011 |
| | |
| 28 | Short Duration Credit Opportunities Fund | Annual report | See notes to financial statements |
| | | | | |
| | | | Maturity | | |
| | Rate (%) | | date | Par value^ | Value |
| Structured Notes (K) 0.2% | | | | $2,242,678 |
|
| (Cost $2,621,631) | | | | | |
| | | | | | |
| Colombia 0.1% | | | | | 1,024,469 |
|
| Republic of Colombia (Citigroup Funding, Inc.) | | | | | |
| Note (S) | 11.000 | | 07-27-20 | COP 250,000,000 | 159,961 |
|
| Republic of Colombia (JPMorgan Chase | | | | | |
| & Company) | | | | | |
| Note (S) | 7.000 | | 05-04-22 | COP 1,640,000,000 | 864,508 |
| | | | | | |
| Indonesia 0.1% | | | | | 1,086,449 |
|
| Republic of Indonesia (Deutsche Bank AG) | | | | | |
| Note (S) | 5.625 | | 05-15-23 | IDR 1,000,000,000 | 82,580 |
| Note (S) | 7.000 | | 05-15-22 | IDR 1,400,000,000 | 128,303 |
|
| Republic of Indonesia (JPMorgan Chase | | | | | |
| & Company) | | | | | |
| Note (S) | 5.625 | | 05-15-23 | IDR 4,000,000,000 | 330,318 |
| Note (S) | 6.625 | | 05-15-33 | IDR 1,000,000,000 | 80,759 |
| Note | 8.250 | | 06-15-32 | IDR 4,820,000,000 | 464,489 |
| | | | | | |
| United Kingdom 0.0% | | | | | 131,760 |
|
| Cablevision SA (Deutsche Bank AG London) | | | | | |
| Bond (S) | 9.375 | | 02-13-18 | 183,000 | 131,760 |
| |
| Term Loans (M) 19.9% | | | | $230,814,521 |
|
| (Cost $229,881,400) | | | | | |
| | | | | | |
| Consumer Discretionary 4.2% | | | | 48,551,346 |
| | | | | |
| Auto Components 0.3% | | | | | |
|
| Allison Transmission, Inc. | 4.250 | | 08-23-19 | 1,585,984 | 1,598,259 |
|
| The Goodyear Tire & Rubber Company | 4.750 | | 04-30-19 | 2,250,000 | 2,267,550 |
| | | | | | |
| Hotels, Restaurants & Leisure 1.0% | | | | | |
|
| Boyd Gaming Corp. | 6.000 | | 12-17-15 | 2,233,875 | 2,239,460 |
|
| Caesars Entertainment Operating | | | | | |
| Company, Inc. | 5.440 | | 01-26-18 | 3,002,514 | 2,657,762 |
|
| CCM Merger, Inc. | 5.000 | | 03-01-17 | 1,384,403 | 1,396,516 |
|
| Great Wolf Resorts, Inc. (T) | TBD | | 08-31-20 | 1,897,000 | 1,897,000 |
|
| MGM Resorts International | 3.500 | | 12-20-19 | 1,218,875 | 1,219,627 |
|
| Scientific Games International, Inc. (T) | TBD | | 05-22-20 | 2,474,000 | 2,464,280 |
| | | | | | |
| Household Durables 0.2% | | | | | |
|
| Alliance Laundry Systems LLC | 4.500 | | 12-07-18 | 1,691,534 | 1,695,763 |
| | | | | | |
| Media 2.7% | | | | | |
|
| Acosta, Inc. | 5.000 | | 03-02-18 | 1,755,000 | 1,768,601 |
|
| Advantage Sales & Marketing LLC | 4.250 | | 12-18-17 | 1,883,117 | 1,891,344 |
|
| Advantage Sales & Marketing LLC | 8.250 | | 06-17-18 | 786,000 | 801,720 |
|
| AMC Entertainment, Inc. | 3.500 | | 04-30-20 | 1,225,928 | 1,228,335 |
|
| Atlantic Broadband Penn LLC | 3.250 | | 12-02-19 | 1,161,225 | 1,161,225 |
|
| Charter Communications Operating LLC | 3.000 | | 07-01-20 | 1,255,000 | 1,249,823 |
|
| Cumulus Media Holdings, Inc. | 4.500 | | 09-17-18 | 2,787,539 | 2,810,509 |
|
| FoxCo Acquisition Sub LLC | 5.500 | | 07-14-17 | 3,391,992 | 3,425,912 |
|
| Hubbard Broadcasting, Inc. | 4.500 | | 04-29-19 | 1,464,524 | 1,466,965 |
|
| LIN Television Corp. | 4.000 | | 12-21-18 | 970,234 | 975,085 |
| | |
| See notes to financial statements | Annual report | Short Duration Credit Opportunities Fund | 29 |
| | | | | |
| | | | Maturity | | |
| | Rate (%) | | date | Par value^ | Value |
| Media (continued) | | | | | |
|
| Mission Broadcasting, Inc. | 4.250 | | 12-03-19 | 375,242 | $378,995 |
|
| Nexstar Broadcasting, Inc. | 4.250 | | 12-03-19 | 887,593 | 887,593 |
|
| Sinclair Television Group, Inc. | 3.000 | | 04-09-20 | 1,496,250 | 1,498,494 |
|
| Tribune Company | 4.000 | | 12-31-19 | 1,786,025 | 1,794,062 |
|
| Univision Communications, Inc. | 4.000 | | 03-02-20 | 2,485,268 | 2,475,061 |
|
| Univision Communications, Inc. | 4.500 | | 03-02-20 | 1,835,400 | 1,841,628 |
|
| UPC Financing Partnership | 4.000 | | 01-29-21 | 1,900,000 | 1,910,688 |
|
| Virgin Media Investment Holdings, Ltd. | 3.500 | | 06-08-20 | 1,565,000 | 1,561,958 |
|
| WMG Acquisition Corp. | 3.750 | | 07-01-20 | 1,983,000 | 1,987,131 |
| | | | | | |
| Consumer Staples 1.8% | | | | 21,348,731 |
| | | | | |
| Food & Staples Retailing 0.6% | | | | | |
|
| AdvancePierre Foods | 5.750 | | 07-10-17 | 1,756,175 | 1,773,737 |
|
| Albertsons LLC | 4.250 | | 03-21-16 | 1,767,482 | 1,781,106 |
|
| Albertsons LLC | 4.750 | | 03-21-19 | 737,962 | 741,422 |
|
| Performance Food Group Company | 6.250 | | 11-29-19 | 1,190,000 | 1,178,100 |
|
| Rite Aid Corp. | 4.875 | | 06-11-21 | 1,198,000 | 1,205,488 |
| | | | | | |
| Food Products 0.5% | | | | | |
|
| Del Monte Corp. | 4.000 | | 03-08-18 | 3,350,494 | 3,350,494 |
|
| HJ Heinz Company | 3.500 | | 06-05-20 | 2,910,000 | 2,935,463 |
| | | | | | |
| Household Products 0.5% | | | | | |
|
| Huish Detergents, Inc. | 5.500 | | 03-23-20 | 3,456,338 | 3,447,697 |
|
| Reynolds Group Holdings, Inc. | 4.750 | | 09-28-18 | 2,322,450 | 2,346,836 |
| | | | | | |
| Personal Products 0.2% | | | | | |
|
| Revlon Consumer Products Corp. | 4.000 | | 11-20-17 | 2,563,819 | 2,588,388 |
| | | | | | |
| Energy 0.9% | | | | 9,983,503 |
| | | | | |
| Energy Equipment & Services 0.5% | | | | | |
|
| Offshore Group Investment, Ltd. | 6.250 | | 10-26-17 | 3,480,497 | 3,496,449 |
|
| Pacific Drilling SA | 4.500 | | 06-04-18 | 1,793,000 | 1,800,620 |
| | | | | | |
| Oil, Gas & Consumable Fuels 0.4% | | | | | |
|
| EP Energy LLC | 3.500 | | 05-24-18 | 2,931,000 | 2,927,946 |
|
| Samson Investment Company | 6.000 | | 09-25-18 | 1,740,000 | 1,758,488 |
| | | | | | |
| Financials 2.2% | | | | 25,912,611 |
| | | | | |
| Capital Markets 1.0% | | | | | |
|
| Gardner Denver, Inc. (T) | TBD | | 07-30-20 | 6,326,000 | 6,345,332 |
|
| Sequa Corp. | 5.250 | | 06-19-17 | 4,868,958 | 4,919,678 |
| | | | | | |
| Diversified Financial Services 0.5% | | | | | |
|
| HB Acquisition Corp. | 6.750 | | 04-09-20 | 1,350,000 | 1,387,125 |
|
| Ocwen Loan Servicing LLC | 5.000 | | 02-15-18 | 2,349,113 | 2,376,520 |
|
| Pinnacle Foods Finance LLC | 3.250 | | 04-29-20 | 1,931,160 | 1,929,953 |
| | | | | | |
| Insurance 0.2% | | | | | |
|
| CNO Financial Group, Inc. | 3.750 | | 09-20-18 | 2,656,424 | 2,658,084 |
| | | | | | |
| Real Estate Investment Trusts 0.3% | | | | | |
|
| iStar Financial, Inc. | 4.500 | | 10-16-17 | 3,930,521 | 3,942,804 |
| | | | | | |
| Real Estate Management & Development 0.2% | | | | |
|
| Realogy Corp. | 4.500 | | 03-05-20 | 2,334,150 | 2,353,115 |
| | |
| 30 | Short Duration Credit Opportunities Fund | Annual report | See notes to financial statements |
| | | | | |
| | | | Maturity | | |
| | Rate (%) | | date | Par value^ | Value |
| Health Care 3.0% | | | | $34,857,167 |
| | | | | |
| Biotechnology 0.2% | | | | | |
|
| Par Pharmaceutical Companies, Inc. | 4.250 | | 09-30-19 | 2,044,576 | 2,047,497 |
| | | | | | |
| Health Care Equipment & Supplies 0.8% | | | | | |
|
| Air Medical Group Holdings, Inc. | 6.500 | | 06-30-18 | 2,313,375 | 2,359,643 |
|
| Biomet, Inc. | 3.960 | | 07-25-17 | 1,186,038 | 1,192,956 |
|
| Hologic, Inc. | 4.500 | | 08-01-19 | 1,565,478 | 1,570,117 |
|
| Kinetic Concepts, Inc. | 4.500 | | 05-04-18 | 3,466,062 | 3,500,723 |
|
| US Renal Care, Inc. | 6.250 | | 07-02-19 | 1,237,807 | 1,233,165 |
| | | | | | |
| Health Care Providers & Services 1.0% | | | | | |
|
| DaVita HealthCare Partners, Inc. | 4.000 | | 11-01-19 | 1,223,850 | 1,228,876 |
|
| DaVita HealthCare Partners, Inc. | 4.500 | | 10-20-16 | 2,177,400 | 2,190,329 |
|
| Envision Healthcare Corp. | 4.000 | | 05-25-18 | 2,200,852 | 2,209,105 |
|
| Golden Gate National Senior Care LLC | 5.000 | | 05-04-18 | 1,493,970 | 1,445,884 |
|
| IASIS Healthcare LLC | 4.500 | | 05-03-18 | 2,652,771 | 2,669,351 |
|
| Vanguard Health Holding Company II LLC | 3.750 | | 01-29-16 | 1,871,803 | 1,874,729 |
| | | | | | |
| Pharmaceuticals 1.0% | | | | | |
|
| Pharmaceutical Product Development, Inc. | 4.250 | | 12-05-18 | 1,238,565 | 1,246,134 |
|
| Surgical Care Affiliates, Inc. | 4.250 | | 06-29-18 | 1,978,000 | 1,979,236 |
|
| Valeant Pharmaceuticals International (T) | TBD | | 06-24-20 | 6,006,000 | 6,081,075 |
|
| Warner Chilcott Company LLC | 4.250 | | 03-15-18 | 2,028,854 | 2,028,347 |
| | | | | | |
| Industrials 1.8% | | | | 20,932,976 |
| | | | | |
| Aerospace & Defense 0.1% | | | | | |
|
| TransDigm, Inc. | 3.750 | | 02-28-20 | 1,755,180 | 1,763,459 |
| | | | | | |
| Aerospace & Defense 0.1% | | | | | |
|
| Accudyne Industries Borrower SCA | 4.000 | | 12-13-19 | 1,776,075 | 1,773,841 |
| | | | | | |
| Building Products 0.3% | | | | | |
|
| Air Distribution Technologies, Inc. | 5.000 | | 11-09-18 | 3,154,150 | 3,163,351 |
| | | | | | |
| Commercial Services & Supplies 0.3% | | | | | |
|
| ADS Waste Holdings, Inc. | 4.250 | | 10-09-19 | 1,166,548 | 1,172,857 |
|
| ARAMARK Corp. | 4.000 | | 09-09-19 | 2,450,000 | 2,471,438 |
| | | | | | |
| Electrical Equipment 0.2% | | | | | |
|
| CeramTec GmbH (T) | TBD | | 08-14-20 | 1,920,000 | 1,929,600 |
| | | | | | |
| Hotels, Restaurants & Leisure 0.2% | | | | | |
|
| Four Seasons Holdings, Inc. | 4.250 | | 06-27-20 | 1,867,000 | 1,888,004 |
| | | | | | |
| Industrial Conglomerates 0.2% | | | | | |
|
| Tomkins LLC | 3.750 | | 09-29-16 | 2,107,489 | 2,119,343 |
| | | | | | |
| Machinery 0.2% | | | | | |
|
| Rexnord LLC | 3.750 | | 04-02-18 | 2,213,798 | 2,220,993 |
| | | | | | |
| Marine 0.2% | | | | | |
|
| Ocean Rig UDW, Inc. | 5.500 | | 07-15-16 | 2,412,000 | 2,430,090 |
| | | | | | |
| Information Technology 1.6% | | | | 18,261,360 |
| | | | | |
| Communications Equipment 0.3% | | | | | |
|
| Alcatel-Lucent USA, Inc. | 7.250 | | 01-30-19 | 3,686,475 | 3,761,358 |
| | | | | | |
| Internet Software & Services 0.2% | | | | | |
|
| SkillSoft Corp. | 5.000 | | 05-26-17 | 2,227,345 | 2,238,482 |
| | |
| See notes to financial statements | Annual report | Short Duration Credit Opportunities Fund | 31 |
| | | | | |
| | | | Maturity | | |
| | Rate (%) | | date | Par value^ | Value |
| Semiconductors & Semiconductor Equipment 0.6% | | | | |
|
| Freescale Semiconductor, Inc. | 5.000 | | 02-28-20 | 3,576,038 | $3,607,328 |
|
| NXP BV | 4.500 | | 03-03-17 | 2,482,850 | 2,520,093 |
|
| NXP BV | 4.750 | | 01-11-20 | 995,000 | 1,012,413 |
| | | | | | |
| Software 0.5% | | | | | |
|
| First Data Corp. | 4.191 | | 03-23-18 | 1,661,632 | 1,659,901 |
|
| Infor US, Inc. | 5.250 | | 04-05-18 | 3,431,758 | 3,461,785 |
| | | | | | |
| Materials 1.3% | | | | 14,674,612 |
| | | | | |
| Chemicals 1.2% | | | | | |
|
| Chemtura Corp. | 5.500 | | 08-27-16 | 2,582,944 | 2,602,316 |
|
| INEOS US Finance LLC | 4.000 | | 05-04-18 | 2,009,687 | 2,005,022 |
|
| MacDermid, Inc. | 4.000 | | 06-07-20 | 1,196,000 | 1,201,980 |
|
| MacDermid, Inc. | 7.750 | | 12-07-20 | 598,000 | 603,980 |
|
| OXEA Finance & Cy SCA | 4.250 | | 11-22-19 | 2,990,000 | 3,019,900 |
|
| OXEA Finance & Cy SCA | 8.250 | | 05-22-20 | 598,000 | 599,495 |
|
| Tronox Pigments BV | 4.500 | | 03-19-20 | 1,224,000 | 1,237,196 |
|
| US Coatings Acquisition, Inc. | 4.750 | | 02-03-20 | 2,448,863 | 2,471,057 |
| | | | | | |
| Construction Materials 0.1% | | | | | |
|
| Apex Tool Group LLC | 4.500 | | 01-31-20 | 927,675 | 933,666 |
| | | | | | |
| Telecommunication Services 1.5% | | | | 17,967,475 |
| | | | | |
| Diversified Telecommunication Services 0.9% | | | | |
|
| Intelsat Jackson Holdings SA | 4.250 | | 04-02-18 | 2,292,675 | 2,308,437 |
|
| Level 3 Financing, Inc. | 4.750 | | 08-01-19 | 2,585,000 | 2,600,595 |
|
| Level 3 Financing, Inc. | 5.250 | | 08-01-19 | 1,973,000 | 1,984,818 |
|
| Syniverse Holdings, Inc. | 5.000 | | 04-23-19 | 2,796,750 | 2,808,113 |
|
| Telesat Canada | 3.500 | | 03-28-19 | 1,264,791 | 1,270,587 |
| | | | | | |
| Internet Software & Services 0.2% | | | | | |
|
| Fibertech Networks LLC | 4.500 | | 12-18-19 | 2,273,575 | 2,284,234 |
| | | | | | |
| Wireless Telecommunication Services 0.4% | | | | | |
|
| Cricket Communications, Inc. | 4.750 | | 10-10-19 | 1,164,150 | 1,168,880 |
|
| Cricket Communications, Inc. | 4.750 | | 03-09-20 | 1,837,000 | 1,847,333 |
|
| LTS Buyer LLC | 4.500 | | 04-13-20 | 1,685,000 | 1,694,478 |
| | | | | | |
| Utilities 1.6% | | | | 18,324,740 |
| | | | | |
| Electric Utilities 0.8% | | | | | |
|
| La Frontera Generation LLC | 4.500 | | 09-30-20 | 1,800,000 | 1,808,438 |
|
| Texas Competitive Electric Holdings | | | | | |
| Company LLC | 4.721 | | 10-10-17 | 10,548,544 | 7,387,283 |
| | | | | | |
| Independent Power Producers & Energy Traders 0.8% | | | | |
|
| Calpine Construction Finance Company LP | 3.000 | | 05-04-20 | 1,842,000 | 1,826,113 |
|
| Calpine Corp. | 4.000 | | 04-02-18 | 2,233,588 | 2,243,907 |
|
| Dynegy, Inc. | 4.000 | | 04-23-20 | 2,581,538 | 2,591,219 |
|
| NRG Energy, Inc. | 2.750 | | 07-02-18 | 2,472,803 | 2,467,780 |
| | |
| 32 | Short Duration Credit Opportunities Fund | Annual report | See notes to financial statements |
| | | | | |
| | | | Maturity | | |
| | Rate (%) | | date | Par value^ | Value |
| Collateralized Mortgage Obligations 16.6% | | | $192,385,713 |
|
| (Cost $181,453,559) | | | | | |
| |
| Commercial & Residential 16.5% | | | | 191,059,085 |
| 7 WTC Depositor LLC Trust | | | | | |
| Series 2012-7WTC, Class A (S) | 4.082 | | 03-13-31 | 1,409,013 | 1,475,613 |
|
| American General Mortgage Loan Trust | | | | | |
| Series 2010-1A, Class A2 (P)(S) | 5.650 | | 03-25-58 | 7,000,000 | 7,303,282 |
|
| American Home Mortgage Assets | | | | | |
| Series 2007-1, Class A1 (P) | 0.862 | | 02-25-47 | 5,459,396 | 3,109,836 |
|
| BAMLL-DB Trust | | | | | |
| Series 2012-OSI , Class A1 (S) | 2.343 | | 04-13-29 | 3,039,949 | 3,068,570 |
|
| BCAP LLC Trust | | | | | |
| Series 2009, Class 7A1 (P)(S) | 5.987 | | 08-26-36 | 1,929,315 | 1,946,862 |
| Series 2011, Class 21A5 (P)(S) | 2.829 | | 06-26-34 | 3,025,770 | 3,068,971 |
| Series 2012-RR9, Class 2A5 (P)(S) | 0.360 | | 08-26-46 | 3,926,439 | 3,843,811 |
|
| BCRR Trust | | | | | |
| Series 2009-1, Class 2A1 (P)(S) | 5.858 | | 07-17-40 | 3,200,000 | 3,543,149 |
|
| Citigroup Mortgage Loan Trust | | | | | |
| Series 2010-8, Class 5A6 (S) | 4.000 | | 11-25-36 | 4,540,794 | 4,576,080 |
| Series 2010-8, Class 6A6 (S) | 4.500 | | 12-25-36 | 4,424,446 | 4,532,606 |
| Series 2012-1, Class 1A1 (P)(S) | 0.560 | | 06-25-35 | 4,367,862 | 4,174,637 |
| Series 2013-2, Class 3A1 (P)(S) | 0.373 | | 04-25-37 | 5,725,783 | 5,294,059 |
| Series 2013-2, Class 5A1 (P)(S) | 0.333 | | 07-25-36 | 1,445,663 | 1,329,487 |
|
| Commercial Mortgage Pass Through Certificates | | | | | |
| Series 2006, Class C8 | 5.377 | | 12-10-46 | 2,075,000 | 1,942,802 |
| Series 2007-C9, Class A4 (P) | 5.800 | | 12-10-49 | 2,475,000 | 2,817,750 |
| Series 2013-THL, Class A2 (P)(S) | 1.245 | | 06-08-30 | 5,175,000 | 5,153,017 |
| Series 2006-FL12, Class B (P)(S) | 0.361 | | 12-15-20 | 7,088,045 | 6,932,257 |
|
| Countrywide Home Loan Mortgage Pass Through Trust | | | | |
| Series 2006-3, Class 3A1 (P) | 0.440 | | 02-25-36 | 2,595,383 | 1,977,090 |
| Series 2004-25, Class 1A1 (P) | 0.520 | | 02-25-35 | 3,964,841 | 3,646,849 |
| Series 2004-25, Class 2A1 (P) | 0.530 | | 02-25-35 | 5,502,664 | 5,252,237 |
|
| Credit Suisse Mortgage Capital Certificates | | | | | |
| Series 2010-16, Class A3 (P)(S) | 3.555 | | 06-25-50 | 2,450,000 | 2,425,902 |
| Series 2010-20R, Class 5A6 (P)(S) | 3.500 | | 09-27-35 | 2,894,355 | 2,934,902 |
|
| Deutsche ALT-A Securities, Inc. Alternate | | | | | |
| Loan Trust | | | | | |
| Series 2007-OA2, Class A1 (P) | 0.933 | | 04-25-47 | 2,651,833 | 2,024,781 |
|
| First Horizon Alternative Mortgage Securities | | | | | |
| Series 2005-AA12, Class 1A1 (P) | 2.322 | | 02-25-36 | 2,680,158 | 1,884,985 |
|
| FREMF Mortgage Trust | | | | | |
| Series 2011-K701, Class C (P)(S) | 4.286 | | 07-25-48 | 6,125,000 | 5,971,269 |
| Series 2012-K710, Class C (P)(S) | 3.819 | | 06-25-47 | 4,500,000 | 4,136,022 |
|
| GS Mortgage Securities Corp. II | | | | | |
| Series 2007, Class G10 (P) | 5.800 | | 08-10-45 | 5,325,000 | 5,245,370 |
|
| HarborView Mortgage Loan Trust | | | | | |
| Series 2007-3, Class 2A1A (P) | 0.392 | | 05-19-47 | 3,905,819 | 3,122,937 |
|
| IndyMac INDA Mortgage Loan Trust | | | | | |
| Series 2005-AR2, Class 1A1 (P) | 2.568 | | 01-25-36 | 1,613,962 | 1,461,683 |
|
| IndyMac INDX Mortgage Loan Trust | | | | | |
| Series 2005-16IP, Class A1 (P) | 0.510 | | 07-25-45 | 3,156,525 | 2,676,436 |
| | |
| See notes to financial statements | Annual report | Short Duration Credit Opportunities Fund | 33 |
| | | | | |
| | | | Maturity | | |
| | Rate (%) | | date | Par value^ | Value |
| Commercial & Residential (continued) | | | | | |
|
| Jefferies & Company, Inc. | | | | | |
| Series 2008-R1, Class A (P)(S) | 7.116 | | 06-25-47 | 2,998,704 | $2,161,855 |
| Series 2009-R2, Class 4A (P)(S) | 2.717 | | 05-26-37 | 1,726,021 | 1,737,817 |
| Series 2009-R9, Class 1A1 (P)(S) | 2.557 | | 08-26-46 | 1,501,864 | 1,531,542 |
| Series 2010-R8, Class 1A1 (P)(S) | 0.393 | | 02-26-47 | 247,861 | 246,734 |
|
| JPMorgan Chase Commercial Mortgage Securities Corp. | | | | |
| Series 2006-LDP9, Class AJ | 5.411 | | 05-15-47 | 2,800,000 | 2,438,747 |
| Series 2010-C1, Class A1 (S) | 3.853 | | 06-15-43 | 2,660,955 | 2,781,284 |
| Series 2011-CCHP, Class A (P)(S) | 2.600 | | 07-15-28 | 599,976 | 598,819 |
|
| JPMorgan Re-REMIC | | | | | |
| Series 2009-12, Class 1A1 (P)(S) | 5.747 | | 07-26-37 | 415,234 | 421,308 |
| Series 2011-2 , Class 1A3 (P)(S) | 0.840 | | 08-26-37 | 2,934,437 | 2,830,247 |
|
| LB–UBS Commercial Mortgage Trust | | | | | |
| Series 2006-C6, Class A4 | 5.372 | | 09-15-39 | 526,000 | 580,683 |
|
| Lehman XS Trust | | | | | |
| Series 2007-4N, Class 3A2A (P) | 0.912 | | 03-25-47 | 805,201 | 609,135 |
|
| Merrill Lynch/Countrywide Commercial | | | | | |
| Mortgage Trust | | | | | |
| Series 2006-4, Class A (P) | 0.312 | | 12-12-49 | 486,566 | 485,728 |
|
| Morgan Stanley Re-REMIC Trust | | | | | |
| Series 2011-KEYA, Class 1A (S) | 4.250 | | 12-19-40 | 2,734,889 | 2,730,257 |
|
| MortgageIT Trust | | | | | |
| Series 2004-2, Class A1 (P) | 0.560 | | 12-25-34 | 2,212,149 | 2,092,266 |
|
| Nomura Resecuritization Trust | | | | | |
| Series 2011-1RA, Class 1A5 (P)(S) | 2.560 | | 03-26-36 | 3,439,659 | 3,466,169 |
|
| OBP Depositor LLC Trust | | | | | |
| Series 2010-OBP, Class A (S) | 4.646 | | 07-15-45 | 2,500,000 | 2,716,563 |
|
| RBSSP Resecuritization Trust | | | | | |
| Series 2012-6, Class 10A1 (P)(S) | 0.340 | | 08-26-36 | 3,151,222 | 2,787,133 |
| Series 2012-6, Class 4A1 (P)(S) | 0.523 | | 01-26-36 | 4,215,952 | 3,694,451 |
| Series 2012-6, Class 5A1 (P)(S) | 0.653 | | 12-26-35 | 2,894,010 | 2,680,775 |
| Series 2012-6, Class 6A1 (P)(S) | 0.530 | | 11-26-35 | 4,733,921 | 4,289,180 |
| Series 2012-6, Class 7A1 (P)(S) | 0.390 | | 02-26-37 | 3,316,655 | 3,034,192 |
| Series 2012-6, Class 9A1 (P)(S) | 0.540 | | 11-26-35 | 2,068,209 | 1,981,144 |
| Series 2013-1, Class 4A1 (P)(S) | 0.363 | | 01-26-37 | 2,080,319 | 1,809,442 |
|
| Structured Asset Mortgage Investments, Inc. | | | | | |
| Series 2005-AR5, Class A3 (P) | 0.442 | | 07-19-35 | 2,547,112 | 2,472,527 |
| Series 2005-AR6, Class 2A1 (P) | 0.500 | | 09-25-45 | 3,952,044 | 3,165,042 |
|
| WaMu Mortgage Pass Through Certificates | | | | | |
| Series 2004-AR8, Class A1 (P) | 0.608 | | 06-25-44 | 1,961,276 | 1,605,541 |
| Series 2005-11, Class A1 (P) | 0.510 | | 08-25-45 | 4,200,212 | 3,774,861 |
| Series 2005-AR1, Class A1A (P) | 0.510 | | 01-25-45 | 1,869,783 | 1,688,881 |
| Series 2005-AR13, Class A1A1 (P) | 0.480 | | 10-25-45 | 3,960,642 | 3,557,603 |
| Series 2005-AR19, Class A1A1 (P) | 0.460 | | 12-25-45 | 4,755,529 | 4,378,924 |
| Series 2005-AR6, Class 2A1A (P) | 0.420 | | 04-25-45 | 5,110,409 | 4,618,077 |
| Series 2005-AR8, Class 1A (P) | 0.460 | | 07-25-45 | 4,650,816 | 4,151,034 |
| Series 2005-AR9, Class A1A (P) | 0.510 | | 07-25-45 | 2,353,313 | 2,156,218 |
|
| Wells Fargo Mortgage Backed Securities Trust | | | | | |
| Series 2005-AR12, Class 2A6 (P) | 2.640 | | 06-25-35 | 1,524,523 | 1,527,474 |
| Series 2005-AR4, Class 2A2 (P) | 2.725 | | 04-25-35 | 2,651,932 | 2,637,323 |
| Series 2005-AR9, Class 3A1 (P) | 2.654 | | 06-25-34 | 754,518 | 746,857 |
| | |
| 34 | Short Duration Credit Opportunities Fund | Annual report | See notes to financial statements |
| | | | | |
| | | | Maturity | | |
| | Rate (%) | | date | Par value^ | Value |
| U.S. Government Agency 0.1% | | | | $1,326,628 |
|
| Federal Home Loan Mortgage Corp. | | | | | |
| Freddie Mac Series 3733, Class A | 4.000 | | 04-15-28 | 304,756 | 311,349 |
| Freddie Mac Series 3829 IO | 4.500 | | 08-15-39 | 7,007,557 | 1,015,279 |
| |
| Asset Backed Securities 3.3% | | | | $38,312,602 |
|
| (Cost $37,549,823) | | | | | |
| | | | | | |
| Cabela’s Master Credit Card Trust | | | | | |
| Series 2010-2A, Class A1 (S) | 2.290 | | 09-17-18 | 3,000,000 | 3,092,583 |
|
| Carrington Mortgage Loan Trust | | | | | |
| Series 2006-FRE1, Class A2 (P) | 0.300 | | 07-25-36 | 4,968,333 | 4,786,949 |
|
| GSAMP Trust | | | | | |
| Series 2006-NC1, Class A2 (P) | 0.370 | | 02-25-36 | 3,191,242 | 2,963,479 |
|
| Long Beach Mortgage Loan Trust | | | | | |
| Series 2005-WL2, Class M1 (P) | 0.660 | | 08-25-35 | 3,108,234 | 3,006,514 |
|
| Morgan Stanley ABS Capital I | | | | | |
| Series 2004-WMC3, Class M2 (P) | 0.985 | | 01-25-35 | 3,716,613 | 3,599,354 |
|
| RAAC Series Trust | | | | | |
| Series 2006-SP2, Class A3 (P) | 0.460 | | 02-25-36 | 3,900,000 | 3,731,824 |
|
| SLC Student Loan Trust | | | | | |
| Series 2010-B, Class A1 (P)(S) | 4.000 | | 07-15-42 | 1,561,726 | 1,643,689 |
|
| SLM Student Loan Trust | | | | | |
| Series 20011-1, Class A1 (P) | 0.710 | | 03-25-26 | 3,634,302 | 3,604,773 |
| Series 2012-C, Class A1 (P)(S) | 1.291 | | 08-15-23 | 1,326,542 | 1,333,603 |
|
| Soundview Home Equity Loan Trust | | | | | |
| Series 2005-OPT3, Class A4 (P) | 0.490 | | 11-25-35 | 1,376,093 | 1,354,226 |
|
| Structured Asset Securities Corp. | | | | | |
| Series 2007-BC3, Class 2A1 (P) | 0.250 | | 05-25-47 | 1,809,183 | 1,778,156 |
| Series 2008-BC4, Class A3 (P) | 0.440 | | 11-25-37 | 3,225,463 | 3,114,478 |
|
| TAL Advantage LLC | | | | | |
| Series 2010-2A, Class A (S) | 4.300 | | 10-20-25 | 2,247,500 | 2,266,671 |
| Series 2011-1A, Class A (S) | 4.600 | | 01-20-26 | 1,987,500 | 2,036,303 |
| |
| | | | | Shares | Value |
| Common Stocks 0.0% | | | | | $182,132 |
|
| (Cost $788,824) | | | | | |
| | | | | | |
| Industrials 0.0% | | | | | 4 |
| | | | | | |
| Air Freight & Logistics 0.0% | | | | | |
|
| General Maritime Corp. | | | | 417 | 4 |
| | | | | | |
| Information Technology 0.0% | | | | | 78,128 |
| | | | | | |
| Computers & Peripherals 0.0% | | | | | |
|
| NetApp, Inc. | | | | 1,900 | 78,128 |
| | | | | | |
| Materials 0.0% | | | | | 104,000 |
| | | | | | |
| Paper & Forest Products 0.0% | | | | | |
|
| NewPage Group, Inc. | | | | 1,300 | 104,000 |
| | |
| See notes to financial statements | Annual report | Short Duration Credit Opportunities Fund | 35 |
| | | | | |
| | | | | Shares | Value |
| Preferred Securities 0.2% | | | | | $2,114,671 |
|
| (Cost $2,346,194) | | | | | |
| | | | | | |
| Energy 0.2% | | | | | 2,114,671 |
| | | | | | |
| Oil, Gas & Consumable Fuels 0.2% | | | | | |
|
| Apache Corp., Series D, 6.000% | | | | 13,780 | 629,746 |
|
| SandRidge Energy, Inc., 8.500% | | | | 15,230 | 1,484,925 |
| | | | | | |
| | Rate | | Maturity | | |
| | (%) | | date | Par value^ | Value |
| Escrow Certificates 0.0% | | | | | $0 |
|
| (Cost $0) | | | | | |
| | | | | | |
| Materials 0.0% | | | | | 0 |
| | | | | | |
| NewPage Corp. (I) | 11.375 | | 12-31-14 | 299,753 | 0 |
| | | | | | |
| | | | | Shares | Value |
| Warrants 0.0% | | | | | $0 |
|
| (Cost $0) | | | | | |
| | | | | | |
| General Maritime Corp. (Expiration Date: | | | | | |
| 5-17-17, Strike Price: $42.50) (I) | | | | 646 | 0 |
| | | | | | |
| | | | Yield (%) | Shares | Value |
| Short-Term Investments 6.5% | | | | | $75,287,982 |
|
| (Cost $75,287,982) | | | | | |
| | | | | | |
| Money Market Funds 6.5% | | | | | 75,287,982 |
| | | | | | |
| State Street Institutional Liquid Reserves Fund | | | 0.0767 (Y) | 75,287,982 | 75,287,982 |
| |
| Total investments (Cost $1,183,619,744)† 102.6% | $1,188,221,980 |
|
| Other assets and liabilities, net (2.6%) | | | | ($30,117,304) |
|
| Total net assets 100.0% | | | | $1,158,104,676 |
|
^ The percentage shown for each investment category is the total value of that category as a percentage of the net assets of the fund. All par values are denominated in U.S. Dollars unless otherwise indicated.
| | | | | |
| Currency Abbreviations | | | | |
| BRL | Brazilian Real | | PEN | Peruvian Nuevo Sol | |
| COP | Colombian Peso | | PLN | Polish Zloty | |
| EUR | Euro | | RON | Romanian New Leu | |
| GBP | Pound Sterling | | RUB | Russian Ruble | |
| HUF | Hungarian Forint | | THB | Thai Baht | |
| IDR | Indonesian Rupiah | | TRY | Turkish Lira | |
| MXN | Mexican Peso | | ZAR | South African Rand | |
| MYR | Malaysian Ringgit | | | | |
| | |
| 36 | Short Duration Credit Opportunities Fund | Annual report | See notes to financial statements |
Notes to Portfolio of Investments
IO Interest-Only Security — (Interest Tranche of Stripped Mortgage Pool). Rate shown is the annualized yield at the end of the period.
LIBOR London Interbank Offered Rate
PIK Paid In Kind
TBA To Be Announced. A forward mortgage-backed securities trade issued by a U.S. Government Agency, to be delivered at an agreed-upon future settlement date.
TBD To Be Determined
(C) Security purchased on a when-issued or delayed delivery.
(H) Non-income producing — Issuer is in default.
(I) Non-income producing security.
(K) Underlying issuer is shown parenthetically in security description.
(M) Term loans are variable rate obligations. The coupon rate shown represents the rate at period end.
(P) Variable rate obligation. The coupon rate shown represents the rate at period end.
(Q) Perpetual bonds have no stated maturity date. Date shown as maturity date is next call date.
(S) These securities are exempt from registration under Rule 144A of the Securities Act of 1933. Such securities may be resold, normally to qualified institutional buyers, in transactions exempt from registration. Rule 144A securities amounted to $223,596,733 or 19.3% of the fund’s net assets as of 7-31-13.
(T) This position represents an unsettled loan commitment at period end. Certain details associated with this purchase are not known prior to the settlement date, including coupon rate.
(Y) The rate shown is the annualized seven-day yield as of 7-31-13.
(Z) Zero coupon bonds are issued at a discount from their principal amount in lieu of paying interest periodically.
† At 7-31-13, the aggregate cost of investment securities for federal income tax purposes was $1,186,827,220. Net unrealized appreciation aggregated $1,394,760, of which $22,864,293 related to appreciated investment securities and $21,469,533 related to depreciated investment securities.
The fund had the following country concentration as a percentage of net assets on 7-31-13:
| | | |
| United States | 75.3% | | |
| Canada | 2.5% | | |
| United Kingdom | 2.1% | | |
| Venezuela | 1.7% | | |
| Brazil | 1.6% | | |
| Netherlands | 1.5% | | |
| Mexico | 1.4% | | |
| Luxembourg | 1.4% | | |
| Turkey | 1.3% | | |
| Cayman Islands | 1.1% | | |
| Other Countries | 10.1% | | |
| |
| | |
| Total | 100.0% | | |
| | |
| See notes to financial statements | Annual report | Short Duration Credit Opportunities Fund | 37 |
F I N A N C I A L S T A T E M E N T S
Financial statements
Statement of assets and liabilities 7-31-13
This Statement of assets and liabilities is the fund’s balance sheet. It shows the value of what the fund owns, is due and owes. You’ll also find the net asset value and the maximum public offering price per share.
| |
| Assets | |
|
| Investments, at value (Cost $1,183,619,744) | $1,188,221,980 |
| Cash | 40,158 |
| Foreign currency, at value (Cost $550,447) | 546,048 |
| Cash held at broker for futures contracts | 4,258,416 |
| Cash segregated at custodian for swap contracts | 1,720,000 |
| Receivable for investments sold | 13,758,755 |
| Receivable for delayed delivery securities sold | 3,974,291 |
| Receivable for fund shares sold | 23,133 |
| Receivable for forward foreign currency exchange contracts | 1,106,081 |
| Dividends and interest receivable | 9,899,772 |
| Receivable due from advisor | 320 |
| Other receivables and prepaid expenses | 40,243 |
| | |
| Total assets | 1,223,589,197 |
| |
| Liabilities | |
|
| Payable for investments purchased | 41,075,844 |
| Payable for forward foreign currency exchange contracts | 238,451 |
| Payable for delayed delivery securities purchased | 20,233,560 |
| Payable for fund shares repurchased | 934,019 |
| Swap contracts, at value (includes net unamortized upfront amounts | |
| paid/received of $2,839,232) | 2,655,566 |
| Payable for futures variation margin | 169,359 |
| Distributions payable | 356 |
| Payable to affiliates | |
| Accounting and legal services fees | 24,594 |
| Transfer agent fees | 328 |
| Trustees’ fees | 1,083 |
| Other liabilities and accrued expenses | 151,361 |
| | |
| Total liabilities | 65,484,521 |
| | |
| Net assets | $1,158,104,676 |
| |
| Net assets consist of | |
|
| Paid-in capital | $1,140,663,587 |
| Accumulated distributions in excess of net investment income | (941,946) |
| Accumulated net realized gain (loss) on investments, futures contracts, | |
| foreign currency transactions and swap agreements | 2,916,652 |
| Net unrealized appreciation (depreciation) on investments, futures | |
| contracts, translation of assets and liabilities in foreign currencies and | |
| swap agreements | 15,466,383 |
| | |
| Net assets | $1,158,104,676 |
| | |
| 38 | Short Duration Credit Opportunities Fund | Annual report | See notes to financial statements |
F I N A N C I A L S T A T E M E N T S
Statement of assets and liabilities (continued)
| |
| Net asset value per share | |
|
| Based on net asset values and shares outstanding — the fund has an | |
| unlimited number of shares authorized with no par value | |
| Class A ($1,764,269 ÷ 171,027 shares)1 | $10.32 |
| Class I ($1,233,952 ÷ 119,545 shares) | $10.32 |
| Class NAV ($1,155,106,455 ÷ 111,918,859 shares) | $10.32 |
| |
| Maximum offering price per share | |
|
| Class A (net asset value per share ÷ 95.5%)2 | $10.81 |
1 Redemption price is equal to net asset value less any applicable contingent deferred sales charge.
2 On single retail sales of less than $100,000. On sales of $100,000 or more and on group sales the offering price is reduced.
| | |
| See notes to financial statements | Annual report | Short Duration Credit Opportunities Fund | 39 |
F I N A N C I A L S T A T E M E N T S
Statement of operations For the year ended 7-31-13
This Statement of operations summarizes the fund’s investment income earned and expenses incurred in operating the fund. It also shows net gains (losses) for the period stated.
| |
| Investment income | |
|
| Interest | $50,770,971 |
| Dividends | 148,178 |
| Less foreign taxes withheld | (10,713) |
| | |
| Total investment income | 50,908,436 |
| |
| Expenses | |
|
| Investment management fees | 7,867,683 |
| Distribution and service fees | 688 |
| Accounting and legal services fees | 150,735 |
| Transfer agent fees | 609 |
| Trustees’ fees | 12,369 |
| State registration fees | 14,103 |
| Printing and postage | 1,101 |
| Professional fees | 89,232 |
| Custodian fees | 203,867 |
| Registration and filing fees | 35,359 |
| Other | 18,534 |
| | |
| Total expenses | 8,394,280 |
| Less expense reductions | (58,631) |
| | |
| Net expenses | 8,335,649 |
| | |
| Net investment income | 42,572,787 |
| |
| Realized and unrealized gain (loss) | |
|
| Net realized gain (loss) on | |
| Investments | 22,611,792 |
| Futures contracts | 5,072,423 |
| Swap contracts | (15,103,583) |
| Foreign currency transactions | (2,908,253) |
| | |
| | 9,672,379 |
| Change in net unrealized appreciation (depreciation) of | |
| Investments | (24,738,869) |
| Futures contracts | 9,506,381 |
| Swap contracts | 4,655,082 |
| Translation of assets and liabilities in foreign currencies | 939,552 |
| | |
| | (9,637,854) |
| | |
| Net realized and unrealized gain | 34,525 |
| | |
| Increase in net assets from operations | $42,607,312 |
| | |
| 40 | Short Duration Credit Opportunities Fund | Annual report | See notes to financial statements |
F I N A N C I A L S T A T E M E N T S
Statements of changes in net assets
These Statements of changes in net assets show how the value of the fund’s net assets has changed during the last two periods. The difference reflects earnings less expenses, any investment gains and losses, distributions, if any, paid to shareholders and the net of fund share transactions.
| | |
| | Year | Year |
| | ended | ended |
| | 7-31-13 | 7-31-12 |
| |
| Increase (decrease) in net assets | | |
|
| From operations | | |
| Net investment income | $42,572,787 | $44,883,578 |
| Net realized gain (loss) | 9,672,379 | (10,452,527) |
| Change in net unrealized appreciation (depreciation) | (9,637,854) | 5,977,353 |
| | | |
| Increase in net assets resulting from operations | 42,607,312 | 40,408,404 |
| | | |
| Distributions to shareholders | | |
| From net investment income | | |
| Class A | (7,298) | (964) |
| Class I | (7,645) | (1,054) |
| Class NAV | (40,597,558) | (45,112,792) |
| From net realized gain | | |
| Class A | — | (114) |
| Class I | — | (114) |
| Class NAV | — | (4,647,740) |
| | | |
| Total distributions | (40,612,501) | (49,762,778) |
| | | |
| From fund share transactions | 86,514,756 | 55,637,380 |
| | | |
| Total increase | 88,509,567 | 46,283,006 |
| | | |
| Net assets | | |
|
| Beginning of year | 1,069,595,109 | 1,023,312,103 |
| | | |
| End of year | $1,158,104,676 | $1,069,595,109 |
| | | |
| Undistributed/(accumulated distributions in excess of) | | |
| net investment income | ($941,946) | $2,765,452 |
| | |
| See notes to financial statements | Annual report | Short Duration Credit Opportunities Fund | 41 |
Financial highlights
The Financial highlights show how the fund’s net asset value for a share has changed during the period.
| | | | | | |
| CLASS A SHARES Period ended | | | 7-31-13 | 7-31-12 | 7-31-11 | 7-31-101 |
| |
| Per share operating performance | | | | | | |
|
| Net asset value, beginning of period | | | $10.30 | $10.41 | $10.25 | $10.00 |
| Net investment income2 | | | 0.36 | 0.38 | 0.39 | 0.25 |
| Net realized and unrealized gain (loss) on investments | | | (0.01) | (0.05) | 0.26 | 0.25 |
| Total from investment operations | | | 0.35 | 0.33 | 0.65 | 0.50 |
| Less distributions | | | | | | |
| From net investment income | | | (0.33) | (0.39) | (0.46) | (0.25) |
| From net realized gain | | | — | (0.05) | (0.03) | — |
| Total distributions | | | (0.33) | (0.44) | (0.49) | (0.25) |
| Net asset value, end of period | | | $10.32 | $10.30 | $10.41 | $10.25 |
| Total return (%)3,4 | | | 3.41 | 3.27 | 6.37 | 5.065 |
| |
| Ratios and supplemental data | | | | | | |
|
| Net assets, end of period (in millions) | | | $2 | —6 | —6 | —6 |
| Ratios (as a percentage of average net assets): | | | | | | |
| Expenses before reductions and amounts recaptured | | | 4.65 | 1.25 | 1.24 | 1.197 |
| Expenses including reductions and amounts recaptured | | | 1.21 | 1.25 | 1.24 | 1.197 |
| Net investment income | | | 3.58 | 3.81 | 3.75 | 3.267 |
| Portfolio turnover (%) | | | 77 | 60 | 80 | 68 |
1 Period from 11-2-09 (inception date) to 7-31-10.
2 Based on the average daily shares outstanding.
3 Does not reflect the effect of sales charges, if any.
4 Total returns would have been lower had certain expenses not been reduced during the applicable periods shown.
5 Not annualized.
6 Less than $500,000.
7 Annualized.
| | |
| 42 | Short Duration Credit Opportunities Fund | Annual report | See notes to financial statements |
| | | | | | |
| CLASS I SHARES Period ended | | | 7-31-13 | 7-31-12 | 7-31-11 | 7-31-101 |
| |
| Per share operating performance | | | | | | |
|
| Net asset value, beginning of period | | | $10.30 | $10.41 | $10.24 | $10.00 |
| Net investment income2 | | | 0.38 | 0.42 | 0.42 | 0.26 |
| Net realized and unrealized gain (loss) on investments | | | —3 | (0.06) | 0.26 | 0.25 |
| Total from investment operations | | | 0.38 | 0.36 | 0.68 | 0.51 |
| Less distributions | | | | | | |
| From net investment income | | | (0.36) | (0.42) | (0.48) | (0.27) |
| From net realized gain | | | — | (0.05) | (0.03) | — |
| Total distributions | | | (0.36) | (0.47) | (0.51) | (0.27) |
| Net asset value, end of period | | | $10.32 | $10.30 | $10.41 | $10.24 |
| Total return (%)4 | | | 3.73 | 3.64 | 6.70 | 5.185 |
| |
| Ratios and supplemental data | | | | | | |
|
| Net assets, end of period (in millions) | | | $1 | —6 | —6 | —6 |
| Ratios (as a percentage of average net assets): | | | | | | |
| Expenses before reductions and amounts recaptured | | | 4.14 | 0.85 | 0.81 | 1.207 |
| Expenses including reductions and amounts recaptured | | | 0.90 | 0.88 | 0.95 | 0.957 |
| Net investment income | | | 3.76 | 4.16 | 4.01 | 3.487 |
| Portfolio turnover (%) | | | 77 | 60 | 80 | 68 |
1 Period from 11-2-09 (inception date) to 7-31-10.
2 Based on the average daily shares outstanding.
3 Less than $0.005 per share.
4 Total returns would have been lower had certain expenses not been reduced during the applicable periods shown.
5 Not annualized.
6 Less than $500,000.
7 Annualized.
| | | | | | |
| CLASS NAV SHARES Period ended | | | 7-31-13 | 7-31-12 | 7-31-11 | 7-31-101 |
| |
| Per share operating performance | | | | | | |
|
| Net asset value, beginning of period | | | $10.30 | $10.41 | $10.24 | $10.00 |
| Net investment income2 | | | 0.40 | 0.43 | 0.44 | 0.29 |
| Net realized and unrealized gain (loss) on investments | | | —3 | (0.05) | 0.26 | 0.24 |
| Total from investment operations | | | 0.40 | 0.38 | 0.70 | 0.53 |
| Less distributions | | | | | | |
| From net investment income | | | (0.38) | (0.44) | (0.50) | (0.29) |
| From net realized gain | | | — | (0.05) | (0.03) | — |
| Total distributions | | | (0.38) | (0.49) | (0.53) | (0.29) |
| Net asset value, end of period | | | $10.32 | $10.30 | $10.41 | $10.24 |
| Total return (%)4 | | | 3.88 | 3.78 | 6.92 | 5.325 |
| |
| Ratios and supplemental data | | | | | | |
|
| Net assets, end of period (in millions) | | | $1,155 | $1,070 | $1,023 | $684 |
| Ratios (as a percentage of average net assets): | | | | | | |
| Expenses before reductions and amounts recaptured | | | 0.75 | 0.75 | 0.77 | 0.786 |
| Expenses including reductions and amounts recaptured | | | 0.74 | 0.75 | 0.77 | 0.776 |
| Net investment income | | | 3.79 | 4.29 | 4.21 | 3.906 |
| Portfolio turnover (%) | | | 77 | 60 | 80 | 68 |
1 Period from 11-2-09 (inception date) to 7-31-10.
2 Based on the average daily shares outstanding.
3 Less than $0.005 per share.
4 Total returns would have been lower had certain expenses not been reduced during the applicable periods shown.
5 Not annualized.
6 Annualized.
| | |
| See notes to financial statements | Annual report | Short Duration Credit Opportunities Fund | 43 |
Notes to financial statements
Note 1 — Organization
John Hancock Short Duration Credit Opportunities Fund, formerly John Hancock Multi Sector Bond Fund (the fund), is a series of John Hancock Funds II (the Trust), an open-end management investment company organized as a Massachusetts business trust and registered under the Investment Company Act of 1940, as amended (the 1940 Act). The investment objective of the fund is to seek maximum total return, which consists of income on its investments and capital appreciation.
The fund may offer multiple classes of shares. The shares currently offered are detailed in the Statement of assets and liabilities. Class A shares are offered to all investors. Class I shares are offered to institutions and certain investors. Class NAV shares are sold to John Hancock affiliated funds of funds and certain 529 plans. Shareholders of each class have exclusive voting rights to matters that affect that class. The distribution and service fees, if any, and transfer agent fees, printing and postage and state registration fees for each class may differ.
Effective March 28, 2013, John Hancock Multi Sector Bond Fund changed its name to John Hancock Short Duration Credit Opportunities Fund.
Note 2 — Significant accounting policies
The financial statements have been prepared in conformity with accounting principles generally accepted in the United States of America, which require management to make certain estimates and assumptions as of the date of the financial statements. Actual results could differ from those estimates and those differences could be significant. Events or transactions occurring after the end of the fiscal period through the date that the financial statements were issued have been evaluated in the preparation of the financial statements. The following summarizes the significant accounting policies of the fund:
Security valuation. Investments are stated at value as of the close of regular trading on the New York Stock Exchange (NYSE), normally at 4:00 P.M., Eastern Time. In order to value the securities, the fund uses the following valuation techniques: Equity securities held by the fund are valued at the last sale price or official closing price on the principal securities exchange on which they trade. In the event there were no sales during the day or closing prices are not available, the securities are valued using the last quoted bid or evaluated price. Investments by the funds in open-end mutual funds are valued at their respective net asset values each business day. Debt obligations are valued based on the evaluated prices provided by an independent pricing service, which utilizes both dealer-supplied and electronic data processing techniques, taking into account factors such as institutional-size trading in similar groups of securities, yield, quality, coupon rate, maturity, type of issue, trading characteristics and other market data. Futures contracts are valued at the quoted daily settlement prices established by the exchange on which they trade. Swaps are marked-to-market daily based upon values from third party vendors, which may include a registered commodities exchange, or broker quotations. Foreign securities and currencies, including forward foreign currency contracts, are valued in U.S. dollars, based on foreign currency exchange rates supplied by an independent pricing service. Certain securities and forward foreign currency contracts traded only in the over-the-counter (OTC) market are valued at the last bid price quoted by brokers making markets in the securities at the close of trading. Certain short-term securities are valued at amortized cost.
| |
| 44 | Short Duration Credit Opportunities Fund | Annual report |
Other portfolio securities and assets, for which reliable market quotations are not readily available, are valued at fair value as determined in good faith by the fund’s Pricing Committee following procedures established by the Board of Trustees, which include price verification procedures. The frequency with which these fair valuation procedures are used cannot be predicted and fair value of securities may differ significantly from the value that would have been used had a ready market for such securities existed. Generally, trading in foreign securities is substantially completed each day at various times prior to the close of trading on the NYSE. Significant market events that affect the values of foreign securities may occur between the time when the valuation of the securities is generally determined and the close of the NYSE. During significant market events, these securities will be valued at fair value, as determined in good faith, following procedures established by the Board of Trustees. The fund may use a fair valuation model to value foreign securities in order to adjust for events that may occur between the close of foreign exchanges and the close of the NYSE.
The fund uses a three-tier hierarchy to prioritize the pricing assumptions, referred to as inputs, used in valuation techniques to measure fair value. Level 1 includes securities valued using quoted prices in active markets for identical securities. Level 2 includes securities valued using other significant observable inputs. Observable inputs may include quoted prices for similar securities, interest rates, prepayment speeds and credit risk. Prices for securities valued using these inputs are received from independent pricing vendors and brokers and are based on an evaluation of the inputs described. Level 3 includes securities valued using significant unobservable inputs when market prices are not readily available or reliable, including the fund’s own assumptions in determining the fair value of investments. Factors used in determining value may include market or issuer specific events or trends, changes in interest rates and credit quality. The inputs or methodology used for valuing securities are not necessarily an indication of the risks associated with investing in those securities. Changes in valuation techniques may result in transfers into or out of an assigned level within the disclosure hierarchy.
The following is a summary of the values by input classification of the Fund’s investments as of July 31, 2013, by major security category or type:
| | | | |
| | | | | LEVEL 3 |
| | | | LEVEL 2 | SIGNIFICANT |
| | TOTAL MARKET | LEVEL 1 | SIGNIFICANT | UNOBSERVABLE |
| INVESTMENTS IN SECURITIES | VALUE AT 7-31-13 | QUOTED PRICE | OBSERVABLE INPUTS | INPUTS |
|
| Corporate Bonds | $492,411,449 | — | $492,411,449 | — |
| U.S. Government & | | | | |
| Agency Obligations | 25,801,965 | — | 25,801,965 | — |
| Foreign Government | | | | |
| Obligations | 109,557,059 | — | 109,557,059 | — |
| Capital Preferred Securities | 156,823 | — | 156,823 | — |
| Convertible Bonds | 18,954,385 | — | 18,954,385 | — |
| Structured Notes | 2,242,678 | — | 2,110,918 | $131,760 |
| Term Loans | 230,814,521 | — | 230,814,521 | — |
| Collateralized Mortgage | | | | |
| Obligations | 192,385,713 | — | 192,385,713 | — |
| Asset Backed Securities | 38,312,602 | — | 38,312,602 | — |
| Common Stocks | 182,132 | $78,128 | — | 104,004 |
| Preferred Securities | 2,114,671 | 629,746 | 1,484,925 | — |
| Short-Term Investments | 75,287,982 | 75,287,982 | — | — |
| |
|
| Total Investments in | | | | |
| Securities | $1,188,221,980 | $75,995,856 | $1,111,990,360 | $235,764 |
| Other Financial Instruments: | | | | |
| Futures | $9,826,074 | $9,826,074 | — | — |
| Forward Foreign Currency | | | | |
| Contracts | $867,630 | — | $867,630 | — |
| Credit Default Swaps | ($2,655,566) | — | ($2,655,566) | — |
| |
| Annual report | Short Duration Credit Opportunities Fund | 45 |
Repurchase agreements. The fund may enter into repurchase agreements. When the fund enters into a repurchase agreement, it receives collateral that is held in a segregated account by the fund’s custodian. The collateral amount is marked-to-market and monitored on a daily basis to ensure that the collateral held is in an amount not less than the principal amount of the repurchase agreement plus any accrued interest.
Repurchase agreements are typically governed by the terms and conditions of the Master Repurchase Agreement and/or Global Master Repurchase Agreement (collectively, MRA). Upon an event of default, the non-defaulting party may close out all transactions traded under the MRA and net amounts owed. Absent an event of default, the MRA does not result in an offset of the reported amounts of assets and liabilities in the statement of assets and liabilities. In the event of a default by the counterparty, realization of the collateral proceeds could be delayed, during which time the collateral value may decline or the counterparty may have insufficient assets to pay back claims resulting from close-out of the transactions. Collateral received by the fund for repurchase agreements is disclosed in the fund’s investments as part of the caption related to the repurchase agreement.
When-issued/delayed-delivery securities. The fund may purchase or sell debt securities on a when-issued or delayed-delivery basis, or in a “To Be Announced” (TBA) or “forward commitment” transaction, with delivery or payment to occur at a later date beyond the normal settlement period. TBA securities resulting from these transactions are included in the fund’s investments or in a schedule to the fund’s investments (Sale Commitments Outstanding). At the time a fund enters into a commitment to purchase or sell a security, the transaction is recorded and the value of the security is reflected in the fund’s net asset value. The price of such security and the date that the security will be delivered and paid for are fixed at the time the transaction is negotiated. The value of the security may vary with market fluctuations. No interest accrues to the fund until settlement takes place. At the time that the fund enters into this type of transaction, the fund is required to have sufficient cash and/or liquid securities to cover its commitments.
Certain risks may arise upon entering into when-issued or delayed-delivery securities transactions, including the potential inability of counterparties to meet the terms of their contracts, and the issuer’s failure to issue the securities due to political, economic or other factors. Additionally, losses may arise due to declines in the value of the securities purchased or increase in the value of securities sold prior to settlement date.
Term loans (Floating rate loans). The fund may invest in term loans, which often include debt securities that are rated below investment grade at the time of purchase. Term loans are generally subject to legal or contractual restrictions on resale. The liquidity of term loans, including the volume and frequency of secondary market trading in such loans, varies significantly over time and among individual loans. During periods of infrequent trading, valuing a term loan can be more difficult and buying and selling a term loan at an acceptable price can be more difficult and delayed, which could result in a loss.
The fund’s ability to receive payments of principal, interest and other amounts in connection with term loans will depend primarily on the financial condition of the borrower. The fund’s failure to receive scheduled payments on a term loan due to a default, bankruptcy or other reason, would adversely affect the fund’s income and would likely reduce the value of its assets. Because many term loans are not rated by independent credit rating agencies, a decision to invest in a particular loan could depend exclusively on the subadvisor’s credit analysis of the borrower and/or term loan agents. The fund may have limited rights to enforce the terms of an underlying loan.
At July 31, 2013, the fund had $3,612,479 in unfunded loan commitments outstanding.
| |
| 46 | Short Duration Credit Opportunities Fund | Annual report |
Security transactions and related investment income. Investment security transactions are accounted for on a trade date plus one basis for daily net asset value calculations. However, for financial reporting purposes, investment transactions are reported on trade date. Interest income is accrued as earned. Interest income includes coupon interest and amortization/accretion of premiums/discounts on debt securities. Debt obligations may be placed in a non-accrual status and related interest income may be reduced by stopping current accruals and writing off interest receivable when the collection of all or a portion of interest has become doubtful. Dividend income is recorded on the ex-date, except for dividends of foreign securities where the dividend may not be known until after the ex-date. In those cases, dividend income, net of withholding taxes, is recorded when the fund becomes aware of the dividends. Gains and losses on securities sold are determined on the basis of identified cost and may include proceeds from litigation.
Foreign currency translation. Assets, including investments and liabilities denominated in foreign currencies, are translated into U.S. dollar values each day at the prevailing exchange rate. Purchases and sales of securities, income and expenses are translated into U.S. dollars at the prevailing exchange rate on the date of the transaction. The effect of changes in foreign currency exchange rates on the value of securities is reflected as a component of the realized and unrealized gains (losses) on investments.
Funds that invest internationally generally carry more risk than funds that invest strictly in U.S. securities. Risks can result from differences in economic and political conditions, regulations, market practices (including higher transaction costs), accounting standards and other factors. Foreign investments are also subject to a decline in the value of a foreign currency versus the U.S. dollar, which reduces the dollar value of securities denominated in that currency.
Foreign taxes. The fund may be subject to withholding tax on income and/or capital gains or repatriation taxes imposed by certain countries in which the fund invests. Taxes are accrued based upon investment income, realized gains or unrealized appreciation.
Line of credit. The fund may borrow from banks for temporary or emergency purposes, including meeting redemption requests that otherwise might require the untimely sale of securities. Pursuant to the fund custodian agreement, the custodian may loan money to the fund to make properly authorized payments. The fund is obligated to repay the custodian for any overdraft, including any related costs or expenses. The custodian may have a lien, security interest or security entitlement in any fund property that is not otherwise segregated or pledged, to the maximum extent permitted by law, to the extent of any overdraft.
In addition, the fund and other affiliated funds have entered into an agreement with Citibank N.A. that enables them to participate in a $300 million unsecured committed line of credit. A commitment fee, payable at the end of each calendar quarter, based on the average daily unused portion of the line of credit, is charged to each participating fund on a pro rata basis and is reflected in other expenses on the Statement of operations. Prior to March 27, 2013, the fund participated in a $200 million unsecured line of credit, also with Citibank, with terms otherwise similar to the existing agreement. Commitment fees for the year ended July 31, 2013 were $652. For the year ended July 31, 2013, the fund had no borrowings under either line of credit.
Expenses. Within the John Hancock funds complex, expenses that are directly attributable to an individual fund are allocated to such fund. Expenses that are not readily attributable to a specific fund are allocated among all funds in an equitable manner, taking into consideration, among other things, the nature and type of expense and the fund’s relative net assets. Expense estimates are accrued in the period to which they relate and adjustments are made when actual amounts are known.
| |
| Annual report | Short Duration Credit Opportunities Fund | 47 |
Class allocations. Income, common expenses and realized and unrealized gains (losses) are determined at the fund level and allocated daily to each class of shares based on the net assets of the class. Class-specific expenses, such as distribution and service fees, if any, transfer agent fees, state registration fees and printing and postage, for all classes, are calculated daily at the class level based on the appropriate net assets of each class and the specific expense rates applicable to each class.
Federal income taxes. The fund intends to continue to qualify as a regulated investment company by complying with the applicable provisions of the Internal Revenue Code and will not be subject to federal income tax on taxable income that is distributed to shareholders. Therefore, no federal income tax provision is required.
As of July 31, 2013, the fund had no uncertain tax positions that would require financial statement recognition, derecognition or disclosure. The fund’s federal tax returns are subject to examination by the Internal Revenue Service for a period of three years.
Distribution of income and gains. Distributions to shareholders from net investment income and net realized gains, if any, are recorded on the ex-date. The fund generally declares dividends daily and pays them monthly. Capital gain distributions, if any, are paid annually. The tax character of distributions for the years ended July 31, 2013 and 2012 was as follows:
| | | | | |
| | JULY 31, 2013 | JULY 31, 2012 | | | |
| | | |
| Ordinary Income | $40,612,501 | $49,762,778 | | | |
Distributions paid by the fund with respect to each class of shares are calculated in the same manner, at the same time and in the same amount, except for the effect of class level expenses that may be applied differently to each class. As of July 31, 2013, the components of distributable earnings on a tax basis consisted of $1,329,287 of undistributed ordinary income and $14,712,800 of undistributed long-term capital gain.
Such distributions and distributable earnings, on a tax basis, are determined in conformity with income tax regulations, which may differ from accounting principles generally accepted in the United States of America. Material distributions in excess of tax basis earnings and profits, if any, are reported in the fund’s financial statements as a return of capital.
Capital accounts within the financial statements are adjusted for permanent book-tax differences. These adjustments have no impact on net assets or the results of operations. Temporary book-tax differences, if any, will reverse in a subsequent period. Book-tax differences are primarily attributable to foreign currency transactions, derivative transactions and amortization and accretion on debt securities.
Note 3 — Derivative instruments
The fund may invest in derivatives in order to meet its investment objectives. Derivatives include a variety of different instruments that may be traded in the over-the-counter market, on a regulated exchange or through a clearing facility. The risks in using derivatives vary depending upon the structure of the instruments, including the use of leverage, optionality, the liquidity or lack of liquidity of the contract, the creditworthiness of the counterparty or clearing organization and the volatility of the position. Some derivatives involve risks that are potentially greater than the risks associated with investing directly in the referenced securities or other referenced underlying instrument. Specifically, the fund is exposed to the risk that the counterparty to an OTC derivatives contract will be unable or unwilling to make timely settlement payments or otherwise honor its obligations. OTC derivatives transactions typically can only be closed out with the other party to the transaction.
| |
| 48 | Short Duration Credit Opportunities Fund | Annual report |
Forward foreign currency contracts and swaps are typically traded through the OTC market. Non-deliverable forwards are all regulated by the Commodity Futures Trading Commission (the CFTC) as swaps. Derivative counterparty risk is managed through an ongoing evaluation of the creditworthiness of all potential counterparties and, if applicable, designated clearing organizations. The fund attempts to reduce its exposure to counterparty risk for derivatives traded in the OTC market, whenever possible, by entering into an International Swaps and Derivatives Association (ISDA) Master Agreement with each of its OTC counterparties. The ISDA gives each party to the agreement the right to terminate all transactions traded under the agreement if there is certain deterioration in the credit quality or contractual default of the other party, as defined in the ISDA. Upon an event of default or a termination of the ISDA, the non-defaulting party has the right to close out all transactions and to net amounts owed. This right to close out and net payments across all transactions traded under the ISDA could result in a reduction of the fund’s risk to a counterparty equal to any amounts payable by the fund, if any.
As defined by the ISDA, the fund may have collateral agreements with certain counterparties to mitigate counterparty risk on OTC derivatives. Subject to established minimum levels, collateral for OTC transactions is generally determined based on the net aggregate unrealized gain or loss on contracts with a particular counterparty. Collateral pledged to the fund is held in a segregated account by a third-party agent or held by the custodian bank for the benefit of the fund and can be in the form of cash or debt securities issued by the U.S. government or related agencies; collateral posted by the fund for OTC transactions is held in a segregated account at the fund’s custodian and is noted in the accompanying fund’s investments, or if cash is posted, on the Statement of assets and liabilities. The fund’s maximum risk of loss due to counterparty risk is equal to the collateral posted by the fund netted against the value on any outstanding contracts.
Futures are traded or cleared on an exchange or central exchange clearinghouse. Exchange-traded or cleared transactions generally present less counterparty risk to the fund. The exchange’s clearinghouse stands between the fund and the broker to the contract and therefore, credit risk is generally limited to the failure of the clearinghouse and the clearing member.
For financial reporting purposes, the fund does not offset OTC derivative assets or liabilities that are subject to master netting arrangements, as defined by the ISDAs, in the Statement of assets and liabilities. In the event of default by the counterparty or a termination of the agreement, the ISDA allows an offset of amounts across the various transactions between the fund and the applicable counterparty and is known as close-out netting.
Futures. A futures contract is a contractual agreement to buy or sell a particular currency or financial instrument at a pre-determined price in the future. Risks related to the use of futures contracts include possible illiquidity of the futures markets, contract prices that can be highly volatile and imperfectly correlated to movements in the underlying financial instrument and potential losses in excess of the amounts recognized on the Statement of assets and liabilities. Use of long futures contracts subjects the fund to the risk of loss up to the notional value of the futures contracts. Use of short futures contracts subjects the fund to unlimited risk of loss.
Upon entering into a futures contract, the fund is required to deposit initial margin with the broker in the form of cash or securities. The amount of required margin is generally based on a percentage of the contract value; this amount is the initial margin for the trade. The margin deposit must then be maintained at the established level over the life of the contract. Futures collateral receivable/payable is included on the Statement of assets and liabilities. Futures contracts are marked-to-market daily and an appropriate payable or receivable for the change in value (variation margin) and unrealized gain or loss is recorded by the fund. When the contract is closed, the fund records a realized gain or loss equal to the difference between the value of the contract at the time it was opened and the value at the time it was closed.
| |
| Annual report | Short Duration Credit Opportunities Fund | 49 |
During the year ended July 31, 2013, the fund used futures contracts to manage the duration of the portfolio. During the year ended July 31, 2013, the fund held futures contracts with notional values ranging from $298.0 million to $359.8 million as measured at each quarter end. The following table summarizes the contracts held at July 31, 2013.
| | | | | | |
| | | | | | | UNREALIZED |
| OPEN | NUMBER OF | | EXPIRATION | | | APPRECIATION |
| CONTRACTS | CONTRACTS | POSITION | DATE | NOTIONAL BASIS | NOTIONAL VALUE | (DEPRECIATION) |
|
| U.S. Treasury 2-year | 170 | Long | Sep 2013 | $37,429,861 | $37,453,125 | $23,264 |
| Note Futures | | | | | | |
| U.S. Treasury 5-Year | 129 | Long | Sep 2013 | 15,827,175 | 15,656,367 | (170,808) |
| Note Futures | | | | | | |
| U.S. Treasury 10-Year | 1,438 | Short | Sep 2013 | (185,796,032) | (181,817,125) | 3,978,907 |
| Note Futures | | | | | | |
| U.S. Treasury Long | 873 | Short | Sep 2013 | (122,762,325) | (117,036,563) | 5,725,762 |
| Bond Futures | | | | | | |
| Ultra Long U.S. | 30 | Short | Sep 2013 | (4,596,449) | (4,327,500) | 268,949 |
| Treasury Bond Futures | | | | | | |
| | | | | | | $9,826,074 |
Forward foreign currency contracts. A forward foreign currency contract is an agreement between two parties to buy and sell a specific currency at a price that is set on the date of the contract. The forward contract calls for delivery of the currency on a future date that is specified in the contract. Risks related to the use of forwards include the possible failure of counterparties to meet the terms of the forward agreement, the failure of the counterparties to timely post collateral, the risk that currency movements will not favor the fund thereby reducing the fund’s total return, and the potential for losses in excess of the amounts recognized on the Statement of assets and liabilities.
The market value of a forward foreign currency contract fluctuates with changes in foreign currency exchange rates. Forward foreign currency contracts are marked-to-market daily and the change in value is recorded by the fund as an unrealized gain or loss. Realized gains or losses, equal to the difference between the value of the contract at the time it was opened and the value at the time it was closed, are recorded upon delivery or receipt of the currency or settlement with the counterparty.
During the year ended July 31, 2013, the fund used forward foreign currency contracts to manage against anticipated currency exchange rates and gain exposure to foreign currency. During the year ended July 31, 2013, the fund held forward foreign currency contracts with USD notional values ranging from $9.5 million to $101.0 million as measured at each quarter end. The following table summarizes the contracts held at July 31, 2013.
| |
| 50 | Short Duration Credit Opportunities Fund | Annual report |
| | | | | | | | | |
| | | | | | | | | | NET UNREALIZED |
| CONTRACT | | CONTRACT | | | SETTLEMENT | UNREALIZED | UNREALIZED | APPRECIATION/ |
| TO BUY | | TO SELL | | COUNTERPARTY | DATE | APPRECIATION | DEPRECIATION | (DEPRECIATION) |
|
| |
| CLP | 39,100,000 | USD | 76,855 | | Citibank N.A. | 8-16-2013 | — | ($918) | ($918) |
| EUR | 9,225,000 | USD | 11,962,242 | | Citibank N.A. | 8-14-2013 | $310,685 | — | 310,685 |
| EUR | 6,026,007 | USD | 7,988,261 | | Citibank N.A. | 8-15-2013 | 28,754 | — | 28,754 |
| USD | 51,376 | HUF | 11,272,500 | | Citibank N.A. | 9-3-2013 | 1,417 | — | 1,417 |
| USD | 154,000 | PEN | 431,200 | | Citibank N.A. | 9-25-2013 | 543 | — | 543 |
| GBP | 301,500 | USD | 457,845 | | Citibank N.A. | 8-15-2013 | 769 | — | 769 |
| HUF | 27,636,400 | USD | 121,000 | | Citibank N.A. | 8-21-2013 | 1,623 | — | 1,623 |
| HUF | 226,310 | USD | 1,000 | | Citibank N.A. | 8-23-2013 | 4 | — | 4 |
| HUF | 11,272,500 | USD | 50,000 | | Citibank N.A. | 9-3-2013 | — | (40) | (40) |
| NGN | 127,185,585 | USD | 763,823 | | Citibank N.A. | 9-18-2013 | 18,314 | — | 18,314 |
| PEN | 724,581 | USD | 260,000 | | Citibank N.A. | 8-26-2013 | — | (1,579) | (1,579) |
| PEN | 702,500 | USD | 250,000 | | Citibank N.A. | 9-25-2013 | 8 | — | 8 |
| RON | 392,000 | USD | 115,788 | | Citibank N.A. | 8-19-2013 | 2,132 | — | 2,132 |
| USD | 24,538,316 | EUR | 18,450,000 | | Citibank N.A. | 8-13-2013 | — | (7,463) | (7,463) |
| USD | 7,867,191 | EUR | 6,026,007 | | Citibank N.A. | 8-15-2013 | — | (149,824) | (149,824) |
| USD | 7,233,154 | EUR | 5,445,000 | | Citibank N.A. | 9-20-2013 | — | (11,755) | (11,755) |
| USD | 12,207,793 | EUR | 9,225,000 | | Citibank N.A. | 8-26-2013 | — | (65,583) | (65,583) |
| USD | 458,830 | GBP | 301,500 | | Citibank N.A. | 8-15-2013 | 216 | — | 216 |
| USD | 477,007 | GBP | 314,200 | | Citibank N.A. | 9-20-2013 | — | (809) | (809) |
| USD | 25,839,000 | GBP | 16,500,000 | | Citibank N.A. | 8-20-2013 | 741,616 | — | 741,616 |
| USD | 122,143 | HUF | 27,636,400 | | Citibank N.A. | 8-21-2013 | — | (480) | (480) |
| | | | | | | | $1,106,081 | ($238,451) | $867,630 |
| |
| Currency Abbreviations | |
| CLP | Chilean Peso |
| EUR | Euro |
| GBP | Pound Sterling |
| HUF | Hungarian Forint |
| NGN | Nigerian Naira |
| PEN | Peruvian Nuevo Sol |
| RON | Romanian New Leu |
| USD | U.S. Dollar |
Swaps. Swap agreements are agreements between the fund and counterparty to exchange cash flows, assets, foreign currencies or market-linked returns at specified intervals. Swap agreements are privately negotiated in the OTC market (OTC swaps) or may be executed on a registered commodities exchange (centrally cleared swaps). Swaps are marked-to-market daily and the change in value is recorded as a component of unrealized appreciation/depreciation of swap contracts. The value of the swap will typically impose collateral posting obligations on the party that is considered out-of-the-money on the swap.
Upfront payments made/received by the fund are amortized/accreted for financial reporting purposes, with the unamortized/unaccreted portion included in the Statement of assets and liabilities. Swaps are marked-to-market daily and the change in value is recorded as unrealized appreciation/depreciation of swap contracts. A termination payment by the counterparty or the fund is recorded as realized gain or loss, as well as the net periodic payments received or paid by the fund.
| |
| Annual report | Short Duration Credit Opportunities Fund | 51 |
Entering into swap agreements involves, to varying degrees, elements of credit, market and documentation risk that may amount to values that are in excess of the amounts recognized on the Statement of assets and liabilities. Such risks involve the possibility that there will be no liquid market for the swap, or that a counterparty may default on its obligation or delay payment under the swap terms. The counterparty may disagree or contest the terms of the swap. Market risks may also accompany the swap, including interest rate risk. The fund may also suffer losses if it is unable to terminate or assign outstanding swaps or reduce its exposure through offsetting transactions.
Interest rate swaps. Interest rate swaps represent an agreement between the fund and a counterparty to exchange cash flows based on the difference between two interest rates applied to a notional amount. The payment flows are usually netted against each other, with the difference being paid by one party to the other. The fund settles accrued net interest receivable or payable under the swap contracts at specified, future intervals.
During the year ended July 31, 2013, the fund used interest rate swaps to manage the duration of the portfolio. During the year ended July 31, 2013, the fund held interest rate swap contracts with total USD notional amounts ranging up to $10.2 million. At July 31, 2013, the fund held no interest rate swap contracts.
Credit default swaps. Credit default swaps (CDS) involve the exchange of a fixed rate premium (paid by the Buyer), for protection against the loss in value of an underlying debt instrument, referenced entity or index, in the event of a defined credit event (such as payment default or bankruptcy). Under the terms of the swap, one party acts as a “guarantor” (the Seller), receiving the premium and agreeing to contingent payments that are specified within the credit default agreement. The fund may enter into CDS in which it may act as either Buyer or Seller. By acting as the Seller, the fund may incur economic leverage since it would be obligated to pay the Buyer the notional amount of the contract in the event of a default. The amount of loss in such case could be significant, but would typically be reduced by any recovery value on the underlying credit.
During the year ended July 31, 2013, the fund used CDS as a Buyer of protection to manage against potential credit events. During the year ended July 31, 2013, the fund held credit default swap contracts with total USD notional amounts ranging from $112.6 million to $231.6 million as measured at each quarter end. The following table summarizes the credit default swap contracts the fund held as of July 31, 2013 as a Buyer of protection.
| | | | | | | | |
| | | | | | | UNAMORTIZED | UNREALIZED | |
| | REFERENCE | USD NOTIONAL | | (PAY)/RECEIVED | MATURITY | UPFRONT | APPRECIATION | MARKET |
| COUNTERPARTY | OBLIGATION | AMOUNT | | FIXED RATE | DATE | PAYMENT | (DEPRECIATION) | VALUE |
|
| Citibank N.A. | CDX IG CDSI | $112,600,000 | | (1.00%) | Jun 2018 | ($553,959) | ($978,332) | ($1,532,291) |
| | S20 5Y DEAL | | | | | | | |
Implied credit spreads are utilized in determining the market value of CDS agreements in which the fund is the Seller at period end. The implied credit spread generally represents the yield of the instrument above a credit-risk free rate, such as the U.S. Treasury Bond Yield, and may include upfront payments required to be made to enter into the agreement. It also serves as an indicator of the current status of the payment/performance risk and represents the likelihood or risk of default for the credit derivative. Wider credit spreads represent a deterioration of the referenced entity’s creditworthiness and an increased risk of default or other credit event occurring as defined under the terms of the agreement.
For CDS agreements where implied credit spreads are not reported or available, the average credit rating on the underlying index is shown. Increasing market values, in absolute terms when compared to the notional amount of the swap, represent a deterioration of the referenced entity’s creditworthiness and a greater likelihood of a credit event occurring. This is also represented by a decrease in the average credit rating of the underlying index. The maximum potential amount of
| |
| 52 | Short Duration Credit Opportunities Fund | Annual report |
future payments (undiscounted) that a fund as the Seller could be required to make under any CDS agreement equals the notional amount of the agreement.
The fund used CDS as a Seller of protection during the year ended July 31, 2013 to take a long exposure to the reference credit indices. During the year ended July 31, 2013, the fund acted as Seller on credit default swap contracts with total USD notional amounts ranging up to $13.8 million as measured at each quarter end. The following table summarizes the credit default swap contracts the fund held as of July 31, 2013 where the fund acted as a Seller of protection.
| | | | | | | | | |
| | | | | IMPLIED | | | UNAMORTIZED | UNREALIZED | |
| | REFERENCE | USD NOTIONAL | | CREDIT | (PAY)/RECEIVED | MATURITY | UPFRONT | APPRECIATION | MARKET |
| COUNTERPARTY | OBLIGATION | AMOUNT | | SPREAD | FIXED RATE | DATE | PAYMENT | (DEPRECIATION) | VALUE |
|
| Citibank N.A. | CMBX NA AAA 4 | $4,000,000 | | 1.30% | 0.350% | Feb 2051 | ($760,510) | $640,782 | ($119,728) |
| Citibank N.A. | CMBX NA AM 4 | 1,150,000 | | 3.40% | 0.500% | Feb 2051 | (284,222) | 166,459 | (117,763) |
| Citibank N.A. | CMBX NA AM 4 | 4,000,000 | | 3.40% | 0.500% | Feb 2051 | (396,495) | (13,116) | (409,611) |
| Citibank N.A. | CMBX NA AM 4 | 3,000,000 | | 3.40% | 0.500% | Feb 2051 | (510,728) | 203,520 | (307,208) |
| Citibank N.A. | CMBX NA AM 4 | 1,650,000 | | 3.40% | 0.500% | Feb 2051 | (333,318) | 164,353 | (168,965) |
| | | $13,800,000 | | | | | ($2,285,273) | $1,161,998 | ($1,123,275) |
Fair value of derivative instruments by risk category
The table below summarizes the fair value of derivatives held by the fund at July 31, 2013 by risk category:
| | | | |
| | | FINANCIAL | ASSET | LIABILITY |
| | STATEMENT OF ASSETS AND | INSTRUMENTS | DERIVATIVES | DERIVATIVES |
| RISK | LIABILITIES LOCATION | LOCATION | FAIR VALUE | FAIR VALUE |
|
| Interest rate contracts | Receivable/Payable | Futures | $9,996,882† | ($170,808)† |
| | for futures | | | |
| |
| Credit contracts | Swap contracts, at value | Credit default | — | (2,655,566) |
| | | swaps | | |
| Foreign currency | Receivable/Payable for | Foreign forward | 1,106,081 | (238,451) |
| contracts | foreign currency | currency | | |
| | exchange contracts | contracts | | |
| Total | | | $11,102,963 | ($3,064,825) |
† Reflects cumulative appreciation/depreciation on futures as disclosed above. Only the year end variation margin is separately disclosed in the Statement of assets and liabilities.
Effect of derivative instruments on the Statement of operations
The table below summarizes the net realized gain (loss) included in the net increase (decrease) in net assets from operations, classified by derivative instrument and risk category, for the year ended July 31, 2013:
| | | | |
| | | | FOREIGN | |
| | FUTURES | | CURRENCY | |
| RISK | CONTRACTS | SWAP CONTRACTS | TRANSACTIONS* | TOTAL |
|
| Interest rate | | | | |
| contracts | $5,072,423 | ($1,652,595) | — | $3,419,828 |
| Credit contracts | — | (13,450,988) | — | (13,450,988) |
| Foreign currency | | | | |
| contracts | — | — | (1,534,819) | (1,534,819) |
| Total | $5,072,423 | ($15,103,583) | ($1,534,819) | ($11,565,979) |
* Realized gain/loss associated with foreign currency contracts is included in this caption on the Statement of operations.
| |
| Annual report | Short Duration Credit Opportunities Fund | 53 |
The table below summarizes the net change in unrealized appreciation (depreciation) included in the net increase (decrease) in net assets from operations, classified by derivative instrument and risk category, for the year ended July 31, 2013:
| | | | |
| | | | FOREIGN | |
| | FUTURES | | CURRENCY | |
| RISK | CONTRACTS | SWAP CONTRACTS | TRANSACTIONS* | TOTAL |
|
| Interest rate | | | | |
| contracts | $9,506,381 | $1,756,702 | — | $11,263,083 |
| Credit contracts | — | 2,898,380 | — | 2,898,380 |
| Foreign currency | | | | |
| contracts | — | — | $950,544 | 950,544 |
| Total | $9,506,381 | $4,655,082 | $950,544 | $15,112,007 |
* Change in unrealized appreciation/depreciation associated with forward foreign currency contracts is included in the caption on the Statements of operations.
Note 4 — Guarantees and indemnifications
Under the Trust’s organizational documents, its Officers and Trustees are indemnified against certain liabilities arising out of the performance of their duties to the Trust, including the fund. Additionally, in the normal course of business, the fund enters into contracts with service providers that contain general indemnification clauses. The fund’s maximum exposure under these arrangements is unknown, as this would involve future claims that may be made against the fund that have not yet occurred. The risk of material loss from such claims is considered remote.
Note 5 — Fees and transactions with affiliates
John Hancock Investment Management Services, LLC (the Advisor) serves as investment advisor for the fund. John Hancock Funds, LLC (the Distributor), an affiliate of the Advisor, serves as principal underwriter of the fund. The Advisor and the Distributor are indirect, wholly owned subsidiaries of Manulife Financial Corporation (MFC).
Management fee. The fund has an investment management agreement with the Advisor under which the fund pays a daily management fee to the Advisor equivalent, on an annual basis, to the sum of: a) 0.740% of the first $250,000,000 of the fund’s average daily net assets; b) 0.700% of the next $500,000,000 of the fund’s average daily net assets; and c) 0.675% of the fund’s average daily net assets in excess of $750,000,000. The Advisor has a subadvisory agreement with Stone Harbor Investment Partners LP. The fund is not responsible for payment of the subadvisory fees.
Effective June 1, 2013, the Advisor has contractually agreed to waive a portion of its management fee for certain funds (the Participating portfolios) of the Trust, John Hancock Funds, John Hancock Funds III and John Hancock Variable Insurance Trust. The waiver equals, on an annualized basis, 0.01% of that portion of the aggregate net assets of all the Participating portfolios that exceeds $75 billion but is less than or equal to $125 billion; 0.0125% of that portion of the aggregate net assets of all the Participating portfolios that exceeds $125 billion but is less than or equal to $150 billion; and 0.015% of that portion of the aggregate net assets of all the Participating porfolios that exceeds $150 billion. The amount of the reimbursement is calculated daily and allocated among all the Participating portfolios in proportion to the daily net assets of each fund. This arrangement may be amended or terminated at any time by the Advisor upon notice to the fund and with the approval of the Board of Trustees.
Prior to June 1, 2013, the Advisor had contractually agreed to waive a portion of its management fee for certain funds (the participating portfolios) of the Trust and John Hancock Variable Insurance Trust. The prior waiver equaled, on an annualized basis, 0.01% of that portion of the aggregate net
| |
| 54 | Short Duration Credit Opportunities Fund | Annual report |
assets of all the participating portfolios that exceeded $75 billion but was less than $100 billion; and 0.015% of that portion of the aggregate net assets of all the participating portfolios that equaled or exceeded $100 billion. The amount of the reimbursement was calculated daily and allocated among all the participating portfolios in proportion to the daily net assets of each fund.
Effective March 28, 2013, the Advisor has contractually agreed to waive fees and/or reimburse operating expenses for Class A and Class I shares excluding certain expenses such as taxes, brokerage commissions, interest expense, short dividend expense, acquired fund fees, litigation and indemnification expenses and other extraordinary expenses not incurred in the ordinary course of the fund’s business. The fee waivers and/or expense reimbursements are such that these expenses will not exceed 1.21% and 0.90% for Class A and Class I shares, respectively. The fee waivers and/or reimbursements will continue in effect until November 30, 2014, unless renewed by mutual agreement of the fund and the Advisor based upon determination that this is appropriate under the circumstances at that time. Prior to March 28, 2013, these fee waivers and/or expense reimbursements were such that the expenses would not exceed 1.25% and 1.05% for Class A and Class I shares, respectively.
Additionally, the Advisor has voluntarily agreed to waive and/or reimburse other expenses of the fund excluding advisory fees, Rule 12b-1 fees, service fees, transfer agent fees, blue sky fees, taxes, brokerage commissions, interest expense, printing and postage, short dividend expense, acquired fund fees, litigation and indemnification expenses and other extraordinary expenses not incurred in the ordinary course of business. The waivers are such that these expenses will not exceed 0.15% of average net assets. This voluntary expense reimbursement will continue in effect until terminated at any time by the Advisor on notice to the fund.
Accordingly, these expense reductions described above amounted to $7,879, $7,266 and 43,486 for Class A, Class I and Class NAV shares for the year ended July 31, 2013.
The investment management fees incurred for the year ended July 31, 2013 were equivalent to a net annual effective rate of 0.70% of the fund’s average daily net assets.
Expense recapture. The Advisor may recapture operating expenses reimbursed or fees waived under previous expense limitation or waiver arrangements for a period of three years following the beginning of the month in which such reimbursements or waivers originally occurred to the extent that the fund is below its expense limitation during this period. The table below outlines the amounts recovered during the year ended July 31, 2013, and the amount of waived or reimbursed expenses subject to potential recovery and the respective expiration dates.
| | | |
| | | | AMOUNT |
| AMOUNTS ELIGIBLE FOR | AMOUNTS ELIGIBLE FOR | AMOUNTS ELIGIBLE FOR | RECOVERED DURING |
| RECOVERY THROUGH | RECOVERY THROUGH | RECOVERY THROUGH | THE PERIOD ENDED |
| JULY 1, 2014 | JULY 1, 2015 | JULY 1, 2016 | JULY 31, 2013 |
|
| — | — | $15,121 | — |
Accounting and legal services. Pursuant to a service agreement, the fund reimburses the Advisor for all expenses associated with providing the administrative, financial, legal, accounting and recordkeeping services to the fund, including the preparation of all tax returns, periodic reports to shareholders and regulatory reports, among other services. These expenses are allocated to each share class based on its relative net assets at the time the expense was incurred. These accounting and legal services fees incurred for the year ended July 31, 2013 amounted to an annual rate of 0.01% of the fund’s average daily net assets.
| |
| Annual report | Short Duration Credit Opportunities Fund | 55 |
Distribution and service plans. The fund has a distribution agreement with the Distributor. The fund has adopted distribution and service plans with respect to Class A shares pursuant to Rule 12b-1 under the 1940 Act, to pay the Distributor for services provided as the distributor of shares of the fund. The fund pays 0.30% for Class A shares for distribution and service fees, expressed as an annual percentage of average daily net assets.
Sales charges. Class A shares are assessed up-front sales charges, which resulted in payments to the Distributor amounting to $11,920 for the year ended July 31, 2013. Of this amount, $1,500 was retained and used for printing prospectuses, advertising, sales literature and other purposes, $10,420 was paid as sales commissions to broker-dealers and $0 was paid as sales commissions to sales personnel of Signator Investors, Inc., a broker-dealer affiliate of the Advisor.
Class A shares may be subject to contingent deferred sales charges (CDSCs). Certain Class A shares that are acquired through purchases of $1 million or more and are redeemed within one year of purchase are subject to a 1.00% sales charge. Proceeds from CDSCs are used to compensate the Distributor for providing distribution-related services in connection with the sale of these shares. During the year ended July 31, 2013, CDSCs received by the Distributor amounted to $862 for Class A shares.
Transfer agent fees. The fund has a transfer agent agreement with John Hancock Signature Services, Inc. (Signature Services), an affiliate of the Advisor. The transfer agent fees paid to Signature Services are determined based on the cost to Signature Services (Signature Services Cost) of providing recordkeeping services. The Signature Services Cost includes a component of allocated John Hancock corporate overhead for providing transfer agent services to the fund and to all other John Hancock affiliated funds. It also includes out-of-pocket expenses that are comprised of payments made to third-parties for recordkeeping services provided to their clients who invest in one or more John Hancock funds. In addition, Signature Services Cost may be reduced by certain fees that Signature Services receives in connection with retirement and small accounts. Signature Services Cost is calculated monthly and allocated, as applicable, to four categories of share classes: Institutional Share Classes, Retirement Share Classes, Municipal Bond Classes and all other Retail Share Classes. Within each of these categories, the applicable costs are allocated to the affected John Hancock affiliated funds and/or classes, based on the relative average daily net assets.
Class level expenses. Class level expenses for the year ended July 31, 2013 were:
| | | | |
| | DISTRIBUTION | TRANSFER | STATE | PRINTING AND |
| CLASS | AND SERVICE FEES | AGENT FEES | REGISTRATION FEES | POSTAGE |
|
| A | $688 | $368 | $7,052 | $801 |
| I | — | 241 | 7,051 | 300 |
| Total | $688 | $609 | $14,103 | $1,101 |
Trustee expenses. The fund compensates each Trustee who is not an employee of the Advisor or its affiliates. The costs of paying Trustee compensation and expenses are allocated to each fund based on its average daily net assets.
| |
| 56 | Short Duration Credit Opportunities Fund | Annual report |
Note 6 — Fund share transactions
Transactions in fund shares for the years ended July 31, 2013 and 2012 were as follows:
| | | | |
| | | Year ended 7-31-13 | | Year ended 7-31-12 |
| | Shares | Amount | Shares | Amount |
| Class A shares | | | | |
|
| Sold | 173,587 | $1,794,593 | — | — |
| Distributions reinvested | 578 | 5,950 | — | — |
| Repurchased | (5,638) | (57,963) | — | — |
| | | | | |
| Net increase | 168,527 | $1,742,580 | — | — |
| |
| Class I shares | | | | |
|
| Sold | 119,339 | $1,244,362 | — | — |
| Distributions reinvested | 654 | 6,741 | — | — |
| Repurchased | (2,948) | (30,230) | — | — |
| | | | | |
| Net increase | 117,045 | $1,220,873 | — | — |
| |
| Class NAV shares | | | | |
|
| Sold | 14,011,129 | $146,281,398 | 11,100,561 | $112,124,293 |
| Distributions reinvested | 3,895,386 | 40,597,558 | 4,945,978 | 49,759,698 |
| Repurchased | (9,840,661) | (103,327,653) | (10,488,234) | (106,246,611) |
| | | | | |
| Net increase | 8,065,854 | $83,551,303 | 5,558,305 | $55,637,380 |
| |
| Total net increase | 8,351,426 | $86,514,756 | 5,558,305 | $55,637,380 |
|
Affiliates of the fund owned 1%, 2% and 100% of shares of beneficial interest of each of Class A, Class I and Class NAV on July 31, 2013.
Note 7 — Purchase and sale of securities
Purchases and sales of securities, other than short-term securities, aggregated $938,471,191 and $840,168,559, respectively, for year ended July 31, 2013.
Note 8 — Investment by affiliated funds
Certain investors in the fund are affiliated funds that are managed by the Advisor and its affiliates. The affiliated funds do not invest in the fund for the purpose of exercising management or control; however, affiliated fund investments may represent a significant portion of the fund’s net assets. At July 31, 2013, the following funds had an affiliate ownership of 5% or more of the fund’s net assets:
| | | |
| | AFFILIATE | | |
| FUND | CONCENTRATION | | |
| | |
| John Hancock Lifestyle Balanced Portfolio | 38.5% | | |
| John Hancock Lifestyle Conservative Portfolio | 15.4% | | |
| John Hancock Lifestyle Growth Portfolio | 13.8% | | |
| John Hancock Lifestyle Moderate Portfolio | 15.6% | | |
| |
| Annual report | Short Duration Credit Opportunities Fund | 57 |
Auditor’s report
Report of Independent Registered Public Accounting Firm
To the Board of Trustees of John Hancock Funds II and Shareholders of
John Hancock Short Duration Credit Opportunities Fund:
In our opinion, the accompanying statement of assets and liabilities, including the schedule of investments, and the related statements of operations and of changes in net assets and the financial highlights present fairly, in all material respects, the financial position of John Hancock Short Duration Credit Opportunities (formerly the John Hancock Multi Sector Bond Fund) (the “Fund”) at July 31, 2013, and the results of its operations for the year then ended, the changes in its net assets for each of the two years in the period then ended and the financial highlights for each of the periods indicated, in conformity with accounting principles generally accepted in the United States of America. These financial statements and financial highlights (hereafter referred to as “financial statements”) are the responsibility of the Fund’s management; our responsibility is to express an opinion on these financial statements based on our audits. We conducted our audits of these financial statements in accordance with the standards of the Public Company Accounting Oversight Board (United States). Those standards require that we plan and perform the audit to obtain reasonable assurance about whether the financial statements are free of material misstatement. An audit includes examining, on a test basis, evidence supporting the amounts and disclosures in the financial statements, assessing the accounting principles used and significant estimates made by management, and evaluating the overall financial statement presentation. We believe that our audits, which included confirmation of securities at July 31, 2013 by correspondence with the custodian, agent banks and brokers, and the application of alternative auditing procedures where securities purchased confirmations had not been received, provide a reasonable basis for our opinion.
PricewaterhouseCoopers LLP
Boston, Massachusetts
September 20, 2013
| |
| 58 | Short Duration Credit Opportunities Fund | Annual report |
Tax information
Unaudited
For federal income tax purposes, the following information is furnished with respect to the distributions of the fund, if any, paid during its taxable year ended July 31, 2013.
The fund reports the maximum amount allowable of its net taxable income as eligible for the corporate dividends-received deduction.
The fund reports the maximum amount allowable of its net taxable income as qualified dividend income as provided in the Jobs and Growth Tax Relief Reconciliation Act of 2003.
Eligible shareholders will be mailed a 2013 Form 1099-DIV in early 2014. This will reflect the tax character of all distributions paid in calendar year 2013.
Please consult a tax advisor regarding the tax consequences of your investment in the fund.
| |
| Annual report | Short Duration Credit Opportunities Fund | 59 |
Evaluation of Advisory and Subadvisory Agreements by the Board of Trustees
This section describes the evaluation by the Board of Trustees (the Board) of John Hancock Funds II (the Trust) of the Advisory Agreement (the Advisory Agreement) with John Hancock Investment Management Services, LLC (the Advisor) and the Subadvisory Agreement (the Subadvisory Agreement) with Stone Harbor Investment Partners LP (the Subadvisor) for Short Duration Credit Opportunities Fund (the fund). The Advisory Agreement and Subadvisory Agreement are collectively referred to as the Agreements.
Approval of Advisory and Subadvisory Agreements
At in-person meetings held on May 16-17, 2013, the Board, including the Trustees who are not considered to be interested persons of the Trust under the Investment Company Act of 1940, as amended (the 1940 Act) (the Independent Trustees), reapproved for an annual period the continuation of the Advisory Agreement between the Trust and the Advisor and the Subadvisory Agreement between the Advisor and the Subadvisor with respect to the fund.
In considering the Advisory Agreement and the Subadvisory Agreement, the Board received in advance of the meeting a variety of materials relating to the fund, the Advisor, and the Subadvisor, including comparative performance, fee and expense information for peer groups of similar mutual funds prepared by an independent third-party provider of mutual fund data; performance information for the fund’s benchmark index; and, with respect to the Subadvisor, comparative performance information for comparably managed accounts; and other information provided by the Advisor and the Subadvisor regarding the nature, extent, and quality of services provided by the Advisor and the Subadvisor under their respective Agreements, as well as information regarding the Advisor’s revenues and costs of providing services to the fund and any compensation paid to affiliates of the Advisor. At the meeting at which the renewal of the Advisory Agreement and Subadvisory Agreement is considered, particular focus is given to information concerning fund performance, comparability of fees and total expenses and profitability. However, the Board notes that the evaluation process with respect to the Advisor and the Subadvisor is an ongoing one. In this regard, the Board also took into account discussions with management and information provided to the Board at prior meetings with respect to the services provided by the Advisor and the Subadvisor to the fund, including quarterly performance reports prepared by management containing reviews of investment results and prior presentations from the Subadvisor with respect to the fund. The Board also considered the nature, quality, and extent of non-advisory services, if any, to be provided to the fund by the Advisor’s affiliates, including distribution services.
Throughout the process, the Board asked questions of and requested additional information from management. The Board is assisted by counsel for the Trust and the Independent Trustees are also separately assisted by independent legal counsel throughout the process. The Independent Trustees also received a memorandum from their independent counsel discussing the legal standards for their consideration of the proposed continuation of the Agreements and discussed the proposed continuation of the Agreements in private sessions with their independent legal counsel at which no representatives of management were present.
Approval of Advisory Agreement
In approving the Advisory Agreement with respect to the fund, the Board, including the Independent Trustees, considered a variety of factors, including those discussed below. The Board also considered other factors (including conditions and trends prevailing generally in the economy, the securities markets, and the industry) and does not treat any single factor as determinative and each Trustee may attribute different weights to different factors. The Board’s conclusions may be based in part on its consideration of the Advisory and Subadvisory Agreements in prior years and on the Board’s ongoing regular review of fund performance and operations throughout the year.
| |
| 60 | Short Duration Credit Opportunities Fund | Annual report |
Nature, extent, and quality of services. Among the information received by the Board from the Advisor relating to the nature, extent, and quality of services provided to the fund, the Board reviewed information provided by the Advisor relating to its operations and personnel, descriptions of its organizational and management structure, and information regarding the Advisor’s compliance and regulatory history, including its Form ADV. The Board also noted that on a regular basis it receives and reviews information from the Trust’s Chief Compliance Officer (CCO) regarding the fund’s compliance policies and procedures established pursuant to Rule 38a-1 under the 1940 Act. The Board also considered the Advisor’s risk management processes. The Board considered that the Advisor is responsible for the management of the day-to-day operations of the fund, including, but not limited to, general supervision of and coordination of the services provided by the Subadvisor, and is also responsible for monitoring and reviewing the activities of the Subadvisor and other third-party service providers.
In considering the nature, extent, and quality of the services provided by the Advisor, the Trustees also took into account their knowledge of the Advisor’s management and the quality of the performance of the Advisor’s duties through Board meetings, discussions, and reports during the preceding year and through each Trustee’s experience as a Trustee of the Trust and of the other trusts in the complex.
In the course of their deliberations regarding the Advisory Agreement, the Board considered, among other things:
(a) the skills and competency with which the Advisor has in the past managed the Trust’s affairs and its subadvisory relationship, the Advisor’s oversight and monitoring of the Subadvisor’s investment performance and compliance programs, such as the Subadvisor’s compliance with fund policies and objective; review of brokerage matters, including with respect to trade allocation and best execution; and the Advisor’s timeliness in responding to performance issues;
(b) the background, qualifications and skills of the Advisor’s personnel;
(c) the Advisor’s compliance policies and procedures and its responsiveness to regulatory changes and mutual fund industry developments;
(d) the Advisor’s administrative capabilities, including its ability to supervise the other service providers for the fund;
(e) the financial condition of the Advisor and whether it has the financial wherewithal to provide a high level and quality of services to the fund; and
(f) the Advisor’s reputation and experience in serving as an investment adviser to the Trust and the benefit to shareholders of investing in funds that are part of a family of funds offering a variety of investments.
The Board concluded that the Advisor may reasonably be expected to continue to provide a high quality of services under the Advisory Agreement with respect to the fund.
Investment performance. In considering the fund’s performance, the Board noted that it reviews at its regularly scheduled meetings information about the fund’s performance results. In connection with the consideration of the Advisory Agreement, the Board:
(a) reviewed information prepared by management regarding the fund’s performance;
(b) considered the comparative performance of the fund’s benchmark;
| |
| Annual report | Short Duration Credit Opportunities Fund | 61 |
(c) considered the performance of comparable funds, if any, as included in the report prepared by an independent third-party provider of mutual fund data. Such report included the fund’s ranking within a smaller group of peer funds and the fund’s ranking within broader groups of funds; and
(d) took into account the Advisor’s analysis of the fund’s performance and its plans and recommendations regarding the Trust’s subadvisory arrangements generally.
The Board noted that the fund outperformed its benchmark index and underperformed its peer group average for the one- and three-year periods ended December 31, 2012. The Board considered management’s discussion of the fund’s investment style and the impact of market conditions during the period, including the fund’s shorter duration mandate relative to many in its peer group.
The Board concluded that the performance of the fund has generally been in line with or outperformed the historical performance of the fund’s benchmark.
Fees and expenses. The Board reviewed comparative information prepared by an independent third-party provider of mutual fund data, including, among other data, the fund’s contractual and net management fees and total expenses as compared to similarly situated investment companies deemed to be comparable to the fund. The Board considered the fund’s ranking within a smaller group of peer funds chosen by the independent third-party provider, as well as the fund’s ranking within a broader group of funds. In comparing the fund’s contractual and net management fees to those of comparable funds, the Board noted that such fees include both advisory and administrative costs.
The Board noted that net management fees for this fund are higher than the peer group median and that total expenses for this fund are equal to the peer group median. The Board took into account management’s discussion of the fund’s expenses.
The Board took into account management’s discussion with respect to the advisory/subadvisory fee structure, including the amount of the advisory fee retained by the Advisor after payment of the subadvisory fee. The Board also took into account that management had agreed to implement an overall fee waiver across a number of funds in the complex, including the fund, which is discussed further below. The Board also noted that, in addition, the Advisor is currently waiving fees and/or reimbursing expenses with respect to the fund. The Board also noted that the Advisor pays the subadvisory fees of the fund, and that such fees are negotiated at arm’s length with respect to the Subadvisor. The Board also noted management’s discussion of the fund’s expenses, as well as certain actions taken over the past several years to reduce the fund’s operating expenses. The Board reviewed information provided by the Advisor concerning investment advisory fees charged to other clients (including other funds in the complex) having similar investment mandates, if any. The Board considered any differences between the Advisor’s and Subadvisor’s services to the fund and the services they provide to other comparable clients or funds. The Board concluded that the advisory fee paid with respect to the fund is reasonable.
Profitability/indirect benefits. In considering the costs of the services to be provided and the profits to be realized by the Advisor and its affiliates from the Advisor’s relationship with the Trust, the Board:
(a) reviewed financial information of the Advisor;
(b) reviewed and considered an analysis presented by the Advisor regarding the net profitability to the Advisor and its affiliates with respect to the fund;
(c) received and reviewed profitability information with respect to the John Hancock fund complex as a whole;
| |
| 62 | Short Duration Credit Opportunities Fund | Annual report |
(d) received information with respect to the Advisor’s allocation methodologies used in preparing the profitability data;
(e) considered that the John Hancock insurance companies that are affiliates of the Advisor, as shareholders of the Trust directly or through their separate accounts, receive certain tax credits or deductions relating to foreign taxes paid and dividends received by certain funds of the Trust and noted that these tax benefits, which are not available to participants in qualified retirement plans under applicable income tax law, are reflected in the profitability analysis reviewed by the Board;
(f) considered that the Advisor also provides administrative services to the fund on a cost basis pursuant to an administrative services agreement;
(g) noted that affiliates of the Advisor provide transfer agency services and distribution services to the fund, and that the Trust’s distributor also receives Rule 12b-1 payments to support distribution of the fund;
(h) noted that the Advisor also derives reputational and other indirect benefits from providing advisory services to the fund;
(i) noted that the subadvisory fees for the fund are paid by the Advisor and are negotiated at arm’s length; and
(j) considered that the Advisor should be entitled to earn a reasonable level of profits in exchange for the level of services it provides to the fund and the entrepreneurial risk that it assumes as Advisor.
Based upon its review, the Board concluded that the level of profitability, if any, of the Advisor and its affiliates from their relationship with the fund was reasonable and not excessive.
Economies of scale. In considering the extent to which economies of scale would be realized as the fund grows and whether fee levels reflect these economies of scale for the benefit of fund shareholders, the Board:
(a) considered that the Advisor has agreed, effective June 1, 2013, to waive its management fee for the fund and each of the open-end funds of John Hancock Funds II, John Hancock Funds III, each other John Hancock fund (except those listed below) (the Participating Portfolios) or otherwise reimburse the expenses of the Participating Portfolios as follows (the Reimbursement):
The Reimbursement shall equal, on an annualized basis, 0.01% of that portion of the aggregate net assets of all the Participating Portfolios that exceeds $75 billion but is less than or equal to $125 billion, 0.0125% of that portion of the aggregate net assets of all the Participating Portfolios that exceeds $125 billion but is less than or equal to $150 billion and 0.015% of that portion of the aggregate net assets of all the Participating Portfolios that exceeds $150 billion. (The funds that are not Participating Portfolios as of the date of this annual report are each of the fund of funds, money market funds, index funds and closed-end funds);
(b) reviewed the Trust’s advisory fee structure and the incorporation therein of any subadvisory fee breakpoints in the advisory fees charged and concluded that (i) the fund’s fee structure contains breakpoints at the subadvisory fee level and that such breakpoints are reflected as breakpoints in the advisory fees for the fund and (ii) although economies of scale cannot be measured with precision, these arrangements permit shareholders of the fund to benefit from economies of scale if the fund grows. The Board also took into account management’s discussion of the fund’s advisory fee structure; and
| |
| Annual report | Short Duration Credit Opportunities Fund | 63 |
(c) the Board also considered the effect of the fund’s growth in size on its performance and fees. The Board also noted that if the fund’s assets increase over time, the fund may realize other economies of scale.
Approval of Subadvisory Agreement
In making its determination with respect to approval of the Subadvisory Agreement, the Board reviewed:
(1) information relating to the Subadvisor’s business, including current subadvisory services to the Trust (and other funds in the John Hancock family of funds);
(2) the historical and current performance of the fund, and comparative performance information relating to the fund’s benchmark and comparable funds;
(3) the subadvisory fee for the fund, including any breakpoints, and comparative fee information, where available, prepared by an independent third-party provider of mutual fund data; and
(4) information relating to the nature and scope of any material relationships and their significance to the Trust’s Advisor and Subadvisor.
Nature, extent, and quality of services. With respect to the services provided by the Subadvisor, the Board received information provided to the Board by the Subadvisor, including the Subadvisor’s Form ADV, as well as took into account information presented throughout the past year. The Board considered the Subadvisor’s current level of staffing and its overall resources, as well as received information relating to the Subadvisor’s compensation program. The Board reviewed the Subadvisor’s history and investment experience, as well as information regarding the qualifica-tions, background, and responsibilities of the Subadvisor’s investment and compliance personnel who provide services to the fund. The Board also considered, among other things, the Subadvisor’s compliance program and any disciplinary history. The Board also considered the Subadvisor’s risk assessment and monitoring process. The Board reviewed the Subadvisor’s regulatory history, including whether it was currently involved in any regulatory actions or investigations as well as material litigation, and any settlements and amelioratory actions undertaken, as appropriate. The Board noted that the Advisor conducts regular, periodic reviews of the Subadvisor and its operations, including regarding investment processes and organizational and staffing matters. The Board also noted that the Trust’s CCO and his staff conduct regular, periodic compliance reviews with the Subadvisor and present reports to the Independent Trustees regarding the same, which includes evaluating the regulatory compliance systems of the Subadvisor and procedures reasonably designed by it to assure compliance with the federal securities laws. The Board also took into account the financial condition of the Subadvisor.
The Board considered the Subadvisor’s investment process and philosophy. The Board took into account that the Subadvisor’s responsibilities include the development and maintenance of an investment program for the fund, that is consistent with the fund’s investment objective, the selection of investment securities and the placement of orders for the purchase and sale of such securities, as well as the implementation of compliance controls related to performance of these services. The Board also received information with respect to the Subadvisor’s brokerage policies and practices, including with respect to best execution and soft dollars.
Subadvisor compensation. In considering the cost of services to be provided by the Subadvisor and the profitability to the Subadvisor of its relationship with the fund, the Board noted that the fees under the Subadvisory Agreement are paid by the Advisor and not the fund.
The Board also relied on the ability of the Advisor to negotiate the Subadvisory Agreement with the Subadvisor, which is not affiliated with the Advisor, and the fees thereunder at arm’s length.
| |
| 64 | Short Duration Credit Opportunities Fund | Annual report |
As a result, the costs of the services to be provided and the profits to be realized by the Subadvisor from its relationship with the Trust were not a material factor in the Board’s consideration of the Subadvisory Agreement.
The Board also received information regarding the nature and scope (including their significance to the Advisor and its affiliates and to the Subadvisor) of any material relationships with respect to the Subadvisor, which includes arrangements in which the Subadvisor or its affiliates provide advisory, distribution, or management services in connection with financial products sponsored by the Trust’s Advisor or its affiliates, and may include other registered investment companies, a 529 education savings plan, managed separate account, and exempt group annuity contracts sold to qualified plans. The Board also received information and took into account any other potential conflicts of interest the Advisor might have in connection with the Subadvisory Agreement.
In addition, the Board considered other potential indirect benefits that the Subadvisor and its affiliates may receive from the Subadvisor’s relationship with the fund, such as the opportunity to provide advisory services to additional funds in the John Hancock fund complex and reputational benefits.
Subadvisory fees. The Board considered that the fund pays an advisory fee to the Advisor and that, in turn, the Advisor pays a subadvisory fee to the Subadvisor. The Board also took into account the sub-advisory fees paid by the Advisor to the Subadvisor with respect to the fund to fees charged by the fund’s Subadvisor to manage other subadvised portfolios and portfolios not subject to regulation under the 1940 Act, as applicable.
Subadvisor performance. As noted above, the Board considered the fund’s performance as compared to the fund’s peer group and benchmark and noted that the Board reviews information about the fund’s performance results at its regularly scheduled meetings. The Board noted the Advisor’s expertise and resources in monitoring the performance, investment style, and risk-adjusted performance of the Subadvisor. The Board was mindful of the Advisor’s focus on the Subadvisor’s performance. The Board also noted the Subadvisor’s long-term performance record for similar accounts, as applicable.
The Board’s decision to approve the Subadvisory Agreement was based on a number of determinations, including the following:
(1) The Subadvisor has extensive experience and demonstrated skills as a manager;
(2) The performance of the fund generally has been in line with or outperformed the historical performance of the fund’s benchmark and the fund’s overall performance is satisfactory;
(3) The subadvisory fees are reasonable in relation to the level and quality of services being provided; and
(4) Subadvisory fee breakpoints are reflected as breakpoints in the advisory fees for the fund in order to permit shareholders to benefit from economies of scale if the fund grows.
Based on the Board’s evaluation of all factors that the Board deemed to be material, including those factors described above, the Board, including the Independent Trustees, concluded that renewal of the Advisory Agreement and the Subadvisory Agreement would be in the best interest of the fund and its shareholders. Accordingly, the Board, and the Independent Trustees voting separately, approved the Advisory Agreement and Subadvisory Agreement for an additional one-year period.
| |
| Annual report | Short Duration Credit Opportunities Fund | 65 |
Trustees and Officers
This chart provides information about the Trustees and Officers who oversee your John Hancock fund. Officers elected by the Trustees manage the day-to-day operations of the fund and execute policies formulated by the Trustees.
| | |
| Independent Trustees | | |
| | | |
| Name, year of birth | Trustee | Number of John |
| Position(s) held with fund | of the | Hancock funds |
| Principal occupation(s) and other | Trust | overseen by |
| directorships during past 5 years | since1 | Trustee |
| |
| James M. Oates, Born: 1946 | 2012 | 231 |
|
| Managing Director, Wydown Group (financial consulting firm) (since 1994); Chairman and Director, |
| Emerson Investment Management, Inc. (since 2000); Independent Chairman, Hudson Castle Group, Inc. |
| (formerly IBEX Capital Markets, Inc.) (financial services company) (1997–2011); Director, Stifel Financial |
| (since 1996); Director, Investor Financial Services Corporation (1995–2007); Director, Connecticut River |
| Bancorp (since 1998); Director, Virtus Funds (formerly Phoenix Mutual Funds) (since 1988). Trustee |
| and Chairperson of the Board, John Hancock retail funds (since 2012); Trustee (2005–2006 and since |
| 2012) and Chairperson of the Board (since 2012), John Hancock Funds III; Trustee (since 2004) and |
| Chairperson of the Board (since 2005), John Hancock Variable Insurance Trust; Trustee and Chairperson |
| of the Board (since 2005), John Hancock Funds II. | | |
| |
| Charles L. Bardelis,3 Born: 1941 | 2012 | 231 |
|
| Director, Island Commuter Corp. (marine transport). Trustee, John Hancock retail funds (since 2012); |
| Trustee, John Hancock Funds III (2005–2006 and since 2012); Trustee, John Hancock Variable Insurance |
| Trust (since 1988); Trustee, John Hancock Funds II (since 2005). | | |
| |
| Peter S. Burgess,3 Born: 1942 | 2012 | 231 |
|
| Consultant (financial, accounting, and auditing matters) (since 1999); Certified Public Accountant; |
| Partner, Arthur Andersen (independent public accounting firm) (prior to 1999); Director, Lincoln |
| Educational Services Corporation (since 2004); Director, Symetra Financial Corporation (since 2010); |
| former Director, PMA Capital Corporation (2004–2010). Trustee, John Hancock retail funds (since 2012); |
| Trustee, John Hancock Funds III (2005–2006 and since 2012); Trustee, John Hancock Variable Insurance |
| Trust and John Hancock Funds II (since 2005). | | |
| |
| William H. Cunningham,2 Born: 1944 | 1994 | 231 |
|
| Professor, University of Texas, Austin, Texas (since 1971); former Chancellor, University of Texas |
| System and former President of the University of Texas, Austin, Texas; Director, LIN Television (since |
| 2009); Chairman (since 2009) and Director (since 2006), Lincoln National Corporation (insurance); |
| Director, Resolute Energy Corporation (since 2009); Director, Southwest Airlines (since 2000); former |
| Director, Introgen (manufacturer of biopharmaceuticals) (until 2008); former Director, Hicks Acquisition |
| Company I, Inc. (until 2007); former Director, Texas Exchange Bank, SSB (formerly Bank of Crowley) |
| (until 2009); former Advisory Director, JPMorgan Chase Bank (formerly Texas Commerce Bank–Austin) |
| (until 2009). Trustee, John Hancock retail funds (since 1986); Trustee, John Hancock Variable Insurance |
| Trust (since 2012); Trustee, John Hancock Funds II (since 2012 and 2005–2006). | |
| |
| Grace K. Fey, Born: 1946 | 2012 | 231 |
|
| Chief Executive Officer, Grace Fey Advisors (since 2007); Director and Executive Vice President, |
| Frontier Capital Management Company (1988–2007); Director, Fiduciary Trust (since 2009). |
| Trustee, John Hancock retail funds (since 2012); Trustee, John Hancock Variable Insurance Trust and |
| John Hancock Funds II (since 2008). | | |
| |
| 66 | Short Duration Credit Opportunities Fund | Annual report |
| | |
| Independent Trustees (continued) | | |
| |
| Name, year of birth | Trustee | Number of John |
| Position(s) held with fund | of the | Hancock funds |
| Principal occupation(s) and other | Trust | overseen by |
| directorships during past 5 years | since1 | Trustee |
| |
| Theron S. Hoffman,3 Born: 1947 | 2012 | 231 |
|
| Chief Executive Officer, T. Hoffman Associates, LLC (consulting firm) (since 2003); Director, The Todd |
| Organization (consulting firm) (2003–2010); President, Westport Resources Management (investment |
| management consulting firm) (2006–2008); Senior Managing Director, Partner, and Operating Head, |
| Putnam Investments (2000–2003); Executive Vice President, The Thomson Corp. (financial and |
| legal information publishing) (1997–2000). Trustee, John Hancock retail funds (since 2012); Trustee, |
| John Hancock Variable Insurance Trust and John Hancock Funds II (since 2008). | |
| |
| Deborah C. Jackson,2 Born: 1952 | 2008 | 231 |
|
| President, Cambridge College, Cambridge, Massachusetts (since 2011); Chief Executive Officer, |
| American Red Cross of Massachusetts Bay (2002–2011); Board of Directors of Eastern Bank Corporation |
| (since 2001); Board of Directors of Eastern Bank Charitable Foundation (since 2001); Board of Directors |
| of American Student Assistance Corporation (1996–2009); Board of Directors of Boston Stock Exchange |
| (2002–2008); Board of Directors of Harvard Pilgrim Healthcare (health benefits company) (2007–2011). |
| Trustee, John Hancock retail funds (since 2008); Trustee of John Hancock Variable Insurance Trust and |
| John Hancock Funds II (since 2012). | | |
| |
| Hassell H. McClellan, Born: 1945 | 2012 | 231 |
|
| Associate Professor, The Wallace E. Carroll School of Management, Boston College (since 1984); |
| Trustee, Virtus Variable Insurance Trust (formerly Phoenix Edge Series Funds) (since 2008); Director, |
| The Barnes Group (since 2010). Trustee, John Hancock retail funds (since 2012); Trustee, John Hancock |
| Funds III (2005–2006 and since 2012); Trustee, John Hancock Variable Insurance Trust and | |
| John Hancock Funds II (since 2005). | | |
| |
| Steven R. Pruchansky,2 Born: 1944 | 1991 | 231 |
|
| Chairman and Chief Executive Officer, Greenscapes of Southwest Florida, Inc. (since 2000); Director |
| and President, Greenscapes of Southwest Florida, Inc. (until 2000); Member, Board of Advisors, First |
| American Bank (until 2010); Managing Director, Jon James, LLC (real estate) (since 2000); Director, |
| First Signature Bank & Trust Company (until 1991); Director, Mast Realty Trust (until 1994); President, |
| Maxwell Building Corp. (until 1991). Trustee (since 1992) and Chairperson of the Board (2011–2012), |
| John Hancock retail funds; Trustee and Vice Chairperson of the Board, John Hancock retail funds, |
| John Hancock Variable Insurance Trust and John Hancock Funds II (since 2012). | |
| |
| Gregory A. Russo,2 Born: 1949 | 2009 | 231 |
|
| Director and Audit Committee Chairman (since 2012) and Member, Audit Committee and Finance |
| Committee (since 2011), NCH Healthcare System, Inc. (holding company for multi-entity healthcare |
| system); Director and Member of Finance Committee, The Moorings, Inc. (nonprofit continuing care |
| community) (since 2012); Vice Chairman, Risk & Regulatory Matters, KPMG LLP (KPMG) (2002–2006); |
| Vice Chairman, Industrial Markets, KPMG (1998–2002); Chairman and Treasurer, Westchester |
| County, New York, Chamber of Commerce (1986–1992); Director, Treasurer and Chairman of |
| Audit and Finance Committees, Putnam Hospital Center (1989–1995); Director and Chairman of |
| Fundraising Campaign, United Way of Westchester and Putnam Counties, New York (1990–1995). |
| Trustee, John Hancock retail funds (since 2008); Trustee, John Hancock Variable Insurance Trust and |
| John Hancock Funds II (since 2012). | | |
| |
| Annual report | Short Duration Credit Opportunities Fund | 67 |
| | |
| Non-Independent Trustees4 | | |
| | | |
| Name, year of birth | Trustee | Number of John |
| Position(s) held with fund | of the | Hancock funds |
| Principal occupation(s) and other | Trust | overseen by |
| directorships during past 5 years | since1 | Trustee |
| |
| James R. Boyle, Born: 1959 | 2012 | 231 |
|
| Senior Executive Vice President, John Hancock Financial Services (1999–2012, including prior positions); |
| Chairman and Director, John Hancock Advisers, LLC, John Hancock Funds, LLC, and John Hancock |
| Investment Management Services, LLC (2005–2010). Trustee, John Hancock retail funds (since 2012 and |
| 2005–2010), Trustee, John Hancock Variable Insurance Trust and John Hancock Funds II (since 2005). |
| |
| Craig Bromley,2 Born: 1966 | 2012 | 231 |
|
| President, John Hancock Financial Services (since 2012); Senior Executive Vice President and General |
| Manager, U.S. Division, John Hancock Financial Services (since 2012); President and Chief Executive |
| Officer, Manulife Insurance Company (Manulife (Japan) (2005–2012), including prior positions). |
| Trustee, John Hancock retail funds (since 2012); Trustee, John Hancock Variable Insurance Trust and |
| John Hancock Funds II (since 2012). | | |
| |
| Warren A. Thomson,2 Born: 1955 | 2012 | 231 |
|
| Senior Executive Vice President and Chief Investment Officer, Manulife Financial Corporation and The |
| Manufacturers Life Insurance Company (since 2009); Chairman and Chief Executive Officer, Manulife |
| Asset Management (since 2001, including prior positions); Director (since 2006), and President and |
| Chief Executive Officer of Manulife Asset Management Limited (since 2013); Director and Chairman, |
| Hancock Natural Resources Group, Inc. (since 2013). Trustee, John Hancock retail funds, John Hancock |
| Variable Insurance Trust and John Hancock Funds II (since 2012). | | |
| |
| Principal officers who are not Trustees | | |
| | | |
| Name, year of birth | | Officer |
| Position(s) held with fund | | of the |
| Principal occupation(s) and other | | Trust |
| directorships during past 5 years | | since |
| |
| Hugh McHaffie, Born: 1959 | | 2009 |
|
| President | | |
| Executive Vice President, John Hancock Financial Services (since 2006, including prior positions); |
| Chairman and Director, John Hancock Advisers, LLC, John Hancock Investment Management Services, |
| LLC and John Hancock Funds, LLC (since 2010); President, John Hancock Advisers, LLC (since 2012); |
| President, John Hancock Investment Management Services, LLC (since 2010). President (since 2012) and |
| former Trustee (2010–2012), John Hancock retail funds; President, John Hancock Variable Insurance |
| Trust and John Hancock Funds II (since 2009). | | |
| |
| Andrew G. Arnott, Born: 1971 | | 2009 |
|
| Executive Vice President | | |
| Senior Vice President, John Hancock Financial Services (since 2009); Director and Executive Vice |
| President, John Hancock Advisers, LLC (since 2005, including prior positions); Director and Executive |
| Vice President, John Hancock Investment Management Services, LLC (since 2006, including prior |
| positions); President, John Hancock Funds, LLC (since 2004, including prior positions); Executive Vice |
| President, John Hancock retail funds, John Hancock Variable Insurance Trust and John Hancock Funds II |
| (since 2007, including prior positions). | | |
| |
| Thomas M. Kinzler, Born: 1955 | | 2006 |
|
| Secretary and Chief Legal Officer | | |
| Vice President, John Hancock Financial Services (since 2006); Secretary and Chief Legal Counsel, |
| John Hancock Funds, LLC (since 2007); Secretary and Chief Legal Officer, John Hancock retail funds, |
| John Hancock Variable Insurance Trust and John Hancock Funds II (since 2006). | |
| |
| 68 | Short Duration Credit Opportunities Fund | Annual report |
| |
| Principal officers who are not Trustees (continued) | |
| |
| Name, year of birth | Officer |
| Position(s) held with fund | of the |
| Principal occupation(s) and other | Trust |
| directorships during past 5 years | since |
| |
| Francis V. Knox, Jr., Born: 1947 | 2005 |
|
| Chief Compliance Officer | |
| Vice President, John Hancock Financial Services (since 2005); Chief Compliance Officer, John Hancock |
| retail funds, John Hancock Variable Insurance Trust, John Hancock Funds II, John Hancock Advisers, |
| LLC and John Hancock Investment Management Services, LLC (since 2005); Vice President and Chief |
| Compliance Officer, John Hancock Asset Management a division of Manulife Asset Management (US) |
| LLC (2005–2008). | |
| |
| Charles A. Rizzo, Born: 1957 | 2007 |
|
| Chief Financial Officer | |
| Vice President, John Hancock Financial Services (since 2008); Senior Vice President, John Hancock | |
| Advisers, LLC and John Hancock Investment Management Services, LLC (since 2008); Chief Financial |
| Officer, John Hancock retail funds, John Hancock Variable Insurance Trust and John Hancock Funds II |
| (since 2007). | |
| |
| Salvatore Schiavone, Born: 1965 | 2009 |
|
| Treasurer | |
| Assistant Vice President, John Hancock Financial Services (since 2007); Vice President, John Hancock |
| Advisers, LLC and John Hancock Investment Management Services, LLC (since 2007); Treasurer, | |
| John Hancock retail funds (since 2007, including prior positions); Treasurer, John Hancock Variable | |
| Insurance Trust and John Hancock Funds II (since 2010 and 2007–2009, including prior positions). | |
John Hancock retail funds is comprised of John Hancock Funds III and 34 other John Hancock funds consisting of 24 series of other John Hancock trusts and 10 closed-end funds.
The business address for all Trustees and Officers is 601 Congress Street, Boston, Massachusetts 02210-2805.
The Statement of Additional Information of the fund includes additional information about members of the Board of Trustees of the Trust and is available without charge, upon request, by calling 800-225-5291.
1 Each Trustee holds office until his or her successor is elected and qualified, or until the Trustee’s death, retirement, resignation or removal.
2 Became a Trustee of the Trust effective December 1, 2012.
3 Member of Audit Committee.
4 Because Messrs. Bromley and Thomson are senior executives or directors and Mr. Boyle held prior positions as a senior executive and director of the Advisor and/or its affiliates, each of them is considered an “interested person,” as defined in the Investment Company Act of 1940, of the Trust.
| |
| Annual report | Short Duration Credit Opportunities Fund | 69 |
More information
| |
| Trustees | Investment advisor |
| James M. Oates, Chairperson | John Hancock Investment Management |
| Steven R. Pruchansky, Vice Chairperson | Services, LLC |
| Charles L. Bardelis* | |
| James R. Boyle† | Subadvisor |
| Craig Bromley† | Stone Harbor Investment Partners LP |
| Peter S. Burgess* | |
| William H. Cunningham | Principal distributor |
| Grace K. Fey | John Hancock Funds, LLC |
| Theron S. Hoffman* | |
| Deborah C. Jackson | Custodian |
| Hassell H. McClellan | State Street Bank and Trust Company |
| Gregory A. Russo | |
| Warren A. Thomson† | Transfer agent |
| | John Hancock Signature Services, Inc. |
| Officers | |
| Hugh McHaffie | Legal counsel |
| President | K&L Gates LLP |
| | |
| Andrew G. Arnott | Independent registered |
| Executive Vice President | public accounting firm |
| | PricewaterhouseCoopers LLP |
| Thomas M. Kinzler | |
| Secretary and Chief Legal Officer | |
| | |
| Francis V. Knox, Jr. | |
| Chief Compliance Officer | |
| | |
| Charles A. Rizzo | |
| Chief Financial Officer | |
| | |
| Salvatore Schiavone | |
| Treasurer | |
| |
| *Member of the Audit Committee | |
| †Non-Independent Trustee | |
The fund’s proxy voting policies and procedures, as well as the fund’s proxy voting record for the most recent twelve-month period ended June 30, are available free of charge on the Securities and Exchange Commission (SEC) website at sec.gov or on our website.
The fund’s complete list of portfolio holdings, for the first and third fiscal quarters, is filed with the SEC on Form N-Q. The fund’s Form N-Q is available on our website and the SEC’s website, sec.gov, and can be reviewed and copied (for a fee) at the SEC’s Public Reference Room in Washington, DC. Call 800-SEC-0330 to receive information on the operation of the SEC’s Public Reference Room.
We make this information on your fund, as well as monthly portfolio holdings, and other fund details available on our website at jhinvestments.com or by calling 800-225-5291.
| | |
| You can also contact us: | | |
| 800-225-5291 | Regular mail: | Express mail: |
| jhinvestments.com | Investment Operations | Investment Operations |
| | John Hancock Signature Services, Inc. | John Hancock Signature Services, Inc. |
| | P.O. Box 55913 | 30 Dan Road |
| | Boston, MA 02205-5913 | Canton, MA 02021 |
| |
| 70 | Short Duration Credit Opportunities Fund | Annual report |

800-225-5291
800-338-8080 EASI-Line
jhinvestments.com
| |
| This report is for the information of the shareholders of John Hancock Short Duration Credit Opportunities Fund. | |
| It is not authorized for distribution to prospective investors unless preceded or accompanied by a prospectus. | 350A 7/13 |
| MF150752 | 9/13 |

A look at performance
Total returns for the period ended July 31, 2013
| | | | | | | | | | | | | |
| | | | | | | | | | | | SEC 30-day | | SEC 30-day |
| | Average annual total returns (%) | | Cumulative total returns (%) | | yield (%) | | yield (%) |
| | with maximum sales charge | | | with maximum sales charge | | subsidized | | unsubsidized1 |
|
| | 1-year | 5-year | 10-year | Since inception2 | | 1-year | 5-year | 10-year | Since inception2 | | as of 7-31-13 | | as of 7-31-13 |
|
| Class A | –1.74 | — | — | 6.63 | | –1.74 | — | — | 27.23 | | 4.60 | | –2.04 |
|
| Class I3 | 3.17 | — | — | 8.27 | | 3.17 | — | — | 34.71 | | 5.14 | | –16.88 |
|
| Class NAV3 | 3.30 | — | — | 8.38 | | 3.30 | — | — | 35.21 | | 5.23 | | 5.23 |
|
| Index 1† | 8.08 | — | — | 10.66 | | 8.08 | — | — | 46.20 | | — | | — |
|
| Index 2† | 4.00 | — | — | 9.74 | | 4.00 | — | — | 41.73 | | — | | — |
|
Performance figures assume all distributions are reinvested. Figures reflect maximum sales charges on Class A shares of 4.50%.
The expense ratios of the fund, both net (including any fee waivers or expense limitations) and gross (excluding any fee waivers or expense limitations), are set forth according to the most recent publicly available prospectuses for the fund and may differ from those disclosed in the Financial highlights tables in this report. The fee waivers and expense limitations are contractual at least until 11-30-14 for Class A and Class I shares. Had the fee waivers and expense limitations not been in place, gross expenses would apply. For all other classes, the net expenses equal the gross expenses. The expense ratios are as follows:
| | | | | | | | |
| | Class A | Class I | Class NAV | | | | | |
| Net (%) | 1.35 | 1.04 | 0.90 | | | | | |
| Gross (%) | 1.55 | 1.15 | 0.90 | | | | | |
The returns reflect past results and should not be considered indicative of future performance. The return and principal value of an investment will fluctuate so that shares, when redeemed, may be worth more or less than their original cost. Due to market volatility, the fund’s current performance may be higher or lower than the performance shown. For current to the most recent month-end performance data, please call 800-225-5291 or visit the fund’s website at jhinvestments.com.
The performance table above and the chart on the next page do not reflect the deduction of taxes that a shareholder may pay on fund distributions or on the redemption of fund shares. The fund’s performance results reflect any applicable fee waivers or expense reductions, without which the expenses would increase and results would have been less favorable.
† Index 1 is the Bank of America Merrill Lynch Global High Yield and Emerging Markets Plus Index. Index 2 is 50% Bank of America Merrill Lynch U.S. High Yield Master II Constrained Index/50% JPMorgan EMBI Global Diversified Index.
See the following page for footnotes.
| |
| 6 | Global High Yield Fund | Annual report |
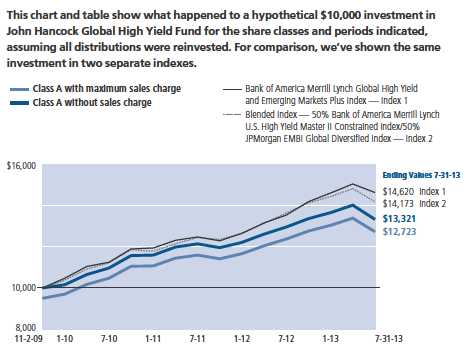
| | | | | |
| | | With maximum | Without | | |
| | Start date | sales charge | sales charge | Index 1 | Index 2 |
|
| Class I3 | 11-2-09 | $13,471 | $13,471 | $14,620 | $14,173 |
|
| Class NAV3 | 11-2-09 | 13,521 | 13,521 | 14,620 | 14,173 |
|
Bank of America Merrill Lynch Global High Yield and Emerging Markets Plus Index tracks the performance of the below and border-line investment grade global debt markets denominated in the major developed market currencies.
BofA Merrill Lynch U.S. High Yield Master II Constrained Index is an unmanaged index composed of U.S. currency high-yield bonds issued by U.S. and non-U.S. issuers.
JPMorgan EMBI Global Diversified Index is a uniquely weighted index that tracks total returns for U.S. dollar-denominated Brady bonds, Eurobonds, traded loans and local market debt instruments issued by sovereign and quasi-sovereign entities.
Blended Index is composed of 50% Bank of America Merrill Lynch High Yield Master II Constrained Index and 50% JPMorgan EMBI Global Diversified Index.
It is not possible to invest directly in an index. Index figures do not reflect expenses or sales charges, which would have resulted in lower values if they did.
Footnotes related to performance pages
1 Unsubsidized yields reflect what the yields would have been without the effect of reimbursements and waivers.
2 From 11-2-09.
3 For certain types of investors as described in the fund’s prospectuses.
| |
| Annual report | Global High Yield Fund | 7 |
Management’s discussion of
Fund performance
Stone Harbor Investment Partners LP
Performance in fixed-income markets was mixed over the past year. In the United States, Treasuries and AAA-rated debt significantly underperformed more credit-sensitive sectors of the market as longer-term U.S. Treasury rates, which began the period near record lows, climbed steadily higher. Part of that movement was driven by macroeconomic concerns, as investors closely watched the actions of Congress and the U.S. Federal Reserve for any potential changes in fiscal and monetary policies.
For the 12 months ended July 31, 2013, Class A shares of John Hancock Global High Yield Fund posted a total return of 2.85%, excluding sales charges. For the same 12-month period, the multisector bond fund category tracked by Morningstar, Inc. returned an average 4.29%.† During the same period, the fund’s blended benchmark index, 50% Bank of America Merrill Lynch U.S. High Yield Master II Constrained Index/50% JPMorgan EMBI Global Diversified Index, gained 4.00%. The fund’s secondary benchmark, the Bank of America Merrill Lynch Global High Yield and Emerging Markets Plus Index, returned 8.08% over the period. Our emerging-market debt allocation lagged the emerging-market portion of the fund’s blended benchmark, primarily due to the fund’s country allocation. The recent U.S. court ruling against the government of Argentina caused prices in that country’s debt and across emerging-market debt in general to drop precipitously. We sold the fund’s position in Argentine debt before the end of the period, but exposure to the country was still the main detractor from relative returns. Earlier in the period, the fund’s limited exposure to the Ivory Coast and Lebanon also detracted from relative returns. We believe those particular markets are some of the riskier ones in the emerging-market space but, nonetheless, investors’ hunt for higher-yielding securities drove prices in those markets higher and the fund’s underweight position detracted from returns. The high-yield portion of the fund outperformed the high-yield component of its blended benchmark, attributable to solid security selection within corporate debt. In terms of sectors, the fund’s overweight positions in the food and beverage and telecommunications sectors contributed positively to relative returns.
This commentary reflects the views of the portfolio managers through the end of the period discussed in this report. As such, they are in no way guarantees of future events and are not intended to be used as investment advice or a recommendation regarding any specific security. They are also subject to change at any time as market and other conditions warrant.
Past performance is no guarantee of future results.
† Figures from Morningstar, Inc. include reinvested distributions and do not take into account sales charges. Actual load-adjusted performance is lower.
| |
| 8 | Global High Yield Fund | Annual report |
Your expenses
These examples are intended to help you understand your ongoing operating expenses of investing in the fund so you can compare these costs with the ongoing costs of investing in other mutual funds.
Understanding fund expenses
As a shareholder of the fund, you incur two types of costs:
▪ Transaction costs, which include sales charges (loads) on purchases or redemptions (varies by share class), minimum account fee charge, etc.
▪ Ongoing operating expenses, including management fees, distribution and service fees (if applicable), and other fund expenses.
We are going to present only your ongoing operating expenses here.
Actual expenses/actual returns
This example is intended to provide information about the fund’s actual ongoing operating expenses and is based on the fund’s actual return. It assumes an account value of $1,000.00 on February 1, 2013, with the same investment held until July 31, 2013.
| | | |
| | Account value | Ending value | Expenses paid during |
| | on 2-1-13 | on 7-31-13 | period ended 7-31-131 |
|
| Class A | $1,000.00 | $976.20 | $6.61 |
|
| Class I | 1,000.00 | 977.60 | 5.10 |
|
| Class NAV | 1,000.00 | 978.40 | 4.41 |
|
Together with the value of your account, you may use this information to estimate the operating expenses that you paid over the period. Simply divide your account value at July 31, 2013, by $1,000.00, then multiply it by the “expenses paid” for your share class from the table above. For example, for an account value of $8,600.00, the operating expenses should be calculated as follows:
| |
| Annual report | Global High Yield Fund | 9 |
Your expenses
Hypothetical example for comparison purposes
This table allows you to compare the fund’s ongoing operating expenses with those of any other fund. It provides an example of the fund’s hypothetical account values and hypothetical expenses based on each class’s actual expense ratio and an assumed 5% annualized return before expenses (which is not the fund’s actual return). It assumes an account value of $1,000.00 on February 1, 2013, with the same investment held until July 31, 2013. Look in any other fund shareholder report to find its hypothetical example and you will be able to compare these expenses. Please remember that these hypothetical account values and expenses may not be used to estimate the actual ending account balance or expenses you paid for the period.
| | | |
| | Account value | Ending value | Expenses paid during |
| | on 2-1-13 | on 7-31-13 | period ended 7-31-131 |
|
| Class A | $1,000.00 | $1,018.10 | $6.76 |
|
| Class I | 1,000.00 | 1,019.60 | 5.21 |
|
| Class NAV | 1,000.00 | 1,020.30 | 4.51 |
|
Remember, these examples do not include any transaction costs, therefore, these examples will not help you to determine the relative total costs of owning different funds. If transaction costs were included, your expenses would have been higher. See the prospectus for details regarding transaction costs.
1 Expenses are equal to the fund’s annualized expense ratio of 1.35%, 1.04%, and 0.90% for Class A, Class I, and Class NAV shares, respectively, multiplied by the average account value over the period, multiplied by 181/365 (to reflect the one-half year period).
| |
| 10 | Global High Yield Fund | Annual report |
Portfolio summary
| | | | |
| Top 10 Issuers (25.6% of Total Investments on 7-31-13)1,2 | |
|
| Republic of Turkey | 4.2% | | Petroleos de Venezuela SA | 2.2% |
| |
|
| Federative Republic of Brazil | 3.8% | | Government of Russia | 2.0% |
| |
|
| Republic of Indonesia | 3.0% | | Republic of Colombia | 1.7% |
| |
|
| Government of Mexico | 2.9% | | Republic of Ukraine | 1.7% |
| |
|
| Republic of Venezuela | 2.5% | | Republic of South Africa | 1.6% |
| |
|
| |
| Quality Distribution4 | | | | |
|
| AAA | 0.1% | | B | 39.6% |
| |
|
| AA | 0.4% | | CCC & Below | 8.7% |
| |
|
| A | 3.2% | | Not Rated | 1.7% |
| |
|
| BBB | 28.3% | | Short-Term Investments & Other | 3.9% |
| |
|
| BB | 14.1% | | | |
| | |
| | | | |
| Country Composition1,3 | | | |
| | | |
| United States | 48.4% | | | |
| | | |
| Venezuela | 4.7% | | | |
| | | |
| Turkey | 4.4% | | | |
| | | |
| Brazil | 4.2% | | | |
| | | |
| Luxembourg | 4.0% | | | |
| | | |
| Mexico | 3.3% | | | |
| | | |
| Indonesia | 3.1% | | | |
| | | |
| Colombia | 2.3% | | | |
| | | |
| Canada | 2.1% | | | |
| | | |
| Russia | 2.1% | | | |
| | | |
| Other | 21.4% | | | |
| | | |
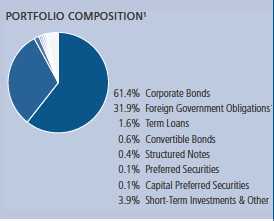
1 As a percentage of net assets on 7-31-13
2 Cash and cash equivalents not included.
3 Fixed-income investments are subject to interest-rate and credit risk; their value will normally decline as interest rates rise or if a creditor is unable or unwilling to make principal or interest payments. Investments in higher yielding, lower-rated securities include a higher risk of default. Foreign investing, especially in emerging markets, has additional risks, such as currency and market volatility and political and social instability. Currency transactions are affected by fluctuations in exchange rates. The use of hedging and derivatives could produce disproportionate gains or losses and may increase costs. Mortgage- and asset-backed securities may be sensitive to changes in interest rates, and may be subject to early repayment and the market’s perception of issuer creditworthiness. Illiquid securities may be difficult to sell at a price approximating their value. Loan participations and assignments involve additional risks, including credit, interest-rate, counterparty, liquidity, and lending risk. Please see the fund’s prospectus for additional risks.
4 Ratings are from Moody’s Investors Service, Inc. If not available, we have used Standard & Poor’s Ratings Services. In the absence of ratings from these agencies, we have used Fitch Ratings, Inc. “Not Rated” securities are those with no ratings available from these agencies. All ratings are as of 7-31-13 and do not reflect subsequent downgrades or upgrades, if any.
| |
| Annual report | Global High Yield Fund | 11 |
Fund’s investments
As of 7-31-13
| | | | | |
| | | | Maturity | | |
| | Rate (%) | | date | Par value^ | Value |
| Corporate Bonds 61.4% | | | | $332,762,310 |
|
| (Cost $327,146,007) | | | | | |
| | | | | | |
| Austria 0.1% | | | | | 278,920 |
|
| ESAL GmbH (S) | 6.250 | | 02-05-23 | 304,000 | 278,920 |
| | | | | | |
| Azerbaijan 0.1% | | | | | 506,990 |
|
| State Oil Company of the Azerbaijan Republic | 5.450 | | 02-09-17 | 484,000 | 506,990 |
| | | | | | |
| Brazil 0.4% | | | | | 2,390,538 |
|
| BM&FBovespa SA (S) | 5.500 | | 07-16-20 | 275,000 | 284,625 |
|
| BM&FBovespa SA | 5.500 | | 07-16-20 | 100,000 | 103,500 |
|
| BR Properties SA (Q)(S) | 9.000 | | 10-29-49 | 153,000 | 150,323 |
|
| Caixa Economica Federal (S) | 2.375 | | 11-06-17 | 300,000 | 280,500 |
|
| Caixa Economica Federal (S) | 3.500 | | 11-07-22 | 156,000 | 130,260 |
|
| Centrais Eletricas Brasileiras SA | 5.750 | | 10-27-21 | 230,000 | 223,675 |
|
| Globo Comunicacao e Participacoes SA | | | | | |
| (6.250% to 7-20-15, then 9.375% | | | | | |
| thereafter) (Q) | 6.250 | | 07-29-49 | 100,000 | 104,000 |
|
| Hypermarcas SA (S) | 6.500 | | 04-20-21 | 284,000 | 284,355 |
|
| Samarco Mineracao SA (S) | 4.125 | | 11-01-22 | 507,000 | 446,160 |
|
| Telemar Norte Leste SA (S) | 5.500 | | 10-23-20 | 106,000 | 99,640 |
|
| Votorantim Cimentos SA (S) | 7.250 | | 04-05-41 | 300,000 | 283,500 |
| | | | | | |
| Canada 2.1% | | | | | 11,413,928 |
|
| Ainsworth Lumber Company, Ltd. (S) | 7.500 | | 12-15-17 | 1,145,000 | 1,213,700 |
|
| Cascades, Inc. | 7.750 | | 12-15-17 | 650,000 | 682,500 |
|
| Cascades, Inc. | 7.875 | | 01-15-20 | 600,000 | 633,000 |
|
| MEG Energy Corp. (S) | 6.500 | | 03-15-21 | 750,000 | 765,000 |
|
| Mercer International, Inc. | 9.500 | | 12-01-17 | 1,270,000 | 1,346,200 |
|
| Quebecor Media, Inc. | 5.750 | | 01-15-23 | 1,275,000 | 1,246,313 |
|
| Taseko Mines, Ltd. | 7.750 | | 04-15-19 | 710,000 | 717,100 |
|
| Trinidad Drilling, Ltd. (S) | 7.875 | | 01-15-19 | 1,679,000 | 1,779,740 |
|
| Videotron, Ltd. | 5.000 | | 07-15-22 | 890,000 | 881,100 |
|
| VPII Escrow Corp. (S) | 6.750 | | 08-15-18 | 675,000 | 712,125 |
|
| VPII Escrow Corp. (S) | 7.500 | | 07-15-21 | 1,340,000 | 1,437,150 |
| | | | | | |
| Cayman Islands 1.2% | | | | | 6,689,854 |
|
| Baidu, Inc. | 3.250 | | 08-06-18 | 200,000 | 200,630 |
|
| Banco do Brasil SA/Cayman Island | 3.875 | | 10-10-22 | 230,000 | 202,975 |
|
| Banco do Brasil SA/Cayman Island (6.250% | | | | | |
| to 4-15-24, then 10 Year U.S. Treasury | | | | | |
| + 4.398%) (Q)(S) | 6.250 | | 12-29-49 | 365,000 | 302,950 |
| | |
| 12 | Global High Yield Fund | Annual report | See notes to financial statements |
| | | | | |
| | | | Maturity | | |
| | Rate (%) | | date | Par value^ | Value |
| Cayman Islands (continued) | | | | | |
|
| BR Malls International Finance, Ltd. (Q)(S) | 8.500 | | 01-29-49 | 137,000 | $135,988 |
|
| Braskem Finance, Ltd. (Q)(S) | 7.375 | | 10-29-49 | 200,000 | 189,500 |
|
| China Overseas Finance Cayman II, Ltd. | 5.500 | | 11-10-20 | 300,000 | 311,554 |
|
| Dubai Holding Commercial Operations | | | | | |
| MTN, Ltd. | 6.000 | | 02-01-17 | GBP 450,000 | 696,543 |
|
| Emaar Sukuk, Ltd. | 6.400 | | 07-18-19 | 600,000 | 640,500 |
|
| General Shopping Finance, Ltd. (Q)(S) | 10.000 | | 11-29-49 | 211,000 | 197,285 |
|
| Grupo Aval, Ltd. (S) | 4.750 | | 09-26-22 | 409,000 | 387,016 |
|
| Grupo Aval, Ltd. (S) | 5.250 | | 02-01-17 | 200,000 | 208,000 |
|
| Gruposura Finance (S) | 5.700 | | 05-18-21 | 200,000 | 204,000 |
|
| Itau Unibanco Holding SA/Cayman Island (S) | 5.650 | | 03-19-22 | 204,000 | 196,860 |
|
| Longfor Properties Co Ltd. | 6.875 | | 10-18-19 | 200,000 | 199,226 |
|
| MCE Finance, Ltd. (S) | 5.000 | | 02-15-21 | 200,000 | 191,000 |
|
| Odebrecht Drilling Norbe VIII/IX, Ltd. | 6.350 | | 06-30-21 | 185,000 | 185,925 |
|
| Odebrecht Finance, Ltd. (S) | 5.125 | | 06-26-22 | 200,000 | 195,000 |
|
| Offshore Group Investment, Ltd. (S) | 7.125 | | 04-01-23 | 1,885,000 | 1,889,713 |
|
| Petrobras International Finance Company | 2.875 | | 02-06-15 | 90,000 | 91,411 |
|
| Petrobras International Finance Company | 5.375 | | 01-27-21 | 64,000 | 63,778 |
| | | | | | |
| Chile 1.1% | | | | | 5,826,377 |
|
| Banco del Estado de Chile (S) | 3.875 | | 02-08-22 | 164,000 | 159,397 |
|
| Cencosud SA (S) | 4.875 | | 01-20-23 | 229,000 | 218,842 |
|
| Cencosud SA (S) | 5.500 | | 01-20-21 | 350,000 | 355,292 |
|
| Corporacion Nacional del Cobre de Chile (S) | 3.000 | | 07-17-22 | 1,166,000 | 1,074,675 |
|
| Corporacion Nacional del Cobre de Chile (S) | 4.250 | | 07-17-42 | 637,000 | 529,281 |
|
| Corporacion Nacional del Cobre de Chile (S) | 6.150 | | 10-24-36 | 255,000 | 278,934 |
|
| Corporacion Nacional del Cobre de Chile | 6.150 | | 10-24-36 | 2,361,000 | 2,582,601 |
|
| Corporacion Nacional del Cobre de Chile | 7.500 | | 01-15-19 | 197,000 | 238,887 |
|
| GeoPark Latin America, Ltd. Agencia en | | | | | |
| Chile (S) | 7.500 | | 02-11-20 | 200,000 | 204,000 |
|
| Telefonica Chile SA (S) | 3.875 | | 10-12-22 | 201,000 | 184,468 |
| | | | | | |
| China 0.1% | | | | | 593,497 |
|
| Country Garden Holdings Company, Ltd. (S) | 7.500 | | 01-10-23 | 202,000 | 187,355 |
|
| Tencent Holdings, Ltd. (S) | 3.375 | | 03-05-18 | 402,000 | 406,142 |
| | | | | | |
| Colombia 0.2% | | | | | 1,147,633 |
|
| Bancolombia SA | 5.125 | | 09-11-22 | 298,000 | 277,140 |
|
| Colombia Telecomunicaciones SA ESP (S) | 5.375 | | 09-27-22 | 350,000 | 329,000 |
|
| Pacific Rubiales Energy Corp. (S) | 5.125 | | 03-28-23 | 351,000 | 330,993 |
|
| Transportadora de Gas Internacional SA ESP (S) | 5.700 | | 03-20-22 | 200,000 | 210,500 |
| | | | | | |
| Cyprus 0.1% | | | | | 284,580 |
|
| Mriya Agro Holding PLC (S) | 9.450 | | 04-19-18 | 306,000 | 284,580 |
| | | | | | |
| Germany 0.5% | | | | | 2,487,318 |
|
| Faenza GmbH (S) | 8.250 | | 08-15-21 | EUR 925,000 | 1,244,356 |
|
| Unitymedia KabelBW GmbH | 9.500 | | 03-15-21 | EUR 825,000 | 1,242,962 |
| | | | | | |
| Hong Kong 0.1% | | | | | 309,955 |
|
| Bangkok Bank PCL (S) | 3.875 | | 09-27-22 | 319,000 | 309,955 |
| | |
| See notes to financial statements | Annual report | Global High Yield Fund | 13 |
| | | | | |
| | | | Maturity | | |
| | Rate (%) | | date | Par value^ | Value |
| India 0.0% | | | | | $249,041 |
|
| ICICI Bank, Ltd. | 5.750 | | 11-16-20 | 100,000 | 102,486 |
|
| ICICI Bank, Ltd. (S) | 5.750 | | 11-16-20 | 143,000 | 146,555 |
| | | | | | |
| Indonesia 0.0% | | | | | 103,625 |
|
| Adaro Indonesia PT | 7.625 | | 10-22-19 | 100,000 | 103,625 |
| | | | | | |
| Ireland 1.1% | | | | | 6,256,057 |
|
| Alfa Bank OJSC (S) | 7.500 | | 09-26-19 | 250,000 | 261,875 |
|
| Ardagh Packaging Finance PLC | 9.250 | | 10-15-20 | EUR 1,175,000 | 1,672,582 |
|
| EDC Finance, Ltd. (S) | 4.875 | | 04-17-20 | 272,000 | 251,600 |
|
| Metalloinvest Finance, Ltd. (S) | 5.625 | | 04-17-20 | 200,000 | 187,000 |
|
| Metalloinvest Finance, Ltd. (S) | 6.500 | | 07-21-16 | 174,000 | 182,265 |
|
| MTS International Funding, Ltd. (S) | 5.000 | | 05-30-23 | 1,000,000 | 935,200 |
|
| Nara Cable Funding, Ltd. (S) | 8.875 | | 12-01-18 | 1,305,000 | 1,370,250 |
|
| Novatek Finance, Ltd. | 5.326 | | 02-03-16 | 235,000 | 246,398 |
|
| Novatek Finance, Ltd. (S) | 6.604 | | 02-03-21 | 358,000 | 387,929 |
|
| OJSC Novolipetsk Steel (S) | 4.450 | | 02-19-18 | 291,000 | 277,963 |
|
| Sibur Securities, Ltd. (S) | 3.914 | | 01-31-18 | 200,000 | 190,500 |
|
| Vimpel Communications (S) | 7.748 | | 02-02-21 | 274,000 | 292,495 |
| | | | | | |
| Jamaica 0.1% | | | | | 618,620 |
|
| Digicel Group, Ltd. (S) | 8.250 | | 09-30-20 | 200,000 | 215,000 |
|
| Digicel Group, Ltd. | 10.500 | | 04-15-18 | 372,000 | 403,620 |
| | | | | | |
| Japan 0.2% | | | | | 880,425 |
|
| Softbank Corp. (S) | 4.500 | | 04-15-20 | 910,000 | 880,425 |
| | | | | | |
| Kazakhstan 1.4% | | | | | 7,496,868 |
|
| KazMunayGas National Company (S) | 5.750 | | 04-30-43 | 421,000 | 370,438 |
|
| KazMunayGas National Company | 6.375 | | 04-09-21 | 448,000 | 486,080 |
|
| KazMunayGas National Company (S) | 6.375 | | 04-09-21 | 433,000 | 469,805 |
|
| KazMunayGas National Company (S) | 7.000 | | 05-05-20 | 325,000 | 366,031 |
|
| KazMunayGas National Company | 7.000 | | 05-05-20 | 2,053,000 | 2,312,191 |
|
| KazMunayGas National Company (S) | 9.125 | | 07-02-18 | 1,317,000 | 1,603,448 |
|
| KazMunayGas National Company | 11.750 | | 01-23-15 | 1,679,000 | 1,888,875 |
| | | | | | |
| Luxembourg 4.0% | | | | | 21,864,362 |
|
| Aguila 3 SA (S) | 7.875 | | 01-31-18 | 680,000 | 700,703 |
|
| Andrade Gutierrez International SA (S) | 4.000 | | 04-30-18 | 215,000 | 203,713 |
|
| APERAM (S) | 7.375 | | 04-01-16 | 900,000 | 866,250 |
|
| APERAM (S) | 7.750 | | 04-01-18 | 550,000 | 519,750 |
|
| ARD Finance SA, PIK (S) | 11.125 | | 06-01-18 | 1,077,484 | 1,163,683 |
|
| Cosan Luxembourg SA (S) | 5.000 | | 03-14-23 | 200,000 | 187,500 |
|
| Far East Capital Ltd. SA (S) | 8.000 | | 05-02-18 | 225,000 | 211,500 |
|
| Far East Capital Ltd. SA (S) | 8.750 | | 05-02-20 | 200,000 | 188,000 |
|
| Gazprom Neft OAO (S) | 4.375 | | 09-19-22 | 300,000 | 277,560 |
|
| Gazprom OAO (S) | 4.950 | | 02-06-28 | 900,000 | 787,500 |
|
| Gazprom OAO | 9.250 | | 04-23-19 | 1,251,000 | 1,532,475 |
|
| Intelsat Jackson Holdings SA | 7.250 | | 04-01-19 | 1,195,000 | 1,292,094 |
|
| Matterhorn Mobile Holdings SA | 8.250 | | 02-15-20 | EUR 1,000,000 | 1,406,951 |
|
| Minerva Luxembourg SA (S) | 7.750 | | 01-31-23 | 293,000 | 284,210 |
|
| Mobile Challenger Intermediate Group SA, PIK | 8.750 | | 03-15-19 | EUR 850,000 | 1,119,489 |
|
| NII International Telecom SCA (S) | 11.375 | | 08-15-19 | 795,000 | 872,513 |
| | |
| 14 | Global High Yield Fund | Annual report | See notes to financial statements |
| | | | | |
| | | | Maturity | | |
| | Rate (%) | | date | Par value^ | Value |
| Luxembourg (continued) | | | | | |
|
| Pacific Drilling SA (S) | 5.375 | | 06-01-20 | 1,600,000 | $1,568,000 |
|
| Russian Agricultural Bank OJSC | 7.750 | | 05-29-18 | 645,000 | 725,625 |
|
| Sberbank of Russia (S) | 6.125 | | 02-07-22 | 200,000 | 212,500 |
|
| Severstal OAO (S) | 5.900 | | 10-17-22 | 300,000 | 276,750 |
|
| Severstal OAO | 6.700 | | 10-25-17 | 101,000 | 106,555 |
|
| Trinseo Materials Operating SCA (S) | 8.750 | | 02-01-19 | 2,710,000 | 2,689,675 |
|
| VTB Bank OJSC Via VTB Capital SA | 6.315 | | 02-22-18 | 202,000 | 211,595 |
|
| VTB Capital SA | 6.250 | | 06-30-35 | 172,000 | 181,890 |
|
| VTB Capital SA | 6.875 | | 05-29-18 | 500,000 | 536,250 |
|
| VTB Capital SA | 6.950 | | 10-17-22 | 475,000 | 478,563 |
|
| Wind Acquisition Finance SA (S) | 6.500 | | 04-30-20 | 1,055,000 | 1,076,100 |
|
| Wind Acquisition Finance SA (S) | 11.750 | | 07-15-17 | 102,000 | 107,610 |
|
| Wind Acquisition Holdings Finance SA, PIK (S) | 12.250 | | 07-15-17 | 2,018,794 | 2,079,358 |
| | | | | | |
| Malaysia 0.5% | | | | | 2,923,827 |
|
| Petroliam Nasional BHD | 7.625 | | 10-15-26 | 223,000 | 286,014 |
|
| Petronas Capital, Ltd. | 7.875 | | 05-22-22 | 2,052,000 | 2,637,813 |
| | | | | | |
| Mexico 0.4% | | | | | 1,999,738 |
|
| America Movil SAB de CV | 2.375 | | 09-08-16 | 200,000 | 205,310 |
|
| America Movil SAB de CV | 3.125 | | 07-16-22 | 200,000 | 186,486 |
|
| BBA Bancomer SA/Texas (S) | 6.750 | | 09-30-22 | 150,000 | 159,375 |
|
| Cemex SAB de CV (S) | 9.500 | | 06-15-18 | 200,000 | 223,500 |
|
| Grupo Bimbo SAB de CV (S) | 4.500 | | 01-25-22 | 100,000 | 102,968 |
|
| Grupo Bimbo SAB de CV (S) | 4.875 | | 06-30-20 | 200,000 | 212,916 |
|
| Metalsa SA de CV (S) | 4.900 | | 04-24-23 | 249,000 | 234,683 |
|
| Mexichem SAB de CV (S) | 4.875 | | 09-19-22 | 200,000 | 197,000 |
|
| Mexico Generadora de Energia S de rl (S) | 5.500 | | 12-06-32 | 500,000 | 477,500 |
| | | | | | |
| Netherlands 1.0% | | | | | 5,389,609 |
|
| Ajecorp BV (S) | 6.500 | | 05-14-22 | 150,000 | 153,375 |
|
| Bharti Airtel International Netherlands BV (S) | 5.125 | | 03-11-23 | 496,000 | 461,280 |
|
| Indo Energy Finance II BV (S) | 6.375 | | 01-24-23 | 208,000 | 175,760 |
|
| Indosat Palapa Company BV | 7.375 | | 07-29-20 | 250,000 | 271,875 |
|
| Indosat Palapa Company BV (S) | 7.375 | | 07-29-20 | 136,000 | 147,900 |
|
| Intergas Finance BV | 6.375 | | 05-14-17 | 158,000 | 170,079 |
|
| Listrindo Capital BV (S) | 6.950 | | 02-21-19 | 201,000 | 212,055 |
|
| Metinvest BV (S) | 8.750 | | 02-14-18 | 210,000 | 202,167 |
|
| Myriad International Holdings BV (S) | 6.000 | | 07-18-20 | 200,000 | 206,500 |
|
| UPC Holding BV | 6.375 | | 09-15-22 | EUR 1,950,000 | 2,593,663 |
|
| VimpelCom Holdings BV (S) | 5.200 | | 02-13-19 | 275,000 | 271,205 |
|
| Zhaikmunai LP (S) | 7.125 | | 11-13-19 | 500,000 | 523,750 |
| | | | | | |
| Panama 0.0% | | | | | 192,610 |
|
| Banco de Credito del Peru/Panama (S) | 5.375 | | 09-16-20 | 187,000 | 192,610 |
| | | | | | |
| Peru 0.2% | | | | | 885,750 |
|
| Banco de Credito del Peru (S) | 4.250 | | 04-01-23 | 109,000 | 99,735 |
|
| BBVA Banco Continental SA (S) | 5.000 | | 08-26-22 | 350,000 | 343,000 |
|
| Cementos Pacasmayo SAA (S) | 4.500 | | 02-08-23 | 225,000 | 209,250 |
|
| Corporacion Azucarera del Peru SA (S) | 6.375 | | 08-02-22 | 112,000 | 110,600 |
|
| Volcan Cia Minera SAA (S) | 5.375 | | 02-02-22 | 126,000 | 123,165 |
| | |
| See notes to financial statements | Annual report | Global High Yield Fund | 15 |
| | | | | |
| | | | Maturity | | |
| Rate (%) | | date | Par value^ | Value |
| Russia 0.1% | | | | | $297,000 |
|
| EuroChem Mineral & Chemical Company OJSC (S) | 5.125 | | 12-12-17 | 300,000 | 297,000 |
| | | | | | |
| Singapore 0.0% | | | | | 202,395 |
|
| STATS ChipPAC, Ltd. (S) | 4.500 | | 03-20-18 | 206,000 | 202,395 |
| | | | | | |
| Thailand 0.1% | | | | | 414,451 |
|
| PTT Global Chemical PCL (S) | 4.250 | | 09-19-22 | 201,000 | 196,062 |
|
| PTTEP Canada International Finance, Ltd. | 5.692 | | 04-05-21 | 200,000 | 218,389 |
| | | | | | |
| Turkey 0.2% | | | | | 1,281,400 |
|
| Akbank TAS (S) | 3.875 | | 10-24-17 | 150,000 | 144,600 |
|
| Akbank TAS | 5.000 | | 10-24-22 | 250,000 | 226,250 |
|
| Koc Holding AS | 3.500 | | 04-24-20 | 200,000 | 172,500 |
|
| Turkiye Garanti Bankasi AS (S) | 5.250 | | 09-13-22 | 610,000 | 552,050 |
|
| Turkiye Is Bankasi | 3.750 | | 10-10-18 | 200,000 | 186,000 |
| | | | | | |
| United Kingdom 1.3% | | | | | 6,893,545 |
|
| Afren PLC (S) | 10.250 | | 04-08-19 | 200,000 | 230,500 |
|
| Bakkavor Finance 2 PLC | 8.250 | | 02-15-18 | GBP 250,000 | 393,624 |
|
| Boparan Finance PLC | 9.750 | | 04-30-18 | EUR 600,000 | 880,226 |
|
| Ferrexpo Finance PLC (S) | 7.875 | | 04-07-16 | 400,000 | 374,660 |
|
| Ineos Finance PLC (S) | 8.375 | | 02-15-19 | 1,190,000 | 1,306,025 |
|
| LBG Capital No.1 PLC | 6.439 | | 05-23-20 | EUR 775,000 | 1,038,754 |
|
| R&R PLC, PIK | 9.250 | | 05-15-18 | EUR 1,100,000 | 1,507,286 |
|
| Ukreximbank Via Biz Finance PLC | 8.375 | | 04-27-15 | 354,000 | 342,495 |
|
| Vedanta Resources PLC (S) | 6.000 | | 01-31-19 | 559,000 | 545,025 |
|
| Vedanta Resources PLC (S) | 7.125 | | 05-31-23 | 282,000 | 274,950 |
| | | | | | |
| United States 41.6% | | | | | 225,445,774 |
|
| Access Midstream Partners LP | 4.875 | | 05-15-23 | 1,215,000 | 1,154,250 |
|
| ACCO Brands Corp. | 6.750 | | 04-30-20 | 1,572,000 | 1,613,265 |
|
| AES Corp. | 4.875 | | 05-15-23 | 1,300,000 | 1,235,000 |
|
| AES Corp. | 7.375 | | 07-01-21 | 1,080,000 | 1,220,400 |
|
| Aircastle, Ltd. | 6.750 | | 04-15-17 | 1,225,000 | 1,326,063 |
|
| Allbritton Communications Company | 8.000 | | 05-15-18 | 1,312,000 | 1,418,600 |
|
| Ally Financial, Inc. | 8.000 | | 11-01-31 | 975,000 | 1,165,125 |
|
| Alphabet Holding Company, Inc., PIK | 7.750 | | 11-01-17 | 815,000 | 843,525 |
|
| AMC Networks, Inc. | 7.750 | | 07-15-21 | 800,000 | 896,000 |
|
| American Builders & Contractors Supply | | | | | |
| Company, Inc. (S) | 5.625 | | 04-15-21 | 950,000 | 947,625 |
|
| American Equity Investment Life | | | | | |
| Holding Company | 6.625 | | 07-15-21 | 765,000 | 791,775 |
|
| American Standard Americas (S) | 10.750 | | 01-15-16 | 405,000 | 426,769 |
|
| Amkor Technology, Inc. (S) | 6.375 | | 10-01-22 | 185,000 | 183,613 |
|
| Amkor Technology, Inc. | 6.375 | | 10-01-22 | 1,841,000 | 1,831,795 |
|
| Amsurg Corp. | 5.625 | | 11-30-20 | 1,020,000 | 1,040,400 |
|
| Arch Coal, Inc. | 7.250 | | 06-15-21 | 1,560,000 | 1,259,700 |
|
| Atlas Pipeline Partners LP (S) | 6.625 | | 10-01-20 | 1,010,000 | 1,030,200 |
|
| B&G Foods, Inc. | 4.625 | | 06-01-21 | 1,290,000 | 1,246,463 |
|
| Basic Energy Services, Inc. | 7.750 | | 02-15-19 | 1,200,000 | 1,212,000 |
|
| Basic Energy Services, Inc. | 7.750 | | 10-15-22 | 1,000,000 | 992,500 |
| | |
| 16 | Global High Yield Fund | Annual report | See notes to financial statements |
| | | | | |
| | | | Maturity | | |
| | Rate (%) | | date | Par value^ | Value |
| United States (continued) | | | | | |
|
| Biomet, Inc. | 6.500 | | 08-01-20 | 1,575,000 | $1,653,750 |
|
| Bonanza Creek Energy, Inc. | 6.750 | | 04-15-21 | 1,215,000 | 1,245,375 |
|
| Boyd Gaming Corp. | 9.125 | | 12-01-18 | 1,345,000 | 1,432,425 |
|
| Brazil Loan Trust 1 (S) | 5.477 | | 07-24-23 | 2,749,805 | 2,849,953 |
|
| Brickman Group Holdings, Inc. (S) | 9.125 | | 11-01-18 | 1,125,000 | 1,209,375 |
|
| Burlington Holdings LLC, PIK (S) | 9.000 | | 02-15-18 | 745,000 | 769,213 |
|
| Cablevision Systems Corp. | 7.750 | | 04-15-18 | 850,000 | 945,625 |
|
| Cablevision Systems Corp. | 8.000 | | 04-15-20 | 1,600,000 | 1,808,000 |
|
| Calpine Corp. (S) | 7.875 | | 01-15-23 | 1,908,000 | 2,070,180 |
|
| Calumet Specialty Products Partners LP | 9.375 | | 05-01-19 | 545,000 | 595,413 |
|
| Calumet Specialty Products Partners LP | 9.625 | | 08-01-20 | 915,000 | 1,011,075 |
|
| CCO Holdings LLC | 5.125 | | 02-15-23 | 585,000 | 535,275 |
|
| CCO Holdings LLC | 6.625 | | 01-31-22 | 1,430,000 | 1,462,175 |
|
| Cemex Finance LLC (S) | 9.375 | | 10-12-22 | 200,000 | 224,000 |
|
| CenturyLink, Inc. | 5.800 | | 03-15-22 | 1,495,000 | 1,487,525 |
|
| CenturyLink, Inc. | 7.650 | | 03-15-42 | 985,000 | 930,825 |
|
| Chemtura Corp. | 5.750 | | 07-15-21 | 795,000 | 791,025 |
|
| Chesapeake Energy Corp. | 3.250 | | 03-15-16 | 1,490,000 | 1,486,275 |
|
| Chiquita Brands International, Inc. (S) | 7.875 | | 02-01-21 | 1,555,000 | 1,652,188 |
|
| Choice Hotels International, Inc. | 5.750 | | 07-01-22 | 730,000 | 766,500 |
|
| Chrysler Group LLC | 8.000 | | 06-15-19 | 1,035,000 | 1,129,444 |
|
| Cincinnati Bell, Inc. | 8.375 | | 10-15-20 | 1,350,000 | 1,424,250 |
|
| Cincinnati Bell, Inc. | 8.750 | | 03-15-18 | 1,120,000 | 1,164,800 |
|
| CIT Group, Inc. | 5.000 | | 08-15-22 | 830,000 | 822,738 |
|
| CIT Group, Inc. | 5.250 | | 03-15-18 | 1,290,000 | 1,370,625 |
|
| Clean Harbors, Inc. | 5.250 | | 08-01-20 | 1,015,000 | 1,040,375 |
|
| Cleaver-Brooks, Inc. (S) | 8.750 | | 12-15-19 | 1,171,000 | 1,258,825 |
|
| Cloud Peak Energy Resources LLC | 8.500 | | 12-15-19 | 1,060,000 | 1,144,800 |
|
| CommScope, Inc. (S) | 8.250 | | 01-15-19 | 1,325,000 | 1,454,188 |
|
| CONSOL Energy, Inc. | 8.250 | | 04-01-20 | 1,850,000 | 1,993,375 |
|
| CPI International, Inc. | 8.000 | | 02-15-18 | 975,000 | 1,001,813 |
|
| Cricket Communications, Inc. | 7.750 | | 10-15-20 | 1,270,000 | 1,444,625 |
|
| Crown Castle International Corp. | 5.250 | | 01-15-23 | 1,210,000 | 1,164,625 |
|
| CyrusOne LP | 6.375 | | 11-15-22 | 1,395,000 | 1,464,750 |
|
| Dean Foods Company | 9.750 | | 12-15-18 | 1,015,000 | 1,153,294 |
|
| Del Monte Corp. | 7.625 | | 02-15-19 | 2,230,000 | 2,330,350 |
|
| DISH DBS Corp. | 5.000 | | 03-15-23 | 3,535,000 | 3,314,063 |
|
| DISH DBS Corp. | 5.875 | | 07-15-22 | 2,070,000 | 2,064,825 |
|
| Edison Mission Energy (H) | 7.000 | | 05-15-17 | 875,000 | 538,125 |
|
| Edison Mission Energy (H) | 7.750 | | 06-15-16 | 850,000 | 516,375 |
|
| Elizabeth Arden, Inc. | 7.375 | | 03-15-21 | 1,125,000 | 1,215,000 |
|
| Envision Healthcare Corp. | 8.125 | | 06-01-19 | 1,215,000 | 1,318,275 |
|
| EP Energy LLC | 6.875 | | 05-01-19 | 960,000 | 1,027,200 |
|
| EP Energy LLC | 9.375 | | 05-01-20 | 1,150,000 | 1,305,250 |
|
| Erickson Air-Crane, Inc. (S) | 8.250 | | 05-01-20 | 1,255,000 | 1,267,550 |
|
| Express LLC | 8.750 | | 03-01-18 | 615,000 | 659,588 |
|
| First Data Corp. (S) | 6.750 | | 11-01-20 | 705,000 | 735,844 |
|
| First Data Corp. (S) | 7.375 | | 06-15-19 | 500,000 | 525,000 |
| | |
| See notes to financial statements | Annual report | Global High Yield Fund | 17 |
| | | | | |
| | | | Maturity | | |
| | Rate (%) | | date | Par value^ | Value |
| United States (continued) | | | | | |
|
| First Data Corp. | 12.625 | | 01-15-21 | 1,100,000 | $1,205,875 |
|
| First Quality Finance Company, Inc. (S) | 4.625 | | 05-15-21 | 650,000 | 619,125 |
|
| Forest Oil Corp. | 7.250 | | 06-15-19 | 1,260,000 | 1,244,250 |
|
| Forest Oil Corp. (S) | 7.500 | | 09-15-20 | 885,000 | 860,663 |
|
| Fresenius Medical Care US Finance II, Inc. (S) | 5.875 | | 01-31-22 | 1,160,000 | 1,223,800 |
|
| Frontier Communications Corp. | 9.000 | | 08-15-31 | 3,539,000 | 3,450,525 |
|
| General Motors Financial Company, Inc. (S) | 4.250 | | 05-15-23 | 1,000,000 | 960,000 |
|
| GenOn Energy, Inc. | 9.500 | | 10-15-18 | 2,870,000 | 3,286,150 |
|
| Genworth Financial, Inc. | 7.625 | | 09-24-21 | 1,305,000 | 1,567,172 |
|
| Gray Television, Inc. | 7.500 | | 10-01-20 | 1,410,000 | 1,484,025 |
|
| GRD Holdings III Corp. (S) | 10.750 | | 06-01-19 | 700,000 | 750,750 |
|
| Griffon Corp. | 7.125 | | 04-01-18 | 1,625,000 | 1,710,313 |
|
| Hawk Acquisition Sub, Inc. (S) | 4.250 | | 10-15-20 | 1,300,000 | 1,248,000 |
|
| HCA Holdings, Inc. | 7.750 | | 05-15-21 | 555,000 | 603,563 |
|
| HCA, Inc. | 5.875 | | 03-15-22 | 1,070,000 | 1,130,188 |
|
| HD Supply, Inc. (S) | 7.500 | | 07-15-20 | 1,475,000 | 1,563,500 |
|
| Health Management Associates, Inc. | 7.375 | | 01-15-20 | 1,170,000 | 1,325,025 |
|
| HealthSouth Corp. | 8.125 | | 02-15-20 | 825,000 | 903,375 |
|
| Hexion US Finance Corp. (S) | 6.625 | | 04-15-20 | 870,000 | 889,575 |
|
| Hexion US Finance Corp. | 6.625 | | 04-15-20 | 1,665,000 | 1,702,463 |
|
| Hologic, Inc. | 6.250 | | 08-01-20 | 860,000 | 910,525 |
|
| Hornbeck Offshore Services, Inc. (S) | 5.000 | | 03-01-21 | 765,000 | 734,400 |
|
| Hornbeck Offshore Services, Inc. | 5.875 | | 04-01-20 | 590,000 | 600,325 |
|
| IASIS Healthcare LLC | 8.375 | | 05-15-19 | 1,360,000 | 1,428,000 |
|
| iGATE Corp. | 9.000 | | 05-01-16 | 1,295,000 | 1,396,981 |
|
| Infor US, Inc. | 11.500 | | 07-15-18 | 1,360,000 | 1,567,400 |
|
| International Lease Finance Corp. | 8.250 | | 12-15-20 | 1,120,000 | 1,296,400 |
|
| Isle of Capri Casinos, Inc. | 5.875 | | 03-15-21 | 2,435,000 | 2,361,950 |
|
| Kinetic Concepts, Inc. | 10.500 | | 11-01-18 | 1,355,000 | 1,490,500 |
|
| Kinetic Concepts, Inc. | 12.500 | | 11-01-19 | 1,150,000 | 1,214,688 |
|
| Kodiak Oil & Gas Corp. (S) | 5.500 | | 01-15-21 | 845,000 | 851,338 |
|
| Landry’s, Inc. (S) | 9.375 | | 05-01-20 | 1,710,000 | 1,851,075 |
|
| Laredo Petroleum, Inc. | 7.375 | | 05-01-22 | 620,000 | 654,100 |
|
| Lennar Corp. (S) | 5.000 | | 11-15-22 | 1,255,000 | 1,204,800 |
|
| Level 3 Financing, Inc. | 7.000 | | 06-01-20 | 1,870,000 | 1,940,125 |
|
| Level 3 Financing, Inc. | 10.000 | | 02-01-18 | 1,075,000 | 1,161,000 |
|
| Levi Strauss & Company | 6.875 | | 05-01-22 | 1,345,000 | 1,479,500 |
|
| Limited Brands, Inc. | 5.625 | | 02-15-22 | 300,000 | 310,875 |
|
| Linn Energy LLC | 7.750 | | 02-01-21 | 1,200,000 | 1,212,000 |
|
| Louisiana-Pacific Corp. | 7.500 | | 06-01-20 | 1,450,000 | 1,595,000 |
|
| Magnachip Semiconductor Corp. (S) | 6.625 | | 07-15-21 | 1,285,000 | 1,288,213 |
|
| MasTec, Inc. | 4.875 | | 03-15-23 | 1,665,000 | 1,565,100 |
|
| Mediacom LLC | 7.250 | | 02-15-22 | 1,225,000 | 1,304,625 |
|
| MGM Resorts International | 6.625 | | 12-15-21 | 2,315,000 | 2,442,294 |
|
| MGM Resorts International | 8.625 | | 02-01-19 | 630,000 | 730,013 |
|
| Midstates Petroleum Company, Inc. (S) | 10.750 | | 10-01-20 | 1,380,000 | 1,435,200 |
|
| Momentive Performance Materials, Inc. | 8.875 | | 10-15-20 | 1,210,000 | 1,288,650 |
| | |
| 18 | Global High Yield Fund | Annual report | See notes to financial statements |
| | | | | |
| | | | Maturity | | |
| | Rate (%) | | date | Par value^ | Value |
| United States (continued) | | | | | |
|
| Nationstar Mortgage LLC | 6.500 | | 07-01-21 | 750,000 | $748,125 |
|
| NBTY, Inc. | 9.000 | | 10-01-18 | 675,000 | 747,563 |
|
| NCR Corp. | 5.000 | | 07-15-22 | 1,585,000 | 1,533,488 |
|
| New Albertsons, Inc. | 8.000 | | 05-01-31 | 2,050,000 | 1,599,000 |
|
| New Albertsons, Inc. | 8.700 | | 05-01-30 | 525,000 | 428,531 |
|
| Nexstar Broadcasting, Inc. (S) | 6.875 | | 11-15-20 | 1,055,000 | 1,091,925 |
|
| Norcraft Companies LP | 10.500 | | 12-15-15 | 1,255,000 | 1,305,200 |
|
| NRG Energy, Inc. | 7.875 | | 05-15-21 | 1,325,000 | 1,457,500 |
|
| NRG Energy, Inc. | 8.250 | | 09-01-20 | 775,000 | 860,250 |
|
| Nuance Communications, Inc. (S) | 5.375 | | 08-15-20 | 1,250,000 | 1,218,750 |
|
| Oasis Petroleum, Inc. | 6.500 | | 11-01-21 | 350,000 | 371,000 |
|
| Oasis Petroleum, Inc. | 7.250 | | 02-01-19 | 1,220,000 | 1,302,350 |
|
| Outerwall, Inc. (S) | 6.000 | | 03-15-19 | 1,525,000 | 1,547,875 |
|
| Park-Ohio Industries, Inc. | 8.125 | | 04-01-21 | 600,000 | 651,000 |
|
| Parker Drilling Company (S) | 7.500 | | 08-01-20 | 665,000 | 666,663 |
|
| Parker Drilling Company | 9.125 | | 04-01-18 | 1,218,000 | 1,303,260 |
|
| Peabody Energy Corp. | 6.250 | | 11-15-21 | 1,775,000 | 1,739,500 |
|
| Pemex Project Funding Master Trust | 6.625 | | 06-15-35 | 152,000 | 162,640 |
|
| Petco Holdings Inc., PIK (S) | 8.500 | | 10-15-17 | 1,115,000 | 1,142,875 |
|
| Pilgrim’s Pride Corp. | 7.875 | | 12-15-18 | 1,110,000 | 1,201,575 |
|
| Pinnacle Entertainment, Inc. | 8.750 | | 05-15-20 | 1,085,000 | 1,174,513 |
|
| PNK Finance Corp. (S) | 6.375 | | 08-01-21 | 590,000 | 593,688 |
|
| Post Holdings, Inc. (S) | 7.375 | | 02-15-22 | 420,000 | 450,450 |
|
| Post Holdings, Inc. | 7.375 | | 02-15-22 | 1,515,000 | 1,624,838 |
|
| Prospect Medical Holdings, Inc. (S) | 8.375 | | 05-01-19 | 1,485,000 | 1,559,250 |
|
| Provident Funding Associates LP/PFG Finance | | | | | |
| Corp. (S) | 6.750 | | 06-15-21 | 500,000 | 506,250 |
|
| Provident Funding Associates LP/PFG Finance | | | | | |
| Corp. (S) | 10.125 | | 02-15-19 | 975,000 | 1,087,125 |
|
| PVH Corp. | 4.500 | | 12-15-22 | 510,000 | 498,525 |
|
| QEP Resources, Inc. | 5.375 | | 10-01-22 | 1,240,000 | 1,230,700 |
|
| Quiksilver, Inc. (S) | 7.875 | | 08-01-18 | 1,095,000 | 1,144,275 |
|
| Quiksilver, Inc. (S) | 10.000 | | 08-01-20 | 665,000 | 686,613 |
|
| Radiation Therapy Services, Inc. | 9.875 | | 04-15-17 | 1,050,000 | 729,750 |
|
| Radio One, Inc., PIK | 12.500 | | 05-24-16 | 1,646,731 | 1,654,965 |
|
| RadioShack Corp. | 6.750 | | 05-15-19 | 570,000 | 396,150 |
|
| Regal Cinemas Corp. | 8.625 | | 07-15-19 | 775,000 | 840,875 |
|
| Reliance Holdings USA, Inc. (S) | 5.400 | | 02-14-22 | 250,000 | 259,824 |
|
| Reynolds Group Issuer, Inc. | 9.875 | | 08-15-19 | 2,250,000 | 2,430,000 |
|
| RHP Hotel Properties LP (S) | 5.000 | | 04-15-21 | 1,260,000 | 1,234,800 |
|
| RSI Home Products, Inc. (S) | 6.875 | | 03-01-18 | 975,000 | 1,004,250 |
|
| Sabine Pass Liquefaction LLC (S) | 5.625 | | 02-01-21 | 1,505,000 | 1,484,306 |
|
| Sabine Pass LNG LP | 7.500 | | 11-30-16 | 890,000 | 979,000 |
|
| Samson Investment Company (S) | 10.000 | | 02-15-20 | 1,845,000 | 1,955,700 |
|
| SandRidge Energy, Inc. | 7.500 | | 03-15-21 | 1,000,000 | 990,000 |
|
| SandRidge Energy, Inc. | 8.750 | | 01-15-20 | 1,100,000 | 1,155,000 |
|
| Sealed Air Corp. (S) | 8.375 | | 09-15-21 | 1,390,000 | 1,577,650 |
|
| ServiceMaster Company | 7.000 | | 08-15-20 | 915,000 | 852,094 |
|
| SESI LLC | 6.375 | | 05-01-19 | 909,000 | 958,995 |
| | |
| See notes to financial statements | Annual report | Global High Yield Fund | 19 |
| | | | | |
| | | | Maturity | | |
| | Rate (%) | | date | Par value^ | Value |
| United States (continued) | | | | | |
|
| SESI LLC | 7.125 | | 12-15-21 | 485,000 | $528,650 |
|
| Shearer’s Foods LLC (S) | 9.000 | | 11-01-19 | 990,000 | 1,058,063 |
|
| Sinclair Television Group, Inc. | 6.125 | | 10-01-22 | 1,260,000 | 1,272,600 |
|
| Smithfield Foods, Inc. | 6.625 | | 08-15-22 | 1,600,000 | 1,692,000 |
|
| Southern Copper Corp. | 5.250 | | 11-08-42 | 150,000 | 119,310 |
|
| Southern Copper Corp. | 6.750 | | 04-16-40 | 100,000 | 95,672 |
|
| Spectrum Brands Escrow Corp. (S) | 6.375 | | 11-15-20 | 1,330,000 | 1,413,125 |
|
| Sprint Capital Corp. | 8.750 | | 03-15-32 | 3,765,000 | 3,972,075 |
|
| SSI Investments II, Ltd. | 11.125 | | 06-01-18 | 775,000 | 854,438 |
|
| Tesoro Logistics LP (S) | 6.125 | | 10-15-21 | 1,160,000 | 1,171,600 |
|
| The Bon-Ton Department Stores, Inc. (S) | 8.000 | | 06-15-21 | 1,265,000 | 1,299,788 |
|
| The Goodyear Tire & Rubber Company | 6.500 | | 03-01-21 | 1,085,000 | 1,135,181 |
|
| The Goodyear Tire & Rubber Company | 7.000 | | 05-15-22 | 400,000 | 425,000 |
|
| The Manitowoc Company, Inc. | 8.500 | | 11-01-20 | 500,000 | 562,500 |
|
| The ServiceMaster Company | 7.450 | | 08-15-27 | 425,000 | 352,750 |
|
| The ServiceMaster Company | 8.000 | | 02-15-20 | 691,000 | 675,453 |
|
| The Sun Products Corp. (S) | 7.750 | | 03-15-21 | 1,305,000 | 1,331,100 |
|
| TransDigm, Inc. | 7.750 | | 12-15-18 | 1,225,000 | 1,306,156 |
|
| TransUnion Holding Company, Inc. | 9.625 | | 06-15-18 | 625,000 | 678,125 |
|
| TransUnion Holding Company, Inc., PIK (S) | 8.125 | | 06-15-18 | 575,000 | 614,531 |
|
| Triumph Group, Inc. | 8.625 | | 07-15-18 | 575,000 | 625,313 |
|
| United Surgical Partners International, Inc. | 9.000 | | 04-01-20 | 1,235,000 | 1,367,763 |
|
| Universal Hospital Services, Inc. | 7.625 | | 08-15-20 | 710,000 | 750,825 |
|
| Univision Communications, Inc. (S) | 7.875 | | 11-01-20 | 1,250,000 | 1,371,875 |
|
| Univision Communications, Inc. (S) | 8.500 | | 05-15-21 | 500,000 | 550,000 |
|
| Venoco, Inc. | 8.875 | | 02-15-19 | 1,355,000 | 1,349,919 |
|
| Windstream Corp. | 7.500 | | 04-01-23 | 2,318,000 | 2,370,155 |
|
| Xerium Technologies, Inc. | 8.875 | | 06-15-18 | 705,000 | 708,525 |
| | | | | | |
| Venezuela 2.2% | | | | | 11,868,302 |
|
| Petroleos de Venezuela SA | 4.900 | | 10-28-14 | 8,798,345 | 8,279,243 |
|
| Petroleos de Venezuela SA | 5.000 | | 10-28-15 | 248,682 | 219,462 |
|
| Petroleos de Venezuela SA | 5.000 | | 10-28-15 | 87,609 | 77,315 |
|
| Petroleos de Venezuela SA | 5.250 | | 04-12-17 | 1,205,500 | 988,510 |
|
| Petroleos de Venezuela SA | 8.500 | | 11-02-17 | 2,504,100 | 2,303,772 |
| | | | | | |
| Virgin Islands 1.0% | | | | | 5,569,321 |
|
| Bestgain Real Estate, Ltd. | 2.625 | | 03-13-18 | 200,000 | 184,771 |
|
| Cosco Finance 2011 Ltd. | 4.000 | | 12-03-22 | 200,000 | 181,811 |
|
| Mega Advance Investments, Ltd. (S) | 5.000 | | 05-12-21 | 200,000 | 207,386 |
|
| QGOG Atlantic/Alaskan Rigs, Ltd. (S) | 5.250 | | 07-30-18 | 277,030 | 281,186 |
|
| Sinochem Overseas Capital Company, Ltd. (S) | 4.500 | | 11-12-20 | 1,120,000 | 1,128,788 |
|
| Sinochem Overseas Capital Company, Ltd. | 4.500 | | 11-12-20 | 2,113,000 | 2,129,579 |
|
| Sinopec Capital 2013, Ltd. (S) | 3.125 | | 04-24-23 | 658,000 | 593,568 |
|
| Sinopec Group Overseas Development | | | | | |
| 2012, Ltd. | 3.900 | | 05-17-22 | 525,000 | 514,566 |
|
| Sinopec Group Overseas Development 2012, | | | | | |
| Ltd. (S) | 4.875 | | 05-17-42 | 371,000 | 347,666 |
| | |
| 20 | Global High Yield Fund | Annual report | See notes to financial statements |
| | | | | |
| | | | Maturity | | |
| | Rate (%) | | date | Par value^ | Value |
| Foreign Government Obligations 31.9% | | | $173,063,108 |
|
| (Cost $184,193,699) | | | | |
| |
| Brazil 3.8% | | | | 20,379,106 |
|
| Federative Republic of Brazil | | | | |
| Bond (Z) | Zero | | 01-01-17 | BRL 1,720,000 | 529,768 |
| Bond | 2.625 | | 01-05-23 | 3,193,000 | 2,753,963 |
| Bond | 5.875 | | 01-15-19 | 2,104,000 | 2,374,364 |
| Bond | 7.125 | | 01-20-37 | 3,007,000 | 3,528,715 |
| Bond | 8.250 | | 01-20-34 | 1,103,000 | 1,433,900 |
| Bond | 8.750 | | 02-04-25 | 285,000 | 390,450 |
| Bond | 8.875 | | 10-14-19 | 242,000 | 315,810 |
| Bond | 8.875 | | 04-15-24 | 299,000 | 408,883 |
| Note | 8.000 | | 01-15-18 | 672,500 | 764,296 |
| Note | 10.000 | | 01-01-23 | BRL 18,740,000 | 7,878,957 |
| |
| Colombia 1.8% | | | | 9,922,226 |
|
| Bogota Distrito Capital | | | | |
| Bond | 9.750 | | 07-26-28 | COP 2,528,000,000 | 1,701,122 |
| Bond | 9.750 | | 07-26-28 | COP 200,000,000 | 134,582 |
|
| Republic of Colombia | | | | |
| Bond | 2.625 | | 03-15-23 | 515,000 | 453,200 |
| Bond | 4.375 | | 07-12-21 | 380,000 | 393,300 |
| Bond | 7.375 | | 09-18-37 | 4,156,000 | 5,257,340 |
| Bond | 10.375 | | 01-28-33 | 391,000 | 608,005 |
| Bond | 11.750 | | 02-25-20 | 545,000 | 798,425 |
| Bond | 12.000 | | 10-22-15 | COP 954,000,000 | 576,252 |
| |
| Costa Rica 0.0% | | | | 185,915 |
|
| Republic of Costa Rica | | | | |
| Bond (S) | 5.625 | | 04-30-43 | 206,000 | 185,915 |
| |
| Croatia 0.2% | | | | 1,201,138 |
|
| Republic of Croatia | | | | |
| Bond (S) | 5.500 | | 04-04-23 | 381,000 | 377,190 |
| Bond | 6.375 | | 03-24-21 | 663,000 | 701,255 |
| Bond (S) | 6.375 | | 03-24-21 | 116,000 | 122,693 |
| |
| Dominican Republic 0.8% | | | | 4,145,467 |
|
| Government of Dominican Republic | | | | |
| Bond | 7.500 | | 05-06-21 | 3,002,000 | 3,249,665 |
| Bond | 9.040 | | 01-23-18 | 812,519 | 895,802 |
| |
| El Salvador 0.1% | | | | 694,690 |
|
| Republic of El Salvador | | | | |
| Bond | 7.750 | | 01-24-23 | 154,000 | 170,940 |
| Bond | 8.250 | | 04-10-32 | 500,000 | 523,750 |
| |
| Ghana 0.1% | | | | 394,844 |
|
| Republic of Ghana | | | | |
| Bond | 8.500 | | 10-04-17 | 361,000 | 394,844 |
| |
| Hungary 1.0% | | | | 5,456,438 |
|
| Republic of Hungary | | | | |
| Bond | 3.500 | | 07-18-16 | EUR 462,000 | 614,437 |
| Bond | 4.125 | | 02-19-18 | 940,000 | 918,850 |
| Bond | 4.375 | | 07-04-17 | EUR 442,000 | 590,455 |
| Bond | 5.000 | | 03-30-16 | GBP 104,000 | 158,906 |
| Bond | 5.375 | | 02-21-23 | 710,000 | 677,163 |
| | |
| See notes to financial statements | Annual report | Global High Yield Fund | 21 |
| | | | | |
| | | | Maturity | | |
| | Rate (%) | | date | Par value^ | Value |
| Hungary (continued) | | | | |
|
| Bond | 5.500 | | 05-06-14 | GBP 601,000 | $926,523 |
| Bond | 6.000 | | 01-11-19 | EUR 331,000 | 463,464 |
| Bond | 6.375 | | 03-29-21 | 1,060,000 | 1,106,640 |
| |
| Indonesia 3.0% | | | | 16,324,078 |
|
| Republic of Indonesia | | | | |
| Bond (S) | 3.375 | | 04-15-23 | 2,922,000 | 2,564,055 |
| Bond | 4.875 | | 05-05-21 | 1,631,000 | 1,655,465 |
| Bond | 6.875 | | 03-09-17 | 874,000 | 977,788 |
| Bond | 7.750 | | 01-17-38 | 1,614,000 | 1,944,870 |
| Bond | 8.500 | | 10-12-35 | 3,270,000 | 4,201,950 |
| Bond | 11.625 | | 03-04-19 | 2,080,000 | 2,849,600 |
| Bond (S) | 11.625 | | 03-04-19 | 1,555,000 | 2,130,350 |
| |
| Iraq 0.4% | | | | 2,458,680 |
|
| Republic of Iraq | | | | |
| Bond | 5.800 | | 01-15-28 | 2,927,000 | 2,458,680 |
| |
| Ivory Coast 0.1% | | | | 578,160 |
|
| Republic of Ivory Coast | | | | |
| Bond | 5.750 | | 12-31-32 | 657,000 | 578,160 |
| |
| Lithuania 0.4% | | | | 1,929,771 |
|
| Republic of Lithuania | | | | |
| Bond | 6.125 | | 03-09-21 | 166,000 | 188,410 |
| Bond (S) | 6.625 | | 02-01-22 | 548,000 | 642,530 |
| Bond | 7.375 | | 02-11-20 | 907,000 | 1,098,831 |
| |
| Mexico 2.9% | | | | 15,813,533 |
|
| Government of Mexico | | | | |
| Bond | 4.750 | | 03-08-44 | 814,000 | 748,880 |
| Bond | 5.625 | | 01-15-17 | 670,000 | 747,050 |
| Bond | 5.750 | | 10-12-10 | 4,002,000 | 3,741,870 |
| Bond | 6.050 | | 01-11-40 | 3,974,000 | 4,411,140 |
| Bond | 6.750 | | 09-27-34 | 1,536,000 | 1,858,560 |
| Bond | 8.000 | | 12-07-23 | MXN 20,690,000 | 1,862,567 |
| Bond | 10.000 | | 12-05-24 | MXN 23,460,000 | 2,443,466 |
| |
| Morocco 0.1% | | | | 686,106 |
|
| Kingdom of Morocco | | | | |
| Bond (S) | 4.250 | | 12-11-22 | 755,000 | 686,106 |
| |
| Nigeria 0.1% | | | | 535,205 |
|
| Federal Republic of Nigeria | | | | |
| Bond (S) | 6.375 | | 07-12-23 | 526,000 | 535,205 |
| |
| Panama 1.4% | | | | 7,355,751 |
|
| Republic of Panama | | | | |
| Bond | 5.200 | | 01-30-20 | 2,838,000 | 3,143,085 |
| Bond | 6.700 | | 01-26-36 | 181,000 | 214,485 |
| Bond | 7.125 | | 01-29-26 | 101,000 | 124,988 |
| Bond | 8.125 | | 04-28-34 | 472,000 | 613,600 |
| Bond | 8.875 | | 09-30-27 | 357,000 | 500,693 |
| Bond | 9.375 | | 04-01-29 | 1,880,000 | 2,758,900 |
| |
| Peru 0.9% | | | | 4,811,786 |
|
| Republic of Peru | | | | |
| Bond | 5.625 | | 11-18-50 | 784,000 | 799,680 |
| Bond | 7.350 | | 07-21-25 | 1,431,000 | 1,824,525 |
| Bond | 8.375 | | 05-03-16 | 203,000 | 235,988 |
| Bond | 8.750 | | 11-21-33 | 1,339,000 | 1,951,593 |
| | |
| 22 | Global High Yield Fund | Annual report | See notes to financial statements |
| | | | | |
| | | | Maturity | | |
| | Rate (%) | | date | Par value^ | Value |
| Philippines 0.7% | | | | | $3,632,370 |
|
| Republic of Philippines | | | | | |
| Bond | 7.750 | | 01-14-31 | 2,577,000 | 3,375,870 |
| Bond | 9.500 | | 02-02-30 | 171,000 | 256,500 |
| |
| Poland 1.1% | | | | | 5,722,342 |
|
| Republic of Poland | | | | | |
| Bond | 5.125 | | 04-21-21 | 2,126,000 | 2,312,025 |
| Bond | 6.375 | | 07-15-19 | 2,915,000 | 3,410,317 |
| |
| Qatar 0.1% | | | | | 729,100 |
|
| Government of Qatar | | | | | |
| Bond | 6.400 | | 01-20-40 | 634,000 | 729,100 |
| |
| Russia 2.0% | | | | | 10,921,595 |
|
| Government of Russia | | | | | |
| Bond | 7.500 | | 03-31-30 | 7,560,448 | 8,864,625 |
| Bond | 12.750 | | 06-24-28 | 1,189,000 | 2,056,970 |
| |
| Slovakia 0.3% | | | | | 1,426,956 |
|
| Government of Slovakia | | | | | |
| Bond (S) | 4.375 | | 05-21-22 | 1,402,000 | 1,426,956 |
| |
| South Africa 1.8% | | | | | 9,887,508 |
|
| Eskom Holdings Soc Ltd. (S) | 6.750 | | 08-06-23 | 1,023,000 | 1,018,827 |
|
| Republic of South Africa | | | | | |
| Bond | 4.665 | | 01-17-24 | 684,000 | 660,060 |
| Bond | 5.500 | | 03-09-20 | 929,000 | 995,191 |
| Bond | 5.875 | | 05-30-22 | 486,000 | 524,880 |
| Bond | 6.875 | | 05-27-19 | 1,450,000 | 1,667,500 |
| Bond | 8.000 | | 12-21-18 | ZAR 47,560,000 | 5,021,050 |
| |
| Turkey 4.2% | | | | | 22,877,247 |
|
| Republic of Turkey | | | | | |
| Bond | 3.250 | | 03-23-23 | 3,390,000 | 2,932,350 |
| Bond | 5.125 | | 03-25-22 | 1,957,000 | 1,981,463 |
| Bond | 5.625 | | 03-30-21 | 161,000 | 169,855 |
| Bond | 6.250 | | 09-26-22 | 1,205,000 | 1,313,450 |
| Bond | 6.300 | | 02-14-18 | TRY 2,630,000 | 1,226,731 |
| Bond | 6.500 | | 01-07-15 | TRY 3,830,000 | 1,911,093 |
| Bond | 6.750 | | 04-03-18 | 454,000 | 509,615 |
| Bond | 6.750 | | 05-30-40 | 438,000 | 466,470 |
| Bond | 6.875 | | 03-17-36 | 948,000 | 1,021,470 |
| Bond | 7.000 | | 09-26-16 | 416,000 | 463,840 |
| Bond | 7.000 | | 06-05-20 | 1,225,000 | 1,402,625 |
| Bond | 7.100 | | 03-08-23 | TRY 1,300,000 | 584,209 |
| Bond | 7.250 | | 03-15-15 | 871,000 | 936,325 |
| Bond | 7.250 | | 03-05-38 | 952,000 | 1,075,760 |
| Bond | 7.375 | | 02-05-25 | 416,000 | 478,400 |
| Bond | 7.500 | | 07-14-17 | 396,000 | 454,410 |
| Bond | 7.500 | | 11-07-19 | 1,967,000 | 2,301,390 |
| Bond | 8.000 | | 02-14-34 | 2,009,000 | 2,435,913 |
| Bond | 8.300 | | 06-20-18 | TRY 2,410,000 | 1,211,878 |
| |
| Ukraine 1.7% | | | | | 9,414,772 |
|
| Republic of Ukraine | | | | | |
| Bond | 4.950 | | 10-13-15 | EUR 762,000 | 975,469 |
| Bond | 6.250 | | 06-17-16 | 202,000 | 189,375 |
| Bond | 6.580 | | 11-21-16 | 1,643,000 | 1,540,313 |
| Bond | 6.750 | | 11-14-17 | 193,000 | 177,367 |
| Bond (S) | 6.875 | | 09-23-15 | 657,000 | 638,933 |
| | |
| See notes to financial statements | Annual report | Global High Yield Fund | 23 |
| | | | | |
| | | | Maturity | | |
| | Rate (%) | | date | Par value^ | Value |
| Ukraine (continued) | | | | | |
|
| Bond | 6.875 | | 09-23-15 | 1,011,000 | $983,198 |
| Bond (S) | 7.500 | | 04-17-23 | 1,040,000 | 908,700 |
| Bond (S) | 7.800 | | 11-28-22 | 2,131,000 | 1,912,573 |
| Bond (S) | 9.000 | | 12-07-17 | 440,000 | 407,000 |
| Bond | 9.250 | | 07-24-17 | 1,684,000 | 1,681,844 |
| | | | | | |
| Uruguay 0.4% | | | | | 2,124,777 |
|
| Republic of Uruguay | | | | | |
| Bond | 7.625 | | 03-21-36 | 608,267 | 791,660 |
| Bond | 8.000 | | 11-18-22 | 1,028,243 | 1,333,117 |
| | | | | | |
| Venezuela 2.5% | | | | | 13,453,547 |
|
| Republic of Venezuela | | | | | |
| Bond | 5.750 | | 02-26-16 | 101,000 | 91,405 |
| Bond | 6.000 | | 12-09-20 | 774,000 | 570,825 |
| Bond | 7.000 | | 12-01-18 | 1,000,000 | 842,500 |
| Bond | 8.500 | | 10-08-14 | 847,000 | 851,235 |
| Bond | 9.000 | | 05-07-23 | 2,369,700 | 1,960,927 |
| Bond | 9.250 | | 09-15-27 | 184,000 | 152,720 |
| Bond | 11.950 | | 08-05-31 | 818,000 | 773,010 |
| Bond | 12.750 | | 08-23-22 | 7,230,000 | 7,374,600 |
| Bond | 13.625 | | 08-15-18 | 810,000 | 836,325 |
| |
| Capital Preferred Securities 0.1% | | | | | $326,275 |
|
| (Cost $316,855) | | | | | |
| | | | | | |
| Cayman Islands 0.1% | | | | | 326,275 |
|
| Hutchison Whampoa International 10, Ltd. | | | | | |
| (6.000% to 10-28-15, then reset of 5 Year | | | | | |
| U.S. Treasury Note Rate + 4.885% until | | | | | |
| 10-28-20, then 3 month LIBOR + 5.638%) (Q) | 6.000 | | 10-28-15 | 310,000 | 326,275 |
| |
| Convertible Bonds 0.6% | | | | $3,573,167 |
|
| (Cost $3,421,233) | | | | | |
| | | | | | |
| China 0.0% | | | | | 20,326 |
|
| Home Inns & Hotels Management, Inc. | 2.000 | | 12-15-15 | 23,000 | 20,326 |
| | | | | | |
| United Kingdom 0.0% | | | | | 101,100 |
|
| Subsea 7 SA | 2.250 | | 10-11-13 | 100,000 | 101,100 |
| | | | | | |
| United States 0.6% | | | | | 3,451,741 |
|
| AirTran Holdings, Inc. | 5.250 | | 11-01-16 | 66,000 | 96,896 |
|
| Alcatel-Lucent USA, Inc., Series A | 2.875 | | 06-15-23 | 158,000 | 153,260 |
|
| Altra Holdings, Inc. | 2.750 | | 03-01-31 | 188,000 | 212,910 |
|
| Callidus Software, Inc. | 4.750 | | 06-01-16 | 85,000 | 90,472 |
|
| Ciena Corp. (S) | 4.000 | | 03-15-15 | 176,000 | 221,980 |
|
| Comtech Telecommunications Corp. | 3.000 | | 05-01-29 | 476,000 | 491,768 |
|
| Dendreon Corp. | 2.875 | | 01-15-16 | 124,000 | 90,055 |
|
| Greenbrier Companies, Inc. | 3.500 | | 04-01-18 | 160,000 | 164,100 |
|
| Hornbeck Offshore Services, Inc. (S) | 1.500 | | 09-01-19 | 5,000 | 6,031 |
|
| Intel Corp. | 2.950 | | 12-15-35 | 201,000 | 215,949 |
|
| NetSuite, Inc. (S) | 0.250 | | 06-01-18 | 144,000 | 150,120 |
|
| Nuance Communications, Inc. | 2.750 | | 11-01-31 | 150,000 | 152,813 |
|
| RTI International Metals, Inc. | 1.625 | | 10-15-19 | 108,000 | 109,620 |
| | |
| 24 | Global High Yield Fund | Annual report | See notes to financial statements |
| | | | | |
| | | | Maturity | | |
| | Rate (%) | | date | Par value^ | Value |
| United States (continued) | | | | | |
|
| RTI International Metals, Inc. | 3.000 | | 12-01-15 | 247,000 | $277,721 |
|
| Stone Energy Corp. | 1.750 | | 03-01-17 | 171,000 | 164,481 |
|
| The Ryland Group, Inc. | 0.250 | | 06-01-19 | 348,000 | 320,160 |
|
| Triumph Group, Inc. | 2.625 | | 10-01-26 | 118,000 | 340,135 |
|
| TRW Automotive, Inc. | 3.500 | | 12-01-15 | 77,000 | 193,270 |
| |
| Structured Notes (K) 0.4% | | | | $2,335,295 |
|
| (Cost $2,595,760) | | | | | |
| | | | | | |
| Colombia 0.3% | | | | | 2,053,055 |
|
| Republic of Colombia (Citigroup Funding, Inc.) | | | | | |
| Note (P)(S) | 0.00 | | 05-05-22 | COP 830,000,000 | 437,525 |
| Note (S) | 11.000 | | 07-27-20 | COP 1,000,000,000 | 639,844 |
| Note (S) | 11.000 | | 07-27-20 | COP 486,000,000 | 310,964 |
|
| Republic of Colombia (JPMorgan | | | | | |
| Chase & Company) | | | | | |
| Note (S) | 7.000 | | 04-07-22 | COP 1,261,000,000 | 664,722 |
|
| |
| United Kingdom 0.1% | | | | | 282,240 |
|
| Cablevision SA (Deutsche Bank AG London) | | | | | |
| Bond (S) | 9.375 | | 02-13-18 | 392,000 | 282,240 |
| |
| Term Loans (M) 1.6% | | | | $8,515,273 |
|
| (Cost $9,003,281) | | | | | |
| | | | | | |
| Indonesia 0.1% | | | | | 552,920 |
|
| Bumi Resources Tbk PT | 11.195 | | 08-07-13 | 601,000 | 552,920 |
| | | | | | |
| United States 1.5% | | | | | 7,962,353 |
|
| Alcatel-Lucent USA, Inc. | 7.250 | | 01-30-19 | 1,287,530 | 1,313,684 |
|
| Caesars Entertainment Operating | | | | | |
| Company, Inc. | 5.440 | | 01-26-18 | 1,450,260 | 1,283,740 |
|
| Freescale Semiconductor, Inc. | 5.000 | | 02-28-20 | 608,475 | 613,799 |
|
| Gardner Denver, Inc. (T) | TBD | | 07-30-20 | 870,000 | 872,659 |
|
| HB Acquisition Corp. | 6.750 | | 04-09-20 | 1,015,000 | 1,042,913 |
|
| Texas Competitive Electric Holdings | | | | | |
| Company LLC | 4.721 | | 10-10-17 | 4,048,987 | 2,835,558 |
| |
| | | | | Shares | Value |
| Preferred Securities 0.1% | | | | | $364,216 |
|
| (Cost $411,681) | | | | | |
| | | | | | |
| United States 0.1% | | | | | 364,216 |
|
| Apache Corp., Series D, 6.000% | | | | 2,380 | 108,766 |
|
| SandRidge Energy, Inc., 8.500% | | | | 2,620 | 255,450 |
| |
| Common Stocks 0.0% | | | | | $205,159 |
|
| (Cost $1,294,787) | | | | | |
| | | | | | |
| United States 0.0% | | | | | 205,159 |
|
| General Maritime Corp. (I) | | | | 816 | 8 |
|
| NetApp, Inc. | | | | 242 | 9,951 |
|
| NewPage Group, Inc. | | | | 2,440 | 195,200 |
| | |
| See notes to financial statements | Annual report | Global High Yield Fund | 25 |
| | | | | |
| | | | Maturity | | |
| | Rate (%) | | date | Par value^ | Value |
| Escrow Certificates 0.0% | | | | | $0 |
|
| (Cost $0) | | | | | |
| | | | | | |
| United States 0.0% | | | | | 0 |
|
| NewPage Corp. (I) | 1.000 | | 12-31-49 | 562,614 | 0 |
| | | | | | |
| | | | | Shares | Value |
| Warrants 0.0% | | | | | $0 |
|
| (Cost $0) | | | | | |
| | | | | | |
| United States 0.0% | | | | | 0 |
|
| General Maritime Corp. (Expiration | | | | | |
| Date: 05-17-17, Strike Price: $42.50) (I) | | | | 1,262 | 0 |
| | | | | | |
| | | | Yield (%) | Shares | Value |
| Short-Term Investments 4.6% | | | | | $24,955,412 |
|
| (Cost $24,955,412) | | | | | |
| | | | | | |
| Money Market Funds 4.6% | | | | | 24,955,412 |
| | | | | | |
| State Street Institutional Liquid Reserves Fund | | | 0.0767 (Y) | 24,955,412 | 24,955,412 |
| |
| Total investments (Cost $555,338,715)† 100.7% | | | | $546,100,215 |
|
| Other assets and liabilities, net (0.7%) | | | | ($3,662,358) |
|
| Total net assets 100.0% | | | | | $542,437,857 |
|
^ The percentage shown for each investment category is the total value of that category as a percentage of the net assets of the fund. All par values are denominated in U.S. Dollars unless otherwise indicated.
|
| Currency Abbreviations |
| BRL — Brazilian Real |
| COP — Colombian Peso |
| EUR — Euro |
| GBP — Pound Sterling |
| MXN — Mexican Peso |
| TRY — Turkish Lira |
| ZAR — South African Rand |
LIBOR London Interbank Offered Rate
PIK Paid In Kind
TBD To be determined
(H) Non-income producing— Issuer is in default.
(I) Non-income producing security.
(K) Underlying issuer is shown parenthetically in security description.
(M) Term loans are variable rate obligations. The coupon rate shown represents the rate at period end.
(P) Variable rate obligation. The coupon rate shown represents the rate at period end.
(Q) Perpetual bonds have no stated maturity date. Date shown as maturity date is next call date.
(S) These securities are exempt from registration under Rule 144A of the Securities Act of 1933. Such securities may be resold, normally to qualified institutional buyers, in transactions exempt from registration. Rule 144A securities amounted to $129,312,661 or 23.8% of the fund’s net assets as of 7-31-13.
(T) This position represents an unsettled loan commitment at period end. Certain details associated with this purchase are not known prior to settlement date, including coupon rate.
(Y) The rate shown is the annualized seven-day yield as of 7-31-13.
(Z) Zero coupon bonds are issued at a discount from their principal amount in lieu of paying interest periodically.
| | |
| 26 | Global High Yield Fund | Annual report | See notes to financial statements |
Notes to Portfolio of Investments
† At 7-31-13, the aggregate cost of investment securities for federal income tax purposes was $556,421,058. Net unrealized depreciation aggregated $10,320,843, of which $11,233,259 related to appreciated investment securities and $21,554,102 related to depreciated investment securities.
The fund had the following sector composition as a percentage of net assets on 7-31-13:
| | | |
| Foreign Government Obligations | 31.9% | | |
| Energy | 14.5% | | |
| Consumer Discretionary | 11.5% | | |
| Telecommunication Services | 6.9% | | |
| Financials | 6.2% | | |
| Materials | 5.4% | | |
| Consumer Staples | 5.2% | | |
| Industrials | 4.8% | | |
| Health Care | 3.6% | | |
| Information Technology | 3.3% | | |
| Utilities | 2.8% | | |
| Short-Term Investments & Other | 3.9% | | |
| |
| | |
| Total | 100.0% | | |
| | |
| See notes to financial statements | Annual report | Global High Yield Fund | 27 |
F I N A N C I A L S T A T E M E N T S
Financial statements
Statement of assets and liabilities 7-31-13
This Statement of assets and liabilities is the fund’s balance sheet. It shows the value of what the fund owns, is due and owes. You’ll also find the net asset value and the maximum public offering price per share.
| |
| Assets | |
|
| Investments, at value (Cost $553,338,715) | $546,100,215 |
| Cash | 96,712 |
| Foreign currency, at value (Cost $994,886) | 986,173 |
| Cash held at clearing house for forward foreign currency exchange contracts | 260,000 |
| Receivable for investments sold | 5,087,182 |
| Receivable for fund shares sold | 267,470 |
| Receivable for forward foreign currency exchange contracts | 88,598 |
| Dividends and interest receivable | 9,163,103 |
| Receivable due from advisor | 326 |
| Other receivables and prepaid expenses | 37,172 |
| | |
| Total assets | 562,086,951 |
| |
| Liabilities | |
|
| Payable for investments purchased | 17,876,940 |
| Payable for forward foreign currency exchange contracts | 366,508 |
| Payable for delayed delivery securities purchased | 1,234,379 |
| Payable for fund shares repurchased | 695 |
| Distributions payable | 434 |
| Payable to affiliates | |
| Accounting and legal services fees | 11,303 |
| Transfer agent fees | 80 |
| Trustees’ fees | 469 |
| Other liabilities and accrued expenses | 158,286 |
| | |
| Total liabilities | 19,649,094 |
| | |
| Net assets | $542,437,857 |
| |
| Net assets consist of | |
|
| Paid-in capital | $549,818,798 |
| Undistributed net investment income | 290,995 |
| Accumulated net realized gain (loss) on investments and foreign | |
| currency transactions | (190,865) |
| Net unrealized appreciation (depreciation) on investments and translation | |
| of assets and liabilities in foreign currencies | (7,481,071) |
| | |
| Net assets | $542,437,857 |
| | |
| 28 | Global High Yield Fund | Annual report | See notes to financial statements |
F I N A N C I A L S T A T E M E N T S
Statement of assets and liabilities (continued)
| |
| Net asset value per share | |
|
| Based on net asset values and shares outstanding — the fund has an | |
| unlimited number of shares authorized with no par value | |
| Class A ($535,818 ÷ 53,103 shares)1 | $10.09 |
| Class I ($129,733 ÷ 12,855 shares) | $10.09 |
| Class NAV ($541,772,306 ÷ 53,680,915 shares) | $10.09 |
| |
| Maximum offering price per share | |
|
| Class A (net asset value per share ÷ 95.5%)2 | $10.57 |
1 Redemption price is equal to net asset value less any applicable contingent deferred sales charge.
2 On single retail sales of less than $100,000. On sales of $100,000 or more and on group sales the offering price is reduced.
| | |
| See notes to financial statements | Annual report | Global High Yield Fund | 29 |
F I N A N C I A L S T A T E M E N T S
Statement of operations For the year ended 7-31-13
This Statement of operations summarizes the fund’s investment income earned and expenses incurred in operating the fund. It also shows net gains (losses) for the period stated.
| |
| Investment income | |
|
| Interest | $32,423,412 |
| Dividends | 24,677 |
| Less foreign taxes withheld | (85) |
| | |
| Total investment income | 32,448,004 |
| |
| Expenses | |
|
| Investment management fees | 4,131,192 |
| Distribution and service fees | 362 |
| Accounting and legal services fees | 68,941 |
| Transfer agent fees | 247 |
| Trustees’ fees | 5,571 |
| State registration fees | 14,103 |
| Printing and postage | 1,100 |
| Professional fees | 74,696 |
| Custodian fees | 288,740 |
| Registration and filing fees | 39,847 |
| Other | 8,082 |
| | |
| Total expenses | 4,632,881 |
| Less expense reductions | (35,159) |
| | |
| Net expenses | 4,597,722 |
| | |
| Net investment income | 27,850,282 |
| |
| Realized and unrealized gain (loss) | |
|
| Net realized gain (loss) on | |
| Investments | 9,511,807 |
| Foreign currency transactions | (1,286,214) |
| | |
| | 8,225,593 |
| Change in net unrealized appreciation (depreciation) of | |
| Investments | (21,090,724) |
| Translation of assets and liabilities in foreign currencies | (162,409) |
| | |
| | (21,253,133) |
| | |
| Net realized and unrealized loss | (13,027,540) |
| | |
| Increase in net assets from operations | $14,822,742 |
| | |
| 30 | Global High Yield Fund | Annual report | See notes to financial statements |
F I N A N C I A L S T A T E M E N T S
Statements of changes in net assets
These Statements of changes in net assets show how the value of the fund’s net assets has changed during the last two periods. The difference reflects earnings less expenses, any investment gains and losses, distributions, if any, paid to shareholders and the net of fund share transactions.
| | |
| | Year | Year |
| | ended | ended |
| | 7-31-13 | 7-31-12 |
| |
| Increase (decrease) in net assets | | |
|
| From operations | | |
| Net investment income | $27,850,282 | $26,600,500 |
| Net realized gain | 8,225,593 | 3,134,710 |
| Change in net unrealized appreciation (depreciation) | (21,253,133) | 982,392 |
| | | |
| Increase in net assets resulting from operations | 14,822,742 | 30,717,602 |
| | | |
| Distributions to shareholders | | |
| From net investment income | | |
| Class A | (6,369) | (1,786) |
| Class I | (2,696) | (1,864) |
| Class NAV | (29,887,473) | (29,872,062) |
| From net realized gain | | |
| Class A | (289) | (354) |
| Class I | (289) | (354) |
| Class NAV | (5,394,311) | (5,312,235) |
| | | |
| Total distributions | (35,291,427) | (35,188,655) |
| | | |
| From fund share transactions | 94,095,424 | 96,123,079 |
| | | |
| Total increase | 73,626,739 | 91,652,026 |
| | | |
| Net assets | | |
|
| Beginning of year | 468,811,118 | 377,159,092 |
| | | |
| End of year | $542,437,857 | $468,811,118 |
| | | |
| Undistributed net investment income | $290,995 | $418,265 |
| | |
| See notes to financial statements | Annual report | Global High Yield Fund | 31 |
Financial highlights
The Financial highlights show how the fund’s net asset value for a share has changed during the period.
| | | | | | |
| CLASS A SHARES Period ended | | | 7-31-13 | 7-31-12 | 7-31-11 | 7-31-101 |
| |
| Per share operating performance | | | | | | |
|
| Net asset value, beginning of period | | | $10.47 | $10.67 | $10.47 | $10.00 |
| Net investment income2 | | | 0.52 | 0.63 | 0.65 | 0.45 |
| Net realized and unrealized gain (loss) on investments | | | (0.21) | 0.02 | 0.42 | 0.49 |
| Total from investment operations | | | 0.31 | 0.65 | 1.07 | 0.94 |
| Less distributions | | | | | | |
| From net investment income | | | (0.57) | (0.71) | (0.68) | (0.47) |
| From net realized gain | | | (0.12) | (0.14) | (0.19) | — |
| Total distributions | | | (0.69) | (0.85) | (0.87) | (0.47) |
| Net asset value, end of period | | | $10.09 | $10.47 | $10.67 | $10.47 |
| Total return (%)3,4 | | | 2.85 | 6.72 | 10.67 | 9.665 |
| |
| Ratios and supplemental data | | | | | | |
|
| Net assets, end of period (in millions) | | | $1 | —6 | —6 | —6 |
| Ratios (as a percentage of average net assets): | | | | | | |
| Expenses before reductions and amounts recaptured | | | 7.91 | 1.41 | 1.39 | 1.347 |
| Expenses including reductions and amounts recaptured | | | 1.34 | 1.30 | 1.30 | 1.307 |
| Net investment income | | | 5.18 | 6.17 | 6.11 | 5.977 |
| Portfolio turnover (%) | | | 71 | 48 | 68 | 49 |
1 Period from 11-2-09 (commencement of operations) to 7-31-10.
2 Based on the average daily shares outstanding.
3 Total returns would have been lower had certain expenses not been reduced during the applicable periods shown.
4 Does not reflect the effect of sales charges, if any.
5 Not annualized.
6 Less than $500,000.
7 Annualized.
| | |
| 32 | Global High Yield Fund | Annual report | See notes to financial statements |
| | | | | | |
| CLASS I SHARES Period ended | | | 7-31-13 | 7-31-12 | 7-31-11 | 7-31-101 |
| |
| Per share operating performance | | | | | | |
|
| Net asset value, beginning of period | | | $10.47 | $10.67 | $10.47 | $10.00 |
| Net investment income2 | | | 0.55 | 0.66 | 0.68 | 0.47 |
| Net realized and unrealized gain (loss) on investments | | | (0.21) | 0.03 | 0.42 | 0.49 |
| Total from investment operations | | | 0.34 | 0.69 | 1.10 | 0.96 |
| Less distributions | | | | | | |
| From net investment income | | | (0.60) | (0.75) | (0.71) | (0.49) |
| From net realized gain | | | (0.12) | (0.14) | (0.19) | — |
| Total distributions | | | (0.72) | (0.89) | (0.90) | (0.49) |
| Net asset value, end of period | | | $10.09 | $10.47 | $10.67 | $10.47 |
| Total return (%)3 | | | 3.17 | 7.05 | 11.00 | 9.894 |
| |
| Ratios and supplemental data | | | | | | |
|
| Net assets, end of period (in millions) | | | —5 | —5 | —5 | —5 |
| Ratios (as a percentage of average net assets): | | | | | | |
| Expenses before reductions and amounts recaptured | | | 16.19 | 1.01 | 0.97 | 1.356 |
| Expenses including reductions and amounts recaptured | | | 1.02 | 1.00 | 1.00 | 1.006 |
| Net investment income | | | 5.31 | 6.47 | 6.41 | 6.256 |
| Portfolio turnover (%) | | | 71 | 48 | 68 | 49 |
1 Period from 11-2-09 (commencement of operations) to 7-31-10.
2 Based on the average daily shares outstanding.
3 Total returns would have been lower had certain expenses not been reduced during the applicable periods shown.
4 Not annualized.
5 Less than $500,000.
6 Annualized.
| | | | | | |
| CLASS NAV SHARES Period ended | | | 7-31-13 | 7-31-12 | 7-31-11 | 7-31-101 |
| |
| Per share operating performance | | | | | | |
|
| Net asset value, beginning of period | | | $10.47 | $10.67 | $10.47 | $10.00 |
| Net investment income2 | | | 0.57 | 0.67 | 0.69 | 0.49 |
| Net realized and unrealized gain (loss) on investments | | | (0.22) | 0.03 | 0.42 | 0.48 |
| Total from investment operations | | | 0.35 | 0.70 | 1.11 | 0.97 |
| Less distributions | | | | | | |
| From net investment income | | | (0.61) | (0.76) | (0.72) | (0.50) |
| From net realized gain | | | (0.12) | (0.14) | (0.19) | — |
| Total distributions | | | (0.73) | (0.90) | (0.91) | (0.50) |
| Net asset value, end of period | | | $10.09 | $10.47 | $10.67 | $10.47 |
| Total return (%)3 | | | 3.30 | 7.15 | 11.09 | 9.964 |
| |
| Ratios and supplemental data | | | | | | |
|
| Net assets, end of period (in millions) | | | $542 | $469 | $377 | $273 |
| Ratios (as a percentage of average net assets): | | | | | | |
| Expenses before reductions and amounts recaptured | | | 0.90 | 0.90 | 0.93 | 0.945 |
| Expenses including reductions and amounts recaptured | | | 0.90 | 0.90 | 0.92 | 0.945 |
| Net investment income | | | 5.44 | 6.55 | 6.50 | 6.515 |
| Portfolio turnover (%) | | | 71 | 48 | 68 | 49 |
1 Period from 11-2-09 (commencement of operations) to 7-31-10.
2 Based on the average daily shares outstanding.
3 Total returns would have been lower had certain expenses not been reduced during the applicable periods shown.
4 Not annualized.
5 Annualized.
| | |
| See notes to financial statements | Annual report | Global High Yield Fund | 33 |
Notes to financial statements
Note 1 — Organization
John Hancock Global High Yield Fund (the fund) is a series of John Hancock Funds II (the Trust), an open-end management investment company organized as a Massachusetts business trust and registered under the Investment Company Act of 1940, as amended (the 1940 Act). The investment objective of the fund is to seek maximum total return, which consists of income on its investments and capital appreciation.
The fund may offer multiple classes of shares. The shares currently offered are detailed in the Statement of assets and liabilities. Class A shares are offered to all investors. Class I shares are offered to institutions and certain investors. Class NAV shares are offered to John Hancock affiliated funds of funds and certain 529 plans. Shareholders of each class have exclusive voting rights to matters that affect that class. The distribution and service fees, if any, transfer agent fees, printing and postage and state registration fees for each class may differ.
Note 2 — Significant accounting policies
The financial statements have been prepared in conformity with accounting principles generally accepted in the United States of America, which require management to make certain estimates and assumptions as of the date of the financial statements. Actual results could differ from those estimates and those differences could be significant. Events or transactions occurring after the end of the fiscal period through the date that the financial statements were issued have been evaluated in the preparation of the financial statements. The following summarizes the significant accounting policies of the fund:
Security valuation Investments are stated at value as of the close of regular trading on the New York Stock Exchange (NYSE), normally at 4:00 P.M., Eastern Time. In order to value the securities, the fund uses the following valuation techniques: Equity securities, including exchange-traded and closed-end funds, held by the fund are valued at the last sale price or official closing price on the principal securities exchange on which they trade. In the event there were no sales during the day or closing prices are not available, the securities are valued using the last quoted bid or evaluated price. Investments by the funds in open-end mutual funds are valued at their respective net asset values each business day. Debt obligations are valued based on the evaluated prices provided by an independent pricing service, which utilizes both dealer-supplied and electronic data processing techniques, taking into account factors such as institutional-size trading in similar groups of securities, yield, quality, coupon rate, maturity, type of issue, trading characteristics and other market data. Foreign securities and currencies, including forward foreign currency contracts, are valued in U.S. dollars, based on foreign currency exchange rates supplied by an independent pricing service. Certain securities and forward foreign currency contracts traded only in the over-the-counter market are valued at the last bid price quoted by brokers making markets in the securities at the close of trading. Certain short-term securities are valued at amortized cost.
Other portfolio securities and assets, for which reliable market quotations are not readily available, are valued at fair value as determined in good faith by the fund’s Pricing Committee following procedures established by the Board of Trustees, which include price verification procedures. The frequency with which these fair valuation procedures are used cannot be predicted and fair value of securities may differ significantly from the value that would have been used had a ready market for such securities existed. Generally, trading in foreign securities is substantially completed each day at various times prior to the close of trading on the NYSE. Significant market events that affect
| |
| 34 | Global High Yield Fund | Annual report |
the values of foreign securities may occur between the time when the valuation of the securities is generally determined and the close of the NYSE. During significant market events, these securities will be valued at fair value, as determined in good faith, following procedures established by the Board of Trustees. The fund may use a fair valuation model to value foreign securities in order to adjust for events that may occur between the close of foreign exchanges and the close of the NYSE.
The fund uses a three-tier hierarchy to prioritize the pricing assumptions, referred to as inputs, used in valuation techniques to measure fair value. Level 1 includes securities valued using quoted prices in active markets for identical securities. Level 2 includes securities valued using other significant observable inputs. Observable inputs may include quoted prices for similar securities, interest rates, prepayment speeds and credit risk. Prices for securities valued using these inputs are received from independent pricing vendors and brokers and are based on an evaluation of the inputs described. Level 3 includes securities valued using significant unobservable inputs when market prices are not readily available or reliable, including the fund’s own assumptions in determining the fair value of investments. Factors used in determining value may include market or issuer specific events or trends, changes in interest rates and credit quality. The inputs or methodology used for valuing securities are not necessarily an indication of the risks associated with investing in those securities. Changes in valuation techniques may result in transfers into or out of an assigned level within the disclosure hierarchy.
The following is a summary of the values by input classification of the fund’s investments as of July 31, 2013, by major security category or type:
| | | | |
| | | | | LEVEL 3 |
| | | | LEVEL 2 | SIGNIFICANT |
| | TOTAL MARKET | LEVEL 1 | SIGNIFICANT | UNOBSERVABLE |
| | VALUE AT 7-31-13 | QUOTED PRICE | OBSERVABLE INPUTS | INPUTS |
|
| Corporate Bonds | $332,762,310 | — | $332,762,310 | — |
| Foreign Government | | | | |
| Obligations | 173,063,108 | — | 173,063,108 | — |
| Capital Preferred Securities | 326,275 | — | 326,275 | — |
| Convertible Bonds | 3,573,167 | — | 3,573,167 | — |
| Structured Notes | 2,335,295 | — | 2,053,055 | $282,240 |
| Term Loans | 8,515,273 | — | 8,515,273 | — |
| Preferred Securities | 364,216 | $108,766 | 255,450 | — |
| Common Stocks | 205,159 | 9,951 | — | 195,208 |
| Short-Term Investments | 24,955,412 | 24,955,412 | — | — |
| |
|
| Total Investments | | | | |
| in Securities | $546,100,215 | $25,074,129 | $520,548,638 | $477,448 |
| Other Financial | | | | |
| Instruments: | | | | |
| Forwards | ($277,910) | — | ($277,910) | — |
Security transactions and related investment income. Investment security transactions are accounted for on a trade date plus one basis for daily net asset value calculations. However, for financial reporting purposes, investment transactions are reported on trade date. Interest income includes coupon interest and amortization/accretion of premiums/discounts on debt securities. Debt obligations may be placed in a non-accrual status and related interest income may be reduced by stopping current accruals and writing off interest receivable when the collection of all or a portion of interest has become doubtful. Dividend income is recorded on the ex-date, except for dividends of foreign securities where the dividend may not be known until after the ex-date. In those cases, dividend income, net of withholding taxes, is recorded when the fund becomes aware of the dividends. Foreign taxes are provided for based on the fund’s understanding of the tax rules and rates that exist in the foreign markets in which it invests. Gains and losses on securities sold are determined on the basis of identified cost and may include proceeds from litigation.
| |
| Annual report | Global High Yield Fund | 35 |
Foreign currency translation. Assets, including investments and liabilities denominated in foreign currencies, are translated into U.S. dollar values each day at the prevailing exchange rate. Purchases and sales of securities, income and expenses are translated into U.S. dollars at the prevailing exchange rate on the date of the transaction. The effect of changes in foreign currency exchange rates on the value of securities is reflected as a component of the realized and unrealized gains (losses) on investments.
Funds that invest internationally generally carry more risk than funds that invest strictly in U.S. securities. Risks can result from differences in economic and political conditions, regulations, market practices (including higher transaction costs), accounting standards and other factors. Foreign investments are also subject to a decline in the value of a foreign currency versus the U.S. dollar, which reduces the dollar value of securities denominated in that currency.
Foreign taxes. The fund may be subject to withholding tax on income and/or capital gains or repatriation taxes imposed by certain countries in which the fund invests. Taxes are accrued based upon investment income, realized gains or unrealized appreciation.
Line of credit. The fund may borrow from banks for temporary or emergency purposes, including meeting redemption requests that otherwise might require the untimely sale of securities. Pursuant to the custodian agreement, the custodian may loan money to the fund to make properly authorized payments. The fund is obligated to repay the custodian for any overdraft, including any related costs or expenses. The custodian may have a lien, security interest or security entitlement in any fund property that is not otherwise segregated or pledged, to the maximum extent permitted by law, to the extent of any overdraft.
In addition, the fund and other affiliated funds have entered into an agreement with Citibank N.A. that enables them to participate in a $300 million unsecured committed line of credit. A commitment fee, payable at the end of each calendar quarter, based on the average daily unused portion of the line of credit, is charged to each participating fund on a pro rata basis and is reflected in other expenses on the Statement of operations. Prior to March 27, 2013, the fund participated in a $200 million unsecured line of credit, also with Citibank, with terms otherwise similar to the existing agreement. Commitment fees for the year ended July 31, 2013 were $486. For the year ended July 31, 2013, the fund had no borrowings under either line of credit.
Expenses. Within the John Hancock funds complex, expenses that are directly attributable to an individual fund are allocated to such fund. Expenses that are not readily attributable to a specific fund are allocated among all funds in an equitable manner, taking into consideration, among other things, the nature and type of expense and the fund’s relative net assets. Expense estimates are accrued in the period to which they relate and adjustments are made when actual amounts are known.
Class allocations. Income, common expenses and realized and unrealized gains (losses) are determined at the fund level and allocated daily to each class of shares based on the net assets of the class. Class-specific expenses, such as distribution and service fees, if any, transfer agent fees, state registration fees and printing and postage expenses, for all classes, are calculated daily at the class level based on the appropriate net assets of each class and the specific expense rates applicable to each class.
Federal income taxes. The fund intends to continue to qualify as a regulated investment company by complying with the applicable provisions of the Internal Revenue Code and will not be subject to federal income tax on taxable income that is distributed to shareholders. Therefore, no federal income tax provision is required.
| |
| 36 | Global High Yield Fund | Annual report |
For federal income tax purposes, net capital losses of $843,430 that are a result of security transactions occurring after October 31, 2012, are treated as occurring on August 1, 2013, the first day of the fund’s next taxable year.
As of, July 31, 2013, the fund had no uncertain tax positions that would require financial statement recognition, derecognition or disclosure. The fund’s federal tax returns are subject to examination by the Internal Revenue Service for a period of three years.
Distribution of income and gains. Distributions to shareholders from net investment income and net realized gains, if any, are recorded on the ex-date. The fund generally declares dividends daily and pays them monthly. Capital gain distributions, if any, are paid annually.
| | | | |
| | JULY 31, 2013 | JULY 31, 2012 | | |
| | |
| Ordinary Income | $31,068,258 | $31,378,221 | | |
| Long-Term Capital Gain | $4,223,169 | $3,810,434 | | |
| |
| | |
| Total | $35,291,427 | $35,188,655 | | |
Distributions paid by the fund with respect to each class of shares are calculated in the same manner, at the same time and in the same amount, except for the effect of class level expenses that may be applied differently to each class. As of July 31, 2013, the components of distributable earnings on a tax basis consisted of $3,734,908 of undistributed long-term capital gains.
Such distributions and distributable earnings, on a tax basis, are determined in conformity with income tax regulations, which may differ from accounting principles generally accepted in the United States of America. Material distributions in excess of tax basis earnings and profits, if any, are reported in the fund’s financial statements as a return of capital.
Capital accounts within the financial statements are adjusted for permanent book-tax differences. These adjustments have no impact on net assets or the results of operations. Temporary book-tax differences, if any, will reverse in a subsequent period. Book-tax differences are primarily attributable to foreign currency transactions, wash sale loss deferrals, post-October loss deferral, characterization of distributions, derivative transactions, and amortization and accretion on debt securities.
Note 3 — Derivative instruments
The fund may invest in derivatives in order to meet its investment objectives. Derivatives include a variety of different instruments that may be traded in the over-the-counter market, on a regulated exchange or through a clearing facility. The risks in using derivatives vary depending upon the structure of the instruments, including the use of leverage, optionality, the liquidity or lack of liquidity of the contract, the creditworthiness of the counterparty or clearing organization and the volatility of the position. Some derivatives involve risks that are potentially greater than the risks associated with investing directly in the referenced securities or other referenced underlying instrument. Specifically, the portfolios are exposed to the risk that the counterparty to an over-the-counter (OTC) derivatives contract will be unable or unwilling to make timely settlement payments or otherwise honor its obligations. OTC derivatives transactions typically can only be closed out with the other party to the transaction.
Forward foreign currency contracts are typically traded through the OTC market. Non-deliverable forwards are all regulated by the Commodity Futures Trading Commission (the CFTC) as swaps. Derivative counterparty risk is managed through an ongoing evaluation of the creditworthiness of all potential counterparties and, if applicable, designated clearing organizations. The portfolio attempts to reduce its exposure to counterparty risk for derivatives traded in the OTC market, whenever possible, by entering into an International Swaps and Derivatives Association (ISDA)
| |
| Annual report | Global High Yield Fund | 37 |
Master Agreement with each of their OTC counterparties. The ISDA gives each party to the agreement the right to terminate all transactions traded under the agreement if there is certain deterioration in the credit quality or contractual default of the other party, as defined in the ISDA. Upon an event of default or a termination of the ISDA, the non-defaulting party has the right to close out all transactions and to net amounts owed. This right to close out and net payments across all transactions traded under the ISDA could result in a reduction of the portfolios’ risk to a counterparty equal to any amounts payable by the portfolios, if any.
As defined by the ISDA, the portfolio may have collateral agreements with certain counterparties to mitigate counterparty risk on OTC derivatives. Subject to established minimum levels, collateral for OTC transactions is generally determined based on the net aggregate unrealized gain or loss on contracts with a particular counterparty. Collateral pledged to the portfolio is held in a segregated account by a third-party agent or held by the custodian bank for the benefit of the portfolio and can be in the form of cash or debt securities issued by the U.S. government or related agencies; collateral posted by the portfolio for OTC transactions is held in a segregated account at the portfolio’s custodian and is noted in the accompanying portfolio of investments, or if cash is posted, on the Statement of assets and liabilities. The fund’s maximum risk of loss due to counterparty risk is equal to the asset value of outstanding contracts offset by collateral received.
For financial reporting purposes, the portfolio does not offset OTC derivative assets or liabilities that are subject to master netting arrangements, as defined by the ISDAs, in the Statement of assets and liabilities. In the event of default by the counterparty or a termination of the agreement, the ISDA allows an offset of amounts across the various transactions between the fund and the applicable counterparty.
Forward foreign currency contracts. A forward foreign currency contract is an agreement between two parties to buy and sell a specific currency at a price that is set on the date of the contract. The forward contract calls for delivery of the currency on a future date that is specified in the contract. Risks related to the use of forwards include the possible failure of counterparties to meet the terms of the forward agreement, the failure of the counterparties to timely post collateral, the risk that currency movements will not favor the fund thereby reducing the fund’s total return, and the potential for losses in excess of the amounts recognized on the Statement of assets and liabilities.
The market value of a forward foreign currency contract fluctuates with changes in foreign currency exchange rates. Forward foreign currency contracts are marked-to-market daily and the change in value is recorded by the fund as an unrealized gain or loss. Realized gains or losses, equal to the difference between the value of the contract at the time it was opened and the value at the time it was closed, are recorded upon delivery or receipt of the currency or settlement with the counterparty.
During the year ended July 31, 2013, the fund used forward foreign currency contracts to manage against anticipated currency exchange rates and to gain exposure to foreign currency. During the year ended July 31, 2013, the fund held forward foreign currency contracts with U.S. dollar
| |
| 38 | Global High Yield Fund | Annual report |
notional values ranging from $18.6 million to $59.7 million, as measured at each quarter end. The following table summarizes the contracts held at July 31, 2013.
| | | | | | | | | | |
| | | | | | | | CONTRACTUAL | | | NET UNREALIZED |
| CONTRACT | | | CONTRACT | | | | SETTLEMENT | UNREALIZED | UNREALIZED | APPRECIATION/ |
| TO BUY | | | TO SELL | | | COUNTERPARTY | DATE | APPRECIATION | DEPRECIATION | (DEPRECIATION) |
|
| COP | 1,355,075,000 | | USD | 703,478 | | Citibank N.A. | 8-12-13 | $11,165 | — | $11,165 |
|
| EUR | 13,498,444 | | USD | 17,888,749 | | Citibank N.A. | 8-15-13 | 69,616 | — | 69,616 |
|
| GBP | 1,418,500 | | USD | 2,154,073 | | Citibank N.A. | 8-15-13 | 3,619 | — | 3,619 |
|
| USD | 717,825 | | COP | 1,355,075,000 | | Citibank N.A. | 8-12-13 | 3,182 | — | 3,182 |
|
| USD | 17,622,010 | | EUR | 13,498,444 | | Citibank N.A. | 8-15-13 | — | ($336,355) | (336,355) |
|
| USD | 2,158,708 | | GBP | 1,418,500 | | Citibank N.A. | 8-15-13 | 1,016 | — | 1,016 |
|
| USD | 16,244,642 | | EUR | 12,228,700 | | Citibank N.A. | 9-20-13 | — | (26,400) | (26,400) |
|
| USD | 2,210,904 | | GBP | 1,456,300 | | Citibank N.A. | 9-20-13 | — | (3,753) | (3,753) |
|
| | | | | | | | | $88,598 | ($366,508) | ($277,910) |
| |
| Currency Abbreviation |
| COP | Colombian Peso |
| EUR | Euro |
| GBP | Pound Sterling |
| USD | U.S. Dollar |
Fair value of derivative instruments by risk category
The table below summarizes the fair value of derivatives held by the fund at July 31, 2013 by risk category:
| | | | |
| | | FINANCIAL | ASSET | LIABILITIES |
| | STATEMENT OF ASSETS AND | INSTRUMENTS | DERIVATIVES | DERIVATIVES |
| RISK | LIABILITIES LOCATION | LOCATION | FAIR VALUE | FAIR VALUE |
|
| Foreign currency | Receivable-payable for | Forward foreign | $88,598 | ($366,508) |
| contracts | forward foreign currency | currency | | |
| | exchange contracts | exchange | | |
| | | contracts | | |
Effect of derivative instruments on the Statement of operations
The table below summarizes the net realized gain (loss) included in the net increase (decrease) in net assets from operations, classified by derivative instrument and risk category, for the year ended July 31, 2013:
| | |
| RISK | STATEMENT OF OPERATIONS LOCATION | FOREIGN CURRENCY TRANSACTIONS* |
|
| Foreign currency contracts | Net realized gain (loss) | ($255,812) |
* Realized gain/loss associated with forward foreign currency contracts is included in the caption on the Statement of operations.
The table below summarizes the net change in unrealized appreciation (depreciation) included in the net increase (decrease) in net assets from operations, classified by derivative instrument and risk category, for the year ended July 31, 2013:
| | |
| | | TRANSLATION OF ASSETS AND LIABILITIES |
| RISK | STATEMENT OF OPERATIONS LOCATION | IN FOREIGN CURRENCIES* |
|
| Foreign currency contracts | Change in unrealized appreciation | ($168,627) |
| | (depreciation) | |
* Change in unrealized appreciation/depreciation associated with forward foreign currency contracts is included in the caption on the Statement of operations.
| |
| Annual report | Global High Yield Fund | 39 |
Note 4 — Guarantees and indemnifications
Under the Trust’s organizational documents, its Officers and Trustees are indemnified against certain liabilities arising out of the performance of their duties to the Trust, including the fund. Additionally, in the normal course of business, the fund enters into contracts with service providers that contain general indemnification clauses. The fund’s maximum exposure under these arrangements is unknown, as this would involve future claims that may be made against the fund that have not yet occurred. The risk of material loss from such claims is considered remote.
Note 5 — Fees and transactions with affiliates
John Hancock Investment Management Services, LLC (the Advisor) serves as investment advisor for the fund. John Hancock Funds, LLC (the Distributor), an affiliate of the Advisor, serves as principal underwriter of the fund. The Advisor and the Distributor are indirect, wholly owned subsidiaries of Manulife Financial Corporation (MFC).
Management fee. The fund has an investment management agreement with the Advisor under which the fund pays a daily management fee to the Advisor equivalent, on an annual basis, to the sum of: a) 0.825% of the first $250,000,000 of the fund’s average daily net assets, b) 0.790% of the next $500,000,000 of the fund’s average daily net assets and c) 0.770% of the fund’s average daily net assets in excess of $750,000,000. The Advisor has a subadvisory agreement with Stone Harbor Investment Partners LP. The fund is not responsible for payment of the subadvisory fees.
Effective June 1, 2013, the Advisor has contractually agreed to waive a portion of its management fee for certain funds (the Participating portfolios) of the Trust, John Hancock Funds, John Hancock Funds III and John Hancock Variable Insurance Trust. The waiver equals, on an annualized basis, 0.01% of that portion of the aggregate net assets of all the Participating portfolios that exceeds $75 billion but is less than or equal to $125 billion; 0.0125% of that portion of the aggregate net assets of all the Participating portfolios that exceeds $125 billion but is less than or equal to $150 billion; and 0.015% of that portion of the aggregate net assets of all the Participating portfolios that exceeds $150 billion. The amount of the reimbursement is calculated daily and allocated among all the Participating portfolios in proportion to the daily net assets of each fund. This arrangement may be amended or terminated at any time by the Advisor upon notice to the fund and with the approval of the Board of Trustees.
Prior to June 1, 2013, the Advisor contractually agreed to waive a portion of its management fee for certain funds (the Participating Portfolios) of the Trust and John Hancock Variable Insurance Trust. The waiver equaled, on an annualized basis, 0.01% of that portion of the aggregate net assets of all the Participating Portfolios that exceeded $75 billion but was less than $100 billion; and 0.015% of that portion of the aggregate net assets of all the Participating Portfolios that equaled or exceeded $100 billion. The amount of the reimbursement was calculated daily and allocated among all the Participating Portfolios in proportion to the daily net assets of each fund.
Effective March 28, 2013, the Advisor has contractually agreed to waive fees and/or reimburse operating expenses for Class A and Class I shares, excluding certain expenses such as taxes, brokerage commissions, interest expense, short dividend expense, acquired fund fees, litigation and indemnification expenses and other extraordinary expenses not incurred in the ordinary course of the fund’s business. The fee waivers and/or reimbursements are such that these expenses will not exceed 1.35% and 1.04% for Class A and Class I shares, respectively. The current expense limitation agreement expires on November 30, 2014 unless renewed by mutual agreement of the fund and the Advisor based upon a determination that this is appropriate under the circumstances at that time. Prior to March 28, 2013, the fee waivers and/or expense reimbursements were such that the expenses would not exceed 1.30% and 1.10% for Class A and Class I shares, respectively.
| |
| 40 | Global High Yield Fund | Annual report |
Additionally, the Advisor has voluntarily agreed to waive and/or reimburse other expenses of the fund, excluding advisory fees, Rule 12b-1 fees, service fees, transfer agent fees, state registration fees, taxes, brokerage commissions, interest expense, printing and postage, short dividend expense, acquired fund fees, litigation and indemnification expenses and other extraordinary expenses not incurred in the ordinary course of business. The waivers are such that these expenses will not exceed 0.15% of average net assets. This voluntary expense reimbursement may be terminated at any time by the Advisor on notice to the fund.
Accordingly, these expense reductions amounted to $7,903, $7,342 and $19,914 for Class A, Class I and Class NAV shares, respectively, for the year ended July 31, 2013. The investment management fees incurred for the year ended July 31, 2013 were equivalent to a net annual effective rate of 0.80% of the fund’s average daily net assets.
Expense recapture. The Advisor may recapture operating expenses reimbursed or fees waived under previous expense limitations or waiver arrangements for a period of three years following the beginning of the month in which such reimbursements or waivers originally occurred to the extent that the fund is below its expense limitation during this period. The table below outlines the amounts recovered if any during the year ended July 31, 2013, and the amount of waived or reimbursed expenses subject to potential recovery and the respective expiration date.
| | | | |
| AMOUNTS ELIGIBLE FOR | AMOUNTS ELIGIBLE FOR | AMOUNTS ELIGIBLE FOR | AMOUNT RECOVERED | |
| RECOVERY THROUGH | RECOVERY THROUGH | RECOVERY THROUGH | DURING THE PERIOD | |
| JULY 1, 2014 | JULY 1, 2015 | JULY 1, 2016 | ENDED JULY 31, 2013 | |
| |
| — | — | $15,223 | — | |
Accounting and legal services. Pursuant to a service agreement, the fund reimburses the Advisor for all expenses associated with providing the administrative, financial, legal, accounting and recordkeeping services to the fund, including the preparation of all tax returns, periodic reports to shareholders and regulatory reports, among other services. These expenses are allocated to each share class based on its relative net assets at the time the expense was incurred. These accounting and legal services fees incurred for the year ended July 31, 2013 amounted to an annual rate of 0.01% of the fund’s average daily net assets.
Distribution and service plans. The fund has a distribution agreement with the Distributor. The fund has adopted distribution and service plans with respect to Class A shares pursuant to Rule 12b-1 under the 1940 Act, to pay the Distributor for services provided as the distributor of shares of the fund. The fund pays 0.30% for Class A shares for distribution and service fees under these arrangements, expressed as an annual percentage of average daily net assets.
Sales charges. Class A shares are assessed up-front sales charges, which resulted in payments to the Distributor amounting to $1,717 for the year ended July 31, 2013. Of this amount, $480 was retained and used for printing prospectuses, advertising, sales literature, and other purposes, and $1,237 was paid as sales commissions to broker-dealers. No sales commission was paid to Signator Investors, Inc., a broker-dealer affiliate of the Advisor.
Class A shares may be subject to contingent deferred sales charges (CDSCs). Certain Class A shares that are acquired through purchases of $1 million or more and are redeemed within one year of purchase are subject to a 1.00% sales charge. Proceeds from CDSCs are used to compensate the Distributor for providing distribution-related services in connection with the sale of these shares. During the year ended July 31, 2013, there were no CDSCs received by the Distributor for Class A shares.
| |
| Annual report | Global High Yield Fund | 41 |
Transfer agent fees. The fund has a transfer agent agreement with John Hancock Signature Services, Inc. (Signature Services), an affiliate of the Advisor. The transfer agent fees paid to Signature Services are determined based on the cost to Signature Services (Signature Services Cost) of providing recordkeeping services. The Signature Services Cost includes a component of allocated John Hancock corporate overhead for providing transfer agent services to the fund and to all other John Hancock affiliated funds. It also includes out-of-pocket expenses that are comprised of payments made to third-parties for recordkeeping services provided to their clients who invest in one or more John Hancock funds. In addition, Signature Services Cost may be reduced by certain fees that Signature Services receives in connection with retirement and small accounts. Signature Services Cost is calculated monthly and allocated, as applicable, to four categories of share classes: Institutional Share Classes, Retirement Share Classes, Municipal Bond Classes and all other Retail Share Classes. Within each of these categories, the applicable costs are allocated to the affected John Hancock affiliated funds and/or classes, based on the relative average daily net assets.
Class level expenses. Class level expenses for the year ended July 31, 2013 were:
| | | | |
| | DISTRIBUTION | TRANSFER | PRINTING AND | STATE |
| CLASS | AND SERVICE FEES | AGENT FEES | POSTAGE | REGISTRATION FEES |
|
| A | $362 | $196 | $800 | $7,052 |
| I | — | 51 | 300 | 7,051 |
| Total | $362 | $247 | $1,100 | $14,103 |
Trustee expenses. The fund compensates each Trustee who is not an employee of the Advisor or its affiliates. The costs of paying Trustee compensation and expenses are allocated to each fund based on its average daily net assets.
Note 6 — Fund share transactions
Transactions in fund shares for the year ended July 31, 2013 and for the year ended July 31, 2012 were as follows:
| | | | |
| | Year ended 7-31-13 | Year ended 7-31-12 |
| | Shares | Amount | Shares | Amount |
| Class A shares | | | | |
|
| Sold | 50,296 | $527,317 | — | — |
| Distributions reinvested | 435 | 4,412 | — | — |
| Repurchased | (128) | (1,292) | — | — |
| | | | | |
| Net increase | 50,603 | $530,437 | — | — |
| |
| Class I shares | | | | |
|
| Sold | 10,238 | $110,000 | — | — |
| Distributions reinvested | 117 | 1,184 | — | — |
| | | | | |
| Net increase | 10,355 | $111,184 | — | — |
| |
| Class NAV shares | | | | |
|
| Sold | 8,620,566 | $90,658,666 | 8,422,198 | $86,135,065 |
| Distributions reinvested | 3,350,641 | 35,281,784 | 3,466,414 | 35,184,198 |
| Repurchased | (3,079,853) | (32,486,647) | (2,441,511) | (25,196,184) |
| | | | | |
| Net increase | 8,891,354 | $93,453,803 | 9,447,101 | $96,123,079 |
| |
| Total net increase | 8,952,312 | $94,095,424 | 9,447,101 | $96,123,079 |
|
There were no fund share transactions for Class A and Class I for the year ended July 31, 2012.
| |
| 42 | Global High Yield Fund | Annual report |
Affiliates of the fund owned 5%, 20% and 100% of shares of beneficial interest of Class A, Class I and Class NAV, respectively, on July 31, 2013.
Note 7 — Purchase and sale of securities
Purchases and sales of securities, other than short-term securities, aggregated $434,665,483 and $346,501,549, respectively, for the year ended July 31, 2013.
Note 8 — Investment by affiliated funds
Certain investors in the fund are affiliated funds that are managed by the Advisor and its affiliates. The affiliated funds do not invest in the fund for the purpose of exercising management or control; however, affiliated fund investments may represent a significant portion of the fund’s net assets. At July 31, 2013, the following funds had an affiliate ownership of 5% or more of the fund’s net assets:
| | | |
| | AFFILIATE | | |
| FUND | CONCENTRATION | | |
| | |
| John Hancock Lifestyle Growth Portfolio | 17.9% | | |
| John Hancock Lifestyle Balanced Portfolio | 31.8% | | |
| John Hancock Lifestyle Moderate Portfolio | 13.6% | | |
| John Hancock Lifestyle Conservative Portfolio | 12.4% | | |
| |
| Annual report | Global High Yield Fund | 43 |
Auditor’s report
Report of Independent Registered Public Accounting Firm
To the Board of Trustees of John Hancock Funds II and Shareholders of
John Hancock Global High Yield Fund:
In our opinion, the accompanying statement of assets and liabilities, including the schedule of investments, and the related statements of operations and of changes in net assets and the financial highlights present fairly, in all material respects, the financial position of John Hancock Global High Yield Fund (the “Fund”) at July 31, 2013, and the results of its operations for the year then ended, the changes in its net assets for each of the two years in the period then ended and the financial highlights for each of the periods indicated, in conformity with accounting principles generally accepted in the United States of America. These financial statements and financial highlights (hereafter referred to as “financial statements”) are the responsibility of the Fund’s management; our responsibility is to express an opinion on these financial statements based on our audits. We conducted our audits of these financial statements in accordance with the standards of the Public Company Accounting Oversight Board (United States). Those standards require that we plan and perform the audit to obtain reasonable assurance about whether the financial statements are free of material misstatement. An audit includes examining, on a test basis, evidence supporting the amounts and disclosures in the financial statements, assessing the accounting principles used and significant estimates made by management, and evaluating the overall financial statement presentation. We believe that our audits, which included confirmation of securities at July 31, 2013 by correspondence with the custodian, agent banks and brokers, and the application of alternative auditing procedures where securities purchased confirmations had not been received, provide a reasonable basis for our opinion.
PricewaterhouseCoopers LLP
Boston, Massachusetts
September 20, 2013
| |
| 44 | Global High Yield Fund | Annual report |
Tax information
Unaudited
For federal income tax purposes, the following information is furnished with respect to the distributions of the fund, if any, paid during its taxable year ended July 31, 2013.
The fund reports the maximum amount allowable of its net taxable income as eligible for the corporate dividends-received deduction.
The fund reports the maximum amount allowable of its net taxable income as qualified dividend income as provided in the Jobs and Growth Tax Relief Reconciliation Act of 2003.
The fund paid $4,223,169 in capital gain dividends.
Eligible shareholders will be mailed a 2013 Form 1099-DIV in early 2014. This will reflect the tax character of all distributions paid in calendar year 2013.
Please consult a tax advisor regarding the tax consequences of your investment in the fund.
| |
| Annual report | Global High Yield Fund | 45 |
Evaluation of Advisory and Subadvisory Agreements by the Board of Trustees
This section describes the evaluation by the Board of Trustees (the Board) of John Hancock Funds II (the Trust) of the Advisory Agreement (the Advisory Agreement) with John Hancock Investment Management Services, LLC (the Advisor) and the Subadvisory Agreement (the Subadvisory Agreement) with Stone Harbor Investment Partners LP (the Subadvisor) for Global High Yield Fund (the fund). The Advisory Agreement and Subadvisory Agreement are collectively referred to as the Agreements.
Approval of Advisory and Subadvisory Agreements
At in-person meetings held on May 16–17, 2013, the Board, including the Trustees who are not considered to be interested persons of the Trust under the Investment Company Act of 1940, as amended (the 1940 Act) (the Independent Trustees), reapproved for an annual period the continuation of the Advisory Agreement between the Trust and the Advisor and the Subadvisory Agreement between the Advisor and the Subadvisor with respect to the fund.
In considering the Advisory Agreement and the Subadvisory Agreement, the Board received in advance of the meeting a variety of materials relating to the fund, the Advisor, and the Subadvisor, including comparative performance, fee and expense information for peer groups of similar mutual funds prepared by an independent third-party provider of mutual fund data; performance information for the fund’s benchmark index; and, with respect to the Subadvisor, comparative performance information for comparably managed accounts; and other information provided by the Advisor and the Subadvisor regarding the nature, extent, and quality of services provided by the Advisor and the Subadvisor under their respective Agreements, as well as information regarding the Advisor’s revenues and costs of providing services to the fund and any compensation paid to affiliates of the Advisor. At the meeting at which the renewal of the Advisory Agreement and Subadvisory Agreement is considered, particular focus is given to information concerning fund performance, comparability of fees and total expenses and profitability. However, the Board notes that the evaluation process with respect to the Advisor and the Subadvisor is an ongoing one. In this regard, the Board also took into account discussions with management and information provided to the Board at prior meetings with respect to the services provided by the Advisor and the Subadvisor to the fund, including quarterly performance reports prepared by management containing reviews of investment results and prior presentations from the Subadvisor with respect to the fund. The Board also considered the nature, quality, and extent of non-advisory services, if any, to be provided to the fund by the Advisor’s affiliates, including distribution services.
Throughout the process, the Board asked questions of and requested additional information from management. The Board is assisted by counsel for the Trust and the Independent Trustees are also separately assisted by independent legal counsel throughout the process. The Independent Trustees also received a memorandum from their independent counsel discussing the legal standards for their consideration of the proposed continuation of the Agreements and discussed the proposed continuation of the Agreements in private sessions with their independent legal counsel at which no representatives of management were present.
Approval of Advisory Agreement
In approving the Advisory Agreement with respect to the fund, the Board, including the Independent Trustees, considered a variety of factors, including those discussed below. The Board also considered other factors (including conditions and trends prevailing generally in the economy, the securities markets, and the industry) and does not treat any single factor as determinative and each Trustee may attribute different weights to different factors. The Board’s conclusions may be based in part on its consideration of the Advisory and Subadvisory Agreements in prior years and on the Board’s ongoing regular review of fund performance and operations throughout the year.
| |
| 46 | Global High Yield Fund | Annual report |
Nature, extent, and quality of services. Among the information received by the Board from the Advisor relating to the nature, extent, and quality of services provided to the fund, the Board reviewed information provided by the Advisor relating to its operations and personnel, descriptions of its organizational and management structure, and information regarding the Advisor’s compliance and regulatory history, including its Form ADV. The Board also noted that on a regular basis it receives and reviews information from the Trust’s Chief Compliance Officer (CCO) regarding the fund’s compliance policies and procedures established pursuant to Rule 38a-1 under the 1940 Act. The Board also considered the Advisor’s risk management processes. The Board considered that the Advisor is responsible for the management of the day-to-day operations of the fund, including, but not limited to, general supervision of and coordination of the services provided by the Subadvisor, and is also responsible for monitoring and reviewing the activities of the Subadvisor and other third-party service providers.
In considering the nature, extent, and quality of the services provided by the Advisor, the Trustees also took into account their knowledge of the Advisor’s management and the quality of the performance of the Advisor’s duties through Board meetings, discussions, and reports during the preceding year and through each Trustee’s experience as a Trustee of the Trust and of the other trusts in the complex.
In the course of their deliberations regarding the Advisory Agreement, the Board considered, among other things:
(a) the skills and competency with which the Advisor has in the past managed the Trust’s affairs and its subadvisory relationship, the Advisor’s oversight and monitoring of the Subadvisor’s investment performance and compliance programs, such as the Subadvisor’s compliance with fund policies and objectives; review of brokerage matters, including with respect to trade allocation and best execution; and the Advisor’s timeliness in responding to performance issues;
(b) the background, qualifications and skills of the Advisor’s personnel;
(c) the Advisor’s compliance policies and procedures and its responsiveness to regulatory changes and mutual fund industry developments;
(d) the Advisor’s administrative capabilities, including its ability to supervise the other service providers for the fund;
(e) the financial condition of the Advisor and whether it has the financial wherewithal to provide a high level and quality of services to the fund; and
(f) the Advisor’s reputation and experience in serving as an investment adviser to the Trust and the benefit to shareholders of investing in funds that are part of a family of funds offering a variety of investments.
The Board concluded that the Advisor may reasonably be expected to continue to provide a high quality of services under the Advisory Agreement with respect to the fund.
Investment performance. In considering the fund’s performance, the Board noted that it reviews at its regularly scheduled meetings information about the fund’s performance results. In connection with the consideration of the Advisory Agreement, the Board:
(a) reviewed information prepared by management regarding the fund’s performance;
(b) considered the comparative performance of the fund’s benchmark;
| |
| Annual report | Global High Yield Fund | 47 |
(c) considered the performance of comparable funds, if any, as included in the report prepared by an independent third-party provider of mutual fund data. Such report included the fund’s ranking within a smaller group of peer funds and the fund’s ranking within broader groups of funds; and
(d) took into account the Advisor’s analysis of the fund’s performance and its plans and recommendations regarding the Trust’s subadvisory arrangements generally.
The Board noted that the fund underperformed its benchmark index for the one- and three-year periods and outperformed its peer group average for the one- and three-year periods ended December 31, 2012.
The Board noted the peer group in which the fund was placed and that the fund has an emerging market mandate in comparison to many of the funds in its peer group. The Board took into account management’s discussion of the factors that contributed to the fund’s performance, noting the differences between the investment strategy of the fund and those of its peer group.
The Board concluded that the performance of the fund has generally been in line with or outperformed the historical performance of comparable funds.
Fees and expenses. The Board reviewed comparative information prepared by an independent third-party provider of mutual fund data, including, among other data, the fund’s contractual and net management fees and total expenses as compared to similarly situated investment companies deemed to be comparable to the fund. The Board considered the fund’s ranking within a smaller group of peer funds chosen by the independent third-party provider, as well as the fund’s ranking within a broader group of funds. In comparing the fund’s contractual and net management fees to those of comparable funds, the Board noted that such fees include both advisory and administrative costs.
The Board noted that net management fees and total expenses for this fund are higher than the peer group medians. The Board took into account management’s discussion of the fund’s expenses.
The Board took into account management’s discussion with respect to the advisory/subadvisory fee structure, including the amount of the advisory fee retained by the Advisor after payment of the sub-advisory fee. The Board also took into account that management had agreed to implement an overall fee waiver across a number of funds in the complex, including the fund, which is discussed further below. The Board also noted that, in addition, the Advisor is currently waiving fees and/or reimbursing expenses with respect to the fund. In addition, the Board noted that the Advisor effected advisory and subadvisory fee reductions in the past year with respect to the fund. The Board also noted that the Advisor pays the subadvisory fees of the fund, and that such fees are negotiated at arm’s length with respect to the Subadvisor. The Board also noted management’s discussion of the fund’s expenses, as well as certain actions taken over the past several years to reduce the fund’s operating expenses. The Board reviewed information provided by the Advisor concerning investment advisory fees charged to other clients (including other funds in the complex) having similar investment mandates, if any. The Board considered any differences between the Advisor’s and Subadvisor’s services to the fund and the services they provide to other comparable clients or funds. The Board concluded that the advisory fee paid with respect to the fund is reasonable.
Profitability/indirect benefits. In considering the costs of the services to be provided and the profits to be realized by the Advisor and its affiliates from the Advisor’s relationship with the Trust, the Board:
(a) reviewed financial information of the Advisor;
(b) reviewed and considered an analysis presented by the Advisor regarding the net profitability to the Advisor and its affiliates with respect to the fund;
| |
| 48 | Global High Yield Fund | Annual report |
(c) received and reviewed profitability information with respect to the John Hancock fund complex as a whole;
(d) received information with respect to the Advisor’s allocation methodologies used in preparing the profitability data;
(e) considered that the John Hancock insurance companies that are affiliates of the Advisor, as shareholders of the Trust directly or through their separate accounts, receive certain tax credits or deductions relating to foreign taxes paid and dividends received by certain funds of the Trust and noted that these tax benefits, which are not available to participants in qualified retirement plans under applicable income tax law, are reflected in the profitability analysis reviewed by the Board;
(f) considered that the Advisor also provides administrative services to the fund on a cost basis pursuant to an administrative services agreement;
(g) noted that affiliates of the Advisor provide transfer agency services and distribution services to the fund, and that the Trust’s distributor also receives Rule 12b-1 payments to support distribution of the fund;
(h) noted that the Advisor also derives reputational and other indirect benefits from providing advisory services to the fund;
(i) noted that the subadvisory fees for the fund are paid by the Advisor and are negotiated at arm’s length; and
(j) considered that the Advisor should be entitled to earn a reasonable level of profits in exchange for the level of services it provides to the fund and the entrepreneurial risk that it assumes as Advisor.
Based upon its review, the Board concluded that the level of profitability, if any, of the Advisor and its affiliates from their relationship with the fund was reasonable and not excessive.
Economies of scale. In considering the extent to which economies of scale would be realized as the fund grows and whether fee levels reflect these economies of scale for the benefit of fund shareholders, the Board:
(a) considered that the Advisor has agreed, effective June 1, 2013, to waive its management fee for the fund and each of the open-end funds of John Hancock Funds II, John Hancock Funds III, each other John Hancock fund (except those listed below) (the Participating Portfolios) or otherwise reimburse the expenses of the Participating Portfolios as follows (the Reimbursement):
The Reimbursement shall equal, on an annualized basis, 0.01% of that portion of the aggregate net assets of all the Participating Portfolios that exceeds $75 billion but is less than or equal to $125 billion, 0.0125% of that portion of the aggregate net assets of all the Participating Portfolios that exceeds $125 billion but is less than or equal to $150 billion and 0.015% of that portion of the aggregate net assets of all the Participating Portfolios that exceeds $150 billion. (The funds that are not Participating Portfolios as of the date of this annual report are each of the fund of funds, money market funds, index funds and closed-end funds);
(b) reviewed the Trust’s advisory fee structure and the incorporation therein of any subadvisory fee breakpoints in the advisory fees charged and concluded that (i) the fund’s fee structure contains breakpoints at the subadvisory fee level and that such breakpoints are reflected as breakpoints in the advisory fees for the fund and (ii) although economies of scale cannot
| |
| Annual report | Global High Yield Fund | 49 |
be measured with precision, these arrangements permit shareholders of the fund to benefit from economies of scale if the fund grows. The Board also took into account management’s discussion of the fund’s advisory fee structure; and
(c) the Board also considered the effect of the fund’s growth in size on its performance and fees. The Board also noted that if the fund’s assets increase over time, the fund may realize other economies of scale.
Approval of Subadvisory Agreement
In making its determination with respect to approval of the Subadvisory Agreement, the Board reviewed:
(1) information relating to the Subadvisor’s business, including current subadvisory services to the Trust (and other funds in the John Hancock family of funds);
(2) the historical and current performance of the fund, and comparative performance information relating to the fund’s benchmark and comparable funds;
(3) the subadvisory fee for the fund, including any breakpoints, and comparative fee information, where available, prepared by an independent third-party provider of mutual fund data; and
(4) information relating to the nature and scope of any material relationships and their significance to the Trust’s Advisor and Subadvisor.
Nature, extent, and quality of services. With respect to the services provided by the Subadvisor, the Board received information provided to the Board by the Subadvisor, including the Subadvisor’s Form ADV, as well as took into account information presented throughout the past year. The Board considered the Subadvisor’s current level of staffing and its overall resources, as well as received information relating to the Subadvisor’s compensation program. The Board reviewed the Subadvisor’s history and investment experience, as well as information regarding the qualifications, background, and responsibilities of the Subadvisor’s investment and compliance personnel who provide services to the fund. The Board also considered, among other things, the Subadvisor’s compliance program and any disciplinary history. The Board also considered the Subadvisor’s risk assessment and monitoring process. The Board reviewed the Subadvisor’s regulatory history, including whether it was currently involved in any regulatory actions or investigations as well as material litigation, and any settlements and amelioratory actions undertaken, as appropriate. The Board noted that the Advisor conducts regular, periodic reviews of the Subadvisor and its operations, including regarding investment processes and organizational and staffing matters. The Board also noted that the Trust’s CCO and his staff conduct regular, periodic compliance reviews with the Subadvisor and present reports to the Independent Trustees regarding the same, which includes evaluating the regulatory compliance systems of the Subadvisor and procedures reasonably designed by it to assure compliance with the federal securities laws. The Board also took into account the financial condition of the Subadvisor.
The Board considered the Subadvisor’s investment process and philosophy. The Board took into account that the Subadvisor’s responsibilities include the development and maintenance of an investment program for the fund, that is consistent with the fund’s investment objective(s), the selection of investment securities and the placement of orders for the purchase and sale of such securities, as well as the implementation of compliance controls related to performance of these services. The Board also received information with respect to the Subadvisor’s brokerage policies and practices, including with respect to best execution and soft dollars.
Subadvisor compensation. In considering the cost of services to be provided by the Subadvisor and the profitability to the Subadvisor of its relationship with the fund, the Board noted that the fees under the Subadvisory Agreement are paid by the Advisor and not the fund.
| |
| 50 | Global High Yield Fund | Annual report |
The Board also relied on the ability of the Advisor to negotiate the Subadvisory Agreement with the Subadvisor, which is not affiliated with the Advisor, and the fees thereunder at arm’s length. As a result, the costs of the services to be provided and the profits to be realized by the Subadvisor from its relationship with the Trust were not a material factor in the Board’s consideration of the Subadvisory Agreement.
The Board also received information regarding the nature and scope (including their significance to the Advisor and its affiliates and to the Subadvisor) of any material relationships with respect to the Subadvisor, which includes arrangements in which the Subadvisor or its affiliates provide advisory, distribution, or management services in connection with financial products sponsored by the Trust’s Advisor or its affiliates, and may include other registered investment companies, a 529 education savings plan, managed separate account, and exempt group annuity contracts sold to qualified plans. The Board also received information and took into account any other potential conflicts of interest the Advisor might have in connection with the Subadvisory Agreement.
In addition, the Board considered other potential indirect benefits that the Subadvisor and its affiliates may receive from the Subadvisor’s relationship with the fund, such as the opportunity to provide advisory services to additional funds in the John Hancock fund complex and reputational benefits.
Subadvisory fees. The Board considered that the fund pays an advisory fee to the Advisor and that, in turn, the Advisor pays a subadvisory fee to the Subadvisor. The Board also took into account the sub-advisory fees paid by the Advisor to the Subadvisor with respect to the fund to fees charged by the fund’s Subadvisor to manage other subadvised portfolios and portfolios not subject to regulation under the 1940 Act, as applicable.
Subadvisor performance. As noted above, the Board considered the fund’s performance as compared to the fund’s peer group and benchmark and noted that the Board reviews information about the fund’s performance results at its regularly scheduled meetings. The Board noted the Advisor’s expertise and resources in monitoring the performance, investment style, and risk-adjusted performance of the Subadvisor. The Board was mindful of the Advisor’s focus on the Subadvisor’s performance. The Board also noted the Subadvisor’s long-term performance record for similar accounts, as applicable.
The Board’s decision to approve the Subadvisory Agreement was based on a number of determinations, including the following:
(1) The Subadvisor has extensive experience and demonstrated skills as a manager;
(2) The performance of the fund generally has been in line with or outperformed the historical performance of comparable funds and the fund’s overall performance is satisfactory;
(3) The subadvisory fees are reasonable in relation to the level and quality of services being provided; and
(4) Subadvisory fee breakpoints are reflected as breakpoints in the advisory fees for the fund in order to permit shareholders to benefit from economies of scale if the fund grows.
Based on the Board’s evaluation of all factors that the Board deemed to be material, including those factors described above, the Board, including the Independent Trustees, concluded that renewal of the Advisory Agreement and the Subadvisory Agreement would be in the best interest of the fund and its shareholders. Accordingly, the Board, and the Independent Trustees voting separately, approved the Advisory Agreement and Subadvisory Agreement for an additional one-year period.
| |
| Annual report | Global High Yield Fund | 51 |
Trustees and Officers
This chart provides information about the Trustees and Officers who oversee your John Hancock fund. Officers elected by the Trustees manage the day-to-day operations of the fund and execute policies formulated by the Trustees.
| | |
| Independent Trustees | | |
| | | |
| Name, year of birth | Trustee | Number of John |
| Position(s) held with fund | of the | Hancock funds |
| Principal occupation(s) and other | Trust | overseen by |
| directorships during past 5 years | since1 | Trustee |
| |
| James M. Oates, Born: 1946 | 2012 | 231 |
|
| Managing Director, Wydown Group (financial consulting firm) (since 1994); Chairman and Director, |
| Emerson Investment Management, Inc. (since 2000); Independent Chairman, Hudson Castle Group, Inc. |
| (formerly IBEX Capital Markets, Inc.) (financial services company) (1997–2011); Director, Stifel Financial |
| (since 1996); Director, Investor Financial Services Corporation (1995–2007); Director, Connecticut River |
| Bancorp (since 1998); Director, Virtus Funds (formerly Phoenix Mutual Funds) (since 1988). Trustee |
| and Chairperson of the Board, John Hancock retail funds (since 2012); Trustee (2005–2006 and since |
| 2012) and Chairperson of the Board (since 2012), John Hancock Funds III; Trustee (since 2004) and |
| Chairperson of the Board (since 2005), John Hancock Variable Insurance Trust; Trustee and Chairperson |
| of the Board (since 2005), John Hancock Funds II. | | |
| |
| Charles L. Bardelis,3 Born: 1941 | 2012 | 231 |
|
| Director, Island Commuter Corp. (marine transport). Trustee, John Hancock retail funds (since 2012); |
| Trustee, John Hancock Funds III (2005–2006 and since 2012); Trustee, John Hancock Variable Insurance |
| Trust (since 1988); Trustee, John Hancock Funds II (since 2005). | | |
| |
| Peter S. Burgess,3 Born: 1942 | 2012 | 231 |
|
| Consultant (financial, accounting, and auditing matters) (since 1999); Certified Public Accountant; |
| Partner, Arthur Andersen (independent public accounting firm) (prior to 1999); Director, Lincoln |
| Educational Services Corporation (since 2004); Director, Symetra Financial Corporation (since 2010); |
| former Director, PMA Capital Corporation (2004–2010). Trustee, John Hancock retail funds (since 2012); |
| Trustee, John Hancock Funds III (2005–2006 and since 2012); Trustee, John Hancock Variable Insurance |
| Trust and John Hancock Funds II (since 2005). | | |
| |
| William H. Cunningham,2 Born: 1944 | 1994 | 231 |
|
| Professor, University of Texas, Austin, Texas (since 1971); former Chancellor, University of Texas |
| System and former President of the University of Texas, Austin, Texas; Director, LIN Television (since |
| 2009); Chairman (since 2009) and Director (since 2006), Lincoln National Corporation (insurance); |
| Director, Resolute Energy Corporation (since 2009); Director, Southwest Airlines (since 2000); former |
| Director, Introgen (manufacturer of biopharmaceuticals) (until 2008); former Director, Hicks Acquisition |
| Company I, Inc. (until 2007); former Director, Texas Exchange Bank, SSB (formerly Bank of Crowley) |
| (until 2009); former Advisory Director, JPMorgan Chase Bank (formerly Texas Commerce Bank–Austin) |
| (until 2009). Trustee, John Hancock retail funds (since 1986); Trustee, John Hancock Variable Insurance |
| Trust (since 2012); Trustee, John Hancock Funds II (since 2012 and 2005–2006). | |
| |
| Grace K. Fey, Born: 1946 | 2012 | 231 |
|
| Chief Executive Officer, Grace Fey Advisors (since 2007); Director and Executive Vice President, |
| Frontier Capital Management Company (1988–2007); Director, Fiduciary Trust (since 2009). |
| Trustee, John Hancock retail funds (since 2012); Trustee, John Hancock Variable Insurance Trust and |
| John Hancock Funds II (since 2008). | | |
| |
| 52 | Global High Yield Fund | Annual report |
| | |
| Independent Trustees (continued) | | |
| |
| Name, year of birth | Trustee | Number of John |
| Position(s) held with fund | of the | Hancock funds |
| Principal occupation(s) and other | Trust | overseen by |
| directorships during past 5 years | since1 | Trustee |
| |
| Theron S. Hoffman,3 Born: 1947 | 2012 | 231 |
|
| Chief Executive Officer, T. Hoffman Associates, LLC (consulting firm) (since 2003); Director, The Todd |
| Organization (consulting firm) (2003–2010); President, Westport Resources Management (investment |
| management consulting firm) (2006–2008); Senior Managing Director, Partner, and Operating Head, |
| Putnam Investments (2000–2003); Executive Vice President, The Thomson Corp. (financial and |
| legal information publishing) (1997–2000). Trustee, John Hancock retail funds (since 2012); Trustee, |
| John Hancock Variable Insurance Trust and John Hancock Funds II (since 2008). | |
| |
| Deborah C. Jackson,2 Born: 1952 | 2008 | 231 |
|
| President, Cambridge College, Cambridge, Massachusetts (since 2011); Chief Executive Officer, |
| American Red Cross of Massachusetts Bay (2002–2011); Board of Directors of Eastern Bank Corporation |
| (since 2001); Board of Directors of Eastern Bank Charitable Foundation (since 2001); Board of Directors |
| of American Student Assistance Corporation (1996–2009); Board of Directors of Boston Stock Exchange |
| (2002–2008); Board of Directors of Harvard Pilgrim Healthcare (health benefits company) (2007–2011). |
| Trustee, John Hancock retail funds (since 2008); Trustee of John Hancock Variable Insurance Trust and |
| John Hancock Funds II (since 2012). | | |
| |
| Hassell H. McClellan, Born: 1945 | 2012 | 231 |
|
| Associate Professor, The Wallace E. Carroll School of Management, Boston College (since 1984); |
| Trustee, Virtus Variable Insurance Trust (formerly Phoenix Edge Series Funds) (since 2008); Director, |
| The Barnes Group (since 2010). Trustee, John Hancock retail funds (since 2012); Trustee, John Hancock |
| Funds III (2005–2006 and since 2012); Trustee, John Hancock Variable Insurance Trust and | |
| John Hancock Funds II (since 2005). | | |
| |
| Steven R. Pruchansky,2 Born: 1944 | 1991 | 231 |
|
| Chairman and Chief Executive Officer, Greenscapes of Southwest Florida, Inc. (since 2000); Director |
| and President, Greenscapes of Southwest Florida, Inc. (until 2000); Member, Board of Advisors, First |
| American Bank (until 2010); Managing Director, Jon James, LLC (real estate) (since 2000); Director, |
| First Signature Bank & Trust Company (until 1991); Director, Mast Realty Trust (until 1994); President, |
| Maxwell Building Corp. (until 1991). Trustee (since 1992) and Chairperson of the Board (2011–2012), |
| John Hancock retail funds; Trustee and Vice Chairperson of the Board, John Hancock retail funds, |
| John Hancock Variable Insurance Trust and John Hancock Funds II (since 2012). | |
| |
| Gregory A. Russo,2 Born: 1949 | 2009 | 231 |
|
| Director and Audit Committee Chairman (since 2012) and Member, Audit Committee and Finance |
| Committee (since 2011), NCH Healthcare System, Inc. (holding company for multi-entity healthcare |
| system); Director and Member of Finance Committee, The Moorings, Inc. (nonprofit continuing care |
| community) (since 2012); Vice Chairman, Risk & Regulatory Matters, KPMG LLP (KPMG) (2002–2006); |
| Vice Chairman, Industrial Markets, KPMG (1998–2002); Chairman and Treasurer, Westchester |
| County, New York, Chamber of Commerce (1986–1992); Director, Treasurer and Chairman of |
| Audit and Finance Committees, Putnam Hospital Center (1989–1995); Director and Chairman of |
| Fundraising Campaign, United Way of Westchester and Putnam Counties, New York (1990–1995). |
| Trustee, John Hancock retail funds (since 2008); Trustee, John Hancock Variable Insurance Trust and |
| John Hancock Funds II (since 2012). | | |
| |
| Annual report | Global High Yield Fund | 53 |
| | |
| Non-Independent Trustees4 | | |
| | | |
| Name, year of birth | Trustee | Number of John |
| Position(s) held with fund | of the | Hancock funds |
| Principal occupation(s) and other | Trust | overseen by |
| directorships during past 5 years | since1 | Trustee |
| |
| James R. Boyle, Born: 1959 | 2012 | 231 |
|
| Senior Executive Vice President, John Hancock Financial Services (1999–2012, including prior positions); |
| Chairman and Director, John Hancock Advisers, LLC, John Hancock Funds, LLC, and John Hancock |
| Investment Management Services, LLC (2005–2010). Trustee, John Hancock retail funds (since 2012 and |
| 2005–2010), Trustee, John Hancock Variable Insurance Trust and John Hancock Funds II (since 2005). |
| |
| Craig Bromley,2 Born: 1966 | 2012 | 231 |
|
| President, John Hancock Financial Services (since 2012); Senior Executive Vice President and General |
| Manager, U.S. Division, John Hancock Financial Services (since 2012); President and Chief Executive |
| Officer, Manulife Insurance Company (Manulife (Japan) (2005–2012), including prior positions). |
| Trustee, John Hancock retail funds (since 2012); Trustee, John Hancock Variable Insurance Trust and |
| John Hancock Funds II (since 2012). | | |
| |
| Warren A. Thomson,2 Born: 1955 | 2012 | 231 |
|
| Senior Executive Vice President and Chief Investment Officer, Manulife Financial Corporation and The |
| Manufacturers Life Insurance Company (since 2009); Chairman and Chief Executive Officer, Manulife |
| Asset Management (since 2001, including prior positions); Director (since 2006), and President and |
| Chief Executive Officer of Manulife Asset Management Limited (since 2013); Director and Chairman, |
| Hancock Natural Resources Group, Inc. (since 2013). Trustee, John Hancock retail funds, John Hancock |
| Variable Insurance Trust and John Hancock Funds II (since 2012). | | |
| |
| Principal officers who are not Trustees | | |
| | | |
| Name, year of birth | | Officer |
| Position(s) held with fund | | of the |
| Principal occupation(s) and other | | Trust |
| directorships during past 5 years | | since |
| |
| Hugh McHaffie, Born: 1959 | | 2009 |
|
| President | | |
| Executive Vice President, John Hancock Financial Services (since 2006, including prior positions); |
| Chairman and Director, John Hancock Advisers, LLC, John Hancock Investment Management Services, |
| LLC and John Hancock Funds, LLC (since 2010); President, John Hancock Advisers, LLC (since 2012); |
| President, John Hancock Investment Management Services, LLC (since 2010). President (since 2012) and |
| former Trustee (2010–2012), John Hancock retail funds; President, John Hancock Variable Insurance |
| Trust and John Hancock Funds II (since 2009). | | |
| |
| Andrew G. Arnott, Born: 1971 | | 2009 |
|
| Executive Vice President | | |
| Senior Vice President, John Hancock Financial Services (since 2009); Director and Executive Vice |
| President, John Hancock Advisers, LLC (since 2005, including prior positions); Director and Executive |
| Vice President, John Hancock Investment Management Services, LLC (since 2006, including prior |
| positions); President, John Hancock Funds, LLC (since 2004, including prior positions); Executive Vice |
| President, John Hancock retail funds, John Hancock Variable Insurance Trust and John Hancock Funds II |
| (since 2007, including prior positions). | | |
| |
| Thomas M. Kinzler, Born: 1955 | | 2006 |
|
| Secretary and Chief Legal Officer | | |
| Vice President, John Hancock Financial Services (since 2006); Secretary and Chief Legal Counsel, |
| John Hancock Funds, LLC (since 2007); Secretary and Chief Legal Officer, John Hancock retail funds, |
| John Hancock Variable Insurance Trust and John Hancock Funds II (since 2006). | |
| |
| 54 | Global High Yield Fund | Annual report |
| |
| Principal officers who are not Trustees (continued) | |
| |
| Name, year of birth | Officer |
| Position(s) held with fund | of the |
| Principal occupation(s) and other | Trust |
| directorships during past 5 years | since |
| |
| Francis V. Knox, Jr., Born: 1947 | 2005 |
|
| Chief Compliance Officer | |
| Vice President, John Hancock Financial Services (since 2005); Chief Compliance Officer, John Hancock |
| retail funds, John Hancock Variable Insurance Trust, John Hancock Funds II, John Hancock Advisers, |
| LLC and John Hancock Investment Management Services, LLC (since 2005); Vice President and Chief |
| Compliance Officer, John Hancock Asset Management a division of Manulife Asset Management (US) |
| LLC (2005–2008). | |
| |
| Charles A. Rizzo, Born: 1957 | 2007 |
|
| Chief Financial Officer | |
| Vice President, John Hancock Financial Services (since 2008); Senior Vice President, John Hancock | |
| Advisers, LLC and John Hancock Investment Management Services, LLC (since 2008); Chief Financial |
| Officer, John Hancock retail funds, John Hancock Variable Insurance Trust and John Hancock Funds II |
| (since 2007). | |
| |
| Salvatore Schiavone, Born: 1965 | 2009 |
|
| Treasurer | |
| Assistant Vice President, John Hancock Financial Services (since 2007); Vice President, John Hancock |
| Advisers, LLC and John Hancock Investment Management Services, LLC (since 2007); Treasurer, | |
| John Hancock retail funds (since 2007, including prior positions); Treasurer, John Hancock Variable | |
| Insurance Trust and John Hancock Funds II (since 2010 and 2007–2009, including prior positions). | |
John Hancock retail funds is comprised of John Hancock Funds III and 34 other John Hancock funds consisting of 24 series of other John Hancock trusts and 10 closed-end funds.
The business address for all Trustees and Officers is 601 Congress Street, Boston, Massachusetts 02210-2805.
The Statement of Additional Information of the fund includes additional information about members of the Board of Trustees of the Trust and is available without charge, upon request, by calling 800-225-5291.
1 Each Trustee holds office until his or her successor is elected and qualified, or until the Trustee’s death, retirement, resignation or removal.
2 Became a Trustee of the Trust effective December 1, 2012.
3 Member of Audit Committee.
4 Because Messrs. Bromley and Thomson are senior executives or directors and Mr. Boyle held prior positions as a senior executive and director of the Advisor and/or its affiliates, each of them is considered an “interested person,” as defined in the Investment Company Act of 1940, of the Trust.
| |
| Annual report | Global High Yield Fund | 55 |
More information
| |
| Trustees | Investment advisor |
| James M. Oates, Chairperson | John Hancock Investment Management |
| Steven R. Pruchansky, Vice Chairperson | Services, LLC |
| Charles L. Bardelis* | |
| James R. Boyle† | Subadvisor |
| Craig Bromley† | Stone Harbor Investment Partners LP |
| Peter S. Burgess* | |
| William H. Cunningham | Principal distributor |
| Grace K. Fey | John Hancock Funds, LLC |
| Theron S. Hoffman* | |
| Deborah C. Jackson | Custodian |
| Hassell H. McClellan | State Street Bank and Trust Company |
| Gregory A. Russo | |
| Warren A. Thomson† | Transfer agent |
| | John Hancock Signature Services, Inc. |
| Officers | |
| Hugh McHaffie | Legal counsel |
| President | K&L Gates LLP |
| | |
| Andrew G. Arnott | Independent registered |
| Executive Vice President | public accounting firm |
| | PricewaterhouseCoopers LLP |
| Thomas M. Kinzler | |
| Secretary and Chief Legal Officer | |
| | |
| Francis V. Knox, Jr. | |
| Chief Compliance Officer | |
| | |
| Charles A. Rizzo | |
| Chief Financial Officer | |
| | |
| Salvatore Schiavone | |
| Treasurer | |
| |
| *Member of the Audit Committee | |
| †Non-Independent Trustee | |
The fund’s proxy voting policies and procedures, as well as the fund’s proxy voting record for the most recent twelve-month period ended June 30, are available free of charge on the Securities and Exchange Commission (SEC) website at sec.gov or on our website.
The fund’s complete list of portfolio holdings, for the first and third fiscal quarters, is filed with the SEC on Form N-Q. The fund’s Form N-Q is available on our website and the SEC’s website, sec.gov, and can be reviewed and copied (for a fee) at the SEC’s Public Reference Room in Washington, DC. Call 800-SEC-0330 to receive information on the operation of the SEC’s Public Reference Room.
We make this information on your fund, as well as monthly portfolio holdings, and other fund details available on our website at jhinvestments.com or by calling 800-225-5291.
| | |
| You can also contact us: | | |
| 800-225-5291 | Regular mail: | Express mail: |
| jhinvestments.com | Investment Operations | Investment Operations |
| | John Hancock Signature Services, Inc. | John Hancock Signature Services, Inc. |
| | P.O. Box 55913 | 30 Dan Road |
| | Boston, MA 02205-5913 | Canton, MA 02021 |
| |
| 56 | Global High Yield Fund | Annual report |

800-225-5291
800-338-8080 EASI-Line
jhinvestments.com
| |
| This report is for the information of the shareholders of John Hancock Global High Yield Fund. | |
| It is not authorized for distribution to prospective investors unless preceded or accompanied by a prospectus. | 352A 7/13 |
| MF150752 | 9/13 |

A look at performance
Total returns for the period ended July 31, 2013
| | | | | | | | | | |
| | | Average annual total returns (%) | | Cumulative total returns (%) | |
| | | with maximum sales charge | | | with maximum sales charge | |
|
| | | | | Since | | | | | Since |
| | | 1-year | 5-year | 10-year | inception1 | | 1-year | 5-year | 10-year | inception1 |
|
| Class A | | 6.44 | — | — | –0.85 | | 6.44 | — | — | –2.54 |
|
| Class I2 | | 10.26 | — | — | 0.62 | | 10.26 | — | — | 1.88 |
|
| Class R62,3 | | 10.34 | — | — | 0.74 | | 10.34 | — | — | 2.24 |
|
| Class NAV2 | | 10.43 | — | — | 0.82 | | 10.43 | — | — | 2.48 |
|
| Index† | | 0.05 | — | — | 0.06 | | 0.05 | — | — | 0.18 |
|
Performance figures assume all distributions have been reinvested. Figures reflect maximum sales charges on Class A shares of 3.00%.
The expense ratios of the fund, both net (including any fee waivers or expense limitations) and gross (excluding any fee waivers or expense limitations), are set forth according to the most recent publicly available prospectuses for the fund and may differ from those disclosed in the Financial highlights tables in this report. The fee waivers and expense limitations are contractual at least until 11-30-13 for Class A and Class R6 shares. Had the fee waivers and expense limitations not been in place, gross expenses would apply. For all other classes, the net expenses equal the gross expenses. The expense ratios are as follows:
| | | | | | | | |
| | Class A | Class I | Class R6 | Class NAV | | | | |
| Net (%) | 1.60 | 1.17 | 1.05 | 0.94 | | | | |
| Gross (%) | 1.74 | 1.17 | 1.40 | 0.94 | | | | |
The returns reflect past results and should not be considered indicative of future performance. The return and principal value of an investment will fluctuate so that shares, when redeemed, may be worth more or less than their original cost. Due to market volatility, the fund’s current performance may be higher or lower than the performance shown. For current to the most recent month-end performance data, please call 800-225-5291 or visit the fund’s website at jhinvestments.com.
The performance table above and the chart on the next page do not reflect the deduction of taxes that a shareholder may pay on fund distributions or on the redemption of fund shares. The fund’s performance results reflect any applicable fee waivers or expense reductions, without which the expenses would increase and results would have been less favorable.
† Index is the Citigroup 1-Month U.S. Treasury Bill Index.
See the following page for footnotes.
| |
| 6 | Currency Strategies Fund | Annual report |
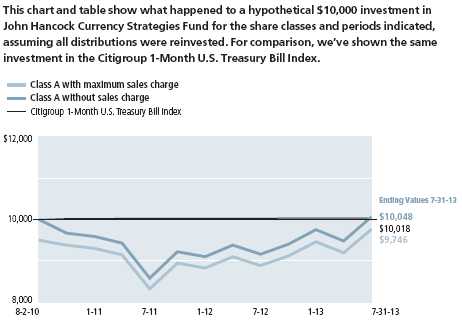
| | | | |
| | | With maximum | Without | |
| | Start date | sales charge | sales charge | Index |
|
| Class I2 | 8-2-10 | $10,188 | $10,188 | $10,018 |
|
| Class R62,3 | 8-2-10 | 10,224 | 10,224 | 10,018 |
|
| Class NAV2 | 8-2-10 | 10,248 | 10,248 | 10,018 |
|
Citigroup 1-Month U.S. Treasury Bill Index is a market value-weighted index of public obligators of the U.S. Treasury with maturities of one month.
It is not possible to invest directly in an index. Index figures do not reflect expenses or sales charges, which would have resulted in lower values if they did.
Footnotes related to performance pages
1 From 8-2-10.
2 For certain types of investors as described in the fund’s prospectuses.
3 Class R6 shares were first offered on 11-1-11. The returns prior to this date are those of Class A shares that have been recalculated to apply the gross fees and expenses of Class R6 shares.
| |
| Annual report | Currency Strategies Fund | 7 |
Management’s discussion of
Fund performance
First Quadrant, L.P.
The 12 months ended July 31, 2013 were marked by ongoing uncertainty about global recovery and the continuation of the risk-on/risk-off trade that had dominated the previous 12 months. As the period began, investors were concerned about the U.S. presidential election and the inability of politicians to agree on a budget deal. Politics also took center stage in the eurozone, where leaders and their austerity measures came under attack. Around the globe, fundamentals took a backseat to sentiment as investors moved their money between safe havens and trades involving riskier assets. In January, equities gained momentum after the U.S. Congress reached a deal to avoid most tax increases and spending cuts. Globally, stocks trended higher until June when concerns rose that the credit conditions would tighten in the United States and China. Those worries commenced after U.S. Federal Reserve Board (Fed) Chairman Ben S. Bernanke said the Fed would begin to taper bond purchases if labor markets continued to improve. That statement, combined with expectations of slowing growth in China, rippled far and wide and raised the likelihood of lower commodity prices as well as slower emerging-market growth.
For the 12 months ended July 31, 2013, John Hancock Currency Strategies Fund’s Class A shares returned 9.69%, excluding sales charges. At the same time the Citigroup 1-Month US Treasury Bill Index, the fund’s benchmark, returned 0.05%. The average return of the currency funds tracked by Morningstar, Inc. was 0.08%.† Despite the myriad concerns, investors maintained their appetite for higher-risk assets over the first half of the period. As a result, we saw a drop in volatility in the currency market. The European Central Bank’s pledge of support for the euro and improved investor confidence contributed to a drop in risk aversion. Our long positions in the euro and Norwegian krone thus contributed to the portfolio’s performance, while short positions in the New Zealand and Australian dollars also helped. Tactical repositioning on the yen also helped performance. For the 12-month period, our positions in the euro, yen, and Norwegian krone were among the top contributors to the fund’s performance.
This commentary reflects the views of the portfolio managers through the end of the period discussed in this report. The managers’ statements reflect their own opinions. As such, they are in no way guarantees of future events and are not intended to be used as investment advice or a recommendation regarding any specific security. They are also subject to change at any time as market and other conditions warrant.
Past performance is no guarantee of future results.
† Figures from Morningstar, Inc. include reinvested dividends and do not take into account sales charges. Actual load-adjusted performance is lower.
| |
| 8 | Currency Strategies Fund | Annual report |
Your expenses
These examples are intended to help you understand your ongoing operating expenses of investing in the fund so you can compare these costs with the ongoing costs of investing in other mutual funds.
Understanding fund expenses
As a shareholder of the fund, you incur two types of costs:
▪ Transaction costs, which include sales charges (loads) on purchases or redemptions (varies by share class), minimum account fee charge, etc.
▪ Ongoing operating expenses, including management fees, distribution and service fees (if applicable) and other fund expenses.
We are going to present only your ongoing operating expenses here.
Actual expenses/actual returns
This example is intended to provide information about the fund’s actual ongoing operating expenses and is based on the fund’s actual return. It assumes an account value of $1,000.00 on February 1, 2013, with the same investment held until July 31, 2013.
| | | |
| | Account value | Ending value | Expenses paid during |
| | on 2-1-13 | on 7-31-13 | period ended on 7-31-131 |
|
| Class A | $1,000.00 | $1,030.10 | $8.05 |
|
| Class I | 1,000.00 | 1,032.90 | 5.49 |
|
| Class R6 | 1,000.00 | 1,032.80 | 5.29 |
|
| Class NAV | 1,000.00 | 1,033.70 | 4.59 |
|
Together with the value of your account, you may use this information to estimate the operating expenses that you paid over the period. Simply divide your account value at July 31, 2013, by $1,000.00, then multiply it by the “expenses paid” for your share class from the table above. For example, for an account value of $8,600.00, the operating expenses should be calculated as follows:
| |
| Annual report | Currency Strategies Fund | 9 |
Your expenses
Hypothetical example for comparison purposes
This table allows you to compare the fund’s ongoing operating expenses with those of any other fund. It provides an example of the fund’s hypothetical account values and hypothetical expenses based on each class’s actual expense ratio and an assumed 5% annualized return before expenses (which is not the fund’s actual return). It assumes an account value of $1,000.00 on February 1, 2013, with the same investment held until July 31, 2013. Look in any other fund shareholder report to find its hypothetical example and you will be able to compare these expenses. Please remember that these hypothetical account values and expenses may not be used to estimate the actual ending account balance or expenses you paid for the period.
| | | |
| | Account value | Ending value | Expenses paid during |
| | on 2-1-13 | on 7-31-13 | period ended on 7-31-131 |
|
| Class A | $1,000.00 | $1,016.90 | $8.00 |
|
| Class I | 1,000.00 | 1,019.40 | 5.46 |
|
| Class R6 | 1,000.00 | 1,019.60 | 5.26 |
|
| Class NAV | 1,000.00 | 1,020.30 | 4.56 |
|
Remember, these examples do not include any transaction costs, therefore, these examples will not help you to determine the relative total costs of owning different funds. If transaction costs were included, your expenses would have been higher. See the prospectus for details regarding transaction costs.
1 Expenses are equal to the fund’s annualized expense ratio of 1.60%, 1.09%, 1.05% and 0.91% for Class A, Class I, Class R6 and Class NAV shares, respectively, multiplied by the average account value over the period, multiplied by 181/365 (to reflect the one-half year period).
| |
| 10 | Currency Strategies Fund | Annual report |
Currency allocation1
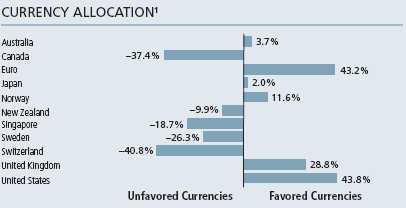
1 As a percentage of net assets on 7-31-13. The fund’s assets are exposed to both short (unfavored) and long (favored) currency positions.
| |
| Annual report | Currency Strategies Fund | 11 |
Fund’s investments
As of 7-31-13
| | | | |
| Short-Term Investments 101.6% | | | $1,214,194,871 |
|
| (Cost $1,214,148,105) | | | | |
| | | Maturity | | |
| | Yield (%)* | date | Par value | Value |
| | | | |
| U.S. Government 94.6% | | | 1,130,941,618 |
| | | | | |
| U.S. Treasury Bill | 0.052 | 9-19-13 | 540,000,000 | 539,980,020 |
|
| U.S. Treasury Bill | 0.053 | 9-26-13 | 466,000,000 | 465,978,098 |
|
| U.S. Treasury Bill | 0.092 | 11-21-13 | 125,000,000 | 124,983,500 |
| | | | | |
| | | Yield (%) | Shares | Value |
| | | | | |
| Money Market Funds 7.0% | | | | 83,253,253 |
| | | | | |
| State Street Institutional Liquid Reserves Fund | | 0.077 (Y) | 83,253,253 | 83,253,253 |
| |
| Total investments (Cost $1,214,148,105)† 101.6% | | $1,214,194,871 |
|
| Other assets and liabilities, net (1.6%) | | | ($19,324,227) |
|
| Total net assets 100.0% | | | $1,194,870,644 |
|
The percentage shown for each investment category is the total value of that category as a percentage of the net assets of the Fund.
* Yield represents the annualized yield at the date of purchase.
(Y) The rate shown is the annualized seven-day yield as of 7-31-13.
† At 7-31-13, the aggregate cost of investment securities for federal income tax purposes was $1,214,148,105. Unrealized appreciation on investment securities was $46,766 as of 7-31-13.
The following table summarizes the forward foreign currency contracts held by the fund at 7-31-13:
| | | | | | | | | | |
| | | | | | | | CONTRACTUAL | | | NET UNREALIZED |
| CONTRACT | | CONTRACT | | | SETTLEMENT | UNREALIZED | UNREALIZED | APPRECIATION/ |
| TO BUY | | TO SELL | | COUNTERPARTY | DATE | APPRECIATION | DEPRECIATION | (DEPRECIATION) |
|
| AUD | 220,261,937 | | USD | 201,950,695 | | Barclays Bank PLC | 9-18-13 | — | ($4,598,365) | ($4,598,365) |
| | | | | | | Wholesale | | | | |
| AUD | 220,261,937 | | USD | 202,526,353 | | J. Aron & Company | 9-18-13 | — | (5,174,022) | (5,174,022) |
| AUD | 36,314,608 | | USD | 33,155,520 | | Morgan Stanley | 9-18-13 | — | (618,021) | (618,021) |
| | | | | | | Capital Services, | | | | |
| | | | | | | Inc. | | | | |
| CAD | 18,259,051 | | USD | 17,599,768 | | Barclays Bank PLC | 9-18-13 | $157,377 | — | 157,377 |
| | | | | | | Wholesale | | | | |
| CAD | 97,690,444 | | USD | 93,590,771 | | J. Aron & Company | 9-18-13 | 1,414,352 | — | 1,414,352 |
| CAD | 33,721,847 | | USD | 31,956,960 | | Morgan Stanley | 9-18-13 | 837,939 | — | 837,939 |
| | | | | | | Capital Services, | | | | |
| | | | | | | Inc. | | | | |
| CHF | 82,172,282 | | USD | 87,605,606 | | Barclays Bank PLC | 9-18-13 | 1,220,621 | — | 1,220,621 |
| | | | | | | Wholesale | | | | |
| | |
| 12 | Currency Strategies Fund | Annual report | See notes to financial statements |
| | | | | | | | | | |
| | | | | | | | CONTRACTUAL | | | NET UNREALIZED |
| CONTRACT | | CONTRACT | | | SETTLEMENT | UNREALIZED | UNREALIZED | APPRECIATION/ |
| TO BUY | | TO SELL | | COUNTERPARTY | DATE | APPRECIATION | DEPRECIATION | (DEPRECIATION) |
|
| CHF | 82,172,282 | | USD | 87,557,138 | | J. Aron & Company | 9-18-13 | $1,269,089 | — | $1,269,089 |
| EUR | 281,119,251 | | USD | 374,278,791 | | Barclays Bank PLC | 9-18-13 | — | ($234,950) | (234,950) |
| | | | | | | Wholesale | | | | |
| EUR | 281,119,251 | | USD | 373,401,441 | | J. Aron & Company | 9-18-13 | 642,400 | — | 642,400 |
| EUR | 237,431,068 | | USD | 314,847,186 | | Morgan Stanley | 9-18-13 | 1,067,246 | — | 1,067,246 |
| | | | | | | Capital Services, | | | | |
| | | | | | | Inc. | | | | |
| GBP | 117,292,049 | | USD | 182,345,152 | | Barclays Bank PLC | 9-18-13 | — | (3,972,016) | (3,972,016) |
| | | | | | | Wholesale | | | | |
| GBP | 91,876,246 | | USD | 142,603,418 | | J. Aron & Company | 9-18-13 | — | (2,881,636) | (2,881,636) |
| GBP | 91,876,246 | | USD | 143,164,047 | | Morgan Stanley | 9-18-13 | — | (3,442,265) | (3,442,265) |
| | | | | | | Capital Services, | | | | |
| | | | | | | Inc. | | | | |
| JPY | 4,091,147,249 | | USD | 41,942,826 | | Barclays Bank PLC | 9-18-13 | — | (147,720) | (147,720) |
| | | | | | | Wholesale | | | | |
| JPY | 9,008,201,551 | | USD | 91,393,724 | | J. Aron & Company | 9-18-13 | 633,944 | — | 633,944 |
| JPY | 4,754,824,964 | | USD | 49,156,401 | | Morgan Stanley | 9-18-13 | — | (581,173) | (581,173) |
| | | | | | | Capital Services, | | | | |
| | | | | | | Inc. | | | | |
| NOK | 488,494,553 | | USD | 83,461,499 | | Barclays Bank PLC | 9-18-13 | — | (707,267) | (707,267) |
| | | | | | | Wholesale | | | | |
| NOK | 574,920,892 | | USD | 97,609,788 | | J. Aron & Company | 9-18-13 | — | (214,358) | (214,358) |
| NOK | 376,112,548 | | USD | 63,049,046 | | Morgan Stanley | 9-18-13 | 666,926 | — | 666,926 |
| | | | | | | Capital Services, | | | | |
| | | | | | | Inc. | | | | |
| NZD | 172,329,009 | | USD | 135,147,993 | | Barclays Bank PLC | 9-18-13 | 2,028,238 | — | 2,028,238 |
| | | | | | | Wholesale | | | | |
| NZD | 172,329,009 | | USD | 135,182,973 | | J. Aron & Company | 9-18-13 | 1,993,259 | — | 1,993,259 |
| NZD | 32,299,654 | | USD | 25,234,848 | | Morgan Stanley | 9-18-13 | 476,116 | — | 476,116 |
| | | | | | | Capital Services, | | | | |
| | | | | | | Inc. | | | | |
| SEK | 291,586,989 | | USD | 44,420,639 | | Barclays Bank PLC | 9-18-13 | 268,397 | — | 268,397 |
| | | | | | | Wholesale | | | | |
| SEK | 87,460,692 | | USD | 13,440,376 | | J. Aron & Company | 9-18-13 | — | (36,026) | (36,026) |
| SEK | 13,546,519 | | USD | 2,057,278 | | Morgan Stanley | 9-18-13 | 18,881 | — | 18,881 |
| | | | | | | Capital Services, | | | | |
| | | | | | | Inc. | | | | |
| SGD | 39,169,213 | | USD | 31,017,503 | | Barclays Bank PLC | 9-18-13 | — | (194,776) | (194,776) |
| | | | | | | Wholesale | | | | |
| SGD | 39,169,213 | | USD | 31,034,214 | | J. Aron & Company | 9-18-13 | — | (211,488) | (211,488) |
| USD | 180,137,551 | | AUD | 193,289,224 | | Barclays Bank PLC | 9-18-13 | 6,952,482 | — | 6,952,482 |
| | | | | | | Wholesale | | | | |
| USD | 180,371,622 | | AUD | 193,289,224 | | J. Aron & Company | 9-18-13 | 7,186,553 | — | 7,186,553 |
| USD | 38,437,374 | | AUD | 41,055,219 | | Morgan Stanley | 9-18-13 | 1,652,339 | — | 1,652,339 |
| | | | | | | Capital Services, | | | | |
| | | | | | | Inc. | | | | |
| USD | 154,935,863 | | CAD | 159,449,145 | | Barclays Bank PLC | 9-18-13 | — | (130,335) | (130,335) |
| | | | | | | Wholesale | | | | |
| USD | 232,075,158 | | CAD | 238,880,538 | | J. Aron & Company | 9-18-13 | — | (239,020) | (239,020) |
| USD | 205,189,069 | | CAD | 211,466,501 | | Morgan Stanley | 9-18-13 | — | (464,631) | (464,631) |
| | | | | | | Capital Services, | | | | |
| | | | | | | Inc. | | | | |
| USD | 248,357,886 | | CHF | 229,515,064 | | Barclays Bank PLC | 9-18-13 | 257,716 | — | 257,716 |
| | | | | | | Wholesale | | | | |
| USD | 247,699,525 | | CHF | 229,515,064 | | J. Aron & Company | 9-18-13 | — | (400,644) | (400,644) |
| | |
| See notes to financial statements | Annual report | Currency Strategies Fund | 13 |
| | | | | | | | | | |
| | | | | | | | CONTRACTUAL | | | NET UNREALIZED |
| CONTRACT | | CONTRACT | | | SETTLEMENT | UNREALIZED | UNREALIZED | APPRECIATION/ |
| TO BUY | | TO SELL | | COUNTERPARTY | DATE | APPRECIATION | DEPRECIATION | (DEPRECIATION) |
|
| USD | 167,956,488 | | CHF | 156,781,782 | | Morgan Stanley | 9-18-13 | — | ($1,520,783) | ($1,520,783) |
| | | | | | | Capital Services, | | | | |
| | | | | | | Inc. | | | | |
| USD | 207,553,425 | | EUR | 158,305,990 | | Barclays Bank PLC | 9-18-13 | — | (3,080,960) | (3,080,960) |
| | | | | | | Wholesale | | | | |
| USD | 207,271,099 | | EUR | 158,305,990 | | J. Aron & Company | 9-18-13 | — | (3,363,286) | (3,363,286) |
| USD | 123,604,687 | | EUR | 94,869,353 | | Morgan Stanley | 9-18-13 | — | (2,623,940) | (2,623,940) |
| | | | | | | Capital Services, | | | | |
| | | | | | | Inc. | | | | |
| USD | 75,541,766 | | GBP | 49,919,369 | | Barclays Bank PLC | 9-18-13 | — | (373,648) | (373,648) |
| | | | | | | Wholesale | | | | |
| USD | 37,166,825 | | GBP | 24,503,566 | | J. Aron & Company | 9-18-13 | — | (97,235) | (97,235) |
| USD | 14,301,712 | | JPY | 1,364,012,943 | | Barclays Bank PLC | 9-18-13 | $366,974 | — | 366,974 |
| | | | | | | Wholesale | | | | |
| USD | 64,829,893 | | JPY | 6,281,067,245 | | J. Aron & Company | 9-18-13 | 662,593 | — | 662,593 |
| USD | 81,634,635 | | JPY | 7,877,527,430 | | Morgan Stanley | 9-18-13 | 1,157,919 | — | 1,157,919 |
| | | | | | | Capital Services, | | | | |
| | | | | | | Inc. | | | | |
| USD | 34,748,069 | | NOK | 203,729,445 | | Barclays Bank PLC | 9-18-13 | 234,943 | — | 234,943 |
| | | | | | | Wholesale | | | | |
| USD | 48,676,613 | | NOK | 290,155,784 | | J. Aron & Company | 9-18-13 | — | (477,710) | (477,710) |
| USD | 20,308,465 | | NOK | 125,670,722 | | Morgan Stanley | 9-18-13 | — | (980,993) | (980,993) |
| | | | | | | Capital Services, | | | | |
| | | | | | | Inc. | | | | |
| USD | 202,936,303 | | NZD | 262,753,437 | | Barclays Bank PLC | 9-18-13 | — | (6,219,002) | (6,219,002) |
| | | | | | | Wholesale | | | | |
| USD | 203,352,768 | | NZD | 262,753,437 | | J. Aron & Company | 9-18-13 | — | (5,802,538) | (5,802,538) |
| USD | 142,795,056 | | SEK | 943,479,063 | | Barclays Bank PLC | 9-18-13 | — | (1,803,884) | (1,803,884) |
| | | | | | | Wholesale | | | | |
| USD | 112,232,574 | | SEK | 739,352,766 | | J. Aron & Company | 9-18-13 | — | (1,081,679) | (1,081,679) |
| USD | 113,794,474 | | SEK | 760,270,984 | | Morgan Stanley | 9-18-13 | — | (2,725,736) | (2,725,736) |
| | | | | | | Capital Services, | | | | |
| | | | | | | Inc. | | | | |
| USD | 127,374,072 | | SGD | 160,567,118 | | Barclays Bank PLC | 9-18-13 | 1,021,867 | — | 1,021,867 |
| | | | | | | Wholesale | | | | |
| USD | 127,485,822 | | SGD | 160,567,118 | | J. Aron & Company | 9-18-13 | 1,133,618 | — | 1,133,618 |
| USD | 32,863,754 | | SGD | 41,294,621 | | Morgan Stanley | 9-18-13 | 368,519 | — | 368,519 |
| | | | | | | Capital Services, | | | | |
| | | | | | | Inc. | | | | |
| | | | | | | | | $33,690,308 | ($54,400,107) | ($20,709,799) |
Currency Abbreviations
| | | | | |
| AUD | Australian Dollar | NOK | Norwegian Krone | | |
| CAD | Canadian Dollar | NZD | New Zealand Dollar | | |
| CHF | Swiss Franc | SEK | Swedish Krona | | |
| EUR | Euro | SGD | Singapore Dollar | | |
| GBP | Pound Sterling | USD | United States Dollar | | |
| JPY | Japanese Yen | | | | |
| | |
| 14 | Currency Strategies Fund | Annual report | See notes to financial statements |
FINANCIAL STATEMENTS
Financial statements
Statement of assets and liabilities 7-31-13
This Statement of assets and liabilities is the fund’s balance sheet. It shows the value of what the fund owns, is due and owes. You’ll also find the net asset value and the maximum offering price per share.
| |
| Assets | |
|
| Investments, at value (Cost $1,214,148,105) | $1,214,194,871 |
| Receivable for fund shares sold | 1,646,264 |
| Receivable for forward foreign currency exchange contracts | 33,690,308 |
| Interest receivable | 4,681 |
| Receivable due from Advisor | 315 |
| Other receivables and prepaid expenses | 31,017 |
| | |
| Total assets | 1,249,567,456 |
| |
| Liabilities | |
|
| Payable for forward foreign currency exchange contracts | 54,400,107 |
| Payable for fund shares repurchased | 157,612 |
| Payable to affiliates | |
| Accounting and legal services fees | 26,372 |
| Transfer agent fees | 9,430 |
| Trustees’ fees | 1,073 |
| Other liabilities and accrued expenses | 102,218 |
| | |
| Total liabilities | 54,696,812 |
| | |
| Net assets | $1,194,870,644 |
| |
| Net assets consist of | |
|
| Paid-in capital | $1,120,126,787 |
| Accumulated net realized gain (loss) on investments and foreign | |
| currency transactions | 95,406,890 |
| Net unrealized appreciation (depreciation) on investments and translation | |
| of assets and liabilities in foreign currencies | (20,663,033) |
| | |
| Net assets | $1,194,870,644 |
| |
| Net asset value per share | |
|
| Based on net asset values and shares outstanding — the fund has an | |
| unlimited number of shares authorized with no par value | |
| Class A ($28,463,187 ÷ 2,871,234 shares)1 | $9.91 |
| Class I ($64,625,305 ÷ 6,429,413 shares) | $10.05 |
| Class R6 ($3,891,291 ÷ 385,507 shares) | $10.09 |
| Class NAV ($1,097,890,861 ÷ 108,541,035 shares) | $10.11 |
| |
| Maximum offering price per share | |
|
| Class A (net asset value per share ÷ 97%)2 | $10.22 |
1 Redemption price is equal to net asset value less any applicable contingent deferred sales charge.
2 On single retail sales of less than $100,000. On sales of $100,000 or more and on group sales the offering price is reduced.
| | |
| See notes to financial statements | Annual report | Currency Strategies Fund | 15 |
FINANCIAL STATEMENTSStatement of operations For the year ended 7-31-13
This Statement of operations summarizes the fund’s investment income earned and expenses incurred in operating the fund. It also shows net gains (losses) for the period stated.
| |
| Investment income | |
|
| Interest | $1,097,300 |
| |
| Expenses | |
|
| Investment management fees | 9,757,724 |
| Distribution and service fees | 55,398 |
| Accounting and legal services fees | 148,734 |
| Transfer agent fees | 96,060 |
| Trustees’ fees | 11,679 |
| State registration fees | 66,315 |
| Printing and postage | 32,093 |
| Professional fees | 85,255 |
| Custodian fees | 108,553 |
| Registration and filing fees | 50,532 |
| Other | 21,542 |
| | |
| Total expenses | 10,433,885 |
| Less expense reductions and amounts recaptured | (48,702) |
| | |
| Net expenses | 10,385,183 |
| | |
| Net investment loss | (9,287,883) |
| |
| Realized and unrealized gain (loss) | |
|
| Net realized gain (loss) on | |
| Investments | 519 |
| Foreign currency transactions | 98,361,597 |
| | |
| | 98,362,116 |
| Change in net unrealized appreciation (depreciation) of | |
| Investments | 46,766 |
| Translation of assets and liabilities in foreign currencies | 25,218,231 |
| | |
| | 25,264,997 |
| | |
| Net realized and unrealized gain | 123,627,113 |
| | |
| Increase in net assets from operations | $114,339,230 |
| | |
| 16 | Currency Strategies Fund | Annual report | See notes to financial statements |
FINANCIAL STATEMENTS
Statements of changes in net assets
This Statement of changes in net assets show how the value of the fund’s net assets has changed since inception. The difference reflects earnings less expenses, any investment gains and losses, distributions, if any, paid to shareholders and the net of fund share transactions.
| | |
| | Year | Year |
| | ended | ended |
| | 7-31-13 | 7-31-12 |
| Increase (decrease) in net assets | | |
|
| From operations | | |
| Net investment loss | ($9,287,883) | ($8,193,951) |
| Net realized gain | 98,362,116 | 63,776,497 |
| Change in net unrealized appreciation (depreciation) | 25,264,997 | 13,616,959 |
| | | |
| Increase in net assets resulting from operations | 114,339,230 | 69,199,505 |
| | | |
| Distributions to shareholders | | |
| From net realized gain | | |
| Class A | (242,826) | — |
| Class I | (841,400) | — |
| Class R6 | (52,774) | — |
| Class NAV | (13,441,057) | — |
| | | |
| Total distributions | (14,578,057) | — |
| | | |
| From fund share transactions | 137,167,224 | (21,577,247) |
| | | |
| Total increase | 236,928,397 | 47,622,258 |
| |
| Net assets | | |
|
| Beginning of year | 957,942,247 | 910,319,989 |
| | | |
| End of year | $1,194,870,644 | $957,942,247 |
| | | |
| Undistributed net investment loss | — | ($4,822,516) |
| | |
| See notes to financial statements | Annual report | Currency Strategies Fund | 17 |
Financial highlights
The Financial highlights show how the fund’s net asset value for a share has changed during the period.
| | | | | |
| CLASS A SHARES Period ended | | | 7-31-13 | 7-31-12 | 7-31-111 |
| |
| Per share operating performance | | | | | |
|
| Net asset value, beginning of period | | | $9.16 | $8.58 | $10.00 |
| Net investment loss2 | | | (0.14) | (0.14) | (0.14) |
| Net realized and unrealized gain (loss) on investments | | | 1.02 | 0.72 | (1.28) |
| Total from investment operations | | | 0.88 | 0.58 | (1.42) |
| Less distributions | | | | | |
| From net realized gain | | | (0.13) | — | — |
| Net asset value, end of period | | | $9.91 | $9.16 | $8.58 |
| Total return (%)3,4 | | | 9.69 | 6.76 | (14.20)5 |
| |
| Ratios and supplemental data | | | | | |
|
| Net assets, end of period (in millions) | | | $28 | $11 | $6 |
| Ratios (as a percentage of average net assets): | | | | | |
| Expenses before reductions | | | 1.54 | 1.74 | 1.566 |
| Expenses including reductions and amounts recaptured | | | 1.60 | 1.60 | 1.566 |
| Net investment loss | | | (1.50) | (1.53) | (1.48)6 |
| Portfolio turnover (%) | | | — | — | — |
1 The inception date for Class A shares is 8-2-10.
2 Based on the average daily shares outstanding.
3 Does not reflect the effect of sales charges, if any.
4 Total returns would have been lower had certain expenses not been reduced during the applicable periods shown.
5 Not annualized.
6 Annualized.
| | | | | |
| CLASS I SHARES Period ended | | | 7-31-13 | 7-31-12 | 7-31-111 |
| |
| Per share operating performance | | | | | |
|
| Net asset value, beginning of period | | | $9.24 | $8.61 | $10.00 |
| Net investment loss2 | | | (0.10) | (0.10) | (0.09) |
| Net realized and unrealized gain (loss) on investments | | | 1.04 | 0.73 | (1.30) |
| Total from investment operations | | | 0.94 | 0.63 | (1.39) |
| Less distributions | | | | | |
| From net realized gain | | | (0.13) | — | — |
| Net asset value, end of period | | | $10.05 | $9.24 | $8.61 |
| Total return (%) | | | 10.26 | 7.32 | (13.90)3 |
| |
| Ratios and supplemental data | | | | | |
|
| Net assets, end of period (in millions) | | | $65 | $43 | $26 |
| Ratios (as a percentage of average net assets): | | | | | |
| Expenses before reductions | | | 1.11 | 1.17 | 1.054 |
| Expenses including reductions and amounts recaptured | | | 1.11 | 1.17 | 1.054 |
| Net investment loss | | | (1.01) | (1.10) | (0.98)4 |
| Portfolio turnover (%) | | | — | — | — |
1 The inception date for Class I shares is 8-2-10.
2 Based on the average daily shares outstanding.
3 Not annualized.
4 Annualized.
| | |
| 18 | Currency Strategies Fund | Annual report | See notes to financial statements |
| | | | | |
| CLASS R6 SHARES Period ended | | | | 7-31-13 | 7-31-121 |
| |
| Per share operating performance | | | | | |
|
| Net asset value, beginning of period | | | | $9.27 | $9.29 |
| Net investment income (loss)2 | | | | (0.09) | (0.07) |
| Net realized and unrealized gain on investments | | | | 1.04 | 0.05 |
| Total from investment operations | | | | 0.95 | (0.02) |
| Less distributions | | | | | |
| From net realized gain | | | | (0.13) | — |
| Net asset value, end of period | | | | $10.09 | $9.27 |
| Total return (%)3 | | | | 10.34 | (0.22)4 |
| |
| Ratios and supplemental data | | | | | |
|
| Net assets, end of period (in millions) | | | | $4 | $3 |
| Ratios (as a percentage of average net assets): | | | | | |
| Expenses before reductions | | | | 1.52 | 1.405 |
| Expenses including reductions and amounts recaptured | | | | 1.05 | 1.055 |
| Net investment income (loss) | | | | (0.95) | (0.97)5 |
| Portfolio turnover (%) | | | | — | — |
1 The inception date for Class R6 shares is 11-1-11.
2 Based on the average daily shares outstanding.
3 Total returns would have been lower had certain expenses not been reduced during the applicable periods shown.
4 Not annualized.
5 Annualized.
| | | | | |
| CLASS NAV SHARES Period ended | | | 7-31-13 | 7-31-12 | 7-31-111 |
| |
| Per share operating performance | | | | | |
|
| Net asset value, beginning of period | | | $9.28 | $8.63 | $10.00 |
| Net investment loss2 | | | (0.08) | (0.08) | (0.08) |
| Net realized and unrealized gain (loss) on investments | | | 1.04 | 0.73 | (1.29) |
| Total from investment operations | | | 0.96 | 0.65 | (1.37) |
| Less distributions | | | | | |
| From net realized gain | | | (0.13) | — | — |
| Net asset value, end of period | | | $10.11 | $9.28 | $8.63 |
| Total return (%)3 | | | 10.43 | 7.53 | (13.70)4 |
| |
| Ratios and supplemental data | | | | | |
|
| Net assets, end of period (in millions) | | | $1,098 | $901 | $878 |
| Ratios (as a percentage of average net assets): | | | | | |
| Expenses before reductions | | | 0.92 | 0.94 | 0.955 |
| Expenses including reductions and amounts recaptured | | | 0.92 | 0.93 | 0.955 |
| Net investment loss | | | (0.82) | (0.86) | (0.86)5 |
| Portfolio turnover (%) | | | — | — | — |
1 The inception date for Class NAV shares is 8-2-10.
2 Based on the average daily shares outstanding.
3 Total returns would have been lower had certain expenses not been reduced during the applicable periods shown.
4 Not annualized.
5 Annualized.
| | |
| See notes to financial statements | Annual report | Currency Strategies Fund | 19 |
Notes to financial statements
Note 1 — Organization
John Hancock Currency Strategies Fund (the fund) is a series of John Hancock Funds II (the Trust), an open-end management investment company organized as a Massachusetts business trust and registered under the Investment Company Act of 1940, as amended (the 1940 Act). The investment objective of the fund is to achieve total return from investments in currency markets.
The fund may offer multiple classes of shares. The shares currently offered are detailed in the Statement of assets and liabilities. Class A shares are offered to all investors. Class I shares are offered to institutions and certain investors. Class R6 shares are available only to certain retirement plans, institutions and other investors. Class NAV shares are offered to John Hancock affiliated funds of funds and certain 529 plans. Shareholders of each class have exclusive voting rights to matters that affect that class. The distribution and service fees, if any, and transfer agent fees, printing and postage and state registration fees for each class may differ.
Note 2 — Significant accounting policies
The financial statements have been prepared in conformity with accounting principles generally accepted in the United States of America, which require management to make certain estimates and assumptions as of the date of the financial statements. Actual results could differ from those estimates and those differences could be significant. Events or transactions occurring after the end of the fiscal period through the date that the financial statements were issued have been evaluated in the preparation of the financial statements. The following summarizes the significant accounting policies of the fund:
Security valuation. Investments are stated at value as of the close of regular trading on the New York Stock Exchange (NYSE), normally at 4:00 P.M., Eastern Time. In order to value the securities, the fund uses the following valuation techniques: Debt obligations are valued based on the evaluated prices provided by an independent pricing service, which utilizes both dealer-supplied and electronic data processing techniques, taking into account factors such as institutional-size trading in similar groups of securities, yield, quality, coupon rate, maturity, type of issue, trading characteristics and other market data. Foreign securities and currencies, including forward foreign currency contracts, are valued in U.S. dollars, based on foreign currency exchange rates supplied by an independent pricing service. Certain securities and forward foreign currency contracts traded only in the over-the-counter market are valued at the last bid price quoted by brokers making markets in the securities at the close of trading. Certain short-term securities are valued at amortized cost. Other portfolio securities and assets, for which reliable market quotations are not readily available, are valued at fair value as determined in good faith by the fund’s Pricing Committee following procedures established by the Board of Trustees, which include price verification procedures. The frequency with which these fair valuation procedures are used cannot be predicted and fair value of securities may differ significantly from the value that would have been used had a ready market for such securities existed.
The fund uses a three-tier hierarchy to prioritize the pricing assumptions, referred to as inputs, used in valuation techniques to measure fair value. Level 1 includes securities valued using quoted prices in active markets for identical securities. Level 2 includes securities valued using other significant observable inputs. Observable inputs may include quoted prices for similar securities, interest rates, prepayment speeds and credit risk. Prices for securities valued using these inputs are received from independent pricing vendors and brokers and are based on an evaluation of the inputs described.
| |
| 20 | Currency Strategies Fund | Annual report |
Level 3 includes securities valued using significant unobservable inputs when market prices are not readily available or reliable, including the fund’s own assumptions in determining the fair value of investments. Factors used in determining value may include market or issuer specific events or trends, changes in interest rates and credit quality. The inputs or methodology used for valuing securities are not necessarily an indication of the risks associated with investing in those securities. Changes in valuation techniques may result in transfers into or out of an assigned level within the disclosure hierarchy.
As of July 31, 2013, all investments are categorized as Level 2 under the hierarchy described above, except for money market funds, which are categorized as Level 1.
Security transactions and related investment income. Investment security transactions are accounted for on a trade date plus one basis for daily net asset value calculations. However, for financial reporting purposes, investment transactions are reported on trade date. Interest income is accrued as earned. Interest income includes coupon interest and amortization/accretion of premiums/discounts on debt securities. Debt obligations may be placed in a non-accrual status and related interest income may be reduced by stopping current accruals and writing off interest receivable when the collection of all or a portion of interest has become doubtful. Gains and losses on securities sold are determined on the basis of identified cost and may include proceeds from litigation.
Foreign currency translation. Assets, including investments and liabilities denominated in foreign currencies, are translated into U.S. dollar values each day at the prevailing exchange rate. Purchases and sales of securities, income and expenses are translated into U.S. dollars at the prevailing exchange rate on the date of the transaction. The effect of changes in foreign currency exchange rates on the value of securities is reflected as a component of the realized and unrealized gains (losses) on investments.
Funds that invest internationally generally carry more risk than funds that invest strictly in U.S. securities. Risks can result from differences in economic and political conditions, regulations, market practices (including higher transaction costs), accounting standards and other factors. Foreign investments are also subject to a decline in the value of a foreign currency versus the U.S. dollar, which reduces the dollar value of securities denominated in that currency.
Line of credit. The fund may borrow from banks for temporary or emergency purposes, including meeting redemption requests that otherwise might require the untimely sale of securities. Pursuant to the fund custodian agreement, the custodian may loan money to the fund to make properly authorized payments. The fund is obligated to repay the custodian for any overdraft, including any related costs or expenses. The custodian may have a lien, security interest or security entitlement in any fund property that is not otherwise segregated or pledged, to the maximum extent permitted by law, to the extent of any overdraft.
In addition, the fund and other affiliated funds have entered into an agreement with Citibank N.A. that enables them to participate in a $300 million unsecured committed line of credit. A commitment fee, payable at the end of each calendar quarter, based on the average daily unused portion of the line of credit, is charged to each participating fund on a pro rata basis and is reflected in other expenses on the Statement of operations. Prior to March 27, 2013, the fund participated in a $200 million unsecured line of credit, also with Citibank, with terms otherwise similar to the existing agreement. Commitment fees for the year ended July 31, 2013 were $648. For the year ended July 31, 2013, the fund had no borrowings under either line of credit.
Expenses. Within the John Hancock funds complex, expenses that are directly attributable to an individual fund are allocated to such fund. Expenses that are not readily attributable to a specific fund are allocated among all funds in an equitable manner, taking into consideration,
| |
| Annual report | Currency Strategies Fund | 21 |
among other things, the nature and type of expense and the fund’s relative net assets. Expense estimates are accrued in the period to which they relate and adjustments are made when actual amounts are known.
Class allocations. Income, common expenses and realized and unrealized gains (losses) are determined at the fund level and allocated daily to each class of shares based on the net assets of the class. Class-specific expenses, such as distribution and service fees, if any, transfer agent fees, state registration fees and printing and postage expenses, for all classes, are calculated daily at the class level based on the appropriate net assets of each class and the specific expense rates applicable to each class.
Federal income taxes. The fund intends to continue to qualify as a regulated investment company by complying with the applicable provisions of the Internal Revenue Code and will not be subject to federal income tax on taxable income that is distributed to shareholders. Therefore, no federal income tax provision is required.
As of July 31, 2013, the fund had no uncertain tax positions that would require financial statement recognition, derecognition or disclosure. The fund’s federal tax returns are subject to examination by the Internal Revenue Service for a period of three years.
Distribution of income and gains. Distributions to shareholders from net investment income and net realized gains, if any, are recorded on the ex-date. The fund generally declares and pays dividends and capital gain distributions, if any, annually. The tax character of distributions for the year ended July 31, 2013 was $14,578,057 of long-term capital gains.
Distributions paid by the fund with respect to each class of shares are calculated in the same manner, at the same time and in the same amount, except for the effect of class level expenses that may be applied differently to each class. As of July 31, 2013, the components of distributable earnings on a tax basis consisted of $22,052,192 of undistributed ordinary income and $50,527,160 of undistributed long-term capital gains.
Such distributions and distributable earnings, on a tax basis, are determined in conformity with income tax regulations, which may differ from accounting principles generally accepted in the United States of America. Material distributions in excess of tax basis earnings and profits, if any, are reported in the fund’s financial statements as a return of capital.
Capital accounts within the financial statements are adjusted for permanent book-tax differences. These adjustments have no impact on net assets or the results of operations. Temporary book-tax differences, if any, will reverse in a subsequent period. Book-tax differences are primarily attributable to net operating losses and derivative transactions.
Note 3 — Derivative instruments
The fund may invest in derivatives in order to meet their investment objectives. Derivatives include a variety of different instruments that may be traded in the over-the-counter market, on a regulated exchange or through a clearing facility. The risks in using derivatives vary depending upon the structure of the instruments, including the use of leverage, optionality, the liquidity or lack of liquidity of the contract, the creditworthiness of the counterparty or clearing organization and the volatility of the position. Some derivatives involve risks that are potentially greater than the risks associated with investing directly in the referenced securities or other referenced underlying instrument. Specifically, the fund is exposed to the risk that the counterparty to an over-the-counter (OTC) derivatives contract will be unable or unwilling to make timely settlement payments or otherwise honor its obligations. OTC derivatives transactions typically can only be closed out with the other party to the transaction.
| |
| 22 | Currency Strategies Fund | Annual report |
Forward foreign currency contracts are typically traded through the OTC market. Non-deliverable forwards are regulated by the Commodity Futures Trading Commission (the CFTC) as swaps. Derivative counterparty risk is managed through an ongoing evaluation of the creditworthiness of all potential counterparties and, if applicable, designated clearing organizations. The fund attempts to reduce its exposure to counterparty risk for derivatives traded in the OTC market, whenever possible, by entering into an International Swaps and Derivatives Association (ISDA) Master Agreement with each of their OTC counterparties. The ISDA gives each party to the agreement the right to terminate all transactions traded under the agreement if there is certain deterioration in the credit quality or contractual default of the other party, as defined in the ISDA. Upon an event of default or a termination of the ISDA, the non-defaulting party has the right to close out all transactions and to net amounts owed. This right to close out and net payments across all transactions traded under the ISDA could result in a reduction of the portfolios’ risk to a counterparty equal to any amounts payable by the portfolios, if any.
As defined by the ISDA, the fund may have collateral agreements with certain counterparties to mitigate counterparty risk on OTC derivatives. Subject to established minimum levels, collateral for OTC transactions is generally determined based on the net aggregate unrealized gain or loss on contracts with a particular counterparty. Collateral pledged to the portfolio is held in a segregated account by a third-party agent or held by the custodian bank for the benefit of the portfolio and can be in the form of cash or debt securities issued by the U.S. government or related agencies; collateral posted by the portfolio for OTC transactions is held in a segregated account at the portfolio’s custodian and is noted in the accompanying portfolio of investments, or if cash is posted, on the Statement of assets and liabilities. The fund’s maximum risk of loss due to counterparty risk is equal to the asset value of outstanding contracts offset by collateral received.
For financial reporting purposes, the fund does not offset OTC derivative assets or liabilities that are subject to master netting arrangements, as defined by the ISDAs, in the Statement of assets and liabilities. In the event of default by the counterparty or a termination of the agreement, the ISDA allows an offset of amounts across the various transactions between the fund and the applicable counterparty and is known as close-out netting. The table below reflects the fund’s exposure to counterparties subject to an ISDA for OTC derivative transactions:
| | | | |
| | TOTAL MARKET VALUE | COLLATERAL POSTED | COLLATERAL | |
| COUNTERPARTY | OF OTC DERIVATIVES | BY COUNTERPARTY | POSTED BY FUND | NET EXPOSURE |
|
| Barclays Bank PLC | | | | |
| Wholesale | ($8,954,308) | — | $6,849,728 | ($2,104,580) |
| J. Aron & Company | (5,043,834) | — | 3,865,845 | (1,177,989) |
| Morgan Stanley | | | | |
| Capital Services, Inc. | (6,711,657) | — | 4,559,814 | (2,151,843) |
| | | | | |
| Totals | ($20,709,799) | — | $15,275,387 | ($5,434,412) |
Forward foreign currency contracts. A forward foreign currency contract is an agreement between two parties to buy and sell a specific currency at a price that is set on the date of the contract. The forward contract calls for delivery of the currency on a future date that is specified in the contract. Risks related to the use of forwards include the possible failure of counterparties to meet the terms of the forward agreement, the failure of the counterparties to timely post collateral, the risk that currency movements will not favor the fund thereby reducing the fund’s total return, and the potential for losses in excess of the amounts recognized on the Statements of Assets and Liabilities.
The market value of a forward foreign currency contract fluctuates with changes in foreign currency exchange rates. Forward foreign currency contracts are marked-to market daily and the change in value is recorded by the portfolios as an unrealized gain or loss. Realized gains or losses, equal to the difference between the value of the contract at the time it was opened and the value at
| |
| Annual report | Currency Strategies Fund | 23 |
the time it was closed, are recorded upon delivery or receipt of the currency or settlement with the counterparty.
During the year ended July 31, 2013, the fund used forward foreign currency contracts to gain currency exposure. During the year ended July 31, 2013, the fund held forward foreign currency contracts with U.S. Dollar notional values ranging from $4.3 billion to $6.8 billion, as measured at each quarter end.
Fair value of derivative instruments by risk category
The table below summarizes the fair value of derivatives held by the fund at July 31, 2013 by risk category:
| | | | |
| | | FINANCIAL | ASSET | LIABILITY |
| | STATEMENT OF ASSETS AND | INSTRUMENTS | DERIVATIVES | DERIVATIVES |
| RISK | LIABILITIES LOCATION | LOCATION | FAIR VALUE | FAIR VALUE |
|
| Foreign Currency | Receivable/payable for | Forward foreign | $33,690,308 | ($54,400,107) |
| Contracts | forward foreign currency | currency | | |
| | exchange contracts | contracts | | |
Effect of derivative instruments on the Statement of operations
The table below summarizes the net realized gain (loss) included in the net increase (decrease) in net assets from operations, classified by derivative instrument and risk category, for the year ended July 31, 2013:
| | |
| | STATEMENT OF | FOREIGN CURRENCY |
| RISK | OPERATIONS LOCATION | TRANSACTIONS* |
|
| |
| Foreign Currency Contracts | Net realized gain (loss) on | $98,361,597 |
*Realized gain/loss associated with forward currency contracts is included in this caption on the Statement of operations.
The table below summarizes the net change in unrealized appreciation (depreciation) included in the net increase (decrease) in net assets from operations, classified by derivative instrument and risk category, for the year ended July 31, 2013:
| | |
| | STATEMENT OF | FOREIGN CURRENCY |
| RISK | OPERATIONS LOCATION | TRANSACTIONS* |
|
| |
| Foreign Currency Contracts | Change in unrealized | $25,218,231 |
| | appreciation (depreciation) of | |
*Change in unrealized appreciation/depreciation associated with forward foreign currency contracts is included in this caption on the Statement of operations.
Note 4 — Guarantees and indemnifications
Under the Trust’s organizational documents, its Officers and Trustees are indemnified against certain liabilities arising out of the performance of their duties to the fund, including the fund. Additionally, in the normal course of business, the fund enters into contracts with service providers that contain general indemnification clauses. The fund’s maximum exposure under these arrangements is unknown, as this would involve future claims that may be made against the fund that have not yet occurred. The risk of material loss from such claims is considered remote.
Note 5 — Fees and transactions with affiliates
John Hancock Investment Management Services, LLC (the Advisor) serves as investment advisor for the fund. John Hancock Funds, LLC (the Distributor), an affiliate of the Advisor, serves as principal underwriter of the fund. The Advisor and the Distributor are indirect, wholly owned subsidiaries of Manulife Financial Corporation (MFC).
| |
| 24 | Currency Strategies Fund | Annual report |
Management fee. The fund has an investment management agreement with the Advisor under which the fund pays a daily management fee to the Advisor equivalent, on an annual basis, to the sum of: a) 0.95% of the first $250,000,000 of the fund’s average daily net assets, b) 0.90% of the next $250,000,000 of the fund’s average daily net assets and c) 0.85% of the fund’s average daily net assets in excess of $500,000,000. The Advisor has a subadvisory agreement with First Quadrant, L.P. The fund is not responsible for payment of the subadvisory fees.
Effective June 1, 2013, the Advisor has contractually agreed to waive a portion of its management fee for certain funds (the Participating portfolios) of the Trust, John Hancock Funds, John Hancock Funds III and John Hancock Variable Insurance Trust. The waiver equals, on an annualized basis, 0.01% of that portion of the aggregate net assets of all the Participating portfolios that exceeds $75 billion but is less than or equal to $125 billion; 0.0125% of that portion of the aggregate net assets of all the Participating portfolios that exceeds $125 billion but is less than or equal to $150 billion; and 0.015% of that portion of the aggregate net assets of all the Participating portfolios that exceeds $150 billion. The amount of the reimbursement is calculated daily and allocated among all the Participating portfolios in proportion to the daily net assets of each fund. This arrangement may be amended or terminated at any time by the Advisor upon notice to the fund and with the approval of the Board of Trustees.
Prior to June 1, 2013, the Advisor contractually agreed to waive a portion of its management fee for certain funds (the Participating portfolios) of the Trust and John Hancock Variable Insurance Trust. The prior waiver equaled, on an annualized basis, 0.01% of that portion of the aggregate net assets of all the Participating portfolios that exceeded $75 billion but was less than $100 billion; and 0.015% of that portion of the aggregate net assets of all the Participating portfolios that equaled or exceeded $100 billion. The amount of the Reimbursement was calculated daily and allocated among all the Participating portfolios in proportion to the daily net assets of each fund.
The Advisor has contractually agreed to waive fees and/or reimburse certain expenses for each share class of the fund excluding certain expenses such as taxes, brokerage commissions, interest expense, litigation and indemnification expenses and other extraordinary expenses not incurred in the ordinary course of the fund’s business, underlying fund expenses and short dividend expense. The fee waivers and/or reimbursements are such that these expenses will not exceed 1.60% and 1.05% for Class A and Class R6 shares, respectively. The fee waiver and/or reimbursement will continue in effect until November 30, 2013, unless renewed by mutual agreement of the fund and Advisor based upon a determination of that this is appropriate under the circumstances at the time. Prior to December 1, 2012 the fee waivers and/or reimbursements were such that these expense limitations did not exceed 1.60%, 1.24% and 1.05% for Class A, Class I and Class R6 shares, respectively.
Additionally, the Advisor has voluntarily agreed to waive other fund level expenses excluding advisory fees, 12b-1 fees, service fees, transfer agent fees, printing and postage, blue sky fees, taxes, brokerage commissions, interest expenses, acquired fund fees, short dividend expense and litigation and indemnification expenses and other extraordinary expenses and other extraordinary expenses not incurred in the ordinary course of business. This voluntary expense reimbursement may be terminated at any time by the Advisor on notice to the fund. The waivers are such that these expenses will not exceed 0.15% of the fund’s average annual net assets.
Accordingly, the fee waivers and/or expense reimbursements described above amounted to $941, $2,369, $17,012 and $39,957 for Class A, Class I, Class R6 and Class NAV shares, respectively, for the year ended July 31, 2013.
The investment management fees incurred for the year ended July 31, 2013 were equivalent to a net annual effective rate of 0.88% of the fund’s average daily net assets.
| |
| Annual report | Currency Strategies Fund | 25 |
Expense recapture. The Advisor may recapture operating expenses reimbursed or fees waived under previous expense limitation or waiver arrangements for a period of three years following the beginning of the month in which such reimbursements or waivers originally occurred to the extent that the fund is below its expense limitation during this period. The table below outlines the amounts recovered during the year ended July 31, 2013, and the amount of waived or reimbursed expenses subject to potential recovery and the respective expiration dates.
| | | | |
| | | | | AMOUNT |
| | AMOUNTS ELIGIBLE | AMOUNTS ELIGIBLE | AMOUNTS ELIGIBLE | RECOVERED |
| | FOR RECOVERY | FOR RECOVERY | FOR RECOVERY | DURING THE |
| | THROUGH | THROUGH | THROUGH | PERIOD ENDED |
| FUND NAME | JULY 1, 2014 | JULY 1, 2015 | JULY 1, 2016 | JULY 31, 2013 |
|
| Currency Strategies | — | $11,286 | $17,064 | $11,577 |
Accounting and legal services. Pursuant to a service agreement, the fund reimburses the Advisor for all expenses associated with providing the administrative, financial, legal, accounting and recordkeeping services to the fund, including the preparation of all tax returns, periodic reports to shareholders and regulatory reports, among other services. These expenses are allocated to each share class based on its relative net assets at the time the expense was incurred. These accounting and legal services fees incurred for the year ended July 31, 2013 amounted to an annual rate of 0.01% of the fund’s average daily net assets.
Distribution and service plans. The fund has a distribution agreement with the Distributor. The fund has adopted distribution and service plans with respect to Class A pursuant to Rule 12b-1 under the 1940 Act, to pay the Distributor for services provided as the distributor of shares of the fund. The fund pays 0.30% for Class A shares for distribution and service fees under these arrangements, expressed as an annual percentage of average daily net assets.
Sales charges. Class A shares are assessed up-front sales charges, which resulted in payments to the Distributor amounting to $28,904 for the year ended July 31, 2013. Of this amount, $3,897 was retained and used for printing prospectuses, advertising, sales literature and other purposes, $24,882 was paid as sales commissions to broker-dealers and $125 was paid as sales commissions to sales personnel of Signator Investors, Inc., a broker-dealer affiliate of the Advisor.
Class A shares may be subject to contingent deferred sales charges (CDSCs). Certain Class A shares that are acquired through purchases of $1 million or more and are redeemed within one year of purchase are subject to a 1.00% sales charge. During the year ended July 31, 2013, CDSCs received by the Distributor amounted to $1 for Class A shares.
Transfer agent fees. The fund has a transfer agent agreement with John Hancock Signature Services, Inc. (Signature Services), an affiliate of the Advisor. The transfer agent fees paid to Signature Services are determined based on the cost to Signature Services (Signature Services Cost) of providing recordkeeping services. The Signature Services Cost includes a component of allocated John Hancock corporate overhead for providing transfer agent services to the fund and to all other John Hancock affiliated funds. It also includes out-of-pocket expenses that are comprised of payments made to third-parties for recordkeeping services provided to their clients who invest in one or more John Hancock funds. In addition, Signature Services Cost may be reduced by certain fees that Signature Services receives in connection with retirement and small accounts. Signature Services Cost is calculated monthly and allocated, as applicable, to four categories of share classes: Institutional Share Classes, Retirement Share Classes, Municipal Bond Classes and all other Retail Share Classes. Within each of these categories, the applicable costs are allocated to the affected John Hancock affiliated funds and/or classes, based on the relative average daily net assets.
| |
| 26 | Currency Strategies Fund | Annual report |
Class level expenses. Class level expenses for the year ended July 31, 2013 were:
| | | | |
| | DISTRIBUTION | TRANSFER | STATE | PRINTING AND |
| CLASS | AND SERVICE FEES | AGENT FEES | REGISTRATION FEES | POSTAGE |
|
| A | $55,398 | $32,132 | $22,622 | $3,912 |
| I | — | 62,970 | 23,716 | 27,457 |
| R6 | — | 958 | 19,977 | 724 |
| Total | $55,398 | $96,060 | $66,315 | $32,093 |
Trustee expenses. The fund compensates each Trustee who is not an employee of the Advisor or its affiliates. The costs of paying Trustee compensation and expenses are allocated to each fund based on its average daily net assets.
Note 6 — Fund share transactions
Transactions in fund shares for the for the years ended July 31, 2013 and 2012 were as follows:
| | | | |
| | Year ended 7-31-13 | Year ended 7-31-12 |
| | Shares | Amount | Shares | Amount |
| Class A shares | | | | |
|
| Sold | 2,026,889 | $19,456,689 | 1,086,324 | $10,070,544 |
| Distributions reinvested | 25,805 | 242,826 | — | — |
| Repurchased | (377,414) | (3,571,049) | (594,882) | (5,444,349) |
| | | | | |
| Net increase | 1,675,280 | $16,128,466 | 491,442 | $4,626,195 |
| |
| Class I shares | | | | |
|
| Sold | 5,919,465 | $57,233,333 | 4,047,716 | $37,829,410 |
| Distributions reinvested | 88,141 | 838,218 | — | — |
| Repurchased | (4,218,643) | (41,908,084) | (2,435,917) | (22,284,404) |
| | | | | |
| Net increase | 1,788,963 | $16,163,467 | 1,611,799 | $15,545,006 |
| |
| Class R6 shares1 | | | | |
|
| Sold | 143,411 | $1,361,026 | 544,454 | $5,124,419 |
| Distributions reinvested | 5,526 | 52,774 | — | — |
| Repurchased | (88,174) | (848,024) | (219,710) | (2,094,427) |
| | | | | |
| Net increase | 60,763 | $565,776 | 324,744 | $3,029,992 |
| |
| Class NAV shares | | | | |
|
| Sold | 22,335,412 | $213,201,264 | 19,606,407 | $180,330,637 |
| Distributions reinvested | 1,405,968 | 13,441,057 | — | — |
| Repurchased | (12,299,583) | (122,332,806) | (24,259,863) | (225,109,077) |
| | | | | |
| Net increase (decrease) | 11,441,797 | $104,309,515 | (4,653,456) | ($44,778,440) |
| |
| Total net increase (decrease) | 14,966,803 | $137,167,224 | (2,225,471) | ($21,577,247) |
|
1 Period from 11-1-11 (inception date) to 7-31-12.
Affiliates of the fund owned 100% of shares of beneficial interest of Class NAV on July 31, 2013.
Note 7 — Purchase and sale of securities
All purchases and sales of the fund were of short-term investments for the year ended July 31, 2013.
| |
| Annual report | Currency Strategies Fund | 27 |
Note 8 — Investment by affiliated funds
Certain investors in the fund are affiliated funds that are managed by the Advisor and its affiliates. The affiliated funds do not invest in the fund for the purpose of exercising management or control; however, affiliated fund investments may represent a significant portion of the fund’s net assets. At July 31, 2013, the following funds had an affiliate ownership of 5% or more of the fund’s net assets:
| | |
| | AFFILIATE | |
| FUND | CONCENTRATION | |
| |
| John Hancock Lifestyle Aggressive portfolio | 7.0% | |
| John Hancock Lifestyle Growth portfolio | 21.5% | |
| John Hancock Lifestyle Balanced portfolio | 26.0% | |
| John Hancock Lifestyle Moderate portfolio | 9.0% | |
| John Hancock Lifestyle Conservative portfolio | 8.2% | |
| |
| 28 | Currency Strategies Fund | Annual report |
Auditor’s report
Report of Independent Registered Public Accounting Firm
To the Board of Trustees of John Hancock Funds II and Shareholders of
John Hancock Currency Strategies Fund:
In our opinion, the accompanying statement of assets and liabilities, including the schedule of investments, and the related statements of operations and of changes in net assets and the financial highlights present fairly, in all material respects, the financial position of John Hancock Currency Strategies Fund (the “Fund”) at July 31, 2013, and the results of its operations for the year then ended, the changes in its net assets for each of the two years in the period then ended and the financial highlights for each of the periods indicated, in conformity with accounting principles generally accepted in the United States of America. These financial statements and financial highlights (hereafter referred to as “financial statements”) are the responsibility of the Fund’s management; our responsibility is to express an opinion on these financial statements based on our audits. We conducted our audits of these financial statements in accordance with the standards of the Public Company Accounting Oversight Board (United States). Those standards require that we plan and perform the audit to obtain reasonable assurance about whether the financial statements are free of material misstatement. An audit includes examining, on a test basis, evidence supporting the amounts and disclosures in the financial statements, assessing the accounting principles used and significant estimates made by management, and evaluating the overall financial statement presentation. We believe that our audits, which included confirmation of securities at July 31, 2013 by correspondence with the custodian, agent banks and brokers, and the application of alternative auditing procedures where securities purchased confirmations had not been received, provide a reasonable basis for our opinion.
PricewaterhouseCoopers LLP
Boston, Massachusetts
September 20, 2013
| |
| Annual report | Currency Strategies Fund | 29 |
Tax information
Unaudited
For federal income tax purposes, the following information is furnished with respect to the distributions of the fund, if any, paid during its taxable year ended July 31, 2013.
The fund paid $14,578,057 in capital gain dividends.
Eligible shareholders will be mailed a 2013 Form 1099-DIV in early 2014. This will reflect the tax character of all distributions paid in calendar year 2013.
Please consult a tax advisor regarding the tax consequences of your investment in the fund.
| |
| 30 | Currency Strategies Fund | Annual report |
Evaluation of Advisory and Subadvisory Agreements by the Board of Trustees
This section describes the evaluation by the Board of Trustees (the Board) of John Hancock Funds II (the Trust) of the Advisory Agreement (the Advisory Agreement) with John Hancock Investment Management Services, LLC (the Advisor) and the Subadvisory Agreement (the Subadvisory Agreement) with First Quadrant, L.P. (the Subadvisor) for Currency Strategies Fund (the fund). The Advisory Agreement and Subadvisory Agreement are collectively referred to as the Agreements.
Approval of Advisory and Subadvisory Agreements
At in-person meetings held on May 16-17, 2013, the Board, including the Trustees who are not considered to be interested persons of the Trust under the Investment Company Act of 1940, as amended (the 1940 Act) (the Independent Trustees), reapproved for an annual period the continuation of the Advisory Agreement between the Trust and the Advisor and the Subadvisory Agreement between the Advisor and the Subadvisor with respect to the fund.
In considering the Advisory Agreement and the Subadvisory Agreement, the Board received in advance of the meeting a variety of materials relating to the fund, the Advisor, and the Subadvisor, including comparative performance, fee and expense information for peer groups of similar mutual funds prepared by an independent third-party provider of mutual fund data; performance information for the fund’s benchmark index; and, with respect to the Subadvisor, comparative performance information for comparably managed accounts; and other information provided by the Advisor and the Subadvisor regarding the nature, extent, and quality of services provided by the Advisor and the Subadvisor under their respective Agreements, as well as information regarding the Advisor’s revenues and costs of providing services to the fund and any compensation paid to affiliates of the Advisor. At the meeting at which the renewal of the Advisory Agreement and Subadvisory Agreement is considered, particular focus is given to information concerning fund performance, comparability of fees and total expenses and profitability. However, the Board notes that the evaluation process with respect to the Advisor and the Subadvisor is an ongoing one. In this regard, the Board also took into account discussions with management and information provided to the Board at prior meetings with respect to the services provided by the Advisor and the Subadvisor to the fund, including quarterly performance reports prepared by management containing reviews of investment results and prior presentations from the Subadvisor with respect to the fund. The Board also considered the nature, quality, and extent of non-advisory services, if any, to be provided to the fund by the Advisor’s affiliates, including distribution services.
Throughout the process, the Board asked questions of and requested additional information from management. The Board is assisted by counsel for the Trust and the Independent Trustees are also separately assisted by independent legal counsel throughout the process. The Independent Trustees also received a memorandum from their independent counsel discussing the legal standards for their consideration of the proposed continuation of the Agreements and discussed the proposed continuation of the Agreements in private sessions with their independent legal counsel at which no representatives of management were present.
Approval of Advisory Agreement
In approving the Advisory Agreement with respect to the fund, the Board, including the Independent Trustees, considered a variety of factors, including those discussed below. The Board also considered other factors (including conditions and trends prevailing generally in the economy, the securities markets, and the industry) and does not treat any single factor as determinative and each Trustee may attribute different weights to different factors. The Board’s conclusions may be based in part on its consideration of the Advisory and Subadvisory Agreements in prior years and on the Board’s ongoing regular review of fund performance and operations throughout the year.
Nature, extent, and quality of services. Among the information received by the Board from the Advisor relating to the nature, extent, and quality of services provided to the fund, the Board
| |
| Annual report | Currency Strategies Fund | 31 |
reviewed information provided by the Advisor relating to its operations and personnel, descriptions of its organizational and management structure, and information regarding the Advisor’s compliance and regulatory history, including its Form ADV. The Board also noted that on a regular basis it receives and reviews information from the Trust’s Chief Compliance Officer (CCO) regarding the fund’s compliance policies and procedures established pursuant to Rule 38a-1 under the 1940 Act. The Board also considered the Advisor’s risk management processes. The Board considered that the Advisor is responsible for the management of the day-to-day operations of the fund, including, but not limited to, general supervision of and coordination of the services provided by the Subadvisor, and is also responsible for monitoring and reviewing the activities of the Subadvisor and other third-party service providers.
In considering the nature, extent, and quality of the services provided by the Advisor, the Trustees also took into account their knowledge of the Advisor’s management and the quality of the performance of the Advisor’s duties through Board meetings, discussions, and reports during the preceding year and through each Trustee’s experience as a Trustee of the Trust and of the other trusts in the complex.
In the course of their deliberations regarding the Advisory Agreement, the Board considered, among other things:
(a) the skills and competency with which the Advisor has in the past managed the Trust’s affairs and its subadvisory relationship, the Advisor’s oversight and monitoring of the Subadvisor’s investment performance and compliance programs, such as the Subadvisor’s compliance with fund policies and objective; review of brokerage matters, including with respect to trade allocation and best execution; and the Advisor’s timeliness in responding to performance issues;
(b) the background, qualifications and skills of the Advisor’s personnel;
(c) the Advisor’s compliance policies and procedures and its responsiveness to regulatory changes and mutual fund industry developments;
(d) the Advisor’s administrative capabilities, including its ability to supervise the other service providers for the fund;
(e) the financial condition of the Advisor and whether it has the financial wherewithal to provide a high level and quality of services to the fund; and
(f) the Advisor’s reputation and experience in serving as an investment adviser to the Trust and the benefit to shareholders of investing in funds that are part of a family of funds offering a variety of investments.
The Board concluded that the Advisor may reasonably be expected to continue to provide a high quality of services under the Advisory Agreement with respect to the fund.
Investment performance. In considering the fund’s performance, the Board noted that it reviews at its regularly scheduled meetings information about the fund’s performance results. In connection with the consideration of the Advisory Agreement, the Board:
(a) reviewed information prepared by management regarding the fund’s performance;
(b) considered the comparative performance of the fund’s benchmark;
(c) considered the performance of comparable funds, if any, as included in the report prepared by an independent third-party provider of mutual fund data. Such report included the fund’s
| |
| 32 | Currency Strategies Fund | Annual report |
ranking within a smaller group of peer funds and the fund’s ranking within broader groups of funds; and
(d) took into account the Advisor’s analysis of the fund’s performance and its plans and recommendations regarding the Trust’s subadvisory arrangements generally.
The Board noted that the fund outperformed its benchmark index and peer group average for the one-year period ended December 31, 2012. The Board noted that the fund had a limited performance history having commenced operations in July 2010. The Board took into account management’s discussion of the differences between the investment strategy of the fund and those of its peer group and the impact of market conditions on the fund’s investment strategy relative to its peer group.
The Board concluded that the performance of the fund has generally been in line with or outperformed the historical performance of comparable funds and the fund’s benchmark.
Fees and expenses. The Board reviewed comparative information prepared by an independent third-party provider of mutual fund data, including, among other data, the fund’s contractual and net management fees and total expenses as compared to similarly situated investment companies deemed to be comparable to the fund. The Board considered the fund’s ranking within a smaller group of peer funds chosen by the independent third-party provider, as well as the fund’s ranking within a broader group of funds. In comparing the fund’s contractual and net management fees to those of comparable funds, the Board noted that such fees include both advisory and administrative costs.
The Board noted that net management fees and total expenses for this fund are lower than the respective peer group medians.
The Board took into account management’s discussion with respect to the advisory/subadvisory fee structure, including the amount of the advisory fee retained by the Advisor after payment of the subadvisory fee. The Board also took into account that management had agreed to implement an overall fee waiver across a number of funds in the complex, including the fund, which is discussed further below. The Board also noted that, in addition, the Advisor is currently waiving fees and/or reimbursing expenses with respect to the fund. The Board also noted that the Advisor pays the subadvisory fees of the fund, and that such fees are negotiated at arm’s length with respect to the Subadvisor. The Board also noted management’s discussion of the fund’s expenses, as well as certain actions taken over the past several years to reduce the fund’s operating expenses. The Board reviewed information provided by the Advisor concerning investment advisory fees charged to other clients (including other funds in the complex) having similar investment mandates, if any. The Board considered any differences between the Advisor’s and Subadvisor’s services to the fund and the services they provide to other comparable clients or funds. The Board concluded that the advisory fee paid with respect to the fund is reasonable.
Profitability/indirect benefits. In considering the costs of the services to be provided and the profits to be realized by the Advisor and its affiliates from the Advisor’s relationship with the Trust, the Board:
(a) reviewed financial information of the Advisor;
(b) reviewed and considered an analysis presented by the Advisor regarding the net profitability to the Advisor and its affiliates with respect to the fund;
(c) received and reviewed profitability information with respect to the John Hancock fund complex as a whole;
| |
| Annual report | Currency Strategies Fund | 33 |
(d) received information with respect to the Advisor’s allocation methodologies used in preparing the profitability data;
(e) considered that the John Hancock insurance companies that are affiliates of the Advisor, as shareholders of the Trust directly or through their separate accounts, receive certain tax credits or deductions relating to foreign taxes paid and dividends received by certain funds of the Trust and noted that these tax benefits, which are not available to participants in qualified retirement plans under applicable income tax law, are reflected in the profitability analysis reviewed by the Board;
(f) considered that the Advisor also provides administrative services to the fund on a cost basis pursuant to an administrative services agreement;
(g) noted that affiliates of the Advisor provide transfer agency services and distribution services to the fund, and that the Trust’s distributor also receives Rule 12b-1 payments to support distribution of the fund;
(h) noted that the Advisor also derives reputational and other indirect benefits from providing advisory services to the fund;
(i) noted that the subadvisory fees for the fund are paid by the Advisor and are negotiated at arm’s length; and
(j) considered that the Advisor should be entitled to earn a reasonable level of profits in exchange for the level of services it provides to the fund and the entrepreneurial risk that it assumes as Advisor.
Based upon its review, the Board concluded that the level of profitability, if any, of the Advisor and its affiliates from their relationship with the fund was reasonable and not excessive.
Economies of scale. In considering the extent to which economies of scale would be realized as the fund grows and whether fee levels reflect these economies of scale for the benefit of fund shareholders, the Board:
(a) considered that the Advisor has agreed, effective June 1, 2013, to waive its management fee for the fund and each of the open-end funds of John Hancock Funds II, John Hancock Funds III, each other John Hancock fund (except those listed below) (the Participating Portfolios) or otherwise reimburse the expenses of the Participating Portfolios as follows (the Reimbursement):
The Reimbursement shall equal, on an annualized basis, 0.01% of that portion of the aggregate net assets of all the Participating Portfolios that exceeds $75 billion but is less than or equal to $125 billion, 0.0125% of that portion of the aggregate net assets of all the Participating Portfolios that exceeds $125 billion but is less than or equal to $150 billion and 0.015% of that portion of the aggregate net assets of all the Participating Portfolios that exceeds $150 billion. (The funds that are not Participating Portfolios as of the date of this annual report are each of the fund of funds, money market funds, index funds and closed-end funds);
(b) reviewed the Trust’s advisory fee structure and the incorporation therein of any subadvisory fee breakpoints in the advisory fees charged and concluded that (i) the fund’s fee structure contains breakpoints at the subadvisory fee level and that such breakpoints are reflected as breakpoints in the advisory fees for the fund and (ii) although economies of scale cannot be measured with precision, these arrangements permit shareholders of the fund to benefit
| |
| 34 | Currency Strategies Fund | Annual report |
from economies of scale if the fund grows. The Board also took into account management’s discussion of the fund’s advisory fee structure; and
(c) the Board also considered the effect of the fund’s growth in size on its performance and fees. The Board also noted that if the fund’s assets increase over time, the fund may realize other economies of scale.
Approval of Subadvisory Agreement
In making its determination with respect to approval of the Subadvisory Agreement, the Board reviewed:
(1) information relating to the Subadvisor’s business, including current subadvisory services to the Trust (and other funds in the John Hancock family of funds);
(2) the historical and current performance of the fund, and comparative performance information relating to the fund’s benchmark and comparable funds;
(3) the subadvisory fee for the fund, including any breakpoints, and comparative fee information, where available, prepared by an independent third-party provider of mutual fund data; and
(4) information relating to the nature and scope of any material relationships and their significance to the Trust’s Advisor and Subadvisor.
Nature, extent, and quality of services. With respect to the services provided by the Subadvisor, the Board received information provided to the Board by the Subadvisor, including the Subadvisor’s Form ADV, as well as took into account information presented throughout the past year. The Board considered the Subadvisor’s current level of staffing and its overall resources, as well as received information relating to the Subadvisor’s compensation program. The Board reviewed the Subadvisor’s history and investment experience, as well as information regarding the qualifications, background, and responsibilities of the Subadvisor’s investment and compliance personnel who provide services to the fund. The Board also considered, among other things, the Subadvisor’s compliance program and any disciplinary history. The Board also considered the Subadvisor’s risk assessment and monitoring process. The Board reviewed the Subadvisor’s regulatory history, including whether it was currently involved in any regulatory actions or investigations as well as material litigation, and any settlements and amelioratory actions undertaken, as appropriate. The Board noted that the Advisor conducts regular, periodic reviews of the Subadvisor and its operations, including regarding investment processes and organizational and staffing matters. The Board also noted that the Trust’s CCO and his staff conduct regular, periodic compliance reviews with the Subadvisor and present reports to the Independent Trustees regarding the same, which includes evaluating the regulatory compliance systems of the Subadvisor and procedures reasonably designed by it to assure compliance with the federal securities laws. The Board also took into account the financial condition of the Subadvisor.
The Board considered the Subadvisor’s investment process and philosophy. The Board took into account that the Subadvisor’s responsibilities include the development and maintenance of an investment program for the fund, that is consistent with the fund’s investment objective, the selection of investment securities and the placement of orders for the purchase and sale of such securities, as well as the implementation of compliance controls related to performance of these services. The Board also received information with respect to the Subadvisor’s brokerage policies and practices, including with respect to best execution and soft dollars.
Subadvisor compensation. In considering the cost of services to be provided by the Subadvisor and the profitability to the Subadvisor of its relationship with the fund, the Board noted that the fees under the Subadvisory Agreement are paid by the Advisor and not the fund.
| |
| Annual report | Currency Strategies Fund | 35 |
The Board also relied on the ability of the Advisor to negotiate the Subadvisory Agreement with the Subadvisor, which is not affiliated with the Advisor, and the fees thereunder at arm’s length. As a result, the costs of the services to be provided and the profits to be realized by the Subadvisor from its relationship with the Trust were not a material factor in the Board’s consideration of the Subadvisory Agreement.
The Board also received information regarding the nature and scope (including their significance to the Advisor and its affiliates and to the Subadvisor) of any material relationships with respect to the Subadvisor, which includes arrangements in which the Subadvisor or its affiliates provide advisory, distribution, or management services in connection with financial products sponsored by the Trust’s Advisor or its affiliates, and may include other registered investment companies, a 529 education savings plan, managed separate account, and exempt group annuity contracts sold to qualified plans. The Board also received information and took into account any other potential conflicts of interest the Advisor might have in connection with the Subadvisory Agreement.
In addition, the Board considered other potential indirect benefits that the Subadvisor and its affiliates may receive from the Subadvisor’s relationship with the fund, such as the opportunity to provide advisory services to additional funds in the John Hancock fund complex and reputational benefits.
Subadvisory fees. The Board considered that the fund pays an advisory fee to the Advisor and that, in turn, the Advisor pays a subadvisory fee to the Subadvisor. The Board also took into account the sub-advisory fees paid by the Advisor to the Subadvisor with respect to the fund to fees charged by the fund’s Subadvisor to manage other subadvised portfolios and portfolios not subject to regulation under the 1940 Act, as applicable.
Subadvisor performance. As noted above, the Board considered the fund’s performance as compared to the fund’s peer group and benchmark and noted that the Board reviews information about the fund’s performance results at its regularly scheduled meetings. The Board noted the Advisor’s expertise and resources in monitoring the performance, investment style, and risk-adjusted performance of the Subadvisor. The Board was mindful of the Advisor’s focus on the Subadvisor’s performance. The Board also noted the Subadvisor’s long-term performance record for similar accounts, as applicable.
The Board’s decision to approve the Subadvisory Agreement was based on a number of determinations, including the following:
(1) The Subadvisor has extensive experience and demonstrated skills as a manager;
(2) The performance of the fund generally has been in line with or outperformed the historical performance of comparable funds and the fund’s benchmark and the fund’s overall performance is satisfactory;
(3) The subadvisory fees are reasonable in relation to the level and quality of services being provided; and
(4) Subadvisory fee breakpoints are reflected as breakpoints in the advisory fees for the fund in order to permit shareholders to benefit from economies of scale if the fund grows.
Based on the Board’s evaluation of all factors that the Board deemed to be material, including those factors described above, the Board, including the Independent Trustees, concluded that renewal of the Advisory Agreement and the Subadvisory Agreement would be in the best interest of the fund and its shareholders. Accordingly, the Board, and the Independent Trustees voting separately, approved the Advisory Agreement and Subadvisory Agreement for an additional one-year period.
| |
| 36 | Currency Strategies Fund | Annual report |
Trustees and Officers
This chart provides information about the Trustees and Officers who oversee your John Hancock fund. Officers elected by the Trustees manage the day-to-day operations of the fund and execute policies formulated by the Trustees.
| | |
| Independent Trustees | | |
| | | |
| Name, year of birth | Trustee | Number of John |
| Position(s) held with fund | of the | Hancock funds |
| Principal occupation(s) and other | Trust | overseen by |
| directorships during past 5 years | since1 | Trustee |
| |
| James M. Oates, Born: 1946 | 2012 | 231 |
|
| Managing Director, Wydown Group (financial consulting firm) (since 1994); Chairman and Director, |
| Emerson Investment Management, Inc. (since 2000); Independent Chairman, Hudson Castle Group, Inc. |
| (formerly IBEX Capital Markets, Inc.) (financial services company) (1997–2011); Director, Stifel Financial |
| (since 1996); Director, Investor Financial Services Corporation (1995–2007); Director, Connecticut River |
| Bancorp (since 1998); Director, Virtus Funds (formerly Phoenix Mutual Funds) (since 1988). Trustee |
| and Chairperson of the Board, John Hancock retail funds (since 2012); Trustee (2005–2006 and since |
| 2012) and Chairperson of the Board (since 2012), John Hancock Funds III; Trustee (since 2004) and |
| Chairperson of the Board (since 2005), John Hancock Variable Insurance Trust; Trustee and Chairperson |
| of the Board (since 2005), John Hancock Funds II. | | |
|
| |
| Charles L. Bardelis,3 Born: 1941 | 2012 | 231 |
|
| Director, Island Commuter Corp. (marine transport). Trustee, John Hancock retail funds (since 2012); |
| Trustee, John Hancock Funds III (2005–2006 and since 2012); Trustee, John Hancock Variable Insurance |
| Trust (since 1988); Trustee, John Hancock Funds II (since 2005). | | |
|
| |
| Peter S. Burgess,3 Born: 1942 | 2012 | 231 |
|
| Consultant (financial, accounting, and auditing matters) (since 1999); Certified Public Accountant; |
| Partner, Arthur Andersen (independent public accounting firm) (prior to 1999); Director, Lincoln |
| Educational Services Corporation (since 2004); Director, Symetra Financial Corporation (since 2010); |
| former Director, PMA Capital Corporation (2004–2010). Trustee, John Hancock retail funds (since 2012); |
| Trustee, John Hancock Funds III (2005–2006 and since 2012); Trustee, John Hancock Variable Insurance |
| Trust and John Hancock Funds II (since 2005). | | |
|
| |
| William H. Cunningham,2 Born: 1944 | 1994 | 231 |
|
| Professor, University of Texas, Austin, Texas (since 1971); former Chancellor, University of Texas |
| System and former President of the University of Texas, Austin, Texas; Director, LIN Television (since |
| 2009); Chairman (since 2009) and Director (since 2006), Lincoln National Corporation (insurance); |
| Director, Resolute Energy Corporation (since 2009); Director, Southwest Airlines (since 2000); former |
| Director, Introgen (manufacturer of biopharmaceuticals) (until 2008); former Director, Hicks Acquisition |
| Company I, Inc. (until 2007); former Director, Texas Exchange Bank, SSB (formerly Bank of Crowley) |
| (until 2009); former Advisory Director, JPMorgan Chase Bank (formerly Texas Commerce Bank–Austin) |
| (until 2009). Trustee, John Hancock retail funds (since 1986); Trustee, John Hancock Variable Insurance |
| Trust (since 2012); Trustee, John Hancock Funds II (since 2012 and 2005–2006). | |
|
| |
| Grace K. Fey, Born: 1946 | 2012 | 231 |
|
| Chief Executive Officer, Grace Fey Advisors (since 2007); Director and Executive Vice President, |
| Frontier Capital Management Company (1988–2007); Director, Fiduciary Trust (since 2009). |
| Trustee, John Hancock retail funds (since 2012); Trustee, John Hancock Variable Insurance Trust and |
| John Hancock Funds II (since 2008). | | |
| |
| Annual report | Currency Strategies Fund | 37 |
| | |
| Independent Trustees (continued) | | |
| |
| Name, year of birth | Trustee | Number of John |
| Position(s) held with fund | of the | Hancock funds |
| Principal occupation(s) and other | Trust | overseen by |
| directorships during past 5 years | since1 | Trustee |
| |
| Theron S. Hoffman,3 Born: 1947 | 2012 | 231 |
|
| Chief Executive Officer, T. Hoffman Associates, LLC (consulting firm) (since 2003); Director, The Todd |
| Organization (consulting firm) (2003–2010); President, Westport Resources Management (investment |
| management consulting firm) (2006–2008); Senior Managing Director, Partner, and Operating Head, |
| Putnam Investments (2000–2003); Executive Vice President, The Thomson Corp. (financial and |
| legal information publishing) (1997–2000). Trustee, John Hancock retail funds (since 2012); Trustee, |
| John Hancock Variable Insurance Trust and John Hancock Funds II (since 2008). | |
|
| |
| Deborah C. Jackson,2 Born: 1952 | 2008 | 231 |
|
| President, Cambridge College, Cambridge, Massachusetts (since 2011); Chief Executive Officer, |
| American Red Cross of Massachusetts Bay (2002–2011); Board of Directors of Eastern Bank Corporation |
| (since 2001); Board of Directors of Eastern Bank Charitable Foundation (since 2001); Board of Directors |
| of American Student Assistance Corporation (1996–2009); Board of Directors of Boston Stock Exchange |
| (2002–2008); Board of Directors of Harvard Pilgrim Healthcare (health benefits company) (2007–2011). |
| Trustee, John Hancock retail funds (since 2008); Trustee of John Hancock Variable Insurance Trust and |
| John Hancock Funds II (since 2012). | | |
|
| |
| Hassell H. McClellan, Born: 1945 | 2012 | 231 |
|
| Associate Professor, The Wallace E. Carroll School of Management, Boston College (since 1984); |
| Trustee, Virtus Variable Insurance Trust (formerly Phoenix Edge Series Funds) (since 2008); Director, |
| The Barnes Group (since 2010). Trustee, John Hancock retail funds (since 2012); Trustee, John Hancock |
| Funds III (2005–2006 and since 2012); Trustee, John Hancock Variable Insurance Trust and | |
| John Hancock Funds II (since 2005). | | |
|
| |
| Steven R. Pruchansky,2 Born: 1944 | 1991 | 231 |
|
| Chairman and Chief Executive Officer, Greenscapes of Southwest Florida, Inc. (since 2000); Director |
| and President, Greenscapes of Southwest Florida, Inc. (until 2000); Member, Board of Advisors, First |
| American Bank (until 2010); Managing Director, Jon James, LLC (real estate) (since 2000); Director, |
| First Signature Bank & Trust Company (until 1991); Director, Mast Realty Trust (until 1994); President, |
| Maxwell Building Corp. (until 1991). Trustee (since 1992) and Chairperson of the Board (2011–2012), |
| John Hancock retail funds; Trustee and Vice Chairperson of the Board, John Hancock retail funds, |
| John Hancock Variable Insurance Trust and John Hancock Funds II (since 2012). | |
|
| |
| Gregory A. Russo,2 Born: 1949 | 2009 | 231 |
|
| Director and Audit Committee Chairman (since 2012) and Member, Audit Committee and Finance |
| Committee (since 2011), NCH Healthcare System, Inc. (holding company for multi-entity healthcare |
| system); Director and Member of Finance Committee, The Moorings, Inc. (nonprofit continuing care |
| community) (since 2012); Vice Chairman, Risk & Regulatory Matters, KPMG LLP (KPMG) (2002–2006); |
| Vice Chairman, Industrial Markets, KPMG (1998–2002); Chairman and Treasurer, Westchester |
| County, New York, Chamber of Commerce (1986–1992); Director, Treasurer and Chairman of |
| Audit and Finance Committees, Putnam Hospital Center (1989–1995); Director and Chairman of |
| Fundraising Campaign, United Way of Westchester and Putnam Counties, New York (1990–1995). |
| Trustee, John Hancock retail funds (since 2008); Trustee, John Hancock Variable Insurance Trust and |
| John Hancock Funds II (since 2012). | | |
| |
| 38 | Currency Strategies Fund | Annual report |
| | |
| Non-Independent Trustees4 | | |
| | | |
| Name, year of birth | Trustee | Number of John |
| Position(s) held with fund | of the | Hancock funds |
| Principal occupation(s) and other | Trust | overseen by |
| directorships during past 5 years | since1 | Trustee |
| |
| James R. Boyle, Born: 1959 | 2012 | 231 |
|
| Senior Executive Vice President, John Hancock Financial Services (1999–2012, including prior positions); |
| Chairman and Director, John Hancock Advisers, LLC, John Hancock Funds, LLC, and John Hancock |
| Investment Management Services, LLC (2005–2010). Trustee, John Hancock retail funds (since 2012 and |
| 2005–2010), Trustee, John Hancock Variable Insurance Trust and John Hancock Funds II (since 2005). |
|
| |
| Craig Bromley,2 Born: 1966 | 2012 | 231 |
|
| President, John Hancock Financial Services (since 2012); Senior Executive Vice President and General |
| Manager, U.S. Division, John Hancock Financial Services (since 2012); President and Chief Executive |
| Officer, Manulife Insurance Company (Manulife (Japan) (2005–2012), including prior positions). |
| Trustee, John Hancock retail funds (since 2012); Trustee, John Hancock Variable Insurance Trust and |
| John Hancock Funds II (since 2012). | | |
|
| |
| Warren A. Thomson,2 Born: 1955 | 2012 | 231 |
|
| Senior Executive Vice President and Chief Investment Officer, Manulife Financial Corporation and The |
| Manufacturers Life Insurance Company (since 2009); Chairman and Chief Executive Officer, Manulife |
| Asset Management (since 2001, including prior positions); Director (since 2006), and President and |
| Chief Executive Officer of Manulife Asset Management Limited (since 2013); Director and Chairman, |
| Hancock Natural Resources Group, Inc. (since 2013). Trustee, John Hancock retail funds, John Hancock |
| Variable Insurance Trust and John Hancock Funds II (since 2012). | | |
| |
| Principal officers who are not Trustees | | |
| | | |
| Name, year of birth | | Officer |
| Position(s) held with fund | | of the |
| Principal occupation(s) and other | | Trust |
| directorships during past 5 years | | since |
| |
| Hugh McHaffie, Born: 1959 | | 2009 |
|
| President | | |
| Executive Vice President, John Hancock Financial Services (since 2006, including prior positions); |
| Chairman and Director, John Hancock Advisers, LLC, John Hancock Investment Management Services, |
| LLC and John Hancock Funds, LLC (since 2010); President, John Hancock Advisers, LLC (since 2012); |
| President, John Hancock Investment Management Services, LLC (since 2010). President (since 2012) and |
| former Trustee (2010–2012), John Hancock retail funds; President, John Hancock Variable Insurance |
| Trust and John Hancock Funds II (since 2009). | | |
|
| |
| Andrew G. Arnott, Born: 1971 | | 2009 |
|
| Executive Vice President | | |
| Senior Vice President, John Hancock Financial Services (since 2009); Director and Executive Vice |
| President, John Hancock Advisers, LLC (since 2005, including prior positions); Director and Executive |
| Vice President, John Hancock Investment Management Services, LLC (since 2006, including prior |
| positions); President, John Hancock Funds, LLC (since 2004, including prior positions); Executive Vice |
| President, John Hancock retail funds, John Hancock Variable Insurance Trust and John Hancock Funds II |
| (since 2007, including prior positions). | | |
|
| |
| Thomas M. Kinzler, Born: 1955 | | 2006 |
|
| Secretary and Chief Legal Officer | | |
| Vice President, John Hancock Financial Services (since 2006); Secretary and Chief Legal Counsel, |
| John Hancock Funds, LLC (since 2007); Secretary and Chief Legal Officer, John Hancock retail funds, |
| John Hancock Variable Insurance Trust and John Hancock Funds II (since 2006). | |
| |
| Annual report | Currency Strategies Fund | 39 |
| |
| Principal officers who are not Trustees (continued) | |
| |
| Name, year of birth | Officer |
| Position(s) held with fund | of the |
| Principal occupation(s) and other | Trust |
| directorships during past 5 years | since |
| |
| Francis V. Knox, Jr., Born: 1947 | 2005 |
|
| Chief Compliance Officer | |
| Vice President, John Hancock Financial Services (since 2005); Chief Compliance Officer, John Hancock |
| retail funds, John Hancock Variable Insurance Trust, John Hancock Funds II, John Hancock Advisers, |
| LLC and John Hancock Investment Management Services, LLC (since 2005); Vice President and Chief |
| Compliance Officer, John Hancock Asset Management a division of Manulife Asset Management (US) |
| LLC (2005–2008). | |
|
| |
| Charles A. Rizzo, Born: 1957 | 2007 |
|
| Chief Financial Officer | |
| Vice President, John Hancock Financial Services (since 2008); Senior Vice President, John Hancock | |
| Advisers, LLC and John Hancock Investment Management Services, LLC (since 2008); Chief Financial |
| Officer, John Hancock retail funds, John Hancock Variable Insurance Trust and John Hancock Funds II |
| (since 2007). | |
|
| |
| Salvatore Schiavone, Born: 1965 | 2009 |
|
| Treasurer | |
| Assistant Vice President, John Hancock Financial Services (since 2007); Vice President, John Hancock |
| Advisers, LLC and John Hancock Investment Management Services, LLC (since 2007); Treasurer, | |
| John Hancock retail funds (since 2007, including prior positions); Treasurer, John Hancock Variable | |
| Insurance Trust and John Hancock Funds II (since 2010 and 2007–2009, including prior positions). | |
John Hancock retail funds is comprised of John Hancock Funds III and 34 other John Hancock funds consisting of 24 series of other John Hancock trusts and 10 closed-end funds.
The business address for all Trustees and Officers is 601 Congress Street, Boston, Massachusetts 02210-2805.
The Statement of Additional Information of the fund includes additional information about members of the Board of Trustees of the Trust and is available without charge, upon request, by calling 800-225-5291.
1 Each Trustee holds office until his or her successor is elected and qualified, or until the Trustee’s death, retirement, resignation or removal.
2 Became a Trustee of the Trust effective December 1, 2012.
3 Member of Audit Committee.
4 Because Messrs. Bromley and Thomson are senior executives or directors and Mr. Boyle held prior positions as a senior executive and director of the Advisor and/or its affiliates, each of them is considered an “interested person,” as defined in the Investment Company Act of 1940, of the Trust.
| |
| 40 | Currency Strategies Fund | Annual report |
More information
| |
| Trustees | Investment advisor |
| James M. Oates, Chairperson | John Hancock Investment Management |
| Steven R. Pruchansky, Vice Chairperson | Services, LLC |
| Charles L. Bardelis* | |
| James R. Boyle† | Subadvisor |
| Craig Bromley† | First Quadrant, L.P. |
| Peter S. Burgess* | |
| William H. Cunningham | Principal distributor |
| Grace K. Fey | John Hancock Funds, LLC |
| Theron S. Hoffman* | |
| Deborah C. Jackson | Custodian |
| Hassell H. McClellan | State Street Bank and Trust Company |
| Gregory A. Russo | |
| Warren A. Thomson† | Transfer agent |
| | John Hancock Signature Services, Inc. |
| Officers | |
| Hugh McHaffie | Legal counsel |
| President | K&L Gates LLP |
| | |
| Andrew G. Arnott | Independent registered |
| Executive Vice President | public accounting firm |
| | PricewaterhouseCoopers LLP |
| Thomas M. Kinzler | |
| Secretary and Chief Legal Officer | |
| | |
| Francis V. Knox, Jr. | |
| Chief Compliance Officer | |
| | |
| Charles A. Rizzo | |
| Chief Financial Officer | |
| | |
| Salvatore Schiavone | |
| Treasurer | |
| |
| *Member of the Audit Committee | |
| †Non-Independent Trustee | |
The fund’s proxy voting policies and procedures, as well as the fund’s proxy voting record for the most recent twelve-month period ended June 30, are available free of charge on the Securities and Exchange Commission (SEC) website at sec.gov or on our website.
The fund’s complete list of portfolio holdings, for the first and third fiscal quarters, is filed with the SEC on Form N-Q. The fund’s Form N-Q is available on our website and the SEC’s website, sec.gov, and can be reviewed and copied (for a fee) at the SEC’s Public Reference Room in Washington, DC. Call 800-SEC-0330 to receive information on the operation of the SEC’s Public Reference Room.
We make this information on your fund, as well as monthly portfolio holdings, and other fund details available on our website at jhinvestments.com or by calling 800-225-5291.
| | |
| You can also contact us: | | |
| 800-225-5291 | Regular mail: | Express mail: |
| jhinvestments.com | Investment Operations | Investment Operations |
| | John Hancock Signature Services, Inc. | John Hancock Signature Services, Inc. |
| | P.O. Box 55913 | 30 Dan Road |
| | Boston, MA 02205-5913 | Canton, MA 02021 |
| |
| Annual report | Currency Strategies Fund | 41 |

800-225-5291
800-338-8080 EASI-Line
jhinvestments.com
| |
| This report is for the information of the shareholders of John Hancock Currency Strategies Fund. | |
| It is not authorized for distribution to prospective investors unless preceded or accompanied by a prospectus. | 364A 7/13 |
| MF150755 | 9/13 |

A look at performance
Total returns for the period ended July 31, 2013
| | | | | | | | |
| | Average annual total returns (%) | Cumulative total returns (%) | |
| | with maximum sales charge | | with maximum sales charge | |
|
| | 1-year | 5-year | 10-year | Since
inception1 | 1-year | 5-year | 10-year | Since
inception1 |
|
| Class A | 20.20 | — | — | 10.95 | 20.20 | — | — | 25.25 |
|
| Class I2 | 27.07 | — | — | 14.12 | 27.07 | — | — | 33.15 |
|
| index† | 25.00 | — | — | 13.43 | 25.00 | — | — | 31.41 |
|
Performance figures assume all distributions have been reinvested. Figures reflect maximum sales charges on Class A shares of 5.00%.
The expense ratios of the fund, both net (including any fee waivers or expense limitations) and gross (excluding any fee waivers or expense limitations), are set forth according to the most recent publicly available prospectuses for the fund and may differ from those disclosed in the Financial highlights tables in this report. The fee waivers and expense limitations are contractual at least until 11-30-13 for Class A and Class I shares. Had the fee waivers and expense limitations not been in place, gross expenses would apply. The expense ratios are as follows:
| | | |
| | Class A | Class I | |
| Net (%) | 1.30 | 0.94 | |
| Gross (%) | 6.29 | 7.53 | |
The returns reflect past results and should not be considered indicative of future performance. The return and principal value of an investment will fluctuate so that shares, when redeemed, may be worth more or less than their original cost. Due to market volatility, the fund’s current performance may be higher or lower than the performance shown. For current to the most recent month-end performance data, please call 800-225-5291 or visit the fund’s website at jhinvestments.com.
The performance table above and the chart on the next page do not reflect the deduction of taxes that a shareholder may pay on fund distributions or on the redemption of fund shares. The fund’s performance results reflect any applicable fee waivers or expense reductions, without which the expenses would increase and results would have been less favorable.
† Index is the S&P 500 Index.
See the following page for footnotes.
| |
| 6 | Fundamental Large Cap Core Fund | Annual report |
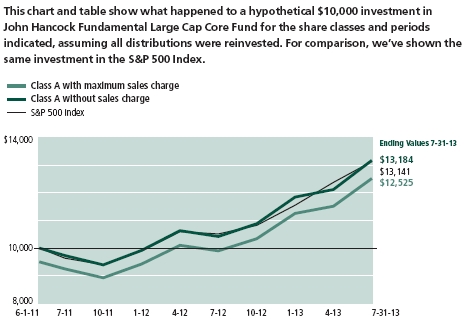
| | | | |
| | | With maximum | Without | |
| | Start date | sales charge | sales charge | Index |
|
| |
| Class I2 | 6-1-11 | $13,315 | $13,315 | $13,141 |
|
S&P 500 Index is an unmanaged index that includes 500 widely traded common stocks.
It is not possible to invest directly in an index. Index figures do not reflect expenses or sales charges, which would have resulted in lower values if they did.
Footnotes related to performance pages
1 From 6-1-11.
2 For certain types of investors as described in the fund’s prospectuses.
| |
| Annual report | Fundamental Large Cap Core Fund | 7 |
Management’s discussion of
Fund performance
John Hancock Asset Management a division of Manulife Asset Management (US) LLC
U.S. equities delivered strong returns for the year ended July 31, 2013, buoyed early on by the U.S. Federal Reserve’s (Fed) plan to undertake $85 billion in monthly bond purchases. A legislative agreement that postponed automatic tax increases and spending cuts from going into effect triggered another rally in the new year. Stocks kept climbing as home values rose, manufacturing picked up and unemployment stayed below 8%. Late-period concern that the Fed might taper its stimulus temporarily shook investors, but the market rebounded as these worries faded and second-quarter corporate earnings came in better than expected.
Over the 12-month reporting period, John Hancock Fundamental Large Cap Core Fund’s Class A shares returned 26.53%, excluding sales charges, beating the 25.00% gain of the S&P 500 Index and the 23.26% average return of its peer group, the Morningstar, Inc. large growth category.† Stock picks and overweights in the financials and consumer discretionary sectors gave the biggest boost to relative performance. Top individual contributors included diversified financial services company Bank of America Corp., whose shares rallied as the improving U.S. economy helped to boost loan demand and as capital adequacy concerns eased. Investment bank Morgan Stanley’s stock posted steep gains after it received regulatory approval to buy the remaining share of a jointly owned global wealth management business, boosting its earnings prospects. In consumer discretionary, home improvement retailer Lowe’s Companies, Inc. saw steep gains fueled by the recovery in U.S. housing and efforts to build same-store sales growth. By contrast, energy security selection hampered relative performance. Detractors included Apache Corp., whose stock fell because of the company’s exposure to the Middle East, and shale gas producer Ultra Petroleum Corp., whose shares suffered from weak gas prices and lower production rates. We sold Ultra midyear.
This commentary reflects the views of the portfolio managers through the end of the period discussed in this report. As such, they are in no way guarantees of future events and are not intended to be used as investment advice or a recommendation regarding any specific security. They are also subject to change at any time as market and other conditions warrant.
Past performance is no guarantee of future results.
† Figures from Morningstar, Inc. include distributions reinvested and do not take into account sales charges. Actual load-adjusted performance is lower.
| |
| 8 | Fundamental Large Cap Core Fund | Annual report |
Your expenses
These examples are intended to help you understand your ongoing operating expenses of investing in the fund so you can compare these costs with the ongoing costs of investing in other mutual funds.
Understanding fund expenses
As a shareholder of the fund, you incur two types of costs:
■ Transaction costs, which include sales charges (loads) on purchases or redemptions (varies by share class), minimum account fee charge, etc.
■ Ongoing operating expenses, including management fees, distribution and service fees (if applicable) and other fund expenses.
We are going to present only your ongoing operating expenses here.
Actual expenses/actual returns
This example is intended to provide information about the fund’s actual ongoing operating expenses and is based on the fund’s actual return. It assumes an account value of $1,000.00 on February 1, 2013, with the same investment held until July 31, 2013.
| | | |
| | Account value | Ending value | Expenses paid during |
| | on 2-1-13 | on 7-31-13 | period ended on 7-31-131 |
|
| Class A | $1,000.00 | $1,112.50 | $6.81 |
|
| Class I | 1,000.00 | 1,114.90 | 4.93 |
|
Together with the value of your account, you may use this information to estimate the operating expenses that you paid over the period. Simply divide your account value at July 31, 2013, by $1,000.00, then multiply it by the “expenses paid” for your share class from the table above. For example, for an account value of $8,600.00, the operating expenses should be calculated as follows:

| |
| Annual report | Fundamental Large Cap Core Fund | 9 |
Hypothetical example for comparison purposes
This table allows you to compare the fund’s ongoing operating expenses with those of any other fund. It provides an example of the fund’s hypothetical account values and hypothetical expenses based on each class’s actual expense ratio and an assumed 5% annualized return before expenses (which is not the fund’s actual return). It assumes an account value of $1,000.00 on February 1, 2013, with the same investment held until July 31, 2013. Look in any other fund shareholder report to find its hypothetical example and you will be able to compare these expenses. Please remember that these hypothetical account values and expenses may not be used to estimate the actual ending account balance or expenses you paid for the period.
| | | |
| | Account value | Ending value | Expenses paid during |
| | on 2-1-13 | on 7-31-13 | period ended on 7-31-131 |
|
| Class A | $1,000.00 | $1,018.30 | $6.51 |
|
| Class I | 1,000.00 | 1,020.10 | 4.71 |
|
Remember, these examples do not include any transaction costs, therefore, these examples will not help you to determine the relative total costs of owning different funds. If transaction costs were included, your expenses would have been higher. See the prospectuses for details regarding transaction costs.
1 Expenses are equal to the fund’s annualized expense ratio of 1.30%, and 0.94% for Class A and Class I shares, respectively, multiplied by the average account value over the period, multiplied by 181/365 (to reflect the one-half year period).
| | |
| 10 | Fundamental Large Cap Core Fund | Annual report |
Portfolio summary
| | | | |
| Top 10 Holdings (40.3% of Net Assets on 7-31-13)1,2 | | | |
|
| Amazon.com, Inc. | 5.4% | | The Goldman Sachs Group, Inc. | 3.5% |
| |
|
| Apple, Inc. | 5.1% | | Google, Inc., Class A | 3.4% |
| |
|
| JPMorgan Chase & Company | 4.9% | | Cisco Systems, Inc. | 2.9% |
| |
|
| Bank of America Corp. | 4.7% | | American International Group, Inc. | 2.9% |
| |
|
| QUALCOMM, Inc. | 4.6% | | Intel Corp. | 2.9% |
| |
|
| |
| |
| Sector Composition1,3 | | | | |
|
| Information Technology | 27.6% | | Consumer Staples | 6.2% |
| |
|
| Financials | 25.9% | | Industrials | 5.7% |
| |
|
| Consumer Discretionary | 13.0% | | Materials | 0.5% |
| |
|
| Energy | 11.9% | | Other | 2.0% |
| |
|
| Health Care | 7.2% | | | |
| | |
| | |
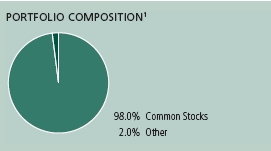
1 As a percentage of net assets on 7-31-13.
2 Cash and cash equivalents not included.
3 Large company stocks as a group could fall out of favor with the market, causing the fund to underperform. Foreign investing, especially in emerging markets, has additional risks such as currency and market volatility and political and social instability. Hedging and other strategic transactions may increase volatility of a fund and, if the transaction is not successful, could result in a significant loss. If the fund invests in illiquid securities, it may be difficult to sell them at a price approximating their value. Sector investing is subject to greater risks than the market as a whole. Because the fund may focus on particular sectors of the economy, its performance may depend on the performance of those sectors and investments focused in one sector may fluctuate more widely than investments diversified across sectors. For additional information on these and other risk considerations, please see the fund’s prospectus.
| |
| Annual report | Fundamental Large Cap Core Fund | 11 |
Fund’s investments
As of 7-31-13
| | |
| | Shares | Value |
| Common Stocks 98.0% | | $22,287,579 |
|
| (Cost $19,583,912) | | |
| | | |
| Consumer Discretionary 13.0% | | 2,949,526 |
| | | |
| Household Durables 2.1% | | |
|
| Lennar Corp., Class A | 14,157 | 479,498 |
| | | |
| Internet & Catalog Retail 5.4% | | |
|
| Amazon.com, Inc. (I) | 4,096 | 1,233,794 |
| | | |
| Media 1.5% | | |
|
| Omnicom Group, Inc. | 5,311 | 341,338 |
| | | |
| Specialty Retail 4.0% | | |
|
| AutoZone, Inc. (I) | 509 | 228,327 |
|
| Bed Bath & Beyond, Inc. (I) | 3,428 | 262,139 |
|
| Lowe’s Companies, Inc. | 9,072 | 404,430 |
| | | |
| Consumer Staples 6.2% | | 1,415,263 |
| | | |
| Beverages 5.2% | | |
|
| Diageo PLC, ADR | 3,129 | 392,158 |
|
| PepsiCo, Inc. | 6,392 | 533,988 |
|
| SABMiller PLC | 5,345 | 262,778 |
| | | |
| Tobacco 1.0% | | |
|
| Philip Morris International, Inc. | 2,538 | 226,339 |
| | | |
| Energy 11.9% | | 2,715,157 |
| | | |
| Energy Equipment & Services 3.8% | | |
|
| National Oilwell Varco, Inc. | 4,180 | 293,311 |
|
| Schlumberger, Ltd. | 6,957 | 565,813 |
| | | |
| Oil, Gas & Consumable Fuels 8.1% | | |
|
| Apache Corp. | 7,962 | 638,951 |
|
| Chevron Corp. | 1,802 | 226,854 |
|
| Exxon Mobil Corp. | 2,314 | 216,938 |
|
| Occidental Petroleum Corp. | 6,129 | 545,787 |
|
| Southwestern Energy Company (I) | 5,865 | 227,503 |
| | | |
| Financials 25.9% | | 5,881,137 |
| | | |
| Capital Markets 9.7% | | |
|
| Morgan Stanley | 23,154 | 630,020 |
|
| State Street Corp. | 6,587 | 458,916 |
|
| T. Rowe Price Group, Inc. | 4,137 | 311,268 |
|
| The Goldman Sachs Group, Inc. | 4,902 | 804,075 |
| | |
| 12 | Fundamental Large Cap Core Fund | Annual report | See notes to financial statements |
| | |
| | Shares | Value |
| Commercial Banks 1.0% | | |
|
| Wells Fargo & Company | 5,189 | $225,722 |
| | | |
| Consumer Finance 1.0% | | |
|
| American Express Company | 2,953 | 217,843 |
| | | |
| Diversified Financial Services 9.6% | | |
|
| Bank of America Corp. | 73,357 | 1,071,012 |
|
| JPMorgan Chase & Company | 20,074 | 1,118,724 |
| | | |
| Insurance 4.6% | | |
|
| American International Group, Inc. (I) | 14,596 | 664,264 |
|
| Prudential Financial, Inc. | 4,803 | 379,293 |
| | | |
| Health Care 7.2% | | 1,633,008 |
| | | |
| Biotechnology 1.0% | | |
|
| Amgen, Inc. | 2,162 | 234,123 |
| | | |
| Health Care Equipment & Supplies 1.6% | | |
|
| Medtronic, Inc. | 6,378 | 352,321 |
| | | |
| Pharmaceuticals 4.6% | | |
|
| Merck & Company, Inc. | 9,185 | 442,441 |
|
| Novartis AG, ADR | 6,197 | 443,767 |
|
| Pfizer, Inc. | 5,486 | 160,356 |
| | | |
| Industrials 5.7% | | 1,290,039 |
| | | |
| Aerospace & Defense 1.6% | | |
|
| L-3 Communications Holdings, Inc. | 3,859 | 359,466 |
| | | |
| Air Freight & Logistics 1.2% | | |
|
| United Parcel Service, Inc., Class B | 3,133 | 271,944 |
| | | |
| Industrial Conglomerates 2.0% | | |
|
| General Electric Company | 18,429 | 449,115 |
| | | |
| Machinery 0.9% | | |
|
| Caterpillar, Inc. | 2,527 | 209,514 |
| | | |
| Information Technology 27.6% | | 6,282,750 |
| | | |
| Communications Equipment 7.5% | | |
|
| Cisco Systems, Inc. | 26,170 | 668,644 |
|
| QUALCOMM, Inc. | 16,153 | 1,042,676 |
| | | |
| Computers & Peripherals 7.7% | | |
|
| Apple, Inc. | 2,545 | 1,151,613 |
|
| EMC Corp. | 23,296 | 609,190 |
| | | |
| Internet Software & Services 3.4% | | |
|
| Google, Inc., Class A (I) | 866 | 768,662 |
| | | |
| IT Services 1.5% | | |
|
| Broadridge Financial Solutions, Inc. | 11,976 | 346,585 |
| | | |
| Semiconductors & Semiconductor Equipment 2.9% | | |
|
| Intel Corp. | 28,179 | 656,571 |
| | | |
| Software 4.6% | | |
|
| FactSet Research Systems, Inc. | 4,274 | 466,635 |
|
| Oracle Corp. | 17,687 | 572,174 |
| | |
| See notes to financial statements | Annual report | Fundamental Large Cap Core Fund | 13 |
| | |
| | Shares | Value |
| Materials 0.5% | | $120,699 |
| | | |
| Chemicals 0.5% | | |
|
| Air Products & Chemicals, Inc. | 1,111 | 120,699 |
| |
| Total investments (Cost $19,583,912)† 98.0% | | $22,287,579 |
|
| |
| Other assets and liabilities, net 2.0% | | $459,469 |
|
| |
| Total net assets 100.0% | | $22,747,048 |
|
| | | |
The percentage shown for each investment is the total value of the category as a percentage of net assets of the fund.
ADR American Depositary Receipts
(I) Non-income producing security.
† At 7-31-13, the aggregate cost of investment securities for federal income tax purposes was $19,608,326. Net unrealized appreciation aggregated $2,679,253 of which $2,847,771 related to appreciated investment securities and $168,518 related to depreciated investment securities.
| | |
| 14 | Fundamental Large Cap Core Fund | Annual report | See notes to financial statements |
F I N A N C I A L S T A T E M E N T S
Financial statements
Statement of assets and liabilities 7-31-13
This Statement of assets and liabilities is the fund’s balance sheet. It shows the value of what the fund owns, is due and owes. You’ll also find the net asset value and the maximum offering price per share.
| |
| Assets | |
|
| Investments, at value (Cost $19,583,912) | $22,287,579 |
| Cash | 729,166 |
| Foreign currency, at value (Cost $1,259) | 1,250 |
| Receivable for fund shares sold | 153,962 |
| Dividends receivable | 11,098 |
| Receivable due from Advisor | 1,450 |
| Other receivables and prepaid expenses | 21,057 |
| | |
| Total assets | 23,205,562 |
| |
| Liabilities | |
|
| Payable for investments purchased | 303,926 |
| Payable for fund shares repurchased | 98,238 |
| Payable to affiliates | |
| Accounting and legal services fees | 467 |
| Transfer agent fees | 2,248 |
| Trustees’ fees | 4 |
| Other liabilities and accrued expenses | 53,631 |
| | |
| Total liabilities | 458,514 |
| | |
| Net assets | $22,747,048 |
| |
| Net assets consist of | |
|
| Paid-in capital | $19,584,503 |
| Undistributed net investment income | 70,156 |
| Accumulated net realized gain (loss) on investments and foreign | |
| currency transactions | 388,734 |
| Net unrealized appreciation (depreciation) on investments and translation | |
| of assets and liabilities in foreign currencies | 2,703,655 |
| | |
| Net assets | $22,747,048 |
| |
| Net asset value per share | |
|
| Based on net asset values and shares outstanding — the fund has an | |
| unlimited number of shares authorized with no par value | |
| Class A ($4,811,006 ÷ 371,413 shares)1 | $12.95 |
| Class I ($17,936,042 ÷ 1,379,675 shares) | $13.00 |
| |
| Maximum offering price per share | |
|
| Class A (net asset value per share ÷ 95%)2 | $13.63 |
1 Redemption price is equal to net asset value less any applicable contingent deferred sales charge.
2 On single retail sales of less than $50,000. On sales of $50,000 or more and on group sales the offering price is reduced.
| | |
| See notes to financial statements | Annual report | Fundamental Large Cap Core Fund | 15 |
F I N A N C I A L S T A T E M E N T S
Statement of operations For the year ended 7-31-13
This Statement of operations summarizes the fund’s investment income earned and expenses incurred in operating the fund. It also shows net gains (losses) for the period stated.
| |
| Investment income | |
|
| Dividends | $235,845 |
| Less foreign taxes withheld | (1,991) |
| | |
| Total investment income | 233,854 |
| |
| Expenses | |
|
| Investment management fees | 92,818 |
| Distribution and service fees | 11,386 |
| Accounting and legal services fees | 1,733 |
| Transfer agent fees | 16,194 |
| Trustees’ fees | 103 |
| State registration fees | 37,326 |
| Printing and postage | 8,384 |
| Professional fees | 41,099 |
| Custodian fees | 12,050 |
| Registration and filing fees | 29,991 |
| Other | 3,981 |
| | |
| Total expenses | 255,065 |
| Less expense reductions | (122,535) |
| | |
| Net expenses | 132,530 |
| | |
| Net investment income | 101,324 |
| |
| Realized and unrealized gain (loss) | |
|
| |
| Net realized gain (loss) on | |
| Investments | 507,752 |
| Foreign currency transactions | (123) |
| | 507,629 |
| Change in net unrealized appreciation (depreciation) of | |
| Investments | 2,533,384 |
| Translation of assets and liabilities in foreign currencies | (12) |
| | 2,533,372 |
| Net realized and unrealized gain | 3,041,001 |
| | |
| Increase in net assets from operations | $3,142,325 |
| | |
| 16 | Fundamental Large Cap Core Fund | Annual report | See notes to financial statements |
F I N A N C I A L S T A T E M E N T S
Statements of changes in net assets
These Statements of changes in net assets show how the value of the fund’s net assets has changed during the last two periods. The difference reflects earnings less expenses, any investment gains and losses, distributions, if any, paid to shareholders and the net of fund share transactions.
| | |
| | Year | Year |
| | ended | ended |
| | 7-31-13 | 7-31-12 |
| |
| Increase (decrease) in net assets | | |
|
| |
| From operations | | |
| Net investment income | $101,324 | $20,880 |
| Net realized gain (loss) | 507,629 | (14,043) |
| Change in net unrealized appreciation (depreciation) | 2,533,372 | 263,704 |
| | | |
| Increase in net assets resulting from operations | 3,142,325 | 270,541 |
| | | |
| Distributions to shareholders | | |
| From net investment income | | |
| Class A | (4,589) | (7,730) |
| Class I | (34,650) | (6,671) |
| From net realized gain | | |
| Class A | (32,865) | (7,947) |
| Class I | (71,193) | (3,824) |
| | | |
| Total distributions | (143,297) | (26,172) |
| | | |
| From fund share transactions | 15,697,060 | 710,675 |
| | | |
| Total increase | 18,696,088 | 955,044 |
| |
| Net assets | | |
|
| Beginning of year | 4,050,960 | 3,095,916 |
| | | |
| End of year | $22,747,048 | $4,050,960 |
| | | |
| Undistributed net investment income | $70,156 | $8,194 |
| | |
| See notes to financial statements | Annual report | Fundamental Large Cap Core Fund | 17 |
Financial highlights
The Financial highlights show how the fund’s net asset value for a share has changed during the period.
| | | |
| CLASS A SHARES Period ended | 7-31-13 | 7-31-12 | 7-31-111 |
| |
| Per share operating performance | | | |
|
| Net asset value, beginning of period | $10.35 | $9.73 | $10.00 |
| Net investment income2 | 0.06 | 0.04 | —3 |
| Net realized and unrealized gain (loss) on investments | 2.67 | 0.64 | (0.27) |
| Total from investment operations | 2.73 | 0.68 | (0.27) |
| Less distributions | | | |
| From net investment income | (0.02) | (0.03) | — |
| From net realized gain | (0.11) | (0.03) | — |
| Total distributions | (0.13) | (0.06) | — |
| Net asset value, end of period | $12.95 | $10.35 | $9.73 |
| Total return (%)4,5 | 26.53 | 7.09 | (2.70)6 |
| |
| Ratios and supplemental data | | | |
|
| Net assets, end of period (in millions) | $5 | $3 | $2 |
| Ratios (as a percentage of average net assets): | | | |
| Expenses before reductions and amounts recaptured | 2.45 | 6.29 | 5.957 |
| Expenses including reductions and amounts recaptured | 1.30 | 1.30 | 1.307 |
| Net investment income (loss) | 0.56 | 0.46 | (0.12)7 |
| Portfolio turnover (%) | 31 | 40 | 4 |
| |
1 The inception date for Class A shares is 6-1-11.
2 Based on the average daily shares outstanding.
3 Less than $0.005 per share.
4 Does not reflect the effect of sales charges, if any.
5 Total returns would have been lower had certain expenses not been reduced during the applicable periods shown.
6 Not annualized.
7 Annualized.
| | |
| 18 | Fundamental Large Cap Core Fund | Annual report | See notes to financial statements |
| | | |
| CLASS I SHARES Period ended | 7-31-13 | 7-31-12 | 7-31-111 |
| |
| Per share operating performance | | | |
|
| Net asset value, beginning of period | $10.38 | $9.74 | $10.00 |
| Net investment income2 | 0.11 | 0.09 | 0.01 |
| Net realized and unrealized gain (loss) on investments | 2.67 | 0.64 | (0.27) |
| Total from investment operations | 2.78 | 0.73 | (0.26) |
| Less distributions | | | |
| From net investment income | (0.05) | (0.06) | — |
| From net realized gain | (0.11) | (0.03) | — |
| Total distributions | (0.16) | (0.09) | — |
| Net asset value, end of period | $13.00 | $10.38 | $9.74 |
| Total return (%)3 | 27.07 | 7.58 | (2.60)4 |
| |
| Ratios and supplemental data | | | |
|
| Net assets, end of period (in millions) | $18 | $1 | $1 |
| Ratios (as a percentage of average net assets): | | | |
| Expenses before reductions and amounts recaptured | 1.80 | 7.53 | 5.615 |
| Expenses including reductions and amounts recaptured | 0.92 | 0.84 | 0.845 |
| Net investment income | 0.89 | 0.93 | 0.365 |
| Portfolio turnover (%) | 31 | 40 | 4 |
| |
1 The inception date for Class I shares is 6-1-11.
2 Based on the average daily shares outstanding.
3 Total returns would have been lower had certain expenses not been reduced during the applicable periods shown.
4 Not annualized.
5 Annualized.
| | |
| See notes to financial statements | Annual report | Fundamental Large Cap Core Fund | 19 |
Notes to financial statements
Note 1 — Organization
John Hancock Fundamental Large Cap Core Fund (the fund) is a series of John Hancock Funds II (the Trust), an open-end management investment company organized as a Massachusetts business trust and registered under the Investment Company Act of 1940, as amended (the 1940 Act). The investment objective of the fund is to seek long-term capital appreciation.
The fund may offer multiple classes of shares. The shares currently offered are detailed in the Statement of assets and liabilities. Class A shares are offered to all investors. Class I shares are offered to institutions and certain investors. Shareholders of each class have exclusive voting rights to matters that affect that class. The distribution and service fees, if any, transfer agent fees, printing and postage and state registration fees for each class may differ.
Note 2 — Significant accounting policies
The financial statements have been prepared in conformity with accounting principles generally accepted in the United States of America, which require management to make certain estimates and assumptions as of the date of the financial statements. Actual results could differ from those estimates and those differences could be significant. Events or transactions occurring after the end of the fiscal period through the date that the financial statements were issued have been evaluated in the preparation of the financial statements. The following summarizes the significant accounting policies of the fund:
Security valuation. Investments are stated at value as of the close of regular trading on the New York Stock Exchange (NYSE), normally at 4:00 P.M., Eastern Time. In order to value the securities, the fund uses the following valuation techniques: Equity securities held by the fund are valued at the last sale price or official closing price on the principal securities exchange on which they trade. In the event there were no sales during the day or closing prices are not available, the securities are valued using the last quoted bid or evaluated price. Foreign securities and currencies are valued in U.S. dollars, based on foreign currency exchange rates supplied by an independent pricing service. Certain securities traded only in the over-the-counter market are valued at the last bid price quoted by brokers making markets in the securities at the close of trading. Other portfolio securities and assets, for which reliable market quotations are not readily available, are valued at fair value as determined in good faith by the fund’s Pricing Committee following procedures established by the Board of Trustees, which include price verification procedures. The frequency with which these fair valuation procedures are used cannot be predicted and fair value of securities may differ significantly from the value that would have been used had a ready market for such securities existed.
The fund uses a three-tier hierarchy to prioritize the pricing assumptions, referred to as inputs, used in valuation techniques to measure fair value. Level 1 includes securities valued using quoted prices in active markets for identical securities. Level 2 includes securities valued using other significant observable inputs. Observable inputs may include quoted prices for similar securities, interest rates, prepayment speeds and credit risk. Prices for securities valued using these inputs are received from independent pricing vendors and brokers and are based on an evaluation of the inputs described. Level 3 includes securities valued using significant unobservable inputs when market prices are not readily available or reliable, including the fund’s own assumptions in determining the fair value of investments. Factors used in determining value may include market or issuer specific events or trends, changes in interest rates and credit quality. The inputs or methodology used for valuing securities are not necessarily an indication of the risks associated with investing in those securities.
| |
| 20 | Fundamental Large Cap Core Fund | Annual report |
Changes in valuation techniques may result in transfers into or out of an assigned level within the disclosure hierarchy.
The following is a summary of the values by input classification of the fund’s investments as of July 31, 2013, by major security category or type:
| | | | |
| | | | | LEVEL 3 |
| | | | LEVEL 2 | SIGNIFICANT |
| | TOTAL MARKET | LEVEL 1 | SIGNIFICANT | UNOBSERVABLE |
| | VALUE AT 7-31-13 | QUOTED PRICE | OBSERVABLE INPUTS | INPUTS |
|
| Common Stocks | | | | |
| Consumer Discretionary | $2,949,526 | $2,949,526 | — | — |
| Consumer Staples | 1,415,263 | 1,152,485 | $262,778 | — |
| Energy | 2,715,157 | 2,715,157 | — | — |
| Financials | 5,881,137 | 5,881,137 | — | — |
| Health Care | 1,633,008 | 1,633,008 | — | — |
| Industrials | 1,290,039 | 1,290,039 | — | — |
| Information Technology | 6,282,750 | 6,282,750 | — | — |
| Materials | 120,699 | 120,699 | — | — |
| |
|
| Total Investments in | | | | |
| Securities | $22,287,579 | $22,024,801 | $262,778 | — |
Security transactions and related investment income. Investment security transactions are accounted for on a trade date plus one basis for daily net asset value calculations. However, for financial reporting purposes, investment transactions are reported on trade date. Interest income is accrued as earned. Dividend income is recorded on the ex-date, except for dividends of foreign securities where the dividend may not be known until after the ex-date. In those cases, dividend income, net of withholding taxes, is recorded when the fund becomes aware of the dividends. Distributions received on securities that represent a return of capital or capital gain are recorded as a reduction of cost of investments and/or as a realized gain if amounts are estimable. Foreign taxes are provided for based on the fund’s understanding of the tax rules and rates that exist in the foreign markets in which it invests. Gains and losses on securities sold are determined on the basis of identified cost and may include proceeds from litigation.
Foreign currency translation. Assets, including investments and liabilities denominated in foreign currencies, are translated into U.S. dollar values each day at the prevailing exchange rate. Purchases and sales of securities, income and expenses are translated into U.S. dollars at the prevailing exchange rate on the date of the transaction. The effect of changes in foreign currency exchange rates on the value of securities is reflected as a component of the realized and unrealized gains (losses) on investments.
Funds that invest internationally generally carry more risk than funds that invest strictly in U.S. securities. Risks can result from differences in economic and political conditions, regulations, market practices (including higher transaction costs), accounting standards and other factors. Foreign investments are also subject to a decline in the value of a foreign currency versus the U.S. dollar, which reduces the dollar value of securities denominated in that currency.
Foreign taxes. The fund may be subject to withholding tax on income and/or capital gains or repatriation taxes imposed by certain countries in which the fund invests. Taxes are accrued based upon investment income, realized gains or unrealized appreciation.
Line of credit. The fund may borrow from banks for temporary or emergency purposes, including meeting redemption requests that otherwise might require the untimely sale of securities. Pursuant to the fund custodian agreement, the custodian may loan money to the fund to make properly authorized payments. The fund is obligated to repay the custodian for any overdraft, including any
| |
| Annual report | Fundamental Large Cap Core Fund | 21 |
related costs or expenses. The custodian may have a lien, security interest or security entitlement in any fund property that is not otherwise segregated or pledged, to the maximum extent permitted by law, to the extent of any overdraft.
In addition, the fund and other affiliated funds have entered into an agreement with Citibank N.A. that enables them to participate in a $300 million unsecured committed line of credit. A commitment fee, payable at the end of each calendar quarter, based on the average daily unused portion of the line of credit, is charged to each participating fund on a pro rata basis and is reflected in other expenses on the Statement of operations. Prior to March 27, 2013, the fund participated in a $200 million unsecured line of credit, also with Citibank, with terms otherwise similar to the existing agreement. Commitment fees for the year ended July 31, 2013 were $342. For the year ended July 31, 2013, the fund had no borrowings under either line of credit.
Expenses. Within the John Hancock funds complex, expenses that are directly attributable to an individual fund are allocated to such fund. Expenses that are not readily attributable to a specific fund are allocated among all funds in an equitable manner, taking into consideration, among other things, the nature and type of expense and the fund’s relative net assets. Expense estimates are accrued in the period to which they relate and adjustments are made when actual amounts are known.
Class allocations. Income, common expenses and realized and unrealized gains (losses) are determined at the fund level and allocated daily to each class of shares based on the net assets of the class. Class-specific expenses, such as distribution and service fees, if any, transfer agent fees, state registration fees and printing and postage expenses, for all classes, are calculated daily at the class level based on the appropriate net assets of each class and the specific expense rates applicable to each class.
Federal income taxes. The fund intends to continue to qualify as a regulated investment company by complying with the applicable provisions of the Internal Revenue Code and will not be subject to federal income tax on taxable income that is distributed to shareholders. Therefore, no federal income tax provision is required.
As of July 31, 2013, the fund had no uncertain tax positions that would require financial statement recognition, derecognition or disclosure. The fund’s federal tax returns are subject to examination by the Internal Revenue Service for a period of three years.
Distribution of income and gains. Distributions to shareholders from net investment income and net realized gains, if any, are recorded on the ex-date. The fund generally declares and pays dividends and capital gain distributions, if any, annually. The tax character of distributions for the years ended July 31, 2013 and 2012 was as follows:
| | | | |
| | JULY 2013 | JULY 2012 | | |
| | |
| Ordinary Income | $73,563 | $26,172 | | |
| Long-term Capital Gains | $69,734 | — | | |
| Total | $143,297 | $26,172 | | |
Distributions paid by the fund with respect to each class of shares are calculated in the same manner, at the same time and in the same amount, except for the effect of class level expenses that may be applied differently to each class. As of July 31, 2013, the components of distributable earnings on a tax basis consisted of $171,398 of undistributed ordinary income, and $311,906 long-term capital gains.
Such distributions and distributable earnings, on a tax basis, are determined in conformity with income tax regulations, which may differ from accounting principles generally accepted in the United States of America. Material distributions in excess of tax basis earnings and profits, if any, are reported in the fund’s financial statements as a return of capital.
| |
| 22 | Fundamental Large Cap Core Fund | Annual report |
Capital accounts within the financial statements are adjusted for permanent book-tax differences. These adjustments have no impact on net assets or the results of operations. Temporary book-tax differences, if any, will reverse in a subsequent period. Book-tax differences are primarily attributable to wash sale loss deferrals.
Note 3 — Guarantees and indemnifications
Under the Trust’s organizational documents, its Officers and Trustees are indemnified against certain liabilities arising out of the performance of their duties to the fund. Additionally, in the normal course of business, the Fund enters into contracts with service providers that contain general indemnification clauses. The fund’s maximum exposure under these arrangements is unknown, as this would involve future claims that may be made against the fund that have not yet occurred. The risk of material loss from such claims is considered remote.
Note 4 — Fees and transactions with affiliates
John Hancock Investment Management Services, LLC (the Advisor) serves as investment advisor for the fund. John Hancock Funds, LLC (the Distributor), an affiliate of the Advisor, serves as principal underwriter of the fund. The Advisor and the Distributor are indirect, wholly owned subsidiaries of Manulife Financial Corporation (MFC).
Management fee. The fund has an investment management agreement with the Advisor under which the fund pays a daily management fee to the Advisor equivalent, on an annual basis, to the sum of: a) 0.725% of the first $500,000,000 of the fund’s average daily net assets; b) 0.700% of the next $500,000,000 of the fund’s average daily net assets; c) 0.675% of the next $500,000,000 of the fund’s average daily net assets; and d) 0.650% of the fund’s average daily net assets in excess of $1,500,000,000. The Advisor has a subadvisory agreement with John Hancock Asset Management a division of Manulife Asset Management (US) LLC, an indirectly owned subsidiary of MFC and an affiliate of the Advisor. The fund is not responsible for payment of the subadvisory fees.
The Advisor has contractually agreed to waive a portion of its management fee for certain funds (the Participating Portfolios) of the Trust, John Hancock Variable Insurance Trust, John Hancock Funds and John Hancock Funds III. The waiver equals, on an annualized basis, 0.01% of that portion of the aggregate net assets of all the Participating Portfolios that exceeds $75 billion up to $125 billion; 0.0125% of that portion of the aggregate netassets of all the Participating Portfolios that exceeds $125 billion up to $150 billion; and 0.015% of that portion of the aggregate net assets of all the Participating Portfolios that exceeds $150 billion. The amount of the reimbursement is calculated daily and allocated among all the Participating Portfolios in proportion to the daily net assets of each fund. This arrangement may be amended or terminated at any time by the Advisor upon notice to the funds and with the approval of the Board of Trustees.
Prior to June 1, 2013 the Advisor contractually agreed to waive a portion of its management fee for certain funds (the Participating Portfolios) of the Trust and John Hancock Variable Insurance Trust. The waiver equaled, on an annualized basis, 0.01% of that portion of the aggregate net assets of all the Participating Portfolios that exceeded $75 billion but was less than $100 billion; and 0.015% of that portion of the aggregate net assets of all the Participating Portfolios that equaled or exceeded $100 billion. The amount of the reimbursement was calculated daily and allocated among all the Participating Portfolios in proportion to the daily net assets of each fund.
The Advisor has contractually agreed to waive all or a portion of its management fee and reimburse or pay operating expenses of the fund to the extent necessary to maintain the fund’s total operating expense at 1.30% and 0.94% for Class A and Class I shares respectively, excluding certain expenses such as taxes, brokerage commissions, interest expense, litigation and indemnification expenses and other extraordinary expenses not incurred in the ordinary course of the fund’s business, underlying fund expenses, and short dividend expense. The current expense limitation agreement
| |
| Annual report | Fundamental Large Cap Core Fund | 23 |
expires on November 30, 2013, unless renewed by mutual agreement of the fund and the Advisor based upon determination that this is appropriate under the circumstances at the time.
Additionally, the Advisor has voluntarily agreed to waive other fund level expenses excluding advisory fees, 12b-1 fees, service fees, transfer agent fees, blue sky fees, taxes, printing and postage, brokerage commissions, interest expense, acquired fund fees, short dividend expense, and litigation and indemnification expenses and other extraordinary expenses not incurred in the ordinary course of business. The waivers are such that these expenses will not exceed 0.20% of average net assets. This voluntary expense reimbursement may be terminated at any time by the advisor on notice to the fund.
Accordingly, these expense reductions described above amounted to $43,803 and $78,732 for Class A and Class I shares, respectively, for the year ended July 31, 2013.
The investment management fees, including the impact of the waivers and reimbursement described above, incurred for the year ended July 31, 2013 were equivalent to a net effective rate of 0.00% of the fund’s average daily net assets.
Expense recapture. The Advisor may recapture operating expenses reimbursed or fees waived under previous expense limitation or waiver arrangements for a period of three years following the beginning of the month in which such reimbursements or waivers originally occurred to the extent that the fund is below its expense limitation during this period. The table below outlines the amounts recovered during the year ended July 31, 2013, and the amount of waived or reimbursed expenses subject to potential recovery and the respective expiration dates.
| | | |
| AMOUNTS ELIGIBLE | AMOUNTS ELIGIBLE | AMOUNTS ELIGIBLE | AMOUNT RECOVERED |
| FOR RECOVERY | FOR RECOVERY | FOR RECOVERY | DURING THE |
| THROUGH | THROUGH | THROUGH | PERIOD ENDED |
| JULY 1, 2014 | JULY 1, 2015 | JULY 1, 2016 | JULY 31, 2013 |
|
| $22,880 | $160,314 | $112,320 | — |
Accounting and legal services. Pursuant to a service agreement, the fund reimburses the Advisor for all expenses associated with providing the administrative, financial, legal, accounting and recordkeeping services to the fund, including the preparation of all tax returns, periodic reports to shareholders and regulatory reports, among other services. These expenses are allocated to each share class based on its relative net assets at the time the expense was incurred. These accounting and legal services fees incurred for the year ended July 31, 2013 amounted to an annual rate of 0.01% of the fund’s average daily net assets.
Distribution and service plans. The fund has a distribution agreement with the Distributor. The fund has adopted distribution and service plans with respect to Class A shares pursuant to Rule 12b-1 under the 1940 Act, to pay the Distributor for services provided as the distributor of shares of the fund. The fund pays 0.30% for Class A shares for distribution and service fees under these arrangements, expressed as an annual percentage of average daily net assets for each class of the fund’s shares.
Sales charges. Class A shares are assessed up-front sales charges, which resulted in payments to the Distributor amounting to $11,817 for the year ended July 31, 2013. Of this amount, $1,890 was retained and used for printing prospectuses, advertising, sales literature and other purposes, $9,920 was paid as sales commissions to broker-dealers and $7 was paid as sales commissions to sales personnel of Signator Investors, Inc., a broker-dealer affiliate of the Advisor.
Class A shares may be subject to contingent deferred sales charges (CDSCs). Certain Class A shares that are acquired through purchases of $1 million or more and are redeemed within one year of purchase are subject to a 1.00% sales charge. CDSCs are applied to the lesser of the current market value at the time of redemption or the original purchase cost of the shares being redeemed.
| |
| 24 | Fundamental Large Cap Core Fund | Annual report |
Proceeds from CDSCs are used to compensate the Distributor for providing distribution-related services in connection with the sale of these shares. During the year ended July 31, 2013, there were no CDSCs received by the Distributor for Class A shares.
Transfer agent fees. The fund has a transfer agent agreement with John Hancock Signature Services, Inc. (Signature Services), an affiliate of the Advisor. The transfer agent fees paid to Signature Services are determined based on the cost to Signature Services (Signature Services Cost) of providing recordkeeping services. The Signature Services Cost includes a component of allocated John Hancock corporate overhead for providing transfer agent services to the fund and to all other John Hancock affiliated funds. It also includes out-of-pocket expenses that are comprised of payments made to third-parties for recordkeeping services provided to their clients who invest in one or more John Hancock funds. In addition, Signature Services Cost may be reduced by certain fees that Signature Services receives in connection with retirement and small accounts. Signature Services Cost is calculated monthly and allocated, as applicable, to four categories of share classes: Institutional Share Classes, Retirement Share Classes, Municipal Bond Classes and all other Retail Share Classes. Within each of these categories, the applicable costs are allocated to the affected John Hancock affiliated funds and/or classes, based on the relative average daily net assets.
Class level expenses. Class level expenses for the year ended July 31, 2013 were:
| | | | |
| | DISTRIBUTION | TRANSFER | STATE | PRINTING AND |
| CLASS | AND SERVICE FEES | AGENT FEES | REGISTRATION FEES | POSTAGE |
|
| A | $11,386 | $6,617 | $17,966 | $2,780 |
| I | — | 9,577 | 19,360 | 5,604 |
| Total | $11,386 | $16,194 | $37,326 | $8,384 |
Trustee expenses. The fund compensates each Trustee who is not an employee of the Advisor or its affiliates. The costs of paying Trustee compensation and expenses are allocated to the fund based on its average daily net assets.
Note 5 — Fund share transactions
Transactions in fund shares for the years ended July 31, 2013 and 2012 were as follows:
| | | | |
| | Year ended 7-31-13 | Year ended 7-31-12 |
| | Shares | Amount | Shares | Amount |
| Class A shares | | | | |
|
| Sold | 136,512 | $1,590,142 | 138,949 | $1,350,466 |
| Distributions reinvested | 1,250 | 13,835 | 383 | 3,593 |
| Repurchased | (48,294) | (564,008) | (59,942) | (593,022) |
| | | | | |
| Net increase | 89,468 | $1,039,969 | 79,390 | $761,037 |
| |
| Class I shares | | | | |
|
| Sold | 1,365,519 | $15,807,369 | 31,664 | $323,806 |
| Distributions reinvested | 9,544 | 105,843 | 1,018 | 9,546 |
| Repurchased | (104,409) | (1,256,121) | (39,151) | (383,714) |
| | | | | |
| Net increase (decrease) | 1,270,654 | $14,657,091 | (6,469) | ($50,362) |
|
| Total net increase | 1,360,122 | $15,697,060 | 72,921 | $710,675 |
Affiliates of the fund owned 51% of shares of beneficial interest of Class A shares on July 31, 2013.
Note 6 — Purchase and sale of securities
Purchases and sales of securities, other than short-term securities, amounted to $19,112,662 and $3,848,898, respectively, for the year ended July 31, 2013.
| |
| Annual report | Fundamental Large Cap Core Fund | 25 |
Auditor’s report
Report of Independent Registered Public Accounting Firm
To the Board of Trustees of John Hancock Funds II and Shareholders of
John Hancock Fundamental Large Cap Core Fund:
In our opinion, the accompanying statement of assets and liabilities, including the schedule of investments, and the related statements of operations and of changes in net assets and the financial highlights present fairly, in all material respects, the financial position of John Hancock Fundamental Large Cap Core Fund (the “Fund”) at July 31, 2013, and the results of its operations for the year then ended, the changes in its net assets for each of the two years in the period then ended and the financial highlights for each of the periods indicated, in conformity with accounting principles generally accepted in the United States of America. These financial statements and financial highlights (hereafter referred to as “financial statements”) are the responsibility of the Fund’s management; our responsibility is to express an opinion on these financial statements based on our audits. We conducted our audits of these financial statements in accordance with the standards of the Public Company Accounting Oversight Board (United States). Those standards require that we plan and perform the audit to obtain reasonable assurance about whether the financial statements are free of material misstatement. An audit includes examining, on a test basis, evidence supporting the amounts and disclosures in the financial statements, assessing the accounting principles used and significant estimates made by management, and evaluating the overall financial statement presentation. We believe that our audits, which included confirmation of securities at July 31, 2013 by correspondence with the custodian, and the application of alternative auditing procedures where securities purchased confirmations had not been received, provide a reasonable basis for our opinion.
PricewaterhouseCoopers LLP
Boston, Massachusetts
September 20, 2013
| |
| 26 | Fundamental Large Cap Core Fund | Annual report |
Tax information
Unaudited
For federal income tax purposes, the following information is furnished with respect to the distributions of the fund, if any, paid during its taxable year ended July 31, 2013.
The fund reports the maximum amount allowable of its net taxable income as eligible for the corporate dividends-received deduction.
The fund reports the maximum amount allowable of its net taxable income as qualified dividend income as provided in the Jobs and Growth Tax Relief Reconciliation Act of 2003.
The fund paid $69,734 in capital gain dividends.
Eligible shareholders will be mailed a 2013 Form 1099-DIV in early 2014. This will reflect the tax character of all distributions paid in calendar year 2013.
Please consult a tax advisor regarding the tax consequences of your investment in the fund.
| |
| Annual report | Fundamental Large Cap Core Fund | 27 |
Evaluation of Advisory and Subadvisory Agreements by the Board of Trustees
This section describes the evaluation by the Board of Trustees (the Board) of John Hancock Funds II (the Trust) of the Advisory Agreement (the Advisory Agreement) with John Hancock Investment Management Services, LLC (the Advisor) and the Subadvisory Agreement (the Subadvisory Agreement) with John Hancock Asset Management a division of Manulife Asset Management (US) LLC (the Subadvisor) for Fundamental Large Cap Core Fund (the fund). The Advisory Agreement and Subadvisory Agreement are collectively referred to as the Agreements.
Approval of Advisory and Subadvisory Agreements
At in-person meetings held on May 16-17, 2013, the Board, including the Trustees who are not considered to be interested persons of the Trust under the Investment Company Act of 1940, as amended (the 1940 Act) (the Independent Trustees), reapproved for an annual period the continuation of the Advisory Agreement between the Trust and the Advisor and the Subadvisory Agreement between the Advisor and the Subadvisor with respect to the fund.
In considering the Advisory Agreement and the Subadvisory Agreement, the Board received in advance of the meeting a variety of materials relating to the fund, the Advisor, and the Subadvisor, including comparative performance, fee and expense information for peer groups of similar mutual funds prepared by an independent third-party provider of mutual fund data; performance information for the fund’s benchmark index; and, with respect to the Subadvisor, comparative performance information for comparably managed accounts; and other information provided by the Advisor and the Subadvisor regarding the nature, extent, and quality of services provided by the Advisor and the Subadvisor under their respective Agreements, as well as information regarding the Advisor’s revenues and costs of providing services to the fund and any compensation paid to affiliates of the Advisor. At the meeting at which the renewal of the Advisory Agreement and Subadvisory Agreement is considered, particular focus is given to information concerning fund performance, comparability of fees and total expenses and profitability. However, the Board notes that the evaluation process with respect to the Advisor and the Subadvisor is an ongoing one. In this regard, the Board also took into account discussions with management and information provided to the Board at prior meetings with respect to the services provided by the Advisor and the Subadvisor to the fund, including quarterly performance reports prepared by management containing reviews of investment results and prior presentations from the Subadvisor with respect to the fund. The Board noted the affiliation of the Subadvisor with the Advisor, noting any potential conflicts of interest. The Board also considered the nature, quality, and extent of non-advisory services, if any, to be provided to the fund by the Advisor’s affiliates, including distribution services.
Throughout the process, the Board asked questions of and requested additional information from management. The Board is assisted by counsel for the Trust and the Independent Trustees are also separately assisted by independent legal counsel throughout the process. The Independent Trustees also received a memorandum from their independent counsel discussing the legal standards for their consideration of the proposed continuation of the Agreements and discussed the proposed continuation of the Agreements in private sessions with their independent legal counsel at which no representatives of management were present.
Approval of Advisory Agreement
In approving the Advisory Agreement with respect to the fund, the Board, including the Independent Trustees, considered a variety of factors, including those discussed below. The Board also considered other factors (including conditions and trends prevailing generally in the economy, the securities markets, and the industry) and does not treat any single factor as determinative and each Trustee may attribute different weights to different factors. The Board’s conclusions may be based in part on its consideration of the Advisory and Subadvisory Agreements in prior years and on the Board’s ongoing regular review of fund performance and operations throughout the year.
| |
| 28 | Fundamental Large Cap Core Fund | Annual report |
Nature, extent, and quality of services. Among the information received by the Board from the Advisor relating to the nature, extent, and quality of services provided to the fund, the Board reviewed information provided by the Advisor relating to its operations and personnel, descriptions of its organizational and management structure, and information regarding the Advisor’s compliance and regulatory history, including its Form ADV. The Board also noted that on a regular basis it receives and reviews information from the Trust’s Chief Compliance Officer (CCO) regarding the fund’s compliance policies and procedures established pursuant to Rule 38a-1 under the 1940 Act. The Board also considered the Advisor’s risk management processes. The Board considered that the Advisor is responsible for the management of the day-to-day operations of the fund, including, but not limited to, general supervision of and coordination of the services provided by the Subadvisor, and is also responsible for monitoring and reviewing the activities of the Subadvisor and third-party service providers.
In considering the nature, extent, and quality of the services provided by the Advisor, the Trustees also took into account their knowledge of the Advisor’s management and the quality of the performance of the Advisor’s duties through Board meetings, discussions, and reports during the preceding year and through each Trustee’s experience as a Trustee of the Trust and of the other trusts in the complex.
In the course of their deliberations regarding the Advisory Agreement, the Board considered, among other things:
(a) the skills and competency with which the Advisor has in the past managed the Trust’s affairs and its subadvisory relationship, the Advisor’s oversight and monitoring of the Subadvisor’s investment performance and compliance programs, such as the Subadvisor’s compliance with fund policies and objective; review of brokerage matters, including with respect to trade allocation and best execution; and the Advisor’s timeliness in responding to performance issues;
(b) the background, qualifications and skills of the Advisor’s personnel;
(c) the Advisor’s compliance policies and procedures and its responsiveness to regulatory changes and mutual fund industry developments;
(d) the Advisor’s administrative capabilities, including its ability to supervise the other service providers for the fund;
(e) the financial condition of the Advisor and whether it has the financial wherewithal to provide a high level and quality of services to the fund; and
(f) the Advisor’s reputation and experience in serving as an investment adviser to the Trust and the benefit to shareholders of investing in funds that are part of a family of funds offering a variety of investments.
The Board concluded that the Advisor may reasonably be expected to continue to provide a high quality of services under the Advisory Agreement with respect to the fund.
Investment performance. In considering the fund’s performance, the Board noted that it reviews at its regularly scheduled meetings information about the fund’s performance results. In connection with the consideration of the Advisory Agreement, the Board:
(a) reviewed information prepared by management regarding the fund’s performance;
(b) considered the comparative performance of the fund’s benchmark;
| |
| Annual report | Fundamental Large Cap Core Fund | 29 |
(c) considered the performance of comparable funds, if any, as included in the report prepared by an independent third-party provider of mutual fund data. Such report included the fund’s ranking within a smaller group of peer funds and the fund’s ranking within broader groups of funds; and
(d) took into account the Advisor’s analysis of the fund’s performance and its plans and recommendations regarding the Trust’s subadvisory arrangements generally.
The Board noted that the fund outperformed its benchmark index and peer group average for the one-year period ended December 31, 2012.
The Board took into account management’s discussion of the fund’s performance and noted that the fund had a limited performance history as it commenced operations on June 1, 2011. The Board noted the fund’s favorable performance relative to the benchmark index and peer group for the one-year period ended December 31, 2012.
The Board concluded that the performance of the fund has generally been in line with or outperformed the historical performance of comparable funds and the fund’s benchmark.
Fees and expenses. The Board reviewed comparative information prepared by an independent third-party provider of mutual fund data, including, among other data, the fund’s contractual and net management fees and total expenses as compared to similarly situated investment companies deemed to be comparable to the fund. The Board considered the fund’s ranking within a smaller group of peer funds chosen by the independent third-party provider, as well as the fund’s ranking within a broader group of funds. In comparing the fund’s contractual and net management fees to those of comparable funds, the Board noted that such fees include both advisory and administrative costs.
The Board noted that net management fees for this fund are lower than the peer group median and that total expenses for this fund are higher than the peer group median. The Board took into account management’s discussion of the fund’s expenses, including the impact of the fund’s current asset size on expenses.
The Board took into account management’s discussion with respect to the advisory/subadvisory fee structure, including the amount of the advisory fee retained by the Advisor after payment of the subadvisory fee. The Board also took into account that management had agreed to implement an overall fee waiver across a number of funds in the complex, including the fund, which is discussed further below. The Board also noted that, in addition, the Advisor is currently waiving fees and/or reimbursing expenses with respect to the fund. The Board also noted management’s discussion of the fund’s expenses, as well as certain actions taken over the past several years to reduce the fund’s operating expenses. The Board reviewed information provided by the Advisor concerning investment advisory fees charged to other clients (including other funds in the complex) having similar investment mandates, if any. The Board considered any differences between the Advisor’s and Subadvisor’s services to the fund and the services they provide to other comparable clients or funds. The Board concluded that the advisory fee paid with respect to the fund is reasonable.
Profitability/indirect benefits. In considering the costs of the services to be provided and the profits to be realized by the Advisor and its affiliates (including the Subadvisor) from the Advisor’s relationship with the Trust, the Board:
(a) reviewed financial information of the Advisor;
(b) reviewed and considered an analysis presented by the Advisor regarding the net profitability to the Advisor and its affiliates with respect to the fund;
| |
| 30 | Fundamental Large Cap Core Fund | Annual report |
(c) received and reviewed profitability information with respect to the John Hancock fund complex as a whole;
(d) received information with respect to the Advisor’s allocation methodologies used in preparing the profitability data;
(e) considered that the John Hancock insurance companies that are affiliates of the Advisor, as shareholders of the Trust directly or through their separate accounts, receive certain tax credits or deductions relating to foreign taxes paid and dividends received by certain funds of the Trust and noted that these tax benefits, which are not available to participants in qualified retirement plans under applicable income tax law, are reflected in the profitability analysis reviewed by the Board;
(f) considered that the Advisor also provides administrative services to the fund on a cost basis pursuant to an administrative services agreement;
(g) noted that the fund’s Subadvisor is an affiliate of the Advisor;
(h) noted that affiliates of the Advisor provide transfer agency services and distribution services to the fund, and that the Trust’s distributor also receives Rule 12b-1 payments to support distribution of the fund;
(i) noted that the Advisor also derives reputational and other indirect benefits from providing advisory services to the fund;
(j) noted that the subadvisory fees for the fund are paid by the Advisor; and
(k) considered that the Advisor should be entitled to earn a reasonable level of profits in exchange for the level of services it provides to the fund and the entrepreneurial risk that it assumes as Advisor.
Based upon its review, the Board concluded that the level of profitability, if any, of the Advisor and its affiliates (including the Subadvisor) from their relationship with the fund was reasonable and not excessive.
Economies of scale. In considering the extent to which economies of scale would be realized as the fund grows and whether fee levels reflect these economies of scale for the benefit of fund shareholders, the Board:
(a) considered that the Advisor has agreed, effective June 1, 2013, to waive its management fee for the fund and each of the open-end funds of John Hancock Funds II, John Hancock Funds III, each other John Hancock fund (except those listed below) (the Participating Portfolios) or otherwise reimburse the expenses of the Participating Portfolios as follows (the Reimbursement):
The Reimbursement shall equal, on an annualized basis, 0.01% of that portion of the aggregate net assets of all the Participating Portfolios that exceeds $75 billion but is less than or equal to $125 billion, 0.0125% of that portion of the aggregate net assets of all the Participating Portfolios that exceeds $125 billion but is less than or equal to $150 billion and 0.015% of that portion of the aggregate net assets of all the Participating Portfolios that exceeds $150 billion. (The funds that are not Participating Portfolios as of the date of this annual report are each of the fund of funds, money market funds, index funds and closed-end funds);
(b) reviewed the Trust’s advisory fee structure and the incorporation therein of any subadvisory fee breakpoints in the advisory fees charged and concluded that (i) the fund’s fee structure
| |
| Annual report | Fundamental Large Cap Core Fund | 31 |
contains breakpoints at the subadvisory fee level and that such breakpoints are reflected as breakpoints in the advisory fees for the fund and (ii) although economies of scale cannot be measured with precision, these arrangements permit shareholders of the fund to benefit from economies of scale if the fund grows. The Board also took into account management’s discussion of the fund’s advisory fee structure; and
(c) the Board also considered the effect of the fund’s growth in size on its performance and fees. The Board also noted that if the fund’s assets increase over time, the fund may realize other economies of scale.
Approval of Subadvisory Agreement
In making its determination with respect to approval of the Subadvisory Agreement, the Board reviewed:
(1) information relating to the Subadvisor’s business, including current subadvisory services to the Trust (and other funds in the John Hancock family of funds);
(2) the historical and current performance of the fund, and comparative performance information relating to the fund’s benchmark and comparable funds; and
(3) the subadvisory fee for the fund, including any breakpoints, and comparative fee information, where available, prepared by an independent third-party provider of mutual fund data.
Nature, extent, and quality of services. With respect to the services provided by the Subadvisor, the Board received information provided to the Board by the Subadvisor, including the Subadvisor’s Form ADV, as well as took into account information presented throughout the past year. The Board considered the Subadvisor’s current level of staffing and its overall resources, as well as received information relating to the Subadvisor’s compensation program. The Board reviewed the Subadvisor’s history and investment experience, as well as information regarding the qualifications, background, and responsibilities of the Subadvisor’s investment and compliance personnel who provide services to the fund. The Board also considered, among other things, the Subadvisor’s compliance program and any disciplinary history. The Board also considered the Subadvisor’s risk assessment and monitoring process. The Board reviewed the Subadvisor’s regulatory history, including whether it was currently involved in any regulatory actions or investigations as well as material litigation, and any settlements and amelioratory actions undertaken, as appropriate. The Board noted that the Advisor conducts regular, periodic reviews of the Subadvisor and its operations, including regarding investment processes and organizational and staffing matters. The Board also noted that the Trust’s CCO and his staff conduct regular, periodic compliance reviews with the Subadvisor and present reports to the Independent Trustees regarding the same, which includes evaluating the regulatory compliance systems of the Subadvisor and procedures reasonably designed by it to assure compliance with the federal securities laws. The Board also took into account the financial condition of the Subadvisor.
The Board considered the Subadvisor’s investment process and philosophy. The Board took into account that the Subadvisor’s responsibilities include the development and maintenance of an investment program for the fund, that is consistent with the fund’s investment objective, the selection of investment securities and the placement of orders for the purchase and sale of such securities, as well as the implementation of compliance controls related to performance of these services. The Board also received information with respect to the Subadvisor’s brokerage policies and practices, including with respect to best execution and soft dollars.
| |
| 32 | Fundamental Large Cap Core Fund | Annual report |
Subadvisor compensation. In considering the cost of services to be provided by the Subadvisor and the profitability to the Subadvisor of its relationship with the fund, the Board noted that the fees under the Subadvisory Agreement are paid by the Advisor and not the fund.
The Board also received information and took into account any other potential conflicts of interest the Advisor might have in connection with the Subadvisory Agreement. In addition, the Board considered other potential indirect benefits that the Subadvisor and its affiliates may receive from the Subadvisor’s relationship with the fund, such as the opportunity to provide advisory services to additional funds in the John Hancock fund complex and reputational benefits.
Subadvisory fees. The Board considered that the fund pays an advisory fee to the Advisor and that, in turn, the Advisor pays a subadvisory fee to the Subadvisor. The Board also took into account the sub-advisory fees paid by the Advisor to the Subadvisor with respect to the fund to fees charged by the fund’s Subadvisor to manage other subadvised portfolios and portfolios not subject to regulation under the 1940 Act, as applicable.
Subadvisor performance. As noted above, the Board considered the fund’s performance as compared to the fund’s peer group and benchmark and noted that the Board reviews information about the fund’s performance results at its regularly scheduled meetings. The Board noted the Advisor’s expertise and resources in monitoring the performance, investment style, and risk-adjusted performance of the Subadvisor. The Board was mindful of the Advisor’s focus on the Subadvisor’s performance. The Board also noted the Subadvisor’s long-term performance record for similar accounts, as applicable.
The Board’s decision to approve the Subadvisory Agreement was based on a number of determinations, including the following:
(1) The Subadvisor has extensive experience and demonstrated skills as a manager;
(2) The performance of the fund generally has been in line with or outperformed the historical performance of comparable funds and the fund’s benchmark and the fund’s overall performance is satisfactory;
(3) The subadvisory fees are reasonable in relation to the level and quality of services being provided; and
(4) Subadvisory fee breakpoints are reflected as breakpoints in the advisory fees for the fund in order to permit shareholders to benefit from economies of scale if the fund grows.
Based on the Board’s evaluation of all factors that the Board deemed to be material, including those factors described above, the Board, including the Independent Trustees, concluded that renewal of the Advisory Agreement and the Subadvisory Agreement would be in the best interest of the fund and its shareholders. Accordingly, the Board, and the Independent Trustees voting separately, approved the Advisory Agreement and Subadvisory Agreement for an additional one-year period.
| |
| Annual report | Fundamental Large Cap Core Fund | 33 |
Trustees and Officers
This chart provides information about the Trustees and Officers who oversee your John Hancock fund. Officers elected by the Trustees manage the day-to-day operations of the fund and execute policies formulated by the Trustees.
Independent Trustees
| | |
| Name, year of birth | Trustee | Number of John |
| Position(s) held with fund | of the | Hancock funds |
| Principal occupation(s) and other | Trust | overseen by |
| directorships during past 5 years | since1 | Trustee |
| |
| James M. Oates, Born: 1946 | 2012 | 231 |
|
| Managing Director, Wydown Group (financial consulting firm) (since 1994); Chairman and Director, |
| Emerson Investment Management, Inc. (since 2000); Independent Chairman, Hudson Castle Group, Inc. |
| (formerly IBEX Capital Markets, Inc.) (financial services company) (1997–2011); Director, Stifel Financial |
| (since 1996); Director, Investor Financial Services Corporation (1995–2007); Director, Connecticut River |
| Bancorp (since 1998); Director, Virtus Funds (formerly Phoenix Mutual Funds) (since 1988). Trustee |
| and Chairperson of the Board, John Hancock retail funds (since 2012); Trustee (2005–2006 and since |
| 2012) and Chairperson of the Board (since 2012), John Hancock Funds III; Trustee (since 2004) and |
| Chairperson of the Board (since 2005), John Hancock Variable Insurance Trust; Trustee and Chairperson |
| of the Board (since 2005), John Hancock Funds II. | | |
|
| |
| Charles L. Bardelis,3 Born: 1941 | 2012 | 231 |
|
| Director, Island Commuter Corp. (marine transport). Trustee, John Hancock retail funds (since 2012); |
| Trustee, John Hancock Funds III (2005–2006 and since 2012); Trustee, John Hancock Variable Insurance |
| Trust (since 1988); Trustee, John Hancock Funds II (since 2005). | | |
|
| |
| Peter S. Burgess,3 Born: 1942 | 2012 | 231 |
|
| Consultant (financial, accounting, and auditing matters) (since 1999); Certified Public Accountant; |
| Partner, Arthur Andersen (independent public accounting firm) (prior to 1999); Director, Lincoln |
| Educational Services Corporation (since 2004); Director, Symetra Financial Corporation (since 2010); |
| former Director, PMA Capital Corporation (2004–2010). Trustee, John Hancock retail funds (since 2012); |
| Trustee, John Hancock Funds III (2005–2006 and since 2012); Trustee, John Hancock Variable Insurance |
| Trust and John Hancock Funds II (since 2005). | | |
|
| |
| William H. Cunningham,2 Born: 1944 | 1994 | 231 |
|
| Professor, University of Texas, Austin, Texas (since 1971); former Chancellor, University of Texas |
| System and former President of the University of Texas, Austin, Texas; Director, LIN Television (since |
| 2009); Chairman (since 2009) and Director (since 2006), Lincoln National Corporation (insurance); |
| Director, Resolute Energy Corporation (since 2009); Director, Southwest Airlines (since 2000); former |
| Director, Introgen (manufacturer of biopharmaceuticals) (until 2008); former Director, Hicks Acquisition |
| Company I, Inc. (until 2007); former Director, Texas Exchange Bank, SSB (formerly Bank of Crowley) |
| (until 2009); former Advisory Director, JPMorgan Chase Bank (formerly Texas Commerce Bank–Austin) |
| (until 2009). Trustee, John Hancock retail funds (since 1986); Trustee, John Hancock Variable Insurance |
| Trust (since 2012); Trustee, John Hancock Funds II (since 2012 and 2005–2006). | |
|
| |
| Grace K. Fey, Born: 1946 | 2012 | 231 |
|
| Chief Executive Officer, Grace Fey Advisors (since 2007); Director and Executive Vice President, |
| Frontier Capital Management Company (1988–2007); Director, Fiduciary Trust (since 2009). |
| Trustee, John Hancock retail funds (since 2012); Trustee, John Hancock Variable Insurance Trust and |
| John Hancock Funds II (since 2008). | | |
| |
| 34 | Fundamental Large Cap Core Fund | Annual report |
Independent Trustees (continued)
| | |
| Name, year of birth | Trustee | Number of John |
| Position(s) held with fund | of the | Hancock funds |
| Principal occupation(s) and other | Trust | overseen by |
| directorships during past 5 years | since1 | Trustee |
| |
| Theron S. Hoffman,3 Born: 1947 | 2012 | 231 |
|
| Chief Executive Officer, T. Hoffman Associates, LLC (consulting firm) (since 2003); Director, The Todd |
| Organization (consulting firm) (2003–2010); President, Westport Resources Management (investment |
| management consulting firm) (2006–2008); Senior Managing Director, Partner, and Operating Head, |
| Putnam Investments (2000–2003); Executive Vice President, The Thomson Corp. (financial and |
| legal information publishing) (1997–2000). Trustee, John Hancock retail funds (since 2012); Trustee, |
| John Hancock Variable Insurance Trust and John Hancock Funds II (since 2008). | |
|
| |
| Deborah C. Jackson,2 Born: 1952 | 2008 | 231 |
|
| President, Cambridge College, Cambridge, Massachusetts (since 2011); Chief Executive Officer, |
| American Red Cross of Massachusetts Bay (2002–2011); Board of Directors of Eastern Bank Corporation |
| (since 2001); Board of Directors of Eastern Bank Charitable Foundation (since 2001); Board of Directors |
| of American Student Assistance Corporation (1996–2009); Board of Directors of Boston Stock Exchange |
| (2002–2008); Board of Directors of Harvard Pilgrim Healthcare (health benefits company) (2007–2011). |
| Trustee, John Hancock retail funds (since 2008); Trustee of John Hancock Variable Insurance Trust and |
| John Hancock Funds II (since 2012). | | |
|
| |
| Hassell H. McClellan, Born: 1945 | 2012 | 231 |
|
| Associate Professor, The Wallace E. Carroll School of Management, Boston College (since 1984); |
| Trustee, Virtus Variable Insurance Trust (formerly Phoenix Edge Series Funds) (since 2008); Director, |
| The Barnes Group (since 2010). Trustee, John Hancock retail funds (since 2012); Trustee, John Hancock |
| Funds III (2005–2006 and since 2012); Trustee, John Hancock Variable Insurance Trust and | |
| John Hancock Funds II (since 2005). | | |
|
| |
| Steven R. Pruchansky,2 Born: 1944 | 1991 | 231 |
|
| Chairman and Chief Executive Officer, Greenscapes of Southwest Florida, Inc. (since 2000); Director |
| and President, Greenscapes of Southwest Florida, Inc. (until 2000); Member, Board of Advisors, First |
| American Bank (until 2010); Managing Director, Jon James, LLC (real estate) (since 2000); Director, |
| First Signature Bank & Trust Company (until 1991); Director, Mast Realty Trust (until 1994); President, |
| Maxwell Building Corp. (until 1991). Trustee (since 1992) and Chairperson of the Board (2011–2012), |
| John Hancock retail funds; Trustee and Vice Chairperson of the Board, John Hancock retail funds, |
| John Hancock Variable Insurance Trust and John Hancock Funds II (since 2012). | |
|
| |
| Gregory A. Russo,2 Born: 1949 | 2009 | 231 |
|
| Director and Audit Committee Chairman (since 2012) and Member, Audit Committee and Finance |
| Committee (since 2011), NCH Healthcare System, Inc. (holding company for multi-entity healthcare |
| system); Director and Member of Finance Committee, The Moorings, Inc. (nonprofit continuing care |
| community) (since 2012); Vice Chairman, Risk & Regulatory Matters, KPMG LLP (KPMG) (2002–2006); |
| Vice Chairman, Industrial Markets, KPMG (1998–2002); Chairman and Treasurer, Westchester |
| County, New York, Chamber of Commerce (1986–1992); Director, Treasurer and Chairman of |
| Audit and Finance Committees, Putnam Hospital Center (1989–1995); Director and Chairman of |
| Fundraising Campaign, United Way of Westchester and Putnam Counties, New York (1990–1995). |
| Trustee, John Hancock retail funds (since 2008); Trustee, John Hancock Variable Insurance Trust and |
| John Hancock Funds II (since 2012). | | |
| |
| Annual report | Fundamental Large Cap Core Fund | 35 |
Non-Independent Trustees4
| | |
| Name, year of birth | Trustee | Number of John |
| Position(s) held with fund | of the | Hancock funds |
| Principal occupation(s) and other | Trust | overseen by |
| directorships during past 5 years | since1 | Trustee |
| |
| James R. Boyle, Born: 1959 | 2012 | 231 |
|
| Senior Executive Vice President, John Hancock Financial Services (1999–2012, including prior positions); |
| Chairman and Director, John Hancock Advisers, LLC, John Hancock Funds, LLC, and John Hancock |
| Investment Management Services, LLC (2005–2010). Trustee, John Hancock retail funds (since 2012 and |
| 2005–2010), Trustee, John Hancock Variable Insurance Trust and John Hancock Funds II (since 2005). |
| |
| |
| Craig Bromley,2 Born: 1966 | 2012 | 231 |
|
| President, John Hancock Financial Services (since 2012); Senior Executive Vice President and General |
| Manager, U.S. Division, John Hancock Financial Services (since 2012); President and Chief Executive |
| Officer, Manulife Insurance Company (Manulife (Japan) (2005–2012), including prior positions). |
| Trustee, John Hancock retail funds (since 2012); Trustee, John Hancock Variable Insurance Trust and |
| John Hancock Funds II (since 2012). | | |
|
| |
| Warren A. Thomson,2 Born: 1955 | 2012 | 231 |
|
| Senior Executive Vice President and Chief Investment Officer, Manulife Financial Corporation and The |
| Manufacturers Life Insurance Company (since 2009); Chairman and Chief Executive Officer, Manulife |
| Asset Management (since 2001, including prior positions); Director (since 2006), and President and |
| Chief Executive Officer of Manulife Asset Management Limited (since 2013); Director and Chairman, |
| Hancock Natural Resources Group, Inc. (since 2013). Trustee, John Hancock retail funds, John Hancock |
| Variable Insurance Trust and John Hancock Funds II (since 2012). | | |
Principal officers who are not Trustees
| |
| Name, year of birth | Officer |
| Position(s) held with fund | of the |
| Principal occupation(s) and other | Trust |
| directorships during past 5 years | since |
| |
| Hugh McHaffie, Born: 1959 | 2009 |
|
| President | |
| Executive Vice President, John Hancock Financial Services (since 2006, including prior positions); | |
| Chairman and Director, John Hancock Advisers, LLC, John Hancock Investment Management Services, |
| LLC and John Hancock Funds, LLC (since 2010); President, John Hancock Advisers, LLC (since 2012); |
| President, John Hancock Investment Management Services, LLC (since 2010). President (since 2012) and |
| former Trustee (2010–2012), John Hancock retail funds; President, John Hancock Variable Insurance |
| Trust and John Hancock Funds II (since 2009). | |
|
| |
| Andrew G. Arnott, Born: 1971 | 2009 |
|
| Executive Vice President | |
| Senior Vice President, John Hancock Financial Services (since 2009); Director and Executive Vice | |
| President, John Hancock Advisers, LLC (since 2005, including prior positions); Director and Executive |
| Vice President, John Hancock Investment Management Services, LLC (since 2006, including prior | |
| positions); President, John Hancock Funds, LLC (since 2004, including prior positions); Executive Vice |
| President, John Hancock retail funds, John Hancock Variable Insurance Trust and John Hancock Funds II�� |
| (since 2007, including prior positions). | |
|
| |
| Thomas M. Kinzler, Born: 1955 | 2006 |
|
| Secretary and Chief Legal Officer | |
| Vice President, John Hancock Financial Services (since 2006); Secretary and Chief Legal Counsel, | |
| John Hancock Funds, LLC (since 2007); Secretary and Chief Legal Officer, John Hancock retail funds, |
| John Hancock Variable Insurance Trust and John Hancock Funds II (since 2006). | |
| |
| 36 | Fundamental Large Cap Core Fund | Annual report |
Principal officers who are not Trustees (continued)
| |
| Name, year of birth | Officer |
| Position(s) held with fund | of the |
| Principal occupation(s) and other | Trust |
| directorships during past 5 years | since |
| |
| Francis V. Knox, Jr., Born: 1947 | 2005 |
|
| Chief Compliance Officer | |
| Vice President, John Hancock Financial Services (since 2005); Chief Compliance Officer, John Hancock |
| retail funds, John Hancock Variable Insurance Trust, John Hancock Funds II, John Hancock Advisers, |
| LLC and John Hancock Investment Management Services, LLC (since 2005); Vice President and Chief |
| Compliance Officer, John Hancock Asset Management a division of Manulife Asset Management (US) |
| LLC (2005–2008). | |
|
| |
| Charles A. Rizzo, Born: 1957 | 2007 |
|
| Chief Financial Officer | |
| Vice President, John Hancock Financial Services (since 2008); Senior Vice President, John Hancock | |
| Advisers, LLC and John Hancock Investment Management Services, LLC (since 2008); Chief Financial |
| Officer, John Hancock retail funds, John Hancock Variable Insurance Trust and John Hancock Funds II |
| (since 2007). | |
|
| |
| Salvatore Schiavone, Born: 1965 | 2009 |
|
| Treasurer | |
| Assistant Vice President, John Hancock Financial Services (since 2007); Vice President, John Hancock |
| Advisers, LLC and John Hancock Investment Management Services, LLC (since 2007); Treasurer, | |
| John Hancock retail funds (since 2007, including prior positions); Treasurer, John Hancock Variable | |
| Insurance Trust and John Hancock Funds II (since 2010 and 2007–2009, including prior positions). | |
John Hancock retail funds is comprised of John Hancock Funds III and 34 other John Hancock funds consisting of 24 series of other John Hancock trusts and 10 closed-end funds.
The business address for all Trustees and Officers is 601 Congress Street, Boston, Massachusetts 02210-2805.
The Statement of Additional Information of the fund includes additional information about members of the Board of Trustees of the Trust and is available without charge, upon request, by calling 800-225-5291.
1 Each Trustee holds office until his or her successor is elected and qualified, or until the Trustee’s death, retirement, resignation or removal.
2 Became a Trustee of the Trust effective December 1, 2012.
3 Member of Audit Committee.
4 Because Messrs. Bromley and Thomson are senior executives or directors and Mr. Boyle held prior positions as a senior executive and director of the Advisor and/or its affiliates, each of them is considered an “interested person,” as defined in the Investment Company Act of 1940, of the Trust.
| |
| Annual report | Fundamental Large Cap Core Fund | 37 |
More information
| |
| Trustees | Investment advisor |
| James M. Oates, Chairperson | John Hancock Investment Management |
| Steven R. Pruchansky, Vice Chairperson | Services, LLC |
| Charles L. Bardelis* | |
| James R. Boyle† | Subadvisor |
| Craig Bromley† | John Hancock Asset Management a division of |
| Peter S. Burgess* | Manulife Asset Management (US) LLC |
| William H. Cunningham | |
| Grace K. Fey | Principal distributor |
| Theron S. Hoffman* | John Hancock Funds, LLC |
| Deborah C. Jackson | |
| Hassell H. McClellan | Custodian |
| Gregory A. Russo | State Street Bank and Trust Company |
| Warren A. Thomson† | |
| | Transfer agent |
| Officers | John Hancock Signature Services, Inc. |
| Hugh McHaffie | |
| President | Legal counsel |
| K&L Gates LLP |
| Andrew G. Arnott | |
| Executive Vice President | Independent registered |
| | public accounting firm |
| Thomas M. Kinzler | PricewaterhouseCoopers LLP |
| Secretary and Chief Legal Officer | |
| | |
| Francis V. Knox, Jr. | |
| Chief Compliance Officer | |
| | |
| Charles A. Rizzo | |
| Chief Financial Officer | |
| | |
| Salvatore Schiavone | |
| Treasurer | |
*Member of the Audit Committee
†Non-Independent Trustee
The fund’s proxy voting policies and procedures, as well as the fund’s proxy voting record for the most recent twelve-month period ended June 30, are available free of charge on the Securities and Exchange Commission (SEC) website at sec.gov or on our website.
The fund’s complete list of portfolio holdings, for the first and third fiscal quarters, is filed with the SEC on Form N-Q. The fund’s Form N-Q is available on our website and the SEC’s website, sec.gov, and can be reviewed and copied (for a fee) at the SEC’s Public Reference Room in Washington, DC. Call 800-SEC-0330 to receive information on the operation of the SEC’s Public Reference Room.
We make this information on your fund, as well as monthly portfolio holdings, and other fund details available on our website at jhinvestments.com or by calling 800-225-5291.
| | |
| You can also contact us: | | |
| 800-225-5291 | Regular mail: | Express mail: |
| jhinvestments.com | Investment Operations | Investment Operations |
| | John Hancock Signature Services, Inc. | John Hancock Signature Services, Inc. |
| | P.O. Box 55913 | 30 Dan Road |
| | Boston, MA 02205-5913 | Canton, MA 02021 |
| |
| 38 | Fundamental Large Cap Core Fund | Annual report |

800-225-5291
800-338-8080 EASI-Line
jhinvestments.com

| |
| This report is for the information of the shareholders of John Hancock Fundamental Large Cap Core Fund. | |
| It is not authorized for distribution to prospective investors unless preceded or accompanied by a prospectus. | 372A 7/13 |
| MF150764 | 9/13 |

A look at performance
Total returns for the period ended July 31, 2013
| | | | | | | | | | |
| | | Average annual total returns (%) | | Cumulative total returns (%) | |
| | | with maximum sales charge | | | with maximum sales charge | |
|
| | | | | | Since | | | | | Since |
| | | 1-year | 5-year | 10-year | inception | | 1-year | 5-year | 10-year | inception |
|
| Class A | | 27.73 | — | — | 13.691 | | 27.73 | — | — | 32.051 |
|
| Class I2 | | 35.11 | — | — | 16.961 | | 35.11 | — | — | 40.431 |
|
| Class NAV2 | | 35.33 | — | — | 32.623 | | 35.33 | — | — | 73.033 |
|
| Index† | | 30.73 | — | — | 14.171 | | 30.73 | — | — | 33.271 |
|
Performance figures assume all distributions have been reinvested. Figures reflect maximum sales charges on Class A shares of 5.00%.
The expense ratios of the fund, both net (including any fee waivers or expense limitations) and gross (excluding any fee waivers or expense limitations), are set forth according to the most recent publicly available prospectuses for the fund and may differ from those disclosed in the Financial highlights tables in this report. The fee waivers and expense limitations are contractual at least until 11-30-13 for Class A and Class I shares. Had the fee waivers and expense limitations not been in place, gross expenses would apply. The expense ratios are as follows:
| | | | | | | |
| | Class A | Class I | Class NAV | | | | |
| Net (%) | 1.30 | 0.94 | 0.74 | | | | |
| Gross (%) | 2.79 | 4.02 | 0.74 | | | | |
The returns reflect past results and should not be considered indicative of future performance. The return and principal value of an investment will fluctuate so that shares, when redeemed, may be worth more or less than their original cost. Due to market volatility, the fund’s current performance may be higher or lower than the performance shown. For current to the most recent month-end performance data, please call 800-225-5291 or visit the fund’s website at jhinvestments.com.
The performance table above and the chart on the next page do not reflect the deduction of taxes that a shareholder may pay on fund distributions or on the redemption of fund shares. The fund’s performance results reflect any applicable fee waivers or expense reductions, without which the expenses would increase and results would have been less favorable.
† Index is the Russell 1000 Value Index.
See the following page for footnotes.
| |
| 6 | Fundamental Large Cap Value Fund | Annual report |

| | | | |
| | | With maximum | Without | |
| | Start date | sales charge | sales charge | Index |
|
| Class I2 | 6-1-11 | $14,043 | $14,043 | $13,327 |
|
| Class NAV2 | 8-23-11 | 17,303 | 17,303 | 16,265 |
|
Russell 1000 Value Index is an unmanaged index containing those securities in the Russell 1000 Index with a less-than-average growth orientation.
It is not possible to invest directly in an index. Index figures do not reflect expenses or sales charges, which would have resulted in lower values if they did.
Footnotes related to performance pages
1 From 6-1-11.
2 For certain types of investors, as described in the fund’s prospectuses.
3 From 8-23-11.
| |
| Annual report | Fundamental Large Cap Value Fund | 7 |
Management’s discussion of
Fund performance
John Hancock Asset Management a division of Manulife Asset Management (US) LLC
U.S. equities rallied sharply for the year ended July 31, 2013, with large-cap value stocks beating their growth peers by a sizable margin. The market climbed last summer in anticipation of new economic stimulus measures, which included a massive monthly bond purchase program. Relief that most automatic federal tax increases and spending cuts did not go into effect as scheduled on January 1 triggered another rally. Stocks kept climbing in the spring, as home values rose and manufacturing picked up. Concern that the U.S. Federal Reserve (Fed) might taper its stimulus rattled investors in late May and June, but the market recovered as second-quarter corporate earnings came in better than expected.
For the 12-month period ended July 31, 2013, John Hancock Fundamental Large Cap Value Fund’s Class A shares returned 34.46%, excluding sales charges, beating the 30.73% advance of its benchmark, the Russell 1000 Value Index, and the 27.83% average return of its peer group, the Morningstar, Inc. large value fund category.† Security selection within financials gave the biggest boost to relative performance, followed by an underweight in utilities, overweight in consumer discretionary, and lack of exposure to telecommunication services. Individual standouts included diversified financial services company Bank of America Corp., whose shares rallied as loan demand increased and capital adequacy concerns eased. In consumer discretionary, an investment in home improvement retailer Lowe’s Companies, Inc. surged, benefiting from the U.S. housing recovery and same-store sales growth. By contrast, stock picks in information technology and energy hurt. Disappointments included consumer technology leader Apple, Inc., which saw slowing revenue growth and a lack of new products pressure its return, and exploration and production company Apache Corp., whose shares slid amid concern that unrest in the Middle East would disrupt its production there. Security selection in healthcare and consumer staples also detracted.
This commentary reflects the views of the portfolio managers through the end of the period discussed in this report. As such, they are in no way guarantees of future events and are not intended to be used as investment advice or a recommendation regarding any specific security. They are also subject to change at any time as market and other conditions warrant.
Past performance is no guarantee of future results.
† Figures from Morningstar, Inc. include distributions reinvested and do not take into account sales charges. Actual load-adjusted performance is lower.
| |
| 8 | Fundamental Large Cap Value Fund | Annual report |
Your expenses
These examples are intended to help you understand your ongoing operating expenses of investing in the fund so you can compare these costs with the ongoing costs of investing in other mutual funds.
Understanding fund expenses
As a shareholder of the fund, you incur two types of costs:
▪ Transaction costs, which include sales charges (loads) on purchases or redemptions (varies by share class), minimum account fee charge, etc.
▪ Ongoing operating expenses, including management fees, distribution and service fees (if applicable) and other fund expenses.
We are going to present only your ongoing operating expenses here.
Actual expenses/actual returns
This example is intended to provide information about the fund’s actual ongoing operating expenses and is based on the fund’s actual return. It assumes an account value of $1,000.00 on February 1, 2013, with the same investment held until July 31, 2013.
| | | |
| | Account value | Ending value | Expenses paid during |
| | on 2-1-13 | on 7-31-13 | period ended 7-31-131 |
|
| Class A | $1,000.00 | $1,119.60 | $6.83 |
|
| Class I | 1,000.00 | 1,122.80 | 4.95 |
|
| Class NAV | 1,000.00 | 1,123.80 | 3.63 |
|
Together with the value of your account, you may use this information to estimate the operating expenses that you paid over the period. Simply divide your account value at July 31, 2013, by $1,000.00, then multiply it by the “expenses paid” for your share class from the table above. For example, for an account value of $8,600.00, the operating expenses should be calculated as follows:
| |
| Annual report | Fundamental Large Cap Value Fund | 9 |
Your expenses
Hypothetical example for comparison purposes
This table allows you to compare the fund’s ongoing operating expenses with those of any other fund. It provides an example of the fund’s hypothetical account values and hypothetical expenses based on each class’s actual expense ratio and an assumed 5% annualized return before expenses (which is not the fund’s actual return). It assumes an account value of $1,000.00 on February 1, 2013, with the same investment held until July 31, 2013. Look in any other fund shareholder report to find its hypothetical example and you will be able to compare these expenses. Please remember that these hypothetical account values and expenses may not be used to estimate the actual ending account balance or expenses you paid for the period.
| | | |
| | Account value | Ending value | Expenses paid during |
| | on 2-1-13 | on 7-31-13 | period ended 7-31-131 |
|
| Class A | $1,000.00 | $1,018.30 | $6.51 |
|
| Class I | 1,000.00 | 1,020.10 | 4.71 |
|
| Class NAV | 1,000.00 | 1,021.40 | 3.46 |
|
Remember, these examples do not include any transaction costs, therefore, these examples will not help you to determine the relative total costs of owning different funds. If transaction costs were included, your expenses would have been higher. See the prospectus for details regarding transaction costs.
1 Expenses are equal to the fund’s annualized expense ratio of 1.30%, 0.94%, and 0.69% for Class A, Class I, and Class NAV shares, respectively, multiplied by the average account value over the period, multiplied by 181/365 (to reflect the one-half year period).
| |
| 10 | Fundamental Large Cap Value Fund | Annual report |
Portfolio summary
| | | | |
| Top 10 Holdings (35.1% of Net Assets on 7-31-13)1,2 | | | |
|
| JPMorgan Chase & Company | 5.0% | | Apache Corp. | 3.1% |
| |
|
| Bank of America Corp. | 4.1% | | Occidental Petroleum Corp. | 2.9% |
| |
|
| The Goldman Sachs Group, Inc. | 4.1% | | AllianceBernstein Holding LP | 2.9% |
| |
|
| Cisco Systems, Inc. | 4.0% | | Morgan Stanley | 2.8% |
| |
|
| American International Group, Inc. | 3.4% | | Northern Trust Corp. | 2.8% |
| |
|
| |
| Sector Composition1,3 | | | | |
|
| Financials | 31.2% | | Consumer Staples | 11.2% |
| |
|
| Information Technology | 16.1% | | Industrials | 8.6% |
| |
|
| Energy | 12.5% | | Health Care | 5.3% |
| |
|
| Consumer Discretionary | 12.3% | | Short-Term Investments & Other | 2.8% |
| |
|
| |
| Country Composition1,3,4 | | | | |
|
| United States | 86.4% | | Germany | 1.4% |
| |
|
| United Kingdom | 4.1% | | France | 1.1% |
| |
|
| Switzerland | 3.2% | | Canada | 0.8% |
| |
|
| Netherlands | 3.0% | | | |
| | |
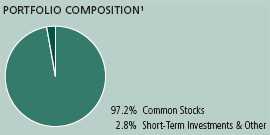
1 As a percentage of net assets on 7-31-13.
2 Cash and cash equivalents not included.
3 Large company stocks as a group could fall out of favor with the market, causing the fund to underperform. Value stocks may not increase in price as anticipated or may decline further in value. Foreign investing, especially in emerging markets has additional risks such as currency and market volatility and political and social instability. Hedging and other strategic transactions may increase volatility of a fund and, if the transaction is not successful, could result in a significant loss. If the fund invests in illiquid securities, it may be difficult to sell them at a price approximating their value. Sector investing is subject to greater risks than the market as a whole. Because the fund may focus on particular sectors of the economy, its performance may depend on the performance of those sectors and investments focused in one sector may fluctuate more widely than investments diversified across sectors. For additional information on these and other risk considerations, please see the fund’s prospectus.
4 Each security trades in U.S. dollars.
| |
| Annual report | Fundamental Large Cap Value Fund | 11 |
Fund’s investments
As of 7-31-13
| | |
| | Shares | Value |
| |
| Common Stocks 97.2% | | $911,335,382 |
|
| (Cost $708,360,483) | | |
| | | |
| Consumer Discretionary 12.3% | | 114,753,297 |
| | | |
| Hotels, Restaurants & Leisure 1.0% | | |
|
| Carnival Corp. | 255,112 | 9,446,796 |
| | | |
| Household Durables 4.3% | | |
|
| Dorel Industries, Inc., Class B | 213,687 | 7,820,557 |
|
| Lennar Corp., Class A | 580,023 | 19,645,379 |
|
| Tempur-Pedic International, Inc. (I) | 324,899 | 12,882,245 |
| | | |
| Media 1.3% | | |
|
| Omnicom Group, Inc. | 185,251 | 11,906,082 |
| | | |
| Specialty Retail 4.2% | | |
|
| Advance Auto Parts, Inc. | 228,320 | 18,834,117 |
|
| Lowe’s Companies, Inc. | 466,732 | 20,806,913 |
| | | |
| Textiles, Apparel & Luxury Goods 1.5% | | |
|
| Adidas AG | 120,400 | 13,411,208 |
| | | |
| Consumer Staples 11.2% | | 105,334,868 |
| | | |
| Beverages 5.8% | | |
|
| Diageo PLC, ADR | 108,710 | 13,624,624 |
|
| Heineken Holding NV | 147,240 | 9,228,238 |
|
| PepsiCo, Inc. | 188,757 | 15,768,760 |
|
| SABMiller PLC | 322,446 | 15,852,490 |
| | | |
| Food Products 1.1% | | |
|
| Danone SA | 124,598 | 9,843,756 |
| | | |
| Household Products 1.3% | | |
|
| The Procter & Gamble Company | 156,518 | 12,568,395 |
| | | |
| Personal Products 1.0% | | |
|
| Avon Products, Inc. | 420,673 | 9,616,585 |
| | | |
| Tobacco 2.0% | | |
|
| Imperial Tobacco Group PLC | 277,088 | 9,313,660 |
|
| Philip Morris International, Inc. | 106,732 | 9,518,360 |
| | | |
| Energy 12.5% | | 117,271,681 |
| | | |
| Energy Equipment & Services 2.8% | | |
|
| National Oilwell Varco, Inc. | 147,246 | 10,332,252 |
|
| Weatherford International, Ltd. (I) | 1,160,986 | 16,207,365 |
| | |
| 12 | Fundamental Large Cap Value Fund | Annual report | See notes to financial statements |
| | |
| | Shares | Value |
| | | |
| Oil, Gas & Consumable Fuels 9.7% | | |
|
| Apache Corp. | 361,238 | $28,989,350 |
|
| Chevron Corp. | 145,626 | 18,332,857 |
|
| Exxon Mobil Corp. | 69,178 | 6,485,438 |
|
| Occidental Petroleum Corp. | 307,965 | 27,424,283 |
|
| Southwestern Energy Company (I) | 244,912 | 9,500,136 |
| | | |
| Financials 31.2% | | 292,747,903 |
| | | |
| Capital Markets 14.7% | | |
|
| AllianceBernstein Holding LP | 1,209,839 | 26,858,426 |
|
| Morgan Stanley | 978,885 | 26,635,461 |
|
| Northern Trust Corp. | 453,306 | 26,536,533 |
|
| State Street Corp. | 281,330 | 19,600,261 |
|
| The Goldman Sachs Group, Inc. | 232,164 | 38,081,861 |
| | | |
| Commercial Banks 2.0% | | |
|
| Wells Fargo & Company | 435,148 | 18,928,938 |
| | | |
| Diversified Financial Services 9.1% | | |
|
| Bank of America Corp. | 2,653,700 | 38,744,020 |
|
| JPMorgan Chase & Company | 838,190 | 46,712,329 |
| | | |
| Insurance 5.4% | | |
|
| American International Group, Inc. (I) | 709,761 | 32,301,223 |
|
| Stewart Information Services Corp. | 593,238 | 18,348,851 |
| | | |
| Health Care 5.3% | | 49,371,862 |
| | | |
| Biotechnology 0.7% | | |
|
| Amgen, Inc. | 63,379 | 6,863,312 |
| | | |
| Health Care Equipment & Supplies 1.6% | | |
|
| Medtronic, Inc. | 268,058 | 14,807,524 |
| | | |
| Pharmaceuticals 3.0% | | |
|
| Merck & Company, Inc. | 288,408 | 13,892,613 |
|
| Novartis AG, ADR | 192,828 | 13,808,413 |
| | | |
| Industrials 8.6% | | 80,974,672 |
| | | |
| Air Freight & Logistics 1.8% | | |
|
| FedEx Corp. | 158,985 | 16,852,410 |
| | | |
| Commercial Services & Supplies 1.5% | | |
|
| Avery Dennison Corp. | 315,122 | 14,095,407 |
| | | |
| Electrical Equipment 2.0% | | |
|
| Sensata Technologies Holding NV (I) | 515,231 | 19,362,381 |
| | | |
| Industrial Conglomerates 2.3% | | |
|
| General Electric Company | 884,708 | 21,560,334 |
| | | |
| Machinery 1.0% | | |
|
| Deere & Company | 109,596 | 9,104,140 |
| | | |
| Information Technology 16.1% | | 150,881,099 |
| | | |
| Communications Equipment 6.5% | | |
|
| Cisco Systems, Inc. | 1,482,789 | 37,885,259 |
|
| QUALCOMM, Inc. | 362,125 | 23,375,169 |
| | |
| See notes to financial statements | Annual report | Fundamental Large Cap Value Fund | 13 |
| | |
| | Shares | Value |
| | | |
| Computers & Peripherals 2.7% | | |
|
| Apple, Inc. | 56,163 | $25,413,758 |
| | | |
| IT Services 1.8% | | |
|
| Broadridge Financial Solutions, Inc. | 596,573 | 17,264,823 |
| | |
| Semiconductors & Semiconductor Equipment 2.2% | |
|
| Intel Corp. | 870,577 | 20,284,444 |
| | | |
| Software 2.9% | | |
|
| Microsoft Corp. | 384,436 | 12,236,598 |
|
| Oracle Corp. | 445,782 | 14,421,048 |
| |
| | Par value | Value |
| |
| Short-Term Investments 2.8% | | $25,782,000 |
|
| (Cost $25,782,000) | | |
| Barclays Tri-Party Repurchase Agreement dated 7-31-13 at 0.070% | |
| to be repurchased at $24,960,049 on 8-1-13, collateralized by | |
| $21,747,700 U.S. Treasury Bond, 4.500% due 5-15-38 (valued at | |
| $25,459,288, including interest) | $24,960,000 | 24,960,000 |
|
| Repurchase Agreement with State Street Corp. dated 7-31-13 at | |
| 0.010% to be repurchased at $822,000 on 8-1-13, collateralized | |
| by $845,000 U.S. Treasury Note, 0.875% due 4-30-17 (valued at | |
| $843,152, including interest) | 822,000 | 822,000 |
| |
| Total investments (Cost $734,142,483)† 100.0% | $937,117,382 |
|
| |
| Other assets and liabilities, net 0.0% | | $283,447 |
|
| |
| Total net assets 100.0% | | $937,400,829 |
|
The percentage shown for each investment is the total value of the category as a percentage of net assets of the fund.
ADR American Depositary Receipts
(I) Non-income producing security.
† At 7-31-13, the aggregate cost of investment securities for federal income tax purposes was $734,445,709. Net unrealized appreciation aggregated $202,671,673, of which $206,526,060 related to appreciated investment securities and $3,854,387 related to depreciated investment securities.
The fund had the following country concentration as a percentage of total investments on 7-31-13:
| | | | | | | |
| United States | | 86.4% | | | | | |
| United Kingdom | | 4.1% | | | | | |
| Switzerland | | 3.2% | | | | | |
| Netherlands | | 3.0% | | | | | |
| Germany | | 1.4% | | | | | |
| France | | 1.1% | | | | | |
| Canada | | 0.8% | | | | | |
| | |
| | | | | |
| Total | | 100.0% | | | | | |
| | |
| 14 | Fundamental Large Cap Value Fund | Annual report | See notes to financial statements |
FINANCIAL STATEMENTS
Financial statements
Statement of assets and liabilities 7-31-13
This Statement of assets and liabilities is the fund’s balance sheet. It shows the value of what the fund owns, is due and owes. You’ll also find the net asset value and the maximum offering price per share.
| |
| Assets | |
|
| Investments, at value (Cost $734,142,483) | $937,117,382 |
| Cash | 1,386,056 |
| Foreign currency, at value (Cost $643,898) | 644,898 |
| Receivable for investments sold | 3,306,973 |
| Receivable for fund shares sold | 1,572 |
| Dividends and interest receivable | 778,736 |
| Receivable due from advisor | 659 |
| Other receivables and prepaid expenses | 22,187 |
| | |
| Total assets | 943,258,463 |
| |
| Liabilities | |
|
| Payable for investments purchased | 2,316,146 |
| Payable for fund shares repurchased | 3,429,557 |
| Payable to affiliates | |
| Accounting and legal services fees | 19,965 |
| Transfer agent fees | 1,801 |
| Trustees’ fees | 998 |
| Other liabilities and accrued expenses | 89,167 |
| | |
| Total liabilities | 5,857,634 |
| | |
| Net assets | $937,400,829 |
| |
| Net assets consist of | |
|
| Paid-in capital | $650,829,693 |
| Undistributed net investment income | 6,672,700 |
| Accumulated net realized gain (loss) on investments and foreign | |
| currency transactions | 76,921,742 |
| Net unrealized appreciation (depreciation) on investments and translation | |
| of assets and liabilities in foreign currencies | 202,976,694 |
| | |
| Net assets | $937,400,829 |
| |
| Net asset value per share | |
|
| Based on net asset values and shares outstanding — the fund has an | |
| unlimited number of shares authorized with no par value | |
| Class A ($9,159,479 ÷ 698,543 shares)1 | $13.11 |
| Class I ($4,134,637 ÷ 314,042 shares) | $13.17 |
| Class NAV ($924,106,713 ÷ 70,241,162 shares) | $13.16 |
| |
| Maximum offering price per share | |
|
| Class A (net asset value per share ÷ 95%)2 | $13.80 |
1 Redemption price per share is equal to the net asset value less any applicable contingent deferred sales charge.
2 On single retail sales of less than $50,000. On sales of $50,000 or more and on group sales the offering price is reduced.
| | |
| See notes to financial statements | Annual report | Fundamental Large Cap Value Fund | 15 |
FINANCIAL STATEMENTSStatement of operations For the year ended 7-31-13
This Statement of operations summarizes the fund’s investment income earned and expenses incurred in operating the fund. It also shows net gains (losses) for the period stated.
| |
| Investment income | |
|
| Dividends | $20,732,187 |
| Interest | 3,346 |
| Less foreign taxes withheld | (204,078) |
| | |
| Total investment income | 20,531,455 |
| |
| Expenses | |
|
| Investment management fees | 5,621,591 |
| Distribution and service fees | 16,802 |
| Accounting and legal services fees | 122,619 |
| Transfer agent fees | 16,967 |
| Trustees’ fees | 9,888 |
| State registration fees | 35,079 |
| Printing and postage | 4,579 |
| Professional fees | 53,566 |
| Custodian fees | 151,956 |
| Registration and filing fees | 36,358 |
| Other | 12,455 |
| | |
| Total expenses | 6,081,860 |
| Less expense reductions | (57,465) |
| | |
| Net expenses | 6,024,395 |
| | |
| Net investment income | 14,507,060 |
| |
| Realized and unrealized gain (loss) | |
|
| Net realized gain (loss) on | |
| Investments in unaffiliated issuers | 101,340,826 |
| Foreign currency transactions | (4,593) |
| | |
| | 101,336,233 |
| Change in net unrealized appreciation (depreciation) of | |
| Investments in unaffiliated issuers | 142,317,668 |
| Translation of assets and liabilities in foreign currencies | 1,795 |
| | |
| | 142,319,463 |
| | |
| Net realized and unrealized gain | 243,655,696 |
| | |
| Increase in net assets from operations | $258,162,756 |
| | |
| 16 | Fundamental Large Cap Value Fund | Annual report | See notes to financial statements |
FINANCIAL STATEMENTS
Statements of changes in net assets
These Statements of changes in net assets show how the value of the fund’s net assets has changed during the last two periods. The difference reflects earnings less expenses, any investment gains and losses, distributions, if any, paid to shareholders and the net of fund share transactions.
| | |
| | Year | Year |
| | ended | ended |
| | 7-31-13 | 7-31-12 |
| |
| Increase (decrease) in net assets | | |
|
| From operations | | |
| Net investment income | $14,507,060 | $6,254,174 |
| Net realized gain | 101,336,233 | 10,970,069 |
| Change in net unrealized appreciation (depreciation) | 142,319,463 | 60,832,734 |
| | | |
| Increase in net assets resulting from operations | 258,162,756 | 78,056,977 |
| | | |
| Distributions to shareholders | | |
| From net investment income | | |
| Class A | (35,015) | (7,223) |
| Class I | (110,922) | (6,741) |
| Class NAV | (11,378,017) | (2,351,019) |
| From net realized gain | | |
| Class A | (172,906) | (5,698) |
| Class I | (394,916) | (3,154) |
| Class NAV | (33,936,142) | (1,081,097) |
| | | |
| Total distributions | (46,027,918) | (3,454,932) |
| | | |
| From Fund share transactions | (66,895,385) | 714,615,382 |
| | | |
| Total increase | 145,239,453 | 789,217,427 |
| |
| Net assets | | |
|
| Beginning of year | 792,161,376 | 2,943,949 |
| | | |
| End of year | $937,400,829 | $792,161,376 |
| | | |
| Undistributed net investment income | $6,672,700 | $3,878,701 |
| | |
| See notes to financial statements | Annual report | Fundamental Large Cap Value Fund | 17 |
Financial highlights
The Financial highlights show how the fund’s net asset value for a share has changed during the period.
| | | | | |
| CLASS A SHARES Period ended | | | 7-31-13 | 7-31-12 | 7-31-111 |
| |
| Per share operating performance | | | | | |
|
| Net asset value, beginning of period | | | $10.27 | $9.46 | $10.00 |
| Net investment income2 | | | 0.11 | 0.09 | —3 |
| Net realized and unrealized gain (loss) on investments | | | 3.32 | 0.78 | (0.54) |
| Total from investment operations | | | 3.43 | 0.87 | (0.54) |
| Less distributions | | | | | |
| From net investment income | | | (0.10) | (0.03) | — |
| From net realized gain | | | (0.49) | (0.03) | — |
| Total distributions | | | (0.59) | (0.06) | — |
| Net asset value, end of period | | | $13.11 | $10.27 | $9.46 |
| Total return (%)4,5 | | | 34.46 | 9.28 | (5.40)6 |
| |
| Ratios and supplemental data | | | | | |
|
| Net assets, end of period (in millions) | | | $9 | $3 | $2 |
| Ratios (as a percentage of average net assets): | | | | | |
| Expenses before reductions and amounts recaptured | | | 1.53 | 2.79 | 5.957 |
| Expenses Including reductions and amounts recaptured | | | 1.30 | 1.30 | 1.307 |
| Net investment income | | | 0.96 | 0.94 | 0.267 |
| Portfolio turnover (%) | | | 38 | 26 | 5 |
1 The inception date for Class A shares is 6-1-11.
2 Based on the average daily shares outstanding.
3 Less than $0.005 per share.
4 Does not reflect the effect of sales charges, if any.
5 Total returns would have been lower had certain expenses not been reduced during the applicable periods shown.
6 Not annualized.
7 Annualized.
| | |
| 18 | Fundamental Large Cap Value Fund | Annual report | See notes to financial statements |
| | | | | |
| CLASS I SHARES Period ended | | | 7-31-13 | 7-31-12 | 7-31-111 |
| |
| Per share operating performance | | | | | |
|
| Net asset value, beginning of period | | | $10.30 | $9.46 | $10.00 |
| Net investment income2 | | | 0.18 | 0.14 | 0.01 |
| Net realized and unrealized gain (loss) on investments | | | 3.32 | 0.79 | (0.55) |
| Total from investment operations | | | 3.50 | 0.93 | (0.54) |
| Less distributions | | | | | |
| From net investment income | | | (0.14) | (0.06) | — |
| From net realized gain | | | (0.49) | (0.03) | — |
| Total distributions | | | (0.63) | (0.09) | — |
| Net asset value, end of period | | | $13.17 | $10.30 | $9.46 |
| Total return (%)3 | | | 35.11 | 9.87 | (5.40)4 |
| |
| Ratios and supplemental data | | | | | |
|
| Net assets, end of period (in millions) | | | $4 | $1 | $1 |
| Ratios (as a percentage of average net assets): | | | | | |
| Expenses before reductions and amounts recaptured | | | 1.09 | 4.02 | 5.615 |
| Expenses including reductions and amounts recaptured | | | 0.92 | 0.84 | 0.845 |
| Net investment income | | | 1.50 | 1.44 | 0.745 |
| Portfolio turnover (%) | | | 38 | 26 | 5 |
1 The inception date for Class I shares is 6-1-11.
2 Based on the average daily shares outstanding.
3 Total returns would have been lower had certain expenses not been reduced during the applicable periods shown.
4 Not annualized.
5 Annualized.
| | | | | |
| CLASS NAV SHARES Period ended | | | | 7-31-13 | 7-31-121 |
| |
| Per share operating performance | | | | | |
|
| Net asset value, beginning of period | | | | $10.30 | $8.13 |
| Net investment income2 | | | | 0.20 | 0.13 |
| Net realized and unrealized gain on investments | | | | 3.31 | 2.13 |
| Total from investment operations | | | | 3.51 | 2.26 |
| Less distributions | | | | | |
| From net investment income | | | | (0.16) | (0.06) |
| From net realized gain | | | | (0.49) | (0.03) |
| Total distributions | | | | (0.65) | (0.09) |
| Net asset value, end of period | | | | $13.16 | $10.30 |
| Total return (%)3 | | | | 35.33 | 27.864 |
| |
| Ratios and supplemental data | | | | | |
|
| Net assets, end of period (in millions) | | | | $924 | $789 |
| Ratios (as a percentage of average net assets): | | | | | |
| Expenses before reductions and amounts recaptured | | | | 0.70 | 0.745 |
| Expenses including reductions and amounts recaptured | | | | 0.69 | 0.755 |
| Net investment income | | | | 1.69 | 1.405 |
| Portfolio turnover (%) | | | | 38 | 26 |
1 The inception date for Class NAV shares is 8-23-11.
2 Based on the average daily shares outstanding.
3 Total returns would have been lower had certain expenses not been reduced during the applicable periods shown.
4 Not annualized.
5 Annualized.
| | |
| See notes to financial statements | Annual report | Fundamental Large Cap Value Fund | 19 |
Notes to financial statements
Note 1 — Organization
John Hancock Fundamental Large Cap Value Fund (the fund) is a series of John Hancock Funds II (the Trust), an open-end management investment company organized as a Massachusetts business trust and registered under the Investment Company Act of 1940, as amended (the 1940 Act). The investment objective of the fund is to seek long-term capital appreciation.
The fund may offer multiple classes of shares. The shares currently offered are detailed in the Statement of assets and liabilities. Class A shares are offered to all investors. Class I shares are offered to institutions and certain investors. Class NAV shares are offered to John Hancock affiliated fund of funds and certain 529 plans. Shareholders of each class have exclusive voting rights to matters that affect that class. The distribution and service fees, if any, transfer agent fees, printing and postage and state registration fees for each class may differ.
Note 2 — Significant accounting policies
The financial statements have been prepared in conformity with accounting principles generally accepted in the United States of America, which require management to make certain estimates and assumptions as of the date of the financial statements. Actual results could differ from those estimates and those differences could be significant. Events or transactions occurring after the end of the fiscal period through the date that the financial statements were issued have been evaluated in the preparation of the financial statements. The following summarizes the significant accounting policies of the fund:
Security valuation. Investments are stated at value as of the close of regular trading on the New York Stock Exchange (NYSE), normally at 4:00 P.M., Eastern Time. In order to value the securities, the fund uses the following valuation techniques: Equity securities held by the fund are valued at the last sale price or official closing price on the principal securities exchange on which they trade. In the event there were no sales during the day or closing prices are not available, the securities are valued using the last quoted bid or evaluated price. Certain securities traded only in the over-the-counter market are valued at the last bid price quoted by brokers making markets in the securities at the close of trading. Other portfolio securities and assets, for which reliable market quotations are not readily available, are valued at fair value as determined in good faith by the fund’s Pricing Committee following procedures established by the Board of Trustees, which include price verification procedures. The frequency with which these fair valuation procedures are used cannot be predicted and fair value of securities may differ significantly from the value that would have been used had a ready market for such securities existed.
The fund uses a three-tier hierarchy to prioritize the pricing assumptions, referred to as inputs, used in valuation techniques to measure fair value. Level 1 includes securities valued using quoted prices in active markets for identical securities. Level 2 includes securities valued using other significant observable inputs. Observable inputs may include quoted prices for similar securities, interest rates, prepayment speeds and credit risk. Prices for securities valued using these inputs are received from independent pricing vendors and brokers and are based on an evaluation of the inputs described. Level 3 includes securities valued using significant unobservable inputs when market prices are not readily available or reliable, including the fund’s own assumptions in determining the fair value of investments. Factors used in determining value may include market or issuer specific events or trends, changes in interest rates and credit quality. The inputs or methodology used for valuing securities are not necessarily an indication of the risks associated with investing in those securities.
| |
| 20 | Fundamental Large Cap Value Fund | Annual report |
Changes in valuation techniques may result in transfers into or out of an assigned level within the disclosure hierarchy.
The following is a summary of the values by input classification of the fund’s investments as of July 31, 2013, by major security category or type:
| | | | | |
| | | | | | LEVEL 3 |
| | | | | LEVEL 2 | SIGNIFICANT |
| | | TOTAL MARKET | LEVEL 1 | SIGNIFICANT | UNOBSERVABLE |
| | | VALUE AT 7-31-13 | QUOTED PRICE | OBSERVABLE INPUTS | INPUTS |
|
| Common Stocks | | | | | |
| Consumer Discretionary | | $114,753,297 | $101,342,089 | $13,411,208 | — |
| Consumer Staples | | 105,334,868 | 61,096,724 | 44,238,144 | — |
| Energy | | 117,271,681 | 117,271,681 | — | — |
| Financials | | 292,747,903 | 292,747,903 | — | — |
| Health Care | | 49,371,862 | 49,371,862 | — | — |
| Industrials | | 80,974,672 | 80,974,672 | — | — |
| Information Technology | | 150,881,099 | 150,881,099 | — | — |
| Short-Term Investments | | 25,782,000 | — | 25,782,000 | — |
| | |
|
| Total Investments | | | | | |
| in Securities | | $937,117,382 | $853,686,030 | $83,431,352 | — |
Repurchase agreements. The fund may enter into repurchase agreements. When a fund enters into a repurchase agreement, it receives collateral that is held in a segregated account by the fund’s custodian. The collateral amount is marked-to-market and monitored on a daily basis to ensure that the collateral held is in an amount not less than the principal amount of the repurchase agreement plus any accrued interest. Collateral for certain tri-party repurchase agreements is held at a third-party custodian bank in a segregated account for the benefit of the fund.
Repurchase agreements are typically governed by the terms and conditions of the Master Repurchase Agreement and/or Global Master Repurchase Agreement (collectively, MRA). Upon an event of default, the non-defaulting party may close out all transactions traded under the MRA and net amounts owed. Absent an event of default, the MRA does not result in an offset of the reported amounts of assets and liabilities in the statement of assets and liabilities. In the event of a default by the counterparty, realization of the collateral proceeds could be delayed, during which time the collateral value may decline or the counterparty may have insufficient assets to pay back claims resulting from close-out of the transactions. Collateral received by the fund for repurchase agreements is disclosed in the Fund’s investments as part of the caption related to the repurchase agreement.
Security transactions and related investment income. Investment security transactions are accounted for on a trade date plus one basis for daily net asset value calculations. However, for financial reporting purposes, investment transactions are reported on trade date. Interest income is accrued as earned. Gains and losses on securities sold are determined on the basis of identified cost and may include proceeds from litigation. Dividend income is recorded on the ex-date, except for dividends of foreign securities where the dividend may not be known until after the ex-date. In those cases, dividend income, net of withholding taxes, is recorded when the fund becomes aware of the dividends. Foreign taxes are provided for based on the fund’s understanding of the tax rules and rates that exist in the foreign markets in which it invests. Gains and losses on securities sold are determined on the basis of identified cost and may include proceeds from litigation.
Foreign taxes. The fund may be subject to withholding tax on income and/or capital gains or repatriation taxes imposed by certain countries in which the fund invests. Taxes are accrued based upon investment income, realized gains or unrealized appreciation.
| |
| Annual report | Fundamental Large Cap Value Fund | 21 |
Line of credit. The fund may borrow from banks for temporary or emergency purposes, including meeting redemption requests that otherwise might require the untimely sale of securities. Pursuant to the fund custodian agreement, the custodian may loan money to the fund to make properly authorized payments. The fund is obligated to repay the custodian for any overdraft, including any related costs or expenses. The custodian may have a lien, security interest or security entitlement in any fund property that is not otherwise segregated or pledged, to the maximum extent permitted by law, to the extent of any overdraft.
In addition, the fund and other affiliated funds have entered into an agreement with Citibank N.A. that enables them to participate in a $300 million unsecured committed line of credit. A commitment fee, payable at the end of each calendar quarter, based on the average daily unused portion of the line of credit, is charged to each participating fund on a pro rata basis and is reflected in other expenses on the Statement of operations. Prior to March 27, 2013, the fund participated in a $200 million unsecured line of credit, also with Citibank, with terms otherwise similar to the existing agreement. Commitment fees for the year ended July 31, 2013 were $591. For the year ended July 31, 2013, the fund had no borrowings under either line of credit.
Expenses. Within the John Hancock funds complex, expenses that are directly attributable to an individual fund are allocated to such fund. Expenses that are not readily attributable to a specific fund are allocated among all funds in an equitable manner, taking into consideration, among other things, the nature and type of expense and the fund’s relative net assets. Expense estimates are accrued in the period to which they relate and adjustments are made when actual amounts are known.
Class allocations. Income, common expenses and realized and unrealized gains (losses) are determined at the fund level and allocated daily to each class of shares based on the net assets of the class. Class-specific expenses, such as distribution and service fees, if any, transfer agent fees, state registration fees and printing and postage, for all classes, are calculated daily at the class level based on the appropriate net assets of each class and the specific expense rates applicable to each class.
Federal income taxes. The fund intends to continue to qualify as a regulated investment company by complying with the applicable provisions of the Internal Revenue Code and will not be subject to federal income tax on taxable income that is distributed to shareholders. Therefore, no federal income tax provision is required.
As of July 31, 2013, the fund had no uncertain tax positions that would require financial statement recognition, derecognition or disclosure. The fund’s federal tax returns are subject to examination by the Internal Revenue Service for a period of three years.
Distribution of income and gains. Distributions to shareholders from net investment income and net realized gains, if any, are recorded on the ex-date. The fund generally declares and pays dividends and capital gain distributions, if any, annually.
The tax character of distributions for the years ended July 31, 2013 and 2012 was as follows:
| | | | | | |
| | JULY 31, 2013 | JULY 31, 2012 | | | | |
| | | | |
| Ordinary Income | $28,283,550 | $3,446,874 | | | | |
| Long-Term Capital Gain | 17,744,368 | 8,058 | | | | |
| Total | $46,027,918 | $3,454,932 | | | | |
Distributions paid by the fund with respect to each class of shares are calculated in the same manner, at the same time and in the same amount, except for the effect of class level expenses that may be applied differently to each class. As of July 31, 2013, the components of distributable earnings on a tax basis consisted of $17,421,087 of undistributed ordinary income and $66,476,583 of long-term capital gains.
| |
| 22 | Fundamental Large Cap Value Fund | Annual report |
Such distributions and distributable earnings, on a tax basis, are determined in conformity with income tax regulations, which may differ from accounting principles generally accepted in the United States of America. Material distributions in excess of tax basis earnings and profits, if any, are reported in the fund’s financial statements as a return of capital.
Capital accounts within the financial statements are adjusted for permanent book-tax differences. These adjustments have no impact on net assets or the results of operations. Temporary book-tax differences, if any, will reverse in a subsequent period. The fund had no material book-tax differences at July 31, 2013.
Note 3 — Guarantees and indemnifications
Under the fund’s organizational documents, its Officers and Trustees are indemnified against certain liabilities arising out of the performance of their duties to the fund. Additionally, in the normal course of business, the fund enters into contracts with service providers that contain general indemnification clauses. The fund’s maximum exposure under these arrangements is unknown, as this would involve future claims that may be made against the fund that have not yet occurred. The risk of material loss from such claims is considered remote.
Note 4 — Fees and transactions with affiliates
John Hancock Investment Management Services, LLC (the Advisor) serves as investment advisor for the fund. John Hancock Funds, LLC (the Distributor), an affiliate of the Advisor, serves as principal underwriter of the funds. The Advisor and the Distributor are indirect, wholly owned subsidiaries of Manulife Financial Corporation (MFC).
Management fee. The fund has an investment management agreement with the Advisor under which the fund pays a daily management fee to the Advisor equivalent, on an annual basis, to the sum of: a) 0.70% of the first $500,000,000 of the fund’s aggregate average daily net assets together with the assets of Fundamental Large Cap Value Trust, a series of John Hancock Variable Insurance Trust (combined aggregate average daily net assets); b) 0.65% of the next $500,000,000 of the combined aggregate average daily net assets; and c) 0.60% of the combined aggregate average daily net assets in excess of $1,000,000,000. The Advisor has a subadvisory agreement with John Hancock Asset Management a division of Manulife Asset Management (US) LLC, an indirectly owned subsidiary of MFC and an affiliate of the Advisor. The fund is not responsible for payment of the subadvisory fees.
Effective June 1, 2013, the Advisor has contractually agreed to waive a portion of its management fee for certain funds (the Participating portfolios) of the Trust, John Hancock Funds, John Hancock Funds III and John Hancock Variable Insurance Trust. The waiver equals, on an annualized basis, 0.01% of that portion of the aggregate net assets of all the Participating portfolios that exceeds $75 billion but is less than or equal to $125 billion; 0.0125% of that portion of the aggregate net assets of all the Participating portfolios that exceeds $125 billion but is less than or equal to $150 billion; and 0.015% of that portion of the aggregate net assets of all the Participating portfolios that exceeds $150 billion. The amount of the reimbursement is calculated daily and allocated among all the Participating portfolios in proportion to the daily net assets of each fund. This arrangement may be amended or terminated at any time by the Advisor upon notice to the fund and with the approval of the Board of Trustees.
Prior to June 1, 2013 the Advisor had contractually agreed to waive a portion of its management fee for certain funds (the Participating Portfolios) of the Trust and John Hancock Variable Insurance Trust. The waiver equaled, on an annualized basis, 0.01% of that portion of the aggregate net assets of all the Participating Portfolios that exceeded $75 billion but was less than $100 billion; and 0.015% of that portion of the aggregate net assets of all the Participating Portfolios that equaled or
| |
| Annual report | Fundamental Large Cap Value Fund | 23 |
exceeded $100 billion. The amount of the reimbursement was calculated daily and allocated among all the Participating Portfolios in proportion to the daily net assets of each fund.
The Advisor has contractually agreed to waive all or a portion of its management fee and reimburse or pay operating expenses of the fund to the extent necessary to maintain the total operating expenses at 1.30% and 0.94% for Class A and Class I shares, respectively, excluding certain expenses such as taxes, brokerage commissions, interest expense, litigation and indemnification expenses and other extraordinary expenses not incurred in the ordinary course of the fund’s business. The current expense limitation agreement expires on November 30, 2013, unless renewed by mutual agreement of the fund and the Advisor based upon a determination that this is appropriate under the circumstances at that time. Prior to January 1, 2013, the fee waivers and/or reimbursements for Class I shares were such that the expenses would not exceed 0.84%. Prior to December 1, 2012, the fee waivers and/or reimbursements for Class NAV shares were such that the expenses would not exceed 0.82%.
Additionally, the Advisor has voluntarily agreed to waive other fund level expenses excluding advisory fees, 12b-1 fees, service fees, transfer agent fees, blue sky fees, taxes, printing and postage, brokerage commissions, interest expense, acquired fund fees, litigation and indemnification expenses and other extraordinary expenses not incurred in the ordinary course of business. The waivers are such that these expenses will not exceed 0.30% of average net assets. This voluntary expense reimbursement may be terminated at any time by the Advisor on notice to the fund.
Accordingly, these expense reductions described above amounted to $12,761, $11,643 and $33,061 for Class A, Class I and Class NAV shares, respectively, for the year ended July 31, 2013.
The investment management fees, including the impact of the waivers and reimbursement described above, incurred for the year ended July 31, 2013 were equivalent to a net effective rate of 0.65% of the fund’s average daily net assets.
Expense recapture. The Advisor may recapture operating expenses reimbursed or fees waived under previous expense limitation or waiver arrangements for a period of three years following the beginning of the month in which such reimbursements or waivers originally occurred to the extent that the fund is below its expense limitation during this period. The table below outlines the amounts recovered during the year ended July 31, 2013, and the amount of waived or reimbursed expenses subject to potential recovery and the respective expiration dates.
| | | | |
| | AMOUNTS | AMOUNTS | AMOUNTS | AMOUNT |
| | ELIGIBLE FOR | ELIGIBLE FOR | ELIGIBLE FOR | RECOVERED |
| | RECOVERY | RECOVERY | RECOVERY | DURING THE |
| | THROUGH | THROUGH | THROUGH | PERIOD ENDED |
| FUND | JULY 1, 2014 | JULY 1, 2015 | JULY 1, 2016 | JULY 31, 2013 |
|
| Fundamental Large Cap Value | $390 | $28,986 | $17,339 | — |
Accounting and legal services. Pursuant to a service agreement, the fund reimburses the Advisor for all expenses associated with providing the administrative, financial, legal, accounting and recordkeeping services to the fund, including the preparation of all tax returns, periodic reports to shareholders and regulatory reports, among other services. These expenses are allocated to each share class based on its relative net assets at the time the expense was incurred. These accounting and legal services fees incurred for the year ended July 31, 2013 amounted to an annual rate of 0.01% of the fund’s average daily net assets.
Distribution and service plans. The fund has a distribution agreement with the Distributor. The fund has adopted distribution and service plans with respect to Class A shares pursuant to Rule 12b-1 under the 1940 Act, to pay the Distributor for services provided as the distributor of shares of the fund. The fund pays 0.30% for Class A shares for distribution and service fees under these
| |
| 24 | Fundamental Large Cap Value Fund | Annual report |
arrangements, expressed as an annual percentage of average daily net assets for each class of the fund’s shares.
Sales charges. Class A shares are assessed up-front sales charges, which resulted in payments to the Distributor amounting to $21,750 for the year ended July 31, 2013. Of this amount, $3,714 was retained and used for printing prospectuses, advertising, sales literature and other purposes, $18,036 was paid as sales commissions to broker-dealers.
Class A shares may be subject to contingent deferred sales charges (CDSCs). Certain Class A shares that are acquired through purchases of $1 million or more and are redeemed within one year of purchase are subject to a 1.00% sales charge. CDSCs are applied to the lesser of the current market value at the time of redemption or the original purchase cost of the shares being redeemed. Proceeds from CDSCs are used to compensate the Distributor for providing distribution-related services in connection with the sale of these shares. During the year ended July 31, 2013, there were no CDSCs received by the Distributor for Class A shares.
Transfer agent fees. The fund has a transfer agent agreement with John Hancock Signature Services, Inc. (Signature Services), an affiliate of the Advisor. The transfer agent fees paid to Signature Services are determined based on the cost to Signature Services (Signature Services Cost) of providing recordkeeping services. The Signature Services Cost includes a component of allocated John Hancock corporate overhead for providing transfer agent services to the fund and to all other John Hancock affiliated funds. It also includes out-of-pocket expenses that are comprised of payments made to third-parties for recordkeeping services provided to their clients who invest in one or more John Hancock funds. In addition, Signature Services Cost may be reduced by certain fees that Signature Services receives in connection with retirement and small accounts. Signature Services Cost is calculated monthly and allocated, as applicable, to four categories of share classes: Institutional Share Classes, Retirement Share Classes, Municipal Bond Classes and all other Retail Share Classes. Within each of these categories, the applicable costs are allocated to the affected John Hancock affiliated funds and/or classes, based on the relative average daily net assets.
Class level expenses. Class level expenses for the year ended July 31, 2013 were:
| | | | |
| | DISTRIBUTION | TRANSFER | PRINTING AND | STATE |
| CLASS | AND SERVICE FEES | AGENT FEES | POSTAGE | REGISTRATION FEES |
|
| A | $16,802 | $9,577 | $2,398 | $17,539 |
| I | — | 7,390 | 2,181 | 17,540 |
| Total | $16,802 | $16,967 | $4,579 | $35,079 |
Trustee expenses. The fund compensates each Trustee who is not an employee of the Advisor or its affiliates. The costs of paying Trustee compensation and expenses are allocated to the fund based on its average daily net assets.
Interfund Lending Program. Pursuant to an Exemptive Order issued by the SEC, the fund(s), along with other funds advised by the Advisor, may participate in an interfund lending program. This program provides an alternative credit facility allowing the funds to borrow from, or lend money to, other participating affiliated funds. At period end, no interfund loans were outstanding. The fund’s activity in this program during the period for which loans were outstanding was as follows:
| | | | |
| BORROWER | AVERAGE | DAYS | WEIGHTED AVERAGE | INTEREST INCOME |
| OR LENDER | LOAN BALANCE | OUTSTANDING | INTEREST RATE | (EXPENSE) |
|
| Lender | $14,206,953 | 1 | 0.445% | $176 |
| |
| Annual report | Fundamental Large Cap Value Fund | 25 |
Note 5 — Fund share transactions
Transactions in fund shares for the years ended July 31, 2013 and 2012 were as follows:
| | | | |
| | Year ended 7-31-13 | | Year ended 7-31-12 |
| | Shares | Amount | Shares | Amount |
| Class A shares | | | | |
|
| Sold | 598,682 | $7,132,228 | 85,071 | $846,464 |
| Distributions reinvested | 8,863 | 97,048 | 123 | 1,153 |
| Repurchased | (165,913) | (2,069,953) | (23,993) | (239,863) |
| | | | | |
| Net increase | 441,632 | $5,159,323 | 61,201 | $607,754 |
| |
| Class I shares | | | | |
|
| Sold | 1,547,473 | $18,191,155 | 19,226 | $204,790 |
| Distributions reinvested | 46,111 | 505,838 | 964 | 9,038 |
| Repurchased | (1,377,727) | (16,666,845) | (37,505) | (368,974) |
| | | | | |
| Net increase (decrease) | 215,857 | $2,030,148 | (17,315) | ($155,146) |
| |
| Class NAV shares1 | | | | |
|
| Sold | 455,014 | $5,404,494 | 77,067,336 | $719,456,567 |
| Distributions reinvested | 4,138,279 | 45,314,159 | 366,288 | 3,432,117 |
| Repurchased | (10,936,314) | (124,803,509) | (849,441) | (8,725,910) |
| | | | | |
| Net increase (decrease) | (6,343,021) | ($74,084,856) | 76,584,183 | $714,162,774 |
| |
| Total net increase (decrease) | (5,685,532) | ($66,895,385) | 76,628,069 | $714,615,382 |
|
1 The inception date for Class NAV shares is 8-23-11.
Affiliates of the fund owned 100% of shares of beneficial interest of Class NAV shares on July 31, 2013.
Note 6 — Purchase and sale of securities
Purchases and sales of securities, other than short-term securities, amounted to $323,116,267 and $433,660,942, respectively, for the year ended July 31, 2013.
Note 7 — Investment by affiliated funds
Certain investors in the fund are affiliated funds that are managed by the Advisor and its affiliates. The affiliated funds do not invest in the fund for the purpose of exercising management or control; however, affiliated fund investments may represent a significant portion of the fund’s net assets. At July 31, 2013, the following funds had an affiliate ownership of 5% or more of the fund’s net assets:
| | | |
| | AFFILIATED | | |
| FUND | CONCENTRATION | | |
| | |
| John Hancock Lifestyle Aggressive Portfolio | 13.6% | | |
| John Hancock Lifestyle Growth Portfolio | 36.9% | | |
| John Hancock Lifestyle Balanced Portfolio | 29.8% | | |
| John Hancock Lifestyle Moderate Portfolio | 8.9% | | |
| |
| 26 | Fundamental Large Cap Value Fund | Annual report |
Auditor’s report
Report of Independent Registered Public Accounting Firm
To the Board of Trustees of John Hancock Funds II and Shareholders of
John Hancock Fundamental Large Cap Value Fund:
In our opinion, the accompanying statement of assets and liabilities, including the schedule of investments, and the related statements of operations and of changes in net assets and the financial highlights present fairly, in all material respects, the financial position of John Hancock Fundamental Large Cap Value Fund (the “Fund”) at July 31, 2013, and the results of its operations for the year then ended, the changes in its net assets for each of the two years in the period then ended and the financial highlights for each of the periods indicated, in conformity with accounting principles generally accepted in the United States of America. These financial statements and financial highlights (hereafter referred to as “financial statements”) are the responsibility of the Fund’s management; our responsibility is to express an opinion on these financial statements based on our audits. We conducted our audits of these financial statements in accordance with the standards of the Public Company Accounting Oversight Board (United States). Those standards require that we plan and perform the audit to obtain reasonable assurance about whether the financial statements are free of material misstatement. An audit includes examining, on a test basis, evidence supporting the amounts and disclosures in the financial statements, assessing the accounting principles used and significant estimates made by management, and evaluating the overall financial statement presentation. We believe that our audits, which included confirmation of securities at July 31, 2013 by correspondence with the custodian, and the application of alternative auditing procedures where securities purchased confirmations had not been received, provide a reasonable basis for our opinion.
PricewaterhouseCoopers LLP
Boston, Massachusetts
September 20, 2013
| |
| Annual report | Fundamental Large Cap Value Fund | 27 |
Tax information
Unaudited
For federal income tax purposes, the following information is furnished with respect to the distributions of the fund, if any, paid during its taxable year ended July 31, 2013.
The fund reports the maximum amount allowable of its net taxable income as eligible for the corporate dividends-received deduction.
The fund reports the maximum amount allowable of its net taxable income as qualified dividend income as provided in the Jobs and Growth Tax Relief Reconciliation Act of 2003.
The fund paid $17,744,368 in capital gain dividends.
Eligible shareholders will be mailed a 2013 Form 1099-DIV in early 2014. This will reflect the tax character of all distributions paid in calendar year 2013.
Please consult a tax advisor regarding the tax consequences of your investment in the fund.
| |
| 28 | Fundamental Large Cap Value Fund | Annual report |
Evaluation of Advisory and Subadvisory Agreements by the Board of Trustees
This section describes the evaluation by the Board of Trustees (the Board) of John Hancock Funds II (the Trust) of the Advisory Agreement (the Advisory Agreement) with John Hancock Investment Management Services, LLC (the Advisor) and the Subadvisory Agreement (the Subadvisory Agreement) with John Hancock Asset Management a division of Manulife Asset Management (US) LLC (the Subadvisor) for Fundamental Large Cap Value Fund (the fund). The Advisory Agreement and Subadvisory Agreement are collectively referred to as the Agreements.
Approval of Advisory and Subadvisory Agreements
At in-person meetings held on May 16-17, 2013, the Board, including the Trustees who are not considered to be interested persons of the Trust under the Investment Company Act of 1940, as amended (the 1940 Act) (the Independent Trustees), reapproved for an annual period the continuation of the Advisory Agreement between the Trust and the Advisor and the Subadvisory Agreement between the Advisor and the Subadvisor with respect to the fund.
In considering the Advisory Agreement and the Subadvisory Agreement, the Board received in advance of the meeting a variety of materials relating to the fund, the Advisor, and the Subadvisor, including comparative performance, fee and expense information for peer groups of similar mutual funds prepared by an independent third-party provider of mutual fund data; performance information for the fund’s benchmark index; and, with respect to the Subadvisor, comparative performance information for comparably managed accounts; and other information provided by the Advisor and the Subadvisor regarding the nature, extent, and quality of services provided by the Advisor and the Subadvisor under their respective Agreements, as well as information regarding the Advisor’s revenues and costs of providing services to the fund and any compensation paid to affiliates of the Advisor. At the meeting at which the renewal of the Advisory Agreement and Subadvisory Agreement is considered, particular focus is given to information concerning fund performance, comparability of fees and total expenses and profitability. However, the Board notes that the evaluation process with respect to the Advisor and the Subadvisor is an ongoing one. In this regard, the Board also took into account discussions with management and information provided to the Board at prior meetings with respect to the services provided by the Advisor and the Subadvisor to the fund, including quarterly performance reports prepared by management containing reviews of investment results and prior presentations from the Subadvisor with respect to the fund. The Board noted the affiliation of the Subadvisor with the Advisor, noting any potential conflicts of interest. The Board also considered the nature, quality, and extent of non-advisory services, if any, to be provided to the fund by the Advisor’s affiliates, including distribution services.
Throughout the process, the Board asked questions of and requested additional information from management. The Board is assisted by counsel for the Trust and the Independent Trustees are also separately assisted by independent legal counsel throughout the process. The Independent Trustees also received a memorandum from their independent counsel discussing the legal standards for their consideration of the proposed continuation of the Agreements and discussed the proposed continuation of the Agreements in private sessions with their independent legal counsel at which no representatives of management were present.
Approval of Advisory Agreement
In approving the Advisory Agreement with respect to the fund, the Board, including the Independent Trustees, considered a variety of factors, including those discussed below. The Board also considered other factors (including conditions and trends prevailing generally in the economy, the securities markets, and the industry) and does not treat any single factor as determinative and each Trustee may attribute different weights to different factors. The Board’s conclusions may be based in part on its consideration of the Advisory and Subadvisory Agreements in prior years and on the Board’s ongoing regular review of fund performance and operations throughout the year.
| |
| Annual report | Fundamental Large Cap Value Fund | 29 |
Nature, extent, and quality of services. Among the information received by the Board from the Advisor relating to the nature, extent, and quality of services provided to the fund, the Board reviewed information provided by the Advisor relating to its operations and personnel, descriptions of its organizational and management structure, and information regarding the Advisor’s compliance and regulatory history, including its Form ADV. The Board also noted that on a regular basis it receives and reviews information from the Trust’s Chief Compliance Officer (CCO) regarding the fund’s compliance policies and procedures established pursuant to Rule 38a-1 under the 1940 Act. The Board also considered the Advisor’s risk management processes. The Board considered that the Advisor is responsible for the management of the day-to-day operations of the fund, including, but not limited to, general supervision of and coordination of the services provided by the Subadvisor, and is also responsible for monitoring and reviewing the activities of the Subadvisor and third-party service providers.
In considering the nature, extent, and quality of the services provided by the Advisor, the Trustees also took into account their knowledge of the Advisor’s management and the quality of the performance of the Advisor’s duties through Board meetings, discussions, and reports during the preceding year and through each Trustee’s experience as a Trustee of the Trust and of the other trusts in the complex.
In the course of their deliberations regarding the Advisory Agreement, the Board considered, among other things:
(a) the skills and competency with which the Advisor has in the past managed the Trust’s affairs and its subadvisory relationship, the Advisor’s oversight and monitoring of the Subadvisor’s investment performance and compliance programs, such as the Subadvisor’s compliance with fund policies and objective; review of brokerage matters, including with respect to trade allocation and best execution; and the Advisor’s timeliness in responding to performance issues;
(b) the background, qualifications and skills of the Advisor’s personnel;
(c) the Advisor’s compliance policies and procedures and its responsiveness to regulatory changes and mutual fund industry developments;
(d) the Advisor’s administrative capabilities, including its ability to supervise the other service providers for the fund;
(e) the financial condition of the Advisor and whether it has the financial wherewithal to provide a high level and quality of services to the fund; and
(f) the Advisor’s reputation and experience in serving as an investment adviser to the Trust and the benefit to shareholders of investing in funds that are part of a family of funds offering a variety of investments.
The Board concluded that the Advisor may reasonably be expected to continue to provide a high quality of services under the Advisory Agreement with respect to the fund.
Investment performance. In considering the fund’s performance, the Board noted that it reviews at its regularly scheduled meetings information about the fund’s performance results. In connection with the consideration of the Advisory Agreement, the Board:
(a) reviewed information prepared by management regarding the fund’s performance;
(b) considered the comparative performance of the fund’s benchmark;
| |
| 30 | Fundamental Large Cap Value Fund | Annual report |
(c) considered the performance of comparable funds, if any, as included in the report prepared by an independent third-party provider of mutual fund data. Such report included the fund’s ranking within a smaller group of peer funds and the fund’s ranking within broader groups of funds; and
(d) took into account the Advisor’s analysis of the fund’s performance and its plans and recommendations regarding the Trust’s subadvisory arrangements generally.
The Board noted that the fund outperformed its benchmark index and peer group average for the one-year period ended December 31, 2012.
The Board noted that the inception date for this fund was June 1, 2011 and that it has a limited performance history. The Board also noted the fund’s favorable performance relative to the benchmark index and peer group for the one-year period.
The Board concluded that the performance of the fund has generally been in line with or outperformed the historical performance of comparable funds and the fund’s benchmark.
Fees and expenses. The Board reviewed comparative information prepared by an independent third-party provider of mutual fund data, including, among other data, the fund’s contractual and net management fees and total expenses as compared to similarly situated investment companies deemed to be comparable to the fund. The Board considered the fund’s ranking within a smaller group of peer funds chosen by the independent third-party provider, as well as the fund’s ranking within a broader group of funds. In comparing the fund’s contractual and net management fees to those of comparable funds, the Board noted that such fees include both advisory and administrative costs.
The Board noted that net management fees for this fund are higher than the peer group median and that total expenses for this fund are lower than the peer group median. The Board took into account management’s discussion of the fund’s expenses.
The Board took into account management’s discussion with respect to the advisory/subadvisory fee structure, including the amount of the advisory fee retained by the Advisor after payment of the subadvisory fee. The Board also took into account that management had agreed to implement an overall fee waiver across a number of funds in the complex, including the fund, which is discussed further below. The Board also noted that, in addition, the Advisor is currently waiving fees and/or reimbursing expenses with respect to the fund. The Board also noted management’s discussion of the fund’s expenses, as well as certain actions taken over the past several years to reduce the fund’s operating expenses. The Board reviewed information provided by the Advisor concerning investment advisory fees charged to other clients (including other funds in the complex) having similar investment mandates, if any. The Board considered any differences between the Advisor’s and Subadvisor’s services to the fund and the services they provide to other comparable clients or funds. The Board concluded that the advisory fee paid with respect to the fund is reasonable.
Profitability/indirect benefits. In considering the costs of the services to be provided and the profits to be realized by the Advisor and its affiliates (including the Subadvisor) from the Advisor’s relationship with the Trust, the Board:
(a) reviewed financial information of the Advisor;
(b) reviewed and considered an analysis presented by the Advisor regarding the net profitability to the Advisor and its affiliates with respect to the fund;
(c) received and reviewed profitability information with respect to the John Hancock fund complex as a whole;
| |
| Annual report | Fundamental Large Cap Value Fund | 31 |
(d) received information with respect to the Advisor’s allocation methodologies used in preparing the profitability data;
(e) considered that the John Hancock insurance companies that are affiliates of the Advisor, as shareholders of the Trust directly or through their separate accounts, receive certain tax credits or deductions relating to foreign taxes paid and dividends received by certain funds of the Trust and noted that these tax benefits, which are not available to participants in qualified retirement plans under applicable income tax law, are reflected in the profitability analysis reviewed by the Board;
(f) considered that the Advisor also provides administrative services to the fund on a cost basis pursuant to an administrative services agreement;
(g) noted that the fund’s Subadvisor is an affiliate of the Advisor;
(h) noted that affiliates of the Advisor provide transfer agency services and distribution services to the fund, and that the Trust’s distributor also receives Rule 12b-1 payments to support distribution of the fund;
(i) noted that the Advisor also derives reputational and other indirect benefits from providing advisory services to the fund;
(j) noted that the subadvisory fees for the fund are paid by the Advisor; and
(k) considered that the Advisor should be entitled to earn a reasonable level of profits in exchange for the level of services it provides to the fund and the entrepreneurial risk that it assumes as Advisor.
Based upon its review, the Board concluded that the level of profitability, if any, of the Advisor and its affiliates (including the Subadvisor) from their relationship with the fund was reasonable and not excessive.
Economies of scale. In considering the extent to which economies of scale would be realized as the fund grows and whether fee levels reflect these economies of scale for the benefit of fund shareholders, the Board:
(a) considered that the Advisor has agreed, effective June 1, 2013, to waive its management fee for the fund and each of the open-end funds of John Hancock Funds II, John Hancock Funds III, each other John Hancock fund (except those listed below) (the Participating Portfolios) or otherwise reimburse the expenses of the Participating Portfolios as follows (the Reimbursement):
The Reimbursement shall equal, on an annualized basis, 0.01% of that portion of the aggregate net assets of all the Participating Portfolios that exceeds $75 billion but is less than or equal to $125 billion, 0.0125% of that portion of the aggregate net assets of all the Participating Portfolios that exceeds $125 billion but is less than or equal to $150 billion and 0.015% of that portion of the aggregate net assets of all the Participating Portfolios that exceeds $150 billion. (The funds that are not Participating Portfolios as of the date of this annual report are each of the fund of funds, money market funds, index funds and closed-end funds);
(b) reviewed the Trust’s advisory fee structure and the incorporation therein of any subadvisory fee breakpoints in the advisory fees charged and concluded that (i) the fund’s fee structure contains breakpoints at the subadvisory fee level and that such breakpoints are reflected as breakpoints in the advisory fees for the fund and (ii) although economies of scale cannot be measured with precision, these arrangements permit shareholders of the fund to benefit
| |
| 32 | Fundamental Large Cap Value Fund | Annual report |
from economies of scale if the fund grows. The Board also took into account management’s discussion of the fund’s advisory fee structure; and
(c) the Board also considered the effect of the fund’s growth in size on its performance and fees. The Board also noted that if the fund’s assets increase over time, the fund may realize other economies of scale.
Approval of Subadvisory Agreement
In making its determination with respect to approval of the Subadvisory Agreement, the Board reviewed:
(1) information relating to the Subadvisor’s business, including current subadvisory services to the Trust (and other funds in the John Hancock family of funds);
(2) the historical and current performance of the fund, and comparative performance information relating to the fund’s benchmark and comparable funds; and
(3) the subadvisory fee for the fund, including any breakpoints, and comparative fee information, where available, prepared by an independent third-party provider of mutual fund data.
Nature, extent, and quality of services. With respect to the services provided by the Subadvisor, the Board received information provided to the Board by the Subadvisor, including the Subadvisor’s Form ADV, as well as took into account information presented throughout the past year. The Board considered the Subadvisor’s current level of staffing and its overall resources, as well as received information relating to the Subadvisor’s compensation program. The Board reviewed the Subadvisor’s history and investment experience, as well as information regarding the qualifications, background, and responsibilities of the Subadvisor’s investment and compliance personnel who provide services to the fund. The Board also considered, among other things, the Subadvisor’s compliance program and any disciplinary history. The Board also considered the Subadvisor’s risk assessment and monitoring process. The Board reviewed the Subadvisor’s regulatory history, including whether it was currently involved in any regulatory actions or investigations as well as material litigation, and any settlements and amelioratory actions undertaken, as appropriate. The Board noted that the Advisor conducts regular, periodic reviews of the Subadvisor and its operations, including regarding investment processes and organizational and staffing matters. The Board also noted that the Trust’s CCO and his staff conduct regular, periodic compliance reviews with the Subadvisor and present reports to the Independent Trustees regarding the same, which includes evaluating the regulatory compliance systems of the Subadvisor and procedures reasonably designed by it to assure compliance with the federal securities laws. The Board also took into account the financial condition of the Subadvisor.
The Board considered the Subadvisor’s investment process and philosophy. The Board took into account that the Subadvisor’s responsibilities include the development and maintenance of an investment program for the fund, that is consistent with the fund’s investment objective, the selection of investment securities and the placement of orders for the purchase and sale of such securities, as well as the implementation of compliance controls related to performance of these services. The Board also received information with respect to the Subadvisor’s brokerage policies and practices, including with respect to best execution and soft dollars.
Subadvisor compensation. In considering the cost of services to be provided by the Subadvisor and the profitability to the Subadvisor of its relationship with the fund, the Board noted that the fees under the Subadvisory Agreement are paid by the Advisor and not the fund.
| |
| Annual report | Fundamental Large Cap Value Fund | 33 |
The Board also received information and took into account any other potential conflicts of interest the Advisor might have in connection with the Subadvisory Agreement. In addition, the Board considered other potential indirect benefits that the Subadvisor and its affiliates may receive from the Subadvisor’s relationship with the fund, such as the opportunity to provide advisory services to additional funds in the John Hancock fund complex and reputational benefits.
Subadvisory fees. The Board considered that the fund pays an advisory fee to the Advisor and that, in turn, the Advisor pays a subadvisory fee to the Subadvisor. The Board also took into account the sub-advisory fees paid by the Advisor to the Subadvisor with respect to the fund to fees charged by the fund’s Subadvisor to manage other subadvised portfolios and portfolios not subject to regulation under the 1940 Act, as applicable.
Subadvisor performance. As noted above, the Board considered the fund’s performance as compared to the fund’s peer group and benchmark and noted that the Board reviews information about the fund’s performance results at its regularly scheduled meetings. The Board noted the Advisor’s expertise and resources in monitoring the performance, investment style, and risk-adjusted performance of the Subadvisor. The Board was mindful of the Advisor’s focus on the Subadvisor’s performance. The Board also noted the Subadvisor’s long-term performance record for similar accounts, as applicable.
The Board’s decision to approve the Subadvisory Agreement was based on a number of determinations, including the following:
(1) The Subadvisor has extensive experience and demonstrated skills as a manager;
(2) The performance of the fund generally has been in line with or outperformed the historical performance of comparable funds and the fund’s benchmark and the fund’s overall performance is satisfactory;
(3) The subadvisory fees are reasonable in relation to the level and quality of services being provided; and
(4) Subadvisory fee breakpoints are reflected as breakpoints in the advisory fees for the fund in order to permit shareholders to benefit from economies of scale if the fund grows.
Based on the Board’s evaluation of all factors that the Board deemed to be material, including those factors described above, the Board, including the Independent Trustees, concluded that renewal of the Advisory Agreement and the Subadvisory Agreement would be in the best interest of the fund and its shareholders. Accordingly, the Board, and the Independent Trustees voting separately, approved the Advisory Agreement and Subadvisory Agreement for an additional one-year period.
| |
| 34 | Fundamental Large Cap Value Fund | Annual report |
Trustees and Officers
This chart provides information about the Trustees and Officers who oversee your John Hancock fund. Officers elected by the Trustees manage the day-to-day operations of the fund and execute policies formulated by the Trustees.
| | |
| Independent Trustees | | |
| | | |
| Name, year of birth | Trustee | Number of John |
| Position(s) held with fund | of the | Hancock funds |
| Principal occupation(s) and other | Trust | overseen by |
| directorships during past 5 years | since1 | Trustee |
| |
| James M. Oates, Born: 1946 | 2012 | 231 |
|
| Managing Director, Wydown Group (financial consulting firm) (since 1994); Chairman and Director, |
| Emerson Investment Management, Inc. (since 2000); Independent Chairman, Hudson Castle Group, Inc. |
| (formerly IBEX Capital Markets, Inc.) (financial services company) (1997–2011); Director, Stifel Financial |
| (since 1996); Director, Investor Financial Services Corporation (1995–2007); Director, Connecticut River |
| Bancorp (since 1998); Director, Virtus Funds (formerly Phoenix Mutual Funds) (since 1988). Trustee |
| and Chairperson of the Board, John Hancock retail funds (since 2012); Trustee (2005–2006 and since |
| 2012) and Chairperson of the Board (since 2012), John Hancock Funds III; Trustee (since 2004) and |
| Chairperson of the Board (since 2005), John Hancock Variable Insurance Trust; Trustee and Chairperson |
| of the Board (since 2005), John Hancock Funds II. | | |
|
| |
| Charles L. Bardelis,3 Born: 1941 | 2012 | 231 |
|
| Director, Island Commuter Corp. (marine transport). Trustee, John Hancock retail funds (since 2012); |
| Trustee, John Hancock Funds III (2005–2006 and since 2012); Trustee, John Hancock Variable Insurance |
| Trust (since 1988); Trustee, John Hancock Funds II (since 2005). | | |
|
| |
| Peter S. Burgess,3 Born: 1942 | 2012 | 231 |
|
| Consultant (financial, accounting, and auditing matters) (since 1999); Certified Public Accountant; |
| Partner, Arthur Andersen (independent public accounting firm) (prior to 1999); Director, Lincoln |
| Educational Services Corporation (since 2004); Director, Symetra Financial Corporation (since 2010); |
| former Director, PMA Capital Corporation (2004–2010). Trustee, John Hancock retail funds (since 2012); |
| Trustee, John Hancock Funds III (2005–2006 and since 2012); Trustee, John Hancock Variable Insurance |
| Trust and John Hancock Funds II (since 2005). | | |
|
| |
| William H. Cunningham,2 Born: 1944 | 1994 | 231 |
|
| Professor, University of Texas, Austin, Texas (since 1971); former Chancellor, University of Texas |
| System and former President of the University of Texas, Austin, Texas; Director, LIN Television (since |
| 2009); Chairman (since 2009) and Director (since 2006), Lincoln National Corporation (insurance); |
| Director, Resolute Energy Corporation (since 2009); Director, Southwest Airlines (since 2000); former |
| Director, Introgen (manufacturer of biopharmaceuticals) (until 2008); former Director, Hicks Acquisition |
| Company I, Inc. (until 2007); former Director, Texas Exchange Bank, SSB (formerly Bank of Crowley) |
| (until 2009); former Advisory Director, JPMorgan Chase Bank (formerly Texas Commerce Bank–Austin) |
| (until 2009). Trustee, John Hancock retail funds (since 1986); Trustee, John Hancock Variable Insurance |
| Trust (since 2012); Trustee, John Hancock Funds II (since 2012 and 2005–2006). | |
|
| |
| Grace K. Fey, Born: 1946 | 2012 | 231 |
|
| Chief Executive Officer, Grace Fey Advisors (since 2007); Director and Executive Vice President, |
| Frontier Capital Management Company (1988–2007); Director, Fiduciary Trust (since 2009). |
| Trustee, John Hancock retail funds (since 2012); Trustee, John Hancock Variable Insurance Trust and |
| John Hancock Funds II (since 2008). | | |
| |
| Annual report | Fundamental Large Cap Value Fund | 35 |
| | |
| Independent Trustees (continued) | | |
| |
| Name, year of birth | Trustee | Number of John |
| Position(s) held with fund | of the | Hancock funds |
| Principal occupation(s) and other | Trust | overseen by |
| directorships during past 5 years | since1 | Trustee |
| |
| Theron S. Hoffman,3 Born: 1947 | 2012 | 231 |
|
| Chief Executive Officer, T. Hoffman Associates, LLC (consulting firm) (since 2003); Director, The Todd |
| Organization (consulting firm) (2003–2010); President, Westport Resources Management (investment |
| management consulting firm) (2006–2008); Senior Managing Director, Partner, and Operating Head, |
| Putnam Investments (2000–2003); Executive Vice President, The Thomson Corp. (financial and |
| legal information publishing) (1997–2000). Trustee, John Hancock retail funds (since 2012); Trustee, |
| John Hancock Variable Insurance Trust and John Hancock Funds II (since 2008). | |
|
| |
| Deborah C. Jackson,2 Born: 1952 | 2008 | 231 |
|
| President, Cambridge College, Cambridge, Massachusetts (since 2011); Chief Executive Officer, |
| American Red Cross of Massachusetts Bay (2002–2011); Board of Directors of Eastern Bank Corporation |
| (since 2001); Board of Directors of Eastern Bank Charitable Foundation (since 2001); Board of Directors |
| of American Student Assistance Corporation (1996–2009); Board of Directors of Boston Stock Exchange |
| (2002–2008); Board of Directors of Harvard Pilgrim Healthcare (health benefits company) (2007–2011). |
| Trustee, John Hancock retail funds (since 2008); Trustee of John Hancock Variable Insurance Trust and |
| John Hancock Funds II (since 2012). | | |
|
| |
| Hassell H. McClellan, Born: 1945 | 2012 | 231 |
|
| Associate Professor, The Wallace E. Carroll School of Management, Boston College (since 1984); |
| Trustee, Virtus Variable Insurance Trust (formerly Phoenix Edge Series Funds) (since 2008); Director, |
| The Barnes Group (since 2010). Trustee, John Hancock retail funds (since 2012); Trustee, John Hancock |
| Funds III (2005–2006 and since 2012); Trustee, John Hancock Variable Insurance Trust and | |
| John Hancock Funds II (since 2005). | | |
|
| |
| Steven R. Pruchansky,2 Born: 1944 | 1991 | 231 |
|
| Chairman and Chief Executive Officer, Greenscapes of Southwest Florida, Inc. (since 2000); Director |
| and President, Greenscapes of Southwest Florida, Inc. (until 2000); Member, Board of Advisors, First |
| American Bank (until 2010); Managing Director, Jon James, LLC (real estate) (since 2000); Director, |
| First Signature Bank & Trust Company (until 1991); Director, Mast Realty Trust (until 1994); President, |
| Maxwell Building Corp. (until 1991). Trustee (since 1992) and Chairperson of the Board (2011–2012), |
| John Hancock retail funds; Trustee and Vice Chairperson of the Board, John Hancock retail funds, |
| John Hancock Variable Insurance Trust and John Hancock Funds II (since 2012). | |
|
| |
| Gregory A. Russo,2 Born: 1949 | 2009 | 231 |
|
| Director and Audit Committee Chairman (since 2012) and Member, Audit Committee and Finance |
| Committee (since 2011), NCH Healthcare System, Inc. (holding company for multi-entity healthcare |
| system); Director and Member of Finance Committee, The Moorings, Inc. (nonprofit continuing care |
| community) (since 2012); Vice Chairman, Risk & Regulatory Matters, KPMG LLP (KPMG) (2002–2006); |
| Vice Chairman, Industrial Markets, KPMG (1998–2002); Chairman and Treasurer, Westchester |
| County, New York, Chamber of Commerce (1986–1992); Director, Treasurer and Chairman of |
| Audit and Finance Committees, Putnam Hospital Center (1989–1995); Director and Chairman of |
| Fundraising Campaign, United Way of Westchester and Putnam Counties, New York (1990–1995). |
| Trustee, John Hancock retail funds (since 2008); Trustee, John Hancock Variable Insurance Trust and |
| John Hancock Funds II (since 2012). | | |
| |
| 36 | Fundamental Large Cap Value Fund | Annual report |
| | |
| Non-Independent Trustees4 | | |
| | | |
| Name, year of birth | Trustee | Number of John |
| Position(s) held with fund | of the | Hancock funds |
| Principal occupation(s) and other | Trust | overseen by |
| directorships during past 5 years | since1 | Trustee |
| |
| James R. Boyle, Born: 1959 | 2012 | 231 |
|
| Senior Executive Vice President, John Hancock Financial Services (1999–2012, including prior positions); |
| Chairman and Director, John Hancock Advisers, LLC, John Hancock Funds, LLC, and John Hancock |
| Investment Management Services, LLC (2005–2010). Trustee, John Hancock retail funds (since 2012 and |
| 2005–2010), Trustee, John Hancock Variable Insurance Trust and John Hancock Funds II (since 2005). |
|
| |
| Craig Bromley,2 Born: 1966 | 2012 | 231 |
|
| President, John Hancock Financial Services (since 2012); Senior Executive Vice President and General |
| Manager, U.S. Division, John Hancock Financial Services (since 2012); President and Chief Executive |
| Officer, Manulife Insurance Company (Manulife (Japan) (2005–2012), including prior positions). |
| Trustee, John Hancock retail funds (since 2012); Trustee, John Hancock Variable Insurance Trust and |
| John Hancock Funds II (since 2012). | | |
|
| |
| Warren A. Thomson,2 Born: 1955 | 2012 | 231 |
|
| Senior Executive Vice President and Chief Investment Officer, Manulife Financial Corporation and The |
| Manufacturers Life Insurance Company (since 2009); Chairman and Chief Executive Officer, Manulife |
| Asset Management (since 2001, including prior positions); Director (since 2006), and President and |
| Chief Executive Officer of Manulife Asset Management Limited (since 2013); Director and Chairman, |
| Hancock Natural Resources Group, Inc. (since 2013). Trustee, John Hancock retail funds, John Hancock |
| Variable Insurance Trust and John Hancock Funds II (since 2012). | | |
| |
| Principal officers who are not Trustees | | |
| | | |
| Name, year of birth | | Officer |
| Position(s) held with fund | | of the |
| Principal occupation(s) and other | | Trust |
| directorships during past 5 years | | since |
| |
| Hugh McHaffie, Born: 1959 | | 2009 |
|
| President | | |
| Executive Vice President, John Hancock Financial Services (since 2006, including prior positions); |
| Chairman and Director, John Hancock Advisers, LLC, John Hancock Investment Management Services, |
| LLC and John Hancock Funds, LLC (since 2010); President, John Hancock Advisers, LLC (since 2012); |
| President, John Hancock Investment Management Services, LLC (since 2010). President (since 2012) and |
| former Trustee (2010–2012), John Hancock retail funds; President, John Hancock Variable Insurance |
| Trust and John Hancock Funds II (since 2009). | | |
|
| |
| Andrew G. Arnott, Born: 1971 | | 2009 |
|
| Executive Vice President | | |
| Senior Vice President, John Hancock Financial Services (since 2009); Director and Executive Vice |
| President, John Hancock Advisers, LLC (since 2005, including prior positions); Director and Executive |
| Vice President, John Hancock Investment Management Services, LLC (since 2006, including prior |
| positions); President, John Hancock Funds, LLC (since 2004, including prior positions); Executive Vice |
| President, John Hancock retail funds, John Hancock Variable Insurance Trust and John Hancock Funds II |
| (since 2007, including prior positions). | | |
|
| |
| Thomas M. Kinzler, Born: 1955 | | 2006 |
|
| Secretary and Chief Legal Officer | | |
| Vice President, John Hancock Financial Services (since 2006); Secretary and Chief Legal Counsel, |
| John Hancock Funds, LLC (since 2007); Secretary and Chief Legal Officer, John Hancock retail funds, |
| John Hancock Variable Insurance Trust and John Hancock Funds II (since 2006). | |
| |
| Annual report | Fundamental Large Cap Value Fund | 37 |
| |
| Principal officers who are not Trustees (continued) | |
| |
| Name, year of birth | Officer |
| Position(s) held with fund | of the |
| Principal occupation(s) and other | Trust |
| directorships during past 5 years | since |
| |
| Francis V. Knox, Jr., Born: 1947 | 2005 |
|
| Chief Compliance Officer | |
| Vice President, John Hancock Financial Services (since 2005); Chief Compliance Officer, John Hancock |
| retail funds, John Hancock Variable Insurance Trust, John Hancock Funds II, John Hancock Advisers, |
| LLC and John Hancock Investment Management Services, LLC (since 2005); Vice President and Chief |
| Compliance Officer, John Hancock Asset Management a division of Manulife Asset Management (US) |
| LLC (2005–2008). | |
|
| |
| Charles A. Rizzo, Born: 1957 | 2007 |
|
| Chief Financial Officer | |
| Vice President, John Hancock Financial Services (since 2008); Senior Vice President, John Hancock | |
| Advisers, LLC and John Hancock Investment Management Services, LLC (since 2008); Chief Financial |
| Officer, John Hancock retail funds, John Hancock Variable Insurance Trust and John Hancock Funds II |
| (since 2007). | |
|
| |
| Salvatore Schiavone, Born: 1965 | 2009 |
|
| Treasurer | |
| Assistant Vice President, John Hancock Financial Services (since 2007); Vice President, John Hancock |
| Advisers, LLC and John Hancock Investment Management Services, LLC (since 2007); Treasurer, | |
| John Hancock retail funds (since 2007, including prior positions); Treasurer, John Hancock Variable | |
| Insurance Trust and John Hancock Funds II (since 2010 and 2007–2009, including prior positions). | |
John Hancock retail funds is comprised of John Hancock Funds III and 34 other John Hancock funds consisting of 24 series of other John Hancock trusts and 10 closed-end funds.
The business address for all Trustees and Officers is 601 Congress Street, Boston, Massachusetts 02210-2805.
The Statement of Additional Information of the fund includes additional information about members of the Board of Trustees of the Trust and is available without charge, upon request, by calling 800-225-5291.
1 Each Trustee holds office until his or her successor is elected and qualified, or until the Trustee’s death, retirement, resignation or removal.
2 Became a Trustee of the Trust effective December 1, 2012.
3 Member of Audit Committee.
4 Because Messrs. Bromley and Thomson are senior executives or directors and Mr. Boyle held prior positions as a senior executive and director of the Advisor and/or its affiliates, each of them is considered an “interested person,” as defined in the Investment Company Act of 1940, of the Trust.
| |
| 38 | Fundamental Large Cap Value Fund | Annual report |
More information
| |
| Trustees | Investment advisor |
| James M. Oates, Chairperson | John Hancock Investment Management |
| Steven R. Pruchansky, Vice Chairperson | Services, LLC |
| Charles L. Bardelis* | |
| James R. Boyle† | Subadvisor |
| Craig Bromley† | John Hancock Asset Management a division of |
| Peter S. Burgess* | Manulife Asset Management (US) LLC |
| William H. Cunningham | |
| Grace K. Fey | Principal distributor |
| Theron S. Hoffman* | John Hancock Funds, LLC |
| Deborah C. Jackson | |
| Hassell H. McClellan | Custodian |
| Gregory A. Russo | State Street Bank and Trust Company |
| Warren A. Thomson† | |
| | Transfer agent |
| Officers | John Hancock Signature Services, Inc. |
| Hugh McHaffie | |
| President | Legal counsel |
| | K&L Gates LLP |
| Andrew G. Arnott | |
| Executive Vice President | Independent registered |
| | public accounting firm |
| Thomas M. Kinzler | PricewaterhouseCoopers LLP |
| Secretary and Chief Legal Officer | |
| | |
| Francis V. Knox, Jr. | |
| Chief Compliance Officer | |
| | |
| Charles A. Rizzo | |
| Chief Financial Officer | |
| | |
| Salvatore Schiavone | |
| Treasurer | |
| |
| *Member of the Audit Committee | |
| †Non-Independent Trustee | |
The fund’s proxy voting policies and procedures, as well as the fund’s proxy voting record for the most recent twelve-month period ended June 30, are available free of charge on the Securities and Exchange Commission (SEC) website at sec.gov or on our website.
The fund’s complete list of portfolio holdings, for the first and third fiscal quarters, is filed with the SEC on Form N-Q. The fund’s Form N-Q is available on our website and the SEC’s website, sec.gov, and can be reviewed and copied (for a fee) at the SEC’s Public Reference Room in Washington, DC. Call 800-SEC-0330 to receive information on the operation of the SEC’s Public Reference Room.
We make this information on your fund, as well as monthly portfolio holdings, and other fund details available on our website at jhinvestments.com or by calling 800-225-5291.
| | |
| You can also contact us: | | |
| 800-225-5291 | Regular mail: | Express mail: |
| jhinvestments.com | Investment Operations | Investment Operations |
| | John Hancock Signature Services, Inc. | John Hancock Signature Services, Inc. |
| | P.O. Box 55913 | 30 Dan Road |
| | Boston, MA 02205-5913 | Canton, MA 02021 |
| |
| Annual report | Fundamental Large Cap Value Fund | 39 |

800-225-5291
800-338-8080 EASI-Line
jhinvestments.com
| |
| This report is for the information of the shareholders of John Hancock Fundamental Large Cap Value Fund. | |
| It is not authorized for distribution to prospective investors unless preceded or accompanied by a prospectus. | 374A 7/13 |
| MF150765 | 9/13 |

A look at performance
Total returns for the period ended July 31, 2013
| | | | | | | | | |
| | Average annual total returns (%) | | Cumulative total returns (%) | |
| | with maximum sales charge | | | with maximum sales charge | |
|
| | 1-year | 5-year | 10-year | Since
inception1 | | 1-year | 5-year | 10-year | Since
inception1 |
|
| Class A | 26.29 | — | — | 11.56 | | 26.29 | — | — | 26.75 |
|
| Class I2 | 33.48 | — | — | 14.75 | | 33.48 | — | — | 34.73 |
|
| Index† | 26.86 | — | — | 13.13 | | 26.86 | — | — | 30.65 |
|
Performance figures assume all distributions have been reinvested. Figures reflect maximum sales charges on Class A shares of 5.00%.
The expense ratios of the fund, both net (including any fee waivers or expense limitations) and gross (excluding any fee waivers or expense limitations), are set forth according to the most recent publicly available prospectuses for the fund and may differ from those disclosed in the Financial highlights tables in this report. The fee waivers and expense limitations are contractual at least until 11-30-13 for Class A and Class I shares. Had the fee waivers and expense limitations not been in place, gross expenses would apply. The expense ratios are as follows:
| | | | | | |
| | Class A | Class I | | | | |
| Net (%) | 1.30 | 0.94 | | | | |
| Gross (%) | 5.62 | 7.00 | | | | |
The returns reflect past results and should not be considered indicative of future performance. The return and principal value of an investment will fluctuate so that shares, when redeemed, may be worth more or less than their original cost. Due to market volatility, the fund’s current performance may be higher or lower than the performance shown. For current to the most recent month-end performance data, please call 800-225-5291 or visit the fund’s website at jhinvestments.com.
The performance table above and the chart on the next page do not reflect the deduction of taxes that a shareholder may pay on fund distributions or on the redemption of fund shares. The fund’s performance results reflect any applicable fee waivers or expense reductions, without which the expenses would increase and results would have been less favorable.
† Index is the Russell 3000 Index.
See the following page for footnotes.
| |
| 6 Fundamental All Cap Core Fund | Annual report |

| | | | |
| | | With maximum | Without | |
| | Start date | sales charge | sales charge | Index |
|
| Class I2 | 6-1-11 | $13,473 | $13,473 | $13,065 |
|
Russell 3000 Index is an unmanaged index of the 3,000 largest U.S. companies based on total market capitalization, which represents approximately 98% of the investable U.S. equity market.
It is not possible to invest directly in an index. Index figures do not reflect expenses or sales charges, which would have resulted in lower values if they did.
Footnotes related to performance pages
1 From 6-1-11.
2 For certain types of investors as described in the fund’s prospectuses.
| |
| Annual report | Fundamental All Cap Core Fund 7 |
Management’s discussion of
Fund performance
John Hancock Asset Management a division of Manulife Asset Management (US) LLC
U.S. equities across all market caps posted strong gains for the year ended July 31, 2013. The market benefited early in the period from new economic stimulus measures that included massive monthly bond purchases. The postponement of automatic federal spending cuts and tax increases gave stocks another strong boost early in the new year. Rising home values, a pickup in manufacturing, and unemployment below 8% fueled added gains in the spring. Concern that the U.S. Federal Reserve might taper its stimulus later shook investors, but stocks rebounded as this fear eased, companies reported better-than-expected second-quarter earnings, and investors began anticipating improved economic growth ahead.
Over the 12-month reporting period, John Hancock Fundamental All Cap Core Fund’s Class A shares returned 32.93%, excluding sales charges, outpacing the 26.86% gain of its benchmark, the Russell 3000 Index, and the average return of its peer group, the Morningstar, Inc. large growth fund category, which returned 23.26%.† Stock picks in financials helped the most. Standouts included diversified financial services company Bank of America Corp., which saw growing loan demand and easing capital adequacy concerns drive steep gains. An overweight in the top-performing consumer discretionary sector and favorable stock picks in healthcare also helped. Top contributors included home improvement retailer Lowe’s Companies, Inc., whose outsized return was fueled by repositioning efforts and the U.S. housing recovery. In healthcare, the stock of medical staffing company AMN Healthcare Services, Inc. rallied as demand for its services picked up. By contrast, security selection within energy detracted from performance, led by oil and exploration company Apache Corp., whose share price fell amid concern over the company’s exposure to the Middle East. An overweight in information technology also hurt. Here, exposure early on to online genealogy company Ancestry.com proved costly, as the stock declined after a big run. We sold the fund’s stake. Last, a small cash position hampered results.
This commentary reflects the views of the portfolio managers through the end of the period discussed in this report. As such, they are in no way guarantees of future events and are not intended to be used as investment advice or a recommendation regarding any specific security. They are also subject to change at any time as market and other conditions warrant.
Past performance is no guarantee of future results.
† Figures from Morningstar, Inc. include distributions reinvested and do not take into account sales charges. Actual load-adjusted performance is lower.
| |
| 8 Fundamental All Cap Core Fund | Annual report |
Your expenses
These examples are intended to help you understand your ongoing operating expenses of investing in the fund so you can compare these costs with the ongoing costs of investing in other mutual funds.
Understanding fund expenses
As a shareholder of the fund, you incur two types of costs:
■ Transaction costs, which include sales charges (loads) on purchases or redemptions (varies by share class), minimum account fee charge, etc.
■ Ongoing operating expenses, including management fees, distribution and service fees (if applicable) and other fund expenses.
We are going to present only your ongoing operating expenses here.
Actual expenses/actual returns
This example is intended to provide information about the fund’s actual ongoing operating expenses and is based on the fund’s actual return. It assumes an account value of $1,000.00 on February 1, 2013, with the same investment held until July 31, 2013.
| | | |
| | Account value | Ending value | Expenses paid during |
| | on 2-1-13 | on 7-31-13 | period ended 7-31-131 |
|
| Class A | $1,000.00 | $1,119.00 | $6.83 |
|
| Class I | 1,000.00 | 1,121.40 | 4.94 |
|
Together with the value of your account, you may use this information to estimate the operating expenses that you paid over the period. Simply divide your account value at July 31, 2013, by $1,000.00, then multiply it by the “expenses paid” for your share class from the table above. For example, for an account value of $8,600.00, the operating expenses should be calculated as follows:
| |
| Annual report | Fundamental All Cap Core Fund 9 |
Your expenses
Hypothetical example for comparison purposes
This table allows you to compare the fund’s ongoing operating expenses with those of any other fund. It provides an example of the fund’s hypothetical account values and hypothetical expenses based on each class’s actual expense ratio and an assumed 5% annualized return before expenses (which is not the fund’s actual return). It assumes an account value of $1,000.00 on February 1, 2013, with the same investment held until July 31, 2013. Look in any other fund shareholder report to find its hypothetical example and you will be able to compare these expenses. Please remember that these hypothetical account values and expenses may not be used to estimate the actual ending account balance or expenses you paid for the period.
| | | |
| | Account value | Ending value | Expenses paid during |
| | on 2-1-13 | on 7-31-13 | period ended 7-31-131 |
|
| Class A | $1,000.00 | $1,018.30 | $6.51 |
|
| Class I | 1,000.00 | 1,020.10 | 4.71 |
|
Remember, these examples do not include any transaction costs, therefore, these examples will not help you to determine the relative total costs of owning different funds. If transaction costs were included, your expenses would have been higher. See the prospectus for details regarding transaction costs.
1 Expenses are equal to the fund’s annualized expense ratio of 1.30% and 0.94% for Class A and Class I shares, respectively, multiplied by the average account value over the period, multiplied by 181/365 (to reflect the one-half year period).
| |
| 10 Fundamental All Cap Core Fund | Annual report |
Portfolio summary
| | | | |
| Top 10 Holdings (45.3% of Net Assets on 7-31-13)1,2 | | | |
|
| Amazon.com, Inc. | 7.5% | | The Goldman Sachs Group, Inc. | 4.1% |
| |
|
| Apple, Inc. | 6.3% | | FactSet Research Systems, Inc. | 3.6% |
| |
|
| QUALCOMM, Inc. | 5.0% | | EMC Corp. | 3.2% |
| |
|
| Bank of America Corp. | 4.9% | | Lennar Corp., Class A | 3.2% |
| |
|
| JPMorgan Chase & Company | 4.4% | | Sensata Technologies Holding NV | 3.1% |
| |
|
| |
| Sector Composition1,3 | | | | |
|
| Information Technology | 29.1% | | Industrials | 7.0% |
| |
|
| Financials | 25.2% | | Consumer Staples | 4.6% |
| |
|
| Consumer Discretionary | 20.2% | | Health Care | 2.2% |
| |
|
| Energy | 8.7% | | Other | 3.0% |
| |
|
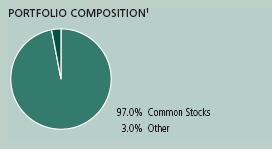
1 As a percentage of net assets on 7-31-13.
2 Cash and cash equivalents not included.
3 Large company stocks as a group could fall out of favor with the market, causing the fund to underperform. The prices of medium and small company stocks can change more frequently and dramatically than those of large company stocks. Foreign investing, especially in emerging markets, has additional risks such as currency and market volatility and political and social instability. If the fund invests in illiquid securities, it may be difficult to sell them at a price approximating their value. Sector investing is subject to greater risks than the market as a whole. Because the fund may focus on particular sectors of the economy, its performance may depend on the performance of those sectors and investments focused in one sector may fluctuate more widely than investments diversified across sectors. For additional information on these and other risk considerations, please see the fund’s prospectus.
| |
| Annual report | Fundamental All Cap Core Fund 11 |
Fund’s investments
As of 7-31-13
| | |
| | Shares | Value |
| Common Stocks 97.0% | | $11,025,319 |
|
| (Cost $9,563,011) | | |
| | | |
| Consumer Discretionary 20.2% | | 2,300,846 |
| | | |
| Hotels, Restaurants & Leisure 1.2% | | |
|
| Starbucks Corp. | 1,950 | 138,917 |
| | | |
| Household Durables 3.9% | | |
|
| Lennar Corp., Class A | 10,602 | 359,090 |
|
| Tempur-Pedic International, Inc. (I) | 2,285 | 90,600 |
| | | |
| Internet & Catalog Retail 9.1% | | |
|
| Amazon.com, Inc. (I) | 2,819 | 849,142 |
|
| Blue Nile, Inc. (I) | 4,647 | 180,443 |
| | | |
| Media 1.0% | | |
|
| Corus Entertainment, Inc., B Shares | 3,935 | 95,205 |
|
| Omnicom Group, Inc. | 220 | 14,139 |
| | | |
| Specialty Retail 5.0% | | |
|
| Advance Auto Parts, Inc. | 3,311 | 273,124 |
|
| Bed Bath & Beyond, Inc. (I) | 1,691 | 129,311 |
|
| Lowe’s Companies, Inc. | 3,833 | 170,875 |
| | | |
| Consumer Staples 4.6% | | 519,766 |
| | | |
| Beverages 4.3% | | |
|
| Diageo PLC, ADR | 819 | 102,645 |
|
| Heineken Holding NV | 1,576 | 98,775 |
|
| SABMiller PLC | 2,316 | 113,862 |
|
| Tsingtao Brewery Company, Ltd., H Shares | 22,479 | 172,274 |
| | | |
| Personal Products 0.3% | | |
|
| Avon Products, Inc. | 1,409 | 32,210 |
| | | |
| Energy 8.7% | | 989,349 |
| | | |
| Energy Equipment & Services 3.7% | | |
|
| National Oilwell Varco, Inc. | 1,265 | 88,765 |
|
| Schlumberger, Ltd. | 1,427 | 116,058 |
|
| Weatherford International, Ltd. (I) | 15,738 | 219,702 |
| | | |
| Oil, Gas & Consumable Fuels 5.0% | | |
|
| Apache Corp. | 2,996 | 240,429 |
|
| Occidental Petroleum Corp. | 2,338 | 208,199 |
|
| Ultra Petroleum Corp. (I) | 5,367 | 116,196 |
| | |
| 12 Fundamental All Cap Core Fund | Annual report | See notes to financial statements |
| | |
| | Shares | Value |
| Financials 25.2% | | $2,862,774 |
| | | |
| Capital Markets 13.5% | | |
|
| AllianceBernstein Holding LP | 15,590 | 346,098 |
|
| Morgan Stanley | 12,370 | 336,588 |
|
| Northern Trust Corp. | 1,913 | 111,987 |
|
| State Street Corp. | 277 | 19,299 |
|
| T. Rowe Price Group, Inc. | 3,501 | 263,415 |
|
| The Goldman Sachs Group, Inc. | 2,811 | 461,088 |
| | | |
| Diversified Financial Services 9.3% | | |
|
| Bank of America Corp. | 37,924 | 553,690 |
|
| JPMorgan Chase & Company | 8,945 | 498,505 |
| | | |
| Insurance 2.4% | | |
|
| American International Group, Inc. (I) | 5,979 | 272,104 |
| | | |
| Health Care 2.2% | | 252,698 |
| | | |
| Health Care Providers & Services 2.2% | | |
|
| AMN Healthcare Services, Inc. (I) | 15,239 | 225,232 |
|
| VCA Antech, Inc. (I) | 955 | 27,466 |
| | | |
| Industrials 7.0% | | 798,035 |
| | | |
| Aerospace & Defense 1.0% | | |
|
| L-3 Communications Holdings, Inc. | 1,235 | 115,040 |
| | | |
| Commercial Services & Supplies 2.4% | | |
|
| Avery Dennison Corp. | 6,033 | 269,856 |
| | | |
| Electrical Equipment 3.1% | | |
|
| Sensata Technologies Holding NV (I) | 9,495 | 356,822 |
| | | |
| Professional Services 0.5% | | |
|
| IHS, Inc., Class A (I) | 513 | 56,317 |
| | | |
| Information Technology 29.1% | | 3,301,851 |
| | | |
| Communications Equipment 6.3% | | |
|
| Cisco Systems, Inc. | 5,970 | 152,534 |
|
| QUALCOMM, Inc. | 8,764 | 565,716 |
| | | |
| Computers & Peripherals 11.6% | | |
|
| Apple, Inc. | 1,574 | 712,235 |
|
| EMC Corp. | 13,908 | 363,694 |
|
| NetApp, Inc. | 5,958 | 244,993 |
| | | |
| Internet Software & Services 3.9% | | |
|
| Bankrate, Inc. (I) | 12,582 | 225,595 |
|
| Google, Inc., Class A (I) | 210 | 186,396 |
|
| VistaPrint NV (I) | 518 | 26,408 |
| | |
| See notes to financial statements | Annual report | Fundamental All Cap Core Fund 13 |
| | |
| | Shares | Value |
| IT Services 3.7% | | |
|
| Broadridge Financial Solutions, Inc. | 4,051 | $117,236 |
|
| VeriFone Systems, Inc. (I) | 15,704 | 299,475 |
| | | |
| Software 3.6% | | |
|
| FactSet Research Systems, Inc. | 3,733 | 407,569 |
|
| Total investments (Cost $9,563,011)† 97.0% | | $11,025,319 |
|
| |
| Other assets and liabilities, net 3.0% | | $338,337 |
|
| |
| Total net assets 100.0% | | $11,363,656 |
|
The percentage shown for each investment category is the total value of the category as a percentage of net assets of the fund.
ADR American Depositary Receipts
(I) Non-income producing security.
† At 7-31-13, the aggregate cost of investment securities for federal income tax purposes was $9,650,149. Net unrealized appreciation aggregated $1,375,170, of which $1,457,481 related to appreciated investment securities and $82,311 related to depreciated investment securities.
| | |
| 14 Fundamental All Cap Core Fund | Annual report | See notes to financial statements |
F I N A N C I A L S T A T E M E N T S
Financial statements
Statement of assets and liabilities 7-31-13
This Statement of assets and liabilities is the fund’s balance sheet. It shows the value of what the fund owns, is due and owes. You’ll also find the net asset value and the maximum offering price per share.
| |
| Assets | |
|
| Investments, at value (Cost $9,563,011) | $11,025,319 |
| Cash | 294,862 |
| Foreign currency, at value (Cost $4,113) | 4,111 |
| Receivable for investments sold | 34,723 |
| Receivable for fund shares sold | 70,979 |
| Dividends receivable | 3,173 |
| Receivable due from advisor | 892 |
| Other receivables and prepaid expenses | 18,578 |
| | |
| Total assets | 11,452,637 |
| |
| Liabilities | |
|
| Payable for investments purchased | 40,589 |
| Payable to affiliates | |
| Accounting and legal services fees | 218 |
| Transfer agent fees | 1,335 |
| Trustees’ fees | 4 |
| Other liabilities and accrued expenses | 46,835 |
| | |
| Total liabilities | 88,981 |
| | |
| Net assets | $11,363,656 |
| |
| Net assets consist of | |
|
| Paid-in capital | $9,510,803 |
| Undistributed net investment income | 2,944 |
| Accumulated net realized gain (loss) on investments and foreign | |
| currency transactions | 387,603 |
| Net unrealized appreciation (depreciation) on investments and translation | |
| of assets and liabilities in foreign currencies | 1,462,306 |
| | |
| Net assets | $11,363,656 |
| |
| Net asset value per share | |
|
| Based on net asset values and shares outstanding — the fund has an | |
| unlimited number of shares authorized with no par value | |
| Class A ($8,835,769 ÷ 685,968 shares)1 | $12.88 |
| Class I ($2,527,887 ÷ 195,527 shares) | $12.93 |
| |
| Maximum offering price per share | |
|
| Class A (net asset value per share ÷ 95%)2 | $13.56 |
1 Redemption price is equal to net asset value less any applicable contingent deferred sales charge.
2 On single retail sales of less than $50,000. On sales of $50,000 or more and on group sales the offering price is reduced.
| | |
| See notes to financial statements | Annual report | Fundamental All Cap Core Fund 15 |
F I N A N C I A L S T A T E M E N T S
Statement of operations For the year ended 7-31-13
This Statement of operations summarizes the fund’s investment income earned and expenses incurred in operating the fund. It also shows net gains (losses) for the period stated.
| |
| Investment income | |
|
| Dividends | $126,295 |
| Less foreign taxes withheld | (561) |
| | |
| Total investment income | 125,734 |
| |
| Expenses | |
|
| Investment management fees | 47,380 |
| Distribution and service fees | 16,254 |
| Accounting and legal services fees | 1,043 |
| Transfer agent fees | 11,086 |
| Trustees’ fees | 66 |
| State registration fees | 35,587 |
| Printing and postage | 3,630 |
| Professional fees | 40,901 |
| Custodian fees | 12,051 |
| Registration and filing fees | 29,297 |
| Other | 3,953 |
| | |
| Total expenses | 201,248 |
| Less expense reductions | (116,238) |
| | |
| Net expenses | 85,010 |
| | |
| Net investment income | 40,724 |
| |
| Realized and unrealized gain (loss) | |
|
| Net realized gain (loss) on | |
| Investments | 564,985 |
| Foreign currency transactions | (282) |
| | 564,703 |
| Change in net unrealized appreciation (depreciation) of | |
| Investments | 1,403,059 |
| Translation of assets and liabilities in foreign currencies | (2) |
| | 1,403,057 |
| Net realized and unrealized gain | 1,967,760 |
| | |
| Increase in net assets from operations | $2,008,484 |
| | |
| 16 Fundamental All Cap Core Fund | Annual report | See notes to financial statements |
F I N A N C I A L S T A T E M E N T S
Statements of changes in net assets
These Statements of changes in net assets show how the value of the fund’s net assets has changed during the last two periods. The difference reflects earnings less expenses, any investment gains and losses, distributions, if any, paid to shareholders and the net of fund share transactions.
| | |
| | Year | Year |
| | ended | ended |
| | 7-31-13 | 7-31-12 |
| Increase (decrease) in net assets | | |
|
| From operations | | |
| Net investment income | $40,724 | $13,942 |
| Net realized gain (loss) | 564,703 | (48,218) |
| Change in net unrealized appreciation (depreciation) | 1,403,057 | 157,874 |
| | | |
| Increase in net assets resulting from operations | 2,008,484 | 123,598 |
| | | |
| Distributions to shareholders | | |
| From net investment income | | |
| Class A | (26,317) | (5,690) |
| Class I | (10,376) | (5,560) |
| From net realized gain | | |
| Class A | (104,544) | (11,479) |
| Class I | (25,779) | (5,456) |
| | | |
| Total distributions | (167,016) | (28,185) |
| | | |
| From fund share transactions | 4,697,528 | 1,550,539 |
| | | |
| Total increase | 6,538,996 | 1,645,952 |
| |
| Net assets | | |
|
| Beginning of year | 4,824,660 | 3,178,708 |
| | | |
| End of year | $11,363,656 | $4,824,660 |
| | | |
| Undistributed net investment income | $2,944 | $2,274 |
| | |
| See notes to financial statements | Annual report | Fundamental All Cap Core Fund 17 |
Financial highlights
The Financial highlights show how the fund’s net asset value for a share has changed during the period.
| | | |
| CLASS A SHARES Period ended | 7-31-13 | 7-31-12 | 7-31-111 |
| |
| Per share operating performance | | | |
|
| Net asset value, beginning of period | $9.96 | $9.73 | $10.00 |
| Net investment income (loss)2 | 0.06 | 0.02 | (0.01) |
| Net realized and unrealized gain (loss) on investments | 3.16 | 0.28 | (0.26) |
| Total from investment operations | 3.22 | 0.30 | (0.27) |
| Less distributions | | | |
| From net investment income | (0.06) | (0.02) | — |
| From net realized gain | (0.24) | (0.05) | — |
| Total distributions | (0.30) | (0.07) | — |
| Net asset value, end of period | $12.88 | $9.96 | $9.73 |
| Total return (%)3,4 | 32.93 | 3.15 | (2.70)5 |
| |
| Ratios and supplemental data | | | |
|
| Net assets, end of period (in millions) | $9 | $4 | $2 |
| Ratios (as a percentage of average net assets): | | | |
| Expenses before reductions and amounts recaptured | 2.78 | 5.62 | 5.776 |
| Expenses including reductions and amounts recaptured | 1.30 | 1.30 | 1.306 |
| Net investment income (loss) | 0.51 | 0.24 | (0.33)6 |
| Portfolio turnover (%) | 59 | 47 | 8 |
| | |
| 1 The inception date for Class A shares is 6-1-11. | | | |
| 2 Based on the average daily shares outstanding. | | | |
| 3 Does not reflect the effect of sales charges, if any. | | | |
| 4 Total returns would have been lower had certain expenses not been reduced during the applicable periods shown. |
| 5 Not annualized. | | | |
| 6 Annualized. | | | |
| |
| CLASS I SHARES Period ended | 7-31-13 | 7-31-12 | 7-31-111 |
| |
| Per share operating performance | | | |
|
| Net asset value, beginning of period | $9.99 | $9.74 | $10.00 |
| Net investment income2 | 0.09 | 0.07 | —3 |
| Net realized and unrealized gain (loss) on investments | 3.19 | 0.28 | (0.26) |
| Total from investment operations | 3.28 | 0.35 | (0.26) |
| Less distributions | | | |
| From net investment income | (0.10) | (0.05) | — |
| From net realized gain | (0.24) | (0.05) | — |
| Total distributions | (0.34) | (0.10) | — |
| Net asset value, end of period | $12.93 | $9.99 | $9.74 |
| Total return (%)4 | 33.48 | 3.63 | (2.60)5 |
| |
| Ratios and supplemental data | | | |
|
| Net assets, end of period (in millions) | $3 | $1 | $1 |
| Ratios (as a percentage of average net assets): | | | |
| Expenses before reductions and amounts recaptured | 3.18 | 7.00 | 5.456 |
| Expenses including reductions and amounts recaptured | 0.91 | 0.84 | 0.846 |
| Net investment income | 0.80 | 0.75 | 0.146 |
| Portfolio turnover (%) | 59 | 47 | 8 |
| |
1 The inception date for Class I shares is 6-1-11.
2 Based on the average daily shares outstanding.
3 Less than $0.005 per share.
4 Total returns would have been lower had certain expenses not been reduced during the applicable periods shown.
5 Not annualized.
6 Annualized.
| | |
| 18 Fundamental All Cap Core Fund | Annual report | See notes to financial statements |
Notes to financial statements
Note 1 — Organization
John Hancock Fundamental All Cap Core Fund (the fund) is a series of John Hancock Funds II (the Trust), an open-end management investment company organized as a Massachusetts business trust and registered under the Investment Company Act of 1940, as amended (the 1940 Act). The investment objective of the fund is to seek long-term capital appreciation.
The fund may offer multiple classes of shares. The shares currently offered are detailed in the Statement of assets and liabilities. Class A shares are offered to all investors. Class I shares are offered to institutions and certain investors. Shareholders of each class have exclusive voting rights to matters that affect that class. The distribution and service fees, if any, transfer agent fees, printing and postage and state registration fees for each class may differ.
Note 2 — Significant accounting policies
The financial statements have been prepared in conformity with accounting principles generally accepted in the United States of America, which require management to make certain estimates and assumptions as of the date of the financial statements. Actual results could differ from those estimates and those differences could be significant. Events or transactions occurring after the end of the fiscal period through the date that the financial statements were issued have been evaluated in the preparation of the financial statements. The following summarizes the significant accounting policies of the fund:
Security valuation. Investments are stated at value as of the close of regular trading on the New York Stock Exchange (NYSE), normally at 4:00 p.m., Eastern Time. In order to value the securities, the fund uses the following valuation techniques: Equity securities held by the fund are valued at the last sale price or official closing price on the principal securities exchange on which they trade. In the event there were no sales during the day or closing prices are not available, the securities are valued using the last quoted bid or evaluated price. Certain securities traded only in the over-the-counter market are valued at the last bid price quoted by brokers making markets in the securities at the close of trading. Other portfolio securities and assets, for which reliable market quotations are not readily available, are valued at fair value as determined in good faith by the fund’s Pricing Committee following procedures established by the Board of Trustees, which include price verification procedures. The frequency with which these fair valuation procedures are used cannot be predicted and fair value of securities may differ significantly from the value that would have been used had a ready market for such securities existed.
The fund uses a three-tier hierarchy to prioritize the pricing assumptions, referred to as inputs, used in valuation techniques to measure fair value. Level 1 includes securities valued using quoted prices in active markets for identical securities. Level 2 includes securities valued using other significant observable inputs. Observable inputs may include quoted prices for similar securities, interest rates, prepayment speeds and credit risk. Prices for securities valued using these inputs are received from independent pricing vendors and brokers and are based on an evaluation of the inputs described. Level 3 includes securities valued using significant unobservable inputs when market prices are not readily available or reliable, including the fund’s own assumptions in determining the fair value of investments. Factors used in determining value may include market or issuer specific events or trends, changes in interest rates and credit quality. The inputs or methodology used for valuing securities are not necessarily an indication of the risks associated with investing in those securities.
| |
| Annual report | Fundamental All Cap Core Fund 19 |
Changes in valuation techniques may result in transfers into or out of an assigned level within the disclosure hierarchy.
The following is a summary of the values by input classification of the fund’s investments as of July 31, 2013, by major security category or type:
| | | | |
| | | | | LEVEL 3 |
| | | | LEVEL 2 | SIGNIFICANT |
| | TOTAL MARKET | LEVEL 1 | SIGNIFICANT | UNOBSERVABLE |
| | VALUE AT 7-31-13 | QUOTED PRICE | OBSERVABLE INPUTS | INPUTS |
|
| Common Stocks | | | | |
|
| Consumer Discretionary | $2,300,846 | $2,300,846 | — | — |
| Consumer Staples | 519,766 | 134,855 | $384,911 | — |
| Energy | 989,349 | 989,349 | — | — |
| Financials | 2,862,774 | 2,862,774 | — | — |
| Health Care | 252,698 | 252,698 | — | — |
| Industrials | 798,035 | 798,035 | — | — |
| Information Technology | 3,301,851 | 3,301,851 | — | — |
| |
|
| Total Investments in | | | | |
| Securities | $11,025,319 | $10,640,408 | $384,911 | — |
Security transactions and related investment income. Investment security transactions are accounted for on a trade date plus one basis for daily net asset value calculations. However, for financial reporting purposes, investment transactions are reported on trade date. Interest income is accrued as earned. Gains and losses on securities sold are determined on the basis of identified cost and may include proceeds from litigation.
Line of credit. The fund may borrow from banks for temporary or emergency purposes, including meeting redemption requests that otherwise might require the untimely sale of securities. Pursuant to the fund custodian agreement, the custodian may loan money to the fund to make properly authorized payments. The fund is obligated to repay the custodian for any overdraft, including any related costs or expenses. The custodian may have a lien, security interest or security entitlement in any fund property that is not otherwise segregated or pledged, to the maximum extent permitted by law, to the extent of any overdraft.
In addition, the fund and other affiliated funds have entered into an agreement with Citibank N.A. that enables them to participate in a $300 million unsecured committed line of credit. A commitment fee, payable at the end of each calendar quarter, based on the average daily unused portion of the line of credit, is charged to each participating fund on a pro rata basis and is reflected in other expenses on the Statement of operations. Prior to March 27, 2013, the fund participated in a $200 million unsecured line of credit, also with Citibank, with terms otherwise similar to the existing agreement. Commitment fees for the year ended July 31, 2013 were $341. For the year ended July 31, 2013, the fund had no borrowings under either line of credit.
Expenses. Within the John Hancock Funds complex, expenses that are directly attributable to an individual fund are allocated to such fund. Expenses that are not readily attributable to a specific fund are allocated among all funds in an equitable manner, taking into consideration, among other things, the nature and type of expense and the fund’s relative net assets. Expense estimates are accrued in the period to which they relate and adjustments are made when actual amounts are known.
Class allocations. Income, common expenses and realized and unrealized gains (losses) are determined at the fund level and allocated daily to each class of shares based on the net assets of the class. Class-specific expenses, such as distribution and service fees, if any, transfer agent
| |
| 20 Fundamental All Cap Core Fund | Annual report |
fees, state registration fees and printing and postage expenses, for all classes, are calculated daily at the class level based on the appropriate net assets of each class and the specific expense rates applicable to each class.
Federal income taxes. The fund intends to continue to qualify as a regulated investment company by complying with the applicable provisions of the Internal Revenue Code and will not be subject to federal income tax on taxable income that is distributed to shareholders. Therefore, no federal income tax provision is required.
As of July 31, 2013, the fund had no uncertain tax positions that would require financial statement recognition, derecognition or disclosure. The fund’s federal tax returns are subject to examination by the Internal Revenue Service for a period of three years.
Distribution of income and gains. Distributions to shareholders from net investment income and net realized gains, if any, are recorded on the ex-date. The fund generally declares and pays dividends and capital gain distributions, if any, annually.
The tax character of distributions for the years ended July 31, 2013 and 2012 was as follows:
| | | | |
| | JULY 31, 2013 | JULY 31, 2012 | | |
| | |
| Ordinary Income | $78,547 | $28,185 | | |
| Long-Term Capital Gain | $88,469 | — | | |
| Total | $167,016 | $28,185 | | |
Distributions paid by the fund with respect to each class of shares are calculated in the same manner, at the same time and in the same amount, except for the effect of class level expenses that may be applied differently to each class. As of July 31, 2013, the components of distributable earnings on a tax basis consists of $98,716 of undistributed ordinary income and $378,956 of undistributed long-term capital gain.
Such distributions and distributable earnings, on a tax basis, are determined in conformity with income tax regulations, which may differ from accounting principles generally accepted in the United States of America. Material distributions in excess of tax basis earnings and profits, if any, are reported in the fund’s financial statements as a return of capital.
Capital accounts within the financial statements are adjusted for permanent book-tax differences. These adjustments have no impact on net assets or the results of operations. Temporary book-tax differences, if any, will reverse in a subsequent period. Book-tax differences are primarily attributable to wash sale loss deferrals.
Note 3 — Guarantees and indemnifications
Under the fund’s organizational documents, its Officers and Trustees are indemnified against certain liabilities arising out of the performance of their duties to the fund. Additionally, in the normal course of business, the fund enters into contracts with service providers that contain general indemnification clauses. The fund’s maximum exposure under these arrangements is unknown, as this would involve future claims that may be made against the fund that have not yet occurred. The risk of material loss from such claims is considered remote.
Note 4 — Fees and transactions with affiliates
John Hancock Investment Management Services, LLC (the Advisor) serves as investment advisor for the fund. John Hancock Funds, LLC (the Distributor), an affiliate of the Advisor, serves as principal underwriter of the fund. The Advisor and the Distributor are indirect, wholly owned subsidiaries of Manulife Financial Corporation (MFC).
| |
| Annual report | Fundamental All Cap Core Fund 21 |
Management fee. The fund has an investment management agreement with the Advisor under which the fund pays a daily management fee to the Advisor equivalent, on an annual basis, to the sum of: a) 0.675% of the first $2,500,000,000 of the fund’s average daily aggregate net assets together with the assets of Fundamental All Cap Core Trust, as series of John Hancock Variable Insurance Trust (combined average daily aggregate net assets); b) 0.650% of the combined average daily aggregate net assets in excess of $2,500,000,000. The Advisor has a subadvisory agreement with John Hancock Asset Management a division of Manulife Asset Management (US) LLC, an indirectly owned subsidiary of MFC and an affiliate of the Advisor. The fund is not responsible for payment of the subadvisory fees.
Effective June 1, 2013, the Advisor has contractually agreed to waive a portion of its management fee for certain funds (the Participating portfolios) of the Trust, John Hancock Funds, John Hancock Funds III and John Hancock Variable Insurance Trust. The waiver equals, on an annualized basis, 0.01% of that portion of the aggregate net assets of all the Participating portfolios that exceeds $75 billion but is less than or equal to $125 billion; 0.0125% of that portion of the aggregate net assets of all the Participating portfolios that exceeds $125 billion but is less than or equal to $150 billion; and 0.015% of that portion of the aggregate net assets of all the Participating portfolios that exceeds $150 billion. The amount of the reimbursement is calculated daily and allocated among all the Participating portfolios in proportion to the daily net assets of each fund. This arrangement may be amended or terminated at any time by the Advisor upon notice to the fund and with the approval of the Board of Trustees.
Prior to June 1, 2013, the Advisor had contractually agreed to waive a portion of its management fee for certain funds (the Participating Portfolios) of the Trust and John Hancock Variable Insurance Trust. The prior waiver equaled, on an annualized basis, 0.01% of that portion of the aggregate net assets of all the Participating Portfolios that exceeded $75 billion but was less than $100 billion; and 0.015% of that portion of the aggregate net assets of all the Participating Portfolios that equaled or exceeded $100 billion. The amount of the reimbursement is calculated daily and allocated among all the Participating Portfolios in proportion to the daily net assets of each fund.
The Advisor has contractually agreed to waive all or a portion of its management fee and reimburse or pay operating expenses of the fund to the extent necessary to maintain the fund’s total operating expense at 1.30% and 0.94% for Class A and Class I shares, excluding certain expenses such as taxes, brokerage commissions, interest expense, litigation and indemnification expenses and other extraordinary expenses not incurred in the ordinary course of the fund’s business, underlying fund’s expenses and short dividend expense. The current expense limitation agreement expires on November 30, 2013, unless renewed by mutual agreement of the fund and the Advisor based upon determination that this is appropriate under the circumstances at the time. Prior to January 1, 2013, the fee waivers and/or reimbursements were such that these expenses would not exceed 0.84% for Class I shares.
Additionally, the Advisor has voluntarily agreed to waive other fund level expenses excluding advisory fees, 12b-1 fees, service fees, transfer agent fees, blue sky fees, taxes, printing and postage, brokerage commissions, interest expense, acquired fund fees, litigation and indemnification expenses and other extraordinary expenses not incurred in the ordinary course of the fund’s business. The waivers are such that these expenses will not exceed 0.20% of average net assets. This voluntary expense reimbursement may be terminated at any time by the Advisor on notice to the fund.
Accordingly, these expense reductions described above amounted to $79,932 and $36,306 for Class A and Class I shares, respectively, for the year ended July 31, 2013.
| |
| 22 Fundamental All Cap Core Fund | Annual report |
The investment management fees, including the impact of the waivers and reimbursement described above, incurred for the year ended July 31, 2013 were equivalent to a net effective rate of 0.00% of the fund’s average daily net assets.
Expense recapture. The Advisor may recapture operating expenses reimbursed or fees waived under previous expense limitation or waiver arrangements for a period of three years following the beginning of the month in which such reimbursements or waivers originally occurred to the extent that the fund is below its expense limitation during this period. The table below outlines the amounts recovered during the year ended July 31, 2013, and the amount of waived or reimbursed expenses subject to potential recovery and the respective expiration dates.
| | | | |
| | AMOUNT | AMOUNT | AMOUNT | AMOUNTS |
| | ELIGIBLE FOR | ELIGIBLE FOR | ELIGIBLE FOR | RECOVERED |
| | RECOVERY | RECOVERY | RECOVERY | DURING THE |
| | THROUGH | THROUGH | THROUGH | PERIOD ENDED |
| FUND | JULY 1, 2014 | JULY 1, 2015 | JULY 1, 2016 | JULY 31, 2013 |
|
| Fundamental All Cap Core | $22,705 | $145,558 | $108,512 | — |
Accounting and legal services. Pursuant to a service agreement, the fund reimburses the Advisor for all expenses associated with providing the administrative, financial, legal, accounting and recordkeeping services to the fund, including the preparation of all tax returns, periodic reports to shareholders and regulatory reports, among other services. These expenses are allocated to each share class based on its relative net assets at the time the expense was incurred. These accounting and legal services fees incurred for the year ended July 31, 2013 amounted to an annual rate of 0.01% of the fund’s average daily net assets.
Distribution and service plans. The fund has a distribution agreement with the Distributor. The fund has adopted distribution and service plans with respect to Class A shares pursuant to Rule 12b-1 under the 1940 Act, to pay the Distributor for services provided as the distributor of shares of the fund. The fund pays 0.30% for Class A shares for distribution and service fees under these arrangements, expressed as an annual percentage of average daily net assets for each class of the fund’s shares.
Sales charges. Class A shares are assessed up-front sales charges, which resulted in payments to the Distributor amounting to $23,246 for the year ended July 31, 2013. Of this amount, $3,802 was retained and used for printing prospectuses, advertising, sales literature and other purposes, $19,151 was paid as sales commissions to broker-dealers and $293 was paid as sales commissions to sales personnel of Signator Investors, Inc., a broker-dealer affiliate of the Advisor.
Class A shares may be subject to contingent deferred sales charges (CDSCs). Certain Class A shares that are acquired through purchases of $1 million or more and are redeemed within one year of purchase are subject to a 1.00% sales charge. CDSCs are applied to the lesser of the current market value at the time of redemption or the original purchase cost of the shares being redeemed. Proceeds from CDSCs are used to compensate the Distributor for providing distribution-related services in connection with the sale of these shares. During the year ended July 31, 2013, CDSCs received by the Distributor amounted to $306 for Class A shares.
Transfer agent fees. The fund has a transfer agent agreement with John Hancock Signature Services, Inc. (Signature Services), an affiliate of the Advisor. The transfer agent fees paid to Signature Services are determined based on the cost to Signature Services (Signature Services Cost) of providing recordkeeping services. The Signature Services Cost includes a component of allocated John Hancock corporate overhead for providing transfer agent services to the fund and to all other John Hancock affiliated funds. It also includes out-of-pocket expenses that are comprised of payments made to third-parties for recordkeeping services provided to their clients who invest in one or more John Hancock funds. In addition, Signature Services Cost may be reduced by certain
| |
| Annual report | Fundamental All Cap Core Fund 23 |
fees that Signature Services receives in connection with retirement and small accounts. Signature Services Cost is calculated monthly and allocated, as applicable, to four categories of share classes: Institutional Share Classes, Retirement Share Classes, Municipal Bond Classes and all other Retail Share Classes. Within each of these categories, the applicable costs are allocated to the affected John Hancock affiliated funds and/or classes, based on the relative average daily net assets.
Class level expenses. Class level expenses for the year ended July 31, 2013 were:
| | | | |
| | DISTRIBUTION | TRANSFER | STATE | PRINTING AND |
| CLASS | AND SERVICE FEES | AGENT FEES | REGISTRATION FEES | POSTAGE |
|
| A | $16,254 | $9,409 | $17,909 | $2,801 |
| I | — | 1,677 | 17,678 | 829 |
| Total | $16,254 | $11,086 | $35,587 | $3,630 |
Trustee expenses. The fund compensates each Trustee who is not an employee of the Advisor or its affiliates. The costs of paying Trustee compensation and expenses are allocated to the fund based on its average daily net assets.
Note 5 — Fund share transactions
Transactions in fund shares for the years ended July 31, 2013 and 2012 were as follows:
| | | | |
| | Year ended 7-31-13 | Year ended 7-31-12 |
| | Shares | Amount | Shares | Amount |
| Class A shares | | | | |
|
| Sold | 403,125 | $4,734,347 | 199,274 | $1,931,654 |
| Distributions reinvested | 6,647 | 72,454 | 416 | 3,789 |
| Repurchased | (102,729) | (1,172,965) | (31,202) | (299,324) |
| | | | | |
| Net increase | 307,043 | $3,633,836 | 168,488 | $1,636,119 |
| |
| Class I shares | | | | |
|
| Sold | 115,760 | $1,363,712 | 25,743 | $266,173 |
| Distributions reinvested | 3,311 | 36,155 | 1,106 | 10,068 |
| Repurchased | (28,907) | (336,175) | (37,736) | (361,821) |
| | | | | |
| Net increase (decrease) | 90,164 | $1,063,692 | (10,887) | ($85,580) |
| |
| Total net increase | 397,207 | $4,697,528 | 157,601 | $1,550,539 |
|
Affiliates of the fund owned 28% of shares of beneficial interest of Class A shares on July 31, 2013.
Note 6 — Purchase and sale of securities
Purchases and sales of securities, other than short-term securities, amounted to $8,372,370 and $4,072,739, respectively, for the year ended July 31, 2013.
| |
| 24 Fundamental All Cap Core Fund | Annual report |
Auditor’s report
Report of Independent Registered Public Accounting Firm
To the Board of Trustees of John Hancock Funds II and Shareholders of John Hancock Fundamental All Cap Core Fund:
In our opinion, the accompanying statement of assets and liabilities, including the schedule of investments, and the related statements of operations and of changes in net assets and the financial highlights present fairly, in all material respects, the financial position of John Hancock Fundamental All Cap Core Fund (the “Fund”) at July 31, 2013, and the results of its operations for the year then ended, the changes in its net assets for each of the two years in the period then ended and the financial highlights for each of the periods indicated, in conformity with accounting principles generally accepted in the United States of America. These financial statements and financial highlights (hereafter referred to as “financial statements”) are the responsibility of the Fund’s management; our responsibility is to express an opinion on these financial statements based on our audits. We conducted our audits of these financial statements in accordance with the standards of the Public Company Accounting Oversight Board (United States). Those standards require that we plan and perform the audit to obtain reasonable assurance about whether the financial statements are free of material misstatement. An audit includes examining, on a test basis, evidence supporting the amounts and disclosures in the financial statements, assessing the accounting principles used and significant estimates made by management, and evaluating the overall financial statement presentation. We believe that our audits, which included confirmation of securities at July 31, 2013 by correspondence with the custodian, and the application of alternative auditing procedures where securities purchased confirmations had not been received, provide a reasonable basis for our opinion.
PricewaterhouseCoopers LLP
Boston, Massachusetts
September 20, 2013
| |
| Annual report | Fundamental All Cap Core Fund 25 |
Tax information
Unaudited
For federal income tax purposes, the following information is furnished with respect to the distributions of the fund, if any, paid during its taxable year ended July 31, 2013.
The fund reports the maximum amount allowable of its net taxable income as eligible for the corporate dividends-received deduction.
The fund reports the maximum amount allowable of its net taxable income as qualified dividend income as provided in the Jobs and Growth Tax Relief Reconciliation Act of 2003.
The fund paid $88,469 in capital gain dividends.
Eligible shareholders will be mailed a 2013 Form 1099-DIV in early 2014. This will reflect the tax character of all distributions paid in calendar year 2013.
Please consult a tax advisor regarding the tax consequences of your investment in the fund.
| |
| 26 Fundamental All Cap Core Fund | Annual report |
Evaluation of Advisory and Subadvisory Agreements by the Board of Trustees
This section describes the evaluation by the Board of Trustees (the Board) of John Hancock Funds II (the Trust) of the Advisory Agreement (the Advisory Agreement) with John Hancock Investment Management Services, LLC (the Advisor) and the Subadvisory Agreement (the Subadvisory Agreement) with John Hancock Asset Management a division of Manulife Asset Management (US) LLC (the Subadvisor) for Fundamental All Cap Core Fund (the fund). The Advisory Agreement and Subadvisory Agreement are collectively referred to as the Agreements.
Approval of Advisory and Subadvisory Agreements
At in-person meetings held on May 16-17, 2013, the Board, including the Trustees who are not considered to be interested persons of the Trust under the Investment Company Act of 1940, as amended (the 1940 Act) (the Independent Trustees), reapproved for an annual period the continuation of the Advisory Agreement between the Trust and the Advisor and the Subadvisory Agreement between the Advisor and the Subadvisor with respect to the fund.
In considering the Advisory Agreement and the Subadvisory Agreement, the Board received in advance of the meeting a variety of materials relating to the fund, the Advisor, and the Subadvisor, including comparative performance, fee and expense information for peer groups of similar mutual funds prepared by an independent third-party provider of mutual fund data; performance information for the fund’s benchmark index; and, with respect to the Subadvisor, comparative performance information for comparably managed accounts; and other information provided by the Advisor and the Subadvisor regarding the nature, extent, and quality of services provided by the Advisor and the Subadvisor under their respective Agreements, as well as information regarding the Advisor’s revenues and costs of providing services to the fund and any compensation paid to affiliates of the Advisor. At the meeting at which the renewal of the Advisory Agreement and Subadvisory Agreement is considered, particular focus is given to information concerning fund performance, comparability of fees and total expenses and profitability. However, the Board notes that the evaluation process with respect to the Advisor and the Subadvisor is an ongoing one. In this regard, the Board also took into account discussions with management and information provided to the Board at prior meetings with respect to the services provided by the Advisor and the Subadvisor to the fund, including quarterly performance reports prepared by management containing reviews of investment results and prior presentations from the Subadvisor with respect to the fund. The Board noted the affiliation of the Subadvisor with the Advisor, noting any potential conflicts of interest. The Board also considered the nature, quality, and extent of non-advisory services, if any, to be provided to the fund by the Advisor’s affiliates, including distribution services.
Throughout the process, the Board asked questions of and requested additional information from management. The Board is assisted by counsel for the Trust and the Independent Trustees are also separately assisted by independent legal counsel throughout the process. The Independent Trustees also received a memorandum from their independent counsel discussing the legal standards for their consideration of the proposed continuation of the Agreements and discussed the proposed continuation of the Agreements in private sessions with their independent legal counsel at which no representatives of management were present.
Approval of Advisory Agreement
In approving the Advisory Agreement with respect to the fund, the Board, including the Independent Trustees, considered a variety of factors, including those discussed below. The Board also considered other factors (including conditions and trends prevailing generally in the economy, the securities markets, and the industry) and does not treat any single factor as determinative and each Trustee may attribute different weights to different factors. The Board’s conclusions may be based in part on its consideration of the Advisory and Subadvisory Agreements in prior years and on the Board’s ongoing regular review of fund performance and operations throughout the year.
| |
| Annual report | Fundamental All Cap Core Fund 27 |
Nature, extent, and quality of services. Among the information received by the Board from the Advisor relating to the nature, extent, and quality of services provided to the fund, the Board reviewed information provided by the Advisor relating to its operations and personnel, descriptions of its organizational and management structure, and information regarding the Advisor’s compliance and regulatory history, including its Form ADV. The Board also noted that on a regular basis it receives and reviews information from the Trust’s Chief Compliance Officer (CCO) regarding the fund’s compliance policies and procedures established pursuant to Rule 38a-1 under the 1940 Act. The Board also considered the Advisor’s risk management processes. The Board considered that the Advisor is responsible for the management of the day-to-day operations of the fund, including, but not limited to, general supervision of and coordination of the services provided by the Subadvisor, and is also responsible for monitoring and reviewing the activities of the Subadvisor and third-party service providers.
In considering the nature, extent, and quality of the services provided by the Advisor, the Trustees also took into account their knowledge of the Advisor’s management and the quality of the performance of the Advisor’s duties through Board meetings, discussions, and reports during the preceding year and through each Trustee’s experience as a Trustee of the Trust and of the other trusts in the complex.
In the course of their deliberations regarding the Advisory Agreement, the Board considered, among other things:
(a) the skills and competency with which the Advisor has in the past managed the Trust’s affairs and its subadvisory relationship, the Advisor’s oversight and monitoring of the Subadvisor’s investment performance and compliance programs, such as the Subadvisor’s compliance with fund policies and objective; review of brokerage matters, including with respect to trade allocation and best execution; and the Advisor’s timeliness in responding to performance issues;
(b) the background, qualifications and skills of the Advisor’s personnel;
(c) the Advisor’s compliance policies and procedures and its responsiveness to regulatory changes and mutual fund industry developments;
(d) the Advisor’s administrative capabilities, including its ability to supervise the other service providers for the fund;
(e) the financial condition of the Advisor and whether it has the financial wherewithal to provide a high level and quality of services to the fund; and
(f) the Advisor’s reputation and experience in serving as an investment adviser to the Trust and the benefit to shareholders of investing in funds that are part of a family of funds offering a variety of investments.
The Board concluded that the Advisor may reasonably be expected to continue to provide a high quality of services under the Advisory Agreement with respect to the fund.
Investment performance. In considering the fund’s performance, the Board noted that it reviews at its regularly scheduled meetings information about the fund’s performance results. In connection with the consideration of the Advisory Agreement, the Board:
(a) reviewed information prepared by management regarding the fund’s performance;
(b) considered the comparative performance of the fund’s benchmark;
| |
| 28 Fundamental All Cap Core Fund | Annual report |
(c) considered the performance of comparable funds, if any, as included in the report prepared by an independent third-party provider of mutual fund data. Such report included the fund’s ranking within a smaller group of peer funds and the fund’s ranking within broader groups of funds; and
(d) took into account the Advisor’s analysis of the fund’s performance and its plans and recommendations regarding the Trust’s subadvisory arrangements generally.
The Board noted that the fund outperformed its benchmark index and peer group average for the one-year period ended December 31, 2012. The Board noted that this fund has a limited performance history, having commenced operations in June 2011. The Board noted the fund’s favorable performance relative to the benchmark index and peer group for the one-year period ended December 31, 2012.
The Board concluded that the performance of the fund has generally been in line with or outperformed the historical performance of comparable funds and the fund’s benchmark.
Fees and expenses. The Board reviewed comparative information prepared by an independent third-party provider of mutual fund data, including, among other data, the fund’s contractual and net management fees and total expenses as compared to similarly situated investment companies deemed to be comparable to the fund. The Board considered the fund’s ranking within a smaller group of peer funds chosen by the independent third-party provider, as well as the fund’s ranking within a broader group of funds. In comparing the fund’s contractual and net management fees to those of comparable funds, the Board noted that such fees include both advisory and administrative costs.
The Board noted that net management fees for this fund are equal to the peer group median and that total expenses for this fund were higher than the peer group median. The Board took into account management’s discussion of the fund’s expenses, including the impact of the fund’s current asset size on expenses.
The Board took into account management’s discussion with respect to the advisory/subadvisory fee structure, including the amount of the advisory fee retained by the Advisor after payment of the subadvisory fee. The Board also took into account that management had agreed to implement an overall fee waiver across a number of funds in the complex, including the fund, which is discussed further below. The Board also noted that, in addition, the Advisor is currently waiving fees and/or reimbursing expenses with respect to the fund. The Board also noted management’s discussion of the fund’s expenses, as well as certain actions taken over the past several years to reduce the fund’s operating expenses. The Board reviewed information provided by the Advisor concerning investment advisory fees charged to other clients (including other funds in the complex) having similar investment mandates, if any. The Board considered any differences between the Advisor’s and Subadvisor’s services to the fund and the services they provide to other comparable clients or funds. The Board concluded that the advisory fee paid with respect to the fund is reasonable.
Profitability/indirect benefits. In considering the costs of the services to be provided and the profits to be realized by the Advisor and its affiliates (including the Subadvisor) from the Advisor’s relationship with the Trust, the Board:
(a) reviewed financial information of the Advisor;
(b) reviewed and considered an analysis presented by the Advisor regarding the net profitability to the Advisor and its affiliates with respect to the fund;
(c) received and reviewed profitability information with respect to the John Hancock fund complex as a whole;
| |
| Annual report | Fundamental All Cap Core Fund 29 |
(d) received information with respect to the Advisor’s allocation methodologies used in preparing the profitability data;
(e) considered that the John Hancock insurance companies that are affiliates of the Advisor, as shareholders of the Trust directly or through their separate accounts, receive certain tax credits or deductions relating to foreign taxes paid and dividends received by certain funds of the Trust and noted that these tax benefits, which are not available to participants in qualified retirement plans under applicable income tax law, are reflected in the profitability analysis reviewed by the Board;
(f) considered that the Advisor also provides administrative services to the fund on a cost basis pursuant to an administrative services agreement;
(g) noted that the fund’s Subadvisor is an affiliate of the Advisor;
(h) noted that affiliates of the Advisor provide transfer agency services and distribution services to the fund, and that the Trust’s distributor also receives Rule 12b-1 payments to support distribution of the fund;
(i) noted that the Advisor also derives reputational and other indirect benefits from providing advisory services to the fund;
(j) noted that the subadvisory fees for the fund are paid by the Advisor; and
(k) considered that the Advisor should be entitled to earn a reasonable level of profits in exchange for the level of services it provides to the fund and the entrepreneurial risk that it assumes as Advisor.
Based upon its review, the Board concluded that the level of profitability, if any, of the Advisor and its affiliates (including the Subadvisor) from their relationship with the fund was reasonable and not excessive.
Economies of scale. In considering the extent to which economies of scale would be realized as the fund grows and whether fee levels reflect these economies of scale for the benefit of fund shareholders, the Board:
(a) considered that the Advisor has agreed, effective June 1, 2013, to waive its management fee for the fund and each of the open-end funds of John Hancock Funds II, John Hancock Funds III, each other John Hancock fund (except those listed below) (the Participating Portfolios) or otherwise reimburse the expenses of the Participating Portfolios as follows (the Reimbursement):
The Reimbursement shall equal, on an annualized basis, 0.01% of that portion of the aggregate net assets of all the Participating Portfolios that exceeds $75 billion but is less than or equal to $125 billion, 0.0125% of that portion of the aggregate net assets of all the Participating Portfolios that exceeds $125 billion but is less than or equal to $150 billion and 0.015% of that portion of the aggregate net assets of all the Participating Portfolios that exceeds $150 billion. (The funds that are not Participating Portfolios as of the date of this annual report are each of the fund of funds, money market funds, index funds and closed-end funds);
(b) reviewed the Trust’s advisory fee structure and the incorporation therein of any subadvisory fee breakpoints in the advisory fees charged and concluded that (i) the fund’s fee structure contains breakpoints at the subadvisory fee level and that such breakpoints are reflected as breakpoints in the advisory fees for the fund and (ii) although economies of scale cannot be measured with precision, these arrangements permit shareholders of the fund to benefit
| |
| 30 Fundamental All Cap Core Fund | Annual report |
from economies of scale if the fund grows. The Board also took into account management’s discussion of the fund’s advisory fee structure; and
(c) the Board also considered the effect of the fund’s growth in size on its performance and fees. The Board also noted that if the fund’s assets increase over time, the fund may realize other economies of scale.
Approval of Subadvisory Agreement
In making its determination with respect to approval of the Subadvisory Agreement, the Board reviewed:
(1) information relating to the Subadvisor’s business, including current subadvisory services to the Trust (and other funds in the John Hancock family of funds);
(2) the historical and current performance of the fund, and comparative performance information relating to the fund’s benchmark and comparable funds; and
(3) the subadvisory fee for the fund, including any breakpoints, and comparative fee information, where available, prepared by an independent third-party provider of mutual fund data.
Nature, extent, and quality of services. With respect to the services provided by the Subadvisor, the Board received information provided to the Board by the Subadvisor, including the Subadvisor’s Form ADV, as well as took into account information presented throughout the past year. The Board considered the Subadvisor’s current level of staffing and its overall resources, as well as received information relating to the Subadvisor’s compensation program. The Board reviewed the Subadvisor’s history and investment experience, as well as information regarding the qualifications, background, and responsibilities of the Subadvisor’s investment and compliance personnel who provide services to the fund. The Board also considered, among other things, the Subadvisor’s compliance program and any disciplinary history. The Board also considered the Subadvisor’s risk assessment and monitoring process. The Board reviewed the Subadvisor’s regulatory history, including whether it was currently involved in any regulatory actions or investigations as well as material litigation, and any settlements and amelioratory actions undertaken, as appropriate. The Board noted that the Advisor conducts regular, periodic reviews of the Subadvisor and its operations, including regarding investment processes and organizational and staffing matters. The Board also noted that the Trust’s CCO and his staff conduct regular, periodic compliance reviews with the Subadvisor and present reports to the Independent Trustees regarding the same, which includes evaluating the regulatory compliance systems of the Subadvisor and procedures reasonably designed by it to assure compliance with the federal securities laws. The Board also took into account the financial condition of the Subadvisor.
The Board considered the Subadvisor’s investment process and philosophy. The Board took into account that the Subadvisor’s responsibilities include the development and maintenance of an investment program for the fund, that is consistent with the fund’s investment objective, the selection of investment securities and the placement of orders for the purchase and sale of such securities, as well as the implementation of compliance controls related to performance of these services. The Board also received information with respect to the Subadvisor’s brokerage policies and practices, including with respect to best execution and soft dollars.
Subadvisor compensation. In considering the cost of services to be provided by the Subadvisor and the profitability to the Subadvisor of its relationship with the fund, the Board noted that the fees under the Subadvisory Agreement are paid by the Advisor and not the fund.
| |
| Annual report | Fundamental All Cap Core Fund 31 |
In addition, the Board considered other potential indirect benefits that the Subadvisor and its affiliates may receive from the Subadvisor’s relationship with the fund, such as the opportunity to provide advisory services to additional funds in the John Hancock fund complex and reputational benefits.
Subadvisory fees. The Board considered that the fund pays an advisory fee to the Advisor and that, in turn, the Advisor pays a subadvisory fee to the Subadvisor. The Board also took into account the sub-advisory fees paid by the Advisor to the Subadvisor with respect to the fund to fees charged by the fund’s Subadvisor to manage other subadvised portfolios and portfolios not subject to regulation under the 1940 Act, as applicable.
Subadvisor performance. As noted above, the Board considered the fund’s performance as compared to the fund’s peer group and benchmark and noted that the Board reviews information about the fund’s performance results at its regularly scheduled meetings. The Board noted the Advisor’s expertise and resources in monitoring the performance, investment style, and risk-adjusted performance of the Subadvisor. The Board was mindful of the Advisor’s focus on the Subadvisor’s performance. The Board also noted the Subadvisor’s long-term performance record for similar accounts, as applicable.
The Board’s decision to approve the Subadvisory Agreement was based on a number of determinations, including the following:
(1) The Subadvisor has extensive experience and demonstrated skills as a manager;
(2) The performance of the fund generally has been in line with or outperformed the historical performance of comparable funds and the fund’s benchmark and the fund’s overall performance is satisfactory;
(3) The subadvisory fees are reasonable in relation to the level and quality of services being provided; and
(4) Subadvisory fee breakpoints are reflected as breakpoints in the advisory fees for the fund in order to permit shareholders to benefit from economies of scale if the fund grows.
Based on the Board’s evaluation of all factors that the Board deemed to be material, including those factors described above, the Board, including the Independent Trustees, concluded that renewal of the Advisory Agreement and the Subadvisory Agreement would be in the best interest of the fund and its shareholders. Accordingly, the Board, and the Independent Trustees voting separately, approved the Advisory Agreement and Subadvisory Agreement for an additional one-year period.
| |
| 32 Fundamental All Cap Core Fund | Annual report |
Trustees and Officers
This chart provides information about the Trustees and Officers who oversee your John Hancock fund. Officers elected by the Trustees manage the day-to-day operations of the fund and execute policies formulated by the Trustees.
Independent Trustees
| | |
| Name, year of birth | Trustee | Number of John |
| Position(s) held with fund | of the | Hancock funds |
| Principal occupation(s) and other | Trust | overseen by |
| directorships during past 5 years | since1 | Trustee |
| |
| James M. Oates, Born: 1946 | 2012 | 231 |
|
| Managing Director, Wydown Group (financial consulting firm) (since 1994); Chairman and Director, |
| Emerson Investment Management, Inc. (since 2000); Independent Chairman, Hudson Castle Group, Inc. |
| (formerly IBEX Capital Markets, Inc.) (financial services company) (1997–2011); Director, Stifel Financial |
| (since 1996); Director, Investor Financial Services Corporation (1995–2007); Director, Connecticut River |
| Bancorp (since 1998); Director, Virtus Funds (formerly Phoenix Mutual Funds) (since 1988). Trustee |
| and Chairperson of the Board, John Hancock retail funds (since 2012); Trustee (2005–2006 and since |
| 2012) and Chairperson of the Board (since 2012), John Hancock Funds III; Trustee (since 2004) and |
| Chairperson of the Board (since 2005), John Hancock Variable Insurance Trust; Trustee and Chairperson |
| of the Board (since 2005), John Hancock Funds II. | | |
| |
| Charles L. Bardelis,3 Born: 1941 | 2012 | 231 |
|
| Director, Island Commuter Corp. (marine transport). Trustee, John Hancock retail funds (since 2012); |
| Trustee, John Hancock Funds III (2005–2006 and since 2012); Trustee, John Hancock Variable Insurance |
| Trust (since 1988); Trustee, John Hancock Funds II (since 2005). | | |
| |
| Peter S. Burgess,3 Born: 1942 | 2012 | 231 |
|
| Consultant (financial, accounting, and auditing matters) (since 1999); Certified Public Accountant; |
| Partner, Arthur Andersen (independent public accounting firm) (prior to 1999); Director, Lincoln |
| Educational Services Corporation (since 2004); Director, Symetra Financial Corporation (since 2010); |
| former Director, PMA Capital Corporation (2004–2010). Trustee, John Hancock retail funds (since 2012); |
| Trustee, John Hancock Funds III (2005–2006 and since 2012); Trustee, John Hancock Variable Insurance |
| Trust and John Hancock Funds II (since 2005). | | |
| |
| William H. Cunningham,2 Born: 1944 | 1994 | 231 |
|
| Professor, University of Texas, Austin, Texas (since 1971); former Chancellor, University of Texas |
| System and former President of the University of Texas, Austin, Texas; Director, LIN Television (since |
| 2009); Chairman (since 2009) and Director (since 2006), Lincoln National Corporation (insurance); |
| Director, Resolute Energy Corporation (since 2009); Director, Southwest Airlines (since 2000); former |
| Director, Introgen (manufacturer of biopharmaceuticals) (until 2008); former Director, Hicks Acquisition |
| Company I, Inc. (until 2007); former Director, Texas Exchange Bank, SSB (formerly Bank of Crowley) |
| (until 2009); former Advisory Director, JPMorgan Chase Bank (formerly Texas Commerce Bank–Austin) |
| (until 2009). Trustee, John Hancock retail funds (since 1986); Trustee, John Hancock Variable Insurance |
| Trust (since 2012); Trustee, John Hancock Funds II (since 2012 and 2005–2006). | |
| |
| Grace K. Fey, Born: 1946 | 2012 | 231 |
|
| Chief Executive Officer, Grace Fey Advisors (since 2007); Director and Executive Vice President, |
| Frontier Capital Management Company (1988–2007); Director, Fiduciary Trust (since 2009). |
| Trustee, John Hancock retail funds (since 2012); Trustee, John Hancock Variable Insurance Trust and |
| John Hancock Funds II (since 2008). | | |
| |
| Annual report | Fundamental All Cap Core Fund 33 |
Independent Trustees (continued)
| | |
| Name, year of birth | Trustee | Number of John |
| Position(s) held with fund | of the | Hancock funds |
| Principal occupation(s) and other | Trust | overseen by |
| directorships during past 5 years | since1 | Trustee |
| |
| Theron S. Hoffman,3 Born: 1947 | 2012 | 231 |
|
| Chief Executive Officer, T. Hoffman Associates, LLC (consulting firm) (since 2003); Director, The Todd |
| Organization (consulting firm) (2003–2010); President, Westport Resources Management (investment |
| management consulting firm) (2006–2008); Senior Managing Director, Partner, and Operating Head, |
| Putnam Investments (2000–2003); Executive Vice President, The Thomson Corp. (financial and |
| legal information publishing) (1997–2000). Trustee, John Hancock retail funds (since 2012); Trustee, |
| John Hancock Variable Insurance Trust and John Hancock Funds II (since 2008). | |
| |
| Deborah C. Jackson,2 Born: 1952 | 2008 | 231 |
|
| President, Cambridge College, Cambridge, Massachusetts (since 2011); Chief Executive Officer, |
| American Red Cross of Massachusetts Bay (2002–2011); Board of Directors of Eastern Bank Corporation |
| (since 2001); Board of Directors of Eastern Bank Charitable Foundation (since 2001); Board of Directors |
| of American Student Assistance Corporation (1996–2009); Board of Directors of Boston Stock Exchange |
| (2002–2008); Board of Directors of Harvard Pilgrim Healthcare (health benefits company) (2007–2011). |
| Trustee, John Hancock retail funds (since 2008); Trustee of John Hancock Variable Insurance Trust and |
| John Hancock Funds II (since 2012). | | |
| |
| Hassell H. McClellan, Born: 1945 | 2012 | 231 |
|
| Associate Professor, The Wallace E. Carroll School of Management, Boston College (since 1984); |
| Trustee, Virtus Variable Insurance Trust (formerly Phoenix Edge Series Funds) (since 2008); Director, |
| The Barnes Group (since 2010). Trustee, John Hancock retail funds (since 2012); Trustee, John Hancock |
| Funds III (2005–2006 and since 2012); Trustee, John Hancock Variable Insurance Trust and | |
| John Hancock Funds II (since 2005). | | |
| |
| Steven R. Pruchansky,2 Born: 1944 | 1991 | 231 |
|
| Chairman and Chief Executive Officer, Greenscapes of Southwest Florida, Inc. (since 2000); Director |
| and President, Greenscapes of Southwest Florida, Inc. (until 2000); Member, Board of Advisors, First |
| American Bank (until 2010); Managing Director, Jon James, LLC (real estate) (since 2000); Director, |
| First Signature Bank & Trust Company (until 1991); Director, Mast Realty Trust (until 1994); President, |
| Maxwell Building Corp. (until 1991). Trustee (since 1992) and Chairperson of the Board (2011–2012), |
| John Hancock retail funds; Trustee and Vice Chairperson of the Board, John Hancock retail funds, |
| John Hancock Variable Insurance Trust and John Hancock Funds II (since 2012). | |
| |
| Gregory A. Russo,2 Born: 1949 | 2009 | 231 |
|
| Director and Audit Committee Chairman (since 2012) and Member, Audit Committee and Finance |
| Committee (since 2011), NCH Healthcare System, Inc. (holding company for multi-entity healthcare |
| system); Director and Member of Finance Committee, The Moorings, Inc. (nonprofit continuing care |
| community) (since 2012); Vice Chairman, Risk & Regulatory Matters, KPMG LLP (KPMG) (2002–2006); |
| Vice Chairman, Industrial Markets, KPMG (1998–2002); Chairman and Treasurer, Westchester |
| County, New York, Chamber of Commerce (1986–1992); Director, Treasurer and Chairman of |
| Audit and Finance Committees, Putnam Hospital Center (1989–1995); Director and Chairman of |
| Fundraising Campaign, United Way of Westchester and Putnam Counties, New York (1990–1995). |
| Trustee, John Hancock retail funds (since 2008); Trustee, John Hancock Variable Insurance Trust and |
| John Hancock Funds II (since 2012). | | |
| |
| 34 Fundamental All Cap Core Fund | Annual report |
Non-Independent Trustees4
| | |
| Name, year of birth | Trustee | Number of John |
| Position(s) held with fund | of the | Hancock funds |
| Principal occupation(s) and other | Trust | overseen by |
| directorships during past 5 years | since1 | Trustee |
| |
| James R. Boyle, Born: 1959 | 2012 | 231 |
|
| Senior Executive Vice President, John Hancock Financial Services (1999–2012, including prior positions); |
| Chairman and Director, John Hancock Advisers, LLC, John Hancock Funds, LLC, and John Hancock |
| Investment Management Services, LLC (2005–2010). Trustee, John Hancock retail funds (since 2012 and |
| 2005–2010), Trustee, John Hancock Variable Insurance Trust and John Hancock Funds II (since 2005). |
| |
| Craig Bromley,2 Born: 1966 | 2012 | 231 |
|
| President, John Hancock Financial Services (since 2012); Senior Executive Vice President and General |
| Manager, U.S. Division, John Hancock Financial Services (since 2012); President and Chief Executive |
| Officer, Manulife Insurance Company (Manulife (Japan) (2005–2012), including prior positions). |
| Trustee, John Hancock retail funds (since 2012); Trustee, John Hancock Variable Insurance Trust and |
| John Hancock Funds II (since 2012). | | |
| |
| Warren A. Thomson,2 Born: 1955 | 2012 | 231 |
|
| Senior Executive Vice President and Chief Investment Officer, Manulife Financial Corporation and The |
| Manufacturers Life Insurance Company (since 2009); Chairman and Chief Executive Officer, Manulife |
| Asset Management (since 2001, including prior positions); Director (since 2006), and President and |
| Chief Executive Officer of Manulife Asset Management Limited (since 2013); Director and Chairman, |
| Hancock Natural Resources Group, Inc. (since 2013). Trustee, John Hancock retail funds, John Hancock |
| Variable Insurance Trust and John Hancock Funds II (since 2012). | | |
| |
| Principal officers who are not Trustees | | |
| | | |
| Name, year of birth | | Officer |
| Position(s) held with fund | | of the |
| Principal occupation(s) and other | | Trust |
| directorships during past 5 years | | since |
| |
| Hugh McHaffie, Born: 1959 | | 2009 |
|
| President | | |
| Executive Vice President, John Hancock Financial Services (since 2006, including prior positions); |
| Chairman and Director, John Hancock Advisers, LLC, John Hancock Investment Management Services, |
| LLC and John Hancock Funds, LLC (since 2010); President, John Hancock Advisers, LLC (since 2012); |
| President, John Hancock Investment Management Services, LLC (since 2010). President (since 2012) and |
| former Trustee (2010–2012), John Hancock retail funds; President, John Hancock Variable Insurance |
| Trust and John Hancock Funds II (since 2009). | | |
| |
| Andrew G. Arnott, Born: 1971 | | 2009 |
|
| Executive Vice President | | |
| Senior Vice President, John Hancock Financial Services (since 2009); Director and Executive Vice |
| President, John Hancock Advisers, LLC (since 2005, including prior positions); Director and Executive |
| Vice President, John Hancock Investment Management Services, LLC (since 2006, including prior |
| positions); President, John Hancock Funds, LLC (since 2004, including prior positions); Executive Vice |
| President, John Hancock retail funds, John Hancock Variable Insurance Trust and John Hancock Funds II |
| (since 2007, including prior positions). | | |
| |
| Thomas M. Kinzler, Born: 1955 | | 2006 |
|
| Secretary and Chief Legal Officer | | |
| Vice President, John Hancock Financial Services (since 2006); Secretary and Chief Legal Counsel, |
| John Hancock Funds, LLC (since 2007); Secretary and Chief Legal Officer, John Hancock retail funds, |
| John Hancock Variable Insurance Trust and John Hancock Funds II (since 2006). | |
| |
| Annual report | Fundamental All Cap Core Fund 35 |
Principal officers who are not Trustees (continued)
| |
| Name, year of birth | Officer |
| Position(s) held with fund | of the |
| Principal occupation(s) and other | Trust |
| directorships during past 5 years | since |
| |
| Francis V. Knox, Jr., Born: 1947 | 2005 |
|
| Chief Compliance Officer | |
| Vice President, John Hancock Financial Services (since 2005); Chief Compliance Officer, John Hancock |
| retail funds, John Hancock Variable Insurance Trust, John Hancock Funds II, John Hancock Advisers, |
| LLC and John Hancock Investment Management Services, LLC (since 2005); Vice President and Chief |
| Compliance Officer, John Hancock Asset Management a division of Manulife Asset Management (US) |
| LLC (2005–2008). | |
| |
| Charles A. Rizzo, Born: 1957 | 2007 |
|
| Chief Financial Officer | |
| Vice President, John Hancock Financial Services (since 2008); Senior Vice President, John Hancock | |
| Advisers, LLC and John Hancock Investment Management Services, LLC (since 2008); Chief Financial |
| Officer, John Hancock retail funds, John Hancock Variable Insurance Trust and John Hancock Funds II |
| (since 2007). | |
| |
| Salvatore Schiavone, Born: 1965 | 2009 |
|
| Treasurer | |
| Assistant Vice President, John Hancock Financial Services (since 2007); Vice President, John Hancock |
| Advisers, LLC and John Hancock Investment Management Services, LLC (since 2007); Treasurer, | |
| John Hancock retail funds (since 2007, including prior positions); Treasurer, John Hancock Variable | |
| Insurance Trust and John Hancock Funds II (since 2010 and 2007–2009, including prior positions). | |
John Hancock retail funds is comprised of John Hancock Funds III and 34 other John Hancock funds consisting of 24 series of other John Hancock trusts and 10 closed-end funds.
The business address for all Trustees and Officers is 601 Congress Street, Boston, Massachusetts 02210-2805.
The Statement of Additional Information of the fund includes additional information about members of the Board of Trustees of the Trust and is available without charge, upon request, by calling 800-225-5291.
1 Each Trustee holds office until his or her successor is elected and qualified, or until the Trustee’s death, retirement, resignation or removal.
2 Became a Trustee of the Trust effective December 1, 2012.
3 Member of Audit Committee.
4 Because Messrs. Bromley and Thomson are senior executives or directors and Mr. Boyle held prior positions as a senior executive and director of the Advisor and/or its affiliates, each of them is considered an “interested person,” as defined in the Investment Company Act of 1940, of the Trust.
| |
| 36�� Fundamental All Cap Core Fund | Annual report |
More information
| |
| Trustees | Investment advisor |
| James M. Oates, Chairperson | John Hancock Investment Management |
| Steven R. Pruchansky, Vice Chairperson | Services, LLC |
| Charles L. Bardelis* | |
| James R. Boyle† | Subadvisor |
| Craig Bromley† | John Hancock Asset Management a division of |
| Peter S. Burgess* | Manulife Asset Management (US) LLC |
| William H. Cunningham | |
| Grace K. Fey | Principal distributor |
| Theron S. Hoffman* | John Hancock Funds, LLC |
| Deborah C. Jackson | |
| Hassell H. McClellan | Custodian |
| Gregory A. Russo | State Street Bank and Trust Company |
| Warren A. Thomson† | |
| | Transfer agent |
| Officers | John Hancock Signature Services, Inc. |
| Hugh McHaffie | |
| President | Legal counsel |
| | K&L Gates LLP |
| Andrew G. Arnott | |
| Executive Vice President | Independent registered |
| | public accounting firm |
| Thomas M. Kinzler | PricewaterhouseCoopers LLP |
| Secretary and Chief Legal Officer | |
| | |
| Francis V. Knox, Jr. | |
| Chief Compliance Officer | |
| | |
| Charles A. Rizzo | |
| Chief Financial Officer | |
| | |
| Salvatore Schiavone | |
| Treasurer | |
| |
| *Member of the Audit Committee | |
| †Non-Independent Trustee | |
The fund’s proxy voting policies and procedures, as well as the fund’s proxy voting record for the most recent twelve-month period ended June 30, are available free of charge on the Securities and Exchange Commission (SEC) website at sec.gov or on our website.
The fund’s complete list of portfolio holdings, for the first and third fiscal quarters, is filed with the SEC on Form N-Q. The fund’s Form N-Q is available on our website and the SEC’s website, sec.gov, and can be reviewed and copied (for a fee) at the SEC’s Public Reference Room in Washington, DC. Call 800-SEC-0330 to receive information on the operation of the SEC’s Public Reference Room.
We make this information on your fund, as well as monthly portfolio holdings, and other fund details available on our website at jhinvestments.com or by calling 800-225-5291.
| | |
| You can also contact us: | | |
| 800-225-5291 | Regular mail: | Express mail: |
| jhinvestments.com | Investment Operations | Investment Operations |
| | John Hancock Signature Services, Inc. | John Hancock Signature Services, Inc. |
| | P.O. Box 55913 | 30 Dan Road |
| | Boston, MA 02205-5913 | Canton, MA 02021 |
| |
| Annual report | Fundamental All Cap Core Fund 37 |

800-225-5291
800-338-8080 EASI-Line
jhinvestments.com
| |
| This report is for the information of the shareholders of John Hancock Fundamental All Cap Core Fund. | |
| It is not authorized for distribution to prospective investors unless preceded or accompanied by a prospectus. | 376A 7/13 |
| MF150763 | 9/13 |
| |
| John Hancock Diversified Strategies Fund | |
| |
| Table of Contents | |
| | |
| Management’s discussion of fund performance | Page 3 |
| A look at performance | Page 5 |
| Your expenses | Page 7 |
| Portfolio summary | Page 8 |
| Fund's investments | Page 9 |
| Financial statements | Page 20 |
| Financial highlights | Page 23 |
| Notes to financial statements | Page 25 |
| Federal tax information | Page 32 |
| Trustees and Officers | Page 40 |
| More information | Page 44 |
John Hancock Diversified Strategies Fund
Management’s Discussion of Fund Performance
By John Hancock Asset Management a division of Manulife Asset Management (US) LLC
John Hancock Diversified Strategies Fund posted positive performance during the 12-month period ended July 31, 2013. The fund’s Class A shares returned 5.81%, excluding sales charges, compared with the 5.61% return of the fund’s benchmark, a blend of 70% Barclays U.S. Aggregate Bond Index/30% S&P 500 Index. During the period, the S&P 500 Index returned 25.00% and the average return of the fund’s peers in the U.S. conservative allocation category was 6.94%, as tracked by Morningstar Inc.†
Equity markets during the 12-month period were driven higher by expanded monetary programs to keep interest rates low and stimulate economic growth. Stock volatility increased in December as fears mounted that tax increases would take effect at the start of 2013 unless the U.S. Congress reached an agreement to avoid them. A last-minute deal emerged, helping drive equities higher early in the year. Bond yields remained low throughout most of the period. But they climbed sharply during the final weeks of the period, triggered by expectations that the U.S. Federal Reserve (Fed) would begin scaling back its bond-buying program earlier than had been previously expected.
The fund’s positive performance resulted from asset allocation, diversification, and a risk mitigation strategy. Every single underlying fund held by the fund experienced positive performance during the period. The fund typically maintains a large allocation to fixed-income holdings, covering many global fixed-income sectors (some of these positions are held in investments in mutual funds). The fixed-income portion of the fund portfolio outperformed its benchmark index by allocating to corporate and high-yield fixed-income securities and away from lower-yielding U.S. Treasury bonds. While U.S. Treasuries are generally considered “risk-free” securities, they experienced negative performance during the period due to their low yields in a rising interest-rate environment.
The equity portion of the fund’s holdings was made up of investments in several mutual funds. The two value-oriented equity strategies underperformed their benchmarks, but with lower relative volatility while generating strong absolute performance. The portion of the fund’s holdings invested in alternative investments such as currency strategies and absolute return strategies outperformed low-risk, fixed-income benchmarks such as the Barclays U.S. Aggregate Bond Index and the Barclays 1-5 Year U.S. Credit Index.
This commentary reflects the views of the portfolio managers through the end of the period discussed in this report. The managers’ statements reflect their own opinions. As such, they are in no way guarantees of future events, and are not intended to be used as investment advice or a recommendation regarding any specific security. They are also subject to change at any time as market and other conditions warrant.
Past performance is no guarantee of future results. The fund’s performance depends on the Advisor's skill in determining the strategic asset class allocations, the mix of underlying strategies and funds and the performance of those underlying strategies and funds. The underlying strategies and funds' performance may be lower than the performance of the asset class that they were selected to represent. The fund is subject to the same risks as the underlying strategies and funds in which it invests, which include the following: stocks and bonds can decline due
to adverse issuer, market, regulatory or economic developments; foreign investing, especially in emerging markets, has additional risks, such as currency and market volatility and political and social instability; the securities of small-capitalization companies are subject to higher volatility than larger, more established companies; and high-yield bonds are subject to additional risks, such as increased risk of default. Absolute return funds are not designed to outperform stocks and bonds in strong markets and there is no guarantee of positive returns. They employ certain techniques which are intended to reduce risk and volatility in the portfolio and provide protection against a decline in the fund’s assets. However, there is no guarantee that any investment strategy will be successful or that the fund’s objectives will be achieved. Commodity investments involve the risk of volatile market price fluctuation of commodities resulting from fluctuating demand, supply disruption, speculation and other factors. The use of hedging and derivatives transactions could produce disproportionate gains or losses and may increase volatility and costs. The issuer or grantor of a security, or counterparty to a transaction, may be unable or unwilling to make principal, interest or settlement payments. If the Fund invests in illiquid securities, it may be difficult to sell them at a price approximating their value.For additional information on these and other risk considerations, please see the fund’s prospectus.
† Figures from Morningstar, Inc. include reinvested distributions and do not take into account sales charges. Actual load-adjusted performance is lower.
A look at performance
Total returns for the period ended July 31, 2013
| | | | | | | | |
| | Average annual total returns (%) | Cumulative total returns (%) | |
| | with maximum sales charge | | with maximum sales charge | |
|
| | 1-year | 5-year | 10-year | Since
inception1 | 1-year | 5-year | 10-year | Since
inception1 |
|
| Class A | 0.53 | — | — | 6.46 | 0.53 | — | — | 12.19 |
|
| Class I2 | 6.30 | — | — | 9.93 | 6.30 | — | — | 19.02 |
|
| Index 1† | 25.00 | — | — | 25.26 | 25.00 | — | — | 51.28 |
|
| Index 2† | –1.90 | — | — | 1.66 | –1.90 | — | — | 3.08 |
|
| Index 3† | 5.61 | — | — | 8.44 | 5.61 | — | — | 16.05 |
|
Performance figures assume all distributions are reinvested. Figures reflect maximum sales charges on Class A shares of 5.00%.
The expense ratios of the fund, both net (including any fee waivers or expense limitations) and gross (excluding any fee waivers or expense limitations), are set forth according to the most recent publicly available prospectuses for the fund and may differ from those disclosed in the Financial highlights tables in this report. The expense ratios are as follows:
| | | |
| | Class A | Class I | |
| Net/Gross (%) | 1.67 | 1.27 | |
The returns reflect past results and should not be considered indicative of future performance. The return and principal value of an investment will fluctuate so that shares, when redeemed, may be worth more or less than their original cost. Due to market volatility, the fund’s current performance may be higher or lower than the performance shown. For current to the most recent month-end performance data, please call 800-225-5291 or visit the fund’s website at jhinvestments.com.
The performance table above and the chart on the next page do not reflect the deduction of taxes that a shareholder may pay on fund distributions or on the redemption of fund shares. The fund’s performance results reflect any applicable fee waivers or expense reductions, without which the expenses would increase and results would have been less favorable.
† Index 1 is the S&P 500 Index. Index 2 is the Barclays U.S. Aggregate Bond Index. Index 3 is the 70% Barclays U.S. Aggregate Bond Index/30% S&P 500 Index.
See the following page for footnotes.
|
| Diversified Strategies Fund | Annual report | 5 | |
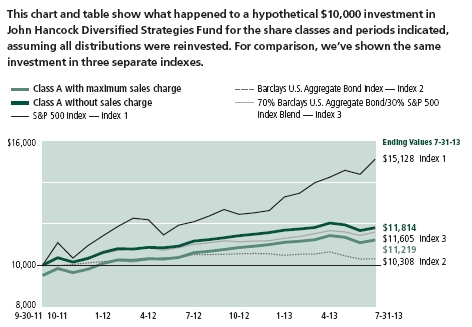
| | | | | | |
| | | With maximum | Without | | | |
| | Start date | sales charge | sales charge | Index 1 | Index 2 | Index 3 |
|
| |
| Class I | 9-30-11 | $11,902 | $11,902 | $15,128 | $10,308 | $11,605 |
|
S&P 500 Index is an unmanaged index that includes 500 widely traded common stocks.
Barclays U.S. Aggregate Bond Index is an unmanaged index of dollar-denominated and nonconvertible investment-grade debt issues.
70% Barclays U.S. Aggregate Bond Index/30% S&P 500 Index Blend is comprised of 70% Barclays U.S. Aggregate Bond Index and 30% S&P 500 Index.
It is not possible to invest directly in an index. Index figures do not reflect expenses, which would have resulted in lower values if they did.
Footnotes related to performance pages
1 From 9-30-11.
2 For certain types of investors as described in the fund’s prospectus.
| |
| 6 |
| | Annual report | Diversified Strategies Fund |
Your expenses
These examples are intended to help you understand your ongoing operating expenses of investing in the fund so you can compare these costs with the ongoing costs of investing in other mutual funds.
Understanding fund expenses
As a shareholder of the fund, you incur two types of costs:
■ Transaction costs which include sales charges (loads) on purchases or redemptions (varies by share class), minimum account fee charge, etc.
■ Ongoing operating expenses including management fees, distribution and service fees (if applicable), and other fund expenses.
We are going to present only your ongoing operating expenses here.
Actual expenses/actual returns
This example is intended to provide information about your fund’s actual ongoing operating expenses, and is based on your fund’s actual return. It assumes an account value of $1,000.00 on February 1, 2013 with the same investment held until July 31, 2013.
| | | |
| | Account value | Ending value | Expenses paid during |
| | on 2-1-13 | on 7-31-13 | period ended 7-31-131,2 |
|
| Class A | $1,000.00 | $1,010.00 | $5.53 |
| Class I | 1,000.00 | 1,011.90 | 3.79 |
Together with the value of your account, you may use this information to estimate the operating expenses that you paid over the period. Simply divide your account value at July 31, 2013 by $1,000.00, then multiply it by the “expenses paid” for your share class from the table above. For example, for an account value of $8,600.00, the operating expenses should be calculated as follows:
Example
[ My account value $8,600.00 / $1,000.00 = 8.6 ] x $[ “expenses paid” from table ] = My actual expenses
Hypothetical example for comparison purposes
This table allows you to compare your fund’s ongoing operating expenses with those of any other fund. It provides an example of the fund’s hypothetical account values and hypothetical expenses based on each class’s actual expense ratio and an assumed 5% annualized return before expenses (which is not your fund’s actual return). It assumes an account value of $1,000.00 on February 1, 2013, with the same investment held until July 31, 2013. Look in any other fund shareholder report to find its hypothetical example and you will be able to compare these expenses.
| | | |
| | Account value | Ending value | Expenses paid during |
| | on 2-1-13 | on 7-31-13 | period ended 7-31-131,2 |
|
| Class A | $1,000.00 | $1,019.30 | $5.56 |
| Class I | 1,000.00 | 1,021.00 | 3.81 |
Remember, these examples do not include any transaction costs, therefore, these examples will not help you to determine the relative total costs of owning different funds. If transaction costs were included, your expenses would have been higher. See the prospectus for details regarding transaction costs.
1 Expenses are equal to the fund's annualized expense ratio of 1.11% and 0.76% for Class A and Class I shares, respectively, multiplied by the average account value over the period, multiplied by 181/365 (to reflect the one-half year period).
2 The fund's expense ratios do not include fees and expenses indirectly incurred by the underlying funds, whose expense ratios can vary based on the underlying funds held by the fund. The range of expense ratios of the underlying funds held by the fund were 0.74% to 1.42% for the year ended July 31, 2013.
Diversified Strategies Fund
Portfolio summary
As of 7/31/13
| |
| | Value as a |
| | Percentage |
| | of fund’s |
| Portfolio Composition1 | net assets |
| Fixed Income (60.2%) | |
| Corporate Bonds | 46.0% |
| Collateralized Mortgage Obligations | 3.4% |
| U.S. Government & Agency Obligations | 3.2% |
| Term Loans | 1.9% |
| Preferred Securities | 1.8% |
| Asset Backed Securities | 1.3% |
| Convertible Bonds | 1.1% |
| Capital Preferred Securities | 0.8% |
| U.S. Government & Agency Collateralized Mortgage Obligations | 0.6% |
| Municipal Bonds | 0.1% |
| |
| Affiliated Investment Companies (34.9%) | |
| Alternative | 7.9% |
| Equity | 17.0% |
| Fixed Income | 10.0% |
| Unaffiliated Investment Companies (3.0%) | |
| Alternative | 3.0% |
| Other assets and Liabilities | 1.9% |
| |
| |
| | Value as a |
| | Percentage |
| | of fund’s |
| Fixed Income Quality Comp2,3 | net assets |
| U.S. Government | 1.7% |
| U.S. Government Agency | 1.5% |
| U.S. Government & Agency Collateralized Mortgage Obligations | 0.6% |
| AAA | 0.9% |
| AA | 0.6% |
| A | 2.6% |
| BBB | 19.6% |
| BB | 9.8% |
| B | 13.4% |
| CCC | 8.2% |
| Not Rated | 1.3% |
1 As a percentage of net assets on 7-31-13.
2 Ratings are from Moody's Investors Service, Inc. If not available, we have used ratings from Standard & Poor's Ratings Services. In the absence of ratings from these agencies, we have used Fitch Ratings, Inc. "Not Rated" securities are those with no ratings available from these agencies. All are as of 7-31-13 and do not reflect subsequent downgrades or upgrades, if any.
3 Composition based on fixed income securities which represent $26,032,674 and 60.2% of the fund's net assets at 7-31-13.
Diversified Strategies Fund
Fund’s investments
As of 7-31-13
| | | | |
| | | Maturity | | |
| | Rate (%) | date | Par value^ | Value |
| |
| Corporate Bonds 46.0% | | | | $19,896,521 |
|
| (Cost $18,682,636) | | | | |
| |
| Consumer Discretionary 6.6% | | | | 2,866,724 |
|
| |
| Auto Components 0.8% | | | | |
| Allison Transmission, Inc. (S) | 7.125 | 05/15/19 | 125,000 | 133,428 |
| Dana Holding Corp. | 6.000 | 09/15/23 | 50,000 | 50,125 |
| Visteon Corp. | 6.750 | 04/15/19 | 144,000 | 153,720 |
| | | | | |
| Automobiles 0.2% | | | | |
| Ford Motor Credit Company LLC | 5.875 | 08/02/21 | 85,000 | 94,325 |
| | | | | |
| Hotels, Restaurants & Leisure 2.2% | | | | |
| Caesars Entertainment Operating Company, Inc. | 11.250 | 06/01/17 | 100,000 | 103,938 |
| CCM Merger, Inc. (S) | 9.125 | 05/01/19 | 150,000 | 159,000 |
| Downstream Development Authority of the Quapaw Tribe of | | | | |
| Oklahoma (S) | 10.500 | 07/01/19 | 100,000 | 103,000 |
| Greektown Superholdings, Inc. | 13.000 | 07/01/15 | 100,000 | 105,250 |
| Landry's, Inc. (S) | 9.375 | 05/01/20 | 50,000 | 54,125 |
| Marina District Finance Company, Inc. | 9.500 | 10/15/15 | 75,000 | 78,375 |
| MGM Resorts International | 8.625 | 02/01/19 | 100,000 | 115,875 |
| Rivers Pittsburgh Borrower LP (S) | 9.500 | 06/15/19 | 14,000 | 15,190 |
| Seminole Indian Tribe of Florida (S) | 7.750 | 10/01/17 | 200,000 | 212,750 |
| Wok Acquisition Corp. (S) | 10.250 | 06/30/20 | 25,000 | 28,000 |
| | | | | |
| Household Durables 0.1% | | | | |
| American Standard Americas (S) | 10.750 | 01/15/16 | 30,000 | 31,613 |
| | | | | |
| Media 0.8% | | | | |
| Cinemark USA, Inc. (S) | 4.875 | 06/01/23 | 30,000 | 28,350 |
| DISH DBS Corp. | 6.750 | 06/01/21 | 125,000 | 132,500 |
| Gibson Brands, Inc. (S) | 8.875 | 08/01/18 | 20,000 | 20,600 |
| XM Satellite Radio, Inc. (S) | 7.625 | 11/01/18 | 150,000 | 165,375 |
| | | | | |
| Multiline Retail 0.6% | | | | |
| Macy's Retail Holdings, Inc. | 7.875 | 08/15/36 | 175,000 | 200,271 |
| The Bon-Ton Department Stores, Inc. (S) | 8.000 | 06/15/21 | 65,000 | 66,788 |
| | | | | |
| Specialty Retail 1.3% | | | | |
| Automotores Gildemeister SA (S) | 8.250 | 05/24/21 | 150,000 | 120,000 |
| AutoNation, Inc. | 5.500 | 02/01/20 | 65,000 | 69,063 |
| CST Brands, Inc. (S) | 5.000 | 05/01/23 | 10,000 | 9,875 |
| Hillman Group, Inc. | 10.875 | 06/01/18 | 100,000 | 107,750 |
| Jo-Ann Stores Holdings, Inc., PIK (S) | 9.750 | 10/15/19 | 50,000 | 52,000 |
| Limited Brands, Inc. | 6.625 | 04/01/21 | 50,000 | 55,000 |
| Toys R Us Property Company II LLC | 8.500 | 12/01/17 | 100,000 | 105,625 |
| Toys R Us, Inc. | 10.375 | 08/15/17 | 50,000 | 51,125 |
| | | | | |
| Textiles, Apparel & Luxury Goods 0.6% | | | | |
| Burlington Coat Factory Warehouse Corp. | 10.000 | 02/15/19 | 125,000 | 139,688 |
| Hot Topic, Inc. (S) | 9.250 | 06/15/21 | 100,000 | 104,000 |
| |
| Consumer Staples 2.6% | | | | 1,100,985 |
|
| |
| Beverages 0.1% | | | | |
| Ajecorp BV (S) | 6.500 | 05/14/22 | 40,000 | 40,900 |
| | | | | |
| Food & Staples Retailing 0.8% | | | | |
| Rite Aid Corp. | 9.250 | 03/15/20 | 150,000 | 167,063 |
| Safeway, Inc. | 7.250 | 02/01/31 | 20,000 | 21,700 |
Diversified Strategies Fund
Fund’s investments
As of 7-31-13
| | | | |
| | | Maturity | | |
| | Rate (%) | date | Par value^ | Value |
| |
| Consumer Staples (continued) | | | | |
|
| Safeway, Inc. | 5.000 | 08/15/19 | 60,000 | $64,074 |
| Sun Merger Sub, Inc. (S) | 5.875 | 08/01/21 | 25,000 | 25,438 |
| Tops Holding Corp. (S) | 8.875 | 12/15/17 | 16,000 | 17,640 |
| Tops Holding II Corp., PIK (S) | 8.750 | 06/15/18 | 20,000 | 19,950 |
| | | | | |
| Food Products 0.5% | | | | |
| B&G Foods, Inc. | 4.625 | 06/01/21 | 15,000 | 14,494 |
| Corporacion Pesquera Inca SAC (S) | 9.000 | 02/10/17 | 78,000 | 79,950 |
| Simmons Foods, Inc. (S) | 10.500 | 11/01/17 | 100,000 | 106,500 |
| | | | | |
| Household Products 0.4% | | | | |
| Harbinger Group, Inc. (S) | 7.875 | 07/15/19 | 45,000 | 46,575 |
| The Sun Products Corp. (S) | 7.750 | 03/15/21 | 60,000 | 61,200 |
| YCC Holdings LLC, PIK | 10.250 | 02/15/16 | 75,000 | 77,063 |
| | | | | |
| Personal Products 0.1% | | | | |
| Revlon Consumer Products Corp. (S) | 5.750 | 02/15/21 | 50,000 | 50,438 |
| | | | | |
| Tobacco 0.7% | | | | |
| Alliance One International, Inc. (S) | 9.875 | 07/15/21 | 100,000 | 98,500 |
| Alliance One International, Inc. | 10.000 | 07/15/16 | 100,000 | 105,000 |
| Vector Group, Ltd. | 7.750 | 02/15/21 | 100,000 | 104,500 |
| |
| Energy 3.2% | | | | 1,402,632 |
|
| |
| Energy Equipment & Services 0.4% | | | | |
| Key Energy Services, Inc. | 6.750 | 03/01/21 | 11,000 | 10,780 |
| Offshore Group Investment, Ltd. (S) | 7.125 | 04/01/23 | 20,000 | 20,050 |
| RKI Exploration & Production LLC (S) | 8.500 | 08/01/21 | 25,000 | 25,375 |
| Trinidad Drilling, Ltd. (S) | 7.875 | 01/15/19 | 100,000 | 106,000 |
| | | | | |
| Gas Utilities 0.1% | | | | |
| DCP Midstream LLC (5.850% to 05/21/2023, then 3 month | | | | |
| LIBOR + 3.850%) (S) | 5.850 | 05/21/43 | 50,000 | 47,750 |
| | | | | |
| Oil, Gas & Consumable Fuels 2.7% | | | | |
| Afren PLC (S) | 10.250 | 04/08/19 | 200,000 | 230,500 |
| BreitBurn Energy Partners LP | 7.875 | 04/15/22 | 20,000 | 20,150 |
| EP Energy LLC | 7.750 | 09/01/22 | 20,000 | 22,000 |
| EV Energy Partners LP | 8.000 | 04/15/19 | 100,000 | 101,000 |
| Goodrich Petroleum Corp. | 8.875 | 03/15/19 | 15,000 | 15,375 |
| Halcon Resources Corp. | 8.875 | 05/15/21 | 30,000 | 30,300 |
| Kinder Morgan Energy Partners LP | 5.800 | 03/15/35 | 200,000 | 210,302 |
| Midstates Petroleum Company, Inc. (S) | 9.250 | 06/01/21 | 100,000 | 98,250 |
| Newfield Exploration Company | 5.750 | 01/30/22 | 100,000 | 103,000 |
| Penn Virginia Corp. | 8.500 | 05/01/20 | 15,000 | 15,075 |
| Petrobras Global Finance BV | 4.375 | 05/20/23 | 40,000 | 36,056 |
| Petroleos de Venezuela SA | 5.375 | 04/12/27 | 50,000 | 29,125 |
| Rex Energy Corp. (S) | 8.875 | 12/01/20 | 15,000 | 15,563 |
| Summit Midstream Holdings LLC (S) | 7.500 | 07/01/21 | 30,000 | 30,600 |
| Targa Resources Partners LP | 6.375 | 08/01/22 | 75,000 | 79,500 |
| TransCanada Pipelines, Ltd. (6.350% to 05/15/2017, then 3 | | | | |
| month LIBOR + 2.210%) | 6.350 | 05/15/67 | 100,000 | 105,006 |
| WPX Energy, Inc. | 6.000 | 01/15/22 | 50,000 | 50,875 |
| |
| Financials 14.2% | | | | 6,151,759 |
|
| |
| Capital Markets 1.6% | | | | |
| Jefferies Group, Inc. | 6.875 | 04/15/21 | 200,000 | 224,280 |
Diversified Strategies Fund
Fund’s investments
As of 7-31-13
| | | | |
| | | Maturity | | |
| | Rate (%) | date | Par value^ | Value |
| |
| Financials (continued) | | | | |
|
| JPMorgan Chase & Company (5.150% to 05/01/2023, then 3 | | | | |
| month LIBOR + 3.250%) (Q) | 5.150 | 05/01/23 | 50,000 | $46,375 |
| Morgan Stanley | 5.750 | 01/25/21 | 300,000 | 333,988 |
| The Goldman Sachs Group, Inc. | 5.750 | 01/24/22 | 95,000 | 105,818 |
| | | | | |
| Commercial Banks 1.7% | | | | |
| Fifth Third Bancorp (5.100% to 06/30/2023, then 3 month | | | | |
| LIBOR + 3.033%) (Q) | 5.100 | 06/30/23 | 60,000 | 56,700 |
| HBOS PLC (S) | 6.000 | 11/01/33 | 95,000 | 87,875 |
| ICICI Bank, Ltd. (S) | 5.750 | 11/16/20 | 200,000 | 204,972 |
| PNC Financial Services Group, Inc. (4.850% to 06/01/2023, | | | | |
| then 3 month LIBOR + 3.040%) (Q) | 4.850 | 06/01/23 | 30,000 | 27,300 |
| Royal Bank of Scotland Group PLC | 6.125 | 12/15/22 | 215,000 | 207,903 |
| Synovus Financial Corp. | 7.875 | 02/15/19 | 20,000 | 22,900 |
| Wells Fargo & Company, Series K (7.980% to 03/15/2018, | | | | |
| then 3 month LIBOR + 3.770%) (Q) | 7.980 | 03/15/18 | 100,000 | 112,250 |
| | | | | |
| Consumer Finance 0.5% | | | | |
| Discover Bank | 7.000 | 04/15/20 | 200,000 | 236,052 |
| | | | | |
| Diversified Financial Services 3.7% | | | | |
| Bank of America Corp. | 5.700 | 01/24/22 | 140,000 | 157,361 |
| Citigroup, Inc. | 3.500 | 05/15/23 | 20,000 | 18,191 |
| General Electric Capital Corp. | 5.300 | 02/11/21 | 250,000 | 274,114 |
| General Electric Capital Corp. (6.375% to 11/15/2017, then 3 | | | | |
| month LIBOR + 2.289%) | 6.375 | 11/15/67 | 15,000 | 15,975 |
| General Electric Capital Corp. (7.125% until 06/15/2022, then | | | | |
| 3 month LIBOR + 5.296%) (Q) | 7.125 | 06/15/22 | 100,000 | 112,500 |
| ING US, Inc. (P)(S) | 5.650 | 05/15/53 | 50,000 | 47,000 |
| iPayment, Inc. | 10.250 | 05/15/18 | 75,000 | 60,188 |
| JPMorgan Chase & Company (7.900% to 04/30/2018, then 3 | | | | |
| month LIBOR + 3.470%) (Q) | 7.900 | 04/30/18 | 200,000 | 222,500 |
| Merrill Lynch & Company, Inc. | 7.750 | 05/14/38 | 200,000 | 238,869 |
| Rabobank Nederland NV (11.000% to 06/30/2019, then 3 | | | | |
| month LIBOR + 10.868%) (Q)(S) | 11.000 | 06/30/19 | 200,000 | 258,000 |
| SPL Logistics Escrow LLC (S) | 8.875 | 08/01/20 | 24,000 | 24,960 |
| Springleaf Finance Corp. (S) | 6.000 | 06/01/20 | 75,000 | 69,188 |
| TMX Finance LLC (S) | 8.500 | 09/15/18 | 50,000 | 51,500 |
| UBS AG | 7.625 | 08/17/22 | 50,000 | 55,668 |
| | | | | |
| Insurance 3.6% | | | | |
| AXA SA | 8.600 | 12/15/30 | 200,000 | 242,235 |
| CNA Financial Corp. | 7.250 | 11/15/23 | 200,000 | 242,782 |
| CNO Financial Group, Inc. (S) | 6.375 | 10/01/20 | 15,000 | 15,956 |
| Glen Meadow Pass-Through Trust (6.505% to 02/15/2017, | | | | |
| then 3 month LIBOR + 2.125%) (S) | 6.505 | 02/12/67 | 200,000 | 189,000 |
| Liberty Mutual Group, Inc. (S) | 6.500 | 03/15/35 | 50,000 | 54,714 |
| Liberty Mutual Group, Inc. (S) | 7.800 | 03/15/37 | 200,000 | 232,500 |
| Lincoln National Corp. (6.050% to 04/20/2017, then 3 month | | | | |
| LIBOR + 2.040%) | 6.050 | 04/20/67 | 150,000 | 150,000 |
| Lincoln National Corp. (7.000% to 05/17/2016, then 3 month | | | | |
| LIBOR + 2.358%) | 7.000 | 05/17/66 | 20,000 | 20,600 |
| MetLife, Inc. | 6.400 | 12/15/36 | 30,000 | 31,200 |
| Nippon Life Insurance Company (P)(S) | 5.000 | 10/18/42 | 200,000 | 199,839 |
| Onex USI Aquisition Corp. (S) | 7.750 | 01/15/21 | 40,000 | 40,200 |
Diversified Strategies Fund
Fund’s investments
As of 7-31-13
| | | | |
| | | Maturity | | |
| | Rate (%) | date | Par value^ | Value |
| |
| Financials (continued) | | | | |
|
| Pacific LifeCorp. (S) | 6.000 | 02/10/20 | 15,000 | $16,905 |
| Prudential Financial, Inc. (P) | 5.200 | 03/15/44 | 10,000 | 9,275 |
| Prudential Financial, Inc. (5.875% to 09/1/2022, then 3 month | | | | |
| LIBOR + 4.175%) | 5.875 | 09/15/42 | 45,000 | 45,450 |
| White Mountains Re Group, Ltd. (7.506% to 06/30/2017, then | | | | |
| 3 month LIBOR + 3.200%) (Q)(S) | 7.506 | 06/30/17 | 50,000 | 52,003 |
| | | | | |
| Real Estate Investment Trusts 2.7% | | | | |
| DDR Corp. | 7.500 | 04/01/17 | 200,000 | 234,477 |
| Highwoods Realty LP | 5.850 | 03/15/17 | 70,000 | 77,202 |
| Host Hotels & Resorts LP | 5.250 | 03/15/22 | 200,000 | 208,489 |
| MPT Operating Partnership LP | 6.375 | 02/15/22 | 35,000 | 36,838 |
| MPT Operating Partnership LP | 6.875 | 05/01/21 | 100,000 | 106,750 |
| ProLogis International Funding II (S) | 4.875 | 02/15/20 | 20,000 | 19,555 |
| Prologis LP | 6.875 | 03/15/20 | 200,000 | 237,186 |
| Weyerhaeuser Company | 7.375 | 03/15/32 | 200,000 | 240,357 |
| | | | | |
| Real Estate Management & Development 0.1% | | | | |
| CBRE Services, Inc. | 5.000 | 03/15/23 | 20,000 | 19,200 |
| General Shopping Investments, Ltd. (12.000% to 03/20/2017, | | | | |
| then 5 Year USGG + 11.052%) (Q)(S) | 12.000 | 03/20/17 | 30,000 | 25,200 |
| NANA Development Corp. (S) | 9.500 | 03/15/19 | 20,000 | 20,400 |
| | | | | |
| Thrifts & Mortgage Finance 0.3% | | | | |
| Nationstar Mortgage LLC | 7.875 | 10/01/20 | 30,000 | 32,175 |
| Nationstar Mortgage LLC | 10.875 | 04/01/15 | 75,000 | 78,844 |
| |
| Health Care 1.2% | | | | 516,485 |
|
| |
| Health Care Equipment & Supplies 0.3% | | | | |
| Alere, Inc. (S) | 6.500 | 06/15/20 | 15,000 | 15,338 |
| Alere, Inc. (S) | 7.250 | 07/01/18 | 40,000 | 43,400 |
| MModal, Inc. (S) | 10.750 | 08/15/20 | 60,000 | 49,200 |
| | | | | |
| Health Care Providers & Services 0.5% | | | | |
| HCA, Inc. | 7.500 | 02/15/22 | 100,000 | 112,750 |
| National Mentor Holdings, Inc. (S) | 12.500 | 02/15/18 | 100,000 | 107,000 |
| | | | | |
| Pharmaceuticals 0.4% | | | | |
| Endo Health Solutions, Inc. | 7.250 | 01/15/22 | 100,000 | 104,250 |
| Mylan, Inc. (S) | 7.875 | 07/15/20 | 55,000 | 63,097 |
| VPII Escrow Corp. (S) | 7.500 | 07/15/21 | 20,000 | 21,450 |
| |
| Industrials 7.1% | | | | 3,062,415 |
|
| |
| Aerospace & Defense 1.3% | | | | |
| Ducommun, Inc. | 9.750 | 07/15/18 | 100,000 | 111,000 |
| Huntington Ingalls Industries, Inc. | 7.125 | 03/15/21 | 150,000 | 165,000 |
| Kratos Defense & Security Solutions, Inc. | 10.000 | 06/01/17 | 120,000 | 129,600 |
| Textron Financial Corp. (6.000% to 02/15/2017, then 3 month | | | | |
| LIBOR + 1.735%) (S) | 6.000 | 02/15/67 | 150,000 | 132,000 |
| Textron, Inc. | 7.250 | 10/01/19 | 30,000 | 35,520 |
| | | | | |
| Airlines 1.9% | | | | |
| American Airlines 2011-1 Class B Pass Through Trust (S) | 7.000 | 01/31/18 | 89,898 | 94,393 |
| British Airways PLC (S) | 5.625 | 06/20/20 | 15,000 | 15,413 |
| Continental Airlines 1997-4 Class A Pass Through Trust | 6.900 | 01/02/18 | 28,400 | 30,459 |
| Continental Airlines 2010-1 Class A Pass Through Trust | 4.750 | 01/12/21 | 178,419 | 192,693 |
| Delta Air Lines 2002-1 Class G-1 Pass Through Trust | 6.718 | 01/02/23 | 68,416 | 75,087 |
| Delta Air Lines 2007-1 Class A Pass Through Trust | 6.821 | 08/10/22 | 137,614 | 154,128 |
Diversified Strategies Fund
Fund’s investments
As of 7-31-13
| | | | |
| | | Maturity | | |
| | Rate (%) | date | Par value^ | Value |
| |
| Industrials (continued) | | | | |
|
| Delta Air Lines 2010-1 Class A Pass Through Trust | 6.200 | 07/02/18 | 151,668 | $164,559 |
| US Airways 2012-1 Class A Pass Through Trust | 5.900 | 10/01/24 | 24,955 | 26,577 |
| US Airways 2012-2 Class A Pass Through Trust | 4.625 | 06/03/25 | 50,000 | 49,125 |
| | | | | |
| Building Products 0.7% | | | | |
| Gibraltar Industries, Inc. (S) | 6.250 | 02/01/21 | 70,000 | 71,750 |
| Voto-Votorantim, Ltd. (S) | 6.750 | 04/05/21 | 200,000 | 214,000 |
| | | | | |
| Commercial Services & Supplies 1.2% | | | | |
| Ahern Rentals, Inc. (S) | 9.500 | 06/15/18 | 20,000 | 20,450 |
| Casella Waste Systems, Inc. | 7.750 | 02/15/19 | 40,000 | 38,800 |
| Garda World Security Corp. (S) | 9.750 | 03/15/17 | 100,000 | 107,250 |
| Iron Mountain, Inc. | 5.750 | 08/15/24 | 45,000 | 42,525 |
| Safway Group Holding LLC (S) | 7.000 | 05/15/18 | 100,000 | 100,500 |
| Steelcase, Inc. | 6.375 | 02/15/21 | 200,000 | 219,485 |
| | | | | |
| Construction & Engineering 0.1% | | | | |
| Tutor Perini Corp. | 7.625 | 11/01/18 | 50,000 | 52,500 |
| | | | | |
| Electrical Equipment 0.3% | | | | |
| Coleman Cable, Inc. | 9.000 | 02/15/18 | 130,000 | 137,800 |
| | | | | |
| Industrial Conglomerates 0.5% | | | | |
| Odebrecht Finance, Ltd. (Q)(S) | 7.500 | 09/14/15 | 200,000 | 197,000 |
| Tenedora Nemak SA de CV (S) | 5.500 | 02/28/23 | 20,000 | 19,750 |
| | | | | |
| Marine 0.1% | | | | |
| Navios South American Logistics, Inc. | 9.250 | 04/15/19 | 50,000 | 53,875 |
| | | | | |
| Road & Rail 0.6% | | | | |
| Florida East Coast Railway Corp. | 8.125 | 02/01/17 | 100,000 | 106,000 |
| The Hertz Corp. | 6.750 | 04/15/19 | 100,000 | 107,750 |
| The Kenan Advantage Group, Inc. (S) | 8.375 | 12/15/18 | 40,000 | 41,600 |
| | | | | |
| Trading Companies & Distributors 0.4% | | | | |
| Aircastle, Ltd. | 6.250 | 12/01/19 | 25,000 | 26,313 |
| Aircastle, Ltd. | 7.625 | 04/15/20 | 15,000 | 16,763 |
| International Lease Finance Corp. (S) | 7.125 | 09/01/18 | 100,000 | 112,750 |
| |
| Information Technology 0.6% | | | | 265,313 |
|
| |
| IT Services 0.4% | | | | |
| Brightstar Corp. (S) | 9.500 | 12/01/16 | 100,000 | 105,250 |
| Global Generations Merger Sub, Inc. (S) | 11.000 | 12/15/20 | 45,000 | 51,413 |
| | | | | |
| Software 0.2% | | | | |
| Aspect Software, Inc. | 10.625 | 05/15/17 | 60,000 | 60,900 |
| First Data Corp. (S) | 11.750 | 08/15/21 | 50,000 | 47,750 |
| |
| Materials 3.8% | | | | 1,658,835 |
|
| |
| Chemicals 0.5% | | | | |
| Braskem Finance, Ltd. (S) | 7.000 | 05/07/20 | 100,000 | 106,500 |
| LyondellBasell Industries NV | 5.000 | 04/15/19 | 55,000 | 60,924 |
| Nufarm Australia, Ltd. (S) | 6.375 | 10/15/19 | 40,000 | 40,100 |
| | | | | |
| Construction Materials 0.1% | | | | |
| American Gilsonite Company (S) | 11.500 | 09/01/17 | 70,000 | 73,675 |
| | | | | |
| Containers & Packaging 0.4% | | | | |
| Consolidated Container Company LLC (S) | 10.125 | 07/15/20 | 35,000 | 36,575 |
| Pretium Packaging LLC | 11.500 | 04/01/16 | 100,000 | 107,500 |
Diversified Strategies Fund
Fund’s investments
As of 7-31-13
| | | | |
| | | Maturity | | |
| | Rate (%) | date | Par value^ | Value |
| |
| Materials (continued) | | | | |
|
| Tekni-Plex, Inc. (S) | 9.750 | 06/01/19 | 32,000 | $35,680 |
| | | | | |
| Metals & Mining 1.8% | | | | |
| AngloGold Ashanti Holdings PLC | 8.500 | 07/30/20 | 60,000 | 59,653 |
| Commercial Metals Company | 7.350 | 08/15/18 | 200,000 | 220,000 |
| Edgen Murray Corp. (S) | 8.750 | 11/01/20 | 30,000 | 30,000 |
| JMC Steel Group (S) | 8.250 | 03/15/18 | 100,000 | 99,500 |
| Metinvest BV (S) | 8.750 | 02/14/18 | 200,000 | 192,540 |
| Rain CII Carbon LLC (S) | 8.000 | 12/01/18 | 40,000 | 41,400 |
| SunCoke Energy, Inc. | 7.625 | 08/01/19 | 100,000 | 104,250 |
| Walter Energy, Inc. (S) | 9.875 | 12/15/20 | 30,000 | 25,650 |
| | | | | |
| Paper & Forest Products 1.0% | | | | |
| Georgia-Pacific LLC | 7.250 | 06/01/28 | 171,000 | 211,293 |
| International Paper Company | 9.375 | 05/15/19 | 110,000 | 145,552 |
| Neenah Paper, Inc. (S) | 5.250 | 05/15/21 | 10,000 | 9,850 |
| Westvaco Corp. | 7.950 | 02/15/31 | 50,000 | 58,193 |
| |
| Telecommunication Services 3.6% | | | | 1,533,607 |
|
| |
| Diversified Telecommunication Services 3.2% | | | | |
| American Tower Corp. | 4.700 | 03/15/22 | 40,000 | 40,077 |
| CenturyLink, Inc. | 5.800 | 03/15/22 | 50,000 | 49,750 |
| CenturyLink, Inc. | 7.600 | 09/15/39 | 200,000 | 189,500 |
| GTP Acquisition Partners I LLC (S) | 4.704 | 05/15/18 | 50,000 | 47,863 |
| Intelsat Jackson Holdings SA | 7.250 | 10/15/20 | 100,000 | 108,250 |
| Level 3 Communications, Inc. | 8.875 | 06/01/19 | 200,000 | 215,500 |
| PAETEC Holding Corp. | 9.875 | 12/01/18 | 100,000 | 112,250 |
| Telecom Italia Capital SA | 6.999 | 06/04/18 | 35,000 | 38,674 |
| Telecom Italia Capital SA | 7.200 | 07/18/36 | 200,000 | 193,826 |
| Telefonica Emisiones SAU | 5.134 | 04/27/20 | 200,000 | 205,617 |
| Windstream Corp. | 7.750 | 10/01/21 | 150,000 | 159,750 |
| | | | | |
| Wireless Telecommunication Services 0.4% | | | | |
| Clearwire Communications LLC (S) | 12.000 | 12/01/15 | 50,000 | 53,000 |
| Digicel, Ltd. (S) | 8.250 | 09/01/17 | 100,000 | 104,250 |
| MetroPCS Wireless, Inc. (S) | 6.250 | 04/01/21 | 15,000 | 15,300 |
| |
| Utilities 3.1% | | | | 1,337,766 |
|
| |
| Electric Utilities 2.1% | | | | |
| DPL, Inc. | 7.250 | 10/15/21 | 200,000 | 207,000 |
| Electricite de France SA (5.250% to 01/29/2023, then 10 | | | | |
| Year Swap Rate + 3.709%) (Q)(S) | 5.250 | 01/29/23 | 100,000 | 95,625 |
| Ipalco Enterprises, Inc. | 5.000 | 05/01/18 | 200,000 | 208,000 |
| Israel Electric Corp. Ltd. (S) | 5.625 | 06/21/18 | 200,000 | 205,085 |
| NextEra Energy Capital Holdings, Inc. (6.650% to | | | | |
| 06/15/2017, then 3 month LIBOR + 2.125%) | 6.650 | 06/15/67 | 30,000 | 31,650 |
| PNM Resources, Inc. | 9.250 | 05/15/15 | 100,000 | 112,250 |
| Southern California Edison Company (6.250% to 02/01/2022, | | | | |
| then 3 month LIBOR + 4.199%) (Q) | 6.250 | 02/01/22 | 35,000 | 37,450 |
| | | | | |
| Independent Power Producers & Energy Traders 0.6% | | | | |
| AES Corp. | 4.875 | 05/15/23 | 100,000 | 95,000 |
| Dynegy, Inc. (S) | 5.875 | 06/01/23 | 15,000 | 14,250 |
| NRG Energy, Inc. | 8.250 | 09/01/20 | 150,000 | 166,500 |
| | | | | |
| Multi-Utilities 0.4% | | | | |
| CMS Energy Corp. | 5.050 | 03/15/22 | 55,000 | 59,956 |
Diversified Strategies Fund
Fund’s investments
As of 7-31-13
| | | | |
| | | Maturity | | |
| | Rate (%) | date | Par value^ | Value |
| Utilities (continued) | | | | |
|
| Integrys Energy Group, Inc. (6.110% to 12/01/2016, then 3 | | | | |
| month LIBOR + 2.120%) | 6.110 | 12/01/66 | 100,000 | $105,000 |
| |
| U.S. Government & Agency Obligations 3.2% | | | | $1,408,073 |
|
| (Cost $1,405,463) | | | | |
| |
| U.S. Government 1.7% | | | | 750,469 |
|
| U.S. Treasury Notes | 1.375 | 06/30/18 | 750,000 | 750,469 |
| | | | | |
| U.S. Government Agency 1.5% | | | | 657,604 |
|
| Federal National Mortgage Association | 4.500 | 01/01/40 | 618,625 | 657,604 |
| |
| Capital Preferred Securities 0.8% | | | | $364,325 |
|
| (Cost $347,006) | | | | |
| |
| Financials 0.8% | | | | 364,325 |
|
| Fifth Third Capital Trust IV (6.500% to 04/15/2037 then 3 | | | | |
| month LIBOR + 1.368%) | 6.500 | 04/15/67 | 150,000 | 150,000 |
| MetLife Capital Trust IV (7.875% to 12/15/2037 then 3 month | | | | |
| LIBOR + 3.960%) (S) | 7.875 | 12/15/67 | 35,000 | 41,300 |
| MetLife Capital Trust X (9.250% to 04/08/2033, then 3 month | | | | |
| LIBOR + 5.540%) (S) | 9.250 | 04/08/38 | 30,000 | 39,900 |
| ZFS Finance USA Trust II (6.450% to 06/15/2016, then 3 | | | | |
| month LIBOR + 2.000%) (S) | 6.450 | 12/15/65 | 100,000 | 106,500 |
| ZFS Finance USA Trust V (6.500% to 05/09/2017, then 3 | | | | |
| month LIBOR + 2.285%) (S) | 6.500 | 05/09/37 | 25,000 | 26,625 |
| |
| Convertible Bonds 1.1% | | | | $460,782 |
|
| (Cost $401,510) | | | | |
| |
| Consumer Discretionary 0.2% | | | | 104,906 |
|
| MGM Resorts International | 4.250 | 04/15/15 | 90,000 | 104,906 |
| | | | | |
| Financials 0.6% | | | | 239,376 |
|
| MGIC Investment Corp. | 2.000 | 04/01/20 | 100,000 | 132,563 |
| Walter Investment Management Corp. | 4.500 | 11/01/19 | 100,000 | 106,813 |
| | | | | |
| Health Care 0.3% | | | | 116,500 |
|
| Vivus, Inc. (S) | 4.500 | 05/01/20 | 100,000 | 116,500 |
| |
| Municipal Bonds 0.1% | | | | $32,486 |
|
| (Cost $32,305) | | | | |
| State of Illinois, GO | 5.100 | 06/01/33 | 35,000 | 32,486 |
| |
| Term Loans (M) 1.9% | | | | $822,197 |
|
| (Cost $788,624) | | | | |
| |
| Consumer Discretionary 0.5% | | | | 237,106 |
|
| Media 0.3% | | | | |
| Clear Channel Communications, Inc. | 3.836 | 01/29/16 | 37,381 | 34,988 |
| Clear Channel Communications, Inc. | 6.936 | 01/30/19 | 110,259 | 101,493 |
| | | | | |
| Multiline Retail 0.2% | | | | |
| JC Penney Corp., Inc. | 6.000 | 05/21/18 | 100,000 | 100,625 |
Diversified Strategies Fund
Fund’s investments
As of 7-31-13
| | | | |
| | | Maturity | | |
| | Rate (%) | date | Par value^ | Value |
| |
| Financials 0.2% | | | | $87,314 |
|
| |
| Real Estate Investment Trusts 0.2% | | | | |
| iStar Financial, Inc. | 4.500 | 10/16/17 | 87,042 | 87,314 |
| |
| Health Care 0.7% | | | | 298,012 |
|
| |
| Health Care Providers & Services 0.7% | | | | |
| Catalent Pharma Solutions, Inc. | 6.500 | 12/29/17 | 150,000 | 150,281 |
| National Mentor Holdings, Inc. | 6.500 | 02/09/17 | 147,363 | 147,731 |
| |
| Industrials 0.5% | | | | 199,765 |
|
| |
| Aerospace & Defense 0.3% | | | | |
| WP CPP Holdings LLC | 4.750 | 12/27/19 | 99,500 | 99,998 |
| | | | | |
| Airlines 0.2% | | | | |
| Delta Air Lines, Inc. | 4.000 | 10/18/18 | 99,500 | 99,767 |
|
| |
| Collateralized Mortgage Obligations 4.0% | | | | $1,717,984 |
|
| (Cost $1,613,342) | | | | |
| |
| Commercial & Residential 3.4% | | | | 1,446,585 |
|
| American Home Mortgage Assets LLC | | | | |
| Series 2006-6, Class XP IO | 1.941 | 12/25/46 | 1,367,592 | 100,061 |
| Americold 2010 LLC Trust | | | | |
| Series 2010-ARTA, Class D (S) | 7.443 | 01/14/29 | 100,000 | 112,753 |
| Commercial Mortgage Pass Through Certificates | | | | |
| Series 2012-CR5, Class XA IO | 1.939 | 12/10/45 | 515,454 | 57,194 |
| Countrywide Alternative Loan Trust | | | | |
| Series 2007-16CB, Class 4A7 | 6.000 | 08/25/37 | 111,890 | 96,146 |
| Extended Stay America Trust | | | | |
| Series 2013-ESHM, Class M (S) | 7.625 | 12/05/19 | 100,000 | 102,139 |
| Fontainebleau Miami Beach Trust | | | | |
| Series 2012-FBLU, Class D (S) | 5.007 | 05/05/27 | 100,000 | 102,306 |
| Greenwich Capital Commercial Funding Corp. | | | | |
| Series 2006-GG7, Class AM (P) | 5.860 | 07/10/38 | 220,000 | 241,120 |
| JPMorgan Chase Commercial Mortgage Securities Corp. | | | | |
| Series 2006-LDP7, Class AM (P) | 5.863 | 04/15/45 | 250,000 | 277,327 |
| Motel 6 Trust | | | | |
| Series 2012-MTL6, Class D (S) | 3.781 | 10/05/25 | 100,000 | 96,688 |
| UBS-Barclays Commercial Mortgage Trust | | | | |
| Series 2012-C2, Class XA IO (S) | 1.808 | 05/10/63 | 542,297 | 51,414 |
| WaMu Mortgage Pass Through Certificates | | | | |
| Series 2005-AR2, Class 2A1B (P) | 0.560 | 01/25/45 | 26,734 | 22,896 |
| Series 2005-AR6, Class X IO | 1.624 | 04/25/45 | 1,728,608 | 112,152 |
| Wells Fargo Commercial Mortgage Trust | | | | |
| Series 2013-BTC, Class E (P) (S) | 3.550 | 04/16/35 | 40,000 | 30,860 |
| Wells Fargo Mortgage Backed Securities Trust | | | | |
| Series 2005-AR5, Class 1A1 (P) | 2.666 | 04/25/35 | 44,668 | 43,529 |
| |
| U.S. Government Agency 0.6% | | | | 271,399 |
|
| Federal Home Loan Mortgage Corp. | | | | |
| Series 288, Class IO | 3.000 | 10/15/27 | 371,106 | 51,301 |
| Series 4077, Class IK IO | 5.000 | 07/15/42 | 107,703 | 27,249 |
| Series K018, Class X1 IO | 1.460 | 01/25/22 | 405,095 | 37,404 |
| Series K710, Class X1 IO | 1.784 | 05/25/19 | 278,846 | 23,907 |
Diversified Strategies Fund
Fund’s investments
As of 7-31-13
| | | | |
| | | Maturity | | |
| | Rate (%) | date | Par value^ | Value |
| |
| U.S. Government Agency (continued) | | | | |
|
| Federal National Mortgage Association | | | | |
| Series 2012-118, Class IB IO | 3.500 | 11/25/42 | 161,220 | $36,889 |
| Series 2012-137, Class WI IO | 3.500 | 12/25/32 | 233,523 | 46,455 |
| Series 407, Class C6 IO | 5.500 | 01/25/40 | 157,590 | 26,692 |
| Government National Mortgage Association | | | | |
| Series 2012-114, Class IO | 1.029 | 01/16/53 | 226,559 | 21,502 |
|
| |
| Asset Backed Securities 1.3% | | | | $553,980 |
|
| (Cost $519,435) | | | | |
| |
| ACE Securities Corp. | | | | |
| Series 2006-ASP5, Class A2B (P) | 0.320 | 10/25/36 | 35,932 | 16,193 |
| Series 2006-ASP5, Class A2C (P) | 0.370 | 10/25/36 | 31,281 | 14,175 |
| Series 2006-ASP5, Class A2D (P) | 0.450 | 10/25/36 | 62,561 | 28,674 |
| Aegis Asset Backed Securities Trust | | | | |
| Series 2005-4, Class M1 (P) | 0.640 | 10/25/35 | 75,000 | 63,372 |
| Argent Securities, Inc. | | | | |
| Series 2006-M2, Class A2C (P) | 0.340 | 09/25/36 | 170,114 | 69,720 |
| Asset Backed Securities Corp. Home Equity | | | | |
| Series 2006-HE1, Class A3 (P) | 0.390 | 01/25/36 | 57,180 | 52,737 |
| Citicorp Residential Mortgage Securities, Inc. | | | | |
| Series 2007-2, Class A6 | 5.989 | 06/25/37 | 33,981 | 34,390 |
| Countrywide Asset-Backed Certificates | | | | |
| Series 2004-10, Class AF5B | 5.110 | 02/25/35 | 59,556 | 62,394 |
| Dominos Pizza Master Issuer LLC | | | | |
| Series 2012-1A, Class A2 (S) | 5.216 | 01/25/42 | 117,300 | 125,474 |
| MASTR Asset Backed Securities Trust | | | | |
| Series 2007-HE2, Class A2 (P) | 0.890 | 08/25/37 | 25,902 | 25,212 |
| Morgan Stanley ABS Capital I | | | | |
| Series 2006-HE4, Class A3 (P) | 0.340 | 06/25/36 | 54,050 | 35,679 |
| Soundview Home Loan Trust | | | | |
| Series 2006-OPT2, Class A3 (P) | 0.370 | 05/25/36 | 28,352 | 25,960 |
| | | | | |
| | | | Shares | Value |
| Preferred Securities 1.8% | | | | $776,326 |
|
| (Cost $731,647) | | | | |
| |
| Consumer Discretionary 0.2% | | | | 112,365 |
|
| General Motors Company, Series B, 4.750% | | | 2,250 | 112,365 |
| |
| Financials 0.6% | | | | 252,557 |
|
| Discover Financial Services, 6.500% | | | 1,100 | 27,489 |
| PNC Financial Services Group, Inc., 6.125% | | | 2,150 | 56,438 |
| Regions Financial Corp., 6.375% | | | 1,935 | 47,659 |
| The Goldman Sachs Group, Inc., 5.500% | | | 1,200 | 28,487 |
| U.S. Bancorp, 6.000% | | | 1,700 | 45,305 |
| Wells Fargo & Company, Series L, 7.500% | | | 18 | 20,934 |
| Weyerhaeuser Company, 6.375% | | | 500 | 26,245 |
| |
| Industrials 0.4% | | | | 173,927 |
|
| Continental Airlines Finance Trust II, 6.000% | | | 2,835 | 131,473 |
| United Technologies Corp., 7.500% | | | 662 | 42,454 |
| |
| Materials 0.2% | | | | $96,462 |
|
| ArcelorMittal, 6.000% | | | 4,600 | 96,462 |
Diversified Strategies Fund
Fund’s investments
As of 7-31-13
| | |
| | Shares | Value |
| |
| Telecommunication Services 0.3% | | 118,060 |
|
| Intelsat SA, 5.750% | 2,000 | 118,060 |
| | | |
| Utilities 0.1% | | 22,955 |
|
| Duke Energy Corp., 5.125% | 995 | 22,955 |
| |
| Affiliated Investment Companies 34.9% | | $15,075,670 |
|
| (Cost $13,810,190) | | |
| | | |
| Alternative 7.9% | | 3,404,651 |
|
| John Hancock Funds II (G) 7.9% | | |
| Currency Strategies, Class NAV (First Quadrant) (I) | 210,340 | 2,126,533 |
| Global Absolute Return Strategies, Class NAV (Standard | | |
| Life) | 117,690 | 1,278,118 |
| | | |
| Equity 17.0% | | 7,355,584 |
|
| John Hancock Funds II (G) 10.0% | | |
| Global Real Estate, Class NAV (Deutsche) | 49,060 | 418,972 |
| Capital Appreciation Value, Class NAV (T.Rowe Price) | 137,379 | 1,737,840 |
| Redwood, Class NAV (RCM) | 192,639 | 2,157,553 |
| | | |
| John Hancock Funds III (G) 7.0% | | |
| Global Shareholder Yield, Class NAV (Epoch) | 270,091 | 3,041,219 |
| | | |
| Fixed Income 10.0% | | 4,315,435 |
|
| John Hancock Funds II (G) 10.0% | | |
| Asia Total Return Bond, Class NAV (John Hancock1) | 273,048 | 2,585,765 |
| Short Duration Credit Opportunities Fund, Class NAV (Stone Harbor) | 167,604 | 1,729,670 |
| |
| Unaffiliated Investment Companies 3.0% | | $1,289,796 |
|
| (Cost $1,243,889) | | |
| | | |
| Alternative 3.0% | | 1,289,796 |
|
| AQR Managed Futures Strategy Fund, Class I | 126,824 | 1,289,796 |
| |
| Total investments (Cost $39,576,047)† 98.1% | | $42,398,140 |
|
| Other assets and liabilities, net 1.9% | | $815,482 |
|
| Total net assets 100.0% | | $43,213,622 |
|
^The percentage shown for each investment category is the total value of the category as a percentage of the net assets of the fund. All par values are denominated in U.S. Dollars unless otherwise indicated.
Notes to Portfolio of Investments
1 Manulife Asset Management (US) LLC is doing business as John Hancock Asset Management.
IO Interest Only Security – (Interest Tranche of Stripped Mortgage Pool). Rate shown is the annualized yield at the end of the period.
LIBOR London Interbank Offered Rate
PIK Paid in Kind
USGG U.S. Generic Government Index
(G) The fund's sub-advisor is shown parenthetically.
(I) Non-income producing security.
(M) Term loans are variable rate obligations. The coupon rate shown represents the rate at period end.
Diversified Strategies Fund
Fund’s investments
As of 7-31-13
(P) Variable rate obligation. The coupon rate shown represents the rate at period end.
(Q) Perpetual bonds have no stated maturity date. Date shown as maturity date is next call date.
(S) These securities are exempt from registration under Rule 144A of the Securities Act of 1933. Such securities may be resold, normally to qualified institutional buyers, in transactions exempt from registration. Rule 144A securities amounted to $7,845,096 or 18.2% of the fund's net assets as of 7-31-13.
† At 7-31-13, the aggregate cost of investment securities for federal income tax purposes was $39,625,793. Net unrealized depreciation aggregated $2,772,347, of which $3,108,296 related to appreciated investment securities and $335,949 related to depreciated investment securities.
Investment Companies
Underlying Funds’ Investment Managers
| | | |
| Deutsche Asset Management, Inc. | (Deutsche) | | |
| Epoch Investment Partners, Inc. | (Epoch) | | |
| First Quadrant, L.P. | (FirstQuadrant) | | |
| JohnHancock AssetManagement | (John Hancock1) | | |
| RCM Capital Management LLC | (RCM) | | |
| Standard Life Investments | | | |
| (Corporate Funds) Limited | (Standard Life) | | |
| Stone Harbor Investment Partners LP | (Stone Harbor) | | |
| T. Rowe Price Associates, Inc. | (T. Rowe Price) | | |
Diversified Strategies Fund
Statement of assets and liabilities — July 31, 2013
| |
| Assets | |
|
| Investments in unaffiliated issuers, at value | |
| (Cost $25,765,857) | $27,322,470 |
| Investments in affiliated issuers, at value (Cost | |
| $13,810,190) | 15,075,670 |
| | |
| Total investments, at value (Cost | |
| $39,576,047) | 42,398,140 |
| | |
| Cash | 918,177 |
| Receivable for investments sold | 343,924 |
| Dividends and interest receivable | 414,695 |
| Other receivables and prepaid expenses | 220 |
| | |
| Total assets | 44,075,156 |
| |
| |
| Liabilities | |
|
| Payable for investments purchased | 816,829 |
| Payable to affiliates | |
| Accounting and legal services fees | 921 |
| Transfer agent fees | 5,421 |
| Trustees' fees | 43 |
| Investment management fees | 257 |
| Other liabilities and accrued expenses | 38,063 |
| | |
| Total liabilities | 861,534 |
| |
| Net assets | $43,213,622 |
| |
| |
| Net assets consist of | |
|
| Paid-in capital | $38,977,459 |
| Undistributed net investment income | 842,399 |
| Accumulated net realized gain (loss) on | |
| investments | 571,671 |
| Net unrealized appreciation (depreciation) on | |
| investments | 2,822,093 |
| | |
| Net assets | $43,213,622 |
| |
| |
| Net asset value per share | |
|
| Based on net asset values and shares | |
| outstanding - the fund has an unlimited number | |
| of shares authorized with no par value | |
| Class A ($33,223,699 ÷ 3,000,000 shares)1 | $11.07 |
| Class I ($9,989,923 ÷ 900,000 shares) | $11.10 |
| |
| Maximum offering price per share | |
| Class A (net asset value per share ÷ 95%)2 | $11.65 |
1 Redemption price per share is equal to the net asset value less any applicable contingent deferred sales charge.
2 On single retail sales of less than $50,000. On sales of $50,000 or more and on group sales the offering price is reduced.
| |
| See notes to financial statements. | |
| | 20 |
Diversified Strategies Fund
Statement of operations — For the year ended July 31, 2013
| |
| Investment income | |
|
| Interest | $1,787,370 |
| Income distributions received from affiliated | |
| underlying funds | 194,840 |
| Dividends | 32,151 |
| Less foreign taxes withheld | (147) |
| | |
| Total investment income | 2,014,214 |
| |
| Expenses | |
|
| Investment management fees | 245,846 |
| Distribution and service fees | 100,202 |
| Accounting and legal services fees | 5,786 |
| Transfer agent fees | 69,373 |
| Trustees' fees | 431 |
| Professional fees | 38,662 |
| Custodian fees | 11,814 |
| Registration and filing fees | 23,433 |
| Other | 2,109 |
| | |
| Total expenses | 497,656 |
| Less expense reductions and amounts | |
| recaptured | (39,180) |
| | |
| Net expenses | 458,476 |
| |
| Net investment income | 1,555,738 |
| |
| |
| Realized and unrealized gain (loss) | |
|
| Net realized gain (loss) on | |
| Investments in unaffiliated issuers | 592,332 |
| Investments in affiliated issuers | 150,931 |
| Capital gain distributions received from affiliated | |
| underlying funds | 126,052 |
| | 869,315 |
| |
| Change in net unrealized appreciation | |
| (depreciation) of | |
| Investments in unaffiliated issuers | (493,091) |
| Investments in affiliated issuers | 594,793 |
| | 101,702 |
| |
| Net realized and unrealized gain | 971,017 |
| |
| Increase in net assets from operations | $2,526,755 |
| |
| See notes to financial statements. | |
| | 21 |
Diversified Strategies Fund
Statements of changes in net assets
| | |
| | Year ended | Period ended |
| | 7-31-13 | 7-31-121 |
| Increase (decrease) in net assets | | |
|
| From operations | | |
| Net investment income | $1,555,738 | $1,267,003 |
| Net realized gain | 869,315 | 534,227 |
| Change in net unrealized appreciation | | |
| (depreciation) | 101,702 | 2,720,391 |
| | | |
| Increase in net assets resulting from | | |
| operations | 2,526,755 | 4,521,621 |
| |
| Distributions to shareholders | | |
| From net investment income | | |
| Class A | (1,269,180) | (298,380) |
| Class I | (419,031) | (98,865) |
| From net realized gain | | |
| Class A | (528,330) | (48,060) |
| Class I | (158,490) | (14,418) |
| | | |
| Total distributions | (2,375,031) | (459,723) |
| |
| From fund share transactions | — | 39,000,000 |
| |
| Total increase | 151,724 | 43,061,898 |
| |
| Net assets | | |
|
| Beginning of period | 43,061,898 | — |
| | | |
| End of period | $43,213,622 | $43,061,898 |
| |
| Undistributed net investment income | $842,399 | $926,966 |
| 1 Inception date is 9-30-11. | | |
| |
| See notes to financial statements. | |
| | 22 |
Diversified Strategies Fund
Financial Highlights
| | |
| Class A Shares | | |
| |
| |
| | Year | Period |
| | ended | ended |
| | 7-31-13 | 7-31-121 |
| Per share operating performance | | |
|
| Net asset value, beginning of period | $11.04 | $10.00 |
| Net investment income2 | 0.39 | 0.32 |
| Net realized and unrealized gain on | | |
| investments | 0.24 | 0.84 |
| | | |
| Total from investment operations | 0.63 | 1.16 |
| |
| Less distributions | | |
| From net investment income | (0.42) | (0.10) |
| From net realized gain | (0.18) | (0.02) |
| | | |
| Total distributions | (0.60) | (0.12) |
| |
| Net asset value, end of period | $11.07 | $11.04 |
| |
| Total return (%)3,4 | 5.81 | 11.655 |
| |
| Ratios and supplemental data | | |
|
| Net assets, end of period (in millions) | $33 | $33 |
| Ratios (as a percentage of average net | | |
| assets): | | |
| Expenses before reductions and amounts | | |
| recaptured6 | 1.23 | 1.357 |
| Expenses including reductions and amounts | | |
| recaptured6 | 1.14 | 1.177 |
| Net investment income | 3.50 | 3.607 |
| Portfolio turnover (%) | 40 | 21 |
1 Inception date for Class A is 9-30-11.
2 Based on the average daily shares outstanding.
3 Does not reflect the effect of sales charges, if any.
4 Total returns would have been lower had certain expenses not been reduced during the applicable periods shown.
5 Not annualized.
6 Ratios do not include expenses indirectly incurred from underlying funds whose expense ratios can vary based on the underlying
funds held by the Fund. The range of expense ratios of the underlying funds held by the fund were as follows: 0.74% to 1.42% and
0.75% to 1.43% for the year ended 7-31-13 and the period ended 7-31-12, respectively.
7 Annualized.
| |
| See notes to financial statements. | |
| | 23 |
Diversified Strategies Fund
Financial Highlights
| | |
| Class I Shares | | |
| |
| |
| | Year | Period |
| | ended | ended |
| | 7-31-13 | 7-31-121 |
| Per share operating performance | | |
|
| Net asset value, beginning of period | $11.06 | $10.00 |
| Net investment income2 | 0.43 | 0.35 |
| Net realized and unrealized gain on | | |
| investments | 0.25 | 0.84 |
| | | |
| Total from investment operations | 0.68 | 1.19 |
| |
| Less distributions | | |
| From net investment income | (0.46) | (0.11) |
| From net realized gain | (0.18) | (0.02) |
| | | |
| Total distributions | (0.64) | (0.13) |
| |
| Net asset value, end of period | $11.10 | $11.06 |
| |
| Total return (%)3 | 6.30 | 11.964 |
| |
| Ratios and supplemental data | | |
|
| Net assets, end of period (in millions) | $10 | $10 |
| Ratios (as a percentage of average net | | |
| assets): | | |
| Expenses before reductions and amounts | | |
| recaptured5 | 0.86 | 0.956 |
| Expenses including reductions and amounts | | |
| recaptured5 | 0.77 | 0.786 |
| Net investment income | 3.87 | 3.996 |
| Portfolio turnover (%) | 40 | 21 |
1 Inception date for Class I shares is 9-30-11.
2 Based on the average daily shares outstanding.
3 Total returns would have been lower had certain expenses not been reduced during the periods shown.
4 Not annualized.
5 Ratios do not include expenses indirectly incurred from underlying funds whose expense ratios can vary based on the underlying
funds held by the Fund. The range of expense ratios of the underlying funds held by the fund were as follows: 0.74% to 1.42% and
0.75% to 1.43% for the year ended 7-31-13 and the period ended 7-31-12, respectively.
6 Annualized.
| |
| See notes to financial statements. | |
| | 24 |
Notes to Financial Statements
Note 1 — Organization
John Hancock Diversified Strategies Fund (the fund) is a series of John Hancock Funds II (the Trust), an open-end management investment company organized as a Massachusetts business trust and registered under the Investment Company Act of 1940, as amended (the 1940 Act). The investment objective of the fund is to seek long term total return. The fund has a broad investment mandate that permits it to use an extensive range of investment strategies and to invest in a wide spectrum of equity and fixed-income securities, as well as derivative instruments, in pursuing its investment objective. Under normal market conditions, the fund invests directly in both fixed-income and equity securities and also in shares of underlying investment funds, including exchange-traded funds (ETFs), that invest in a wide range of asset classes.
The fund may offer multiple classes of shares. The shares currently offered are detailed in the Statement of assets and liabilities. Class A shares are offered to all investors. Class I shares are offered to institutions and certain investors. Shareholders of each class have exclusive voting rights to matters that affect that class. The distribution and service fees, if any, transfer agent fees, printing and postage and state registration fees for each class may differ.
The accounting policies of the John Hancock underlying funds in which the fund invests are outlined in the underlying funds’ shareholder reports, which include the underlying funds’ financial statements, available without charge by calling 800-225-5291, and jhinvestments.com, on the Securities and Exchange Commission (SEC) Web site at www.sec.gov or at the SEC’s public reference room in Washington, DC. The underlying funds are not covered by this report.
Note 2 - Significant accounting policies
The financial statements have been prepared in conformity with accounting principles generally accepted in the United States of America, which require management to make certain estimates and assumptions as of the date of the financial statements. Actual results could differ from those estimates and those differences could be significant. Events or transactions occurring after the end of the fiscal period through the date that the financial statements were issued have been evaluated in the preparation of the financial statements. The following summarizes the significant accounting policies of the fund:
Security valuation. Investments are stated at value as of the close of regular trading on the New York Stock Exchange (NYSE), normally at 4:00 P.M., Eastern Time. In order to value the securities, the fund uses the following valuation techniques: Equity securities held by the fund are valued at the last sale price or official closing price on the principal securities exchange on which they trade. In the event there were no sales during the day or closing prices are not available, the securities are valued using the last quoted bid or evaluated price. Investments by the fund in underlying affiliated funds and/or other open-end management investment companies are valued at their respective net asset values each business day. Debt obligations are valued based on the evaluated prices provided by an independent pricing service, which utilizes both dealer-supplied and electronic data processing techniques, taking into account factors such as institutional-size trading in similar groups of securities, yield, quality, coupon rate, maturity, type of issue, trading characteristics and other market data. Certain short-term securities are valued at amortized cost.
Other portfolio securities and assets, for which reliable market quotations are not readily available, are valued at fair value as determined in good faith by the fund’s Pricing Committee following procedures established by the Board of Trustees, which include price verification procedures. The frequency with which these fair valuation procedures are used cannot be predicted and fair value of securities may differ significantly from the value that would have been used had a ready market for such securities existed. The fund uses a three-tier hierarchy to prioritize the pricing assumptions, referred to as inputs, used in valuation techniques to measure fair value. Level 1 includes securities valued using quoted prices in active markets for identical securities, including registered investment companies. Level 2 includes securities valued using other significant observable inputs. Observable inputs may include quoted prices for similar securities, interest rates, prepayment speeds and credit risk. Prices for securities valued using
these inputs are received from independent pricing vendors and brokers and are based on an evaluation of the inputs described. Level 3 includes securities valued using significant unobservable inputs when market prices are not readily available or reliable, including the fund’s own assumptions in determining the fair value of investments. Factors used in determining value may include market or issuer specific events or trends, changes in interest rates and credit quality. The inputs or methodology used for valuing securities are not necessarily an indication of the risks associated with investing in those securities. Changes in valuation techniques may result in transfers into or out of an assigned level within the disclosure hierarchy.
The following is a summary of the values by input classification of the fund’s investments as of July 31, 2013, by major security category or type:
| | | | |
| | | | Level 2 | Level 3 |
| | Total Market | | Significant | Significant |
| | Value at | Level 1 Quoted | Observable | Unobservable |
| | 07-31-13 | Price | Inputs | Inputs |
| | | | | |
| Corporate Bonds | $19,896,521 | — | $19,871,321 | $25,200 |
| U.S. Government & Agency Obligations | 1,408,073 | — | 1,408,073 | — |
| Capital Preferred Securities | 364,325 | — | 364,325 | — |
| Convertible Bonds | 460,782 | — | 460,782 | — |
| Municipal Bonds | 32,486 | — | 32,486 | — |
| Term Loans | 822,197 | — | 822,197 | — |
| Collateralized Mortgage Obligations | 1,717,984 | — | 1,717,984 | — |
| Asset Backed Securities | 553,980 | — | 553,980 | — |
| Preferred Securities | 776,326 | $616,366 | 159,960 | — |
| Affiliated Investment Companies | 15,075,670 | 15,075,670 | — | — |
| Unaffiliated Investment Companies | 1,289,796 | 1,289,796 | — | — |
| |
|
| Total Investments in Securities | $42,398,140 | $16,981,832 | $25,391,108 | $25,200 |
Security transactions and related investment income. Investment security transactions are accounted for on a trade date plus one basis for daily net asset value calculations. However, for financial reporting purposes, investment transactions are reported on trade date. Interest income is accrued as earned. Interest income includes coupon interest and amortization/accretion of premiums/discounts on debt securities. Debt obligations may be placed in a non-accrual status and related interest income may be reduced by stopping current accruals and writing off interest receivable when the collection of all or a portion of interest has become doubtful. Dividend income is recorded on the ex-date, except for dividends on foreign securities where the dividend may not be known until after the ex-date. In those cases, dividend income, net of withholding taxes, is recorded when the fund becomes aware of the dividends. Income and capital gain distributions from underlying funds are recorded on ex-date. Gains and losses on securities sold are determined on the basis of identified cost and may include proceeds from litigation.
Line of credit. The fund may borrow from banks for temporary or emergency purposes, including meeting redemption requests that otherwise might require the untimely sale of securities. Pursuant to the fund’s custodian agreement, the custodian may loan money to the fund to make properly authorized payments. The fund is obligated to repay the custodian for any overdraft, including any related costs or expenses. The custodian may have a lien, security interest or security entitlement in any fund property that is not otherwise segregated or pledged, to the maximum extent permitted by law, to the extent of any overdraft.
In addition, the fund and other affiliated funds have entered into an agreement with Citibank N.A. that enables them to participate in a $300 million unsecured committed line of credit. A commitment fee, payable at the end of each calendar quarter, based on the average daily unused portion of the line of credit, is charged to each participating fund on a pro rata basis and is reflected in other expenses on the Statement of operations. Prior to March 27, 2013, the fund participated in a $200 million unsecured line of credit, also with Citibank N.A., with terms otherwise similar to the existing agreement. Commitment fees for the year ended July 31, 2013, were $351. For the year ended July 31 2013, the fund had no borrowings under either line of credit.
Expenses. Within the John Hancock Funds complex, expenses that are directly attributable to an individual fund are allocated to such fund. Expenses that are not readily attributable to a specific fund are allocated among all funds in an equitable manner, taking into consideration, among other things, the nature and type of expense and the fund’s relative net assets. Expense estimates are accrued in the period to which they relate and adjustments are made when actual amounts are known.
Class allocations. Income, common expenses and realized and unrealized gains (losses) are determined at the fund level and allocated daily to each class of shares based on the net assets of the class. Class-specific expenses, such as distribution and service fees, if any, transfer agent fees, state registration fees and printing and postage expenses, for all classes, are calculated daily at the class level based on the appropriate net assets of each class and the specific expense rates applicable to each class.
Federal income taxes. The fund intends to continue to qualify as a regulated investment company by complying with the applicable provisions of the Internal Revenue Code and will not be subject to federal income tax on taxable income that is distributed to shareholders. Therefore, no federal income tax provision is required.
As of July 31, 2013, the fund had no uncertain tax positions that would require financial statement recognition, derecognition or disclosure. The fund’s federal tax returns are subject to examination by the Internal Revenue Service for a period of three years.
Distribution of income and gains. Distributions to shareholders from net investment income and net realized gains, if any, are recorded on the ex-date. The fund generally declares and pays dividends and capital gain distributions, if any, annually.
The tax character of distributions for the year ended July 31, 2013, and the period ended July 31, 2012, were as follows:
| | |
| | July 31, 2013 | July 31, 2012 |
|
| Ordinary Income | $2,354,712 | $459,473 |
|
| Long-Term Capital Gain | $20,319 | $250 |
|
| Total | $2,375,031 | $459,723 |
|
Distributions paid by the fund with respect to each class of shares are calculated in the same manner, at the same time and in the same amount, except for the effect of class level expenses that may be applied differently to each class. As of July 31, 2013, the components of distributable earnings on a tax basis included $907,912 of undistributed ordinary income and $555,904 of undistributed long-term capital gain.
Such distributions, on a tax basis, are determined in conformity with income tax regulations, which may differ from accounting principles generally accepted in the United States of America. Material distributions in excess of tax basis earnings and profits, if any, are reported in the fund’s financial statements as a return of capital. Short-term gains from underlying funds are treated as ordinary income for tax purposes.
Capital accounts within the financial statements are adjusted for permanent book-tax differences. These adjustments have no impact on net assets or the results of operations. Temporary book-tax differences, if any, will reverse in a subsequent period. Book-tax differences are primarily attributable to amortization and accretion on debt securities.
Note 3 - Guarantees and indemnifications
Under the fund’s organizational documents, its Officers and Trustees are indemnified against certain liabilities arising out of the performance of their duties to the fund. Additionally, in the normal course of business, the fund enters into contracts with service providers that contain general indemnification clauses. The fund’s maximum exposure under these arrangements is unknown, as this would involve future claims that may be made against the fund that have not yet occurred. The risk of material loss from such claims is considered remote.
Note 4 – Fees and transactions with affiliates
John Hancock Investment Management Services, LLC (the Advisor) serves as investment advisor for the Trust. John Hancock Funds, LLC (the Distributor), an affiliate of the Advisor, serves as principal underwriter of the fund. The Advisor and the Distributor are indirect, wholly owned subsidiaries of Manulife Financial Corporation (MFC).
Management fee. The fund currently has an investment management agreement with the Advisor under which the fund pays a daily management fee to the Advisor equivalent, on an annual basis, to the sum of: (a) a fee on assets invested in a fund of John Hancock Funds III (JHF III) or John Hancock Funds II (JHFII) and (b) a fee on assets invested in investments other than a fund of JHF III and JHF II (Other Assets). A fee on assets invested in the fund of JHF III and JHF II is stated as an annual percentage of the current value of the aggregate net assets of the fund and is equivalent to the sum of: (a) 0.250% of the first $1,000,000,000 of the fund’s aggregate net assets and (b) 0.225% of the excess of $1,000,000,000 of the fund’s aggregate net assets. The fee on Other Assets is stated as an annual percentage of the current value of the aggregate net assets of the fund and is equivalent to the sum of: (a) 0.700% of the first $1,000,000,000 of the fund’s aggregate net assets and (b) 0.675% of the fund’s aggregate net assets in excess of $1,000,000,000. The Advisor has a subadvisory agreement with John Hancock Asset Management a division of Manulife Asset Management (US) LLC, an indirectly owned subsidiary of MFC and an affiliate of the Advisor. The fund is not responsible for payment of the subadvisory fees.
Effective June 1, 2013, the Advisor has contractually agreed to waive a portion of its management fee for certain funds (the Participating portfolios) of the Trust, John Hancock Funds, John Hancock Funds III and John Hancock Variable Insurance Trust. The waiver equals, on an annualized basis, 0.01% of that portion of the aggregate net assets of all the Participating portfolios that exceeds $75 billion but is less than or equal to $125 billion; 0.0125% of that portion of the aggregate net assets of all the Participating portfolios that exceeds $125 billion but is less than or equal to $150 billion; and 0.015% of that portion of the aggregate net assets of all the Participating portfolios that exceeds $150 billion. The amount of the reimbursement is calculated daily and allocated among all the Participating portfolios in proportion to the daily net assets of each fund. This arrangement may be amended or terminated at any time by the Advisor upon notice to the fund and with the approval of the Board of Trustees.
The Advisor has voluntarily agreed to waive fees and/or reimburse certain expenses for each share class of the fund excluding certain expenses such as taxes, brokerage commissions, interest expense, short dividend expense, acquired fund fees, litigation and indemnification expenses and other extraordinary expenses not incurred in the ordinary course of the fund’s business. The fee waivers and/or reimbursements are such that these expenses will not exceed 1.22% and 0.80% for Class A and Class I shares, respectively. This voluntary arrangement can be amended or terminated at any time by the Advisor upon notice to the fund.
The Advisor has voluntarily agreed to reduce its management fee for the fund, or if necessary make payment to the fund, in an amount equal to the amount by which the expenses of the fund exceed 0.10% of the average annual net assets (on an annualized basis) of the fund. “Expenses” means all the expenses of the fund, excluding (a) taxes, (b) brokerage commissions, (c) interest expense, (d) litigation and indemnification expenses and other extraordinary expenses not incurred in the ordinary course of the fund’s business, (e) advisory fees, (f) Rule 12b-1 fees, (g) transfer agent fees and service fees, (h) blue sky fees, (i) printing and postage, (j) underlying fund expenses (“acquired fund fees”) and (k) short dividend expense. This voluntary expense reimbursement will continue in effect until terminated at any time by the Advisor on notice to the fund.
The Advisor has voluntarily agreed to waive its advisory fee for the fund so that the aggregate advisory fee retained by the Advisor with respect to both the fund and its underlying investments (after payment of subadvisory fees) does not exceed 0.70% of the fund's first $1.0 billion of average annual net assets and 0.675% of the fund's average annual net assets in excess of $1.0 billion. The Advisor may terminate this voluntary waiver at any time upon notice to the fund.
Subject to shareholder approval, the Advisor has proposed to revise the fund’s advisory fee so that the fund would pay the Advisor: (a) 1.000% of the first $500 million of the fund’s aggregate net assets and (b)
0.950% of the excess over $500 million of the fund’s aggregate net assets. The fee would be accrued and paid daily based on the aggregate net assets of the fund. Shareholders of the fund will be asked to approve the amendment to the fund’s advisory fee at a special meeting of shareholders scheduled for September 20, 2013. If shareholders approve the amendments to the fund’s advisory fee, the Advisor has proposed that it will voluntarily agree to reduce its management fee for the fund, or if necessary make payment to the fund, in an amount equal to the amount by which the expenses of Class A and Class I shares of the fund exceed 1.70% and 1.39%, respectively, of the average annual net assets (on an annualized basis) of such class. “Expenses” means all the expenses of the fund, excluding (a) taxes, (b) brokerage commissions, (c) interest expense, (d) litigation and indemnification expenses and other extraordinary expenses not incurred in the ordinary course of the fund’s business, (e) advisory fees, (f) 12b-1 fees, (g) transfer agent fees and service fees, (h) blue sky fees, (i) printing and postage, (j) underlying fund expenses (“acquired fund fees”) and (k) short dividend expense. These voluntary expense reimbursements will continue in effect until terminated at any time by the Advisor on notice to the fund.
Accordingly, the fee waivers and/or expense reimbursements described above amount to $30,124 and $9,056 for Class A and Class I shares, respectively, for the year ended July 31, 2013.
The investment management fees including the impact of waivers and reimbursements described above, incurred for the year ended July 31, 2013, were equivalent to the net effective rate of 0.48% of the fund’s average daily net assets.
Expense recapture. The Advisor may recapture operating expenses reimbursed or fees waived under previous expense limitation or waiver arrangements for a period of three years following the beginning of the month in which such reimbursements or waivers originally occurred to the extent that the fund is below its expense limitation during this period. The table below outlines the amounts recovered during the year ended July 31, 2013, and the amount of waived or reimbursed expenses subject to potential recovery and the respective expiration dates.
| | | |
| AMOUNT ELIGIBLE FOR | AMOUNT ELIGIBLE FOR | AMOUNT ELIGIBLE FOR | AMOUNT RECOVERED |
| RECOVERY THROUGH | RECOVERY THROUGH | RECOVERY THROUGH | DURING THE PERIOD |
| JULY 1, 2014 | JULY 1, 2015 | JULY 1, 2016 | ENDED JULY 31, 2013 |
|
| -- | $57,148 | $40,121 | $1,327 |
Accounting and legal services. Pursuant to a service agreement, the fund reimburses the Advisor for all expenses associated with providing the administrative, financial, legal, accounting and recordkeeping services to the fund, including the preparation of all tax returns, periodic reports to shareholders and regulatory reports, among other services. These expenses are allocated to each share class based on its relative net assets at the time the expense was incurred. Accounting and legal services fees incurred for the year ended July 31, 2013, amounted to an annual rate of 0.01% of the fund’s average daily net assets.
Distribution and service plans. The fund has a distribution agreement with the Distributor. The fund has adopted distribution and service plans with respect to Class A pursuant to Rule 12b-1 under the 1940 Act, to pay the Distributor for services provided as the distributor of shares of the fund. The fund pays 0.30% for Class A shares of distribution and service fees under these arrangements, expressed as an annual percentage of average daily net assets.
Sales charges. Class A shares may be subject to contingent deferred sales charges (CDSCs). Certain Class A shares that are acquired through purchases of $1 million or more and are redeemed within one year of purchase are subject to a 1.00% sales charge. CDSCs are applied to the lesser of the current market value at the time of redemption or the original purchase cost of the shares being redeemed. Proceeds from CDSCs are used to compensate the Distributor for providing distribution-related services in connection with the sale of these shares. During the year ended July 31, 2013 there were no CDSCs received by the Distributor for Class A shares.
Transfer agent fees. The fund has a transfer agent agreement with John Hancock Signature Services, Inc. (Signature Services), an affiliate of the Advisor. The transfer agent fees paid to Signature Services
are determined based on the cost to Signature Services (Signature Services Cost) of providing recordkeeping services. The Signature Services Cost includes a component of allocated John Hancock corporate overhead for providing transfer agent services to the fund and to all other John Hancock affiliated funds. It also includes out-of-pocket expenses that are comprised of payments made to third-parties for recordkeeping services provided to their clients who invest in one or more John Hancock Funds. In addition, Signature Services Cost may be reduced by certain fees that Signature Services receives in connection with retirement and small accounts. Signature Services Cost is calculated monthly and allocated, as applicable, to four categories of share classes: Institutional Share Classes, Retirement Share Classes, Municipal Bond Classes and all other Retail Share Classes. Within each of these categories, the applicable costs are allocated to the affected John Hancock affiliated funds and/or classes, based on the relative average daily net assets.
Class level expenses. Class level expenses for the year ended July 31, 2013, were:
| | |
| Class | Distribution and service fees | Transfer agent fees |
|
| A | $100,202 | $58,910 |
|
| I | -- | 10,463 |
|
| Total | $100,202 | $69,373 |
|
Note 5 – Fund share transactions
Transactions in fund shares for the year ended July 31, 2013, and the period ended July 31, 2012 were as follows:
| | | | |
| | Year ended | Period ended |
| | 7-31-13 | 7-31-121 |
| | Shares | Amount | Shares | Amount |
| | | | | |
| Class A shares | | | | |
| Sold | -- | -- | 3,000,000 | $30,000,000 |
| Net increase | -- | -- | 3,000,000 | $30,000,000 |
| Class I shares | | | | |
| Sold | -- | -- | 900,000 | $9,000,000 |
| Net increase | -- | -- | 900,000 | $9,000,000 |
| Net increase | -- | -- | 3,900,000 | $39,000,000 |
| 1 Inception date is 9-30-11. | | | | |
Affiliates of the fund owned 100% of shares of beneficial interest of Class A and Class I, respectively, on July 31, 2013.
Note 6 - Purchase and sale of securities
Purchases and sales of securities, other than short-term securities and U.S. Treasury obligations, amounted to $17,149,206 and $17,782,523, respectively, for the year ended July 31, 2013. Purchases and sales of U.S. Treasury obligations aggregated $1,996,771 and $1,772,748, respectively, for the year ended July 31, 2013.
Note 7 – Investment in affiliated underlying funds
The fund invests in affiliated underlying funds that are managed by the Advisor and its affiliates. The fund does not invest in the affiliated underlying funds for the purpose of exercising management or control; however, the fund’s investment may represent a significant portion of each underlying fund’s net assets. For the year ended July 31, 2013, the fund does not hold 5% or more of an underlying fund’s net assets.
Report of Independent Registered Public Accounting Firm
To the Board of Trustees of John Hancock Funds II and Shareholders of John Hancock Diversified Strategies Fund:
In our opinion, the accompanying statement of assets and liabilities, including the schedule of investments, and the related statements of operations and of changes in net assets and the financial highlights present fairly, in all material respects, the financial position of John Hancock Diversified Strategies Fund (the “Fund”) at July 31, 2013, and the results of its operations for the year then ended, the changes in its net assets for the two periods then ended and the financial highlights for each of the periods indicated, in conformity with accounting principles generally accepted in the United States of America. These financial statements and financial highlights (hereafter referred to as “financial statements”) are the responsibility of the Fund’s management; our responsibility is to express an opinion on these financial statements based on our audits. We conducted our audits of these financial statements in accordance with the standards of the Public Company Accounting Oversight Board (United States). Those standards require that we plan and perform the audit to obtain reasonable assurance about whether the financial statements are free of material misstatement. An audit includes examining, on a test basis, evidence supporting the amounts and disclosures in the financial statements, assessing the accounting principles used and significant estimates made by management, and evaluating the overall financial statement presentation. We believe that our audits, which included confirmation of securities at July 31, 2013 by correspondence with the custodian, agent banks and brokers, and the application of alternative auditing procedures where securities purchased confirmations had not been received, provide a reasonable basis for our opinion.
PricewaterhouseCoopers LLP
Boston, Massachusetts
September 20, 2013
Federal Tax Information (Unaudited)
The fund reports the maximum amount allowable of its net taxable income as eligible for the corporate dividends-received deduction.
The fund reports the maximum amount allowable of its net taxable income as qualified dividend income as provided in the Jobs and Growth Tax Relief Reconciliation Act of 2003.
The fund paid $20,319 in capital gain dividends.
Eligible shareholders will be mailed a 2013 Form 1099-DIV in early 2014. This will reflect the tax character of all distributions paid in calendar year 2013.
Please consult a tax advisor regarding the tax consequences of your investment in the fund.
|
| EVALUATION OF ADVISORY AND SUBADVISORY |
| AGREEMENTS BY THE BOARD OF TRUSTEES |
| |
| Diversified Strategies Fund |
This section describes the evaluation by the Board of Trustees (the Board) of John Hancock Funds II (the Trust) of the Advisory Agreement (the Advisory Agreement) with John Hancock Investment Management Services, LLC (the Advisor) and the Subadvisory Agreement (the Subadvisory Agreement) with John Hancock Asset Management a division of Manulife Asset Management (US) LLC (the Subadvisor) for Diversified Strategies Fund (the fund). The Advisory Agreement and Subadvisory Agreement are collectively referred to as the Agreements.
Approval of Advisory and Subadvisory Agreements
At in-person meetings held on May 16 17, 2013, the Board, including the Trustees who are not considered to be “interested persons” of the Trust under the Investment Company Act of 1940, as amended (the 1940 Act) (the Independent Trustees), reapproved for an annual period, the continuation of the Advisory Agreement between the Trust and the Advisor and the Subadvisory Agreement between the Advisor and the Subadvisor with respect to the fund.
In considering the Advisory Agreement and the Subadvisory Agreement, the Board received in advance of the meeting a variety of materials relating to the fund, the Advisor and the Subadvisor, including comparative performance, fee and expense information for peer groups of similar mutual funds prepared by an independent third party provider of mutual fund data, performance information for relevant indices, and, with respect to the Subadvisor, comparative performance information for comparably managed accounts, and other information provided by the Advisor and the Subadvisor regarding the nature, extent and quality of services provided by the Advisor and the Subadvisor under their respective Agreement, as well as information regarding the Advisor’s revenues and costs of providing services to the fund and compensation paid to affiliates of the Advisor. At the meeting at which the renewal of the Advisory Agreement and Subadvisory Agreement is considered, particular focus is given to information concerning Fund performance, comparability of fees and total expenses, and profitability. However, the Board notes that the evaluation process with respect to the Advisor and the Subadvisor is an ongoing one. In this regard, the Board also took into account discussions with management and information provided to the Board at prior meetings with respect to the services provided by the Advisor and the Subadvisor to the fund, including quarterly performance reports prepared by management containing reviews of investment results, and periodic presentations from the Subadvisor with respect to the fund. The Board noted the affiliation of the Subadvisor with the Advisor, noting any potential conflicts of interest. The Board also considered the nature, quality, and extent of the services to be provided to John Hancock Fund portfolios by the Advisor’s affiliates, including distribution services.
Throughout the process, the Board asked questions of and requested additional information from management. The Board is assisted by counsel for the Trust and the Independent Trustees are also separately assisted by independent legal counsel throughout the process. The Independent Trustees also received a memorandum from their independent counsel discussing the legal standards for their consideration of the proposed continuation of the Agreements and discussed the proposed continuation of the Agreements in private sessions with their independent legal counsel at which no representatives of management were present.
Approval of Advisory Agreement
In approving the Advisory Agreement with respect to the fund, the Board, including the Independent Trustees, considered a variety of factors, including those discussed below. The Board also considered other factors (including conditions and trends prevailing generally in the economy, the securities markets, and the industry) and does not treat any single factor as determinative, and each Trustee may attribute different weights to different factors. The Board’s conclusions may be based in part on its consideration of the advisory and subadvisory arrangements in prior years and on the Board’s ongoing regular review of Fund performance and operations throughout the year.
Nature, extent and quality of services. Among the information received by the Board from the Advisor relating to the nature, extent and quality of services provided to the fund, the Board reviewed information provided by the Advisor relating to its operations and personnel, descriptions of its organizational and management structure, and information regarding the Advisor's compliance and regulatory history, including its Form ADV. The Board also noted that on a regular basis it receives and reviews information from the Trust’s Chief Compliance Officer (CCO) regarding the fund’s compliance policies and procedures established pursuant to Rule 38a-1 under the 1940 Act. The Board also considered the Advisor’s risk management processes. The Board considered that the Advisor is responsible for the management of the day-to-day operations of the fund, including but not limited to, general supervision of and coordination of the services provided by the Subadvisor, and is also responsible for monitoring and reviewing the activities of the Subadvisor and other third-party service providers.
In considering the nature, extent, and quality of the services provided by the Advisor, the Trustees also took into account their knowledge of the Advisor’s management and the quality of the performance of its duties, through Board meetings, discussions, and reports during the preceding year and through each Trustee’s experience as a Trustee of the Trust and of the other trusts in the complex.
In the course of their deliberations regarding the Advisory Agreement, the Board considered, among other things:
(a) the skills and competency with which the Advisor has in the past managed the Trust’s affairs and its subadvisory relationships, the Advisor’s oversight and monitoring of the Subadvisor’s investment performance and compliance programs, such as the Subadvisor’s compliance with fund policies and objective(s), review of brokerage matters including with respect to trade allocation and best execution, and the Advisor’s timeliness in responding to performance issues;
(b) the background, qualifications and skills of the Advisor’s personnel;
(c) the Advisor’s compliance policies and procedures and its responsiveness to regulatory changes and mutual fund industry developments;
(d) the Advisor’s administrative capabilities, including its ability to supervise the other service providers for the fund;
(e) the financial condition of the Advisor and whether it has the financial wherewithal to provide a high level and quality of services to the fund; and
(f) the Advisor’s reputation and experience in serving as an investment adviser to the Trust and the benefit to shareholders of investing in funds that are part of a family of funds offering a variety of investments.
The Board concluded that the Advisor may reasonably be expected to continue to provide a high quality of services under the Advisory Agreement with respect to the fund.
Investment performance. In considering the fund’s performance, the Board noted that it reviews at its regularly scheduled meetings information about the fund’s performance results. In connection with the consideration of the Advisory Agreement, the Board:
(a) reviewed information prepared by management regarding the fund’s performance;
(b) considered the comparative performance of the fund’s benchmark;
(c) considered the performance of comparable funds, if any, as included in the report prepared by an independent third party provider of mutual fund data. Such report included the fund’s ranking within a smaller group of peer funds and the fund’s ranking within broader groups of funds; and
(d) took into account the Advisor’s analysis of the fund’s performance and its plans and recommendations regarding the Trust’s subadvisory arrangements generally.
The Board noted that the fund outperformed its peer group average for the one-year and since-inception periods ended December 31, 2012 and underperformed and outperformed its benchmark index and peer group average, respectively, for the one-year and since-inception periods ended December 31, 2012.
The Board took into account management’s discussion of the fund’s performance, including the favorable performance relative to the fund’s peer group for the one-year period and the fund’s favorable performance since inception, and concluded that the performance of the fund has generally been in line with or outperformed the historical performance of comparable funds and the fund’s benchmark.
Fees and expenses. The Board reviewed comparative information prepared by an independent third party provider of mutual fund data, including, among other data, the fund’s contractual and actual advisory fees and total expenses as compared to similarly situated investment companies deemed to be comparable to the fund. The Board considered the fund’s ranking within a smaller group of peer funds chosen by the independent third party provider, as well as the fund’s ranking within broader groups of funds. In comparing the fund’s actual and contractual management fee to that of comparable funds, the Board noted that such fee includes both advisory and administrative costs.
The Board noted that net management fees for this Fund are lower than the peer group median and that total expenses for this Fund are lower than the peer group median.
The Board also took into account management’s discussion with respect to the advisory/subadvisory fee structure, including the amount of the advisory fee retained by the Advisor after payment of the subadvisory fee. The Board also took into account that management had agreed to implement an overall fee waiver across a number of funds in the complex, including for the fund effective June 1, 2013, which is discussed further below. The Board also noted management’s discussion of the fund’s expenses and that the fund has a voluntary fee waiver and/or expense reimbursement which reduces certain expenses of the fund and that such waiver is not reflected in the comparative fee information. The Board reviewed information provided by the Advisor concerning investment advisory fees charged by the Advisor or one of its advisory affiliates to other clients (including other funds in the complex) having similar investment mandates, if any. The Board considered any differences between the Advisor’s and Subadvisor’s services to the fund and the services they provide to other comparable clients or funds. The Board concluded that the advisory fee paid with respect to the fund is reasonable.
In addition, the Trustees reviewed the advisory fee to be paid to the Advisor for the fund and concluded that the advisory fee is based on services provided that are in addition to, rather than duplicative of, the services provided pursuant to the advisory agreements for the underlying portfolios of the fund and that the additional services are necessary because of the differences between the investment policies, strategies and techniques of a fund of funds and those of its underlying portfolios.
Profitability/indirect benefits. In considering the costs of the services to be provided and the profits to be realized by the Advisor and its affiliates (including the Subadvisor) from the Advisor’s relationship with the Trust, the Board:
(a) reviewed financial information of the Advisor;
(b) reviewed and considered an analysis presented by the Advisor regarding the net profitability to the Advisor and its affiliates, of the fund;
(c) received and reviewed profitability information with respect to the John Hancock fund complex as a whole;
(d) received information with respect to the Advisor’s allocation methodologies used in preparing the profitability data;
(e) considered that the John Hancock insurance companies that are affiliates of the Advisor, as shareholders of the Trust directly or through their separate accounts, receive certain tax credits or deductions relating to foreign taxes paid and dividends received by certain funds of the Trust and noted that these tax
benefits, which are not available to participants in qualified retirement plans under applicable income tax law, are reflected in the profitability analysis reviewed by the Board;
(f) considered that the Advisor also provides administrative services to the fund on a cost basis pursuant to an administrative services agreement;
(g) noted that the fund���s Subadvisor is an affiliate of the Advisor;
(h) noted that affiliates of the Advisor provide transfer agency services and distribution services to the fund, respectively, and that the Trust’s distributor also receives Rule 12b-1 payments to support distribution of the fund;
(i) noted that the Advisor also derives reputational and other indirect benefits from providing advisory services to the fund;
(j) noted that the subadvisory fees for the fund are paid by the Advisor;
(k) the Board noted that the advisory fee is in addition to the fees received by the Advisor and its affiliates with regard to the underlying portfolios in which the fund invests; and
(l) considered that the Advisor should be entitled to earn a reasonable level of profits in exchange for the level of services it provides to the fund and the entrepreneurial risk that it assumes as Advisor.
Based upon its review, the Board concluded that the level of profitability, if any, of the Advisor and its affiliates (including the Subadvisor), from their relationship with the fund was reasonable and not excessive.
Economies of scale. In considering the extent to which economies of scale would be realized as the fund grows and whether fee levels reflect these economies of scale for the benefit of Fund shareholders, the Board:
(a) with respect to each fund in the John Hancock fund complex, including the fund, (except those listed below), considered that the Advisor has agreed, effective June 1, 2013, to waive its management fee for the fund and each of the open-end funds of John Hancock Funds II, John Hancock Funds III, each other John Hancock Fund (except those listed below) (the Participating Portfolios) or otherwise reimburse the expenses of the Participating Portfolios as follows (the Reimbursement): The Reimbursement shall equal, on an annualized basis, 0.01% of that portion of the aggregate net assets of all the Participating Portfolios that exceed $75 billion but is less than or equal to $125 billion, 0.0125% of that portion of the aggregate net assets of all the Participating Portfolios that exceed $125 billion but is less than or equal to $150 billion and 0.015% of that portion of the aggregate net assets of all the Participating Portfolios that exceeds $150 billion. (The John Hancock Funds that are not Participating Portfolios as of the date of this report are each of the fund of funds, money market funds, index funds and closed-end funds);
(b) reviewed the Trust’s advisory fee structure and the incorporation therein of any subadvisory fee breakpoints in the advisory fees charged and concluded that (i) the fund’s fee structure contains breakpoints at the subadvisory fee level and that such breakpoints are reflected as breakpoints in the advisory fees for the fund and (ii) although economies of scale cannot be measured with precision, these arrangements permit shareholders of the fund to benefit from economies of scale if the fund grows. The Board also took into account management’s discussion of the fund’s advisory fee structure; and
(c) the Board also considered the effect of the fund’s growth in size on its performances and fees. The Board also noted that if the fund’s assets increase over time, the fund may realize other economies of scale.
Approval of Subadvisory Agreements
In making its determination with respect to approval of the Subadvisory Agreements, the Board reviewed:
(1) information relating to the Subadvisor’s business, including current subadvisory services to the Trust (and other funds in the John Hancock family of funds);
(2) the historical and current performance of the fund and comparative performance information relating to the fund’s benchmark and comparable funds; and
(3) the subadvisory fee for the fund, including any breakpoints, and comparative fee information, where available, prepared by an independent third party provider of mutual fund data.
Nature, extent and quality of services. With respect to the services provided by the Subadvisor, the Board received information provided to the Board by the Subadvisor, including the Subadvisor’s Form ADV, as well as took into account information presented throughout the past year. The Board considered the Subadvisor’s current level of staffing and its overall resources, as well as received information relating to the Subadvisor’s compensation program. The Board reviewed the Subadvisor’s history and investment experience, as well as information regarding the qualifications, background, and responsibilities of the Subadvisor’s investment and compliance personnel who provide services to the fund. The Board also considered, among other things, the Subadvisor’s compliance program and any disciplinary history. The Board also considered the Subadvisor’s risk assessment and monitoring process. The Board reviewed the Subadvisor’s regulatory history, including whether it was currently involved in any regulatory actions or investigations as well as material litigation, and any settlements and amelioratory actions undertaken, as appropriate. The Board noted that the Advisor conducts regular, periodic reviews of the Subadvisor and its operations, including regarding investment processes and organizational and staffing matters. The Board also noted that the CCO and his staff conduct regular, periodic compliance reviews with the Subadvisor and present reports to the Independent Trustees regarding the same, which includes evaluating the regulatory compliance systems of the Subadvisor and procedures reasonably designed by it to assure compliance with the federal securities laws. The Board also took into account the financial condition of the Subadvisor.
The Board considered the Subadvisor’s investment process and philosophy. The Board took into account that the Subadvisor’s responsibilities include the development and maintenance of an investment program for the fund which is consistent with the fund’s investment objectives, the selection of investment securities and the placement of orders for the purchase and sale of such securities, as well as the implementation of compliance controls related to performance of these services. The Board also received information with respect to the Subadvisor’s brokerage policies and practices, including with respect to best execution and soft dollars.
Subadvisor compensation. In considering the cost of services to be provided by the Subadvisor and the profitability to the Subadvisor of its relationship with the fund, the Board noted that the fees under the Subadvisory Agreement are paid by the Advisor and not the fund.
The Board also received information and took into account any other potential conflicts of interest the Advisor might have in connection with the Subadvisory Agreement.
In addition, the Board considered other potential indirect benefits that the Subadvisor and its affiliates may receive from the Subadvisor’s relationship with the fund, such as the opportunity to provide advisory services to additional portfolios of the Trusts and reputational benefits.
Subadvisory fees. The Board considered that the fund pays an advisory fee to the Advisor and that, in turn, the Advisor pays a subadvisory fee to the Subadvisor. The Board also took into account the sub-advisory fees paid by the Advisor to fees charged by the fund’s Subadvisor to manage other subadvised portfolios and portfolios not subject to regulation under the 1940 Act, as applicable.
Subadvisor performance. As noted above, the Board considered the fund’s performance as compared to the fund’s respective peer group and benchmark and noted that the Board reviews information about the fund’s performance results at its regularly scheduled meetings. The Board noted the Advisor’s expertise and resources in monitoring the performance, investment style, and risk-adjusted performance of the Subadvisor. The Board was mindful of the Advisor’s focus on the Subadvisor’s performance. The Board also noted the Subadvisor’s long-term performance record for similar accounts, as applicable.
The Board’s decision to approve the Subadvisory Agreement was based on a number of determinations, including the following:
(1) The Subadvisor has extensive experience and demonstrated skills as a manager;
(2) The performance of the fund generally has been in line with or outperformed the historical performance of comparable funds and the fund’s benchmark and the fund’s overall performance is satisfactory;
(3) The subadvisory fees are reasonable in relation to the level and quality of services being provided; and
(4) Subadvisory fee breakpoints are reflected as breakpoints in the advisory fees for the fund in order to permit shareholders to benefit from economies of scale if the fund grows.
In addition, the Trustees reviewed the subadvisory fee to be paid to the Subadvisor for the fund and concluded that the subadvisory fee is based on services provided that are in addition to, rather than duplicative of, the services provided pursuant to the subadvisory agreements for the underlying portfolios in which the fund invests and that the additional services are necessary because of the differences between the investment policies, strategies and techniques of a fund of funds and those of the underlying portfolios.
Based on the Board’s evaluation of all factors that the Board deemed to be material, including those factors described above, the Board, including the Independent Trustees, concluded that renewal of the Advisory Agreement and the Subadvisory Agreement would be in the best interest of the fund and its shareholders. Accordingly, the Board, and the Independent Trustees voting separately, approved the Advisory Agreement and Subadvisory Agreement for an additional one-year period.
|
| EVALUATION OF ADVISORY AND SUBADVISORY |
| AGREEMENT AMENDMENTS BY THE BOARD OF TRUSTEES |
| |
| Diversified Strategies Fund |
At an in-person meeting held on June 24 26, 2013 (the June Meeting), the Board, including a majority of the Independent Trustees, approved the proposed Advisory Agreement Amendment and Subadvisory Agreement Amendment for the fund. At the June Meeting, the Board took into account certain information and materials that the Board received and considered in connection with the annual evaluation of the Advisory and Subadvisory Agreements conducted at the in-person meeting held on May 16 17, 2013 (the May Meeting).
At the June Meeting, the Board revisited the factors it previously considered at the May Meeting to the extent relevant to the proposed Advisory Agreement Amendment and Subadvisory Agreement Amendment. The Board also took into account other factors it considered relevant in its evaluation of the Amendments, including the potential benefits that the fund and its shareholders may realize from a global absolute return strategy.
At the June Meeting, the Board reviewed all information it considered reasonably necessary to evaluate the Amendments pursuant to Sections 15(a) and (c) of the 1940 Act, including the nature, extent and quality of services provided by the Advisor and the Subadvisor, including the Advisor’s and Subadvisor’s history and experience providing investment services to the fund and their experience managing other open-end funds in a similar strategy. The Board considered the quality and depth of the investment professionals having principal investment responsibility for the fund and the investment performance record of the fund. The Board also considered the investment professionals’ experience and performance record in managing other portfolios with investment styles similar to that of the fund, and was generally satisfied with their performance.
In addition to evaluating the nature, extent and quality of services provided by the Advisor and the Subadvisor, the Board further considered that the Advisor and Subadvisor would be responsible for managing the fund pursuant to a global absolute return strategy by investing directly in equity and fixed-income securities, and other investments, rather than as a fund of funds. The Board took into account management’s explanation that the
fund’s current advisory and subadvisory fees are not commensurate with the nature and level of services that the Advisor and Subadvisor will provide to the fund under its broader investment techniques that allow for direct investments in equity and fixed-income securities, as well as certain derivative instruments. The Board noted that under the fund’s current investment strategy as a fund of funds, the Advisor receives both advisory fees from the fund as well as advisory fees from the underlying funds, and that under the fund’s revised investment strategy the Advisor would no longer receive these underlying fund fees. The Board also noted that the fund is currently in development, and there are currently no unaffiliated shareholders of the fund.
The Board reviewed the fund’s proposed contractual management fee rate payable by the fund to the Advisor as compared to the other funds in its expense group with similar global absolute return strategies and the investment subadvisory fee rate payable by the Advisor to the Subadvisor for investment subadvisory services provided to funds with a similar investment mandate. The Board noted that the fund’s proposed management fee rate, which includes both advisory and administrative costs, was below the average of its Lipper absolute return and Morningstar multi-alternative categories. he Board noted that the fund’s proposed subadvisory fees were above the average of its respective Lipper and Morningstar categories, but took into account the limited size of these peer groups and noted that the fund’s subadvisory fees are paid by the Advisor and not by the fund. The Board considered the services to be provided under the global absolute return strategy and the fees charged by the Advisor to another fund with a similar investment mandate. The Board considered the expense ratio of the fund under both the current and proposed fee structures. The Board also noted that the fund’s estimated net expenses were below the average of its respective Lipper and Morningstar categories. The Board also took into account that the Advisor was proposing to implement voluntary expense limitations on the fund’s total expenses. The Board also received information about the investment subadvisory fee rate payable by the Advisor to the Subadvisor for investment subadvisory services provided to funds with similar global absolute return strategies. The Board concluded that the fees proposed to be charged by the Advisor and the Subadvisor were reasonable.
The Board took into account management’s discussion regarding the Advisor’s and its affiliates’ anticipated profitability under the proposed fee structure. The Board considered that the proposed fee structure was similar to that of other JHF II funds that do not operate as funds of funds. The Board concluded that the Advisor and its affiliates’ anticipated level of profitability from their relationship with the fund is reasonable and not excessive.
With respect to the Advisory Agreement Amendment and the Subadvisory Agreement Amendment, the Board considered the extent to which economies of scale might be realized as the assets of the fund increase. The Board noted that the fund’s fee structure contains breakpoints at the subadvisory fee level and that such breakpoints are reflected as breakpoints in the advisory fees for the fund.
Based on its review, the Board, including the Independent Trustees, determined that the terms of the Advisory Agreement Amendment and Subadvisory Agreement Amendment, including the proposed advisory and subadvisory fee rates, were fair and reasonable and in the best interest of the fund and its shareholders, and the Board, including a majority of the Independent Trustees, approved the Advisory Agreement Amendment and Subadvisory Agreement Amendment.
Trustees and Officers
This chart provides information about the Trustees and Officers who oversee your John Hancock fund. Officers elected by the Trustees manage the day-to-day operations of the fund and execute policies formulated by the Trustees.
| | |
| Independent Trustees | | |
| | | |
| Name, year of birth | Trustee | Number of John |
| Position(s) held with fund | of the | Hancock funds |
| Principal occupation(s) and other | Trust | overseen by |
| directorships during past 5 years | since1 | Trustee |
| |
| James M. Oates, Born: 1946 | 2012 | 231 |
|
| Managing Director, Wydown Group (financial consulting firm) (since 1994); Chairman and Director, |
| Emerson Investment Management, Inc. (since 2000); Independent Chairman, Hudson Castle Group, Inc. |
| (formerly IBEX Capital Markets, Inc.) (financial services company) (1997–2011); Director, Stifel Financial |
| (since 1996); Director, Investor Financial Services Corporation (1995–2007); Director, Connecticut River |
| Bancorp (since 1998); Director, Virtus Funds (formerly Phoenix Mutual Funds) (since 1988). Trustee |
| and Chairperson of the Board, John Hancock retail funds (since 2012); Trustee (2005–2006 and since |
| 2012) and Chairperson of the Board (since 2012), John Hancock Funds III; Trustee (since 2004) and |
| Chairperson of the Board (since 2005), John Hancock Variable Insurance Trust; Trustee and Chairperson |
| of the Board (since 2005), John Hancock Funds II. | | |
|
| |
| Charles L. Bardelis,3 Born: 1941 | 2012 | 231 |
|
| Director, Island Commuter Corp. (marine transport). Trustee, John Hancock retail funds (since 2012); |
| Trustee, John Hancock Funds III (2005–2006 and since 2012); Trustee, John Hancock Variable Insurance |
| Trust (since 1988); Trustee, John Hancock Funds II (since 2005). | | |
|
| |
| Peter S. Burgess,3 Born: 1942 | 2012 | 231 |
|
| Consultant (financial, accounting, and auditing matters) (since 1999); Certified Public Accountant; |
| Partner, Arthur Andersen (independent public accounting firm) (prior to 1999); Director, Lincoln |
| Educational Services Corporation (since 2004); Director, Symetra Financial Corporation (since 2010); |
| former Director, PMA Capital Corporation (2004–2010). Trustee, John Hancock retail funds (since 2012); |
| Trustee, John Hancock Funds III (2005–2006 and since 2012); Trustee, John Hancock Variable Insurance |
| Trust and John Hancock Funds II (since 2005). | | |
|
| |
| William H. Cunningham,2 Born: 1944 | 1994 | 231 |
|
| Professor, University of Texas, Austin, Texas (since 1971); former Chancellor, University of Texas |
| System and former President of the University of Texas, Austin, Texas; Director, LIN Television (since |
| 2009); Chairman (since 2009) and Director (since 2006), Lincoln National Corporation (insurance); |
| Director, Resolute Energy Corporation (since 2009); Director, Southwest Airlines (since 2000); former |
| Director, Introgen (manufacturer of biopharmaceuticals) (until 2008); former Director, Hicks Acquisition |
| Company I, Inc. (until 2007); former Director, Texas Exchange Bank, SSB (formerly Bank of Crowley) |
| (until 2009); former Advisory Director, JPMorgan Chase Bank (formerly Texas Commerce Bank–Austin) |
| (until 2009). Trustee, John Hancock retail funds (since 1986); Trustee, John Hancock Variable Insurance |
| Trust (since 2012); Trustee, John Hancock Funds II (since 2012 and 2005–2006). | |
|
| |
| Grace K. Fey, Born: 1946 | 2012 | 231 |
|
| Chief Executive Officer, Grace Fey Advisors (since 2007); Director and Executive Vice President, |
| Frontier Capital Management Company (1988–2007); Director, Fiduciary Trust (since 2009). |
| Trustee, John Hancock retail funds (since 2012); Trustee, John Hancock Variable Insurance Trust and |
| John Hancock Funds II (since 2008). | | |
| |
| 40 |
| Diversified Strategies Fund | Annual report | |
| | |
| Independent Trustees (continued) | | |
| |
| Name, year of birth | Trustee | Number of John |
| Position(s) held with fund | of the | Hancock funds |
| Principal occupation(s) and other | Trust | overseen by |
| directorships during past 5 years | since1 | Trustee |
| |
| Theron S. Hoffman,3 Born: 1947 | 2012 | 231 |
|
| Chief Executive Officer, T. Hoffman Associates, LLC (consulting firm) (since 2003); Director, The Todd |
| Organization (consulting firm) (2003–2010); President, Westport Resources Management (investment |
| management consulting firm) (2006–2008); Senior Managing Director, Partner, and Operating Head, |
| Putnam Investments (2000–2003); Executive Vice President, The Thomson Corp. (financial and |
| legal information publishing) (1997–2000). Trustee, John Hancock retail funds (since 2012); Trustee, |
| John Hancock Variable Insurance Trust and John Hancock Funds II (since 2008). | |
|
| |
| Deborah C. Jackson,2 Born: 1952 | 2008 | 231 |
|
| President, Cambridge College, Cambridge, Massachusetts (since 2011); Chief Executive Officer, |
| American Red Cross of Massachusetts Bay (2002–2011); Board of Directors of Eastern Bank Corporation |
| (since 2001); Board of Directors of Eastern Bank Charitable Foundation (since 2001); Board of Directors |
| of American Student Assistance Corporation (1996–2009); Board of Directors of Boston Stock Exchange |
| (2002–2008); Board of Directors of Harvard Pilgrim Healthcare (health benefits company) (2007–2011). |
| Trustee, John Hancock retail funds (since 2008); Trustee of John Hancock Variable Insurance Trust and |
| John Hancock Funds II (since 2012). | | |
|
| |
| Hassell H. McClellan, Born: 1945 | 2012 | 231 |
|
| Associate Professor, The Wallace E. Carroll School of Management, Boston College (since 1984); |
| Trustee, Virtus Variable Insurance Trust (formerly Phoenix Edge Series Funds) (since 2008); Director, |
| The Barnes Group (since 2010). Trustee, John Hancock retail funds (since 2012); Trustee, John Hancock |
| Funds III (2005–2006 and since 2012); Trustee, John Hancock Variable Insurance Trust and | |
| John Hancock Funds II (since 2005). | | |
|
| |
| Steven R. Pruchansky,2 Born: 1944 | 1991 | 231 |
|
| Chairman and Chief Executive Officer, Greenscapes of Southwest Florida, Inc. (since 2000); Director |
| and President, Greenscapes of Southwest Florida, Inc. (until 2000); Member, Board of Advisors, First |
| American Bank (until 2010); Managing Director, Jon James, LLC (real estate) (since 2000); Director, |
| First Signature Bank & Trust Company (until 1991); Director, Mast Realty Trust (until 1994); President, |
| Maxwell Building Corp. (until 1991). Trustee (since 1992) and Chairperson of the Board (2011–2012), |
| John Hancock retail funds; Trustee and Vice Chairperson of the Board, John Hancock retail funds, |
| John Hancock Variable Insurance Trust and John Hancock Funds II (since 2012). | |
|
| |
| Gregory A. Russo,2 Born: 1949 | 2009 | 231 |
|
| Director and Audit Committee Chairman (since 2012) and Member, Audit Committee and Finance |
| Committee (since 2011), NCH Healthcare System, Inc. (holding company for multi-entity healthcare |
| system); Director and Member of Finance Committee, The Moorings, Inc. (nonprofit continuing care |
| community) (since 2012); Vice Chairman, Risk & Regulatory Matters, KPMG LLP (KPMG) (2002–2006); |
| Vice Chairman, Industrial Markets, KPMG (1998–2002); Chairman and Treasurer, Westchester |
| County, New York, Chamber of Commerce (1986–1992); Director, Treasurer and Chairman of |
| Audit and Finance Committees, Putnam Hospital Center (1989–1995); Director and Chairman of |
| Fundraising Campaign, United Way of Westchester and Putnam Counties, New York (1990–1995). |
| Trustee, John Hancock retail funds (since 2008); Trustee, John Hancock Variable Insurance Trust and |
| John Hancock Funds II (since 2012). | | |
| |
| 41 |
| | Annual report | Diversified Strategies Fund |
| | |
| Non-Independent Trustees4 | | |
| | | |
| Name, year of birth | Trustee | Number of John |
| Position(s) held with fund | of the | Hancock funds |
| Principal occupation(s) and other | Trust | overseen by |
| directorships during past 5 years | since1 | Trustee |
| |
| James R. Boyle, Born: 1959 | 2012 | 231 |
|
| Senior Executive Vice President, John Hancock Financial Services (1999–2012, including prior positions); |
| Chairman and Director, John Hancock Advisers, LLC, John Hancock Funds, LLC, and John Hancock |
| Investment Management Services, LLC (2005–2010). Trustee, John Hancock retail funds (since 2012 and |
| 2005–2010), Trustee, John Hancock Variable Insurance Trust and John Hancock Funds II (since 2005). |
|
| |
| Craig Bromley,2 Born: 1966 | 2012 | 231 |
|
| President, John Hancock Financial Services (since 2012); Senior Executive Vice President and General |
| Manager, U.S. Division, John Hancock Financial Services (since 2012); President and Chief Executive |
| Officer, Manulife Insurance Company (Manulife (Japan) (2005–2012), including prior positions). |
| Trustee, John Hancock retail funds (since 2012); Trustee, John Hancock Variable Insurance Trust and |
| John Hancock Funds II (since 2012). | | |
|
| |
| Warren A. Thomson,2 Born: 1955 | 2012 | 231 |
|
| Senior Executive Vice President and Chief Investment Officer, Manulife Financial Corporation and The |
| Manufacturers Life Insurance Company (since 2009); Chairman and Chief Executive Officer, Manulife |
| Asset Management (since 2001, including prior positions); Director (since 2006), and President and |
| Chief Executive Officer of Manulife Asset Management Limited (since 2013); Director and Chairman, |
| Hancock Natural Resources Group, Inc. (since 2013). Trustee, John Hancock retail funds, John Hancock |
| Variable Insurance Trust and John Hancock Funds II (since 2012). | | |
| |
| Principal officers who are not Trustees | | |
| | | |
| Name, year of birth | | Officer |
| Position(s) held with fund | | of the |
| Principal occupation(s) and other | | Trust |
| directorships during past 5 years | | since |
| |
| Hugh McHaffie, Born: 1959 | | 2009 |
|
| President | | |
| Executive Vice President, John Hancock Financial Services (since 2006, including prior positions); |
| Chairman and Director, John Hancock Advisers, LLC, John Hancock Investment Management Services, |
| LLC and John Hancock Funds, LLC (since 2010); President, John Hancock Advisers, LLC (since 2012); |
| President, John Hancock Investment Management Services, LLC (since 2010). President (since 2012) and |
| former Trustee (2010–2012), John Hancock retail funds; President, John Hancock Variable Insurance |
| Trust and John Hancock Funds II (since 2009). | | |
|
| |
| Andrew G. Arnott, Born: 1971 | | 2009 |
|
| Executive Vice President | | |
| Senior Vice President, John Hancock Financial Services (since 2009); Director and Executive Vice |
| President, John Hancock Advisers, LLC (since 2005, including prior positions); Director and Executive |
| Vice President, John Hancock Investment Management Services, LLC (since 2006, including prior |
| positions); President, John Hancock Funds, LLC (since 2004, including prior positions); Executive Vice |
| President, John Hancock retail funds, John Hancock Variable Insurance Trust and John Hancock Funds II |
| (since 2007, including prior positions). | | |
|
| |
| Thomas M. Kinzler, Born: 1955 | | 2006 |
|
| Secretary and Chief Legal Officer | | |
| Vice President, John Hancock Financial Services (since 2006); Secretary and Chief Legal Counsel, |
| John Hancock Funds, LLC (since 2007); Secretary and Chief Legal Officer, John Hancock retail funds, |
| John Hancock Variable Insurance Trust and John Hancock Funds II (since 2006). | |
| |
| | 42 |
| Diversified Strategies Fund | Annual report | |
| |
| Principal officers who are not Trustees (continued) | |
| |
| Name, year of birth | Officer |
| Position(s) held with fund | of the |
| Principal occupation(s) and other | Trust |
| directorships during past 5 years | since |
| |
| Francis V. Knox, Jr., Born: 1947 | 2005 |
|
| Chief Compliance Officer | |
| Vice President, John Hancock Financial Services (since 2005); Chief Compliance Officer, John Hancock |
| retail funds, John Hancock Variable Insurance Trust, John Hancock Funds II, John Hancock Advisers, |
| LLC and John Hancock Investment Management Services, LLC (since 2005); Vice President and Chief |
| Compliance Officer, John Hancock Asset Management a division of Manulife Asset Management (US) |
| LLC (2005–2008). | |
|
| |
| Charles A. Rizzo, Born: 1957 | 2007 |
|
| Chief Financial Officer | |
| Vice President, John Hancock Financial Services (since 2008); Senior Vice President, John Hancock | |
| Advisers, LLC and John Hancock Investment Management Services, LLC (since 2008); Chief Financial |
| Officer, John Hancock retail funds, John Hancock Variable Insurance Trust and John Hancock Funds II |
| (since 2007). | |
|
| |
| Salvatore Schiavone, Born: 1965 | 2009 |
|
| Treasurer | |
| Assistant Vice President, John Hancock Financial Services (since 2007); Vice President, John Hancock |
| Advisers, LLC and John Hancock Investment Management Services, LLC (since 2007); Treasurer, | |
| John Hancock retail funds (since 2007, including prior positions); Treasurer, John Hancock Variable | |
| Insurance Trust and John Hancock Funds II (since 2010 and 2007–2009, including prior positions). | |
John Hancock retail funds is comprised of John Hancock Funds III and 34 other John Hancock funds consisting of 24 series of other John Hancock trusts and 10 closed-end funds.
The business address for all Trustees and Officers is 601 Congress Street, Boston, Massachusetts 02210-2805.
The Statement of Additional Information of the fund includes additional information about members of the Board of Trustees of the Trust and is available without charge, upon request, by calling 800-225-5291.
1 Each Trustee holds office until his or her successor is elected and qualified, or until the Trustee’s death, retirement, resignation or removal.
2 Became a Trustee of the Trust effective December 1, 2012.
3 Member of Audit Committee.
4 Because Messrs. Bromley and Thomson are senior executives or directors and Mr. Boyle held prior positions as a senior executive and director of the Advisor and/or its affiliates, each of them is considered an “interested person,” as defined in the Investment Company Act of 1940, of the Trust.
| |
| 43 |
| | Annual report | Diversified Strategies Fund |
More information
| |
| Trustees | Investment adviser |
| James M. Oates, Chairperson | John Hancock Investment Management Services, LLC |
| Steven R. Pruchansky, Vice Chairperson | |
| Charles L. Bardelis* | Investment subadviser |
| James R. Boyle† | John Hancock Asset Management a division of |
| Craig Bromley† | Manulife Asset Management (US) LLC |
| Peter S. Burgess* | |
| William H. Cunningham | Principal distributor |
| Grace K. Fey | John Hancock Funds, LLC |
| Theron S. Hoffman* | |
| Deborah C. Jackson | Custodian |
| Hassell H. McClellan | State Street Bank and Trust Company |
| Gregory A. Russo | |
| Warren A. Thomson† | Transfer agent |
| | John Hancock Signature Services, Inc. |
| |
| Officers | Legal counsel |
| Hugh McHaffie | K&L Gates LLP |
| President | |
| Andrew G. Arnott | Independent registered |
| Executive Vice President | public accounting firm |
| Thomas M. Kinzler | PricewaterhouseCoopers LLP |
| Secretary and Chief Legal Officer | |
| Francis V. Knox, Jr. | |
| Chief Compliance Officer | |
| Charles A. Rizzo | |
| Chief Financial Officer | |
| Salvatore Schiavone | |
| Treasurer | |
* Member of the Audit Committee
† Non-Independent Trustee
The fund’s proxy voting policies and procedures, as well as the fund’s proxy voting record, if any, for the most recent twelve-month period ended June 30, are available free of charge on the Securities and Exchange Commission (SEC) Web site at www.sec.gov or on our Web site.
The fund’s complete list of portfolio holdings, for the first and third fiscal quarters, is filed with the SEC on Form N-Q. The fund’s Form N-Q is available on our Web site and the SEC’s Web site, www.sec.gov, and can be reviewed and copied (for a fee) at the SEC’s Public Reference Room in Washington, DC. Call 800-SEC-0330 to receive information on the operation of the SEC's Public Reference Room.
We make this information on your fund, as well as monthly portfolio holdings, and other fund details available on our Web site at www.jhinvestments.com or by calling 800-225-5291.
| | |
| You can also contact us: | | |
| 800-225-5291 | Regular mail: | Express mail: |
| jhinvestments.com | John Hancock Signature Services, Inc. | John Hancock Signature Services, Inc. |
| | P.O. Box 55913 | Mutual Fund Investment Operations |
| | Boston, MA 02205-5913 | 30 Dan Road |
| | | Canton, MA 02021 |
| |
| John Hancock China Emerging Leaders Fund | |
| |
| Table of Contents | |
| |
| Management's discussion of fund performance | Page 3 |
| A look at performance | Page 4 |
| Your expenses | Page 6 |
| Portfolio summary | Page 7 |
| Fund's investments | Page 8 |
| Financial statements | Page 11 |
| Financial highlights | Page 14 |
| Notes to financial statements | Page 17 |
| Auditors report | Page 23 |
| Federal tax information | Page 24 |
| Trustees and Officers | Page 32 |
| More information | Page 36 |
John Hancock China Emerging Leaders Fund
Management’s Discussion of Fund Performance
By Atlantis Investment Management (Hong Kong) Ltd.
The Chinese equity market rallied during the 12 months ended July 31, 2013, amid ongoing volatility. Global equity markets struggled for traction at the beginning of the period amid the run-up to the U.S. presidential election, as investors began to focus on the nation’s looming fiscal cliff and increasing concerns over the eurozone outlook. The start of 2013 was marked by a boost in investors’ confidence, and the overall positive purchasing managers’ reports suggested that the manufacturing sector ended 2012 on an optimistic note. China’s economy demonstrated robust export and import data in January, surprising the market on the upside, and inflation in that country continued to recede. However, the Chinese equity market slumped in March and April, as did the Hong Kong market, amid uncertainties arising from the isolated bird flu outbreak in China, and the implications of further cooling measures imposed on China and Hong Kong property markets. In June, short-term money market rates skyrocketed as the country was hit by an unprecedented cash crunch, and equities plummeted, recovering slightly since.
For the 12 months ended July 31, 2013, the fund’s Class A shares declined 3.96%, excluding sales charges, trailing the 8.20% return of its benchmark, the MSCI China Index, and the average 14.53% return of Morningstar, Inc.’s China region fund category. † Stock selection in the consumer, industrials, and materials sectors detracted the most from the fund’s relative performance, while the fund’s sector allocations, specifically overweights in the consumer and utilities sectors, and underweights in energy and telecommunication services, slightly offset the relative shortfall. Among the top individual detractors from performance were China Metal Recycling Holdings, Inc. in the materials sector, Silver Base Group Holdings, Ltd. in consumer discretionary and China Foods, Ltd. in consumer staples. China Metal Recycling has been suspended from trading since late January 2013 due to fraud allegations and has been written down to reflect its fair value. Silver Base is a leading wine distributor which suffered from short term negative sentiments in the sector due to a government clamp down on liquor and luxury goods consumption by public sector employees. China Foods is a diversified food and beverage company which also has exposure to wine and suffered margin squeeze in their edible oil business.
This commentary reflects the views of the portfolio manager through the end of the period discussed in this report. As such, they are in no way guarantees of future events, and are not intended to be used as investment advice or a recommendation regarding any specific security. They are also subject to change at any time as market and other conditions warrant.Past performance is no guarantee of future results.
International investing involves special risks such as political, economic, and currency risks and differences in accounting standards and financial reporting. Although they are larger and/or more established than many emerging markets, the markets of China function in many ways as emerging markets, and carry the high levels of risk associated with emerging markets. These include higher inflation, interest rates, and unemployment as well as greater social, economic, regulatory and political uncertainties than more developed countries. For these and other risks, please see the fund’s prospectus.
† Figures from Morningstar, Inc. include distributions reinvested and do not take into account sales charges. Actual load-adjusted performance is lower.
A look at performance
Total returns for the period ended July 31, 2013
| | | | | | | | | | |
| | | Average annual total returns (%) | | Cumulative total returns (%) | |
| | | with maximum sales charge | | | with maximum sales charge | |
|
| | | | | | Since | | | | | Since |
| | | 1-year | 5-year | 10-year | inception1 | | 1-year | 5-year | 10-year | inception1 |
|
| Class A | | –8.76 | — | — | –9.70 | | –8.76 | — | — | –15.00 |
|
| Class I2 | | –3.61 | — | — | –6.38 | | –3.61 | — | — | –9.97 |
|
| Class NAV2 | | –3.41 | — | — | –6.27 | | –3.41 | — | — | –9.79 |
|
| Index† | | 8.20 | — | — | 8.53 | | 8.20 | — | — | 13.92 |
|
Performance figures assume all distributions are reinvested. Figures reflect maximum sales charges on Class A shares of 5.00%.
The expense ratios of the fund, both net (including any fee waivers or expense limitations) and gross (excluding any fee waivers or expense limitations), are set forth according to the most recent publicly available prospectuses for the fund and may differ from those disclosed in the Financial highlights tables in this report. For all classes the net expenses equal the gross expenses. The expense ratios are as follows:
| | | | | | | |
| | Class A | Class I | Class NAV | | | | |
| Net/Gross (%) | 1.83 | 1.44 | 1.34 | | | | |
The returns reflect past results and should not be considered indicative of future performance. The return and principal value of an investment will fluctuate so that shares, when redeemed, may be worth more or less than their original cost. Due to market volatility, the fund’s current performance may be higher or lower than the performance shown. For current to the most recent month-end performance data, please call 800-225-5291 or visit the fund’s website at jhinvestments.com.
The performance table above and the chart on the next page do not reflect the deduction of taxes that a shareholder may pay on fund distributions or on the redemption of fund shares. The fund’s performance results reflect any applicable fee waivers or expense reductions, without which the expenses would increase and results would have been less favorable.
† Index is the MSCI China Index.
See the following page for footnotes.
| |
| 4 |
| China Emerging Leaders Fund | Annual report | |
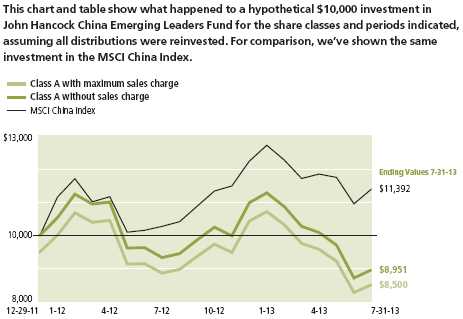
| | | | |
| | | With maximum | Without | |
| | Start date | sales charge | sales charge | Index |
|
| Class I2 | 12-29-11 | $9,003 | $9,003 | $11,392 |
|
| Class NAV2 | 12-29-11 | 9,021 | 9,021 | 11,392 |
|
MSCI China Index (gross of foreign withholding taxes on dividends) is an unmanaged free float-adjusted market capitalization weighted index that is designed to measure large and mid cap equity market performance in China.
It is not possible to invest directly in an index. Index figures do not reflect expenses or sales charges, which would have resulted in lower values if they did.
Footnotes related to performance pages
1 From 12-29-11.
2 For certain types of investors as described in the fund’s prospectuses.
| |
| 5 |
| | Annual report | China Emerging Leaders Fund |
Your expenses
These examples are intended to help you understand your ongoing operating expenses of investing in the fund so you can compare these costs with the ongoing costs of investing in other mutual funds.
Understanding your fund expenses
As a shareholder of the fund, you incur two types of costs:
• Transaction costs which include sales charges (loads) on purchases or redemptions (varies by share class), minimum account fee charge, etc.
• Ongoing operating expenses including management fees, distribution and service fees (if applicable), and other fund expenses.
We are going to present only your ongoing operating expenses here.
Actual expenses/actual returns
This example is intended to provide information about your fund’s actual ongoing operating expenses, and is based on your fund’s actual return. It assumes an account value of $1,000.00 on February 1, 2013, with the same investment held until July 31, 2013.
| | | |
| | Account value | Ending value | Expenses paid during |
| | on 2-1-13 | on 7-31-13 | period ended 7-31-131 |
|
| Class A | $1,000.00 | $793.60 | $7.65 |
|
| Class I | 1,000.00 | 794.90 | 6.10 |
|
| Class NAV | 1,000.00 | 795.80 | 5.61 |
|
Together with the value of your account, you may use this information to estimate the operating expenses that you paid over the period. Simply divide your account value at July 31, 2013, by $1,000.00, then multiply it by the “expenses paid” for your share class from the table above. For example, for an account value of $8,600.00, the operating expenses should be calculated as follows:
Example
[ My account value $8,600.00 / $1,000.00 = 8.6 ] x $[ “expenses paid” from table ] = My actual expenses
Hypothetical example for comparison purposes
This table allows you to compare the fund’s ongoing operating expenses with those of any other fund. It provides an example of the fund’s hypothetical account values and hypothetical expenses based on each class’s actual expense ratio and an assumed 5% annualized return before expenses (which is not the fund’s actual return). It assumes an account value of $1,000.00 on February 1, 2013, with the same investment held until July 31, 2013. Look in any other fund shareholder report to find it’s hypothetical Example and you will be able to compare these expenses.
| | | |
| | Account value | Ending value | Expenses paid during |
| | on 2-1-13 | on 7-31-13 | period ended 7-31-131 |
|
| Class A | $1,000.00 | $1,016.30 | $8.60 |
|
| Class I | 1,000.00 | 1,018.00 | 6.85 |
|
| Class NAV | 1,000.00 | 1,018.50 | 6.31 |
|
Remember, these examples do not include any transaction costs; therefore, these examples will not help you to determine the relative total costs of owning different funds. If transaction costs were included, your expenses would have been higher. See the prospectus for details regarding transaction costs.
1 Expenses are equal to the fund's annualized expense ratio of 1.72%, 1.37% and 1.26% for Class A, Class I and Class NAV shares, respectively, multiplied by the average account value over the period, multiplied by 181/365 (to reflect the one-half year period).
China Emerging Leaders Fund
As of 7-31-13
Portfolio Summary
| |
| Top 10 Holdings (44.0% of Net Assets on 7-31-13)1,2 | |
| NQ Mobile, Inc., Class A | 5.7% |
| Renhe Commercial Holdings Company, Ltd. | 5.4% |
| China Yurun Food Group, Ltd. | 5.3% |
| Silver Base Group Holdings, Ltd. | 4.4% |
| Hua Han Bio-Pharmaceutical Holdings, Ltd., H Shares | 4.4% |
| iShares Asia Trust Fund | 4.2% |
| People's Insurance Company Group of China, Ltd., H Shares | 4.1% |
| Haier Electronics Group Company, Ltd. | 3.8% |
| China Resources Power Holdings, Ltd. | 3.5% |
| Biosensors International Group, Ltd. | 3.2% |
| |
| |
| Country Concentration1 | |
| China | 52.1% |
| Hong Kong | 38.9% |
| United States | 3.2% |
| Singapore | 3.2% |
| Bermuda | 2.3% |
| Mongolia | 0.3% |
| |
| |
| Sector Composition1,3 | |
| Financials | 18.1% |
| Consumer Discretionary | 14.3% |
| Consumer Staples | 12.9% |
| Industrials | 12.2% |
| Health Care | 9.6% |
| Information Technology | 9.0% |
| Utilities | 8.5% |
| Telecommunication Services | 5.0% |
| Materials | 3.9% |
| Energy | 3.3% |
| Short-Term Investments & Other | 3.2% |
1 As a percentage of net assets on 7-31-13.
2 Cash and cash equivalents not included.
3 Sector investing is subject to greater risks than the market as a whole. Because the fund may focus on particular sectors of the economy, its performance may depend on the performance of those sectors. International investing involves special risks such as political, economic and currency risks and differences in accounting standards and financial reporting. Although they are larger and/or more established than many emerging markets, the markets of China function in many ways as emerging markets and carry the high levels of risk associated with emerging markets.
China Emerging Leaders Fund
Fund’s investments
As of 7-31-13
| | |
| | Shares | Value |
| |
| Common Stocks 90.3% | | $299,464,493 |
|
| (Cost $344,918,776) | | |
| |
| China 52.1% | | 172,799,052 |
|
| Beijing Capital International Airport Company, Ltd., H Shares | 11,000,000 | 6,804,784 |
| China Communications Construction Company, Ltd., H Shares | 10,000,000 | 7,626,115 |
| China Communications Services Corp., Ltd., H Shares | 10,000,000 | 6,533,707 |
| China Harmony Auto Holding, Ltd. (I) | 5,000,000 | 3,939,089 |
| China Qinfa Group, Ltd. | 10,000,000 | 708,643 |
| China Shipping Container Lines Company, Ltd., H Shares (I) | 13,000,000 | 3,148,412 |
| China Telecom Corp., Ltd., H Shares | 20,000,000 | 9,934,107 |
| China Yurun Food Group, Ltd. (I) | 25,000,000 | 17,493,012 |
| Chinasoft International, Ltd. (I) | 20,500,000 | 5,544,088 |
| CITIC Securities Company, Ltd., H Shares | 2,200,000 | 4,138,301 |
| Fosun International, Ltd. | 2,500,000 | 1,892,597 |
| Guangzhou Shipyard International Company, Ltd., H Shares | 3,000,000 | 2,490,747 |
| Huadian Power International Corp., H Shares | 13,000,000 | 5,996,299 |
| Huili Resources Group, Ltd. (I) | 12,000,000 | 2,999,949 |
| Inner Mongolia Yitai Coal Company, H Shares | 3,500,000 | 6,782,969 |
| NQ Mobile, Inc., Class A (I)(R) | 6,250,000 | 18,789,919 |
| People's Insurance Company Group of China, Ltd., H Shares | 30,000,000 | 13,452,205 |
| Ping An Insurance Group Company, H Shares | 1,000,000 | 6,468,729 |
| Renhe Commercial Holdings Company, Ltd. (I) | 300,000,000 | 17,785,432 |
| Sany Heavy Equipment International Holdings Company, Ltd. | 13,000,000 | 3,821,818 |
| Shandong Weigao Group Medical Polymer Company, Ltd., H Shares | 7,000,000 | 6,600,529 |
| Sinopec Engineering Group Company, Ltd. (I) | 4,000,000 | 5,278,958 |
| Tencent Holdings, Ltd. | 120,000 | 5,439,139 |
| Xiao Nan Guo Restaurants Holdings, Ltd. | 25,000,000 | 3,731,188 |
| Zhaojin Mining Industry Company, Ltd., H Shares | 8,000,000 | 5,398,316 |
| |
| Hong Kong 34.7% | | 114,934,398 |
|
| China Foods, Ltd. | 20,000,000 | 7,836,838 |
| China Mengniu Dairy Company, Ltd. | 2,500,000 | 10,025,680 |
| China Metal Recycling Holdings, Ltd. (I) | 15,000,000 | 0 |
| China Power International Development, Ltd. | 7,000,000 | 2,955,876 |
| China Resources Power Holdings, Ltd. | 5,000,000 | 11,620,728 |
| China Water Affairs Group, Ltd. | 22,000,000 | 7,509,314 |
| ChinaVision Media Group, Ltd. (I) | 50,000,000 | 3,056,398 |
| Far East Global Group, Ltd. (I) | 15,000,000 | 4,734,885 |
| Gemdale Properties and Investment Corp., Ltd. (I) | 12,000,000 | 1,560,862 |
| Glorious Property Holdings, Ltd. (I) | 10,000,000 | 1,443,165 |
| Haier Electronics Group Company, Ltd. | 7,000,000 | 12,634,338 |
| Hao Tian Resources Group, Ltd. (I) | 35,000,000 | 1,534,280 |
| Hua Han Bio-Pharmaceutical Holdings, Ltd., H Shares | 55,000,000 | 14,600,587 |
| Ming Fung Jewellery Group, Ltd. (I) | 83,000,000 | 2,567,760 |
| Silver Base Group Holdings, Ltd. (V) | 75,000,000 | 14,685,953 |
| Silver Grant International, Ltd. | 10,000,000 | 1,391,709 |
| Tianjin Development Holdings, Ltd. (I) | 5,000,000 | 2,798,426 |
| Tibet 5100 Water Resources Holdings, Ltd. | 10,000,000 | 3,763,778 |
| Viva China Holdings, Ltd. (I) | 120,000,000 | 6,654,650 |
| Wison Engineering Services Company, Ltd. (I) | 8,000,000 | 3,559,171 |
| |
| Mongolia 0.3% | | 1,105,199 |
|
| Mongolian Mining Corp. (I) | 5,333,000 | 1,105,199 |
See notes to financial statements
China Emerging Leaders Fund
Fund’s investments
As of 7-31-13
| | | |
| | | Shares | Value |
| |
| Singapore 3.2% | | | 10,625,844 |
|
| Biosensors International Group, Ltd. | | 13,000,000 | 10,625,844 |
| | | | |
| | | Shares | Value |
| |
| Participation Notes (K) 2.3% | | | $7,515,251 |
|
| (Cost $12,406,341) | | | |
| |
| Bermuda 2.3% | | | 7,515,251 |
|
| Anhui Quanchai Engine Company, A Shares (Expiration Date: 3-30-17; Counterparty: | | |
| CLSA Asia-Pacific Markets) (I) | | 3,000,111 | 3,891,510 |
| Wuliangye Yibin Company, Ltd. (Expiration Date: 12-11-13; Counterparty: CLSA Asia- | | |
| Pacific Markets) (I)(S) | | 1,172,018 | 3,623,741 |
| |
| Exchange-Traded Funds 4.2% | | | $13,825,004 |
|
| (Cost $15,110,031) | | | |
| |
| Hong Kong 4.2% | | | 13,825,004 |
|
| iShares Asia Trust Fund | | 12,000,000 | 13,825,004 |
| | | | |
| | Yield (%) | Shares | Value |
| |
| Short-Term Investments 2.9% | | | $9,616,411 |
|
| (Cost $9,616,411) | | | |
| |
| Money Market Funds 2.9% | | | 9,616,411 |
|
| State Street Institutional Liquid Reserves Fund | 0.0767(Y) | 9,616,411 | 9,616,411 |
| |
| Total investments (Cost $382,051,559)† 99.7% | | | $330,421,159 |
|
| Other assets and liabilities, net 0.3% | | | $1,118,852 |
|
| Total net assets 100.0% | | | $331,540,011 |
|
The percentage shown for each investment category is the total value of the category as a percentage of the net assets of the fund.
(I) Non-income producing security.
(K) Underlying issuer is shown parenthetically in security description.
(R) Direct placement securities are restricted to resale and the fund has limited rights to registration under the Securities Act of 1933.
| | | | | | |
| | Original | | Beginning | Ending | Value as a | |
| Issuer, Description | acquisition | Acquisition cost | share | share | percentage of | Value as of |
| | date | | amount | amount | fund’s net assets | 7-31-13 |
| |
| |
| NQ Mobile, Inc., | 07/02/2013 | $10,000,000 | 6,250,000 | 6,250,000 | 5.67% | $18,789,919 |
| Class A | | | | | | |
(S) These securities are exempt from registration under Rule 144A of the Securities Act of 1933. Such securities may be resold, normally to qualified institutional buyers, in transactions exempt from registration.
(V) The fund owns 5% or more of the outstanding voting shares of the issuer and the security is considered an affiliate of the fund. For more information on this security refer to the Notes to the financial statements.
(Y) The rate shown is the annualized seven-day yield as of 7-31-13.
See notes to financial statements
China Emerging Leaders Fund
Fund’s investments
As of 7-31-13
† At 7-31-13, the aggregate cost of investment securities for federal income tax purposes was $382,075,674. Net unrealized depreciation aggregated $51,654,515, of which $28,869,071 related to appreciated investment securities and $80,523,586 related to depreciated investment securities.
The fund had the following sector composition as a percentage of total net assets on 7-31-13:
| | | | | | | |
| Financials | | 18.1% | | | | | |
| Consumer Discretionary | | 14.3% | | | | | |
| Consumer Staples | | 12.9% | | | | | |
| Industrials | | 12.2% | | | | | |
| Health Care | | 9.6% | | | | | |
| Information Technology | | 9.0% | | | | | |
| Utilities | | 8.5% | | | | | |
| Telecommunication Services | | 5.0% | | | | | |
| Materials | | 3.9% | | | | | |
| Energy | | 3.3% | | | | | |
| Short-Term Investments & Other | | 3.2% | | | | | |
| | |
| | | | | |
| Total | | 100.0% | | | | | |
See notes to financial statements
China Emerging Leaders Fund
Statement of Assets and Liabilities — July 31, 2013
| | | | |
| Assets | | | | |
| | |
| Investments in unaffiliated issuers, at value | | | | |
| (Cost $352,740,351) | $ | 315,735,206 | | |
| Investments in affiliated issuers, at value (Cost | | | | |
| $29,311,208) | | 14,685,953 | | |
| | | | | |
| Total investments, at value (Cost | | | | |
| $382,051,559) | | 330,421,159 | | |
| | | | | |
| Foreign currency, at value (Cost $9,819) | | 9,818 | | |
| Dividends and interest receivable | | 1,394,495 | | |
| Other receivables and prepaid expenses | | 1,613 | | |
| | | | | |
| Total assets | | 331,827,085 | | |
| | | |
| | | |
| Liabilities | | | | |
| | |
| Payable for investments purchased | | 134,752 | | |
| Payable to affiliates | | | | |
| Accounting and legal services fees | | 6,593 | | |
| Transfer agent fees | | 20 | | |
| Trustees' fees | | 286 | | |
| Other liabilities and accrued expenses | | 145,423 | | |
| | | | | |
| Total liabilities | | 287,074 | | |
| | | |
| Net assets | $ | 331,540,011 | | |
| | | |
| | | |
| Net assets consist of | | | | |
| | |
| Paid-in capital | $ | 372,241,877 | | |
| Undistributed net investment income | | 1,152,273 | | |
| Accumulated net realized gain (loss) on | | | | |
| investments and foreign currency transactions | | 9,775,774 | | |
| Net unrealized appreciation (depreciation) on | | | | |
| investments and translation of assets and | | | | |
| liabilities in foreign currencies | | (51,629,913) | | |
| | | | | |
| Net assets | $ | 331,540,011 | | |
| | | |
| | | |
| Net asset value per share | | | | |
| | |
| Based on net asset values and shares | | | | |
| outstanding-the Fund has an unlimited number | | | | |
| of shares authorized with no par value | | | | |
| Class A ($86,502 ÷ 10,000 shares) 1 | $ | 8.65 | | |
| Class I ($86,818 ÷ 10,000 shares) | $ | 8.68 | | |
| Class NAV ($331,366,691 ÷ 38,145,070 shares) | $ | 8.69 | | |
| | | |
| Maximum offering price per share | | | | |
| Class A (net asset value per share ÷ 95%)2 | $ | 9.11 | | |
1 Redemption price is equal to net asset value less any applicable contingent deferred sales charge.
2 On single retail sales of less than $50,000. On sales of $50,000 or more and on group sales the offering price is reduced.
See notes to financial statements
China Emerging Leaders Fund
Statement of Operations — For the Year Ended July 31, 2013
| | | | |
| Investment income | | | | |
| | |
| Dividends | $ | 5,471,873 | | |
| Interest | | 18,651 | | |
| Less foreign taxes withheld | | (299,323) | | |
| | | | | |
| Total investment income | | 5,191,201 | | |
| | | |
| Expenses | | | | |
| | |
| Investment management fees | | 3,513,696 | | |
| Distribution and service fees | | 296 | | |
| Accounting and legal services fees | | 41,893 | | |
| Transfer agent fees | | 278 | | |
| Trustees' fees | | 3,703 | | |
| Professional fees | | 53,865 | | |
| Custodian fees | | 389,197 | | |
| Registration and filing fees | | 57,709 | | |
| Other | | 4,545 | | |
| | | | | |
| Total expenses | | 4,065,182 | | |
| | | | | |
| Less expense reductions | | (12,366) | | |
| | | | | |
| Net expenses | | 4,052,816 | | |
| | | |
| Net investment income | | 1,138,385 | | |
| | | |
| | | |
| Realized and unrealized gain (loss) | | | | |
| | |
| Net realized gain (loss) on | | | | |
| Investments in unaffiliated issuers | | 14,536,487 | | |
| Foreign currency transactions | | (587) | | |
| | | | | |
| | | 14,535,900 | | |
| | | |
| Change in net unrealized appreciation | | | | |
| (depreciation) of | | | | |
| Investments in unaffiliated issuers | | (12,673,118) | | |
| Investments in affiliated issuers | | (14,625,255) | | |
| Translation of assets and liabilities in foreign | | | | |
| currencies | | 551 | | |
| | | | | |
| | | (27,297,822) | | |
| | | |
| Net realized and unrealized loss | | (12,761,922) | | |
| | | |
| Decrease in net assets from operations | $ | (11,623,537) | | |
See notes to financial statements
China Emerging Leaders Fund
Statements of Changes in Net Assets
| | | | | | | |
| | | Year ended | | | Period ended | | |
| | | 7/31/13 | | | 7/31/121 | | |
| | | |
| Increase (decrease) in net assets | | | | | | | |
| | |
| From operations | | | | | | | |
| Net investment income | $ | 1,138,385 | | $ | 838,340 | | |
| Net realized gain | | 14,535,900 | | | 6,354,139 | | |
| Change in net unrealized appreciation | | | | | | | |
| (depreciation) | | (27,297,822) | | | (24,332,091) | | |
| | | | | | | | |
| Decrease in net assets resulting from | | | | | | | |
| operations | | (11,623,537) | | | (17,139,612) | | |
| | | |
| | | |
| Distributions to shareholders | | | | | | | |
| From net investment income | | | | | | | |
| Class I | | (256) | | | — | | |
| Class NAV | | (1,058,174) | | | — | | |
| From net realized gain | | | | | | | |
| Class A | | (3,558) | | | — | | |
| Class I | | (3,558) | | | — | | |
| Class NAV | | (10,873,251) | | | — | | |
| | | | | | | | |
| Total distributions | | (11,938,797) | | | — | | |
| | | |
| From Fund share transactions | | 70,372,684 | | | 301,869,273 | | |
| | | |
| | | |
| Total increase | | 46,810,350 | | | 284,729,661 | | |
| | | |
| Net assets | | | | | | | |
| | |
| Beginning of year | | 284,729,661 | | | — | | |
| | | | | | | | |
| End of year | $ | 331,540,011 | | $ | 284,729,661 | | |
| | | |
| Undistributed net investment income | $ | 1,152,273 | | $ | 798,129 | | |
1 The inception date is 12-29-11.
See notes to financial statements
China Emerging Leaders Fund
Financial Highlights
Class A Shares
| | | | | |
| | | 7-31-13 | | 7-31-121 | |
| Per share operating performance | | | | | |
| |
| |
| |
| Net asset value, beginning of period | $ | 9.32 | $ | 10.00 | |
| Net investment income (loss) 2 | | (0.02) | | 0.02 | |
| Net realized and unrealized loss on | | | | | |
| investments | | (0.29) | | (0.70) | |
| | | | | | |
| Total from investment operations | | (0.31) | | (0.68) | |
| | |
| Less distributions | | | | | |
| From net realized gain | | (0.36) | | — | |
| | | | | | |
| Total distributions | | (0.36) | | — | |
| | |
| Net asset value, end of period | $ | 8.65 | $ | 9.32 | |
| | |
| Total return (%)3,4 | | (3.96) | | (6.80)5 | |
| | |
| Ratios and supplemental data | | | | | |
| |
| |
| |
| Net assets, end of period (in millions) | $ | — 6 | $ | — 6 | |
| Ratios (as a percentage of average net | | | | | |
| assets): | | | | | |
| Expenses before reductions | | 1.75 | | 1.837 | |
| Expenses including reductions and amounts | | | | | |
| recaptured | | 1.76 | | 1.807 | |
| Net investment income (loss) | | (0.20) | | 0.357 | |
| Portfolio turnover (%) | | 51 | | 35 | |
1 The inception date for Class A shares is 12-29-11.
2 Based on the average daily shares outstanding.
3 Does not reflect the effect of sales charges, if any.
4 Total returns would have been lower had certain expenses not been reduced during the applicable periods shown.
5 Not annualized.
6 Less than $500,000.
7 Annualized.
| | |
| See notes to financial statements | | China Emerging Leaders Fund |
| 14 |
China Emerging Leaders Fund
Financial Highlights
Class I Shares
| | | | | |
| | | 7-31-13 | | 7-31-121 | |
| Per share operating performance | | | | | |
| |
| |
| |
| Net asset value, beginning of period | $ | 9.34 | $ | 10.00 | |
| Net investment income2 | | 0.02 | | 0.04 | |
| Net realized and unrealized loss on | | | | | |
| investments | | (0.29) | | (0.70) | |
| | | | | | |
| Total from investment operations | | (0.27) | | (0.66) | |
| | |
| Less distributions | | | | | |
| From net investment income | | (0.03) | | — | |
| From net realized gain | | (0.36) | | — | |
| | | | | | |
| Total distributions | | (0.39) | | — | |
| | |
| Net asset value, end of period | $ | 8.68 | $ | 9.34 | |
| | |
| Total return (%)3 | | (3.61) | | (6.60)4 | |
| | |
| Ratios and supplemental data | | | | | |
| |
| |
| |
| Net assets, end of period (in millions) | $ | — 5 | $ | — 5 | |
| Ratios (as a percentage of average net | | | | | |
| assets): | | | | | |
| Expenses before reductions | | 1.37 | | 1.446 | |
| Expenses including reductions and amounts | | | | | |
| recaptured | | 1.37 | | 1.446 | |
| Net investment income | | 0.19 | | 0.726 | |
| Portfolio turnover (%) | | 51 | | 35 | |
1 The inception date for Class I shares is 12-29-11.
2 Based on the average daily shares outstanding.
3 Total returns would have been lower had certain expenses not been reduced during the applicable periods shown.
4 Not annualized.
5 Less than $500,000.
6 Annualized.
| | |
| See notes to financial statements | | China Emerging Leaders Fund |
| 15 |
China Emerging Leaders Fund
Financial Highlights
Class NAV Shares
| | | | | |
| | | 7-31-13 | | 7-31-121 | |
| Per share operating performance | | | | | |
| |
| |
| |
| Net asset value, beginning of period | $ | 9.34 | $ | 10.00 | |
| Net investment income2 | | 0.04 | | 0.05 | |
| Net realized and unrealized loss on | | | | | |
| investments | | (0.30) | | (0.71) | |
| | | | | | |
| Total from investment operations | | (0.26) | | (0.66) | |
| | |
| Less distributions | | | | | |
| From net investment income | | (0.03) | | — | |
| From net realized gain | | (0.36) | | — | |
| | | | | | |
| Total distributions | | (0.39) | | — | |
| | |
| Net asset value, end of period | $ | 8.69 | $ | 9.34 | |
| | |
| Total return (%)3 | | (3.41) | | (6.60)4 | |
| | |
| Ratios and supplemental data | | | | | |
| |
| |
| |
| Net assets, end of period (in millions) | $ | 331 | $ | 285 | |
| Ratios (as a percentage of average net | | | | | |
| assets): | | | | | |
| Expenses before reductions | | 1.27 | | 1.345 | |
| Expenses including reductions and amounts | | | | | |
| recaptured | | 1.27 | | 1.345 | |
| Net investment income | | 0.36 | | 0.845 | |
| Portfolio turnover (%) | | 51 | | 35 | |
1 The inception date for Class NAV shares is 12-29-11.
2 Based on the average daily shares outstanding.
3 Total returns would have been lower had certain expenses not been reduced during the applicable periods shown.
4 Not annualized.
5 Annualized.
| | |
| See notes to financial statements | | China Emerging Leaders Fund |
| 16 |
China Emerging Leaders Fund
Notes to Financial Statements
Note 1 — Organization
John Hancock China Emerging Leaders Fund (the fund) is a series of John Hancock Funds II (the Trust), an open-end management investment company organized as a Massachusetts business trust and registered under the Investment Company Act of 1940, as amended (the 1940 Act). The investment objective of the fund is to achieve long-term capital appreciation.
The fund may offer multiple classes of shares. The shares currently offered are detailed in the Statement of assets and liabilities. Class A shares are offered to all investors. Class I shares are offered to institutions and certain investors. Class NAV shares are offered to John Hancock affiliated funds of funds and certain 529 plans. Shareholders of each class have exclusive voting rights to matters that affect that class. The distribution and service fees, if any, transfer agent fees, printing and postage and state registration fees for each class may differ.
Note 2 - Significant accounting policies
The financial statements have been prepared in conformity with accounting principles generally accepted in the United States of America, which require management to make certain estimates and assumptions as of the date of the financial statements. Actual results could differ from those estimates and those differences could be significant. Events or transactions occurring after the end of the fiscal period through the date that the financial statements were issued have been evaluated in the preparation of the financial statements. The following summarizes the significant accounting policies of the fund:
Security valuation. Investments are stated at value as of the close of regular trading on the New York Stock Exchange (NYSE), normally at 4:00 P.M., Eastern Time. In order to value the securities, the fund uses the following valuation techniques: Equity securities, held by the fund are valued at the last sale price or official closing price on the principal securities exchange on which they trade. In the event there were no sales during the day or closing prices are not available, the securities are valued using the last quoted bid or evaluated price. Foreign securities and currencies are valued in U.S. dollars, based on foreign currency exchange rates supplied by an independent pricing service. Certain securities traded only in the over-the-counter market are valued at the last bid price quoted by brokers making markets in the securities at the close of trading. Certain short-term securities are valued at amortized cost. Other portfolio securities and assets, for which reliable market quotations are not readily available, are valued at fair value as determined in good faith by the fund’s Pricing Committee following procedures established by the Board of Trustees, which include price verification procedures. The frequency with which these fair valuation procedures are used cannot be predicted and fair value of securities may differ significantly from the value that would have been used had a ready market for such securities existed. Generally, trading in foreign securities is substantially completed each day at various times prior to the close of trading on the NYSE. Significant market events that affect the values of foreign securities may occur between the time when the valuation of the securities is generally determined and the close of the NYSE. During significant market events, these securities will be valued at fair value, as determined in good faith, following procedures established by the Board of Trustees. The fund may use a fair valuation model to value foreign securities in order to adjust for events that may occur between the close of foreign exchanges and the close of the NYSE.
The fund uses a three-tier hierarchy to prioritize the pricing assumptions, referred to as inputs, used in valuation techniques to measure fair value. Level 1 includes securities valued using quoted prices in active markets for identical securities. Level 2 includes securities valued using other significant observable inputs. Observable inputs may include quoted prices for similar securities, interest rates, prepayment speeds and credit risk. Prices for securities valued using these inputs are received from independent pricing vendors and brokers and are based on an evaluation of the inputs described. Level 3 includes securities valued using significant unobservable inputs when market prices are not readily available or reliable, including the fund’s own assumptions in determining the fair value of investments. Factors used in determining value may include market or issuer specific events or trends, changes in interest rates and credit quality. The inputs or methodology used for valuing securities are not necessarily
an indication of the risks associated with investing in those securities. Changes in valuation techniques may result in transfers into or out of an assigned level within the disclosure hierarchy. Securities with a market value of approximately $10,626,324 at the beginning of the year were transferred from Level 2 to Level 3 during the period due to suspended trading. At July 31, 2013, these securities were valued at zero. As of July 31, 2013 all other investments are categorized as Level 2 under the hierarchy described above, except for short-term investments which were categorized as Level 1.
Security transactions and related investment income. Investment security transactions are accounted for on a trade date plus one basis for daily net asset value calculations. However, for financial reporting purposes, investment transactions are reported on trade date. Interest income is accrued as earned. Dividend income is recorded on the ex-date, except for dividends of foreign securities where the dividend may not be known until after the ex-date. In those cases, dividend income, net of withholding taxes, is recorded when the fund becomes aware of the dividends. Distributions received on securities that represent a return of capital or capital gain are recorded as a reduction of cost of investments and/or as a realized gain if amounts are estimable. Foreign taxes are provided for based on the fund’s understanding of the tax rules and rates that exist in the foreign markets in which it invests. Gains and losses on securities sold are determined on the basis of identified cost and may include proceeds from litigation.
Foreign currency translation. Assets, including investments and liabilities denominated in foreign currencies, are translated into U.S. dollar values each day at the prevailing exchange rate. Purchases and sales of securities, income and expenses are translated into U.S. dollars at the prevailing exchange rate on the date of the transaction. The effect of changes in foreign currency exchange rates on the value of securities is reflected as a component of the realized and unrealized gains (losses) on investments. Funds that invest internationally generally carry more risk than funds that invest strictly in U.S. securities. Risks can result from differences in economic and political conditions, regulations, market practices (including higher transaction costs), accounting standards and other factors. Foreign investments are also subject to a decline in the value of a foreign currency versus the U.S. dollar, which reduces the dollar value of securities denominated in that currency.
Foreign taxes. The fund may be subject to withholding tax on income and/or capital gains or repatriation taxes imposed by certain countries in which the fund invests. Taxes are accrued based upon investment income, realized gains or unrealized appreciation.
Line of credit. The fund may borrow from banks for temporary or emergency purposes, including meeting redemption requests that otherwise might require the untimely sale of securities. Pursuant to the funds custodian agreement, the custodian may loan money to the fund to make properly authorized payments. The fund is obligated to repay the custodian for any overdraft, including any related costs or expenses. The custodian may have a lien, security interest or security entitlement in any fund property that is not otherwise segregated or pledged, to the maximum extent permitted by law, to the extent of any overdraft.
In addition, the fund and other affiliated funds have entered into an agreement with Citibank N.A. that enables them to participate in a $300 million unsecured committed line of credit. A commitment fee, payable at the end of each calendar quarter, based on the average daily unused portion of the line of credit, is charged to each participating fund on a pro rata basis and is reflected in other expenses on the Statement of operations. Prior to March 27, 2013, the fund participated in a $200 million unsecured line of credit, also with Citibank, with terms otherwise similar to the existing agreement. Commitment fees for the year ended July 31, 2013 were $435. For the year ended July 31, 2013, the fund had no borrowings under either line of credit.
Expenses. Within the John Hancock funds complex, expenses that are directly attributable to an individual fund are allocated to such fund. Expenses that are not readily attributable to a specific fund are allocated among all funds in an equitable manner, taking into consideration, among other things, the nature and type of expense and the fund’s relative net assets. Expense estimates are accrued in the period to which they relate and adjustments are made when actual amounts are known.
Class allocations. Income, common expenses and realized and unrealized gains (losses) are determined at the fund level and allocated daily to each class of shares based on the net assets of the class. Class-specific expenses, such as distribution and service fees, if any, transfer agent fees, state registration fees and printing and postage expenses, for all classes, are calculated daily at the class level based on the appropriate net assets of each class and the specific expense rates applicable to each class.
Federal income taxes. The fund intends to continue to qualify as a regulated investment company by complying with the applicable provisions of the Internal Revenue Code and will not be subject to federal income tax on taxable income that is distributed to shareholders. Therefore, no federal income tax provision is required.
As of July 31, 2013, the fund had no uncertain tax positions that would require financial statement recognition, derecognition or disclosure. The fund’s federal tax returns are subject to examination by the Internal Revenue Service for a period of three years.
Distribution of income and gains. Distributions to shareholders from net investment income and net realized gains, if any, are recorded on the ex-date. The fund generally declares and pays dividends and capital gain distributions, if any, annually. The tax character of distributions for the year ended July 31, 2013 was $11,938,797 of ordinary income.
Distributions paid by the fund with respect to each class of shares are calculated in the same manner, at the same time and in the same amount, except for the effect of class level expenses that may be applied differently to each class. As of July 31, 2013, the components of distributable earnings on a tax basis consisted of $8,340,136 of undistributed ordinary income and $2,612,026 of long-term capital gains.
Such distributions and distributable earnings, on a tax basis, are determined in conformity with income tax regulations, which may differ from accounting principles generally accepted in the United States of America. Material distributions in excess of tax basis earnings and profits, if any, are reported in the fund’s financial statements as a return of capital.
Capital accounts within the financial statements are adjusted for permanent book-tax differences. These adjustments have no impact on net assets or the results of operations. Temporary book-tax differences, if any, will reverse in a subsequent period. Book-tax differences are primarily attributable to passive foreign investment companies.
Note 3 - Guarantees and indemnifications
Under the Trust’s organizational documents, its Officers and Trustees are indemnified against certain liabilities arising out of the performance of their duties to the fund, including the fund. Additionally, in the normal course of business, the fund enters into contracts with service providers that contain general indemnification clauses. The fund’s maximum exposure under these arrangements is unknown, as this would involve future claims that may be made against the fund that have not yet occurred. The risk of material loss from such claims is considered remote.
Note 4 – Fees and transactions with affiliates
John Hancock Investment Management Services, LLC (the Advisor) serves as investment advisor for the fund. John Hancock Funds, LLC (the Distributor), an affiliate of the Advisor, serves as principal underwriter of the fund. The Advisor and the Distributor are indirect, wholly owned subsidiaries of Manulife Financial Corporation (MFC).
Management fee. The fund has an investment management agreement with the Advisor under which the fund pays a daily management fee to the Advisor equivalent, on an annual basis, to the sum of: a) 1.10% of the first $500,000,000 of the fund’s average daily net assets; b) 1.05% of the next $500,000,000 of the fund’s average daily net assets; and c) 1.00% of the fund’s average daily net assets in excess of $1,000,000,000. The Advisor has a subadvisory agreement with Atlantis Investment Management (Hong Kong) Ltd. The fund is not responsible for payment of the subadvisory fees.
Effective June 1, 2013, the Advisor has contractually agreed to waive a portion of its management fee for certain funds (the Participating portfolios) of the Trust, John Hancock Funds, John Hancock Funds III and John Hancock Variable Insurance Trust. The waiver equals, on an annualized basis, 0.01% of that portion of the aggregate net assets of all the Participating portfolios that exceeds $75 billion but is less than or equal to $125 billion; 0.0125% of that portion of the aggregate net assets of all the Participating portfolios that exceeds $125 billion but is less than or equal to $150 billion; and 0.015% of that portion of the aggregate net assets of all the Participating porfolios that exceeds $150 billion. The amount of the reimbursement is calculated daily and allocated among all the Participating portfolios in proportion to the daily net assets of each fund. This arrangement may be amended or terminated at any time by the Advisor upon notice to the fund and with the approval of the Board of Trustees.
Prior to June 1, 2013, the Advisor had contractually agreed to waive a portion of its management fee for certain funds (the participating portfolios) of the Trust and John Hancock Variable Insurance Trust. The prior waiver equaled, on an annualized basis, 0.01% of that portion of the aggregate net assets of all the participating portfolios that exceeded $75 billion but is less than $100 billion; and 0.015% of that portion of the aggregate net assets of all the participating portfolios that equaled or exceeded $100 billion. The amount of the reimbursement was calculated daily and allocated among all the participating portfolios in proportion to the daily net assets of each fund.
The Advisor has voluntarily agreed to waive and/or reimburse operating expenses for Class A and Class I shares, excluding certain expenses such as taxes, brokerage commissions, interest expense, litigation and indemnification expenses, acquired fund fees, short dividend expense and other extraordinary expenses not incurred in the ordinary course of the fund’s business. The fee waivers and/or reimbursements are such that the expenses will not exceed 1.80% and 1.44% for Class A and Class I shares, respectively. Prior to January 1, 2013, the fee waivers and/or reimbursements were contractual. This voluntary expense reimbursement may be terminated at any time by the Advisor on notice to the fund.
Additionally, the Advisor has voluntarily agreed to waive and/or reimburse a portion of its management fee in order to limit the fund’s expenses, excluding certain expenses such as taxes, brokerage commissions, interest expense, litigation and indemnification expenses and other extraordinary expenses not incurred in the ordinary course of the fund’s business, advisory fees, 12b-1 fees, transfer agent fees and service fees, state registration fees, acquired fund fees, short dividend expense and printing and postage, to 0.25% of the fund’s average net assets. This voluntary expense reimbursement may be terminated at any time by the Advisor on notice to the fund.
Accordingly, these expense reductions amounted to $4, $4 and $12,373 for Class A, Class I and Class NAV shares, respectively for the period ended July 31, 2013.
The investment management fees incurred for the year ended July 31, 2013 were equivalent to a net annual effective rate of 1.10% of the fund’s average daily net assets.
Expense recapture. The Advisor may recapture operating expenses reimbursed or fees waived under previous expense limitation or waiver arrangements for a period of three years following the beginning of the month in which such reimbursements or waivers originally occurred to the extent that the fund is below its expense limitation during this period. For the period ended July 31, 2013 the fund recaptured $15. As of July 31, 2013, the fund has no amounts waived or reimbursed subject to recovery going forward.
Accounting and legal services. Pursuant to a service agreement, the fund reimburses the Advisor for all expenses associated with providing the administrative, financial, legal, accounting and recordkeeping services to the fund, including the preparation of all tax returns, periodic reports to shareholders and regulatory reports, among other services. These expenses are allocated to each share class based on its relative net assets at the time the expense was incurred. These accounting and legal services fees
incurred for the year ended July 31, 2013 amounted to an annual rate of 0.01% of the fund’s average daily net assets.
Distribution and service plans. The fund has a distribution agreement with the Distributor. The fund has adopted distribution and service plans with respect to Class A shares pursuant to Rule 12b-1 under the 1940 Act, to pay the Distributor for services provided as the distributor of shares of the fund. The fund pays 0.30% for Class A shares for distribution and service fees, expressed as an annual percentage of average daily net assets of the fund’s shares.
Transfer agent fees. The fund has a transfer agent agreement with John Hancock Signature Services, Inc. (Signature Services), an affiliate of the Advisor. The transfer agent fees paid to Signature Services are determined based on the cost to Signature Services (Signature Services Cost) of providing recordkeeping services. The Signature Services Cost includes a component of allocated John Hancock corporate overhead for providing transfer agent services to the fund and to all other John Hancock affiliated funds. It also includes out-of-pocket expenses that are comprised of payments made to third-parties for recordkeeping services provided to their clients who invest in one or more John Hancock funds. In addition, Signature Services Cost may be reduced by certain fees that Signature Services receives in connection with retirement and small accounts. Signature Services Cost is calculated monthly and allocated, as applicable, to four categories of share classes: Institutional Share Classes, Retirement Share Classes, Municipal Bond Classes and all other Retail Share Classes. Within each of these categories, the applicable costs are allocated to the affected John Hancock affiliated funds and/or classes, based on the relative average daily net assets.
Class level expenses. Class level expenses for the year ended July 31, 2013 were:
| | | | |
| | Distribution and | | | |
| Class | service fees | Transfer agent fees | | |
| | |
| A | $296 | $175 | | |
| | |
| I | - | 103 | | |
| | |
| Total | $296 | $278 | | |
| | |
The Fund did not incur printing or postage and state registration fees for the year ended July 31, 2013.
Trustee expenses. The fund compensates each Trustee who is not an employee of the Advisor or its affiliates. The costs of paying Trustee compensation and expenses are allocated to each fund based on its average daily net assets.
Note 5 - Fund share transactions
Transactions in fund shares for the year ended July 31, 2013 and the period ended July 31, 2012 were as follows:
| | | | | | | | |
| | | Year ended | | period ended |
| | | 7/31/13 | | 7/31/121 |
| | |
| |
|
| | | Shares | | Amount | | Shares | | Amount |
| Class A shares | | | | | | | | |
| Sold | | — | $ | — | | 10,000 | $ | 100,000 |
| | |
| |
| |
| |
|
| Total net increase | | — | $ | — | | 10,000 | $ | 100,000 |
| | |
| |
| |
| |
|
| Class I shares | | | | | | | | |
| Sold | | — | $ | — | | 10,000 | $ | 100,000 |
| | |
| |
| |
| |
|
| Total net increase | | — | $ | — | | 10,000 | $ | 100,000 |
| | |
| |
| |
| |
|
| Class NAV shares | | | | | | | | |
| Sold | | 6,903,780 | $ | 62,149,839 | | 30,477,216 | $ | 301,911,759 |
| Distributions reinvested | | 1,165,178 | | 11,931,425 | | — | | — |
| Repurchased | | (376,638) | | (3,708,580) | | (24,466) | | (242,486) |
| | |
| |
| |
| |
|
| Total net increase | | 7,692,320 | $ | 70,372,684 | | 30,452,750 | $ | 301,669,273 |
| | |
| |
| |
| |
|
| Total net increase | | 7,692,320 | $ | 70,372,684 | | 30,472,750 | $ | 301,869,273 |
| | |
| |
| |
| |
|
1The inception date is 12-29-11.
Affiliates of the fund owned 100% of shares of beneficial interest of the fund on July 31, 2013.
Note 6 - Purchase and sale of securities
Purchases and sales of securities, other than short-term securities, amounted to $228,952,403 and $156,541,304, respectively, for the year ended July 31, 2013.
Note 7 - Investment by affiliated funds
Certain investors in the fund are affiliated funds that are managed by the Advisor and its affiliates. The affiliated funds do not invest in the fund for the purpose of exercising management or control; however, affiliated fund investments may represent a significant portion of the fund’s net assets. At July 31, 2013, the following funds had an affiliate ownership of 5% or more of the fund’s net assets:
| | | |
| Fund | Affiliated | | |
| | Concentration | | |
| John Hancock Lifestyle Growth Portfolio | 28.2% | | |
| John Hancock Lifestyle Balanced Portfolio | 37.8% | | |
| John Hancock Lifestyle Aggressive Portfolio | 17.0% | | |
Note 8 – Transactions in securities of affiliated issuers
Affiliated issuers, as defined by the 1940 Act, are those in which the fund’s holdings of an issuer represent 5% or more of the outstanding voting securities of the issuer. A summary of the fund’s transactions in the securities of these issuers during the year ended July 31, 2013, is set forth below:
| | | | | |
| | Beginning | Ending | Realized | | |
| | share | share | gain | Dividend | Ending |
| Affiliate | amount | amount | (loss) | income | value |
|
| Silver Base Group Holdings, | | | | | |
| Ltd. | | | | | |
| Bought: 47,411,000 Sold: | | | | | |
| None | 26,714,000 | 75,000,000 | - | 225,625 | $14,685,953 |
| Corporate Action | | | | | |
| Bonus offer: 875,000 | | | | | |
Report of Independent Registered Public Accounting Firm
To the Board of Trustees of John Hancock Funds II and Shareholders of John Hancock
China Emerging Leaders Fund:
In our opinion, the accompanying statement of assets and liabilities, including the schedule of investments, and the related statements of operations and of changes in net assets and the financial highlights present fairly, in all material respects, the financial position of John Hancock China Emerging Leaders Fund (the “Fund”) at July 31, 2013, the results of its operations for the year then ended and the changes in its net assets and the financial highlights for each of the periods indicated, in conformity with accounting principles generally accepted in the United States of America. These financial statements and financial highlights (hereafter referred to as “financial statements”) are the responsibility of the Fund’s management; our responsibility is to express an opinion on these financial statements based on our audits. We conducted our audits of these financial statements in accordance with the standards of the Public Company Accounting Oversight Board (United States). Those standards require that we plan and perform the audit to obtain reasonable assurance about whether the financial statements are free of material misstatement. An audit includes examining, on a test basis, evidence supporting the amounts and disclosures in the financial statements, assessing the accounting principles used and significant estimates made by management, and evaluating the overall financial statement presentation. We believe that our audits, which included confirmation of securities at July 31, 2013 by correspondence with the custodian, and the application of alternative auditing procedures where securities purchased confirmations had not been received, provide a reasonable basis for our opinion.
PricewaterhouseCoopers LLP
Boston, Massachusetts
September 20, 2013
Federal Tax Information (Unaudited)
For federal income tax purposes, the following information is furnished with respect to the distributions of the fund, if any, paid during its taxable year ended July 31, 2013.
The fund reports the maximum amount allowable of its net taxable income as eligible for the corporate dividends-received deduction.
The fund reports the maximum amount allowable of its net taxable income as qualified dividend income as provided in the Jobs and Growth Tax Relief Reconciliation Act of 2003.
Income derived from foreign sources was $5,471,873. The fund intends to pass through foreign tax credits of $299,323.
Eligible shareholders will be mailed a 2013 Form 1099-DIV in early 2014. This will reflect the tax character of all distributions paid in calendar year 2013.
Please consult a tax advisor regarding the tax consequences of your investment in the fund.
|
| EVALUATION OF ADVISORY AND SUBADVISORY |
| AGREEMENTS BY THE BOARD OF TRUSTEES |
| |
| China Emerging Leaders Fund |
This section describes the evaluation by the Board of Trustees (the Board) of John Hancock Funds II (the Trust) of the Advisory Agreement (the Advisory Agreement) with John Hancock Investment Management Services, LLC (the Advisor) and the Subadvisory Agreement (the Subadvisory Agreement) with Atlantis Investment Management (Hong Kong) Ltd. (the Subadvisor) for China Emerging Leaders Fund (the fund). The Advisory Agreement and Subadvisory Agreement are collectively referred to as the Agreements.
Approval of Advisory and Subadvisory Agreements
At in-person meetings held on May 16 17, 2013, the Board, including the Trustees who are not considered to be interested persons of the Trust under the Investment Company Act of 1940, as amended (the 1940 Act) (the Independent Trustees), reapproved for an annual period the continuation of the Advisory Agreement between the Trust and the Advisor and the Subadvisory Agreement between the Advisor and the Subadvisor with respect to the fund.
In considering the Advisory Agreement and the Subadvisory Agreement, the Board received in advance of the meeting a variety of materials relating to the fund, the Advisor, and the Subadvisor, including comparative performance, fee and expense information for peer groups of similar mutual funds prepared by an independent third-party provider of mutual fund data; performance information for the fund’s benchmark index; and, with respect to the Subadvisor, comparative performance information for comparably managed accounts; and other information provided by the Advisor and the Subadvisor regarding the nature, extent, and quality of services provided by the Advisor and the Subadvisor under their respective Agreements, as well as information regarding the Advisor’s revenues and costs of providing services to the fund and any compensation paid to affiliates of the Advisor. At the meeting at which the renewal of the Advisory Agreement and Subadvisory Agreement is considered, particular focus is given to information concerning fund performance, comparability of fees and total expenses and profitability. However, the Board notes that the evaluation process with respect to the Advisor and the Subadvisor is an ongoing one. In this regard, the Board also took into account discussions with management and information provided to the Board at prior meetings with respect to the services provided by the Advisor and the Subadvisor to the fund, including quarterly performance reports prepared by management containing reviews of investment results and prior presentations from the Subadvisor with respect to the fund. The Board also considered the nature, quality, and extent of non-advisory services, if any, to be provided to the fund by the Advisor’s affiliates, including distribution services.
Throughout the process, the Board asked questions of and requested additional information from management. The Board is assisted by counsel for the Trust and the Independent Trustees are also separately assisted by independent legal counsel throughout the process. The Independent Trustees also received a memorandum from their independent counsel discussing the legal standards for their consideration of the proposed continuation of the Agreements and discussed the proposed continuation of the Agreements in private sessions with their independent legal counsel at which no representatives of management were present.
Approval of Advisory Agreement
In approving the Advisory Agreement with respect to the fund, the Board, including the Independent Trustees, considered a variety of factors, including those discussed below. The Board also considered other factors (including conditions and trends prevailing generally in the economy, the securities markets, and the industry) and does not treat any single factor as determinative and each Trustee may attribute different weights to different factors. The Board’s conclusions may be based in part on its consideration of the Advisory and Subadvisory Agreements in prior years and on the Board’s ongoing regular review of fund performance and operations throughout the year.
Nature, extent, and quality of services. Among the information received by the Board from the Advisor relating to the nature, extent, and quality of services provided to the fund, the Board reviewed information provided by the Advisor relating to its operations and personnel, descriptions of its organizational and management structure, and information regarding the Advisor's compliance and regulatory history, including its Form ADV. The Board also noted that on a regular basis it receives and reviews information from the Trust’s Chief Compliance Officer (CCO) regarding the fund’s compliance policies and procedures established pursuant to Rule 38a-1 under the 1940 Act. The Board also considered the Advisor’s risk management processes. The Board considered that the Advisor is responsible for the management of the day-to-day operations of the fund, including, but not limited to, general supervision of and coordination of the services provided by the Subadvisor, and is also responsible for monitoring and reviewing the activities of the Subadvisor and other third-party service providers.
In considering the nature, extent, and quality of the services provided by the Advisor, the Trustees also took into account their knowledge of the Advisor’s management and the quality of the performance of the Advisor’s duties through Board meetings, discussions, and reports during the p receding year and through each Trustee’s experience as a Trustee of the Trust and of the other trusts in the complex.
In the course of their deliberations regarding the Advisory Agreement, the Board considered, among other things:
(a) the skills and competency with which the Advisor has in the past managed the Trust’s affairs and its subadvisory relationship, the Advisor’s oversight and monitoring of the Subadvisor’s investment performance and compliance programs, such as the Subadvisor’s compliance with fund policies and objective; review of brokerage matters, including with respect to trade allocation and best execution; and the Advisor’s timeliness in responding to performance issues;
(b) the background, qualifications and skills of the Advisor’s personnel;
(c) the Advisor’s compliance policies and procedures and its responsiveness to regulatory changes and mutual fund industry developments;
(d) the Advisor’s administrative capabilities, including its ability to supervise the other service providers for the fund;
(e) the financial condition of the Advisor and whether it has the financial wherewithal to provide a high level and quality of services to the fund; and
(f) the Advisor’s reputation and experience in serving as an investment adviser to the Trust and the benefit to shareholders of investing in funds that are part of a family of funds offering a variety of investments.
The Board concluded that the Advisor may reasonably be expected to continue to provide a high quality of services under the Advisory Agreement with respect to the fund.
Investment performance. In considering the fund’s performance, the Board noted that it reviews at its regularly scheduled meetings information about the fund’s performance results. In connection with the consideration of the Advisory Agreement, the Board:
(a) reviewed information prepared by management regarding the fund’s performance;
(b) considered the comparative performance of the fund’s benchmark;
(c) considered the performance of comparable funds, if any, as included in the report prepared by an independent third-party provider of mutual fund data. Such report included the fund’s ranking within a smaller group of peer funds and the fund’s ranking within broader groups of funds; and
(d) took into account the Advisor’s analysis of the fund’s performance and its plans and recommendations regarding the Trust’s subadvisory arrangements generally.
The Board noted that the fund underperformed its benchmark index and peer group average for the one-year period ended December 31, 2012. The Board took into account management’s discussion of the fund’s performance, including the impact of current market conditions on the fund’s investment strategy relative to the peer group. The Board also noted that the fund has a relatively limited performance history having commenced operations on December 29, 2011.
The Board concluded that the fund’s performance is being monitored and reasonably addressed.
Fees and expenses. The Board reviewed comparative information prepared by an independent third-party provider of mutual fund data, including, among other data, the fund’s contractual and net management fees and total expenses as compared to similarly situated investment companies deemed to be comparable to the fund. The Board considered the fund’s ranking within a smaller group of peer funds chosen by the independent third-party provider, as well as the fund’s ranking within a bro ader group of funds. In comparing the fund’s contractual and net management fees to those of comparable funds, the Board noted that such fees include both advisory and administrative costs.
The Board noted that net management fees for this fund are higher than the peer group median and that total expenses for this fund are lower than the peer group median. The Board took into account management’s discussion of the fund’s expenses.
The Board took into account management’s discussion with respect to the advisory/subadvisory fee structure, including the amount of the advisory fee retained by the Advisor after payment of the subadvisory fee. The Board also took into account that management had agreed to implement an overall fee waiver across a number of funds in the complex, including the fund, which is discussed further below. The Board also noted that the Advisor pays the subadvisory fees of the fund, and that such fees are negotiated at arm’s length with respect to the Subadvisor. The Board also noted that, in addition, the Advisor is currently voluntarily waiving fees and/or reimbursing expenses with respect to the fund. The Board also noted management’s discussion of the fund’s expenses, as well as certain actions taken over the past several years to reduce the fund’s operating expenses. The Board reviewed information provided by the Advisor concerning investment advisory fees charged to other clients (including other funds in the complex) having similar investment mandates, if any. The Board considered any differences between the
Advisor’s and Subadvisor’s services to the fund and the services they provide to other comparable clients or funds. The Board concluded that the advisory fee paid with respect to the fund is reasonable.
Profitability/indirect benefits. In considering the costs of the services to be provided and the profits to be realized by the Advisor and its affiliates from the Advisor’s relationship with the Trust, the Board:
(a) reviewed financial information of the Advisor;
(b) reviewed and considered an analysis presented by the Advisor regarding the net profitability to the Advisor and its affiliates with respect to the fund;
(c) received and reviewed profitability information with respect to the John Hancock fund complex as a whole;
(d) received information with respect to the Advisor’s allocation methodologies used in preparing the profitability data;
(e) considered that the John Hancock insurance companies that are affiliates of the Advisor, as shareholders of the Trust directly or through their separate accounts, receive certain tax credits or deductions relating to foreign taxes paid and dividends received by certain funds of the Trust and noted that these tax benefits, which are not available to participants in qualified retirement plans under applicable income tax law, are reflected in the profitability analysis reviewed by the Board;
(f) considered that the Advisor also provides administrative services to the fund on a cost basis pursuant to an administrative services agreement;
(g) noted that affiliates of the Advisor provide transfer agency services and distribution services to the fund, and that the Trust’s distributor also receives Rule 12b-1 payments to support distribution of the fund;
(h) noted that the Advisor also derives reputational and other indirect benefits from providing advisory services to the fund;
(i) noted that the subadvisory fees for the fund are paid by the Advisor and are negotiated at arm’s length; and
(j) considered that the Advisor should be entitled to earn a reasonable level of profits in exchange for the level of services it provides to the fund and the entrepreneurial risk that it assumes as Advisor.
Based upon its review, the Board concluded that the level of profitability, if any, of the Advisor and its affiliates from their relationship with the fund was reasonable and not excessive.
Economies of scale. In considering the extent to which economies of scale would be realized as the fund grows and whether fee levels reflect these economies of scale for the benefit of fund shareholders, the Board:
(a) considered that the Advisor has agreed, effective June 1, 2013, to waive its management fee for the fund and each of the open-end funds of John Hancock Funds II, John Hancock Funds III, each
other John Hancock fund (except those listed below) (the Participating Portfolios) or otherwise reimburse the expenses of the Participating Portfolios as follows (the Reimbursement):
The Reimbursement shall equal, on an annualized basis, 0.01% of that portion of the aggregate net assets of all the Participating Portfolios that exceeds $75 billion but is less than or equal to $125 billion, 0.0125% of that portion of the aggregate net assets of all the Participating Portfolios that exceeds $125 billion but is less than or equal to $150 billion and 0.015% of that portion of the aggregate net assets of all the Participating Portfolios that exceeds $150 billion. (The funds that are not Participating Portfolios as of the date of this annual report are each of the fund of funds, money market funds, index funds and closed-end funds);
(b) reviewed the Trust’s advisory fee structure and the incorporation therein of any subadvisory fee breakpoints in the advisory fees charged and concluded that (i) the fund’s fee structure contains breakpoints at the subadvisory fee level and that such breakpoints are reflected as breakpoints in the advisory fees for the fund and (ii) although economies of scale cannot be measured with precision, these arrangements permit shareholders of the fund to benefit from economies of scale if the fund grows. The Board also took into account management’s discussion of the fund’s advisory fee structure; and
(c) the Board also considered the effect of the fund’s growth in size on its performance and fees. The Board also noted that if the fund’s assets increase over time, the fund may realize other economies of scale.
Approval of Subadvisory Agreement
In making its determination with respect to approval of the Subadvisory Agreement, the Board reviewed:
(1) information relating to the Subadvisor’s business, including current subadvisory services to the Trust (and other funds in the John Hancock family of funds);
(2) the historical and current performance of the fund, and comparative performance information relating to the fund’s benchmark and comparable funds;
(3) the subadvisory fee for the fund, including any breakpoints, and comparative fee information, where available, prepared by an independent third-party provider of mutual fund data; and
(4) information relating to the nature and scope of any material relationships and their significance to the Trust’s Advisor and Subadvisor.
Nature, extent, and quality of services. With respect to the services provided by the Subadvisor, the Board received information provided to the Board by the Subadvisor, including the Subadvisor’s Form ADV, as well as took into account information presented throughout the past year. The Board considered the Subadvisor’s current level of staffing and its overall resources, as well as received information relating to the Subadvisor’s compensation program. The Board reviewed the Subadvisor’s history and investment experience, as well as information regarding the qualifications, background, and responsibilities of the Subadvisor’s investment and compliance personnel who provide services to the fund. The Board also considered, among other things, the Subadvisor’s compliance program and any
disciplinary history. The Board also considered the Subadvisor’s risk assessment and monitoring process. The Board reviewed the Subadvisor’s regulatory history, including whether it was currently involved in any regulatory actions or investigations as well as material litigation, and any settlements and amelioratory actions undertaken, as appropriate. The Board noted that the Advisor conducts regular, periodic reviews of the Subadvisor and its operations, including regarding investment processes and organizational and staffing matters. The Board also noted that the Trust’s CCO and his staff conduct regular, periodic compliance reviews with the Subadvisor and present reports to the Independent Trustees regarding the same, which includes evaluating the regulatory compliance systems of the Subadvisor and procedures reasonably designed by it to assure compliance with the federal securities laws. The Board also took into account the financial condition of the Subadvisor.
The Board considered the Subadvisor’s investment pro cess and philosophy. The Board took into account that the Subadvisor’s responsibilities include the development and maintenance of an investment program for the fund, that is consistent with the fund’s investment objective, the selection of investment securities and the placement of orders for the purchase and sale of such securities, as well as the implementation of compliance controls related to performance of these services. The Board also received information with respect to the Subadvisor’s brokerage p olicies and practices, including with respect to best execution and soft dollars.
Subadvisor compensation. In considering the cost of services to be provided by the Subadvisor and the profitability to the Subadvisor of its relationship with the fund, the Board noted that the fees under the Subadvisory Agreement are paid by the Advisor and not the fund.
The Board also relied on the ability of the Advisor to negotiate the Subadvisory Agreement with the Subadvisor, which is not affiliated with the Advisor, a nd the fees thereunder at arm’s length. As a result, the costs of the services to be provided and the profits to be realized by the Subadvisor from its relationship with the Trust were not a material factor in the Board’s consideration of the Subadvisory Agreement.
The Board also received information regarding the nature and scope (including their significance to the Advisor and its affiliates and to the Subadvisor) of any material relationships with respect to the Subadvisor, which includes arrangements in which the Subadvisor or its affiliates provide advisory, distribution, or management services in connection with financial products sponsored by the Trust’s Advisor or its affiliates, and may include other registered investment companies, a 529 education savings plan, managed separate account, and exempt group annuity contracts sold to qualified plans. The Board also received information and took into account any other potential conflicts of interest the Advisor might have in connection with the Subadvisory Agreement.
In addition, the Board considered other potential indirect benefits that the Subadvisor and its affiliates may receive from the Subadvisor’s relationship with the fund, such as the opportunity to provide advisory services to additional funds in the John Hancock fund complex and reputational benefits.
Subadvisory fees. The Board considered that the fund pays an advisory fee to the Advisor and that, in turn, the Advisor pays a subadvisory fee to the Subadvisor. The Board also took into account the sub-advisory fees paid by the Advisor to the Subadvisor with respect to the fund to fees charged by the fund’s Subadvisor to manage other subadvised portfolios and portfolios not subject to regulation under the 1940 Act, as applicable.
Subadvisor performance. As noted above, the Board considered the fund’s performance as compared to the fund’s peer group and benchmark and noted that the Board reviews information about the fund’s performance results at its regularly scheduled meetings. The Board noted the Advisor’s expertise
and resources in monitoring the performance, investment style, and risk-adjusted performance of the Subadvisor. The Board was mindful of the Advisor’s focus on the Subadvisor’s performance. The Board also noted the Subadvisor’s long-term performance record for similar accounts, as applicable.
The Board’s decision to approve the Subadvisory Agreement was based on a number of determinations, including the following:
(1) The Subadvisor has extensive experience and demonstrated skills as a manager;
(2) The performance of the fund is being monitored and reasonably addressed;
(3) The subadvisory fees are reasonable in relation to the level and quality of services being provided; and
(4) Subadvisory fee breakpoints are reflected as breakpoints in the advisory fees for the fund in order to permit shareholders to benefit from economies of scale if the fund grows.
Based on the Board’s evaluation of all factors that the Board deemed to be material, including those factors described above, the Board, including the Independent Trustees, concluded that renewal of the Advisory Agreement and the Subadvisory Agreement would be in the best interest of the fund and its shareholders. Accordingly, the Board, and the Independent Trustees voting separately, approved the Advisory Agreement and Subadvisory Agreement for an additional one-year period.
Trustees and Officers
This chart provides information about the Trustees and Officers who oversee your John Hancock fund. Officers elected by the Trustees manage the day-to-day operations of the fund and execute policies formulated by the Trustees.
| | |
| Independent Trustees | | |
| | | |
| Name, year of birth | Trustee | Number of John |
| Position(s) held with fund | of the | Hancock funds |
| Principal occupation(s) and other | Trust | overseen by |
| directorships during past 5 years | since1 | Trustee |
| |
| James M. Oates, Born: 1946 | 2012 | 231 |
|
| Managing Director, Wydown Group (financial consulting firm) (since 1994); Chairman and Director, |
| Emerson Investment Management, Inc. (since 2000); Independent Chairman, Hudson Castle Group, Inc. |
| (formerly IBEX Capital Markets, Inc.) (financial services company) (1997–2011); Director, Stifel Financial |
| (since 1996); Director, Investor Financial Services Corporation (1995–2007); Director, Connecticut River |
| Bancorp (since 1998); Director, Virtus Funds (formerly Phoenix Mutual Funds) (since 1988). Trustee |
| and Chairperson of the Board, John Hancock retail funds (since 2012); Trustee (2005–2006 and since |
| 2012) and Chairperson of the Board (since 2012), John Hancock Funds III; Trustee (since 2004) and |
| Chairperson of the Board (since 2005), John Hancock Variable Insurance Trust; Trustee and Chairperson |
| of the Board (since 2005), John Hancock Funds II. | | |
|
| |
| Charles L. Bardelis,3 Born: 1941 | 2012 | 231 |
|
| Director, Island Commuter Corp. (marine transport). Trustee, John Hancock retail funds (since 2012); |
| Trustee, John Hancock Funds III (2005–2006 and since 2012); Trustee, John Hancock Variable Insurance |
| Trust (since 1988); Trustee, John Hancock Funds II (since 2005). | | |
|
| |
| Peter S. Burgess,3 Born: 1942 | 2012 | 231 |
|
| Consultant (financial, accounting, and auditing matters) (since 1999); Certified Public Accountant; |
| Partner, Arthur Andersen (independent public accounting firm) (prior to 1999); Director, Lincoln |
| Educational Services Corporation (since 2004); Director, Symetra Financial Corporation (since 2010); |
| former Director, PMA Capital Corporation (2004–2010). Trustee, John Hancock retail funds (since 2012); |
| Trustee, John Hancock Funds III (2005–2006 and since 2012); Trustee, John Hancock Variable Insurance |
| Trust and John Hancock Funds II (since 2005). | | |
|
| |
| William H. Cunningham,2 Born: 1944 | 1994 | 231 |
|
| Professor, University of Texas, Austin, Texas (since 1971); former Chancellor, University of Texas |
| System and former President of the University of Texas, Austin, Texas; Director, LIN Television (since |
| 2009); Chairman (since 2009) and Director (since 2006), Lincoln National Corporation (insurance); |
| Director, Resolute Energy Corporation (since 2009); Director, Southwest Airlines (since 2000); former |
| Director, Introgen (manufacturer of biopharmaceuticals) (until 2008); former Director, Hicks Acquisition |
| Company I, Inc. (until 2007); former Director, Texas Exchange Bank, SSB (formerly Bank of Crowley) |
| (until 2009); former Advisory Director, JPMorgan Chase Bank (formerly Texas Commerce Bank–Austin) |
| (until 2009). Trustee, John Hancock retail funds (since 1986); Trustee, John Hancock Variable Insurance |
| Trust (since 2012); Trustee, John Hancock Funds II (since 2012 and 2005–2006). | |
|
| |
| Grace K. Fey, Born: 1946 | 2012 | 231 |
|
| Chief Executive Officer, Grace Fey Advisors (since 2007); Director and Executive Vice President, |
| Frontier Capital Management Company (1988–2007); Director, Fiduciary Trust (since 2009). |
| Trustee, John Hancock retail funds (since 2012); Trustee, John Hancock Variable Insurance Trust and |
| John Hancock Funds II (since 2008). | | |
| |
| 32 |
| China Emerging Leaders Fund | Annual report | |
| | |
| Independent Trustees (continued) | | |
| |
| Name, year of birth | Trustee | Number of John |
| Position(s) held with fund | of the | Hancock funds |
| Principal occupation(s) and other | Trust | overseen by |
| directorships during past 5 years | since1 | Trustee |
| |
| Theron S. Hoffman,3 Born: 1947 | 2012 | 231 |
|
| Chief Executive Officer, T. Hoffman Associates, LLC (consulting firm) (since 2003); Director, The Todd |
| Organization (consulting firm) (2003–2010); President, Westport Resources Management (investment |
| management consulting firm) (2006–2008); Senior Managing Director, Partner, and Operating Head, |
| Putnam Investments (2000–2003); Executive Vice President, The Thomson Corp. (financial and |
| legal information publishing) (1997–2000). Trustee, John Hancock retail funds (since 2012); Trustee, |
| John Hancock Variable Insurance Trust and John Hancock Funds II (since 2008). | |
|
| |
| Deborah C. Jackson,2 Born: 1952 | 2008 | 231 |
|
| President, Cambridge College, Cambridge, Massachusetts (since 2011); Chief Executive Officer, |
| American Red Cross of Massachusetts Bay (2002–2011); Board of Directors of Eastern Bank Corporation |
| (since 2001); Board of Directors of Eastern Bank Charitable Foundation (since 2001); Board of Directors |
| of American Student Assistance Corporation (1996–2009); Board of Directors of Boston Stock Exchange |
| (2002–2008); Board of Directors of Harvard Pilgrim Healthcare (health benefits company) (2007–2011). |
| Trustee, John Hancock retail funds (since 2008); Trustee of John Hancock Variable Insurance Trust and |
| John Hancock Funds II (since 2012). | | |
|
| |
| Hassell H. McClellan, Born: 1945 | 2012 | 231 |
|
| Associate Professor, The Wallace E. Carroll School of Management, Boston College (since 1984); |
| Trustee, Virtus Variable Insurance Trust (formerly Phoenix Edge Series Funds) (since 2008); Director, |
| The Barnes Group (since 2010). Trustee, John Hancock retail funds (since 2012); Trustee, John Hancock |
| Funds III (2005–2006 and since 2012); Trustee, John Hancock Variable Insurance Trust and | |
| John Hancock Funds II (since 2005). | | |
|
| |
| Steven R. Pruchansky,2 Born: 1944 | 1991 | 231 |
|
| Chairman and Chief Executive Officer, Greenscapes of Southwest Florida, Inc. (since 2000); Director |
| and President, Greenscapes of Southwest Florida, Inc. (until 2000); Member, Board of Advisors, First |
| American Bank (until 2010); Managing Director, Jon James, LLC (real estate) (since 2000); Director, |
| First Signature Bank & Trust Company (until 1991); Director, Mast Realty Trust (until 1994); President, |
| Maxwell Building Corp. (until 1991). Trustee (since 1992) and Chairperson of the Board (2011–2012), |
| John Hancock retail funds; Trustee and Vice Chairperson of the Board, John Hancock retail funds, |
| John Hancock Variable Insurance Trust and John Hancock Funds II (since 2012). | |
|
| |
| Gregory A. Russo,2 Born: 1949 | 2009 | 231 |
|
| Director and Audit Committee Chairman (since 2012) and Member, Audit Committee and Finance |
| Committee (since 2011), NCH Healthcare System, Inc. (holding company for multi-entity healthcare |
| system); Director and Member of Finance Committee, The Moorings, Inc. (nonprofit continuing care |
| community) (since 2012); Vice Chairman, Risk & Regulatory Matters, KPMG LLP (KPMG) (2002–2006); |
| Vice Chairman, Industrial Markets, KPMG (1998–2002); Chairman and Treasurer, Westchester |
| County, New York, Chamber of Commerce (1986–1992); Director, Treasurer and Chairman of |
| Audit and Finance Committees, Putnam Hospital Center (1989–1995); Director and Chairman of |
| Fundraising Campaign, United Way of Westchester and Putnam Counties, New York (1990–1995). |
| Trustee, John Hancock retail funds (since 2008); Trustee, John Hancock Variable Insurance Trust and |
| John Hancock Funds II (since 2012). | | |
| |
| 33 |
| Annual report | China Emerging Leaders Fund |
| | |
| Non-Independent Trustees4 | | |
| | | |
| Name, year of birth | Trustee | Number of John |
| Position(s) held with fund | of the | Hancock funds |
| Principal occupation(s) and other | Trust | overseen by |
| directorships during past 5 years | since1 | Trustee |
| |
| James R. Boyle, Born: 1959 | 2012 | 231 |
|
| Senior Executive Vice President, John Hancock Financial Services (1999–2012, including prior positions); |
| Chairman and Director, John Hancock Advisers, LLC, John Hancock Funds, LLC, and John Hancock |
| Investment Management Services, LLC (2005–2010). Trustee, John Hancock retail funds (since 2012 and |
| 2005–2010), Trustee, John Hancock Variable Insurance Trust and John Hancock Funds II (since 2005). |
|
| |
| Craig Bromley,2 Born: 1966 | 2012 | 231 |
|
| President, John Hancock Financial Services (since 2012); Senior Executive Vice President and General |
| Manager, U.S. Division, John Hancock Financial Services (since 2012); President and Chief Executive |
| Officer, Manulife Insurance Company (Manulife (Japan) (2005–2012), including prior positions). |
| Trustee, John Hancock retail funds (since 2012); Trustee, John Hancock Variable Insurance Trust and |
| John Hancock Funds II (since 2012). | | |
|
| |
| Warren A. Thomson,2 Born: 1955 | 2012 | 231 |
|
| Senior Executive Vice President and Chief Investment Officer, Manulife Financial Corporation and The |
| Manufacturers Life Insurance Company (since 2009); Chairman and Chief Executive Officer, Manulife |
| Asset Management (since 2001, including prior positions); Director (since 2006), and President and |
| Chief Executive Officer of Manulife Asset Management Limited (since 2013); Director and Chairman, |
| Hancock Natural Resources Group, Inc. (since 2013). Trustee, John Hancock retail funds, John Hancock |
| Variable Insurance Trust and John Hancock Funds II (since 2012). | | |
| |
| Principal officers who are not Trustees | | |
| | | |
| Name, year of birth | | Officer |
| Position(s) held with fund | | of the |
| Principal occupation(s) and other | | Trust |
| directorships during past 5 years | | since |
| |
| Hugh McHaffie, Born: 1959 | | 2009 |
|
| President | | |
| Executive Vice President, John Hancock Financial Services (since 2006, including prior positions); |
| Chairman and Director, John Hancock Advisers, LLC, John Hancock Investment Management Services, |
| LLC and John Hancock Funds, LLC (since 2010); President, John Hancock Advisers, LLC (since 2012); |
| President, John Hancock Investment Management Services, LLC (since 2010). President (since 2012) and |
| former Trustee (2010–2012), John Hancock retail funds; President, John Hancock Variable Insurance |
| Trust and John Hancock Funds II (since 2009). | | |
|
| |
| Andrew G. Arnott, Born: 1971 | | 2009 |
|
| Executive Vice President | | |
| Senior Vice President, John Hancock Financial Services (since 2009); Director and Executive Vice |
| President, John Hancock Advisers, LLC (since 2005, including prior positions); Director and Executive |
| Vice President, John Hancock Investment Management Services, LLC (since 2006, including prior |
| positions); President, John Hancock Funds, LLC (since 2004, including prior positions); Executive Vice |
| President, John Hancock retail funds, John Hancock Variable Insurance Trust and John Hancock Funds II |
| (since 2007, including prior positions). | | |
|
| |
| Thomas M. Kinzler, Born: 1955 | | 2006 |
|
| Secretary and Chief Legal Officer | | |
| Vice President, John Hancock Financial Services (since 2006); Secretary and Chief Legal Counsel, |
| John Hancock Funds, LLC (since 2007); Secretary and Chief Legal Officer, John Hancock retail funds, |
| John Hancock Variable Insurance Trust and John Hancock Funds II (since 2006). | |
| |
| 34 |
| China Emerging Leaders Fund | Annual report | |
| |
| Principal officers who are not Trustees (continued) | |
| |
| Name, year of birth | Officer |
| Position(s) held with fund | of the |
| Principal occupation(s) and other | Trust |
| directorships during past 5 years | since |
| |
| Francis V. Knox, Jr., Born: 1947 | 2005 |
|
| Chief Compliance Officer | |
| Vice President, John Hancock Financial Services (since 2005); Chief Compliance Officer, John Hancock |
| retail funds, John Hancock Variable Insurance Trust, John Hancock Funds II, John Hancock Advisers, |
| LLC and John Hancock Investment Management Services, LLC (since 2005); Vice President and Chief |
| Compliance Officer, John Hancock Asset Management a division of Manulife Asset Management (US) |
| LLC (2005–2008). | |
|
| |
| Charles A. Rizzo, Born: 1957 | 2007 |
|
| Chief Financial Officer | |
| Vice President, John Hancock Financial Services (since 2008); Senior Vice President, John Hancock | |
| Advisers, LLC and John Hancock Investment Management Services, LLC (since 2008); Chief Financial |
| Officer, John Hancock retail funds, John Hancock Variable Insurance Trust and John Hancock Funds II |
| (since 2007). | |
|
| |
| Salvatore Schiavone, Born: 1965 | 2009 |
|
| Treasurer | |
| Assistant Vice President, John Hancock Financial Services (since 2007); Vice President, John Hancock |
| Advisers, LLC and John Hancock Investment Management Services, LLC (since 2007); Treasurer, | |
| John Hancock retail funds (since 2007, including prior positions); Treasurer, John Hancock Variable | |
| Insurance Trust and John Hancock Funds II (since 2010 and 2007–2009, including prior positions). | |
John Hancock retail funds is comprised of John Hancock Funds III and 34 other John Hancock funds consisting of 24 series of other John Hancock trusts and 10 closed-end funds.
The business address for all Trustees and Officers is 601 Congress Street, Boston, Massachusetts 02210-2805.
The Statement of Additional Information of the fund includes additional information about members of the Board of Trustees of the Trust and is available without charge, upon request, by calling 800-225-5291.
1 Each Trustee holds office until his or her successor is elected and qualified, or until the Trustee’s death, retirement, resignation or removal.
2 Became a Trustee of the Trust effective December 1, 2012.
3 Member of Audit Committee.
4 Because Messrs. Bromley and Thomson are senior executives or directors and Mr. Boyle held prior positions as a senior executive and director of the Advisor and/or its affiliates, each of them is considered an “interested person,” as defined in the Investment Company Act of 1940, of the Trust.
| |
| 35 |
| Annual report | China Emerging Leaders Fund |
More information
| |
| Trustees | Investment adviser |
| James M. Oates, Chairperson | John Hancock Investment Management Services, LLC |
| Steven R. Pruchansky, Vice Chairperson | |
| Charles L. Bardelis* | Investment subadviser |
| James R. Boyle† | John Hancock Asset Management a division of |
| Craig Bromley† | Manulife Asset Management (US) LLC |
| Peter S. Burgess* | |
| William H. Cunningham | Principal distributor |
| Grace K. Fey | John Hancock Funds, LLC |
| Theron S. Hoffman* | |
| Deborah C. Jackson | Custodian |
| Hassell H. McClellan | State Street Bank and Trust Company |
| Gregory A. Russo | |
| Warren A. Thomson† | Transfer agent |
| | John Hancock Signature Services, Inc. |
| | |
| Officers | Legal counsel |
| Hugh McHaffie | K&L Gates LLP |
| President | |
| Andrew G. Arnott | Independent registered |
| Executive Vice President | public accounting firm |
| Thomas M. Kinzler | PricewaterhouseCoopers LLP |
| Secretary and Chief Legal Officer | |
| Francis V. Knox, Jr. | |
| Chief Compliance Officer | |
| Charles A. Rizzo | |
| Chief Financial Officer | |
| Salvatore Schiavone | |
| Treasurer | |
| |
| *Member of the Audit Committee | |
| †Non-Independent Trustee | |
The fund’s proxy voting policies and procedures, as well as the fund’s proxy voting record, if any, for the most recent twelve-month period ended June 30, are available free of charge on the Securities and Exchange Commission (SEC) Web site at www.sec.gov or on our Web site.
The fund’s complete list of portfolio holdings, for the first and third fiscal quarters, is filed with the SEC on Form N-Q. The fund’s Form N-Q is available on our Web site and the SEC’s Web site, www.sec.gov, and can be reviewed and copied (for a fee) at the SEC’s Public Reference Room in Washington, DC. Call 800-SEC-0330 to receive information on the operation of the SEC's Public Reference Room.
We make this information on your fund, as well as monthly portfolio holdings, and other fund details available on our Web site at www.jhinvestments.com or by calling 800-225-5291.
| | |
| You can also contact us: | | |
| 800-225-5291 | Regular mail: | Express mail: |
| jhinvestments.com | John Hancock Signature Services, Inc. | John Hancock Signature Services, Inc. |
| | P.O. Box 55913 | Mutual Fund Investment Operations |
| | Boston, MA 02205-5913 | 30 Dan Road |
| | | Canton, MA 02021 |
A look at performance
Total returns for the period ended July 31, 2013
| | | | | | | | | |
| | Average annual total returns (%) | | Cumulative total returns (%) | |
| | with maximum sales charge | | | with maximum sales charge | |
|
| | | | Since | | | | | Since |
| | 1-year | 5-year | 10-year | inception | | 1-year | 5-year | 10-year | inception |
|
| Class A | –1.88 | — | — | 2.391 | | –1.88 | — | — | 3.911 |
|
| Class C | 1.50 | — | — | 1.502 | | 1.50 | — | — | 1.502 |
|
| Class I3 | 3.65 | — | — | 6.091 | | 3.65 | — | — | 10.081 |
|
| Class R23 | 3.08 | — | — | 1.554 | | 3.08 | — | — | 2.214 |
|
| Class R63 | 3.66 | — | — | 2.094 | | 3.66 | — | — | 2.984 |
|
| Class NAV3 | 3.78 | — | — | 6.111 | | 3.78 | — | — | 10.111 |
|
| Index 1† | 0.11 | — | — | 0.121 | | 0.11 | — | — | 0.191 |
|
| Index 2† | 23.96 | — | — | 21.821 | | 23.96 | — | — | 37.801 |
|
Performance figures assume all distributions have been reinvested. Figures reflect maximum sales charges on Class A shares of 5.00%.
The expense ratios of the fund, both net (including any fee waivers or expense limitations) and gross (excluding any fee waivers or expense limitations), are set forth according to the most recent publicly available prospectuses for the fund and may differ from those disclosed in the Financial highlights tables in this report. The fee waivers and expense limitations are contractual at least until 11-30-13 for Class A, Class C, Class I, Class R2, and Class R6 shares. Had the fee waivers and expense limitations not been in place, gross expenses would apply. For all other classes the net expenses equal the gross expenses. The expense ratios are as follows:
| | | | | | |
| | Class A | Class C* | Class I | Class R2* | Class R6* | Class NAV |
| Net (%) | 1.95 | 2.65 | 1.59 | 2.00 | 1.50 | 1.43 |
| Gross (%) | 1.97 | 17.65 | 1.60 | 17.12 | 16.60 | 1.43 |
* Expenses have been estimated for the class’s first full year of operations.
The returns reflect past results and should not be considered indicative of future performance. The return and principal value of an investment will fluctuate so that shares, when redeemed, may be worth more or less than their original cost. Due to market volatility, the fund’s current performance may be higher or lower than the performance shown. For current to the most recent month-end performance data, please call 800-225-5291 or visit the fund’s website at jhinvestments.com.
The performance table above and the chart on the next page do not reflect the deduction of taxes that a shareholder may pay on fund distributions or on the redemption of fund shares. The fund’s performance results reflect any applicable fee waivers or expense reductions, without which the expenses would increase and results would have been less favorable.
† Index 1 is the Bank of America Merrill Lynch U.S. Dollar 1-Month LIBID Average Index. Index 2 is the MSCI World Index.
See the following page for footnotes.
| |
| 6 Global Absolute Return Strategies Fund | Annual report |
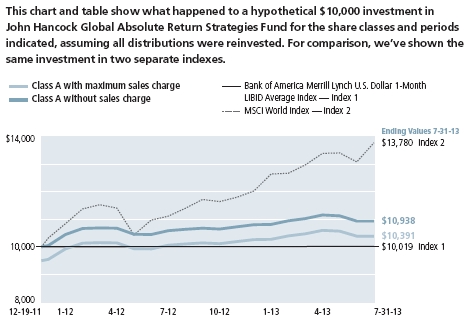
| | | | | |
| | | With maximum | Without | | |
| | Start date | sales charge | sales charge | Index 1 | Index 2 |
|
| Class C | 8-1-12 | $10,150 | $10,250 | $10,011 | $12,396 |
|
| Class I3 | 12-19-11 | 11,008 | 11,008 | 10,019 | 13,780 |
|
| Class R23 | 3-1-12 | 10,221 | 10,221 | 10,016 | 12,109 |
|
| Class R63 | 3-1-12 | 10,298 | 10,298 | 10,016 | 12,109 |
|
| Class NAV3 | 12-19-11 | 11,011 | 11,011 | 10,019 | 13,780 |
|
Bank of America Merrill Lynch U.S. Dollar 1-Month LIBID Average Index tracks the performance of a synthetic asset paying LIBID (London Interbank Bid Rate) to a stated maturity.
MSCI World Index (gross of foreign withholding taxes on dividends) is a free float-adjusted market capitalization weighted index that is designed to measure equity market performance of developed markets.
It is not possible to invest directly in an index. Index figures do not reflect expenses or sales charges, which would have resulted in lower values if they did.
Footnotes related to performance pages
1 From 12-19-11.
2 From 8-1-12.
3 For certain types of investors as described in the fund’s prospectuses.
4 From 3-1-12.
| |
| Annual report | Global Absolute Return Strategies Fund 7 |
Management’s discussion of
Fund performance
Standard Life Investments (Corporate Funds) Limited
The 12-month period ended July 31, 2013, was marked by ongoing uncertainty about global recovery and the continuation of the so-called risk-on/risk-off trade that had dominated the previous 12-month period. Globally, stocks continued to trend higher until June, when concerns rose that the credit conditions would tighten in the United States and China, the world’s two largest economies. Risk aversion and, as a result, volatility spiked after U.S. Federal Reserve (Fed) Chairman Ben S. Bernanke set out a road map for quantitative easing (QE), noting that the Fed would begin to taper bond purchases in 2013 and bring QE to an end in 2014. Stock markets around the world sank in response. The changed policy stance, combined with expectations of slowing growth in China, rippled far and wide, and raised the likelihood of lower commodity prices as well as slower emerging-market growth.
For the 12 months ended July 31, 2013, John Hancock Global Absolute Return Strategies Fund’s Class A shares returned 3.28%, excluding sales charges. At the same time, the Bank of America Merrill Lynch 1-month U.S. LIBID Average Index, the fund’s benchmark, returned 0.11%, and the Morningstar, Inc. multi-alternative fund category returned an average of 3.47%.† In the same period, the broad MSCI World Index gained 23.96%.
The search for yield continued, and in the first six months of the period, the fund benefited from its long positions in credit-sensitive fixed-income securities, including stakes in European corporate bonds and high-yield securities. Our global equity positioning, and particularly our exposure to U.S. equities, was also a top contributor to the fund’s performance.
The on-and-off periods of risk aversion helped our currency strategy, as did the multispeed growth patterns we are seeing among global economies. Our long U.S. dollar position versus the euro and Japanese yen boosted returns. We also benefited from our short positions in the commodity-linked currencies, especially amid slowing Chinese growth expectations.
Our long U.S. dollar position versus the Japanese yen boosted returns. We took that position because we believed that the U.S. dollar would benefit from differentials in debt burdens, policy responses to the financial crisis, and demographic trends. We also benefited from our short positions in the commodity-linked currencies, such as the Canadian and Australian dollars, especially amid strong Chinese growth expectations.
This commentary reflects the views of the portfolio manager through the end of the period discussed in this report. The manager’s statements reflect his own opinions. As such, they are in no way guarantees of future events and are not intended to be used as investment advice or a recommendation regarding any specific security. They are also subject to change at any time as market and other conditions warrant.
Past performance is no guarantee of future results.
† Figures from Morningstar, Inc. include reinvested distributions and do not take into account sales charges. Actual load-adjusted performance is lower.
| |
| 8 Global Absolute Return Strategies Fund | Annual report |
Your expenses
These examples are intended to help you understand your ongoing operating expenses of investing in the fund so you can compare these costs with the ongoing costs of investing in other mutual funds.
Understanding fund expenses
As a shareholder of the fund, you incur two types of costs:
■ Transaction costs, which include sales charges (loads) on purchases or redemptions (varies by share class), minimum account fee charge, etc.
■ Ongoing operating expenses, including management fees, distribution and service fees (if applicable) and other fund expenses.
We are going to present only your ongoing operating expenses here.
Actual expenses/actual returns
This example is intended to provide information about the fund’s actual ongoing operating expenses and is based on the fund’s actual return. It assumes an account value of $1,000.00 on February 1, 2013, with the same investment held until July 31, 2013.
| | | |
| | Account value | Ending value | Expenses paid during |
| | on 2-1-13 | on 7-31-13 | period ended 7-31-131 |
|
| Class A | $1,000.00 | $1,011.20 | $8.93 |
|
| Class C | 1,000.00 | 1,007.50 | 12.44 |
|
| Class I | 1,000.00 | 1,013.00 | 7.09 |
|
| Class R2 | 1,000.00 | 1,010.30 | 9.97 |
|
| Class R6 | 1,000.00 | 1,013.10 | 7.49 |
|
| Class NAV | 1,000.00 | 1,013.10 | 6.44 |
|
Together with the value of your account, you may use this information to estimate the operating expenses that you paid over the period. Simply divide your account value at July 31, 2013, by $1,000.00, then multiply it by the “expenses paid” for your share class from the table above. For example, for an account value of $8,600.00, the operating expenses should be calculated as follows:
| |
| Annual report | Global Absolute Return Strategies Fund 9 |
Your expenses
Hypothetical example for comparison purposes
This table allows you to compare the fund’s ongoing operating expenses with those of any other fund. It provides an example of the fund’s hypothetical account values and hypothetical expenses based on each class’s actual expense ratio and an assumed 5% annualized return before expenses (which is not the fund’s actual return). It assumes an account value of $1,000.00 on February 1, 2013, with the same investment held until July 31, 2013. Look in any other fund shareholder report to find its hypothetical example and you will be able to compare these expenses. Please remember that these hypothetical account values and expenses may not be used to estimate the actual ending account balance or expenses you paid for the period.
| | | |
| | Account value | Ending value | Expenses paid during |
| | on 2-1-13 | on 7-31-13 | period ended 7-31-131 |
|
| Class A | $1,000.00 | $1,015.90 | $8.95 |
|
| Class C | 1,000.00 | 1,012.40 | 12.47 |
|
| Class I | 1,000.00 | 1,017.80 | 7.10 |
|
| Class R2 | 1,000.00 | 1,014.90 | 9.99 |
|
| Class R6 | 1,000.00 | 1,017.40 | 7.50 |
|
| Class NAV | 1,000.00 | 1,018.40 | 6.46 |
|
Remember, these examples do not include any transaction costs, therefore, these examples will not help you to determine the relative total costs of owning different funds. If transaction costs were included, your expenses would have been higher. See the prospectus for details regarding transaction costs.
1 Expenses are equal to the fund’s annualized expense ratio of 1.79%, 2.50%, 1.42%, 2.00%, 1.50% and 1.29% for Class A, Class C, Class I, Class R2, Class R6 and Class NAV shares, respectively, multiplied by the average account value over the period, multiplied by 181/365 (to reflect the one-half year period).
| |
| 10 Global Absolute Return Strategies Fund | Annual report |
Portfolio summary
| | | | |
| Corporate Bonds | 12.6% | | Foreign Government Obligations | 4.8% |
| |
|
| United States | 5.8% | | Mexico | 4.7% |
| |
|
| France | 1.4% | | Germany | 0.1% |
| |
|
| United Kingdom | 1.1% | | | |
| | | |
| Netherlands | 1.0% | | Purchased Options | 2.0% |
| |
|
| Luxembourg | 0.6% | | United States | 1.9% |
| |
|
| Spain | 0.4% | | South Korea | 0.1% |
| |
|
| Ireland | 0.4% | | | |
| | |
| Italy | 0.3% | | Short-Term Investments | 54.0% |
| |
|
| Germany | 0.3% | | Certificate of Deposit | 25.9% |
| |
|
| Denmark | 0.2% | | Commercial Paper | 15.4% |
| |
|
| Other Countries | 1.1% | | Time Deposits | 8.3% |
| |
|
| | | | U.S. Government | 4.0% |
| | |
|
| Equities | 26.9% | | Repurchase Agreement | 0.4% |
| |
|
| United States | 10.8% | | | |
| | |
| Japan | 2.3% | | | |
| | |
| Hong Kong | 2.0% | | | |
| | |
| United Kingdom | 2.0% | | | |
| | |
| China | 1.8% | | | |
| | |
| France | 1.4% | | | |
| | |
| Russia | 1.2% | | | |
| | |
| Australia | 0.9% | | | |
| | |
| Canada | 0.8% | | | |
| | |
| Netherlands | 0.5% | | | |
| | |
| Other Countries | 3.2% | | | |
| | |
As a percentage of net assets on 7-31-13.
Absolute return funds are not designed to outperform stocks and bonds in strong markets. There is no guarantee of a positive return, of the fund achieving its objective, or that volatility-reducing strategies will be successful. The use of hedging and derivatives could produce disproportionate gains or losses and may increase costs. Illiquid securities may be difficult to sell at a price approximating their value. Currency transactions are affected by fluctuations in exchange rates. Foreign investing, especially in emerging markets, has additional risks, such as currency and market volatility and political and social instability. Investments in higher-yielding, lower-rated securities include a higher risk of default. The stock prices of midsize and small companies can change more frequently and dramatically than those of large companies. Please see the fund’s prospectus for additional risks.
| |
| Annual report | Global Absolute Return Strategies Fund 11 |
Fund’s investments
As of 7-31-13
| | | | | |
| | | | Maturity | | |
| | Rate (%) | | date | Par value^ | Value |
|
| Corporate Bonds 12.6% | | | | $471,895,462 |
|
| (Cost $460,109,953) | | | | | |
| | | | | | |
| Australia 0.1% | | | | | 4,442,242 |
|
| BHP Billiton Finance, Ltd. | 2.125 | | 11-29-18 | EUR 110,000 | 149,470 |
|
| FMG Resources August 2006 Pty, Ltd. (S) | 6.875 | | 04-01-22 | 595,000 | 589,050 |
|
| FMG Resources August 2006 Pty, Ltd. (S) | 8.250 | | 11-01-19 | 1,600,000 | 1,688,000 |
|
| Santos Finance, Ltd. (8.250% to | | | | | |
| 9-22-17, then 3 month EURIBOR | | | | | |
| + 6.851%) | 8.250 | | 09-22-70 | EUR 750,000 | 1,096,291 |
|
| Telstra Corp., Ltd. | 2.500 | | 09-15-23 | EUR 700,000 | 919,431 |
| | | | | | |
| Belgium 0.0% | | | | | 1,029,216 |
|
| Anheuser-Busch InBev NV | 2.000 | | 12-16-19 | EUR 350,000 | 472,327 |
|
| Anheuser-Busch InBev NV | 4.000 | | 06-02-21 | EUR 370,000 | 556,889 |
| | | | | | |
| Bermuda 0.0% | | | | | 384,139 |
|
| Central European Media Enterprises, Ltd. | 11.625 | | 09-15-16 | EUR 275,000 | 384,139 |
| | | | | | |
| Brazil 0.0% | | | | | 1,436,394 |
|
| OGX Austria GmbH (S) | 8.500 | | 06-01-18 | 2,450,000 | 490,000 |
|
| Vale SA | 3.750 | | 01-10-23 | EUR 200,000 | 264,074 |
|
| Vale SA | 4.375 | | 03-24-18 | EUR 470,000 | 682,320 |
| | | | | | |
| Canada 0.1% | | | | | 4,467,862 |
|
| Ainsworth Lumber Company, Ltd. (S) | 7.500 | | 12-15-17 | 140,000 | 148,400 |
|
| Air Canada 2013-1 Class B Pass | | | | | |
| Through Trust (S) | 5.375 | | 05-15-21 | 290,000 | 282,025 |
|
| Bombardier, Inc. (S) | 6.125 | | 01-15-23 | 767,000 | 784,258 |
|
| Bombardier, Inc. (S) | 7.750 | | 03-15-20 | 500,000 | 571,250 |
|
| Great-West Lifeco, Inc. | 2.500 | | 04-18-23 | EUR 650,000 | 843,744 |
|
| HudBay Minerals, Inc. | 9.500 | | 10-01-20 | 713,000 | 709,435 |
|
| Inmet Mining Corp. (S) | 8.750 | | 06-01-20 | 1,075,000 | 1,128,750 |
| | | | | | |
| Cayman Islands 0.2% | | | | | 6,877,916 |
|
| Hutchison Whampoa Europe | | | | | |
| Finance 13, Ltd. (3.750% to | | | | | |
| 5-10-18, then 5 Year Euro Swap | | | | | |
| Rate + 2.941%) (Q) | 3.750 | | 05-10-18 | EUR 550,000 | 700,595 |
|
| Hutchison Whampoa Finance 09, Ltd. | 4.750 | | 11-14-16 | EUR 1,150,000 | 1,691,751 |
|
| IPIC GMTN, Ltd. | 4.875 | | 05-14-16 | EUR 910,000 | 1,322,732 |
|
| IPIC GMTN, Ltd. | 5.875 | | 03-14-21 | EUR 600,000 | 946,531 |
|
| Nord Anglia Education, Inc., PIK (S) | 8.500 | | 02-15-18 | 1,400,000 | 1,379,124 |
| | |
| 12 Global Absolute Return Strategies Fund | Annual report | See notes to financial statements |
| | | | | |
| | | | Maturity | | |
| | Rate (%) | | date | Par value^ | Value |
| Cayman Islands (continued) | | | | | |
|
| Thames Water Utilities Cayman | | | | | |
| Finance, Ltd. | 3.250 | | 11-09-16 | EUR 100,000 | $141,959 |
|
| UPCB Finance, Ltd. | 7.625 | | 01-15-20 | EUR 485,000 | 695,224 |
| | | | | | |
| Czech Republic 0.0% | | | | | 768,224 |
|
| CET 21 spol. s r.o. | 9.000 | | 11-01-17 | EUR 50,000 | 72,504 |
|
| CEZ A/S | 4.500 | | 06-29-20 | EUR 460,000 | 695,720 |
| | | | | | |
| Denmark 0.2% | | | | | 6,990,150 |
|
| AP Moeller — Maersk A/S | 3.375 | | 08-28-19 | EUR 650,000 | 893,094 |
|
| AP Moeller — Maersk A/S | 4.875 | | 10-30-14 | EUR 530,000 | 736,871 |
|
| Danske Bank A/S | 3.875 | | 05-18-16 | EUR 200,000 | 284,801 |
|
| Danske Bank A/S | 3.875 | | 02-28-17 | EUR 1,400,000 | 2,013,780 |
|
| Danske Bank A/S (4.100% to | | | | | |
| 3-16-15, then 3 month EURIBOR | | | | | |
| + 1.810%) | 4.100 | | 03-16-18 | EUR 650,000 | 883,751 |
|
| DONG Energy A/S | 4.875 | | 12-16-21 | EUR 300,000 | 464,384 |
|
| DONG Energy A/S (6.250% to | | | | | |
| 6-26-23, then 5 Year Euro Swap | | | | | |
| Rate + 4.750%) | 6.250 | | 06-26-43 | EUR 316,000 | 428,273 |
|
| DONG Energy A/S | 6.500 | | 05-07-19 | EUR 350,000 | 573,805 |
|
| TDC A/S | 4.375 | | 02-23-18 | EUR 480,000 | 711,391 |
| | | | | | |
| Finland 0.1% | | | | | 1,863,370 |
|
| Fortum OYJ | 4.000 | | 05-24-21 | EUR 200,000 | 295,795 |
|
| Pohjola Bank PLC | 5.750 | | 02-28-22 | EUR 500,000 | 778,676 |
|
| Teollisuuden Voima OYJ | 4.625 | | 02-04-19 | EUR 330,000 | 490,076 |
|
| Teollisuuden Voima OYJ | 6.000 | | 06-27-16 | EUR 200,000 | 298,823 |
| | | | | | |
| France 1.4% | | | | | 52,076,730 |
|
| Alstom SA | 3.875 | | 03-02-16 | EUR 500,000 | 705,277 |
|
| Areva SA | 4.625 | | 10-05-17 | EUR 1,100,000 | 1,599,924 |
|
| Autoroutes du Sud de la France SA | 4.000 | | 09-24-18 | EUR 300,000 | 442,603 |
|
| Autoroutes du Sud de la France SA | 7.375 | | 03-20-19 | EUR 300,000 | 511,377 |
|
| AXA SA (5.250% to 4-16-20, then | | | | | |
| 3 month EURIBOR + 3.050%) | 5.250 | | 04-16-40 | EUR 800,000 | 1,105,378 |
|
| Banque PSA Finance SA | 6.000 | | 07-16-14 | EUR 400,000 | 550,190 |
|
| BNP Paribas SA | 2.500 | | 08-23-19 | EUR 800,000 | 1,087,707 |
|
| BNP Paribas SA | 2.875 | | 11-27-17 | EUR 700,000 | 980,536 |
|
| BNP Paribas SA | 3.000 | | 02-24-17 | EUR 300,000 | 421,649 |
|
| BNP Paribas SA | 3.500 | | 03-07-16 | EUR 500,000 | 706,386 |
|
| BNP Paribas SA (4.730% to 4-12-16, | | | | | |
| then 3 month EURIBOR + 1.690%) (Q) | 4.730 | | 04-12-16 | EUR 150,000 | 198,056 |
|
| BPCE SA | 2.000 | | 04-24-18 | EUR 400,000 | 535,796 |
|
| BPCE SA | 4.500 | | 02-10-22 | EUR 700,000 | 1,065,446 |
|
| Casino Guichard Perrachon SA | 3.157 | | 08-06-19 | EUR 300,000 | 411,768 |
|
| Casino Guichard Perrachon SA | 3.311 | | 01-25-23 | EUR 600,000 | 788,224 |
|
| Casino Guichard Perrachon SA | 4.379 | | 02-08-17 | EUR 450,000 | 652,708 |
|
| Casino Guichard Perrachon SA | 4.472 | | 04-04-16 | EUR 700,000 | 1,006,948 |
|
| Casino Guichard Perrachon SA | 4.726 | | 05-26-21 | EUR 200,000 | 295,094 |
|
| Christian Dior SA | 3.750 | | 09-23-14 | EUR 450,000 | 615,459 |
|
| Christian Dior SA | 4.000 | | 05-12-16 | EUR 600,000 | 846,465 |
| | |
| See notes to financial statements | Annual report | Global Absolute Return Strategies Fund | 13 |
| | | | | |
| | | | Maturity | | |
| | Rate (%) | | date | Par value^ | Value |
| France (continued) | | | | | |
|
| Cie de Saint-Gobain | 3.500 | | 09-30-15 | EUR 200,000 | $279,798 |
|
| Cie de Saint-Gobain | 3.625 | | 06-15-21 | EUR 125,000 | 172,530 |
|
| Cie de Saint-Gobain | 4.500 | | 09-30-19 | EUR 640,000 | 943,975 |
|
| Cie Financiere et Industrielle des | | | | | |
| Autoroutes SA | 5.000 | | 05-24-21 | EUR 250,000 | 394,933 |
|
| CNP Assurances (6.875% to | | | | | |
| 9-30-21, then 12 Month EURIBOR | | | | | |
| + 4.400%) | 6.875 | | 09-30-41 | EUR 400,000 | 586,684 |
|
| Credit Agricole SA | 3.900 | | 04-19-21 | EUR 350,000 | 461,678 |
|
| Credit Agricole SA | 5.971 | | 02-01-18 | EUR 850,000 | 1,264,946 |
|
| Credit Logement SA | 5.454 | | 02-16-21 | EUR 300,000 | 445,088 |
|
| Electricite de France SA | 3.875 | | 01-18-22 | EUR 700,000 | 1,027,796 |
|
| Electricite de France SA | 4.500 | | 11-12-40 | EUR 150,000 | 221,084 |
|
| Electricite de France SA | 4.625 | | 09-11-24 | EUR 250,000 | 386,579 |
|
| Electricite de France SA | 4.625 | | 04-26-30 | EUR 800,000 | 1,206,042 |
|
| Europcar Groupe SA | 11.500 | | 05-15-17 | EUR 400,000 | 603,979 |
|
| Eutelsat SA | 5.000 | | 01-14-19 | EUR 700,000 | 1,054,432 |
|
| Faurecia | 8.750 | | 06-15-19 | EUR 375,000 | 566,230 |
|
| France Telecom SA | 3.875 | | 04-09-20 | EUR 330,000 | 478,969 |
|
| France Telecom SA | 8.125 | | 01-28-33 | EUR 200,000 | 401,936 |
|
| GDF Suez | 3.500 | | 10-18-22 | EUR 1,075,000 | 1,555,548 |
|
| Kering | 2.500 | | 07-15-20 | EUR 400,000 | 534,454 |
|
| Kering | 3.125 | | 04-23-19 | EUR 592,000 | 831,132 |
|
| Lafarge SA | 5.875 | | 07-09-19 | EUR 200,000 | 290,708 |
|
| Lafarge SA | 6.625 | | 11-29-18 | EUR 1,500,000 | 2,238,580 |
|
| Lafarge SA | 8.875 | | 05-27-14 | EUR 330,000 | 464,322 |
|
| Lagardere SCA | 4.125 | | 10-31-17 | EUR 400,000 | 559,959 |
|
| Legrand SA | 4.375 | | 03-21-18 | EUR 500,000 | 745,978 |
|
| Mercialys SA | 4.125 | | 03-26-19 | EUR 400,000 | 576,535 |
|
| Orange SA | 3.875 | | 01-14-21 | EUR 1,200,000 | 1,740,845 |
|
| Pernod-Ricard SA | 4.875 | | 03-18-16 | EUR 1,000,000 | 1,451,646 |
|
| Pernod-Ricard SA | 5.000 | | 03-15-17 | EUR 700,000 | 1,041,087 |
|
| RCI Banque SA | 1.750 | | 07-06-16 | EUR 500,000 | 664,249 |
|
| RCI Banque SA | 4.250 | | 04-27-17 | EUR 630,000 | 898,021 |
|
| RCI Banque SA | 5.625 | | 03-13-15 | EUR 776,000 | 1,096,487 |
|
| RTE EDF Transport SA | 4.125 | | 02-03-21 | EUR 500,000 | 750,863 |
|
| Societe des Autoroutes Paris-Rhin-Rhone | 5.000 | | 01-12-17 | EUR 200,000 | 295,231 |
|
| Societe des Autoroutes Paris-Rhin-Rhone | 7.500 | | 01-12-15 | EUR 300,000 | 436,415 |
|
| Societe Fonciere Lyonnaise SA | 4.625 | | 05-25-16 | EUR 800,000 | 1,141,919 |
|
| Societe Generale SA | 4.000 | | 04-20-16 | EUR 500,000 | 714,202 |
|
| Societe Generale SA | 4.000 | | 06-07-23 | EUR 800,000 | 999,784 |
|
| Societe Generale SA | 4.250 | | 07-13-22 | EUR 300,000 | 443,643 |
|
| Societe Generale SA | 4.750 | | 03-02-21 | EUR 300,000 | 456,068 |
|
| Societe Generale SA (9.375% to | | | | | |
| 9-4-19, then 3 month EURIBOR | | | | | |
| + 8.901%) (Q) | 9.375 | | 09-04-19 | EUR 150,000 | 221,503 |
|
| SPCM SA | 5.500 | | 06-15-20 | EUR 605,000 | 861,202 |
|
| Suez Environnement SA | 6.250 | | 04-08-19 | EUR 100,000 | 165,025 |
|
| Unibail-Rodamco SE | 3.875 | | 12-13-17 | EUR 690,000 | 1,005,687 |
| | |
| 14 | Global Absolute Return Strategies Fund | Annual report | See notes to financial statements |
| | | | | |
| | | | Maturity | | |
| | Rate (%) | | date | Par value^ | Value |
| France (continued) | | | | | |
|
| Unibail-Rodamco SE | 4.625 | | 09-23-16 | EUR 75,000 | $110,325 |
|
| Valeo SA | 5.750 | | 01-19-17 | EUR 400,000 | 600,403 |
|
| Veolia Environnement SA (4.450% | | | | | |
| to 4-16-18, then 5 Year Euro Swap | | | | | |
| Rate + 3.603%) (Q) | 4.450 | | 04-16-18 | EUR 200,000 | 258,514 |
|
| Veolia Environnement SA | 4.625 | | 03-30-27 | EUR 200,000 | 289,799 |
|
| Veolia Environnement SA | 5.125 | | 05-24-22 | EUR 100,000 | 156,139 |
|
| Veolia Environnement SA | 6.750 | | 04-24-19 | EUR 840,000 | 1,393,492 |
|
| Vivendi SA | 4.125 | | 07-18-17 | EUR 800,000 | 1,161,576 |
|
| Vivendi SA | 4.750 | | 07-13-21 | EUR 600,000 | 901,719 |
| | | | | | |
| Germany 0.3% | | | | | 10,941,879 |
|
| Commerzbank AG | 7.750 | | 03-16-21 | EUR 300,000 | 416,067 |
|
| FMC Finance VIII SA | 6.500 | | 09-15-18 | EUR 575,000 | 881,606 |
|
| Henkel AG & Company KGaA | | | | | |
| (5.375% to 11-25-15, then | | | | | |
| 3 month EURIBOR + 2.850%) | 5.375 | | 11-25-04 | EUR 280,000 | 395,779 |
|
| KM Germany Holdings GmbH | 8.750 | | 12-15-20 | EUR 575,000 | 805,111 |
|
| MAN SE | 7.250 | | 05-20-16 | EUR 150,000 | 234,168 |
|
| Mondi Consumer Packaging | | | | | |
| International AG | 9.750 | | 07-15-17 | EUR 150,000 | 223,499 |
|
| Muenchener Rueckversicherungs | | | | | |
| AG (6.250% to 5-26-22, then | | | | | |
| 3 month EURIBOR + 4.950%) | 6.250 | | 05-26-42 | EUR 400,000 | 621,268 |
|
| RWE AG (4.625 to 9-28-15, | | | | | |
| then reset of 5 year mid-swaps | | | | | |
| + 2.650% until 9-28-20, then | | | | | |
| EURIBOR + 3.650%) (Q) | 4.625 | | 09-28-15 | EUR 295,000 | 398,575 |
|
| Schaeffler Finance BV | 7.750 | | 02-15-17 | EUR 300,000 | 446,379 |
|
| ThyssenKrupp AG | 9.250 | | 06-18-14 | EUR 1,130,000 | 1,599,115 |
|
| Trionista TopCo GmbH | 6.875 | | 04-30-21 | EUR 700,000 | 954,526 |
|
| UniCredit Bank AG | 6.000 | | 02-05-14 | EUR 300,000 | 407,571 |
|
| Unitymedia Hessen GmbH & | | | | | |
| Company KG | 7.500 | | 03-15-19 | EUR 225,000 | 323,511 |
|
| Unitymedia Hessen GmbH & | | | | | |
| Company KG | 8.125 | | 12-01-17 | EUR 108,113 | 152,101 |
|
| Unitymedia KabelBW GmbH | 9.500 | | 03-15-21 | EUR 200,000 | 301,324 |
|
| Unitymedia KabelBW GmbH | 9.625 | | 12-01-19 | EUR 710,000 | 1,054,314 |
|
| Volkswagen Leasing GmbH | 3.250 | | 05-10-18 | EUR 1,200,000 | 1,726,965 |
| | | | | | |
| Ireland 0.4% | | | | | 13,756,710 |
|
| AIB Mortgage Bank | 2.625 | | 07-29-16 | EUR 200,000 | 269,474 |
|
| Aquarius + Investments PLC | | | | | |
| (4.250% to 10-2-23, then | | | | | |
| 3 month EURIBOR + 3.450%) | 4.250 | | 10-02-43 | EUR 650,000 | 855,406 |
|
| Aquarius + Investments PLC | | | | | |
| (6.375% to 9-1-19, then 5 Year | | | | | |
| U.S. Swap Rate + 5.210%) | 6.375 | | 09-01-24 | 300,000 | 303,375 |
|
| Ardagh Glass Finance PLC | 8.750 | | 02-01-20 | EUR 100,000 | 138,689 |
|
| Ardagh Packaging Finance PLC (S) | 7.000 | | 11-15-20 | 400,000 | 394,000 |
|
| Ardagh Packaging Finance PLC | 7.375 | | 10-15-17 | EUR 400,000 | 566,729 |
|
| Ardagh Packaging Finance PLC (S) | 9.125 | | 10-15-20 | 505,000 | 547,925 |
| | |
| See notes to financial statements | Annual report | Global Absolute Return Strategies Fund | 15 |
| | | | | |
| | | | Maturity | | |
| | Rate (%) | | date | Par value^ | Value |
| Ireland (continued) | | | | | |
|
| Ardagh Packaging Finance PLC | 9.250 | | 10-15-20 | EUR 225,000 | $320,282 |
|
| Bank of Ireland Mortgage Bank | 3.125 | | 11-20-15 | EUR 500,000 | 681,705 |
|
| Bord Gais Eireann | 3.625 | | 12-04-17 | EUR 400,000 | 560,762 |
|
| ESB Finance, Ltd. | 6.250 | | 09-11-17 | EUR 1,000,000 | 1,534,559 |
|
| FGA Capital Ireland PLC | 4.375 | | 09-18-14 | EUR 500,000 | 680,381 |
|
| FGA Capital Ireland PLC | 5.250 | | 02-28-14 | EUR 330,000 | 446,340 |
|
| GE Capital European Funding | 2.625 | | 03-15-23 | EUR 250,000 | 328,071 |
|
| GE Capital European Funding | 3.625 | | 06-15-17 | EUR 336,000 | 482,418 |
|
| GE Capital European Funding | 4.250 | | 03-01-17 | EUR 350,000 | 512,507 |
|
| GE Capital European Funding | 4.625 | | 02-22-27 | EUR 500,000 | 771,938 |
|
| GE Capital European Funding | 5.375 | | 01-16-18 | EUR 570,000 | 882,221 |
|
| GE Capital European Funding | 6.000 | | 01-15-19 | EUR 600,000 | 964,095 |
|
| Ono Finance II PLC | 11.125 | | 07-15-19 | EUR 100,000 | 140,695 |
|
| Rottapharm, Ltd. | 6.125 | | 11-15-19 | EUR 775,000 | 1,059,374 |
|
| Smurfit Kappa Acquisitions | 4.125 | | 01-30-20 | EUR 615,000 | 818,165 |
|
| Smurfit Kappa Acquisitions | 5.125 | | 09-15-18 | EUR 100,000 | 139,708 |
|
| Smurfit Kappa Acquisitions | 7.750 | | 11-15-19 | EUR 150,000 | 217,927 |
|
| Willow No. 2 Ireland PLC | 3.375 | | 06-27-22 | EUR 100,000 | 139,964 |
| | | | | | |
| Italy 0.3% | | | | | 11,126,811 |
|
| Assicurazioni Generali SpA | 5.125 | | 09-16-24 | EUR 800,000 | 1,136,495 |
|
| Edison SpA | 3.250 | | 03-17-15 | EUR 200,000 | 275,348 |
|
| Edison SpA | 3.875 | | 11-10-17 | EUR 450,000 | 649,064 |
|
| Eni Spa | 3.250 | | 07-10-23 | EUR 450,000 | 603,076 |
|
| GTECH SpA | 5.375 | | 12-05-16 | EUR 400,000 | 588,653 |
|
| Intesa Sanpaolo SpA (3.750% to | | | | | |
| 3-2-15, then 3 month EURIBOR | | | | | |
| + 0.890%) | 3.750 | | 03-02-20 | EUR 250,000 | 292,677 |
|
| Intesa Sanpaolo SpA | 4.000 | | 11-09-17 | EUR 100,000 | 136,629 |
|
| Intesa Sanpaolo SpA | 4.125 | | 09-19-16 | EUR 100,000 | 137,921 |
|
| Intesa Sanpaolo SpA | 4.375 | | 10-15-19 | EUR 100,000 | 135,238 |
|
| Intesa Sanpaolo SpA | 4.875 | | 07-10-15 | EUR 200,000 | 279,354 |
|
| Intesa Sanpaolo SpA | 5.000 | | 02-28-17 | EUR 1,800,000 | 2,546,234 |
|
| Snam SpA | 3.875 | | 03-19-18 | EUR 300,000 | 423,062 |
|
| Snam SpA | 5.000 | | 01-18-19 | EUR 750,000 | 1,106,399 |
|
| Telecom Italia SpA | 5.125 | | 01-25-16 | EUR 300,000 | 420,110 |
|
| Telecom Italia SpA | 7.000 | | 01-20-17 | EUR 700,000 | 1,030,583 |
|
| Unicredit SpA | 4.875 | | 03-07-17 | EUR 770,000 | 1,081,121 |
|
| Unicredit SpA | 5.250 | | 01-14-14 | EUR 210,000 | 284,847 |
| | | | | | |
| Jamaica 0.0% | | | | | 1,327,625 |
|
| Digicel Group, Ltd. (S) | 8.250 | | 09-30-20 | 1,235,000 | 1,327,625 |
| | | | | | |
| Japan 0.0% | | | | | 1,209,375 |
|
| Softbank Corp. (S) | 4.500 | | 04-15-20 | 1,250,000 | 1,209,375 |
| | | | | | |
| Jersey, Channel Islands 0.1% | | | | | 4,781,973 |
|
| Heathrow Funding, Ltd. | 4.125 | | 10-12-16 | EUR 960,000 | 1,388,931 |
|
| Heathrow Funding, Ltd. | 4.375 | | 01-25-17 | EUR 300,000 | 439,088 |
|
| Heathrow Funding, Ltd. | 4.600 | | 09-30-14 | EUR 180,000 | 249,825 |
|
| Heathrow Funding, Ltd. | 4.600 | | 02-15-18 | EUR 300,000 | 449,599 |
| | |
| 16 | Global Absolute Return Strategies Fund | Annual report | See notes to financial statements |
| | | | | |
| | | | Maturity | | |
| | Rate (%) | | date | Par value^ | Value |
| Jersey, Channel Islands (continued) | | | | | |
|
| HSBC Capital Funding LP (5.369% to | | | | | |
| 3-24-14, then 3 month EURIBOR | | | | | |
| + 2.000%) (Q) | 5.369 | | 03-24-14 | EUR 260,000 | $348,591 |
|
| Prosecure Funding LP | 4.668 | | 06-30-16 | EUR 800,000 | 1,093,760 |
|
| UBS AG (4.500% to 9-16-14, then | | | | | |
| 3 month EURIBOR + 1.260%) | 4.500 | | 09-16-19 | EUR 600,000 | 812,179 |
| | | | | | |
| Luxembourg 0.6% | | | | | 23,015,439 |
|
| ArcelorMittal | 6.000 | | 03-01-21 | 1,015,000 | 1,022,613 |
|
| ArcelorMittal | 7.250 | | 03-01-41 | 1,343,000 | 1,243,954 |
|
| ArcelorMittal | 9.500 | | 02-15-15 | 200,000 | 220,000 |
|
| ARD Finance SA, PIK | 11.125 | | 06-01-18 | EUR 428,121 | 612,267 |
|
| Cabot Financial Luxembourg SA | 10.375 | | 10-01-19 | GBP 625,000 | 1,050,614 |
|
| Cemex Espana Luxembourg (S) | 9.250 | | 05-12-20 | 1,340,000 | 1,463,950 |
|
| Cirsa Funding Luxembourg SA | 8.750 | | 05-15-18 | EUR 250,000 | 339,272 |
|
| Expro Finance Luxembourg SCA (S) | 8.500 | | 12-15-16 | 825,000 | 870,375 |
|
| Fiat Finance & Trade SA | 7.000 | | 03-23-17 | EUR 300,000 | 423,969 |
|
| Fiat Industrial Finance Europe SA | 5.250 | | 03-11-15 | EUR 720,000 | 1,003,350 |
|
| Fiat Industrial Finance Europe SA | 6.250 | | 03-09-18 | EUR 1,150,000 | 1,691,613 |
|
| Finmeccanica Finance SA | 8.125 | | 12-03-13 | EUR 130,000 | 176,661 |
|
| Gazprom OAO | 3.755 | | 03-15-17 | EUR 1,100,000 | 1,496,018 |
|
| Geo Debt Finance SCA | 7.500 | | 08-01-18 | EUR 100,000 | 138,356 |
|
| Geo Travel Finance SCA | 10.375 | | 05-01-19 | EUR 400,000 | 560,077 |
|
| Gestamp Funding Luxembourg SA | 5.875 | | 05-31-20 | EUR 500,000 | 655,197 |
|
| Glencore Finance Europe SA | 5.250 | | 03-22-17 | EUR 950,000 | 1,393,330 |
|
| Hannover Finance Luxembourg | | | | | |
| SA (5.750% to 2-26-14, then | | | | | |
| 3 month EURIBOR + 2.630%) | 5.750 | | 02-26-24 | EUR 420,000 | 568,481 |
|
| INEOS Group Holdings SA (S) | 6.125 | | 08-15-18 | 275,000 | 268,125 |
|
| Intelsat Jackson Holdings SA | 7.250 | | 10-15-20 | 650,000 | 703,625 |
|
| Intelsat Luxembourg SA (S) | 7.750 | | 06-01-21 | 2,832,000 | 2,980,680 |
|
| Matterhorn Mobile Holdings SA | 8.250 | | 02-15-20 | EUR 500,000 | 703,476 |
|
| Telecom Italia Finance SA | 7.750 | | 01-24-33 | EUR 50,000 | 71,744 |
|
| Wind Acquisition Finance SA (S) | 6.500 | | 04-30-20 | 600,000 | 612,000 |
|
| Wind Acquisition Finance SA | 7.375 | | 02-15-18 | EUR 730,000 | 1,005,146 |
|
| Wind Acquisition Finance SA | 11.750 | | 07-15-17 | EUR 150,000 | 211,027 |
|
| Wind Acquisition Finance SA (S) | 11.750 | | 07-15-17 | 900,000 | 949,500 |
|
| Wind Acquisition Holdings Finance | | | | | |
| SA, PIK (S) | 12.250 | | 07-15-17 | 563,125 | 580,019 |
| | | | | | |
| Marshall Islands 0.0% | | | | | 1,601,400 |
|
| Millennium Offshore Services | | | | | |
| Superholdings LLC (S) | 9.500 | | 02-15-18 | 1,570,000 | 1,601,400 |
| | | | | | |
| Mexico 0.1% | | | | | 1,769,729 |
|
| America Movil SAB de CV | 3.000 | | 07-12-21 | EUR 350,000 | 475,252 |
|
| America Movil SAB de CV | 3.750 | | 06-28-17 | EUR 750,000 | 1,080,267 |
|
| Kansas City Southern de Mexico SA de CV | 6.125 | | 06-15-21 | 18,000 | 20,250 |
|
| Petroleos Mexicanos | 5.500 | | 01-09-17 | EUR 130,000 | 193,960 |
| | |
| See notes to financial statements | Annual report | Global Absolute Return Strategies Fund | 17 |
| | | | | |
| | | | Maturity | | |
| | Rate (%) | | date | Par value^ | Value |
| Netherlands 1.0% | | | | | $37,245,931 |
|
| ABN AMRO Bank NV (4.310% to | | | | | |
| 3-10-16, then 3 month EURIBOR | | | | | |
| + 1.660%) (Q) | 4.310 | | 03-10-16 | EUR 100,000 | 124,720 |
|
| ABN AMRO Bank NV | 6.375 | | 04-27-21 | EUR 270,000 | 402,737 |
|
| Adecco International Financial Services BV | 2.750 | | 11-15-19 | EUR 500,000 | 664,337 |
|
| Aegon NV | 3.000 | | 07-18-17 | EUR 250,000 | 352,299 |
|
| Allianz Finance II BV | 4.750 | | 07-22-19 | EUR 150,000 | 232,393 |
|
| Allianz Finance II BV (5.750% to | | | | | |
| 7-8-21, then 3 month EURIBOR | | | | | |
| + 2.349%) | 5.750 | | 07-08-41 | EUR 800,000 | 1,187,492 |
|
| Coca-Cola HBC Finance BV | 2.375 | | 06-18-20 | EUR 500,000 | 660,273 |
|
| Coca-Cola HBC Finance BV | 4.250 | | 11-16-16 | EUR 128,000 | 185,559 |
|
| Conti-Gummi Finance BV | 6.500 | | 01-15-16 | EUR 340,000 | 471,542 |
|
| Conti-Gummi Finance BV | 7.125 | | 10-15-18 | EUR 150,000 | 208,532 |
|
| Deutsche Annington Finance BV | 2.125 | | 07-25-16 | EUR 600,000 | 804,482 |
|
| Deutsche Annington Finance BV | 3.125 | | 07-25-19 | EUR 600,000 | 803,334 |
|
| Deutsche Bahn Finance BV | 3.000 | | 03-08-24 | EUR 400,000 | 563,921 |
|
| Deutsche Telekom International | | | | | |
| Finance BV | 4.250 | | 07-13-22 | EUR 380,000 | 569,721 |
|
| Deutsche Telekom International | | | | | |
| Finance BV | 6.625 | | 03-29-18 | EUR 13,000 | 21,305 |
|
| E.ON International Finance BV | 5.750 | | 05-07-20 | EUR 430,000 | 712,426 |
|
| EDP Finance BV | 5.750 | | 09-21-17 | EUR 770,000 | 1,091,670 |
|
| EN Germany Holdings BV | 10.750 | | 11-15-15 | EUR 92,000 | 115,049 |
|
| Enel Finance International NV | 4.625 | | 06-24-15 | EUR 625,000 | 879,007 |
|
| Enel Finance International NV | 4.875 | | 03-11-20 | EUR 500,000 | 713,227 |
|
| Enel Finance International NV (S) | 5.750 | | 10-24-18 | EUR 1,450,000 | 2,183,636 |
|
| HeidelbergCement Finance BV | 6.750 | | 12-15-15 | EUR 600,000 | 887,146 |
|
| HeidelbergCement Finance BV | 7.500 | | 04-03-20 | EUR 150,000 | 240,760 |
|
| HeidelbergCement Finance BV | 8.000 | | 01-31-17 | EUR 800,000 | 1,253,722 |
|
| HIT Finance BV | 5.750 | | 03-09-18 | EUR 300,000 | 453,026 |
|
| Iberdrola International BV (5.750% | | | | | |
| to 2-27-18, then 5 Year Euro Swap | | | | | |
| Rate + 4.810%) (Q) | 5.750 | | 02-27-18 | EUR 200,000 | 264,074 |
|
| ING Bank NV | 4.000 | | 12-23-16 | EUR 100,000 | 144,223 |
|
| ING Bank NV | 4.250 | | 01-13-17 | EUR 800,000 | 1,164,173 |
|
| ING Bank NV (4.625% to 3-15-14, | | | | | |
| then 3 month EURIBOR + 1.440%) | 4.625 | | 03-15-19 | EUR 820,000 | 1,087,614 |
|
| ING Bank NV | 4.875 | | 01-18-21 | EUR 430,000 | 661,290 |
|
| KBC IFIMA NV | 3.875 | | 03-31-15 | EUR 300,000 | 417,858 |
|
| KBC IFIMA NV | 4.500 | | 03-27-17 | EUR 1,350,000 | 1,979,503 |
|
| KPN NV | 5.625 | | 09-30-24 | EUR 300,000 | 465,628 |
|
| KPN NV | 6.500 | | 01-15-16 | EUR 150,000 | 225,111 |
|
| KPN NV | 7.500 | | 02-04-19 | EUR 600,000 | 1,007,975 |
|
| LeasePlan Corp. NV | 2.500 | | 09-19-16 | EUR 400,000 | 547,026 |
|
| LeasePlan Corp. NV | 4.125 | | 01-13-15 | EUR 500,000 | 695,335 |
|
| Linde Finance BV (7.375% to | | | | | |
| 7-14-16, then 3 month EURIBOR | | | | | |
| + 4.125%) | 7.375 | | 07-14-66 | EUR 490,000 | 744,150 |
|
| NXP BV (S) | 3.750 | | 06-01-18 | 750,000 | 738,750 |
| | |
| 18 | Global Absolute Return Strategies Fund | Annual report | See notes to financial statements |
| | | | | |
| | | | Maturity | | |
| | Rate (%) | | date | Par value^ | Value |
| Netherlands (continued) | | | | | |
|
| NXP BV (S) | 5.750 | | 02-15-21 | 650,000 | $667,875 |
|
| NXP BV (S) | 9.750 | | 08-01-18 | 100,000 | 111,500 |
|
| Rabobank Nederland NV | 3.500 | | 10-17-18 | EUR 1,350,000 | 1,955,108 |
|
| Rabobank Nederland NV | 3.875 | | 04-20-16 | EUR 153,000 | 219,059 |
|
| Rabobank Nederland NV | 4.125 | | 01-14-20 | EUR 750,000 | 1,115,335 |
|
| Rabobank Nederland NV (8.375% to | | | | | |
| 7-26-16, then 5 Year U.S. Treasury | | | | | |
| Note Rate + 6.425%) (Q) | 8.375 | | 07-26-16 | 450,000 | 486,432 |
|
| Repsol International Finance BV | 4.250 | | 02-12-16 | EUR 300,000 | 424,664 |
|
| Robert Bosch Investment Nederland BV | 2.625 | | 05-24-28 | EUR 600,000 | 782,875 |
|
| RWE Finance BV | 6.500 | | 08-10-21 | EUR 400,000 | 685,632 |
|
| RWE Finance BV | 6.625 | | 01-31-19 | EUR 300,000 | 494,681 |
|
| Schaeffler Finance BV | 4.250 | | 05-15-18 | EUR 100,000 | 134,232 |
|
| Swiss Reinsurance Company | | | | | |
| (5.252% to 5-25-16, then | | | | | |
| 6 month EURIBOR + 2.090%) (Q) | 5.252 | | 05-25-16 | EUR 350,000 | 479,591 |
|
| Telefonica Europe BV | 5.875 | | 02-14-33 | EUR 120,000 | 176,101 |
|
| TenneT Holding BV (6.655% to | | | | | |
| 6-1-17, then 5 Year Euro Swap | | | | | |
| Rate + 3.600%) (Q) | 6.655 | | 06-01-17 | EUR 450,000 | 651,758 |
|
| UPC Holding BV | 8.375 | | 08-15-20 | EUR 500,000 | 731,692 |
|
| Volkswagen International Finance NV | 2.000 | | 03-26-21 | EUR 1,150,000 | 1,507,217 |
|
| Ziggo NV | 3.625 | | 03-27-20 | EUR 530,000 | 697,153 |
| | | | | | |
| Norway 0.1% | | | | | 2,704,555 |
|
| DNB Bank ASA | 4.375 | | 02-24-21 | EUR 1,060,000 | 1,607,180 |
|
| Statkraft AS | 2.500 | | 11-28-22 | EUR 100,000 | 132,162 |
|
| Statkraft AS | 6.625 | | 04-02-19 | EUR 580,000 | 965,213 |
| | | | | | |
| Spain 0.4% | | | | | 14,546,517 |
|
| Amadeus Capital Markets SA | 4.875 | | 07-15-16 | EUR 830,000 | 1,206,972 |
|
| Banco Bilbao Vizcaya Argentaria SA | 3.500 | | 12-05-17 | EUR 900,000 | 1,249,357 |
|
| Banco Bilbao Vizcaya Argentaria SA | 4.250 | | 03-30-15 | EUR 150,000 | 208,369 |
|
| Banco Santander SA | 4.375 | | 03-16-15 | EUR 200,000 | 278,459 |
|
| Bankia SA | 3.500 | | 11-13-14 | EUR 450,000 | 599,321 |
|
| BBVA Senior Finance SAU | 3.250 | | 04-23-15 | EUR 550,000 | 745,655 |
|
| BBVA Senior Finance SAU | 4.375 | | 09-21-15 | EUR 300,000 | 415,405 |
|
| BBVA Senior Finance SAU | 4.875 | | 01-23-14 | EUR 100,000 | 135,432 |
|
| CaixaBank | 3.000 | | 03-22-18 | EUR 400,000 | 535,237 |
|
| Ence Energia y Celulosa SA | 7.250 | | 02-15-20 | EUR 200,000 | 275,409 |
|
| Ferrovial Emisiones SA | 3.375 | | 01-30-18 | EUR 800,000 | 1,090,478 |
|
| Gas Natural Capital Markets SA | 5.000 | | 02-13-18 | EUR 900,000 | 1,323,373 |
|
| Gas Natural Capital Markets SA | 5.625 | | 02-09-17 | EUR 400,000 | 595,224 |
|
| Iberdrola Finanzas SAU | 4.750 | | 01-25-16 | EUR 600,000 | 859,998 |
|
| Iberdrola Finanzas SAU | 5.625 | | 05-09-18 | EUR 700,000 | 1,059,431 |
|
| Telefonica Emisiones SAU | 3.661 | | 09-18-17 | EUR 350,000 | 486,010 |
|
| Telefonica Emisiones SAU | 4.710 | | 01-20-20 | EUR 700,000 | 998,248 |
|
| Telefonica Emisiones SAU | 4.750 | | 02-07-17 | EUR 300,000 | 431,157 |
|
| Telefonica Emisiones SAU | 4.967 | | 02-03-16 | EUR 600,000 | 856,436 |
|
| Telefonica Emisiones SAU | 5.811 | | 09-05-17 | EUR 800,000 | 1,196,546 |
| | |
| See notes to financial statements | Annual report | Global Absolute Return Strategies Fund | 19 |
| | | | | |
| | | | Maturity | | |
| | Rate (%) | | date | Par value^ | Value |
| Sweden 0.2% | | | | | $6,440,446 |
|
| Atlas Copco AB | 2.500 | | 02-28-23 | EUR 500,000 | 666,532 |
|
| Investor AB | 3.250 | | 09-17-18 | EUR 500,000 | 716,872 |
|
| Norcell Sweden Holding 2 AB | 10.750 | | 09-29-19 | EUR 500,000 | 715,715 |
|
| Nordea Bank AB | 4.000 | | 06-29-20 | EUR 430,000 | 638,495 |
|
| Nordea Bank AB | 4.000 | | 03-29-21 | EUR 310,000 | 433,611 |
|
| Nordea Bank AB (4.625% to | | | | | |
| 2-15-17, then 5 Year Euro Swap | | | | | |
| Rate + 3.150%) | 4.625 | | 02-15-22 | EUR 600,000 | 855,541 |
|
| Nordea Bank AB (6.250% to | | | | | |
| 9-10-13, then 3 month EURIBOR | | | | | |
| + 3.200%) | 6.250 | | 09-10-18 | EUR 140,000 | 187,144 |
|
| Svenska Handelsbanken AB | 4.375 | | 10-20-21 | EUR 250,000 | 383,729 |
|
| Swedbank AB | 3.375 | | 02-09-17 | EUR 580,000 | 826,839 |
|
| TeliaSonera AB | 3.625 | | 02-14-24 | EUR 530,000 | 765,556 |
|
| Vattenfall AB | 6.750 | | 01-31-19 | EUR 150,000 | 250,412 |
| | | | | | |
| United Arab Emirates 0.1% | | | | | 2,301,529 |
|
| Shelf Drilling Holdings, Ltd. (S) | 8.625 | | 11-01-18 | 1,724,000 | 1,836,060 |
|
| Xstrata Finance Dubai, Ltd. | 1.750 | | 05-19-16 | EUR 350,000 | 465,469 |
| | | | | | |
| United Kingdom 1.1% | | | | | 40,521,686 |
|
| Abbey National Treasury Services PLC | 1.750 | | 01-15-18 | EUR 150,000 | 199,171 |
|
| Abbey National Treasury Services PLC | 2.625 | | 07-16-20 | EUR 500,000 | 666,224 |
|
| Abbey National Treasury Services PLC | 3.375 | | 10-20-15 | EUR 405,000 | 564,619 |
|
| Arqiva Broadcast Finance PLC | 9.500 | | 03-31-20 | GBP 1,280,000 | 2,088,372 |
|
| Aviva PLC (5.700% to 9-29-15, then | | | | | |
| 3 month EURIBOR + 2.350%) (Q) | 5.700 | | 09-29-15 | EUR 170,000 | 228,421 |
|
| Aviva PLC (6.125% to 2-27-18, then | | | | | |
| 5 Year Euro Swap Rate + 5.130%) | 6.125 | | 07-05-43 | EUR 750,000 | 1,030,190 |
|
| Barclays Bank PLC | 4.000 | | 01-20-17 | EUR 470,000 | 683,034 |
|
| Barclays Bank PLC (4.500% to | | | | | |
| 3-4-14, then 3 month EURIBOR | | | | | |
| + 3.200%) | 4.500 | | 03-04-19 | EUR 190,000 | 253,146 |
|
| Barclays Bank PLC | 6.625 | | 03-30-22 | EUR 150,000 | 232,285 |
|
| Barclays Bank PLC | 7.625 | | 11-21-22 | 3,139,000 | 3,123,305 |
|
| BAT International Finance PLC | 3.625 | | 11-09-21 | EUR 510,000 | 740,575 |
|
| Boparan Finance PLC | 9.750 | | 04-30-18 | EUR 525,000 | 770,198 |
|
| Brambles Finance PLC | 4.625 | | 04-20-18 | EUR 230,000 | 342,821 |
|
| Coventry Building Society | 2.250 | | 12-04-17 | EUR 1,000,000 | 1,339,676 |
|
| Credit Agricole SA | 3.000 | | 07-20-15 | EUR 650,000 | 899,202 |
|
| Credit Agricole SA | 3.125 | | 07-17-23 | EUR 400,000 | 531,478 |
|
| Credit Agricole SA | 3.875 | | 02-13-19 | EUR 100,000 | 145,249 |
|
| EC Finance PLC | 9.750 | | 08-01-17 | EUR 100,000 | 144,037 |
|
| Experian Finance PLC | 4.750 | | 02-04-20 | EUR 500,000 | 763,363 |
|
| FCE Bank PLC | 2.875 | | 10-03-17 | EUR 250,000 | 346,002 |
|
| FCE Bank PLC | 4.750 | | 01-19-15 | EUR 580,000 | 812,287 |
|
| G4S International Finance PLC | 2.625 | | 12-06-18 | EUR 290,000 | 378,954 |
|
| G4S International Finance PLC | 2.875 | | 05-02-17 | EUR 681,000 | 911,906 |
|
| Hammerson PLC | 2.750 | | 09-26-19 | EUR 700,000 | 946,052 |
|
| Hammerson PLC | 4.875 | | 06-19-15 | EUR 660,000 | 939,612 |
| | |
| 20 | Global Absolute Return Strategies Fund | Annual report | See notes to financial statements |
| | | | | |
| | | | Maturity | | |
| | Rate (%) | | date | Par value^ | Value |
| United Kingdom (continued) | | | | | |
|
| HBOS PLC (4.375% to 10-30-14, | | | | | |
| then 3 month EURIBOR + 1.36%) | 4.375 | | 10-30-19 | EUR 115,000 | $152,019 |
|
| HBOS PLC | 4.875 | | 03-20-15 | EUR 140,000 | 192,293 |
|
| Heathrow Finance PLC | 5.375 | | 09-02-19 | GBP 625,000 | 960,289 |
|
| HSBC Holdings PLC | 6.000 | | 06-10-19 | EUR 200,000 | 310,540 |
|
| Imperial Tobacco Finance PLC | 5.000 | | 12-02-19 | EUR 650,000 | 1,003,025 |
|
| Imperial Tobacco Finance PLC | 8.375 | | 02-17-16 | EUR 545,000 | 853,499 |
|
| Jaguar Land Rover Automotive PLC (S) | 5.625 | | 02-01-23 | 150,000 | 147,000 |
|
| Jaguar Land Rover Automotive PLC | 8.125 | | 05-15-18 | GBP 375,000 | 618,959 |
|
| Kerling PLC | 10.625 | | 02-01-17 | EUR 370,000 | 522,994 |
|
| LBG Capital No.2 PLC | 15.000 | | 12-21-19 | EUR 300,000 | 563,097 |
|
| Legal & General Group PLC (4.000% | | | | | |
| to 6-8-15 then 3 month EURIBOR | | | | | |
| +1.700%) | 4.000 | | 06-08-25 | EUR 680,000 | 917,846 |
|
| Lloyds TSB Bank PLC | 3.750 | | 09-07-15 | EUR 530,000 | 745,494 |
|
| Lloyds TSB Bank PLC | 6.375 | | 06-17-16 | EUR 560,000 | 853,269 |
|
| Lloyds TSB Bank PLC | 6.500 | | 03-24-20 | EUR 1,020,000 | 1,516,785 |
|
| Lloyds TSB Bank PLC (10.375% to | | | | | |
| 2-12-19, then 5 Year Euro Swap | | | | | |
| Rate + 8.500%) | 10.375 | | 02-12-24 | EUR 150,000 | 241,887 |
|
| Matalan Finance PLC | 8.875 | | 04-29-16 | GBP 200,000 | 310,335 |
|
| Matalan Finance PLC | 9.625 | | 03-31-17 | GBP 175,000 | 256,901 |
|
| Mondi Finance PLC | 3.375 | | 09-28-20 | EUR 400,000 | 542,853 |
|
| Mondi Finance PLC | 5.750 | | 04-03-17 | EUR 380,000 | 571,229 |
|
| Motability Operations Group PLC | 3.250 | | 11-30-18 | EUR 390,000 | 559,189 |
|
| National Grid PLC | 5.000 | | 07-02-18 | EUR 305,000 | 472,207 |
|
| Nationwide Building Society | 6.750 | | 07-22-20 | EUR 850,000 | 1,261,230 |
|
| NGG Finance PLC (4.250% to | | | | | |
| 6-18-20, then 7 Year Euro Swap | | | | | |
| Rate + 2.880%) | 4.250 | | 06-18-76 | EUR 300,000 | 398,107 |
|
| Nord Anglia Education UK Holdings | | | | | |
| PLC (S) | 10.250 | | 04-01-17 | 200,000 | 221,000 |
|
| Pennon Group PLC (6.750% to | | | | | |
| 3-8-18, then 3 month LIBOR | | | | | |
| + 10.745%) (Q) | 6.750 | | 03-08-18 | GBP 200,000 | 316,420 |
|
| Phones4u Finance PLC | 9.500 | | 04-01-18 | GBP 100,000 | 158,971 |
|
| SSE PLC (5.025% to 10-1-15, then | | | | | |
| 5 Year EUR Swap Rate + 3.150%) (Q) | 5.025 | | 10-01-15 | EUR 550,000 | 767,399 |
|
| SSE PLC (5.625% to 10-1-17, then | | | | | |
| 5 Year Euro Swap Rate + 4.620%) (Q) | 5.625 | | 10-01-17 | EUR 300,000 | 427,022 |
|
| Stagecoach Group PLC | 5.750 | | 12-16-16 | GBP 100,000 | 168,840 |
|
| The Royal Bank of Scotland PLC | 4.875 | | 01-20-17 | EUR 400,000 | 587,855 |
|
| The Royal Bank of Scotland PLC | 5.375 | | 09-30-19 | EUR 724,000 | 1,100,036 |
|
| The Royal Bank of Scotland PLC | 6.934 | | 04-09-18 | EUR 976,000 | 1,350,249 |
|
| Thomas Cook Group PLC | 6.750 | | 06-22-15 | EUR 150,000 | 209,530 |
|
| Thomas Cook Group PLC | 7.750 | | 06-22-17 | GBP 300,000 | 470,066 |
|
| UBS AG | 6.000 | | 04-18-18 | EUR 380,000 | 604,997 |
|
| Virgin Media Finance PLC | 8.875 | | 10-15-19 | GBP 100,000 | 166,197 |
|
| Voyage Care Bondco PLC | 6.500 | | 08-01-18 | GBP 600,000 | 921,878 |
| | |
| See notes to financial statements | Annual report | Global Absolute Return Strategies Fund | 21 |
| | | | | |
| | | | Maturity | | |
| | Rate (%) | | date | Par value^ | Value |
| United States 5.8% | | | | | $217,949,751 |
|
| Advanced Micro Devices, Inc. | 7.750 | | 08-01-20 | 670,000 | 661,625 |
|
| Affinia Group, Inc. (S) | 7.750 | | 05-01-21 | 1,089,000 | 1,121,670 |
|
| Aleris International, Inc. | 7.625 | | 02-15-18 | 250,000 | 262,500 |
|
| Aleris International, Inc. | 7.875 | | 11-01-20 | 1,287,000 | 1,344,915 |
|
| AMC Entertainment, Inc. | 9.750 | | 12-01-20 | 1,510,000 | 1,721,400 |
|
| American Axle & Manufacturing, Inc. | 6.625 | | 10-15-22 | 1,657,000 | 1,752,278 |
|
| American Axle & Manufacturing, Inc. | 7.750 | | 11-15-19 | 289,000 | 327,293 |
|
| American International Group, Inc. | 5.000 | | 06-26-17 | EUR 300,000 | 443,127 |
|
| Amgen, Inc. | 4.375 | | 12-05-18 | EUR 550,000 | 826,877 |
|
| Approach Resources, Inc. | 7.000 | | 06-15-21 | 895,000 | 903,950 |
|
| APX Group, Inc. (S) | 6.375 | | 12-01-19 | 790,000 | 770,250 |
|
| APX Group, Inc. (S) | 8.750 | | 12-01-20 | 1,838,000 | 1,838,000 |
|
| Ashland, Inc. (S) | 6.875 | | 05-15-43 | 220,000 | 225,500 |
|
| AT&T, Inc. | 2.500 | | 03-15-23 | EUR 400,000 | 524,552 |
|
| AT&T, Inc. | 3.550 | | 12-17-32 | EUR 150,000 | 199,272 |
|
| Athlon Holdings LP (S) | 7.375 | | 04-15-21 | 1,360,000 | 1,380,400 |
|
| Atlas Pipeline Partners LP (S) | 5.875 | | 08-01-23 | 900,000 | 859,500 |
|
| Atlas Pipeline Partners LP (S) | 6.625 | | 10-01-20 | 620,000 | 632,400 |
|
| Atwood Oceanics, Inc. | 6.500 | | 02-01-20 | 373,000 | 397,245 |
|
| Avis Budget Car Rental LLC (S) | 5.500 | | 04-01-23 | 958,000 | 943,630 |
|
| Avis Budget Finance PLC | 6.000 | | 03-01-21 | EUR 575,000 | 790,577 |
|
| Bank of America Corp. (P) | 1.062 | | 03-28-18 | EUR 600,000 | 754,308 |
|
| Bank of America Corp. | 2.500 | | 07-27-20 | EUR 800,000 | 1,055,374 |
|
| Bank of America Corp. | 4.750 | | 04-03-17 | EUR 950,000 | 1,402,500 |
|
| Bank of America Corp. | 7.000 | | 06-15-16 | EUR 850,000 | 1,311,729 |
|
| Biomet, Inc. | 6.500 | | 08-01-20 | 1,477,000 | 1,550,850 |
|
| BOE Intermediate Holding Corp., PIK (S) | 9.000 | | 11-01-17 | 855,000 | 872,100 |
|
| BOE Merger Corp., PIK (S) | 9.500 | | 11-01-17 | 1,100,000 | 1,160,500 |
|
| Boise Paper Holdings LLC | 8.000 | | 04-01-20 | 2,480,000 | 2,666,000 |
|
| Boyd Gaming Corp. | 9.000 | | 07-01-20 | 1,575,000 | 1,685,250 |
|
| Cablevision Systems Corp. | 5.875 | | 09-15-22 | 1,735,000 | 1,726,325 |
|
| Cablevision Systems Corp. | 8.625 | | 09-15-17 | 1,350,000 | 1,555,875 |
|
| Caesars Entertainment Operating | | | | | |
| Company, Inc. (S) | 9.000 | | 02-15-20 | 3,090,000 | 2,891,400 |
|
| Calpine Corp. (S) | 7.875 | | 07-31-20 | 1,230,000 | 1,334,550 |
|
| Casella Waste Systems, Inc. | 7.750 | | 02-15-19 | 2,510,000 | 2,434,700 |
|
| CCM Merger, Inc. (S) | 9.125 | | 05-01-19 | 1,881,000 | 1,993,860 |
|
| CCO Holdings LLC | 5.250 | | 09-30-22 | 500,000 | 466,250 |
|
| CCO Holdings LLC | 5.750 | | 01-15-24 | 3,110,000 | 2,907,850 |
|
| CDW LLC | 8.500 | | 04-01-19 | 1,225,000 | 1,344,438 |
|
| Cemex Finance LLC (S) | 9.500 | | 12-14-16 | 980,000 | 1,043,700 |
|
| CenturyLink, Inc. | 5.625 | | 04-01-20 | 2,035,000 | 2,075,700 |
|
| Cequel Communications Escrow 1 LLC (S) | 6.375 | | 09-15-20 | 1,710,000 | 1,765,575 |
|
| Cequel Communications Holdings I | | | | | |
| LLC (S) | 5.125 | | 12-15-21 | 540,000 | 518,400 |
|
| Chaparral Energy, Inc. | 8.250 | | 09-01-21 | 825,000 | 872,438 |
|
| Chassix, Inc. (S) | 9.250 | | 08-01-18 | 1,253,000 | 1,306,253 |
| | |
| 22 | Global Absolute Return Strategies Fund | Annual report | See notes to financial statements |
| | | | | |
| | | | Maturity | | |
| | Rate (%) | | date | Par value^ | Value |
| United States (continued) | | | | | |
|
| Chesapeake Energy Corp. | 6.875 | | 11-15-20 | 1,515,000 | $1,658,925 |
|
| Chesapeake Energy Corp. | 7.250 | | 12-15-18 | 740,000 | 834,350 |
|
| Chesapeake Oilfield Operating LLC | 6.625 | | 11-15-19 | 125,000 | 126,250 |
|
| Chrysler Group LLC | 8.250 | | 06-15-21 | 1,500,000 | 1,668,750 |
|
| Citigroup, Inc. (1.469% to 8-30-13 | | | | | |
| then 3 month EURIBOR +1.270%) | 1.469 | | 11-30-17 | EUR 300,000 | 385,735 |
|
| Citigroup, Inc. | 4.000 | | 11-26-15 | EUR 730,000 | 1,034,222 |
|
| Citigroup, Inc. (4.750% to 2-10-14, | | | | | |
| then 3 month EURIBOR + 1.400%) | 4.750 | | 02-10-19 | EUR 720,000 | 949,748 |
|
| Citigroup, Inc. | 5.000 | | 08-02-19 | EUR 120,000 | 183,937 |
|
| Citigroup, Inc. | 7.375 | | 09-04-19 | EUR 1,200,000 | 2,049,688 |
|
| CityCenter Holdings LLC, PIK | 10.750 | | 01-15-17 | 1,225,788 | 1,323,851 |
|
| Clear Channel Communications, Inc. | 9.000 | | 03-01-21 | 1,910,000 | 1,881,350 |
|
| Clear Channel Worldwide Holdings, Inc. | 7.625 | | 03-15-20 | 1,220,000 | 1,287,100 |
|
| Concho Resources, Inc. | 5.500 | | 10-01-22 | 1,250,000 | 1,257,813 |
|
| Concho Resources, Inc. | 6.500 | | 01-15-22 | 500,000 | 535,000 |
|
| Continental Resources, Inc. | 4.500 | | 04-15-23 | 450,000 | 437,625 |
|
| Continental Resources, Inc. | 5.000 | | 09-15-22 | 1,992,000 | 2,001,960 |
|
| Cricket Communications, Inc. | 7.750 | | 10-15-20 | 2,160,000 | 2,457,000 |
|
| Crown Americas LLC (S) | 4.500 | | 01-15-23 | 770,000 | 718,025 |
|
| Crown Americas LLC | 6.250 | | 02-01-21 | 100,000 | 106,250 |
|
| Del Monte Corp. | 7.625 | | 02-15-19 | 1,620,000 | 1,692,900 |
|
| DIRECTV Holdings LLC | 2.750 | | 05-19-23 | EUR 600,000 | 767,990 |
|
| DISH DBS Corp. (S) | 5.125 | | 05-01-20 | 1,220,000 | 1,198,650 |
|
| DISH DBS Corp. | 5.875 | | 07-15-22 | 760,000 | 758,100 |
|
| DISH DBS Corp. | 6.750 | | 06-01-21 | 1,075,000 | 1,139,500 |
|
| DJO Finance LLC | 7.750 | | 04-15-18 | 500,000 | 496,250 |
|
| DJO Finance LLC | 9.875 | | 04-15-18 | 700,000 | 740,250 |
|
| DR Horton, Inc | 4.375 | | 09-15-22 | 1,460,000 | 1,372,400 |
|
| DR Horton, Inc. | 3.625 | | 02-15-18 | 290,000 | 284,200 |
|
| Eagle Midco, Inc. (S) | 9.000 | | 06-15-18 | 690,000 | 695,175 |
|
| El Paso Corp. | 7.000 | | 06-15-17 | 1,470,000 | 1,638,396 |
|
| El Paso Pipeline Partners Operating | | | | | |
| Company LLC | 6.500 | | 04-01-20 | 62,000 | 72,227 |
|
| Endo Health Solutions, Inc. | 7.250 | | 01-15-22 | 750,000 | 781,875 |
|
| Endo Pharmaceuticals Holdings, Inc. | 7.000 | | 12-15-20 | 1,500,000 | 1,567,500 |
|
| Energy Future Intermediate Holding | | | | | |
| Company LLC | 10.000 | | 12-01-20 | 2,775,000 | 3,003,938 |
|
| Energy XXI Gulf Coast, Inc. | 7.750 | | 06-15-19 | 1,425,000 | 1,496,250 |
|
| EP Energy LLC | 7.750 | | 09-01-22 | 555,000 | 610,500 |
|
| EP Energy LLC | 9.375 | | 05-01-20 | 995,000 | 1,129,325 |
|
| Epicor Software Corp. | 8.625 | | 05-01-19 | 548,000 | 580,880 |
|
| First Data Corp. (S) | 8.250 | | 01-15-21 | 575,000 | 600,875 |
|
| Freescale Semiconductor, Inc. | 10.750 | | 08-01-20 | 2,217,000 | 2,483,040 |
|
| Fresenius Medical Care US Finance II, | | | | | |
| Inc. (S) | 5.625 | | 07-31-19 | 954,000 | 1,010,048 |
|
| Frontier Communications Corp. | 7.625 | | 04-15-24 | 1,255,000 | 1,267,550 |
|
| Frontier Communications Corp. | 8.125 | | 10-01-18 | 885,000 | 986,775 |
| | |
| See notes to financial statements | Annual report | Global Absolute Return Strategies Fund | 23 |
| | | | | |
| | | | Maturity | | |
| | Rate (%) | | date | Par value^ | Value |
| United States (continued) | | | | | |
|
| Frontier Communications Corp. | 8.250 | | 04-15-17 | 975,000 | $1,101,750 |
|
| GenOn Americas Generation LLC | 8.500 | | 10-01-21 | 125,000 | 136,250 |
|
| GenOn Energy, Inc. | 9.500 | | 10-15-18 | 2,520,000 | 2,885,400 |
|
| Gibson Brands, Inc. (S) | 8.875 | | 08-01-18 | 890,000 | 916,700 |
|
| Goodrich Petroleum Corp. | 8.875 | | 03-15-19 | 2,194,000 | 2,248,850 |
|
| GWR Operating Partnership LLP | 10.875 | | 04-01-17 | 1,100,000 | 1,230,625 |
|
| Halcon Resources Corp. | 8.875 | | 05-15-21 | 1,515,000 | 1,530,150 |
|
| Halcon Resources Corp. | 9.750 | | 07-15-20 | 645,000 | 669,188 |
|
| HCA, Inc. | 5.875 | | 05-01-23 | 500,000 | 505,000 |
|
| HCA, Inc. | 7.250 | | 09-15-20 | 2,825,000 | 3,089,844 |
|
| HCA, Inc. | 7.500 | | 11-15-95 | 1,960,000 | 1,768,900 |
|
| HDTFS, Inc. | 6.250 | | 10-15-22 | 60,000 | 63,600 |
|
| Hexion US Finance Corp. | 6.625 | | 04-15-20 | 1,935,000 | 1,978,538 |
|
| Hexion US Finance Corp. | 8.875 | | 02-01-18 | 425,000 | 442,000 |
|
| Hiland Partners LP (S) | 7.250 | | 10-01-20 | 2,010,000 | 2,110,500 |
|
| HSBC Finance Corp. | 3.750 | | 11-04-15 | EUR 700,000 | 984,609 |
|
| Infor US, Inc. | 10.000 | | 04-01-19 | EUR 1,420,000 | 2,096,897 |
|
| Infor US, Inc. | 11.500 | | 07-15-18 | 733,000 | 844,783 |
|
| Innovation Ventures LLC (S) | 9.500 | | 08-15-19 | 570,000 | 464,550 |
|
| Interface Security Systems Holdings, | | | | | |
| Inc. (S) | 9.250 | | 01-15-18 | 1,000,000 | 1,030,000 |
|
| Jarden Corp. | 7.500 | | 05-01-17 | 1,554,000 | 1,734,653 |
|
| JPMorgan Chase & Company | | | | | |
| (4.375% to 11-12-14, then | | | | | |
| 3 month EURIBOR + 1.500%) | 4.375 | | 11-12-19 | EUR 400,000 | 537,785 |
|
| Kinetic Concepts, Inc. | 10.500 | | 11-01-18 | 1,006,000 | 1,106,600 |
|
| Laredo Petroleum, Inc. | 7.375 | | 05-01-22 | 215,000 | 226,825 |
|
| Laredo Petroleum, Inc. | 9.500 | | 02-15-19 | 450,000 | 499,500 |
|
| Laureate Education, Inc. (S) | 9.250 | | 09-01-19 | 3,025,000 | 3,282,125 |
|
| Level 3 Communications, Inc. | 8.875 | | 06-01-19 | 910,000 | 980,525 |
|
| Level 3 Financing, Inc. | 8.125 | | 07-01-19 | 250,000 | 271,250 |
|
| Level 3 Financing, Inc. | 8.625 | | 07-15-20 | 2,095,000 | 2,304,500 |
|
| Libbey Glass, Inc. | 6.875 | | 05-15-20 | 982,000 | 1,050,740 |
|
| Linn Energy LLC (S) | 6.250 | | 11-01-19 | 780,000 | 733,200 |
|
| Linn Energy LLC | 6.500 | | 05-15-19 | 1,455,000 | 1,414,988 |
|
| Lynx I Corp. | 6.000 | | 04-15-21 | GBP 650,000 | 1,014,107 |
|
| Marina District Finance Company, Inc. | 9.500 | | 10-15-15 | 1,770,000 | 1,849,650 |
|
| McGraw-Hill Global Education | | | | | |
| Holdings LLC (S) | 9.750 | | 04-01-21 | 860,000 | 903,000 |
|
| Mcron Finance Sub LLC (S) | 8.375 | | 05-15-19 | 920,000 | 1,000,500 |
|
| MetroPCS Wireless, Inc. | 6.625 | | 11-15-20 | 850,000 | 892,500 |
|
| MGM Resorts International | 7.625 | | 01-15-17 | 1,625,000 | 1,828,125 |
|
| Michael Foods, Inc. | 9.750 | | 07-15-18 | 900,000 | 990,000 |
|
| Midstates Petroleum Company, Inc. (S) | 9.250 | | 06-01-21 | 400,000 | 393,000 |
|
| Midstates Petroleum Company, Inc. (S) | 10.750 | | 10-01-20 | 962,000 | 1,000,480 |
|
| Milacron LLC (S) | 7.750 | | 02-15-21 | 725,000 | 739,500 |
|
| Mobile Mini, Inc. | 7.875 | | 12-01-20 | 28,000 | 30,520 |
| | |
| 24 | Global Absolute Return Strategies Fund | Annual report | See notes to financial statements |
| | | | | |
| | | | Maturity | | |
| | Rate (%) | | date | Par value^ | Value |
| United States (continued) | | | | | |
|
| Morgan Stanley | 2.250 | | 03-12-18 | EUR 700,000 | $934,784 |
|
| Morgan Stanley | 4.500 | | 02-23-16 | EUR 1,200,000 | 1,708,010 |
|
| Morgan Stanley | 5.375 | | 08-10-20 | EUR 100,000 | 152,221 |
|
| Morgan Stanley | 5.500 | | 10-02-17 | EUR 500,000 | 753,362 |
|
| New Academy Finance Company | | | | | |
| LLC, PIK (S) | 8.000 | | 06-15-18 | 175,000 | 180,250 |
|
| Novelis, Inc. | 8.750 | | 12-15-20 | 780,000 | 859,950 |
|
| NPC International, Inc. | 10.500 | | 01-15-20 | 1,730,000 | 1,985,175 |
|
| NRG Energy, Inc. | 8.250 | | 09-01-20 | 1,110,000 | 1,232,100 |
|
| Pemex Project Funding Master Trust | 6.375 | | 08-05-16 | EUR 973,000 | 1,473,709 |
|
| Pfizer, Inc. | 5.750 | | 06-03-21 | EUR 650,000 | 1,091,481 |
|
| Philip Morris International, Inc. | 2.750 | | 03-19-25 | EUR 450,000 | 588,798 |
|
| Philip Morris International, Inc. | 3.125 | | 06-03-33 | EUR 200,000 | 255,720 |
|
| PNK Finance Corp. (S) | 6.375 | | 08-01-21 | 160,000 | 161,000 |
|
| Production Resource Group, Inc. | 8.875 | | 05-01-19 | 1,005,000 | 781,388 |
|
| Rain CII Carbon LLC (S) | 8.250 | | 01-15-21 | 625,000 | 632,813 |
|
| Rain CII Carbon LLC | 8.500 | | 01-15-21 | EUR 625,000 | 796,131 |
|
| Regions Bank | 7.500 | | 05-15-18 | 500,000 | 590,585 |
|
| Resolute Forest Products, Inc. (S) | 5.875 | | 05-15-23 | 1,030,000 | 927,000 |
|
| Reynolds Group Issuer, Inc. | 7.875 | | 08-15-19 | 1,005,000 | 1,105,500 |
|
| Reynolds Group Issuer, Inc. | 8.500 | | 05-15-18 | 680,000 | 707,200 |
|
| Rite Aid Corp. | 8.000 | | 08-15-20 | 1,840,000 | 2,063,100 |
|
| Roche Holdings, Inc. | 6.500 | | 03-04-21 | EUR 550,000 | 963,974 |
|
| Sabine Pass Liquefaction LLC (S) | 5.625 | | 02-01-21 | 2,095,000 | 2,066,194 |
|
| Sabine Pass Liquefaction LLC (S) | 5.625 | | 04-15-23 | 400,000 | 390,000 |
|
| SandRidge Energy, Inc. | 8.750 | | 01-15-20 | 2,014,000 | 2,114,700 |
|
| Sealed Air Corp. (S) | 6.500 | | 12-01-20 | 1,094,000 | 1,181,520 |
|
| Select Medical Corp. (S) | 6.375 | | 06-01-21 | 1,200,000 | 1,164,000 |
|
| Service Corp. International | 7.000 | | 05-15-19 | 600,000 | 645,750 |
|
| Service Corp. International | 8.000 | | 11-15-21 | 480,000 | 559,800 |
|
| Simmons Foods, Inc. (S) | 10.500 | | 11-01-17 | 1,251,000 | 1,332,315 |
|
| Sky Growth Acquisition Corp. (S) | 7.375 | | 10-15-20 | 525,000 | 546,000 |
|
| Sprint Capital Corp. | 6.875 | | 11-15-28 | 2,846,000 | 2,618,320 |
|
| Sprint Communications, Inc. | 6.000 | | 11-15-22 | 2,361,000 | 2,272,463 |
|
| Sprint Communications, Inc. (S) | 7.000 | | 03-01-20 | 115,000 | 125,350 |
|
| Sprint Communications, Inc. | 7.000 | | 08-15-20 | 400,000 | 421,500 |
|
| Sprint Communications, Inc. | 9.125 | | 03-01-17 | 45,000 | 51,863 |
|
| Steelcase, Inc. | 6.375 | | 02-15-21 | 65,000 | 71,333 |
|
| Summit Materials LLC | 10.500 | | 01-31-20 | 965,000 | 1,032,550 |
|
| SunGard Data Systems, Inc. | 7.625 | | 11-15-20 | 1,350,000 | 1,464,750 |
|
| Taminco Global Chemical Corp. (S) | 9.750 | | 03-31-20 | 50,000 | 56,375 |
|
| Tenet Healthcare Corp. (S) | 4.500 | | 04-01-21 | 2,205,000 | 2,056,163 |
|
| Tenet Healthcare Corp. | 8.000 | | 08-01-20 | 378,000 | 401,625 |
|
| The Hertz Corp. | 5.875 | | 10-15-20 | 1,065,000 | 1,123,575 |
|
| Toll Brothers Finance Corp. | 6.750 | | 11-01-19 | 1,140,000 | 1,288,200 |
| | |
| See notes to financial statements | Annual report | Global Absolute Return Strategies Fund | 25 |
| | | | | |
| | | | Maturity | | |
| | Rate (%) | | date | Par value^ | Value |
| United States (continued) | | | | | |
|
| Tops Holding II Corp., PIK (S) | 8.750 | | 06-15-18 | 670,000 | $668,325 |
|
| Townsquare Radio LLC (S) | 9.000 | | 04-01-19 | 890,000 | 947,850 |
|
| TransUnion Holding Company, Inc., | | | | | |
| PIK (S) | 8.125 | | 06-15-18 | 1,170,000 | 1,250,438 |
|
| TransUnion Holding Company, Inc. | 9.625 | | 06-15-18 | 389,000 | 422,065 |
|
| Triumph Group, Inc. | 8.625 | | 07-15-18 | 105,000 | 114,188 |
|
| Tronox Finance LLC (S) | 6.375 | | 08-15-20 | 1,455,000 | 1,393,163 |
|
| UAL 2007-1 Pass Through Trust | 6.636 | | 07-02-22 | 1,396,601 | 1,466,431 |
|
| United Rentals North America, Inc. | 5.750 | | 07-15-18 | 840,000 | 898,800 |
|
| United Rentals North America, Inc. | 7.625 | | 04-15-22 | 469,000 | 522,935 |
|
| Univision Communications, Inc. (S) | 6.750 | | 09-15-22 | 960,000 | 1,032,000 |
|
| Univision Communications, Inc. (S) | 7.875 | | 11-01-20 | 1,000,000 | 1,097,500 |
|
| US Airways 2011-1 Class A Pass | | | | | |
| Through Trust | 7.125 | | 10-22-23 | 2,012,246 | 2,248,685 |
|
| Valeant Pharmaceuticals | | | | | |
| International, Inc. (S) | 6.750 | | 08-15-21 | 1,420,000 | 1,469,700 |
|
| Vector Group, Ltd. | 7.750 | | 02-15-21 | 1,335,000 | 1,395,075 |
|
| Visant Corp. | 10.000 | | 10-01-17 | 1,290,000 | 1,219,050 |
|
| Wachovia Corp. | 4.375 | | 11-27-18 | EUR 800,000 | 1,172,234 |
|
| Wal-Mart Stores, Inc. | 4.875 | | 09-21-29 | EUR 100,000 | 162,508 |
|
| Walter Energy, Inc. (S) | 9.875 | | 12-15-20 | 500,000 | 427,500 |
|
| Wex, Inc. (S) | 4.750 | | 02-01-23 | 580,000 | 545,200 |
|
| Windstream Corp. | 6.375 | | 08-01-23 | 970,000 | 921,500 |
|
| Windstream Corp. | 7.750 | | 10-01-21 | 2,135,000 | 2,273,775 |
|
| Zurich Insurance USA, Inc. (5.750% | | | | | |
| to 10-2-13, then 3 month | | | | | |
| EURIBOR + 2.670%) | 5.750 | | 10-02-23 | EUR 445,000 | 594,966 |
| | | | | | |
| Uruguay 0.0% | | | | | 317,863 |
|
| Navios South American Logistics, Inc. (S) | 9.250 | | 04-15-19 | 295,000 | 317,863 |
| |
| |
| Capital Preferred Securities 0.0% | | | | | $838,487 |
|
| (Cost $753,485) | | | | | |
| | | | | | |
| United States 0.0% | | | | | 838,487 |
|
| GE Capital Trust IV (4.625% to | | | | | |
| 9-15-16, then month EURIBOR | | | | | |
| +1.600%) (S) | 4.625 | | 09-15-66 | EUR 635,000 | 838,487 |
| |
| |
| Foreign Government Obligations 4.8% | | | $181,309,929 |
|
| (Cost $185,795,814) | | | | | |
| | | | | | |
| Germany 0.1% | | | | | 5,207,247 |
|
| Federal Republic of Germany | | | | | |
| Bond | 1.500 | | 02-15-23 | EUR 200,000 | 262,904 |
| Bond | 1.500 | | 05-15-23 | EUR 3,000,000 | 3,929,188 |
| Bond | 3.250 | | 01-04-20 | EUR 230,000 | 349,375 |
| Bond | 5.625 | | 01-04-28 | EUR 350,000 | 665,780 |
| | | | | | |
| Italy 0.0% | | | | | 685,729 |
|
| Republic of Italy | | | | | |
| Bond | 4.250 | | 03-01-20 | EUR 500,000 | 685,729 |
| | |
| 26 | Global Absolute Return Strategies Fund | Annual report | See notes to financial statements |
| | | | | |
| | | | Maturity | | |
| | Rate (%) | | date | Par value^ | Value |
| Mexico 4.7% | | | | | $175,416,953 |
|
| Government of Mexico | | | | | |
| Bond | 6.500 | | 06-10-21 | MXN 541,674,800 | 44,119,901 |
| Bond | 7.500 | | 06-03-27 | MXN 507,230,200 | 43,637,821 |
| Bond | 8.500 | | 05-31-29 | MXN 474,307,700 | 43,507,972 |
| Bond | 10.000 | | 12-05-24 | MXN 423,901,400 | 44,151,259 |
| | |
| | Shares | Value |
| Common Stocks 26.8% | $1,006,381,336 |
|
| (Cost $941,643,117) | | |
| | | |
| Australia 0.9% | | 33,288,457 |
|
| Dexus Property Group | 1,279,301 | 1,206,025 |
|
| GPT Group | 1,070,541 | 3,519,530 |
|
| Mirvac Group | 3,016,365 | 4,449,859 |
|
| Oil Search, Ltd. | 1,012,978 | 7,368,032 |
|
| Santos, Ltd. | 592,829 | 7,279,264 |
|
| Westfield Group | 939,048 | 9,465,747 |
| | | |
| Austria 0.1% | | 4,883,049 |
|
| Oesterreichische Post AG | 114,293 | 4,883,049 |
| | | |
| Bermuda 0.2% | | 7,770,059 |
|
| Lazard, Ltd., Class A | 213,698 | 7,770,059 |
| | | |
| Canada 0.8% | | 28,714,808 |
|
| Africa Oil Corp. (I) | 479,383 | 3,603,593 |
|
| Alimentation Couche Tard, Inc. | 183,505 | 11,246,850 |
|
| First Quantum Minerals, Ltd. | 356,882 | 5,733,184 |
|
| Suncor Energy, Inc. | 257,287 | 8,131,181 |
| | | |
| China 1.8% | | 68,438,622 |
|
| 51job, Inc., ADR (I) | 77,972 | 5,185,138 |
|
| Agricultural Bank of China, Ltd., H Shares | 3,201,000 | 1,295,092 |
|
| Anhui Conch Cement Company, Ltd., H Shares | 294,500 | 868,855 |
|
| Baidu, Inc., ADR (I) | 21,020 | 2,781,156 |
|
| Bank of China, Ltd., H Shares | 14,758,000 | 6,161,777 |
|
| Bank of Communications Company, Ltd., H Shares | 651,000 | 422,790 |
|
| China Citic Bank Corp., Ltd., H Shares | 886,000 | 409,987 |
|
| China Construction Bank Corp., H Shares | 9,380,000 | 6,997,756 |
|
| China Life Insurance Company, Ltd., H Shares | 944,000 | 2,255,496 |
|
| China Merchants Bank Company, Ltd., H Shares | 486,000 | 813,435 |
|
| China Oilfield Services, Ltd., H Shares | 952,000 | 2,156,370 |
|
| China Pacific Insurance Group Company, Ltd., H Shares | 287,600 | 959,755 |
|
| China Petroleum & Chemical Corp., H Shares | 3,728,400 | 2,766,460 |
|
| China Shenhua Energy Company, Ltd., H Shares | 301,000 | 869,415 |
|
| China Telecom Corp., Ltd., H Shares | 2,024,000 | 1,005,332 |
|
| CNOOC, Ltd. | 1,680,000 | 3,024,554 |
|
| Dongfeng Motor Group Company, Ltd., H Shares | 326,000 | 435,254 |
|
| Haitian International Holdings, Ltd. | 299,000 | 504,701 |
|
| Hengan International Group Company, Ltd. | 134,500 | 1,479,017 |
|
| Industrial & Commercial Bank of China, Ltd., H Shares | 11,556,000 | 7,571,259 |
|
| Jiangxi Copper Company, Ltd., H Shares | 255,000 | 427,619 |
|
| Lenovo Group, Ltd. | 2,036,000 | 1,855,229 |
| | |
| See notes to financial statements | Annual report | Global Absolute Return Strategies Fund | 27 |
| | |
| | Shares | Value |
| China (continued) | | |
|
| Minth Group, Ltd. | 290,000 | $516,136 |
|
| New Oriental Education & Technology Group, ADR | 142,800 | 3,168,732 |
|
| PetroChina Company, Ltd., H Shares | 1,662,000 | 1,939,339 |
|
| Ping An Insurance Group Company, H Shares | 264,500 | 1,710,979 |
|
| Shandong Weigao Group Medical Polymer Company, Ltd., H Shares | 988,000 | 931,618 |
|
| Tencent Holdings, Ltd. | 130,300 | 5,905,999 |
|
| Tingyi Cayman Islands Holding Corp. | 388,000 | 958,124 |
|
| Vipshop Holdings, Ltd., ADR (I) | 34,623 | 1,458,321 |
|
| Want Want China Holdings, Ltd. | 874,000 | 1,178,638 |
|
| Zhuzhou CSR Times Electric Company, Ltd., H Shares | 161,000 | 424,289 |
| | | |
| Denmark 0.3% | | 9,737,580 |
|
| Danske Bank A/S (I) | 528,230 | 9,737,580 |
| | | |
| Finland 0.2% | | 8,343,530 |
|
| Wartsila OYJ Abp | 184,614 | 8,343,530 |
| | | |
| France 1.4% | | 52,395,544 |
|
| BNP Paribas SA | 190,838 | 12,418,083 |
|
| Carrefour SA | 350,701 | 10,722,684 |
|
| Ingenico SA | 84,418 | 6,333,667 |
|
| Klepierre | 95,158 | 4,137,673 |
|
| Sanofi | 105,338 | 11,284,717 |
|
| Unibail-Rodamco SE | 21,629 | 5,265,219 |
|
| Unibail-Rodamco SE (Amsterdam Stock Exchange) | 9,175 | 2,233,501 |
| | | |
| Germany 0.0% | | 1,478,239 |
|
| GSW Immobilien AG | 36,502 | 1,478,239 |
| | | |
| Hong Kong 2.0% | | 73,458,440 |
|
| AIA Group, Ltd. | 450,600 | 2,133,749 |
|
| Belle International Holdings, Ltd. | 773,000 | 1,115,364 |
|
| BOC Hong Kong Holdings, Ltd. | 3,094,000 | 9,708,660 |
|
| China Mengniu Dairy Company, Ltd. | 1,618,000 | 6,488,619 |
|
| China Metal Recycling Holdings, Ltd. (I) | 1,799,400 | 0 |
|
| China Mobile, Ltd. | 1,176,500 | 12,482,595 |
|
| China Overseas Land & Investment, Ltd. | 1,004,000 | 2,884,126 |
|
| China Resources Land, Ltd. | 994,000 | 2,721,688 |
|
| China Resources Power Holdings, Ltd. | 776,000 | 1,803,537 |
|
| China State Construction International Holdings, Ltd. | 636,000 | 1,016,313 |
|
| China Unicom Hong Kong, Ltd. | 714,000 | 1,051,186 |
|
| Galaxy Entertainment Group, Ltd. (I) | 504,000 | 2,642,381 |
|
| Henderson Land Development Company, Ltd. | 616,900 | 3,847,209 |
|
| Hong Kong Land Holdings, Ltd. | 481,000 | 3,248,603 |
|
| Kunlun Energy Company, Ltd. | 532,000 | 781,518 |
|
| New World Development Company, Ltd. | 2,418,000 | 3,518,000 |
|
| Sands China, Ltd. | 1,663,600 | 9,001,759 |
|
| Shanghai Industrial Holdings, Ltd. | 161,000 | 500,272 |
|
| Sun Hung Kai Properties, Ltd. | 538,000 | 7,187,978 |
|
| Swire Properties, Ltd. | 451,000 | 1,324,883 |
| | |
| 28 | Global Absolute Return Strategies Fund | Annual report | See notes to financial statements |
| | |
| | Shares | Value |
| Ireland 0.3% | | $9,926,559 |
|
| Accenture PLC, Class A | 134,488 | 9,926,559 |
| | | |
| Israel 0.1% | | 2,675,090 |
|
| Mellanox Technologies, Ltd. (I) | 58,600 | 2,675,090 |
| | | |
| Italy 0.1% | | 5,018,669 |
|
| Prada SpA | 538,100 | 5,018,669 |
| | | |
| Japan 2.3% | | 88,173,589 |
|
| Mitsubishi Estate Company, Ltd. | 182,000 | 4,615,735 |
|
| Mitsui Fudosan Company, Ltd. | 549,000 | 16,550,971 |
|
| Nippon Building Fund, Inc. | 168 | 1,829,623 |
|
| Nippon Prologis REIT, Inc. | 220 | 1,907,557 |
|
| Nippon Steel Corp. | 3,177,000 | 9,222,962 |
|
| ORIX Corp. | 550,100 | 8,137,180 |
|
| Otsuka Corp. | 106,100 | 11,974,764 |
|
| Resorttrust, Inc. | 176,800 | 5,366,497 |
|
| Sekisui House, Ltd. | 471,000 | 6,079,181 |
|
| Seven & I Holdings Company, Ltd. | 223,500 | 8,417,981 |
|
| Sumitomo Mitsui Financial Group, Inc. | 308,100 | 14,071,138 |
| | | |
| Jersey, Channel Islands 0.0% | | 92,862 |
|
| LXB Retail Properties PLC (I) | 52,415 | 92,862 |
| | | |
| Netherlands 0.5% | | 18,655,340 |
|
| Koninklijke Philips Electronics NV | 250,531 | 8,016,284 |
|
| LyondellBasell Industries NV, Class A | 154,840 | 10,639,056 |
| | | |
| Norway 0.3% | | 12,336,793 |
|
| DNB ASA | 742,911 | 12,336,793 |
| | | |
| Portugal 0.2% | | 7,294,930 |
|
| Galp Energia SGPS SA | 455,672 | 7,294,930 |
| | | |
| Russia 1.2% | | 45,844,979 |
|
| Gazprom OAO, ADR | 1,339,613 | 10,408,793 |
|
| LUKOIL OAO, ADR | 175,721 | 10,448,371 |
|
| Magnit OJSC, GDR | 17,401 | 1,002,298 |
|
| MMC Norilsk Nickel OJSC, ADR | 518,176 | 6,948,740 |
|
| NovaTek OAO, GDR | 6,417 | 748,111 |
|
| NovaTek OAO, GDR | 40,479 | 4,707,708 |
|
| Rosneft OAO, GDR | 501,276 | 3,549,034 |
|
| Sberbank of Russia, ADR | 135,764 | 1,573,505 |
|
| Sberbank of Russia, ADR | 487,857 | 5,651,344 |
|
| VTB Bank OJSC, GDR | 285,589 | 807,075 |
| | | |
| Singapore 0.1% | | 3,764,289 |
|
| Ascendas Real Estate Investment Trust | 811,000 | 1,480,377 |
|
| CapitaLand, Ltd. | 507,000 | 1,286,116 |
|
| Mapletree Commercial Trust | 1,059,000 | 997,796 |
| | | |
| South Korea 0.1% | | 3,130,799 |
|
| Samsung Electronics Company, Ltd. | 2,747 | 3,130,799 |
| | | |
| Spain 0.2% | | 6,607,611 |
|
| Grifols SA | 155,848 | 6,607,611 |
| | |
| See notes to financial statements | Annual report | Global Absolute Return Strategies Fund | 29 |
| | |
| | Shares | Value |
| Sweden 0.4% | | $15,679,573 |
|
| Elekta AB, B Shares | 566,623 | 9,675,255 |
|
| Lundin Petroleum AB (I) | 273,120 | 6,004,318 |
| | | |
| Switzerland 0.5% | | 18,318,980 |
|
| Roche Holdings AG | 44,376 | 10,910,244 |
|
| Syngenta AG | 18,700 | 7,408,736 |
| | | |
| United Kingdom 2.0% | | 73,410,492 |
|
| Aveva Group PLC | 104,453 | 3,831,002 |
|
| BT Group PLC | 2,026,994 | 10,480,018 |
|
| D.S. Smith PLC | 559,110 | 2,200,265 |
|
| Derwent London PLC, ADR | 87,647 | 3,213,865 |
|
| Great Portland Estates PLC | 484,003 | 4,093,063 |
|
| Hammerson PLC | 863,121 | 6,935,979 |
|
| Inmarsat PLC | 328,563 | 3,423,543 |
|
| Land Securities Group PLC | 399,293 | 5,781,488 |
|
| Lloyds Banking Group PLC (I) | 12,709,200 | 13,276,785 |
|
| Petrofac, Ltd. | 233,416 | 4,677,034 |
|
| Rio Tinto PLC | 190,179 | 8,583,337 |
|
| Segro PLC | 648,614 | 3,057,280 |
|
| Telecity Group PLC | 231,844 | 3,141,192 |
|
| Workspace Group PLC | 104,285 | 715,641 |
| | | |
| United States 10.8% | | 406,942,453 |
|
| Acuity Brands, Inc. | 119,627 | 10,347,736 |
|
| Amgen, Inc. | 86,874 | 9,407,585 |
|
| AvalonBay Communities, Inc. | 37,972 | 5,139,130 |
|
| Baxter International, Inc. | 133,036 | 9,716,949 |
|
| Beam, Inc. | 90,888 | 5,906,811 |
|
| BorgWarner, Inc. | 82,114 | 7,836,139 |
|
| Boston Properties, Inc. | 48,086 | 5,142,798 |
|
| Calpine Corp. (I) | 588,368 | 11,773,244 |
|
| Citigroup, Inc. | 333,591 | 17,393,435 |
|
| CMS Energy Corp. | 288,827 | 8,084,268 |
|
| Cobalt International Energy, Inc. (I) | 134,003 | 3,865,987 |
|
| DDR Corp. | 232,176 | 3,965,566 |
|
| Delta Air Lines, Inc. | 366,023 | 7,770,668 |
|
| eBay, Inc. (I) | 177,299 | 9,164,585 |
|
| Equinix, Inc. (I) | 37,614 | 6,746,071 |
|
| Equity Residential | 88,504 | 4,956,224 |
|
| Essex Property Trust, Inc. | 20,387 | 3,288,219 |
|
| Express Scripts Holding Company (I) | 155,597 | 10,199,383 |
|
| Extra Space Storage, Inc. | 93,419 | 3,928,269 |
|
| Facebook, Inc., Class A (I) | 14,102 | 519,377 |
|
| Federal Realty Investment Trust | 19,216 | 2,024,021 |
|
| First Republic Bank | 232,585 | 10,045,346 |
|
| General Growth Properties, Inc. | 310,561 | 6,441,035 |
|
| General Motors Company (I) | 287,003 | 10,294,798 |
|
| Google, Inc., Class A (I) | 17,999 | 15,975,912 |
| | |
| 30 | Global Absolute Return Strategies Fund | Annual report | See notes to financial statements |
| | |
| | Shares | Value |
| United States (continued) | | |
|
| Halliburton Company | 143,597 | $6,489,148 |
|
| Hanesbrands, Inc. | 127,196 | 8,071,858 |
|
| Health Care REIT, Inc. | 58,643 | 3,781,887 |
|
| Host Hotels & Resorts, Inc. | 288,098 | 5,145,430 |
|
| J.B. Hunt Transport Services, Inc. | 100,508 | 7,531,064 |
|
| Kansas City Southern | 59,421 | 6,402,613 |
|
| Kilroy Realty Corp. | 36,584 | 1,914,807 |
|
| Kimco Realty Corp. | 202,553 | 4,567,570 |
|
| Kraft Foods Group, Inc. | 170,829 | 9,665,505 |
|
| Las Vegas Sands Corp. | 68,416 | 3,801,877 |
|
| Lennar Corp., Class A | 33,241 | 1,125,873 |
|
| Monster Beverage Corp. (I) | 90,445 | 5,516,241 |
|
| NetApp, Inc. | 139,364 | 5,730,648 |
|
| Occidental Petroleum Corp. | 111,817 | 9,957,304 |
|
| ON Semiconductor Corp. (I) | 1,028,058 | 8,471,198 |
|
| Pall Corp. | 133,537 | 9,342,249 |
|
| Polycom, Inc. (I) | 128,406 | 1,227,561 |
|
| Precision Castparts Corp. | 37,946 | 8,413,387 |
|
| Prologis, Inc. | 198,457 | 7,612,811 |
|
| Public Storage | 19,504 | 3,105,427 |
|
| PulteGroup, Inc. | 30,302 | 503,922 |
|
| Simon Property Group, Inc. | 70,830 | 11,337,050 |
|
| SL Green Realty Corp. | 78,122 | 7,081,759 |
|
| Starbucks Corp. | 136,727 | 9,740,431 |
|
| Starwood Hotels & Resorts Worldwide, Inc. | 21,335 | 1,411,310 |
|
| State Street Corp. | 123,438 | 8,599,925 |
|
| The Charles Schwab Corp. | 412,479 | 9,111,661 |
|
| The Estee Lauder Companies, Inc., Class A | 101,709 | 6,677,196 |
|
| The Home Depot, Inc. | 126,169 | 9,971,136 |
|
| The Macerich Company | 69,037 | 4,283,746 |
|
| Time Warner Cable, Inc. | 63,914 | 7,290,670 |
|
| Time Warner, Inc. | 135,690 | 8,448,059 |
|
| TJX Companies, Inc. | 155,362 | 8,085,038 |
|
| Vornado Realty Trust | 77,733 | 6,592,536 |
|
| |
| Preferred Securities 0.1% | | $3,436,463 |
|
| (Cost $3,648,399) | | |
| | | |
| Brazil 0.1% | | 3,436,463 |
|
| Vale SA | 278,500 | 3,436,463 |
| | |
| See notes to financial statements | Annual report | Global Absolute Return Strategies Fund | 31 |
| | |
| | Shares | Value |
| Purchased Options 2.0% | | $75,272,728 |
|
| (Cost $67,481,433) | | |
| |
| Call Options 1.8% | | 66,022,080 |
|
| Exchange Traded on S&P 500 INDEX | | |
| (Expiration Date: 3-22-14; Strike Price: $1,550) (I) | 235,000 | 38,363,750 |
|
| Over the Counter on the USD vs. CNY | | |
| (Expiration Date: 12-11-13; Strike Price: $6.38: | | |
| Counterparty: UBS AG) (I) | 155,000,000 | 220,409 |
|
| Over the Counter on the USD vs. CNY | | |
| (Expiration Date: 8-28-13; Strike Price: $6.45: | | |
| Counterparty: UBS AG) (I) | 19,171,779 | 19 |
|
| Over the Counter on the USD vs. JPY | | |
| (Expiration Date: 12-11-13; Strike Price: $84.50; | | |
| Counterparty: UBS AG) (I) | 155,000,000 | 21,178,735 |
|
| Over the Counter on the USD vs. JPY | | |
| (Expiration Date: 12-18-14; Strike Price: $83.00; | | |
| Counterparty: Goldman Sachs Group, Inc.) (I) | 18,750,000 | 2,980,313 |
|
| Over the Counter on the USD vs. JPY | | |
| (Expiration Date: 8-28-13; Strike Price: $81.00; | | |
| Counterparty: UBS AG) (I) | 19,171,779 | 3,278,854 |
| |
| Put Options 0.2% | | 9,250,648 |
|
| Exchange Traded on Apple CBOE Flex Options | | |
| (Expiration Date: 10-19-13; Strike Price: $270) (I) | 18,000 | 1,219,957 |
|
| Over the Counter on Hang Seng Index | | |
| (Expiration Date: 12-30-13; Strike Price: HKD 15,982.72; | | |
| Counterparty: Goldman Sachs Group, Inc.) (I) | 2,400 | 20,322 |
|
| Over the Counter on Hang Seng Index | | |
| (Expiration Date: 12-30-13; Strike Price: HKD 15,995.83; | | |
| Counterparty: UBS AG) (I) | 2,000 | 17,020 |
|
| Over the Counter on Hang Seng Index | | |
| (Expiration Date: 12-30-13; Strike Price: HKD 16,003.08; | | |
| Counterparty: UBS AG) (I) | 3,650 | 31,147 |
|
| Over the Counter on Hang Seng Index | | |
| (Expiration Date: 12-30-13; Strike Price: HKD 16,140.43; | | |
| Counterparty: UBS AG) (I) | 2,000 | 17,989 |
|
| Over the Counter on Hang Seng Index | | |
| (Expiration Date: 12-30-13; Strike Price: HKD 16,199.60; | | |
| Counterparty: UBS AG) (I) | 2,500 | 23,005 |
|
| Over the Counter on Hang Seng Index | | |
| (Expiration Date: 12-30-13; Strike Price: HKD 16,304.39; | | |
| Counterparty: UBS AG) (I) | 3,500 | 33,543 |
|
| Over the Counter on Hang Seng Index | | |
| (Expiration Date: 12-30-13; Strike Price: HKD 16,531.99; | | |
| Counterparty: The Royal Bank of Scotland, PLC) (I) | 5,000 | 52,399 |
|
| Over the Counter on Hang Seng Index | | |
| (Expiration Date: 12-30-13; Strike Price: HKD 16,858.17; | | |
| Counterparty: UBS AG) (I) | 7,430 | 88,781 |
|
| Over the Counter on Hang Seng Index | | |
| (Expiration Date: 12-30-13; Strike Price: HKD 16,907.08; | | |
| Counterparty: UBS AG) (I) | 9,200 | 112,153 |
|
| Over the Counter on KOSPII 200 Index | | |
| (Expiration Date: 12-30-13; Strike Price: KRW 240.00; | | |
| Counterparty: Morgan Stanley) (I) | 320,000,000 | 1,525,838 |
| | |
| 32 | Global Absolute Return Strategies Fund | Annual report | See notes to financial statements |
| | |
| | Shares | Value |
| Put Options (continued) | | |
|
| Over the Counter on KOSPII 200 Index | | |
| (Expiration Date: 12-30-13; Strike Price: KRW 241.79; | | |
| Counterparty: BNP Paribas SA) (I) | 221,000,000 | $1,163,914 |
|
| Over the Counter on the USD vs. CNY | | |
| (Expiration Date: 12-11-13; Strike Price: $6.38: | | |
| Counterparty: UBS AG) (I) | 131,875,643 | 4,041,159 |
|
| Over the Counter on the USD vs. CNY | | |
| (Expiration Date: 8-28-13; Strike Price $6.45; | | |
| Counterparty: UBS AG) (I) | 19,171,779 | 807,457 |
|
| Over the Counter on the USD vs. JPY | | |
| (Expiration Date: 12-11-13; Strike Price: $79.50; | | |
| Counterparty: UBS AG) (I) | 155,000,000 | 95,945 |
|
| Over the Counter on the USD vs. JPY | | |
| (Expiration Date: 8-28-13; Strike Price: $76.00; | | |
| Counterparty: UBS AG) (I) | 19,171,779 | 19 |
|
| |
| Rights 0.0% | | $0 |
|
| (Cost $0) | | |
| New World Development | | |
| (Expiration Date: 12-31-13; Strike Price HKD 1.00) (I) | 21,375 | 0 |
| | | | | |
| | | | Maturity | | |
| | Yield (%)* | | date | Par value^ | Value |
| Short-Term Investments 54.0% | | | | $2,030,546,869 |
|
| (Cost $2,030,440,139) | | | | | |
| | | | | | |
| Certificate of Deposit 25.9% | | | | | $972,945,945 |
|
| AMRO Bank NV | 0.380 | | 01-21-14 | 15,000,000 | 15,000,000 |
|
| AMRO Bank NV | 0.480 | | 10-02-13 | 15,000,000 | 15,006,290 |
|
| Banque Federative du Credit Mutuel | 0.440 | | 10-18-13 | 45,000,000 | 44,978,769 |
|
| Commerzbank AG | 0.315 | | 08-19-13 | 65,000,000 | 65,003,705 |
|
| Credit Agricole SA | 0.440 | | 09-06-13 | 45,000,000 | 45,010,157 |
|
| Credit Agricole SA | 0.450 | | 11-14-13 | 15,000,000 | 15,006,164 |
|
| Danske Bank A/S | 0.510 | | 09-16-13 | 25,000,000 | 25,009,450 |
|
| Deutsche Bank AG | 0.250 | | 09-11-13 | 70,000,000 | 69,985,300 |
|
| Export Development Canada | 0.160 | | 01-13-14 | 50,000,000 | 49,914,300 |
|
| FMS Wertmanagement AoR | 0.150 | | 08-27-13 | 75,000,000 | 74,992,125 |
|
| ING Direct NV | 0.530 | | 04-30-14 | 60,000,000 | 60,000,000 |
|
| ING Direct NV | 0.890 | | 10-17-13 | 18,000,000 | 18,025,270 |
|
| KBC Bank NV | 0.330 | | 09-26-13 | 15,000,000 | 15,002,610 |
|
| KBC Bank NV | 0.350 | | 08-14-13 | 55,000,000 | 55,003,636 |
|
| KFW | 0.110 | | 10-28-13 | 75,000,000 | 74,978,465 |
|
| Nationwide Building Society | 0.340 | | 11-08-13 | 60,000,000 | 60,009,954 |
|
| Natixis SA | 0.470 | | 09-20-13 | 20,000,000 | 20,006,786 |
|
| Natixis SA | 0.470 | | 10-15-13 | 25,000,000 | 25,011,060 |
|
| Pohjola Bank PLC | 0.240 | | 10-01-13 | 70,000,000 | 69,975,570 |
|
| RBS Holdings NV | 0.410 | | 12-05-13 | 55,000,000 | 55,015,466 |
|
| Societe Generale SA | 0.400 | | 08-01-13 | 25,000,000 | 25,000,153 |
|
| Societe Generale SA | 0.450 | | 11-01-13 | 25,000,000 | 25,010,715 |
|
| Wells Fargo Bank NA | 0.200 | | 09-10-13 | 50,000,000 | 50,000,000 |
| | |
| See notes to financial statements | Annual report | Global Absolute Return Strategies Fund | 33 |
| | | | | |
| | | | Maturity | | |
| | Yield (%)* | | date | Par value^ | Value |
| Commercial Paper 15.4% | | | | | $579,909,470 |
|
| Agence Centrale Organismes | 0.120 | | 08-07-13 | 75,000,000 | 74,998,500 |
|
| Bank Nederlandse Gemeenten | 0.250 | | 03-11-14 | 50,000,000 | 49,924,420 |
|
| Caisse des Depots et Consignat | 0.140 | | 08-09-13 | 75,000,000 | 74,997,667 |
|
| DZ Bank AG | 0.195 | | 08-08-13 | 75,000,000 | 74,997,157 |
|
| EnBW Energie Baden-Wuerttember | 0.110 | | 08-05-13 | 75,000,000 | 74,999,083 |
|
| Landwirtschaftliche Rentenbank | 0.080 | | 08-02-13 | 75,000,000 | 74,999,833 |
|
| Landwirtschaftliche Rentenbank | 0.085 | | 09-03-13 | 80,000,000 | 79,993,956 |
|
| Societe Nationale des Chemins de | | | | | |
| fer Francais | 0.110 | | 08-06-13 | 75,000,000 | 74,998,854 |
| | | | | | |
| Time Deposits 8.3% | | | | | 311,620,937 |
|
| Abbey National | 0.100 | | 08-02-13 | 58,006,987 | 58,006,987 |
|
| Barclays Bank PLC | 0.020 | | 08-02-13 | 36,733,572 | 36,733,572 |
|
| BNP Paribas | 0.100 | | 08-01-13 | 53,005,795 | 53,005,795 |
|
| DZ Bank AG | 0.090 | | 08-02-13 | 84,854,116 | 84,854,116 |
|
| Sumitomo Mitsui Banking Corp. | 0.110 | | 08-01-13 | 38,207,525 | 38,207,525 |
|
| UBS AG | 0.080 | | 08-01-13 | 40,812,942 | 40,812,942 |
| | | | | | |
| U.S. Government 4.0% | | | | | 149,987,517 |
|
| U.S. Treasury Bill | 0.040 | | 08-22-13 | 50,000,000 | 49,999,417 |
|
| U.S. Treasury Bill | 0.060 | | 11-14-13 | 25,000,000 | 24,997,275 |
|
| U.S. Treasury Bill | 0.060 | | 11-21-13 | 25,000,000 | 24,996,700 |
|
| U.S. Treasury Bill | 0.060 | | 11-29-13 | 25,000,000 | 24,996,675 |
|
| U.S. Treasury Bill | 0.060 | | 11-07-13 | 25,000,000 | 24,997,450 |
| | | | | | |
| Repurchase Agreement 0.4% | | | | | 16,083,000 |
|
| Repurchase Agreement with State Street Corp. | | | | |
| dated 7-31-13 at 0.010% to be repurchased | | | | |
| at $16,083,004 on 8-1-13, collateralized by | | | | |
| $16,680,000 U.S. Treasury Notes 0.625% | | | | |
| due 8-31-17 (valued at $16,408,950, | | | | | |
| including interest) | | | | 16,083,000 | 16,083,000 |
|
| Total investments (Cost $3,689,872,340)† 100.3% | $3,769,681,274 |
|
| |
| Other assets and liabilities, net (0.3)% | | | | ($10,405,818) |
|
| |
| Total net assets 100.0% | | | | $3,759,275,456 |
|
^ The percentage shown for each investment category is the total value of that category as a percentage of the net assets of the fund. All par values are denominated in U.S. Dollars unless otherwise indicated.
| |
| ADR | American Depositary Receipts |
| EURIBOR | Euro Interbank Offered Rate |
| GDR | Global Depositary Receipt |
| PIK | Paid In Kind |
(I) Non-income producing security.
(P) Variable rate obligation. The coupon rate shown represents the rate at period end.
(Q) Perpetual bonds have no stated maturity date. Date shown as maturity date is next call date.
(S) These securities are exempt from registration under Rule 144A of the Securities Act of 1933. Such securities may be resold, normally to qualified institutional buyers, in transactions exempt from registration.
* Yield represents either the annualized yield at the date of purchase, the stated coupon rate or, for floating rate securities, the rate at period end.
| | |
| 34 | Global Absolute Return Strategies Fund | Annual report | See notes to financial statements |
Notes to Schedule of Investments
† At 7-31-13, the aggregate cost of investment securities for federal income tax purposes was $3,697,184,346. Net unrealized appreciation aggregated $72,496,928, of which $111,068,133 related to appreciated investment securities and $38,571,205 related to depreciated investment securities.
| |
| Currency abreviations |
| CNY | Chinese Yuan Renminbi |
| EUR | Euro |
| GBP | Pound Sterling |
| HKD | Hong Kong Dollar |
| JPY | Japanese Yen |
| KRW | Korean Won |
| MXN | Mexican Peso |
The fund had the following portfolio allocation as a percentage of net assets on 7-31-13:
| | |
| Financials | 12.8% | |
| Consumer Discretionary | 5.0% | |
| Foreign Government Obligations | 4.8% | |
| Energy | 4.0% | |
| Industrials | 3.3% | |
| Information Technology | 3.2% | |
| Materials | 2.6% | |
| Health Care | 2.5% | |
| Consumer Staples | 2.5% | |
| Telecommunication Services | 2.1% | |
| Purchased Options | 2.0% | |
| Utilities | 1.5% | |
| Short-Term Investments & Other | 53.7% | |
| | |
| |
| Total | 100.0% | |
| | |
| See notes to financial statements | Annual report | Global Absolute Return Strategies Fund | 35 |
F I N A N C I A L S T A T E M E N T S
Financial statements
Statement of assets and liabilities 7-31-13
This Statement of assets and liabilities is the fund’s balance sheet. It shows the value of what the fund owns, is due and owes. You’ll also find the net asset value and the maximum offering price per share.
| |
| Assets | |
|
| Investments, at value (Cost $3,689,872,340) | $3,769,681,274 |
| Cash | 8,803 |
| Foreign currency, at value (Cost $5,876,192) | 5,890,246 |
| Cash held at broker for futures contracts | 51,170,876 |
| Cash held at clearing house for swap contracts | 4,351,017 |
| Receivable for investments sold | 72,228,777 |
| Receivable for fund shares sold | 25,410,481 |
| Receivable for forward foreign currency exchange contracts | 55,429,260 |
| Dividends and interest receivable | 13,589,368 |
| Swap contracts, at value (includes net unamortized upfront payments | |
| of $2,481,579) | 16,256,008 |
| Other receivables and prepaid expenses | 73,570 |
| | |
| Total assets | 4,014,089,680 |
| |
| Liabilities | |
|
| Payable for investments purchased | 140,708,619 |
| Payable for forward foreign currency exchange contracts | 46,154,254 |
| Payable for fund shares repurchased | 5,022,449 |
| Written options, at value (premiums received $35,588,073) | 44,972,119 |
| Swap contracts, at value | 14,659,473 |
| Payable for futures variation margin | 1,865,168 |
| Payable to affiliates | |
| Accounting and legal services fees | 80,461 |
| Transfer agent fees | 332,825 |
| Trustees’ fees | 940 |
| Other liabilities and accrued expenses | 1,017,916 |
| | |
| Total liabilities | 254,814,224 |
| | |
| Net assets | $3,759,275,456 |
| |
| Net assets consist of | |
|
| Paid-in capital | $3,723,819,592 |
| Undistributed net investment income | 47,158,133 |
| Accumulated net realized gain (loss) on investments, futures contracts, | |
| written options, foreign currency transactions and swap agreements | (59,773,266) |
| Net unrealized appreciation (depreciation) on investments, futures | |
| contracts, written options, translation of assets and liabilities in foreign | |
| currencies and swap agreements | 48,070,997 |
| | |
| Net assets | $3,759,275,456 |
| | |
| 36 | Global Absolute Return Strategies Fund | Annual report | See notes to financial statements |
F I N A N C I A L S T A T E M E N T S
Statement of assets and liabilities (continued)
| |
| Net asset value per share | |
|
| Based on net asset values and shares outstanding — the fund has an | |
| unlimited number of shares authorized with no par value | |
| Class A ($1,160,590,581 ÷ 107,064,024 shares)1 | $10.84 |
| Class C ($145,702,547 ÷ 13,486,892 shares)1 | $10.80 |
| Class I ($1,739,837,062 ÷ 160,060,451 shares) | $10.87 |
| Class R2 ($1,155,577 ÷ 106,691 shares) | $10.83 |
| Class R6 ($39,206,918 ÷ 3,611,226 shares) | $10.86 |
| Class NAV ($672,782,771 ÷ 61,927,296 shares) | $10.86 |
| |
| Maximum offering price per share2 | |
|
| Class A (net asset value per share ÷ 95%) | $11.41 |
1 Redemption price is equal to net asset value less any applicable contingent deferred sales charge.
2 On single retail sales of less than $50,000. On sales of $50,000 or more and on group sales the offering price is reduced.
| | |
| See notes to financial statements | Annual report | Global Absolute Return Strategies Fund | 37 |
F I N A N C I A L S T A T E M E N T S
Statement of operations For the year ended 7-31-13
This Statement of operations summarizes the fund’s investment income earned and expenses incurred in operating the fund. It also shows net gains (losses) for the period stated.
| |
| Investment income | |
|
| Interest | $29,743,796 |
| Dividends | 13,652,866 |
| Less foreign taxes withheld | (1,130,741) |
| | |
| Total investment income | 42,265,921 |
| |
| Expenses | |
|
| Investment management fees | 25,327,045 |
| Distribution and service fees | 2,335,612 |
| Accounting and legal services fees | 284,191 |
| Transfer agent fees | 2,031,342 |
| Trustees’ fees | 17,732 |
| State registration fees | 164,629 |
| Printing and postage | 193,086 |
| Professional fees | 184,846 |
| Custodian fees | 1,255,011 |
| Registration and filing fees | 464,195 |
| Other | 22,777 |
| | |
| Total expenses | 32,280,466 |
| Less expense reductions and amounts recaptured | (101,178) |
| | |
| Net expenses | 32,179,288 |
| | |
| Net investment income | 10,086,633 |
| |
| Realized and unrealized gain (loss) | |
|
| Net realized gain (loss) on | |
| Investments | 1,195,217 |
| Futures contracts | (72,748,114) |
| Written options | 7,516,440 |
| Swap contracts | 15,772,577 |
| Foreign currency transactions | 27,753,755 |
| | (20,510,125) |
| Change in net unrealized appreciation (depreciation) of | |
| Investments | 72,230,796 |
| Futures contracts | (34,809,182) |
| Written options | (5,032,077) |
| Swap contracts | 4,917,601 |
| Translation of assets and liabilities in foreign currencies | 10,236,484 |
| | 47,543,622 |
| Net realized and unrealized gain | 27,033,497 |
| | |
| Increase in net assets from operations | $37,120,130 |
| | |
| 38 | Global Absolute Return Strategies Fund | Annual report | See notes to financial statements |
F I N A N C I A L S T A T E M E N T S
Statements of changes in net assets
These Statements of changes in net assets show how the value of the fund’s net assets has changed during the last two periods. The difference reflects earnings less expenses, any investment gains and losses, distributions, if any, paid to shareholders and the net of fund share transactions.
| | |
| | Year | Year |
| | ended | ended |
| | 7-31-13 | 7-31-121 |
|
| |
| Increase (decrease) in net assets | | |
|
| From operations | | |
| Net investment income | $10,086,633 | $1,227,312 |
| Net realized gain (loss) | (20,510,125) | 16,210,939 |
| Change in net unrealized appreciation (depreciation) | 47,543,622 | 527,375 |
| | | |
| Increase in net assets resulting from operations | 37,120,130 | 17,965,626 |
| | | |
| Distributions to shareholders | | |
| From net investment income | | |
| Class A | (950,792) | — |
| Class I | (3,500,080) | — |
| Class R2 | (4) | — |
| Class R6 | (19,029) | — |
| Class NAV | (3,794,422) | — |
| From net realized gain | | |
| Class A | (3,171,454) | — |
| Class C | (195,118) | — |
| Class I | (4,218,719) | — |
| Class R2 | (848) | — |
| Class R6 | (27,087) | — |
| Class NAV | (3,753,256) | — |
| | | |
| Total distributions | (19,630,809) | — |
| | | |
| From fund share transactions | 2,902,408,638 | 821,411,871 |
| | | |
| Total increase | 2,919,897,959 | 839,377,497 |
| |
| Net assets | | |
|
| Beginning of period | 839,377,497 | — |
| | | |
| End of period | $3,759,275,456 | $839,377,497 |
| | | |
| Undistributed net investment income | $47,158,133 | $10,940,964 |
1 Period from 12-19-11 (commencement of operations) to 7-31-12.
| | |
| See notes to financial statements | Annual report | Global Absolute Return Strategies Fund | 39 |
Financial highlights
The Financial highlights show how the fund’s net asset value for a share has changed during the period.
| | |
| CLASS A SHARES Period ended | 7-31-13 | 7-31-121 |
| |
| Per share operating performance | | |
|
| Net asset value, beginning of period | $10.59 | $10.00 |
| Net investment income2 | 0.02 | —3 |
| Net realized and unrealized gain on investments | 0.33 | 0.59 |
| Total from investment operations | 0.35 | 0.59 |
| Less distributions | | |
| From net investment income | (0.03) | — |
| From net realized gain | (0.07) | — |
| Total distributions | (0.10) | — |
| Net asset value, end of period | $10.84 | $10.59 |
| Total return (%)4,5 | 3.28 | 5.906 |
| |
| Ratios and supplemental data | | |
|
| Net assets, end of period (in millions) | $1,161 | $175 |
| Ratios (as a percentage of average net assets): | | |
| Expenses before reductions and amounts recaptured | 1.80 | 1.977 |
| Expenses including reductions and amounts recaptured | 1.80 | 1.957 |
| Net investment income (loss) | 0.18 | (0.01)7 |
| Portfolio turnover (%) | 106 | 33 |
1 Period from 12-19-11 (commencement of operations) to 7-31-12.
2 Based on the average daily shares outstanding.
3 Less than $0.005 per share.
4 Does not reflect the effect of sales charges, if any.
5 Total returns would have been lower had certain expenses not been reduced during the applicable periods shown.
6 Not annualized.
7 Annualized.
| |
| CLASS C SHARES Period ended | 7-31-131 |
| |
| Per share operating performance | |
|
| Net asset value, beginning of period | $10.61 |
| Net investment loss2 | (0.06) |
| Net realized and unrealized gain on investments | 0.32 |
| Total from investment operations | 0.26 |
| Less distributions | |
| From net realized gain | (0.07) |
| Total distributions | (0.07) |
| Net asset value, end of period | $10.80 |
| Total return (%)3,4 | 2.50 |
| |
| Ratios and supplemental data | |
|
| Net assets, end of period (in millions) | $146 |
| Ratios (as a percentage of average net assets): | |
| Expenses before reductions and amounts recaptured | 2.53 |
| Expenses including reductions and amounts recaptured | 2.52 |
| Net investment loss | (0.55) |
| Portfolio turnover (%) | 106 |
| |
1 The inception date for Class C shares is 8-1-12.
2 Based on the average daily shares outstanding.
3 Does not reflect the effect of sales charges, if any.
4 Total returns would have been lower had certain expenses not been reduced during the applicable periods shown.
| | |
| 40 | Global Absolute Return Strategies Fund | Annual report | See notes to financial statements |
| | |
| CLASS I SHARES Period ended | 7-31-13 | 7-31-121 |
| |
| Per share operating performance | | |
|
| Net asset value, beginning of period | $10.62 | $10.00 |
| Net investment income2 | 0.06 | 0.04 |
| Net realized and unrealized gain on investments | 0.33 | 0.58 |
| Total from investment operations | 0.39 | 0.62 |
| Less distributions | | |
| From net investment income | (0.07) | — |
| From net realized gain | (0.07) | — |
| Total distributions | (0.14) | — |
| Net asset value, end of period | $10.87 | $10.62 |
| Total return (%)3 | 3.65 | 6.204 |
| |
| Ratios and supplemental data | | |
|
| Net assets, end of period (in millions) | $1,740 | $167 |
| Ratios (as a percentage of average net assets): | | |
| Expenses before reductions and amounts recaptured | 1.43 | 1.605 |
| Expenses including reductions and amounts recaptured | 1.42 | 1.595 |
| Net investment income | 0.58 | 0.585 |
| Portfolio turnover (%) | 106 | 33 |
| |
1 Period from 12-19-11 (commencement of operations) to 7-31-12.
2 Based on the average daily shares outstanding.
3 Total returns would have been lower had certain expenses not been reduced during the applicable periods shown.
4 Not annualized.
5 Annualized.
| | |
| CLASS R2 SHARES Period ended | 7-31-13 | 7-31-121 |
| |
| Per share operating performance | | |
|
| Net asset value, beginning of period | $10.58 | $10.67 |
| Net investment income (loss)2 | —3 | 0.01 |
| Net realized and unrealized gain (loss) on investments | 0.32 | (0.10) |
| Total from investment operations | 0.32 | (0.09) |
| Less distributions | | |
| From net realized gain | (0.07) | — |
| Total distributions | (0.07) | — |
| Net asset value, end of period | $10.83 | $10.58 |
| Total return (%)4 | 3.08 | (0.84)5 |
| |
| Ratios and supplemental data | | |
|
| Net assets, end of period (in millions) | $1 | —6 |
| Ratios (as a percentage of average net assets): | | |
| Expenses before reductions and amounts recaptured | 8.88 | 18.317 |
| Expenses including reductions and amounts recaptured | 2.00 | 2.007 |
| Net investment income (loss) | (0.01) | 0.197 |
| Portfolio turnover (%) | 106 | 33 |
| |
1 The inception date for Class R2 shares is 3-1-12.
2 Based on the average daily shares outstanding.
3 Less than $0.005 per share.
4 Total returns would have been lower had certain expenses not been reduced during the applicable periods shown.
5 Not annualized.
6 Less than $500,000.
7 Annualized.
| | |
| See notes to financial statements | Annual report | Global Absolute Return Strategies Fund | 41 |
| | |
| CLASS R6 SHARES Period ended | 7-31-13 | 7-31-121 |
| |
| Per share operating performance | | |
|
| Net asset value, beginning of period | $10.60 | $10.67 |
| Net investment income2 | 0.05 | 0.03 |
| Net realized and unrealized gain (loss) on investments | 0.34 | (0.10) |
| Total from investment operations | 0.39 | (0.07) |
| Less distributions | | |
| From net investment income | (0.06) | — |
| From net realized gain | (0.07) | — |
| Total distributions | (0.13) | — |
| Net asset value, end of period | $10.86 | $10.60 |
| Total return (%)3 | 3.66 | (0.66)4 |
| |
| Ratios and supplemental data | | |
|
| Net assets, end of period (in millions) | $39 | —5 |
| Ratios (as a percentage of average net assets): | | |
| Expenses before reductions and amounts recaptured | 1.51 | 18.046 |
| Expenses including reductions and amounts recaptured | 1.50 | 1.506 |
| Net investment income | 0.51 | 0.696 |
| Portfolio turnover (%) | 106 | 33 |
| |
1 The inception date for Class R6 shares is 3-1-12.
2 Based on the average daily shares outstanding.
3 Total returns would have been lower had certain expenses not been reduced during the applicable periods shown.
4 Not annualized.
5 Less than $500,000.
6 Annualized.
| | |
| CLASS NAV SHARES Period ended | 7-31-13 | 7-31-121 |
| |
| Per share operating performance | | |
|
| Net asset value, beginning of period | $10.61 | $10.00 |
| Net investment income2 | 0.08 | 0.04 |
| Net realized and unrealized gain on investments | 0.32 | 0.57 |
| Total from investment operations | 0.40 | 0.61 |
| Less distributions | | |
| From net investment income | (0.08) | — |
| From net realized gain | (0.07) | — |
| Total distributions | (0.15) | — |
| Net asset value, end of period | $10.86 | $10.61 |
| Total return (%)3 | 3.78 | 6.104 |
| |
| Ratios and supplemental data | | |
|
| Net assets, end of period (in millions) | $673 | $497 |
| Ratios (as a percentage of average net assets): | | |
| Expenses before reductions and amounts recaptured | 1.29 | 1.435 |
| Expenses including reductions and amounts recaptured | 1.29 | 1.435 |
| Net investment income | 0.73 | 0.695 |
| Portfolio turnover (%) | 106 | 33 |
| |
1 Period from 12-19-11 (commencement of operations) to 7-31-12.
2 Based on the average daily shares outstanding.
3 Total returns would have been lower had certain expenses not been reduced during the applicable periods shown.
4 Not annualized.
5 Annualized.
| | |
| 42 | Global Absolute Return Strategies Fund | Annual report | See notes to financial statements |
Notes to financial statements
Note 1 — Organization
John Hancock Global Absolute Return Strategies Fund (the fund) is a series of John Hancock Funds II (the Trust), an open-end management investment company organized as a Massachusetts business trust and registered under the Investment Company Act of 1940, as amended (the 1940 Act). The investment objective of the fund is to seek long term total return.
The fund may offer multiple classes of shares. The shares currently offered by the Trust are detailed in the Statements of assets and liabilities. Class A and Class C shares are open to all investors. Class I shares are offered to institutions and certain investors. Class R2 shares are available only to certain retirement plans. Class R6 shares are only available to certain retirement plans, institutions and other investors. Class NAV shares are offered to John Hancock affiliated funds of funds and cerain 529 plans. Shareholders of each class have exclusive voting rights to matters that affect that class. The distribution and service fees, if any, transfer agent fees, printing and postage and state registration fees for each class may differ.
Note 2 — Significant accounting policies
The financial statements have been prepared in conformity with accounting principles generally accepted in the United States of America, which require management to make certain estimates and assumptions as of the date of the financial statements. Actual results could differ from those estimates and those differences could be significant. Events or transactions occurring after the end of the fiscal period through the date that the financial statements were issued have been evaluated in the preparation of the financial statements. The following summarizes the significant accounting policies of the fund:
Security valuation. Investments are stated at value as of the close of regular trading on the New York Stock Exchange (NYSE), normally at 4:00 p.m., Eastern Time. In order to value the securities, the fund uses the following valuation techniques: Equity securities held by the fund are valued at the last sale price or official closing price on the principal securities exchange on which they trade. In the event there were no sales during the day or closing prices are not available, the securities are valued using the last quoted bid or evaluated price. Debt obligations are valued based on the evaluated prices provided by an independent pricing service, which utilizes both dealer-supplied and electronic data processing techniques, taking into account factors such as institutional-size trading in similar groups of securities, yield, quality, coupon rate, maturity, type of issue, trading characteristics and other market data. Options listed on an exchange are valued at the mean between the last bid and ask prices from the exchange on which they are principally traded. For options not listed on an exchange, an independent pricing source is used to value the options at the mean between the last bid and ask prices. Futures contracts are valued at the quoted daily settlement prices established by the exchange on which they trade. Swaps are marked-to-market daily based upon values from third party vendors, which may include a registered commodities exchange, or broker quotations. Foreign securities and currencies, including forward foreign currency contracts, are valued in U.S. dollars, based on foreign currency exchange rates supplied by an independent pricing service. Certain securities and forward foreign currency contracts traded only in the over-the-counter market are valued at the last bid price quoted by brokers making markets in the securities at the close of trading. Certain short-term securities are valued at amortized cost.
| |
| Annual report | Global Absolute Return Strategies Fund 43 |
Other portfolio securities and assets, for which reliable market quotations are not readily available, are valued at fair value as determined in good faith by the fund’s Pricing Committee following procedures established by the Board of Trustees, which include price verification procedures. The frequency with which these fair valuation procedures are used cannot be predicted and fair value of securities may differ significantly from the value that would have been used had a ready market for such securities existed. Generally, trading in foreign securities is substantially completed each day at various times prior to the close of trading on the NYSE. Significant market events that affect the values of foreign securities may occur between the time when the valuation of the securities is generally determined and the close of the NYSE. During significant market events, these securities will be valued at fair value, as determined in good faith, following procedures established by the Board of Trustees. The fund may use a fair valuation model to value foreign securities in order to adjust for events that may occur between the close of foreign exchanges and the close of the NYSE.
The fund uses a three-tier hierarchy to prioritize the pricing assumptions, referred to as inputs, used in valuation techniques to measure fair value. Level 1 includes securities valued using quoted prices in active markets for identical securities. Level 2 includes securities valued using other significant observable inputs. Observable inputs may include quoted prices for similar securities, interest rates, prepayment speeds and credit risk. Prices for securities valued using these inputs are received from independent pricing vendors and brokers and are based on an evaluation of the inputs described. Level 3 includes securities valued using significant unobservable inputs when market prices are not readily available or reliable, including the fund’s own assumptions in determining the fair value of investments. Factors used in determining value may include market or issuer specific events or trends, changes in interest rates and credit quality. The inputs or methodology used for valuing securities are not necessarily an indication of the risks associated with investing in those securities. Changes in valuation techniques may result in transfers into or out of an assigned level within the disclosure hierarchy.
The following is a summary of the values by input classification of the fund’s investments as of July 31, 2013, by major security category or type:
| | | | |
| | | | | LEVEL 3 |
| | | | LEVEL 2 | SIGNIFICANT |
| | TOTAL MARKET | LEVEL 1 | SIGNIFICANT | UNOBSERVABLE |
| | VALUE AT 7-31-13 | QUOTED PRICE | OBSERVABLE INPUTS | INPUTS |
|
| Corporate Bonds | $471,895,462 | — | $471,895,462 | — |
| Capital Preferred Securities | 838,487 | — | 838,487 | — |
| Foreign Government | | | | |
| Obligations | 181,309,929 | — | 181,309,929 | — |
|
| Common Stocks | 1,006,381,336 | $498,088,448 | 508,292,888 | — |
| Preferred Securities | 3,436,463 | 3,436,463 | — | — |
| Purchased Options | 75,272,728 | 38,363,750 | 36,908,978 | — |
| Short-Term Investments | 2,030,546,869 | — | 2,030,546,869 | — |
| |
|
| Total Investments | | | | |
| in Securities | $3,769,681,274 | $539,888,661 | $3,229,792,613 | — |
| Other Financial Instruments | | | | |
| Futures | ($30,842,634) | ($29,435,144) | ($1,407,490) | — |
| Forward Foreign | | | | |
| Currency Contracts | $9,275,006 | — | $9,275,006 | — |
| Written Options | ($44,972,119) | — | ($44,972,119) | — |
| Interest Rate Swaps | ($5,317,078) | — | ($5,317,078) | — |
| Credit Default Swaps | $5,090,819 | — | $5,090,819 | — |
| Variance Swaps | $1,822,794 | — | $1,822,794 | — |
Repurchase agreements. The fund may enter into repurchase agreements. When the fund enters into a repurchase agreement, it receives collateral that is held in a segregated account by the fund’s custodian. The collateral amount is marked-to-market and monitored on a daily basis to ensure that
| |
| 44 Global Absolute Return Strategies Fund | Annual report |
the collateral held is in an amount not less than the principal amount of the repurchase agreement plus any accrued interest.
Repurchase agreements are typically governed by the terms and conditions of the Master Repurchase Agreement and/or Global Master Repurchase Agreement (collectively, MRA). Upon an event of default, the non-defaulting party may close out all transactions traded under the MRA and net amounts owed. Absent an event of default, the MRA does not result in an offset of the reported amounts of assets and liabilities in the statement of assets and liabilities. In the event of a default by the counterparty, realization of the collateral proceeds could be delayed, during which time the collateral value may decline or the counterparty may have insufficient assets to pay back claims resulting from close-out of the transactions. Collateral received by the fund for repurchase agreements is disclosed in the Portfolio of investments as part of the caption related to the repurchase agreement.
Security transactions and related investment income. Investment security transactions are accounted for on a trade date plus one basis for daily net asset value calculations. However, for financial reporting purposes, investment transactions are reported on trade date. Interest income is accrued as earned. Interest income includes coupon interest and amortization/accretion of premiums/discounts on debt securities. Debt obligations may be placed in a non-accrual status and related interest income may be reduced by stopping current accruals and writing off interest receivable when the collection of all or a portion of interest has become doubtful. Dividend income is recorded on the ex-date, except for dividends of foreign securities where the dividend may not be known until after the ex-date. In those cases, dividend income, net of withholding taxes, is recorded when the fund becomes aware of the dividends. Foreign taxes are provided for based on the fund’s understanding of the tax rules and rates that exist in the foreign markets in which it invests. Gains and losses on securities sold are determined on the basis of identified cost and may include proceeds from litigation.
Foreign currency translation. Assets, including investments and liabilities denominated in foreign currencies, are translated into U.S. dollar values each day at the prevailing exchange rate. Purchases and sales of securities, income and expenses are translated into U.S. dollars at the prevailing exchange rate on the date of the transaction. The effect of changes in foreign currency exchange rates on the value of securities is reflected as a component of the realized and unrealized gains (losses) on investments.
Funds that invest internationally generally carry more risk than funds that invest strictly in U.S. securities. Risks can result from differences in economic and political conditions, regulations, market practices (including higher transaction costs), accounting standards and other factors. Foreign investments are also subject to a decline in the value of a foreign currency versus the U.S. dollar, which reduces the dollar value of securities denominated in that currency.
Foreign taxes. The fund may be subject to withholding tax on income and/or capital gains or repatriation taxes imposed by certain countries in which the fund invests. Taxes are accrued based upon investment income, realized gains or unrealized appreciation.
Line of credit. The fund may borrow from banks for temporary or emergency purposes, including meeting redemption requests that otherwise might require the untimely sale of securities. Pursuant to the custodian agreement, the custodian may loan money to the fund to make properly authorized payments. The fund is obligated to repay the custodian for any overdraft, including any related costs or expenses. The custodian may have a lien, security interest or security entitlement in any fund property that is not otherwise segregated or pledged, to the maximum extent permitted by law, to the extent of any overdraft.
| |
| Annual report | Global Absolute Return Strategies Fund 45 |
In addition, the fund and other affiliated funds have entered into an agreement with Citibank N.A. that enables them to participate in a $300 million unsecured committed line of credit. A commitment fee, payable at the end of each calendar quarter, based on the average daily unused portion of the line of credit, is charged to each participating fund on a pro rata basis and is reflected in other expenses on the Statement of operations. Prior to March 27, 2013, the fund participated in a $200 million unsecured line of credit, also with Citibank, with terms otherwise similar to the existing agreement. Commitment fees for the year ended July 31, 2013 were $939. For the year ended July 31, 2013, the fund had no borrowings under either line of credit.
Expenses. Within the John Hancock fund complex, expenses that are directly attributable to an individual fund are allocated to such fund. Expenses that are not readily attributable to a specific fund are allocated among all funds in an equitable manner, taking into consideration, among other things, the nature and type of expense and the fund’s relative net assets. Expense estimates are accrued in the period to which they relate and adjustments are made when actual amounts are known.
Class allocations. Income, common expenses and realized and unrealized gains (losses) are determined at the fund level and allocated daily to each class of shares based on the net assets of the class. Class-specific expenses, such as distribution and service fees, if any, transfer agent fees, state registration fees and printing and postage expenses, for all classes, are calculated daily at the class level based on the appropriate net assets of each class and the specific expense rates applicable to each class.
Federal income taxes. The fund intends to continue to qualify as a regulated investment company by complying with the applicable provisions of the Internal Revenue Code and will not be subject to federal income tax on taxable income that is distributed to shareholders. Therefore, no federal income tax provision is required.
Under the Regulated Investment Company Modernization Act of 2010, the fund is permitted to carry forward capital losses for an unlimited period. Capital losses that are carried forward will retain their character as either short-term or long-term capital losses rather than being considered all short-term as under previous law.
For federal income tax purposes, as of July 31, 2013, the fund has a short-term capital loss carryfoward of $11,524,190 and a long-term capital loss carryforward of $8,466,887 available to offset future net realized capital gains, which do not expire. Net capital losses of $39,632,841, that are the result of security transactions occurring after October 31, 2012, are treated as occurring on August 1, 2013, the first day of the fund’s next taxable year.
As of July 31, 2013, the fund had no uncertain tax positions that would require financial statement recognition, derecognition or disclosure. The fund’s federal tax returns are subject to examination by the Internal Revenue Service for a period of three years.
Distribution of income and gains. Distributions to shareholders from net investment income and net realized gains, if any, are recorded on the ex-date. The fund declares and pays dividends and capital gain distributions, if any, annually. The tax character of distributions for the period ended July 31, 2013 was as follows:
| | | | |
| | JULY 31, 2013 | JULY 31, 2012 | | |
| | |
| Ordinary Income | $15,292,862 | — | | |
| | |
| Long-Term Capital Gain | 4,337,947 | — | | |
|
| | |
| Total | $19,630,809 | — | | |
Distributions paid by the fund with respect to each class of shares are calculated in the same manner, at the same time and in the same amount, except for the effect of class level expenses
| |
| 46 Global Absolute Return Strategies Fund | Annual report |
that may be applied differently to each class. As of July 31, 2013, the components of distributable earnings on a tax basis consisted of $57,203,498 of undistributed ordinary income.
Such distributions and distributable earnings, on a tax basis, are determined in conformity with income tax regulations, which may differ from accounting principles generally accepted in the United States of America. Material distributions in excess of tax basis earnings and profits, if any, are reported in the fund’s financial statements as a return of capital.
Capital accounts within the financial statements are adjusted for permanent book-tax differences. These adjustments have no impact on net assets or the results of operations. Temporary book-tax differences, if any, will reverse in a subsequent period. Book-tax differences are primarily attributable to foreign currency transactions, passive foreign investment companies, wash sale loss deferrals, derivative transactions and amortization and accretion on debt securities.
Note 3 — Derivative instruments
The fund may invest in derivatives in order to meet its investment objectives. Derivatives include a variety of different instruments that may be traded in the over-the-counter market, on a regulated exchange or through a clearing facility. The risks in using derivatives vary depending upon the structure of the instruments, including the use of leverage, optionality, the liquidity or lack of liquidity of the contract, the creditworthiness of the counterparty or clearing organization and the volatility of the position. Some derivatives involve risks that are potentially greater than the risks associated with investing directly in the referenced securities or other referenced underlying instrument. Specifically, the fund is exposed to the risk that the counterparty to an over-the-counter (OTC) derivatives contract will be unable or unwilling to make timely settlement payments or otherwise honor its obligations. OTC derivatives transactions typically can only be closed out with the other party to the transaction.
Forward foreign currency contracts, certain options and swaps are typically traded through the OTC market. Non-deliverable forwards, currency options and cash settled currency swaps are all regulated by the Commodity Futures Trading Commission (the CFTC) as swaps. Derivative counterparty risk is managed through an ongoing evaluation of the creditworthiness of all potential counterparties and, if applicable, designated clearing organizations. The fund attempts to reduce its exposure to counterparty risk for derivatives traded in the OTC market, whenever possible, by entering into an International Swaps and Derivatives Association (ISDA) Master Agreement with each of its OTC counterparties. The ISDA gives each party to the agreement the right to terminate all transactions traded under the agreement if there is certain deterioration in the credit quality or contractual default of the other party, as defined in the ISDA. Upon an event of default or a termination of the ISDA, the non-defaulting party has the right to close out all transactions and to net amounts owed. This right to close out and net payments across all transactions traded under the ISDA could result in a reduction of the fund’s risk to a counterparty equal to any amounts payable by the fund, if any.
As defined by the ISDA, the fund may have collateral agreements with certain counterparties to mitigate counterparty risk on OTC derivatives. Subject to established minimum levels, collateral for OTC transactions is generally determined based on the net aggregate unrealized gain or loss on contracts with a particular counterparty. Collateral pledged to the fund is held in a segregated account by a third-party agent or held by the custodian bank for the benefit of the fund and can be in the form of cash or debt securities issued by the U.S. government or related agencies; collateral posted by the fund for OTC transactions is held in a segregated account at the fund’s custodian and is noted in the accompanying portfolio of investments, or if cash is posted, on the Statement of assets and liabilities. The fund’s maximum risk of loss due to counterparty risk is equal to the collateral posted by the fund netted against the value on any outstanding contracts.
| |
| Annual report | Global Absolute Return Strategies Fund 47 |
Futures, certain options and cleared swaps are traded or cleared on an exchange or central exchange clearinghouse. Exchange-traded or cleared transactions generally present less counterparty risk to the fund. The exchange’s clearinghouse stands between the fund and the broker to the contract and therefore, credit risk is generally limited to the failure of the clearinghouse and the clearing member.
Cleared swap contracts are subject to clearing house rules, including initial and variation margin requirements, daily settlement of obligations and the clearinghouse guarantee of payments to the broker. There is, however, still counterparty risk due to the insolvency of the broker with respect to any margin held in the brokers’ customer accounts. While clearing members are required to segregate customer assets from their own assets, in the event of insolvency, there may be a shortfall in the amount of margin held by the broker for its clients. Collateral or margin requirements for exchange-traded or cleared derivatives are set by the broker or applicable clearinghouse. Margin for exchange-traded and exchanged cleared transactions are detailed in the Statements of assets and liabilities as Cash held at broker for futures contracts and Cash held at broker for swap contracts, respectively. Securities pledged by the fund for exchanged-traded and cleared transactions are noted as collateral or margin requirements in the Portfolio of investments.
For financial reporting purposes, the fund does not offset OTC derivative assets or liabilities that are subject to master netting arrangements, as defined by the ISDAs, in the Statement of assets and liabilities. In the event of default by the counterparty or a termination of the agreement, the ISDA allows an offset of amounts across the various transactions between the fund and the applicable counterparty and is known as close-out netting. The table below reflects certain fund’s exposure to counterparties subject to an ISDA for OTC derivative transactions:
| | | | |
| | TOTAL MARKET VALUE | COLLATERAL POSTED | COLLATERAL | |
| COUNTERPARTY | OF OTC DERIVATIVES | BY COUNTERPARTY | POSTED BY FUND | NET EXPOSURE |
|
| Barclays Bank | | | | |
| PLC Wholesale | ($11,321,554) | — | $11,000,804 | ($320,750) |
| BNP Paribas SA | (4,036,264) | — | 5,868,138 | 1,831,874 |
| Goldman Sachs | | | | |
| Group Inc. | 2,385,249 | ($2,176,262) | — | 208,987 |
| Morgan Stanley | 824,869 | — | 3,860,633 | 4,685,502 |
| The Royal Bank | | | | |
| of Scotland PLC | 781,993 | — | — | 781,993 |
| UBS AG | 20,515,003 | (19,349,995) | — | 1,165,008 |
| | | | | |
| Totals | $9,149,296 | ($21,526,257) | $20,729,575 | $8,352,614 |
Futures. A futures contract is a contractual agreement to buy or sell a particular currency or financial instrument at a pre-determined price in the future. Risks related to the use of futures contracts include possible illiquidity of the futures markets, contract prices that can be highly volatile and imperfectly correlated to movements in the underlying financial instrument and potential losses in excess of the amounts recognized on the Statement of assets and liabilities. Use of long futures contracts subjects the fund to the risk of loss up to the notional value of the futures contracts. Use of short futures contracts subjects the fund to unlimited risk of loss.
Upon entering into a futures contract, the fund is required to deposit initial margin with the broker in the form of cash or securities. The amount of required margin is generally based on a percentage of the contract value; this amount is the initial margin for the trade. The margin deposit must then be maintained at the established level over the life of the contract. Futures collateral receivable/ payable is included on the Statement of assets and liabilities. Futures contracts are marked-to-market daily and an appropriate payable or receivable for the change in value (variation margin) and unrealized gain or loss is recorded by the fund. When the contract is closed, the fund records a realized gain or loss equal to the difference between the value of the contract at the time it was opened and the value at the time it was closed.
| |
| 48 Global Absolute Return Strategies Fund | Annual report |
During the year ended July 31, 2013, the fund used futures contracts to manage against anticipated changes in securities markets, gain exposure to certain securities markets and/or substitute for securities purchased (or to be purchased) and maintain diversity and liquidity of the portfolio. During the year ended July 31, 2013, the fund held futures contracts with U.S. Dollar notional values ranging from $473.2 million to $2.4 billion, as measured at each quarter end. The following table summarizes the contracts held at July 31, 2013.
| | | | | | |
| | | | | | | UNREALIZED |
| OPEN | NUMBER OF | | EXPIRATION | NOTIONAL | NOTIONAL | APPRECIATION |
| CONTRACTS | CONTRACTS | POSITION | DATE | BASIS | VALUE | (DEPRECIATION) |
|
| DAX Index Futures | 540 | Long | Sep 2013 | $146,749,368 | $148,158,729 | $1,409,361 |
| FTSE 100 Index | 431 | Long | Sep 2013 | 41,384,226 | 43,037,450 | 1,653,224 |
| Futures | | | | | | |
| Hang Seng Index | 25 | Long | Aug 2013 | 3,524,272 | 3,523,905 | (367) |
| Futures | | | | | | |
| NASDAQ 100 E-Mini | 3,988 | Long | Sep 2013 | 235,287,862 | 245,900,080 | 10,612,218 |
| Index Futures | | | | | | |
| Nikkei 225 Futures | 800 | Long | Sep 2013 | 116,620,311 | 111,122,459 | (5,497,852) |
| U.S. Treasury 10-Year | 4,963 | Long | Sep 2013 | 641,528,097 | 627,509,313 | (14,018,784) |
| Note Futures | | | | | | |
| CAC 40 Index Future | 2,820 | Short | Aug 2013 | (145,344,371) | (149,707,057) | (4,362,686) |
| Euro STOXX 50 | 2,170 | Short | Sep 2013 | (77,156,266) | (79,821,653) | (2,665,387) |
| Index Futures | | | | | | |
| MSCI Taiwan Index | 2,830 | Short | Aug 2013 | (81,122,876) | (80,485,200) | 637,676 |
| Futures | | | | | | |
| OMX 30 Index | 1,095 | Short | Aug 2013 | (20,454,779) | (20,734,468) | (279,689) |
| Futures | | | | | | |
| Russell 2000 Mini | 4,717 | Short | Sep 2013 | (461,996,189) | (491,935,930) | (29,939,741) |
| Index Futures | | | | | | |
| S&P 500 E-Mini | 799 | Short | Sep 2013 | (67,325,306) | (67,135,975) | 189,331 |
| Index Futures | | | | | | |
| SPI 200 Index | 107 | Short | Sep 2013 | (11,442,275) | (12,046,160) | (603,885) |
| Futures | | | | | | |
| Swiss Market Index | 295 | Short | Sep 2013 | (24,515,296) | (24,949,646) | (434,350) |
| Futures | | | | | | |
| TOPIX Index Futures | 295 | Short | Sep 2013 | (33,553,049) | (33,948,376) | (395,327) |
| Ultra Long U.S. | 1,586 | Short | Sep 2013 | (241,634,124) | (228,780,500) | 12,853,624 |
| Treasury Bond | | | | | | |
| Futures | | | | | | |
| | | | | | | ($30,842,634) |
Forward foreign currency contracts. A forward foreign currency contract is an agreement between two parties to buy and sell a specific currency at a price that is set on the date of the contract. The forward contract calls for delivery of the currency on a future date that is specified in the contract. Risks related to the use of forwards include the possible failure of counterparties to meet the terms of the forward agreement, the failure of the counterparties to timely post collateral, the risk that currency movements will not favor the fund thereby reducing the fund’s total return, and the potential for losses in excess of the amounts recognized on the Statement of assets and liabilities.
The market value of a forward foreign currency contract fluctuates with changes in foreign currency exchange rates. Forward foreign currency contracts are marked-to-market daily and the change in value is recorded by the fund as an unrealized gain or loss. Realized gains or losses,
| |
| Annual report | Global Absolute Return Strategies Fund 49 |
equal to the difference between the value of the contract at the time it was opened and the value at the time it was closed, are recorded upon delivery or receipt of the currency or settlement with the counterparty.
During the year ended July 31, 2013, the fund used forward foreign currency contracts to manage against anticipated currency exchange rates and gain exposure to foreign currency. During the year ended July 31, 2013, the fund held forward foreign currency contracts with U.S. Dollar notional values ranging from $558.5 million to $3.5 billion, as measured at each quarter end. The following table summarizes the contracts held at July 31, 2013.
| | | | | | | | | |
| | | | | | | CONTRACTUAL | | | NET UNREALIZED |
| | CONTRACT | | CONTRACT | | | SETTLEMENT | UNREALIZED | UNREALIZED | APPRECIATION/ |
| | TO BUY | | TO SELL | | COUNTERPARTY | DATE | APPRECIATION | DEPRECIATION | (DEPRECIATION) |
|
| AUD | 2,185 | USD | 2,078 | | Barclays Bank | 9-5-13 | — | ($119) | ($119) |
| | | | | | PLC Wholesale | | | | |
| AUD | 136,131 | USD | 128,263 | | BNP Paribas SA | 9-5-13 | — | (6,187) | (6,187) |
| AUD | 2,260 | USD | 2,146 | | Goldman Sachs | 9-5-13 | — | (119) | (119) |
| | | | | | Group Inc. | | | | |
| AUD | 2,072 | USD | 1,990 | | UBS AG | 9-5-13 | — | (133) | (133) |
| AUD | 486,764 | USD | 464,829 | | BNP Paribas SA | 9-11-13 | — | (28,492) | (28,492) |
| CNY | 383,322,000 | USD | 61,518,536 | | The Royal Bank | 8-21-13 | $934,675 | — | 934,675 |
| | | | | | of Scotland PLC | | | | |
| CNY | 49,984,000 | USD | 8,021,826 | | The Royal Bank | 8-22-13 | 121,261 | — | 121,261 |
| | | | | | of Scotland PLC | | | | |
| CNY | 20,597,615 | USD | 3,305,668 | | The Royal Bank | 8-23-13 | 49,715 | — | 49,715 |
| | | | | | of Scotland PLC | | | | |
| CNY | 67,046,864 | USD | 10,760,209 | | The Royal Bank | 8-26-13 | 159,342 | — | 159,342 |
| | | | | | of Scotland PLC | | | | |
| CNY | 41,940,864 | USD | 6,731,001 | | The Royal Bank | 8-27-13 | 99,158 | — | 99,158 |
| | | | | | of Scotland PLC | | | | |
| CNY | 60,725,920 | USD | 9,745,774 | | The Royal Bank | 8-28-13 | 142,820 | — | 142,820 |
| | | | | | of Scotland PLC | | | | |
| CNY | 39,705,750 | USD | 6,300,000 | | BNP Paribas SA | 8-29-13 | 165,185 | — | 165,185 |
| CNY | 14,542,170 | USD | 2,333,842 | | The Royal Bank | 8-29-13 | 34,022 | — | 34,022 |
| | | | | | of Scotland PLC | | | | |
| CNY | 48,633,740 | USD | 7,805,126 | | The Royal Bank | 8-30-13 | 113,180 | — | 113,180 |
| | | | | | of Scotland PLC | | | | |
| EUR | 67,908,406 | USD | 90,600,000 | | BNP Paribas SA | 8-19-13 | — | (253,376) | (253,376) |
| EUR | 5,262,254 | USD | 6,875,653 | | BNP Paribas SA | 9-5-13 | 125,718 | — | 125,718 |
| EUR | 49,773 | USD | 65,185 | | Goldman Sachs | 9-5-13 | 1,038 | — | 1,038 |
| | | | | | Group Inc. | | | | |
| EUR | 972,168 | USD | 1,296,882 | | The Royal Bank | 9-5-13 | — | (3,423) | (3,423) |
| | | | | | of Scotland PLC | | | | |
| EUR | 698,242 | USD | 914,603 | | UBS AG | 9-5-13 | 14,401 | — | 14,401 |
| EUR | 206,811 | USD | 274,440 | | Barclays Bank | 9-11-13 | 725 | — | 725 |
| | | | | | PLC Wholesale | | | | |
| EUR | 1,441,617 | USD | 1,898,577 | | BNP Paribas SA | 9-11-13 | 19,521 | — | 19,521 |
| GBP | 464,497 | USD | 712,609 | | BNP Paribas SA | 9-11-13 | — | (6,189) | (6,189) |
| GBP | 469,725 | USD | 724,908 | | UBS AG | 9-11-13 | — | (10,538) | (10,538) |
| HKD | 7,253,721 | USD | 935,321 | | BNP Paribas SA | 9-11-13 | 127 | — | 127 |
| HKD | 3,848,378 | USD | 496,018 | | The Royal Bank | 9-11-13 | 272 | — | 272 |
| | | | | | of Scotland PLC | | | | |
| HKD | 15,172,150 | USD | 1,956,691 | | Barclays Bank | 9-13-13 | — | (61) | (61) |
| | | | | | PLC Wholesale | | | | |
| HKD | 30,716,070 | USD | 3,960,412 | | BNP Paribas SA | 9-13-13 | 792 | — | 792 |
| HKD | 5,909,052 | USD | 762,172 | | The Royal Bank | 9-13-13 | — | (130) | (130) |
| | | | | | of Scotland PLC | | | | |
| |
| 50 Global Absolute Return Strategies Fund | Annual report |
| | | | | | | | | |
| | | | | | | CONTRACTUAL | | | NET UNREALIZED |
| | CONTRACT | | CONTRACT | | | SETTLEMENT | UNREALIZED | UNREALIZED | APPRECIATION/ |
| | TO BUY | | TO SELL | | COUNTERPARTY | DATE | APPRECIATION | DEPRECIATION | (DEPRECIATION) |
|
| INR | 2,119,522,663 | USD | 37,814,856 | | Barclays Bank | 10-21-13 | — | ($3,654,802) | ($3,654,802) |
| | | | | | PLC Wholesale | | | | |
| INR | 4,638,425,000 | USD | 82,556,287 | | Barclays Bank | 11-21-13 | — | (8,323,671) | (8,323,671) |
| | | | | | PLC Wholesale | | | | |
| JPY | 8,548,414,400 | USD | 86,763,471 | | UBS AG | 8-21-13 | $554,219 | — | 554,219 |
| JPY | 955,722,593 | USD | 9,789,331 | | UBS AG | 8-22-13 | — | (27,061) | (27,061) |
| JPY | 176,201,000 | USD | 1,804,820 | | UBS AG | 8-23-13 | — | (4,998) | (4,998) |
| JPY | 525,438,607 | USD | 5,382,159 | | UBS AG | 8-26-13 | — | (14,929) | (14,929) |
| JPY | 796,803,193 | USD | 8,161,877 | | UBS AG | 8-27-13 | — | (22,680) | (22,680) |
| JPY | 438,732,823 | USD | 4,494,108 | | UBS AG | 8-28-13 | — | (12,510) | (12,510) |
| JPY | 538,989,516 | USD | 5,521,104 | | UBS AG | 8-29-13 | — | (15,368) | (15,368) |
| JPY | 95,858,895 | USD | 984,583 | | Barclays Bank | 8-30-13 | — | (5,387) | (5,387) |
| | | | | | PLC Wholesale | | | | |
| JPY | 1,921,688,605 | USD | 19,684,794 | | UBS AG | 8-30-13 | — | (54,789) | (54,789) |
| JPY | 54,075,820 | USD | 545,268 | | BNP Paribas SA | 9-11-13 | 7,149 | — | 7,149 |
| JPY | 52,779,874 | USD | 559,401 | | Goldman Sachs | 9-11-13 | — | (20,222) | (20,222) |
| | | | | | Group Inc. | | | | |
| JPY | 90,984,349 | USD | 928,011 | | UBS AG | 9-11-13 | 1,450 | — | 1,450 |
| MXN | 325,600,000 | USD | 26,571,037 | | BNP Paribas SA | 10-18-13 | — | (1,256,153) | (1,256,153) |
| MXN | 330,000,000 | USD | 26,753,358 | | BNP Paribas SA | 10-21-13 | — | (1,102,981) | (1,102,981) |
| MXN | 1,835,000,000 | USD | 147,084,258 | | BNP Paribas SA | 10-22-13 | — | (4,464,840) | (4,464,840) |
| MXN | 92,400,000 | USD | 7,557,417 | | The Royal Bank | 10-22-13 | — | (375,927) | (375,927) |
| | | | | | of Scotland PLC | | | | |
| MXN | 330,000,000 | USD | 26,749,021 | | BNP Paribas SA | 10-23-13 | — | (1,103,041) | (1,103,041) |
| MXN | 278,853,595 | USD | 22,945,059 | | BNP Paribas SA | 10-24-13 | — | (1,275,784) | (1,275,784) |
| MXN | 73,146,405 | USD | 6,018,635 | | The Royal Bank | 10-24-13 | — | (334,542) | (334,542) |
| | | | | | of Scotland PLC | | | | |
| SEK | 10,402,892 | USD | 1,570,781 | | BNP Paribas SA | 9-5-13 | 24,021 | — | 24,021 |
| SGD | 1,080,657 | USD | 856,442 | | Barclays Bank | 9-11-13 | — | (6,059) | (6,059) |
| | | | | | PLC Wholesale | | | | |
| SGD | 3,457,032 | USD | 2,705,964 | | BNP Paribas SA | 9-11-13 | 14,415 | — | 14,415 |
| USD | 7,014,138 | AUD | 6,890,265 | | The Royal Bank | 8-13-13 | 825,498 | — | 825,498 |
| | | | | | of Scotland PLC | | | | |
| USD | 135,840 | AUD | 142,647 | | BNP Paribas SA | 9-5-13 | 7,919 | — | 7,919 |
| USD | 7,612,468 | AUD | 8,000,000 | | BNP Paribas SA | 9-9-13 | 440,281 | — | 440,281 |
| USD | 6,103,104 | AUD | 6,400,000 | | The Royal Bank | 9-9-13 | 365,355 | — | 365,355 |
| | | | | | of Scotland PLC | | | | |
| USD | 1,614,795 | AUD | 1,761,280 | | BNP Paribas SA | 9-11-13 | 35,975 | — | 35,975 |
| USD | 15,391,051 | AUD | 16,227,241 | | Goldman Sachs | 9-11-13 | 844,878 | — | 844,878 |
| | | | | | Group Inc. | | | | |
| USD | 1,070,953 | AUD | 1,171,423 | | The Royal Bank | 9-11-13 | 20,885 | — | 20,885 |
| | | | | | of Scotland PLC | | | | |
| USD | 2,052,875 | AUD | 2,274,696 | | UBS AG | 9-11-13 | 13,827 | — | 13,827 |
| USD | 29,970,000 | AUD | 29,996,939 | | The Royal Bank | 9-18-13 | 3,093,066 | — | 3,093,066 |
| | | | | | of Scotland PLC | | | | |
| USD | 27,750,000 | AUD | 27,288,685 | | The Royal Bank | 9-19-13 | 3,301,250 | — | 3,301,250 |
| | | | | | of Scotland PLC | | | | |
| USD | 29,600,000 | AUD | 29,319,994 | | The Royal Bank | 9-20-13 | 3,333,077 | — | 3,333,077 |
| | | | | | of Scotland PLC | | | | |
| USD | 27,750,000 | AUD | 27,295,717 | | The Royal Bank | 9-23-13 | 3,301,422 | — | 3,301,422 |
| | | | | | of Scotland PLC | | | | |
| USD | 23,600,000 | AUD | 25,149,324 | | BNP Paribas SA | 9-24-13 | 1,075,421 | — | 1,075,421 |
| USD | 5,180,000 | AUD | 5,221,537 | | The Royal Bank | 9-24-13 | 503,416 | — | 503,416 |
| | | | | | of Scotland PLC | | | | |
| USD | 113,232,904 | AUD | 110,745,992 | | UBS AG | 9-24-13 | 14,045,076 | — | 14,045,076 |
| |
| Annual report | Global Absolute Return Strategies Fund 51 |
| | | | | | | | | |
| | | | | | | CONTRACTUAL | | | NET UNREALIZED |
| | CONTRACT | | CONTRACT | | | SETTLEMENT | UNREALIZED | UNREALIZED | APPRECIATION/ |
| | TO BUY | | TO SELL | | COUNTERPARTY | DATE | APPRECIATION | DEPRECIATION | (DEPRECIATION) |
|
| USD | 9,223,852 | CAD | 9,357,653 | | The Royal Bank | 8-13-13 | $115,648 | — | $115,648 |
| | | | | | of Scotland PLC | | | | |
| USD | 6,248,175 | CAD | 6,379,000 | | BNP Paribas SA | 9-9-13 | 43,163 | — | 43,163 |
| USD | 8,923,315 | CAD | 9,250,000 | | The Royal Bank | 9-9-13 | — | ($74,389) | (74,389) |
| | | | | | of Scotland PLC | | | | |
| USD | 2,371,349 | CAD | 2,421,000 | | UBS AG | 9-9-13 | 16,383 | — | 16,383 |
| USD | 124,450,521 | CAD | 126,818,690 | | BNP Paribas SA | 9-12-13 | 1,099,836 | — | 1,099,836 |
| USD | 43,331,854 | CAD | 44,217,774 | | Barclays Bank | 9-17-13 | 328,495 | — | 328,495 |
| | | | | | PLC Wholesale | | | | |
| USD | 123,966,472 | CAD | 128,570,960 | | BNP Paribas SA | 11-21-13 | — | (871,307) | (871,307) |
| USD | 25,343,294 | CAD | 25,911,111 | | BNP Paribas SA | 11-22-13 | 185,153 | — | 185,153 |
| USD | 117,046,252 | CAD | 119,970,653 | | UBS AG | 11-22-13 | 561,914 | — | 561,914 |
| USD | 56,604,313 | CAD | 57,877,628 | | BNP Paribas SA | 11-25-13 | 412,721 | — | 412,721 |
| USD | 6,943,634 | CHF | 6,466,065 | | The Royal Bank | 8-13-13 | — | (43,794) | (43,794) |
| | | | | | of Scotland PLC | | | | |
| USD | 10,040,955 | CHF | 9,470,000 | | Barclays Bank | 9-9-13 | — | (195,043) | (195,043) |
| | | | | | PLC Wholesale | | | | |
| USD | 3,851,182 | CHF | 3,550,000 | | BNP Paribas SA | 9-9-13 | 14,034 | — | 14,034 |
| USD | 2,661,984 | CHF | 2,450,000 | | The Royal Bank | 9-9-13 | 13,812 | — | 13,812 |
| | | | | | of Scotland PLC | | | | |
| USD | 48,000,000 | CNY | 301,344,000 | | BNP Paribas SA | 8-21-13 | — | (1,096,844) | (1,096,844) |
| USD | 13,000,000 | CNY | 81,978,000 | | The Royal Bank | 8-21-13 | — | (356,367) | (356,367) |
| | | | | | of Scotland PLC | | | | |
| USD | 8,000,000 | CNY | 49,984,000 | | BNP Paribas SA | 8-22-13 | — | (143,087) | (143,087) |
| USD | 3,280,397 | CNY | 20,597,615 | | BNP Paribas SA | 8-23-13 | — | (74,985) | (74,985) |
| USD | 4,654,901 | CNY | 29,267,864 | | BNP Paribas SA | 8-26-13 | — | (111,794) | (111,794) |
| USD | 6,000,000 | CNY | 37,779,000 | | The Royal Bank | 8-26-13 | — | (152,856) | (152,856) |
| | | | | | of Scotland PLC | | | | |
| USD | 654,901 | CNY | 4,107,864 | | BNP Paribas SA | 8-27-13 | — | (14,074) | (14,074) |
| USD | 6,000,000 | CNY | 37,833,000 | | The Royal Bank | 8-27-13 | — | (161,184) | (161,184) |
| | | | | | of Scotland PLC | | | | |
| USD | 654,901 | CNY | 4,115,920 | | Barclays Bank | 8-28-13 | — | (15,335) | (15,335) |
| | | | | | PLC Wholesale | | | | |
| USD | 9,000,000 | CNY | 56,610,000 | | BNP Paribas SA | 8-28-13 | — | (218,359) | (218,359) |
| USD | 654,901 | CNY | 4,115,920 | | Barclays Bank | 8-29-13 | — | (15,284) | (15,284) |
| | | | | | PLC Wholesale | | | | |
| USD | 5,000,000 | CNY | 31,385,000 | | BNP Paribas SA | 8-29-13 | — | (110,338) | (110,338) |
| USD | 3,000,000 | CNY | 18,747,000 | | UBS AG | 8-29-13 | — | (52,526) | (52,526) |
| USD | 7,700,000 | CNY | 48,633,740 | | UBS AG | 8-30-13 | — | (218,306) | (218,306) |
| USD | 1,397,240 | DKK | 7,924,221 | | UBS AG | 8-13-13 | — | (16,923) | (16,923) |
| USD | 478,853 | DKK | 2,740,000 | | The Royal Bank | 9-9-13 | — | (10,292) | (10,292) |
| | | | | | of Scotland PLC | | | | |
| USD | 26,135,123 | EUR | 19,901,840 | | The Royal Bank | 8-13-13 | — | (342,175) | (342,175) |
| | | | | | of Scotland PLC | | | | |
| USD | 126,221,202 | EUR | 95,200,000 | | BNP Paribas SA | 8-19-13 | — | (434,674) | (434,674) |
| USD | 56,398,332 | EUR | 43,273,325 | | The Royal Bank | 8-19-13 | — | (1,173,316) | (1,173,316) |
| | | | | | of Scotland PLC | | | | |
| USD | 527,486 | EUR | 411,301 | | UBS AG | 9-4-13 | — | (19,744) | (19,744) |
| USD | 174,320,528 | EUR | 135,116,787 | | Barclays Bank | 9-5-13 | — | (5,450,934) | (5,450,934) |
| | | | | | PLC Wholesale | | | | |
| USD | 39,149,762 | EUR | 30,043,180 | | BNP Paribas SA | 9-5-13 | — | (822,370) | (822,370) |
| USD | 33,194,829 | EUR | 25,396,985 | | UBS AG | 9-5-13 | — | (595,592) | (595,592) |
| |
| 52 Global Absolute Return Strategies Fund | Annual report |
| | | | | | | | | |
| | | | | | | CONTRACTUAL | | | NET UNREALIZED |
| | CONTRACT | | CONTRACT | | | SETTLEMENT | UNREALIZED | UNREALIZED | APPRECIATION/ |
| | TO BUY | | TO SELL | | COUNTERPARTY | DATE | APPRECIATION | DEPRECIATION | (DEPRECIATION) |
|
| USD | 12,424,388 | EUR | 9,300,000 | | BNP Paribas SA | 9-9-13 | $50,657 | — | $50,657 |
| USD | 2,574,361 | EUR | 1,922,000 | | The Royal Bank | 9-9-13 | 17,123 | — | 17,123 |
| | | | | | of Scotland PLC | | | | |
| USD | 36,517,864 | EUR | 27,848,000 | | UBS AG | 9-9-13 | — | ($534,144) | (534,144) |
| USD | 8,368,887 | EUR | 6,399,098 | | Barclays Bank | 9-11-13 | — | (145,230) | (145,230) |
| | | | | | PLC Wholesale | | | | |
|
| USD | 5,033,962 | EUR | 3,878,536 | | BNP Paribas SA | 9-11-13 | — | (126,501) | (126,501) |
| USD | 997,159 | EUR | 764,109 | | UBS AG | 9-11-13 | — | (19,503) | (19,503) |
| USD | 59,265,112 | EUR | 44,604,705 | | Barclays Bank | 9-16-13 | — | (83,346) | (83,346) |
| | | | | | PLC Wholesale | | | | |
| USD | 72,000,000 | EUR | 55,712,203 | | The Royal Bank | 9-17-13 | — | (2,127,726) | (2,127,726) |
| | | | | | of Scotland PLC | | | | |
| USD | 37,373,822 | EUR | 27,986,316 | | Barclays Bank | 9-24-13 | 135,756 | — | 135,756 |
| | | | | | PLC Wholesale | | | | |
| USD | 95,619,639 | EUR | 71,383,137 | | UBS AG | 9-25-13 | 638,236 | — | 638,236 |
| USD | 32,003,775 | EUR | 24,899,654 | | The Royal Bank | 10-16-13 | — | (1,129,994) | (1,129,994) |
| | | | | | of Scotland PLC | | | | |
| USD | 43,216,947 | EUR | 33,576,654 | | Barclays Bank | 10-17-13 | — | (1,463,407) | (1,463,407) |
| | | | | | PLC Wholesale | | | | |
| USD | 32,507,170 | EUR | 24,895,458 | | Barclays Bank | 10-25-13 | — | (622,169) | (622,169) |
| | | | | | PLC Wholesale | | | | |
| USD | 1,181,518 | EUR | 911,699 | | Barclays Bank | 12-6-13 | — | (31,938) | (31,938) |
| | | | | | PLC Wholesale | | | | |
| USD | 18,262,698 | GBP | 11,752,217 | | The Royal Bank | 8-13-13 | 386,048 | — | 386,048 |
| | | | | | of Scotland PLC | | | | |
| USD | 8,027,787 | GBP | 5,328,994 | | BNP Paribas SA | 9-5-13 | — | (76,982) | (76,982) |
| USD | 170,951 | GBP | 114,161 | | The Royal Bank | 9-5-13 | — | (2,675) | (2,675) |
| | | | | | of Scotland PLC | | | | |
| USD | 5,710,974 | GBP | 3,630,000 | | Barclays Bank | 9-9-13 | 190,308 | — | 190,308 |
| | | | | | PLC Wholesale | | | | |
| USD | 13,154,521 | GBP | 8,420,000 | | BNP Paribas SA | 9-9-13 | 349,010 | — | 349,010 |
| USD | 15,936,828 | GBP | 10,490,000 | | Goldman Sachs | 9-9-13 | — | (16,831) | (16,831) |
| | | | | | Group Inc. | | | | |
| USD | 4,604,274 | GBP | 2,950,000 | | The Royal Bank | 9-9-13 | 117,783 | — | 117,783 |
| | | | | | of Scotland PLC | | | | |
| USD | 1,563,160 | GBP | 1,000,000 | | UBS AG | 9-9-13 | 42,315 | — | 42,315 |
| USD | 1,465,735 | GBP | 987,182 | | Barclays Bank | 9-11-13 | — | (35,597) | (35,597) |
| | | | | | PLC Wholesale | | | | |
| USD | 20,527,791 | GBP | 13,419,930 | | BNP Paribas SA | 9-11-13 | 118,416 | — | 118,416 |
| USD | 146,020 | GBP | 96,530 | | Goldman Sachs | 9-11-13 | — | (785) | (785) |
| | | | | | Group Inc. | | | | |
| USD | 2,216,553 | GBP | 1,481,116 | | The Royal Bank | 9-11-13 | — | (35,967) | (35,967) |
| | | | | | of Scotland PLC | | | | |
| USD | 558,647 | GBP | 367,064 | | UBS AG | 9-11-13 | 406 | — | 406 |
| USD | 1,910,660 | HKD | 14,824,771 | | Barclays Bank | 8-13-13 | — | (926) | (926) |
| | | | | | PLC Wholesale | | | | |
| USD | 39,401,815 | HKD | 305,825,071 | | BNP Paribas SA | 8-13-13 | — | (32,913) | (32,913) |
| USD | 36,402,397 | HKD | 282,513,539 | | Goldman Sachs | 8-13-13 | — | (26,418) | (26,418) |
| | | | | | Group Inc. | | | | |
| USD | 5,773,712 | HKD | 44,789,269 | | The Royal Bank | 8-13-13 | — | (1,658) | (1,658) |
| | | | | | of Scotland PLC | | | | |
| USD | 12,523,613 | HKD | 97,196,139 | | UBS AG | 8-13-13 | — | (9,379) | (9,379) |
| USD | 3,435,526 | HKD | 26,650,000 | | Barclays Bank | 9-9-13 | — | (1,261) | (1,261) |
| | | | | | PLC Wholesale | | | | |
| USD | 1,404,545 | HKD | 10,900,000 | | BNP Paribas SA | 9-9-13 | — | (1,120) | (1,120) |
| |
| Annual report | Global Absolute Return Strategies Fund 53 |
| | | | | | | | | |
| | | | | | | CONTRACTUAL | | | NET UNREALIZED |
| | CONTRACT | | CONTRACT | | | SETTLEMENT | UNREALIZED | UNREALIZED | APPRECIATION/ |
| | TO BUY | | TO SELL | | COUNTERPARTY | DATE | APPRECIATION | DEPRECIATION | (DEPRECIATION) |
|
| USD | 4,299,658 | HKD | 33,350,000 | | The Royal Bank | 9-9-13 | — | ($1,163) | ($1,163) |
| | | | | | of Scotland PLC | | | | |
| USD | 1,976,034 | HKD | 15,325,256 | | Barclays Bank | 9-11-13 | — | (327) | (327) |
| | | | | | PLC Wholesale | | | | |
| USD | 1,753,534 | HKD | 13,599,899 | | Goldman Sachs | 9-11-13 | — | (324) | (324) |
| | | | | | Group Inc. | | | | |
| USD | 2,758,660 | HKD | 21,399,975 | | The Royal Bank | 9-11-13 | — | (1,103) | (1,103) |
| | | | | | of Scotland PLC | | | | |
| USD | 17,666,450 | HKD | 137,074,960 | | The Royal Bank | 9-13-13 | — | (11,006) | (11,006) |
| | | | | | of Scotland PLC | | | | |
| USD | 6,837,006 | JPY | 700,000,000 | | BNP Paribas SA | 8-13-13 | — | (312,834) | (312,834) |
| USD | 15,964,602 | JPY | 1,565,308,455 | | The Royal Bank | 8-13-13 | — | (23,547) | (23,547) |
| | | | | | of Scotland PLC | | | | |
| USD | 96,000,000 | JPY | 8,548,414,400 | | Barclays Bank | 8-21-13 | $8,682,310 | — | 8,682,310 |
| | | | | | PLC Wholesale | | | | |
| USD | 7,000,000 | JPY | 696,280,900 | | Barclays Bank | 8-22-13 | — | (112,192) | (112,192) |
| | | | | | PLC Wholesale | | | | |
| USD | 2,948,037 | JPY | 259,441,692 | | The Royal Bank | 8-22-13 | 297,958 | — | 297,958 |
| | | | | | of Scotland PLC | | | | |
| USD | 2,000,000 | JPY | 176,201,000 | | The Royal Bank | 8-23-13 | 200,177 | — | 200,177 |
| | | | | | of Scotland PLC | | | | |
| USD | 1,613,615 | JPY | 141,628,607 | | Barclays Bank | 8-26-13 | 166,913 | — | 166,913 |
| | | | | | PLC Wholesale | | | | |
| USD | 4,000,000 | JPY | 383,810,000 | | UBS AG | 8-26-13 | 79,473 | — | 79,473 |
| USD | 1,613,615 | JPY | 141,626,993 | | Barclays Bank | 8-27-13 | 166,922 | — | 166,922 |
| | | | | | PLC Wholesale | | | | |
| USD | 7,000,000 | JPY | 655,176,200 | | UBS AG | 8-27-13 | 307,497 | — | 307,497 |
| USD | 3,000,000 | JPY | 284,333,700 | | Barclays Bank | 8-28-13 | 95,569 | — | 95,569 |
| | | | | | PLC Wholesale | | | | |
| USD | 1,762,366 | JPY | 154,399,122 | | The Royal Bank | 8-28-13 | 185,199 | — | 185,199 |
| | | | | | of Scotland PLC | | | | |
| USD | 4,000,000 | JPY | 385,077,600 | | Barclays Bank | 8-29-13 | 66,462 | — | 66,462 |
| | | | | | PLC Wholesale | | | | |
| USD | 1,762,367 | JPY | 153,911,916 | | The Royal Bank | 8-29-13 | 190,169 | — | 190,169 |
| | | | | | of Scotland PLC | | | | |
| USD | 15,000,000 | JPY | 1,360,207,500 | | BNP Paribas SA | 8-30-13 | 1,105,512 | — | 1,105,512 |
| USD | 8,000,000 | JPY | 657,340,000 | | UBS AG | 8-30-13 | 1,285,287 | — | 1,285,287 |
| USD | 17,935,630 | JPY | 1,700,000,000 | | Goldman Sachs | 9-9-13 | 569,262 | — | 569,262 |
| | | | | | Group Inc. | | | | |
| USD | 16,196,051 | JPY | 1,625,000,000 | | The Royal Bank | 9-9-13 | — | (404,154) | (404,154) |
| | | | | | of Scotland PLC | | | | |
| USD | 9,753,763 | JPY | 970,906,162 | | Barclays Bank | 9-11-13 | — | (164,642) | (164,642) |
| | | | | | PLC Wholesale | | | | |
| USD | 5,339,308 | JPY | 530,861,522 | | BNP Paribas SA | 9-11-13 | — | (83,769) | (83,769) |
| USD | 439,899 | JPY | 43,989,215 | | The Royal Bank | 9-11-13 | — | (9,478) | (9,478) |
| | | | | | of Scotland PLC | | | | |
| USD | 850,209 | JPY | 84,674,652 | | UBS AG | 9-11-13 | — | (14,794) | (14,794) |
| USD | 92,942,221 | JPY | 9,281,117,200 | | Goldman Sachs | 11-19-13 | — | (1,911,340) | (1,911,340) |
| | | | | | Group Inc. | | | | |
| USD | 60,856,996 | JPY | 6,058,776,445 | | Barclays Bank | 11-20-13 | — | (1,064,601) | (1,064,601) |
| | | | | | PLC Wholesale | | | | |
| USD | 90,600,000 | MXN | 1,165,704,900 | | BNP Paribas SA | 9-17-13 | — | (276,273) | (276,273) |
| USD | 1,077,424 | NOK | 6,262,413 | | UBS AG | 8-13-13 | 15,125 | — | 15,125 |
| USD | 399,573 | NOK | 2,350,000 | | The Royal Bank | 9-9-13 | 1,333 | — | 1,333 |
| | | | | | of Scotland PLC | | | | |
| |
| 54 Global Absolute Return Strategies Fund | Annual report |
| | | | | | | | | |
| | | | | | | CONTRACTUAL | | | NET UNREALIZED |
| | CONTRACT | | CONTRACT | | | SETTLEMENT | UNREALIZED | UNREALIZED | APPRECIATION/ |
| | TO BUY | | TO SELL | | COUNTERPARTY | DATE | APPRECIATION | DEPRECIATION | (DEPRECIATION) |
|
| USD | 1,054 | SEK | 6,928 | | Barclays Bank | 8-13-13 | — | ($8) | ($8) |
| | | | | | PLC Wholesale | | | | |
| USD | 3,755,159 | SEK | 24,460,917 | | The Royal Bank | 8-13-13 | $3,324 | — | 3,324 |
| | | | | | of Scotland PLC | | | | |
| USD | 1,530,028 | SEK | 10,232,129 | | Barclays Bank | 9-5-13 | — | (38,596) | (38,596) |
| | | | | | PLC Wholesale | | | | |
| USD | 1,389,389 | SEK | 9,200,000 | | Barclays Bank | 9-9-13 | — | (20,885) | (20,885) |
| | | | | | PLC Wholesale | | | | |
| USD | 24,772 | SEK | 163,855 | | BNP Paribas SA | 9-11-13 | — | (345) | (345) |
| USD | 1,783,807 | SGD | 2,200,000 | | UBS AG | 8-13-13 | 52,654 | — | 52,654 |
| USD | 1,065,165 | SGD | 1,345,000 | | Barclays Bank | 9-9-13 | 6,768 | — | 6,768 |
| | | | | | PLC Wholesale | | | | |
| USD | 6,328,849 | SGD | 7,892,669 | | Barclays Bank | 9-11-13 | 118,012 | — | 118,012 |
| | | | | | PLC Wholesale | | | | |
| USD | 396,163 | SGD | 500,974 | | The Royal Bank | 9-11-13 | 1,941 | — | 1,941 |
| | | | | | of Scotland PLC | | | | |
| USD | 615,939 | SGD | 780,091 | | UBS AG | 9-11-13 | 2,077 | — | 2,077 |
| USD | 38,131,204 | SGD | 47,163,724 | | Barclays Bank | 10-21-13 | 1,015,651 | — | 1,015,651 |
| | | | | | PLC Wholesale | | | | |
| USD | 87,421,491 | SGD | 108,304,300 | | Barclays Bank | 11-21-13 | 2,185,896 | — | 2,185,896 |
| | | | | | PLC Wholesale | | | | |
|
| | | | | | | | $55,429,260 | ($46,154,254) | $9,275,006 |
| |
| Currency Abbreviation |
| AUD | Australian Dollar |
| CAD | Canadian Dollar |
| CHF | Swiss Franc |
| CNY | Chinese Yuan Renminbi |
| DKK | Danish Krone |
| EUR | Euro |
| GBP | Pound Sterling |
| HKD | Hong Kong Dollar |
| INR | Indian Rupee |
| JPY | Japanese Yen |
| MXN | Mexican Peso |
| NOK | Norwegian Krone |
| SEK | Swedish Krona |
| SGD | Singapore Dollar |
| USD | U.S. Dollar |
Options. There are two types of options, put options and call options. Options are traded either over-the-counter or on an exchange. A call option gives the purchaser of the option the right to buy (and the seller the obligation to sell) the underlying instrument at the exercise price. A put option gives the purchaser of the option the right to sell (and the writer the obligation to buy) the underlying instrument at the exercise price. Writing puts and buying calls may increase the fund’s exposure to changes in the value of the underlying instrument. Buying puts and writing calls may decrease the fund’s exposure to such changes. Risks related to the use of options include the loss of premiums, possible illiquidity of the options markets, trading restrictions imposed by an exchange and movements in underlying security values, and for written options, potential losses in excess of the amounts recognized on the Statement of assets and liabilities. In addition, over-the-counter options are subject to the risks of all over-the-counter derivatives contracts.
When the fund purchases an option, the premium paid by the fund is included in the Portfolio of investments and subsequently “marked-to-market” to reflect current market value. If the purchased option expires, the fund realizes a loss equal to the cost of the option. If the fund exercises a call option, the cost of the securities acquired by exercising the call is increased by the premium paid to buy the call. If the fund exercises a put option, it realizes a gain or loss from the sale of the
| |
| Annual report | Global Absolute Return Strategies Fund 55 |
underlying security and the proceeds from such sale are decreased by the premium paid. If the fund enters into a closing sale transaction, the fund realizes a gain or loss, depending on whether proceeds from the closing sale are greater or less than the original cost. When the fund writes an option, the premium received is included as a liability and subsequently “marked-to-market” to reflect the current market value of the option written. Premiums received from writing options that expire unexercised are recorded as realized gains. Premiums received from writing options which are exercised or are closed are added to or offset against the proceeds or amount paid on the transaction to determine the realized gain or loss. If a put option on a security is exercised, the premium received reduces the cost basis of the securities purchased by the fund.
During the year ended July 31, 2013, the fund used purchased options to manage against anticipated currency exchange rates, changes in securities markets and to gain exposure to foreign currency, certain markets and/or substitute for securities purchased (or to be purchased). During the year ended July 31, 2013, the fund held purchased options with market values ranging from $25.7 million to $75.3 million, as measured at each quarter end.
During the year ended July 31, 2013, the fund wrote option contracts to manage against anticipated currency exchanges rates, changes in securities markets and anticipated interest rate changes and to gain exposure to foreign currency and certain markets and/or substitute for a securities purchase or to be purchased. The following tables summarize the fund’s written options activities during the year ended July 31, 2013 and the contracts held at July 31, 2013.
Options on securities
| | | | | | |
| | | | EXPIRATION | NUMBER OF | | |
| NAME OF ISSUER | EXERCISE PRICE | | DATE | CONTRACTS | PREMIUM | VALUE |
|
| Calls | | | | | | |
| Apple, Inc. | $515.00 | | Oct 2013 | 180 | $637,208 | ($47,956) |
| |
| | | | | | | |
| Index options | | | | | | |
| | | | EXPIRATION | NOTIONAL | | |
| NAME OF ISSUER | EXERCISE PRICE | | DATE | AMOUNT | PREMIUM | VALUE |
|
| Calls | | | | | | |
| Kospi 200 Index | 240.00 | | Dec 2013 | KRW 320,000,000 | $3,223,625 | ($4,520,775) |
| Kospi 200 Index | 241.79 | | Dec 2013 | KRW 221,000,000 | 2,062,667 | (2,883,665) |
| | | | | 541,000,000 | $5,286,292 | ($7,404,440) |
| |
| | | | | | | |
| | | | EXPIRATION | NUMBER OF | | |
| NAME OF ISSUER | EXERCISE PRICE | | DATE | CONTRACTS | PREMIUM | VALUE |
|
| Puts | | | | | | |
| S&P 500 Index | 1,137.31 | | Dec 2013 | 4,000 | $416,316 | ($5,568) |
| S&P 500 Index | 1,150.92 | | Dec 2013 | 6,500 | 647,023 | (10,023) |
| S&P 500 Index | 1,144.08 | | Dec 2013 | 4,500 | 465,608 | (6,592) |
| S&P 500 Index | 1,158.51 | | Dec 2013 | 3,170 | 324,316 | (5,172) |
| S&P 500 Index | 1,182.54 | | Dec 2013 | 13,800 | 1,339,079 | (26,832) |
| S&P 500 Index | 1,177.62 | | Dec 2013 | 17,940 | 1,668,061 | (33,663) |
| S&P 500 Index | 1,168.43 | | Dec 2013 | 9,200 | 830,980 | (16,146) |
| | | | | 59,110 | $5,691,383 | ($103,996) |
| |
| 56 Global Absolute Return Strategies Fund | Annual report |
Foreign currency options
| | | | | | | |
| | | EXERCISE | | EXPIRATION | NOTIONAL | | |
| DESCRIPTION | COUNTERPARTY | PRICE | | DATE | AMOUNT | PREMIUM | VALUE |
|
| Calls | | | | | | | |
| USD versus CNY | The Royal Bank | $6.38 | | Dec 2013 | $155,000,000 | $155,000 | ($220,410) |
| | of Scotland PLC | | | | | | |
| USD versus CNY | The Royal Bank | 6.45 | | Aug 2013 | 19,171,779 | 1,917 | (19) |
| | of Scotland PLC | | | | | | |
| USD versus JPY | Barclays Bank | 105.00 | | May 2014 | 27,700,000 | 508,572 | (438,823) |
| | PLC | | | | | | |
| USD versus JPY | Barclays Bank | 105.00 | | May 2014 | 27,700,000 | 835,986 | (436,635) |
| | PLC | | | | | | |
| USD versus JPY | Barclays Bank | 105.00 | | May 2014 | 27,700,000 | 872,827 | (434,419) |
| | PLC | | | | | | |
| USD versus JPY | The Royal Bank | 105.00 | | May 2014 | 27,700,000 | 944,570 | (430,209) |
| | of Scotland PLC | | | | | | |
| USD versus JPY | The Royal Bank | 105.00 | | May 2014 | 27,700,000 | 925,457 | (432,120) |
| | of Scotland PLC | | | | | | |
| USD versus JPY | The Royal Bank | 105.00 | | May 2014 | 27,300,000 | 814,905 | (428,146) |
| | of Scotland PLC | | | | | | |
|
| USD versus JPY | UBS AG | 81.00 | | Aug 2013 | 7,668,712 | 181,518 | (1,311,541) |
| USD versus JPY | UBS AG | 81.00 | | Aug 2013 | 5,368,098 | 126,419 | (918,079) |
| USD versus JPY | UBS AG | 81.00 | | Aug 2013 | 6,134,969 | 139,448 | (1,049,233) |
| USD versus JPY | UBS AG | 84.50 | | Dec 2013 | 9,249,743 | 234,712 | (1,263,857) |
| USD versus JPY | UBS AG | 84.50 | | Dec 2013 | 11,562,179 | 314,491 | (1,579,821) |
| USD versus JPY | UBS AG | 84.50 | | Dec 2013 | 6,937,307 | 195,285 | (947,893) |
| USD versus JPY | UBS AG | 84.50 | | Dec 2013 | 4,624,872 | 130,190 | (631,929) |
| USD versus JPY | UBS AG | 84.50 | | Dec 2013 | 11,562,179 | 319,694 | (1,579,821) |
| USD versus JPY | UBS AG | 84.50 | | Dec 2013 | 11,562,179 | 376,060 | (1,579,821) |
| USD versus JPY | UBS AG | 84.50 | | Dec 2013 | 3,468,654 | 121,836 | (473,947) |
| USD versus JPY | UBS AG | 84.50 | | Dec 2013 | 23,124,357 | 1,188,014 | (3,159,620) |
| USD versus JPY | UBS AG | 84.50 | | Dec 2013 | 11,562,179 | 585,624 | (1,579,810) |
| USD versus JPY | UBS AG | 84.50 | | Dec 2013 | 23,124,357 | 1,263,977 | (3,159,643) |
| USD versus JPY | UBS AG | 84.50 | | Dec 2013 | 18,221,994 | 1,008,223 | (2,489,799) |
| USD versus JPY | UBS AG | 84.50 | | Dec 2013 | 20,000,000 | 1,172,000 | (2,732,720) |
| | | | | | $514,143,558 | $12,416,725 | ($27,278,315) |
| |
| Puts | | | | | | | |
| USD versus CNY | The Royal Bank | $6.38 | | Dec 2013 | $155,000,000 | $3,704,500 | ($4,041,160) |
| | of Scotland PLC | | | | | | |
| USD versus CNY | The Royal Bank | 6.45 | | Aug 2013 | 19,171,779 | 674,847 | (807,458) |
| | of Scotland PLC | | | | | | |
| USD versus JPY | Barclays Bank | 95.00 | | May 2014 | 27,700,000 | 590,564 | (861,276) |
| | PLC Wholesale | | | | | | |
| USD versus JPY | Barclays Bank | 95.00 | | May 2014 | 27,700,000 | 553,723 | (858,368) |
| | PLC Wholesale | | | | | | |
| USD versus JPY | The Royal Bank | 95.00 | | May 2014 | 27,700,000 | 501,093 | (855,930) |
| | of Scotland PLC | | | | | | |
| USD versus JPY | The Royal Bank | 95.00 | | May 2014 | 27,700,000 | 481,980 | (852,274) |
| | of Scotland PLC | | | | | | |
| USD versus JPY | The Royal Bank | 95.00 | | May 2014 | 27,300,000 | 629,265 | (846,300) |
| | of Scotland PLC | | | | | | |
| USD versus JPY | Goldman Sachs | 68.00 | | Dec 2014 | 18,750,000 | 1,066,375 | (54,525) |
| | Group Inc. | | | | | | |
| USD versus JPY | UBS AG | 76.00 | | Aug 2013 | 7,668,712 | 193,252 | (8) |
| USD versus JPY | UBS AG | 76.00 | | Aug 2013 | 5,368,098 | 135,008 | (5) |
| USD versus JPY | UBS AG | 76.00 | | Aug 2013 | 6,134,969 | 157,362 | (6) |
| USD versus JPY | UBS AG | 79.50 | | Dec 2013 | 9,249,743 | 229,162 | (5,726) |
| USD versus JPY | UBS AG | 79.50 | | Dec 2013 | 11,562,179 | 266,219 | (7,157) |
| USD versus JPY | UBS AG | 79.50 | | Dec 2013 | 6,937,307 | 156,610 | (4,294) |
| USD versus JPY | UBS AG | 79.50 | | Dec 2013 | 4,624,872 | 104,407 | (2,863) |
| USD versus JPY | UBS AG | 79.50 | | Dec 2013 | 11,562,179 | 264,485 | (7,157) |
| USD versus JPY | UBS AG | 79.50 | | Dec 2013 | 11,562,179 | 225,752 | (7,157) |
| USD versus JPY | UBS AG | 79.50 | | Dec 2013 | 3,468,654 | 54,284 | (2,147) |
| USD versus JPY | UBS AG | 79.50 | | Dec 2013 | 23,124,357 | 168,230 | (14,314) |
| |
| Annual report | Global Absolute Return Strategies Fund 57 |
| | | | | | | |
| | | EXERCISE | | EXPIRATION | NOTIONAL | | |
| DESCRIPTION | COUNTERPARTY | PRICE | | DATE | AMOUNT | PREMIUM | VALUE |
|
| Puts (continued) | | | | | | | |
| USD versus JPY | UBS AG | 79.50 | | Dec 2013 | $11,562,179 | $84,982 | ($7,157) |
| USD versus JPY | UBS AG | 79.50 | | Dec 2013 | 23,124,357 | 147,533 | (14,314) |
| USD versus JPY | UBS AG | 79.50 | | Dec 2013 | 18,221,994 | 119,354 | (11,279) |
| USD versus JPY | UBS AG | 79.50 | | Dec 2013 | 20,000,000 | 129,500 | (12,380) |
| USD versus JPY | UBS AG | 95.00 | | May 2014 | 27,700,000 | 917,978 | (864,157) |
| | | | | | $532,893,558 | $11,556,465 | ($10,137,412) |
| | | |
| | NUMBER OF | NOTIONAL | |
| | CONTRACTS | (CURRENCY & | PREMIUMS |
| | (EQUITY) | INTEREST RATE) | RECEIVED |
|
| Outstanding, beginning of period | 70,588 | 272,000,000 | $31,367,081 |
| Options written | 4,950 | 1,867,437,116 | 45,804,116 |
| Option closed | (16,248) | (545,000,000) | (41,042,324) |
| Options exercised | — | — | — |
| Options expired | — | (6,400,000) | (540,800) |
| Outstanding, end of period | 59,290 | 1,588,037,116 | $35,588,073 |
Swaps. Swap agreements are agreements between the fund and counterparty to exchange cash flows, assets, foreign currencies or market-linked returns at specified intervals. Swap agreements are privately negotiated in the OTC market (OTC swaps) or may be executed on a registered commodities exchange (centrally cleared swaps). Swaps are marked-to-market daily and the change in value is recorded as a component of unrealized appreciation/depreciation of swap contracts. The value of the swap will typically impose collateral posting obligations on the party that is considered out-of-the-money on the swap.
Upfront payments made/received by the fund are amortized/accreted for financial reporting purposes, with the unamortized/unaccreted portion included in the Statement of assets and liabilities. Swaps are marked-to-market daily and the change in value is recorded as unrealized appreciation/depreciation of swap contracts. A termination payment by the counterparty or the fund is recorded as realized gain or loss, as well as the net periodic payments received or paid by the fund.
Entering into swap agreements involves, to varying degrees, elements of credit, market and documentation risk that may amount to values that are in excess of the amounts recognized on the Statement of assets and liabilities. Such risks involve the possibility that there will be no liquid market for the swap, or that a counterparty may default on its obligation or delay payment under the swap terms. The counterparty may disagree or contest the terms of the swap. Market risks may also accompany the swap, including interest rate risk. The fund may also suffer losses if it is unable to terminate or assign outstanding swaps or reduce its exposure through offsetting transactions.
Interest rate swaps. Interest rate swaps represent an agreement between the fund and a counterparty to exchange cash flows based on the difference between two interest rates applied to a notional amount. The payment flows are usually netted against each other, with the difference being paid by one party to the other. The fund settles accrued net interest receivable or payable under the swap contracts at specified, future intervals.
During the year ended July 31, 2013, the fund used interest rate swaps to manage against anticipated interest rate changes and maintain diversity and liquidity in the portfolio. During the year ended July 31, 2013, the fund held interest rate swaps with total U.S. Dollar notional values ranging from $64.4 million to $1.1 billion, as measured at each quarter end. The following table summarizes the interest rate swap contracts held as of July 31, 2013.
| |
| 58 Global Absolute Return Strategies Fund | Annual report |
| | | | | | | | | | |
| | | | | USD | | | PAYMENTS | | UNREALIZED | |
| | NOTIONAL | | | NOTIONAL | | PAYMENTS MADE | RECEIVED | MATURITY | APPRECIATION | MARKET |
| COUNTERPARTY | AMOUNT | | CURRENCY | AMOUNT | | BY FUND | BY FUND | DATE | (DEPRECIATION) | VALUE |
|
| Morgan Stanley | 35,580,000 | | EUR | $46,008,522 | | EUR-EURIBOR- | Fixed 2.715% | Mar 2027 | ($751,330) | ($751,330) |
| | | | | | | TELERATE | | | | |
| Morgan Stanley | 35,580,000 | | EUR | 46,273,596 | | EUR-EURIBOR- | Fixed 2.780% | Mar 2027 | (486,416) | (486,416) |
| | | | | | | TELERATE | | | | |
| Morgan Stanley | 35,580,000 | | EUR | 45,855,479 | | EUR-EURIBOR- | Fixed 2.670% | Mar 2027 | (935,994) | (935,994) |
| | | | | | | TELERATE | | | | |
| Morgan Stanley | 96,660,000 | | EUR | 124,237,174 | | EUR-EURIBOR- | Fixed 2.615% | Mar 2027 | (3,184,378) | (3,184,378) |
| | | | | | | TELERATE | | | | |
| Morgan Stanley | 15,280,000 | | EUR | 19,758,578 | | Fixed 2.755% | EUR-EURIBOR- | Mar 2047 | 174,790 | 174,790 |
| | | | | | | | TELERATE | | | |
| Morgan Stanley | 15,280,000 | | EUR | 19,872,416 | | Fixed 2.805% | EUR-EURIBOR- | Mar 2047 | (28,272) | (28,272) |
| | | | | | | | TELERATE | | | |
| Morgan Stanley | 15,280,000 | | EUR | 19,692,853 | | Fixed 2.7125% | EUR-EURIBOR- | Mar 2047 | 347,938 | 347,938 |
| | | | | | | | TELERATE | | | |
| Morgan Stanley | 41,460,000 | | EUR | 53,288,571 | | Fixed 2.645% | EUR-EURIBOR- | Mar 2047 | 1,695,841 | 1,695,841 |
| | | | | | | | TELERATE | | | |
| The Royal Bank of | 66,500,000 | | EUR | 86,060,970 | | EUR-EURIBOR- | Fixed 2.645% | Mar 2027 | (1,941,975) | (1,941,975) |
| Scotland PLC | | | | | | TELERATE | | | | |
| The Royal Bank of | 35,100,000 | | EUR | 45,266,725 | | EUR-EURIBOR- | Fixed 2.681% | Mar 2027 | (891,058) | (891,058) |
| Scotland PLC | | | | | | TELERATE | | | | |
| The Royal Bank of | 28,600,000 | | EUR | 37,012,688 | | Fixed 2.671% | EUR-EURIBOR- | Mar 2047 | 967,690 | 967,690 |
| Scotland PLC | | | | | | | TELERATE | | | |
| The Royal Bank of | 15,100,000 | | EUR | 19,473,720 | | Fixed 2.710% | EUR-EURIBOR- | Mar 2047 | 356,900 | 356,900 |
| Scotland PLC | | | | | | | TELERATE | | | |
| |
| Exchange Cleared Swaps | | | | | | | |
|
| | 86,250,000 | | EUR | 113,190,165 | | EUR-EURIBOR- | Fixed 1.380% | Jun 2016 | 412,339 | 412,339 |
| | | | | | | TELERATE | | | | |
| | 172,500,000 | | EUR | 225,949,184 | | EUR-EURIBOR- | Fixed 1.250% | Jun 2016 | 523,088 | 523,088 |
| | | | | | | TELERATE | | | | |
| | 12,000,000 | | EUR | 15,699,594 | | EUR-EURIBOR- | Fixed 2.780% | Jun 2027 | (219,271) | (219,271) |
| | | | | | | TELERATE | | | | |
| | 90,000,000 | | EUR | 117,823,563 | | EUR-EURIBOR- | Fixed 2.765% | Jun 2027 | (1,799,001) | (1,799,001) |
| | | | | | | TELERATE | | | | |
| | 4,000,000 | | EUR | 5,233,198 | | Fixed 2.790% | EUR-EURIBOR- | Jun 2047 | 25,025 | 25,025 |
| | | | | | | | TELERATE | | | |
| | 40,000,000 | | EUR | 52,366,028 | | Fixed 2.774% | EUR-EURIBOR- | Jun 2047 | 417,006 | 417,006 |
| | | | | | | | TELERATE | | | |
|
| | | | | $1,093,063,024 | | | | | ($5,317,078) | ($5,317,078) |
Credit default swaps. Credit default swaps (CDS) involve the exchange of a fixed rate premium (paid by the Buyer), for protection against the loss in value of an underlying debt instrument, referenced entity or index, in the event of a defined credit event (such as payment default or bankruptcy). Under the terms of the swap, one party acts as a “guarantor” (the Seller), receiving the premium and agreeing to contingent payments that are specified within the credit default agreement. The fund may enter into CDS in which it may act as either Buyer or Seller. By acting as the Seller, the fund may incur economic leverage since it would be obligated to pay the Buyer the notional amount of the contract in the event of a default. The amount of loss in such case could be significant, but would typically be reduced by any recovery value on the underlying credit.
During the year ended July 31, 2013, the fund used CDS as a Buyer of protection to manage against potential credit events and gain exposure to security or credit index. During the year ended July 31, 2013, the fund held credit default swap contracts with total U.S. Dollar notional values ranging up to $96.1 million, as measured at each quarter end. There were no open contracts as of July 31, 2013.
| |
| Annual report | Global Absolute Return Strategies Fund 59 |
Implied credit spreads are utilized in determining the market value of CDS agreements in which the fund is the Seller at period end. The implied credit spread generally represents the yield of the instrument above a credit-risk free rate, such as the U.S. Treasury Bond Yield, and may include upfront payments required to be made to enter into the agreement. It also serves as an indicator of the current status of the payment/performance risk and represents the likelihood or risk of default for the credit derivative. Wider credit spreads represent a deterioration of the referenced entity’s creditworthiness and an increased risk of default or other credit event occurring as defined under the terms of the agreement.
For CDS agreements where implied credit spreads are not reported or available, the average credit rating on the underlying index is shown. Increasing market values, in absolute terms when compared to the notional amount of the swap, represent a deterioration of the referenced entity’s creditworthiness and a greater likelihood of a credit event occurring. This is also represented by a decrease in the average credit rating of the underlying index. The maximum potential amount of future payments (undiscounted) that a fund as the Seller could be required to make under any CDS agreement equals the notional amount of the agreement.
The fund used CDS as a Seller of protection during the year ended July 31, 2013 to take a long position in the exposure of the benchmark credit and gain exposure to security or credit index. During the year ended July 31, 2013, the fund acted as Seller on credit default swap contracts with total U.S. Dollar notional values ranging from $74.3 million to $210.6 million, as measured at each quarter end. The following table summarizes the credit default swap contracts the fund held as of July 31, 2013 where the fund acted as a Seller of protection.
| | | | | | | | | | | | |
| | | IMPLIED | | | | | | | | | | |
| | | CREDIT | | | | | | | | | | |
| | | SPREAD | | | | | | | | UNAMORTIZED | | |
| | | AND/OR | | | | | | (PAY)/ | | UPFRONT | | |
| | | CREDIT | | | | USD | | RECEIVED | | PAYMENT | UNREALIZED | |
| | REFERENCE | RATING AT | NOTIONAL | | CUR- | NOTIONAL | | FIXED | MATURITY | PAID | APPRECIATION | MARKET |
| COUNTERPARTY | OBLIGATION | 7-31-13 | AMOUNT | | RENCY | AMOUNT | | RATE | DATE | (RECEIVED) | (DEPRECIATION) | VALUE |
|
| BNP Paribas SA | CDx North | 3.65% | 30,000,000 | | USD | $30,000,000 | | 5.00% | Jun 2018 | $854,521 | $1,054,536 | $1,909,057 |
| | America High | | | | | | | | | | | |
| | Yield 20 5Y | | | | | | | | | | | |
| Morgan Stanley | CDx North | 3.65% | 40,000,000 | | USD | 40,000,000 | | 5.00% | Jun 2018 | 1,124,369 | 1,421,041 | 2,545,410 |
| | America High | | | | | | | | | | | |
| | Yield 20 5Y | | | | | | | | | | | |
| |
| Exchange Cleared Swaps | | | | | | | | | | | |
|
| | CDx HY CDSI | 3.65% | 10,000,000 | | USD | 10,000,000 | | 5.00% | Jun 2018 | 502,689 | 133,663 | 636,352 |
| | S20 5Y PRC | | | | | | | | | | | |
|
| | | | | | | $80,000,000 | | | | $2,481,579 | $2,609,240 | $5,090,819 |
Variance swaps. Variance swap agreements involve two parties agreeing to exchange cash flows based on the measured variance (or square of volatility) of a specified underlying asset. One party agrees to exchange a “fixed rate” or strike price payment for the “floating rate” or realized price variance on the underlying asset with respect to the notional amount. At inception, the strike price is generally chosen such that the fair value of the swap is zero. At the maturity date, a net cash flow is exchanged, where the payoff amount is equivalent to the difference between the realized price variance of the underlying asset and the strike price multiplied by the notional amount. As a receiver of the realized price variance, the fund would receive the payoff amount when the realized price variance of the underlying asset is greater than the strike price and would owe the payoff amount when the price variance is less than the strike price. As a payer of the realized price variance the fund would owe the payoff amount when the realized price variance of the underlying asset is greater than the strike price and would receive the payoff amount when the variance is less than the strike price.
| |
| 60 Global Absolute Return Strategies Fund | Annual report |
The fund used variance swaps during the year ended July 31, 2013 to manage against anticipated changes in securities markets. During the year ended July 31, 2013 the fund held variance swap contracts with total U.S. Dollar notional values ranging from $1.1 million to $5.1 million, as measured at each quarter end. The following table summarizes the variance swap contracts the fund held as of July 31, 2013.
| | | | | | | | | | | |
| | | | | | | | | | UNAMORTIZED | UNREALIZED | |
| REFERENCE | CUR- | NOTIONAL | USD NOTIONAL | | PAY/RECEIVE | | VOLATILITY | UPFRONT PAYMENT | APPRECIATION | |
| COUNTERPARTY | ENTITY | RENCY | AMOUNT | AMOUNT | | VARIANCE | MATURITY DATE | STRIKE PRICE | PAID (RECEIVED) | (DEPRECIATION) | MARKET VALUE |
|
| BNP Paribas SA | FTSE 100 | GBP | 35,000 | $56,760 | | Pay | Dec 2013 | 24.00% | — | $407,055 | $407,055 |
| BNP Paribas SA | China Ent. | HKD | 500,000 | 64,451 | | Receive | Dec 2013 | 36.50% | — | (714,610) | (714,610) |
| Index | | | | | | | | | | |
| BNP Paribas SA | China Ent. | HKD | 450,000 | 58,041 | | Receive | Dec 2013 | 32.60% | — | (467,240) | (467,240) |
| Index | | | | | | | | | | |
|
| BNP Paribas SA | FTSE 100 | GBP | 51,456 | 80,133 | | Pay | Dec 2013 | 26.50% | — | 733,409 | 733,409 |
| BNP Paribas SA | FTSE 100 | GBP | 16,178 | 25,725 | | Pay | Dec 2014 | 28.50% | — | 220,968 | 220,968 |
| BNP Paribas SA | FTSE 100 | GBP | 34,377 | 54,788 | | Pay | Dec 2014 | 28.20% | — | 460,167 | 460,167 |
| BNP Paribas SA | FTSE 100 | GBP | 35,000 | 56,759 | | Pay | Dec 2014 | 25.20% | — | 351,700 | 351,700 |
| BNP Paribas SA | FTSE 100 | GBP | 44,000 | 70,436 | | Pay | Dec 2014 | 26.90% | — | 528,434 | 528,434 |
| BNP Paribas SA | FTSE 100 | GBP | 90,000 | 143,901 | | Pay | Dec 2014 | 25.00% | — | 875,664 | 875,664 |
| BNP Paribas SA | S&P 500 | USD | 300,000 | 300,000 | | Pay | Dec 2014 | 21.60% | — | 629,232 | 629,232 |
| BNP Paribas SA | S&P 500 | USD | 300,000 | 300,000 | | Pay | Dec 2014 | 21.40% | — | 576,882 | 576,882 |
| BNP Paribas SA | China Ent. | HKD | 109,541 | 14,123 | | Receive | Dec 2014 | 34.25% | — | (97,716) | (97,716) |
| Index | | | | | | | | | | | |
| BNP Paribas SA | China Ent. | HKD | 317,178 | 40,891 | | Receive | Dec 2014 | 34.00% | — | (274,216) | (274,216) |
| Index | | | | | | | | | | |
| BNP Paribas SA | China Ent. | HKD | 450,000 | 58,041 | | Receive | Dec 2014 | 33.30% | — | (358,024) | (358,024) |
| Index | | | | | | | | | | |
| BNP Paribas SA | China Ent. | HKD | 480,000 | 61,891 | | Receive | Dec 2014 | 33.65% | — | (402,679) | (402,679) |
| Index | | | | | | | | | | |
| BNP Paribas SA | China Ent. | HKD | 800,000 | 103,203 | | Receive | Dec 2014 | 33.50% | — | (641,759) | (641,759) |
| Index | | | | | | | | | | |
| BNP Paribas SA | China Ent. | HKD | 2,328,300 | 299,922 | | Receive | Dec 2014 | 28.90% | — | 10,023 | 10,023 |
| Index | | | | | | | | | | |
| BNP Paribas SA | Hang Seng | HKD | 2,328,900 | 300,123 | | Receive | Dec 2014 | 23.00% | — | 64,061 | 64,061 |
| Index | | | | | | | | | | |
| Morgan Stanley | FTSE 100 | GBP | 62,000 | 98,059 | | Pay | Dec 2013 | 27.80% | — | 934,160 | 934,160 |
| Morgan Stanley | China Ent. | HKD | 762,600 | 98,196 | | Receive | Dec 2013 | 37.70% | — | (1,180,892) | (1,180,892) |
| Index | | | | | | | | | | |
| Morgan Stanley | Kospi 2 | KRW | 290,250,000 | 249,905 | | Receive | Dec 2014 | 23.00% | — | (284,642) | (284,642) |
| Index | | | | | | | | | | |
| Morgan Stanley | S&P 500 | USD | 250,000 | 250,000 | | Pay | Dec 2014 | 21.30% | — | 452,817 | 452,817 |
| | | | | $2,785,348 | | | | | — | $1,822,794 | $1,822,794 |
Inflation swaps. In an inflation swap, one party pays a fixed rate on a notional principal amount while the other party pays a floating rate linked to an inflation index on that same notional amount. The party paying the floating rate pays the inflation adjusted rate multiplied by the notional principal amount. If the average inflation rate over the term of the swap is the same as the fixed rate of the swap, the two legs will have the same value and the swap will break even.
The fund used inflation swaps during the year ended July 31, 2013 to maintain diversity and liquidity of the portfolio and manage against anticipated changes in inflation. During the year ended July 31, 2013, the fund held inflation swap contracts with total U.S. Dollar notional values ranging from up to $31.6 million, as measured at each quarter end. There were no open contracts as of July 31, 2013.
| |
| Annual report | Global Absolute Return Strategies Fund 61 |
Fair value of derivative instruments by risk category
The table below summarizes the fair value of derivatives held by the fund at July 31, 2013 by risk category:
| | | | |
| | | FINANCIAL | ASSET | LIABILITY |
| | STATEMENT OF ASSETS | INSTRUMENTS | DERIVATIVES | DERIVATIVES |
| RISK | AND LIABILITIES LOCATION | LOCATION | FAIR VALUE | FAIR VALUE |
|
| Interest rate contracts | Receivable/payable for futures | Futures† | $12,853,624 | ($14,018,784) |
| Interest rate contracts | Swap contracts, at value | Interest rate swaps | 4,920,617 | (10,237,695) |
| Foreign exchange contracts | Investments, at value* | Purchased options | 32,602,910 | — |
| Foreign exchange contracts | Written options, at value | Written options | — | (37,415,727) |
| Foreign exchange contracts | Receivable/payable for forward | Forward foreign | 55,429,260 | (46,154,254) |
| | foreign currency exchange contracts | currency contracts | | |
| Equity contracts | Investments, at value* | Purchased options | 42,669,818 | — |
| Equity contracts | Written options, at value | Written options | — | (7,556,392) |
| Equity contracts | Receivable/payable for futures | Futures† | 14,501,810 | (44,179,284) |
| Equity contracts | Swap contracts, at value | Variance swaps | 6,244,572 | (4,421,778) |
| Credit contracts | Swap contracts, at value | Credit default swaps | 5,090,819 | — |
* Purchased options are included in the Portfolio of investments.
† Reflects cumulative appreciation/depreciation on futures as disclosed in Note 3. Only the period end variation margin is separately disclosed on the Statement of assets and liabilities.
Effect of derivative instruments on the Statement of operations
The table below summarizes the net realized gain (loss) included in the net increase (decrease) in net assets from operations, classified by derivative instrument and risk category, for the year ended July 31, 2013:
| | | | | | | |
| | STATEMENT OF | INVESTMENTS | | | | FOREIGN | |
| | OPERATIONS | (PURCHASED | WRITTEN | FUTURES | SWAP | CURRENCY | |
| RISK | LOCATION | OPTIONS) | OPTIONS | CONTRACTS | CONTRACTS | TRANSACTIONS* | TOTAL |
|
| Interest rate | Net realized | $7,032,608 | $6,765,244 | $2,365,514 | ($2,082,918) | — | $14,080,448 |
| contracts | gain (loss) | | | | | | |
| Foreign exchange | Net realized | — | — | — | — | $22,756,480 | 22,756,480 |
| contracts | gain (loss) | | | | | | |
| Equity contracts | Net realized | 833,759 | 751,196 | (75,113,628) | 7,770,030 | — | (65,758,643) |
| | gain (loss) | | | | | | |
| Credit contracts | Net realized | — | — | — | 10,085,465 | — | 10,085,465 |
| | gain (loss) | | | | | | |
| Total | | $7,866,367 | $7,516,440 | ($72,748,114) | $15,772,577 | $22,756,480 | ($18,836,250) |
*Realized gain/loss associated with forward foreign currency contracts is included in the caption on the Statement of operations.
| |
| 62 Global Absolute Return Strategies Fund | Annual report |
The table below summarizes the net change in unrealized appreciation (depreciation) included in the net increase (decrease) in net assets from operations, classified by derivative instrument and risk category, for the year ended July 31, 2013:
| | | | | | | |
| | | | | | | TRANSLATION | |
| | | | | | | OF ASSETS | |
| | STATEMENT OF | INVESTMENTS | | | | AND LIABILITIES | |
| | OPERATIONS | (PURCHASED | FUTURES | WRITTEN | SWAP | IN FOREIGN | |
| RISK | LOCATION | OPTIONS) | CONTRACTS | OPTIONS | CONTRACTS | CURRENCIES* | TOTAL |
|
| Interest rate | Change in | ($1,610,018) | ($5,385,517) | $5,510,499 | ($2,974,884) | — | ($4,459,920) |
| contracts | unrealized | | | | | | |
| | appreciation | | | | | | |
| | (depreciation) | | | | | | |
| | | | | | | |
| Foreign exchange | Change in | 3,070,229 | — | (14,012,581) | — | $10,071,033 | ($871,319) |
| contracts | unrealized | | | | | | |
| | appreciation | | | | | | |
| | (depreciation) | | | | | | |
| | | | | | | | |
| Equity contracts | Change in | 9,032,353 | (29,423,665) | 3,470,005 | 4,044,246 | — | ($12,877,061) |
| | unrealized | | | | | | |
| | appreciation | | | | | | |
| | (depreciation) | | | | | | |
| | | | | | | | |
| Credit contracts | Change in | — | — | — | 3,848,239 | — | $3,848,239 |
| | unrealized | | | | | | |
| | appreciation | | | | | | |
| | (depreciation) | | | | | | |
| Total | | $10,492,564 | ($34,809,182) | ($5,032,077) | $4,917,601 | $10,071,033 | ($14,360,061) |
* Change in unrealized appreciation/depreciation associated with forward foreign currency contracts is included in the caption on the Statement of operations.
Note 4 — Guarantees and indemnifications
Under the Trust’s organizational documents, its Officers and Trustees are indemnified against certain liabilities arising out of the performance of their duties to the fund. Additionally, in the normal course of business, the fund enters into contracts with service providers that contain general indemnification clauses. The fund’s maximum exposure under these arrangements is unknown, as this would involve future claims that may be made against the fund that have not yet occurred. The risk of material loss from such claims is considered remote.
Note 5 — Fees and transactions with affiliates
John Hancock Investment Management Services, LLC (the Advisor) serves as investment advisor for the fund. John Hancock Funds, LLC (the Distributor), an affiliate of the Advisor, serves as principal underwriter of the fund. The Advisor and the Distributor are indirect, wholly owned subsidiaries of Manulife Financial Corporation (MFC).
Management fee. The fund has an investment management contract with the Advisor under which the fund pays a daily management fee to the Advisor equivalent, on an annual basis, to the sum of: (a) 1.30% of the first $200,000,000 of the fund’s average daily net assets; (b) 1.25% of the next $300,000,000 of the fund’s average daily net assets; (c) 1.20% of the next $2,500,000,000 of the fund’s average daily net assets provided that if aggregate net assets exceed $500 million, but are less than or equal to $3.0 billion, the 1.20% rate applies retroactively to all assets; and (d) 1.15% of the fund’s average daily net assets in excess of $3,000,000,000. If the aggregate net assets of the fund exceed $3.0 billion, the daily management fee paid to the Advisor is equivalent, on an annualized basis, to the sum of: (a) 1.20% of the first $3.0 billion of the fund’s average daily net assets; and (b) 1.15% of the fund’s average daily net assets in excess of $3.0 billion. Prior to July 1, 2013, if the net assets of the fund were equal to or less than $500,000,000, the management
| |
| Annual report | Global Absolute Return Strategies Fund 63 |
fee paid to the Advisor was equivalent, on an annual basis, to the sum of: a) 1.30% of the first $200,000,000 of the fund’s average daily net assets; and b) 1.25% of the next $300,000,000 of the fund’s average daily net assets. If the net assets of the fund exceeded $500,000,000, the management fee paid to the Advisor equivalent, on an annual basis, was 1.20% of average daily net assets. The Advisor has a subadvisory agreement with Standard Life Investments (Corporate Funds) Limited. The fund is not responsible for payment of the subadvisory fees.
Effective June 1, 2013, the Advisor has contractually agreed to waive a portion of its management fee for certain funds (the Participating portfolios) of the Trust, John Hancock Funds, John Hancock Funds III and John Hancock Variable Insurance Trust. The waiver equals, on an annualized basis, 0.01% of that portion of the aggregate net assets of all the Participating portfolios that exceeds $75 billion but is less than or equal to $125 billion; 0.0125% of that portion of the aggregate net assets of all the Participating portfolios that exceeds $125 billion but is less than or equal to $150 billion; and 0.015% of that portion of the aggregate net assets of all the Participating portfolios that exceeds $150 billion. The amount of the reimbursement is calculated daily and allocated among all the Participating portfolios in proportion to the daily net assets of each fund. This arrangement may be amended or terminated at any time by the Advisor upon notice to the fund and with the approval of the Board of Trustees.
Prior to June 1, 2013, the Advisor had contractually agreed to waive a portion of its management fee for certain funds (the Participating Funds) of the Trust and John Hancock Variable Insurance Trust. The waiver equaled, on an annualized basis, 0.01% of that portion of the aggregate net assets of all the Participating Funds that exceeded $75 billion but was less than $100 billion; and 0.015% of that portion of the aggregate net assets of all the Participating Funds that equaled or exceeded $100 billion. The amount of the reimbursement was calculated daily and allocated among all the Participating Funds in proportion to the daily net assets of each fund.
The Advisor has contractually agreed to waive all or a portion of its management fee and reimburse operating expenses of the fund to the extent necessary to maintain the fund’s total operating expenses at 1.95%, 2.65%, 1.59%, 2.00% and 1.50% for Class A, Class C, Class I, Class R2 and Class R6 shares, respectively, excluding certain expenses such as taxes, brokerage commissions, interest expense, litigation and indemnification expenses and other extraordinary expenses. The fee waivers and/or reimbursements will continue in effect until November 30, 2013 for Class A, Class C, Class I, Class R2 and Class R6 shares, unless renewed by mutual agreement of the fund and the Advisor based upon a determination that this is appropriate under the circumstances at the time.
The Advisor has voluntarily agreed to waive a portion of its management fee and/or reimburse the fund, in order to limit the fund’s expenses, excluding taxes, brokerage commissions, interest expense, litigation and indemnifications expenses and other extraordinary expenses not incurred in the ordinary course of the fund’s business, advisory fees, acquired fund fees, short dividend expense, Rule 12b-1 fees, transfer agent fees and service fees, state registration fees and printing and postage fees, to 0.20% of the fund’s average daily net asset value, on an annual basis. This voluntary arrangement may be amended or terminated at any time by the Advisor upon notice to the fund.
| |
| 64 Global Absolute Return Strategies Fund | Annual report |
For the year ended July 31, 2013, the expense reductions amounted to the following:
| | | | | |
| | EXPENSE | | | | |
| CLASS | REDUCTIONS | | | | |
| Class A | $25,359 | | | | |
| Class C | 2,483 | | | | |
| Class I | 37,373 | | | | |
| Class R2 | 21,194 | | | | |
| Class R6 | 8,628 | | | | |
| Class NAV | 22,695 | | | | |
| Total | $117,732 | | | | |
The investment management fees incurred for the year ended July 31, 2013 were equivalent to a net annual effective rate of 1.19% of the fund’s average daily net assets.
Expense recapture. The Advisor may recapture operating expenses reimbursed or fees waived under previous expense limitation or waiver arrangements for a period of three years following the beginning of the month in which such reimbursements or waivers originally occurred to the extent that the fund is below its expense limitation during this period. The table below outlines the amounts recovered during the year ended July 31, 2013, and the amount of waived or reimbursed expenses subject to potential recovery and the respective expiration dates.
| | | | |
| | | | AMOUNT RECOVERED | |
| AMOUNTS ELIGIBLE FOR | AMOUNTS ELIGIBLE FOR | AMOUNTS ELIGIBLE FOR | DURING THE | |
| RECOVERY THROUGH | RECOVERY THROUGH | RECOVERY THROUGH | PERIOD ENDED | |
| JULY 1, 2014 | JULY 1, 2015 | JULY 1, 2016 | JULY 31, 2013 | |
| |
| — | $6,712 | $29,154 | $16,554 | |
Accounting and legal services. Pursuant to a service agreement, the fund reimburses the Advisor for all expenses associated with providing the administrative, financial, legal, accounting and recordkeeping services to the fund, including the preparation of all tax returns, periodic reports to shareholders and regulatory reports, among other services. These expenses are allocated to each share class based on its relative net assets at the time the expense was incurred. These accounting and legal services fees incurred for the year ended July 31, 2013 amounted to an annual rate of 0.01% of the fund’s average daily net assets.
Distribution and service plans. The fund has a distribution agreement with the Distributor. The fund has adopted distribution and service plans with respect to Class A, Class C and Class R2 shares pursuant to Rule 12b-1 under the 1940 Act, to pay the Distributor for services provided as the distributor of shares of the fund. The fund may pay up to 0.30%, 1.00% and 0.25% for Class A, Class C and Class R2 shares, respectively, for distribution and service fees, expressed as an annual percentage of average daily net assets for each class of the fund’s shares.
Sales charges. Class A and Class C shares are assessed up-front sales charges, which resulted in payments to the Distributor amounting to $1,957,075 for the year ended July 31, 2013. Of this amount, $316,991 was retained and used for printing prospectuses, advertising, sales literature and other purposes, $1,633,140 was paid as sales commissions to broker-dealers and $6,944 was paid as sales commissions to sales personnel of Signator Investors, Inc., a broker-dealer affiliate of the Advisor.
Class A shares may be subject to contingent deferred sales charges (CDSCs). Certain Class A shares that are acquired through purchases of $1 million or more and are redeemed within one year of purchase are subject to a 1.00% sales charge. CDSCs are applied to the lesser of the current market value at the time of redemption or the original purchase cost of the shares being redeemed. Class C shares that are redeemed within one year of purchase are subject to a 1.00% CDSC. CDSCs are
| |
| Annual report | Global Absolute Return Strategies Fund 65 |
applied to the lesser of the current market value at the time of redemption or the original purchase cost of the shares being redeemed. Proceeds from CDSCs are used to compensate the Distributor for providing distribution-related services in connection with the sale of these shares. During the year ended July 31, 2013, CDSCs received by the Distributor amounted to $9,000 for Class A shares.
Transfer agent fees. The fund has a transfer agent agreement with John Hancock Signature Services, Inc. (Signature Services), an affiliate of the Advisor. The transfer agent fees paid to Signature Services are determined based on the cost to Signature Services (Signature Services Cost) of providing recordkeeping services. The Signature Services Cost includes a component of allocated John Hancock corporate overhead for providing transfer agent services to the fund and to all other John Hancock affiliated funds. It also includes out-of-pocket expenses that are comprised of payments made to third-parties for recordkeeping services provided to their clients who invest in one or more John Hancock funds. In addition, Signature Services Cost may be reduced by certain fees that Signature Services receives in connection with retirement and small accounts. Signature Services Cost is calculated monthly and allocated, as applicable, to four categories of share classes: Institutional Share Classes, Retirement Share Classes, Municipal Bond Classes and all other Retail Share Classes. Within each of these categories, the applicable costs are allocated to the affected John Hancock affiliated funds and/or classes, based on the relative average daily net assets.
Class level expenses. Class level expenses for the year ended July 31, 2013 were:
| | | | |
| | DISTRIBUTION | TRANSFER | STATE | PRINTING AND |
| CLASS | AND SERVICE FEES | AGENT FEES | REGISTRATION FEES | POSTAGE |
|
| Class A | $1,785,195 | $1,013,307 | $48,479 | $102,235 |
| Class C | 549,647 | 91,330 | 22,507 | 3,520 |
| Class I | — | 923,053 | 50,901 | 83,207 |
| Class R2 | 770 | 75 | 21,344 | 1,086 |
| Class R6 | — | 3,577 | 21,398 | 3,038 |
| Total | $2,335,612 | $2,031,342 | $164,629 | $193,086 |
Trustee expenses. The Trust compensates each Trustee who is not an employee of the Advisor or its affiliates. The costs of paying Trustee compensation and expenses are allocated to each fund based on its average daily net assets.
Note 6 — Fund share transactions
Transactions in fund shares for the years ended July 31, 2013 and 2012 were as follows:
| | | | |
| | | Year ended 7-31-13 | | Year ended 7-31-12 |
| | Shares | Amount | Shares | Amount |
| Class A shares1 | | | | |
|
| Sold | 101,961,758 | $1,107,245,332 | 17,012,010 | $178,509,182 |
| Distributions reinvested | 384,649 | 4,096,508 | — | — |
| Repurchased | (11,802,459) | (128,308,378) | (491,934) | (5,169,958) |
| | | | | |
| Net increase | 90,543,948 | $983,033,462 | 16,520,076 | $173,339,224 |
| |
| Class C shares2 | | | | |
|
| Sold | 14,028,318 | $152,472,412 | — | — |
| Distributions reinvested | 18,002 | 191,898 | — | — |
| Repurchased | (559,428) | (6,111,479) | — | — |
| | | | | |
| Net increase | 13,486,892 | $146,552,831 | — | — |
| |
| 66 Global Absolute Return Strategies Fund | Annual report |
| | | | |
| | | Year ended 7-31-13 | | Year ended 7-31-12 |
| | Shares | Amount | Shares | Amount |
| Class I shares1 | | | | |
|
| Sold | 164,457,240 | $1,788,855,952 | 16,693,504 | $176,277,719 |
| Distributions reinvested | 716,332 | 7,636,093 | — | — |
| Repurchased | (20,868,596) | (226,995,052) | (938,029) | (9,894,949) |
| | | | | |
| Net increase | 144,304,976 | $1,569,496,993 | 15,755,475 | $166,382,770 |
| |
| Class R2 shares3 | | | | |
|
| Sold | 98,096 | $1,080,410 | 9,372 | $100,000 |
| Distributions reinvested | 15 | 157 | — | — |
| Repurchased | (792) | (8,621) | — | — |
| | | | | |
| Net increase | 97,319 | $1,071,946 | 9,372 | $100,000 |
| |
| Class R6 shares3 | | | | |
|
| Sold | 3,674,241 | $39,896,756 | 9,372 | $100,000 |
| Distributions reinvested | 4,219 | 44,937 | — | — |
| Repurchased | (76,606) | (828,222) | — | — |
| | | | | |
| Net increase | 3,601,854 | $39,113,471 | 9,372 | $100,000 |
| |
| Class NAV shares1 | | | | |
|
| Sold | 15,941,681 | $172,518,005 | 47,020,792 | $483,507,167 |
| Distributions reinvested | 708,702 | 7,547,678 | — | — |
| Repurchased | (1,550,325) | (16,925,748) | (193,554) | (2,017,290) |
| | | | | |
| Net increase | 15,100,058 | $163,139,935 | 46,827,238 | $481,489,877 |
| |
| Total net increase | 267,135,047 | $2,902,408,638 | 79,121,533 | $821,411,871 |
|
1 Prior period presented is from 12-19-11 (commencement of operations) to 7-31-12.
2 The inception date for Class C shares is 8-1-12.
3 The inception date for Class R2 and Class R6 shares is 3-1-12.
Affiliates of the fund owned 9% and 100% of shares of beneficial interest of Class R2 and Class NAV, respectively, on July 31, 2013.
Note 7 — Purchase and sale of securities
Purchases and sales of securities, other than short-term securities and U.S. Treasury obligations, amounted to $3,167,224,987 and $1,117,304,844, respectively, for the year ended July 31, 2013. Purchases and sales of U.S. Treasury obligations aggregated $288,410,220 and $418,668,144, respectively, for the year ended July 31, 2013.
| |
| Annual report | Global Absolute Return Strategies Fund 67 |
Auditor’s report
Report of Independent Registered Public Accounting Firm
To the Board of Trustees of John Hancock Funds II and Shareholders of John Hancock Global Absolute Return Strategies Fund:
In our opinion, the accompanying statement of assets and liabilities, including the schedule of investments, and the related statements of operations and of changes in net assets and the financial highlights present fairly, in all material respects, the financial position of John Hancock Global Absolute Return Strategies Fund (the “Fund”) at July 31, 2013, the results of its operations for the year then ended and the changes in its net assets and the financial highlights for each of the periods indicated, in conformity with accounting principles generally accepted in the United States of America. These financial statements and financial highlights (hereafter referred to as “financial statements”) are the responsibility of the Fund’s management; our responsibility is to express an opinion on these financial statements based on our audits. We conducted our audits of these financial statements in accordance with the standards of the Public Company Accounting Oversight Board (United States). Those standards require that we plan and perform the audit to obtain reasonable assurance about whether the financial statements are free of material misstatement. An audit includes examining, on a test basis, evidence supporting the amounts and disclosures in the financial statements, assessing the accounting principles used and significant estimates made by management, and evaluating the overall financial statement presentation. We believe that our audits, which included confirmation of securities at July 31, 2013 by correspondence with the custodian and brokers, and the application of alternative auditing procedures where securities purchased confirmations had not been received, provide a reasonable basis for our opinion.
PricewaterhouseCoopers LLP
Boston, Massachusetts
September 23, 2013
| |
| 68 Global Absolute Return Strategies Fund | Annual report |
Tax information
Unaudited
For federal income tax purposes, the following information is furnished with respect to the distributions of the fund, if any, paid during its taxable year ended July 31, 2013.
The fund reports the maximum amount allowable of its net taxable income as eligible for the corporate dividends-received deduction.
The fund reports the maximum amount allowable of its net taxable income as qualified dividend income as provided in the Jobs and Growth Tax Relief Reconciliation Act of 2003.
The fund paid $4,337,947 in capital gain dividends.
Eligible shareholders will be mailed a 2013 Form 1099-DIV in early 2014. This will reflect the tax character of all distributions paid in calendar year 2013.
Please consult a tax advisor regarding the tax consequences of your investment in the fund.
| |
| Annual report | Global Absolute Return Strategies Fund 69 |
Evaluation of Advisory and Subadvisory Agreements by the Board of Trustees
This section describes the evaluation by the Board of Trustees (the Board) of John Hancock Funds II (the Trust) of the Advisory Agreement (the Advisory Agreement) with John Hancock Investment Management Services, LLC (the Advisor) and the Subadvisory Agreement (the Subadvisory Agreement) with Standard Life Investments (Corporate Funds) Limited (the Subadvisor) for Global Absolute Return Strategies Fund (the fund). The Advisory Agreement and Subadvisory Agreement are collectively referred to as the Agreements.
Approval of Advisory and Subadvisory Agreements
At in-person meetings held on May 16-17, 2013, the Board, including the Trustees who are not considered to be interested persons of the Trust under the Investment Company Act of 1940, as amended (the 1940 Act) (the Independent Trustees), reapproved for an annual period the continuation of the Advisory Agreement between the Trust and the Advisor and the Subadvisory Agreement between the Advisor and the Subadvisor with respect to the fund.
In considering the Advisory Agreement and the Subadvisory Agreement, the Board received in advance of the meeting a variety of materials relating to the fund, the Advisor, and the Subadvisor, including comparative performance, fee and expense information for peer groups of similar mutual funds prepared by an independent third-party provider of mutual fund data; performance information for the fund’s benchmark index; and, with respect to the Subadvisor, comparative performance information for comparably managed accounts; and other information provided by the Advisor and the Subadvisor regarding the nature, extent, and quality of services provided by the Advisor and the Subadvisor under their respective Agreements, as well as information regarding the Advisor’s revenues and costs of providing services to the fund and any compensation paid to affiliates of the Advisor. At the meeting at which the renewal of the Advisory Agreement and Subadvisory Agreement is considered, particular focus is given to information concerning fund performance, comparability of fees and total expenses and profitability. However, the Board notes that the evaluation process with respect to the Advisor and the Subadvisor is an ongoing one. In this regard, the Board also took into account discussions with management and information provided to the Board at prior meetings with respect to the services provided by the Advisor and the Subadvisor to the fund, including quarterly performance reports prepared by management containing reviews of investment results and prior presentations from the Subadvisor with respect to the fund. The Board also considered the nature, quality, and extent of non-advisory services, if any, to be provided to the fund by the Advisor’s affiliates, including distribution services.
Throughout the process, the Board asked questions of and requested additional information from management. The Board is assisted by counsel for the Trust and the Independent Trustees are also separately assisted by independent legal counsel throughout the process. The Independent Trustees also received a memorandum from their independent counsel discussing the legal standards for their consideration of the proposed continuation of the Agreements and discussed the proposed continuation of the Agreements in private sessions with their independent legal counsel at which no representatives of management were present.
Approval of Advisory Agreement
In approving the Advisory Agreement with respect to the fund, the Board, including the Independent Trustees, considered a variety of factors, including those discussed below. The Board also considered other factors (including conditions and trends prevailing generally in the economy, the securities markets, and the industry) and does not treat any single factor as determinative and each Trustee may attribute different weights to different factors. The Board’s conclusions may be based in part on its consideration of the Advisory and Subadvisory Agreements in prior years and on the Board’s ongoing regular review of fund performance and operations throughout the year.
| |
| 70 Global Absolute Return Strategies Fund | Annual report |
Nature, extent, and quality of services. Among the information received by the Board from the Advisor relating to the nature, extent, and quality of services provided to the fund, the Board reviewed information provided by the Advisor relating to its operations and personnel, descriptions of its organizational and management structure, and information regarding the Advisor’s compliance and regulatory history, including its Form ADV. The Board also noted that on a regular basis it receives and reviews information from the Trust’s Chief Compliance Officer (CCO) regarding the fund’s compliance policies and procedures established pursuant to Rule 38a-1 under the 1940 Act. The Board also considered the Advisor’s risk management processes. The Board considered that the Advisor is responsible for the management of the day-to-day operations of the fund, including, but not limited to, general supervision of and coordination of the services provided by the Subadvisor, and is also responsible for monitoring and reviewing the activities of the Subadvisor and other third-party service providers.
In considering the nature, extent, and quality of the services provided by the Advisor, the Trustees also took into account their knowledge of the Advisor’s management and the quality of the performance of the Advisor’s duties through Board meetings, discussions, and reports during the preceding year and through each Trustee’s experience as a Trustee of the Trust and of the other trusts in the complex.
In the course of their deliberations regarding the Advisory Agreement, the Board considered, among other things:
(a) the skills and competency with which the Advisor has in the past managed the Trust’s affairs and its subadvisory relationship, the Advisor’s oversight and monitoring of the Subadvisor’s investment performance and compliance programs, such as the Subadvisor’s compliance with fund policies and objective; review of brokerage matters, including with respect to trade allocation and best execution; and the Advisor’s timeliness in responding to performance issues;
(b) the background, qualifications and skills of the Advisor’s personnel;
(c) the Advisor’s compliance policies and procedures and its responsiveness to regulatory changes and mutual fund industry developments;
(d) the Advisor’s administrative capabilities, including its ability to supervise the other service providers for the fund;
(e) the financial condition of the Advisor and whether it has the financial wherewithal to provide a high level and quality of services to the fund; and
(f) the Advisor’s reputation and experience in serving as an investment adviser to the Trust and the benefit to shareholders of investing in funds that are part of a family of funds offering a variety of investments.
The Board concluded that the Advisor may reasonably be expected to continue to provide a high quality of services under the Advisory Agreement with respect to the fund.
Investment performance. In considering the fund’s performance, the Board noted that it reviews at its regularly scheduled meetings information about the fund’s performance results. In connection with the consideration of the Advisory Agreement, the Board:
(a) reviewed information prepared by management regarding the fund’s performance;
(b) considered the comparative performance of the fund’s benchmark;
(c) considered the performance of comparable funds, if any, as included in the report prepared by an independent third-party provider of mutual fund data. Such report included the fund’s ranking within a smaller group of peer funds and the fund’s ranking within broader groups of funds; and
| |
| Annual report | Global Absolute Return Strategies Fund 71 |
(d) took into account the Advisor’s analysis of the fund’s performance and its plans and recommendations regarding the Trust’s subadvisory arrangements generally.
The Board noted that the fund outperformed its benchmark index and peer group average for the one-year period ended December 31, 2012.
The Board noted that the fund had a limited performance history having commenced operations on December 19, 2011. The Board also noted the fund’s favorable performance relative to the benchmark index and peer group for the one-year period.
The Board concluded that the performance of the fund has generally been in line with or outperformed the historical performance of comparable funds and the fund’s benchmark.
Fees and expenses. The Board reviewed comparative information prepared by an independent third-party provider of mutual fund data, including, among other data, the fund’s contractual and net management fees and total expenses as compared to similarly situated investment companies deemed to be comparable to the fund. The Board considered the fund’s ranking within a smaller group of peer funds chosen by the independent third-party provider, as well as the fund’s ranking within a broader group of funds. In comparing the fund’s contractual and net management fees to those of comparable funds, the Board noted that such fees include both advisory and administrative costs.
The Board noted that net management fees for this fund are higher than the peer group median and that total expenses for this fund are higher than the peer group median. The Board took into account management’s discussion of the fund’s expenses, including the more recent decline in the fund’s net expenses.
The Board took into account management’s discussion with respect to the advisory/subadvisory fee structure, including the amount of the advisory fee retained by the Advisor after payment of the subadvisory fee. The Board also took into account that management had agreed to implement an overall fee waiver across a number of funds in the complex, including the fund, which is discussed further below. The Board also noted that, in addition, the Advisor is currently waiving fees and/ or reimbursing expenses with respect to the fund. The Board also noted that the Advisor pays the subadvisory fees of the fund, and that such fees are negotiated at arm’s length with respect to the Subadvisor. The Board also noted management’s discussion of the fund’s expenses, as well as certain actions taken over the past several years to reduce the fund’s operating expenses. The Board reviewed information provided by the Advisor concerning investment advisory fees charged to other clients (including other funds in the complex) having similar investment mandates, if any. The Board considered any differences between the Advisor’s and Subadvisor’s services to the fund and the services they provide to other comparable clients or funds. The Board concluded that the advisory fee paid with respect to the fund is reasonable.
Profitability/indirect benefits. In considering the costs of the services to be provided and the profits to be realized by the Advisor and its affiliates from the Advisor’s relationship with the Trust, the Board:
(a) reviewed financial information of the Advisor;
(b) reviewed and considered an analysis presented by the Advisor regarding the net profitability to the Advisor and its affiliates with respect to the fund;
(c) received and reviewed profitability information with respect to the John Hancock fund complex as a whole;
(d) received information with respect to the Advisor’s allocation methodologies used in preparing the profitability data;
| |
| 72 Global Absolute Return Strategies Fund | Annual report |
(e) considered that the John Hancock insurance companies that are affiliates of the Advisor, as shareholders of the Trust directly or through their separate accounts, receive certain tax credits or deductions relating to foreign taxes paid and dividends received by certain funds of the Trust and noted that these tax benefits, which are not available to participants in qualified retirement plans under applicable income tax law, are reflected in the profitability analysis reviewed by the Board;
(f) considered that the Advisor also provides administrative services to the fund on a cost basis pursuant to an administrative services agreement;
(g) noted that affiliates of the Advisor provide transfer agency services and distribution services to the fund, and that the Trust’s distributor also receives Rule 12b-1 payments to support distribution of the fund;
(h) noted that the Advisor also derives reputational and other indirect benefits from providing advisory services to the fund;
(i) noted that the subadvisory fees for the fund are paid by the Advisor and are negotiated at arm’s length; and
(j) considered that the Advisor should be entitled to earn a reasonable level of profits in exchange for the level of services it provides to the fund and the entrepreneurial risk that it assumes as Advisor.
Based upon its review, the Board concluded that the level of profitability, if any, of the Advisor and its affiliates from their relationship with the fund was reasonable and not excessive.
Economies of scale. In considering the extent to which economies of scale would be realized as the fund grows and whether fee levels reflect these economies of scale for the benefit of fund shareholders, the Board:
(a) considered that the Advisor has agreed, effective June 1, 2013, to waive its management fee for the fund and each of the open-end funds of John Hancock Funds II, John Hancock Funds III, each other John Hancock fund (except those listed below) (the Participating Portfolios) or otherwise reimburse the expenses of the Participating Portfolios as follows (the Reimbursement):
The Reimbursement shall equal, on an annualized basis, 0.01% of that portion of the aggregate net assets of all the Participating Portfolios that exceeds $75 billion but is less than or equal to $125 billion, 0.0125% of that portion of the aggregate net assets of all the Participating Portfolios that exceeds $125 billion but is less than or equal to $150 billion and 0.015% of that portion of the aggregate net assets of all the Participating Portfolios that exceeds $150 billion. (The funds that are not Participating Portfolios as of the date of this annual report are each of the fund of funds, money market funds, index funds and closed-end funds);
(b) reviewed the Trust’s advisory fee structure and the incorporation therein of any subadvisory fee breakpoints in the advisory fees charged and concluded that (i) the fund’s fee structure contains breakpoints at the subadvisory fee level and that such breakpoints are reflected as breakpoints in the advisory fees for the fund and (ii) although economies of scale cannot be measured with precision, these arrangements permit shareholders of the fund to benefit from economies of scale if the fund grows. The Board also took into account management’s discussion of the fund’s advisory fee structure; and
| |
| Annual report | Global Absolute Return Strategies Fund 73 |
(c) the Board also considered the effect of the fund’s growth in size on its performance and fees. The Board also noted that if the fund’s assets increase over time, the fund may realize other economies of scale.
Approval of Subadvisory Agreement
In making its determination with respect to approval of the Subadvisory Agreement, the Board reviewed:
(1) information relating to the Subadvisor’s business, including current subadvisory services to the Trust (and other funds in the John Hancock family of funds);
(2) the historical and current performance of the fund, and comparative performance information relating to the fund’s benchmark and comparable funds;
(3) the subadvisory fee for the fund, including any breakpoints, and comparative fee information, where available, prepared by an independent third-party provider of mutual fund data; and
(4) information relating to the nature and scope of any material relationships and their significance to the Trust’s Advisor and Subadvisor.
Nature, extent, and quality of services. With respect to the services provided by the Subadvisor, the Board received information provided to the Board by the Subadvisor, including the Subadvisor’s Form ADV, as well as took into account information presented throughout the past year. The Board considered the Subadvisor’s current level of staffing and its overall resources, as well as received information relating to the Subadvisor’s compensation program. The Board reviewed the Subadvisor’s history and investment experience, as well as information regarding the qualifications, background, and responsibilities of the Subadvisor’s investment and compliance personnel who provide services to the fund. The Board also considered, among other things, the Subadvisor’s compliance program and any disciplinary history. The Board also considered the Subadvisor’s risk assessment and monitoring process. The Board reviewed the Subadvisor’s regulatory history, including whether it was currently involved in any regulatory actions or investigations as well as material litigation, and any settlements and amelioratory actions undertaken, as appropriate. The Board noted that the Advisor conducts regular, periodic reviews of the Subadvisor and its operations, including regarding investment processes and organizational and staffing matters. The Board also noted that the Trust’s CCO and his staff conduct regular, periodic compliance reviews with the Subadvisor and present reports to the Independent Trustees regarding the same, which includes evaluating the regulatory compliance systems of the Subadvisor and procedures reasonably designed by it to assure compliance with the federal securities laws. The Board also took into account the financial condition of the Subadvisor.
The Board considered the Subadvisor’s investment process and philosophy. The Board took into account that the Subadvisor’s responsibilities include the development and maintenance of an investment program for the fund, that is consistent with the fund’s investment objectives, the selection of investment securities and the placement of orders for the purchase and sale of such securities, as well as the implementation of compliance controls related to performance of these services. The Board also received information with respect to the Subadvisor’s brokerage policies and practices, including with respect to best execution and soft dollars.
Subadvisor compensation. In considering the cost of services to be provided by the Subadvisor and the profitability to the Subadvisor of its relationship with the fund, the Board noted that the fees under the Subadvisory Agreement are paid by the Advisor and not the fund.
The Board also relied on the ability of the Advisor to negotiate the Subadvisory Agreement with the Subadvisor, which is not affiliated with the Advisor, and the fees thereunder at arm’s length.
| |
| 74 Global Absolute Return Strategies Fund | Annual report |
As a result, the costs of the services to be provided and the profits to be realized by the Subadvisor from its relationship with the Trust were not a material factor in the Board’s consideration of the Subadvisory Agreement.
The Board also received information regarding the nature and scope (including their significance to the Advisor and its affiliates and to the Subadvisor) of any material relationships with respect to the Subadvisor, which includes arrangements in which the Subadvisor or its affiliates provide advisory, distribution, or management services in connection with financial products sponsored by the Trust’s Advisor or its affiliates, and may include other registered investment companies, a 529 education savings plan, managed separate account, and exempt group annuity contracts sold to qualified plans. The Board also received information and took into account any other potential conflicts of interest the Advisor might have in connection with the Subadvisory Agreement.
In addition, the Board considered other potential indirect benefits that the Subadvisor and its affiliates may receive from the Subadvisor’s relationship with the fund, such as the opportunity to provide advisory services to additional funds in the John Hancock fund complex and reputational benefits.
Subadvisory fees. The Board considered that the fund pays an advisory fee to the Advisor and that, in turn, the Advisor pays a subadvisory fee to the Subadvisor. The Board also took into account the sub-advisory fees paid by the Advisor to the Subadvisor with respect to the fund to fees charged by the fund’s Subadvisor to manage other subadvised portfolios and portfolios not subject to regulation under the 1940 Act, as applicable.
Subadvisor performance. As noted above, the Board considered the fund’s performance as compared to the fund’s peer group and benchmark and noted that the Board reviews information about the fund’s performance results at its regularly scheduled meetings. The Board noted the Advisor’s expertise and resources in monitoring the performance, investment style, and risk-adjusted performance of the Subadvisor. The Board was mindful of the Advisor’s focus on the Subadvisor’s performance. The Board also noted the Subadvisor’s long-term performance record for similar accounts, as applicable.
The Board’s decision to approve the Subadvisory Agreement was based on a number of determinations, including the following:
(1) The Subadvisor has extensive experience and demonstrated skills as a manager;
(2) The performance of the fund generally has been in line with or outperformed the historical performance of comparable funds and the fund’s benchmark and the fund’s overall performance is satisfactory;
(3) The subadvisory fees are reasonable in relation to the level and quality of services being provided; and
(4) Subadvisory fee breakpoints are reflected as breakpoints in the advisory fees for the fund in order to permit shareholders to benefit from economies of scale if the fund grows.
Based on the Board’s evaluation of all factors that the Board deemed to be material, including those factors described above, the Board, including the Independent Trustees, concluded that renewal of the Advisory Agreement and the Subadvisory Agreement would be in the best interest of the fund and its shareholders. Accordingly, the Board, and the Independent Trustees voting separately, approved the Advisory Agreement and Subadvisory Agreement for an additional one-year period.
| |
| Annual report | Global Absolute Return Strategies Fund 75 |
Trustees and Officers
This chart provides information about the Trustees and Officers who oversee your John Hancock fund. Officers elected by the Trustees manage the day-to-day operations of the fund and execute policies formulated by the Trustees.
Independent Trustees
| | |
| Name, year of birth | Trustee | Number of John |
| Position(s) held with fund | of the | Hancock funds |
| Principal occupation(s) and other | Trust | overseen by |
| directorships during past 5 years | since1 | Trustee |
| |
| James M. Oates, Born: 1946 | 2012 | 231 |
|
| Managing Director, Wydown Group (financial consulting firm) (since 1994); Chairman and Director, |
| Emerson Investment Management, Inc. (since 2000); Independent Chairman, Hudson Castle Group, Inc. |
| (formerly IBEX Capital Markets, Inc.) (financial services company) (1997–2011); Director, Stifel Financial |
| (since 1996); Director, Investor Financial Services Corporation (1995–2007); Director, Connecticut River |
| Bancorp (since 1998); Director, Virtus Funds (formerly Phoenix Mutual Funds) (since 1988). Trustee |
| and Chairperson of the Board, John Hancock retail funds (since 2012); Trustee (2005–2006 and since |
| 2012) and Chairperson of the Board (since 2012), John Hancock Funds III; Trustee (since 2004) and |
| Chairperson of the Board (since 2005), John Hancock Variable Insurance Trust; Trustee and Chairperson |
| of the Board (since 2005), John Hancock Funds II. | | |
| |
| Charles L. Bardelis,3 Born: 1941 | 2012 | 231 |
|
| Director, Island Commuter Corp. (marine transport). Trustee, John Hancock retail funds (since 2012); |
| Trustee, John Hancock Funds III (2005–2006 and since 2012); Trustee, John Hancock Variable Insurance |
| Trust (since 1988); Trustee, John Hancock Funds II (since 2005). | | |
| |
| Peter S. Burgess,3 Born: 1942 | 2012 | 231 |
|
| Consultant (financial, accounting, and auditing matters) (since 1999); Certified Public Accountant; |
| Partner, Arthur Andersen (independent public accounting firm) (prior to 1999); Director, Lincoln |
| Educational Services Corporation (since 2004); Director, Symetra Financial Corporation (since 2010); |
| former Director, PMA Capital Corporation (2004–2010). Trustee, John Hancock retail funds (since 2012); |
| Trustee, John Hancock Funds III (2005–2006 and since 2012); Trustee, John Hancock Variable Insurance |
| Trust and John Hancock Funds II (since 2005). | | |
| |
| William H. Cunningham,2 Born: 1944 | 1994 | 231 |
|
| Professor, University of Texas, Austin, Texas (since 1971); former Chancellor, University of Texas |
| System and former President of the University of Texas, Austin, Texas; Director, LIN Television (since |
| 2009); Chairman (since 2009) and Director (since 2006), Lincoln National Corporation (insurance); |
| Director, Resolute Energy Corporation (since 2009); Director, Southwest Airlines (since 2000); former |
| Director, Introgen (manufacturer of biopharmaceuticals) (until 2008); former Director, Hicks Acquisition |
| Company I, Inc. (until 2007); former Director, Texas Exchange Bank, SSB (formerly Bank of Crowley) |
| (until 2009); former Advisory Director, JPMorgan Chase Bank (formerly Texas Commerce Bank–Austin) |
| (until 2009). Trustee, John Hancock retail funds (since 1986); Trustee, John Hancock Variable Insurance |
| Trust (since 2012); Trustee, John Hancock Funds II (since 2012 and 2005–2006). | |
| |
| Grace K. Fey, Born: 1946 | 2012 | 231 |
|
| Chief Executive Officer, Grace Fey Advisors (since 2007); Director and Executive Vice President, |
| Frontier Capital Management Company (1988–2007); Director, Fiduciary Trust (since 2009). |
| Trustee, John Hancock retail funds (since 2012); Trustee, John Hancock Variable Insurance Trust and |
| John Hancock Funds II (since 2008). | | |
| |
| 76 Global Absolute Return Strategies Fund | Annual report |
Independent Trustees (continued)
| | |
| Name, year of birth | Trustee | Number of John |
| Position(s) held with fund | of the | Hancock funds |
| Principal occupation(s) and other | Trust | overseen by |
| directorships during past 5 years | since1 | Trustee |
| |
| Theron S. Hoffman,3 Born: 1947 | 2012 | 231 |
|
| Chief Executive Officer, T. Hoffman Associates, LLC (consulting firm) (since 2003); Director, The Todd |
| Organization (consulting firm) (2003–2010); President, Westport Resources Management (investment |
| management consulting firm) (2006–2008); Senior Managing Director, Partner, and Operating Head, |
| Putnam Investments (2000–2003); Executive Vice President, The Thomson Corp. (financial and |
| legal information publishing) (1997–2000). Trustee, John Hancock retail funds (since 2012); Trustee, |
| John Hancock Variable Insurance Trust and John Hancock Funds II (since 2008). | |
| |
| Deborah C. Jackson,2 Born: 1952 | 2008 | 231 |
|
| President, Cambridge College, Cambridge, Massachusetts (since 2011); Chief Executive Officer, |
| American Red Cross of Massachusetts Bay (2002–2011); Board of Directors of Eastern Bank Corporation |
| (since 2001); Board of Directors of Eastern Bank Charitable Foundation (since 2001); Board of Directors |
| of American Student Assistance Corporation (1996–2009); Board of Directors of Boston Stock Exchange |
| (2002–2008); Board of Directors of Harvard Pilgrim Healthcare (health benefits company) (2007–2011). |
| Trustee, John Hancock retail funds (since 2008); Trustee of John Hancock Variable Insurance Trust and |
| John Hancock Funds II (since 2012). | | |
| |
| Hassell H. McClellan, Born: 1945 | 2012 | 231 |
|
| Associate Professor, The Wallace E. Carroll School of Management, Boston College (since 1984); |
| Trustee, Virtus Variable Insurance Trust (formerly Phoenix Edge Series Funds) (since 2008); Director, |
| The Barnes Group (since 2010). Trustee, John Hancock retail funds (since 2012); Trustee, John Hancock |
| Funds III (2005–2006 and since 2012); Trustee, John Hancock Variable Insurance Trust and | |
| John Hancock Funds II (since 2005). | | |
| |
| Steven R. Pruchansky,2 Born: 1944 | 1991 | 231 |
|
| Chairman and Chief Executive Officer, Greenscapes of Southwest Florida, Inc. (since 2000); Director |
| and President, Greenscapes of Southwest Florida, Inc. (until 2000); Member, Board of Advisors, First |
| American Bank (until 2010); Managing Director, Jon James, LLC (real estate) (since 2000); Director, |
| First Signature Bank & Trust Company (until 1991); Director, Mast Realty Trust (until 1994); President, |
| Maxwell Building Corp. (until 1991). Trustee (since 1992) and Chairperson of the Board (2011–2012), |
| John Hancock retail funds; Trustee and Vice Chairperson of the Board, John Hancock retail funds, |
| John Hancock Variable Insurance Trust and John Hancock Funds II (since 2012). | |
| |
| Gregory A. Russo,2 Born: 1949 | 2009 | 231 |
|
| Director and Audit Committee Chairman (since 2012) and Member, Audit Committee and Finance |
| Committee (since 2011), NCH Healthcare System, Inc. (holding company for multi-entity healthcare |
| system); Director and Member of Finance Committee, The Moorings, Inc. (nonprofit continuing care |
| community) (since 2012); Vice Chairman, Risk & Regulatory Matters, KPMG LLP (KPMG) (2002–2006); |
| Vice Chairman, Industrial Markets, KPMG (1998–2002); Chairman and Treasurer, Westchester |
| County, New York, Chamber of Commerce (1986–1992); Director, Treasurer and Chairman of |
| Audit and Finance Committees, Putnam Hospital Center (1989–1995); Director and Chairman of |
| Fundraising Campaign, United Way of Westchester and Putnam Counties, New York (1990–1995). |
| Trustee, John Hancock retail funds (since 2008); Trustee, John Hancock Variable Insurance Trust and |
| John Hancock Funds II (since 2012). | | |
| |
| Annual report | Global Absolute Return Strategies Fund 77 |
Non-Independent Trustees4
| | |
| Name, year of birth | Trustee | Number of John |
| Position(s) held with fund | of the | Hancock funds |
| Principal occupation(s) and other | Trust | overseen by |
| directorships during past 5 years | since1 | Trustee |
| |
| James R. Boyle, Born: 1959 | 2012 | 231 |
|
| Senior Executive Vice President, John Hancock Financial Services (1999–2012, including prior positions); |
| Chairman and Director, John Hancock Advisers, LLC, John Hancock Funds, LLC, and John Hancock |
| Investment Management Services, LLC (2005–2010). Trustee, John Hancock retail funds (since 2012 and |
| 2005–2010), Trustee, John Hancock Variable Insurance Trust and John Hancock Funds II (since 2005). |
| |
| Craig Bromley,2 Born: 1966 | 2012 | 231 |
|
| President, John Hancock Financial Services (since 2012); Senior Executive Vice President and General |
| Manager, U.S. Division, John Hancock Financial Services (since 2012); President and Chief Executive |
| Officer, Manulife Insurance Company (Manulife (Japan) (2005–2012), including prior positions). |
| Trustee, John Hancock retail funds (since 2012); Trustee, John Hancock Variable Insurance Trust and |
| John Hancock Funds II (since 2012). | | |
| |
| Warren A. Thomson,2 Born: 1955 | 2012 | 231 |
|
| Senior Executive Vice President and Chief Investment Officer, Manulife Financial Corporation and The |
| Manufacturers Life Insurance Company (since 2009); Chairman and Chief Executive Officer, Manulife |
| Asset Management (since 2001, including prior positions); Director (since 2006), and President and |
| Chief Executive Officer of Manulife Asset Management Limited (since 2013); Director and Chairman, |
| Hancock Natural Resources Group, Inc. (since 2013). Trustee, John Hancock retail funds, John Hancock |
| Variable Insurance Trust and John Hancock Funds II (since 2012). | | |
Principal officers who are not Trustees
| |
| Name, year of birth | Officer |
| Position(s) held with fund | of the |
| Principal occupation(s) and other | Trust |
| directorships during past 5 years | since |
| |
| Hugh McHaffie, Born: 1959 | 2009 |
|
| President | |
| Executive Vice President, John Hancock Financial Services (since 2006, including prior positions); | |
| Chairman and Director, John Hancock Advisers, LLC, John Hancock Investment Management Services, |
| LLC and John Hancock Funds, LLC (since 2010); President, John Hancock Advisers, LLC (since 2012); |
| President, John Hancock Investment Management Services, LLC (since 2010). President (since 2012) and |
| former Trustee (2010–2012), John Hancock retail funds; President, John Hancock Variable Insurance |
| Trust and John Hancock Funds II (since 2009). | |
| |
| Andrew G. Arnott, Born: 1971 | 2009 |
|
| Executive Vice President | |
| Senior Vice President, John Hancock Financial Services (since 2009); Director and Executive Vice | |
| President, John Hancock Advisers, LLC (since 2005, including prior positions); Director and Executive |
| Vice President, John Hancock Investment Management Services, LLC (since 2006, including prior | |
| positions); President, John Hancock Funds, LLC (since 2004, including prior positions); Executive Vice |
| President, John Hancock retail funds, John Hancock Variable Insurance Trust and John Hancock Funds II |
| (since 2007, including prior positions). | |
| |
| Thomas M. Kinzler, Born: 1955 | 2006 |
|
| Secretary and Chief Legal Officer | |
| Vice President, John Hancock Financial Services (since 2006); Secretary and Chief Legal Counsel, | |
| John Hancock Funds, LLC (since 2007); Secretary and Chief Legal Officer, John Hancock retail funds, |
| John Hancock Variable Insurance Trust and John Hancock Funds II (since 2006). | |
| |
| 78 Global Absolute Return Strategies Fund | Annual report |
Principal officers who are not Trustees (continued)
| |
| Name, year of birth | Officer |
| Position(s) held with fund | of the |
| Principal occupation(s) and other | Trust |
| directorships during past 5 years | since |
| |
| Francis V. Knox, Jr., Born: 1947 | 2005 |
|
| Chief Compliance Officer | |
| Vice President, John Hancock Financial Services (since 2005); Chief Compliance Officer, John Hancock |
| retail funds, John Hancock Variable Insurance Trust, John Hancock Funds II, John Hancock Advisers, |
| LLC and John Hancock Investment Management Services, LLC (since 2005); Vice President and Chief |
| Compliance Officer, John Hancock Asset Management a division of Manulife Asset Management (US) |
| LLC (2005–2008). | |
| |
| Charles A. Rizzo, Born: 1957 | 2007 |
|
| Chief Financial Officer | |
| Vice President, John Hancock Financial Services (since 2008); Senior Vice President, John Hancock | |
| Advisers, LLC and John Hancock Investment Management Services, LLC (since 2008); Chief Financial |
| Officer, John Hancock retail funds, John Hancock Variable Insurance Trust and John Hancock Funds II |
| (since 2007). | |
| |
| Salvatore Schiavone, Born: 1965 | 2009 |
|
| Treasurer | |
| Assistant Vice President, John Hancock Financial Services (since 2007); Vice President, John Hancock |
| Advisers, LLC and John Hancock Investment Management Services, LLC (since 2007); Treasurer, | |
| John Hancock retail funds (since 2007, including prior positions); Treasurer, John Hancock Variable | |
| Insurance Trust and John Hancock Funds II (since 2010 and 2007–2009, including prior positions). | |
John Hancock retail funds is comprised of John Hancock Funds III and 34 other John Hancock funds consisting of 24 series of other John Hancock trusts and 10 closed-end funds.
The business address for all Trustees and Officers is 601 Congress Street, Boston, Massachusetts 02210-2805.
The Statement of Additional Information of the fund includes additional information about members of the Board of Trustees of the Trust and is available without charge, upon request, by calling 800-225-5291.
1 Each Trustee holds office until his or her successor is elected and qualified, or until the Trustee’s death, retirement, resignation or removal.
2 Became a Trustee of the Trust effective December 1, 2012.
3 Member of Audit Committee.
4 Because Messrs. Bromley and Thomson are senior executives or directors and Mr. Boyle held prior positions as a senior executive and director of the Advisor and/or its affiliates, each of them is considered an “interested person,” as defined in the Investment Company Act of 1940, of the Trust.
| |
| Annual report | Global Absolute Return Strategies Fund 79 |
More information
| |
| Trustees | Investment advisor |
| James M. Oates, Chairperson | John Hancock Investment Management |
| Steven R. Pruchansky, Vice Chairperson | Services, LLC |
| Charles L. Bardelis* | |
| James R. Boyle† | Subadvisor |
| Craig Bromley† | Standard Life Investments (Corporate Funds) |
| Peter S. Burgess* | Limited |
| William H. Cunningham | |
| Grace K. Fey | Principal distributor |
| Theron S. Hoffman* | John Hancock Funds, LLC |
| Deborah C. Jackson | |
| Hassell H. McClellan | Custodian |
| Gregory A. Russo | State Street Bank and Trust Company |
| Warren A. Thomson† | |
| | Transfer agent |
| Officers | John Hancock Signature Services, Inc. |
| Hugh McHaffie | |
| President | Legal counsel |
| | K&L Gates LLP |
| Andrew G. Arnott | |
| Executive Vice President | Independent registered |
| | public accounting firm |
| Thomas M. Kinzler | PricewaterhouseCoopers LLP |
| Secretary and Chief Legal Officer | |
| | |
| Francis V. Knox, Jr. | |
| Chief Compliance Officer | |
| | |
| Charles A. Rizzo | |
| Chief Financial Officer |
| | |
| Salvatore Schiavone | |
| Treasurer | |
| | |
| *Member of the Audit Committee | |
| †Non-Independent Trustee | |
The fund’s proxy voting policies and procedures, as well as the fund’s proxy voting record for the most recent twelve-month period ended June 30, are available free of charge on the Securities and Exchange Commission (SEC) website at sec.gov or on our website.
The fund’s complete list of portfolio holdings, for the first and third fiscal quarters, is filed with the SEC on Form N-Q. The fund’s Form N-Q is available on our website and the SEC’s website, sec.gov, and can be reviewed and copied (for a fee) at the SEC’s Public Reference Room in Washington, DC. Call 800-SEC-0330 to receive information on the operation of the SEC’s Public Reference Room.
We make this information on your fund, as well as monthly portfolio holdings, and other fund details available on our website at jhinvestments.com or by calling 800-225-5291.
| | |
| You can also contact us: | | |
| 800-225-5291 | Regular mail: | Express mail: |
| jhinvestments.com | Investment Operations | Investment Operations |
| | John Hancock Signature Services, Inc. | John Hancock Signature Services, Inc. |
| | P.O. Box 55913 | 30 Dan Road |
| | Boston, MA 02205-5913 | Canton, MA 02021 |
| |
| 80 Global Absolute Return Strategies Fund | Annual report |

800-225-5291
800-338-8080 EASI-Line
jhinvestments.com
| |
| This report is for the information of the shareholders of John Hancock Global Absolute Return Strategies Fund. | |
| It is not authorized for distribution to prospective investors unless preceded or accompanied by a prospectus. | 395A 7/13 |
| MF150759 | 9/13 |

A look at performance
Total returns for the period ended July 31, 2013
| | | | | | | | | | |
| | | Average annual total returns (%) | | Cumulative total returns (%) | |
| | | with maximum sales charge | | | with maximum sales charge | |
|
| | | | | Since | | | | | Since |
| | | 1-year | 5-year | 10-year | inception1 | | 1-year | 5-year | 10-year | inception1 |
|
| Class A2 | | 10.15 | 1.22 | — | 1.70 | | 10.15 | 6.23 | — | 11.58 |
|
| Class I2,3 | | 16.87 | 3.54 | — | 3.82 | | 16.87 | 19.01 | — | 27.61 |
|
| Index† | | 20.64 | 1.04 | — | 1.64 | | 20.64 | 5.32 | — | 11.17 |
|
Performance figures assume all dividends have been reinvested. Figures reflect maximum sales charge on Class A shares of 5%.
The expense ratios of the fund, both net (including any fee waivers or expense limitations) and gross (excluding any fee waivers or expense limitations), are set forth according to the most recent publicly available prospectuses for the fund and may differ from those disclosed in the Financial highlights tables in this report. The fee waivers and expense limitations are contractual at least until 1-31-15 for Class A and Class I shares. Had the fee waivers and expense limitations not been in place, gross expenses would apply. The expense ratios are as follows:
| | | | | | | |
| | Class A | Class I | | | | | |
| Net (%) | 1.35 | 1.10 | | | | | |
| Gross (%) | 2.19 | 1.69 | | | | | |
The returns reflect past results and should not be considered indicative of future performance. The return and principal value of an investment will fluctuate so that shares, when redeemed, may be worth more or less than their original cost. Due to market volatility, the fund’s current performance may be higher or lower than the performance shown. For performance data current to the most recent month end, please call 800-225-5291 or visit the fund’s website at jhinvestments.com.
The performance table above and the chart on the next page do not reflect the deduction of taxes that a shareholder would pay on fund distributions or the redemption of fund shares. The fund’s performance results reflect any applicable expense reductions, without which the expenses would increase and results would have been less favorable.
† Index is the MSCI World ex-USA Growth Index.
See the following page for footnotes.
| |
| 6 | International Growth Equity Fund | Annual report |

| | | | |
| | | With maximum | Without | |
| | Start date | sales charge | sales charge | Index |
|
| Class I3 | 1-31-07 | $12,761 | $12,761 | $11,117 |
|
MSCI World ex-USA Growth Index (gross of foreign withholding taxes on dividends) is a free float-adjusted market capitalization weighted index that is designed to measure the equity market performance of developed markets, excluding the United States of America, that have higher than average growth characteristics.
It is not possible to invest directly in an index. Index figures do not reflect expenses or sales charges, which would have resulted in lower values if they did.
Footnotes related to performance pages
1 From 1-31-07.
2 The fund is the successor to the Turner International Growth Fund (the Predecessor Fund). The performance information shown is the historical performance of the Predecessor Fund’s Investor class shares, which commenced operations on 10-31-08. Periods prior to 10-31-08 represent the performance of the Predecessor Fund’s Institutional class shares, which commenced operations on 1-31-07. Performance for all periods shown has been recalculated to reflect the gross fees and expenses and sales charges of the fund’s Class A shares, which were first offered on 1-14-13. The performance history of the Institutional class shares of the Predecessor Fund was redesignated as that of John Hancock International Growth Equity Fund Class I shares, which were first offered on 1-14-13.
3 For certain types of investors as described in the fund’s prospectuses.
| |
| Annual report | International Growth Equity Fund | 7 |
Management’s discussion of
Fund performance
Turner Investments, L.P.
In the 10-month period ended July 31, 2013, global equities markets were driven higher by expanded monetary programs to keep interest rates low and stimulate economic growth. The role of major central banks continued to serve as a catalyst when stocks pulled back from mid-May to mid-June, triggered by expectations that the U.S. Federal Reserve would begin scaling back its bond-buying program earlier than had been previously forecast. In Japan, steps by newly elected Prime Minister Shinzo Abe to expand the nation’s monetary base fueled optimism that the economy might finally enter a period of sustained growth. Japanese equities rallied in March and April but quickly stalled in mid-May as doubts began to set in about whether the reforms would generate long-term economic progress.
For the 10 months ended July 31, 2013, the fund’s Class A shares posted a total return of 11.37%, excluding sales charges. This result trailed the 14.76% return of the fund’s benchmark, the MSCI World ex-USA Growth Index, and the 11.97% average return of foreign large-cap growth funds as tracked by Morningstar, Inc.† The fund’s underweight in Japanese equities relative to its benchmark significantly detracted from results due to the strong recent performance of Japanese equities. At the sector level, stock selection in consumer discretionary had the largest negative impact, followed by telecommunications services and energy. Sector weightings in industrials and materials contributed positively to fund results. The fund’s top individual contributor was Copa Holdings SA, a Panama-based airline that benefited from expanding air travel in Latin American countries. Another key contributor was Canadian Pacific Railway, Ltd., which was lifted by brisk business related to oil sands energy projects in Canada. Mitsui Fudosan Company, Ltd., a Japanese real estate developer, benefited from growing occupancy rates in Japan’s office buildings. The largest detractor was SoftBank Corp., a Japanese information technology conglomerate. The fund sold its position in this stock during the period. The market reacted negatively to the company’s decision to acquire U.S. wireless carrier Sprint Nextel. Canadian mining stocks Silver Wheaton Corp. and Goldcorp, Inc. were detractors as precious metals prices declined due to the constrained outlook for global economic growth. The fund sold its positions in both stocks during the period. Economic factors also hampered two out-of-benchmark energy positions, Petroleum Geo-Services ASA and Suncor Energy, Inc.
This commentary reflects the views of the portfolio manager through the end of the period discussed in this report. As such, they are in no way guarantees of future events and are not intended to be used as investment advice or a recommendation regarding any specific security. They are also subject to change at any time as market and other conditions warrant.
Past performance is no guarantee of future results.
† Figures from Morningstar, Inc. include reinvested distributions and do not take into account sales charges. Actual load-adjusted performance is lower.
| |
| 8 | International Growth Equity Fund | Annual report |
Your expenses
These examples are intended to help you understand your ongoing operating expenses of investing in the fund so you can compare these costs with the ongoing costs of investing in other mutual funds.
Understanding fund expenses
As a shareholder of the fund, you incur two types of costs:
▪ Transaction costs, which include sales charges (loads) on purchases or redemptions (varies by share class), minimum account fee charge, etc.
▪ Ongoing operating expenses, including management fees, distribution and service fees (if applicable) and other fund expenses.
We are going to present only your ongoing operating expenses here.
Actual expenses/actual returns
This example is intended to provide information about the fund’s actual ongoing operating expenses and is based on the fund’s actual return. It assumes an account value of $1,000.00 on February 1, 2013, with the same investment held until July 31, 2013.
| | | |
| | Account value | Ending value | Expenses paid during |
| | on 2-1-13 | on 7-31-13 | period ended 7-31-131 |
|
| Class A | $1,000.00 | $1,023.10 | $6.77 |
|
| Class I | 1,000.00 | 1,023.90 | 5.52 |
|
Together with the value of your account, you may use this information to estimate the operating expenses that you paid over the period. Simply divide your account value at July 31, 2013 by $1,000.00, then multiply it by the “expenses paid” for your share class from the table above. For example, for an account value of $8,600.00, the operating expenses should be calculated as follows:
| |
| Annual report | International Growth Equity Fund | 9 |
Your expenses
Hypothetical example for comparison purposes
This table allows you to compare the fund’s ongoing operating expenses with those of any other fund. It provides an example of the fund’s hypothetical account values and hypothetical expenses based on each class’s actual expense ratio and an assumed 5% annualized return before expenses (which is not the fund’s actual return). It assumes an account value of $1,000.00 on February 1, 2013, with the same investment held until July 31, 2013. Look in any other fund shareholder report to find its hypothetical example and you will be able to compare these expenses. Please remember that these hypothetical account values and expenses may not be used to estimate the actual ending account balance or expenses you paid for the period.
| | | |
| | Account value | Ending value | Expenses paid during |
| | on 2-1-13 | on 7-31-13 | period ended 7-31-131 |
|
| Class A | $1,000.00 | $1,018.10 | $6.76 |
|
| Class I | 1,000.00 | 1,019.30 | 5.51 |
|
Remember, these examples do not include any transaction costs, therefore, these examples will not help you to determine the relative total costs of owning different funds. If transaction costs were included, your expenses would have been higher. See the prospectus for details regarding transaction costs.
1 Expenses are equal to the fund’s annualized expense ratio of 1.35% and 1.10% for Class A and Class I shares, respectively, multiplied by the average account value over the period, multiplied by 181/365 (to reflect the one-half year period).
| |
| 10 | International Growth Equity Fund | Annual report |
Portfolio summary
| | | | |
| Top 10 Holdings (22.8% of Net Assets on 7-31-13)1,2 | | | |
|
| Roche Holdings AG | 3.3% | | Diageo PLC | 2.0% |
| |
|
| Nestle SA | 3.2% | | GlaxoSmithKline PLC | 2.0% |
| |
|
| Toyota Motor Corp. | 2.7% | | GEA Group AG | 1.9% |
| |
|
| BT Group PLC | 2.1% | | British American Tobacco PLC | 1.8% |
| |
|
| Bayer AG | 2.0% | | Salvatore Ferragamo Italia SpA | 1.8% |
| |
|
| |
| Sector Composition1,3 | | | | |
|
| Consumer Staples | 17.9% | | Materials | 8.1% |
| |
|
| Industrials | 16.6% | | Information Technology | 8.0% |
| |
|
| Consumer Discretionary | 12.8% | | Energy | 6.7% |
| |
|
| Healthcare | 12.7% | | Telecommunication Services | 3.0% |
| |
|
| Financials | 12.6% | | Short-Term Investments & Other | 1.6% |
| |
|
| |
| Top 10 Countries1,2,3 | | | | |
|
| United Kingdom | 16.1% | | France | 5.7% |
| |
|
| Japan | 12.7% | | Sweden | 4.9% |
| |
|
| Switzerland | 12.6% | | Netherlands | 4.2% |
| |
|
| Canada | 8.1% | | Australia | 3.3% |
| |
|
| Germany | 6.9% | | Brazil | 3.2% |
| |
|
1 As a percentage of net assets on 7-31-13.
2 Cash and cash equivalents not included.
3 Foreign investing, especially in emerging markets, has additional risks, such as currency and market volatility and political and social instability. Emerging-market countries may experience higher inflation, interest rates, and unemployment as well as greater social, economic, regulatory, and political uncertainties than more developed countries. Growth stocks may be more susceptible to earnings disappointments. Currency transactions are affected by fluctuations in exchange rates, and frequent trading may increase fund transaction costs. Sector investing is subject to greater risks than the market as a whole. Because the fund may focus on particular sectors of the economy, its performance may depend on the performance of those sectors and investments focused in one sector may fluctuate more widely than investments diversified across sectors. Please see the fund’s prospectuses for additional risks.
| |
| Annual report | International Growth Equity Fund | 11 |
Fund’s investments
As of 7-31-13
| | |
| | Shares | Value |
| |
| Common Stocks 98.4% | | $31,579,209 |
|
| (Cost $27,843,192) | | |
| | | |
| Australia 3.3% | | 1,045,627 |
| | | |
| BHP Billiton, Ltd. | 17,890 | 559,254 |
|
| CSL, Ltd. | 8,190 | 486,373 |
| | | |
| Belgium 0.6% | | 206,425 |
| | | |
| Anheuser-Busch InBev NV | 2,150 | 206,425 |
| | | |
| Brazil 3.2% | | 1,029,426 |
| | | |
| BR Malls Participacoes SA | 24,670 | 218,654 |
|
| Cosan SA Industria e Comercio | 15,070 | 285,764 |
|
| Mills Estruturas e Servicos de Engenharia SA | 17,127 | 213,961 |
|
| Tim Participacoes SA | 83,680 | 311,047 |
| | | |
| Canada 8.1% | | 2,590,766 |
| | | |
| Canadian Pacific Railway, Ltd. | 4,330 | 531,730 |
|
| Enbridge, Inc. | 9,100 | 403,746 |
|
| Franco-Nevada Corp. | 6,320 | 266,641 |
|
| Intact Financial Corp. | 6,900 | 405,831 |
|
| Lululemon Athletica, Inc. (I)(L) | 6,250 | 434,813 |
|
| Suncor Energy, Inc. | 17,340 | 548,005 |
| | | |
| China 0.8% | | 247,608 |
| | | |
| Want Want China Holdings, Ltd. | 183,610 | 247,608 |
| | | |
| Denmark 1.1% | | 338,090 |
| | | |
| Novo Nordisk AS, Class B | 2,000 | 338,090 |
| | | |
| France 5.7% | | 1,829,205 |
| | | |
| Danone SA | 6,710 | 530,118 |
|
| L’Oreal SA | 3,298 | 551,643 |
|
| Sanofi | 2,268 | 242,968 |
|
| Schneider Electric SA | 6,350 | 504,476 |
| | | |
| Germany 6.9% | | 2,208,197 |
| | | |
| BASF SE | 4,980 | 441,551 |
|
| Bayer AG | 5,554 | 645,412 |
|
| GEA Group AG | 14,400 | 593,872 |
|
| Linde AG | 2,740 | 527,362 |
| | | |
| Hong Kong 2.4% | | 771,033 |
| | | |
| AIA Group, Ltd. | 114,149 | 540,536 |
|
| Beijing Enterprises Holdings, Ltd. | 34,660 | 230,497 |
| | |
| 12 | International Growth Equity Fund | Annual report | See notes to financial statements |
| | |
| | Shares | Value |
| | | |
| Ireland 2.4% | | $783,986 |
| | | |
| Covidien PLC | 5,220 | 321,709 |
|
| Experian PLC | 24,688 | 462,277 |
| | | |
| Italy 1.8% | | 586,327 |
| | | |
| Salvatore Ferragamo Italia SpA | 17,187 | 586,327 |
| | | |
| Japan 12.7% | | 4,088,622 |
| | | |
| FANUC Corp. | 3,350 | 507,313 |
|
| Hitachi, Ltd. | 62,540 | 418,952 |
|
| Honda Motor Company, Ltd. | 13,960 | 516,101 |
|
| Japan Tobacco, Inc. | 13,380 | 466,962 |
|
| Komatsu, Ltd. | 19,800 | 441,115 |
|
| Mitsui Fudosan Company, Ltd. | 15,670 | 472,411 |
|
| Murata Manufacturing Company, Ltd. | 5,990 | 411,484 |
|
| Toyota Motor Corp. | 14,020 | 854,284 |
| | | |
| Macau 0.5% | | 157,590 |
| | | |
| Wynn Macau, Ltd. | 55,829 | 157,590 |
| | | |
| Mexico 2.7% | | 871,457 |
| | | |
| Arca Continental SAB de CV | 42,019 | 314,631 |
|
| Cemex SAB de CV (I) | 288,540 | 332,529 |
|
| Concentradora Fibra Hotelera Mexicana SA de CV | 112,880 | 224,297 |
| | | |
| Netherlands 4.2% | | 1,344,893 |
| | | |
| ING Groep NV (I) | 33,180 | 338,585 |
|
| Unilever NV | 14,090 | 565,933 |
|
| Yandex NV, Class A (I) | 13,550 | 440,375 |
| | | |
| Norway 1.4% | | 457,461 |
| | | |
| Petroleum Geo-Services ASA | 34,090 | 457,461 |
| | | |
| Panama 1.3% | | 423,077 |
| | | |
| Copa Holdings SA, Class A | 3,040 | 423,077 |
| | | |
| Philippines 0.9% | | 274,719 |
| | | |
| Metropolitan Bank & Trust Company | 112,540 | 274,719 |
| | | |
| Russia 0.9% | | 296,640 |
| | | |
| Magnit OJSC, GDR | 5,150 | 296,640 |
| | | |
| Singapore 1.2% | | 380,372 |
| | | |
| Avago Technologies, Ltd. | 10,370 | 380,372 |
| | | |
| Spain 1.6% | | 513,211 |
| | | |
| Inditex SA | 3,830 | 513,211 |
| | | |
| Sweden 4.9% | | 1,582,645 |
| | | |
| Assa Abloy AB, Series B | 11,700 | 520,038 |
|
| Swedbank AB, Class A | 22,591 | 542,917 |
|
| Telefonaktiebolaget LM Ericsson, B Shares | 43,830 | 519,690 |
| | | |
| Switzerland 12.6% | | 4,043,165 |
| | | |
| Cie Financiere Richemont SA | 5,530 | 545,049 |
|
| Credit Suisse Group AG (I) | 17,588 | 516,531 |
|
| Nestle SA | 15,217 | 1,029,577 |
|
| Roche Holdings AG | 4,330 | 1,064,570 |
| | |
| See notes to financial statements | Annual report | International Growth Equity Fund | 13 |
| | | |
| | | Shares | Value |
| | | | |
| Switzerland (continued) | | | |
| | | | |
| STMicroelectronics NV (L) | | 44,305 | $379,458 |
|
| Wolseley PLC | | 10,581 | 507,980 |
| | | | |
| United Kingdom 16.1% | | | 5,173,804 |
| | | | |
| BG Group PLC | | 25,850 | 467,869 |
|
| British American Tobacco PLC | | 10,740 | 574,403 |
|
| BT Group PLC | | 128,770 | 665,770 |
|
| Diageo PLC | | 20,750 | 650,320 |
|
| GlaxoSmithKline PLC | | 25,130 | 641,737 |
|
| HSBC Holdings PLC | | 44,960 | 510,019 |
|
| InterContinental Hotels Group PLC | | 17,213 | 499,360 |
|
| Rexam PLC | | 63,260 | 472,843 |
|
| Rolls-Royce Holdings PLC | | 22,298 | 397,585 |
|
| SABMiller PLC (I) | | 5,978 | 293,898 |
| | | | |
| United States 1.1% | | | 334,863 |
| | | | |
| Valeant Pharmaceuticals International, Inc. (I) | | 3,609 | 334,863 |
| |
| | Yield (%) | Shares | Value |
| |
| Securities Lending Collateral 2.2% | | | $693,859 |
|
| (Cost $693,846) | | | |
| | | | |
| John Hancock Collateral Investment Trust (W) | 0.1995 (Y) | 69,335 | 693,859 |
|
| |
| Short-Term Investments 0.7% | | | $230,474 |
|
| (Cost $230,474) | | | |
| | | | |
| Money Market Funds 0.7% | | | 230,474 |
| | | | |
| State Street Institutional Treasury Plus Money | | | |
| Market Fund | 0.0000 (Y) | 230,474 | 230,474 |
| |
| Total investments (Cost $28,767,512)† 101.3% | | | $32,503,542 |
|
| |
| Other assets and liabilities, net (1.3%) | | | ($405,016) |
|
| |
| Total net assets 100.0% | | | $32,098,526 |
|
The percentage shown for each investment category is the total value of the category as a percentage of the net assets of the fund.
GDR Global Depositary Receipt
(I) Non-income producing security.
(L) A portion of this security is on loan as of 7-31-13.
(W) Investment is an affiliate of the fund, the advisor and/or subadvisor. This investment represents collateral received for securities lending.
(Y) The rate shown is the annualized seven-day yield as of 7-31-13.
† At 7-31-13, the aggregate cost of investment securities for federal income tax purposes was $29,234,838. Net unrealized appreciation aggregated $3,268,704, of which $3,713,788 related to appreciated investment securities and $445,084 related to depreciated investment securities.
| | |
| 14 | International Growth Equity Fund | Annual report | See notes to financial statements |
Notes to Schedule of Investments
The fund had the following sector composition as a percentage of net assets on 7-31-13:
| | | | | | |
| Consumer Staples | | 17.9% | | | | |
| Industrials | | 16.6% | | | | |
| Consumer Discretionary | | 12.8% | | | | |
| Health Care | | 12.7% | | | | |
| Financials | | 12.6% | | | | |
| Materials | | 8.1% | | | | |
| Information Technology | | 8.0% | | | | |
| Energy | | 6.7% | | | | |
| Telecommunication Services | | 3.0% | | | | |
| Short-Term Investments & Other | | 1.6% | | | | |
| | |
| | | | |
| Total | | 100% | | | | |
| | |
| See notes to financial statements | Annual report | International Growth Equity Fund | 15 |
FINANCIAL STATEMENTSFinancial statements
Statement of assets and liabilities 7-31-13
This Statement of assets and liabilities is the fund’s balance sheet. It shows the value of what the fund owns, is due and owes. You’ll also find the net asset value and the maximum offering price per share.
| |
| Assets | |
|
| Investments in unaffiliated issuers, at value (Cost $28,073,666) including | |
| $668,431 of securities loaned | $31,809,683 |
| Investments in affiliated issuers, at value (Cost $693,846) | 693,859 |
| | |
| Total investments, at value (Cost $28,767,512) | 32,503,542 |
| Foreign currency, at value (Cost $101,341) | 104,376 |
| Receivable for investments sold | 679,208 |
| Receivable for fund shares sold | 8,977 |
| Dividends and interest receivable | 44,556 |
| Receivable for securities lending income | 295 |
| Other receivables and prepaid expenses | 3,301 |
| | |
| Total assets | 33,344,255 |
| |
| Liabilities | |
|
| Payable for investments purchased | 489,389 |
| Payable for fund shares repurchased | 2,695 |
| Payable upon return of securities loaned | 693,890 |
| Payable to affiliates | |
| Accounting and legal services fees | 681 |
| Transfer agent fees | 3,136 |
| Trustees’ fees | 14 |
| Investment management fees | 1,316 |
| Other liabilities and accrued expenses | 54,608 |
| | |
| Total liabilities | 1,245,729 |
| | |
| Net assets | $32,098,526 |
| |
| Net assets consist of | |
|
| Paid-in capital | $28,307,391 |
| Undistributed net investment income | 261,319 |
| Accumulated net realized gain (loss) on investments and foreign | |
| currency transactions | (208,133) |
| Net unrealized appreciation (depreciation) on investments and translation | |
| of assets and liabilities in foreign currencies | 3,737,949 |
| | |
| Net assets | $32,098,526 |
| |
| Net asset value per share | |
|
| Based on net asset values and shares outstanding — the fund has an | |
| unlimited number of shares authorized with no par value | |
| Class A ($3,880,791 ÷ 325,129 shares) | $11.94 |
| Class I ($28,217,735 ÷ 2,349,791 shares) | $12.01 |
| |
| Maximum offering price per share | |
|
| Class A (net asset value per share ÷ 95%)1 | $12.57 |
1 On single retail sales of less than $50,000. On sales of $50,000 or more and on group sales the offering price is reduced.
| | |
| 16 | International Growth Equity Fund | Annual report | See notes to financial statements |
FINANCIAL STATEMENTS
Statement of operations For the ten-month period ended 7-31-13 and the year ended 9-30-12
These Statements of operations summarize the fund’s investment income earned and expenses incurred in operating the fund. They also show net gains (losses) for the periods stated.
| | |
| | Period ended | Year ended |
| | 7-31-131 | 9-30-12 |
| |
| Investment income | | |
|
| Dividends | $744,925 | $411,438 |
| Securities lending | 13,749 | — |
| Interest | 75 | — |
| Less foreign taxes withheld | (54,427) | (41,228) |
| | | |
| Total investment income | 704,322 | 370,210 |
| |
| Expenses | | |
|
| Investment management fees | 226,427 | 172,025 |
| Distribution and service fees | 11,727 | — |
| Accounting and legal services fees | 12,138 | 24,755 |
| Transfer agent fees | 27,600 | 24,723 |
| Trustees’ fees | 1,106 | 2,388 |
| State registration fees | 15,086 | — |
| Printing and postage | 6,229 | 3,007 |
| Professional fees | 41,187 | 4,503 |
| Custodian fees | 51,161 | 82,040 |
| Registration and filing fees | 24,637 | 26,926 |
| Other | 5,698 | 4,474 |
| | | |
| Total expenses | 422,996 | 344,841 |
| Less expense reductions | (118,903) | (137,111) |
| | | |
| Net expenses | 304,093 | 207,730 |
| | | |
| Net investment income | 400,229 | 162,480 |
| |
| Realized and unrealized gain (loss) | | |
|
| Net realized gain (loss) on | | |
| Investments in unaffiliated issuers | 2,004,199 | (1,416,703) |
| Investments in affiliated issuers | 40 | — |
| Foreign currency transactions | (28,841) | (36,144) |
| | 1,975,398 | (1,452,847) |
| Change in net unrealized appreciation | | |
| (depreciation) of | | |
| Investments in unaffiliated issuers | 1,179,984 | 3,859,468 |
| Investments in affiliated issuers | 13 | — |
| Translation of assets and liabilities in | | |
| foreign currencies | 2,566 | (245) |
| | | |
| | 1,182,563 | 3,859,223 |
| | | |
| Net realized and unrealized gain | 3,157,961 | 2,406,376 |
| | | |
| Increase in net assets from operations | $3,558,190 | $2,568,856 |
1 For the ten-month period ended 7-31-13. The fund changed its fiscal year end from September 30 to July 31.
| | |
| See notes to financial statements | Annual report | International Growth Equity Fund | 17 |
FINANCIAL STATEMENTSStatements of changes in net assets
These Statements of changes in net assets show how the value of the fund’s net assets has changed during the last three periods. The difference reflects earnings less expenses, any investment gains and losses, distributions, if any, paid to shareholders and the net of fund share transactions.
| | | |
| | Period | Year | Year |
| | ended | ended | ended |
| | 7-31-131 | 9-30-122 | 9-30-112 |
| |
| Increase (decrease) in net assets | | | |
|
| From operations | | | |
| Net investment income | $400,229 | $162,480 | $52,436 |
| Net realized gain (loss) | 1,975,398 | (1,452,847) | 422,722 |
| Change in net unrealized appreciation (depreciation) | 1,182,563 | 3,859,223 | (2,124,854) |
| | | | |
| Increase (decrease) in net assets resulting | | | |
| from operations | 3,558,190 | 2,568,856 | (1,649,696) |
| | | | |
| Distributions to shareholders | | | |
| From net investment income | | | |
| Class A | (38,207) | — | (1,395) |
| Class I | (231,228) | — | (47,647) |
| | | | |
| Total distributions | (269,435) | — | (49,042) |
| | | | |
| From fund share transactions | (766,765) | 16,083,620 | 7,493,662 |
| | | | |
| Total increase | 2,521,990 | 18,652,476 | 5,794,924 |
| |
| Net assets | | | |
|
| Beginning of period | 29,576,536 | 10,924,060 | 5,129,136 |
| | | | |
| End of period | $32,098,526 | $29,576,536 | $10,924,060 |
| | | | |
| Undistributed (distributions in excess of) | | | |
| net investment income | $261,319 | $123,142 | ($3,219) |
1 For the ten-month period ended 7-31-13. The fund changed its fiscal year end from September 30 to July 31.
2 Audited by previous independent registered public accounting firm.
| | |
| 18 | International Growth Equity Fund | Annual report | See notes to financial statements |
Financial highlights
The Financial highlights show how the fund’s net asset value for a share has changed during the period.
| | | | | | |
| CLASS A SHARES Period ended | | 7-31-131,2 | 9-30-123 | 9-30-113 | 9-30-103 | 9-30-093,4 |
| |
| Per share operating performance | | | | | | |
|
| Net asset value, beginning of period | | $10.79 | $9.17 | $9.39 | $8.24 | $6.27 |
| Net investment income5 | | 0.12 | 0.08 | 0.05 | 0.05 | 0.07 |
| Net realized and unrealized gain (loss) on investments | | 1.10 | 1.54 | (0.20) | 1.23 | 2.01 |
| Total from investment operations | | 1.22 | 1.62 | (0.15) | 1.28 | 2.08 |
| Less distributions | | | | | | |
| From net investment income | | (0.07) | — | (0.07) | (0.13) | (0.11) |
| Net asset value, end of period | | $11.94 | $10.79 | $9.17 | $9.39 | $8.24 |
| Total return (%)6 | | 11.377 | 17.67 | (1.67) | 15.61 | 33.95 |
| |
| Ratios and supplemental data | | | | | | |
|
| Net assets, end of period (in millions) | | $4 | $6 | $5 | —8 | —8 |
| Ratios (as a percentage of average net assets): | | | | | | |
| Expenses before reductions | | 1.919 | 2.15 | 2.46 | 4.15 | 5.599 |
| Expenses net of fee waivers and credits | | 1.359 | 1.35 | 1.35 | 1.35 | 1.299 |
| Net investment income | | 1.279 | 0.78 | 0.44 | 0.61 | 1.149 |
| Portfolio turnover (%) | | 132 | 138 | 210 | 120 | 139 |
1 For the ten-month period ended 7-31-13. The fund changed its fiscal year end from September 30 to July 31.
2 After the close of business on 1-11-13, holders of Investor Class shares of the former Turner International Growth Fund (the Predecessor Fund) became owners of an equal number of full and fractional Class A shares of the John Hancock International Growth Equity Fund. These shares were first offered on 1-14-13. Additionally, the accounting and performance history of the Investor Class shares of the Predecessor Fund was redesignated as that of John Hancock International Growth Equity Fund Class A.
3 Audited by previous independent registered public accounting firm.
4 Commenced operations on 10-31-08. All ratios for the period have been annualized.
5 Based on the average daily shares outstanding.
6 Total returns would have been lower had certain expenses not been reduced during the applicable periods shown.
7 Not annualized.
8 Less than $500,000.
9 Annualized.
| | |
| See notes to financial statements | Annual report | International Growth Equity Fund | 19 |
| | | | | | |
| CLASS I SHARES Period ended | 7-31-131,2 | 9-30-123 | 9-30-113 | 9-30-103 | 9-30-093 | 9-30-083 |
| |
| Per share operating performance | | | | | | |
|
| Net asset value, beginning of period | $10.86 | $9.21 | $9.41 | $8.24 | $8.34 | $12.21 |
| Net investment income4 | 0.15 | 0.11 | 0.08 | 0.04 | 0.08 | 0.12 |
| Net realized and unrealized gain (loss) | | | | | | |
| on investments | 1.10 | 1.54 | (0.19) | 1.26 | (0.07) | (3.87) |
| Total from investment operations | 1.25 | 1.65 | (0.11) | 1.30 | 0.01 | (3.75) |
| Less distributions | | | | | | |
| From net investment income | (0.10) | — | (0.09) | (0.13) | (0.11) | (0.02) |
| From net realized gain | — | — | — | — | — | (0.10) |
| Total distributions | (0.10) | — | (0.09) | (0.13) | (0.11) | (0.12) |
| Net asset value, end of period | $12.01 | $10.86 | $9.21 | $9.41 | $8.24 | $8.34 |
| Total return (%)5 | 11.606 | 17.92 | (1.32) | 15.88 | 0.71 | (31.04) |
| |
| Ratios and supplemental data | | | | | | |
|
| Net assets, end of period (in millions) | $28 | $23 | $6 | $5 | $4 | $3 |
| Ratios (as a percentage of average net assets): | | | | | | |
| Expenses before reductions | 1.537 | 1.90 | 2.41 | 3.93 | 5.24 | 3.05 |
| Expenses net of fee waivers and credits | 1.107 | 1.10 | 1.10 | 1.10 | 1.10 | 1.108 |
| Net investment income | 1.547 | 1.03 | 0.70 | 0.51 | 1.31 | 1.10 |
| Portfolio turnover (%) | 132 | 138 | 210 | 120 | 139 | 245 |
1 For the ten-month period ended 7-31-13. The fund changed its fiscal year end from September 30 to July 31.
2 After the close of business on 1-11-13, holders of Institutional Class shares of the former Turner International Growth Fund (the Predecessor Fund) became owners of an equal number of full and fractional Class I shares of the John Hancock International Growth Equity Fund. These shares were first offered on 1-14-13. Additionally, the accounting and performance history of the Institutional Class shares of the Predecessor Fund was redesignated as that of John Hancock International Growth Equity Fund Class I.
3 Audited by previous independent registered public accounting firm.
4 Based on the average daily shares outstanding.
5 Total returns would have been lower had certain expenses not been reduced during the applicable periods shown.
6 Not annualized.
7 Annualized.
8 Excluding fees paid indirectly, the ratio of net expenses to average net assets would have been 1.11%.
| | |
| 20 | International Growth Equity Fund | Annual report | See notes to financial statements |
Notes to financial statements
Note 1 — Organization
John Hancock International Growth Equity Fund (the fund) (see Note 7) is a series of John Hancock Funds II (the Trust), an open-end management investment company organized as a Massachusetts business trust and registered under the Investment Company Act of 1940, as amended (the 1940 Act). The investment objective of the fund is to seek long-term capital appreciation. During the period ended July 31, 2013, the fund changed its fiscal year end from September 30 to July 31.
The fund may offer multiple classes of shares. The shares currently offered by the fund are detailed in the Statement of assets and liabilities. Class A shares are offered to all investors. Class I shares are offered to institutions and certain investors. Shareholders of each class have exclusive voting rights to matters that affect that class. The distribution and service fees, if any, transfer agent fees, printing and postage and state registration fees for each class may differ.
The fund is the accounting and performance successor of the Turner International Growth Fund (the Predecessor Fund). At the close of business on January 11, 2013, the fund acquired substantially all the assets and assumed the liabilities of the Predecessor Fund pursuant to an agreement and plan of reorganization, in exchange for Class A and Class I shares of the fund.
Note 2 — Significant accounting policies
The financial statements have been prepared in conformity with accounting principles generally accepted in the United States of America, which require management to make certain estimates and assumptions as of the date of the financial statements. Actual results could differ from those estimates and those differences could be significant. Events or transactions occurring after the end of the fiscal period through the date that the financial statements were issued have been evaluated in the preparation of the financial statements. The following summarizes the significant accounting policies of the fund:
Security valuation. Investments are stated at value as of the close of regular trading on the New York Stock Exchange (NYSE), normally at 4:00 P.M., Eastern Time. In order to value the securities, the fund uses the following valuation techniques: Equity securities held by the fund are valued at the last sale price or official closing price on the principal securities exchange on which they trade. In the event there were no sales during the day or closing prices are not available, the securities are valued using the last quoted bid or evaluated price. Investments by the fund in open-end mutual funds, including John Hancock Collateral Investment Trust (JHCIT), are valued at their respective net asset values each business day. Foreign securities and currencies are valued in U.S. dollars, based on foreign currency exchange rates supplied by an independent pricing service. Certain securities traded only in the over-the-counter market are valued at the last bid price quoted by brokers making markets in the securities at the close of trading. Certain short-term securities are valued at amortized cost.
Other portfolio securities and assets, for which reliable market quotations are not readily available, are valued at fair value as determined in good faith by the fund’s Pricing Committee following procedures established by the Board of Trustees, which include price verification procedures. The frequency with which these fair valuation procedures are used cannot be predicted and fair value of securities may differ significantly from the value that would have been used had a ready market for such securities existed. Generally, trading in foreign securities is substantially completed each day at various times prior to the close of trading on the NYSE. Significant market events that affect the values of foreign securities may occur between the time when the valuation of the securities is
| |
| Annual report | International Growth Equity Fund | 21 |
generally determined and the close of the NYSE. During significant market events, these securities will be valued at fair value, as determined in good faith, following procedures established by the Board of Trustees. The fund may use a fair valuation model to value foreign securities in order to adjust for events that may occur between the close of foreign exchanges and the close of the NYSE.
The fund uses a three-tier hierarchy to prioritize the pricing assumptions, referred to as inputs, used in valuation techniques to measure fair value. Level 1 includes securities valued using quoted prices in active markets for identical securities. Level 2 includes securities valued using other significant observable inputs. Observable inputs may include quoted prices for similar securities, interest rates, prepayment speeds and credit risk. Prices for securities valued using these inputs are received from independent pricing vendors and brokers and are based on an evaluation of the inputs described. Level 3 includes securities valued using significant unobservable inputs when market prices are not readily available or reliable, including the fund’s own assumptions in determining the fair value of investments. Factors used in determining value may include market or issuer specific events or trends, changes in interest rates and credit quality. The inputs or methodology used for valuing securities are not necessarily an indication of the risks associated with investing in those securities.
Changes in valuation techniques may result in transfers into or out of an assigned level within the disclosure hierarchy. Securities with a market value of approximately $13,600,000 at the beginning of the year were transferred from Level 1 to Level 2 during the period since these securities are being valued using significant observable inputs.
The following is a summary of the values by input classification of the fund’s investments as of July 31, 2013, by major security category or type:
| | | | | |
| | | | | | LEVEL 3 |
| | | | | LEVEL 2 | SIGNIFICANT |
| | | TOTAL MARKET | LEVEL 1 | SIGNIFICANT | UNOBSERVABLE |
| | | VALUE AT 7-31-13 | QUOTED PRICE | OBSERVABLE INPUTS | INPUTS |
|
| Common Stocks | | | | | |
| Australia | | $1,045,627 | — | $1,045,627 | — |
| Belgium | | 206,425 | — | 206,425 | — |
| Brazil | | 1,029,426 | $1,029,426 | — | — |
| Canada | | 2,590,766 | 2,590,766 | — | — |
| China | | 247,608 | — | 247,608 | — |
| Denmark | | 338,090 | — | 338,090 | — |
| France | | 1,829,205 | — | 1,829,205 | — |
| Germany | | 2,208,197 | — | 2,208,197 | — |
| Hong Kong | | 771,033 | — | 771,033 | — |
| Ireland | | 783,986 | 321,709 | 462,277 | — |
| Italy | | 586,327 | — | 586,327 | — |
| Japan | | 4,088,622 | — | 4,088,622 | — |
| Macau | | 157,590 | — | 157,590 | — |
| Mexico | | 871,457 | 871,457 | — | — |
| Netherlands | | 1,344,893 | 440,375 | 904,518 | — |
| Norway | | 457,461 | — | 457,461 | — |
| Panama | | 423,077 | 423,077 | — | — |
| Philippines | | 274,719 | — | 274,719 | — |
| Russia | | 296,640 | — | 296,640 | — |
| Singapore | | 380,372 | 380,372 | — | — |
| Spain | | 513,211 | — | 513,211 | — |
| Sweden | | 1,582,645 | — | 1,582,645 | — |
| Switzerland | | 4,043,165 | — | 4,043,165 | — |
| |
| 22 | International Growth Equity Fund | Annual report |
| | | | | |
| | | | | | LEVEL 3 |
| | | | | LEVEL 2 | SIGNIFICANT |
| | | TOTAL MARKET | LEVEL 1 | SIGNIFICANT | UNOBSERVABLE |
| | | VALUE AT 7-31-13 | QUOTED PRICE | OBSERVABLE INPUTS | INPUTS |
|
| Common Stocks (continued) | | | | | |
| United Kingdom | | $5,173,804 | — | $5,173,804 | — |
| United States | | 334,863 | $334,863 | — | — |
| Securities Lending | | | | | |
| Collateral | | 693,859 | 693,859 | — | — |
| Short-Term Investments | | 230,474 | 230,474 | — | — |
| | |
|
| Total Investments | | | | | |
| in Securities | | $32,503,542 | $7,316,378 | $25,187,164 | — |
Security transactions and related investment income. Investment security transactions are accounted for on a trade date plus one basis for daily net asset value calculations. However, for financial reporting purposes, investment transactions are reported on trade date. Interest income is accrued as earned. Dividend income is recorded on the ex-date, except for dividends of foreign securities where the dividend may not be known until after the ex-date. In those cases, dividend income, net of withholding taxes, is recorded when the fund becomes aware of the dividends. Foreign taxes are provided for based on the fund’s understanding of the tax rules and rates that exist in the foreign markets in which it invests. Gains and losses on securities sold are determined on the basis of identified cost and may include proceeds from litigation.
Securities lending. The fund may lend its securities to earn additional income. It receives cash collateral from the borrower in an amount not less than the market value of the loaned securities. The fund will invest its collateral in JHCIT, an affiliate of the fund, which has a floating net asset value (NAV) and is registered with the SEC as an investment company. JHCIT invests cash received as collateral as part of the securities lending program in short-term money-market investments. The fund will receive the benefit of any gains and bear any losses generated by JHCIT with respect to the cash collateral.
If a borrower fails to return loaned securities when due, then the lending agent is responsible to and indemnifies the fund for the lent securities. The lending agent uses the collateral received from the borrower to purchase replacement securities of the same issue, type, class and series of the loaned securities. If the value of the collateral is less than the purchase cost of replacement securities, the lending agent is responsible for satisfying the shortfall but only to the extent that the shortfall is not due to any decrease in the value of JHCIT.
Although the risk of the loss of the securities lent is mitigated by receiving collateral from the borrower and through lending agent indemnification, the fund could experience a delay in recovering its securities or could experience a lower than expected return if the borrower fails to return the securities on a timely basis. The fund may receive compensation for lending its securities by retaining a portion of the return on the investment of the collateral and compensation from fees earned from borrowers of the securities. Net income received from JHCIT is a component of securities lending income as recorded on the Statements of operations.
Collateral received by the fund is shown on the Statement of assets and liabilities as Payable upon return of securities loaned.
Foreign currency translation. Assets, including investments and liabilities denominated in foreign currencies, are translated into U.S. dollar values each day at the prevailing exchange rate. Purchases and sales of securities, income and expenses are translated into U.S. dollars at the prevailing exchange rate on the date of the transaction. The effect of changes in foreign currency exchange rates on the value of securities is reflected as a component of the realized and unrealized gains (losses) on investments.
| |
| Annual report | International Growth Equity Fund | 23 |
Funds that invest internationally generally carry more risk than funds that invest strictly in U.S. securities. Risks can result from differences in economic and political conditions, regulations, market practices (including higher transaction costs), accounting standards and other factors. Foreign investments are also subject to a decline in the value of a foreign currency versus the U.S. dollar, which reduces the dollar value of securities denominated in that currency.
Foreign taxes. The fund may be subject to withholding tax on income and/or capital gains or repatriation taxes imposed by certain countries in which the fund invests. Taxes are accrued based upon investment income, realized gains or unrealized appreciation.
Line of credit. The fund may borrow from banks for temporary or emergency purposes, including meeting redemption requests that otherwise might require the untimely sale of securities. Pursuant to the fund custodian agreement, the custodian may loan money to the fund to make properly authorized payments. The fund is obligated to repay the custodian for any overdraft, including any related costs or expenses. The custodian may have a lien, security interest or security entitlement in any fund property that is not otherwise segregated or pledged, to the maximum extent permitted by law, to the extent of any overdraft.
In addition, the fund and other affiliated funds have entered into an agreement with Citibank N.A. that enables them to participate in a $300 million unsecured committed line of credit. A commitment fee, payable at the end of each calendar quarter, based on the average daily unused portion of the line of credit, is charged to each participating fund on a pro rata basis and is reflected in other expenses on the Statements of operations. From January 14, 2013 to March 27, 2013, the fund participated in a $200 million unsecured line of credit, also with Citibank, with terms otherwise similar to the existing agreement. Commitment fees for the period January 14, 2013 to July 31, 2013 were $187. For the period ended July 31, 2013 the fund had no borrowings under either line of credit.
Expenses. Within the John Hancock funds complex, expenses that are directly attributable to an individual fund are allocated to such fund. Expenses that are not readily attributable to a specific fund are allocated among all funds in an equitable manner, taking into consideration, among other things, the nature and type of expense and the fund’s relative net assets. Expense estimates are accrued in the period to which they relate and adjustments are made when actual amounts are known.
Class allocations. Income, common expenses and realized and unrealized gains (losses) are determined at the fund level and allocated daily to each class of shares based on the net assets of the class. Class-specific expenses, such as distribution and service fees, if any, transfer agent fees, state registration fees and printing and postage expenses, for all classes, are calculated daily at the class level based on the appropriate net assets of each class and the specific expense rates applicable to each class.
Federal income taxes. The fund intends to continue to qualify as a regulated investment company by complying with the applicable provisions of the Internal Revenue Code and will not be subject to federal income tax on taxable income that is distributed to shareholders. Therefore, no federal income tax provision is required.
As of July 31, 2013, the fund had no uncertain tax positions that would require financial statement recognition, derecognition or disclosure. The fund’s federal tax returns are subject to examination by the Internal Revenue Service for a period of three years.
Distribution of income and gains. Distributions to shareholders from net investment income and net realized gains, if any, are recorded on the ex-date. The fund generally declares and pays dividends and capital gain distributions, if any, annually. The tax character of distributions for
| |
| 24 | International Growth Equity Fund | Annual report |
the ten-month period ended July 31, 2013 and the years ended September 30, 2012 and 2011 was as follows:
| | | | |
| | JULY 31, 2013 | SEPTEMBER 30, 2012 | SEPTEMBER 30, 2011 | |
| |
| Ordinary Income | $269,435 | — | $49,042 | |
Distributions paid by the fund with respect to each class of shares are calculated in the same manner, at the same time and in the same amount, except for the effect of class level expenses that may be applied differently to each class. As of July 31, 2013, the components of distributable earnings on a tax basis consisted of $284,533 of undistributed ordinary income and long-term capital gains of $236,300.
Such distributions and distributable earnings, on a tax basis, are determined in conformity with income tax regulations, which may differ from accounting principles generally accepted in the United States of America. Material distributions in excess of tax basis earnings and profits, if any, are reported in the fund’s financial statements as a return of capital.
Capital accounts within the financial statements are adjusted for permanent book-tax differences. These adjustments have no impact on net assets or the results of operations. Temporary book-tax differences, if any, will reverse in a subsequent period. Book-tax differences are primarily attributable to foreign currency transactions, passive foreign investment companies and wash sale loss deferrals.
Note 3 — Guarantees and indemnifications
Under the Trust’s organizational documents, its Officers and Trustees are indemnified against certain liabilities arising out of the performance of their duties to the Trust, including the fund. Additionally, in the normal course of business, the fund enters into contracts with service providers that contain general indemnification clauses. The fund’s maximum exposure under these arrangements is unknown, as this would involve future claims that may be made against the fund that have not yet occurred. The risk of material loss from such claims is considered remote.
Note 4 — Fees and transactions with affiliates
John Hancock Investment Management Services, LLC (the Advisor) serves as investment advisor for the fund. John Hancock Funds, LLC (the Distributor), an affiliate of the Advisor, serves as principal underwriter of the fund. The Advisor and the Distributor are indirect, wholly owned subsidiaries of Manulife Financial Corporation (MFC).
Management fee. The fund has an investment management agreement with the Advisor under which the fund pays a daily management fee to the Advisor equivalent, on an annual basis, to the sum of: (a) 0.850% of the first $750,000,000 of the fund’s average daily net assets; (b) 0.800% of the next $500,000,000 of the fund’s average daily net assets; and (c) 0.750% of the fund’s average daily net assets in excess over $1,250,000,000. The Advisor has a subadvisory agreement with Turner Investments, L.P. (Turner). The fund is not responsible for payment of the subadvisory fees. Prior to January 14, 2013, the Predecessor Fund paid a daily management fee to Turner, on an annual basis of 0.850% based on average net assets.
Effective June 1, 2013, the Advisor has contractually agreed to waive a portion of its management fee for certain funds (the Participating portfolios) of the Trust, John Hancock Variable Insurance Trust, John Hancock Funds and John Hancock Funds III. The waiver equals, on an annualized basis, 0.01% of that portion of the aggregate net assets of all the Participating portfolios that exceeds $75 billion but is less than or equal to $125 billion; 0.0125% of that portion of the aggregate net assets of all the Participating portfolios that exceeds $125 billion but is less than or equal to $150 billion; and 0.015% of that portion of the aggregate net assets of all the Participating portfolios that
| |
| Annual report | International Growth Equity Fund | 25 |
exceeds $150 billion. The amount of the reimbursement is calculated daily and allocated among all the Participating portfolios in proportion to the daily net assets of each fund. This arrangement may be amended or terminated at any time by the Advisor upon notice to the fund and with the approval of the Board of Trustees.
Prior to June 1, 2013 the Advisor had contractually agreed to waive a portion of its management fee for certain funds (the participating portfolios) of the Trust and John Hancock Variable Insurance Trust. The prior waiver equaled, on an annualized basis, 0.01% of that portion of the aggregate net assets of all the participating portfolios that exceeded $75 billion but was less than $100 billion; and 0.015% of that portion of the aggregate net assets of all the participating portfolios that equaled or exceeded $100 billion. The amount of the reimbursement was calculated daily and allocated among all the participating portfolios in proportion to the daily net assets of each fund.
The Advisor has contractually agreed to waive all or a portion of its management fee and/or reimburse or pay operating expenses of the fund to the extent necessary to maintain the fund’s total operating expenses at 1.35% and 1.10%, for Class A and Class I shares, respectively, excluding certain expenses such as taxes, brokerage commissions, interest expense, acquired fund fees and expenses, short dividend expense and litigation and indemnification expenses and other extraordinary expenses not incurred in the ordinary course of the fund’s business. The current expense limitation agreement expires on January 31, 2015, unless renewed by mutual agreement of the fund and the Advisor based upon a determination that this is appropriate under the circumstances at that time.
Additionally, the Advisor has voluntarily agreed to waive and/or reimburse a portion of its management fee or other expenses of the fund if certain expenses of the fund exceed 0.25% of average net assets. Expenses excluded from this waiver include taxes, brokerage commissions, interest expense, litigation and indemnification expenses and other extraordinary expenses not incurred in the ordinary course of the fund’s business, advisory fees, Rule 12b-1 fees, transfer agent and service fees, blue sky fees, printing and postage expenses, acquired fund fees and short dividend expense. This voluntary expense reimbursement may be terminated at any time by the Advisor on notice to the fund.
Accordingly, these expense reductions amounted to $13,113 and $53,487 for Class A and Class I shares, respectively, for the period January 14, 2013 to July 31, 2013.
Prior to January 14, 2013, the Predecessor Fund’s advisor, Turner, the current advisor, had contractually agreed to waive all or a portion of its fees, excluding acquired fund fees and expenses, and interest expenses relating to short sales, to reimburse expenses in order that total fund operating expenses did not exceed 1.35% and 1.10% for Investor Class and Institutional Class shares, respectively, of the Predecessor Fund.
Accordingly, these expense reductions amounted to $10,515 and $41,788 for Investor Class and Institutional Class shares, respectively, for the period October 1, 2012 to January 11, 2013.
The investment management fees, including the impact of the waivers and reimbursements described above, incurred for the ten months ended July 31, 2013 were equivalent to a net annual effective rate of 0.40% of the fund’s average daily net assets.
Expense recapture. The Advisor may recapture operating expenses reimbursed or fees waived under previous expense limitation or waiver arrangements for a period of three years following the beginning of the month in which such reimbursements or waivers originally occurred to the extent that the fund is below its expense limitation during this period. The table below outlines the amounts recovered during the period ended January 14, 2013 through July 31, 2013, and
| |
| 26 | International Growth Equity Fund | Annual report |
the amount of waived or reimbursed expenses subject to potential recovery and the respective expiration dates. Certain reimbursements or waivers are not subject to recapture.
| | | |
| AMOUNTS ELIGIBLE FOR RECOVERY | AMOUNTS RECOVERED DURING | | |
| THROUGH JULY 1, 2016 | THE PERIOD ENDED JULY 31, 2013 | | |
| | |
| $65,806 | — | | |
Accounting and legal services. Pursuant to a service agreement, the fund reimburses the Advisor for all expenses associated with providing the administrative, financial, legal, accounting and recordkeeping services to the fund, including the preparation of all tax returns, periodic reports to shareholders and regulatory reports, among other services. These expenses are allocated to each share class based on its relative net assets at the time the expense was incurred. These accounting and legal services fees incurred for the period January 14, 2013 through July 31, 2013, amounted to an annual rate of 0.01% of the fund’s average daily net assets.
Prior to January 14, 2013, pursuant to an administration agreement, Turner provided administrative services to the Predecessor Fund, as part of Turner Funds. For its services Turner received an annual fee of 0.15% of the aggregate average daily net assets of Turner Funds up to $2 billion and 0.12% of the aggregate average daily net assets over $2 billion. Turner Funds also had a sub-administration Agreement with Citi Funds Services Ohio, Inc., which provided certain fund accounting services to Turner Funds. These administrative and sub-administrative services fees amounted to an annual rate of 0.12% and 0.03% of the Predecessor Fund’s average daily net assets, respectively, for the period October 1, 2012 through January 11, 2013.
For the ten-month period ended July 31, 2013, the combined accounting and legal services and administrative and sub-administrative fees amounted to an annual rate of 0.046%.
Distribution and service plans. The fund has a distribution agreement with the Distributor. The fund has adopted distribution and service plans with respect to Class A shares pursuant to Rule 12b-1 under the 1940 Act, to pay the Distributor for services provided as the distributor of shares of the fund. The fund may pay up to the following contractual rates of distribution and service fees under these arrangements, expressed as an annual percentage of average daily net assets for Class A shares:
| | | | |
| CLASS | RULE 12b–1 FEE | | | |
| | | |
| Class A | 0.30% | | | |
For the period from October 1, 2012 to January 11, 2013, the Predecessor Fund paid DST Systems, Inc. an annual rate of 0.25% of average daily net assets of Investor Class shares for shareholder services fees, which amounted to $4,267.
Sales charges. Class A shares are assessed up-front sales charges, which resulted in payments to the Distributor amounting to $2,355 for the period January 14, 2013 to July 31, 2013. Of this amount, $358 was retained and used for printing prospectuses, advertising, sales literature and other purposes and $1,997 was paid as sales commissions to broker-dealers.
Class A shares may be subject to contingent deferred sales charges (CDSCs). Certain Class A shares that are acquired through purchases of $1 million or more and are redeemed within one year of purchase are subject to a 1.00% sales charge. CDSCs are applied to the lesser of the current market value at the time of redemption or the original purchase cost of the shares being redeemed. Proceeds from CDSCs are used to compensate the Distributor for providing distribution-related services in connection with the sale of these shares. During the period January 14, 2013 to July 31, 2013, the fund did not pay CDSCs for Class A shares.
| |
| Annual report | International Growth Equity Fund | 27 |
Transfer agent fees. The fund has a transfer agent agreement with John Hancock Signature Services, Inc. (Signature Services), an affiliate of the Advisor. The transfer agent fees paid to Signature Services are determined based on the cost to Signature Services (Signature Services Cost) of providing recordkeeping services. The Signature Services Cost includes a component of allocated John Hancock corporate overhead for providing transfer agent services to the fund and to all other John Hancock affiliated funds. It also includes out-of-pocket expenses that are comprised of payments made to third-parties for recordkeeping services provided to their clients who invest in one or more John Hancock funds. In addition, Signature Services Cost may be reduced by certain fees that Signature Services receives in connection with retirement and small accounts. Signature Services Cost is calculated monthly and allocated, as applicable, to four categories of share classes: Institutional Share Classes, Retirement Share Classes, Municipal Bond Classes and all other Retail Share Classes. Within each of these categories, the applicable costs are allocated to the affected John Hancock affiliated funds and/or classes, based on the relative average daily net assets. These transfer agent fees for the period January 14, 2013 through July 31, 2013, amounted to $21,128.
Prior to January 14, 2013, DST Systems, Inc. served as transfer agent of the Predecessor Fund. These transfer agent fees for the period October 1, 2012 through January 11, 2013, amounted to $6,472.
Class level expenses. Class level expenses for the ten months ended July 31, 2013 were:
| | | | |
| | DISTRIBUTION AND | TRANSFER | PRINTING AND | STATE |
| CLASS | SERVICE FEES | AGENT FEES | POSTAGE | REGISTRATION FEES |
|
| A | $11,727 | $5,530 | $1,874 | $3,340 |
| I | — | 22,070 | 4,355 | 11,746 |
| Total | $11,727 | $27,600 | $6,229 | $15,086 |
Trustee expenses. The Trust compensates each Trustee who is not an employee of the Advisor or its affiliates. The costs of paying Trustee compensation and expenses are allocated to each fund based on its average daily net assets.
Note 5 — Fund share transactions
Transactions in fund shares for the ten months ended July 31, 2013 and for the years ended September 30, 2012 and 2011 were as follows:
| | | | | | |
| | Ten months ended 7-31-131 | Year ended 9-30-12 | Year ended 9-30-11 |
| | Shares | Amount | Shares | Amount | Shares | Amount |
| Class A shares | | | | | | |
|
| Sold | 87,066 | $976,815 | 648,843 | $6,899,468 | 572,073 | $6,584,074 |
| Distributions | | | | | | |
| reinvested | 3,427 | 38,005 | — | — | 129 | 1,393 |
| Repurchased | (337,170) | (3,871,397) | (612,673) | (6,345,955) | (48,309) | (510,623) |
| | | | | | | |
| Net increase | | | | | | |
| (decrease) | (246,677) | ($2,856,577) | 36,170 | $553,513 | 523,893 | $6,074,844 |
| | | | | | | |
| Class I shares | | | | | | |
|
| Sold | 233,362 | $2,557,858 | 1,509,128 | $15,611,150 | 126,268 | $1,511,673 |
| Distributions | | | | | | |
| reinvested | 20,275 | 225,863 | — | — | 5,910 | 47,647 |
| Repurchased | (58,226) | (693,909) | (7,869) | (81,043) | (12,657) | (140,502) |
| | | | | | | |
| Net increase | 195,411 | $2,089,812 | 1,501,259 | $15,530,107 | 119,521 | $1,418,818 |
| | | | | | | |
| Total net increase | | | | | | |
| (decrease) | (51,266) | ($766,765) | 1,537,429 | $16,083,620 | 643,414 | $7,493,662 |
|
1 For the ten-month period ended 7-31-13. The fund changed its fiscal year end from September 30 to July 31.
| |
| 28 | International Growth Equity Fund | Annual report |
Note 6 — Purchase and sale of securities
Purchases and sales of securities, other than short-term securities, amounted to $41,144,824 and $41,946,479, respectively, for the ten months ended July 31, 2013.
Note 7 — Reorganization
At the close of business on January 11, 2013, the fund acquired all the assets and liabilities of the Predecessor Fund in exchange for the Class A and Class I shares of the fund. The fund had no assets, liabilities or operations prior to the reorganization.
The Agreement provided for (a) the acquisition of all the assets, subject to all of the liabilities, of the Predecessor Fund in exchange for a representative amount of shares of the fund; (b) the liquidation of the Predecessor Fund; and (c) the distribution to the Predecessor Fund’s shareholders of the fund’s shares. The reorganization was intended to allow the fund to be better positioned to increase asset size and achieve additional economies of scale by increasing sales and spreading fixed expenses over a larger asset base. As a result of the reorganization, the fund is the legal survivor, and the accounting and performance successor to the Predecessor Fund. Investor Class and Institutional Class shares of the Predecessor Fund have been redesignated as that of Class A and Class I shares, respectively, of the fund.
Based on the opinion of tax counsel, the reorganization qualified as a tax-free reorganization for federal income tax purposes with no gain or loss recognized by the Predecessor Fund or its shareholders. Thus, the investments were transferred to the fund at the Predecessor Fund’s identified cost. In addition, the expenses of the reorganization were borne by the Advisors of both the Predecessor Fund and the fund. The effective time of the reorganization occurred immediately after the close of regularly scheduled trading on the NYSE on January 11, 2013. The following outlines the reorganization:
| | | | |
| | ACQUIRED NET ASSET | APPRECIATION OF | | |
| | VALUE OF THE | PREDECESSOR FUND'S | SHARES ISSUED | TOTAL NET ASSETS |
| PREDECESSOR FUND | PREDECESSOR FUND | INVESTMENTS | BY THE FUND | AFTER COMBINATION |
|
| Turner International | $33,298,902 | $4,223,198 | 2,903,133 | $33,298,902 |
| Growth Fund | | | | |
| |
| Annual report | International Growth Equity Fund | 29 |
Auditor’s report
Report of Independent Registered Public Accounting Firm
To the Board of Trustees of John Hancock Funds II and Shareholders of
John Hancock International Growth Equity Fund:
In our opinion, the accompanying statement of assets and liabilities, including the schedule of investments, and the related statements of operations and of changes in net assets and the financial highlights present fairly, in all material respects, the financial position of John Hancock International Growth Equity Fund (the “Fund”) at July 31, 2013, and the results of its operations, the changes in its net assets and the financial highlights for the period then ended, in conformity with accounting principles generally accepted in the United States of America. These financial statements and financial highlights (hereafter referred to as “financial statements”) are the responsibility of the Fund’s management; our responsibility is to express an opinion on these financial statements based on our audit. We conducted our audit of these financial statements in accordance with the standards of the Public Company Accounting Oversight Board (United States). Those standards require that we plan and perform the audit to obtain reasonable assurance about whether the financial statements are free of material misstatement. An audit includes examining, on a test basis, evidence supporting the amounts and disclosures in the financial statements, assessing the accounting principles used and significant estimates made by management, and evaluating the overall financial statement presentation. We believe that our audit, which included confirmation of securities at July 31, 2013 by correspondence with the custodian, agent banks and brokers, and the application of alternative auditing procedures where securities purchased confirmations had not been received, provides a reasonable basis for our opinion.
The statement of operations of the Fund for the year ending September 30, 2012, the statements of changes in net assets for the years ending September 30, 2012 and September 30, 2011, and the financial highlights for the years ending September 30, 2008 through September 30, 2012 were audited by another independent registered public accounting firm, whose report dated November 29, 2012 expressed an unqualified opinion on those financial statements.
PricewaterhouseCoopers LLP
Boston, Massachusetts
September 20, 2013
| |
| 30 | International Growth Equity Fund | Annual report |
Tax information
Unaudited
For federal income tax purposes, the following information is furnished with respect to the distributions of the fund, if any, paid during its taxable year ended July 31, 2013.
The fund reports the maximum amount allowable of its net taxable income as eligible for the corporate dividends-received deduction.
The fund reports the maximum amount allowable of its net taxable income as qualified dividend income as provided in the Jobs and Growth Tax Relief Reconciliation Act of 2003.
Income derived from foreign sources was $629,843. The fund intends to pass through foreign tax credits of $31,694.
Eligible shareholders will be mailed a 2013 Form 1099-DIV in early 2014. This will reflect the tax character of all distributions paid in calendar year 2013.
Please consult a tax advisor regarding the tax consequences of your investment in the fund.
| |
| Annual report | International Growth Equity Fund | 31 |
Trustees and Officers
This chart provides information about the Trustees and Officers who oversee your John Hancock fund. Officers elected by the Trustees manage the day-to-day operations of the fund and execute policies formulated by the Trustees.
| | |
| Independent Trustees | | |
| | | |
| Name, year of birth | Trustee | Number of John |
| Position(s) held with fund | of the | Hancock funds |
| Principal occupation(s) and other | Trust | overseen by |
| directorships during past 5 years | since1 | Trustee |
| |
| James M. Oates, Born: 1946 | 2012 | 231 |
|
| Managing Director, Wydown Group (financial consulting firm) (since 1994); Chairman and Director, |
| Emerson Investment Management, Inc. (since 2000); Independent Chairman, Hudson Castle Group, Inc. |
| (formerly IBEX Capital Markets, Inc.) (financial services company) (1997–2011); Director, Stifel Financial |
| (since 1996); Director, Investor Financial Services Corporation (1995–2007); Director, Connecticut River |
| Bancorp (since 1998); Director, Virtus Funds (formerly Phoenix Mutual Funds) (since 1988). Trustee |
| and Chairperson of the Board, John Hancock retail funds (since 2012); Trustee (2005–2006 and since |
| 2012) and Chairperson of the Board (since 2012), John Hancock Funds III; Trustee (since 2004) and |
| Chairperson of the Board (since 2005), John Hancock Variable Insurance Trust; Trustee and Chairperson |
| of the Board (since 2005), John Hancock Funds II. | | |
|
| |
| Charles L. Bardelis,3 Born: 1941 | 2012 | 231 |
|
| Director, Island Commuter Corp. (marine transport). Trustee, John Hancock retail funds (since 2012); |
| Trustee, John Hancock Funds III (2005–2006 and since 2012); Trustee, John Hancock Variable Insurance |
| Trust (since 1988); Trustee, John Hancock Funds II (since 2005). | | |
|
| |
| Peter S. Burgess,3 Born: 1942 | 2012 | 231 |
|
| Consultant (financial, accounting, and auditing matters) (since 1999); Certified Public Accountant; |
| Partner, Arthur Andersen (independent public accounting firm) (prior to 1999); Director, Lincoln |
| Educational Services Corporation (since 2004); Director, Symetra Financial Corporation (since 2010); |
| former Director, PMA Capital Corporation (2004–2010). Trustee, John Hancock retail funds (since 2012); |
| Trustee, John Hancock Funds III (2005–2006 and since 2012); Trustee, John Hancock Variable Insurance |
| Trust and John Hancock Funds II (since 2005). | | �� |
|
| |
| William H. Cunningham,2 Born: 1944 | 1994 | 231 |
|
| Professor, University of Texas, Austin, Texas (since 1971); former Chancellor, University of Texas |
| System and former President of the University of Texas, Austin, Texas; Director, LIN Television (since |
| 2009); Chairman (since 2009) and Director (since 2006), Lincoln National Corporation (insurance); |
| Director, Resolute Energy Corporation (since 2009); Director, Southwest Airlines (since 2000); former |
| Director, Introgen (manufacturer of biopharmaceuticals) (until 2008); former Director, Hicks Acquisition |
| Company I, Inc. (until 2007); former Director, Texas Exchange Bank, SSB (formerly Bank of Crowley) |
| (until 2009); former Advisory Director, JPMorgan Chase Bank (formerly Texas Commerce Bank–Austin) |
| (until 2009). Trustee, John Hancock retail funds (since 1986); Trustee, John Hancock Variable Insurance |
| Trust (since 2012); Trustee, John Hancock Funds II (since 2012 and 2005–2006). | |
|
| |
| Grace K. Fey, Born: 1946 | 2012 | 231 |
|
| Chief Executive Officer, Grace Fey Advisors (since 2007); Director and Executive Vice President, |
| Frontier Capital Management Company (1988–2007); Director, Fiduciary Trust (since 2009). |
| Trustee, John Hancock retail funds (since 2012); Trustee, John Hancock Variable Insurance Trust and |
| John Hancock Funds II (since 2008). | | |
| |
| 32 | International Growth Equity Fund | Annual report |
| | |
| Independent Trustees (continued) | | |
| |
| Name, year of birth | Trustee | Number of John |
| Position(s) held with fund | of the | Hancock funds |
| Principal occupation(s) and other | Trust | overseen by |
| directorships during past 5 years | since1 | Trustee |
| |
| Theron S. Hoffman,3 Born: 1947 | 2012 | 231 |
|
| Chief Executive Officer, T. Hoffman Associates, LLC (consulting firm) (since 2003); Director, The Todd |
| Organization (consulting firm) (2003–2010); President, Westport Resources Management (investment |
| management consulting firm) (2006–2008); Senior Managing Director, Partner, and Operating Head, |
| Putnam Investments (2000–2003); Executive Vice President, The Thomson Corp. (financial and |
| legal information publishing) (1997–2000). Trustee, John Hancock retail funds (since 2012); Trustee, |
| John Hancock Variable Insurance Trust and John Hancock Funds II (since 2008). | |
|
| |
| Deborah C. Jackson,2 Born: 1952 | 2008 | 231 |
|
| President, Cambridge College, Cambridge, Massachusetts (since 2011); Chief Executive Officer, |
| American Red Cross of Massachusetts Bay (2002–2011); Board of Directors of Eastern Bank Corporation |
| (since 2001); Board of Directors of Eastern Bank Charitable Foundation (since 2001); Board of Directors |
| of American Student Assistance Corporation (1996–2009); Board of Directors of Boston Stock Exchange |
| (2002–2008); Board of Directors of Harvard Pilgrim Healthcare (health benefits company) (2007–2011). |
| Trustee, John Hancock retail funds (since 2008); Trustee of John Hancock Variable Insurance Trust and |
| John Hancock Funds II (since 2012). | | |
|
| |
| Hassell H. McClellan, Born: 1945 | 2012 | 231 |
|
| Associate Professor, The Wallace E. Carroll School of Management, Boston College (since 1984); |
| Trustee, Virtus Variable Insurance Trust (formerly Phoenix Edge Series Funds) (since 2008); Director, |
| The Barnes Group (since 2010). Trustee, John Hancock retail funds (since 2012); Trustee, John Hancock |
| Funds III (2005–2006 and since 2012); Trustee, John Hancock Variable Insurance Trust and | |
| John Hancock Funds II (since 2005). | | |
|
| |
| Steven R. Pruchansky,2 Born: 1944 | 1991 | 231 |
|
| Chairman and Chief Executive Officer, Greenscapes of Southwest Florida, Inc. (since 2000); Director |
| and President, Greenscapes of Southwest Florida, Inc. (until 2000); Member, Board of Advisors, First |
| American Bank (until 2010); Managing Director, Jon James, LLC (real estate) (since 2000); Director, |
| First Signature Bank & Trust Company (until 1991); Director, Mast Realty Trust (until 1994); President, |
| Maxwell Building Corp. (until 1991). Trustee (since 1992) and Chairperson of the Board (2011–2012), |
| John Hancock retail funds; Trustee and Vice Chairperson of the Board, John Hancock retail funds, |
| John Hancock Variable Insurance Trust and John Hancock Funds II (since 2012). | |
|
| |
| Gregory A. Russo,2 Born: 1949 | 2009 | 231 |
|
| Director and Audit Committee Chairman (since 2012) and Member, Audit Committee and Finance |
| Committee (since 2011), NCH Healthcare System, Inc. (holding company for multi-entity healthcare |
| system); Director and Member of Finance Committee, The Moorings, Inc. (nonprofit continuing care |
| community) (since 2012); Vice Chairman, Risk & Regulatory Matters, KPMG LLP (KPMG) (2002–2006); |
| Vice Chairman, Industrial Markets, KPMG (1998–2002); Chairman and Treasurer, Westchester |
| County, New York, Chamber of Commerce (1986–1992); Director, Treasurer and Chairman of |
| Audit and Finance Committees, Putnam Hospital Center (1989–1995); Director and Chairman of |
| Fundraising Campaign, United Way of Westchester and Putnam Counties, New York (1990–1995). |
| Trustee, John Hancock retail funds (since 2008); Trustee, John Hancock Variable Insurance Trust and |
| John Hancock Funds II (since 2012). | | |
| |
| Annual report | International Growth Equity Fund | 33 |
| | |
| Non-Independent Trustees4 | | |
| | | |
| Name, year of birth | Trustee | Number of John |
| Position(s) held with fund | of the | Hancock funds |
| Principal occupation(s) and other | Trust | overseen by |
| directorships during past 5 years | since1 | Trustee |
| |
| James R. Boyle, Born: 1959 | 2012 | 231 |
|
| Senior Executive Vice President, John Hancock Financial Services (1999–2012, including prior positions); |
| Chairman and Director, John Hancock Advisers, LLC, John Hancock Funds, LLC, and John Hancock |
| Investment Management Services, LLC (2005–2010). Trustee, John Hancock retail funds (since 2012 and |
| 2005–2010), Trustee, John Hancock Variable Insurance Trust and John Hancock Funds II (since 2005). |
|
| |
| Craig Bromley,2 Born: 1966 | 2012 | 231 |
|
| President, John Hancock Financial Services (since 2012); Senior Executive Vice President and General |
| Manager, U.S. Division, John Hancock Financial Services (since 2012); President and Chief Executive |
| Officer, Manulife Insurance Company (Manulife (Japan) (2005–2012), including prior positions). |
| Trustee, John Hancock retail funds (since 2012); Trustee, John Hancock Variable Insurance Trust and |
| John Hancock Funds II (since 2012). | | |
|
| |
| Warren A. Thomson,2 Born: 1955 | 2012 | 231 |
|
| Senior Executive Vice President and Chief Investment Officer, Manulife Financial Corporation and The |
| Manufacturers Life Insurance Company (since 2009); Chairman and Chief Executive Officer, Manulife |
| Asset Management (since 2001, including prior positions); Director (since 2006), and President and |
| Chief Executive Officer of Manulife Asset Management Limited (since 2013); Director and Chairman, |
| Hancock Natural Resources Group, Inc. (since 2013). Trustee, John Hancock retail funds, John Hancock |
| Variable Insurance Trust and John Hancock Funds II (since 2012). | | |
| |
| Principal officers who are not Trustees | | |
| | | |
| Name, year of birth | | Officer |
| Position(s) held with fund | | of the |
| Principal occupation(s) and other | | Trust |
| directorships during past 5 years | | since |
| |
| Hugh McHaffie, Born: 1959 | | 2009 |
|
| President | | |
| Executive Vice President, John Hancock Financial Services (since 2006, including prior positions); |
| Chairman and Director, John Hancock Advisers, LLC, John Hancock Investment Management Services, |
| LLC and John Hancock Funds, LLC (since 2010); President, John Hancock Advisers, LLC (since 2012); |
| President, John Hancock Investment Management Services, LLC (since 2010). President (since 2012) and |
| former Trustee (2010–2012), John Hancock retail funds; President, John Hancock Variable Insurance |
| Trust and John Hancock Funds II (since 2009). | | |
|
| |
| Andrew G. Arnott, Born: 1971 | | 2009 |
|
| Executive Vice President | | |
| Senior Vice President, John Hancock Financial Services (since 2009); Director and Executive Vice |
| President, John Hancock Advisers, LLC (since 2005, including prior positions); Director and Executive |
| Vice President, John Hancock Investment Management Services, LLC (since 2006, including prior |
| positions); President, John Hancock Funds, LLC (since 2004, including prior positions); Executive Vice |
| President, John Hancock retail funds, John Hancock Variable Insurance Trust and John Hancock Funds II |
| (since 2007, including prior positions). | | |
|
| |
| Thomas M. Kinzler, Born: 1955 | | 2006 |
|
| Secretary and Chief Legal Officer | | |
| Vice President, John Hancock Financial Services (since 2006); Secretary and Chief Legal Counsel, |
| John Hancock Funds, LLC (since 2007); Secretary and Chief Legal Officer, John Hancock retail funds, |
| John Hancock Variable Insurance Trust and John Hancock Funds II (since 2006). | |
| |
| 34 | International Growth Equity Fund | Annual report |
| |
| Principal officers who are not Trustees (continued) | |
| |
| Name, year of birth | Officer |
| Position(s) held with fund | of the |
| Principal occupation(s) and other | Trust |
| directorships during past 5 years | since |
| |
| Francis V. Knox, Jr., Born: 1947 | 2005 |
|
| Chief Compliance Officer | |
| Vice President, John Hancock Financial Services (since 2005); Chief Compliance Officer, John Hancock |
| retail funds, John Hancock Variable Insurance Trust, John Hancock Funds II, John Hancock Advisers, |
| LLC and John Hancock Investment Management Services, LLC (since 2005); Vice President and Chief |
| Compliance Officer, John Hancock Asset Management a division of Manulife Asset Management (US) |
| LLC (2005–2008). | |
|
| |
| Charles A. Rizzo, Born: 1957 | 2007 |
|
| Chief Financial Officer | |
| Vice President, John Hancock Financial Services (since 2008); Senior Vice President, John Hancock | |
| Advisers, LLC and John Hancock Investment Management Services, LLC (since 2008); Chief Financial |
| Officer, John Hancock retail funds, John Hancock Variable Insurance Trust and John Hancock Funds II |
| (since 2007). | |
|
| |
| Salvatore Schiavone, Born: 1965 | 2009 |
|
| Treasurer | |
| Assistant Vice President, John Hancock Financial Services (since 2007); Vice President, John Hancock |
| Advisers, LLC and John Hancock Investment Management Services, LLC (since 2007); Treasurer, | |
| John Hancock retail funds (since 2007, including prior positions); Treasurer, John Hancock Variable | |
| Insurance Trust and John Hancock Funds II (since 2010 and 2007–2009, including prior positions). | |
John Hancock retail funds is comprised of John Hancock Funds III and 34 other John Hancock funds consisting of 24 series of other John Hancock trusts and 10 closed-end funds.
The business address for all Trustees and Officers is 601 Congress Street, Boston, Massachusetts 02210-2805.
The Statement of Additional Information of the fund includes additional information about members of the Board of Trustees of the Trust and is available without charge, upon request, by calling 800-225-5291.
1 Each Trustee holds office until his or her successor is elected and qualified, or until the Trustee’s death, retirement, resignation or removal.
2 Became a Trustee of the Trust effective December 1, 2012.
3 Member of Audit Committee.
4 Because Messrs. Bromley and Thomson are senior executives or directors and Mr. Boyle held prior positions as a senior executive and director of the Advisor and/or its affiliates, each of them is considered an “interested person,” as defined in the Investment Company Act of 1940, of the Trust.
| |
| Annual report | International Growth Equity Fund | 35 |
More information
| |
| Trustees | Investment advisor |
| James M. Oates, Chairperson | John Hancock Investment Management |
| Steven R. Pruchansky, Vice Chairperson | Services, LLC |
| Charles L. Bardelis* | |
| James R. Boyle† | Subadvisor |
| Craig Bromley† | Turner Investments, L.P. |
| Peter S. Burgess* | |
| William H. Cunningham | Principal distributor |
| Grace K. Fey | John Hancock Funds, LLC |
| Theron S. Hoffman* | |
| Deborah C. Jackson | Custodian |
| Hassell H. McClellan | State Street Bank and Trust Company |
| Gregory A. Russo | |
| Warren A. Thomson† | Transfer agent |
| | John Hancock Signature Services, Inc. |
| Officers | |
| Hugh McHaffie | Legal counsel |
| President | K&L Gates LLP |
| | |
| Andrew G. Arnott | Independent registered |
| Executive Vice President | public accounting firm |
| | PricewaterhouseCoopers LLP |
| Thomas M. Kinzler | |
| Secretary and Chief Legal Officer | |
| | |
| Francis V. Knox, Jr. | |
| Chief Compliance Officer | |
| | |
| Charles A. Rizzo | |
| Chief Financial Officer | |
| | |
| Salvatore Schiavone | |
| Treasurer | |
| |
| *Member of the Audit Committee | |
| †Non-Independent Trustee | |
The fund’s proxy voting policies and procedures, as well as the fund’s proxy voting record for the most recent twelve-month period ended June 30, are available free of charge on the Securities and Exchange Commission (SEC) website at sec.gov or on our website.
The fund’s complete list of portfolio holdings, for the first and third fiscal quarters, is filed with the SEC on Form N-Q. The fund’s Form N-Q is available on our website and the SEC’s website, sec.gov, and can be reviewed and copied (for a fee) at the SEC’s Public Reference Room in Washington, DC. Call 800-SEC-0330 to receive information on the operation of the SEC’s Public Reference Room.
We make this information on your fund, as well as monthly portfolio holdings, and other fund details available on our website at jhinvestments.com or by calling 800-225-5291.
| | |
| You can also contact us: | | |
| 800-225-5291 | Regular mail: | Express mail: |
| jhinvestments.com | Investment Operations | Investment Operations |
| | John Hancock Signature Services, Inc. | John Hancock Signature Services, Inc. |
| | P.O. Box 55913 | 30 Dan Road |
| | Boston, MA 02205-5913 | Canton, MA 02021 |
| |
| 36 | International Growth Equity Fund | Annual report |

800-225-5291
800-338-8080 EASI-Line
jhinvestments.com
| |
| This report is for the information of the shareholders of John Hancock International Growth Equity Fund. | |
| It is not authorized for distribution to prospective investors unless preceded or accompanied by a prospectus. | 420A 7/13 |
| MF150743 | 9/13 |
ITEM 2. CODE OF ETHICS.
(a) As of the end of the fiscal year July 31, 2013 the registrant has adopted a code of ethics, as defined in Item 2 of Form N-CSR, that applies to its Principal Executive Officer and Principal Chief Financial Officer. A copy of the code of ethics is filed as an exhibit to this Form N-CSR.
(b)Not applicable
(c)Not applicable
(d)Not applicable
(e)Not applicable
(f)(1) A copy of the Code of Ethics is attached hereto.
|
| JOHN HANCOCK VARIABLE INSURANCE TRUST |
| JOHN HANCOCK FUNDS |
| JOHN HANCOCK FUNDS II |
| JOHN HANCOCK FUNDS III |
| |
| SARBANES-OXLEY CODE OF ETHICS |
| FOR |
| PRINCIPAL EXECUTIVE, PRINCIPAL FINANCIAL OFFICERS & TREASURER |
I. Covered Officers/Purpose of the Code
This code of ethics (this “Code”) for John Hancock Variable Insurance Trust, John Hancock Funds1, John Hancock Funds II and John Hancock Funds III, each a registered management investment company under the Investment Company Act of 1940, as amended (“1940 Act”), which may issue shares in separate and distinct series (each investment company and series thereunder to be hereinafter referred to as a “Fund”), applies to each Fund’s Principal Executive Officer (“President”), Principal Financial Officer (“Chief Financial Officer”) and Treasurer (“Treasurer”) (the “Covered Officers” as set forth in Exhibit A) for the purpose of promoting:
► honest and ethical conduct, including the ethical handling of actual or apparent conflicts of interest between personal and professional relationships;
► full, fair, accurate, timely and understandable disclosure in reports and documents that the Fund files with, or submits to, the Securities and Exchange Commission (“SEC”) and in other public communications made by the Fund;
► compliance with applicable laws and governmental rules and regulations;
► the prompt internal reporting of violations of the Code to an appropriate person or persons identified in the Code; and
► accountability for adherence to the Code.
____________________________________
1 John Hancock Funds includes the following trusts: John Hancock Financial Opportunities Fund; John Hancock Bond Trust; John Hancock California Tax-Free Income Fund; John Hancock Capital Series; John Hancock Current Interest; John Hancock Income Securities Trust; John Hancock Investment Trust; John Hancock Investment Trust II; John Hancock Investment Trust III; John Hancock Investors Trust; John Hancock Municipal Securities Trust; John Hancock Premium Dividend Fund ; John Hancock Preferred Income Fund; John Hancock Preferred Income Fund II; John Hancock Preferred Income Fund III; John Hancock Series Trust; John Hancock Sovereign Bond Fund; John Hancock Strategic Series; John Hancock Tax-Exempt Series Fund; John Hancock Tax-Advantaged Dividend Income Fund; John Hancock Tax-Advantaged Global Shareholder Yield Fund and John Hancock Hedged Equity and Income Fund.
Each of the Covered Officers should adhere to a high standard of business ethics and should be sensitive to situations that may give rise to actual as well as apparent conflicts of interest.
II. Covered Officers Should Handle Ethically Actual and Apparent Conflicts of Interest
Overview
A “conflict of interest” occurs when a Covered Officer’s private interest interferes with the interests of, or his service to, the Fund. For example, a conflict of interest would arise if a Covered Officer, or a member of his family, receives improper personal benefits as a result of his position with the Fund. Certain conflicts of interest arise out of the relationships between the Covered Officers and the Fund and already are subject to conflict of interest provisions in the Investment Company Act of 1940, as amended (the “Investment Company Act”) and the Investment Advisers Act of 1940, as amended (the “Investment Advisers Act”). For example, Covered Officers may not individually engage in certain transactions (such as the purchase or sale of securities or other property) with the Fund because of their status as “affiliated persons” of the Fund. Each of the Covered Officers is an officer or employee of the investment adviser or a service provider (“Service Provider”) to the Fund. The Fund’s, the investment adviser’s and the Service Provider’s compliance programs and procedures are designed to prevent, or identify and correct, violations of these provisions. This Code does not, and is not intended to, repeat or replace these programs and procedures, and such conflicts fall outside of the parameters of this Code.
Although typically not presenting an opportunity for improper personal benefit, conflicts arise from, or as a result of, the contractual relationship between the Fund and the investment adviser and the Service Provider of which the Covered Officers are also officers or employees. As a result, this Code recognizes that the Covered Officers will, in the normal course of their duties (whether formally for the Fund, for the investment adviser or for the Service Provider), be involved in establishing policies and implementing decisions which will have different effects on the investment adviser, the Service Provider and the Fund. The participation of the Covered Officers in such activities is inherent in the contractual relationship between the Fund and the investment adviser and the Service Provider and is consistent with the performance by the Covered Officers of their duties as officers of the Fund. Thus, if such participation is performed in conformity with the provisions of the Investment Company Act and the Investment Advisers Act, it will be deemed to have been handled ethically. In addition, it is recognized by the Fund’s Board of Trustees/Directors (the “Board”) that the Covered Officers may also be officers or employees of one or more other investment companies covered by other Codes.
Other conflicts of interest are covered by the Code, even if such conflicts of interest are not subject to provisions in the Investment Company Act and the Investment Advisers Act. The following list provides examples of conflicts of interest under the Code, but the Covered Officers should keep in mind that these examples are not exhaustive. The overarching principle is that the personal interest of a Covered Officer should not be placed improperly before the interest of the Fund.
Each Covered Officer must:
► not use his/her personal influence or personal relationships improperly to influence investment decisions or financial reporting by the Fund whereby the Covered Officer would benefit personally to the detriment of the Fund;
► not cause the Fund to take action, or fail to take action, for the individual personal benefit of the Covered Officer rather than for the benefit of the Fund; and
► not use material non-public knowledge of portfolio transactions made or contemplated for the Fund to trade personally or cause others to trade personally in contemplation of the market effect of such transactions.
Additionally, conflicts of interest may arise in other situations, the propriety of which may be discussed, if material, with the Fund’s Chief Compliance Officer (“CCO”). Examples of these include:
► service as a director/trustee on the board of any public or private company;
► the receipt of any non-nominal gifts;
► the receipt of any entertainment from any company with which the Fund has current or prospective business dealings unless such entertainment is business-related, reasonable in cost, appropriate as to time and place, and not so frequent as to raise any question of impropriety (or other formulation as the Fund already uses in another code of conduct);
► any ownership interest in, or any consulting or employment relationship with, any of the Fund’s service providers, other than its investment adviser, any sub-adviser, principal underwriter, administrator or any affiliated person thereof; and
► a direct or indirect financial interest in commissions, transaction charges or spreads paid by the Fund for effecting portfolio transactions or for selling or redeeming shares other than an interest arising from the Covered Officer’s employment, such as compensation or equity ownership.
III. Disclosure & Compliance
► Each Covered Officer should familiarize himself or herself with the disclosure requirements generally applicable to the Fund;
► Each Covered Officer should not knowingly misrepresent, or cause others to misrepresent, facts about the Fund to others, whether within or outside the Fund, including to the Fund’s directors and auditors, and to governmental regulators and self-regulatory organizations;
► Each Covered Officer should, to the extent appropriate within his/her area of responsibility, consult with other officers and employees of the Fund and the Fund’s adviser or any sub-adviser with the goal of promoting full, fair, accurate, timely and understandable disclosure in the reports and documents the Fund files with, or submits to, the SEC and in other public communications made by the Fund; and
► It is the responsibility of each Covered Officer to promote compliance with the standards and restrictions imposed by applicable laws, rules and regulations.
IV. Reporting & Accountability
Each Covered Officer must:
► upon adoption of the Code (or thereafter as applicable, upon becoming an Covered Officer), affirm in writing to the Fund’s CCO that he/she has received, read, and understands the Code;
► annually thereafter affirm to the Fund’s CCO that he/she has complied with the requirements of the Code;
► not retaliate against any employee or Covered Officer or their affiliated persons for reports of potential violations that are made in good faith;
► notify the Fund’s CCO promptly if he/she knows of any violation of this Code (Note: failure to do so is itself a violation of this Code); and
► report at least annually any change in his/her affiliations from the prior year.
The Fund’s CCO is responsible for applying this Code to specific situations in which questions are presented under it and has the authority to interpret this Code in any particular situation. However, any approvals or waivers sought by the Principal Executive Officer will be considered by the Fund’s Board or the Compliance Committee thereof (the “Committee”).
The Fund will follow these procedures in investigating and enforcing this Code:
► the Fund’s CCO will take all appropriate action to investigate any potential violations reported to him/her;
► if, after such investigation, the CCO believes that no violation has occurred, the CCO is not required to take any further action;
► any matter that the CCO believes is a violation will be reported to the Board or, if applicable, Compliance Committee;
► if the Board or, if applicable, Compliance Committee concurs that a violation has occurred, the Board, either upon its determination of a violation or upon recommendation of the Compliance Committee, if applicable, will consider appropriate action, which may include review of, and appropriate modifications to, applicable policies and procedures; notification to appropriate personnel of the Service Provider or the investment adviser or its board; or a recommendation to dismiss the Registrant’s Executive Officer;
► the Board, or if applicable the Compliance Committee, will be responsible for granting waivers, as appropriate; and
► any changes to or waivers of this Code will, to the extent required, be disclosed as provided by SEC rules.
V. Other Policies & Procedures
This Code shall be the sole code of ethics adopted by the Fund for purposes of Section 406 of the Sarbanes-Oxley Act of 2002 and the rules and forms applicable to registered investment companies thereunder. Insofar as other policies or procedures of the Fund, the Fund’s adviser, any sub-adviser, principal underwriter or other service providers govern or purport to govern the behavior or activities of the Covered Officers who are subject to this Code, they are superseded by this Code to the extent that they overlap or conflict with the provisions of this Code. The Fund’s and its investment adviser’s codes of ethics under Rule 204A-1 under the Investment Advisers Act and Rule 17j-1 under the Investment Company Act, respectively, are separate requirements applying to the Covered Officers and others, and are not part of this Code.
VI. Amendments
Any amendments to this Code, other than amendments to Exhibit A, must be approved or ratified by a majority vote of the Fund’s Board, including a majority of independent directors.
VII. Confidentiality
All reports and records prepared or maintained pursuant to this Code will be considered confidential and shall be maintained and protected accordingly. Except as otherwise required by law or this Code, such matters shall not be disclosed to anyone other than the Fund’s Board and its counsel, the investment adviser and the relevant Service Providers.
VIII. Internal Use
The Code is intended solely for the internal use by the Fund and does not constitute an admission, by or on behalf of the Fund, as to any fact, circumstance, or legal conclusion.
|
| Exhibit A |
| Persons Covered by this Code of Ethics |
| (As of June 2013) |
John Hancock Variable Insurance Trust
► Principal Executive Officer and President – Hugh McHaffie
► Principal Financial Officer and Chief Financial Officer – Charles Rizzo
► Treasurer – Salvatore Schiavone
John Hancock Funds
► Principal Executive Officer and President – Hugh McHaffie
► Principal Financial Officer and Chief Financial Officer – Charles Rizzo
► Treasurer – Salvatore Schiavone
John Hancock Funds II
► Principal Executive Officer and President – Hugh McHaffie
► Principal Financial Officer and Chief Financial Officer – Charles Rizzo
► Treasurer – Salvatore Schiavone
John Hancock Funds III
► Principal Executive Officer and President – Hugh McHaffie
► Principal Financial Officer and Chief Financial Officer – Charles Rizzo
► Treasurer – Salvatore Schiavone
(f)(2) Not applicable.
(f)(3) The Registrant will provide a copy of the Code of Ethics to any person without charge, upon request by calling the following toll free number (800) 344-1029.
ITEM 3. AUDIT COMMITTEE FINANCIAL EXPERT.
The Board of Trustees has determined that at least one member of its audit committee is an “audit committee financial expert”. Peter S. Burgess is the audit committee financial expert and is “independent”, pursuant to general instructions on Form N-CSR Item 3.
ITEM 4. PRINCIPAL ACCOUNTANT FEES AND SERVICES.
| | |
| (a) | AUDIT FEES: |
| | 2013: $482,312 |
| | 2012: $418,589 |
These fees represent aggregate fees billed for the last two fiscal years (the “Reporting Periods���) for professional services rendered by the principal accountant for the audits of the Registrant’s annual financial statements or services that are normally provided by the accountant in connection with statutory and regulatory filing or engagements for such Reporting Periods.
| | |
| (b) | AUDIT RELATED FEES: |
| | 2013: $22,233 |
| | 2012: $7,770 |
These fees represent the aggregate fees billed for the Reporting Periods for assurance and related services by the principal accountant that are reasonably related to the performance of the audit of the Registrant’s financial statements and are not reported under paragraph (a) of this Item. Such fees relate to professional services rendered by the principal accountant for separate reports in connection with service provider internal controls reviews.
| | |
| (c) | TAX FEES: |
| | 2013: $38,502 |
| | 2012: $34,485 |
These fees represent aggregate fees billed for the Reporting Periods for professional services
rendered by the principal accountant for tax compliance, tax advice and tax planning. The tax services provided by the principal accountant related to the review of the Registrant’s federal and state tax returns and tax distribution requirements.
| | |
| (d) | ALL OTHER FEES: |
| | 2013: $4,514 |
| | 2012: $8,533 |
These fees represent all other fees billed to the Registrant for products and services provided by the principal accountant. These fees were billed to the Registrant and were approved by the Registrant’s audit committee.
(e) (1) Audit Committee Pre-Approval Policies and Procedures:
The Trust’s Audit Committee must pre-approve all audit and non-audit services provided by the independent registered public accounting firm (the “Auditor”) relating to the operations or financial reporting of the funds. Prior to the commencement of any audit or non-audit services to a fund, the Audit Committee reviews the services to determine whether they are appropriate and permissible under applicable law.
The Trust’s Audit Committee has adopted policies and procedures to, among other purposes, provide a framework for the Committee’s consideration of audit-related and non-audit services by the Auditor. The policies and procedures require that any audit-related and non-audit service provided by the Auditor and any non-audit service provided by the Auditor to a fund service provider that relates directly to the operations and financial reporting of a fund are subject to approval by the Audit Committee before such service is provided. Audit-related services provided by the Auditor that are expected to exceed $25,000 per instance/per fund are subject to specific pre-approval by the Audit Committee. Tax services provided by the Auditor that are expected to exceed $30,000 per instance/per fund are subject to specific pre-approval by the Audit Committee.
All audit services, as well as the audit-related and non-audit services that are expected to exceed the amounts stated above, must be approved in advance of provision of the service by formal resolution of the Audit Committee. At the regularly scheduled Audit Committee meetings, the Committee reviews a report summarizing the services, including fees, provided by the Auditor.
(2) Amount approved by the Audit Committee pursuant paragraph (c) (7) (i) (C) of Rule 2-01 of Regulation S-X: None.
(f) Not applicable.
(g) The aggregate non-audit fees billed by the registrant’s principal accountant for services rendered to the registrant and rendered to the registrant’s control affiliates for each of the last two fiscal years of the registrant were $3,114,794 for the fiscal year ended July 31, 2013 and $4,022,758 for the fiscal year ended July 31, 2012.
(h) The audit committee of the registrant has considered the non-audit services provided by the registrant’s principal accountant to the control affiliates and has determined that the services that were non pre-approved are compatible with maintaining the principal accountant’s independence.
ITEM 5. AUDIT COMMITTEE OF LISTED REGISTRANTS
Peter S. Burgess – Chairman
Charles L. Bardelis
Theron S. Hoffman
ITEM 6. SCHEDULE OF INVESTMENTS.
(a) This schedule is included as part of the Report to shareholders filed under Item 1 of this form.
(b) Not applicable.
ITEM 7. DISCLOSURE OF PROXY VOTING POLICIES AND PROCEDURES FOR CLOSED-END MANAGEMENT INVESTMENT COMPANIES.
Not applicable.
ITEM 8. PORTFOLIO MANAGERS OF CLOSED-END MANAGEMENT INVESTMENT COMPANIES.
Not applicable.
ITEM 9. PURCHASE OF EQUITY SECURITIES BY CLOSED-END MANAGEMENT INVESTMENT COMPANIES AND AFFILIATED PURCHASERS.
Not applicable.
ITEM 10. SUBMISSION OF MATTERS TO VOTE OF SECURITY HOLDERS.
(a) The registrant has adopted procedures by which shareholders may recommend nominees to the registrant's Board of Trustees. A copy of the procedures is filed as an exhibit to this Form N-CSR. See attached "John Hancock Funds – Nominating and Governance Committee Charter".
ITEM 11. CONTROLS AND PROCEDURES.
(a) EVALUATION OF DISCLOSURE CONTROLS AND PROCEDURES. The Registrant maintains disclosure controls and procedures that are designed to ensure that information required to be disclosed in this Form N-CSR is recorded, processed, summarized and reported within the periods specified in the rules and forms of the Securities and Exchange Commission. Such disclosure controls and procedures include controls and procedures designed to ensure that such information is accumulated and communicated to the Registrant's management, including its principal executive officer and principal financial officer, as appropriate, to allow timely decisions regarding required disclosure.
Within 90 days prior to the filing date of this Form N-CSR, the Registrant had carried out an evaluation, under the supervision and with the participation of the Registrant's management, including the Registrant's principal executive officer and the Registrant's principal financial officer, of the effectiveness of the design and operation of the Registrant's disclosure controls and procedures relating to information required to be disclosed on Form N-CSR. Based on such evaluation, the Registrant's principal executive officer and principal financial officer concluded that the Registrant's disclosure controls and procedures are operating effectively to ensure that:
(i) information required to be disclosed in this Form N-CSR is recorded, processed, summarized and reported within the periods specified in the rules and forms of the Securities and Exchange Commission, and
(ii) information is accumulated and communicated to the Registrant’s management, including its principal executive officer and principal financial officer, as appropriate, to allow timely decisions regarding required disclosure.
(b) CHANGE IN REGISTRANT’S INTERNAL CONTROL: Not applicable.
ITEM 12. EXHIBITS.
(a)(1) Code of Ethics for Principal Executive Officer and Principal Financial Officer.
(a)(2) The certifications required by Rule 30a-2(a) under the 1940 Act.
(b) The certifications required by Rule 30a-2(b) under the 1940 Act.
(c)(1) Submission of Matters to a Vote of Security Holders is attached. See attached "John Hancock Funds – Nominating and Governance Committee Charter".
(c)(2) Contact person at the registrant.
Pursuant to the requirements of the Securities Exchange Act of 1934 and the Investment Company Act of 1940, the registrant has duly caused this report to be signed on its behalf by the undersigned, thereunto duly authorized.
|
| JOHN HANCOCK FUNDS II |
| |
| |
| |
| |
| /s/ Hugh McHaffie |
| |
| Hugh McHaffie |
| President |
| Date: September 19, 2013 |
Pursuant to the requirements of the Securities Exchange Act of 1934 and the Investment Company Act of 1940, this report has been signed below by the following persons on behalf of the registrant and in the capacities and on the dates indicated.
|
| /s/ Hugh McHaffie |
| |
| Hugh McHaffie |
| President |
| Date: September 19, 2013 |
| |
| |
| |
| |
| /s/ Charles A. Rizzo |
| |
| Charles A. Rizzo |
| Chief Financial Officer |
| Date: September 19, 2013 |